“feasibility study for development of riverine port … · “feasibility study for development...
TRANSCRIPT

FEB 2017
COMMERCE & TRANSPORT DEPARTMENT(GOVERNMENT OF ODISHA)
“FEASIBILITY STUDY FOR DEVELOPMENT OFRIVERINE PORT ON RIVER MAHANADI”
FINAL FEASIBILITY REPORT
WAPCOS Limited(A GOVERNMENT OF INDIA UNDERTAKING –MINISTRY OF WATER RESOURCES, RIVER DEVELOPMENT AND GANGAREJUVENATION)76-C,Sector-18, GURGAON – 122015, INDIA : +91-124 - 2397395 / 2397388 / 2348028Fax : +91-124 – 2349180 / 2397392 / 2399224Email : [email protected] : www.wapcos.gov.in

FEASIBILITY STUDY FOR PORT ON RIVER MAHANADI FINAL FEASIBILITY REPORTCONTENTS
i
CONTENTS
EXECUTIVE SUMMARY………………..…………………………………………………………………….i
CHAPTER 1 INTRODUCTION………………………………………...........………………………. 1
1.1 Introduction………………………………………............………….…………………………..…. 11.2 Need for the Project………………………………………………………………………………….11.3 Purpose of Proposed ……………………………..………................................………….21.4 Scope of the Study and Structure of the report……………………..………………….3
CHAPTER 2 SITE CONDITIONS AND ANALYSIS………..............................………….4
2.1 Site Conditions ……………………..........................………………………..….………..…. 42.2 Topography……………………........................................................…….………..…. 42.3 Bathymetry……………………........................................................…….………..…. 52.4 Review of oceanographic data ……………………..........................…….………..…. 52.5 Analysis of meteorological data ……………………........................…….………..…. 92.6 Seismicity……………………...........................................................…….………..…. 13
CHAPTER 3 ENGINEERING SURVEY AND INVESTIGATIONS……………………………. 14
3.1 General ……………………….…………………..............................................………..…. 143.2 Hydrographic Survey……………………………………….….........………………………..…. 143.3 Topographic survey……………………………………….…...........………………………..…. 193.4 Geotechnical Investigation……………...........…….…...........………………………..…. 23
CHAPTER 4 TRAFFIC SURVEYS AND DEMAND ASSESSMENT……….………………….39
4.1 Methodology…………………………………………………………….…………………………..….394.2 Primary Data Collection………………………………………………………………………..…. 394.3 Market Size……………………………………………………..……….…………………………..…. 414.4 Share Factor Analysis…………………………………………………………………………..…. 444.5 Market Share ……………………………….……............................……………………..…. 454.6 Vessel calls……………………………………….…………………………………………………..…. 474.7 Traffic Projection for proposed port ……………………………………….…………..…. 494.8 Conclusion ……………………………….........................................……….…………..…. 51
CHAPTER 5 FACILITY REQUIREMENTSAND PROJECT DESCRIPTION………………. 52
5.1 Basic Requirements……………………..................................………………………..…. 525.2 Navigational Requirement …………….…………….….............………………………..….575.3 Cargo Servicing……………………………………..…….…..............………………………..….695.4 Dredging……………......................................................................…….………..….855.5 Reclamation……………........................................…………………………….………..….915.6 Other Development Areas in the vicinity of Port……………................……..…. 925.7 Proposed Port Limits…………….........................…………………………….………..…. 92

FEASIBILITY STUDY FOR PORT ON RIVER MAHANADI FINAL FEASIBILITY REPORTCONTENTS
ii
CHAPTER 6 PROJECT DESIGN ………………………………..……………………………….……. 93
6.1 Design Basis …………….…………….………………………………………………….………..…. 936.2 Design Approach …………….………………………………………………………….………..…. 936.3 Design Parameters…………….……………………………………………………….………..…. 936.4 Environmental Data…………….…………………………………………………….………..….. 946.5 Design Levels…………….…………………………………............………………….………..…. 956.6 Design Specifications…………….……………………............……..…………….………..….966.7 Design Codes and Standards …………….…………...…………..…………….………..…. 966.8 Design of Bulk Cargo Berth…………….…………...…………..………....…….………..….. 976.9 Design of Bulk Cargo Berth…………….…………...…………..………....…….………..….. 1066.10 Container Berth…………….…………...…………..………......................…….………..…. 1066.11 Fender System…………….…………...…………..………........................…….………..…. 1156.12 Mooring Arrangement and Bollards …………….……..................…….………..….. 1186.13 Tug and other floating craft required for berthing/un-berthing….………..…. 120
CHAPTER 7 CARGO HANDLING SYSTEMS AND EQUIPMENT…………......…………. 121
7.1 General…………….………................................................…………….…….………..….1217.2 Concepts…………….…………………………………......................……………….………..….1227.3 Berth and Handling System Required …………….………………....……….………..…. 1237.4 Bulk Handling …………….……….....................……………………….………….………..….1247.5 Container Handling…………….……….....................……………….………….………..…. 1287.6 General Cargo Handling…………….……................……………….………….………..…. 135
CHAPTER 8 INFRASTRUCTURE FACILITES ………...........................…………………. 137
8.1 General…………….…………….……………………………….………………………….………..…. 1378.2 Road and Railways…………….….………………….…….......…………………….………..…. 1378.3 Navigation Aids …………….…….….........................................….………………….….1388.4 Ship-to-Shore Communications …………….…………….....…….....……….………..…. 1408.5 Harbour Craft…………….…………….……..………….……….....………………….………..…. 1418.6 Water Requirement …………….……………....…………………………………….………..….1418.7 Fire Fighting System…………….…………….………………….................…….………..…. 1438.8 Drainage and Sewerage System…………….…………………………………….………..….1438.9 Electric System …………….………………........................…………………….………..…. 1448.10 Port Operations…………….………………........................…………………….………..…. 1458.11 Communication System …………….………………....................…………….………..….1478.12 Port Buildings…………….………………....................................…………….………..…. 148
CHAPTER 9 MODEL STUDIES ………..………...............................………………………. 149
9.1 Model studies …………….……………....………………….………………………….………..….1499.2 Wave Tranquillity Studies…………….………….………………………………….………..…. 1499.3 Tidal Hydrodynamics and Sedimentation Studies…………….………….………..…. 1649.4 Estimation of Capital Dredging…………………….................................………..…. 1739.5 Estimation of Maintenance Dredging…………………….......................………..…. 174

FEASIBILITY STUDY FOR PORT ON RIVER MAHANADI FINAL FEASIBILITY REPORTCONTENTS
iii
9.6 Conclusions……………………...............................................................………..…. 176
CHAPTER 10 ENVIRONMENTAL ASPECTS ………..………...............……………………….177
10.1 Introduction……………………........................................................…….………..…. 17710.2 Environmental Regulations and Legal Framework …………….....…….………..….17810.3 Statutory Clearances required for the Project…………...............…….………..….18110.4 Environmental Features of the Study Area…………….................…….………..….18110.5 Socio Economic Environment……………........................................….………..…. 19210.6 Village Land Type and PAF (Project Affected families)………………...………..…. 19810.7 Fisheries……………......................................................................…….………..….20010.8 EIA Study for the Proposed Development……………..................…….………..…. 202
CHAPTER 11 PROJECT IMPLEMENTATION SCHEDULE ………..……………….….……….203
CHAPTER 12 PROJECT COST AND FINANCIAL ANALYSIS………..…....……..….……….206
12.1 General…………….…………….……………………………….………………………….………..…. 20612.2 Basis of Estimates…………….…………….……………….………………………….………..…. 20612.3 Capital Cost …………….…………….……………..................…………………….………..…. 20712.4 Operating Cost…………….…………….……………………….………...…………...………..…. 20912.5 Rate of Return.……………………….................................................…...………..…. 210
CHAPTER 13 CONCLUSIONS AND RECOMMENDATIONS…...……..………..….………. 218

FEASIBILITY STUDY FOR PORT ON RIVER MAHANADI FINAL FEASIBILITY REPORTCONTENTS
iv
LIST OF TABLES
Table 2.1 Percentage occurrence of wave height & direction off Paradip forentire year (January - December) ………………................…….………..….6
Table 2.2 Maximum and minimum current speeds recorded off jetty andat the mouth of Mahanadi estuary…………………….........…….………..….7
Table 2.3 Monthly Littoral Drift Transport…………………….............…….………..…. 9Table 2.4 Nomenclatures of the Cyclone Distribution…………………….………..…. 11Table 2.5 Historical Severe Cyclone Storm Events……………........…….…………….. 11
Table 3.1 Geodetic Parameters……………......................................…….………..…. 16Table 3.2 Projection Parameters……………....................................…….………..…. 16Table 3.3 Bench Mark Levels w.r.t. MSL…………...........................…….………..…. 20Table 3.4 Details of Boreholes……………........................................…….………..…. 23Table 3.5 Summary on Chemical Analysis of Water……….….........…….………..…. 26Table 3.6 Summary on Chemical Analysis of Soil. …………............…….………..…. 27Table 3.7 Soil Profile ……………......................................................…….………..…. 28Table 3.8 Details of the foundation suitable for the locations…………………..…. 34
Table 4.1 List of companies/industries which were visited during the sitevisit…………........................................................................……………….40
Table 4.2 Total market size of detailed cargo within hinterland…………….…….. 42Table 4.3 Total market size of major commodity within the hinterland.......... 43Table 4.4 Total vessel calls based on Low, Medium and High Case………………. 48Table 4.5 Phase wise volume projection in low case scenario……………………….49Table 4.6 Phase wise volume projection in Medium case scenario……………....50Table 4.7 Phase wise volume projection in high case scenario………………….…. 51
Table 5.1 Expected Cargo Volume for Basic Facility Requirement ……..……..….55Table 5.2 Ship sizes expected at the port……............................................…….. 56Table 5.3 Number of Ship Calls ……………………....……………………..…………………. 56Table 5.4 Design Vessel Dimensions ……………....................................…………….58Table 5.5 Depth of channel (BIS)……………........................………………..…………….60Table 5.6 Additional Width for Straight Channel Sections……………………….…….62Table 5.7 Extra width of channel at curvature sections…….......................……..64Table 5.8 Depth of channel (PIANC - General)…………….................……..……..…. 64Table 5.9 Depth of channel (PIANC - Specific)………………................……..……….. 65Table 5.10 Width of channel at straight sections ………………............……..……….. 65Table 5.11 Extra width of channel at curvature sections …..............……..……….. 65Table 5.12 Depth of channel (Summary) ….......................................……..………..65Table 5.13 Geometrical characteristics of navigation channel at straight
sections…................................................................................……….. 66Table 5.14 Extra width of channel at curvature sections (Specific)…..........……..66Table 5.15 Allowable Wave Heights near the Berths as per PIANC …......……….. 69Table 5.16 Allowable Wave Heights near the Berths as per IS 4651….....……….. 69Table 5.17 Limiting norms for Berth occupancy Factors….........…...............……..72Table 5.18 Phase wise Number of Berths and Handling Capacity…............…….. 73

FEASIBILITY STUDY FOR PORT ON RIVER MAHANADI FINAL FEASIBILITY REPORTCONTENTS
v
Table 5.19 Depth at All Berths…..................................................................……..74Table 5.20 Stack volume quantity basis …...................................................……..75Table 5.21 Area adopted for other infrastructure activities in planning….....…..75Table 5.22 Area Requirements....…................................................................…..76Table 5.23 Comparison of Layouts....…..........................................................….. 84Table 5.24 Quantity of Dredge material....…..................................................…..90Table 5.25 Quantity of earth fill for land reclamation....….............................…..92
Table 6.1 Design Vessel Sizes....…..................................................................... 94Table 6.2 Grade of Concrete and Steel....…..................................................…..96Table 6.3 Unit weight of materials....…........................................................….. 96Table 6.4 List of Codes and Standards....…...................................................…..97Table 6.5 Design Parameters for Bulk Cargo Berth....…...............................….. 99Table 6.6 Critical Forces in structural members of bulk cargo berth....…....….. 106Table 6.7 Design Parameters for Container Berth................................….....…..107Table 6.8 Critical Forces in structural members of Container Berth.....…....….. 115Table 6.9 Fendering system for Berths.....….................................................…..116Table 6.10 CSS Fender Performance at Design Deflection.....….....................….. 116Table 6.11 Specification of the CSS Fender.....…............................................….. 117Table 6.12 Specification of Bollard.....….........................................................….. 119
Table 7.1 Facility requirement for different Phases of development..........….. 124Table 7.2 Belt conveyor capacity and HP selection for 2 standard lengths...... 126
Table 9.1 Percentage Occurrence of Wave Height & Direction off Paradip …..150Table 9.2 Allowable wave heights near the berths (IPA Norms)………….......…..151Table 9.3 Allowable wave heights near the berths (IS-4651).......…………….….. 151Table 9.4 Wave transformations from deep sea to near shore waters....….…..153Table 9.5 Percentage Occurrence of Wave Height & Direction at
Refraction point for Entire Year (January – December).............….. 154Table 9.6 Significant wave conditions...............................................…........….. 154Table 9.7 Comparison of Wave Condition along Approach Channel...........….. 159
Table 10.1 Land Use Pattern as Per Satellite Imagery (21st January 2007)…….. 182Table 10.2 Past Meteorological Data of the Study Area………............……….…….. 184Table 10.3 Past Meteorological Data of the Study Area (Wind Flow Pattern)….185Table 10.4 Past Meteorological Data of the Study Area
(Weather Phenomenon)................................................................... 186Table 10.5 List of Fauna within the Study Area…………....................……….……….. 187Table 10.6 List of State Protected Monuments in Jagatsinghpur district……….. 191Table 10.7 Demographic Profiles within 10 Km Radius (Population)……..………..193Table 10.8 Demographic Profiles within 10 Km Radius (SC ST) …………………….. 194Table 10.9 Demographic Profiles within 10 Km Radius (Literacy)…………….…….. 195Table 10.10 Village wise Economic Profile of the Study Area………………………….. 196Table 10.11 Village wise Workforce of the Study Area…………..............…………….. 197Table 10.12 Ownership of Land……………………………………..……………….……………….. 199Table 10.13 Village population and No. of Households………….............…………….. 200

FEASIBILITY STUDY FOR PORT ON RIVER MAHANADI FINAL FEASIBILITY REPORTCONTENTS
vi
Table 10.14 Number of Project Affected Families………….....................…………….. 200Table 10.15 Data Regarding Fishing Activity at Paradip………………….……………….. 201Table 10.16 Overall Fishing Fleet…………………………………………………….………………..201Table 10.17 Overall Fish Production……………………………………………….……………….. 202
Table 11.1 Project Implementation Schedule……………………………….……………….. 205
Table 12.1 Capital Cost…………………………………..…………………………….……………….. 207Table 12.2 Operation & Maintenance cost ………………………………….……………….. 210Table 12.3 Financial internal rate of return (FIRR)…………………………..…………….. 212Table 12.4 FIRR for relative concession periods…….………………………..…………….. 213Table 12.5 Sensitivity Analysis – FIRR…………………………………..……….……………….. 213Table 12.6 Export and import transaction of India ……………..…….……..………….. 214Table 12.7 Conversion from Financial Cost to Economic Cost……….……………….. 215Table 12.8 Cash flow chart for EIRR……………………………………………………………….. 215Table 12.9 Sensitivity Analysis – EIRR…………………………………..……….……………….. 217

FEASIBILITY STUDY FOR PORT ON RIVER MAHANADI FINAL FEASIBILITY REPORTCONTENTS
vii
LIST OF FIGURES
Fig. 2.1 Location Map ……………................................................…….………..…. 4Fig. 2.2 Extract of Naval Hydrographic Chart 352…………..........…….………..…. 5Fig. 2.3 Off-Shore Wave Rose Diagram at Paradeep …………………………....…. 7Fig. 2.4 Typical drift distributions for the month of July……….…….………..…. 8Fig. 2.5 Monthly Avg. of Max, Min & Mean Temperature (°C) ……………..…. 10Fig. 2.6 Avg. monthly rainfall (mm) 1982 – 2013 ……………............………..…. 10Fig. 2.7 Track of the depression …………….............................................…..…. 12Fig. 2.8 Track of the depression of PHAILIN……....……….................………..…. 12Fig. 2.9 Seismic Index Map of India……………............................…….………..…. 13
Fig. 3.1 Hydrographic Survey Area……………......................................……..…. 15Fig. 3.2 Bathymetry Area…………….....................................Enclosed SeparatelyFig. 3.3 Topographic Survey Area……………...............................…….………..…. 20Fig. 3.4 Topography area……………..................................... Enclosed Separately
Fig. 4.1 Market share in low case scenario…………….......................………..…. 46Fig. 4.2 Market Share in medium case scenario……………................………..…. 46Fig. 4.3 Market Share in High case Scenario……………...............…….………..…. 47Fig. 4.4 Vessel calls for bulk cargo……………..............................…….………..…. 48Fig. 4.5 Vessel calls for Container cargo……………....................……..………..…. 48Fig. 4.6 Vessel calls for other cargo…………..............................…….….……..…. 48
Fig. 5.1 Width of the Channel……………...................................……...………..…. 59Fig. 5.2 Widening of Channel at Curvature……………................…….………...…. 60Fig. 5.3 Additional widening at the Curvature of the approach channel……. 63Fig. 5.4 Width of swept track in a turn as a function of rudder angle
and water depth…………….......................................................……..….63Fig. 5.5 Relationship between the waiting to service time ratio (Tw/Ts) –
Berth Occupancy……………........................................…….……….......…. 72Fig. 5.6 Definition of the berth lengths…………….......................….…………..…. 73Fig. 5.7 Offshore bathymetric survey in front of River Mahanadi mouth…...77Fig. 5.8 Cross shore bed profile…………….................................…….………...…. 78Fig. 5.9 Shore parallel bed profile…………….............................…….………...…. 79Fig. 5.10 Typical flow pattern at river mouth…………...........…….......……………. 79Fig. 5.11 Morphological formation in front of River Mahanadi……….………..….80Fig. 5.12 Offshore Approach Channel Alignment………...............…….………..…. 82Fig. 5.13 Combined bathymetric chart (River and offshore) …………………..…. 82Fig. 5.14 Layout I: Right Bank of River Mahanadi…………...... Enclosed SeparatelyFig. 5.15 Layout II: Left Bank of River Mahanadi……............ Enclosed SeparatelyFig. 5.16 Detailed port layout……………................................ Enclosed SeparatelyFig. 5.17 Typical details of TSHD……………..................................…….………..…. 88Fig. 5.18 Typical Cutter Suction Dredger……………............................………..…. 89Fig. 5.19 Calculation of dredging quantity……………............. Enclosed SeparatelyFig. 5.20 IOCL Pipeline Crossing Below River Mahanadi Bed…..........………..…. 91

FEASIBILITY STUDY FOR PORT ON RIVER MAHANADI FINAL FEASIBILITY REPORTCONTENTS
viii
Fig. 5.21 Cross sectional profile showing pipelines and portchannel…………….................................................... Enclosed Separately
Fig. 5.22 Calculation for quantity of earth fill required for reclamationand land development……………............….………..…. Enclosed Separately
Fig. 5.23 Other Development Areas in the vicinity of Port .. Enclosed SeparatelyFig. 5.24 Proposed Port Limits……………................................ Enclosed Separately
Fig. 6.1 The plan and cross section of bulk cargo berth..… Enclosed SeparatelyFig. 6.2 STAAD Panel of the Bulk Cargo Berth……………............….…….……..…. 98Fig. 6.3A Design calculations, drawing Beam……………......... Enclosed SeparatelyFig. 6.3B Design calculations, drawing Pile……………............. Enclosed SeparatelyFig. 6.3C Design calculations, drawing slab……………............ Enclosed SeparatelyFig. 6.4 The plan and cross section of container berth…… Enclosed SeparatelyFig. 6.5 STAAD Panel of the Container Berth…………….............…….…..……..….107Fig. 6.6 Pad and Wheel arrangement of Mobile Harbour Crane…………....…. 110Fig. 6.7A Design calculations, drawing of Beam………............ Enclosed SeparatelyFig. 6.7B Design calculations, drawing of Pile…………..........… Enclosed SeparatelyFig. 6.7C Design calculations, drawing of Slab……………......... Enclosed SeparatelyFig. 6.8 CSS Fender Installed at Jetty…………...........................…….……..…..…. 117Fig. 6.9 Elastic Characteristics of CSS Fender……………...........…….…………..…. 117Fig. 6.10 Drawing of the CSS Fender……………..........................…….…………..…. 118Fig. 6.11 Typical mooring arrangements of a vessel…………...........….………..…. 118Fig. 6.12 Typical Details of Bollard……………..........................…....….…………..…. 119Fig. 6.13 Example of Tractor type tug boat with Schottel propeller (left) and
Voith Schneider propeller (right) ………............................….………..….120
Fig. 7.1 Typical details of a Grab Unloader working on a ship…………..…...….125Fig. 7.2 Flow chart for the Coal Handling at the Port………........….……………. 127
Fig. 8.1 Proposed road and rail networks plan……………….… Enclosed Separately
Fig. 9.1 Off Shore Wave Rose Diagram off Paradip for Entire Year(Jan-Dec) …………….....................................................…….…………..…. 150
Fig. 9.2 Model Area Showing Refraction Line from 50m to 15m depthContour…………….........................................................…….………….…. 152
Fig. 9.3 Inshore Wave Rose Diagram at Paradip for Entire Period(Jan-Dec)…………….........................................................…….………..…. 155
Fig. 9.4 Bathymetry Plot for Existing Condition……………..........…….………..…. 156Fig. 9.5 Wave height contour Plot for waves approaching from South
direction in Existing Condition……………......................…….………....…. 156Fig. 9.6 Bathymetry Plot showing the proposed channel layout……………..….157Fig. 9.7 Wave Height Contour Plot for Waves Approaching from East
Direction…………….......................................................…….………....…. 157
Fig. 9.8 Wave Height Contour Plot for Waves Approaching fromSouth Direction……………...............................................….………..…. 158

FEASIBILITY STUDY FOR PORT ON RIVER MAHANADI FINAL FEASIBILITY REPORTCONTENTS
ix
Fig. 9.9 Wave Height Contour Plot for Waves Approaching from SSW…..…. 158Fig. 9.10 Comparison of wave heights along approach channel before
And after dredging……………..........................................…….………..…. 160Fig. 9.11 Bathymetry Plot with Proposed Condition for MIKE 21 BW model…162Fig. 9.12 Wave Heights Distribution Plot for Waves Incident from East
Direction……………......................................................…….…………..…. 162Fig. 9.13 Wave Heights Distribution Plot for inclined Waves ….….……..…..…. 163Fig. 9.14 Layout of proposed port development ……................…….………..…. 164Fig. 9.15 Computational Model with Proposed Channel Layout and
Reclamation. ……………................................................…….………...…. 166Fig. 9.16 Bathymetry under existing condition…………….............…….………..…. 168Fig. 9.17 Flow Pattern during peak flood in existing condition………………….... 169Fig. 9.18 Flow Pattern during peak ebb in existing condition……...……….…..….169Fig. 9.19 Computational model with proposed development……...…………..….170Fig. 9.20 Flow Pattern during Peak Ebb……………......................…….……..…..…. 171Fig. 9.21 Flow Pattern during Peak Flood……………...................…….………....…. 171Fig. 9.22 Flow Pattern during Peak Flood……………...................…….………....…. 172Fig. 9.23 Flow Pattern during Peak Ebb……………............................…………..…. 172Fig. 9.24 Channel Layout considered for Capital Dredging…………...……………. 173Fig. 9.25 Estimated Siltation in Navigation Channel in existing condition….... 174Fig. 9.26 Estimated Siltation in the proposed condition during Monsoon
Season. ……………...........................................................…….………..…. 175
Fig. 10.1 Land Use Pattern as Per Satellite Imagery (21st January 2007)………182Fig. 10.2 Land-use/ Land-cover Map within 15 km of the proposed Jetty
location …………….........................................................…….………..…. 183Fig. 10.3 Index Map Showing the Boundary of Gahirmatha Marine
Sanctuary……………................................................….......….………..…. 191Fig. 10.4 Village maps falling in Project Land Area……………...............………..….198Fig. 10.5 Proposed land area of port……………......................….......….………..…. 198Fig. 10.6 Superimposed port land area map………................….......….………..…. 199
Fig. 12.1 Sensitivity Analysis - FIRR…………….........................….......….………..…. 214Fig. 22.2 Sensitivity Analysis - EIRR…………….........................….......….………..….217

FEASIBILITY STUDY FOR PORT ON RIVER MAHANADI FINAL FEASIBILITY REPORTCONTENTS
x
APPENDICES
Appendix 1.1 Detailed Scope of Work
Appendix 3.1 DGPS Control Points and Traverse PointsAppendix 3.2 Site PhotographsAppendix 3.3 Borehole Details
Appendix 4.1 Brief Minutes of Meetings for Traffic Survey
Appendix 5.1 Dredging QuantityAppendix 5.2 Calculation of Quantity Earth Fill
Appendix 6.1 Land Records

FEASIBILITY STUDY FOR PORT ON RIVER MAHANADI FINAL FEASIBILITY REPORTCONTENTS
xi
LIST OF ABBREVIATION
NIO - National Institute of OceanographyIMD - India Meteorological DepartmentVSCS - Very Severe Cyclonic StormCS - cyclonic stormSCS - severe cyclonic stormSSHWS - Saffir-Simpson Hurricane Wind ScaleATG - Automatic Tide GaugeUTM - Universal Transverse MercatorSBES - Single Beam Echo SounderFBF - Fugro Binary FormatGPS - Global Positioning SystemGSDP - Gross state domestic productCAGR - compounded annual growth rate
PIANC - Permanent International Association of NavigationCongress
TSHD - Trailer Suction Hopper DredgerCSD - Cutter Suction DredgerEDI - Electronic Data Inter-changeVTS - Vessel Traffic ServicePMIS - Port Management and Information SystemOIDC - Odisha Industrial Development CorporationOSEB - Odisha State Electricity BoardST - sediment transportMoEF - Ministry of Environment & ForestEIA - Environmental Impact AssessmentEAC - Expert Appraisal CommitteeSEAC - State Expert Appraisal CommitteeCRZ - Coastal Regulation ZoneHTL - High Tide LineLTL - Low Tide LineIRR - internal rate of return

FEASIBILITY STUDY FOR PORT ON RIVER MAHANADI FINAL FEASIBILITY REPORTEXECUTIVE SUMMARY
i
EXECUTIVE SUMMARY
0.1 The Governor of Odisha acting through the Commerce & Transport Department,Government of Odisha, and represented by the Principal Secretary of theDepartment is engaged in the development of Port and as part of this endeavour,the Authority has decided to undertake the development of a Port on RiverMahanadi through Public Private Partnership on Build, Own, Operate, Share &Transfer (BOOST) basis.
0.2 Odisha has a vast hinterland generating cargo, comprising of the developingEastern and Central Indian States. Exports and imports of food grains, mineralsands, raw materials, finished goods, fertilizers and edible oils and petroleumproducts, by the large industrial houses located in the hinterland offer long termpotential for cargo. Any economic development taking place in the hinterlandStates would have a direct bearing on the ports in Odisha. And also Odisha willhave to play a vital role in the overall development of Eastern region of thecountry, if its natural maritime endowments are to be optimally utilized.
0.3 From the initial considerations and reconnaissance survey various locations forport development are analysed, and considering non availability of required landarea on right side, development of port on left side of river Mahanadi has beenproposed.
0.4 The proposed port site is located near to industrial sites, adjacent to the NationalHighway NH-5A (Now NH-53). The proposed port is located at Latitude20°20'23.02"N and Longitude 86°37'16.00"E and is connected to Cuttack byNH - 5A (Now NH - 53) which is about 90 km from the project site. Paradip railway
station is located 8 kms away to the project site. Waterways connection of theproposed port site exists with sea ports of Paradip and Dhamra and further tooverseas. The proposed port site is just 12 km inside the creek from the open seain the Bay of Bengal.

FEASIBILITY STUDY FOR PORT ON RIVER MAHANADI FINAL FEASIBILITY REPORTEXECUTIVE SUMMARY
ii
0.5 The site for the proposed port is uncultivated, flat land devoid of significantvegetation except for sparsely spread common shrubs and grasses. It is low-lyingand gets water logged during monsoon. There is a shallow area at the river mouthdue to presence of a sandbar and the depth in the river varied mostly between2 m and 10 m. Tides in the area are mixed, semidiurnal type with an averagespring tide range of 2.0 m and a neap tide range of 0.7 m. The predominant wavedirections in deep water are from SW to NE with the maximum wave heights ofthe order of 4.5m. The current speed varies with the tidal state and the maximumspeeds coincide with the spring tide with a magnitude of 2.42 knots at mid depth.The direction of the current is predominantly in the estuary during flood tide andreversed during the ebb tide. The direction of the current is about 3250 to 3400 Nduring flooding tides and 1500 to 1700 N during ebbing. It has been estimated thatabout 1.5 Mm3 sand movements takes place in a year due to littoral drift. Themean wind speed prevailing in the area is around 14.1 km/hr. The annual rainfallat Paradip is 1642.09 mm. The Project area falls in Zone III i.e. moderate intensityseismic zone
0.6 In order to augment the available data various field investigations such asgeotechnical survey, Topographic survey and hydrographic surveys were carriedout. The hydrographic survey reveals that river bed within the survey area issloping from edges to the center of creek. The water depths are varying upto 10.0m. The seabed within the survey area is sloping from West to East. The waterdepths are varying between 0.2 m and 16.9 m. The topographic survey revealsthat ground levels are varying from 2.2 m to 3.0 m. In order to obtain informationon the sub soil strata 6 boreholes were drilled on the left bank of River Mahanadi.Subsurface profile generally alternating sequence of unconsolidated silty-clay;silty-sand and poorly graded sand belonging to the recent geological period.Based on Information from these surveys, investigation and available data,various navigational facilities were optimized.
0.7 The traffic projections were arrived at, based on origin/destination surveys in theimmediate hinterland and reports on earlier studies and discussions with the localindustries and traders. The anticipated traffic figures are summarised below
Phase - I Phase -IICommodity 2018-2027 2028-2037
Iron ore 10.45 27.06Coal 4.65 11.45Fertilizers 1.81 3.87Other bulk cargo 0.52 1.14Containers 1.00 2.36
Total (Millions Tonne) 18.43 45.88

FEASIBILITY STUDY FOR PORT ON RIVER MAHANADI FINAL FEASIBILITY REPORTEXECUTIVE SUMMARY
iii
As revealed from the traffic study it can be seen that Iron Ore, Coal and Fertilizermake up the bulk cargo traffic, which will constitute the major traffic that will becoming to the port.
0.8 Based on types and volume of cargo to be handled, the number of ship calls andthereby types and number of berths required for each commodity were workedout. Two jetties are proposed for phase I development to cater to the trafficdemand, with total length of 500m. An additional berth length of 1000m isproposed in phase II to handle the additional Iron ore and coal cargo expected inthe phase – II. Separate berths are required in phase II for Container and OtherCargo Berths. The areas considered are tabulated below:
Commodity Phase I Phase IITh.
(MTPA)Area(Ha)
Th.(MTPA)
Area(Ha)
Iron ore 10.45 11.80 27.06 27.50Coal 4.65 15.30 11.45 36.90Fertilizers 1.81 4.10 3.86 8.70Other Bulk Cargo 0.52 0.90 1.14 1.90Containers* 1.00 1.65 2.36 3.90Total area cargo related 18.43 33.75 45.88 78.90
Rail Siding 40.0 60.0Approach roads 20.0 30.0Service utilities 2.0 6.0ADMN & Support Building 25.0 35.0Green belt 25.0 40.0Total 112.00 171.00Total Area 145.75 249.9020% Extra provision 29.15 49.98Total Land Area 174.90 299.88
* MTEU Say 175 Ha Say 300 Ha
The storage area requirements work out to 175 Hectare in initial phase going upto 300 Hectare in ultimate phase. Based on these requirements, planning of waterarea, alignment, width and depth of the approach channel in the outer and innerreaches, layouts of berths etc. were evolved. In addition, depths and dimensionsof manoeuvring areas such as turning circle, berths etc. are also determined,based on National as well as International codes and practices.
0.9 Different layouts were evolved and their merits, demerits have also beendiscussed. Out of these, Layout II : Left Bank of River Mahanadi is selected as finallayout. Waterfront facilities on left bank of River Mahanadi are planned. All berthswill be open piled jetties. The coal berth being dusty cargo has been kept farthestfrom container berth. The stacking space required for each commodity isprovided on reclaimed land. The land will be reclaimed to a level of +5.0m aboveCD. On the waterside bund will be created and area behind the bund will be filledwith dredged material. The berths are placed in detached way. When conveyor

FEASIBILITY STUDY FOR PORT ON RIVER MAHANADI FINAL FEASIBILITY REPORTEXECUTIVE SUMMARY
iv
systems are different for different cargo detached berth are preferable. This willfacilitate to align the berth properly as per prevailing velocity in front. Being ariverine port in shallow area, which is located 13km inside from river mouth andin order to have access to the port a 190 m wide outer channel and 160m innerchannel is proposed to be dredged to -14 m and -12 m having length ofapproximately 14 km and 13 Km respectively. The total quantity of dredgingworks out 30 Million m3 for phase I development. It is proposed to dredge usingcombination of Trailing Suction Hopper Dredger and Cutter suction dredger.
0.10 The handling systems requirements at berth for each phase of the project are asfollows
* TEU/hr.Phase Phase I (2016-25) Phase II (2026-35) (Additional)Cargo Th.
(MT)No. ofberths
Capacity(tph)
Th.(MT)
No. ofberths
Capacity(tph)
Iron ore 10.45 1 1 x 5000 27.06 1 1 x 5000Coal 4.65
11 x 2000 11.45 1 1 x 2000
Fertilizers &Other Bulk Cargo 2.33 2 x 500 5.01 1 1 x 500
Containers* 1.00 1 x 35* 2.36 1 -Total 18.43 2 45.88 4
It is proposed that the port will comprise of the following handling systems:
Bulk handling system for iron ore and coal Break bulk handling system for fertiliser and general cargo Container handling system for containers
The equipment for the facility is planned in three different tiers according to theirusage:
a) Quay equipmentb) Conveying systems mechanismc) Yard equipment
The capacities and types of equipment as furnished as under:
I. Bulk Handling Systema) Quay equipment : 1 x 5000 tph - Continuous Loader (For Iron Ore)
1 x 2500 tph – Continuous Unloader (For Coal)b) Conveying system : 1000mm belt conveyorc) Yard equipment : Stacker cum Reclaimer 2 nos. each for Coal &
Iron Ore
II. Break Bulk Handling Systema) Quay equipment : 2 x 500 tph - Mobile Cranesb) Conveying system : Tractor and trailersc) Yard equipment : Fork Lift Trucks (FLTs)

FEASIBILITY STUDY FOR PORT ON RIVER MAHANADI FINAL FEASIBILITY REPORTEXECUTIVE SUMMARY
v
III. Container Handling Systema) Quay equipment : 1 x 35 TEU/hr. Rail Mounted (40T) Cranesb) Conveying System : Tractor and trailersc) Yard equipment : 2 nos. Rubber tyred gantry cranes
1 no. Rail mounted crane
0.11 The facilities created for receipt and dispatch of the anticipated traffic have to bebacked by well-planned infrastructure facilities, taking into account the futureexpansion. The infrastructure facilities would include roads and railways,navigational aids, port crafts, electric power supply, water supply and sewage,drainage, firefighting etc.
For the cargo terminals at Mahanadi Port, a two-lane road access to the port hasto take off from the link road which will connect NH-5A (Now NH-53) through the750m long proposed bridge across the River Mahanadi. Similarly, a 6 km longbranch railway line from Haridaspur Paradip BG line would be connected withMahanadi Port including rail Bridge of length 750m. It is anticipated thatHaridaspur-Paradip rail link would get completed in 2018.
Navigational aids including VTMIS, floating marks (such as buoys and beaconstransit and clearing marks), signalling systems, radio aids and communications,electronic systems, radar etc., which are installed on land or in water for safemanoeuvring during day and night have been proposed. The bouyage would startfrom the ‘Landfall Buoy’ at a depth of water of about 20m. This would be large,lighted and with radar reflectors for identification from 3 to 5 nautical miles. Theentire fairway would be marked with port and starboard channel marker buoys,including a fairway buoy at the sea-ward end of the dredged channel. These willbe supplemented by shore based marks provided for guiding navigators. To helpnavigating large ships and to provide assistance the port would be equipped withport crafts such as tugs, mooring boats, fire tenders and pilot launches.
The electric power supply will be taken from Odisha State Electricity Board at 66KV with an initial demand of 10 MVA at a mutually acceptable location. Thevoltage will be stepped down to 11 KV with a distribution system to varioussubstations and further stepped down at the substations 3.3 KV, 415 V (both) and230 V single phase to the various equipment. The port water supply would betapped from be obtained from Odisha Industrial Development Corporation(OIDC). A general firefighting station will be provided for cargo as well as otherport activities. The port at its vital installations would be equipped with firedetection and warning systems. Special firefighting equipment such as foam andcarbon dioxide extinguishers are provided for chemical and electrical fires. Theport would be provided with adequate drainage and sewage network.
0.12 WAPCOS evolved the basic channel/berth layouts to be examined to ascertain itsfeasibility by mathematical model studies in regard to wave tranquillity, tidalhydrodynamics/siltation and maintenance dredging point of view. Accordingly,

FEASIBILITY STUDY FOR PORT ON RIVER MAHANADI FINAL FEASIBILITY REPORTEXECUTIVE SUMMARY
vi
WAPCOS has undertaken mathematical model studies for wave tranquillity andmathematical model studies for tidal hydrodynamics and sedimentation. Wavetranquillity study revealed that the wave heights near the proposed berth and inthe turning circle region would remain less than 0.06m throughout the year,which is within the permissible limits for the design ships. Tidal hydrodynamicsand sedimentation study revealed that the flow direction is almost parallel to thedredged channel and the cross flow is not significant in the channel. It is alsonoticed that sufficient depths are available for the design vessels during all phasesof the spring and neap tide. During low water low lying areas get exposed andonly water is available in the dredged channel as usual. Based on the results, it isfound that the quantity of siltation is of the order of 4.5 Mm3 per year for theentire navigation channel.
0.13 Proposed project envisages construction of following facilities:
Iron Ore Berth - 250m X 25m Multi Cargo Handling Berth - 250m X 25m Coal Storage Area - 15.30 Ha (4Nos. -1000m X38m) Iron Ore Storage - 11.80 Ha (3Nos. - 1000m X 38m) Fertilizer Storage Area - 4.10 Ha (2 Nos. - 275m X 75m) Break Bulk Storage Area - 0.90 Ha (150m X 75m) Container Storage Area - 1.65 Ha (220m X 55m) Admin Building - 30m X 20m Workshop - 60m X 15m Fuel Station - 30m X 30m Electrical Building - 20m X 30m Sub Station - 50m X 50m Security Building - 5m X 5m Road Bridge - 750m X 10m Rail Bridge - 750m X 6m Fire Station - 20 X 20m Port Users Building - 30 X 20m Rail Yard for Iron Ore - 500 X 50 m Rail Yard for Coal - 500 X 50 m Dredging in navigation Channel in Mahanadi - 13 km Dredging in navigation Channel in sea up to river mouth - 14 km Quantity of dredged material - 30 Mm3
Quantity of maintenance dredging - 4.5 Mm3 /year Construction of port area roads - 10 km Green Belt, Truck Parking Area
0.14 The initial environmental impact assessment with regard to baselineenvironmental setting, preliminary assessment of impacts likely to assure onvarious aspects of environment during project construction and operation phasewas carried out. In addition, the framework of Environmental Management Plan

FEASIBILITY STUDY FOR PORT ON RIVER MAHANADI FINAL FEASIBILITY REPORTEXECUTIVE SUMMARY
vii
(EMP) is also outlined. It is imperative to study the pre-project or baseline statusof environment which can serve as a baseline for comparison during projectconstruction and operation phases.
0.15 The estimated cost for the development of port on river Mahanadi is aboutRs. 2110 crores. It is proposed to develop the proposed port through PublicPrivate Partnership on Build, Own, Operate, Share and Transfer (BOOST) basis. Inthis PPP mode, the government builds and owns port, while the maintenance andoperation are leased out to the private partnership. The IRR calculation indicatesan attractive return of about 13.41%.
0.16 In conclusion, it can be stated that development of Multi-cargo Port at Mahanadiis technically feasible and financially attractive.

FEASIBILITY STUDY FOR PORT ON RIVER MAHANADI FINAL FEASIBILITY REPORTCHAPTER – 1
INTRODUCTION1
CHAPTER 1
INTRODUCTION
1.1 Introduction
1.1.1 The Governor of Odisha acting through the Commerce & Transport Department,Government of Odisha, and represented by the Principal Secretary of theDepartment is engaged in the development of Port and as part of this endeavour,the Authority has decided to undertake the development of a Port on RiverMahanadi through Public Private Partnership on Build, Own, Operate, Share &Transfer (BOOST) basis. The objective of this consultancy is to undertakefeasibility studies and prepare a Feasibility Report for the purpose of firming upthe Authority’s requirements in respect of development and construction of thePort and enabling the prospective bidders to assess the Authority’s requirementsin a clear and predictable manner with a view to ensuring:
(i) a high level of service for the Port users;(ii) superior operation and maintenance a high enhanced operational
efficiency of the Port;(iii) minimal adverse impact on the local population due to development and
construction of port;(iv) minimal adverse impact on marine habitat and environment;(v) minimal additional acquisition of land; and(vi) phased development of the Port for improving its financial viability
1.1.2 The scope of consultancy services includes traffic surveys and demandassessment, Site analysis, engineering surveys and investigations, Developmentplan for the Port, Facility Requirement, Project Description, Project Design,Preliminary Social Impact Assessment, Preliminary Environment ImpactAssessment, Preliminary design of Port, Preparation of Land Plan Schedules andUtility Relocation Plans, Preparation of indicative BOQ and rough Cost Estimates,Preparation of the technical Schedules of the Concession Agreement. Detailedscope of work of has been given in Appendix 1.1.
1.2 Need for a port
1.2.1 Odisha has a vast hinterland generating cargo, comprising of the developingEastern and Central Indian States. Exports and imports of food grains, mineralsands, raw materials, finished goods, fertilizers and edible oils and petroleumproducts, by the large industrial houses located in the hinterland offer long termpotential for cargo. Any economic development taking place in the hinterlandStates would have a direct bearing on the ports in Odisha.
FEASIBILITY STUDY FOR PORT ON RIVER MAHANADI FINAL FEASIBILITY REPORTCHAPTER – 1
INTRODUCTION2
1.2.2 In the recent past, new and improved technological developments haveoccurred in the global shipping scenario. These technological developmentsdemand new institutional set up to capture the flow of major investments inthe State’s port sector. The port locations and the perennial riverine systems ofOdisha are ideally situated to adapt to the current developments in technology, inthe areas of communication, automation, cargo handling and ship technology.
1.2.3 Eastern and Central Indian States exports and imports of food grains, mineralsands, raw materials, finished goods, fertilizers and edible oils and petroleumproducts, by the large industrial houses located in the hinterland offer long termpotential for cargo. Any economic development taking place in the hinterlandStates would have a direct bearing on the ports in Odisha.
1.2.4 Odisha will have to play a vital role in the overall development of Eastern regionof the country, if its natural maritime endowments are to be optimally utilized.
1.2.5 Sea-bound transport is the most cost-efficient as well as economical means oftransport for the conveyance of raw materials, as well as finished products, inbulk. Such an infrastructure could be the necessary backbone, for attracting large-scale industries.
1.2.6 The Odisha State would encourage and lay down the pathway for thedevelopment of ports and other associated infrastructure, for promoting industry,trade and commerce. The logic of locating major industries near ports is clear,since the large business establishments want to import industrial raw materialsand export their finished products and require easy access to the internationalmarkets, through viable and economic sea routes.
1.3 Purpose of the project
1.3.1 Maritime trade has been a major cause of prosperity to many countries across theworld. Many such examples can be cited throughout the world, including in India.Modern day industry requires a larger market and economical transportationsystems to get its input or base materials at lowest costs and the finishedproducts are disposed at many destinations at a comparative cost. To achievethis, appropriate transportation facilities are very essential. Thus suchpropositions are possible only if such industries are set up as near as possible to asea port.
1.3.2 The absence of any suitable Major / non Major ports has led to lack of growth inIMPEX trade from hinterland districts of central and northern Odisha and poses abottleneck to development. Hence, construction of a modern port with State ofart facilities between will definitely bring about the required boost inindustrialization and other allied developments. Establishing a multi cargo portwould not only serve the immediate surrounding area of the port but, also caterto the hinterland north and central Odisha.

FEASIBILITY STUDY FOR PORT ON RIVER MAHANADI FINAL FEASIBILITY REPORTCHAPTER – 1
INTRODUCTION3
1.4 Scope of the Study and Structure of the report
1.4.1 The results and analysis of traffic survey, hydrographic survey, topographic surveyand sub soil investigations have been considered for planning and design purpose.The results of previous available field studies near the proposed site have beenreferred in planning. The draft feasibility report consists of following chapters,
Chapter – 1 IntroductionChapter – 2 Site conditions and AnalysisChapter – 3 Engineering Surveys and InvestigationsChapter – 4 Traffic surveys and Demand AssessmentChapter – 5 Facility Requirements and Project DescriptionChapter – 6 Project DesignChapter – 7 Cargo Handling Systems and EquipmentChapter – 8 Infrastructure FacilitiesChapter – 9 Model StudiesChapter – 10 Environmental AspectsChapter – 11 Project Implementation ScheduleChapter – 12 Project Cost and Financial AnalysisChapter – 13 Conclusions and Recommendations
Besides all the above, Tables, Figures and Appendices shall also form as a part ofthis draft feasibility report.

FEASIBILITY STUDY FOR PORT ON RIVER MAHANADI FINAL FEASIBILITY REPORTCHAPTER – 2
SITE CONDITIONS AND ANALYSIS4
CHAPTER 2
SITE CONDITIONS AND ANALYSIS
2.1 Site Conditions
2.1.1 The project site is located near to industrial sites adjacent to the NationalHighway NH-5A (Now NH-53) and located on the left bank of the River Mahanadi.The project area is very active economically. The proposed port is located atLatitude 20°20'23.02"N and Longitude 86°37'16.00"E and is connected to Cuttackby NH-5A (Now NH-53) which is about 90 km from the project site. IFFCO & ESSARsteel plants are opposite side to the project site. Paradip railway station is located8 kms away to the project site. There are various industrial sites in the area andthere are residential areas. Waterways connection of the proposed port site existswith sea ports of Paradip and Dhamra and further to overseas. The proposed portsite is just 10 km inside the creek from the open sea in the Bay of Bengal. Theproposed site for river port is shown in the Fig. 2.1.
Fig. 2.1 Location Map
2.2 Topography
2.2.1 The coastal land between the bank of the Mahanadi River to the north and theTaladanda Canal to the south is flat without significant undulations andvegetation. Some parts of the land are used for rain-fed agriculture. The land isgenerally low-lying and gets inundated during monsoon season.
Proposed port Site
River Mahanadi

FEASIBILITY STUDY FOR PORT ON RIVER MAHANADI FINAL FEASIBILITY REPORTCHAPTER – 2
SITE CONDITIONS AND ANALYSIS5
2.2.2 The site identified for the proposed port is uncultivated, flat land devoid ofsignificant vegetation except for sparsely spread common shrubs and grasses. It islow-lying and gets water logged during monsoon and needs to be raised to anaverage height of 3 m above the existing level. Dredged material obtained fromcapital dredging will be used for this purpose.
2.2.3 There is no eco-sensitive area (National park / Wild life sanctuary) within 10 kmradius of the proposed project. The nearest protected site is the GahirmathaMarine Wildlife Sanctuary which is about 13 km away from the proposed jettylocation.
2.3 Bathymetry
National Institute of Oceanography (NIO), Goa conducted a study in 2008 toexamine the available depths in the stretch between the confluence and the bankopposite to IFFCO Plant. The study revealed the presence of a shallow area at theriver mouth due to presence of a sandbar and the depth in the river varied mostlybetween 2 m and 10 m. The sea bathymetry has been studied from admiraltyChart 352 (Fig. 2.2). Theseabed contours in thestudy area covers from1m to 10m in the nearshore to 20m in theoffshore. In general, allthe depth contours tendparallel to the coast. Thegradient between thedepth contours 1 to 10meters resembles steepgradient whereas seafloor gradient between the depths contours 10 m to 20 m appears gentle. Thedistance of 10m and 20m depth contour from coast is 3 km and 10 kmrespectively. This indicates that the deeper contours are reasonably near incomparison to other coast of Odisha and scope of developing a harbour is quitegood.
2.4 Review of oceanographic data
2.4.1 Tide data
By virtue of its proximity to the Bay of Bengal, the Mahanadi River estuaryexperiences fairly medium/low tidal ranges in the mouth zone. The tidal profileundergoes a minor modification as the tide progresses along the length of theestuary with moderate changes in the tidal range and durations of flood and ebbphases. Short-term measurements conducted during previous studies off theexisting fishing harbour near the mouth of estuary indicate spring and neap tide
Fig. 2.2 Extract of Naval Hydrographic Chart 352

FEASIBILITY STUDY FOR PORT ON RIVER MAHANADI FINAL FEASIBILITY REPORTCHAPTER – 2
SITE CONDITIONS AND ANALYSIS6
ranges of 1.99 m and 1.2 m respectively. The tidal levels at Paradip near to theproject site with respect to chart datum as reported in admiralty Chart No. 352are as follows:
HHWL 3.25 m MHWS 2.60 mMSL 1.70 m MLWS 0.70 mLLWL 0.40 m MHWN 2.00 m
MLWN 1.30 mTides in the area are mixed, semidiurnal type with an average spring tide range of2.0 m and a neap tide range of 0.7 m.
2.4.2 Waves
Waves in the open sea are generated by winds. The offshore wave data reportedby India Meteorological Department (IMD) as observed from ships plying in deepwaters off Paradip were analyzed. The frequency distribution of wave heights forentire year for the above offshore data is given in Table 2.1. Corresponding waverose diagrams are presented in Fig. 2.3. It may be noted that the wave heightbased on ship observed data closely corresponds to significant wave height, whichrepresents average energy of the random wave train.
Table 2.1 Percentage occurrence of wave height & direction off Paradip forentire year (January - December)
WaveHeight
(m)0.5 1.0 1.5 2.0 2.5 3.0 3.5 4.0 4.5 5.0 TOTAL
Direction Calm 4.3222.5 1.20 1.31 0.91 0.61 0.16 0.18 0.00 0.03 0.00 0.00 4.4045.0 1.73 3.72 1.27 0.73 0.37 0.14 0.13 0.05 0.01 0.00 8.1367.5 1.01 1.68 1.29 0.46 0.60 0.22 0.00 0.01 0.07 0.00 5.3590.0 1.10 0.94 0.55 0.33 0.18 0.04 0.00 0.05 0.11 0.00 3.30
112.5 0.97 0.66 0.57 0.26 0.06 0.05 0.00 0.02 0.02 0.00 2.61135.0 0.67 0.37 0.43 0.18 0.23 0.21 0.11 0.10 0.00 0.00 2.29157.5 1.84 0.91 0.90 0.75 0.16 0.33 0.09 0.04 0.04 0.00 5.05180.0 1.60 3.00 2.62 2.23 0.91 0.71 0.27 0.15 0.07 0.00 11.58202.5 1.56 3.11 3.40 2.77 1.61 1.77 0.62 0.55 0.27 0.09 15.75225.0 2.73 4.73 3.33 2.76 2.08 1.30 0.97 0.74 0.37 0.10 19.10247.5 0.71 1.78 1.77 1.37 1.24 0.49 0.37 0.21 0.04 0.06 8.06270.0 0.57 0.8 0.61 0.32 0.22 0.45 0.20 0.17 0.00 0.00 3.34292.5 0.36 0.65 0.05 0.03 0.08 0.04 0.05 0.10 0.03 0.00 1.40315.0 0.27 0.29 0.05 0.14 0.08 0.00 0.04 0.02 0.05 0.00 0.93337.5 0.50 0.35 0.15 0.00 0.05 0.07 0.08 0.09 0.03 0.00 1.34360.0 0.85 1.18 0.60 0.12 0.15 0.04 0.00 0.00 0.08 0.00 3.01Total 17.68 25.48 18.51 13.06 8.17 6.04 2.93 2.32 1.20 0.25 100.00
From the above table and figure, it is observed that the significant waves areapproaching from SW to South direction from the deep sea and the maximumsignificant wave height is 4.0m.

FEASIBILITY STUDY FOR PORT ON RIVER MAHANADI FINAL FEASIBILITY REPORTCHAPTER – 2
SITE CONDITIONS AND ANALYSIS7
Sig. Wave HeightAbove 5
4.5 - 54 -4.5
3.5 - 43 -3.5
2.5 - 32 -2.5
1.5 - 21 -1.5
0.5 - 1Below 0.5
N
Calm4.32 %
10 %
Sig. Wave HeightAbove 4.5
4 - 4.53.5 - 4
3 - 3.52.5 - 3
2 - 2.51.5 - 2
1 - 1.50.5 - 1
Below 0.5
N
Calm4.74 %
10 %
Fig. 2.3 Off-Shore Wave Rose Diagram at Paradeep for Annual Period
2.4.3 Current
To have an idea of the flow-field in Mahanadi, short-term measurements ofcurrents were undertaken by ESSAR in river and at the mouth of the estuaryduring December 2010. The currents were recorded at 0.5 m below the waterlevel (Surface), mid-depth and above the bed level. The maximum and minimumcurrent speeds knots are given in Table 2.2.
Table 2.2 Maximum and minimum current speeds recordedoff jetty and at the mouth of Mahanadi estuary
Location TideSurface Mid-depth Above bed
Max Min Max Min Max Min
JettySpring 2.34 0.05 2.42 0.11 2.37 0.13Neap 1.09 0.05 1.18 0.04 0.90 0.03
MouthSpring 2.53 0.23 2.13 0.20 2.32 0.18Neap 1.61 0.02 1.64 0.06 1.66 0.04
The current speed varies with the tidal state and the maximum speeds coincidewith the spring tide. The direction of the current was predominantly in theestuary during flood tide and reversed during the ebb tide. The direction of thecurrent is about 3250 to 3400 N during flooding tides and 1500 to 1700 N duringebbing.

FEASIBILITY STUDY FOR PORT ON RIVER MAHANADI FINAL FEASIBILITY REPORTCHAPTER – 2
SITE CONDITIONS AND ANALYSIS8
2.4.4 Littoral Drift
The Odisha coast is subjected to strong littoral drift and long shore current fromsouth to north due to oblique action of waves against the coast. Besides, frequentoccurrence of tropical cyclones and floods also contribute to the shorelinechanges. It has been estimated that about 1.5 Mm3 sand movements takes placein a year due to littoral drift alone. During the southwest monsoon season highenergy waves coming from south and southeast cause sand movementnorthwards. During the northeast monsoon predominance of north easterlywaves causes a return drift in the opposite direction. Associated with the higherwave energy during southwest monsoon season the drift from south to north is ofthe order of 0.9 million m3/ year and the return drift during northeast monsoonseason is only 0.16 million m3/year.
In depth littoral drift studies have been carried out for Gopalpur port by CWPRSand presented in Report No. 3392. As the present site is only 30 km south ofGopalpur. The wave climate, cross-shore beach profile will be similar to Gopalpur.The finding of the study is summarized in the Table 2.3. From the table it may beseen major littoral drift occurs in SW monsoon period in the month of June, July &August. The peak drift is in the month of August and is 0.3 million cum towardsnorth. Prominent southward drift occurs in the months of October, November &December. The total northward drift is 1.06 million cum and the total southwarddrift is 0.12 million cum.
In planning groyne length and orientation not only the total drift but the driftdistribution across the beach is also important. The typical drift distribution forthe month of July is shown in Fig.2.4. In the figures besides net andgross-drift the bathymetryunderneath water is also shown inthe figure. From the figure it may beseen that peak drift occurs at adepth of 3.5 m. If any groyne isplanned to intercept the drift at leastthe groin, should be extend beyond3.5 m contour.
Fig. 2.4 Typical drift distributions for the month of July

FEASIBILITY STUDY FOR PORT ON RIVER MAHANADI FINAL FEASIBILITY REPORTCHAPTER – 2
SITE CONDITIONS AND ANALYSIS9
Table 2.3 Monthly Littoral Drift Transport
Month Net (cum) Gross (cum) Northward(cum)
Southward(cum)
January 8830 9780 430 9305February 5770 8440 1335 7105
March -4740 6970 5855 1115April -76180 79560 77870 1690May -81010 113600 97300 16295June -245200 254800 250000 4800July -172400 175700 174050 1650
August -299200 313000 301100 6900September -70120 78970 74545 4425
October -17030 71890 44460 27430November 1701 40080 19189 20891December 4550 25310 10380 14930
2.5 Analysis of meteorological data
The specific meteorological data at Paradip latitude 20o16’ N and longitude 86o42’E has been taken which is near to the site from Indian MeteorologicalDepartment.
2.5.1 Wind
Mean wind speed during summer varies from 16 to 22 km/hr with predominantdirection south and southwest. The mean wind speed was about 10 to 13 km/hrduring winter with the direction north and northeast. The maximum wind speedestimated by India Meteorological department for the super cyclone, which hitParadip coast on 29.10.1999 was 260 km/hr. The mean wind speed prevailing inthe area is around 14.1 km/hr.
2.5.2 Temperature
The mean maximum temperature steadily increases from 29.50C in January to35.50C in July and then decrease to attain minimum (28.60C) in December.Similarly, the mean minimum temperature rises from 13.30C in January to 24.90Cin September followed by gradual decrease till December. The Monthly avg. ofMax, Min & Mean Temperature (°C) during 1982-2013 is given in Fig. 2.5.

FEASIBILITY STUDY FOR PORT ON RIVER MAHANADI FINAL FEASIBILITY REPORTCHAPTER – 2
SITE CONDITIONS AND ANALYSIS10
Fig. 2.5 Monthly Avg. of Max, Min & Mean Temperature (°C)
2.5.3 Rainfall
The annual rainfall at Paradip is 1642.09 mm which is distributed amongst threemain sub-periods – of winter (January and February) : 37.14 mm; SouthwestMonsoon (March to September) : 1305.80 mm; and Northeast Monsoon (Octoberto December) : 299.15 mm.
Fig. 2.6 Avg. monthly rainfall (mm) 1982 – 2013

FEASIBILITY STUDY FOR PORT ON RIVER MAHANADI FINAL FEASIBILITY REPORTCHAPTER – 2
SITE CONDITIONS AND ANALYSIS11
2.5.4 Relative Humidity and Vapour pressure
The relative humidity in the morning is 90 % and above throughout the year whilethe minimum during the evening hours is 60 % during southwest monsoon seasonand 55 % during north-east monsoon and winter months.
2.5.5 Cyclones and Depressions
The formation of storms and depressions is negligible during January – March andvery high during October and November months. Monsoon depressions form inthe head Bay and move towards Odisha coast during SW monsoon season (May-August). The initial movement of the cyclone is towards north westerly direction,but occasionally they change their direction and move in a north easterlydirection (generally referred as recurvature of cyclone). This recurvature ofcyclones takes place during April, May, October and November months. DuringSW monsoon, depressions form in the head of Bay of Bengal and move in awesterly/ north westerly direction. Nomenclatures of the Cyclonic disturbancesaccording to the wind speed used by IMD, has been shown in Table 2.4 .Thetracks of the various Cyclonic storms in the Bay of Bengal also reveals that mostof the cyclonic storms are crossing the east coast through coastal Odisha and EastGodavari district of AP.
Table 2.4 Nomenclatures of the Cyclone DistributionSl.
No.Weather System Maximum sustained surface
wind speed (KMPH)1. Low Less than 312. Depression 31-493. Deep Depression 50-614. Cyclonic System 62-885. Severe Cyclonic System 89-1176. Very Severe Cyclonic Storm 118-2217. Super Cyclonic Storm 222 and above
Table 2.5 Historical Severe Cyclone Storm EventsDate Type Wind Velocity
(Kmph)9th Nov. 1973 VSCS 20930th Oct. 1971 VSCS 18731st Oct. 1912 VSCS 1859th Nov. 1995 VSCS NR22nd Sept. 1972 VSCS 18510th Sept.1972 VSCS 17612th May 1979 VSCS 17016th Nov. 1942 VSCS 16817th Oct. 1999 (Gopalpur) VSCS 18529th Oct.1999 (Paradip) Super Cyclone(SuCS) 32912th Oct. 2013 (Gopalpur) VSCS 200

FEASIBILITY STUDY FOR PORT ON RIVER MAHANADI FINAL FEASIBILITY REPORTCHAPTER – 2
SITE CONDITIONS AND ANALYSIS12
During October 1999, two cyclones formed in theBay of Bengal and crossed Odisha Coast. Thecyclone during 14-19 October crossed atGopalpur and the ‘Super Cyclone’ (25-29October) crossed at Paradeep on 29.10.1999. Adepression formed at 13.8° N; 92.8° E on15.10.1999 intensified into a cyclonic storm,moved west North West and crossed at Gopalpuron 19.10.1999. Another depression whichformed on 25.10.1999 at 12.8° N; 98° E, movedrapidly and intensified into a severe cyclonicstorm with core of hurricane winds. The severecyclone further intensified into a ‘Super cyclone’ and crossed at Paradeep on29.10.1999. The lowest sea level pressure recorded at Paradeep was 963.1 mb.The maximum wind speed estimated was 260 km/hr and the radius of maximumwind was 10-15 km. While crossing the coast, the super cyclone produced 5.5 mstorm surge above CD, which inundated land upto about 30 km inland.
A Very Severe Cyclonic Storm (VSCS) PHAILIN originated from a remnant cycloniccirculation from the South China Sea. The cyclonic circulation lay as a lowpressure area over Tenasserim coast on 6th October 2013, marked as a well-marked low pressure area on 7th October over north Andaman Sea, thenconcentrated into a depression over the same region on 8th October and movingwest north-westwards, it intensified into a deep depression on 9th morning andfurther into cyclonic storm (CS), ‘PHAILIN’ in the same day evening. It furtherintensified into a severe cyclonic storm (SCS) in the morning and into a VSCS inthe forenoon of 10th Oct. over east central Bay of Bengal. This VSCS, PHAILINcrossed Odisha & adjoining northAndhra Pradesh coast nearGopalpur (Odisha) around 2230hrs IST of 12th October 2013 witha sustained maximum surfacewind speed of 200-210 kmphgusting to 220 kmph. It wascategory 1 hurricane in SSHWS(Saffir-Simpson Hurricane WindScale) scale of measurement by10th October and it attained apeak of category 5 hurricane andmade landfall near Gopalpur;subsequently it weakened overland and degenerated into wellmarked area of low pressureresulting in torrential rainfall.
Fig. 2.7 Track of the depression
Fig. 2.8 Track of the depression of PHAILIN

FEASIBILITY STUDY FOR PORT ON RIVER MAHANADI FINAL FEASIBILITY REPORTCHAPTER – 2
SITE CONDITIONS AND ANALYSIS13
The lowest sea level pressure recorded at Gopalpur was 940 mb. The maximumwind speed estimated was 200 km/hr. While crossing the coast, the cycloneproduced 6.0 m storm surge above CD, which inundated land up to about 30 kminland.
2.6 Seismicity
According to IS 1893 (Part 1): 2002,India has been divided into four seismiczones i.e., Zone II, Zone III, Zone IV, andZone V. The Project area falls in Zone IIIi.e. moderate intensity seismic zonewhere the basic co-efficient may beconsidered around 0.16. No majorearthquake has been reported in theproject area in recent years or recentpast. As a result, jetty, berth, landbuildings and land based structures forthis project would be designed towithstand maximum lateral load due togravity load.
Fig. 2.9 Seismic Index Map of India

FEASIBILITY STUDY FOR PORT ON RIVER MAHANADI FINAL FEASIBILITY REPORTCHAPTER – 3
ENGINEERING SURVEYS AND INVESTIGATIONS14
CHAPTER 3
ENGINEERING SURVEYS AND INVESTIGATIONS
3.1 General
3.1.1 The basic design of the Port layout must provide the necessary comfort to ships,both for loading / unloading operations at the berths and for ease of transit in theapproaches to / from the Port. These operations are contingent uponTopographic and Hydrographic survey which have to be available to the plannerfor arriving at the optimum layout, which would maximize the throughput at themost economic cost. Since a good port plan would require operations to continueuninterrupted throughout the year, it is necessary that long-term data areavailable to the planner, so that the down time due to adverse weatherconditions are kept to a minimum, such as is acceptable to the port management.
3.1.2 For planning of port facilities, it is necessary to carry out surveys such astopographic and hydrographic surveys and geotechnical investigations. Theavailable Naval hydrographic chart and topographic chart only gives the macrolevel information about the bathymetry and topography of the area. Therefore,for planning of port facilities, it is necessary to undertake fresh field surveys andinvestigations. Accordingly, following fresh site investigations were carried out:
i) Hydrographic Surveyii) Topographic Surveyiii) Geotechnical Investigations
3.2 Hydrographic Survey
3.2.1 Scope of work
The hydrographic survey was carried out at project site between February 19 andMarch 8, 2014 covering an area of 38 Sq. km. The hydrographic survey area isshown in Fig. 3.1. Hydrographic survey has been carried out as per below:
Bathymetry survey at the Mahanadi River was conducted from river mouth to12 km upstream. Longitudinal survey lines were run at 500 m spacing. Crosslines were run at 25 m interval extending bank to bank.
The bathymetry survey at sea was conducted for a three (03) km stretch, withline spacing not more than 100 m, keeping the river mouth at the centre till 15m water depth contour in the sea.
Single beam echo sounder system along with associated DGPS was deployedfor collecting raw water depth data.

FEASIBILITY STUDY FOR PORT ON RIVER MAHANADI FINAL FEASIBILITY REPORTCHAPTER – 3
ENGINEERING SURVEYS AND INVESTIGATIONS15
An Automatic Tide Gauge (ATG) was deployed at a suitable location at ParadipFishing Harbour Jetty and levelled against the newly established BM in thevicinity. The tidal heights were logged for the entire duration of survey, at 10minutes intervals, and the same was used to reduce raw soundings to MSL.
Fig. 3.1 Hydrographic Survey Area
3.2.2 Horizontal Control
The Starfix HP DGPS was used for positioning the survey vessel during this survey.Starfix software suite was used for navigation, data logging and online qualitycontrol of the survey data.
3.2.3 Vertical Control
All water depths mentioned in the reports and charts are with respect to the MSLin the survey area.
3.2.4 Tidal Reduction
A Valeport 740 automatic tide gauge was installed at Paradip Fishing HarbourJetty and was levelled to the client supplied Bench Mark (BM value 4.25 m w.r.tMSL). Tidal heights in the area were recorded at 10 minute intervals for the entiretenure of survey. The raw bathymetry was reduced to the MSL using these tidalheights recorded in the Automatic Tide Gauge.
3.2.5 Projection Parameters
Survey was conducted in WGS 84 spheroid, Indian Datum, Grid co-ordinates are interms of Universal Transverse Mercator (UTM) Projection (Zone 45 N, CM 087° E).Details of Spheroid and Grid systems are as given in Table 3.1 & Table 3.2.

FEASIBILITY STUDY FOR PORT ON RIVER MAHANADI FINAL FEASIBILITY REPORTCHAPTER – 3
ENGINEERING SURVEYS AND INVESTIGATIONS16
Table 3.1 Geodetic Parameters
Datum WGS 84 Spheroid WGS 84
Semi-Major Axis (a) 6378 137.000 m Semi-Minor Axis (b) 6356752.314 m
First Eccentricity Squared (e^2) 0.006694380 Inverse Flattening (1/f) 298.257223563
Datum WGS 84 Spheroid WGS 84
Semi-Major Axis (a) 6378 137.000 m Semi-Minor Axis (b) 6356752.314 m
First Eccentricity Squared (e^2) 0.006694380 Inverse Flattening (1/f) 298.257223563
Table 3.2 Projection Parameters
Grid Projection Universal Transverse Mercator Central Meridian (CM) 87.0° East (Zone 45)
Origin Latitude (False Lat.) 00.0° Hemisphere North
False Easting (FE) 500000.0 m False Northing (FN) 0.0 m
Scale Factor on CM 0.999600 Units Meters
Grid Projection Universal Transverse Mercator Central Meridian (CM) 75.0° North (Zone 43)
Origin Latitude (False Lat.) 00.0° Hemisphere North
False Easting (FE) 500000.0 m False Northing (FN) 0.0 m
Scale Factor on CM 0.999600 Units Meters
3.2.6 Single Beam Echo Sounder (SBES)
ODOM Hydrotrac single frequency single beam echo sounder, with transduceroperating at 210 kHz frequency was used for measuring the water depths. Theecho sounder system was bench tested at workshop prior to mobilisation for thesurvey. The echo sounder transducer was vertically side mounted on the surveyvessel and its draft below the water-line was measured and recorded. The echosounder system was interfaced with the Starfix.Seis navigation and survey systemfor logging the depth vs. position data. Sound velocity of water was measured ona regular basis using sound velocity meter and the average value was set on theecho sounder. The echo sounder was calibrated against a „Bar Check‟ method inthe field at different occasions.
3.2.7 Automatic Tide Gauge (ATG)
A Valeport 740 Automatic Tide Gauge or equivalent was installed at a suitablelocation at Paradip Fishing Harbour Jetty in close proximity to survey area andwas levelled to the client supplied Bench Mark (BM value 4.25 m w.r.t MSL) in thearea. The site selected was so that the ATG sensor did not dry up during low tidesand also the ATG sensor was not unduly disturbed by any boat/vesselmovements.

FEASIBILITY STUDY FOR PORT ON RIVER MAHANADI FINAL FEASIBILITY REPORTCHAPTER – 3
ENGINEERING SURVEYS AND INVESTIGATIONS17
The ATG sensor was levelled to the nearest BM level. Heights of tide were loggedat 10 min intervals. The performance of the ATG was checked on a regular basisagainst measurement of the height of waterline from the jetty level using acalibrated measuring tape. The tidal data was downloaded on a regular basis.
3.2.8 Data Acquisition and Online Quality Control
3.2.8.1 Data Acquisition & Survey Run-Line Logs
On successful completion of mobilisation and Calibration, Verification & Testing ofall equipment as per the standard work practices, the survey data acquisitioncommenced as per the project plan to achieve the objectives of survey.
Navigation System and Bathymetry
The navigation data from the Starfix.HP DGPS was logged continuously andmonitored using the Starfix.Seis navigation suite. The survey data was logged inFugro Binary Format (FBF). Water depths recorded through single beam echosounder was also logged in Fugro Binary Format.
Event Markings
The on-line computer system was interfaced for closure to the analogue traces onthe survey vessel. Event marks corresponding to position fixes were generatedautomatically from the on-line Navigation Computer interface and passed to theanalogue recorders at regular intervals of 25 m across the ground.
Survey Run-Line Logs
Survey lines were planned as per scope of work and digital pre-plots for the areawas prepared prior to commencement of survey. These lines were run on thenavigational computer while doing the survey and this enabled the Navigator toguide the vessel along the planned survey line all the time. A survey line log wasmaintained which consists the particulars about the surveyed line, Date, Time,Session Number, Event Number, KP, Sensors Deployed and all the significantevents occurred during the survey.
3.2.8.2 On-line QC of data logged
Standard procedures and standard formats for documenting the Quality Controlof acquired data for each sensor deployed were followed during the survey.Experienced operators were constantly monitoring the real time data quality asthe survey progressed. A log of profiles was maintained and quality of data wasnoted. Re-shoots of survey lines were carried out as and when required.

FEASIBILITY STUDY FOR PORT ON RIVER MAHANADI FINAL FEASIBILITY REPORTCHAPTER – 3
ENGINEERING SURVEYS AND INVESTIGATIONS18
All computers connected to the Navigation network were synchronised with theGPS (high precision) 1PPS time signal by means of the Starfix Timing Module,allowing all data to be time stamped
Navigation
The Starfix.HP DGPS performed well at all times. The performance of the systemwas continuously monitored using the Starfix.Seis navigation suite.
Single Beam Echo Sounder
The Odom Hydrotrac single frequency (210 kHz) single beam echo sounderperformed well throughout the duration of the survey.
Motion Sensor
MRU-Z motion sensor performed well throughout the period of the survey.
Automatic Tide Gauge (ATG)
The Valeport 740 Automatic Tide Gauge was installed at a suitable location wherethe sensor never dried up during low tides and was not disturbed by anyboat/vessel movements. The performance of the ATG was checked againstmeasurement of the height of waterline from the jetty level using a calibratedmeasuring tape. Also, the tidal data was downloaded on a regular basis forreview.
3.2.9 Data Processing, Charting and Quality Checks
3.2.9.1 Navigation and Positioning
The survey data was logged in Fugro Binary Format (FBF), and processed using theStarfix.Proc software. Motion and position data were processed and checked toensure good data quality. The position data for bathymetry and land surveyinstruments were processed and plotted for charting and reporting.
The measured offsets for all survey sensors were entered into the navigationsystem and processed using Starfix.Proc to enable track charts to be plotted and„corrected‟ navigation files to be integrated with other sensor data at a laterstage. These included:
GPS position absolute of the primary & secondary positioning systems Common Reference Point Single beam echo sounder position

FEASIBILITY STUDY FOR PORT ON RIVER MAHANADI FINAL FEASIBILITY REPORTCHAPTER – 3
ENGINEERING SURVEYS AND INVESTIGATIONS19
3.2.9.2 Bathymetry Data Processing and Analysis
The survey data pertaining to bathymetry survey was logged using Starfix.Loggingmodule and further processed in Starfix.Proc software. Starfix.Proc andStarfix.Workbench were used to import, quality check, and process the navigationand bathymetry. The data was filtered, cleaned, and combined to creategeographically positioned bathymetric data set that has been corrected fordam/reservoir water level during the period of survey.
The data was processed further and interpreted using Starfix.Proc and furthergraphical interpretation / digitization was done. The interpreted data wasexported as a report.txt, which can opened / plotted in Micro station / AutoCADsoftware and can be saved in respective design / drawing files formats for finalcharting.
3.2.10 Survey Results
River Mahanadi Area
This seabed within the survey area is sloping from edges to the centre of creek.Two possible islands of negative depth (height) were noticed in the area. One is atabout midway of the survey area, the other one is located at north-western sideof the survey area. The raw water depths are reduced to MSL using ObservedTide. The water depths are varying between -1.7 m and 28.5 m.
Sea Area
This seabed within the survey area is sloping from West to East. The raw waterdepths are reduced to MSL using Observed Tide. The water depths are varyingbetween 0.2 m and 16.9 m.
Bathymetry of the area has been presented in Fig. 3.2.
3.3 Topographic survey
3.3.1 Scope of Work
The Topographic survey was carried out at project site from 13th Mar. 2015 to1st Apr. 2015 covering an area of 6 Sq. km along the left and right banks of theMahanadi River as shown in Fig. 3.3. Spot level data was collected at 30 m x 30 mgrid spacing with respect to MSL. Positions of all existing features weredemarcated within the area. Six (06) Bench Marks were established at suitablelocations within the survey area. Each Bench Mark was established by leveltransfer from the existing nearest GTS benchmark. All the Bench Marks wereassigned vertical value with respect to MSL and horizontal coordinates.

FEASIBILITY STUDY FOR PORT ON RIVER MAHANADI FINAL FEASIBILITY REPORTCHAPTER – 3
ENGINEERING SURVEYS AND INVESTIGATIONS20
Fig. 3.3 Topographic Survey Area
3.3.2 Establishment of Bench Marks
One GTS Bench Mark was established successfully inside fishing harbor on jetty infront of the Indian Oil Fuel Office, access from main gate of fishing harbour. Thenearest Bench Mark (BM) available in the site was 4.25 m above MSL. All otherBMs were connected to this GTS BM. Total Six (06) BM‟s (BM1, BM2, BM3, BM4,BM5 and BM6) were established during current survey. The heights of these BMsw.r.t MSL are given in following table:
Table 3.3 Bench Mark Levels w.r.t. MSLBench Mark (BM)Name / ID
Height (m) of BMw.r.t MSL
Client supplied BM 4.250BM1 3.881BM2 3.260BM3 4.533BM4 3.477BM5 3.442BM6 3.492
3.3.3 Methodology
3.3.3.1 Levelling
The survey with contours work was conducted at a grid of 30m x 30m. Thelevelling work was started from BM at Fishery Harbor near Jawahar Guest Houseon 12.03.2015. The value of this BM is 4.250m above MSL. The levelling work was

FEASIBILITY STUDY FOR PORT ON RIVER MAHANADI FINAL FEASIBILITY REPORTCHAPTER – 3
ENGINEERING SURVEYS AND INVESTIGATIONS21
carried out using double tertiary double levelling method. The levelling workusing Leica Auto Level was connected with the Control Points fixed earlier.
The levelling was carried out with DGPS from the Client provided Bench Mark to02 in nos. Temporary Bench Marks (i.e. BM 5 & BM 6) at site. The Reduced Levelsof the stations were calculated and transferred at site. The DGPS observationswere carried out simultaneously on the Client provided BM and the new BM atsite for a period of 08 hours. On completion of the observations, the raw data wasprocessed to obtain the height difference between both the bench marks. Rest 04in nos. Bench Marks (BM 1 to BM 4) was levelled using Auto level w.r.t. BM 5 andconnected to Client provided BM for obtaining height above Mean Sea Level.
3.3.3.2 DGPS Control Points
The DGPS Survey team was mobilized to site on 14.03.2015 for establishing theDGPS Control Points. Before starting the actual work a reconnaissance surveyshall be carried out for the entire site area. While finalizing the locations of DGPScontrol points following parameters shall be kept in mind:
• The location is open to sky and free from any obstructions.• There are no interferences from traffic and high voltage currents.• The location is at safe distance from any construction activity so that the
points don’t get disturbed while the construction work is in progress.
The DGPS survey was started by fixing the base station on the Control Point PillarBM1, at the south break water. The co-ordinate of BM1 was taken as 20° 19'45.238" N and 086° 37' 46.202" E from the previous survey. This point was takenas reference station for fixing the other control points.
The Rover unit was set up at GPS1, GPS2, GPS3, GPS4, GPS5 and GPS6. GPS 1, 2and 3 were fixed on Site –II and GPS 4, 5 and 6 were fixed on Site – I.
The DGPS observation was carried out for the duration of one hour at each point.The DGPS raw data was downloaded in the site computer and was processedthrough Geomax Geo Office software for deriving the WGS 84 co-ordinates.
The UTM co-ordinates were also processed for working out the plane co-ordinates. UTM Zone 45 N projection was used for post processing the raw data.The DGPS control points were fixed in static mode covering the entire proposedarea.
The post processing by Geomax office for setting DGPS points, the list of DGPScontrol points and traverse points are given in Appendix 3.1.

FEASIBILITY STUDY FOR PORT ON RIVER MAHANADI FINAL FEASIBILITY REPORTCHAPTER – 3
ENGINEERING SURVEYS AND INVESTIGATIONS22
3.3.3.3 Topographical Survey
After completion of fixing of Horizontal and Vertical Control Points, thetopographical survey was started using GEOMAX ZT20R Total Station. Thetopographical survey was carried out by taking spot levels at 30 m grid. During thesurvey all manmade features were observed and recorded in the Total Station. Allexisting physical features such as high water and low water line creeks, buoys,existing structures and road, hillock, houses, important town, villages en-route,roads, railways, embankments, bridges, landmarks, boundary fencing etc. weresurveyed. The survey was at all the 3 sites on the northern bank of RiverMahanadi as well on the southern bank near village Chaumuhani. Proper codingmethod was adapted to each feature for plotting of data and preparation ofmaps.
After the collection of field data, the measured data was downloaded to the sitecomputer and the plotting of survey features was done on daily basis. The areasurveyed for all 4 sites are 6 Sq. Kms.
3.3.3.4 Topographical Features and Survey Results
The topographic surveys were carried on 3 sites on the northern bank ofMahanadi River and on the southern bank near village Choumuhani. The 3 siteson the northern bank are divided by the estuaries of Mahanadi River. The Site –Iis on the eastern side near Bahakuda village. There is one small temple at thewestern corner of the site. Site –I is having a protection bund on the southernside along the river. The top level of the embankment is 4.15m. On the easternboundary River Mahanadi branches. The ground almost flat and the levels varyfrom 2.3 to 2.8m w.r.t MSL.
The Site –II is on the west of Site –I. Village Pitapath is on the eastern side of thesite. Underground IOCL petroleum pipeline passes through centre of the site. Theprotection bund road also runs along the Mahanadi River connecting the villagesDasrajpur and Pitapath. The ground level varies from 2.2 to 3.0 m.
Site – III is on the west of River Mahanadi. At this site also the protection bundroad runs along the River Mahanadi. The top level of the bund is 5.8m. Thenatural ground level is between 2.2 to 2.9m. The Photographs of site survey aregiven in Appendix 3.2.
Topography of the area has been presented in Fig. 3.4.

FEASIBILITY STUDY FOR PORT ON RIVER MAHANADI FINAL FEASIBILITY REPORTCHAPTER – 3
ENGINEERING SURVEYS AND INVESTIGATIONS23
3.4 Geotechnical Investigation
3.4.1 General
In order to find out sub soil data for planning and design of port facilities it wasconsidered necessary to undertake geotechnical investigations at the project site.The main objective of the investigations is to ascertain the subsoil condition at theproposed site and to make foundation investigation of the proposed structurebased on the findings of field and laboratory investigations. The investigationshave been carried out by sinking/drilling boreholes of different depths andconducting related laboratory tests on soil samples.
3.4.2 Geology of the Area
This area lying close to the present coast featured in toposheet 73L-11, of itsformation both by fluvial and marine activities. The area evolved both under subaerial and submarine conditions under the influence of several depositionalenvironments such as surface running water; sea waves, tides, littoral drifts andwind action. The process environments and the energy conditions of depositionalmedia have all affected sediment assembly which in turn decided thegeomorphology and land use. The principal agents in the area formation areflowing water of Mahanadi river channels and flood plains; sea waves, tides, longshore currents and wind. The different sub environments are fluvial; estuarine;marine and aeolian. The land pattern is of tidal swamp with numerous tidalcreeks. The general ground level is close to the sea level; for which drainage ispoor in the area. The area is susceptible to both flurried and tidal flooding cycloneand Mahanadi floods are two major environmental problems beside its very poorconductive of soil for foundation of structure
3.4.3 Field Investigations
3.4.3.1 The field investigations were carried out during March 2015 at specified locationsand consist of 6 nos. of Boreholes. The details of Borehole locations and depth aretabulated below
Table 3.4 Details of Boreholes
BHNo.
Geographical Coordinates UTM (Zone 45) Depth of BoreHoles below
Ground Level /River Bed (m)
Latitude Longitude Northing(m N)
Easting(m E)
LB 1 20°20'25.60"N 86°37'16.45"E 460465.00 m 2249201.00 m 30.45LB 2 20°20'23.75"N 86°38'19.64"E 462297.00 m 2248544.87 m 30.45LB 3 20°20'34.30"N 86°38'56.31"E 463361.00 m 2249462.00 m 30.23LB 4 20°20'45.70"N 86°37'44.72"E 461286.00 m 2249817.00 m 30.26LB 5 20°20'42.04"N 86°36'17.43"E 458876.00 m 2249806.00 m 30.45LB 6 20°20'35.31"N 86°35'43.06"E 458022.00 m 2249184.00 m 28.10

FEASIBILITY STUDY FOR PORT ON RIVER MAHANADI FINAL FEASIBILITY REPORTCHAPTER – 3
ENGINEERING SURVEYS AND INVESTIGATIONS24
3.4.3.2 The drilling was facilitated using Tripods, boring equipments, winch, flush jointcasings, pumps, diesel engines, soil cutter, tools, thin walled samplers, split spoonsamplers etc.
3.4.3.3 Position fixing was carried out by Global Positioning System (GPS) with horizontalpositional accuracy of + 10 m. Casing was used to support sides of borehole.Stabilisation of boreholes was achieved by bentonite slurry.
3.4.3.4 The split spoon sampler conforming to Indian standard 9640 is used to evaluatestandard strength data such as ‘N’ value (Number of blows per 30 cm. ofpenetration). The sampler is lowered to the bottom of bore hole and pit atrequired level with strings of ‘A’ type drill rods. The drive weight of 63.5 kg. ishammered with a free fall of 0.75 mtr through one guide for S.P.T test. Thenumber of blows required to effect each 15 cm. penetration is recorded.
The first 15 cm. is considered as seating drive. The total blows required for thesecond and third 15 cm. penetration is termed as penetration resistance ‘N’; andthe depth of penetration is also recorded. The test is carried out at every 1.50mtr. depth of boring as per codal procedure. After the S.P.T volumes is obtainedthe spilt spoon sampler is opened and length and weight of the sample recoveredis measured for calculation of bulk density and samples are preserved forLaboratory test.
3.4.3.5 In addition, undisturbed samples are collected by thin walled samplers as per theguidelines of IS: 2132 & 1892 from cohesive soil layer by instruments as perIS:11594. After collection of soil in the samplers both ends of the U.D.S tube arereamed to 20mm and sealed with paraffin wax and covered with tight fitting caps.Then the samples are labelled and transported to firm’s laboratory for laboratorytests to assess the geotechnical parameter of the soil. Also, disturbed samples areobtained from the bottom of SPT test level in the course of drilling fromboreholes. Disturbed samples were collected and sealed properly in aluminiumcans and transported to laboratory for testing purpose.
3.4.3.6 Soil & waters from borehole are collected; preserved and carried to thelaboratory for chemical testing and analysis from required depth.
3.4.3.7 Water table in land boreholes are measured as per the procedures of I.S : 6935.Ground water table is shown in the bore record sheet of each borehole attachedwith this report. The Ground water table at the time of investigation is foundnearer to the ground surface level.
3.4.4 Laboratory Tests
3.4.4.1 Laboratory work consists of mostly physical & chemical tests. Specification andprocedure are adopted as per B.I.S. Specification.

FEASIBILITY STUDY FOR PORT ON RIVER MAHANADI FINAL FEASIBILITY REPORTCHAPTER – 3
ENGINEERING SURVEYS AND INVESTIGATIONS25
Standard penetration test samples; Undisturbed & Disturbed soil samples andBoreholes water samples are carried to firms Laboratory and tested as perrelevant I.S. specifications. The test results are shown in tabular form with properreference.
(A) Particle Size Distribution : (a) Sieve Analysis are done by standard sievesby mechanical means. The analysis are done as per IS: 2770 (Part-4). (b)Silt & clay analysis are done from the samples where more than 10percent of the material passes 75 micron by hydrometer method as per IS: 2720 (Part-4).
(B) Natural Moisture Content : Natural moisture contents of samples aredetermined in the laboratory as per IS : 2720 (Part-2) and presented in thelaboratory tests sheets.
(C) Bulk Density : Bulk Density from soil samples are determined as perIS:2720 (Part-28). Bulk densities are computed and presented in the testreport.
(D) Specific Gravity : Specific gravity from soil Samples are determined as perIS: 2720 (Part-3/Sec2) and test result found from laboratory tests arepresented in the test report.
(E) Liquid; Plastic Limit & Shrinkage Limit : Liquid, Plastic & Shrinkage Limit inpercentage of the samples are determined as per IS: 2720 (Part-5 & 6) andpresented in test report sheets.
(F) Differential Free Swell Index : Differential Free Swell Index value ofundisturbed soil samples are conducted as per IS: 2720 (Part-40) andpresented in the test report sheet.
(G) Shear Strength Parameters Of A Specimen :
Unconsolidated Undrained Triaxial Compression test without themeasurement of pore water Pressure : The Triaxial compression of U.D.Ssamples collected from cohesive soil are determined by Triaxialcompression apparatus as per IS: 2720 (Part-11) under condition of cellPressure maintained to constant without measuring the pore waterpressure. Result obtained by this test i.e.; CUU & ØUU are presented intest report with stress strain curve and data sheet.
(H) Determination of consolidation properties : Consolidation properties ofsoil at chosen levels from each boreholes are determined by onedimensional consolidation test following procedures described in IS : 2720(Part-15). Data concerning dial readings with time for each pressureincrement for both loading and unloading stages are recorded. Test results

FEASIBILITY STUDY FOR PORT ON RIVER MAHANADI FINAL FEASIBILITY REPORTCHAPTER – 3
ENGINEERING SURVEYS AND INVESTIGATIONS26
of consolidation tests are presented in sets of curves showing therelationship of ‘e’ versus ‘p’; log of time plot; which are appended withthis report. Coefficient of consolidation; coefficient of compressibility andcompression index are presented in test reports.
(I) Void Ratio Computation : Void ratio of U.D.S & S.P.T Samples arecalculated and presented in the laboratory report sheets.
(J) Soil Classification : Soils are properly identified and classified as per IS:1498 and presented in the record sheets.
(K) Chemical Analysis Of Bore Hole Water and Soil : Both sub-soil and borehole water are analysed chemically for its aggressiveness towardsreinforced concrete as per B.I.S. Specification and provided with thisreport. One Summary report for Soil and water are given below in tabularformat.
Bore Hole Water :
i) pH Value Tests are conducted as per specifications of IS : 3025(Part-11) and report of test are enclosed.
ii) Chloride Chloride content is determined as per specificationsof IS : 3025 (Part-32) and report of test are enclosed.
iii) Sulphate Content Sulphate content is determined as per specificationsof IS : 3025 (Part-24) and report of test are enclosed.
iv) Salinity It has been determined by “Electrometric Method”reference of test book.
Table 3.5 Summary on Chemical Analysis of Water
Sl.No. BH No pH Value Sulphates
in PPMChlorides
in PPM
Salinitycontentin PPT
Remarks
1 LBH-1 7.081 58.93 2719 0.4
Salin
e En
viro
nmen
tal
cond
ition
(Sev
ere
type
expo
sure
) is a
ssig
ned
due
to h
igh
chlo
ride
conc
entr
atio
n.2 LBH-2 7.845 66.34 2263 0.3
3 LBH-3 7.778 79.35 3485 0.6
4 LBH-4 7.934 81.27 3254 0.6
5 LBH-5 7.945 62.31 3370 0.5
6 LBH-6 7.896 77.29 3044 0.4

FEASIBILITY STUDY FOR PORT ON RIVER MAHANADI FINAL FEASIBILITY REPORTCHAPTER – 3
ENGINEERING SURVEYS AND INVESTIGATIONS27
Chemical Properties of Borehole Soil :
i) pH Value pH value is determined as per specification of IS: 2720 (Part-26) and report of test is enclosed.
ii) Chloride Content Soluble chloride content is determined as perspecification of IS : 3025 (Part-32) and report oftest is enclosed.
iii) Sulphate Content Soluble Sulphate content is determined as perspecification of IS : 2720 (Part-27) & 3025 (Part-24) and report of test is enclosed.
iv) Salinity It has been determined by “ElectrometricMethod” with reference of text book.
Table 3.6 Summary on Chemical Analysis of Soil
Sl.NO.
BoreholeNo
pHValue
Sulphatein ppm
Chloridein ppm
Salinitycontentin PPT
Remarks
1 LBH-1 6.841 44.05 148.96 0.1 Exposure conditionClass-I as per IS :456 specifications
for sulphatecontent in soil
samples
2 LBH-2 6.778 34.05 118.55 0.13 LBH-3 6.894 44.27 124.74 0.24 LBH-4 7.014 41.60 136.90 0.15 LBH-5 7.031 38.79 113.25 0.26 LBH-6 7.048 42.38 112.31 0.1
3.4.5 Soil Profile
The area is underlain by alternating sequence of unconsolidated silty-clay; silty-sand and poorly graded sand belonging to the recent geological period. Subsurface soil found to be poor. Ground water table is found at short depth. Thedrainage condition is very low. Characteristics analysis of both physical &chemical have been conducted & appended to this report; which is selfexplanatory. The individual Borehole details are given in Appendix 3.3. Onesummary table showing sub-surface soil condition at investigation locations aregiven below.

FEASIBILITY STUDY FOR PORT ON RIVER MAHANADI FINAL FEASIBILITY REPORTCHAPTER – 3
SURVEY AND INVESTIGATIONS28
Table 3.7 Soil Profile
B.H
No
Loca
tion Types of strata encountered in course of boring
Stratum – I Stratum – II Stratum – III Stratum – IV Stratum – V Stratum – VI
LBH-
01
N :
2249
201.
00 &
E :
4604
65.0
0
Soft silty-clay of highplasticity (CH) soilfound from groundlevel to 2m depthand again between9m to 11.85m depthsandwiched withvery soft to soft silty& sandy clay ofintermediateplasticity (CI)between 2m to 9mdepth
Medium densepoorly graded sand-silt mixture (SP-SM)soil found between11.85m to 14.50mdepth followed bymedium dense poorlygraded sand-siltmixture (SM) soilbetween 14.50m to15.90m depth andagain 19m to 20.40mdepth sandwichedwith medium denseclayey-sand (SC) soilbetween 15.90m to19m depth.
Dense poorly gradedsand (SP) foundbetween 20.40m to22.10m depth andagain same soil invery dense conditionbetween 24.45m to27.65m depthsandwiched withvery stiff sandy-clayof intermediateplasticity (CI)between 22.10m to23m depth followedby medium denseclayey-sand (SC) soilbetween 23m to24.45m depth
Very stiff silty & sandclay of high plasticity(CH) soil found from27.65m to boringtermination depthi.e.; 30.45m
- -

FEASIBILITY STUDY FOR PORT ON RIVER MAHANADI FINAL FEASIBILITY REPORTCHAPTER – 3
SURVEY AND INVESTIGATIONS29
B.H
No
Loca
tion Types of strata encountered in course of boring
Stratum – I Stratum – II Stratum – III Stratum – IV Stratum – V Stratum – VILB
H-02
N :
2248
544.
87 &
E :
4622
97.0
0Very soft silty &sandy clay ofintermediateplasticity (CI) soilfound from groundlevel to 4.95m depth.
Poorly graded sand-silt mixture (SP-SM)soil in medium densecondition found from4.95m to 6.60mdepth and againbetween 7.10m to9.15m depthsandwiched with athin layer of silty-claysoil between 6.60mto 7.10m depth.Poorly graded sand-silt mixture (SM)found in loosecondition between9.15m to 9.45mdepth followed bypoorly graded sand-silt mixture inmedium densecondition between9.45m to 11.50mdepth followed bypoorly graded sand-silt mixture (SM) soilin medium densecondition between11.50m to 13mdepth.
Silty & sandy clay ofintermediateplasticity (CI) soil instiff condition foundbetween 13m to14.40m depthfollowed by clayey-sand soil (SC) inmedium densecondition between14.40m to 20.55mdepth.
Poorly graded sand-silt mixture (SM) soilin dense conditionfound from 20.55mto 23m depthfollowed by clayey-sand (SC) soil indense conditionbetween 23m to24.50m depth
Very stiff sandy clayof high plasticity (CH)soil found between24.50m to 25.65mdepth.
Poorly graded sand-silt mixture (SP-SM)soil in very densecondition found from25.65m to 30.45mi.e.; boringtermination depth.

FEASIBILITY STUDY FOR PORT ON RIVER MAHANADI FINAL FEASIBILITY REPORTCHAPTER – 3
SURVEY AND INVESTIGATIONS30
B.H
No
Loca
tion Types of strata encountered in course of boring
Stratum – I Stratum – II Stratum – III Stratum – IV Stratum – V Stratum – VILB
H-03
N :
2249
46.0
0 &
E :
4633
61.0
0Very soft silty-clay ofintermediateplasticity (CI) soilfound from groundlevel to 7.30m depthand again the samesoil but in firmcondition foundbetween 11.70m to14.10m depthsandwiched withpoorly graded sand-silt mixture (SM) invery loose conditionbetween 7.30m to8.50m depthfollowed by poorlygraded sand-siltmixture (SP-SM) invery dense conditionbetween 8.50m to11.70m depth.
Very dense poorlygraded sand (SP) soilfound between14.10m to 15.70mdepth followed byclayey-sand (SC) soilin medium densecondition between15.70m to 21mdepth.
Poorly graded sand-silt mixture (SM) soilfound in densecondition between21m to 24.85mdepth followed byclayey-sand (SC) soilupto 26.90m depth
Poorly graded sand-silt mixture (SP-SM)soil in densecondition foundbetween 26.90m to28.50m depthfollowed by poorlygraded sand (SP) soilin very densecondition up toboring terminationdepth i.e.; 30.23 m.
- -

FEASIBILITY STUDY FOR PORT ON RIVER MAHANADI FINAL FEASIBILITY REPORTCHAPTER – 3
SURVEY AND INVESTIGATIONS31
B.H
No
Loca
tion Types of strata encountered in course of boring
Stratum – I Stratum – II Stratum – III Stratum – IV Stratum – V Stratum – VILB
H-04
N :
2249
817.
00 &
E :
4612
86.0
0Soft silty-clay ofintermediateplasticity (CI) soilfound from groundlevel to 2.90m depthfollowed by very softsilty-clay of highplasticity (CH) soilbetween 2.90m to5.60m depth andagain the soil (CH)but in soft to firmcondition between6.50m to 9.75mdepth sandwichedwith poorly gradedsand-silt mixture (SP-SM) soil in loosecondition between5.60m to 6.50mdepth.
Soft silty-clay ofintermediateplasticity (CI) soilfound from 9.75m to12m depth followedby silty-clay of highplasticity (CH) soil infirm condition foundfrom 12m to 17mdepth.
Medium denseclayey-sand (SC) soilfound from 17m to21m depth and againbetween 23m to 24mdepth sandwichedwith poorly gradedsand-silt mixture(SM) soil in loose tomedium densecondition between21m to 23m depth.
Poorly graded sand-silt mixture (SP-SM)soil in densecondition found from24m to 27m depthfollowed by poorlygraded sand (SP) soilin very densecondition up toboring terminationdepth i.e.; 30.26m.
- -

FEASIBILITY STUDY FOR PORT ON RIVER MAHANADI FINAL FEASIBILITY REPORTCHAPTER – 3
SURVEY AND INVESTIGATIONS32
B.H
No
Loca
tion Types of strata encountered in course of boring
Stratum – I Stratum – II Stratum – III Stratum – IV Stratum – V Stratum – VILB
H-05
N :
2249
806.
00 &
E :
4588
76.0
0Very soft silty-clay ofintermediateplasticity (CI) soilfound from groundlevel to 8.80m depth.
Poorly graded sand-silt mixture (SP-SM)soil in medium densecondition found from8.80m to 12m depthand again between13.50m to 14.60mdepth sandwichedwith poorly gradedsand-silt mixture(SM) in loosecondition between12m to 13.50mdepth.
Silty & sandy-clay ofintermediateplasticity (CI) soil insoft condition foundfrom 14.60m to16.30m depth andagain the same soilbut in stiff conditionfound between21.80m to 22.50mdepth sandwichedwith poorly gradedsand (SP) soil inmedium densecondition between16.30m to 21.80mdepth
Poorly graded sand-silt mixture (SP-SM)soil in medium densecondition found from22.50m to 25mdepth followed bypoorly graded sand(SP) soil in very densecondition up toboring terminationdepth i.e.; 30.45mdepth.
- -

FEASIBILITY STUDY FOR PORT ON RIVER MAHANADI FINAL FEASIBILITY REPORTCHAPTER – 3
SURVEY AND INVESTIGATIONS33
B.H
No
Loca
tion Types of strata encountered in course of boring
Stratum – I Stratum – II Stratum – III Stratum – IV Stratum – V Stratum – VILB
H-06
N :
2249
184.
00 &
E :
4580
22.0
0Very soft silty &sandy-clay ofintermediateplasticity soil (CI)found from groundlevel to 5.25m depth,and again the sametype soil but in stiffcondition foundbetween 11.25m to12m depthsandwiched withpoorly graded sand(SP) soil in mediumdense conditionbetween 5.25m to11.25m depth.
Clayey-sand (SC) soilin medium densecondition found from12m to 15m depthfollowed by poorlygraded sand-siltmixture (SM) soil inmedium densecondition between15m to 16.50m depthand the same soil (SP-SM) also in mediumdense condition from16.50m to 20.10mdepth.
Very stiff silty &sandy-clay of highplasticity (CH) soilfound from 20.10mto 21.60m depth andstiff silty & sandy clayof intermediateplasticity (CI) soilfound from 22.30mto 23.15m depthsandwiched with athin layer of silty-sand between21.60m to 22.30mdepth.
Dense poorly gradedsand (SP) foundbetween 23.15m to26m depth and thesame soil but in verydense conditionfound from 28.10mto boring terminationdepth i.e.; 30.45msandwiched withclayey-sand (SC) soilin medium densecondition between26m to 28.10mdepth
- -

FEASIBILITY STUDY FOR PORT ON RIVER MAHANADI FINAL FEASIBILITY REPORTCHAPTER – 3
SURVEY AND INVESTIGATIONS34
3.4.6 Foundations Recommendations
A) Open Foundation
Sub-surface soil at shallow foundation depth at LB 2 & LB 3 locations arevery soft to with stand any type of structural load. Though at LB 1 sandy-soil layer is available at top level but it is only in loose condition and sitedupon compressible silty-clay layer in soft condition. Hence construction ofopen foundation will not be suitable at all these locations.
B) Deep Foundation
Deep foundation like construction of piles may be adopted for structures.Piles may be rested inside the sand layer found sufficiently below thesurficial soil due to tidal influence. Uniform diameter bored cast-in-situpiles will be suitable here. Load carrying capacity of piles for verticalcompression and uplift are computed at two suitable depths of differentdiameters following guidelines of IS: 2911 Part-I/Sec.-II both for light &heavy structures. Detail calculation sheets are appended borehole wise inthe report. One summary table is shown below for immediate reference.
Table 3.8 Details of the foundation suitable for the locations
Boreholenumber /Location
Length ofpile/Cutoff level
in m
Diameterof pile in
mm
Safe Load carrying capacity of pileVertical
compressionin ton
Uplift inton
Lateral LoadFixed Head Free Head
5mm 12mm 5mm 12mm
LBH-
01;
N :
2249
201.
00 &
E : 4
6046
5.00 13/1
375 22 15 5.93 14.24 1.97 4.73400 25 16.29 6.58 15.79 2.19 5.25450 32 19 7.94 19.06 2.64 6.33500 39 21.26 9.40 22.56 3.12 7.49
25/1
500 92 45 8.71 20.90 3.27 7.86600 139 59 11.66 27.99 4.38 10.53750 238 83 17.00 40.00 6.27 15.04
1000 489 129 26.40 63.36 9.93 23.83
LBH-
02;
N :
2248
544.
87 &
E : 4
6229
7.00
10.50/1
375 21 10 5.16 12.38 2.00 4.81400 24.30 11.40 5.72 13.73 2.22 5.33450 32 14 6.91 16.58 2.68 6.43500 40 16 8.18 19.62 3.17 7.62
21/1
500 62 32 7.62 18.28 2.91 6.99600 92 42 10.20 24.48 3.89 9.35750 152 58 14.58 34.98 5.56 13.36
1000 291 82 23.10 55.43 8.82 21.17
27/1
500 86 46 8.17 19.62 3.08 7.38600 127 62 11.00 26.27 4.11 9.88750 210 87 15.64 37.54 5.88 14.12
1000 405 130 24.78 59.48 9.32 22.33

FEASIBILITY STUDY FOR PORT ON RIVER MAHANADI FINAL FEASIBILITY REPORTCHAPTER – 3
SURVEY AND INVESTIGATIONS35
Boreholenumber /Location
Length ofpile/Cutoff level
in m
Diameterof pile in
mm
Safe Load carrying capacity of pileVertical
compressionin ton
Uplift inton
Lateral LoadFixed Head Free Head
5mm 12mm 5mm 12mmLB
H-03
;N
: 22
4946
2.00
&E
: 463
361.
00 9/1
300 9 6 3.87 9.28 1.29 3.08375 14 8 5.53 13.27 1.84 4.41400 16 8.46 6.13 14.71 2.04 4.89450 20 10.07 7.40 17.76 2.46 5.90500 26 12.00 8.76 21.02 2.91 6.99
22/1
500 68 39 8.18 19.62 3.08 7.38600 100 53 10.95 26.27 4.12 9.88750 168 77 15.64 37.54 5.88 14.12
1000 317 114 24.79 59.47 9.32 22.37
LBH-
04;
N :
2249
817.
00 &
E : 4
6128
6.00 18/1
300 20 18.93 4.42 10.61 1.49 3.58375 25.20 23.88 6.32 15.17 2.13 5.12400 27.00 25.56 7.01 16.82 2.37 5.68450 31.00 28.76 8.46 20.31 2.86 6.85500 34.00 31.96 10.01 24.04 3.38 8.11
25/1
500 67 44 8.71 20.90 3.32 7.98600 95 56 11.66 27.98 4.45 10.69750 149 74 16.66 39.99 6.37 15.28
1000 283 109 26.40 63.36 10.09 24.20
LBH-
05;
N :
2249
806.
00 &
E : 4
5887
6.00
10/1
375 15 8.61 5.16 12.38 1.97 4.73400 17 9.34 5.72 13.73 2.19 5.25450 22 11.00 6.91 16.58 2.64 6.33500 28 13.00 8.18 19.62 3.12 7.50
17/1
500 54 29.18 9.40 22.56 3.08 7.38600 81 40.00 12.59 30.21 4.12 9.88750 133 58.00 17.99 43.17 5.88 14.12
1000 252 86.00 28.50 68.40 9.32 22.73
26/1
500 94 50 10.88 26.12 3.12 7.50600 143 70 14.57 34.96 4.18 10.04750 240 106 20.82 49.97 5.97 14.34
1000 466 172 32.99 79.17 9.46 22.72
LBH-
06;
N :
2249
184.
00 &
E : 4
5802
2.00
7.50/1
300 9 5.27 4.42 10.61 1.47 3.53375 14.50 7.41 6.32 15.17 2.10 5.04400 16.80 8.19 7.01 16.82 2.33 5.59450 22.05 9.86 8.46 20.31 2.81 6.74500 27.28 10.98 10.01 24.04 3.33 7.99
17/1
300 20.20 13.49 4.42 11.00 1.45 3.47375 32.00 19.73 6.33 15.17 2.07 4.96400 36.60 22.05 7.00 17.00 2.30 5.50450 47.00 27.06 8.50 20.00 2.77 7.00500 58.30 31.91 10.00 24.00 3.00 8.00
24/1
500 84.00 47.28 8.71 20.90 3.28 7.86600 123.00 63.58 11.66 27.99 4.38 11.00750 200.00 90.56 16.66 39.99 6.27 15.04
1000 382.00 141.00 26.40 63.37 9.93 23.83

FEASIBILITY STUDY FOR PORT ON RIVER MAHANADI FINAL FEASIBILITY REPORTCHAPTER – 3
SURVEY AND INVESTIGATIONS36
Negative Skin Friction
Negative Skin friction is the drag down force exerted on the pile by cohesive soillayer under lying the non-cohesive fill material during the consolidation processinitiated by the fill material. The negative skin friction usually generates tension inthe pile, which may hamper the structural load carrying capacity of the pile.Therefore, negative skin friction should be added to structural load of pile, whiledesigning. The negative skin friction calculation at the proposed site for thearrangement of the pile; comes out to be very less. Thus it can be neglected.While calculating the negative skin friction effect of cohesive layer is onlyconsidered. The negative skin friction calculated is less than 1 ton.
Transient Loading
The maximum permissible increase over the safe load of a pile; as arising out ofwind loading is 25 percent. In case of load and moments arising out of earthquakeeffects, the increase of safe load on a single pile may be limited to the provisionscontained in I.S: 1893. For transient loading arising out of superimposed loads; noincrease is required.
Control in Cast-in-situ Bored Piling Installation
(a) Concreting
Concrete should be so designed or chosen as to have homogeneous mixhaving a flowable character consistent with the method of concreting inpile installation. Minimum grade of concrete M-25 should be used andhaving a slump between 150 to 180mm. The minimum cement contentshould be in accordance with I.S: 456 as concrete is exposed to normalcondition and additional 10% of cement is to be used since pile is to becasted under sub-soil water.
The average compressive stress under working load should not exceed 25percent of the specified works cube strength at 28days calculated on thetotal cross sectional area of the pile. As the concreting will be throughtremie pipes nominal size of more than 20mm should not be used asconcreting aggregates.
(b) Control of Alignment
Piles should be installed as possible as per the design: An angulardeviation of 1.5 percent is permissible in vertical piles. Piles should notdeviate 75mm or D/4 in piles having diameter more than 600mm. In caseof piles deviating beyond these limits and to such an extent that theresulting eccentricity cannot be taken care of by a redesign of the pile cap

FEASIBILITY STUDY FOR PORT ON RIVER MAHANADI FINAL FEASIBILITY REPORTCHAPTER – 3
SURVEY AND INVESTIGATIONS37
of pile ties; the piles should be replaced or supplemented by one or moreadditional piles.
(c) Sequence of Pilling
In a group the sequence of installation of piles should be from the centreto periphery of the group or from one side to the other.
(d) Casing Pipes
A minimum length of one meter of temporary casing is to be inserted ineach bored pile unless otherwise specifically desired. Additional length oftemporary casing may be used depending on workability.
(e) Drilling Mud
Drilling mud (Bentonite) having following properties should be used forstabilizing sides of the holes
(i) Liquid limit between 300 to 450 percent.(ii) Sand content less than 7 percent.(iii) The density of the bentonite solution when bentonite mix with fresh
water for circulation using pump should be about 1 : 12.(iv) Marsh viscosity should be about 37 seconds.(v) The swelling index as measured by the swelled volume after 12
hours in abundant quantity of water shall be at least 2 times its dryvolume.
(vi) The pH value of the bentonite suspension should be less than 11.5.
Consistency of the drilling mud suspension should be controlledthroughout the boring as well as concreting operations in order to keepthe hole stabilized as well as to avoid concrete getting mixed up with thethicken suspension of the mud.
(f) Cleaning of Hole
The cleaning of the hole may be ensured by careful operation of boringtool and / or flushing of the drilling mud through the bottom of the hole.Flushing of bore holes before concreting with fresh drilling fluid / mud ispreferred.
(g) Tremie method of Concreting
Concreting should be done either with the use of tremie method or by theuse of specially designed under water placer to permit deposition ofconcrete in successive layers, without permitting the concrete within the

FEASIBILITY STUDY FOR PORT ON RIVER MAHANADI FINAL FEASIBILITY REPORTCHAPTER – 3
SURVEY AND INVESTIGATIONS38
placed to fall through free water. The hopper and tremie should be aclosed system embedded in the placed concrete, through which watercannot pass. For 20mm aggregate the tremie pipe should be of diameternot less than 200mm. The first charge of concrete should be placed with asliding plug pushed down the tube ahead of it or with a steel plate ofadequate charge to prevent mixing of concrete and water. The tremie pipeshould always penetrate well in to the concrete with an adequate marginif safety against accidental withdrawal of the pipe is surged to dischargethe concrete. Normally concreting of the piles is uninterrupted. In theexceptional case of interruption of concreting; but which can be resumedwithin 102 hours; the tremie shall not be taken out of the concrete.Instead it shall be raised and lowered slowly; from time to time to preventthe concrete around the tremie from setting. In case of withdrawal oftremie out of the concrete; either accidentally or to remove a choke in thetremie; the tremie may be re-introduced in the manner so that it preventimpregnation of laitance or scum lying on the top of the concrete alreadydeposited in the bore.

FEASIBILITY STUDY FOR PORT ON RIVER MAHANADI FINAL FEASIBILITY REPORTCHAPTER – 4
TRAFFIC SURVEYS AND DEMAND ASSESSMENT39
CHAPTER 4
TRAFFIC SURVEYS AND DEMAND ASSESSMENT
4.1 Methodology
4.1.1 The traffic study covers the market projections for a period of 20 years startingfrom the year 2015. The traffic projection covers three scenario namely, Lowcase, Medium case and High case scenario traffic.
4.1.2 The major mining and industrial units operating in the hinterland were studied interms of their production capacity and the current export/import volumes. Thecurrent export/import volume corresponding to each of the unit was added up toobtain the total size of the market presently made available by the hinterland forports and harbour industry as of now.
4.1.3 The present market size thus obtained is projected on basis of a growth rate of areliable economic indicator. GSDP (Gross state domestic product) being the bestindicator of economic development taking place in a particular state. GSDPgrowth rate was applied to generate the traffic projections in this study. Thecompounded annual growth rate (CAGR) corresponding past 5 year-GSDP ofOdisha and Jharkhand was used to project export-import volume of units locatedin respective regions. Apart from projecting the cargo volume on basis of GSDPgrowth rate, future capacity additions in form of new industrial units andexpansions has been factored in. This additional volume is included in the cargoprojection, starting from 2020 year.
4.1.4 The projected market size is further distributed among various ports which will beserving the same hinterland along with the proposed port. The distribution isbased on competency of each of the port in attracting traffic towards itself.Factors such as depth, number of berths, proximity to major shipping lines andworld shipping routes decide the competency of a particular port. Share FactorAnalysis method which systematically rates a port based on its competency wasimplemented to arrive at the potential market share of the proposed port incomparison to the competing ports.
4.1.5 Vessel arrival pattern at Paradip port is the closest representative of vesseldistribution that can be expected at the proposed port. The size wise distributionof vessels arriving at Paradip port was taken as a reference in arriving at thepotential the distribution for the proposed port at River Mahanadi.
4.2 Primary Data Collection
4.2.1 A site visit was conducted in Odisha state from 15th to 21st May 2014 regardingcollection of primary data by meeting key industrial personnel. The visit covers

FEASIBILITY STUDY FOR PORT ON RIVER MAHANADI FINAL FEASIBILITY REPORTCHAPTER – 4
TRAFFIC SURVEYS AND DEMAND ASSESSMENT40
meeting and interviewing person form various industry/companies andorganizations related to steel, mining, fertilizers, aluminum, etc.
4.2.2 The objective of the site visit was:
Meeting key person from each type of industry/organization/corporationwhich is relevant to the project and interviewing them.
To understand the present import/export cargo activity of the companies/industries.
To collect the information regarding the volume of cargo, port preference,cargo handling, preferred mode of transport, etc.
To understand the views of the people regarding the upcoming port.
4.2.3 The visit was planned to meet at least on type of industry from Steel, Aluminium,Fertilizers, Ferro alloys, Refractories, Mining & mineral trading companies. Thefollowing list of companies was considered for the visit is shown in Table 4.1below
Table 4.1 List of companies/industries which were visited during the site visit
S.No
Company/Association Name Industry
1. Jindal Stainless Limited- JSL Steel2. Bhushan Steel Ltd. Steel3. SAIL Steel4. MESCO Steel Plant Steel5. Jindal Steel & Power Ltd. Steel6. POSCO- India Pvt. Ltd Steel7. Adhunik Metaliks limited Steel and alloys8. Aarti steels limited Steel9. NALCO Aluminium
10. IFFCO Fertilizers11. Paradip phosphate limited Fertilizers12. Indian Metal and Ferro alloys limited Alloys13. Ferro alloys corporation limited Alloys14. MANISHRI Refractories & Ceramics Pvt. Ltd Refractories15. Odisha mining corporation Minerals16. Mahima group Mining17. Kashvi Group of Companies Iron ore export18. Essar Steel Odisha Ltd. Iron pellet19. Brahmani river pellets limited Iron pellets20. Cargill Edible oil Oil21. Odisha thermal power corp. Power22. Sponge iron association Iron

FEASIBILITY STUDY FOR PORT ON RIVER MAHANADI FINAL FEASIBILITY REPORTCHAPTER – 4
TRAFFIC SURVEYS AND DEMAND ASSESSMENT41
4.2.4 All the above mentioned companies from the tables were visited at their offices inBhubaneshwar and respective working plants. Some companies could not able tomeet because of no response from the personnel regarding the meeting. TheCompanies/organizations which were not been able to meet, an email was sentout to them asking for the information required for the study.
4.3 Market Size
4.3.1 The Market Size is the total volume of EXIM cargo that will be generated in thehinterland. Based on the study of industrial units and mining activities present inthe hinterland various types of cargo that will be handled at the proposed portare identified.
4.3.2 The identified are grouped together on basis of way they are packaged andhandled at the port as follows:
Bulk cargo- Iron ore & Pellets, Raw Fertilizer, Coal Container cargo- Steel and Steel products Other cargo- Commodities having small volumes assumed to be handled as
general cargo.
4.3.3 The EXIM volume of a particular commodity is obtained by studying the historicaltrend of export/import volumes for the particular commodity and export/importpolicies set for the particular commodity.
4.3.4 In case of certain commodities statistics on export import volume generatedspecifically from the hinterland was not available. For such commodities theexport volume was derived by using national production to export ratiocorresponding to the commodity and percentage contribution of that particularcommodity to national output. For example the national Production to Exportratio for steel is 15%, which was applied to arrive at the export traffic for steel.
4.3.5 During 2015 and 2016 there was massive drop in the iron-ore exports fromOdisha and Jharkhand owing to high export duties on iron-ore. Recently,Government of India has reduced the duties on the iron ore with 30% of ironcontent, but it will only lift export scenario in Goa as iron ore produced inJharkhand and Odisha has more than 30% of iron content in ore. The 2016-17Budget removed export duty on iron ore lumps and fines with iron content ofmore than 30 per cent. While the move is expected to incentivize exports fromGoa, it has failed to cheer exporters in Odisha In iron ore rich states like Odishaand Jharkhand, the inventory has been building up. As on end-March, iron orestock (of lumps and fines) in Odisha was 76.9 million tonnes (mt) and 24.7mt inJharkhand.

FEASIBILITY STUDY FOR PORT ON RIVER MAHANADI FINAL FEASIBILITY REPORTCHAPTER – 4
TRAFFIC SURVEYS AND DEMAND ASSESSMENT42
4.3.6 According to Ministry of mines India, Iron ore price has moved up from $40 atonne to $70 a tonne in global markets in the last few months. The export surge isdespite a 30% export duty on high grade iron ore, which accounts for only a smallpart of the overall iron ore exports.
4.3.7 Keeping this in view it is assumed that in near future the exports will pick up andreach at earlier level hence the average export figures for iron ore for past 8 yearshave been considered to derive base year market size.
4.3.8 Coal being another commodity having a decisive factor on proposed port iselaborated further. The import of thermal coal will be reduced in future to almostnil as per present policy of Ministry of power India. Due to coal linkage policy thethermal power plants in the eastern part of country will be self-sufficient and nocoal imports will be required. Further there is possibility of coastal movement ofcoal from rich mines in Odisha and Jharkhand to the states like Tamilnadu andAndhra Pradesh, yet the economies of coastal transport of thermal coal over railis to be established we have not considered the coastal movement of thermalcoal from proposed port. India is rich in production of thermal coal but don’t havesufficient resources of coking coal, hence though the imports of thermal coal willreduce the imports for coking coal will surge owing to increase in the productioncapacity of steel in India. Also, many iron and steel companies are located withinthe hinterland of proposed port which will further drive the demand for importedcoking coal. For production of 1 ton of iron we require 0.6 ton of coking coal,keeping this in view the demand for imported coking coal has been derived.
4.3.5 The detail cargo wise break-up of market size is shown in the Table 4.2 below
Table 4.2 Total market size of detailed cargo within hinterlandAll units are in MMTPA
Year Total Market Size- cargo wise
Iron ore Fertilizers Coal Steel other bulkcargo
2017 23.86 4.85 11.13 1.05 1.572018 26.11 5.24 12.13 1.15 1.692019 28.58 5.65 13.22 1.25 1.832020 31.29 6.09 14.40 1.37 1.972021 34.28 6.57 15.71 1.50 2.132022 37.56 7.09 17.13 3.70 2.302023 41.17 7.64 18.69 4.03 2.492024 45.15 8.25 20.39 4.38 2.692025 49.52 8.89 22.26 4.77 2.912026 54.34 9.59 24.31 5.19 3.142027 59.64 10.35 26.55 5.65 3.402028 65.49 11.16 29.01 6.15 3.67

FEASIBILITY STUDY FOR PORT ON RIVER MAHANADI FINAL FEASIBILITY REPORTCHAPTER – 4
TRAFFIC SURVEYS AND DEMAND ASSESSMENT43
Year Total Market Size- cargo wise
Iron ore Fertilizers Coal Steel other bulkcargo
2029 71.94 12.04 31.71 6.70 3.972030 79.05 12.98 34.67 7.30 4.292031 86.89 14.01 37.91 7.96 4.642032 95.54 15.11 41.48 8.68 5.022033 105.10 16.30 45.40 9.46 5.432034 115.64 17.58 49.70 10.32 5.872035 127.29 18.96 54.43 11.26 6.352036 140.17 20.45 59.63 12.29 6.872037 154.40 22.06 65.34 13.42 7.43
4.3.6 The total market size for Bulk, Container and Other cargo is shown in Table 4.3below
Table 4.3 Total market size of major commodity within the hinterlandAll units are in MMTPA
YearMarket Size- Cargo category
Container cargo Other Cargo2017 1.05 1.572018 1.15 1.692019 1.25 1.832020 1.37 1.972021 1.50 2.132022 3.70 2.302023 4.03 2.492024 4.38 2.692025 4.77 2.912026 5.19 3.142027 5.65 3.402028 6.15 3.672029 6.70 3.972030 7.30 4.292031 7.96 4.642032 8.68 5.022033 9.46 5.432034 10.32 5.872035 11.26 6.352036 12.29 6.872037 13.42 7.43

FEASIBILITY STUDY FOR PORT ON RIVER MAHANADI FINAL FEASIBILITY REPORTCHAPTER – 4
TRAFFIC SURVEYS AND DEMAND ASSESSMENT44
4.4 Share Factor Analysis
4.4.1 The most critical part of the study is to understand the potential market share ofthe proposed Port. The cargo generated from the primary hinterland of theproposed port is mainly shared by Paradip & Vizag. In future the port ofBaliharachandi, Bahabalpur and Bahuda Muhana will also be attracting cargovolume from this hinterland after commencement of the port. Since Dhamra Portwill mostly focus on handling captive cargo of Tata and L&T, it is not included infactor analysis while, the cargo generated by the two companies is not consideredin total market size.
4.4.2 The analysis of potential market share of the port is made by taking intoconsideration the various factors which play a key role in attracting the traffic tothe port. The ports are given scores based on the how much they perform foreach factor. The market share is derived from the total scores of each port. Thefactors considered to determine the market share are:
Port Connectivity
Port location plays a key role in selecting a particular port. The portconnectivity consists of transportation of cargo from the nearest road andrailway facility available. Road connectivity determines the time and cost oftransporting the cargo to and from the port premises. Hence it is an importantport selection criterion. The road connectivity of each port from all the majorindustrial districts present in the hinterland is assed. Ports are given scoresbased on the road distances, lower the distance higher is the score. Like roadconnectivity, the time and money consumed in transporting the cargo fromthe port to the client’s premises depends upon the rail connectivity. Alsorailway transportation offers economies of scale. Hence better railconnectivity can give an edge to a port over its competitors. Ports withshorter rail distances from the port premises get higher scores. The factorsdiscussed above i.e. road and rail connectivity already exist hence the scoresobtained by the proposed port for these factors are based on actual scenario.
Road and rail distance of major industrial regions in hinterland to the ports iscomplied to obtain a distance matrix. Scores are assigned based on theavarage distance a port from the industrial regions. Lower the averagedistance better is the score.
Draft
Draft availability determines the size of vessel that will be accommodated at aparticular port. Large vessels offer the advantage of economy of scale, hencedeeper the draft more number of clients will be attracted to the port. Also thelarge size liner market can be tapped by offering deep drafted berths.

FEASIBILITY STUDY FOR PORT ON RIVER MAHANADI FINAL FEASIBILITY REPORTCHAPTER – 4
TRAFFIC SURVEYS AND DEMAND ASSESSMENT45
No. of berths
The throughput of any given port directly corresponds to total number ofberths available at its premise. With higher number of berths the port canhandle more vessels simultaneously resulting to lower turnaround time.
4.4.3 Unlike existing ports, all the factors corresponding to the proposed port do notexist. The factors can be bifurcated into fixed factors i.e, factors which areassociated with the port site and future factors which will come into existenceafter detailed designing phase of the project. Fixed factors include distance of theport site from industrial cluster and major shipping routes. Whereas, draft, costper ton and no. of berths are future factors.
4.4.4 Factor analysis is carried out by keeping fixed factors constant and assuming thefuture factors at three different levels namely Low Case, Medium Case and HighCase as follows:
Low case scenario, in which it is assumed that the port will have lowestnumber of berth and low draft among the competitor ports.
Medium case scenario, in which the proposed port will have and averagedraft & number of berths.
Best i.e. High case scenario, in which it will have the best configuration ascompared to the competitor ports.
In all three case the scores for rail/road will remain same. The scores in eachscenario will provided us the market share of the port with minimum, averageand high investment scenarios. The scores for the factors are defined on a scale of1 to 5, where 1 is the lowest and 5 with the highest score. Each score represents arange of value with respect to a particular parameter.
4.5 Market Share
4.5.1 Low Case Scenario
The port specification for low case scenario is assumed as follows:
Draft: 12 meter No. of berths: 2 berth
Graph as given below shows the market share of the proposed port as comparedto other competing ports. It can be seen that if minimum level of facilitiesprovided the port can have a market share of 15%.

FEASIBILITY STUDY FOR PORT ON RIVER MAHANADI FINAL FEASIBILITY REPORTCHAPTER – 4
TRAFFIC SURVEYS AND DEMAND ASSESSMENT46
Fig. 4.1 Market share in low case scenario
4.5.2 Medium Case Scenario
The port specification for low case scenario is assumed as follows:
Draft: 14 meter No. of berths: 4 berths
Fig. 4.2 Market Share in medium case scenarioGraph as given above shows the market share of the proposed port as comparedother competing ports. It can be seen that if the port provides average level offacilities it can have a market share of 18%.
4.5.3 High Case Scenario
The port specification for low case scenario is assumed as follows:
Draft: 16 meter No. of berths: 6 berths

FEASIBILITY STUDY FOR PORT ON RIVER MAHANADI FINAL FEASIBILITY REPORTCHAPTER – 4
TRAFFIC SURVEYS AND DEMAND ASSESSMENT47
Graph as given below shows the market share of the proposed port as comparedother competing ports. It can be seen that if the port provides best level offacilities it can have a market share of 22%.
Fig. 4.3 Market Share in High case Scenario
4.6 Vessel calls
4.6.1 The Paradip port is the closest representative of the market that will be served bythe port at Mahanadi River in future. The vessel call traffic at Paradip port wastaken as a reference in arriving at the potential vessel calls for the proposed port.The size wise breakup pattern of vessels calling at paradip was studied and used togenerate the arrival pattern chart of vessels expected at the the proposed port.The vessel calls for each category of commodity was projected for a period of 20years.
4.6.2 The past trend of vessel arrival pattern from Paradip port was used to arrive atthe potential vessel calls for the proposed port at Mahanadi river. The data wassourced for the India port association handbook for major ports. The vessel callsfor each category of commodity i.e. Bulk, Container and Other was taken fromthe IPA data.
4.6.3 The size wise breakup pattern of vessels calling at paradip was studied and apercentage arrival pattern was established. Each category of vessel then wasaveraged out within past 5 years to arrive at percentage vessel calls throughout.
4.6.4 The percentage average of vessel calls was then applied to the respective type ofcargo to generate the arrival pattern chart of vessels expected at the the proposedport. The percetagewise vessel calls for each type of commodity i.e. bulk,container and other is shown below in the figs.

FEASIBILITY STUDY FOR PORT ON RIVER MAHANADI FINAL FEASIBILITY REPORTCHAPTER – 4
TRAFFIC SURVEYS AND DEMAND ASSESSMENT48
Fig. 4.4 Vessel calls for bulk cargo
Fig. 4.5 Vessel calls for Container cargo
Fig. 4.6 Vessel calls for other cargo4.6.5 Traffic vessel calls as per three scenario for major commodity of cargo i.e. Bulk,
Liquid, Container and Other is shown in the Table 4.4 below
Table 4.4 Total vessel calls based on Low, Medium and High Case
Total Vessel calls All units in nos. vesselYear Low case Medium case High case2015 275 311 3972016 299 339 431

FEASIBILITY STUDY FOR PORT ON RIVER MAHANADI FINAL FEASIBILITY REPORTCHAPTER – 4
TRAFFIC SURVEYS AND DEMAND ASSESSMENT49
Total Vessel calls All units in nos. vesselYear Low case Medium case High case2017 326 368 4692018 354 401 5112019 386 437 5562020 454 513 6542021 494 559 7122022 538 609 7762023 586 663 8452024 639 723 9212025 697 788 10042026 759 859 10952027 828 937 11942028 904 1022 13022029 986 1115 14212030 1076 1218 15512031 1175 1330 16942032 1284 1452 18502033 1403 1587 20222034 1533 1734 22102035 1676 1896 2416
4.7 Traffic Projection for proposed port
4.7.1 The projection of traffic for the proposed port at River Mahanadi is done for aperiod of 20 years assuming the commissioning of the port operation from theyear 2015. The traffic projection covers three scenario namely, Low case, Mediumcase and High case scenario traffic.
4.7.2 Traffic projection of cargo volume in low case scenario is shown in Table 4.5below
Table 4.5 Phase wise volume projection in low case scenarioAll units are in MMTPA
Year Iron Ore Fertilizer Steel Coking Coal Other bulk2017 3.70 0.75 0.16 1.72 0.212018 4.04 0.81 0.18 1.88 0.232019 4.43 0.87 0.19 2.05 0.252020 4.85 0.94 0.21 2.23 0.272021 5.31 1.02 0.23 2.43 0.292022 5.82 1.10 0.49 2.65 0.312023 6.38 1.18 0.53 2.90 0.34

FEASIBILITY STUDY FOR PORT ON RIVER MAHANADI FINAL FEASIBILITY REPORTCHAPTER – 4
TRAFFIC SURVEYS AND DEMAND ASSESSMENT50
Year Iron Ore Fertilizer Steel Coking Coal Other bulk2024 6.99 1.28 0.58 3.16 0.362025 7.67 1.38 0.63 3.45 0.392026 8.42 1.49 0.69 3.77 0.432027 9.24 1.60 0.75 4.11 0.462028 10.15 1.73 0.82 4.49 0.502029 11.15 1.87 0.90 4.91 0.542030 12.25 2.01 0.98 5.37 0.582031 13.46 2.17 1.07 5.87 0.632032 14.80 2.34 1.17 6.43 0.682033 16.28 2.52 1.28 7.03 0.742034 17.92 2.72 1.39 7.70 0.802035 19.72 2.94 1.52 8.43 0.862036 21.72 3.17 1.67 9.24 0.942037 23.92 3.42 1.82 10.12 1.01
4.7.3 Traffic projection of cargo volume in Medium case scenario is shown in Table 4.6below
Table 4.6 Phase wise volume projection in Medium case scenarioAll units are in MMTPA
Year Iron Ore Fertilizer Steel Coking Coal Other bulk2017 4.18 0.85 0.18 1.95 0.242018 4.58 0.92 0.20 2.13 0.262019 5.01 0.99 0.22 2.32 0.282020 5.48 1.07 0.24 2.52 0.302021 6.01 1.15 0.26 2.75 0.332022 6.58 1.24 0.56 3.00 0.352023 7.22 1.34 0.60 3.28 0.382024 7.91 1.45 0.66 3.57 0.412025 8.68 1.56 0.72 3.90 0.452026 9.52 1.68 0.78 4.26 0.482027 10.45 1.81 0.85 4.65 0.522028 11.48 1.96 0.93 5.08 0.562029 12.61 2.11 1.02 5.56 0.612030 13.85 2.28 1.11 6.08 0.662031 15.23 2.45 1.21 6.64 0.712032 16.74 2.65 1.32 7.27 0.772033 18.42 2.86 1.44 7.96 0.832034 20.27 3.08 1.58 8.71 0.902035 22.31 3.32 1.72 9.54 0.982036 24.57 3.58 1.88 10.45 1.06

FEASIBILITY STUDY FOR PORT ON RIVER MAHANADI FINAL FEASIBILITY REPORTCHAPTER – 4
TRAFFIC SURVEYS AND DEMAND ASSESSMENT51
Year Iron Ore Fertilizer Steel Coking Coal Other bulk2037 27.06 3.87 2.06 11.45 1.14
4.7.4 Traffic projection of cargo volume in Medium case scenario is shown in Table 4.7below
Table 4.7 Phase wise volume projection in high case scenarioAll units are in MMTPA
Year Iron Ore Fertilizer Steel Coking Coal Other bulk2017 5.33 1.08 0.23 2.49 0.312018 5.83 1.17 0.26 2.71 0.332019 6.38 1.26 0.28 2.95 0.362020 6.99 1.36 0.30 3.22 0.392021 7.65 1.47 0.33 3.51 0.422022 8.39 1.58 0.71 3.82 0.452023 9.19 1.71 0.77 4.17 0.492024 10.08 1.84 0.84 4.55 0.532025 11.06 1.99 0.91 4.97 0.572026 12.13 2.14 1.00 5.43 0.612027 13.32 2.31 1.09 5.93 0.662028 14.62 2.49 1.19 6.48 0.722029 16.06 2.69 1.29 7.08 0.782030 17.65 2.90 1.41 7.74 0.842031 19.40 3.13 1.54 8.47 0.912032 21.34 3.37 1.68 9.26 0.982033 23.47 3.64 1.84 10.14 1.062034 25.82 3.92 2.01 11.10 1.152035 28.42 4.23 2.19 12.15 1.252036 31.30 4.57 2.40 13.31 1.352037 34.48 4.93 2.62 14.59 1.46
4.8 Conclusion
4.8.1 As revealed by this traffic study it can be seen that Iron Ore, Coal and Fertilizermake up the bulk cargo traffic, which will constitute the major traffic that will becoming to the port.

FEASIBILITY STUDY FOR PORT ON RIVER MAHANADI FINAL FEASIBILITY REPORTCHAPTER – 5
FACILITY REQUIREMENTS AND PROJECT DESCRIPTION52
CHAPTER 5
FACILITY REQUIREMENTS AND PROJECT DESCRIPTION
5.1 Basic Requirements
5.1.1 General
The high cost of modern ships and shipping economics dictate a rapid turn roundof ships calling at any port, with minimum pre-berth waiting times, and times foroperations at the berth, such as berthing and de-berthing, loading and unloadingin the port, with a view to maximise the voyage time of the ships. However, thisrequirement has to be balanced against the navigation and manoeuvringrequirements in the port area and ship movement and handling limitationscaused by the need to wait for rise of tide (where natural depth is inadequate),and adverse effects of excessive currents, velocities, excessive ship motions,mechanical and human factors etc. Excessive motions of the berthed ships notonly can impede cargo operations but also cause damage to ships and portstructures such as jetties and wharves as well as the cargoes themselves.Adequately tranquil water within the port is, therefore essential, for berthing /de-berthing and loading / unloading operations. There are stringent requirementsfor certain types of vessels and on certain loading /unloading equipment to beused on vessels, for example, Container Vessels cannot tolerate rolling motionswithout jamming of the boxes and Bulk Cargo vessels have similar constraints ifcontinuous unloaders are utilized. Thus planning for a harbour calls forconsideration of a number of inter-connected factors, such as:
Characteristics and quantum of cargoes to be handled Ship sizes and characteristics Marine environmental conditions Cargo type and average shipment/parcel size Methodology of loading/unloading and equipment type for each cargo Access from the land side Scope for expansion
Each of the above considerations is itself dependent on a number of factors, someof which are outside the control of port planners or operators. The aboveparameters are discussed in the following paragraphs to enable evolving thelayout of the port
The type and volume of traffic in each commodity has already been discussed inChapter 4, from which other planning parameters, such as ship sizes, parcel sizeetc. can be readily arrived at to provide the most cost-efficient port. Similarly themethodology of loading/unloading vessels and other land-side parameters, suchas storage areas, rail and road access can be readily understood and planned for

FEASIBILITY STUDY FOR PORT ON RIVER MAHANADI FINAL FEASIBILITY REPORTCHAPTER – 5
FACILITY REQUIREMENTS AND PROJECT DESCRIPTION53
maximum efficiency. These parameters go in to what may be called port planning.However, the merging of marine environmental parameters in to the planningprocess of what may be called Harbour Planning is perhaps equally, if not more,important since it determines the throughput of the facilities. These aspects arefirst discussed in conceptual terms, before going in to the overall planning of thefacility.
One of the first aspects to be seen in the design of a harbour is the nature andquantities of material to be dredged. If the material is of good quality, the samecould be used for reclamation purposes, providing much needed land, and at thesame time reducing the cost of disposal in the deep sea. The area to be reclaimedhas therefore to be first identified, keeping in mind the future operations withinthe port.
The next aspect to be considered is whether the approach channel provides acomfortable entry, requiring wind, wave and current forces to be on the bow orstern, rather than broadside. The wind and wave direction during the monsoon,when the environmental parameters are critical, are seen to be from south tosouthwest. Thus a channel alignment approximating the present flow directionswould be ideal.
Perhaps the most important single aspect in harbour design is the tranquillity atthe berth. A vessel in motion can withstand very adverse weather conditions,given adequate manoeuvring area and depth, but at a berth, the vessel merelyreacts in a static manner to the external forces, without the ability to manoeuvreusing engine power, resulting in buffeting of the vessel against the berth. Thusfrom the point of view of the safety of the vessel and the berthing structure, themovement of the vessel at the berth has to be kept to a minimum. A moreimportant reason to keep the movement of vessels to a minimum is the drop inefficiency of container handling and continuous bulk unloaders, when themovement of the vessel is beyond the limit of tolerance of the equipment. Thusthe environment in which the berth is located is of vital importance. Finally thelayout has to adhere to the various environmental regulations.
The above-mentioned aspects pertaining to conceptual planning are consideredin greater detail at the end of this chapter, after determining the type of ships tobe accommodated in the harbour, the number of berths required, determinationof the characteristics of the operational areas for the vessels (consistent withtheir safety) and the environmental constraints, if any.
5.1.2 Planning Parameters
The facilities are planned using the most modern port planning concepts so thatthe new port will have the necessary operational capabilities and flexibility toattract maximum traffic. And with the deployment of vessels described in thenext section, there will be reduction or virtual elimination of demurrage

FEASIBILITY STUDY FOR PORT ON RIVER MAHANADI FINAL FEASIBILITY REPORTCHAPTER – 5
FACILITY REQUIREMENTS AND PROJECT DESCRIPTION54
payments and maximisation of despatch money earnings, etc; all with minimalcapital investment and operating costs.
On the basis of cargo and ship sizes, this section deals with the basic layout of thefacility. It will elaborate on the berth requirement, storage area and other supportinfrastructure requirements.
The concept, as spelt out herein, is the guideline for overall port planninginclusive of the facilities of Phase I and future. While selecting the quantum andcapacities of the various constituents of the port facilities, the following basicconcepts have been adopted:
The selection of facilities will take into account the growth in traffic asforecast to avoid the necessity of taking up additional construction workimmediately or soon after the commissioning of a particular facility, to caterto the expected increase in traffic in the very near future.
Only whole number of individual units of equipment such asloaders/unloaders, stacker/reclaimer, conveyor, wagon loading system, etc.,will be considered with the increase in the traffic. No attempt will be made toincrease the capacity of individual units of equipment already installed sincethe same will not be economical and in most cases not practical. Sincemajority portion of the traffic is speculative in nature, equipment for thefacilities shall be based on the initial requirements with some spare capacity.
All systems will be so planned that marginal variations in traffic, from those asforecast, will not adversely affect the operations of the facilities or result inundue congestion.
The functional planning of the proposed port will envelop various aspects. Manyof these parameters interlinked with each other and values / data of such interrelated parameters are to be arrived at for effective optimisation betweenacceptable end results and quantum of inputs that will have bearing oninvestment for meeting the levels of annual throughputs, over stages of time. Theparameters of the ship-server-service system and interlinked linked logisticelements are:
Annual Throughput Average ship size Berth occupancy permissible Tw/Ts (waiting time/service time ratio) Cargo loading/unloading rate / hour No. of ship server cranes / No. of berths to meet annual throughputs

FEASIBILITY STUDY FOR PORT ON RIVER MAHANADI FINAL FEASIBILITY REPORTCHAPTER – 5
FACILITY REQUIREMENTS AND PROJECT DESCRIPTION55
5.1.3 Cargo Volume
In Chapter 4, the traffic expected to be handled at the Port has been discussed indetail. The traffic projections are reproduced here for ready reference. It must berecognised that for the purpose of this report, the detailed functional planning isrestricted to the first 10 year period, and for subsequent phases of development,a Master Plan approach has been taken. This methodology affords theadvantages of utilizing actual realization of cargo types and throughputs, ship sizebuild-up, clientele/user pattern and preferences, and revenue realization.
Table 5.1 Expected Cargo Volume for Basic Facility Requirement
Cargo Type Expected Cargo Volume (Million tones)Year 10 Year 20
2025 2035Iron ore 10.45 27.06Fertilizers 1.81 3.87Coal 4.65 11.45Other Bulk Cargo 0.52 1.14Containers* 0.04* 0.09*
Total 17.43 + 0.04* 43.52 + 0.09**MTEU
5.1.4 Ships Sizes Expected at the Port
A very important aspect of port planning is to determine the types, sizes andnumbers of ships that may be expected to call at the port to carry the forecasttraffic. The types of ships are related to the trade in cargo. Specialized ships areused for the carriage of Petroleum products, Chemicals, Containers, break- bulkand dry bulk cargoes. The size of ships usually depends on voyage and traderelated factors. Considerable reduction in freight rates is realizable, usingincreasing vessel sizes. Thus generally, large bulk carriers are used for longvoyages due to cost advantages. For shorter coastal hauls, smaller vessels areused. Another aspect, which may have a decisive influence on ship-size, is thetrade routes on which the ships will ply. There are some types of vessels, whichhave come to be preferred due to their cost-effectiveness on certain trade routes.Finally, draft limitations, if any, at the loading and/or destination ports would alsogovern the sizes of the ships calling at the port. After considering the variousfactors, the ranges of vessels, likely to call at the proposed port at River Mahanadihas been worked out. Small vessels are likely to be used for carrying generalcargo, since these will probably come from various coastal locations in India. Theship sizes together with their main dimensions considered working out basicfacility requirement are given below:

FEASIBILITY STUDY FOR PORT ON RIVER MAHANADI FINAL FEASIBILITY REPORTCHAPTER – 5
FACILITY REQUIREMENTS AND PROJECT DESCRIPTION56
Table 5.2 Ship sizes expected at the port
Phase Type of Vessel VesselAverage
Size (DWT)
Design vessel DimensionsLength
LOA (m)Beam
(m)Max.Draft(m)
I & IIBulk Vessel (Panamax) 65000 225 34.0 13.0General Cargo Vessel 25000 178 26.4 10.7Container Vessel 1000* 195 28.5 10.1
*TEU
5.1.5 Number of Ship Calls
With the volume of cargo and ship sizes having been set out in the earlierparagraphs, the number of ship-calls may now be calculated. The distribution ofships sizes are to be considered to assess the no. of ships calls that would occurfor each commodity between the possible maximum size governing the Oceantrade and the minimum size of vessel. As such the throughput of each commoditywill be handled, total number of ships under a particular distribution of ship sizes,in this case the pattern of distribution is taken as normal distribution asevidenced by observations of such occurrence in ocean trade.
Accordingly, attempt has been made to arrive at the number of ships based onprobable distribution indicating vessel size and numbers for meeting thethroughput in each commodity. The table below gives such data for the 2 phasesof traffic horizons, considering a normal distribution of ship with respect to thesize of vessel for various commodities:
Table 5.3 Number of Ship Calls
Phase Years Commodity Totalthroughput
(MTPA)
AssumedVessel size
(DWT)
No. ofShips calls
Inter arrivaltime of ship
I 2016-25 Iron ore 10.45 65000 161 2Fertilizers 1.81 25000 73 5Coal 4.65 65000 72 5Other Bulk Cargo 0.52 25000 21 16Containers 0.04* 1000** 40 8Total ship calls 367
II 2026-35 Iron ore 27.06 65000 417 1Fertilizers 3.87 25000 155 2Coal 11.45 65000 176 2Other Bulk Cargo 1.14 25000 46 7Containers 0.09* 1000** 94 4Total ship calls 888
* MTEU ** TEUThe basic requirement for the port has been worked out based on the targetcapacity (projected cargo volume), expected vessel sizes and no. of ship calls.

FEASIBILITY STUDY FOR PORT ON RIVER MAHANADI FINAL FEASIBILITY REPORTCHAPTER – 5
FACILITY REQUIREMENTS AND PROJECT DESCRIPTION57
5.2 Navigational Requirement
5.2.1 Water Areas
Any harbour has to have well laid out operational areas on the land side as well asthe water side. In this section the water areas required for ship operations andtheir dimensioning are discussed. The essential operational areas, with briefdescription of each are:
(i) Approach Channel: is that portion of the channel from the land fall pointor Pilot Station leading up to the harbour entrance, per-se. Where harbourentrance is in deep water an approach channel may not be required.
(ii) Entrance Channel: is that portion of the channel which is the transitionbetween the exposed approach channel and the sheltered port channel,including the sector passing the entrance.
(iii) Port Channel(s): could be one or more channels inside the sheltered portarea leading to one or more port terminals such as docks, jetties and othertype of berthing facilities, anchorages or special areas.
(iv) Turning Circle / Manoeuvring Area: This is a special water area usuallyinside the port meant for turning ships around or carrying out manoeuvrestypically for the purpose of berthing or de-berthing.
5.2.2 Dimensioning
Dimensioning or designing of water areas are of critical importance for safety andefficiency of ship operations in the port. The design parameters are depth,breadth (or diameter), length, location, alignment etc. Since these parametersmust necessarily be sufficient to accommodate all ships, the first requirement isto determine the dimensions of the Design Ship. Since, there is a proportionalrelation between length, beam (breadth of ship), draft, dead weight of ships, thelargest DWT ship expected usually serves as the Design ship, and its dimensionsare accepted for designing channels, turning circles etc. However, if an extra wideor deep drafted vessel type is to frequent the port, the relevant dimensions areincorporated as the Design Vessel dimensions.
In the instant case the critical vessel in terms of length and beam in all phases isIron Ore and Coal carrier with a capacity of 65,000 DWT, Length of 225 m andBeam of 34 m. The draft of this vessel is 13.0m. Therefore, the Iron Ore and Coalcarrier of the length (225 m) and beam (34 m) may have to be taken as the Designvessel. This is particularly a critical requirement in terms of depth of channelbecause of the need to consider emergency requirements. It must be understoodthat the critical nature of the cargo necessarily requires that movements of anvessel are permitted to be carried out at all or nearly all tidal levels. Furthermore,the channel design would have to take into account emergency movements at alltidal levels. The navigational requirement of the port at Mahanadi has beenworked out considering the following design vessel

FEASIBILITY STUDY FOR PORT ON RIVER MAHANADI FINAL FEASIBILITY REPORTCHAPTER – 5
FACILITY REQUIREMENTS AND PROJECT DESCRIPTION58
Table 5.4 Design Vessel Dimensions
Phase Vessel Average Size(DWT)
Design vessel DimensionsLength (LOA)
(m)Beam
(m)Max. Draft
(m)I & II 65000 225 34 13.0
5.2.3 Navigation channel
In order to define the geometric dimensions of the navigation channel IndianStandard 4651 “Code of practice for planning and design of ports and harbours.Part V: Layout and functional requirements” and the recommendations of theReport by the PIANC-IAPH Working Group II-30 “Approach channels - A guide fordesign” have been followed. The resulting values can be compared in order todetermine the channel geometry.
Indian Standard
Indian Standard 4651 lays down functional requirements for planning anddeveloping commercial ports and harbours and gives general recommendationfor the layout of the harbour and operational facilities:
Navigation channel Harbour basin Piers and wharves Storage areas and sheds and storage of hazardous/obnoxious cargo Open storage area Other functional and operational buildings Roads and port railways, and Fire protection measures
Water ways should be laid out in proper configuration and designed for goodcontrol and safe manoeuvrability of ships under winds, currents, waves, visibilityand in adverse weather conditions.
Taking into consideration the size and trim of the design vessel, currents, wavesand winds, and tidal variation, it is recommended that minimum under keelclearances should not be less than 10 % of the draft for the vessel in the channel,15 % at the turning circle and 20 % at the entrance of the channel in unshelteredareas. The clear width of restricted channel measured at the bottom of thedredged bed may be taken as the sum of the following three zones (see Fig. 5.1). Manoeuvring lane (single lane) should be 180 to 200 %of the vessel’s beam in
straight channels and suitably widened in curved channels.

FEASIBILITY STUDY FOR PORT ON RIVER MAHANADI FINAL FEASIBILITY REPORTCHAPTER – 5
FACILITY REQUIREMENTS AND PROJECT DESCRIPTION59
Bank clearance: Normally 75 to 150 %of the beam of the largest vessel oneach side.
Passing clearance: The distance between adjacent manoeuvring lanes in twolane channel should not be less than the beam of the largest vessel.
The width of the channel is to be reduced at the harbour entrance for obtainingtranquillity conditions, the reduced width between pier heads shall be a minimumof 0.7 to 1 times the length of the largest designed vessel. The entrance inbetween sloping breakwaters the width should be measured at the maximumdraft at mean low water.
In case of riverine ports having a very long channel with no intermediateanchorage and where navigation is dependent on tides, the width of the channelmay have to be increased at places to allow for the vessel to swing round.
In increasing the width of the channel at curvature the widening of the curveshould be done by the parallel bank method. The slope of the transition should beat least 1 in 20 (see Fig. 5.2).
ONE LANE CHANNEL
TWO LANE CHANNELSource: Indian Standard 4651 Part V
Fig. 5.1 Width of the Channel

FEASIBILITY STUDY FOR PORT ON RIVER MAHANADI FINAL FEASIBILITY REPORTCHAPTER – 5
FACILITY REQUIREMENTS AND PROJECT DESCRIPTION60
Source: Indian Standard 4651 Part VFig. 5.2 Widening of Channel at Curvature
Width: Straight Sections
The bottom width for a straight one-lane channel is between 3.3B and 5.0B,which corresponds to 112.2 m and 170 m. In the case of two-lane channel, thewidth is among 5.1B and 8.0B, which corresponds to 173.5 m and 272 m.
Width: Curvature sections
According to the previous results, the extra width at curvatures sections rangesbetween 17 m and 34 m, obtaining values of total width ranges between 177 mand 194 m in the case of one-lane channel and ranges between 17 m and 32 m,obtaining values of total width ranges between 289 m and 306 m in the case oftwo-lane channel.
Depth
The requisite water depth in the different parts of the water area is shown atTable 5.5.
Table 5.5 Depth of channel (BIS)
Water Area Under-keelClearance
Depth
Channel 10% 1.30 m 14.30 mTurning circle 15% 1.95 m 14.95 mUnsheltered & entrance 20% 2.60 m 15.60 m

FEASIBILITY STUDY FOR PORT ON RIVER MAHANADI FINAL FEASIBILITY REPORTCHAPTER – 5
FACILITY REQUIREMENTS AND PROJECT DESCRIPTION61
Permanent International Association of Navigation Congress (PIANC)
PIANC Working Group (PIANC-IAPH Working Group II-30) published the Report:“Approach channels, a guide for design”. This publication provides someinstructions to determinate the geometric characteristics of navigations channels.A simpler way to allow for squat, draft and sounding uncertainties (and also togive a margin for safety) is to set a minimum value on water depth/draft ratio. Inmany parts of the world a value of 1.10 has become accepted although a value of1.15 can be adopted. These values are for calm water and greater values wouldbe necessary if the channel is subjected to wave action, where values of 1.2 ormore may be used. The closer the ratio is to unity, the more directionally stable isthe ship and, consequently, the more sluggish its response. It is usual to allow forthis by increasing channel width – another occasion when width and depth arelinked.
The Report “Approach channels, a guide for design” also introduces a conceptdesign method for approach channels. It is meant for use in early design andtrade-off studies. It represents good modern practice and channels designed tothis method should result in an adequate level of navigational safety.
Although it can be applied to channels world-wide, local conditions may requiredimensions or alignment which differs, from those derived from the informationgiven below. The Concept Design method deals with the width and depth ofstraight sections and gives guidelines for bends. It is accompanied by some notesand definitions and is followed by a few worked examples to illustrate its use.
Width: Straight sections
The bottom width w of the waterway with a one-way channel is given by theformula:
BgBr
n
iiBM wwwww
1
For a two-way channel by:
pBgBr
n
iiBM wwwwww
1
22
where wBr and wBg are the bank clearances on the ‘red’ and ‘green’ sides of thechannel, wp is the passing distance (comprising the sum of a separation distancebased on ship speed and additional distance based on traffic density) and w i arethe additional widths for straight channel sections. wBM represent the basicmanoeuvring width and in given as a multiple of the beam B of the design ship.
The values of the width in the different parts of the channel (inner and outerparts) are shown at Table 5.6 for one-lane channel, which would meet the initialrequirements

FEASIBILITY STUDY FOR PORT ON RIVER MAHANADI FINAL FEASIBILITY REPORTCHAPTER – 5
FACILITY REQUIREMENTS AND PROJECT DESCRIPTION62
Table 5.6 Additional Width for Straight Channel Sections
Vessel LOA, LVessel Beam, BVessel Draft, TVessel Speed
225 m34 m13 m12 Knots (Outer Channel)5 Knots (Inner Channel)
Factor Assumption OuterChannel
InnerChannel
Basic Manoeuvring Lane (m) Moderate 1.5 B 1.5 B51.0 51.0
Prevailing Cross Wind (knots) Moderate> 15 – 33
0.4 B 0.5 B13.6 17.0
Prevailing Cross Current (knots) Moderate> 0.5 – 1.5
0.7 B 0.8 B23.8 27.2
Prevailing Longitudinal Current(knots)
Low< 1.5
0.0 B 0.0 B0 0
Significant Wave Height Hs andLength λ (m)
3 > Hs > 1 andλ = L
1.0 B 0.0 B34.0 0
Aids to Navigation Good 0.1 B 0.1 B3.4 3.4
Bottom Surface Depth < 1.5 TSmooth and soft
0.1 B 0.1 B3.4 3.4
Depth of Waterway Depth < 1.25 T 0.2 B 0.4 B6.8 13.6
Cargo Hazard Level Medium 0.5 B 0.4 B17.0 13.6
Additional width for bank clearance Sloping channeledges and shoals
0.5 B 0.3 B17.0 10.2
TOTAL WIDTH (m) 5 B 4.1 B170.0 139.4
Width: Curvature sections
Bend width and radius can be estimated from the ship turning data in Fig. 5.3. Amean rudder angle for the bend should be chosen and the appropriate radius andwidth read off for a given depth/draught ratio.
If, in traffic studies, it becomes apparent that passing on bend is unavoidable,then a separate, detailing, will be required for each bend so affected. Additionalwidth is preferably placed on the inside rather than the outside of the bend.

FEASIBILITY STUDY FOR PORT ON RIVER MAHANADI FINAL FEASIBILITY REPORTCHAPTER – 5
FACILITY REQUIREMENTS AND PROJECT DESCRIPTION63
Source: “Approach channels, a guide for design”-PIANCFig. 5.3 Additional widening at the Curvature of the approach channel
Source: “Approach channels, a guide for design”-PIANCFig. 5.4 Width of swept track in a turn as a function of
rudder angle and water depth

FEASIBILITY STUDY FOR PORT ON RIVER MAHANADI FINAL FEASIBILITY REPORTCHAPTER – 5
FACILITY REQUIREMENTS AND PROJECT DESCRIPTION64
Depending on rudder angle (values are given for 10º, 20º and 30º) turning radiusand width of swept track has been calculated for a 1.10 water depth/draft ratiofrom Fig. 5.4, as shown at Table 5.7.
Table 5.7 Extra width of channel at curvature sections
Rudder Angle Extra Width Minimum Turning Radius
100 37.40 m 1164.38 m200 40.80 m 1771.88 m300 44.20 m 3290.63 m
Depth
Depth is estimated from:
At-rest draft of design ship Tide height throughout transit of channel Squat Wave-induced motion Margin, depending on type of bottom Water density, and its effect in draft
All the above values for draft, squat, wave action and margin are additive.
In the absence of other information, minimum values of depth/draft ratio shouldbe taken as 1.10 in sheltered waters, 1.3 in waves up to one meter in height and1.5 in higher waves with unfavourable periods and directions.
According to PIANC’s general methodology, the requisite water depth in thedifferent parts of the water area is shown at Table 5.8.
Table 5.8 Depth of channel (PIANC - General)
Water Area Under-Keel Clearance DepthCalm Water (Inner Channel) 10%-15% 1.30m-1.95 m 14.30m -14.95 mHS ≤ 1 m (Outer Channel) 30% 3.9 m 16.9 mHS ≥ 1 m (Outer Channel) 50% 6.5 m 19.5 m
According to PIANC’s specific methodology, the values of the water depth in thedifferent parts of the channel are shown at Table 5.9. As design criteria, it isconsidered inner channel (sheltered waters) the area with waves up to one meterof significant wave height (Hs) and outer channel the area with waves up to threemeters of significant wave height (the maximum wave height is Hmax=1.8·HS).

FEASIBILITY STUDY FOR PORT ON RIVER MAHANADI FINAL FEASIBILITY REPORTCHAPTER – 5
FACILITY REQUIREMENTS AND PROJECT DESCRIPTION65
Table 5.9 Depth of channel (PIANC - Specific)
Parameters Inner Channel Outer ChannelKeel Clearance Depth Keel Clearance Depth
0.5·Hmax 0.9 m - 2.7 m -Squat 0.4 m - 0.6 m -Gross reserve 0.6 m - 0.6 m -Sum 15% 1.9 m 14.9 m 30% 3.9 m 16.9 m
Results summary
Tables 5.10 to 5.14 summarize the previous estimations:
Table 5.10 Width of channel at straight sections
Standard One-lane ChannelInner Channel Outer Channel
Indian Standard 112.2 m – 170.0 mPIANC’s specific methodology 139.4 m 170.0 m
Table 5.11 Extra width of channel at curvature sections
Rudder Angle Extra Width Minimum TurningRadiusPIANC Indian Standard
100 37.40 m
17 m – 34 m
1164.38 m
200 40.80 m 1771.88 m
300 44.20 m 3290.63 m
Table 5.12 Depth of channel (Summary)
Standard Inner Channel Outer ChannelIndian Standard 14.3 m 15.6 mPIANC’s General Methodology 14.3 m 16.9 mPIANC’s Specific Methodology 14.9 m 16.9 m
As shown at those tables the PIANC’s specific methodology provides sharperresults while general methodology (PIANC’s and Indian Standard) provides resultsin a wider range of values. That becomes apparent with the depth of the channel,where the PIANC’s specific methodology’s provides results which are included inthe numerical range provide by the Indian Standard and PIANC’s generalmethodology.

FEASIBILITY STUDY FOR PORT ON RIVER MAHANADI FINAL FEASIBILITY REPORTCHAPTER – 5
FACILITY REQUIREMENTS AND PROJECT DESCRIPTION66
Therefore, we find that PIANC’s specific methodology’s results are the mostsuitable in order to determine the geometrical characteristics of the navigationchannel, as shown at Table 5.13 and Table 5.14.
Table 5.13 Geometrical characteristics of navigation channel at straight sections
Parameters Inner Channel Outer ChannelOne-Lane One-Lane
Width 139.4 m 170.0 mDepth 14.9 m 16.9 m
Table 5.14 Extra width of channel at curvature sections (Specific)
Geometrical Characteristics Of Navigation ChannelRudder Angle Extra Width Minimum Turning Radius
100 37.40 m 1164.38 m200 40.80 m 1771.88 m300 44.20 m 3290.63 m
The final dimensions of the inner and the outer channel for different phasesconsidered are the following:
Inner Channel : Width - 160 m Depth (-) 15 m CDOuter Channel : Width - 190 m Depth (-) 17 m CD
However planning the dredging for the MLWS condition, the dredged depths inthe inner channel will be 14.2 m and the outer channel 16.2 m CD.
From the bathymetry of the project area, it can be seen that -16m contour isabout 22 Km from the project area. As per norm if the channel depth is kept at-16m CD, it would account for a huge amount of dredging quantities. Therefore, itis obvious that navigation has to be done taking advantage of tidal window.Presuming that ship will ply during tidal window total depth available will be 16 mfor -14 m bed level in outer channel and 14 m for -12 m bed level in inner channelwith 2m tidal window. Accordingly, it is proposed that the outer channel would bedredged to -14.0m and inner channel would be dredged to -12.0m. As the shipsare expected to be moored at the berth even after high tide has passed, the fulldraft of vessel and under keel clearance is to be taken into consideration.Accordingly, the dredging depth in port basin is proposed as -14.0m (CD).
5.2.4 Turning Circle
As per BIS Code IS: 4651 (Part V) – 1980, the minimum diameter of turning circleshould be 1.70 to 2.0 times the length of the largest vessel to be turned. Thefactor of 1.70 is for protected basins, and factor of 2.0 is for exposed locations.

FEASIBILITY STUDY FOR PORT ON RIVER MAHANADI FINAL FEASIBILITY REPORTCHAPTER – 5
FACILITY REQUIREMENTS AND PROJECT DESCRIPTION67
Since the proposed port location would be inside creek on right bank of RiverMahanadi which will be a protected basin. Also, in the case of the Mahanadi Portthe existing geometrical limitations and the convenience of minimizing thevolume of material to be dredged recommend to reduce as much as possible theturning circle dimensions. Therefore, the assistance of tugs has been consideredand a diameter of 2 times the length of the largest ship has been applied. Hence,the recommended turning circle is 450m.
5.2.5 Other Aspects of Channel Design
In addition to its width and depth there are other aspects of equal importancewhich have to be incorporated in a good channel design. These are discussed inbrief below:
Alignment: As compared to a road or rail vehicle, there are severe limitations onthe manoeuvrability of a ship, specially a large one like the design vessel. An evenmore aggravating factor in this regard is the high “windage” offered by a ship dueto its superstructure. Thus every effort has to be made in drawing up a favourablealignment. The ideal alignment would be a dead-straight-one from land fall to theberth, parallel to the direction of wind and current. Clearly the ideal alignment isnearly impossible in almost any location. Therefore, compromises have to bemade. If bends or curves in the channel alignment cannot be avoided they shouldbe as few as possible and very flat with a radius of curvature of about 7 to 10times length of Design vessel, depending on the degree of turn. Keeping in viewtypical steering machinery and techniques, two straight legs with a flat bendconnecting them is preferable to a long continuous curve. “S” curves whichrequire a ship to turn in one direction first and in the opposite directionimmediately thereafter should be shunned. It is necessary for a vessel to comeout of a turn in any direction and steady up on a straight course before it is readyto go into a turn in the opposite direction. The leg of the channel which takes avessel into the harbour entrance should be straight. There should be no bend orturn near or just outside the harbour entrance.
Stopping Distance: When a ship enters a harbour and is approaching the berth orturning area, it is necessary for her to progressively reduce speed. Reducingspeed impairs her manoeuvrability and hence this leg of the channel should bestraight for a long enough distance to allow her to come to a complete or nearcomplete stop without losing control. For the design vessel, the minimumstopping distance would be about seven times the length of the ship or about1575m. Moreover, this straight leg should be in sheltered water so that tugs canbe secured on lines well before the vessel arrives in the Turning Circle ormanoeuvring area.
Orientation: It is impossible to orient the channel parallel to wind and current inall seasons and at all stages of the tide. However, the orientation of the channelvis-à-vis these forces needs deliberation. Under certain conditions such as when

FEASIBILITY STUDY FOR PORT ON RIVER MAHANADI FINAL FEASIBILITY REPORTCHAPTER – 5
FACILITY REQUIREMENTS AND PROJECT DESCRIPTION68
current is very strong, navigation may have to be suspended until the currentslackens sufficiently. Beam Sea and wind are to be avoided in a channel ofrestricted dimensions but where unavoidable its dimensions have to be increasedsufficiently. At proposed Mahanadi port as wind and wave direction will bemostly S & SW during the critical weather period, the channel alignment,dimensions and orientation have been planned accordingly.
The aids to navigation (also known as ATON) are markers, which aid the vessels intheir nautical navigation, and there exist some types. Lateral markers are thosethat indicate the navigation channel sides. At the IALA A system (valid in India),when entering the port the green colour markers are located at the starboardside (right) and the red colour markers are located at the port side (left).
In the proposed Port floating lateral markers (buoys) are proposed to be used tosignal its navigation channel, with a longitudinal distance between markers of2,000 meters. These buoys can be staggered on either side of the channel, whichwill reduce the number of buoys.
5.2.6 Tranquillity
An analysis of several years of wave data from the Bay of Bengal indicates thatwave parameters such as significant wave height, wave period and mean wavedirection are significantly different for various weather events. In general, duringfair weather season off Paradip significant wave heights are below 1.0 m, duringmonsoon below 3.5 m and during extreme weather events of the order of 5.0 to7.0 m.
The wave climate off the East Coast of India is often rough during the southwestmonsoon (June to September) and comparatively calm during the remaining partof the year. Generally, the significant wave height varies from 1 to 3 m during thesouthwest monsoon except during the cyclone periods. The average wave periodvaries from 9 to 12 sec for the greater part of the year but increases to 10 to 14sec during storm conditions. The waves approach the coast predominantly fromthe southeast during March to September and from the east during December toFebruary. A maximum significant wave height of 3.29 m has been reported atTikkavanipalem, south of Visakhapatnam during a cyclone in November 1998. Theheight of the highest wave recorded off Visakhapatnam during normal monsoonof 2009 (no cyclone or deep depression) for a period of 4 months varied from1.05 to 5.01 m with maximum significant wave height of 2.62 m.
The permissible wave disturbance at berthing depends on ship size, mooring andberthing system, the method of loading and unloading used at berth and onorientation of the berth with respect to wave direction. The acceptable waveheights for different types of vessels recommended by the InternationalAssociation of Ports and Harbours are given in the following table

FEASIBILITY STUDY FOR PORT ON RIVER MAHANADI FINAL FEASIBILITY REPORTCHAPTER – 5
FACILITY REQUIREMENTS AND PROJECT DESCRIPTION69
Table 5.15 Allowable Wave Heights near the Berths as per PIANC
Type of vesselsApprox. acceptable wave heights - Hs(m)Incident angle 00
(head on)Incident angle
(450 – 900)Conventional general cargo vessels 1.0 0.8Container vessels 0.5 0.4Dry bulk carrier 30,000-100,000 DWT (loading) 1.5 1.0Dry bulk carrier 30,000-100,000 DWT (unloading) 1.0 0.8 – 1.0Tankers 30,000-200,000 DWT 1.5 - 2.5 1.0 – 1.2
As per IS 4651 (Part V), the wave disturbance within the harbour should notexceed the tranquillity conditions given in following table
Table 5.16 Allowable Wave Heights near the Berths as per IS 4651
Type of vesselsApproximate acceptable wave heights - Hs (m)
At berth Turning circleGeneral cargo 0.65 0.90Bulk cargo 0.90 1.20Container cargo 0.65 1.20Dredgers - 0.45 – 2.0
In view of above, for bulk cargo of 65,000 DWT class vessels which are proposedto be brought at the port, wave height in the vicinity of the proposed berths iswell within the above permissible limits during entire year.
5.2.7 Berth Alignment
Alignment of berths is required to be fixed based on the river current directionat the berths location. The previous studies on the project indicate that thedirection of the current is about 3250 to 3400 N during flooding tides and 1500 to1700 N during ebbing. Hence, alignment of the berth structure needs to be fixedat 3400 N.
5.3 Cargo Servicing
Cargo servicing comprised of Cargo Berths, Cargo Handling, Cargo Storage andCargo Evacuation. The number of berths required to handle a given volume ofannual traffic depends on a number of inter-connected factors. These are, foreach commodity, the annual through put, average typical “parcel size” or averagesize of shipment, the number of ship calls and the average berth occupation timeat each call. Obviously, the average shipment size or parcel size would determinethe number of ship calls for the given volume of annual throughput. The averageperiod of berth occupation by the ships calling at the port would depend on therate of discharge or loading, which in turn depends on the cargo handlingequipment available for the purpose, and number of working days. Finally, theacceptable berth occupancy ratios need careful selection. This is because, for

FEASIBILITY STUDY FOR PORT ON RIVER MAHANADI FINAL FEASIBILITY REPORTCHAPTER – 5
FACILITY REQUIREMENTS AND PROJECT DESCRIPTION70
ships arriving randomly, (which is to be normally expected) high berth occupancyratios usually mean ships waiting to get a vacant berth. Berthing delays result inhigher freight rates being levied on cargoes shipped to or from the Port, whichwill correspondingly increase the total transportation costs. On the other handneedlessly low berth occupancy ratios may result in more berths and result inhigh capital costs, without matching benefits. Some types of cargoes wouldrequire an exclusive berth due to their very nature e.g. petroleum products etc.while some cargoes could be handled at a common multi-purpose berth. Thus,decision on the number of berths and their utilisation is a complex optimizationexercise. In the case of the Mahanadi Port, separate berths are proposed for IronOre, Coal, Containers and Fertilizer and Other Bulk Cargo is proposed in the phaseI. Additional separate berths for are proposed Iron Ore and Coal in phase II.
5.3.1 Berths and Cargo Handling Requirement
The required number of berths depends mainly on the cargo volumes and thehandling rates. While various general cargos including some low volumes of drybulk can be handled at the same (multi-purpose) berth, major bulk cargo wouldrequire dedicated facilities. Other factors that influence the number of berths are:
Types and Volumes of Cargo to be handled Vessel sizes and parcel sizes Operational time with respect to number of operational days per year and
number of working hours per day Allowable berth occupancy Time required for peripheral activities
5.3.1.1 Operational Time
It is assumed that Mahanadi port will work seven days a week, which brings theeffective number of working days to 330 days per year, allowing for 35 non-operational days - due to weather (20 days of monsoon) and holidays (15 days)Further, it is assumed that the port will operate round the clock i.e. three shifts ofeight hours each. This results in an effective working time of 24 hours a day.
5.3.1.2 Allowable Berth Occupancy
It depends on ship arrival pattern and waiting and servicing ratio.
Ship Arrival Pattern
Schedules are important and modern ports strive to contribute to the regularityof the services. Till specific schedules are established for the port througharrangements with the liner and shipping community, it is unlikely that the portwill have any control over the frequency, or periodicity of ship calls. Planning

FEASIBILITY STUDY FOR PORT ON RIVER MAHANADI FINAL FEASIBILITY REPORTCHAPTER – 5
FACILITY REQUIREMENTS AND PROJECT DESCRIPTION71
parameters of the Mahanadi Port are conservative with the adoption of Poissonarrivals (M) with its ‘Memory-less’ attribute, treating each ship call asindependent. The service times of the series of ships handled, are distributed asErlang with shape factor K=2 (E2) by convention (Fig. 5.5). This would be areasonable assumption as K=1 applies to the exponential distribution with higherrandomness normally associated with a non-mechanized facility. On the otherhand, K=3 (or higher) applies to the likely case for a modern container terminal,but may be ambitious for a new terminal at its inception.
Waiting Time to Service Time Ratio
The average waiting time to service time ratio (Tw/Ts) determines the probabletotal turnaround time of the ships at the port. The selection of this ratio, whileplanning any facility, is a matter of judgement depending on the type of facility,likely variations in the actual annual throughputs from those for which the facilityis planned for, etc. This ratio depends on the berth occupancy levels and the shiparrival and service patterns.
For any particular set of ship arrival and distribution patterns, the higher theberth occupancy the higher the ratio Tw/Ts. The sensitivity of the ratio alsoincreases with the berth occupancy levels and if a facility is planned on the basisof unduly high berth occupancy levels, even marginal increases in the actualoccupancy levels, say, due to slight increase in the volume of traffic, occasionalbunching of ships, or any fall in the handling rates at the berths due to unforeseenreasons, etc., can result in sudden and substantial increase in the Tw/Ts ratio andconsequent congestion and unmanageable queuing of ships at the port.
It is quite common to plan new port facilities on the basis of Tw/Ts = 1. However,taking into consideration the various aspects relevant to the planning of the newport, such as competition with neighbourhood ports, growing cost of ship-day,incentive to the shipping line, the Tw/Ts ratio of 0.75 has been adopted for bulkberth for the purpose of planning, to limit the total turnaround time of ships atthe port within reasonable levels and also to allow adequate flexibility to cater toany probable variations in the annual throughputs from those forecast.
Assuming Poisson arrivals, Erlangian K-2 service distribution pattern and thewaiting time to service time ratios as 0.75, as selected earlier, it can be seen fromFig. 5.5 that the berth occupancy levels will preferably be limited approximatelyto following values given in Table 5.17.
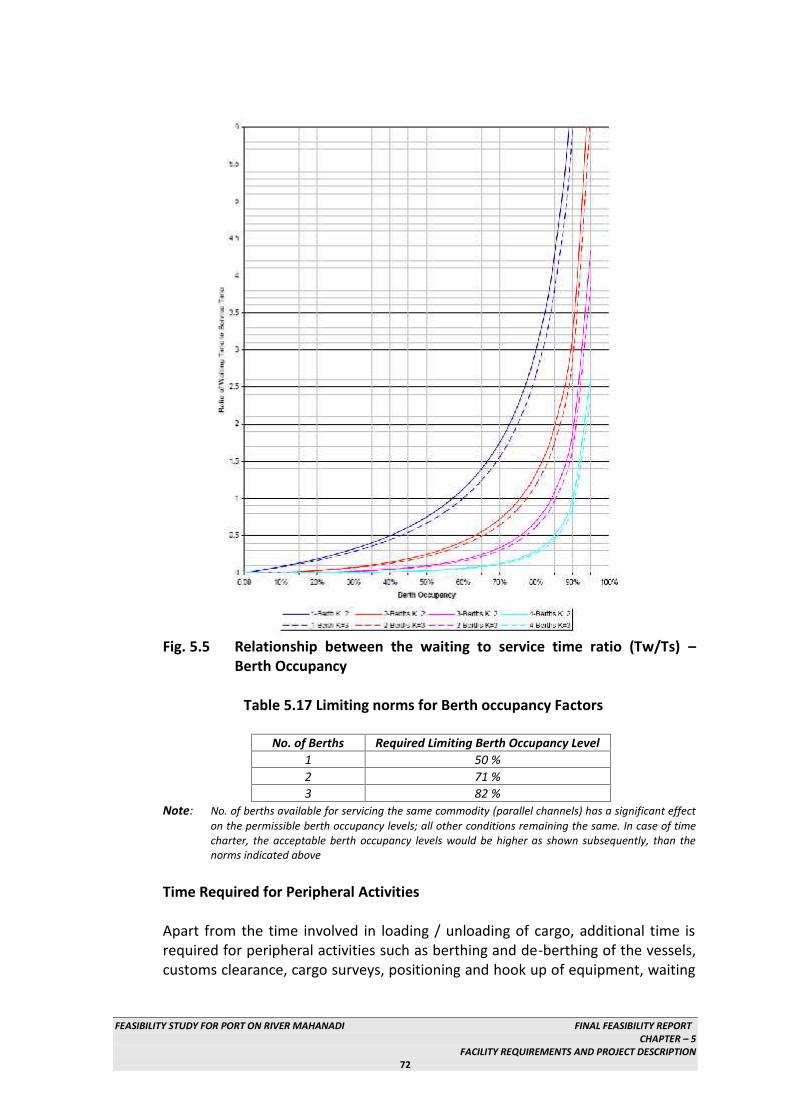
FEASIBILITY STUDY FOR PORT ON RIVER MAHANADI FINAL FEASIBILITY REPORTCHAPTER – 5
FACILITY REQUIREMENTS AND PROJECT DESCRIPTION72
Fig. 5.5 Relationship between the waiting to service time ratio (Tw/Ts) –Berth Occupancy
Table 5.17 Limiting norms for Berth occupancy Factors
No. of Berths Required Limiting Berth Occupancy Level1 50 %2 71 %3 82 %
Note: No. of berths available for servicing the same commodity (parallel channels) has a significant effecton the permissible berth occupancy levels; all other conditions remaining the same. In case of timecharter, the acceptable berth occupancy levels would be higher as shown subsequently, than thenorms indicated above
Time Required for Peripheral Activities
Apart from the time involved in loading / unloading of cargo, additional time isrequired for peripheral activities such as berthing and de-berthing of the vessels,customs clearance, cargo surveys, positioning and hook up of equipment, waiting

FEASIBILITY STUDY FOR PORT ON RIVER MAHANADI FINAL FEASIBILITY REPORTCHAPTER – 5
FACILITY REQUIREMENTS AND PROJECT DESCRIPTION73
for clearance to sail, etc. These activities are assumed to take, on an average, 2hours per vessel call, as per break up given below:
Particulars Bulk Vessel Container & General Cargo VesselBerthing/De berthing 1.0 hour 1.0 hourPositioning 1.0 hour 0.5 hourDocumentation 1.0 hour 0.5 hoursTotal 3.0 hours 2.0 hours
Cargo handling
The minimum handling capacity and the number of berths required for eachcommodity is given in the following table.
Table 5.18 Phasewise Number of Berths and Handling Capacity
Phase Phase I (2016-25) Phase II (2026-35) (Additional)Cargo Th.
(MT)No. ofberths
Capacity(tph)
Th.(MT)
No. ofberths
Capacity(tph)
Iron ore 10.45 1 1 x 5000 27.06 1 1 x 5000Coal 4.65
11 x 2000 11.45 1 1 x 2000
Fertilizers & OtherBulk Cargo 2.33 2 x 500 5.01 1 1 x 500
Containers* 0.04* 1 x 35** 0.09* 1 -
Total 17.43 +0.04* MTEU 2 43.52 +
0.09*MTEU 4
* MTEU ** TEU/hr.
Berth Dimensions
a. Length of Berth: As per BIS: 4651 (Part V) – 1980, for preliminary assessment,the length of the berth is recommended to be 10% more than the overalllength of the largest vessel expected, subject to a minimum of 15 m. Section6.3 of the Indian Standard 4651 Part V presents the figure (Fig. 5.6) fromwhere the clearances for both sides of the vessels can be obtained.
Source: Indian Standard 4651. Part VFig. 5.6 Definition of the berth lengths

FEASIBILITY STUDY FOR PORT ON RIVER MAHANADI FINAL FEASIBILITY REPORTCHAPTER – 5
FACILITY REQUIREMENTS AND PROJECT DESCRIPTION74
In all the cases the clearances have been considered equal to 25 meters.
Berth Length of the Berth Requiredin Phase – 1
Additional Length of theBerth Required Phase 2
Iron Ore 250 m 250 mCoal 250 m 250 mFertilizer, OtherDry & Bulk
250 m
Container 250 mTotal 500 m 1000 m
Two jetties are proposed for phase I development to cater to the trafficdemand, with total length of 500m. An additional berth length of 1000m isproposed in phase II to handle the additional Iron ore and coal cargo expectedin the phase – II. Separate berths are required in phase II for Container andOther Cargo Berths.
b. Width of Berth: Width of the berth is based on the functional requirement ofrail-mounted cranes and adequate manoeuvring space for other equipments.25m width has been proposed for the berths.
c. Depth at Berth: BIS: 4651 (Part V) – 1980 recommends that the water depthshould be 10% more than the loaded draft of design vessel in the shelteredparts viz. berths and hauling out spaces. The depth requirement in the area atberth has been calculated and is given below:
Table 5.19 Depth at All Berths
Phase Under-keel Clearance DepthRequirement (m)(% of Draft) (m)
Phase I & II 10 1.30 14.30 14.00 m
d. Deck Elevation: BIS: 4651 (Part V) – 1980 recommends that the deck elevationis recommended to be at or above highest high water springs plus half heightof an incident wave at the berth location plus a clearance of 1 m. The MHWSat project site is +3.50 m above CD. An incident maximum wave height of 1.0m is considered at the planned berths location. Hence, the deck elevationworks out to be +5.00 m above CD. It is recommended to keep the deckelevation at +5.00 m above CD.

FEASIBILITY STUDY FOR PORT ON RIVER MAHANADI FINAL FEASIBILITY REPORTCHAPTER – 5
FACILITY REQUIREMENTS AND PROJECT DESCRIPTION75
5.3.2 Cargo Storage
5.3.2.1 For purpose of determining the storage requirement, it is necessary to look at thepotential of the port in terms of the optimistic projections so that the provisionfor future does not fall short. Accordingly, the area requirements are examined.
5.3.2.2 The standard norms have been taken into consideration for area provisions forstorage / stock pile, rail siding, service & main roads, administrative and otheroffice / dwellings, safety systems, green belt etc. Storage / stock pile areas forcommodities are within the port operational boundaries and infrastructure &support system are outside the port operational boundary.
Table 5.20 Stack volume quantity basis
Storage areacommodities
Norm (Whichever is higher)
Iron Ore 6 times ship size or 1 month throughput whicheveris higher
Coal 6 times ship size or 1 month throughput whicheveris higher
Containers 6 times ship size or 15 days storage whichever ishigher
Fertilizer and other cargo 6 times ship size or 1 month throughput whicheveris higher
Table 5.21 Area adopted for other infrastructure activities in planning
INFRASTRUCTURE PROVISIONRail 4 line main entry sidingwith ½ km loop
4 entering lines : 50 x 500m4 exit lines : 50 x 500m2 Establing lines : 25 x 760m2 Engine escape : 25 x 760m1 Sick line : 25 x 760m2 Crossing gap : 50 x 1000 m2 Washing lines : 25 x 760m
Roads Main highway approach into Port 7.0 km long x12m wide (1 Roads)
Service Utilities Fire Station: 5 Nos.Staff Building : 50 x 100m5 nos. Tender parking : 5 x 20mWater tankage, over ground : 250m2
Foam storage : 50 x 20mDedicated fire tender exist roads : 5 nos. x 6m x500m : 15000m2

FEASIBILITY STUDY FOR PORT ON RIVER MAHANADI FINAL FEASIBILITY REPORTCHAPTER – 5
FACILITY REQUIREMENTS AND PROJECT DESCRIPTION76
INFRASTRUCTURE PROVISIONPower Sub-Station 132 KV / 33 KV : 150 x 150
33/11 KV Switch yard and load dispatch : 100 x50m3 unit sub-station for 11 KV/3.3KV and 11 KV/415V3no. x 50 x 20mFenced area and approach: 3 x 9000m.
ADM Buildings, Officecomplex, Staff quarters
2 storey main port officeCustoms offices2 Bank counters8 Cargo agents officesCanteen for staff & officersStaff Quarters for 500; (2 storey units), Park,green belts , car parks at each office units : 1000x 500mIndustrial Potable Garden Service
Water Supply Water treatment plant, pump rooms100 x 100 m
Green belt 10000m x 10m
Adopting the above norms / basis of provisions the areas required have beenworked out. General uncertainty allocation of 20% is accounted for areaevaluation. The areas thus considered are tabulated below:
Table 5.22 Area Requirements
Commodity Phase I Phase IITh.
(MTPA)Area(Ha)
Th.(MTPA)
Area(Ha)
Iron ore 10.45 11.80 27.06 27.50Coal 4.65 15.30 11.45 36.90Fertilizers 1.81 4.10 3.86 8.70Other Bulk Cargo 0.52 0.90 1.14 1.90Containers* 0.04* 1.65 0.09* 3.90Total area cargo related 17.44 +
0.04* MTEU33.75 43.52 +
0.09*MTEU78.90
Rail Siding 40.0 60.0Approach roads 20.0 30.0Service utilities 2.0 6.0ADMN & Support Building 25.0 35.0Green belt 25.0 40.0Total 112.00 171.00Total Area 145.75 249.9020% Extra provision 29.15 49.98Total Land Area 174.90 299.88
* MTEU Say 175 Ha Say 300 Ha

FEASIBILITY STUDY FOR PORT ON RIVER MAHANADI FINAL FEASIBILITY REPORTCHAPTER – 5
FACILITY REQUIREMENTS AND PROJECT DESCRIPTION77
5.3.3 Water Front Planning
5.3.3.1 Harbour Layouts
The Mahanadi River Mouth is situated at 5 km north of Paradip Port. It is wellknown that in East Coast of India, littoral drift moves from South to North.Approach channel extends up to 15 m depth contour. It is obvious that the littoraldrift is completely cut off by Paradip port structure. This has caused short supplyof sediment on north side resulting deepening of sea bed.
In developing a new port, essential things are an Approach Channel, EntranceChannel, Turning Circle and port structures in the form of piles jetties / berths.The different components involved in development at Mahanadi port arediscussed below:
(a) Approach Channel
Fresh survey has been carried out along and in front of Mahanadi. Thesurvey covers 3.4 km in North-South direction and 10 km in East-Westdirection extending up to 15 m depth contour. The entrance bathymetry isrequired to be critically analysed which is essential to decide on location andorientation of the sea portion of the channel. Natural sea bed withoutinfluence of port structure and river outfall gradually slopes down inoffshore direction. However there are different slopes at different zonesdepending on wave condition and characteristics of beach material. Slopechanges gradually. There is no abrupt change. The survey has been carriedout in four overlapping compartments. The first three covers the riverportion while the forth one covers the sea portion in front of river. Theoffshore portion of the channel is shown in Fig. 5.7.
Fig. 5.7 Offshore bathymetric survey in front of River Mahanadi mouth

FEASIBILITY STUDY FOR PORT ON RIVER MAHANADI FINAL FEASIBILITY REPORTCHAPTER – 5
FACILITY REQUIREMENTS AND PROJECT DESCRIPTION78
From Fig. 5.7 it may be seen that at southern limit on Paradip side the bed isdeep, bed slope is flat. Very near to coast at about 300 m away the depth is5 m and at 14 km, depth is 16 m. The bed profile on this line is shown in Fig.5.8. There is noticeable change in bed profile on northern side, bed levelrises in faster rate as one proceeds from offshore to shore. The bed profilealong one more lines in between has been also analysed. The preferredapproach channel in offshore region in front of the river should be asstraight as possible. At the same time the centre line of the approachchannel follow the deep depths. Accordingly, the centre line has beenderived and the bed profile along this line is also shown in Fig. 5.8. From Fig.5.7 it may be noticed that the approach channel passes through north-westcorner of the designated dumping ground of Paradip port. To avoid thedumping ground the channel maybe required to be shifted towards north.
Fig. 5.8 Cross shore bed profile
As there are two proposed approach channel, they are defined as southernchannel and northern channel. The depth along the northern channel issame as the profile at northern limit. The length of northern channel ishigher as it follows curved path. From the Fig. 5.8 it is evident that deeperdepths are available on southern side. Like cross shore profile, four shoreparallel profiles have been also analysed and shown in Fig. 5.9. The sectionsanalysed are marked in Fig. 5.7. The section away from coast at deep sea isnumbered as section-1 and sections are taken at certain intervals. Nearcoast the changes are abrupt hence the section intervals are reduced. Atdeeper area along shore profile is uniform. This indicates at deeper zonebottom is not felt by passing waves and at the same time bed is lessinfluenced by river flow at entrance.
At the entrance there is complex interaction among various natural forces.Such as inflow, outflow, waves, littoral drift etc. In lean period when freshetdischarge is negligibly small, flow at entrance is equally strong during floodand ebb. However flow pattern is different. Typical flow pattern at entranceis shown in Fig 5.10.

FEASIBILITY STUDY FOR PORT ON RIVER MAHANADI FINAL FEASIBILITY REPORTCHAPTER – 5
FACILITY REQUIREMENTS AND PROJECT DESCRIPTION79
Fig. 5.9 Shore parallel bed profile
Flood flow enters the river like a sink preferably from two or one side. Itcreates flood channels on two sides. Ebb flow comes out from entrance likea jet following the path inside the mouth. This ebb flow creates its ownpathway. Hence flood channel and ebb channel are not same. Designeralways prefer to select ebb channel as approach channel which is not alwaysbest. For proper decision, in depth understanding is necessary of bypassingsystem of the river mouth of the particular river in this case Mahanadientrance. At the entrance there is complex interaction among variousnatural forces. Such as inflow, outflow, waves, littoral drift etc. In leanperiod when freshet discharge is negligibly small, flow at entrance is equallystrong during flood and ebb. However flow pattern is different. Typical flowpattern at entrance is shown in Fig. 5.10. Flood flow enters the river like asink preferably from two or one side. It creates flood channels on two sides.Ebb flow comes out from entrance like a jet following the path inside themouth. This ebb flow creates its own pathway. Hence flood channel and ebbchannel are not same.
Fig. 5.10 Typical flow pattern at river mouth

FEASIBILITY STUDY FOR PORT ON RIVER MAHANADI FINAL FEASIBILITY REPORTCHAPTER – 5
FACILITY REQUIREMENTS AND PROJECT DESCRIPTION80
The morphological formation in front of Mahanadi is shown in Fig. 5.11. Ebbchannel is clearly well defined. Deeper contours on sea side are met if onemoves on south of it. The shape is typical in estuary mouth. At outfall insideriver on south side there exists deep channel depths are of the order of 15to 20 m. Deep channel is narrow. On the north side wide shallow sand flatexists. As an explanation for this formation it can be stated that in-spite ofconstruction of dam and barrages across, the river brings good amount ofsand. Due to presence of bend at this location flow concentration takesplace on south side creating a flow shadow on north bank. This creates deeppocket on south side and shallow sand flats on north side. Any attempt tomodify this natural configuration will not work. The aim of designer of portparticularly at estuary mouth should be to put least resistance to naturalsystem, natural formation.
The sediment brought by freshet discharge during monsoon season ispushed to sea through the deep channel at south side. Due to channelorientation the sediment is thrown in north east direction and a sandbar isformed at the mouth. The sand bar is marked in Fig. 5.11. This sand barhelps to bypass sand at the entrance. The wind waves reach the sand barand break and create the littoral current which carries the sand from southto north. This natural sand bypassing arrangements maintains a delicatebalance of sand budget in coast particularly on north side where wildlifesanctuary exists.
Fig. 5.11 Morphological formation in front of River Mahanadi
The littoral drift from south to north is nearly absent, because of presenceof Paradip port approach channel and breakwater. Hence the width ofsandbar is less hardly 450 m. The longitudinal shape of sandbar is shown inFig. 5.11. Putting channel across this sandbar requires deepening the bar by

FEASIBILITY STUDY FOR PORT ON RIVER MAHANADI FINAL FEASIBILITY REPORTCHAPTER – 5
FACILITY REQUIREMENTS AND PROJECT DESCRIPTION81
dredging. This dredged channel will act as sand trap. It is established thatsand movement from south to north is maximum. Hence it is alwaysadvantageous to align the channel on south side. Hence south channel ishydraulically preferable considering ship navigation, wave approach, andsand bypassing. Though drift is reduced the wave energy on south side hasincreased because of deepening of sea bed. The approach channel for thisproposed port has two distinct parts
(i) Offshore channel(ii) River channel
There exists a transition at outfall of the river which is included in offshorechannel. Selecting channel in river require some considerations arising fromriver hydraulics, estuarine hydraulics in particular, in this case, whereasoffshore portion of the channel has been evolved from consideration ofcoastal engineering, inlet hydraulics in particular.
In case of straight coast without outfall of river and without interference ofother structures or any installation arising from presence of nearby port theapproach channel should be as straight as possible. The channel should beparallel to predominant wave ray direction as far as possible to avoid wavestrike from side. Due to refraction effect wave crest tries to be parallel tobed contour / coast, so near coast wave ray becomes almost perpendicularto coast. Hence in case of coastal port approach channel is always almostperpendicular to coast with slight tilt to match with site specific wavecomputed from physical / mathematical model.
At outlet of River Sea bed contour does not follow general pattern. Thedepth contour at sea bed is pushed towards the sea due to formation of ebbshoal at river inlet (Fig. 5.11). Due to absence of definite pattern of bedcontour at inlet wave fronts (wave crests) also appear broken. Sea current isusually weak and parallel to coast but at times river velocity becomes strongduring monsoon discharge. Only tide induced velocity is also quite high astidal prism of Mahanadi is considerable and flow velocity is perpendicular tosea current. It is well known that when ship is at speed control over shipmaneuvering is more. To meet all these requirements the approach channelin front of river mouth should be as straight as possible. The deep portion ofthe channel at the entry of river is having restricted width. The channel isadhering right bank on Paradip side. There is another consideration duepresence of Paradip port. Drift coming from south side is less. If channelremains on south side, sand coming from river may bypass from northportion of river entrance.
Keeping these aspects in view the straight approach has been proposed asAlternative-I. To avoid demarcated dumping ground of Paradip port achannel has been also proposed with bend and termed as Alternative-II.

FEASIBILITY STUDY FOR PORT ON RIVER MAHANADI FINAL FEASIBILITY REPORTCHAPTER – 5
FACILITY REQUIREMENTS AND PROJECT DESCRIPTION82
Both alternatives of offshore channel are shown in Fig. 5.12. For selectingchannel depth two options have been considered, 14 m and 16 m (BelowC.D.). These two channel bed levels are marked in Fig. 5.12 which showsalong possible channel center lines. From the figure it is evident that mostpreferred channel alignment is the central channel because deeper depthsare met along this line at shorter distance. The preferred depth is 14 mbelow CD because this channel can be created just by dredging through thehump (Sand Bar).
Fig. 5.12 Offshore Approach Channel Alignment
(b) Entrance Channel
The natural deep channel inside river in continuation of approach channel insea has been plotted in Fig. 5.13. From the plot it is evident that the deepchannel inside the river is only 250 m in width. At entrance it is on rightbank for 4 km covering fishing harbour and it moves towards left bank andmove 3 km adhering left bank, then river becomes quite wide and deepchannel disappears. Again deep channel appears at further distance nearIFFCO site and continue further for 5 km. From this description it is clearthat natural channel is not always adhering right bank where as proposedport development is initially planned on right bank.
Fig. 5.13 Combined bathymetric chart (River and offshore)

FEASIBILITY STUDY FOR PORT ON RIVER MAHANADI FINAL FEASIBILITY REPORTCHAPTER – 5
FACILITY REQUIREMENTS AND PROJECT DESCRIPTION83
(c) Alternative Port Layouts
While developing port layout with riverine jetties, the jetty head will belocated in intermediate depth involving some dredging. The maximum tidallevel at project site is 2.5 m while general topographic elevation is only 2 m.Taking storm surge at project area as approximately 2m, the reclamationlevel has to be 5 m.
(i) Layout I : Right Bank of River Mahanadi
In this layout, the entire development is envisaged on right bank ofRiver Mahanadi. The layout is shown in Fig. 5.14. A turning circle of 450m diameter is provided at northern end of jetties. In this layout alljetties are put at 10 m contour one each for iron ore, coal, fertilizer &other cargo and container. Two berths will be open piled jetties in oneline with total length of 500m in initial phase. In order to have access tothe port 160 m wide (inner channel) and 190 m wide (outer channel) isproposed to be dredged to -12 m and -14 m having length ofapproximately 12 km and 14 Km respectively.
ii) Layout II : Left Bank of River Mahanadi
In this layout, the entire development is envisaged on right bank ofRiver Mahanadi. The layout is shown in Fig. 5.15. A turning circle of 450m diameter is provided at northern end of jetties.
In this layout all jetties are proposed very adjacent to land, withoutusing any approach trestle. In phase I, two berths are planned to handlecargo like, container cargo, coal, iron ore and fertilizer and other breakbulk. Iron Ore is proposed to be handle in a single separate berth.
All berths will be open piled jetties, with total length of 500m in initialphase. In order to have access to the port 160 m wide (inner channel)and 190 m wide (outer channel) is proposed to be dredged to -12 m and-14 m having length of approximately 13 km and 14 Km respectively.
5.3.3.2 Comparison of Layouts
The advantages and disadvantages of both the layouts are outlined in followingtable:

FEASIBILITY STUDY FOR PORT ON RIVER MAHANADI FINAL FEASIBILITY REPORTCHAPTER – 5
FACILITY REQUIREMENTS AND PROJECT DESCRIPTION84
Table 5.23 Comparison of Layouts
LayoutNo.
Position Advantage Disadvantage
I Right Bank of RiverMahanadi
a) Not exposed towaves
a) Deep depthcontours areavailable nearby
b) Length ofApproach Trestleis less.
a) Available deeppocket is narrower.
b) The backup area ispreoccupied by otherdevelopers.
c) The area isencroached by sandfrom both west andnorth requiring moremaintenancedredging.
d) Reclaimable intertidal zone isnarrower.
II Left Bank of RiverMahanadi
a) Not exposed towaves
b) Berthingoperation may beeasier. As berth isoff set from mainflow.
c) Reclaimable intertidal zone iswider
d) Less movementof ship at berth.
e) Small length ofapproach trestle.
f) Enough Backupland available forpresent andfuturedevelopment
a) Requirement ofcapital dredging andmaintenancedredging is more inport basin.
b) Connectivity cost willbe higher because ofmore distance.
5.3.3.3 Selection of Final Layout
As the port has to be located on left bank of River Mahanadi, examination of thearea indicated that intertidal zone (area between low and high water) issomewhat large. Port layout has been developed on left bank. The final choice

FEASIBILITY STUDY FOR PORT ON RIVER MAHANADI FINAL FEASIBILITY REPORTCHAPTER – 5
FACILITY REQUIREMENTS AND PROJECT DESCRIPTION85
will depend on many factors such as wave tranquillity at the site, adequate backup area for port infrastructure, proximity of deep depth contour, magnitude oftidal window etc.
In order to have an economical port layout, maintenance dredging has to beminimum. Alignments of jetties are kept parallel to river flow so that flow cannotbe disturbed. The third aspect is tranquillity from the waves. The area is notaffected by waves at all. Hence the layout II in which all facilities are proposed onleft bank is selected.
In order to have proper navigation a channel will have to be dredged connectingproposed jetty and outer channel. Also, reclaimable inter tidal zone is wider forport infrastructure and if all facilities are located left bank adequate land wouldbe available. Adequate area for stacking of coal, general cargo and container isavailable.
From traffic study it appears that for Phase I forecast (2016-25) 2 berths will berequired for iron ore, coal, fertilizer & other cargo and containers. While for finalphase (2026-35) 4 additional berths will be required. Thus, the total number ofberths in final phase works out to 6 berths.
The entrance channel width is taken as 190 m for one way navigation and waterdepth required in approach channel, Turning circle and at berth is 12 m, 12 m and14 m respectively. In order to reduce cost of dredging it has been decided to takeadvantage of tidal window. The vessel movement will be restricted to high water.In case it is not proposed to use tidal window it is required to analyze thepercentage occurrence of low water. Hence, to meet the required depth it isproposed to dredge the entrance channel of 12 m depth (B.C.D.). The finaldetailed port layout is shown in Fig. 5.16.
5.4 Dredging
Dredging is the process of dislodging, raising, handling and transporting mainlysoil underwater from layers of the earth in order to create/maintain artificialdepths. The dredging process when applied to construction of harbours andtrenches for foundations/pipelines is called ‘Capital Dredging’. However whenapplied for removal of siltation in existing harbours, rivers and clearance ofsiltation in lakes etc. is termed as ‘Maintenance Dredging’.
Dredging and underwater excavation are an important aspect in the design andconstruction of ports and related infrastructure. In the design of a new port ifaccess channels or water deepening of a basin are required for the first timeCapital dredging will be an important element of port construction. Maintenancedredging is essential to keep required depth of navigation for entire year.The dredging process can be split up into the following four sub systems:-

FEASIBILITY STUDY FOR PORT ON RIVER MAHANADI FINAL FEASIBILITY REPORTCHAPTER – 5
FACILITY REQUIREMENTS AND PROJECT DESCRIPTION86
Pre-treatment Excavation Transportation and Disposal
The pre-treatment consists of treating the ground surface before the excavationprocess. This is mainly required for dredging of rock and similar hard materials inorder to fragment/loosen the same either mechanically or by use of explosives.The excavation process is a combination of two operations, namely, disintegrationand movement of soil. The disintegration of soil can be performed eithermechanically or hydraulically.
The transportation process involves the movement of the dredged material fromdredging site to disposal site. For transportation four systems are normallyadopted, namely, self-contained hopper, self-propelled barge and pipelines. Incase of self-contained hopper, self-propelled and dumb barges, the material isreleased from the hopper into water either by bottom opening doors, valves orsliding doors. In some dredgers, pumps are used for employing the material fromthe hopper through a separate pipeline. The selection of method oftransportation depends upon the distance between the dredging and disposalsite.
5.4.1 Factors affecting Selection of Dredger
The following factors govern the selection of a dredger for a particular work:
Site characteristics and conditions Nature of soil/rock to be excavated The nature of dredged material to be transported Environmental factors
The selection of the dredging plant largely depends upon the characteristics ofthe site such as accessibility, minimum and maximum depth of water, locationand accessibility of disposal site, dimensions of the dredging area, proximity tothe structures, accuracy of dredging required etc. and the meteorological andoceanographic conditions, traffic etc. and the dredging plants and equipment fora particular site is selected based on site specific information.
In present case dredging in shallow areas is involved therefore either dredgersrequiring only draft available are selected or dredgers which are able to dredgeahead of their hull such as cutter suction, grab and bucket dredgers on selectedso that they can dredge from deep water moving towards shallower depthsmaking room for their movement, or a combination of two types of dredgers aredeployed. Similarly, wind, wave and swells are the main meteorological andoceanographic conditions which affect the working of the dredger.

FEASIBILITY STUDY FOR PORT ON RIVER MAHANADI FINAL FEASIBILITY REPORTCHAPTER – 5
FACILITY REQUIREMENTS AND PROJECT DESCRIPTION87
At inner channel, i.e., inside the Mahanadi River Wave action is insignificantbecause of narrow entrance at the mouth of river. In outer channel waves areapproaching from SW to South direction from the deep sea and the maximumsignificant wave height is 4.0m. Generally calm conditions prevail throughout theyear except during the times of extreme wind action. Therefore, it may bepossible to operate dredgers throughout the year as far as wave climate isconcerned.
Currents mainly affect the manoeuvrability of the dredger and are importantwhen dredging in confined areas. Dipper, backhoe and bucket dredgers givensufficient anchorage can work in current up to 3 knots. In strong current thepositioning of grab in case of grab dredgers becomes difficult. In strong currentsthe production of bucket and grab dredgers also reduces drastically. The cuttersuction dredgers suffer from current in two respects; lateral; pressure on thedredger and the floating pipeline. The large cutter suction dredgers can work inthe current up to 2 knots.
At proposed jetty position peak flood current and peak ebb current are 2.42 and1.09 knots respectively. Similarly at mouth of river peak flood current and peakebb current are 2.53 and 1.61 knots respectively. It is observed that the peakflood and ebb currents are of comparable magnitude and are of the order of 2knots indicating that dredging may be possible most of the time as far as currentis concerned.
From the foregoing discussions in view of current and wave climate prevailing atthe site it may be assumed that the dredgers would be able to work for about 300days in the year.
The geo-technical/geophysical investigation in the area is underlain by alternatingsequence of unconsolidated silty-clay; silty-sand and poorly graded sandbelonging to the recent geological period.
Thickness of silty-clay, silty-sand poorly graded soil varies from 2m to 11.85m,11.85m to 20.4m, 20.4m to 27.65m respectively. Very stiff silty & sand clay ofhigh plasticity (CH) soil found from 27.65m to boring termination depth i.e.;30.45m.
The dredge cut required is of the order of -14m in outer channel, -12m in innerchannel & turning circle, and -14m in basin.
5.4.2 Dredgers
There are various types of dredging equipment available for executing capitaldredging works. These include the following:

FEASIBILITY STUDY FOR PORT ON RIVER MAHANADI FINAL FEASIBILITY REPORTCHAPTER – 5
FACILITY REQUIREMENTS AND PROJECT DESCRIPTION88
Trailer Suction Hopper Dredger (TSHD) Cutter Suction Dredger (CSD) Bucket Dredger Grab / Clamshell Dredger Backhoe Dredger
The most common type of dredgers used for large scale works are TSHD and CSD.It is proposed to deploy these equipment at Mahanadi River to carry out thedredging work. The features of these dredgers are discussed hereunder;
5.4.2.1 Trailer Suction Hopper Dredger (TSHD)
The TSHD is a sea-going self-propelled vessel which is equipped with trailingsuction heads provided on the sides of the vessel which can be lowered to the seabed. The suction pipes terminate at the lower end in a drag head which isprovided to draw the maximum amount of sea bed material and discharge it intoa hopper in the vessel. The TSHD is a very versatile dredging unit. This equipmentis most suitable for deployment in busy navigational channels. It can dredgematerial varying from sand, silt gravel and soft to medium clay. It can work inexposed conditions with wave heights up to 3 m. Typical details of trailer suctionhopper dredger are shown in Fig. 5.17.
Fig. 5.17 Typical details of TSHD5.4.2.2 Cutter Suction Dredger (CSD)
The CSD comprises a rotating cutter head mounted at the end of a suction pipeand connected to a dredging pump in the main body of the dredger. The dredgerpivots around a spud located at the rear of the dredger by using a system ofanchor wires and winches. The cutter head cuts the material on seabed and then

FEASIBILITY STUDY FOR PORT ON RIVER MAHANADI FINAL FEASIBILITY REPORTCHAPTER – 5
FACILITY REQUIREMENTS AND PROJECT DESCRIPTION89
the material is sucked up through the suction pipe by the dredger pump anddischarged through a pipeline. The CSD can dredge a variety of different type ofsoils, including clay, silt, sand and weak rocks. It is sensitive to wave conditionsand can operate for significant wave conditions up to 1 m. A Cutter suctiondredger is shown in Fig. 5.18.
Fig. 5.18 Typical Cutter Suction Dredger
5.4.3 Choice of Dredger for Mahanadi riverine Port
Major part of the dredging work can be accomplished by deployment of theTSHD. However, there could be some stiff clay and rock patches for which a CSDcan be deployed. Hence for the dredging project, a CSD and TSHD will bedeployed.
5.4.4 Dredging Plan
In this section a dredging plan has been prepared considering the variousavailable equipment and site conditions. The dredging quantities for deepeningthe approach and entrance channel and manoeuvring areas have been estimatedon the basis of recommended dimension of channel.
The characteristic of the soil strata in the dredging channel is as follows: The area is underlain by alternating sequence of unconsolidated silty-clay;
silty-sand and poorly graded sand. Presence of hard rock material are not found in the proposed channel
alignment i.e.; outer, inner channels, turning circle and basin. Underground IOCL petroleum pipeline passes through the site which is
crossing river on west side of the site.

FEASIBILITY STUDY FOR PORT ON RIVER MAHANADI FINAL FEASIBILITY REPORTCHAPTER – 5
FACILITY REQUIREMENTS AND PROJECT DESCRIPTION90
5.4.5 Methodology
The analysis of sea bed indicates that in the channel the sea bed is composedalternating sequence of unconsolidated silty-clay; silty-sand and poorly gradedsand. By taking sections at 200 m interval and assuming side slope of 1 in 4 and byusing trapezoidal and prismoidal formula, the capital dredging quantity has beenworked out. The capital dredging quantity works out to be approximately 30.07Mm3 and 20.33 Mm3 for phase I and phase II respectively.
Table 5.24 Quantity of Dredge material
Dredging Area Dredge level(m)
Side slope(V:H)
Quantity of Dredge material (m3)Phase I Phase II
Outer channel -14 1 : 4 11475300 4433450Inner channel -12 1 : 4 16471388 15903972Turning Circle -12 1 : 4 628000 0Basin -14 1 : 4 1501640 0
Total 30076328 20337422
Calculation of dredging quantity is shown in Fig. 5.19 and Appendix 5.1.
It is proposed to dredge this quantity using combination of Trailing SuctionHopper Dredger and Cutter suction dredger.
5.4.6 Indian Oil Corporation Limited (IOCL) Pipeline Crossing River Mahanadi Bed Level
The 1302 km long crude oil pipeline from Paradip in Odisha to Barauni in Biharhas 328 km long Paradip-Haldia and 498 km long Haldia-Barauni sections. Inaddition, the pipeline system include 20 km long offshore pipeline from SinglePoint Mooring system to tank farm in Paradip. It also has a loopline of 437 km.The crude oil requirement of Indian Oil's refineries at Haldia, Barauni andBongaigaon is transported through this pipeline. Two IOCL pipelines one 30”diameter crude pipeline and another 3” diameter pipeline have been crossingport channel and basin area as shown in Fig. 5.20. The port channel has beenmarked on cross sectional profile of the pipelines as shown in Fig. 5.21. It can beseen from the figure that the pipeline laid by Indian Oil Corporation Limited (IOCL)from Haldia to Paradip does not obstruct the channel of the proposed port. Thereis ample cover on the pipeline. The dredged level is well above laid pipeline levels.

FEASIBILITY STUDY FOR PORT ON RIVER MAHANADI FINAL FEASIBILITY REPORTCHAPTER – 5
FACILITY REQUIREMENTS AND PROJECT DESCRIPTION91
Fig. 5.20 IOCL Pipeline Crossing Below River Mahanadi Bed
5.4.7 Disposal of Dredged Material
The type of material to be dredged will greatly influence the method of disposal.However, costs can be turned into profits if the dredged material can be used toreclaim land for industry, roads, housing or leisure. Rest of dredged material afterutilization of reclamation purpose would be disposed in identified dumping sitesor in deep water (beyond –20m contour).
The dumping ground has to be judicially selected so that the material dumpeddoes not come back to channel, at the same time distance between dredging site& dumping site should not be too long. From this consideration the dumpingground for different sites has been chosen as follows:
The dredged material from port basin and entrance channel up to River mouthcan be used for reclamation. The dredged material in sea can be dumped in thearea in between 10m depth contour and 20m depth contour, where the velocityis almost in S-W direction.
5.5 Reclamation
Materials from dredging, vary in their suitability for reclamation. Sand is the mostsuitable material for reclamation but all types of granular materials (crushedlimestone, gravel, etc.) are suitable. Silt can be used for reclamation if sufficienttime is available for drying out and settlement. Due to its fine texture, silt doesnot dry out as quickly as sand. Instead, before drying out to a fine powderyconsistency, it goes through the “muddy” stage, which can take anywhere up to afew months to dry. However, mixed with sand, silty deposits tend to dry out muchfaster. Sand also improves the consistency of the reclaimed land.
IOCL PIPELINEBELOW RIVER BED

FEASIBILITY STUDY FOR PORT ON RIVER MAHANADI FINAL FEASIBILITY REPORTCHAPTER – 5
FACILITY REQUIREMENTS AND PROJECT DESCRIPTION92
Soft clay, once churned up by a cutter-suction dredger, is not suitable as a fillunless it is dried out. This material is only suitable as agricultural fill and cannot beused for foundations or roads. Stiff clay forms into clay balls during the dredgingoperation and again it is only suitable as agricultural fill.
The dredged spoil in river Mahanadi, consisting of silty-clay and silty-sand may beused for reclamation to create back up area for the port and infrastructurefacilities. This spoil clay requires considerable time for consolidation beforebecoming fit to take any load. Suitable soil stabilization methods can reduceconsolidation time and can improve bearing capacity.
In the first phase about 175 hectare of land only shall be reclaimed using thematerial from the dredging of the harbour basin and the entrance channel. In thesubsequent phases the reclamation will be progressively carried out based onrequirement.
The layout of the development of the Port is shown as Fig. 5.16. The backup areafor storage in located in the shallow area reclaimed using the dredged sandobtained by dredging the harbour area. Calculation for quantity of earth fillrequired for reclamation and land development is shown in Fig. 5.22 andAppendix 5.2.
Table 5.25 Quantity of earth fill for land reclamation
Sl.No.
Phase Land areaRequired (Ha)
Reclaimedlevel(m)
Quantity of Earth fillmaterial required (Mm3)
1 Phase I 175 +5m 3.852 Phase II 300 +5m 3.47
5.6 Other Development Areas in the vicinity of Port
The Paradip Mangalgadhi stretch of National waterway no. 5 has been meeting inRiver Mahanadi near proposed port. The facilities for IWT terminal has beenplanned at the meeting point. M/s Essar Bulk Terminal Paradip Limited (EBTPL)which is proposing to establish a jetty terminal on the right bank of the RiverMahanadi to serve the steel complex. Also, M/s IFFCO intends to develop bargejetties on the right bank of the River Mahanadi for evacuation of bagged fertilizerfrom Paradip. Area for development of terminal for National waterway No.5,barge jetties of IFFCO & ESAAR along with shipbuilding and repair facilities havebeen shown in Fig. 5.23.
5.7 Proposed Port Limits
The port limits of proposed port are shown in Fig. 5.24

FEASIBILITY STUDY FOR PORT ON RIVER MAHANADI FINAL FEASIBILITY REPORTCHAPTER – 6
PROJECT DESIGN93
CHAPTER 6
PROJECT DESIGN
6.1 Design Basis
6.1.1 The proposed jetties are required for handling cargo & containers. The designphilosophy is such that jetties are to be designed to cater the 80,000t vessels forbulk cargo berth and 1000 TEUs for container berth. Jetties with facilities toreceive dry bulk, break bulk, liquid bulk and containers are proposed. The jettiesare proposed to be located near bank. The salient features of the facilities aregiven below:
Bulk Cargo Berth
Length of Berth - 250mWidth of Berth - 25m
Container Berth
Length of Berth - 250mWidth of Berth - 40m
6.2 Design Approach
6.2.1 Open type wharf is the most appropriate solution. A structural and geotechnicalanalysis determines its arrangement, dimensions, number of resting piles, andtheir sizes etc. The open berth structure mainly implies berthing structure on piles.In this type of structure the berth is on pile foundations. Since the pile foundationsare discrete columns provided at a designed interval, free flow of water is nothindered. Due to their inherent nature of offering minimum resistance to theexisting flow regime and sediment movement, the piled structures have very littleor no impact on the coastal morphology. Accordingly, the piled berth is suitable inalmost every location except where it is to serve as an earth retaining structure.The decking of the berth is provided with reinforced cement concrete structuresconsisting of beams and top slab. The beams and slabs together get integrated bydesign and then constructed as a continuous monolithic plate for better and evendistribution of live and superimposed loads.
6.3 Design Parameters
6.3.1 Design Vessel
Based on the present and future requirements, following vessel size and theirdimensions are taken for designing purpose:

FEASIBILITY STUDY FOR PORT ON RIVER MAHANADI FINAL FEASIBILITY REPORTCHAPTER – 6
PROJECT DESIGN94
Table 6.1 Design Vessel Sizes
Name of Vessel StandardLoad(Ton )
Full Load(Ton)
LengthOverall
(m)
Beam(m)
Draft(m)
Bulk Carrier 80000 98000 240 36.5 14.0
Container 1000*(25000)
33500 195 28.5 10.1
*TEU
The bulk cargo berth has been designed to handle Bulk carrier up to 80000 DWT &container berth has been designed to cater up to 1000 TEU vessels.
6.4 Environmental Data
6.4.1 Tide Levels
By virtue of its proximity to the Bay of Bengal, the Mahanadi River estuaryexperiences fairly medium/low tidal ranges in the mouth zone. The tidal profileundergoes a minor modification as the tide progresses along the length of theestuary with moderate changes in the tidal range and durations of flood and ebbphases. Short-term measurements conducted during previous studies off theexisting fishing harbour near the mouth of estuary indicate spring and neap tideranges of 1.99 m and 1.2 m respectively. The tidal levels at Paradip near to theproject site with respect to chart datum as reported in admiralty Chart No. 352are as follows:
MHWS 2.60 mMHWN 2.00 mMSL 1.70 mMLWN 1.30 mMLWS 0.70 m
Tides in the area are mixed, semidiurnal type with an average spring tide range of2.0 m and a neap tide range of 0.7 m.
6.4.2 Waves
Wave parameters such as significant wave height, wave period and mean wavedirection are significantly different for various weather events. In general, duringfair weather season off Paradip significant wave heights are below 1.0 m, duringmonsoon below 3.5 m and during extreme weather events of the order of 5.0 to7.0 m. But the wave effect is negligible inside River Mahanadi at the location ofberths.
FEASIBILITY STUDY FOR PORT ON RIVER MAHANADI FINAL FEASIBILITY REPORTCHAPTER – 6
PROJECT DESIGN95
6.4.3 Current
To have an idea of the flow-field in Mahanadi, short-term measurements ofcurrents were undertaken by ESSAR in river and at the mouth of the estuaryduring December 2010. The currents were recorded at 0.5 m below the waterlevel (Surface), mid-depth and above the bed level. The maximum current speedobserved was 1.3 m/s.
6.4.4 Wind
The wind speed and wind direction is determined by the season and by the dailytemperature differences between land and sea. The predominant wind directionduring the monsoon period i.e. from June to September is west to south-west andthe effect of land breeze is not dominant during this period. During the non-monsoon periods, the predominant wind direction is from north-east during themorning and west during the evening, which shows influence of land breeze. Thebasic wind speed observed was of the order of 50m/s.
6.4.5 Soil Profile
Knowledge of the composition of soil strata beneath the proposed development isvital for determining the geotechnical safety of the structures. For design offoundation of structure, LBH-2 (20020’23.75”N, 86038’19.64”) has beenconsidered based on closed proximity of proposed facilities. The geo-technical inthe area reveal that the top layer of the sub soil consists of deposit of very softsilty and sandy clay of intermediate plasticity followed by medium dense poorlygraded sand-silt mixture, medium dense clayey sand and Very Dense clayey Sand.The boreholes were terminated at a maximum depth of 30m below sea bed level.
6.5 Design Levels
6.5.1 The berth is planned as berthing structure proposed to be on piles, which provideleast resistance to natural equilibrium and ease of extension/addition of portfacilities at a later date. The important design levels taken into consideration arediscussed as follows:
Dredged Level: The required Dredged level is taken as -14 m CD at outer face ofberth.
Founding Level: Based on the Geotechnical data and the check for embeddeddepth with respect to bearing capacity of Piles the founding level for the piles isfixed at -30m.
Deck Level: Proposed elevation of the deck is +5.00 considering the MHHW tide(+2.6m CD) and the other operational requirements.

FEASIBILITY STUDY FOR PORT ON RIVER MAHANADI FINAL FEASIBILITY REPORTCHAPTER – 6
PROJECT DESIGN96
6.6 Design Specifications
6.6.1 Grade of Concrete and Steel
Concrete and steel grade will be as per IS: 456-1978 which is as follows
Table 6.2 Grade of Concrete and Steel
Structure Material (N/mm2)Concrete Steel
Sub-Structure M 40 Fe 500Super Structure M 40 Fe 500
6.6.2 Cover to Main Reinforcement
The cover to the main reinforcement used for the design of facilities is used asfollows:
Structure Cover
Sub-Structure 75 mmSuper Structure 50 mm
6.6.3 Unit Weights
The following unit weights have been used for design purpose:
Table 6.3 Unit weight of materials
Material Unit Weight (KN/m3)RCC 25.00PCC 24.00Sea water 10.025Steel 78.50
6.7 Design Codes and Standards
6.7.1 All works shall satisfy the requirement of the latest relevant codes and standards.Generally Indian Standards shall be followed. Wherever, the details for part ofworks are not defined adequately in Indian standards, the relevant acceptableInternational Standards shall be adopted. The list of codes and standards coveringthe major part of the works to be followed are listed below:

FEASIBILITY STUDY FOR PORT ON RIVER MAHANADI FINAL FEASIBILITY REPORTCHAPTER – 6
PROJECT DESIGN97
Table 6.4 List of Codes and Standards
IS: 456 Code of practice for Plain and Reinforced Concrete
IS: 875 Code of practice for Design Loads for Buildings & Structures
IS: 1893 Criteria for Earthquake Resistant Design of Structures
IS: 4651 Code of practice for Planning and Design of Ports and Harbours
IS: 9527 Code of practice for Design and Construction of Port andHarbour Structures
BS 6349-Part 2 Code of practice for Marine structure quay, Wharves, jetties &Dolphins
IS: 800 Code of practice for General Construction in Steel
IS: 1786 Specification for High Strength Deformed Steel bars and wiresfor Concrete Reinforcement
IS: 13920 Ductile detailing of Reinforced Concrete Structures subjectedto Seismic Forces - Code of Practice
IS: 2911 Code of practice for Design and Construction of PileFoundations
IS: 1904 Code of practice for Design and Construction of Foundations inSoils : General Requirements
SP: 7 National Building Code of India
SP: 16 Design aids for Reinforced Concrete to IS: 456
SP: 34 Hand book on Concrete Reinforcement and Detailing
IRC : 21 Standard Specifications and Code of Practice for Road BridgesSection III
IRC : 6 Standard Specifications and Code of Practice for Road BridgesSection II
6.8 Design of Bulk Cargo Berth
6.8.1 Structural System of Bulk Cargo Berth
The proposed bulk cargo berth at Mahanadi is required to handle Bulk carrierupto 80000 DWT. The berth is planned as a berthing structure proposed to be onpiles, which provide least resistance to natural equilibrium and ease ofextension/addition of facilities at a later date. The berthing structure is of length250 m and width 25m.
The deck level of berth is kept at +5.00m. The thickness of the deck slab of berth is0.45 m. The slab at deck level is supported on Cross beams of 1.0m x 1.0m in thelateral direction, secondary beams of 1.0 m x 1.0 m in the longitudinal direction.

FEASIBILITY STUDY FOR PORT ON RIVER MAHANADI FINAL FEASIBILITY REPORTCHAPTER – 6
PROJECT DESIGN98
The Cross beams rest on the pile caps / pile muffs which in turn support thelongitudinal beams. The 1000 mm diameter bored cast in situ piles with 6mmthick liner are fixed to the pile caps at the top and fixed into the ground at thebottom. The plan and cross section of bulk cargo berth is shown as Fig 6.1. Theimportant design levels taken into consideration are discussed as follows:
(i) Dredged Level: The required Dredged level is taken as -14 m CD at outerface of berth.
(ii) Founding Level: Based on the Geotechnical data and the check forembedded depth with respect to bearing capacity of Piles (Reference: IS2911-Part-I, section -2, pn-22), the founding level for the piles is fixed at -30m CD.
(iii) Deck Level: Proposed elevation of the deck is +5.0 considering the MHHWtide (+2.6 CD) and the other operational requirements.
6.8.2 Analysis of Bulk Cargo Berth
6.8.2.1 STAAD Pro Modeling
The analysis of the structure has been performed in STAAD Pro as shown in Fig.6.2. In the model the piles are assumed to be fixed at base. The pile length used inanalysis is based on fixity length i.e. 7.3m. The cut off level of piles is +3.0/2.95.
Load 1X
Y
Z
Fig. 6.2 STAAD Panel of the Bulk Cargo Berth
The important levels, design parameters are tabulated in Table 6.5 below:

FEASIBILITY STUDY FOR PORT ON RIVER MAHANADI FINAL FEASIBILITY REPORTCHAPTER – 6
PROJECT DESIGN99
Table 6.5 Design Parameters for Bulk Cargo Berth
Top Level of Berth (Deck slab) +5.00 mTop level of Piles +3.0 m/+2.95mDiameter of piles (D) 1.00 mBed level 0.00 mRequired Dredged Level -14.00 mMHWL +2.60 mMLWL +0.70 mUnit wt. of RCC 25.0 KN/m3
Unit wt. of sea water 10.025 KN/m3
Unit wt. of Steel 78.50 KN/m3
Fixity length 7.30 mFounding Level of Piles -30.00 m
6.8.2.2 Design Loads and Load Combinations
The berths have been designed considering the following loads:
A. Vertical Loadsa) Dead Loadb) Live Loads
i) Uniform loadingii) Truck loading (IRC Class)iii) Rail mounted crane loading
B. Horizontal Loadsc) Berthing loadd) Mooring loade) Wind loadf) Current loadg) Seismic load
C. Combination of above
The loading has been considered taking into account the guidelines of IS 4651(Part III): 1974, IRC 6:2000, IS 1893: 2002 (Part 1), IS 875 : 1987 (Part 1 and Part 3).
(a) Dead Load
The dead load consists of the weight of the entire structure, including allthe permanent attachments such as mooring hardware, light poles, utilitybooms, brows, platforms, vaults, sheds, and service utility lines. A realisticassessment of all present and future attachments has been made andincluded. Overestimation of dead loads generally will not adversely affect

FEASIBILITY STUDY FOR PORT ON RIVER MAHANADI FINAL FEASIBILITY REPORTCHAPTER – 6
PROJECT DESIGN100
the cost of the structure. However, overestimation of dead loads wouldnot be conservative for tension or uplift controlled design. Standard unitweights have been used to calculate dead loads. Dead load of the structurecan be applied on STAAD MODEL.
Dead Weight of Slab
Component Depth of Slab(mm)
Unit Weight(KN/m3)
Load(KN/m2)
Bulk Cargo Berth 450 25 11.25
Dead weight of Crane Rails
UDL of Crane Rail - 0.6 kN/m
(b) Live Loads
Uniform Live Loads
(i) 50 KN/m2
Truck Loading
IRC Class A truck load has been applied as moving load. The loadspecification of IRC Class A train of vehicles (with impact factor) is given asunder:
P1 =27 KN dD1 = 0.5 m
P2=27 KN D1 = 1.1 m
P3= 114 KN D2 = 3.2 m
P4= 114 KN D3 = 1.2 m
P5=68 KN D4 = 4.3 m
P6=68 KN D5 = 3.0 m
P7 =68 KN D6 = 3.0 m
P8 =68 KN D7 = 3.0 m

FEASIBILITY STUDY FOR PORT ON RIVER MAHANADI FINAL FEASIBILITY REPORTCHAPTER – 6
PROJECT DESIGN101
Rail Mounted Crane Loading
It is proposed that rail mounted crane of 50t capacity at 45m will serve atberth. The crane will have the following specifications:
Crane Span = 10mEach wheel load = 60 tSpacing among wheel = 0.8m
Impact of wheel is considered as 25% of wheel load (As per IS 4561 Part III: 1974)
*Impact factor is not applicable to the design of column
Crane load specifications
(c) Berthing Force
The actual kinetic energy E absorbed by the fender system is calculated asper the following
Efender = Ce x Cg x Cd x Cc x Eship
Where:
Efender = Energy to be absorbed by the fender systemCb = Berthing coefficient = Cm x Ce x Cs. Sometimes Eccentricity coefficient(Ce), mass coefficient (Cm), softness coefficient (Cs), Cm = Effective mass orvirtual mass coefficient. The Value of Ce=0.56, Cs=0.95 have been used forcalculation of Berthing energy.
Then the value of Cb = 0.5*0.95= 0.532
Added mass coefficient, Cm = (1+π/4*D2Lw)/WD
Cm = (1+π/4*D2Lw)/WD
Cm = (1+π/4*142*240*1.025)/100000= 1.38
Eship = WD* V2/2g, where V is the approach velocity of ship =0.1 m/s

FEASIBILITY STUDY FOR PORT ON RIVER MAHANADI FINAL FEASIBILITY REPORTCHAPTER – 6
PROJECT DESIGN102
Eship = (100000) * 0.12/2* 9.81Eship = 51 tm
Efender = Cb*Cm*Eship
= 0.53*1.38*51= 37.42 tm
Berthing energy should be increased by 50% to take into accountaccidental berthing impact. Taking Factor of safetyEfender = 37.4 * 1.5
= 56.13 tm
(d) Mooring Force
This force is taken according to IS-4561- 1974-Part-III,
(i) Mooring force due to wind
Mooring Force due to wind: Fw = Cw Aw P
Cw = Shape FactorAw = Windage Area in sqm = 1.175*Lp (Dm-DL)P = Wind Speed pressure in N/sqm = 0.6 Vz
2
Vz = Vb *k1 * k2* k3 , where the k1, k2 and k3 are probability factorand terrain height and structure size factor and Topography factorrespectively. Values of coefficients are taken from IS-875-Part-III,k1 = 1k2 = 1.08k3 = 0.99
The wind speed is considered as 50 m/s for Bhubaneswar (IS -875-III Part 3 1987, cl-5.4 & pg-9)
Shape Factor Cw = 1.5 is taken for calculation of Mooring forcedue to wind.
Calculation summery of mooring force is given below
Aw = 1.175*Lp (Dm-DL) = 1.175*228*(17.5-7.0)= 2812.95 m2
P = 0.6 Vz2 =0.6*(53.46)2
= 1714.78 N/m2
Fw = 7235 KN= 723.5 t

FEASIBILITY STUDY FOR PORT ON RIVER MAHANADI FINAL FEASIBILITY REPORTCHAPTER – 6
PROJECT DESIGN103
(ii) Mooring force due to current
Mooring force due to current: Fc = Lpp Dr Pc
Fc = Mooring Force due to current in kgLpp = Length between the perpendiculars in m = 228 mDr = Loaded draft of vessel in m = 14.0 mPc = Pressure due to current in kg/sq.m = 89.13The current velocity is assumed as 1.3 m/s
Fc = Lpp * Dr*Pc
= 228*14*89.13= 284.5 t
Assuming that the mooring force due to current and wind actsimultaneously in the same direction.
Total Mooring Force (FT) = (F2w + F2
c )0.5
= 777.5 t
Considering at least 8 nos. of bollards per vessel, mooring force at eachpile,
FT = 777.5/8 = 97.19 t Say 100 t
Bollards strength of 100t on Sea side has been proposed.
(e) Wind Load
The wind loads on the structure has been considered as per IS 875:Part3.The basic wind speed for Cochin is 39 m /sec. Design Wind Speed can beobtained by the following formula:
Design Wind Speed Vz =K1*K2*K3*Vb
Where,K1, Risk Coefficient as 1.00K2, Terrain (Category 2), Height (10m) and structure size factor (class C) as1.08K3, Topography Factor as 0.99
Accordingly, the design wind pressure, pz = 0.6 Vz2
pz = 0.6 Vz2 = 0.6*(50*1.00*1.08*0.99)2
= 1714.78 N/m2

FEASIBILITY STUDY FOR PORT ON RIVER MAHANADI FINAL FEASIBILITY REPORTCHAPTER – 6
PROJECT DESIGN104
(f) Current Force
The current force is given by γV2/2g
Where γ = Unit weight at water = 1.025 t/m3
V = Current velocity = 1.3 m/sec.FC = γV2/2g
= 1.025*1.3^2/(2*9.81)= 0.09 T
(g) Seismic Force
The seismic force has been calculated as per IS-1893-2002. The designhorizontal seismic coefficient Ah for a structure shall be determined by thefollowing expression:
Ah = (Z/2)*(I/R)*(Sa/g)Where,
Z = Zone factor given in Table 2, IS-1893-2002. Z at the site has beenadopted as 0.16 corresponding to Zone III. Map showing the seismic zonefrom IS 1893-part – I, Bhubaneswar falls in Zone – III.
I = Importance factor =1.5 has been used.
R = Response reduction factor has been taken as 5.0 for RCC Structures asper Table 7 of IS-1893-2002.
Sa/g = Average response acceleration coefficient has been taken as 1.4 asper Figure 2 of IS-1893(Part 1):2002 corresponding to T=0.91 seconds. Theearthquake force has been applied in X as well as Z directions.
(h) Load Combinations as per IS 4651 Part IV 2007
Method of Design: The Berth and its structural components have beendesigned as per Limit State Method. The partial safety factors for loads inlimit state design method has been used. Accordingly, following loadcombinations have been considered as per IS : 4651-2007 (Draft copy)

FEASIBILITY STUDY FOR PORT ON RIVER MAHANADI FINAL FEASIBILITY REPORTCHAPTER – 6
PROJECT DESIGN105
Limit state of serviceability
1.0(DL+LL)1.0(DL+LL+BF-S)1.0(DL+LL+BF-(L)1.0(DL+LL+MF-S)1.0(DL+LL+MF-L)1.0(DL+LL+SFX)1.0(DL+LL+SF-X)
Limit state of collapsibility
1.2(DL+LL)+(CLX)1.2(DL+LL)+(CL-X)1.5(DL+LL+BF-S)+1.0CLX1.5(DL+LL+BF-L)+1.0CLX1.5(DL+LL+BF-S)+1.0CL-X1.5(DL+LL+BF-L)+1.0CL-X1.5(DL+LL+MF-S)+1.0CLX1.5(DL+LL+MF-L)+1.0CLX1.5(DL+LL+MF-S)+1.0CL-X1.5(DL+LL+MF-L)+1.0CL-X1.2(DL+LL)+1.0CLX1.2(DL+LL)+1.0CL-X1.2(DL+LL)+1.0CLX+1.5SFX1.2(DL+LL)+1.0CL-X+1.5SFX1.2(DL+LL)+1.0CLX+1.5SF-X1.2(DL+LL)+1.0CL-X+1.5SF-X1.2(DL+LL)+1.0CLX+1.5SFZ1.2(DL+LL)+1.0CL-X+1.5SFZ1.2(DL+LL)+1.0CLX+1.5SF-Z1.2(DL+LL)+1.0CL-X+1.5SF-Z1.2(DL+LL)+1.5SWLX+1.0CLX1.2(DL+LL)+1.5SWLX+1.0CL-X1.2(DL+LL)+1.5SWL-X+1.0CLX1.2(DL+LL)+1.5SWL-X+1.0CL-X1.2(DL+LL)+1.5SWLZ+1.0CLX1.2(DL+LL)+1.5SWLZ+1.0CL-X1.2(DL+LL)+1.5SWL-Z+1.0CLX1.2(DL+LL)+1.5SWL-Z+1.0CL-X
DL – Dead LoadLL – Live LoadMF-S – Mooring Force Sea SideMF-L – Mooring Force Lee SideBF-S – Berthing Force Sea Side

FEASIBILITY STUDY FOR PORT ON RIVER MAHANADI FINAL FEASIBILITY REPORTCHAPTER – 6
PROJECT DESIGN106
BF-L – Berthing Force Lee SideSF – Earthquake loadCL-Current LoadWL-Wind Load
6.9 Design of Bulk Cargo Berth
The governing STAAD Results for Longitudinal Beams, Cross Beams, and columnshave been summarized as below:
Table 6.6 Critical Forces in structural members of bulk cargo berth
Based on design calculations, drawing of bulk cargo berth beam, pile and slab isprepared and shown as Fig. 6.3 A, Fig. 6.3 B, Fig. 6.3 C respectively.
6.10 Container Berth
6.10.1 Structural System of Berth
The proposed container berth at Mahanadi is required to handle container upto1000 TEU. The berth is planned as a berthing structure proposed to be on piles,which provide least resistance to natural equilibrium and ease ofextension/addition of facilities at a later date. The berthing structure is of length250 m and width 40m.
The deck level of berth is kept at +5.00m. The thickness of the deck slab of berth is0.45 m. The slab at deck level is supported on Cross beams of 1.0m x 1. 0 m in thelateral direction, secondary beams of 1.0 m x 1.0 m in the longitudinal direction.The Cross beams rest on the pile caps / pile muffs which in turn support thelongitudinal beams. The 1000 mm diameter bored cast in situ piles with 6mmthick liner are fixed to the pile caps at the top and fixed into the ground at thebottom. The plan and cross section of container berth is shown as Fig. 6.4. Theimportant design levels taken into consideration are discussed as follows:
(ii) Dredged Level: The required Dredged level is taken as -10.5 m CD at outerface of berth.
Beams Design Moment (KNm) Shear (KN)1847 1846
Piles P (KN) Mux (KNm) Muy (KNm)5739 1009 669
SlabDesign Moment
(KNm)150

FEASIBILITY STUDY FOR PORT ON RIVER MAHANADI FINAL FEASIBILITY REPORTCHAPTER – 6
PROJECT DESIGN107
(ii) Founding Level: Based on the Geotechnical data and the check forembedded depth with respect to bearing capacity of Piles (Reference: IS2911-Part-I, section -2, pn-22), the founding level for the piles is fixed at -30m CD.
(iii) Deck Level: Proposed elevation of the deck is +5.0 considering the MHHWtide (+2.6 CD) and the other operational requirements.
6.10.2 Analysis of Container Berth
6.10.2.1 STAAD Pro Modeling
The analysis of the structure has been performed in STAAD Pro 2007 as shown inFig. 6.5. In the model the piles are assumed to be fixed at base. The pile lengthused in analysis is based on fixity length i.e. 7.3m. The cut off level of piles is+3.0/2.95.
Load 1X
Y
Z
Fig. 6.5 STAAD Panel of the Container Berth
The important levels, design parameters are tabulated in Table 6.7 below:
Table 6.7 Design Parameters for Container Berth
Top Level of Berth (Deck slab) +5.00 mTop level of Piles +3.00 m/+2.95mDiameter of piles (D) 1.00 mBed level 0.00 mRequired Dredged Level --14.00 mMHWL +2.60 mMLWL +0.70 mUnit wt. of RCC 25.0 KN/m3
Unit wt. of sea water 10.025 KN/m3
Unit wt. of Steel 78.50 KN/m3

FEASIBILITY STUDY FOR PORT ON RIVER MAHANADI FINAL FEASIBILITY REPORTCHAPTER – 6
PROJECT DESIGN108
Fixity length 7.30 mFounding Level of Piles -30.00 m
6.10.2.2 Design Loads and Load Combinations
The container berth has been designed considering the following loads:
A. Vertical Loadsa) Dead Loadb) Live Loads
i) Uniform loadingii) Truck loading (IRC Class)iii) Rail mounted crane loading
B. Horizontal Loadsa) Berthing loadb) Mooring loadc) Wind loadd) Current loade) Seismic load
C. Combination of above
The loading has been considered taking into account the guidelines of IS 4651(Part III): 1974, IRC 6:2000, IS 1893: 2002 (Part 1), IS 875 : 1987 (Part 1 and Part 3).
(a) Dead Load
The dead load consists of the weight of the entire structure, including allthe permanent attachments such as mooring hardware, light poles, utilitybooms, brows, platforms, vaults, sheds, and service utility lines. A realisticassessment of all present and future attachments has been made andincluded. Overestimation of dead loads generally will not adversely affectthe cost of the structure. However, overestimation of dead loads wouldnot be conservative for tension or uplift controlled design. Standard unitweights have been used to calculate dead loads. Dead load of the structurecan be applied on STAAD MODEL.
Dead Weight of Slab
Component Depth of Slab(mm)
Unit Weight(KN/m3)
Load(KN/m2)
Container Berth 450 25 11.25

FEASIBILITY STUDY FOR PORT ON RIVER MAHANADI FINAL FEASIBILITY REPORTCHAPTER – 6
PROJECT DESIGN109
(b) Live Loads
Uniform Live Loads
(ii) 40 KN/m2
Truck Loading
IRC Class A truck load has been applied as moving load. The loadspecification of IRC Class A train of vehicles (with impact factor) is given asunder:
P1 =27 KN dD1 = 0.5 m
P2=27 KN D1 = 1.1 m
P3= 114 KN D2 = 3.2 m
P4= 114 KN D3 = 1.2 m
P5=68 KN D4 = 4.3 m
P6=68 KN D5 = 3.0 m
P7 =68 KN D6 = 3.0 m
P8 =68 KN D7 = 3.0 m
Mobile Harbour Crane Loading
It is proposed that Mobile Harbour Crane (Liebhher 280) of 35 cycles perhour capacity (For containers) will serve at berth. The cranes will have thefollowing specifications:
Longitudinal Pad Spacing = 11.0mTransverse Pad Spacing = 11.0mTotal Surface Load = 242tNumber of Pads = 4 Nos.Each Pad Load = 60.5t
Impact of wheel is considered as 25% of wheel load (IS 4561 Part III: 1974)*Impact factor is not applicable to the design of column. The Mobile Harbour Crane load as given abovedominates the Moving Load Designs.

FEASIBILITY STUDY FOR PORT ON RIVER MAHANADI FINAL FEASIBILITY REPORTCHAPTER – 6
PROJECT DESIGN110
Fig. 6.6 Pad and Wheel arrangement of Mobile Harbour Crane
(c) Berthing Force
The actual kinetic energy E absorbed by the fender system is calculated asper the following
Efender = Ce x Cg x Cd x Cc x Eship
Where:
Efender = Energy to be absorbed by the fender systemCb = Berthing coefficient = Cm x Ce x Cs. Sometimes Eccentricity coefficient(Ce), mass coefficient (Cm), softness coefficient (Cs), Cm = Effective mass orvirtual mass coefficient. The Value of Ce=0.5, Cs=0.95 have been used forcalculation of Berthing energy.
Then the value of Cb = 0.56*0.95= 0.532
Added mass coefficient, Cm = (1+π/4*D2Lw)/WD
Cm = (1+π/4*D2Lw)/WD
Cm = (1+π/4*10.12*195*1.025)/33000= 1.48
Eship = WD* V2/2g, where V is the approach velocity of ship =0.1 m/s
Eship
Eship = 19.86 tm
Efender = Cb*Cm*Eship
= 0.532*1.48*(33000) * 0.12/2* 9.81= 13.24 tm ~ 13tm
Berthing energy should be increased by 50% to take into accountaccidental berthing impact. Taking Factor of safetyEfender = 13.24 * 1.5
= 19.86 tm

FEASIBILITY STUDY FOR PORT ON RIVER MAHANADI FINAL FEASIBILITY REPORTCHAPTER – 6
PROJECT DESIGN111
(d) Mooring Force
This force is taken according to IS-4561- 1974-Part-III,
(i) Mooring force due to wind
Mooring Force due to wind: Fw = Cw Aw P
Cw = Shape FactorAw = Windage Area in sqm = 1.175*Lp (Dm-DL)P = Wind Speed pressure in N/sqm = 0.6 Vz
2
Vz = Vb *k1 * k2* k3 , where the k1, k2 and k3 are probability factorand terrain height and structure size factor and Topography factorrespectively. Values of coefficients are taken from IS-875-Part-III,k1 = 1k2 = 1.08k3 = 0.99
The wind speed is considered as 50 m/s for Bhubaneswar (IS -875-III Part 3 1987, cl-5.4 & pg-9)
Shape Factor Cw = 1.5 is taken for calculation of Mooring forcedue to wind.
Calculation summery of mooring force is given below
Aw = 1.175*Lp (Dm-DL) = 1.175*185*(12.625-5.05)= 1646.62 m2
P = 0.6 Vz2 =0.6*(53.46)2
= 1714.78 N/m2
Fw = 423.5T
(ii) Mooring force due to current
Mooring force due to current: Fc = Lpp Dr Pc
Fc = Mooring Force due to current in kgLpp = Length between the perpendiculars in m = 195 mDr = Loaded draft of vessel in m = 10.1 mPc = Pressure due to current in kg/sq.m = 89.13The current velocity is assumed as 1.3 m/s
Fc = Lpp * Dr*Pc

FEASIBILITY STUDY FOR PORT ON RIVER MAHANADI FINAL FEASIBILITY REPORTCHAPTER – 6
PROJECT DESIGN112
= 185*10.1*86.4= 166.5 t
Assuming that the mooring force due to current and wind actsimultaneously in the same direction.
Total Mooring Force (FT) = (F2w + F2
c )0.5
= 455.10 T
Considering at least 6 nos. of bollards per vessel, mooring force at eachpile,
FT = 455.10/6 = 75.85 t Say 100 t
(e) Wind Load
The wind loads on the structure has been considered as per IS 875:Part3.The basic wind speed for Cochin is 39 m /sec. Design Wind Speed can beobtained by the following formula:
Design Wind Speed Vz =K1*K2*K3*Vb
Where,K1, Risk Coefficient as 1.00K2, Terrain (Category 2), Height (10m) and structure size factor (class C) as1.08K3, Topography Factor as 0.99
Accordingly, the design wind pressure, pz = 0.6 Vz2
pz = 0.6 Vz2 = 0.6*(50*1.00*1.08*0.99)2
= 1714.78 N/m2
(f) Current Force
The current force is given by γV2/2g
Where γ = Unit weight at water = 1.025 t/m3
V = Current velocity = 1.3 m/sec.FC = γV2/2g
= 1.025*1.3^2/(2*9.81)= 0.09 T

FEASIBILITY STUDY FOR PORT ON RIVER MAHANADI FINAL FEASIBILITY REPORTCHAPTER – 6
PROJECT DESIGN113
(g) Seismic Force
The seismic force has been calculated as per IS-1893-2002. The designhorizontal seismic coefficient Ah for a structure shall be determined by thefollowing expression:
Ah = (Z/2)*(I/R)*(Sa/g)
Where,
Z = Zone factor given in Table 2, IS-1893-2002. Z at the site has beenadopted as 0.16 corresponding to Zone III. Map showing the seismic zonefrom IS 1893-part – I, Bhubaneswar falls in Zone – III.
I = Importance factor =1.5 has been used.
R = Response reduction factor has been taken as 5.0 for RCC Structures asper Table 7 of IS-1893-2002.
Sa/g = Average response acceleration coefficient has been taken as 1.4 asper Figure 2 of IS-1893(Part 1):2002 corresponding to T=0.91 seconds. Theearthquake force has been applied in X as well as Z directions.
(h) Load Combinations as per IS 4651 Part IV 2007
Method of Design: The Berth and its structural components have beendesigned as per Limit State Method. The partial safety factors for loads inlimit state design method has been used. Accordingly, following loadcombinations have been considered as per IS : 4651-2007 (Draft copy)
Limit state of serviceability
1.0(DL+LL)1.0(DL+LL+BF-S)1.0(DL+LL+BF-(L)1.0(DL+LL+MF-S)1.0(DL+LL+MF-L)1.0(DL+LL+SFX)1.0(DL+LL+SF-X)
Limit state of collapsibility
1.2(DL+LL)+(CLX)1.2(DL+LL)+(CL-X)1.5(DL+LL+BF-S)+1.0CLX1.5(DL+LL+BF-L)+1.0CLX

FEASIBILITY STUDY FOR PORT ON RIVER MAHANADI FINAL FEASIBILITY REPORTCHAPTER – 6
PROJECT DESIGN114
1.5(DL+LL+BF-S)+1.0CL-X1.5(DL+LL+BF-L)+1.0CL-X1.5(DL+LL+MF-S)+1.0CLX1.5(DL+LL+MF-L)+1.0CLX1.5(DL+LL+MF-S)+1.0CL-X1.5(DL+LL+MF-L)+1.0CL-X1.2(DL+LL)+1.0CLX1.2(DL+LL)+1.0CL-X1.2(DL+LL)+1.0CLX+1.5SFX1.2(DL+LL)+1.0CL-X+1.5SFX1.2(DL+LL)+1.0CLX+1.5SF-X1.2(DL+LL)+1.0CL-X+1.5SF-X1.2(DL+LL)+1.0CLX+1.5SFZ1.2(DL+LL)+1.0CL-X+1.5SFZ1.2(DL+LL)+1.0CLX+1.5SF-Z1.2(DL+LL)+1.0CL-X+1.5SF-Z1.2(DL+LL)+1.5SWLX+1.0CLX1.2(DL+LL)+1.5SWLX+1.0CL-X1.2(DL+LL)+1.5SWL-X+1.0CLX1.2(DL+LL)+1.5SWL-X+1.0CL-X1.2(DL+LL)+1.5SWLZ+1.0CLX1.2(DL+LL)+1.5SWLZ+1.0CL-X1.2(DL+LL)+1.5SWL-Z+1.0CLX1.2(DL+LL)+1.5SWL-Z+1.0CL-X
DL – Dead LoadLL – Live LoadMF-S – Mooring Force Sea SideMF-L – Mooring Force Lee SideBF-S – Berthing Force Sea SideBF-L – Berthing Force Lee SideSF – Earthquake loadCL-Current LoadWL-Wind Load
6.10.2.3 Design of Container Berth
The governing STAAD Results for Longitudinal Beams, Cross Beams, and columnshave been summarized as below:

FEASIBILITY STUDY FOR PORT ON RIVER MAHANADI FINAL FEASIBILITY REPORTCHAPTER – 6
PROJECT DESIGN115
Table 6.8 Critical Forces in structural members of Container Berth
Based on Design calculations, drawing of container berth beam, pile and slab isprepared and shown as Fig. 6.7 A, Fig. 6.7 B, Fig. 6.7 C respectively.
6.11 Fender System
6.11.1 Marine fender is a necessary interface between berthing ship and berth structure.The principal function of a fender is to transform ship’s berthing energies intoreactions which both the ship and berth structure can safely sustain. A properlydesigned fender system must therefore be able to gently stop a moving orberthing ship without damaging the ship, the berth structure or the fender. Onceships are safely moored, the fender should be able to protect the ship and theberthing structure from the motions caused by wind, wave, current, tidal changesand loading or unloading of cargo.
6.11.2 The fendering system has been designed for normal impacts due to design vesselunder maximum design conditions and also for a reasonable abnormal impact dueto mishandling or exceptionally adverse wind or current, which may occur fromtime to time.
6.11.3 Selection of Fender
The energy to be absorbed by a fender is computed for a ship with the approachvelocity of 0.1 m/s. It is found that the Circle Fender with Frontal Pad (CSS Fender)is found suitable to accommodate the berthing energy.
The CSS fender is a well-established fender type. This fender has a hollowcylindrical body with fully rubber-imbedded mounting flanges and is designed todeflect in an axial direction. Originally designed to replace cylindrical fenders,these fenders have more than 30 years track record with only some minorimprovements over the years. Cell fenders are very robust and have been used fordecades in many ports around the world.
The CSS-style fender's well-known and admired characteristics include:
Beams Design Moment (KNm) Shear (KN)805 699
Piles P (KN) Mux (KNm) Muy (KNm)975 818 39
SlabDesign Moment
(KNm)109

FEASIBILITY STUDY FOR PORT ON RIVER MAHANADI FINAL FEASIBILITY REPORTCHAPTER – 6
PROJECT DESIGN116
Good energy absorption to reaction force ratio (E/R) Integrated and fully-embedded fender flanges make assembly & installation
simple Good shear force resistance due to the large diameter of the fender flanges Large fender footprint with good force distribution could lead to relative light
panel construction
The proposed fendering system for berths has been given in Table 6.9
Table 6.9 Fendering system for Berths
Berth BerthingEnergy
(tm)
Type offender
EnergyAbsorption
(tm)
ReactionForce
(t)
Size ofFender(in mm)
Spacing offenders
(m)Iron Ore 56.13 CSS 57.5 104.5 1250 H 20.0Coal 56.13 CSS 57.5 104.5 1250 H 20.0Container 19.86 CSS 20.3 46.2 1000 H 15.0GeneralCargo
19.99 CSS 20.3 46.2 1000 H 15.0
The performance and specification of the CSS 1250H G2.6 and CSS 1000H G1.6
fenders are mentioned in the Table 6.10 and Table 6.11 respectively. The pictureof a CSS fender installed at jetty, its elastic characteristics and drawing are shownin the Fig. 6.8 to Fig. 6.10 respectively.
Table 6.10 CSS Fender Performance at Design Deflection

FEASIBILITY STUDY FOR PORT ON RIVER MAHANADI FINAL FEASIBILITY REPORTCHAPTER – 6
PROJECT DESIGN117
Table 6.11 Specification of the CSS Fender
Fig. 6.8 CSS Fender Installed at Jetty
Fig. 6.9 Elastic Characteristics of CSS Fender

FEASIBILITY STUDY FOR PORT ON RIVER MAHANADI FINAL FEASIBILITY REPORTCHAPTER – 6
PROJECT DESIGN118
Fig. 6.10 Drawing of the CSS Fender
6.12 Mooring Arrangement and Bollards
The mooring loads are the lateral load caused by the mooring line when they pullthe ship into or along the dock or hold it against the force of the wind or current.As per IS 875, Part III the governing wind speed in Mahanadi port is 53.5 m/s.
A vessel is said to be ’moored’ when it is fastened to a fixed object such as abollard, pier, quay or the seabed, or to a floating object such as an anchor buoy.Mooring is often accomplished using thick ropes called mooring lines or hawsers.The lines are fixed to deck fittings on the vessel at one end, and fittings on theshore, such as bollards, rings, or cleats, on the other end as shown below
Fig. 6.11 Typical mooring arrangements of a vessel
Bollards
The bollard pull has been worked out as 150 tons and 100 tons for 80,000 DWTand 60,000 DWT ships respectively. The specification of 150 T bollard and 100 Tbollard is mentioned in the Table 6.12. The picture of a bollard installed at jettyand drawing is shown in the Fig. 6.12.

FEASIBILITY STUDY FOR PORT ON RIVER MAHANADI FINAL FEASIBILITY REPORTCHAPTER – 6
PROJECT DESIGN119
Table 6.12 Specification of Bollard
Fig. 6.12 Typical Details of Bollard

FEASIBILITY STUDY FOR PORT ON RIVER MAHANADI FINAL FEASIBILITY REPORTCHAPTER – 6
PROJECT DESIGN120
6.13 Tug and other floating craft required for berthing/un-berthing
The assistance of tugs for the turning of the vessels is required. Three or four tugswill be necessary for the approach, berthing and un-berthing vessel operations(depending on the climate conditions).
The main characteristics of the required tugs are the following:
Type: Tractor type tug boat with Schottel or Voith-Schneider propeller. Power: 4,000 HP. Bollard pull: 40 tonnes.
The tractor type tug boat has been proposed is suitable as a bow and stern tugboat, for pushing and towing operations. It is highly maneuverable, even movingsideways and has a large pulling force in all directions.
Fig. 6.13 Example of Tractor type tug boat with Schottel propeller (left) andVoith-Schneider propeller (right)
Other auxiliary boats are required for support operations in the followingactivities:
Embarkation/disembarkation of the pilots. Bathymetric surveys Port maintenance. Buoys and navigational aids maintenance. Rescue. Fight against the marine pollution. Help at the mooring/un-mooring and berthing/un-berthing operations.
The required power for these auxiliary small crafts will be between 80 and 120 HP.

FEASIBILITY STUDY FOR PORT ON RIVER MAHANADI FINAL FEASIBILITY REPORTCHAPTER – 7
CARGO HANDLING SYSTEMS AND EQUIPMENT121
CHAPTER 7
CARGO HANDLING SYSTEMS AND EQUIPMENT
7.1 General
7.1.1 A port can be of maximum benefit to the users, owners and the areas served by it,only when it is properly laid out, adequately equipped and efficiently operated.The quality of the service rendered by the port, particularly its promptness andspeed, safety and security of the goods handled and also the total user costs forthe services are the basic requirements for the success of the port and its futuregrowth. These can be achieved only by a proper layout and well engineeredsystems and equipment for (i) import cargoes, including ship unloading, landsideloading and dispatch/delivery to the users, (ii) receipt, unloading and ship loadingof export goods and (iii) in-port storage and transfer of both.
7.1.2 The cargo handling systems and equipment cannot be evolved in isolation, butshould be tailor-designed to suit the port layout which will be influenced by siteparameters and various limitations and considerations of harbour engineering,connecting transport linkages etc. In turn, the port layout will also be decided bythe cargo handling systems and equipment and thus each will influence the other.A change in layout may require substantial changes in cargo handlingsystems/equipment and vice versa. The port layout and cargo handling systemsand equipment should be viewed as an integrated system and evolved foroptimizing the performance of the port as a whole.
7.1.3 The cargo handling systems and equipment have generally been developed forthe cargo flow from ships to storages and delivery/dispatch to the users via railand road. The only exception is the export of iron ore where the cargo flow wouldbe in the reverse direction i.e. unloading and receipt and transfer to storage andship loading. In addition, container traffic will include both import and export ofcontainers but unlike other cargoes, container systems are basically suitable for atwo way movement of containers. For general cargo also the system is generallybi-directional, and capable of handling flows in both directions.
7.1.4 The traffic assessment for the Mahanadi indicates the immense potential of theproposed port with regard to the traffic. However, with increasing competitionthe service level of the ports worldwide is receiving the due attention.Accordingly, it is very essential to plan the handling logistics in an efficient mannerso as to the ships are received, serviced and sent out seamlessly.
7.1.5 It must however be remembered that traffic build up at a particular port takestime to stabilize, partly due to long term commitments and partly due tointermodal transfers. However, in order for this (shifting of preference for thisport) to happen, the service level and the facilities at the proposed port must be

FEASIBILITY STUDY FOR PORT ON RIVER MAHANADI FINAL FEASIBILITY REPORTCHAPTER – 7
CARGO HANDLING SYSTEMS AND EQUIPMENT122
as good if not better than the existing ports in the region. In addition, theGreenfield ports start at an advantage of planning from the scratch and thereforecan afford to phase the facilities, keeping pace with the growth in traffic.Therefore, the proposed developments would have to be suitably phased, so thatthe growth to attain the master plan level is organic in nature.
7.2 Concepts
7.2.1 The broad concepts on which the cargo handling systems have been evolvedare:
The port will work round the clock. All ships are to be turned around in a maximum of 3 days (72 hours). As a
matter of abundant caution the system capacities will enable theunloading/loading the maximum size of ships of any particular cargo in about48 hours time.
Uni-flow of cargoes without any back tracking or contra-flow at any stage. Parallel flows of cargoes so that crossing of flows is avoided. Even if there is
any crossing of flows, there will be a grade separation so that flows will notinterrupt each other.
Protection of cargoes from climatic conditions, during receipt, handling,transfer and storage e.g. coal being conveyed with totally enclosed systems
Provision of facilities for weighment/measurement of cargoes received andcargoes despatched like belt scales, flow-meters, weighbridges, etc. for allcommercial and accounting proposes at appropriate stages.
Separation of storage of import and export cargoes in the case of generalcargo, containerized cargo etc.
Storage of containers will be 3+1 tiered with adequate storage space forpeaking.
Adequate storage capacity for each cargo so that there is no simultaneousreceipt as well as despatch of materials from any individual storagearea/stack.
Separate access to each storage for cargo evacuation so that the outflow fromeach area will be smooth and unhindered.
Minimal Environmental Impact particularly in handling of coal, providingcovered conveying and storage, together with provision of dust controlmeasures.
Easy road access to all the operational areas, storages. Minimising the rail network in the port while fully meeting the rail evacuation
requirements. The systems designed for operation with minimal man power and also with a
built-in suitability for complete automation. Provide with latest Electronic Data Inter-change (EDI) facilities Minimising the initial investments with provision for future investments to be
made as and when necessary.

FEASIBILITY STUDY FOR PORT ON RIVER MAHANADI FINAL FEASIBILITY REPORTCHAPTER – 7
CARGO HANDLING SYSTEMS AND EQUIPMENT123
Adequate spaces for future expansion with availability of contiguous areas foreach individual cargo, for meeting any unanticipated growth.
Minimal disruption and hazards to the on-going port operational activitiesduring construction at the time of future expansion.
Central Co-ordination Control tower to monitor port activities and houselatest Meteorological facilities
7.2.2 Material handling would inter-alia include properly located and planned adequatestorages. The storage areas of the port are generally planned to cater to theunavoidable mismatches in the rates of cargo receipt/dispatch by sea andhinterland transport system, with adequate operating space, and retrievalsystems.
7.2.3 The port is proposed to be developed in phases. In the first phase, in order tokeep the investment low but providing the desired facilities it is proposed toconstruct 2 berths for the following purpose
Iron Ore Berth Coal Berth Fertilizer, Other Dry Bulk & Break Bulk Container Berth
7.2.4 In the initial phase, one common berth will be used for handling Coal, Fertilizer,Other Dry bulk, Containers and Break Bulk Cargo. A dedicated berth is proposedfor handling Iron Ores.
7.2.5 In the final phase, another two berths shall be constructed for handling additionalcargo of Iron Ore and Coal. Additional separate container berth and multi cargoberth is proposed for handling other dry bulk and fertilizers..
7.3 Berth and Handling System Required
7.3.1 The land area requirement for storage and other needs of the port is described inthe earlier chapter on Facility Requirements and Project Description (Chapter 5).However, before describing the requirements and the specifications for thehandling systems at the port, it was considered necessary to recapitulate thesame. In addition, in order to achieve the target traffic to be handled in the port,the necessary service levels and berth out puts also need to be defined. In thefollowing Table 7.1, the berth requirements, the nature and capacity of thehandling equipment are detailed which would be able to handle the projectedcargo.

FEASIBILITY STUDY FOR PORT ON RIVER MAHANADI FINAL FEASIBILITY REPORTCHAPTER – 7
CARGO HANDLING SYSTEMS AND EQUIPMENT124
Table 7.1 Facility requirement for different Phases of development
Phase Phase I (2016-25) Phase II (2026-35)(Additional)
Cargo Th.(MT)
No. ofberths
Capacity(tph)
Th.(MT)
No. ofberths
Capacity(tph)
Iron ore 10.45 1 1 x 5000 27.06 1 1 x 5000Coal 4.65
1
1 x 2000 11.45 1 1 x 2000Fertilizers & OtherBulk Cargo 2.33 2 x 500 5.01 1 1 x 500
Containers* 0.04* 1 x 35** 0.09* 1 -
Total 17.43 +0.04* MTEU 2 43.52 +
0.09*MTEU 4
* MTEU ** TEU/hr.
7.4 Bulk Handling
While planning the system requirements for bulk handling the following aspectsrequires careful attention in order to meet the regulations on environment:
“While loading/unloading dry bulk fugitive emission is properly controlled andmonitored at the point of receiving the above cargo by ships, at jetty and storage,loading and unloading in trucks/dumps and also at the material transfer point”
This applies to all bulk commodities which emanate dust during handling and itshall be ensured that such dust is contained. This will be ensured through, strictcontrol of dust generation at all handling and transfer points, suppressioncapturing and removal of dust at all transfer points and at stock piles. This will beachieved by the following provisions to be enforced through suitablespecifications on suppliers of equipment.
Minimising of dust generation during ship-shore transfer by selecting suitableloaders/ unloaders as well as specifying suitable labyrinth joints seals andaspiration arrangements.
Enclosure of all transfer points Dust extraction and filtration arrangements at all belt transfer point Provision of self adjusting telescopic chutes, at the stackers in stackyard and
for loading in rail wagons/road trucks Alignment of stack yards along favourable direction vis-à-vis the wind. So that
emanating dust is directed away from dwellings. Water sprinkling arrangements in stack yards, with a dedicated water tank and
pumping and pipeline system. Spray points will be at every 50m along pile andthe spray system will be inter-connected to the anemometer for pre selectedwind speed to commence spray.
There would be a wind shield with or without creepers around the bulk stackyards so that the fugitive emissions are arrested. The height of the wind shieldwould depend on the stack heights which is limited to 14 m at the present.

FEASIBILITY STUDY FOR PORT ON RIVER MAHANADI FINAL FEASIBILITY REPORTCHAPTER – 7
CARGO HANDLING SYSTEMS AND EQUIPMENT125
In addition to the wind shields, there will be provision for a 10 m wide greenbelt around the stack yards to act as a second line of defence for the emissioncontrol. The trees shall be selected based on the advice of the local forest andthe horticulture department of the State Government.
7.4.1 Unloaders
There are basically 2 types of unloaders available
- Grab Type- Continuous type
Grab type has the advantage of simplicity in operation and has been in use fordecades and users and operators are well conversant with this system. Over theyears the basic feature of unloading has not changed at all but technologicalimprovements have taken place in materials, increasing the payload/tare weightratio from 1.0 to 1.2 to 1.6 (the higher figure with heavier bulk density materialsand as such with comparatively smaller benefits for a light commodity like coal). 4rope grabs have come up on the scene with better scooping capabilities.Hydraulically operated grabs are also being used now-a-days. All these havehelped in improving the handling rates.
Fig. 7.1 Typical details of a Grab Unloader working on a ship
A good hold clean up of the material can be achieved by a pay loader/bull dozer ofa suitable capacity operating on the hold. One unit is necessary for each bulkberth.

FEASIBILITY STUDY FOR PORT ON RIVER MAHANADI FINAL FEASIBILITY REPORTCHAPTER – 7
CARGO HANDLING SYSTEMS AND EQUIPMENT126
7.4.2 Conveyors
The belt conveyors design envisages 450 troughs, EP and steel cord belting(depends on belt tension). The steel cord belt will be used where conveyor lengthand tension is more due to reduce elongation. The spacing of the carrying idlers is1.1m and spacing of return idlers is 3m. The belt width considered 1000 mm.
Table 7.2 in general, gives the conveyor ratings for 500 m and 1000m longsystems for capacities of 500, 1000, 2000, 4000, 6000 and 8000 TPH. Anyintermediate capacities are extrapolatable / intrapolatable, if required.
The conveyor tensions, speed, load capacity and HP for 1000 m and 500 m lengthare given in the table below. Certain standardization is desirable for pulley andbelt width of all conveyors by use of one value of speed which wouldconsequently reduce the spares inventory on all pulleys and enableinterchangeability.
Table 7.2 Belt conveyor capacity and HP selection for 2 standard lengths
BeltLength
Cap.TPH
MPMSpeed
Tensions PowerLoad Empty Lift Total Shaft
HPHP
MotorKW
MotorFrame
1000m 500 230 1320 3960 200 5480 400 487 350 x 11000 2640 4620 400 7660 559 682 500 x 12000 4950 4950 750 10650 777 948 350 x 24000 9900 5280 1500 16680 1218 1485 500 x 26000 14850 5610 2250 22710 1658 2022 500 x 38000 19800 5940 3000 28140 2098 2559 500 x 4
500 m 500 660 1650 200 2510 184 224 701000 1320 1815 400 3535 258 315 125 x 22000 1980 1584 750 4314 315 384 150 x 24000 4950 2145 1500 8595 628 766 300 x 26000 7425 2228 2250 11903 869 1060 400 x 28000 9900 2310 3000 15210 1111 1355 500 x 2
7.4.3 Stackers cum Reclaimers
Stacker cum Reclaimer is considered instead of an independent stacker andreclaimer for proper utilization and cost effectiveness.
The coal unloaded from ship using unloaders will be transferred to a completelyenclosed wharf belt conveyor elevated to about 6 m above ground which willenable road traffic to cross under it at suitable places. This belt conveyor will havediverter arrangements and will discharge to one of the two inclined conveyors,(fully enclosed) which will raise the height of conveyance to about 13m-14m andtransfer the coal to the stack feed belt-conveyor running alongside the enclosed

FEASIBILITY STUDY FOR PORT ON RIVER MAHANADI FINAL FEASIBILITY REPORTCHAPTER – 7
CARGO HANDLING SYSTEMS AND EQUIPMENT127
coal stockyard. The stack feed conveyor will be provided with a motor driventravelling tripper arrangement which in turn will feed a stacker also movinglongitudinally and parallel to the belt.
Fig. 7.2 Flow chart for the Coal Handling at the Port
The second inclined conveyor will be provided in the second phase of expansionof the port. One stacker cum Reclaimer at the yard would be sufficient at thestack yard for the cargo handling. The sequence of cargo handling would be asfollows (Refer Fig. 7.2)
Unloading from ship and transfer to the wharf belt conveyor. Transfer through a belt chain to stack feed conveyor Transfer to the stacker through a tripper Stacking and Reclaiming by a stacker cum Recamier Transfer to the loader through a tripper and loading wagons/trucks
7.4.4 Other Ancillary Equipment
a) Electro Magnetic Separator
Three overhung electromagnetic separators are necessary to pick up anytramp steel/iron pieces that may be found in coal. One will be provided at thebeginning of stack feed conveyor from each quay.

FEASIBILITY STUDY FOR PORT ON RIVER MAHANADI FINAL FEASIBILITY REPORTCHAPTER – 7
CARGO HANDLING SYSTEMS AND EQUIPMENT128
b) Continuous Belt Weighing
Load cell operated belt scales with per metre loading of upto 5000 t/h capacitywill be provided, with read outs for instantaneous and cumulative transfer ofbulk quantities for coal.
c) Dust Control at stock pile
The stacks will be provided with multi nozzle water spray system on the sides,with water pumps of adequate capacity for sprinkling water for dust control.The nozzles will be at about 50 m intervals with a maximum spray rate1.5m3/h from each nozzle.
Suitable drainage arrangements with traps and desilting facilities will beprovided. The drain water will be collected in a pond, filtered and recycled. Adedicated water tank with pumping facilities will be provided for water sprayarrangements. As water application is usually only needed under windy ordrying conditions, it will be automatically controlled by anemometers withmanual override for special combination of weather conditions or for otherreasons.
7.5 Container Handling
7.5.1 Planning Criteria
To be competitive, the port should broadly aim at the following as a minimum
Ship waiting time to be 0.5 days. (less than or equal to 0.5 days) Over all container berth handling rate not below 25 moves/hour/crane which
will roughly correspond to 35-40 TEU/hour of the start with the present levelof 40’ box/20’ box ratio. With improvement in this ratio the TEU/hr handlingrate will also increase.
One quay crane per berth will be provided from the start (for smaller ships say1000 TEU and below one crane only need be operated) each with a capacity of 35-40 containers/hour corresponding to a working cycle of 1.5-2 minutes. The craneswill have 45 m outreach for the unloading and loading operations.
7.5.2 System requirements
Container handling systems are basically bi-directional with capability for shipunloading and transferring of containers from ship to the inland as well as thecapability for transferring export containers from inland to wharf and loadingthem on ships.

FEASIBILITY STUDY FOR PORT ON RIVER MAHANADI FINAL FEASIBILITY REPORTCHAPTER – 7
CARGO HANDLING SYSTEMS AND EQUIPMENT129
The containers received by sea will basically have 3 different destinations viz.the rail yard for onward rail dispatch to an ICD, the container park for onwardroad dispatch to an ICD, or to the consignee’s premises (as a container itself) andto the container freight station (CFS) for stripping of the container of its contentsand onward dispatch by road as loose goods.
Similarly, on the export side, there will be 3 flows in the reverse directioncomprising containers received from an ICD though rail, containers coming onroad vehicles from ICD or consignee’s premises after stuffing and goods comingloose to container freight station by road being stuffed into containers in thecontainer freight station. All these containers will move to the quay and getloaded in ships to go to their respective destinations.
In addition there will also be empty container movement both ways. Incomingempty containers may go to the CFS, consignee or to another ICD by rail forstuffing. Similarly, empty containers released by one of these can be loaded in theships to another destination for a subsequent use.
Unlike loose general cargo, where some visual checks of the incoming or outgoinggoods are possible, containerised cargo cannot be subjected to any checks fromoutside. As such the involvement of customs in container traffic is moreimportant especially in the container freight station and provision has to be madefor meeting the requirements of customs authorities fully. As a consequence it isquite likely that some containers (both import and export) may get held up at theport, because of the requirements of Customs. Similarly some of the containers toand from ICD, or consignee may be opened up by customs authorities for visualinspection in the port. As such the port should have adequate storage andhandling capacities for meeting the requirement of Customs authorities also.
Another special feature of the container traffic is the Reefer containers i.e.containers with refrigeration facilities for transporting perishable goods. Thesecan be of air cooled type with only circulation of cold air through the container orthose having in built refrigeration equipment. The latter systems can operate at415V III phase 220 V single Phase. The port should have facilities for keeping theair conditioning systems operative in all Reefer containers by provision of a centralcooling system with suitable points for inlet and outlet of cool air from containersand plug points for operating refrigeration equipment at the appropriate voltages.
7.5.3 Handling System
The three critical parts of container handling system are:
- Loading/unloading system- Transfer system- Storage system

FEASIBILITY STUDY FOR PORT ON RIVER MAHANADI FINAL FEASIBILITY REPORTCHAPTER – 7
CARGO HANDLING SYSTEMS AND EQUIPMENT130
These are inter-linked in that each system would influence the other two systemse.g. a multi-tier storage of containers reduces the space requirements butincreases the handling considerably and also complicates it. But this reduces therequirements of transfer vehicles like tractors/trailers etc.
Of the three alternatives handling systems in vogue, viz. (1) Trailer storage, (2)Straddle Carrier and (3) Gantry Crane system, the first would require large spacesand also increase the capital investments for transfer viz. tractors/trailers etc. TheStraddle Carrier system is highly flexible but less reliable because of thecomplicated nature of equipment. A number of Straddle Carriers have to beprovided which will substantially increase the capital, maintenance, and operationcosts. The gantry crane system (as in the case of trailer system) basicallyseparates the lifting (by gantry cranes) and transfer operation (by tractors/trailers)to different equipments which can be designed for their specific purposes. Theother advantage of the system is its suitability for automation. The system hasgood reliability without any heavy or extraordinary maintenance requirements. Assuch the gantry crane system will be adopted in the Port. The system will involve:
- Quay (Mobile Harbour Crane) cranes for unloading/ loading of containersfrom/into the ships
- Rubber tyred gantry cranes for loading/unloading of containers into/fromroad/rail vehicles/trailers
- Internal transfer of containers between wharf and handling areas will be ontrailers hauled by tractors
7.5.4 Equipment
Quay cranes
These will be mobile harbour cranes. The cranes will have a 50t lifting capacity.They will have a front outreach of 45 m. The cranes will be provided withtelescopic spreaders. 1 Nos. mobile harbour crane shall be provided on berth forhandling containers in both the phases.
Handling in Container Park
The container park will basically serve 3 purposes:
Storage of containers (import and export) awaiting onward movement toWharf, CFS and Rail loading areas.
Loading/unloading of containers on/from trailers under transfer betweencontainer Park and Wharf/CFS/Rail loading area.

FEASIBILITY STUDY FOR PORT ON RIVER MAHANADI FINAL FEASIBILITY REPORTCHAPTER – 7
CARGO HANDLING SYSTEMS AND EQUIPMENT131
Unloading of export containers received through road vehicles and loading ofimport containers on road vehicles for road dispatch from the port.
The container Park will do the maximum handling in the entire port because:
All imported containers cannot straightaway go to CFS/Rail yard. A sizableportion of them will first move to the container park, to vacate the ship asquickly as possible
A majority of export containers (excepting those which are moved in advanceto the quay) awaiting ship arrival will come to container park and wait there.
In the above manner, the container park basically serves the purpose ofminimising the holdings of containers at the other 3 operational areas viz. Wharf,CFS and Rail yard thereby ensuring that adequate storage capacity andmaneuvering space/room will be available at all these places, to handle containersquickly, efficiently, and promptly at all times. By the nature of its functions, thecontainer park will:
Hold maximum number of containers at any time, which may exceed the totalof all the containers available in all the other areas of operation.
The quantum of container handling in park will also be considerably higherand may be more than the total handling at all other places combined.
The handling (lifting and lowering) at container park is basically high because ofthe following reasons:
Though each container coming into the park theoretically needs a minimum of2 handlings, on the overall average, it will be 3 or even more.
Because of 3 high storage and the need to select the individual containers thatwill have to go out of the container park, to any particular place e.g. a bottomcontainer may have to be taken out but there may be 2 other containersabove that container, which are to be shifted before the required container islifted.
Because of these the average actual lifting and lowering operations in thecontainer park alone may be 3 or even more for every container handled. Due tounavoidable mismatches in the inflow and outflow of containers (both import andexport) at any particular time, a large percentage of containers will touch thecontainer park i.e. about 80 + 10% of the total throughput.
For the throughput of 0.09 million TEUs per annum, the number of handlings inthe container park would be of the order of 0.18 million TEU. With 40’ containersforming 33%, the number of boxes handled per annum would be 0.18/1.33 = 0.13million boxes/annum

FEASIBILITY STUDY FOR PORT ON RIVER MAHANADI FINAL FEASIBILITY REPORTCHAPTER – 7
CARGO HANDLING SYSTEMS AND EQUIPMENT132
With an overall crane utilisation factor of 0.5 (which is higher than the bestachieved in JNPT) and a handling rate of 25 boxes/hr/crane, the number of cranesrequired would be (assuming 330 working days in a year)
0.13 x 10⁶ 1---------------- x --- = 1.36 cranes, Say 2 Cranes330 x 24 x 0.5 25
The choices for the cranes in the container park can be
Rail mounted gantry (RMG) type Rubber tyred gantry (RTG) type Front loader or side loader type
The front and side loaders have the inherent disadvantages such as:
Their reach access is only to one and at the most 2 (two) rows. Transfer ofcontainers say from row 1 to row 3 is not possible.
The stacking pattern will have to provide access to all the containers from thefront (or side) as the case may be. This reduces the stacking capacity in thesame area by 20%.
Reach stackers can access even 3 rows, but the storage capacity will besubstantially reduced for the reach stacker access.
Because of the above reasons front/side loaders or reach stackers are notpreferable and the choice is to be restricted to RMG or RTG. RTGs are moreexpensive as they are diesel powered as against RMGs which can operate onelectrical power. But RMGs have a major disadvantage in that their area ofoperation is fixed and not changeable, as they move on rail. This will be a serioushandicap, since if one RMG becomes inoperative, the RMG working on theadjacent tracks cannot be transferred to this track and as such the containerscovered by it cannot be handled. RTGs being rubber tyred can be transferred fromone area to another and if required two can work in the same area for increasedhandling from that particular area. Because of these advantages the containerparks are mostly provided with RTGs and in this port also 2 RTGs will be provided.Each RTG will have a telescopic spreader.
The port can commence operations with two RTGs and a third RTG can also beordered after a year or two when the traffic picks up and the need for the same isfelt. Each crane will be provided with a telescopic spreader.
The RTG will be capable of dealing with 3 high stacking and taking containers ontop of 3 high stacks for shifting/loading/unloading. They will also load/unloadroad trailers of containers despatched/received via road.

FEASIBILITY STUDY FOR PORT ON RIVER MAHANADI FINAL FEASIBILITY REPORTCHAPTER – 7
CARGO HANDLING SYSTEMS AND EQUIPMENT133
As trailer movement in Container Park will be substantial, 2 trailer lanes for 3 rowsof container stacks or one trailer lane with 4 rows of container stacks have to beprovided. RTG has to span all these i.e. a span of 24 m is required. Adequatenumbers of gantry covered areas can be arranged to suit the overall storagerequirements. Even though it is not proposed to use AGVs (Automated GuidedVehicles) for container transfer to and from quay the layout of wharf andContainer Park would be made to be suitable for AGV introduction at a later date.
Rail yard handling
As already brought out earlier, front/side loaders will not be advantageous for railyard also, even though loading/unloading of containers will be only on oneparticular track at any time. This is because a gantry crane can load/unloadcontainers from either side of the track, while in the same position this is notpossible with front/side loaders.
But the handling operations in a rail yard are significantly different from those ofthe container park in that:
The gantry crane has to necessarily cover the full length of the train. Single stacking in the area adjacent to the track would be adequate to unload
a whole train. Even if the train is to be back loaded, another row of dispatchcontainers, again on a single high stacking will be adequate.
The gantry crane has to necessarily work in the same area having the railtracks and as such there is no requirement of transferring gantry crane toanother area.
RMGs can therefore be advantageously employed, as it will be cheaper in capitalcost, requires less maintenance (as there is no diesel engine to be maintained)and (consequently) has better availability. (a downtime of less than 10% ascompared to the likely 20 - 25% with RTG).
The rail handling of boxes will be roughly 20% of the throughput, the boxes perannum would be
0.2 x 0.09 = 0.018 million TEUs/annum.
Daily handling 0.018 x 10⁶ TEU = 54 TEUs---------------------
330
or 54/1.33 = 41 boxes/day
Each box will be handled twice (1 lift + 1 lowering)

FEASIBILITY STUDY FOR PORT ON RIVER MAHANADI FINAL FEASIBILITY REPORTCHAPTER – 7
CARGO HANDLING SYSTEMS AND EQUIPMENT134
Total number of handlings by RMG = 82 boxes/day
Taking each RMG will do 20 moves/hour and will work effectively for 20 hr/day
RMGs required = 82---------- = 0.205 120 x 20
Alternatively, the requirement of RMGs can be estimated from railloading/unloading considerations. The no. of railway rakes required per day (92TEUs will be despatched or received in one rake)
0.018 x 10⁶ 1------------ x ----- = 0.3 1 rake/day2 x 92 330
Assuming each rake is loaded and unloaded in 10-12 hrs, with a single RMG, (24effective working hours/day) the number of cranes required:1 x 12----------- = 0.5 or say 1 crane (The same as worked out for handling the boxes)
24
Trailers and Tractors
The requirements would be
Tractors 6 (of 200 – 250 HP)Trailers 25 20’ long 10
40’ long 10Universal 5
Suitably enhanced requirements will be provided for respective through puts ofthe phases.
Container Freight Station (CFS)
The main operations in the container freight station are receipt of loose goodsfrom inland, their temporary storage and stuffing in export containers, stripping ofimport containers, temporary storage of goods stripped of containers, and loadingthem in road vehicles for dispatch to the users’ premises, facilitating verificationand checks of the imported and exported goods by customs authorities to theextent required by them, facilitating occasional checks of through import/exportcontainers (transported by road/rail) at the CFS as required by the customsauthorities.

FEASIBILITY STUDY FOR PORT ON RIVER MAHANADI FINAL FEASIBILITY REPORTCHAPTER – 7
CARGO HANDLING SYSTEMS AND EQUIPMENT135
Most of the handling operations will be handled by Fork Lift Trucks (FLTs) of 3tcapacity (FLTs are also being used for handling of empty and even loadedcontainers using forks or even spreader but lifting of containers is not planned inCFS). For moving into the container boxes and stuffing/stripping, special low mast(low height type) FLTs are required. For the operations loading/unloading of roadtrucks, FLTs need not be of the special type but of ordinary type without anyheight restriction. Accordingly, 2 FLTs of 3 t capacity are to be provided for thispurpose.
Empty Container Park handling
For handling empty containers, slewing Fork lift trucks or reach stackers can beused, 2 such units will be required.
7.6 General Cargo Handling
7.6.1 System Planning
General cargo will be handled using Mobile harbour cranes. The handling andtransfer of equipment will all be bi-directional i.e. the handling equipment canload or unload the ship, rail wagon or a road truck and the transfer equipment willenable cargoes to flow either way i.e. from quay to port and onward dispatch orreceipt in and transfer to quay.
The transfer of cargo from quay to storage and vice versa will be done throughtrailers hauled by tractors. The transfer to rail loading/unloading platformfrom/to quay and terminal storage will also be done by tractor-trailerarrangement.
7.6.2 Storage requirements
In view of the varied nature of the cargo, it is necessary to provide adequatestorage (both covered as well as open). Separate storages will have to bearranged for import and export cargoes to avoid mix up. To minimize in porthandling all these storage areas will have direct road access for receipt ofmaterials through trailers and even normal trucks in the rear side, while the front(quay) side would facilitate unhindered cargo transfer operations between theship and the quay.
7.6.3 Handling Mechanism
2 nos. Mobile harbour cranes would be deployed in phase I for the handling of theGeneral cargo in the port and then transferred by trucks or trailers.
7.6.4 Handling equipment

FEASIBILITY STUDY FOR PORT ON RIVER MAHANADI FINAL FEASIBILITY REPORTCHAPTER – 7
CARGO HANDLING SYSTEMS AND EQUIPMENT136
a. Quay for one berth
30 t heavy lift mobile harbour crane 2 nos.20t level luffing crane wharf crane with grab / 3 nos.hook attachments
b. Handling for in-port storage and dispatch/receipt of cargoes
5 t FLT’s 410 t FLT’s 210 t Pay loaders 3
Suitably enhanced requirements will be provided for the throughputs ofsubsequent phases.

FEASIBILITY STUDY FOR PORT ON RIVER MAHANADI FINAL FEASIBILITY REPORTCHAPTER – 8
INFRASTRUCTURE FACILITIES137
CHAPTER 8
INFRASTRUCTURE FACILITIES
8.1 General
8.1.1 The berthing, cargo handling and transfer facilities created would not beadequate to serve the overall purpose unless backed by well-plannedinfrastructure facilities for receipt and dispatch of projected cargo taking intoaccount the future expansion of the port. The infrastructure facilities includeroads, rail lines and pipelines, and within the port, water and power supply anddistribution, sewage treatment and drainage, bunkering, port craft, navigation,firefighting systems, safety and control systems, EDI/computerisation systemsand communications, office buildings and residential accommodation.
8.1.2 The scope of work does not cover the off port infrastructure of rail and roadlinkages to the main line of existing rail network and to national/state highwaysrespectively. However as these infrastructure facilities are very critical forfunctioning of the port, the broad requirements of these off-port infrastructurefacilities are also dealt with in this chapter along with the detailed requirementsof in-port infrastructure facilities.
8.2 Road and Railways
8.2.1 Road Linkages to the Port
Since a substantial share of cargo will be transported by road, the approach roadto the cargo terminals and the service roads within the terminal area will formvital parts of the cargo evacuation system. This is to be facilitated by an effectiveand efficient road network connecting the port to the various usage points.
Presently there is no major road near proposed site, it is found that a village road5m wide is passing near by the site. NH 5A (Now NH 53) runs 7 km west of projectsite. The Mahanadi port can be connected with NH 5A (Now NH 53) near Paradipthrough the 750m long proposed bridge across the River Mahanadi. For the cargoterminals at Mahanadi Port, a two-lane road access to the port has to take offfrom the link road which will connect NH-5A (Now NH 53). This road would haveto be widened to 4-lane (and possibly to 6-lane) in subsequent phases of thedevelopment of the port, commensurate with the traffic as it develops in varioustime frames.
8.2.2 Rail Connections to the Port
The Haridaspur-Paradip (82KM) Project is an extension of the Daitari/TomkaBanspani new BG line under construction and purports to join the iron ore rich

FEASIBILITY STUDY FOR PORT ON RIVER MAHANADI FINAL FEASIBILITY REPORTCHAPTER – 8
INFRASTRUCTURE FACILITIES138
belts of Banspani and Daitari sectors of the State of Odisha with Paradip Port. Itwill be the third line connecting Paradip Port with East Coast Main Line and shallrelieve congestion of the double line connected via Cuttack. Further, this line canbe used as exclusive route to & from main line from Howrah & Kharagpur andalso direct route to Jakhapura-Banspani line. A 6 km long branch line fromHaridaspur Paradip BG line would be connected with Mahanadi Port including railbridge of length 750m. Haridaspur-Paradip rail link would get completed in 2018.Fig. 8.1 shows proposed road and rail networks plan.
8.3 Navigation Aids
The terms Aids to Navigation, Nav-aids and Navigational aids usedinterchangeably, are all meant to convey marks, including floating marks, such asbuoys and beacons, transit and clearing marks as well as signalling systems, radioaids and communications, electronic systems, radar etc. which are installed onland or in water for guidance to all ships for safe and regulated navigation in thechannels, anchorages, berths, docks etc. It is envisaged that navigation will becarried out throughout the year, by day and night except during times of highwind speeds and low visibility.
8.3.1 Buoyage
The most commonly used navigational aid in any port is a system of floatingmarkers known as buoyage system. There are several buoyage systems in vogueat various ports around the world. However, International organizations havebeen able to, by and large, standardize these systems. For Mahanadi port and itsapproaches the Uniform International Lateral Buoyage System and IALA zone ‘A’code is envisaged. Starting from seaward, a “Landfall Buoy” may be laid in deepi.e. about 20 m depth of water. This buoy should be large, lighted and providedwith radar reflectors or more advanced fittings to make it visible and/ordiscernible from a distance of not less than 3 to 5 nautical miles in clear visibility.Ships intending to call at the port may head for this buoy. Embarkation of Pilotstoo may be done off this Landfall Buoy.
As mentioned in the earlier chapters, a channel will be dredged from a seawardpoint where the natural depth is more than 14 m below Chart Datum to theTurning Circle inside the port. This channel will ultimately have a bottom width of160 m and a depth of 14 m below CD. Both edges of the channel will have sideslopes of around 1:4. For convenience, the passage confined between the outeredges of the side slopes, is termed as the Fairway. The entire Fairway will have tobe properly marked by laying port hand and starboard hand channel markerbuoys of the appropriate shape, colour, top-mark and light characteristics on bothedges of the channel. However, a Fairway Buoy may be laid a short distanceseaward of the beginning (seaward end) of the dredged channel. It is proposedthat a gated pattern – in which port and starboard buoys are laid in pairs on therespective sides of the channel opposite one another – may be used for

FEASIBILITY STUDY FOR PORT ON RIVER MAHANADI FINAL FEASIBILITY REPORTCHAPTER – 8
INFRASTRUCTURE FACILITIES139
positioning the channel buoys so as to provide clear guidance to the pilots. Buoysmay be laid on the outer edges of the fairway so that vessels will not be hinderedby buoys in using the full 160m width of the dredged channel. Gated pairs ofbuoys may be laid at intervals of 1.5 to 2.0 km in the straight sectors of thechannel. In the case of a bend in the channel extra buoys may have to be laid atthe start and end of the bend. This scheme of buoyage may be extended only ashort distance beyond the harbour entrance. Thereafter, channel marking mayhave to depend partly or entirely on transit marks so as not to impede shipmovements in an already restricted area. A total of 14 buoys, which include onefairway buoy (3.5m dia.), 4 port hand buoys (3m dia.), 4 Starboard Hand Buoys(2.5m dia.), 5 inner channel buoys and one landfall buoy are required for thenavigational purpose.
8.3.2 Shore Based Marks
Due to the mobile nature of buoys implicit reliance cannot be placed on them fornavigation. In this respect shore based marks have more reliability and will beused wherever possible either as supplements to buoyage or by themselves.
A pair of Transit Marks may be constructed at suitable points on the land todefine the Centreline of the Approach Channel. The top marks of the back andfront marks should both be prominent but different in shape so as to bedistinguishable from one another. The rear of the two marks (as seen fromseaward), i.e. Back Mark should be sufficiently taller than the Front Mark toensure that the Back Mark is seen above the top of the Front Mark at any pointwithin the usable part of the transit line i.e. the Centre line of the channel. Thedistance between the Front and Back marks should not be less than one-eighththe distance between the front marks and the most distant point on the usefulpart of the transit line, i.e. approach channel. If this distance is reduced, thesensitivity of the transit will be reduced thereby compromising its usefulness.Both the transit marks should be lit by lights of suitable colour and characteristicsso that the transit is visible and usable for day and night navigation. In the case ofa bent channel one pair of transit marks will have to be installed for each leg ofthe navigation channel. There will be a requirement of 2 sets of leading lights forthe whole channel. Each leading light will be installed on a lattice structure whichwill be on suitable pile foundation.
8.3.3 Beacons / Mole Lights
There will be a requirement of two sets Mole Lights and Beacons.

FEASIBILITY STUDY FOR PORT ON RIVER MAHANADI FINAL FEASIBILITY REPORTCHAPTER – 8
INFRASTRUCTURE FACILITIES140
8.3.4 VTMIS
The purpose of the VTMIS is to provide a clear and concise real time portrayal ofvessel movements and interaction in the Vessel Traffic Service (VTS) area. InMahanadi Port case, the service area will be the approach channel, the anchoragearea, basin etc. This system will be used for marine operations and will also belinked to the PMIS (Port Management and Information System). The informationprovided by VTMIS system allows the operator or user of the system to:
- Provide the required level of VTS: Information, Assistance or Organisation- Enhance safety of life and property- Reduce risks associated with marine operations- Enhance efficiency of vessel movements and port marine resources- Distribute VTS related information- Provide Search and rescue assistance- Provide VTS data for administrative purposes, analysis of incidents and
planning
The VTS in recent years has changed from Traffic Monitoring to Traffic Planning byintroduction and interconnection of databases and expert systems. It allowsaccess of static and dynamic information about ships, their cargo and port servicerequirements. Together with an automatic update of traffic information theVTMIS provides a powerful tool for programming of traffic movement within thesurveillance area. Operators can associate tracked targets with vessels registeredin the database, which makes the data readily available and allows the system toautomatically provide pertinent voyage information to other port serviceproviders.
It is envisaged that navigation will be carried out throughout the year, by day andby night, except during cyclonic weather, when rough seas, high wind speeds, andnegative storm surge may result in low/inadequate draft. At all times, whennavigation berthing/deberthing takes place, navigation aids are required forensuring safety. These aids are markers, including floating markers, such as buoysand beacons, transit and clearing as well as signalling systems, radio aids andcommunication under VTMS, electronic systems, radar etc., which are installed onland or in water for guidance to all vessels for safe and regulated navigation inchannels, anchorages, berths and docks.
8.4 Ship-to-Shore Communications
8.4.1 Efficient and reliable ship-to-shore communication is a basic need for smooth portoperations. In the past this was achieved through visual means such asSemaphore and Flags hoisted on ship and shore signal masts. These systems stillcater to dire emergencies and during failures of all modern systems, whichdepend on electric power. Accordingly, a Signal Mast complete with yard andhalyards may be erected at a prominent location visible from ships in sight of the

FEASIBILITY STUDY FOR PORT ON RIVER MAHANADI FINAL FEASIBILITY REPORTCHAPTER – 8
INFRASTRUCTURE FACILITIES141
port. Full sets of flags and other types of hoists and visual storm and other signalshapes should be provided in suitable storages.
8.4.2 The Port Signal Station or communication centre should be equipped withmodern, multi-channel radio communication systems for voice and signalcommunications with ships at, near or relatively distant from the port. The systemwill consist of communication equipment, antennas and radar, as required. Theradio equipment will be transistorised and IC designed for high reliability and lowpower consumption. The centre should be manned by qualified operating andmaintenance staff. A proper E.T.A Reporting system for ships, intending to call atthe Port should be promulgated and enforced.
8.5 Harbour Craft
8.5.1 Tugs
Due to restricted navigable channels and manoeuvring areas, Tugs would be vitalfor the safe movement and manoeuvres of all ships calling at the Port. Theywould assist the ship as required and ordered by the Pilot-in-charge in turning thevessel in the Turning Circle and to berth where designated. For outward boundvessels the tugs would assist in hauling out from berth, turning around if requiredand steering the ship clear of the entrance. Due to the high cost of powerfulmodern tugs it would be necessary to undertake a special assessment to evaluateand select the most cost effective tug fleet required to meet the needs of thePort. The assessment would cover the technology and horse power to bedeployed and the timing and source of tug procurement. For the initial stage 3tugs of 40t bollard pull capacity are needed.
8.5.2 Other Minor Port Crafts
A variety of other Port crafts would have to be commissioned with the harbour.These would include mooring boats, pilot launches and a mooring buoy. Harbourtugs are sometimes equipped for firefighting as well. However the importantconsideration would be accessing of all areas by land vis-a-vis by water. With thepresent location of the port, access by land will be equally convenient and as suchfirefighter tugs are not being considered.
8.6 Water Requirement
8.6.1 Water is required in the port for the following purposes:
Drinking and cleaning purposes in the housing colony, offices and other areasof work
Sprinkling water for horticulture, floriculture, arboriculture etc. Bunkering of ships Sprinkling water for dust control at stockpiles

FEASIBILITY STUDY FOR PORT ON RIVER MAHANADI FINAL FEASIBILITY REPORTCHAPTER – 8
INFRASTRUCTURE FACILITIES142
Fire water at berths, stackyard and other areas
Water requirement for each of the above purposes except fire fighting has beendiscussed in the following paragraphs. For fire fighting sea water will be used.
8.6.2 Water requirement for drinking, cleaning etc. in the port area depends upon thepopulation in peak hours which comprises residents in the township, visitors, staffetc. Assuming a population of 2000 persons in the port premises at peak hoursand per capita water requirements of 150 litres per day, daily requirement for thispurpose works out as 300 m3/day.
8.6.3 Water requirement for horticulture, floriculture, arboriculture etc. depends uponthe area of green belt to be maintained in the port area. Assuming a total of 25hectares of green belt to be maintained in the port premises, this will requireabout 250 m3 per hectare per year. With 250 days of watering in a year, waterrequirement for this purpose works out as 25 m3/day.
8.6.4 Water sprinkling of coal and iron ore stacks will be required as a dust suppressionmeasure at the port. The stacks will be covered on top and also on the sides,which automatically reduces the dust ingress into the ambient and watersprinkling will be correspondingly reduced. Further water sprinkling will not berequired all round the year and sprinkling will be needed only under certainclimatic conditions (viz. windy and drying) with automatic activation throughanemometer sensing. Assuming that there will be 40 nozzles for all stockpilesdelivering water at a rate of 1.5 m3 /hr, for 4 hrs. a day, the total consumption willbe 2400 m3/day for iron ore and 3000 m3/day for coal. This water also need notbe potable but has to be chloride free.
8.6.5 In addition bunkering of potable water to ships will also be provided as per theirneeds; water pipelines will be laid to the individual jetties for this purpose. Theballast water supply requirements have to be based on the likely annual average.At initial stage total about 367 ships are likely to visit Mahanadi port. Assuming50% of ships require fresh water, water requirement of ships works out as 100m3/day. While this need not be potable this has to be fresh water (and not Seawater) as the ship’s water tanks should not get corroded in the long run.
8.6.6 The total water requirements including potable water requirements would thusbe 5.8 mld. Potable Water Supply requirement for the port may be met fromground water near the proposed port site or may be obtained from OdishaIndustrial Development Corporation (OIDC). Underground and overhead tanks ofsuitable capacities with a closed loop grid system with necessary connections andvalve stations would be provided inside the port premises. Water supply will bealso provided to the berths by running pipelines with 600 lpm discharge capacity.A water treatment plant is proposed for treatment of water before distributionfor drinking purposes. Pump houses will be provided with necessary pumps and

FEASIBILITY STUDY FOR PORT ON RIVER MAHANADI FINAL FEASIBILITY REPORTCHAPTER – 8
INFRASTRUCTURE FACILITIES143
controls to pump the water to the overhead tanks and also supply water at therequired pressure to reach various supply points.
8.7 Fire Fighting System
The fire fighting system is to be designed to be capable of both controlling andextinguishing fires. Separate fire fighting facilities will be provided for all the portareas and activities. The system would broadly consist of a water intake to drawwater from the sea, and a separate pump house with pumps, tower mountedwater monitors, nozzles for water curtains along the front side of operatingplatform, hydrants and distribution networks. The fire fighting system forberth/stack yard will be a freshwater system with a separate pump house withpumps which will draw water from fresh water tanks/reservoirs.
Fire detection and alarm systems for conveyors, electrical room, and control roomwill be provided. The same would consist of heat/smoke detectors, break glassstations, hooters/sirens and control fire alarm panel, for local operation. Inaddition manual call points will be provided for warning and alerting the wholeport or any individual sections or persons without loss of time.
The system will be a closed loop grid system and fire hydrants will be located insuch a manner that hose lines can effectively reach any part of the area. Thesystem will be designed to maintain 5 kg/cm2 at the hydrant outlet for all areas.Sea water will be used for the fire fighting purpose. Electric pumps of adequatecapacity will be provided with stand by pumps (diesel driven) as per regulations.
A centralised fire station will be provided for attending to all calls which willhouse 5 mobile fire tenders. All fire tender will be provided with snorkelattachments.
Special fire fighting equipment such as foam and carbon-di-oxide extinguisherswill also be provided for chemical and electrical fires. Fire detection and warningsystem will be provided, in all vulnerable area of the port.
8.8 Drainage and Sewerage System
8.8.1 Storm Water Drainage
Storm water run-off from the port area is collected using a network of catch-basins and inter connecting pipes. One catch basin is envisaged to cater to around4000 sq. metres of area. The runoff will be led to the waterway behind berthsusing multiple discharge points. For the bulk handling facilities area, a system ofcovered drains will be provided to discharge the collected runoff into thewaterway, through a settling and purification pond.

FEASIBILITY STUDY FOR PORT ON RIVER MAHANADI FINAL FEASIBILITY REPORTCHAPTER – 8
INFRASTRUCTURE FACILITIES144
8.8.2 Sewage System
Sewerage system will be designed to integrate with the overall sewage disposalsystem being planned for the project. A system of interconnecting sewer lineswill be laid both in the port so as to be connected to the main sewer lines atsuitable locations. The sanitary sewage discharge from berthed ships will bepumped into the sewer system in the port area which would be discharged intothe sea after treatment.
8.9 Electric System
8.9.1 Power supply source and distribution system
The electrical demand for ultimate stage would be around 10 MVA. Power supplyhas to be arranged from the nearest recommended substation (Take of point) ofOdisha State Electricity Board (OSEB) from a suitable point in their distributionsystem.
No special difficulty is anticipated in getting the required amount of power supplyfrom OSEB in Phase I. As the power demand is not heavy in first phase, powersupply can be taken at 33/66 KV, with the receiving station being as close to theharbour as possible, at a convenient location. Considering the high cost ofbreakdowns, emphasis is to be placed on ensuring that power supply is reliableand continuous.
The unloading and handling equipments and other items will be utilizing thefollowing voltages;
6.6 KV 3 phase Motors 200 KW & above415 KV 3 phase Motors below 200 KW.215 V Single phase Lighting & control systems
Suitable step-down arrangements and distribution systems are to be provided toget the above supply voltages, at the required points.
The distribution system should be simple to operate and maintain, and also beaccessible for inspection and repair with safety. For localized supply it isrecommended that ring main system be adopted. The system and the equipmentshould also be suitable for operating within a voltage variation +10%, a frequencyvariation of +5%, and a combined voltage frequency variation of +10%. Thevariation on supply is specified to take care of the quality of incoming supply fromState Electricity Board. Accordingly, the selection of internal electrical equipmentfor the plant can be chosen to meet these supply variation. Preventivemaintenance requirements such as adequate working space, easy access forinspection, facilities for checking and testing, disconnection means for isolation of

FEASIBILITY STUDY FOR PORT ON RIVER MAHANADI FINAL FEASIBILITY REPORTCHAPTER – 8
INFRASTRUCTURE FACILITIES145
circuits, protection of operating personnel, etc. would also need to be provided.Every electrical system at the terminal shall earth as per OSEB rules and so alsothe main & auxiliary distribution station. All conveyor transfer / drive houses shallbe provided with electrical rooms.
Adequate provision for general and security lighting of the berths and other portareas, access roads, etc. has to be made.
The cables and equipment should be suitable for operation at temperatures up to500 Celsius ambient and maximum relative humidity of 90% confirming to ISIspecification.
8.9.2 Emergency and Stand-by Power System
In order to avoid demurrage of the ships, the ships in the process of loading orunloading shall be provided with emergency power in order to avoid disruptionsin the services. No new ships would be allowed to occupy the berths in case oflong scheduled power cuts.
In addition, independent source of electric power shall be available for operationof other vital installations like fire fighting, radio communication system, security,perimeter lighting, emergency warning system etc. The centralized control room,fire fighting system, maintenance workshop etc. should also have standby supplyfacilities which should be brought into operation in the event of failure of the gridsupply from OSEB. The requirements of standby power supply systems for theinitial stage will be of about 3 MW, which has to be a diesel driven generator set.The general principle in the berth to stock system (at least 1 ship exit system) shallbe operable in the event of OSEB break down so that ships are not detainedunduly.
8.10 Port Operations
8.10.1 Modalities
The port operations will have different players’ viz. a few large operators and alarge number of small and medium-sized companies, which may not haverequisite skills, or resources to manage independent databases and proceduresrelated to the transit of goods through the port. To deal with the differentpartners as well as the great complexity of the flows of information accompanyingport operations, the data-processing operations will essentially require codifyingprocedures and sharing information through communication systems. It istherefore necessary to computerize the whole port with suitable software andhardware to achieve the goal of speed and efficient management of the entirerange of its services. The computer systems of the port are to be interconnectedand exchange of data is done in real time, for meeting the requirementsnecessary to the opening of the port to EDI. The computer system is to be

FEASIBILITY STUDY FOR PORT ON RIVER MAHANADI FINAL FEASIBILITY REPORTCHAPTER – 8
INFRASTRUCTURE FACILITIES146
planned and evolved towards a forum for EDI communication and exchangeaiming at:
Dissociating the network from service offered Separating functions (communication services, services connected with goods,
containers etc. and ships) Using the network to any sector – based telemetric services Providing a value added EDI service (information storage and sharing)
Advantages
The stakes in EDI developments are:
Promptness, speed and accuracy in the management of information flows,(beyond the mere replacement of paper documents with data exchanges),resulting in a veritable rationalization and enrichment of information flows.
Productivity increases in physical flows by allowing management to forecast,for optimal use of resources within the port, and the setting up of emergencyprocedures for a rapid and efficient correction of errors and mishaps.
The following would be essential for realizing the above advantages:
Communication information and data open to the outside and to the maininternational network, as necessary
Value added to the flows by the implementation of cargo database and by theaggregation of the system.
8.10.2 Automation and Control Systems
The system for port management and control will be basically a hierarchical onewith an integrated computer based port control and management. Typically therecan be 4 roles in the hierarchy as under:
Port management and control at the top of the hierarchy Independent operating systems for the terminals like bulk terminal, container
terminal, CFS Middle level with a number of equipment or equipment sub systems with
each controlled by a microprocessor or a programmable logic controller. Thislevel provides for local control, acquisition of signals/faults, communicationsof data to higher level and/to local equipment operators.
Lowest level will comprise individual motor controllers, limit switches, andsensors, etc. connected each of the equipment subsystems.
The port management computer system at the top of hierarchical level ensuresthe strategic planning, accounting, administration and part of the information

FEASIBILITY STUDY FOR PORT ON RIVER MAHANADI FINAL FEASIBILITY REPORTCHAPTER – 8
INFRASTRUCTURE FACILITIES147
management functions of the port. The information management system wouldbe distributed among the various computers dedicated to the bulk, containerterminal and the CFS etc. This would facilitate independent day to day operationsfor bulk and container terminal respectively, while simultaneously reporting tothe port management computer.
8.10.3 System Architecture and Configuration
It is recommended that the system architecture, configuration etc. be finalised byengaging competent system and software consultants for a detailed study of allthe requirements and finalise the system, its equipments, supporting data andcommunication links, manpower training etc. at a later stage.
The scope of systems in container handling is very large and the systems could besteadily improved to interchange data, assigned computerised slot parking ofcontainers, electronic transactions of operational documents, pinpoint loosecargo, tracking before stuffing or after de-stuffing, reefer container operations,improving customer services and human resources management, etc. These couldbe gradually introduced in stages.
8.11 Communication System
8.11.1 For effective in-port communication and also outside communications with allport users the following have been envisaged:
Telephone, Telex, Fax, E-Mail systems Public Address System for paging, announcements etc. Radio Communication system for point to point communications
8.11.2 Communication system will comprise compact EPABX equipment with deskmounted/wall mounted type telephone handsets at all strategic locations likecontrol tower, transfer towers, handling stations and other auxiliary buildings.
8.11.3 The telephone handset mounted on each mobile machine will be interfaced withthe plant communication system.
8.11.4 In addition, distributed type public address system consisting of desk/wallmounted type handset stations with built-in amplifiers, loud speakers etc. will belocated at strategic locations to form a part of port communication.

FEASIBILITY STUDY FOR PORT ON RIVER MAHANADI FINAL FEASIBILITY REPORTCHAPTER – 8
INFRASTRUCTURE FACILITIES148
8.12 Port Buildings
The port buildings would mainly consist of the following
Administration Buildings Operational Buildings Storage Buildings Maintenance Buildings Electrical Buildings Gate Complex Port Users’ Complex for stevedores companies, shipping companies, cargo
agents, surveyors, Customs, freight forwarders, banks, post office, canteen,etc.
The administration buildings would consist of administration, finance & trafficdepartment, planning & environmental department, canteen & dispensary etc.
The operational buildings would consist of plant office building, Terminal controltower, Security building, Fuelling station, etc.
Maintenance buildings would consist of workshop, services facilities formechanical/electrical equipment, spare part warehouse, fire station etc.

FEASIBILITY STUDY FOR PORT ON RIVER MAHANADI FINAL FEASIBILITY REPORTCHAPTER – 10
ENVIRONMENTAL ASPECTS177
CHAPTER 10
ENVIRONMENTAL ASPECTS
10.1 Introduction
10.1.1 The Governor of Odisha acting through the Commerce & Transport Department,Government of Odisha, and represented by the Principal Secretary of theDepartment is engaged in the development of Port and as part of this endeavour,the Authority has decided to undertake the development of a Port on RiverMahanadi through Public Private Partnership on Build, Own, Operate, Share &Transfer (BOOST) basis. The objective of this consultancy is to undertakefeasibility studies and prepare a Feasibility Report for the purpose of firming upthe Authority’s requirements in respect of development and construction of thePort and enabling the prospective bidders to assess the Authority’s requirementsin a clear and predictable manner with a view to ensuring:
(i) a high level of service for the Port users;(ii) superior operation and maintenance a high enhanced operational
efficiency of the Port;(iii) minimal adverse impact on the local population due to development and
construction of port;(iv) minimal adverse impact on marine habitat and environment;(v) minimal additional acquisition of land; and(vi) phased development of the Port for improving its financial viability
10.1.2 The scope of consultancy services includes traffic surveys and demandassessment, Site analysis, engineering surveys and investigations, Developmentplan for the Port, Facility Requirement, Project Description, Project Design,Preliminary Social Impact Assessment, Preliminary Environment ImpactAssessment, Preliminary design of Port, Preparation of Land Plan Schedules andUtility Relocation Plans, Preparation of indicative BOQ and rough Cost Estimates,Preparation of the technical Schedules of the Concession Agreement.
10.1.3 Government of Odisha acting through the Commerce & Transport Department,Government of Odisha, and represented by the Principal Secretary of theDepartment proposes to construct a port with approach at the left bank of RiverMahanadi close to the mouth of the Bay of Bengal for transporting cargoin vessels of 65,000 tonnes. The cargo handling capacity is envisaged to be 18.43MT per annum in the first stage. The site is located in Akhadisali village underMahakalpada Block of Kendrapada district in Odisha. For implementation of theproject Prior Environmental Clearance is required from the Ministry ofEnvironment & Forest (MoEF) in accordance with the EIA Notification, 14thSeptember 2006 and its subsequent amendments. To obtain Environmental

FEASIBILITY STUDY FOR PORT ON RIVER MAHANADI FINAL FEASIBILITY REPORTCHAPTER – 10
ENVIRONMENTAL ASPECTS178
Clearance, Environmental Impact Assessment study is to be carried out as perthe TOR provided by the Expert Appraisal Committee of MoEF.
10.2 Environmental Regulations and Legal Framework
10.2.1 Environment (Protection) Act, 1986
The Environment (Protection) Act is the most comprehensive law on the subject.The law grants power to the Central Government to take all measures necessaryto protect and improve the quality of environment and to prevent pollution of theenvironment.
In terms of responsibilities, the Act and the associated Rules requires forobtaining environmental clearances for specific types of new/expansion projects(addressed under Environmental Impact Assessment Notification, 14thSeptember 2006) and for submission of an environmental statement to the StatePollution Control Board annually.
10.2.2 EIA Notification, 2006
As per the Environmental Impact Assessment (EIA) Notification, 14th September2006 and its amendment up to December 2009, new projects or activities requirePrior Environmental Clearance. Projects have been grouped under Category ‘A’requiring clearance from Expert Appraisal Committee (EAC) of MoEF,Government of India and Category ‘B’ requiring clearance from the StateExpert Appraisal Committee (SEAC). The concerned Committee (EAC or SEAC) willfinalize the TOR on the basis of Form-1, proposed TOR & Pre-Feasibility/Feasibility Report. Environmental Impact Assessment study is to be carried out asper the TOR provided by the Committee. Public Hearing is required for Category‘A’ project.
Ports and Harbour projects with more than 5 MTPA cargo handling capacity comeunder “Category A” and less than 5 MTPA cargo handling capacity come under“Category B”
10.2.3 Coastal Regulation Zone Notification (CRZ), 2011
Central Government have declared the coastal stretches of seas, bays, estuaries,creeks, rivers and back waters which are influenced by tidal action (in thelandward side) up to 500m from the High Tide Line (HTL) and the land betweenthe Low Tide Line (LTL) & High Tide Line (HTL) as “Coastal Regulation Zone” (CRZ),as per the provisions of the CRZ Notification 6th January 2011. The mainobjectives of the Coastal Regulation Zone Notification, 2011 are:
To ensure livelihood security to the fishing communities and other localcommunities living in the coastal areas;

FEASIBILITY STUDY FOR PORT ON RIVER MAHANADI FINAL FEASIBILITY REPORTCHAPTER – 10
ENVIRONMENTAL ASPECTS179
To conserve and protect coastal stretches and;
To promote development in a sustainable manner based on scientific principles,taking into account the dangers of natural hazards in the coastal areas and sealevel rise due to global warming.
For regulating development activities, the coastal stretches within 500 meters ofHigh Tide Line on the landward side are classified into four categories, namely:
CRZ-I: Areas that are ecologically sensitive and important, such as national parks /marine parks, sanctuaries, reserve forests, wildlife habitats, mangroves, corals /coral reefs, areas close to breeding and spawning grounds of fish and othermarine life, areas of outstanding natural beauty / historically / heritage areas,areas rich in genetic diversity, areas likely to be inundated due to rise in sea levelconsequent upon global warming and such other areas, and Area between lowtide line and the high tide line
CRZ-II: The areas that have already been developed up to or close to theshoreline. For this purpose, “developed area” is referred to as that area within themunicipal limits or in other legally designated urban areas which are alreadysubstantially built up and which have been provided with drainage and roads andother infrastructural facilities, such as water supply and sewerage mains.
CRZ-III: Areas that are relatively undisturbed and those which do not belong toeither CRZ-I or CRZ-II. These will include coastal zone in the rural areas(developed and undeveloped) and also areas within Municipal limits or in otherlegally designated urban areas which are not substantially built up.
CRZ-IV:
A. the water area from the Low Tide Line to twelve nautical miles on the seawardside;B. shall include the water area of the tidal influenced water body from the mouthof the water body at the sea up to the influence of tide which is measured as fiveparts per thousand during the driest season of the year.
The development or construction activities in different categories of CRZ areashall be regulated by the concerned authorities at the State / Union Territorylevel, in accordance with norms stipulated in the CRZ regulation and in the state /UT coastal zone management plan.

FEASIBILITY STUDY FOR PORT ON RIVER MAHANADI FINAL FEASIBILITY REPORTCHAPTER – 10
ENVIRONMENTAL ASPECTS180
10.2.4 Forest (Conservation) Act, 1980 and its amendment
This Act provides for the conservation of forests and regulating diversion offorestlands for non-forestry purposes. When projects fall within forestlands, priorclearance is required from relevant authorities under the Forest (Conservation)Act, 1980. State Governments cannot de- reserve any forestland or authorize itsuse for any non-forest purposes without approval from the Central Government.For diversion of forestland, the project proponent needs to apply to the StateGovernment. Depending on the area required to be diverted, the proposals arecleared by MoEF Regional or Central Offices provided that the cost ofcompensatory afforestation, cost of rehabilitation of endangered/rare species offlora/fauna, and the net present value of the forest resources are depositedupfront with the state Forest Department.
• If the area of forests to be diverted exceeds 20 Ha (or 10 Ha in hilly area),prior permission of Central Government is required;
• If the area of forest to be diverted is between 5 to 20 Ha, the Regional Officeof Chief Conservator of Forests is empowered to approve;
• If the area of forest to be diverted is below or equal to 5 HA, the StateGovernment can give permission; and,
• If the area to be clear-felled has a forest density of more than 40%, permissionto undertake any work is needed from the Central Government, irrespectiveof the area to be cleared.
10.2.5 Water (Prevention & Control of Pollution) Act, 1974 & Air (Prevention & Controlof Pollution) Act, 1981
These two laws are in force to prevent and control land-based pollution. Theselaws prescribe the standards for effluent discharge and air emissions andestablished the State Pollution Control Board to enforce the provisions of theActs. The requirement is to obtain a No Objection Certificate i.e., Consent toEstablish and Consent to Operate from State Pollution Control Board.
10.2.6 Ancient Monuments and Archaeological Sites and Remains Act, 1958
The legal requirement is to obtain from ASI a no-objection certificate if anyprotected cultural property is within 10km of the project.

FEASIBILITY STUDY FOR PORT ON RIVER MAHANADI FINAL FEASIBILITY REPORTCHAPTER – 10
ENVIRONMENTAL ASPECTS181
10.3 Statutory Clearances required for the Project
10.3.1 Environmental Clearance
As per EIA Notification, 14th September 2006 and subsequent amendment,under the Environment (Protection) Act 1986, Prior Environmental Clearance isrequired for projects listed in the Schedule of the Notification. The presentproject is the construction of port for cargo handling capacity of 18.43 MTPA.
Therefore, the proposed project is a Category ‘A’ project and EnvironmentalClearance will be required from the MoEF.
10.3.2 CRZ Clearance
As per the provisions of the CRZ Notification, 6th January 2011 CRZ Clearance isrequired for proposed project from the “Odisha State Coastal Zone ManagementAuthority”.
10.3.3 No Objection Certificate
Under the Air Act, 1981 and Water Act, 1974, No Objection Certificate fromOdisha Pollution Control Board (OPCB) will be required for the overall activities.
10.4 Environmental Features of the Study Area
10.4.1 Geology, Topography & Soil
The area around Paradip is part of the Mahanadi delta. The delta is around theconfluence of the river Mahanadi and Bay of Bengal along the eastern coast ofIndia. It is a type delta with a spread of 9000 sq. km. The origin of the east coasthas a direct bearing with breaking up of Gondwana land, movement of Indianplateau to north, its collision with the Asian plate and a variety of neo-tectonicmovements. Mahakalpada Block lies in the eastern section of the Mahanadi deltain the coastal plain of of Kendrapada district in the state of Odisha.Physiographically, Kujang may be divided into two distinct tracts; the first one is amarshy and almost uninhabited strip along the coast of the Bay of Bengal, and itabounds in swamps and morasses. The second is the low-lying arable landsintersected by innumerable creeks and tidal streams. Soil type of the area isdeltaic alluvial. The characteristics of soil are of two types; the clayey loam downto a depth of 3 feet from the top, and stiff black clay downwards. The claygenerally predominates in the sub-soil downwards up to about 40 feet to 50 feet.The soil map is given in Fig. 10.1.

FEASIBILITY STUDY FOR PORT ON RIVER MAHANADI FINAL FEASIBILITY REPORTCHAPTER – 10
ENVIRONMENTAL ASPECTS182
10.4.2 Land Use
Land use patter of surrounding area of the proposed site is mainly agricultural,followed by water body (sea, river, canal), marshy area, settlement, vacant land,coastal vegetation etc. The land-use/ land-cover map of the surrounding area ofthe proposed jetty site is presented in Table 10.1 and Fig. 10.2.
Fig. 10.1 Soil Map of Kendrapara & Jagatsinghpur Districts
Table 10.1 Land Use Pattern as Per Satellite Imagery (21st January 2007)
Land-use / Land-cover Area in Sq. km Area in Ha Percentage (%)Sea 1088.73 108873 55.47River 64.18 6418 3.27Mangroves 90.97 9097 4.63Sand 27.82 2782 1.42Aquaculture Ponds 4.57 457 0.23Clouds 82.54 8254 4.21Shadow 49.86 4986 2.54Fallow Land 356.54 35654 18.16Fringe Vegetation 196.19 19619 10.00Built-up land 1.28 128 0.07TOTAL AREA 1962.68 196268 100.00Source: EIA Study Report of Existing Paradeep Fertilizer Complex of IFFCO

FEASIBILITY STUDY FOR PORT ON RIVER MAHANADI FINAL FEASIBILITY REPORTCHAPTER – 10
ENVIRONMENTAL ASPECTS183
Source: EIA Study Report of Existing Paradeep Fertilizer Complex of IFFCOFig. 10.2 Land-use/ Land-cover Map within 15 km of the proposed Jetty location
10.4.3 Climate & Meteorology
Odisha lying just South of the Tropic of Cancer, has a tropical climate. It is warmalmost throughout the year. In the coastal districts, the climate is equable buthighly humid and sticky with hot summer from March to Mid-June, a humidmonsoon or rainy season stretching from Mid-June to September, a short post-monsoon season during October and November, and winter spanning betweenDecember and February. Therefore, climatologically, four seasons viz. summer(pre-monsoon), monsoon, post-monsoon and winter could be decipheredcomprising the following months:
Summer : March, April, May
Monsoon : June, July, August, September
Post-monsoon : October, November
Winter : December, January, February.
In summer, maximum temperature ranges between 32-40°C and the minimumtemperature ranges between 15-20°C in winter. The south-west monsoonnormally sets in between 5th June in the coastal plain. Weather tends to beoppressive during July due to high humidity and high temperature. The rest of the

FEASIBILITY STUDY FOR PORT ON RIVER MAHANADI FINAL FEASIBILITY REPORTCHAPTER – 10
ENVIRONMENTAL ASPECTS184
period of the monsoon is fairly comfortable due to reduced day temperatures,although humidity continues to be high.
The average annual rainfall is 200 cm, mainly due to south west monsoon duringJuly- September. The month of July is the wettest and the major rivers may getflooded. The State also experiences some rainfall from the retreating monsoon inthe months of October- November. January and February months are dry.
Relative humidity is generally high about 75% throughout the year. Humidity inthe coastal area is comparatively more than in the interior part. In Winter &Summer seasons, relative humidity is slightly less than the monsoon season.
Cyclonic storms during the monsoon which originate in the Bay of Bengal oftencross the east coast between Paradip and Chandbali and proceed towards north-west causing heavy rain and strong winds. There are two cyclonic peaks, oneduring May-July and the other during October-November. Maximum number ofcyclones occurs during south-west monsoon followed by the north-east monsoon.
The nearest Meteorological Observatory of Indian Meteorological Department isat Paradip Port located at a distance of about 5-kms from Paradip FertilizerComplex. The past meteorological data of Paradip IMD is presented in Table 10.2.
In the study area, January is the coldest month with the mean daily minimumtemperature of 15.3°C and maximum of 27.7°C. March onwards the temperaturebegins to rise rapidly and May is the hottest month with mean daily maximumtemperature of 33.1°C. The air of the area is humid throughout the year and themean relative humidity rises to above 80% in the monsoon months. The annualmean relative humidity is 81% in the morning and 80% in the evening. The totalannual rainfall receive in the area is about 1661.6 mm and total number of rainydays is about 65 days per year. Winds are generally moderate in strength withsome increase in force during the late summer and monsoon season. The annualmean wind speed is around 16.9 km/hour with the mean monthly wind speed10.0 km/hour during December and 23.9 km/hour during the month of May(Table 10.2).
Table 10.2 Past Meteorological Data of the Study Area(based on records of IMD Observatory at Paradeep, 1951 – 1980)
MonthMaximum
Temperature(°C)
MinimumTemperature
(°C)
RelativeHumidity
(%)
TotalRainfall(mm)
No.of
RainyDays
WindSpeed
(Km/hr)
January III
27.7 15.3 7771
17.6 1.0 12.3
February III
29.1 18.3 7875
6.5 0.5 14.7

FEASIBILITY STUDY FOR PORT ON RIVER MAHANADI FINAL FEASIBILITY REPORTCHAPTER – 10
ENVIRONMENTAL ASPECTS185
MonthMaximum
Temperature(°C)
MinimumTemperature
(°C)
RelativeHumidity
(%)
TotalRainfall(mm)
No.of
RainyDays
WindSpeed
(Km/hr)
March III
31.2 22.0 7980
26.7 1.4 18.0
April III
32.0 24.6 8284
23.5 1.4 22.7
May III
33.1 25.8 8283
54.3 2.6 23.9
June III
32.7 26.2 8384
225.7 8.8 21.1
July III
31.5 25.3 8686
329.3 13.8 20.5
August III
31.3 25.5 8685
345.9 13.8 18.6
September III
32.0 25.6 8383
242.9 10.8 18.0
October III
31.7 24.3 8179
206.3 7.2 11.7
November III
30.2 20.5 7975
108.7 3.3 10.8
December III
28.0 15.3 7670
21.7 0.4 10.0
AnnualTotal /Mean
III
30.9 22.4 8180
1661.6 65.0 16.9
Source: IMD Observatory at Paradip Port
Table 10.3 Past Meteorological Data of the Study Area (Wind Flow Pattern)
MonthPercentage no. of days of wind from Mean Wind
SpeedKm/hr.N NE E SE S SW W NW Calm
January I 53 11 3 2 3 5 6 15 2 12.3II 15 20 21 15 17 7 1 4 0
FebruaryI 26 13 4 4 13 16 9 12 3
14.7II 6 7 19 22 33 12 1 0 0
March I 11 4 1 3 27 36 7 8 3 18.0II 5 1 7 9 44 32 1 1 0
April I 1 1 1 6 37 49 3 1 1 22.7II 0 0 1 5 45 48 1 0 0
May I 1 2 2 9 40 41 4 1 0 23.9II 1 2 2 12 41 42 0 0 0
June I 3 4 3 9 27 41 9 4 0 21.1II 2 3 3 9 32 41 6 2 2

FEASIBILITY STUDY FOR PORT ON RIVER MAHANADI FINAL FEASIBILITY REPORTCHAPTER – 10
ENVIRONMENTAL ASPECTS186
MonthPercentage no. of days of wind from Mean Wind
SpeedKm/hr.N NE E SE S SW W NW Calm
July I 2 1 3 3 16 47 22 4 2 20.5II 1 1 2 4 24 53 12 2 1
August I 5 1 5 6 20 29 21 11 13 18.6II 2 2 4 10 29 36 12 5 0
September I 8 3 5 10 22 26 18 7 1 18.0II 2 3 6 13 34 28 7 4 3
October I 29 9 8 6 10 11 11 13 3 11.7II 10 12 18 16 23 12 4 2 3
November I 56 12 5 2 3 3 5 13 1 10.8II 22 29 14 11 10 6 1 2 5
December I 75 12 1 0 1 0 2 9 0 10.0II 25 35 21 8 7 2 1 0 1AnnualTotal/Mean
I 23 6 3 5 18 25 10 8 216.9II 8 10 10 11 28 27 4 2 0
Source: IMD Observatory at Paradip Port
Table 10.4 Past Meteorological Data of the Study Area (Weather Phenomenon)
MonthNo. of days with
Hail Thunder Fog Dust Storm Squall
January 0.0 0.0 0.7 0.0 0.0
February 0.0 0.3 0.5 0.0 0.0
March 0.0 0.5 0.0 0.0 0.0
April 0.0 0.2 0.0 0.0 0.0
May 0.0 0.8 0.0 0.0 0.1
June 0.0 0.8 0.0 0.0 0.0
July 0.0 0.9 0.0 0.0 0.0
August 0.0 0.8 0.0 0.0 0.0
September 0.0 1.6 0.0 0.0 0.0
October 0.0 0.8 0.1 0.0 0.0
November 0.0 0.1 0.0 0.0 0.0
December 0.0 0.0 0.1 0.0 0.0
AnnualTotal/ Mean 0.0 6.8 1.4 0.0 0.1
Source: IMD Observatory at Paradip Port

FEASIBILITY STUDY FOR PORT ON RIVER MAHANADI FINAL FEASIBILITY REPORTCHAPTER – 10
ENVIRONMENTAL ASPECTS187
10.4.4 Ecology
The study area around IFFCO Paradip mainly comprises of terrestrial ecosystem(agricultural land, waste land and barren land) and aquatic ecosystem (Sea, River,Canal, Creeks etc.). Secondary data on flora and fauna reveals that vegetation inthe study area falls under Tropical Moist Mixed Deciduous and Tropical Dry MixedDeciduous types.
10.4.5 Flora
The most dominant trees in this region are Bombax ceiba, Phoenix sylvestris,Cocos nucifera, Mangifera indica, Ficusre ligiosa, Azadiracta indica, Albizia lebbeckare found in co-association and phytosociological order with Borassusflaberllifer, Terminalia bellerica, Terminali atomenstosa, Syzygium cumini,Bauhinia variegata, Phyllanthur emblica which are sparse in distribution. Amongthe cultivated species in this region are Thevetia peruviana, Acacia auriculiformis,Tamarindus indica, Carica papaya, Dendrocalamus strictus and Areca catechu. Onwasteland the vegetation cover consisting of Pongamiapinnata, Ficus spp.,Buteamonosperma and Jatropha sps nc were observed. The shrubs consist ofZizyphus mauritiana, Xanthium indium, Tridax procumbens, Tephrosia hamiltonii,Lantana camara, Calotrops gigantean etc. Species of bamboo and grasses likeDendrocalamus strictus, Cynodondactylon, Eragrostis japonica, Cymbopogonmartini etc. are also found in this region.
10.4.6 Fauna
The list of domestic & wild fauna of the study area is presented in Table 10.5.
Table 10.5 List of Fauna within the Study Area
S. No.No.
Local Name Scientific Name1 Harina Axis axis2 Sambar Cervus unicolor3 Barha Sus scrofa4 Bilua Canis aurecus5 Kalara Patria Bagha Panthera6 The fishing cat Felis viverrina7 BanaBhuan or Katas Felis chauskutas8 Baghata Felis bengalnesis9 HundaBagha Hyaena hyaena
10 Neula Herpestes Edwardsi11 PaniOdha Lutra perspicillata12 SaliaPatani Viverricula indica13 Chhuchhundra Suncrusmuninus14 Ghoda Equus cabolus

FEASIBILITY STUDY FOR PORT ON RIVER MAHANADI FINAL FEASIBILITY REPORTCHAPTER – 10
ENVIRONMENTAL ASPECTS188
15 Rat Rattus rattus16 Ud Lutranair17 Sasa Oryetolagus cuniculus18 Kasav Trionyx sp.19 Sarada Calates versicolor20 Gharpad Varanus sp.21 Pal Hemilactylus sp.22 Sheli Capra sp.23 Beduk Rana tigrina24 Vinchu. Palamnaeus sp.
Reptiles1 Nag Naja naja2 Ghonas Viper arusselli3 Dhaman Ptyas mucosus4 Pansap Natrix psicator5 Neneti Natrix stolata6 Kandar Bungarus calruleus
Source: Secondary data collected from site
Avifauna: Many bird species including quails, sand grouses, bayas, sparrows,munias, crows, mybas, parakeets, kites, hawks, doves, bee-eaters, ibis, bulbuls,babblers, larks, ducks, pigeons, etc. are commonly observed in the area.Occurrence of bird species in good numbers is due to suitable climate andavailability of food. Some of the common birds reported by State ForestDepartment indicate the presence of bhattitar, house crow, wood pecker, owl,house sparrow, parrot and eagle, etc.
Livestock: Agriculture is the main activity in the study area. Domestic animals areseen frequently. Common animals in the study area are cows, buffaloes, sheep,goats, poultry farms and pigs which are used for livestock generation. Livestockhas proved to be a very valuable asset to the farmers.
Olive Ridley Turtles: The Gahirmatha coast, mouth of Devi River and mouth ofRushikulya River is well-known for housing the world's largest rookery of the OliveRidley (Lepidochelysolivacea) sea turtles. Olive Ridley sea turtle has found place inSchedule-I of Indian Wildlife (Protection) Act, 1972 (amended 1991). All thespecies of sea turtles in the coastal water of Odisha are listed as "endangered" asper IUCN Red Data Book. The sea turtle are protected under the 'MigratorySpecies Convention' and CITES (Convention of International Trade on WildlifeFlora and Fauna).
The endangered Olive Ridley turtle are known for their mass-nesting behavior.Between December and March, they emerge from the ocean water on to the flatbeaches to lay eggs at night. The phenomenon is known as arribada – Spanish forthe word arrival.

FEASIBILITY STUDY FOR PORT ON RIVER MAHANADI FINAL FEASIBILITY REPORTCHAPTER – 10
ENVIRONMENTAL ASPECTS189
To provide protection and proper management for Olive Ridley turtle breedingand nesting ground of Gahirmatha, the Government of Odisha has declared it as aMarine Sanctuary. The notification for declaring the Marine Sanctuary waspublished in the extraordinary issue No.1268 of the Odisha Gazette dated17thOctober 1997. The fishing area of Gahirmatha coast became restricted in1993 and fishing was completely banned in this area in 1997, when Gahirmathawas given the status of a Marine Sanctuary.
There was no mass nesting at Gahirmatha Coast for two consecutive years during1996-97 and 1997-98 nesting seasons. During 1998-99, ending all speculations,the Olive Ridley Turtle started this mass nesting on March 12, 1999 at Penthalocated at the sourthern end of the Gahirmatha Coast. The first mass nesting inPentha last for two days with 7,000 turtles nesting during day and night. A secondmass nesting occurred in Pentha during 21st and 22nd April, 1999, during whichabout 28,000 turtles nested. In the year 2000, a total of about 7.11 lakhs turtlescame to Gahirmatha to nest over a 12-day nesting period. The turtles laid eggs infour islands viz., Nasi-I, Nasi-II, Babubali and a newly formed island. During theyear 2001, as many as 7.42 lakhs turtles emerged on Nasi-II island beach.
On 26 February 2011, thousands of Olive Ridley turtle crawled in Gahrimathabeach in Odisha. Using their rear flippers, they dug pits in the soft beach sand andstarted laying eggs, more than 100 at a time. Two days later, another group ofOlive Ridley turtle arrived. When they began to dig pits, many of them destroyedthe existing nests because the beach has shrunk to less than 1 km and as many as350,000 Olive Ridley nested on this small stretch in a span of 10 days. Theimpending result is that hatching will be fewer this year.
The once abundant Olive Ridleysare now rapidly declining in numbers as theirhabitats are disappearing. In India, Gahirmatha coast, mouth of Devi River andmouth of Rushikulya River are the remaining arribadasites. An ongoing study bythe Wildlife Institute of India (WII) reveals that Gahirmatha beach – part of theMarine Wildlife Sanctuary, decreased to 950m in 2010, which was 32 km long in1975. The reason behind this phenomenal decline is the successive cyclone, whicheroded the beach as well as industrial projects in the region.
10.4.7 Ecologically Sensitive Areas
In Odisha, there are 18 (eighteen) Wildlife Sanctuaries and National Parks, out ofwhich only one marine sanctuary i.e. Gahirmatha Marine Sanctuary is comingwithin 15 km radius of the proposed project site.
Apart from Wildlife Sanctuary and National Park, two Reserved Forest namelyHatamundia Reserved Forest, BhitarKharinasi Reserved Forest are also comingwithin 15 km radius of the proposed project site.

FEASIBILITY STUDY FOR PORT ON RIVER MAHANADI FINAL FEASIBILITY REPORTCHAPTER – 10
ENVIRONMENTAL ASPECTS190
Gahirmatha Marine Sanctuary
Gahirmatha is a sandy coast situated in Kendrapara district, Rajanagartaluk on thenortheastern part of Odisha state. The area extends approximately along 35-40km stretch of the coastline from Maipura river mouth in the North up to Hansuariver mouth in the south. The beach is more or less flat with scattered sand dunesof 2-3 m height. The average beach width is 80 m above the high tide linealthough in some places the width exceeds 100 m.
The Gahirmatha coast which separates the Bhitarkanika mangroves from the Bayof Bengal is well-known for housing the world's largest rookery of the Olive Ridley(Lepidochelysolivacea) sea turtles. Olive Ridley sea turtle has found place inSchedule-I of Indian Wildlife (Protection) Act, 1972 (amended 1991). All thespecies of sea turtles in the coastal water of Odisha are listed as "endangered" asper IUCN Red Data Book. The sea turtle are protected under the 'MigratorySpecies Convention' and CITES (Convention of International Trade on WildlifeFlora and Fauna).
To provide protection and proper management for Olive Ridley turtle breedingand nesting ground of Gahirrmatha, the Government of Odisha has declared it asa Marine Sanctuary. The notification for declaring the Marine Sanctuary waspublished in the extraordinary issue No.1268 of the Odisha Gazette dated 17thOctober 1997. The fishing area of Gahirmatha coast became restricted in 1993and fishing was completely banned in this area in 1997, when Gahirmatha wasgiven the status of a Marine Sanctuary.
The core area of the sanctuary is 725 sq. km where fishing is prohibitedthroughout the year. The Buffer zone stretches over an average width of 10 kmwhere fishing is restricted during the nesting season from December to April. Thearea covered under sanctuary is shown in Fig. 10.3.
The sanctuary is located between 20°4’ N – 20° 8’ N latitude and 86°45’ E – 87°50’E longitude covering an area of about 672 sq. km. The following species are foundin the Gahirmatha coastal region; Lepidochely solivacea, Avicennia alba, Avicenniaofficinalis, Avicennia marina, Lumnitzera racemosa, Exoecaria agallocha,Xylocarpus granatum, Xylocarpus mokongensi, Derris scandens, Bruguieragymnorrhiza, Bruguiera sexangula, Bruguiera parviflora, Bruguiera cylindrica,Ceriopsdecendra, and Ceriopstagal.
About 0.2 – 0.7 million turtles are estimated to be visited Gahirmatha beach everyyear during early winter for mass nesting (Chadha and Kar 1999). However, theactual number varies year to year. During 1982, 1988, 1997 and 1998, only a fewthousand turtles visited the coast for nesting. However, during 2000, maximumnumber of about 0.7 million turtles visited Gahirmatha. The Barrier Island (Barrierridge) called Ekakulanasi is the main turtle breeding ground of this coast.

FEASIBILITY STUDY FOR PORT ON RIVER MAHANADI FINAL FEASIBILITY REPORTCHAPTER – 10
ENVIRONMENTAL ASPECTS191
Source: website of Department of Forest & Environment, Government of OdishaFig. 10.3 Index Map Showing the Boundary of Gahirmatha Marine Sanctuary
10.4.8 Archaeological Sites
In Jagatsinghpur district, there are 19 protected monuments under the control ofState Government but there are no centrally protected monuments under thecontrol of Central Government. However, none of these are located within closeproximity of the proposed project site. Location wise detailed list of Stateprotected monuments are provided in Table 10.6.
Table 10.6 List of State Protected Monuments in Jagatsinghpur district
S. No. Name of the Monuments Period Locality
1. Basudeva Image 13th C.A.D Douduasinghapur
2. Chandrasekhar & Ganesha Temple 19th C.A.D Tirtol3. Kantaresvara Temple 10th – 11th C.A.D Kantara4. Kapilesvara Mahadeva Temple 19th C.A.D Kopala

FEASIBILITY STUDY FOR PORT ON RIVER MAHANADI FINAL FEASIBILITY REPORTCHAPTER – 10
ENVIRONMENTAL ASPECTS192
S. No. Name of the Monuments Period Locality
5. Khandesvara Temple 10th – 11th C.A.D Nasikesvar, Tirtol6. Kuttamachandi Temple 18th – 19th C.A.D Debidola7. Loose Sculptures 9th – 10th C.A.D Khorat8. Nagesvari Thakurani Temple 19th C.A.D Odisagada9. Nandikesvara Temple 10th – 11th C.A.D Nandigarh10. Panchupandava Temple 10th – 11th C.A.D Dhanisa11. Parasara Temple 10th – 11th C.A.D Paradeepgarh12. Radhamadhavajiu Temple 19th C.A.D Gajarajpur13. Saptamatruka & Ajaikapada 10th C.A.D Sathalapur14. Sarala Temple 18th – 19th C.A.D Jhankada15. Sculpture Shed 9th – 10th C.A.D Tirthamatha16. Sisuananta Temple 19th C.A.D Odisagada17. Subarnesvara Temple 19th C.A.D Sahada18. Svapnesvara Temple 19th C.A.D Puranasudeipur19. Trilochanesvara Temple 11th C.A.D Kundesvar
Source: Archaeological Survey of India, Bhubaneswar Circle, Bhubaneswar
10.5 Socio Economic Environment
The entire 10-kms study around IFFCO Paradip Unit falls in two districts of Odishanamely Jagatsinghpur and Kendrapara. The proposed jetty falls underMahakalpada Block of Kendrapada district. This Tehsil is located in northerndirection of Mahanadi River. Within 10-kms study area, total numbers of villagesare 40, out of which 22 villages fall under Kujang Tehsil and remaining 18 villagesfall under Kendrapara Tehsil. Village-wise data on number of households,population (total, male and female), and population below 6 years are presentedin Table 10.7. Village-wise data on scheduled caste and scheduled tribe (total,male and female) are presented in Table 10.8. Village-wise data on male,female and total literacy for settlements located within these distance ispresented in Table 10.9.
As per Census Hand Book - 2001, the total number of households of the villagesfalling under study area is 14,964. Total population of the study area is 73,428 outof which percentage of male population is 52.32 and percentage of femalepopulation is 47.68. Under the category of sex ratio, the number of females per1000 males is 911. The social compositions in the study area are such that nearly16.73% of total population is Scheduled Caste population and nearly 3.72% of thetotal population is Scheduled Tribe. The literacy rate in the study area is 60.01%,out of which the literacy rate in male category is higher (70.11%) whereas theliteracy rate is only 48.91% in female category. In other words it may beconcluded that female category of the population is less educated in rural areas.

FEASIBILITY STUDY FOR PORT ON RIVER MAHANADI FINAL FEASIBILITY REPORTCHAPTER – 10
ENVIRONMENTAL ASPECTS193
Table 10.7 Demographic Profiles within 10 Km Radius (Population)S.
No.Name of the
VillagesNo. of
Households
Population > 7 years Population (0-6 years)
Total Male Female Total Male FemaleKujang Tehsil
1. Bhutumundai 717 3541 1860 1681 494 269 2252. Singitalia 163 839 422 417 121 61 603. Pipal 437 2240 1149 1091 318 160 1584. Chakradharpur 201 883 459 424 72 35 375. Balidia 328 1768 910 858 223 107 1166. Nuagarh 360 2128 1072 1056 277 136 1417. Aganasi 6 17 10 7 4 3 18. Musadia 805 3008 2156 852 355 220 1359. Udayabata 163 711 395 316 88 39 49
10. Paradeepgarh 754 4053 2066 1987 524 274 25011. Chunabelari 258 1385 765 620 171 87 8412. Katakulla 153 772 420 352 96 56 4013. Koladia 165 820 423 397 96 53 4314. Jagati 210 1019 519 500 119 60 5915. Nunukua 268 1462 730 732 183 94 8916. Narendrapur 144 706 364 342 104 53 5117. Kothi 499 2058 1047 1011 291 150 14118. Jhimani 559 2880 1462 1418 395 194 20119. Siju 234 1349 684 665 184 100 8420. Pitambarpur 103 604 301 303 77 37 4021. Rangiagarh 357 1906 997 909 283 143 14022. Bagadia 425 2134 1099 1035 299 147 152
Kendrapara Tehsil23. Chadeiguan 281 1197 566 631 145 76 6924. Sathiabati 203 1199 618 581 183 104 7925. GokhaKhati 221 1106 549 557 161 90 7126. Barakandha 362 1547 762 785 219 113 10627. Baulakani 861 3988 2089 1899 738 375 36328. Petchhela 867 4404 2305 2099 746 384 36229. Sarumunhi 88 378 198 180 57 28 2930. Kentia 90 517 267 250 112 57 5531. Kochila 175 936 476 460 135 68 6732. PalliGarh 127 605 314 291 88 50 3833. Bahakuda(Pitapat) 378 1771 900 871 335 171 16434. BarajaBahakuda 280 1358 691 667 244 113 13135. Banabiharipur 9 19 13 6 1 0 136. Badatubi 193 926 467 459 184 85 9937. Kharinasi 1198 5623 2887 2736 999 515 48438. Ramanagar 1086 5000 2587 2413 839 414 42539. BarakoliKhala 632 3426 1781 1645 616 313 30340. Batighar 604 3145 1636 1509 569 294 275
Total 14964 73428 38416 35012 11145 5728 5417

FEASIBILITY STUDY FOR PORT ON RIVER MAHANADI FINAL FEASIBILITY REPORTCHAPTER – 10
ENVIRONMENTAL ASPECTS194
Table 10.8 Demographic Profiles within 10 Km Radius (SC ST)S.No. Name of Villages
TotalPopln.
Schedule Caste Schedule Tribe
Total Male Female Total Male Female
Kujang Tehsil1. Bhutumundai 3541 729 384 345 5 1 42. Singitalia 839 63 36 27 90 43 473. Pipal 2240 760 389 371 0 0 04. Chakradharpur 883 209 105 104 11 6 55. Balidia 1768 28 16 12 0 0 06. Nuagarh 2128 227 116 111 0 0 07. Aganasi 17 0 0 0 0 0 08. Musadia 3008 161 96 65 218 120 989. Udayabata 711 85 50 35 59 23 36
10. Paradeepgarh 4053 1764 878 886 47 26 2111. Chunabelari 1385 50 33 17 6 4 212. Katakulla 772 56 31 25 0 0 013. Koladia 820 354 188 166 111 54 5714. Jagati 1019 168 76 92 2 2 015. Nunukua 1462 337 170 167 0 0 016. Narendrapur 706 266 130 136 0 0 017. Kothi 2058 244 124 120 100 57 4318. Jhimani 2880 415 205 210 92 47 4519. Siju 1349 208 105 103 3 3 020. Pitambarpur 604 73 38 35 0 0 021. Rangiagarh 1906 378 209 169 2 2 022. Bagadia 2134 775 393 382 0 0 0
Kendrapara Tehsil23. Chadeiguan 1197 89 37 52 0 0 024. Sathiabati 1199 264 133 131 0 0 025. GokhaKhati 1106 197 95 102 0 0 026. Barakandha 1547 56 26 30 0 0 027. Baulakani 3988 109 56 53 611 315 29628. Petchhela 4404 317 161 156 938 501 43729. Sarumunhi 378 12 6 6 0 0 030. Kentia 517 0 0 0 0 0 031. Kochila 936 57 30 27 0 0 032. PalliGarh 605 273 133 140 0 0 033. Bahakuda 1771 490 248 242 0 0 034. BarajaBahakuda 1358 112 60 52 308 160 14835. Banabiharipur 19 1 1 0 0 0 036. Badatubi 926 35 20 15 0 0 037. Kharinasi 5623 1389 720 669 0 0 038. Ramanagar 5000 1258 629 629 130 63 6739. BarakoliKhala 3426 16 11 5 0 0 040. Batighar 3145 261 137 124 0 0 0
Total 73428 12286 6275 6011 2733 1427 1306

FEASIBILITY STUDY FOR PORT ON RIVER MAHANADI FINAL FEASIBILITY REPORTCHAPTER – 10
ENVIRONMENTAL ASPECTS195
Table 10.9 Demographic Profiles within 10 Km Radius (Literacy)S.No.
Name of VillagePopulation Literates Illiterates
Total Male Female Male Female Male FemaleKujang Tehsil01. Bhutumundai 3541 1860 1681 1402 976 458 70502. Singitalia 839 422 417 316 254 106 16303. Pipal 2240 1149 1091 910 651 239 44004. Chakradharpur 883 459 424 416 326 43 9805. Balidia 1768 910 858 713 529 197 32906. Nuagarh 2128 1072 1056 864 675 208 38107. Aganasi 17 10 7 3 1 7 608. Musadia 3008 2156 852 1671 348 485 50409. Udayabata 711 395 316 275 97 120 21910. Paradeepgarh 4053 2066 1987 1604 1273 462 71411. Chunabelari 1385 765 620 617 415 148 20512. Katakulla 772 420 352 329 221 91 13113. Koladia 820 423 397 300 201 123 19614. Jagati 1019 519 500 418 336 101 16415. Nunukua 1462 730 732 586 421 144 31116. Narendrapur 706 364 342 278 209 86 13317. Kothi 2058 1047 1011 737 525 310 48618. Jhimani 2880 1462 1418 1069 734 393 68419. Siju 1349 684 665 516 362 168 30320. Pitambarpur 604 301 303 246 198 55 10521. Rangiagarh 1906 997 909 718 482 279 42722. Bagadia 2134 1099 1035 795 523 304 512
Kendrapara Tehsil23. Chadeiguan 1197 566 631 456 401 110 23024. Sathiabati 1199 618 581 435 285 183 29625. GokhaKhati 1106 549 557 371 285 178 27226. Barakandha 1547 762 785 548 426 214 35927. Baulakani 3988 2089 1899 1193 589 896 131028. Petchhela 4404 2305 2099 1323 660 982 143929. Sarumunhi 378 198 180 101 63 97 11730. Kentia 517 267 250 179 135 88 11531. Kochila 936 476 460 354 256 122 20432. PalliGarh 605 314 291 213 145 101 14633. Bahakuda 1771 900 871 449 249 451 62234. BarajaBahakuda 1358 691 667 366 262 325 40535. Banabiharipur 19 13 6 12 3 1 336. Badatubi 926 467 459 309 175 158 28437. Kharinasi 5623 2887 2736 1740 1054 1147 168238. Ramanagar 5000 2587 2413 1764 1042 823 137139. BarakoliKhala 3426 1781 1645 1237 735 544 91040. Batighar 3145 1636 1509 1102 604 534 905
Total 73428 38416 35012 26935 17126 11481 17886

FEASIBILITY STUDY FOR PORT ON RIVER MAHANADI FINAL FEASIBILITY REPORTCHAPTER – 10
ENVIRONMENTAL ASPECTS196
Table 10.10 Village wise Economic Profile of the Study AreaS.No.
Name of Village TotalPpln.
Totalworker
Main Workers Marginal workers Non Workers
Male Female Male Female Male FemaleKujang Tehsil01. Bhutumundai 3541 1101 808 48 142 103 910 153002. Singitalia 839 253 199 46 4 4 219 36703 Pipal 2240 562 514 9 25 14 610 106804. Chakradharpur 883 239 227 9 2 1 230 41405. Balidia 1768 428 400 5 18 5 492 84806. Nuagarh 2128 562 454 22 70 16 548 101807. Aganasi 17 8 6 0 0 2 4 508. Musadia 3008 2061 1601 122 164 174 391 55609. Udayabata 711 328 215 55 32 26 148 23510. Paradeepgarh 4053 1030 750 101 160 19 1156 186711. Chunabelari 1385 529 365 19 11 134 389 46712. Katakulla 772 197 156 8 32 1 232 34313. Koladia 820 294 170 68 48 8 205 32114. Jagati 1019 337 242 25 39 31 238 44415. Nunukua 1462 406 304 16 35 51 391 66516. Narendrapur 706 237 141 9 40 47 183 28617. Kothi 2058 646 523 70 27 26 497 91518. Jhimani 2880 910 777 100 15 18 670 130019. Siju 1349 379 306 5 47 21 331 63920 Pitambarpur 604 151 126 2 20 3 155 29821. Rangiagarh 1906 504 327 14 142 21 528 87422. Bagadia 2134 625 500 82 31 12 568 941Kendrapara Tehsil
23. Chadeiguan 281 274 266 6 2 0 298 62524. Sathiabati 203 492 323 28 25 116 270 43725. GokhaKhati 221 317 257 13 13 34 279 51026. Barakandha 362 568 404 16 34 114 324 65527. Baulakani 861 1397 960 51 121 265 1008 158328. Petchhela 867 1989 1232 349 57 351 1016 139929. Sarumunhi 88 228 112 15 7 94 79 7130. Kentia 90 184 82 11 7 84 178 15531. Kochila 175 475 277 79 31 88 168 29332. PalliGarh 127 200 159 4 29 8 126 27933. Bahakuda 378 682 443 21 34 184 423 66634. BarajBahakuda 280 406 386 16 2 2 303 64935. Banabiharipur 9 11 9 0 0 2 4 436. Badatubi 193 348 238 12 15 83 214 36437. Kharinasi 1198 2277 1391 173 163 550 1333 201338. Ramanagar 1086 1392 1086 71 184 51 1317 229139. BarakoliKhala 632 968 843 33 38 54 900 155840. Batighar 604 1064 786 59 78 141 772 1309Total 73428 25059 18365 1792 1944 2958 18107 30262

FEASIBILITY STUDY FOR PORT ON RIVER MAHANADI FINAL FEASIBILITY REPORTCHAPTER – 10
ENVIRONMENTAL ASPECTS197
Table 10.11 Village wise Workforce of the Study AreaSl.No.
Name ofvillage
TotalWorkers
CultivatorsAgriculturalLabourers
HouseholdIndustry
Others
Kujang Village01. Bhutumundai 1101 214 68 26 54802. Singitalia 253 58 35 2 15003 Pipal 562 227 63 63 17004. Chakradharpur 239 69 38 1 12805. Balidia 428 110 56 11 22806. Nuagarh 562 135 32 8 30107. Aganasi 8 0 0 0 608. Musadia 2061 4 0 2 171709. Udayabata 328 13 6 3 24810. Paradeepgarh 1030 72 25 16 73811. Chunabelari 529 105 9 0 27012. Katakulla 197 38 16 0 11013. Koladia 294 25 0 1 21214. Jagati 337 82 15 2 16815. Nunukua 406 82 1 41 19616. Narendrapur 237 46 32 25 4717. Kothi 646 182 133 3 27518. Jhimani 910 325 83 3 46619. Siju 379 105 29 4 17320 Pitambarpur 151 86 0 0 4221. Rangiagarh 504 30 32 7 27222. Bagadia 625 85 24 50 423
Kendrapara Tehsil23. Chadeiguan 274 172 23 0 7724. Sathiabati 492 197 42 9 10325. GokhaKhati 317 167 68 0 3526. Barakandha 568 262 122 1 3527. Baulakani 1397 498 350 1 16228. Petchhela 1989 1089 341 3 14829. Sarumunhi 228 121 0 1 530. Kentia 184 93 0 0 031. Kochila 475 320 0 1 3532. PalliGarh 200 110 30 0 2333. Bahakuda 682 115 190 3 15634. BarajBahakuda 406 128 143 0 13135. Banabiharipur 11 8 0 0 136. Badatubi 348 86 42 5 11737. Kharinasi 2277 285 120 24 113538. Ramanagar 1392 382 322 20 43339. BarakoliKhala 968 417 182 3 27440. Batighar 1064 214 101 3 527
Total 25059 6757 2773 342 10285

FEASIBILITY STUDY FOR PORT ON RIVER MAHANADI FINAL FEASIBILITY REPORTCHAPTER – 10
ENVIRONMENTAL ASPECTS198
10.6 Village Land Type and PAF (Project Affected families)
The data of the villages were collected from Tehsil office of relevant villagespertaining to type of land, number of households, population female and maleetc. The land covered in village maps is shown as Fig. 10.4.
Fig. 10.4 Village maps falling in Project Land Area
The proposed land area of the port is shown in Fig. 10.5.
Fig. 10.5 Proposed land area of port
The proposed port land area was superimposed on village maps as shown in Fig.10.6.

FEASIBILITY STUDY FOR PORT ON RIVER MAHANADI FINAL FEASIBILITY REPORTCHAPTER – 10
ENVIRONMENTAL ASPECTS199
Fig. 10.6 Superimposed port land area map
After superimposing proposed port land area on village maps it was found thatthere are mainly five villages falling under the project site viz. Akhadasali,Dasarajapur, Palli Garh, Bahakuda and Baharagada Badadandua.
Akhadasali - Thana-Mahakala Pada, No-77Dasarajapur - Thana-Mahakala Pada, No-76Palli Garh - Thana-Mahakala Pada, No-145Bahakuda - Thana-Mahakala Pada, No-147Baharagada Badadandua - Thana-Mahakala Pada, No-78
All villages are under Kendrapada district.
The ownership of the land as was found from the collected data is given in Table10.12.
Table 10.12 Ownership of Land
S.No. VILLAGE NAME PRIVATELAND (Ha)
GOVT.LAND (Ha)
TOTAL Agri. PvtLand (Ha)
1. Akhadasali 225.794 71.266 297.060 210.9432. Dasarajapur 65.505 13.506 79.011 65.4893. Palli Garh 45.077 15.840 60.919 37.9394. Bahakuda 76.004 108.809 184.813 69.1055. Baharagada
Badadandua24.231 2.445 27.518 24.231
Akhadasali village is the largest village falling in project area and has maximumproportion of private land. The villages maximum area is private agricultural land.Bahakuda village and akhadasali village has maximum coverage of governmentland.
The village population and no. of households is given in Table 10.13

FEASIBILITY STUDY FOR PORT ON RIVER MAHANADI FINAL FEASIBILITY REPORTCHAPTER – 10
ENVIRONMENTAL ASPECTS200
Table 10.13 Village population and No. of Households
Village landNumberof house
holds
TotalPopulation
TotalMale
TotalFemale
Dasarajapur Rural 16 61 30 31Akhadasali Rural 35 174 89 85Palli Garh Rural 133 666 336 330Bahakuda(Pitapat) Rural 460 2159 1090 1069BaharagadaBadadandua Rural 201 944 478 466
*from census 2011, complete village data
The number of project affected families is given in Table 10.14
Table 10.14 Number of Project Affected FamiliesS.No. VILLAGE NAME Number of
Affected Families1 Akhadasali 2042 Dasarajapur 793 Palli Garh 364 Bahakuda 235 Baharagada Badadandua 22*From village land records.
10.7 Fisheries
Paradip of Jagatsinghpur district and Kendrapara tehsil of Kendrapara district areone of the most important maritime districts of the state. About 100 villageslocated in the coastal area of Jagatsinghpur and Kendrapara are engaged infishing activities. Fishing though considered under developed ranks only next toagriculture as far as means of livelihood is concerned. The fishing industry ismainly dependent upon the exploitation of maritime resources. The fishingseason commences from September and lasts till the end of May of the year.There is practically no fishing in the monsoon season except in the creeks, lakesand rivers.
Two industrial units of prawn and fish processing factories viz., Suryo UdyogLimited and Falcon Marine export Limited have become the main source ofincome of large number of people. The people in and around Paradip seem to bein beeline to earn livelihood from both the prawn processing units. Majority ofthem earn their living by means of their traditional boats and nets in creeks andrivers in the riparian villages. Some of them have grown rich and are involved incommercial enterprises of prawn farming and a few of them have become the

FEASIBILITY STUDY FOR PORT ON RIVER MAHANADI FINAL FEASIBILITY REPORTCHAPTER – 10
ENVIRONMENTAL ASPECTS201
owners of deep-sea trawlers. At present Kalinga Karnadhar Primary FishermenCo-operative Society is the biggest fishermen co-operative society of Odishahaving numerical strength of membership more than ten thousands and itconsists of 101 fishing villages of both the districts of Kendrapara andJagatsinghpur. Data regarding fishing activity at Paradip have been collected fromFishery Department and presented below:
Table 10.15 Data Regarding Fishing Activity at ParadipA.1.
New Fishing HarbourBOAT(A) Total No. of Boats(B) Trawler(C) Motor Boat
- 830 nos.- 632nos.- 200 nos.
2. FISHERMAN(A) Total no. of Crew Members - 7000 nos.(B) Ancillary Workers - 3000 nos.(C) Owners - 1000 nos.(D) Involved directly in the trade
(Other work, Transportation, Dry Dock,Processing Plant (08-10), Packing Unit)
(E) Vendor
- 2000 nos.
- 5000 nos.
3. FISH PRODUCTION
(A) 2010 – 11 - 30261.16 MT(B) 2009 – 10 - 28325.42 MT(C) 2008 – 09 - 25228.35 MT(D) 2007 – 08 - 21958.41 MT(E) 2006 – 07 - 21068.53 MT
Table 10.16 Overall Fishing Fleet
Landing Centre Trawler(Nos.)
Gill Netter(Nos.)
MotorizedBoat (Nos.)
Non MotorizedBoat (Nos.)
Total(Nos.)
New Harbour 632 119 200 Nil 951Atharbanki Nil 55 54 38 147
Chaumuhani Nil Nil 9 98 107Noliasahi Nil Nil 28 403 431Bandar Nil Nil 21 187 208

FEASIBILITY STUDY FOR PORT ON RIVER MAHANADI FINAL FEASIBILITY REPORTCHAPTER – 10
ENVIRONMENTAL ASPECTS202
Table 10.17 Overall Fish Production
YEAR New FishingHarbour (MT)
Atharbanki(MT)
Chaumuhani(MT)
Noliasahi(MT)
Bandar(MT)
2010-11 30261.16 3665.17 469.48 681.32 578.392009-10 28325.42 5400.26 678.04 969.22 964.552008-09 25228.35 4405.08 884.33 1687.07 914.542007-08 21958.41 4362.57 1128.81 3326.51 2249.642006-07 21068.53 4451.10 1055.25 3509.30 3094.83
10.8 EIA Study for the Proposed Development
EIA Study of the proposed jetty is to be carried out as per the approved TOR andsteps to be followed for conducting the study given below:
a) MoEF will issue TOR for conducting EIA Studyb) MoEF will decide whether the EIA Report is to be prepared based on One
Season data or Three Seasons data.c) Baseline Environmental Monitoring as per the approved TORd) Preparation of Draft EIA & EMP report as per the approved TORe) Submission of Draft EIA & EMP to SPCB for conducting Public Hearingf) Submission of Draft EIA & EMP to SPCB for Consent to Establish (NOC)g) Submission of Draft EIA & EMP along with CRZ MAP & CRZ Report to State
CRZ Authority for CRZ Clearanceh) Public Hearingi) Preparation of Final EIA & EMP Report incorporating the issues raised during
the Public Hearingj) Submission of Final EIA & EMP to OSEAC for Environmental Clearancek) Presentation before the MoEF for Environmental Clearancel) Environmental Clearance

FEASIBILITY STUDY FOR PORT ON RIVER MAHANADI FINAL FEASIBILITY REPORTCHAPTER – 11
PROJECT IMPLEMENTATION SCHEDULE203
CHAPTER 11
PROJECT IMPLEMENTATION SCHEDULE
11.1 The overview of the project reveal from the implementation point of view theproject could be divided into the following parts:
Pre construction activities
o Investigationso Model Studieso Market Surveyo Preparation of DPRo Clearances (including Environmental Clearance)o Financial Closureo Water supplyo Powero Tender engineering and fixing of EPC Contractor
Construction activities
o Bertho Approach Trestleo Dredgingo Buildingso Development of storage areas including consolidation, if requiredo Road and rail linkageso Internal road/railo Fencingo Procurement and installation of Harbour Craftso Procurement of Navigation Aidso Procurement and installation of treatment plantso Procurement and installation of electrical equipmento Procurement and installation of pollution control facilitieso Procurement and installation of EDI/Control Systems
Post Construction Activities
o Post Construction Surveyso Preparation of as built drawingso Commissioning of equipment and control systems

FEASIBILITY STUDY FOR PORT ON RIVER MAHANADI FINAL FEASIBILITY REPORTCHAPTER – 11
PROJECT IMPLEMENTATION SCHEDULE204
Ancillary Activities
o Agreement with port userso Recruitment and training of port operation manpowero Contracting of O&M Agencies
11.2 Construction schedule has been worked out based on layout of the harbour. Inabsence of results of investigations, for working out time schedule of constructionberths, the nature of berthing structure could not be decided exactly at this stage.However looking at the sub–soil condition from the geotechnical investigationsresults, piled construction appears to be most appropriate and constructionschedule for the berth and approach trestle has been worked out with piledBerth.
11.3 It is presumed that specialised dredging contractors would be deployed for thedredging of the approach channel. It is assumed that marine clay would bedumped beyond -20 m contour in the sea. However, the sand, silt and weatheredrock would be utilised in construction of ring bunds and in reclamation of thebackup area to the designed level.
11.4 For working out construction schedule following rates for execution of variousitems of works has been assumed.
i) Concreting @ 150 cum per dayii) Earth work and stone dumping @ 4000 t/dayiii) Dredging soft soil output - @ 100000 cum per day
(3-4 dredgers working simultaneously)iv) Retention bund, 20-30 m per dayv) Railway line 20m per day.vi) Roadway 20m per day.
The implementation schedule of the project is enclosed as Table 11.1.

FEASIBILITY STUDY FOR PORT ON RIVER MAHANADI FINAL FEASIBILITY REPORTCHAPTER – 11
PROJECT IMPLEMENTATION SCHEDULE205

FEASIBILITY STUDY FOR PORT ON RIVER MAHANADI FINAL FEASIBILITY REPORTCHAPTER – 12
PROJECT COST AND FINANCIAL ANALYSIS206
CHAPTER 12
PROJECT COST AND FINANCIAL ANALYSIS
12.1 General
12.1.1 The technical aspects of development of port facilities for handling of theprojected traffic are dealt with in the previous chapters. In the present chaptercost estimates are developed for the project elements.
12.1.2 In order to arrive at capital cost for the proposal it is necessary to ascertain, forbudgetary purposes, unit rates of materials used for construction, dredging etc.Accordingly, efforts were made to obtain the above information from the relevantsources.
12.2 Basis of Estimates
12.2.1 The item rates for the civil works and cost of various equipment and machinerywere arrived at based on different methods. These are broadly classified intofollowing categories depending on the margin of error in their assessment. Theyare:
i Based on budgetary quotationsii Based on rates for individual items of work of similar natureiii Based on rates collected from vendors andiv Best judgment
12.2.2 The component of excise duty, sales tax and octroi in the case of indigenous itemsand that of customs and other duties in respect of imported items are included inthe overall cost. Similarly, in the case of pollution mitigation measures, manyitems such as sewage disposal, dust control are included in the estimates for therespective civil, mechanical or electrical estimates.
12.2.3 The provision for cost of bunkering facilities is not included in the capital costestimates since it would be provided, operated and charged for independent ofport operations. The cost of the railway lines and main marshalling yard andholding yard has been included. However, the cost of operating the railwaysystem has not been included, and no provision has been made foraccommodating the railway system operating staff. The cost of infrastructure andfacilitation as required has been included in the capital costs. The provision forphysical and price contingencies, interest during construction and other financingcosts, pre-construction expenses etc. have been provided for at 25% of the totalcapital cost.

FEASIBILITY STUDY FOR PORT ON RIVER MAHANADI FINAL FEASIBILITY REPORTCHAPTER – 12
PROJECT COST AND FINANCIAL ANALYSIS207
12.3 Capital Cost
12.3.1 The capital cost for development of Mahanadi Port only has been estimated asRs. 1920 Crores. A road bridge and a rail bridge needs to be constructed on RiverNuna for road and rail connectivity of the port with NH 5A (Now NH 53) andnearest railhead respectively. About 175 Ha land area will be required in Phase Ifor creating port backup facilities. Out of which 100 ha needs to be acquired beingprivate land. The total project cost inclusive of land acquisition cost, road bridgecost and rail bridge cost has been estimated as Rs. 2110 Crores. The costestimates for the civil structures are based on the prevailing unit price and theprevailing market cost of various items and is adopted after discussions withcontracting agencies. However, as far as material handling and other equipmentare concerned, the estimate is based on budgetary costs available from vendors.The present estimate also considers the cost as per discussions with variousagencies supplying these equipment and information available with WAPCOSfrom earlier projects. The breakup of the cost estimate of the project componentsis given in Table 12.1.
Table 12.1 Capital CostRs. in Lakhs
S.No.
Particulars Unit Phase I (2016-25)
Qty. Rate Amount
1.0 Dredging 600001.1 Dredging of soil - Entrance Channel & Port Area Mm3 30.00 0.0020 600002.0 Land Development 119302.1 Reclamation & Land Improvement Mm3 3.85 0.0018 69302.2 Land Acquisition Ha 100 50 50003.0 Common Infrastructure Facilities 29073.1 Administration Building Sq m 600 0.115 693.2 Security Building Sq m 25 0.10 2.53.3 Compound wall Rm 3500 0.15 5253.4 Fencing Rm 3500 0.10 3503.5 Drainage/Sewerage Rm 6000 0.10 6003.6 Fire Station building Sq m 400 0.20 803.7 Port Users building Sq m 600 0.2 1203.8 Road lighting km 6 17 1023.9 CFS Sq m 1400 0.16 224
3.10 Work Shop Sq m 900 0.16 1443.11 Fuel Station Sq m 900 0.1 903.12 Water Supply System LS - 100 1003.13 Receiving Substation LS - 500 5004.0 Port Works (Quays & Trestle) 106004.1 Berthing Jetty m 500 20 100004.2 Approach Trestle m 200 3 6005.0 Coastal / Shore protection 4035.1 Dyke m 1000 0.34 336

FEASIBILITY STUDY FOR PORT ON RIVER MAHANADI FINAL FEASIBILITY REPORTCHAPTER – 12
PROJECT COST AND FINANCIAL ANALYSIS208
S.No.
Particulars Unit Phase I (2016-25)
Qty. Rate Amount
5.2 Pitching m 1000 0.04 375.3 Geotextile with filter m 1000 0.03 306.0 Cargo Terminal Infrastructure 23416.1 Dry Bulk Ha 20.40 80 16326.2 Break Bulk Ha 4.90 65 3196.3 Containers Ha 1.20 325 3907.0 Cargo Handling Equipment 281457.1 Iron Ore
7.1.1 LoaderContinuous Loader 5000 tph No. 1 5500 5500
7.1.2 Wagon TipplerNo. 2 600 1200
7.1.3 ConveyorDry Bulk 2500 tph m 800 1.2 960
7.1.4 Stacker cum reclaimerDry Bulk 2500 tph No. 2 1500 3000
7.1.5 Pay LoadersDry Bulk 1000 tph No. 4 65 260
7.2 Coal7.1.1 Unloader
Continuous unoader 2500 tph No. 1 3500 35007.1.5 Pay Loaders & Dozers
Dry Bulk 1000 tph No. 4 65 2607.1.3 Conveyor
Dry Bulk 2500 tph m 800 1.2 9607.1.4 Stacker cum reclaimer
Dry Bulk 2500 tph No. 2 1500 30007.1.5 Wagon/Truck loader
Dry Bulk 1000 tph No. 2 600 12007.1.7 Spray System (For Coal & Iron Ore) Unit 1 200 2007.1.8 Belt weighing, sampling, weigh bridges, etc. SET 1 100 1007.2 Break Bulk Handling System
7.2.1 20t level luffing Crane No. 3 40 1207.2.2 10t FLT's No. 2 30 607.2.3 5t FLT's No. 4 15 607.2.4 10t Pay Loaders No. 3 25 757.2.5 Mobile Harbour Cranes No. 2 1500 30007.3 Container Handling System
7.3.1 Mobile Harbour Crane No. 1 2500 25007.3.2 RTGC (Yard) No. 2 750 15007.3.3 Tractors Trailers No. 6 50 3007.3.4 Reach Stackers No. 1 250 2507.3.5 Empty Handlers No. 1 140 1408.0 Navigational aids 37008.1 Foundation Structure No. 10 170 17008.2 Buoys, Transit Lights Set 2 500 10008.3 VTMS System 1 1000 10009.0 Harbour Crafts 14250

FEASIBILITY STUDY FOR PORT ON RIVER MAHANADI FINAL FEASIBILITY REPORTCHAPTER – 12
PROJECT COST AND FINANCIAL ANALYSIS209
S.No.
Particulars Unit Phase I (2016-25)
Qty. Rate Amount
9.1 Tugs 40 T bollard pull No. 2 4000 80009.2 Towing Tugs 30 T pull No. 1 2000 20009.3 Pilot launch No. 1 2000 20009.4 Survey launch No. 1 600 6009.5 Mooring launch No. 2 200 4009.6 Buoy Maintenance Vessel No. 1 900 9009.7 VIP Launch No. 1 350 350
10.0 Provision of External Power Km 3 330 99011.0 Provision of External Water supply Km 3 120 36012.0 Provision of External Telecommunication Km 3 16 4813.0 Road 1280013.1 External Road Km 6 700 420013.2 Internal Main Road Km 4 500 200013.3 Internal arterial Road Km 6 350 210013.4 Road Bridge Km 0.75 6000 450014.0 Rail 1380014.1 External Rail Km 6 800 480014.2 Internal Rail Km 6 500 300014.3 Rail Bridge Km 0.75 8000 600015.0 Fire Fighting System/ Hazard Mitigation 275015.1 Fire Protection System System 1 2000 200015.2 Mobile Firefighting System 1 500 50015.3 Foundations for Fire protection system L.S. 250 25016.0 Environment Aspects 105016.1 Equipment (Oil Boom etc.) System 1 1000 100016.2 Others (Chemicals/Collection etc.) L.S. 50 50
18.0 Project management & Engineeringconsultancy 2731
TOTAL Rs. (Crores) 1,688Physical and price contingencies, interest during construction and otherfinancing costs, pre-construction expenses etc. @ 25% Rs. (Crores) 422
TOTAL COST OF THE PROJECT Rs. (Crores) 2,110
12.4 Operating Costs
12.4.1 The port is planned to be developed by Public Private Partnership (PPP).Government of Odisha is the project proponent and the maintenance cost isdeemed to be borne by private operators for the continual commercial operationof the facility. The total maintenance cost calculated is varied from Rs. 179.03crores to Rs. 291.83 crores per year, which are equivalent to 8.48% to 13.83% ofthe total cost required for the operation of the facility. The maintenance cost ofdredging open channel is required in every year. The operation and maintenancecost is calculated based on the following basis:
i. Maintenance Dredging of Approach Channel : 15% of capital dredgingestimated through model studies

FEASIBILITY STUDY FOR PORT ON RIVER MAHANADI FINAL FEASIBILITY REPORTCHAPTER – 12
PROJECT COST AND FINANCIAL ANALYSIS210
ii. Civil Works : 1% of Capital costiii. Equipment and Machinery : 8% of capital costiv. Port Crafts & Navigation Aids : 5% of capital costv. Mechanical and Electrical works : 8% of capital costThe operation & maintenance cost breakup of the project is given in Table 12.2.
Table 12.2 Operation & Maintenance costRs. in Lakhs
Year Dredging CivilWorks
E&M Port craft/Nav aids
Salary PreliminaryExpenses
Contingencies Govt.Royalty
Total
2020 9000 572.28 2471.60 897.5 2050.00 2110.05 513.04 288.60 17903.07
2021 9000 572.28 2471.60 897.5 2111.50 2110.05 514.89 346.50 18024.31
2022 9000 572.28 2471.60 897.5 2174.85 2110.05 516.79 426.16 18169.22
2023 9000 572.28 2471.60 897.5 2240.09 2110.05 518.75 511.90 18322.16
2024 9000 572.28 2471.60 897.5 2307.29 2110.05 520.76 614.92 18494.40
2025 9000 572.28 2471.60 897.5 2376.51 2110.05 522.84 739.22 18690.00
2026 9000 572.28 2471.60 897.5 2447.81 2110.05 524.98 889.15 18913.36
2027 9000 572.28 2471.60 897.5 2521.24 2110.05 527.18 1069.26 19169.11
2028 9000 572.28 2471.60 897.5 2596.88 2110.05 529.45 1176.19 19353.94
2029 9000 572.28 2471.60 897.5 2674.79 2110.05 531.79 1293.81 19551.80
2030 9000 572.28 2471.60 897.5 2755.03 2110.05 534.19 1423.19 19763.83
2031 9000 572.28 2471.60 897.5 2837.68 2110.05 536.67 1565.51 19991.28
2032 9000 572.28 2471.60 897.5 2922.81 2110.05 539.23 1722.06 20235.52
2033 9000 572.28 2471.60 897.5 3010.49 2110.05 541.86 1894.26 20498.04
2034 9000 572.28 2471.60 897.5 3100.81 2110.05 544.57 2083.69 20780.49
2035 9000 572.28 2471.60 897.5 3193.83 2110.05 547.36 2292.06 21084.67
2036 9000 572.28 2471.60 897.5 3289.65 2110.05 550.23 2521.26 21412.57
2037 9000 572.28 2471.60 897.5 3388.34 2110.05 553.19 2773.39 21766.34
2038 9000 572.28 2471.60 897.5 3489.99 2110.05 556.24 3050.73 22148.38
2039 9000 572.28 2471.60 897.5 3594.69 2110.05 559.38 3355.80 22561.30
2040 9000 572.28 2471.60 897.5 3702.53 2110.05 562.62 3691.38 23007.95
2041 9000 572.28 2471.60 897.5 3813.60 2110.05 565.95 4060.52 23491.50
2042 9000 572.28 2471.60 897.5 3928.01 2110.05 569.38 4466.57 24015.39
2043 9000 572.28 2471.60 897.5 4045.85 2110.05 572.92 4913.23 24583.42
2044 9000 572.28 2471.60 897.5 4167.23 2110.05 576.56 5404.55 25199.76
2045 9000 572.28 2471.60 897.5 4292.24 2110.05 580.31 5945.00 25868.98
2046 9000 572.28 2471.60 897.5 4421.01 2110.05 584.17 6539.50 26596.11
2047 9000 572.28 2471.60 897.5 4553.64 2110.05 588.15 7193.45 27386.67
2048 9000 572.28 2471.60 897.5 4690.25 2110.05 592.25 7912.80 28246.73
2049 9000 572.28 2471.60 897.5 4830.96 2110.05 596.47 8704.08 29182.94
12.5 Rate of Return
In order to calculate Internal Rate of Return (IRR) for the proposed Port at RiverMahanadi the following factors are considered:
i. Capital investment is repayable in 10 equal installments after the completionof construction period. During the operation period only interest on residual
FEASIBILITY STUDY FOR PORT ON RIVER MAHANADI FINAL FEASIBILITY REPORTCHAPTER – 12
PROJECT COST AND FINANCIAL ANALYSIS211
capital is considered. Similar repayment procedures have been considered forPhase II investment.
ii. Operation and maintenance, salaries and wages have been taken into accountiii. Physical and price contingencies, interest during construction and other
financing costs, pre-construction expenses etc. @25% is considered on thecapital as actually utilised, and added to the total capital investment
iv. Mobilization of investment is considered with a Debt: Equity ratio of 70:30v. A straight line depreciation calculation is adopted with the following life
periodsa) Civil works : 50 yearsb) Equipment : 15 yearsc) Port crafts : 15 years
vi. Margin Money: Three months expenditure towards Operation of Equipmentand Machinery, Navigation Aids, Salaries and Wages, has been taken.
vii. In order to arrive at the tariff, the rates presently adopted at Paradip Port,Dhamra port and Gopalpur port have been considered and compared, beingthe nearest modern port to proposed Mahanadi Port.
Vessel RelatedPort Dues : Rs. 21.00/GRTPilotage & Towage : Rs. 44.00/GRTBerth hire charges : Rs. 15.00/GRTTOTAL : Rs. 80.00/GRT
Cargo RelatedWharfage (Average) : Rs. 85.00/TonneCargo Handling Charges : Rs. 90.00/TonneOther Charges (Storage etc.) : Rs. 10.00/TonneTOTAL : Rs. 185.00/Tonne
The cargo handling charges are set at Rs. 265 per tonne.
In the present BOOST scenario, additional land for port development shall beacquired and owned by the State Government. The cost of land shall beinitially borne by the developer. The amount towards cost of land shall beadjusted in equal annual instalments without interest within 15 years fromthe date of commencement. The cost of additional land to be acquired hasbeen estimated as Rs. 5000 lakhs which will be borne by developer. StateGovernment would adjust the land cost in 15 equal instalments of Rs. 333lakhs per year which can be treated as revenue to the developer each yearupto 15 years. Cargo handling facilities and land adjustment cost can generaterevenue varied from Rs. 258.26 lakhs per year to Rs. 618.59 crores per year
viii. The tariff increases by 5% per annum. However, decision to increase will betaken at a suitable time based on the market
ix. Preliminary Expenses: Rs. 25 crores

FEASIBILITY STUDY FOR PORT ON RIVER MAHANADI FINAL FEASIBILITY REPORTCHAPTER – 12
PROJECT COST AND FINANCIAL ANALYSIS212
12.5.1 Financial Internal Rate of Return (FIRR)
The value of internal rate of return (IRR) is calculated as an equivalent value tomake a net present value of the sum of income and cost to be 0 (zero) in a certainperiod of time. Thus, normally, when FIRR gets larger than a normal and mid-terminterest rate in the market, the validity of the project is often appreciated.
The FIRR of the project calculated under the above conditions came to 13.41% asshown in Table 12.3.
Table 12.3 Financial internal rate of return (FIRR)Rs. in Lakhs
Year Capital cost AnnualO & M Cost
Total Cost Financial Benefits Net Cash Flow
1 2 3 4 = (2+3) 5 6 = (5-4)2017 43646 0 43646 0 -436462018 59081 0 59081 0 -590812019 59081 0 59081 0 -590812020 17903 17903 25826.33 79232021 18024 18024 28158.33 101342022 18169 18169 31444.33 132752023 18322 18322 34306.33 159842024 18494 18494 37433.33 189392025 18690 18690 42905.58 24216
2026 18913 18913 46884.56 27971
2027 19169 19169 51225.26 32056
2028 19354 19354 51225.26 31871
2029 19552 19552 51225.26 31673
2030 19764 19764 53769.85 34006
2031 19991 19991 53769.85 337792032 20236 20236 53769.85 335342033 20498 20498 53769.85 332722034 20780 20780 53769.85 329892035 21085 21085 56108.35 350242036 21413 21413 56108.35 346962037 21766 21766 56108.35 343422038 22148 22148 56108.35 339602039 22561 22561 56108.35 335472040 23008 23008 58913.76 359062041 23491 23491 58913.76 35422

FEASIBILITY STUDY FOR PORT ON RIVER MAHANADI FINAL FEASIBILITY REPORTCHAPTER – 12
PROJECT COST AND FINANCIAL ANALYSIS213
Year Capital cost AnnualO & M Cost
Total Cost Financial Benefits Net Cash Flow
1 2 3 4 = (2+3) 5 6 = (5-4)2042 24015 24015 58913.76 348982043 24583 24583 58913.76 343302044 25200 25200 58913.76 337142045 25869 25869 61859.45 359902046 26596 26596 61859.45 352632047 27387 27387 61859.45 344732048 28247 28247 61859.45 336132049 29183 29183 61859.45 32677
Total 147703 654413 802116 1553892 651013
FIRR (%) 13.41%
The result indicates that the rate of return from the project is commerciallyattractive. The likely FIRR for relative concession periods is given below:
Table 12.4 FIRR for relative concession periodsConcession Period IRR NPV
(Rs. In Lakhs)20 Years 12.30% 1898225 Years 13.07% 3205330 Years 13.41% 39387
12.5.2 Sensitivity Analysis - FIRR
As far as sensitivity analysis is concerned, it is to be created out in order to see themagnitude of changes in critical element and the financial analysis. To evaluatethe project in more comprehensive manner, we conducted a sensitivity analysiswith fluctuating parameters on capital cost, annual operation & maintenance andrevenue at the rate of 10% from the base case in order to assess the possible risksof the project. The results of calculations are as follows
Table 12.5 Sensitivity Analysis – FIRR-10% Base +10%
Capital cost 13.26% 12.17% 11.23%Revenue 10.26% 12.17% 13.94%Annual O & M Cost 12.98% 12.17% 11.34%
The results of sensitivity analysis for capital cost +10%, sales revenue +10%, andoperation cost -10% indicate that revenue has the greatest impact on FIRR.Operation cost has the least impact because its value is relatively small. Moreoverthe changes in FIRR of project resulting from fluctuation in capital cost and sales

FEASIBILITY STUDY FOR PORT ON RIVER MAHANADI FINAL FEASIBILITY REPORTCHAPTER – 12
PROJECT COST AND FINANCIAL ANALYSIS214
revenue are 0.95% and 1.98% respectively. Consequently it can be concluded thatproject feasibility will be most directly impacted by changes in sales revenuerather than other parameters. In other words, this element is the critical factorsfor this project.
Fig. 12.1 Sensitivity Analysis - FIRR
12.5.3 Economic Evaluation
Cost-Benefit Analysis
Conditions for estimate of Economic Internal rate of Return (EIRR)
(i) Standard conversion factor (SCF)Based on the following data on export and import transaction values in2014-2015, it is estimated that the standard conversion factor (SCF) forcalculation of the economic cost of non-trade goods and service is 0.934.
Table 12.6 Export and import transaction of India(Unit: Rs. Crore)
Total ImportValue (2014-
2015)1,409,467
Total ExportValue (2014-
2015)972,272
Customsduty (2014-
2015)188,016
Source: Ministry of Finance, Govt. of India
(ii) Estimated from price discrepancy of average salary between market pricein the surrounding of study area and the legal price, the conversion factor

FEASIBILITY STUDY FOR PORT ON RIVER MAHANADI FINAL FEASIBILITY REPORTCHAPTER – 12
PROJECT COST AND FINANCIAL ANALYSIS215
of labour is adjusted to be 0.6.(iii) Since land transactions and associated taxes and public dues are
considered to be carried out in the domestic economy, capital transfersassociated with land are excluded from the economic analysis.
Conversion from Financial Cost to Economic Cost
(i) The financial cost of the project is separated into two parts: trade goodsand services (TGS) and non-trade goods and services (NTGS). These costsare converted into the CIF price and economic cost accordingly as shownbelow.
(ii) Capital cost of each project components are subdivided into foreign anddomestic based on the respective characteristics.
(iii) Labour cost is assumed to be 10% of total construction costs for bothindustrial sites and private factories in foreign financial cost, whereas thedomestic labour cost is based on 40% of the total construction cost fromwhich skilled labour and unskilled labour are subdivided into 20% and 80%of the total labour cost.
Table 12.7 Conversion from Financial Cost to Economic CostRs. in Lakhs
ItemFinancial
Cost(Foreign)
FOBFinancial
Cost(Domestic)
SCF EconomicCost Total
Capital GoodsCost 34,331 34,331 100,716 0.934 94,035 128,365
Labour Cost 3,433 3,433 40,286 - 19,337 22,770SkilledLabour 3,433 3,433 8,057 0.000 0 3,433
UnskilledLabour - 0 32,229 0.600 19,337 19,337
Land Acquisition - 0 5,000 - 0 0Tax - 0 - - 0 0
Base Cost 37,764 37,764 146,002 - 113,372 151,136Economic Cost 37,764 113,372 151,136
Economic Internal Rate of Return (EIRR)
As shown in table below, the EIRR of the proposed project is 17.09%. The resultcould indicate that the EIRR of this value envisions the viability and high benefit ofproject accrued for the opportunity cost. The benefit/cost ratio is 2.04 and it canbe regarded to reach the base line of the project’s feasibility evaluation, which isnormally adapted by the international development financial organizations.

FEASIBILITY STUDY FOR PORT ON RIVER MAHANADI FINAL FEASIBILITY REPORTCHAPTER – 12
PROJECT COST AND FINANCIAL ANALYSIS216
Table 12.8 Cash flow chart for EIRRRs. in Lakhs
Year Constructioncost
AnnualO & MCost
Total Cost Benefits Net CashFlow
1 2 3 4 = (2+3) 5 6 = (5-4)2017 21159 0 21159 0 -211592018 42318 0 42318 0 -423182019 42318 0 42318 0 -423182020 17903 17903 25826 79232021 18024 18024 28158 101342022 18169 18169 31444 132752023 18322 18322 34306 159842024 18494 18494 37433 189392025 18690 18690 42906 24216
2026 18913 18913 46885 27971
2027 19169 19169 51225 32056
2028 19354 19354 51225 31871
2029 19552 19552 51225 31673
2030 19764 19764 53770 34006
2031 19991 19991 53770 337792032 20236 20236 53770 335342033 20498 20498 53770 332722034 20780 20780 53770 329892035 21085 21085 56108 350242036 21413 21413 56108 346962037 21766 21766 56108 343422038 22148 22148 56108 339602039 22561 22561 56108 335472040 23008 23008 58914 359062041 23491 23491 58914 354222042 24015 24015 58914 348982043 24583 24583 58914 343302044 25200 25200 58914 337142045 25869 25869 61859 359902046 26596 26596 61859 352632047 27387 27387 61859 344732048 28247 28247 61859 336132049 29183 29183 61859 32677
Total 105795 654413 760208 1553892 692921
IRR(%) 17.09%

FEASIBILITY STUDY FOR PORT ON RIVER MAHANADI FINAL FEASIBILITY REPORTCHAPTER – 12
PROJECT COST AND FINANCIAL ANALYSIS217
Sensitivity Analysis - EIRR
The sensitivity of primary variables was studied by fluctuating anticipated benefitsand construction cost by 10% from the base case. These sensitivity analysesresults show that even in the case of negative impacts to the project, effects areminor and the benefit / cost ratio remains higher standard.
Table 12.9 Sensitivity Analysis – EIRR
-10% Base +10%Capital cost 18.38% 17.09% 15.98%Revenue 14.73% 17.09% 19.30%Annual O & M Cost 18.17% 17.09% 16.00%
Fig. 12.2 Sensitivity Analysis – EIRR
Evaluation
Economic analysis evaluates that the gross production of value added is positivelyenvisaged. The EIRR of the proposed project becomes 17.09%. This rate of returnis adequate enough to justify project development and subsequentlyinfrastructure developments can be expected to provide substantial benefits at arelatively low opportunity cost domain of the project site.

FEASIBILITY STUDY FOR PORT ON RIVER MAHANADI FINAL FEASIBILITY REPORTCHAPTER – 13
CONCLUSION AND RECOMMENDATIONS218
CHAPTER 13
CONCLUSIONS AND RECOMMENDATIONS
13.1 The selected alternative suggesting development of port facilities at left bank ofRiver Mahanadi including all associated facilities has been discussed in detail inthe previous Chapters. The details of the development and configurations of thedevelopment are also discussed in detail.
13.2 It must be clearly understood that port facility cannot exist in isolation andrequires adequate rail and road connectivity. It is understood that the rail androad connectivity is covered under a different BOOST proposal. However, in orderto aim for a realistic operation schedule for the harbour, the rail and roadnetwork should also be made operational concurrently, if not before. Thereforeconcerned works should be taken under the control of Government of Odisha.
13.3 Dredging and associated reclamation is the single most important activity for thedevelopment. Accordingly, all reputed construction firms / dredging companiesshould be contacted through a Global tender during the detailed Engineeringstage for obtaining competitive bids.
13.4 With the capital cost outlay of over Rs. 2110 Crores including IDC, the IRRcalculation indicates an attractive return of about 13.41%.
13.5 It has to be borne in mind that infrastructure projects have a lower rate of return,as a result of which Government as a national policy has been providingincentives for development, by way of tax holiday and other tax incentives. It isnecessary to further consider this capital cost in order to bring it down by at least30% by examining various options including reduction in dredging rates, fastertransport of construction material and other innovations, both on the civil andmechanical sides.
13.6 The harbour has a potential for future development of port land to the tune ofabout 300 ha and would be ideal for developing a Multi-commodity port.
13.7 For the first phase of development it is proposed to provide 2 berths, one for ironore and one combined berth for coal, fertilizer & other cargo and containers. Thecargo has been assumed to grow from an initial level of 18.43 million tonnesgrowing to 45.88 million tonnes per annum in the ultimate phase.
13.8 In conclusion, it can be stated with confidence that, development ofMulti-cargo Port at the left bank of River Mahanadi is technically feasible andfinancially attractive.