anz research new zealand economics anz property focus · new zealand economics anz property focus...
TRANSCRIPT
NEW ZEALAND ECONOMICS ANZ PROPERTY FOCUS
ANZ RESEARCH
December 2016
INSIDE
Chief Economist Corner: Will
History Repeat? 2
The Property Market in
Pictures 6
Property Gauges 10
Economic Overview 12
Mortgage Borrowing Strategy 13
Key Forecasts 14
CONTRIBUTORS
Cameron Bagrie Chief Economist Telephone: +64 4 802 2212 E-mail: [email protected]
Twitter @ANZ_cambagrie Philip Borkin Senior Economist Telephone: +64 9 357 4065 Email: [email protected] David Croy Senior Rates Strategist Telephone: +64 4 576 1022 E-mail: [email protected] Sharon Zöllner Senior Economist Telephone: +64 9 357 4094 E-mail: [email protected]
LAST CALL
SUMMARY
Our monthly Property Focus publication provides an independent appraisal of recent
developments in the property market.
CHIEF ECONOMIST CORNER: WILL HISTORY REPEAT?
It’s midnight at the bar. We’ve had a good time. Do we go home or stay out until 4am?
History says the New Zealand economy (housing market) stays out and binges. The
end result is an economic hangover as a bust follows the boom. Warning signs are
starting to flash with regard to leverage (credit expansion relative to incomes) and
asset valuations. The term “this time is different” is a phrase that can come back to
haunt an economist but there are some key differences now. We have a housing boom
but not a consumption equivalent as households show more restraint, which in
combination with the high NZD and other deflationary forces is keeping inflation (and
the RBNZ) at bay. Housing supply is still not keeping pace with demand so we don’t
have a surfeit of stock that could pressure prices. We don’t have a shadow banking
sector. The regulator (RBNZ) is playing bouncer at the door through loan-to-value
restrictions and banks the responsible bar-tender tightening up the availability of
credit. This will help dampen the extent of excesses built up at the top, which will
lessen the pressure for an adjustment on the other side.
PROPERTY GAUGES
The housing market has slowed as the combination of extended valuations, movement
in interest rates off lows, prudential policy changes (LVR restrictions) and tighter credit
availability act as headwinds. But questions will surround how long the moderation will
last given the fundamental shortage of dwellings across the market, which continues to
get more pronounced with the impetus from surging migration.
ECONOMIC OVERVIEW
The New Zealand economy is entering its eighth year of expansion with strong
momentum. But natural headwinds are now emerging (capacity pressures, a turn in
credit cycle, tighter financial conditions, stretched asset valuations) that should see
growth ease over the course of the year (from 3½-4% towards 3%). That’s a natural
moderation, as opposed to a downturn. We view it as healthy in the context of the
country’s medium-term stability and its resilience to external shocks. The RBNZ
remains on the side-lines for now, although price pressures are now building.
MORTGAGE BORROWING STRATEGY
Although there has been little change to floating mortgage rates, rates with terms of 2
years and longer continue to move gradually higher. This has occurred largely as a
result of higher global interest rates (which tend to have a larger influence on New
Zealand longer-term rates than local factors do), and rising funding costs. As we noted
last month, we believe mortgage rates have seen their lows, and although rises from
here are likely to be gradual, they are rises nonetheless. Although rates are not quite
as attractive as they were a month ago and we maintain our view that it is worthwhile
considering fixing some portion of your mortgage for longer than 1-2 years, recent
rises do make it a much closer call. With the OCR on hold, 1-2 mortgage year rates
won’t go up for a while.
ANZ Property Focus / December 2016 / 2 of 16
CHIEF ECONOMIST CORNER: WILL HISTORY REPEAT?
SUMMARY
It’s midnight at the bar. We’ve had a good time. Do we go home or stay out until 4am? History says the New
Zealand economy (housing market) stays out and binges. The end result is an economic hangover as a bust
follows the boom. Warning signs are starting to flash with regard to leverage (credit expansion relative to
incomes) and asset valuations. The term “this time is different” is a phrase that can come back to haunt an
economist but there are some key differences now. We have a housing boom but not a consumption equivalent as
households show more restraint, which in combination with the high NZD and other deflationary forces is keeping
inflation (and the RBNZ) at bay. Housing supply is still not keeping pace with demand so we don’t have a surfeit of
stock that could pressure prices. We don’t have a shadow banking sector. The regulator (RBNZ) is playing bouncer
at the door through loan-to-value restrictions and banks the responsible bar-tender tightening up the availability
of credit. This will help dampen the extent of excesses built up at the top, which will lessen the pressure for an
adjustment on the other side.
The economy goes through good times and not-so-good times. It is called the business cycle and it is
normal. Night follows day just as day follows night. Businesses, households and investors need to manage such
volatility.
In the case of New Zealand, it has been the extremities of these swings that have presented the
biggest challenges. We affectionately refer to the New Zealand economy as the 3-speed economy: fifth, neutral
and reverse. This is particularly so for sectors sensitive to domestic interest rates, such as the housing market.
Large swings in the business cycle can typically be linked to four key dynamics:
● A turn in the global economy. Where they go we follow.
● Mother Nature.
● A build-up of economic imbalances (excesses) that ultimately require purging and the piper being paid.
● Large swings in the stance of monetary policy (interest rates) and the associated fallout for the NZD. The
former hits the housing market particularly hard.
The first two are beyond New Zealand’s direct control. Where we are more in control of our own destiny is the
latter two.
When we assess the state of the current business cycle, warning signs are starting to flash.
● Debt is rising fast. Household debt is now 165% of disposable income (it peaked at 159% prior to the GFC)
and annual credit growth is running at more than 8%. Even though income growth has recovered, it is
running only around 5%. We’re borrowing and spending our way to growth. That isn’t sustainable in the long
run.
● There is a strong correlation between house prices and debt accumulation. Where the former heads,
the latter tends to follow, although the causation can also run the other way. Credit availability is also a key
driver of asset prices.
● New Zealand is already heavily indebted to the rest of the world. Net external debt is 56% of GDP,
and most of that is private sector debt. It’s an issue. Rating agencies such as Standard & Poor’s, Fitch and
Moody’s note that it is too high. To be fair, it is a lot lower than was around the time of the GFC (it peaked at
84% of GDP in 2009), but we are starting to see those pre-2008 style behaviours creep in again.
● Households are starting to dip back into the piggy bank. The household saving rate fell to -2.2% in the
year to March 2016, on par with what was seen in 2009.
● Investor housing lending has been growing rapidly. It rose from 29% to 38% of total new mortgage
lending between August 2014 and mid-2016 (although it has eased most recently). Moreover, around 55% of
new loans to investors are on interest-only terms (compared to 30% for other buyers).
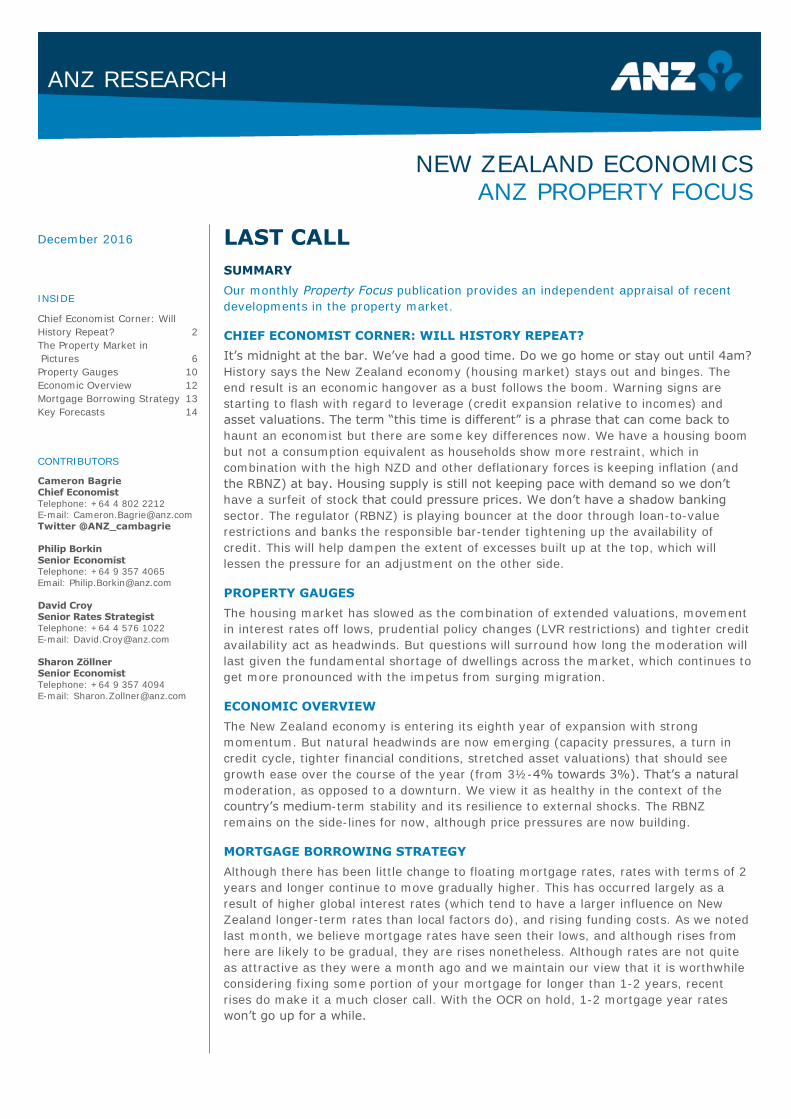
● The average Auckland house price is at least nine times the average income. Average house prices
across the rest of the country are around five times. Both are too high. Go back 50-70 years and the average
family couldn’t afford a car, but they could afford a house. Now it’s the other way around, and while we don’t
want to get political, it’s an irony that some people are now living in cars. Nobody wins from unaffordable
house prices in the long term.
ANZ Property Focus / December 2016 / 3 of 16
CHIEF ECONOMIST CORNER: WILL HISTORY REPEAT?
FIGURE 1. REGIONAL HOUSE PRICES TO INCOME
Source: ANZ, REINZ, Statistics NZ
● Rental yields continue to fall. They are at historic lows in Auckland (below 3% in a number of suburbs);
people are obviously purchasing for capital gain. House price expectations – particularly with regard to
Auckland – remain high (the average response over the past 12 months within our consumer confidence
survey is over 6%).
● Auckland house prices have surged close to 40% in two years. Rents have risen 6.5% over the same
period. So it’s not purely a supply shortage story that is driving activity. Exuberance and ‘animal spirits’
within the market are clear to see.
● Housing-related inflation (construction costs, property maintenance etc) is strong; historically
that has spilled over into general inflation. Non-tradable inflation is now tracking up. The labour
market is tightening, which is typically a precursor to rising service sector inflation. Attention is turning to
when the RBNZ will begin withdrawing monetary policy stimulus.
We’ve seen this playbook before and the endgame is typically not a happy one. Casting our minds back
to just prior to the Asian Crisis and GFC, the same symptoms were apparent. Such forces weakened the
economy from a structural perspective. The economy was already slowing rapidly. And the result, when hit by a
foreign / Mother Nature shock, was an extreme turn in the cycle. The booms quickly turned into busts.
Is New Zealand setting itself up for the same again? We’re not picking that a global recession is around
the corner (though we would place non-trivial odds on one) but we do closely monitor how the economy stands
when entering periods of heightened uncertainty.
While we indeed have semblances of vulnerability, notably as regards to housing, we don’t believe
we have wholesale excesses like we have had in the past, and on some levels there are clear
differences.
● The current account deficit is lower (~3.0% of GDP compared with 7.9% in 2006 just prior to the GFC).
It’s been projected to deteriorate each year and hasn’t, which we take as a sign that structural forces are
becoming more influential (i.e. we are no longer such a ‘bad’ nation saving-wise). Borrow-and-spend
growth has not manifested itself in a deteriorating external position. Net external debt (noted above) is also
far lower. Admittedly, it’s still a high number, so it’s more of a case that we’re ‘less bad’.
● Households are carrying a lot of debt, but at least business balance sheets are in good shape.
The sector has been generating good cash flow and its net saving position (6.6% of national disposable
income) is the highest since 2003. Leverage build-up has also been demure (especially outside of the dairy
and property sectors). Despite business sector credit running at 7.8% in the year to September, the RBNZ
estimates that debt-to-income ratio in the non-property business sector is only 16.7%, which is below its
GFC peak and only a touch above its average since 2000.
2
3
4
5
6
7
8
9
91 93 95 97 99 01 03 05 07 09 11 13 15
Ratio
New Zealand NZ ex Auckland Auckland
ANZ Property Focus / December 2016 / 4 of 16
CHIEF ECONOMIST CORNER: WILL HISTORY REPEAT?
● We’re not seeing the traditional flow-on from a strong property market and debt-driven
excesses into the retail sector. Consumption per capita, and consumption growth more broadly, has
been restrained, and that has contained the spill-over from housing inflation more broadly into non-tradable
inflation. Talk to any retailer and they’ll tell you how tough a gig it is. Some would argue that high house
prices have led to increased precautionary savings on the part of first home buyers, and also concern
among the middle class that they’re going to have to fund their kids into their first homes. Research by
Treasury shows those in their 20s are actually saving like mad, at least relative to how much generations
before them did at the same age.
● There are still massive disinflationary forces shaping the outlook for inflation: technology, high
global leverage, the high NZD and low inflation expectations. The supply side of the labour market is
alleviating extreme tightness via migration and participation. It doesn’t look like interest rates will be
moving up any time soon, and if they do it won’t be by much. The last few years have shown it’s impossible
to be too far out of step with the global scene interest rate-wise as tighter monetary policy here versus
loose policy elsewhere sends your currency into orbit.
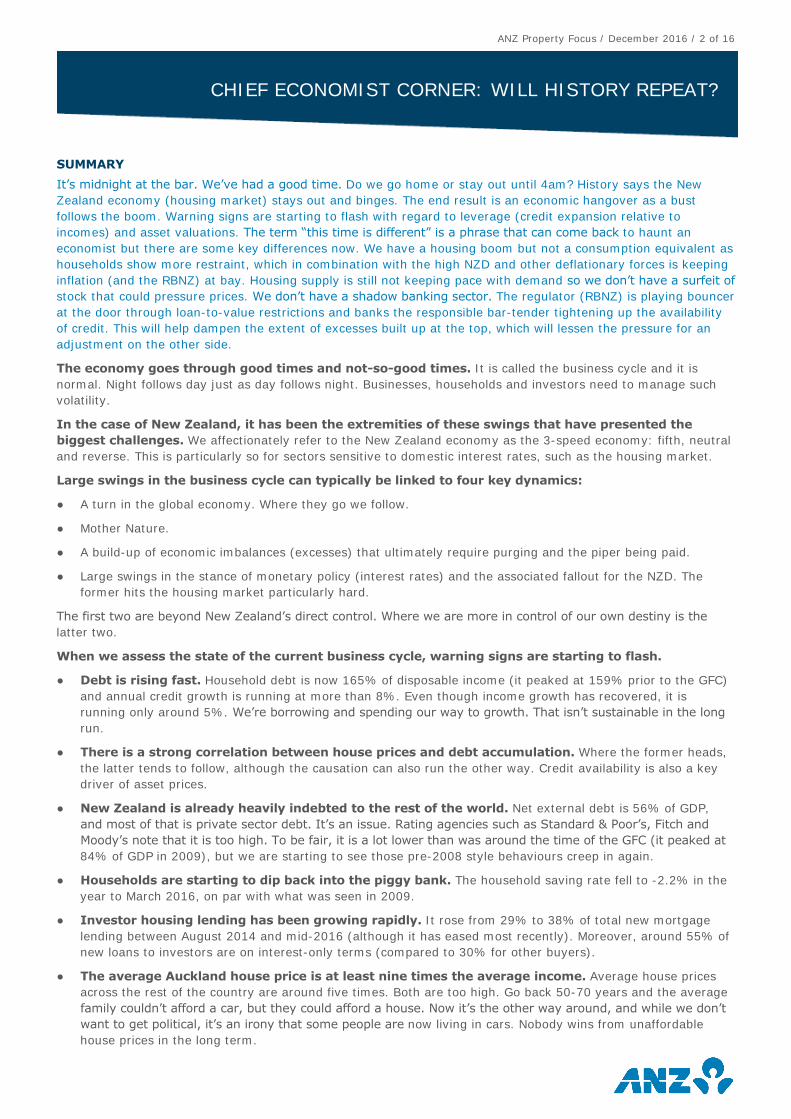
● While New Zealand still has a high offshore debt burden, the maturity of that funding has
lengthened. Financial firewalls have been strengthened.
FIGURE 2. GROSS INTERNATIONAL DEBT LIABILITIES MATURITY < 90 DAYS
Source: ANZ, Statistics NZ
● Household debt levels may be higher, but debt serviceability has improved, courtesy of much
lower interest rates. Household debt servicing as a share of income rose to over a whopping 14% in
2008; it sits at 8.7% now. Even if we assume interest rates nudge up over the coming years, the debt-
servicing burden will not turn onerous for quite a while.
● KiwiSaver is now entrenched in the national psyche. Close to 2.7 million Kiwis now have a KiwiSaver
account, and contributions are growing at a circa $5bn annual clip. KiwiSaver funds have grown as a result
of surging equity and bond prices here and abroad, as well as because of contributions.
● We don’t have a shadow banking sector. Finance company lending outside the ambit of the regulator
was a problem in the lead-up to the GFC.
● We’re still not building enough houses. Typically at the top of the cycle we build too many. Now we
can’t keep up with the demand.
● The regulator (RBNZ) is into its third round of prudential policy tweaks and the latest tightening
(40% deposit requirement for investors) is not mucking around. It’s hit the housing market hard. More
(debt-to-income limits) will be on offer if the market takes off again.
20
25
30
35
40
45
50
55
00 01 02 03 04 05 06 07 08 09 10 11 12 13 14 15 16
% o
f to
tal
ANZ Property Focus / December 2016 / 5 of 16
CHIEF ECONOMIST CORNER: WILL HISTORY REPEAT?
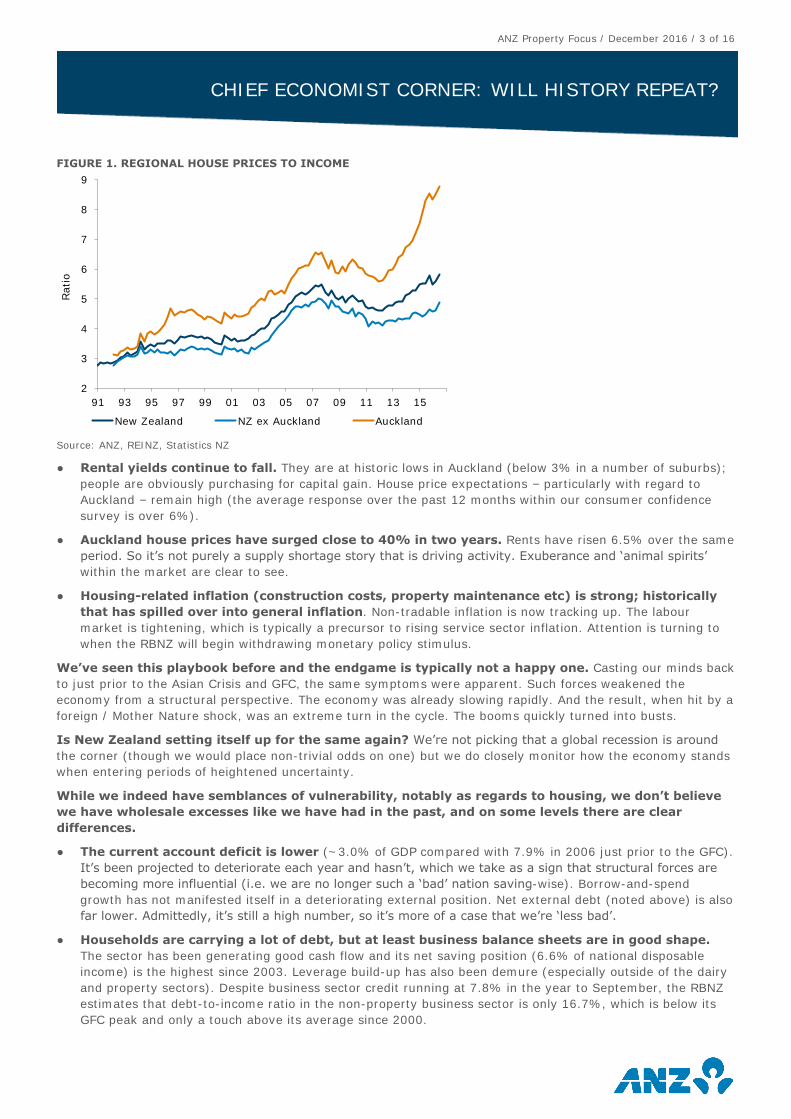
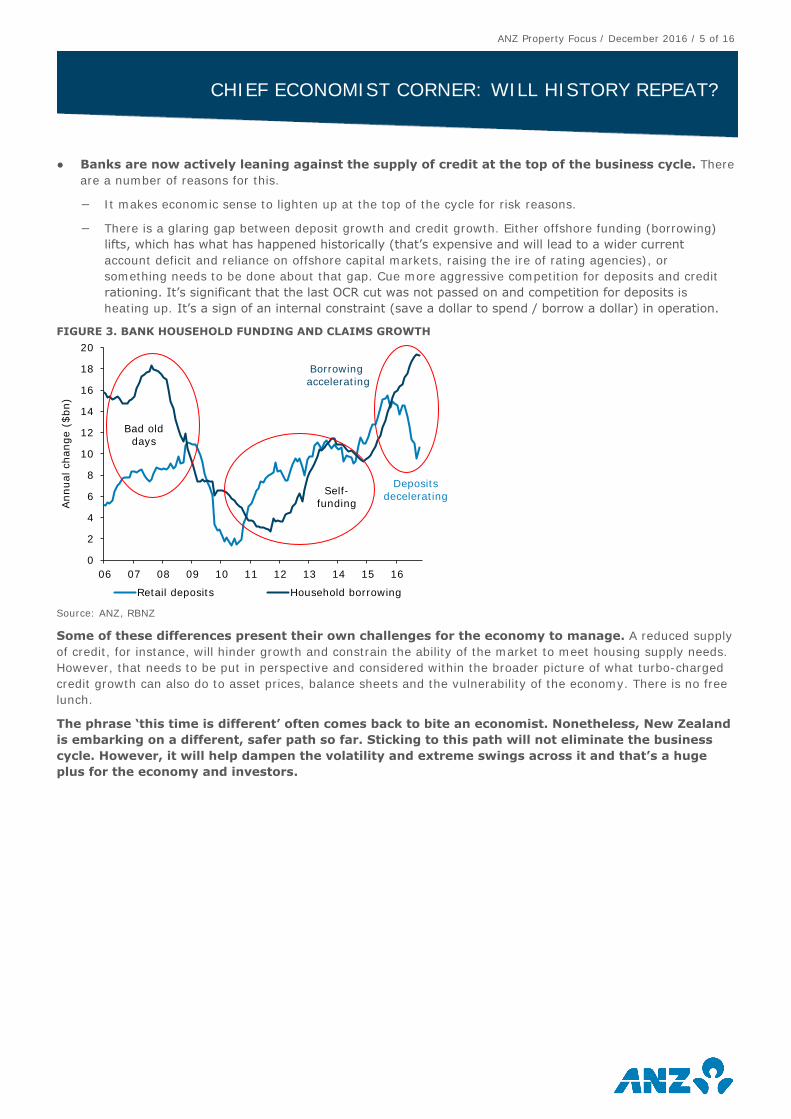
● Banks are now actively leaning against the supply of credit at the top of the business cycle. There
are a number of reasons for this.
− It makes economic sense to lighten up at the top of the cycle for risk reasons.
− There is a glaring gap between deposit growth and credit growth. Either offshore funding (borrowing)
lifts, which has what has happened historically (that’s expensive and will lead to a wider current
account deficit and reliance on offshore capital markets, raising the ire of rating agencies), or
something needs to be done about that gap. Cue more aggressive competition for deposits and credit
rationing. It’s significant that the last OCR cut was not passed on and competition for deposits is
heating up. It’s a sign of an internal constraint (save a dollar to spend / borrow a dollar) in operation.
FIGURE 3. BANK HOUSEHOLD FUNDING AND CLAIMS GROWTH
Source: ANZ, RBNZ
Some of these differences present their own challenges for the economy to manage. A reduced supply
of credit, for instance, will hinder growth and constrain the ability of the market to meet housing supply needs.
However, that needs to be put in perspective and considered within the broader picture of what turbo-charged
credit growth can also do to asset prices, balance sheets and the vulnerability of the economy. There is no free
lunch.
The phrase ‘this time is different’ often comes back to bite an economist. Nonetheless, New Zealand
is embarking on a different, safer path so far. Sticking to this path will not eliminate the business
cycle. However, it will help dampen the volatility and extreme swings across it and that’s a huge
plus for the economy and investors.
0
2
4
6
8
10
12
14
16
18
20
06 07 08 09 10 11 12 13 14 15 16
Annual change (
$bn)
Retail deposits Household borrowing
Borrowing
accelerating
Deposits
deceleratingSelf-
funding
Bad old
days
ANZ Property Focus / December 2016 / 6 of 16
THE PROPERTY MARKET IN PICTURES
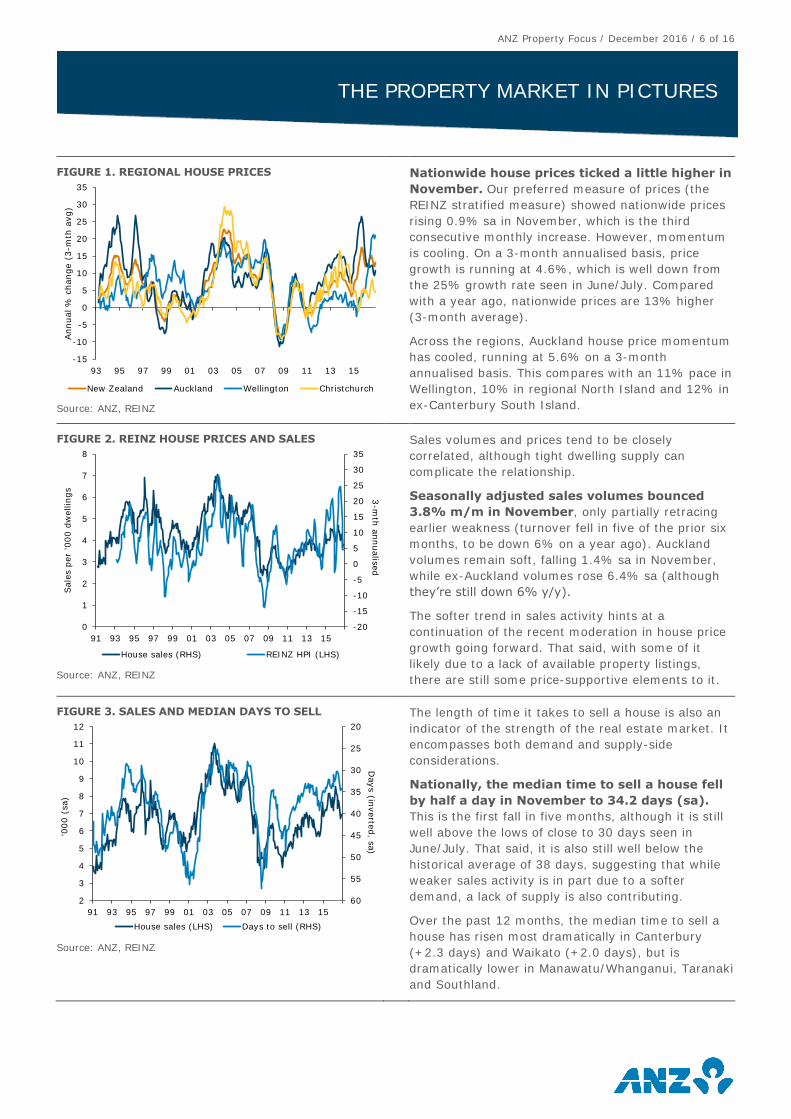
FIGURE 1. REGIONAL HOUSE PRICES
Source: ANZ, REINZ
Nationwide house prices ticked a little higher in
November. Our preferred measure of prices (the
REINZ stratified measure) showed nationwide prices
rising 0.9% sa in November, which is the third
consecutive monthly increase. However, momentum
is cooling. On a 3-month annualised basis, price
growth is running at 4.6%, which is well down from
the 25% growth rate seen in June/July. Compared
with a year ago, nationwide prices are 13% higher
(3-month average).
Across the regions, Auckland house price momentum
has cooled, running at 5.6% on a 3-month
annualised basis. This compares with an 11% pace in
Wellington, 10% in regional North Island and 12% in
ex-Canterbury South Island.
FIGURE 2. REINZ HOUSE PRICES AND SALES
Source: ANZ, REINZ
Sales volumes and prices tend to be closely
correlated, although tight dwelling supply can
complicate the relationship.
Seasonally adjusted sales volumes bounced
3.8% m/m in November, only partially retracing
earlier weakness (turnover fell in five of the prior six
months, to be down 6% on a year ago). Auckland
volumes remain soft, falling 1.4% sa in November,
while ex-Auckland volumes rose 6.4% sa (although
they’re still down 6% y/y).
The softer trend in sales activity hints at a
continuation of the recent moderation in house price
growth going forward. That said, with some of it
likely due to a lack of available property listings,
there are still some price-supportive elements to it.
FIGURE 3. SALES AND MEDIAN DAYS TO SELL
Source: ANZ, REINZ
The length of time it takes to sell a house is also an
indicator of the strength of the real estate market. It
encompasses both demand and supply-side
considerations.
Nationally, the median time to sell a house fell
by half a day in November to 34.2 days (sa).
This is the first fall in five months, although it is still
well above the lows of close to 30 days seen in
June/July. That said, it is also still well below the
historical average of 38 days, suggesting that while
weaker sales activity is in part due to a softer
demand, a lack of supply is also contributing.
Over the past 12 months, the median time to sell a
house has risen most dramatically in Canterbury
(+2.3 days) and Waikato (+2.0 days), but is
dramatically lower in Manawatu/Whanganui, Taranaki
and Southland.
-15
-10
-5
0
5
10
15
20
25
30
35
93 95 97 99 01 03 05 07 09 11 13 15
Annual %
change (
3-m
th a
vg)
New Zealand Auckland Wellington Christchurch
-20
-15
-10
-5
0
5
10
15
20
25
30
35
0
1
2
3
4
5
6
7
8
91 93 95 97 99 01 03 05 07 09 11 13 15
3-m
th a
nnualis
ed
Sale
s p
er
'000 d
wellin
gs
House sales (RHS) REINZ HPI (LHS)
20
25
30
35
40
45
50
55
602
3
4
5
6
7
8
9
10
11
12
91 93 95 97 99 01 03 05 07 09 11 13 15
Days (in
verte
d, s
a)
'000 (
sa)
House sales (LHS) Days to sell (RHS)
ANZ Property Focus / December 2016 / 7 of 16
THE PROPERTY MARKET IN PICTURES
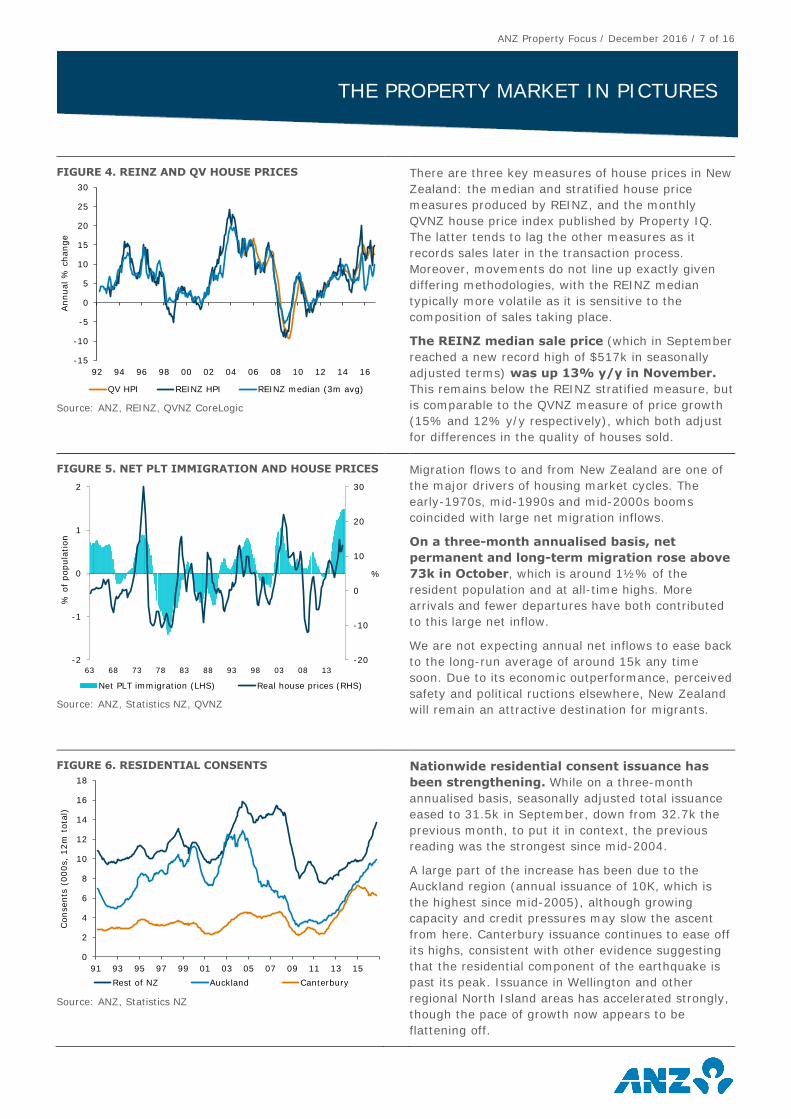
FIGURE 4. REINZ AND QV HOUSE PRICES
Source: ANZ, REINZ, QVNZ CoreLogic
There are three key measures of house prices in New
Zealand: the median and stratified house price
measures produced by REINZ, and the monthly
QVNZ house price index published by Property IQ.
The latter tends to lag the other measures as it
records sales later in the transaction process.
Moreover, movements do not line up exactly given
differing methodologies, with the REINZ median
typically more volatile as it is sensitive to the
composition of sales taking place.
The REINZ median sale price (which in September
reached a new record high of $517k in seasonally
adjusted terms) was up 13% y/y in November.
This remains below the REINZ stratified measure, but
is comparable to the QVNZ measure of price growth
(15% and 12% y/y respectively), which both adjust
for differences in the quality of houses sold.
FIGURE 5. NET PLT IMMIGRATION AND HOUSE PRICES
Source: ANZ, Statistics NZ, QVNZ
Migration flows to and from New Zealand are one of
the major drivers of housing market cycles. The
early-1970s, mid-1990s and mid-2000s booms
coincided with large net migration inflows.
On a three-month annualised basis, net
permanent and long-term migration rose above
73k in October, which is around 1½% of the
resident population and at all-time highs. More
arrivals and fewer departures have both contributed
to this large net inflow.
We are not expecting annual net inflows to ease back
to the long-run average of around 15k any time
soon. Due to its economic outperformance, perceived
safety and political ructions elsewhere, New Zealand
will remain an attractive destination for migrants.
FIGURE 6. RESIDENTIAL CONSENTS
Source: ANZ, Statistics NZ
Nationwide residential consent issuance has
been strengthening. While on a three-month
annualised basis, seasonally adjusted total issuance
eased to 31.5k in September, down from 32.7k the
previous month, to put it in context, the previous
reading was the strongest since mid-2004.
A large part of the increase has been due to the
Auckland region (annual issuance of 10K, which is
the highest since mid-2005), although growing
capacity and credit pressures may slow the ascent
from here. Canterbury issuance continues to ease off
its highs, consistent with other evidence suggesting
that the residential component of the earthquake is
past its peak. Issuance in Wellington and other
regional North Island areas has accelerated strongly,
though the pace of growth now appears to be
flattening off.
-15
-10
-5
0
5
10
15
20
25
30
92 94 96 98 00 02 04 06 08 10 12 14 16
Annual %
change
QV HPI REINZ HPI REINZ median (3m avg)
-20
-10
0
10
20
30
-2
-1
0
1
2
63 68 73 78 83 88 93 98 03 08 13
%
% o
f popula
tion
Net PLT immigration (LHS) Real house prices (RHS)
0
2
4
6
8
10
12
14
16
18
91 93 95 97 99 01 03 05 07 09 11 13 15
Consents
(000s,
12m
tota
l)
Rest of NZ Auckland Canterbury
ANZ Property Focus / December 2016 / 8 of 16
THE PROPERTY MARKET IN PICTURES
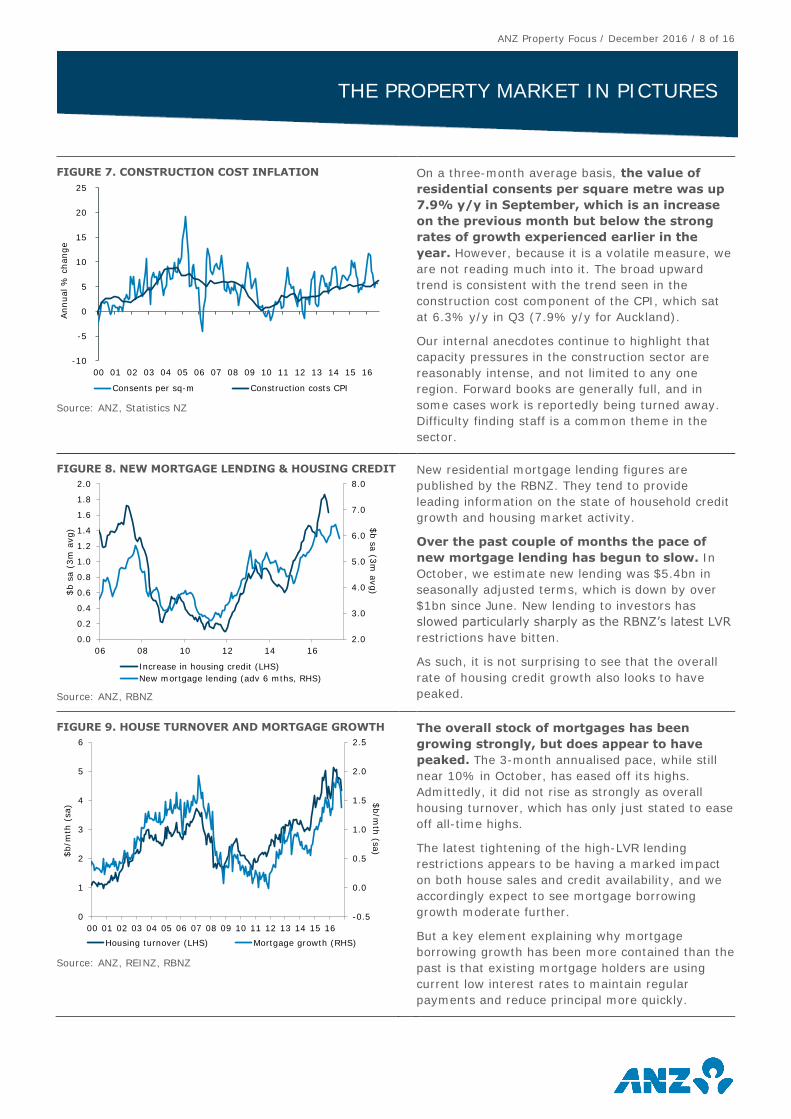
FIGURE 7. CONSTRUCTION COST INFLATION
Source: ANZ, Statistics NZ
On a three-month average basis, the value of
residential consents per square metre was up
7.9% y/y in September, which is an increase
on the previous month but below the strong
rates of growth experienced earlier in the
year. However, because it is a volatile measure, we
are not reading much into it. The broad upward
trend is consistent with the trend seen in the
construction cost component of the CPI, which sat
at 6.3% y/y in Q3 (7.9% y/y for Auckland).
Our internal anecdotes continue to highlight that
capacity pressures in the construction sector are
reasonably intense, and not limited to any one
region. Forward books are generally full, and in
some cases work is reportedly being turned away.
Difficulty finding staff is a common theme in the
sector.
FIGURE 8. NEW MORTGAGE LENDING & HOUSING CREDIT
Source: ANZ, RBNZ
New residential mortgage lending figures are
published by the RBNZ. They tend to provide
leading information on the state of household credit
growth and housing market activity.
Over the past couple of months the pace of
new mortgage lending has begun to slow. In
October, we estimate new lending was $5.4bn in
seasonally adjusted terms, which is down by over
$1bn since June. New lending to investors has
slowed particularly sharply as the RBNZ’s latest LVR
restrictions have bitten.
As such, it is not surprising to see that the overall
rate of housing credit growth also looks to have
peaked.
FIGURE 9. HOUSE TURNOVER AND MORTGAGE GROWTH
Source: ANZ, REINZ, RBNZ
The overall stock of mortgages has been
growing strongly, but does appear to have
peaked. The 3-month annualised pace, while still
near 10% in October, has eased off its highs.
Admittedly, it did not rise as strongly as overall
housing turnover, which has only just stated to ease
off all-time highs.
The latest tightening of the high-LVR lending
restrictions appears to be having a marked impact
on both house sales and credit availability, and we
accordingly expect to see mortgage borrowing
growth moderate further.
But a key element explaining why mortgage
borrowing growth has been more contained than the
past is that existing mortgage holders are using
current low interest rates to maintain regular
payments and reduce principal more quickly.
-10
-5
0
5
10
15
20
25
00 01 02 03 04 05 06 07 08 09 10 11 12 13 14 15 16
Annual %
change
Consents per sq-m Construction costs CPI
2.0
3.0
4.0
5.0
6.0
7.0
8.0
0.0
0.2
0.4
0.6
0.8
1.0
1.2
1.4
1.6
1.8
2.0
06 08 10 12 14 16
$b s
a (3
m a
vg)$
b s
a (
3m
avg)
Increase in housing credit (LHS)
New mortgage lending (adv 6 mths, RHS)
-0.5
0.0
0.5
1.0
1.5
2.0
2.5
0
1
2
3
4
5
6
00 01 02 03 04 05 06 07 08 09 10 11 12 13 14 15 16
$b/m
th (s
a)
$b/m
th (
sa)
Housing turnover (LHS) Mortgage growth (RHS)
ANZ Property Focus / December 2016 / 9 of 16
THE PROPERTY MARKET IN PICTURES
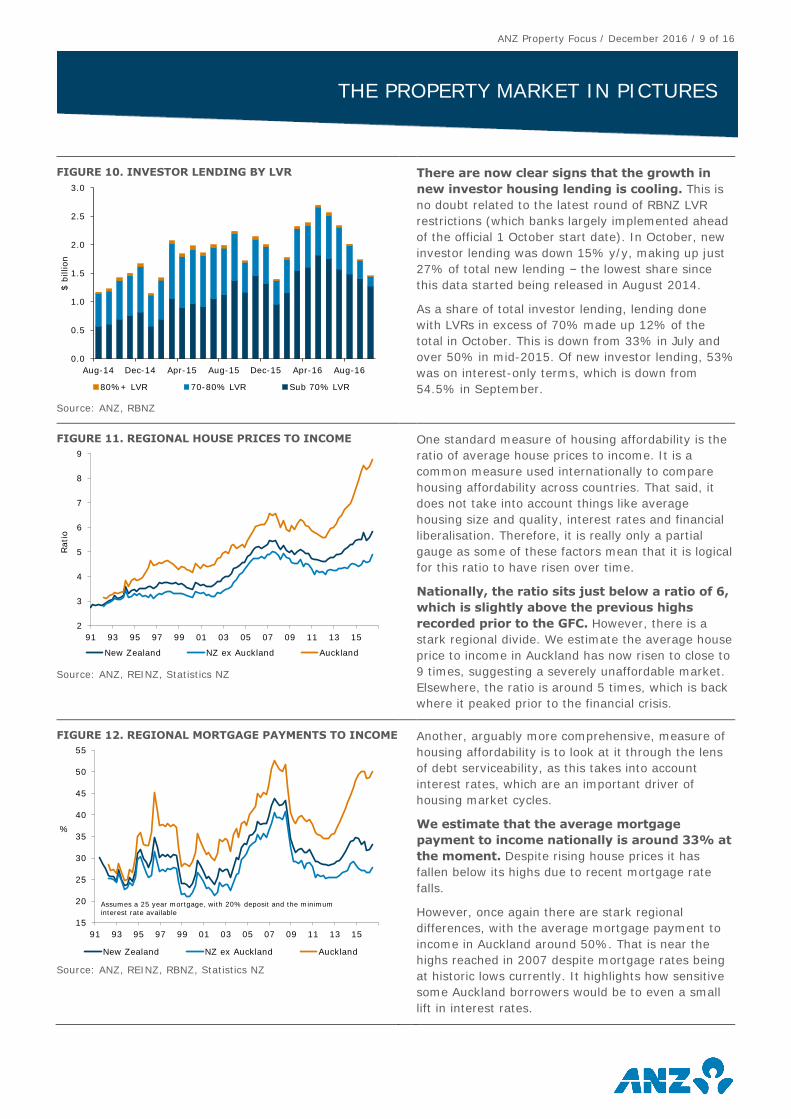
FIGURE 10. INVESTOR LENDING BY LVR
Source: ANZ, RBNZ
There are now clear signs that the growth in
new investor housing lending is cooling. This is
no doubt related to the latest round of RBNZ LVR
restrictions (which banks largely implemented ahead
of the official 1 October start date). In October, new
investor lending was down 15% y/y, making up just
27% of total new lending – the lowest share since
this data started being released in August 2014.
As a share of total investor lending, lending done
with LVRs in excess of 70% made up 12% of the
total in October. This is down from 33% in July and
over 50% in mid-2015. Of new investor lending, 53%
was on interest-only terms, which is down from
54.5% in September.
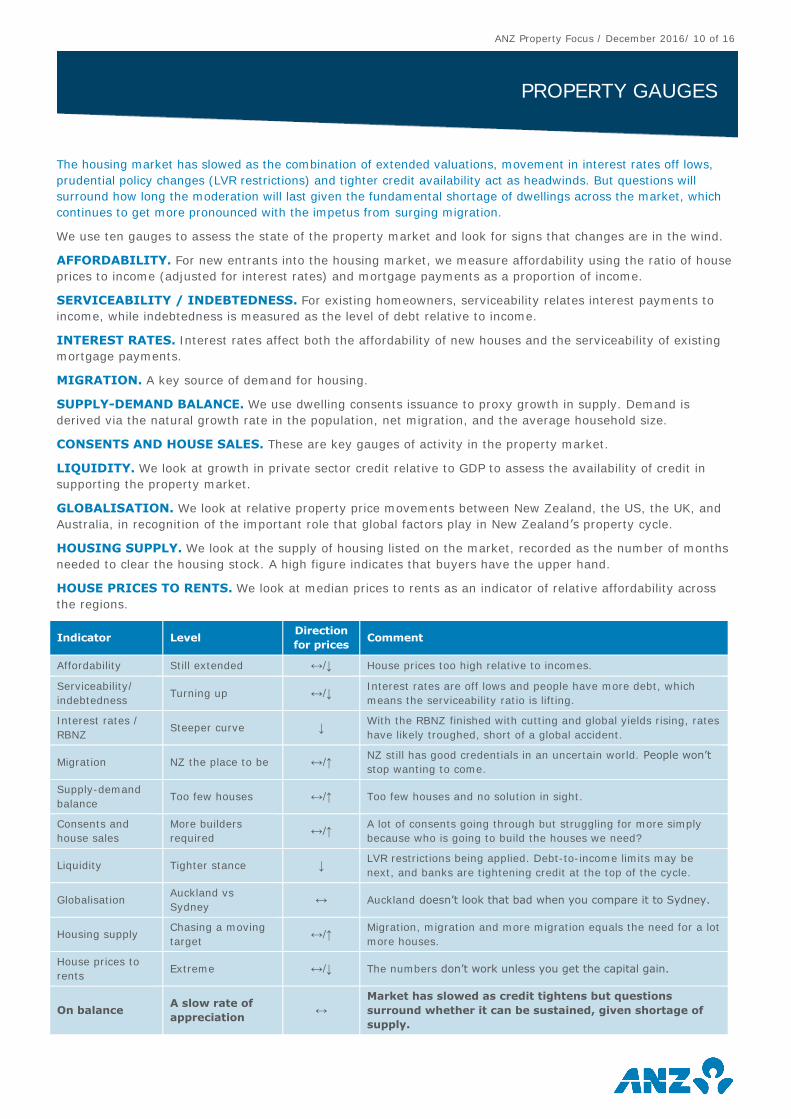
FIGURE 11. REGIONAL HOUSE PRICES TO INCOME
Source: ANZ, REINZ, Statistics NZ
One standard measure of housing affordability is the
ratio of average house prices to income. It is a
common measure used internationally to compare
housing affordability across countries. That said, it
does not take into account things like average
housing size and quality, interest rates and financial
liberalisation. Therefore, it is really only a partial
gauge as some of these factors mean that it is logical
for this ratio to have risen over time.
Nationally, the ratio sits just below a ratio of 6,
which is slightly above the previous highs
recorded prior to the GFC. However, there is a
stark regional divide. We estimate the average house
price to income in Auckland has now risen to close to
9 times, suggesting a severely unaffordable market.
Elsewhere, the ratio is around 5 times, which is back
where it peaked prior to the financial crisis.
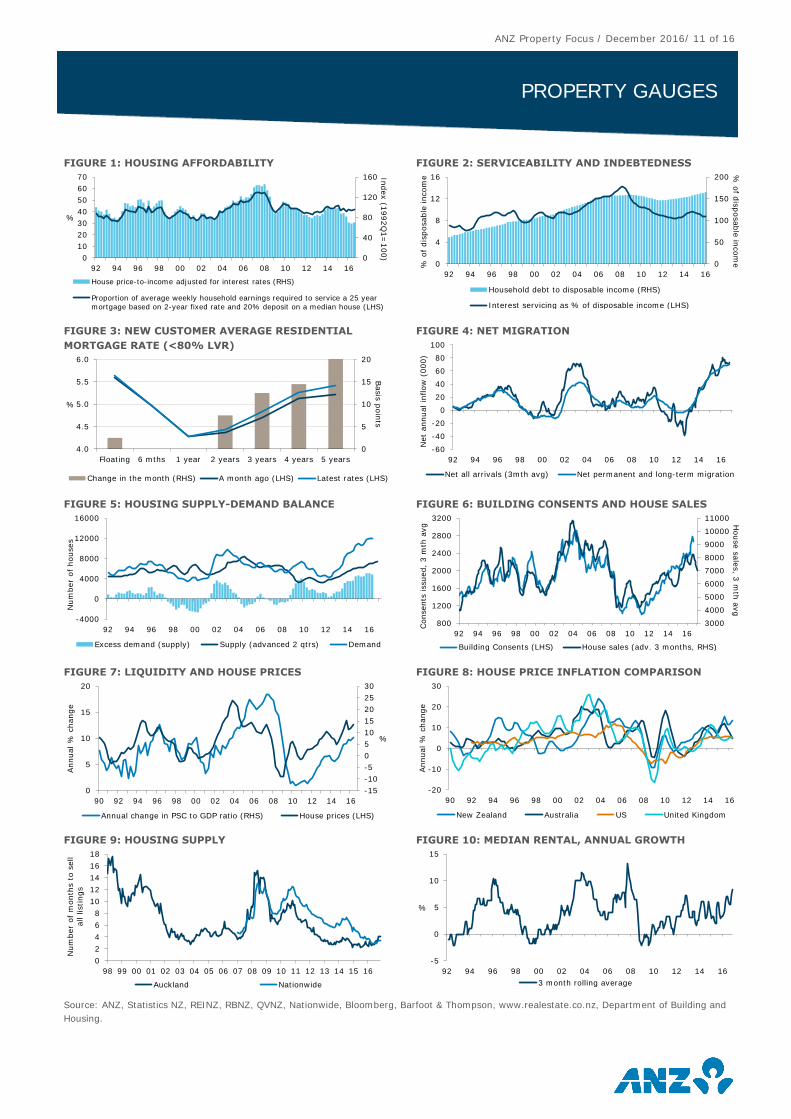
FIGURE 12. REGIONAL MORTGAGE PAYMENTS TO INCOME
Source: ANZ, REINZ, RBNZ, Statistics NZ
Another, arguably more comprehensive, measure of
housing affordability is to look at it through the lens
of debt serviceability, as this takes into account
interest rates, which are an important driver of
housing market cycles.
We estimate that the average mortgage
payment to income nationally is around 33% at
the moment. Despite rising house prices it has
fallen below its highs due to recent mortgage rate
falls.
However, once again there are stark regional
differences, with the average mortgage payment to
income in Auckland around 50%. That is near the
highs reached in 2007 despite mortgage rates being
at historic lows currently. It highlights how sensitive
some Auckland borrowers would be to even a small
lift in interest rates.
0.0
0.5
1.0
1.5
2.0
2.5
3.0
Aug-14 Dec-14 Apr-15 Aug-15 Dec-15 Apr-16 Aug-16
$ b
illion
80%+ LVR 70-80% LVR Sub 70% LVR
2
3
4
5
6
7
8
9
91 93 95 97 99 01 03 05 07 09 11 13 15
Ratio
New Zealand NZ ex Auckland Auckland
15
20
25
30
35
40
45
50
55
91 93 95 97 99 01 03 05 07 09 11 13 15
%
New Zealand NZ ex Auckland Auckland
Assumes a 25 year mortgage, with 20% deposit and the minimum interest rate available
ANZ Property Focus / December 2016/ 10 of 16
PROPERTY GAUGES
The housing market has slowed as the combination of extended valuations, movement in interest rates off lows,
prudential policy changes (LVR restrictions) and tighter credit availability act as headwinds. But questions will
surround how long the moderation will last given the fundamental shortage of dwellings across the market, which
continues to get more pronounced with the impetus from surging migration.
We use ten gauges to assess the state of the property market and look for signs that changes are in the wind.
AFFORDABILITY. For new entrants into the housing market, we measure affordability using the ratio of house
prices to income (adjusted for interest rates) and mortgage payments as a proportion of income.
SERVICEABILITY / INDEBTEDNESS. For existing homeowners, serviceability relates interest payments to
income, while indebtedness is measured as the level of debt relative to income.
INTEREST RATES. Interest rates affect both the affordability of new houses and the serviceability of existing
mortgage payments.
MIGRATION. A key source of demand for housing.
SUPPLY-DEMAND BALANCE. We use dwelling consents issuance to proxy growth in supply. Demand is
derived via the natural growth rate in the population, net migration, and the average household size.
CONSENTS AND HOUSE SALES. These are key gauges of activity in the property market.
LIQUIDITY. We look at growth in private sector credit relative to GDP to assess the availability of credit in
supporting the property market.
GLOBALISATION. We look at relative property price movements between New Zealand, the US, the UK, and
Australia, in recognition of the important role that global factors play in New Zealand’s property cycle.
HOUSING SUPPLY. We look at the supply of housing listed on the market, recorded as the number of months
needed to clear the housing stock. A high figure indicates that buyers have the upper hand.
HOUSE PRICES TO RENTS. We look at median prices to rents as an indicator of relative affordability across
the regions.
Indicator Level Direction
for prices Comment
Affordability Still extended ↔/↓ House prices too high relative to incomes.
Serviceability/
indebtedness Turning up ↔/↓ Interest rates are off lows and people have more debt, which
means the serviceability ratio is lifting.
Interest rates /
RBNZ Steeper curve ↓ With the RBNZ finished with cutting and global yields rising, rates
have likely troughed, short of a global accident.
Migration NZ the place to be ↔/↑ NZ still has good credentials in an uncertain world. People won’t
stop wanting to come.
Supply-demand
balance Too few houses ↔/↑ Too few houses and no solution in sight.
Consents and
house sales
More builders
required ↔/↑ A lot of consents going through but struggling for more simply
because who is going to build the houses we need?
Liquidity Tighter stance ↓ LVR restrictions being applied. Debt-to-income limits may be
next, and banks are tightening credit at the top of the cycle.
Globalisation Auckland vs
Sydney ↔ Auckland doesn’t look that bad when you compare it to Sydney.
Housing supply Chasing a moving
target ↔/↑ Migration, migration and more migration equals the need for a lot
more houses.
House prices to
rents Extreme ↔/↓ The numbers don’t work unless you get the capital gain.
On balance A slow rate of
appreciation ↔
Market has slowed as credit tightens but questions
surround whether it can be sustained, given shortage of
supply.
ANZ Property Focus / December 2016/ 11 of 16
PROPERTY GAUGES
FIGURE 1: HOUSING AFFORDABILITY
FIGURE 2: SERVICEABILITY AND INDEBTEDNESS
FIGURE 3: NEW CUSTOMER AVERAGE RESIDENTIAL
MORTGAGE RATE (<80% LVR)
FIGURE 4: NET MIGRATION
FIGURE 5: HOUSING SUPPLY-DEMAND BALANCE
FIGURE 6: BUILDING CONSENTS AND HOUSE SALES
FIGURE 7: LIQUIDITY AND HOUSE PRICES
FIGURE 8: HOUSE PRICE INFLATION COMPARISON
FIGURE 9: HOUSING SUPPLY
FIGURE 10: MEDIAN RENTAL, ANNUAL GROWTH
Source: ANZ, Statistics NZ, REINZ, RBNZ, QVNZ, Nationwide, Bloomberg, Barfoot & Thompson, www.realestate.co.nz, Department of Building and
Housing.
0
40
80
120
160
0
10
20
30
40
50
60
70
92 94 96 98 00 02 04 06 08 10 12 14 16
Index (1
992Q
1=
100)
%
House price-to-income adjusted for interest rates (RHS)
Proportion of average weekly household earnings required to service a 25 year mortgage based on 2-year fixed rate and 20% deposit on a median house (LHS)
0
50
100
150
200
0
4
8
12
16
92 94 96 98 00 02 04 06 08 10 12 14 16
% o
f dis
posable
incom
e
% o
f dis
posable
incom
e
Household debt to disposable income (RHS)
Interest servicing as % of disposable income (LHS)
0
5
10
15
20
4.0
4.5
5.0
5.5
6.0
Floating 6 mths 1 year 2 years 3 years 4 years 5 years
Basis
poin
ts%
Change in the month (RHS) A month ago (LHS) Latest rates (LHS)
-60
-40
-20
0
20
40
60
80
100
92 94 96 98 00 02 04 06 08 10 12 14 16
Net
annual in
flow
(000)
Net all arrivals (3mth avg) Net permanent and long-term migration
-4000
0
4000
8000
12000
16000
92 94 96 98 00 02 04 06 08 10 12 14 16
Num
ber
of houses
Excess demand (supply) Supply (advanced 2 qtrs) Demand
3000
4000
5000
6000
7000
8000
9000
10000
11000
800
1200
1600
2000
2400
2800
3200
92 94 96 98 00 02 04 06 08 10 12 14 16
House s
ale
s, 3
mth
avg
Consents
issued,
3 m
th a
vg
Building Consents (LHS) House sales (adv. 3 months, RHS)
-15
-10
-5
0
5
10
15
20
25
30
0
5
10
15
20
90 92 94 96 98 00 02 04 06 08 10 12 14 16
%
Annual %
change
Annual change in PSC to GDP ratio (RHS) House prices (LHS)
-20
-10
0
10
20
30
90 92 94 96 98 00 02 04 06 08 10 12 14 16
Annual %
change
New Zealand Australia US United Kingdom
0
2
4
6
8
10
12
14
16
18
98 99 00 01 02 03 04 05 06 07 08 09 10 11 12 13 14 15 16
Num
ber
of m
onth
s t
o s
ell
all lis
tings
Auckland Nationwide
-5
0
5
10
15
92 94 96 98 00 02 04 06 08 10 12 14 16
%
3 month rolling average
ANZ Property Focus / December 2016 / 12 of 16
ECONOMIC OVERVIEW
SUMMARY
The New Zealand economy is entering its eighth year of expansion with strong momentum. But natural headwinds
are now emerging (capacity pressures, a turn in credit cycle, tighter financial conditions, stretched asset
valuations) that should see growth ease over the course of the year (from 3½-4% towards 3%). That’s a natural
moderation, as opposed to a downturn. We view it as healthy in the context of the country’s medium-term stability
and its resilience to external shocks. The RBNZ remains on the side-lines for now, although price pressures are now
building.
OUR VIEW
As we look towards 2017, the economy is growing briskly. We estimate the economy grew around 3½%
over 2016 and forward indicators, like our own confidence composite and financial conditions gauges, suggest that
a similar pace of annualised growth (if not a little stronger) is on track for at least the first half of 2017.
The drivers of this growth are reasonably familiar – and we expect them to generally continue. Strong
population growth on the back of record net migrant inflows is boosting demand. The construction sector pipeline
remains large (with the damage resulting from the latest earthquakes creating another source of impetus) even if
capacity and capital are becoming increasingly constraining factors. The strengthening labour market is supporting
household confidence and consumption, as are historically low borrowing costs. The tourism sector is booming.
Prospects in the dairy sector have improved as prices have recovered and non-dairy agriculture sectors continue to
perform strongly. The terms of trade looks to be at, or near, its cyclical low, with the outlook now one of modest
improvement, supporting national incomes (and income growth).
We expect growth to slow over 2017 but we are talking about a ‘gallop to a canter’ style moderation.
Firms’ are finding it more difficult to get staff; it’s now firms’ biggest problem.
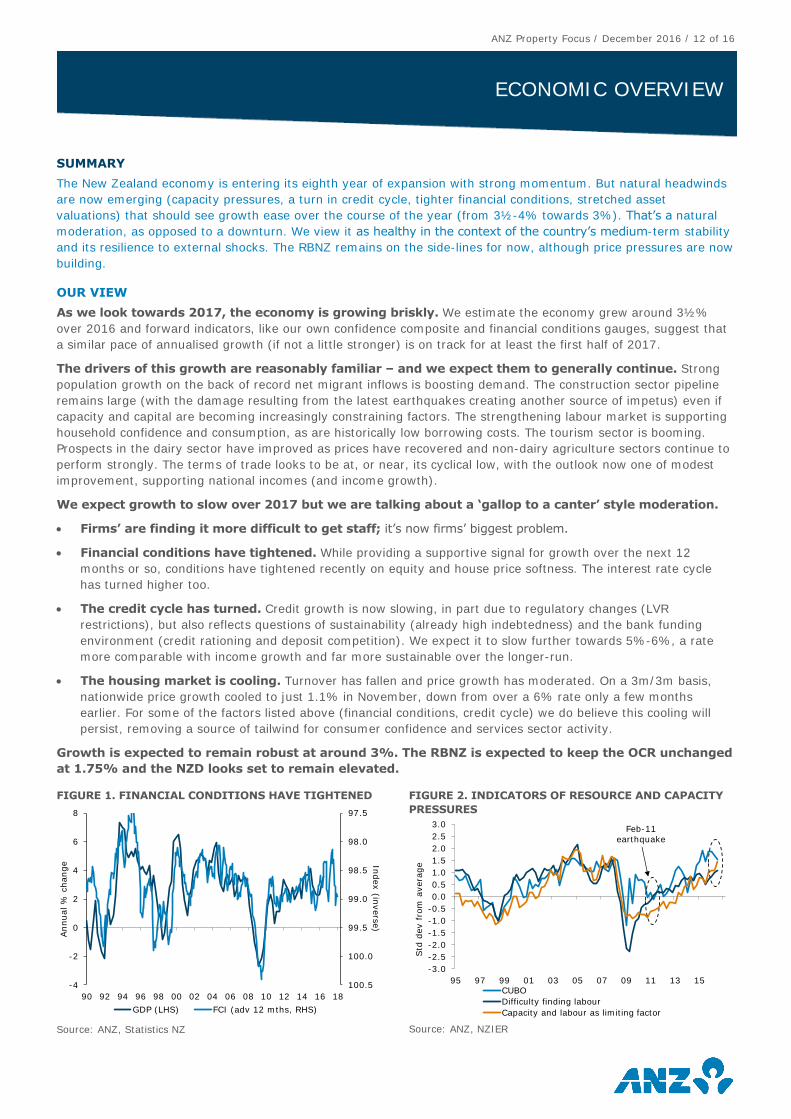
Financial conditions have tightened. While providing a supportive signal for growth over the next 12
months or so, conditions have tightened recently on equity and house price softness. The interest rate cycle
has turned higher too.
The credit cycle has turned. Credit growth is now slowing, in part due to regulatory changes (LVR
restrictions), but also reflects questions of sustainability (already high indebtedness) and the bank funding
environment (credit rationing and deposit competition). We expect it to slow further towards 5%-6%, a rate
more comparable with income growth and far more sustainable over the longer-run.
The housing market is cooling. Turnover has fallen and price growth has moderated. On a 3m/3m basis,
nationwide price growth cooled to just 1.1% in November, down from over a 6% rate only a few months
earlier. For some of the factors listed above (financial conditions, credit cycle) we do believe this cooling will
persist, removing a source of tailwind for consumer confidence and services sector activity.
Growth is expected to remain robust at around 3%. The RBNZ is expected to keep the OCR unchanged
at 1.75% and the NZD looks set to remain elevated.
FIGURE 1. FINANCIAL CONDITIONS HAVE TIGHTENED
Source: ANZ, Statistics NZ
FIGURE 2. INDICATORS OF RESOURCE AND CAPACITY
PRESSURES
Source: ANZ, NZIER
97.5
98.0
98.5
99.0
99.5
100.0
100.5-4
-2
0
2
4
6
8
90 92 94 96 98 00 02 04 06 08 10 12 14 16 18
Index (in
vers
e)
Annual %
change
GDP (LHS) FCI (adv 12 mths, RHS)
-3.0
-2.5
-2.0
-1.5
-1.0
-0.5
0.0
0.5
1.0
1.5
2.0
2.5
3.0
95 97 99 01 03 05 07 09 11 13 15
Std
dev f
rom
avera
ge
CUBO
Difficulty finding labour
Capacity and labour as limiting factor
Feb-11
earthquake
ANZ Property Focus / December 2016 / 13 of 16
MORTGAGE BORROWING STRATEGY
SUMMARY
Although there has been little change to floating mortgage rates, rates with terms of 2 years and longer continue
to move gradually higher. This has occurred largely as a result of higher global interest rates (which tend to have
a larger influence on New Zealand longer-term rates than local factors do), and rising funding costs. As we noted
last month, we believe mortgage rates have seen their lows, and although rises from here are likely to be gradual,
they are rises nonetheless. Although rates are not quite as attractive as they were a month ago and we maintain
our view that it is worthwhile considering fixing some portion of your mortgage for longer than 1-2 years, recent
rises do make it a much closer call. With the OCR on hold, 1-2 mortgage year rates won’t go up for a while.
OUR VIEW
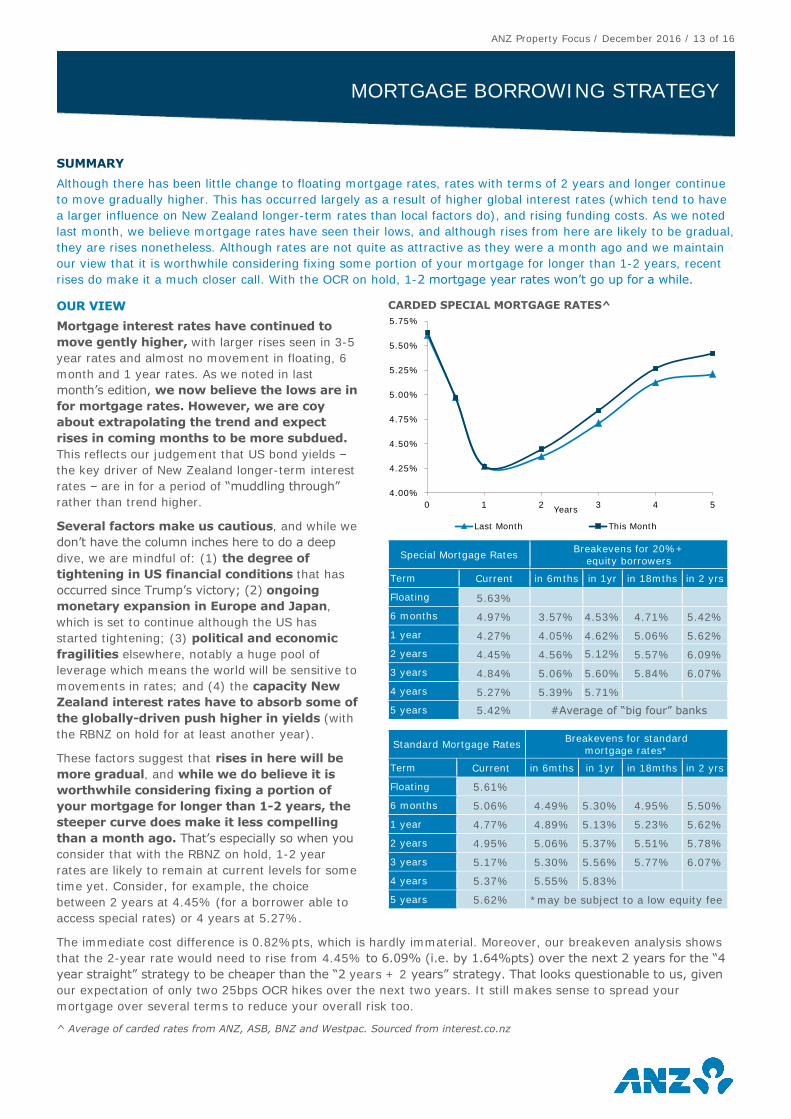
Mortgage interest rates have continued to
move gently higher, with larger rises seen in 3-5
year rates and almost no movement in floating, 6
month and 1 year rates. As we noted in last
month’s edition, we now believe the lows are in
for mortgage rates. However, we are coy
about extrapolating the trend and expect
rises in coming months to be more subdued.
This reflects our judgement that US bond yields –
the key driver of New Zealand longer-term interest
rates – are in for a period of “muddling through”
rather than trend higher.
Several factors make us cautious, and while we
don’t have the column inches here to do a deep
dive, we are mindful of: (1) the degree of
tightening in US financial conditions that has
occurred since Trump’s victory; (2) ongoing
monetary expansion in Europe and Japan,
which is set to continue although the US has
started tightening; (3) political and economic
fragilities elsewhere, notably a huge pool of
leverage which means the world will be sensitive to
movements in rates; and (4) the capacity New
Zealand interest rates have to absorb some of
the globally-driven push higher in yields (with
the RBNZ on hold for at least another year).
These factors suggest that rises in here will be
more gradual, and while we do believe it is
worthwhile considering fixing a portion of
your mortgage for longer than 1-2 years, the
steeper curve does make it less compelling
than a month ago. That’s especially so when you
consider that with the RBNZ on hold, 1-2 year
rates are likely to remain at current levels for some
time yet. Consider, for example, the choice
between 2 years at 4.45% (for a borrower able to
access special rates) or 4 years at 5.27%.
CARDED SPECIAL MORTGAGE RATES^
Special Mortgage Rates Breakevens for 20%+
equity borrowers
Term Current in 6mths in 1yr in 18mths in 2 yrs
Floating 5.63%
6 months 4.97% 3.57% 4.53% 4.71% 5.42%
1 year 4.27% 4.05% 4.62% 5.06% 5.62%
2 years 4.45% 4.56% 5.12% 5.57% 6.09%
3 years 4.84% 5.06% 5.60% 5.84% 6.07%
4 years 5.27% 5.39% 5.71%
5 years 5.42% #Average of “big four” banks
Standard Mortgage Rates Breakevens for standard
mortgage rates*
Term Current in 6mths in 1yr in 18mths in 2 yrs
Floating 5.61%
6 months 5.06% 4.49% 5.30% 4.95% 5.50%
1 year 4.77% 4.89% 5.13% 5.23% 5.62%
2 years 4.95% 5.06% 5.37% 5.51% 5.78%
3 years 5.17% 5.30% 5.56% 5.77% 6.07%
4 years 5.37% 5.55% 5.83%
5 years 5.62% *may be subject to a low equity fee
The immediate cost difference is 0.82%pts, which is hardly immaterial. Moreover, our breakeven analysis shows
that the 2-year rate would need to rise from 4.45% to 6.09% (i.e. by 1.64%pts) over the next 2 years for the “4
year straight” strategy to be cheaper than the “2 years + 2 years” strategy. That looks questionable to us, given
our expectation of only two 25bps OCR hikes over the next two years. It still makes sense to spread your
mortgage over several terms to reduce your overall risk too.
^ Average of carded rates from ANZ, ASB, BNZ and Westpac. Sourced from interest.co.nz
4.00%
4.25%
4.50%
4.75%
5.00%
5.25%
5.50%
5.75%
0 1 2 3 4 5
Last Month This Month
Years
ANZ Property Focus / December 2016 / 14 of 16
KEY FORECASTS
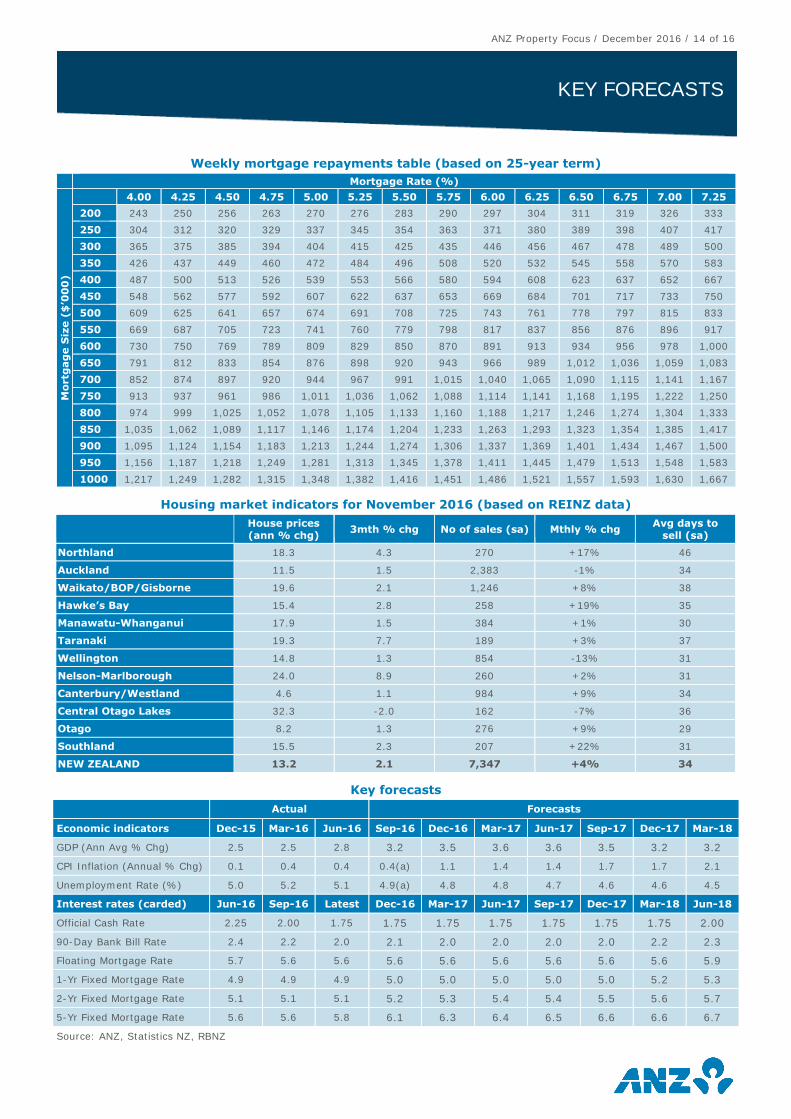
Weekly mortgage repayments table (based on 25-year term)
Mortgage Rate (%)
Mo
rtg
ag
e S
ize (
$’0
00
)
4.00 4.25 4.50 4.75 5.00 5.25 5.50 5.75 6.00 6.25 6.50 6.75 7.00 7.25
200 243 250 256 263 270 276 283 290 297 304 311 319 326 333
250 304 312 320 329 337 345 354 363 371 380 389 398 407 417
300 365 375 385 394 404 415 425 435 446 456 467 478 489 500
350 426 437 449 460 472 484 496 508 520 532 545 558 570 583
400 487 500 513 526 539 553 566 580 594 608 623 637 652 667
450 548 562 577 592 607 622 637 653 669 684 701 717 733 750
500 609 625 641 657 674 691 708 725 743 761 778 797 815 833
550 669 687 705 723 741 760 779 798 817 837 856 876 896 917
600 730 750 769 789 809 829 850 870 891 913 934 956 978 1,000
650 791 812 833 854 876 898 920 943 966 989 1,012 1,036 1,059 1,083
700 852 874 897 920 944 967 991 1,015 1,040 1,065 1,090 1,115 1,141 1,167
750 913 937 961 986 1,011 1,036 1,062 1,088 1,114 1,141 1,168 1,195 1,222 1,250
800 974 999 1,025 1,052 1,078 1,105 1,133 1,160 1,188 1,217 1,246 1,274 1,304 1,333
850 1,035 1,062 1,089 1,117 1,146 1,174 1,204 1,233 1,263 1,293 1,323 1,354 1,385 1,417
900 1,095 1,124 1,154 1,183 1,213 1,244 1,274 1,306 1,337 1,369 1,401 1,434 1,467 1,500
950 1,156 1,187 1,218 1,249 1,281 1,313 1,345 1,378 1,411 1,445 1,479 1,513 1,548 1,583
1000 1,217 1,249 1,282 1,315 1,348 1,382 1,416 1,451 1,486 1,521 1,557 1,593 1,630 1,667
Housing market indicators for November 2016 (based on REINZ data)
House prices
(ann % chg) 3mth % chg No of sales (sa) Mthly % chg
Avg days to
sell (sa)
Northland 18.3 4.3 270 +17% 46
Auckland 11.5 1.5 2,383 -1% 34
Waikato/BOP/Gisborne 19.6 2.1 1,246 +8% 38
Hawke’s Bay 15.4 2.8 258 +19% 35
Manawatu-Whanganui 17.9 1.5 384 +1% 30
Taranaki 19.3 7.7 189 +3% 37
Wellington 14.8 1.3 854 -13% 31
Nelson-Marlborough 24.0 8.9 260 +2% 31
Canterbury/Westland 4.6 1.1 984 +9% 34
Central Otago Lakes 32.3 -2.0 162 -7% 36
Otago 8.2 1.3 276 +9% 29
Southland 15.5 2.3 207 +22% 31
NEW ZEALAND 13.2 2.1 7,347 +4% 34
Key forecasts
Actual Forecasts
Economic indicators Dec-15 Mar-16 Jun-16 Sep-16 Dec-16 Mar-17 Jun-17 Sep-17 Dec-17 Mar-18
GDP (Ann Avg % Chg) 2.5 2.5 2.8 3.2 3.5 3.6 3.6 3.5 3.2 3.2
CPI Inflation (Annual % Chg) 0.1 0.4 0.4 0.4(a) 1.1 1.4 1.4 1.7 1.7 2.1
Unemployment Rate (%) 5.0 5.2 5.1 4.9(a) 4.8 4.8 4.7 4.6 4.6 4.5
Interest rates (carded) Jun-16 Sep-16 Latest Dec-16 Mar-17 Jun-17 Sep-17 Dec-17 Mar-18 Jun-18
Official Cash Rate 2.25 2.00 1.75 1.75 1.75 1.75 1.75 1.75 1.75 2.00
90-Day Bank Bill Rate 2.4 2.2 2.0 2.1 2.0 2.0 2.0 2.0 2.2 2.3
Floating Mortgage Rate 5.7 5.6 5.6 5.6 5.6 5.6 5.6 5.6 5.6 5.9
1-Yr Fixed Mortgage Rate 4.9 4.9 4.9 5.0 5.0 5.0 5.0 5.0 5.2 5.3
2-Yr Fixed Mortgage Rate 5.1 5.1 5.1 5.2 5.3 5.4 5.4 5.5 5.6 5.7
5-Yr Fixed Mortgage Rate 5.6 5.6 5.8 6.1 6.3 6.4 6.5 6.6 6.6 6.7
Source: ANZ, Statistics NZ, RBNZ
ANZ Property Focus / December 2016 / 15 of 16
IMPORTANT NOTICE
The distribution of this document or streaming of this video broadcast (as applicable, “publication”) may be restricted by law in certain jurisdictions. Persons who receive this publication must inform themselves about and observe all relevant restrictions.
1. Disclaimer for all jurisdictions, where content is authored by ANZ Research: Except if otherwise specified in section 2 below, this document is issued and distributed in your country/region by Australia and New Zealand Banking Group Limited (ABN11 005 357 522) (“ANZ”), on the basis that it is only for the information of the specified recipient or permitted user of the relevant website (collectively, “recipient”). This document is confidential and may not be reproduced, distributed or published by any recipient for any purpose. It is general information and has been prepared without taking into account the objectives, financial situation or needs of any person. Nothing in this document is intended to be an offer to sell, or a solicitation of an offer to buy, any product, security, instrument or investment, to effect any transaction or to conclude any legal act of any kind. If, despite the foregoing, any services or products referred to in this document are deemed to be offered in the jurisdiction in which this document is received or accessed, no such service or product is intended for nor available to persons resident in that jurisdiction if it would be contradictory to local law or regulation. Such local laws, regulations and other limitations always apply with non-exclusive jurisdiction of local courts. Certain financial products may be subject to mandatory clearing, regulatory reporting and/or other related obligations. These obligations may vary by jurisdiction and be subject to frequent amendment. Before making an investment decision, recipients should seek independent financial, legal, tax and other relevant advice having regard to their particular circumstances. The views and recommendations expressed in this publication are the author’s. They are based on information known by the author and on sources which the author believes to be reliable, but may involve material elements of subjective judgement and analysis. Unless specifically stated otherwise: they are current on the date of this publication and are subject to change without notice; and, all price information is indicative only. Any of the views and recommendations which comprise estimates, forecasts or other projections, are subject to significant uncertainties and contingencies that cannot reasonably be anticipated. On this basis, such views and recommendations may not always be achieved or prove to be correct. Indications of past performance in this publication will not necessarily be repeated in the future. No representation is being made that any investment will or is likely to achieve profits or losses similar to those achieved in the past, or that significant losses will be avoided. Additionally, this publication may contain ‘forward looking statements’. Actual events or results or actual performance may differ materially from those reflected or contemplated in such forward looking statements. All investments entail a risk and may result in both profits and losses. Foreign currency rates of exchange may adversely affect the value, price or income of any products or services described in this publication. The products and services described in this publication are not suitable for all investors, and transacting in these products or services may be considered risky. ANZ and its related bodies corporate and affiliates, and the officers, employees, contractors and agents of each of them (including the author) (“Affiliates”), do not make any representation as to the accuracy, completeness or currency of the views or recommendations expressed in this publication. Neither ANZ nor its Affiliates accept any responsibility to inform you of any matter that subsequently comes to their notice, which may affect the accuracy, completeness or currency of the information in this publication. Except as required by law, and only to the extent so required: neither ANZ nor its Affiliates warrant or guarantee the performance of any of the products or services described in this publication or any return on any associated investment; and, ANZ and its Affiliates expressly disclaim any responsibility and shall not be liable for any loss, damage, claim, liability, proceedings, cost or expense (“Liability”) arising directly or indirectly and whether in tort (including negligence), contract, equity or otherwise out of or in connection with this publication. If this publication has been distributed by electronic transmission, such as e-mail, then such transmission cannot be guaranteed to be secure or error-free as information could be intercepted, corrupted, lost, destroyed, arrive late or incomplete, or contain viruses. ANZ and its Affiliates do not accept any Liability as a result of electronic transmission of this publication. ANZ and its Affiliates may have an interest in the subject matter of this publication as follows: They may receive fees from customers for dealing in the products or services described in this publication, and their staff and introducers of
business may share in such fees or receive a bonus that may be influenced by total sales. They or their customers may have or have had interests or long or short positions in the products or services described in this publication,
and may at any time make purchases and/or sales in them as principal or agent. They may act or have acted as market-maker in products described in this publication. ANZ and its Affiliates may rely on information barriers and other arrangements to control the flow of information contained in one or more business areas within ANZ or within its Affiliates into other business areas of ANZ or of its Affiliates. This document is published in accordance with ANZ’s policies on Conflicts of Interest and Information Barriers. Please contact your ANZ point of contact with any questions about this publication including for further information on these disclosures of interest.
2. Country/region specific information: Australia. This publication is distributed in Australia by ANZ. ANZ holds an Australian Financial Services licence no. 234527. A copy of ANZ's Financial Services Guide is available at http://www.anz.com/documents/AU/aboutANZ/FinancialServicesGuide.pdf and is available upon request from your ANZ point of contact. If trading strategies or recommendations are included in this publication, they are solely for the information of ‘wholesale clients’ (as defined in section 761G of the Corporations Act 2001 Cth). Persons who receive this publication must inform themselves about and observe all relevant restrictions. Brazil. This publication is distributed in Brazil by ANZ on a cross border basis and only following request by the recipient. No securities are being offered or sold in Brazil under this publication, and no securities have been and will not be registered with the Securities Commission - CVM. Brunei. Japan. Kuwait. Malaysia. Switzerland. Taiwan. This publication is distributed in each of Brunei, Japan, Kuwait, Malaysia, Switzerland and Taiwan by ANZ on a cross-border basis. Cambodia. APS222 Disclosure. The recipient acknowledges that although ANZ Royal Bank (Cambodia) Ltd. is a subsidiary of ANZ, it is a separate entity to ANZ and the obligations of ANZ Royal Bank (Cambodia) Ltd. do not constitute deposits or other liabilities of ANZ and ANZ is not required to meet the obligations of ANZ Royal Bank (Cambodia) Ltd. European Economic Area (“EEA”): United Kingdom. ANZ in the United Kingdom is authorised by the Prudential Regulation Authority (“PRA”). Subject to regulation by the Financial Conduct Authority (“FCA”) and limited regulation by the PRA. Details about the extent of our regulation by the PRA are available from us on request. This publication is distributed in the United Kingdom by ANZ solely for the information of persons who would come within the FCA definition of “eligible counterparty” or “professional client”. It is not intended for and must not be distributed to any person who would come within the FCA definition of “retail client”. Nothing here excludes or restricts any duty or liability to a customer which ANZ may have under the UK Financial Services and Markets Act 2000 or under the regulatory system as defined in the Rules of the PRA and the FCA. Germany. This publication is distributed in Germany by the Frankfurt Branch of ANZ solely for the information of its clients. Other EEA countries. This publication is distributed in the EEA by ANZ Bank (Europe) Limited (“ANZBEL”) which is authorised by the PRA and regulated by the FCA and the PRA in the United Kingdom, to persons who would come within the FCA definition of “eligible counterparty” or “professional client” in other countries in the EEA. This publication is distributed in those countries solely for the information of such persons upon their request. It is not intended for, and must not be distributed to, any person in those countries who would come within the FCA definition of “retail client”. Fiji. For Fiji regulatory purposes, this publication and any views and recommendations are not to be deemed as investment advice. Fiji investors must seek licensed professional advice should they wish to make any investment in relation to this publication. Hong Kong. This publication is issued or distributed in Hong Kong by the Hong Kong branch of ANZ, which is registered at the Hong Kong Monetary Authority to conduct Type 1 (dealing in securities), Type 4 (advising on securities) and Type 6 (advising on corporate finance) regulated activities. The contents of this publication have not been reviewed by any regulatory authority in Hong Kong. If in doubt about the contents of this publication, you should obtain independent professional advice.
ANZ Property Focus / December 2016 / 16 of 16
IMPORTANT NOTICE
India. This publication is distributed in India by ANZ on a cross-border basis. If this publication is received in India, only you (the specified recipient) may print it provided that before doing so, you specify on it your name and place of printing. Further copying or duplication of this publication is strictly prohibited. Myanmar. This publication is intended to be of a general nature as part of customer service and marketing activities provided by ANZ in the course of implementing its functions as a licensed bank. This publication does not take into account your financial situation or goals and is not Securities Investment Advice (as that term is defined in the Myanmar Securities Transaction Law 2013). The contents of this publication have not been reviewed by any regulatory authority in Myanmar. If in doubt about the contents of this publication, you should obtain independent professional advice. New Zealand. This publication is intended to be of a general nature, does not take into account your financial situation or goals, and is not a personalised adviser service under the Financial Advisers Act 2008. Oman. This publication has been prepared by ANZ. ANZ neither has a registered business presence nor a representative office in Oman and does not undertake banking business or provide financial services in Oman. Consequently ANZ is not regulated by either the Central Bank of Oman or Oman’s Capital Market Authority. The information contained in this publication is for discussion purposes only and neither constitutes an offer of securities in Oman as contemplated by the Commercial Companies Law of Oman (Royal Decree 4/74) or the Capital Market Law of Oman (Royal Decree 80/98), nor does it constitute an offer to sell, or the solicitation of any offer to buy non-Omani securities in Oman as contemplated by Article 139 of the Executive Regulations to the Capital Market Law (issued vide CMA Decision 1/2009). ANZ does not solicit business in Oman and the only circumstances in which ANZ sends information or material describing financial products or financial services to recipients in Oman, is where such information or material has been requested from ANZ and by receiving this publication, the person or entity to whom it has been dispatched by ANZ understands, acknowledges and agrees that this publication has not been approved by the CBO, the CMA or any other regulatory body or authority in Oman. ANZ does not market, offer, sell or distribute any financial or investment products or services in Oman and no subscription to any securities, products or financial services may or will be consummated within Oman. Nothing contained in this publication is intended to constitute Omani investment, legal, tax, accounting or other professional advice. People’s Republic of China (“PRC”). Recipients must comply with all applicable laws and regulations of PRC, including any prohibitions on speculative transactions and CNY/CNH arbitrage trading. If and when the material accompanying this document is distributed by Australia and New Zealand Banking Group Limited (ABN 11 005 357 522) (“ANZ”) or an affiliate (other than Australia and New Zealand Bank (China) Company Limited (“ANZ C”)), the following statement and the text below is applicable: No action has been taken by ANZ or any affiliate which would permit a public offering of any products or services of such an entity or distribution or re-distribution of this document in the PRC. Accordingly, the products and services of such entities are not being offered or sold within the PRC by means of this document or any other document. This document may not be distributed, re-distributed or published in the PRC, except under circumstances that will result in compliance with any applicable laws and regulations. If and when the material accompanying this document relates to the products and/or services of ANZ C, the following statement and the text below is applicable: This document is distributed by ANZ C in the Mainland of the PRC. Qatar. This publication has not been, and will not be lodged or registered with, or reviewed or approved by, the Qatar Central Bank (“QCB”), the Qatar Financial Centre (“QFC”) Authority, QFC Regulatory Authority or any other authority in the State of Qatar (“Qatar”); or authorised or licensed for distribution in Qatar; and the information contained in this publication does not, and is not intended to, constitute a public offer or other invitation in respect of securities in Qatar or the QFC. The financial products or services described in this publication have not been, and will not be registered with the QCB, QFC Authority, QFC Regulatory Authority or any other governmental authority in Qatar; or authorised or licensed for offering, marketing, issue or sale, directly or indirectly, in Qatar. Accordingly, the financial products or services described in this publication are not being, and will not be, offered, issued or sold in Qatar, and this publication is not being, and will not be, distributed in Qatar. The offering, marketing, issue and sale of the financial products or services described in this publication and distribution of this publication is being made in, and is subject to the laws, regulations and rules of, jurisdictions outside of Qatar and the QFC. Recipients of this publication must abide by this restriction and not distribute this publication in breach of this restriction. This publication is being sent/issued to a limited number of institutional and/or sophisticated investors (i) upon their request and confirmation that they understand the statements above; and (ii) on the condition that it will not be provided to any person other than the original recipient, and is not for general circulation and may not be reproduced or used for any other purpose. Singapore. This publication is distributed in Singapore by the Singapore branch of ANZ solely for the information of “accredited investors”, “expert investors” or (as the case may be) “institutional investors” (each term as defined in the Securities and Futures Act Cap. 289 of Singapore). ANZ is licensed in Singapore under the Banking Act Cap. 19 of Singapore and is exempted from holding a financial adviser’s licence under Section 23(1)(a) of the Financial Advisers Act Cap. 100 of Singapore. In respect of any matters arising from, or in connection with the distribution of this publication in Singapore, contact your ANZ point of contact. United Arab Emirates. This publication is distributed in the United Arab Emirates (“UAE”) or the Dubai International Financial Centre (as applicable) by ANZ. This publication: does not, and is not intended to constitute an offer of securities anywhere in the UAE; does not constitute, and is not intended to constitute the carrying on or engagement in banking, financial and/or investment consultation business in the UAE under the rules and regulations made by the Central Bank of the United Arab Emirates, the Emirates Securities and Commodities Authority or the United Arab Emirates Ministry of Economy; does not, and is not intended to constitute an offer of securities within the meaning of the Dubai International Financial Centre Markets Law No. 12 of 2004; and, does not constitute, and is not intended to constitute, a financial promotion, as defined under the Dubai International Financial Centre Regulatory Law No. 1 of 200. ANZ DIFC Branch is regulated by the Dubai Financial Services Authority (“DFSA”). The financial products or services described in this publication are only available to persons who qualify as “Professional Clients” or “Market Counterparty” in accordance with the provisions of the DFSA rules. In addition, ANZ has a representative office (“ANZ Representative Office”) in Abu Dhabi regulated by the Central Bank of the United Arab Emirates. ANZ Representative Office is not permitted by the Central Bank of the United Arab Emirates to provide any banking services to clients in the UAE. United States. ANZ Securities, Inc. (“ANZSI”) is a member of the Financial Industry Regulatory Authority (“FINRA”) (www.finra.org) and registered with the SEC. ANZSI’s address is 277 Park Avenue, 31st Floor, New York, NY 10172, USA (Tel: +1 212 801 9160 Fax: +1 212 801 9163). Except where this is an FX- related publication, this publication is distributed in the United States by ANZSI (a wholly owned subsidiary of ANZ), which accepts responsibility for its content. Information on any securities referred to in this publication may be obtained from ANZSI upon request. This publication or material is intended for institutional use only – not retail. If you are an institutional customer wishing to effect transactions in any securities referred to in this publication you must contact ANZSI, not its affiliates. ANZSI is authorised as a broker-dealer only for institutional customers, not for US Persons (as “US person” is defined in Regulation S under the US Securities Act of 1933, as amended) who are individuals. If you have registered to use this website or have otherwise received this publication and are a US Person who is an individual: to avoid loss, you should cease to use this website by unsubscribing or should notify the sender and you should not act on the contents of this publication in any way. Non-U.S. Analysts: Non-U.S. analysts may not be associated persons of ANZSI and therefore may not be subject to FINRA Rule 2242 restrictions on communications with subject company, public appearances and trading securities held by the analysts. Where this is an FX-related publication, it is distributed in the United States by ANZ's New York Branch, which is also located at 277 Park Avenue, 31st Floor, New York, NY 10172, USA (Tel: +1 212 801 916 0 Fax: +1 212 801 9163). Commodity-related products are not insured by any U.S. governmental agency, and are not guaranteed by ANZ or any of its affiliates. Transacting in these products may involve substantial risks and could result in a significant loss. You should carefully consider whether transacting in commodity-related products is suitable for you in light of your financial condition and investment objectives. Vietnam. This publication is distributed in Vietnam by ANZ or ANZ Bank (Vietnam) Limited, a subsidiary of ANZ. Please note that the contents of this publication have not been reviewed by any regulatory authority in Vietnam. If you are in any doubt about any of the contents of this publication, you should obtain independent professional advice.
This document has been prepared by ANZ Bank New Zealand Limited, Level 10, 171 Featherston Street, Wellington 6011, New Zealand, Ph 64 4 802 2212, e-mail [email protected], http://www.anz.co.nz