any d’souza tibor auer jens frahm hans...
TRANSCRIPT

1
Vol.33,No.3/March2016/©JournaloftheOpticalSocietyofAmericaAA53Oneprintorelectroniccopymaybemadeforpersonaluseonly.Systematicreproductionanddistribution,duplicationofany
materialinthispaperforafeeorforcommercialpurposes,ormodificationsofthecontentofthispaperareprohibited.
Dependence of chromatic responses in V1 on visual field eccentricity and spatial frequency: an fMRI study
DANY V. D’SOUZA,1 TIBOR AUER,1 JENS FRAHM,1 HANS STRASBURGER,2 BARRY B. LEE1,3,*
1Max Planck Institute for Biophysical Chemistry, Göttingen, Germany 2University of Göttingen, Göttingen, Germany 3 SUNY College of Optometry, Biological Sciences, New York, USA Corresponding author: Barry B. Lee, [email protected]
Psychophysicalsensitivitytored‐greenchromaticmodulationdecreaseswithvisualeccentricity,comparedtosensitivitytoluminancemodulation,evenafterappropriatestimulusscaling.Thisislikelytooccuratacentral, rather than a retinal, site. Blood oxygenation level dependent (BOLD) functional MRI (fMRI)responsestostimulidesignedtoseparatelystimulatedifferentafferentchannels(red‐green,luminanceandshort‐wavelength[S]cone)circulargratingswererecordedasafunctionofvisualeccentricity(+/‐10deg)andspatial frequency inhumanprimaryvisualcortex (V1)and furthervisualareas (V2v,VP). InV1, thespatial frequency tuning of BOLD fMRI responses became coarserwith eccentricity. For red‐green andluminancegratingssimilarspatialfrequencytuningcurveswerefoundatalleccentricities.Thepatternforshort‐wavelength cone modulation differed, with spatial frequency tuning changing more slowly witheccentricity than for theother twomodalities.Thismaybedue to thedifferent retinaldistributionwitheccentricity of this receptor type. A similar pattern held in V2v and VP. This would suggest thattransformationorspatialfilteringofthechromatic(red‐green)signaloccursbeyondtheseareas.OCIScodes:(330.1720)Colorvision;(330.4270)Visualsystemneurophysiology;(330.5510)Psychophysics.http://dx.doi.org/10.1364/JOSAA.33.000A53
1.INTRODUCTION
Visualabilitieschangeoverthevisualfield(seeStrasburgeretal.[1]forreview).Mostattentionhasbeenpaidtoachromatic(i.e. luminance modulated) stimuli; chromatic stimuli havebeen lesswell studied.Colorperception inperipheralvisionwasclassicallyconsideredtobepoor,butwith largeenoughstimuli,colornaminginperipheralvisionisasinthefovea[2‐5]. However, chromatic discrimination is generallyconsidered to be poorer in peripheral compared to centralvision even after size scaling, especially for red‐greensensitivity[6‐11].
For achromatic gratings, foveal and peripheral visualperformance can often be made similar if stimulus size issuitably increased and spatial frequency decreased for theperipheral stimuli [12‐15]. Early work was concerned torelatesuchscalingtoganglioncelldensityandtheareaofV1devotedtodifferenteccentricities[15‐17].InreferencetothecorticalmagnificationfactorM[18,19]suchstimulusscalingis usually referred to as M‐scaling. The variation of thepsychophysical scaling factorwithvisual‐field eccentricity istypicallydescribedby a linear function that is characterizedbyitsslopeandx‐axisintercept.Thelattervaluehasbecometo be known as that function’s E2 value [20]. E2 values formanyvisualfunctionsweresummarizedbyStrasburgeretal.
[1]. For low‐level function, most work has used achromatic(i.e. luminance modulated) stimuli, and M‐scaling forchromaticstimulimayfollowdifferentrules.
Available evidence suggests Old‐World primatesperformanceissimilartohumansonsimplecolorvisionandspatialtasks(e.g.,[21,22]).Inprimates,midgetganglioncellsoftheparvocellular(PC)pathwayarethoughttobetheoriginof the red‐green channel for color vision, whereas smallbistratifiedcellsofthekoniocellular(KC)pathwayareoneofthe cell typeswhichmakeup a substrate of theblue‐yellowchannelofcolorvision(seeLee[23]forreview).ForPCcells,red‐greenopponencyresultsfromantagonisticinteractionofthemiddle‐ (M)and long‐wavelength (L) cones, either+L‐Mor+M‐L.Inandnearthefovea,amidgetganglioncell’scenterisdrivenbyasinglecone(e.g.,anL‐cone)viaamidgetbipolarcell,whilethesurroundreceivesinputeitherfromadifferentcone type (e.g., M‐cone; selective surround) or from mixedcone‐types (mixed surrounds). Both schemes result in coloropponency,althoughphysiologicalevidencesuggestsat leastsomedegreeofconeselectivityinthesurroundnearthefovea[24‐30]. Beyond about 10 deg eccentricity, convergence ofmidget bipolar cells onto midget ganglion cells begins tooccur so that, by 20 degree eccentricity, there is substantialconvergence(10‐20bipolarsperganglioncell;[31,32].Itwas

2
proposedthatthelossofred‐greenchromaticdiscriminationinperipheralvisionisassociatedwithrandommidgetbipolarinputtothemidgetganglioncellcenter,whichcausesalossofchromaticresponsivityinmidgetganglioncells[7,9,10,33].However,asubstantialproportionofmidgetganglioncellsateccentricitiesgreaterthan20degshow|L‐M|opponencythatis justaspronouncedasnear the fovea [34,35],althoughathigher eccentricity, physiological evidence does suggest lossof opponency [36, 37]. However, the psychophysical loss ofred‐green chromatic sensitivity is alreadypronounced at 10degeccentricity,wheretheone‐to‐onemidgetmorphologyiswellmaintained.Thiswouldsuggestthatthepsychophysicalsensitivity loss occurs beyond the retina. Although therelation of chromatic sensitivity with eccentricity has notbeen specifically studied in macaque lateral geniculatenucleus(LGN)manyrecordingsateccentricitiesgreaterthan10 deg (e.g., [38, 39]) have not noted any loss in chromaticresponsivityintheparvocellularlayers.Thus,itisdifficulttoavoid the conclusion that any loss in |M‐L| psychophysicalsensitivityintheperipheryoccursatcorticalsites.
Psychophysical sensitivity of M‐scaled stimuli isolatingthe S‐cone pathway also decreases with eccentricity morerapidlythansensitivitytoachromaticstimuli,butnotsomuchaswith|M‐L|stimuli[7,40]Thesmall‐bistratifiedcellsoftheKC pathway receive excitatory input from the short‐wavelength (S) cones opposed by some combination of theothertwoconetypes(+S‐(M+L)).However,onecomplicatingfactor is the difference between S‐cone (and the associatedganglion cell) density and M‐ and L‐cone densities as afunctionofeccentricity[41].TherearenoScones inasmallpatch of central fovea (10‐20 arcmin); their proportionincreases to around 7‐9% at 5‐7 deg eccentricity andthereafterremainsstable.Thiswould indicatethat theusualmagnification factor equation is not appropriate for S‐conemechanisms, and there is somepsychophysical evidence forthis [42, 43]. This factor has generally not been consideredwhendesigningM‐scaledstimulitappingtheS‐conepathway.
TherehavebeennumerousreportsonfMRIresponsesinV1 to chromatic modulation; both |L‐M| and S‐conemodulating stimuli yield vigorous responses [44‐51]. Therehave also been studies of spatial frequency tuning of fMRIresponses in V1, but mostly with respect to luminanceresponses [46, 52]. Two studies have been concerned withcomparingluminance, |M‐L|andS‐coneresponses inV1andelsewhere[48,53]atdifferenteccentricities;wecompareourresultswiththesestudiesinthediscussion.
Wehavepreviouslyreportedonthetemporalfrequencytuning of V1 and further visual areas [51], in an attempt tolocate a loss of high‐temporal‐frequency response tochromatic modulation by following chromatic fMRI signalsthroughthevisualpathways.PCandKCretinalganglioncellsrespond to much higher temporal frequencies than can bedetectedpsychophysically,sothatacorticallossofsensitivityis implicated. Here we attempt to specifically investigate apossiblelossofperipheralchromaticsensitivitybymeasuringchromatic responses as a function of eccentricity. Weexpanded on previous studies in that we explored a broadrangeofspatial frequencies.This ledus toconsiderpossibledifferences in M‐scaling of luminance, |M‐L| and S‐conefunctionwitheccentricity.
Twofeaturesoftheresultsare,firstly,that,comparedtoLum responses, |L‐M| responses are largely maintained atleast up to 10 deg eccentricity inV1, and secondly, that the
spatial frequency tunings of |L‐M| and Lum responses aresimilar.Boththesefeaturesappeartoreflectpropertiesoftheretinalinputratherthanpsychophysicalperformance.Spatialfrequency tuning of S‐cone responses follows a differentpattern. Itwasmore difficult to draw conclusions for visualareasbeyondV1,butatleastinV2vandV3vasimilarpatternofresultsislikelytohold.
2.METHODS
A.Subjects
Threehealthyvolunteers(1femaleand2male;meanage26years) participated in the study. All subjects had normalvisual acuity and were color‐normal; normalcy for colorvision was confirmed by the Farnsworth Munsell 100‐HueTest. Informed written consent was obtained from subjectsprior to participation in each experimental session. Allexperimental procedures strictly conformed to theinstitutional guidelines. Each subject participated in twoexperimental sessions. In the first, we used standardretinotopicmappingprocedurestoidentifyboundariesoftheprimary visual cortex (V1) and further areas. In the second,wemeasured fMRI responses to selective stimulation of thechromatic (|L‐M| cone‐opponent and S‐cone) and luminancepathways using circular grating stimuli of various spatialfrequencies.
B.Visualdisplaysystem
Visual stimuli were generated using a VSG ViSaGe system(CambridgeResearchSystemsLtd.,Rochester,UK)andwerepresented by a SANYO, PLC‐XT 11 LCD projector (pixelresolution1024×768,framerate80Hz,meanluminance126cd/m2) on a translucent screenmounted on the top of theMRI headcoil in front of a 45° tilted mirror (Schäfter &Kirchhoff,Hamburg,Germany).Thevisualdisplaysubtendeda visual angle of approximately 28° horizontally and 21°vertically. For retinotopic mapping experiments, the visualstimuli were generated using a stand‐alone software tool(StimulDX, Brain Innovation, Maastricht, The Netherlands)based on the Microsoft DirectX library. The VISaGe systemhas14bitresolutionandaftergammacorrectionca.8bit,i.e.,0.5%.
C.Calibration
TheLCDprojector systemwas calibrated for luminance andchromaticity by defining gamma curves and spectralproperties separately for each of the three RGB colorchannels. For gamma correction within the scanner, wetransmittedlocalluminancevaluesbyafiberopticcabletoadigital luminance meter (Mavo‐Monitor USB, GOSSEN Foto‐und Lichtmesstechnik GmbH, Nürnberg, Germany) locatedoutside the scanner, following the procedures described byStrasburger, Wüstenberg and Jäncke [54] to determine therelationship between the digital input and resultingluminance. Attenuation of each primary by the fiber opticcablewas separately checked and corrected. The luminancevalues were entered manually into the VSG gammacalibrationsoftware.Thechromaticityoftheprojectoroutputwas calibrated with a PR‐650 Spectra Colorimeter(PhotoResearch Inc., Chatsworth, MA) using a mirrorarrangement. The CIE chromaticity coordinates for theR, G,and B primaries were then entered into the VSG softwarebefore the gamma‐corrected look‐up‐tables (LUTs) were

3
generated. To check the temporal characteristics of the LCDprojector we used a photodiode in combination with anoperationalamplifier,andadigitaloscilloscope(TDS2024B,Tektronix,Beaverton,OR).
D.VisualStimuli
The stimuli were contrast‐reversing (2 Hz sinusoidalmodulation)circularsine‐wavegratings,spanningadiameterof21°visualangle,withacentralcross(1°indiameter)thatwas used for the fixation task. Stimuli of various spatialfrequencies (SFs of 0.27, 0.55, 1.09, 2.2, and 4.4 cpd) wereused.InadditiontogratingstimuliwithafixedSFwithinthepattern, we also tested an approximately M‐scaled circulargratingwherethecentralSF(4.4cpd)wasscaledacrosstheradius,resultingin0.16cpdatthestimulusperimeter.Fig,1Aillustratesthespatiallayoutofstimuli;forsimplicityonlytwospatialfrequencyexamplesareshown.Threetypesofstimuli,‘|L‐M|’, ‘Lum’, and ‘S’,were designed to individually activate|M‐L| cone‐opponent, luminance, and S‐cone postreceptoralpathways, respectively. The |L‐M| and S stimuli wereisoluminant. We constructed stimuli using the Smith andPokorny 10° cone fundamentals [55]. Cone fundamentalsweremultipliedwith theemission spectraof the red, green,andbluespectraloutputsofourLCDprojector,resultinginacalibrationmatrix. Thematrix values represent the spectralabsorptionsoftheS‐,M‐,andL‐conestored,green,andbluelights, respectively. Using these cone‐excitation values, wecomputed the chromaticity values for pathway‐selectivestimuli. In the results described, the mean CIE (x,y)chromaticity coordinates for the |L‐M|, Lum, and S‐coneconditions were (0.51, 0.47), (0.51, 0.47), and (0.26, 0.22),respectively. We also carried out extensive preliminaryexperiments in which stimuli for all conditions weremodulatedaroundequal‐energywhite.Thisresultedinlowercone contrasts, and fMRI signals were weaker and lessreliable,especiallyinextra‐striatevisualareas.However,thepattern of results was similar to those presented here. Thestimulihadameanluminanceof127cd/m2,andmodulationof the LCD primaries was modified to give a mean conecontrastof29%,calculatedasthevectorlength(squarerootof the sum of squares) of individual cone‐contrasts [45].Isoluminancepointsforthechromaticstimuliwereobtainedfor each observer using the minimum‐motion techniqueinside the MR scanner in the same experimental setup. Inpractice, for all subjects tested, isoluminance values wereclosetothoseofthestandardCIEobserver.
E.Experimentaldesign
Each subject participated in three experimental runs; eachrun lasted 10 minutes. In a typical run one of the threestimulus gratings (|L‐M|, Lum, or S) was shown at sixdifferentspatialfrequencies(0.27,0.55,1.09,2.2,4.4,aswellas 4.4‐cpd scaled), using a block‐design paradigm (Fig. 1B)similar to that used byHenriksson, Nurminen, Hyvärinen&Vanni [52]. Each experimental run (|L‐M|, Lum, or S)commenced with a 24 s control period (data from the first12swerediscarded in the analysis), followedby6 stimuluscycles.Eachcycle(96s)inturnconsistedof6stimulusblocks(12seach)andacontrolblock(24s).Ineachstimulusblockwepresentedcontrastreversinggratingsatoneof thegivenspatialfrequencies.Theorderinwhichthesewerepresentedwaspseudo‐randomizedwithineachcycleandbalanced
Fig. 1. A,Pathway‐selective stimuli at various spatialfrequencies (SFs). Circular sine‐wave gratings subtending avisual angle of 21 deg were used. The pathway‐selectivestimuli are shown in three columns. Upper two rows showexamplespatial frequencies.Rowthreeshowsscaledstimuliwith a central SF of 4.4 cpd decreasing to 0.16 cpd at thestimulusperimeter.B.Anexperimentalrun,commencedwitha control period (mean‐chromaticity screen) followed by 6cycles.Eachcycleconsistedof6stimulusblocksandacontrolblock. Ineachstimulusblockthecontrastof thegratingwasmodulatedatoneofthesixdifferentSFs.TheorderinwhichtheSFswerepresentedwaspseudo‐randomizedwithineachcycle. C. Identification of the visual cortices (V1) andeccentricitymaps.BoundariesseparatingV1fromthedorsaland ventral parts of area V2 are shown on a reconstructedcortical surface (left hemisphere) of a single subject.Eccentricities are color coded, with near‐foveal regionsrepresented in reddish‐orange and higher eccentricitieshaving yellowish‐green representation. White circlescorrespond to regions of interest (ROIs) at the followingeccentricities:1.4,2.2,3.0,3.8,4.6,6.3,8.1,and9.8deg.across the experimental run. During the control blocks, nostimulus appeared and a blank screen was shown with thesame mean chromaticity and luminance as the gratingstimulus.Eachrunlasted600s(300functionalvolumes,TR=2s).Sinceeachrunwaslimitedtoonecondition(|L‐M|,Lum,or S), mean chromaticity and luminance was the samethroughouttherun.
To maintain attention and fixation during the stimulusand control blocks, a small fixation cross was luminance‐modulated (2Hz sinusoidal)with 50%Michelson contrast,and at random intervals was replaced by a black cross.

4
Subjects were asked to detect the occurrences of the blackfixation cross during the experimental run. All subjectsdetectedabove95%ofthedimmingevents.
F.Magneticresonanceimaging(MRI)
All imaging studies were performed on a 3 T scanner(Magnetom Tim Trio, Siemens, Erlangen, Germany) using a12‐channel receive‐only phased‐array head coil. Foranatomical data, a high‐resolution T1‐weighted 3D data set(MPRAGE, 1×1×1.1 mm3) was acquired in each retinotopysession. These imageswere used to reconstruct the corticalsurfaces for mapping and visualization purposes. At thebeginningofeachmainexperimentalsession,T1‐weighted3DFLASH images (1×1×1 mm3) were acquired. Theseanatomical images served to coregister the functional datawiththeMPRAGEdataacquiredintheretinotopysession.Forfunctional data, blood oxygenation level dependent (BOLD)fMRI responses were measured with use of a T2*‐sensitivegradient‐echo echo‐planar imaging (GE‐EPI) technique withan in‐plane resolution of 2×2 mm2 (repetition time (TR):2000ms, echo time (TE): 36ms, flip angle: 70°, acquisitionmatrix: 96×96). Functional volumes comprised 22consecutive sections of 4 mm thickness, orientedapproximately perpendicular to the calcarine fissure andcovering early aswell as higher visual areas in theoccipitallobe.
G.MRIdataprocessingandanalysis
Data analysis was performed using BrainVoyager QX 1.10(Brain Innovation, Maastricht, The Netherlands). Theanatomical volumes (MPRAGE) acquired during theretinotopy sessionswere first interpolated to a1×1×1mm3isotropic resolution. Subsequent processing steps includedcorrection for intensity non‐uniformity, AC‐PCtransformation, and finally transformation of the data to astandard stereotaxic space (Talairach transformation). Weused the Talairach transformed data to reconstruct corticalsurfaces at the white‐gray matter boundary. These surfacereconstructions for each hemisphere were then inflated.Anatomical volumes acquired during the second sessionswere automatically aligned to MPRAGE data from the firstsessions. Preprocessing of the functional data includeddeletion of the initial 6 volumes (that were prepended toallowlongitudinalmagnetizationtoreachasteadystate),3D‐motion correction (also including intra‐session alignment),slice‐time correction, temporal high‐pass filtering (3cycles/run), linear‐trend removal, spatial smoothing with aGaussian kernel (full width at half maximum 4×4×4 mm3).Afterpreprocessing,functionaldatawereco‐registeredtotheanatomicalvolume(FLASH)acquiredatthebeginningofthesame session, and subsequently transformed into Talairachspace.
H.Identificationofvisualareas
Retinotopic mapping was performed for each of the threesubjects in separate scanning sessions. Standard phase‐encoded retinotopicmapping procedureswere employed tomap the visual field eccentricities (expanding rings) and todistinguishboundariesseparatingthevisualareasV1andV2(polar angle mapping) [56, 57]. In brief, for eccentricitymapping, six ring stimuli (checkerboards, scaled foreccentricity,highcontrast,8.33Hzreversal)werepresentedsequentially in 10 s duration blocks. A cross‐correlation
analysiswasperformed[58,59].Eccentricitymapswerealsoconfirmedwith travelingwave stimuli [56, 57]. In addition,wealsoobtainedmapsofthehorizontalandverticalmeridianby using meridian‐specific stimuli. Briefly, high contrastreversing(8.3Hz)wedge(30deg)checkerboardswereused.Horizontal and vertical meridian stimuli were alternated inblocks of 12 s duration, over 12 cycles. Again, a correlationmethod was used to delineate area boundaries. Theseconfirmed boundaries obtained using the standard rotatingwedgestimuliforpolaranglemeasurements[57,60,61].
I.Regionofinterest(ROI)analysis
ROIs with a mean size of 25 voxels were definedcorrespondingtoalocationnearthefovea(1.4°eccentricity)andat increasingvisual fieldeccentricities inprimaryvisualcortex (V1).EachROIhaddimensionsof222mm3, ca25voxels.Thespatialprofileofthestimuluscorrespondsto40‐45mmofcorticaldistance inV1,and theROIswere locatedalmost abutting along this axis as illustrated in Fig. 1C.Wenote that it is unlikely that the hemodynamic responsederivessolelyfromcortexwithineachROI,andsomeblurringis inevitable. WethusconsideredusinganarcofcortexasaROI, but this would have led to a further potential lack ofresolution. To estimate the strength of the fMRI responsewithin each of these ROIs, we performed a General LinearModel(GLM)analysisseparatelyforeachhemisphere.Todoso,we first extracted themean fMRI time course of a givenROI for a given experimental run, corresponding to each ofthethreestimulusconditions(|L‐M|,Lum,orS),byaveragingover all voxels. In the subsequent step, the time coursewasnormalized using the z‐value‐transformation. Next, the GLMwith6predictors (corresponding to the6SFconditions;seebelow) and a baseline (control block) was fit to thenormalized time course. The time course of the predictorswas computed from the stimulation protocol and wasconvolved with the two‐gamma hemodynamic‐responsefunction [62]. In the GLM equation, each predictor timecourse is associated with a coefficient or beta weight β,quantifyingitscontributioninexplainingtheROItimecourse.ThesixbetaweightsinthiscontextreflectthestrengthofthefMRI responseat5SFs (0.27,0.55,1.09,2.2,4.4cpd),andaspatial‐frequency scaled stimulus (4.4 cpd scaled). A similarprocedurewasadoptedwithfurthervisualareas.
J.Spatialfrequencytuningcurves
For the tested eccentricities the fMRI response, averagedacrosssubjects,wasplottedasafunctionofSFofthecirculargratings for three stimulus conditions: |L‐M|, Lum, and S,respectively.TocharacterizetheSFtuningpropertiesattheseeccentricities,wefittedGaussianfunctionstothedatawithaproceduresimilartothatdescribedbyHenrikssonetal.[52].Thefour‐parameterGaussianfunctionusedintheanalysisisgivenby
R R0 R1 exp f 2
2 2
where R is the fMRI response (beta‐weight) at a particularspatial frequency f, and R0, R1, and µ, are parameters thatwereestimatedusingtheMarquardt‐Levenbergminimizationalgorithm provided in Sigmaplot®. For each data set withband‐pass tuning characteristics, the fitted parameter µindicatedtheoptimalSF;forthetuningdatawithlow‐passor

5
high‐passtuningcharacteristics,thelowestorthehighestSF,respectively,wasconsideredastheoptimumSF.
3.RESULTS
A.ResponsivityasafunctionofeccentricityinV1
ThefMRIresponsetoselectivestimulationofthechromatic(|L‐M|andS‐cone)andluminancepathwaysweremeasuredinROIscorrespondingtothenear‐fovea(1.4deg)throughhighereccentricitiesuptoapproximately10deg,inretinotopically‐mappedprimaryvisualcortex(V1).Wemeasuredresponsestocircularsine‐wavegratingsatarangeofspatialfrequenciesandalsotoM‐scaledcirculargratings,wherethespatialfrequencyincreasesacrosstheradiusinanattempttomatchthecorticalmagnificationfactor.
InFig.2,fMRIBOLDresponsesinV1,averagedacrosssixhemispheres,areplotted forasetofspatial frequenciesasafunction of visual field eccentricity. The data show that V1respondsrobustlytoallstimuli,withthestrongestresponsesto|L‐M|cone‐opponent,comparedtoluminance(Lum)andS‐cone stimulus conditions across all spatial frequencies. Thisresult is in line with previous fMRI reports on corticalprocessing of chromatic modulation [44‐46, 49]. There areinteractionsbetweenspatialfrequencyandeccentricityforallconditions.Thus,foraspatialfrequencyof0.27cpd(Fig.2A),both |L‐M| and luminance responses are largest at highereccentricities whereas at the highest spatial frequencymeasured (4.4 cpd), themaximumresponse is at the lowesteccentricity. Eccentricity‐dependent changes are also seenwith S‐cone stimulation. These shifts inmaximum responseare consistentwith a coarser representation of visual spacewithincreasingeccentricity.
We tested an M‐scaled grating stimulus to try andequalizeresponseamplitudeacrosseccentricity(Fig.2,lowerright).Thescaledstimulus(4.4cpdatthecenterand0.16cpdat theperimeter)wasused for the threestimulus types.For|L‐M| and Lum, the scaling was only partially effective;althoughthedatashowconsistentlystrongresponseswithaflatter characteristic, although there is a slight inverse‐Ushape;curves forboth theseconditionswereverysimilar inshape. For the S‐cone stimulus, the shape of the curvedeviates fromtheother twocondition,a resultwereturn tobelow.
To compare these changes more directly betweenchannels,thedatawerereplotted,normalizedineachcasetothepeakresponseforthatconditionatthateccentricity(Fig.3A). The |L‐M| and Lum curves generally show a similarpatternasafunctionofeccentricityforallspatialfrequencies.There are some deviations from this finding. The 0.27 cpdcurve shows a larger response for |L‐M| and S cone stimuliclose to the foveacompared to therespectiveLumstimulus.Thisisconsistentwithalow‐passspatialfrequencyresponseofchromaticpathwayscomparedtoluminanceresponses,asseen both physiologically at precortical levels [63, 64] andpsychophysically. For the scaled stimulus (lower right), theresponses are not entirely independent of eccentricity.However, the shapes of the curves for |L‐M| and Lum aresimilar.BothdifferathighereccentricitiescomparedwiththeS‐conestimulus.Thisissueistakenupbelow.
To quantify this further, we plotted the ratio betweenLumand|L‐M|responsesforeachspatialfrequencyinFig.3B.Apartfromthedifferentshapefor0.27cpdnotedabove(duetoarelativelyweakLumresponseatloweccentricities),and
Fig. 2. BOLD fMRI response as a function of visual fieldeccentricityinV1,averagedoversixhemispheres,areplottedasafunctionofvisualfieldeccentricityforstimulationofthethree post‐receptoral pathways:. Each plot showseccentricity‐dependent responses at a different spatialfrequency, and to the scaled stimulus. The data show thatresponsesdependonconditionandvarywithstimulusspatialfrequencyandeccentricity.
for 4.4 cpd at high eccentricities (where S‐cone responseswere weak), ratios do not change systematically witheccentricity.Takingalldatatogether,therewasnosignificanteffect of eccentricity on the Lum/|L‐M| ratio (ANOVA testusingGLM:P=0.068).FortheS‐conestimuli,however,theresultsdifferedfromtheother two conditions. Responses fall off more rapidly athigherspatialfrequenciesasafunctionofeccentricity.Thisisseen in Fig. 3C, which shows the ratio of (Lum)/S‐coneresponses; there is a consistent andpronounced increase inratio with eccentricity, especially for spatial frequenciesabove 1.09 cpd (at 2.2 and 4.4 cpd). This difference wasstatisticallysignificant(ANOVAtestusingGLM:P<0.001).Asimilar result was found when S‐cone responses werecompared to the |L‐M| responses (not shown). We alsoperformed an extensive series of preliminary observationswithstimulimodulatedaround thewhitepoint,withsimilarresults. However, we focus here on the data from theconcatenated block design, which yielded more reliableresults.
These data suggest that, especially for |L‐M| andluminancestimuli,asimilarspatial‐frequencytuningpatternis found across eccentricities, and implies that for |L‐M|opponent stimuli, responsivity is well maintained in theperipheralrepresentationofV1.TheS‐coneresponsesshowadifferentpatterntotheotherconditionsandwenowshow
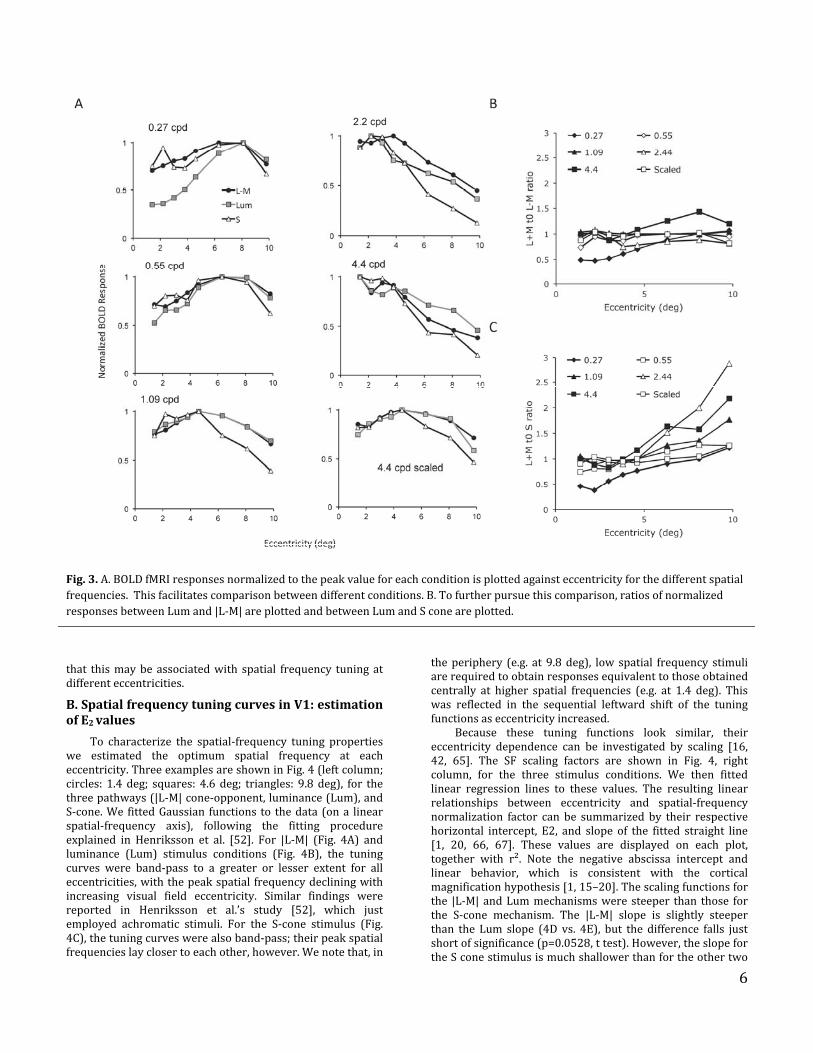
6
Fig.3.A.BOLDfMRIresponsesnormalizedtothepeakvalueforeachconditionisplottedagainsteccentricityforthedifferentspatialfrequencies.Thisfacilitatescomparisonbetweendifferentconditions.B.Tofurtherpursuethiscomparison,ratiosofnormalizedresponsesbetweenLumand|L‐M|areplottedandbetweenLumandSconeareplotted.
that thismaybe associatedwith spatial frequency tuning atdifferenteccentricities.
B.SpatialfrequencytuningcurvesinV1:estimationofE2values
To characterize the spatial‐frequency tuning propertieswe estimated the optimum spatial frequency at eacheccentricity.ThreeexamplesareshowninFig.4(leftcolumn;circles: 1.4 deg; squares: 4.6 deg; triangles: 9.8 deg), for thethreepathways(|L‐M|cone‐opponent,luminance(Lum),andS‐cone.We fittedGaussian functions to thedata (ona linearspatial‐frequency axis), following the fitting procedureexplained in Henriksson et al. [52]. For |L‐M| (Fig. 4A) andluminance (Lum) stimulus conditions (Fig. 4B), the tuningcurves were band‐pass to a greater or lesser extent for alleccentricities,withthepeakspatial frequencydecliningwithincreasing visual field eccentricity. Similar findings werereported in Henriksson et al.’s study [52], which justemployed achromatic stimuli. For the S‐cone stimulus (Fig.4C),thetuningcurveswerealsoband‐pass;theirpeakspatialfrequencieslayclosertoeachother,however.Wenotethat,in
theperiphery (e.g. at 9.8deg), low spatial frequency stimuliarerequiredtoobtainresponsesequivalenttothoseobtainedcentrally at higher spatial frequencies (e.g. at 1.4 deg). Thiswas reflected in the sequential leftward shift of the tuningfunctionsaseccentricityincreased.
Because these tuning functions look similar, theireccentricity dependence can be investigated by scaling [16,42, 65]. The SF scaling factors are shown in Fig. 4, rightcolumn, for the three stimulus conditions. We then fittedlinear regression lines to these values. The resulting linearrelationships between eccentricity and spatial‐frequencynormalization factor can be summarized by their respectivehorizontal intercept, E2, and slope of the fitted straight line[1, 20, 66, 67]. These values are displayed on each plot,together with r². Note the negative abscissa intercept andlinear behavior, which is consistent with the corticalmagnificationhypothesis[1,15–20].Thescalingfunctionsforthe |L‐M|andLummechanismswere steeper than those forthe S‐cone mechanism. The |L‐M| slope is slightly steeperthan the Lum slope (4D vs. 4E), but the difference falls justshortofsignificance(p=0.0528,ttest).However,theslopefortheSconestimulusismuchshallowerthanfortheothertwo

7
conditions at high significance level (p<0.001, t test). ThisfindingiseffectivelyareformulationofthedatainFig.4C.
Fig. 4. Spatial frequency tuning functions in V1 at differenteccentricities. A‐C. BOLD fMRI responses as a function ofspatialfrequencyatdifferenteccentricities(o:1.4deg;□:4.6deg;∆:9.8deg)forstimulationofthethreepathways:(A)|L‐M|,(B)Lum,and(C)S,respectively.Forquantificationoftheoptimum spatial frequencies, Gaussian functions (solid line:1.4deg;dotted line:4.6deg; shortdashed line:9.8deg) arefitted to the data. Right column: Spatial frequency scalingfactorsrequiredfornormalizingthethreescalingfunctionsateccentricities 1.4, 4.6, and 9.8 deg to that at 1.4 deg bymatching their optimum spatial frequency values: |L‐M|,Lum,andS,respectively.Straightlinesarefittedtothedata.E2valueistheeccentricityaxisintercept.
ThedifferencebetweenS‐cone,andLumand|L‐M|data,
may be related to the different receptor densities acrosseccentricity in these pathways, a topic taken up in thediscussion.Takentogether,thedatainFigs.3–5suggestthat|L‐M| responses in V1 remain robust up to 10 degreeseccentricity. We now briefly consider responses in othervisualareas.
C.Responsesasa functionofeccentricity inareasbeyondV1
Werestrictedanalysisof eccentricity‐related responsivity toventral areas (V2v, V3v and V4), since the phase‐relatedeccentricity mapping was better defined for these areas.Thereareindicationsthattheremaybesomeenlargementof
thefovealrepresentationintheseareas[68‐71].However,weused the eccentricitymapsgeneratedwith annuli to give anindicationofeccentricityandwedidnotattempttotakesuchconsiderationsintoaccount.
Fig.5AshowstheamplitudeoftheBOLDfMRIsignalasafunctionofeccentricityatdifferentspatialfrequenciesinV2v.As inV1(Fig.2),robustresponsesarepresentto|L‐M|(andS‐cone)aswellastoachromatic(Lum)stimulation.However,the markedly larger responses to |L‐M| stimulation (closedcircles)ascomparedtotheothermodalities(LumandScone)are lessapparentandareconfined to frequenciesof2.2cpdandabove(andrelativetoS‐coneresponsesat2.7cpd).Thiswasalso thecase in furtherventralareasand is takenupattheendofthissection.
Thechangesinspatial‐frequencytuningwitheccentricityobserved inV1arealsopresent.Forexample, theresponsesto0.27cpdare largestathighereccentricitiesbutat4.4cpdthe largest responses are closer to the fovea. That changeappearscommonto|L‐M|andachromatic(Lum)stimulation,whereasthepatternfortheSconeisagaindifferent.Thiswasmadeclearerwhendatawereplottedasafunctionofspatialfrequencytoobtaintuningcurves(notshown).WeattemptedtoanalyzethedatabyfittingtuningcurvesasforV1(i.e.asinFig. 4). However, this proved unsatisfactory since, with anoptimumresponsetypicallyoccurringaround1cpdorlower,the peakswere not alwayswell defined; fitted curveswerepoorly constrained because the lowest spatial frequencytested (0.27 cpd) did not capture the curve’s low spatialfrequency roll‐off of the curve. This is probably due to thelargerreceptivefieldsizesobservedinV2andfurtherventralvisualareas[72,73].To further analyze these changes, we performed the sameratiocalculationofBOLDfMRIresponsesasinFig.3B,C.ThisanalysisisshowninFig.5Bwheretheseratiosare,asbefore,plotted as a function of eccentricity. As in V1, there is littlesystematic trend in the relative strengths of |L‐M| and Lumsignals with eccentricity over the different conditions(ANOVA test using GLM: P = 0.435). On the other hand, theratios for Lum‐cone relative to S‐cone stimulation increasesignificantly with eccentricity at the higher spatialfrequencies, i.e., S‐cone responses become relativelyweaker(ANOVA test using GLM: P < 0.001). This is consistentwithdifferent eccentricity scaling for S‐cone mechanisms thanthosedependingontheLandMcones,aswasshowninFig.4for V1. We did not pursue this further, since there may besomeuncertaintyastoeccentricityscalinginV2ascomparedtoV1,asnotedabove.
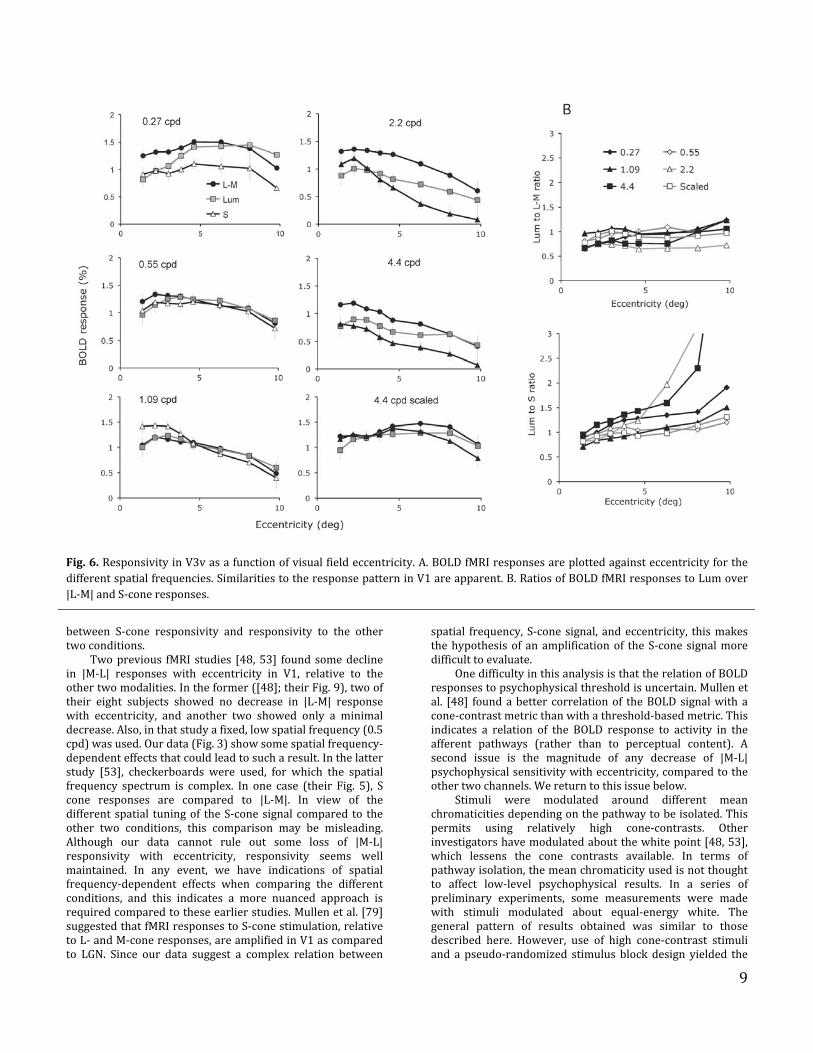
Fig. 6 shows the corresponding analyses for area V3v.EccentricityfunctionsforallspatialfrequenciesareshowninFig.6A.AsimilarpatternisseenasforV2v.Thereisthesameinteraction between spatial frequency and eccentricity as intheearlierareas.AratioanalysisisshowninFig.6B.ForthecomparisonofachromaticLumto|L‐M|,thedatajustreachedsignificance(ANOVAtestusingGLM:P=0.049)HoweverforthecomparisonofLumtoS, thedatawerehighlysignificant(ANOVAtestusingGLM:P=0.002).ThedatashowninFigs.5and 6 suggest that no substantial difference in thedependence of |L‐M| and achromatic (Lum) signals witheccentricitydevelopsfromV1toV3v.Also,thedifferenceinS‐conesignal‐scalingwitheccentricityismaintained.
WealsoattemptedasimilaranalysisforV4(notshown).ItshouldbenotedthattherepresentationofthevisualfieldinV4inhumanisamatterofdispute(e.g.[69,74‐76];reviewed

8
Fig.5.ResponsivityinV2vasafunctionofvisualfieldeccentricity.A.BOLDfMRIresponsesareplottedagainsteccentricityforthedifferentspatialfrequencies.SimilaritiestotheresponsepatterninV1areapparent.B.RatiosofBOLDfMRIresponsestoLumover|L‐M|andS‐coneresponses,respectively.
in [77]. We obtained robust responses for all conditions. Adifferent pattern appeared to be present in these resultscompared to V1, V2V and V3v. It should be noted that therepresentationofthevisualfieldinV4inhumanisamatterofdispute (e.g. [69, 74‐76]; reviewed in [77]. So, due to theuncertaintyofretinotopicorganizationinV4,wearecautiousin interpreting thesedata, but it appears that the consistentpattern observed in V1, V2 and V3v is changed, with moresimilarresponsesbetweencolorchannels.
4.DISCUSSION
A.TheBOLDfMRIsignalinrelationtoeccentricity
We measured BOLD fMRI responses to stimuli designed toselectively stimulate the different afferent retino‐geniculo‐cortical pathways, a neurophysiological ‘bottom up’ ratherthana‘top‐down’approach,inwhichfMRIresponsesdependon behavioral or cognitive contexts. Psychophysicalsensitivity to red‐green chromatic modulation is commonlyheld to decline more steeply toward the peripheral visualfield thandoes luminancesensitivityor sensitivity toS‐conestimuli;itwasproposedthismighthavearetinalbasisinthe
changes of midget morphology with eccentricity [6‐9].However, electrophysiological measurements have shownthatred‐greenresponsitivityofPCcellsiswellmaintainedupto quite high eccentricities (>20 degrees) [34, 35]. Fromanatomical studies it is further evident that the one‐to‐oneconnectivityofthemidgetpathwayismaintaineduptoca.10deg and thereafter declines only gradually [78].Psychophysicallossofsensitivityisalreadymarkedat10degeccentricity. There has been no direct study of eccentricity‐dependence and chromatic properties at the LGN level, butLGN studies (e.g., Derrington et al. [38]) have recordedextensivelyfrom0‐15degandhavenotnotedanychangein|L‐M| opponency. Thiswould implicate a cortical site in thesensitivityloss.
The eccentricity‐dependent chromatic (|L‐M| cone‐opponentandS‐conepathways)andluminanceresponsesarecompared inFigs.2–4forV1. Inourdata, therewas littleorno difference in |L‐M| relative to the achromatic (Lum)responseasafunctionofeccentricity,asevidentinFig.3.Thiswould suggest that any loss of |M‐L| psychophysicalsensitivityintheperipherydoesnotoccurinV1,anddatainFigs. 5 and 6 suggest a similar conclusion for V2v and V3v.Thereare,however,spatialfrequency‐dependentdifferences
9
Fig.6.ResponsivityinV3vasafunctionofvisualfieldeccentricity.A.BOLDfMRIresponsesareplottedagainsteccentricityforthedifferentspatialfrequencies.SimilaritiestotheresponsepatterninV1areapparent.B.RatiosofBOLDfMRIresponsestoLumover|L‐M|andS‐coneresponses.
between S‐cone responsivity and responsivity to the othertwoconditions.
Twoprevious fMRI studies [48,53] foundsomedeclinein |M‐L| responses with eccentricity in V1, relative to theothertwomodalities.Intheformer([48];theirFig.9),twooftheir eight subjects showed no decrease in |L‐M| responsewith eccentricity, and another two showed only a minimaldecrease.Also,inthatstudyafixed,lowspatialfrequency(0.5cpd)wasused.Ourdata(Fig.3)showsomespatialfrequency‐dependenteffectsthatcouldleadtosucharesult.Inthelatterstudy [53], checkerboards were used, for which the spatialfrequency spectrum is complex. In one case (their Fig. 5), Scone responses are compared to |L‐M|. In view of thedifferent spatial tuningof theS‐conesignal compared to theother two conditions, this comparison may be misleading.Although our data cannot rule out some loss of |M‐L|responsivity with eccentricity, responsivity seems wellmaintained. In any event, we have indications of spatialfrequency‐dependent effects when comparing the differentconditions, and this indicates a more nuanced approach isrequiredcomparedtotheseearlierstudies.Mullenetal.[79]suggestedthatfMRIresponsestoS‐conestimulation,relativetoL‐andM‐coneresponses,areamplifiedinV1ascomparedto LGN. Since our data suggest a complex relation between
spatial frequency, S‐cone signal, andeccentricity, thismakesthehypothesisof anamplificationof theS‐cone signalmoredifficulttoevaluate.
OnedifficultyinthisanalysisisthattherelationofBOLDresponsestopsychophysicalthresholdisuncertain.Mullenetal. [48] foundabetter correlationof theBOLDsignalwith acone‐contrastmetricthanwithathreshold‐basedmetric.Thisindicates a relation of the BOLD response to activity in theafferent pathways (rather than to perceptual content). Asecond issue is the magnitude of any decrease of |M‐L|psychophysicalsensitivitywitheccentricity,comparedtotheothertwochannels.Wereturntothisissuebelow.
Stimuli were modulated around different meanchromaticitiesdependingonthepathwaytobeisolated.Thispermits using relatively high cone‐contrasts. Otherinvestigatorshavemodulatedaboutthewhitepoint[48,53],which lessens the cone contrasts available. In terms ofpathwayisolation,themeanchromaticityusedisnotthoughtto affect low‐level psychophysical results. In a series ofpreliminary experiments, some measurements were madewith stimuli modulated about equal‐energy white. Thegeneral pattern of results obtained was similar to thosedescribed here. However, use of high cone‐contrast stimuliand a pseudo‐randomized stimulus blockdesign yielded the

10
most reliable results with the least inter‐individualvariability, and these experiments form the basis of theresultssection.Thespatialfrequencytuningof|L‐M|andLumresponses, and its relation to eccentricity, appeared to besimilar(Fig.4)andsimilartothetuningcurvesforluminancegratings inHenrikssonet al. [52] fordifferent eccentricities.Forluminance,spatial‐frequencytuningcurvesnearthefoveahad a band‐pass character as these authors describe. Thetuningcurvesforthechromaticgratingswerelessband‐passinshape(Fig.4).
Basedonthepresentresults,theresponsepropertiesofV2v and V3v qualitatively resemble the V1 data. As in V1,therewas a foveal preference for higher spatial frequenciesand peripheral preference for lower spatial frequencies.However, visual information processing in V2v throughV3vappears tooccurataprogressivelycoarserscale, i.e., spatialfrequencytuningbecomescoarserthaninV1.Forexample,inV3vthedataindicateadeclineinresponseacrosseccentricityevenat0.55cpd, thespatial frequencyusedbyMullenetal.[48]. In V1, there is an increase in response acrosseccentricityforthesamespatialfrequency.Overall,itappearsthateccentricity‐related|L‐M|sensitivity lossdoesnotoccurinV1throughV3v.
B.Eccentricityandmagnificationfactor
For theassessmentof localcorticalmagnification factorsweused an indirect approachwhere stimulus size and locationwerekeptconstantandonlyspatial‐frequencycontentvaried.Estimates of the cortical magnification factor were thenobtainedbycomparingthespatial‐frequencytuningcurvesatthe different eccentricities. Thisworkedwell for V1 but notfor the later areas, largely because in those areas spatialtuningwascoarser,andtherangeofspatialfrequenciesusedwasnotwideenoughtoalwayscapturethetuningfunction’speak. Within V1 the range sufficed, however; the resultinginverse‐linearfunctionsandtheirE2valuesforthe|L‐M|andLum channels corresponded roughly to those previouslyobtained with achromatic stimuli, both in fMRI andpsychophysicalstudies(seeStrasburgeretal.[1],Section3.2,for review). Note that a numerical comparison of E2 valuesobtained across different approaches is limited by the factthat, particularly in those from cortical location maps (e.g.Larsson&Heeger [69]),E2andM0 (i.e. fovealM)estimatesarestronglynegativelycorrelated,suchthatthesevaluesaremeaningfulonlyasapair.
Responses in V1 showed a similar spatial tuning forachromatic (Lum) and |L‐M| responses as a function ofeccentricity (Fig. 4). This is consistent with the same rulesgoverning eccentricity scaling in V1 for both |L‐M| andachromatic signals. The original M‐scaling concept wasdirectly based on density of retinal elements and theirrepresentationinV1[16].BothPC‐andMC‐pathwaysderivereceptor input from theM‐ and L‐cones,with little or no S‐cone input [80]. The ratio of cone to ganglion cell densityremains similar from fovea to mid‐periphery, as does theproportionofparasol(MC)tomidget(PC)ganglioncells[25,81].However,thescalingfunctionfortheS‐coneresponseinV1(Fig.5F)isdifferentfromtheothers.Itappearsshallower,which implies thatspatial tuningscales lessrapidlythantheotherstowardtheperiphery.
Anatomical and physiological studies have providedevidence that blue‐yellow cone‐opponencypasses throughaseparate pathway originating in the small bistratified
ganglioncelltypeoftheretinaaswellasothercelltypes[23,82, 83]. This pathway remains distinct through thekoniocellularlayersoftheLGNandtotheblobsofV1.S‐conesareabsentinthecenterofthetritanopicfovea,thenincreaserapidly relative to M‐ and L‐cones up to ca. 6–7 degeccentricity;beyondthispointtheirproportionstabilizesandremainsrelativelyconstant(atabout7%;[41]).
Weattemptedtoanalyzethechangeinscaling,basedonestimatesofconedensityofCurcioandcollaborators[41,84].TheanalysisassumedthatthedensityofS‐coneganglioncellsisproportionaltoS‐conedensity,andthatconvergenceofS‐cone LGN cells onto cortical neurons is determined by thedensity of input from S‐cone cells in the LGN rather thancortical magnification per se. Calculations based on S‐conedensitypredict a flatteningof theE2 relation for the S‐conecomparedtothatfortheM,Lcones.Therewereconsiderableuncertaintiesinthisanalysis,butitisconsistentwiththeideathatSconepercentagewillaffectthescalingofoptimalspatialfrequency of S‐cone chromatic mechanisms, and that thismightbedifferentfromtoachromaticand|L‐M|mechanisms,atleastpartlyaccountingforourdata.
C.Psychophysicalconsiderations
Color naming experiments showed that color naming wasfairly normal in the peripheral visual field [2‐4], counteringearliersuggestionsthatcolorvisionwaspoorornonexistentintheperiphery.Nevertheless,thereisconsiderableevidencethat|M‐L|contrastsensitivitydeclineswitheccentricitymorerapidlythandoesachromaticsensitivity[6,7,33],anditwasproposed that thiswasassociatedwith randomconnectivityof midget bipolars to midget ganglion cells with increasingconvergence at higher eccentricities [9]. To bolster thishypothesis, it is desirable to show that psychophysicalsensitivity of the |L‐M| chromatic channel declines morerapidly than sensitivity of a channel based on S‐conesensitivity.Somestudiesshowthatthisisthecase[5,10,11],althoughnoneofthemspecificallyconsiderthepossibilityofdifferent spatial scaling of the S‐cone mechanism.Nevertheless, at least in one study [10] the range of spatialfrequencies investigated should have compensated fordifficultiesfromthissource,andeccentricitiesextendedwellbeyond10deg.Somepsychophysicalstudieshavespecificallytargetedthepossibilityofdifferentscalingswitheccentricitybased on cone densities. Volbrecht et al. [43] found Riccò’sareaforS‐conestimulitochangedifferentlywitheccentricitycomparedwithachromaticor|L‐M|mechanisms,andtriedtoexplain this with the differential distributions of cones.Vakrou et al. [42] found that psychophysical contrastsensitivitycurvesbasedonS‐coneactivityscaledlessrapidlywith eccentricity than those for the other two modalities,qualitativelyresemblingourdata.
As inmany cases when physiology is related to neuralmodels for psychophysical data [85], the neurobiologicalfoundationsforbehavioralresultsmaybemorecomplexthananticipated. We show here evidence for a differentphysiological scaling with eccentricity for the S‐conemechanism compared to the other two modalities, a factorthathaslargelybeenneglected.Finally,wewouldstressthatone‐to‐onemidget connectivity is well maintained up to 10deg andbeyond [78], an eccentricity atwhich a decrease in|L‐M| psychophysical sensitivity is already apparent [10].This decrease must presumably have a central locus; itremains to be seen whether, with appropriately scaled
11
stimuli, S‐cone psychophysical sensitivity shows a similarchange.Inanyevent,itseemslikelythatchangesinchromatic(andachromatic)psychophysicalsensitivitywitheccentricityderivefrombothretinalandcorticalsubstrates.Funding. National Institutes of Health NEI R01‐13112(BBL)Acknowledgements.WethankDietmarMerboldt,DirkVoit,LutzPräkelt,KurtBöhm,andHenryLütckefortechnicalassistance.
REFERENCES
1. H. Strasburger, I. Rentschler, and M. Juttner, "Peripheral vision and pattern recognition: a review," J Vision 11, 13 (2011).
2. I. Abramov and J. Gordon, "Color vision in the peripheral retina II, Hue and saturation," JOSA 67, 202‐206 (1977).
3. C. Noorlander, J. J. Koenderink, R. J. den Ouden, and B. W. Edens, "Sensitivity to spatiotemporal colour contrast in the peripheral visual field," Vision Res. 23, 1‐11 (1983).
4. I. Abramov, J. Gordon, and H. Chan, "Color appearance in the peripheral retina: effects of stimulus size," JOSA A. 8, 404‐414 (1991).
5. T. Hansen, L. Pracejus, and K. R. Gegenfurtner, "Color perception in the intermediate periphery of the visual field," J Vision 9, 26 21‐12 (2009).
6. S. J. Anderson, K. T. Mullen, and R. F. Hess, "Human peripheral spatial resolution for achromatic and chromatic stimuli: limits imposed by optical and retinal factors," J Physiol 442, 47‐64 (1991).
7. K. T. Mullen, "Colour vision as a post‐receptoral specialization of the central visual field," Vision Res 31, 119‐130 (1991).
8. C. F. Stromeyer, 3rd, J. Lee, and R. T. Eskew, Jr., "Peripheral chromatic sensitivity for flashes: a post‐receptoral red‐green asymmetry," Vision Res 32, 1865‐1873 (1992).
9. K. T. Mullen and F. A. Kingdom, "Losses in peripheral colour sensitivity predicted from "hit or miss" post‐receptoral cone connections," Vision Res 36, 1995‐2000 (1996).
10. K. T. Mullen and F. A. Kingdom, "Differential distributions of red‐green and blue‐yellow cone opponency across the visual field," Vis Neurosci 19, 109‐118 (2002).
11. K. T. Mullen, M. Sakurai, and W. Chu, "Does L/M cone opponency disappear in human periphery?," Perception 34, 951‐959 (2005).
12. J. J. Koenderink, M. A. Bouman, A. E. Bueno de Mesquita, and S. Slappendel, "Perimetry of contrast detection thresholds of moving spatial sine wave patterns. III. The target extent as a sensitivity controlling parameter," JOSA. 68, 854‐860 (1978).
13. J. J. Koenderink, M. A. Bouman, A. E. Bueno de Mesquita, and S. Slappendel, "Perimetry of contrast detection thresholds of moving spatial sine patterns. II. The far peripheral visual field (eccentricity 0 degrees‐50 degrees)," JOSA 68, 850‐854 (1978).
14. J. J. Koenderink, M. A. Bouman, A. E. Bueno de Mesquita, and S. Slappendel, "Perimetry of contrast detection thresholds of moving spatial sine wave patterns. I. The near peripheral visual field (eccentricity 0 degrees‐8 degrees)," JOSA 68, 845‐849 (1978).
15. J. Rovamo and V. Virsu, "An estimation and application of the human cortical magnification factor," Exp Brain Res 37, 495‐510 (1979).
16. V. Virsu and J. Rovamo, "Visual resolution, contrast sensitivity, and the cortical magnification factor.," Exp Brain Res 37, 475‐494 (1979).
17. V. Virsu, R. Näsänen, and K. Osmoviita, "Cortical magnification and peripheral vision," JOSA A. 4, 1568‐1578 (1987).
18. P. M. Daniel and D. Whitteridge, "The representation of the visual field on the cerebral cortex in monkeys," J Physiol 159, 203‐221 (1961).
19. A. Cowey and E. T. Rolls, "Human cortical magnification factor and its relation to visual acuity," Exp Brain Res 21, 447‐454 (1974).
20. D. M. Levi, S. A. Klein, and A. P. Aitsebaomo, "Vernier acuity, crowding and cortical magnification," Vision Res 25, 963‐977 (1985).
21. R. L. DeValois, C. Morgan, M. C. Polson, W. R. Mead, and E. M. Hull, "Psychophysical studies of monkey vision‐I. Macaque luminosity and color vision tests," Vision Res 14, 53‐67 (1974).
22. R. L. DeValois, H. Morgan, and D. M. Snodderly, "Psychophysical studies of monkey vision ‐ III. Spatial luminance contrast sensitivity tests of macaque and human observers," Vision Res 14, 75‐81 (1974).
23. B. B. Lee, "Visual pathways and psychophysical channels in the primate," J Physiol 589, 41‐47 (2011).
24. T. Wiesel and D. H. Hubel, "Spatial and chromatic interactions in the lateral geniculate body of the rhesus monkey," J Neurophysiol 29, 1115‐1156 (1966).
25. H. Wässle and B. B. Boycott, "Functional architecture of the mammalian retina," Physiol Rev 71, 447‐480 (1991).
26. R. C. Reid and R. M. Shapley, "Spatial structure of cone inputs to receptive fields in primate lateral geniculate nucleus," Nature 356, 716‐718 (1992).
27. D. J. Calkins, S. J. Schein, Y. Tsukamoto, and P. Sterling, "M and L cones in macaque fovea connect to midget ganglion cells by different numbers of excitatory synapses," Nature 371, 70‐72 (1994).
28. B. B. Lee, J. Kremers, and T. Yeh, "Receptive fields of primate ganglion cells studied with a novel technique," Vis Neurosci 15, 161‐175 (1998).
29. R. C. Reid and R. M. Shapley, "Space and time maps of cone photoreceptor signals in macaque lateral geniculate nucleus," J Neurosci 22, 6158‐6175 (2002).
30. B. B. Lee, R. M. Shapley, M. J. Hawken, and H. Sun, "The spatial distributions of cone inputs to cells of the parvocellular pathway investigated with cone‐isolating gratings," JOSA A (2012).
31. B. B. Boycott and J. E. Dowling, "Organization of the primate retina: Light microscopy," Phil Trans Roy Soc Lond B 255, 109‐184 (1969).
32. H. Wässle, U. Grünert, P. R. Martin, and B. B. Boycott, "Color coding in the primate retina: predictions and constrants from anatomy," in Structural and functional organization of the neocortex. A symposium in the memory of Otto D. Creutzfeldt, B. Albowitz, K. Albus, U. Kuhnt, H. C. Nothdurft, and P. Wahle, eds. (Springer, Berlin, Heidelberg, New York, 1994), pp. 94‐104.

12
33. J. R. Newton and R. T. Eskew, Jr., "Chromatic detection and discrimination in the periphery: a postreceptoral loss of color sensitivity," Vis Neurosci 20, 511‐521 (2003).
34. P. R. Martin, B. B. Lee, A. J. White, S. G. Solomon, and L. Rüttiger, "Chromatic sensitivity of ganglion cells in peripheral primate retina," Nature 410, 933‐936 (2001).
35. S. G. Solomon, B. B. Lee, A. J. White, L. Ruttiger, and P. R. Martin, "Chromatic organization of ganglion cell receptive fields in the peripheral retina," J Neurosci 25, 4527‐4539 (2005).
36. J. D. Crook, M. B. Manookin, O. S. Packer, and D. M. Dacey, "Horizontal cell feedback without cone type‐selective inhibition mediates "red‐green" color opponency in midget ganglion cells of the primate retina," J Neurosci 31, 1762‐1772 (2011).
37. G. D. Field, J. L. Gauthier, A. Sher, M. Greschner, T. A. Machado, L. H. Jepson, J. Shlens, D. E. Gunning, K. Mathieson, W. Dabrowski, L. Paninski, A. M. Litke, and E. J. Chichilnisky, "Functional connectivity in the retina at the resolution of photoreceptors," Nature 467, 673‐677 (2010).
38. A. M. Derrington, J. Krauskopf, and P. Lennie, "Chromatic mechanisms in lateral geniculate nucleus of macaque," J. Physiol. (Lond). 357, 241‐265 (1984).
39. A. M. Derrington and P. Lennie, "Spatial and temporal contrast sensitivities of neurones in lateral geniculate nucleus of macaque," J Physiol 357, 219‐240 (1984).
40. W. H. Swanson, H. Sun, B. B. Lee, and D. Cao, "Responses of Retinal Ganglion Cells to Perimetric Stimuli," Inv. Ophth Vis Sci 51(2010).
41. C. A. Curcio, A. A. Kimberly, K. R. Sloan, C. L. Lerea, J. B. Hurley, I. B. Klock, and A. H. Milam, "Distribution and morphology of human cone photoreceptors stained with anti‐blue opsin," J Comp Neurol 312, 610‐624 (1991).
42. C. Vakrou, D. Whitaker, P. V. McGraw, and D. McKeefry, "Functional evidence for cone‐specific connectivity in the human retina," J Physiol 566, 93‐102 (2005).
43. V. J. Volbrecht, E. E. Shrago, B. E. Schefrin, and J. S. Werner, "Spatial summation in human cone mechanisms from 0 degrees to 20 degrees in the superior retina," JOSA A. 17, 641‐650 (2000).
44. A. Kleinschmidt, B. B. Lee, M. Requardt, and J. Frahm, "Functional mapping of color processing by magnetic resonance imaging of responses to selective P‐ and M‐pathway stimulation," Exp Brain Res 110, 279‐288 (1996).
45. J. Liu and B. A. Wandell, "Specializations for chromatic and temporal signals in human visual cortex," J Neurosci 25, 3459‐3468 (2005).
46. S. Engel, X. Zhang, and B. Wandell, "Colour tuning in human visual cortex measured with functional magnetic resonance imaging," Nature 388, 68‐71 (1997).
47. K. D. Singh, A. T. Smith, and M. W. Greenlee, "Spatiotemporal frequency and direction sensitivities of human visual areas measured using fMRI," Neuroimage 12, 550‐564 (2000).
48. K. T. Mullen, S. O. Dumoulin, K. L. McMahon, G. I. de Zubicaray, and R. F. Hess, "Selectivity of human retinotopic visual cortex to S‐cone‐opponent, L/M‐cone‐opponent and achromatic stimulation," Eur J Neurosci 25, 491‐502 (2007).
49. A. Wade, M. Augath, N. Logothetis, and B. Wandell, "fMRI measurements of color in macaque and human," J Vision 8, 1‐19 (2008).
50. K. T. Mullen, B. Thompson, and R. F. Hess, "Responses of the human visual cortex and LGN to achromatic and chromatic temporal modulations: an fMRI study," J Vision 10, 13 (2010).
51. D. V. D'Souza, T. Auer, H. Strasburger, J. Frahm, and B. B. Lee, "An fMRI study of chromatic processing in humans: Temporal characteristics of cortical visual areas " J Vision 11, 1‐17 (2011).
52. L. Henriksson, L. Nurminen, A. Hyvarinen, and S. Vanni, "Spatial frequency tuning in human retinotopic visual areas," J Vision 8, 1‐13 (2008).
53. S. Vanni, L. Henriksson, M. Viikari, and A. C. James, "Retinotopic distribution of chromatic responses in human primary visual cortex," Eur J Neurosci 24, 1821‐1831 (2006).
54. H. Strasburger, T. Wustenberg, and L. Jancke, "Calibrated LCD/TFT stimulus presentation for visual psychophysics in fMRI," J Neurosci Methods 121, 103‐110 (2002).
55. V. C. Smith and J. Pokorny, "Spectral sensitivity of the foveal cone photopigments between 400 and 500 nm," Vision Res 15, 161‐171 (1975).
56. E. A. DeYoe, G. J. Carman, P. Bandettini, S. Glickman, J. Wieser, R. Cox, D. Miller, and J. Neitz, "Mapping striate and extrastriate visual areas in human cerebral cortex," Proc Natl Acad Sci 93, 2382‐2386 (1996).
57. S. A. Engel, D. E. Rumelhart, B. A. Wandell, A. T. Lee, G. H. Glover, E. J. Chichilnisky, and M. N. Shadlen, "fMRI of human visual cortex," Nature 369, 525 (1994).
58. D. E. Linden, U. Kallenbach, A. Heinecke, W. Singer, and R. Goebel, "The myth of upright vision. A psychophysical and functional imaging study of adaptation to inverting spectacles," Perception 28, 469‐481 (1999).
59. H. Lu, G. Basso, J. T. Serences, S. Yantis, X. Golay, and P. C. van Zijl, "Retinotopic mapping in the human visual cortex using vascular space occupancy‐dependent functional magnetic resonance imaging," Neuroreport 16, 1635‐1640 (2005).
60. E. A. DeYoe, P. Bandettini, J. Neitz, D. Miller, and P. Winans, "Functional magnetic resonance imaging (FMRI) of the human brain," J Neurosci Methods 54, 171‐187 (1994).
61. M. I. Sereno, A. M. Dale, J. B. Reppas, K. K. Kwong, J. W. Belliveau, T. J. Brady, B. R. Rosen, and R. B. Tootell, "Borders of multiple visual areas in humans revealed by functional magnetic resonance imaging," Science 268, 889‐893 (1995).
62. G. M. Boynton, S. A. Engel, G. H. Glover, and D. J. Heeger, "Linear systems analysis of functional magnetic resonance imaging in human V1," J Neurosci 16, 4207‐4221 (1996).
63. T. P. Hicks, B. B. Lee, and T. R. Vidyasagar, "The responses of cells in macaque lateral geniculate nucleus to sinusoiodal gratings," J Physiol 337, 183‐200 (1983).
64. B. B. Lee, H. Sun, and A. Valberg, "Segregation of chromatic and luminance signals using a novel grating stimulus," J Physiol 589, 59‐73 (2011).
65. A. B. Watson, "Estimation of local spatial scale," JOSA A. 4, 1579‐1582 (1987).
66. N. Drasdo, "Neural substrates and threshold gradients of peripheral vision," in Limits of Vision, J. J. Kulikowski, V. Walsh, and I. J. Murray, eds. (MacMillan Press, London, 1991), pp. 250‐264.
67. F. W. Weymouth, "Visual sensory units and the minimal angle of resolution," Am J Ophthal 46, 102‐113 (1958).

13
68. R. F. Dougherty, V. M. Koch, A. A. Brewer, B. Fischer, J. Modersitzki, and B. A. Wandell, "Visual field representations and locations of visual areas V1/2/3 in human visual cortex," J Vision 3, 586‐598 (2003).
69. J. Larsson and D. J. Heeger, "Two retinotopic visual areas in human lateral occipital cortex," J Neurosci 26, 13128‐13142 (2006).
70. M. M. Schira, A. R. Wade, and C. W. Tyler, "Two‐dimensional mapping of the central and parafoveal visual field to human visual cortex," J Neurophysiol 97, 4284‐4295 (2007).
71. M. M. Schira, C. W. Tyler, M. Breakspear, and B. Spehar, "The foveal confluence in human visual cortex," J Neurosci 29, 9050‐9058 (2009).
72. J. B. Levitt, D. C. Kiper, and J. A. Movshon, "Receptive fields and functional architecture of macaque V2," J Neurophysiol 71, 2517‐2542 (1994).
73. A. T. Smith, K. D. Singh, A. L. Williams, and M. W. Greenlee, "Estimating receptive field size from fMRI data in human striate and extrastriate visual cortex," Cereb Cortex 11, 1182‐1190 (2001).
74. K. A. Hansen, K. N. Kay, and J. L. Gallant, "Topographic organization in and near human visual area V4," J Neurosci 27, 11896‐11911 (2007).
75. A. R. Wade, A. A. Brewer, J. W. Rieger, and B. A. Wandell, "Functional measurements of human ventral occipital cortex: retinotopy and colour," Phil Trans Roy Soc Lond B. Biol. Sci. 357, 963‐973 (2002).
76. B. A. Wandell and J. Winawer, "Imaging retinotopic maps in the human brain," Vision Res 51, 718‐737 (2011).
77. C. W. Tyler, L. T. Likova, C. C. Chen, L. L. Kontsevich, M. M. Schira, and A. W. Wade, "Extended concepts of occipital retinotopy," Current Medical Imaging Reviews 1, 319‐329 (2005).
78. B. B. Lee, P. R. Martin, and U. Grünert, "Retinal connectivity and primate vision," Prog Ret Res 29, 622‐639 (2010).
79. K. T. Mullen, S. O. Dumoulin, and R. F. Hess, "Color responses of the human lateral geniculate nucleus: selective amplification of S‐cone signals between the lateral geniculate nucleno and primary visual cortex measured with high‐field fMRI," Eur J Neurosci 28, 1911‐1923 (2008).
80. H. Sun, H. Smithson, Q. Zaidi, and B. B. Lee, "Specificity of cone inputs to macaque ganglion cells," J Neurophysiol 95, 837‐849 (2006).
81. U. Grünert, U. Greferath, B. B. Boycott, and H. Wässle, "Parasol (Pa) ganglion cells of the primate fovea: Immunocytochemical staining with antibodies against GABAA ‐ receptors," Vision Res 33, 1‐14 (1993).
82. D. M. Dacey and B. B. Lee, "The blue‐ON opponent pathway in primate retina originates from a distinct bistratified ganglion cell type," Nature 367, 731‐735 (1994).
83. P. R. Martin and B. B. Lee, "Distribution and specificity of S‐cone ("blue cone") signals in subcortical visual pathways," Vis Neurosci 31, 177‐187 (2014).
84. C. A. Curcio, K. R. Sloan, R. E. Kalina, and A. E. Hendrickson, "Human photoreceptor topography," J Comp Neurol 292, 497‐523 (1990).
85. B. B. Lee, "Neural models and physiological reality," Vis Neurosci 251, 231‐241 (2008).