anti fraud training course - home - avepa · anti fraud training course risks of fraud: measurement...
TRANSCRIPT

Anti Fraud training course
Risks of fraud: measurement models for and analysis supporting tools
Padova, May 6-26th 2015
This event is supported by the European Union Programme Hercule III (2014-2020). This programme is implemented by the European Commission.
It was established to promote activities in the field of the protection of the financial interests of the European Union. (for more information see http://ec.europa.eu/anti_fraud/about-us/funding/index_en.htm)'
Risks of fraud: measurement models for and analysis supporting tools
Padova, May 26th 2015
This document reflects the author’s view and the European Commission is not responsible for the views displayed in the publications and/or in conjunction with the activities for which the grant is used.
The information contained in this publication does not necessarily reflect the position or opinion of the European Commission.
Mr. Andrea Chiusani Mr. Luca MarzegalliMr. Piero Di MicheleMr. Marco Ferrara

Introduction to Data Analysis
Rules based analysis and Alerting tools
Models for Data Analysis
Dashboarding and decision process
eDiscovery
Link Analysis
Agenda

Introduction to Data Analysis

Why Fraud Data Analytics
Data Analytics (DA) is the science that dealswith examining the data (structured and rough)in order to draw conclusions on suchinformation.
Data Analytics is used in large companies andorganizations in order to support themanagement in identifying the best businessdecisions.
Data Analytics Object
spiegare causa-effetto dei fenomeni
Individuare un particolare problema
anticipare gli eventi che possono determinare il futuro di una azienda
Cause and Effect
Identify specific problem
Improve future actions

Anti fraud control through inspection of 100% of transactions
Automating the analysis of forensic auditors and fraud examiners
Retrospective and/or real time
Independently validate compliance with company code of conduct
Measures gap between policy and expectation vs. what really happens and report on control effectiveness
Detect risks as they happen - when they are less costly and less complex to prove, correct and remediate
Why Fraud Data Analytics
ERROR
WASTE MISUSE
ABUSE FRAUD
Detection
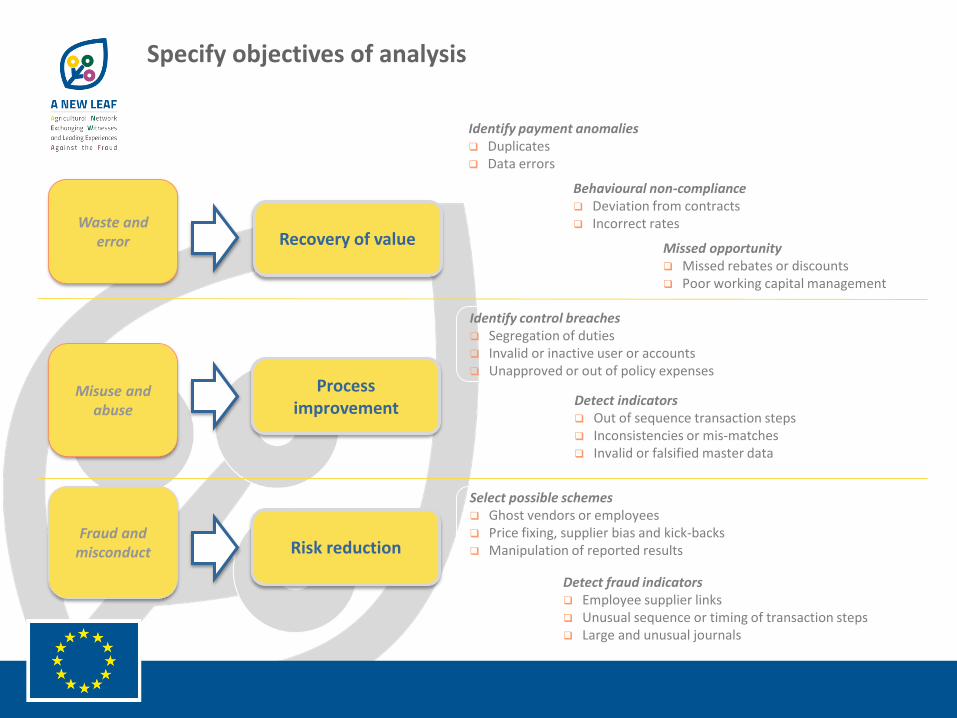
Recovery of valueWaste and
error
Identify payment anomalies Duplicates Data errors
Behavioural non-compliance Deviation from contracts Incorrect rates
Missed opportunity Missed rebates or discounts Poor working capital management
Misuse and abuse
Identify control breaches Segregation of duties Invalid or inactive user or accounts Unapproved or out of policy expenses
Detect indicators Out of sequence transaction steps Inconsistencies or mis-matches Invalid or falsified master data
Fraud and misconduct
Select possible schemes Ghost vendors or employees Price fixing, supplier bias and kick-backs Manipulation of reported results
Detect fraud indicators Employee supplier links Unusual sequence or timing of transaction steps Large and unusual journals
Specify objectives of analysis
Process improvement
Risk reduction
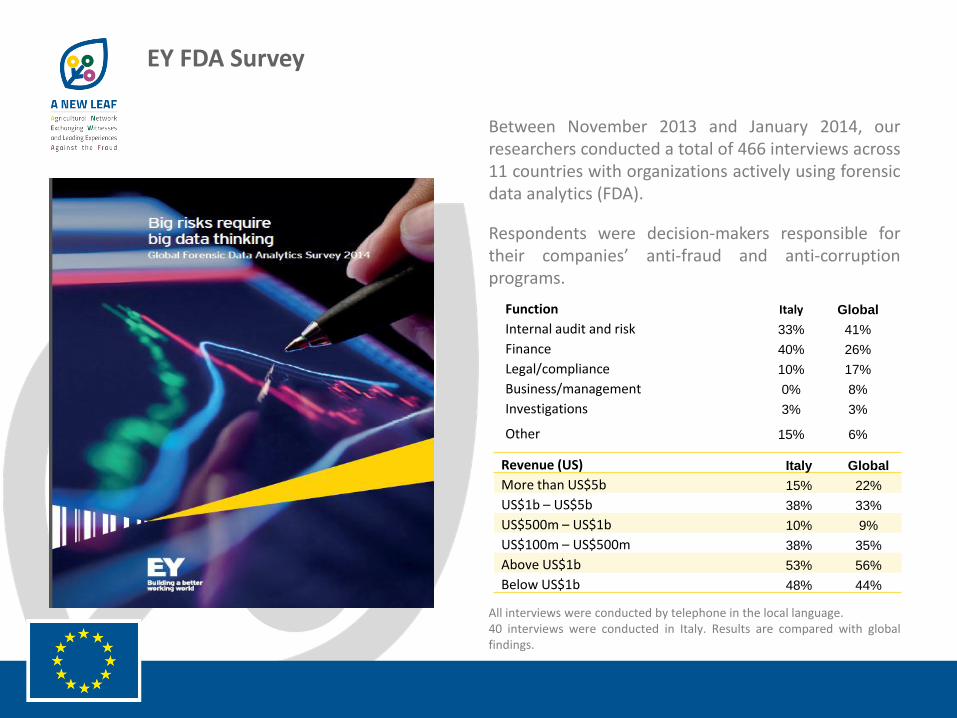
Between November 2013 and January 2014, ourresearchers conducted a total of 466 interviews across11 countries with organizations actively using forensicdata analytics (FDA).
Respondents were decision-makers responsible fortheir companies’ anti-fraud and anti-corruptionprograms.
All interviews were conducted by telephone in the local language.40 interviews were conducted in Italy. Results are compared with globalfindings.
Function Italy Global
Internal audit and risk 33% 41%
Finance 40% 26%
Legal/compliance 10% 17%
Business/management 0% 8%
Investigations 3% 3%
Other 15% 6%
Revenue (US) Italy Global
More than US$5b 15% 22%
US$1b – US$5b 38% 33%
US$500m – US$1b 10% 9%
US$100m – US$500m 38% 35%
Above US$1b 53% 56%
Below US$1b 48% 44%
EY FDA Survey

Forensic Data Analytics primary benefits

Global results
Italy Total TransportationConsumer
productsManufacturing
Financial
services
Life
sciencesMining
Oil and
gas
Technology,
communications
and entertainment
38 422 28 85 30 100 47 23 88 21
Spreadsheet tools such as
Microsoft Excel39% 65% 75% 79% 77% 55% 55% 57% 63% 62%
Database tools such as Microsoft
Access or Microsoft SQL Server26% 43% 39% 53% 37% 44% 43% 13% 42% 57%
Forensic analytics software (ACL,
IDEA)11% 26% 25% 21% 27% 24% 36% 26% 27% 24%
Statistical analysis and data mining
packages11% 11% 0% 11% 10% 14% 15% 4% 13% 14%
Continuous monitoring tools, which
may include governance risk and
compliance tools
24% 29% 25% 26% 27% 26% 36% 35% 35% 19%
Visualization and reporting tools 8% 12% 18% 16% 7% 11% 13% 4% 10% 10%
Big data technologies 0% 2% 4% 1% 0% 3% 4% 0% 2% 0%
Text analytics tools or keyword
searching24% 26% 14% 33% 37% 21% 28% 22% 25% 24%
Social media/web monitoring tools 16% 21% 18% 25% 23% 23% 21% 4% 17% 24%
Voice searching and analysis 0% 2% 0% 2% 0% 3% 4% 0% 1% 5%
Data Analytics tools used in organization

Focus on quick win: prioritize initial objectives of the project
Communicate: share information on early successes within the company and among the business units, in order to gain internal consensus
Go beyond rule based analytics
Deliveries take time: avoid the last minute rush
Data Analytics – Top 5 success factor

In Italy:
51% of people interviewed consider corruption as the main risk of fraud which they are exposed to
75% of italian companies use Forensic Data Analytics (FDA) tools in order to reduce the riskof fraud and corruption
According to 89% of the people surveyed, the benefits produced by FDA tools derive from «their capability to incercept potentially poor behaviour», hard to find by other means
70% of companies interviewed believe that new FDA technologies applied to large amountsof information (i.e. «Big Data») are gaining a central role in prevention and detection of suspect behaviours within the company.
EY FDA Survey – Italian market
Rules based analysis and Alerting tools
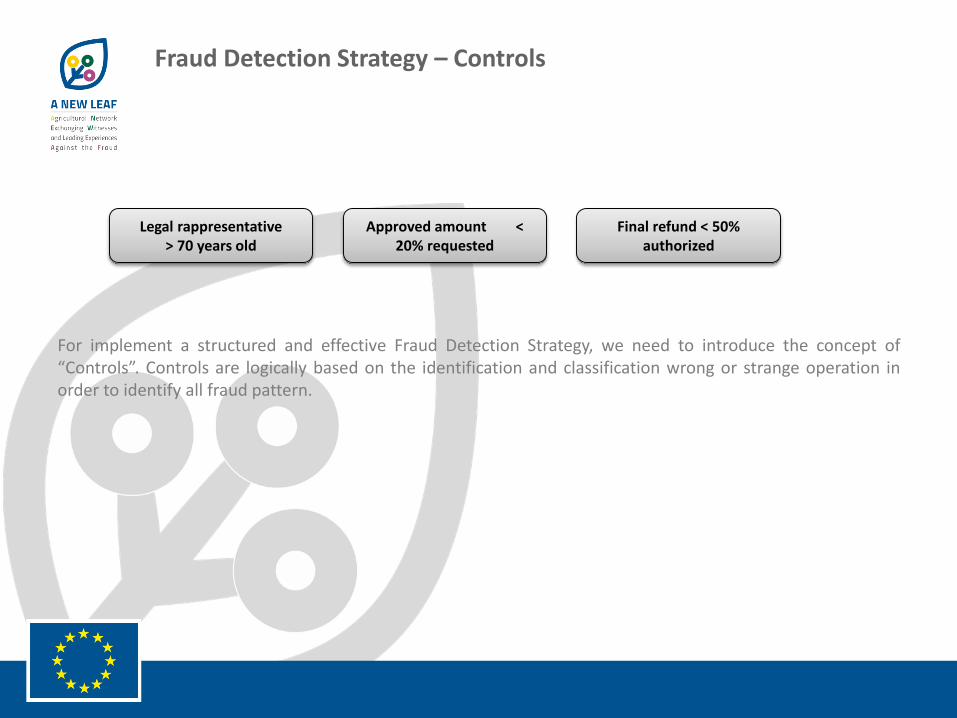
Fraud Detection Strategy – Controls
Legal rappresentative > 70 years old
Approved amount < 20% requested
Final refund < 50% authorized
For implement a structured and effective Fraud Detection Strategy, we need to introduce the concept of“Controls”. Controls are logically based on the identification and classification wrong or strange operation inorder to identify all fraud pattern.
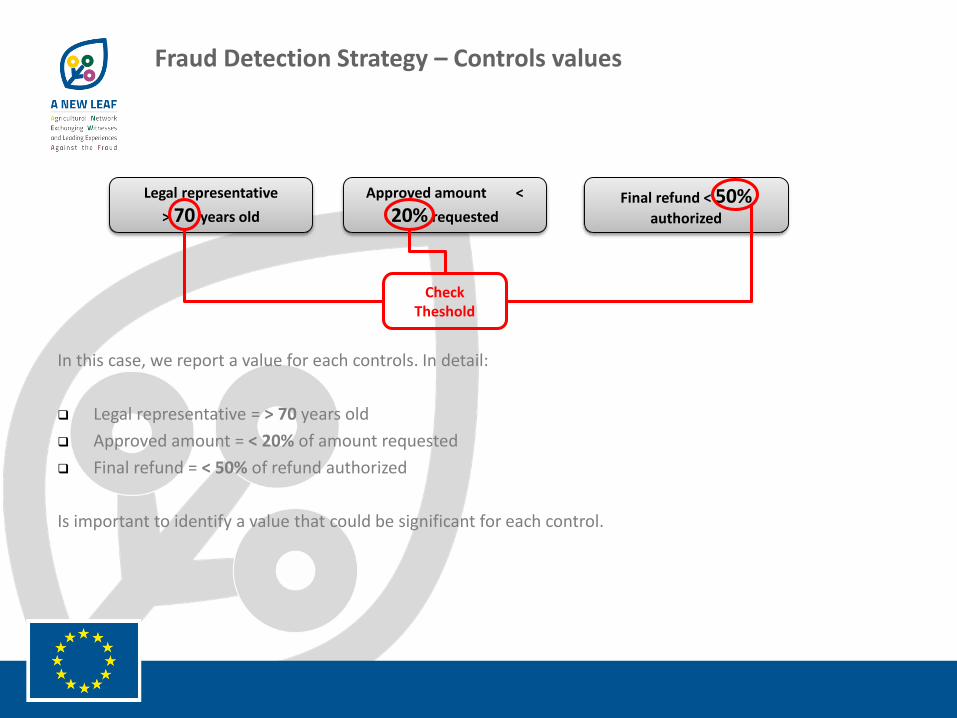
Fraud Detection Strategy – Controls values
Legal representative
> 70 years old
Approved amount <
20% requestedFinal refund < 50%
authorized
Check Theshold
In this case, we report a value for each controls. In detail:
Legal representative = > 70 years old
Approved amount = < 20% of amount requested
Final refund = < 50% of refund authorized
Is important to identify a value that could be significant for each control.

Fraud Detection Strategy – Measure
Scoring Overall
Legal representative > 70 years old
Approved amount < 20% requested
Final refund < 50% authorized
Measure TOT 100
30 60 10
For each control, in order to calculate the math formulas, could be assigned a specific value. In this example weassigned:
Legal representative > 70 years old = 30
Approved amount < 20% of amount requested = 60
Final refund < 50% of refund authorized = 10
The total of all control’s value is 100.

Fraud Detection Strategy – Alert threshold
Scoring Overall
Legal representative > 70 years old
Approved amount < 20% requested
Final refund < 50% authorized
30 60 10
0,5Alert
Threshold
For the scoring overall, could be assigned a value that separate the alert threshold operation. If the value ofspecific controls are wired than the level designed, so the system has an alert.

Fraud Detection Strategy – Example values
Scoring Overall
Legal representative > 70 years old
Approved amount < 20% requested
Final refund < 50% authorized
30 60 10
Legal representative
71 years old
1
Final refund = 55%authorized
Example
ID d
om
and
a =
16
Approved amount = 16%requested
1 0
0,5
1 = True0 = False
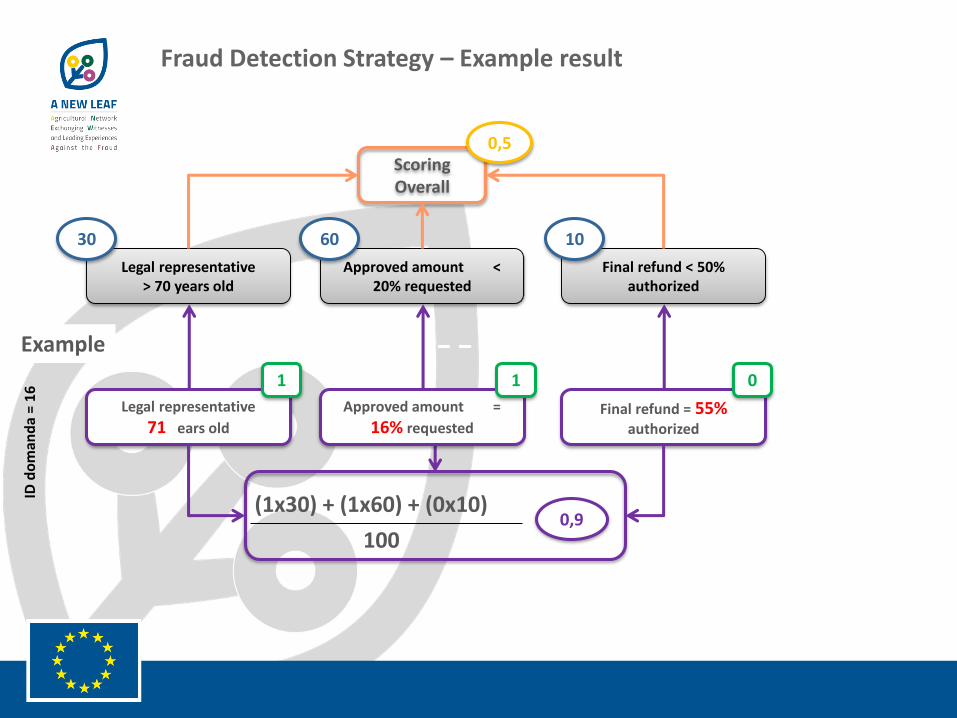
Fraud Detection Strategy – Example result
Scoring Overall
Legal representative > 70 years old
Approved amount < 20% requested
Final refund < 50% authorized
30 60 10
Legal representative
71 years old
1
Final refund = 55%authorized
(1x30) + (1x60) + (0x10)
100
Example
ID d
om
and
a =
16
Approved amount =
16% requested
1 0
0,5
0,9
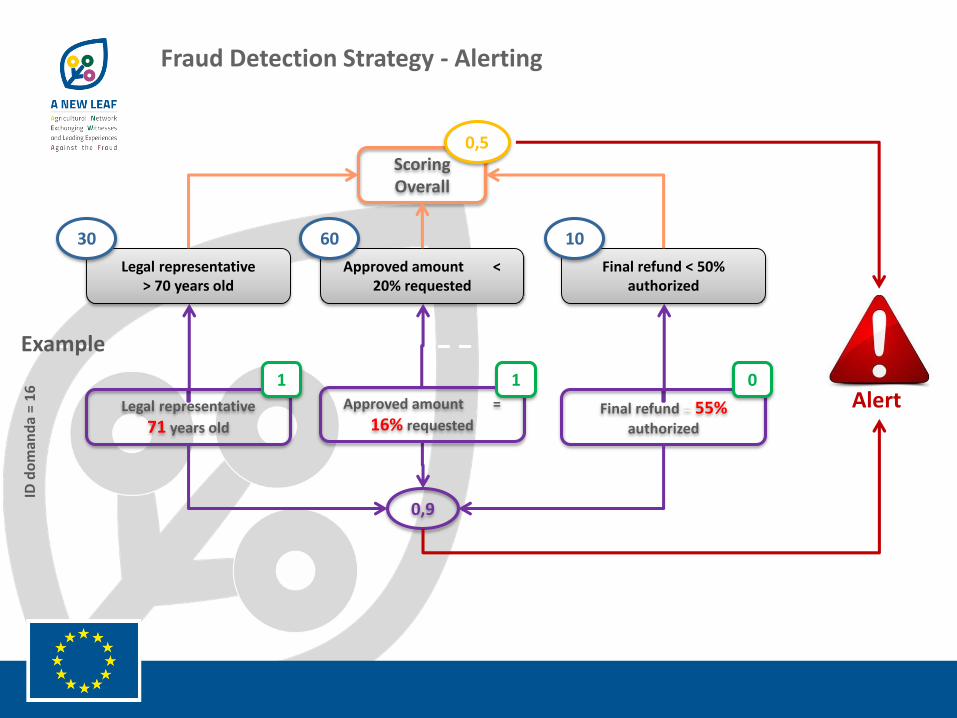
Fraud Detection Strategy - Alerting
Scoring Overall
Legal representative > 70 years old
Approved amount < 20% requested
Final refund < 50% authorized
30 60 10
Legal representative
71 years old
1
Final refund = 55%authorized
Example
ID d
om
and
a =
16
Approved amount =
16% requested
1 0
0,5
0,9
Alert

Excel example: data

Excel example: formulas

Excel example: conditional formatting

Excel example: output and alarm overall
ALERTING

Advanced Graph and Chart

False Positive – The importance of analysis
Allowed FraudAll request
ID Request: 1
. . . .
ID Request: 2
ID Request: 3
ID Request: 1
ID Request: 2
ID Request: 3

False Positive – Misuse detection
Fraud
Alert
You have to define as unacceptable behavior and identify the misuse.
ID Request: 3

False Positive – Anomaly detection
Allowed
Alert
You have to define as acceptable behavior and identify, logically, the other one.
ID Request: 1
ID Request: 2

False Positive and False Negative
Allowed FraudAllowed Fraud
Misuse detectionAnomaly detection
False Positive : an acceptable behaviour give an alarm
False Negative: an unacceptable behavior don’t give an alarm
False negative
False positive
False positive
False negative
Legal entity
Legal representative
SupplierRequest
Employee
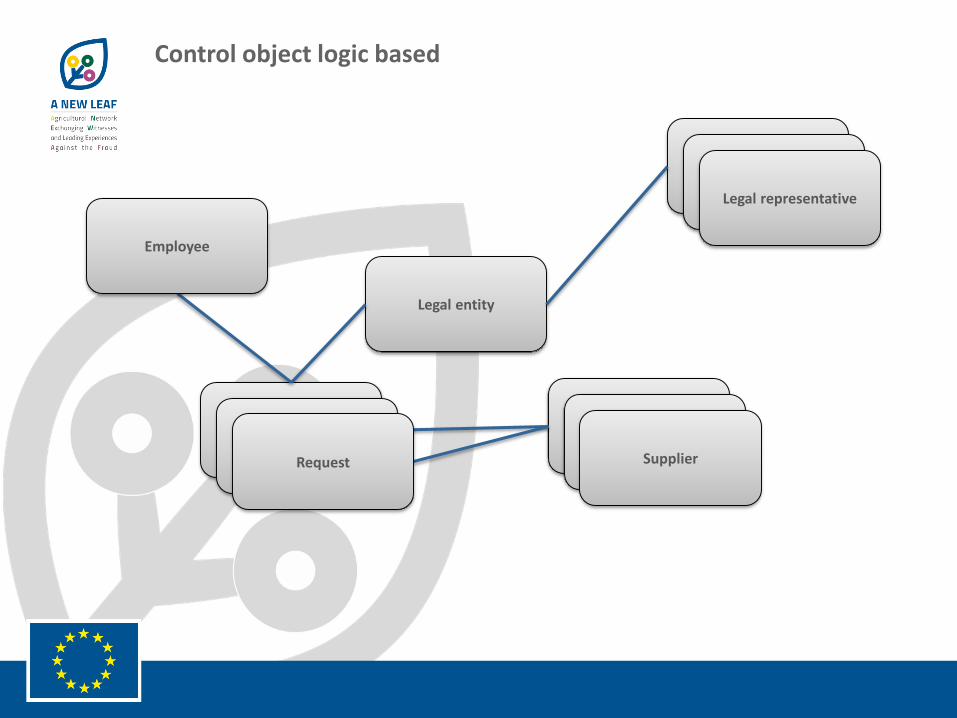
Control object logic based

Legal entity
Legal representative
SupplierRequest
Employee
Control object logic based: example
There are legal representatives that request more than one question?
There is a vendor that appears to only one question, and that has never seen for any other questions?
Spreadsheet vs Relational Database
SpreadsheetId Misura PraticaId Domanda Des Stato Domanda Ente Delegato Cuaa Ragione Sociale Indirizzo Sede Legale Cap Sede LegaleDescr Comune Sede LegaleDescr Provincia Sede Legale
12100AZ 2774979 NON FINANZIABILE SPORTELLO UNICO DI ROVIGO DSRFPP77M03H620A AZIENDA AGRICOLA VIVAI DE SERO FILIPPO VIA VERDI GIUSEPPE 113 45010 VILLADOSE ROVIGO
12100AZ 2774979 NON FINANZIABILE SPORTELLO UNICO DI ROVIGO DSRFPP77M03H620A AZIENDA AGRICOLA VIVAI DE SERO FILIPPO VIA VERDI GIUSEPPE 113 45010 VILLADOSE ROVIGO
12100AZ 2774979 NON FINANZIABILE SPORTELLO UNICO DI ROVIGO DSRFPP77M03H620A AZIENDA AGRICOLA VIVAI DE SERO FILIPPO VIA VERDI GIUSEPPE 113 45010 VILLADOSE ROVIGO
12100AZ 2779497 RICEVIBILE SPORTELLO UNICO DI VENEZIA CLLMLE57R09H823U AZIENDA AGRICOLA CELLA EMILIO VIA M POLO 9 30027 SAN DONA' DI PIAVE VENEZIA
12100AZ 2780086 RICEVIBILE SPORTELLO UNICO DI TREVISO 04172990261 SOCIETA' AGRICOLA GIUSTI - DAL COL S.R.L. VIA ZILIO N 1 31041 CORNUDA TREVISO
12100AZ 2780086 RICEVIBILE SPORTELLO UNICO DI TREVISO 04172990261 SOCIETA' AGRICOLA GIUSTI - DAL COL S.R.L. VIA ZILIO N 1 31041 CORNUDA TREVISO
12100AZ 2780086 RICEVIBILE SPORTELLO UNICO DI TREVISO 04172990261 SOCIETA' AGRICOLA GIUSTI - DAL COL S.R.L. VIA ZILIO N 1 31041 CORNUDA TREVISO
12100AZ 2780637 RICEVIBILE SPORTELLO UNICO DI PADOVA TMBNZR64T31E682R TAMBARA NAZZARENO VIA GARZAN 621 37040 ZIMELLA VERONA
12100AZ 2780637 RICEVIBILE SPORTELLO UNICO DI PADOVA TMBNZR64T31E682R TAMBARA NAZZARENO VIA GARZAN 621 37040 ZIMELLA VERONA
12100AZ 2781800 RICEVIBILE SPORTELLO UNICO DI VERONA FRGMSM70C25H783B FRIGOTTO MASSIMO VIA G AROLDI N 22 37032 MONTEFORTE D'ALPONE VERONA
12100AZ 2781800 RICEVIBILE SPORTELLO UNICO DI VERONA FRGMSM70C25H783B FRIGOTTO MASSIMO VIA G AROLDI N 22 37032 MONTEFORTE D'ALPONE VERONA
12100AZ 2781803 FINANZIABILE SPORTELLO UNICO DI PADOVA BLLNTN80M18L364P BELLOMI ANTONIO VIA SANTA GIUSTINA 11 37031 ILLASI VERONA
12100AZ 2781803 FINANZIABILE SPORTELLO UNICO DI PADOVA BLLNTN80M18L364P BELLOMI ANTONIO VIA SANTA GIUSTINA 11 37031 ILLASI VERONA
12100AZ 2781884 RICEVIBILE SPORTELLO UNICO DI TREVISO 04030120267 IRIS VIGNETI SOC.SEMPLICE SOCIETA' AGRICOLAVIA GRAVE 1 SANTA MARIA DI PIAVE31010 MARENO DI PIAVE TREVISO
12100AZ 2781884 RICEVIBILE SPORTELLO UNICO DI TREVISO 04030120267 IRIS VIGNETI SOC.SEMPLICE SOCIETA' AGRICOLAVIA GRAVE 1 SANTA MARIA DI PIAVE31010 MARENO DI PIAVE TREVISO
12100AZ 2781884 RICEVIBILE SPORTELLO UNICO DI TREVISO 04030120267 IRIS VIGNETI SOC.SEMPLICE SOCIETA' AGRICOLAVIA GRAVE 1 SANTA MARIA DI PIAVE31010 MARENO DI PIAVE TREVISO
12100AZ 2782362 FINANZIABILE SPORTELLO UNICO DI TREVISO BNTLDA58A23I124R BONOTTO ALDO VIA FERRAREZZA 18 31020 VILLORBA TREVISO
12100AZ 2782362 FINANZIABILE SPORTELLO UNICO DI TREVISO BNTLDA58A23I124R BONOTTO ALDO VIA FERRAREZZA 18 31020 VILLORBA TREVISO
vs Relational Database
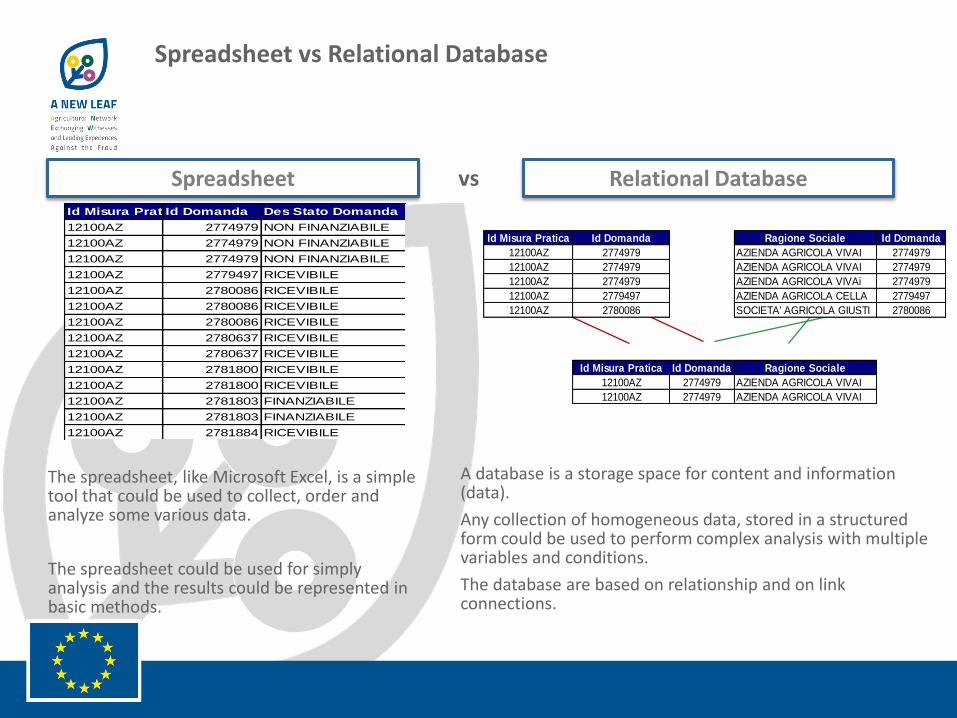
The spreadsheet, like Microsoft Excel, is a simple tool that could be used to collect, order and analyze some various data.
The spreadsheet could be used for simply analysis and the results could be represented in basic methods.
A database is a storage space for content and information (data).
Any collection of homogeneous data, stored in a structured form could be used to perform complex analysis with multiple variables and conditions.
The database are based on relationship and on link connections.
Id Misura Pratica Id Domanda Ragione Sociale Id Domanda
12100AZ 2774979 AZIENDA AGRICOLA VIVAI 2774979
12100AZ 2774979 AZIENDA AGRICOLA VIVAI 2774979
12100AZ 2774979 AZIENDA AGRICOLA VIVAi 2774979
12100AZ 2779497 AZIENDA AGRICOLA CELLA 2779497
12100AZ 2780086 SOCIETA' AGRICOLA GIUSTI 2780086
Id Misura Pratica Id Domanda Ragione Sociale
12100AZ 2774979 AZIENDA AGRICOLA VIVAI
12100AZ 2774979 AZIENDA AGRICOLA VIVAI

Relational Databases - Introduction
Relational databases are category of databases (actually the most common at the moment) in which the dataare stored in tables, originally called relations.
A table is a collection of related data entries and it consists of columns and rows.
A database contains one or more tables, and each table contains rows (records) of data
ID FIRST_NAME LAST_NAME CITY COUNTRY Height
1 Albert Lucas London England 184
2 Beatrice Monroe New York USA 171
3 Charles Jones New York USA 176
4 Diane Mc Gregor New York USA 165
For instance, the table above contains 4 records, each one of those having 6 fields.
In order to interact with a relational database systems, that is to insert and retrieve data, we have to use aspecific programming language. To this purpose, most of databases uses SQL (Standard Query Language).
SQL provides the syntax to create, retrieve, update or delete a piece of information

Databases are specifically designed for dealing with large amounts of data
• They use scripting languages specific for data manipulation
• They provide features for mission critical aspects such as security, efficiency, reliability, fault tolerance,data consistency, backup, etc.
Why databases are useful
However, most of business applications use a database system and the use of databases is the key for dataanalytics.
Nevertheless, when the amount of information grows, using spreadsheets becomes particularly difficult, oreven unfeasible.
Relational Databases - Querying
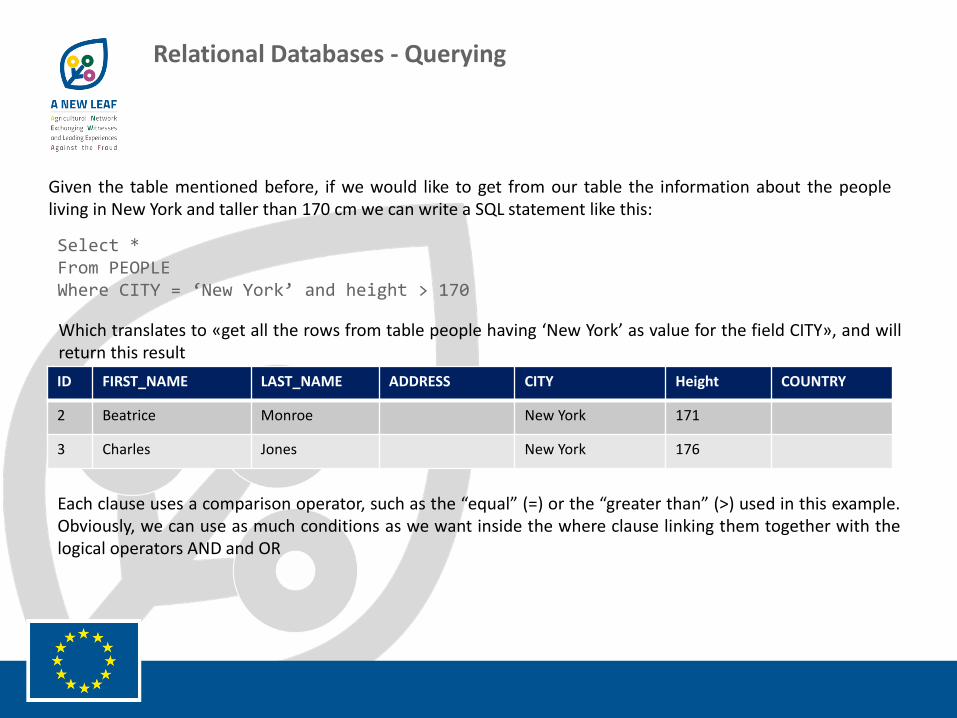
Given the table mentioned before, if we would like to get from our table the information about the peopleliving in New York and taller than 170 cm we can write a SQL statement like this:
Each clause uses a comparison operator, such as the “equal” (=) or the “greater than” (>) used in this example.Obviously, we can use as much conditions as we want inside the where clause linking them together with thelogical operators AND and OR
Select *From PEOPLEWhere CITY = ‘New York’ and height > 170
Which translates to «get all the rows from table people having ‘New York’ as value for the field CITY», and willreturn this result
ID FIRST_NAME LAST_NAME ADDRESS CITY Height COUNTRY
2 Beatrice Monroe New York 171
3 Charles Jones New York 176

Relational Databases – Joining tables
However, one of the key principles of a databasesis to have multiple tables, in order to organize theinformation in an efficient and effective manner.
For example we might have a second tablecontaining the phone numbers:
Select FIRST_NAME, LAST_NAME, PHONE_TYPE, PHONE_NUMBERFrom PEOPLE as P join PHONE_BOOK as BON PEOPLE.PERSON_ID = B.PERSON_ID
In order to associate the owner’s name to eachphone number we can write a SQL statementcontain a JOIN instruction:
PHONE_ID PERSON_ID PHONE_TYPE PHONE_NUMBER
1 1 Mobile_business 122548215
2 1 Mobile_personal 445431287
3 2 Home_personal 245482136
4 4 Mobile_business 545825315
5 4 Home_personal 785453568
FIRST_NAME LAST_NAME PHONE_TYPE PHONE_NUMBER
Albert Lucas Mobile_business 122548215
Albert Lucas Mobile_personal 445431287
Beatrice Monroe Home_personal 245482136
Diane Mc Gregor Mobile_business 545825315
Diane Mc Gregor Home_personal 785453568
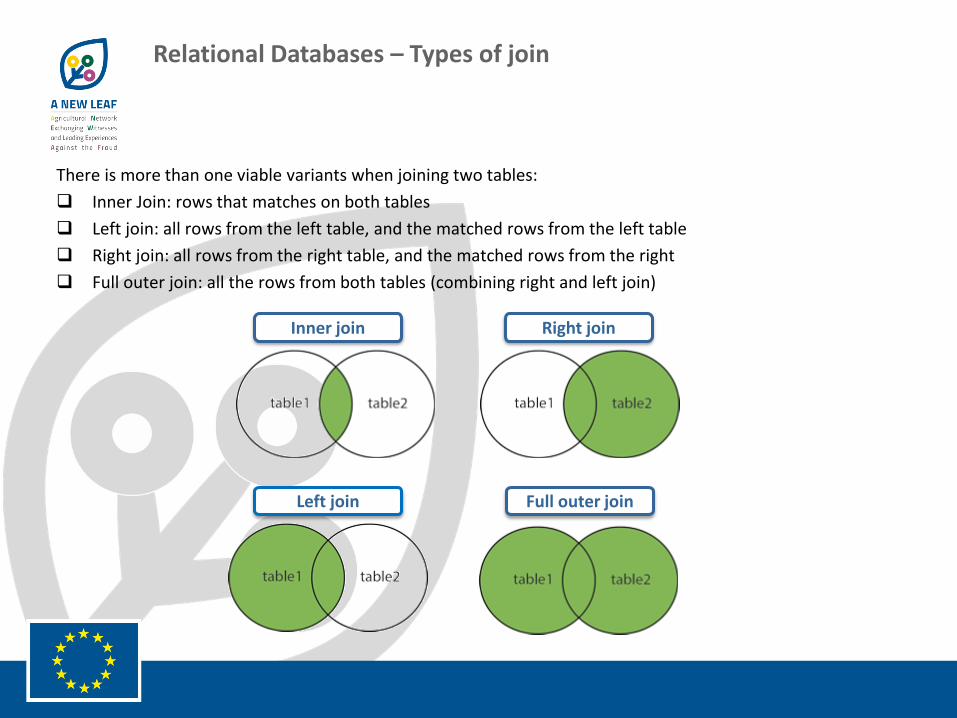
There is more than one viable variants when joining two tables:
Inner Join: rows that matches on both tables
Left join: all rows from the left table, and the matched rows from the left table
Right join: all rows from the right table, and the matched rows from the right
Full outer join: all the rows from both tables (combining right and left join)
Relational Databases – Types of join
Inner join Right join
Left join Full outer join

Relational Databases – Aggregate functions
Aggregation is a common operation when dealingwith data. Considering those data, we could needfor example to compute the total amount.
To this purpose we can use the aggregate functionsum(<field>):
PURCHASE_ID PURCHASE_TYPE AMOUNT DATE
1 cat_1 1000 2015/02/10
2 cat_3 1500 2015/03/16
3 cat_1 700 2015/02/22
4 cat_2 1400 2015/03/07
5 cat_3 400 2015/04/27
6 cat_3 1850 2015/05/08
7 cat_2 975 2015/05/21
Select SUM(AMOUNT)From PURCHASES
This translates to «sum all the values of the field AMOUNT», andproduces the result on the right.
TOT_AMOUNT
7825
SQL provides a large number of aggregate functions, like min,max, avg, stdev, etc.
Select SUM(AMOUNT), min(AMOUNT), max(AMOUNT)From PURCHASES
TOT_AMOUNT MIN_AMOUNT MAX_AMOUNT
7825 400 1850
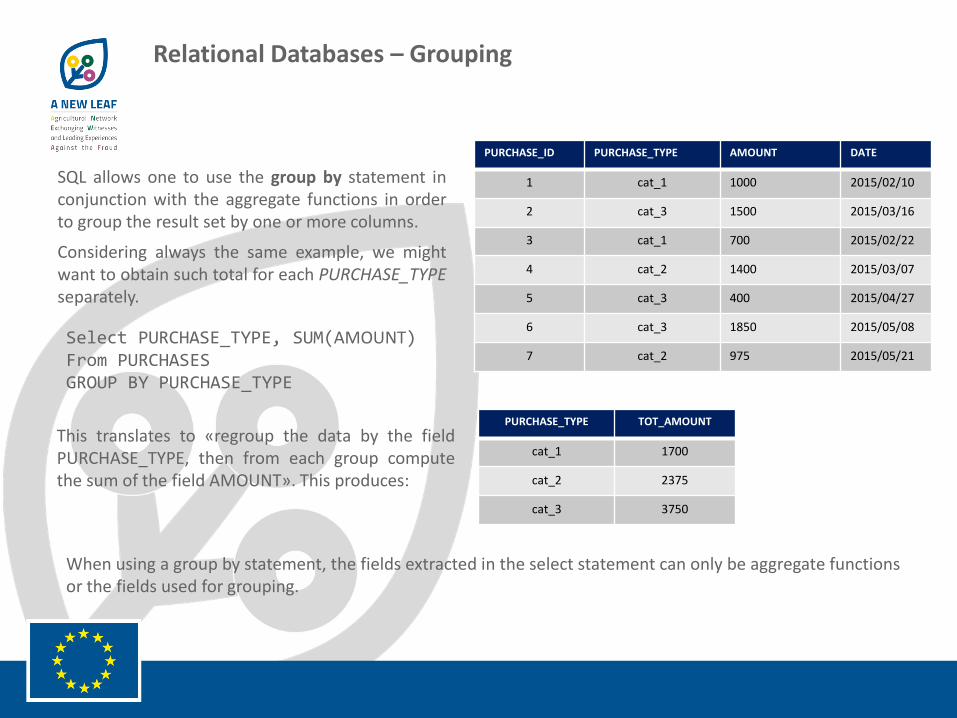
Relational Databases – Grouping
SQL allows one to use the group by statement inconjunction with the aggregate functions in orderto group the result set by one or more columns.
Considering always the same example, we mightwant to obtain such total for each PURCHASE_TYPEseparately.
PURCHASE_ID PURCHASE_TYPE AMOUNT DATE
1 cat_1 1000 2015/02/10
2 cat_3 1500 2015/03/16
3 cat_1 700 2015/02/22
4 cat_2 1400 2015/03/07
5 cat_3 400 2015/04/27
6 cat_3 1850 2015/05/08
7 cat_2 975 2015/05/21Select PURCHASE_TYPE, SUM(AMOUNT)From PURCHASESGROUP BY PURCHASE_TYPE
This translates to «regroup the data by the fieldPURCHASE_TYPE, then from each group computethe sum of the field AMOUNT». This produces:
PURCHASE_TYPE TOT_AMOUNT
cat_1 1700
cat_2 2375
cat_3 3750
When using a group by statement, the fields extracted in the select statement can only be aggregate functionsor the fields used for grouping.

Dashboarding and decision process

DashboardingIntroduction to Tableau
Tableau Software is designed to quickly analyze, visualize and share information. You can work with data, movefrom simple to complex visualizations and combine them in interactive dashboards.

Tableau applies label, color, shape and size to visualizations using the view cards.
Dashboarding The Marks Card and Buttons
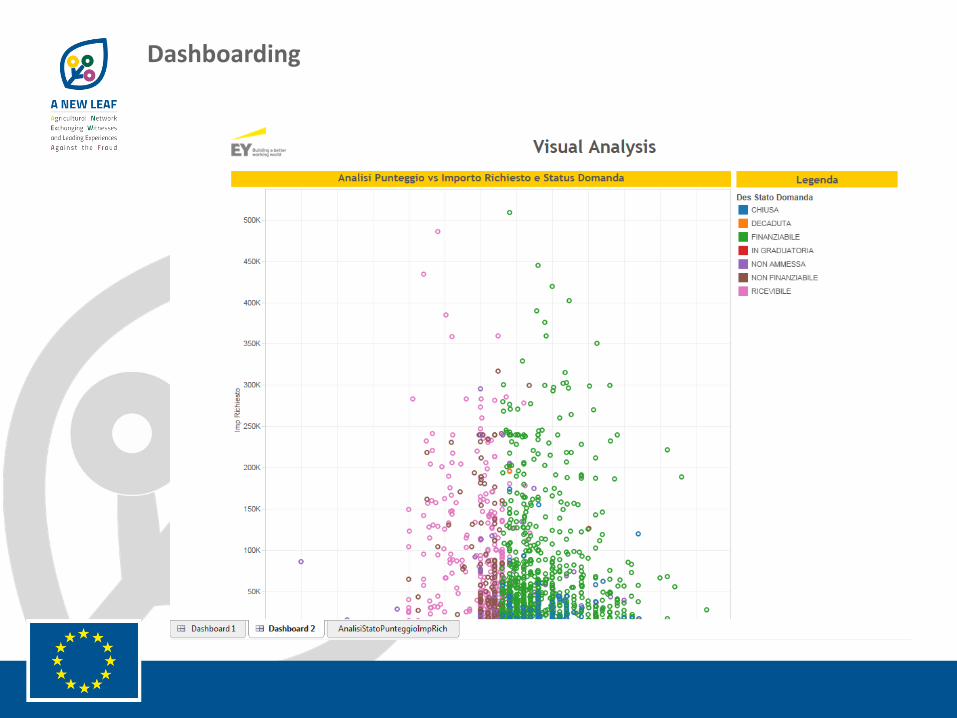
Dashboarding Example dashboard

Structured and Unstructured Data
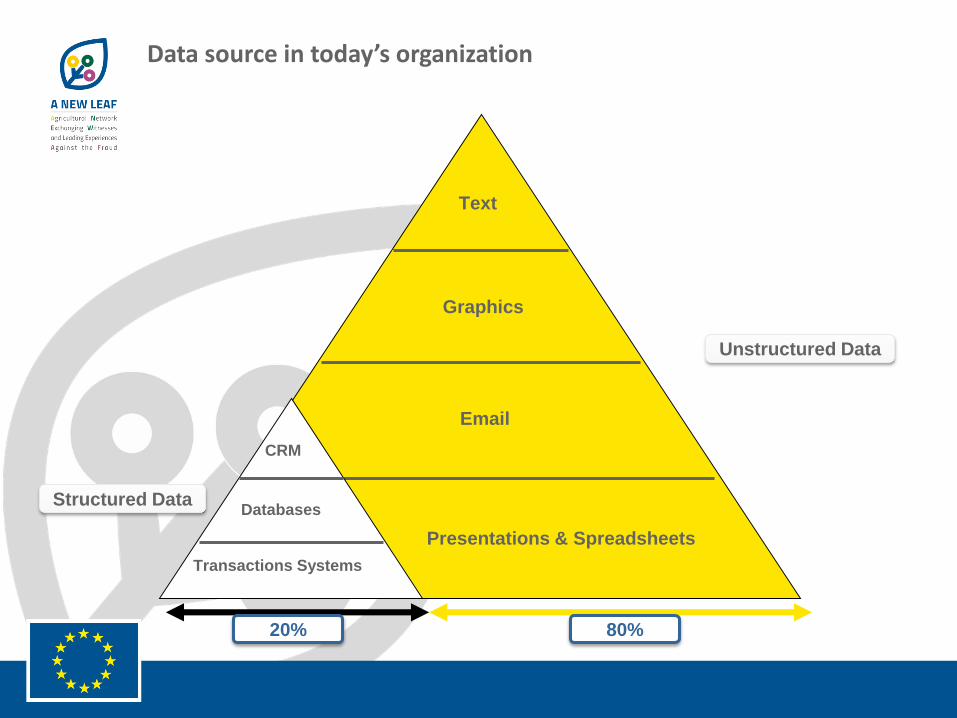
Data source in today’s organization
Text
Graphics
Presentations & Spreadsheets
20% 80%
CRM
Databases
Transactions Systems
Structured Data
Unstructured Data
20% 80%

Electronic Discovery: the process of identifying, managing, preserving, processing, analyzing, reviewing producing and presenting of electronically stored information, usually in the context of an investigation or litigation.
Project Management
Experience
Not Relevant
RelevantCustodians
Keywords
Date range
Validation and cleansing
Metadata and text extraction
De-duplication
Quality control
Exception reporting
Robust processHighly trained personnel
Tracking and reporting
eDiscovery

Fraud Data Analytics eDiscovery
Link Analisys
Output Output
Analysis of the relationships between the identified findings and reconstruction of dependencies.
Data Sources: anomalous transactions , relevant documents
Next frontier – Link Analysis
