anthropogenic copper inventories and mercury profiles from lake
TRANSCRIPT

J. Great Lakes Res. 25(4):663–682Internat. Assoc. Great Lakes Res., 1999
Anthropogenic Copper Inventories and Mercury Profiles from Lake Superior: Evidence for Mining Impacts
W. Charles Kerfoot*,1, Sandra Harting1, Ronald Rossmann2, and John A. Robbins3
1Lake Superior Ecosystem Research Center and Department of Biological SciencesMichigan Technological University
Houghton, Michigan 49931
2United States Environmental Protection AgencyMid-Continent Ecology Division, Large Lakes Research Station
9311 Groh RoadGrosse Ile, Michigan 48138
3NOAA Great Lakes Environmental Research Laboratory2205 Commonwealth Blvd
Ann Arbor, Michigan 48105
ABSTRACT. During the past 150 years, the mining industry discharged more than a billion tons oftailings along Lake Superior shorelines and constructed numerous smelters in the watershed. Given thevast size of Lake Superior, were sediment profiles at locations far offshore impacted by nearshore activi-ties? Did copper and associated precious metal mining modify regional fluxes for copper and mercury?Samples from thirty sediment cores document that background concentrations of copper are high (mean60.9 ± 7.0 µg/g), due to the proximity of natural ore sources. Anthropogenic inventories uncorrected forfocusing also are high, ranging from 20 to 780 µg/cm2 (mean 187 ± 54 µg/cm2). Focusing factor correc-tions decrease the mean estimate and reduce variance (144 ± 24 µg/cm2). Several approaches to estimat-ing inputs suggest that only 6 to 10% of historic copper deposition originated directly from atmosphericsources, emphasizing terrestrial sources. Moreover, coastal sediment cores often show synchronous earlyincreases in copper and mercury with buried maxima. Around the Keweenaw Peninsula, twenty-two corestrace high copper and mercury inventories back to mill and smelting sources. Direct assays of ores fromthirteen mine sites confirm a natural amalgam source of mercury in the stamp mill discharges. Corerecords from inland lakes (Michigamme Project) also reveal patterns of copper and mercury inputs froma variety of mining sources: historic tailing inputs, amalgam assay releases, and atmospheric smelterplumes.
INDEX WORDS: Lake Superior, copper, mining, mercury, sediment.
663
INTRODUCTION
The Great Lakes ecosystem is susceptible toloading of trace metal contaminants from both ter-restrial and atmospheric sources, yet the relativeimportance of various sources and the details of cy-cling in nearshore and offshore environments arepoorly understood (Galloway et al. 1982, Hong etal. 1996). Patchy industrial discharges react withshoreline, wetland, and forest ecosystem compo-nents. For example, in the dilute waters of Lake Su-
perior, contaminants from shoreline or atmosphericsources move between solid and dissolved phases,adsorb onto settling organic particulate matter, andbecome buried in sediments. One beneficial conse-quence of this process is that sediment cores offerexcellent opportunities for reconstructing contami-nant loading histories (Edgington and Robbins1976, Christensen and Osuna 1989). However, thesediment inventories of large lakes are often spa-tially heterogeneous, reflecting site-specific inputsand the long-term consequences of sediment move-ment. How to utilize sediment cores to clarify in-puts and to provide insight into element cycling is a*Corresponding author. E-mail: [email protected]

664 Kerfoot et al.
weenaw Waterway system, and into Lake Superiorbetween 1850 and 1968 (Kerfoot et al. 1994). Ker-foot et al. (1994) presented an extensive geographicdiscussion of these historical discharges. Beachesnear many Keweenaw Peninsula towns consist oftailing fans that erode by wave action and that rede-posit coarse and fine-grained material along theshoreline and into deeper waters. These tailings arestamp sands, i.e., crushed basalt and conglomerate,that are distinctive in color, mineral content, andphysical characteristics from natural lake sedi-ments. Deposits of stamp sand material near millsites and along the Keweenaw Waterway containcopper in concentrations that locally average 850 to3,750 µg/g (Kraft and Sypniewski 1981, Kerfootand Robbins 1999). In addition, 50 million metrictons of mine tailings were discharged directly intoLake Superior along the western coastline (Freda/Redridge region) of the Keeweenaw Peninsula byfive stamp mills that operated between l895 andl968 (Champion, Trimountain, Adventure, Baltic,and Atlantic Mills; Babcock and Spiroff 1970, Ker-foot et al. 1994). Smaller amounts were releasedfrom Eagle River and Copper Harbor. Along theeastern coastline of the Keweenaw Peninsula, 23million metric tons were sluiced into KeweenawBay at Gay between 1902 and 1932, with other
challenge (Galloway and Likens 1979, Galloway etal. 1982).
The IJC (1989) asserts that 95% of the contami-nants which enter Lake Superior come from long-distance atmospheric deposition. While manyorganic compounds are subject to long-distancetransport, copper and mercury loadings may bemuch more closely associated with regional water-shed activities than previously suspected. Early cal-culations apparently incorporated some seriouserrors, and previous coring efforts failed to detectimportant coastal patterns. Two early investigatorsof Lake Superior sediments, Nussman (1965) andKemp et al. (1978), suspected that copper enrich-ments in Lake Superior sediments came from sev-eral intensively mined regions: The KeweenawPeninsula of Michigan; Thunder Bay, Marathon,and Sault Ste. Marie regions of Ontario, Canada(Fig. 1). Values near the Keweenaw Peninsula coin-cided with the path of the Keweenaw Current, sug-gesting that copper-rich sediments were transportedconsiderable distances from their original sourcesby currents or ice rafting (Kerfoot et al. 1994).
Investigations initially concentrated on the Ke-weenaw Peninsula region (Fig. 2), where a half bil-lion metric tons of copper mine tailings weredischarged into rivers, the interconnected Ke-
FIG. 1. Lake Superior drainage basin showing the location of 30 1983 NOAAinventory cores plus the location of an additional core (EV11A).

Copper and Mercury Profiles in Lake Superior Sediments 665
smaller inputs occurring at Bete Grise Bay andL’Anse Bay (Mass, Michigan Mills).
To what extent did mining activities in the LakeSuperior watershed disturb the entire lake ecosys-tem and continue to this day to influence metal cy-cling? How important and widespread are miningsignatures in sediments, and what is the relationshipwith long-distance and localized atmospheric in-puts? Thirty inventory cores taken from Lake Supe-rior by NOAA in 1983 (Fig. 1) were analyzed forcopper and mercury. These cores provided a muchmore extensive coverage of Lake Superior than pre-vious efforts (six sampling sites of Kemp et al.(1978) or of Kolak et al. (1998). The cores allowedcalculation of copper inventories and examinationof associations between copper and mercury pro-files from a wide variety of depositional environ-ments. Sites were distributed throughout the lakebasin and included nearshore bays and easterntrough sediments, suspected sites of high sedimen-tation. Cesium-137 inventories were used to correctfor sediment focusing effects, a technique not avail-able to Kemp et al. (1978). A second set of twenty-two additional cores from nearshore environments(Keweenaw Waterway, L’Anse Bay) permitted trac-ing high copper and mercury inventories back toshoreline sources. An independent, third set ofcores from small, isolated inland lakes
(Michigamme Project) allowed inspection of local-ized sediment profiles that result from differenttypes of mining-related activities (stamp mill tail-ings, smelter plumes, assay laboratory discharges).
METHODS AND MATERIALS
Offshore Inventory Cores and Focusing Factor Corrections
Offshore sediment core samples were providedby the NOAA Great Lakes Environmental ResearchLaboratory from cores originally collected at 30stations in 1983. The cores were taken from theR/V Limnos as part of a National Water ResearchInstitute program (study leader Rick Bourbonniere)and archived. The core sampling sites were distrib-uted over several sedimentation basins (Fig. 1): Du-luth Basin (I7, EV4, EV8, SV180), Thunder BayBasin (S24, EV13), Chefswet Basin (EV12, G18,SV157, SV169, B247, JAR), Isle Royale Basin(EV21, EV24, EV26A, SJE, PS8, 25A, PS16),Marathon Basin (T46A), Keweenaw Basin Trough(KB, SV62), Caribou Basin (L42C, L42A), LakeSuperior Troughs (SV42, SV43, SV45), WawaTrough (EV23), Batchwana Bay (PS20), GoulaisBay (PS21), and Whitefish Bay (EV11A). Coreswere obtained with a 7.6 cm diameter gravity corerwhich did not free-fall, but was carefully lowered
FIG. 2. The Keweenaw Peninsula region illustrating a) the position ofstamp mills, smelters, and Michigame Project lakes (round symbols).Prevailing wind direction (west) is indicated in lower left.

666 Kerfoot et al.
into the sediment, minimizing loss of surface layersand reducing compaction artifacts. All cores weresectioned immediately upon retrieval. The majorityof the cores were sectioned at 2 cm intervals to adepth of 20 cm. Selected cores were sectioned at0.5 cm intervals to a depth of 10 cm and at 1 cm in-tervals thereafter.
Sediment subsamples for metals analysis were airdried and then homogenized by grinding to a finepowder with a mortar and pestle. A small aliquot (< 0.25 g) of each sample was placed into a pre-weighed Teflon digestion vessel. Ultrapure nitricacid solution (25 mL of 10% v/v) was added toeach vessel and the vessels tightly capped and re-weighed. The samples were digested using a CEMmicrowave digestor at 100% power for 10 minutesfollowed by 50 minutes at 75% power. The vesselswere reweighed to insure that no loss of liquid oc-curred during the digestion process. The contents ofthe vessels were then filtered using 47 mm GelmanSupor-450 filters and the filtrate transferred to 60mL acid-leached storage bottles.
The samples were analyzed for copper, silver,and zinc by flame atomic absorption spectropho-tometry using a Perkin-Elmer model 5000 atomicabsorption spectrophotometer. The samples wereanalyzed for total mercury by the cold vapor tech-nique using a Perkin-Elmer atomic absorption spec-trophotometer and a Perkin-Elmer MHS-20mercury/hydride system. With this method the mer-cury is reduced to the elemental form using stan-nous chloride and then collected as an amalgam ongold foil which is heated rapidly, removing the mer-cury as a concentrated spike.
Keweenaw Inventory Cores
Twenty-two 5.1 cm diameter sediment cores wereobtained from the Keweenaw Waterway andnearshore regions of the Keweenaw Peninsula dur-ing 1996 and 1997, using a Phleger-type KB gravitycorer (Fig. 2). Water sampling depths ranged be-tween 12 and 20 m. The core sites extend from Ke-weenaw Bay into the interior reaches of theKeweenaw Waterway. The coring device was low-ered from one of two boats, the 9.5 m RV Naviculaand a 5.2 m Boston Whaler. A Lowrance model X-16 sonar unit with tape printout helped positionthe corer 3 to 4 m above sediments prior to release.Cores were plugged, capped, and transported toPortage View Hospital where they were x-rayed forslime varve stratigraphy, which provides detailedtime-stratigraphic information (Kerfoot et al. 1994).
Cores were sliced into 2 cm sections and analyzedfor Cu, Ag, and Hg. Element analysis followedmethods outlined above. In addition, copper oresamples from fourteen mine sites (poor rock pilesamples and archived museum ore samples) wereassayed for mercury concentrations.
Quality Assurance
Standard reference materials (SRM) and repli-cated samples provided QA/QC information forcopper and zinc analyses. Standard Reference Ma-terial for the LS 83 samples (copper and zinc analy-sis) was SRM 2704 (Buffalo River sediment fromthe National Bureau of Standards). Copper recovery(N = 20) was 93.18 ± 7.07%, Zn 92.03 ± 5.28%.Replicate Cu samples (N = 20) from cores were90.42 ± 4.77% similar, whereas Zn samples were91.87 ± 3.43% similar. Standard Reference Materialfor the Keweenaw cores was from Ultra ScientificCo (Natural Matrix Certified Reference Material“Metals on Soil/Sediment #4”). Recoveries (N =15) were Cu 90.01 ± 11.56%, Zn 97.28 ± 9.03%,and Hg 96.65 ± 9.01%. Replicate core samples(N = 16) gave the following similarity values: Cu 90.35 ± 5.77%, Zn 92.05 ± 6.11%, Hg 91.12 ±4.46%.
In the offshore Hg determinations, approximately16% of all analyses were blanks, standard referencematerials, and replicate extracts of samples. Basedon the standard deviation of blanks, the detectionlimit was < 0.00489 µg/g for the typical weight ofsample extracted. All blanks were below the limitof detection for the instrument, whereas all sampleresults were above this limit. The mean percent rel-ative difference for replicate extracts was 8.4%.Standard Reference Material 2704 was extractedwith each set of microwave digested samples (NIST1990). For the EPA lab, the acceptable recoveryrange was 80 to 120%. SRM 2704 recoveriesranged between 84 and 118%, with a mean of104%. The certified concentration for mercury inSRM 2704 was 1.47 µg/g, whereas the extractedamount was 1.53 µg/g.
Inventory Calculations
It is assumed that post-depositional diagenetic re-mobilization of Cu, Zn, and Hg is small relative tothe difference between anthropogenic and naturalloadings. Anthropogenic copper inventories werecalculated by determining the excess copper inven-tory above background over the length of the core:

Copper and Mercury Profiles in Lake Superior Sediments 667
Ca = ∑ i (Ct – Cb )Mi (1)
where Ca = anthropogenic copper (µg/cm2) summedover depth (i, in cm), Ct = total copper concentra-tion (µg/g), Cb = background concentration (µg/g),and Mi = total mass (g/cm2). The sediment accumu-lation rate for anthropogenic copper in recent sedi-ments is:
R = Ci * Mi * 1/t (2)
where R = net flux (µg/cm2/yr), Ci = inventory con-centration (µg/cm2), t = accumulation duration(years). Deposition rates for 16 core sites were de-rived from literature values based on close-intervalsectioned cores taken at the same sites.
137Cs and 210Pb dating (Robbins and Edgington1975; Whitefish Bay core) and slime clay layers(Keweenaw cores) aided time-specific assignmentof Cu and Hg increases (Kerfoot et al. 1994, Ker-foot and Robbins 1999). Sediment focusing, how-ever, can redistribute sediment in a non-uniformmanner, requiring corrections. In the NOAA 2 cm-sectioned cores, 137Cs inventories were usedprimarily to correct for sediment focusing, using anexpected mean value of 24.0 dpm/cm2 derived fromdecay-corrected atmospheric deposition. That is,
Focusing Correction = R/F (3)
where F = focusing factor= Observed/Expected137Cs inventory.
Cu/Zn Ratios and Cu Concentrations
To help trace nearshore patterns back to sources,Cu/Zn ratios and Cu concentrations were used.Prior Neutron Activation studies (Kerfoot and Rob-bins 1999) showed that the Cu/Zn ratio is a strongindicator of local mining perturbations. Cu/Zn ra-tios for stamp sand samples from the Gay, IsleRoyale, and Point Mills stamp sand piles range be-tween 10 and 67 for the < 1 mm and 12 and 38 forthe < 177 mm size fraction. Copper is differentiallyenriched in copper ore lodes relative to Zn, andeven more strongly enriched in the fine “slimeclay” fraction of stamp sands, the fraction most eas-ily dispersed from tailing piles into Lake Superior.Consequently, Cu/Zn ratios were inspected frompublished data on sediment samples and from in-ventory cores taken across the eastern Lake Supe-rior basin.
To illustrate the association between the location
of stamp sand mills and copper in sediments (surfi-cial Cu concentrations, antropogenic inventories),values along the stretch of the Keweenaw Water-way were plotted, starting from the North Entry(km 0) to the South Entry (km 37). The values werecompiled from literature records (Fitchko andHutchinson 1975, Wright et al. 1975, Sypniewski1977, Kraft and Sypniewski 1981, Malueg et al.1984, Leddy 1973, Kerfoot et al. 1994). A Splineregression (Systat, Wilkinson 1989) was fit to thevalues.
Michigamme Project Inland Lake Cores
As part of a regional investigation of trace metalcontamination (Evans 1986), a Wildco KB 5.1 cmdiameter gravity corer was used to obtain coresfrom seven lakes on or near the Keweenaw Penin-sula. Only cores with a relatively undisturbed sur-face were selected for analysis. Cores for theMichigamme Project were extruded and sliced into1 cm sections. Samples were analyzed at theMDNR laboratory, Lansing, following US EPA ap-proved analytical methodologies. Data and coresamples were made available to us as part of a 1995Deer Lake Project.
RESULTS
Lake Superior Copper Inventories
The locations of coring sites across Lake Supe-rior are indicated in Figure 1. Surface and back-ground copper concentrations, maximum values,and anthropogenic inventories from individual sitesare listed in Table 1. The text gives ninety-five per-cent confidence intervals for mean estimates.
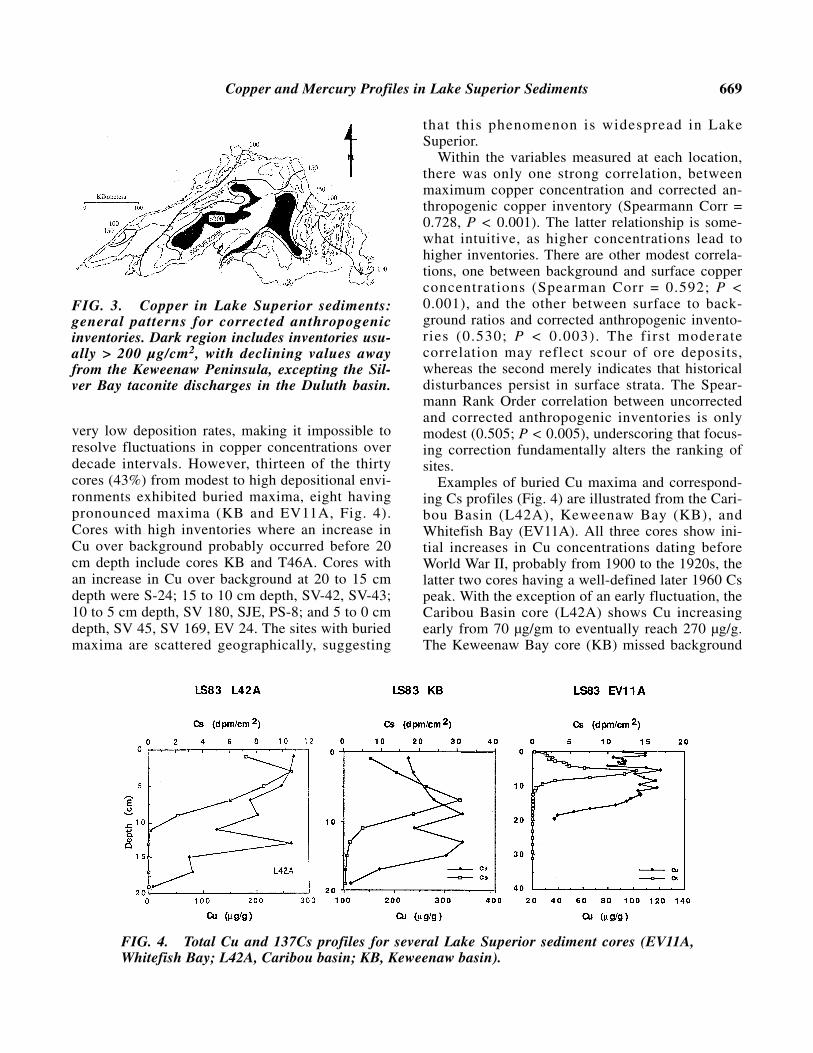
After excluding cores whose lowest strata (20 cmdepth) clearly had not reached background levels, itwas found that background copper concentrationsranged from 21 to 75 µg/g (mean ± 95%CL, 60.9 ±7.0 µg/g, CV = 32%), whereas surface copper con-centrations ranged from 47 to 281 µg/g (164.3 ±22.1 µg/g; CV = 37%). Surface Cu concentrations(Fig. 3) were lowest in the extreme western andeastern basins (Duluth Basin, Whitefish Bay) andhighest in mid-lake and mid-eastern basin regions.
At shallow depths in the cores, the ratio of the Cuconcentration peak to background values rangedfrom 1.6 to 8.9 (3.1 ± 0.2, CV = 41%), indicatingsizable anthropogenic inputs. The ratio of maxi-mum copper to background concentration was low-est in the western basins (Duluth, Thunder Bay),

668 Kerfoot et al.
but exceeded 3.0 at several mid-lake and easternbasin sites.
Total copper inventories for cores were high (563± 76 µg/cm2; CV = 37%), a reflection of basin oresources naturally scoured along shorelines andseamounts as well as anthropogenic inputs. Anthro-pogenic inventories uncorrected for focusing (Fig.3) varied from 20 to 780 µg/cm2 (187 ± 54 µg/cm2;CV = 81%). In general, inventories were highest inmid-lake and deep-water eastern depositionalbasins. Exceptionally high values came from sitesnear mining activity (I7, Silver Bay taconite dis-charges into the Duluth Basin; KB, Gay stamp milldischarges into Keweenaw Bay).
Based on 137Cs inventories, focusing factorsranged from 0.4 to 4.2 (1.46 ± 0.36), suggesting abroad range of erosional (< 1.0) and excess deposi-tional (> 1.0) regimes. The relatively large meanvalue underscores the deep scour zone of the high-energy Lake Superior environment, moving fine-grained sediment off shelves less than 50 m intodeeper waters. Overall, focusing corrections low-ered the inventory mean value and decreased sitevariance (144 ± 22 µg/cm2; CV = 42%). Correctedinventory values emphasized the Cu-enriched region around the Keweenaw Peninsula (Fig. 3,Table 2).
At deep-water stations, several of the cores had
TABLE 1. Copper concentrations, inventories, and important ratios from the 1983 Lake Superior cores.Abbreviations in table heading correspond to: bkg = background concentrations; Surf = Surficial concen-trations; Max = maximum concentrations; S:B = Surficial/Background ratio; M:B = Maximum/Back-ground ratio; Total = total copper inventory; Anth = anthropogenic copper inventory; FF = Focusing Fac-tor, calculated from cesium accumulation; Corr Anth = anthropogenic inventory corrected for sedimentfocusing. Units of measure are given under the measurements.
Bkg Sur Max Total Anth Corr. AnthStation (µg/g) S:B M:B (µg/cm2) FF (µg/cm2)
EV11A 36.8 91.9 120.9 2.5 3.3 585.8 308.3 3.0 102.8SV45 61.7 204.4 204.4 3.3 3.3 510.4 71.1 0.7 101.6EV24 50.6 171.0 171.0 3.4 3.4 561.6 108.6 0.6 181.0SJE 59.1 174.0 174.0 2.9 2.9 449.1 130.0 1.3 100.0I7 20.6 47.3 184.2 2.3 8.9 652.7 421.1 2.6 162.0L42C 72.5 171.8 201.2 2.4 2.8 446.8 90.1 0.7 128.7B247 47.70 147.3 147.3 3.1 3.1 581.8 94.3 1.0 94.3EV23 40.1 147.9 147.9 3.7 3.7 318.0 44.5 1.0 44.5JAR 67.2 196.5 196.5 2.9 2.9 639.1 116.8 1.1 106.2PS21 49.9 81.4 81.4 1.6 1.6 570.0 134.7 2.1 64.1SV180 63.1 75.5 116.8 1.2 1.9 384.5 46.6 0.5 93.2EV8 60.0 109.7 123.0 1.8 2.1 394.2 122.8 0.9 136.4EV26A 60.1 213.9 226.8 3.6 3.8 240.5 240.5 1.1 218.6T46A 93.76 281.0 281.0 3.0 3.0 839.4 383.8 2.0 191.9L42A 77.4 270.6 270.6 3.5 3.5 644.5 348.9 1.5 232.6SV169 52.5 219.7 219.7 4.2 4.2 594.9 153.2 0.6 255.3PS16 66.8 196.8 196.8 2.9 2.9 500.7 136.8 0.9 152.025A 47.9 154.3 173.6 3.2 3.6 483.2 266.1 2.2 121.0SV42 65.9 215.1 225.5 3.3 3.4 531.1 261.6 2.0 130.8EV12 53.7 152.7 152.7 2.8 2.8 459.2 96.9 0.9 107.7SV43 61.7 213.9 236.2 3.5 3.8 660.6 228.2 0.9 253.6PS8 98.6 263.2 263.2 2.7 2.7 840.8 167.8 0.9 186.4SV157 55.0 143.5 143.5 2.6 2.6 535.2 72.2 0.3 240.7PS20 37.8 89.2 89.2 2.4 2.4 486.2 151.5 1.7 89.1EV21 45.9 153.9 170.9 3.4 3.7 446.3 184.4 0.8 230.5EV4 52.8 95.8 111.1 1.8 2.1 660.7 94.7 1.1 86.1KB 113.4 227.5 335.5 2.0 3.0 1,450.8 779.8 4.2 185.7G18 60.5 177.1 177.1 2.9 2.9 402.9 121.3 1.2 101.1S24 69.2 142.8 145.9 2.1 2.1 513.5 211.6 3.1 68.3EV13 86.0 99.6 112.6 1.2 1.3 542.0 20.8 3.6 5.8
Copper and Mercury Profiles in Lake Superior Sediments 669
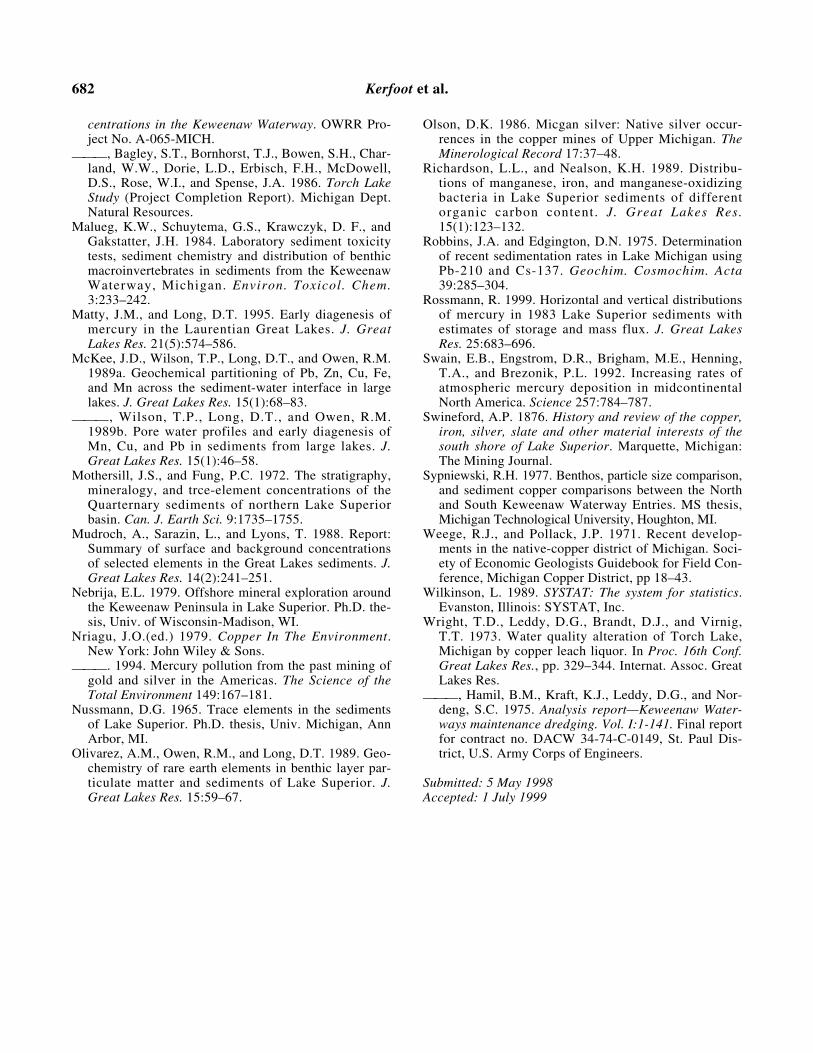
very low deposition rates, making it impossible toresolve fluctuations in copper concentrations overdecade intervals. However, thirteen of the thirtycores (43%) from modest to high depositional envi-ronments exhibited buried maxima, eight havingpronounced maxima (KB and EV11A, Fig. 4).Cores with high inventories where an increase inCu over background probably occurred before 20cm depth include cores KB and T46A. Cores withan increase in Cu over background at 20 to 15 cmdepth were S-24; 15 to 10 cm depth, SV-42, SV-43;10 to 5 cm depth, SV 180, SJE, PS-8; and 5 to 0 cmdepth, SV 45, SV 169, EV 24. The sites with buriedmaxima are scattered geographically, suggesting
that this phenomenon is widespread in Lake Superior.
Within the variables measured at each location,there was only one strong correlation, betweenmaximum copper concentration and corrected an-thropogenic copper inventory (Spearmann Corr =0.728, P < 0.001). The latter relationship is some-what intuitive, as higher concentrations lead tohigher inventories. There are other modest correla-tions, one between background and surface copperconcentrations (Spearman Corr = 0.592; P <0.001), and the other between surface to back-ground ratios and corrected anthropogenic invento-ries (0.530; P < 0.003). The first moderatecorrelation may reflect scour of ore deposits,whereas the second merely indicates that historicaldisturbances persist in surface strata. The Spear-mann Rank Order correlation between uncorrectedand corrected anthropogenic inventories is onlymodest (0.505; P < 0.005), underscoring that focus-ing correction fundamentally alters the ranking ofsites.
Examples of buried Cu maxima and correspond-ing Cs profiles (Fig. 4) are illustrated from the Cari-bou Basin (L42A), Keweenaw Bay (KB), andWhitefish Bay (EV11A). All three cores show ini-tial increases in Cu concentrations dating beforeWorld War II, probably from 1900 to the 1920s, thelatter two cores having a well-defined later 1960 Cspeak. With the exception of an early fluctuation, theCaribou Basin core (L42A) shows Cu increasingearly from 70 µg/gm to eventually reach 270 µg/g.The Keweenaw Bay core (KB) missed background
FIG. 3. Copper in Lake Superior sediments:general patterns for corrected anthropogenicinventories. Dark region includes inventories usu-ally > 200 µg/cm2, with declining values awayfrom the Keweenaw Peninsula, excepting the Sil-ver Bay taconite discharges in the Duluth basin.
FIG. 4. Total Cu and 137Cs profiles for several Lake Superior sediment cores (EV11A,Whitefish Bay; L42A, Caribou basin; KB, Keweenaw basin).

670 Kerfoot et al.
strata as bottom (20-cm) Cu concentrations increasebeyond 100 µg/g upwards and peak at over 300 µg/g, then decline below 230 µg/g in surfacestrata. The Cs peak occurs in this core after the de-cline in Cu. In Whitefish Bay (EV11A), Cu concen-trations are much lower at 20 cm depth, around 40µg/g, increase to a value of 120 µg/g initially, thenfluctuate between 80 and 110 µg/g. In this case the1960 Cs peak occurs at the beginning of the declinein Cu concentrations. High Cu inventories near theMarathon Basin (T46A, 25A), Thunder Bay (S24),Keweenaw Bay (KB), and Silver Bay (I7, SV180)correspond to elevated mining activities in those re-gions. Core I7 reflects local inputs of taconite tail-ings from the Reserve Mining operation at SilverBay, MN (Rossmann 1999).
Site Copper Fluxes and Loading
Site-specific sedimentation rates for sixteen loca-tions were multiplied by copper concentrations todetermine site-specific surficial Cu fluxes (Table 3).Three sites gave exceptionally high values: I7 in theDuluth Basin (19.9 µg/cm2/yr); KB in the Ke-weenaw Bay Trough (9.9 µg/cm2/yr); and T46A inthe Marathon Basin (7.2 µg/cm2/yr). Based on allsixteen sites, the mean lake-wide loading estimatefor Cu is 5.0 ± 2.5 µg/cm2/yr. If the three extremelyhigh deposition sites are removed, the mean loadingestimate is reduced to 3.4 ± 1.2 µg/cm2/yr.
Evidence for Mining Impacts: Cu/Zn Ratios
Copper is normally less abundant than Zn in lakesediments, due to the constitution of elements inbedrock, the greater solubility of Zn, and higherconcentrations of Zn relative to Cu in living matter.
Neutron activation studies (Kerfoot and Robbins1999) revealed that a high abundance of Cu relativeto Zn is characteristic of native copper ores. Thusthe ratio of the two elements provides a good indi-cator of local mining influences around the Ke-weenaw Peninsula. Ratios are very high in ores andstamp sands, and remained moderately high in lakesand along shorelines that received stamp sand clayparticles (Fig. 5, Table 4).
Table 4 lists the 95% confidence limits for Cu/Znratios run on stamp sand samples and surficial sedi-ments from a variety of sites: Portage Lake, the restof the Keweenaw Waterway, Lake Superior, and in-land lakes. Copper to zinc ratios ranged between 10and 67 (mean 23.4) in the so-called slime clay frac-tion of stamp sands, between 4 and 15 (mean 10.0)in Torch Lake sediments and 1 and 24 (mean 9.0) inPortage Lake surface and deeper mining era sedi-ments. A review of published sediment valuesshows that Cu/Zn ratios are higher in the southernsites of the eastern Lake Superior Basin, and lowerin the northern sites. Southern Lake Superior siteshad a mean Cu/Zn ratio of 1.95 at –5 cm depth, de-creasing to 1.64 in surface sediments. NorthernLake Superior sites had a mean of 1.06 at –5 cmdepth, decreasing to 0.92 in surface sediments. Al-though the mean differences seem slight, they aresignificant (P < .05; Table 4). Inland lakes had amean Cu/Zn ratio of 0.79.
Not all local environments showed mining im-pacts. At the South Entry of the Keweenaw Penin-sula, wetland regions of the waterway apparentlywere protected from slime clay-laden mining dis-charges by the large volume of water discharged by the Sturgeon River. In this region, zinc domi-nated, giving Cu/Zn ratios between 0.3 and 0.5
TABLE 2. Summary statistics for 1983 Lake Superior core variablesand copper inventories. Concentrations in µg/g and inventories in µg/cm2.
Variable N Mean SE SD CV
Background Cu Conc 30 60.9 3.5 19.2 31Surface Cu Conc 30 164.3 11.1 60.5 37Surface: Background Conc 30 2.74 0.14 0.75 27Maximum Cu Conc 30 180 11 60 33Maximum: Background Conc 30 3.12 0.24 1.29 41Total Cu Inventory 30 563 38 206 37Anthropogenic Inventory 30 187 27 151 81Focusing Factor 30 1.46 0.18 1.00 68Corrected Anth. Inventory 30 144 12 67 47

Copper and Mercury Profiles in Lake Superior Sediments 671
(mean 0.4), similar to data from undisturbed inlandhabitats.
There are high correlations between Cu concen-tration and the Cu/Zn ratio in Portage Lake coresand in the 1983 Lake Superior cores (Figs. 5a–c).This relationship seems unique to Lake Superioramong the Laurentian Great Lakes and possibly re-lates directly to mining activity and naturallyscoured ore deposits. The high correlations betweenCu concentration and the Cu/Zn ratio suggest thatthe fine fraction from tailing discharges (slime clayfraction) provided a source of fine, copper-rich par-ticulate material to at least nearshore sediments, ifnot deeper offshore stations. Regression coeffi-cients are similar, suggesting a simple dispersal anddilution relationship for dispersed clay-sized parti-cles. At deep-water sites, Cu cycling through vari-ous dissolved states and through food chains, whichfavor Zn relative to Cu, should correct the mining-related imbalance with time, returning the sedimentratios to more typical values. Transformation of Cu from slime clay particle-bound forms into solu-ble forms capable of cycling through deep-waterfood chains is probably an important process cur-rently operating in Lake Superior offshore waters.The presence of a buried Cu/Zn maximum in thesediment profile signals either that the recoveryprocess is underway or that remobilized copper isplating out on the redox horizon (McKey et al1989) perhaps in proportion to increased historicalinventories.
Tracing Enrichments Back to Sources: Surface CuPatterns and Copper/Mercury Profiles
Three different types of copper and mercury sedi-ment profiles (Fig. 6) are distinguished. One pat-tern, primarily found far offshore at low deposition,deep-water sites, exhibits surface increases in cop-per and mercury concentrations, with low invento-
FIG. 5. Cu/Zn ratios plotted against Cu concen-trations for: A) various depths of Portage Lakecore #3, central basin, B) various depths ofPortage Lake core #7, near Sturgeon River dis-charge; C) various depths of 1983 Lake Superiorinventory cores. Least-square regression equa-tions fit to points and coefficients of determination(R2) given at bottom of graphs. Note that regres-sion slopes are similar over wide range of absolutevalues.

672 Kerfoot et al.
ries suggestive of atmospheric sources or an activefloc exchange layer (stations PS 8 and EV 21). Asecond pattern, characteristic of intermediate depo-sition regimes at deep-water sites, features early in-creases in copper concentrations, corresponding toturn-of-the-century mining discharges, followedlater by an increase in mercury concentrationswhich peaks near the surface (station L 42A). Athird pattern, present at high depositional sitesstrongly influenced by coastal currents, shows si-multaneous early rises of copper and mercury con-centrations with examples of buried maxima andhigh inventories (station KB).
Several regional and local sources of copper andmercury occur within the basin. Natural erosion ofmetal-rich geologic formations historically elevatedmetal fluxes relative to other Great Lakes water-sheds. Mining of base metal deposits (gold, silver,copper) accelerated these high background fluxes.Historically, mercury associated with mining camefrom three principal sources: 1) imported into thebasin for metal extraction and assay procedures(gold amalgamation technique; ferrous iron assay),2) found as a natural amalgam in silver-rich copperand gold deposits, becoming locally enriched intailings deposits, and 3) discharged from smeltersthat processed copper enriched in silver, spreadingmetal-enriched plumes across regional watershedsand drainage systems.
Indirect evidence for the natural amalgam hy-pothesis comes from a significant association be-
tween mercury and silver concentrations at severalsediment core sites. It is hard to believe that such apattern could arise from long-distance deposition ofmercury, since silver has restricted atmospheric mo-bility. At coring site T-46A, the concentration of Hgis high (mean 0.086 µg/g) relative to backgroundlevels, ranging between 0.045 and 0.150 µg/g. Sil-ver is also high at this site (mean 0.453 µg/g), rang-ing between 0.327 and 0.607 µg/g. The correlationbetween Hg and Ag is significant (r = 0.671; 0.05 >P > 0.01). Concentrations of both Hg and Ag arealso high at PS-8 (Hg mean 0.071 µg/g, range 0.045to 0.155; Ag mean 0.321 µg/g; range 0.258 to0.412) and also significantly correlated (r = 0.810,0.01 > P > 0.001, N = 10). Several stations off theKeweenaw Peninsula also have significant Hg:Agcorrelations (L-42C, Ag mean 0.087 µg/g, r =0.951, P < 0.001, N = 10; SJE, Ag mean 0.18 µg/g, r = 0.642, P < 0.05, N = 10; SV-169, Ag mean0.174 µg/g, r = 0.899, P < 0.001, N = 10).
Contributions from stamp mills (terrestrial in-puts) are relatively easy to trace back to shorelinesources, using high Cu concentrations, Cu/Zn ra-tios, or ore elemental composition (Kerfoot andRobbins 1999). Identifying contributions fromsmelters (terrestrial slag dumps, atmosphericplumes) is more difficult. Stamp sand dischargesites are well known historically (Kerfoot et al.1994) and easily marked by shoreline piles, yetsmelting operations in the Keweenaw Region alsostretched across the entire peninsula, were generally
TABLE 3. Estimated sediment flux and calculated Cu flux at sixteen lakeSuperior sampling locations. Sources for sediment flux estimates listed byauthor.
Station Sed. Flux (g/cm2/yr) Cu Conc. (µg/g) Flux (µg/cm2/yr) Source
EV24 0.013 171.0 2.22 KlumpSJE 0.018 174.0 3.13 KlumpI7 0.42 47.3 19.9 RossmannB247 0.017 147.3 2.50 BrulandEV23 0.014 147.9 2.07 EvansEV8 0.022 109.7 2.41 EvansEV26A 0.022 213.9 4.71 EvansT46A 0.0255 281.0 7.17 Kemp25A 0.0155 154.3 2.39 KempEV12 0.016 152.7 2.44 EvansPS20 0.08 89.0 7.12 KlumpEV21 0.007 153.9 1.08 EvansEV4 0.016 95.8 1.53 EvansKB 0.0435 227.5 9.90 KempS24 0.046 142.8 6.57 KempEV13 0.053 99.6 5.28 Evans

Copper and Mercury Profiles in Lake Superior Sediments 673
located near water for ease of finished ingot ship-ment, and produced plumes that blanketed down-wind watersheds (Fig. 2).
For example, surficial copper concentrationsalong the Keweenaw Waterway peak near locationsof stamp mills (Fig. 7). Concentrations start at rela-tively high values, 100 to 600 µg/g, near the NorthEntry due to shoreline reworking of stamp sandsdischarged from the five mills at Freda andRedridge. Values increase to extremely high levels,1,600 to 2,400 µg/g, near the central Houghton andHancock mill sites, then decline to very low values,30 to 40 µg/g, near the South Entry. Sediment coresamples taken from Keweenaw Bay and from theKeweenaw Waterway near stamp mill sites showhigh concentrations for Cu and Hg and correlated
inventories (Fig. 8, Table 5). Figure 8 illustratestwo examples of sediment core profiles, one fromL’Anse Bay (near the Mass and Michigan Mill dis-charges) and one from Portage Lake (receiving dis-charges from the Franklin and Centennial Mills atPoint Mills, Isle Royale Mill east of Houghton).Major increases in Cu concentrations above back-ground levels (20 to 40 µg/g) in both cores signalthe onset of turn-of-the-century stamp mill dis-charges (Kerfoot et al. 1994, Kerfoot and Robbins1999). However, these cores also clearly show anincrease in Hg concentrations that begins aroundthe time of the initial Cu increase. In both casesthere is evidence for a buried maximum, althoughpeak Hg concentrations are less in L’Anse Bay(0.140 µg/g) than in Portage Lake (0.800 µg/g), re-
FIG. 6. Concentration profiles for copper and mercury from 1983 Lake Superior sediment cores. Sta-tions PS8 and EV21 are from the center of Lake Superior, east of Isle Royale, whereas L42A is just north of the path of the Keweenaw Current and KB is from Keweenaw Bay. Sampling sites are plotted inFigure 1.

674 Kerfoot et al.
lated to total stamp mill discharges. Copper andmercury inventories for the 36 total cores are highlycorrelated among sites (r = .874, with the one out-lier), again reflecting a strong association withstamp mill discharges.
The core studies reported here are the first todocument high mercury concentrations in Ke-weenaw Bay and Waterway deep sediments and toassociate these patterns with mining activity. Directevidence for the natural amalgam hypothesis comesfrom analyzing copper ore samples from severalmine sites, both chunks of copper from poor rockpiles and museum voucher samples. For example,the Isle Royale Mine, one of the three large opera-
FIG. 7. Transect along the Keweenaw Waterway,moving from the North Entry (km 0) to the SouthEntry (km 37), illustrating how a) surface copperconcentrations and b) copper inventories peaknear the location of stamp mills. A spline regres-sion fit traces the general mean trend of surfacecopper concentration.
FIG. 8. Copper and mercury inventories forKeweenaw Waterway and Keweenaw Bay (L’AnseBay portion) sites. Selected examples from A)Portage Lake and B) L’Anse Bay; C) values fromentire set of 22 cores (Table 5).

Copper and Mercury Profiles in Lake Superior Sediments 675
tions that contributed to Portage Lake stamp milldischarges, had total mercury concentrations thatranged between 0.842 and 4.388 µg/g (N = 4, mean2.445 µg/g) in copper samples. Mercury concentra-tions in copper samples from the thirteen mine sitesranged between 0.761 and 10.850 µg/g (N = 27,mean 4.884 ±1.234 µg/g).
Michigamme Project Lakes
The Michigamme data set (Evans 1988) allowedchecks on highly localized signatures of mining ac-tivity, including stamp mills, smelter plumes, andassay laboratory discharges. Anthropogenic inven-tories for Cu from various small lakes are presentedin Table 6. Gratiot Lake is located near naturallyrich Cu ore bodies as reflected in the high back-ground concentrations, but was never a site of min-ing. The Gratiot Lake copper anthropogenicinventory is low, despite the proximity to ore bod-ies. Lakes Emily and Medora are also distant frommining activities. However, Lac LaBelle was thesite of two small stamp mills that operated between1864 and 1889, as well as a short-lived smeltingoperation in the 1860s. Deer Lake (a recognizedArea of Concern), Ishpeming, is the site of theRopes Gold Mine, an operation which historicallyutilized mercury amalgamation. Deer Lake also re-ceived ionic mercury discharged from a mining lab-oratory in Negaunee during 1929 to 1981,generated from a ferrous iron assay technique.
Because high copper concentrations, high Cu/Zn
ratios, and high mercury concentrations are charac-teristic of milling sites, the isolated Lac LaBellecore profiles were used as an independent check onstamp sand discharges (Fig. 9). Lac LaBelle turnedout to have the highest Cu inventories of the sevenlakes, high Cu/Zn concentration ratios, and highsediment Hg concentrations. However, concentra-tions of Hg in Deer Lake sediments were so highthat they required a scale shift (Fig. 10). Althoughhistoric smelter plume impacts on the KeweenawPeninsula watershed have not been thoroughly in-vestigated, cores taken downwind of smelterplumes, in Rice Lake (Superior Smelter, DollarBay) and Lakes Emily and Roland (east of theWhite Pine Smelter) also suggest atmospheric tracemetal (Cu,Hg) inputs from smelter plumes (Fig.10).
DISCUSSION
In one of the few early studies of copper fromLake Superior sediments, Kemp et al. (1978) attrib-uted high anthropogenic copper loadings across thelake basin to mining activities, i.e. local sources.Curiously, Kemp et al. (1978) also stated that at-mospheric inputs contributed 26.5% of total copperloading, suggesting major, perhaps long-distance,atmospheric inputs. Given the great areal expanseof Lake Superior, the two concepts are not incom-patible. That is, depositional basins far offshorecould be heavily influenced by atmospheric inputs,at the same time that nearshore discharges gradu-
TABLE 4. Mean Cu/Zn ratios for surface sediments at various locations around theestern Lake Superior basin, with sample sizes (N), standard errors (SE), coefficients ofvariation (CV, expressed as % mean), standard deviations (SD), and 95% confidenceintervals for mean estimates (95% CL). Northern and southern Lake Superior samplesbroken into surface (s) and five centimeters depth (5). Lake Superior sources includeHelmke et al. 1977; Mothersill and Fund 1972; Kemp et al. 1978; Nebrija 1979; whereasKeweenaw Waterway and Portage Lake include Kerfoot et al. 1994; Kerfoot and Robbins1999; Leddy 1986; Malueg et al. 1984; and Wright et al. 193, 1975.
Site N Mean (SD) CV SE 95% CL
Stamp Sands 19 23.40 (15.83) 68% 3.63 ± 7.62Torch Lake 21 9.97 (2.53) 55% 0.55 ± 1.15Portage Lake 16 9.00 (5.33) 133% 1.33 ± 2.83Keweenaw Waterway 217 5.49 (4.06) 28% 0.28 ± 0.45S. Lake Superior (s) 192 1.64 (1.45) 10% 0.10 ± 0.20S. Lake Superior (5) 106 1.95 (1.66) 16% 0.16 ± 0.32N. Lake Superior (s) 74 0.92 (0.58) 7% 0.07 ± 0.14N. Lake Superior (5) 33 1.06 (0.76) 13% 0.13 ± 0.26Inland Lakes 45 0.79 (0.71) 11% 0.11 ± 0.22South Portage 5 0.37 (0.07) 3% 0.03 ± 0.08

676 Kerfoot et al.
ally work their way toward the center of Lake Su-perior with appreciable time lags.
Some of the Lake Superior core estimates agreeclosely with published values, whereas others shownotable departures. Background copper concentra-tions from the 1983 cores (range 21 to 75 µg/g,mean 60.9 ± 7.0 µg/g) are similar to values reported
by previous workers (Nussman 1965, mean 71;Mudroch et al. 1988, 30 to 84; Kemp et al. 1978,30 to 84; Kolak et al. 1998, mean 57). Surface cop-per concentrations (47 to 281 µg/g, mean 164.3 ±22.1) fall within Nussman’s (1965) reported range(19 to 691 µg/g; mean surficial 230), although themean value reported here is lower, perhaps reflect-
TABLE 5. Anthropogenic copper and mercury inventories from KeweenawPeninsula region (Keneenaw Waterway, L’Anse Bay) and offshore Lake Superiorcoring sites. These inventories are the data plotted in Figure 8c.
Anthropogenic Inventories
Region Copper (µg/cm2) Mercury (ng/cm2)
A. Keenenaw WaterwayNorth Portage Arm 16,509 5,348Off Dollar Bay-1 14,568 4,161Off Dollar Bay-2 4,606 882Portage Lake Proper-1 5,405 3,093Portage Lake Proper-2 7,877 3,680Portage Lake Proper-3 4,536 1,881Deep Hole-Portage Lake 6,559 3,070Off Isle Royale SS Pile 10,998 4,939South Portage Lake 4,800 3,539Lepisto Marine 11,251 1,022North of Lamarinde Shoal 9,213 3,049South of Lamarinde Shoal 5,805 3,032New Coast Guard Station 20,163 7,929Pike Bay 1,081 923Hancock 13,371 6,278Coles Creek 12,514 2,979Highpoint Bay 6,912 261Oskar Bay 4,417 565Osmar Plat 10,481 1,183
B. L’Anse Bay Portion of Keweenaw BayL’Anse Bay-1A 2,315 444L’Anse Bay-1B 2,968 329L’Anse Bay-2 2,711 426
C. Lake Superior SeriesB-247 94 352EV-4 95 291EV-21 184 139EV-24 109 63I7 421 288JAR 117 147L42A 349 253L42C 90 65SJE 130 96SV-42 262 122SV-157 72 41SV-169 153 72SV-180 47 62T-46A 944 151

Copper and Mercury Profiles in Lake Superior Sediments 677
thropogenic loadings of copper to Lake Superiorfrom Kemp et al.’s sediment cores averaged 3.8µg/cm2/yr, whereas natural (background) loadingaveraged 2.1 µg/cm2/yr, giving a total flux of 5.9µg/cm2/yr. After correction for the depositionalbasin size, anthropogenic loading was estimated as66.3% of the total accumulation. The IJC report(1977) lists atmospheric inputs as 370 tonnes/yr andterrestrial inputs as 1,025 tonnes/yr. Using the IJCvalue for lake surface area, 370 × 1012 µg Cu weredeposited over 82,103 × 1010 cm2, giving an esti-mated atmospheric flux of 0.45 µg Cu/cm2/yr. Di-viding the latter value by the total estimatedloading, 5.9 µg/cm2/yr, gives 7.6%, not the 26.5%claimed by Kemp et al. (1978). Correction of thiscalculation removes the ambiguity inherent in theoriginal claims and emphasizes the terrestrialinputs.
Another estimate of atmospheric loading can bederived from a single nearshore site (Kerfoot et al.1994). Copper fluxes from McNearney Lake (Cooket al. 1990), an isolated kettlehole seepage lake 5.4km south of Whitefish Bay, were contrasted with astation in the center of Whitefish Bay (Ile Parisi-enne Basin), located immediately north of McNear-ney Lake in Lake Superior. Total deposition of Cubetween 1880 and 1973 in McNearney Lake waslow (inventory of 32 µg/cm2; mean flux 0.34µg/cm2/yr), increasing from 0.1 to 0.2 µg/cm2/yr topeak at 0.7 µg/cm2/yr around 1960. The maximumvalue agreed with direct measurements of atmos-pheric deposition from the 1970s (0.7 µg/cm2/yr;Kunz in Nriagu 1979). Total copper deposition atthe Whitefish Bay site over the same interval (1880to 1973) was high, 495 µg/cm2, with a background
TABLE 6. Copper concentrations and inventories in inland lakes, takenduring 1988 as part of the Michigamme project. (Bkg = background con-centrations; Surf = Surficial concentrations; max = maximum concen-trations; S:B = Surficial/Background ratio; M:B = Maximum/Back-ground ratio; Anth = total anthropogenic copper accumulation)
Bkg Sur Max AnthStation (µg/g) S:B M:B (µg/cm2)
Gratiot Lake 60.3 64 64 1.06 1.06 1.6Lake Emily 25.7 140 140 5.45 5.45 75.0Lake Medora 30.7 52 52 1.70 1.70 24.7Rice Lake 25.7 174 178 6.78 6.93 221.4Lake Roland 17.3 78 78 4.47 4.47 32.2Lac LaBelle 52.3 380 410 7.26 7.83 1,193.4Deer Lake 48 210 220 4.38 4.58 703.4
ing progressive recovery. The surface values gener-ally fall within other reported values (Mudroch etal. 1988, range 113 to 300 µg/g; Kemp et al. range113 to 213), but are higher than Kolak et al.’s rangeof 75 to 185 µg/g. The enrichment factor for copper(surface/background), 2.74 ± 0.28, is higher thanthe estimate obtained by Kemp et al. (1978; range0.8–2.8, mean 1.88). The average background con-centration of copper in Lake Superior cores is1.5–2× higher than samples from other Great Lakessediments, agreeing with the estimates of Mudrochet al. (1988).
Atmospheric Component
Determining the relative contributions from atmospheric or terrestrial sources accurately is dif-ficult. The controversy over atmospheric contribu-tions demands attention, because of largeuncertainties associated with overall cycling andthe vast areal extent of Lake Superior. There areseveral ways to estimate atmospheric inputs of cop-per: 1) by obtaining sediment cores from isolatedkettlehole lakes not subject to weathered bedrock ormining inputs, 2) by directly measuring atmos-pheric deposition at atmospheric monitoring sta-tions, or 3) by using stable isotope techniques.None of these methods has been extensively em-ployed in the Lake Superior basin, yet all are poten-tially applicable.
Kemp et al.’s estimated values for the atmos-pheric loading contribution came from two differentsources, sediment core inventories (six cores) andtables of atmospheric deposition values from an In-ternational Joint Commision report (IJC 1977). An-

678 Kerfoot et al.
estimated input of 186 µg/cm2 (37.6% total), givingan anthropogenic inventory of 495 – 186 = 309µg/cm2 (62.4% total). If the McNearney Lake totalcorrectly estimated regional atmospheric input, at-mospheric deposition accounted for 6.5% of thetotal (i.e., 32/495). However, The Whitefish Bay es-timate is a single nearshore estimate and neither itnor the revised Kemp estimate incorporated correc-tions for sediment focusing.
Recently, Kolak et al. (1998) estimated regionalatmospheric flux at 0.13 to 0.19 µg/cm2/yr fromthree OMEE (Ontario Ministry of Environment andEnergy) monitoring sites. Estimated copper fluxeswere low at five, largely deep-water core sites,ranging between 0.59 and1.48 µg/cm2/yr. The meaninventory was estimated to be 52 µg/cm2, correctedfor focusing. The Kolak et al. study estimated thatatmospheric contributions ranged between 21 to38% of total input. Yet this high value is largely be-cause of low total copper inventories at chosen coresites (predominantly mid-lake and western basin),and more correctly reflects deep-water, rather thantotal, Lake Superior deposition patterns.
Published mass deposition rates at the coringsites in this study (Table 3) allow additional esti-
FIG. 9. Profiles for Hg concentration, Cu/Znratio, and Cu concentration in sediment coresfrom Michigamme Project lakes. Symbols in lowerright identify samples from specific lakes.
FIG. 10. Mercury concentration profiles fromthe Michigamme Project lakes, illustrating theextreme values for Deer Lake.

Copper and Mercury Profiles in Lake Superior Sediments 679
mates of lake-wide fluxes. Three nearshore stationsdirectly influenced by mining discharges revealedvery high fluxes (I7 19.87 µg/cm2/yr; KB 9.90µg/cm2/yr; T46A 7.17 µg/cm2/yr). Including thesevalues gave a mean Cu loading of 5.02± 2.50µg/cm2/yr to Lake Superior, whereas dropping thethree high sites reduced the estimated loading to3.35 ± 1.17 µg/cm2/yr. Using the mean McNearneyvalue for atmospheric deposition (0.34 µg/cm2/yr),an estimated atmospheric contribution is obtainedof 6.8% for the total or 10.1% if the high coastalsites are dropped. Use of the OMEE atmosphericestimates results in much lower values (3 to 6%).Thus the values reported here are in good agree-ment with the corrected Kemp estimates, but con-siderably less than that estimated by Kolak et al.(1997). Atmospheric loading of Cu to Lake Supe-rior appears to be less than 10% of total copperloading.
Mining Signature
Previous work on Cu suggests strong offshore-nearshore gradients, where solution dynamics dom-inate offshore regions, whereas particle dynamicsdominate nearshore regions. In the oligotrophic off-shore waters of Lake Superior, most work on traceelement cycling has examined accumulation andearly diagenesis only in the solid-phase of near-sur-face sediments. Enrichments of several trace metals(Cu, Zn, Pb, rare earth elements) are recognizedand attributed to near-surface oxic precipitation ofFe and Mn, metals that are mobilized under reduc-ing conditions at greater sediment depths (McKeeet al. 1989a, McKee et al. 1989b, Olivarez et al.1989, Richardson and Nealson 1989). If copper isalso mobilized, then buried maxima could reflectredox gradients, rather than historic events. If over-all loses are minimal, inventories would still be ac-curate. At some sites, diagenetic enrichmentsappear to be overwhelmed by high concentrationsof trace metals, presumably anthropogenic, in finenear-bottom suspended particles and unconsoli-dated surface sediment (McKee et al., 1989a). Thelatter observations are fully compatible with long-range transport of slime clay particles. Diageneticrelease of Hg from central lake sediments also hasbeen shown (Matty and Long 1995), yet the sources(atmospheric, terrigenous) are not clearly identified.
Sediment cores taken in nearshore environmentsdocument early deposition and high inventories ofCu and Hg at several sites around the coastal regionof Lake Superior. Copper concentrations and cop-
per to zinc ratios are particularly high in coresacross the southern portion of the eastern basin, atcore depths that correspond to the initiation of turn-of-the-century mining activities. The high correla-tion between the Cu/Zn ratio and the absolutecopper concentration suggests that mining had awidespread influence. The nearly simultaneous in-crease of mercury with copper, high silver:mercurycorrelations, examples of buried mercury maxima,and higher mercury inventories all suggest shore-line sources of mercury (Harting et al. 1996).
It is likely that the mercury contamination associ-ated with mining activity in the Keweenaw camefrom two primary sources: 1) present in copper orelodes as a natural amalgam, dispersed in tailing dis-charges and released during smelting, and 2) dis-carded as a by-product of early amalgamationextraction or assay techniques. The natural amal-gam hypothesis explains many patterns. Direct as-says of copper ores reveal moderate to high Hgconcentrations. Silver-mercury correlations in coresamples also suggest natural mineral associations.Silver and gold ores often contain mercury in smallquantities as a natural amalgam. Silver is character-istic of copper lodes around Lake Superior, produc-ing the highly valued “Lake Copper” alloy(Cronshaw 1921). On the Keweenaw Peninsula, na-tive copper mines yielded about 1 part of silver per1,000 parts of copper. For example, in 1918 elec-trolytical refining yielded 56,127,000 lb of copperand 509,467 oz of silver. By 1977, Michigan coppermines recorded production of over 5 billion kilo-grams of copper (Weege and Pollack 1971) andover half a million kilograms of silver (16,469, 544troy ounces). However, actual silver production wasprobably twice the recorded total, because of min-ers and mine managers pocketing nuggets (Olson1986). Small amounts of silver were found in virtu-ally all the lodes mined on the peninsula, but somecopper mines were rich enough to be consideredinitially as silver mines (Isle Royale, Huron, Port-land, Sheldon, and Columbian mines near PortageLake). A more southern cluster of mines, associatedwith the Nonesuch Shale, was known as the SilverCity district (Carp Lake Mine 1858, CuyahagaMine 1860, Lafayette Mine 1860, Porcupine Mine1860, Cleveland Mine, Union Mine 1865, ScrantonMine 1973, Superior Mine 1873, Collins and Dele-van Mines, Nonesuch Mine 1867, Halliwell Mine1896, White Pine Mines 1914,1915).
Amalgamation extraction techniques were rare inthe northern native copper lodes, where separationrelied on crushing the rock under steam-driven

680 Kerfoot et al.
stamps, followed by gravity separation in jigs and“slime” separation on Wilfley Tables (Benedict1955). However, in the silver district of Michigan,stamp mills often featured amalgamation tech-niques for extraction of silver (Ontonagon SilverWorks; Swineford 1876; Jamison 1950). Determin-ing amalgamation activity and mercury use fromcompany records is difficult, although yearly ex-pense sheets list “amalgamators” under labor costsand document the cost of mercury not recoveredduring processing (“loss of mercury, 3/4 lb. per tonore” Swineford 1876). The loss of mercury in themills of western United States generally variedfrom 0.3 to 3.0 kg/tonne of silver ore treated(Nriagu 1994). The increasing rates of atmosphericmercury deposition reported in midcontinentalNorth America (Swain et al. 1992) may contain ac-cumulative effects of Hg vaporization from minetailing piles and amalgamation heaps (Nriagu1994).
Smelting apparently broadcast copper and mer-cury-rich plumes across downwind watersheds.Whereas much of the mercury associated with sil-ver in sediments may be mineral-bound, a genuineconcern is vaporization from tailing piles or thathigh methylation rates of mercury may occur inwetlands located downwind from smelters or alonglake estuarine habitats where humic-stained waterspass through stamp sand strata. High methylationrates are due to a combination of a favorable envi-ronment for methylating bacteria (rich source of or-ganic material) as well as greatly fluctuating watertables, accentuated along the southern shoreline ofLake Superior by “lake effect” precipitation.
Long distance dispersal of tailing particles(“slime clay” portion) by the Keweenaw Currentand subsequent dissolution in the Caribou basin is aconcern. Long distance dispersal of mining tailingsis not without precedent in Lake Superior. Between1955 and 1980, approximately 500 million tons oftaconite tailings were discharged near Silver Bay,Minnesota, by Reserve Mining Company. This is amass equivalent to the entire discharge from a cen-tury of copper mining in the Keweenaw Peninsulaof Michigan. Iron-rich sediments moved into theDuluth basin, considerably beyond the confines ofthe permitted 9-square mile dumping site. Small as-bestiform particles from the discharge spreadwidely over three western basins of Lake Superior(Duluth, Chefswet, and Thunder Bay basins), mostnoticeably impacting core site I7. These particlesare now located several hundred kilometers fromthe original discharge site (Cook et al. 1974, IJC
1977, Cook et. al. 1985). More recently, Cook (per-sonal communication) uncovered evidence that theasbestiform particles have now moved throughoutthe entire lake, presumably due to long-termprocesses of sediment resuspension and focusing.Thus the copper and iron mining studies of LakeSuperior sediments underscore one fundamentalprinciple: deposition of any fine grain materials intothe high-energy nearshore environment of Lake Su-perior, especially into the littoral scour zone, willresult in eventual movement of this material tens tohundreds of kilometers from the original site of deposition.
CONCLUSION
With regard to metal cycling, rather than view-ing the Lake Superior watershed as a pristine envi-ronment under assault solely from long distanceatmospheric discharges, the lake is more appropri-ately viewed as an ecosystem that was disturbedearlier by turn-of-the-century mining in a patch-work manner along the shoreline. Portions of thelake are in a recovery phase, whereas other areasare still impacted by slow resuspension-depositiondynamics and by continuing mining activities. Pre-viously contaminated nearshore sediments are un-dergoing a combination of deep burial and gradualcirculation into deep, net-deposition basins. Trans-port is influenced by several physical and biogeo-chemical processes that redistribute metals and thatperpetuate elevated fluxes, although coastal anddeep-water dynamics will probably differ inprocess details.
High copper-mercury concentrations can betraced back to shoreline stamp mills and smelters.Elevated mercury occurs in nearshore stamp sandsediments, occuring as a natural amalgam with sil-ver and copper. Several smelting operations alsodischarged copper and mercury-enriched plumes,blanketing watersheds downwind. Elevated tracemetal profiles are present in sediments of inlandlakes, are derived from both milling and smeltingpractices, and suggest elevated regional cycling ofcopper and mercury. The net effect of historicsmelter and mining activities interacting with nat-ural humic substances from juxtaposed wetlands isa concern. Whereas organic complexation of copper will reduce toxicity and accelerate removalto sediments, a beneficial consequence, corre-sponding methylation of mercury may increasetoxicity and decrease deep burial in sediment ofthis element.

Copper and Mercury Profiles in Lake Superior Sediments 681
ACKNOWLEDGMENTS
Research was supported by NSF OCE 97-12827to WCK and two Michigan Great Lakes ProtectionFund awards, #910417 and #090192, to WCK and JR, administered by the Michigan Departmentof Natural Resources, Lansing, Michigan. Wethank the National Water Research Institute andR.A. Bourbonniere, study leader for the R/V LIM-NOS cruise, for taking the NOAA cores. Addi-t ional funding for analysis of the recent 22nearshore cores came from NSF OCE 97-12827 toWCK. Susan Savage (MTU) helped draft initialgraphs and Nancy Moorehead (GLERL) made137Cs measurements. Ron Rossmann determinedHg concentrations in the 30 Lake Superior inven-tory cores. Jon Kolak, Michigan State University,and Edward Swain, Minnesota Pollution ControlAgency, provided helpful comments on initialdrafts.
REFERENCESBabcock, L.L., and Spiroff, K. 1970. Recovery of copper
from Michigan stamp sands. Inst. Mineral Res., Mich.Technol. Univ., U.S. Bureau of Mines Proj. G080241(SWD-18), Vol. 1.
Benedict, C.H. 1955. Lake Superior milling practice.Houghton, Michigan: Michigan College of Miningand Technology.
Christensen, E.R., and Osuna, J.L. 1989. Atmosphericfluxes of lead, zinc, and cadmium from frequencydomain deconvolution of sedimentary records. J. Geo-phys. Res. 94(C10):14,585–14,597.
Cook, P.M. 1985. Mineral fibers in Lake Superior: Asummary of ten years of water monitoring,1973–1983. Internal EPA Report.
———, Glass, G.E., and Tucker, J.H. 1974. Asbestiformamphibole minerals: detection and measurement ofhigh concentrations in municipal water supplies. Sci-ence 185:853–855.
Cook, R.B., Kreis Jr., R.G., Kingston, J.C., Camburn,K.E., Norton, S.A., Mitchell, M.J., Fry, B., and Shane,L.C.K. 1990. Paleolimnology of McNearney Lake: anacidic lake in northern Michigan. J. Paleolimnol.3:13–34.
Cronshaw, H.B. 1921. Silver Ores. Albemaric Street, W.London: John Murry.
Edgington, D.N., and Robbins, J.A. 1976. Records oflead deposition in Lake Michigan sediments since1800. Environ. Sci. Technol. 10:266–274.
Evans, E.D. 1986. Preliminary heavy metals data forbald eagle feathers from Michigan. MDNR SurfaceWater Quality Division. Report No. MI/DNR/SWQ-90/072.
Evans, R. 1988. Michigamme Project Report. MichiganDept. of Natural Resources.
Fitchko, J., and Hutchinson, T.C. 1975. A comparativestudy of heavy-metal concentrations in river mouthsediments around the Great Lakes. J. Great LakesRes. 1:46–78.
Galloway, J.N., and Likens, G.E. 1979. Atmosphericenhancement of metal deposition in Adirondack lakesediments. Limnol. Oceanogr. 24(3):427–433.
———, Thornton, J.D., Norton, S.A., Volchok, H.L., andMcLean, R.A.N. 1982. Trace metals in atmosphericdeposition: A review and assessment. AtmosphericEnvironment 16(7):1677–1700.
Harting, S.L., Kerfoot, W.C., Robbins, J.A., and Ross-mann, R. 1996. Mercury around Lake Superior: Cali-brating the historic record. Abstracts, American Soci-ety of Limnology and Oceanography, University ofWisconsin-Milwaukee.
Helmke, P.A., Koons, R.D., Schomberg, P. J., and Iskan-dar, I.K. 1977. Determination of trace element conta-mination of sediments by multielement analysis ofclay-size fraction. Environ. Sci. 11:984–989.
Hong, S., Candelone, J.P., Patterson, C.C., and Boutron,C.F. 1996. History of ancient copper smelting pollu-tion during Roman and Medieval times recorded inGreenland ice. Science 272:246–248.
IJC. 1977. The waters of Lake Huron and Lake Superior.Windsor, Ontario.
———. 1989. Fifth biennial report on Great Lakes waterquality. International Joint Commission, Windsor,Ontario.
Jamison, J.K. 1950. The mining ventures of this Onton-agon County. Copper Country Archives, MichiganTechnological University.
Kemp, A.L.W., Williams, J.D.H., Thomas, R.L., andGregory, M.L. 1978. Impact of man’s activities on thechemical composition of the sediments of lakes Supe-rior and Huron. Water, Air and Soil Pollution10:381–402.
Kerfoot, W.C. and Robbins, J.A. 1999. Nearshoreregions of Lake Superior: Multi-element signatures ofmining discharges and a test of Pb-210 depositionunder conditions of variable sediment mass flux. J.Great Lakes Res. 25(4):697–720.
———, Lauster, G., and Robbins, J.A. 1994. Paleolimno-logical study of copper mining around Lake Superior:Artificial varves from Portage Lake provide a highresolution record. Limnol. Oceanogr. 39(3):649–669.
Kolak, J.J., Long, D.T., Beals, T.M., Eisenreich, S.J.,and Swackhamer, D.L. 1998. Anthropogenic invento-ries and historical and present accumulation rates ofcopper in Great Lakes sediments. Applied Geochem-istry, 13:59–75.
Kraft, K.J., and Sypniewski, R.H. 1981. Effect of sedi-ment copper on the distribution of benthic macroin-vertebrates in the Keweenaw Waterway. J. GreatLakes Res. 15(1):68–83.
Leddy, D.G. 1973. Factors controlling copper (II) con-
682 Kerfoot et al.
centrations in the Keweenaw Waterway. OWRR Pro-ject No. A-065-MICH.
———, Bagley, S.T., Bornhorst, T.J., Bowen, S.H., Char-land, W.W., Dorie, L.D., Erbisch, F.H., McDowell,D.S., Rose, W.I., and Spense, J.A. 1986. Torch LakeStudy (Project Completion Report). Michigan Dept.Natural Resources.
Malueg, K.W., Schuytema, G.S., Krawczyk, D. F., andGakstatter, J.H. 1984. Laboratory sediment toxicitytests, sediment chemistry and distribution of benthicmacroinvertebrates in sediments from the KeweenawWaterway, Michigan. Environ. Toxicol. Chem.3:233–242.
Matty, J.M., and Long, D.T. 1995. Early diagenesis ofmercury in the Laurentian Great Lakes. J. GreatLakes Res. 21(5):574–586.
McKee, J.D., Wilson, T.P., Long, D.T., and Owen, R.M.1989a. Geochemical partitioning of Pb, Zn, Cu, Fe,and Mn across the sediment-water interface in largelakes. J. Great Lakes Res. 15(1):68–83.
———, Wilson, T.P., Long, D.T., and Owen, R.M.1989b. Pore water profiles and early diagenesis ofMn, Cu, and Pb in sediments from large lakes. J.Great Lakes Res. 15(1):46–58.
Mothersill, J.S., and Fung, P.C. 1972. The stratigraphy,mineralogy, and trce-element concentrations of theQuarternary sediments of northern Lake Superiorbasin. Can. J. Earth Sci. 9:1735–1755.
Mudroch, A., Sarazin, L., and Lyons, T. 1988. Report:Summary of surface and background concentrationsof selected elements in the Great Lakes sediments. J.Great Lakes Res. 14(2):241–251.
Nebrija, E.L. 1979. Offshore mineral exploration aroundthe Keweenaw Peninsula in Lake Superior. Ph.D. the-sis, Univ. of Wisconsin-Madison, WI.
Nriagu, J.O.(ed.) 1979. Copper In The Environment.New York: John Wiley & Sons.
———. 1994. Mercury pollution from the past mining ofgold and silver in the Americas. The Science of theTotal Environment 149:167–181.
Nussmann, D.G. 1965. Trace elements in the sedimentsof Lake Superior. Ph.D. thesis, Univ. Michigan, AnnArbor, MI.
Olivarez, A.M., Owen, R.M., and Long, D.T. 1989. Geo-chemistry of rare earth elements in benthic layer par-ticulate matter and sediments of Lake Superior. J.Great Lakes Res. 15:59–67.
Olson, D.K. 1986. Micgan silver: Native silver occur-rences in the copper mines of Upper Michigan. TheMinerological Record 17:37–48.
Richardson, L.L., and Nealson, K.H. 1989. Distribu-tions of manganese, iron, and manganese-oxidizingbacteria in Lake Superior sediments of differentorganic carbon content. J. Great Lakes Res.15(1):123–132.
Robbins, J.A. and Edgington, D.N. 1975. Determinationof recent sedimentation rates in Lake Michigan usingPb-210 and Cs-137. Geochim. Cosmochim. Acta39:285–304.
Rossmann, R. 1999. Horizontal and vertical distributionsof mercury in 1983 Lake Superior sediments withestimates of storage and mass flux. J. Great LakesRes. 25:683–696.
Swain, E.B., Engstrom, D.R., Brigham, M.E., Henning,T.A., and Brezonik, P.L. 1992. Increasing rates ofatmospheric mercury deposition in midcontinentalNorth America. Science 257:784–787.
Swineford, A.P. 1876. History and review of the copper,iron, silver, slate and other material interests of thesouth shore of Lake Superior. Marquette, Michigan:The Mining Journal.
Sypniewski, R.H. 1977. Benthos, particle size comparison,and sediment copper comparisons between the Northand South Keweenaw Waterway Entries. MS thesis,Michigan Technological University, Houghton, MI.
Weege, R.J., and Pollack, J.P. 1971. Recent develop-ments in the native-copper district of Michigan. Soci-ety of Economic Geologists Guidebook for Field Con-ference, Michigan Copper District, pp 18–43.
Wilkinson, L. 1989. SYSTAT: The system for statistics.Evanston, Illinois: SYSTAT, Inc.
Wright, T.D., Leddy, D.G., Brandt, D.J., and Virnig,T.T. 1973. Water quality alteration of Torch Lake,Michigan by copper leach liquor. In Proc. 16th Conf.Great Lakes Res., pp. 329–344. Internat. Assoc. GreatLakes Res.
———, Hamil, B.M., Kraft, K.J., Leddy, D.G., and Nor-deng, S.C. 1975. Analysis report—Keweenaw Water-ways maintenance dredging. Vol. I:1-141. Final reportfor contract no. DACW 34-74-C-0149, St. Paul Dis-trict, U.S. Army Corps of Engineers.
Submitted: 5 May 1998Accepted: 1 July 1999