antenna patterns from single slots in carbon fibre ... · antenna patterns from single slots in...
TRANSCRIPT

Antenna Patterns from Single Slots in Carbon Fibre Reinforced Plastic Waveguides
K.J. Nicholson and P.J. Callus
Air Vehicles Division
Defence Science and Technology Organisation
DSTO-TR-2389
ABSTRACT
Slotted Waveguide Antenna Stiffened Structure (SWASS) is a type of conformal load-bearing antenna where top-hat cross-section stiffeners on skins, or blade stiffeners in sandwich panels, serve the dual purpose of acting both as structural stiffeners and as waveguides. Cutting slots through the outer skin and into these waveguide stiffeners creates slotted waveguide antenna arrays. Two of the key requirements for SWASS are adequate antenna performance and the capability to design SWASS antenna arrays. The first step toward this goal, and the subject of this report, was to satisfy these requirements for single slot antennas. Eight 100 mm long waveguide antennas, with internal cross-section of 22.86 mm x 10.16 mm and a single slot, were manufactured from aerospace grade carbon fibre reinforced plastic (CFRP). Two slotted waveguides antennas were also manufactured from copper rigid rectangular WR-90 waveguide. Antenna gain in the bore-sight direction from 8 to 12 GHz and the E- and H- plane antenna pattern at 10 GHz were measured for each slotted waveguide. The radiation pattern of CFRP antennas was similar to that of copper antennas, with approximately 3 dB reduction in gain. Measured behaviour correlated well with the predictions made using CST – Microwave Studio. Discrepancies of up to 2 dB occurred at frequencies above 10 GHz. It is concluded that losses due to the finite conductivity of CFRP are acceptable for first generation SWASS and simulation accuracy is sufficient for initial array design.
RELEASE LIMITATION
Approved for public release

Published by Air Vehicles Division DSTO Defence Science and Technology Organisation 506 Lorimer St Fishermans Bend, Victoria 3207 Australia Telephone: (03) 9626 7000 Fax: (03) 9626 7999 © Commonwealth of Australia 2010 AR-014-720 February 2010 APPROVED FOR PUBLIC RELEASE

Antenna Patterns from Single Slots in Carbon Fibre Reinforced Plastic Waveguides
Executive Summary Conformal Load-bearing Antenna Structure (CLAS) offers the potential to enhance dramatically the operational effectiveness of military platforms. The location and size of traditional antennas are restricted because they interfere with other systems, add weight and drag to the platform and the load-bearing structure must be modified to support them. In contrast, CLAS may be distributed over much of the external skin of a platform. This allows the individual antenna elements, and antenna arrays, to be substantially larger than their traditional counterparts. The beams from larger antenna arrays have higher gain, are narrower and may operate at lower frequencies. In some cases this will allow a platform to carry a system that previously could not be accommodated because of the physical requirements of the antennas. These features offer tremendous potential to enhance the effectiveness of existing, or to create new, missions. One promising CLAS concept, developed jointly by DSTO and the United States Air Force Research Laboratory, is called Slotted Waveguide Antenna Stiffened Structure (SWASS). In SWASS the top-hat cross-section stiffeners commonly used to reinforce thin aircraft skins, or blade stiffeners in sandwich panels, serve the dual purpose of acting both as structural stiffeners and as waveguides. Slotted waveguide antenna arrays are created by cutting slots through the outer skin and into these waveguide stiffeners. The slots are filled with a radiofrequency transparent cover to maintain the original aerodynamic platform exterior. Two of the key requirements for SWASS are adequate antenna performance and the capability to design SWASS antenna arrays. The first step toward this goal, and the subject of this report, is to satisfy these requirements for single slot antennas. Eight 100 mm long waveguide antennas, each with an internal cross-section of 22.86 mm x 10.16 mm, were manufactured from carbon fibre reinforced plastic (CFRP), specifically T650/F584 plain weave fabric prepreg. This cross-section is the same as that for standard rigid rectangular WR-90 waveguides that operate from 8.2 - 12.4 GHz. Two copper WR-90 waveguide antennas were also manufactured. A single slot was cut into each waveguide and the (i) bore-sight gain from 8 – 12 GHz, and (ii) E- and H-plane antenna pattern at 10 GHz, were measured.

The antenna patterns of the CFRP and copper waveguide antennas were very similar, with the gain of CFRP antenna being approximately 3 dB lower. This reduction was attributed to the complex impedance of the CFRP and poor impedance match between the CFRP waveguide and metallic waveguide feed components. It was concluded that such losses were acceptable for a first generation SWASS array. The measured gains and patterns were compared with predictions made using models of the slotted waveguide antennas in CST – Microwave Studio. It was found that a simple isotropic finite conductivity model of the CFRP was sufficient to achieve good agreement between the numerical simulation and the measured performance of the CFRP waveguide antennas. The quality of the correlation deteriorated at higher frequencies, with discrepancies of up to 2 dB, and it was concluded that a more complex model of CFRP behaviour would be necessary for detailed design at frequencies above approximately 10 GHz.

Authors
K.J. Nicholson Air Vehicles Division Kelvin J. Nicholson completed his B.Sc in Physics and B.Eng (Hons.) in Electrical Engineering from the University of Melbourne in 2005. He joined the DSTO in 2006 as part of their Advanced Composites Technology group. Within this group he is currently working towards his PhD in electrical engineering at RMIT University. His current research interests at DSTO include metamaterials and advanced composites for antenna and radar absorbing applications.
____________________ ________________________________________________
P.J. Callus Air Vehicles Division Dr Paul Callus gained his PhD from Monash University in 1993. He worked with CSIRO developing electrode coatings for ceramic fuel cells then at RMIT investigating the mechanical behaviour of textile composites. He joined DSTO in 1997 and is currently a Senior Research Scientist in the Advanced Composite Technologies Work Group. His major work programs have focused on understanding the mechanical behaviour of advanced fibre composites, the development of composite replacement panels with an emphasis on airworthiness certification, and more recently to develop multifunctional aircraft structure for the Australian Defence Force. In 2006/2007 he worked on this topic at the Advanced Structural Concepts Branch of the Air Force Research Laboratory at Wright Patterson Air Force Base, Dayton, Ohio.
____________________ ________________________________________________

Contents
1. INTRODUCTION............................................................................................................... 1 1.1 Slotted waveguide antenna stiffened structure (SWASS) ................................ 1 1.2 Radiofrequency attenuation in a SWASS waveguide ....................................... 1 1.3 Slotted waveguide antennas from carbon fibre reinforced plastic ................. 4
2. EXPERIMENTAL TECHNIQUES.................................................................................... 5 2.1 Test specimens........................................................................................................... 5
2.1.1 Waveguide manufacture ........................................................................ 5 2.1.2 Slotting ...................................................................................................... 5
2.2 RF measurement procedure .................................................................................... 5 2.2.1 Test setup.................................................................................................. 6 2.2.2 Calibration ................................................................................................ 7 2.2.3 Test specimen........................................................................................... 7 2.2.4 Measurement of bore-sight gain ........................................................... 7 2.2.5 Measurement of antenna pattern .......................................................... 8
3. RESULTS .............................................................................................................................. 9 3.1 SWASS-030401........................................................................................................... 9 3.2 SWASS-030402......................................................................................................... 10 3.3 SWASS-090101......................................................................................................... 12 3.4 SWASS-030301......................................................................................................... 13 3.5 SWASS-030302......................................................................................................... 14 3.6 SWASS-090102......................................................................................................... 16 3.7 SWASS-030201......................................................................................................... 17 3.8 SWASS-030202......................................................................................................... 18 3.9 SWASS-030101......................................................................................................... 20 3.10 SWASS-030102......................................................................................................... 21
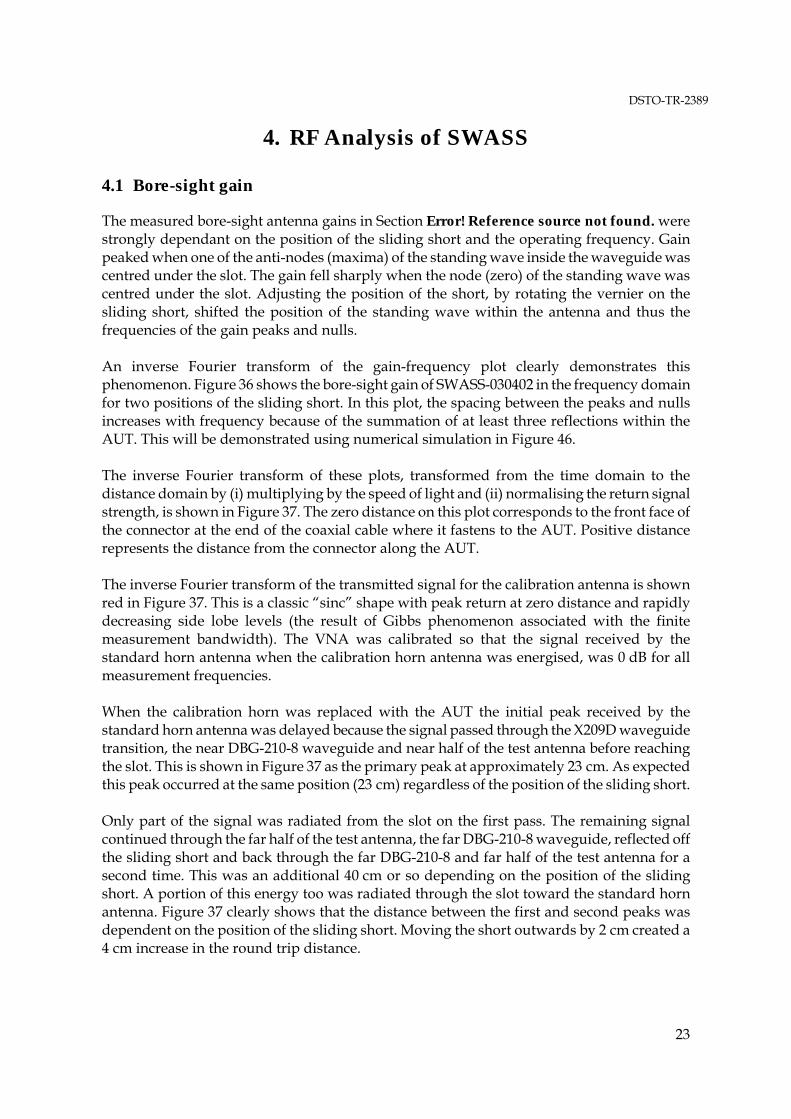
4. RF ANALYSIS OF SWASS.............................................................................................. 23 4.1 Bore-sight gain......................................................................................................... 23
5. COMPUTER MODELLING OF SWASS...................................................................... 26 5.1 Coordinate system .................................................................................................. 27 5.2 Solution process ...................................................................................................... 28 5.3 Simulation results................................................................................................... 30
6. CONCLUSION .................................................................................................................. 33
7. REFERENCES .................................................................................................................... 34

DSTO-TR-2389
1. Introduction
1.1 Slotted waveguide antenna stiffened structure (SWASS)
The Slotted Waveguide Antenna Stiffened Structure (SWASS) concept has been described in detail elsewhere [1-4]. In summary, the concept is for the top-hat cross-section stiffeners that are commonly used to reinforce thin aircraft skins or the blade stiffeners in sandwich panels, to serve the dual purpose of acting both as structural stiffeners and as waveguides. Slotted waveguide antenna arrays are created by cutting slots through the outer skin and into these waveguide stiffeners. The slots are filled with a radiofrequency (RF) transparent cover, to maintain the original aerodynamic platform exterior. To date, only standard rectangular waveguide geometries where the broad-wall dimension (a) is approximately double the narrow-wall dimension (b), have been incorporated into potential SWASS configurations. Figure 1 and Figure 2 show the two orientations options for these waveguides. In Figure 1 it is the waveguide broad-walls, while in Figure 2 it is the waveguide narrow-walls that are parallel to the exterior skin. Relative to the broad-wall configurations of Figure 1, the narrow-wall configurations of Figure 2 would, for the same section thicknesses, have increased bending stiffness, resistance to skin buckling, panel depth and weight. Figure 1 and Figure 2 also show photographs of specimens manufactured from CFRP to demonstrate the concepts. Note that those in Figure 1 do not contain any slots and that in Figure 2 contains a range of potential slot and slot array geometries. It is expected that any SWASS component would only contain one type of slot or array, although multiple slot/array types may be used if the desired antenna performance cannot be realised using one type. Although the current SWASS development program is limited to standard rectangular waveguides, alternative waveguide cross-sections such as circular, elliptical and half-elliptical may be considered in the future. There are likely to be applications where such waveguide sections will be easier to manufacture or more suited to the application geometry, such as cylindrical or highly curved parts. SWASS will be validated through the analysis, design, manufacture and test of a Demonstrator SWASS Panel. This panel will comply with the two conditions defined in Table 1. Table 2 details the first three aspects of SWASS that have been selected for validation. The first of these requirements has been validated previously and is described in Section 1.2. Demonstration of the latter two requirements is the subject of this report. 1.2 Radiofrequency attenuation in a SWASS waveguide
Previous work [2, 4] concluded that the conductivity of waveguides manufactured from commercially available, aerospace grade, CRFP was sufficiently high for use in SWASS without the need for treatment to enhance conductivity.
1

DSTO-TR-2389
(a)
(b)
Figure 1: Diagrams and photographs of SWASS configurations with the broad-wall parallel to the skin. (a) Hat-stiffened skins and (b) blade-stiffened sandwich panels
2

DSTO-TR-2389
(a)
Figure 2: Diagrams and photographs of SWASS configurations with the narrow-wall parallel to the skin. (a) A hat-stiffened skin and (b) blade-stiffened sandwich panels
Attenuation losses in waveguides manufactured from metal and typical CFRP prepregs (AS4/3501-6 and IM7/5250-4 unidirectional tape, and T650/F584 plain-weave fabric), regardless of stacking-sequence, were measured and found to be predicted well by the attenuation in a waveguide due to finite conductivity of the waveguide material. As reported in [4], the effective conductivity () of CFRP waveguides was 18-28 x 103 S m-1 across the X-band with an attenuation approximately 0.05 dB cm-1 at 10 GHz. For aluminium waveguides with conductivity ≈ 10 x 106 S m-1 across the X-band, the attenuation is approximately 0.001 dB cm-1. Although the conductivity for the CFRP waveguides was low, resulting in high attenuation, it was concluded that this is still sufficient for first generation SWASS antennas.
3

DSTO-TR-2389
Table 1: Frequency band and material to be used for Demonstrator SWASS Panel
Condition Limitation Reason
Frequency
Demonstrator SWASS Panel will operate in the X-band (8.2 – 12.4 GHz) The standard rectangular waveguide used for these frequencies is the WR-90, with inner dimensions of 22.86 mm x 10.16 mm
(i) Manufacture and handling of waveguides is convenient and straightforward using standard processes for the production of composite aircraft components
(ii) WR-90 dimensions are similar to the height of top-hat stiffeners or thickness of sandwich panels. This will make testing of structural performance in future work more relevant
(iii) Only moderate numbers of waveguides will be required to create laboratory test specimens that are representative of real structure
Material
Demonstrator SWASS Panel to be manufactured from commercially available, aerospace grade, CFRP
CFRP is used extensively for the manufacture of components that require high specific stiffness and strength, such as airframes.
Table 2: The first RF requirements to be addressed in validating the SWASS concept
Waveguide conductivity
Inner lining of the SWASS waveguide stiffeners must be sufficiently conductive for radiofrequency (RF) radiation to propagate in that waveguide with an acceptable attenuation
The slotted waveguide antennas in SWASS must radiate an acceptable radiation pattern with acceptable efficiency Antenna
characteristics The characteristics of the radiation from the slotted waveguide antennas must be predicted with sufficient accuracy to allow the design of slot and array geometry
1.3 Slotted waveguide antennas from carbon fibre reinforced plastic
To the authors knowledge slotted waveguide antennas manufactured from CFRP have not been used to support structural loads. However, slotted waveguide antennas manufactured from CFRP have been used in satellites such as Envisat ASAR [5] and TerraSAR-X [6]. In the TerraSAR-X satellite, three metre long sections of CFRP waveguide were used to create the 4.8 m x 0.8 m Synthetic Aperture Radar antenna [7]. The radiating elements consisted of 384 pairs of 40 cm long slotted waveguides. The antennas were excited by internal wires and horizontal (relative to the direction of flight) polarisation achieved using longitudinal slots in the waveguide short-walls. Vertical polarisation was achieved using offset slots in the broad wall of the second set of waveguide pairs. CRFP was used as the waveguide material because of its very high specific stiffness and almost zero coefficient of thermal expansion [8]. The latter was particularly important for space applications where structures may experience temperatures variations of 100°C [9]. In contrast to SWASS, the CFRP waveguides in Terra SAR X were not required to support primary structural loads. Rather, they were required to maintain dimensional accuracy in the presence of the large thermal gradients arising from alternate exposure to the sun and shadow. A relatively massive aluminium framework supported the CFRP antenna. In addition the CFRP waveguides in the Terra SAR satellite were lined with silver in order to increase conductivity and extract maximum performance from the antenna while reducing
4

DSTO-TR-2389
mass and thermo-elastic distortion [8]. The costs of manufacture and silver coating were very high, but justified by the very high costs of sending payloads into orbit. Ideally SWASS antennas would not require such lining. As discussed in Section 1.2, it has been concluded that sufficient energy can be transmitted through waveguides manufactured from untreated, commercially available, aerospace grade, CRFP for first generation SWASS antennas. The next step is to establish, and develop techniques to predict, the performance of slot antennas in CFRP waveguides. This step, for single slots, is the subject of this report. Future work will extend this to multi-slot and multi-waveguide arrays.
2. Experimental Techniques
2.1 Test specimens
2.1.1 Waveguide manufacture
CFRP waveguides were manufactured from Hexcel T650/F584 plain weave carbon/epoxy prepreg, with a [45 -45]s stacking sequence, in accordance with the process detailed in [10]. The internal cross-section of these waveguides was nominally 22.86 mm x 10.16 mm, which is the same as rigid rectangular WR-90 waveguides. Metallic WR-90 waveguides are used for operations in the X-band (8.2 - 12.4 GHz). The CFRP waveguides were manufactured as approximately 300 mm lengths then cut to the test specimen length of 100.0 mm using a water-cooled diamond saw. Two 100.0 mm lengths of copper WR-90 waveguide (Penn Engineering Components, Inc., 29045 Avenue, CA, USA) with 1.27 mm (0.05”) wall thickness were cut to length using a drop saw. 2.1.2 Slotting
The slots and waveguides into which they were cut are detailed in Table 3. The slots in all, including the two copper, specimens were cut using a Multicam M-I Small Format CNC Router in accordance with the process detailed in [10]. After slotting, waveguide flanges were bonded to each end of each test specimen using the procedure described in the final section of [10]. The completed specimens, consisting of slotted waveguide and flanges (Penn Engineering Components, Inc.), are referred to as test antennas in the remainder of this report. 2.2 RF measurement procedure
The gain and antenna pattern of each test antenna was measured in an anechoic test chamber in accordance with the procedure described in the remainder of Section 2.2. This is consistent with the IEEE Test Procedure for Antennas [11].
5

DSTO-TR-2389
2.2.1 Test setup
A photograph of items inside the anechoic chamber, the transmit (Antenna Under Test (AUT)) and receive (standard horn antenna) antennas, is shown in Figure 3. The separation between the AUT and standard horn antenna was 4.0 m, which satisfied the far field criteria for measurements in the X-band. The Perspex support frame was fastened to an altitude-over-azimuth mount with angular resolution of 0.01o in both altitude and azimuth axes. The AUT, either a calibration horn antenna or test antenna, was fastened to the Perspex support frame using Nylon fasteners. Table 3: Slot locations and geometries
Specimen ID (SWASS
[RRPPSS])*
Wall containing
slot Slot direction Angle (°) Length
(mm) Width (mm)
Offset from longitudinal
centreline (mm)
030401 3.0
030402 6.0
090101
Broad Longitudinal 90 14.0 2.5
6.0
030301 0.0
030302 2.5
090102
Longitudinal 90 14.0 2.5
2.5
030201 20 2.06 0.0
030202 35 2.06 0.0
030101 35 3.5 0.0
030102
Narrow
Inclined
35
6.0
5.9 0.0 * Nomenclature for SWASS specimen numbers:
RR – Run number; PP – Part (waveguide) number; SS – Specimen number
Standard horn antenna
Perspex support frame
Antenna Under Test (AUT). Either a Calibration horn antenna (shown) or test
antenna
Figure 3: Photograph of the antenna measurement range showing the calibration setup. The standard horn antenna is in the foreground and the calibration horn antenna is fastened to the Perspex support frame.
6

DSTO-TR-2389
)
The antennas were connected to the ports of an Agilent E8364B Vector Network Analyser (VNA) using coaxial cable (Insulated Wire, Type 2803 Coax). Custom software was developed to coordinate both the antenna mount and network analyser and thus automate the antenna pattern measurement. 2.2.2 Calibration
The VNA was calibrated using a simple ‘THRU’ technique with known antennas as the standard. In this work both of these were the broadband (1 to 18 GHz) standard horns (Sunol, Model RDH-118) pictured in Figure 3. Bore-sight direction and polarisation alignment was performed with the calibration horn antenna fastened to the Perspex support frame. The horn antennas were first levelled using a digital spirit level and the transmitted signal was maximised by adjusting the azimuth and altitude of the calibration horn. 2.2.3 Test specimen
The AUT shown in Figure 4 was constructed, in turn, for each test antenna. Straight 203.2 mm long sections of aluminium WR-90 waveguide (Systron Donner, DBG-210-8) were fastened to either side of the test antenna. The aluminium waveguide sections ensured that the wave propagating into the Test antenna was a well behaved wave with a TE01 mode. A WR-90 to APC-7 adaptor (Maury Microwave, Model X209D) was fastened to the free end of one aluminium waveguide and a sliding short (W. H. Sanders, Model SC16) with vernier adjustment (More & Wright, Metric) to the free end of the other DBG-210-8 waveguide. The sliding short created a standing-wave pattern in the AUT. Prior to the measurement of antenna patterns the vernier was adjusted to give the greatest return on the VNA (through the standard horn antenna) at 10 GHz. This vernier position located one of the peaks in the standing wave in the AUT at the centre of the slot in the test antenna. 2.2.4 Measurement of bore-sight gain
Bore-sight gain ( = = 0°) from 8.0 to 12.0 GHz was measured for each of the test antennas. This was achieved by measuring the relative gain (S21) of each test antenna in the configuration of Figure 4 as a function of frequency. The realised gain of this AUT (GAUT) was then determined using the equation
()()( Standard dBGdBSdBG 21AUT (1)
Sliding Short DBG-210-8 Test antenna DBG-210-8 X209D
Figure 4: Photograph of the AUT showing the coax adaptor, stabilising lengths of metallic waveguide, test antenna and sliding short
7

DSTO-TR-2389
where GStandard was the gain of the standard horn and S21 was the relative gain of the test antenna after the THRU calibration. This technique is commonly referred to as the gain-transfer or gain-comparison method [12, 13]. 2.2.5 Measurement of antenna pattern
The E- and H- plane antenna patterns at 10 GHz were measured for each test antenna. The mount that held the Perspex support frame was rotated in the azimuth direction (about the vertical axis). A computer program was devised that coordinated the movement of the mount and the network analyser measurements. In order to measure both E- and H-plane antenna patterns it was necessary to change the orientation of the calibration horn and the AUT in the frame to ensure that transmit and receive polarisations were parallel. Figure 5 shows the two orientations that were tested and specifies the plane (E- or H-) that was measured for that orientation.
(a) (b)
(c) (d)
Figure 5: Photographs of antennas in the Perspex support frame showing the orientations for measurement of the H-plane antenna pattern for the (a) calibration horn antenna and (b) AUT, and the E-plane antenna pattern for the (c) calibration horn antenna and (d) AUT. Rotation during measurement was about the vertical axis.
8

DSTO-TR-2389
3. Results
Each sub-section in Section 3 shows a photograph, the bore-sight gain, the antenna pattern and the key antenna parameters for each of the ten test antennas defined in Table 3. The slot on each photograph is outlined with a dashed red line for clarity. The sliding short was adjusted to give maximum bore-sight gain at 10 GHz. This was, for all test antennas, at a vernier position of 6.0 mm. This position was not adjusted during measurement, consequently the plot of bore sight gain versus frequency showed a series of peaks and nulls. This corresponded to the shifting location of the peaks and nulls in the standing wave as frequency, and thus wavelength, varied. 3.1 SWASS-030401
As shown in Figure 6, this test antenna consisted of a longitudinal slot in the broad-wall, 14.0 mm long x 2.5 mm wide and offset from the waveguide centreline by 3.0 mm. Figure 7 shows the effect of frequency on bore-sight gain, Figure 8 the antenna pattern at 10 GHz, and Table 4 the corresponding antenna characteristics.
Figure 6: A photograph of SWASS-030401
8 8.5 9 9.5 10 10.5 11 11.5 12-30
-25
-20
-15
-10
-5
0
5
Frequency (GHz)
Gai
n (d
B)
Figure 7: Bore-sight gain of SWASS-030401
9

DSTO-TR-2389
-25
-25
-20
-20
-15
-15
-10
-10
-5
-5
0
0
5
5
10 dB
10 dB
90o
60o
30o
0o
-30o
-60o
-90o
-120o
-150o
180o
150o
120o
-25
-25
-20
-20
-15
-15
-10
-10
-5
-5
0
0
5
5
10 dB
10 dB
90o
60o
30o
0o
-30o
-60o
-90o
-120o
-150o
180o
150o
120o
E-Plane H-Plane
Figure 8: E- and H-plane antenna patterns for SWASS-030401 at 10 GHz
Table 4: Characteristics of the SWASS-030401 antenna in the E- and H-plane at 10 GHz
Parameter E-plane H-plane
Main Lobe Magnitude (dB) -1.0 -0.7
Main Lobe Direction (°) -6.0 2.0
Half Power (3dB) Beam Width (°) 80.0 70.0
3.2 SWASS-030402
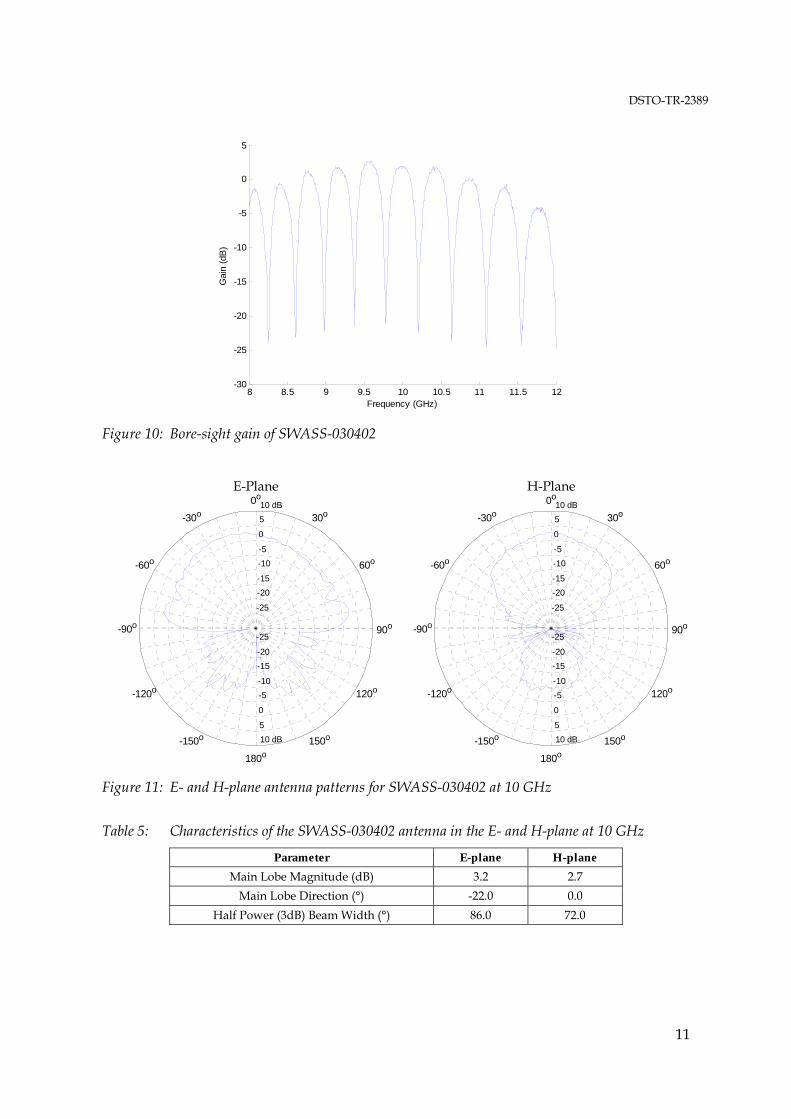
As shown in Figure 9, this test antenna consisted of a 14.0 mm long x 2.5 mm wide longitudinal slot in the broad-wall, offset from the waveguide centreline by 6.0 mm. Figure 10 shows the effect of frequency on bore-sight gain, Figure 11 the antenna pattern at 10 GHz, and Table 5 the corresponding antenna characteristics.
Figure 9: A photograph of SWASS-030402
10
DSTO-TR-2389
8 8.5 9 9.5 10 10.5 11 11.5 12-30
-25
-20
-15
-10
-5
0
5
Frequency (GHz)
Gai
n (d
B)
Figure 10: Bore-sight gain of SWASS-030402
-25
-25
-20
-20
-15
-15
-10
-10
-5
-5
0
0
5
5
10 dB
10 dB
90o
60o
30o
0o
-30o
-60o
-90o
-120o
-150o
180o
150o
120o
-25
-25
-20
-20
-15
-15
-10
-10
-5
-5
0
0
5
5
10 dB
10 dB
90o
60o
30o
0o
-30o
-60o
-90o
-120o
-150o
180o
150o
120o
E-Plane H-Plane
Figure 11: E- and H-plane antenna patterns for SWASS-030402 at 10 GHz
Table 5: Characteristics of the SWASS-030402 antenna in the E- and H-plane at 10 GHz
Parameter E-plane H-plane
Main Lobe Magnitude (dB) 3.2 2.7
Main Lobe Direction (°) -22.0 0.0
Half Power (3dB) Beam Width (°) 86.0 72.0
11
DSTO-TR-2389
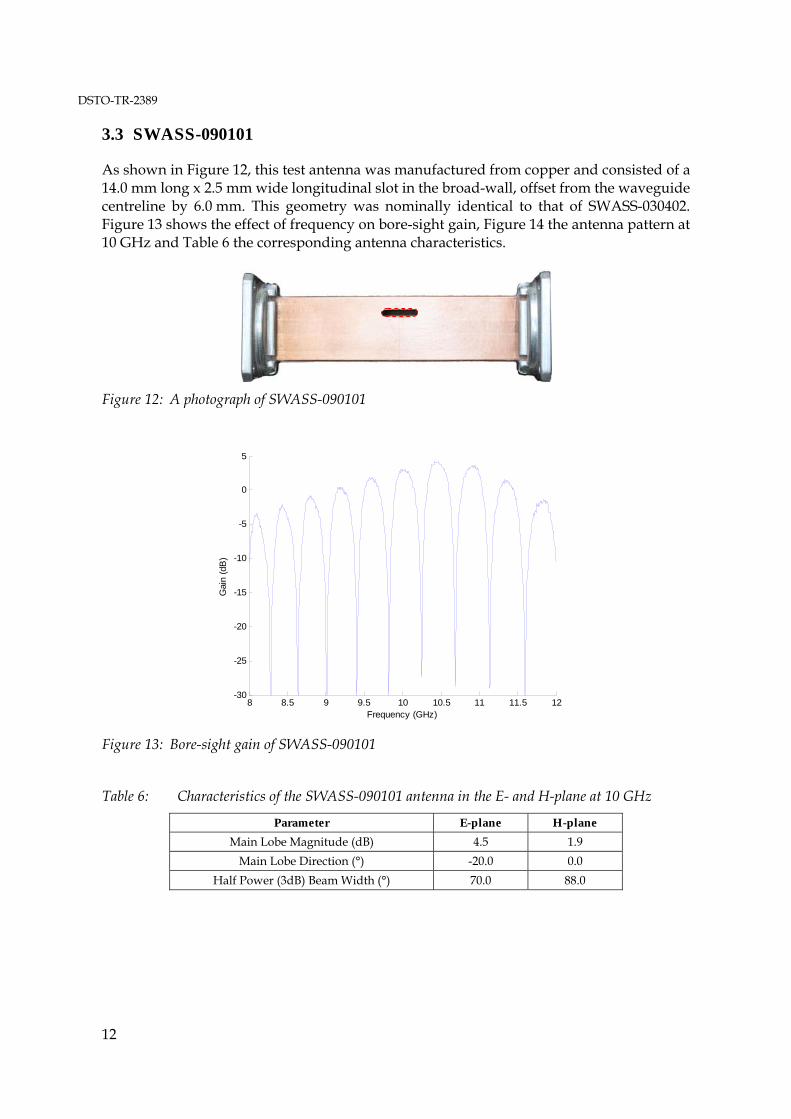
3.3 SWASS-090101
As shown in Figure 12, this test antenna was manufactured from copper and consisted of a 14.0 mm long x 2.5 mm wide longitudinal slot in the broad-wall, offset from the waveguide centreline by 6.0 mm. This geometry was nominally identical to that of SWASS-030402. Figure 13 shows the effect of frequency on bore-sight gain, Figure 14 the antenna pattern at 10 GHz and Table 6 the corresponding antenna characteristics.
Figure 12: A photograph of SWASS-090101
8 8.5 9 9.5 10 10.5 11 11.5 12-30
-25
-20
-15
-10
-5
0
5
Frequency (GHz)
Gai
n (d
B)
Figure 13: Bore-sight gain of SWASS-090101
Table 6: Characteristics of the SWASS-090101 antenna in the E- and H-plane at 10 GHz
Parameter E-plane H-plane
Main Lobe Magnitude (dB) 4.5 1.9
Main Lobe Direction (°) -20.0 0.0
Half Power (3dB) Beam Width (°) 70.0 88.0
12

DSTO-TR-2389
-25
-25
-20
-20
-15
-15
-10
-10
-5
-5
0
0
5
5
10 dB
10 dB
90o
60o
30o
0o
-30o
-60o
-90o
-120o
-150o
180o
150o
120o
-25
-25
-20
-20
-15
-15
-10
-10
-5
-5
0
0
5
5
10 dB
10 dB
90o
60o
30o
0o
-30o
-60o
-90o
-120o
-150o
180o
150o
120o
E-Plane H-Plane
Figure 14: E- and H-plane antenna patterns for SWASS-090101 at 10 GHz
3.4 SWASS-030301
As shown in Figure 15, this test antenna consisted of a 14.0 mm long x 2.5 mm wide longitudinal slot in the narrow-wall, centred along the waveguide centreline. Figure 16 shows the effect of frequency on bore-sight gain, Figure 17 the antenna pattern at 10 GHz and Table 7 the corresponding antenna characteristics.
Figure 15: A photograph of SWASS-030301
Table 7: Characteristics of the SWASS-030301 antenna in the E- and H-plane at 10 GHz
Parameter E-plane H-plane
Main Lobe Magnitude (dB) 2.3 0.9
Main Lobe Direction (°) 4.0 0.0
Half Power (3dB) Beam Width (°) 132.0 80.0
13

DSTO-TR-2389
8 8.5 9 9.5 10 10.5 11 11.5 12-30
-25
-20
-15
-10
-5
0
5
Frequency (GHz)
Gai
n (d
B)
Figure 16: Bore-sight gain of SWASS-030301
-25
-25
-20
-20
-15
-15
-10
-10
-5
-5
0
0
5
5
10 dB
10 dB
90o
60o
30o
0o
-30o
-60o
-90o
-120o
-150o
180o
150o
120o
-25
-25
-20
-20
-15
-15
-10
-10
-5
-5
0
0
5
5
10 dB
10 dB
90o
60o
30o
0o
-30o
-60o
-90o
-120o
-150o
180o
150o
120o
E-Plane H-Plane
Figure 17: E- and H-plane antenna patterns for SWASS-030301 at 10 GHz
3.5 SWASS-030302
As shown in Figure 18, this test antenna consisted of a 14.0 mm long x 2.5 mm wide longitudinal slot in the narrow-wall, offset from the waveguide centreline by 2.5 mm. Figure 19 shows the effect of frequency on bore-sight gain, Figure 20 the antenna pattern at 10 GHz, and Table 8 the corresponding antenna characteristics.
14

DSTO-TR-2389
Figure 18: A photograph of SWASS-030302
8 8.5 9 9.5 10 10.5 11 11.5 12-30
-25
-20
-15
-10
-5
0
5
Frequency (GHz)
Gai
n (d
B)
Figure 19: Bore-sight gain of SWASS-030302
-25
-25
-20
-20
-15
-15
-10
-10
-5
-5
0
0
5
5
10 dB
10 dB
90o
60o
30o
0o
-30o
-60o
-90o
-120o
-150o
180o
150o
120o
-25
-25
-20
-20
-15
-15
-10
-10
-5
-5
0
0
5
5
10 dB
10 dB
90o
60o
30o
0o
-30o
-60o
-90o
-120o
-150o
180o
150o
120o
E-Plane H-Plane
Figure 20: E- and H-plane antenna patterns for SWASS-030302 at 10 GHz
15

DSTO-TR-2389
Table 8: Characteristics of the SWASS-030302 antenna in the E- and H-plane at 10 GHz
Parameter E-plane H-plane
Main Lobe Magnitude (dB) 2.3 1.3
Main Lobe Direction (°) -4.0 0.0
Half Power (3dB) Beam Width (°) 132.0 80.0
3.6 SWASS-090102
As shown in Figure 21, this test antenna was manufactured from copper and consisted of a 14.0 mm long x 2.5 mm wide longitudinal slot in the narrow-wall, offset from the waveguide centreline by 2.5 mm. This geometry was nominally identical to that of SWASS-030302. Figure 22 shows the effect of frequency on bore-sight gain, Figure 23 the antenna pattern at 10 GHz and Table 9 the corresponding antenna characteristics.
Figure 21: A photograph of SWASS-090102
8 8.5 9 9.5 10 10.5 11 11.5 12-30
-25
-20
-15
-10
-5
0
5
Frequency (GHz)
Gai
n (d
B)
Figure 22: Bore-sight gain of SWASS-090102
16

DSTO-TR-2389
-25
-25
-20
-20
-15
-15
-10
-10
-5
-5
0
0
5
5
10 dB
10 dB
90o
60o
30o
0o
-30o
-60o
-90o
-120o
-150o
180o
150o
120o
-25
-25
-20
-20
-15
-15
-10
-10
-5
-5
0
0
5
5
10 dB
10 dB
90o
60o
30o
0o
-30o
-60o
-90o
-120o
-150o
180o
150o
120o
E-Plane H-Plane
Figure 23: E- and H-plane antenna patterns for SWASS-090102 at 10 GHz
Table 9: Characteristics of the SWASS-090102 antenna in the E- and H-plane at 10 GHz
Parameter E-plane H-plane
Main Lobe Magnitude (dB) 3.2 2.3
Main Lobe Direction (°) -4.0 0.0
Half Power (3dB) Beam Width (°) 132.0 76.0
3.7 SWASS-030201
As shown in Figure 24, this test antenna consisted of a 6.0 mm long x 2.1 mm wide inclined slot in the narrow-wall, oriented at 20° from the broad-wall normal. Figure 25 shows the effect of frequency on bore-sight gain and Figure 26 the antenna pattern at 10 GHz. No antenna characteristics were determined because the antenna pattern showed no clear main lobe and the gain was close to the noise floor of the measurement facility.
Figure 24: A photograph of SWASS-030201
17

DSTO-TR-2389
8 8.5 9 9.5 10 10.5 11 11.5 12-50
-45
-40
-35
-30
-25
-20
-15
-10
-5
0
Frequency (GHz)
Gai
n (d
B)
Figure 25: Bore-sight gain of SWASS-030201
-25
-25
-20
-20
-15
-15
-10
-10
-5
-5
0
0
5
5
10 dB
10 dB
90o
60o
30o
0o
-30o
-60o
-90o
-120o
-150o
180o
150o
120o
-25
-25
-20
-20
-15
-15
-10
-10
-5
-5
0
0
5
5
10 dB
10 dB
90o
60o
30o
0o
-30o
-60o
-90o
-120o
-150o
180o
150o
120o
E-Plane H-Plane
Figure 26: E- and H-plane antenna patterns for SWASS-030201 at 10 GHz
A subsequent CST simulation of this test antenna revealed that the gain is typically below -30 dB. This is well below the noise floor of the current measurement facilities. 3.8 SWASS-030202
As shown in Figure 27, this test antenna consisted of a 6.0 mm long x 2.1 mm wide inclined slot in the narrow-wall, oriented at 35° from the broad-wall normal. Figure 28 shows the effect of frequency on bore-sight gain and Figure 29 the antenna pattern at 10 GHz.
18

DSTO-TR-2389
Figure 27: A photograph of SWASS-030202
8 8.5 9 9.5 10 10.5 11 11.5 12-50
-45
-40
-35
-30
-25
-20
-15
-10
-5
0
Frequency (GHz)
Gai
n (d
B)
Figure 28: Bore–sight gain of SWASS-030202
-25
-25
-20
-20
-15
-15
-10
-10
-5
-5
0
0
5
5
10 dB
10 dB
90o
60o
30o
0o
-30o
-60o
-90o
-120o
-150o
180o
150o
120o
-25
-25
-20
-20
-15
-15
-10
-10
-5
-5
0
0
5
5
10 dB
10 dB
90o
60o
30o
0o
-30o
-60o
-90o
-120o
-150o
180o
150o
120o
E-Plane H-Plane
Figure 29: E- and H-plane antenna patterns for SWASS-030202 at 10 GHz
19

DSTO-TR-2389
No antenna characteristics were determined because the antenna pattern showed no clear main lobe and the gain was close to the noise floor of the measurement facility. As with SWASS-030201, a subsequent CST simulation of this test antenna predicted a gain that was typically below -30 dB. This is well below the noise floor of the measurement facilities used in this work. 3.9 SWASS-030101
As shown in Figure 30, this test antenna consisted of a 6.0 mm long x 3.5 mm wide inclined slot in the narrow-wall, oriented at 35° from the broad-wall normal. Figure 31 shows the effect of frequency on bore-sight gain and Figure 32 the antenna pattern at 10 GHz. No antenna characteristics were determined because the antenna pattern showed no clear main lobe and the gain was close to the noise floor of the measurement facility. As with SWASS-[030201 and 030202], a subsequent CST simulation of this test antenna predicted a gain that was typically below -30 dB. This is well below the noise floor of the measurement facilities used in this work.
Figure 30: A photograph of SWASS-030101
8 8.5 9 9.5 10 10.5 11 11.5 12-50
-45
-40
-35
-30
-25
-20
-15
-10
-5
0
Frequency (GHz)
Gai
n (d
B)
Figure 31: Bore-sight gain of SWASS-030101
20

DSTO-TR-2389
-25
-25
-20
-20
-15
-15
-10
-10
-5
-5
0
0
5
5
10 dB
10 dB
90o
60o
30o
0o
-30o
-60o
-90o
-120o
-150o
180o
150o
120o
-25
-25
-20
-20
-15
-15
-10
-10
-5
-5
0
0
5
5
10 dB
10 dB
90o
60o
30o
0o
-30o
-60o
-90o
-120o
-150o
180o
150o
120o
E-Plane H-Plane
Figure 32: E- and H-plane antenna patterns for SWASS-030101 at 10 GHz
3.10 SWASS-030102
As shown in Figure 33, this test antenna consisted of a 6.0 mm long x 5.9 mm wide inclined slot in the narrow-wall, oriented at 35° from the broad-wall normal. Figure 34 shows the effect of frequency on bore-sight gain and Figure 35 the antenna pattern at 10 GHz. No antenna characteristics were determined because the antenna pattern showed no clear main lobe and the gain was close to the noise floor of the measurement facility. As with SWASS-[030201, 030202 and 030101], a subsequent CST simulation of this test antenna predicted a gain that was typically below -30 dB. This is well below the noise floor of the measurement facilities used in this work.
Figure 33: A photograph of SWASS-030102
21

DSTO-TR-2389
8 8.5 9 9.5 10 10.5 11 11.5 12-50
-45
-40
-35
-30
-25
-20
-15
-10
-5
0
Frequency (GHz)
Gai
n (d
B)
Figure 34: Bore-sight gain of SWASS-030102
-25
-25
-20
-20
-15
-15
-10
-10
-5
-5
0
0
5
5
10 dB
10 dB
90o
60o
30o
0o
-30o
-60o
-90o
-120o
-150o
180o
150o
120o
-25
-25
-20
-20
-15
-15
-10
-10
-5
-5
0
0
5
5
10 dB
10 dB
90o
60o
30o
0o
-30o
-60o
-90o
-120o
-150o
180o
150o
120o
E-Plane H-Plane
Figure 35: E- and H-plane antenna patterns for SWASS-030102 at 10 GHz
22
DSTO-TR-2389
4. RF Analysis of SWASS
4.1 Bore-sight gain
The measured bore-sight antenna gains in Section Error! Reference source not found. were strongly dependant on the position of the sliding short and the operating frequency. Gain peaked when one of the anti-nodes (maxima) of the standing wave inside the waveguide was centred under the slot. The gain fell sharply when the node (zero) of the standing wave was centred under the slot. Adjusting the position of the short, by rotating the vernier on the sliding short, shifted the position of the standing wave within the antenna and thus the frequencies of the gain peaks and nulls. An inverse Fourier transform of the gain-frequency plot clearly demonstrates this phenomenon. Figure 36 shows the bore-sight gain of SWASS-030402 in the frequency domain for two positions of the sliding short. In this plot, the spacing between the peaks and nulls increases with frequency because of the summation of at least three reflections within the AUT. This will be demonstrated using numerical simulation in Figure 46. The inverse Fourier transform of these plots, transformed from the time domain to the distance domain by (i) multiplying by the speed of light and (ii) normalising the return signal strength, is shown in Figure 37. The zero distance on this plot corresponds to the front face of the connector at the end of the coaxial cable where it fastens to the AUT. Positive distance represents the distance from the connector along the AUT. The inverse Fourier transform of the transmitted signal for the calibration antenna is shown red in Figure 37. This is a classic “sinc” shape with peak return at zero distance and rapidly decreasing side lobe levels (the result of Gibbs phenomenon associated with the finite measurement bandwidth). The VNA was calibrated so that the signal received by the standard horn antenna when the calibration horn antenna was energised, was 0 dB for all measurement frequencies. When the calibration horn was replaced with the AUT the initial peak received by the standard horn antenna was delayed because the signal passed through the X209D waveguide transition, the near DBG-210-8 waveguide and near half of the test antenna before reaching the slot. This is shown in Figure 37 as the primary peak at approximately 23 cm. As expected this peak occurred at the same position (23 cm) regardless of the position of the sliding short. Only part of the signal was radiated from the slot on the first pass. The remaining signal continued through the far half of the test antenna, the far DBG-210-8 waveguide, reflected off the sliding short and back through the far DBG-210-8 and far half of the test antenna for a second time. This was an additional 40 cm or so depending on the position of the sliding short. A portion of this energy too was radiated through the slot toward the standard horn antenna. Figure 37 clearly shows that the distance between the first and second peaks was dependent on the position of the sliding short. Moving the short outwards by 2 cm created a 4 cm increase in the round trip distance.
23

DSTO-TR-2389
8 8.5 9 9.5 10 10.5 11 11.5 12-30
-25
-20
-15
-10
-5
0
5
Frequency (GHz)
Gai
n (d
B)
0 cm
2 cm
Figure 36 Bore-sight gain of SWASS-030402 for two positions of the sliding short
0 10 20 30 40 50 60 70 80 90 1000
0.1
0.2
0.3
0.4
0.5
0.6
0.7
0.8
0.9
1
Distance (cm)
Nor
mal
ised
Mag
nitu
de
Calibration
0 cm
2 cm
4 cm.
Figure 37: Inverse Fourier transform of Figure 36, showing the distance from 0 cm to 100 cm in SWASS-030402 for the indicated positions of the sliding short
The incident wave that reflected from the sliding short will interfere constructively or destructively to create a standing wave in the AUT. This is clearly evident in the peak and null shape of the bore-site gain in Figure 36. However, it is useful to measure antenna performance without the confounding effects of this interference. This was achieved by applying a time gate, or window, about the first peak and performing subsequent analysis on this peak only. The window chosen was a modified form of the Kaiser-Bessel function [14] and is shown in Figure 38. Applying this window to the signal received by the standard horn antenna reduced the apparent peak gain of the test antenna and eliminated the deep nulls because the reflected signal could not interfere with the forward propagating (first-pass) signal. The single-pass
24

DSTO-TR-2389
gain of the test antenna was determined using an inverse Fourier transform of the time-gated bore-site gain data. The single-pass gain for SWASS-030402 using the time gate technique is shown in Figure 39. This result was tested experimentally by replacing the sliding short of Figure 4 with an absorbing termination (Maury Microwave, Model X314), pictured in Figure 40. This termination absorbed much of the first-pass signal that reached it. Figure 41 shows the time-gated and measured bore-sight single-pass gain of SWASS-030402. Clearly there is excellent agreement between the two techniques thereby validating the time-gating approach.
0 0.5 1 1.5 2 2.5 30
0.1
0.2
0.3
0.4
0.5
0.6
0.7
0.8
0.9
1
Distance (cm)
Nor
mal
ised
Mag
nitu
de
0 cm
1 ns Time Gate
Figure 38: The time gate applied to the normalised bore-sight gain for SWASS-030402
8 8.5 9 9.5 10 10.5 11 11.5 12-30
-25
-20
-15
-10
-5
0
5
Frequency (GHz)
Gai
n (d
B)
Sliding Short
Absorbing Load
Figure 39: Bore-sight gains for SWASS-030402 with (a) sliding short (at 6 mm) as measured, and (b)
with absorbing load as predicted using a time gate
25

DSTO-TR-2389
Figure 40: Maury Microwave X314 absorbing termination
8 8.5 9 9.5 10 10.5 11 11.5 12-10
-9
-8
-7
-6
-5
-4
-3
-2
-1
0
Frequency (GHz)
Gai
n (d
B)
Time-Gated
Absorbing Load
Figure 41: Predicted and measured single-pass bore-sight gain of SWASS-030402
5. Computer Modelling of SWASS
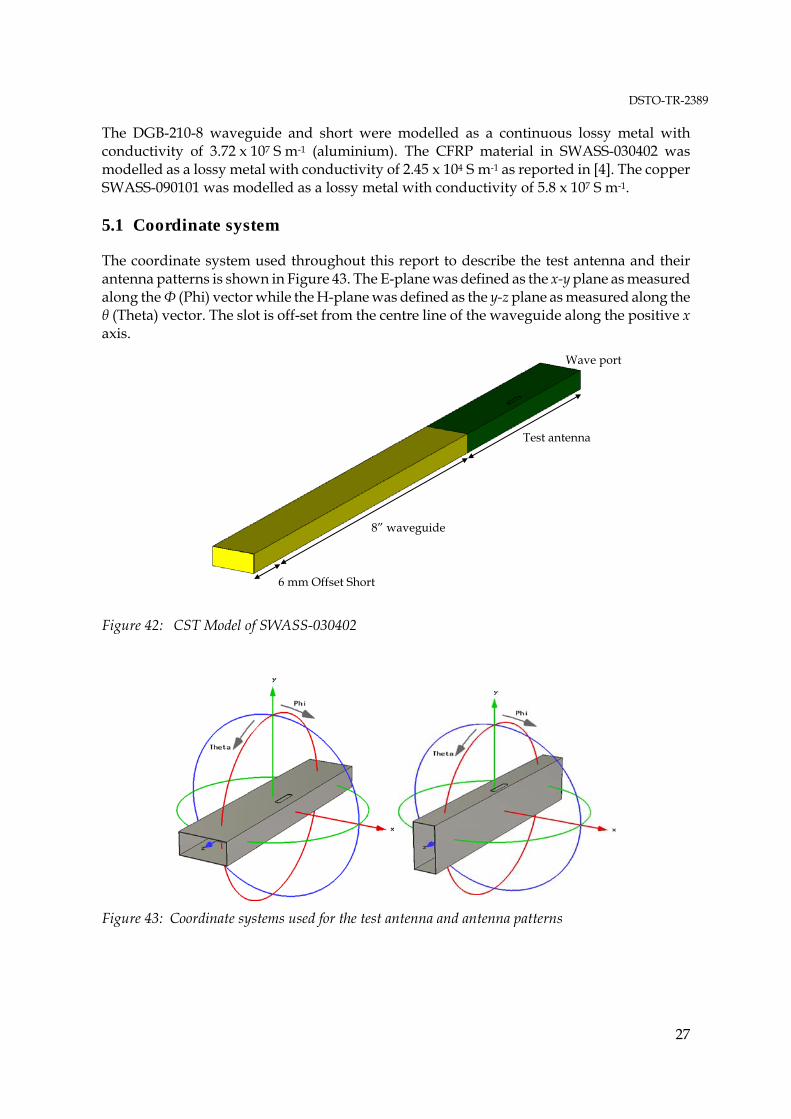
Computer modelling was used to demonstrate the capability to predict SWASS antenna performance. The software package CST – Microwave Studio [15] was selected because of its capability to solve electromagnetic problems using a variety of computational techniques. Two test antennas were modelled, the CFRP SWASS-030402 and its metallic equivalent SWASS-090101. The general layout of the models is shown in Figure 42. These models included the test antenna, far DGB-210-8 waveguide and sliding short. The short was located 6 mm beyond the end of the far DGB-210-8 waveguide. The antenna was fed through a wave port at the inlet face of the test antenna. It was not necessary to model the remaining parts of the experimental setup shown in Figure 4 (coax-to-waveguide adaptor and first DGB-210-8 waveguide) because CST assumes an infinite waveguide of identical geometry behind this wave port and a perfectly formed TE10 wave at this port.
26
DSTO-TR-2389
The DGB-210-8 waveguide and short were modelled as a continuous lossy metal with conductivity of 3.72 x 10⁷ S m-1 (aluminium). The CFRP material in SWASS-030402 was modelled as a lossy metal with conductivity of 2.45 x 10⁴ S m-1 as reported in [4]. The copper SWASS-090101 was modelled as a lossy metal with conductivity of 5.8 x 10⁷ S m-1. 5.1 Coordinate system
The coordinate system used throughout this report to describe the test antenna and their antenna patterns is shown in Figure 43. The E-plane was defined as the x-y plane as measured along the Φ (Phi) vector while the H-plane was defined as the y-z plane as measured along the θ (Theta) vector. The slot is off-set from the centre line of the waveguide along the positive x axis.
Wave port
Test antenna
8” waveguide
6 mm Offset Short
Figure 42: CST Model of SWASS-030402
Figure 43: Coordinate systems used for the test antenna and antenna patterns
27

DSTO-TR-2389
5.2 Solution process
The electromagnetic size of the structure and the computing resources available necessitated the use of the transient solver in CST. As implied by Figure 44, the transient solver is well suited to weakly resonating antenna devices where broadband far field parameters are required. The transient solver calculates the development of the electromagnetic field through time at discrete locations within the structure. The fields are calculated step-by-step using a ‘leap frog’ updating scheme. Once the transient response of the structure is determined, the broadband scattering parameters (as a function of frequency) are calculated by discrete Fourier transform. The tetrahedral mesh used for this process, including the refinement in the vicinity of the slot, is illustrated in Figure 45.
Figure 44: CST Solver performance [15]
Figure 45: CST transient solver mesh for SWASS-030402
28

DSTO-TR-2389
The time evolution of the signal at the wave port is presented in Figure 46. The default Gaussian band limited (8 to 12 GHz) input signal is displayed in red. The reflected signal, as recorded at the wave port, is displayed in green. The first return (peak ≈ 1.5e-9 s) is the reflection from the slot on the forward pass, the second return (peak ≈ 3.7e-9 s) is the impedance mismatch between the CFRP and aluminium waveguides on the forward pass, the third return (peak ≈ 6.2e-9 s) is the reflection from the short. Subsequent reflections are too small in magnitude to distinguish in Figure 46. The complex summation of all these reflected signals explains the complex bore-site gain of Figure 36. A discrete Fourier transform was conducted on this transient signal to calculate the broad band S11 scattering parameter (return loss). This is plotted in Figure 47 for SWASS-030402. The return loss exhibited strong peaks and nulls, highlighting the resonant nature of the antenna and the poor impedance match between the various sections of the AUT.
Figure 46: Time evolution of the wave port signal for SWASS-030402
Figure 47: S11 (return loss) of SWASS-030402
29

DSTO-TR-2389
5.3 Simulation results
To compare the measured gain of the test antennas against the CST simulation it was necessary to pay particular attention to the return loss of the antenna. As implied in the previous section there were large impedance mismatches between the various parts of the AUT. This necessitated that the gain be calculated according to Equation 2.
211( ) ( ) 1CSTG dB G dB S (2)
where GCST is the simulated gain calculated according to
Power radiated per unit solid angle
4Input (accepted) power at the wave portCSTG (3)
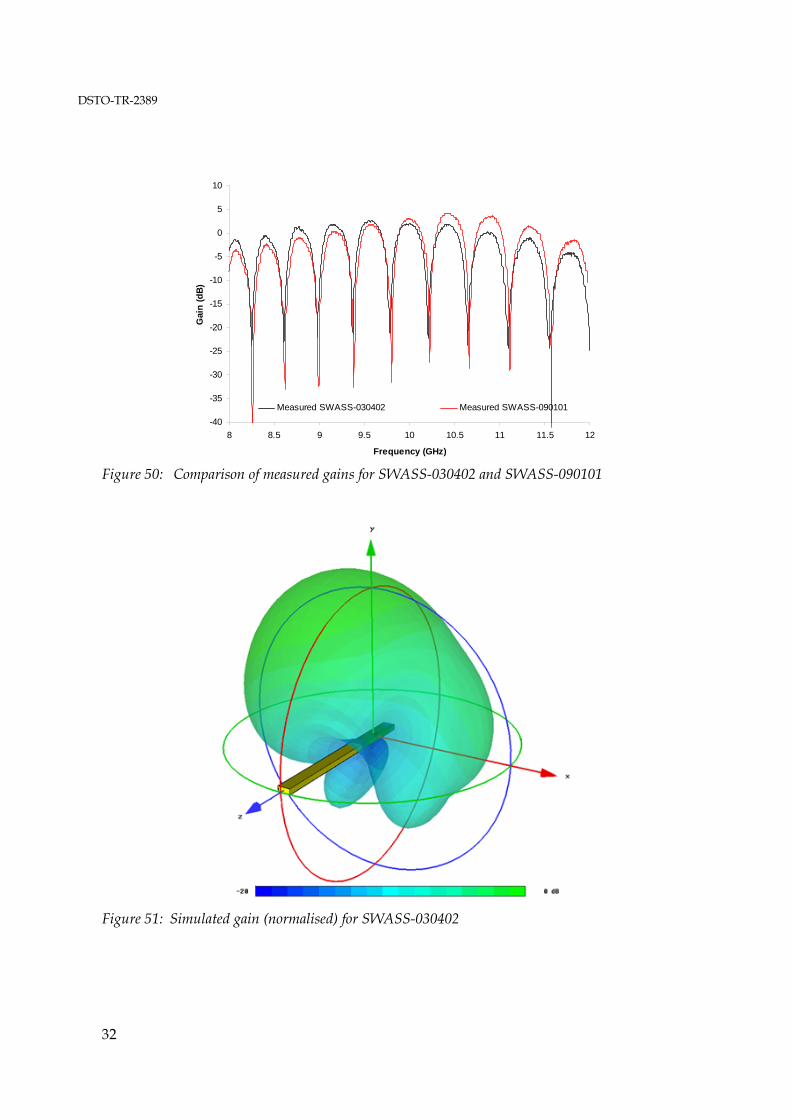
and S11 is the simulated return loss of the AUT as shown in Figure 47. A comparison of the broadband gain of the CST and measured results is presented in Figure 48 for SWASS-030402 and Figure 49 for SWASS-090101. Clearly there was good agreement between the CST models and the measured results. The simple isotropic finite conductivity model of the CFRP was sufficient to achieve excellent agreement between the measured and simulated gain for frequencies below approximately 10 GHz. Even at frequencies above this, the discrepancy is 2 dB at most. This is considered to be more than sufficient for the design of a first generation SWASS Demonstrator. The measured bore-site gains of CFRP SWASS-030402 and copper SWASS-090101 are compared in Figure 50. The difference in gain between these antennas can be attributed almost entirely to the material used in their manufacture given that their geometry and dimensions were identical to within the manufacturing limits. The peak gain of the metallic antenna was lower at low frequencies and higher at high frequencies. The difference rose to approximately 3 dB for frequencies above approximately 10 GHz. This difference was probably the result of the finite conductivity of the CFRP and will be more significant at the higher frequencies. Importantly, this moderate loss in performance of CFRP slotted waveguide antennas when compared to their metallic counterparts is not expected to prevent the development of a practical SWASS Demonstrator. It is possible that the complex behaviour of CFRP at higher frequencies may account for the discrepancy between the simulated and measured gains. For example, the discontinuous impedance due to the fibre orientation in the various CFRP plies around the circumference of the slot may have reduced the gain for SWASS-030402. Further characterisation of the CFRP conductivity dependence on frequency and electric field polarisation will be required to improve this model beyond the current error margin. The predicted three dimensional gain of SWASS-030402 is shown in Figure 51. Peak gain was off-set from the y axis by a small angle. This compares favourably with the measured E-plane pattern of Figure 11.
30

DSTO-TR-2389
-40
-35
-30
-25
-20
-15
-10
-5
0
5
10
8 8.5 9 9.5 10 10.5 11 11.5 12
Frequency (GHz)
Gai
n (
dB
)
Measured SWASS-030402 Simulated SWASS-030402
Figure 48: Measured and simulated gain for SWASS-030402 (CFRP)
-40
-35
-30
-25
-20
-15
-10
-5
0
5
10
8 8.5 9 9.5 10 10.5 11 11.5 12
Frequency (GHz)
Gai
n (
dB
)
Measured SWASS-090101 Simulated SWASS-090101
Figure 49: Measured and simulated gain for SWASS-090101 (Copper)
31
DSTO-TR-2389
-40
-35
-30
-25
-20
-15
-10
-5
0
5
10
8 8.5 9 9.5 10 10.5 11 11.5 12
Frequency (GHz)
Gai
n (
dB
)
Measured SWASS-030402 Measured SWASS-090101
Figure 50: Comparison of measured gains for SWASS-030402 and SWASS-090101
Figure 51: Simulated gain (normalised) for SWASS-030402
32

DSTO-TR-2389
6. Conclusion
Slotted Waveguide Antenna Stiffened Structures (SWASS) offers the potential to enhance dramatically the operational effectiveness of military platforms by integrating antennas into load bearing structure. Two of the key requirements for SWASS are adequate antenna performance and the capability to design SWASS antenna arrays. The work described in this report demonstrates that these requirements have been achieved for single slot antennas. Eight waveguides, each with an internal cross-section of 22.86 mm x 10.16 mm, were manufactured from aerospace grade carbon fibre reinforced plastic (CFRP). This cross-section is the same as that for rigid rectangular WR-90 waveguides that operate from 8.2 - 12.4 GHz. A single slot was cut in the narrow- or broad-wall of each waveguide. Two of these geometries were also manufactured from copper. The bore-sight gain from 8 – 12 GHz, and E- and H-plane antenna pattern at 10 GHz, were measured. The antenna patterns of the CFRP and copper waveguide antennas were very similar, with the gain of CFRP antenna being approximately 3 dB lower. This reduction was attributed to the complex impedance of the CFRP and poor impedance match between the CFRP waveguide and metallic waveguide feed components. It was concluded that such losses were acceptable for a first generation SWASS array. The measured gains and patterns were compared with predictions made using models of the slotted waveguide antennas in CST – Microwave Studio. It was found that a simple isotropic finite conductivity model of the CFRP was sufficient to achieve good agreement between the numerical simulation and the measured performance of the CFRP waveguide antennas. The quality of the correlation deteriorated at higher frequencies and it was concluded that a more complex model of CFRP behaviour would be necessary for detailed design at frequencies above approximately 10 GHz.
33

DSTO-TR-2389
7. References
1. Callus, P. J. (2007) Novel concepts for Conformal Load-bearing Antenna Structure. DSTO Technical Report (DSTO-TR-2096) 2008
2. Callus, P. J., Baron, W., Truss, J. ,Harpe, J. D. (2007) Slotted waveguide antenna stiffened structure (SWASS). In: Progress in Radar Research, Adelaide, Australia: 30 October to 1 November, 2007
3. Harpe, J. D., Callus, P. J., Baron, W. ,Truss, J. (2008) Slotted waveguide antenna stiffened structure (SWASS): An archetype altering approach for structural design. In: ASME Conference on Smart Materials, Adaptive Structures and Intelligent Systems, Ellicott City, MD, USA: 28 - 30 October, 2008
4. Callus, P. J., Baron, W., Tuss, L. ,Harpe, J. D. (2009) Slotted Waveguide Antenna Stiffened Structure (SWASS): Integrating Antennas into Aircraft Structure. In: AIAC-13, Melbourne, Australia
5. Desnos, Y. L., C. Buck, Guijarro, J., Suchail, J. L., Torres, R. ,Attema, E. (2000) ASAR - Envisat's Advanced Synthetic Aperture Radar. ESA Bulletin (102) 91
6. Ochs, S. and Pitz, W. (2007) The TerraSAR-X and TamDEM-X Satellites. In: Recent Advances in Space Technologies, Istanbul, Turkey: 14-16 June, IEEE
7. Grafmuller, B., Herschlein, A. and Fischer, C. (2005) The TerraSAR-X Antenna System. In: IEEE Radar Conference, Arlington, Virginia, IEEE
8. Stangl, M., Werninghaus, R. and Zahn, R. (2003) The TerraSAR-X active phased array antenna. In: IEEE International Symposium on Phased Array Systems and Technology,
9. Stangl, M., Werninghaus, R., Schweizer, B., Fischer, C., Brandfass, M., Mittermayer, J., Breit, H. (2006) TerraSAR-X technologies and first results. IEE Proc. Radar Sonar Navig. 15. (2)
10. Callus, P. J. (2010) Procedure for the Manufacture of Slotted Waveguide Antenna Stiffened Structures. DSTO Technical Notes (DSTO-TN-0937) 2010
11. IEEE standard test procedure for antennas. (1979) IEEE Std 149-1979
12. Balanis, C. A. (2005) Antenna Theory. Third ed. New Jersey, John Wiles & Sons, Inc.
13. Hollis, T. S., Lyon, T. J. and Clayton, L. (1985) Microwave Antenna Measurements. Atlanta, Scientific-Atlanta Inc.
14. Amiet, A. (2003) Free Space Permittivity and Permeability Measurements at Microwave Frequencies. Melbourne, Monash University
15. Computer Simulation Technology - Microwave Studio. [Accessed January 2009]; Available from: www.cst.com.
34

Page classification: UNCLASSIFIED
DEFENCE SCIENCE AND TECHNOLOGY ORGANISATION
DOCUMENT CONTROL DATA 1. PRIVACY MARKING/CAVEAT (OF DOCUMENT)
2. TITLE Antenna Patterns from Single Slots in Carbon Fibre Reinforced Plastic Waveguides
3. SECURITY CLASSIFICATION (FOR UNCLASSIFIED REPORTS THAT ARE LIMITED RELEASE USE (L) NEXT TO DOCUMENT CLASSIFICATION) Document (U) Title (U) Abstract (U)
4. AUTHOR(S) K.J. Nicholson and P.J. Callus
5. CORPORATE AUTHOR DSTO Defence Science and Technology Organisation 506 Lorimer St Fishermans Bend Victoria 3207 Australia
6a. DSTO NUMBER DSTO-TR-2389
6b. AR NUMBER AR-014-720
6c. TYPE OF REPORT Technical Report
7. DOCUMENT DATE February 2010
8. FILE NUMBER 2009/1104392
9. TASK NUMBER ERP 07/292
10. TASK SPONSOR CMPD
11. NO. OF PAGES 34
12. NO. OF REFERENCES 15
13. URL on the World Wide Web http://www.dsto.defence.gov.au/corporate/reports/DSTO-TR-2389.pdf
14. RELEASE AUTHORITY Chief, Air Vehicles Division
15. SECONDARY RELEASE STATEMENT OF THIS DOCUMENT
Approved for public release OVERSEAS ENQUIRIES OUTSIDE STATED LIMITATIONS SHOULD BE REFERRED THROUGH DOCUMENT EXCHANGE, PO BOX 1500, EDINBURGH, SA 5111 16. DELIBERATE ANNOUNCEMENT No Limitations 17. CITATION IN OTHER DOCUMENTS Yes 18. DSTO RESEARCH LIBRARY THESAURUS http://web-vic.dsto.defence.gov.au/workareas/library/resources/dsto_thesaurus.shtml Antenna design, Antenna radiation patterns, Carbon fibre reinforced composites, Composite structures 19. ABSTRACT Slotted Waveguide Antenna Stiffened Structure (SWASS) is a type of conformal load-bearing antenna where top-hat cross-section stiffeners on skins, or blade stiffeners in sandwich panels, serve the dual purpose of acting both as structural stiffeners and as waveguides. Cutting slots through the outer skin and into these waveguide stiffeners creates slotted waveguide antenna arrays. Two of the key requirements for SWASS are adequate antenna performance and the capability to design SWASS antenna arrays. The first step toward this goal, and the subject of this report, was to satisfy these requirements for single slot antennas. Eight 100 mm long waveguide antennas, with internal cross-section of 22.86 mm x 10.16 mm and a single slot, were manufactured from aerospace grade carbon fibre reinforced plastic (CFRP). Two slotted waveguides antennas were also manufactured from copper rigid rectangular WR-90 waveguide. Antenna gain in the bore-sight direction from 8 to 12 GHz and the E- and H- plane antenna pattern at 10 GHz were measured for each slotted waveguide. The radiation pattern of CFRP antennas was similar to that of copper antennas, with approximately 3 dB reduction in gain. Measured behaviour correlated well with the predictions made using CST - Microwave Studio. Discrepancies of up to 2 dB occurred at frequencies above 10 GHz. It is concluded that losses due to the finite conductivity of CFRP are acceptable for first generation SWASS and simulation accuracy is sufficient for initial array design.
Page classification: UNCLASSIFIED