ansi/ashrae standard 140-2011 building thermal envelope and fabric...
TRANSCRIPT

ANSI/ASHRAE Standard 140-2011 Building Thermal Envelope and Fabric Load Tests
DesignBuilder Version 4.2 (incorporating EnergyPlus version 8.1.0) - Oct 2014
Purpose
The ANSI/ASHRAE Standard 140-20111 specifies test procedures that can be applied to evaluate the
range of applicability and capability of software designed to calculate the thermal performance of buildings and their environmental control systems. The tests are based on the principle of comparing the performance of one program against the performance of other programs and while the tests are not intended to evaluate all aspects of the software, they are designed to indicate any serious flaws or limitations. Interested readers are advised to refer to the standard itself for more information.
The tests as applied to DesignBuilder have three main objectives:
To indicate the relative performance of DesignBuilder compared with various other state-of-the-art building energy computer programs.
To compare the results from EnergyPlus run from within DesignBuilder with the results taken from the GARD Analytics report
2.
To allow future versions of DesignBuilder to be compared with previous versions as part of the DesignBuilder Quality Assurance procedure.
DesignBuilder v4.2.0.054 (using EnergyPlus DLL v8.1.0.009) was used for these tests.
Report Format
This report consists of five sections
A. Mandatory Results Section as prescribed by ASHRAE 140 B. Mandatory Notes Sections as prescribed by ASHRAE 140 C. Comparison with EnergyPlus D. A Guide describing the setting up of the texts E. References
Executive Summary
DesignBuilder v4.2 generates results within the specified bounds for 59 of the 63 Building Thermal Envelope and Fabric Load tests. Section C shows that DesignBuilder lies only very slightly outside the range for these tests: 630, 930, 650FF and 950FF. While no explanation is offered as why DesignBuilder results do not lie within range for these tests, note that the bounds quoted in the standard are fairly arbitrarily based on results for a range of simulation programs that are 20 or more years old, most of which are no longer considered state of the art in building simulation. The next ASHRAE 140 standard aims to fix this by updating the ranges. Section C also shows that EnergyPlus v8.1 ASHRAE 140 test files generate results which lie outside bounds for 9 of the 63 tests. DesignBuilder v4.2 uses the EnergyPlus v8.1 engine and these results illustrate how much difference can be made by input data options in building energy simulation software.

SECTION B Mandatory Notes Sections as prescribed by ASHRAE 140 This section is produced in the format specified in ASHRAE 140

ASHRAE Standard 140-2011
Test Results Comparison
for
Section 5.2 - Building Thermal Envelope and Fabric Load Tests
Results for V4.2
(DesignBuilder)
vs.
Informative Annex B8, Section B8.1 Example Results
Prepared By
DesignBuilder Software
(DesignBuilder)
Results Developed
03-Oct-2014

ASHRAE Standard 140-2011
Computer Programs, Program Authors, and Producers of Example Results for
Section 5.2 - Building Thermal Envelope and Fabric Load Tests
The programs used to generate the example results are described in Table B11-1. Under the
computer program column, the first entry in each cell is the proper program name and version
number. The entries in parentheses are the abbreviations for the programs generally used in the
tables and charts which follow.
The second column ("Authoring Organization") indicates the national research facility, university,
or industry organization with expertise in building science that wrote the simulation software.
The third column ("Implemented By") indicates the national research facility, university, or industry
organization with expertise in building science that performed the simulations. The majority of
organizations that performed simulations either ran software written by their organization or
otherwise ran other building energy simulation software in addition to that written by their organization.
See Standard 140, Annex B11 for further details.
TABLE B11-1
Computer Programs, Program Authors, and Producers of Example Results
Computer Program (Abbrev.) Authoring Organization Example Results Produced by
BLAST-3.0 level 193 v.1
(BLAST-US/IT)CERL,
a United States (U.S.) NREL,
b U.S.
Politecnico Torino, Italy
DOE-2.1D 14
(DOE21D)LANL/LBNL,
c U.S. NREL, U.S.
ESP-RV8
(ESP-DMU)
Strathclyde University, United
Kingdom (U.K.)
De Montfort University, U.K.
SERIRES/SUNCODE 5.7
(SRES/SUN)
NREL/Ecotope, U.S. NREL, U.S.
SERIRES 1.2
(SRES-BRE)NREL/BRE,
d U.S./U.K. BRE, U.K.
S3PAS University of Sevilla, Spain University of Sevilla, Spain
TASE Tampere University, Finland Tampere University, Finland
TRNSYS 13.1
(TSYS-BEL/BRE)
University of Wisconsin, U.S. BRE, U.K.
Vrije Universiteit (VUB) Brussels,
Belgium
aCERL-U.S. Army Construction Engineering Research Laboratories
bNREL-National Renewable Energy Laboratory
cLANL/LBNL-Los Alamos National Laboratory/Lawrence Berkeley National Laboratory
dBRE-Building Research Establishment

Table Description Sheet Tab Cell RBnge
B8-1 Annual Heating Loads B7 - P47
B8-2 Annual Sensible Cooling Loads B48 - P89
B8-3 Annual Hourly Integrated Peak Heating Loads B7 - AH47
B8-4 Annual Hourly Integrated Peak Sensible Cooling Loads B48 - AH88
B8-5 Free-Float Temperature Output B89 - AH118
B8-6 Low Mass Basic Sensitivity Tests B7 - P39
B8-7 High Mass Basic Sensitivity Tests B41 - P81
B8-8 Low Mass In-Depth (Cases 195 thru 320) Sensitivity Tests Tables 4 B7 - P78
B8-9 Low Mass In-Depth (Cases 395 thru 440) Sensitivity Tests B7 - P45
B8-10 High Mass Basic and In-depth Sensitivity Tests B47 - P91
B8-11 Annual Transmissivity Coefficient of Windows B7 - O14
B8-12 Annual Shading Coefficient of Window Shading Devices: Overhangs & Fins B16 - O23
B8-13 Case 600 Annual Incident Solar Radiation (kWh/m2) B25 - O34
B8-14 Case 600 Annual Transmitted Solar Radiation – Unshaded (kWh/m2) B36 - O42
B8-15 Case 600 Annual Transmitted Solar Radiation –Shaded (kWh/m2) B44 - O50
Tables 1
Tables 2
Tables 3
Tables 5
Tables 6
ASHRAE Standard 140-2010 Section 5.2 - Building Thermal Envelope and Fabric Load Tests
V4.2 (DesignBuilder) vs. Annex B8, Section B8.1 Example Results
By DesignBuilder Software (DesignBuilder), 03-Oct-2014
List of Tables

Figure Title Sheet Tab
B8-1 BESTEST BASIC Annual Incident Solar Radiation Fig B8-1 Ann Incident Solar
B8-2 BESTEST BASIC Annual Transmitted Solar Radiation Unshaded Fig B8-2 Ann SolRad Unshaded
B8-3 BESTEST BASIC Annual Transmitted Solar Radiation Shaded Fig B8-3 Ann SolRad Shaded
BESTEST BASIC Annual Transmissivity Coefficient of Windows
(Unshaded Transmitted)/(Incident Solar Radiation)
BESTEST BASIC Annual Overhang and Fin Shading Coefficients
(1-(Shaded)/(Unshaded)) Transmitted Solar Radiation
B8-6 BESTEST BASIC Low Mass Annual Heating Fig B8-6 Lomass Ann Heat
B8-7 BESTEST BASIC Low Mass Annual Sensible Cooling Fig B8-7 Lomass Ann Cool
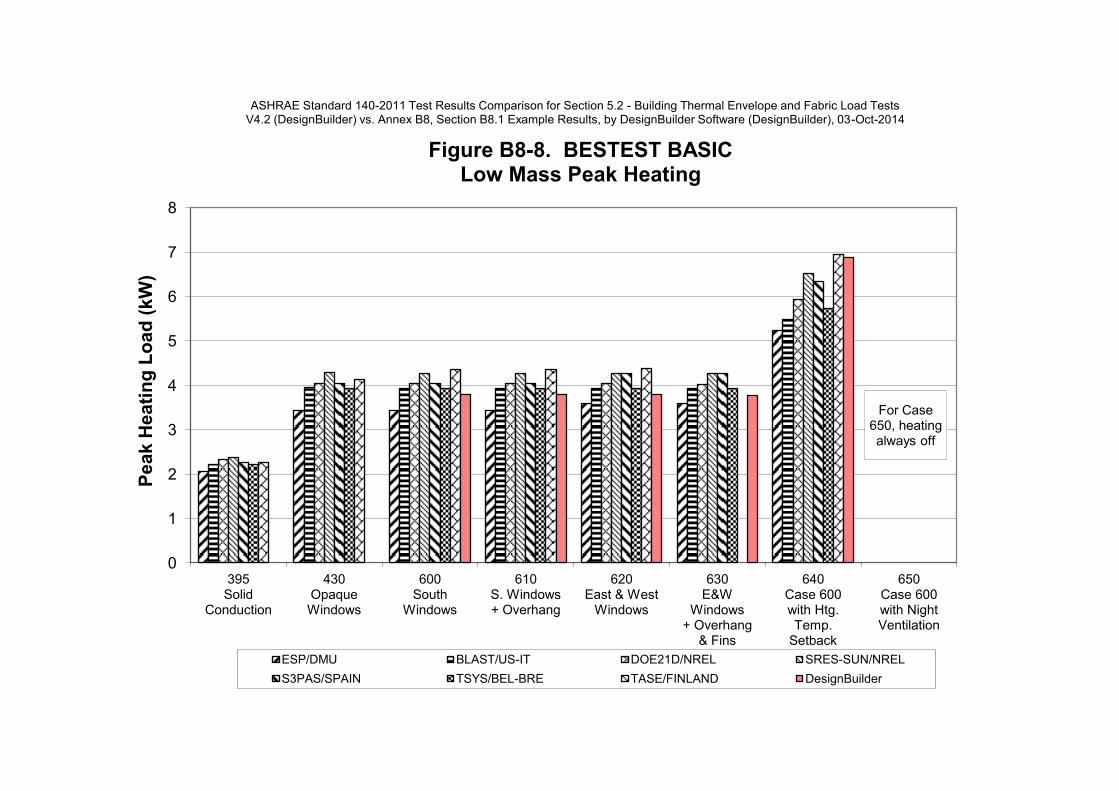
B8-8 BESTEST BASIC Low Mass Peak Heating Fig B8-8 Lomass Peak Heat
B8-9 BESTEST BASIC Low Mass Peak Sensible Cooling Fig B8-9 Lomass Peak Cool
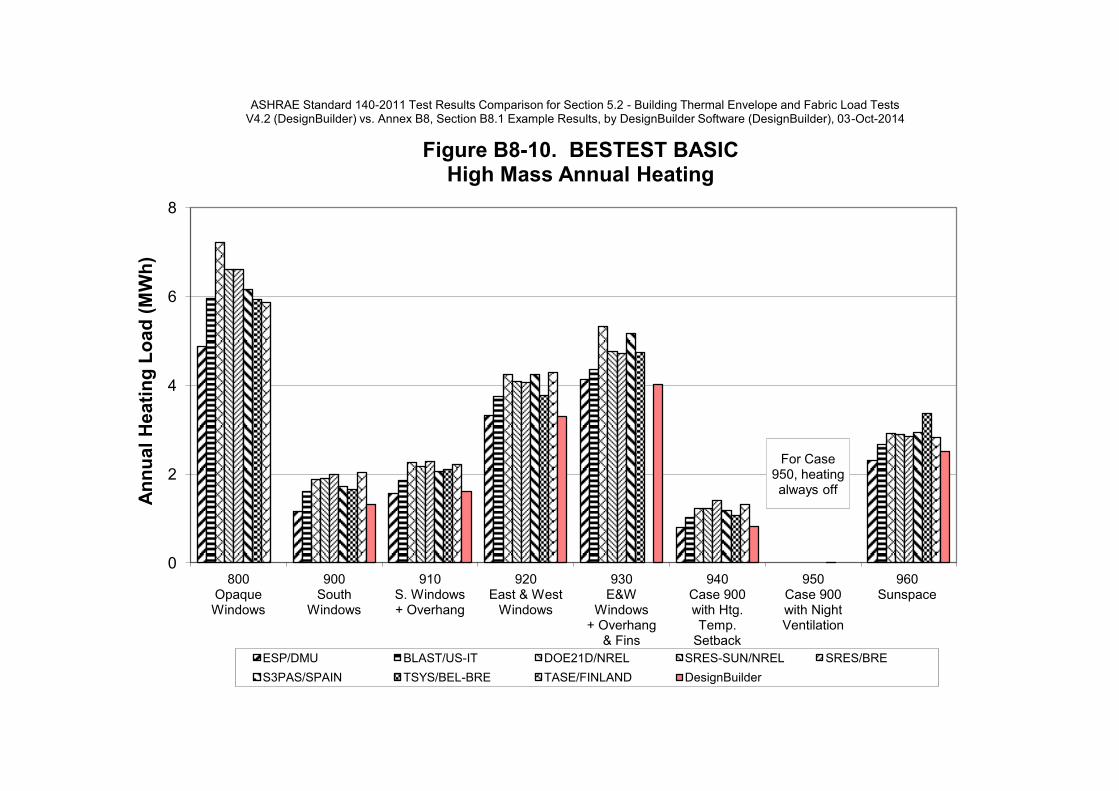
B8-10 BESTEST BASIC High Mass Annual Heating Fig B8-10 Himass Ann Heat
B8-11 BESTEST BASIC High Mass Annual Sensible Cooling Fig B8-11 Himass Ann Cool
B8-12 BESTEST BASIC High Mass Peak Heating Fig B8-12 Himass Peak Heat
B8-13 BESTEST BASIC High Mass Peak Sensible Cooling Fig B8-13 Himass Peak Cool
B8-14 BESTEST BASIC Maximum Hourly Annual Temperature Free-Float Cases Fig B8-14 FF Maximum Temp
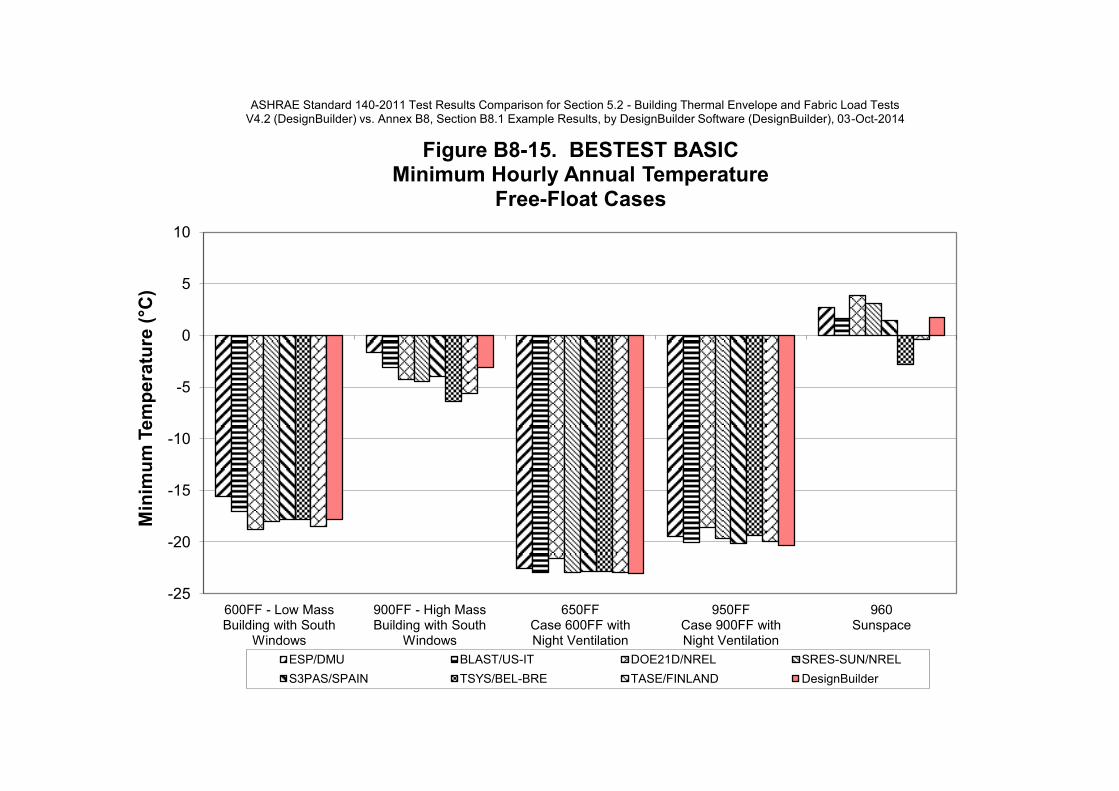
B8-15 BESTEST BASIC Minimum Hourly Annual Temperature Free-Float Cases Fig B8-15 FF Minimum Temp
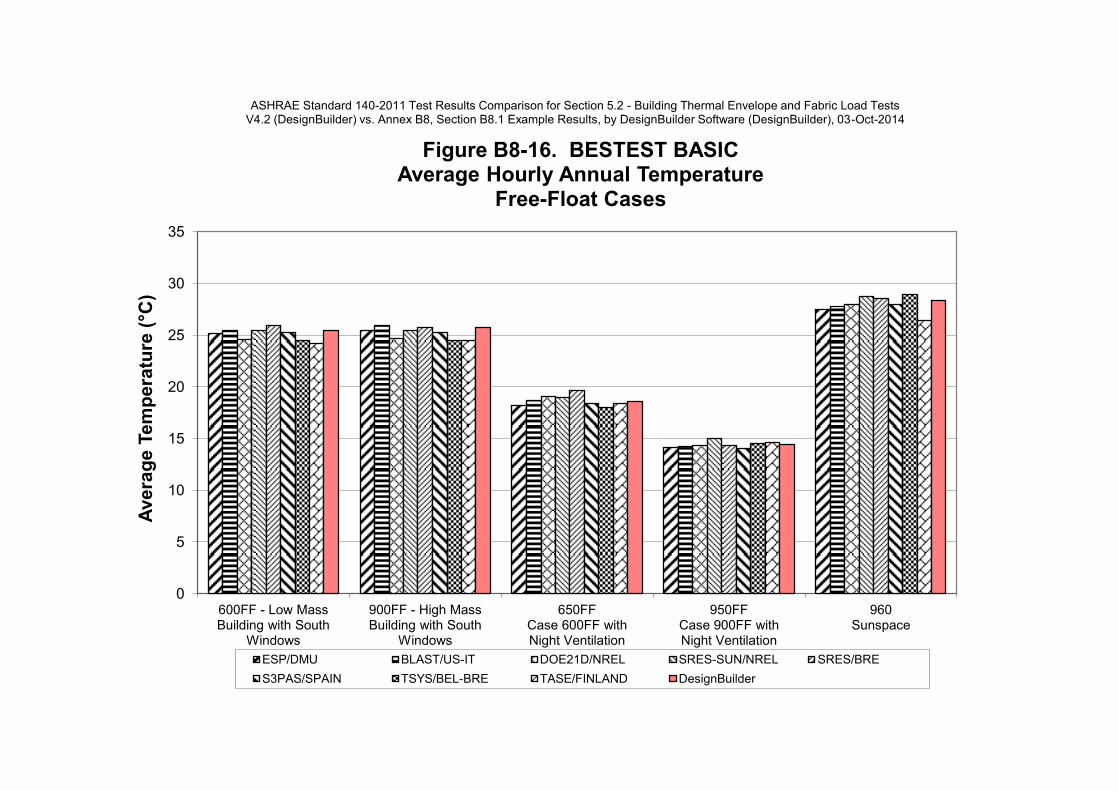
B8-16 BESTEST BASIC Average Hourly Annual Temperature Free-Float Cases Fig B8-16 FF Average Temp
B8-17 BESTEST BASIC South Window Shading (Delta) Fig B8-17 Delta-S Shade-Load
Annual Heating and Sensible Cooling
BESTEST BASIC South Window Shading (Delta)
Peak Heating and Sensible Cooling
BESTEST BASIC East & West Window (Delta)
Annual Heating and Sensible Cooling
BESTEST BASIC East & West Window (Delta)
Peak Heating and Sensible Cooling
BESTEST BASIC East & West Shaded Window (Delta)
Annual Heating and Sensible Cooling
BESTEST BASIC East & West Shaded Window (Delta)
Peak Heating and Sensible Cooling
B8-23 BESTEST BASIC Thermostat Setback (Delta) Annual Heating Fig B8-23 Delta-TSetback-Heat
B8-24 BESTEST BASIC Thermostat Setback (Delta) Peak Heating Fig B8-24 Delta-TSetback-Peak
B8-25 BESTEST BASIC Vent Cooling (Delta) Annual Sensible Cooling Fig B8-25 Delta-VentCool-Load
B8-26 BESTEST BASIC Vent Cooling (Delta) Peak Sensible Cooling Fig B8-26 Delta-VentCool-Peak
B8-27 BESTEST BASIC Sunspace (Delta) Annual Heating and Sensible Cooling Fig B8-27 Delta-Sunspace-Load
B8-28 BESTEST BASIC Sunspace (Delta) Peak Heating and Sensible Cooling Fig B8-28 Delta-Sunspace-Peak
BESTEST BASIC AND IN-DEPTH Mass Effect (Delta)
Annual Heating and Sensible Cooling
BESTEST BASIC AND IN-DEPTH Mass Effect (Delta)
Peak Heating and Sensible Cooling
BESTEST IN-DEPTH South Window (Delta)
Annual Heating and Sensible Cooling
BESTEST IN-DEPTH South Window (Delta)
Peak Heating and Sensible Cooling
B8-33 BESTEST IN-DEPTH Low Mass Annual Heating Cases 195 to 250 Fig B8-33 Indepth 1
B8-34 BESTEST IN-DEPTH Low Mass Annual Sensible Cooling Cases 195 to 250 Fig B8-34 Indepth 2
B8-35 BESTEST IN-DEPTH Low Mass Peak Heating Cases 195 to 250 Fig B8-35 Indepth 3
B8-4 Fig B8-4 Trans Coeff
B8-5 Fig B8-5 OH&Fin Shade Coeff
B8-18 Fig B8-18 Delta-S Shade-Peak
B8-19 Fig B8-19 Delta-E&W-Load
B8-30 Fig B8-30 Delta-Mass Effect-Pk
B8-29 Fig B8-29 Delta-Mass Effect-Ann
B8-20 Fig B8-20 Delta-E&W-Peak
B8-21 Fig B8-21 Delta-E&WShade-Load
B8-22 Fig B8-22 Delta-E&WShade-Peak
B8-31 Fig B8-31 Delta-S Win-Ann
B8-32 Fig B8-32 Delta-S Win-Peak
ASHRAE Standard 140-2010 Section 5.2 - Building Thermal Envelope and Fabric Load Tests
V4.2 (DesignBuilder) vs. Annex B8, Section B8.1 Example Results
By DesignBuilder Software (DesignBuilder), 03-Oct-2014
List of Figures
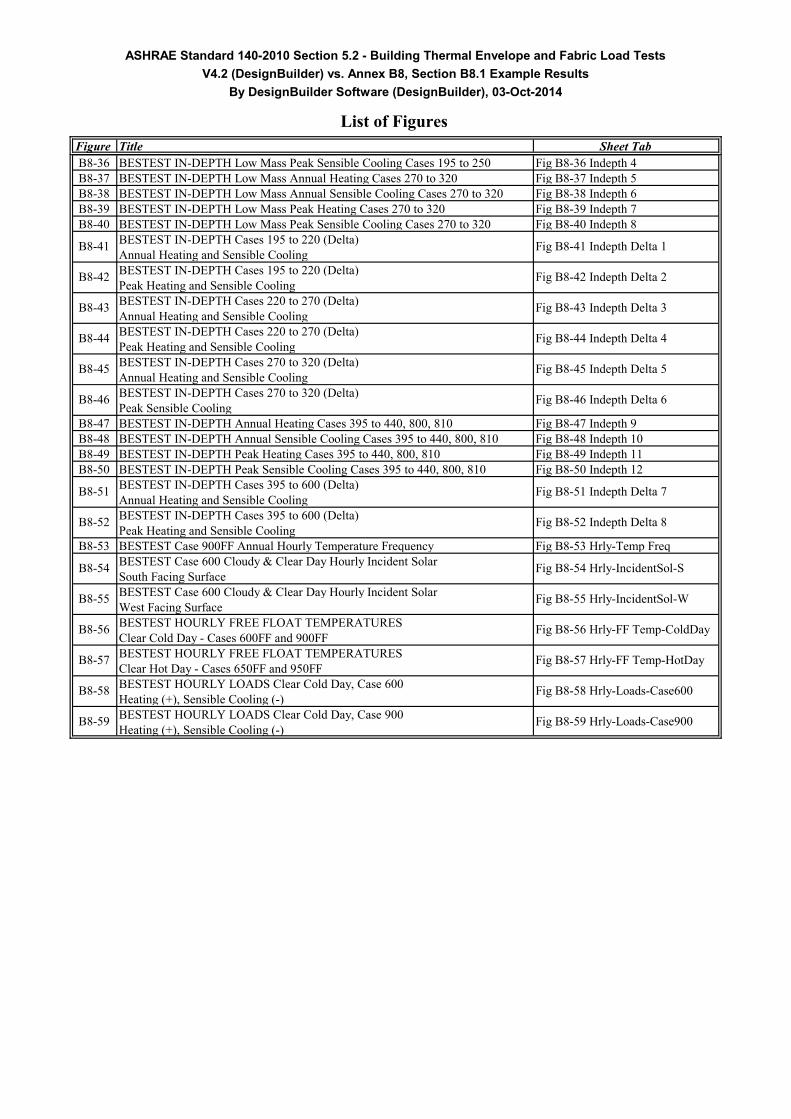
Figure Title Sheet Tab
ASHRAE Standard 140-2010 Section 5.2 - Building Thermal Envelope and Fabric Load Tests
V4.2 (DesignBuilder) vs. Annex B8, Section B8.1 Example Results
By DesignBuilder Software (DesignBuilder), 03-Oct-2014
List of Figures
B8-36 BESTEST IN-DEPTH Low Mass Peak Sensible Cooling Cases 195 to 250 Fig B8-36 Indepth 4
B8-37 BESTEST IN-DEPTH Low Mass Annual Heating Cases 270 to 320 Fig B8-37 Indepth 5
B8-38 BESTEST IN-DEPTH Low Mass Annual Sensible Cooling Cases 270 to 320 Fig B8-38 Indepth 6
B8-39 BESTEST IN-DEPTH Low Mass Peak Heating Cases 270 to 320 Fig B8-39 Indepth 7
B8-40 BESTEST IN-DEPTH Low Mass Peak Sensible Cooling Cases 270 to 320 Fig B8-40 Indepth 8
BESTEST IN-DEPTH Cases 195 to 220 (Delta)
Annual Heating and Sensible Cooling
BESTEST IN-DEPTH Cases 195 to 220 (Delta)
Peak Heating and Sensible Cooling
BESTEST IN-DEPTH Cases 220 to 270 (Delta)
Annual Heating and Sensible Cooling
BESTEST IN-DEPTH Cases 220 to 270 (Delta)
Peak Heating and Sensible Cooling
BESTEST IN-DEPTH Cases 270 to 320 (Delta)
Annual Heating and Sensible Cooling
BESTEST IN-DEPTH Cases 270 to 320 (Delta)
Peak Sensible Cooling
B8-47 BESTEST IN-DEPTH Annual Heating Cases 395 to 440, 800, 810 Fig B8-47 Indepth 9
B8-48 BESTEST IN-DEPTH Annual Sensible Cooling Cases 395 to 440, 800, 810 Fig B8-48 Indepth 10
B8-49 BESTEST IN-DEPTH Peak Heating Cases 395 to 440, 800, 810 Fig B8-49 Indepth 11
B8-50 BESTEST IN-DEPTH Peak Sensible Cooling Cases 395 to 440, 800, 810 Fig B8-50 Indepth 12
BESTEST IN-DEPTH Cases 395 to 600 (Delta)
Annual Heating and Sensible Cooling
BESTEST IN-DEPTH Cases 395 to 600 (Delta)
Peak Heating and Sensible Cooling
B8-53 BESTEST Case 900FF Annual Hourly Temperature Frequency Fig B8-53 Hrly-Temp Freq
BESTEST Case 600 Cloudy & Clear Day Hourly Incident Solar
South Facing Surface
BESTEST Case 600 Cloudy & Clear Day Hourly Incident Solar
West Facing Surface
BESTEST HOURLY FREE FLOAT TEMPERATURES
Clear Cold Day - Cases 600FF and 900FF
BESTEST HOURLY FREE FLOAT TEMPERATURES
Clear Hot Day - Cases 650FF and 950FF
BESTEST HOURLY LOADS Clear Cold Day, Case 600
Heating (+), Sensible Cooling (-)
BESTEST HOURLY LOADS Clear Cold Day, Case 900
Heating (+), Sensible Cooling (-)
B8-42 Fig B8-42 Indepth Delta 2
B8-41 Fig B8-41 Indepth Delta 1
B8-51 Fig B8-51 Indepth Delta 7
B8-46 Fig B8-46 Indepth Delta 6
B8-43 Fig B8-43 Indepth Delta 3
B8-45 Fig B8-45 Indepth Delta 5
B8-44 Fig B8-44 Indepth Delta 4
B8-58 Fig B8-58 Hrly-Loads-Case600
B8-52 Fig B8-52 Indepth Delta 8
B8-55 Fig B8-55 Hrly-IncidentSol-W
B8-54 Fig B8-54 Hrly-IncidentSol-S
B8-59 Fig B8-59 Hrly-Loads-Case900
B8-56 Fig B8-56 Hrly-FF Temp-ColdDay
B8-57 Fig B8-57 Hrly-FF Temp-HotDay
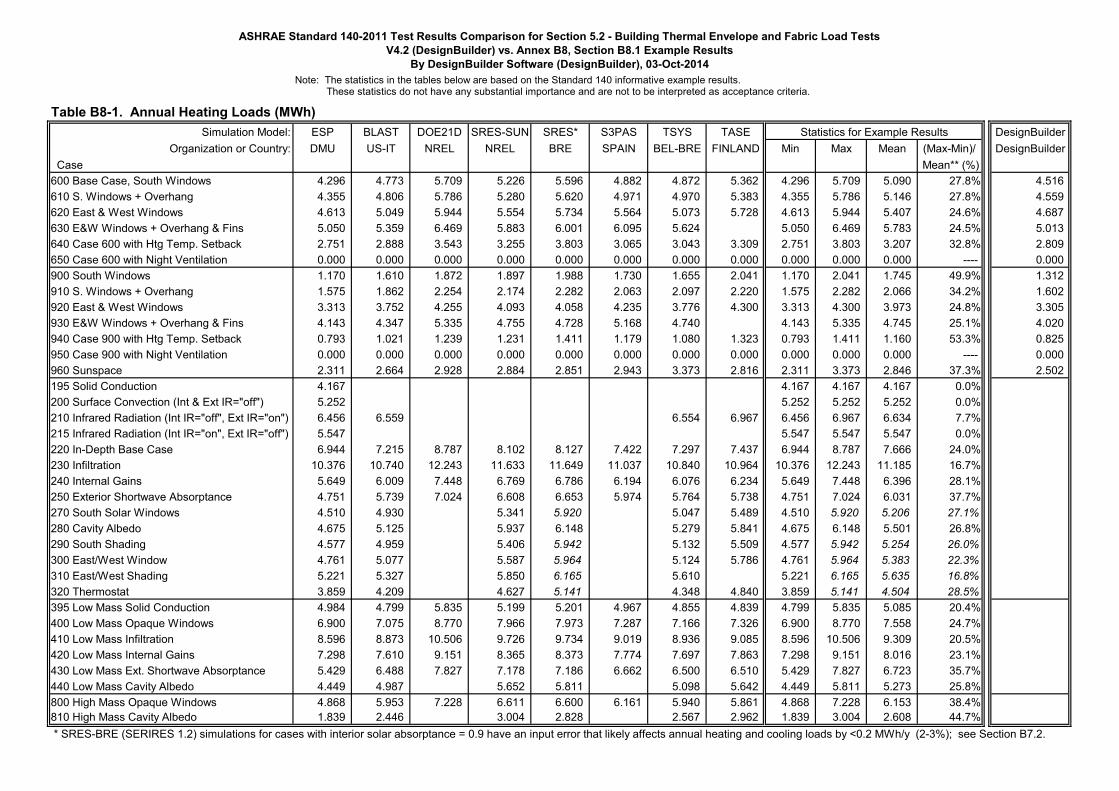
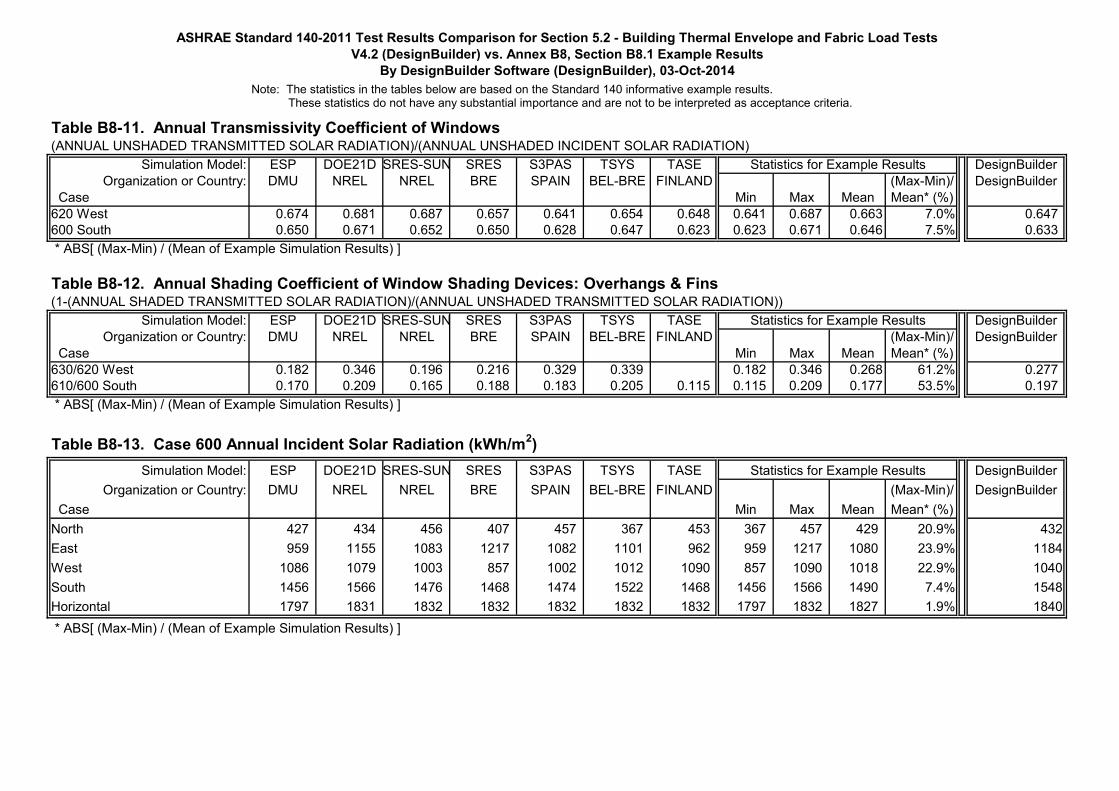
Note: The statistics in the tables below are based on the Standard 140 informative example results. These statistics do not have any substantial importance and are not to be interpreted as acceptance criteria.
Table B8-1. Annual Heating Loads (MWh)
Simulation Model: ESP BLAST DOE21D SRES-SUN SRES* S3PAS TSYS TASE DesignBuilder
Organization or Country: DMU US-IT NREL NREL BRE SPAIN BEL-BRE FINLAND Min Max Mean (Max-Min)/ DesignBuilder
Case Mean** (%)
600 Base Case, South Windows 4.296 4.773 5.709 5.226 5.596 4.882 4.872 5.362 4.296 5.709 5.090 27.8% 4.516
610 S. Windows + Overhang 4.355 4.806 5.786 5.280 5.620 4.971 4.970 5.383 4.355 5.786 5.146 27.8% 4.559
620 East & West Windows 4.613 5.049 5.944 5.554 5.734 5.564 5.073 5.728 4.613 5.944 5.407 24.6% 4.687
630 E&W Windows + Overhang & Fins 5.050 5.359 6.469 5.883 6.001 6.095 5.624 5.050 6.469 5.783 24.5% 5.013
640 Case 600 with Htg Temp. Setback 2.751 2.888 3.543 3.255 3.803 3.065 3.043 3.309 2.751 3.803 3.207 32.8% 2.809
650 Case 600 with Night Ventilation 0.000 0.000 0.000 0.000 0.000 0.000 0.000 0.000 0.000 0.000 0.000 ---- 0.000
900 South Windows 1.170 1.610 1.872 1.897 1.988 1.730 1.655 2.041 1.170 2.041 1.745 49.9% 1.312
910 S. Windows + Overhang 1.575 1.862 2.254 2.174 2.282 2.063 2.097 2.220 1.575 2.282 2.066 34.2% 1.602
920 East & West Windows 3.313 3.752 4.255 4.093 4.058 4.235 3.776 4.300 3.313 4.300 3.973 24.8% 3.305
930 E&W Windows + Overhang & Fins 4.143 4.347 5.335 4.755 4.728 5.168 4.740 4.143 5.335 4.745 25.1% 4.020
940 Case 900 with Htg Temp. Setback 0.793 1.021 1.239 1.231 1.411 1.179 1.080 1.323 0.793 1.411 1.160 53.3% 0.825
950 Case 900 with Night Ventilation 0.000 0.000 0.000 0.000 0.000 0.000 0.000 0.000 0.000 0.000 0.000 ---- 0.000
960 Sunspace 2.311 2.664 2.928 2.884 2.851 2.943 3.373 2.816 2.311 3.373 2.846 37.3% 2.502
195 Solid Conduction 4.167 4.167 4.167 4.167 0.0%
200 Surface Convection (Int & Ext IR="off") 5.252 5.252 5.252 5.252 0.0%
210 Infrared Radiation (Int IR="off", Ext IR="on") 6.456 6.559 6.554 6.967 6.456 6.967 6.634 7.7%
215 Infrared Radiation (Int IR="on", Ext IR="off") 5.547 5.547 5.547 5.547 0.0%
220 In-Depth Base Case 6.944 7.215 8.787 8.102 8.127 7.422 7.297 7.437 6.944 8.787 7.666 24.0%
230 Infiltration 10.376 10.740 12.243 11.633 11.649 11.037 10.840 10.964 10.376 12.243 11.185 16.7%
240 Internal Gains 5.649 6.009 7.448 6.769 6.786 6.194 6.076 6.234 5.649 7.448 6.396 28.1%
250 Exterior Shortwave Absorptance 4.751 5.739 7.024 6.608 6.653 5.974 5.764 5.738 4.751 7.024 6.031 37.7%
270 South Solar Windows 4.510 4.930 5.341 5.920 5.047 5.489 4.510 5.920 5.206 27.1%
280 Cavity Albedo 4.675 5.125 5.937 6.148 5.279 5.841 4.675 6.148 5.501 26.8%
290 South Shading 4.577 4.959 5.406 5.942 5.132 5.509 4.577 5.942 5.254 26.0%
300 East/West Window 4.761 5.077 5.587 5.964 5.124 5.786 4.761 5.964 5.383 22.3%
310 East/West Shading 5.221 5.327 5.850 6.165 5.610 5.221 6.165 5.635 16.8%
320 Thermostat 3.859 4.209 4.627 5.141 4.348 4.840 3.859 5.141 4.504 28.5%
395 Low Mass Solid Conduction 4.984 4.799 5.835 5.199 5.201 4.967 4.855 4.839 4.799 5.835 5.085 20.4%
400 Low Mass Opaque Windows 6.900 7.075 8.770 7.966 7.973 7.287 7.166 7.326 6.900 8.770 7.558 24.7%
410 Low Mass Infiltration 8.596 8.873 10.506 9.726 9.734 9.019 8.936 9.085 8.596 10.506 9.309 20.5%
420 Low Mass Internal Gains 7.298 7.610 9.151 8.365 8.373 7.774 7.697 7.863 7.298 9.151 8.016 23.1%
430 Low Mass Ext. Shortwave Absorptance 5.429 6.488 7.827 7.178 7.186 6.662 6.500 6.510 5.429 7.827 6.723 35.7%
440 Low Mass Cavity Albedo 4.449 4.987 5.652 5.811 5.098 5.642 4.449 5.811 5.273 25.8%
800 High Mass Opaque Windows 4.868 5.953 7.228 6.611 6.600 6.161 5.940 5.861 4.868 7.228 6.153 38.4%
810 High Mass Cavity Albedo 1.839 2.446 3.004 2.828 2.567 2.962 1.839 3.004 2.608 44.7%
* SRES-BRE (SERIRES 1.2) simulations for cases with interior solar absorptance = 0.9 have an input error that likely affects annual heating and cooling loads by <0.2 MWh/y (2-3%); see Section B7.2.
Statistics for Example Results
ASHRAE Standard 140-2011 Test Results Comparison for Section 5.2 - Building Thermal Envelope and Fabric Load Tests
V4.2 (DesignBuilder) vs. Annex B8, Section B8.1 Example Results
By DesignBuilder Software (DesignBuilder), 03-Oct-2014

Note: The statistics in the tables below are based on the Standard 140 informative example results. These statistics do not have any substantial importance and are not to be interpreted as acceptance criteria.
ASHRAE Standard 140-2011 Test Results Comparison for Section 5.2 - Building Thermal Envelope and Fabric Load Tests
V4.2 (DesignBuilder) vs. Annex B8, Section B8.1 Example Results
By DesignBuilder Software (DesignBuilder), 03-Oct-2014
** ABS[ (Max-Min) / (Mean of Example Simulation Results) ]

Note: The statistics in the tables below are based on the Standard 140 informative example results. These statistics do not have any substantial importance and are not to be interpreted as acceptance criteria.
ASHRAE Standard 140-2011 Test Results Comparison for Section 5.2 - Building Thermal Envelope and Fabric Load Tests
V4.2 (DesignBuilder) vs. Annex B8, Section B8.1 Example Results
By DesignBuilder Software (DesignBuilder), 03-Oct-2014
Table B8-2. Annual Sensible Cooling Loads (MWh)
Simulation Model: ESP BLAST DOE21D SRES-SUN SRES* S3PAS TSYS TASE DesignBuilder
Organization or Country: DMU US-IT NREL NREL BRE SPAIN BEL-BRE FINLAND Min Max Mean (Max-Min)/ DesignBuilder
Case Mean** (%)
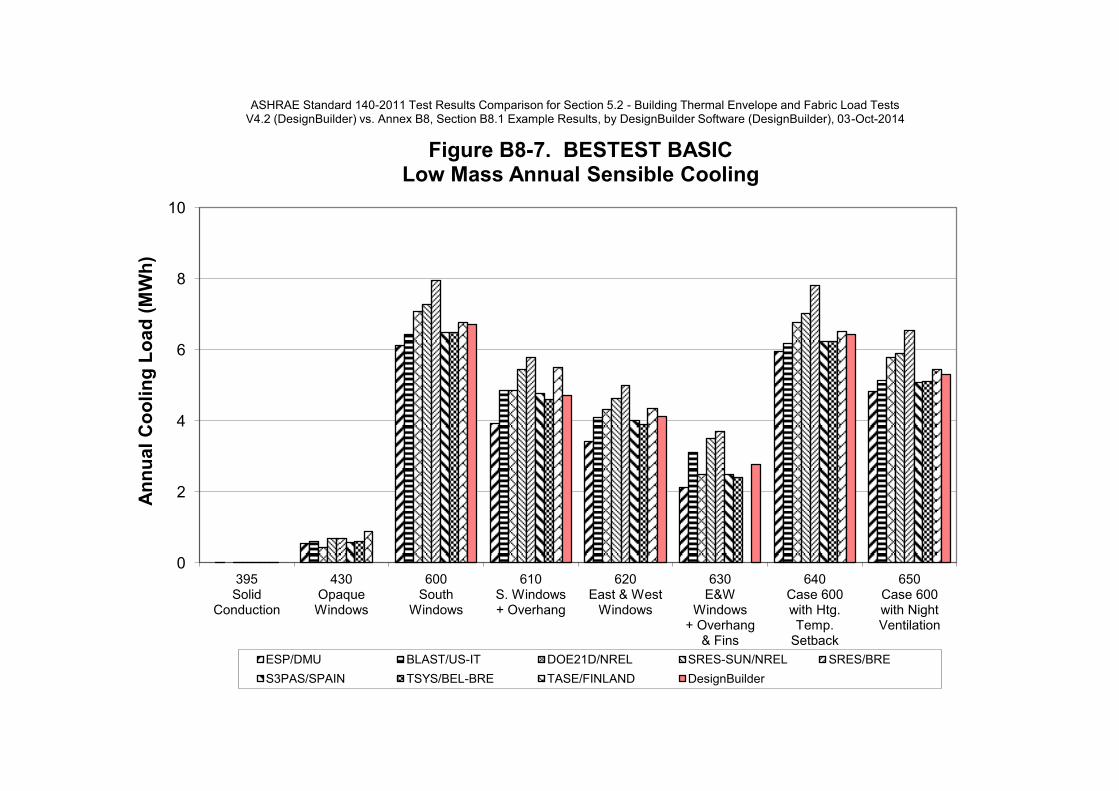
600 Base Case, South Windows 6.137 6.433 7.079 7.278 7.964 6.492 6.492 6.778 6.137 7.964 6.832 26.7% 6.710
610 S. Windows + Overhang 3.915 4.851 4.852 5.448 5.778 4.764 4.601 5.506 3.915 5.778 4.964 37.5% 4.717
620 East & West Windows 3.417 4.092 4.334 4.633 5.004 4.011 3.901 4.351 3.417 5.004 4.218 37.6% 4.135
630 E&W Windows + Overhang & Fins 2.129 3.108 2.489 3.493 3.701 2.489 2.416 2.129 3.701 2.832 55.5% 2.761
640 Case 600 with Htg Temp. Setback 5.952 6.183 6.759 7.026 7.811 6.247 6.246 6.508 5.952 7.811 6.592 28.2% 6.447
650 Case 600 with Night Ventilation 4.816 5.140 5.795 5.894 6.545 5.088 5.119 5.456 4.816 6.545 5.482 31.5% 5.319
900 South Windows 2.132 2.600 2.455 3.165 3.415 2.572 2.485 2.599 2.132 3.415 2.678 47.9% 2.442
910 S. Windows + Overhang 0.821 1.533 0.976 1.872 1.854 1.428 1.326 1.767 0.821 1.872 1.447 72.6% 1.180
920 East & West Windows 1.840 2.616 2.440 2.943 3.092 2.457 2.418 2.613 1.840 3.092 2.552 49.1% 2.492
930 E&W Windows + Overhang & Fins 1.039 1.934 1.266 2.173 2.238 1.439 1.416 1.039 2.238 1.644 73.0% 1.604
940 Case 900 with Htg. Temp. Setback 2.079 2.536 2.340 3.036 3.241 2.489 2.383 2.516 2.079 3.241 2.578 45.1% 2.368
950 Case 900 with Night Ventilation 0.387 0.526 0.538 0.921 0.589 0.551 0.561 0.771 0.387 0.921 0.605 88.2% 0.532
960 Sunspace 0.488 0.666 0.428 0.803 0.718 0.643 0.411 0.786 0.411 0.803 0.618 63.4% 0.616
195 Solid Conduction 0.414 0.414 0.414 0.414 0.0%
200 Surface Convection (Int & Ext IR="off") 0.570 0.570 0.570 0.570 0.0%
210 Infrared Radiation (Int IR="off", Ext IR="on") 0.162 0.613 0.668 0.641 0.162 0.668 0.521 97.1%
215 Infrared Radiation (Int IR="on", Ext IR="off") 0.639 0.639 0.639 0.639 0.0%
220 In-Depth Base Case 0.186 0.701 0.399 0.827 0.835 0.734 0.737 0.683 0.186 0.835 0.638 101.8%
230 Infiltration 0.454 0.976 0.692 1.131 1.139 1.020 1.040 0.985 0.454 1.139 0.930 73.7%
240 Internal Gains 0.415 1.072 0.660 1.239 1.246 1.108 1.114 1.045 0.415 1.246 0.987 84.2%
250 Exterior Shortwave Absorptance 3.213 2.545 2.177 2.924 2.931 2.486 2.684 3.380 2.177 3.380 2.793 43.1%
270 South Solar Windows 7.528 8.670 9.828 10.350 8.764 8.714 7.528 10.350 8.976 31.4%
280 Cavity Albedo 4.873 5.895 6.511 7.114 5.761 6.257 4.873 7.114 6.069 36.9%
290 South Shading 5.204 7.011 7.871 8.089 6.699 7.431 5.204 8.089 7.051 40.9%
300 East/West Window 4.302 5.836 6.665 7.100 5.721 5.781 4.302 7.100 5.901 47.4%
310 East/West Shading 2.732 4.570 5.245 5.471 3.727 2.732 5.471 4.349 63.0%
320 Thermostat 5.061 5.906 6.725 7.304 5.956 5.663 5.061 7.304 6.103 36.8%
395 Low Mass Solid Conduction 0.000 0.011 0.000 0.016 0.014 0.010 0.010 0.011 0.000 0.016 0.009 177.1%
400 Low Mass Opaque Windows 0.000 0.040 0.002 0.061 0.058 0.042 0.045 0.044 0.000 0.061 0.036 167.3%
410 Low Mass Infiltration 0.000 0.059 0.010 0.084 0.084 0.063 0.067 0.065 0.000 0.084 0.054 155.5%
420 Low Mass Internal Gains 0.011 0.147 0.051 0.189 0.188 0.154 0.158 0.143 0.011 0.189 0.130 136.9%
430 Low Mass Ext. Shortwave Absorptance 0.542 0.617 0.422 0.704 0.684 0.563 0.617 0.875 0.422 0.875 0.628 72.1%
440 Low Mass Cavity Albedo 3.967 4.172 4.674 5.204 3.975 4.684 3.967 5.204 4.446 27.8%
800 High Mass Opaque Windows 0.113 0.224 0.055 0.272 0.222 0.195 0.207 0.325 0.055 0.325 0.202 133.9%
810 High Mass Cavity Albedo 1.052 1.405 1.711 1.708 1.191 1.624 1.052 1.711 1.449 45.5%
* SRES-BRE (SERIRES 1.2) simulations for cases with interior solar absorptance = 0.9 have an input error that likely affects annual heating and cooling loads by <0.2 MWh/y (2-3%); see Section B7.2.
Statistics for Example Results

Note: The statistics in the tables below are based on the Standard 140 informative example results. These statistics do not have any substantial importance and are not to be interpreted as acceptance criteria.
ASHRAE Standard 140-2011 Test Results Comparison for Section 5.2 - Building Thermal Envelope and Fabric Load Tests
V4.2 (DesignBuilder) vs. Annex B8, Section B8.1 Example Results
By DesignBuilder Software (DesignBuilder), 03-Oct-2014
Affected results for Cases 270 and 290 through 320 are indicated by italics
** ABS[ (Max-Min) / (Mean of Example Simulation Results) ]

Note: The statistics in the tables below are based on the Standard 140 informative example results. These statistics do not have any substantial importance and are not to be interpreted as acceptance criteria.
Table B8-3. Annual Hourly Integrated Peak Heating Loads
Simulation Model: ESP BLAST DOE21D SRES-SUN SRES S3PAS TSYS TASE DesignBuilder
Organization or Country: DMU US-IT NREL NREL BRE* SPAIN BEL-BRE FINLAND Min Max Mean (Max-Min)/ DesignBuilder
Case kW Date Hr kW Date Hr kW Date Hr kW Date Hr kW Date Hr kW Date Hr kW Date Hr kW kW kW Mean** (%) kW Date Hr
600 Base Case, South Windows 3.437 04-Jan 5 3.940 04-Jan 5 4.045 04-Jan 5 4.258 04-Jan 2 4.037 04-Jan 2 3.931 04-Jan 6 4.354 04-Jan 2 3.437 4.354 4.000 22.9% 3.803 04-Jan 5
610 S. Windows + Overhang 3.437 04-Jan 5 3.941 04-Jan 5 4.034 04-Jan 5 4.258 04-Jan 2 4.037 04-Jan 2 3.922 04-Jan 6 4.354 04-Jan 2 3.437 4.354 3.998 22.9% 3.792 04-Jan 5
620 East & West Windows 3.591 04-Jan 6 3.941 04-Jan 5 4.046 04-Jan 5 4.277 04-Jan 2 4.277 04-Jan 2 3.922 04-Jan 6 4.379 04-Jan 2 3.591 4.379 4.062 19.4% 3.794 04-Jan 5
630 E&W Windows + Overhang & Fins 3.592 04-Jan 7 3.941 04-Jan 5 4.025 04-Jan 5 4.280 04-Jan 2 4.278 04-Jan 2 3.922 04-Jan 6 3.592 4.280 4.006 17.2% 3.772 04-Jan 5
640 Case 600 with Htg. Temp. Setback 5.232 04-Jan 7 5.486 04-Jan 8 5.943 04-Jan 8 6.530 04-Jan 8 6.347 04-Jan 8 5.722 04-Jan 8 6.954 04-Jan 8 5.232 6.954 6.031 28.6% 6.886 04-Jan 8
650 Case 600 with Night Ventilation 0.000 0.000 04-Jan 0.000 0.000 0.000 0.000 0.000 0.000 0.000 0.000 ---- 0.000
900 South Windows 2.850 04-Jan 7 3.453 04-Jan 7 3.557 04-Jan 7 3.760 04-Jan 7 3.608 04-Jan 8 3.517 04-Jan 7 3.797 04-Jan 7 2.850 3.797 3.506 27.0% 3.229 04-Jan 7
910 S. Windows + Overhang 2.858 04-Jan 7 3.456 04-Jan 7 3.564 04-Jan 7 3.764 04-Jan 7 3.618 04-Jan 8 3.536 04-Jan 7 3.801 04-Jan 7 2.858 3.801 3.514 26.8% 3.230 04-Jan 7
920 East & West Windows 3.308 04-Jan 7 3.703 04-Jan 7 3.805 04-Jan 7 4.013 04-Jan 7 4.029 04-Jan 7 3.708 04-Jan 7 4.061 04-Jan 7 3.308 4.061 3.804 19.8% 3.534 04-Jan 7
930 E&W Windows + Overhang & Fins 3.355 04-Jan 7 3.732 04-Jan 7 3.832 04-Jan 7 4.042 04-Jan 7 4.064 04-Jan 7 3.744 04-Jan 7 3.355 4.064 3.795 18.7% 3.556 04-Jan 7
940 Case 900 with Htg. Temp. Setback 3.980 04-Jan 7 5.028 04-Jan 8 5.665 04-Jan 8 6.116 04-Jan 8 6.117 04-Jan 8 5.122 03-Jan 9 6.428 04-Jan 8 3.980 6.428 5.494 44.6% 5.159 04-Jan 8
950 Case 900 with Night Ventilation 0.000 0.000 0.000 0.000 0.000 0.000 0.000 0.000 0.000 0.000 ---- 0.000
960 Sunspace 2.410 04-Jan 7 2.751 04-Jan 8 2.727 04-Jan 8 2.863 04-Jan 8 2.852 04-Jan 8 2.522 04-Jan 8 2.779 04-Jan 8 2.410 2.863 2.701 16.8% 2.721 04-Jan 8
195 Solid Conduction 2.004 04-Jan 2 2.004 2.004 2.004 0.0%
200 Surface Convection (Int & Ext IR="off") 2.651 04-Jan 5 2.651 2.651 2.651 0.0%
210 Infrared Radiation (Int IR="off", Ext IR="on") 2.701 04-Jan 5 2.973 04-Jan 5 2.981 04-Jan 5 3.325 04-Jan 2 2.701 3.325 2.995 20.8%
215 Infrared Radiation (Int IR="on", Ext IR="off") 2.787 04-Jan 5 2.787 2.787 2.787 0.0%
220 In-Depth Base Case 2.867 04-Jan 5 3.280 04-Jan 5 3.465 04-Jan 5 3.695 04-Jan 2 3.348 04-Jan 8 3.336 04-Jan 6 3.520 04-Jan 2 2.867 3.695 3.359 24.7%
230 Infiltration 4.386 04-Jan 5 4.984 04-Jan 2 4.994 04-Jan 2 5.279 04-Jan 2 5.159 04-Jan 2 4.892 04-Jan 6 5.107 04-Jan 2 4.386 5.279 4.972 18.0%
240 Internal Gains 2.685 04-Jan 5 3.100 04-Jan 5 3.282 04-Jan 5 3.495 04-Jan 2 3.159 04-Jan 8 3.153 04-Jan 6 3.333 04-Jan 8 2.685 3.495 3.172 25.5%
250 Exterior Shortwave Absorptance 2.866 04-Jan 5 3.279 04-Jan 5 3.465 04-Jan 5 3.695 04-Jan 2 3.341 04-Jan 6 3.336 04-Jan 6 3.525 04-Jan 2 2.866 3.695 3.358 24.7%
270 South Windows 2.863 04-Jan 5 3.277 04-Jan 5 3.661 04-Jan 2 3.336 04-Jan 6 3.738 04-Jan 2 2.863 3.738 3.375 25.9%
280 Cavity Albedo 2.864 04-Jan 5 3.278 04-Jan 5 3.685 04-Jan 2 3.336 04-Jan 6 3.759 04-Jan 2 2.864 3.759 3.384 26.4%
290 South Shading 2.863 04-Jan 5 3.277 04-Jan 5 3.661 04-Jan 2 3.328 04-Jan 6 3.738 04-Jan 2 2.863 3.738 3.373 25.9%
300 East/West Window 3.014 04-Jan 6 3.276 04-Jan 5 3.681 04-Jan 2 3.328 04-Jan 6 3.770 04-Jan 2 3.014 3.770 3.414 22.1%
310 East/West Shading 3.015 04-Jan 6 3.277 04-Jan 5 3.669 04-Jan 2 3.328 04-Jan 6 3.015 3.669 3.322 19.7%
320 Thermostat 2.861 04-Jan 5 3.275 04-Jan 5 3.651 04-Jan 2 3.336 04-Jan 6 3.735 04-Jan 3 2.861 3.735 3.372 25.9%
395 Low Mass Solid Conduction 2.062 04-Jan 7 2.209 04-Jan 8 2.328 04-Jan 3 2.385 04-Jan 3 2.263 04-Jan 4 2.221 04-Jan 8 2.270 04-Jan 3 2.062 2.385 2.248 14.4%
400 Low Mass Opaque Windows 2.867 04-Jan 5 3.280 04-Jan 5 3.476 04-Jan 5 3.695 04-Jan 2 3.342 04-Jan 8 3.336 04-Jan 6 3.520 04-Jan 2 2.867 3.695 3.359 24.6%
410 Low Mass Infiltration 3.625 04-Jan 5 4.124 04-Jan 5 4.233 04-Jan 5 4.487 04-Jan 2 4.227 04-Jan 2 4.114 04-Jan 6 4.314 04-Jan 2 3.625 4.487 4.161 20.7%
420 Low Mass Internal Gains 3.443 04-Jan 5 3.944 04-Jan 5 4.050 04-Jan 5 4.287 04-Jan 2 4.044 04-Jan 2 3.931 04-Jan 6 4.126 04-Jan 2 3.443 4.287 3.975 21.2%
430 Low Mass Ext. Shortwave Absorptance 3.442 04-Jan 5 3.944 04-Jan 5 4.050 04-Jan 5 4.287 04-Jan 2 4.044 04-Jan 2 3.931 04-Jan 6 4.137 04-Jan 2 3.442 4.287 3.976 21.3%
440 Low Mass Cavity Albedo 3.439 04-Jan 5 3.942 04-Jan 5 4.277 04-Jan 2 3.931 04-Jan 6 4.376 04-Jan 2 3.439 4.376 3.993 23.5%
800 High Mass Opaque Windows 3.227 04-Jan 5 3.793 04-Jan 7 3.909 04-Jan 7 4.138 04-Jan 2 3.902 04-Jan 8 3.786 04-Jan 7 3.939 04-Jan 7 3.227 4.138 3.813 23.9%
810 High Mass Cavity Albedo 2.979 04-Jan 7 3.566 04-Jan 7 3.915 04-Jan 7 3.606 04-Jan 7 3.963 04-Jan 7 2.979 3.963 3.606 27.3%
* SRES-BRE (SERIRES 1.2) simulations did not produce output for this variable.
** ABS[ (Max-Min) / (Mean of Example Simulation Results) ]
Example Result Statistics
ASHRAE Standard 140-2011 Test Results Comparison for Section 5.2 - Building Thermal Envelope and Fabric Load Tests
V4.2 (DesignBuilder) vs. Annex B8, Section B8.1 Example Results
By DesignBuilder Software (DesignBuilder), 03-Oct-2014

Note: The statistics in the tables below are based on the Standard 140 informative example results. These statistics do not have any substantial importance and are not to be interpreted as acceptance criteria.
ASHRAE Standard 140-2011 Test Results Comparison for Section 5.2 - Building Thermal Envelope and Fabric Load Tests
V4.2 (DesignBuilder) vs. Annex B8, Section B8.1 Example Results
By DesignBuilder Software (DesignBuilder), 03-Oct-2014
Table B8-4. Annual Hourly Integrated Peak Sensible Cooling Loads
Simulation Model: ESP BLAST DOE21D SRES-SUN SRES S3PAS TSYS TASE DesignBuilder
Organization or Country: DMU US-IT NREL NREL BRE* SPAIN BEL-BRE FINLAND Min Max Mean (Max-Min)/ DesignBuilder
Case kW Date Hr kW Date Hr kW Date Hr kW Date Hr kW Date Hr kW Date Hr kW Date Hr kW kW kW Mean** (%) kW Date Hr
600 Base Case, South Windows 6.194 17-Oct 13 5.965 16-Oct 14 6.656 16-Oct 13 6.827 16-Oct 14 6.286 25-Nov 14 6.486 16-Oct 14 6.812 17-Oct 14 5.965 6.827 6.461 13.3% 6.558 17-Oct 13
610 S. Windows + Overhang 5.669 25-Nov 13 5.824 25-Nov 14 6.064 13-Jan 14 6.371 25-Nov 14 6.170 25-Nov 14 5.675 25-Nov 14 6.146 17-Oct 14 5.669 6.371 5.988 11.7% 6.143 25-Dec 13
620 East & West Windows 3.634 26-Jul 16 4.075 26-Jul 17 4.430 26-Jul 17 4.593 26-Jul 17 4.297 26-Jul 17 4.275 26-Jul 17 5.096 26-Jul 16 3.634 5.096 4.343 33.7% 3.928 02-Jul 10
630 E&W Windows + Overhang & Fins 3.072 26-Jul 16 3.704 26-Jul 17 3.588 26-Jul 17 4.116 26-Jul 17 3.665 26-Jul 17 3.608 26-Jul 17 3.072 4.116 3.626 28.8% 3.400 26-Jul 17
640 Case 600 with Htg. Temp. Setback 6.161 17-Oct 13 5.892 16-Oct 14 6.576 16-Oct 14 6.776 16-Oct 14 6.250 25-Nov 14 6.442 16-Oct 14 6.771 17-Oct 14 5.892 6.776 6.410 13.8% 6.497 17-Oct 13
650 Case 600 with Night Ventilation 6.031 17-Oct 13 5.831 16-Oct 14 6.516 16-Oct 14 6.671 16-Oct 14 6.143 25-Nov 14 6.378 17-Oct 14 6.679 17-Oct 14 5.831 6.679 6.321 13.4% 6.401 16-Oct 14
900 South Windows 2.888 17-Oct 14 3.155 06-Oct 15 3.458 17-Oct 14 3.871 17-Oct 14 3.334 17-Oct 15 3.567 17-Oct 15 3.457 17-Oct 15 2.888 3.871 3.390 29.0% 3.238 17-Oct 15
910 S. Windows + Overhang 1.896 17-Oct 15 2.500 21-Oct 15 2.336 17-Oct 15 3.277 17-Oct 15 2.786 17-Oct 15 2.792 17-Oct 15 3.147 17-Oct 15 1.896 3.277 2.676 51.6% 2.572 17-Oct 15
920 East & West Windows 2.385 26-Jul 16 2.933 26-Jul 17 3.109 26-Jul 17 3.487 26-Jul 17 3.071 26-Jul 17 3.050 26-Jul 17 3.505 26-Jul 17 2.385 3.505 3.077 36.4% 2.780 26-Jul 17
930 E&W Windows + Overhang & Fins 1.873 26-Jul 17 2.546 26-Jul 17 2.388 26-Jul 18 3.080 26-Jul 17 2.486 26-Jul 17 2.498 26-Jul 17 1.873 3.080 2.479 48.7% 2.289 26-Jul 18
940 Case 900 with Htg. Temp. Setback 2.888 17-Oct 14 3.155 06-Oct 15 3.458 17-Oct 14 3.871 17-Oct 14 3.334 17-Oct 15 3.567 17-Oct 15 3.457 17-Oct 15 2.888 3.871 3.390 29.0% 3.238 17-Oct 15
950 Case 900 with Night Ventilation 2.033 02-Sep 14 2.621 02-Sep 15 2.664 02-Sep 15 3.170 02-Sep 14 2.677 02-Sep 15 2.686 02-Sep 15 2.867 02-Sep 14 2.033 3.170 2.674 42.5% 2.590 02-Sep 15
960 Sunspace 0.953 16-Aug 16 1.144 26-Jul 16 1.057 26-Jul 16 1.370 26-Jul 16 1.179 26-Jul 16 1.378 26-Jul 16 1.403 26-Jul 16 0.953 1.403 1.212 37.1% 1.142 16-Aug 15
195 Solid Conduction 0.651 26-Jul 15 0.651 0.651 0.651 0.0%
200 Surface Convection (Int & Ext IR="off") 0.863 16-Aug 14 0.863 0.863 0.863 0.0%
210 Infrared Radiation (Int IR="off", Ext IR="on") 0.476 16-Aug 16 1.017 26-Jul 15 1.068 26-Jul 16 1.142 26-Jul 15 0.476 1.142 0.926 71.9%
215 Infrared Radiation (Int IR="on", Ext IR="off") 1.007 11-Aug 14 1.007 1.007 1.007 0.0%
220 In-Depth Base Case 0.560 27-Jul 15 1.166 26-Jul 15 0.937 27-Jul 14 1.340 26-Jul 15 1.215 26-Jul 16 1.179 26-Jul 16 1.213 26-Jul 15 0.560 1.340 1.087 71.7%
230 Infiltration 1.059 27-Jul 15 1.646 26-Jul 15 1.455 27-Jul 14 1.875 26-Jul 15 1.700 26-Jul 15 1.708 26-Jul 16 1.749 26-Jul 15 1.059 1.875 1.599 51.0%
240 Internal Gains 0.739 27-Jul 15 1.347 26-Jul 15 1.119 27-Jul 14 1.540 26-Jul 15 1.398 26-Jul 16 1.361 26-Jul 16 1.397 26-Jul 15 0.739 1.540 1.272 63.0%
250 Exterior Shortwave Absorptance 3.360 05-Sep 12 3.036 05-Sep 12 2.605 05-Sep 11 2.590 26-Aug 14 2.258 26-Aug 14 3.228 05-Sep 13 4.912 05-Sep 12 2.258 4.912 3.141 84.5%
270 South Windows 6.356 25-Nov 13 6.641 25-Nov 14 7.234 16-Oct 14 6.764 17-Oct 14 6.867 16-Oct 14 6.356 7.234 6.772 13.0%
280 Cavity Albedo 4.444 17-Oct 13 4.631 25-Nov 13 5.220 16-Oct 14 4.786 16-Oct 14 5.236 16-Oct 14 4.444 5.236 4.863 16.3%
290 South Shading 6.269 13-Jan 13 6.555 25-Nov 14 6.976 25-Nov 14 6.203 25-Nov 14 6.621 25-Nov 14 6.203 6.976 6.525 11.9%
300 East/West Window 3.404 26-Jul 16 4.093 26-Jul 17 4.657 26-Jul 17 4.278 26-Jul 17 4.929 26-Jul 17 3.404 4.929 4.272 35.7%
310 East/West Shading 2.848 26-Jul 16 3.749 30-Jun 17 4.164 26-Jul 17 3.589 26-Jul 17 2.848 4.164 3.587 36.7%
320 Thermostat 5.701 25-Nov 13 5.946 25-Nov 14 6.553 16-Oct 14 6.178 17-Oct 14 6.141 16-Oct 14 5.701 6.553 6.104 14.0%
395 Low Mass Solid Conduction 0.000 0.362 26-Jul 18 0.000 0.394 26-Jul 17 0.356 26-Jul 18 0.363 26-Jul 18 0.345 26-Jul 18 0.000 0.394 0.260 151.6%
400 Low Mass Opaque Windows 0.000 0.581 26-Jul 17 0.265 27-Jul 17 0.666 26-Jul 16 0.612 26-Jul 17 0.613 26-Jul 17 0.572 26-Jul 17 0.000 0.666 0.473 140.9%
410 Low Mass Infiltration 0.035 27-Jul 16 0.699 26-Jul 17 0.413 27-Jul 17 0.814 26-Jul 15 0.724 26-Jul 16 0.743 26-Jul 17 0.710 26-Jul 17 0.035 0.814 0.591 131.8%
420 Low Mass Internal Gains 0.258 27-Jul 15 0.923 26-Jul 15 0.631 27-Jul 15 1.047 26-Jul 15 0.938 26-Jul 15 0.938 26-Jul 16 0.921 26-Jul 15 0.258 1.047 0.808 97.7%
430 Low Mass Ext. Shortwave Absorptance 1.493 16-Aug 14 1.772 26-Aug 14 1.427 16-Aug 14 1.762 26-Jul 15 1.575 26-Jul 15 1.798 05-Sep 13 2.578 05-Sep 12 1.427 2.578 1.772 64.9%
440 Low Mass Cavity Albedo 4.546 17-Oct 13 4.424 16-Oct 14 5.053 16-Oct 14 4.686 16-Oct 14 5.278 17-Oct 14 4.424 5.278 4.797 17.8%
800 High Mass Opaque Windows 0.585 27-Jul 14 0.967 16-Aug 14 0.743 28-Jul 14 1.352 27-Jul 14 1.028 27-Jul 15 0.983 16-Aug 14 1.358 05-Sep 12 0.585 1.358 1.002 77.1%
810 High Mass Cavity Albedo 1.852 02-Sep 14 2.357 26-Aug 14 2.991 02-Sep 14 2.344 02-Sep 14 2.862 02-Sep 14 1.852 2.991 2.481 45.9%
* SRES-BRE (SERIRES 1.2) simulations did not produce output for this variable.
** ABS[ (Max-Min) / (Mean of Example Simulation Results) ]
Example Result Statistics

Note: The statistics in the tables below are based on the Standard 140 informative example results. These statistics do not have any substantial importance and are not to be interpreted as acceptance criteria.
ASHRAE Standard 140-2011 Test Results Comparison for Section 5.2 - Building Thermal Envelope and Fabric Load Tests
V4.2 (DesignBuilder) vs. Annex B8, Section B8.1 Example Results
By DesignBuilder Software (DesignBuilder), 03-Oct-2014
Table B8-5. Free-Float Temperature Output
MAXIMUM ANNUAL HOURLY INTEGRATED ZONE TEMPERATURE
Simulation Model: ESP BLAST DOE21D SRES-SUN SRES S3PAS TSYS TASE DesignBuilder
Organization or Country: DMU US-IT NREL NREL BRE* SPAIN BEL-BRE FINLAND Min Max Mean (Max-Min)/ DesignBuilder
Case T (°C) Date Hr T (°C) Date Hr T (°C) Date Hr T (°C) Date Hr T (°C) Date Hr T (°C) Date Hr T (°C) Date Hr T (°C) T (°C) T (°C) Mean** (%) T (°C) Date Hr
600FF - Low Mass with S. Windows 64.9 17-Oct 15 65.1 16-Oct 15 69.5 17-Oct 15 68.6 16-Oct 15 64.9 16-Oct 16 65.3 17-Oct 16 65.3 15-Oct 16 64.9 69.5 66.2 6.9% 65.6 16-Oct 16
900FF - High Mass with S. Windows 41.8 17-Oct 15 43.4 02-Sep 16 42.7 02-Sep 15 44.8 02-Sep 15 43.0 02-Sep 15 42.5 17-Oct 15 43.2 15-Sep 15 41.8 44.8 43.1 6.9% 44.0 02-Sep 15
650FF Case 600FF with Night Ventilation 63.2 17-Oct 15 63.5 16-Oct 15 68.2 17-Oct 15 67.0 16-Oct 15 63.3 16-Oct 16 63.7 17-Oct 16 63.8 16-Oct 16 63.2 68.2 64.7 7.7% 64.0 16-Oct 16
950FF Case 900FF with Night Ventilation 35.5 02-Sep 16 36.2 02-Sep 16 35.9 02-Sep 16 38.5 02-Sep 15 36.1 02-Sep 16 35.7 02-Sep 15 37.6 15-Sep 16 35.5 38.5 36.5 8.1% 37.4 02-Sep 16
960 Sunspace 48.9 17-Oct 15 48.9 06-Oct 15 49.0 17-Oct 15 51.0 17-Oct 15 50.2 17-Oct 15 55.3 17-Oct 15 48.9 15-Oct 15 48.9 55.3 50.3 12.8% 51.2 17-Oct 15
MINIMUM ANNUAL HOURLY INTEGRATED ZONE TEMPERATURE
Simulation Model: ESP BLAST DOE21D SRES-SUN SRES S3PAS TSYS TASE DesignBuilder
Organization or Country: DMU US-IT NREL NREL BRE* SPAIN BEL-BRE FINLAND Min Max Mean (Max-Min)/ DesignBuilder
Case T (°C) Date Hr T (°C) Date Hr T (°C) Date Hr T (°C) Date Hr T (°C) Date Hr T (°C) Date Hr T (°C) Date Hr T (°C) T (°C) T (°C) Mean** (%) T (°C) Date Hr
600FF - Low Mass with S. Windows -15.6 04-Jan 7 -17.1 04-Jan 8 -18.8 04-Jan 8 -18.0 04-Jan 7 -17.8 04-Jan 8 -17.8 04-Jan 7 -18.5 08-Jan 9 -18.8 -15.6 -17.6 18.3% -17.8 04-Jan 8
900FF - High Mass with S. Windows -1.6 04-Jan 8 -3.2 04-Jan 8 -4.3 04-Jan 8 -4.5 04-Jan 8 -4.0 04-Jan 8 -6.4 04-Jan 8 -5.6 08-Jan 9 -6.4 -1.6 -4.2 111.9% -3.1 04-Jan 8
650FF Case 600FF with Night Ventilation -22.6 04-Jan 6 -23.0 04-Jan 7 -21.6 04-Jan 2 -23.0 04-Jan 2 -22.9 04-Jan 2 -22.8 04-Jan 7 -22.9 02-Jan 23 -23.0 -21.6 -22.7 6.2% -23.1 04-Jan 3
950FF Case 900FF with Night Ventilation -19.5 04-Jan 6 -20.0 04-Jan 7 -18.6 04-Jan 7 -19.7 04-Jan 7 -20.2 04-Jan 7 -19.3 04-Jan 7 -20.0 07-Jan 22 -20.2 -18.6 -19.6 8.2% -20.4 04-Jan 7
960 Sunspace 2.7 06-Feb 6 1.6 06-Feb 7 3.9 06-Feb 7 3.1 06-Feb 7 1.4 06-Feb 6 -2.8 04-Jan 8 -0.4 05-Feb 7 -2.8 3.9 1.4 492.6% 1.7 06-Feb 7
AVERAGE ANNUAL HOURLY INTEGRATED ZONE TEMPERATURE
Simulation Model: ESP BLAST DOE21D SRES-SUN SRES S3PAS TSYS TASE DesignBuilder
Organization or Country: DMU US-IT NREL NREL BRE SPAIN BEL-BRE FINLAND Min Max Mean (Max-Min)/ DesignBuilder
Case T (°C) T (°C) T (°C) T (°C) T (°C) T (°C) T (°C) T (°C) T (°C) T (°C) T (°C) Mean** (%) T (°C)
600FF - Low Mass with S. Windows 25.1 25.4 24.6 25.5 25.9 25.2 24.5 24.2 24.2 25.9 25.1 6.8% 25.5 24-Jan 26
900FF - High Mass with S. Windows 25.5 25.9 24.7 25.5 25.7 25.2 24.5 24.5 24.5 25.9 25.2 5.9% 25.7 24-Jan 26
650FF Case 600FF with Night Ventilation 18.2 18.7 19.1 19.0 19.6 18.4 18.0 18.4 18.0 19.6 18.7 8.7% 18.6 18-Jan 20
950FF Case 900FF with Night Ventilation 14.1 14.3 14.3 15.0 14.3 14.0 14.5 14.6 14.0 15.0 14.4 6.7% 14.5 14-Jan 15
960 Sunspace 27.5 27.7 28.0 28.7 28.5 28.0 29.0 26.4 26.4 29.0 28.0 9.0% 28.4 26-Jan 29
* SRES-BRE (SERIRES 1.2) simulations did not produce output for this variable.
** ABS[ (Max-Min) / (Mean of Example Simulation Results) ]
Example Result Statistics
Example Result Statistics
Example Result Statistics
Note: The statistics in the tables below are based on the Standard 140 informative example results. These statistics do not have any substantial importance and are not to be interpreted as acceptance criteria.
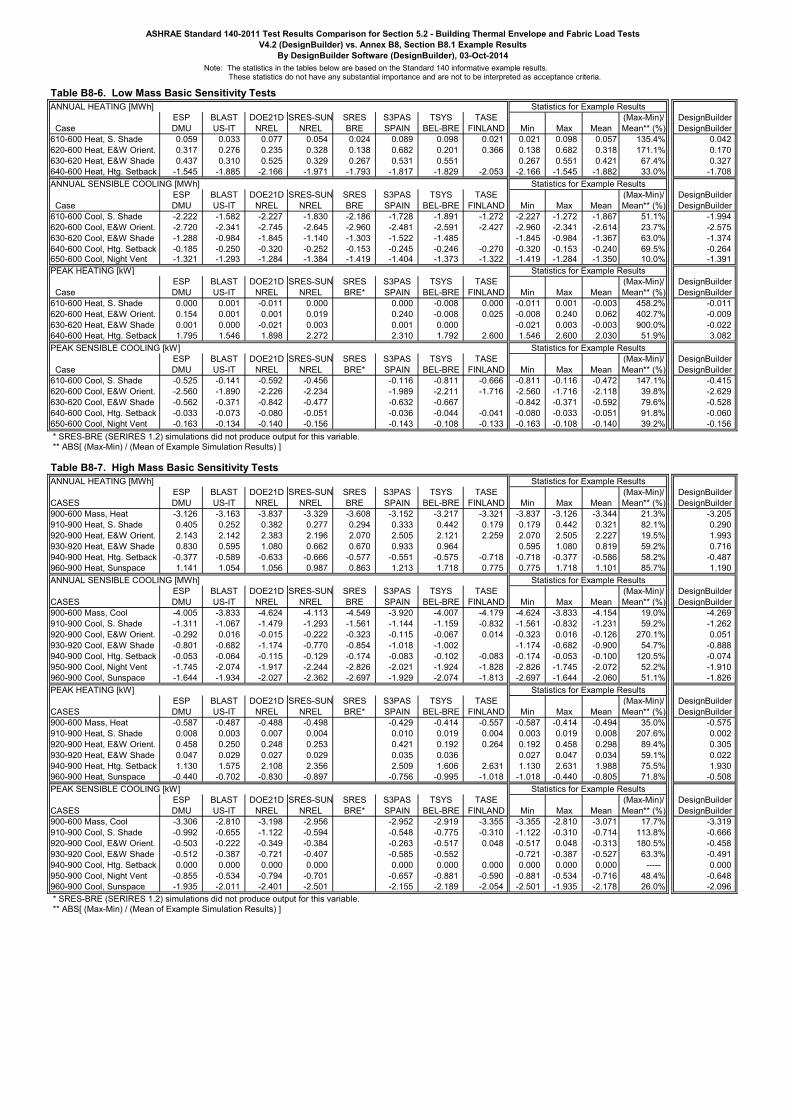
Table B8-6. Low Mass Basic Sensitivity Tests
ANNUAL HEATING [MWh]
ESP BLAST DOE21D SRES-SUN SRES S3PAS TSYS TASE (Max-Min)/ DesignBuilder
Case DMU US-IT NREL NREL BRE SPAIN BEL-BRE FINLAND Min Max Mean Mean** (%) DesignBuilder
610-600 Heat, S. Shade 0.059 0.033 0.077 0.054 0.024 0.089 0.098 0.021 0.021 0.098 0.057 135.4% 0.042
620-600 Heat, E&W Orient. 0.317 0.276 0.235 0.328 0.138 0.682 0.201 0.366 0.138 0.682 0.318 171.1% 0.170
630-620 Heat, E&W Shade 0.437 0.310 0.525 0.329 0.267 0.531 0.551 0.267 0.551 0.421 67.4% 0.327
640-600 Heat, Htg. Setback -1.545 -1.885 -2.166 -1.971 -1.793 -1.817 -1.829 -2.053 -2.166 -1.545 -1.882 33.0% -1.708
ANNUAL SENSIBLE COOLING [MWh]
ESP BLAST DOE21D SRES-SUN SRES S3PAS TSYS TASE (Max-Min)/ DesignBuilder
Case DMU US-IT NREL NREL BRE SPAIN BEL-BRE FINLAND Min Max Mean Mean** (%) DesignBuilder
610-600 Cool, S. Shade -2.222 -1.582 -2.227 -1.830 -2.186 -1.728 -1.891 -1.272 -2.227 -1.272 -1.867 51.1% -1.994
620-600 Cool, E&W Orient. -2.720 -2.341 -2.745 -2.645 -2.960 -2.481 -2.591 -2.427 -2.960 -2.341 -2.614 23.7% -2.575
630-620 Cool, E&W Shade -1.288 -0.984 -1.845 -1.140 -1.303 -1.522 -1.485 -1.845 -0.984 -1.367 63.0% -1.374
640-600 Cool, Htg. Setback -0.185 -0.250 -0.320 -0.252 -0.153 -0.245 -0.246 -0.270 -0.320 -0.153 -0.240 69.5% -0.264650-600 Cool, Night Vent -1.321 -1.293 -1.284 -1.384 -1.419 -1.404 -1.373 -1.322 -1.419 -1.284 -1.350 10.0% -1.391
PEAK HEATING [kW]
ESP BLAST DOE21D SRES-SUN SRES S3PAS TSYS TASE (Max-Min)/ DesignBuilder
Case DMU US-IT NREL NREL BRE* SPAIN BEL-BRE FINLAND Min Max Mean Mean** (%) DesignBuilder
610-600 Heat, S. Shade 0.000 0.001 -0.011 0.000 0.000 -0.008 0.000 -0.011 0.001 -0.003 458.2% -0.011
620-600 Heat, E&W Orient. 0.154 0.001 0.001 0.019 0.240 -0.008 0.025 -0.008 0.240 0.062 402.7% -0.009
630-620 Heat, E&W Shade 0.001 0.000 -0.021 0.003 0.001 0.000 -0.021 0.003 -0.003 900.0% -0.022
640-600 Heat, Htg. Setback 1.795 1.546 1.898 2.272 2.310 1.792 2.600 1.546 2.600 2.030 51.9% 3.082
PEAK SENSIBLE COOLING [kW]
ESP BLAST DOE21D SRES-SUN SRES S3PAS TSYS TASE (Max-Min)/ DesignBuilder
Case DMU US-IT NREL NREL BRE* SPAIN BEL-BRE FINLAND Min Max Mean Mean** (%) DesignBuilder
610-600 Cool, S. Shade -0.525 -0.141 -0.592 -0.456 -0.116 -0.811 -0.666 -0.811 -0.116 -0.472 147.1% -0.415
620-600 Cool, E&W Orient. -2.560 -1.890 -2.226 -2.234 -1.989 -2.211 -1.716 -2.560 -1.716 -2.118 39.8% -2.629
630-620 Cool, E&W Shade -0.562 -0.371 -0.842 -0.477 -0.632 -0.667 -0.842 -0.371 -0.592 79.6% -0.528
640-600 Cool, Htg. Setback -0.033 -0.073 -0.080 -0.051 -0.036 -0.044 -0.041 -0.080 -0.033 -0.051 91.8% -0.060
650-600 Cool, Night Vent -0.163 -0.134 -0.140 -0.156 -0.143 -0.108 -0.133 -0.163 -0.108 -0.140 39.2% -0.156
* SRES-BRE (SERIRES 1.2) simulations did not produce output for this variable.
** ABS[ (Max-Min) / (Mean of Example Simulation Results) ]
Table B8-7. High Mass Basic Sensitivity Tests
ANNUAL HEATING [MWh]
ESP BLAST DOE21D SRES-SUN SRES S3PAS TSYS TASE (Max-Min)/ DesignBuilder
CASES DMU US-IT NREL NREL BRE SPAIN BEL-BRE FINLAND Min Max Mean Mean** (%) DesignBuilder
900-600 Mass, Heat -3.126 -3.163 -3.837 -3.329 -3.608 -3.152 -3.217 -3.321 -3.837 -3.126 -3.344 21.3% -3.205
910-900 Heat, S. Shade 0.405 0.252 0.382 0.277 0.294 0.333 0.442 0.179 0.179 0.442 0.321 82.1% 0.290
920-900 Heat, E&W Orient. 2.143 2.142 2.383 2.196 2.070 2.505 2.121 2.259 2.070 2.505 2.227 19.5% 1.993
930-920 Heat, E&W Shade 0.830 0.595 1.080 0.662 0.670 0.933 0.964 0.595 1.080 0.819 59.2% 0.716
940-900 Heat, Htg. Setback -0.377 -0.589 -0.633 -0.666 -0.577 -0.551 -0.575 -0.718 -0.718 -0.377 -0.586 58.2% -0.487
960-900 Heat, Sunspace 1.141 1.054 1.056 0.987 0.863 1.213 1.718 0.775 0.775 1.718 1.101 85.7% 1.190
ANNUAL SENSIBLE COOLING [MWh]
ESP BLAST DOE21D SRES-SUN SRES S3PAS TSYS TASE (Max-Min)/ DesignBuilder
CASES DMU US-IT NREL NREL BRE SPAIN BEL-BRE FINLAND Min Max Mean Mean** (%) DesignBuilder
900-600 Mass, Cool -4.005 -3.833 -4.624 -4.113 -4.549 -3.920 -4.007 -4.179 -4.624 -3.833 -4.154 19.0% -4.269
910-900 Cool, S. Shade -1.311 -1.067 -1.479 -1.293 -1.561 -1.144 -1.159 -0.832 -1.561 -0.832 -1.231 59.2% -1.262
920-900 Cool, E&W Orient. -0.292 0.016 -0.015 -0.222 -0.323 -0.115 -0.067 0.014 -0.323 0.016 -0.126 270.1% 0.051
930-920 Cool, E&W Shade -0.801 -0.682 -1.174 -0.770 -0.854 -1.018 -1.002 -1.174 -0.682 -0.900 54.7% -0.888
940-900 Cool, Htg. Setback -0.053 -0.064 -0.115 -0.129 -0.174 -0.083 -0.102 -0.083 -0.174 -0.053 -0.100 120.5% -0.074
950-900 Cool, Night Vent -1.745 -2.074 -1.917 -2.244 -2.826 -2.021 -1.924 -1.828 -2.826 -1.745 -2.072 52.2% -1.910
960-900 Cool, Sunspace -1.644 -1.934 -2.027 -2.362 -2.697 -1.929 -2.074 -1.813 -2.697 -1.644 -2.060 51.1% -1.826
PEAK HEATING [kW]
ESP BLAST DOE21D SRES-SUN SRES S3PAS TSYS TASE (Max-Min)/ DesignBuilder
CASES DMU US-IT NREL NREL BRE* SPAIN BEL-BRE FINLAND Min Max Mean Mean** (%) DesignBuilder
900-600 Mass, Heat -0.587 -0.487 -0.488 -0.498 -0.429 -0.414 -0.557 -0.587 -0.414 -0.494 35.0% -0.575
910-900 Heat, S. Shade 0.008 0.003 0.007 0.004 0.010 0.019 0.004 0.003 0.019 0.008 207.6% 0.002
920-900 Heat, E&W Orient. 0.458 0.250 0.248 0.253 0.421 0.192 0.264 0.192 0.458 0.298 89.4% 0.305
930-920 Heat, E&W Shade 0.047 0.029 0.027 0.029 0.035 0.036 0.027 0.047 0.034 59.1% 0.022
940-900 Heat, Htg. Setback 1.130 1.575 2.108 2.356 2.509 1.606 2.631 1.130 2.631 1.988 75.5% 1.930
960-900 Heat, Sunspace -0.440 -0.702 -0.830 -0.897 -0.756 -0.995 -1.018 -1.018 -0.440 -0.805 71.8% -0.508
PEAK SENSIBLE COOLING [kW]
ESP BLAST DOE21D SRES-SUN SRES S3PAS TSYS TASE (Max-Min)/ DesignBuilder
CASES DMU US-IT NREL NREL BRE* SPAIN BEL-BRE FINLAND Min Max Mean Mean** (%) DesignBuilder
900-600 Mass, Cool -3.306 -2.810 -3.198 -2.956 -2.952 -2.919 -3.355 -3.355 -2.810 -3.071 17.7% -3.319
910-900 Cool, S. Shade -0.992 -0.655 -1.122 -0.594 -0.548 -0.775 -0.310 -1.122 -0.310 -0.714 113.8% -0.666
920-900 Cool, E&W Orient. -0.503 -0.222 -0.349 -0.384 -0.263 -0.517 0.048 -0.517 0.048 -0.313 180.5% -0.458
930-920 Cool, E&W Shade -0.512 -0.387 -0.721 -0.407 -0.585 -0.552 -0.721 -0.387 -0.527 63.3% -0.491
940-900 Cool, Htg. Setback 0.000 0.000 0.000 0.000 0.000 0.000 0.000 0.000 0.000 0.000 ----- 0.000
950-900 Cool, Night Vent -0.855 -0.534 -0.794 -0.701 -0.657 -0.881 -0.590 -0.881 -0.534 -0.716 48.4% -0.648
960-900 Cool, Sunspace -1.935 -2.011 -2.401 -2.501 -2.155 -2.189 -2.054 -2.501 -1.935 -2.178 26.0% -2.096
* SRES-BRE (SERIRES 1.2) simulations did not produce output for this variable.
** ABS[ (Max-Min) / (Mean of Example Simulation Results) ]
Statistics for Example Results
Statistics for Example Results
Statistics for Example Results
Statistics for Example Results
Statistics for Example Results
ASHRAE Standard 140-2011 Test Results Comparison for Section 5.2 - Building Thermal Envelope and Fabric Load Tests
V4.2 (DesignBuilder) vs. Annex B8, Section B8.1 Example Results
By DesignBuilder Software (DesignBuilder), 03-Oct-2014
Statistics for Example Results
Statistics for Example Results
Statistics for Example Results
Note: The statistics in the tables below are based on the Standard 140 informative example results. These statistics do not have any substantial importance and are not to be interpreted as acceptance criteria.
Table B8-11. Annual Transmissivity Coefficient of Windows(ANNUAL UNSHADED TRANSMITTED SOLAR RADIATION)/(ANNUAL UNSHADED INCIDENT SOLAR RADIATION)
Simulation Model: ESP DOE21D SRES-SUN SRES S3PAS TSYS TASE DesignBuilder
Organization or Country: DMU NREL NREL BRE SPAIN BEL-BRE FINLAND (Max-Min)/ DesignBuilder
Case Min Max Mean Mean* (%)
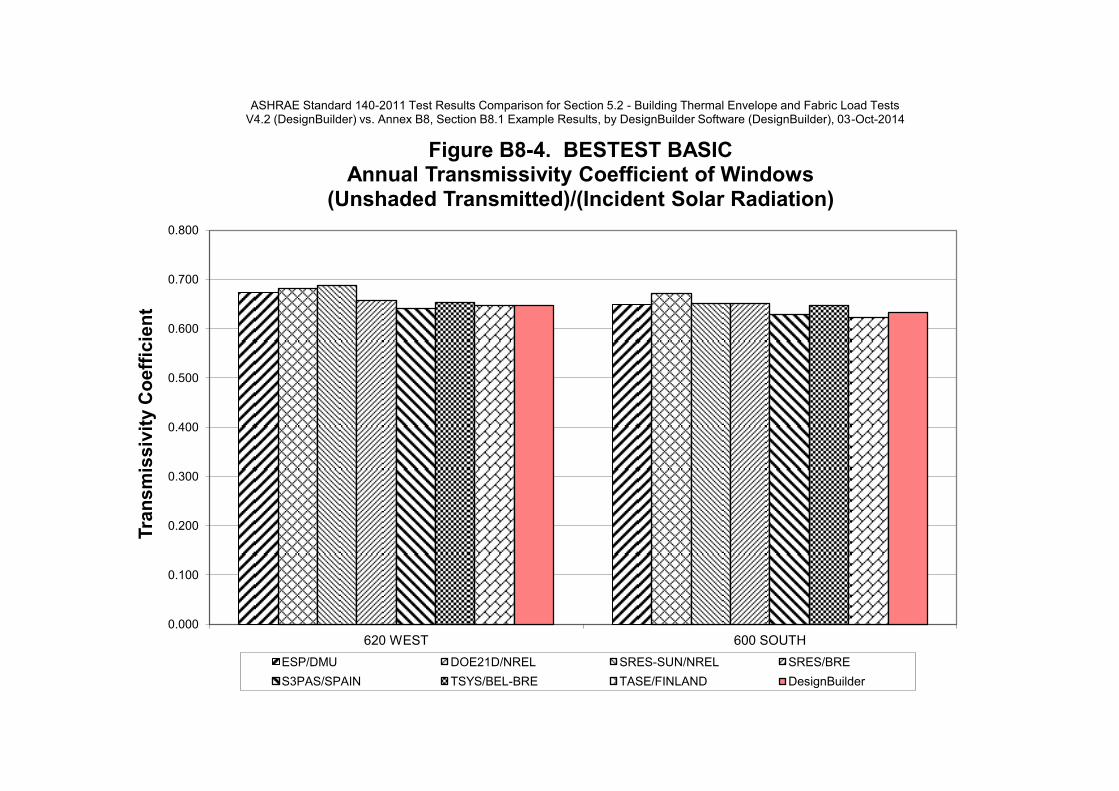
620 West 0.674 0.681 0.687 0.657 0.641 0.654 0.648 0.641 0.687 0.663 7.0% 0.647
600 South 0.650 0.671 0.652 0.650 0.628 0.647 0.623 0.623 0.671 0.646 7.5% 0.633
* ABS[ (Max-Min) / (Mean of Example Simulation Results) ]
Table B8-12. Annual Shading Coefficient of Window Shading Devices: Overhangs & Fins(1-(ANNUAL SHADED TRANSMITTED SOLAR RADIATION)/(ANNUAL UNSHADED TRANSMITTED SOLAR RADIATION))
Simulation Model: ESP DOE21D SRES-SUN SRES S3PAS TSYS TASE DesignBuilder
Organization or Country: DMU NREL NREL BRE SPAIN BEL-BRE FINLAND (Max-Min)/ DesignBuilder
Case Min Max Mean Mean* (%)
630/620 West 0.182 0.346 0.196 0.216 0.329 0.339 0.182 0.346 0.268 61.2% 0.277
610/600 South 0.170 0.209 0.165 0.188 0.183 0.205 0.115 0.115 0.209 0.177 53.5% 0.197
* ABS[ (Max-Min) / (Mean of Example Simulation Results) ]
Table B8-13. Case 600 Annual Incident Solar Radiation (kWh/m2)
Simulation Model: ESP DOE21D SRES-SUN SRES S3PAS TSYS TASE DesignBuilder
Organization or Country: DMU NREL NREL BRE SPAIN BEL-BRE FINLAND (Max-Min)/ DesignBuilder
Case Min Max Mean Mean* (%)
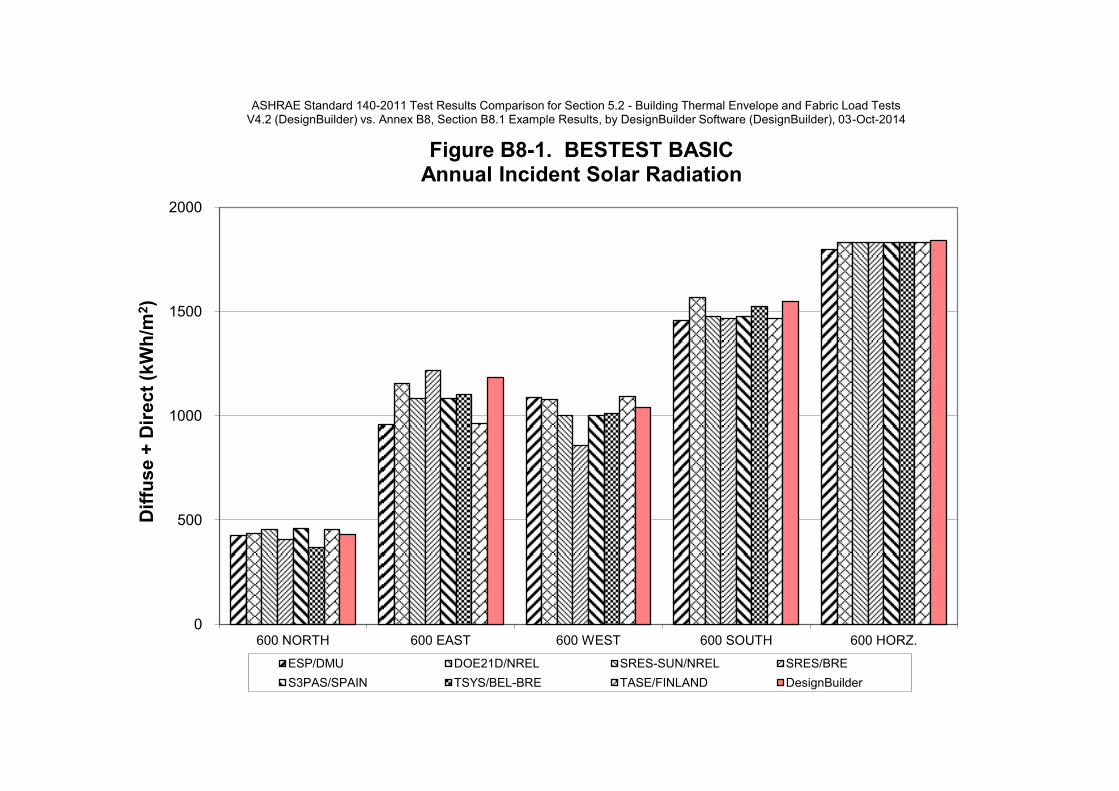
North 427 434 456 407 457 367 453 367 457 429 20.9% 432
East 959 1155 1083 1217 1082 1101 962 959 1217 1080 23.9% 1184
West 1086 1079 1003 857 1002 1012 1090 857 1090 1018 22.9% 1040
South 1456 1566 1476 1468 1474 1522 1468 1456 1566 1490 7.4% 1548
Horizontal 1797 1831 1832 1832 1832 1832 1832 1797 1832 1827 1.9% 1840
* ABS[ (Max-Min) / (Mean of Example Simulation Results) ]
Statistics for Example Results
Statistics for Example Results
Statistics for Example Results
ASHRAE Standard 140-2011 Test Results Comparison for Section 5.2 - Building Thermal Envelope and Fabric Load Tests
V4.2 (DesignBuilder) vs. Annex B8, Section B8.1 Example Results
By DesignBuilder Software (DesignBuilder), 03-Oct-2014

Note: The statistics in the tables below are based on the Standard 140 informative example results. These statistics do not have any substantial importance and are not to be interpreted as acceptance criteria.
ASHRAE Standard 140-2011 Test Results Comparison for Section 5.2 - Building Thermal Envelope and Fabric Load Tests
V4.2 (DesignBuilder) vs. Annex B8, Section B8.1 Example Results
By DesignBuilder Software (DesignBuilder), 03-Oct-2014
Table B8-14. Case 600 Annual Transmitted Solar Radiation - Unshaded (kWh/m2)
Simulation Model: ESP DOE21D SRES-SUN SRES S3PAS TSYS TASE DesignBuilder
Organization or Country: DMU NREL NREL BRE SPAIN BEL-BRE FINLAND (Max-Min)/ DesignBuilder
Case Min Max Mean Mean* (%)
Statistics for Example Results
0
500
1000
1500
2000
600 NORTH 600 EAST 600 WEST 600 SOUTH 600 HORZ.
Dif
fus
e +
Dir
ec
t (k
Wh
/m2)
Figure B8-1. BESTEST BASIC Annual Incident Solar Radiation
ESP/DMU DOE21D/NREL SRES-SUN/NREL SRES/BRE
S3PAS/SPAIN TSYS/BEL-BRE TASE/FINLAND DesignBuilder
ASHRAE Standard 140-2011 Test Results Comparison for Section 5.2 - Building Thermal Envelope and Fabric Load Tests V4.2 (DesignBuilder) vs. Annex B8, Section B8.1 Example Results, by DesignBuilder Software (DesignBuilder), 03-Oct-2014

0
200
400
600
800
1000
1200
620 WEST 600 SOUTH
Dif
fus
e +
Dir
ec
t (k
Wh
/m2)
Figure B8-2. BESTEST BASIC Annual Transmitted Solar Radiation - Unshaded
ESP/DMU DOE21D/NREL SRES-SUN/NREL SRES/BRE
S3PAS/SPAIN TSYS/BEL-BRE TASE/FINLAND DesignBuilder
ASHRAE Standard 140-2011 Test Results Comparison for Section 5.2 - Building Thermal Envelope and Fabric Load Tests V4.2 (DesignBuilder) vs. Annex B8, Section B8.1 Example Results, by DesignBuilder Software (DesignBuilder), 03-Oct-2014 ASHRAE Standard 140-2011 Test Results Comparison for Section 5.2 - Building Thermal Envelope and Fabric Load Tests
V4.2 (DesignBuilder) vs. Annex B8, Section B8.1 Example Results, by DesignBuilder Software (DesignBuilder), 03-Oct-2014

0
200
400
600
800
1000
630 WEST 610 SOUTH
Dif
fus
e +
Dir
ec
t (k
Wh
/m2)
Figure B8-3. BESTEST BASIC Annual Transmitted Solar Radiation - Shaded
ESP/DMU DOE21D/NREL SRES-SUN/NREL SRES/BRE
S3PAS/SPAIN TSYS/BEL-BRE TASE/FINLAND DesignBuilder
ASHRAE Standard 140-2011 Test Results Comparison for Section 5.2 - Building Thermal Envelope and Fabric Load Tests V4.2 (DesignBuilder) vs. Annex B8, Section B8.1 Example Results, by DesignBuilder Software (DesignBuilder), 03-Oct-2014
0.000
0.100
0.200
0.300
0.400
0.500
0.600
0.700
0.800
620 WEST 600 SOUTH
Tra
ns
mis
siv
ity C
oe
ffic
ien
t Figure B8-4. BESTEST BASIC
Annual Transmissivity Coefficient of Windows (Unshaded Transmitted)/(Incident Solar Radiation)
ESP/DMU DOE21D/NREL SRES-SUN/NREL SRES/BRE
S3PAS/SPAIN TSYS/BEL-BRE TASE/FINLAND DesignBuilder
ASHRAE Standard 140-2011 Test Results Comparison for Section 5.2 - Building Thermal Envelope and Fabric Load Tests V4.2 (DesignBuilder) vs. Annex B8, Section B8.1 Example Results, by DesignBuilder Software (DesignBuilder), 03-Oct-2014

0.000
0.100
0.200
0.300
0.400
630/620 WEST 610/600 SOUTH
Sh
ad
ing
Co
eff
icie
nt
Figure B8-5. BESTEST BASIC Annual Overhang and Fin Shading Coefficients
(1-(Shaded)/(Unshaded)) Transmitted Solar Radiation
ESP/DMU DOE21D/NREL SRES-SUN/NREL SRES/BRE
S3PAS/SPAIN TSYS/BEL-BRE TASE/FINLAND DesignBuilder
ASHRAE Standard 140-2011 Test Results Comparison for Section 5.2 - Building Thermal Envelope and Fabric Load Tests V4.2 (DesignBuilder) vs. Annex B8, Section B8.1 Example Results, by DesignBuilder Software (DesignBuilder), 03-Oct-2014

0
2
4
6
8
10
395 Solid
Conduction
430 Opaque Windows
600 South
Windows
610 S. Windows + Overhang
620 East & West
Windows
630 E&W
Windows + Overhang
& Fins
640 Case 600 with Htg. Temp.
Setback
650 Case 600 with Night Ventilation
An
nu
al
He
ati
ng
Lo
ad
(M
Wh
) Figure B8-6. BESTEST BASIC
Low Mass Annual Heating
ESP/DMU BLAST/US-IT DOE21D/NREL SRES-SUN/NREL SRES/BRE
S3PAS/SPAIN TSYS/BEL-BRE TASE/FINLAND DesignBuilder
For Case 650, heating always off
ASHRAE Standard 140-2011 Test Results Comparison for Section 5.2 - Building Thermal Envelope and Fabric Load Tests V4.2 (DesignBuilder) vs. Annex B8, Section B8.1 Example Results, by DesignBuilder Software (DesignBuilder), 03-Oct-2014
0
2
4
6
8
10
395 Solid
Conduction
430 Opaque Windows
600 South
Windows
610 S. Windows + Overhang
620 East & West
Windows
630 E&W
Windows + Overhang
& Fins
640 Case 600 with Htg. Temp.
Setback
650 Case 600 with Night Ventilation
An
nu
al
Co
oli
ng
Lo
ad
(M
Wh
) Figure B8-7. BESTEST BASIC
Low Mass Annual Sensible Cooling
ESP/DMU BLAST/US-IT DOE21D/NREL SRES-SUN/NREL SRES/BRE
S3PAS/SPAIN TSYS/BEL-BRE TASE/FINLAND DesignBuilder
ASHRAE Standard 140-2011 Test Results Comparison for Section 5.2 - Building Thermal Envelope and Fabric Load Tests V4.2 (DesignBuilder) vs. Annex B8, Section B8.1 Example Results, by DesignBuilder Software (DesignBuilder), 03-Oct-2014
0
1
2
3
4
5
6
7
8
395 Solid
Conduction
430 Opaque Windows
600 South
Windows
610 S. Windows + Overhang
620 East & West
Windows
630 E&W
Windows + Overhang
& Fins
640 Case 600 with Htg. Temp.
Setback
650 Case 600 with Night Ventilation
Pe
ak
He
ati
ng
Lo
ad
(k
W)
Figure B8-8. BESTEST BASIC Low Mass Peak Heating
ESP/DMU BLAST/US-IT DOE21D/NREL SRES-SUN/NREL
S3PAS/SPAIN TSYS/BEL-BRE TASE/FINLAND DesignBuilder
For Case 650, heating always off
ASHRAE Standard 140-2011 Test Results Comparison for Section 5.2 - Building Thermal Envelope and Fabric Load Tests V4.2 (DesignBuilder) vs. Annex B8, Section B8.1 Example Results, by DesignBuilder Software (DesignBuilder), 03-Oct-2014

0
1
2
3
4
5
6
7
8
395 Solid
Conduction
430 Opaque Windows
600 South
Windows
610 S. Windows + Overhang
620 East & West
Windows
630 E&W
Windows + Overhang
& Fins
640 Case 600 with Htg. Temp.
Setback
650 Case 600 with Night Ventilation
Pe
ak
Co
oli
ng
Lo
ad
(k
W)
Figure B8-9. BESTEST BASIC Low Mass Peak Sensible Cooling
ESP/DMU BLAST/US-IT DOE21D/NREL SRES-SUN/NREL
S3PAS/SPAIN TSYS/BEL-BRE TASE/FINLAND DesignBuilder
ASHRAE Standard 140-2011 Test Results Comparison for Section 5.2 - Building Thermal Envelope and Fabric Load Tests V4.2 (DesignBuilder) vs. Annex B8, Section B8.1 Example Results, by DesignBuilder Software (DesignBuilder), 03-Oct-2014
0
2
4
6
8
800 Opaque Windows
900 South
Windows
910 S. Windows + Overhang
920 East & West
Windows
930 E&W
Windows + Overhang
& Fins
940 Case 900 with Htg. Temp.
Setback
950 Case 900 with Night Ventilation
960 Sunspace
An
nu
al
He
ati
ng
Lo
ad
(M
Wh
) Figure B8-10. BESTEST BASIC
High Mass Annual Heating
ESP/DMU BLAST/US-IT DOE21D/NREL SRES-SUN/NREL SRES/BRE
S3PAS/SPAIN TSYS/BEL-BRE TASE/FINLAND DesignBuilder
For Case 950, heating always off
ASHRAE Standard 140-2011 Test Results Comparison for Section 5.2 - Building Thermal Envelope and Fabric Load Tests V4.2 (DesignBuilder) vs. Annex B8, Section B8.1 Example Results, by DesignBuilder Software (DesignBuilder), 03-Oct-2014

0.0
0.5
1.0
1.5
2.0
2.5
3.0
3.5
4.0
800 Opaque Windows
900 South
Windows
910 S. Windows + Overhang
920 East & West
Windows
930 E&W
Windows + Overhang
& Fins
940 Case 900 with Htg. Temp.
Setback
950 Case 900 with Night Ventilation
960 Sunspace
An
nu
al
Co
oli
ng
Lo
ad
(M
Wh
) Figure B8-11. BESTEST BASIC
High Mass Annual Sensible Cooling
ESP/DMU BLAST/US-IT DOE21D/NREL SRES-SUN/NREL SRES/BRE
S3PAS/SPAIN TSYS/BEL-BRE TASE/FINLAND DesignBuilder
ASHRAE Standard 140-2011 Test Results Comparison for Section 5.2 - Building Thermal Envelope and Fabric Load Tests V4.2 (DesignBuilder) vs. Annex B8, Section B8.1 Example Results, by DesignBuilder Software (DesignBuilder), 03-Oct-2014

0
1
2
3
4
5
6
7
800 Opaque Windows
900 South
Windows
910 S. Windows + Overhang
920 East & West
Windows
930 E&W
Windows + Overhang
& Fins
940 Case 900 with Htg. Temp.
Setback
950 Case 900 with Night Ventilation
960 Sunspace
Pe
ak
He
ati
ng
Lo
ad
(k
W)
Figure B8-12. BESTEST BASIC High Mass Peak Heating
ESP/DMU BLAST/US-IT DOE21D/NREL SRES-SUN/NREL
S3PAS/SPAIN TSYS/BEL-BRE TASE/FINLAND DesignBuilder
For Case 950, heating always off
ASHRAE Standard 140-2011 Test Results Comparison for Section 5.2 - Building Thermal Envelope and Fabric Load Tests V4.2 (DesignBuilder) vs. Annex B8, Section B8.1 Example Results, by DesignBuilder Software (DesignBuilder), 03-Oct-2014

0
1
2
3
4
5
800 Opaque Windows
900 South
Windows
910 S. Windows + Overhang
920 East & West
Windows
930 E&W
Windows + Overhang
& Fins
940 Case 900 with Htg. Temp.
Setback
950 Case 900 with Night Ventilation
960 Sunspace
Pe
ak
Co
oli
ng
Lo
ad
(k
W)
Figure B8-13. BESTEST BASIC High Mass Peak Sensible Cooling
ESP/DMU BLAST/US-IT DOE21D/NREL SRES-SUN/NREL
S3PAS/SPAIN TSYS/BEL-BRE TASE/FINLAND DesignBuilder
ASHRAE Standard 140-2011 Test Results Comparison for Section 5.2 - Building Thermal Envelope and Fabric Load Tests V4.2 (DesignBuilder) vs. Annex B8, Section B8.1 Example Results, by DesignBuilder Software (DesignBuilder), 03-Oct-2014

0
10
20
30
40
50
60
70
80
600FF - Low Mass Building with South
Windows
900FF - High Mass Building with South
Windows
650FF Case 600FF with Night Ventilation
950FF Case 900FF with Night Ventilation
960 Sunspace
Ma
xim
um
Te
mp
era
ture
(°C
) Figure B8-14. BESTEST BASIC
Maximum Hourly Annual Temperature Free-Float Cases
ESP/DMU BLAST/US-IT DOE21D/NREL SRES-SUN/NREL
S3PAS/SPAIN TSYS/BEL-BRE TASE/FINLAND DesignBuilder
ASHRAE Standard 140-2011 Test Results Comparison for Section 5.2 - Building Thermal Envelope and Fabric Load Tests V4.2 (DesignBuilder) vs. Annex B8, Section B8.1 Example Results, by DesignBuilder Software (DesignBuilder), 03-Oct-2014
-25
-20
-15
-10
-5
0
5
10
600FF - Low Mass Building with South
Windows
900FF - High Mass Building with South
Windows
650FF Case 600FF with Night Ventilation
950FF Case 900FF with Night Ventilation
960 Sunspace
Min
imu
m T
em
pe
ratu
re (
°C)
Figure B8-15. BESTEST BASIC Minimum Hourly Annual Temperature
Free-Float Cases
ESP/DMU BLAST/US-IT DOE21D/NREL SRES-SUN/NREL
S3PAS/SPAIN TSYS/BEL-BRE TASE/FINLAND DesignBuilder
ASHRAE Standard 140-2011 Test Results Comparison for Section 5.2 - Building Thermal Envelope and Fabric Load Tests V4.2 (DesignBuilder) vs. Annex B8, Section B8.1 Example Results, by DesignBuilder Software (DesignBuilder), 03-Oct-2014
0
5
10
15
20
25
30
35
600FF - Low Mass Building with South
Windows
900FF - High Mass Building with South
Windows
650FF Case 600FF with Night Ventilation
950FF Case 900FF with Night Ventilation
960 Sunspace
Ave
rag
e T
em
pe
ratu
re (
°C)
Figure B8-16. BESTEST BASIC Average Hourly Annual Temperature
Free-Float Cases
ESP/DMU BLAST/US-IT DOE21D/NREL SRES-SUN/NREL SRES/BRE
S3PAS/SPAIN TSYS/BEL-BRE TASE/FINLAND DesignBuilder
ASHRAE Standard 140-2011 Test Results Comparison for Section 5.2 - Building Thermal Envelope and Fabric Load Tests V4.2 (DesignBuilder) vs. Annex B8, Section B8.1 Example Results, by DesignBuilder Software (DesignBuilder), 03-Oct-2014

-2.5
-2.0
-1.5
-1.0
-0.5
0.0
0.5
1.0
610-600 Low Mass, Heating
S. Shade
610-600 Low Mass, Cooling
S. Shade
910-900 High Mass, Heating
S. Shade
910-900 High Mass, Cooling
S. Shade
Lo
ad
Dif
fere
nc
e (
MW
h)
Figure B8-17. BESTEST BASIC South Window Shading (Delta)
Annual Heating and Sensible Cooling
ESP/DMU BLAST/US-IT DOE21D/NREL SRES-SUN/NREL SRES/BRE
S3PAS/SPAIN TSYS/BEL-BRE TASE/FINLAND DesignBuilder
ASHRAE Standard 140-2011 Test Results Comparison for Section 5.2 - Building Thermal Envelope and Fabric Load Tests V4.2 (DesignBuilder) vs. Annex B8, Section B8.1 Example Results, by DesignBuilder Software (DesignBuilder), 03-Oct-2014

-1.2
-1.0
-0.8
-0.6
-0.4
-0.2
0.0
0.2
610-600 Low Mass, Heating
S. Shade
610-600 Low Mass, Cooling
S. Shade
910-900 High Mass, Heating
S. Shade
910-900 High Mass, Cooling
S. Shade
Lo
ad
Dif
fere
nc
e (
kW
) Figure B8-18. BESTEST BASIC South Window Shading (Delta)
Peak Heating and Sensible Cooling
ESP/DMU BLAST/US-IT DOE21D/NREL SRES-SUN/NREL
S3PAS/SPAIN TSYS/BEL-BRE TASE/FINLAND DesignBuilder
ASHRAE Standard 140-2011 Test Results Comparison for Section 5.2 - Building Thermal Envelope and Fabric Load Tests V4.2 (DesignBuilder) vs. Annex B8, Section B8.1 Example Results, by DesignBuilder Software (DesignBuilder), 03-Oct-2014

-4
-3
-2
-1
0
1
2
3
620-600 Low Mass, Heating E&W Orientation
620-600 Low Mass, Cooling E&W Orientation
920-900 High Mass, Heating
E&W Orientation
920-900 High Mass, Cooling
E&W Orientation
Lo
ad
Dif
fere
nc
e (
MW
h)
Figure B8-19. BESTEST BASIC East & West Window (Delta)
Annual Heating and Sensible Cooling
ESP/DMU BLAST/US-IT DOE21D/NREL SRES-SUN/NREL SRES/BRE
S3PAS/SPAIN TSYS/BEL-BRE TASE/FINLAND DesignBuilder
ASHRAE Standard 140-2011 Test Results Comparison for Section 5.2 - Building Thermal Envelope and Fabric Load Tests V4.2 (DesignBuilder) vs. Annex B8, Section B8.1 Example Results, by DesignBuilder Software (DesignBuilder), 03-Oct-2014

-3.0
-2.5
-2.0
-1.5
-1.0
-0.5
0.0
0.5
1.0
620-600 Low Mass, Heating E&W Orientation
620-600 Low Mass, Cooling E&W Orientation
920-900 High Mass, Heating
E&W Orientation
920-900 High Mass, Cooling
E&W Orientation
Lo
ad
Dif
fere
nc
e (
kW
) Figure B8-20. BESTEST BASIC
East & West Window (Delta) Peak Heating and Sensible Cooling
ESP/DMU BLAST/US-IT DOE21D/NREL SRES-SUN/NREL
S3PAS/SPAIN TSYS/BEL-BRE TASE/FINLAND DesignBuilder
ASHRAE Standard 140-2011 Test Results Comparison for Section 5.2 - Building Thermal Envelope and Fabric Load Tests V4.2 (DesignBuilder) vs. Annex B8, Section B8.1 Example Results, by DesignBuilder Software (DesignBuilder), 03-Oct-2014

-2.0
-1.5
-1.0
-0.5
0.0
0.5
1.0
1.5
630-620 Low Mass, Heating
E&W Shade
630-620 Low Mass, Cooling
E&W Shade
930-920 High Mass, Heating
E&W Shade
930-920 High Mass, Cooling
E&W Shade
Lo
ad
Dif
fere
nc
e (
MW
h)
Figure B8-21. BESTEST BASIC East & West Shaded Window (Delta)
Annual Heating and Sensible Cooling
ESP/DMU BLAST/US-IT DOE21D/NREL SRES-SUN/NREL
SRES/BRE S3PAS/SPAIN TSYS/BEL-BRE DesignBuilder
ASHRAE Standard 140-2011 Test Results Comparison for Section 5.2 - Building Thermal Envelope and Fabric Load Tests V4.2 (DesignBuilder) vs. Annex B8, Section B8.1 Example Results, by DesignBuilder Software (DesignBuilder), 03-Oct-2014
-1.0
-0.8
-0.6
-0.4
-0.2
0.0
0.2
630-620 Low Mass, Heating
E&W Shade
630-620 Low Mass, Cooling
E&W Shade
930-920 High Mass, Heating
E&W Shade
930-920 High Mass, Cooling
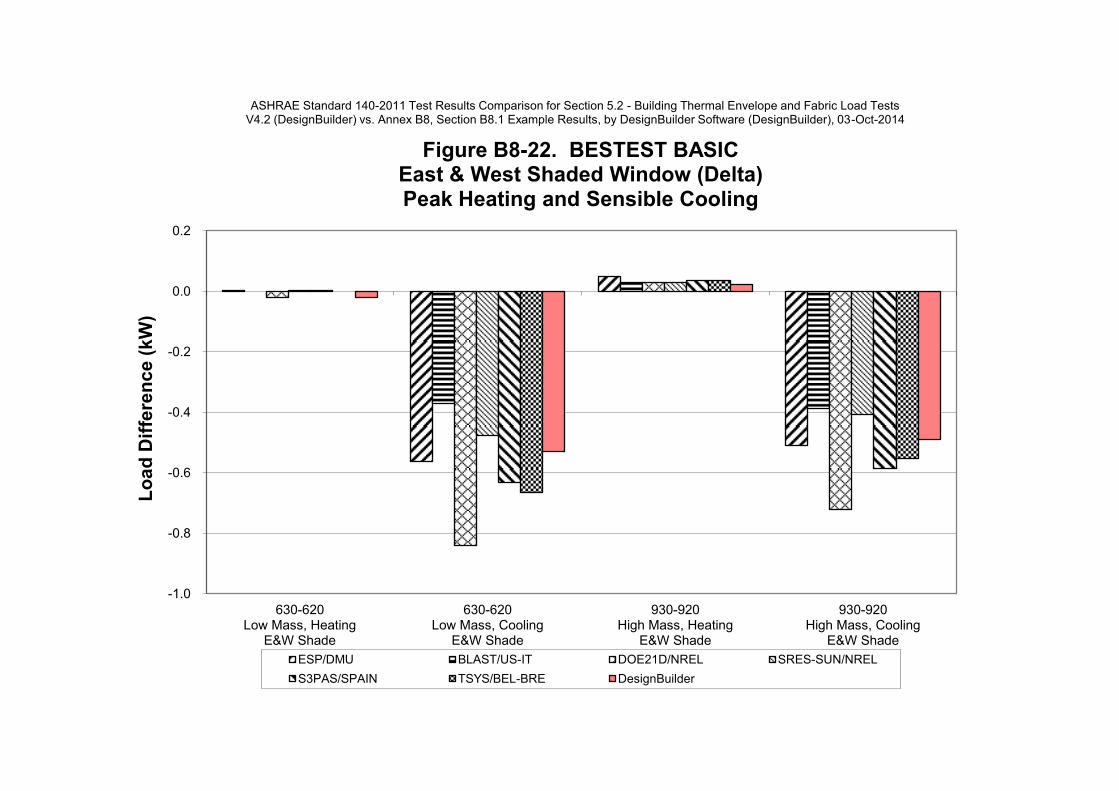
E&W Shade
Lo
ad
Dif
fere
nc
e (
kW
) Figure B8-22. BESTEST BASIC
East & West Shaded Window (Delta) Peak Heating and Sensible Cooling
ESP/DMU BLAST/US-IT DOE21D/NREL SRES-SUN/NREL
S3PAS/SPAIN TSYS/BEL-BRE DesignBuilder
ASHRAE Standard 140-2011 Test Results Comparison for Section 5.2 - Building Thermal Envelope and Fabric Load Tests V4.2 (DesignBuilder) vs. Annex B8, Section B8.1 Example Results, by DesignBuilder Software (DesignBuilder), 03-Oct-2014

-2.5
-2.0
-1.5
-1.0
-0.5
0.0
640-600 Low Mass, Heating
Heating Setback
940-900 High Mass, Heating
Heating Setback
Lo
ad
Dif
fere
nc
e (
MW
h)
Figure B8-23. BESTEST BASIC Thermostat Setback (Delta)
Annual Heating
ESP/DMU BLAST/US-IT DOE21D/NREL SRES-SUN/NREL SRES/BRE
S3PAS/SPAIN TSYS/BEL-BRE TASE/FINLAND DesignBuilder
ASHRAE Standard 140-2011 Test Results Comparison for Section 5.2 - Building Thermal Envelope and Fabric Load Tests V4.2 (DesignBuilder) vs. Annex B8, Section B8.1 Example Results, by DesignBuilder Software (DesignBuilder), 03-Oct-2014

0.0
0.5
1.0
1.5
2.0
2.5
3.0
3.5
640-600 Low Mass, Heating
Heating Setback
940-900 High Mass, Heating
Heating Setback
Lo
ad
Dif
fere
nc
e (
kW
) Figure B8-24. BESTEST BASIC
Thermostat Setback (Delta) Peak Heating
ESP/DMU BLAST/US-IT DOE21D/NREL SRES-SUN/NREL
S3PAS/SPAIN TSYS/BEL-BRE TASE/FINLAND DesignBuilder
ASHRAE Standard 140-2011 Test Results Comparison for Section 5.2 - Building Thermal Envelope and Fabric Load Tests V4.2 (DesignBuilder) vs. Annex B8, Section B8.1 Example Results, by DesignBuilder Software (DesignBuilder), 03-Oct-2014
-3.0
-2.5
-2.0
-1.5
-1.0
-0.5
0.0
650-600 Low Mass, Cooling
Night Ventilation
950-900 High Mass, Cooling
Night Ventilation
Lo
ad
Dif
fere
nc
e (
MW
h)
Figure B8-25. BESTEST BASIC Vent Cooling (Delta)
Annual Sensible Cooling
ESP/DMU BLAST/US-IT DOE21D/NREL SRES-SUN/NREL SRES/BRE
S3PAS/SPAIN TSYS/BEL-BRE TASE/FINLAND DesignBuilder
ASHRAE Standard 140-2011 Test Results Comparison for Section 5.2 - Building Thermal Envelope and Fabric Load Tests V4.2 (DesignBuilder) vs. Annex B8, Section B8.1 Example Results, by DesignBuilder Software (DesignBuilder), 03-Oct-2014
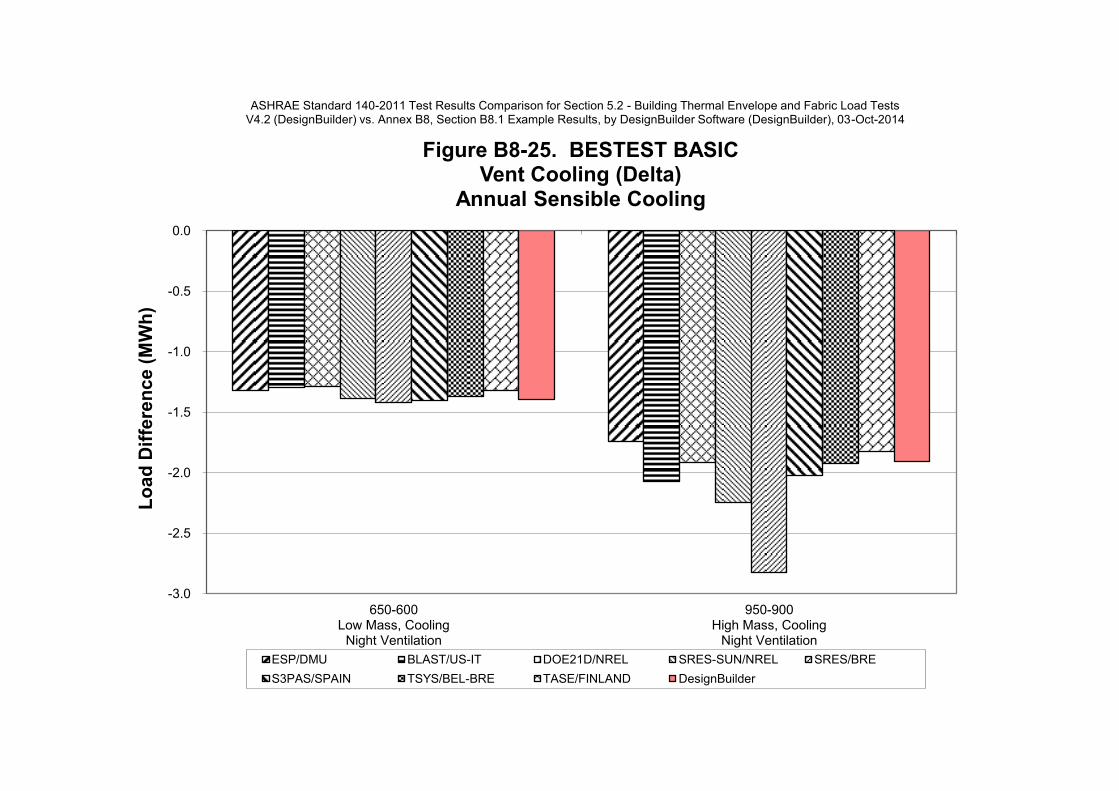
-1.0
-0.8
-0.6
-0.4
-0.2
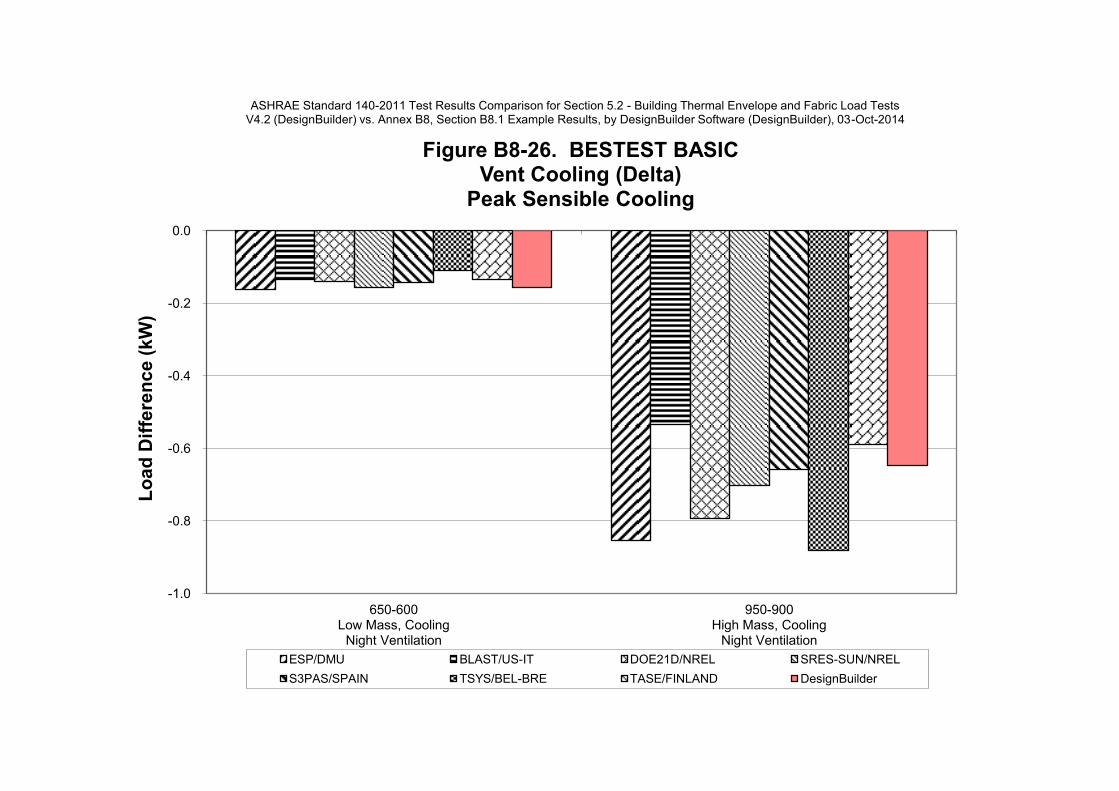
0.0
650-600 Low Mass, Cooling
Night Ventilation
950-900 High Mass, Cooling
Night Ventilation
Lo
ad
Dif
fere
nc
e (
kW
) Figure B8-26. BESTEST BASIC
Vent Cooling (Delta) Peak Sensible Cooling
ESP/DMU BLAST/US-IT DOE21D/NREL SRES-SUN/NREL
S3PAS/SPAIN TSYS/BEL-BRE TASE/FINLAND DesignBuilder
ASHRAE Standard 140-2011 Test Results Comparison for Section 5.2 - Building Thermal Envelope and Fabric Load Tests V4.2 (DesignBuilder) vs. Annex B8, Section B8.1 Example Results, by DesignBuilder Software (DesignBuilder), 03-Oct-2014
-3
-2
-1
0
1
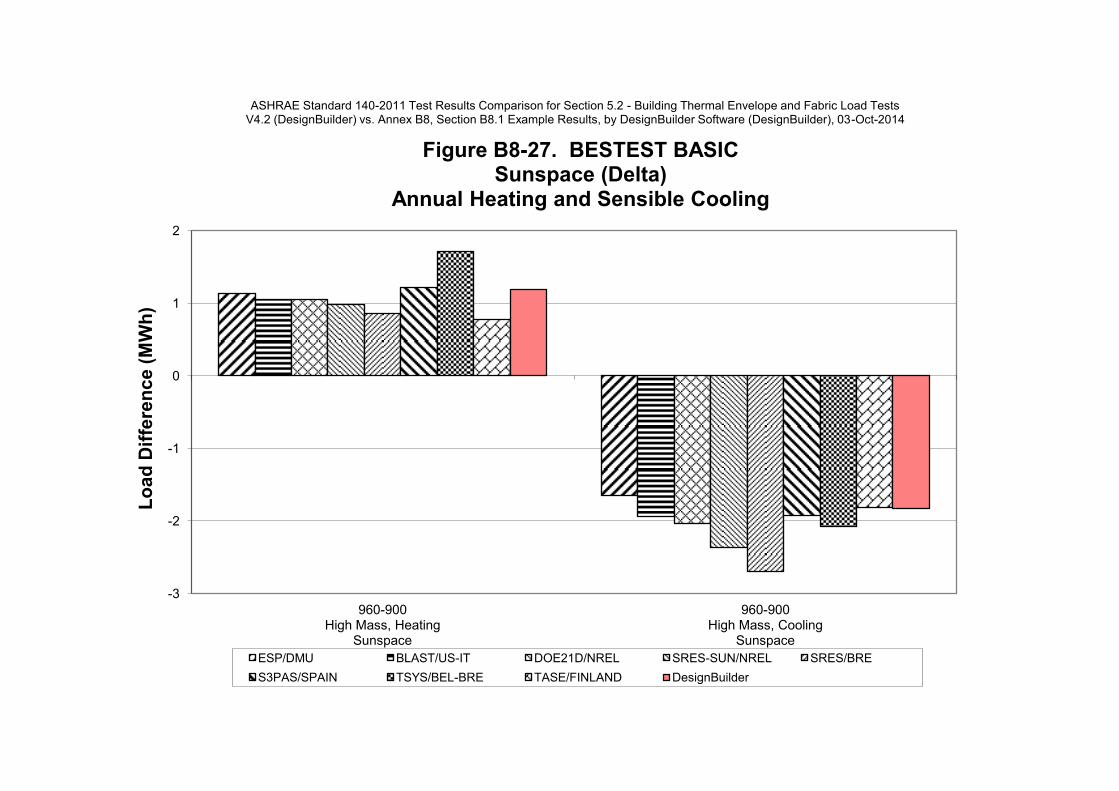
2
960-900 High Mass, Heating
Sunspace
960-900 High Mass, Cooling
Sunspace
Lo
ad
Dif
fere
nc
e (
MW
h)
Figure B8-27. BESTEST BASIC Sunspace (Delta)
Annual Heating and Sensible Cooling
ESP/DMU BLAST/US-IT DOE21D/NREL SRES-SUN/NREL SRES/BRE
S3PAS/SPAIN TSYS/BEL-BRE TASE/FINLAND DesignBuilder
ASHRAE Standard 140-2011 Test Results Comparison for Section 5.2 - Building Thermal Envelope and Fabric Load Tests V4.2 (DesignBuilder) vs. Annex B8, Section B8.1 Example Results, by DesignBuilder Software (DesignBuilder), 03-Oct-2014

-3.0
-2.5
-2.0
-1.5
-1.0
-0.5
0.0
960-900 High Mass, Heating
Sunspace
960-900 High Mass, Cooling
Sunspace
Lo
ad
Dif
fere
nc
e (
kW
) Figure B8-28. BESTEST BASIC
Sunspace (Delta) Peak Heating and Sensible Cooling
ESP/DMU BLAST/US-IT DOE21D/NREL SRES-SUN/NREL
S3PAS/SPAIN TSYS/BEL-BRE TASE/FINLAND DesignBuilder
ASHRAE Standard 140-2011 Test Results Comparison for Section 5.2 - Building Thermal Envelope and Fabric Load Tests V4.2 (DesignBuilder) vs. Annex B8, Section B8.1 Example Results, by DesignBuilder Software (DesignBuilder), 03-Oct-2014

-7.0
-6.0
-5.0
-4.0
-3.0
-2.0
-1.0
0.0
800-430 Mass, Heating
w/ Op. Win.
800-430 Mass, Cooling w/ Op. Win.
900-600 Mass, Heating
900-600 Mass, Cooling
940-640 Mass, Heating
w/ Heating Setback
950-650 Mass, Cooling w/ Night Vent
Lo
ad
Dif
fere
nc
e (
MW
h)
Figure B8-29. BESTEST BASIC AND IN-DEPTH Mass Effect (Delta)
Annual Heating and Sensible Cooling
ESP/DMU BLAST/US-IT DOE21D/NREL SRES-SUN/NREL SRES/BRE
S3PAS/SPAIN TSYS/BEL-BRE TASE/FINLAND DesignBuilder
ASHRAE Standard 140-2011 Test Results Comparison for Section 5.2 - Building Thermal Envelope and Fabric Load Tests V4.2 (DesignBuilder) vs. Annex B8, Section B8.1 Example Results, by DesignBuilder Software (DesignBuilder), 03-Oct-2014

-5
-4
-3
-2
-1
0
800-430 Mass, Heating
w/ Op. Win.
800-430 Mass, Cooling w/ Op. Win.
900-600 Mass, Heating
900-600 Mass, Cooling
940-640 Mass, Heating
w/ Heating Setback
950-650 Mass, Cooling w/ Night Vent
Lo
ad
Dif
fere
nc
e (
KW
) Figure B8-30. BESTEST BASIC AND IN-DEPTH
Mass Effect (Delta) Peak Heating and Sensible Cooling
ESP/DMU BLAST/US-IT DOE21D/NREL SRES-SUN/NREL
S3PAS/SPAIN TSYS/BEL-BRE TASE/FINLAND DesignBuilder
ASHRAE Standard 140-2011 Test Results Comparison for Section 5.2 - Building Thermal Envelope and Fabric Load Tests V4.2 (DesignBuilder) vs. Annex B8, Section B8.1 Example Results, by DesignBuilder Software (DesignBuilder), 03-Oct-2014

0
100
200
300
400
500
-10 -5 0 5 10 15 20 25 30 35 40 45 50
Nu
mb
er
of
Oc
cu
rre
nce
s
Temperature Bins (°C)
Figure B8-53. BESTEST Case 900FF Annual Hourly Temperature Frequency
ESP/DMU BLAST/US-IT DOE21D/NREL SRES-SUN/NREL SRES/BRE
S3PAS/SPAIN TSYS/BEL-BRE TASE/FINLAND DesignBuilder
Hourly Occurrences For Each 1 ºC Bin
ASHRAE Standard 140-2011 Test Results Comparison for Section 5.2 - Building Thermal Envelope and Fabric Load Tests V4.2 (DesignBuilder) vs. Annex B8, Section B8.1 Example Results, by DesignBuilder Software (DesignBuilder), 03-Oct-2014
0
100
200
300
400
500
600
1 2 3 4 5 6 7 8 9 10 11 12 13 14 15 16 17 18 19 20 21 22 23 24
Incid
en
t S
ola
r R
ad
iati
on
(W
h/m
2)
Hour of Day
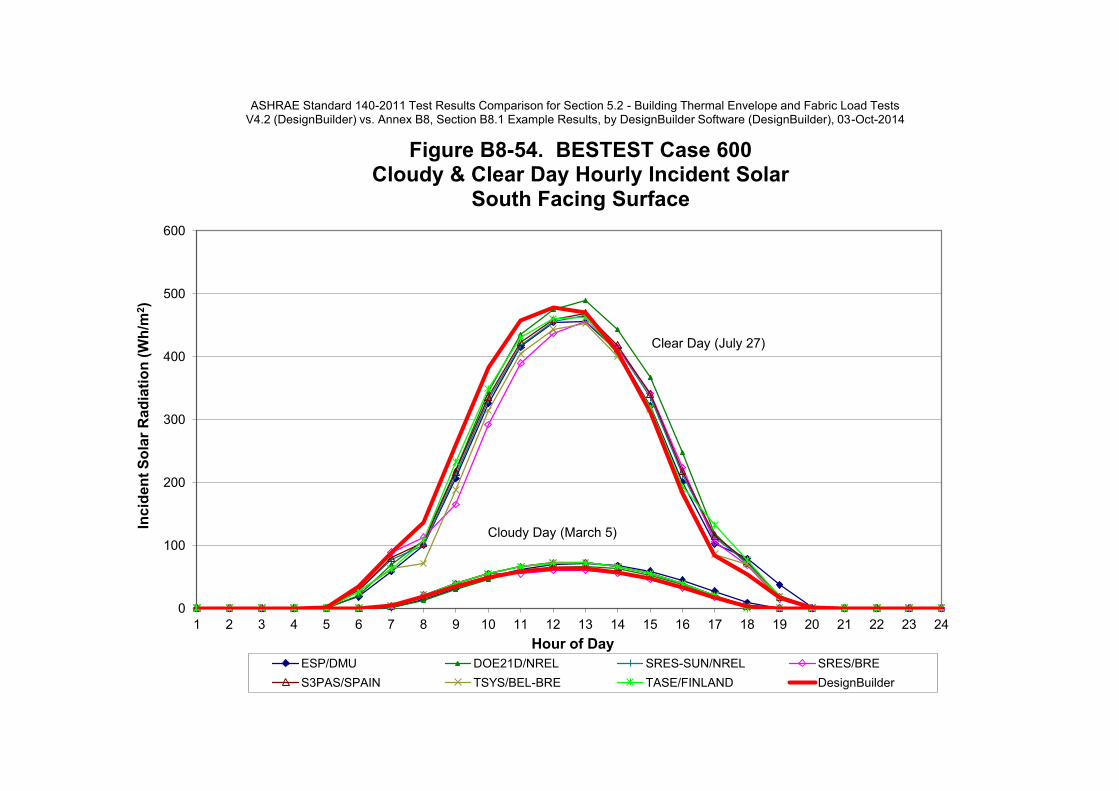
Figure B8-54. BESTEST Case 600 Cloudy & Clear Day Hourly Incident Solar
South Facing Surface
ESP/DMU DOE21D/NREL SRES-SUN/NREL SRES/BRE
S3PAS/SPAIN TSYS/BEL-BRE TASE/FINLAND DesignBuilder
Clear Day (July 27)
Cloudy Day (March 5)
ASHRAE Standard 140-2011 Test Results Comparison for Section 5.2 - Building Thermal Envelope and Fabric Load Tests V4.2 (DesignBuilder) vs. Annex B8, Section B8.1 Example Results, by DesignBuilder Software (DesignBuilder), 03-Oct-2014

0
200
400
600
800
1000
1 2 3 4 5 6 7 8 9 10 11 12 13 14 15 16 17 18 19 20 21 22 23 24
Incid
en
t S
ola
r R
ad
iati
on
(W
h/m
2)
Hour of Day
Figure B8-55. BESTEST Case 600 Cloudy & Clear Day Hourly Incident Solar
West Facing Surface
ESP/DMU DOE21D/NREL SRES-SUN/NREL SRES/BRE
S3PAS/SPAIN TSYS/BEL-BRE TASE/FINLAND DesignBuilder
Clear Day (July 27)
Cloudy Day (March 5)
ASHRAE Standard 140-2011 Test Results Comparison for Section 5.2 - Building Thermal Envelope and Fabric Load Tests V4.2 (DesignBuilder) vs. Annex B8, Section B8.1 Example Results, by DesignBuilder Software (DesignBuilder), 03-Oct-2014 ASHRAE Standard 140-2011 Test Results Comparison for Section 5.2 - Building Thermal Envelope and Fabric Load Tests
V4.2 (DesignBuilder) vs. Annex B8, Section B8.1 Example Results, by DesignBuilder Software (DesignBuilder), 03-Oct-2014

-30
-20
-10
0
10
20
30
40
1 2 3 4 5 6 7 8 9 10 11 12 13 14 15 16 17 18 19 20 21 22 23 24
Te
mp
era
ture
(°C
)
Hour of Day
Figure B8-56. BESTEST HOURLY FREE FLOAT TEMPERATURES Clear Cold Day - Cases 600FF and 900FF
ESP/DMU BLAST/US-IT DOE21D/NREL SRES-SUN/NREL
S3PAS/SPAIN TSYS/BEL-BRE TASE/FINLAND DesignBuilder
Case 600FF
Case 900FF
ASHRAE Standard 140-2011 Test Results Comparison for Section 5.2 - Building Thermal Envelope and Fabric Load Tests V4.2 (DesignBuilder) vs. Annex B8, Section B8.1 Example Results, by DesignBuilder Software (DesignBuilder), 03-Oct-2014

0
10
20
30
40
50
60
1 2 3 4 5 6 7 8 9 10 11 12 13 14 15 16 17 18 19 20 21 22 23 24
Te
mp
era
ture
(°C
)
Hour of Day
Figure B8-57. BESTEST HOURLY FREE FLOAT TEMPERATURES Clear Hot Day - Cases 650FF and 950FF
ESP/DMU BLAST/US-IT DOE21D/NREL SRES-SUN/NREL
S3PAS/SPAIN TSYS/BEL-BRE TASE/FINLAND DesignBuilder
Case 650FF
Case 950FF
ASHRAE Standard 140-2011 Test Results Comparison for Section 5.2 - Building Thermal Envelope and Fabric Load Tests V4.2 (DesignBuilder) vs. Annex B8, Section B8.1 Example Results, by DesignBuilder Software (DesignBuilder), 03-Oct-2014
INTRODUCTION This document includes supplemental information about the ASHRAE Standard 140 tests performed. One S140outNotes document shall be provided for each set of tests (e.g., one for the building thermal and fabric load tests of Section 5.2, one for the space cooling equipment analytical verification tests of Sections 5.3.1 and 5.3.2, etc.) The types of information listed below shall be provided in this document, each in a separate section: A. Software Information B. Alternative Modeling Methods C. Equivalent Modeling Methods D. Non-Specified Inputs E. Omitted Test Cases and Results F. Changes Made to Source Code for the Purpose of Running the Tests, where Such Changes are not Available in Publicly Released Versions of the Software G. Anomalous Results. Notes in this document shall be limited to the topics shown above. Notes must be factual and objective and shall only refer to the software being tested. Notes shall not refer to any other software program. INFORMATIVE NOTE: Text at the start of each section describes the content of the section for the reader and provides instructions for supplying the content. Sample notes are provided in a separate document (S140outNotes_Examples.TXT). A. SOFTWARE INFORMATION CONTENT: This section shall include reference information for the software - the vendor, name and version of the software plus operating system and computer hardware requirements. INSTRUCTIONS: Information for items 1 through 7 below shall be provided. Information for Item 8 shall be permitted, but is not required.
1. SOFTWARE VENDOR: DesignBuilder Software ltd (Partner 'Vendors' operate in some countries outside UK, website www.designbuilder.co.uk has details) 2. SOFTWARE NAME: DesignBuilder (EnergyPlus Simulation) 3. SOFTWARE VERSION: 4.1.0.021 4. OPERATING SYSTEM REQUIREMENTS: XP(SP3), Vista, Windows 7, Windows 8 5. APPROX HARD DISK SPACE REQUIRED FOR INSTALLATION: 200MB 6. MINIMUM RAM REQUIRED FOR SOFTWARE OPERATION: 2GB 7. MINIMUM DISPLAY MONITOR REQUIREMENTS: 800X600 Resolution, 32 bit colour. 8. OTHER HARDWARE OR SOFTWARE-RELATED REQUIREMENTS: OpenGL compatible 3D graphics adapter. Pointing device.

B. REPORT BLOCK FOR ALTERNATIVE MODELING METHODS CONTENT: If the software being tested provides alternative modeling methods or algorithms for performing the tests, this section shall describe modeling methods used for the tests. INSTRUCTIONS: If alternative modeling methods are applicable, a separate note for each alternative modeling method or algorithm situation shall be provided. The standard format shown below and a separate number and title for each noteshall be applied. If alternative modeling methods are not applicable, specify "NONE" in place of the information below. NOTE 1 – Inside convection algorithm --------------------------------------------------------- 1.1 Describe the Effect Being Simulated: Method to estimate internal convection coefficients for use in classical equation (Newton's law of cooling) of convective heat transfer. 1.2 Optional Settings or Modeling Capabilities The model specified in this field is the default algorithm for the inside face all the surfaces. The key choices are Simple, TARP, CeilingDiffuser, and AdaptiveConvectionAlgorithm. 1.2.1 Simple The Simple model applies constant heat transfer coefficients depending on the surface orientation. 1.2.2 TARP The TARP model correlates the heat transfer coefficient to the temperature difference for various orientations. This model is based on flat plate experiments. 1.2.3 Ceiling Diffuser The Ceiling Diffuser model is a mixed and forced convection model for ceiling diffuser configurations. The model correlates the heat transfer coefficient to the air change rate for ceilings, walls and floors. These correlations are based on experiments performed in an isothermal room with a cold ceiling jet. To avoid discontinuities in surface heat transfer rate calculations, all correlations have been extrapolated beyond the lower limit of the data set (3 ACH) to a natural convection limit that is applied during the hours when the system is off. 1.2.4 Adaptive Convection Algorithm The Adaptive Convection Algorithm model is an dynamic algorithm that organizes a large number of different convection models and automatically selects the one that best applies. 1.3 Setting or Capability Used: TARP. DesignBuilder uses same options as GARD ANALYTICS use for their EnergyPlus ASHRAE 140 Tests. NOTE 2 – Outside convection algorithm --------------------------------------------------------- 2.1 Describe the Effect Being Simulated: Method to estimate external convection coefficients for use in classical equation (Newton's law of cooling) of convective heat transfer. 2.2 Optional Settings or Modeling Capabilities The model specified in this field is the global algorithm for external face of surfaces. The key choices are Simple Combined, TARP, MoWiTT, DOE-2, and Adaptive Convection Algorithm. Note that the Simple Combined option is fundamentally different to the others in that it incorporates the radiation coefficient. The others are convection only heat transfer coefficients; radiation heat transfer coefficients are calculated automatically by the program. Also, the convection only models apply heat transfer coefficients depending on the roughness, windspeed, and terrain of the building’s location. 2.2.1 Simple Combined The Simple convection model applies heat transfer coefficients depending on the roughness and windspeed. This is a combined heat transfer coefficient that includes radiation to sky, ground, and air. The correlation is based on Figure 1, Page 25.1 (Thermal and Water Vapor Transmission Data), 2001 ASHRAE Handbook of Fundamentals.
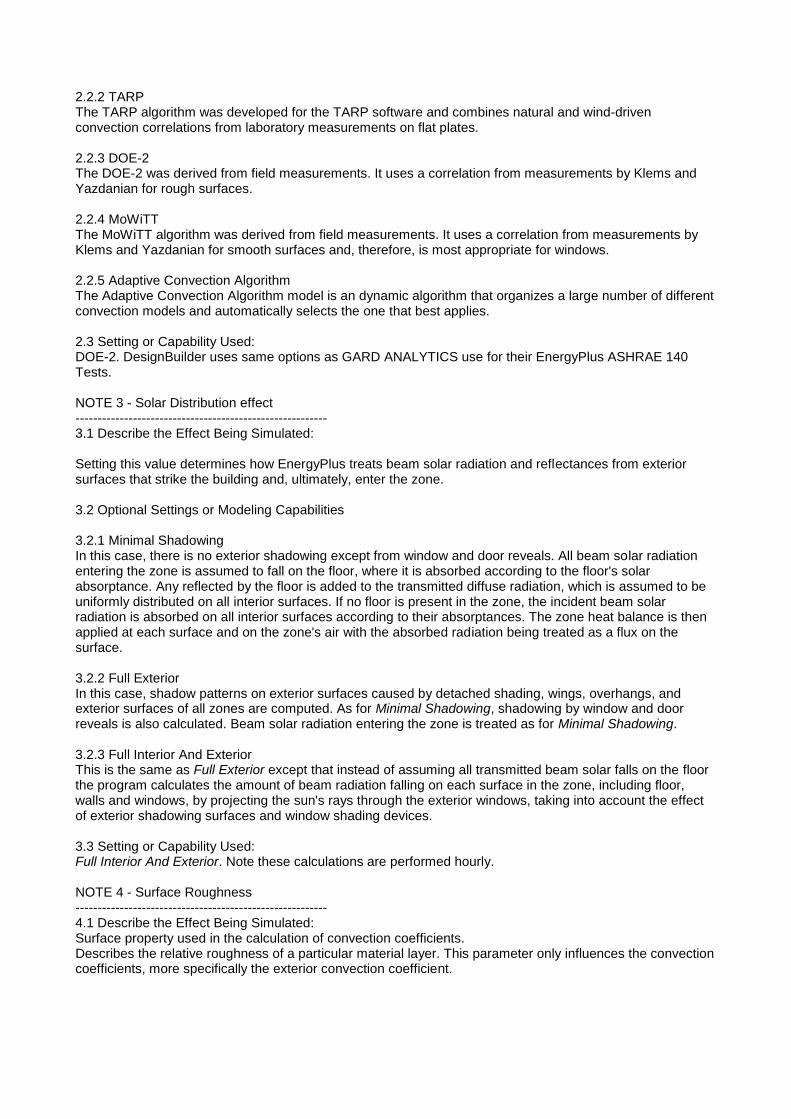
2.2.2 TARP The TARP algorithm was developed for the TARP software and combines natural and wind-driven convection correlations from laboratory measurements on flat plates. 2.2.3 DOE-2 The DOE-2 was derived from field measurements. It uses a correlation from measurements by Klems and Yazdanian for rough surfaces. 2.2.4 MoWiTT The MoWiTT algorithm was derived from field measurements. It uses a correlation from measurements by Klems and Yazdanian for smooth surfaces and, therefore, is most appropriate for windows. 2.2.5 Adaptive Convection Algorithm The Adaptive Convection Algorithm model is an dynamic algorithm that organizes a large number of different convection models and automatically selects the one that best applies. 2.3 Setting or Capability Used: DOE-2. DesignBuilder uses same options as GARD ANALYTICS use for their EnergyPlus ASHRAE 140 Tests. NOTE 3 - Solar Distribution effect --------------------------------------------------------- 3.1 Describe the Effect Being Simulated: Setting this value determines how EnergyPlus treats beam solar radiation and reflectances from exterior surfaces that strike the building and, ultimately, enter the zone. 3.2 Optional Settings or Modeling Capabilities 3.2.1 Minimal Shadowing In this case, there is no exterior shadowing except from window and door reveals. All beam solar radiation entering the zone is assumed to fall on the floor, where it is absorbed according to the floor's solar absorptance. Any reflected by the floor is added to the transmitted diffuse radiation, which is assumed to be uniformly distributed on all interior surfaces. If no floor is present in the zone, the incident beam solar radiation is absorbed on all interior surfaces according to their absorptances. The zone heat balance is then applied at each surface and on the zone's air with the absorbed radiation being treated as a flux on the surface. 3.2.2 Full Exterior In this case, shadow patterns on exterior surfaces caused by detached shading, wings, overhangs, and exterior surfaces of all zones are computed. As for Minimal Shadowing, shadowing by window and door reveals is also calculated. Beam solar radiation entering the zone is treated as for Minimal Shadowing. 3.2.3 Full Interior And Exterior This is the same as Full Exterior except that instead of assuming all transmitted beam solar falls on the floor the program calculates the amount of beam radiation falling on each surface in the zone, including floor, walls and windows, by projecting the sun's rays through the exterior windows, taking into account the effect of exterior shadowing surfaces and window shading devices. 3.3 Setting or Capability Used: Full Interior And Exterior. Note these calculations are performed hourly. NOTE 4 - Surface Roughness --------------------------------------------------------- 4.1 Describe the Effect Being Simulated: Surface property used in the calculation of convection coefficients. Describes the relative roughness of a particular material layer. This parameter only influences the convection coefficients, more specifically the exterior convection coefficient.
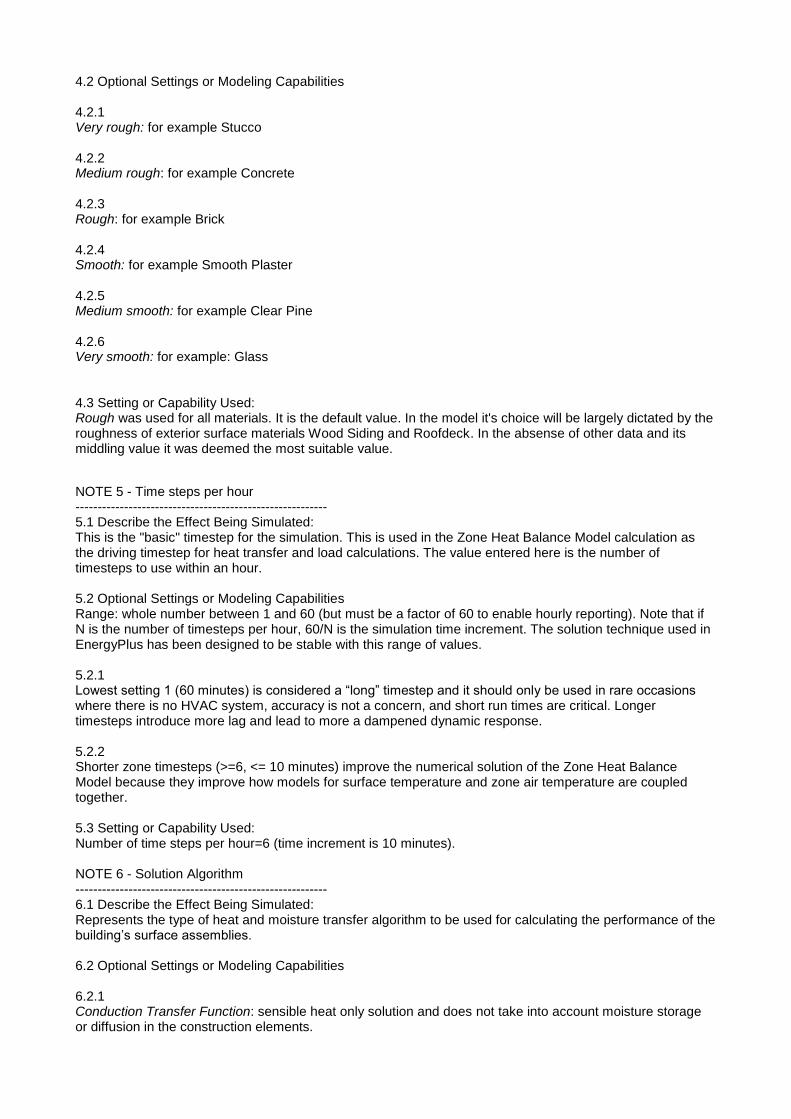
4.2 Optional Settings or Modeling Capabilities 4.2.1 Very rough: for example Stucco 4.2.2 Medium rough: for example Concrete 4.2.3 Rough: for example Brick 4.2.4 Smooth: for example Smooth Plaster 4.2.5 Medium smooth: for example Clear Pine 4.2.6 Very smooth: for example: Glass 4.3 Setting or Capability Used: Rough was used for all materials. It is the default value. In the model it's choice will be largely dictated by the roughness of exterior surface materials Wood Siding and Roofdeck. In the absense of other data and its middling value it was deemed the most suitable value.
NOTE 5 - Time steps per hour --------------------------------------------------------- 5.1 Describe the Effect Being Simulated: This is the "basic" timestep for the simulation. This is used in the Zone Heat Balance Model calculation as the driving timestep for heat transfer and load calculations. The value entered here is the number of timesteps to use within an hour. 5.2 Optional Settings or Modeling Capabilities Range: whole number between 1 and 60 (but must be a factor of 60 to enable hourly reporting). Note that if N is the number of timesteps per hour, 60/N is the simulation time increment. The solution technique used in EnergyPlus has been designed to be stable with this range of values. 5.2.1 Lowest setting 1 (60 minutes) is considered a “long” timestep and it should only be used in rare occasions where there is no HVAC system, accuracy is not a concern, and short run times are critical. Longer timesteps introduce more lag and lead to more a dampened dynamic response. 5.2.2 Shorter zone timesteps (>=6, <= 10 minutes) improve the numerical solution of the Zone Heat Balance Model because they improve how models for surface temperature and zone air temperature are coupled together. 5.3 Setting or Capability Used: Number of time steps per hour=6 (time increment is 10 minutes). NOTE 6 - Solution Algorithm --------------------------------------------------------- 6.1 Describe the Effect Being Simulated: Represents the type of heat and moisture transfer algorithm to be used for calculating the performance of the building’s surface assemblies. 6.2 Optional Settings or Modeling Capabilities 6.2.1 Conduction Transfer Function: sensible heat only solution and does not take into account moisture storage or diffusion in the construction elements.

6.2.2 Finite Difference: sensible heat only solution and does not take into account moisture storage or diffusion in the construction elements. This is considered an advanced / research option and provides facilities for modelling phase change materials and materials with variable thermal conductivity. 6.3 Setting or Capability Used: Conduction Transfer Function: The additional functionality of the Finite Difference algorithms is not needed in these models. NOTE 7 – Site Terrain --------------------------------------------------------- 7.1 Describe the Effect Being Simulated: The site’s terrain affects how the wind hits the building – as does the building height. In addition, the external conduction method usually has its own parameters for the calculation. 7.2 Optional Settings or Modeling Capabilities 7.2.1 Country For Flat, Open Country 7.2.2 Suburbs For Rough, Wooded Country, Suburbs 7.2.3 City For Towns, city outskirts, center of large cities 7.2.4 Ocean For Ocean, Bayou flat country 7.2.5 Urban For Urban, Industrial, Forest 7.3 Setting or Capability Used: Country was used as seemed to best match site description in Table A1-1: =============================================================================== C. REPORT BLOCK FOR EQUIVALENT MODELING METHODS =============================================================================== CONTENT: This section shall describe equivalent modeling methods used to perform the tests. When the software does not model an effect exactly as stated in the Standard or does not permit the input values required, equivalent modeling methods shall be permitted to perform the test. INSTRUCTIONS: If equivalent modeling methods are applied, a separate note for each instance of equivalent modeling shall be provided. The standard format shown below and a separate number and title for each note shall be applied. If equivalent modeling methods are not applicable, specify "NONE" in place of the information below. NOTE 1 – Glass thermophysical properties ------------------------------------------------------------------------------- 1.1 Describe the Effect Being Simulated: material density and specific heat capacity 1.2 Section(s) of the Standard where Relevant Inputs are Specified: 5.2.1.11.2 and Table 5-6 (Window Properties) 1.3 Equivalent Input(s) Used: DesignBuilder EnergyPlus does not model thermal mass effects in glazing, heat transfer is considered instant thus density and specific heat capacity can be considered to have value zero.

1.4 Physical, Mathematical or Logical Justification of the Equivalent Input(s) Glazing heat transfer is dominated by radiation and convection. Relatively little heat is transferred by conduction and the materials are either thin (glass) or have minimal volumetric heat capacity (air). Thus the dynamic nature of heat transfer in glazing is negligible. =============================================================================== D. REPORT BLOCK FOR USE OF NON-SPECIFIED INPUTS =============================================================================== CONTENT: This section shall describe non-specified inputs used to perform the tests. Use of non-specified inputs shall be permitted only for the following specified sections relating to the following topics: * Interior combined radiative and convective surface coefficients in Sections 5.2.1.10, 5.2.3.2.2, and 5.3.1.9 * Interior solar distribution in Sections 5.2.1.12, 5.2.2.1.2.2, 5.2.2.2.7.4, 5.2.3.9.3, 5.2.3.10.2, and 5.2.3.12.2 * Air density given at specific altitudes for the space cooling and space heating equipment cases in Sections 5.3.1.4.3, 5.3.3.4.3, and 5.4.1.4.3. INSTRUCTIONS: If non-specified inputs are applied, a separate note for each use of non-specified inputs shall be provided. The standard format shown below and a separate number and title for each note shall be applied. If non-specified inputs are not applied, specify "NONE" in place of the information below. =============================================================================== E. REPORT BLOCK FOR OMITTED TEST CASES AND RESULTS =============================================================================== CONTENT: This section shall describe test cases that were omitted and/or individual results of test cases that were omitted along with the reason for the omission. INSTRUCTIONS: If test cases were omitted, a separate note to describe each type of omission shall be provided. The standard format shown below and a separate number and title for each note shall be applied. If there are no omitted test cases, specify "NONE" in place of the information below. NOTE 1 – IN-DEPTH Tests ------------------------------------------------------------------------------- 1.1 List the Case(s) where Results Were Omitted, and which Results Were Omitted for the Case(s): All IN-DEPTH Tests (195, 200, 210, 215, 220, 230, 240, 250, 270, 280, 290, 300, 310, 320, 395, 400, 410, 420, 430, 440, 800, 810) 1.2 Explanation for Omitting the Test Case(s) Results: Historically the In-Depth tests have been not included in DesignBuilder ASHRAE 140 envelope testing. 60% of these involve non-deadband non-proportional thermostat modelling which is not possible with this version. The remaining IN-DEPTH tests were not included due to the absence of the base models for the IN-DEPTH tests. =============================================================================== F. REPORT BLOCK FOR CHANGES TO SOURCE CODE FOR THE PURPOSE OF RUNNING THE TESTS, WHERE SUCH CHANGES ARE NOT AVAILABLE IN PUBLICLY RELEASED VERSIONS OF THE SOFTWARE. =============================================================================== CONTENT: This section shall describe changes to software source code made to allow the software to run a test, where such changes are not available in a

publicly released version of the software. INFORMATIVE NOTE: This section addresses special situations where a change to source code is necessary to activate a feature or permit inputs needed for a test when these features are not available in the publicly released version of the software. INSTRUCTIONS: If changes to the source code for the purpose of running a test are applied, separate notes to describe each source code modification shall be provided. The standard format shown below and a separate number and title for each note shall be applied. If changes to source code are not applied, specify "NONE" in place of the information below. NONE =============================================================================== G. REPORT BLOCK FOR ANOMALOUS RESULTS =============================================================================== CONTENT: Describing anomalous results shall be permitted, but is not required. If anomalous test results are described, this section shall be used. INSTRUCTIONS: If anomalous test results are described, each type of anomalous result shall be described in a separate note. The standard format shown below and a separate number and title for each note item shall be applied. If anomalous results are not discussed, it shall be permitted to specify "NONE" in place of the information below. NONE =============================================================================== <END OF DOCUMENT> ===============================================================================

SECTION C
Comparison with EnergyPlus The first ASHRAE-140 tests DesignBuilder undertook were in June 2006 using DesignBuilder v1.2.0. For each subsequent release the models were imported into the current version. If relevant, new features were added to the models as these became available in EnergyPlus and utilised in the tests conducted on the standalone version of EnergyPlus. The EnergyPlus Report
2 contains a comprehensive list of changes made
to their models since August 2001. At this time one of the main purposes of the tests as applied to DesignBuilder was to check the results from DesignBuilder against the results from EnergyPlus run in standalone mode. For the majority comparisons comprising annual heating and cooling, peak heating and cooling and free float temperatures, the results from EnergyPlus (standalone) and DesignBuilder were identical. Over these years it has been amply proven that DesignBuilder is a reliable interface to EnergyPlus.In December 2013 (DesignBuilder v3.2) we changed the emphasis of the testing to show that DesignBuilder could provide reliable and accurate calculations using default settings and without the need for the use of less obvious features. The models were reproduced in the simplest manner from the specifications laid out in ASHRAE-140 (2011). The accompanying Section D provides a step by step explanation for this process. The charts in Section A display comparative results for ASHRAE 140 fabric tests. In versions of this report written to 2007 requirements it was simpler to provide direct comparison with EnergyPlus within the official tables and charts. However, the 2011 reporting is intended only for comparison against the benchmark programs. Thus the following tables are provided for direct comparison of EnergyPlus
2 and DesignBuilder.
The tables show that the simple DesignBuilder models now used for testing are no less accurate than those used for the standalone EnergyPlus tests.

Low Mass Heating and Cooling
Test Case 600 610 620 630 640 650
Minimum 4.296 4.355 4.613 5.050 2.751
Maximum 5.709 5.786 5.944 6.469 3.803
Av erage 5.046 5.098 5.328 5.686 3.135
4.378 4.422 4.550 4.881 2.684
4.516 4.559 4.687 5.013 2.809
YES YES YES NO YES
Minimum 6.137 3.915 3.417 2.129 5.952 4.816
Maximum 8.448 6.139 5.482 3.701 8.097 7.064
Av erage 7.053 5.144 4.416 2.951 6.790 5.708
6.740 4.746 4.168 2.780 6.454 5.304
6.710 4.717 4.135 2.761 6.447 5.319
YES YES YES YES YES YES
Peak Heating (kW)
Minimum 3.437 3.437 3.591 3.592 5.232
Maximum 4.354 4.354 4.379 4.280 6.954
Av erage 3.952 3.947 3.998 3.949 5.903
3.750 3.740 3.741 3.721 6.277
3.803 3.792 3.794 3.772 6.886
YES YES YES YES YES
Peak Cooling (kW)
Minimum 5.965 5.669 3.634 3.072 5.884 5.831
Maximum 7.188 6.673 5.096 4.116 7.126 6.679
Av erage 6.535 6.090 4.393 3.688 6.478 6.321
6.565 6.164 3.921 3.376 6.501 6.373
6.558 6.143 3.928 3.400 6.497 6.401
YES YES YES YES YES YES
Annual Heating (MWh)
Energy Plus
DesignBuilder
DesignBuilder within Range
Annual Cooling (MWh)
Energy Plus
DesignBuilder
DesignBuilder within Range
Energy Plus
DesignBuilder
DesignBuilder within Range
Energy Plus
DesignBuilder
DesignBuilder within Range
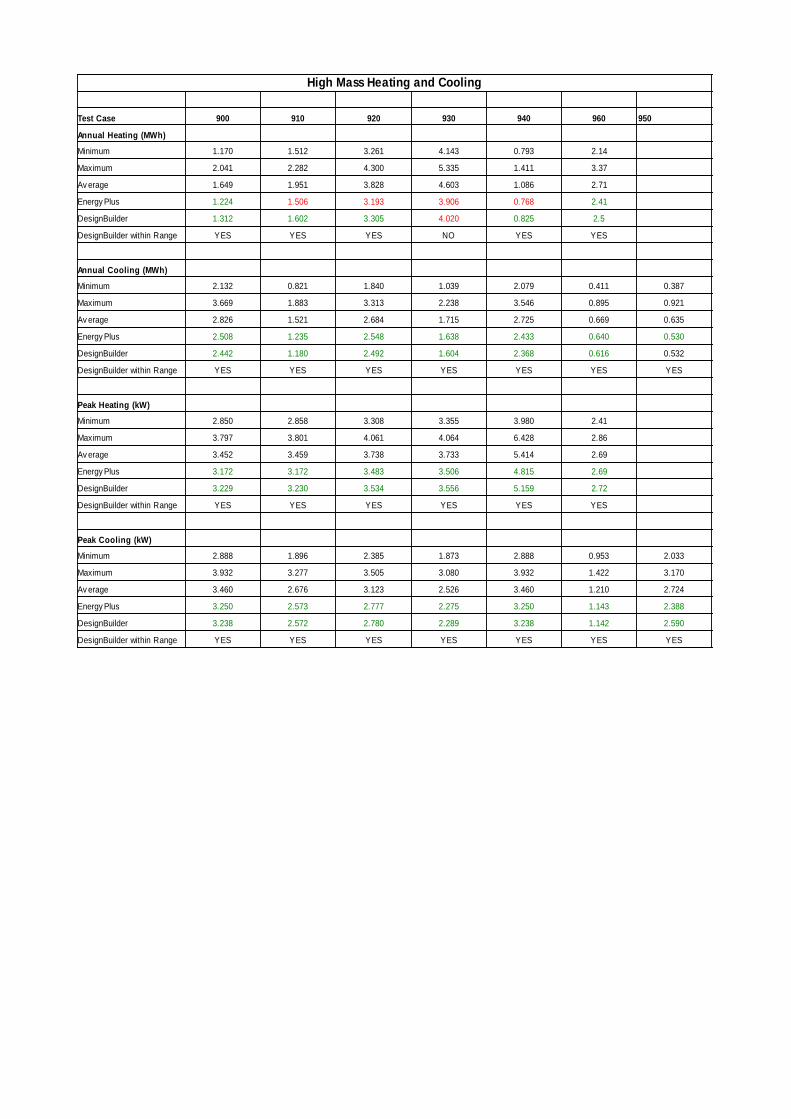
High Mass Heating and Cooling
Test Case 900 910 920 930 940 960 950
Annual Heating (MWh)
Minimum 1.170 1.512 3.261 4.143 0.793 2.14
Maximum 2.041 2.282 4.300 5.335 1.411 3.37
Av erage 1.649 1.951 3.828 4.603 1.086 2.71
Energy Plus 1.224 1.506 3.193 3.906 0.768 2.41
DesignBuilder 1.312 1.602 3.305 4.020 0.825 2.5
DesignBuilder within Range YES YES YES NO YES YES
Annual Cooling (MWh)
Minimum 2.132 0.821 1.840 1.039 2.079 0.411 0.387
Maximum 3.669 1.883 3.313 2.238 3.546 0.895 0.921
Av erage 2.826 1.521 2.684 1.715 2.725 0.669 0.635
Energy Plus 2.508 1.235 2.548 1.638 2.433 0.640 0.530
DesignBuilder 2.442 1.180 2.492 1.604 2.368 0.616 0.532
DesignBuilder within Range YES YES YES YES YES YES YES
Peak Heating (kW)
Minimum 2.850 2.858 3.308 3.355 3.980 2.41
Maximum 3.797 3.801 4.061 4.064 6.428 2.86
Av erage 3.452 3.459 3.738 3.733 5.414 2.69
Energy Plus 3.172 3.172 3.483 3.506 4.815 2.69
DesignBuilder 3.229 3.230 3.534 3.556 5.159 2.72
DesignBuilder within Range YES YES YES YES YES YES
Peak Cooling (kW)
Minimum 2.888 1.896 2.385 1.873 2.888 0.953 2.033
Maximum 3.932 3.277 3.505 3.080 3.932 1.422 3.170
Av erage 3.460 2.676 3.123 2.526 3.460 1.210 2.724
Energy Plus 3.250 2.573 2.777 2.275 3.250 1.143 2.388
DesignBuilder 3.238 2.572 2.780 2.289 3.238 1.142 2.590
DesignBuilder within Range YES YES YES YES YES YES YES
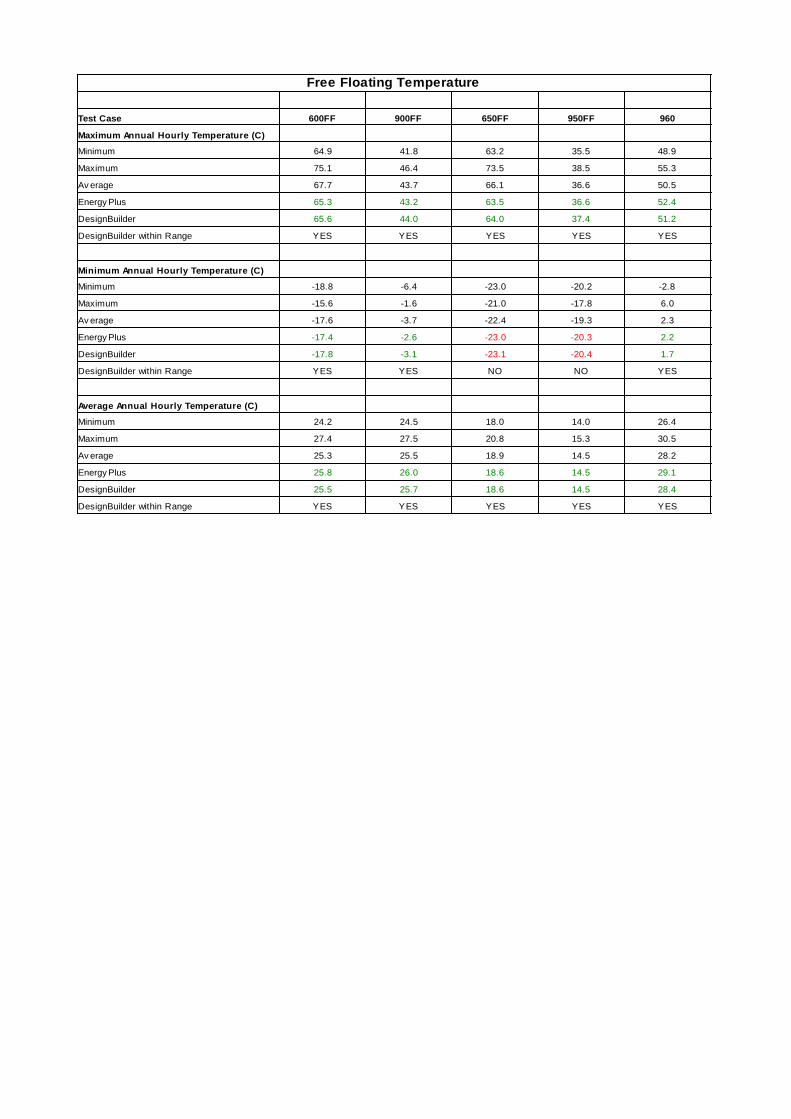
Free Floating Temperature
Test Case 600FF 900FF 650FF 950FF 960
Maximum Annual Hourly Temperature (C)
Minimum 64.9 41.8 63.2 35.5 48.9
Maximum 75.1 46.4 73.5 38.5 55.3
Av erage 67.7 43.7 66.1 36.6 50.5
Energy Plus 65.3 43.2 63.5 36.6 52.4
DesignBuilder 65.6 44.0 64.0 37.4 51.2
DesignBuilder within Range YES YES YES YES YES
Minimum Annual Hourly Temperature (C)
Minimum -18.8 -6.4 -23.0 -20.2 -2.8
Maximum -15.6 -1.6 -21.0 -17.8 6.0
Av erage -17.6 -3.7 -22.4 -19.3 2.3
Energy Plus -17.4 -2.6 -23.0 -20.3 2.2
DesignBuilder -17.8 -3.1 -23.1 -20.4 1.7
DesignBuilder within Range YES YES NO NO YES
Average Annual Hourly Temperature (C)
Minimum 24.2 24.5 18.0 14.0 26.4
Maximum 27.4 27.5 20.8 15.3 30.5
Av erage 25.3 25.5 18.9 14.5 28.2
Energy Plus 25.8 26.0 18.6 14.5 29.1
DesignBuilder 25.5 25.7 18.6 14.5 28.4
DesignBuilder within Range YES YES YES YES YES

Section D A Guide describing the setting up of the tests This section is incorporated to show how the tests were set up and output recorded in DesignBuilder. It is also intended to demonstate that the DesignBuilder models can be produced with the minimum of alterations to default ‘out of the box’ settings. Relatively little experience of using DesignBuilder should be necessary to replicate the tests using the following guidance. Note that there is a comprehensive help menu accessible through the software and it is recommended that users use this as a first supplementary resource if following the instructions. The bulk of instructions describe the setting up of Base test case 600. These tests were set up in DesignBuilder v3.2. whilst the interface will develop further in future releases this guide should suffice for later versions for some time to come. Note that that tools can generally be accessed via the traditional menu, toolbar and right hand panel. Reference to tables and paragraphs refer to AHRAE 140-2011
1.
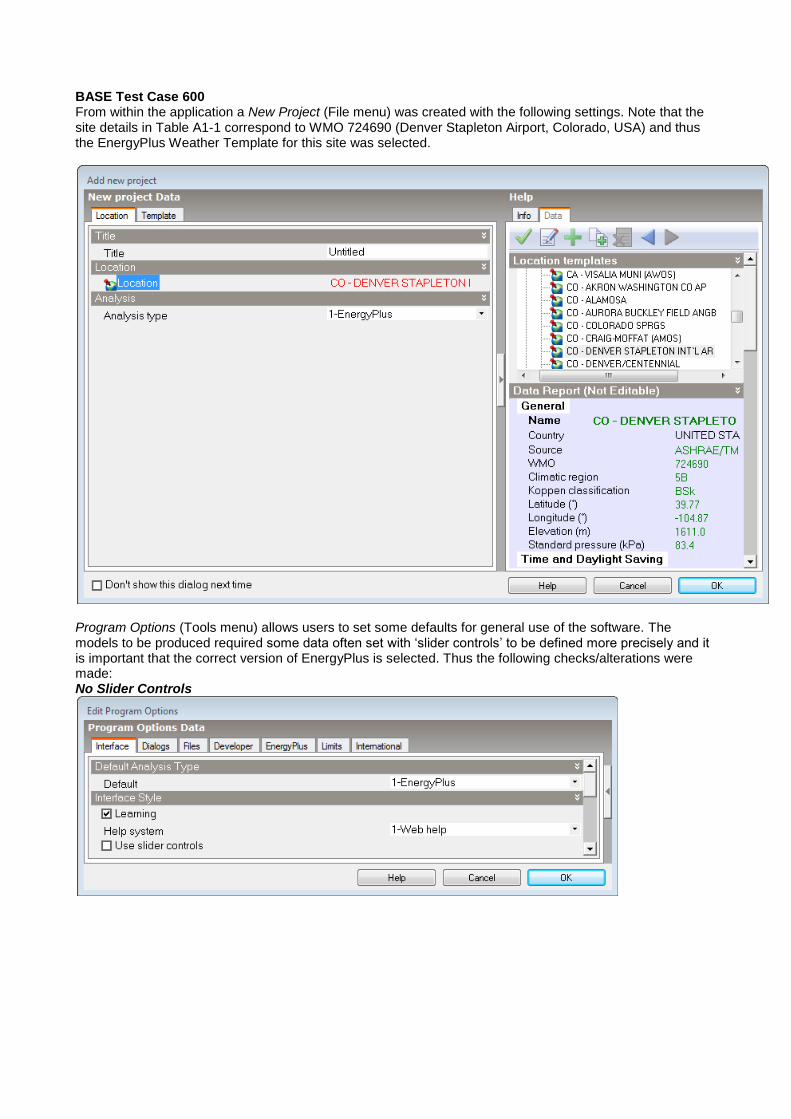
BASE Test Case 600 From within the application a New Project (File menu) was created with the following settings. Note that the site details in Table A1-1 correspond to WMO 724690 (Denver Stapleton Airport, Colorado, USA) and thus the EnergyPlus Weather Template for this site was selected.
Program Options (Tools menu) allows users to set some defaults for general use of the software. The models to be produced required some data often set with ‘slider controls’ to be defined more precisely and it is important that the correct version of EnergyPlus is selected. Thus the following checks/alterations were made: No Slider Controls

Version of EnergyPlus
Note that other versions of DesignBuilder will have different defaults though will be able to access more than one version of EnergyPlus. ASHRAE 140 includes an hourly weather file in TMY format. This can be converted to EnergyPlus native format (epw) using a tool accessible through the DesignBuilder interface. The folder in which Weather files are stored/accessed needs to be opened so that this file can be transferred and accessed in the correct folder.
Copy DRYCOLD.TMY into this folder from the Official ASHRAE-140 folder.

Select the Weather data conversion tool:
Select DRYCOLD.TMY for conversion
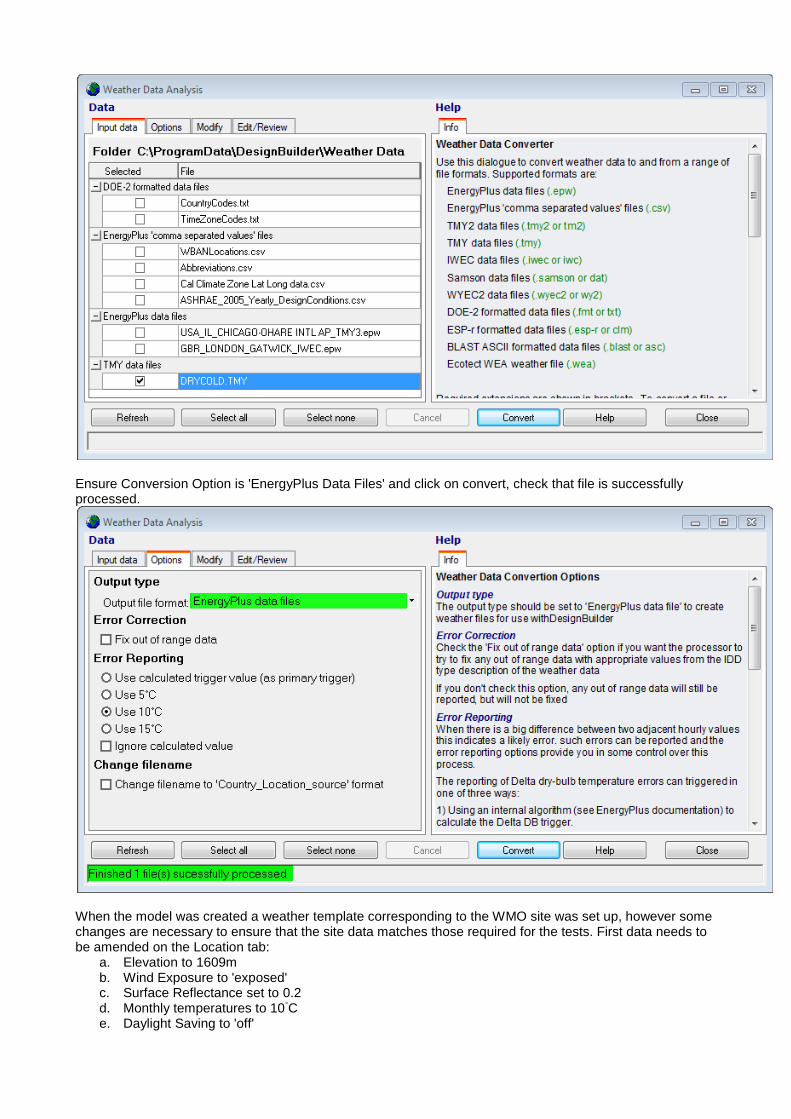
Ensure Conversion Option is 'EnergyPlus Data Files' and click on convert, check that file is successfully processed.
When the model was created a weather template corresponding to the WMO site was set up, however some changes are necessary to ensure that the site data matches those required for the tests. First data needs to be amended on the Location tab:
a. Elevation to 1609m b. Wind Exposure to 'exposed' c. Surface Reflectance set to 0.2 d. Monthly temperatures to 10
◦C
e. Daylight Saving to 'off'

The declared ground temperatures are applied to the lower surface of the defined ground construction. For the tests this is at 2m depth. The Ground Construction needs to be defined: Select Ground Construction (currently Cultivated Clay in screenshot above) and add new construction made up of the following layers (note that maximum thickness of a layer is 0.5, thus four layers of the same material are required to create a depth of 2m. Soil Material also needs to be defined.


Select Hourly Weather data and create new template importing weather file DRYCOLD.epw
Now the site data is complete. The Building should now be added: On Layout tab, select add building, choose 'Draw building + standard data'
The building comprises a single block: Add Block with following attributes
a. Building Block Type b. Extruded Form c. 0.1m Wall thickness (compromise value for lightweight walls (0.085m thick) and heavyweight
walls (0.1705m thick)) d. Height 2.7m e. Rectangle Shape f. Dimensions 8.2m x 6.2m

Note there are various options for drawing a rectangular block. Note these are external dimensions as per DesignBuilder format for drawing blocks. This creates an internal space 8 x 6 x 2.7m.
The basic building geometry is now created. Windows On Openings tab set Glazing Layout to No glazing so that Custom Glazing may be drawn on the south wall
Check that reveal depths are zero , windows have no frame / dividers and no shading is defined

Draw two 3 x 2m windows with sill height 0.2m and inset 0.5m on south facing wall.
Note that whilst the geometry is now complete, construction and glazing specification needs to be assigned. This can be done in any order. The instructions below will complete the data set on the Openings tab: Create New Glazing, definition: Material Layers, 2 layers. Note that DesignBuilder uses WINDOW 5 Format and thus requires other data than specified in ASHRAE format. Glazing uses 'ordinary uncoated glass' of thickness 1/8" so use Generic Clear Glass 3mm as base and edit available properties:
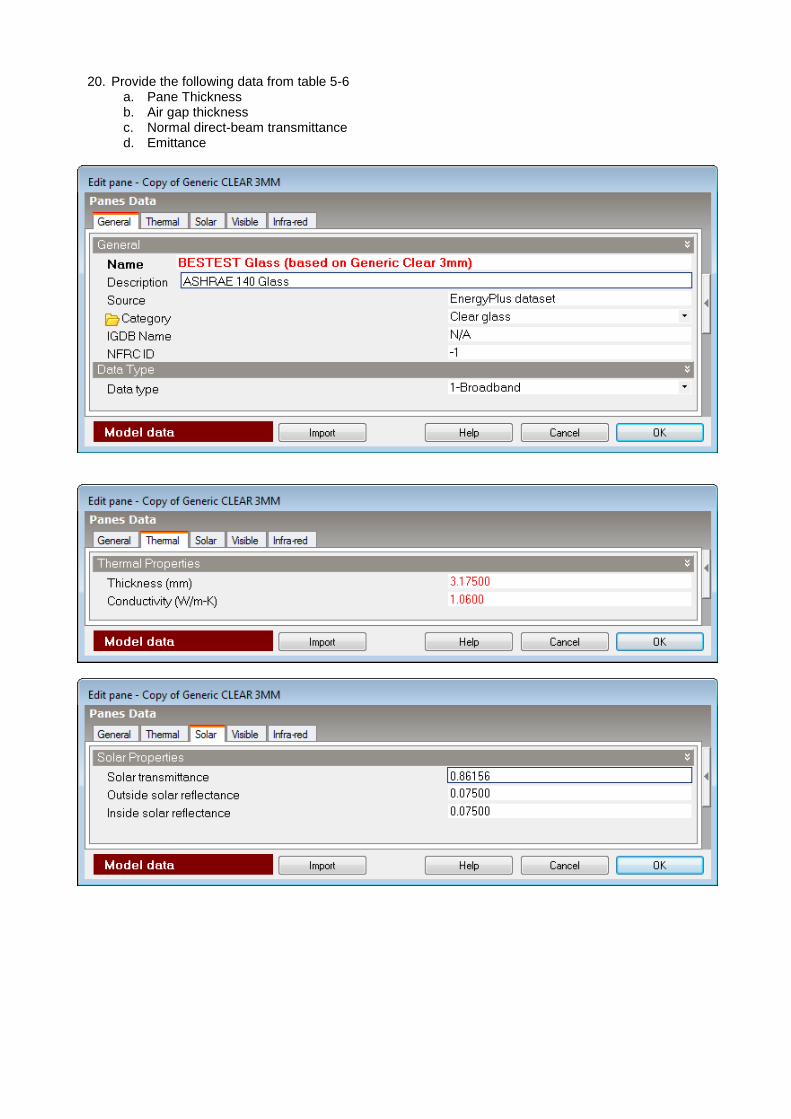
20. Provide the following data from table 5-6 a. Pane Thickness b. Air gap thickness c. Normal direct-beam transmittance d. Emittance

Note that AIR 13mm should be available under window gas, if not select air and set thickness,
Check Calculated data against Table 5-6 for a. Solar Heat Gain Coefficient b. U value (EN 673)
Openings data is now complete.

Model Options Once there is a building in the model then Model Options (Edit menu) can be accessed and setting for the model can be made. This can be accessed via the spanner icon on the toolbar or the edit menu. Make the following settings: General tab
a. Simple HVAC b. Adequate sizing c. Auxilliary Energy calculations <none>

Advanced tab: Untick all Merge and Lump settings, these are all intended to simplify models and thus speed up simulations and are not necessary for the simple ASHRAE models.
Constructions tab Create Constructions in Table 5-1 for Exterior Wall: Lightweight, Ground Floor: Lightweight and Flat Roof. Set the number of layers and the thicknesses as appear in said table. Check U-value surface-surface correct.

Note this will involve creating new materials. The following data will need to be set for each material (from Table 5-1 and table 5-3)

a. Conductivity (General Tab) b. Specific Heat (") c. Density (") d. Emissivity (Surface Properties Tab: 0.9 in all cases) e. Solar absorptance (Surface Properties Tab: 0.6 in all cases) f. Roughness (Surface Properties Tab: Rough in all cases)
Set Infiltration to 0.5, schedule 'On'. Construction details all complete!

Lighting tab
Set Lighting Template to NONE, check General, Task and Exterior lighting are not set: There is no lighting in the ASHRAE 140 models. The internal gains that are present are described later (Activity tab)
HVAC Tab
Select Template <NONE>. Select HEATED and COOLED tick boxes, set schedules for each as 'On' (General Folder). Make the following checks:
a. DHW is off b. mechanical ventilation is off c. natural ventilation is off d. Auxilliary Energy is (effectively) off e. There is no humidity control f. Air Distribution is Mixed
Note that CoP can be set as 1.0 as specified in Section 5.2.1.13.2 however this will not affect the outputs (CoPs were not changed from defaults, nor were fuel types).
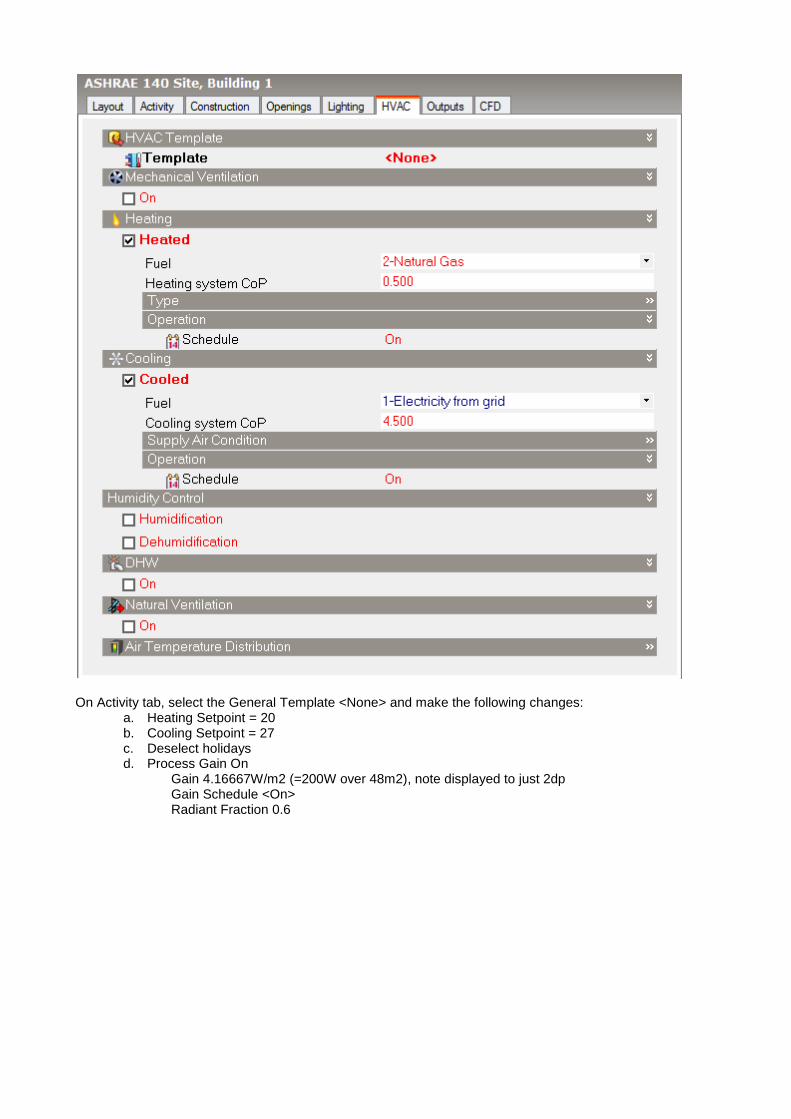
On Activity tab, select the General Template <None> and make the following changes:
a. Heating Setpoint = 20 b. Cooling Setpoint = 27 c. Deselect holidays d. Process Gain On
Gain 4.16667W/m2 (=200W over 48m2), note displayed to just 2dp Gain Schedule <On> Radiant Fraction 0.6


Outputs Test 600 requires both hourly and annual data on heating and sensible cooling energies, annual incident solar for all surfaces plus hourly incident solar for South and West walls. The Options tab provides all the output data options:
a. For Heating And Sensible Cooling then tick ‘Energy, HVAC etc’ b. For Incident Solar tick ‘Store surface output’ and then select ‘Solar Incident’
Note that Heating and Cooling Energy selections can be made at Building/Block or Zone Level. Surface Output settings can be made at Building/Block/Zone or individual Surface levels. Selecting the options at a lower level will generally reduce the amount of output data produced. Note that other tests require:
c. Free Floating Air temperature: tick ‘Environmental’ d. Solar Transmitted: tick ‘store opening output’ and ‘Solar Trans’
The simplest way of ensuring that all outputs for all tests are produced is to make the settings at Building level for all these outputs in Test 600. The remaining tests will effectively use Test 600 as a base and thus will inherit the output settings made in this model.

Calculating Select the simulation tab which should automatically bring up the ‘Calculation Options data’ window. On the General tab set Simulation to run for complete year and ensure that annual and hourly data set for output. On the Options tab set Time Step to 6 per hour and solar distribution as Full Interior and Exterior. Note Temperature Control should be ‘Air-temperature’. . All other data should not need to be reset.
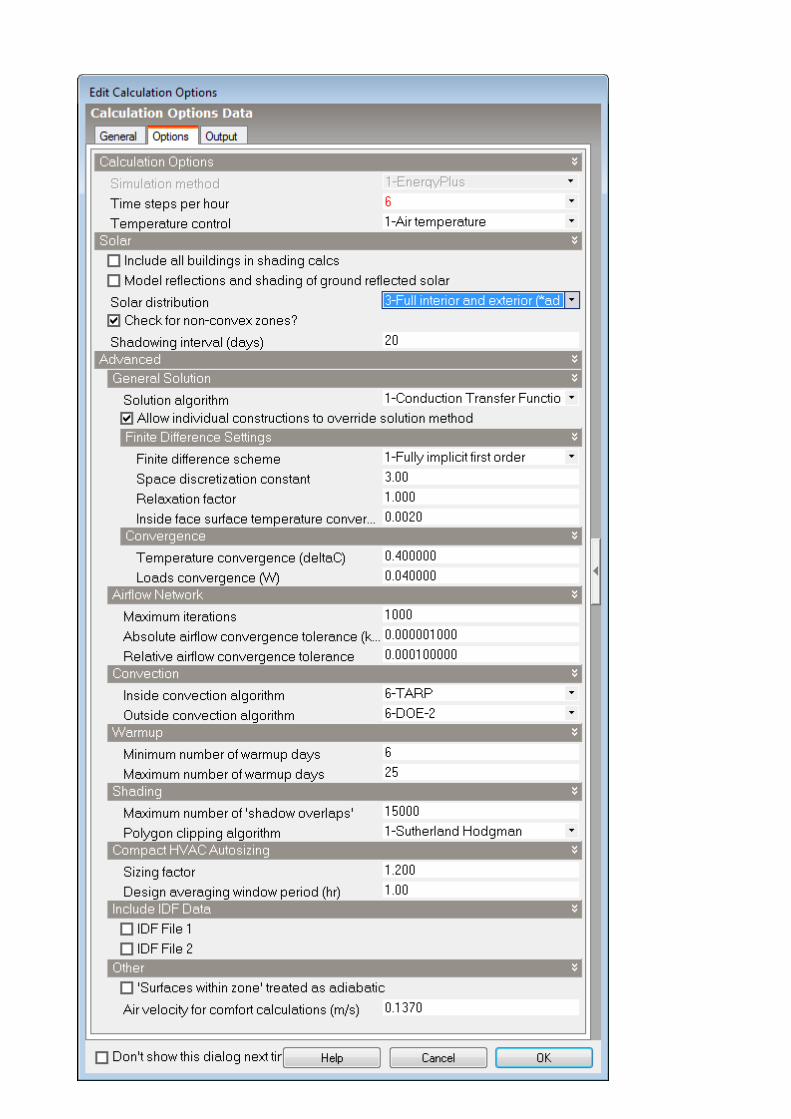

Viewing / Saving Output Once the calculation has been completed then the required outputs can be read as follows. Note that data can also be exported in csv format using the Export Data icon (below)
Select the Interval according to whether the output required is annual or hourly. Select the building level the output applies to:
ANNUAL OUTPUT Zone Level
Read Zone Heating (kWh) convert to MWh Read Zone Sensible Cooling (kWh) convert to MWh Surface Level
Read Solar Incident (kWh) and divide by displayed Area for kWh/m2 value Note: for tests performed with DesignBuilder v4.2.0.054 monthly output of incident Solar was used to generate the annual data due to an error in the reporting of this annual parameter.
Ditto with all walls HOURLY OUTPUT Zone Level Click on Header for required data (Zone Heating, Zone Sensible Cooling) to toggle sort (ascend/descend) and record peak values. Note Date and Time also needed.

Test Case 600 also requires 24 hours of load data for specific days. Scroll down to required date (4
th Jan) for
hourly heating and sensible cooling. Sum the values for total load for each hour (better to export data as csv and calculate using spreadsheet).
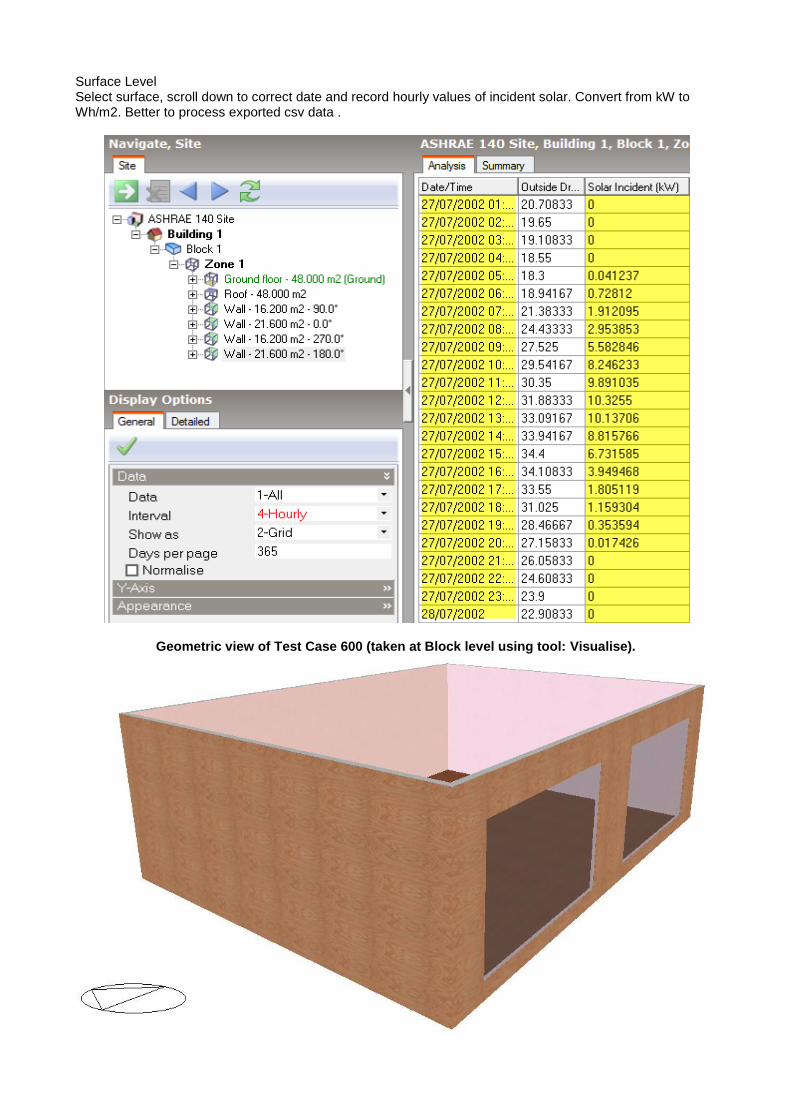
Surface Level Select surface, scroll down to correct date and record hourly values of incident solar. Convert from kW to Wh/m2. Better to process exported csv data .
Geometric view of Test Case 600 (taken at Block level using tool: Visualise).

The following table summarises the output requirements from all the models:
Output Frequency Units Required Units/
Format
Conversion Applies To Tests
heating load annual kWh MWh /1000 Zone (back zone)
600,610,620,630,640,650,900,910,920,930,
940,950,(960)
Sensible cooling load
Annual kWh MWh /1000 Zone (back zone)
600,610,620,630,640,650,900,910,920,
930,940,950, (960)
Peak heating load
Hourly kW kW - Zone (back zone)
600,610,620,630,640,650,900,910,920, 930,940,950,(960)
Peak sensible
cooling load
Hourly kW kW - Zone (back zone)
600,610,620,630,640,650,900,910,920, 930,940,950,(960)
Peak heating load
date/hour
Hourly (xy-Pqr/Z)
Zone (back zone)
600,610,620,630,640,650,900,910,920, 930,940,950,(960)
Peak sensible
cooling load date/hour
Hourly
(xy-Pqr/Z)
Zone (back zone)
600,610,620,630,640,650,900,910,920, 930,940,950,(960)
Air Temperature (Free Float Max/Min/
Mean)
Hourly-Annual for
mean
◦C
◦C - Zone
(sunspace) 600FF,650FF,900FF,
950FF, (960)
Free Float Max/Min/Me
an Hourly Zone Temp date/hour
Hourly-Annual for
mean
(xy-Pqr/Z)
sunspace 960
Free Float Hourly Zone
Temp
Hourly for specified
day(s)
◦C
◦C
Zone 600FF, 900FF,650FF,
950FF
BIN Temperature
Hourly
- Zone 900FF
Load Data (Heating + Cooling)
Hourly for specified
day(s)
Zone 600, 900
Solar Incident
Annual kWh kWh/m2 /surface area Surface (N,S,E,W,roof)
600
Solar Transmitted
Annual kWh/m2 /total window area
window 910(S), 920(W), 930(W), 920(S)
Solar Incident
Hourly - Cloudy /
Clear day
kW Wh/m2 1000/surface area
surface 600(S), 600(W)

Basic Test Case 610 (Low Mass with South Shading) Test case 610 is the same as test case 600 with the addition of a 1m horizontal overhang that runs across the entire length of the south-facing wall at roof level. Copy model 600 or save as 610. The overhang is set on the Openings tab under Local Shading, create a new shading Type. Note that as there are only windows on the south wall, these can be specified at any level of the building (Building—Surface).
Using data from Figure 5-2 (ASHRAE 140), make the required settings on the Overhang Tab (and check that there are no Louvres or Sidefins defined):
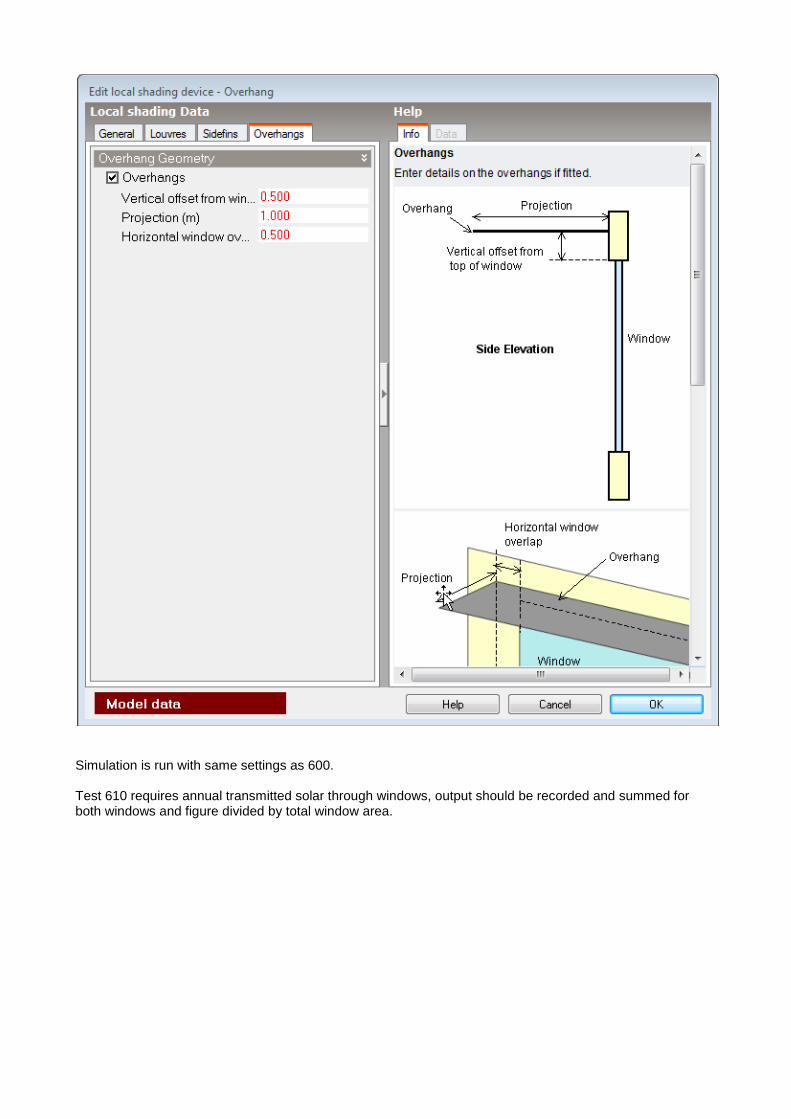
Simulation is run with same settings as 600. Test 610 requires annual transmitted solar through windows, output should be recorded and summed for both windows and figure divided by total window area.

Geometric view of Test Case 610 (taken at Block level using tool: Visualise).
Basic Test Case 620 (Low Mass with East-West Window Orientation)
Test case 620 is the same as test case 600 except that the south-facing windows are removed and 6m2 of window area is added to the east and west facades:
Custom windows can be deleted at Building or surface by selecting and deleting

East and West windows drawn in same way as South windows.

Simulation is run with same settings as 600.
Geometric view of Test Case 620 (taken at Block level using tool: Visualise).
Basic Test Case 630 (Low Mass with East-West Shading)
Based on Test Case 620. Shading is defined in the same way as Test Case 610. This is best defined at Building/Block or Zone level as it will then be applied to East and West windows. The Shading is defined as below:

Geometric view of Test Case 630 (taken at Block level using tool: Visualise)

Basic Test Case 640 (Low Mass with Thermostat Setback) Test case 640 is the same as test case 600 except that the following setpoint schedule is used:
2300-0700 hours: heating ON if inside temperature < 10C
0700-2300 hours: heating ON if inside temperature < 20C
All hours: cooling ON if inside temperature > 27C
Otherwise heating and cooling is OFF
Copy Model 600 / save as 640.
Cooling is controlled as in Test 600 so no change here. Heating requires a new schedule and setback temperature of 10°C.
Activity tab
HVAC tab
Add a new Schedule, this will require a new daily profile:

Profile is applied to all days:
Basic test Case 650 (Low Mass with Night Ventilation)This test is based on Case 600 and requires the following changes to environmental control:
a. Heating Off all hours b. Cooling on in Daytime (07:00-18:00) c. Ventilation on overnight (18.00-07:00)
Note that ventilation rate 1703.16 m3/hour equates to 13.1467 ach/hour for a zone of volume 129.6m
3 (8 x 6
x 2.7)

The following changes to the model are required:
a. Heating schedule deselected b. New cooling schedule based on 365 days of daily profile 07:00-18:00 (already available) c. Ventilation (Mechanical or Natural) with new schedule ( 365 days) of new profile 18:00 – 07:00 d. Check there is no limiting minimum temperature for the ventilation


Basic Test Case 900 (Heavyweight Base Case) Note that the heavyweight test cases 900, 910, 920 930, 940 and 950 are all derived from lightweight test cases 600, 610, 620, 630, 640 and 650 respectively. They all require the same changes. These changes will be detailed in the description of this test 900. The new data generated to produce case 900 can be exported and then imported into the remaining heavyweight cases. This will be explained in Test Case 910. The heavyweight cases employ different wall and ground floor constructions. The data for the layers is detailed in Table 5-11. They are created in the same way as described in Base Test 600. Only the following materials need creating:
a. Concrete Block b. Foam Insulation c. Concrete Slab
The Construction Tab should have only these new constructions incorporated:
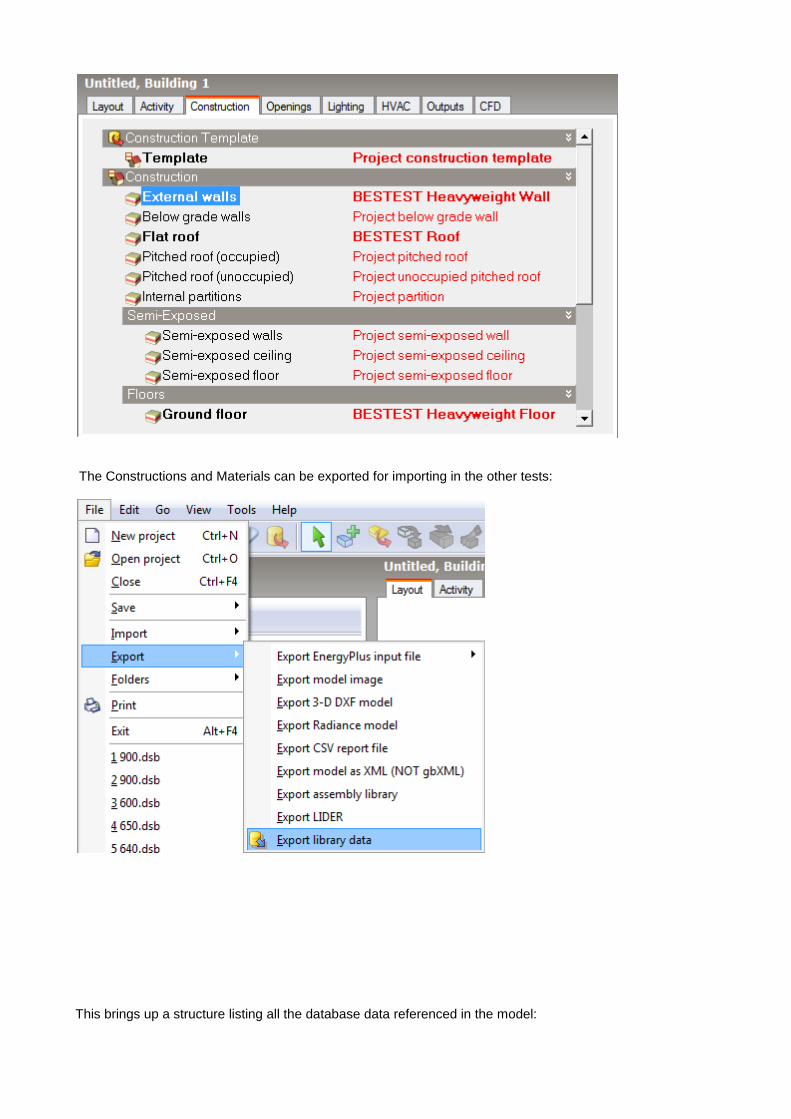
The Constructions and Materials can be exported for importing in the other tests:
This brings up a structure listing all the database data referenced in the model:

Note that only the three materials and two constructions need to be exported. Basic Test Case 910 (High mass with South Shading) This test is derived from case 610. Import Library data exported from 900:
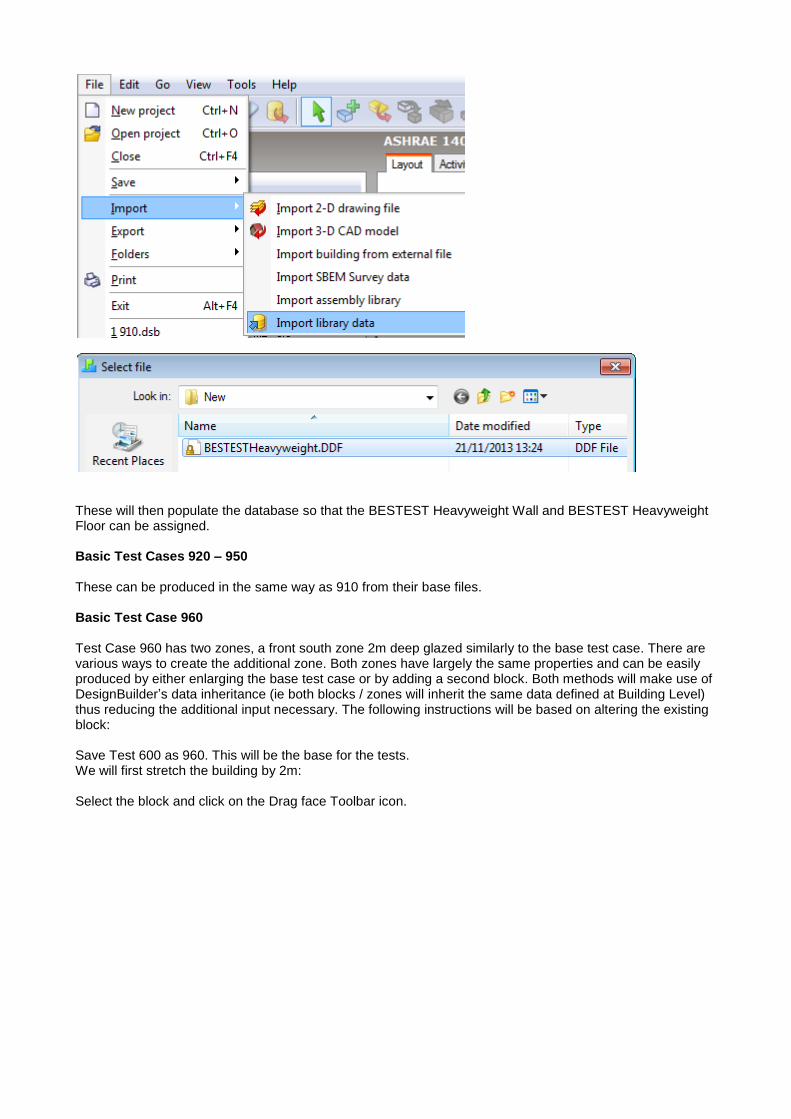
These will then populate the database so that the BESTEST Heavyweight Wall and BESTEST Heavyweight Floor can be assigned. Basic Test Cases 920 – 950 These can be produced in the same way as 910 from their base files. Basic Test Case 960 Test Case 960 has two zones, a front south zone 2m deep glazed similarly to the base test case. There are various ways to create the additional zone. Both zones have largely the same properties and can be easily produced by either enlarging the base test case or by adding a second block. Both methods will make use of DesignBuilder’s data inheritance (ie both blocks / zones will inherit the same data defined at Building Level) thus reducing the additional input necessary. The following instructions will be based on altering the existing block: Save Test 600 as 960. This will be the base for the tests. We will first stretch the building by 2m: Select the block and click on the Drag face Toolbar icon.

Select the South face and drag 2m south (or type in 2)

The sill height for these windows is 0.5m compared with 0.2m in the base case. The windows can be deleted and redrawn but it is quicker to move them: Select both windows by either dragging a net over them or using the CTRL key (used in the same way as selecting multiple files in a folder). Then select the Move selected objects tool from the toolbar.
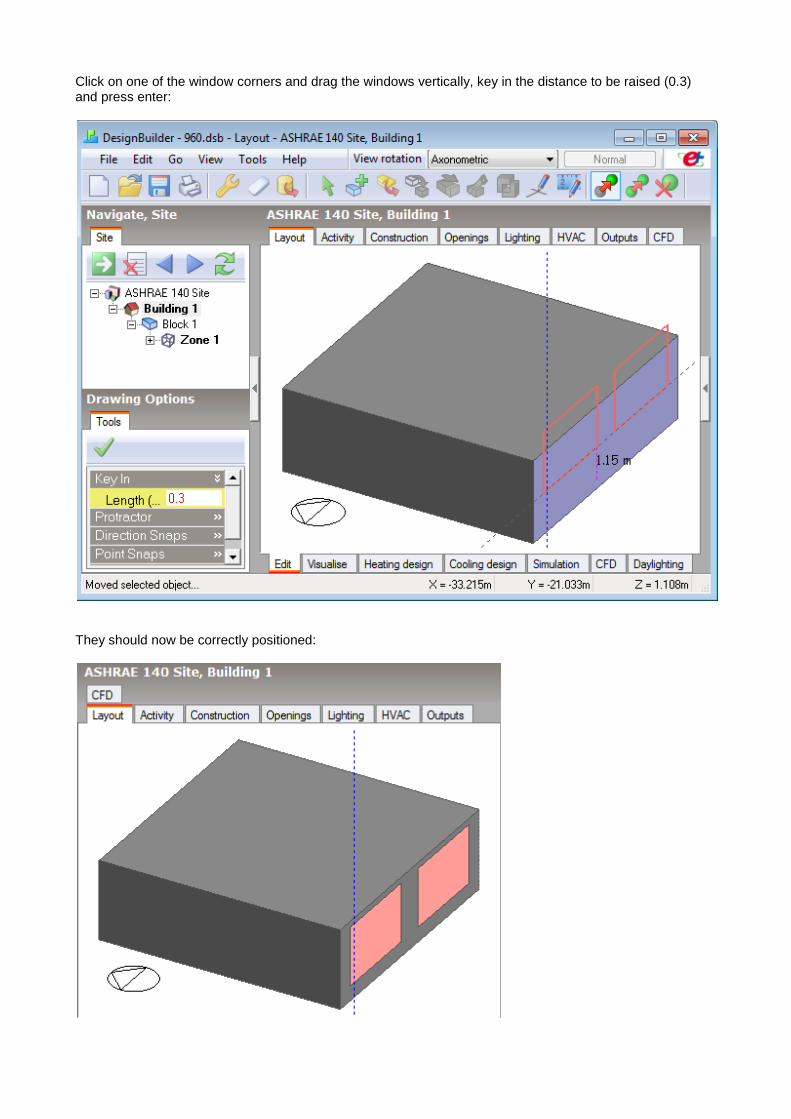
Click on one of the window corners and drag the windows vertically, key in the distance to be raised (0.3) and press enter:
They should now be correctly positioned:

Now split the block into two zones: At block level select draw partition tool and draw partition 2m from south wall
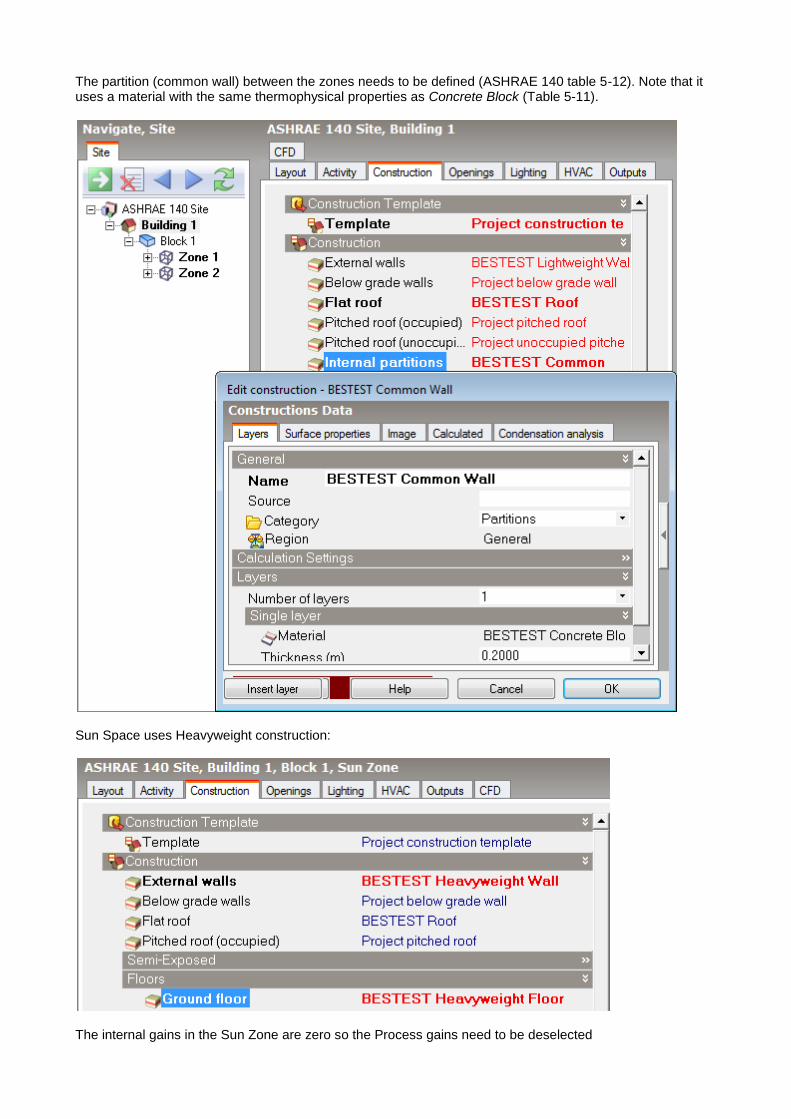
The partition (common wall) between the zones needs to be defined (ASHRAE 140 table 5-12). Note that it uses a material with the same thermophysical properties as Concrete Block (Table 5-11).
Sun Space uses Heavyweight construction:
The internal gains in the Sun Zone are zero so the Process gains need to be deselected

The sun zone is unconditioned
Geometric view of Test Case 960 (taken at Block level using tool: Visualise)
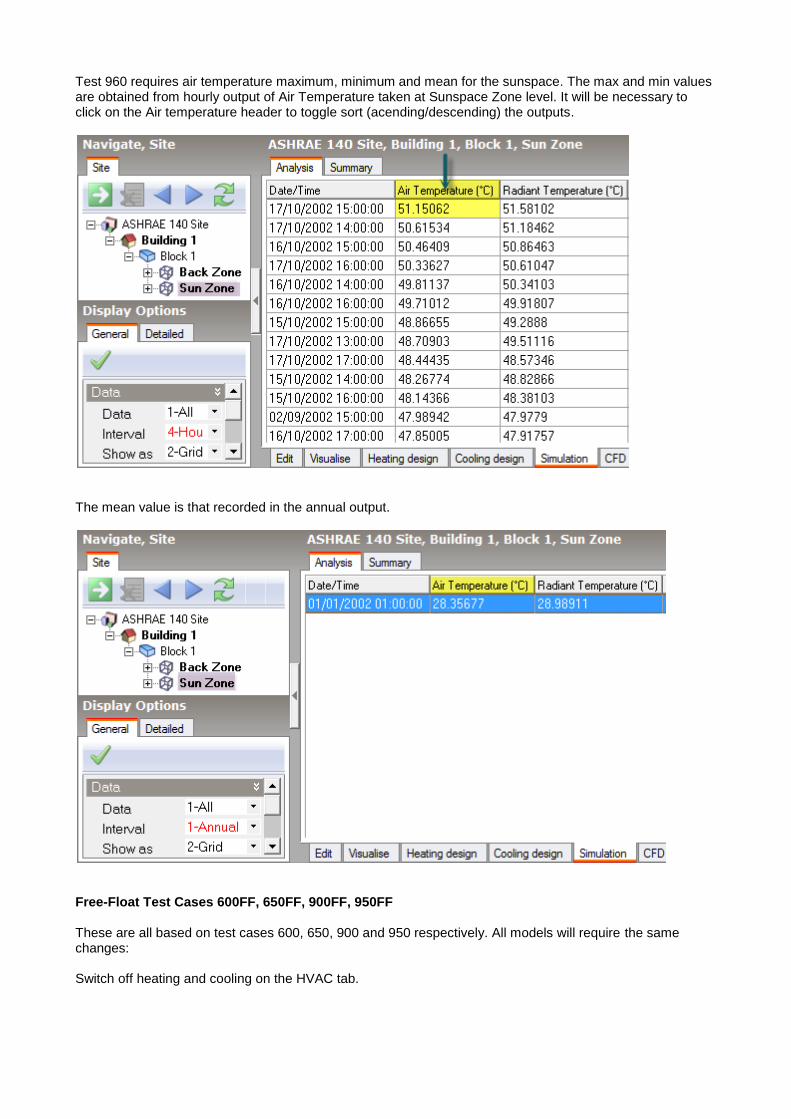
Test 960 requires air temperature maximum, minimum and mean for the sunspace. The max and min values are obtained from hourly output of Air Temperature taken at Sunspace Zone level. It will be necessary to click on the Air temperature header to toggle sort (acending/descending) the outputs.
The mean value is that recorded in the annual output.
Free-Float Test Cases 600FF, 650FF, 900FF, 950FF These are all based on test cases 600, 650, 900 and 950 respectively. All models will require the same changes: Switch off heating and cooling on the HVAC tab.

Section E References
1 ANSI/ASHRAE 2011. Standard 140-2011, Standard Method of Test for the evaluation of Building Energy Analysis Computer Programs.
2 EnergyPlus Testing with Building Thermal Envelope and Fabric Load Tests from ANSI/ASHRAE Standard 140-2011, EnergyPlus version 8.1.0.009 – GARD Analytics, November 2012