anomaly detection in large graphs - school of computer science
TRANSCRIPT
Anomaly Detection in Large Graphs
Leman Akoglu Mary McGlohon Christos FaloutsosNovember 2009
CMU-CS-09-173
School of Computer ScienceCarnegie Mellon University
Pittsburgh, PA 15213
Abstract
Discovering anomalies is an important and challenging taskfor many settings, from network intru-sion to fraud detection. However, most work to date has focused on clouds of multi-dimensionalpoints, with little emphasis on graph data; even then, the focus is on un-weighted, node-labeledgraphs. Here we proposeOddBall , an algorithm to detect anomalous nodes in weighted graphs.The contributions are the following: (a) we carefully choose features, that easily reveal nodeswith strange behavior; (b) we discover several new rules (power laws) in density, weights, ranksand eigenvalues that seem to govern the so-called “neighborhood graphs” and we show how touse them for anomaly detection; (c) we empirically show thatour method scales linearly with thenumber of edges in the graph, and (d) we report experiments onmany real graphs with up to1.5million nodes, whereOddBall indeed spots unusual nodes that agree with intuition.

Keywords: outlier, anomaly detection, graph mining

1 Introduction
Given a real graph, with weighted edges, which nodes should we consider as “strange”? Appli-cations of this setting abound: For example, in network intrusion detection, we have computerssending packets to each other, and we want to know which nodesmisbehave (e.g., spammers, port-scanners). In a who-calls-whom network [33], strange behavior may indicate defecting customers,or telemarketers, or even faulty equipment dropping connections too often. In a social network,like FaceBook and LinkedIn, again we want to spot users whosebehavior deviates from the usualbehavior, such as people adding friends indiscriminately,in “popularity contests”.
The list of applications continues: Anomalous behavior could signify irregularities, like creditcard fraud, calling card fraud, campaign donation irregularities, accounting inefficiencies or fraud[6], extremely cross-disciplinary authors in an author-paper graph [34], suspicious cargo shipments[16], electronic auction fraud [12, 31], and many others.
In addition to revealing suspicious, illegal and/or dangerous behavior, anomaly detection isuseful for spotting rare events, as well as for the thankless, but absolutely vital task of data cleans-ing [14, 15]. Moreover, anomaly detection is intimately related with the pattern and law discovery:unless the majority of our nodes closely obey a pattern (say,a power law), only then can we confi-dently consider as outliers the few nodes that deviate [9].
Most anomaly detection algorithms focus on clouds of multi-dimensional points, as we de-scribe in the survey section. Our goal, on the other hand, is to spot strange nodes in agraph, withweighted edges. What patterns and laws do such graphs obey? What features should we extractfrom each node? We answer all these questions.
Main contributions of this work are:
1. Feature extraction: We propose to focus on neighborhoods, that is, a sphere, or aball (hencethe nameOddBall ) around each node(theego): that is, for each node, we consider theinduced subgraph of its neighboring nodes, which is referred to as theegonet. Out of thehuge number of numerical features one could extract from theegonet of a given node, wegive a carefully chosen list, with features that are both fast to compute, as well as effectivein revealing outliers. Thus, every node becomes a point in a low-dimensional feature space.
2. Egonet patterns: We show that egonets obey some surprising patterns (like theEgonet Den-sity Power Law(EDPL), EWPL, ELWPL, andERPL), which gives us confidence to declareas outliers the ones that deviate. We support our observations by showing that theERPLyields theEWPL.
3. Our hybrid algorithm: Based on those patterns, we proposeOddBall , a novel, hybridmethod for outlier node detection. The method works well forgraphs withmillionsof nodes,and it scaleslinearly with number of edges. Moreover, we propose several approximationsthat improve its speed, with small or zero impact on its accuracy.
4. Application on real data: We applyOddBall to numerous real graphs (DBLP, politicaldonations, and other domains) and we show that it indeed spots nodes that a human wouldagree are strange and/or extreme.
Jumping ahead, the major types of anomalous nodes we can spotare as follows (see Fig.1 forexamples).
1
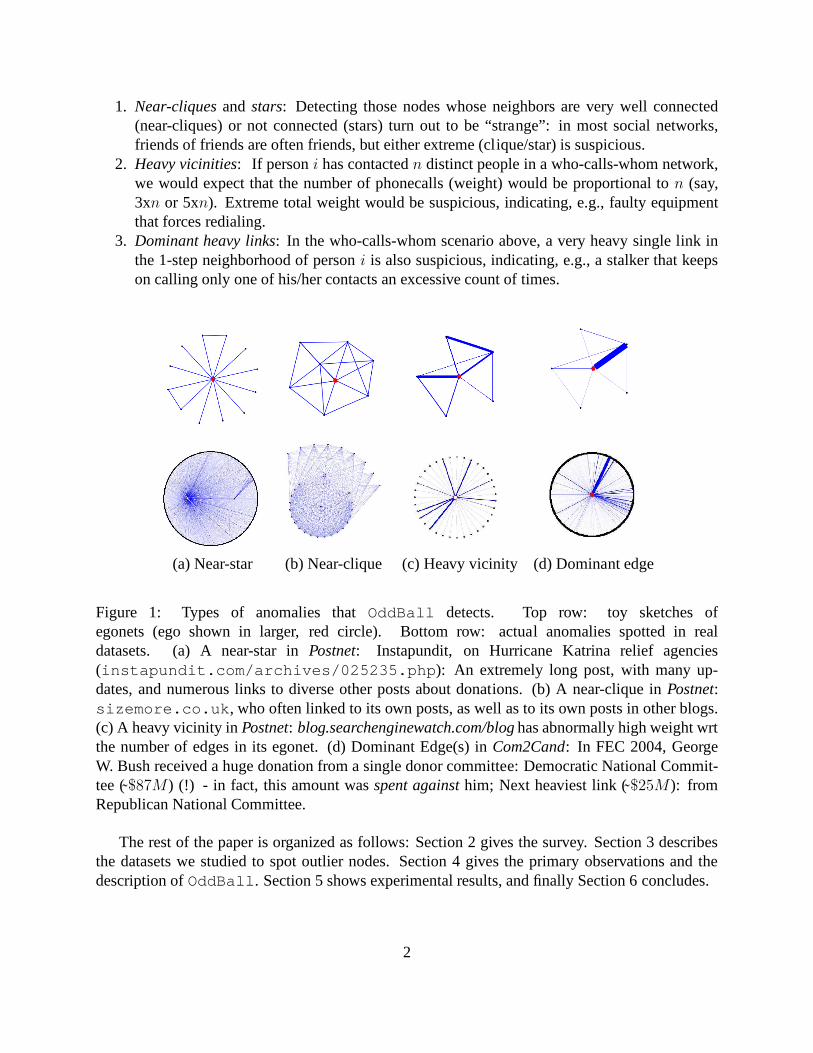
1. Near-cliquesand stars: Detecting those nodes whose neighbors are very well connected(near-cliques) or not connected (stars) turn out to be “strange”: in most social networks,friends of friends are often friends, but either extreme (clique/star) is suspicious.
2. Heavy vicinities: If personi has contactedn distinct people in a who-calls-whom network,we would expect that the number of phonecalls (weight) wouldbe proportional ton (say,3xn or 5xn). Extreme total weight would be suspicious, indicating, e.g., faulty equipmentthat forces redialing.
3. Dominant heavy links: In the who-calls-whom scenario above, a very heavy single link inthe 1-step neighborhood of personi is also suspicious, indicating, e.g., a stalker that keepson calling only one of his/her contacts an excessive count oftimes.
(a) Near-star (b) Near-clique (c) Heavy vicinity (d) Dominant edge
Figure 1: Types of anomalies thatOddBall detects. Top row: toy sketches ofegonets (ego shown in larger, red circle). Bottom row: actual anomalies spotted in realdatasets. (a) A near-star inPostnet: Instapundit, on Hurricane Katrina relief agencies(instapundit.com/archives/025235.php ): An extremely long post, with many up-dates, and numerous links to diverse other posts about donations. (b) A near-clique inPostnet:sizemore.co.uk , who often linked to its own posts, as well as to its own posts in other blogs.(c) A heavy vicinity inPostnet: blog.searchenginewatch.com/bloghas abnormally high weight wrtthe number of edges in its egonet. (d) Dominant Edge(s) inCom2Cand: In FEC 2004, GeorgeW. Bush received a huge donation from a single donor committee: Democratic National Commit-tee ($87M) (!) - in fact, this amount wasspent againsthim; Next heaviest link (˜$25M): fromRepublican National Committee.
The rest of the paper is organized as follows: Section 2 givesthe survey. Section 3 describesthe datasets we studied to spot outlier nodes. Section 4 gives the primary observations and thedescription ofOddBall . Section 5 shows experimental results, and finally Section 6concludes.
2

2 Related Work
2.1 Outlier Detection
Outlier detection has attracted wide interest, being a difficult problem, despite its apparent simplic-ity. Even the definition of the outlier is hard to give: For instance, Hawkins [20] defines an outlieras “an observation that deviates so much from other observations as to arouse suspicion that it wasgenerated by a different mechanism.” Similar, but not identical, definitions have been given byBarnett and Lewis [5], and Johnson [21].
Outlier detection methods form two classes,parametricandnon-parametric. Statistical para-metric methods assume there exists a standard underlying distribution of the observations that fitthe data [20, 5]. The latter class includesdistance-basedanddensity-baseddata mining methods.These methods typically define as an outlier the (n-D) point that is too far away from the rest, andthus lives in a low-density area [23]. Typical methods include LOF [8] and LOCI [32]. Thesemethods not only flag a point as an outlier but they also give outlierness scores; thus, they can sortthe points according to their “strangeness”.
Many otherdensity-basedmethods that perform well in detecting outliers in very large datasetsof high dimension are proposed in [1, 4, 13, 19, 29, 36, 22]. Feature bagging [24] also proves tobe useful to tackle high dimensionality, where features arerandomly grouped into multiple setsof different sizes and outlier detection algorithms are performed on each different set after whichthe scores are combined. Finally, most clustering algorithms [19, 29, 36, 22] reveal outliers as aby-product.
2.2 Anomaly Detection in Graph Data
Noble and Cook [30] detect anomalous sub-graphs using variants of theMinimum DescriptionLength(MDL) principle. Eberle and Holder [17] also use the MDL principle as well as otherprobabilistic measures to detect several types of anomalies (e.g. unexpected/missing nodes/edges).Liu et. al [26] detect noncrashing bugs in software using frequent execution flow graphs combinedwith classification. Chakrabarti [10] uses MDL to spot anomalous edges. Sun et al. [34] useproximity and random walks, to assess the normality of nodesin bipartite graphs. OutRank andLOADED [18, 28] use similarity graphs of objects to detect outliers.
In contrast to the above, we work withunlabeledgraphs. We explicitly focus on nodes, whileinteractions are also considered implicitly as we studyneighborhood subgraphs. Finally, we con-sider both bipartite and unipartite graphs as well as edgeweights.
2.3 Real-world graph properties
Several properties of real-world unweighted graphs have been discovered, surveyed in [11]. In ourstudy, we explicitly concentrate on anomalous node detection in weightedgraphs, adding to lawsof weighted graphs discovered in [2, 27] and relying on theseobservations to detect anomalies.
3
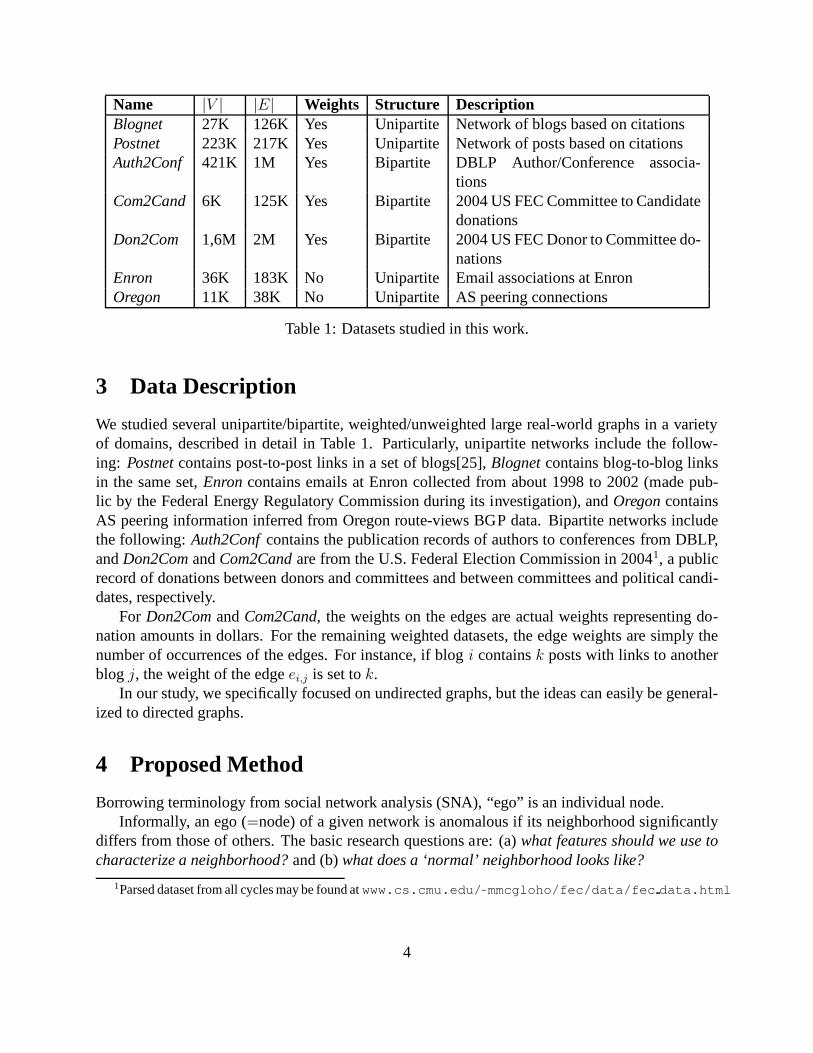
Name |V | |E| Weights Structure DescriptionBlognet 27K 126K Yes Unipartite Network of blogs based on citationsPostnet 223K 217K Yes Unipartite Network of posts based on citationsAuth2Conf 421K 1M Yes Bipartite DBLP Author/Conference associa-
tionsCom2Cand 6K 125K Yes Bipartite 2004 US FEC Committee to Candidate
donationsDon2Com 1,6M 2M Yes Bipartite 2004 US FEC Donor to Committee do-
nationsEnron 36K 183K No Unipartite Email associations at EnronOregon 11K 38K No Unipartite AS peering connections
Table 1: Datasets studied in this work.
3 Data Description
We studied several unipartite/bipartite, weighted/unweighted large real-world graphs in a varietyof domains, described in detail in Table 1. Particularly, unipartite networks include the follow-ing: Postnetcontains post-to-post links in a set of blogs[25],Blognetcontains blog-to-blog linksin the same set,Enroncontains emails at Enron collected from about 1998 to 2002 (made pub-lic by the Federal Energy Regulatory Commission during its investigation), andOregoncontainsAS peering information inferred from Oregon route-views BGP data. Bipartite networks includethe following: Auth2Confcontains the publication records of authors to conferencesfrom DBLP,andDon2ComandCom2Candare from the U.S. Federal Election Commission in 20041, a publicrecord of donations between donors and committees and between committees and political candi-dates, respectively.
For Don2ComandCom2Cand, the weights on the edges are actual weights representing do-nation amounts in dollars. For the remaining weighted datasets, the edge weights are simply thenumber of occurrences of the edges. For instance, if blogi containsk posts with links to anotherblog j, the weight of the edgeei,j is set tok.
In our study, we specifically focused on undirected graphs, but the ideas can easily be general-ized to directed graphs.
4 Proposed Method
Borrowing terminology from social network analysis (SNA),“ego” is an individual node.Informally, an ego (=node) of a given network is anomalous if its neighborhood significantly
differs from those of others. The basic research questions are: (a)what features should we use tocharacterize a neighborhood?and (b)what does a ‘normal’ neighborhood looks like?
1Parsed dataset from all cycles may be found atwww.cs.cmu.edu/ ˜ mmcgloho/fec/data/fec data.html
4

Both questions are open-ended, but we give some answers below. First, let’s define terminol-ogy: the “k-step neighborhood” of nodei is the collection of nodei, all itsk-step-away nodes, andall the connections among all of these nodes – formally, thisis the “induced subgraph”. In SNA,the 1-step neighborhood of a node is specifically known as its“egonet”.
How should we choose the value ofk steps to study neighborhoods? Given that real-worldgraphs have small diameter [3], we need to stay with small values ofk, and specifically, we recom-mendk=1. We report our findings only fork=1, because usingk > 1 does not provide any moreintuitive or revealing information, while it has heavy computational overhead, possibly intractablefor very large graphs.
4.1 Feature Extraction
The first of our two inter-twined questions iswhich statistics/features to extractfrom a neighbor-hood.
Intuitively, we should select easy-to-compute features which help spot the type of anomalieswe are interested in. Types of anomalies we want to find and related features are the following:(1) for near-cliqueandstars, we want to see the relation between the number of entities and thenumber of links between them, as strange patterns among “friends of friends” would arise suspi-cion; (2) for heavy vicinities, or a highly active egonet, total weight should significantly surpassthe number of links; and (3) fordominant heavy link, or a single highly active link in an egonet, theeigenvalue of the weighted adjacency matrix of the egonet should be very close to the total weight.To accommodate detection of all of these anomalies, we propose to use the following features inour study.
1. Ni: number of neighbors (degree) of egoi.2. Ei: number of edges in egoneti.3. Wi: total weight of egoneti,4. λw,i: principal eigenvalue of theweightedadjacency matrix of egoneti.
The next question is how to look for outliers, in such ann-dimensional feature space, with onepoint for each node of the graph. In our case,n=4, but one might have more features dependingon the application and types of anomalies one wants to detect. A quick answer to this would be touse traditional outlier detection methods for clouds of points using all the features.
In our setting, we can do better. As we show next, we group features into carefully chosen pairs,where we expect to find new patterns of normal behaviour. We flag those points that significantlydeviate from the discovered patterns as anomalous. Pairs offeatures we studied and the types ofanomalies each pair helps to detect are the following:
• E vsN : CliqueStar: detects near-cliques and stars• W vsE: HeavyVicinity: detects many reoccurences of interactions• λw vsW : DominantPair: detects single dominating heavy edge (strongly connectedpair)
Here, we note that we studied other features such as the effective radius of each node, numberof neighbors of degree 1, the principal eigenvalues of egonets, etc. as well as triplets of features.However, we do not show these results for the sake of brevity.
5
4.2 Laws and Observations
The second of our research questions iswhat do normal neighborhoods look like. Thus, it isimportant to find patterns (“laws”) for neighborhoods of real graphs, and then report the deviations,if any. In this work, we report some new, surprising patterns:
For a given graphG, nodei ∈ V(G), and the egonetGi of node i,
Observation 1 (EDPL: Egonet Density Power Law) the number of nodesNi and the number ofedgesEi of Gi follow a power law.
Ei ∝ Nαi , 1 ≤ α ≤ 2.
In our experiments theEDPLexponentα ranged from1.10 to 1.66. Fig. 3 illustrates this observa-tion, for several of our datasets. Plots showEi versusNi for every node (green points); the blackcircles are the median values for each bucket of points (separated by vertical dotted lines) afterappyling logarithmic binning on thex-axis as in [27]; the red line is the least squares(LS) fit on themedians. The plots also show a blue line of slope 2, that corresponds to cliques, and a black lineof slope 1, that corresponds to stars. All the plots are in log-log scales.
Observation 2 (EWPL: Egonet Weight Power Law) the total weightWi and the number of edgesEi of Gi follow a power law.
Wi ∝ Eβi , β ≥ 1.
In our experiments theEWPLexponentβ ranged up to 1.29 (See Fig. 4). Values ofβ > 1 indicatesuperlinear growth in the total weight with respect to increasing total edge count in the egonet.
Observation 3 (ELWPL: Egonet λw Power Law) the principal eigenvalue of the weighted adja-cency matrixλw,i and the total weightWi of Gi follow a power law.
λw,i ∝ Wγi , 0.5 ≤ γ ≤ 1.
In our experiments theELWPLexponentγ ranged from 0.53 to 0.98 (See Fig. 5).γ=0.5 indi-cates uniform weight distribution whereasγ 1 indicates a dominant heavy edge, in which case theweighted eigenvalue follows the maximum edge weight.γ=1 if the egonet contains only one edge.
Observation 4 (ERPL: Egonet Rank Power Law) the rankRi,j and the weightWi,j of edgej inGi follow a power law.
Wi,j ∝ Rθi,j , θ ≤ 0.
TheERPLsuggests that edge weights in the egonet have a skewed distribution. This is intuitive;for example in a friendship network, a person could have manynot-so-close friends (small weightlinks), but only a few close friends (heavy links). In Fig. 2 we show theERPLfor top three nodeswith the highest number of edges in their egonet fromBlognet– other datasets have similar results.
Next we show that if theERPLholds, then theEWPLalso holds. Given an egonet graphGi,the total weightWi and the number of edgesEi of Gi, letWi denote the ordered set of weights ofthe edges,Wi,j denote the weight of edgej, Wmin be the minimum edge weight, andRi,j denotethe rank of weightWi,j in setWi. Then,
6

Figure 2: WeightWi,j vs. RankRi,j for each edgej in the egonet of nodei. Top three nodeswith the highest edgecount in their egonet fromBlognetare shown. LS line is fit in log-log scalespointing out a power-law relation (ERPL).
Lemma 1 If Wi,j ∝ Rθi,j, θ ≤ 0, then
Wi ∝ Eβi
{
β = 1, if −1 ≤ θ ≤ 0β > 1, if θ < −1
Proof 1 For brevity, we give the proof forθ < −1 – other cases are similar. Given thatWi,j =cRθ
i,j, Wmin = cEθi , i.e. c = WminE−θ
i . Then we can writeWi as
Wi = WminE−θi
(
Ei∑
j=1
jθ
)
≈ WminE−θi
(∫ Ei
j=1
jθdj
)
= WminE−θi
(
jθ+1
θ + 1
∣
∣
∣
Ei
j=1
)
= WminE−θi
(
1
−θ − 1−
1
(−θ − 1)E−θ−1
i
)
For largeEi and consideringθ < −1, the second term in parenthesis goes to0. Therefore;
Wi ≈ c′E−θi
wherec′ = Wmin
−θ−1, and sinceθ < −1, β > 1.
4.3 Anomaly Detection
We can easily use the observations given in part 4.2 in anomaly detection since anomalous nodeswould behave away from the normal pattern. To score the outlierness of a node, we take thedistance-to-fitting-line as a measure. Let us define they-value of a nodei asyi and similarly, let
7

xi denote thex-value of nodei for a particular feature pairf(x, y). Given the power law equationy = Cxθ for f(x, y), we define the outlierness score of nodei to be
out-line(i) =max(yi, Cxθ
i )
min(yi, Cxθi )
∗ log(|yi − Cxθi | + 1)
Here we penalize the nodes with both thenumber of timesthat they deviate from their expected y-value for their x-value and with the logarithm of theamountof deviation. This way, the minimumoutlierness score is0 –for which the actual valueyi is equal to the expected valueCxθ
i .This simple and easy-to-compute method not only helps in detecting outliers, but also provides
a way to sort the nodes according to their outlierness scores. However, this method is prone to yieldfalse positives for the following reason: Assume that thereexists some points that are far away fromthe remaining points but that are still located close to the fitting line. In our experiments with realdata, we observe that this is almost always the case for high values ofx andy. For example, inFig. 3(a), the points marked with left-triangles(⊳) are almost on the fitting line even though theyare far away from the rest of the points.
We want to flag both types of points as outliers, and thus we propose to combine our heuristicwith a density-based outlier detection technique. We used LOF [8], which also assigns outliernessscoresout-lof(i) to data points; but any other outlier detection method woulddo, as long as it givessuch a score. To obtain the final outlierness score of a data point i, one might use several methodssuch as taking a linear function of both scores and re-ranking the nodes according to the newscore, or merging the two ranked lists of nodes. In our work, we simply used the sum of the twonormalized(by dividing by the maximum) scores, that is,out-score(i)= out-line(i)+out-lof(i).
5 Experimental Results
5.0.1 CliqueStar
Here, we are interested in the communities that neighbors ofa node form. In particular,CliqueS-tar detects anomalies having to do with near-cliques and near-stars. UsingCliqueStar, we weresuccessful in detecting many anomalies over the unipartitedatasets (although it is irrelevant forbipartite graphs since by nature the egonet forms a “star”).
In social media dataPostnetandBlognet, we detected posts or blogs that had either all theirneighbors connected (cliques) or mostly disconnected (stars). We show some illustrative ex-amples along with descriptions fromPostnetin Fig. 1. See Fig.3a for the detected outliers onthe scatter-plot from the same dataset. InBlognet(Fig.3b), the method detected several “linkblogs”, blogs devoted to posting links to a wide array of sources that do not always have sim-ilar content. For instancemfisn.com links to tech blogs, politics stories, and flash cartoons.dev.upian.com/hotlinks also links to a wide range of other posts each day.
In Enron(Fig.3c), the node with the highest outlier score turns out to be “Kenneth Lay”, whowas the CEO and is best known for his role in the Enron scandal in 2001. Our method reveals thatnone of his over 1K contacts ever sent emails to each other. InOregon(Fig.3d), the top outliersare the three large ISPs (“Verizon”, “ Sprint” and “AT&T”).
8

(a) Postnet (b) Blognet
(c) Enron (d) Oregon
Figure 3: Illustration of the Egonet Density Power Law (EDPL), and the corresponding anomalyCliqueStar, with outliers marked with triangles. Edge count versus node count (log-log scale); redline is the LS fit on the median values (black circles); dashedblack and blue lines have slopes 1and 2 respectively, corresponding to stars, and cliques. Top outlying points are enlarged. Moststriking outlier: Ken Lay (CEO of Enron), with a star-like neighborhood. See Section 5.1.1 formore discussion and Fig.1 for example illustrations fromPostnet.
5.0.2 HeavyVicinity
HeavyVicinitydetects nodes that have considerably high total edge weightcompared to the numberof edges in their egonet. In our datasets,HeavyVicinitydetected “heavy egonets”, with anomaliesmarked in Fig.4. InPostnet(Fig.4h), often anomalous posts were the ones that linked toanotherpost repeatedly2 or were listed as the blog’s home page3.
In Blognet(Fig.4g), we detected blogs that linked to just a few other sources, either a singlepost or multiple posts from the same blog. Interesting anomalies are “Automotive News Today”4,which linked 241 times to the GM blog5, but never to any other blog in our dataset. One political
2leados.blogs.com/blog/2005/08/overview of cia.html3blog.searchenginewatch.com/blog4www.automotive-news-today.com5fastlane.gmblogs.com
9

blog 6 had 1816 total in- and out-links, to only 30 other blogs. On the other extreme, “Bandelier”7
had an abnormally high number of edges, but a low weight upon each. The blog had a single postin the dataset, so it was naturally uncommon for blogs to linkto that blog multiple times.
HeavyVicinityrevealed interesting observations in bipartite graphs as well, spotting duplicatesand irregularities. InCom2Cand(Fig.4a,b), we see that “Democratic National Committee” gaveaway a lot of money compared to the number of candidates that it donated to. In addition, “(John)Kerry Victory 2004” donated a large amount to a single candidate, whereas “Liberty CongressionalPolitical Action Committee” donated a very small amount ($5) to a single candidate. Looking attheCandidatesplot for the same bipartite graph, we also flagged “Aaron Russo”, the lone recipientof that PAC. (In fact, Aaron Russo is the founder of the Constitution Party which never ran anycandidates, and Russo shut it down after 18 months.)
In Don2Com(Fig.4c,d), we see that “Bush-Cheney ’04 Inc.” received a lot of money from asingle donor. This is strange, as it was also listed as an anomaly in LoneStar, having many degree1 donors. Looking at the data, we notice that that committee is listed twice with two different IDs.
On the other hand, we notice that the “Kerry Committee” received less money than would beexpected looking at the number of checks it received in total. Further analysis shows that most ofthe edges in its egonet are of weight0, showing that most of the donations to that committee haveactually been returned.
In Auth2Conf(Fig.4e,f), “Averill M. Law” published 40 papers to the “Winter Simulation Con-ference” and nowhere else. This might be due to the fact that there exists no other conference thatwould capture the interest of that author. In fact, underLoneStar, we saw that “Winter SimulationConference” was one of those conferences with most of its authors with degree 1, pointing to thesame possibility that it is a unique conference in a particular area.
Here, other interesting points are “Wei Wang” and “Wei Li”. Those authors have many pa-pers, but they get them published to as many distinct conferences, probably once or twice to eachconference.
5.0.3 DominantPair
DominantPairmeasures whether there is a single dominant heavy edge in theegonet. In otherwords, this method detected “bursty” if not exclusive edges. In Postnet(Fig.5h) nodes such as“ThinkProgress”’s post on a leak scandal8 and “A Freethinker’s Paradise” post 9 linking severaltimes to the “ThinkProgress” post were both flagged. InBlognet(Fig. 5g), we detected a “Drudge”blogger10, who had 298 links, all but 4 to another blogger in the same site 11. “Nocapital” alsoappeared here, since it had around 300 links each to two otherblogs.
In Com2Cand(Fig.5a,b), “Democratic National Committee” is one of the top outliers. Wewould guess that the single large amount of donation was madeto “John F. Kerry”. Counterintu-
6nocapital.blogspot.com7www.bandelier.com8www.thinkprogress.org/leak-scandal9leados.blogs.com/blog/2005/08/overview of cia.html
10drudge.com/user/rcade11drudge.com/user/gzlives
10

(a) Com2Cand (b) Com2Cand (c) Don2Com
(d) Don2Com (e) Auth2Conf (f) Auth2Conf
(g) Blognet (h) Postnet
Figure 4: Illustration of the Egonet Weight Power Law (EWPL) and the weight-edge anomalyHeavyVicinity. Plots show total weight vs. total count of edges in the egonet for all nodes(in log-log scales). Detected outliers include Democratic National Committee and John F. Kerry (in FECcampaign donations), and Averill M. Law in DBLP. See Section5.2.1 for more discussions, andFig.1 for an illustrative example fromPostnet.
itively, however, we see that that amount was spent for an opposing advertisement against “GeorgeW. Bush”).
In Don2Com(Fig.5c,d), there exists points above the slope 1 line. Further inspection shows thatthese points correspond to authorities having negative weighted edges due to returns. Points belowthe fitting line, such as “Dean For America” on theCommitteesplot, correspond to authorities witheven weight distributions on the edges, without any particular dominant heavy link.
DominantPairflagged extremely focused authors (those publish heavily toone conference) inthe DBLP data, shown in Fig.4(e,f). For instance, “Toshio Fukuda” has 115 papers in 17 con-ferences (at the time of data collection), with more than half (87) of his papers in one particular
11

(a) Com2Cand (b) Com2Cand (c) Don2Com
(d) Don2Com (e) Auth2Conf (f) Auth2Conf
(g) Blognet (h) Postnet
Figure 5: Illustration of the Egonetλw Power Law (ELWPL) and dominant heavy link anomalyDominantPair. Top anomalies are marked with triangles and labeled. See Section 5.2.2 for detaileddiscussions for each dataset and Fig.1 for an illustrative example fromCom2Cand.
conference (ICRA). “Alberto-Sangiovanni Vincentelli” published 279 papers to 45 distinct con-ferences, with 76 of his papers in DAC. On theConferencesplot, “Programming Languages andTheir Definition” has 21 papers from 6 authors, with 16 papers by one particular author (“HansBekic”).
5.1 Scalability
Major computational cost of our method is in feature extraction. In particular, computing thosefeatures, such as the total number of edges and total weight,for the egonets is the bottleneck asone needs to find the induced 1-step neighborhood subgraphs for all nodes in the network.
The problem of finding the number of edges in the egonet of a given node can be reduced to the
12

problem of triangle counting. One straightforwardlisting method for local triangle counting is theNode-Iteratoralgorithm. Node-Iteratorconsiders each one of theN nodes and examines whichpairs of its neighbors are connected. Time complexity of thealgorithm isO(Nd2
max). Approximatestreaming algorithms for local triangle counting can be applied to reduce the time complexity toO(E log N) with space complexityO(N) [7].
Figure 6: (a) Computation time of computing egonet featuresvs. number of edges inEnron. Effectof pruning degree-1 and degree-2 nodes on computation time of counting triangles. Solid(–): nopruning, dashed(−−): pruningd ≤ 1, and dotted(. . . ): pruningd ≤ 2 nodes. Computation timeincreases linearly with increasing number of edges, whereas it decreases with pruning. (b) Timevs. accuracy. Effect of pruning on accuracy of finding top anomalies as in the original rankingbefore pruning. New rankings are scored using Normalized Cumulative Discounted Gain. Pruningreduces time for bothNode-IteratorandEigen-Trianglefor different number of eigenvalues whilekeeping accuracy at as high as˜1 and .9, respectively.
In our experiments, we useEigen-Triangle, proposed in [35], which uses eigenvalues/vectorsto approximate the number of paths of length three, i.e. local triangle counts, without performingactual counting. We compare its performance toNode-Iterator, which gives exact counts. Toimprove speed even more, we propose pruning low degree nodes. Notice that removing degree-1nodes has no effect on the number of triangles in the graph. Wealso try removing degree-2 nodes;this would remove some triangles but hopefully would not change the relative number of trianglesacross nodes drastically and still reveal similar outliers.
In Figure 6a, we show computation time forNode-Iterator(green), and forEigen-Triangleusing2(red),10(blue), and30(black) eigenvalues versus graph size in terms of number of edges forEnron(E = 180K). Solid(–), dashed(−−), and dotted(. . . ) lines are for no pruning, after pruningd ≤ 1, andd ≤ 2 nodes, respectively. We empirically note that computationtime grows linearlywith increasing graph size and also reduces with pruning. (Experiments ran on a Pentium classworkstation, with 16GB of RAM, running Linux Fedora Core. Toaccount for possible variabilitydue to system state, each run is repeated 10 times and execution time results are averaged. Errorbars show the variance across repeated runs.)
Pruning low-degree nodes and usingEigen-Trianglereduces computation time, however, theyonly provide approximate answers. In order to quantify their accuracy, we compare the rank list of
13

outliers returned byNode-Iteratorto the rank list of outliers returned by each approximate method.To measure how rankings changed with approximation compared to the original rankings, we useNormalized Dicounted Cumulative Gain(NDCG) which is prevailingly used in Information Re-trieval for measuring the effectiveness of search engines.The premise of NDCG is that highlyranked items in the original list appearing lower in the approximated list are penalized logarithmi-cally proportional to their positions in the approximated list.
Figure 6b shows time vs. NDCG scores forEigen-Triangleusing2, 5, 10 and30 eigenvalues,and alsoNode-Iteratorfor top k anomalies. For brevity, we only show ranking scores fork=100.*, +, and o symbols represent no pruning, pruningd ≤ 1, andd ≤ 2 nodes, respectively. We noticethat while reducing computation time, pruning low degree nodes as well as usingEigen-Trianglekeeps the accuracy at as high as˜.9 for Eigen-Triangle(30), and above0.55 for Eigen-Triangle(2).
6 Conclusion
This is one of the few papers that focus on anomaly detection in graph data, including weightedgraphs. The major contributions are the following:
1. Proposing to work with “egonets”, that is, the induced sub-graph of the node of interest andits neighbors; we give a small, carefully designed list of numerical features for egonets.
2. Discovery of new patterns that egonets follow, such as patterns in density (Obs.1:EDPL),weights (Obs.2:EWPL), principal eigenvalues (Obs.3:ELWPL), and ranks (Obs.4:ERPL).Proof of Lemma 1, linking theERPLto theEWPL.
3. OddBall , a fast, hybrid, unsupervised method to detect abnormal nodes in weighted graphs.Possible approximations in feature extraction that provides speed-up, keeping accuracy at ashigh as .9.
4. Experiments on real graphs of over 1M nodes, whereOddBall reveals nodes that indeedhave strange or extreme behavior.
Future work could generalizeOddBall to time-evolving graphs, where the challenge is to findpatterns that neighborhood sub-graphs follow and to extract features incrementally over time.
References[1] Charu C. Aggarwal and Philip S. Yu. Outlier detection forhigh dimensional data. InSIGMOD, pages 37–46,
2001.
[2] Leman Akoglu, Mary McGlohon, and Christos Faloutsos. RTM: Laws and a recursive generator for weightedtime-evolving graphs. InICDM, Pisa, Italy, December 2008.
[3] Reka Albert, Hawoong Jeong, and Albert-Laszlo Barabasi. Diameter of the world wide web.Nature, (401):130–131, 1999.
[4] Andreas Arning, Rakesh Agrawal, and Prabhakar Raghavan. A linear method for deviation detection in largedatabases. InKDD, pages 164–169, 1996.
[5] V. Barnett and T. Lewis.Outliers in Statistical Data. John Wiley and Sons, Chichester, New York, 1994.
14

[6] Stephen Bay, Krishna Kumaraswamy, Markus G. Anderle, Rohit Kumar, and David M. Steier. Large scaledetection of irregularities in accounting data. InICDM, 2006.
[7] Luca Becchetti, Paolo Boldi, Carlos Castillo, and Aristides Gionis. Efficient semi-streaming algorithms for localtriangle counting in massive graphs. InKDD, pages 16–24, 2008.
[8] Markus M. Breunig, Hans-Peter Kriegel, Raymond T. Ng, and Jorg Sander. Lof: Identifying density-based localoutliers. InSIGMOD, pages 93–104, 2000.
[9] A. Z. Broder, R. Kumar, F. Maghoul, P. Raghavan, S. Rajagopalan, R. Stata, A. Tomkins, and J. L. Wiener.Graph structure in the web.Computer Networks, 33:309–320, 2000.
[10] Deepayan Chakrabarti. Autopart: Parameter-free graph partitioning and outlier detection. InPKDD, pages112–124, 2004.
[11] Deepayan Chakrabarti and Christos Faloutsos. Graph mining: Laws, generators, and algorithms.ACM Comput.Surv., 38(1), 2006.
[12] Duen Horng Chau, Shashank Pandit, and Christos Faloutsos. Detecting fraudulent personalities in networks ofonline auctioneers.PKDD, 2006.
[13] Amitabh Chaudhary, Alexander S. Szalay, and Andrew W. Moore. Very fast outlier detection in large multidi-mensional data sets. InDMKD, 2002.
[14] Ping Chen, Rebecca B. Buchheit, Jr, and Sue Mcneil. Web-vacuum: Web-based environment for automatedassessment of civil infrastructure data.Journal of Computing in Civil Engineering, 19(2):137–147, 2005.
[15] Tamraparni Dasu and Theodore Johnson.Exploratory Data Mining and Data Cleaning. Wiley-Interscience,May 2003.
[16] William Eberle and Lawrence B. Holder. Detecting anomalies in cargo shipments using graph properties. InISI,pages 728–730, 2006.
[17] William Eberle and Lawrence B. Holder. Discovering structural anomalies in graph-based data. InICDMWorkshops, pages 393–398, 2007.
[18] Amol Ghoting, Matthew Eric Otey, and Srinivasan Parthasarathy. Loaded: Link-based outlier and anomalydetection in evolving data sets. InICDM, 2004.
[19] Sudipto Guha, Rajeev Rastogi, and Kyuseok Shim. Cure: An efficient clustering algorithm for large databases.Inf. Syst., 26(1):35–58, 2001.
[20] D. Hawkins. Identification of outliers.Chapman and Hall, 1980.
[21] R. A. Johnson and D. W. Wichern.Applied Multivariate Statistical Analysis. Prentice Hall, 1998.
[22] L. Kaufman and P. J. Rousseeuw.Finding Groups in Data: An Introduction to Cluster Analysis. John Wiley,1990.
[23] Edwin M. Knorr and Raymond T. Ng. Algorithms for mining distance-based outliers in large datasets. InVLDB,pages 392–403, 1998.
[24] Aleksandar Lazarevic and Vipin Kumar. Feature baggingfor outlier detection. InKDD, pages 157–166, 2005.
[25] Jure Leskovec, Mary McGlohon, Christos Faloutsos, Natalie Glance, and Matthew Hurst. Cascading behavior inlarge blog graphs: Patterns and a model. InSociety of Applied and Industrial Mathematics: Data Mining, 2007.
[26] Chao Liu, Xifeng Yan, Hwanjo Yu, Jiawei Han, and Philip S. Yu. Mining behavior graphs for ”backtrace” ofnoncrashing bugs. InSDM, 2005.
[27] Mary McGlohon, Leman Akoglu, and Christos Faloutsos. Weighted graphs and disconnected components:Patterns and a model. InACM SIG-KDD, Las Vegas, Nev., USA, August 2008.
15

[28] H. D. K. Moonesinghe and Pang-Ning Tan. Outrank: a graph-based outlier detection framework using randomwalk. International Journal on Artificial Intelligence Tools, 17(1), 2008.
[29] Raymond T. Ng and Jiawei Han. Efficient and effective clustering methods for spatial data mining. InVLDB,pages 144–155, 1994.
[30] Caleb C. Noble and Diane J. Cook. Graph-based anomaly detection. InKDD, pages 631–636, 2003.
[31] Shashank Pandit, Duen Horng Chau, Samuel Wang, and Christos Faloutsos. Netprobe: a fast and scalable systemfor fraud detection in online auction networks. InWWW ’07, New York, NY, USA, 2007.
[32] Spiros Papadimitriou, Hiroyuki Kitagawa, Phillip B. Gibbons, and Christos Faloutsos. Loci: Fast outlier detec-tion using the local correlation integral. InICDE, pages 315–, 2003.
[33] Mukund Seshadri, Sridhar Machiraju, Ashwin Sridharan, Jean Bolot, Christos Faloutsos, and Jure Leskovec.Mobile call graphs: Beyond power-law and lognormal distributions. InACM SIGKDD, 2008.
[34] Jimeng Sun, Huiming Qu, Deepayan Chakrabarti, and Christos Faloutsos. Neighborhood formation and anomalydetection in bipartite graph.ICDM, November 27-30 2005.
[35] Charalampos Tsourakakis. Fast counting of triangles in large real networks, without counting: Algorithms andlaws. InICDM, 2008.
[36] Tian Zhang, Raghu Ramakrishnan, and Miron Livny. Birch: An efficient data clustering method for very largedatabases. InSIGMOD, pages 103–114, 1996.
16