annual shareholders’ meeting 2013 - total.com · annual shareholders’ meeting – may 17, 2013...
TRANSCRIPT

Annual Shareholders’ Meeting – May 17, 2013 1
Meeting 2013
May 17, 2013
Annual Shareholders’

Annual Shareholders’ Meeting – May 17, 2013 2
ZONE D’IMAGE
Corporate Governance Christophe de Margerie

Annual Shareholders’ Meeting – May 17, 2013 3
Closing accounts, budget and financial policy Defining strategic orientation
– Approving and monitoring progress of major projects – Strategic perspectives of the business segments
Overseeing risk management and internal control Governance
– Preparing the Annual Shareholders’ Meeting – Determining compensation of executive officers, review
and potential update of the principles and rules applicable – Reviewing anti-fraud and anti-corruption policies and procedures – Assessing of the independence of directors
under the AFEP-MEDEF Code
Investment Ichthys (Australia)
Activity of the Board of Directors in 2012
Monitoring incidents Elgin (U.K.)

Annual Shareholders’ Meeting – May 17, 2013 4
A Board and Committees applying the best practices of corporate governance
External evaluations of the Board for continuous improvement
With active and engaged Directors
5 women (33%) out of 15 members
4 non-French nationals (27%)
12 independent Directors (80%)
1 Employee-shareholder Director
A diverse Board
Meetings Attendance
Board of Directors 9 96%
Audit Committee 8 92%
Compensation Committee 3 93%
Governance and Ethics Committee 2 100%
Strategic Committee 1 100%
4 non-voting CCE delegates

Annual Shareholders’ Meeting – May 17, 2013 5
A global and structured risk management system
Group Risk Committee
Internal Control and Internal Audit
COMEX
Board of Directors
• Evaluating and monitoring major projects by the Board
• Different instances
and procedures to anticipate and evaluate risks at every level
• Integrated and transverse risk management (safety, security, finance, strategy, law, ethics, environment, social…)
• Risk Management, Internal Control and Audit Charter formalized in 2012
CORISK
Business segments and functional divisions
Group Ethics
Committee

Annual Shareholders’ Meeting – May 17, 2013 6
Ethics, an efficient and transparent organization
A Group Ethics Committee – Reports directly to the Chairman and CEO of the Group – 7 members, including 5 business segment representatives – 77 cases handled directly in 2012 – Annual reporting to the Governance and Ethics Committee, annual reporting
by the Compliance division on anti-corruption to the Audit Committee
Clear, widely distributed and accessible guidelines
A Governance and Ethics Committee responsible for supervising implementation of our ethics and compliance programs
2011 2008 2009 2000
Code of Conduct
Business Integrity Guide
Compliance policy and program
Anti-fraud and anti-corruption policy and program Human Rights Internal Guide
2003
Ethics Charter

Annual Shareholders’ Meeting – May 17, 2013 7
objectives in 2012
18% in 2015 16% Percentage of females in upper management
< 2 in 2013 1.8 Total Recordable Injury Rate
- 50% between 2005 and 2014
- 28% vs 2005
Flaring from E&P operations
Corporate Social Responsibility, a priority for Total and its Board
Contribute actively to the energy transition Improve energy efficiency by 1.5% per year during 2012-17
Enable as many people as possible to access to energy Awango by Total benefitting 5 million people by 2015
Committed to setting concrete and measurable targets

Annual Shareholders’ Meeting – May 17, 2013 8
A Compensation Committee for a balanced and incentive-based approach
A compensation policy that is balanced and objective – Developing management compensation policies
– Evaluating the performance of the CEO
– Recommendations and proposals to the Board of Directors
Examples
Proposing in 2012 to award performance shares Considering the AMF recommendations on executive compensation Proposing the compensation package of the CEO after comparative analysis Considering the retirement benefits for the CEO
Annual Shareholders’ Meeting – May 17, 2013 9
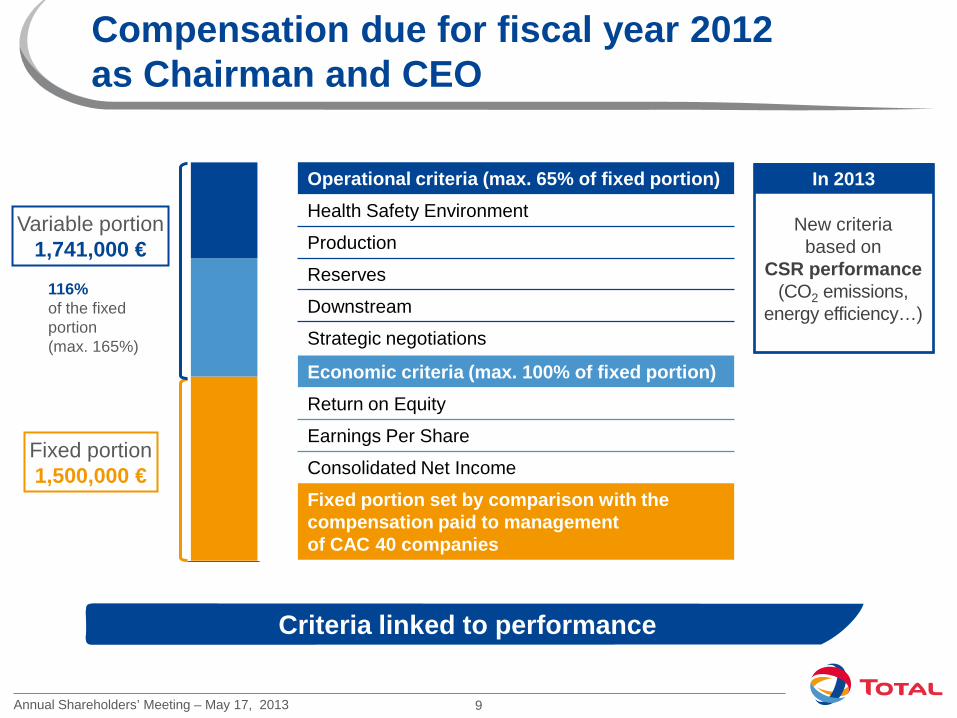
Compensation due for fiscal year 2012 as Chairman and CEO
Criteria linked to performance
Economic criteria (max. 100% of fixed portion) Return on Equity
Earnings Per Share
Consolidated Net Income
Fixed portion set by comparison with the compensation paid to management of CAC 40 companies
Fixed portion 1,500,000 €
116% of the fixed portion (max. 165%)
Variable portion 1,741,000 €
New criteria based on
CSR performance (CO2 emissions,
energy efficiency…)
In 2013 Operational criteria (max. 65% of fixed portion) Health Safety Environment
Production
Reserves
Downstream
Strategic negotiations
Annual Shareholders’ Meeting – May 17, 2013 10
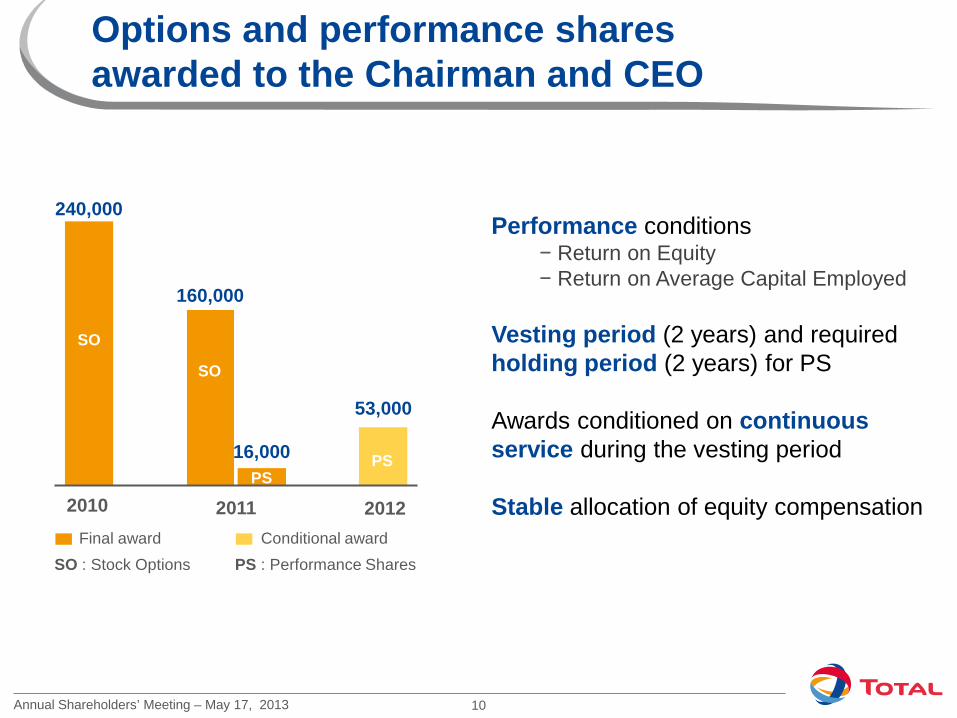
240,000
160,000
53,000
16,000
2010 2011 2012
Options and performance shares awarded to the Chairman and CEO
Performance conditions − Return on Equity − Return on Average Capital Employed
Vesting period (2 years) and required holding period (2 years) for PS Awards conditioned on continuous service during the vesting period Stable allocation of equity compensation
Final award Conditional award SO : Stock Options PS : Performance Shares
SO
SO
PS PS
2010 2012

Annual Shareholders’ Meeting – May 17, 2013 11
• About 520,000 individual shareholders
• Performance shares awarded in 2012 to more than 10,000 people in the Group
• Employee stock purchase plan with limited dilution effect (0.45% of capital)
Fostering individual and employee shareholding
32% Europe (outside France)
9.9% Rest of world
29.6% North America
28.5% France
* As of December 31, 2012, excluding treasury stock. ** Based on the definition of employee shareholding pursuant to Article L. 225-102 of the French Commercial Code.
4.6% Group
employees**
8.4% Individual
shareholders
87% Institutional shareholders
Shareholder base by region* Shareholder base by category*

Annual Shareholders’ Meeting – May 17, 2013 12
Increasing shareholder return
Clear dividend policy
Payout ratio averaging around 50% since 2008
In 2012, proposed dividend of 2.34 euros per share, an increase of about 3%
First quarter 2013 interim dividend of 0.59 euro per share
Dividend multiplied by more than 2 over the past ten years
Growing the dividend regularly for the past 30 years
1.03
1.35
1.87
2.28 2.28 2.34
2002 2004 2006 2008 2010 2012
€/share

Annual Shareholders’ Meeting – May 17, 2013 13
Creating value across the globe
23 B€ investments
(incl. acquisitions)
700 industrial
sites
97,126 employees
Present in
+ 130 countries
5.5 B€ R&D over 5 years
316 M€ community
development
29 B€ goods
and services purchased
7.1 B€ Wages
(incl. social shares)
5.3 B€ dividends
13 B€ (56.2%)
taxes

Annual Shareholders’ Meeting – May 17, 2013 14
Contribution of Total in France in 2012
1.6 G€ Investments
(incl. acquisitions)
6 B€ Goods
and services purchased
35,439 employees
1 B€ paid in taxes
395 M€ R&D
360 SMBs supported over
past 3 years
32 M€ for social and professional
integration since 2009
116 Operated
industrial sites

Annual Shareholders’ Meeting – May 17, 2013 15

Annual Shareholders’ Meeting – May 17, 2013 16
ZONE D’IMAGE
Results of 2012 & 1Q 2013 Patrick de La Chevardière

Annual Shareholders’ Meeting – May 17, 2013 17
% decrease in TRIR, a safety indicator
Mboe/d production
Major discoveries
% organic reserve replacement
B€ adjusted net income
B€ net investment
18
Key figures for 2012
2.3
4
100
12.4
17
Good performance in 2012

Annual Shareholders’ Meeting – May 17, 2013 18
Different regional evolutions
A favorable environment in 2012
2010 2011 2012
Stable on average BRENT
112 $/b
GAS
80
100
120
16 $/Mbtu in Asia
9 $/Mbtu in Europe
3 $/Mbtu in USA 5
10
15
20
2010 2011 2012

Annual Shareholders’ Meeting – May 17, 2013 19
Good performance from business segments
Upstream 18% ROACE
Refining & Chemicals 9% ROACE
2010 2011 2012
10.3 B€
11.4 B€ 12.4 B€
Marketing & Services 12% ROACE
Other
Adjusted net income
+20%
ROACE: return on average capital employed
16% Group ROACE in 2012 and 18% return on equity

Annual Shareholders’ Meeting – May 17, 2013 20
Evolution of Upstream production
2.30 Decline
Start-ups
Price effect
2012 2011
2.35
One-offs
Portfolio changes
Production Mboe/d

Annual Shareholders’ Meeting – May 17, 2013 21
Results of a revitalized exploration strategy
A vast and promising exploration portfolio
2012 main discoveries 2012 main new acreage
Argentina
Brazil
Colombia
United States
Norway
Nigeria

Annual Shareholders’ Meeting – May 17, 2013 22
2012 reserve replacement rate
Organic reserve replacement rate
of 100%
Proved reserves Bboe at 12/31/12
136% average reserve replacement rate for 2010-2012 More than 13 years of proved reserves More than 20 years of proved and probable reserves More than 40 years of resources 2011
Production
New contributions
2012
11.4 11.4

Annual Shareholders’ Meeting – May 17, 2013 23
Adjusted net operating income
Improved results in a favorable, but volatile, environment
Refining & Chemicals
2012 2011
1.4 B€
ROACE 5% 9%
2010
6%
+40% 1.0 B€
ERMI 17 $/t 36 $/t 27 $/t
0.8 B€

Annual Shareholders’ Meeting – May 17, 2013 24
Adjusted net operating income 2012
New Energies
0.8 B€
Europe
Africa/ Middle East
Asia Americas
Lubricants and other specialties
Retail network/ Commercial sales
Other
1.0 B€
-0.2 B€
Diverse worldwide positions provide strong resilience and growth potential
Marketing & Services, New Energies

Annual Shareholders’ Meeting – May 17, 2013 25
Solid cash flow generation
17.1 B€ net investments in line with budget
22.5 B€
Dividend
Change in net debt
Organic investments
Cash flow from operations
Net asset sales/ acquisitions
5.3 B€ dividend, including 2Q12 increase
21% gearing at end-2012
2012
Funding Capex and dividend, increasing financial flexibility
Cash flow allocation

Annual Shareholders’ Meeting – May 17, 2013 26
15% Group ROACE
Upstream 17% ROACE
Refining & Chemicals 10% ROACE
4Q 2012 1Q 2013
2.9 B€
Marketing & Services 13% ROACE
Other
Adjusted net income
Progressive restart of Elgin-Franklin Launched Moho Nord in Congo Sold stake in Voyageur Upgrader in Canada
Modernization of Normandy refinery
Good contribution from speciality products Improvement in New Energies
ROACE: return on average capital employed
Solid performance for 1Q 2013
Annual Shareholders’ Meeting – May 17, 2013 27
ZONE D’IMAGE
Strategy and Outlook Christophe de Margerie
Annual Shareholders’ Meeting – May 17, 2013 28
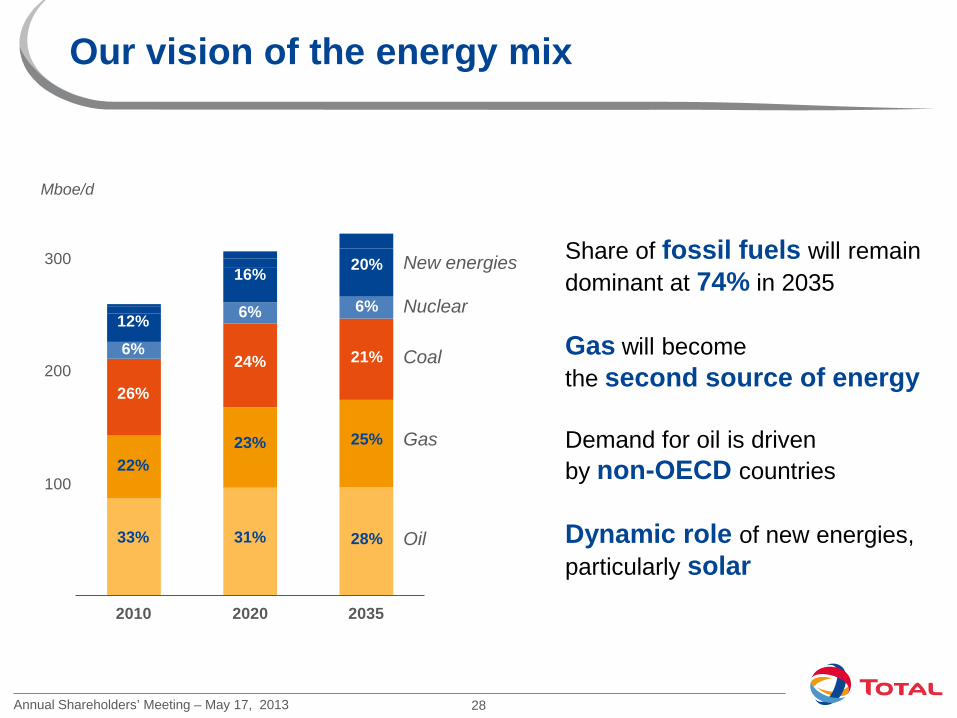
Our vision of the energy mix
Mboe/d
Share of fossil fuels will remain dominant at 74% in 2035
Gas will become the second source of energy
Demand for oil is driven by non-OECD countries
Dynamic role of new energies, particularly solar
100
300
200
Nuclear
Oil
New energies
Gas
Coal
28%
25%
21%
6%
20%
33%
22%
26%
6%
12%
31%
23%
24%
6%
16%
2010 2035 2020
Annual Shareholders’ Meeting – May 17, 2013 29
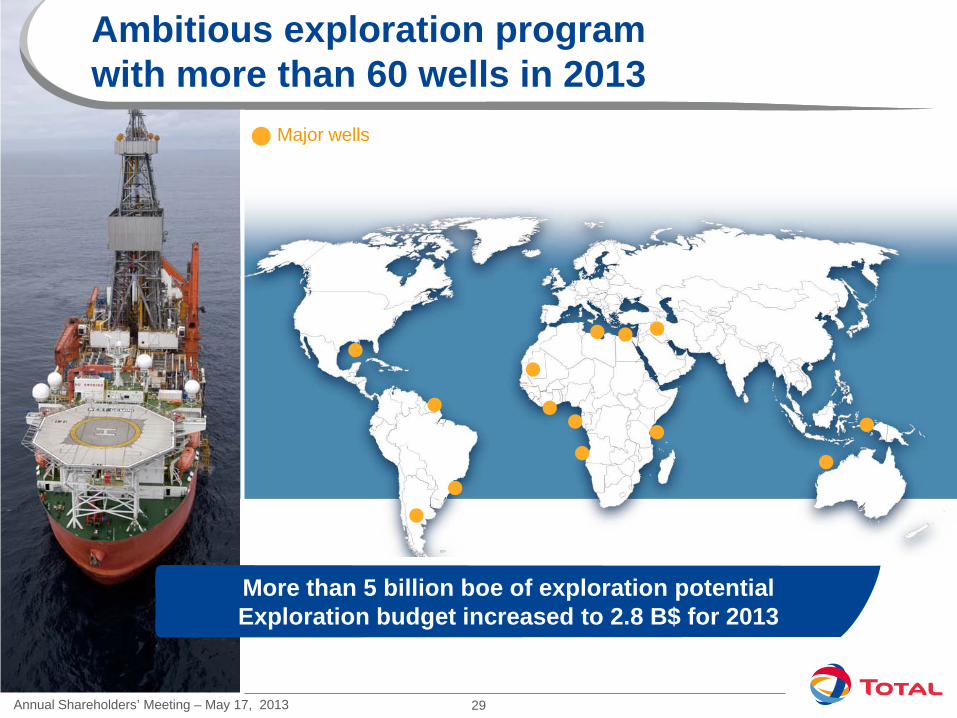
Ambitious exploration program with more than 60 wells in 2013
More than 5 billion boe of exploration potential Exploration budget increased to 2.8 B$ for 2013
Major wells

Annual Shareholders’ Meeting – May 17, 2013 30
Exciting pipeline of major start-ups
2014 2015 2016 2017 2013
Sulige
Anguille Ph 3
Angola LNG
Kashagan
OML 58 Upgrade
Ekofisk South
CLOV
Laggan-Tormore
Ofon 2
Tempa Rossa
Moho Nord
Martin Linge
Ichthys
Eldfisk 2
Surmont 2
GLNG
Termokarstovoye
Egina
Dagny
Developing 800 kboe/d of equity production, around 50% in OECD countries

Annual Shareholders’ Meeting – May 17, 2013 31
0
500
1000
1500
2000
2500
3000
3500
2011 2015 2017
2011-15
+3%
2
1
3
~3 Mboe/d
+1 Mboe/d
Production Mboe/d – Brent price 100 $/b
Good visibility for production growth
Production potential of 3 Mboe/d in 2017
Accelerating growth post-2015
~ 95% of 2017 potential already in production or under development
New projects Projects under study

Annual Shareholders’ Meeting – May 17, 2013 32
Refining & Chemicals, improving profitability by 2015
2011-2013 2014-2015
2010 2015 Speciality chemicals
Portfolio changes
Efficiency/ Synergies
Major
platforms
In a 2010 environment: ERMI 27 $/t, mid-cycle for petrochemicals, $/€ 1.33
Evolution of ROACE (return on average capital employed)
6% +1,5
+1
+2
+2,5 13%

Annual Shareholders’ Meeting – May 17, 2013 33
Marketing & Services, New Energies
MARKETING & SERVICES Create a popular brand on a worldwide basis Maintain balanced positions across all regions and in all market segments Rigor and responsibility for sustainable growth A visible, modern and attractive presence Keep a profitability superior to 16%
NEW ENERGIES
Solar, reducing costs and returning to profitability Maintain Sunpower’s leading position in solar technologies
Profitable growth and brand recognition

Annual Shareholders’ Meeting – May 17, 2013 34
Rising cash flow supports investment strategy
*2013-17 in a Brent 100$/b scenario Net investments = Capex + acquisitions – asset sales
Accelerating cash flow growth
Investing for the future
Funding competitive dividend growth
Maintaining a solid balance sheet Average
2012-14 Average 2015-17
Average 2008-11
Flexibility on part of unsanctioned Capex
Group cash flow from operations Net investments
Operating cash flow and net investments* B$
40
20

Annual Shareholders’ Meeting – May 17, 2013 35
Committed to operating responsibly
Upholding our ethics values, and promoting transparency and human rights
Building relationships on trust
Managing the environmental impact of our activities
Supporting development, employment and access to energy at a local level

Annual Shareholders’ Meeting – May 17, 2013 36
A clear path forward
Relying on an ambitious exploration program
Delivering the next generation of major projects
Increasing our competitiveness
Actively managing our portfolio
Investing in tomorrow’s energy mix
Creating value for the Group

Annual Shareholders’ Meeting – May 17, 2013 37
Disclaimer
This document may contain forward-looking information on the Group (including objectives and trends), as well as forward-looking statements within the meaning of the Private Securities Litigation Reform Act of 1995, notably with respect to the financial condition, results of operations, business, strategy and plans of TOTAL. These data do not represent forecasts within the meaning of European Regulation No. 809/2004. Such forward-looking information and statements included in this document are based on a number of economic data and assumptions made in a given economic, competitive and regulatory environment. They may prove to be inaccurate in the future, and are subject to a number of risk factors that could lead to a significant difference between actual results and those anticipated, including currency fluctuations, the price of petroleum products, the ability to realize cost reductions and operating efficiencies without unduly disrupting business operations, environmental regulatory considerations and general economic and business conditions. Certain financial information is based on estimates particularly in the assessment of the recoverable value of assets and potential impairments of assets relating thereto. Neither TOTAL nor any of its subsidiaries assumes any obligation to update publicly any forward-looking information or statement, objectives or trends contained in this document whether as a result of new information, future events or otherwise. Further information on factors, risks and uncertainties that could affect the Company’s financial results or the Group’s activities is provided in the most recent Registration Document filed by the Company with the French Autorité des Marchés Financiers and annual report on Form 20-F filed with the United States Securities and Exchange Commission (“SEC”).
Financial information by business segment is reported in accordance with the internal reporting system and shows internal segment information that is used to manage and measure the performance of TOTAL. Performance indicators excluding the adjustment items, such as adjusted operating income, adjusted net operating income, and adjusted net income are meant to facilitate the analysis of the financial performance and the comparison of income between periods. These adjustment items include: (i) Special items Due to their unusual nature or particular significance, certain transactions qualified as "special items" are excluded from the business segment figures. In general, special items relate to transactions that are significant, infrequent or unusual. However, in certain instances, transactions such as restructuring costs or asset disposals, which are not considered to be representative of the normal course of business, may be qualified as special items although they may have occurred within prior years or are likely to occur again within the coming years. (ii) Inventory valuation effect The adjusted results of the Refining & Chemicals and Marketing & Services segments are presented according to the replacement cost method. This method is used to assess the segments’ performance and facilitate the comparability of the segments’ performance with those of its competitors.
In the replacement cost method, which approximates the LIFO (Last-In, First-Out) method, the variation of inventory values in the statement of income is, depending on the nature of the inventory, determined using either the month-end prices differential between one period and another or the average prices of the period rather than the historical value. The inventory valuation effect is the difference between the results according to the FIFO (First-In, First-Out) and the replacement cost. (iii) Effect of changes in fair value The effect of changes in fair value presented as an adjustment item reflects for some transactions differences between internal measures of performance used by TOTAL’s management and the accounting for these transactions under IFRS. IFRS requires that trading inventories be recorded at their fair value using period-end spot prices. In order to best reflect the management of economic exposure through derivative transactions, internal indicators used to measure performance include valuations of trading inventories based on forward prices. Furthermore, TOTAL, in its trading activities, enters into storage contracts, which future effects are recorded at fair value in Group’s internal economic performance. IFRS precludes recognition of this fair value effect.
The adjusted results (adjusted operating income, adjusted net operating income, adjusted net income) are defined as replacement cost results, adjusted for special items, excluding the effect of changes in fair value.
Dollar amounts presented herein represent euro amounts converted at the average euro-dollar exchange rate for the applicable period and are not the result of financial statements prepared in dollars. Cautionary Note to U.S. Investors – The SEC permits oil and gas companies, in their filings with the SEC, to separately disclose proved, probable and possible reserves that a company has determined in accordance with SEC rules. We may use certain terms in this presentation, such as resources, that the SEC’s guidelines strictly prohibit us from including in filings with the SEC. U.S. investors are urged to consider closely the disclosure in our Form 20-F, File N° 1-10888, available from us at 2, Place Jean Millier – Arche Nord Coupole/Regnault - 92078 Paris-La Défense Cedex, France, or at our Web site: www.total.com. You can also obtain this form from the SEC by calling 1-800-SEC-0330 or on the SEC’s Web site: www.sec.gov.