annual shareholders’ meeting 2013 - basf€¦ · business development 2012 million € 2 sales...
TRANSCRIPT

Annual Shareholders’ Meeting 2013 Dr. Kurt Bock Chairman of the Board of Executive Directors of BASF SE

Business development 2012 Million €
2
Sales +7%
+5%
2012
2011
2012
2011
78,729
73,497
8,881
8,447
EBIT before special items

Sales by segment 2012 Million €
3
Chemicals
Plastics
Performance Products
Functional Solutions
Agricultural Solutions
Oil & Gas
Other
+7% +4% +1% +1%
+12% +39% -24%
13,824 12,958
11,402 10,990
15,871 15,697
11,460 11,361
16,700 12,051
4,679 4,165
4,793 6,275
2012 2011

EBIT before special items by segment 2012 Million €
4
Chemicals
Plastics
Performance Products
Functional Solutions
Agricultural Solutions
Oil & Gas
Other
-30% -27% -17%
0% +28% +94%
1,717 2,441
873 1,203
1,428 1,727
561 559
4,104 2,111
1,037 810
-839 -404
2012 2011

BASF shares compared with indices Average annual performance 2002 – 2012
5
BASF
+4%
DAX 30
+19%
+10%
+11%
EURO STOXX
MSCI World Chemicals

Business development 1st quarter 2013 * Million €
6
+5%
+10%
Q1 2013
Q1 2012
Q1 2013
Q1 2012
19,738
18,840
2,214
2,010
EBIT before special items
Sales
* We have applied International Reporting Standards 10 and 11 since January 1, 2013; the figures for 2012 have been restated accordingly.
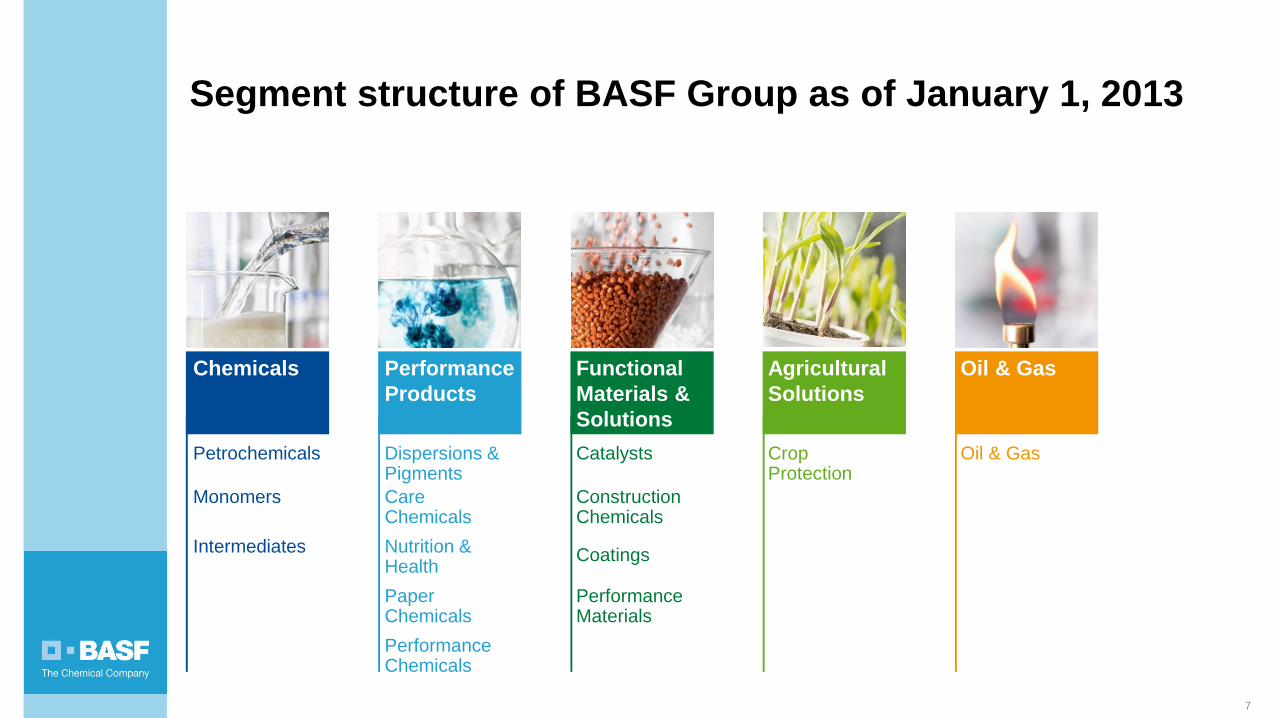
Segment structure of BASF Group as of January 1, 2013
7
Crop Protection
Performance Products
Dispersions & Pigments Care Chemicals
Functional Materials & Solutions
Agricultural Solutions
Performance Chemicals
Nutrition & Health Paper Chemicals
Oil & Gas
Oil & Gas
Chemicals
Monomers
Intermediates
Petrochemicals
Functional Materials & Solutions
Construction Chemicals
Coatings
Catalysts
Performance Materials

Targets 2015
8
~ €80 billion
~ €7.50
~ €14 billion
Sales
EBITDA
Earnings per share

Portfolio development
9
Acquisitions Engineering plastics Electronic chemicals Catalysts Construction chemicals Water-based resins Pigments Plastic additives Oil & Gas Personal care & nutrition Battery materials Functional crop care Omega-3 fatty acids
~ €15 billion (sales)
Divestitures Pharma Fibers Printing systems Polyolefins Polystyrene North America Agro generics Vitamins premix Fertilizers Styrenics
~ €10 billion* (sales)
BASF
Strong partnerships
Selected transactions 2001 − today
*without Styrenics
Gazprom Monsanto Petronas Shell Sinopec Total

Catalysts
10

smart forvision
11

Our purpose
12
We create chemistry for a sustainable future