annual review 1 january 2020 31 december 2020
TRANSCRIPT
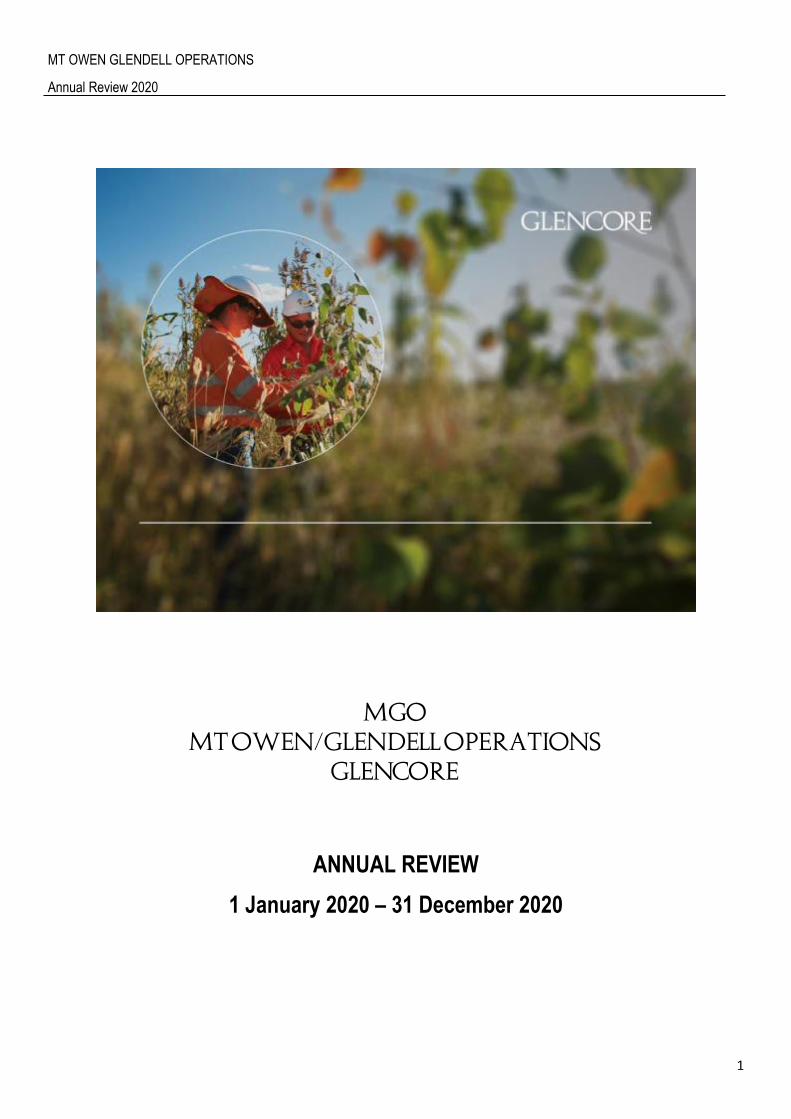
MT OWEN GLENDELL OPERATIONS
Annual Review 2020
1
ANNUAL REVIEW
1 January 2020 – 31 December 2020
MGO
MT OWEN/GLENDELL OPERATIONS
GLENCORE

MT OWEN GLENDELL OPERATIONS
Annual Review 2020
2
THIS PAGE HAS BEEN INTENTIONALLY LEFT BLANK.

MT OWEN GLENDELL OPERATIONS
Annual Review 2020
3
Title Block
Name of operation Mt Owen Glendell Operations
Name of operator Mt Owen, Ravensworth East and Glendell Mines
Development consent/ project approval MGO Mining Operations Plan (Mt Owen, Glendell and Ravensworth East), DA SSD-5850 (Mt Owen and Ravensworth East) and DA 80/952 (Glendell).
Name of holder of development consent/ project approval
Mt Owen Pty Limited
Mining lease and Exploration Lease # Mt Owen & Rav East – CCL715, CL383, ML1355, ML1415, ML1419, ML1453, ML1475, ML1561, ML1608, ML1629, ML1673, ML1694, ML1741, ML1802, MLA512, MLA513, EL6254, EL5824, A268, A423, A429, AL08
Glendell – ML1629, ML1673
Name of holder of mining lease Mt Owen Pty Limited
Mining lease and Exploration Lease # Glendell – CL358, MPL343, ML1410, ML1476, EL6594, EL8184
Name of holder of mining lease Glendell Tenements Pty Ltd
Water licence # Refer list provided in Table 31
Name of holder of water licences Mt Owen Pty Limited
MOP/ RMP start date January 2020
MOP/ RMP end date June 2024
Annual Review start date 01/01/2020
Annual review end date 31/12/2020
I, Jason Desmond, certify that this audit report is a true and accurate record of the compliance status of Mt Owen Glendell Operations for the period 01/01/2020 to 31/12/2020 and that I am authorised to make this statement on behalf of Mt Owen Glendell Operations.
Note.
a) The Annual Review is an ‘environmental audit’ for the purposes of section 122B (2) of the Environmental Planning and Assessment Act 1979. Section 122E provides that a person must not include false or misleading information (or provide information for inclusion in) an audit report produced to the Minister in connection with an environmental audit if the person knows that the information is false or misleading in a material respect. The maximum penalty is, in the case of a corporation, $1 million and for an individual, $250,000.
b) The Crimes Act 1900 contains other offences relating to false and misleading information: section 192G (Intention to defraud by false or misleading statement—maximum penalty 5 years imprisonment); sections 307A, 307B and 307C (False or misleading applications/information/documents—maximum penalty 2 years imprisonment or $22,000, or both).
Name of authorised reporting officer Jason Desmond
Tittle of authorised reporting officer Environment and Community Manager
Signature of authorised reporting officer
Date 31/03/2021
MT OWEN GLENDELL OPERATIONS
Annual Review 2020
4
Contents
1 Executive Summary and Statement of Compliance.................................................................................................................... 9
1.1 Executive Summary ........................................................................................................................................................... 9
1.2 Statement of Compliance ................................................................................................................................................. 13
1.3 Statutory Requirements ................................................................................................................................................... 14
2 Introduction ............................................................................................................................................................................... 18
3 Approvals .................................................................................................................................................................................. 23
4 Operations Summary ................................................................................................................................................................ 28
4.1 Mining Operations ............................................................................................................................................................ 28
4.2 Project Approvals ............................................................................................................................................................. 29
Mt Owen Continued Operations ............................................................................................................................................... 29
Glendell Continued Operations................................................................................................................................................. 30
Glendell Mine – Modification 4 – Minor Extension .................................................................................................................... 30
4.3 Other Operations ............................................................................................................................................................. 30
4.3.1 Train and Conveyer Movements ................................................................................................................................. 30
4.3.2 Waste and Other Hazardous Material Management ................................................................................................... 31
4.3.3 Environmental Incidents .............................................................................................................................................. 33
4.3.4 Land Ownership .......................................................................................................................................................... 34
4.3.5 Exploration................................................................................................................................................................... 35
4.3.6 Next Reporting Period ................................................................................................................................................. 35
5 Actions Required from Previous Annual Review ...................................................................................................................... 36
6 Environmental Performance ..................................................................................................................................................... 37
6.1 Operational Noise ............................................................................................................................................................ 37
6.1.1 Noise Monitoring Program ........................................................................................................................................... 37
6.1.2 MGO Dust and Noise Analysis Tool – DNAT .............................................................................................................. 40
6.1.3 MGO Sound Power Level Assessment ....................................................................................................................... 40
6.1.4 Noise Monitoring Performance .................................................................................................................................... 40
6.1.5 Continuous Improvement ............................................................................................................................................ 44
6.2 Blasting ............................................................................................................................................................................ 44
6.2.1 Blast Management and Monitoring .............................................................................................................................. 44
6.2.2 Blast Performance ....................................................................................................................................................... 46
6.3 Air Quality ........................................................................................................................................................................ 48
6.3.1 Air Quality Management and Monitoring ..................................................................................................................... 48
6.3.2 Meteorological Conditions ........................................................................................................................................... 50
6.3.3 Air Quality Performance .............................................................................................................................................. 51
6.3.4 Continuous Improvement ............................................................................................................................................ 55
6.3.5 Greenhouse Gas ......................................................................................................................................................... 55
MT OWEN GLENDELL OPERATIONS
Annual Review 2020
5
6.4 Biodiversity and Land Management ................................................................................................................................. 57
6.4.1 Biodiversity Offset Areas ............................................................................................................................................. 57
6.4.2 Rehabilitation Woodland Offset ................................................................................................................................... 62
6.4.3 Flora Monitoring ........................................................................................................................................................... 63
6.4.4 Fauna Monitoring ......................................................................................................................................................... 69
6.4.5 Biodiversity Offset Areas (BOAs) Management ........................................................................................................... 74
6.5 Heritage ........................................................................................................................................................................... 84
6.5.1 Aboriginal Heritage ...................................................................................................................................................... 84
6.5.2 European Heritage ...................................................................................................................................................... 87
6.5.3 Visual Amenity ............................................................................................................................................................. 89
6.5.4 Demolition Works ........................................................................................................................................................ 89
7 Water Management .................................................................................................................................................................. 92
7.1 Water and Salt Balance ................................................................................................................................................... 95
7.2 Hunter River Salinity Trading Scheme (HRSTS) ............................................................................................................. 96
7.3 Surface Water .................................................................................................................................................................. 97
Monitoring Program and Triggers ............................................................................................................................................. 97
7.3.1 Water Quality ............................................................................................................................................................... 97
7.3.2 Surface Water Performance ...................................................................................................................................... 103
7.4 Groundwater .................................................................................................................................................................. 116
Monitoring Program and Triggers ........................................................................................................................................... 116
7.4.1 Groundwater Performance ........................................................................................................................................ 119
7.4.2 Groundwater Inflows Estimates ................................................................................................................................. 123
8 Rehabilitation .......................................................................................................................................................................... 129
8.1 Rehabilitation Monitoring ............................................................................................................................................... 132
8.2 Further Improvements, Trials and Research.................................................................................................................. 143
8.3 Rehabilitation Activities for the next reporting period (2021) .......................................................................................... 145
9 Community ............................................................................................................................................................................. 147
9.1 Community Engagement and Activities 2020 ................................................................................................................ 147
9.2 Community Contributions ............................................................................................................................................... 148
9.3 Summary of MGO Community Complaints .................................................................................................................... 150
9.4 Complaint Trends and Actions ....................................................................................................................................... 150
10 Independent Audit .................................................................................................................................................................. 152
11 Incidents and Non-Compliances 2020 .................................................................................................................................... 153
12 Activities to Improve Environmental Management in 2021 ..................................................................................................... 154
List of Figures
MT OWEN GLENDELL OPERATIONS
Annual Review 2020
6
Figure 1: Mt Owen/Glendell Operations Overview and Disturbance as of 31 December 2020 ........................................................ 20 Figure 2: MGO Overview – Regional Context ................................................................................................................................... 21 Figure 3: MGO Mining Tenements .................................................................................................................................................... 27 Figure 4: MGO Noise Monitoring Locations ...................................................................................................................................... 39 Figure 5: MGO Blast Monitoring Locations ........................................................................................................................................ 45 Figure 6: MGO Air Quality Monitoring Locations ............................................................................................................................... 49 Figure 7: 2020 Annual Wind Roses for Sx13 M1, Sx13 M2 and Sx13 M8 ........................................................................................ 50 Figure 8: MGO Biodiversity Offset Areas .......................................................................................................................................... 60 Figure 9: MGO Site Biodiversity Offset Areas - Detail ....................................................................................................................... 61 Figure 10: Photo monitoring locations for Conservation Areas ......................................................................................................... 64 Figure 11: Acacia Decora germinate in direct seeding rip line of Southern Remnant CA ................................................................. 69 Figure 12: Oppurtunistic photos of fauna identified in offset areas .................................................................................................... 71 Figure 13: Example of direct seeding works completed at Stringybark Offset Area .......................................................................... 74 Figure 14: Nest Boxes Installed at MGO in 2020 .............................................................................................................................. 77 Figure 15: Habitat Augmentation features installed within BOAs ...................................................................................................... 78 Figure 16: Targeted weed control works in MGO Offset Areas ......................................................................................................... 80 Figure 17: Images captured on motion cameras in Offset Areas during 2020 .................................................................................. 82 Figure 18: Images captured during buffer land spring baiting program ............................................................................................. 83 Figure 19: Retouched mudstone blade artefact monitored in 2020 in MGO's Buffer Lands .............................................................. 86 Figure 20: Silcrete core artefact monitored in 2020 in MGO's Buffer Lands ...................................................................................... 86 Figure 21: Fence at Marali Homestead ............................................................................................................................................. 88 Figure 22: Timber loading ramp to be managed in-situ ..................................................................................................................... 88 Figure 23: Demolition of Hebden PS - before .................................................................................................................................... 90 Figure 24: Demolition of Hebden PS - after ....................................................................................................................................... 90 Figure 25: Ravensworth Public School - before ................................................................................................................................ 91 Figure 26: Demolition of Ravensworth Public School - After ............................................................................................................. 92 Figure 27: MGO Surface Monitoring Locations ................................................................................................................................. 98 Figure 28: Stream Stability and Stream Health Assessment Locations .......................................................................................... 102 Figure 29: Yorks Creek Diversion (Hebden Rd) remediation works completed in 2020 .................................................................. 116 Figure 30: MGO Groundwater Extraction and Monitoring Bores ..................................................................................................... 118 Figure 31: Newly completed rehabilitation at Glendell .................................................................................................................... 131 Figure 32: Rehabilitation Parameters Monitored ............................................................................................................................. 135 Figure 33: Summary of Rehabilitation Performance for 2020 Monitoring ........................................................................................ 142 Figure 34: Example of seed nursery development at Mt Owen ....................................................................................................... 144 Figure 35: 7.5ha area of re-seeding to woodland in the North Void ................................................................................................ 145 Figure 36: Mt Owen Complex Proposed Rehabilitation for 2020..................................................................................................... 146 Figure 37: Hebden RFS Community Donation ................................................................................................................................ 149 Figure 38: Comparison of Complaints Received at Mt Owen and Glendell from 2013 to 2020....................................................... 151
List of Tables
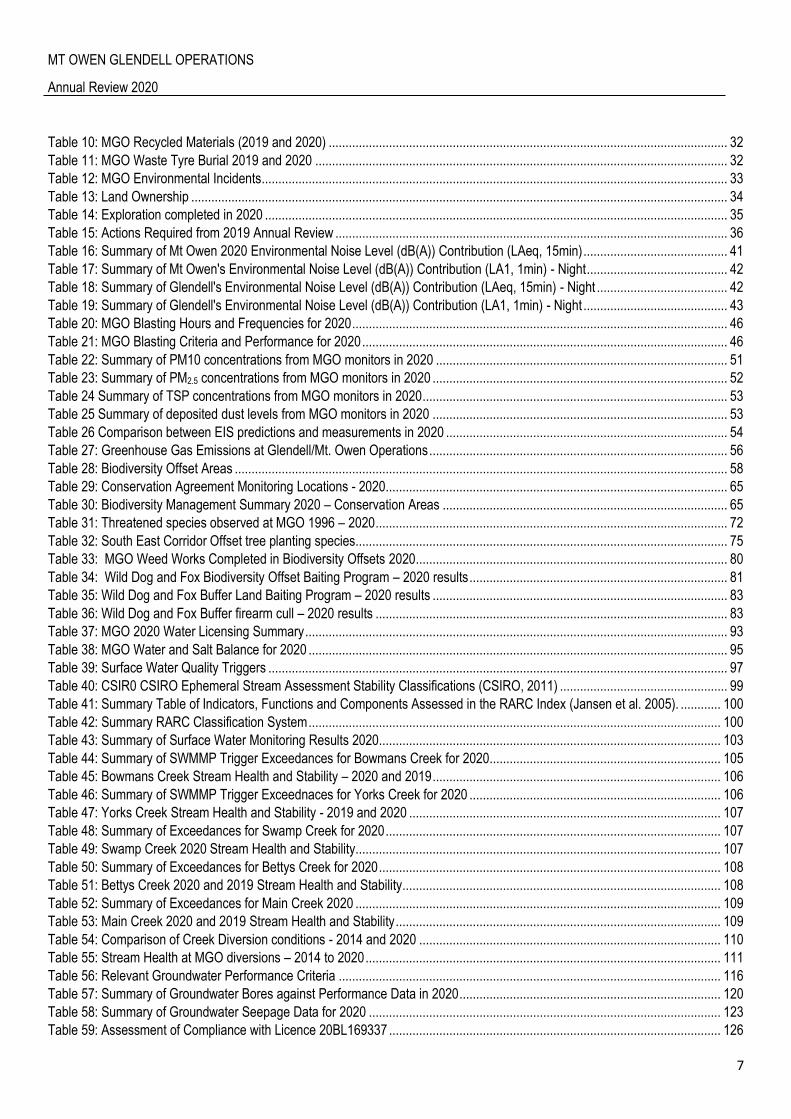
Table 1: Summary of ROM and Product Coal ..................................................................................................................................... 9 Table 2: Statement of Compliance for 2020 ...................................................................................................................................... 13 Table 3: Non-Compliances ................................................................................................................................................................ 14 Table 4: Statutory Requirements ....................................................................................................................................................... 14 Table 5: MGO Contact Details .......................................................................................................................................................... 22 Table 6: MGO Approval Conditions ................................................................................................................................................... 23 Table 7: MGO Environmental Management Plans ............................................................................................................................ 28 Table 8: MGO Production Summary ................................................................................................................................................. 29 Table 9: MGO Train and Conveyor Movements 2020 ....................................................................................................................... 31
MT OWEN GLENDELL OPERATIONS
Annual Review 2020
7
Table 10: MGO Recycled Materials (2019 and 2020) ....................................................................................................................... 32 Table 11: MGO Waste Tyre Burial 2019 and 2020 ........................................................................................................................... 32 Table 12: MGO Environmental Incidents ........................................................................................................................................... 33 Table 13: Land Ownership ................................................................................................................................................................ 34 Table 14: Exploration completed in 2020 .......................................................................................................................................... 35 Table 15: Actions Required from 2019 Annual Review ..................................................................................................................... 36 Table 16: Summary of Mt Owen 2020 Environmental Noise Level (dB(A)) Contribution (LAeq, 15min) ........................................... 41 Table 17: Summary of Mt Owen's Environmental Noise Level (dB(A)) Contribution (LA1, 1min) - Night .......................................... 42 Table 18: Summary of Glendell's Environmental Noise Level (dB(A)) Contribution (LAeq, 15min) - Night ....................................... 42 Table 19: Summary of Glendell's Environmental Noise Level (dB(A)) Contribution (LA1, 1min) - Night ........................................... 43 Table 20: MGO Blasting Hours and Frequencies for 2020 ................................................................................................................ 46 Table 21: MGO Blasting Criteria and Performance for 2020 ............................................................................................................. 46 Table 22: Summary of PM10 concentrations from MGO monitors in 2020 ....................................................................................... 51 Table 23: Summary of PM2.5 concentrations from MGO monitors in 2020 ........................................................................................ 52 Table 24 Summary of TSP concentrations from MGO monitors in 2020 ........................................................................................... 53 Table 25 Summary of deposited dust levels from MGO monitors in 2020 ........................................................................................ 53 Table 26 Comparison between EIS predictions and measurements in 2020 .................................................................................... 54 Table 27: Greenhouse Gas Emissions at Glendell/Mt. Owen Operations ......................................................................................... 56 Table 28: Biodiversity Offset Areas ................................................................................................................................................... 58 Table 29: Conservation Agreement Monitoring Locations - 2020 ...................................................................................................... 65 Table 30: Biodiversity Management Summary 2020 – Conservation Areas ..................................................................................... 65 Table 31: Threatened species observed at MGO 1996 – 2020 ......................................................................................................... 72 Table 32: South East Corridor Offset tree planting species............................................................................................................... 75 Table 33: MGO Weed Works Completed in Biodiversity Offsets 2020 ............................................................................................. 80 Table 34: Wild Dog and Fox Biodiversity Offset Baiting Program – 2020 results ............................................................................. 81 Table 35: Wild Dog and Fox Buffer Land Baiting Program – 2020 results ........................................................................................ 83 Table 36: Wild Dog and Fox Buffer firearm cull – 2020 results ......................................................................................................... 83 Table 37: MGO 2020 Water Licensing Summary .............................................................................................................................. 93 Table 38: MGO Water and Salt Balance for 2020 ............................................................................................................................. 95 Table 39: Surface Water Quality Triggers ......................................................................................................................................... 97 Table 40: CSIR0 CSIRO Ephemeral Stream Assessment Stability Classifications (CSIRO, 2011) .................................................. 99 Table 41: Summary Table of Indicators, Functions and Components Assessed in the RARC Index (Jansen et al. 2005). ............ 100 Table 42: Summary RARC Classification System ........................................................................................................................... 100 Table 43: Summary of Surface Water Monitoring Results 2020...................................................................................................... 103 Table 44: Summary of SWMMP Trigger Exceedances for Bowmans Creek for 2020..................................................................... 105 Table 45: Bowmans Creek Stream Health and Stability – 2020 and 2019 ...................................................................................... 106 Table 46: Summary of SWMMP Trigger Exceednaces for Yorks Creek for 2020 ........................................................................... 106 Table 47: Yorks Creek Stream Health and Stability - 2019 and 2020 ............................................................................................. 107 Table 48: Summary of Exceedances for Swamp Creek for 2020 .................................................................................................... 107 Table 49: Swamp Creek 2020 Stream Health and Stability............................................................................................................. 107 Table 50: Summary of Exceedances for Bettys Creek for 2020 ...................................................................................................... 108 Table 51: Bettys Creek 2020 and 2019 Stream Health and Stability ............................................................................................... 108 Table 52: Summary of Exceedances for Main Creek 2020 ............................................................................................................. 109 Table 53: Main Creek 2020 and 2019 Stream Health and Stability ................................................................................................. 109 Table 54: Comparison of Creek Diversion conditions - 2014 and 2020 .......................................................................................... 110 Table 55: Stream Health at MGO diversions – 2014 to 2020 .......................................................................................................... 111 Table 56: Relevant Groundwater Performance Criteria .................................................................................................................. 116 Table 57: Summary of Groundwater Bores against Performance Data in 2020 .............................................................................. 120 Table 58: Summary of Groundwater Seepage Data for 2020 ......................................................................................................... 123 Table 59: Assessment of Compliance with Licence 20BL169337 ................................................................................................... 126

MT OWEN GLENDELL OPERATIONS
Annual Review 2020
8
Table 60: MGO Rehabilitation Summary ......................................................................................................................................... 129 Table 61: 2020 Rehabilitation works compared to MOP ................................................................................................................. 130 Table 62: Rehabilitation Parameters Monitored .............................................................................................................................. 133 Table 63: 2020 Rehabilitation Progress Summary - Open Grassland Rehabilitation LTM Block .................................................... 136 Table 64: 2020 Rehabilitation Progress Summary - Corridors/Shelter Belts Rehabilitation LTM Blocks ........................................ 136 Table 65: 2020 Rehabilitation Progress Summary - Open Woodland (CHGBIW) LTM Blocks ....................................................... 137 Table 66: 2020 Rehabilitation Progress Summary - Open Woodland (CHSGIGBF) LTM Blocks ................................................... 140 Table 67: Community Engagement Activities for 2020 .................................................................................................................... 147 Table 68: 2020 MGO Community Contributions .............................................................................................................................. 148 Table 69: IEA report response to audit findings and action plan following audit ............................................................................. 152 Table 70: Non-Compliance Reported in 2020 ................................................................................................................................. 153 Table 71: Performance Improvement Summary for 2021................................................................................................................ 154
MT OWEN GLENDELL OPERATIONS
Annual Review 2020
9
1 Executive Summary and Statement of Compliance
1.1 Executive Summary This Annual Review (‘the report’) is for the period of 01 January 2020 to 31 December 2020. It is required under:
Schedule 5, Condition 5, of Development Approval SSD-5850 (MTO and Ravensworth East)
Schedule 5, Condition 5, of Development Approval 80/952 (Glendell).
The report has been prepared in accordance with the NSW Department of Planning and Environment (DP&E) Annual Review
Guideline, dated October 2015.
Mt Owen Glendell Operations (MGO) produced a total of 12.82 Million tonnes of run of mine (ROM) coal during the reporting period.
In 2020, Product Coal totalled 7.48 Million tonnes (see Table 1).
Table 1: Summary of ROM and Product Coal
*Only 17 million tonnes of ROM Coal allowed to be processed via CHPP in a calendar year as per SSD-5850
A total of 860 trains were loaded during the reporting period, with 7.39 Mt of the 7.48Mt Product Coal railed from site
(Approximately 0.09Mt stockpiled at year end).
On 30 January 2020 DPIE approved Mt Owen Continued Operations Modification 3 (SSD-5850) and on 4 March 2020 DPIE
approved Glendell DA80/952 Modification 4.
On 14 April 2020 DPIE RR approved MGO MOP Amendment A for the period 2020-June 2024 and on 18 December 2020 DPIE
RR approved MGO MOP Amendment B for the period 2020-June 2024.
Air Quality
Late 2019 coincided with a period of unprecedented bushfires in Australia that continued into January and February of 2020. These
conditions adversely affected air quality across many parts of NSW and a total of 24 days in 2020 were subsequently declared as
extraordinary events. Measurements of PM10, PM2.5, TSP and deposited dust were compared to the short and long term impact
assessment criteria from the Mt Owen and Glendell development consents. It was determined that Mt Owen Glendell Operations
was in compliance with its development consents (DA 80/952 and SSD-5850) in terms of air quality impacts at all reportable
monitoring sites for data collected in 2020.
Site 2020 ROM Coal (Mt) ROM Consent Limit (Mt) 2020 Product Coal (Mt)
Mt Owen 8.06 10 4.46
Glendell 3.56 4.5 2.19
Ravensworth East 1.20 4 0.83
Total 12.82 17* 7.48
MT OWEN GLENDELL OPERATIONS
Annual Review 2020
10
Predictions of air quality from the latest environmental assessment of the approved operation were compared to the measurement
results. The comparisons showed that predicted PM10, TSP and deposited dust levels were generally higher than the 2020
measurement results. This outcome reflected the generally conservative nature of air quality models as well as the increase in rainfall
that was observed in 2020.
Water
The Surface Water Management and Monitoring Plan (SWMMP), Groundwater Management and Monitoring Plan (GWMMP),
Erosion and Sediment Control Plan, Creek Diversions Plan and Surface Water and Groundwater Response Plan (SWGWRP) were
all revised and approved by DPIE in 2020.
In 2020, there were a number of monitoring results that exceeded baseline trigger levels for the creek’s at MGO. The sites that
triggered SWMMP criteria in 2020 were internally reviewed in accordance with the 2020 SWGWRP. These reviews confirmed that
external reporting of these results was not required in line with the SWGWRP.
Stream condition at Bowman’s Creek, Swamp Creek and Betts creek remained stable in classiciation to that of 2019. There was
either no change or a slight decrease in stream health at Yorks Creek from 2019. At Main Creek, stream health remained constant
or slightly improved compared to 2019. Creek diversions onsite undergo quarterly condition monitoring and annual stream stability
and stream health assessments. Outcomes of Creek monitoring show mixed results, with decreased conditions, improved conditions,
or no change. Generally an improvement in vegetation cover was noted due to high rainfall being received.
MGO monitor groundwater level and quality for 98 groundwater monitoring bores as per the MGO GWMMP. Monitoring results for a
number of bores exceeded the decline in level (drawdown) during 2020. Review of water quality results and comparison to trigger
levels for EC and pH identified several trigger exceedances in 2020. Generally, these exceedances were either in line with historical
trends or correlated with groundwater conditions recovering from several years of drought conditions.
Biodiversity
MGO completed its third round of monitoring on its Conservation Agreements (CAs) Offsets with overall good composite value scored
throughout the offsets, the report also provided recommended actions to be completed in 2021.
In addition, comprehensive fauna and flora monitoring surveys were conducted at MGO offsets in 2020, identifying a new bird
species, the Wonga Pigeon in the North West Offset. Eight threatened species were recorded in 2020, which included 3 birds, 3
terrestrial/arboreal mammals and 2 microbat species. The Spotted-tail Quoll, Squirrel Glider and Brush-tailed Phascogale were
recorded by either remote camera monitoring or nest box occupation.
A total of 78 new nest boxes and 5 log habitat stuctures were installed at MGO in 2020 (throughout the biodiversity offsets and on
site). Of the 295 total nest boxes there was an occupation rate of 15.2% in 2020.
The weed action plan implemented in 2018 continued in 2020, with targeted weed control continuing across MGO offsets and
rehabilitation areas. The targeted wild dog and fox baiting program continued in the MGO offsets during the report period. The
program consisted of a seasonal ‘1080’ baiting program undertaken in Autumn (May) and Spring (October) across on-site
Biodiversity Offset Areas (BOAs) and monthly canid ejector bait program across off-site BOAs.
MT OWEN GLENDELL OPERATIONS
Annual Review 2020
11
Noise
The noise monitoring program for MGO incorporates both continuous noise monitors and attended noise monitoring. During the
attended noise monitoring, there was one non-compliance, where the Mt Owen mine exceeded the nominated criteria during
applicable meteorological conditions. The exceedance occurring in June was reported to the relevant agencies and no further
action was requested. The applicable noise criteria and the predicted noise levels are the same for each of the monitoring locations
and therefore the comparison with the criteria also demonstrates a comparison with the predicted noise levels. Results do not
appear to indicate any trends in the data.
During 2020 MGO continued to develop the Noise Analysis Tool (NAT), to allow enhanced separation of noise contribution, which
assists Mining Supervisors to plan and modify operational controls in adverse noise conditions.
Blasting
There was a decrease in the number of blasts during 2020, a total of 238 blasts occurred at MGO compared to 248 in 2019. 2020
blasting consisted of 90 blasts at Mt Owen, 110 blasts at Glendell and 38 blasts at Ravensworth East. No blasting was undertaken
in the North Void. MGO recorded no non-compliances with the Blast Management Plan during 2020.
Heritage
Inspections were carried out during the 2020 reporting period for Aboriginal and European cultural heritage sites, in accordance with
the Ground Disturbance Permit process. In 2020 MGO, in conjunction with two Registered Aboriginal Parties (RAPs) and an OzArk
archaeologist, continued the monitoring of Aboriginal heritage sites across both MGO and Integra Underground. During this reporting
period, four Aboriginal sites were salvaged, one site was fully salvaged and two others had specific segments salvaged to allow for
mining under DA 80/952. One other site was attempted to be salvaged for mining under SSD-5850 however the artefact could not
be located and the site was determined to be destroyed by the RAPs and archaeologist. Artefacts salvaged were taken to Umwelt
as agreed with the RAPs. Artefacts salvaged are under the care of MGO and will be housed in the storage facility at the Wollombi
Brook Conservation Agreement Area once building has been completed in 2021. There were no environmental incidents relating to
Aboriginal heritage in 2020.
During the reporting period MGO continued to care for Ravensworth Homestead and undertake quarterly monitoring of European
sites. In 2020, the former Ravensworth Public School underwent demolition works and became a managed ruin. Unfortunately, on
the 15 April 2020, Hebden Public School burnt down due to a suspected arson attack. On the 26 August 2020, the damaged school
remains were dismantled and disposed of.
Rehabilitation
Rehabilitation continued across MGO during 2020 generally in accordance with the Rehabilitation Management Plan (RMP) / Mining
Operations Plan (MOP). Glendell completed 56.5ha of rehabilitation during 2020 including 35.1 ha of open grassland or pasture
areas and 21.4 ha of open woodland areas. In 2020 Mt Owen rehabilitated a total of 38 ha of open forest rehabilitation. This included
13.2 ha of the natural landform design technique being incorporated at Mt Owen North Pit.
MT OWEN GLENDELL OPERATIONS
Annual Review 2020
12
Rehabilitation across MGO was generally stable and no critical erosion features were identified. Some erosion features were
identified during the 2020 monitoring which will require monitoring and or maintenance. Weed incursion has been identified as the
main issue for rehabilitation impacts at MGO. The results from the 2020 monitoring also highlighted the requirement in some areas
for increases and decreases in existing stem densities and lower and mid storey vegetation depending on existing performance
condition. The management of these requirements is also ongoing and targeted based on the outcomes of annual monitoring
recommendations so that improvement trends can be monitored overtime.
While there are localised issues with rehabilitation performance identified across the site (which in most cases could be
successfully controlled/ treated in the next reporting period), established rehabilitation at MGO generally showed good performance
in 2020 following improved rainfall conditions compared to the drought conditions of the previous several years.
Environmental Incidents
MGO recorded 56 environmental incidents during the reporting period, compared to 44 environmental incidents in 2019. One incident
was classified as category 2, thirty six as category 1, and nineteen were classified as nil category . Of the 36 Category 1 incidents,
there were 26 hydrocarbon spills less than 1000 L, one noise exceedance, three blast fume related events, one illegal dumping
incident, one Ground Disturbance Permit breach, one erosion related event, one water incident, one spontaneous combustion
incident and one fire incident. Contaminated material from hydrocarbon spill related incidents was collected and taken to the
bioremediation area at Glendell and Mt Owen for treatment.
Community Complaints and Consultation
During 2020, four community complaints were recorded at MTO. The complaints consisted of one relating to noise and three relating
to blast vibrations. Responses were quickly provided for the complaints where complainants were not anonymous and the blast
parameters were explained. Glendell and Ravensworth East received a total of 12 community complaints consisting of 10 relating to
noise, one for blast dust and one relating to air quality. Two Community Consultative Committee (CCC) meetings and four Community
Gatherings were held during 2020. The May 2020 CCC meeting was held via Webex due to site Covid-19 controls being enforced.
Visual Impact
MGO undertook direct seeding and tube stock planting works in September 2019 as part of the development of the Middle Falbrook
Tree Screening as described in MOCO MOD 2. Seeding works utilised a mix of species endemic to the local area. Preparatory weed
control, ripping and fencing works were also undertaken during the reporting period prior to planting.
In 2020, additional direct seeding and tube stock planting was completed which the screen demonstrated great ground cover with
evidence of thriving saplings. MGO will continue to monitor and manage the development of the tree screen during the next reporting
period in accordance with Schedule 3 Condition 39A of SSD-5850.
Demolition Works
During the reporting period, two properties were demolished which comprised of Former Hebden Public School and Ravensworth’s
Primary School (as mentioned in heritage section above). Approximately 20.84 tonnes of waste was removed from the site including
MT OWEN GLENDELL OPERATIONS
Annual Review 2020
13
8.34 tonnes of mixed waste and 12.5 tonnes of Asbestos contaminated soil was removed from Hebden public school. For
Ravensworth Public School, approximately 415.6 tonnes of waste was removed from the site including 38.24 tonnes of mixed waste,
308.18 tonnes of concrete waste, 69.18 tonnes of asbestos material.
In 2021, demolition works are planned to improve visual amenity on Glennies Creek Road. Two dilapidated houses are planned to
be demolished and all waste is to be removed from site.
Independent Audit
An independent environmental audit as required by the approvals was conducted by Jacobs at MGO during December 2020. The
audit covered the reporting period 31 October 2017 to 2 December 2020, and consisted of a desktop review of documentation,
interviews with key MGO staff, and a field inspection. The audit identified 7 non-compliance recommendations with no ‘high-risk’ non-
compliances were identified. All 7 issues were classified as administrative in nature. The audit report was submitted to DPIE in
February 2021, at the time of this report feedback is yet to be received.
1.2 Statement of Compliance Mt Owen/Glendell Operations (MGO) incorporates:
Mt Owen Open Cut Mine (MTO), including the MGO Coal Handling and Preparation Plant (CHPP)
Glendell Open Cut Mine
Ravensworth East Open Cut Mine.
During the reporting period, each operation functioned under their own development consent and Environment Protection Licence
(EPL), together with Mining Leases (MLs) and secondary approvals, such as management plans and water licences.
MGO holds over 100 approvals, containing more than 2,000 conditions. Table 2 summarises the state of compliance against the site’s
major approvals during 2020. Non-compliances are listed in Table 3 and detailed in later sections of this report.
Table 2: Statement of Compliance for 2020
Relevant Approvals Compliance
MOC Mining Operations Plan (Mt Owen, Glendell and Ravensworth East) Yes
DA SSD-5850 (Mt Owen / Ravensworth East) No
DA 80/952 (Glendell) Yes
EPBC 2013/6978 Yes
Mt Owen EPL 4460 No
Glendell EPL12840 Yes
CCL0715 Yes
CL0358 Yes
CL0382 Yes
CL0383 Yes

MT OWEN GLENDELL OPERATIONS
Annual Review 2020
14
Relevant Approvals Compliance
ML 1355 Yes
ML 1419 Yes
ML 1453 Yes
ML 1561 Yes
ML 1475 Yes
ML 1608 Yes
ML 1410 Yes
ML 1415 Yes
ML 1476 Yes
ML 1694 Yes
ML 1629 Yes
ML 1741 Yes
ML 1794 No
MPL 343 Yes
EL5824 No
EL6594 Yes
EL8184 Yes
Water Licences Yes
Table 3: Non-Compliances
Relevant Approval
Condition # Condition Description 2020 Compliance
Status Comment
Annual Review Section
DA SSD-5850* Schedule 5, Condition 9A
Breach of operational noise conditions – June 2020
Non-Compliant N1 Noise Exceedance. DPIE & EPA notified.
Section 11
*Non-compliance also reported to EPA as a breach against EPL 4460, condition L3.1, noise operating criteria.
Compliance status key for Table 2:
Risk Level Colour Code Description
High Non-Compliant Non-compliance with potential for significant environmental consequences, regardless of the likelihood of occurrence
Medium Non-Compliant
Non-compliance with:
potential for serious environmental consequences, but is unlikely to occur; or
potential for moderate environmental consequences, but is likely to occur
Low Non-Compliant
Non-compliance with:
potential for moderate environmental consequences, but is unlikely to occur; or
potential for low environmental consequences, but is likely to occur
Administrative non-
compliance Non-Compliant
Only to be applied where the non-compliance does not result in any risk of environmental harm (e.g. submitting a report to government later than required under approval conditions)
1.3 Statutory Requirements Various statutory approvals stipulate the requirements related to this Annual Review. These requirements are summarised in Table 4.
Table 4: Statutory Requirements

MT OWEN GLENDELL OPERATIONS
Annual Review 2020
15
Approval Condition Relevant Section of
Document
Development Consents SSD-5850 (Mt Owen
and Ravensworth) and 80/952 (Glendell),
Schedule 5, Condition 5
By the end of March each year, or as otherwise agreed with the Secretary, the Applicant must submit a report to the Department reviewing the environmental performance of the development to the satisfaction of the Secretary. This review must: (a) describe the development (including any rehabilitation) that was carried out in the previous calendar year, and the development that is proposed to be carried out over the current calendar year; (b) include a comprehensive review of the monitoring results and complaints records of the development over the previous calendar year, which includes a comparison of these results against the:
relevant statutory requirements, limits or performance measures/criteria;
monitoring results of previous years; and
relevant predictions in the documents listed in condition 2(a) of Schedule 2 or 3; (c) identify any non-compliance or incident over the past year, and describe what actions were (or are being) taken to rectify the non-compliance and avoid reoccurrence; (d) identify any trends in the monitoring data over the life of the development; (e) identify any discrepancies between the predicted and actual impacts of the development, and analyse the potential cause of any significant discrepancies; and (f) describe what measures will be implemented over the next year to improve the environmental performance of the development.
(a) 4, 6, 7, 8
(b) 6, 7, 8, 9 (c) 1, 11 (d) Various (e) Various (f) Various
Development Consent 80/952 (Glendell),
Schedule 4, Condition 7
Continuous Improvement 7. The Applicant must: (a) implement all reasonable and feasible best practice noise mitigation measures; (b) investigate ways to reduce the noise generated by the development, including maximum noise levels which may result in sleep disturbance; and (c) report on these investigations and the implementation and effectiveness of these measures in the Annual Review.
6
Development Consent 80/952 (Glendell),
Schedule 4, Condition 46
Monitoring of Coal Transport 46. The Applicant must keep records of the amount of coal transported from the site each year, and include these records in the Annual Review.
4.3.1 and Appendix B
Development Consent 80/952 (Glendell),
Schedule 4, Condition 52
The Applicant must … (e) report on waste management and minimisation in the Annual Review,
…
4.3.2
Development Consent SSD-5850 (Mt Owen and Ravensworth)
Schedule 3, Condition 41
The Applicant must … (d) monitor and report on the effectiveness of the waste minimisation and management measures in the annual review referred to in condition 5 of Schedule 5.
Development Consent SSD-5850 (Mt Owen and Ravensworth)
Schedule 3, Condition 26
Water Management Plan The Applicant must … (vii) a protocol to report on the measures, monitoring results and performance criteria identified above, in the annual review referred to in condition 5 of Schedule 5.
Development Consent SSD-5850 (Mt Owen and Ravensworth)
Schedule 3, Condition 18
Air Quality Operating Conditions The Applicant must: … (h) carry out regular monitoring to determine whether the development is complying with the relevant conditions of this consent, and report on this in the annual review referred to in condition 5 of Schedule 5.
6.3 and Appendix F
Development Consent SSD-5850 (Mt Owen and Ravensworth)
Schedule 3, Condition 31
Biodiversity Management Plan The Applicant must … report on the effectiveness of the above measures against the periodic performance and completion criteria, as part of the annual review referred to in condition 5 of Schedule 5
6.4
MT OWEN GLENDELL OPERATIONS
Annual Review 2020
16
Approval Condition Relevant Section of
Document
Development Consent SSD-5850 (Mt Owen and Ravensworth)
Schedule 3, Condition 45
Rehabilitation Management Plan The Applicant must … include a program to monitor, independently audit and report on the effectiveness of the measures in paragraph (h) above, and progress against the detailed performance and completion criteria in paragraph (g) above (at a minimum these reporting requirements must be included as part of the annual review referred to in condition 5 of Schedule 5)
8
Exploration Licence EL8184, Conditions 043
and 044
043. The licence holder must submit an Environmental Management Report to the Department in the following circumstances: a) where the licence holder is seeking to renew this exploration licence, an Environmental Management Report must accompany an exploration licence renewal application; or b) where the licence holder is seeking to cancel or part cancel this exploration licence, an Environmental Management Report must accompany an exploration licence cancellation application; c) where the licence holder is not seeking to renew or cancel this exploration licence, and Environmental Management Report must be submitted prior to the expiry of this exploration licence. 044. The report must be prepared in accordance with any Director-General's requirements for environmental and rehabilitation reporting on exploration licences and include information on all disturbance resulting from prospecting operations and rehabilitation carried out within the exploration licence area. The report must be prepared to the satisfaction of the Direction-General.
043. Entire document
044. Entire document
Mining Tenement CCL0715, Schedule 00 Conditions 004 and 005
004. The lease holder must lodge Environmental Management Reports (EMR) with the Director-General annually or at dates otherwise directed by the Director-General.
005. The EMR must: a) report against compliance with the MOP; b) report on progress in respect of rehabilitation completion criteria; c) report on the extent of compliance with regulatory requirements; and d) have regard to any relevant guidelines adopted by the Director-General.
004. Entire document
005. a) 8 b) 8 c) Entire document d) Entire document
Mining Tenement CL0358, Schedule 00
Condition 004
The lease holder must lodge Environmental Management Reports (EMR) with the Director-General annually or at dates otherwise directed by the Director-General. The EMR must: i) report against compliance with the MOP; ii) report on progress n respect of rehabilitation completion criteria; iii) report on the extent of compliance with regulatory requirements; and iv) have regard to any relevant guidelines adopted by the Director-General.
i) 8 ii) 8 iii) Entire document iv) Entire document
Mining Tenements ML1410, ML1415, ML1453, ML1475, ML1476, ML1561,
Schedule 00 Conditions 003.01 and 003.02
003.01. Within 12 months of the commencement of mining operations and thereafter annually or, at such other times as may be allowed by the Director-General, the lease holder must lodge an Annual Environmental Management Report (AEMR) with the Director-General. 003.02. The AEMR must be prepared in accordance with the Director-General's guidelines current at the time of reporting and contain a review and forecast of performance for the preceding and ensuing twelve months in terms of:- a) the accepted Mining Operations Plan; b) development consent requirements and conditions; c) Environment Protection Authority and Department of Land and Water Conservation licences and approvals; d) any other statutory environmental requirements; e) details of any variations to environmental approvals applicable to the lease area. and f) where relevant, progress towards final rehabilitation objectives.
003.01 Entire document 003.02 a) 8 b) Various c) Various d) Various e) 4.2 f) 8
Mining Tenements ML1608 and ML1629,
Schedule 00 Conditions 04 and 05
04. The lease holder must lodge Environmental Management Reports (EMR) with The Director-General annually or at dates otherwise directed by the Director- General.
05. The EMR must: - report against compliance with the MOP; - report on progress in respect of rehabilitation completion criteria; - report on the extent of compliance with regulatory requirements; and - have regard to any relevant guidelines adopted by the Director-General.
04. Whole document 05. - 8 - 18 - Entire document - Entire document

MT OWEN GLENDELL OPERATIONS
Annual Review 2020
17
Approval Condition Relevant Section of
Document
Mining Tenements ML1694 and MP0343,
Schedule 00 Condition 04
The lease holder must lodge Environmental Management Reports (EMR) with the Director-General annually or at dates otherwise directed by the Director-General. The EMR must: (i) report against compliance with the MOP; (ii) report on progress in respect of rehabilitation completion criteria; (iii) report on the extent of compliance with regulatory requirements; and (iv) have regard to any relevant guidelines adopted by the Director-General.
i) 8 ii) 18 iii) Entire document iv) Entire document
MT OWEN GLENDELL OPERATIONS
Annual Review 2020
18
2 Introduction Mt. Owen/Glendell Operations (MGO) comprises of (see Error! Reference source not found. and Error! Reference source not fo
und.):
Mt Owen Open Cut Mine (MTO), including the MGO Coal Handling and Preparation Plant (CHPP)
Glendell Open Cut Mine (Glendell)
Ravensworth East Open Cut Mine (Ravensworth East)
This Annual Review (‘the report’) is prepared for the reporting period 01 January 2020 to 31 December 2020. The report has been
prepared in accordance with the NSW Department of Planning and Environment (DP&E) Annual Review Guideline, dated October
2015. It covers the reporting requirements of:
Development consent (DA) SSD-5850 for MTO and Ravensworth East
DA 80/952 for Glendell
Associated approvals, mining and exploration leases, and environmental management plans.
Mt. Owen/Glendell Operations (MGO)
MGO is located on Hebden Road at Ravensworth, approximately 20 km north-west of Singleton, NSW. MGO is owned and managed
by Mt Owen Pty Limited (Mt Owen), which is a wholly owned subsidiary of Glencore Coal Pty Limited (Glencore). MTO is operated
by Thiess Proprietary (Pty) Limited (Ltd) (Thiess).
Mt Owen Open Cut Coal Mine (MTO)
Mining operations at MTO began in 1993 under the management of Hunter Valley Coal Corporation Pty Limited (HVCC). Xstrata
(now Glencore) acquired MTO in 2003. MTO was granted DA 14-01-2004 in December 2004, which was supported by the MTO
Environmental Impact Statement (EIS), December 2003 (Umwelt, 2003).
A modification to DA 14-1-2004 was approved in December 2010. This allowed for the construction and operation of a rail facility on
the MTO rail loop. Further modification was approved in 2014 to increase the CHPP to 17 Million tonnes per annum (Mtpa) run-of-
mine (ROM) coal equivalent from MTO, Glendell and Ravensworth East.
In January 2018 an application was made to DP&E to surrender DA 14-01-2004 as it is replaced by DA SSD-5850. Approval to
surrender DA 14-01-2004 was received from DP&E on 29 May 2018.
Mount Owen Continued Operations (MOCO)
Mount Owen Continued Operations (MOCO), the continued operation of both MTO and Ravensworth East, was granted DA SSD-
5850 in November 2016. The approval was supported by the MOCO EIS, January 2015 (Umwelt, 2015).
A modification to DA SSD-5850 was approved in August 2017 to allow for the inclusion of the Greater Ravensworth Water Sharing
Scheme (GRAWTS), and the construction of a water pipeline from Integra Underground Mine to MGO.
MT OWEN GLENDELL OPERATIONS
Annual Review 2020
19
A second modification to DA SSD-5850 was approved September 2019 to allow an increased disturbance area and extend mining
operations to 31 December 2037. A third modification to SSD-5850 was approved January 2020 which was an administrative
modification in which a land parcel was included within the Schedule of Land.
Glendell Open Cut Coal Mine
Glendell was granted DA 80/952 in May 1993.
The DA was modified in 1997 to enable the extraction of coal from an undeveloped coal reserve, totalling 3.6 Mtpa of ROM coal. The
modification allowed for the construction of a CHPP and the MTO rail loop, and for Glendell to be integrated into the MOC. A further
modification of the DA 80/952 was undertaken in February 2008. This was to allow for mining operations to continue until the end of
June 2024, and to permit extraction of up to 4.5 Mt of ROM coal annually. Modification 3 of DA 80/952 was approved in late 2016.
The modification permits the relocation of a section of the 132 kilovolt (kV) powerlines, to allow for the continuation of mining in the
Barrett Pit.
A fourth modification to DA80/952 was approved in March 2020 which is an extension to the approved Barrett pit shell to access
additional ROM coal and to install a western haul road under the existing approval.
Ravensworth East Open Cut Coal Mine
Ravensworth East was acquired in 1997 by Peabody Resources Ltd. In March 2000, DA 52-03-99 was granted. This was to enable
production of up to 4 Mtpa. This allowed mining operations to commence in August 2000 and continue for up to 21 years.
Enex Resources (now Glencore) purchased Ravensworth Operations Pty Ltd in March 2002. The operation included the
Ravensworth East and Narama mines. A mining operations plan (MOP) was granted in December 2002, which allowed for the
transport and processing of coal from Ravensworth East to the MTO CHPP. Modification to the DA in 2005 allowed the integration
of Ravensworth East with MTO.
In 2016, Modification 6 to the DA was approved. This allowed an integrated tailings management strategy between Liddell Operations,
Ravensworth Operations and the MOC.
In January 2018 an application was made to DP&E to surrender DA 52-03-99 as Ravensworth East has been included in SSD-5850.
Approval to surrender DA 52-03-99 was received from DP&E on 29 May 2018.
MT OWEN GLENDELL OPERATIONS
Annual Review 2020
20
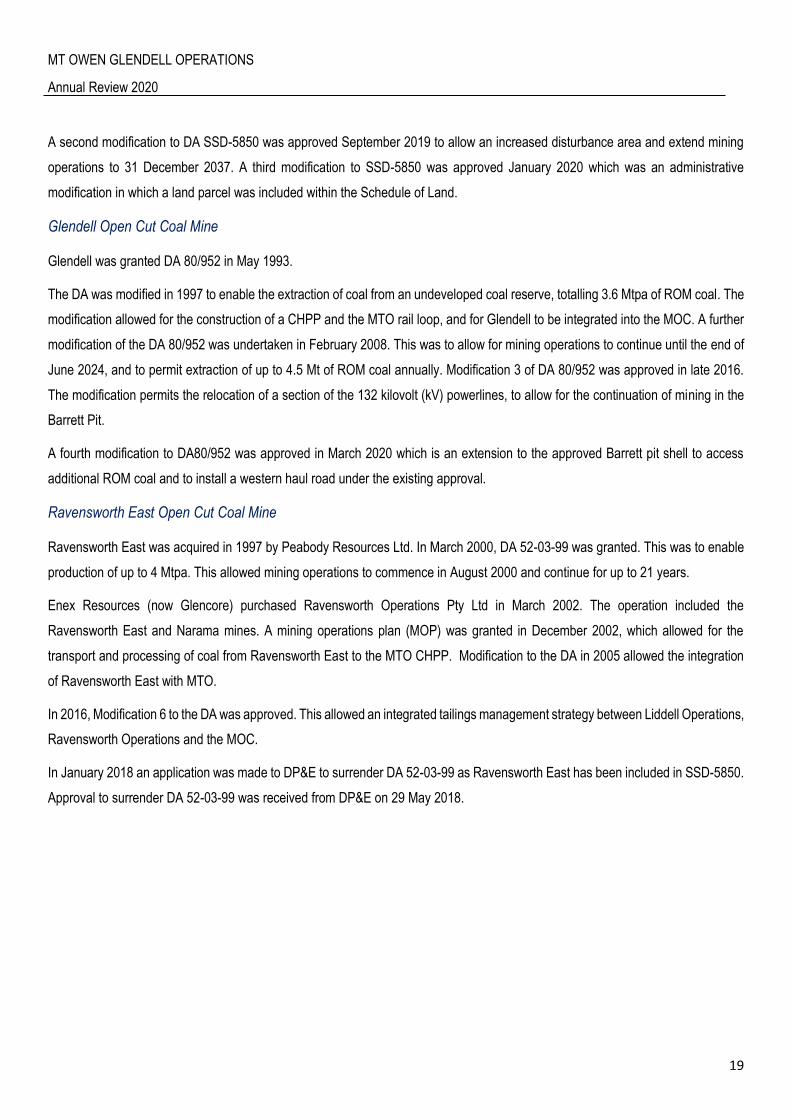
Figure 1: Mt Owen/Glendell Operations Overview and Disturbance as of 31 December 2020

MT OWEN GLENDELL OPERATIONS
Annual Review 2020
21
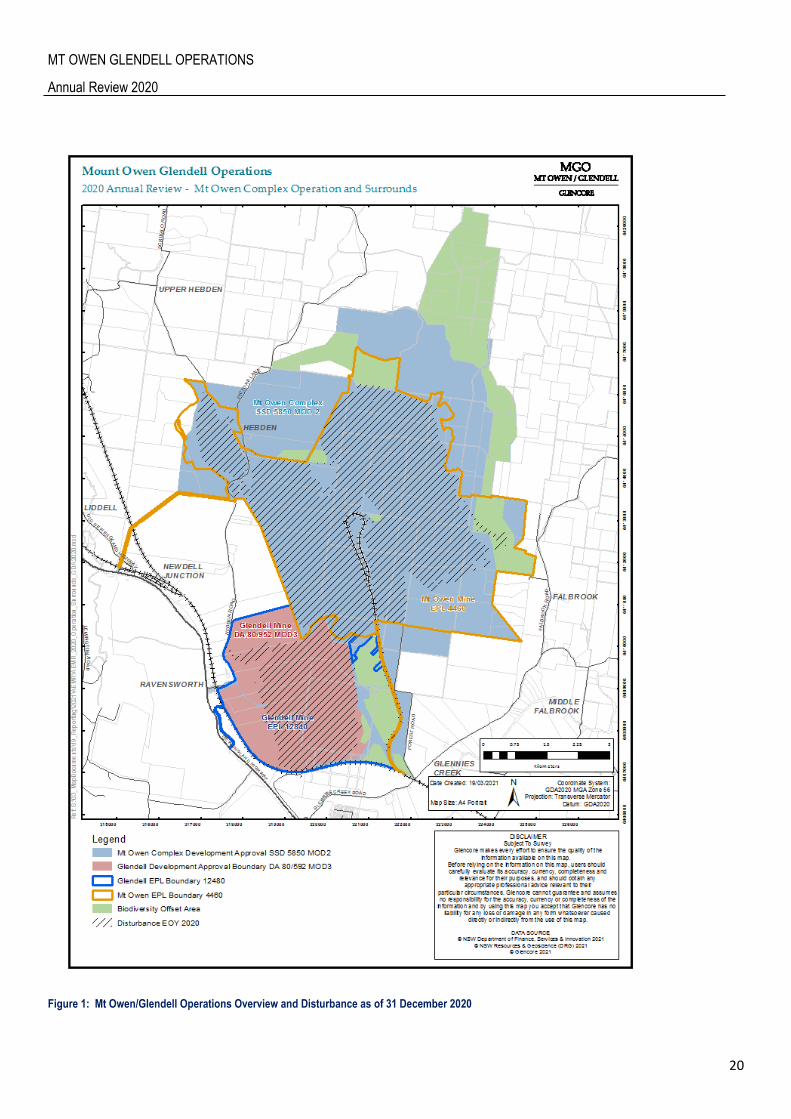
Figure 2: MGO Overview – Regional Context

MT OWEN GLENDELL OPERATIONS
Annual Review 2020
22
Mine Contacts
Mine contacts are provided in Table 5.
Table 5: MGO Contact Details
Name Position Held Contact Details
Mt Owen Glendell Operations Management
Geoff Kelly Mt Owen / Glendell Operations – Operations Manager (02) 6520 2601
Jeroen Hendricks Thiess Operations Manager (02) 6570 0811
Jason Desmond Environment and Community Manager
(02) 6520 2693
General Contact Details
Mt Owen / Glendell
Operations
Street Address: Postal Address: Phone: Facsimile : 24-hour Community Hotline: 24-hour Blasting Hotline: Emergency Response Line: Website:
158 Hebden Road Ravensworth NSW 2330 PO Box 320, Singleton NSW 2330 02 6570 0800 02 6576 1643 1800 730 883 1800 319 566 1800 248 745 www.mtowencomplex.com.au

MT OWEN GLENDELL OPERATIONS
Annual Review 2020
23
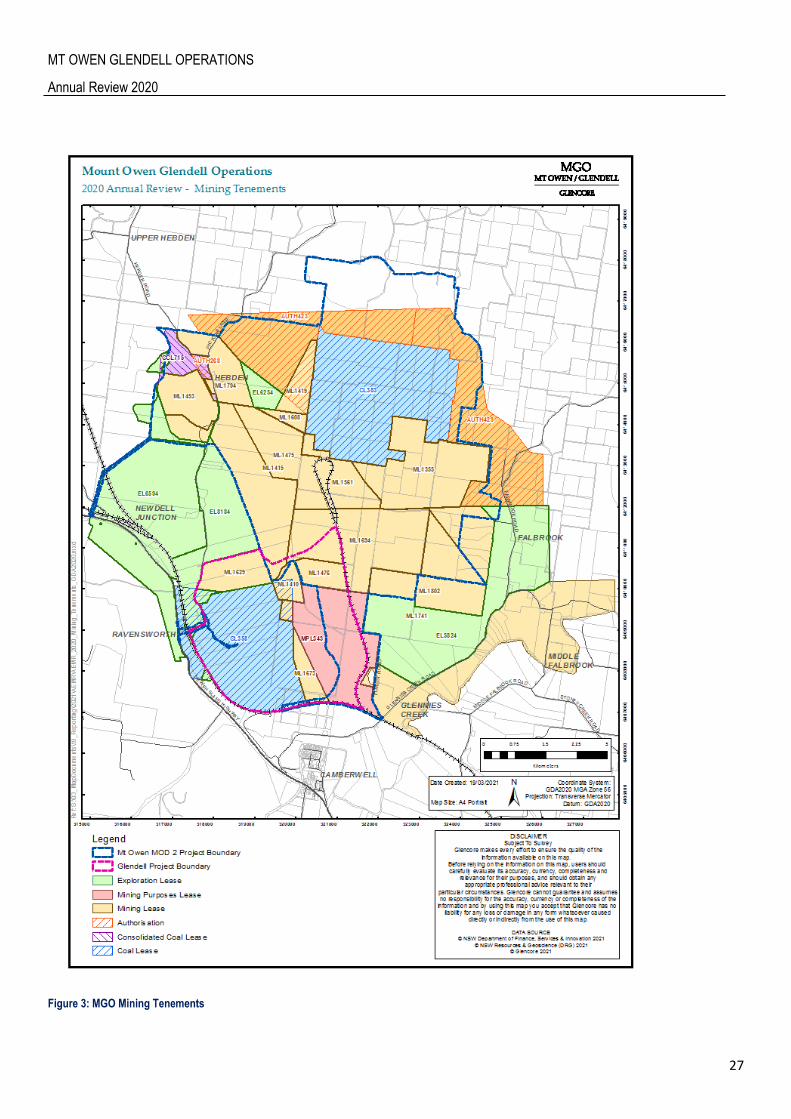
3 Approvals MGO operates under a number of approvals and licences which are summarised in Table 6 and illustrated in Figure 3.
Updates to MGO approvals throughout the 2020 reporting period included:
30 January 2020 - Mt Owen SSD-5850 Modification 3 was approved by DPIE. This approval was an administrative
modification in which a land parcel was included within the Schedule of Land. 4 March 2020 – Glendell DA80/952
Modification 4 was approved by DPIE. This approval allowed for an extension to the approved Barrett pit shell to access
additional ROM coal and to install a western haul road under the existing approval.
14 April 2020 - MGO MOP Amendment A for the period 2020-June 2024 was approved by DPIE RR until 31 December
2020. This MOP Amendment incorporated the Glendell Mod 4 approval.
18 December 2020 – MGO MOP Amendment B for the period 2020-June 2024 was approved by DPIE RR until 30 June
2024. This MOP Amendment incorporated the reduction of mining within the Ravensworth East mining area.
As at 31 December 2020 MGO approvals awaiting determination:
Mt Owen SSD-5850 Modification 4 awaiting DPIE approval. This modification relates to to the amalgamation of SSD-5850
with Glendell Continued Operations Project (GCOP) (SSD-9349).
Mt Owen SSD-5850 Modification 5 awaiting DPIE approval. This modification is administrative to remove the TSR
Biodiversity Offset and seek alternative offset arrangements.
Mt Owen SSD-5850 Modification 6 awaiting DPIE approval. This modification is for the realignment of the Mt Owen to
Ravensworth water pipeline under GRAWTS to run along the southern extent of Glendell Barrett Pit. The existing pipeline
is north of the current operation within the GCOP project footprint.
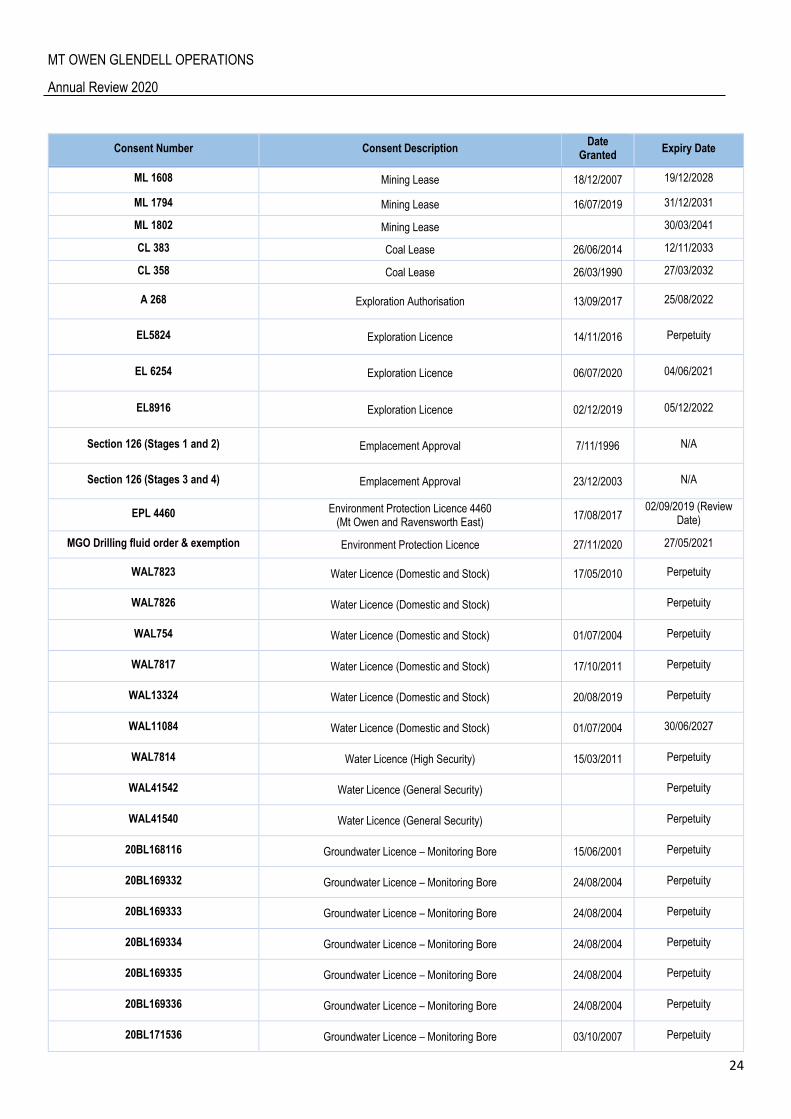
Table 6: MGO Approval Conditions
Consent Number Consent Description Date
Granted Expiry Date
MGO MOP (Mt Owen, Glendell and Ravensworth East)
Mt Owen Complex Mining Operations Plan (Mt Owen, Glendell and Ravensworth East)
18/12/2020 30/06/2024
DA SSD-5850 (Mt Owen and Ravensworth East) Development Approval SSD-5850 03/11/2016 31/12/2037
EPBC 2013/6978 Environment Protection and Biodiversity Conservation (EPBC) Act approval 2013/6978
19/01/2017 31/12/2037
WA 20WA210940 Water Supply Works 01/08/2009 31/07/2029
WA 20WA211430 Water Approval (Water Supply Works) – Swamp Creek Lower
Diversion 01/05/2008 31/07/2022
WA 20WA211425 Water Supply Works – Swamp Creek Middle Diversion 01/08/2009 31/07/2022
WA 20WA211429 Water Supply Works – Yorks Creek Diversion 16/05/2007 15/05/2023
WA 20WA212660 Water Approval (Water Supply Works) – Bettys Creek Lower
Diversion 11/02/2013 07/02/2023
WA 20WA212187 Water Supply Works – Bettys Creek Upper and Middle Diversion 01/08/2009 17/10/2022
ML 1355 Mining Lease 30/06/2014 23/07/2036
ML 1419 Mining Lease 02/02/2015 12/11/2033
ML 1561 Mining Lease 16/02/2005 16/02/2026
MT OWEN GLENDELL OPERATIONS
Annual Review 2020
24
Consent Number Consent Description Date
Granted Expiry Date
ML 1608 Mining Lease 18/12/2007 19/12/2028
ML 1794 Mining Lease 16/07/2019 31/12/2031
ML 1802 Mining Lease 30/03/2041
CL 383 Coal Lease 26/06/2014 12/11/2033
CL 358 Coal Lease 26/03/1990 27/03/2032
A 268 Exploration Authorisation 13/09/2017 25/08/2022
EL5824 Exploration Licence 14/11/2016 Perpetuity
EL 6254 Exploration Licence 06/07/2020 04/06/2021
EL8916 Exploration Licence 02/12/2019 05/12/2022
Section 126 (Stages 1 and 2) Emplacement Approval 7/11/1996 N/A
Section 126 (Stages 3 and 4) Emplacement Approval 23/12/2003 N/A
EPL 4460 Environment Protection Licence 4460 (Mt Owen and Ravensworth East)
17/08/2017 02/09/2019 (Review
Date)
MGO Drilling fluid order & exemption Environment Protection Licence 27/11/2020 27/05/2021
WAL7823 Water Licence (Domestic and Stock) 17/05/2010 Perpetuity
WAL7826 Water Licence (Domestic and Stock) Perpetuity
WAL754 Water Licence (Domestic and Stock) 01/07/2004 Perpetuity
WAL7817 Water Licence (Domestic and Stock) 17/10/2011 Perpetuity
WAL13324 Water Licence (Domestic and Stock) 20/08/2019 Perpetuity
WAL11084 Water Licence (Domestic and Stock) 01/07/2004 30/06/2027
WAL7814 Water Licence (High Security) 15/03/2011 Perpetuity
WAL41542 Water Licence (General Security) Perpetuity
WAL41540 Water Licence (General Security) Perpetuity
20BL168116 Groundwater Licence – Monitoring Bore 15/06/2001 Perpetuity
20BL169332 Groundwater Licence – Monitoring Bore 24/08/2004 Perpetuity
20BL169333 Groundwater Licence – Monitoring Bore 24/08/2004 Perpetuity
20BL169334 Groundwater Licence – Monitoring Bore 24/08/2004 Perpetuity
20BL169335 Groundwater Licence – Monitoring Bore 24/08/2004 Perpetuity
20BL169336 Groundwater Licence – Monitoring Bore 24/08/2004 Perpetuity
20BL171536 Groundwater Licence – Monitoring Bore 03/10/2007 Perpetuity
MT OWEN GLENDELL OPERATIONS
Annual Review 2020
25
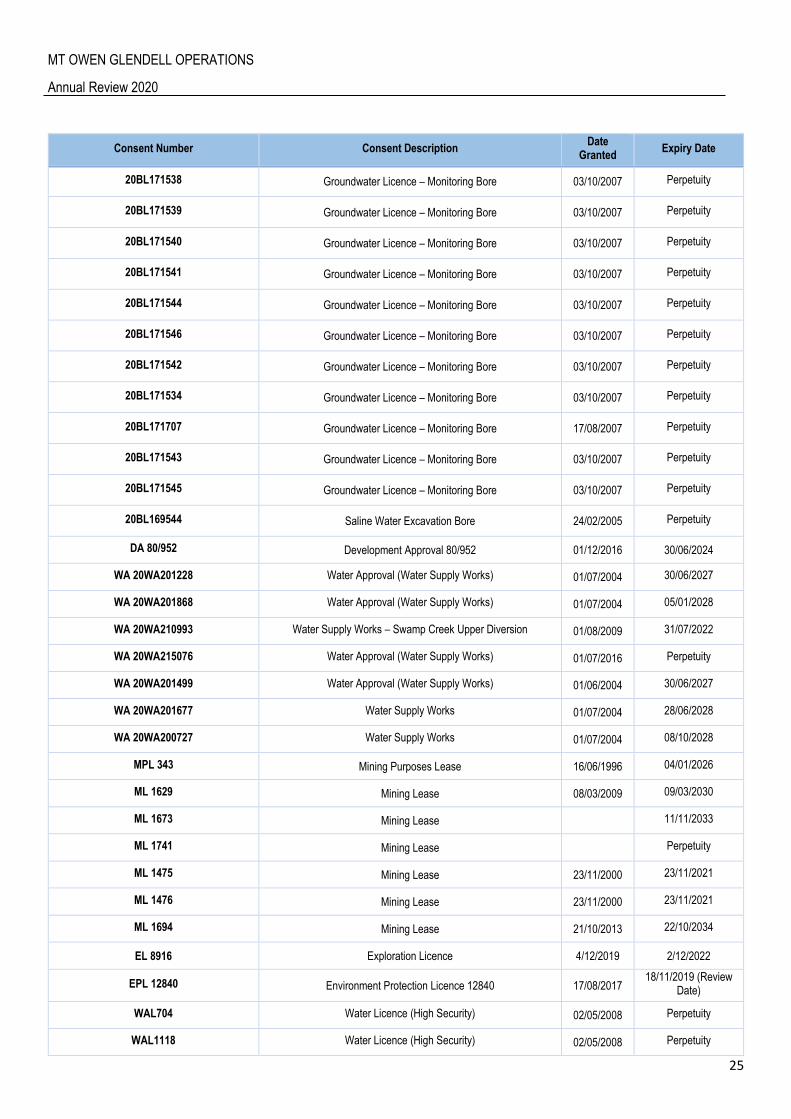
Consent Number Consent Description Date
Granted Expiry Date
20BL171538 Groundwater Licence – Monitoring Bore 03/10/2007 Perpetuity
20BL171539 Groundwater Licence – Monitoring Bore 03/10/2007 Perpetuity
20BL171540 Groundwater Licence – Monitoring Bore 03/10/2007 Perpetuity
20BL171541 Groundwater Licence – Monitoring Bore 03/10/2007 Perpetuity
20BL171544 Groundwater Licence – Monitoring Bore 03/10/2007 Perpetuity
20BL171546 Groundwater Licence – Monitoring Bore 03/10/2007 Perpetuity
20BL171542 Groundwater Licence – Monitoring Bore 03/10/2007 Perpetuity
20BL171534 Groundwater Licence – Monitoring Bore 03/10/2007 Perpetuity
20BL171707 Groundwater Licence – Monitoring Bore 17/08/2007 Perpetuity
20BL171543 Groundwater Licence – Monitoring Bore 03/10/2007 Perpetuity
20BL171545 Groundwater Licence – Monitoring Bore 03/10/2007 Perpetuity
20BL169544 Saline Water Excavation Bore 24/02/2005 Perpetuity
DA 80/952 Development Approval 80/952 01/12/2016 30/06/2024
WA 20WA201228 Water Approval (Water Supply Works) 01/07/2004 30/06/2027
WA 20WA201868 Water Approval (Water Supply Works) 01/07/2004 05/01/2028
WA 20WA210993 Water Supply Works – Swamp Creek Upper Diversion 01/08/2009 31/07/2022
WA 20WA215076 Water Approval (Water Supply Works) 01/07/2016 Perpetuity
WA 20WA201499 Water Approval (Water Supply Works) 01/06/2004 30/06/2027
WA 20WA201677 Water Supply Works 01/07/2004 28/06/2028
WA 20WA200727 Water Supply Works 01/07/2004 08/10/2028
MPL 343 Mining Purposes Lease 16/06/1996 04/01/2026
ML 1629 Mining Lease 08/03/2009 09/03/2030
ML 1673 Mining Lease 11/11/2033
ML 1741 Mining Lease Perpetuity
ML 1475 Mining Lease 23/11/2000 23/11/2021
ML 1476 Mining Lease 23/11/2000 23/11/2021
ML 1694 Mining Lease 21/10/2013 22/10/2034
EL 8916 Exploration Licence 4/12/2019 2/12/2022
EPL 12840 Environment Protection Licence 12840 17/08/2017 18/11/2019 (Review
Date)
WAL704 Water Licence (High Security) 02/05/2008 Perpetuity
WAL1118 Water Licence (High Security) 02/05/2008 Perpetuity
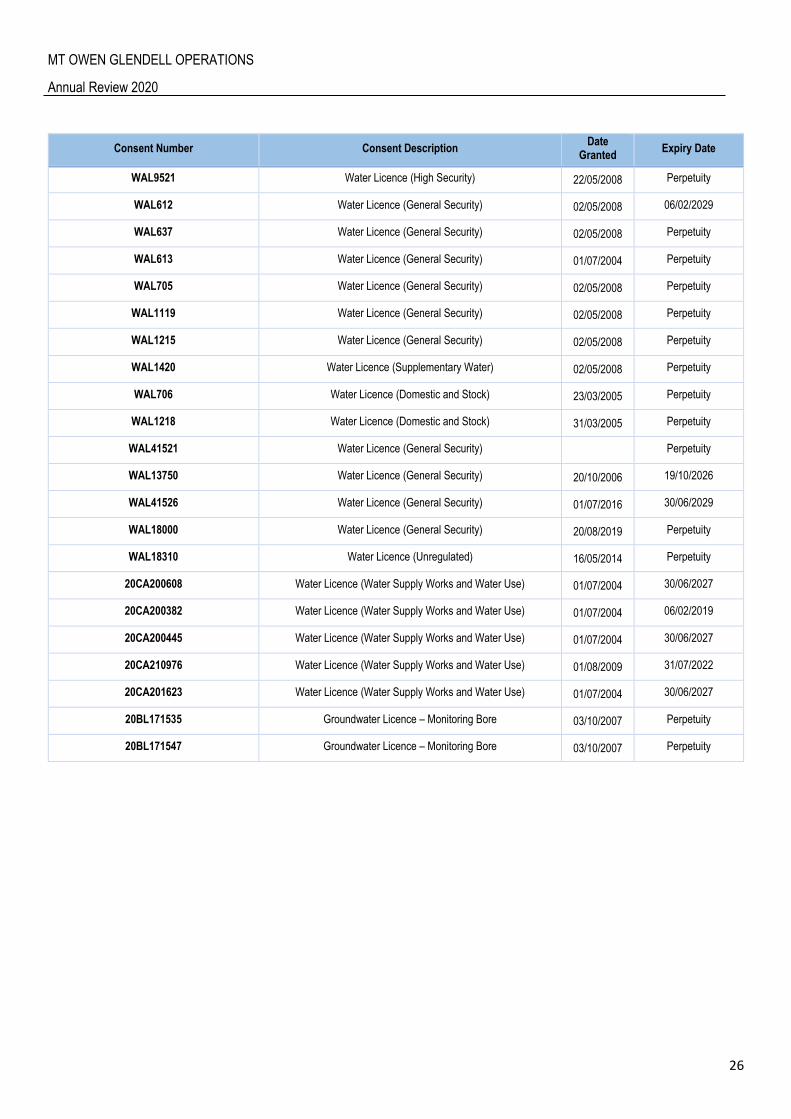
MT OWEN GLENDELL OPERATIONS
Annual Review 2020
26
Consent Number Consent Description Date
Granted Expiry Date
WAL9521 Water Licence (High Security) 22/05/2008 Perpetuity
WAL612 Water Licence (General Security) 02/05/2008 06/02/2029
WAL637 Water Licence (General Security) 02/05/2008 Perpetuity
WAL613 Water Licence (General Security) 01/07/2004 Perpetuity
WAL705 Water Licence (General Security) 02/05/2008 Perpetuity
WAL1119 Water Licence (General Security) 02/05/2008 Perpetuity
WAL1215 Water Licence (General Security) 02/05/2008 Perpetuity
WAL1420 Water Licence (Supplementary Water) 02/05/2008 Perpetuity
WAL706 Water Licence (Domestic and Stock) 23/03/2005 Perpetuity
WAL1218 Water Licence (Domestic and Stock) 31/03/2005 Perpetuity
WAL41521 Water Licence (General Security) Perpetuity
WAL13750 Water Licence (General Security) 20/10/2006 19/10/2026
WAL41526 Water Licence (General Security) 01/07/2016 30/06/2029
WAL18000 Water Licence (General Security) 20/08/2019 Perpetuity
WAL18310 Water Licence (Unregulated) 16/05/2014 Perpetuity
20CA200608 Water Licence (Water Supply Works and Water Use) 01/07/2004 30/06/2027
20CA200382 Water Licence (Water Supply Works and Water Use) 01/07/2004 06/02/2019
20CA200445 Water Licence (Water Supply Works and Water Use) 01/07/2004 30/06/2027
20CA210976 Water Licence (Water Supply Works and Water Use) 01/08/2009 31/07/2022
20CA201623 Water Licence (Water Supply Works and Water Use) 01/07/2004 30/06/2027
20BL171535 Groundwater Licence – Monitoring Bore 03/10/2007 Perpetuity
20BL171547 Groundwater Licence – Monitoring Bore 03/10/2007 Perpetuity
MT OWEN GLENDELL OPERATIONS
Annual Review 2020
27
Figure 3: MGO Mining Tenements
MT OWEN GLENDELL OPERATIONS
Annual Review 2020
28
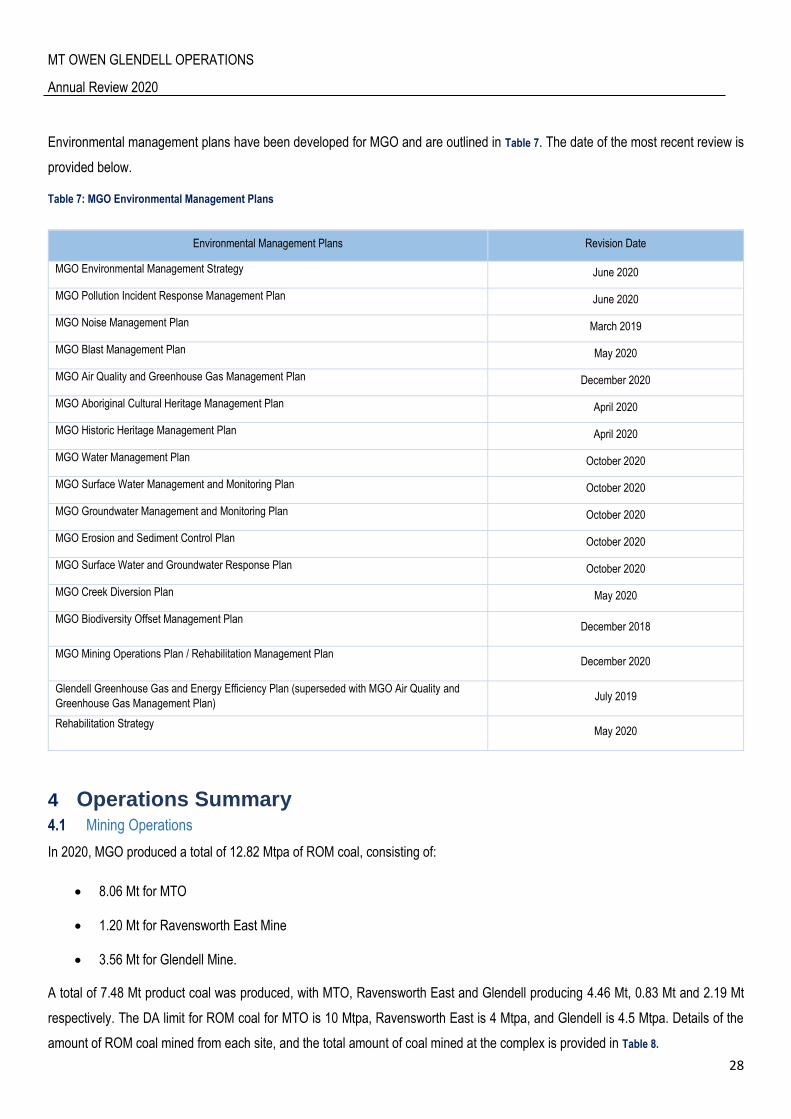
Environmental management plans have been developed for MGO and are outlined in Table 7. The date of the most recent review is
provided below.
Table 7: MGO Environmental Management Plans
4 Operations Summary 4.1 Mining Operations
In 2020, MGO produced a total of 12.82 Mtpa of ROM coal, consisting of:
8.06 Mt for MTO
1.20 Mt for Ravensworth East Mine
3.56 Mt for Glendell Mine.
A total of 7.48 Mt product coal was produced, with MTO, Ravensworth East and Glendell producing 4.46 Mt, 0.83 Mt and 2.19 Mt
respectively. The DA limit for ROM coal for MTO is 10 Mtpa, Ravensworth East is 4 Mtpa, and Glendell is 4.5 Mtpa. Details of the
amount of ROM coal mined from each site, and the total amount of coal mined at the complex is provided in Table 8.
Environmental Management Plans Revision Date
MGO Environmental Management Strategy June 2020
MGO Pollution Incident Response Management Plan June 2020
MGO Noise Management Plan March 2019
MGO Blast Management Plan May 2020
MGO Air Quality and Greenhouse Gas Management Plan December 2020
MGO Aboriginal Cultural Heritage Management Plan April 2020
MGO Historic Heritage Management Plan April 2020
MGO Water Management Plan October 2020
MGO Surface Water Management and Monitoring Plan October 2020
MGO Groundwater Management and Monitoring Plan October 2020
MGO Erosion and Sediment Control Plan October 2020
MGO Surface Water and Groundwater Response Plan October 2020
MGO Creek Diversion Plan May 2020
MGO Biodiversity Offset Management Plan December 2018
MGO Mining Operations Plan / Rehabilitation Management Plan December 2020
Glendell Greenhouse Gas and Energy Efficiency Plan (superseded with MGO Air Quality and
Greenhouse Gas Management Plan) July 2019
Rehabilitation Strategy May 2020

MT OWEN GLENDELL OPERATIONS
Annual Review 2020
29
Table 8: MGO Production Summary
Material Approved limit (specify
source) 2020 Reporting
Period (Forecast) 2020 Reporting Period (Actual)
2021 Reporting Period (Forecast)
Mt Owen
Prime Overburden (Mbcm)
- 38.10 36.86 35.69
ROM Coal Mined (Mt) 10 (Development Consent)
8.63 8.06 7.75
Saleable Product (Mt) - 4.74 4.46 4.68
ROM Coal Fed (Mt) - 8.42 7.89 8.09
Glendell
Prime Overburden (Mbcm)
- 20.11 21.14 14.71
ROM mined (Mt) 4.5 (Development Consent)
3.66 3.56 3.44
Saleable Product (Mt) - 2.03 2.19 2.18
ROM Coal Fed - 3.48 3.55 3.53
Ravensworth East
Prime Overburden (Mbcm)
- 9.14 8.45 2.66
ROM mined (Mt) 4 (Development Consent)
1.89 1.20 1.36
Saleable Product (Mt) - 0.97 0.83 0.81
ROM Coal Fed - 1.80 1.40 1.36
CHPP
Coarse Waste Reject (Mt) - 3.58 3.36 3.67
Total MGO ROM Coal Fed 17 (Development Consent)
13.69 12.84 12.98
Fine Waste Reject (Mt) - 2.38 2.10 1.83
During 2020 a MOP Amendment B was drafted to include operational changes. The MOP was submitted to DPIE RR and approved
18 December 2020. In 2020, approximately 243 people were employed at Glendell and 366 at Mt Owen (58 Glencore and 308
Thiess).
4.2 Project Approvals
Mt Owen Continued Operations
Mt Owen Continued Operation (MOCO) received approval in November 2016, under SSD-5850. The approval combined the
existing development consents for Mt Owen and Ravensworth East, extending the operation until 2031. In August 2017, MGO
modified SSD-5850 (‘Modification 1’) to allow for the construction of a mine water pipeline from Integra Underground Mine to MGO.
In September 2019, Modification 2 (Mod 2) to SSD-5850 was approved. This allows the additional mining of 35 Mt of ROM coal
and extends the life of mine to 31 December 2037. During January 2020, Modification 3 (Mod 3), an administrative mod, was
approved by DPIE for the inclusion of one land parcel within the ‘Schedule of Land’.
During 2020, MGO submitted the following modifications for approval by DPIE:
MOCO Mod 4 – This modification relates to the amalgamation of SSD-5850 with Glendell Continued Operations Project
(GCOP) (SSD-9349).

MT OWEN GLENDELL OPERATIONS
Annual Review 2020
30
MOCO Mod 5 – This modification is administrative to remove the TSR Biodiversity Offset and seek alternative offset
arrangements.
MOCO Mod 6 - This modification is for the realignment of the Mt Owen to Ravensworth water pipeline under GRAWTS to
run along the southern extent of Glendell Barrett Pit. The existing pipeline is north of the current operation within the
GCOP (SSD-9349) project footprint.
Glendell Continued Operations
Glencore is seeking approval to extend the open cut mining operations at Glendell, north from the existing Barrett Pit known as
Glendell Continued Operations Project (GCOP)(SSD-9349). The extension of the current operations would extract an additional 140
Mt of ROM coal, down to the Hebden coal seam. This would extend the mining operations of Glendell to approximately 2044.
During 2018, a Preliminary Environmental Assessment for the project was prepared and submitted to DPIE. The Secretary’s
environmental assessment requirements (SEARs) were received by Glencore in July 2018. A development application, accompanied
by a detailed Environmental Impact Statement (EIS) was submitted to DPIE during 2019. DPIE placed the EIS on Public exhibition
from 11 December 2019 until 14th February 2020. There was 359 submissions received for the Project. These included 16 from
Government, 16 from Special Interest Groups and 327 from Community Members. Of the 327 Community submissions; 200 were
supporting, 117 objecting and 10 provided comment.
The Response to submissions was submitted to DPIE in two parts during May and October 2020. A separate response to the Federal
Government’s Independent Expert Scientific Committee (IESC) was submitted in August 2020. During the end of 2020 Glencore
continued to respond to Government Departments and complete further consultation with the Heritage Council and Singleton Council
regarding the proposed Ravensworth Homestead relocation options.
Glencore continued consultation with near neighbours and stakeholders regarding the project during the reporting period.
A project specific website was established in 2020 in relation to this project: www.glendell.com.au
Glendell Mine – Modification 4 – Minor Extension
In November 2018 Glencore submitted an application to modify DA 80/952 to provide for a minor extension to the Barrett Pit at
Glendell Mine in order to access an additional 2.5 Mt ROM Coal (Modification 4). Thirty nine (39) submissions were received on the
application, including four from government agencies and thirty five (35) from community members, organisations and special interest
groups. A Response to Submissions was prepared and submitted to DPIE in May 2019. DPIE referred the Mod to the IPC during
November 2019 for Determination. During early 2020, MGO engaged with the IPC prior to DPIE approval being granted 4th March
2020.
4.3 Other Operations
4.3.1 Train and Conveyer Movements
Table 9 summarises the train and conveyor movements undertaken at the MGO during 2020. Daily train movements are provided in
Appendix B.
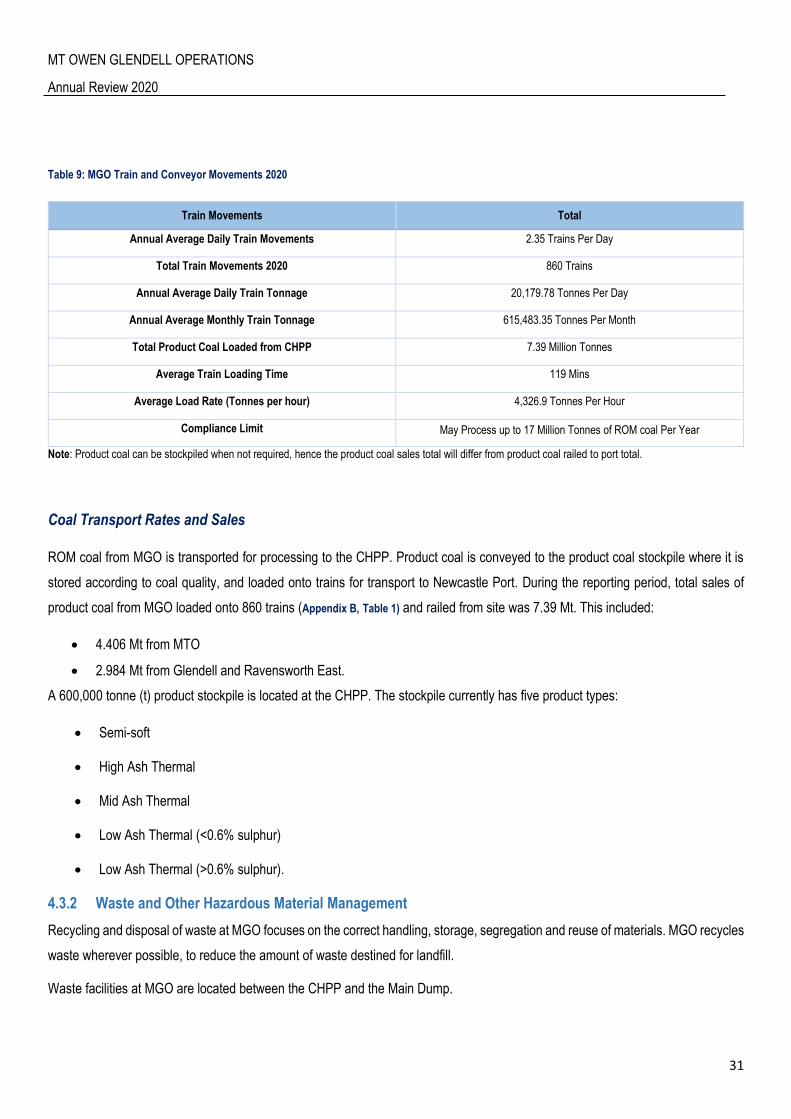
MT OWEN GLENDELL OPERATIONS
Annual Review 2020
31
Table 9: MGO Train and Conveyor Movements 2020
Train Movements Total
Annual Average Daily Train Movements 2.35 Trains Per Day
Total Train Movements 2020 860 Trains
Annual Average Daily Train Tonnage 20,179.78 Tonnes Per Day
Annual Average Monthly Train Tonnage 615,483.35 Tonnes Per Month
Total Product Coal Loaded from CHPP 7.39 Million Tonnes
Average Train Loading Time 119 Mins
Average Load Rate (Tonnes per hour) 4,326.9 Tonnes Per Hour
Compliance Limit May Process up to 17 Million Tonnes of ROM coal Per Year
Note: Product coal can be stockpiled when not required, hence the product coal sales total will differ from product coal railed to port total.
Coal Transport Rates and Sales
ROM coal from MGO is transported for processing to the CHPP. Product coal is conveyed to the product coal stockpile where it is
stored according to coal quality, and loaded onto trains for transport to Newcastle Port. During the reporting period, total sales of
product coal from MGO loaded onto 860 trains (Appendix B, Table 1) and railed from site was 7.39 Mt. This included:
4.406 Mt from MTO
2.984 Mt from Glendell and Ravensworth East.
A 600,000 tonne (t) product stockpile is located at the CHPP. The stockpile currently has five product types:
Semi-soft
High Ash Thermal
Mid Ash Thermal
Low Ash Thermal (<0.6% sulphur)
Low Ash Thermal (>0.6% sulphur).
4.3.2 Waste and Other Hazardous Material Management
Recycling and disposal of waste at MGO focuses on the correct handling, storage, segregation and reuse of materials. MGO recycles
waste wherever possible, to reduce the amount of waste destined for landfill.
Waste facilities at MGO are located between the CHPP and the Main Dump.
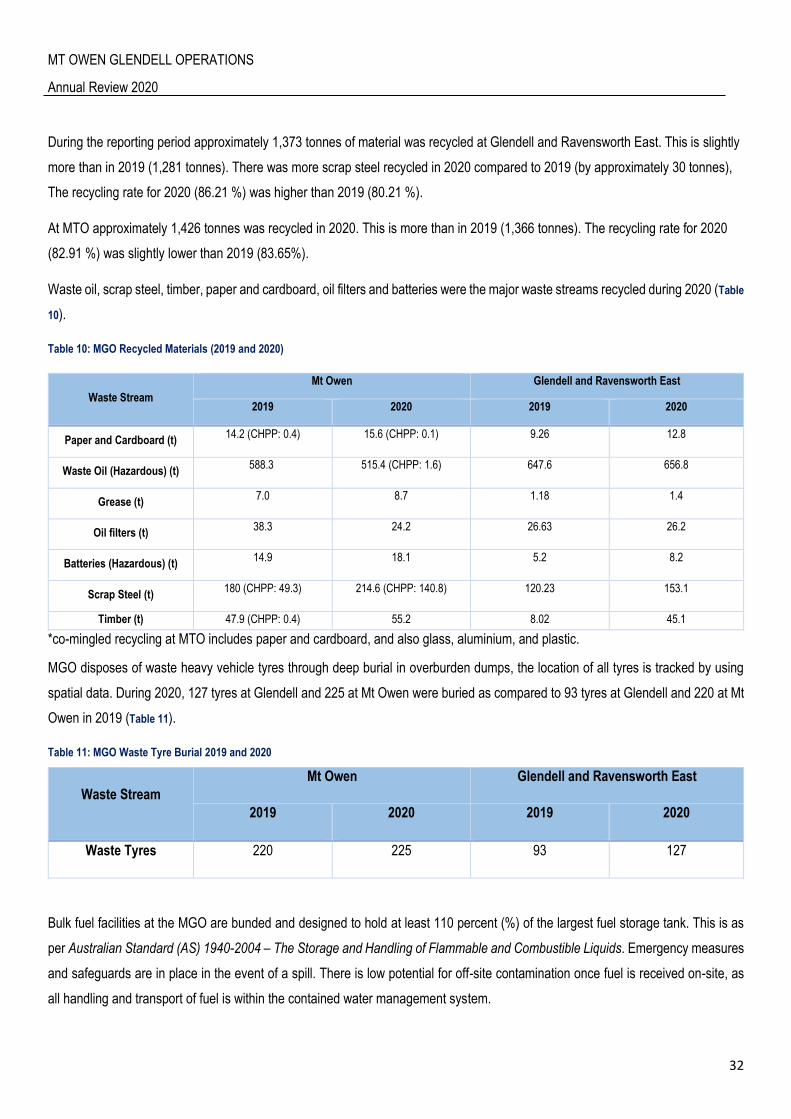
MT OWEN GLENDELL OPERATIONS
Annual Review 2020
32
During the reporting period approximately 1,373 tonnes of material was recycled at Glendell and Ravensworth East. This is slightly
more than in 2019 (1,281 tonnes). There was more scrap steel recycled in 2020 compared to 2019 (by approximately 30 tonnes),
The recycling rate for 2020 (86.21 %) was higher than 2019 (80.21 %).
At MTO approximately 1,426 tonnes was recycled in 2020. This is more than in 2019 (1,366 tonnes). The recycling rate for 2020
(82.91 %) was slightly lower than 2019 (83.65%).
Waste oil, scrap steel, timber, paper and cardboard, oil filters and batteries were the major waste streams recycled during 2020 (Table
10).
Table 10: MGO Recycled Materials (2019 and 2020)
Waste Stream
Mt Owen Glendell and Ravensworth East
2019 2020 2019 2020
Paper and Cardboard (t) 14.2 (CHPP: 0.4) 15.6 (CHPP: 0.1) 9.26 12.8
Waste Oil (Hazardous) (t) 588.3 515.4 (CHPP: 1.6) 647.6 656.8
Grease (t) 7.0 8.7 1.18 1.4
Oil filters (t) 38.3 24.2 26.63 26.2
Batteries (Hazardous) (t) 14.9 18.1 5.2 8.2
Scrap Steel (t) 180 (CHPP: 49.3) 214.6 (CHPP: 140.8) 120.23 153.1
Timber (t) 47.9 (CHPP: 0.4) 55.2 8.02 45.1
*co-mingled recycling at MTO includes paper and cardboard, and also glass, aluminium, and plastic.
MGO disposes of waste heavy vehicle tyres through deep burial in overburden dumps, the location of all tyres is tracked by using
spatial data. During 2020, 127 tyres at Glendell and 225 at Mt Owen were buried as compared to 93 tyres at Glendell and 220 at Mt
Owen in 2019 (Table 11).
Table 11: MGO Waste Tyre Burial 2019 and 2020
Waste Stream
Mt Owen Glendell and Ravensworth East
2019 2020 2019 2020
Waste Tyres 220 225 93 127
Bulk fuel facilities at the MGO are bunded and designed to hold at least 110 percent (%) of the largest fuel storage tank. This is as
per Australian Standard (AS) 1940-2004 – The Storage and Handling of Flammable and Combustible Liquids. Emergency measures
and safeguards are in place in the event of a spill. There is low potential for off-site contamination once fuel is received on-site, as
all handling and transport of fuel is within the contained water management system.
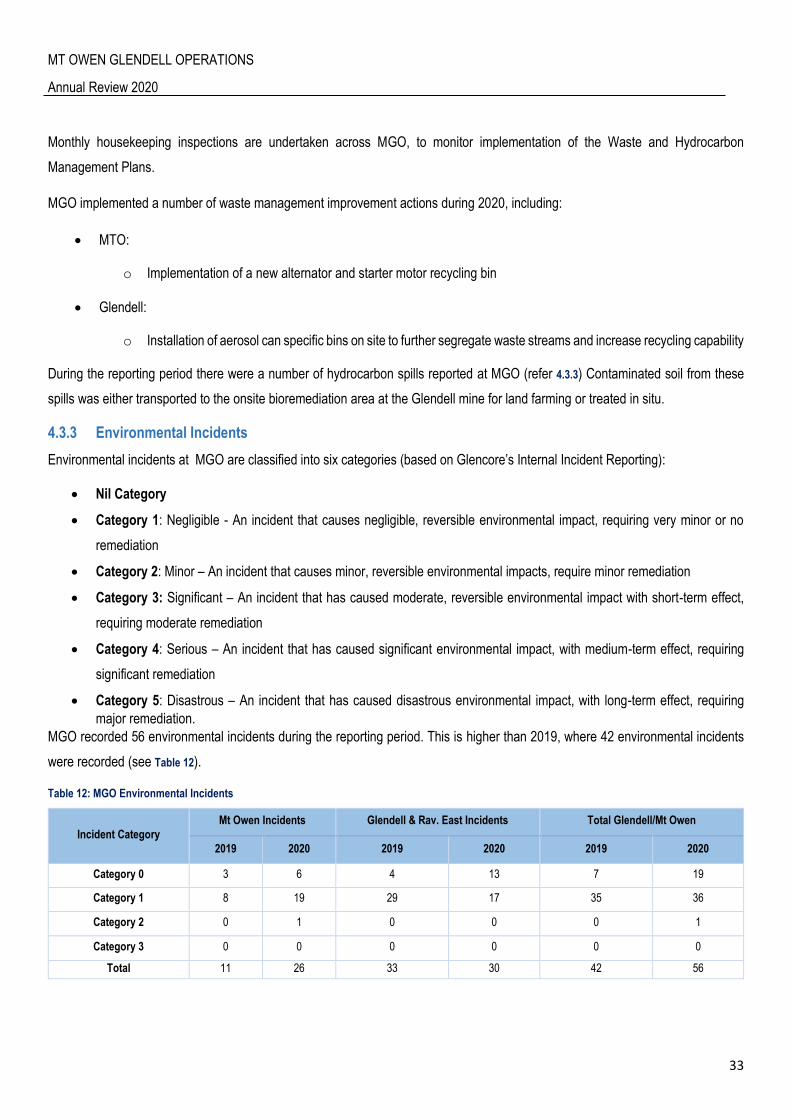
MT OWEN GLENDELL OPERATIONS
Annual Review 2020
33
Monthly housekeeping inspections are undertaken across MGO, to monitor implementation of the Waste and Hydrocarbon
Management Plans.
MGO implemented a number of waste management improvement actions during 2020, including:
MTO:
o Implementation of a new alternator and starter motor recycling bin
Glendell:
o Installation of aerosol can specific bins on site to further segregate waste streams and increase recycling capability
During the reporting period there were a number of hydrocarbon spills reported at MGO (refer 4.3.3) Contaminated soil from these
spills was either transported to the onsite bioremediation area at the Glendell mine for land farming or treated in situ.
4.3.3 Environmental Incidents
Environmental incidents at MGO are classified into six categories (based on Glencore’s Internal Incident Reporting):
Nil Category
Category 1: Negligible - An incident that causes negligible, reversible environmental impact, requiring very minor or no
remediation
Category 2: Minor – An incident that causes minor, reversible environmental impacts, require minor remediation
Category 3: Significant – An incident that has caused moderate, reversible environmental impact with short-term effect,
requiring moderate remediation
Category 4: Serious – An incident that has caused significant environmental impact, with medium-term effect, requiring
significant remediation
Category 5: Disastrous – An incident that has caused disastrous environmental impact, with long-term effect, requiring
major remediation.
MGO recorded 56 environmental incidents during the reporting period. This is higher than 2019, where 42 environmental incidents
were recorded (see Table 12).
Table 12: MGO Environmental Incidents
Incident Category
Mt Owen Incidents Glendell & Rav. East Incidents Total Glendell/Mt Owen
2019 2020 2019 2020 2019 2020
Category 0 3 6 4 13 7 19
Category 1 8 19 29 17 35 36
Category 2 0 1 0 0 0 1
Category 3 0 0 0 0 0 0
Total 11 26 33 30 42 56
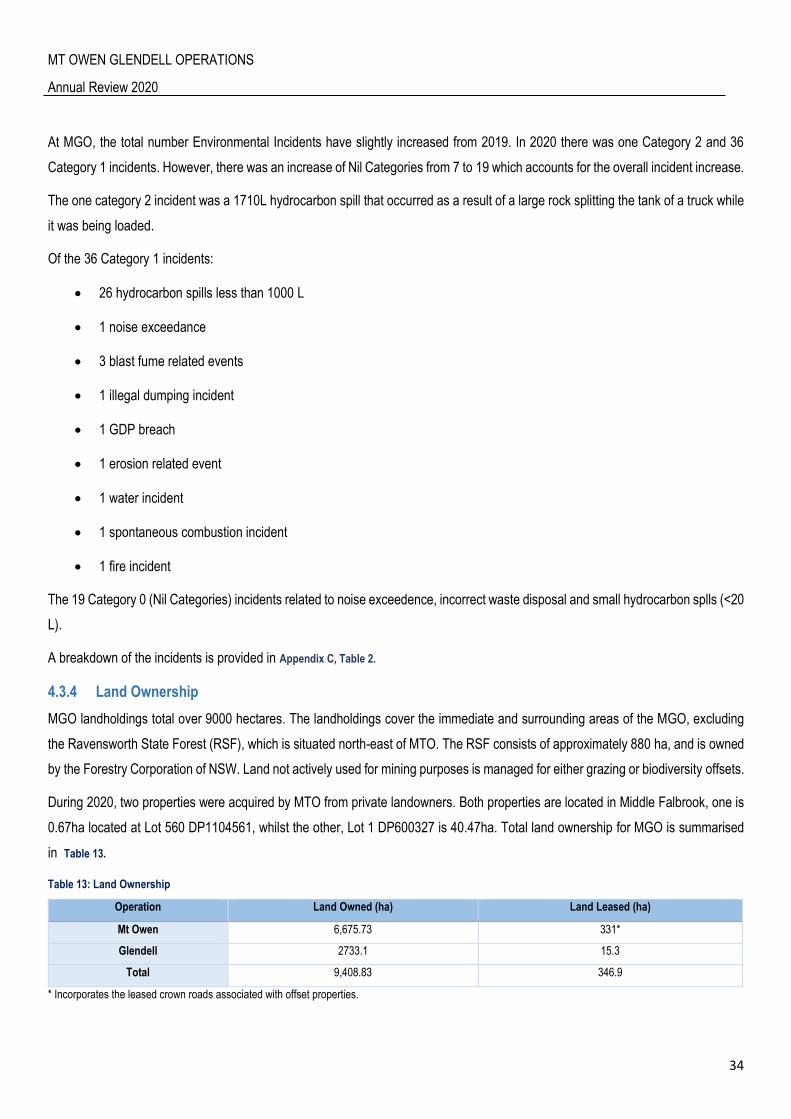
MT OWEN GLENDELL OPERATIONS
Annual Review 2020
34
At MGO, the total number Environmental Incidents have slightly increased from 2019. In 2020 there was one Category 2 and 36
Category 1 incidents. However, there was an increase of Nil Categories from 7 to 19 which accounts for the overall incident increase.
The one category 2 incident was a 1710L hydrocarbon spill that occurred as a result of a large rock splitting the tank of a truck while
it was being loaded.
Of the 36 Category 1 incidents:
26 hydrocarbon spills less than 1000 L
1 noise exceedance
3 blast fume related events
1 illegal dumping incident
1 GDP breach
1 erosion related event
1 water incident
1 spontaneous combustion incident
1 fire incident
The 19 Category 0 (Nil Categories) incidents related to noise exceedence, incorrect waste disposal and small hydrocarbon splls (<20
L).
A breakdown of the incidents is provided in Appendix C, Table 2.
4.3.4 Land Ownership
MGO landholdings total over 9000 hectares. The landholdings cover the immediate and surrounding areas of the MGO, excluding
the Ravensworth State Forest (RSF), which is situated north-east of MTO. The RSF consists of approximately 880 ha, and is owned
by the Forestry Corporation of NSW. Land not actively used for mining purposes is managed for either grazing or biodiversity offsets.
During 2020, two properties were acquired by MTO from private landowners. Both properties are located in Middle Falbrook, one is
0.67ha located at Lot 560 DP1104561, whilst the other, Lot 1 DP600327 is 40.47ha. Total land ownership for MGO is summarised
in Table 13.
Table 13: Land Ownership
Operation Land Owned (ha) Land Leased (ha)
Mt Owen 6,675.73 331*
Glendell 2733.1 15.3
Total 9,408.83 346.9
* Incorporates the leased crown roads associated with offset properties.
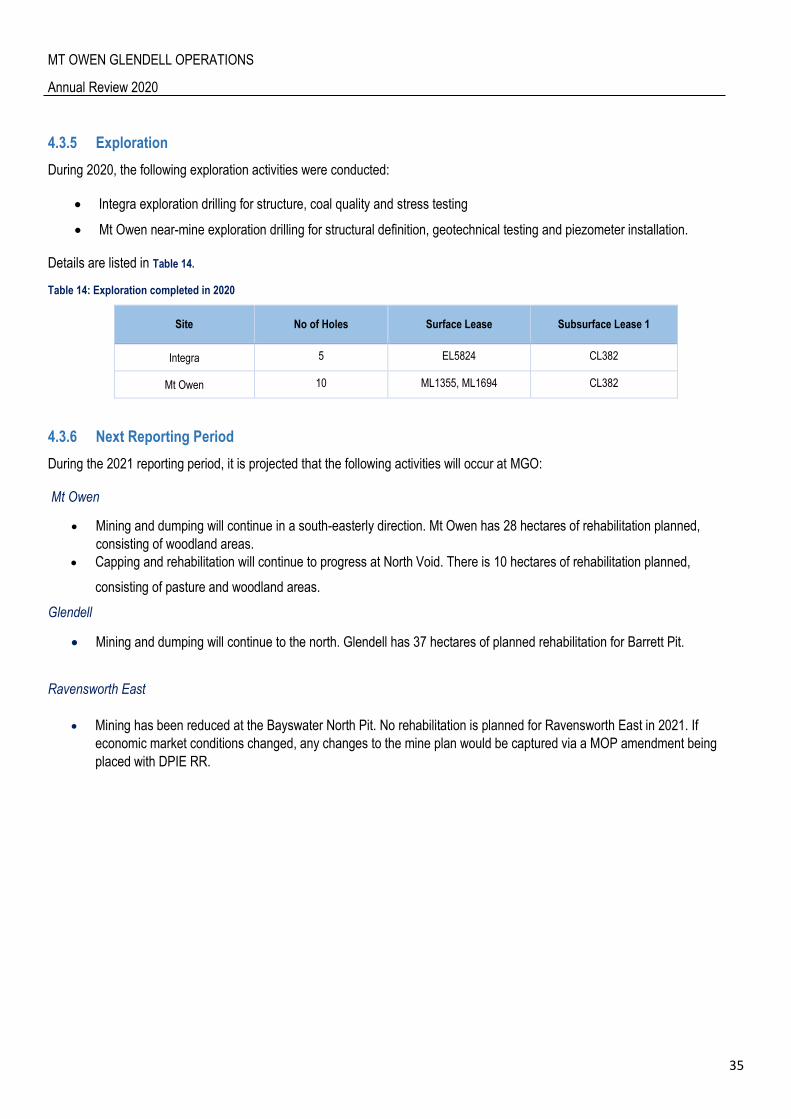
MT OWEN GLENDELL OPERATIONS
Annual Review 2020
35
4.3.5 Exploration
During 2020, the following exploration activities were conducted:
Integra exploration drilling for structure, coal quality and stress testing
Mt Owen near-mine exploration drilling for structural definition, geotechnical testing and piezometer installation.
Details are listed in Table 14.
Table 14: Exploration completed in 2020
Site No of Holes Surface Lease Subsurface Lease 1
Integra 5 EL5824 CL382
Mt Owen 10 ML1355, ML1694 CL382
4.3.6 Next Reporting Period
During the 2021 reporting period, it is projected that the following activities will occur at MGO:
Mt Owen
Mining and dumping will continue in a south-easterly direction. Mt Owen has 28 hectares of rehabilitation planned,
consisting of woodland areas.
Capping and rehabilitation will continue to progress at North Void. There is 10 hectares of rehabilitation planned,
consisting of pasture and woodland areas.
Glendell
Mining and dumping will continue to the north. Glendell has 37 hectares of planned rehabilitation for Barrett Pit.
Ravensworth East
Mining has been reduced at the Bayswater North Pit. No rehabilitation is planned for Ravensworth East in 2021. If
economic market conditions changed, any changes to the mine plan would be captured via a MOP amendment being
placed with DPIE RR.
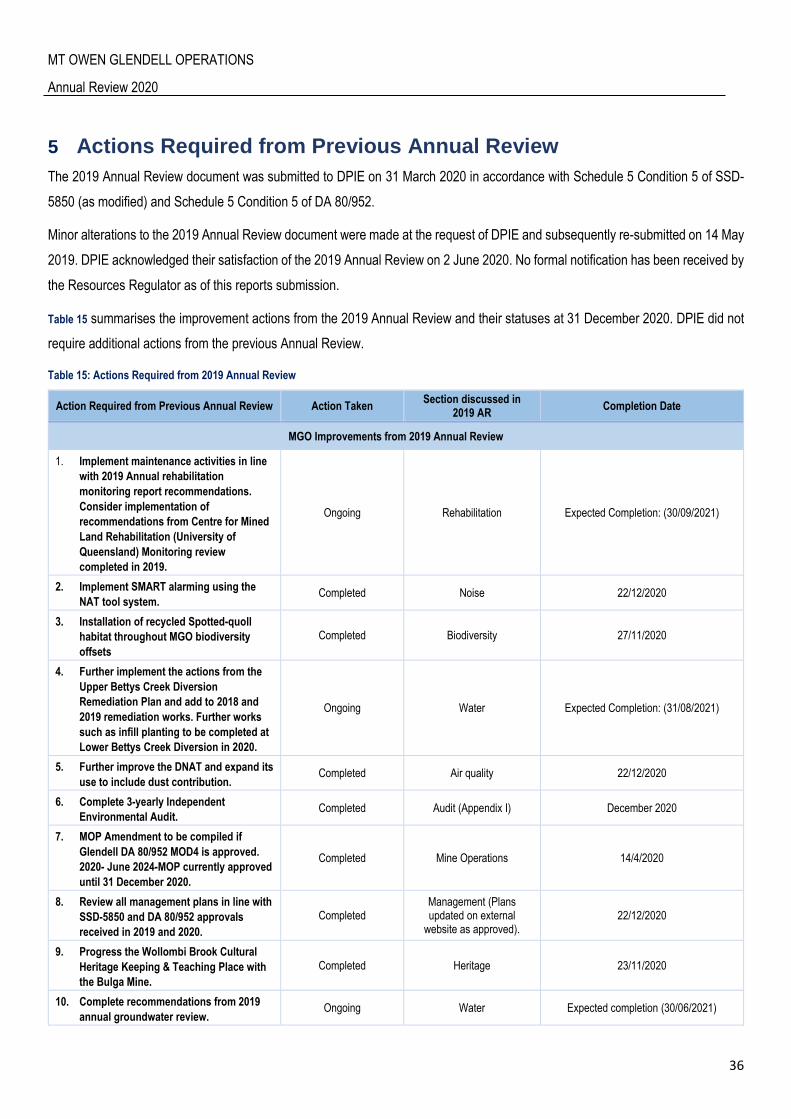
MT OWEN GLENDELL OPERATIONS
Annual Review 2020
36
5 Actions Required from Previous Annual Review
The 2019 Annual Review document was submitted to DPIE on 31 March 2020 in accordance with Schedule 5 Condition 5 of SSD-
5850 (as modified) and Schedule 5 Condition 5 of DA 80/952.
Minor alterations to the 2019 Annual Review document were made at the request of DPIE and subsequently re-submitted on 14 May
2019. DPIE acknowledged their satisfaction of the 2019 Annual Review on 2 June 2020. No formal notification has been received by
the Resources Regulator as of this reports submission.
Table 15 summarises the improvement actions from the 2019 Annual Review and their statuses at 31 December 2020. DPIE did not
require additional actions from the previous Annual Review.
Table 15: Actions Required from 2019 Annual Review
Action Required from Previous Annual Review Action Taken Section discussed in
2019 AR Completion Date
MGO Improvements from 2019 Annual Review
1. Implement maintenance activities in line
with 2019 Annual rehabilitation
monitoring report recommendations.
Consider implementation of
recommendations from Centre for Mined
Land Rehabilitation (University of
Queensland) Monitoring review
completed in 2019.
Ongoing Rehabilitation Expected Completion: (30/09/2021)
2. Implement SMART alarming using the
NAT tool system. Completed Noise 22/12/2020
3. Installation of recycled Spotted-quoll
habitat throughout MGO biodiversity
offsets
Completed Biodiversity 27/11/2020
4. Further implement the actions from the
Upper Bettys Creek Diversion
Remediation Plan and add to 2018 and
2019 remediation works. Further works
such as infill planting to be completed at
Lower Bettys Creek Diversion in 2020.
Ongoing Water Expected Completion: (31/08/2021)
5. Further improve the DNAT and expand its
use to include dust contribution. Completed Air quality 22/12/2020
6. Complete 3-yearly Independent
Environmental Audit. Completed Audit (Appendix I) December 2020
7. MOP Amendment to be compiled if
Glendell DA 80/952 MOD4 is approved.
2020- June 2024-MOP currently approved
until 31 December 2020.
Completed Mine Operations 14/4/2020
8. Review all management plans in line with
SSD-5850 and DA 80/952 approvals
received in 2019 and 2020.
Completed Management (Plans updated on external
website as approved). 22/12/2020
9. Progress the Wollombi Brook Cultural
Heritage Keeping & Teaching Place with
the Bulga Mine.
Completed Heritage 23/11/2020
10. Complete recommendations from 2019
annual groundwater review. Ongoing Water Expected completion (30/06/2021)
MT OWEN GLENDELL OPERATIONS
Annual Review 2020
37
6 Environmental Performance MGO environmental performance is measured against the criteria set out in:
DA SSD-5850 for both MTO and Ravensworth East
DA 80/952 for Glendell
An Environmental Management Strategy and specific management plans (see Table 7) have been developed to minimise
environmental impacts from the MGO. They provide the strategic context for environmental management across the complex.
Performance in the reporting period is discussed in the following sections.
6.1 Operational Noise
MGO has a range of management strategies in place to limit the generation of noise and noise impacts to the surrounding
environment. During 2020, the following activities were undertaken:
regular attended noise monitoring in accordance with the MGO Noise Monitoring Program;
noise monitoring supplementary to the regular noise monitoring to ensure periods of potential adverse weather were
represented by monitoring data;
continued use of directional real-time noise units integrated to MGO Noise Monitoring Network;
maintenance of the real-time noise monitoring Sentinex (Sx) network ;
ongoing measurement of machine sound power levels to monitor equipment performance and the potential for degradation
of the noise attenuation equipment;
continue to use the Air Quality Control System environmental forecast summary report to identify periods of potential
adverse weather that could affect the propagation of noise;
ongoing MGO employee education on noise management;
development and implementation of MGO specific Noise training packages delivered to site specific personnel; and
review of MGO Noise Management Plan (Approved by DPIE December 2020) following Glendell Mod 4.
6.1.1 Noise Monitoring Program
The noise monitoring program includes both continuous noise monitors and attended noise monitoring. It is designed to measure the
contribution that Mt Owen, Ravensworth East and Glendell Mines make to the environmental noise levels in the region surrounding
MGO.
Compliance with the development consents and regulatory requirements is determined from the routine attended noise monitoring.
Unattended Sentinex (Sx) noise monitors provide supporting information to the compliance assessment process when high noise
levels are recorded during the attended noise monitoring program.

MT OWEN GLENDELL OPERATIONS
Annual Review 2020
38
A detailed noise compliance assessment, including an assessment of compliance with noise criteria, is provided in the MGO attended
noise monitoring reports available via the MGO website (Mt Owen/Glendell Open Cut (glencore.com.au).
The details of the noise monitoring locations (attended and real-time units) are provided in Appendix D Table 3 and shown in Figure 4.
Attended noise monitoring locations N1 to N4, N8 to N11 and N17 are shown on Figure 4. Continuous and attended locations were
selected as being representative of the nearest and/or most affected residences to the east, south and south-east of MGO. Locations
are reviewed and where necessary, revised over the life of operations.
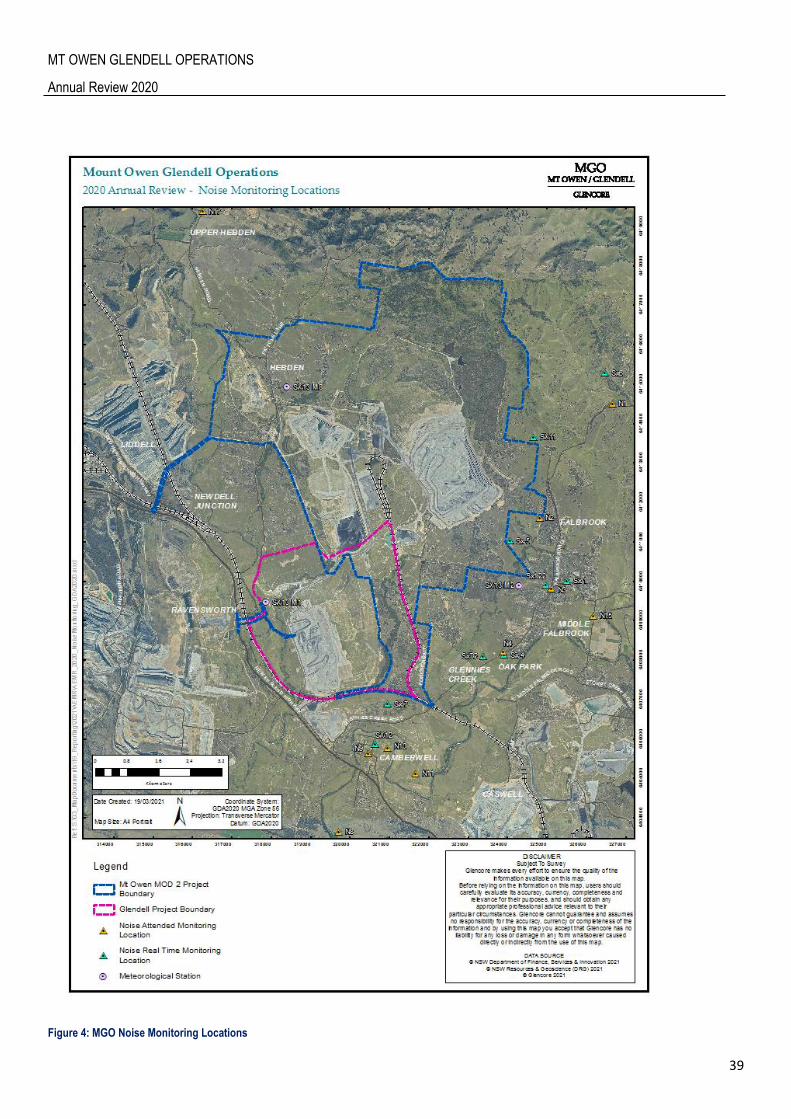
MT OWEN GLENDELL OPERATIONS
Annual Review 2020
39
Figure 4: MGO Noise Monitoring Locations
MT OWEN GLENDELL OPERATIONS
Annual Review 2020
40
6.1.2 MGO Dust and Noise Analysis Tool – DNAT
The Dust/Noise Analysis Tool (DNAT) continued to be utilised to monitor environmental impacts on the Camberwell, Falbrook and
Middle Falbrook areas during the reporting period. The DNAT is a web page based tool that assists Mining Supervisors to plan and
modify operational controls in adverse noise conditions. The readings from the Upper Hunter Air Quality Monitor in Camberwell were
included in the webpage to assist in the management of dust.
6.1.3 MGO Sound Power Level Assessment MGO is required to undertake an assessment of the equipment fleet against the indicative equipment listed in DA 80/952 every
5 years to confirm that noise impacts have not significantly changed. Global Acoustics were engaged to determine sound power
data for mobile equipment at Glendell. A total of 26 plant items were tested during the 2020 sound power survey. A copy of the
assessment report is included in Appendix D.
Under the Mount Owen Continued Operations (SSD-5850) development approval, a minimum of 20% of the mobile fleet requires
sound power testing per year. Thearle Engineering were engaged to complete the sound power testing. The assessment results
were compared with the nominated sound power levels for the operating fleets in Appendix E of the Noise Impact Assessment in the
Mt Owen Continued Operations Environmental Assessment (2014).The assessment results are also compared against the Glencore
Coal Assets Australia (GCAA) protocol GCAA 11.11 Noise Management as a secondary reference. A total of 19 plant items were
tested. A copy of the assessment report developed by Thearle Engineering is included in Appendix D.
6.1.4 Noise Monitoring Performance
Attended noise monitoring was undertaken monthly during the night-time periods in accordance with the Noise Management Plan
and the EMS. Additional monitoring of day and evening periods occurred seasonally at Mt Owen in accordance with EPL 4460 during
the reporting period.
Results of the 2020 attended noise monitoring program are summarised in Table 16 and Table 17, for Mt Owen, and Table 18 and Table
19, for Glendell. During the attended noise monitoring, there was one non-compliance, where the Mt Owen mine exceeded the
nominated criteria during applicable meteorological conditions. The exceedance occurring in June was reported to the relevant
agencies and no further action was requested.
Night time monitoring results are displayed in Appendix D, Figures 1 and 2. Detailed seasonal noise reports are also available on the
Glencore website at https://www.glencore.com.au/. The results presented in Appendix D and within the seasonal reports do not appear
to indicate any trends in the data.
Generally, the applicable noise criteria and the predicted noise levels are the same for each of the monitoring locations and therefore
the comparison with the criteria also demonstrates a comparison with the predicted noise levels.
MT OWEN GLENDELL OPERATIONS
Annual Review 2020
41
Table 16: Summary of Mt Owen 2020 Environmental Noise Level (dB(A)) Contribution (LAeq, 15min)
Monitoring Location
Monitoring Period
Cri
teri
a
Jan
202
0
Feb
202
0
Mar
ch 2
020
Ap
ril 2
020
May
202
0
Jun
e 20
20
July
202
0
Au
g 2
020
Sep
202
0
Oct
202
0
No
v 20
20
Dec
202
0
N1
Day 35 IA N/A2 N/A2 <25 N/A2 N/A2 IA N/A2 N/A2 IA N/A2 N/A2
Evening 35 IA N/A2 N/A2 <30 N/A2 N/A2 IA N/A2 N/A2 IA N/A2 N/A2
Night 35 IA IA IA <30 <25
37
30 33 <25 IA <30 <30 363
294
N21
Day N/A <30 N/A2 N/A2 <30 N/A2 N/A2 <30 N/A2 N/A2 <30 N/A2 N/A2
Evening N/A IA N/A2 N/A2 27 N/A2 N/A2 <25 N/A2 N/A2 IA N/A2 N/A2
Night N/A IA <25 <25 36 31 45 <30 40 41 IA <30 <30
N3
Day 41 <30 N/A2 N/A2 <30 N/A2 N/A2 <30 N/A2 N/A2 IA N/A2 N/A2
Evening 41 <30 N/A2 N/A2 35 N/A2 N/A2 IA N/A2 N/A2 IA N/A2 N/A2
Night 41 IA IA IA IA 38 <36 35 37 35 39 31 <30
N4 Night 42 IA IA IA IA <35 <35 40 <39 37 39 39 IA
N81 Night N/A IA IA IA IA IA IA IA IA IA IA IA IA
N91 Night N/A IA IA IA IA <35 IA IA IA IA <35 IA IA
N10 Night 35 IA IA IA <35 <35 IA <35 IA IA <33 IA IA
N11 Night 35 IA IA IA IA IA IA IA IA IA <35 IA IA
Note: 1 There is no noise criteria for this monitoring location.
2 Day and evening monitoring is only required once every quarter and was not required for this monthly monitoring round.
3 Re-measure undertaken following an initial exceedance at N1 as per the NMP
4 Follow-up measurement undertaken after an initial exceedance at N1 as per the NMP
MT OWEN GLENDELL OPERATIONS
Annual Review 2020
42
Table 17: Summary of Mt Owen's Environmental Noise Level (dB(A)) Contribution (LA1, 1min) - Night
Monitoring Location
Cri
teri
a
Jan
202
0
Feb
202
0
Mar
ch 2
020
Ap
ril 2
020
May
202
0
Jun
e 20
20
July
202
0
Au
g 2
020
Sep
202
0
Oct
202
0
No
v 20
20
Dec
202
0
N1 45 IA IA IA <30 <30
44
38 43 <35 IA <35 32 432
343
N21 N/A IA <25 <25 41 44 57 <30 51 55 IA <35 <30
N3 45 IA IA IA IA 43 39 43 45 44 43 40 39
N4 50 IA IA IA IA <35 42 50 45 42 44 46 IA
N81 N/A IA IA IA IA IA IA IA IA IA IA IA IA
N91 N/A IA IA IA IA <35 IA IA IA IA <35 IA IA
N10 45 IA IA IA <35 <40 IA <40 IA IA <33 IA IA
N11 45 IA IA IA IA IA IA IA IA IA <35 IA IA
Note: 1 There is no noise criteria for this monitoring location.
2 Re-measure undertaken following an initial exceedance at N1 as per the NMP
3 Follow-up measurement undertaken after an initial exceedance at N1 as per the NMP
Table 18: Summary of Glendell's Environmental Noise Level (dB(A)) Contribution (LAeq, 15min) - Night
Monitoring Location
Monitoring Period
Cri
teri
a
Jan
202
0
Feb
202
0
Mar
ch 2
020
Ap
ril 2
020
May
202
0
Jun
e 20
20
July
202
0
Au
g 2
020
Sep
202
0
Oct
202
0
No
v 20
20
Dec
202
0
N11 Night N/A IA IA IA IA IA IA IA IA IA IA IA IA
N21 Night N/A IA IA IA IA IA IA IA IA IA IA IA IA
N3 Night 38 IA IA IA IA <35 <35 <35 IA <35 <36 <35 31
N4 Night 38 IA IA IA IA IA IA <35 IA <35 IA IA IA
N8 Night 35 IA IA IA IA IA IA IA 32 <35 IA IA IA
N9 Night 42 <30 IA IA
<42
<35 <35 <35 40 <35 <35 <35 <35 402
<403
N10 Night 40 <35 IA IA 38 IA <35 <35 37 <35 IA 37 <35
N11 Night 38 <35 IA IA <35 <35 IA <35 38 <35 IA <35 <35
Note: 1 There is no noise criteria for this monitoring location.
2 Re-measure undertaken following an initial exceedance at N9 as per the NMP
3 Follow-up measurement undertaken after an initial exceedance at N9 as per the NMP
MT OWEN GLENDELL OPERATIONS
Annual Review 2020
43
Table 19: Summary of Glendell's Environmental Noise Level (dB(A)) Contribution (LA1, 1min) - Night
Monitoring Location
Cri
teri
a
Jan
202
0
Feb
202
0
Mar
ch 2
020
Ap
ril 2
020
May
202
0
Jun
e 20
20
July
202
0
Au
g 2
020
Sep
202
0
Oct
202
0
No
v 20
20
Dec
202
0
N11 N/A IA IA IA IA IA IA IA IA IA IA IA IA
N21 N/A IA IA IA IA IA IA IA IA IA IA IA IA
N3 45 IA IA IA IA <35 <40 44 IA <35 44 <35 <35
N4 45 IA IA IA IA IA IA <35 IA 40 IA IA IA
N8 45 IA IA IA IA IA IA IA 38 <35 IA IA IA
N9 45 38 IA IA
54
<35
40
<35 <45 43 40 <40 <35 452
423
N10 45 <35 IA IA 44 IA <35 <35 <45 42 IA 43 <35
N11 45 38 IA IA <35 <35 IA 40 45 <40 IA <40 <40
Note: 1 There is no noise criteria for this monitoring location.
2 Re-measure undertaken following an initial exceedance at N9 as per the NMP
3 Follow-up measurement undertaken after an initial exceedance at N9 as per the NMP
MT OWEN GLENDELL OPERATIONS
Annual Review 2020
44
6.1.5 Continuous Improvement
As a part of the ongoing commitment to the management of noise impacts from the MGO, a range of activities have been undertaken
during 2020 that fall within the continuous improvement program. The most important being:
Dust & Noise Analysis Tool (DNAT) smart alarm improvements and noise roses – Allows enhanced separation of noise
contribution (Trains, neighbouring mine noise, community). The continued implementation of the web-based tool assists in
managing operational noise (refer 6.1.2) across MGO
Development of a 3D Predictive Noise Model for MGO
Implementation of DPIE approved MGO Noise Management Plan
Modifications and improvement of real-time monitoring network
Review and simplification of noise alarm response
During 2021, continuous assessment and improvement of the real-time monitoring network and management alarms will continue.
6.2 Blasting
6.2.1 Blast Management and Monitoring
MGO blast management practices for the life of operations are managed in accordance with the MGO Blast Management Plan.
Blast monitoring locations are shown in Figure 5.
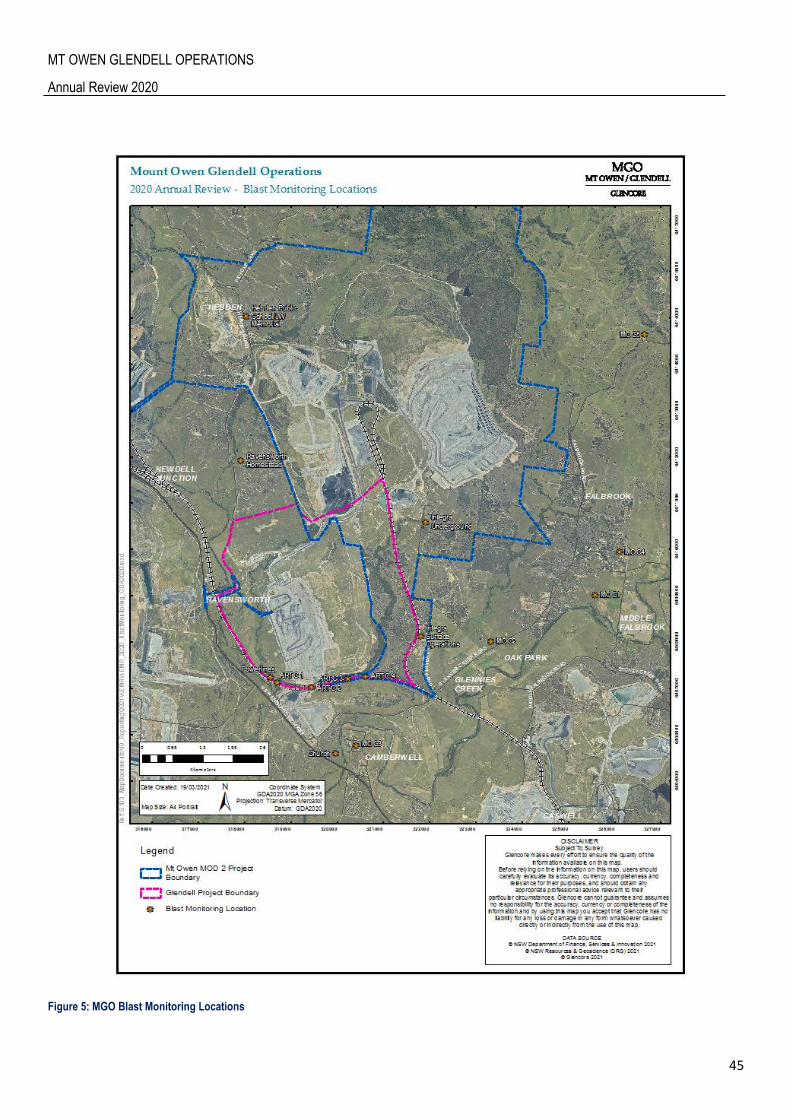
MT OWEN GLENDELL OPERATIONS
Annual Review 2020
45
Figure 5: MGO Blast Monitoring Locations
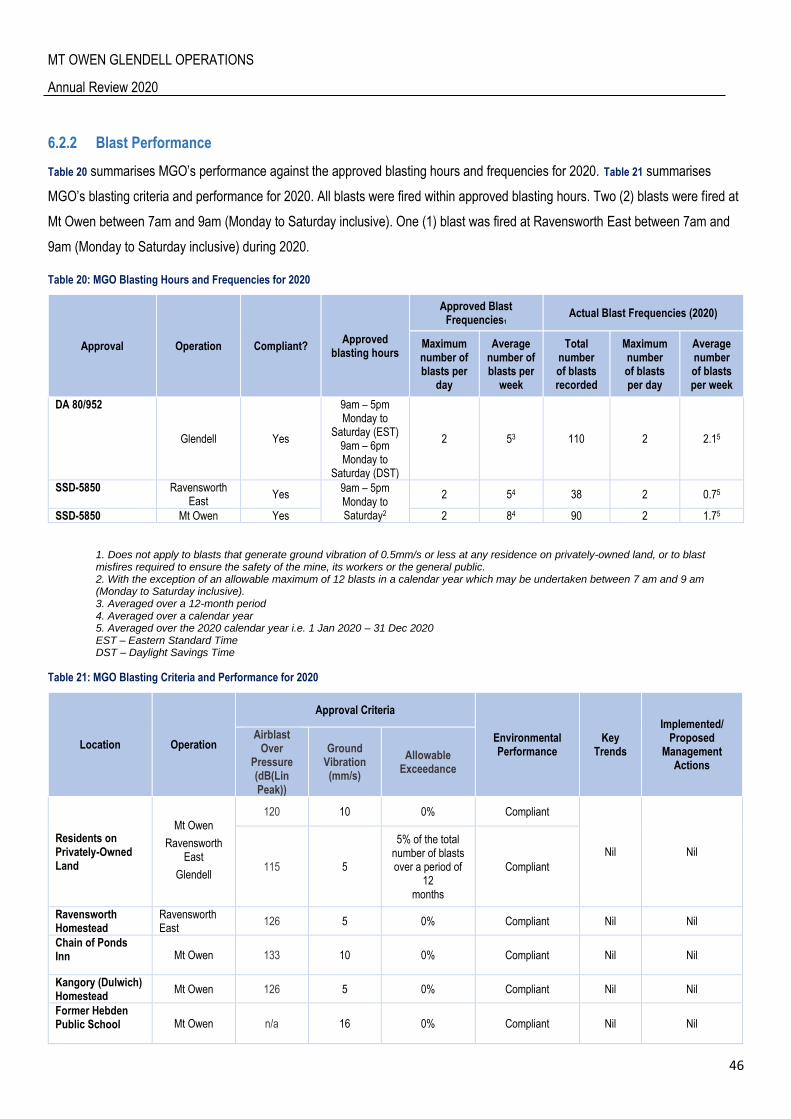
MT OWEN GLENDELL OPERATIONS
Annual Review 2020
46
6.2.2 Blast Performance
Table 20 summarises MGO’s performance against the approved blasting hours and frequencies for 2020. Table 21 summarises
MGO’s blasting criteria and performance for 2020. All blasts were fired within approved blasting hours. Two (2) blasts were fired at
Mt Owen between 7am and 9am (Monday to Saturday inclusive). One (1) blast was fired at Ravensworth East between 7am and
9am (Monday to Saturday inclusive) during 2020.
Table 20: MGO Blasting Hours and Frequencies for 2020
Approval Operation Compliant? Approved
blasting hours
Approved Blast Frequencies1
Actual Blast Frequencies (2020)
Maximum number of blasts per
day
Average number of blasts per
week
Total number of blasts recorded
Maximum number of blasts per day
Average number of blasts per week
DA 80/952
Glendell Yes
9am – 5pm Monday to
Saturday (EST) 9am – 6pm Monday to
Saturday (DST)
2 53 110 2 2.15
SSD-5850 Ravensworth East
Yes 9am – 5pm Monday to Saturday2
2 54 38 2 0.75
SSD-5850 Mt Owen Yes 2 84 90 2 1.75
1. Does not apply to blasts that generate ground vibration of 0.5mm/s or less at any residence on privately-owned land, or to blast misfires required to ensure the safety of the mine, its workers or the general public. 2. With the exception of an allowable maximum of 12 blasts in a calendar year which may be undertaken between 7 am and 9 am (Monday to Saturday inclusive). 3. Averaged over a 12-month period 4. Averaged over a calendar year 5. Averaged over the 2020 calendar year i.e. 1 Jan 2020 – 31 Dec 2020 EST – Eastern Standard Time DST – Daylight Savings Time
Table 21: MGO Blasting Criteria and Performance for 2020
Location Operation
Approval Criteria
Environmental Performance
Key Trends
Implemented/ Proposed
Management Actions
Airblast Over
Pressure (dB(Lin Peak))
Ground Vibration (mm/s)
Allowable Exceedance
Residents on Privately-Owned Land
Mt Owen
Ravensworth East
Glendell
120 10 0% Compliant
Nil Nil
115 5
5% of the total number of blasts over a period of
12 months
Compliant
Ravensworth Homestead
Ravensworth East
126 5 0% Compliant Nil Nil
Chain of Ponds Inn Mt Owen 133 10 0% Compliant Nil Nil
Kangory (Dulwich) Homestead
Mt Owen 126 5 0% Compliant Nil Nil
Former Hebden Public School Mt Owen n/a 16 0% Compliant Nil Nil

MT OWEN GLENDELL OPERATIONS
Annual Review 2020
47
John Winter Memorial
Mt Owen n/a 250 0% Compliant Nil Nil
St Clements Church
Glendell 120 5 0 % Compliant Nil Nil
Glendell 115 2
5% of the total number of blasts over a period of
12 months
Compliant Nil Nil
Main Northern Railway Culverts and Bridges
Glendell 120 25 Negotiated Agreement
Compliant Nil Nil
Powerlines Glendell n/a 25 Negotiated Agreement
Compliant Nil Nil
Integra Underground Surface
Mt Owen n/a 25 or 100 0% Compliant Nil Nil
Integra Underground Workings
Mt Owen n/a 10 or 250 0% Compliant Nil Nil
Mt Owen
Overpressure and vibration compliance results for Mt Owen are detailed in Appendix E, Tables 6 to 10. Compliance
summaries are provided in Appendix E, Table 4 and 5.
There were a total of 90 blasts fired at Mt Owen during the reporting period averaging less than 2 blasts fired per week
(maximum of 8 blasts per week over the 12 month period allowed), no blasting non-compliances were identified at Mt
Owen during the report period.
Glendell
Overpressure and vibration compliance results for Glendell are detailed in Appendix E, Table 11 to 14. Compliance
summaries are provided in Appendix E, Tables 4 and 5.
There were a total of 110 blasts fired at Glendell during the reporting period averaging over 2 blasts (maximum of 5 blasts
per week averaged over the 12 month period allowed) fired per week, no blasting non-compliances were identified at
Glendell during the report period.
Ravensworth East
Overpressure and vibration compliance results for Ravensworth East are detailed in Appendix E, Tables 6 to 10.
Compliance summaries are provided in Appendix E, Tables 4 and 5.
There were a total of 38 blasts fired at Ravensworth East during the reporting period averaging less than 1 blast fired per
week (maximum of 5 blasts per week average over the 12 month period allowed) , no blasting non-compliances were
identified at Ravensworth East during the report period.
All blasting results from MGO are also available on the website at: https://www.glencore.com.au/operations-and-
projects/coal/current-operations/mt-owen-glendell-open-cut
MT OWEN GLENDELL OPERATIONS
Annual Review 2020
48
6.3 Air Quality
6.3.1 Air Quality Management and Monitoring
Air quality is managed in accordance with the approved MGO Air Quality Management Plan. Monitoring locations are shown in Figure
6: MGO Air Quality Monitoring Locations. Results of air quality monitoring are presented in Appendix F.
Air quality conditions can be characterised by various substances and by various measurement techniques. Airborne particulate
matter is typically the key air quality issue for open cut mining and the monitoring in the vicinity of MGO includes the measurement
of:
Particulate matter (as PM10)
Particulate matter (as PM2.5)
Particulate matter (as TSP)
Dust deposition
Appendix F, Tables 15 - 20 present the monitoring results for 2020 and for recent years. It should be noted that the measurement data
represent the contributions from all sources that have at some stage been upwind of each monitor. In the case of particulate matter
(as PM10), the background concentration may contain emissions from many sources such as from mining activities, construction
works, bushfires and ‘burning off’, industry, vehicles, roads, wind-blown dust from nearby and remote areas, fragments of pollens,
moulds etc.
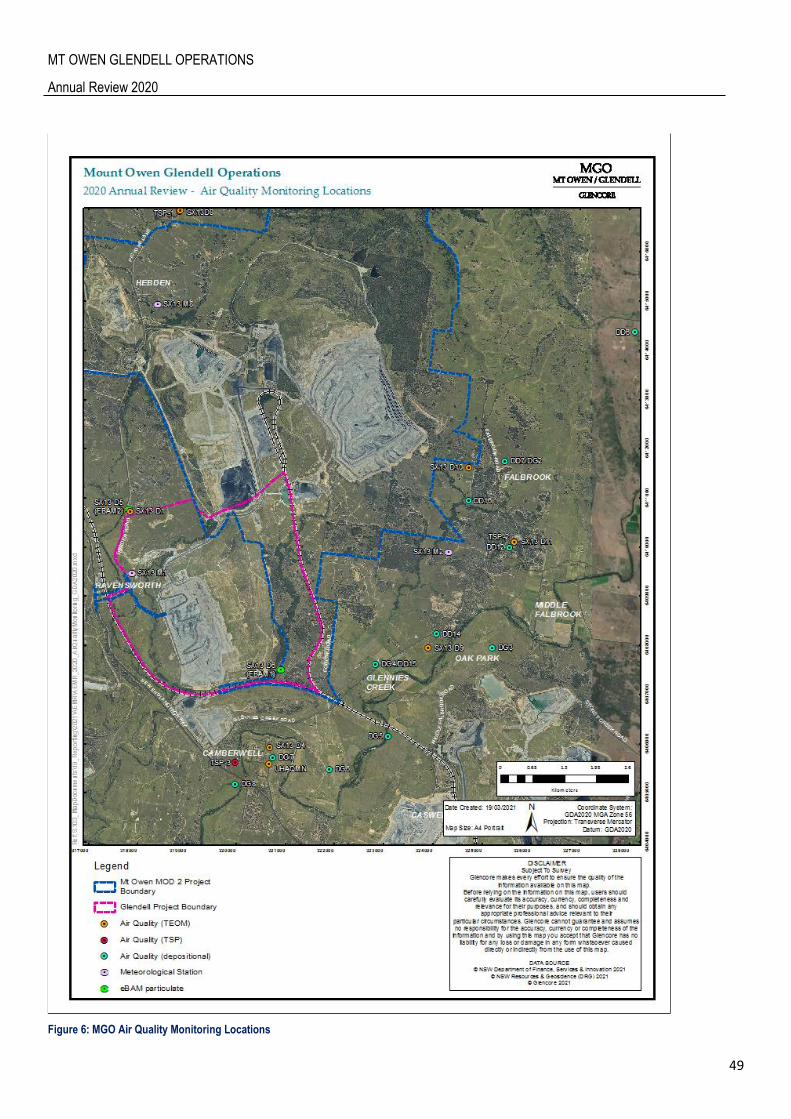
MT OWEN GLENDELL OPERATIONS
Annual Review 2020
49
Figure 6: MGO Air Quality Monitoring Locations

MT OWEN GLENDELL OPERATIONS
Annual Review 2020
50
6.3.2 Meteorological Conditions
Meteorological monitoring is undertaken at MGO in accordance with SSD-5850 and DA 80/952 at the locations shown in Figure 6:
MGO Air Quality Monitoring Locations. MGO operates a continuous meteorological monitoring network which includes three
(3) 10 metre tower weather stations,(known as Sx13 M1, Sx13 M2 and Sx13 M8), located to the west and south-east of the active
mining areas respectively.
The wind-roses (Figure 7: 2020 Annual Wind Roses for Sx13 M1, Sx13 M2 and Sx13 M8) show the frequency of wind
speeds and wind directions based on hourly records for each location. The circular format of the wind rose shows the direction
from which the wind blew and the length of each "spoke" around the circle shows how often the wind blew from that direction. The
different colours of each spoke provide details on the speed of the wind from each direction.
It can be seen from Figure 7 that winds in 2020 were from the southeast and northwest. This pattern of winds is common for many
parts of the Hunter Valley and reflects the northwest-southeast alignment of the valley. Wind patterns were similar at all three
locations.
Rainfall data for Singleton Army Base (the closest monitoring station), collected from the Bureau of Meteorology (BoM) website,
confirms that 2020 was much wetter than average. A total of 945.8 mm was recorded in 2020 and was well above (265.8mm) the
long term average of 680 mm.
Approximately 841mm of rainfall was recorded at MGO at Sx13 M2 during the reporting period. Due to faults in the SX13 M1
sample site in 2020, data from sample site SX13 M2 was used in the period. In the previous reporting period, approximately
397mm of rainfall was recorded, highlighting that 2020 was wetter than previous years.
Figure 7: 2020 Annual Wind Roses for Sx13 M1, Sx13 M2 and Sx13 M8
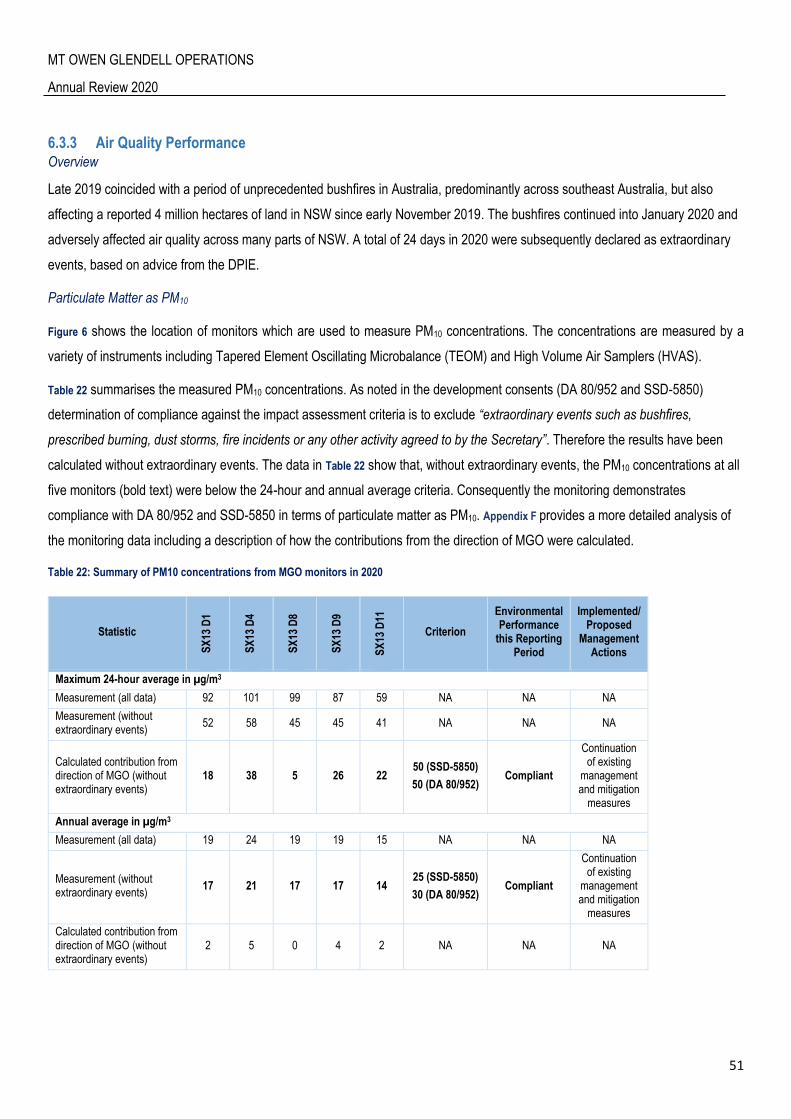
MT OWEN GLENDELL OPERATIONS
Annual Review 2020
51
6.3.3 Air Quality Performance Overview
Late 2019 coincided with a period of unprecedented bushfires in Australia, predominantly across southeast Australia, but also
affecting a reported 4 million hectares of land in NSW since early November 2019. The bushfires continued into January 2020 and
adversely affected air quality across many parts of NSW. A total of 24 days in 2020 were subsequently declared as extraordinary
events, based on advice from the DPIE.
Particulate Matter as PM10
Figure 6 shows the location of monitors which are used to measure PM10 concentrations. The concentrations are measured by a
variety of instruments including Tapered Element Oscillating Microbalance (TEOM) and High Volume Air Samplers (HVAS).
Table 22 summarises the measured PM10 concentrations. As noted in the development consents (DA 80/952 and SSD-5850)
determination of compliance against the impact assessment criteria is to exclude “extraordinary events such as bushfires,
prescribed burning, dust storms, fire incidents or any other activity agreed to by the Secretary”. Therefore the results have been
calculated without extraordinary events. The data in Table 22 show that, without extraordinary events, the PM10 concentrations at all
five monitors (bold text) were below the 24-hour and annual average criteria. Consequently the monitoring demonstrates
compliance with DA 80/952 and SSD-5850 in terms of particulate matter as PM10. Appendix F provides a more detailed analysis of
the monitoring data including a description of how the contributions from the direction of MGO were calculated.
Table 22: Summary of PM10 concentrations from MGO monitors in 2020
Statistic
SX
13 D
1
SX
13 D
4
SX
13 D
8
SX
13 D
9
SX
13 D
11
Criterion
Environmental Performance
this Reporting Period
Implemented/ Proposed
Management Actions
Maximum 24-hour average in µg/m3
Measurement (all data) 92 101 99 87 59 NA NA NA
Measurement (without extraordinary events)
52 58 45 45 41 NA NA NA
Calculated contribution from direction of MGO (without extraordinary events)
18 38 5 26 22 50 (SSD-5850)
50 (DA 80/952) Compliant
Continuation of existing
management and mitigation
measures
Annual average in µg/m3
Measurement (all data) 19 24 19 19 15 NA NA NA
Measurement (without extraordinary events)
17 21 17 17 14 25 (SSD-5850)
30 (DA 80/952) Compliant
Continuation of existing
management and mitigation
measures
Calculated contribution from direction of MGO (without extraordinary events)
2 5 0 4 2 NA NA NA
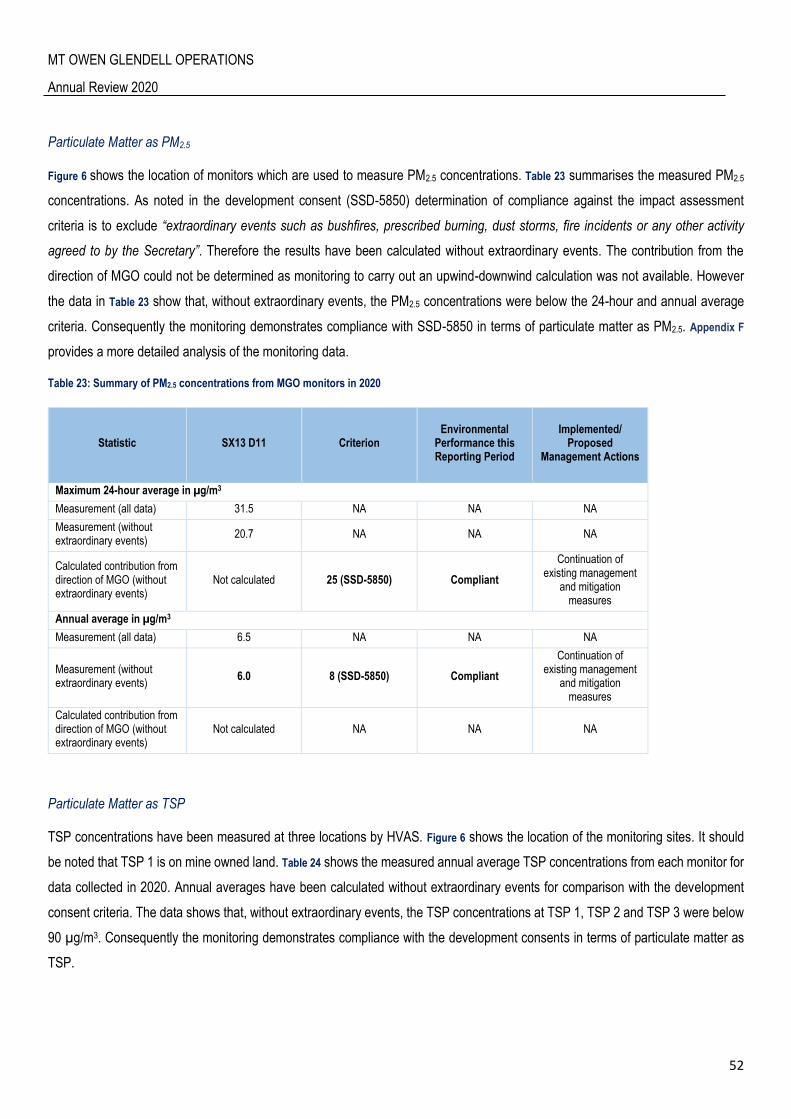
MT OWEN GLENDELL OPERATIONS
Annual Review 2020
52
Particulate Matter as PM2.5
Figure 6 shows the location of monitors which are used to measure PM2.5 concentrations. Table 23 summarises the measured PM2.5
concentrations. As noted in the development consent (SSD-5850) determination of compliance against the impact assessment
criteria is to exclude “extraordinary events such as bushfires, prescribed burning, dust storms, fire incidents or any other activity
agreed to by the Secretary”. Therefore the results have been calculated without extraordinary events. The contribution from the
direction of MGO could not be determined as monitoring to carry out an upwind-downwind calculation was not available. However
the data in Table 23 show that, without extraordinary events, the PM2.5 concentrations were below the 24-hour and annual average
criteria. Consequently the monitoring demonstrates compliance with SSD-5850 in terms of particulate matter as PM2.5. Appendix F
provides a more detailed analysis of the monitoring data.
Table 23: Summary of PM2.5 concentrations from MGO monitors in 2020
Statistic SX13 D11 Criterion Environmental
Performance this Reporting Period
Implemented/ Proposed
Management Actions
Maximum 24-hour average in µg/m3
Measurement (all data) 31.5 NA NA NA
Measurement (without extraordinary events)
20.7 NA NA NA
Calculated contribution from direction of MGO (without extraordinary events)
Not calculated 25 (SSD-5850) Compliant
Continuation of existing management
and mitigation measures
Annual average in µg/m3
Measurement (all data) 6.5 NA NA NA
Measurement (without extraordinary events)
6.0 8 (SSD-5850) Compliant
Continuation of existing management
and mitigation measures
Calculated contribution from direction of MGO (without extraordinary events)
Not calculated NA NA NA
Particulate Matter as TSP
TSP concentrations have been measured at three locations by HVAS. Figure 6 shows the location of the monitoring sites. It should
be noted that TSP 1 is on mine owned land. Table 24 shows the measured annual average TSP concentrations from each monitor for
data collected in 2020. Annual averages have been calculated without extraordinary events for comparison with the development
consent criteria. The data shows that, without extraordinary events, the TSP concentrations at TSP 1, TSP 2 and TSP 3 were below
90 µg/m3. Consequently the monitoring demonstrates compliance with the development consents in terms of particulate matter as
TSP.
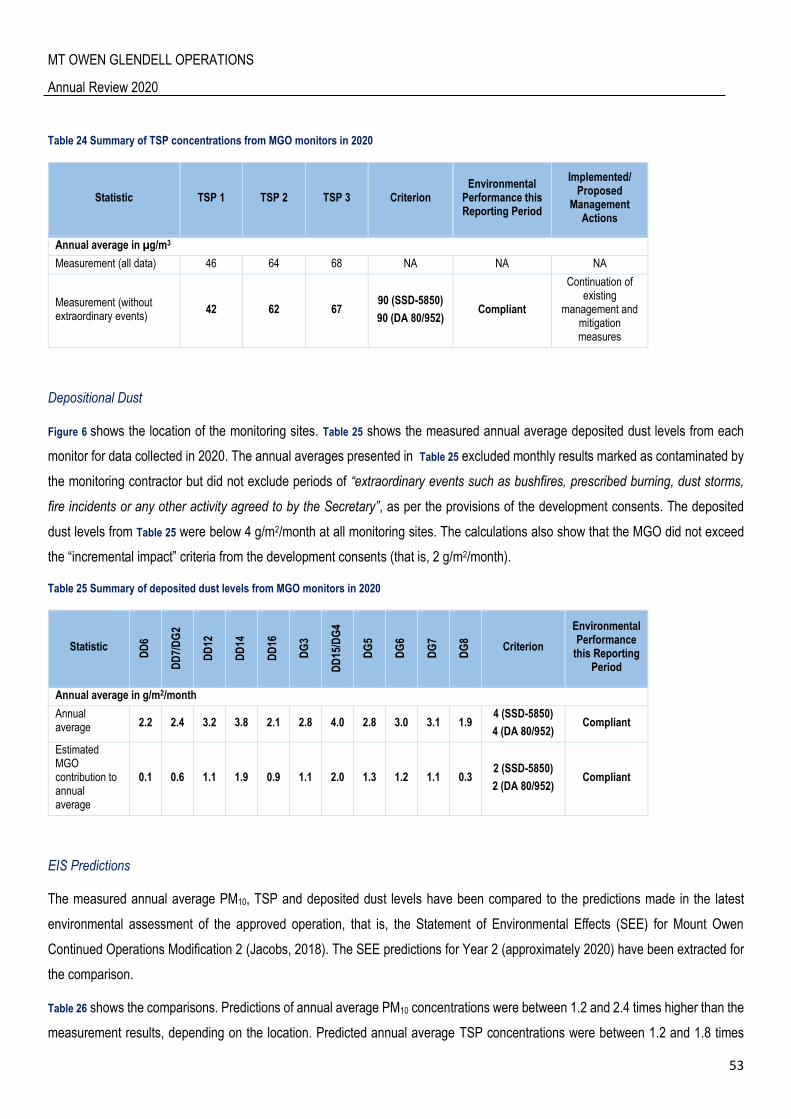
MT OWEN GLENDELL OPERATIONS
Annual Review 2020
53
Table 24 Summary of TSP concentrations from MGO monitors in 2020
Statistic TSP 1 TSP 2 TSP 3 Criterion Environmental
Performance this Reporting Period
Implemented/ Proposed
Management Actions
Annual average in µg/m3
Measurement (all data) 46 64 68 NA NA NA
Measurement (without extraordinary events)
42 62 67 90 (SSD-5850)
90 (DA 80/952) Compliant
Continuation of existing
management and mitigation measures
Depositional Dust
Figure 6 shows the location of the monitoring sites. Table 25 shows the measured annual average deposited dust levels from each
monitor for data collected in 2020. The annual averages presented in Table 25 excluded monthly results marked as contaminated by
the monitoring contractor but did not exclude periods of “extraordinary events such as bushfires, prescribed burning, dust storms,
fire incidents or any other activity agreed to by the Secretary”, as per the provisions of the development consents. The deposited
dust levels from Table 25 were below 4 g/m2/month at all monitoring sites. The calculations also show that the MGO did not exceed
the “incremental impact” criteria from the development consents (that is, 2 g/m2/month).
Table 25 Summary of deposited dust levels from MGO monitors in 2020
Statistic
DD
6
DD
7/D
G2
DD
12
DD
14
DD
16
DG
3
DD
15/D
G4
DG
5
DG
6
DG
7
DG
8
Criterion
Environmental Performance
this Reporting Period
Annual average in g/m2/month
Annual average 2.2 2.4 3.2 3.8 2.1 2.8 4.0 2.8 3.0 3.1 1.9
4 (SSD-5850)
4 (DA 80/952) Compliant
Estimated MGO contribution to annual average
0.1 0.6 1.1 1.9 0.9 1.1 2.0 1.3 1.2 1.1 0.3 2 (SSD-5850)
2 (DA 80/952) Compliant
EIS Predictions
The measured annual average PM10, TSP and deposited dust levels have been compared to the predictions made in the latest
environmental assessment of the approved operation, that is, the Statement of Environmental Effects (SEE) for Mount Owen
Continued Operations Modification 2 (Jacobs, 2018). The SEE predictions for Year 2 (approximately 2020) have been extracted for
the comparison.
Table 26 shows the comparisons. Predictions of annual average PM10 concentrations were between 1.2 and 2.4 times higher than the
measurement results, depending on the location. Predicted annual average TSP concentrations were between 1.2 and 1.8 times

MT OWEN GLENDELL OPERATIONS
Annual Review 2020
54
higher than the measurement results and predicted annual average deposited dust levels were between 0.8 lower and 1.8 times
higher than the measurement results. The comparisons highlight the generally conservative nature of air quality models. In addition,
rainfall in 2020 was above the long term average and would likely have been a key factor for minimising elevated levels of these air
quality indicators. The air quality models do not usually simulate the effect of rainfall on air quality. The results are also generally
within the factor-of-two accuracy that has been recognised for these types of models (US EPA, 2005).
Table 26 Comparison between EIS predictions and measurements in 2020
Location Prediction
(Mt Owen Mod 2 for Year 2)
Measurement
(2020 excluding extraordinary events)
Annual average PM10 in µg/m3
SX13 D1 41 17
SX13 D4 35 21
SX13 D8 21 17
SX13 D9 30 17
SX13 D11 25 14
Annual average TSP in µg/m3
TSP 1 74 42
TSP 2 76 62
TSP 3 79 67
Annual average deposited dust in g/m2/month
DD6 2.1 2.2
DD7/DG2 2.7 2.4
DD12 3.1 3.2
DD14 3.0 3.8
DD16 3.8 2.1
DG3 3.0 2.8
DD15/DG4 3.0 4
DG5 3.2 2.8
DG6 3.5 3
DG7 3.1 3.1
DG8 3.4 1.9
Summary
Late 2019 coincided with a period of unprecedented bushfires in Australia that continued into January and February of 2020. These
conditions adversely affected air quality across many parts of NSW and a total of 24 days in 2020 were subsequently declared as
extraordinary events. Measurements of PM10, PM2.5, TSP and deposited dust were compared to the short and long term impact
assessment criteria from the Mt Owen and Glendell development consents. It was determined that Mt Owen Glendell Operations
was in compliance with its development consents (DA 80/952 and SSD-5850) in terms of air quality impacts at all reportable
monitoring sites for data collected in 2020.
Predictions of air quality from the latest environmental assessment of the approved operation were compared to the measurement
results. The comparisons showed that predicted PM10, TSP and deposited dust levels were generally higher than the 2020
MT OWEN GLENDELL OPERATIONS
Annual Review 2020
55
measurement results. This outcome reflected the generally conservative nature of air quality models as well as the increase in rainfall
that was observed in 2020.
Further information on the air quality data can be found in the independent air quality report, prepared by a suitably qualified air
quality specialist, in Appendix F.
6.3.4 Continuous Improvement
As a part of the ongoing commitment to the management of dust impacts from MGO, a range of activities have been undertaken
during 2020 that fall within the continuous improvement program. The most important being:
Dust suppression tools added to Glendell stemming trucks;
Modification and improvement of real-time monitoring network;
Acquisition of refurbished TEOM unit from USA to be used as part replacement for old units;
Installation of two PM2.5 TEOMs monitors as required by the MOCO Mod 2 approval;
Review and update of the Air Quality and Greenhouse Gas Management Plan; and
Implementation of Glendell and Mt Owen Dust Analysis Tool on the existing Noise Analysis Tool (DNAT) web page, to
assist mining supervisors with the management of dust.
A number of activities to be undertaken in 2021 include:
Implementation of two PM2.5 TEOMs monitors to be part of MGO Real Time Dust Monitoring Network for Mt Owen following
the approval of the Air Quality and Greenhouse Gas Management Plan in December 2020;
Continuous assessment and improvement of the real-time monitoring network and management alarms;
Review and simplification of dust alarm response;
New water fill point to be installed near WOOP dump closer to Mount Owen North Pit active operations; and
Further DNAT development to incorporate site specific contribution dust contribution.
6.3.5 Greenhouse Gas
Energy consumption at MGO is monitored and reported in accordance with Glencore requirements and with the reporting
requirements of the National Greenhouse & Energy Reporting (NGER) system. In the 2019/2020 financial year reporting period,
the total emissions produced by Glendell were estimated to be 202,165 t CO2-e. Total emissions produced by Mt Owen in the
2019/2020 NGER report period were estimated to be 175,794 t CO2-e. A summary of greenhouse gas emissions for 2019/2020 is
provided in Table 27.
In 2020, Glendell and Mt Owen’s separate Greenhouse Gas reporting requirements were updated in accordance with section 22X
of the NGER Act. In April 2020, the Clean Energy Regulator (CER) approved the combined facility of Mt Owen Complex. The
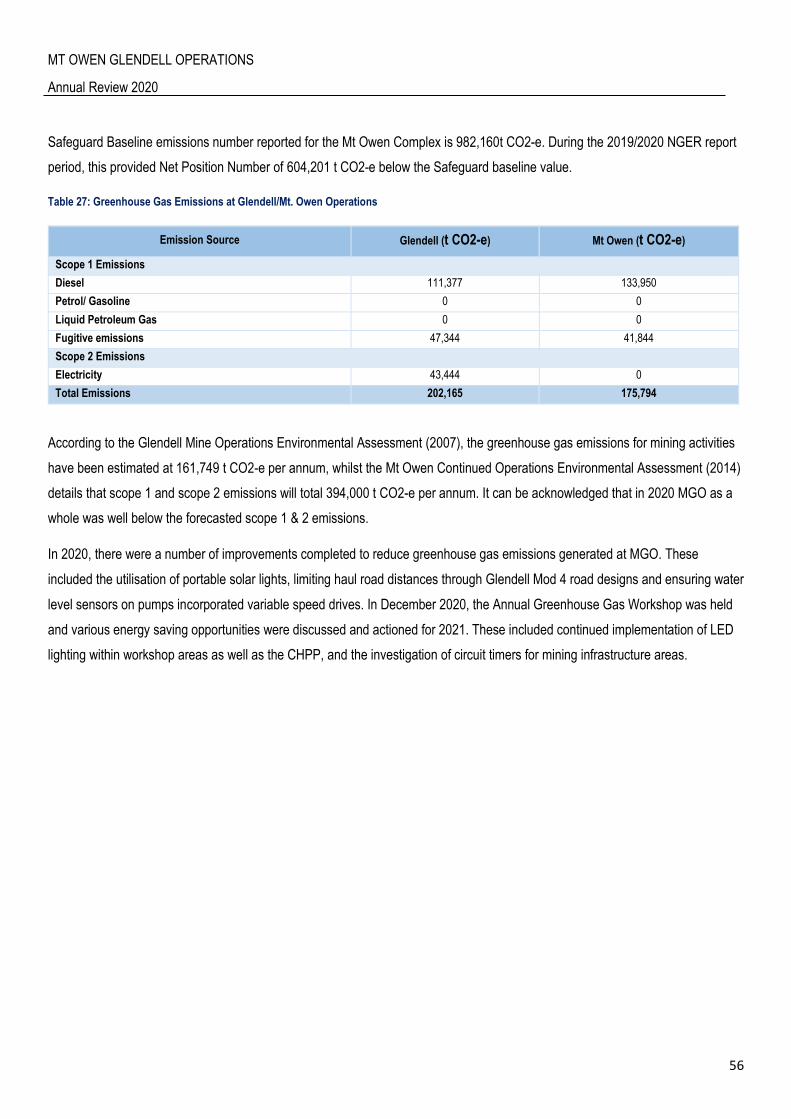
MT OWEN GLENDELL OPERATIONS
Annual Review 2020
56
Safeguard Baseline emissions number reported for the Mt Owen Complex is 982,160t CO2-e. During the 2019/2020 NGER report
period, this provided Net Position Number of 604,201 t CO2-e below the Safeguard baseline value.
Table 27: Greenhouse Gas Emissions at Glendell/Mt. Owen Operations
Emission Source Glendell (t CO2-e) Mt Owen (t CO2-e)
Scope 1 Emissions
Diesel 111,377 133,950
Petrol/ Gasoline 0 0
Liquid Petroleum Gas 0 0
Fugitive emissions 47,344 41,844
Scope 2 Emissions
Electricity 43,444 0
Total Emissions 202,165 175,794
According to the Glendell Mine Operations Environmental Assessment (2007), the greenhouse gas emissions for mining activities
have been estimated at 161,749 t CO2-e per annum, whilst the Mt Owen Continued Operations Environmental Assessment (2014)
details that scope 1 and scope 2 emissions will total 394,000 t CO2-e per annum. It can be acknowledged that in 2020 MGO as a
whole was well below the forecasted scope 1 & 2 emissions.
In 2020, there were a number of improvements completed to reduce greenhouse gas emissions generated at MGO. These
included the utilisation of portable solar lights, limiting haul road distances through Glendell Mod 4 road designs and ensuring water
level sensors on pumps incorporated variable speed drives. In December 2020, the Annual Greenhouse Gas Workshop was held
and various energy saving opportunities were discussed and actioned for 2021. These included continued implementation of LED
lighting within workshop areas as well as the CHPP, and the investigation of circuit timers for mining infrastructure areas.
MT OWEN GLENDELL OPERATIONS
Annual Review 2020
57
6.4 Biodiversity and Land Management
The Biodiversity Offset Management Plan (BOMP) at MGO forms part of the MGO EMS. The BOMP is used to describe the controls
and monitoring implemented for the management of flora and fauna. The objectives for land management at MGO are based on land
management principles, including:
erosion prevention
pasture diversity
careful grazing management
noxious weed and feral animal control.
Natural regeneration is promoted where practical to enhance biodiversity and landscape amenity.
6.4.1 Biodiversity Offset Areas
MGO were required to secure a number of Biodiversity Offset Areas (BOAs) in accordance with conditions of SSD-5850 and DA
80/952.
In 2018, five Conservation Agreements (CAs) were gazetted in consultation with the NSW Environment, Energy and Science Group
(then Office of Environment and Heritage OEH) and the Biodiversity Conservation Trust (BCT). These CAs were implemented for
the following Conservation Areas:
Bettys Creek (Enex Foydell) Conservation Area.
Bettys Creek (Glendell) Conservation Area.
Mount Owen Offsets Conservation Area, represented by a cluster of four smaller offset areas, being;
o North East Offset;
o Forest East Offset;
o South East Offset;
o South East Corridor Offset.
Southern Remnant Offset Conservation Area.
North West Offset Conservation Area.
All Conservation areas were inspected by the BCT during June 2020 as part of the annual inspection regime.
MGO is in the process of long term securing the remaining BOAs through Stewardship Agreements under the BioBanking Biodiversity
and Offset Scheme, therefore, BOAs are current managed under the BOMP, and those include the following properties:
Cross Creek Offset Site.
Stringybark Habitat Corridor Offset Site.
Esparanga Offset Site.
Mitchell Hills North Offset Site.
All BOAs in the process of Stewardship Agreemenmts were inspected by the BCT during September 2020 as part of the
Stewardship Agreement application process.
Details of the CAs and BOAs are provided in Table 28 with their locations shown in in Figure 8: MGO Biodiversity Offset Areas
and Figure 9.

MT OWEN GLENDELL OPERATIONS
Annual Review 2020
58
The specific location of the Rehabilitation Woodland Offset is yet to be determined; selection of this area will be undertaken in
accordance with the Schedule 3 Condition 31 (d) of SSD-5850.

MT OWEN GLENDELL OPERATIONS
Annual Review 2020
59
Table 28: Biodiversity Offset Areas
Offset Area Plant Community Type Size (ha)
DA 80/952
Bettys Creek Habitat Management Area (HMA) incorporating*:
- Bettys Creek (Enex Foydell)
- Bettys Creek (Glendell))
1691 - Narrow-leaved Ironbark – Grey Box Grassy Woodland of the Central and Upper Hunter 174.0
1692 - Bull Oak Grassy Woodland of the Central Hunter Valley
1731 - Swamp Oak – Weeping Grass Grassy Riparian Forest of the Hunter Valley
Derived Native Grassland
DA SSD-5850 (Mount Owen Offsets)
Northwest Offset* 1602 - Spotted Gum - Narrow-leaved Ironbark Shrub - Grass Open Forest of the Central and Lower Hunter
71.4
1590 Spotted Gum - Broad-leaved Mahogany - Red Ironbark shrubby open forest (1213 Decommissioned and merged with 1590)
Derived Native Grassland
Northeast Offset* 1590 Spotted Gum - Broad-leaved Mahogany - Red Ironbark shrubby open forest (1213 Decommissioned and merged with 1590
83.6
1614 - Grey Gum - Grey Myrtle - Narrow-leaved Stringybark - Rusty Fig open forest on ranges of the Upper Hunter
Derived Native Grassland
Southeast Offset* 1602 - Spotted Gum - Narrow-leaved Ironbark Shrub - Grass Open Forest of the Central and Lower Hunter (Including planted variant)
58.3
Derived Native Grassland
Southeast Corridor Offset* 1602 - Spotted Gum - Narrow-leaved Ironbark Shrub - Grass Open Forest of the Central and Lower Hunter (including planted variant)
74.1
Derived Native Grassland
1731 - Swamp Oak – Weeping Grass Grassy Riparian Forest of the Hunter Valley
Forest East Offset* 1602 - Spotted Gum - Narrow-leaved Ironbark Shrub - Grass Open Forest of the Central and Lower Hunter (including planted variant)
110.9
Derived Native Grassland
1590 Spotted Gum - Broad-leaved Mahogany - Red Ironbark shrubby open forest (1213 Decommissioned and merged with 1590)
Southern Remnant Offset* 1602 - Spotted Gum - Narrow-leaved Ironbark Shrub - Grass Open Forest of the Central and Lower Hunter (including planted variant)
4.0
Cross Creek Offset Site 1602 - Spotted Gum - Narrow-leaved Ironbark Shrub - Grass Open Forest of the Central and Lower Hunter (including red gum variant)
367.0
Derived Native Grassland
Stringybark Habitat Corridor Offset Site
1602 - Spotted Gum - Narrow-leaved Ironbark Shrub - Grass Open Forest of the Central and Lower Hunter
97.5
1598 Forest Red Gum grassy open forest on floodplains of the lower Hunter
Dry Rainforest
1731 - Swamp Oak – Weeping Grass Grassy Riparian Forest of the Hunter Valley
Derived Native Grassland
African Olive Infestation
Esparanga Offset Site 618 White Box x Grey Box - Red gum - Rough-barked Apple grassy woodland on rich soils on hills in the upper Hunter Valley
303.0
281 Rough-Barked Apple - Red gum - Yellow Box woodland on alluvial clay to loam soils on valley flats in the northern NSW South Western Slopes Bioregion and Brigalow Belt South Bioregion
618 White Box x Grey Box - Red gum - Rough-barked Apple grassy woodland on rich soils on hills in the upper Hunter Valley (Shrubby variant)
281 Rough-Barked Apple - red gum - Yellow Box woodland on alluvial clay to loam soils on valley flats in the northern NSW South Western Slopes Bioregion and Brigalow Belt South Bioregion
1607 Blakelys Red Gum - Narrow-leaved Ironbark - Rough-barked Apple shrubby woodland of the upper Hunter

MT OWEN GLENDELL OPERATIONS
Annual Review 2020
60
Offset Area Plant Community Type Size (ha)
1654 Narrow-leaved Ironbark - Grey Gum shrubby open forest on sandstone ranges of the upper Hunter Valley
Derived Native Grassland
Mitchell Hills North Offset Site 1590 Spotted Gum - Broad-leaved Mahogany - Red Ironbark shrubby open forest (1213 Decommissioned and merged with 1590)
143.7
1543 Rusty Fig - Native Quince - Native Olive dry rainforest of the Central Hunter Valley
624 Large-fruited Grey Gum - Narrow-leaved Stringybark open forest on sheltered sandstone hillslopes in the Scone region of the upper Hunter Valley
Derived Native Grassland
Rehabilitation Woodland 1602 - Spotted Gum - Narrow-leaved Ironbark Shrub - Grass Open Forest of the Central and Lower Hunter
518.0
* Conservation Areas gazetted in consultation with the Biodiversity and Conservation Division (BCD) of DPIE and the Biodiversity Conservation Trust (BCT) and as administered by
the Minister administering the Biodiversity Conservation Act 2016 (BC Act).

MT OWEN GLENDELL OPERATIONS
Annual Review 2020
61
Figure 8: MGO Biodiversity Offset Areas
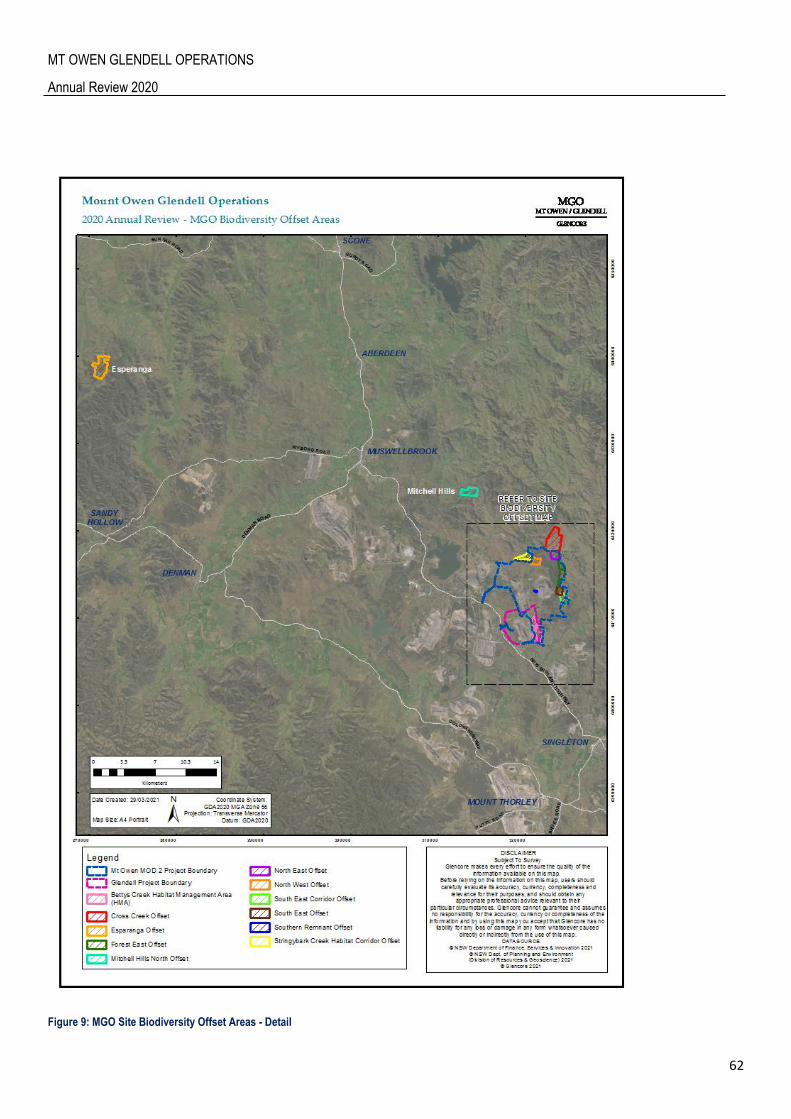
MT OWEN GLENDELL OPERATIONS
Annual Review 2020
62
Figure 9: MGO Site Biodiversity Offset Areas - Detail

MT OWEN GLENDELL OPERATIONS
Annual Review 2020
63
6.4.2 Rehabilitation Woodland Offset MGO is required to identify 518 hectares of mine rehabilitation to commit as a BOA within five years of commencement of operations
(i.e. by 2022). This area is to be restored to Central Hunter Ironbark – Spotted Gum – Grey Box Forest in the NSW North Coast and
Sydney Basin Bioregions EEC under the BC Act. The long term conservation of this offset will be determined in accordance with
Condition 29, Schedule 3 of SSD-5850 (MOD2).
Details of the rehabilitation to be undertaken in the Rehabilitation Woodland Offset Area are included in the MOP as well as the
Rehabilitation Strategy.

MT OWEN GLENDELL OPERATIONS
Annual Review 2020
64
6.4.3 Flora Monitoring As specified within Annexure D of the CAs, annual monitoring of each Conservation Area is required. Monitoring methods during
2020 were consistent with Annexure D of each CA and included:
photo monitoring for comparison to baseline photos taken between 2015 and 2017 (undertaken at the exact location and
from the exact bearings as baseline photos)
quadrat monitoring, to compare data to benchmark data provided in Annexure D, Table 2 of each CA
walkthrough assessment of opportunistic sightings, including:
o fire events or impacts of fire management
o weeds (including compilation of list of exotic species and recording new weed infestations including location and
extent)
o pest animals (species and location must be recorded, including evidence of pest animals such as burrows, scats
or disturbance)
o visitor impact and vehicle access (including evidence of any recent usage, and the presence of any new access
trails or tracks)
o rubbish dumping
o natural regeneration of previously disturbed areas and
o sightings of threatened species.
All monitoring works were undertaken by qualified ecologists. Monitoring was undertaken at the locations required as per Annexure
D, Table 1 of each CA, and reproduced in Table 29: Conservation Agreement Monitoring Locations - 2020. Photo monitoring locations are
shown in Figure 10.
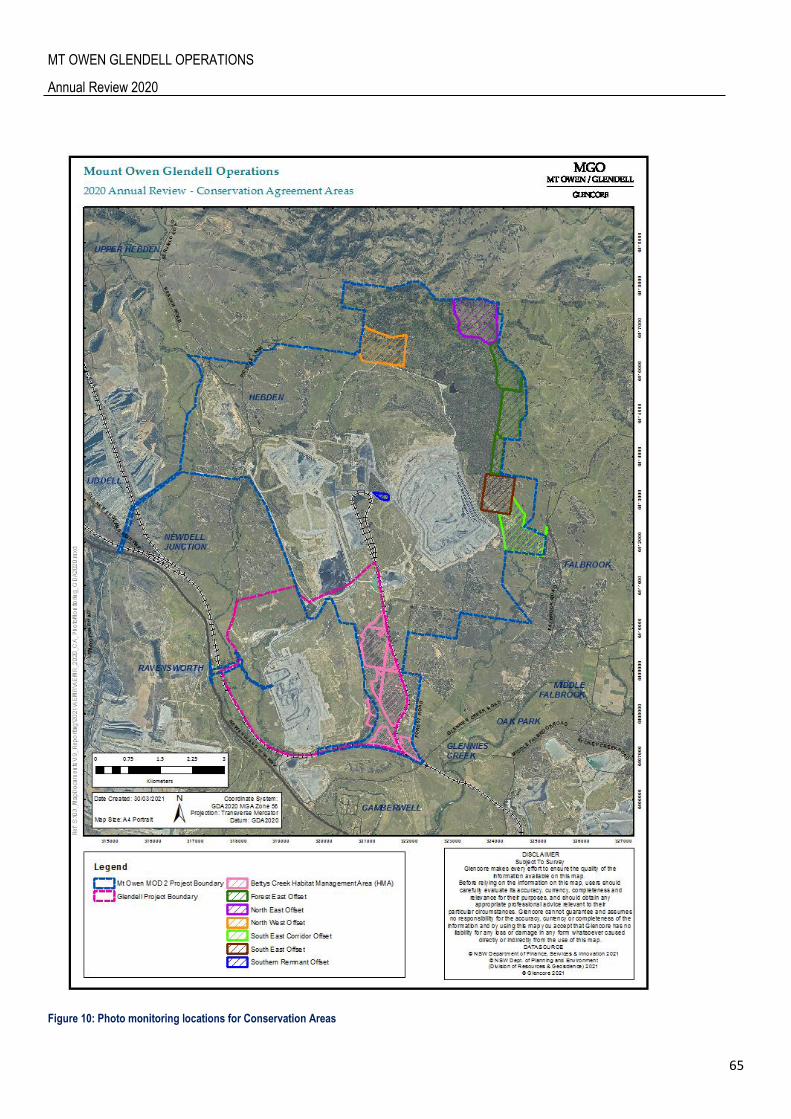
MT OWEN GLENDELL OPERATIONS
Annual Review 2020
65
Figure 10: Photo monitoring locations for Conservation Areas

MT OWEN GLENDELL OPERATIONS
Annual Review 2020
66
Table 29: Conservation Agreement Monitoring Locations - 2020
Site Name Plant Community Type Monitoring Type
Bettys Creek (Enex Foydell) CA*
P07 Derived Native Grassland (proposed for 1692 - Bull Oak Grassy Woodland of the Central Hunter Valley) Photo & Quadrat
P08 1691 - Narrow-leaved Ironbark – Grey Box Grassy Woodland of the Central and Upper Hunter Photo & Quadrat
P09 1731 - Swamp Oak – Weeping Grass Grassy Riparian Forest of the Hunter Valley Photo & Quadrat
GHMA05 1691 - Narrow-leaved Ironbark – Grey Box Grassy Woodland of the Central and Upper Hunter Photo & Quadrat
GHMA08 Derived Native Grassland (proposed for 1691 - Narrow-leaved Ironbark – Grey Box Grassy Woodland of the Central and Upper Hunter)
Photo & Quadrat
GHMA09 1691 - Narrow-leaved Ironbark – Grey Box Grassy Woodland of the Central and Upper Hunter Photo & Quadrat
GHMA11 Derived Native Grassland (proposed for 1691 - Narrow-leaved Ironbark – Grey Box Grassy Woodland of the Central and Upper Hunter)
Photo & Quadrat
GHMA13 Derived Native Grassland (proposed for 1692 - Bull Oak Grassy Woodland of the Central Hunter Valley) Photo & Quadrat
Bettys Creek (Glendell) CA*
BCCA-A Derived Native Grassland (proposed for 1692 - Bull Oak Grassy Woodland of the Central Hunter Valley) Photo & Quadrat^
Mount Owen Offsets CA*
P01 1731 - Swamp Oak – Weeping Grass Grassy Riparian Forest of the Hunter Valley Photo & Quadrat
P02 Derived Native Grassland (Proposed for Plant Community Type (PCT) 1602 - Spotted Gum - Narrow-leaved Ironbark Shrub - Grass Open Forest of the Central and Lower Hunter)
Photo & Quadrat
P05 1602 - Spotted Gum - Narrow-leaved Ironbark Shrub - Grass Open Forest of the Central and Lower Hunter Photo & Quadrat
Photo 3 1614 - Grey Gum - Grey Myrtle - Narrow-leaved Stringybark - Rusty Fig open forest on ranges of the Upper Hunter
Photo & Quadrat^
Photo 4 1602 - Spotted Gum - Narrow-leaved Ironbark Shrub - Grass Open Forest of the Central and Lower Hunter Photo & Quadrat^
Southern Remnant CA
Photo 6 1602 - Spotted Gum - Narrow-leaved Ironbark Shrub - Grass Open Forest of the Central and Lower Hunter Photo & Quadrat^
Northwest Offset CA
P06 1602 - Spotted Gum - Narrow-leaved Ironbark Shrub - Grass Open Forest of the Central and Lower Hunter Photo & Quadrat
Photo 5 Derived Native Grassland (Proposed for PCT 1602 - Spotted Gum - Narrow-leaved Ironbark Shrub - Grass Open Forest of the Central and Lower Hunter)
Photo & Quadrat^
* The CA naming conventions differ slightly from the BOAs (due to ownership/cadastral issues) in the following ways:
Bettys Creek HMA is split into the Bettys Creek (Enex Foydell) and Bettys Creek (Glendell) CAs (see Table 28); and
Northeast Offset, Southeast Offset, Southeast Corridor and Forest East Offset are amalgamated into the collective Mount Owen Offsets CA.
^ Additional quadrat monitoring sites were established at previously photo monitoring sites to track vegetation change over time and allow comparisons against benchmarks
6.4.3.1 2020 Flora Monitoring Results
Biodiversity management performance in the Conservation Areas for 2020 is summarised in Table 30 and includes recommended
management actions for 2021.
Table 30: Biodiversity Management Summary 2020 – Conservation Areas

MT OWEN GLENDELL OPERATIONS
Annual Review 2020
67
Conservation Area
Management actions undertaken in previous 12 months
Key Trends Actions for 2021
Bettys Creek (Enex Foydell) CA
Weed Control of Coolatai Grass, African Boxthorn, Galenia and Prickly Pear
Pest Control
Supplementary planting
Monitored direct seeding works
Canopy thinning of PCT 1692
Incorporated habitat features such as fallen logs and rock piles in active regeneration areas.
CA composite site value scores increased in 2020 compared to 2019. No site scored below ‘Moderate’.
Native species richness increased in 2020 compared to 2019 during drought conditions.
Native over-storey and ground cover other (forbs, ferns and graminoids) increased in 2020, likely due to above average rainfall.
Habitat values indicative of mature forest and woodland ecosystems (i.e. fallen logs and trees with hollows) were well below benchmark values.
Passive Regeneration sites generally met or exceeded benchmark values in native plant species richness, native ground cover other and native over-storey cover
No new records of threatened plants were recorded. Grey-crowned Babblers continue to persist and utilise the CA as breeding and foraging habitat.
Ongoing management of Coolatai Grass. Investigate potential alternative techniques to manage Coolatai Grass
Introduce ecological fire regime to encourage regeneration as well as maintain open grasslands and woodland structure.
Continue to monitor European Rabbit, Brown Hare and macropod populations.
Continue to monitor 2020 revegetation.
Continue to monitor 2019 direct seeding works
Incorporate habitat features such as fallen logs, rock piles in active regeneration areas.
Continue to monitor nest box use by native species.
Improve track near entrance with gravel for all weather access.
Prepare and submit project plan of canopy thinning trial of PCT 1692 to BCT.
Bettys Creek (Glendell) CA
Site value score decreased in 2020 and remained at Low. This is largely driven by decreases in native species richness and increases in exotic species cover.
An increase in native grass cover and exotic cover, and decrease of native forbs, ferns and graminoids occurred in 2020 relative to 2019.
Above average rainfall and overcompetitive nature of exotic species and the native grass Cynodon dactylon present at the site has displaced other common native species that were recorded in low numbers in 2019.
Native grass cover was the only attribute that met benchmark values.
No records of threatened plants were recorded.
MT OWEN GLENDELL OPERATIONS
Annual Review 2020
68
Conservation Area
Management actions undertaken in previous 12 months
Key Trends Actions for 2021
Mount Owen Offsets CA
Weed control of Coolatai Grass, African Olive, Sharp Rush Galenia and Prickly Pear.
Monitor European Rabbit, Brown Hare and macropod populations.
Monitor direct seeding works and continue works if technique is successful.
Incorporate habitat features such as fallen logs, rock piles in active regeneration areas.
Native vine control (non-lethal) in PCT 1614.
Realignment of Site P01 to avoid crossing the creek line and better represent the PCT’s condition. This realignment will be completed in the 2020 monitoring period
Higher species richness was recorded across all sites.
Monitoring sites within the Mount Owen Offset CA received Moderate and Good composite site value scores.
Native over-storey cover and native mid-storey cover increased generally and is likely a result of above average rainfall.
Native grass cover shows a steady decline in direct response to competition from increased weed species richness and cover. Other sites remained stable or increased in native grass cover.
Four attributes measured in PCT 1614 met benchmark values, including native over-storey, native mid-storey cover, native groundcover other and native plant species richness, indicating the dry rainforest has responded well to wetter conditions and is improving in structure and species richness.
For Existing Woodland/ Forest management zones in PCT 1602 native over-storey cover, native groundcover other, native plant species richness and fallen logs reached or exceeded benchmark values
Passive Regeneration performed poorly despite the above average rainfall suggesting the need for more intervention or increased sampling effort to better represent the management zone
Existing Woodland/ Forest management zone of PCT 1731 performed better in 2020 with four attributes: native overstorey cover, mid-storey cover, native groundcover grass and native plant species reaching benchmark targets.
No records of threatened plants were recorded in 2020.
Ongoing weed control of Coolatai Grass, African Olive, Galenia and Pear.
Continue to monitor European Rabbit, Brown Hare and macropod populations.
Continue to monitor success of 2020 revegetation.
Continue to monitor 2019 direct seeding works
Repair track to allow all weather access.
Incorporate habitat features such as fallen logs, rock piles in active regeneration areas.
Implement non-lethal native vine control trial in PCT 1614 .
A Vegetation Management Plan (VMP) should be developed and implemented
Continue to monitor erosion associated with Bettys Creek Diversion
Introduce ecological fire regime
North West Offset CA
Weed control of African
Olive, Coolatai Grass
and Pear.
Monitor pest species
European Rabbit,
Brown Hare and
macropod populations.
Incorporate habitat features such as fallen logs, rock piles in active regeneration areas
The monitoring sites across the North West CA received Moderate
and Good composite site value scores.
Native mid-storey remained stable between 2018 and 2020. The
increase in native herbs, ferns and graminoids is also indicative of
wetter conditions promoting a flush of germinates.
For Active Regeneration management zones, no attributes met
benchmark values.
Ongoing weed control
of African Olive,
Coolatai Grass and
Pear.
Continue to monitor
pest species
European Rabbit,
Brown Hare and
macropod
populations.
Incorporate habitat
features such as
fallen logs and rock
piles in active
regeneration areas.
Introduce ecological
fire regime to
encourage
regeneration as well
MT OWEN GLENDELL OPERATIONS
Annual Review 2020
69
Conservation Area
Management actions undertaken in previous 12 months
Key Trends Actions for 2021
as maintain open
grasslands and
woodland structure.
Southern Remnant Offset CA
Weed control of Prickly
Pear.
Monitor pest species
European Rabbit,
Brown Hare and
macropod populations.
Monitor direct seeding
works and continue
works if technique is
successful.
Incorporate habitat
features such as fallen
logs, rock piles in
active regeneration
areas.
Monitor nest box use by native animals and check condition. Nest box adjacent site Photo06 had fallen and was infested by bees
The monitoring site within the Southern Remnant CA improved
further with a higher composite site value score than last year
Increases in native species richness, native over-storey, native mid-
storey and the cover of native herb, ferns and graminoids were
recorded in 2020.
Exotic plant cover remained at zero despite above average rainfall,
which is encouraging.
Five attributes met or exceeded benchmark values, including native
over-storey cover, native mid-storey, native groundcover others,
native species richness number of trees with hollows and fallen
logs.
The open understorey and large edge to area ratio continues to
favour a large population of Noisy Miners, which were seen
harassing Grey-crowned Babblers during the 2020 monitoring
The revegetation in 2019 is showing promising signs with good
recruitment of understorey plants in rip lines.
No records of threatened plants were recorded in 2020.
Continue to monitor
pest species
European Rabbit,
Brown Hare and
macropod
populations.
Investigate Noisy
Miner management.
Continue to monitor
2019 direct seeding
works.
Monitor recovery of
disturbed land
associated with
boundary fence
realignment for
potential weed
populations.
Incorporate habitat
features such as
fallen logs, rock piles
in active regeneration
areas.
Continue to monitor
nest box use by
native animals and
check condition.
Re-install the nest
box adjacent site
Photo06.
Introduce ecological
fire regime
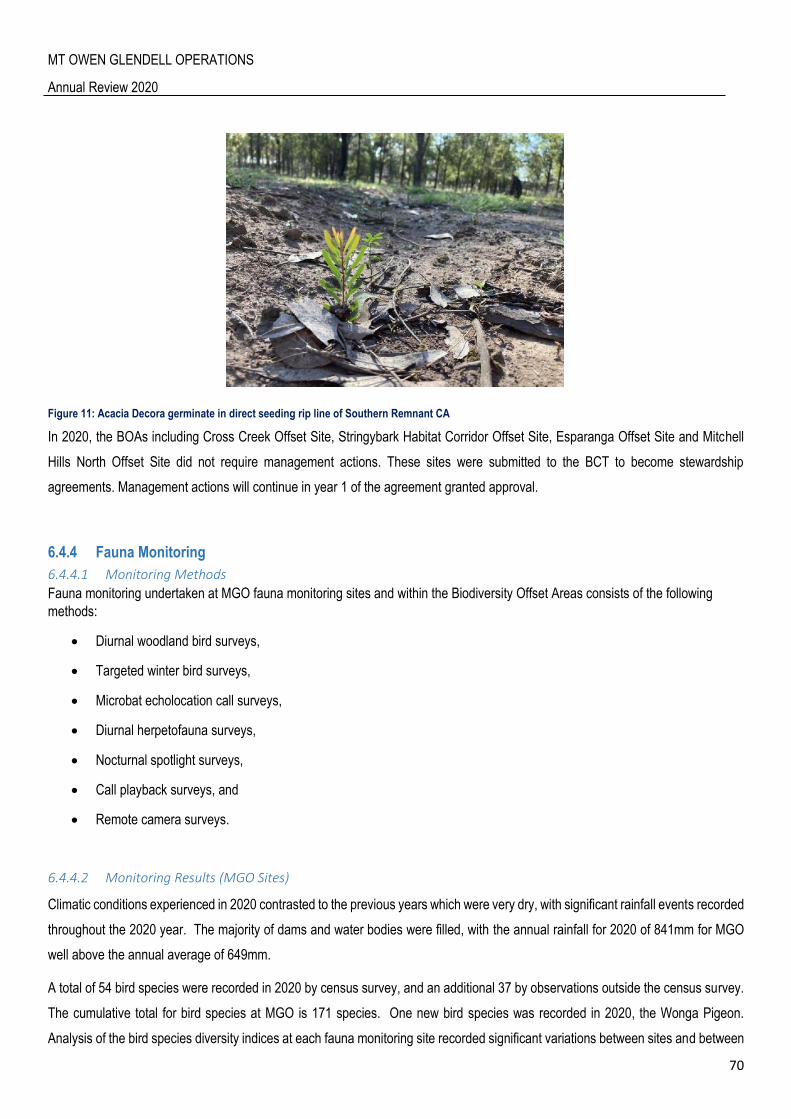
MT OWEN GLENDELL OPERATIONS
Annual Review 2020
70
Figure 11: Acacia Decora germinate in direct seeding rip line of Southern Remnant CA
In 2020, the BOAs including Cross Creek Offset Site, Stringybark Habitat Corridor Offset Site, Esparanga Offset Site and Mitchell
Hills North Offset Site did not require management actions. These sites were submitted to the BCT to become stewardship
agreements. Management actions will continue in year 1 of the agreement granted approval.
6.4.4 Fauna Monitoring
6.4.4.1 Monitoring Methods
Fauna monitoring undertaken at MGO fauna monitoring sites and within the Biodiversity Offset Areas consists of the following
methods:
Diurnal woodland bird surveys,
Targeted winter bird surveys,
Microbat echolocation call surveys,
Diurnal herpetofauna surveys,
Nocturnal spotlight surveys,
Call playback surveys, and
Remote camera surveys.
6.4.4.2 Monitoring Results (MGO Sites)
Climatic conditions experienced in 2020 contrasted to the previous years which were very dry, with significant rainfall events recorded
throughout the 2020 year. The majority of dams and water bodies were filled, with the annual rainfall for 2020 of 841mm for MGO
well above the annual average of 649mm.
A total of 54 bird species were recorded in 2020 by census survey, and an additional 37 by observations outside the census survey.
The cumulative total for bird species at MGO is 171 species. One new bird species was recorded in 2020, the Wonga Pigeon.
Analysis of the bird species diversity indices at each fauna monitoring site recorded significant variations between sites and between
MT OWEN GLENDELL OPERATIONS
Annual Review 2020
71
years. The rehabilitation site Reh1 recorded the highest bird species diversity in 2020, with Rehabilitation Site Reh3 scoring high
bird species diversity also. The two remnant Forest sites also scored highly in 2020.
Monitoring for mammal species in 2020 was undertaken with remote field cameras, trapping surveys for smaller mammals and
microbats, and nest box inspections. Field cameras recorded a diverse number of medium to larger mammals, including 3 introduced
species. The threatened Spotted-tail Quoll was captured at one location in 2020, but also recorded by field camera at nearby offsets
also. The threatened Brush-tailed Phascogale and Squirrel Glider were recorded in nestboxes in 2020, both being located in
Rehabilitation sites. Many additional nestboxes throughout MGO also exhibit evidence of use due to presence of their characteristic
leaf nests. The small terrestrial native mammals, Common Dunnart and Yellow-footed Antechinus are still persistent within MGO,
although numbers captured in 2020 were significantly lower. Twelve microbat species were recorded by trapping and echolocation
call recordings.
Nest boxes installed in the rehabilitation sites recorded the presence of Squirrel Glider, Brush-tailed Phascogale, Common Brushtail
Possum and evidence of microbat use. Boxes specific to some fauna groups were only installed in 2018 – 2019, with relatively rapid
occupation within 12 months of installation.
Six reptile species were detected in 2020, including one new species in 2020, the Burton’s Snake-lizard. Surveys for frogs recorded
increased diversity and abundance compared to 2019, due to many of the dams filling following several years of extended drought.
The annual rainfall recorded at MGO in 2020 was 841mm, above previous reporting period 397mm.
In 2020, 12 threatened species were recorded, 6 bird species, 3 non-flying mammals and 3 microbat species. A total of 27 threatened
species have been detected at the MGO since the commencement of fauna monitoring. Overall usage of nest boxes across all broad
habitats and nest box types indicate 10.4% of all installed boxes were utilised in 2020 within the Mt Owen Glendell Operation.
However, analysis of separate fauna groups reveal higher occupation rates by specific species, such as gliders (36.8% of boxes
utilised), possums (25.0% of boxes utilised) and bird boxes (12.5% utilisation). The low usage of microbats is attributed to the older
style of nest boxes which have been installed since 1994, and many of which are now in relatively poor condition.
Fauna species recovered from felled habitat trees include Lace Monitor (x4), Robust Velvet Gecko (1) and Common Brushtail Possum
(x2). No individuals were injured in the felling operation, and were either removed and released in nearby forest, or allowed to
disperse without human intervention. Habitat features such as dead trees with hollows were identified for use as either ground logs
or standing trees to be placed in the rehabilitation areas.
6.4.4.3 Monitoring Results (MGO Offsets)
Overall, the fauna monitoring for MGO Offsets, undertaken over the period 1996 – 2020, has recorded a total of:
165 native and 2 introduced bird species
45 native and 10 introduced mammal species
32 reptiles
19 frog species.
In the 2020 monitoring period, a total of 86 bird species, 12 native and 9 introduced mammals, 10 microbat species, 7 reptile and 6
frog species were recorded. The highest bird species diversity in 2020 was recorded at Esparanga, Mitchell Hills and Bettys Creek

MT OWEN GLENDELL OPERATIONS
Annual Review 2020
72
HMZ, each supporting very different vegetation communities and habitat types. Significant bird species diversity scores at several
offset sites likely a combination of improved climatic conditions in 2020, with above average rainfall recorded at each offset.
C: Wedge-tail Eagle viewing field camera, Esparanga Offset
D: Squirrel Glider in nestbox, Stringybark Creek VCA
A: Brushtail Possum in nestbox, Bettys Creek HMZ
B: Lace Monitor in nestbox, South East Corridor, VCA
Figure 12: Oppurtunistic photos of fauna identified in offset areas
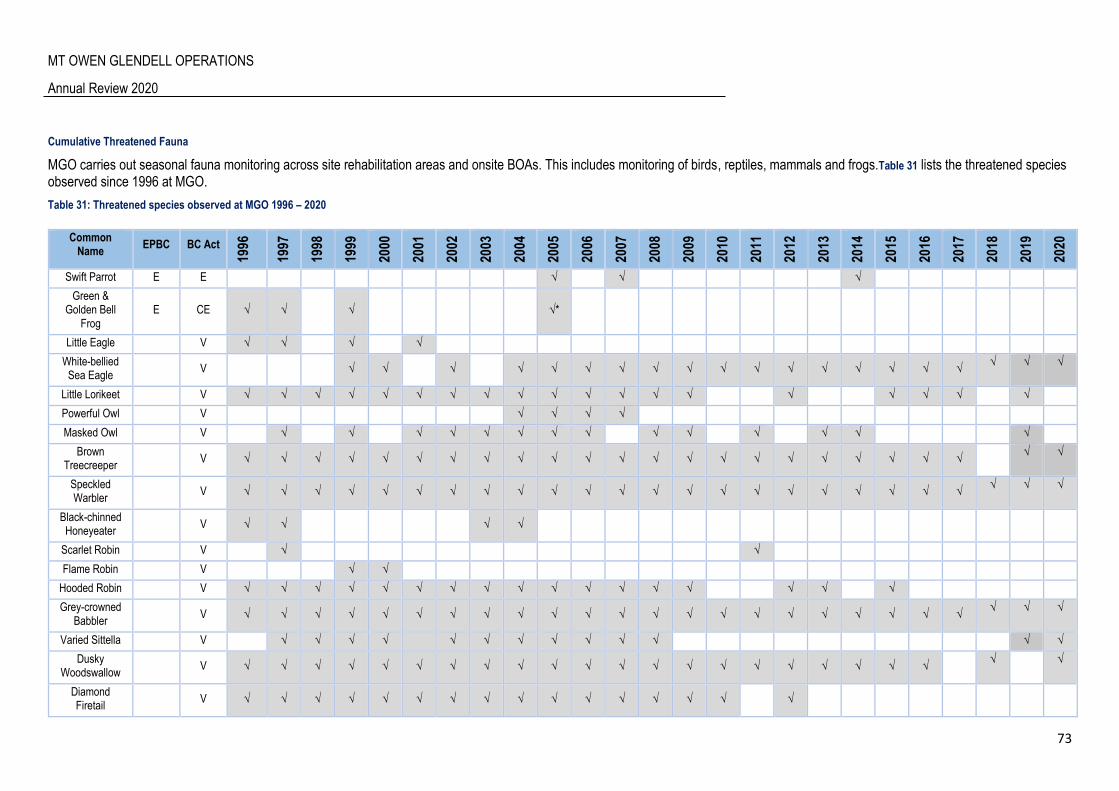
MT OWEN GLENDELL OPERATIONS
Annual Review 2020
73
Cumulative Threatened Fauna
MGO carries out seasonal fauna monitoring across site rehabilitation areas and onsite BOAs. This includes monitoring of birds, reptiles, mammals and frogs.Table 31 lists the threatened species observed since 1996 at MGO.
Table 31: Threatened species observed at MGO 1996 – 2020
Common Name
EPBC BC Act 19
96
1997
1998
1999
2000
2001
2002
2003
2004
2005
2006
2007
2008
2009
2010
2011
2012
2013
2014
2015
2016
2017
2018
2019
2020
Swift Parrot E E √ √ √
Green & Golden Bell
Frog E CE √ √ √ √*
Little Eagle V √ √ √ √
White-bellied Sea Eagle
V √ √ √ √ √ √ √ √ √ √ √ √ √ √ √ √ √ √ √ √
Little Lorikeet V √ √ √ √ √ √ √ √ √ √ √ √ √ √ √ √ √ √ √
Powerful Owl V √ √ √ √
Masked Owl V √ √ √ √ √ √ √ √ √ √ √ √ √ √
Brown Treecreeper
V √ √ √ √ √ √ √ √ √ √ √ √ √ √ √ √ √ √ √ √ √ √ √ √
Speckled Warbler
V √ √ √ √ √ √ √ √ √ √ √ √ √ √ √ √ √ √ √ √ √ √ √ √ √
Black-chinned Honeyeater
V √ √ √ √
Scarlet Robin V √ √
Flame Robin V √ √
Hooded Robin V √ √ √ √ √ √ √ √ √ √ √ √ √ √ √ √ √
Grey-crowned Babbler
V √ √ √ √ √ √ √ √ √ √ √ √ √ √ √ √ √ √ √ √ √ √ √ √ √
Varied Sittella V √ √ √ √ √ √ √ √ √ √ √ √ √
Dusky Woodswallow
V √ √ √ √ √ √ √ √ √ √ √ √ √ √ √ √ √ √ √ √ √ √ √
Diamond Firetail
V √ √ √ √ √ √ √ √ √ √ √ √ √ √ √ √
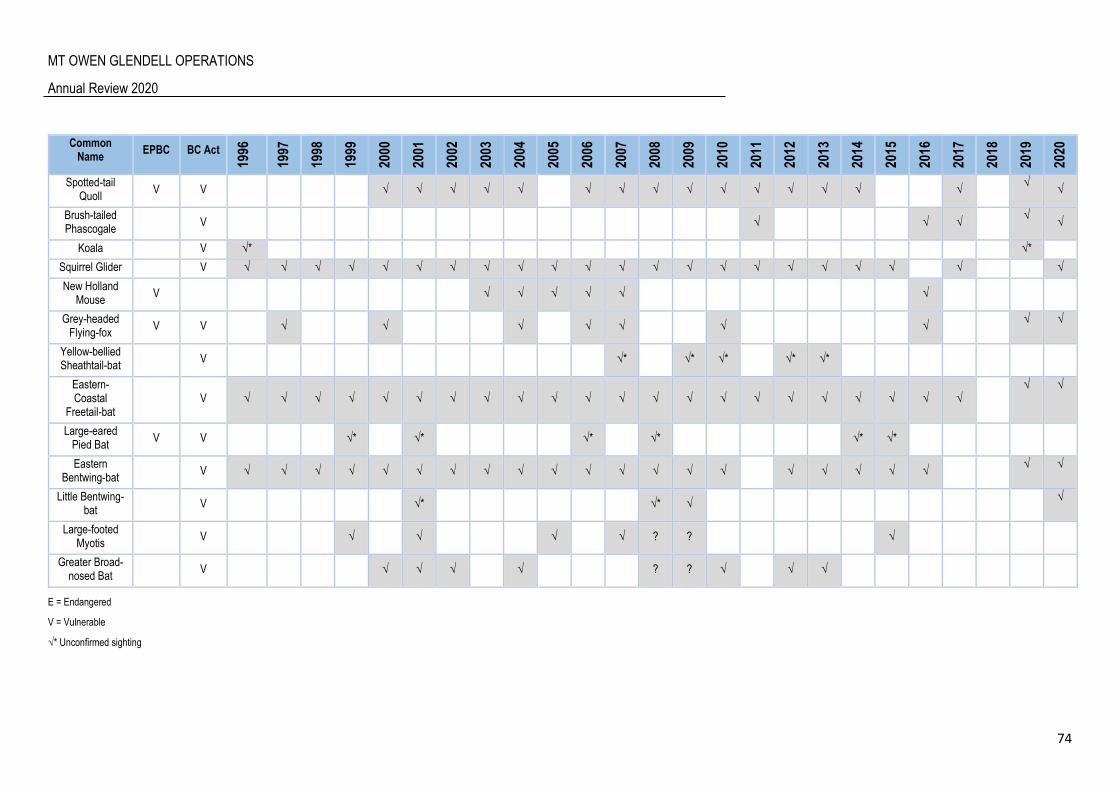
MT OWEN GLENDELL OPERATIONS
Annual Review 2020
74
Common Name
EPBC BC Act
1996
1997
1998
1999
2000
2001
2002
2003
2004
2005
2006
2007
2008
2009
2010
2011
2012
2013
2014
2015
2016
2017
2018
2019
2020
Spotted-tail Quoll
V V √ √ √ √ √ √ √ √ √ √ √ √ √ √ √ √
√
Brush-tailed Phascogale
V √ √ √ √
√
Koala V √* √*
Squirrel Glider V √ √ √ √ √ √ √ √ √ √ √ √ √ √ √ √ √ √ √ √ √ √
New Holland Mouse
V √ √ √ √ √ √
Grey-headed Flying-fox
V V √ √ √ √ √ √ √ √ √
Yellow-bellied Sheathtail-bat
V √* √* √* √* √*
Eastern-Coastal
Freetail-bat
V √ √ √ √ √ √ √ √ √ √ √ √ √ √ √ √ √ √ √ √ √ √ √ √
Large-eared Pied Bat
V V √* √* √* √* √* √*
Eastern Bentwing-bat
V √ √ √ √ √ √ √ √ √ √ √ √ √ √ √ √ √ √ √ √ √ √
Little Bentwing-bat
V √* √* √ √
Large-footed Myotis
V √ √ √ √ ? ? √
Greater Broad-nosed Bat
V √ √ √ √ ? ? √ √ √
E = Endangered
V = Vulnerable
√* Unconfirmed sighting
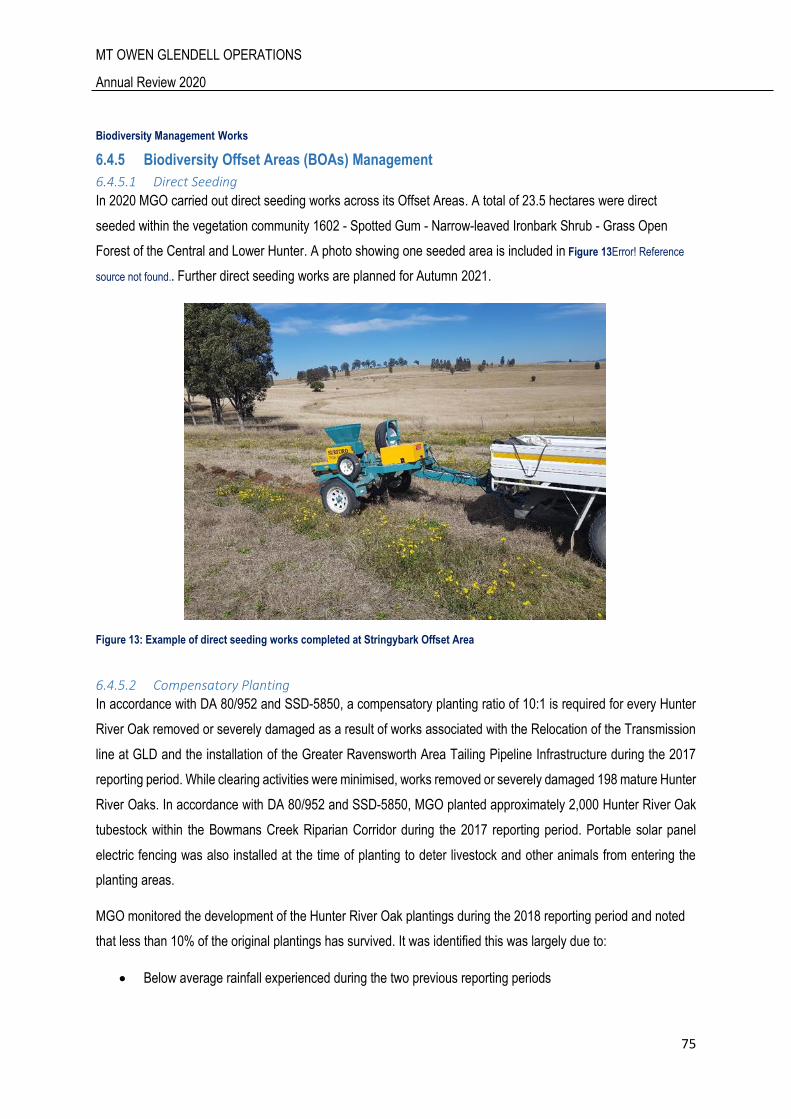
MT OWEN GLENDELL OPERATIONS
Annual Review 2020
75
Biodiversity Management Works
6.4.5 Biodiversity Offset Areas (BOAs) Management
6.4.5.1 Direct Seeding
In 2020 MGO carried out direct seeding works across its Offset Areas. A total of 23.5 hectares were direct
seeded within the vegetation community 1602 - Spotted Gum - Narrow-leaved Ironbark Shrub - Grass Open
Forest of the Central and Lower Hunter. A photo showing one seeded area is included in Figure 13Error! Reference
source not found.. Further direct seeding works are planned for Autumn 2021.
Figure 13: Example of direct seeding works completed at Stringybark Offset Area
6.4.5.2 Compensatory Planting
In accordance with DA 80/952 and SSD-5850, a compensatory planting ratio of 10:1 is required for every Hunter
River Oak removed or severely damaged as a result of works associated with the Relocation of the Transmission
line at GLD and the installation of the Greater Ravensworth Area Tailing Pipeline Infrastructure during the 2017
reporting period. While clearing activities were minimised, works removed or severely damaged 198 mature Hunter
River Oaks. In accordance with DA 80/952 and SSD-5850, MGO planted approximately 2,000 Hunter River Oak
tubestock within the Bowmans Creek Riparian Corridor during the 2017 reporting period. Portable solar panel
electric fencing was also installed at the time of planting to deter livestock and other animals from entering the
planting areas.
MGO monitored the development of the Hunter River Oak plantings during the 2018 reporting period and noted
that less than 10% of the original plantings has survived. It was identified this was largely due to:
Below average rainfall experienced during the two previous reporting periods
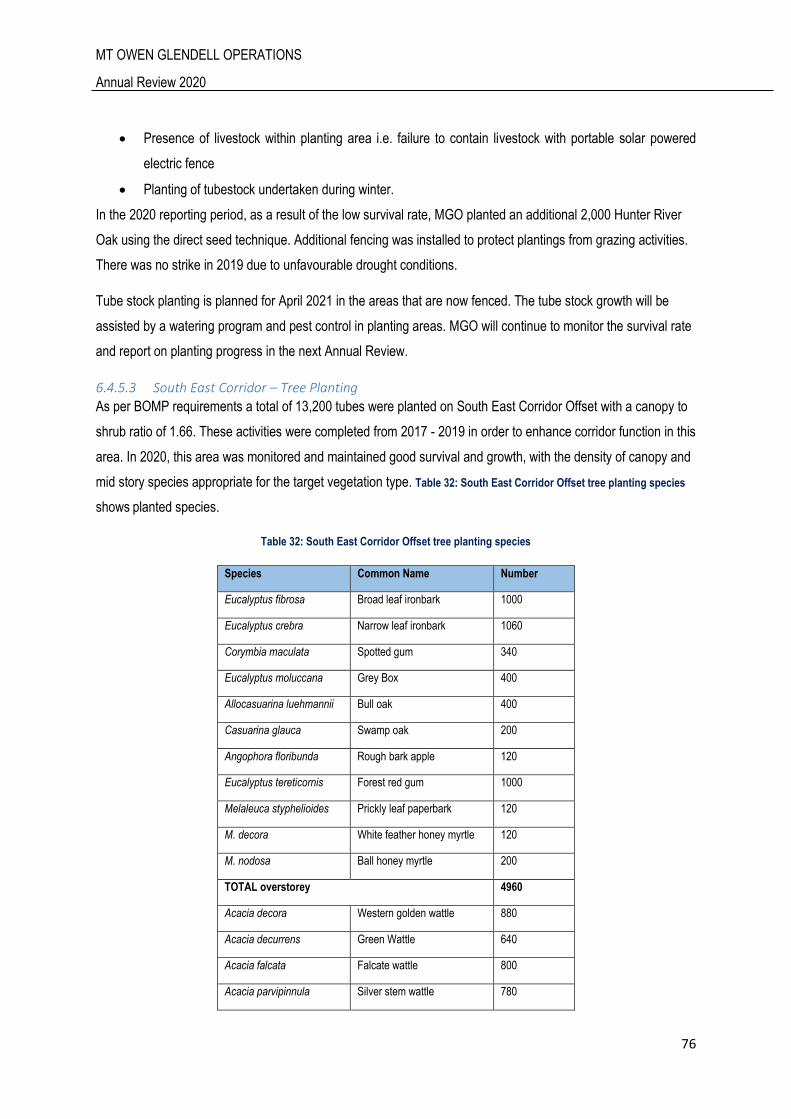
MT OWEN GLENDELL OPERATIONS
Annual Review 2020
76
Presence of livestock within planting area i.e. failure to contain livestock with portable solar powered
electric fence
Planting of tubestock undertaken during winter.
In the 2020 reporting period, as a result of the low survival rate, MGO planted an additional 2,000 Hunter River
Oak using the direct seed technique. Additional fencing was installed to protect plantings from grazing activities.
There was no strike in 2019 due to unfavourable drought conditions.
Tube stock planting is planned for April 2021 in the areas that are now fenced. The tube stock growth will be
assisted by a watering program and pest control in planting areas. MGO will continue to monitor the survival rate
and report on planting progress in the next Annual Review.
6.4.5.3 South East Corridor – Tree Planting
As per BOMP requirements a total of 13,200 tubes were planted on South East Corridor Offset with a canopy to
shrub ratio of 1.66. These activities were completed from 2017 - 2019 in order to enhance corridor function in this
area. In 2020, this area was monitored and maintained good survival and growth, with the density of canopy and
mid story species appropriate for the target vegetation type. Table 32: South East Corridor Offset tree planting species
shows planted species.
Table 32: South East Corridor Offset tree planting species
Species Common Name Number
Eucalyptus fibrosa Broad leaf ironbark 1000
Eucalyptus crebra Narrow leaf ironbark 1060
Corymbia maculata Spotted gum 340
Eucalyptus moluccana Grey Box 400
Allocasuarina luehmannii Bull oak 400
Casuarina glauca Swamp oak 200
Angophora floribunda Rough bark apple 120
Eucalyptus tereticornis Forest red gum 1000
Melaleuca styphelioides Prickly leaf paperbark 120
M. decora White feather honey myrtle 120
M. nodosa Ball honey myrtle 200
TOTAL overstorey 4960
Acacia decora Western golden wattle 880
Acacia decurrens Green Wattle 640
Acacia falcata Falcate wattle 800
Acacia parvipinnula Silver stem wattle 780
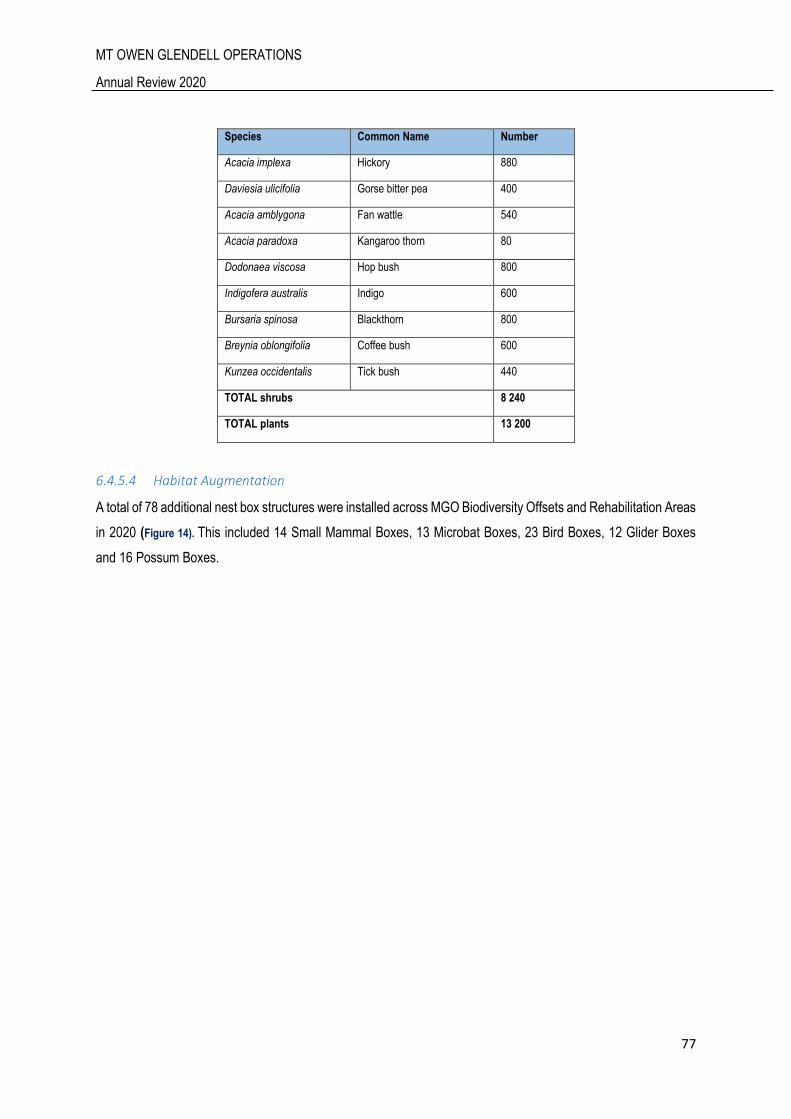
MT OWEN GLENDELL OPERATIONS
Annual Review 2020
77
Species Common Name Number
Acacia implexa Hickory 880
Daviesia ulicifolia Gorse bitter pea 400
Acacia amblygona Fan wattle 540
Acacia paradoxa Kangaroo thorn 80
Dodonaea viscosa Hop bush 800
Indigofera australis Indigo 600
Bursaria spinosa Blackthorn 800
Breynia oblongifolia Coffee bush 600
Kunzea occidentalis Tick bush 440
TOTAL shrubs 8 240
TOTAL plants 13 200
6.4.5.4 Habitat Augmentation
A total of 78 additional nest box structures were installed across MGO Biodiversity Offsets and Rehabilitation Areas
in 2020 (Figure 14). This included 14 Small Mammal Boxes, 13 Microbat Boxes, 23 Bird Boxes, 12 Glider Boxes
and 16 Possum Boxes.
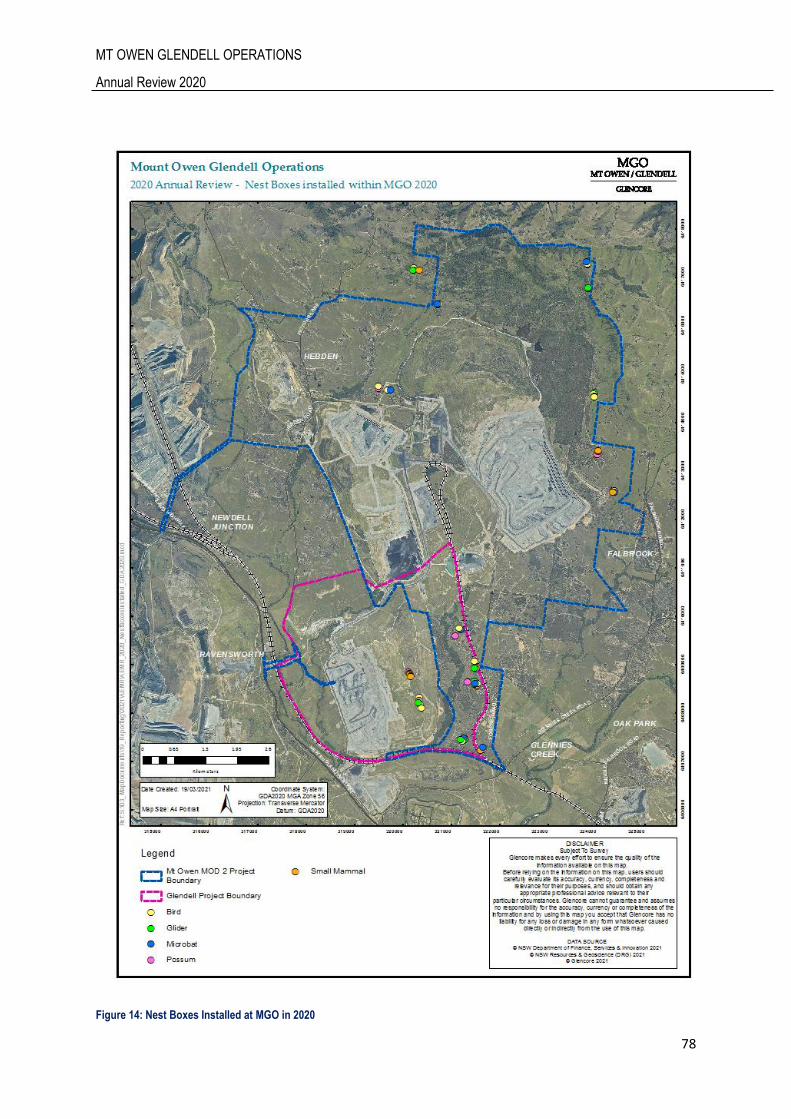
MT OWEN GLENDELL OPERATIONS
Annual Review 2020
78
Figure 14: Nest Boxes Installed at MGO in 2020
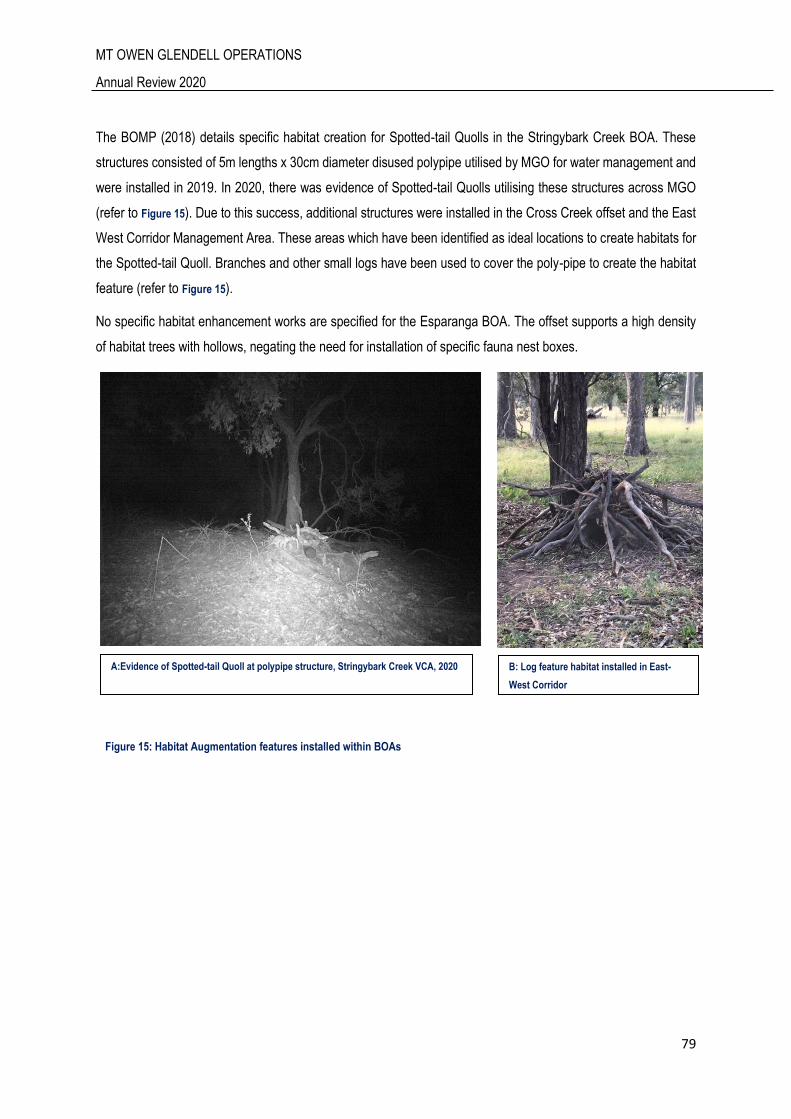
MT OWEN GLENDELL OPERATIONS
Annual Review 2020
79
The BOMP (2018) details specific habitat creation for Spotted-tail Quolls in the Stringybark Creek BOA. These
structures consisted of 5m lengths x 30cm diameter disused polypipe utilised by MGO for water management and
were installed in 2019. In 2020, there was evidence of Spotted-tail Quolls utilising these structures across MGO
(refer to Figure 15). Due to this success, additional structures were installed in the Cross Creek offset and the East
West Corridor Management Area. These areas which have been identified as ideal locations to create habitats for
the Spotted-tail Quoll. Branches and other small logs have been used to cover the poly-pipe to create the habitat
feature (refer to Figure 15).
No specific habitat enhancement works are specified for the Esparanga BOA. The offset supports a high density
of habitat trees with hollows, negating the need for installation of specific fauna nest boxes.
A:Evidence of Spotted-tail Quoll at polypipe structure, Stringybark Creek VCA, 2020 B: Log feature habitat installed in East-
West Corridor
Figure 15: Habitat Augmentation features installed within BOAs
MT OWEN GLENDELL OPERATIONS
Annual Review 2020
80
6.4.5.5 Weed Management
A Weed Action Plan was developed to identify all targeted weed control activities at the MGO. The plan was
implemented during the 2020 reporting period, continuing the active programs of control that have been
implemented since 1996. Throughout the MGO rehabilitated areas, weeds targeted during 2020 included:
Galenia
Lantana
Coolatai Grass
Prickly Pear
Acacia Saligna.
Weeds were also sprayed in areas across the MGO buffer land and BOAs, targeting species including but not
limited to:
African Boxthorn - Lycium ferocissimum
African Olive - Olea europaea subsp. Cuspidate
African Lovegrass - E. curvula
Acacia Saligna.
Bathurst Burr - Xanthium spinosum
Blackberry - Rubus fruticosus species aggregate
Coolatai Grass - Hyparrhenia hirta
Cotton Bush – Gomphocarpus fructicous
Inkweed - Phytolacca octandra L.
Lantana - Lantana camara
Pampass Grass – Cortaderia spp.
Prickly Pear - Opuntia spp.
Saffron Thistle – Carthamus Ianatus
Scotch Thistle - Onopordum acanthium
Tiger Pear - Opuntia aurantiaca
Spear Thistle - Cirsium vulgare
A summary of weed management works undertaken in MGO biodiversity offsets during the reporting period is
included in Table 33.During 2020 a successful weed management program was implemented targeting Acacia
Saligna, African Boxthorn and Kia Apple. Targeted weed management actions can be seen in Figure 16.
MT OWEN GLENDELL OPERATIONS
Annual Review 2020
81
Figure 16: Targeted weed control works in MGO Offset Areas
Table 33: MGO Weed Works Completed in Biodiversity Offsets 2020
Offset Area Weed Control Applied to Area Weeds Targeted
Northwest Offset Woody, herbaceous
Low volume basal bark spray application of African Olive,
Low volume foliar spray application of Coolatai Grass, Prickly Pear.
Cut and paint of African Olive using chainsaws and hand saws.
High volume spray application targeting Coolatai Grass.
Northeast Offset Woody, herbaceous
Low volume basal bark spray application of African Olive,
Low volume foliar spray application of Coolatai Grass, Prickly Pear and St John’s Wort.
Cut and paint of African Olive using chainsaws and hand saws.
High volume spray application targeting Coolatai Grass.
High Volume Spray Application targeting Lantana
Southeast Offset Herbaceous Low volume spray application of E. curvula (African Lovegrass) and H. hirta (Coolatai Grass).
MT OWEN GLENDELL OPERATIONS
Annual Review 2020
82
Low volume spray application of Galenia
Cut and paint of African Olive using chainsaws and hand saws.
High volume spray application targeting Coolatai Grass
High volume spray application targeting Prickly Pear.
High Volume Spray Application targeting Lantana
Forest East Offset Herbaceous
Low volume spray application of E. curvula (African Lovegrass) and H. hirta (Coolatai Grass).
Cut and paint of African Olive using chainsaws and hand saws.
High volume spray application targeting Coolatai Grass
High volume spray application targeting Prickly Pear.
High Volume Spray Application targeting Lantana
Southeast Corridor Offset Herbaceous
Low volume spray application of E. curvula (African Lovegrass) and H. hirta (Coolatai Grass).
Cut and paint of African Olive using chainsaws and hand saws.
High volume spray application targeting Coolatai Grass
High volume spray application targeting Prickly Pear
Southern Remnant Offset Woody Low volume spray application of Prickly Pear.
Stringybark Creek Habitat Corridor
Woody, herbaceous
Low volume basal bark spray application of African Olive, low volume foliar spray application of Coolatai Grass, Prickly Pear.
Cut and paint of African Olive using chainsaws and hand saws.
High volume spray application targeting Coolatai Grass.
Esparanga Offset Foliar Spray Low volume foliar spray application of Coolatai Grass,
Prickly Pear and Inkweed
Mitchell Hills Offset Foliar Spray Low volume foliar spray application of Coolatai Grass,
Prickly Pear..
Bettys Creek Habitat Management Area (HMA)
Woody, herbaceous
High volume spray application targeting Coolatai Grass and African Lovegrass.
Low volume spray application of Prickly Pear.
Low volume spray application of Galenia species.
Cut and paint application on African Boxthorn.
Low volume and high-volume spray application of lines 1m wide were applied to all vegetation.
6.4.5.6 Offset & Buffer Land Pest Control
A Vertebrate Pest Monitoring Program (VPMP) was implemented across MGO BOAs and buffer lands during the
report period, utilising a range of temporary and permanently installed motion detection cameras. The VPMP
detected a range of pests, including deer, wild dogs, pigs, foxes and humans (as a result of unauthorised access).
Offset Pest Control
A targeted wild dog and fox baiting program was conducted across MGO offsets during the report period. The
program consisted of a seasonal ‘1080’ baiting program undertaken in Autumn (May) and Spring (October) across
on-site BOAs, and monthly canid ejector bait program across off-site BOAs. Trained personnel placed ‘1080’
poison baits, and ejector baits around across all areas. Results of the 2020 offset baiting program are summarised
in Error! Reference source not found., and photos in Error! Not a valid bookmark self-reference..
Table 34: Wild Dog and Fox Biodiversity Offset Baiting Program – 2020 results
MT OWEN GLENDELL OPERATIONS
Annual Review 2020
83
Number of bait
locations
Total number of baits made available to
targeted species
Number of baits taken by targeted
species
Targeted species
success rate
1080 Baiting Program
Autumn 74 222 26 (10 Wild Dogs & 16
Foxes) 11.7%
Spring 74 222 50 (33 Wild Dogs & 17
Foxes) 22.5%
Ejector Baiting Program
Annual 23 276 122 44.2%
Figure 17: Images captured on motion cameras in Offset Areas during 2020
MT OWEN GLENDELL OPERATIONS
Annual Review 2020
84
Buffer land Pest Control
During 2020, 9 baits were taken by non-target species, including 5 goannas and 4 miscellaneous. The poison is
not lethal to goannas. Goannas tend to be problematic in the warmer months when they are more active and, as
such, baiting in summer is not recommended. Of the baits taken by goannas, all were taken during the spring
program. Trapping was not conducted in Spring 2020 (see Table 35 and photos in Figure 18).
Table 35: Wild Dog and Fox Buffer Land Baiting Program – 2020 results
Number of locations
Total number of baits made available to
targeted species
Number of targeted species culled
Targeted species
success rate
1080 Baiting Program
Autumn 80 240 11 4.5%
Spring 84 252 47 19%
Trapping
Autumn 38 - 7 18.4%
Spring N/A N/A N/A N/A
A number of combined firearm culls were undertaken during 2020 across buffer lands and offsets. This resulted in
the culling of the following target species listed inTable 36.
Table 36: Wild Dog and Fox Buffer firearm cull – 2020 results
Target Species Number
Figure 18: Images captured during buffer land spring baiting program

MT OWEN GLENDELL OPERATIONS
Annual Review 2020
85
Deer 18
Rabbits 221
6.5 Heritage
6.5.1 Aboriginal Heritage
MGO has implemented an Aboriginal Cultural Heritage Management Plan (ACHMP). The ACHMP provides
strategies for the management of remaining registered Aboriginal sites. It also provides for the management of the
Bettys Creek, Swamp Creek, Yorks Creek and Bowmans Creek areas that fall outside the approved MGO
disturbance boundaries. These areas retain Aboriginal heritage and archaeological values that require
management, despite being salvaged.
MGO utilises ground disturbance permits (GDPs) to prevent damage to known valid Aboriginal sites. Alternatively,
a due diligence assessment is conducted, and any necessary controls implemented. This is completed prior to
authorisation of ground disturbance work.
A meeting between MGO and the Aboriginal community was held in June 2020. Another meeting was attempted
to be held in November 2020, however a lack of attendance from stakeholders resulted in it being cancelled. The
Aboriginal Cultural Heritage Working Group (ACHWG) representatives discussed the greater involvement of the
Aboriginal community stakeholders in the conservation and management of Aboriginal cultural heritage. Further
discussion was also held regarding the construction and housing of salvaged artefacts at the Wollombi Brook
Conservation Agreement Area, with construction of the facility scheduled to commence in 2020. Unfortunately due
to Covid-19, the open day was unable to be held with the Registered Aboriginal Parties (RAP’s) to discuss
management options for the York’s Creek Aboriginal Conservation Area.
2020 Monitoring Program
In 2020 MGO, in conjunction with two RAPs and an OzArk archaeologist, continued the monitoring of Aboriginal
heritage sites across both MGO and Integra Underground (see Figure 19 and Figure 20). The monitoring, occurring
quarterly, includes:
site condition monitoring - previously recorded sites are inspected to evaluate the condition of the site.
management recommendations may be made to improve the condition of a site, should it be required.
MGO monitored quadrants 1, 3 and 4 during 2020 with over 51 artefact sites visited. Quadrant 2 could not be
visited due to heavy rain restricting access to sites on the scheduled day. Artefacts were found to be well-preserved
with minor management recommendations such as improved signage required.

MT OWEN GLENDELL OPERATIONS
Annual Review 2020
86
MGO and an OzArk archaeologist are also required to undertake photographic monitoring every three years. In
2020, photographic monitoring was performed in August and November, covering 10 previously recorded sites.
No immediate management was required at the sites however some stones at Bettys Creek Stone Arrangement
have been dislodged by kangaroo traffic and consultation with RAPs on future management strategies is
recommended.
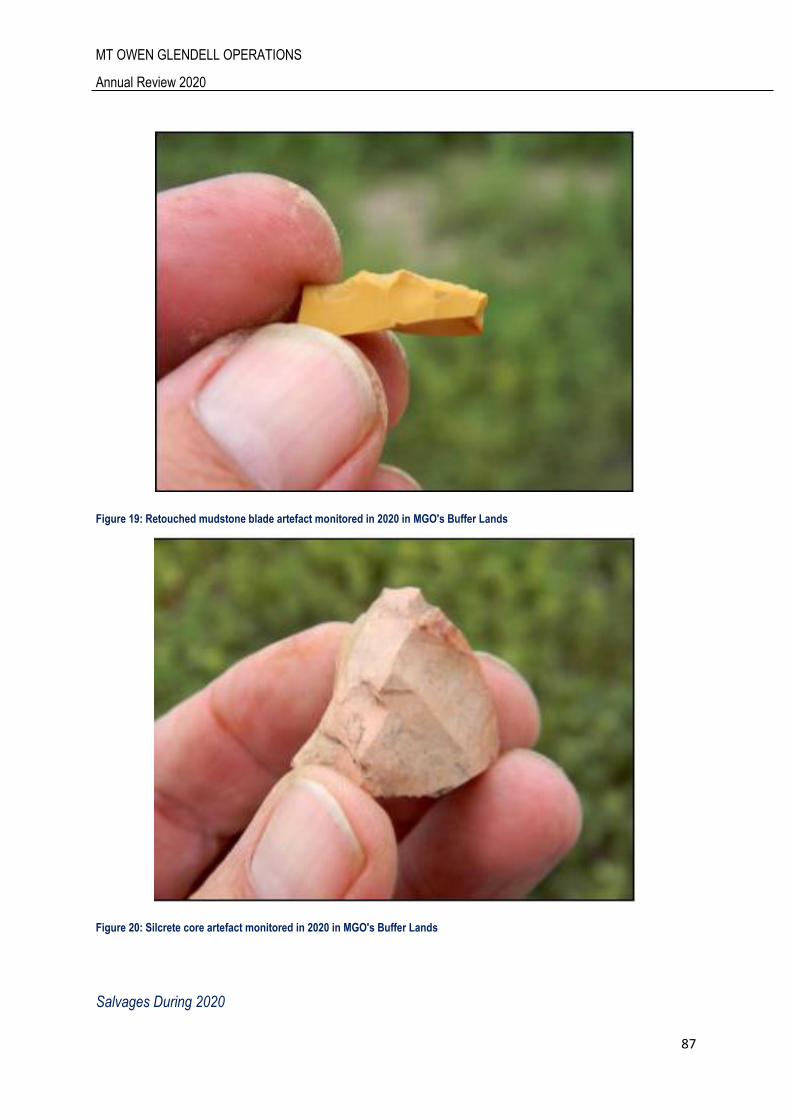
MT OWEN GLENDELL OPERATIONS
Annual Review 2020
87
Figure 19: Retouched mudstone blade artefact monitored in 2020 in MGO's Buffer Lands
Figure 20: Silcrete core artefact monitored in 2020 in MGO's Buffer Lands
Salvages During 2020

MT OWEN GLENDELL OPERATIONS
Annual Review 2020
88
During 2020, four sites were salvaged under permit, and in accordance with the ACHMP. One site was fully
salvaged and two others had specific segments salvaged to allow for mining under DA 80/952. One other site was
attempted to be salvaged for mining under SSD-5850 however the artefact could not be located and the site was
determined to be destroyed by the RAPs and archaeologist. Artefacts salvaged were taken to Umwelt as agreed
with the RAPs.
6.5.2 European Heritage
MGO manages European heritage through the implementation of the Historic Heritage Management Plan (HHMP).
MGO demonstrates a varied historical pattern of European habitation. Prior European land use in the area has
identified a range of activities, from dairying to mixed farming, cropping, and mining activities.
MGO has committed to continual historical heritage management initiatives. They include:
Implementing a quarterly heritage monitoring program
Ongoing maintenance of sites.
During 2020 the Marali House had the fence and signage fixed. (see Figure 21). Monitoring during the reporting
period found that sites are well-preserved with minimal management recommendations required, such as the
timber loading ramps pictured below in Figure 22.
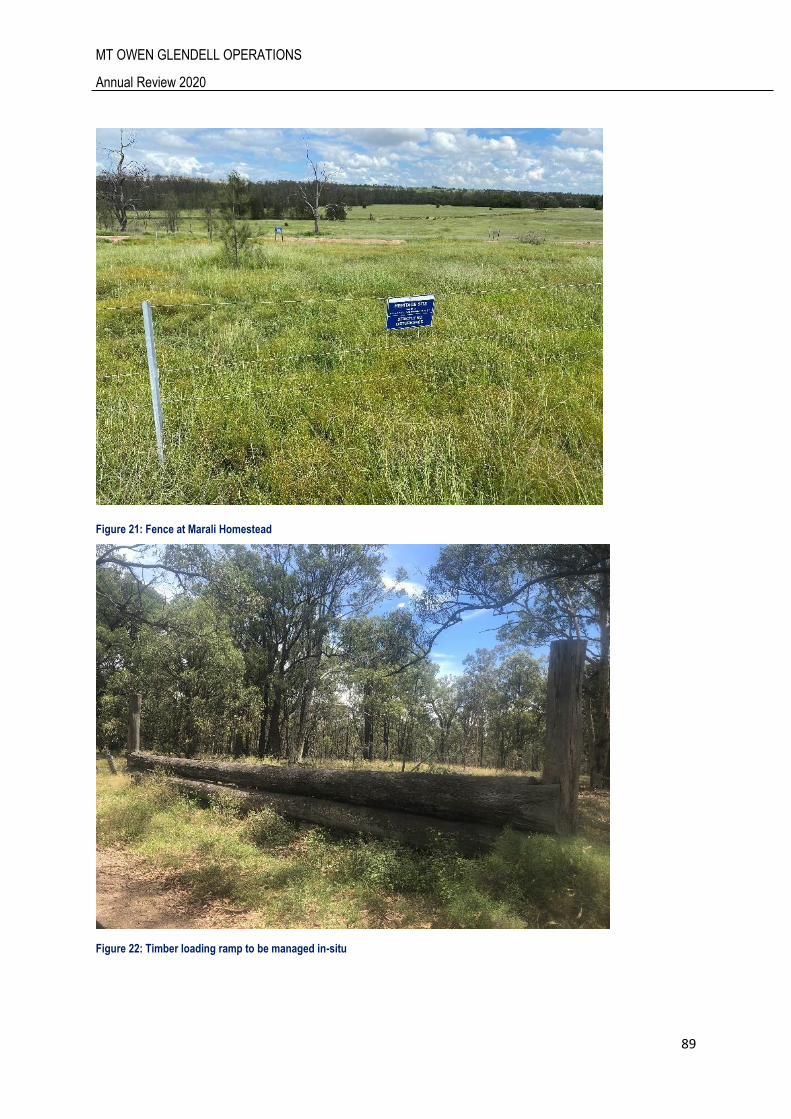
MT OWEN GLENDELL OPERATIONS
Annual Review 2020
89
Figure 21: Fence at Marali Homestead
Figure 22: Timber loading ramp to be managed in-situ

MT OWEN GLENDELL OPERATIONS
Annual Review 2020
90
6.5.3 Visual Amenity MGO undertook direct seeding and tube stock planting works in September 2019 as part of the development of
the Middle Falbrook Tree Screening as described in MOCO MOD 2. Seeding works utilised a mix of species
endemic to the local area. Preparatory weed control, ripping and fencing works were also undertaken during the
reporting period prior to planting.
In 2020, additional direct seeding and tube stock planting was completed which the screen demonstrated great
ground cover with evidence of thriving saplings. This included the planting of an additional 120 overstorey
tubestock and seeding of overstorey as well as mid storey species. Evidence of this work was provided to DPIE
during August 2020 (DPIE Portal reference SSD-5850-PA-32). MGO will continue to monitor and manage the
development of the tree screen during the next reporting period in accordance with Schedule 3 Condition 39A of
SSD-5850.
6.5.4 Demolition Works During the reporting period two properties were demolished which comprised of Former Hebden Public School
as well as a Ravensworth Primary School.
Hebden Public School
Hebden Public School was dismantled and disposed of due to a fire that burnt it down on the 15 April 2020 from
a suspected arson attack. Demolition commenced on the 26 August 2020 and was completed with waste
removed on the 17 September 2020. Figure 23 and Figure 24 shows before and after photos of the demolition.
Approximately 20.84 tonnes of waste was removed from the site including 8.34 tonnes of mixed waste and 12.5
tonnes of Asbestos contaminated soil.
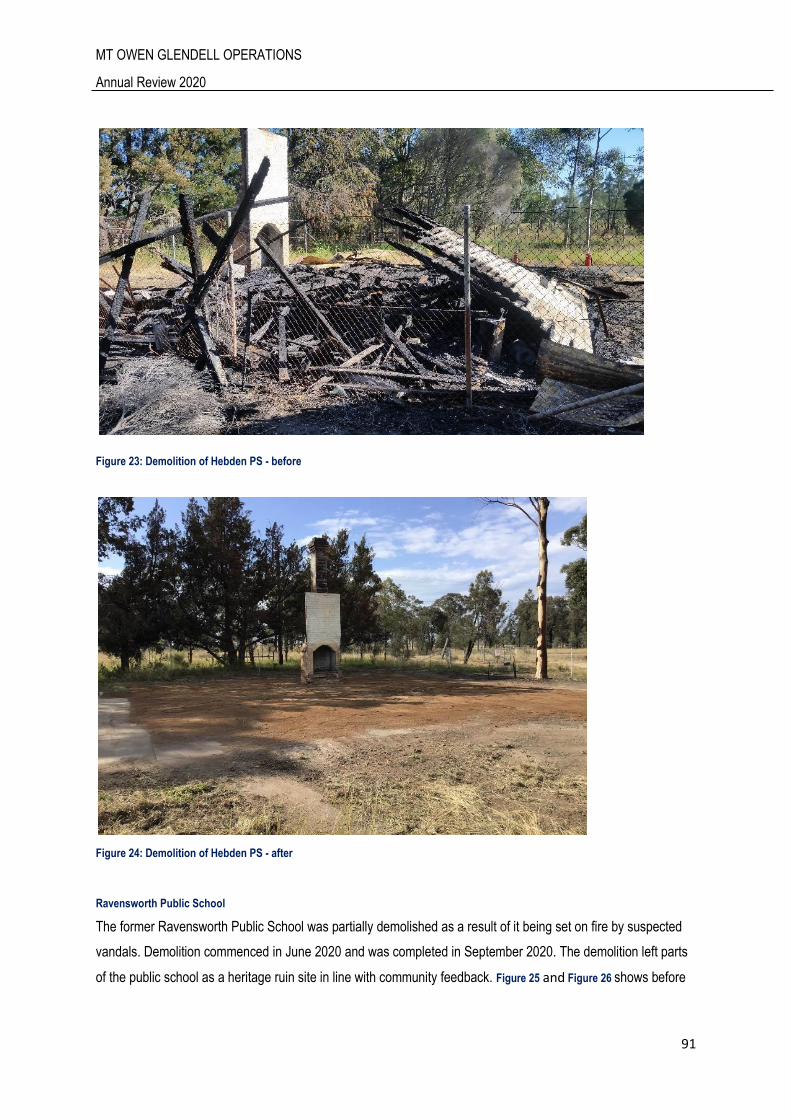
MT OWEN GLENDELL OPERATIONS
Annual Review 2020
91
Figure 23: Demolition of Hebden PS - before
Figure 24: Demolition of Hebden PS - after
Ravensworth Public School
The former Ravensworth Public School was partially demolished as a result of it being set on fire by suspected
vandals. Demolition commenced in June 2020 and was completed in September 2020. The demolition left parts
of the public school as a heritage ruin site in line with community feedback. Figure 25 and Figure 26 shows before
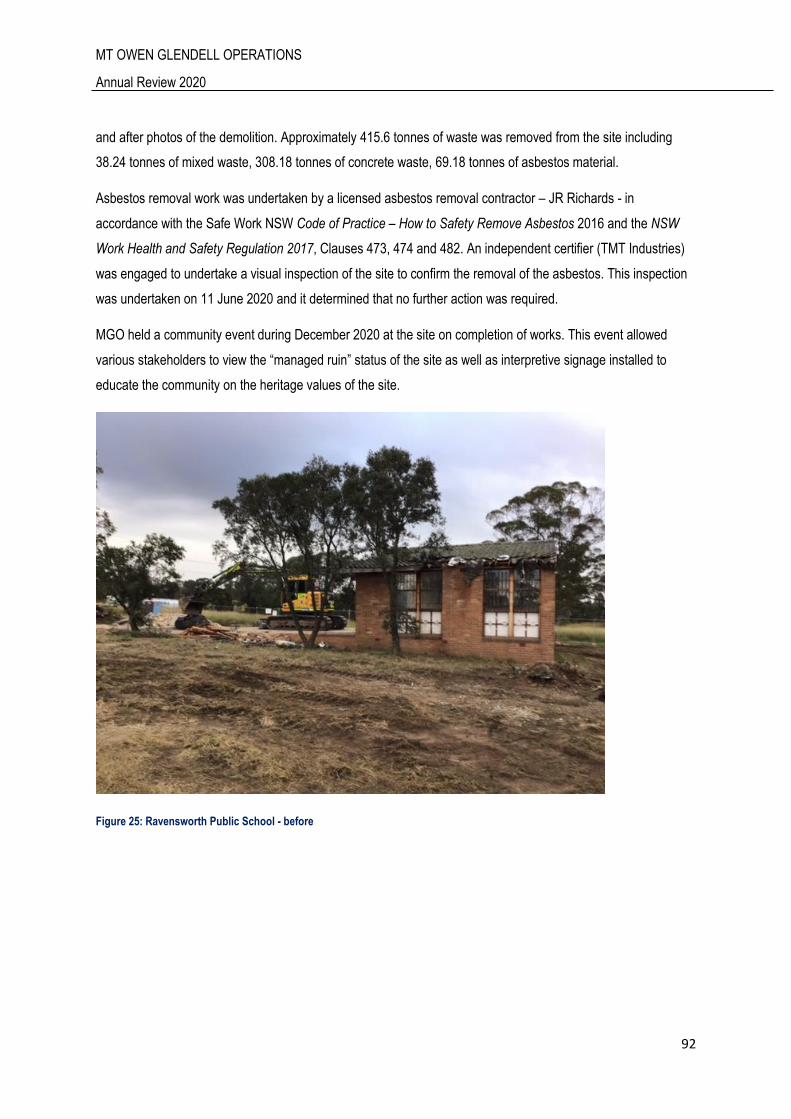
MT OWEN GLENDELL OPERATIONS
Annual Review 2020
92
and after photos of the demolition. Approximately 415.6 tonnes of waste was removed from the site including
38.24 tonnes of mixed waste, 308.18 tonnes of concrete waste, 69.18 tonnes of asbestos material.
Asbestos removal work was undertaken by a licensed asbestos removal contractor – JR Richards - in
accordance with the Safe Work NSW Code of Practice – How to Safety Remove Asbestos 2016 and the NSW
Work Health and Safety Regulation 2017, Clauses 473, 474 and 482. An independent certifier (TMT Industries)
was engaged to undertake a visual inspection of the site to confirm the removal of the asbestos. This inspection
was undertaken on 11 June 2020 and it determined that no further action was required.
MGO held a community event during December 2020 at the site on completion of works. This event allowed
various stakeholders to view the “managed ruin” status of the site as well as interpretive signage installed to
educate the community on the heritage values of the site.
Figure 25: Ravensworth Public School - before

MT OWEN GLENDELL OPERATIONS
Annual Review 2020
93
Figure 26: Demolition of Ravensworth Public School - After
7 Water Management MGO operates under a suite of water management plans, all of which were approved by DPIE during 2020.These
include:
Water Management Plan (Overarching) (October 2020)
Surface Water Management and Monitoring Plan (SWMMP) (October 2020)
Groundwater Management and Monitoring Plan (GWMMP) (October 2020)
Erosion and Sediment Control Plan (October 2020)
Creek Diversions Plan (May 2020)
Surface Water and Groundwater Response Plan (SWGWRP) (October 2020)
The SWMMP, GWMMP and SWGWRP were all reviewed during 2020, in consultation with relevant government
agencies.
Mining related water licensing and relevant pumped volumes at MGO are outlined in Table 37. Glencore owns a
number of additional surface water licences associated with farm irrigation on Glencore land. These licences have
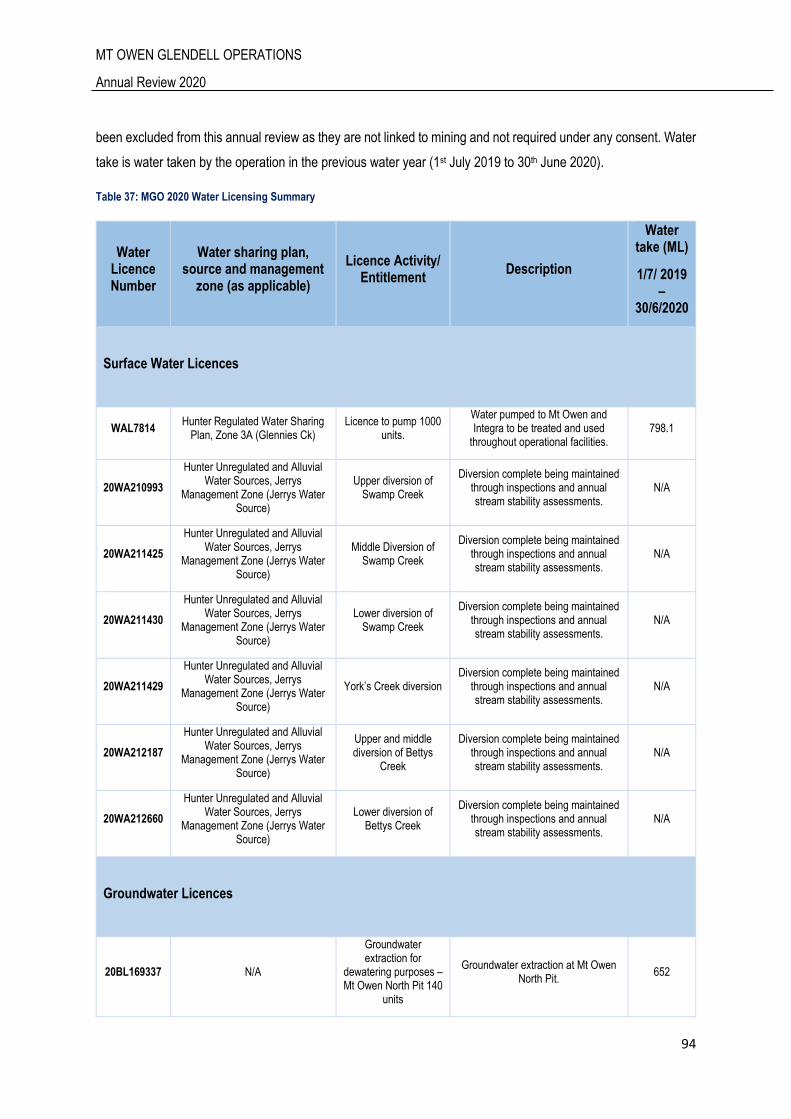
MT OWEN GLENDELL OPERATIONS
Annual Review 2020
94
been excluded from this annual review as they are not linked to mining and not required under any consent. Water
take is water taken by the operation in the previous water year (1st July 2019 to 30th June 2020).
Table 37: MGO 2020 Water Licensing Summary
Water Licence Number
Water sharing plan, source and management
zone (as applicable)
Licence Activity/ Entitlement
Description
Water take (ML)
1/7/ 2019 –
30/6/2020
Surface Water Licences
WAL7814 Hunter Regulated Water Sharing
Plan, Zone 3A (Glennies Ck) Licence to pump 1000
units.
Water pumped to Mt Owen and Integra to be treated and used
throughout operational facilities. 798.1
20WA210993
Hunter Unregulated and Alluvial Water Sources, Jerrys
Management Zone (Jerrys Water Source)
Upper diversion of Swamp Creek
Diversion complete being maintained through inspections and annual stream stability assessments.
N/A
20WA211425
Hunter Unregulated and Alluvial Water Sources, Jerrys
Management Zone (Jerrys Water Source)
Middle Diversion of Swamp Creek
Diversion complete being maintained through inspections and annual stream stability assessments.
N/A
20WA211430
Hunter Unregulated and Alluvial Water Sources, Jerrys
Management Zone (Jerrys Water Source)
Lower diversion of Swamp Creek
Diversion complete being maintained through inspections and annual stream stability assessments.
N/A
20WA211429
Hunter Unregulated and Alluvial Water Sources, Jerrys
Management Zone (Jerrys Water Source)
York’s Creek diversion Diversion complete being maintained
through inspections and annual stream stability assessments.
N/A
20WA212187
Hunter Unregulated and Alluvial Water Sources, Jerrys
Management Zone (Jerrys Water Source)
Upper and middle diversion of Bettys
Creek
Diversion complete being maintained through inspections and annual stream stability assessments.
N/A
20WA212660
Hunter Unregulated and Alluvial Water Sources, Jerrys
Management Zone (Jerrys Water Source)
Lower diversion of Bettys Creek
Diversion complete being maintained through inspections and annual stream stability assessments.
N/A
Groundwater Licences
20BL169337 N/A
Groundwater extraction for
dewatering purposes – Mt Owen North Pit 140
units
Groundwater extraction at Mt Owen North Pit.
652
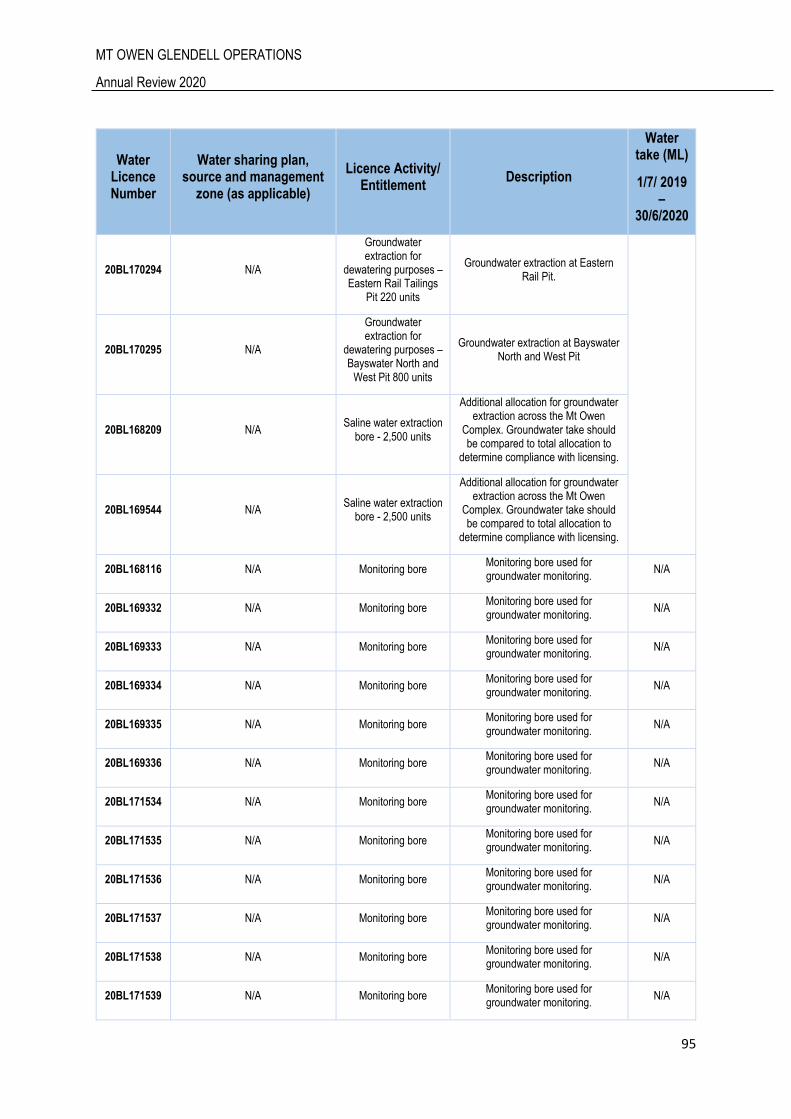
MT OWEN GLENDELL OPERATIONS
Annual Review 2020
95
Water Licence Number
Water sharing plan, source and management
zone (as applicable)
Licence Activity/ Entitlement
Description
Water take (ML)
1/7/ 2019 –
30/6/2020
20BL170294 N/A
Groundwater extraction for
dewatering purposes – Eastern Rail Tailings
Pit 220 units
Groundwater extraction at Eastern Rail Pit.
20BL170295 N/A
Groundwater extraction for
dewatering purposes – Bayswater North and
West Pit 800 units
Groundwater extraction at Bayswater North and West Pit
20BL168209 N/A Saline water extraction
bore - 2,500 units
Additional allocation for groundwater extraction across the Mt Owen
Complex. Groundwater take should be compared to total allocation to
determine compliance with licensing.
20BL169544 N/A Saline water extraction
bore - 2,500 units
Additional allocation for groundwater extraction across the Mt Owen
Complex. Groundwater take should be compared to total allocation to
determine compliance with licensing.
20BL168116 N/A Monitoring bore Monitoring bore used for groundwater monitoring.
N/A
20BL169332 N/A Monitoring bore Monitoring bore used for groundwater monitoring.
N/A
20BL169333 N/A Monitoring bore Monitoring bore used for groundwater monitoring.
N/A
20BL169334 N/A Monitoring bore Monitoring bore used for groundwater monitoring.
N/A
20BL169335 N/A Monitoring bore Monitoring bore used for groundwater monitoring.
N/A
20BL169336 N/A Monitoring bore Monitoring bore used for groundwater monitoring.
N/A
20BL171534 N/A Monitoring bore Monitoring bore used for groundwater monitoring.
N/A
20BL171535 N/A Monitoring bore Monitoring bore used for groundwater monitoring.
N/A
20BL171536 N/A Monitoring bore Monitoring bore used for groundwater monitoring.
N/A
20BL171537 N/A Monitoring bore Monitoring bore used for groundwater monitoring.
N/A
20BL171538 N/A Monitoring bore Monitoring bore used for groundwater monitoring.
N/A
20BL171539 N/A Monitoring bore Monitoring bore used for groundwater monitoring.
N/A
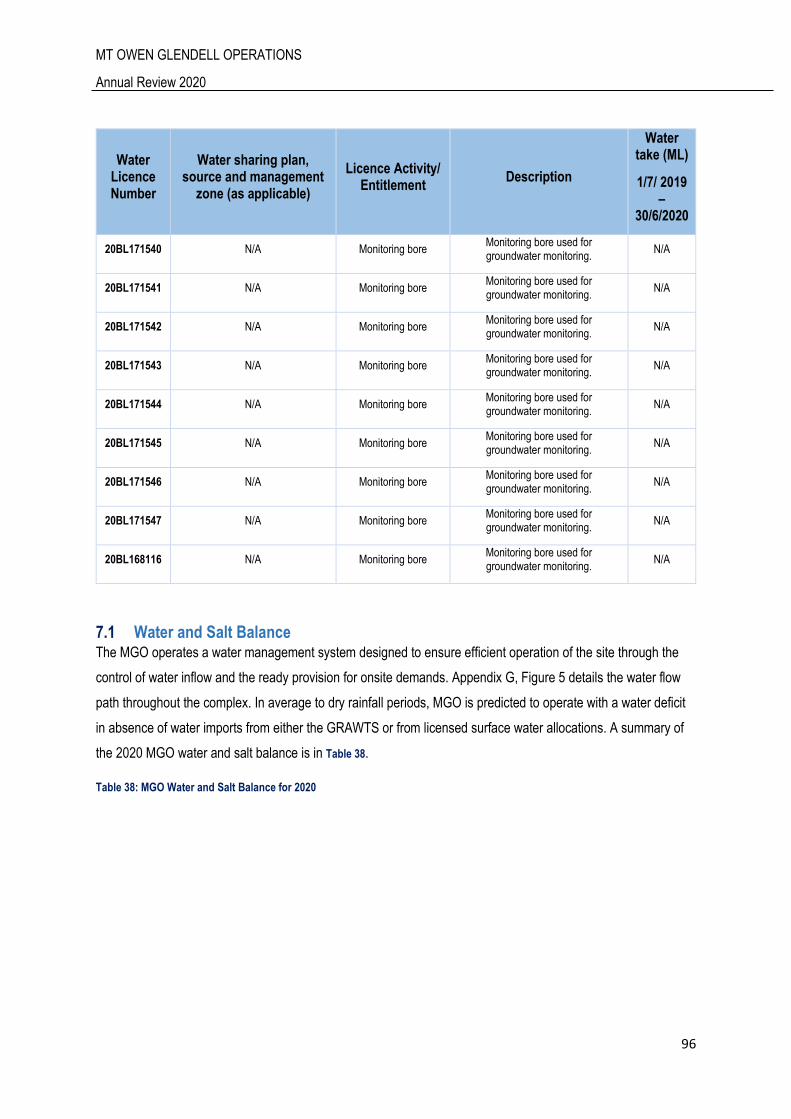
MT OWEN GLENDELL OPERATIONS
Annual Review 2020
96
Water Licence Number
Water sharing plan, source and management
zone (as applicable)
Licence Activity/ Entitlement
Description
Water take (ML)
1/7/ 2019 –
30/6/2020
20BL171540 N/A Monitoring bore Monitoring bore used for groundwater monitoring.
N/A
20BL171541 N/A Monitoring bore Monitoring bore used for groundwater monitoring.
N/A
20BL171542 N/A Monitoring bore Monitoring bore used for groundwater monitoring.
N/A
20BL171543 N/A Monitoring bore Monitoring bore used for groundwater monitoring.
N/A
20BL171544 N/A Monitoring bore Monitoring bore used for groundwater monitoring.
N/A
20BL171545 N/A Monitoring bore Monitoring bore used for groundwater monitoring.
N/A
20BL171546 N/A Monitoring bore Monitoring bore used for groundwater monitoring.
N/A
20BL171547 N/A Monitoring bore Monitoring bore used for groundwater monitoring.
N/A
20BL168116 N/A Monitoring bore Monitoring bore used for groundwater monitoring.
N/A
7.1 Water and Salt Balance The MGO operates a water management system designed to ensure efficient operation of the site through the
control of water inflow and the ready provision for onsite demands. Appendix G, Figure 5 details the water flow
path throughout the complex. In average to dry rainfall periods, MGO is predicted to operate with a water deficit
in absence of water imports from either the GRAWTS or from licensed surface water allocations. A summary of
the 2020 MGO water and salt balance is in Table 38.
Table 38: MGO Water and Salt Balance for 2020
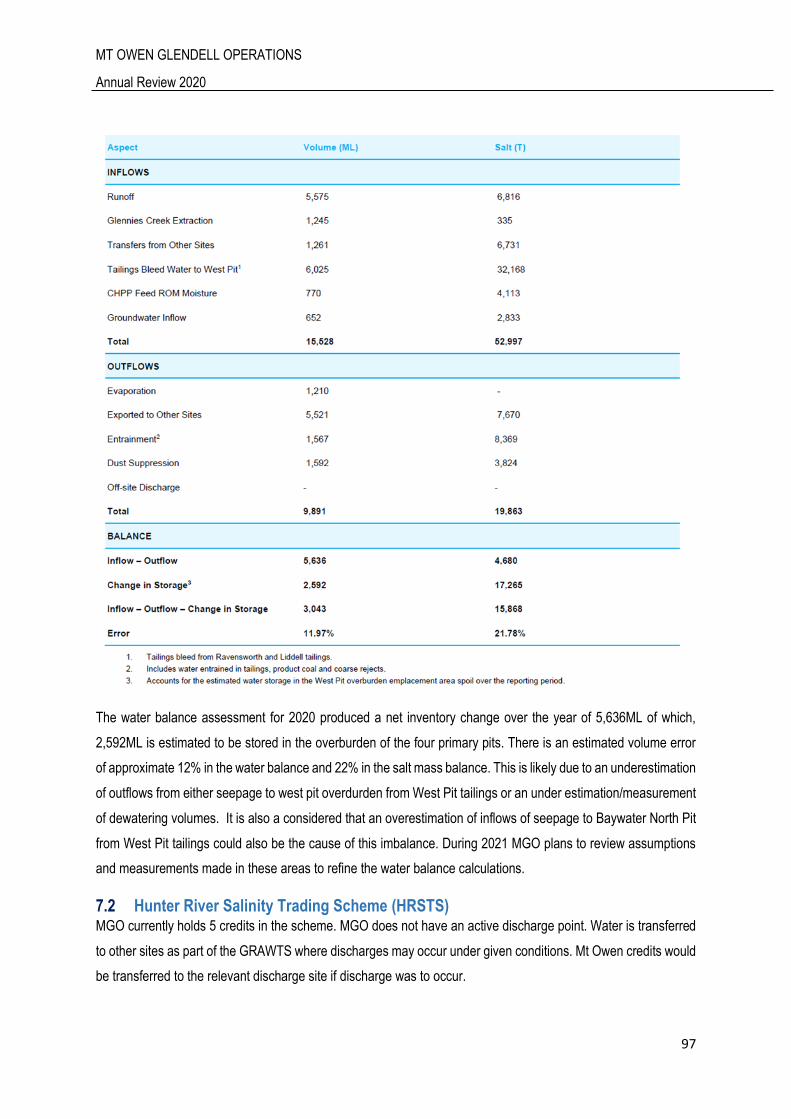
MT OWEN GLENDELL OPERATIONS
Annual Review 2020
97
The water balance assessment for 2020 produced a net inventory change over the year of 5,636ML of which,
2,592ML is estimated to be stored in the overburden of the four primary pits. There is an estimated volume error
of approximate 12% in the water balance and 22% in the salt mass balance. This is likely due to an underestimation
of outflows from either seepage to west pit overdurden from West Pit tailings or an under estimation/measurement
of dewatering volumes. It is also a considered that an overestimation of inflows of seepage to Baywater North Pit
from West Pit tailings could also be the cause of this imbalance. During 2021 MGO plans to review assumptions
and measurements made in these areas to refine the water balance calculations.
7.2 Hunter River Salinity Trading Scheme (HRSTS) MGO currently holds 5 credits in the scheme. MGO does not have an active discharge point. Water is transferred
to other sites as part of the GRAWTS where discharges may occur under given conditions. Mt Owen credits would
be transferred to the relevant discharge site if discharge was to occur.
MT OWEN GLENDELL OPERATIONS
Annual Review 2020
98
7.3 Surface Water
Monitoring Program and Triggers
7.3.1 Water Quality
MGO monitors surface water quality at 19 creek locations surrounding the site (Figure 27). These include:
Bowmans Creek (5 sites: BMC1-BMC5)
Yorks Creek (3 sites: YC1-YC3)
Swamp Creek (4 sites: SC1-SC4)
Bettys Creek (4 sites: BC1-BC4)
Main Creek (3 sites: MC1-MC3).
Sites are monitored for pH, electrical conductivity (EC) and total suspended solids (TSS). Results are recorded
within the site Environmental Monitoring Database. Results are assessed against baseline trigger levels outlined
in the MGO SWMMP.
Table 39: Surface Water Quality Triggers
Water Quality
Variable Bowmans Creek Yorks Creek Swamp Creek Bettys Creek Main Creek
pH 7.5 – 8.1 7.0 – 7.9 7.1 – 8.6 7.1 – 8.3 7.1 – 8.4
EC (µS/cm)¹ 1,288 - 2,430 5,286 - 8,852 824 - 8,824 1,882 - 6,680 1,191 – 5,440
TSS (mg/L)¹ 10 - 26 20 - 33 21 - 35 16 - 52 10 - 140
¹ 80th percentile range for EC and TSS. Sites have specific triggers as per MGO’s approved SWMMP.
MGO has defined 80th percentile trigger values for EC and TSS, and 20th percentile (acidic) and 80th percentile (alkaline) triggers for pH. Triggers are specific to each individual creek monitoring site. These values are based on historical datasets for each site. The Specific triggers are contained within MGO’s approved SWMMP.
MT OWEN GLENDELL OPERATIONS
Annual Review 2020
99
Figure 27: MGO Surface Monitoring Locations
MT OWEN GLENDELL OPERATIONS
Annual Review 2020
100
Channel Stability and Stream Health
Annual channel stability and stream health assessment is also carried out across both existing creeks and creek
diversions at the site. MGO monitors channel stability and stream health at 41 locations (Figure 28). These include:
Bowmans Creek (2 sites: BMC1-BMC2)
Yorks Creek (3 sites: YC1-YC3)
Swamp Creek (4 sites: SC1-SC4)
Bettys Creek (2 sites: BC1-BC2)
Main Creek (2 sites: MC1-MC2)
Bettys Creek Diversion (25 sites: UBD1-UBD6, MBD1-MBD6 and LBD1-LBD13)
Swamp Creek Diversion (3 sites: SC1A-SC1C).
Channel stability is assessed using the CSIRO Ephemeral Stream Assessment and Stream Health (2011) and
the using the Rapid Appraisal of Riparian Condition (RARC) (2005) methodologies. Table 40 and Table 41 outline
the scoring system for both these methodologies.
Table 40: CSIRO Ephemeral Stream Assessment Stability Classifications (CSIRO, 2011)
Activity Rating (%) Classification Discussion of Classification
> 80 Very Stable Drainage line is very stable and likely to be in original form. It is
able to withstand all flow velocities that have previously occurred
in this area and only minimal monitoring is required,
predominantly after high flow events, to ensure condition does
not deteriorate.
70-80 Stable Drainage line is stable. It is important to assess this zone in
relation to the other classifications and define whether this zone
is moving from potentially stabilising to a more stable form, or if it
is deteriorating from a very stable form. The nature of this
relationship will identify the type of monitoring required.
60-69 Potentially Stabilising Drainage line is potentially stabilising. Ongoing monitoring is
required while rehabilitation works are not needed in the
immediate future.
50-59 Active Drainage line is actively eroding and remedial actions are
required. It is important to classify if erosion is caused primarily
by upstream flows, lateral flows or unstable wall materials so that
appropriate rehabilitation can be carried out.
<50 Very Active Drainage line is very actively eroding and immediate remedial
actions are required. It is important to classify if erosion is
caused primarily by upstream flows, lateral flows or unstable wall
materials so that appropriate rehabilitation can be carried out.
MT OWEN GLENDELL OPERATIONS
Annual Review 2020
101
Table 41: Summary Table of Indicators, Functions and Components Assessed in the RARC Index (Jansen et al. 2005).
Functions of the riparian zone at
different levels of organisation
Components of the riparian
ecosystem that perform those
functions
Indicators of the functions used in
the RARC
Physical
Reduction of erosion of banks Roots, groundcover Vegetation cover
Sediment trapping Roots, fallen logs, ground cover Canopy cover, fallen logs, ground
cover vegetation, leaf litter cover
Controlling stream
microclimate/discharge/water
temperatures
Riparian forest Canopy cover
Filtering of nutrients from upslope Vegetation, leaf litter Ground cover vegetation, leaf litter
cover
Community
Provision of organic matter to
aquatic food chains
Vegetation Vegetation cover*, leaf litter cover
Retention of plant propagules Fallen logs, leaf litter Fallen logs, litter cover
Maintenance of plant diversity Regeneration of dominant species,
presence of important species,
dominance of natives versus exotics
Native canopy and shrub
regeneration, grazing damage to
regeneration, reeds, native vegetation
cover*
Provision of habitat for aquatic and
terrestrial fauna
Fallen Logs, leaf litter, standing dead
trees/hollows, riparian forest, habitat
complexity
Fallen logs, leaf litter cover, standing
dead trees, hollows, vegetation cover*,
number of vegetation layers
Landscape
Provision of biological connections
in
the landscape
Riparian forest (cover, width,
connectedness)
Vegetation cover*, width of riparian
vegetation, longitudinal continuity of
riparian vegetation, proximity to other
habitat
Provision of biological connections
in
the landscape
Riparian forest (cover, width,
connectedness)
Vegetation cover*, width of riparian
vegetation, longitudinal continuity of
riparian vegetation, proximity to other
habitat
Table 42: Summary RARC Classification System
RARC Total Score Classification
40-50 Excellent

MT OWEN GLENDELL OPERATIONS
Annual Review 2020
102
35-39 Good
30-34 Average
25-29 Poor
< 25 Very Poor
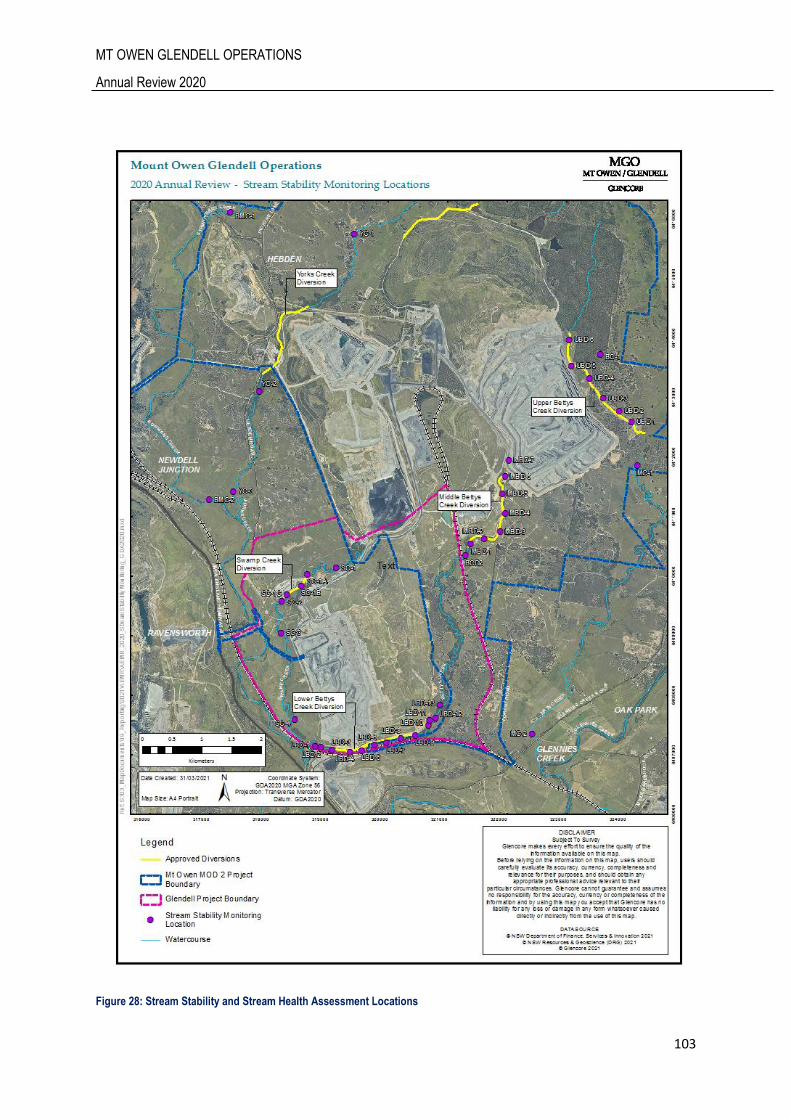
MT OWEN GLENDELL OPERATIONS
Annual Review 2020
103
Figure 28: Stream Stability and Stream Health Assessment Locations
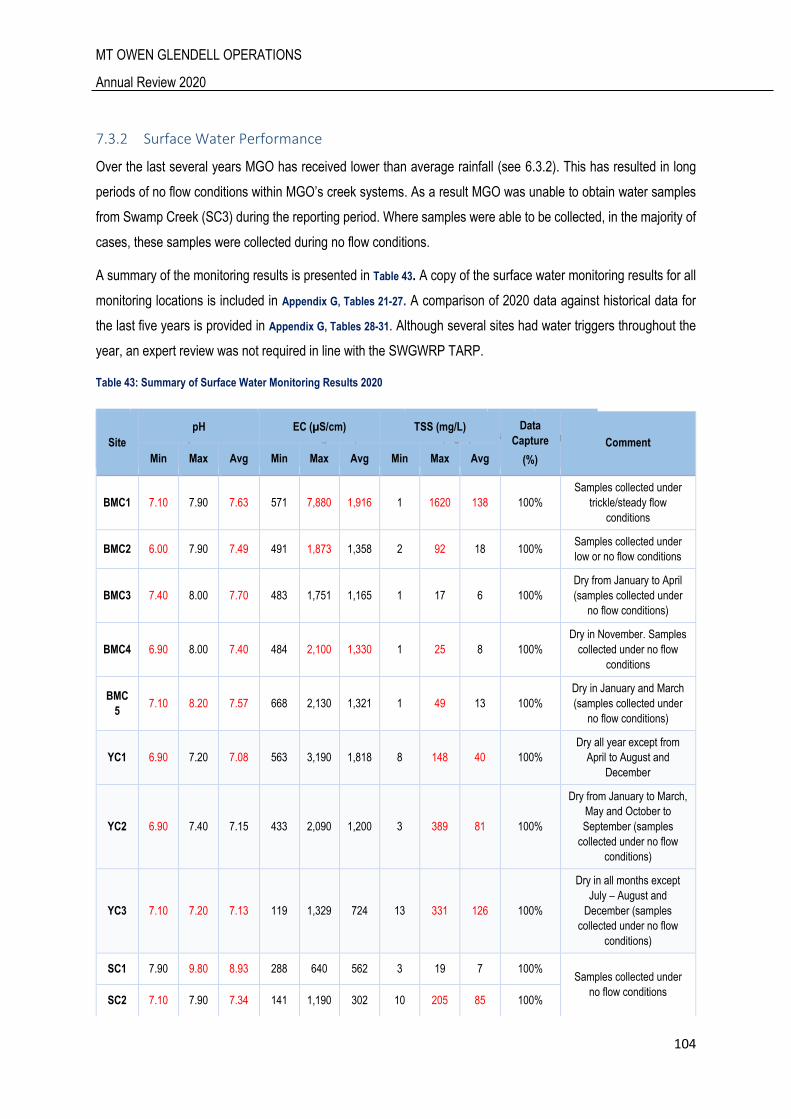
MT OWEN GLENDELL OPERATIONS
Annual Review 2020
104
7.3.2 Surface Water Performance
Over the last several years MGO has received lower than average rainfall (see 6.3.2). This has resulted in long
periods of no flow conditions within MGO’s creek systems. As a result MGO was unable to obtain water samples
from Swamp Creek (SC3) during the reporting period. Where samples were able to be collected, in the majority of
cases, these samples were collected during no flow conditions.
A summary of the monitoring results is presented in Table 43. A copy of the surface water monitoring results for all
monitoring locations is included in Appendix G, Tables 21-27. A comparison of 2020 data against historical data for
the last five years is provided in Appendix G, Tables 28-31. Although several sites had water triggers throughout the
year, an expert review was not required in line with the SWGWRP TARP.
Table 43: Summary of Surface Water Monitoring Results 2020
Site pH EC (µS/cm) TSS (mg/L)
Data
Capture
(%)
Comment Site
pH EC (µS/cm) TSS (mg/L) Data
Capture
(%)
Comment
Min Max Avg Min Max Avg Min Max Avg
BMC1 7.10 7.90 7.63 571 7,880 1,916 1 1620 138 100%
Samples collected under
trickle/steady flow
conditions
BMC2 6.00 7.90 7.49 491 1,873 1,358 2 92 18 100% Samples collected under
low or no flow conditions
BMC3 7.40 8.00 7.70 483 1,751 1,165 1 17 6 100%
Dry from January to April
(samples collected under
no flow conditions)
BMC4 6.90 8.00 7.40 484 2,100 1,330 1 25 8 100%
Dry in November. Samples
collected under no flow
conditions
BMC
5 7.10 8.20 7.57 668 2,130 1,321 1 49 13 100%
Dry in January and March
(samples collected under
no flow conditions)
YC1 6.90 7.20 7.08 563 3,190 1,818 8 148 40 100%
Dry all year except from
April to August and
December
YC2 6.90 7.40 7.15 433 2,090 1,200 3 389 81 100%
Dry from January to March,
May and October to
September (samples
collected under no flow
conditions)
YC3 7.10 7.20 7.13 119 1,329 724 13 331 126 100%
Dry in all months except
July – August and
December (samples
collected under no flow
conditions)
SC1 7.90 9.80 8.93 288 640 562 3 19 7 100% Samples collected under
no flow conditions SC2 7.10 7.90 7.34 141 1,190 302 10 205 85 100%
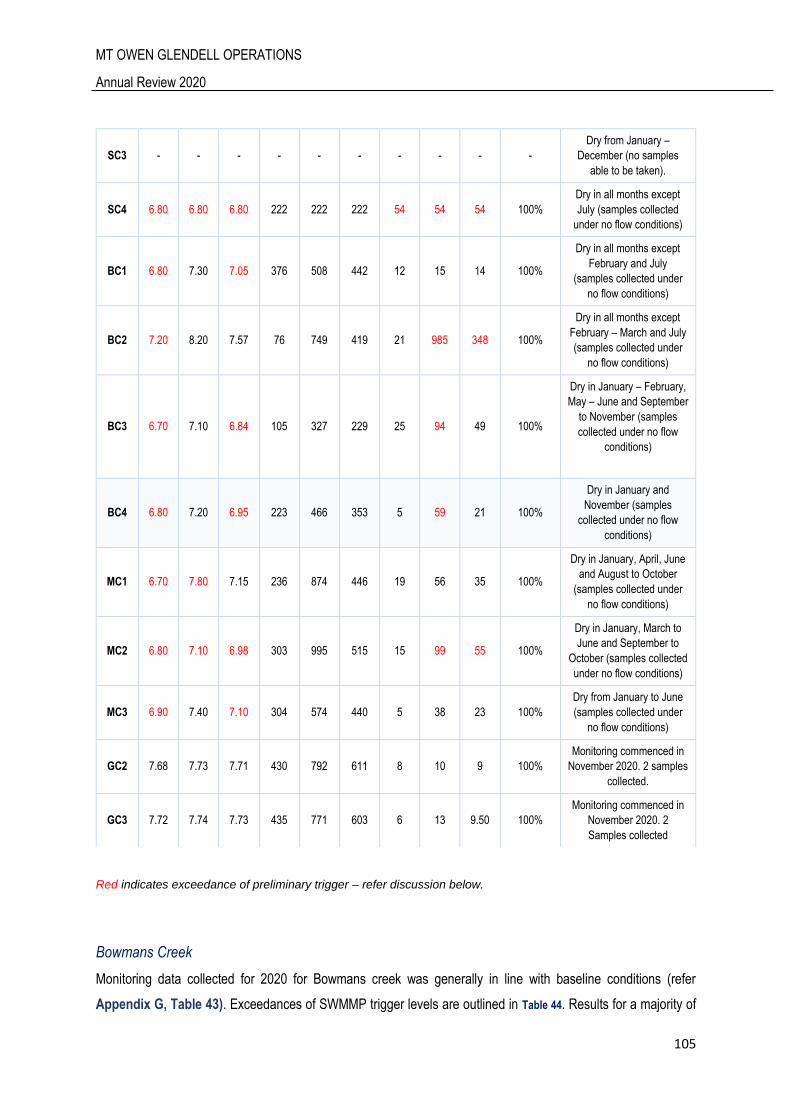
MT OWEN GLENDELL OPERATIONS
Annual Review 2020
105
Red indicates exceedance of preliminary trigger – refer discussion below.
Bowmans Creek
Monitoring data collected for 2020 for Bowmans creek was generally in line with baseline conditions (refer
Appendix G, Table 43). Exceedances of SWMMP trigger levels are outlined in Table 44. Results for a majority of
SC3 - - - - - - - - - -
Dry from January –
December (no samples
able to be taken).
SC4 6.80 6.80 6.80 222 222 222 54 54 54 100%
Dry in all months except
July (samples collected
under no flow conditions)
BC1 6.80 7.30 7.05 376 508 442 12 15 14 100%
Dry in all months except
February and July
(samples collected under
no flow conditions)
BC2 7.20 8.20 7.57 76 749 419 21 985 348 100%
Dry in all months except
February – March and July
(samples collected under
no flow conditions)
BC3 6.70 7.10 6.84 105 327 229 25 94 49 100%
Dry in January – February,
May – June and September
to November (samples
collected under no flow
conditions)
BC4 6.80 7.20 6.95 223 466 353 5 59 21 100%
Dry in January and
November (samples
collected under no flow
conditions)
MC1 6.70 7.80 7.15 236 874 446 19 56 35 100%
Dry in January, April, June
and August to October
(samples collected under
no flow conditions)
MC2 6.80 7.10 6.98 303 995 515 15 99 55 100%
Dry in January, March to
June and September to
October (samples collected
under no flow conditions)
MC3 6.90 7.40 7.10 304 574 440 5 38 23 100%
Dry from January to June
(samples collected under
no flow conditions)
GC2 7.68 7.73 7.71 430 792 611 8 10 9 100%
Monitoring commenced in
November 2020. 2 samples
collected.
GC3 7.72 7.74 7.73 435 771 603 6 13 9.50 100%
Monitoring commenced in
November 2020. 2
Samples collected
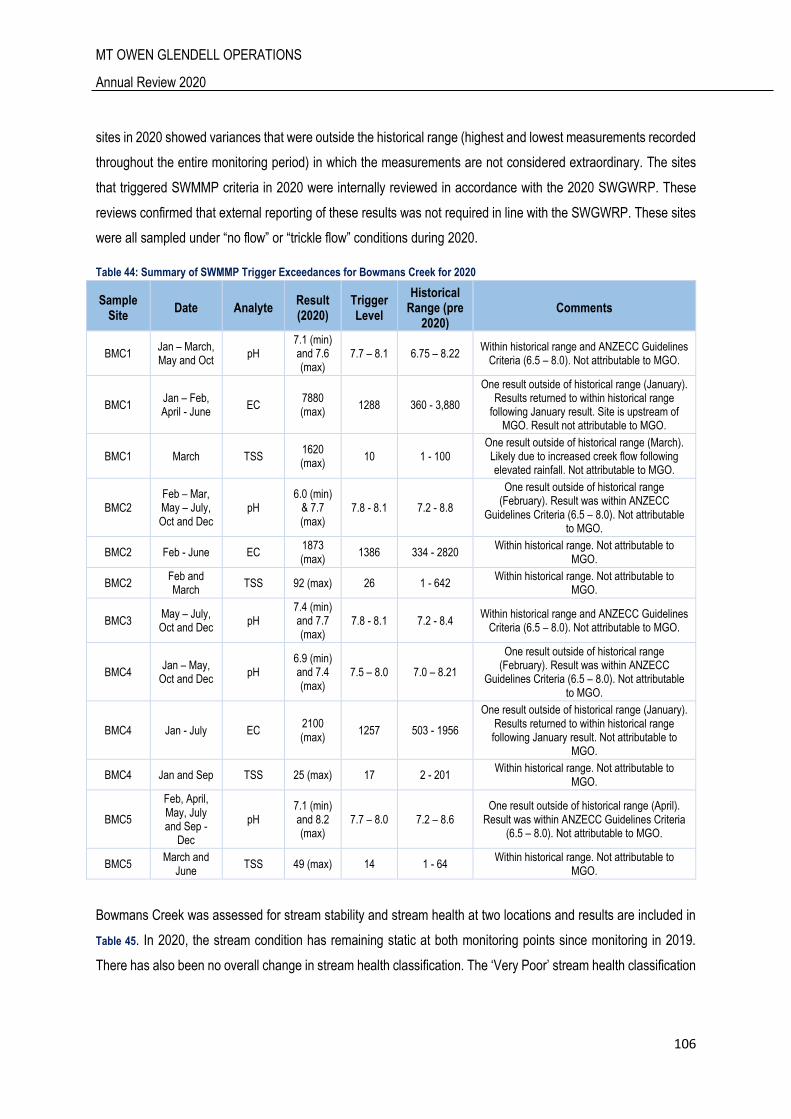
MT OWEN GLENDELL OPERATIONS
Annual Review 2020
106
sites in 2020 showed variances that were outside the historical range (highest and lowest measurements recorded
throughout the entire monitoring period) in which the measurements are not considered extraordinary. The sites
that triggered SWMMP criteria in 2020 were internally reviewed in accordance with the 2020 SWGWRP. These
reviews confirmed that external reporting of these results was not required in line with the SWGWRP. These sites
were all sampled under “no flow” or “trickle flow” conditions during 2020.
Table 44: Summary of SWMMP Trigger Exceedances for Bowmans Creek for 2020
Sample Site
Date Analyte Result (2020)
Trigger Level
Historical Range (pre
2020) Comments
BMC1 Jan – March, May and Oct
pH 7.1 (min) and 7.6 (max)
7.7 – 8.1 6.75 – 8.22 Within historical range and ANZECC Guidelines
Criteria (6.5 – 8.0). Not attributable to MGO.
BMC1 Jan – Feb, April - June
EC 7880 (max)
1288 360 - 3,880
One result outside of historical range (January). Results returned to within historical range
following January result. Site is upstream of MGO. Result not attributable to MGO.
BMC1 March TSS 1620 (max)
10 1 - 100 One result outside of historical range (March). Likely due to increased creek flow following elevated rainfall. Not attributable to MGO.
BMC2 Feb – Mar, May – July, Oct and Dec
pH 6.0 (min)
& 7.7 (max)
7.8 - 8.1 7.2 - 8.8
One result outside of historical range (February). Result was within ANZECC
Guidelines Criteria (6.5 – 8.0). Not attributable to MGO.
BMC2 Feb - June EC 1873 (max)
1386 334 - 2820 Within historical range. Not attributable to
MGO.
BMC2 Feb and March
TSS 92 (max) 26 1 - 642 Within historical range. Not attributable to
MGO.
BMC3 May – July, Oct and Dec
pH 7.4 (min) and 7.7 (max)
7.8 - 8.1 7.2 - 8.4 Within historical range and ANZECC Guidelines
Criteria (6.5 – 8.0). Not attributable to MGO.
BMC4 Jan – May,
Oct and Dec pH
6.9 (min) and 7.4 (max)
7.5 – 8.0 7.0 – 8.21
One result outside of historical range (February). Result was within ANZECC
Guidelines Criteria (6.5 – 8.0). Not attributable to MGO.
BMC4 Jan - July EC 2100 (max)
1257 503 - 1956
One result outside of historical range (January). Results returned to within historical range following January result. Not attributable to
MGO.
BMC4 Jan and Sep TSS 25 (max) 17 2 - 201 Within historical range. Not attributable to
MGO.
BMC5
Feb, April, May, July and Sep -
Dec
pH 7.1 (min) and 8.2 (max)
7.7 – 8.0 7.2 – 8.6 One result outside of historical range (April).
Result was within ANZECC Guidelines Criteria (6.5 – 8.0). Not attributable to MGO.
BMC5 March and
June TSS 49 (max) 14 1 - 64
Within historical range. Not attributable to MGO.
Bowmans Creek was assessed for stream stability and stream health at two locations and results are included in
Table 45. In 2020, the stream condition has remaining static at both monitoring points since monitoring in 2019.
There has also been no overall change in stream health classification. The ‘Very Poor’ stream health classification
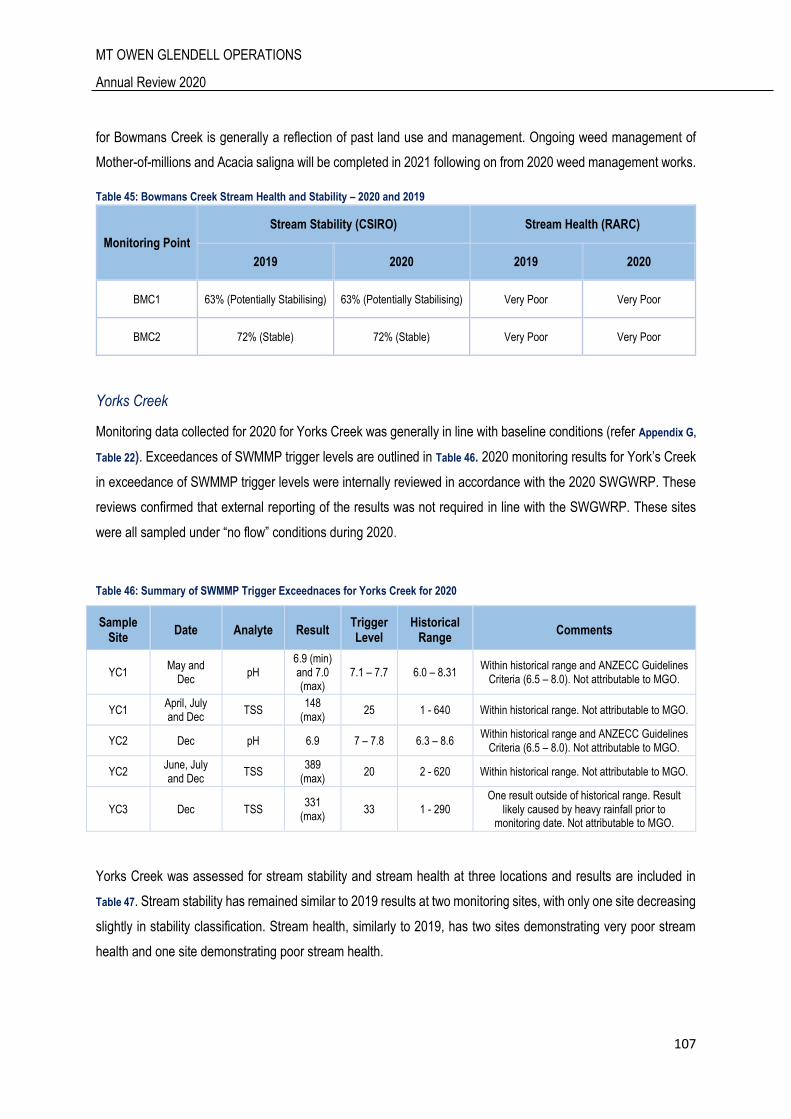
MT OWEN GLENDELL OPERATIONS
Annual Review 2020
107
for Bowmans Creek is generally a reflection of past land use and management. Ongoing weed management of
Mother-of-millions and Acacia saligna will be completed in 2021 following on from 2020 weed management works.
Table 45: Bowmans Creek Stream Health and Stability – 2020 and 2019
Monitoring Point
Stream Stability (CSIRO) Stream Health (RARC)
2019 2020 2019 2020
BMC1 63% (Potentially Stabilising) 63% (Potentially Stabilising) Very Poor Very Poor
BMC2 72% (Stable) 72% (Stable) Very Poor Very Poor
Yorks Creek
Monitoring data collected for 2020 for Yorks Creek was generally in line with baseline conditions (refer Appendix G,
Table 22). Exceedances of SWMMP trigger levels are outlined in Table 46. 2020 monitoring results for York’s Creek
in exceedance of SWMMP trigger levels were internally reviewed in accordance with the 2020 SWGWRP. These
reviews confirmed that external reporting of the results was not required in line with the SWGWRP. These sites
were all sampled under “no flow” conditions during 2020.
Table 46: Summary of SWMMP Trigger Exceednaces for Yorks Creek for 2020
Sample Site
Date Analyte Result Trigger Level
Historical Range
Comments
YC1 May and
Dec pH
6.9 (min) and 7.0 (max)
7.1 – 7.7 6.0 – 8.31 Within historical range and ANZECC Guidelines
Criteria (6.5 – 8.0). Not attributable to MGO.
YC1 April, July and Dec
TSS 148
(max) 25 1 - 640 Within historical range. Not attributable to MGO.
YC2 Dec pH 6.9 7 – 7.8 6.3 – 8.6 Within historical range and ANZECC Guidelines
Criteria (6.5 – 8.0). Not attributable to MGO.
YC2 June, July and Dec
TSS 389
(max) 20 2 - 620 Within historical range. Not attributable to MGO.
YC3 Dec TSS 331
(max) 33 1 - 290
One result outside of historical range. Result likely caused by heavy rainfall prior to
monitoring date. Not attributable to MGO.
Yorks Creek was assessed for stream stability and stream health at three locations and results are included in
Table 47. Stream stability has remained similar to 2019 results at two monitoring sites, with only one site decreasing
slightly in stability classification. Stream health, similarly to 2019, has two sites demonstrating very poor stream
health and one site demonstrating poor stream health.
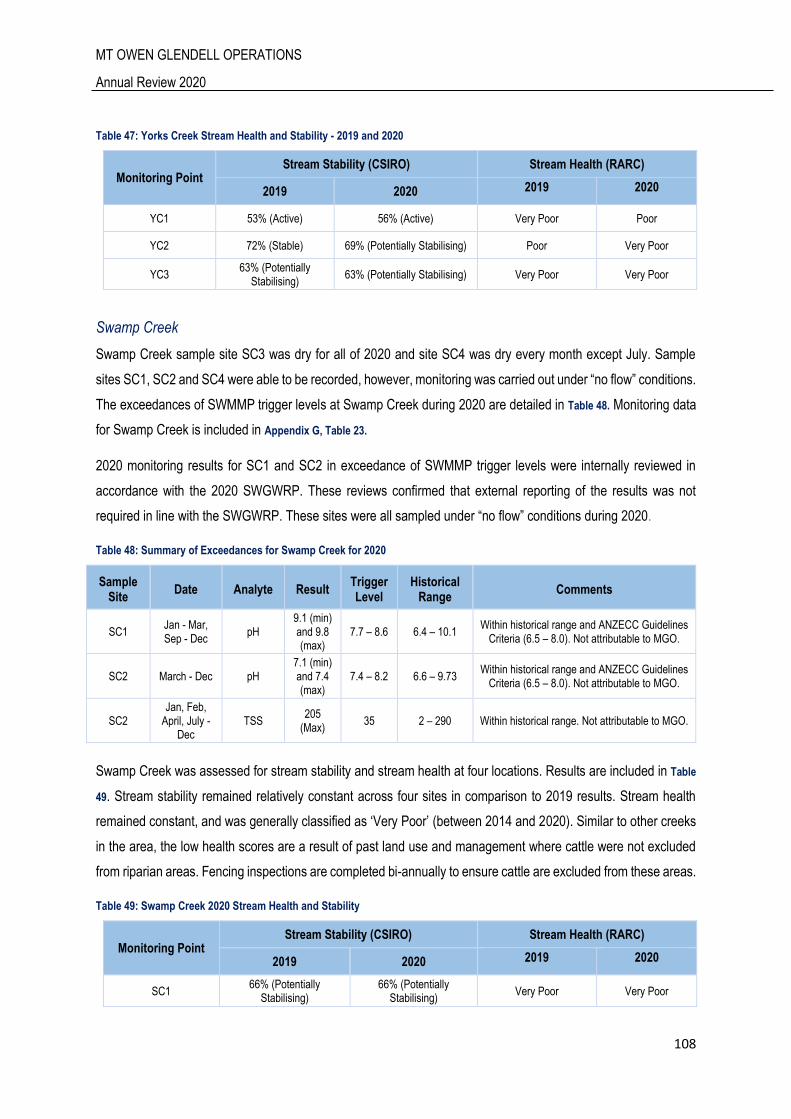
MT OWEN GLENDELL OPERATIONS
Annual Review 2020
108
Table 47: Yorks Creek Stream Health and Stability - 2019 and 2020
Monitoring Point Stream Stability (CSIRO) Stream Health (RARC)
2019 2020 2019 2020
YC1 53% (Active) 56% (Active) Very Poor Poor
YC2 72% (Stable) 69% (Potentially Stabilising) Poor Very Poor
YC3 63% (Potentially
Stabilising) 63% (Potentially Stabilising) Very Poor Very Poor
Swamp Creek
Swamp Creek sample site SC3 was dry for all of 2020 and site SC4 was dry every month except July. Sample
sites SC1, SC2 and SC4 were able to be recorded, however, monitoring was carried out under “no flow” conditions.
The exceedances of SWMMP trigger levels at Swamp Creek during 2020 are detailed in Table 48. Monitoring data
for Swamp Creek is included in Appendix G, Table 23.
2020 monitoring results for SC1 and SC2 in exceedance of SWMMP trigger levels were internally reviewed in
accordance with the 2020 SWGWRP. These reviews confirmed that external reporting of the results was not
required in line with the SWGWRP. These sites were all sampled under “no flow” conditions during 2020.
Table 48: Summary of Exceedances for Swamp Creek for 2020
Sample Site
Date Analyte Result Trigger Level
Historical Range
Comments
SC1 Jan - Mar, Sep - Dec
pH 9.1 (min) and 9.8 (max)
7.7 – 8.6 6.4 – 10.1 Within historical range and ANZECC Guidelines
Criteria (6.5 – 8.0). Not attributable to MGO.
SC2 March - Dec pH 7.1 (min) and 7.4 (max)
7.4 – 8.2 6.6 – 9.73 Within historical range and ANZECC Guidelines
Criteria (6.5 – 8.0). Not attributable to MGO.
SC2 Jan, Feb,
April, July - Dec
TSS 205
(Max) 35 2 – 290 Within historical range. Not attributable to MGO.
Swamp Creek was assessed for stream stability and stream health at four locations. Results are included in Table
49. Stream stability remained relatively constant across four sites in comparison to 2019 results. Stream health
remained constant, and was generally classified as ‘Very Poor’ (between 2014 and 2020). Similar to other creeks
in the area, the low health scores are a result of past land use and management where cattle were not excluded
from riparian areas. Fencing inspections are completed bi-annually to ensure cattle are excluded from these areas.
Table 49: Swamp Creek 2020 Stream Health and Stability
Monitoring Point Stream Stability (CSIRO) Stream Health (RARC)
2019 2020 2019 2020
SC1 66% (Potentially
Stabilising) 66% (Potentially
Stabilising) Very Poor Very Poor
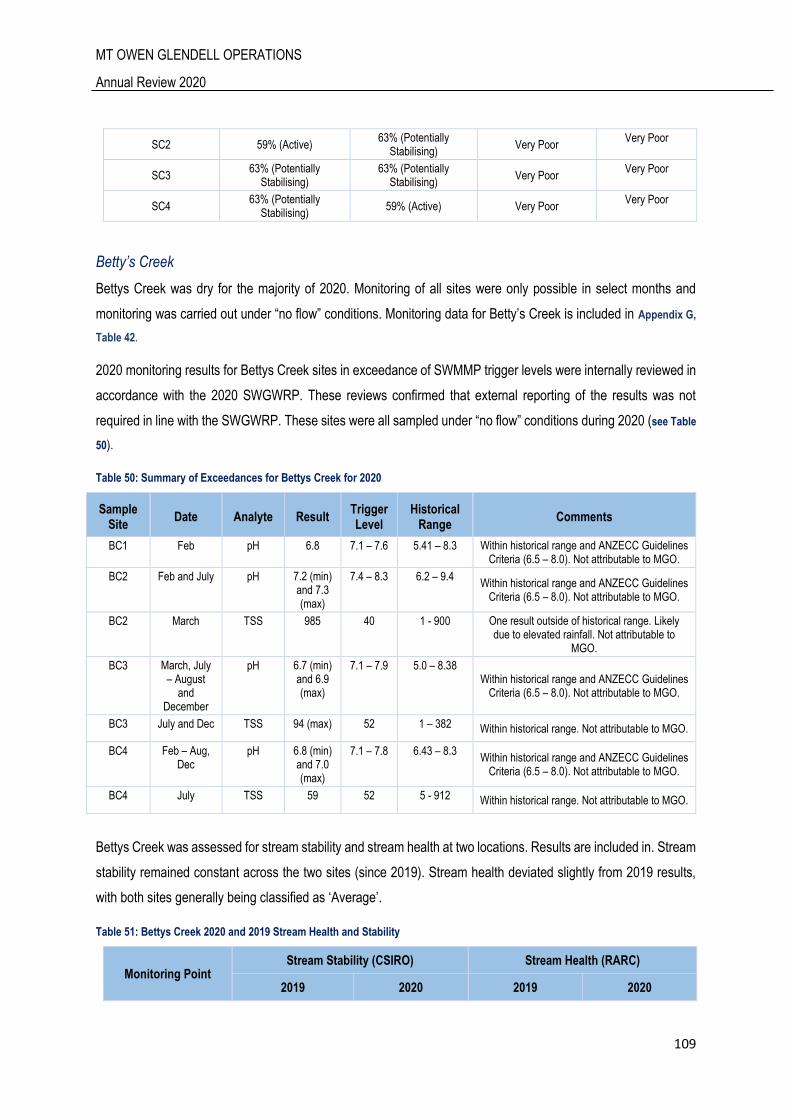
MT OWEN GLENDELL OPERATIONS
Annual Review 2020
109
SC2 59% (Active) 63% (Potentially
Stabilising) Very Poor
Very Poor
SC3 63% (Potentially
Stabilising) 63% (Potentially
Stabilising) Very Poor
Very Poor
SC4 63% (Potentially
Stabilising) 59% (Active) Very Poor
Very Poor
Betty’s Creek
Bettys Creek was dry for the majority of 2020. Monitoring of all sites were only possible in select months and
monitoring was carried out under “no flow” conditions. Monitoring data for Betty’s Creek is included in Appendix G,
Table 42.
2020 monitoring results for Bettys Creek sites in exceedance of SWMMP trigger levels were internally reviewed in
accordance with the 2020 SWGWRP. These reviews confirmed that external reporting of the results was not
required in line with the SWGWRP. These sites were all sampled under “no flow” conditions during 2020 (see Table
50).
Table 50: Summary of Exceedances for Bettys Creek for 2020
Sample Site
Date Analyte Result Trigger Level
Historical Range
Comments
BC1 Feb pH 6.8 7.1 – 7.6 5.41 – 8.3 Within historical range and ANZECC Guidelines Criteria (6.5 – 8.0). Not attributable to MGO.
BC2 Feb and July pH 7.2 (min) and 7.3 (max)
7.4 – 8.3 6.2 – 9.4 Within historical range and ANZECC Guidelines
Criteria (6.5 – 8.0). Not attributable to MGO.
BC2 March TSS 985 40 1 - 900 One result outside of historical range. Likely due to elevated rainfall. Not attributable to
MGO.
BC3 March, July – August
and December
pH 6.7 (min) and 6.9 (max)
7.1 – 7.9 5.0 – 8.38 Within historical range and ANZECC Guidelines
Criteria (6.5 – 8.0). Not attributable to MGO.
BC3 July and Dec TSS 94 (max) 52 1 – 382 Within historical range. Not attributable to MGO.
BC4 Feb – Aug, Dec
pH 6.8 (min) and 7.0 (max)
7.1 – 7.8 6.43 – 8.3 Within historical range and ANZECC Guidelines
Criteria (6.5 – 8.0). Not attributable to MGO.
BC4 July TSS 59 52 5 - 912 Within historical range. Not attributable to MGO.
Bettys Creek was assessed for stream stability and stream health at two locations. Results are included in. Stream
stability remained constant across the two sites (since 2019). Stream health deviated slightly from 2019 results,
with both sites generally being classified as ‘Average’.
Table 51: Bettys Creek 2020 and 2019 Stream Health and Stability
Monitoring Point Stream Stability (CSIRO) Stream Health (RARC)
2019 2020 2019 2020
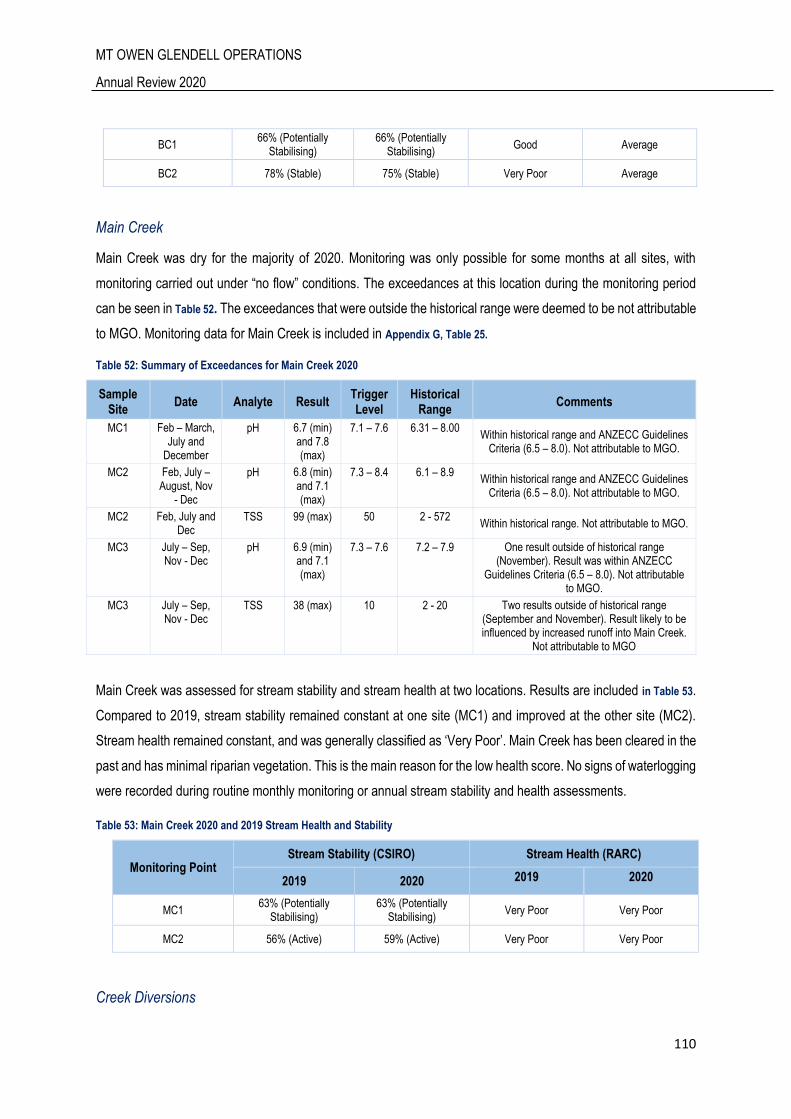
MT OWEN GLENDELL OPERATIONS
Annual Review 2020
110
BC1 66% (Potentially
Stabilising) 66% (Potentially
Stabilising) Good Average
BC2 78% (Stable) 75% (Stable) Very Poor Average
Main Creek
Main Creek was dry for the majority of 2020. Monitoring was only possible for some months at all sites, with
monitoring carried out under “no flow” conditions. The exceedances at this location during the monitoring period
can be seen in Table 52. The exceedances that were outside the historical range were deemed to be not attributable
to MGO. Monitoring data for Main Creek is included in Appendix G, Table 25.
Table 52: Summary of Exceedances for Main Creek 2020
Sample Site
Date Analyte Result Trigger Level
Historical Range
Comments
MC1 Feb – March, July and
December
pH 6.7 (min) and 7.8 (max)
7.1 – 7.6 6.31 – 8.00 Within historical range and ANZECC Guidelines
Criteria (6.5 – 8.0). Not attributable to MGO.
MC2 Feb, July – August, Nov
- Dec
pH 6.8 (min) and 7.1 (max)
7.3 – 8.4 6.1 – 8.9 Within historical range and ANZECC Guidelines
Criteria (6.5 – 8.0). Not attributable to MGO.
MC2 Feb, July and Dec
TSS 99 (max) 50 2 - 572 Within historical range. Not attributable to MGO.
MC3 July – Sep, Nov - Dec
pH 6.9 (min) and 7.1 (max)
7.3 – 7.6 7.2 – 7.9 One result outside of historical range (November). Result was within ANZECC
Guidelines Criteria (6.5 – 8.0). Not attributable to MGO.
MC3 July – Sep, Nov - Dec
TSS 38 (max) 10 2 - 20 Two results outside of historical range (September and November). Result likely to be influenced by increased runoff into Main Creek.
Not attributable to MGO
Main Creek was assessed for stream stability and stream health at two locations. Results are included in Table 53.
Compared to 2019, stream stability remained constant at one site (MC1) and improved at the other site (MC2).
Stream health remained constant, and was generally classified as ‘Very Poor’. Main Creek has been cleared in the
past and has minimal riparian vegetation. This is the main reason for the low health score. No signs of waterlogging
were recorded during routine monthly monitoring or annual stream stability and health assessments.
Table 53: Main Creek 2020 and 2019 Stream Health and Stability
Monitoring Point Stream Stability (CSIRO) Stream Health (RARC)
2019 2020 2019 2020
MC1 63% (Potentially
Stabilising) 63% (Potentially
Stabilising) Very Poor Very Poor
MC2 56% (Active) 59% (Active) Very Poor Very Poor
Creek Diversions
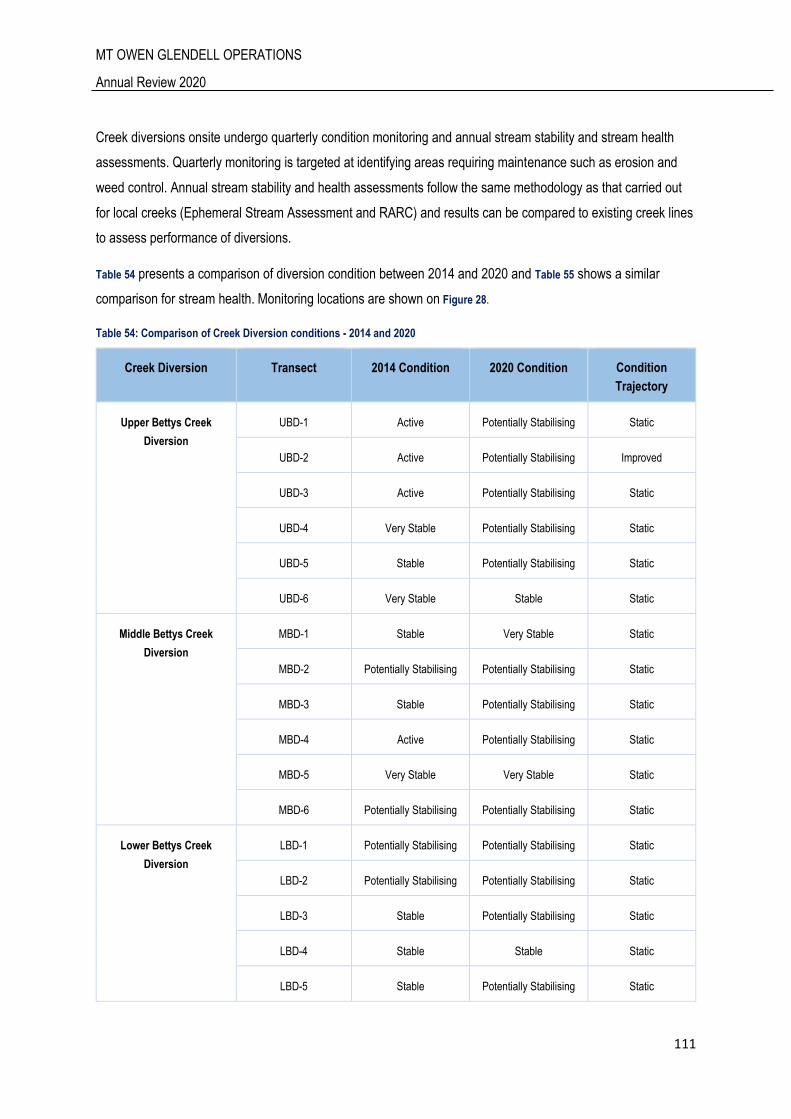
MT OWEN GLENDELL OPERATIONS
Annual Review 2020
111
Creek diversions onsite undergo quarterly condition monitoring and annual stream stability and stream health
assessments. Quarterly monitoring is targeted at identifying areas requiring maintenance such as erosion and
weed control. Annual stream stability and health assessments follow the same methodology as that carried out
for local creeks (Ephemeral Stream Assessment and RARC) and results can be compared to existing creek lines
to assess performance of diversions.
Table 54 presents a comparison of diversion condition between 2014 and 2020 and Table 55 shows a similar
comparison for stream health. Monitoring locations are shown on Figure 28.
Table 54: Comparison of Creek Diversion conditions - 2014 and 2020
Creek Diversion Transect 2014 Condition 2020 Condition Condition
Trajectory
Upper Bettys Creek
Diversion
UBD-1 Active Potentially Stabilising Static
UBD-2 Active Potentially Stabilising Improved
UBD-3 Active Potentially Stabilising Static
UBD-4 Very Stable Potentially Stabilising Static
UBD-5 Stable Potentially Stabilising Static
UBD-6 Very Stable Stable Static
Middle Bettys Creek
Diversion
MBD-1 Stable Very Stable Static
MBD-2 Potentially Stabilising Potentially Stabilising Static
MBD-3 Stable Potentially Stabilising Static
MBD-4 Active Potentially Stabilising Static
MBD-5 Very Stable Very Stable Static
MBD-6 Potentially Stabilising Potentially Stabilising Static
Lower Bettys Creek
Diversion
LBD-1 Potentially Stabilising Potentially Stabilising Static
LBD-2 Potentially Stabilising Potentially Stabilising Static
LBD-3 Stable Potentially Stabilising Static
LBD-4 Stable Stable Static
LBD-5 Stable Potentially Stabilising Static
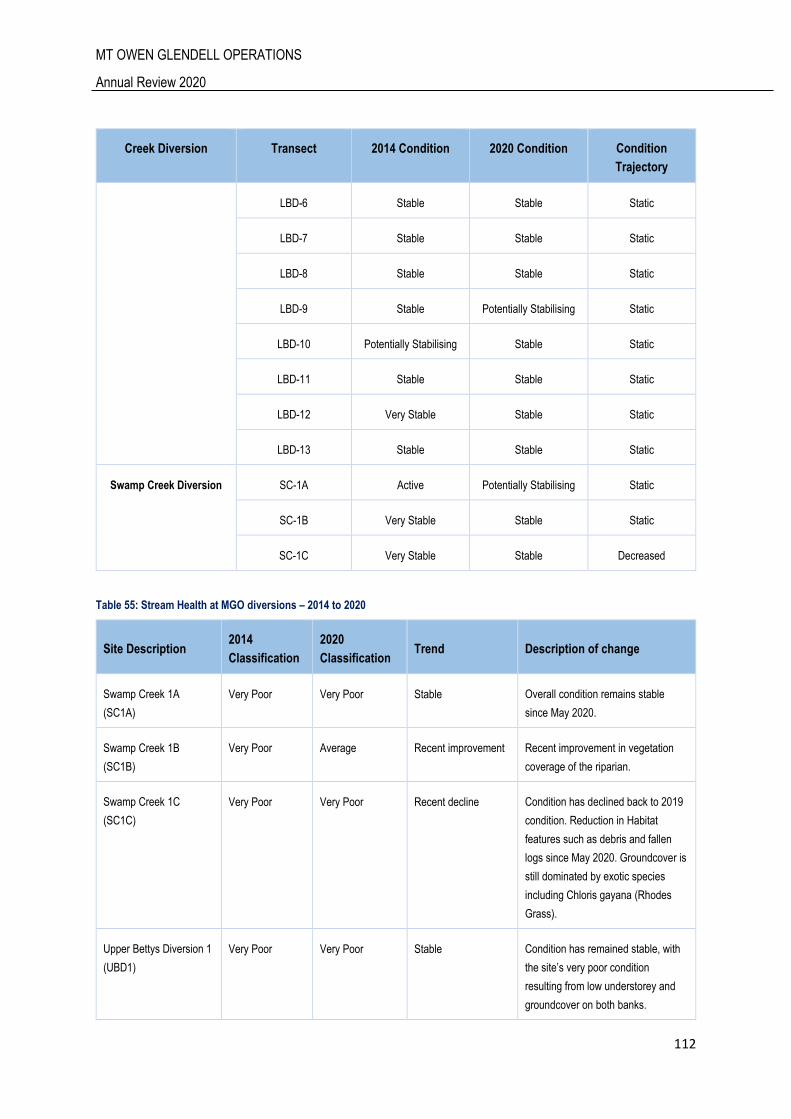
MT OWEN GLENDELL OPERATIONS
Annual Review 2020
112
Creek Diversion Transect 2014 Condition 2020 Condition Condition
Trajectory
LBD-6 Stable Stable Static
LBD-7 Stable Stable Static
LBD-8 Stable Stable Static
LBD-9 Stable Potentially Stabilising Static
LBD-10 Potentially Stabilising Stable Static
LBD-11 Stable Stable Static
LBD-12 Very Stable Stable Static
LBD-13 Stable Stable Static
Swamp Creek Diversion SC-1A Active Potentially Stabilising Static
SC-1B Very Stable Stable Static
SC-1C Very Stable Stable Decreased
Table 55: Stream Health at MGO diversions – 2014 to 2020
Site Description 2014
Classification
2020
Classification Trend Description of change
Swamp Creek 1A
(SC1A)
Very Poor Very Poor Stable Overall condition remains stable
since May 2020.
Swamp Creek 1B
(SC1B)
Very Poor Average Recent improvement Recent improvement in vegetation
coverage of the riparian.
Swamp Creek 1C
(SC1C)
Very Poor Very Poor Recent decline Condition has declined back to 2019
condition. Reduction in Habitat
features such as debris and fallen
logs since May 2020. Groundcover is
still dominated by exotic species
including Chloris gayana (Rhodes
Grass).
Upper Bettys Diversion 1
(UBD1)
Very Poor Very Poor Stable Condition has remained stable, with
the site’s very poor condition
resulting from low understorey and
groundcover on both banks.
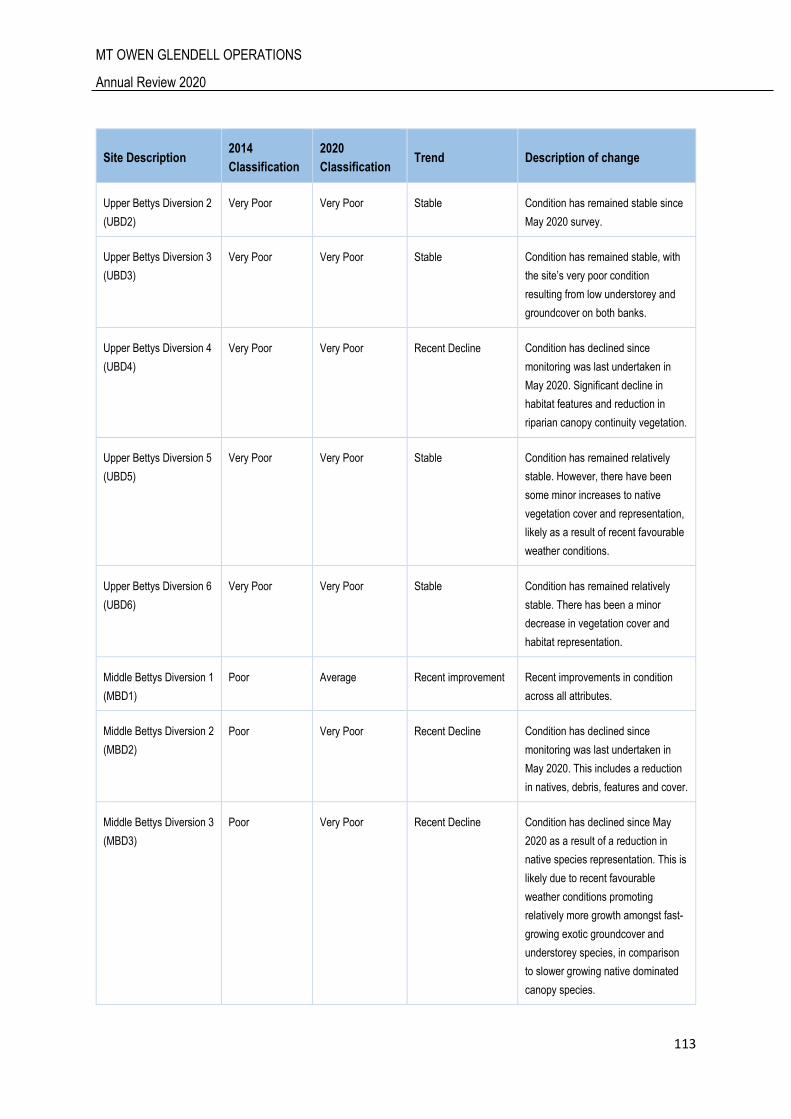
MT OWEN GLENDELL OPERATIONS
Annual Review 2020
113
Site Description 2014
Classification
2020
Classification Trend Description of change
Upper Bettys Diversion 2
(UBD2)
Very Poor Very Poor Stable Condition has remained stable since
May 2020 survey.
Upper Bettys Diversion 3
(UBD3)
Very Poor Very Poor Stable Condition has remained stable, with
the site’s very poor condition
resulting from low understorey and
groundcover on both banks.
Upper Bettys Diversion 4
(UBD4)
Very Poor Very Poor Recent Decline Condition has declined since
monitoring was last undertaken in
May 2020. Significant decline in
habitat features and reduction in
riparian canopy continuity vegetation.
Upper Bettys Diversion 5
(UBD5)
Very Poor Very Poor Stable Condition has remained relatively
stable. However, there have been
some minor increases to native
vegetation cover and representation,
likely as a result of recent favourable
weather conditions.
Upper Bettys Diversion 6
(UBD6)
Very Poor Very Poor Stable Condition has remained relatively
stable. There has been a minor
decrease in vegetation cover and
habitat representation.
Middle Bettys Diversion 1
(MBD1)
Poor Average Recent improvement Recent improvements in condition
across all attributes.
Middle Bettys Diversion 2
(MBD2)
Poor Very Poor Recent Decline Condition has declined since
monitoring was last undertaken in
May 2020. This includes a reduction
in natives, debris, features and cover.
Middle Bettys Diversion 3
(MBD3)
Poor Very Poor Recent Decline Condition has declined since May
2020 as a result of a reduction in
native species representation. This is
likely due to recent favourable
weather conditions promoting
relatively more growth amongst fast-
growing exotic groundcover and
understorey species, in comparison
to slower growing native dominated
canopy species.
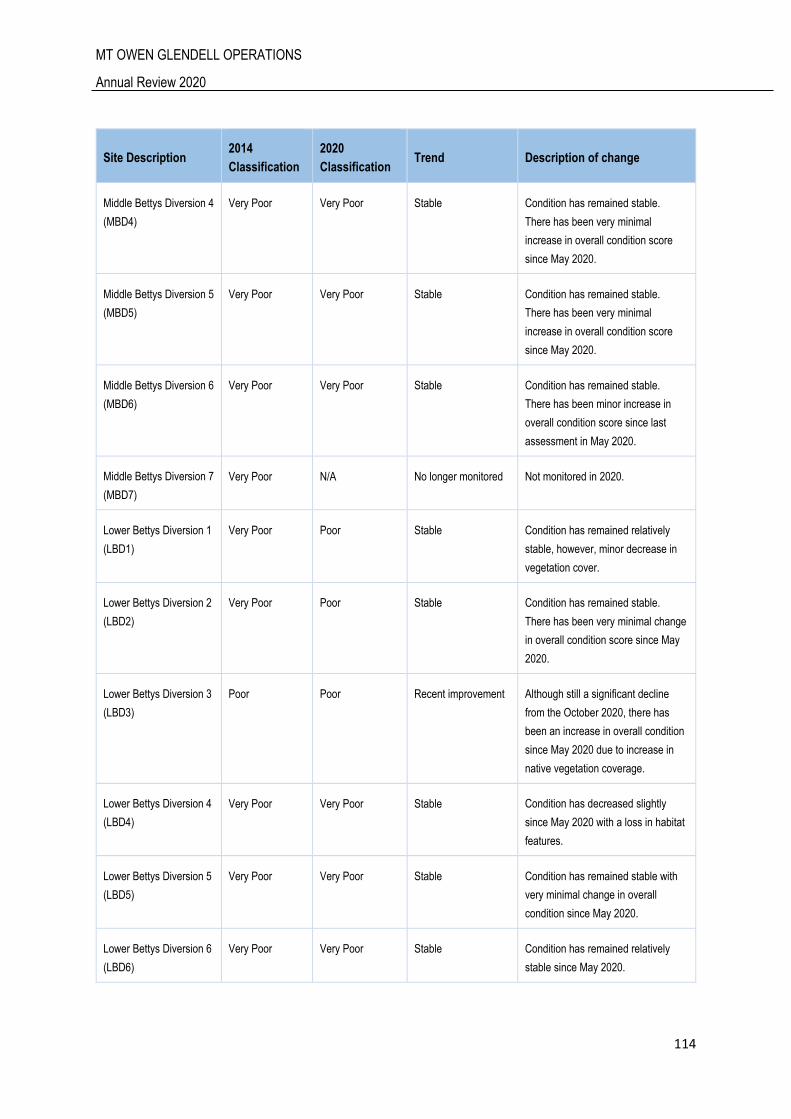
MT OWEN GLENDELL OPERATIONS
Annual Review 2020
114
Site Description 2014
Classification
2020
Classification Trend Description of change
Middle Bettys Diversion 4
(MBD4)
Very Poor Very Poor Stable Condition has remained stable.
There has been very minimal
increase in overall condition score
since May 2020.
Middle Bettys Diversion 5
(MBD5)
Very Poor Very Poor Stable Condition has remained stable.
There has been very minimal
increase in overall condition score
since May 2020.
Middle Bettys Diversion 6
(MBD6)
Very Poor Very Poor Stable Condition has remained stable.
There has been minor increase in
overall condition score since last
assessment in May 2020.
Middle Bettys Diversion 7
(MBD7)
Very Poor N/A No longer monitored Not monitored in 2020.
Lower Bettys Diversion 1
(LBD1)
Very Poor Poor Stable Condition has remained relatively
stable, however, minor decrease in
vegetation cover.
Lower Bettys Diversion 2
(LBD2)
Very Poor Poor Stable Condition has remained stable.
There has been very minimal change
in overall condition score since May
2020.
Lower Bettys Diversion 3
(LBD3)
Poor Poor Recent improvement Although still a significant decline
from the October 2020, there has
been an increase in overall condition
since May 2020 due to increase in
native vegetation coverage.
Lower Bettys Diversion 4
(LBD4)
Very Poor Very Poor Stable Condition has decreased slightly
since May 2020 with a loss in habitat
features.
Lower Bettys Diversion 5
(LBD5)
Very Poor Very Poor Stable Condition has remained stable with
very minimal change in overall
condition since May 2020.
Lower Bettys Diversion 6
(LBD6)
Very Poor Very Poor Stable Condition has remained relatively
stable since May 2020.
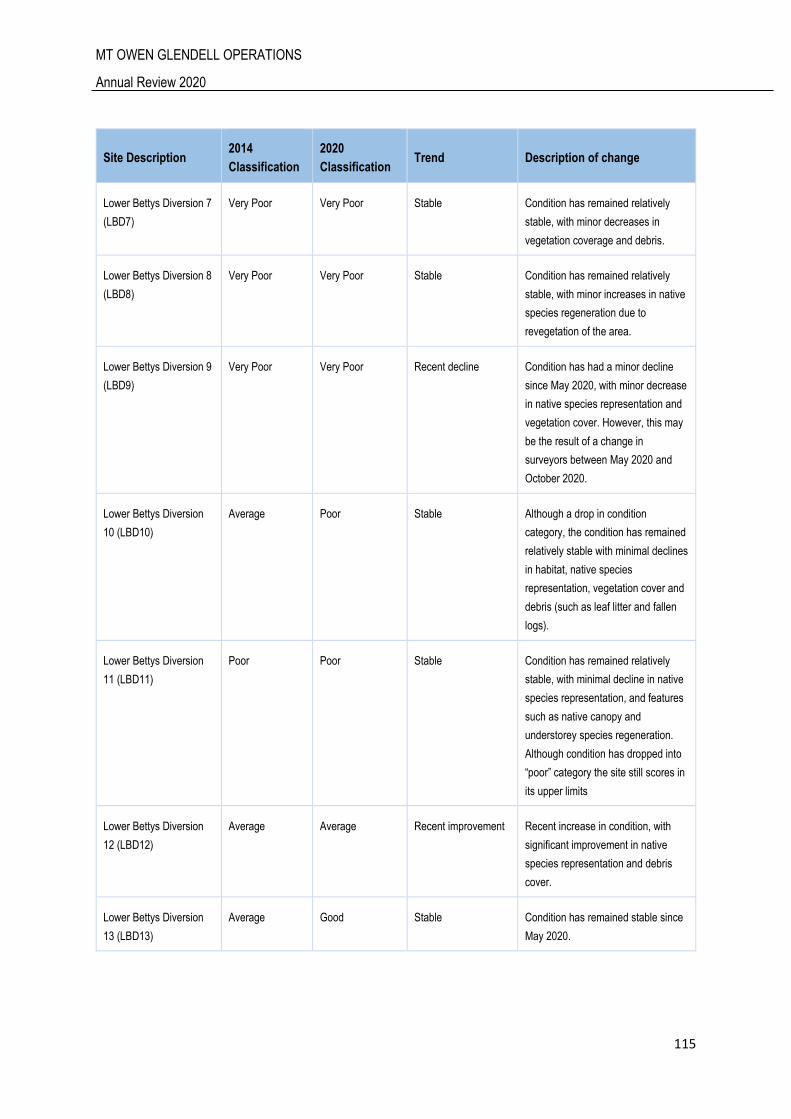
MT OWEN GLENDELL OPERATIONS
Annual Review 2020
115
Site Description 2014
Classification
2020
Classification Trend Description of change
Lower Bettys Diversion 7
(LBD7)
Very Poor Very Poor Stable Condition has remained relatively
stable, with minor decreases in
vegetation coverage and debris.
Lower Bettys Diversion 8
(LBD8)
Very Poor Very Poor Stable Condition has remained relatively
stable, with minor increases in native
species regeneration due to
revegetation of the area.
Lower Bettys Diversion 9
(LBD9)
Very Poor Very Poor Recent decline Condition has had a minor decline
since May 2020, with minor decrease
in native species representation and
vegetation cover. However, this may
be the result of a change in
surveyors between May 2020 and
October 2020.
Lower Bettys Diversion
10 (LBD10)
Average Poor Stable Although a drop in condition
category, the condition has remained
relatively stable with minimal declines
in habitat, native species
representation, vegetation cover and
debris (such as leaf litter and fallen
logs).
Lower Bettys Diversion
11 (LBD11)
Poor Poor Stable Condition has remained relatively
stable, with minimal decline in native
species representation, and features
such as native canopy and
understorey species regeneration.
Although condition has dropped into
“poor” category the site still scores in
its upper limits
Lower Bettys Diversion
12 (LBD12)
Average Average Recent improvement Recent increase in condition, with
significant improvement in native
species representation and debris
cover.
Lower Bettys Diversion
13 (LBD13)
Average Good Stable Condition has remained stable since
May 2020.
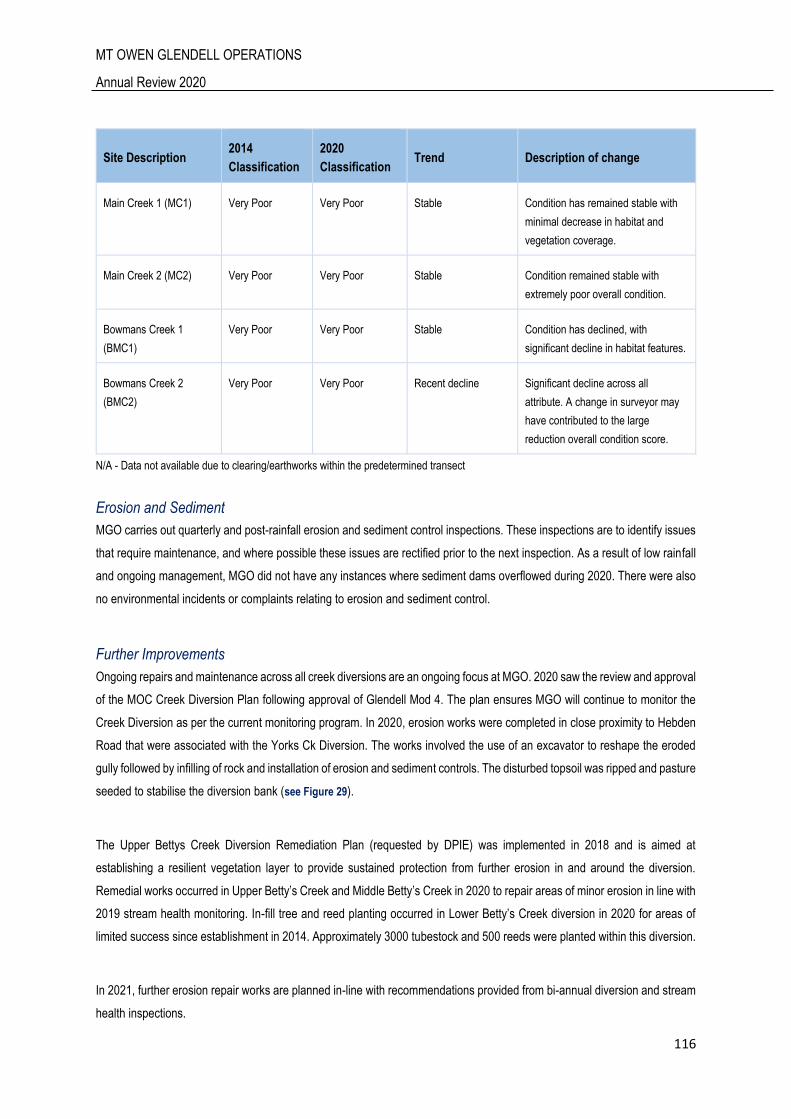
MT OWEN GLENDELL OPERATIONS
Annual Review 2020
116
Site Description 2014
Classification
2020
Classification Trend Description of change
Main Creek 1 (MC1) Very Poor Very Poor Stable Condition has remained stable with
minimal decrease in habitat and
vegetation coverage.
Main Creek 2 (MC2) Very Poor Very Poor Stable Condition remained stable with
extremely poor overall condition.
Bowmans Creek 1
(BMC1)
Very Poor Very Poor Stable Condition has declined, with
significant decline in habitat features.
Bowmans Creek 2
(BMC2)
Very Poor Very Poor Recent decline Significant decline across all
attribute. A change in surveyor may
have contributed to the large
reduction overall condition score.
N/A - Data not available due to clearing/earthworks within the predetermined transect
Erosion and Sediment
MGO carries out quarterly and post-rainfall erosion and sediment control inspections. These inspections are to identify issues
that require maintenance, and where possible these issues are rectified prior to the next inspection. As a result of low rainfall
and ongoing management, MGO did not have any instances where sediment dams overflowed during 2020. There were also
no environmental incidents or complaints relating to erosion and sediment control.
Further Improvements
Ongoing repairs and maintenance across all creek diversions are an ongoing focus at MGO. 2020 saw the review and approval
of the MOC Creek Diversion Plan following approval of Glendell Mod 4. The plan ensures MGO will continue to monitor the
Creek Diversion as per the current monitoring program. In 2020, erosion works were completed in close proximity to Hebden
Road that were associated with the Yorks Ck Diversion. The works involved the use of an excavator to reshape the eroded
gully followed by infilling of rock and installation of erosion and sediment controls. The disturbed topsoil was ripped and pasture
seeded to stabilise the diversion bank (see Figure 29).
The Upper Bettys Creek Diversion Remediation Plan (requested by DPIE) was implemented in 2018 and is aimed at
establishing a resilient vegetation layer to provide sustained protection from further erosion in and around the diversion.
Remedial works occurred in Upper Betty’s Creek and Middle Betty’s Creek in 2020 to repair areas of minor erosion in line with
2019 stream health monitoring. In-fill tree and reed planting occurred in Lower Betty’s Creek diversion in 2020 for areas of
limited success since establishment in 2014. Approximately 3000 tubestock and 500 reeds were planted within this diversion.
In 2021, further erosion repair works are planned in-line with recommendations provided from bi-annual diversion and stream
health inspections.
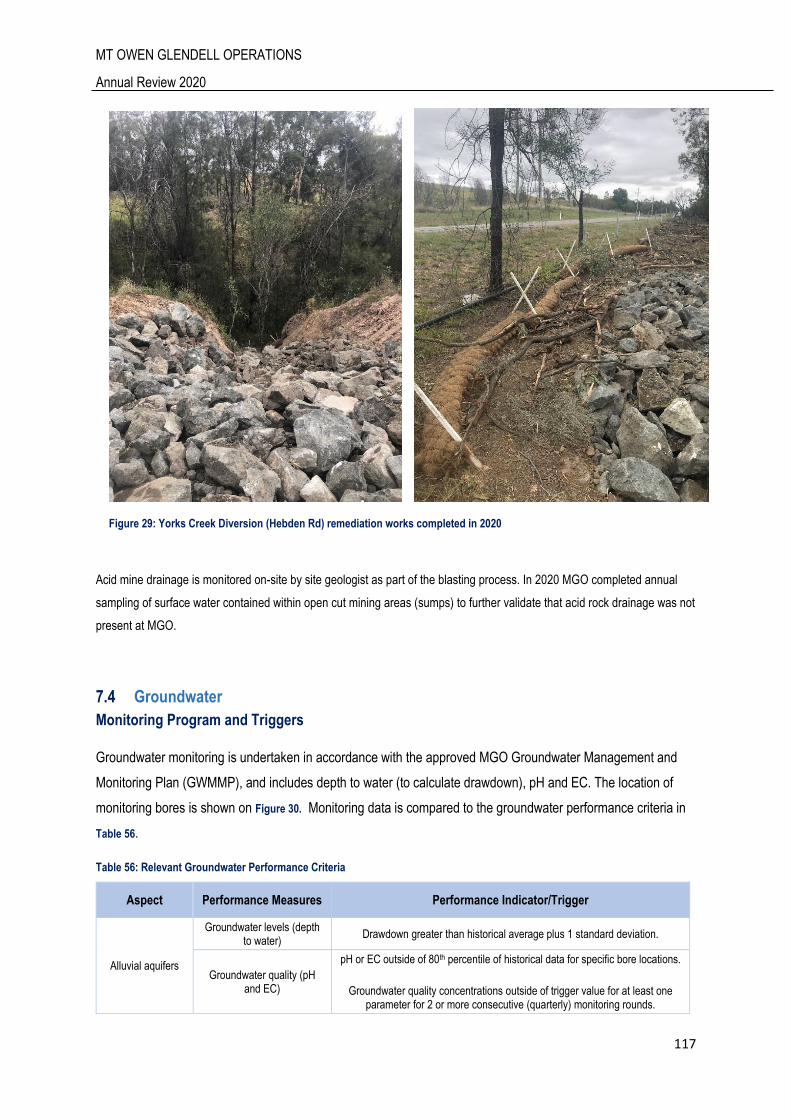
MT OWEN GLENDELL OPERATIONS
Annual Review 2020
117
Figure 29: Yorks Creek Diversion (Hebden Rd) remediation works completed in 2020
Acid mine drainage is monitored on-site by site geologist as part of the blasting process. In 2020 MGO completed annual
sampling of surface water contained within open cut mining areas (sumps) to further validate that acid rock drainage was not
present at MGO.
7.4 Groundwater
Monitoring Program and Triggers
Groundwater monitoring is undertaken in accordance with the approved MGO Groundwater Management and
Monitoring Plan (GWMMP), and includes depth to water (to calculate drawdown), pH and EC. The location of
monitoring bores is shown on Figure 30. Monitoring data is compared to the groundwater performance criteria in
Table 56.
Table 56: Relevant Groundwater Performance Criteria
Aspect Performance Measures Performance Indicator/Trigger
Alluvial aquifers
Groundwater levels (depth to water)
Drawdown greater than historical average plus 1 standard deviation.
Groundwater quality (pH and EC)
pH or EC outside of 80th percentile of historical data for specific bore locations.
Groundwater quality concentrations outside of trigger value for at least one parameter for 2 or more consecutive (quarterly) monitoring rounds.
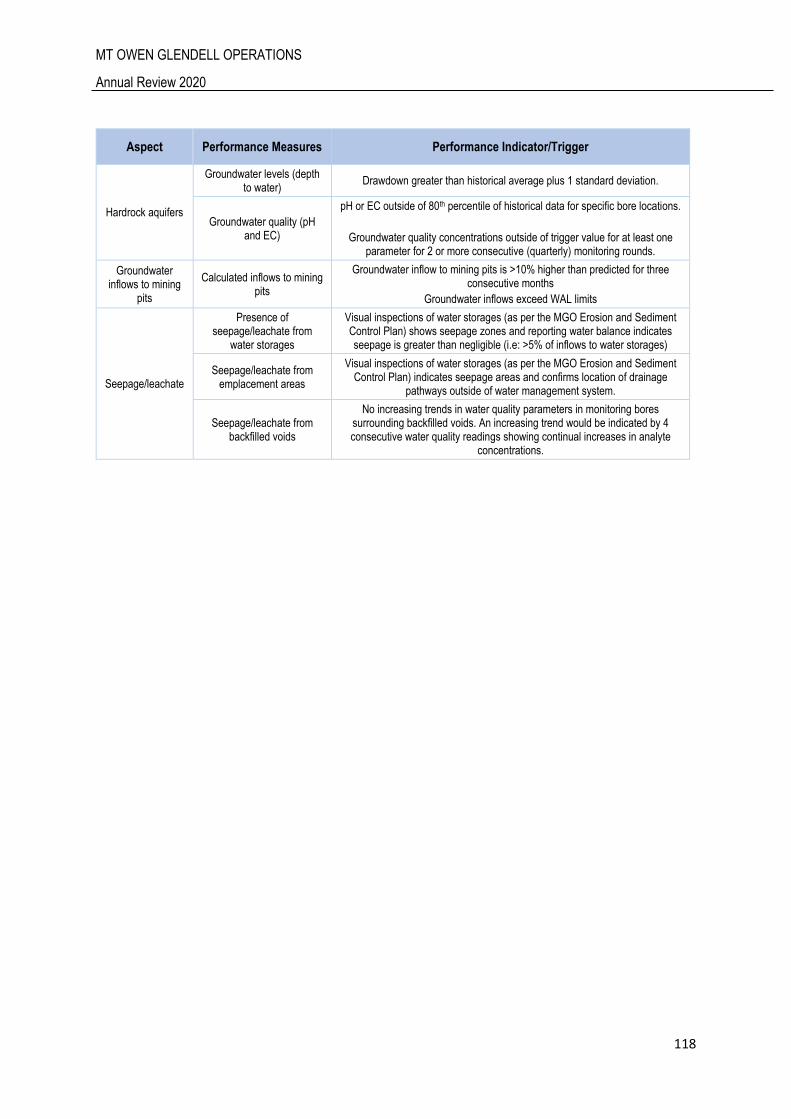
MT OWEN GLENDELL OPERATIONS
Annual Review 2020
118
Aspect Performance Measures Performance Indicator/Trigger
Hardrock aquifers
Groundwater levels (depth to water)
Drawdown greater than historical average plus 1 standard deviation.
Groundwater quality (pH and EC)
pH or EC outside of 80th percentile of historical data for specific bore locations.
Groundwater quality concentrations outside of trigger value for at least one parameter for 2 or more consecutive (quarterly) monitoring rounds.
Groundwater inflows to mining
pits
Calculated inflows to mining pits
Groundwater inflow to mining pits is >10% higher than predicted for three consecutive months
Groundwater inflows exceed WAL limits
Seepage/leachate
Presence of seepage/leachate from
water storages
Visual inspections of water storages (as per the MGO Erosion and Sediment Control Plan) shows seepage zones and reporting water balance indicates seepage is greater than negligible (i.e: >5% of inflows to water storages)
Seepage/leachate from emplacement areas
Visual inspections of water storages (as per the MGO Erosion and Sediment Control Plan) indicates seepage areas and confirms location of drainage
pathways outside of water management system.
Seepage/leachate from backfilled voids
No increasing trends in water quality parameters in monitoring bores surrounding backfilled voids. An increasing trend would be indicated by 4 consecutive water quality readings showing continual increases in analyte
concentrations.
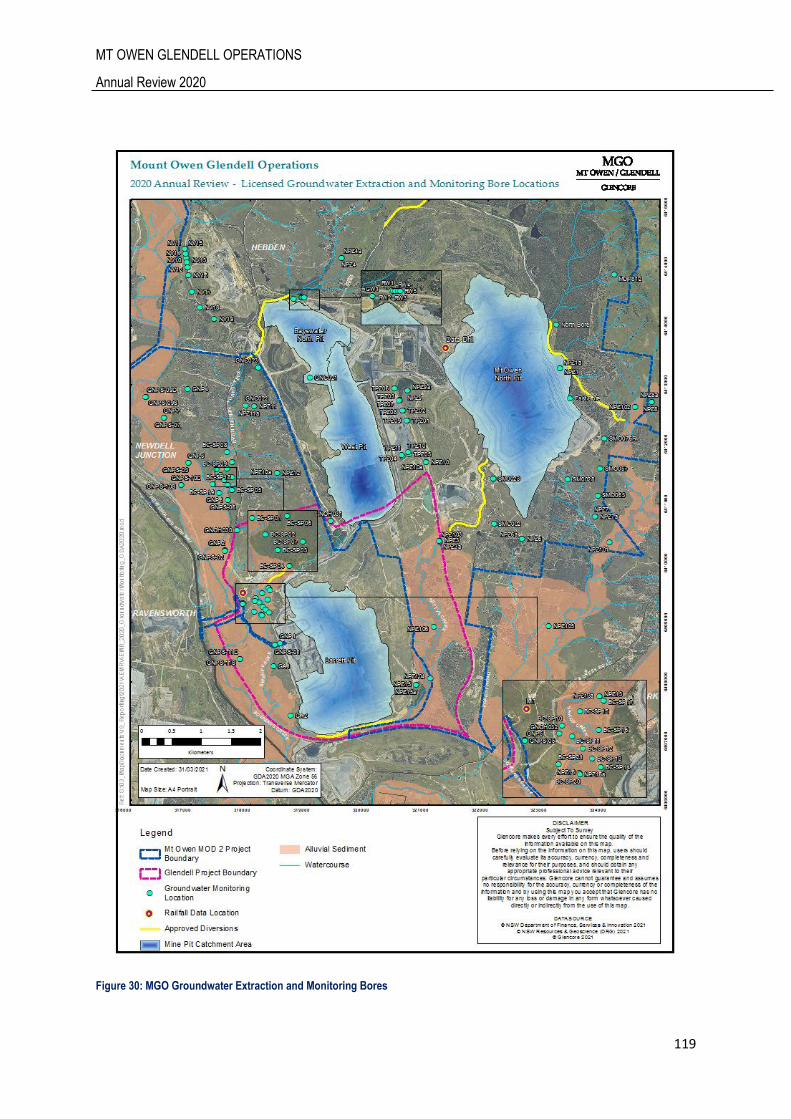
MT OWEN GLENDELL OPERATIONS
Annual Review 2020
119
Figure 30: MGO Groundwater Extraction and Monitoring Bores
MT OWEN GLENDELL OPERATIONS
Annual Review 2020
120
7.4.1 Groundwater Performance
Groundwater monitoring results for 2020 were used to assess the predicted impacts on the surrounding areas and
compared against predicted studies. A summary of the findings is provided in Table 57.
The annual groundwater review for the 2020 monitoring period (SLR, 2020) identified several trigger exceedances
in the
as summarised below:
Water Level drawdown:
o Bores: NPZ103, NPZ106,BC-SP02, BC-SP04, BC-SP06, BC-SP07, BC-SP08, BC-SP09, GA1,
BC-SP10, BC-SP14, BC-SP21, NPZ101 and NPZ107S, NPZ1, NPZ4, NPZ6, NPZ9, NPZ11,
NPZ13, North, NPZ1a, NPZ7a, NPZ8a, NPZ7, NPZ8, NPZ16, NPZ107D, NPZ108D, NPZ11a,
NPZ4a, NPZ6a, NPZ13a, and NPZ15a.
o At all VWP locations
Electrical Conductivity:
o Bores BC-SP04, BC-SP05 and BC-SP08, NPZ101, NPZ107S, NPZ108S, NPZ1, NPZ3a, NPZ4,
NPZ11, NPZ1a, NPZ8, NPZ16, NPZ4a, NPZ10a, and NPZ13a .
pH:
o Bores NPZ1a, NPZ107D, NPZ180D, and NPZ11a
A summary of the findings from the investigations 2020 are included below:For alluvial bores:
o Decreased water levels were determined to be associated with prevalent dry climate in recent
years. During 2020 average rainfall was experienced however this was yet to lead to widespread
recovery of water levels in the shallow alluvium. The region entered non-drought conditions in
November 2020;
o Electrical Conductivity (EC) triggers were deemed to be attributed to the lack of freshwater
recharge as a result of climatic conditions, it is expected that the EC will improve with recovering
water levels.
For hard rock aquifers:
o The water levels and EC levels in some monitoring bores show a clear response to climate
conditions with some monitoring bores also responding to depressurisation as a result of mining.
MT OWEN GLENDELL OPERATIONS
Annual Review 2020
121
A review into the water level decline including a comparison to predicted groundwater level
impacts will be conducted in 2021.
pH observations in NPZ107D and NPZ108D have been elevated during the length of their respective
record. There is no sign of a trend apparent. A revision of trigger levels will be conducted during 2021 to
reflect historical results.
A copy of the monitoring results for individual groundwater monitoring locations is included in Appendix G, Table 32
along with a summary of the 2020 results for all bores (Appendix G, Table 33).
A comprehensive review of groundwater is located in the 2020 Annual Groundwater Review (SLR, March 2021)
report, which is also included in Appendix G.
Table 57: Summary of Groundwater Bores against Performance Data in 2020
Site ID
Investigation Criteria Triggered?
Drawdown pH EC
12,800 µS/cm trigger >1,000 µS/cm change
Yorks Creek Alluvium
BC-SP06
(Q1, Q2, Q3, Q4) x x x
BC-SP07
(Q1, Q2, Q3, Q4) Insufficient water to sample
BC-SP08
(Q1, Q2, Q3, Q4) x
(Q2, Q3, Q4) x
BC-SP09
(Q1, Q2, Q3, Q4) x
(Q3) x
NPZ4
(Q1, Q2, Q3, Q4)
(Q2)
(Q1, Q2, Q3, Q4) x
NPZ11
(Q1, Q2, Q3, Q4) x
(Q2, Q3, Q4) x
Yorks Creek and Bowmans Creek Alluvium
BC-SP01 Insufficient water to sample
BC-SP02
(Q1, Q2, Q3, Q4) x x x
BC-SP03 Insufficient water to sample
BC-SP04
(Q1, Q2, Q3, Q4) x
(Q2, Q4) x
BC-SP05 x x
(Q2, Q3, Q4) x
Bowmans Creek Alluvium
MT OWEN GLENDELL OPERATIONS
Annual Review 2020
122
Site ID
Investigation Criteria Triggered?
Drawdown pH EC
12,800 µS/cm trigger >1,000 µS/cm change
BC-SP18 Insufficient water to sample
BC-SP19 Insufficient water to sample
BC-SP22
(Q2) x x x
GNPS-02
(Q1)
(Q2) x x
GNPS-03 Insufficient water to sample
GNPS-05 Insufficient water to sample
GNPS-06
(Q1, Q2)
(Q1, Q2) x x
GNPS-07 Insufficient water to sample
GNP09S x x x x
GNP10S x x x x
GNP11S x x x x
Swamp Creek and Bowmans Creek Alluvium
BC-SP20 Insufficient water to sample
BC-SP21
(Q3, Q4) x x x
Swamp Creek Alluvium
BC-SP10
(Q1, Q2, Q3, Q4) Insufficient water to sample
BC-SP11
(Q1, Q2, Q3, Q4) x x x
BC-SP12
(Q2) x x x
BC-SP13 Insufficient water to sample
BC-SP14
(Q1, Q2, Q3, Q4) x x x
BC-SP15
(Q3) Insufficient water to sample
BC-SP16
(Q3) Insufficient water to sample
BC-SP17
(Q3) Insufficient water to sample
GA1
(Q1, Q2, Q3, Q4) Insufficient water to sample
GA2
(Q1, Q2, Q3) x x x
Lower Pikes Gully
NPZ13 x x x
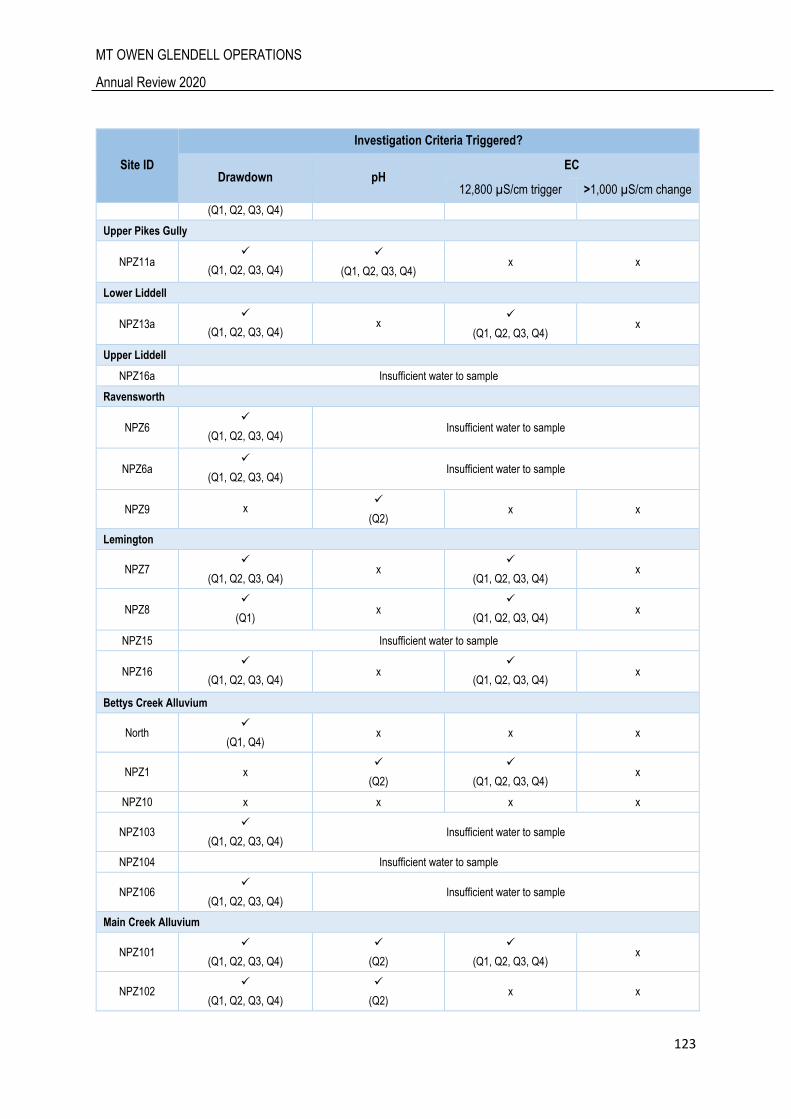
MT OWEN GLENDELL OPERATIONS
Annual Review 2020
123
Site ID
Investigation Criteria Triggered?
Drawdown pH EC
12,800 µS/cm trigger >1,000 µS/cm change
(Q1, Q2, Q3, Q4)
Upper Pikes Gully
NPZ11a
(Q1, Q2, Q3, Q4)
(Q1, Q2, Q3, Q4) x x
Lower Liddell
NPZ13a
(Q1, Q2, Q3, Q4) x
(Q1, Q2, Q3, Q4) x
Upper Liddell
NPZ16a Insufficient water to sample
Ravensworth
NPZ6
(Q1, Q2, Q3, Q4) Insufficient water to sample
NPZ6a
(Q1, Q2, Q3, Q4) Insufficient water to sample
NPZ9 x
(Q2) x x
Lemington
NPZ7
(Q1, Q2, Q3, Q4) x
(Q1, Q2, Q3, Q4) x
NPZ8
(Q1) x
(Q1, Q2, Q3, Q4) x
NPZ15 Insufficient water to sample
NPZ16
(Q1, Q2, Q3, Q4) x
(Q1, Q2, Q3, Q4) x
Bettys Creek Alluvium
North
(Q1, Q4) x x x
NPZ1 x
(Q2)
(Q1, Q2, Q3, Q4) x
NPZ10 x x x x
NPZ103
(Q1, Q2, Q3, Q4) Insufficient water to sample
NPZ104 Insufficient water to sample
NPZ106
(Q1, Q2, Q3, Q4) Insufficient water to sample
Main Creek Alluvium
NPZ101
(Q1, Q2, Q3, Q4)
(Q2)
(Q1, Q2, Q3, Q4) x
NPZ102
(Q1, Q2, Q3, Q4)
(Q2) x x
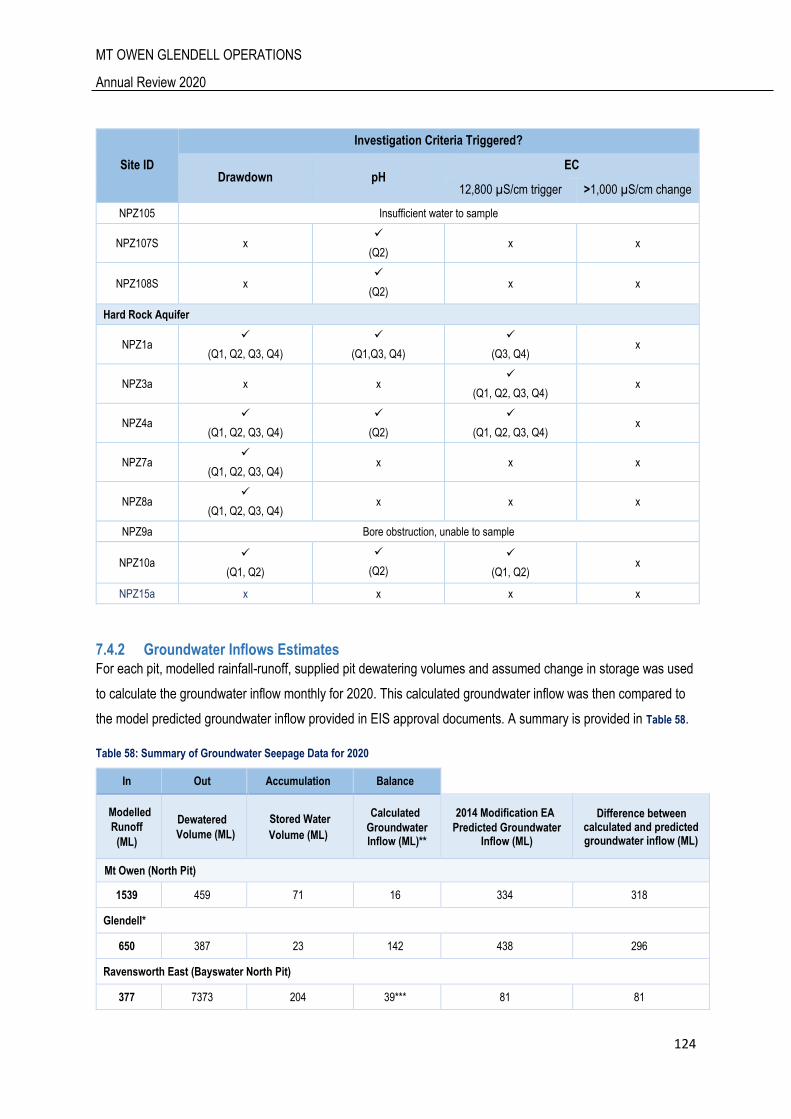
MT OWEN GLENDELL OPERATIONS
Annual Review 2020
124
Site ID
Investigation Criteria Triggered?
Drawdown pH EC
12,800 µS/cm trigger >1,000 µS/cm change
NPZ105 Insufficient water to sample
NPZ107S x
(Q2) x x
NPZ108S x
(Q2) x x
Hard Rock Aquifer
NPZ1a
(Q1, Q2, Q3, Q4)
(Q1,Q3, Q4)
(Q3, Q4) x
NPZ3a x x
(Q1, Q2, Q3, Q4) x
NPZ4a
(Q1, Q2, Q3, Q4)
(Q2)
(Q1, Q2, Q3, Q4) x
NPZ7a
(Q1, Q2, Q3, Q4) x x x
NPZ8a
(Q1, Q2, Q3, Q4) x x x
NPZ9a Bore obstruction, unable to sample
NPZ10a
(Q1, Q2)
(Q2)
(Q1, Q2) x
NPZ15a x x x x
7.4.2 Groundwater Inflows Estimates For each pit, modelled rainfall-runoff, supplied pit dewatering volumes and assumed change in storage was used
to calculate the groundwater inflow monthly for 2020. This calculated groundwater inflow was then compared to
the model predicted groundwater inflow provided in EIS approval documents. A summary is provided in Table 58.
Table 58: Summary of Groundwater Seepage Data for 2020
In Out Accumulation Balance
Modelled
Runoff
(ML)
Dewatered
Volume (ML)
Stored Water
Volume (ML)
Calculated
Groundwater Inflow (ML)**
2014 Modification EA
Predicted Groundwater Inflow (ML)
Difference between calculated and predicted groundwater inflow (ML)
Mt Owen (North Pit)
1539 459 71 16 334 318
Glendell*
650 387 23 142 438 296
Ravensworth East (Bayswater North Pit)
377 7373 204 39*** 81 81

MT OWEN GLENDELL OPERATIONS
Annual Review 2020
125
In Out Accumulation Balance
Modelled
Runoff + Tailings
Recovery water
(ML)
Dewatered
Volume + Evaporation
(ML)
Stored Water
Volume (ML)
Calculated
Groundwater Inflow (ML)
2014 Modification EA
Predicted Groundwater Inflow (ML)
Difference between calculated and predicted groundwater inflow (ML)
Ravensworth East (West Pit)**
2204 3000 163 494 110 384
Note: * Glendell predicted groundwater inflow (ML) was calculated from the 2007 Modification EA.
** Other inflows are under investigation which may reduce the ‘balance’ currently attributed to groundwater inflow.
*** Modelled GW inflow
Mt Owen (North Pit)
As Table 58 shows, 1539 ML of runoff was modelled as reporting to the North Pit while dewatering estimates totalled
459 ML. To ensure calculated groundwater inflows in each month were not negative, the stored pit water volumes
were assumed which resulted in a stored water volume of 71 ML at the end of the reporting period (this would
include water stored within the in-pit waste rock emplacement). This results in a calculated groundwater inflow of
16 ML. This is 318 ML less than the total 2014 MOCO Project model predicted groundwater inflow volume of 334
ML.
Glendell Pit
Data provided in Table 58 shows that 650 ML of runoff was modelled as reporting to the Glendell Pit while dewatering
estimates totalled 387 ML. To ensure calculated groundwater inflows in each month were not negative, the stored
pit water volumes were assumed which resulted in a stored water volume of 23 ML at the end of the 2020 calendar
year (this would include water stored within the in-pit waste rock emplacement). This results in a calculated
groundwater inflow of 142 ML. This is 296 ML less than the total 2007 Modification EA model predicted groundwater
inflow volume of 438 ML.
It should be emphasised that, given the lack of available estimates of stored water volume, the monthly stored
water volumes are an assumption. It is also noted that mining in the Glendell Pit is occurring up-dip and therefore
there is likely to be a significant volume of water stored within backfilled in-pit waste rock. This assumption directly
affects the estimated groundwater inflow rates.
Ravensworth East (Bayswater North Pit)
As Table 58 shows, 377 ML of runoff was modelled as reporting to the Bayswater North Pit while dewatering
estimates totalled 7373 ML. To ensure calculated groundwater inflows in each month were not negative, the
stored pit water volumes were assumed which resulted in a stored water volume of 204 ML at the end of 2020
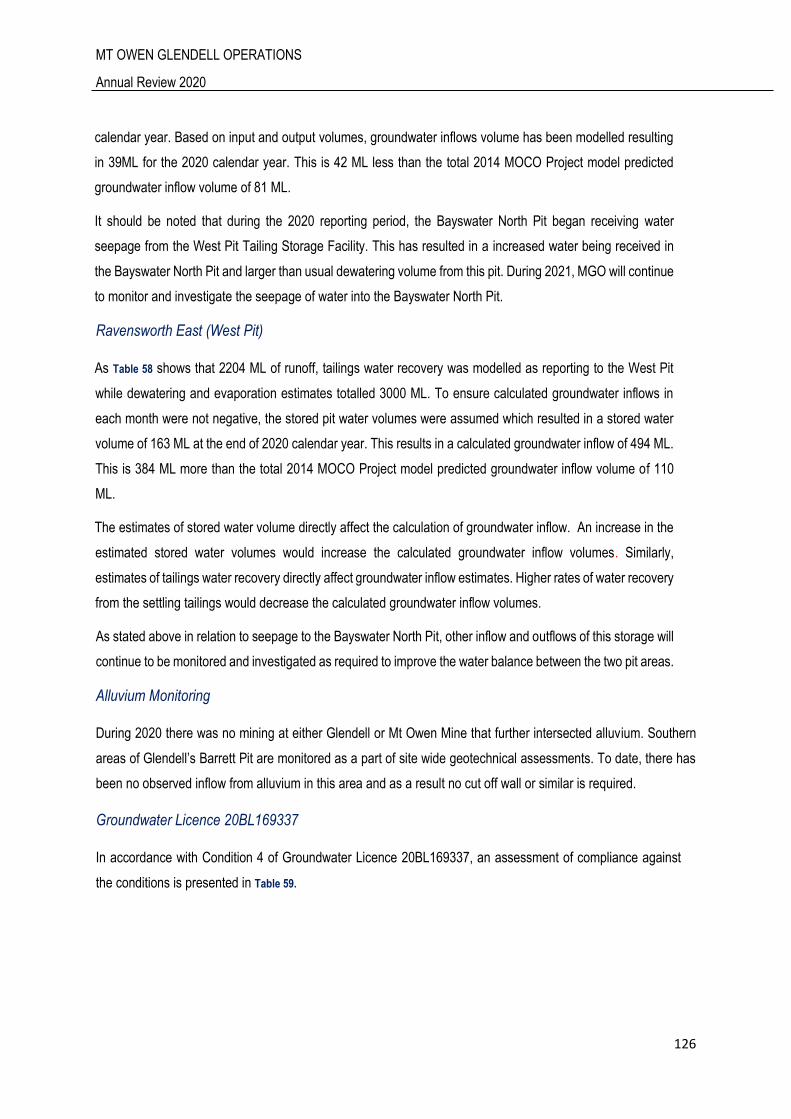
MT OWEN GLENDELL OPERATIONS
Annual Review 2020
126
calendar year. Based on input and output volumes, groundwater inflows volume has been modelled resulting
in 39ML for the 2020 calendar year. This is 42 ML less than the total 2014 MOCO Project model predicted
groundwater inflow volume of 81 ML.
It should be noted that during the 2020 reporting period, the Bayswater North Pit began receiving water
seepage from the West Pit Tailing Storage Facility. This has resulted in a increased water being received in
the Bayswater North Pit and larger than usual dewatering volume from this pit. During 2021, MGO will continue
to monitor and investigate the seepage of water into the Bayswater North Pit.
Ravensworth East (West Pit)
As Table 58 shows that 2204 ML of runoff, tailings water recovery was modelled as reporting to the West Pit
while dewatering and evaporation estimates totalled 3000 ML. To ensure calculated groundwater inflows in
each month were not negative, the stored pit water volumes were assumed which resulted in a stored water
volume of 163 ML at the end of 2020 calendar year. This results in a calculated groundwater inflow of 494 ML.
This is 384 ML more than the total 2014 MOCO Project model predicted groundwater inflow volume of 110
ML.
The estimates of stored water volume directly affect the calculation of groundwater inflow. An increase in the
estimated stored water volumes would increase the calculated groundwater inflow volumes. Similarly,
estimates of tailings water recovery directly affect groundwater inflow estimates. Higher rates of water recovery
from the settling tailings would decrease the calculated groundwater inflow volumes.
As stated above in relation to seepage to the Bayswater North Pit, other inflow and outflows of this storage will
continue to be monitored and investigated as required to improve the water balance between the two pit areas.
Alluvium Monitoring
During 2020 there was no mining at either Glendell or Mt Owen Mine that further intersected alluvium. Southern
areas of Glendell’s Barrett Pit are monitored as a part of site wide geotechnical assessments. To date, there has
been no observed inflow from alluvium in this area and as a result no cut off wall or similar is required.
Groundwater Licence 20BL169337
In accordance with Condition 4 of Groundwater Licence 20BL169337, an assessment of compliance against
the conditions is presented in Table 59.
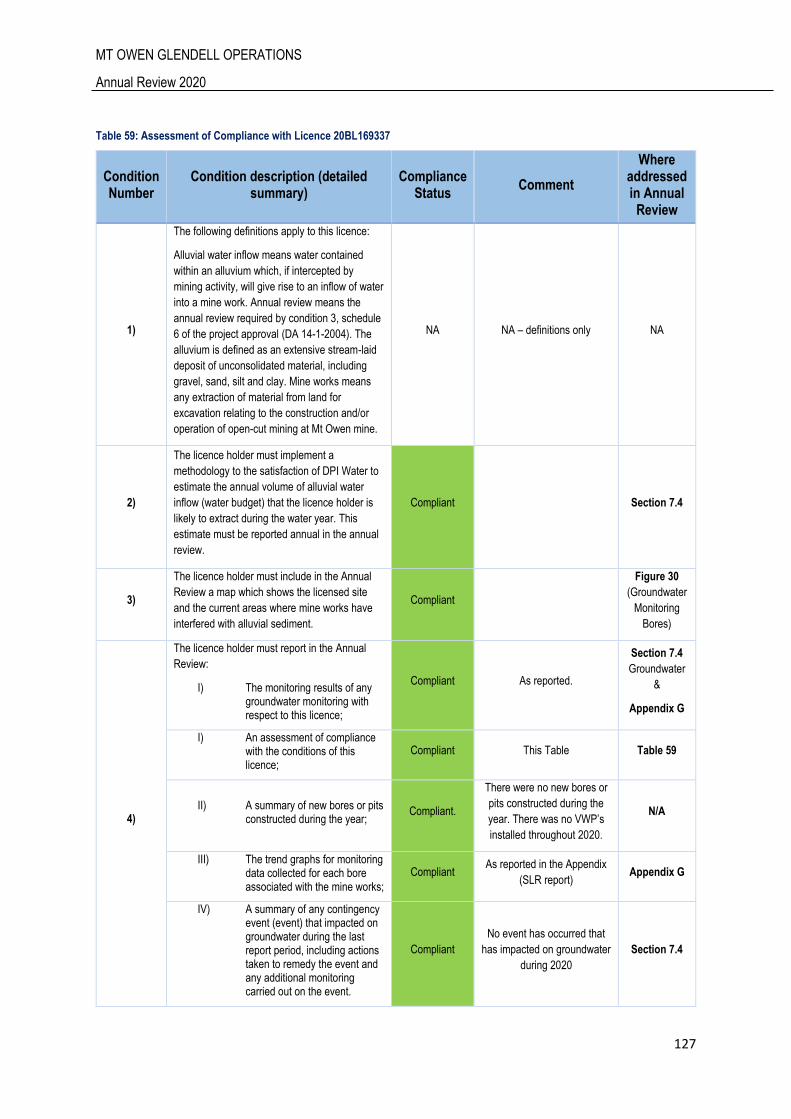
MT OWEN GLENDELL OPERATIONS
Annual Review 2020
127
Table 59: Assessment of Compliance with Licence 20BL169337
Condition Number
Condition description (detailed summary)
Compliance Status
Comment
Where addressed in Annual
Review
1)
The following definitions apply to this licence:
Alluvial water inflow means water contained
within an alluvium which, if intercepted by
mining activity, will give rise to an inflow of water
into a mine work. Annual review means the
annual review required by condition 3, schedule
6 of the project approval (DA 14-1-2004). The
alluvium is defined as an extensive stream-laid
deposit of unconsolidated material, including
gravel, sand, silt and clay. Mine works means
any extraction of material from land for
excavation relating to the construction and/or
operation of open-cut mining at Mt Owen mine.
NA NA – definitions only NA
2)
The licence holder must implement a
methodology to the satisfaction of DPI Water to
estimate the annual volume of alluvial water
inflow (water budget) that the licence holder is
likely to extract during the water year. This
estimate must be reported annual in the annual
review.
Compliant
Section 7.4
3)
The licence holder must include in the Annual
Review a map which shows the licensed site
and the current areas where mine works have
interfered with alluvial sediment.
Compliant
Figure 30
(Groundwater
Monitoring
Bores)
4)
The licence holder must report in the Annual
Review:
I) The monitoring results of any groundwater monitoring with respect to this licence;
Compliant As reported.
Section 7.4
Groundwater
&
Appendix G
I) An assessment of compliance with the conditions of this licence;
Compliant This Table Table 59
II) A summary of new bores or pits constructed during the year;
Compliant.
There were no new bores or
pits constructed during the
year. There was no VWP’s
installed throughout 2020.
N/A
III) The trend graphs for monitoring data collected for each bore associated with the mine works;
Compliant As reported in the Appendix
(SLR report) Appendix G
IV) A summary of any contingency event (event) that impacted on groundwater during the last report period, including actions taken to remedy the event and any additional monitoring carried out on the event.
Compliant
No event has occurred that
has impacted on groundwater
during 2020
Section 7.4
MT OWEN GLENDELL OPERATIONS
Annual Review 2020
128
Condition Number
Condition description (detailed summary)
Compliance Status
Comment
Where addressed in Annual
Review
5)
An extraction measurement device must be
installed and maintained on each extraction
device (pump) used for extraction of water
under this licence, and such devices must be of
a type and standard, and must be maintained in
a manner, which is acceptable to DPI Water.
Compliant A flow meter device was
installed in 2017. N/A
6)
The licence holder must ensure that the
independent environmental audit as required by
condition 8 of schedule 6 DA 14-1-2004 is
submitted to DPI Water. The audit must:
I) Assess compliance with the conditions of the licence, including the groundwater monitoring and contingency plan;
Compliant
Refer to Independent Audit
Report
www.mtowencomplex.com.au
The latest Independent Audit
was conducted in December
2020. Report currently
awaiting regulatory review.
N/A
II) Review actual impacts of the extractions on any aquifers, groundwater dependent eco-systems and any streams in the area;
Compliant
Refer to Independent Audit
Report
www.mtowencomplex.com.au
The latest Independent Audit
was conducted in December
2020. Report currently
awaiting regulatory review.
N/A
III) Make comparisons between actual and predicted impacts (modelled results);
Compliant
Refer to Independent Audit
Report
www.mtowencomplex.com.au
The latest Independent Audit
was conducted in December
2020. Report currently
awaiting regulatory review.
Error! Reference
source not found.
IV) Provide recommendations as to works that ought to be performed or additional obligations that ought to be imposed in order to rectify any impacts on groundwater.
Compliant
Refer to Independent Audit
Report
www.mtowencomplex.com.au
The latest Independent Audit
was conducted in December
2020. Report currently
awaiting regulatory review.
N/A
MT OWEN GLENDELL OPERATIONS
Annual Review 2020
129
Condition Number
Condition description (detailed summary)
Compliance Status
Comment
Where addressed in Annual
Review
7)
DPI water shall have the right during the
currency of this licence to vary at any time the
volumetric allocation, or the rate at which this
allocation is taken.
NA N/A – note only N/A
8)
The volume of groundwater extracted from the
works authorised by this licence shall not
exceed 140 megalitres in any 12 month period
commencing 1st July.
Compliant
The extraction beyond this
licence limit is included in the
5.9GL of allocated hardrock
aquifer licences held by MGO
Section 7.4.2
Further Improvements
The following summarises the recommendations made by the 2020 Annual Groundwater review (SLR, March
2021):
Attempt to restore function to faulty VWP sensors/ sensors with no data, i.e:
o All sensors at GNP1, GNP3 and GNP6
o SMO028-LBA, GNP2-MLD and GNP5-BAR
o Sensor S1567 at GNC022 and sensor S1346 at GNC023
Investigate the obstruction at bore NPZ10a and attempt to clear for resumption of sampling
Investigate the status of bore GNPS-01
Continue to monitor all bores in accordance with approval requirements, including the backfilled void
bores
Develop a trigger value assessment protocol for the VWP sensors
Investigate the water level trigger exceedances for the hard rock bores, including a comparison with
predicted water level impacts
Review of groundwater level trigger limits to prevent natural variations and predicted drawdown from
mine activities resulting in trigger exceedances.
Review the groundwater monitoring network to clearly identify the screened lithology in each bore and
outline the purpose and applicability of each bore for assessing potential groundwater related impacts.
This includes the removal of bores that have been blocked for several years or have other issues that
make the data less reliable:
o NPZ109D, NPZ9a, NPZ10a, NV10C, NV11C, NV12C, NV13C, TPZ10 and TPZ11 – Blocked
o BNO009 and BNO011 can only be dipped (blocked)
o NPZ11A, NV14A – periodically blocked (tree roots) and high gas levels, potentially
decommission
MT OWEN GLENDELL OPERATIONS
Annual Review 2020
130
o NV12A, NV12B – Damaged (pipe bent)
o GNPS-01 - Destroyed
o GNP3 – VWP reported faulty
o SMO023 – Unknown sensor depths
Amend the GMMP to reflect changes in bore network.
8 Rehabilitation During the reporting period MGO submitted two amendments to the MOP/Rehabilitation Management Plan to
Resources Regulator for approval. The revised MOP included updated text and plans to reflect current, mining
operations and rehabilitation.
Rehabilitation was carried out in accordance with:
MGO MOP/ Rehabilitation Management Plan
MGO Biodiversity and Offset Strategy
MGO Rehabilitation Strategy
Mt Owen and Glendell Annual Rehabilitation and Closure Management Plan (ARLCP, an internal MGO
document).
Rehabilitation is designed to achieve a stable final landform compatible with the surrounding environment and to
meet the landform commitments presented in the MOP/ Rehabilitation Management Plan as well as the
Rehabilitation Strategy.
Table 60 provides a summary of rehabilitation activities at MGO for 2019 and 2020 and the rehabilitation forecast
to be undertaken in 2021. All values presented are in hectares.
Table 60: MGO Rehabilitation Summary
Mine Area Type Previous Reporting
Period (2019)
This Reporting Period – Forecast (2020)*
This Reporting Period - Actual
(2020)
Next Reporting Period – Forecast (2021)**
Total Mine Footprint 2860 2875.4 2995.7 3056.2
Total active Disturbance 1396 1415.7 1436.4 1479.9
Land being prepared for rehabilitation 0 0 0 0
Land under active rehabilitation 1464 1459.7 1559.3 1576.3
Completed Rehabilitation 104 104.4 95.3 67.1
* Forecasts for 2020 based on MOP Amendment A. These differ from values within the current MOP Amendment B approved December 2020.
MT OWEN GLENDELL OPERATIONS
Annual Review 2020
131
**Forecasts based on MOP Amendment B.
Rehabilitation continued across MGO during 2020 generally in line with the ARCP / MOP (Table 61). 95.3 ha of
rehabilitation was completed across MGO, made up of 56.5ha at Glendell and 38.8 ha at Mt Owen.
Table 61: 2020 Rehabilitation works compared to MOP
Mine Area Type 2020 Actual Data (Mt Owen Complex) MOP Prediction
Rehabilitation (ha) 95.3 84.8
Disturbance (ha) 54.9 44
Rehabilitation Disturbance (ha) 61.0* 19.6
Note: increased rehabilitation disturbance was partially rehabilitated in same year. This has resulted in a higher rehab total than what was predicted.
Glendell
GLD completed 56.5 ha of rehabilitation during 2020 including 35.1ha of open grassland or pasture areas and
21.4ha of open woodland areas (see Figure 31). In woodland areas, GLD continued to use a species mix which
incorporates a number of shrub and understorey species, characteristic of the Central Hunter Ironbark-Spotted
Gum-Grey Box Forest. GLD also made improvements to the rehabilitation process, deep ripping directly prior to
seeding. This change in the rehabilitation process provides a rougher surface finish improving infiltration, limiting
surface runoff and therefore reducing any potential erosion issues.
Mt Owen
In 2020 MTO rehabilitated 38ha of open forest rehabilitation. Rehabilitation methodology remains largely
unchanged at MTO with past success an indicator that processes are suitable for the conditions. Focus is placed
on the use of direct place topsoil from pre-strip areas and the majority of 2020 rehabilitation was able to utilise this
resource. The rest of the area was rehabilitated using subsoil with the addition of gypsum to counter any soil
dispersion. Natural landform design continued to be incorporated into the rehabilitation process during 2020, with
13.2 ha completed on the North Pit rehabilitation area.
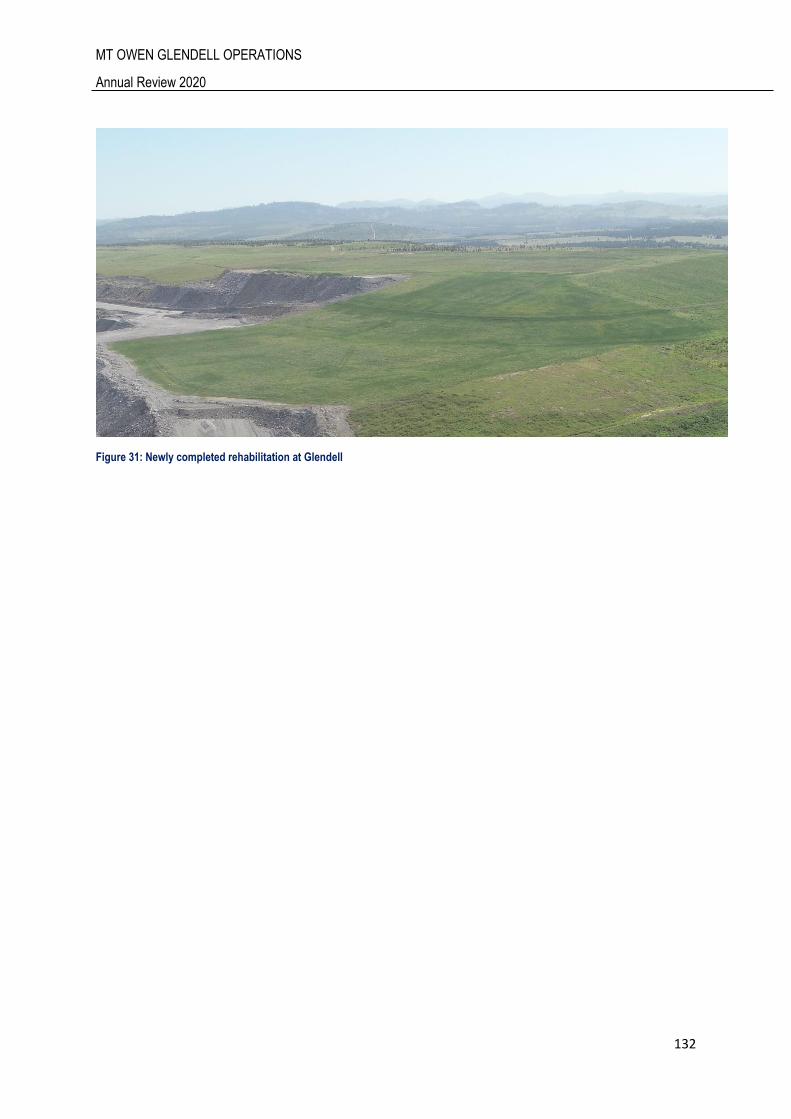
MT OWEN GLENDELL OPERATIONS
Annual Review 2020
132
Figure 31: Newly completed rehabilitation at Glendell
MT OWEN GLENDELL OPERATIONS
Annual Review 2020
133
8.1 Rehabilitation Monitoring The objective of rehabilitation monitoring is to assess the progression of rehabilitation areas towards relevant
criteria and commitments and to facilitate continuous improvements in rehabilitation practices.
Commencing in 2020, GCAA implemented across its NSW operations common templates for rehabilitation
monitoring, performance indicators and completion criteria. This standardised approach adopts monitoring
according based on the establishment age of the rehabilitation areas. These are defined by two distinct groups
known as Initial Establishment Monitoring (IEM) and Long Term Monitoring (LTM).
Initial Establishment Monitoring focuses on rehabilitation which is 1 to 3 years of age since establishment.
Monitoring of these areas evaluates the germination success, landform stability and early identification of
problematic weeds.
Long Term Monitoring focuses of rehabilitation which is 4 years or greater in age since establishment and evaluates
and tracks progress towards completion criteria using detailed scientific monitoring methods.
The 2020 monitoring program included a combination of:
Remote sensing – identification of mapping areas of recalcitrant bare ground >1,000m2 in size;
Walkover inspection – high level assessment of rehabilitation condition and ground-truthing the findings
of remote sensing; and
Long term monitoring – plot/transect based monitoring collecting scientific data and trends on vegetation
community establishment.
The 2020 monitoring campaign included the assessment of 22 rehabilitation blocks covering a cumulative area of
486.9ha, comprising of 14 IEM blocks and 8 LTM blocks. In addition, one native reference site was also monitoring
in 2020 under the GCAA reference site sharing program. The monitoring program is designed to assess all
rehabilitation block areas at least once every three years. As this monitoring methodology was introduced in 2020
data presented here presents the current trends for the blocks monitored, over the next several years all blocks
will be monitored under this methodology which will then allow for more direct comparison of trends over time.
Table 62: Rehabilitation Parameters Monitored provides details of the rehabilitation blocks monitored in 2020
and Figure 32 shows the locations.
Performance against key rehabilitation metrics was assessed for each rehabilitation polygon. A summary of this
data is presented in Table 62Error! Reference source not found.. Each polygon is assigned one of four performance r
ankings as per the criteria below.
Category Criteria
Rework Does not meet completion criteria.
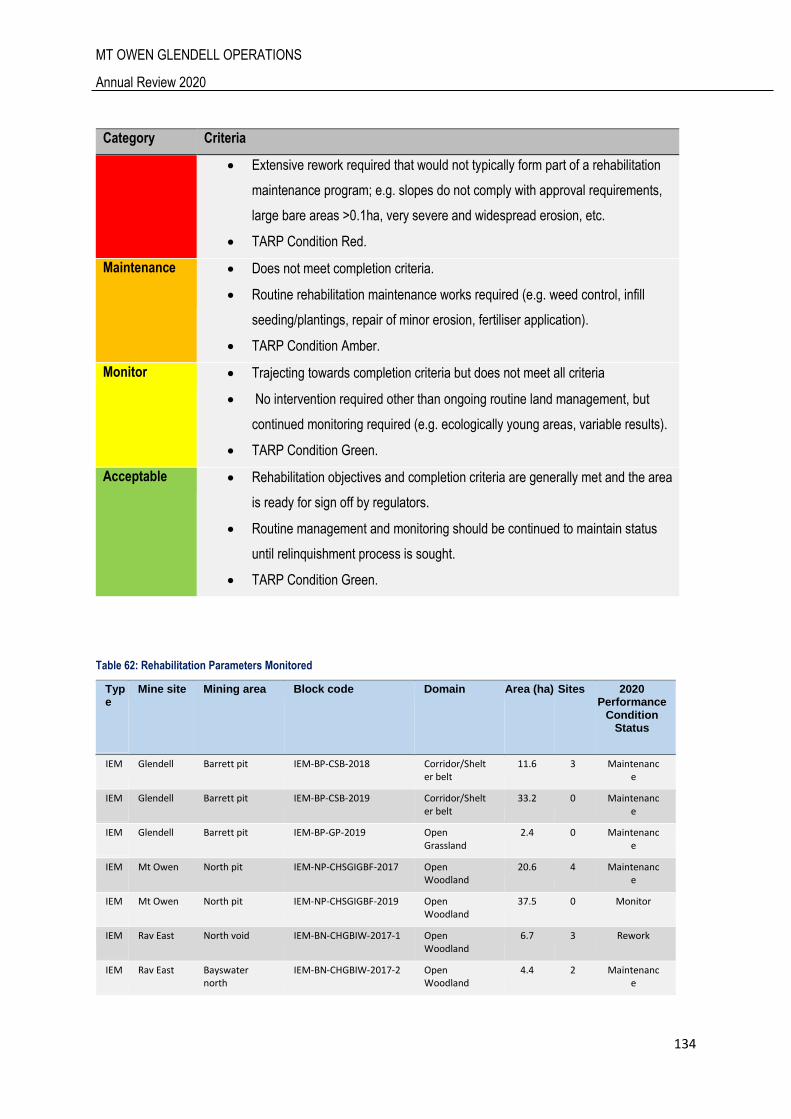
MT OWEN GLENDELL OPERATIONS
Annual Review 2020
134
Category Criteria
Extensive rework required that would not typically form part of a rehabilitation
maintenance program; e.g. slopes do not comply with approval requirements,
large bare areas >0.1ha, very severe and widespread erosion, etc.
TARP Condition Red.
Maintenance
Does not meet completion criteria.
Routine rehabilitation maintenance works required (e.g. weed control, infill
seeding/plantings, repair of minor erosion, fertiliser application).
TARP Condition Amber.
Monitor Trajecting towards completion criteria but does not meet all criteria
No intervention required other than ongoing routine land management, but
continued monitoring required (e.g. ecologically young areas, variable results).
TARP Condition Green.
Acceptable Rehabilitation objectives and completion criteria are generally met and the area
is ready for sign off by regulators.
Routine management and monitoring should be continued to maintain status
until relinquishment process is sought.
TARP Condition Green.
Table 62: Rehabilitation Parameters Monitored
Type
Mine site Mining area Block code Domain Area (ha) Sites 2020 Performance
Condition Status
IEM Glendell Barrett pit IEM-BP-CSB-2018 Corridor/Shelter belt
11.6 3 Maintenance
IEM Glendell Barrett pit IEM-BP-CSB-2019 Corridor/Shelter belt
33.2 0 Maintenance
IEM Glendell Barrett pit IEM-BP-GP-2019 Open Grassland
2.4 0 Maintenance
IEM Mt Owen North pit IEM-NP-CHSGIGBF-2017 Open Woodland
20.6 4 Maintenance
IEM Mt Owen North pit IEM-NP-CHSGIGBF-2019 Open Woodland
37.5 0 Monitor
IEM Rav East North void IEM-BN-CHGBIW-2017-1 Open Woodland
6.7 3 Rework
IEM Rav East Bayswater north
IEM-BN-CHGBIW-2017-2 Open Woodland
4.4 2 Maintenance
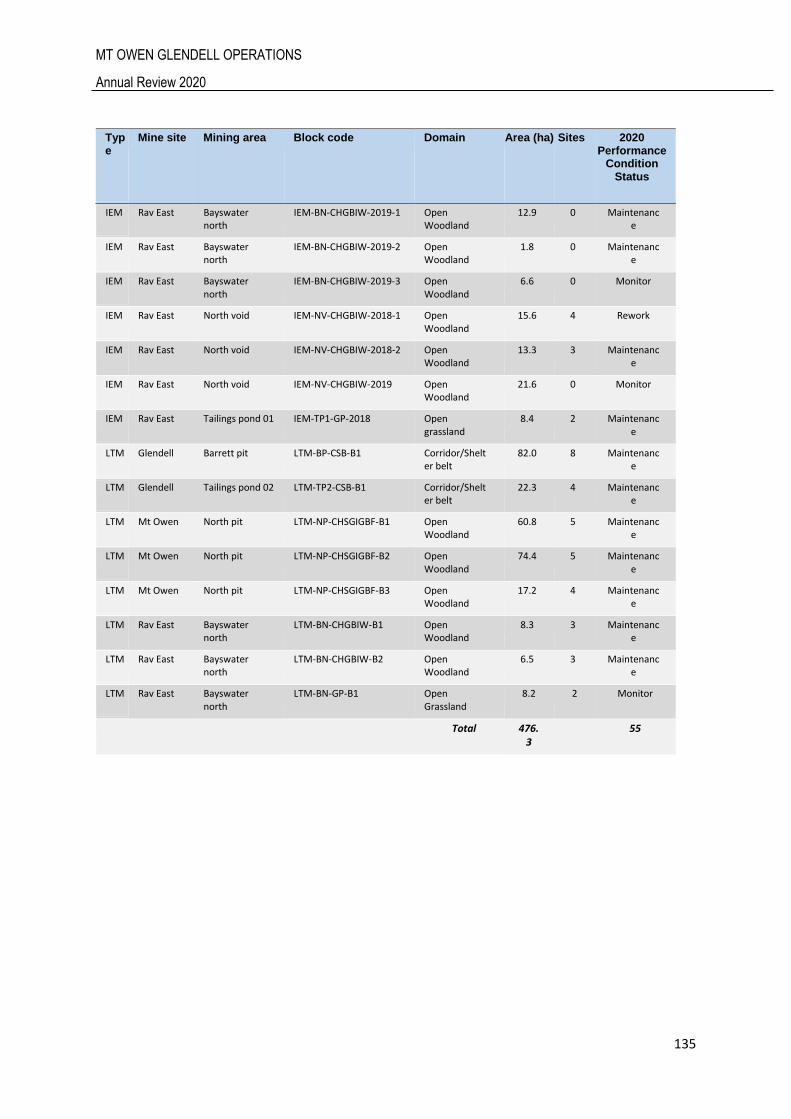
MT OWEN GLENDELL OPERATIONS
Annual Review 2020
135
Type
Mine site Mining area Block code Domain Area (ha) Sites 2020 Performance
Condition Status
IEM Rav East Bayswater north
IEM-BN-CHGBIW-2019-1 Open Woodland
12.9 0 Maintenance
IEM Rav East Bayswater north
IEM-BN-CHGBIW-2019-2 Open Woodland
1.8 0 Maintenance
IEM Rav East Bayswater north
IEM-BN-CHGBIW-2019-3 Open Woodland
6.6 0 Monitor
IEM Rav East North void IEM-NV-CHGBIW-2018-1 Open Woodland
15.6 4 Rework
IEM Rav East North void IEM-NV-CHGBIW-2018-2 Open Woodland
13.3 3 Maintenance
IEM Rav East North void IEM-NV-CHGBIW-2019 Open Woodland
21.6 0 Monitor
IEM Rav East Tailings pond 01 IEM-TP1-GP-2018 Open grassland
8.4 2 Maintenance
LTM Glendell Barrett pit LTM-BP-CSB-B1 Corridor/Shelter belt
82.0 8 Maintenance
LTM Glendell Tailings pond 02 LTM-TP2-CSB-B1 Corridor/Shelter belt
22.3 4 Maintenance
LTM Mt Owen North pit LTM-NP-CHSGIGBF-B1 Open Woodland
60.8 5 Maintenance
LTM Mt Owen North pit LTM-NP-CHSGIGBF-B2 Open Woodland
74.4 5 Maintenance
LTM Mt Owen North pit LTM-NP-CHSGIGBF-B3 Open Woodland
17.2 4 Maintenance
LTM Rav East Bayswater north
LTM-BN-CHGBIW-B1 Open Woodland
8.3 3 Maintenance
LTM Rav East Bayswater north
LTM-BN-CHGBIW-B2 Open Woodland
6.5 3 Maintenance
LTM Rav East Bayswater north
LTM-BN-GP-B1 Open Grassland
8.2 2 Monitor
Total 476.3
55
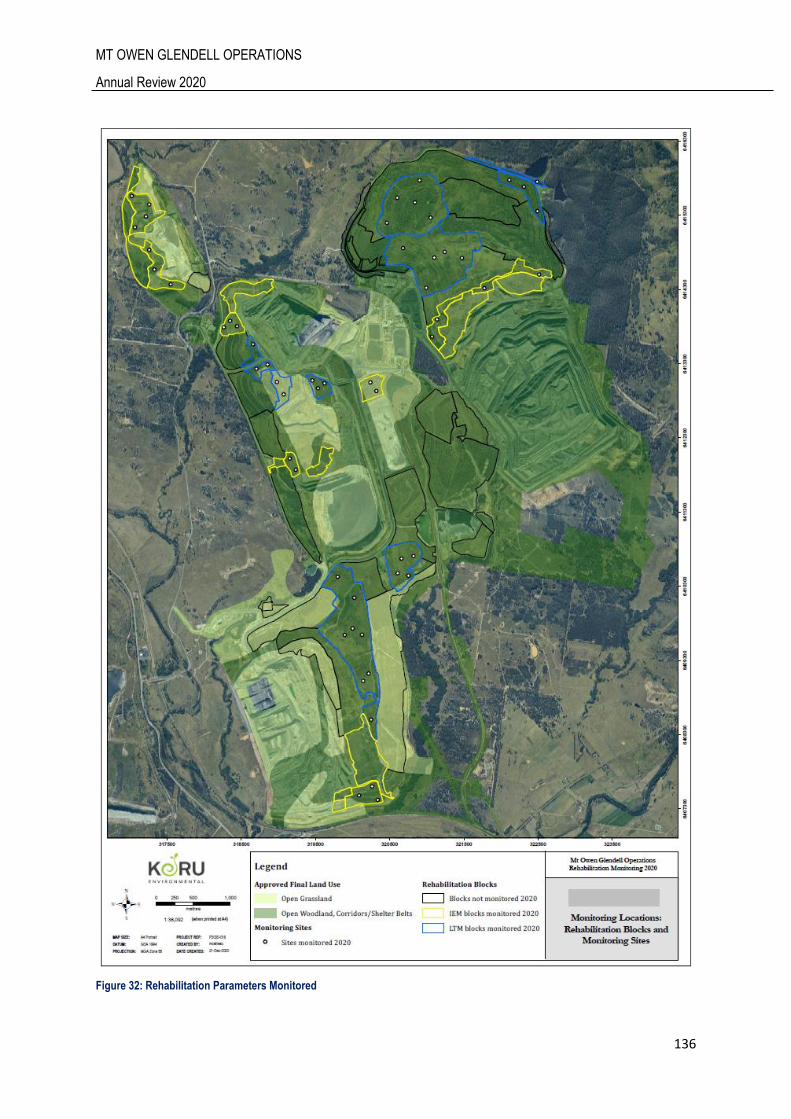
MT OWEN GLENDELL OPERATIONS
Annual Review 2020
136
Figure 32: Rehabilitation Parameters Monitored

MT OWEN GLENDELL OPERATIONS
Annual Review 2020
137
Based on the observations and results from the 2020 walkover inspection and transect-based monitoring an
assessment of rehabilitation progress against the relevant MOP (including TARP) and Rehabilitation Strategy
criteria is provided in Table 63 for the LTM Open Grassland block.
Table 63: 2020 Rehabilitation Progress Summary - Open Grassland Rehabilitation LTM Block
Monitoring Block LTM-BN-GP-B1
MOP / Rehabilitation Strategy Criteria Compliant TARP
Slopes generally <14 degrees (Glendell) Yes Green
No drainage issues threating to cause rehabilitation failure Yes Green
Land capability classification criteria met Yes Green
No large bare patches indicating poor soil/spoil quality Yes Green
No evidence of spontaneous combustion Yes Green
No gully or tunnel erosion features, or rill erosion >200mm deep Yes Green
Protective ground cover is at least 80% Yes Green
Weed presence does not present a risk to the intended land use Yes Green
Pasture establishment is in good health and provides adequate cover Yes Green
>75% of herbage cover provided by grasses and legumes suitable for
grazing
No Amber
Pasture production is comparable to similarly managed pastures No n/a
Based on the observations and results from the 2020 walkover inspection and transect-based monitoring an
assessment of rehabilitation progress against the relevant MOP (including TARP) and Rehabilitation Strategy
criteria is presented in Table 64 for the LTM Corridors/Shelter belts blocks.
Table 64: 2020 Rehabilitation Progress Summary - Corridors/Shelter Belts Rehabilitation LTM Blocks
Monitoring Block LTM-BP-CSB-B1 LTM-BP-CSB-B1
MOP / Rehabilitation Strategy Criteria Complian
t TARP
Complian
t TARP
Slopes generally <14 degrees (Glendell) Yes Green Yes Green
No evidence of spontaneous combustion Yes Green Yes Green
No large bare patches indicating poor soil/spoil
quality
Yes Green Yes Green
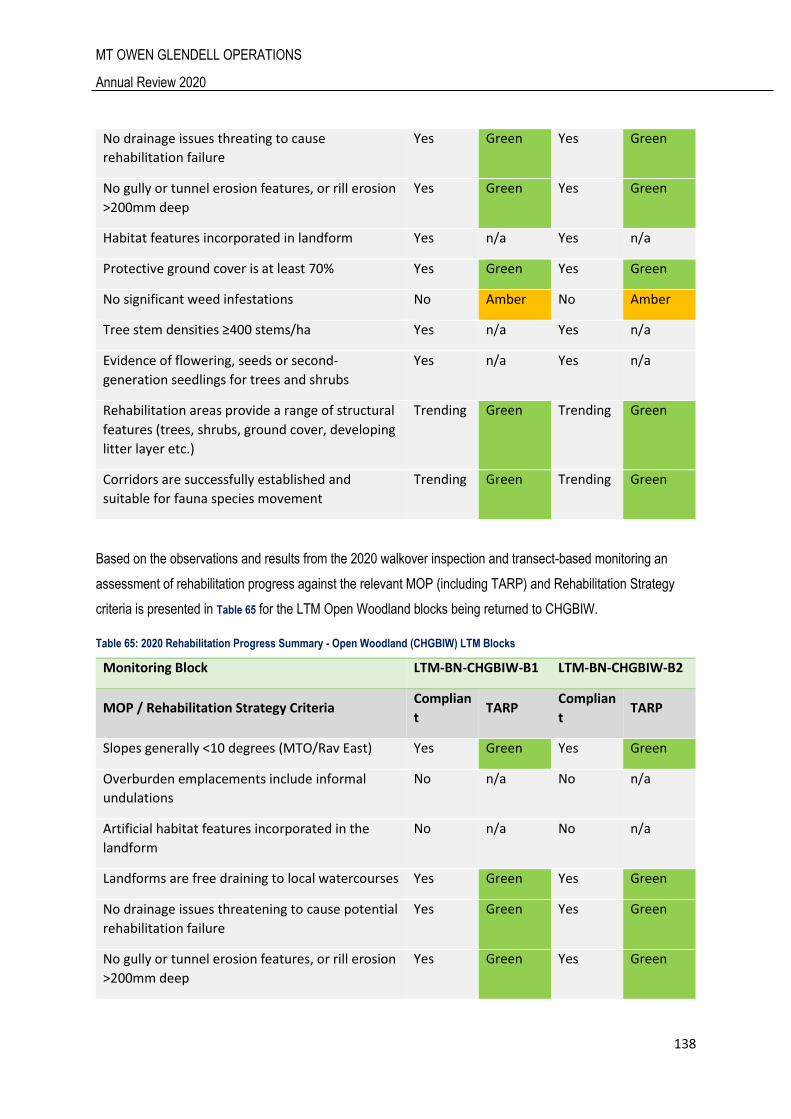
MT OWEN GLENDELL OPERATIONS
Annual Review 2020
138
No drainage issues threating to cause
rehabilitation failure
Yes Green Yes Green
No gully or tunnel erosion features, or rill erosion
>200mm deep
Yes Green Yes Green
Habitat features incorporated in landform Yes n/a Yes n/a
Protective ground cover is at least 70% Yes Green Yes Green
No significant weed infestations No Amber No Amber
Tree stem densities ≥400 stems/ha Yes n/a Yes n/a
Evidence of flowering, seeds or second-
generation seedlings for trees and shrubs
Yes n/a Yes n/a
Rehabilitation areas provide a range of structural
features (trees, shrubs, ground cover, developing
litter layer etc.)
Trending Green Trending Green
Corridors are successfully established and
suitable for fauna species movement
Trending Green Trending Green
Based on the observations and results from the 2020 walkover inspection and transect-based monitoring an
assessment of rehabilitation progress against the relevant MOP (including TARP) and Rehabilitation Strategy
criteria is presented in Table 65 for the LTM Open Woodland blocks being returned to CHGBIW.
Table 65: 2020 Rehabilitation Progress Summary - Open Woodland (CHGBIW) LTM Blocks
Monitoring Block LTM-BN-CHGBIW-B1 LTM-BN-CHGBIW-B2
MOP / Rehabilitation Strategy Criteria Complian
t TARP
Complian
t TARP
Slopes generally <10 degrees (MTO/Rav East) Yes Green Yes Green
Overburden emplacements include informal
undulations
No n/a No n/a
Artificial habitat features incorporated in the
landform
No n/a No n/a
Landforms are free draining to local watercourses Yes Green Yes Green
No drainage issues threatening to cause potential
rehabilitation failure
Yes Green Yes Green
No gully or tunnel erosion features, or rill erosion
>200mm deep
Yes Green Yes Green
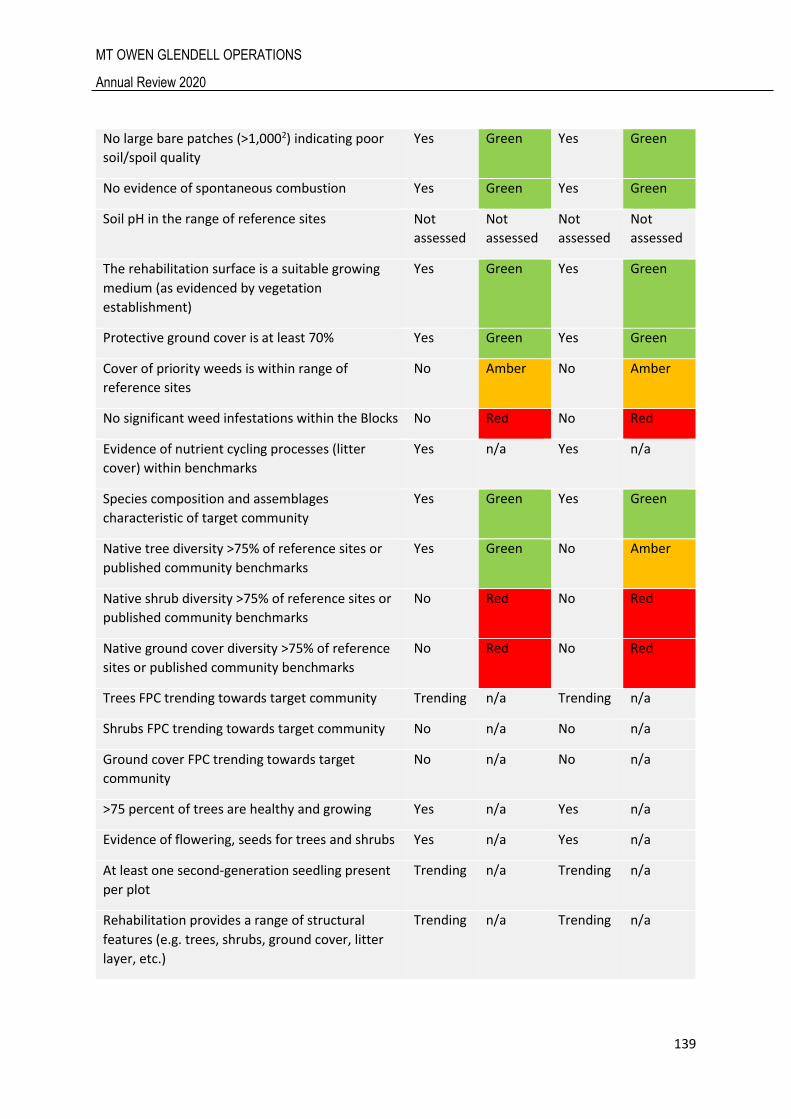
MT OWEN GLENDELL OPERATIONS
Annual Review 2020
139
No large bare patches (>1,0002) indicating poor
soil/spoil quality
Yes Green Yes Green
No evidence of spontaneous combustion Yes Green Yes Green
Soil pH in the range of reference sites Not
assessed
Not
assessed
Not
assessed
Not
assessed
The rehabilitation surface is a suitable growing
medium (as evidenced by vegetation
establishment)
Yes Green Yes Green
Protective ground cover is at least 70% Yes Green Yes Green
Cover of priority weeds is within range of
reference sites
No Amber No Amber
No significant weed infestations within the Blocks No Red No Red
Evidence of nutrient cycling processes (litter
cover) within benchmarks
Yes n/a Yes n/a
Species composition and assemblages
characteristic of target community
Yes Green Yes Green
Native tree diversity >75% of reference sites or
published community benchmarks
Yes Green No Amber
Native shrub diversity >75% of reference sites or
published community benchmarks
No Red No Red
Native ground cover diversity >75% of reference
sites or published community benchmarks
No Red No Red
Trees FPC trending towards target community Trending n/a Trending n/a
Shrubs FPC trending towards target community No n/a No n/a
Ground cover FPC trending towards target
community
No n/a No n/a
>75 percent of trees are healthy and growing Yes n/a Yes n/a
Evidence of flowering, seeds for trees and shrubs Yes n/a Yes n/a
At least one second-generation seedling present
per plot
Trending n/a Trending n/a
Rehabilitation provides a range of structural
features (e.g. trees, shrubs, ground cover, litter
layer, etc.)
Trending n/a Trending n/a

MT OWEN GLENDELL OPERATIONS
Annual Review 2020
140
Based on the observations and results from the 2020 walkover inspection and transect-based monitoring an
assessment of rehabilitation progress against the relevant MOP (including TARP) and Rehabilitation Strategy
criteria is provided in Table 66 for the LTM Open Woodland blocks being returned to CHSGIGBF.
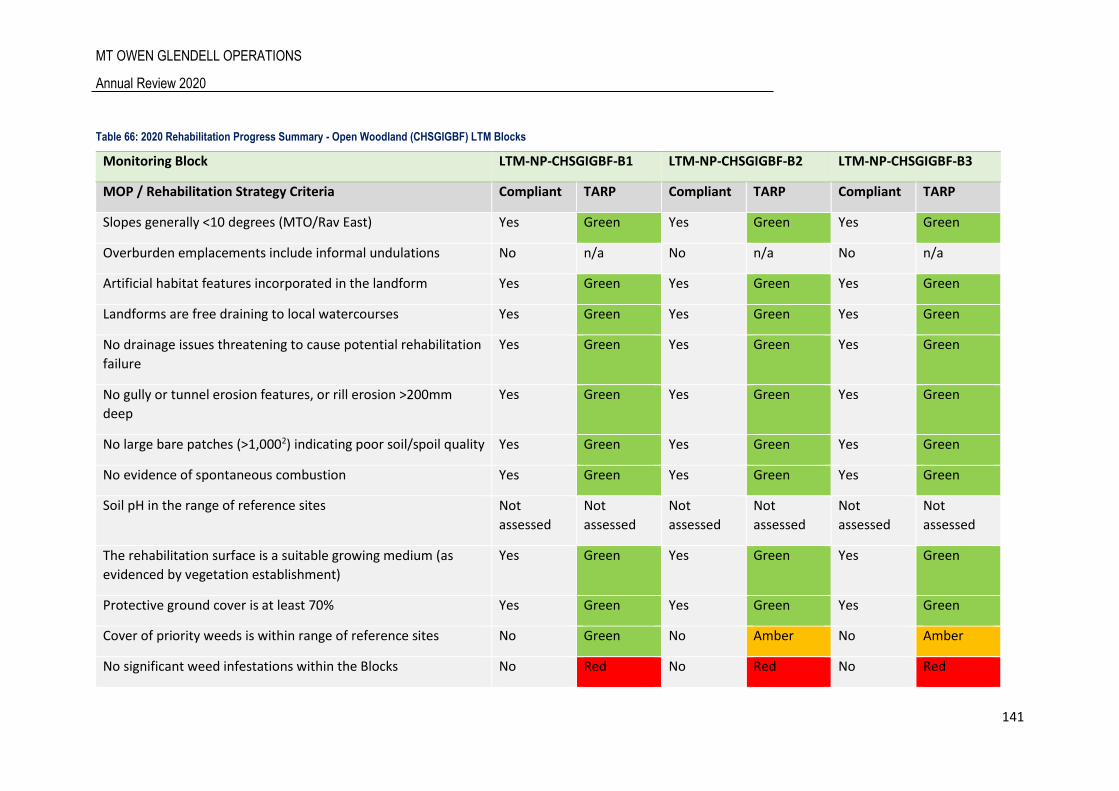
MT OWEN GLENDELL OPERATIONS
Annual Review 2020
141
Table 66: 2020 Rehabilitation Progress Summary - Open Woodland (CHSGIGBF) LTM Blocks
Monitoring Block LTM-NP-CHSGIGBF-B1 LTM-NP-CHSGIGBF-B2 LTM-NP-CHSGIGBF-B3
MOP / Rehabilitation Strategy Criteria Compliant TARP Compliant TARP Compliant TARP
Slopes generally <10 degrees (MTO/Rav East) Yes Green Yes Green Yes Green
Overburden emplacements include informal undulations No n/a No n/a No n/a
Artificial habitat features incorporated in the landform Yes Green Yes Green Yes Green
Landforms are free draining to local watercourses Yes Green Yes Green Yes Green
No drainage issues threatening to cause potential rehabilitation
failure
Yes Green Yes Green Yes Green
No gully or tunnel erosion features, or rill erosion >200mm
deep
Yes Green Yes Green Yes Green
No large bare patches (>1,0002) indicating poor soil/spoil quality Yes Green Yes Green Yes Green
No evidence of spontaneous combustion Yes Green Yes Green Yes Green
Soil pH in the range of reference sites Not
assessed
Not
assessed
Not
assessed
Not
assessed
Not
assessed
Not
assessed
The rehabilitation surface is a suitable growing medium (as
evidenced by vegetation establishment)
Yes Green Yes Green Yes Green
Protective ground cover is at least 70% Yes Green Yes Green Yes Green
Cover of priority weeds is within range of reference sites No Green No Amber No Amber
No significant weed infestations within the Blocks No Red No Red No Red
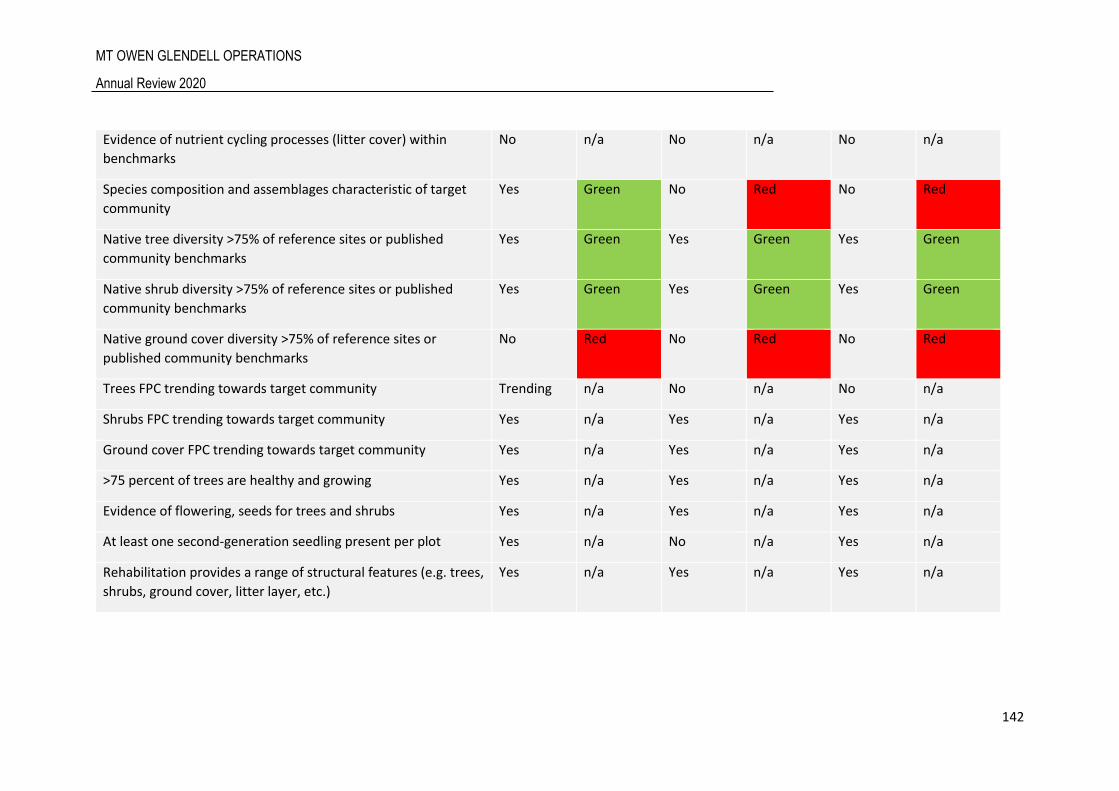
MT OWEN GLENDELL OPERATIONS
Annual Review 2020
142
Evidence of nutrient cycling processes (litter cover) within
benchmarks
No n/a No n/a No n/a
Species composition and assemblages characteristic of target
community
Yes Green No Red No Red
Native tree diversity >75% of reference sites or published
community benchmarks
Yes Green Yes Green Yes Green
Native shrub diversity >75% of reference sites or published
community benchmarks
Yes Green Yes Green Yes Green
Native ground cover diversity >75% of reference sites or
published community benchmarks
No Red No Red No Red
Trees FPC trending towards target community Trending n/a No n/a No n/a
Shrubs FPC trending towards target community Yes n/a Yes n/a Yes n/a
Ground cover FPC trending towards target community Yes n/a Yes n/a Yes n/a
>75 percent of trees are healthy and growing Yes n/a Yes n/a Yes n/a
Evidence of flowering, seeds for trees and shrubs Yes n/a Yes n/a Yes n/a
At least one second-generation seedling present per plot Yes n/a No n/a Yes n/a
Rehabilitation provides a range of structural features (e.g. trees,
shrubs, ground cover, litter layer, etc.)
Yes n/a Yes n/a Yes n/a
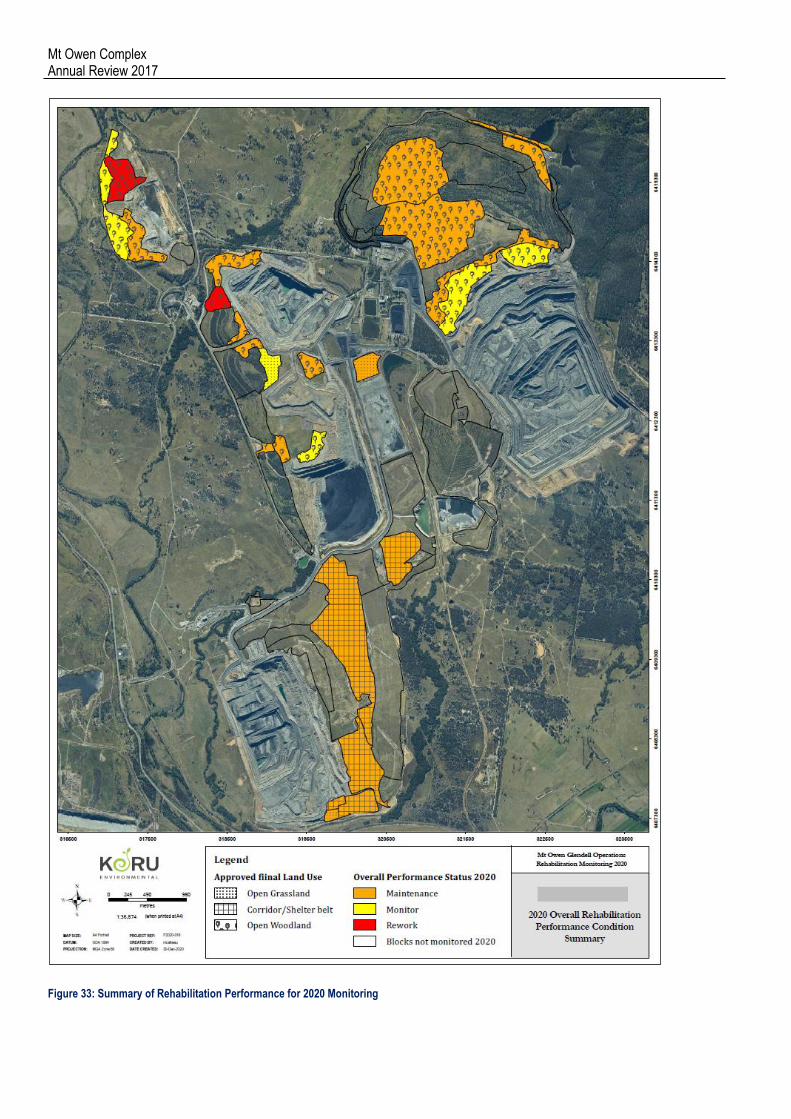
Mt Owen Complex Annual Review 2017
Figure 33: Summary of Rehabilitation Performance for 2020 Monitoring
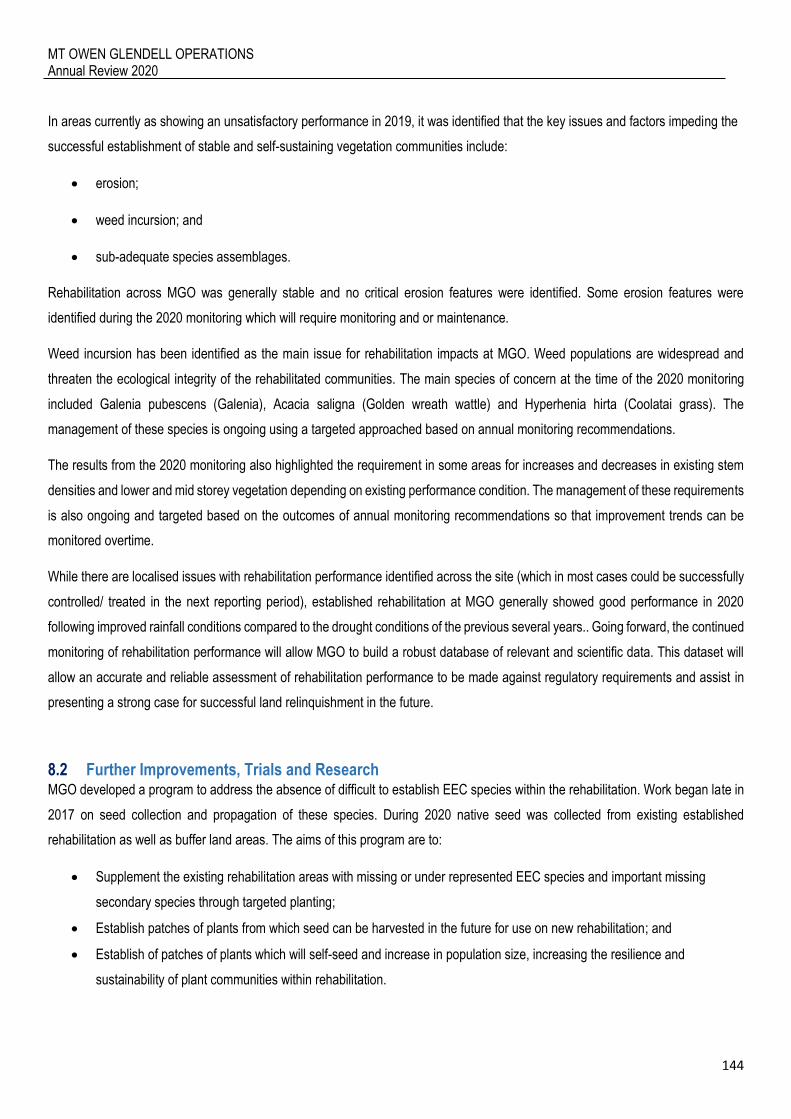
MT OWEN GLENDELL OPERATIONS Annual Review 2020
144
In areas currently as showing an unsatisfactory performance in 2019, it was identified that the key issues and factors impeding the
successful establishment of stable and self-sustaining vegetation communities include:
erosion;
weed incursion; and
sub-adequate species assemblages.
Rehabilitation across MGO was generally stable and no critical erosion features were identified. Some erosion features were
identified during the 2020 monitoring which will require monitoring and or maintenance.
Weed incursion has been identified as the main issue for rehabilitation impacts at MGO. Weed populations are widespread and
threaten the ecological integrity of the rehabilitated communities. The main species of concern at the time of the 2020 monitoring
included Galenia pubescens (Galenia), Acacia saligna (Golden wreath wattle) and Hyperhenia hirta (Coolatai grass). The
management of these species is ongoing using a targeted approached based on annual monitoring recommendations.
The results from the 2020 monitoring also highlighted the requirement in some areas for increases and decreases in existing stem
densities and lower and mid storey vegetation depending on existing performance condition. The management of these requirements
is also ongoing and targeted based on the outcomes of annual monitoring recommendations so that improvement trends can be
monitored overtime.
While there are localised issues with rehabilitation performance identified across the site (which in most cases could be successfully
controlled/ treated in the next reporting period), established rehabilitation at MGO generally showed good performance in 2020
following improved rainfall conditions compared to the drought conditions of the previous several years.. Going forward, the continued
monitoring of rehabilitation performance will allow MGO to build a robust database of relevant and scientific data. This dataset will
allow an accurate and reliable assessment of rehabilitation performance to be made against regulatory requirements and assist in
presenting a strong case for successful land relinquishment in the future.
8.2 Further Improvements, Trials and Research MGO developed a program to address the absence of difficult to establish EEC species within the rehabilitation. Work began late in
2017 on seed collection and propagation of these species. During 2020 native seed was collected from existing established
rehabilitation as well as buffer land areas. The aims of this program are to:
Supplement the existing rehabilitation areas with missing or under represented EEC species and important missing
secondary species through targeted planting;
Establish patches of plants from which seed can be harvested in the future for use on new rehabilitation; and
Establish of patches of plants which will self-seed and increase in population size, increasing the resilience and
sustainability of plant communities within rehabilitation.
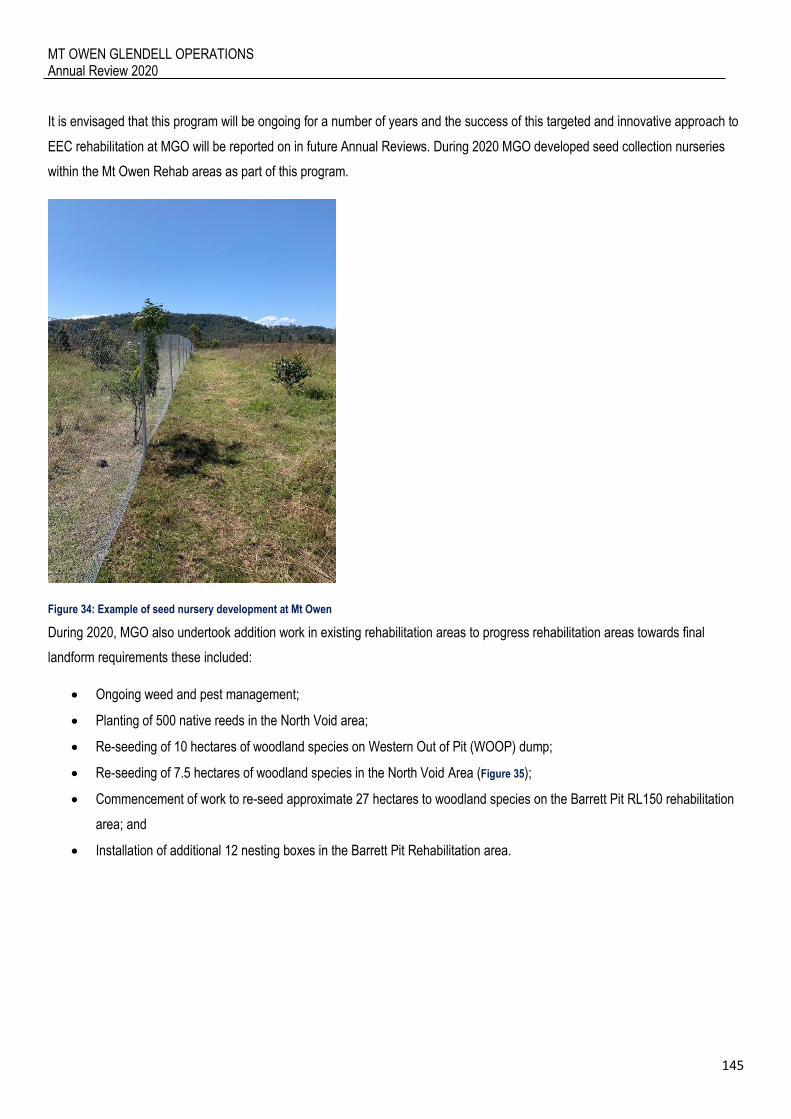
MT OWEN GLENDELL OPERATIONS Annual Review 2020
145
It is envisaged that this program will be ongoing for a number of years and the success of this targeted and innovative approach to
EEC rehabilitation at MGO will be reported on in future Annual Reviews. During 2020 MGO developed seed collection nurseries
within the Mt Owen Rehab areas as part of this program.
Figure 34: Example of seed nursery development at Mt Owen
During 2020, MGO also undertook addition work in existing rehabilitation areas to progress rehabilitation areas towards final
landform requirements these included:
Ongoing weed and pest management;
Planting of 500 native reeds in the North Void area;
Re-seeding of 10 hectares of woodland species on Western Out of Pit (WOOP) dump;
Re-seeding of 7.5 hectares of woodland species in the North Void Area (Figure 35);
Commencement of work to re-seed approximate 27 hectares to woodland species on the Barrett Pit RL150 rehabilitation
area; and
Installation of additional 12 nesting boxes in the Barrett Pit Rehabilitation area.
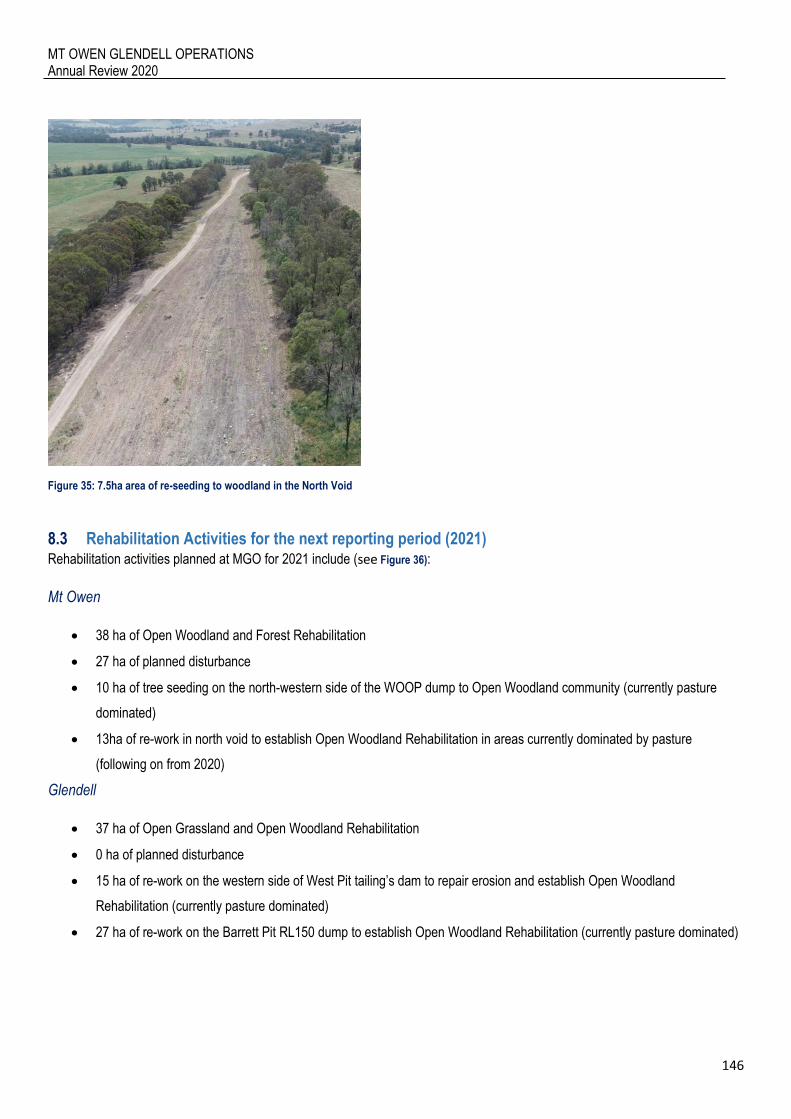
MT OWEN GLENDELL OPERATIONS Annual Review 2020
146
Figure 35: 7.5ha area of re-seeding to woodland in the North Void
8.3 Rehabilitation Activities for the next reporting period (2021) Rehabilitation activities planned at MGO for 2021 include (see Figure 36):
Mt Owen
38 ha of Open Woodland and Forest Rehabilitation
27 ha of planned disturbance
10 ha of tree seeding on the north-western side of the WOOP dump to Open Woodland community (currently pasture
dominated)
13ha of re-work in north void to establish Open Woodland Rehabilitation in areas currently dominated by pasture
(following on from 2020)
Glendell
37 ha of Open Grassland and Open Woodland Rehabilitation
0 ha of planned disturbance
15 ha of re-work on the western side of West Pit tailing’s dam to repair erosion and establish Open Woodland
Rehabilitation (currently pasture dominated)
27 ha of re-work on the Barrett Pit RL150 dump to establish Open Woodland Rehabilitation (currently pasture dominated)

MT OWEN GLENDELL OPERATIONS Annual Review 2020
147
Figure 36: Mt Owen Complex Proposed Rehabilitation for 2020
MT OWEN GLENDELL OPERATIONS Annual Review 2020
148
9 Community
9.1 Community Engagement and Activities 2020 During the reporting period, informal discussions continued with local landowners, regulatory authorities and other stakeholders on
the status of operational activities within MGO.
MGO implemented the community engagement program, consisting of:
one-on-one meetings with:
o community neighbours
o regulators
o non-governmental organisations
distribution of Community Newsletters
Community Consultative Committee (CCC) meetings.
Informal community gatherings
Topics of discussion included:
progress of development applications
progress of MOP / RMP
current operational environmental performance
environmental monitoring results
rehabilitation progress.
Details of community engagement activities undertaken at MGO during 2020 are included in Table 67 with an example in.
Table 67: Community Engagement Activities for 2020
Date Community Group Community Activity Topics Covered
30 April 2020 CCC Community Consultative Committee
Meeting
General overview of MGO operations,
environmental performance, approvals
update, exploration activities update and
Integra Mine update.
05 May 2020 Hebden Community Gathering Community Gathering Cancelled due to Covid 19
04 June 2020 Aboriginal Cultural Heritage
Working Group Meeting Biannual Meeting
General overview of MGO operations,
environmental performance, approvals
update, aboriginal cultural heritage update,
Integra Mine update and York’s Creek VCA
area update.
04 August 2020 Glennies Creek Community Coffee and a Chat (Day 1) General overview of MGO operations and
Environmental performance.
MT OWEN GLENDELL OPERATIONS Annual Review 2020
149
Date Community Group Community Activity Topics Covered
21 August 2020 Glennies Creek Community Coffee and a Chat (Day 2) General overview of MGO operations and
Environmental performance.
12 November 2020 Aboriginal Cultural Heritage
Working Group Meeting Biannual Meeting
Meeting forced to be cancelled due to lack of
stakeholder turnout.
22 October 2020 Camberwell Community Coffee and a Chat General overview of MGO operations and
Environmental performance
29 October 2020 CCC Community Consultative Committee
Meeting
General overview of MGO operations,
environmental performance, approvals
update, exploration activities update, local
historical heritage, and Integra Mine update.
10 December 2020 Hebden Community Coffee and a Chat
General overview of MGO operations,
Environmental performance and history and
management of Ravensworth Primary
School.
21 December 2020 Singleton Neighbourhood Centre Donation Drop off and delivery
MGO and CHPP donations were delivered to
the neighbourhood centre. Hampers were
then delivered by the team to struggling
singleton locals.
MGO organised community coffee events at Hebden, Glennies Creek and Camberwell for the residents of the Goorangoola,
Falbrook, Camberwell Village and Hebden areas, as well as the CCC representatives. These events provided an opportunity to
discuss topics such as:
post-mining land use
rehabilitation
updates on the MGO projects
feral animal control
air quality, blast and noise management.
9.2 Community Contributions Table 68 summarises the community contributions made by MGO during 2020.
Table 68: 2020 MGO Community Contributions
Date Community Group Reason for Contribution Amount
January 2020 Mt Pleasant Public School Education Support Program $4500
February 2020 Police Citizens Youth Club Friday Afternoon Fun Program $5250
March 2020 Wildlife Aid Food and medical supplies injured animals
$2000
June 2019 St. Catherine’s Catholic College Chicken Caravan Installation $4176
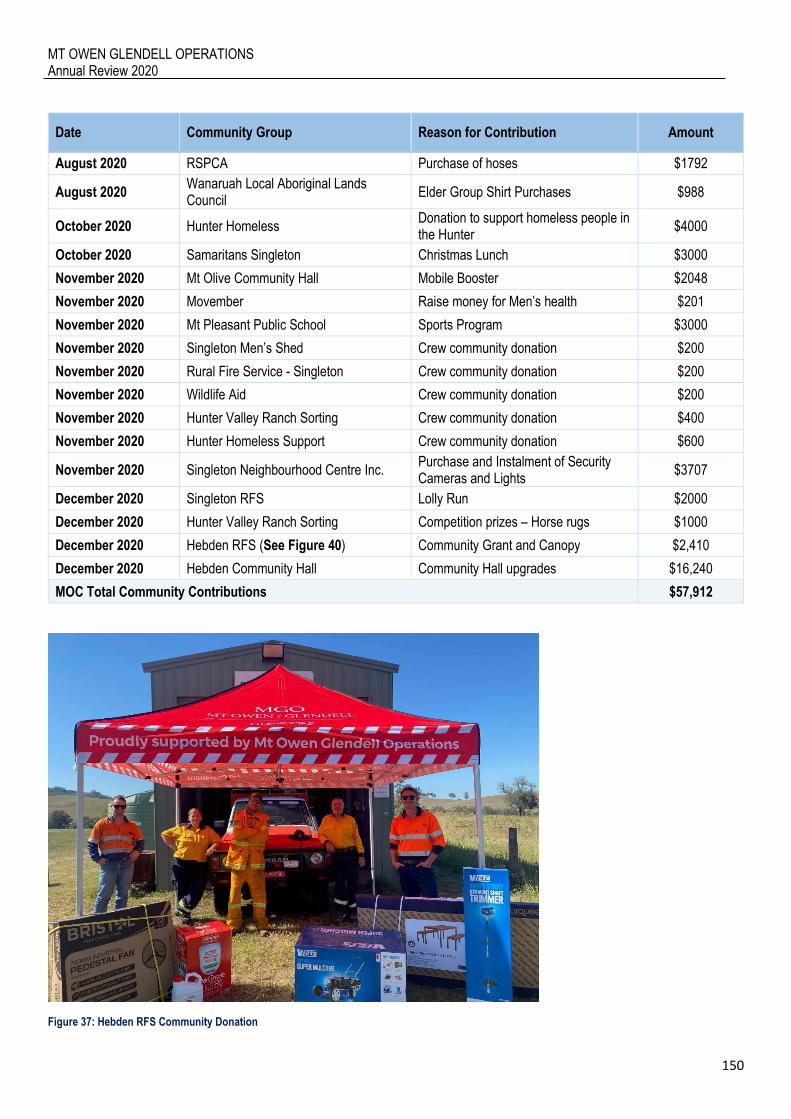
MT OWEN GLENDELL OPERATIONS Annual Review 2020
150
Date Community Group Reason for Contribution Amount
August 2020 RSPCA Purchase of hoses $1792
August 2020 Wanaruah Local Aboriginal Lands Council
Elder Group Shirt Purchases $988
October 2020 Hunter Homeless Donation to support homeless people in the Hunter
$4000
October 2020 Samaritans Singleton Christmas Lunch $3000
November 2020 Mt Olive Community Hall Mobile Booster $2048
November 2020 Movember Raise money for Men’s health $201
November 2020 Mt Pleasant Public School Sports Program $3000
November 2020 Singleton Men’s Shed Crew community donation $200
November 2020 Rural Fire Service - Singleton Crew community donation $200
November 2020 Wildlife Aid Crew community donation $200
November 2020 Hunter Valley Ranch Sorting Crew community donation $400
November 2020 Hunter Homeless Support Crew community donation $600
November 2020 Singleton Neighbourhood Centre Inc. Purchase and Instalment of Security Cameras and Lights
$3707
December 2020 Singleton RFS Lolly Run $2000
December 2020 Hunter Valley Ranch Sorting Competition prizes – Horse rugs $1000
December 2020 Hebden RFS (See Figure 40) Community Grant and Canopy $2,410
December 2020 Hebden Community Hall Community Hall upgrades $16,240
MOC Total Community Contributions $57,912
Figure 37: Hebden RFS Community Donation
MT OWEN GLENDELL OPERATIONS Annual Review 2020
151
9.3 Summary of MGO Community Complaints Mt Owen received 4 community complaints during 2020 consisting of:
3 for blasting (Vibration)
1 for noise
Glendell and Ravensworth East received a total of 12 community complaints during 2020 consisting of:
10 for noise;
1 for air quality;
1 for blasting (dust)
MGO responded and investigated all complaints received during 2020. All complaints are contained within the Community
Complaints Register which is available on the Glencore website: https://www.glencore.com.au/
Further information can be found in Appendix H, Table 34.
9.4 Complaint Trends and Actions In 2020 Mt Owen received 4 community complaints, compared to one received in 2019 (Figure 38). This is a slight increase in the
number of complaints received from the previous year.
Glendell received 12 community complaints in 2020, a significant decrease of 31 complaints received in 2019 (43). This included a
decrease of four noise complaints and an increase of six air quality complaints compared to 2018.
Each complaint is investigated individually for compliance.
Noise related complaints during the morning period dominated during 2020. This is consistent with a predominant temperature
inversion at that time of the day. Temperature inversions are monitored across MGO on a daily basis in an effort to reduce associated
impacts. MGO adjust production to reduce noise impacts associated with heavy machinery during periods of increased risk.
Blasts are systematically monitored and constant improvements are made through meteorology predictions and blast modelling to
reduce community impacts. Blast overpressure and vibration results for MGO were all within approval compliance limits during the
report period.
Air Quality across MGO is continually monitored through a system of meteorological predictions, modelling and reactive alarming
systems to reduce community impacts. As operations progress, these systems are reviewed and revised to ensure air quality is
suitably managed onsite.
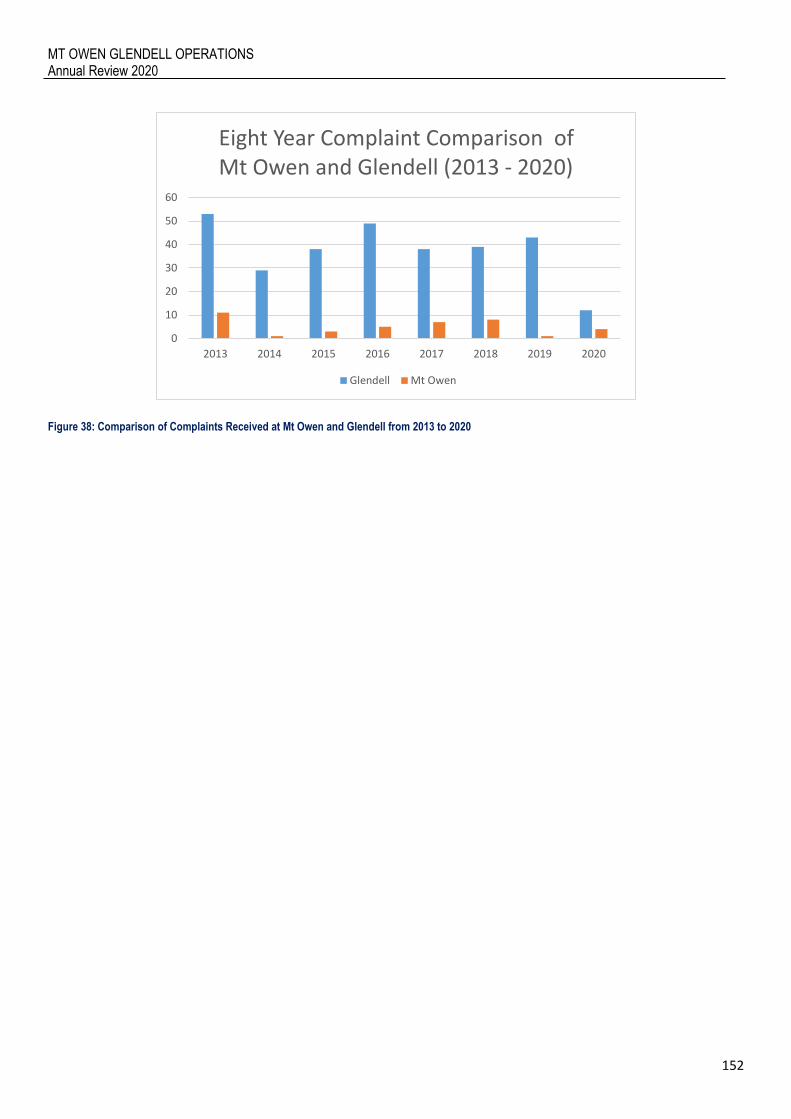
MT OWEN GLENDELL OPERATIONS Annual Review 2020
152
Figure 38: Comparison of Complaints Received at Mt Owen and Glendell from 2013 to 2020
0
10
20
30
40
50
60
2013 2014 2015 2016 2017 2018 2019 2020
Eight Year Complaint Comparison of Mt Owen and Glendell (2013 - 2020)
Glendell Mt Owen
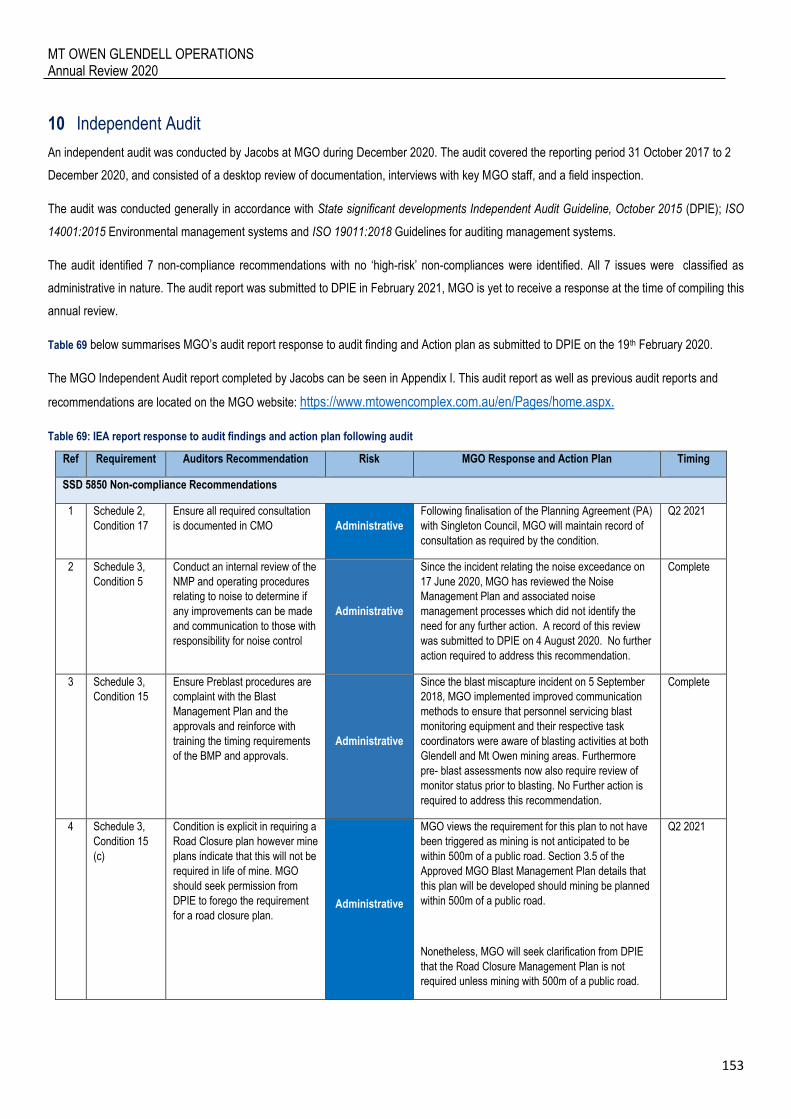
MT OWEN GLENDELL OPERATIONS Annual Review 2020
153
10 Independent Audit
An independent audit was conducted by Jacobs at MGO during December 2020. The audit covered the reporting period 31 October 2017 to 2
December 2020, and consisted of a desktop review of documentation, interviews with key MGO staff, and a field inspection.
The audit was conducted generally in accordance with State significant developments Independent Audit Guideline, October 2015 (DPIE); ISO
14001:2015 Environmental management systems and ISO 19011:2018 Guidelines for auditing management systems.
The audit identified 7 non-compliance recommendations with no ‘high-risk’ non-compliances were identified. All 7 issues were classified as
administrative in nature. The audit report was submitted to DPIE in February 2021, MGO is yet to receive a response at the time of compiling this
annual review.
Table 69 below summarises MGO’s audit report response to audit finding and Action plan as submitted to DPIE on the 19th February 2020.
The MGO Independent Audit report completed by Jacobs can be seen in Appendix I. This audit report as well as previous audit reports and
recommendations are located on the MGO website: https://www.mtowencomplex.com.au/en/Pages/home.aspx.
Table 69: IEA report response to audit findings and action plan following audit
Ref Requirement Auditors Recommendation Risk MGO Response and Action Plan Timing
SSD 5850 Non-compliance Recommendations
1 Schedule 2,
Condition 17
Ensure all required consultation
is documented in CMO Administrative
Following finalisation of the Planning Agreement (PA)
with Singleton Council, MGO will maintain record of
consultation as required by the condition.
Q2 2021
2 Schedule 3,
Condition 5
Conduct an internal review of the
NMP and operating procedures
relating to noise to determine if
any improvements can be made
and communication to those with
responsibility for noise control
Administrative
Since the incident relating the noise exceedance on
17 June 2020, MGO has reviewed the Noise
Management Plan and associated noise
management processes which did not identify the
need for any further action. A record of this review
was submitted to DPIE on 4 August 2020. No further
action required to address this recommendation.
Complete
3 Schedule 3,
Condition 15
Ensure Preblast procedures are
complaint with the Blast
Management Plan and the
approvals and reinforce with
training the timing requirements
of the BMP and approvals.
Administrative
Since the blast miscapture incident on 5 September
2018, MGO implemented improved communication
methods to ensure that personnel servicing blast
monitoring equipment and their respective task
coordinators were aware of blasting activities at both
Glendell and Mt Owen mining areas. Furthermore
pre- blast assessments now also require review of
monitor status prior to blasting. No Further action is
required to address this recommendation.
Complete
4 Schedule 3,
Condition 15
(c)
Condition is explicit in requiring a
Road Closure plan however mine
plans indicate that this will not be
required in life of mine. MGO
should seek permission from
DPIE to forego the requirement
for a road closure plan. Administrative
MGO views the requirement for this plan to not have
been triggered as mining is not anticipated to be
within 500m of a public road. Section 3.5 of the
Approved MGO Blast Management Plan details that
this plan will be developed should mining be planned
within 500m of a public road.
Nonetheless, MGO will seek clarification from DPIE
that the Road Closure Management Plan is not
required unless mining with 500m of a public road.
Q2 2021
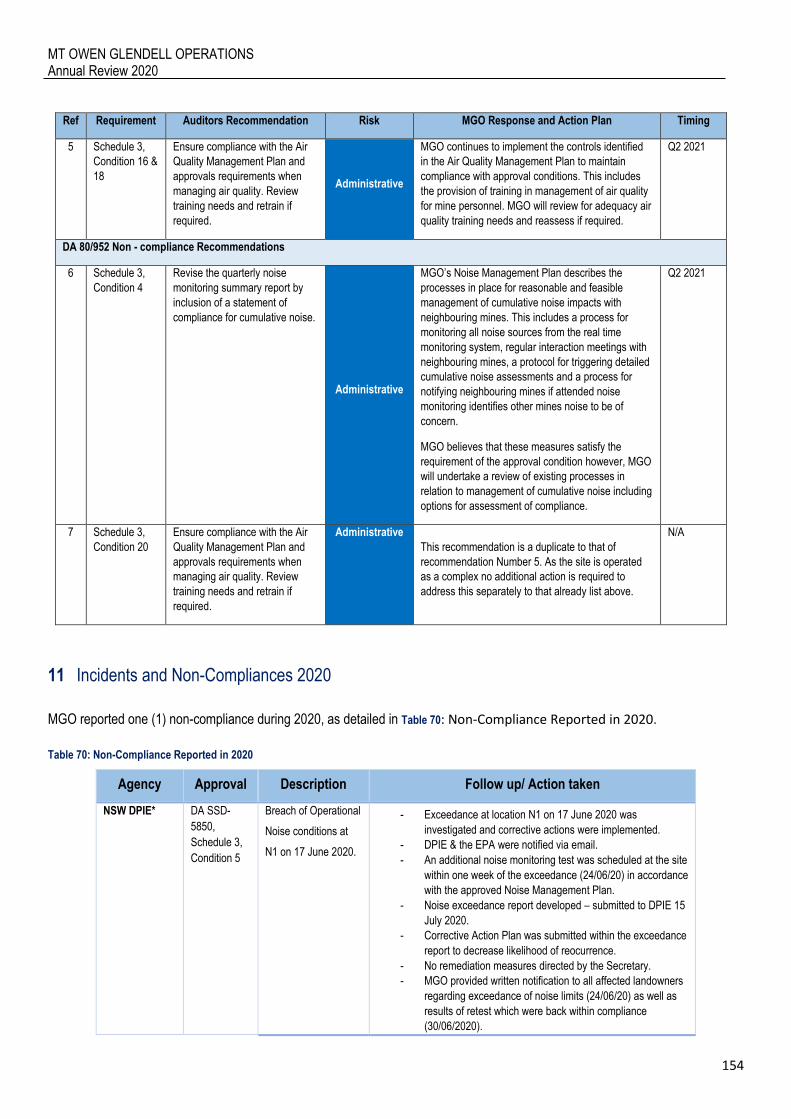
MT OWEN GLENDELL OPERATIONS Annual Review 2020
154
Ref Requirement Auditors Recommendation Risk MGO Response and Action Plan Timing
5 Schedule 3,
Condition 16 &
18
Ensure compliance with the Air
Quality Management Plan and
approvals requirements when
managing air quality. Review
training needs and retrain if
required.
Administrative
MGO continues to implement the controls identified
in the Air Quality Management Plan to maintain
compliance with approval conditions. This includes
the provision of training in management of air quality
for mine personnel. MGO will review for adequacy air
quality training needs and reassess if required.
Q2 2021
DA 80/952 Non - compliance Recommendations
6 Schedule 3,
Condition 4
Revise the quarterly noise
monitoring summary report by
inclusion of a statement of
compliance for cumulative noise.
Administrative
MGO’s Noise Management Plan describes the
processes in place for reasonable and feasible
management of cumulative noise impacts with
neighbouring mines. This includes a process for
monitoring all noise sources from the real time
monitoring system, regular interaction meetings with
neighbouring mines, a protocol for triggering detailed
cumulative noise assessments and a process for
notifying neighbouring mines if attended noise
monitoring identifies other mines noise to be of
concern.
MGO believes that these measures satisfy the
requirement of the approval condition however, MGO
will undertake a review of existing processes in
relation to management of cumulative noise including
options for assessment of compliance.
Q2 2021
7 Schedule 3,
Condition 20
Ensure compliance with the Air
Quality Management Plan and
approvals requirements when
managing air quality. Review
training needs and retrain if
required.
Administrative
This recommendation is a duplicate to that of
recommendation Number 5. As the site is operated
as a complex no additional action is required to
address this separately to that already list above.
N/A
11 Incidents and Non-Compliances 2020
MGO reported one (1) non-compliance during 2020, as detailed in Table 70: Non-Compliance Reported in 2020.
Table 70: Non-Compliance Reported in 2020
Agency Approval Description Follow up/ Action taken
NSW DPIE*
DA SSD-
5850,
Schedule 3,
Condition 5
Breach of Operational
Noise conditions at
N1 on 17 June 2020.
- Exceedance at location N1 on 17 June 2020 was
investigated and corrective actions were implemented.
- DPIE & the EPA were notified via email.
- An additional noise monitoring test was scheduled at the site
within one week of the exceedance (24/06/20) in accordance
with the approved Noise Management Plan.
- Noise exceedance report developed – submitted to DPIE 15
July 2020.
- Corrective Action Plan was submitted within the exceedance
report to decrease likelihood of reocurrence.
- No remediation measures directed by the Secretary.
- MGO provided written notification to all affected landowners
regarding exceedance of noise limits (24/06/20) as well as
results of retest which were back within compliance
(30/06/2020).
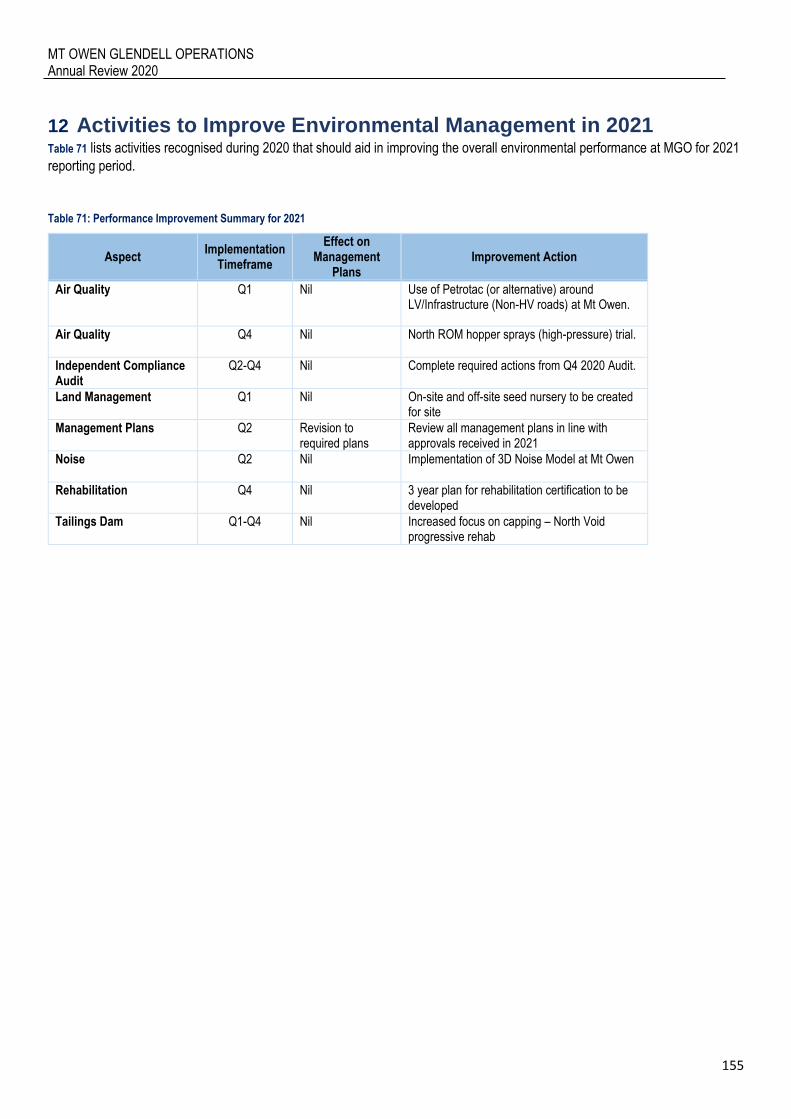
MT OWEN GLENDELL OPERATIONS Annual Review 2020
155
12 Activities to Improve Environmental Management in 2021 Table 71 lists activities recognised during 2020 that should aid in improving the overall environmental performance at MGO for 2021
reporting period.
Table 71: Performance Improvement Summary for 2021
Aspect Implementation
Timeframe
Effect on Management
Plans Improvement Action
Air Quality Q1 Nil Use of Petrotac (or alternative) around LV/Infrastructure (Non-HV roads) at Mt Owen.
Air Quality Q4 Nil North ROM hopper sprays (high-pressure) trial.
Independent Compliance Audit
Q2-Q4 Nil Complete required actions from Q4 2020 Audit.
Land Management Q1 Nil On-site and off-site seed nursery to be created for site
Management Plans Q2 Revision to required plans
Review all management plans in line with approvals received in 2021
Noise Q2 Nil Implementation of 3D Noise Model at Mt Owen
Rehabilitation Q4 Nil 3 year plan for rehabilitation certification to be developed
Tailings Dam Q1-Q4 Nil Increased focus on capping – North Void progressive rehab