annual results 2013 - finance.open.global · annual results 2013 valérie benvenuto ... guy...
TRANSCRIPT
Annual Results 2013
Valérie Benvenuto - Financial Director
Frédéric Sebag - Co-President
Guy Mamou-Mani - Co-President
Thursday 20th March 2014
Shangri-La Hotel
Contents
Financial Results
Summary & Perspectives
1
3
Introducing the Company 2
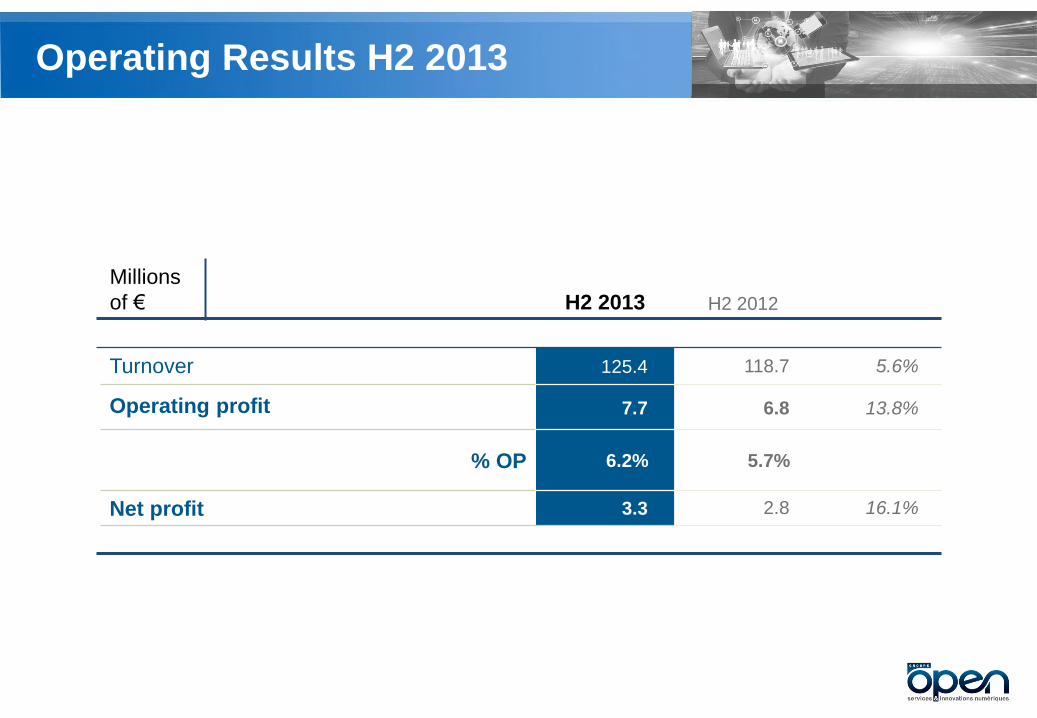
Operating Results H2 2013
H2 2013 H2 2012
Millions
of €
Turnover 125.4 118.7 5.6%
Operating profit 7.7 6.8 13.8%
% OP 6.2% 5.7%
Net profit 3.3 2.8 16.1%
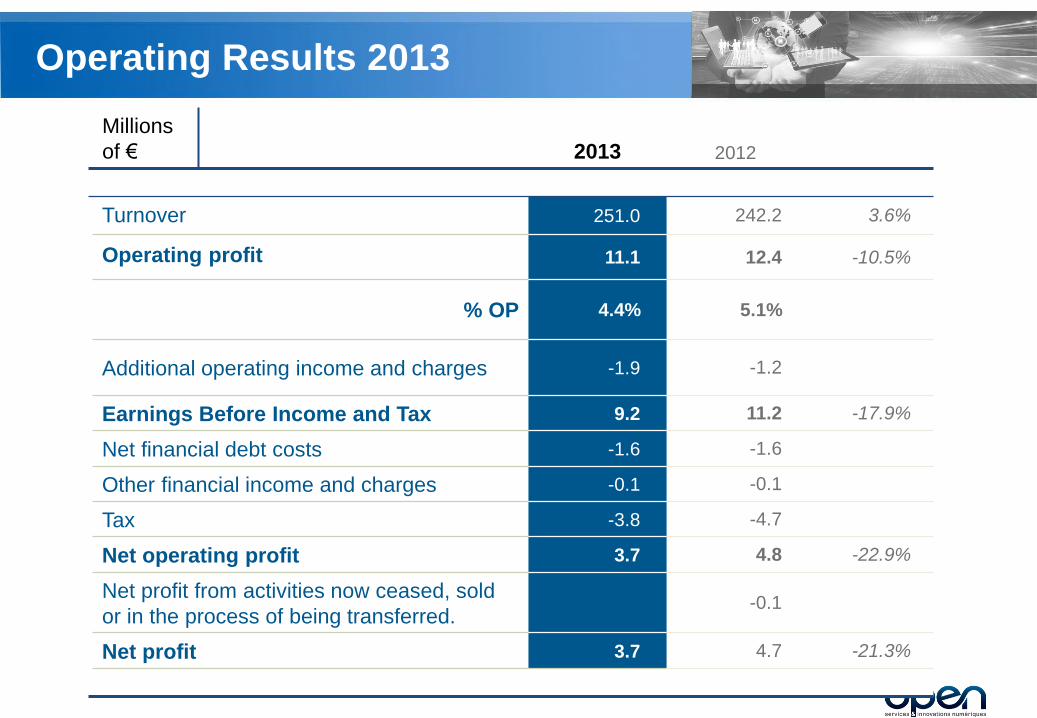
Operating Results 2013
2013 2012
Millions
of €
Turnover 251.0 242.2 3.6%
Operating profit 11.1 12.4 -10.5%
% OP 4.4% 5.1%
Additional operating income and charges -1.9 -1.2
Earnings Before Income and Tax 9.2 11.2 -17.9%
Net financial debt costs -1.6 -1.6
Other financial income and charges -0.1 -0.1
Tax -3.8 -4.7
Net operating profit 3.7 4.8 -22.9%
Net profit from activities now ceased, sold
or in the process of being transferred. -0.1
Net profit 3.7 4.7 -21.3%
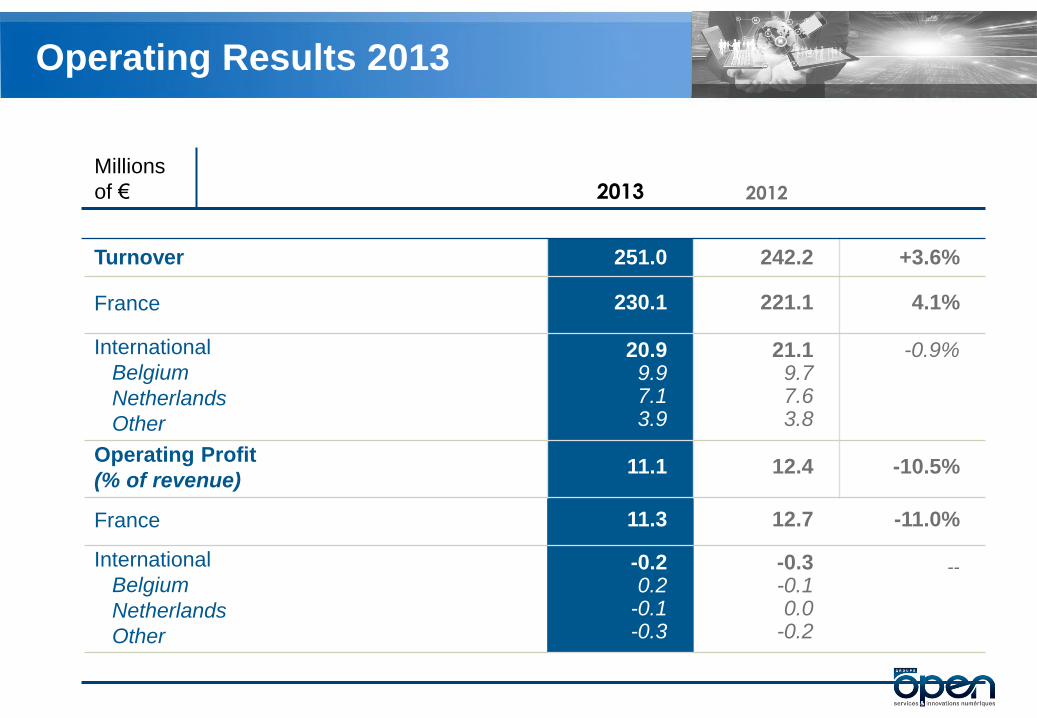
2013 2012
Millions
of €
Turnover 251.0 242.2 +3.6%
France 230.1 221.1 4.1%
International
Belgium
Netherlands
Other
20.9 9.9 7.1 3.9
21.1 9.7 7.6 3.8
-0.9%
Operating Profit
(% of revenue) 11.1 12.4 -10.5%
France 11.3 12.7 -11.0%
International
Belgium
Netherlands
Other
-0.2 0.2
-0.1 -0.3
-0.3 -0.1 0.0
-0.2
--
Operating Results 2013
Operating Results 2013
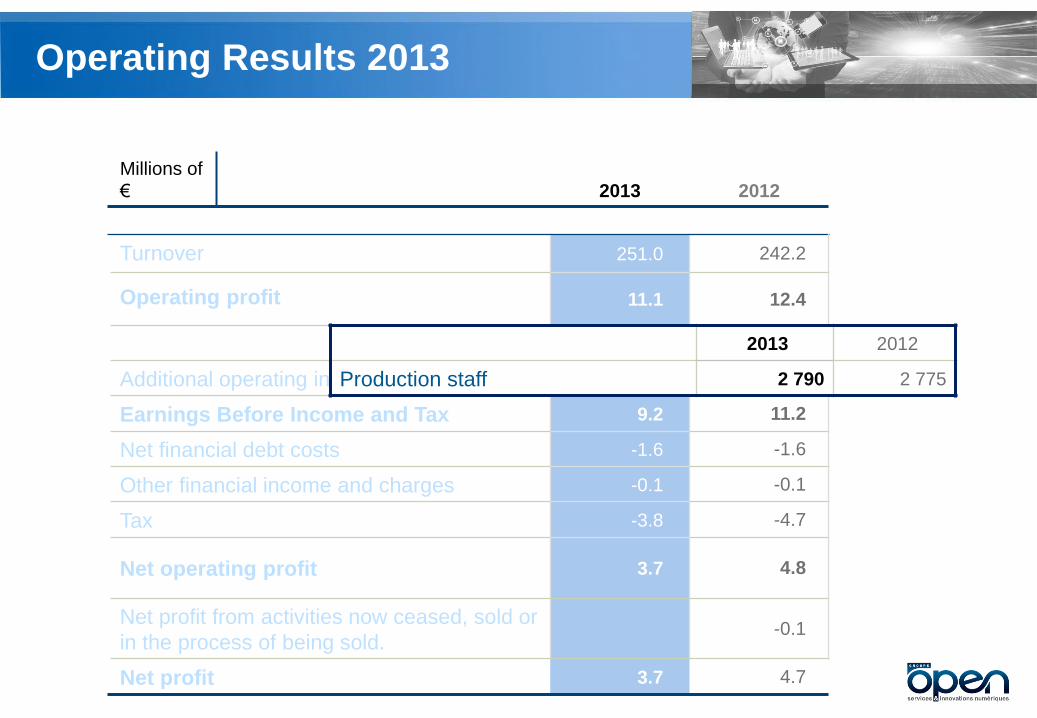
2013 2012
Millions of
€
Turnover 251.0 242.2
Operating profit 11.1 12.4
% OP 4.4% 5.1%
Additional operating income and charges -1.9 -1.2
Earnings Before Income and Tax 9.2 11.2
Net financial debt costs -1.6 -1.6
Other financial income and charges -0.1 -0.1
Tax -3.8 -4.7
Net operating profit 3.7 4.8
Net profit from activities now ceased, sold or
in the process of being sold. -0.1
Net profit 3.7 4.7
2013 2012
Production staff 2 790 2 775
Operating Results 2013
2013 2012 M€
Turnover 251.0 242.2
Operating profit 11.1 12.4
% OP 4.4% 5.1%
Additional operating income and charges -1.9 -1.2
Earnings Before Income and Tax 9.2 11.2
Net financial debt costs -1.6 -1.6
Other financial income and charges -0.1 -0.1
Tax -3.8 -4.7
Net operating profit 3.7 4.8
Net profit from activities now ceased, sold
or in the process of being sold. -0.1
Net profit 3.7 4.7
2013 2012
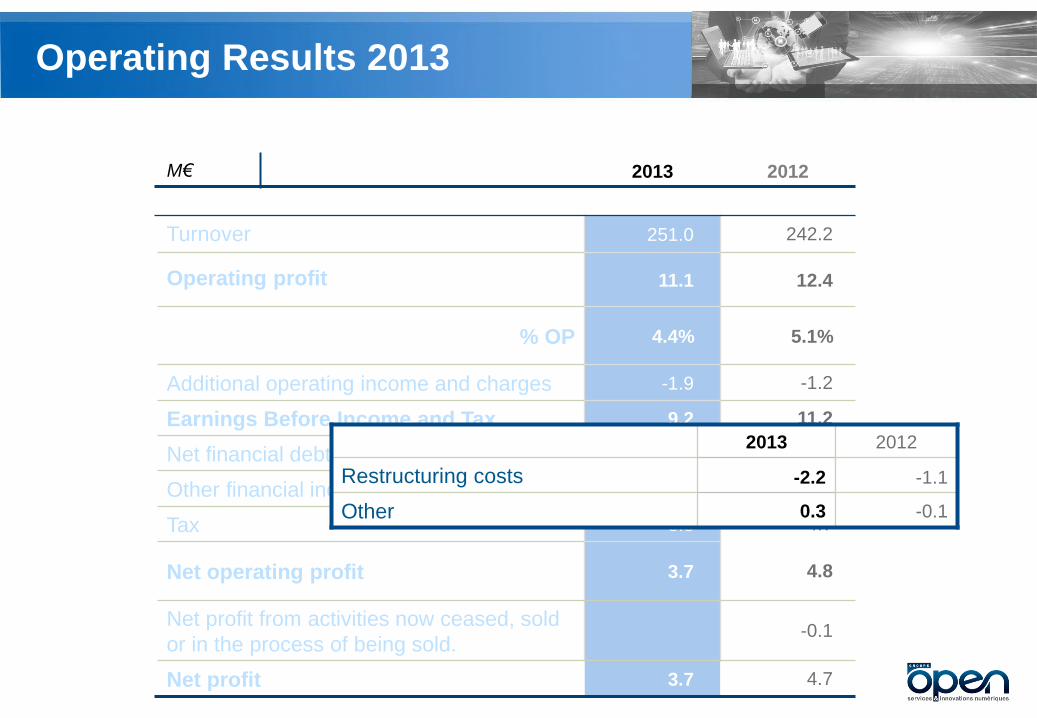
Restructuring costs -2.2 -1.1
Other 0.3 -0.1

Operating Results 2013
2013 2012 M€
Turnover 251.0 242.2
Operating profit 11.1 12.4
% OP 4.4% 5.1%
Additional operating income and charges -1.9 -1.2
Earnings Before Income and Tax 9.2 11.2
Net financial debt costs -1.6 -1.6
Other financial income and charges -0.1 -0.1
Tax -3.8 -4.7
Net operating profit 3.7 4.8
Net profit from activities now ceased, sold
or in the process of being sold. -0.1
Net profit 3.7 4.7
2013 2012
Interests on loans -1.6 -1.8
Other 0.2

Operating Results 2013
2013 2012 M€
Turnover 251.0 242.2
Operating profit 11.1 12.4
% OP 4.4% 5.1%
Additional operating income and charges -1.9 -1.2
Earnings Before Income and Tax 9.2 11.2
Net financial debt costs -1.6 -1.6
Other financial income and charges -0.1 -0.1
Tax -3.8 -4.7
Net operating profit 3.7 4.8
Net profit from activities now ceased,
sold or in the process of being sold. -0.1
Net profit 3.7 4.7
2013 2012
Local corporation tax -3.1 -2.8
Corporation tax -0.7 -1.9

Operating Results 2013
2013 2012
Millions
of €
Turnover 251.0 242.2 3.6%
Operating profit 11.1 12.4 -10.5%
% OP 4.4% 5.1%
Additional operating income and charges -1.9 -1.2
Earnings Before Income and Tax 9.2 11.2 -17.9%
Net financial debt costs -1.6 -1.6
Other financial income and charges -0.1 -0.1
Tax -3.8 -4.7
Net operating profit 3.7 4.8 -22.9%
Net profit from activities now ceased, sold or in the
process of being sold. -0.1
Net profit 3.7 4.7 -21.3%

Balance sheet 2013
M€
2013 2012
Goodwill 102.0 102.0
Intangible assets 0.6 0.8
Non-current assets 109.2 109.4
Liquid assets 24.8 24.8
Current assets 86.9 81.4
Total ASSETS 196.1 190.8
2013
2012
Equity 93.9 93.2
Financial debts 21.4 19.2
Non-current liabilities 10.8 21.3
Current liabilities 91.4 76.3
Factoring 5.5 4.8
Total LIABILITIES 196.1 190.8
31/12/13 31/12/12
Gearing 2% 0%

Cash flow
2013
2012 M€
Net cash flow generated by activities 3.0 14.1
Net cash flow from investments -1.2 -2.6
Net cash flow from financing operations -5.1 -8.1
Variation in net liquid assets -3.3 3.4
Cash and cash equivalents at opening 24.3 20.9
Cash and cash equivalents at close 21.0 24.3

Introducing the company Frédéric Sebag, Co-President Valérie Benvenuto – Financial Director
Guy Mamou-Mani – Co-President
Thursday 20th March 2014
Shangri-La Hotel
Sommaire
The Digital Age
Positioning and Assets
Focus 2014
1
3
4
Digital Transformation in Business 2

The Digital Age
Connected
devices
PC
Tablet
Mobile
Objects
INDIVIDUAL
Data
Produced Accessible Analysed Implemented
Uses
Social
Collaborative
Share
Responsibility
Commerce

The implementation of
new uses
of digital technologies
to boost
value creation
From a business perspective
The Digital Age

Digital Transformation in Business
Helping a business make its Digital Transformation
means implementing
SMAC Technologies and related practices
in the following areas:
* Social Mobility Analytics Cloud
CO
MPA
NY
CONNECTED
PRODUCTS/SERVICES CUSTOMER
RELATIONS
BRAND (E-reputation)
PROCESSES (staff / ecosystem)
By treating data as a precious resource
(information).
Digital Transformation in Business
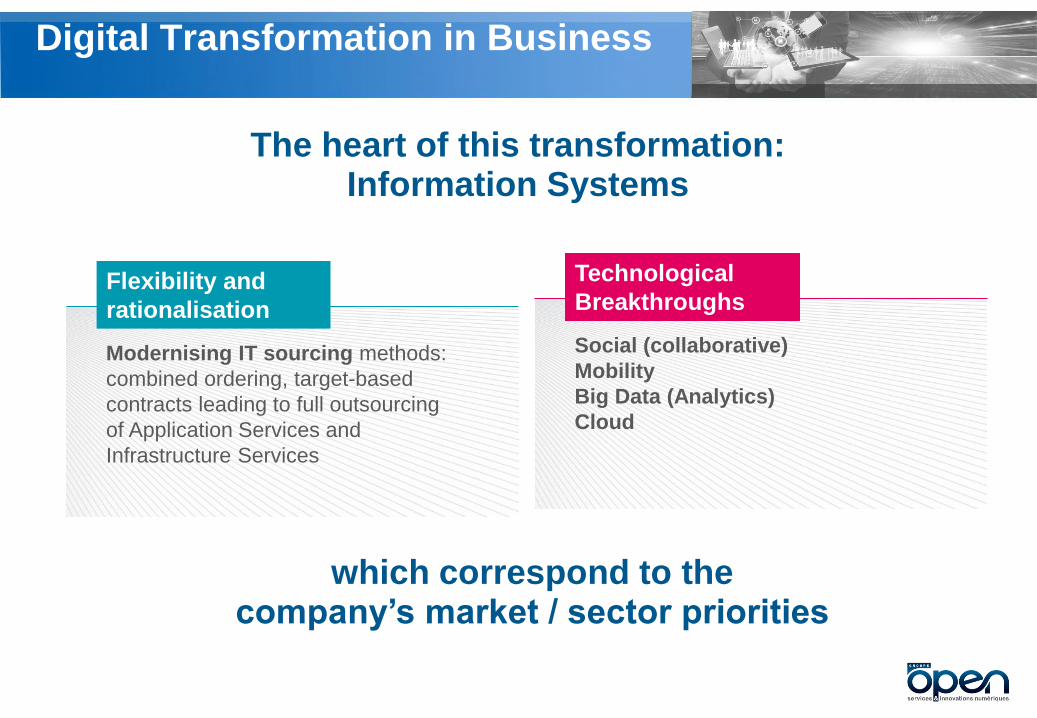
The heart of this transformation: Information Systems
which correspond to the company’s market / sector priorities
Flexibility and
rationalisation
Modernising IT sourcing methods:
combined ordering, target-based
contracts leading to full outsourcing
of Application Services and
Infrastructure Services
Technological
Breakthroughs
Social (collaborative)
Mobility
Big Data (Analytics)
Cloud
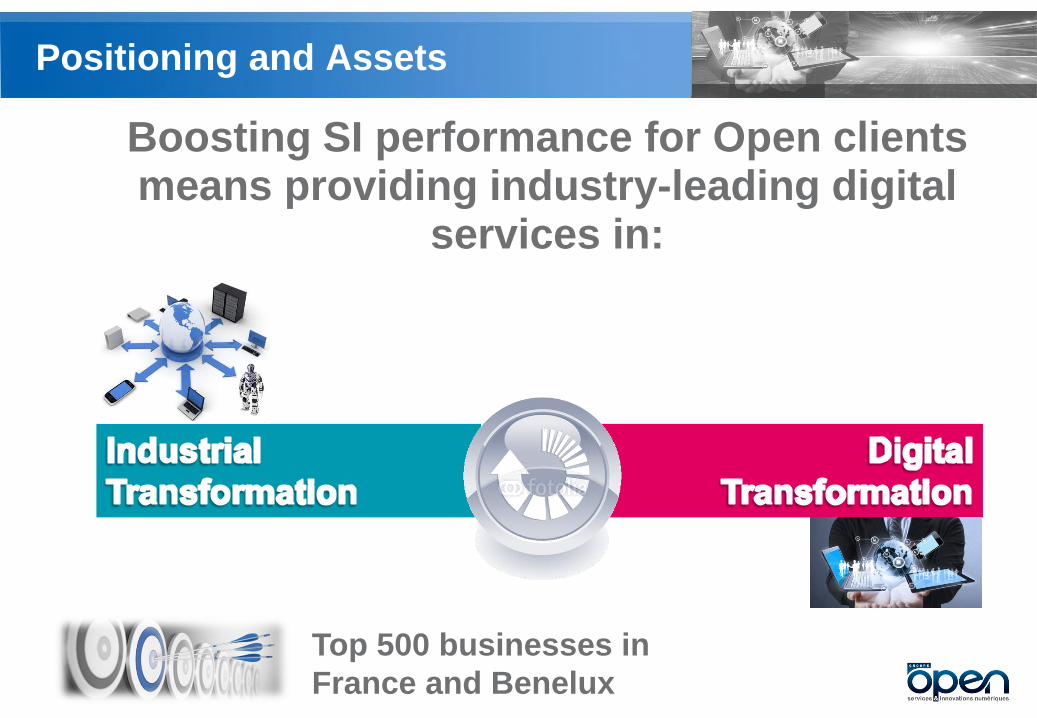
Positioning and Assets
Boosting SI performance for Open clients means providing industry-leading digital
services in:
Top 500 businesses in
France and Benelux
Positioning and Assets
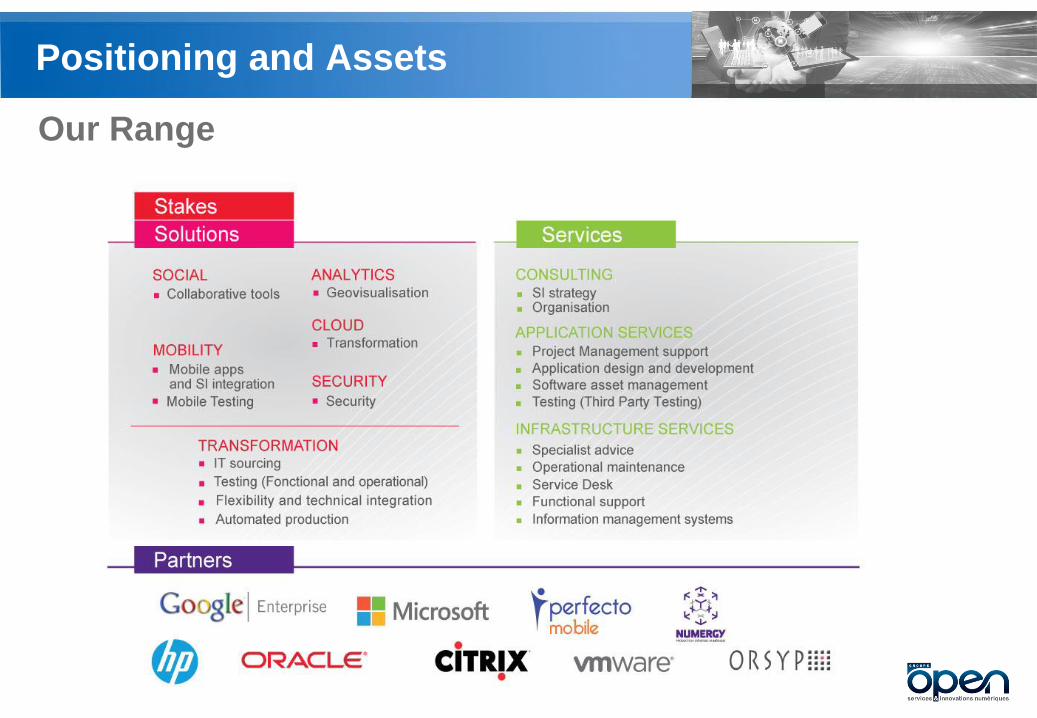
Our Range

Test
Comprehensive
run-through
Industrial methods
Safety certification
Multiple
configurations
Tester différemment
Development
Methodology,
expert analysis
Security
SI Integration
Fabriquer l’expérience numérique
Advice
Audit,
Workshops,
Priority analysis,
Positioning,
Mobile strategy
Imaginer la mobilité
Hébergement
Supervision.
Administration.
IT Support
Resource
management
Decommissioning
Maintenir et anticiper
Design
Latest technology,
Ergonomy
Design
Choice of mobile
platforms (Terminal. OS. Format)
Créer les services
Deployment
Distribution
Ensuring the
security of the
application & data
Selective roll-out
Déployer sur toutes les plateformes
Positioning and Assets
Close-up: Mobility Imagining new
forms of
mobility
Creating
services
Crafting the
digital
experience
Testing with a
difference
Deploying the
solution across
all platforms
Maintenance
and forward
planning
Positioning and Assets
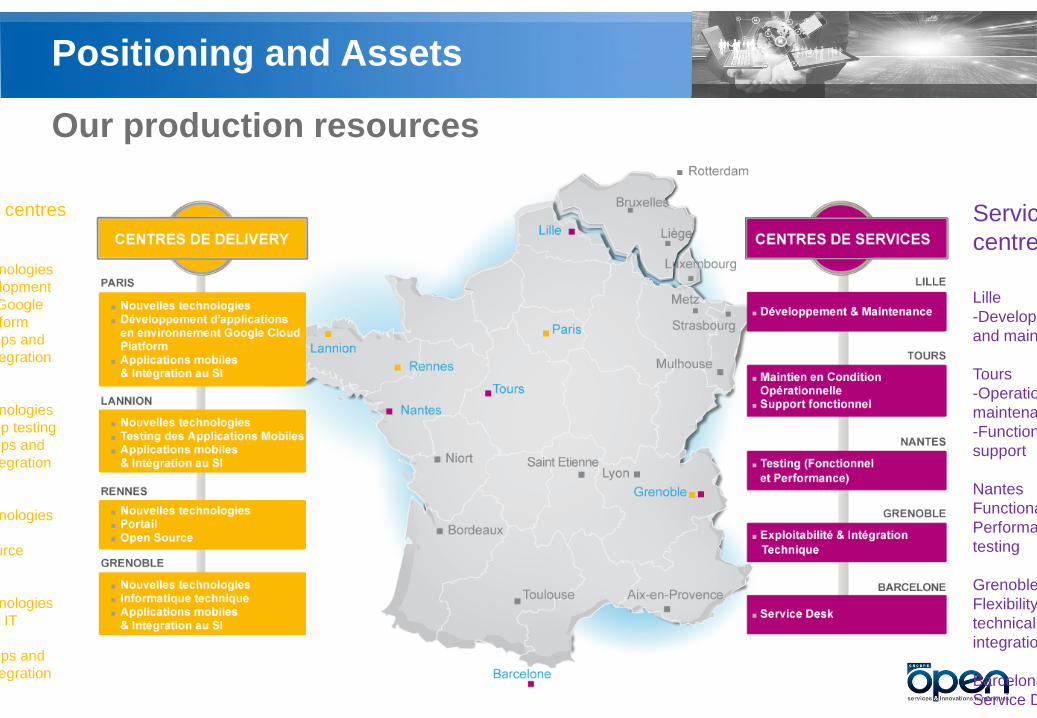
Our production resources
Delivery centres
Paris
-New technologies
-App development
using the Google
Cloud platform
-Mobile apps and
system integration
Lannion
-New technologies
-Mobile app testing
-Mobile apps and
system integration
Rennes
-New technologies
-Portals
-Open Source
Grenoble
-New technologies
-Technical IT
systems
-Mobile apps and
system integration
Service
centres
Lille
-Development
and maintenance
Tours
-Operational
maintenance
-Functional
support
Nantes
Functional and
Performance
testing
Grenoble
Flexibility and
technical
integration
Barcelona
Service Desk

Positioning and Assets
Clients – Industrial Transformation

Positioning and Assets
Clients – Digital Transformation
CO
MPA
NY
CONNECTED
PRODUCTS/SERVI
CES
CUSTOMER
RELATIONS
BRAND (E-reputation)
PROCESSES (staff / ecosystem)

Focus 2014
Structuring our activities around our growth drivers
Industrial
Transformation
Turnover
Operating Profit
Digital
Transformation
Turnover
Operating Profit

Summary & Perspectives Guy Mamou-Mani, Co-Président Valérie Benvenuto, Financial Director
Frédéric Sebag, Co-President
Thursday 20th March 2014
Shangri-La Hotel
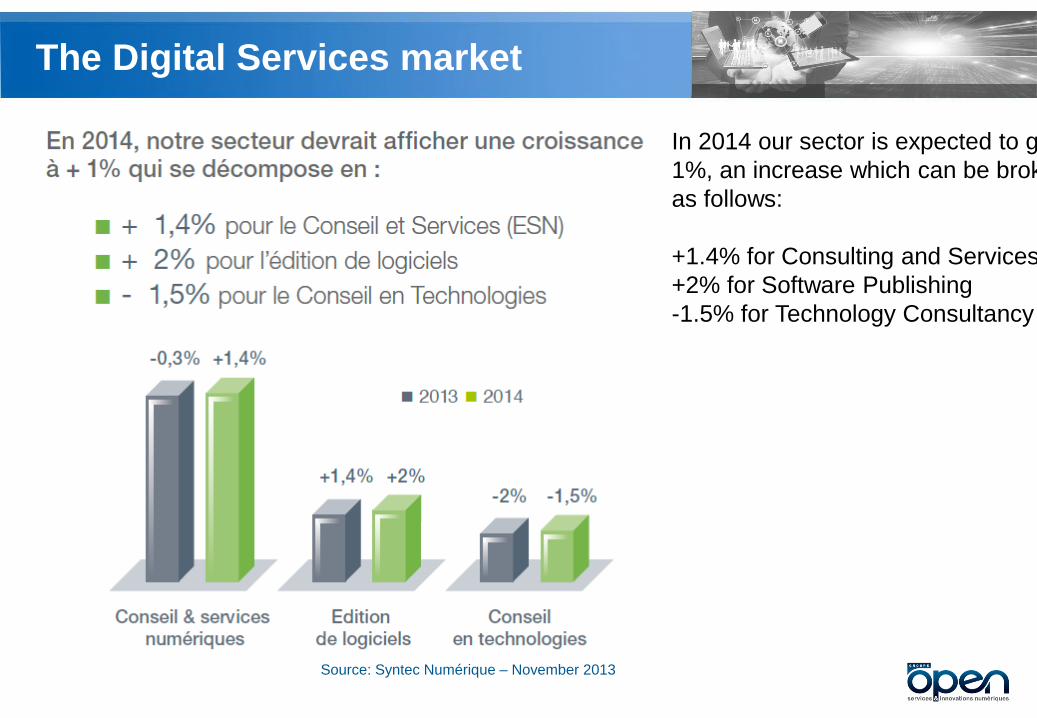
The Digital Services market
Source: Syntec Numérique – November 2013
In 2014 our sector is expected to grow by
1%, an increase which can be broken down
as follows:
+1.4% for Consulting and Services
+2% for Software Publishing
-1.5% for Technology Consultancy

The SMAC market
Digital transformation, at the heart of our growth perspectives
20% increase in revenue, 18% reduction in costs
10% annual growth in the ‘Portal’ and ‘Collaborative Tools’ sectors between
now and 2015
42% growth in the Business Network market between now and 2016
138 billion mobile application downloads
268 billion downloads predicted in 2017. Source: Cabinet Gartner
49 %
average growth rate for
Cloud infrastructures
between now and 2017
The Big Data market is
growing 6 times
faster than the IT
market as a whole

Positioning
A Responsible & Innovative Digital Services Provider
leading the way in
Industrial and Digital Transformation
for businesses in France and Benelux
Excellence underpinned by five core values and a strong CSR policy
Pertinence Audacity Ethics & Responsibility Passion Commitment

The 5 priorities of our CSR policy
INDUSTRIAL PERFORMANCE
AN AMBITIOUS INNOVATION STRATEGY
‘BETTER LIVING WITH OPEN’
DELIVERING EXCELLENCE FOR OUR CLIENTS
OUR RESPONSIBILITY PROMISE

Summary & Perspectives
Finalising the transformation of the Open Group to reflect the
evolution of the market
A remarkable second half of 2013, with increases in both turnover and
profit
Every reason to expect similar operating profit
as that seen in H2 2013
Staff figures positive
Strong dynamic in first months of 2014

Summary & Perspectives
Objectives: substantial growth in both
Turnover and Operating Profit
In 2014
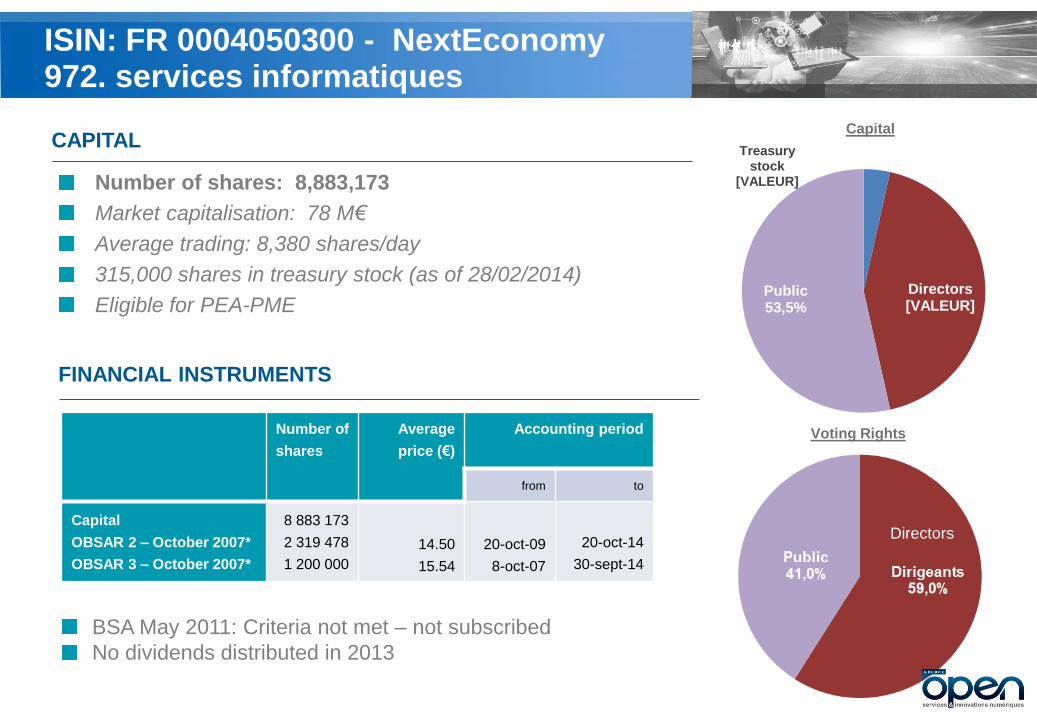
ISIN: FR 0004050300 - NextEconomy 972. services informatiques
Number of shares: 8,883,173
Market capitalisation: 78 M€
Average trading: 8,380 shares/day
315,000 shares in treasury stock (as of 28/02/2014)
Eligible for PEA-PME
CAPITAL
FINANCIAL INSTRUMENTS
Number of
shares
Average
price (€)
Accounting period
from to
Capital
OBSAR 2 – October 2007*
OBSAR 3 – October 2007*
8 883 173
2 319 478
1 200 000
14.50
15.54
20-oct-09
8-oct-07
20-oct-14
30-sept-14
Capital
Voting Rights
Treasury stock
[VALEUR]
Directors [VALEUR]
Public 53,5%
BSA May 2011: Criteria not met – not subscribed
No dividends distributed in 2013
Directors

Annual Results 2013
Thank you for listening
Thursday 20th March 2014
Shangri-La Hotel