annual residents survey 2012 full results 4 2012 – full results 1 annual residents survey 2012 –...
TRANSCRIPT

ARS 2012 – Full Results
1
Annual Residents Survey 2012 – Full Results
1 Methodology
1.1 This year the Annual Residents survey had 990 responses, this
is less than last years response rate of 1193, but similar to the response rates on 2010 and 2009 (1010 and 974 respectively).
1.2 As with previous years the responses were weighted as a way
of tackling the issue of over- and underrepresentation in the sample. The data was weighted by sex, age, ethnicity and
disability to the known profile of the area, and then by a further weight to adjust for household size.
2 Satisfaction with the council
Taking everything into account how satisfied are you with the way
the council runs things?
13%
52%
23%
9%3%
Very satisfied Fairly satisfied
Neither satisfied nor dissatisfied Fairly dissatisfied
Very dissatisfied
Base: all valid responses (932)
2.1 This year 66% of respondents were either very satisfied or
fairly satisfied with how the council run things. This is an increase on last year’s figure of 62%.
2.2 The numbers of people either very dissatisfied or fairly
dissatisfied with the way the council run things is 12%. This is an increase on last year’s figure of 11%.

ARS 2012 – Full Results
2
Year on Year Comparison – Satisfaction with the Council
Taking everything into account, how satisfied or dissatisfied are you with
the way the council run things? (%)
66 62 60 65 59 54 53
17171512141112
ARS 12 ARS 11 ARS 10 ARS 09 Place 08 ARS 07 BVPI 06
Dissatisfied
Satisfied
Base: all valid responses (931)
3 Satisfaction with the local area as a place to live
Overall, how satisfied or dissatisfied are you with your local area
as a place to live?
31%
54%
8%6%1%
Very satisfied
Fairly satisfied
Neither satisfied nor
dissatisfied
Fairly dissatisfied
Very dissatisfied
Base: all valid responses (976)
3.1 85% of respondents were either very or fairly satisfied with
their local area as a place to live. This is an increase of 1 percentage point on last years figure.
3.2 7% of respondents were either very or fairly dissatisfied. This is a decrease on last year’s figure of 8%.

ARS 2012 – Full Results
3
Year on Year Comparison – Satisfaction with the Local Area
Overall, how satisfied are you with the local area as a place to live? (%)
85 83 80 83 80 72 71
7 8 9 8 9 15 12
ARS 12 ARS 11 ARS 10 ARS 09 Place 08 ARS 07 BVPI 06
Dissatisfied
Satisfied
Base: all valid responses (976)
4 Council’s Image
To what extent do you agree or disagree that LBHF provides value
for money?
14%
47%
24%
11%4%
Strongly agree Tend to agree
Neither agree nor disagree Tend to disagree
Strongly disagree
Base: all valid responses (909)
4.1 61% of respondents either strongly agreed or tended to agree
that Hammersmith and Fulham provide value for money. This was an increase on 6 percentage points on last year’s figures.
ARS 2012 – Full Results
4
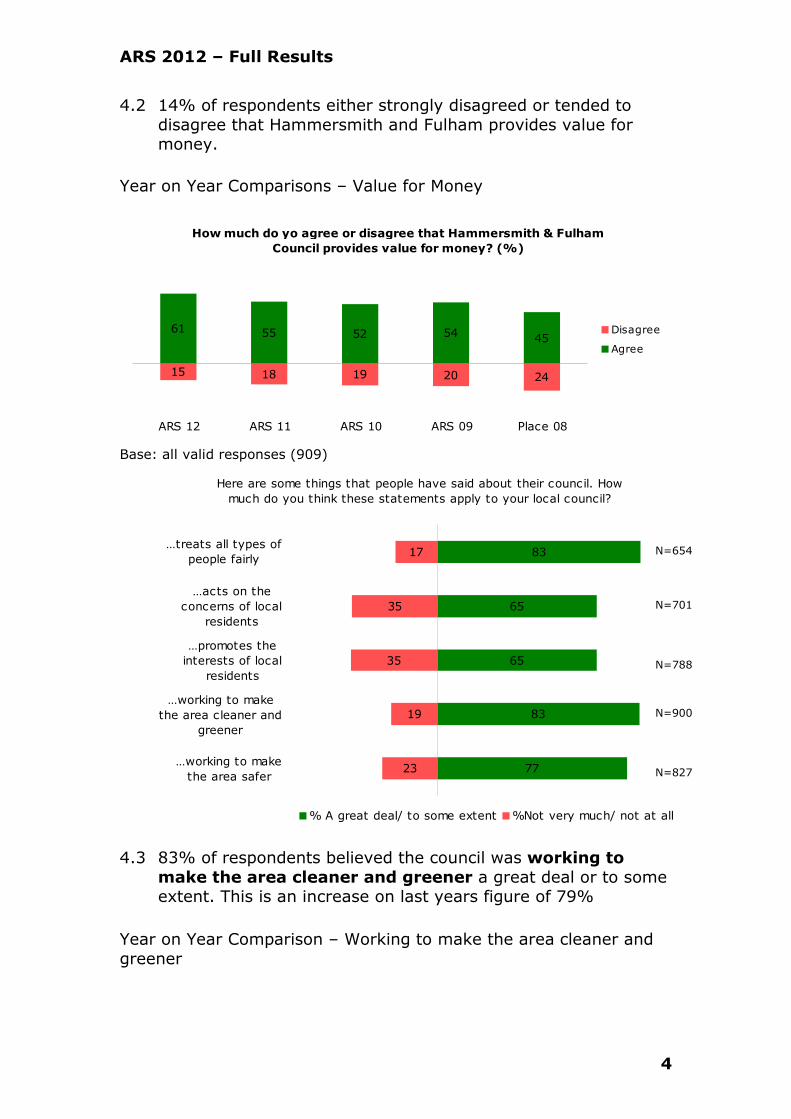
4.2 14% of respondents either strongly disagreed or tended to
disagree that Hammersmith and Fulham provides value for money.
Year on Year Comparisons – Value for Money
How much do yo agree or disagree that Hammersmith & Fulham
Council provides value for money? (%)
61 55 52 54 45
15 18 19 20 24
ARS 12 ARS 11 ARS 10 ARS 09 Place 08
Disagree
Agree
Base: all valid responses (909)
Here are some things that people have said about their council. How
much do you think these statements apply to your local council?
77
83
65
65
8317
35
35
19
23…working to make
the area safer
…working to make
the area cleaner and
greener
…promotes the
interests of local
residents
…acts on the
concerns of local
residents
…treats all types of
people fairly
% A great deal/ to some extent %Not very much/ not at all
4.3 83% of respondents believed the council was working to
make the area cleaner and greener a great deal or to some extent. This is an increase on last years figure of 79%
Year on Year Comparison – Working to make the area cleaner and
greener
N=654
N=701
N=788
N=9008
N=827

ARS 2012 – Full Results
5
How much do think the council is working to make the area cleaner and
greener?
81 79 74 76 67 72 68
19 21 26 24 32 28 32
ARS 12 ARS 11 ARS 10 ARS 09 Place 08 ARS 07 BVPI 06
% A great deal/ to some extent % Not very much/ not at all
Base: all valid responses (908)
4.4 77% of respondents felt the council was working to
make the area safer a great deal or to some extent. This is a decrease on last year’s figure of 78%.
83

ARS 2012 – Full Results
6
Year on Year Comparison – Working to make the area safer
How much do think the council is working to make the area safer?
77 78 80 81 71 70 59
23 22 20 19 29 29 41
ARS 12 ARS 11 ARS 10 ARS 09 Place 08 ARS 07 BVPI 06
% A great deal/ to some extent % Not very much/ not at all
Base: all valid responses (827)
4.5 65% of respondents felt the council promotes the interests
of local residents either a great deal or to some extent. This is the same as last year.
Year on Year Comparison – Promotes the interests of local residents
How much do think the council promotes the interests of local residents?
65 65 62 6749
64 54
463651
33383535
ARS 12 ARS 11 ARS 10 ARS 09 Place 08 ARS 07 BVPI 06
% A great deal/ to some extent % Not very much/ not at all
Base: all valid responses (788)
4.6 65% of respondents felt the council acts on the concerns of
local residents either a great deal or to some extent. This is an increase on last year’s figure of 63%.

ARS 2012 – Full Results
7
Year on Year Comparison – Acts on the concerns of local residents
How much do think the council acts on the concerns of local residents?
65 63 63 6450 61 54
35 37 37 37 49 39 46
ARS 12 ARS 11 ARS 10 ARS 09 Place 08 ARS 07 BVPI 06
% A great deal/ to some extent % Not very much/ not at all
Base: all valid responses (701)
4.7 83% of respondents agreed the council treats all types of
people fairly. This is an increase on last year’s figure of 80%.
Year on Year Comparison – Treat all types of people fairly
How much do think the council treats all types of people fairly?
83 80 79 84 75 74 71
17 20 21 17 26 25 29
ARS 12 ARS 11 ARS 10 ARS 09 Place 08 ARS 07 BVPI 06
Agree Disagree
Base: all valid responses (693)

ARS 2012 – Full Results
8
5 Satisfaction with Public Services
How satisfied or dissatisfied are you with each of the following public
services in your area? (%)
22
26
31
31
22
35
21
34
34
23
16
11
14
10
10
5
1
6
6
2
1
0
2
1
2
21
41
11
19
41
Metropolitan Police
London Fire Brigade
Your GP
Your Local Hospital
Your Local Dentist
Very satisfied Fairly satisfied
Neither satisfied nor dissatisfied Fairly dissatisfied
Very dissatisfied Haven't used service
5.1 41% of respondents hadn’t used their local dentist service.
45% were satisfied and 4% were dissatisfied.
5.2 19% of respondents hadn’t used their local hospital. 65% were satisfied and 7% were dissatisfied.
5.3 11% of respondents hadn’t used their local GP service. 65%
were satisfied and 9% were dissatisfied.
5.4 41% of respondents hadn’t used the fire brigade. 47% were
satisfied and 1% were dissatisfied.
5.5 21% of respondents hadn’t used the metropolitan police. 57% were satisfied and 6% were dissatisfied.
N=956
N=972
N=967
N=967
N=974

ARS 2012 – Full Results
9
6 Services Provided by or Supported by Hammersmith and
Fulham
How satisfied or dissatisfied are you with each of the following public
services provided or supported by Hammersmtih and Fulham? (%)
22
41
36
21
19
34
15
18
32
51
41
40
34
44
41
27
40
46
9
8
13
27
22
16
35
25
16
12
6
7
14
12
6
12
11
5
6
3
4
3
4
3
10
5
2
Keeping Public Land Clear of Litter
Refuse Collection
Doorstep Recycling
Local Tips
Sport/ Leisure Facilities
Libraries
Museums/ Galleries
Theatres/ Concert Halls
Parks and Open Spaces
Very satisfied Fairly satisfied
Neither satisfied nor dissatisfied Fairly dissatisfied
Very dissatisfied
6.1 74% of respondents were either very or fairly satisfied that the
council were keeping public land clear of litter. This is an increase on last year’s figure of 69%.
Year on Year Comparison – Keeping Public Land Clear of Litter
How satisfied are you that the council keeps public land clear of litter
and refuse? (%)
74 69 68 66 56 57 59
56493021202018
ARS 12 ARS 11 ARS 10 ARS 09 Place 08 ARS 07 BVPI 06
Satisfied Dissatisfied
Base: all valid responses (942)
N=927
N=619
N=522
N=693
N=681
N=652
N=854
N=932
N=942

ARS 2012 – Full Results
10
6.2 82% of respondents were either very or fairly satisfied with
their refuse collection. This is no change on last year.
Year on Year Comparison – Refuse Collection
How satisfied or dissatisfied are you with the refuse collection service
provided by Hammersmith and Fulham council? (%)
82 82 81 79 75 77 70
10 11 11 12 13 12 16
ARS 12 ARS 11 ARS 10 ARS 09 Place 08 ARS 07 BVPI 06
Satisfied Dissatisfied
Base: all valid responses (932)
6.3 76% of respondents were either very or fairly satisfied with doorstep recycling. This is an increase of 1 percentage point
on last year.
Year on Year Comparison – Doorstep Recycling
How satisfied or dissatisfied are you with the Doorstep Recycling
provided by Hammersmith and Fulham council? (%)
76 75 73 71 71 72 71
11 11 15 15 15 13 16
ARS 12 ARS 11 ARS 10 ARS 09 Place 08 ARS 07 BVPI 06
Satisfied Dissatisfied
Base: all valid responses (854)
6.4 55% of respondents were either very or fairly satisfied with local tips/ household waste recycling centres. This is a
decrease on last year’s figure of 58%.

ARS 2012 – Full Results
11
Year on Year Comparison – Local Tips
How satisfied or dissatisfied are you with the local tip/ household waste
recycling service provided by Hammersmith and Fulham council? (%) (Not
asked in 2007)
55 58 59 6449
66
18 21 20 12 139
ARS 12 ARS 11 ARS 10 ARS 09 Place 08 ARS 07 BVPI 06
Satisfied Dissatisfied
Base: all valid responses (652)
6.5 63% of respondents were either very or fairly satisfied with
sport/ leisure facilities. This is an increase on last year’s figure of 55%.
Year on Year Comparison – Sport/ Leisure Facilities
How satisfied or dissatisfied are you with the sport and leisure facilites
provided by Hammersmith and Fulham council? (%)
63 55 54 55 47 50 45
15 19 18 16 22 17 21
ARS 12 ARS 11 ARS 10 ARS 09 Place 08 ARS 07 BVPI 06
Satisfied Dissatisfied
Base: all valid responses (681)

ARS 2012 – Full Results
12
6.6 75% of respondents were either very or fairly satisfied with
libraries. This is an increase on last year’s figure of 73%.
Year on Year Comparison – Libraries
How satisfied or dissatisfied are you with the libraries provided by
Hammersmith and Fulham council? (%)
75 73 74 77 65 68 61
9 10 9 9 10 16 18
ARS 12 ARS 11 ARS 10 ARS 09 Place 08 ARS 07 BVPI 06
Satisfied Dissatisfied
Base: all valid responses (693)
6.7 42% of respondents were either very or fairly satisfied with
museums and galleries. This is a decrease on last year’s figure of 46%.
Year on Year Comparison – Museums/ Galleries
How satisfied or dissatisfied are you with the museums and galleries
supported by Hammersmith and Fulham council? (%)
42 46 42 4731 33
22
22 20 22 2032 23 25
ARS 12 ARS 11 ARS 10 ARS 09 Place 08 ARS 07 BVPI 06
Satisfied Dissatisfied
Base: all valid responses (522)

ARS 2012 – Full Results
13
6.8 59% of respondents were either very or fairly satisfied with
theatres/ concert halls. This is a decrease on last year’s figure of 65%.
Year on Year Comparison – Theatres/ Concert Halls
How satisfied or dissatisfied are you with the theatres/ concert halls
supported by Hammersmith and Fulham council? (%)
59 65 61 6446 43 39
16 10 14 12 20 16 18
ARS 12 ARS 11 ARS 10 ARS 09 Place 08 ARS 07 BVPI 06
Satisfied Dissatisfied
Base: all valid responses (619)
6.9 78% of respondents were either very or fairly satisfied with parks and open spaces. This is an increase on last year’s
figure of 76%.
Year on Year Comparison – Parks and Open Spaces
How satisfied or dissatisfied are you with the parks and open spaces in
Hammersmith and Fulham council? (%)
78 76 78 76 72 70 67
2015151011126
ARS 12 ARS 11 ARS 10 ARS 09 Place 08 ARS 07 BVPI 06
Satisfied Dissatisfied
Base: all valid responses (927)

ARS 2012 – Full Results
14
7 Communications
How informed do you feel about the following? (%)
55
49
24
37
53
90
73
45
51
76
63
47
10
27
How to complain to the council
How well your local council is performing
What to do in the event of an emergency
How you can get involved in local decision
making
How your council tax is spent
How and where to register and vote
Services, plans and benefits provided by the
council
Uninformed(%) Informed (%)
7.1 73% of respondents said that they were very or fairly well
informed about services, plans and benefits. This is the same as last year.
7.2 90% of residents said that they were very or fairly well
informed about how and where to register and vote. This is the same as last year.
7.3 53% of residents said that they were very or fairly well
informed about how their council tax is spent. This is
slightly more than last year’s figure of 51%.
7.4 37% of residents said that they were very or fairly well informed about how to get involved in local decision
making. This is slightly less than last year’s figure of 38%.
7.5 24% of residents said that they were very or fairly well informed about how to get involved in what to do in the
event of an emergency. This is slightly more than last years figure of 23%
N=882
N=906
N=852
N=801
N=787
N=835
N=792

ARS 2012 – Full Results
15
7.6 49% of residents said that they were very or fairly well
informed about how well the council is performing. This is the same as last year.
7.7 55% of residents said that they were very or fairly well
informed about how to complain to the council. This is an increase on last year’s figure of 52%.
8 Complaints
Have you contacted the council with a complaint?
22%
78%
Yes
No
Base: all valid responses (958)
8.1 22% of respondents had contacted the council with a
complaint in the last 12 months. This is a decrease on last years figure of 24%.

ARS 2012 – Full Results
16
Have you contacted the council with a complaint? (%)
78 76 76 76 73 74
262824242422
ARS 12 ARS 11 ARS 10 ARS 09 Place 08 ARS 07 BVPI 06
Yes No
Base: all valid responses (927)
How satisfied or dissatisfied are you with the way in which your
complaint(s) was (were) handled?
17%
31%
8%
29%
15%
Very satisfied
Fairly satisfied
Neither satisfied nor
dissatisfied
Fairly dissatisfied
Very dissatisfied
Base: all valid responses (235)
8.2 48% of those who complained were satisfied with how their
complaint was handled. This is an increase on last year’s figure of 32%.

ARS 2012 – Full Results
17
Year on Year Comparison – Satisfaction with how your complaint
was handled
How satisfied or dissatisfied are you with the way in which your
complaint(s) was (were) handled?(%) (Not asked in 2008)
48 32 37 37 31 28
44 48 51 51 59 63
ARS 12 ARS 11 ARS 10 ARS 09 Place 08 ARS 07 BVPI 06
Satisfied Dissatisfied
9 Specific publications1
9.1 This year the Annual Residents’ Survey included questions on
council communications, specifically the different methods employed to inform residents about council news and their
usefulness.
9.2 33% of respondents in the postcodes that Your Fulham Mag
is delivered to said they had never seen the publication. Of those that had seen the publication, 71% found it useful and
15% did not find it useful in informing them about council news. The rest found it neither useful nor of no use.
9.3 44% of respondents in the postcodes that Your
Hammersmith Mag is delivered to said they had never seen the publication. Of those that had seen the publication, 63%
found it useful and 24% did not find it useful in informing them about council news.
9.4 52% of respondents in the postcodes that Your Shepherds
Bush Mag is delivered to said they had never seen the
publication. Of those that had seen the publication, 73% found it useful and 19% did not find it useful in informing them about
council news.
9.5 28% of respondents said they had never seen the council website. Of those that had seen the website 78% found it
useful and 12% did not find it useful in informing them about council news.
1 This data is unweighted as the publications cover various parts of the borough.

ARS 2012 – Full Results
18
9.6 52% of respondents said they had never seen the ‘Council
News’ section in the Chronicle. Of those that had seen it 62% found it useful and 21% did not find it useful in informing
them about council news.
9.7 62% of respondents had never seen the My Account portal. Of those that had seen it 62% found it useful and 21% did not
find it useful in informing them about council news.
9.8 53% of respondents who lived in council rented accommodation or were council leaseholders (i.e. those who
should receive Your Home magazine) had never seen it. Of those that had seen it 63% found it useful in informing them
about council news.
9.9 81% of respondents had never seen the Buzz Newspaper for
Young People. Of those that had seen it 44% found it useful in informing them about council news.
9.10 80% of respondents had never seen the council’s Twitter
feed. Of those that had seen it 31% found it useful in informing them about council news.
9.11 Respondents were asked how they would prefer to receive
news relating to H&F. Of those who only ticked one box, 28% said email, 29% said letter, 15% said Your Mag, and 12%
said the council website. Of all respondents (i.e. those who ticked any number of boxes) 37% said letter, 37% said email
and 29% said Your Mag.2
2 Totals value more than 100% because respondents ticked more than one box.

ARS 2012 – Full Results
19
10 Community Safety
10.1 39% of respondents felt vehicle crime was a problem. This is a decrease on last year’s figure of 49%.
10.2 33% of respondents felt violence or assault was a problem.
This is a decrease on last year’s figure of 39%.
10.3 49% of respondents felt robbery was a problem. This is a decrease on last year’s figure of 50%.
10.4 58% of respondents felt burglary was a problem. This is a
decrease on last year’s figure of 59%.
How much of a problem do you think each of the following are in your
local area?
61
67
51
42
68
61
57
74
58
66
97
39
33
49
58
32
39
43
26
42
34
3
Motor Vehicle Crime
Violence or assault
Robbery
Burglary
Noisy neighbours
Teenagers hanging
around
Rubbish
Vandalism
People using or
dealing drugs
People being drunk or
rowdy
Abandoned cars
% Problem % Not a problem
n=771
n=880
n=729
n=852
n=932
n=919
n=932
n=743
n=688
n=748
n=674

ARS 2012 – Full Results
20
10.5 32% of respondents felt noisy neighbours were a problem.
This is a decrease on last year’s figure of 36%.
10.6 39% of respondents felt teenagers hanging around on the streets were a problem. This is a decrease on last year’s figure
of 47%.
10.7 43% of respondents felt rubbish and litter lying around was a problem. This is a slight increase on last year’s figure of 42%.
10.8 26% of respondents felt vandalism, graffiti etc. was a
problem. This is a decrease on last year’s figure of 30%.
10.9 42% of respondents felt people using or dealing drugs was a problem. This is the same as last years figure.
10.10 34% of respondents felt people being drunk or rowdy in public was a problem. This is an decrease on last year’s figure
of 41%.
10.11 3% of respondents felt abandoned cars were a problem. This is the same as last year.
Year on Year Comparisons – Crime/ ASB Types
Q18. Thinking about this local area,
how much of a problem do you think
each of the following are … (% problem)
ARS
12
ARS
11
ARS
10
ARS
09
Place
08
ARS
07
BVPI
06
% % % % % % %
…vehicle crime (674 responses) 39 49 N/A N/A N/A N/A N/A
…violence/assault (748) 33 39 N/A N/A N/A N/A N/A
…robbery (688) 49 50 N/A N/A N/A N/A N/A
…burglary (743) 58 59 N/A N/A N/A N/A N/A
...noisy neighbours or loud parties (932) 32 36 24 22 25 32 29
…teenagers hanging around on the
streets (919) 39 47 36 41 50 57 61
…rubbish and litter lying around (932) 43 42 39 47 55 60 61
…vandalism, graffiti and other deliberate
damage to property or vehicles (852) 26 30 34 32 42 40 47
…people using or dealing drugs (729) 42 42 32 32 36 48 50
…people being drunk or rowdy in public
spaces (880) 34 41 34 38 41 39 48
…abandoned or burnt out cars (771) 3 3 6 5 6 6 7

ARS 2012 – Full Results
21
10.12 37% of respondents agreed that the police and local public
services sought peoples views on these crime/ ASB issues. This is a slight decrease on last years’ figure of 38%.
How much would you agree or disagree that the police and other local
public services seek people's views about these issues? (%)
37 38 34 39 30
26 22 27 19 28
ARS 12 ARS 11 ARS 10 ARS 09 Place 08
% Agree % Disagree
Base: all valid responses (977)
10.13 42% of respondents agreed that the police and local public services were successfully dealing with these crime/ ASB
issues. This is a slight increase on last years’ figure of 38%.
How much would you agree or disagree that the police and other local
public services are successfully dealing with these issues? (%)
42 38 38 41 33
15 15 18 14 21
ARS 12 ARS 11 ARS 10 ARS 09 Place 08
% Agree % Disagree
Base: all valid responses (970)

ARS 2012 – Full Results
22
10.14 44% of respondents agreed that parents took enough
responsibility for the behaviour of their children. This is an increase on last year’s figure of 37%.
To what extent do you agree or disagree that in your local area, parents
take enough responsibility for the behaviour of their children? (%)
44 37 39 36 27
5139384134
ARS 12 ARS 11 ARS 10 ARS 09 Place 08
% Agree % Disagree
Base: all valid responses (887)
10.15 61% of respondents said that they felt safe while outside in their local area after dark. This is an increase on last years
figure of 58%. Safety during the day stayed the same as last year at 88% of respondents.
How safe do you feel when outside in your local area after dark? (%)
61 58 60 59
23 23 24 24
ARS 12 ARS 11 ARS 10 ARS 09
Safe Unsafe
Base: all valid responses (963)

ARS 2012 – Full Results
23
11 Respect and Consideration 11.1 26% of residents felt there was a problem in their local area
with people not treating each other with respect. This is a decrease on last years figure of 37%.
In your local area, how much of a problem do you think there is with
people not treating each other with respect?
74 64 68 68 62 52 45
26 37 32 32 39 49 56
ARS 12 ARS 11 ARS 10 ARS 09 Place 08 ARS 07 BVPI 06
%Not a problem %A problem
Base: all valid responses (899)
11.2 10% of people said that they were rarely or never treated
with respect by their local council. This is a slight increase on last years figure of 9%.
In the last year would you say that you have been treated with respect
and consideration by your local council? (%)
73 67 70 77 74
10 9 11 6 6
ARS 12 ARS 11 ARS 10 ARS 09 Place 08
% All/ most of the time % Rarely/ never
Base: all valid responses (783)

ARS 2012 – Full Results
24
12 Social Cohesion
How much do you agree or disagree that your local area is a place
where people get on?
19%
69%
8%4%
Definately agree
Tend to agree
Tend to disagree
Definately disagree
12.1 88% of respondents agreed that the local area was a place
where people of different backgrounds got on. This is an increase on last year’s figure of 82%.
How much do you agree or disagree that your local area is a place where
people get on? (%)
88 82 80 85 78 78 76
12 18 20 15 22 23 22
ARS 12 ARS 11 ARS 10 ARS 09 Place 08 ARS 07 BVPI 06
Agree Disagree
Base: all valid responses (885)

ARS 2012 – Full Results
25
13 Getting Involved
How much do you agree or disagree that you can influence decisions
affecting your local area?
7%
35%
40%
18%
Definately agree
Tend to agree
Tend to disagree
Definately disagree
Base: all valid responses (726)
13.1 43% of respondents agreed that they could influence decisions
in their local area. This is an increase on last year’s figure of
40%.
How much do you agree or disagree that you can influence decisions in
my local area? (%)
43 40 41 46 36 40 40
57 60 59 54 64 61 61
ARS 12 ARS 11 ARS 10 ARS 09 Place 08 ARS 07 BVPI 06
Agree Disagree
Base: all valid responses (726)

ARS 2012 – Full Results
26
14 Community Participation
Generally speaking, would you like to be more involved in the decisions
that affect your local area?
30%
10%
60%
Yes
No
Depends on issue
Base: all valid responses (930)
14.1 31% of respondents said they would like to be more involved in
the decisions that affect their local area. 59% said they would like to be involved depending on the issue.
Performance & Information Team January 2013