annual reprt 2014 castrol india limited · annual reprt 2014 1 ... crb mini-truck lasted three...
TRANSCRIPT

annual report 2014
1
Board of Directors
Mr. S. M. Datta — Chairman
Mr. R. Gopalakrishnan — Independent Director
Mr. Uday Khanna — Independent Director
Mr. Ralph Hewins — Nominee Director
Mr. Peter Weidner — Nominee Director
Mr. Sashi Mukundan — Nominee Director
Mr. Ravi Kirpalani — Managing Director
Ms. Rashmi Joshi — Director – Finance (Chief Financial Officer)
Mr. Jayanta Chatterjee — Director – Supply Chain
Mr. Sandeep Deshmukh — Company Secretary
Auditors
M/s. S. R. Batliboi & Co. LLP Chartered Accountants
Bankers
Deutsche Bank
HDFC Bank Ltd.
The Hong Kong & Shanghai Banking Corporation Ltd.
State Bank of India
Citibank N.A.
DBS Bank Ltd.
J P Morgan Chase Bank N.A.
Registered OfficeTechnopolis Knowledge ParkMahakali Caves Road,Chakala, Andheri (East),Mumbai 400 093, INDIA.CIN: L23200MH1979PLC021359Telephone: 022-66984100Website: www.castrol.co.in.
Registrar & Share Transfer AgentsTSR Darashaw LimitedUnit: Castrol India Limited6-10, Haji Moosa Patrawala Industrial Estate,20, Dr. E. Moses Road, Mahalaxmi,Mumbai 400 011, INDIA.
CASTROL INDIA LIMITED
ContentsPage Nos.
1. Financial Highlights 10
2. Directors’ Report 13
3. Management Discussion & Analysis Report
18
4. Corporate Governance Report 30
5. Business Responsibility Report 41
6. Auditors’ Report 51
7. Balance Sheet 56
8. Statement of Profit and Loss 57
9. Cash Flow Statement 58
10. Notes to Financial Statements 60

STRONG BRANDS
®Castrol Activ Scooter with ZipBoosters is leading the new category of scooter engine oils
Castrol Activ motorcycle engine oil with Actibond molecules that cling to engine parts providing continuous protection
Castrol Go! - a value for money offering for mass motorcycle segment
GET THE ULTIMATEAPP FOR BIKERS!
ACTIBONDS CLING ONTO YOUR ENGINE FOR
CONTINUOUS PROTECTION
CASTROL ACTIVCONTINUOUS PROTECTIONEVEN WHEN THE ENGINE IS OFF.
The Castrol Power1 Biking app - a first of its kind mobile biking application, has won several awards for innovative technology
Castrol brand ambassador and biking enthusiast, actor John Abraham, promotes the launch of a new variant of Castrol Power1

STRONG BRANDS
The high performance range of Castrol passenger car engine oils catering to different vehicle segments
Castrol MAGNATEC Stop-Start, specially designed for stop-start city driving conditions, was launched through a 360 degrees marketing programme
YOUR ENGINE IS USING AN OIL WITHTMFLUID STRENGTH TECHNOLOGY ...
OIL STRENGTH FOR MAXIMUMENGINE PERFORMANCE
WITHFLUID STRENGTH
TMTECHNOLOGY
Castrol EDGE Professional - the world’s first certified carbon neutral engine oil range was launched in India, re-emphasizing Castrol’s pioneering technology

Castrol VECTON - an internationally acclaimed commercial engine oil was successfully launched in India
Castrol CRB Mini-Truck with Heat Shield Boosters is specially engineered for mini-trucks and delivers three times better heat protection
Customer engagement in rural areas for Castrol CRB range
USE CRB MINI-TRUCK AND GET UPTO 3 TIMES BETTER HEAT PROTECTION
NEW CASTROLCRB MINI-TRUCK OILSPECIALLY DESIGNED
FOR YOUR MINI-TRUCK
* Based on field trial data Tata Ace vs. Tata 2516C. *Dipstick visual representation of performance at 6000 km. *In Industry oxidation testing, CRB Mini-Truck lasted three times longer than a conventional API CF-4 Oil 15W-40.*
CONVENTIONALOIL
CRBMINI-TRUCK OIL
DID YOU KNOW THAT A MINI-TRUCK’SENGINE RUNS 25°C HOTTER THANA BIG-TRUCK’S ENGINE**?
STRONG BRANDS

Team Castrol VECTON won Individual and Team titles at the first TATA T1 Truck Racing Championship in 2014. Pictures show the winning truck and the winning team
Castrol customers had the opportunity to visit the ICC Cricket Academy in Dubai, meet with international cricketers, experience professional cricket coaching facilities and be a part of a big screen match viewing experience of the T20 Cricket World Cup 2014 as part of the Castrol World of Winners promotion
As part of the Castrol Activ Cling On to Football campaign run during the FIFA World Cup 2014, football fans had the opportunity to be a part of a big screen match viewing experience hosted by Castrol brand ambassador and Bollywood star John Abraham
Asia’s first lightbox hangout pioneered by Castrol Activ was part of the brand’s Cling On to Football campaign run during the FIFA World Cup 2014. Picture above shows the hangout in action whilst poster alongside shows the highlights of the campaign’s achievements
SPONSORSHIPS

Sashi Mukundan - Regional President & Head of Country - India, BP Group Companies, handing over the Castrol rolling trophy for Safety and Overall Performance for transport contractors to Satish Dhingra - owner of DGFC Transport and his team
Sunil Aima - VP Sales - India & South Asia, CIL (on extreme left),felicitating a mechanic for safety leadership. Also seen in picture (on extreme right) is Harbir Gill- Market Activation Manager, CIL, winner of Castrol’s internal SMART Professional Driving Safety programme from Asia & Pacific region
The Castrol Family Connect programme enables Castrol to engage with truckers and their families to promote road safety messages
SAFETY
safe from the moment you startSMART
The Castrol supported Good Road campaign to promote wearing of helmets, received wide recognition and acclaim

INFRASTRUCTURE UPGRADATION
Castrol’s Patalganga Plant was upgraded with blending automation processes and high speed filling lines. Pictures on page show the inauguration and various areas of the upgraded facilities
Picture above shows the Patalganga project team along with visiting leadership team members. (From left to right) Manoj Lavania - Manufacturing Excellence Manager, Asia & Pacific, BP Lubricants; Ravi Kirpalani - MD, CIL; Eugene Tan - Regional Supply Chain Director, Asia & Pacific, BP Lubricants; Jayanta Chatterjee - Director Supply Chain, CIL; Neil Sutton - VP, Global Supply Chain, BP Lubricants; Manish Kamat - GM Patalganga Plant, CIL; Amitabh Sharma - Programme Manager, Innova, CIL; Shriram Bhardwaj - Senior Manager, Project & Engineering, Patalganga Plant, CIL and Devashis Sarkar - Manager, Project & Engineering, Patalganga Plant, CIL. Inset picture: Neil Sutton unveiling the inauguration plaque
The high speed small pack filling line
Operators managing blending operations from the central control room
Overview of the medium pack filling line area
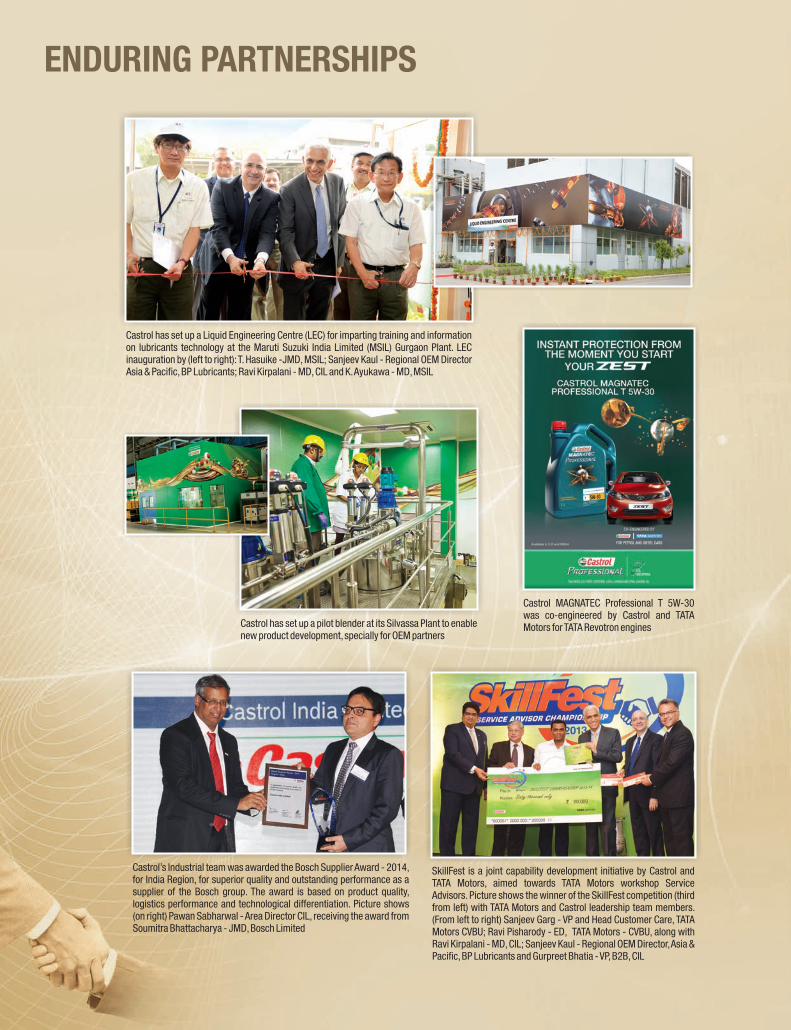
Castrol has set up a Liquid Engineering Centre (LEC) for imparting training and information on lubricants technology at the Maruti Suzuki India Limited (MSIL) Gurgaon Plant. LEC inauguration by (left to right): T. Hasuike -JMD, MSIL; Sanjeev Kaul - Regional OEM Director Asia & Pacific, BP Lubricants; Ravi Kirpalani - MD, CIL and K. Ayukawa - MD, MSIL
Castrol has set up a pilot blender at its Silvassa Plant to enable new product development, specially for OEM partners
SkillFest is a joint capability development initiative by Castrol and TATA Motors, aimed towards TATA Motors workshop Service Advisors. Picture shows the winner of the SkillFest competition (third from left) with TATA Motors and Castrol leadership team members. (From left to right) Sanjeev Garg - VP and Head Customer Care, TATA Motors CVBU; Ravi Pisharody - ED, TATA Motors - CVBU, along with Ravi Kirpalani - MD, CIL; Sanjeev Kaul - Regional OEM Director, Asia & Pacific, BP Lubricants and Gurpreet Bhatia - VP, B2B, CIL
ENDURING PARTNERSHIPS
Castrol’s Industrial team was awarded the Bosch Supplier Award - 2014, for India Region, for superior quality and outstanding performance as a supplier of the Bosch group. The award is based on product quality, logistics performance and technological differentiation. Picture shows (on right) Pawan Sabharwal - Area Director CIL, receiving the award from Soumitra Bhattacharya - JMD, Bosch Limited
Castrol MAGNATEC Professional T 5W-30 was co-engineered by Castrol and TATA Motors for TATA Revotron engines
AWARDS & ACCOLADES
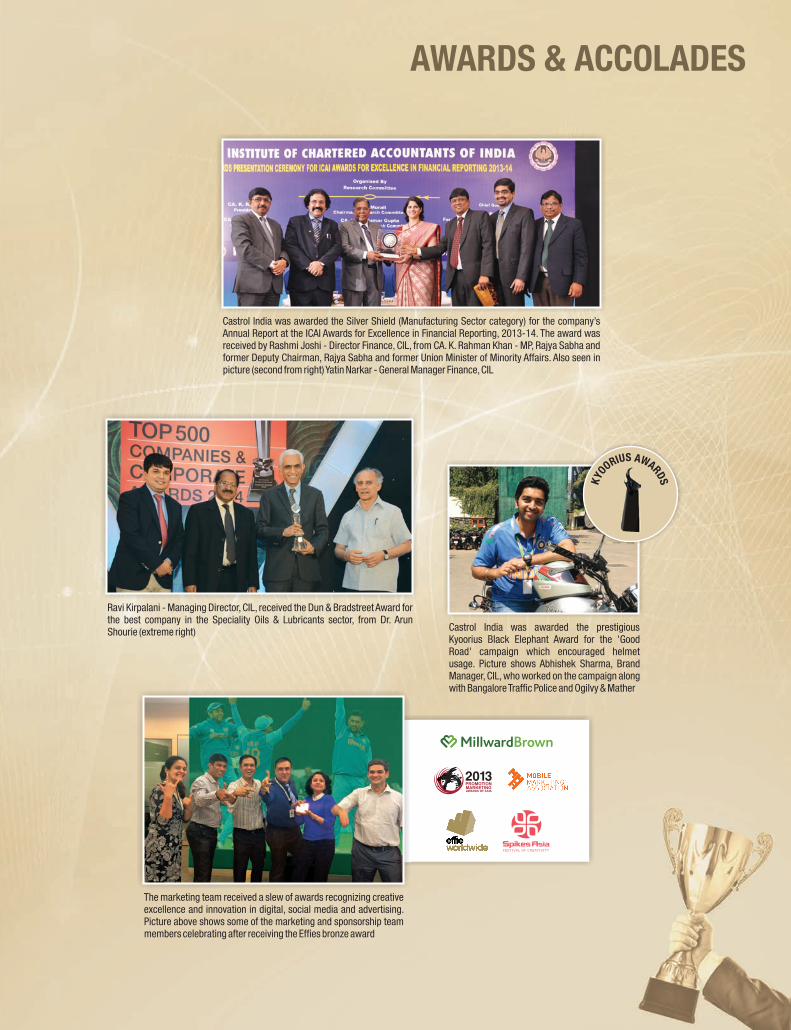
Ravi Kirpalani - Managing Director, CIL, received the Dun & Bradstreet Award for the best company in the Speciality Oils & Lubricants sector, from Dr. Arun Shourie (extreme right) Castrol India was awarded the prestigious
Kyoorius Black Elephant Award for the 'Good Road' campaign which encouraged helmet usage. Picture shows Abhishek Sharma, Brand Manager, CIL, who worked on the campaign along with Bangalore Traffic Police and Ogilvy & Mather
Castrol India was awarded the Silver Shield (Manufacturing Sector category) for the company’s Annual Report at the ICAI Awards for Excellence in Financial Reporting, 2013-14. The award was received by Rashmi Joshi - Director Finance, CIL, from CA. K. Rahman Khan - MP, Rajya Sabha and former Deputy Chairman, Rajya Sabha and former Union Minister of Minority Affairs. Also seen in picture (second from right) Yatin Narkar - General Manager Finance, CIL
The marketing team received a slew of awards recognizing creative excellence and innovation in digital, social media and advertising. Picture above shows some of the marketing and sponsorship team members celebrating after receiving the Effies bronze award
FESTIVAL OF CREATIVITY
PROMOTION
AWARDS OF ASIAMARKETING

10
annual report 2014 FINANCIAL HIGHLIGHTS
annual report 2014 annual report 2014
11
FINANCIAL HIGHLIGHTS

12
FINANCIAL HIGHLIGHTSannual report 2014
particulars 2014 2013 2012 2011 2010 2009 2008
Rupees in Crores
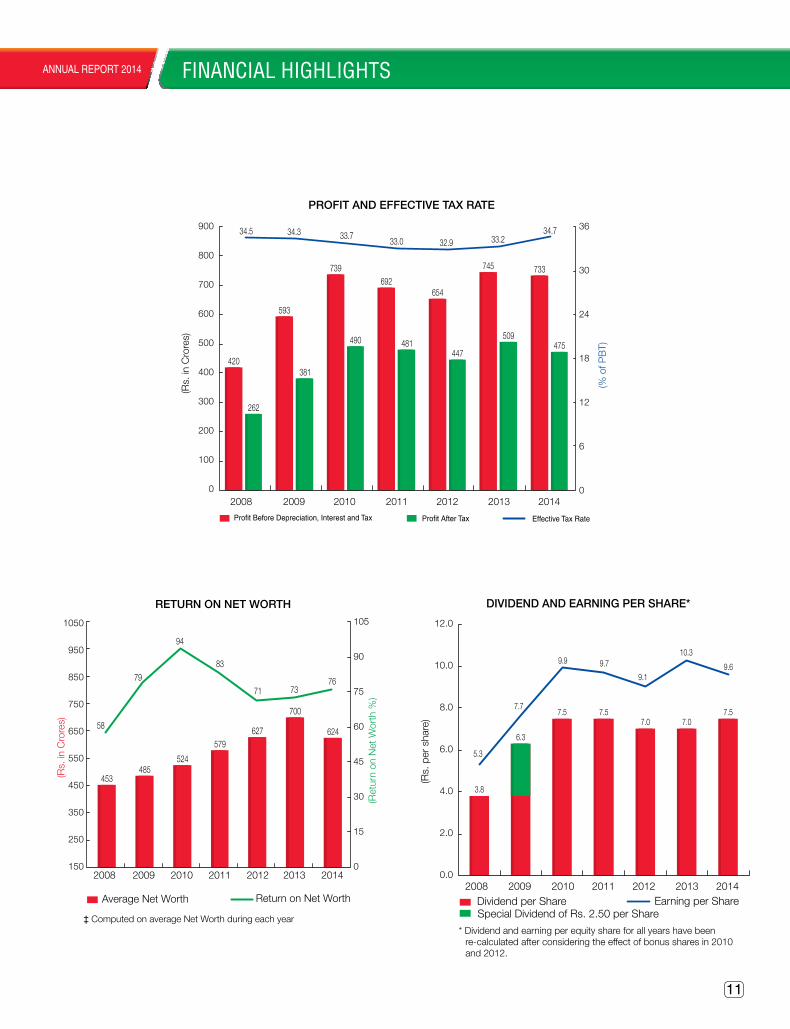
revenue from operations (Gross) 3,918.62 3,677.50 3,605.38 3,439.23 3,146.88 2,695.05 2,542.60
less: excise Duty 526.29 497.88 484.52 445.96 403.97 367.04 326.01
revenue from operations (net) 3,392.33 3,179.62 3,120.86 2,993.27 2,742.91 2,328.01 2,216.59
other Income 16.06 35.06 30.84 21.66 5.42 7.42 9.88
Cost of Materials consumed 1,937.50 1,788.47 1,824.27 1,694.49 1,384.67 1,123.78 1,313.09
employee Benefits and other expenses 738.11 703.67 673.67 628.90 625.00 619.05 492.89
earnings before Interest, tax, Depreciation, amortisation and exceptional Item 732.78 722.54 653.76 691.54 738.66 592.60 420.49
exceptional Item — 22.80 — — — — —
earnings before Interest, tax, Depreciation and amortisation (eBItDa) 732.78 745.34 653.76 691.54 738.66 592.60 420.49
Depreciation and amortisation expense 36.13 30.45 26.64 25.11 24.33 27.18 25.68
Finance Costs 2.38 1.71 2.14 1.91 2.42 3.45 3.65
Interest Income 32.04 48.58 41.34 51.43 25.93 18.83 21.04
profit Before taxation 726.31 761.76 666.32 715.95 737.84 580.80 412.20
Current taxation 260.60 241.06 227.78 255.44 251.09 206.83 151.00
Deferred taxation (8.85) 12.13 (8.85) (19.13) (2.49) (7.80) (8.60)
Fringe Benefit tax — — — — — 0.71 5.75
Short/(excess) provision of tax relating to earlier years — — — (1.39) (1.07) — 1.68
profit after taxation 474.56 508.57 447.39 481.03 490.31 381.06 262.37
Dividend 370.92 346.20 346.20 370.92 370.92 309.10 185.46
net Fixed assets 187.74 175.33 157.08 141.82 133.92 134.69 143.31
Investments — — — — — 0.52 0.52
net assets 496.78 751.42 649.23 604.20 553.50 495.00 478.36
Share Capital 247.28 494.56 494.56 247.28 247.28 123.64 123.64
reserves & Surplus 249.50 256.86 154.67 356.92 306.22 371.36 351.93
net Worth 496.78 751.42 649.23 604.20 553.50 495.00 475.57
loan Funds — — — — — — 2.79
Deferred tax assets/(liability) (net) 61.81 52.96 65.09 56.24 37.11 34.62 26.82
Rupees
earning per Share* 9.60 10.28 9.05 9.73 9.92 7.71 5.31
Dividend per Share* 7.50 7.00 7.00 7.50 7.50 ‡ 6.25 3.75
Book Value per Share* 20.09 15.19 13.13 12.22 11.19 10.01 9.62
Debt equity ratio — — — — — — 0.02 :1
* after considering adjustments for issue of bonus shares in 2010 and 2012.
‡ Includes Special Dividend of rs. 2.50 per share (adjusted for issue of bonus shares in 2010 & 2012 i.e. rs. 10 per share, pre-Bonus).

annual report 2014
13
DIRECTORS’ REPORT
Report of the Directors to the Shareholders of the Company in respect of the year ended 31st December, 2014.
ParticularsFor the year ended
31st December, 2014 (Rupees in crores)
For the year ended 31st December, 2013
(Rupees in crores)
Profit before Interest, Depreciation, Exceptional Items & Tax 732.78 722.54
Interest Income (Net of Finance Cost) 29.66 46.87
Exceptional items — 22.80
Profit before Depreciation & Tax 762.44 792.21
Depreciation & Amortisation 36.13 30.45
Tax Expenses
Current Tax 260.60 241.06
Deferred Tax (8.85) 12.13
Profit after Tax 474.56 508.57
Adding thereto:
Balance as per last Balance Sheet brought forward 94.86 43.53
Profit available for Appropriation 569.42 552.10
The appropriations are:
Dividend
Interim 173.10 173.10
Final 197.82 173.10
Tax on Dividend
Interim 29.42 29.42
Final 39.55 29.42
Final – 2013 — 1.34
Tax on Capital Reduction 42.03 —
Transfer to General Reserves — 50.86
Net surplus in the Statement of Profit & Loss 87.50 94.86
569.42 552.10

annual report 2014
14
PERFORMANCE
Sales realisation of the Company has increased by about 7% over the previous year to Rs. 3,907 crores, mainly due to an increase in per unit sales realizations. However, the sales volumes have declined by 1% over the previous year. Cost of material, has increased by about 8% over the previous year to Rs. 1,938 crores primarily due to weakening of Rupee. Despite the challenging economic environment, its the performance of personal mobility brands which has helped your Company to improve its unit gross margins and gross profit. Operating and other expenses increased by about Rs. 40 crores as compared to the previous year mainly due to inflation. Profit from operations has increased by about 4%.
Profit Before Tax decreased by about 5% over previous year to Rs. 726.3 crores. Profit After Tax decreased by 7% over the previous year to Rs. 474.6 crores.
The Company’s performance has been discussed in detail in Management Discussion and Analysis Report.
DIVIDEND
Your Directors are pleased to recommend a Final Dividend of Rs. 4.00 per equity share of Rs. 5/- each, for the year ended 31st December, 2014. The Interim Dividend of Rs. 3.50 per equity share was paid in August, 2014.
The Final Dividend, subject to approval of members, will be paid within statutory period, to the members whose names appear in the Register of Members, as per the book closure. The total dividend for the financial year, including the proposed Final Dividend, amounts to Rs. 7.50 per equity share and will absorb Rs. 370.9 crores (Previous year Rs. 7.00 per equity share amounting to Rs. 346.20 crores). The Company also returned Rs. 5 per share to its shareholders (Rs. 247.28 crores) under Capital Reduction Scheme, in March, 2014.
DIRECTORS
In accordance with the provisions of Section 161 of the Companies Act, 2013 (the Act) and Article 115(a) of the Articles of Association, Mr. Jayanta Chatterjee was appointed as an Additional Director with effect from 30th October, 2014. Mr. Chatterjee was also appointed as Whole-time Director, designated as ‘Director –
Supply Chain’ with effect from 30th October, 2014. His appointment has been put up for approval of Members of the Company through Postal Ballot and approval of Central Government is also being obtained.
Pursuant to provisions of the Act and Clause 49 of the Listing Agreement, Mr. S.M. Datta, Mr. R. Gopalakrishnan and Mr. Uday Khanna were appointed as Independent Directors for a period of 5 years from 1st October, 2014 and shall not be liable to retire by rotation. Mr. Ravi Kirpalani and Mr. Peter Weidner retire by rotation and being eligible, offer themselves for re-appointment. The information of directors seeking appointment/re-appointment as required under Clause 49 of the Listing Agreement has been given in Corporate Governance section of the Annual Report.
DIRECTORS’ RESPONSIBILITY STATEMENT
Pursuant to the provisions of Section 217(2AA) of the Companies Act, 1956, with respect to Directors’ Responsibility Statement, it is hereby confirmed that:
(i) in the preparation of the annual accounts, the applicable accounting standards have been followed and no material departures have been made from the same.
(ii) the Directors have selected such accounting policies and applied them consistently and made judgments and estimates that are reasonable and prudent so as to give a true and fair view of the state of affairs of the Company as on 31st December, 2014 and of the profits of the Company for the year ended 31st December, 2014.
(iii) the Directors have taken proper and sufficient care for the maintenance of adequate accounting records in accordance with the provisions of the Companies Act, 1956 for safeguarding the assets of the Company and for preventing and detecting fraud and other irregularities.
(iv) the Directors have prepared the annual accounts on a going concern basis.
AUDITORS
The present statutory auditors of the Company, M/s. S.R. Batliboi & Co. LLP, Chartered Accountants, have communicated that from FY 2015
DIRECTORS’ REPORT

annual report 2014
15
the statutory audit will be conducted by their associate firm M/s. SRBC & Co. LLP, Chartered Accountants, due to internal restructuring. The Board of Directors, on recommendation of the Audit Committee, recommends the appointment of M/s. SRBC & Co. LLP, Chartered Accountants (Firm Registration No. 324982E), as the Statutory Auditors of the Company from the conclusion of this Annual General Meeting until the conclusion of the next Annual General Meeting of the Company. A certificate from them has been received, to the effect that their appointment as Statutory Auditors of the Company, if made, would be in accordance with the provisions of Sections 139 and 141 of the Companies Act, 2013 and rules framed thereunder.
Further, the Board of Directors, on recommendation of the Audit Committee, have appointed M/s. Kishore Bhatia & Co., Cost Accountants, as Cost Auditors of the Company, for the Financial Year 2015, subject to the approval of the Members, which is being obtained in the ensuing Annual General Meeting. A certificate from M/s. Kishore Bhatia & Co. has been received assuring that their appointment as Cost Auditors of the Company, if made, would be in accordance with the limits specified under of Section 141 of the Companies Act, 2013 and rules framed thereunder.
CONSERVATION OF ENERGY
(a) Energy conservation measures taken:
Following steps were taken at Patalganga, Silvassa and Paharpur factories:
• UsageofLED lightsacrossdifferentareas inthe plant to reduce power consumption and increase in lux level.
• Maximize output in general shift by ensuringuptime of equipment, so as to minimize power and utility operations in second shift.
• Provide timers for ACs in IT server room, torun in alternate mode thereby reducing total power consumption.
• Change stacking in pail line from 3*3 to 3*4matrix, resulting in reduction of cycle time.
• Replace the conventional float valves by SSPUF filled floats of water storage tank.
• Reduction in lighting power consumption byusage of automated plant lights during night time.
• Air leakage audits and addressing most ofidentified leak points.
• Usage of energy efficient luminaries in thefilling area.
• Provisionofsolartubeonplantshedroofsforutilization of natural light.
• Fuel saving in Hot Oil System (HSD) byinsulation & repair, and creating awareness by monitoring & sharing of information to run the operation efficiently.
• Replacementofwatercooledinductionsealerswith energy efficient air cooled induction sealers.
• Provision of control with timer mechanismfor switching on/off of air conditioners in administration office.
• Provision of aluminum cladding on thermicfluid heater line to minimize the heat transfer loss.
• UsageofJetmixersforblenderswhichhelpinreducing the batch cycle time.
• Rationalization of certain blending operationsfor a few products with reduced temperature, to reduce energy consumption.
• Increasing awareness level amongst thework force for various energy conservation measures at the plant level.
(b) Additional investments and proposals, if any, being implemented for reduction of consumption of energy.
Nil
(c) Impact of Measures at (a) and (b) above for reduction of energy consumption and consequent impact on the cost of production of goods.
The improvement measures have led to efficient use of energy and optimization in the production per unit cost.
DIRECTORS’ REPORT

annual report 2014
16
TECHNOLOGY ABSORPTION
1. Your Company continues to derive sustainable benefits from its India Technology Centre located in Mumbai. The year 2014 was yet another year where your Company’s product development capability helped the business meet pressing consumer needs, partner closely with its customers and leverage strengths of its global affiliates to meet the needs of the local market.
2. In the year under review, your Company continued its investment in a world-class two-wheeler oil product development team, based out of the India Technology Centre to support the needs of the domestic and global market. To enable this team in its work, your Company further added state-of-the-art test rigs specific to two-wheeler engine oil development. This has helped us to study friction properties and screen candidates for further engine trials. It not only helps us develop differentiation, but also hastens the product development cycle.
3. With Intelligent Molecules that cling and protect, Castrol Magnatec is an engine-oil for cars with a unique proposition. But with unique requirements of city driving with multiple start and stops in a journey; Castrol embarked on a journey to launch a custom made oil for driving in these conditions – yet fulfilling the Magnatec promise of cling and protect. Your Company launched a project focused on the Indian passenger car market aimed to develop a fuel efficient, durable SAE 5W-30, ACEA A5/B5 2012 compliant Engine oil for Maruti Suzuki diesel engines. This was a first ever co-engineering project with this important passenger car OEM with dominant market share in the domestic market that resulted in Castrol being the only oil marketer to supply oil that optimized fuel efficiency performance, while maintaining engine protection. In 2014, your Company also focused on the Indian passenger car market to develop a fuel efficient, durable SAE 5W-30, ACEA A5/B5 2012 compliant engine oil common for Tata Motors covering entire range of Gasoline and Diesel engines. This product is extensively tested for durability and fuel efficiency in Tata Motors gasoline and diesel cars. This is also the only and first lubricant to be approved for the Tata new generation “Revotron Series of Engine”
with optimized fuel efficiency performance while maintaining engine protection.
4. India, where the hub and spoke model plays a key role in its supply chain – has a large number of ultra-light commercial vehicles. To cater to this unique demand – where the engine is constantly under stress – your Company developed and launched Castrol CRB Mini Truck – specifically designed and locally tested for these vehicles.
5. Building capability within to sell the technologically superior products developed by your Company is a critical link to ensure our customers understand the superior value they are getting when they purchase our products. Towards this end, your company had invested in a “Liquid Engineering Centre” (LEC) a few years ago. This year your Company launched the virtual engine training program to bring multiple locations together using virtual reality platform. This created a huge impact in the market wherein the benefits of our products could be technically explained to the customers. Your Company invests in creating a state-of-the-art semi replica of the liquid engineering centre at our key customer – Maruti Suzuki India Ltd.
6. Another major milestone that was achieved in the year 2014 was the renewal of the ISO 14001 and 9001:2008 certification for the India Technology Centre. Both these certifications are effectively a license-to-operate today for a reputed organization such as your Company. The ISO 9001:2008 assures the management of your Company that the operations of the Centre continue to be streamlined and efficient. The ISO 14001 certification is a mark of your Company’s commitment to the customer and shareholder to be environmentally responsible and to adopt sustainable business practices.
RESEARCH & DEVELOPMENT (R&D)
(A) Specific areas in respect of which R&D was carried out:
(i) New product launches with stronger consumer benefit:
Following brands were re-launched during the year with strong consumer benefits viz.:
DIRECTORS’ REPORT

annual report 2014
17
a. Magnatec 5W-30 Stop Start with intelligent molecules that give you instant protection from the moment you start – every time you start.
b. Magnatec Professional A1 5W-30
c. CRB Mini Truck – to cater to the fast growing category of mini trucks
d. SF0007 RP – a mid-flash rust preventive for tube industry
e. Optigear MX320 – for wind turbines
(ii) New products and offers for Original Equipment Manufacturers (OEM’s):
Your Company has been successful in obtaining endorsement for fuel efficient products from two of the leading car manufacturers viz. TATA Motors and Maruti Suzuki.
(iii) Driving efficiencies:
Several initiatives were taken during the year to ensure that your Company availed of the maximum efficiencies by creating alternative raw material options. This will also ensure a strong security of supply in case of any crisis.
(B) Benefits derived as a result of R&D
Based on the R&D activities mentioned above being implemented, your Company was able to further strengthen its connect with its consumers and the OEM’s. It also helped your Company in forging new partnerships with OEM’s and demonstrating its technical superiority.
(C) Future plan of action
Innovation is a journey and your Company is well placed to ensure that it continues to maintain a strong track record in this field. Your Company will continue its focus on generating fuel efficient products for its consumers, strengthening its synthetic technology based portfolio and working on the state-of-the-art technologies of modelling to fast track product development cycles.
(D) Expenditure on R&D (Rs. in crores)
(i) Capital 3.65
(ii) Recurring 10.56
(iii) Total 14.21
FOREIGN EXCHANGE EARNING AND OUTGO
1. Activities relating to Export
There were no significant exports by the Company during the year. However, some quantities of the products were exported to China, Thailand & Saudi Arabia.
2. Earning and Outgo
Members are requested to refer to note Nos. 32 and 33 of notes to Financial Statements for the year ended 31st December, 2014.
PARTICULARS OF EMPLOYEES
The information required to be published under the provisions of Section 217(2A) of the Companies Act, 1956 (the Act) read with Companies (Particulars of Employees) Rules, 1975 as amended, is provided in the Annexure forming part of the Report. In terms of Section 219(1)(b)(iv) of the Act, the Report and Accounts are being sent to the Members excluding the aforesaid Annexure. Any member interested in obtaining a copy of the same may write to the Company Secretary at the Registered Office address.
ACKNOWLEDGEMENT
The Board wishes to place on record its sincere appreciation of the efforts put in by the Company’s workers, staff and executives for achieving encouraging results in difficult environment. The Board also wishes to thank its members, distributors, vendors, customers, bankers, government and all other business associates for their support during the year.
On behalf of the Board of Directors
Ravi Kirpalani Rashmi Joshi Managing Director Director – Finance
Mumbai Dated: 25th February, 2015
DIRECTORS’ REPORT

18
annual report 2014 MANAGEMENT DISCUSSION & ANALYSIS REPORT
MANAGEMENT DISCUSSION & ANALYSIS REPORT
Pursuant to Clause 49 of the Listing Agreement, a Management Discussion & Analysis Report covering segment-wise performance and outlook is given below:
(A) Industry structure and developments – 2014
Your Company operates across all three major market sectors of the lubricants industry – Automotive, Industrial and Marine & Energy applications. The overall industry is led by your Company and the Indian national oil companies, who contribute to approximately 55% of the market in terms of volumes. Another 20% of the market, by volume, is accounted for by other multinationals which are mostly integrated oil companies and the rest of the market is constituted by numerous smaller players, largely local in nature. There are over 30 established players in this industry, making it very competitive. The market for automotive applications, where your Company has established a well-entrenched position over the years, is the predominant one amongst the three sectors within the lubricant industry.
Demand drivers: India is an important market for the lubricant industry world-wide, contributing to over 5.5% of global automotive lubricants demand and over 4% of industrial lubricants demand.
Demand for automotive lubricants is driven largely by the dual forces of growth in vehicle population and the extent of use of these vehicles. ‘Automotive lubricants’ is a collective term to describe the vehicle-fluids requirements of two-wheelers, passenger cars and commercial vehicles.
The demand for lubricants in the Industrial sector is primarily driven by industrial production. The Index of Industrial Production (IIP) has been observed to have a strong correlation to consumption demand for industrial lubricants in India.
In case of Marine applications, global and local ship movements are the drivers of its demand. Large-scale global movement of goods happens predominantly by sea and demand for shipping services drives fleet utilization rates and freight rates for shipping companies, in turn driving consumption of marine lubricants. With Energy lubricants, the installed base of off-shore rigs along the coast-line of India and their up-time drive demand for such products.
Supply drivers: Lubricants are manufactured by blending base-oils and additives, with base-oil being the main component. India is a net base-oil deficit market and many additives used in lubricants are manufactured outside India. This necessitates large-scale imports of raw materials and thus also exposes lubricants businesses to fluctuations in foreign exchange rates. While the foreign exchange rates remain volatile, base oil prices dropped towards the end of 2014.
Major industry developments
The year 2014 was a challenging business environment due to the twin-effects of a slower GDP growth rate of around 5% and relatively high inflation rate prevailing through the year. In addition, the lubricant industry faced many other strong headwinds affecting demand and supply drivers alike, during the year.
Automotive sector
Vehicle sales grew by 9% in the year 2014 compared to the previous year. With respect to sales in the previous year, commercial vehicle sales declined by 12%, passenger car sales increased by a marginal 1%, while two-wheeler sales grew by 12%. In addition, the slowing down of the economic growth translated into weakening of goods movement across the country and also a slowing down of infrastructure projects. This had a direct impact on lubricant consumption in the commercial vehicles sector and other business-to-business automotive segments.
Other longer term macro-trends in the industry remained largely unchanged. The choice of lubricant and its specification plays a key role in enabling Original Equipment Manufacturers (OEMs) to comply with tightening regulations on tail-pipe emissions and to meet demands for lower cost of operations. This places onus on the lubricant industry to respond with products that are able to cope with the increasing sophistication of these modern vehicles. These improved products, typically synthetic lubricants, are also able to maintain their physio-chemical and performance properties for a longer period of usage than earlier generation lubricants, lengthening oil drain intervals.
This has an impact on structural demand in the industry. Lubricant volume consumption for the same rate of use decreases while per unit cost and price

19
annual report 2014 annual report 2014 MANAGEMENT DISCUSSION & ANALYSIS REPORT
realization increases. Therefore, other drivers remaining unchanged, the growth in demand for lubricants is expected to lag vehicle population growth rate in the foreseeable future.
Two-wheelers: In the two-wheeler industry, gearless scooters seem to be finding favour with the consumer over the past few years. Scooter sales have grown by 29% in 2014, helping the industry overcome the relatively lower growth rates in motorcycles sales (6%). This has translated into an increase of 9% in two-wheeler population in the country and a similar growth in demand for two-wheeler oils.
With an increasing number of two-wheelers being sold into the smaller towns and villages over the past decade, an estimated 50% of the two-wheeler population resides in rural India today.
Passenger cars: Passenger car sales reversed its declining trend in the year 2014 vis-à-vis the previous year with a marginal growth of 1%. The year witnessed an increase of 8% in passenger car population due to higher sales in last few years. This has, in turn, increased demand for car engine oils, which got slightly offset by the shift to higher quality, synthetic lubricants that provide longer drain intervals in these cars. In 2014, the overall category oil consumption increased by 8%.
Commercial vehicles: The medium and heavy commercial vehicle (M&HCV) population in India grew by circa 1%, while the micro-light commercial vehicles grew by 9% in the year 2014. Continuing weak transporter sentiment, due to higher interest rates and weaker freight rates, continued to adversely impact M&HCV usage in 2014. Your Company estimates that this has resulted in a circa 2% decline in consumption of overall truck engine oils.
Tractors: Tractor sales have experienced 4% decline during the year 2014 over 2013. However, this comes post a rapid growth in tractor sales of 15% in 2013. Tractor population in India is estimated to have increased by 11% during the year over 2013.
Off-road applications: Off-road vehicle sales and utilization were negatively impacted by the slowing down of many material infrastructure-related projects and due to the bottlenecks in the mining sector during 2014.
Non-automotive sectors
Industrial lubricants
Industrial production, measured by the IIP, has shown only modest improvement during 2014. Most of the key industrial sectors faced challenges like high input costs, high interest rates, sustained high inflation and slower than expected local and global demand during the year.
As economic reforms gain momentum, India’s manufacturing sector performance is likely to return to growth phase during 2015. India’s growth is also likely to accelerate towards its high long-run potential with a major new national program ‘Make in India’, which is designed to facilitate investment, foster innovation and drive manufacturing in the country. To realize the full potential, progress on domestic reforms, roll out of national Goods and Services Tax (GST) and renewed focus on manufacturing sector can be transformational and significantly improve the competitiveness of Indian manufacturing firms.
Marine and Energy lubricants
Globally, the shipping industry is still passing through one of its worst phases in several decades. The Indian shipping industry has followed the global pattern to a large extent, where global trade had grown 12.6% during 2010 before slowing down to 3.2% in 2012 and about 3.1% in 2014 (as per the November 2014 forecast by WTO).
The ban on iron ore export from India and changes in taxation structure of coal exporting countries, coupled with high cost of funding and trade sanctions against certain countries, have exacerbated the problems of the Indian shipping business.
However, the new Central Government’s push to de-bottleneck infrastructure projects has improved prospects, with global trade growth estimate pegged at 4% in 2015.
Impact of foreign exchange, crude oil and raw material prices
The year 2014 posed many challenges, particularly during the first half, when we witnessed higher crude prices, forex and tight supply market. During this period, average crude price stayed at level of US$106 per barrel and forex at around INR 61 to US dollar.

20
annual report 2014 MANAGEMENT DISCUSSION & ANALYSIS REPORT
The second half of the year saw a volatile business environment, with falling crude prices on one hand and rupee depreciation on the other. These market uncertainties continued to put pressure on raw material costs.
High crude prices in almost three quarters of 2014 kept upward pressure on prices of base oils, additives and chemicals during the year. This resulted in higher input cost across all commodity segments for the industry and your Company.
Increased business activity in the Asia Pacific region in first half of 2014 continued to exert upward pressure on base oil prices before taking a steep downward trend starting fourth quarter of 2014. These market factors created testing times for your Company through the year.
The following graph indicates the trend of crude prices and Rupee/USD for the year 2014.
Prices of polymers showed an upward trend during most part of 2014 with an average increase of 12% over exit 2013. As polymers form majority of packaging material used by the industry, this contributed to an increase in cost of goods throughout the year.
However, in a very volatile and challenging business environment, your Company continued generating value for its investors through strategic sourcing, value improvement initiatives, extensive focus on service and continuous monitoring of costs.
Your Company worked determinedly on a cost effective purchase model and value-based inventory management, keeping a close watch on cash-costs and working capital.
(B) Market behaviour and outlook
GDP growth rate is believed to have bottomed out in 2014 and is expected to average slightly higher in 2015 than it was for 2014, at over 6.5%. The Consumer Inflation, though, is estimated to hover around 6% in 2015, negating to some extent the favourable impact of higher GDP growth in the year. Consumer sentiment is expected to be marked by higher levels of optimism than before given that we have a stable majority government helmed by a reform oriented, decisive leader.
Automotive sector
The outlook for the automotive sector in 2015 has been examined closely by your Company through the three broad dimensions of demand drivers, distribution channels and competitive activity.
1. Demand drivers
The key drivers of demand growth in each segment where your Company operates are explained below:
Two-wheelers: The two-wheeler population is expected to grow by 9% during 2015, despite its high base of 2014 and is expected to drive the demand for two-wheeler lubricants. Rural segment will be leading the growth in motorcycle sales in India. A separate sub-category of scooter oils is expected to take off in coming years due to surge in demand for gearless scooters.
Passenger cars: Passenger car population is expected to grow by 8% in 2015 over the previous year while car sales are expected to be a key growth driver – likely to grow at 5% compared to the previous year. In spite of the strong trend of increasing oil drain intervals and use of higher quality lubricants, passenger car engine oil industry is expected to grow by 8% in 2015.
Commercial vehicles: The demand for lubricants for old generation commercial vehicles is expected to decline more sharply than in 2014 due to continued low freight rates keeping fleet utilization levels unchanged from the previous year. At the same time, demand for lubricants in micro-light commercial vehicles (MLCVs) is expected to increase in 2015 on the back of a projected 8% increase in MLCV population. Overall, commercial vehicle population is expected to grow

21
annual report 2014 annual report 2014 MANAGEMENT DISCUSSION & ANALYSIS REPORT
by 3% in 2015; however lubricants demand for this category is expected to be static due to continuing low utilization rates of vehicles and longer oil drain intervals.
Tractors: There is an estimated 11% increase expected in tractor population along with increased area under sowing for the Kharif crop and improved price realization. This will benefit the agriculture economy in 2015 and the demand for tractor oils is expected to grow. However, due to longer oil drain intervals, tractor oil consumption is expected to grow at 3% during the same period.
Off-road vehicles: The slowdown observed in the infrastructure sector is expected to continue, though moderated. This, together with key projects likely to be delayed during the year, will keep equipment utilization levels low.
2. Channels of distribution
Customers in urban India continue to move towards ‘syntheticisation’ or premiumisation, of lubricants, driven mostly by manufacturer specifications. Rural customers have also begun to make their presence felt with higher levels of consumption demand for the category.
The composition of dealer types within the retail channel continues to evolve as Government investment in the rural economy has seen a rapid rise in the disposable incomes of rural households leading to increasing economic activity for small towns and villages.
Your Company has yet again pioneered the development of effective and efficient distribution networks to harness this opportunity. Over the last two years, innovations in the route-to-market have led to exponential growth in business from small towns and rural India. In urban markets, your Company’s focus has been on improving the customer service by providing increasing levels of reliable service and more relevant customer oriented loyalty programmes. Your Company has, as in the past, stayed at the cutting edge of technology to service customers better – be it through usage of PDAs which enables its sales force to customize offers to dealers, or through the use of GPS technology to reach out to smaller dealers and workshops in urban India.
3. Competitive activity
The competitive situation remains largely unchanged with all major international lubricant players present in the market. Television remains the most popular medium for reaching out to consumers with brand messages across the automotive sector, with different players dominating different categories. Your Company continues to be one of the leading brands in the retail automotive sector, followed by the public sector brands. However, the smaller players have been competing aggressively with lower prices and higher sales promotions to gain market share. In the urban retail automotive segment, against a background of strong competitive action, your Company has increased its market share by 120 basis points, spread out more or less evenly across all segments.
Non-automotive sector
Industrial lubricants
With economic reforms gaining momentum, India’s long term prospects for growth remain optimistic. ‘Make in India’ programme is also expected to drive the growth of manufacturing sector including some key industrial sectors like automotive, automotive components and machinery manufacturing.
Likely correction in interest rates is also expected to improve the consumer sentiment and push up demand for goods and services. Lower fuel prices and lower interest rates, in particular, are expected to drive the demand for cars and two-wheelers and hence automotive manufacturing, in 2015.
Marine and Energy lubricants
The marine industry continues to operate in a very challenging environment. During 2014, many Indian shipping and ship management companies increased scrapping and sale of vessels, with several going bankrupt. This, and the lower utilization rates of fleets, higher lay-ups and the adoption of slow steaming, has led to a drop in the volumes of marine business. Estimates put the date of recovery in the marine industry at around 2016-17, when the demand and supply balance of vessels and cargo will balance out, pushing up the currently low charter rates.
The Energy lubricants sub-sector witnessed significant turmoil during the year 2014 as policy changes were
22
annual report 2014 MANAGEMENT DISCUSSION & ANALYSIS REPORT
in discussion between the Oil & Gas Ministry and other stakeholders, which continued to withhold future investments that can fuel further activities in exploration and drilling.
(C) Opportunities and threats
Automotive sector
(i) Opportunities
a. First Time Users (FTUs) of personal mobility: With higher share of domestic private consumption and household income distribution moving from pyramid to diamond structure, Indian households have higher disposable incomes. This in turn has given significant boost to personal mobility through two-wheelers and four-wheelers. The first time users of personal mobility are young, more tech savvy and require reliable solutions to ensure the upkeep of their prized investments. This requires product and marketing communications to bring the new consumer segments on board.
Two-way engagement media, prominently digital and social media, are emerging as strong alternatives to communicate with these FTUs. The next two opportunity areas detail out the further possibilities in the personal mobility space.
b. Two-wheelers in small towns and emergence of scooters: Over 50% of two-wheelers are sold in the small towns and villages in the country. With lagging public transport infrastructure, these two-wheelers are the only reliable mode of transport for many. Providing reliable supply of vehicle fluids to ensure the upkeep of these essential mobility solutions for two-wheeler owners in these markets is a material opportunity.
The share of gearless scooters in two-wheeler sales has also consistently risen over the last six years, with rising number of women drivers. This is an emergence of a new category within the two-wheeler segment.
c. Partnerships with Original Equipment Manufacturers (OEMs): Building strong partnerships with key OEMs across vehicle types is a significant opportunity for your Company. The need of the hour is not only to join hands for business, but also for technology development to address the total cost of ownership challenge faced by OEMs. Despite relatively
muted levels of economic growth, there have been signs of activity and increased commitment to operate in India by almost all international automotive OEMs.
Stronger emission norms and demand for fuel efficiency is driving OEMs to keep developing new engine technology at a faster pace. These factors will result in a demand for lubricants with very specific physio-chemical and performance properties.
d. Micro-Light Commercial Vehicles (MLCVs): The MLCV segment has emerged as a robust last mile connectivity option and the vehicle population in this segment is growing at a healthy pace. Although the segment has been moderately impacted by economic downturn, it is still underpenetrated and offers good opportunities.
(ii) Threats
(a) Economic uncertainty: With the world becoming more and more interconnected, events in any part of the globe could have repercussions on other geographies as well. Although we are witnessing a downward spiral in crude prices, the trend might reverse. Indian rupee has been relatively stable for some period; however, volatility might pose challenges in future.
(b) Competitive activity: Competition in the Indian lubricant market is intense and is likely to remain so in the foreseeable future. Most international players have identified India as a focus market. The industry has also witnessed a trend of some OEMs introducing lubricants under their own brand name, further impacting the competitive landscape.
Non-automotive sector
(i) Opportunities
Industrial lubricants
The industrial output growth is likely to be broad based with automotive, automotive components, machinery manufacturing and metals amongst other segments. Your Company’s inherent focus on customers from these core segments would ensure another year of superior performance in 2015.
Marine and Energy lubricants
State owned oil and natural gas companies have plans to double the gas production from current levels in next

23
annual report 2014 annual report 2014 MANAGEMENT DISCUSSION & ANALYSIS REPORT
four to five years thus keeping a positive long term outlook for offshore drilling sector.
Central Government has proposed to develop sixteen new ports projects with focus on port connectivity and development of inland waterways to improve the capacity for the transportation of goods. This will be an emerging opportunity in coastal trans-shipments and inland water ways shipment in India.
(ii) Threats
Industrial lubricants
While the Indian manufacturing industry is expected to recover swiftly in 2015, global situation may still impact its path of recovery.
Marine and Energy lubricants
In short to mid-term, Energy companies may reduce their capex and field development plans as oil prices fall. This may in turn negatively affect the energy lubricants demand. In addition, competition may become aggressive on pricing of marine lubricants given the softening of crude and emerging opportunities for sector.
(D) Performance of segments and categories
I. Automotive lubricants
Overview
Your Company continued to deliver a strong performance across the truck, passenger car and two-wheeler oil categories in the year 2014, driven by performance of its Power Brands – Castrol Activ, Castrol Power1, Castrol GTX, Castrol MAGNATEC, Castrol EDGE and Castrol CRB Turbo. The Castrol brand continued to pioneer and drive the syntheticisation of the category in response to the demands from vehicle manufacturers (OEMs) for better performing and environment-friendly products, while also selectively making a play in the mid-price segment in certain categories. Your Company continued its close association with its OEM partners, especially Maruti Suzuki, the Volkswagen group and Tata Motors.
Your Company also further deepened relations with key retail channel partners through the highly successful Anmol Ratn programme during the course of the year 2014. Castrol Engine Experts Club, launched last year, has been extremely successful in endearing brand
Castrol further to mechanics, who are key influencers in the choice of oil and who are the primary handlers of lubricants in many categories.
There were also, however, significant challenges that your Company encountered in the Heavy Duty category, which caters to large fleets, mining, and building & construction equipment applications. This is due to the twin effects of lowered economic activity in this category and rising input costs for the industry.
The following sub-sections of the Management Discussion & Analysis Report detail out the performance of each category within automotive lubricants.
Personal Mobility
Two-wheeler oils: The two-wheeler oils segment comprises engine oils for four-stroke and two-stroke engines that power motorcycles and scooters. Oils for four-stroke motorcycle engines dominate the category currently, while the gearless scooter segment is witnessing a re-emergence. Castrol operates in this space through three principal product brands- Castrol Activ, Castrol Power1 and Castrol Go!. Castrol Bike Points are exclusive stock-and-sell independent two-wheeler workshops and are a key driver of growth for your Company in this category.
Safety being a key value of your Company, Castrol partnered with Bangalore Traffic Police and Ogilvy Bangalore, on project ‘Good Road’ to spread the message of using helmets whilst riding. This was done in an innovative and highly effective manner through technology innovation (bike would not start unless the helmet is worn). Through 360 degree on line and on-ground activation, your Company has reached more than one million consumers with this message and over 163,000 motorcyclists have pledged on www.thegoodroad.in to wear a helmet, making it a good road for millions. This initiative of your Company was recognised by various external bodies nationally as well as internationally, leading to your Company winning Black Elephant at Kyoorius advertising awards 2014 (the award is the highest category at the Kyoorius Advertising and Digital Awards and awarded to ‘ground breaking work that redefined the category’) and Gold for Innovation at SPIKES ASIA 2014 held in Singapore. You too can join the movement

24
annual report 2014 MANAGEMENT DISCUSSION & ANALYSIS REPORT
by visiting any of the following online site:Website: http://www.thegoodroad.in or view the programme on:YouTube: https://www.youtube.com/watch?v=NvISHezDqrU
The two-wheeler segment was the key growth driver of your Company’s performance in 2014 and delivered strong volume and value growth. This reflected in significant market share gain of 300 basis points, indicating superior performance versus category. Castrol two-wheeler brands also built higher engagement with consumers, reflecting in superior Brand Health vis-à-vis key competition. This was driven by various exciting high impact initiatives like clutter breaking television campaign, launch of new packaging, increasing digital presence and leveraging sponsorship assets like your Company’s association with the International Cricket Council (ICC) and the global association with FIFA. All the initiatives have been activated through strong on-ground and digital activations and by building advocacy amongst Engine Experts through loyalty programme. Your Company has also pioneered in conducting Asia’s first Lightbox Hangout in partnership with Google.
Castrol Activ, the largest brand in volume terms for your Company and market leader in the two-wheeler oil segment, grew ahead of category. Higher growth was achieved on the back of leading category creation for scooter engine oils by launching Castrol Activ Scooter during the early part of year and driving it aggressively through a high impact media campaign, leveraging Castrol’s global FIFA sponsorship. This was done by engaging with youth on digital across social media platforms. The efforts also included expanding presence in rural markets, acquiring new Castrol Bike Points and building higher engagement with dealers and Engine Experts. The innovative Castrol Activ Scooter Zip Factor Digital Campaign won a Bronze at the coveted Effie Awards. This campaign was run during the ICC T20 World Cup.
Castrol Power1 continued to engage with one of the largest on line communities for bikers – Castrol Biking, on Facebook, and kept its over one million users engaged through exciting content. Launch of Castrol Power1 biking app received encouraging response and has been downloaded by 30,000+ bikers. The app was also recognised by industry experts and
your Company won a Silver award for the same at the Mobile Marketing Association’s ‘Smarties India’ and Bronze award at Socialathon for ‘Best use of social media on mobile’ category.
Castrol Go!, your Company’s foray in the mid-price segment, has received tremendous success in market and has surpassed volume delivery expectations.
Led by acquisition of new Castrol Bike Points, this exclusive Castrol channel delivered double digit growth during 2014.
Passenger Car Oils in the After-Market (PCO Retail): PCO Retail comprises engine oils for cars & utility vehicles and brake-fluids. It caters to the market with principally three product brands – Castrol GTX, Castrol MAGNATEC and Castrol EDGE. Passenger car oils sell through two major channels in the after-market – retail channel and the stock-and-sell independent workshops.
Despite 2014 being a challenging year for the automotive industry, the PCO Retail business experienced a volume growth over the previous year. Your Company also achieved significant progress on the syntheticisation agenda in the category, with strong growth in both Castrol MAGNATEC and Castrol EDGE. The year was also significant for the successful launch of Castrol MAGNATEC Stop-Start which was underpinned by a strong consumer insight especially relevant to urban driving conditions. In addition, two exciting programmes enabled these growth stories:
a. Winning in big cities: With less than 2% of the Indian population owning cars, there is a very high concentration of cars, in the key metros. Your Company’s targeted approach to win in these big cities through a 360° micro-marketing initiative has enabled focused investment in markets with highest potential. The PCO Retail business is now growing at twice the national growth rate in these markets.
b. Winning with mechanics: Your Company has a customised training-on-wheels programme in key cities to spread awareness about the special requirements of modern engines and to explain why the new generation Castrol MAGNATEC, is the right solution for these sophisticated machines. The 12 training units that were operational across the key cities were

25
annual report 2014 annual report 2014 MANAGEMENT DISCUSSION & ANALYSIS REPORT
well-appreciated by the mechanic community. The programme was recognized with the prestigious 2014 PMAA (Promotion Marketing Awards of Asia) Dragons of Asia award. Continued focus in this domain has also helped significantly increase the ‘Advocacy’ score among mechanics.
Passenger Car Oils in OEM Franchised Workshops (PCO FW): The PCO FW segment consists of engine oils and drive-line oils. OEM approvals and strong grassroots relationships with Franchise Workshops of OEMs are the business drivers for this segment. Since the year 2011, your Company has embarked on a journey to cater to this specialised channel through a dedicated range of products called the Castrol Professional series. Through a combination of variants – Castrol MAGNATEC Professional, Castrol GTX Professional and Castrol EDGE Professional, your Company caters to the engine oil requirement of franchise workshops of Maruti Suzuki, Ford, the Volkswagen group, Jaguar-Land Rover, Tata Motors and other OEMs.
Your Company’s volumes in the PCO FW channel grew by circa 3% during 2014. This growth was driven by a few key enablers, described below:
Castrol Champions League: This is a dedicated Service Advisor advocacy programme run across key Maruti Suzuki Franchised Workshops. Your Company reaches out to end consumers through these Service Advisors who interact directly with car owners and are able to explain the benefits of the Castrol Professional range to them.
Growth in Maruti Suzuki Franchised Workshops: Through a combination of key account acquisitions and gaining share in existing accounts, your Company delivered a significant volume growth in the Maruti Suzuki network. The Castrol Champions League was a key enabler in delivering this outcome. The year 2014 was also a landmark year for your Company’s partnership with Maruti Suzuki on account of the inauguration of the Liquid Engineering Centre at Maruti Suzuki Gurgaon plant. This state-of-the-art lubricant training centre enables Maruti Suzuki staff and employees to learn about the latest lubricant technology in an interesting and exciting manner whilst showcasing your Company’s pioneering technology.
Growth in European OEM segment: Through exclusive tie-ups and aggressive account retention programmes, your Company tapped into the rapid growth in population of European cars in the country and delivered more than 20% growth in volumes in this segment during the year.
Commercial Vehicle Oils (CVO)
Commercial vehicle oils category comprises lubricant applications for small and large trucks, farm equipment and specialised products for the Heavy Duty segment. In product terms, it comprises engine oils for new and old generation commercial vehicles, hydraulic oils and the ‘Specialty Products’ range. ‘Specialty products’ is an umbrella term representing essential vehicle fluids other than engine oils; such as drive-line oils, greases and coolants. Castrol CRB is the oldest and best known brand in this segment, participating in the agri-sector and old-generation MHCVs with Castrol CRB Plus and in the new generation commercial vehicles segment with Castrol CRB Turbo. Castrol RX Super leads the play for your Company in the mid-price segment in truck applications.
In 2014, we continued to face a challenging market environment resulting in moderate market growth of lubricants in this segment. While overall performance was impacted by the unfavourable economic conditions, mentioned below are some of the highlights of the business during the period under review:
a. Your Company broad-based its participation in the mid-tier price segment in trucks with the Castrol RX Super brand and in tractors with the Castrol CRB Prima brand.
b. Your Company launched Castrol CRB Mini-Truck, a product specially designed for Micro LCV segment. Micro LCVs operate in city traffic and go through multiple loads that result in the engines running hotter. Castrol CRB Mini-Truck has ‘Heat Shield Boosters’ which deliver three times better heat protection.
II. Non-automotive lubricants
Industrial lubricants
The year 2014 was a very successful year for Castrol’s Industrial business. Your Company consolidated its position as the leading supplier of metal-working fluids

26
annual report 2014 MANAGEMENT DISCUSSION & ANALYSIS REPORT
and high performance lubricants, products which are technologically superior and deliver substantial value to the customers. Your Company also successfully introduced new generation metal-working fluids and differentiated corrosion preventives during the year.
Your Company’s Industrial segment delivered strong volume and margin growth of 8% in 2014 despite a stagnant manufacturing environment. This volume growth was achieved by winning new customers and increasing market share in key industrial segments. Profitability was maintained despite significant increase in raw material costs and the business was able to successfully recover this from the market through price increases and trading up customers to advanced products with higher benefits.
Marine and Energy lubricants
Your Company continues to focus on customer intimacy and provides products and services that are best-in-class in this segment. Introduction of environment friendly biodegradable lubricants for stern tube and value added services like fleet optimiser and SDA (Scavenge drain analysis) were embraced by Marine customers. Your Company will continue to focus its efforts to bring in better efficiency in its operations and concentrate on value driven and profitable customers to maintain its value and thought leadership position in the Marine segment.
Your Company has maintained its leadership position in the offshore drilling segment during the year under review, by focusing its efforts on value offers despite minimal drilling activity by a leading player in the segment. Introduction of environment friendly biodegradable lubricants to offshore drilling sector was welcomed by the major drillers in the country.
As drilling moves into deeper seas, your Company will maintain its focus on value and specialist offers such as sub-sea solutions, to further consolidate its market share in the offshore drilling segment.
(E) Risks and concerns
The macro-economic environment remains uncertain and hence continues to pose challenge to lubricants consumption and demand. This may impact your Company’s performance during 2015. The aggressive pricing strategy by local as well as international competition, in an attempt to gain market share, and
commoditisation of products in the premium segments, will have an impact on overall industry margin. Although the political environment in the country is settling, the economy is to be watched cautiously for revival signs. In addition, forex uncertainty may also have adverse impact on cost of goods despite crude softening.
Employee attrition could result in loss of knowledge and business disruption, which may impact your Company’s ability to support its growth agenda.
Safety and product integrity continue to be focus areas for your Company. Given the extremely challenging road conditions in India, road safety is an area of particular concern for your Company as it moves its goods and people across the country.
Your Company has put together a plan to address the impact of the identified risks and put in place the necessary monitoring and mitigation actions.
(F) Technology
Your Company continues to derive sustainable benefits from its India Technology Centre located in Mumbai. During 2014, your Company’s product development capability helped the business meet pressing customer needs, partner closely with its customers and leverage strengths of its global affiliates to meet the needs of the local market.
Developments in two-wheeler oils
During the year under review, your Company continued its investment in a world-class two-wheeler oil product development team based out of the India Technology Centre to support the needs of the global market. To enable this team to enhance delivery, your Company increased the number of state-of-the-art test rigs specific to two-wheeler engine oil development. This has helped in studying friction properties and screen candidates for further engine trials. These test rigs not only help your Company develop differentiated products but also hasten the product development cycle. This was an imperative as India has established itself as the world’s second largest two-wheeler market.
Developments in passenger car oils
Castrol MAGNATEC ‘with Intelligent Molecules that cling and protect’ is an engine oil for cars with a unique proposition. Given the unique requirements of city driving with multiple start and stops, Castrol

27
annual report 2014 annual report 2014 MANAGEMENT DISCUSSION & ANALYSIS REPORT
embarked on a journey to launch a custom made oil for driving in these conditions – yet fulfilling the Castrol MAGNATEC promise of cling and protect.
Your Company launched a fuel efficient, durable SAE 5W-30, ACEA A5/B5 2012 compliant engine oil for Maruti Suzuki diesel engines. This was a first ever co-engineering project with this important passenger car OEM with dominant market share in the domestic market. Castrol is the only oil marketer to supply oil that optimises fuel efficiency performance while maintaining engine protection.
In 2014, your Company also developed a fuel efficient, durable SAE 5W-30, ACEA A5/B5 2012 compliant engine oil for Tata Motors covering the entire range of Gasoline and Diesel engines. This product has been extensively tested for durability and fuel efficiency in Tata Motors cars. This is also the first and only lubricant to be approved for the new generation Tata ‘Revotron Series of Engines,’ with optimized fuel efficiency performance while maintaining engine protection.
Developments in commercial vehicle oils
The hub and spoke model plays a key role in India’s supply chain and hence the country has a large population of micro light commercial vehicles (MLCVs). These MLCVs are constantly under stress and their engines run hotter. Your Company has developed and launched Castrol CRB Mini-Truck diesel engine oil specifically designed and locally tested to meet the unique operating conditions of these vehicles.
Investments in capability building
Building capability to sell the technologically superior products developed by your Company is a critical link to ensuring customers understand the superior value they are getting when they purchase your Company’s products. Towards this end, your Company had invested in the concept of Liquid Engineering Centres (LECs) a few years ago. During 2014, your Company set up one more LEC, at the Maruti Suzuki Gurgaon Plant. Your Company has also launched a virtual engine training programme to bring multiple locations together using the virtual reality platform. Your Company has built a network of training programmes to reach out to more than 1000 distributor sales representatives across the country. This has created a huge impact in the market
wherein the benefits of your Company’s products can be technically explained to customers.
Focus on quality
Another major milestone that was achieved during the year 2014 was the renewal of the ISO 14001 and 9001:2008 certification for the India Technology Centre. Both these certifications are effectively a license-to-operate today for a reputed organisation such as your Company. The ISO 9001:2008 assures the Management of your Company that the operations of the Centre continue to be streamlined and efficient. The ISO 14001 certification is a mark of your Company’s commitment to the customer and shareholder to be environmentally responsible and to adopt sustainable business practices.
(G) Internal control systems and their adequacy
Your Company maintains an adequate and effective Internal Control system commensurate with its size and complexity. We believe that these internal control systems provide, among other things, a reasonable assurance that transactions are executed with Management authorisation and that they are recorded in all material respects to permit preparation of financial statements in conformity with established accounting principles and that the assets of your Company are adequately safe-guarded against significant misuse or loss. An independent Internal Audit function is an important element of your Company’s internal control system. The internal control system is supplemented through an extensive internal audit programme and periodic review by Management and Audit committee.
(H) Health, safety, security and environment
Your Company maintains the highest standards of Occupational Health, Safety, Security and Environment (HSSE) and complies with all applicable laws of the land. The HSSE performance has been integral to your Company’s business performance and your Company continues to focus on the goal: ‘No Accidents, No Harm to People and No Damage to the Environment’.
All three blending plants of your Company are certified for the Environment Management system (ISO 14001:2004) and Occupational Health & Safety Management System (OHSAS 18001:2007).

28
annual report 2014 MANAGEMENT DISCUSSION & ANALYSIS REPORT
Your Company also implements ISO 9001:2008 (Quality Management System Standard) and ISO/TS 16949:2009 (Automotive Customer Specific Standard) to continually improve its processes. Compliance to these systems has been certified by internationally recognised and accredited bodies. BP’s global Operating Management System (OMS) is being implemented to make processes and operations safe, systematic and reliable. This also drives continuous improvement in systems.
Various awards and recognitions received by your Company’s plants by industry bodies for their exemplary safety and sustainability track-record, demonstrate your Company’s commitment to HSSE. The Patalganga Plant received Certificate of Merit for Energy Conservation by Ministry of Power (GoI). Your Company is also proud to inform you that Patalganga plant completed 17 years without a Lost Time Injury (LTI).
Your Company has taken many initiatives towards environment conservation viz. use of solar lighting and procurement of Chloro-Fluoro Carbon (CFC) free air-conditioning units, amongst others. Your Company also strives to be a benchmark for road safety practices in India. Multitude of road safety initiatives were undertaken and engagement programmes like Family Connect for truck drivers and their families and Logistic contractors meets, were conducted to sustain your Company’s track record on road safety.
(I) Developments in human resources management
Values & behaviours and employee value proposition
People are a key resource for your Company. During the year under review, focus continued to be on the development of the various facets of leadership capability and talent management with a view to ensure alignment to the overall business strategy.
One of the key focus areas during 2014 was employee engagement and creating a Winning culture which was actively driven through an inclusive process of dialogue and articulation of your Company’s Values & Behaviours, with a special focus on Respect at the workplace.
In the spirit of continuous learning and building capability to support the Business and People Strategy,
your Company continued to offer programmes to help Line Managers get better at the People Processes by building their awareness and capability to be better people managers and coaches.
Your Company is pleased to share that under the Castrol Learning Academy launched in 2013, we have completed the assessment for all sales frontline employees and they now have development plans which are based on a “70:20:10” capability building approach for which the basic philosophy is that development is a function of 70% Application, 20% Experience and 10% Learning.
Your Company has continued on its journey to build a diverse and inclusive workforce during the year 2014. As part of entry level talent programmes – the Graduate and Sales Trainee programme – we have increased our gender diversity to 50% and are focussed on diverse lateral hires in Frontline sales roles.
Reward and Recognition
It is your Company’s constant endeavour to review its reward structure, benefits and employee policies in order to make its total reward offer both contemporary and competitive. Towards that objective, a voluntary scheme for the Hospitalisation Cover for dependant parents was launched.
In order to help wealth creation at the time of superannuation, your Company has also launched the National Pension Scheme as a voluntary scheme. This has been subscribed to by around 15% of the employee population.
Your Company continues to focus on recognition through the Castrol STAR Club Awards. This programme is based on bringing your Company’s values to life and lays emphasis on recognition rather than reward. There are five categories of awards based on each Value – Safety Champions (Safety), We Not I (Respect), Above & Beyond (Excellence), Challenge for Change (Courage) and Synergy for Success (One Team). The recognition acknowledges the demonstration of your Company’s values and behaviours at the work place.
These initiatives are expected to engage and retain your Company’s valuable employees more effectively. As a result of the various initiatives taken, staff attrition during 2014 was the lowest in the last eight years.

29
annual report 2014 annual report 2014 MANAGEMENT DISCUSSION & ANALYSIS REPORT
Control and compliance
During the year 2014, your Company continued its high degree of compliance with employment legislations by conducting audits in many of its locations and closing any gaps in all locations audited. It also improved two-tier compliance monitoring system comprising of quarterly compliance checklist and a self-assessment checklist (for monthly reporting) which enabled improving and sustaining the compliance culture in your Company.
Employee relations at Plants
Your Company has a contemporary employee relations scenario with a participative culture, receptive to technical upgradation, at all Plants. The country-wide employee engagement scores, which are highest at the Plants, are indicative of this.
There continued to be a harmonious employee relations environment at all three Plants throughout the implementation of capex projects. During the pendency of settlement negotiations there has been no loss of productivity at the Paharpur Plant. A notable accomplishment has been the 17 years without a Lost Time Injury (LTI) at Patalganga Plant despite complex technical process changes and upgradation.
The regular medical check-up for employees based at Plants as well as the necessary financial assistance has been appreciated by the workmen. The strength of the employee relations at the Plants is also indicative by the absence of unionisation of contractual labour, which is prevalent in the neighbouring industries.
The total number of people employed in your Company as on 31st December 2014, including factory workmen, was 802.
(J) Discussion on financial performance with respect to operational performance
Your Company delivered a strong Gross Profit growth of 5% in 2014 over 2013, due to underlying improvement in unit sales realisation by circa 7%, although volumes declined in the last quarter due to weakening of demand in the OEM and retail channels.
Cost of sales continued to increase during 2014 by 8% over the previous year primarily due to weakening of the Rupee against US Dollar. Your Company held its Unit Margin due to its focus on delivery in selected segments and sale of premium product mix.
Operating and other expenses increased by Rs. 40 crores as compared to 2013 due to investment in safety, people, brands, investment in Enterprise Resource Planning (ERP) and business growth opportunities.
The Profit After Tax (PAT) has decreased by Rs. 34 crores and is at Rs. 474.6 crores compared to 2013 mainly due to reduction in other income from sale of non-operating Plant and absence of divestment profit.
With the current drop in crude oil prices, the input costs for 2015 are expected to be lower than 2014. However, the Indian Rupee is yet to show signs of stabilising against US Dollar. While there is an overall optimism in the economy, the industrial and economic growth has been slow compared to the expectations generated post the General Elections in May 2014. This may continue to put pressure on your Company’s margins.
The Management is confident that your Company, with its strong brands, enduring relationships with key stakeholders and commitment of its staff, will continue to sustain its strong performance during the year 2015.
On behalf of the Board of Directors
Ravi Kirpalani Rashmi Joshi Managing Director Director – Finance
Mumbai
Dated: 25th February, 2015

30
annual report 2014
1. Company’s Philosophy on Code of Governance
Good governance practices stem from the value
system and philosophy of the organization and at
Castrol we are committed to meet the aspirations of all
the stakeholders. This is demonstrated in shareholder
returns, governance processes and an entrepreneurial,
performance focused work environment. Our customers
have benefited from high quality products delivered
at the most competitive prices due to technological
leadership of the Company in the lubricants market
in India.
The Board is collectively responsible for pursuing
this purpose and Corporate Governance processes
are structured to direct the Company’s actions,
assets and agents to achieve this purpose, while
complying with the Code of Governance. The
Company’s policies reflect those adopted by the
Parent Company in the UK – BP plc (“BP plc Board
Governance Principles”) and covers aspects such as
ethical conduct, health, safety and the environment;
control and finance; commitment to employees;
and relationships. Key aspects of the Company’s
Governance Processes are:
• Clear statements of Board Processes and
the Board’s relationship with Executive
Management.
• A framework of prudent and effective controls
which enable risks to be assessed and managed.
• Set the Company’s values and standards and
ensure that obligations to shareholders and
others are understood and met. The Board
recognises that in conducting its business, the
Company should be responsive to other relevant
constituencies.
• Review and where appropriate determine
the long term strategy and the annual plan
for the Company based on proposals made by
REPORT ON CORPORATE GOVERNANCE the Management, for achieving the Company’s
purpose.
The Company also has been on journey to embed
itsvalues i.e.Safety,Respect,Excellenence,Courage
and One Team in its way of working. These values
are fundamental drivers of sustainable business
performance.
2. Board of Directors
Composition:
The Board of Directors of the Company comprises
of an optimum combination of Executive and Non-
Executive Directors, which is in conformity with the
requirement of Clause 49 of the Listing Agreement
with the Stock Exchanges. As of the year ended
31st December, 2014, the Board comprised of Nine
Directors comprising of Three Executive Directors,
Three Non-Executive Directors nominated by
Castrol Limited,UKasprovidedunder theArticlesof
Association of the Company and Three Independent
Directors. The Chairman of the Board is a Non-
Executive Independent Director.
The Directors of the Company are appointed by
members at the General Meetings and two-
third directors other than Independent Directors
retire by rotation pursuant to the provisions of the
Companies Act, 2013. The Executive Directors on
the Board serve in accordance with the terms of their
contract of service with the Company. Based on
the evaluation of the relationships disclosed, all the
Non-Executive – Independent Directors (which also
includes Chairman) are independent in terms of
revisedClause49of theListingAgreement (effective
from 1st October, 2014).
The necessary disclosures regarding other Board
Committees have been made by all the Directors.
None of the Directors on the Board is a member of
more than 10 Committees and Chairman of more than
5 Committees across all Companies in which they are
Directors.
REPORT ON CORPORATE GOVERNANCE

31
annual report 2014
Board Meetings
During the financial year, total four (4) Board Meetings were held i.e. on 17th February, 2014, 13th May, 2014, 31st July, 2014 and 30th October, 2014, respectively.
The Board Meetings are governed by a structured agenda. The agenda along with the detailed explanatory notes and supporting material are circulated well in advance before each meeting to all the Directors for facilitating effective discussion and decision making. Considerable time is spent by the Directors on discussion and deliberations at the Board Meetings.
Independent Directors and Executive Directors are issued Letters of Appointment setting out in detail,the terms of appointment, duties, responsibilities and expected time commitments. The induction process for Non-Executive Independent Directors include interactive sessions with Management Committee members, Business and Functional Heads, visit to market / plant, etc.
Training of Board Members
The Independent Directors of the Company are the individuals having long experience and expertise being
The composition of the Board, Directorships/ Committee positions in other Companies as on 31st December, 2014, number of meetings held and attended during the year are as follows:
Name of Director Designation Board Meetings during the year
Attendance at last AGM
Other Directorships
in India (including
Castrol India Limited)
Committee Memberships in other Companies
Held Attended Member Chairperson
Mr.S.M.Datta* Chairman 4 4 Yes 14 4 1
Mr.R.Gopalakrishnan* Non-Executive Director 4 4 Yes 12 2 None
Mr.UdayKhanna* Non-Executive Director 4 4 Yes 10 2 2
Mr.SashiMukundan** Non-Executive Director 4 3 No 1 None None
Mr.RalphHewins** Non-Executive Director 4 3 Yes None None None
Mr.PeterWeidner** Non-Executive Director 4 3 Yes None None None
Mr.RaviKirpalani Managing Director 4 4 Yes None None None
Ms.RashmiJoshi Whole-time Director 4 4 Yes None None None
Mr.JayantaChatterjee*** Whole-time Director 4 1 No None None None
* IndependentDirectors** NomineeDirectors*** Appointedwitheffectfrom30th October, 2014
Note: ‘Other Directorships’ exclude directorships in Foreign Companies. “Other Board Committees Membership” include memberships of AuditCommitteesandStakeholderRelationshipCommitteesofPublicLimitedCompaniesonly.
leaders in their respective fields. Similarly ExecutiveDirectors & Director’s nominated by the parent Company also have long experience in their respective fields. Periodic presentations are made at the Board and Board Committee Meetings, on business and performance updates of the Company, global business environment, strategy and risks involved, so that they are updated on the business model, the risk profile of the business of the Company and also about their roles and responsibilities as Directors of the Company.
Mechanism for evaluating Non-Executive Board Members
The performance evaluation of Non-Executive Directors is done as per the policies and process which are put in place in BP Group. The Company is in the process of implementing comprehensive performance evaluation mechanism.
Whistle Blower Policy
BP Group has a robust Whistle Blower Policy applicable worldwide, which is referred to as ‘Open Talk’ and is discussed in thisReport.All theemployeesandotherstakeholders have access to the same.
REPORT ON CORPORATE GOVERNANCE

32
annual report 2014
The Nomination and Remuneration Committee isresponsible to overview the process of evaluation of performance of the Board as a whole, Board Committees and the Directors individually.
3. Audit Committee
ThemembersoftheAuditCommitteehavewideexposureand knowledge in area of finance and accounting. The termsof referenceof theAuditCommitteehavebeenamendedinlinewithClause49oftheListingAgreementwith the Stock Exchanges and Section 177 of theCompaniesAct,2013.TheAuditCommittee,inter alia, provides reassurance to the Board on the existence of an effective internal control environment.
The Audit Committee comprises of four (4) members which include three (3) Independent Directors viz. Mr. S. M. Datta, Mr. R. Gopalakrishnan, Mr. Uday Khanna and one Nominee Director viz. Mr. Ralph Hewins. Mr. Uday Khanna, is the Chairman of the Committee.
The terms of reference of the Committee are briefly described below:
1. Oversight of the Company’s financial reporting process and the disclosure of its financial information.
2. Recommending to the Board, the appointment, re-appointment and, if required, the replacement or removal of the statutory auditor and the fixation of audit fees.
3. Reviewing and monitoring the auditor’sindependence and performance.
4. RecommendingtotheBoard,theappointmentandremunerationofCostAuditor.
5. Approval of payment to statutoryauditors for anyother services rendered by the statutory auditors.
6. Reviewing, with the management, the annualfinancial statements and quarterly financial statements.
7. Reviewing with the management, performanceof internal auditors and adequacy of the internal control systems.
8. Reviewingtheadequacyofinternalauditfunction,if any, including the structure of the internal audit department, staffing and frequency of internal audit.
9. Discussing with internal auditors any significant findings and follow-up thereon.
10. Reviewingthefindingsofanyinternalinvestigationsby the internal auditors into matters where there is suspected fraud or irregularity or a failure of internal control systems of a material nature and reporting the matter to the Board.
11. Discussion with statutory auditors before the audit commences.
12. To look into the reasons for substantial defaults in the payment to the depositors, debenture holders, shareholders (in case of non payment of declared dividends) and creditors.
13. To review the functioning of the Whistle Blower mechanism.
14. Approval or any subsequent modification oftransactions of the Company with related parties.
15. To evaluate internal financial controls and risk managements systems.
16. ApprovalofappointmentofCFO.
17. Suchotherfunctionsasmaybeprescribedunderthe applicable laws and regulations.
The meetings of Audit Committee are also attended by Managing Director, CFO, Statutory Auditors andInternal Auditors as special invitees. The CompanySecretaryoftheCompanyactsastheSecretarytotheCommittee.
Total four (4) Audit Committee meetings were held during the financial year ended on 31st December, 2014. TheAttendanceofeachmemberof theCommittee isgiven below:
Name Designation No. of Meetings
held
No. of Meetings attended
Mr. Uday Khanna Chairman 4 4
Mr.S.M.Datta Member 4 4
Mr.R.Gopalakrishnan Member 4 4
Mr.RalphHewins Member 4 3
REPORT ON CORPORATE GOVERNANCE

33
annual report 2014
4. Nomination and Remuneration Committee
During the year, the Remuneration Committee wasreconstituted as “Nomination and RemunerationCommittee”. The Committee’s terms of reference functions include-
1. Identify persons who are qualified to become directors and who may be appointed in senior management in accordance with the criteria laid down, recommend to the Board their appointment / removal.
2. Carry out evaluation of every director’s performance.
3. Devising a policy on Board diversity.
4. Formulate criteria for determining qualifications, positive attributes and independence of a director and recommend to the Board a policy relating to the remuneration for the directors, key managerial personnel and other employees.
The Committee comprises of the following members viz. Mr. R. Gopalakrishnan, Mr. S. M. Datta, Mr. Ralph Hewins and Mr. Peter Weidner.The Remuneration Committee is chaired by Mr. R. Gopalakrishnan, who is the IndependentDirector. The Committee met two (2) times during the financial year ended 31st December, 2014. The details of attendance of each member of the Committee is as follows:
Name of Director Designation No. of Meetings
held
No. of Meetings attended
Mr.R.Gopalakrishnan Chairman 2 2
Mr.S.M.Datta* Member 2 1
Mr.RalphHewins Member 2 2
Mr. Peter Weidner Member 2 2
*Appointedasamemberduringtheyear.
Details of Remuneration paid to the Directors
The Executive Directors are paid Salary andPerformance Linked Bonus, which is calculated, based on pre-determined parameters of performance. The Independent Directors are paid sitting fees and commission as determined by the Board from
time to time. Details of remuneration of Executive Directors for the financial year ended 31st December, 2014 is as under:
(Rs.)
Name Basic Salary
Perquisites Retrial Benefits
Performance based
incentives
Total
Mr.RaviKirpalani 64,97,469 1,04,29,232 22,95,558 51,93,921 2,44,16,180
Mr.JayantaChatterjee* 5,85,895 20,14,569 1,19,112 4,04,267 31,23,843
Ms.RashmiJoshi 36,58,602 67,14,144 12,92,583 22,76,551 1,39,41,880
* w.e.f. – 30th October, 2014
Notes-
• Performancebasedincentiveforyear2013paidintheyear2014.
• The agreement with each Whole-time Director and Managing Director isfor a period of 5 years. Further, either party to the agreement is entitled to terminatetheAgreementbygivingnotlessthansixmonths’noticeinwritingto the other party.
• Presently,theCompanydoesnothaveaschemeforgrantofstockoptionstoitsemployees.However,themanagementstaffisentitledtotheSharesofBPp.l.c.undertheBPShare-matchschemeasinforce.
Details of remuneration of Non-Executive Directors for the financial year ended 31st December, 2014:
(Rs.)
Name of Director Commission* Sitting Fees Total
Mr.S.M.Datta 10,00,000 2,60,000 12,60,000
Mr.R.Gopalakrishnan 8,00,000 2,40,000 10,40,000
Mr. Uday Khanna 8,00,000 1,60,000 9,60,000
* CommissionforFinancialyear2013hasbeenpaidin2014
Mr. S. M. Datta (in individual capacity and as a jointholder) holds 28,236 shares, while Mr. Uday Khanna holds 800 shares of the Company.
5. Stakeholders’ Relationship Committee
Stakeholders’ Relationship Committee has beenconstituted to monitor and review investors’ grievances. It comprises of Mr. S. M. Datta, Mr. Ravi Kirpalani andMs.RashmiJoshi.Mr.S.M.DattaistheChairmanof theCommittee.Mr.SandeepDeshmukh,CompanySecretary is the Compliance Officer. Total 15 shareholders’ complaints were received during the year from Stock Exchange/Securities andExchange Board of India, etc. and were reported to the Committee. All the complaints wereresolved and there was no pending complaint as on 31st December, 2014. The Committee met four (4) times during the year on the same dates of Board Meeting dates and all members attended the Meeting.
REPORT ON CORPORATE GOVERNANCE

34
annual report 2014
6. Corporate Social Responsibility (CSR) Committee
The Board of Directors, during the year constituted “Corporate Social Responsibility Committee” asrequired under Section 135 of the Companies Act,2013.TheCorporateSocialResponsibilityCommitteecomprises of Mr. R. Gopalakrishnan as Chairman,Mr. Sashi Mukundan, Mr. Ravi Kirpalani and Ms. Rashmi Joshi as members. The Company SecretaryactsastheSecretarytotheCommittee.
The Committee met two (2) times during the year. The Corporate Social Responsibility Committeerecommends to the Board Corporate SocialResponsibilityPolicyandtheCSRinitiativesanditalsomonitors implementation of the activities undertaken as per the policy.
7. Risk Management Committee
The Board of Directors, during the year, constituted “Risk Management Committee” as required underClause 49 of the Listing Agreement. The Committeeis responsible for risk identification, evaluation and mitigation and to set up process for risk management plan. The Risk Management CommitteecomprisesofMr.RaviKirpalani,ManagingDirector who is the Chairman of the Committee and other members viz. Ms. Rashmi Joshi, Director, Mr.JayantaChatterjee,Director,Mr.PawanSabharwalandMr.SiddharthShetty.
TheCompanySecretaryactsas theSecretary to theCommittee.
8. Directors seeking appointment/re-appointment
Mr. Ravi Kirpalani
Mr.Kirpalanihasabout34yearsofexperienceinSales,Marketing and Strategy. Mr. Kirpalani served as theChief Operating Officer and Director of AutomotiveDivisionofCastrolIndiaLtd.fromMay1,2009toApril26, 2013. He joined Castrol India Ltd. in 1999 as the General Manager, East and was promoted in 2002 to Vice President, Sales. In 2004, he was appointed asthe Customer Director for India, Middle East, Turkey and Africa. In 2005, he moved to the UK as theTransformation Director and was a member of the
global strategy team. Mr. Kirpalani played a key role in the implementation of the global strategy.
Prior toCastrol,heworked forM/s.ReckittBenckiser for 12 years, in various roles and for a leading consumer products company in Muscat, Oman. Mr. Kirpalani has been a Director of Castrol India Ltd. since May 1, 2009. He is an Economics (Hons) graduate from St. Stephens College, Delhi and holds an MBAfrom IIM, Kolkata. Mr. Kirpalani is not on the Board of any other Company.
Mr. Peter Weidner
Mr. Peter Weidner is the Regional Vice PresidentAsia & Pacific Lubricants in Castrol. He first joined Castrol in 1987 and worked in a variety of roles in Sales in various countries around Europe. Prior to his appointment as Regional Vice PresidentAsia & Pacific, Mr. Weidner was the Regional VicePresidentofEurope&Africaandworkedinsalesand marketing roles. Mr. Weidner is on the Board of following group companies:
1. BPSingaporePteLtd.
2. BPAsiaPacificPteLtd.
3. BP- Castrol (Thailand) Ltd.
4. Arabian Production and Marketing LubricantsCompany Limited
9. General Body Meetings
(a) Location and time where last three AGMs were held
Location Date Time
1. BirlaMatushriSabhagar,Marine Lines, Mumbai 400 020
: 13.05.2014 3.30 p.m.
2. Y. B. Chavan Centre, General Jagannath Bhosale Marg, Next to SachivalyaGymkhana,Mumbai 400 021
26.04.2013 3.30 p.m.
3. BirlaMatushriSabhagar,Marine Lines, Mumbai 400 020
16.04.2012 3.30 p.m.
REPORT ON CORPORATE GOVERNANCE

35
annual report 2014
(b) Whether any Special Resolutions were passed in the previous three AGMs
Special Resolution was passed by theShareholders at the 35th Annual GeneralMeeting of the Company for appointment of Mr. Bijay Kamath as a Wholetime Director of the Company.
Special Resolution was passed by theShareholders at the 36th Annual GeneralMeeting of the Company for appointments of Mr. Ravi Kirpalani as Managing Director andMs.RashmiJoshiasaWholetimeDirectorofthe Company.
(c) Whether any Special Resolution was passed through Postal Ballot, last year
No such resolution passed
(d) Persons who conducted the Postal Ballot exercise
NotApplicable
(e) Whether any Special Resolution is proposed to be conducted through Postal Ballot
Postal ballot is being conducted inter se for appointment of Mr. Jayanta Chatterjee as a Wholetime Director. (Results to be declared on 17th March, 2015).
(f) Procedure for Postal Ballot
After receiving the approval of the Boardof Directors and consent of the scrutiniser, notice of the Postal Ballot containing text of theResolutionandExplanatoryStatement tobe passed through postal ballot, Postal Ballot Form and self-addressed postage pre-paid envelopes were sent to the shareholders to enable them to consider and vote for or against the proposal within a period of 30 days from the date of dispatch. The Company also provided e-voting facility to enable the shareholders to cast their vote by electronic means. A notice was published inthe newspapers regarding dispatch of Postal Ballotnotices.After the lastdateofreceiptofballots, the Scrutiniser, after due verification
shall submit the result to the Chairman or Managing Director. Thereafter, the result of the postal ballot will be declared on 17th March, 2015.ThesamealongwithScrutiniser’sReportwillbesubmittedtotheStockExchangesandwill also be displayed on the website of the Company.
10. Disclosure
(a) Disclosures on materially significant related party transactions that may have potential conflict with the interests of the Company at large.
There are no material transactions during the financial year that have a potential conflict with the interests of the Company. All therelated party transactions are at arm’s length and in ordinary centre of business.
(b) Details of non-compliance by the Company, penalties, and strictures imposed on the Company by Stock Exchange or SEBI or any statutory authority, on any matter related to capital market, during the last three years.
None in the last three years.
(c) Whistle Blower Policy and affirmation that no personnel have been denied access to the Audit Committee.
The Company is a part of BP Group Mechanism and has robust whistle-blower applying to entire BP group of companies, worldwide, which is called “Open Talk’’.
The employees are encouraged to raise any of their concerns by way of whistle-blowing and none of the employees has been denied accesstotheAuditCommitteeChairman.
(d) Code of Conduct
The Company is governed by BP Code of Conduct which sets the standard we all work to. It is aligned with our values, group standards and legal requirements, and clarifies the ethics and compliance expectations for everyone who works with the Company. The Code reflects
REPORT ON CORPORATE GOVERNANCE

36
annual report 2014
a value-based approach, where rules are not stated explicitly and everyday business decisions will be guided by our values.
The Code was simplified during the last year for ease of understanding and application. The Code, covers health, safety and the environment; our people, our partners and suppliers, governments and communities; and protecting Company’s assets. Each section contains key principles, basic rules and advice on where to find further information. A newsection, ‘Living our Code’, is designed to help people make decisions when faced with dilemmas where there are no clear rules to follow.
The Code also includes key points from new BP standards related to anti-bribery and corruption, anti-money laundering, competition and antitrust law and trade sanctions.
(e) Details of Compliance with mandatory requirements and adoption of the non-mandatory requirements of this clause.
The Company has complied with all the mandatory requirements of Clause 49. Asregards to non-mandatory requirements the extent of compliance has been stated in this report against each item.
11. Means of Communication
(a) QuarterlyResults
Published in the newspapers in terms of Clause 41oftheListingAgreement.
(b) Newspapers in which results are normally published in
(i) BusinessStandard
Mumbai,NewDelhi,Kolkata,Ahmedabad,Bangalore, Bhubaneshwar, Chandigarh, Chennai, Hyderabad, Kochi, Lucknow and Pune in English editions.
(ii) SakalinMarathi.
(c) Anywebsite,wheredisplayed
www.castrol.co.in
(d) Whether it also displays official news release
Yes
(e) The presentations made to institutional investors or to the analysts
Uploaded on website
12. General Shareholder Information
(a) Annual General Meeting
Date and Time : Thursday, 14th May, 2015 at 3.30 p.m.
Venue : BirlaMatushriSabhagar,Marine Lines, Mumbai 400 020
(b) Financial Calendar
•FinancialYear : January–December
•FirstQuarter31st March, 2015
: May 2015
•SecondQuarterand Half yearly Results– 30th June, 2015
: July 2015
•ThirdQuarterResults– 30thSeptember,2015
: November 2015
•FourthQuarterandAnnualResults– 31st December, 2015
: January-February 2016
(c) Date of Book Closure
: Friday 8th May, 2015 to Thursday 14th May, 2015 (Both days inclusive)
(d) Dividend Payment Dates
: Interim Dividend – Paid on 21stAugust,2014 Final Dividend – on or around 4th June, 2015
REPORT ON CORPORATE GOVERNANCE

37
annual report 2014
(e) Due Dates for transfer of Unclaimed Dividend to (IEPF):
Year Dividend Date of Declaration
Due for transfer to IEPF
2007 Final 29.04.2008 02.06.2015
2008 Interim 31.07.2008 03.09.2015
2008 Final 27.09.2009 01.06.2016
2009 Interim 27.07.2009 30.08.2016
2009 Final 30.04.2010 03.06.2017
2010 Interim 15.07.2010 18.08.2017
2010 Final 27.06.2011 31.07.2018
2011 Interim 11.08.2011 15.09.2018
2011 Final 16.04.2012 20.05.2019
2012 Interim 16.07.2012 19.08.2019
2012 Final 26.04.2013 30.05.2020
2013 Interim 01.08.2013 03.10.2020
2013 Final 13.05.2014 15.06.2021
2014 Interim 31.07.2014 02.09.2021
(f) Listing
The Company’s shares are listed on the BSE Limited and the National Stock Exchange of IndiaLimited. The Company has paid the listing fees for the period 1st April,2014to31st March, 2015.
(g) Stock Code
BSELimited 500870
NationalStockExchangeofIndiaLimited CASTROLIND
ISIN INE172A01027
(h) Market Price Data
MonthlyhighandlowquotationofsharestradedonBSEandNSEduringtheFinancialYear2014
MONTHS BSE NSE
High(Rs.) Low(Rs.) High(Rs.) Low(Rs.)
January 2014 320.00 286.00 320.50 285.60
February 2014 305.00 286.15 304.80 285.60
March 2014 317.00 285.80 317.00 285.00
April2014 312.90 293.45 312.50 293.00
May 2014 308.00 282.00 308.70 283.10
June 2014 351.95 293.75 351.80 294.00
July 2014 364.80 318.00 365.00 316.20
August2014 364.00 325.15 363.95 325.35
September2014 451.50 349.80 451.80 350.00
October 2014 450.40 406.85 449.90 406.40
November 2014 509.05 409.50 511.00 409.00
December 2014 544.00 468.00 544.70 460.80
(i) Stock Performance in comparison to the BSE Sensex and NSE Nifty
REPORT ON CORPORATE GOVERNANCE

38
annual report 2014
Share Transfer System
The Company Secretary has been authorized toapprove the transfer of shares which is done within the time-limitstipulatedbytheListingAgreement.ThesaidtransfersarethennotedatthesubsequentStakeholderRelationshipCommitteeMeeting.
(j) Address for correspondence
TSR Darashaw Limited6-10 Haji Moosa Patrawala Industrial Estate,20Dr.E.MosesRoad,Mahalakshmi,Mumbai 400 011
Tel: +91-22-6656 8484Fax: +91-22-6656 8494Email: [email protected]
(k) Distribution of shareholding by size class as on 31st December, 2014
No. of Shares held
No. of shares
No. of shareholders
% of shareholders
Upto 500 86,24,204 65,743 76.55
501-1000 57,95,822 7,718 8.99
1001-2000 75,77,486 5,118 5.96
2001-3000 50,79,684 2,048 2.38
3001-4000 47,43,935 1,326 1.54
4001-5000 34,96,574 769 0.89
5001-10000 1,42,10,255 2,041 2.38
10001 and above 44,50,33,232 1,122 1.31
Grand Total 49,45,61,192 85,885 100.00
(l) Distribution of shareholding by ownership as on 31st December, 2014
Sr. No.
Category No. of Shareholders
No. of Shares
held
% of the total Paid up Capital
i Foreign Company 1 5,41,896 0.11
ii Foreign Collaborator
1 35,07,49,820 70.92
iii Foreign Institutional Investors
85 3,63,60,465 7.35
iv Overseas Bodies Corporate
2 4,000 0.00
v Non-ResidentIndividuals
1,398 13,28,090 0.27
vi Public Financial Institutions
15 2,79,51,412 5.65
vii Indian Mutual Funds
63 57,69,749 1.17
viii (a) Nationalised Banks
20 1,83,209 0.04
(b) Other Banks 48 2,21,042 0.04
ix Domestic Companies
1,506 65,87,718 1.33
x ResidentIndividuals
82,743 6,48,34,755 13.11
xi Directors & Relatives
3 29,036 0.01
Total 85,885 49,45,61,192 100.00
As on 31st December, 2014, about 98.03% of the Paid-upShareCapitalhasbeendematerialised.TradinginEquitySharesof theCompany ispermittedonly indematerialised form. Promoter’s holding is held in dematerialised form.
(m) Outstanding GDRs/ADRs/Warrants or any convertible instruments, conversion date and likely impact on equity
The Company has not issued any GDRs/ADRs/Warrants or any convertible instruments.
(n) Plant Locations
The Company’s plants are located at Patalganga in Maharashtra;PaharpurinWestBengalandatSilvassa(Union Territory).
REPORT ON CORPORATE GOVERNANCE

39
annual report 2014
NON-MANDATORY REQUIREMENTS
1. Chairman of the Board
The Chairman of the Board does not maintain a Chairman’s office at the Company’s expense. However, the Company from time to time reimburses the expenses in relation to the Chairman’s office in connection with performance of his duties as the Chairman of the Company.
2. Shareholder Rights – Half yearly results
As the Company’s half yearly results are published in English newspapers having a circulation all over India and in a Marathi newspaper (having a circulation
in Mumbai), the same are not sent to the shareholders of the Company.
3. Audit Qualification
There are no qualifications contained in the Audit Report.
4. Separate Posts of Chairman and CEO/Managing Director
The Posts of Chairman and Managing Director are separate.
5. Reporting of Internal Auditors
The Internal Auditors of the Company report to the AuditCommittee.
CODE OF CONDUCT DECLARATION
InaccordancewithClause49sub-clause(II)(E)(ii)oftheListingAgreementexecutedwiththeBSELimitedandtheNationalStockExchangeofIndiaLimited,I,RaviKirpalaniinmycapacityastheManagingDirectoroftheCompanyherebyconfirmthatallmembersoftheBoardofDirectorsandSeniorManagementPersonneloftheCompanyhaveaffirmed their compliance for the financial year 2014 with the Company’s Code of Conduct.
RaviKirpalani Managing DirectorMumbaiDated: 25th February, 2015
To,
The Members of Castrol India Limited
We have examined the compliance of conditions of Corporate Governance by Castrol India Limited (“the Company”), for the year ended on December 31, 2014, asstipulatedinClause49oftheListingAgreementofthesaidCompanywiththeStockExchanges.
The compliance of conditions of Corporate Governance is the responsibility of the management. Our examination was limited to procedures and implementation thereof, adopted by the Company for ensuring the compliance of the conditions of the Corporate Governance. It is neither an audit nor an expression of opinion on the financial statements of the Company.
In our opinion and to the best of our information and according to the explanations given to us, we certify that the Company has complied with the conditions
of Corporate Governance as stipulated in the above-mentionedListingAgreement.
We further state that such compliance is neither an assurance as to the future viability of the Company nor the efficiency or effectiveness with which the management has conducted the affairs of the Company.
ForS.R.BATLIBOI&CO. LLPCharteredAccountantsICAIFirmRegistrationNo.301003E
per Dolphy D’souza Partner Membership No.: 38730
Place: Mumbai,Dated: 25th February, 2015
AUDITORS’ CERTIFICATE
REPORT ON CORPORATE GOVERNANCE

40
annual report 2014
CEO-CFO CERTIFICATETo, The Board of Directors Castrol India Limited,
We, the undersigned, in our respective capacities as Managing Director (Chief Executive Officer) and Director Finance (Chief Financial Officer) of Castrol India Limited (“the Company”), to the best of our knowledge and belief certify that:
(a) We have reviewed the financial statements and the cash flow statement for the financial year ended 31st December, 2014 and based on our knowledge and belief, we state that:
(i) these statements do not contain any materially untrue statement or omit any material fact or contain any statements that might be misleading.
(ii) these statements together present a true and fair view of the Company’s affairs and are in compliance with the existing accounting standards, applicable laws and regulations.
(b) We further state that to the best of our knowledge and belief, there are no transactions entered into by the Company during the year, which are fraudulent, illegal or violative of the Company’s Code of Conduct.
(c) We hereby declare that all the members of the Board of Directors and Management Committee have confirmed compliance with the Code of Conduct as adopted by the Company.
(d) We are responsible for establishing and maintaining internal controls and for evaluating the effectiveness of the same over the financial reporting of the Companyandhavedisclosed to theAuditorsandtheAuditCommittee,deficienciesinthedesignoroperation of internal controls, if any, of which we are aware and the steps we have taken or propose to take to rectify these deficiencies.
(e) We have indicated, based on our most recent evaluation,whereverapplicable,totheAuditorsandAuditCommittee:
(i) significant changes, if any, in the internal control over financial reporting during the year;
(ii) significant changes, if any, in the accounting policies made during the year and that the same has been disclosed in the notes to the financial statements; and
(iii) instances of significant fraud of which we have become aware and the involvement therein, if any, of the management or an employee having significant role in the Company’s internal control system over financial reporting.
On behalf of the Board of Directors
RaviKirpalani RashmiJoshiManaging Director Director – Finance
Mumbai
Dated: 25th February, 2015
REPORT ON CORPORATE GOVERNANCE

41
annual report 2014 annual report 2014 BUSINESS RESPONSIBILITY REPORT
Section A: General information about the Company
Sr. No. Particulars Information
1. Corporate Identity Number (CIN) of the Company L23200MH1979PLC021359
2. Name of the Company Castrol India Limited
3. Registered Address Technopolis Knowledge Park, Mahakali Caves Road, Chakala, Andheri (East), Mumbai–400 093.
4. Website www.castrol.co.in
5. E-mail id [email protected]
6. Financial Year Reported January 1, 2014 – December 31, 2014
7. Sector(s) that the Company is engaged in (industrial activity code-wise)
2 7 1 0 0 0 . 6 1 – Lubricating oils
8. List three key products/services that the Company manufactures/provides (as in balance sheet):
Lubricating oils
9. Total number of locations where business activity is undertaken by the Company
• NumberofInternationalLocations(Providedetails of major 5): None
• NumberofNationalLocations:9 Corporate Office – 1 Regional Offices – 4 Plants – 3 Technology Centre – 1
10. Markets served by the Company – Local/State/National/International
National
Section B: Financial details of the Company
Sr. No. Particulars Information
1. Paid up Capital (INR) Rs. 247.3 crores
2. Total Turnover (INR) Rs. 3,380.8 crores
3. Total profit after taxes (INR) Rs. 474.5 crores
4. Total Spending on Corporate Social Responsibility (CSR) as percentage of profit after tax (%)
– Total Spends – Rs. 2.7 crores (0.57%)a. ‘Eklavya’ Spends – Rs. 2.54 crores
(Total Mechanics trained in 2014: 33,141 Total Mechanics trained till date 1,70,000)
b. Community investment around Silvassa plant – Rs. 0.16 crore
5. List of activities in which expenditure in 4 above has been incurred:
a. Eklavya – a basic technical training programme for two-wheeler mechanics.
b. Community investment around Silvassa plant

42
annual report 2014 BUSINESS RESPONSIBILITY REPORT
Section C: Other Details
1. Does the Company have any Subsidiary Company/Companies?
The Company does not have any Subsidiary Company.
2. Do the Subsidiary Company/Companies participate in the BR Initiatives of the parent company? If yes, then indicate the number of such subsidiary company(s).
Not Applicable.
3. Do any other entity/entities (e.g. suppliers, distributors etc.) that the Company does business with, participate in the BR initiatives of the Company? If yes, then indicate the percentage of such entity/entities? [Less than 30%, 30-60%, More than 60%]
The Code of Conduct is applicable to all the business entities who do business with the Company. The business partners however do not directly participate in Business Responsibility initiatives of the Company.
Section D: BR Information
Details of Director/Directors responsible for BR
(a) Details of the Director/Directors responsible for implementation of the BR policy/policies:
Particulars Details
DIN Number 02613688 06641898
Name Mr. Ravi Kirpalani Ms. Rashmi Joshi
Designation Managing Director Director – Finance
(b) Details of the BR head:
Sr. No. Particulars Details
1. DIN Number (if applicable) 02613688 06641898
2. Name Mr. Ravi Kirpalani Ms. Rashmi Joshi
3. Designation Managing Director Director – Finance
4. Telephone number 91-22-66984100
5. E-mail id [email protected]

43
annual report 2014 annual report 2014 BUSINESS RESPONSIBILITY REPORT
2. Principle-wise (as per NVGs) BR Policy/policies (Reply in Y/N)
Sr. No. Questions P P P P P P P P P
1 2 3 4 5 6 7 8 9
Bu
sin
ess
Eth
ics
Su
stai
nab
ility
Em
plo
yees
’ wel
l-b
ein
g
Sta
keh
old
ers’
Wel
fare
Hu
man
Rig
hts
Env
iro
nm
ent
Reg
ula
tory
Po
licy
Eq
uit
able
Dev
elo
pm
ent
Cu
sto
mer
Res
po
nsi
bili
ty
1. Do you have a policy/policies for.... Y Y Y Y Y Y Y Y Y
2. Has the policy being formulated in consultation with the relevant stakeholders?
Y Y Y Y Y Y Y Y Y
3. Does the policy conform to any national /international standards? If yes, specify? (50 words)
Majority of the Company policies are aligned with BP group policies which incorporate the global best practices. The Company is an ISO 9001 Company and the manufacturing locations are 14001 and 18001 certified.
4. Has the policy being approved by the Board? If yes, has it been signed by MD/Owner/CEO/appropriate Board Director?
Y Y Y Y Y Y Y Y Y
The Code of Conduct and the other frameworks adopted by the parent company BP, globally have been adopted by the Company.
5. Does the Company have a specified committee of the Board/Director/Official to oversee the implementation of the policy?
Y Y Y Y Y Y Y Y Y
6. Indicate the link for the policy to be viewed online?
http://www.castrol.com/content/dam/castrolcountry/en_in/About%20Us/Financials/Code-of-Conduct%20.docx
7. Has the policy been formally communicated to all relevant internal and external stakeholders?
Y Y Y Y Y Y Y Y Y
8. Does the Company have in-house structure to implement the policy/policies?
Y Y Y Y Y Y Y Y Y
9. Does the Company have a grievance redressal mechanism related to the policy/policies to address stakeholders’ grievances related to the policy/policies?
Y Y Y Y Y Y Y Y Y
10. Has the Company carried out independent audit/evaluation of the working of this policy by an internal or external agency?
Y Y Y Y Y Y Y Y Y

44
annual report 2014 BUSINESS RESPONSIBILITY REPORT
2a. If answer to Sr. No. 1 against any principle, is ‘No’, please explain why: (Tick up to 2 options)
Sr. No. Questions P P P P P P P P P
1 2 3 4 5 6 7 8 9
1. The Company has not understood the Principles NA NA NA NA NA NA NA NA NA2. The Company is not at a stage where it finds
itself in a position to formulate and implement the policies on specified principles
NA NA NA NA NA NA NA NA NA
3. The Company does not have financial or manpower resources available for the task
NA NA NA NA NA NA NA NA NA
4. It is planned to be done within next 6 months NA NA NA NA NA NA NA NA NA5. It is planned to be done within next 1 year NA NA NA NA NA NA NA NA NA6. Any other reason (please specify) NA NA NA NA NA NA NA NA NA
3. Governance related to BR • Indicate the frequency with which the Board of Directors, Committee of the Board or CEO to assess
the BR performance of the Company. Within 3 months, 3-6 months, Annually, More than 1 year. The Board of Directors of the Company assesses various initiatives forming part of the BR performance of the Company at least once a year.
• Does the Company publish a BR or a Sustainability Report? What is the hyperlink for viewing this report? How frequently it is published? The Company publishes the information on BR in the Annual Report of the Company. The hyperlink to view the Annual Report is: www.castrol.co.in
Section E: Principle-wise performance
Principle 1
Policy relating to ethics, bribery and corruption
Code of Conduct
Company’s Code of Conduct (also referred to as the ‘Code’) outlines its commitment to ethical standards and compliance with applicable local laws. As mentioned earlier, Company’s policies reflect those adopted by its Parent Company globally. Company’s Code is based on its values and clarifies the ethics and compliance expectations for everyone who works for the Company. The Code includes sections on operating safely, responsibly & reliably; its people; its business partners; the governments and communities the Company works with and its assets and financial integrity. The Code takes into account key points from Company’s internal standards related to anti-bribery and corruption, anti-money
laundering, competition and anti-trust law and trade sanctions. Company conducts due diligence on all its vendors and customers in accordance with these policies.
Who the Code of Conduct applies to
The Code applies to every employee of the Company and the endeavor is to extend this Code to all its contractors and business partners. Where feasible, the Company seeks a contractual commitment from its contractors and business partners to comply and work in line with the Code. Where the Company has the right to do so, it may consider terminating contracts where a contractor has not complied with the obligations or not renewing a contract where a contractor has acted in a manner that is not consistent with Company’s values or the Code. The Company rigorously follows ethical business decisions, ensuring the actions of all its employees, vendors, business partners and customers are consistent with the law.

45
annual report 2014 annual report 2014 BUSINESS RESPONSIBILITY REPORT
The Company collaborates closely with all stakeholders in order to initiate and foster fair business practices in all spheres of business to create and sustain an ethical and transparent environment.
Certifying the Code
Each year, the Company engages its employees in Code of Conduct certification. It is embedded in the annual performance contract of all employees to comply with the Code and to create an environment where people can confidently raise concerns without fear of reprisal.
During the year, five (5) instances of breach of the Code were reported for which appropriate inquiries were initiated and appropriate action taken. One contractor was dismissed for non-compliance of the Code or unethical behaviour and disciplinary action taken against 5 employees.
Fostering a ‘speak up’ culture
The Company is committed to providing an open environment where its employees, contractors and other stakeholders are comfortable speaking up whenever they have a question about our code of conduct or think that law, regulations or the Code, may have been breached. All stakeholders are encouraged to raise concerns with the Company’s management team or BP’s global helpline.
Your Company has adopted a Policy for Prevention of Sexual Harassment at the workplace and the Internal Complaints Committee is constituted. No complaints received during the year.
Principle 2
Businesses should provide goods and services that are safe and contribute to sustainability throughout their life cycle
The Company has ISO certificates of 9001:2008, 14001 and ISO/TS 16949:2009. The Company launched/re-launched several products throughout 2014, with superior products and benefits to consumers. 2014 saw many new launches. Castrol launched the world’s first certified CO2 neutral engine oil in Castrol Professional range meant for car OEM with a promise
towards neutralising CO2 footprint by investing in offset projects around the world. Castrol Magnatec stop start was launched – an innovative product specially designed to protect car engines from the damage caused by today’s stop-start traffic. CRB Mini Truck – a dedicated product for Micro Light Commercial Vehicles (MLCVs) was also launched catering to the needs of the growing MLCV parc. This product provides better heat protection in MLCVs whose engines run hotter than bigger trucks.
Both our raw material sourcing and finished goods distribution are optimised with a view to reduce the distance travelled and environmental impact.
The Company has taken various energy efficiency measures at its plants, including:
• Using energy efficient technology like solar andLED lights to reduce energy consumption.
• Usingfueladditivewithfurnaceoiltoobtainbestfuelefficiency Boiler condensate recovery and maintenance resulting in lower furnace oil consumption.
• Optimizingpowerandutilityoperations.
• Recyclingtreatedwaterfromeffluenttreatmentplantwhich is now being used for sanitation, resulting in reduction of fresh water consumption.
• Improveboilerefficiencythroughoptimisedrunningof blend operation, reduce power consumption by improving power factor and reduce water consumption through various initiatives.
The Company’s Technology Centre in India hosts the global product development centre for motorcycle engine oils. As part of our initiative to ensure development of the highest standards; we have bought state of the art friction testing equipments that help us develop differentiation in our product and also reduce product development life cycle time.
Principle 3
Businesses should promote the well-being of all employees
The Company’s approach for managing its core asset i.e. its people, is founded on the following beliefs:
1. People’s safety is our first priority

46
annual report 2014 BUSINESS RESPONSIBILITY REPORT
2. BP grows best by growing its own people
3. Our people have potential – we need to develop it
4. Diversity matters – so does inclusion
5. We need the best talent – and need to meet the expectations of the best talent.
In our endeavor to be a contemporary organisation, we constantly review our policies and benchmark them against the best in class to ensure that the Company’s agenda on employee well-being and engagement is serviced effectively. The Company gets feedback from its employees through an annual survey conducted globally. In 2014, the survey indicated that overall employee engagement score for the Company was in the top quartile indicating very good engagement with 81% of the employees feeling strongly engaged. Further, maintaining its excellent track record of cordial relationship with its trade unions, there were no industrial disputes raised, cordial negotiations are in progress with the employee unions at its Paharpur and Wadala facilities.
The total headcount as on December 31, 2014 is 802, of which 93 are permanent women employees. The Company has hired 186 employees on a contractual/temporary basis. The Company does not have any employees with permanent disability. There is workers’ trade union active mainly in plants and approximately 24% of permanent employees are members of this trade union.
In summary, Company’s people agenda is focused on the following principles:
1. Health & Safety: HSSE (Health, Safety, Security and Environment) is at the heart of everything that the Company does and is a key enabler of its business strategy. The Company is committed to the goal of ‘No accidents, no harm to people and no damage to the environment’. Our HSSE strategy is designed around following three key elements :
• Havingsafeandhealthyemployees
• Beingaresponsibleoperator
• Ensuring our products and services can betrusted
The Company empowers and thus expects every employee to be a safety leader; our safety leadership pledge being – “I commit to lead all in safety, so that all employees go home safely every day. This is more important to us than anything else that we do”. Road safety continues to be a focus area for the Company and thus all professional drivers undergo a rigorous defensive driver training and all road safety related incidents, howsoever minor, are reported and investigated. The same driving standards are used while dealing with contractors engaged in transporting raw material and finished goods. All permanent and contract employees are given safety training during the year.
The Company has been steadily progressing in implementing BP’s Operating Management System (OMS) to continuously improve the delivery of safe, responsible and reliable operations. The OMS has helped the Company to manage four key elements of operating – People, Plant, Processes and Performance, effectively.
The Company has been regularly providing annual preventive health checks for all employees at its own cost. Further, to enable employees manage work-life balance and related stress, if any, the Company has taken several initiatives, including:
• Agile Working: A core component of the Company’s Diversity & Inclusion ambition, agile working encompasses a wide range of working options that enables employees to work flexibly at full potential. Part time working, job-share, home working and flexible hours are some options granted under this initiative.
• Career Break and Maternity/Paternity Leave: These benefits are available to employees of the Company irrespective of the level that they operate at.
• PRISM-Gender Diversity Offer: The Company has introduced a specific offer for women managers in sales and marketing function called PRISM (Progress through Sales and

47
annual report 2014 annual report 2014 BUSINESS RESPONSIBILITY REPORT
Marketing), to empower and enable them to be successful by creating an inclusive workplace.
• Workplace facilities: At all offices and facilities of the Company, attention is paid to ergonomics to ensure a comfortable work environment.
2. Leadership Development: Building both, people and functional capability is one of the key elements of our investment in people. Last year, the Company took concrete steps to embed BP’s global leadership framework that requires leaders to demonstrate capabilities in managing culture, performance, talent and development. Further, this year, the capability calendar was designed to look at the leadership development requirements around differentstagesofanemployee’scareer,viz–NewJoiners, Leading Self, Leading Others, Leading Managers and Leading a Function or Business. Discover BP, Leading the BP Way, Responsible Leadership, Leading through people processes were some of the key leadership development programmes successfully implemented by the Company this year.
3. Diversity and Inclusion: As a part of a large multinational group, the Company wants the workforce to represent the societies in which its operates. Company’s commitment to Diversity and Inclusion enables it to be creative, competitive and thrive in our environment. Improving gender diversity continues to be the focus area for the Company and has taken several initiatives articulating its Diversity & Inclusion ambition and strategy, agile working. The Company ran various empowering and educational events through group International Women’s Network (BPWIN). Workshops were also held to equip managers with knowledge and skills to manage a multigenerational workforce and enable women to succeed in the workplace. Refresher courses on Diversity & Inclusion were also held. Both in the industry and outside, BP has been recognised for its work on gender diversity.
There were no complaints relating to child labour, forced labour, involuntary labour or sexual harassment in the last financial year.
Principle 4
Businesses should respect the interests of, and be responsive towards all stakeholders, especially those who are disadvantaged, vulnerable and marginalised
The Company has identified and is responsive to the needs of all its stakeholders, especially those who are disadvantaged, vulnerable and marginalized.Towardsthis end, the Company runs community investment programmes for the communities it operates within – especially around its plant in Silvassa. The various programmes undertaken around the Silvassa plant include:
• Supporting the Red Cross school for differentlyabled children
• Computer education in Rakholi GovernmentSchool
• Sponsoring Doctor’s services at the Sayli HealthCentre
• SupportinglocalNGOwhichworksforthewelfareof tribals
In addition to the community investment progammes, Castrol also runs programmes for other key stakeholders like mechanics and farmers in the areas of technology upgradation, skill enhancement and safety. For the last five years, Castrol has been running a mechanic training programme called Eklavya – with the objective of imparting knowledge to independent two-wheeler mechanics about the constantly evolving automotive and lubricant technology. We trained over 170,000 mechanics through this programme. Currently the programme is paused since we are looking at options and opportunities of doing the programme differently. But we will continue to focus on this segment in future as well.
Our marketing team also runs regular mechanic and farmer meets where they share knowledge and information on evolving technologies, safety and business management skills.

48
annual report 2014 BUSINESS RESPONSIBILITY REPORT
Principle 5
Businesses should respect and promote Human Rights
A formal Human Right’s policy was launched this year which applies to every employee. This policy contains following seven key principles:
• TheCompanyconducts itsbusiness inamannerthat respects the rights and dignity of all people, complying with all legal requirements.
• TheCompany respects internationally recognisedhuman rights, as set out in the International Bill of Human Rights and the International Labour Organisation’s declaration on Fundamental Principles and Rights at Work.
• The Company recognises its responsibility torespect human rights and avoid complicity in humanrightsabuses,asstatedintheUNGuidingPrinciples on Business and Human Rights.
• The Company treats everyone who works for us,fairly and without discrimination. The employees, agency staff and suppliers are entitled to work in an environment and under conditions that respect their rights and dignity.
• The Company respects freedom of association.Where its employees wish to be represented by trade unions or works councils, the Company will cooperate in good faith with the bodies that its employees collectively choose to represent them within the appropriate national legal frameworks.
• The Company respects the rights of peoplein communities impacted by its activities. The Company will seek to identify adverse human rights impact and take appropriate steps to avoid, minimise and/or mitigate them.
• The Company will seek to make contractualcommitments with suppliers with a view to encourage them to adhere to the same principles.
The policy applies to every employee. The Company’s employees, contractors, suppliers and business partners are entitled to work in an environment and under conditions that respect their rights and dignity.
Principle 6
Business should respect, protect, and make efforts to restore the environment
The Company is not only committed to comply with all applicable laws and requirements but also to maintain highest standards of Occupational Health, Safety & Environment. This is also as spelt in the policy which uniformly applies to every employee. Safety & Environmental Performance has been integral to the business performance of your Company and continues to focus on the goal: ‘no accidents, no harm to people and no damage to the environment’.
Worldwide, industry is talking about reduced dependency on natural resources and driving towards sustainable technologies. Pressure to reduce environment impact, as well as costs, comes from every direction: customers, business partners and governments. The Company sees these challenges as opportunities for change and continues to develop sustainable solutions to reduce its environmental impact and optimise its energy efficiencies.
The Company takes a systematic approach to make the operations safe, systematic, reliable and environmentally friendly through its Operating Management System. All three blending plants of your Company are also certified for the Environment Management System (ISO 14001:2004) and Occupational Health & Safety Management System (OHSAS 18001:2007). Your Company also implements ISO 9001:2008 (Quality Management System Standard) and ISO/TS 16949:2009 (Automotive Customer Specific Standard) to continually improve its processes. Compliance to these systems has been certified by internationally recognised and accredited bodies. In 2014 the Company launched the World’s first Certified CO2 neutral engine oil for car OEMs.

49
annual report 2014 annual report 2014 BUSINESS RESPONSIBILITY REPORT
Initiatives to mitigate possible environmental risks and reduce environment footprint are in place. All efforts are taken to minimise energy consumption, water consumption and waste generation from manufacturing operations viz. optimising the batchsizes,switchingtoenergyefficientlighting,maximisingthe use of solar lighting during the day, regular water monitoring and audits to name a few. The Company’s Environment performance have also been recognised and appreciated by various organisations.
The Company has not received any show cause/ legal notices from CPCB/SPCB which are pending as on end of financial year.
Principle 7
Businesses, when engaged in influencing public and regulatory policy, should do so in a responsible manner
The Code of Conduct of the Company provides that although the Company does not directly take part in political activity, it could engage in policy debate in various ways including lobbying, on subjects of legitimate concern to the Company, its staff and the communities in which it operates. This is done in highly regulated manner by authorised people.
The Company does not take part directly in party political activity. The Company does not make any political contributions – either in cash or in kind.
The Company aims to engage constructively with Governments everywhere it operates, as well as tobuild constructive relationships with the media.
The Company complies with all laws and regulations that prohibit bribery and corruption, and ensure that its suppliers, contractors and joint venture partners, if any do the same. All business partners who represent or act on behalf of the Company are asked to comply with applicable bribery and corruption laws. Where appropriate, they are required to show that they have appropriate programmes in place to prevent bribery.
The Company is represented in many industry and business Associations which work in the relevant areas, including:
• FederationofIndianChambersofCommerceandIndustry (FICCI)
• BombayChamberofCommerce&Industry
• TheAdvertisingStandardsCouncilofIndia
• AllIndiaManagementAssociation
Principle 8
Businesses should support inclusive growth and equitable development
CIL seeks to translate its policies in action through effective governance mechanisms and initiatives. The BP Code of Conduct guides the way we do business. Our Code represents our commitment to do the right thing, including respecting the rights of others. In line with the recent mandate of the Companies Act 2013 by the Indian government, the Company is in the process of finalizing its new CSR policy and programmes.The Policy defines the approach and direction of the companies CSR vision and on ground activities.
In 2014, the Company continued its social investment programme called Eklavya, under which it has trained over 170,000 two-wheeler mechanics since the inception of the programme in 2009. The programme was aimed at fostering inclusive growth and ensuring that the smaller independent mechanics do not lose out due to lack of skills in the face of constantly evolving automotive technology. Eklavya was conceptualised recognising the large universe of unorganised road side mechanics with no access to formal skills training and therefore unable to keep up with the rapid changes in technology and the opportunities it provides. Regular engagement has enabled providing them with requisite knowledge and skills as per their market requirements. Through updated and refresher modules the programme has sought to stay connected with the beneficiaries by offering further enhancement of their skills translating in to better incomes and opportunities.

50
annual report 2014 BUSINESS RESPONSIBILITY REPORT
The programme was suspended in Q4 2014 to enable us to evaluate further opportunities and take a fresh look at the Company’s CSR programmes in line with the new Companies Act.
The Company’s CSR programme aims to create a sustainable and meaningful impact – one that is relevant to local needs and aligned with the Company’s business. Towards this end, it also works with local authorities and communities to deliver community programmes around its plants in Patalganga and Silvassa – the focus here being on education and healthcare.
Principle 9
Businesses should engage with and provide value to their customers and consumers in a responsible manner
The Company is in the business of meeting the needs of its customers and consumers in an efficient and compelling manner. The products are developed basis insights gained from regular consumer and customer interactions and structured research projects. In 2014 Castrol launched the world’s first certified CO2 neutral engine oil in Castrol Professional range meant for Car OEMs , thus benefiting the environment. The Company continuously monitors the trends in automotive and manufacturing industries and launches products suitable for emerging segments. CRB Mini Truck was launched in 2014 catering to the needs of the growing MLCVs parc. This product provides better heat protection in MLCVs whose engines run hotter than bigger trucks. Castrol Magnatec stop start was launched which is designed to protect car engines from the damage caused by today’s stop-start traffic conditions. CompanyhasorganizeditsbusinessaroundBusiness
to Business (B2B) and Business to Consumers (B2C) channels. The Company offers a blend of products and solutions based offers; for example, for its large workshop customers, the Company offers training on soft skills aimed at improving Customer Satisfaction Index (CSI) scores and for its small independent workshops, the Company provides equipment for servicing and collaterals and programmes for attracting more customers. The Company regularly tracks satisfaction score of its distributor partners as well as trade and references the same against market norms. Appropriate actions are taken to improve customer satisfaction. The Company has less than 8% complaints which are under resolution. The complaint closure as on December 2014 was 92%. Significant emphasis is laid to ensure product integrity and formulation compliance. Regular internal and external audits are conducted at the plant level as well as the formulation level to ensure that only compliant products reach the customers and consumers. The Company mentions information such as product benefits to the consumer, technology used in the product, etc. in addition to the mandatory information. There are no cases pertaining to Anti-Trust or Competition Law filed by or against the Company. However, there are some complaints/cases filed by consumers/ shareholders which are pending in Consumer Forums/Courts. These are being appropriately dealt with by the Company.
On behalf of the Board of Directors
Ravi Kirpalani Rashmi Joshi Managing Director Director – Finance
Mumbai Dated: 25th February, 2015

51
annual report 2014 annual report 2014 INDEPENDENT AUDITORS’ REPORT
To
The Members of Castrol India Limited
Report on the Financial Statements
We have audited the accompanying financial statements of Castrol India Limited (“the Company”), which comprise the Balance Sheet as at December 31, 2014, and the Statement of Profit and Loss and Cash Flow Statement for the year then ended, and a summary of significant accounting policies and other explanatory information.
Management’s Responsibility for the Financial Statements
Management is responsible for the preparation of these financial statements that give a true and fair view of the financial position, financial performance and cash flows of the Company in accordance with accounting principles generally accepted in India, including the Accounting Standards notified under the Companies Act, 1956 (“the Act”), read with General Circular 8/2014 dated 4 April 2014 issued by the Ministry of Corporate Affairs. This responsibility includes the design, implementation and maintenance of internal control relevant to the preparation and presentation of the financial statements that give a true and fair view and are free from material misstatement, whether due to fraud or error.
Auditor’s Responsibility
Our responsibility is to express an opinion on these financial statements based on our audit. We conducted our audit in accordance with the Standards on Auditing issued by the Institute of Chartered Accountants of India. Those Standards require that we comply with ethical requirements and plan and perform the audit to obtain reasonable assurance about whether the financial statements are free from material misstatement.
An audit involves performing procedures to obtain audit evidence about the amounts and disclosures in the financial statements. The procedures selected depend on the auditor’s judgment, including the assessment of the risks of material misstatement of the financial statements, whether due to fraud or error. In making those risk assessments, the auditor considers internal control relevant to the Company’s preparation and fair presentation of the financial statements in order to design audit procedures that are appropriate in the circumstances but not for the purpose of expressing an opinion on the effectiveness of the entity’s internal control. An audit also includes evaluating the appropriateness of accounting policies used and the reasonableness of the accounting estimates made by management, as well as evaluating the overall presentation of the financial statements. We believe that the audit evidence we have obtained is sufficient and appropriate to provide a basis for our audit opinion.
Opinion
In our opinion and to the best of our information and according to the explanations given to us, the financial statements give the information required by the Companies Act, 1956 (“the Act”) in the manner so required and give a true and fair view in conformity with the accounting principles generally accepted in India:
(a) in the case of the Balance Sheet, of the state of affairs of the Company as at December 31, 2014;
(b) in the case of the Statement of Profit and Loss, of the profit/loss for the year ended on that date; and
(c) in the case of the Cash Flow Statement, of the cash flows for the year ended on that date.
Report on Other Legal and Regulatory Requirements
1. As required by the Companies (Auditor’s Report) Order, 2003 (“the Order”) issued by the Central Government of India in terms of sub-section (4A) of Section 227 of the Act, we give in the Annexure a statement on the matters specified in paragraphs 4 and 5 of the Order.
Independent AudItORS’ RepORt

52
annual report 2014 INDEPENDENT AUDITORS’ REPORT
2. As required by Section 227(3) of the Act, we report that:
(a) We have obtained all the information and explanations which to the best of our knowledge and belief were necessary for the purpose of our audit;
(b) In our opinion proper books of account as required by law have been kept by the Company so far as appears from our examination of those books;
(c) The Balance Sheet, Statement of Profit and Loss and Cash Flow Statement dealt with by this Report are in agreement with the books of account;
(d) In our opinion, the Balance Sheet, the Statement of Profit and Loss and the Cash Flow Statement comply with the Accounting Standards notified under the Companies Act, 1956, read with General Circular 8/2014 dated 4 April 2014 issued by the Ministry of Corporate Affairs;
(e) On the basis of written representations received from the directors as on December 31, 2014 under section 164(2) of the Companies Act, 2013, and taken on record by the Board of Directors, none of the directors is disqualified as on December 31, 2014, from being appointed as a director in terms of clause (g) of sub-section (1) of section 274 of the Companies Act, 1956, provisions of which are consistent with those under section 164(2) of the Companies Act, 2013.
For S. R. Batliboi & Co. LLPChartered AccountantsICAI Firm Registration Number: 301003E
per Dolphy D’souzaPartnerMembership Number: 38730
Place : MumbaiDate : February 25, 2015

53
annual report 2014 annual report 2014 INDEPENDENT AUDITORS’ REPORT
Annexure referred to in paragraph of audit report on Other Legal and Regulatory Requirements of even date
Re: Castrol India Limited (‘the Company’)
(i) (a) The Company has maintained proper records showing full particulars, including quantitative details and situation of fixed assets.
(b) All fixed assets have not been physically verified by the management during the year but there is a regular programme of verification which, in our opinion, is reasonable having regard to the size of the Company and the nature of its assets. No material discrepancies were noticed on such verification.
(c) There was no substantial disposal of fixed assets during the year.
(ii) (a) The management has conducted physical verification of inventory at reasonable intervals during the year.
(b) The procedures of physical verification of inventory followed by the management are reasonable and adequate in relation to the size of the Company and the nature of its business.
(c) The Company is maintaining proper records of inventory and no material discrepancies were noticed on physical verification.
(iii) (a)-(d) According to the information and explanations given to us, the Company has not granted any loans, secured or unsecured to companies, firms or other parties (determined in the manner stated in clause (v) below) covered in the register maintained under section 301 of the Companies Act, 1956. Accordingly, the provisions of clause 4(iii) (a) to (d) of the Order are not applicable to the Company and hence not commented upon.
(e)-(g) According to information and explanations given to us, the Company has not taken any loans, secured or unsecured, from companies, firms or other parties covered in the register maintained under section 301 of the Companies Act, 1956 (determined in the manner stated in clause (v) below). Accordingly, the provisions of clause 4(iii) (e) to (g) of the Order are not applicable to the Company and hence not commented upon.
(iv) In our opinion and according to the information and explanations given to us, there is an adequate internal control system commensurate with the size of the Company and the nature of its business, for the purchase of inventory and fixed assets and for the sale of goods and services. During the course of our audit, we have not observed any major weakness or continuing failure to correct any major weakness in the internal control system of the Company in respect of these areas.
(v) (a) According to the information and explanations provided by the management, we are of the opinion that the particulars of contracts or arrangements referred to in section 301 of the Companies Act, 1956 that need to be entered into the register maintained under section 301 have been so entered. In evaluating the parties to be covered under section 301, only contracts or arrangements upto March 31, 2014 (being the last day up to which this section was applicable to the Company) were considered.
(b) In our opinion and according to the information and explanations given to us, the transactions made in pursuance of such contracts or arrangements and exceeding the value of Rupees five lakhs have been entered into during the financial year at prices which are reasonable having regard to the prevailing market prices at the relevant time except in respect of certain transactions, where because of the unique and specialized nature of the items involved and absence of any comparable prices, we are unable to comment whether the transactions were made at the prevailing market prices at the relevant time.
(vi) The Company has not accepted any deposits from the public.

54
annual report 2014 INDEPENDENT AUDITORS’ REPORT
(vii) In our opinion, the Company has an internal audit system commensurate with the size and nature of its business.
(viii) We have broadly reviewed the books of account maintained by the Company pursuant to the rules made by the Central Government for the maintenance of cost records under section 209(1)(d) of the Companies Act, 1956 for the period upto March 31, 2014 (the Companies Act, 1956 and relevant section has been replaced by the Companies Act, 2013 effective April 1, 2014), related to the manufacture of Lubricating Oils and Greases and are of the opinion that prima facie, the prescribed accounts and records have been made and maintained.
(ix) (a) The Company is regular in depositing with appropriate authorities undisputed statutory dues including provident fund, investor education and protection fund, employees’ state insurance, income-tax, sales-tax, wealth-tax, service tax, customs duty, excise duty, cess and other material statutory dues applicable to it.
(b) According to the information and explanations given to us, no undisputed amounts payable in respect of provident fund, investor education and protection fund, employees’ state insurance, income-tax, wealth-tax, service tax, sales-tax, customs duty, excise duty, cess and other undisputed statutory dues were outstanding, at the year end, for a period of more than six months from the date they became payable.
(c) According to the records of the Company, the dues outstanding of income tax, sales-tax, wealth-tax, service tax, customs duty, excise duty and cess on account of any dispute, are as follows:
name of Statute nature of dues Amount (Rs. Crores)
period to which amount relates
Forum where dispute is pending
Local Sales Tax Act, VAT Act and Central Sales Tax Act
Tax, Interest and Penalty 91.68 1987 to 2014 Assistant/Deputy/ Additional/Joint/Special, Revisional Board/Commissioner, Tribunal, High Court.
Central Excise Act, 1944
Duty and Penalty 26.16 1987 to 2014 Assistant/Deputy/ Additional/Joint Commissioner, Commissioner (A), CESTAT, High Court & Supreme Court.
Customs Act, 1962 Duty and Interest 2.83 1997 to 2006 Tribunal
Service Tax, Chapter V of the Finance Act, 1994
Tax and Penalty 113.76 1997 to 2014 Assistant/Deputy/ Additional/Joint Commissioner, Commissioner (A), CESTAT, High Court.
The Income Tax Act, 1961
Tax and Interest 1.16 Assessment years 2000-2001, 2008-2009 and 2009-2010
Deputy Commissioner of Income Tax, Commissioner of Income Tax (A) & ITAT
(x) The Company has no accumulated losses at the end of the financial year and it has not incurred cash losses in the current and immediately preceding financial year.
(xi) Based on our audit procedures and as per the information and explanations given by the management, we are of the opinion that the Company has not defaulted in repayment of dues to bank. The Company has no outstanding dues in respect of financial institution or debenture holders.
55
annual report 2014 annual report 2014 INDEPENDENT AUDITORS’ REPORT
(xii) According to the information and explanations given to us and based on the documents and records produced to us, the Company has not granted loans and advances on the basis of security by way of pledge of shares, debentures and other securities.
(xiii) In our opinion, the Company is not a chit fund or a nidhi/mutual benefit fund/society. Therefore, the provisions of clause 4(xiii) of the Companies (Auditor’s Report) Order, 2003 (as amended) are not applicable to the Company.
(xiv) In our opinion, the Company is not dealing in or trading in shares, securities, debentures and other investments. Accordingly, the provisions of clause 4(xiv) of the Companies (Auditor’s Report) Order, 2003 (as amended) are not applicable to the Company.
(xv) According to the information and explanations given to us, the Company has not given any guarantee for loans taken by others from bank or financial institutions.
(xvi) The Company did not have any term loans outstanding during the year.
(xvii) According to the information and explanations given to us and on an overall examination of the balance sheet and cash flow statement of the Company, we report that no funds raised on short-term basis have been used for long-term investment.
(xviii) The Company has not made any preferential allotment of shares during the year to parties or companies covered in the register maintained under section 301 of the Companies Act, 1956 for the period upto March 31, 2014 (the Companies Act, 1956 and the relevant sections has been replaced by the Companies Act, 2013 effective April 1, 2014).
(xix) The Company did not have any outstanding debentures during the year.
(xx) The Company has not raised any money by way of public issue during the year.
(xxi) Based upon the audit procedures performed for the purpose of reporting the true and fair view of the financial statements and as per the information and explanations given by the management, we report that no fraud on or by the Company has been noticed or reported during the year.
For S. R. Batliboi & Co. LLPChartered AccountantsICAI Firm Registration Number: 301003E
per Dolphy D’souzaPartnerMembership Number: 38730
Place : MumbaiDate : February 25, 2015

56
annual report 2014
Balance Sheet as at December 31, 2014
BALANCE SHEET
Particulars Note No. As at December 31, 2014 Rupees in Crores
As at December 31, 2013 Rupees in Crores
EQUITY AND LIABILITIES
Shareholders’ funds
Share capital 3 247.28 494.56 Reserves and surplus 4 249.50 256.86
496.78 751.42
Non-current liabilities
Other long-term liabilities 5 11.03 10.83 Long-term provisions 6 2.64 2.48
13.67 13.31
Current liabilities
Trade payables 7 539.86 472.83 Other current liabilities 7 137.35 120.95 Short-term provisions 6 304.18 256.50
981.39 850.28
TOTAL 1,491.84 1,615.01
ASSETS
Non-current assets Fixed assets Tangible assets 8 162.21 143.22 Intangible assets 8 9.86 0.24 Capital work-in-progress 15.67 31.87 Deferred tax assets (net) 9 61.81 52.96 Long-term loans and advances 10 85.03 87.59
334.58 315.88
Current assets
Inventories 11 365.47 374.01 Trade receivables 12 271.50 237.24 Cash and bank balances 13 431.45 594.22 Short-term loans and advances 10 86.21 86.44 Other assets 14 2.63 7.22
1,157.26 1,299.13
TOTAL 1,491.84 1,615.01
Summary of significant accounting policies 2
The accompanying notes are an integral part of the financial statements.
As per our report of even date For and on behalf of Board of DirectorsFor S. R. BATLIBOI & CO. LLPChartered Accountants S. M. DATTA Chairman RAvI KIRPALANI Managing DirectorICAI Firm Registration no : 301003E
RASHMI JOSHI } Executive DirectorsJAyANTA CHATTERJEE
per DOLPHy D’SOuzA SANDEEP DESHMuKH R. GOPALAKRISHNAN
}
Non-Executive Directors
Partner Company Secretary RALPH HEwINSMembership No. : 38730 SASHI MuKuNDAN
uDAy KHANNAPETER wEIDNER
Place: Mumbai Place: MumbaiFebruary 25, 2015 February 25, 2015

57
annual report 2014
Statement of Profit and Loss for the year ended December 31, 2014
Particulars Note No. For the year ended December 31, 2014 Rupees in Crores
For the year ended December 31, 2013 Rupees in Crores
INCOmE
Revenue from operations (gross) 15 3,918.62 3,677.50
Less: Excise duty 526.29 497.88
Revenue from operations (net) 3,392.33 3,179.62
Other income 16.1 16.06 35.06
Total revenue 3,408.39 3,214.68
ExPENSES
Cost of materials consumed 17.1 1,760.46 1,681.42
Purchase of traded goods 17.2 160.23 138.47
(Increase)/decrease in inventories 17.3 16.81 (31.42)
Employee benefits expense 18 161.56 145.97
Other expenses 19 576.55 557.70
Total expenses 2,675.61 2,492.14
Earnings before interest, tax, depreciation, amortisation and exceptional items 732.78 722.54
Exceptional item 16.1.a – 22.80
Earnings before interest, tax, depreciation and amortisation (EBITDA) 732.78 745.34
Depreciation and amortisation expense 20 36.13 30.45
Finance costs 21 2.38 1.71
Interest income 16.2 32.04 48.58
PROFIT/(LOSS) BEFORE TAx 726.31 761.76
Tax expenses
Current tax 260.60 241.06
Deferred tax (8.85) 12.13
Total tax expenses 251.75 253.19
PROFIT/(LOSS) FOR ThE YEAR 474.56 508.57
Nominal value of share (Rs.) 5.00 10.00
Earnings per equity share – Basic & Diluted (Rs.) 22 9.60 10.28
Summary of significant accounting policies 2
The accompanying notes are an integral part of the financial statements.
STATEMENT OF PROFIT AND LOSS
As per our report of even date For and on behalf of Board of DirectorsFor S. R. BATLIBOI & CO. LLPChartered Accountants S. M. DATTA Chairman RAvI KIRPALANI Managing DirectorICAI Firm Registration no : 301003E
RASHMI JOSHI } Executive DirectorsJAyANTA CHATTERJEE
per DOLPHy D’SOuzA SANDEEP DESHMuKH R. GOPALAKRISHNAN
}
Non-Executive Directors
Partner Company Secretary RALPH HEwINSMembership No. : 38730 SASHI MuKuNDAN
uDAy KHANNAPETER wEIDNER
Place: Mumbai Place: MumbaiFebruary 25, 2015 February 25, 2015

58
annual report 2014 CASH FLOW STATEMENT
Cash Flow Statement for the year ended December 31, 2014
Particulars As at December 31, 2014 Rupees in Crores
As at December 31, 2013 Rupees in Crores
Cash Flow from Operating Activities
Net profit before tax 726.31 761.76
Adjustment to reconcile profit before tax to net cash flows:
Depreciation and amortisation expenses 36.13 30.45
Loss/(gain) on disposal/write off of fixed assets (net) 0.95 (22.67)
Provision for doubtful advances (net) 0.40 (0.21)
Provision for doubtful debts (net) 2.14 (2.27)
unrealised foreign exchange (gain)/loss 0.29 0.90
Finance costs 2.38 1.71
Interest (income) (32.04) (48.58)
Operating profit before working capital changes 736.56 721.09
Movements in working capital:
Decrease/(increase) in inventories 8.54 (58.25)
Decrease/(increase) in trade receivables (36.40) (18.35)
Decrease/(increase) in short-term loans & advances 0.23 (35.41)
Decrease/(increase) in long-term loans & advances (0.69) 7.76
Increase/(decrease) in other long-term liabilities 0.20 2.54
Increase/(decrease) in other current liabilities 21.06 (3.15)
Increase/(decrease) in long-term provisions 0.16 (0.95)
Increase/(decrease) in trade payables 67.03 36.20
Increase/(decrease) in short-term provisions (2.11) (0.21)
Cash generated from/(used in) operations 794.58 651.27
Direct taxes paid (net of refunds) (246.98) (254.82)
Net Cash Flow from/(used in) Operating Activities (A) 547.60 396.45
Cash Flow from Investing Activities
Purchase of fixed assets, including CwIP (50.65) (54.34)
Proceeds from sale of fixed assets 0.28 28.29
Maturity of margin deposits 0.26 –
Interest received 36.37 55.91
Net Cash Flow from/(used in) Investing Activities (B) (13.74) 29.86

59
annual report 2014 CASH FLOW STATEMENT
Cash Flow Statement for the year ended December 31, 2014 (contd.)
Particulars As at December 31, 2014 Rupees in Crores
As at December 31, 2013 Rupees in Crores
Cash Flow from Financing Activities
Dividend paid (346.20) (346.20)
Dividend tax paid (58.84) (58.84)
Dividend tax paid on account of capital reduction (42.03) –
Interest paid (2.28) (1.64)
Payment on account of capital reduction (247.28) –
Net Cash Flow from/(used in) Financing Activities (C) (696.63) (406.68)
Net Increase/(decrease) in Cash and Cash Equivalents (A+B+C) (162.77) 19.63
Cash and cash equivalents at the beginning of the year 594.22 574.59
Cash and Cash Equivalents at the end of the year 431.45 594.22
Components of Cash and Cash Equivalents
Cash on hand 0.02 0.02
Balance with banks:
On current accounts 6.91 1.37
Deposits with original maturity of less than 3 months 188.60 257.86
Deposits with original maturity of more than 3 months 226.54 327.41
unclaimed dividend account [note (b) below] 9.38 7.56
Total Cash and Cash Equivalents (note 13) 431.45 594.22
Notes:
(a) The above Cash Flow Statement has been prepared under the “Indirect Method” as set out in the Accounting Standard-3 on Cash Flow Statement as notified under Companies (Accounting Standards) Rules, 2006 (as amended).
(b) The Company can utilise these balances only towards settlement of unclaimed dividend.
(c) Previous year’s figures have been regrouped wherever necessary.
As per our report of even date For and on behalf of Board of DirectorsFor S. R. BATLIBOI & CO. LLPChartered Accountants S. M. DATTA Chairman RAvI KIRPALANI Managing DirectorICAI Firm Registration no : 301003E
RASHMI JOSHI } Executive DirectorsJAyANTA CHATTERJEE
per DOLPHy D’SOuzA SANDEEP DESHMuKH R. GOPALAKRISHNAN
}
Non-Executive Directors
Partner Company Secretary RALPH HEwINSMembership No. : 38730 SASHI MuKuNDAN
uDAy KHANNAPETER wEIDNER
Place: Mumbai Place: MumbaiFebruary 25, 2015 February 25, 2015

60
annual report 2014 NOTES
1. Corporate information Castrol India Limited (the ‘Company’) is a public limited company domiciled in India and incorporated under the provisions of the
Companies Act, 1956. The Company is engaged in the business of manufacturing & marketing of Automotive, Non-Automotive Lubricants and related services.
1.1. Basis of preparation of accounts: The Financial Statements of the Company have been prepared in accordance with generally accepted accounting principles in
India, mandatory accounting standards notified under the Companies (Accounting Standards) Rules, 2006, (as amended) and the relevant provisions of the Companies Act, 1956 read with General Circular 8/2014 dated April 4, 2014, issued by the Ministry of Corporate Affairs. The Financial Statements have been prepared under the historical cost convention on an accrual basis, except in case of assets for which provision for impairment is made and derivative financial instruments which have been measured at fair value. The accounting policies applied by the Company are consistent with those used in the previous year.
All the assets and liabilities have been classified as current or non-current as per the Company’s normal operating cycle and other criteria set out in Revised Schedule vI to the Companies Act, 1956 read with General Circular 8/2014 dated April 4, 2014, issued by the Ministry of Corporate Affairs. Based on the nature of products and time between the acquisition of assets for processing and their realisation in cash or cash equivalents, the Company has ascertained its operating cycle as twelve months for the purpose of current/non-current classification of assets and liabilities.
2. Significant accounting policies a. Use of estimates
The preparation of Financial Statements in conformity with generally accepted accounting principles requires management to make estimates and assumptions that affect the reported amounts of assets and liabilities and disclosure of contingent liabilities at the date of the Financial Statements and the results of operations during the reporting period. Although these estimates are based upon management’s best knowledge of current events and actions, actual results could differ from these estimates.
b. Tangible fixed assets
Tangible fixed assets are stated at cost less accumulated depreciation and impairment provision. The cost comprises of the purchase price (net of Cenvat and vAT credit wherever applicable) and any attributable cost of bringing the assets to its working condition for its intended use.
c. Intangible assets
Intangible assets acquired separately are measured on initial recognition at cost. Following initial recognition, intangible assets are carried at cost less accumulated amortisation and accumulated impairment losses, if any.
d. Depreciation and amortisation
Depreciation is provided pro-rata to the period of use on straight-line method based on the estimated useful lives of the assets, which have been determined by management, as stated below. These rates of depreciation are higher than the rates specified under Schedule XIv of the Companies Act, 1956.
Asset description Useful life as per managementResidential and office building 25 years
Factory building 30 years
Plant & machinery 10 years to 21 years
Moulds 4 years
Furniture & fixtures 8 years
Office equipments 10 years
Computers 4 years
vehicles 4 years
workshop equipments [refer note (i) below] 2 years to 4 years
Equipment and boards with dealers 3 years
Computer software 4 years
(i) workshop equipments provided against sales agreements are depreciated over the standard period of agreement. (ii) Lease-hold land and lease-hold improvements are being amortised on a straight-line basis over the period of lease. (iii) Assets individually costing less than Rs. 5,000/- are fully depreciated in the year of acquisition.
Notes to the Financial Statements for the year ended December 31, 2014

61
annual report 2014 NOTES
e. Impairment of tangible and intangible assets
The carrying amounts of assets are reviewed at each Balance Sheet date if there is any indication of impairment based on internal/external factors. An impairment loss is recognised wherever the carrying amount of an asset exceeds its recoverable amount. The recoverable amount is the greater of an asset’s or cash generating unit’s net selling price and its value in use. In assessing value in use, the estimated future cash flows are discounted to their present value using a pre-tax discount rate that reflects current market assessments of the time value of money and risks specific to the asset.
After impairment, depreciation is provided on the revised carrying amount of the asset over its remaining useful life. A previously recognised impairment loss is increased or reversed depending on changes in circumstances. However, the carrying value after reversal is not increased beyond the carrying value that would have prevailed by charging usual depreciation if there was no impairment.
f. Leases
where the Company is lessee
Operating lease
Leases where the lessor effectively retains substantially all the risks and benefits of ownership of the leased assets, are classified as operating leases. Operating lease payments are recognised as an expense in the Statement of Profit and Loss on a straight-line basis over the lease term.
g. Inventories
(i) Raw materials, packages, traded items and finished goods are valued at lower of weighted average cost and net realisable value. Cost of finished goods includes material and packaging cost, proportion of manufacturing overheads based on normal operating capacity and excise duty. Custom duty on stock lying in bonded warehouses is included in cost. Cost of traded items includes cost of purchase and other cost incurred in bringing the inventories to the present location and condition.
(ii) Stores and consumables are valued at cost.
(iii) Net realisable value is the estimated selling price in the ordinary course of business, less estimated costs of completion and estimated costs necessary to make the sale.
(iv) Due allowances are made in respect of slow moving, non moving and obsolete inventory based on estimates made by Management.
h. Revenue recognition
Revenue is recognised to the extent that it is probable that the economic benefits will flow to the Company and the revenue can be reliably measured.
Sale of goods
Sales are recognised when goods are supplied and are recorded net of rebates and Sales Tax/value Added Taxes (vAT) and inclusive of excise duty. The Company collects Sales Tax / vAT on behalf of the Government and, therefore, these are not economic benefits flowing to the Company. Hence, they are excluded from revenue.
Income from services
Income from services is recognised based on the terms of the agreements as and when the services are rendered and are net of service tax (wherever applicable).
Interest
Interest is recognised on a time proportion basis taking into account the amount outstanding and the rate applicable.
i. Cash and cash equivalents
Cash and cash equivalents for the purposes of cash flow statement comprise cash at bank and in hand, fixed deposits with banks which are short term, highly liquid investments that are readily convertible into known amounts of cash and which are subject to an insignificant risk of changes in value.
2. Significant accounting policies (contd.)
Notes to the Financial Statements for the year ended December 31, 2014

62
annual report 2014
j. Retirement and other employee benefits
Long term employee benefits
Defined contribution plans
Company’s contributions paid/payable during the year to Company’s Pension Fund, ESIC and Labour welfare Fund, Medical Insurance Benefits, Post Retiral Medical Benefit Scheme and Sharematch are recognised in the Statement of Profit and Loss, when an employee rendered the related service.
If the contribution payable to the scheme for service received before the Balance Sheet date exceeds the contribution already paid, the deficit payable to the scheme is recognised as a liability after deducting the contribution already paid.
If the contribution already paid exceeds the contribution due for services received before the Balance Sheet date, then excess is recognised as an asset to the extent that the pre payment will lead to, for example, a reduction in future payment or a cash refund.
Defined benefit plans
Company’s liabilities towards gratuity, survivor protection (death benefit), pension benefit to past employees are actuarially determined using the projected unit credit method, at each year-end, which considers each period of service as giving rise to an additional unit of benefit entitlement and measures each unit separately to build up the final obligation. Past services in relation to benefits mentioned above are recognised on a straight-line basis over the average period until the amended benefits become vested. Actuarial gain and losses are recognised immediately in the Statement of Profit and Loss as income or expense. Obligation is measured at the present value of estimated future cash flows using a discounted rate that is determined by reference to market yields at the Balance Sheet date on Government Securities where the currency and terms of the Government Securities are consistent with the currency and estimated terms of the defined benefit obligation.
Provident Fund
The Company administers employees provident fund benefits through a trust, whereby amounts determined at a fixed percentage of basic salaries of the employees are deposited to the trust every month. The benefit vests upon commencement of the employment. The interest rate payable by the trust to the beneficiaries every year is notified by the government and the Company has an obligation to make good the shortfall, if any, between the return from the investments of the trust and the notified interest rate. The Company has obtained actuarial valuation to determine the shortfall, if any, as at the Balance Sheet date.
Retirement and other employee benefits
Long term compensated absences are provided for based on actuarial valuation. The actuarial valuation is done as per projected unit credit method at the year-end. Actuarial gains/losses are immediately taken to the Statement of Profit and Loss and are not deferred.
Short term employee benefits are recognised as an expense at the undiscounted amount in the Statement of Profit and Loss of the year in which the related service is rendered.
voluntary Retirement Scheme expenses are fully charged to the Statement of Profit and Loss in the year in which they accrue.
k. Foreign currency transactions
Foreign currency transactions are recorded in the reporting currency, by applying to the foreign currency amount the exchange rate between the reporting currency and the foreign currency at the date of the transaction. All monetary assets and liabilities as at the Balance Sheet date, are reinstated at the applicable exchange rates prevailing on that date. All exchange differences arising on transactions, are charged to Statement of Profit and Loss. Non-monetary items, which are measured in terms of historical cost denominated in a foreign currency, are reported using the exchange rate at the date of the transaction.
l. Derivative instruments
The Company uses foreign exchange forward contracts for exposure to movement in foreign exchange rates. The Company has adopted the principles of Accounting Standard 30, Financial Instruments: Recognition and Measurement (AS-30) issued by ICAI to the extent the adoption of AS-30 does not conflict with existing accounting standards prescribed by Companies (Accounting Standards) Rules, 2006 and other authoritative pronouncements. AS-30 is applied on those contracts which are not covered under AS-11.
In accordance with the recognition and measurement principles set out in AS-30, gains/losses on mark to market of derivative financial instruments are recognised in the Statement of Profit and Loss. Gains and losses arising on account of rollover/cancellation of forward contracts are recognised as income/expense of the period in which such rollover/ cancellation takes place.
NOTES
2. Significant accounting policies (contd.)
Notes to the Financial Statements for the year ended December 31, 2014

63
annual report 2014
m. Income taxes
Tax expense comprises of current and deferred tax. Current income tax is measured at the amount expected to be paid to the tax authorities in accordance with the Indian Income Tax Act, 1961.
Deferred tax is measured based on the tax rates and the tax laws enacted or substantively enacted at the Balance Sheet date. Deferred tax is recognised at the Balance Sheet date, subject to the considerations of prudence, on timing differences, being the difference between taxable income and accounting income that originate in one period and are capable of reversal in one or more subsequent periods.
Deferred tax assets are recognised only to the extent that there is reasonable certainty that sufficient future taxable income will be available against which such deferred tax assets can be realised.
The tax year for the Company being the year ending March 31, the provision for taxation for the year is aggregate of the provision made for the three months ended on March 31, 2014 and the provision for the remaining period of nine months ending on December 31, 2014. The provision for the remaining period of nine months has been arrived at by applying the effective tax rate of the financial year 2014-15 to Profit Before Tax of the said period.
At each reporting date, the Company re-assesses unrecognised deferred tax assets. It recognises unrecognised deferred tax asset to the extent that it has become reasonably certain or virtually certain, as the case may be, that sufficient future taxable income will be available against which such deferred tax assets can be realised.
n. Provisions
A provision is recognised when the Company has a present obligation as a result of past event and it is probable that an outflow of resources will be required to settle the obligation, in respect of which a reliable estimate can be made. Provisions are not discounted to its present value and are determined based on management estimate required to settle the obligation at the Balance Sheet date. These are reviewed at each Balance Sheet date and adjusted to reflect the current best estimates.
o. Segment reporting
The Company prepares its segment information in conformity with the accounting policies adopted for preparing and presenting the Financial Statements of the Company as a whole. The Company’s operating businesses are organised and managed separately according to the nature of products and services provided. The analysis of geographical segments is based on the areas in which major operating divisions of the Company operate. Revenues and expenses directly attributable to segments are reported under each reportable segment. Revenue and expenses, which relate to the Company as a whole and are not allocable to segments on a reasonable basis, have been included under “unallocable”.
p. Earning per share
Basic earning per share is calculated by dividing the net profit or loss for the year attributable to equity shareholders (after deducting attributable taxes) by the weighted average number of equity shares outstanding during the year. The weighted average number of equity shares outstanding during the year is adjusted for events of bonus issue; bonus element in a rights issue to existing shareholders; share split; and reverse share split (consolidation of shares). For the purpose of calculating diluted earning per share, the net profit or loss for the year attributable to equity shareholders and the weighted average number of shares outstanding during the year are adjusted for the effects of all dilutive potential equity shares.
q. Contingent liabilities
A contingent liability is a possible obligation that arises from past events whose existence will be confirmed by the occurrence or non-occurrence of one or more uncertain future events beyond the control of the Company or a present obligation that is not recognised because it is not probable that an outflow of resources will be required to settle the obligation. A contingent liability also arises in extremely rare cases where there is a liability that cannot be recognised because it cannot be measured reliably. The Company does not recognise a contingent liability but discloses its existence in the Financial Statements.
r. measurement of EBITDA
As permitted by the Guidance Note on the Revised Schedule vI to the Companies Act, 1956, the Company has elected to present earnings before interest expense, tax, depreciation and amortisation (EBITDA) as a separate line item on the face of the Statement of the Profit and Loss. In its measurement, the Company doesn’t include depreciation, impairment and amortisation expenses, finance costs, interest income and tax expenses.
NOTES
2. Significant accounting policies (contd.)
Notes to the Financial Statements for the year ended December 31, 2014

64
annual report 2014
Notes to the Financial Statements for the year ended December 31, 2014
3. Share capital As at
December 31, 2014 Rupees in Crores
As at December 31, 2013 Rupees in Crores
Authorised shares
990,000,000 equity shares of Rs. 5/- each (2013 : 495,000,000 equity shares of Rs. 10/- each) [refer note (i) below] 495.00 495.00
495.00 495.00
Issued, subscribed and fully paid-up shares
494,561,192 equity shares of Rs. 5/- each (2013 : 494,561,192 equity shares of Rs. 10/- each) 247.28 494.56
247.28 494.56
Note (i) Pursuant to the approval by the shareholders and consequent to the scheme of reduction of share capital becoming effective, the Company has altered the authorised share capital to 990,000,000 equity shares of Rs. 5/- each effective from January 20, 2014.
a. Reconciliation of the shares outstanding at the beginning and at the end of the reporting year:
Equity shares As at December 31, 2014
As at December 31, 2013
No. of Shares
Rupees in Crores
No. of Shares
Rupees in Crores
At the beginning of the year 494,561,192 494.56 494,561,192 494.56
Reduction in fully paid-up face value of equity shares [refer note (i) below] – 247.28 – –
Outstanding at the end of the year 494,561,192 247.28 494,561,192 494.56
Note (i) Pursuant to the scheme of reduction of share capital u/s 100 to 105 of the Companies Act, 1956 as approved by the shareholders and Hon’ble High Court of Bombay, the Company has reduced the fully paid-up face value of equity shares from Rs.10/- per share to Rs. 5/- per share effective January 20, 2014. Consequently, the Company has paid Rs. 5/- per share on March 10, 2014 to the shareholders as per the record date of March 3, 2014.
b. Terms/rights attached to equity shares:
The Company has only one class of equity shares having par value of Rs. 5/- per share (2013: Rs. 10/- per share). Each holder of equity shares is entitled to one vote per share. The dividend proposed by the Board of Directors is subject to the approvals of the shareholders in the ensuing Annual General Meeting. The Company declares and pays dividend in Indian Rupees.
During the year ended December 31, 2014, the amount of per share interim dividend recognised as distribution to equity shareholders was Rs. 3.50 (2013 : Rs. 3.50). The amount of interim dividend distributed to equity shareholders is Rs. 173.10 crores (2013 : Rs. 173.10 crores). In addition, the Company has also proposed a per share final dividend recognised as distribution to equity shareholders of Rs. 4.00 (2013 : Rs. 3.50). The amount of final proposed dividend distributed to equity shareholders is Rs. 197.82 crores (2013 : Rs. 173.10 crores). Both dividends aggregating to Rs. 7.50 per share (2013 : Rs. 7.00 per share).
In the event of the Company being liquidated, since the equity shares of the Company are fully paid-up, there would be no additional liability on the shareholders of the Company. However, post settlement of the liabilities of the Company, the surplus, if any, would be distributed amongst the shareholders in proportion to the number of shares held by each one of them.
c. Equity shares in the Company held by its holding/ultimate holding company and/or their subsidiaries/associates are as below:
As at December 31, 2014 Rupees in Crores
As at December 31, 2013 Rupees in Crores
Castrol Limited, u.K. 350,749,820 (2013 : 350,749,820) equity shares of Rs. 5/- each (2013 : Rs. 10/- each) fully paid (holding company) 175.37 350.75
BP Mauritius Limited 541,896 (2013 : 541,896) equity shares of Rs. 5/- each (2013 : Rs. 10/- each) (subsidiary of ultimate holding company) 0.27 0.54
NOTES

65
annual report 2014
3. Share capital (contd.)
d. Aggregate number of bonus shares issued, for consideration other than cash during the period of five years immediately preceding the reporting date:
As at December 31, 2014
No. of Shares
As at December 31, 2013
No. of Shares
Equity shares allotted as fully paid bonus shares by capitalisation of general reserve 370,920,894 370,920,894
e. Details of shareholders holding more than 5% shares in the Company are as below:
As at December 31, 2014
As at December 31, 2013
No. of Shares
% holding in the class
No. of Shares
% holding in the class
Equity shares of Rs. 5/- each (2013 : Rs. 10/- each) fully paid-up Castrol Limited, u.K. 350,749,820 70.92% 350,749,820 70.92%
As per records of the Company, including its register of shareholders/members and other declarations received from shareholders regarding beneficial interest, the above shareholding represents both legal and beneficial ownership of shares.
4. Reserves and surplus As at
December 31, 2014 Rupees in Crores
As at December 31, 2013 Rupees in Crores
Capital reserve 13.62 13.62
General reserve
Balance as per the last financial statements 148.38 97.52
Add: Amount transferred from surplus balance in the Statement of Profit and Loss – 50.86
Closing balance 148.38 148.38
Surplus/(deficit) in the Statement of Profit and Loss
Balance as per last financial statements 94.86 43.53
Profit for the year 474.56 508.57
Less: Appropriations
Interim dividend on equity shares [amount per share Rs. 3.50 (2013 : Rs. 3.50)] 173.10 173.10
Tax on interim dividend 29.42 29.42
Proposed final dividend on equity shares [amount per share Rs. 4.00 (2013 : Rs. 3.50)] 197.82 173.10
Tax on final dividend 39.55 29.42
Tax on final dividend 2012 – 1.34
Tax on capital reduction payment 42.03 –
Transfer to general reserve – 50.86
Total appropriations 481.92 457.24
Net surplus in the Statement of Profit and Loss 87.50 94.86
Total reserves and surplus 249.50 256.86
Notes to the Financial Statements for the year ended December 31, 2014
NOTES

66
annual report 2014
Notes to the Financial Statements for the year ended December 31, 2014
5. Other long-term liabilities As at
December 31, 2014 Rupees in Crores
As at December 31, 2013 Rupees in Crores
Employee benefits payable 11.02 10.82
Deposit from distributors and others 0.01 0.01
11.03 10.83
6. ProvisionsLong-term Short-term
As at December 31, 2014 Rupees in Crores
As at December 31, 2013 Rupees in Crores
As at December 31, 2014 Rupees in Crores
As at December 31, 2013 Rupees in Crores
Provision for employee benefits
Provision for company pension plan 1.41 1.41 0.15 0.16
Provision for leave benefits 1.23 1.07 0.13 0.14
2.64 2.48 0.28 0.30
Other provisions
Provision for tax (net of advance tax) – – 32.16 17.22
Provision for indirect taxes [refer note (a) below] – – 34.37 36.46
Provision for proposed final dividend – – 197.82 173.10
Provision for tax on proposed final dividend – – 39.55 29.42
– – 303.90 256.20
2.64 2.48 304.18 256.50
Notes:
(a) movement in provision for indirect taxes:
As at December 31, 2014 Rupees in Crores
As at December 31, 2014 Rupees in Crores
As at December 31, 2013 Rupees in Crores
As at December 31, 2013 Rupees in Crores
Excise, customs and service tax
Sales tax and VAT
Excise, customs and service tax
Sales tax and vAT
Balance as at January 1 6.15 30.31 6.30 30.36
Addition during the year 0.61 1.93 0.99 3.46
Reversed/paid during the year 0.14 4.49 1.14 3.51
Balance as at December 31 6.62 27.75 6.15 30.31
Total 34.37 36.46
(b) The Company has made provisions for known litigation cases and pending assessments in respect of taxes, duties and other levies, the outflow of which would depend on cessation of respective events.
NOTES

67
annual report 2014
Notes to the Financial Statements for the year ended December 31, 2014
NOTES
7. Trade payables and other current liabilities Current
As at December 31, 2014 Rupees in Crores
As at December 31, 2013 Rupees in Crores
Trade payables
(Refer note 27 for details of dues to micro and small enterprises) 539.86 472.83
Other current liabilities Capex payables 10.95 16.00 Interest accrued and dues on deposit from distributors and others 0.65 0.55 Advance from customers 3.74 3.91 unpaid dividend [refer note (a) below] 9.38 7.56 Deposit from distributors & others 11.09 9.73 Forward contract payable 0.02 0.90 Statutory dues 76.01 61.51 Employee benefits payable 25.51 20.79
137.35 120.95
677.21 593.78 Note (a) There are no amounts due for payment to the Investor Education & Protection fund under Section 205C of the Companies Act,
1956 as at the year end.
8. Tangible and intangible assets Rupees in Crores
Tangible assets Intangible
assetsFreehold
land Leasehold
land [refer note (a)]
Leasehold Improvement
Building [refer note (b)]
Plant & machinery
Furniture & fixture
Office equipment
motor vehicle
Total tangible assets
Computer software
Cost or valuationAs at January 1, 2013 6.44 0.92 32.12 46.07 165.49 44.81 25.27 0.88 322.00 6.71 Additions – – 3.91 3.00 28.69 16.17 1.64 – 53.41 –Disposals 2.52 – 4.54 – 18.31 4.49 14.61 – 44.47 1.08 As at December 31, 2013 3.92 0.92 31.49 49.07 175.87 56.49 12.30 0.88 330.94 5.63 Additions – – 7.17 1.79 28.61 16.28 1.08 – 54.93 11.04 Disposals – – 0.46 0.18 23.09 2.18 0.44 – 26.35 –As at December 31, 2014 3.92 0.92 38.20 50.68 181.39 70.59 12.94 0.88 359.52 16.67 Depreciation As at January 1, 2013 – 0.46 17.51 16.93 105.29 27.25 11.13 0.54 179.11 4.94 Charge for the year – 0.02 1.80 2.04 14.18 10.77 1.03 0.02 29.86 0.59 Disposals – – 1.87 – 11.83 1.98 5.94 – 21.62 0.14 As at December 31, 2013 – 0.48 17.44 18.97 107.64 36.04 6.22 0.56 187.35 5.39 Charge for the year – 0.02 3.59 2.00 15.33 12.58 1.18 0.01 34.71 1.42 Disposals – – 0.03 0.05 22.44 2.14 0.40 – 25.06 –As at December 31, 2014 – 0.50 21.00 20.92 100.53 46.48 7.00 0.57 197.00 6.81 Impairment loss As at January 1, 2013 – – – 0.86 5.61 2.45 8.59 0.31 17.82 0.72 Disposals – – – 0.86 5.40 2.40 8.56 – 17.22 0.95 Reclassification – – – – (0.15) (0.05) (0.03) – (0.23) 0.23 As at December 31, 2013 – – – – 0.06 – – 0.31 0.37 –Additions – – – – – – – – – –Disposals – – – – 0.06 – – – 0.06 –Reclassification – – – – – – – – – –As at December 31, 2014 – – – – – – – 0.31 0.31 –Net block As at December 31, 2013 3.92 0.44 14.05 30.10 68.17 20.45 6.08 0.01 143.22 0.24 As at December 31, 2014 3.92 0.42 17.20 29.76 80.86 24.11 5.94 – 162.21 9.86
Notes:(a) Cost includes Rs. 0.49 crore (2013 : Rs. 0.49 crore) for which execution of land lease agreement in respect of plots in Mumbai is in progress. (b) Comprises of cost of premises including shares of paid-up value of Rs. 0.01 crore (2013 : Rs. 0.01 crore) in co-operative societies.

68
annual report 2014
Notes to the Financial Statements for the year ended December 31, 2014
NOTES
9. Deferred tax assets (net) Non-current
As at December 31, 2014 Rupees in Crores
As at December 31, 2013 Rupees in Crores
Deferred tax liability Fixed assets: Impact of difference between tax depreciation and depreciation/
amortisation charge for the financial reporting – 1.34
Gross deferred tax liabilities – 1.34
Deferred tax asset Impact of expenditure charged to the Statement of Profit and Loss in the
current year but allowed for tax purposes on payment basis 53.49 45.63 Provision for doubtful debts 7.86 8.67 Fixed assets: Impact of difference between tax depreciation and depreciation/
amortisation charge for the financial reporting 0.46 –
Gross deferred tax assets 61.81 54.30
Net deferred tax asset/(liability) 61.81 52.96
10. Loans and advances (Unsecured, considered good unless
otherwise stated) Non-current Current
As at December 31, 2014 Rupees in Crores
As at December 31, 2013 Rupees in Crores
As at December 31, 2014 Rupees in Crores
As at December 31, 2013 Rupees in Crores
Capital advances 3.65 7.82 – – Security deposits 9.72 8.35 0.48 1.53
(A) 13.37 16.17 0.48 1.53 Advances recoverable in cash or kind 28.89 31.80 54.40 61.23 Less: Provision for doubtful advances 19.47 16.23 2.20 3.19
(B) 9.42 15.57 52.20 58.04 Other loans and advances Advance income-tax (net of provisions) 25.26 23.94 – – Forward contract receivable – – 0.56 – Prepaid expenses 1.19 0.89 2.87 2.20 Loans to employees [refer note (a) below] 1.49 1.41 0.60 0.58 Balance with statutory/government
authorities 34.30 29.61 29.50 24.09
(C) 62.24 55.85 33.53 26.87
Total (A+B+C) 85.03 87.59 86.21 86.44
Note (a) : Loans to employees include loans and advances due by directors or other officers etc.
Non-current Current
As at December 31, 2014 Rupees in Crores
As at December 31, 2013 Rupees in Crores
As at December 31, 2014 Rupees in Crores
As at December 31, 2013 Rupees in Crores
Dues from executive director (As a part of service condition extended
to all its eligible employees)
0.12 0.12 0.01 0.01

69
annual report 2014
Notes to the Financial Statements for the year ended December 31, 2014
NOTES
11. Inventories (lower of cost and net realisable value)
Current
As at December 31, 2014 Rupees in Crores
As at December 31, 2013 Rupees in Crores
Raw materials [includes stock in transit Rs. 12.62 crores (2013 : Rs. 9.52 crores)] 168.61 160.13
Packing materials 6.49 4.57
Stores and consumables 1.46 1.39
Finished goods 147.02 161.48
Traded goods [including stock in transit Rs. 6.48 crores (2013 : Rs. 9.79 crores)] 41.89 46.44
365.47 374.01
12. Trade receivables
Current
As at December 31, 2014 Rupees in Crores
As at December 31, 2013 Rupees in Crores
Unsecured, considered good unless stated otherwise
Outstanding for a period exceeding six months from the date they are due for payment
Secured, considered good – –
unsecured, considered good 0.07 0.21
Doubtful 6.24 4.84
6.31 5.05
Less: Provision for doubtful receivables 6.24 4.84
(A) 0.07 0.21
Other receivables
Secured, considered good 9.14 6.98
unsecured, considered good 262.29 230.05
Doubtful 1.78 1.28
273.21 238.31
Less: Provision for doubtful receivables 1.78 1.28
(B) 271.43 237.03
Total (A+B) 271.50 237.24

70
annual report 2014
Notes to the Financial Statements for the year ended December 31, 2014
NOTES
13. Cash and bank balances
Current
As at December 31, 2014 Rupees in Crores
As at December 31, 2013 Rupees in Crores
Cash and cash equivalents
Cash on hand 0.02 0.02
Balance with banks
On current accounts 6.91 1.37
Deposits with original maturity of less than 3 months 188.60 257.86
Deposits with original maturity of more than 3 months but less than 12 months [refer note (a) below] 226.54 327.41
unclaimed dividend account [refer note (b) below] 9.38 7.56
(A) 431.45 594.22
Other bank balances
Margin money deposit – 0.26
Amount disclosed under “Other assets” (note 14) – (0.26)
(B) – –
Total (A+B) 431.45 594.22
Notes:
(a) Deposits with original maturity of more than 3 months can be withdrawn by the Company at any point at a very short notice and without penalty on the principal amount.
(b) These balances are available for use only towards settlement of corresponding unpaid dividend liabilities.
14. Other assets Unsecured, considered good unless
stated otherwise
Current
As at December 31, 2014 Rupees in Crores
As at December 31, 2013 Rupees in Crores
Interest accrued on deposits 2.63 6.96
Margin money deposit (note 13) – 0.26
2.63 7.22

71
annual report 2014 NOTES
Notes to the Financial Statements for the year ended December 31, 2014
15. Revenue from operationsFor the year ended December 31, 2014 Rupees in Crores
For the year ended December 31, 2013 Rupees in Crores
Revenue from operations
Sale of products [net of rebates Rs. 162.77 crores (2013 : Rs. 157.69 crores) refer note (a) below]
Finished goods 3,671.07 3,451.88
Traded goods 236.01 212.09
Other operating revenue
Commission, royalty and service income 7.37 9.92
Scrap sale 4.17 3.61
Revenue from operations (gross) 3,918.62 3,677.50
Less: Excise duty [refer note (b) below] 526.29 497.88
Revenue from operations (net) 3,392.33 3,179.62
Notes:
(a) Detail of products sold
Finished goods sold
Lubricating oils and greases 3,671.07 3,451.88
3,671.07 3,451.88
Traded goods sold
Lubricating oils and greases 236.01 212.09
236.01 212.09
3,907.08 3,663.97
(b) Excise duty on sales amounting to Rs. 526.29 crores (2013 : Rs. 497.88 crores) has been reduced from sales in Statement of Profit and Loss and excise duty on increase/(decrease) in stock amounting to Rs. (2.20) crores (2013 : Rs. 6.50 crores) has been considered as (income)/expense in note 17.3 of the financial statements.
16.1 Other income For the year ended December 31, 2014 Rupees in Crores
For the year ended December 31, 2013 Rupees in Crores
Excess accruals written back 0.36 20.50
Debts written off in earlier years, realised – 0.05
Provision for Doubtful Debts (net) – 4.08
Provision for doubtful advance – 0.21
Miscellaneous income 15.70 10.22
16.06 35.06
16.1.a Exceptional item During the year ended December 31, 2013, the Company completed the sale of two of its non-operating plants. The resulting
gain of Rs. 22.80 crores has been disclosed as an exceptional item.
16.2 Interest income Interest income
From bank deposits 30.77 47.41
Others 1.27 1.17
32.04 48.58

72
annual report 2014 NOTES
Notes to the Financial Statements for the year ended December 31, 2014
17.1 Cost of materials consumedFor the year ended December 31, 2014 Rupees in Crores
For the year ended December 31, 2013 Rupees in Crores
Raw materials and packing materials consumed [refer note (a) below]
Inventory at the beginning of the year 164.70 144.29
Add: Purchases during the year 1,770.86 1,701.83
1,935.56 1,846.12
Less: Inventory at the end of the year [refer note (b) below] 175.10 164.70
Total raw materials and packing materials consumed 1,760.46 1,681.42
Notes:
(a) Details of raw materials and packing materials consumed
Base oil 1,051.05 1,007.21
Additives and chemicals 504.14 482.59
Packages (individual items each being less than 10% of the total) 205.27 191.62
Total raw materials and packing materials consumed 1,760.46 1,681.42
(b) Details of raw materials and packing materials at the end of the year
Base oil 105.35 102.23
Additives and chemicals 63.26 57.90
Packages (individual items each being less than 10% of the total) 6.49 4.57
Total raw materials and packing materials at the end of the year 175.10 164.70
17.2 Purchase of traded goods Lubricating oils and greases 160.23 138.47
160.23 138.47
17.3 (Increase)/decrease in inventories of finished/traded goods Inventories at the end of the year
Traded goods [refer note (a) below] 41.89 46.44
Finished goods [refer note (a) below] 147.02 161.48
188.91 207.92
Inventories at the beginning of the year
Traded goods 46.44 50.40
Finished goods 161.48 119.60
207.92 170.00
Less: Excise duty on account of increase/(decrease) in stock of finished products (2.20) 6.50
16.81 (31.42)
Note:
(a) Details of traded and finished goods at the end of the year:
Traded goods
Lubricating oils and greases 41.89 46.44
41.89 46.44
Finished goods
Lubricating oils and greases 147.02 161.48
147.02 161.48

73
annual report 2014 NOTES
Notes to the Financial Statements for the year ended December 31, 2014
18. Employee benefits expenseFor the year ended December 31, 2014 Rupees in Crores
For the year ended December 31, 2013 Rupees in Crores
Salaries, wages and bonus [refer note 28] 141.75 121.18 Contribution to provident and other funds 5.77 8.48 Gratuity expense 4.45 4.34 Staff welfare expenses 9.58 11.08 voluntary retirement/severance scheme expenses 0.01 0.89
161.56 145.97
19. Other expensesFor the year ended December 31, 2014 Rupees in Crores
For the year ended December 31, 2013 Rupees in Crores
Rent 16.49 17.10 Rates and taxes 14.24 19.85 Power and fuel 5.29 5.51 Stores and consumables 0.95 0.94 Freight and forwarding charges 104.46 92.00 Insurance 3.17 2.62 Repairs and maintenance Land and buildings 4.11 5.10 Plant and equipments 4.30 3.76 Others 14.16 9.71 Bad debts written off 0.23 1.81 Provision for doubtful debts 1.91 – Provision for doubtful advance 0.40 – Processing and filling charges 10.45 10.07 Advertising and sales promotion 120.09 113.14 Stock point operating charges 24.75 21.26 Loss on disposal/write off of fixed assets (net) 0.95 0.13 Director sitting fees 0.07 0.04 Commission to resident non-whole time Indian directors 0.26 0.26 Royalty 73.19 77.29 Sales promotion fees 113.23 103.26 Travelling expenses 10.41 13.27 Legal and professional fees 31.54 35.58 Payment to auditors [refer note (i) below] 1.12 0.91 Exchange difference (net) 4.19 4.01 Loss on forward contract (including provision for MTM) 1.14 3.57 Miscellaneous expenses 15.45 16.51
576.55 557.70
Note: (i) Payment to auditor (excluding service tax)
As auditor: Audit fee 0.63 0.42 Tax accounts and tax audit fees 0.25 0.20 Limited review 0.16 0.16
In other capacity: Certification fees 0.06 0.11 Reimbursement of expenses 0.02 0.02
1.12 0.91

74
Notes to the Financial Statements for the year ended December 31, 2014
20. Depreciation and amortisation expenseFor the year ended December 31, 2014Rupees in Crores
For the year ended December 31, 2013 Rupees in Crores
Depreciation of tangible assets 34.71 29.86 Amortisation of intangible assets 1.42 0.59
36.13 30.45
21. Finance costsFor the year ended December 31, 2014Rupees in Crores
For the year ended December 31, 2013 Rupees in Crores
Interest others 2.38 1.71
2.38 1.71
22. Earnings per share (EPS)For the year ended December 31, 2014Rupees in Crores
For the year ended December 31, 2013 Rupees in Crores
The following reflects the profit and share data used in the basic and diluted EPS computations:
Total operations for the year Profit after tax 474.56 508.57
Net profit for calculation of basic and diluted EPS 474.56 508.57
No. of Shares No. of Shares
Weighted average number of equity shares in calculating Basic and Diluted EPS 494,561,192 494,561,192 Basic and diluted earnings per share (Rs.) 9.60 10.28 Nominal value per share (Rs.) 5.00 10.00
23. Employee benefits Defined contribution plan
Amounts recognised as an expense
Contribution to Provident and Other Funds’ in Note 18 includes Rs. 3.35 crores (2013 : Rs. 3.23 crores) for Pension Fund, ESIC and Labour Welfare Fund. Note 19 includes ‘Insurance’ Rs. 1.62 crores (2013 : Rs. 1.31 crores) for Medical Insurance benefits and post retiral medical benefit scheme. Salaries, wages and bonus in Note 18 includes Rs. 2.34 crores (2013 : Rs. 2.30 crores) for Sharematch.
General description of defined benefit plan
Gratuity
The Company operates gratuity plan wherein every employee is entitled to the benefit equivalent to fifteen days/one month salary last drawn for each completed year of service depending on the date of joining. The same is payable on termination of service, retirement or death, whichever is earlier. The benefit vests after five years of continuous service.
Provident fund
The Provident Fund (administered by a trust) is a defined benefit scheme whereby the Company deposits amounts determined as a fixed percentage of basic pay to the fund every month. The actuary has provided a valuation and determined the fund assets and obligations as at December 31, 2014. Further, it has been determined that the yield on the investments of the trust is adequate to meet the obligation towards the payment of the interest rate notified by the government.
Particulars As at December 31, 2014 Rupees in Crores
As at December 31, 2013 Rupees in Crores
Plan obligation (114.14) (98.56)Plan assets at fair value 116.16 96.88 Asset/(liability) recognised in the Balance Sheet 2.02 (1.68)
ANNuAL REPORT 2014 NOTES
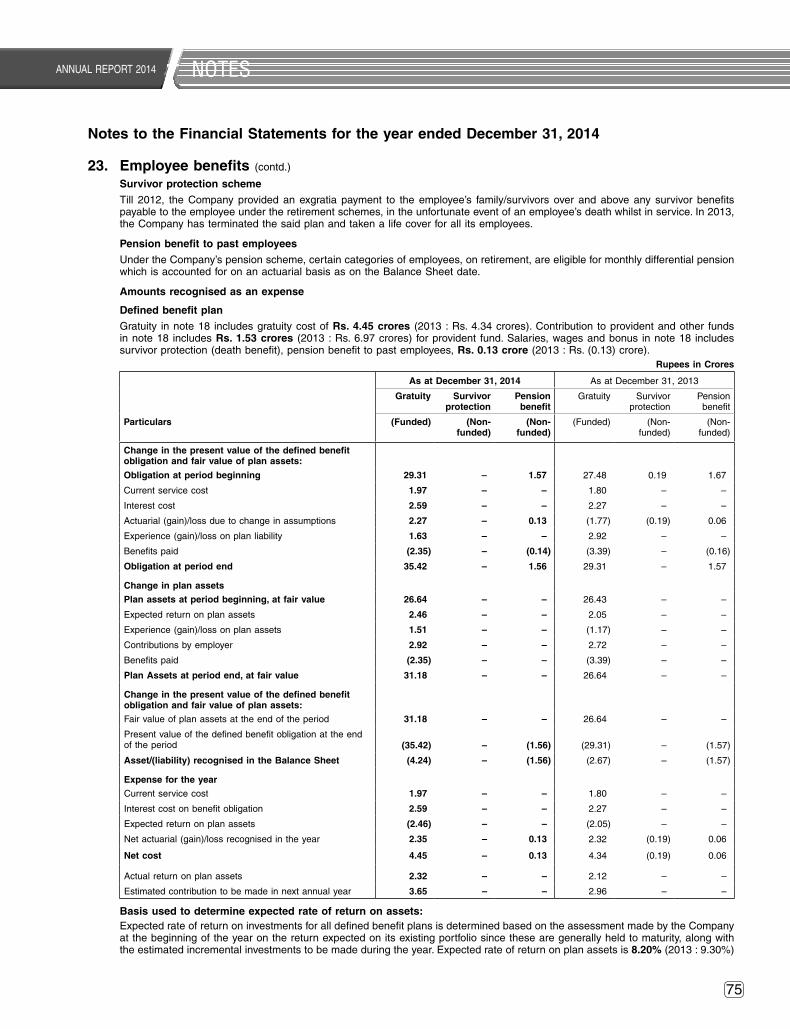
75
Notes to the Financial Statements for the year ended December 31, 2014
Survivor protection scheme
Till 2012, the Company provided an exgratia payment to the employee’s family/survivors over and above any survivor benefits payable to the employee under the retirement schemes, in the unfortunate event of an employee’s death whilst in service. In 2013, the Company has terminated the said plan and taken a life cover for all its employees.
Pension benefit to past employees
under the Company’s pension scheme, certain categories of employees, on retirement, are eligible for monthly differential pension which is accounted for on an actuarial basis as on the Balance Sheet date.
Amounts recognised as an expense
Defined benefit plan
Gratuity in note 18 includes gratuity cost of Rs. 4.45 crores (2013 : Rs. 4.34 crores). Contribution to provident and other funds in note 18 includes Rs. 1.53 crores (2013 : Rs. 6.97 crores) for provident fund. Salaries, wages and bonus in note 18 includes survivor protection (death benefit), pension benefit to past employees, Rs. 0.13 crore (2013 : Rs. (0.13) crore).
Rupees in Crores
As at December 31, 2014 As at December 31, 2013
Gratuity Survivor protection
Pension benefit
Gratuity Survivor protection
Pension benefit
Particulars (Funded) (Non-funded)
(Non-funded)
(Funded) (Non- funded)
(Non- funded)
Change in the present value of the defined benefit obligation and fair value of plan assets:
Obligation at period beginning 29.31 – 1.57 27.48 0.19 1.67
Current service cost 1.97 – – 1.80 – –
Interest cost 2.59 – – 2.27 – –
Actuarial (gain)/loss due to change in assumptions 2.27 – 0.13 (1.77) (0.19) 0.06
Experience (gain)/loss on plan liability 1.63 – – 2.92 – –
Benefits paid (2.35) – (0.14) (3.39) – (0.16)
Obligation at period end 35.42 – 1.56 29.31 – 1.57
Change in plan assets
Plan assets at period beginning, at fair value 26.64 – – 26.43 – –
Expected return on plan assets 2.46 – – 2.05 – –
Experience (gain)/loss on plan assets 1.51 – – (1.17) – –
Contributions by employer 2.92 – – 2.72 – –
Benefits paid (2.35) – – (3.39) – –
Plan Assets at period end, at fair value 31.18 – – 26.64 – –
Change in the present value of the defined benefit obligation and fair value of plan assets:
Fair value of plan assets at the end of the period 31.18 – – 26.64 – –
Present value of the defined benefit obligation at the end of the period (35.42) – (1.56) (29.31) – (1.57)
Asset/(liability) recognised in the Balance Sheet (4.24) – (1.56) (2.67) – (1.57)
Expense for the year
Current service cost 1.97 – – 1.80 – –
Interest cost on benefit obligation 2.59 – – 2.27 – –
Expected return on plan assets (2.46) – – (2.05) – –
Net actuarial (gain)/loss recognised in the year 2.35 – 0.13 2.32 (0.19) 0.06
Net cost 4.45 – 0.13 4.34 (0.19) 0.06
Actual return on plan assets 2.32 – – 2.12 – –
Estimated contribution to be made in next annual year 3.65 – – 2.96 – –
Basis used to determine expected rate of return on assets: Expected rate of return on investments for all defined benefit plans is determined based on the assessment made by the Company
at the beginning of the year on the return expected on its existing portfolio since these are generally held to maturity, along with the estimated incremental investments to be made during the year. Expected rate of return on plan assets is 8.20% (2013 : 9.30%)
23. Employee benefits (contd.)
ANNuAL REPORT 2014 NOTES

76
Notes to the Financial Statements for the year ended December 31, 2014
As at December 31, 2014 As at December 31, 2013
Assumptions Gratuity Survivor protection
Pension benefit
Gratuity Survivor protection
Pension benefit
Discount rate 8.20% – 8.20% 9.30% – 9.30%
Employee turnover Executives: upto 35 years – 15% p.a.
thereafter – 10% p.a. Expats & Workers – 1% p.a.
– – Executives: upto 35 years – 15% p.a.
thereafter – 10% p.a. Expats & Workers – 1% p.a.
– –
Mortality Indian Assured
Lives Mortality (2006-08) Ultimate
– Indian Assured
Lives Mortality (2006-08) Ultimate
Indian Assured
Lives Mortality
(2006-08) ultimate
– Indian Assured
Lives Mortality
(2006-08) ultimate
The estimates of future salary increases, considered in actuarial valuation, take account of inflation, seniority, promotion, and other relevant factors, such as supply and demand in the employment market.
The composition of plan assets
ParticularsAs at December 31, 2014 As at December 31, 2013
Gratuity Provident fund Gratuity Provident fund
Debt instruments 95% 84% 95% 80%
Others 5% 16% 5% 20%
100% 100% 100% 100%
Amount for the current and previous periods are as follows:Rupees in Crores
As at December 31, 2014 As at December 31, 2013
Particulars
Gratuity Survivor protection
Pension benefit
Gratuity Survivor protection
Pension benefit
(Funded) (Non- funded)
(Non- funded)
(Funded) (Non- funded)
(Non- funded)
Experience (gain)/loss on plan liability 1.63 – 0.13 2.92 (0.19) 0.06
Fair value of plan assets at the end of the period 31.18 – – 26.64 – –
Present value of the defined benefit obligation at the end of the period (35.42) – (1.56) (29.31) – (1.57)
Asset/(liability) recognised in the Balance Sheet (4.24) – (1.56) (2.67) – (1.57)
Rupees in Crores
Particulars
As at December 31, 2012 As at December 31, 2011 As at December 31, 2010
Gratuity Survivor protection
Pension benefit
Gratuity Survivor protection
Pension benefit
Gratuity Survivor protection
Pension benefit
(Funded) (Non- funded)
(Non- funded)
(Funded) (Non- funded)
(Non- funded)
(Funded) (Non- funded)
(Non- funded)
Experience (gain)/loss on plan liability 2.38 0.05 0.08 1.86 – – 1.39 – –
Fair value of plan assets at the end of the period 26.43 – – 23.81 – – 23.92 – –
Present value of the defined benefit obligation at the end of the period (27.48) (0.19) (1.67) (23.82) (0.17) (1.77) (22.97) (0.17) (1.88)
Asset/(liability) recognised in the Balance Sheet (1.05) (0.19) (1.67) (0.01) (0.17) (1.77) 0.95 (0.17) (1.88)
23. Employee benefits (contd.)
ANNuAL REPORT 2014 NOTES

77
24. Leases Operating Lease: Company as lessee
The Company has entered into agreements for leasing office/residential premises on leave and license basis. The specified disclosure in respect of these agreements is given below:
For the year ended December 31, 2014Rupees in Crores
For the year ended December 31, 2013 Rupees in Crores
Charged to Statement of Profit and Loss 15.64 16.39
Future minimum rentals payable under non-cancellable operating leases are as follows:
Within one year 11.79 14.96
After one year but not more than five years 2.72 14.40
More than five years – –
14.51 29.36
Office premises, residential flats, motor cars and equipments are obtained on operating lease. The lease terms range from one year to four years and are renewable at the option of the Company.
25. Segment information The business segment has been considered as the primary segment. The Company is organised into two business segments,
Automotive and Non-Automotive.
The above business segments have been identified considering:
– The customers
– The differing risks and returns
– The organisation structure
– The internal financial reporting system
Segment revenue, results, assets and liabilities have been accounted for on the basis of their relationship to the operating activities of the segment and amounts allocated on a reasonable basis.
Business segment:
Rupees in Crores
Automotive Non-Automotive Unallocated Total
For the year ended December 31, 2014
RevenueRevenue from operations (net) 2,953.75 438.58 – 3,392.33
ResultsSegment results 617.38 77.63 – 695.01 unallocable income net of unallocable (expenditure) – – 33.68 33.68 Finance costs – – 2.38 2.38
Profit before tax (including Exceptional Items) 726.31 Less: Provision for current tax 260.60 Less: Provision for deferred tax (8.85)Profit after tax 474.56
Other information
As at December 31, 2014Segment assets 781.28 188.54 522.02 1,491.84 Segment liabilities 640.79 75.35 278.92 995.06 Capital expenditure (including capital work-in-progress) 48.33 1.44 – 49.77 Depreciation/amortisation for the year 34.72 1.41 – 36.13
Notes to the Financial Statements for the year ended December 31, 2014
ANNuAL REPORT 2014 NOTES

78
Notes to the Financial Statements for the year ended December 31, 2014
Automotive Non-Automotive Unallocated Total
Geographical segment:For the year ended December 31, 2014RevenueIndia 3,388.40 Outside India 3.93
3,392.33
As at December 31, 2014AssetsIndia 1,488.79 Outside India 3.05
1,491.84
Capital expenditure (including capital work-in-progress)India 49.77 Outside India –
49.77
Business segment: Rupees in Crores
Automotive Non-Automotive Unallocated Total
For the year ended December 31, 2013RevenueRevenue from operations (net) 2,791.56 388.06 – 3,179.62
ResultsSegment results 635.13 78.94 – 714.07unallocable income net of unallocable (expenditure) – – 49.40 49.40Finance costs – – 1.71 1.71Profit before tax 761.76Less: Provision for current tax 241.06Less: Provision for deferred tax 12.13
Profit after tax 508.57
Other informationAs at December 31, 2013Segment assets 767.02 169.65 678.34 1,615.01Segment liabilities 563.17 70.61 229.81 863.59Capital expenditure (including capital work-in-progress) 51.83 2.49 – 54.32Depreciation/amortisation for the year 29.16 1.29 – 30.45
Geographical segment:For the year ended December 31, 2013RevenueIndia 3,174.77 Outside India 4.85
3,179.62
As at December 31, 2013
AssetsIndia 1,611.94 Outside India 3.07
1,615.01
Capital expenditure (including capital work-in-progress)India 54.32Outside India –
54.32
25. Segment information (contd.)Rupees in Crores
ANNuAL REPORT 2014 NOTES

79
Notes to the Financial Statements for the year ended December 31, 2014
26. Contingent liabilities & commitmentsAs at
December 31, 2014Rupees in Crores
As atDecember 31, 2013 Rupees in Crores
(a) Contingent liabilities
(1) Excise/sales tax/service tax demands made by the authorities, in respect of which appeals have been filed [refer note (a) below] 27.68 16.77
(2) Claims against the Company not acknowledged as debts estimated at:
— In respect of third parties – miscellaneous 1.16 0.98
(A) 28.84 17.75
(b) Commitments
(1) Estimated amount of contracts remaining to be executed on capital account and not provided for (net of advances) 17.06 7.33
(2) Long-term advertisement contracts 21.18 44.61
(B) 38.24 51.94
Total (A + B) 67.08 69.69
Notes:
(a) The management does not expect these claim to succeed. Accordingly no provision for contingent liability has been recognised in the financial statements.
(b) A shareholder of the Company had filed a public interest petition in the Delhi High Court interalia challenging the allotment of 3,537,862 equity shares on preferential basis to Castrol Limited, uK. The said petition has been dismissed by the Delhi High Court on January 11, 2005. However, the shareholder has gone to appeal by way of a special leave petition to the Supreme Court of India. The appeal has been admitted but no interim relief has been granted. The matter has to-date not come up for hearing.
27. Details of dues to micro and small enterprises as defined under the Micro and Small Enterprise Development (MSMED) Act 2006*
As at December 31, 2014Rupees in Crores
As atDecember 31, 2013 Rupees in Crores
a. The principal amount and the interest due thereon remaining unpaid to any supplier as at the end of each accounting year
– Principal amount due to micro and small enterprises 6.12 5.72
– Interest due on above – –
b. The amount of interest paid by the buyer in terms of Section 16 of the Micro and Small Enterprise Development Act, 2006, along with the amounts of the payment made to the supplier beyond the appointed day during each accounting year. – –
c. The amount of interest due and payable for the period of delay in making payment (which have been paid but beyond the appointed day during the year) but without adding the interest specified under Micro and Small Enterprise Development Act, 2006. – –
d. The amount of interest accrued and remaining unpaid at the end of each accounting year. – –
e. The amount of further interest remaining due and payable even in the succeeding years, until such date when the interest dues as above are actually paid to the small enterprise for the purpose of disallowance as a deductible expenditure under Section 23 of Micro and Small Enterprise Development Act, 2006. – –
* The Company has initiated the process of identification of suppliers registered under Micro and Small Enterprise Development Act, 2006, by obtaining confirmations from all suppliers. Information has been collated only to the extent of information received.
ANNuAL REPORT 2014 NOTES
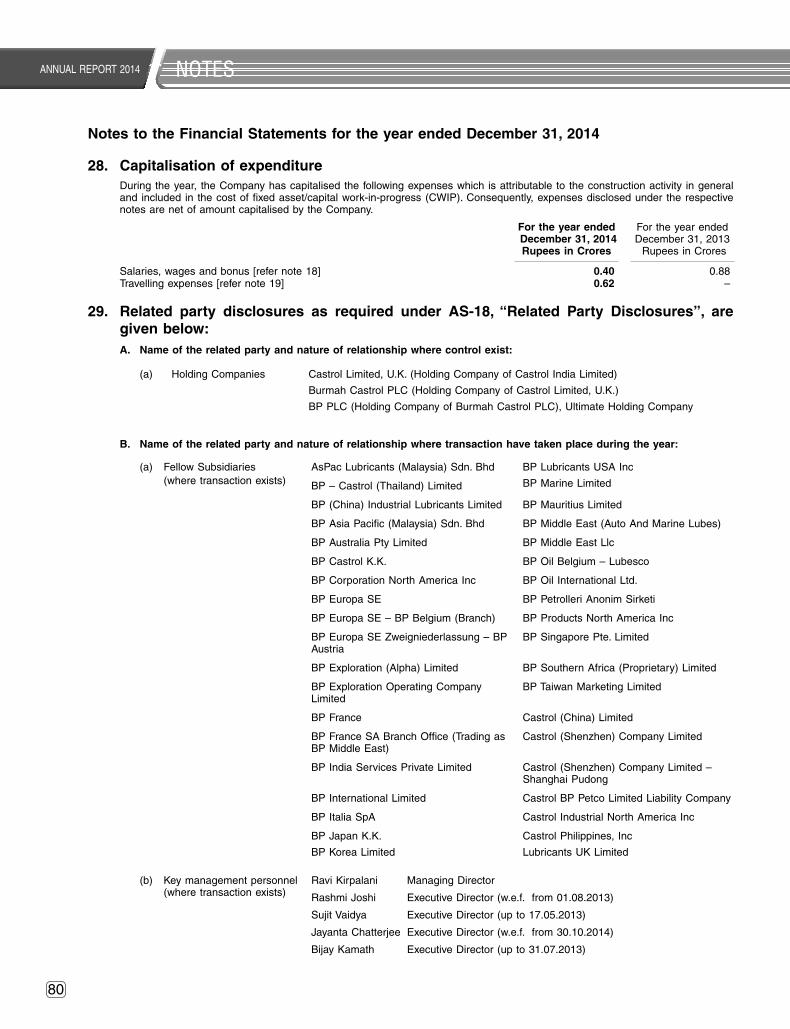
80
28. Capitalisation of expenditure During the year, the Company has capitalised the following expenses which is attributable to the construction activity in general
and included in the cost of fixed asset/capital work-in-progress (CWIP). Consequently, expenses disclosed under the respective notes are net of amount capitalised by the Company.
For the year ended December 31, 2014Rupees in Crores
For the year ended December 31, 2013 Rupees in Crores
Salaries, wages and bonus [refer note 18] 0.40 0.88 Travelling expenses [refer note 19] 0.62 –
29. Related party disclosures as required under AS-18, “Related Party Disclosures”, are given below:
A. Name of the related party and nature of relationship where control exist:
(a) Holding Companies Castrol Limited, u.K. (Holding Company of Castrol India Limited)
Burmah Castrol PLC (Holding Company of Castrol Limited, u.K.)
BP PLC (Holding Company of Burmah Castrol PLC), ultimate Holding Company
B. Name of the related party and nature of relationship where transaction have taken place during the year:
(a) Fellow Subsidiaries AsPac Lubricants (Malaysia) Sdn. Bhd BP Lubricants uSA Inc (where transaction exists) BP – Castrol (Thailand) Limited BP Marine Limited
BP (China) Industrial Lubricants Limited BP Mauritius Limited
BP Asia Pacific (Malaysia) Sdn. Bhd BP Middle East (Auto And Marine Lubes)
BP Australia Pty Limited BP Middle East Llc
BP Castrol K.K. BP Oil Belgium – Lubesco
BP Corporation North America Inc BP Oil International Ltd.
BP Europa SE BP Petrolleri Anonim Sirketi
BP Europa SE – BP Belgium (Branch) BP Products North America Inc
BP Europa SE Zweigniederlassung – BP Austria
BP Singapore Pte. Limited
BP Exploration (Alpha) Limited BP Southern Africa (Proprietary) Limited
BP Exploration Operating Company Limited
BP Taiwan Marketing Limited
BP France Castrol (China) Limited
BP France SA Branch Office (Trading as BP Middle East)
Castrol (Shenzhen) Company Limited
BP India Services Private Limited Castrol (Shenzhen) Company Limited – Shanghai Pudong
BP International Limited Castrol BP Petco Limited Liability Company
BP Italia SpA Castrol Industrial North America Inc
BP Japan K.K. Castrol Philippines, Inc
BP Korea Limited Lubricants uK Limited
(b) Key management personnel (where transaction exists)
Ravi Kirpalani
Rashmi Joshi
Sujit Vaidya
Jayanta Chatterjee
Bijay Kamath
Managing Director
Executive Director (w.e.f. from 01.08.2013)
Executive Director (up to 17.05.2013)
Executive Director (w.e.f. from 30.10.2014)
Executive Director (up to 31.07.2013)
Notes to the Financial Statements for the year ended December 31, 2014
ANNuAL REPORT 2014 NOTES

81
B. Transactions with related parties (contd.)
Nature of Relationship
For the year ended December 31, 2014Rupees in Crores
For the year endedDecember 31, 2013 Rupees in Crores
Purchase of materials/traded goodsBP Europa SE Fellow subsidiary 21.72 28.23 BP Europa SE – BP Belgium (Branch) Fellow subsidiary 19.45 9.41 Castrol Industrial North America Inc Fellow subsidiary 17.86 8.36 BP France Fellow subsidiary 4.88 5.72 Others Fellow subsidiaries 10.84 5.06
Total 74.75 56.78
Sale of goods & related expensesBP (China) Industrial Lubricants Limited Fellow subsidiary 0.71 2.43BP – Castrol (Thailand) Limited Fellow subsidiary 0.15 0.36BP Europa SE Fellow subsidiary – 0.46Castrol (Shenzhen) Company Limited Fellow subsidiary 0.79 –Others Fellow subsidiaries 0.17 0.08
Total 1.82 3.33
Receiving of servicesBP Corporation North America Inc Fellow subsidiary – 4.50BP Singapore Pte Limited Fellow subsidiary 12.18 0.46BP International Limited Fellow subsidiary 6.45 1.16Lubricants uK Limited Fellow subsidiary 8.74 7.54Others Fellow subsidiaries 0.64 0.67
Total 28.01 14.33
Rendering of services & deputation of employeesCastrol Limited, u.K. Holding company 3.13 3.11BP International Limited Fellow subsidiary 4.46 0.58BP India Services Private Limited Fellow subsidiary 8.17 8.76Lubricants uK Limited Fellow subsidiary 3.17 2.71Others Fellow subsidiaries 2.43 2.17
Total 21.36 17.33
Other income (excess accrual written back)Lubricants uK Limited Fellow subsidiary – 2.50 BP Corporation North America Inc Fellow subsidiary – 9.80
Total – 12.30
Commission incomeBP Marine Limited Fellow subsidiary 2.27 4.64
Total 2.27 4.64
Transfer in/transfer outBP International Limited Fellow subsidiary 4.50 – BP Corporation North America Inc Fellow subsidiary (4.50) –
Payment on account of capital reductionCastrol Limited, u.K. Holding company 175.37 –Other Fellow subsidiary 0.27 –
Total 175.64 –
Notes to the Financial Statements for the year ended December 31, 2014
29. Related party disclosures as required under AS-18, “Related Party Disclosures”, are given below: (contd.)
ANNuAL REPORT 2014 NOTES

82
B. Transactions with related parties (contd.)
Nature of Relationship
For the year ended December 31, 2014Rupees in Crores
For the year endedDecember 31, 2013 Rupees in Crores
DividendCastrol Limited, u.K. Holding company 263.06 245.52
Other Fellow subsidiary 0.41 0.38
Total 263.47 245.90
Royalty expenseCastrol Limited, u.K. Holding company 73.19 77.29
Total 73.19 77.29
Recovery of loan & interest thereon Ravi Kirpalani Key management
personnel 0.01 0.01
Total 0.01 0.01
Balance as at year endedNature of Relationship
As at December 31, 2014Rupees in Crores
As atDecember 31, 2013 Rupees in Crores
Amounts payableCastrol Limited, u.K. Holding company 202.51 189.75 Other Fellow subsidiary 37.99 22.98
Total 240.50 212.73
Amounts receivableBP India Services Private Limited Fellow subsidiary 0.82 0.84 BP Europa SE Fellow subsidiary – 0.46 BP Marine Limited Fellow subsidiary 0.61 1.12 BP Singapore Pte Limited Fellow subsidiary 0.84 0.05 Lubricants uK Limited Fellow subsidiary 1.11 1.45 Other Fellow subsidiaries 0.74 0.72
Total 4.12 4.64
Remuneration to executive directors paid/payableRavi Kirpalani Key management
personnel 2.44 2.05 Rashmi Joshi (w.e.f. 01.08.2013) Key management
personnel 1.39 0.70 Sujit Vaidya (up to 17.05.2013) Key management
personnel – 0.32 Bijay Kamath (w.e.f. 01.11.2012 & up to 31.07.2013)
Key management personnel – 0.58
Jayanta Chatterjee (w.e.f. 30.10.2014) Key management personnel 0.31 –
Total 4.14 3.65
Loan outstanding
Ravi Kirpalani Key management personnel 0.13 0.13
Total 0.13 0.13
Notes to the Financial Statements for the year ended December 31, 2014
29. Related party disclosures as required under AS-18, “Related Party Disclosures”, are given below: (contd.)
ANNuAL REPORT 2014 NOTES

83
Notes to the Financial Statements for the year ended December 31, 2014
30. Forward contracts and unhedged foreign currency exposures:
30.1 Forward contracts outstanding as at the Balance Sheet dateAs at
December 31, 2014As at
December 31, 2013
No. of buy contracts relating to firm commitments 25 5 Foreign currency – uSD 13,343,000 12,019,551Rs. crores 85.04 74.72
30.2 Foreign currency exposures which are not hedged as at the Balance Sheet dateParticulars USD EURO GBP CNY SGD AUD JPY
December 31, 2014 Trade payables – Foreign currency 15,312,765 828,062 630,234 14,300 141,884 – 3,930,587 Trade payables – Rs. crores 96.99 6.38 6.21 0.01 0.68 – 0.21 Trade receivables – Foreign currency 213,733 – – – – – – Trade receivables – Rs. crores 1.35 – – – – – – Loans and advances given – Foreign currency 1,629,723 40,123 31,759 – – – – Loans and advances given – Rs. crores 10.31 0.31 0.31 – – – –
December 31, 2013 Trade payables – Foreign currency 9,337,843 1,651,227 579,635 – 12,990 52,434 1,166,864 Trade payables – Rs. crores 57.78 14.09 5.92 – 0.06 0.29 0.07 Trade receivables – Foreign currency 304,902 54,440 – – – – – Trade receivables – Rs. crores 1.87 0.46 – – – – – Loans and advances given – Foreign currency 1,700,827 173,169 – – – – – Loans and advances given – Rs. crores 10.52 1.48 – – – – –
31. C.I.F. value of importsFor the year ended December 31, 2014Rupees in Crores
For the year endedDecember 31, 2013 Rupees in Crores
Raw materials 828.57 758.79 Capital goods 13.13 6.63
32. Expenditure in foreign currency (on accrual basis)For the year ended December 31, 2014Rupees in Crores
For the year endedDecember 31, 2013 Rupees in Crores
Travelling expenses 0.52 1.07 Imports of goods for resale 92.31 55.77 Royalty (gross) [tax deducted at source Rs. 7.80 crores
(2013 : Rs. 7.86 crores)] 73.19 77.29 Advertisement and sales promotion 7.96 9.97 Sales promotion fees 9.32 3.02 Others (net of tax, where applicable) 22.08 16.39
33. Earnings in foreign currency (on accrual basis)For the year ended December 31, 2014Rupees in Crores
For the year endedDecember 31, 2013 Rupees in Crores
Supplies to foreign vessels 3.83 3.78 Commission 2.27 4.67 FOB value of goods exported 2.79 3.20 Energy supplies 1.14 1.65 Others 3.89 3.08
ANNuAL REPORT 2014 NOTES

84
As per our report of even date For and on behalf of Board of DirectorsFor S. R. BATLIBOI & CO. LLPChartered Accountants S. M. DATTA Chairman RAVI KIRPALANI Managing DirectorICAI Firm Registration no : 301003E
RASHMI JOSHI } Executive DirectorsJAyANTA CHATTERJEE
per DOLPHy D’SOuZA SANDEEP DESHMuKH R. GOPALAKRISHNAN
}
Non-Executive Directors
Partner Company Secretary RALPH HEWINSMembership No. : 38730 SASHI MuKuNDAN
uDAy KHANNAPETER WEIDNER
Place: Mumbai Place: MumbaiFebruary 25, 2015 February 25, 2015
34. Imported and Indigenous raw materials, packing materials, components and spare parts consumed
For the year ended December 31, 2014
For the year ended December 31, 2013
Rupees in Crores
% of Total Rupees in Crores
% of Total
Imported:
Base oil 699.04 39.71 637.86 37.94
Additive and chemicals 245.55 13.95 249.69 14.85
Indigenous:
Base oil 352.01 20.00 369.35 21.97
Additive and chemicals 258.59 14.69 232.90 13.85
Packages 205.27 11.66 191.62 11.40
1,760.46 100.00 1,681.42 100.00
35. Details of dividend/capital reduction remitted during the year, to two (2013 – two) non-resident shareholders are as follows:
Dividend in respect of the year ended No. of Shares
As at December 31, 2014Rupees in Crores
As at December 31, 2013 Rupees in Crores
31-12-2012 (Final) 351,291,716 – 122.95
31-12-2013 (Interim) 351,291,716 – 122.95
31-12-2013 (Final) 351,291,716 122.95 –
31-12-2014 (Interim) 351,291,716 122.95 –
31-12-2014 (Capital reduction) 351,291,716 175.65 –
36. Previous year figures The Company has reclassified previous year figures to conform to this year’s classification.
Notes to the Financial Statements for the year ended December 31, 2014
ANNuAL REPORT 2014 NOTES

vakils