annual report to congress - taxpayer advocate … · taxpayer advocate service — 2015 annual...
TRANSCRIPT

National Taxpayer Advocate
ANNUAL REPORT TO CONGRESS
TAS Research and Related Studies Volume 2 2015
www.TaxpayerAdvocate.irs.gov/2015AnnualReport


Taxpayer Advocate Service — 2015 Annual Report to Congress — Volume Two i
Contents
Contents
STUDY OF TAXPAYERS THAT OBTAINED RECOGNITION AS IRC § 501(C)(3) ORGANIZATIONS ON THE BASIS OF FORM 1023-EZ . . . . . . . . . . . . . . . . . . . . . . . . . . . . . . . . . . . . . . . 1
IRS COLLECTIBILITY CURVE . . . . . . . . . . . . . . . . . . . . . . . . . . . . . . . . . . . . . . . . . . . . . . . . . . . . . . . . . . . . 33
AUDIT IMPACT STUDY . . . . . . . . . . . . . . . . . . . . . . . . . . . . . . . . . . . . . . . . . . . . . . . . . . . . . . . . . . . . . . . . . . 67
UNDERSTANDING THE HISPANIC UNDERSERVED POPULATION . . . . . . . . . . . . . . . . . . . . . . . . . . . 101

CONTENTSii
Contents
This page intentionally left blank.

Volume 2 TAS Research and Related Studies
Study of Taxpayers That Obtained Recognition as IRC § 501(c)(3) Organizations
on the Basis of Form 1023-EZ
Study of Taxpayers that Obtained Recognition as IRC § 501(C)(3) Organizations on the Basis of Form 1023-EZ
Section One — FORM 1023-EZ
Form 1023-EZ IRS Collectibility Curve Audit Impact Study Understanding the Hispanic Underserved
2
Study of Taxpayers that Obtained Recognition as IRC § 501(c)(3) Organizations on the Basis of Form 1023-EZ
EXECUTIVE SUMMARY . . . . . . . . . . . . . . . . . . . . . . . . . . . . . . . . . . . . . . . . . . . . . . . . . . . . . . . . . . . . . . . . 3
INTRODUCTION . . . . . . . . . . . . . . . . . . . . . . . . . . . . . . . . . . . . . . . . . . . . . . . . . . . . . . . . . . . . . . . . . . . . . . 4
BACKGROUND . . . . . . . . . . . . . . . . . . . . . . . . . . . . . . . . . . . . . . . . . . . . . . . . . . . . . . . . . . . . . . . . . . . . . . . 5
Form 1023-EZ Drastically Reduced the Amount of Information Required to Apply for Exempt Status As an IRC § 501(c)(3) Organization . . . . . . . . . . . . . . . . . . . . . . . . . . . . . . . . . . . . . . . . . . . . . . . 5
The Introduction of Form 1023-EZ Did Not Affect the Legal Requirements for Exempt Status As an IRC § 501(c)(3) Organization . . . . . . . . . . . . . . . . . . . . . . . . . . . . . . . . . . . . . . . . . . . . . . . . . . . . 7
IRC § 501(c)(3) Organizations Must Satisfy an Organizational Test . . . . . . . . . . . . . . . . . . . . . . . . . . . . 7
IRC § 501(c)(3) Organizations Must Satisfy an Operational Test . . . . . . . . . . . . . . . . . . . . . . . . . . . . . . 8
RESEARCH QUESTIONS . . . . . . . . . . . . . . . . . . . . . . . . . . . . . . . . . . . . . . . . . . . . . . . . . . . . . . . . . . . . . . . 9
1 . Whether the Organization Satisfied the Organizational Test . . . . . . . . . . . . . . . . . . . . . . . . . . . . . 9
2 . Whether the Organization was Eligible to Apply for Exempt Status Using Form 1023-EZ . . . . . . 9
3 . Whether Information on the Organization’s Website, if Any, Provided Transparency . . . . . . . . . . . 9
METHODOLOGY . . . . . . . . . . . . . . . . . . . . . . . . . . . . . . . . . . . . . . . . . . . . . . . . . . . . . . . . . . . . . . . . . . . . . . 9
DATA COLLECTION . . . . . . . . . . . . . . . . . . . . . . . . . . . . . . . . . . . . . . . . . . . . . . . . . . . . . . . . . . . . . . . . . . . 10
FINDINGS . . . . . . . . . . . . . . . . . . . . . . . . . . . . . . . . . . . . . . . . . . . . . . . . . . . . . . . . . . . . . . . . . . . . . . . . . . 11
General Characteristics of the Organizations in the Sample . . . . . . . . . . . . . . . . . . . . . . . . . . . . . . . . . 11
Thirty-Seven Percent of Organizations Failed the Organizational Test Because Their Articles Lacked an Adequate Purpose Clause, Dissolution Clause, or Both . . . . . . . . . . . . . . . . . . . . . . . . . . . . 11
It Takes Only a Few Minutes to Review Articles of Incorporation, and Inadequacies Appear to Be Easily Correctable . . . . . . . . . . . . . . . . . . . . . . . . . . . . . . . . . . . . . . . . . . . . . . . . . . . . . . . . . . . . . . 14
Some Organizations in the Sample Were Not Eligible to Use Form 1023-EZ . . . . . . . . . . . . . . . . . . . . 15
Information on Organizations’ Websites May Provide Additional Information, But Only About 60 Percent of the Organizations Had Websites, Including Facebook . . . . . . . . . . . . . . . . . . . . . . . . . . . 15
FOLLOW-UP STEPS IN LIGHT OF STUDY FINDINGS . . . . . . . . . . . . . . . . . . . . . . . . . . . . . . . . . . . . . . . 16
CONCLUSION . . . . . . . . . . . . . . . . . . . . . . . . . . . . . . . . . . . . . . . . . . . . . . . . . . . . . . . . . . . . . . . . . . . . . . . 17
RECOMMENDATIONS . . . . . . . . . . . . . . . . . . . . . . . . . . . . . . . . . . . . . . . . . . . . . . . . . . . . . . . . . . . . . . . . 17
APPENDIX A: Data Collection Instrument . . . . . . . . . . . . . . . . . . . . . . . . . . . . . . . . . . . . . . . . . . . . . . 18
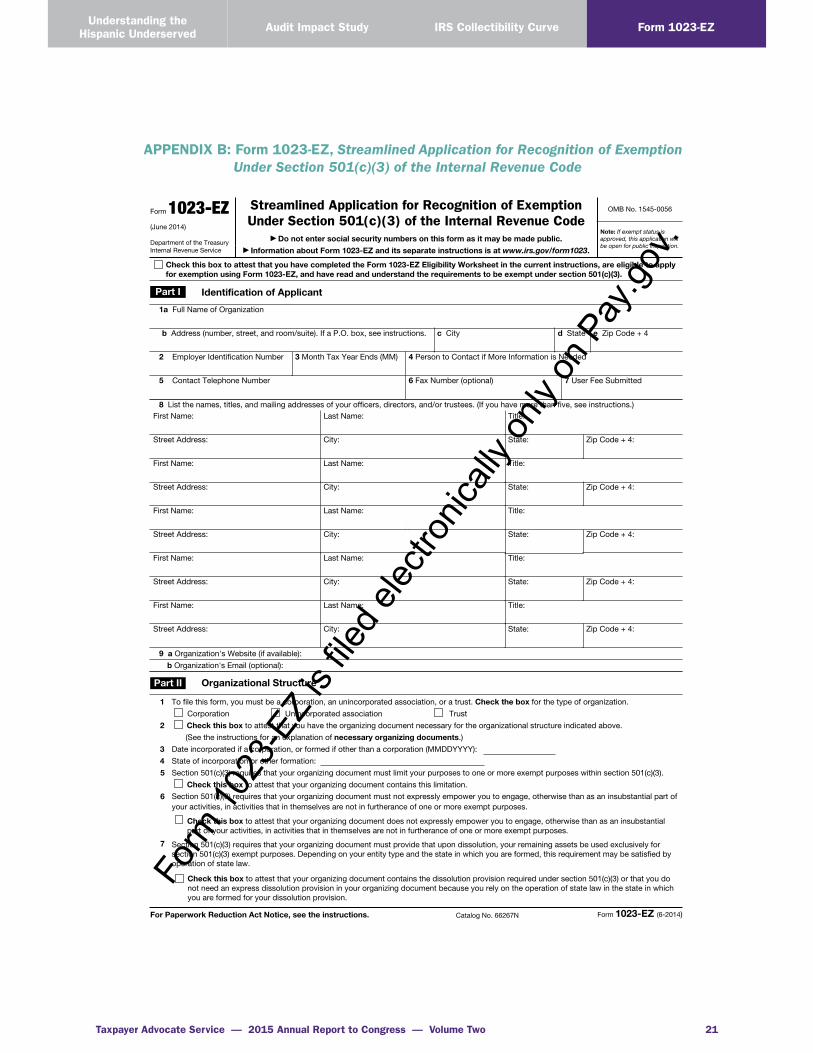
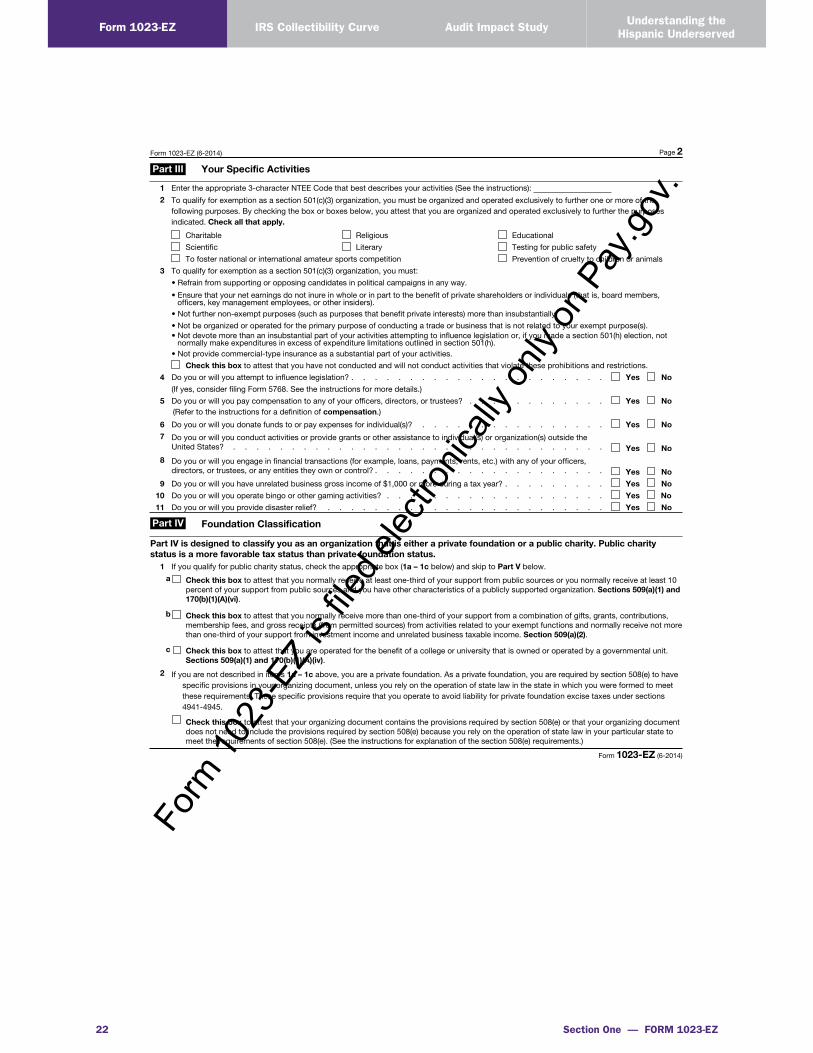
APPENDIX B: Form 1023-EZ, Streamlined Application for Recognition of Exemption Under Section 501(c)(3) of the Internal Revenue Code . . . . . . . . . . . . . . . . . . . . . . . . . . . . . . . . . . . . 21
APPENDIX C: Form 1023-EZ Eligibility Worksheet . . . . . . . . . . . . . . . . . . . . . . . . . . . . . . . . . . . . . . . 24
APPENDIX D: Contents of Letter EO Uses to Advise Form 1023-EZ Filers their Articles of Incorporation Do Not Meet the Organizational Test, in Pertinent Part . . . . . . . . . . . . . . . . . . . . . . 31

Taxpayer Advocate Service — 2015 Annual Report to Congress — Volume Two 3
Understanding the Hispanic Underserved Audit Impact Study Form 1023-EZIRS Collectibility Curve
EXECUTIVE SUMMARYOn July 1, 2014, the IRS released Form 1023-EZ, Streamlined Application for Recognition of Exemption Under Section 501(c)(3) of the Internal Revenue Code . The application allows certain organizations to attest that they meet requirements for exempt status and does not require any supporting documentation or substantiation of those attestations . TAS undertook a study to examine a representative sample of orga-nizations in 20 states that make articles of incorporation viewable online at no cost whose Form 1023-EZ was approved by the IRS . The objective of the study is to ascertain the extent to which approved or-ganizations actually satisfied the organizational test, a legal requirement for qualification as an Internal Revenue Code (IRC) § 501(c)(3) organization, and the extent to which approved organizations, whether they met the organizational test or not, were eligible to apply for exempt status using Form 1023-EZ . The study findings for the population studied are statistically valid at the 95 percent confidence level with a margin of error no greater than +/-5 percent .
The study found that for organizations in 20 states that make articles of incorporation viewable online at no cost:
■■ Thirty-seven percent do not meet the organizational test for qualification as an IRC § 501(c)(3) organization;
■■ Thirty percent of these organizations’ articles of incorporation do not have an acceptable purpose clause;
■■ Twenty-three percent of these organizations’ articles of incorporation do not provide for distribu-tion of assets upon dissolution as the law requires;
■■ It takes on average less than three minutes to review articles of incorporation and determine wheth-er the organizational test is met and in over 90 percent of the cases, it took five minutes or less; and
■■ Only about half of the organizations maintain websites that could provide additional information .
Thus, the IRS approves a significant portion of Form 1023-EZ applications from organizations that do not meet the legal requirements for qualification as IRC § 501(c)(3) organizations . To the extent these organizations receive amounts that should be treated as taxable receipts they are improperly subsidized by other taxpayers . Eight organizations in our sample filed Form 1120, U.S. Corporation Income Tax Return, for at least one tax period prior to obtaining recognition of exempt status, which raises the question of whether the organizations merely continued to operate a for-profit entity in the guise of an exempt orga-nization . To the extent non-exempt organizations receive contributions deducted by the donor, tax dollars are inappropriately diverted . Moreover, the skeletal Form 1023-EZ, the brevity of the annual report required of these organizations, and the probability that the organizations will not have a website result in a disturbing lack of information about them, undermining the public’s and the IRS’s ability to effectively monitor this segment of the exempt organization population .

Section One — FORM 1023-EZ
Form 1023-EZ IRS Collectibility Curve Audit Impact Study Understanding the Hispanic Underserved
4
INTRODUCTION1
Taxpayers seeking exempt status as IRC § 501(c)(3) organizations must generally apply to the IRS to have their exempt status recognized .2 Those excepted from the requirement to apply include organiza-tions with gross receipts of normally not more than $5,000,3 but even these very small organizations must submit an application if they are seeking reinstatement of exempt status following automatic revocation .4 Some organizations, such as churches, request recognition of exempt status although they are not required to do so .5 From fiscal year (FY) 2010-2014, the annual number of applications for recognition of exempt status as an IRC § 501(c)(3) evaluated by the Exempt Organizations (EO) function of the Tax Exempt and Government Entities division (TE/GE) ranged from 45,000 to more than 100,000 .6
Prior to July 1, 2014, organizations submitted their applications on Form 1023, Application for Recognition of Exemption Under Section 501(c)(3) of the Internal Revenue Code, which is 12 pages long .7 Thereafter, many organizations submitted their application on the three-page Form 1023-EZ, Streamlined Application for Recognition of Exemption Under Section 501(c)(3) of the Internal Revenue Code, which ap-pears as Appendix B . Most organizations that applied for exempt status as IRC § 501(c)(3) organizations in FY 2015 did so using Form 1023-EZ .8 Figure 1 .1 shows the number of applications from organiza-tions seeking IRC § 501(c)(3) status for which EO made determinations from FY 2010 to FY 2014, and the number and rate at which EO approved those applications .
1 The primary author of this study is Jill MacNabb, Senior Attorney Advisor to the National Taxpayer Advocate.2 IRC § 508.3 IRC § 508(c)(1)(B); Treas. Reg. § 1.508-1(a)(3) (excepting small organizations that are not private foundations from the
requirement to apply for recognition of exempt status). See also Treas. Reg. § 1.508-1(a)(3)(ii) (defining gross receipts as not normally more than $5,000 depending on how long the organization has been in existence).
4 IRC § 6033(j)(1) provides for automatic revocation of exempt status of organizations that fail to file a required return or notice for three consecutive years. IRC § 6033(j)(2) requires organizations whose exempt status was automatically revoked to apply for reinstatement “regardless of whether such organization was originally required to make such an application.”
5 See IRC § 508(c)(1); Brice S. McKeever and Sarah L. Pettijohn, The Nonprofit Sector in Brief 2014 16, n3, Urban Institute (Oct. 2014) noting that out of an estimated 345,000 houses of worship in the U.S. approximately 220,000 are registered with the IRS.
6 Table 24, Closures of Applications for Tax-Exempt Status, by Organization Type and Internal Revenue Code Section, IRS Data Books, 2010-2014, showing determinations under IRC § 501(c)(3) of 59,945; 55,319; 51,748; 45,289; and 100,032 for FYs 2010-2014, respectively, for an average of 62,467.
7 See also Instructions to Form 1023, 24, estimating that on average it takes nine hours and 39 minutes to prepare the form, involves 89 hours 26 minutes of recordkeeping, and takes five hours 10 minutes to learn about the law or the form. Copying, assembling, and sending the form to the IRS takes on average 48 minutes.
8 TE/GE Fourth Qtr Business Performance Review (BPR) at 4 (Dec. 2015), reporting that 55 percent of all applications for recog-nition as an IRC § 501(c)(3) organization received in FY 2015 were submitted on Form 1023-EZ.

Taxpayer Advocate Service — 2015 Annual Report to Congress — Volume Two 5
Understanding the Hispanic Underserved Audit Impact Study Form 1023-EZIRS Collectibility Curve
FIGURE 1.19
Organizations Seeking IRC § 501(c)(3) Status FYs 2010-2014: Total Applications, Number Approved, and Approval Rates
FY 2014 Total Applications100,03294,635 (94%)
FY 2013 Total Applications45,28937,946 (84%)
FY 2012 Total Applications51,74845,029 (87%)
FY 2011 Total Applications55,31949,677 (90%)
FY 2010 Total Applications59,94548,934 (82%)
Approved Applications
TAS undertook a study of a representative sample of organizations in 20 states that make articles of incorporation viewable online at no cost whose Form 1023-EZ was approved by the IRS . The study was undertaken to determine the extent to which the approved organizations actually met the organizational test, a legal requirement for tax exempt status as an IRC § 501(c)(3) organization, and the extent to which approved organizations (whether or not they met the organizational test) were actually eligible to apply using Form 1023-EZ . Our findings for the population studied are statistically valid at the 95 percent confidence level with a margin of error no greater than +/-5 percent .
BACKGROUND
Form 1023-EZ Drastically Reduced the Amount of Information Required to Apply for Exempt Status As an IRC § 501(c)(3) OrganizationFor more than 30 years prior to the introduction of Form 1023-EZ, taxpayers seeking exempt status as IRC § 501(c)(3) organizations applied using Form 1023 .10 The IRS estimates it takes more than nine hours on average to complete a full Form 1023, which is 12 pages long (not counting any required schedules or attachments) .11 Because the IRS does not need such extensive information to determine whether most small organizations are exempt, the National Taxpayer Advocate recommended that TE/GE
9 Table 24, Closures of Applications for Tax-Exempt Status, by Organization Type and Internal Revenue Code Section, IRS Data Books, 2010-2014. As the FY 2014 Data Book notes, the increase from FY 2013 to FY 2014 “is attributable to the intro-duction of a streamlined application process in FY 2014 for all determination applications and the implementation of the electronic Form 1023-EZ, a streamlined three-page version of the 26-page Form 1023, Application for Recognition of Exemption Under Section 501(c)(3) of the Internal Revenue Code.”
10 See, e.g., Office of Information and Regulatory Affairs, Office of Management and Budget, Information Collection Request Ref. No. 198104-1545-056, approving a 1981 revision of the form.
11 Instructions to Form 1023, 24, estimating that on average it takes nine hours and 39 minutes to prepare the form, involves 89 hours 26 minutes of recordkeeping, and takes five hours 10 minutes to learn about the law or the form. Copying, assembling, and sending the form to the IRS takes on average 48 minutes.

Section One — FORM 1023-EZ
Form 1023-EZ IRS Collectibility Curve Audit Impact Study Understanding the Hispanic Underserved
6
adopt a less burdensome Form 1023-EZ .12 As discussed below and elsewhere in this report, the IRS has now adopted a Form 1023-EZ that has gone too far in the opposite direction by “eliciting” only a series of checkmarks in boxes and the organization’s attestation, or affirmation, that it meets the legal requirements for exempt status .13
Eligibility to request exempt status using Form 1023-EZ requires, among other things, that the organiza-tion’s gross receipts have not exceeded $50,000 in any of the last three years and that its total assets do not exceed $250,000 .14 Organizations applying for retroactive reinstatement of exempt status following auto-matic revocation may use Form 1023-EZ if, in addition to meeting the other eligibility requirements, they apply within 15 months from the date of the revocation .15 Applicants attest (by checking a box) that they have completed the Eligibility Worksheet contained in the instructions to Form 1023-EZ (the worksheet appears as Appendix C), and that they are eligible to apply for exemption using Form 1023-EZ .
Form 1023-EZ differs from Form 1023 in three crucial areas:
■■ Form 1023-EZ does not require the applicant to submit its organizing documents, such as articlesof incorporation;
■■ Form 1023-EZ does not require the applicant to describe its activities; and
■■ Form 1023-EZ does not elicit information (beyond yes or no responses) that would signal a poten-tial for inurement or private benefit .16
TE/GE analyzes, on an ongoing basis, a random sample of organizations that successfully applied for exempt status using Form 1023-EZ .17 The results of that analysis, discussed earlier in this report, did not reassure the National Taxpayer Advocate that Form 1023-EZ allows the IRS to determine, with an accept-able level of accuracy, whether applicants should be recognized as IRC § 501(c)(3) organizations .18
By December of 2014, 54 percent of all applications for exempt status as an IRC § 501(c)(3) organiza-tion were submitted on Form 1023-EZ; by July 1, 2015, one year after Form 1023-EZ was introduced, the frequency was 58 percent .19 In the interim, in view of her misgivings about the adequacy of the new form, the National Taxpayer Advocate announced that TAS would independently review a random sample of approved Form 1023-EZ filers .20
12 National Taxpayer Advocate 2011 Annual Report to Congress Status Update: The IRS Makes Reinstatement of an Organization’s Exempt Status Following Revocation Unnecessarily Burdensome 437, 448.
13 See Most Serious Problem: Form 1023-EZ: Recognition as a Tax-Exempt Organization Is Now Virtually Automatic for Most Applicants, Which Invites Noncompliance, Diverts Tax Dollars and Taxpayer Donations, and Harms Organizations Later Determined to be Taxable, supra.
14 Rev. Proc. 2015-5, sec. 2, 2015-1 I.R.B. 186 sets out the eligibility requirements for using Form 1023-EZ. They are reflected in the Eligibility Worksheet, which appears as Appendix C.
15 Id. sec. 8.03. Applicants seeking only prospective reinstatement are not subject to the 15-month deadline.16 See National Taxpayer Advocate FY 2015 Objectives Report to Congress 35 at 62. 17 See Rev. Proc. 2014-40, § 5.03, 2014-30 I.R.B. 229 (providing that “the Service will select a statistically valid random sample
of Forms 1023-EZ for pre-determination reviews”); Rev. Proc. 2015-5, § 5.03, 2015-1 I.R.B. 186 (providing the same). 18 Most Serious Problem: Form 1023-EZ: Recognition as a Tax-Exempt Organization Is Now Virtually Automatic for Most Applicants,
Which Invites Noncompliance, Diverts Tax Dollars and Taxpayer Donations, and Harms Organizations Later Determined to be Taxable, supra.
19 TE/GE First Qtr BPR 2015 at 2 (Feb. 2015); TE/GE Third Qtr BPR 2015 at 4 (Oct. 2015). For FY 2015, 55 percent of all applications for recognition as an IRC § 501(c)(3) organization were submitted on Form 1023-EZ. TE/GE Fourth Qtr BPR at 4 (Dec. 2015).
20 See National Taxpayer Advocate FY 2016 Objectives Report to Congress 70 at 76.

Taxpayer Advocate Service — 2015 Annual Report to Congress — Volume Two 7
Understanding the Hispanic Underserved Audit Impact Study Form 1023-EZIRS Collectibility Curve
The Introduction of Form 1023-EZ Did Not Affect the Legal Requirements for Exempt Status As an IRC § 501(c)(3) OrganizationThe rules for obtaining recognition of exempt status did not change with the introduction of Form 1023-EZ . An IRC § 501(c)(3) organization, which is generally exempt from income taxation and may receive tax deductible contributions, is one that is “organized and operated exclusively” for one or more of the following eight purposes:21
■■ Religious;
■■ Charitable;
■■ Scientific;
■■ Testing for public safety;
■■ Literary;
■■ Educational;
■■ To foster national or international amateur sports competition (but only if no part of its activitiesinvolve the provision of athletic facilities or equipment); or
■■ For the prevention of cruelty to children or animals .22
Whether an organization applies using Form 1023 or Form 1023-EZ, if it fails either the organizational test or the operational test, discussed below, it is not an organization described in IRC § 501(c)(3) .23 It is subject to taxation on its income .
IRC § 501(c)(3) Organizations Must Satisfy an Organizational TestTo meet the “organizational test,” an organization, which may be a corporation, an unincorporated as-sociation, or a trust, must have “articles of organization” that:
■■ Limit the organization’s purposes to one or more exempt purposes;
■■ Do not expressly empower the organization to engage, other than as an insubstantial part of its ac-tivities, in activities which themselves are not in furtherance of one or more exempt purposes; and
■■ Permanently dedicate the organization’s assets to IRC § 501(c)(3) purposes on dissolution .24
Thus, the organization’s articles must generally contain an acceptable purpose clause and a sufficient dissolution clause . In some states, a nonprofit corporation’s articles need not include a specific dissolution provision because by operation of state law the organization’s assets would be distributed upon dissolution
21 Organizations exempt from tax under IRC § 501(c)(3) are generally not required to pay tax on their related income, and may receive tax deductible contributions. See IRC §§ 501 and 170(c)(2). An organization determined to not have been tax exempt would be treated as a taxable entity required to report and pay tax on income (whether related to the erstwhile exempt purpose or not).
22 See IRC §§ 501 and 170(c)(2). Unrelated business income may be subject to tax. See IRC § 511 et seq. Further, in order to qualify as an IRC § 501(c)(3) organization, no part of the organization’s net earnings can inure to the benefit of any private shareholder or individual (IRC § 501(c)(3); Treas. Reg. § 1.501(c)(3)-1(c)(2)); the organization cannot devote more than an insubstantial part of its activities to attempting to influence legislation by propaganda or otherwise attempting to influence legislation (IRC § 501(c)(3); Treas. Reg. § 1.501(c)(3)-1(b)(3)(i)); and the organization cannot participate in, or intervene in (including the publishing or distributing of statements), any political campaign on behalf of (or in opposition to) any candidate for public office (IRC § 501(c)(3)).
23 Treas. Reg. § 1.501(c)(3)–1(a)(1).24 Treas. Reg. §§ 1.501(c)(3)-1(b)(1)(i)(a), (b); 1.501(c)(3)-1(b)(4). “Articles of organization” includes “the trust instrument, the
corporate charter, the articles of association, or any other written instrument by which an organization is created.” Treas. Reg. § 1.501(c)(3)-1(b)(2).

Section One — FORM 1023-EZ
Form 1023-EZ IRS Collectibility Curve Audit Impact Study Understanding the Hispanic Underserved
8
for one or more exempt purposes, or to the federal government, or to a state or local government, for a public purpose .25 The nine states with such laws, sometimes referred to as cy pres states, are Arkansas, California, Louisiana, Massachusetts, Minnesota, Missouri, Ohio, Oklahoma, and Texas .26 In general, a determination as to whether a corporation satisfies the organizational test can be made after reviewing its articles of incorporation .
This study is limited to Form 1023-EZ filers that were corporations (we did not consider applications submitted by unincorporated associations or trusts) .27 The first part of the data collection instrument, discussed below, focuses on whether the corporation met the organizational test .
IRC § 501(c)(3) Organizations Must Satisfy an Operational TestAn organization meets the “operational test” if:
■■ It engages primarily in activities which accomplish one or more of the eight exempt purposes speci-fied in IRC § 501(c)(3);28
■■ No more than an insubstantial part of its activities is not in furtherance of an exempt purpose;29
and
■■ It is operated to further public rather than private interests .30
Because the terms “exclusively,” “primarily” and “insubstantial” are undefined in IRC § 501(c)(3) and the regulations, whether an organization meets the operational test may depend on the facts and circum-stances .31 This research project did not involve reviewing the approved Form 1023-EZ, contacting any organization, or otherwise attempting to develop a conclusion about whether an organization met the operational test . However, the second part of the data collection instrument, discussed below, allowed us to gather some descriptive information that could be relevant to such a determination .
25 See Treas. Reg. § 1.501(c)(3)-1(b)(4). 26 Rev. Proc. 82-2, 1982-1 C.B. 367, Tex. Bus. Orgs. Code Ann. § 22.304(a)(2) (2012). Cy pres is “[t]he equitable doctrine
under which a court reforms a written instrument with a gift to charity as closely to the donor’s intention as possible, so that the gift does not fail.” Black’s law Dictionary (9th ed. 2009). State law or court action of the type described in Rev. Proc. 82-2 satisfies the requirement for a dissolution provision where there is no provision in the creating docu-ment. However, if the creating document contains a dissolution provision that is defective, state law or court action would not cure the defect. See Elizabeth Ardoin, 2004 EO CPE Text Organizational Test – IRC 501(c)(3) 12, Q.11, available at https://www.irs.gov/pub/irs-tege/eotopicd04.pdf.
27 Most Form 1023-EZ applicants are corporations. For example, of the 29,067 approved Form 1023-EZ applications from July 1, 2014–Mar. 27, 2015, 26,076 of the applicants were corporations, 2,752 were unincorporated associations other than a trust, and 239 were trusts. TE/GE response to TAS information request (June 11, 2015).
28 See Treas. Reg.§ 1.501(c)(3)-1(c)(1), providing that “[a]n organization will be regarded as operated exclusively for one or more exempt purposes only if it engages primarily in activities which accomplish one or more of such exempt purposes specified in section 501(c)(3).”
29 See Treas. Reg.§ 1.501(c)(3) -1(c)(1), providing that “[a]n organization will not be so regarded if more than an insubstantial part of its activities is not in furtherance of an exempt purpose.”
30 Treas. Reg. § 1.501 (c)(3) -1(d)(1)(ii).31 An exception is IRC § 501(h), an elective “safe harbor” that allows for a determination, based solely on the electing
IRC § 501(c)(3) organization’s expenditures, of whether its lobbying activities are within permissible limits.
Taxpayer Advocate Service — 2015 Annual Report to Congress — Volume Two 9
Understanding the Hispanic Underserved Audit Impact Study Form 1023-EZIRS Collectibility Curve
RESEARCH QUESTIONS
Our study examines a representative sample of corporations:
■■ That were organized in states with a free, publicly accessible electronic database of legible copies ofcorporations’ articles of incorporation;32 and
■■ Whose Forms 1023-EZ were approved between July 1, 2014 and March 27, 2015 .
For the 408 organizations in the representative sample, we inquired into three areas:
1 . Whether the Organization Satisfied the Organizational Test
■■ Whether its articles of incorporation contained an acceptable purpose clause;
■■ Whether its articles contained an adequate dissolution clause;33 and
■■ How long it takes to retrieve and review articles of incorporation from state websites .
2 . Whether the Organization was Eligible to Apply for Exempt Status Using Form 1023-EZ
■■ The number ineligible because their application for retroactive reinstatement was apparentlysubmitted more than 15 months after the organization’s exempt status was automaticallyrevoked; and
■■ The number ineligible for other reasons .34
3 . Whether Information on the Organization’s Website, if Any, Provided Transparency
■■ The number of organizations that had websites; and
■■ The number of websites that identified directors or identified a contact person .
METHODOLOGY
TE/GE provided TAS Research a data file with the names, Employer Identification Numbers (EINs), state of incorporation, ruling date, and addresses of all corporations whose Form 1023-EZ applications were approved from July 1, 2014, when Form 1023-EZ was introduced, through March 27, 2015 .35 There were 26,064 separate organizations in the data file .36 Of these organizations, 11,000 (about 40 percent), were incorporated in states in which the Secretary of State maintains a website that permitted TAS to view legible copies of corporations’ articles of incorporation at no charge (20 states) .37 The IRS has sought
32 There are 20 such states, enumerated below.33 As noted above, not all states require a dissolution clause, but even in those states a defective dissolution clause is not cured
by the operation of the cy pres doctrine. Thus, all dissolution clauses required review. 34 Organizations with total assets in excess of $250,000 and those expecting annual gross receipts to exceed $50,000 are not
eligible to use Form 1023-EZ. Because we did not review the applications themselves, we did not determine whether any such organizations were included in our sample. However, as discussed below, we were able to ascertain whether organizations in our sample ran afoul of other eligibility requirements. For example, organizations formed as limited liability companies, church-es, schools, colleges, and universities, hospitals, credit counselling organizations, and medical research organizations, among others, are all ineligible to use Form 1023-EZ. See Rev. Proc. 2014-40, § 2.01, 2014-30 I.R.B. 229.
35 Because the TE/GE database used to process the applications did not initially reflect the state of incorporation, there were 2,792 organizations in the data file for which the state of incorporation was not shown. TE/GE response to TAS information request (May 26, 2015). TAS adjusted the data collection instrument (DCI) to address the possibility that an organization’s mailing address differed from its state of incorporation. See DCI Question 8, infra.
36 Twelve duplicate organizations were found and we kept the duplicate with the latest date.37 These states are: Alaska, Colorado, Florida, Idaho, Indiana, Iowa, Kansas, Kentucky, Maryland, Massachusetts, Michigan,
Mississippi, Missouri, New Hampshire, North Carolina, Ohio, Oregon, Rhode Island, South Dakota, and Texas. Of these, Massachusetts, Missouri, Ohio, and Texas are cy pres states.

Section One — FORM 1023-EZ
Form 1023-EZ IRS Collectibility Curve Audit Impact Study Understanding the Hispanic Underserved
10
access to these records for states that do not currently make them available to the public .38 Out of these 11,000 organizations, TAS Research identified a representative, random sample of 420 organizations for further analysis . Articles of incorporation for 11 organizations could not be located on the official site for the state in which, according to TE/GE, the organization was formed .39 Further, one organization’s articles of incorporation were viewable on the appropriate state website, but portions were not legible . We excluded these twelve organizations from our sample, resulting in a sample size of 408 . Our findings for the study population are statistically valid at the 95 percent confidence level with a margin of error no greater than +/-5 percent, which allows study findings to be projected to the population of 11,000 organizations from states in our study . Some findings are for smaller portions of the sample and will have a larger margin of error . The TAS team, led by a Technical Liaison with more than 15 years of experience as an EO determinations specialist, included a second Technical Liaison, two Revenue Agent Technical Advisors (RATAs), a Research Analyst, a Supervisory Research Analyst, and a Senior Attorney Advisor .40
DATA COLLECTION
The team lead, using training material developed by TE/GE, trained the RATAs on the legal require-ments for exempt status as an IRC § 501(c)(3) organization .41 The project team then developed a DCI, which appears in Appendix A, to capture information about each organization . The Technical Liaisons and RATAs completed the DCI for each organization in the sample . Some DCI questions required a review of the organization’s publicly available articles of incorporation . Other DCI questions required a review of the IRS’s publicly accessible Select Check database .42 Still other DCI questions required a review of the organization’s website (if any) . To minimize bias, case reviewers were thoroughly and consistently briefed on the purpose of the data collection and provided instructions on proper completion of the DCI . The project lead reviewed ten completed DCIs from each team member for accuracy, and the team discussed ten additional DCIs as a group . In addition, the DCI includes the question “is your review complete?” and one possible response is “needs additional review .” If that option was selected, the team lead reviewed the DCI for that organization . TAS Research collected additional data from return
38 In its third quarter, BPR, TE/GE reported that “24 states publicly post articles of incorporation, 22 states do not have electron-ic versions publicly available, and the remaining four states charge fees or have a lengthy application process to get access to the articles.” TE/GE is exploring the possibility of gaining access to any Secretary of State offices that have internal systems with electronic articles of incorporation, or to such electronic versions maintained by state Attorneys General. TE/GE Third Qtr BPR 2015 at 5 (Oct. 2015). No mention of these efforts appears in TE/GE’s Fourth Qtr BPR.
39 If an organization with the name shown in the data file TE/GE provided did not appear on the state database for the state shown in the TE/GE data file for that organization, we attempted to determine whether the organization appeared on that state database under a name that, due to a typographical error, differed from the name in the TE/GE data file. If we were able to confirm that it was the same organization (e.g., by comparing the organization’s EIN in the TE/GE data file with an EIN shown on the state database), we included the organization in the sample.
40 Internal Revenue Agent Technical Liaisons in TAS provide technical advice to the Executive Director of Systemic Advocacy on systemic problems that affect taxpayers; plan, organize, and carry through to completion analytical studies involving signifi-cant IRS policies; and provide guidance on issue resolutions, among other things. See IRS Standard Position Description No. 97730. Internal RATAs in TAS provide expert advice on tax examination issues; research technical issues and apply tax law to facts; and access and analyze taxpayer returns and related documents, among other things. See IRS Standard Position Description No. 92548.
41 See Exempt Organizations Determinations Training, Unit 1a Student Guide (Rev. 2009), available at http://www.taxanalysts.com/www/features.nsf/Features/230B8FFB8A9A85A685257C63004AFA5B. The training focused on Lesson 8 - Introduction to 501(c)(3) and Organizational Test, Lesson 9 - 501(c)(3) Operational Test, Lesson 10 Section A, Charitable Organizations Purposes and Types, and Lesson 10 Section B, Other Activities Considered Charitable. Additional training material was Elizabeth Ardoin, 2004 EO CPE Text Organizational Test – IRC 501(c)(3), available at https://www.irs.gov/pub/irs-tege/eotopicd04.pdf.
42 EO Select Check is an online search tool, available at http://apps.irs.gov/app/eos/, that allows users to search for organiza-tions eligible to receive tax deductible contributions, organizations whose tax exemption has been automatically revoked for not filing a Form 990-series return or notice for three consecutive years, and organizations that have filed a Form 990-N (also called an e-Postcard), an annual notice required to be filed by small exempt organizations.

Taxpayer Advocate Service — 2015 Annual Report to Congress — Volume Two 11
Understanding the Hispanic Underserved Audit Impact Study Form 1023-EZIRS Collectibility Curve
databases, such as whether the organization filed Forms 1120, 990, or 990-N in any of the last four tax years (i.e., 2012–2015) .
FINDINGS
General Characteristics of the Organizations in the SampleThe organizations in the sample are geographically distributed among states in the United States as shown by Figure 1 .2 .
FIGURE 1.2
States with organizations in the sample
Geographical Distribution of Organizations in the Sample
The exempt status of 69 (16 percent) of organizations in the sample had been automatically revoked, from which we inferred that they filed Form 1023-EZ seeking reinstatement of their exempt status .
Thirty-Seven Percent of Organizations Failed the Organizational Test Because Their Articles Lacked an Adequate Purpose Clause, Dissolution Clause, or BothAs described above, in order to qualify for exempt status as an IRC § 501(c)(3) organization, the articles of incorporation for all the organizations in our sample are required to contain an acceptable purpose clause . Of the 408 organizations in the sample, 284 (70 percent) organizations meet this requirement and 124 (30 percent) do not .

Section One — FORM 1023-EZ
Form 1023-EZ IRS Collectibility Curve Audit Impact Study Understanding the Hispanic Underserved
12
In addition, the articles of incorporation must contain an adequate dissolution clause, unless, under the doctrine of cy pres, a dissolution clause is not required .43 Out of the 408 organizations in the sample there are 313 whose assets upon dissolution would be distributed as the law requires, a rate of 77 percent . The articles of 95 organizations, or 23 percent, do not meet this requirement . Figures 1 .3 and 1 .4 show the number of organizations in the sample that meet the organizational test and those that do not, further characterized by whether the organization is in a cy pres state . For those organizations that do not meet the organizational test, the reason for not meeting the test (inadequate purpose clause, inadequate dissolu-tion clause, or both) is also shown .
FIGURE 1.3, Number and Percent of Organizations With Approved Form 1023-EZ Applications in TAS Sample, Shown by Whether They Meet the IRC § 501(c)(3) Organizational Test
Purpose and Dissolution Clauses Total Cy Pres
Non Cy Pres Total Cy Pres
Non Cy Pres
Both Inadequate 70 3 67 17% 2% 25%
Inadequate Purpose Adequate Dissolution
54 39 15 13% 28% 6%
Adequate Purpose Inadequate Dissolution
25 3 22 6% 2% 8%
Both Adequate 259 93 166 63% 67% 61%
Total 408 138 270 100% 100% 100%
Source: TAS Representative Sample of Organizations in 20 States Where Articles of Incorporation Are Available Online at No Cost
43 Of the 408 organizations in the sample, 138 organizations are in cy pres states and 270 organizations are not. Of the 138 organizations in cy pres states, six contained a dissolution clause (although no clause is required) and the clause was inad-equate. Because, as noted above, state law or court action would not cure a defective dissolution provision contained in articles of incorporation, we counted these six organizations among those that did not have an adequate dissolution clause. Sixty-eight of the organizations in cy pres states were organized in Texas, 30 in Ohio, 23 in Massachusetts, and 17 in Missouri.

Taxpayer Advocate Service — 2015 Annual Report to Congress — Volume Two 13
Understanding the Hispanic Underserved Audit Impact Study Form 1023-EZIRS Collectibility Curve
FIGURE 1.4
Number of Organizations With Approved Form 1023-EZ Applications in TAS Sample, Shown by Whether They Meet the IRC § 501(c)(3) Organizational Test
408 organizations in TAS sample
138 in cy pres states 270 in non cy pres states
45 did not meet organizational test
93 met organizational test
104 did not meet organizational test
166 met organizational test
22 with purpose clause adequate, dissolution
clause inadequate
15 with purpose clause inadequate, dissolution
clause adequate
67 with both purpose and dissolution clause
inadequate
3 with purpose clause adequate, dissolution
clause inadequate
39 with purpose clause inadequate, dissolution
clause adequate
3 with both purpose and dissolution clause
inadequate
Source: TAS Representative Sample of Organizations in 20 States Where Articles of Incorporation Are Available Online at No Cost
Overall, as Figure 1 .5 shows, of 408 organizations in the sample, 259 (63 percent) meet the organizational test and 149 (37 percent) do not .
FIGURE 1.5
Proportion of Organizations With Approved Form 1023-EZ Applications in TAS Sample, Shown by Whether They Meet the IRC § 501(c)(3) Organizational Test
63% 6% 13% 17%
Inadequate Purpose, Adequate Dissolution
Adequate Purpose, Inadequate Dissolution
Both Adequate Both Inadequate
67% 2% 28% 2%Cy Pres
61% 8% 6% 25%Non Cy Pres
Total
Numbers may not add to 100% due to rounding.
Source: TAS Representative Sample of Organizations in 20 States Where Articles of Incorporation Are Available Online at No Cost
Section One — FORM 1023-EZ
Form 1023-EZ IRS Collectibility Curve Audit Impact Study Understanding the Hispanic Underserved
14
The overall rate of compliance for organizations in cy pres states and non cy pres states is similar (67 per-cent compared to 61 percent) . Unsurprisingly, for organizations in cy pres states, the failure to meet the organizational test was usually (in 42 out of 45 such cases) due to the lack of an adequate purpose clause . For organizations in non cy pres states that did not meet the organizational test, however, formulating an adequate purpose clause was also an obstacle . For these organizations, the lack of a dissolution clause was not the predominant reason for the noncompliance . Rather, these organizations usually (in 67 out of 104 such cases) lacked both an adequate purpose clause and an adequate dissolution clause . Thus, cy pres doctrines assist organizations to meet the requirements for exempt status, but the difficulty of crafting an acceptable purpose clause appears to result in comparable compliance levels, for purposes of the organiza-tional test, of organizations in cy pres states and those in non cy pres states .
For the 259 organizations in the sample that meet the organizational test, we were usually able to identify more than one exempt purpose; only 60 appear to have a single exempt purpose .44 Common combina-tions of purposes are religious, charitable, scientific, and educational (72 organizations) and charitable and educational (51 organizations) .
It Takes Only a Few Minutes to Review Articles of Incorporation, and Inadequacies Appear to Be Easily CorrectableIt took the reviewers about three minutes on average to review an organization’s articles and determine whether there were acceptable purpose and dissolution clauses .45 The longest it took to search for and review articles was 15 minutes (in four cases) . In over 90 percent of the cases, it took five minutes or less .
The articles of incorporation for the organizations in our sample contain a wide variety in wording or word choice . Each organization’s articles required attentive review because, as IRS training materi-als note, “[t]he difference between the right word and the almost right word is the difference between lightning and the lightning bug .”46 Articles that are “almost right” cannot, as a matter of law, satisfy the requirements for IRC § 501(c)(3) status . For example, an organization’s purpose clause might consist of a mission statement suggesting an exempt purpose, but no limitation imposing exclusivity with respect to that exempt purpose or purposes as required by IRC § 501(c)(3) .47 Similarly, an organization’s articles might provide that its assets on dissolution will be distributed to a named organization that is described in IRC § 501(c)(3), but make no provision ensuring that the assets will be dedicated to a charitable purpose in the event the named organization is unwilling to accept the assets, is no longer described in IRC § 501(c)(3), or is no longer in existence .48 In either situation, the organization does not meet the requirements of IRC § 501(c)(3) . However, if the organization were made aware of the deficiency and would be willing to adjust its articles (and its operations, if necessary), cases such as these could be easily
44 Of these 60 organizations, 39 have only a charitable purpose, 12 have only an educational purpose, four have prevention of cruelty to children or animals as the only purpose, two have only the purpose of fostering amateur sports competition, and three have only a religious purpose. None of the organizations that meet the organizational test have only scientific, literary, or testing for public safety purposes.
45 The average number of minutes was 2.7.46 Elizabeth Ardoin, quoting Mark Twain, 2004 EO CPE Text Organizational Test – IRC 501(c)(3) 1, available at
https://www.irs.gov/pub/irs-tege/eotopicd04.pdf. 47 The instructions to Form 1023 on page 7 provide this example of an acceptable dissolution clause: “The organization is orga-
nized exclusively for charitable, religious, educational, and scientific purposes, under section 501(c)(3) of the Internal Revenue Code, or corresponding section of any future federal tax code.”
48 The instructions to Form 1023 on page 7 provide this example of an acceptable purpose clause: “Upon the dissolution of this organization, assets shall be distributed for one or more exempt purposes within the meaning of section 501(c)(3) of the Internal Revenue Code, or corresponding section of any future federal tax code, or shall be distributed to the federal govern-ment, or to a state or local government, for a public purpose.”

Taxpayer Advocate Service — 2015 Annual Report to Congress — Volume Two 15
Understanding the Hispanic Underserved Audit Impact Study Form 1023-EZIRS Collectibility Curve
resolved during the application process and before granting IRC § 501(c)(3) status . TE/GE’s practice, when it reviews articles of incorporation as part of its pre-determination review of a random sample of Form 1023-EZ applicants, is to advise organizations of any deficiencies in their organizing documents .49 However, TE/GE does not actually require affected organizations to demonstrate they adjusted their articles, but only to attest they have done so . The applicable paragraph from the letter TE/GE uses for this purpose appears as Appendix D .
Some Organizations in the Sample Were Not Eligible to Use Form 1023-EZAs described above, eligibility to file Form 1023-EZ is restricted to organizations that meet certain characteristics in terms of size and organizational attributes . Specifically, organizations responding affirmatively to any of the questions on the Eligibility Worksheet are not eligible to apply using Form 1023-EZ . Organizations that do not meet these eligibility requirements may qualify as IRC § 501(c)(3) organizations, but they must apply for recognition using a full Form 1023 . In the representative sample of 408 organizations, the articles of incorporation of 18, or four percent, showed they were not eligible to apply using Form 1023-EZ .50
Information on Organizations’ Websites May Provide Additional Information, But Only About 60 Percent of the Organizations Had Websites, Including FacebookOrganizations eligible to apply for recognition as IRC § 501(c)(3) organizations using Form 1023-EZ may generally meet their annual reporting requirements by submitting Form 990-N, or e-Postcard, which contains eight pieces of information:
■■ the organization’s EIN;
■■ the tax year;
■■ the organization’s legal name and mailing address;
■■ any other names the organization uses;
■■ the name and address of a principal officer;
■■ the website address if the organization has one;
■■ confirmation that the organization’s annual gross receipts are $50,000 or less: and, if applicable,
■■ a statement that the organization has terminated or is terminating (going out of business) .
Because these eight pieces of information convey very little about the organization, the best public source of information may be the organization’s website . There is no requirement that an exempt organization maintain a website, and out of the 408 organizations in the sample, fewer than half (191 organizations, or 47 percent) had websites other than Facebook .51
49 For a description of TE/GE’s predetermination review of a representative sample of Form 1023-EZ applicants, see Most Serious Problem: Form 1023-EZ: Recognition as a Tax-Exempt Organization is Now Virtually Automatic for Most Applicants, Which Invites Noncompliance, Diverts Tax Dollars and Taxpayer Donations, and Harms Organizations Later Determined to be Taxable, supra.
50 Nine organizations are schools, colleges, or universities or supporting organizations, four are churches, two are organized as limited liability companies (LLCs), two are credit counseling organizations, and one is a medical research organization. In addition, one organization appears to have filed Form 1023-EZ to obtain retroactive reinstatement of its exempt status, even though it filed Form 1023-EZ more than 15 months after its automatic revocation. See Form 1023-EZ Instructions at 10.
51 Of the 408 organizations in the sample, 217 did not have websites; in seven cases we could not determine whether there was a website. Of the 217 organizations in the sample that did not have websites, 54 had Facebook pages. Internal Revenue Manual (IRM) Exhibit 10.8.27-1 (Sept. 29, 2014) prohibits employees from “using social media (e.g., Google Groups, Wikipedia, MySpace, Facebook, YouTube, Second Life, Flickr, Twitter) in an official capacity, or during their duty time, and such use shall be separate from their job.”

Section One — FORM 1023-EZ
Form 1023-EZ IRS Collectibility Curve Audit Impact Study Understanding the Hispanic Underserved
16
As noted above, of the 408 organizations in the sample, 124 either had an inadequate purpose clause or no clause at all in their articles of incorporation . Of these 124 organizations, 61 had websites we could access to obtain additional information .52 From viewing those 61 websites, we were able to ascertain the organization’s purpose in 42 cases, but the purpose of the remaining 19 remains obscure . Only 11 of the 61 websites identified a contact person (with or without a separate email address or phone number for that person) and only 19 out of the 61 websites identified the organization’s directors .
The website of one organization whose articles of incorporation have acceptable purpose and dissolution clauses (i.e ., the organization met the organizational test) raises concern about whether the organization serves a private, as opposed to public, interest . The website notes:
[T]he [X, a named individual] Memorial Fund Was created, not only to carry out [X]’s legacy,but to also establish a college fund for his two children [Y and Z] . [X] was a beloved stand-up comedian and country music artist known by many for his original songs and comedyperformances . By donating to this fund you are not only aiding in keeping [X’]’s legacy alive,but also aiding in the future and education of a child . The [X] Memorial Fund is a voice forhis fans in this time of mourning . Please take a moment to donate and reflect on the life ofthe beloved [X] .
This description raises serious doubts about whether the organization intends to serve a public, as op-posed to a private, interest . The website of a different organization, which also met the organizational test, reveals that it is actually a for-profit business .53 Eight organizations in our sample filed Form 1120, U.S. Corporation Income Tax Return for at least one tax period prior to obtaining recognition of exempt status, which raises the question of whether the organizations merely continued to operate a for-profit entity in the guise of an exempt organization .
FOLLOW-UP STEPS IN LIGHT OF STUDY FINDINGS
As discussed above, our study showed that a significant number of Form 1023-EZ applicants were recognized as IRC § 501(c)(3) organizations despite failing to meet the legal requirements for such status . Those that intended to organize and operate exclusively for an exempt purpose but simply drafted their articles of incorporation inartfully did not receive from the IRS the minimal amount of service needed to identify the deficiency and notify the organization of the need to correct it . Organizations that misrepre-sented their qualifications as exempt organizations, intentionally or not, were aided by the IRS in mislead-ing the public . Taxpayers’ right to quality service and their right to be informed were thereby undermined .54 To the extent organizations received amounts that should have been treated as taxable receipts they were improperly subsidized by other taxpayers . To the extent organizations not qualified as IRC § 501(c)(3) organizations received contributions deducted by the donor, tax dollars were inappropriately diverted . In any case, the IRS missed a valuable opportunity to avert noncompliance as the organizations commenced or continued their operations . In order to allow the IRS to work with organizations in our sample identi-fied as not meeting the requirements of exempt status as IRC § 501(c)(3) organizations, we provided their EINs to TE/GE . We recommended that TE/GE advise the organizations of the deficiencies in their articles and require the organizations to demonstrate (not simply attest) that they amended their articles
52 Sixty-two of the 124 organizations without an adequate purpose clause in their articles of incorporation also did not have web-sites. Of the 62 that did not have websites, 16 had Facebook pages.
53 Two other organizations’ websites raise concerns that the organization serves a private benefit. They did not satisfy the organi-zational test because their articles lack an acceptable purpose clause.
54 See Taxpayer Bill of Rights, available at www.TaxpayerAdvocate.irs.gov/taxpayer-rights.

Taxpayer Advocate Service — 2015 Annual Report to Congress — Volume Two 17
Understanding the Hispanic Underserved Audit Impact Study Form 1023-EZIRS Collectibility Curve
to comply with the requirements for qualification as IRC § 501(c)(3) organizations . We will ask TE/GE which organizations it contacted, and TAS will determine how many amended their articles of incorpora-tion to comport with the requirements for exempt status as IRC § 501(c)(3) organizations .
CONCLUSION
A significant number of organizations recognized as exempt under IRC § 501(c)(3) do not meet the legal requirements for that status . It takes only a few minutes to ascertain whether an organization’s articles of incorporation contain adequate purpose and dissolution clauses, and some inadequacies in the articles appear to be easily correctable . Moreover, because Form 1023-EZ does not require narrative responses or substantiating documents and Form 990-N provides only minimal information, together with the prob-ability that a Form 1023-EZ applicant does not maintain a website, there is a disturbing lack of informa-tion about organizations whose Form 1023-EZ was approved .
RECOMMENDATIONS
The National Taxpayer Advocate recommends that the IRS adjust Form 1023-EZ to require organizations to submit their organizing documents, unless they are available online at no cost, and require a narrative statement of the organization’s activities and its financial information . The IRS should make a determina-tion only after reviewing these materials, and to the extent a deficiency can be corrected by amending the organizing document, the IRS should require the applicant to submit an amendment that corrects the deficiency and has been approved by the state . The IRS should also continue its efforts to gain electronic access to articles of incorporation of corporations organized in states that do not presently make these records publicly available online .

Section One — FORM 1023-EZ
Form 1023-EZ IRS Collectibility Curve Audit Impact Study Understanding the Hispanic Underserved
18
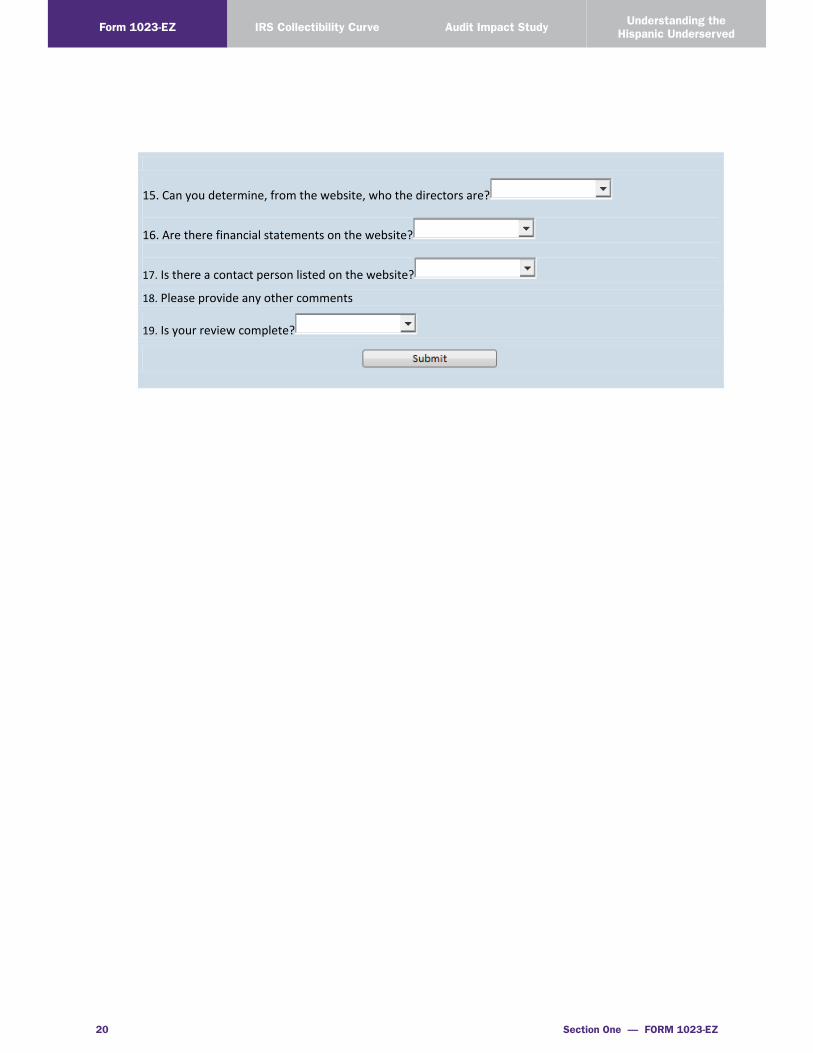
APPENDIX A: Data Collection Instrument
C. :
incorporated
Second
Form 1023-EZ Data Collection Instrument
A. Who is the reviewer?
B. EIN:
Organization Name
D. State:
Does an organization with this name appear on the Secretary of State’s database as an organization
in that state?
If not, what is the correct name?
Ruling Month: Ruling Year:
1.a. Are the articles of incorporation posted and viewable on the State charitable organization
website?
1. b. Filing Date
1. c. Were articles amended after ruling date?
First Amendment Date, MM/DD/YYYY, (if applicable):
Amendment Date, MM/DD/YYYY, (if applicable):
Third Amendment Date, MM/DD/YYYY, (if applicable):
Please specify additional amendment dates, if more than 3:
1. d. Do the organization’s articles of incorporation state that it is a mutual benefit corporation?
2. Is there an acceptable dissolution clause?

Taxpayer Advocate Service — 2015 Annual Report to Congress — Volume Two 19
Understanding the Hispanic Underserved Audit Impact Study Form 1023-EZIRS Collectibility Curve
3. Is there an acceptable purpose clause?
Select the purpose(s):
4. How long did it take you to retrieve the articles of incorporation and answer questions 1-3 (INMINUTES)?
5. Do the articles of incorporation indicate the organization is any of the following:
6. Do the articles of incorporation indicate the organization isany of the following:(note that credit counseling organization Indicates where the organization’s activities involve theeducation of the consumer on budgeting, personal finance, financial literacy, mortgage foreclosureassistance, or other consumer credit areas)
7. As of the ruling date, does the organization appear to have been in good standing?
8. Does the organization have a website?
Does the website show the organization in a state different than the state shown in box D. above?
If so, what State is on the site?
Insert the hyperlink here: Attach a screenshot here:
Click here to insert a hyperlink
9. The organization’s website clearly show that the organization participates in or intervenes in a
political campaign on behalf of or in opposition to a candidate for public office.
10. The organization’s website clearly shows that private individuals will receive financial gain because
of their position within the organization. 11. According to the website, what are the organization's activities?
14. Does Select Check show the organization’s exempt status was automatically revoked?
What was the Revocation Date?
Section One — FORM 1023-EZ
Form 1023-EZ IRS Collectibility Curve Audit Impact Study Understanding the Hispanic Underserved
20
15. Can you determine, from the website, who the directors are?
16. Are there financial statements on the website?
17. Is there a contact person listed on the website?
18. Please provide any other comments
19. Is your review complete?
Taxpayer Advocate Service — 2015 Annual Report to Congress — Volume Two 21
Understanding the Hispanic Underserved Audit Impact Study Form 1023-EZIRS Collectibility Curve
APPENDIX B: Form 1023-EZ, Streamlined Application for Recognition of Exemption Under Section 501(c)(3) of the Internal Revenue Code
Section One — FORM 1023-EZ
Form 1023-EZ IRS Collectibility Curve Audit Impact Study Understanding the Hispanic Underserved
22
Form 1023-EZ (6-2014) Page 2
Part III Your Specific Activities
1 Enter the appropriate 3-character NTEE Code that best describes your activities (See the instructions):
2 To qualify for exemption as a section 501(c)(3) organization, you must be organized and operated exclusively to further one or more of the following purposes. By checking the box or boxes below, you attest that you are organized and operated exclusively to further the purposes indicated. Check all that apply.
Charitable Religious Educational
Scientific Literary Testing for public safety
To foster national or international amateur sports competition Prevention of cruelty to children or animals
3 To qualify for exemption as a section 501(c)(3) organization, you must:
• Refrain from supporting or opposing candidates in political campaigns in any way.
• Ensure that your net earnings do not inure in whole or in part to the benefit of private shareholders or individuals (that is, board members, officers, key management employees, or other insiders).
• Not further non-exempt purposes (such as purposes that benefit private interests) more than insubstantially.
• Not be organized or operated for the primary purpose of conducting a trade or business that is not related to your exempt purpose(s).• Not devote more than an insubstantial part of your activities attempting to influence legislation or, if you made a section 501(h) election, not
normally make expenditures in excess of expenditure limitations outlined in section 501(h).• Not provide commercial-type insurance as a substantial part of your activities.
Check this box to attest that you have not conducted and will not conduct activities that violate these prohibitions and restrictions.
4 Do you or will you attempt to influence legislation? . . . . . . . . . . . . . . . . . . . . . .
(If yes, consider filing Form 5768. See the instructions for more details.)
Yes No
5 Do you or will you pay compensation to any of your officers, directors, or trustees? . . . . . . . . . . . .(Refer to the instructions for a definition of compensation.)
Yes No
6 Do you or will you donate funds to or pay expenses for individual(s)? . . . . . . . . . . . . . . . . Yes No
7 Do you or will you conduct activities or provide grants or other assistance to individual(s) or organization(s) outside the United States? . . . . . . . . . . . . . . . . . . . . . . . . . . . . . . . . Yes No
8 Do you or will you engage in financial transactions (for example, loans, payments, rents, etc.) with any of your officers, directors, or trustees, or any entities they own or control? . . . . . . . . . . . . . . . . . . . . Yes No
9 Do you or will you have unrelated business gross income of $1,000 or more during a tax year? . . . . . . . . . Yes No
10 Do you or will you operate bingo or other gaming activities? . . . . . . . . . . . . . . . . . . . Yes No
11 Do you or will you provide disaster relief? . . . . . . . . . . . . . . . . . . . . . . . . Yes No
Part IV Foundation Classification
Part IV is designed to classify you as an organization that is either a private foundation or a public charity. Public charity status is a more favorable tax status than private foundation status.
1 If you qualify for public charity status, check the appropriate box (1a – 1c below) and skip to Part V below.
a Check this box to attest that you normally receive at least one-third of your support from public sources or you normally receive at least 10 percent of your support from public sources and you have other characteristics of a publicly supported organization. Sections 509(a)(1) and 170(b)(1)(A)(vi).
b Check this box to attest that you normally receive more than one-third of your support from a combination of gifts, grants, contributions, membership fees, and gross receipts (from permitted sources) from activities related to your exempt functions and normally receive not more than one-third of your support from investment income and unrelated business taxable income. Section 509(a)(2).
c Check this box to attest that you are operated for the benefit of a college or university that is owned or operated by a governmental unit. Sections 509(a)(1) and 170(b)(1)(A)(iv).
2 If you are not described in items 1a – 1c above, you are a private foundation. As a private foundation, you are required by section 508(e) to have specific provisions in your organizing document, unless you rely on the operation of state law in the state in which you were formed to meet these requirements. These specific provisions require that you operate to avoid liability for private foundation excise taxes under sections 4941-4945.
Check this box to attest that your organizing document contains the provisions required by section 508(e) or that your organizing document does not need to include the provisions required by section 508(e) because you rely on the operation of state law in your particular state to meet the requirements of section 508(e). (See the instructions for explanation of the section 508(e) requirements.)
Form 1023-EZ (6-2014)
Form
1023
-EZ
is file
d elec
tronic
ally o
nly on
Pay
.gov.

Taxpayer Advocate Service — 2015 Annual Report to Congress — Volume Two 23
Understanding the Hispanic Underserved Audit Impact Study Form 1023-EZIRS Collectibility Curve
Printed on recycled paper

Section One — FORM 1023-EZ
Form 1023-EZ IRS Collectibility Curve Audit Impact Study Understanding the Hispanic Underserved
24
APPENDIX C: Form 1023-EZ Eligibility Worksheet
Page 11 of 20 Fileid: … /I1023EZ/201508/A/XML/Cycle05/source 11:49 - 13-Jul-2015The type and rule above prints on all proofs including departmental reproduction proofs. MUST be removed before printing.
Form 1023-EZ Eligibility Worksheet(Must be completed prior to completing Form 1023-EZ)
If you answer “Yes” to any of the worksheet questions, you are not eligible to apply for exemption under section 501(c)(3) using Form 1023-EZ. You must apply on Form 1023. If you answer “No” to all of the worksheet questions, you may apply using Form 1023-EZ.
1. Do you project that your annual gross receipts will exceed $50,000 in any of the next 3 years?
Gross receipts are the total amounts the organization received from all sources during its annual accounting period, without subtracting any costs or expenses. You should consider this year and the next two years.
Yes No
2. Have your annual gross receipts exceeded $50,000 in any of the past 3 years? Yes No3. Do you have total assets the fair market value of which is in excess of $250,000?
Total assets includes cash, accounts receivable, inventories, bonds and notes receivable, corporate stocks, loans receivable, other investments, depreciable and depletable assets, land, buildings, equipment, and any other assets.
Yes No
4. Were you formed under the laws of a foreign country (United States territories and possessions are not considered foreign countries)?
You are formed under the laws of a foreign country if you are not formed under the laws of (1) the United States, its states, territories, or possessions; (2) federally recognized Indian tribal or Alaskan native governments; or (3) the District of Columbia.
Yes No
5. Is your mailing address in a foreign country (United States territories and possessions are not considered foreign countries)?
Your mailing address is the address where all correspondence will be sent.
Yes No
6. Are you a successor to, or controlled by, an entity suspended under section 501(p) (suspension of tax-exempt status of terrorist organizations)?
Section 501(p)(1) suspends the exemption from tax under section 501(a) of any organization described in section 501(p)(2). An organization is described in section 501(p)(2) if the organization is designated or otherwise individually identified (1) under certainprovisions of the Immigration and Nationality Act as a terrorist organization or foreignterrorist organization; (2) in or pursuant to an Executive Order which is related to terrorismand issued under the authority of the International Emergency Economic Powers Act orsection 5 of the United Nations Participation Act of 1945 for the purpose of imposing onsuch organization an economic or other sanction; or (3) in or pursuant to an ExecutiveOrder issued under the authority of any federal law, if the organization is designated orotherwise individually identified in or pursuant to the Executive Order as supporting orengaging in terrorist activity (as defined in the Immigration and Nationality Act) orsupporting terrorism (as defined in the Foreign Relations Authorization Act) and theExecutive Order refers to section 501(p)(2).
Under section 501(p)(3) of the Code, suspension of an organization’s tax exemption begins on the date of the first publication of a designation or identification with respect to the organization, as described above, or the date on which section 501(p) was enacted, whichever is later. This suspension continues until all designations and identifications of the organization are rescinded under the law or Executive Order under which such designation or identification was made.
Yes No
Form 1023-EZ Instructions -11-

Taxpayer Advocate Service — 2015 Annual Report to Congress — Volume Two 25
Understanding the Hispanic Underserved Audit Impact Study Form 1023-EZIRS Collectibility Curve
Page 12 of 20 Fileid: … /I1023EZ/201508/A/XML/Cycle05/source 11:49 - 13-Jul-2015The type and rule above prints on all proofs including departmental reproduction proofs. MUST be removed before printing.
7. Are you organized as an entity other than a corporation, unincorporated association, or trust?
Answer “Yes” if you are organized as an LLC under the laws of the state in which you were formed.
Yes No
8. Are you a successor to a for-profit entity?
You are a successor if you have:
1. Substantially taken over all of the assets or activities of a for-profit entity;2. Been converted or merged from a for-profit entity; or3. Installed the same officers, directors, or trustees as a for-profit entity that no longer
exists.
Yes No
9. Were you previously revoked or are you a successor to a previously revoked organization (other than an organization the tax-exempt status of which was automatically revoked for failure to file a Form 990-series return for three consecutive years)?
Do not check “Yes” if your previous revocation, or your predecessor’s revocation, was an automatic revocation (pursuant to section 6033(j)) for failing to satisfy Form 990-series filing requirements for three consecutive years.
Yes No
10. Are you a church or a convention or association of churches described in section 170(b)(1)(A)(i)?
There is no single definition of the word “church” for tax purposes; however, the characteristics generally attributed to churches include:
A distinct legal existence,A recognized creed and form of worship,A definite and distinct ecclesiastical government, A formal code of doctrine and discipline,A distinct religious history, A membership not associated with any other church or denomination,Ordained ministers ministering to the congregation,Ordained ministers selected after completing prescribed courses of study,A literature of its own,Established places of worship,Regular congregations, Regular religious services,Sunday schools for the religious instruction of the young, andSchools for the preparation of ministers.
Although it is not necessary that each of the above characteristics be present, a congregation or other religious membership group that meets regularly for religious worship is generally required. A church includes mosques, temples, synagogues, and other forms of religious organizations. For more information, see Publication 1828.
Yes No
-12- Form 1023-EZ Instructions

Section One — FORM 1023-EZ
Form 1023-EZ IRS Collectibility Curve Audit Impact Study Understanding the Hispanic Underserved
26
Page 13 of 20 Fileid: … /I1023EZ/201508/A/XML/Cycle05/source 11:49 - 13-Jul-2015The type and rule above prints on all proofs including departmental reproduction proofs. MUST be removed before printing.
11. Are you a school, college, or university described in section 170(b)(1)(A)(ii)?
An organization is a school if it:
1. Presents formal instruction as its primary function,2. Has a regularly scheduled curriculum,3. Has a regular faculty of qualified teachers,4. Has a regularly enrolled student body, and5. Has a place where educational activities are regularly carried on.
The term “school” includes primary, secondary, preparatory, high schools, colleges, and universities. It does not include organizations engaged in both educational and non-educational activities, unless the latter are merely incidental to the educational activities.
Yes No
12. Are you a hospital or medical research organization described in section 170(b)(1)(A)(iii) or a hospital organization described in section 501(r)(2)(A)(i)?
An organization is a hospital described in section 170(b)(1)(A)(iii) if its principal purpose or function is providing medical or hospital care, or medical education or research. Medical care includes treatment of any physical or mental disability or condition, on an inpatient or outpatient basis. Thus, if an organization is a rehabilitation institution, outpatient clinic, or community mental health or drug treatment center, it is a hospital if its principal function is providing treatment services as described above.
A hospital does not include convalescent homes, homes for children or the aged, or institutions whose principal purpose or function is to train handicapped individuals to pursue a vocation.
An organization is a medical research organization described in section 170(b)(1)(A)(iii) if its principal purpose or function is the direct, continuous, and active conduct of medical research in conjunction with a hospital. The hospital with which the organization is affiliated must be described in section 501(c)(3), a federal hospital, or an instrumentality of a governmental unit, such as a municipal hospital.
An organization is a hospital organization described in section 501(r)(2)(A)(i) if the organization operates a facility which is required by a state to be licensed, registered, or similarly recognized as a hospital.
Yes No
Form 1023-EZ Instructions -13-

Taxpayer Advocate Service — 2015 Annual Report to Congress — Volume Two 27
Understanding the Hispanic Underserved Audit Impact Study Form 1023-EZIRS Collectibility Curve
Page 14 of 20 Fileid: … /I1023EZ/201508/A/XML/Cycle05/source 11:49 - 13-Jul-2015The type and rule above prints on all proofs including departmental reproduction proofs. MUST be removed before printing.
13. Are you applying for exemption as a cooperative hospital service organization under section 501(e)?
A cooperative hospital service organization described in section 501(e) is organized and operated on a cooperative basis to provide its section 501(c)(3) hospital members one or more of the following activities.
Data processing. Purchasing (including purchasing insurance on a group basis).Warehousing.Billing and collection (including purchasing patron accounts receivable on a recourse basis).Food.Clinical.Industrial engineering.Laboratory.Printing.Communications.Record center.Personnel (including selecting, testing, training, and educating personnel) services.
A cooperative hospital service organization must also meet certain other requirements specified in section 501(e).
Yes No
14. Are you applying for exemption as a cooperative service organization of operating educational organizations under section 501(f)?
An organization is a cooperative service organization of operating educational organizations if it is organized and operated solely to provide investment services to its members. Those members must be organizations described in section 170(b)(1)(A)(ii) or (iv) that are tax exempt under section 501(a) or whose income is excluded from taxationunder section 115.
Yes No
-14- Form 1023-EZ Instructions
Section One — FORM 1023-EZ
Form 1023-EZ IRS Collectibility Curve Audit Impact Study Understanding the Hispanic Underserved
28
Page 15 of 20 Fileid: … /I1023EZ/201508/A/XML/Cycle05/source 11:49 - 13-Jul-2015The type and rule above prints on all proofs including departmental reproduction proofs. MUST be removed before printing.
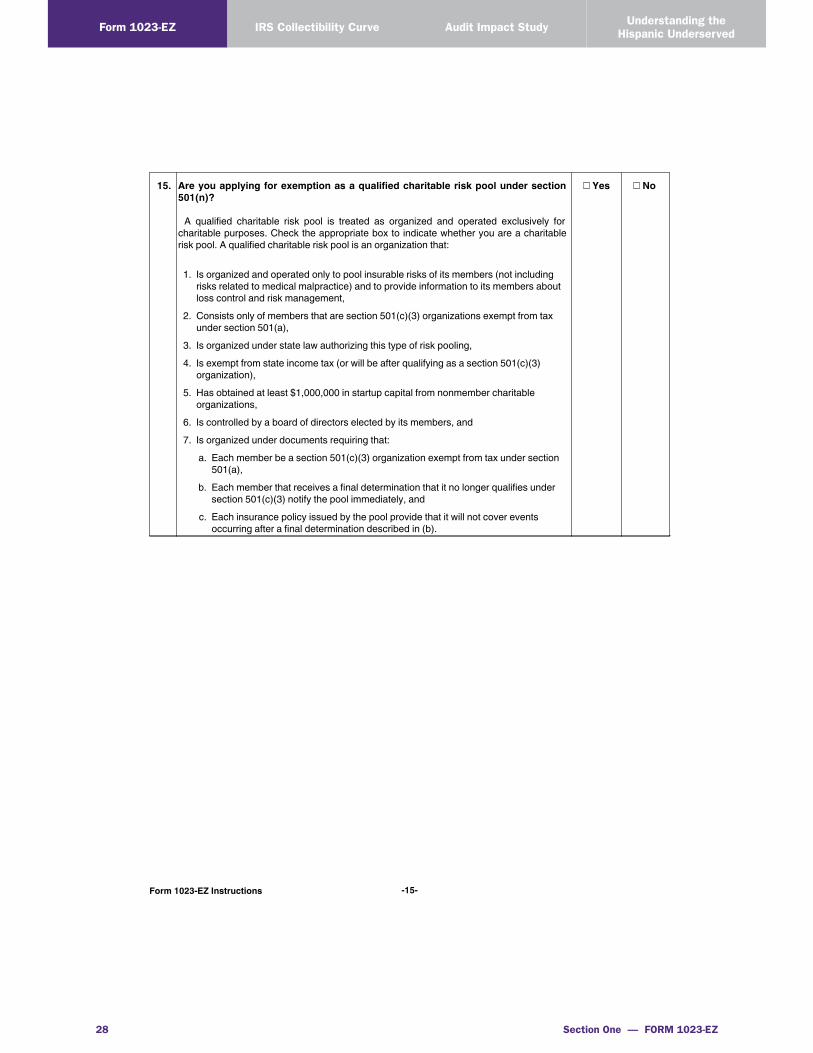
15. Are you applying for exemption as a qualified charitable risk pool under section 501(n)?
A qualified charitable risk pool is treated as organized and operated exclusively for charitable purposes. Check the appropriate box to indicate whether you are a charitable risk pool. A qualified charitable risk pool is an organization that:
1. Is organized and operated only to pool insurable risks of its members (not including risks related to medical malpractice) and to provide information to its members about loss control and risk management,
2. Consists only of members that are section 501(c)(3) organizations exempt from tax under section 501(a),
3. Is organized under state law authorizing this type of risk pooling,4. Is exempt from state income tax (or will be after qualifying as a section 501(c)(3)
organization),5. Has obtained at least $1,000,000 in startup capital from nonmember charitable
organizations,6. Is controlled by a board of directors elected by its members, and7. Is organized under documents requiring that:
a. Each member be a section 501(c)(3) organization exempt from tax under section 501(a),
b. Each member that receives a final determination that it no longer qualifies under section 501(c)(3) notify the pool immediately, and
c. Each insurance policy issued by the pool provide that it will not cover events occurring after a final determination described in (b).
Yes No
Form 1023-EZ Instructions -15-

Taxpayer Advocate Service — 2015 Annual Report to Congress — Volume Two 29
Understanding the Hispanic Underserved Audit Impact Study Form 1023-EZIRS Collectibility Curve
Page 16 of 20 Fileid: … /I1023EZ/201508/A/XML/Cycle05/source 11:49 - 13-Jul-2015The type and rule above prints on all proofs including departmental reproduction proofs. MUST be removed before printing.
16. Are you requesting classification as a supporting organization under section 509(a)(3)?
A supporting organization (as defined in section 509(a)(3)) differs from the other types of public charities described in section 509. Instead of describing an organization that conducts a particular kind of activity or that receives financial support from the general public, section 509(a)(3) describes organizations that have established certain relationships in support of public charities described in section 509(a)(1) or 509(a)(2). Thus, an organization can qualify as a supporting organization (and not be classified as a private foundation) even though it may be funded by a single donor, family, or corporation. This kind of funding ordinarily would indicate private foundation status, but a section 509(a)(3) organization has limited purposes and activities, and gives up a significant degree ofindependence. A supporting organization is an organization that:
1. Is organized and operated exclusively for the benefit of, to perform the functions of, or to carry out the purposes of one or more specified organizations as described in section 509(a)(1) or 509(a)(2). These section 509(a)(1) and 509(a)(2) organizations are commonly called publicly supported organizations.
2. Has one of three types of relationships with one or more organizations described in section 509(a)(1) or 509(a)(2). It must be: a. Operated, supervised, or controlled by one or more section 509(a)(1) or 509(a)(2)
organizations (Type I supporting organization);b. Supervised or controlled in connection with one or more section 509(a)(1) or
509(a)(2) organizations (Type II supporting organization); or c. Operated in connection with one or more section 509(a)(1) or 509(a)(2)
organizations (Type III supporting organization).3. Is not controlled directly or indirectly by disqualified persons (as defined in section
4946) other than foundation managers and other than one or more organizations described in section 509(a)(1) or 509(a)(2).
See Publication 557 for more information.
Yes No
17. Is a substantial purpose of your activities to provide assistance to individuals through credit counseling activities such as budgeting, personal finance, financial literacy, mortgage foreclosure assistance, or other consumer credit areas?
These activities involve the education of the consumer on budgeting, personal finance, financial literacy, mortgage foreclosure assistance, or other consumer credit areas. It may also involve assisting the consumer in consolidating debt and negotiating between debtors and creditors to lower interest rates and waive late and over-limit fees.
Yes No
18. Do you or will you invest 5% or more of your total assets in securities or funds that are not publicly traded?
Yes No
19. Do you participate, or intend to participate, in partnerships (including entities or arrangements treated as partnerships for federal tax purposes) in which you share losses with partners other than section 501(c)(3) organizations?
Yes No
20. Do you sell, or intend to sell carbon credits or carbon offsets? Yes No21. Are you a Health Maintenance Organization (HMO)? Yes No
-16- Form 1023-EZ Instructions

Section One — FORM 1023-EZ
Form 1023-EZ IRS Collectibility Curve Audit Impact Study Understanding the Hispanic Underserved
30
Page 17 of 20 Fileid: … /I1023EZ/201508/A/XML/Cycle05/source 11:49 - 13-Jul-2015The type and rule above prints on all proofs including departmental reproduction proofs. MUST be removed before printing.
22. Are you an Accountable Care Organization (ACO), or an organization that engages in, or intends to engage in, ACO activities (such as participation in the Medicare Shared Savings Program (MSSP) or in activities unrelated to the MSSP described in Notice 2011–20, 2011–16 I.R.B. 652)?
ACOs are entities formed by groups of physicians, hospitals, and other health care service providers and suppliers to manage and coordinate the care provided to patients. For a discussion of tax law issues relating to ACOs, see Notice 2011-20 and FS-2011-11, available at www.irs.gov/uac/Tax-Exempt-Organizations-Participating-in-the-Medicare-Shared-Savings-Program-through-Accountable-Care-Organizations.
Yes No
23. Do you maintain or intend to maintain one or more donor advised funds?
In general, a donor advised fund is a fund or account that is owned and controlled by the organization but that is separately identified by reference to contributions of a donor or donors and with respect to which a donor (or any person appointed or designated by the donor) has or expects to have advisory privileges concerning the distribution or investment of amounts held in the fund or account by reason of the donor’s status as a donor. For additional information, see Publication 557.
Check “No” if you are a governmental unit referred to in section 170(c)(1) or a private foundation referred to in section 509(a).
Yes No
24. Are you organized and operated exclusively for testing for public safety and requesting a foundation classification under section 509(a)(4)?
Generally, these organizations test consumer products to determine their acceptability for use by the general public.
Yes No
25. Are you requesting classification as a private operating foundation?
Private foundations lack general public support. What distinguishes a private operating foundation from other private foundations is that it engages directly in the active conduct of charitable, religious, educational, and similar activities (as opposed to indirectly carrying out these activities by providing grants to individuals or other organizations). Private operating foundations are subject to more favorable rules than other private foundations in terms of charitable contribution deductions and attracting grants from private foundations. However, to be classified as a private operating foundation, an organization must meet certain tests. Additional information about private operating foundations is available at www.irs.gov/Charities- &-Non-Profits/Private-Foundations/Private-Operating-Foundations.
Yes No
26. Are you applying for retroactive reinstatement of exemption under section 5 or 6 of Rev. Proc. 2014-11, after being automatically revoked?
Only organizations applying for reinstatement under section 4 or 7 of Rev. Proc. 2014-11 may use Form 1023-EZ. If you are applying for retroactive reinstatement under section 5 or 6 of Rev. Proc. 2014-11, you must submit the full Form 1023 along with the appropriate reasonable cause statement and a statement confirming you have filed the required annual returns as described in the revenue procedure.
Yes No
Form 1023-EZ Instructions -17-

Taxpayer Advocate Service — 2015 Annual Report to Congress — Volume Two 31
Understanding the Hispanic Underserved Audit Impact Study Form 1023-EZIRS Collectibility Curve
APPENDIX D: Contents of Letter EO Uses to Advise Form 1023-EZ Filers their Articles of Incorporation Do Not Meet the Organizational Test, in Pertinent Part
Penalties of Perjury Declaration
Include the following declaration with your response, signed and dated by an officer, director, trustee, or other governing body member (not an authorized representative) . You can sign and date the statement below or reproduce it in the body of your signed response . The declaration must accompany responses per Revenue Procedure [20XX-4] .
Under penalties of perjury, I declare that I have examined this information, including accompanying docu-ments, and, to the best of my knowledge and belief, the information contains all the relevant facts relating to the request for the information, and such facts are true, correct, and complete.
___________________________________________ _________________ SIGN HERE Date
Your organizing document does not meet the organizational test of IRC Section 501(c)(3) . To meet these requirements, you must amend your organizing document to include [an] adequate [purpose/dissolution/ purpose and dissolution] clause[s] then sign below to verify you completed the amendment . The follow-ing is an example of an acceptable purpose [and dissolution] clause: [Said organization is organized exclusively for charitable, religious, educational, and scientific purposes, including, for such purposes, the making of distributions to organizations that qualify as exempt organizations described under Section 501(c)(3) of the Internal Revenue Code, or cor-responding section of any future federal tax code.] [Upon the dissolution of the organization, as-sets shall be distributed for one or more exempt purposes within the meaning of Section 501(c)(3) of the Internal Revenue Code, or corresponding section of any future federal tax code, or shall be distributed to the federal government, or to a state or local government, for a public purpose. Any such assets not disposed of shall be disposed of by a court of competent jurisdiction in the county in which the principal office of the organization is then located, exclusively for such purposes or to such organization or organizations, as said Court shall determine, which are organized and operated exclusively for such purposes.]
See page 7 of the Instructions for Form 1023 at www .irs .gov for more details and examples of specific language that meets the requirements . [A corporation must file an amendment with the appropriate state agency .][An unincorporated association’s amendment must have two signatures and show the date it was adopted .][A trust amendment must be signed and dated by a trustee .]
Note: You don’t need to submit a copy of your amendment .
We amended our organizing document as indicated to include the above provision[s] or other substantially similar wording that meet[s] the requirements of Section 501(c)(3).
X____________________________________________ SIGN HERE

Section One — FORM 1023-EZ 32
Form 1023-EZ IRS Collectibility Curve Audit Impact Study Understanding the Hispanic Underserved
This page intentionally left blank.

Volume 2 TAS Research and Related Studies
IRS Collectibility Curve1
1 The principal authors of this study are Tom Beers, Carol Hatch, Joe Saldana, and Jeff Wilson, TAS Research and Analysis.
Section Two — IRS COLLECTIBILITY CURVE 34
Form 1023-EZ IRS Collectibility Curve Audit Impact Study Understanding the Hispanic Underserved
INTRODUCTION
When taxpayers incur delinquent tax liabilities, the Internal Revenue Service (IRS) sends them a series of notices during a six-month period during which the taxpayers are in “notice status.” If the taxpayer does not resolve his or her liability during notice status, the account enters into taxpayer delinquent account (TDA) status. The IRS then determines whether the case will be referred to the Automated Collection System (ACS), assigned directly to the Collection Field function (CFf ) for in-person contact by a Revenue Officer, assigned to the Collection Queue (“Queue”) to await assignment to a revenue officer, or shelved.2
The ACS is a computerized inventory system and telephone call center. After a case arrives in ACS, the IRS checks for levy sources, telephone numbers, and other characteristics. These actions result in additional computer-generated notices to taxpayers. Customer Service Representatives (referred to as “Collection Representatives”3) work ACS cases and primarily respond to phone calls from taxpayers who call in response to IRS enforcement actions (e.g., levies or liens) rather than proactively contacting taxpayers.
The Queue is an electronic holding bin that holds TDA accounts awaiting assignment to field revenue officers based on inventory levels.4 Cases assigned to the Queue are prioritized using a risk scoring algo-rithm. Shelved cases are not actively worked by the IRS while in shelved status, but continue to accumu-late penalties and interest. This study does not specifically explore collections on shelved cases.
TAS was interested in examining what happens over the life of a tax debt: do people pay more of the tax debt if collections are made earlier in the debt cycle (closer to when the debt actually occurs)? Are there patterns that indicate the likelihood of collecting a debt over time? To this end, TAS Research examined the Individual Master File (IMF) Accounts Receivable Dollar Inventory (ARDI) to determine how dollars collected fluctuate as time elapses.
We looked at delinquencies that originated in each of ten years (2003 through 2012) and analyzed those delinquencies over two time periods: the next three years and the next ten years.5 For purposes of brevity, the figures in the body of this paper include only newly assigned TDAs in 2003, 2005, 2007, 2009, and 2011; however, the appendix contains data on TDAs newly assigned from 2003 through 2012.
Budgetary constraints make the efficient collection of delinquencies paramount. The IRS should use data on the practical delinquency collection “window” to form the basis for its Collection policies. Good in-formation on the time available to collect various delinquencies effectively will assist the IRS in determin-ing what liabilities should be collected first and if it makes sense to defer the collection of smaller, more current liabilities in favor of older, larger liabilities. Furthermore, this research may provide significant insights into which delinquencies the IRS should place in the Collection TDA queue and which it should shelved.6
2 Shelving refers to the IRS reporting a liability as currently not collectible (CNC) because of its small balance due. 3 Internal Revenue Manual (IRM) 21.1.1.6, Customer Service Representative (CSR) Duties (Mar. 2, 2015).4 Work also goes into the Queue from ACS if it cannot be resolved while in ACS status. In fiscal year (FY) 2015, ACS transferred
22.6 percent of the modules leaving ACS to the queue, amounting to over $14.5 billion,5 We chose the ten-year period for analysis because the IRS’s authority to collect delinquent taxes (i.e., the collection statute)
expires ten years after the date of assessment.6 In FY 2015, the IRS shelved 16.3 percent of its disposed TDA modules. IRS Collection Activity Report 5000-2 (Oct. 5, 2015).

Taxpayer Advocate Service — 2015 Annual Report to Congress — Volume Two 35
Understanding the Hispanic Underserved Audit Impact Study Form 1023-EZIRS Collectibility Curve
BACKGROUND
In past Annual Reports to Congress, the National Taxpayer Advocate noted that many of the TDAs7 in the IRS Automated Collection Branch and the CFf are delinquencies that have existed for several years. The following statistics highlight the age of the IRS TDA inventory at the end of FY 2015.8
■■ Overall, almost 55 percent of the IRS IMF TDA inventory has been in the function assigned thedelinquency for at least ten months (the delinquency may have been in TDA status much longer);
■■ Nearly 70 percent of the IMF TDAs in IRS inventory at the end of 2015 are tax year (TY) 2011and prior liabilities; and
■■ Over 22 percent of the IMF TDAs have less than four years remaining on the collection statute,meaning that the delinquency has existed for over six years.
OBJECTIVES
We identified nine objectives to explore the relationship between the age of a TDA and the dollars that the IRS collects on these liabilities. These objectives explore the dollars collected as TDAs age, and differentiate between dollars collected from subsequent payments9 and dollars collected by offset.10 We also explore subsequent payments and offsets by various categories of the balance due amount, the type of assessment, and the accumulation of penalties and interest. Specifically, for IMF liabilities reaching TDA status, we:
■■ Determine amounts collected from subsequent payments on delinquencies for the three years afterthe liability reaches TDA status;
■■ Quantify the dollars from subsequent payments collected during the entire ten-year statutoryperiod for collection;
■■ Delineate the dollars collected from offsets of other overpayments and compare them to collectionsfrom other subsequent payments;
■■ Determine how the collection of liabilities varies by the amount of the delinquency;
■■ Determine if the rate of collection varies between self-reported liabilities and additionalassessments;
■■ Quantify how penalty and interest cause the liability from a tax assessment to increase the totalbalance due;
■■ Determine the percent of liabilities abated by the IRS and if the percentage abated varies by thesource of assessment;
■■ Examine the percent of cases resolved during the ten-year statutory collection period; and
■■ Determine if the percent of TDA dollars collected varies by Collection channel.
7 A TDA represents only one module, generally a tax return for a single tax year. A taxpayer may have multiple TDA delinquen-cies.
8 IRS, Collection Activity Report No. 5000-5 (Oct. 3, 2015).9 Subsequent payments include voluntary payments from taxpayers, such as those from installment agreements, and involuntary
payments such as from an IRS levy.10 Dollars collected from refunds or overpayments due to the taxpayer.

36 Section Two — IRS COLLECTIBILITY CURVE
Form 1023-EZ IRS Collectibility Curve Audit Impact Study Understanding the Hispanic Underserved
METHODOLOGY
TAS Research examined the IMF ARDI to determine how dollars collected fluctuate as time elapses. We looked at delinquencies that entered TDA status from 2003 through 2012. We analyzed liabilities enter-ing TDA status in 2003, 2004, and 2005 for ten years.11 We analyzed the later years through 2014. We focused initially on payments received during the first three years after the accounts entered TDA status. To examine payments over the ten-year collection statute and to better differentiate between subse-quent payments and offsets from other taxpayer overpayments, we used transaction code data from the IMF. This allowed us to distinguish between payments and offsets, as well as to quantify abatements.12 Transaction codes were also used to classify assessed interest and penalties.13 We classified a liability by the first calendar year when it reached TDA status. If a delinquent module left and returned to TDA status, we continued to classify it by the first year the IRS assigned the liability to TDA status.14
We used the major source of assessment (from the ARDI file) to classify the source of assessment. Sometimes, a liability is comprised of more than one type of assessment. For example, a liability might be comprised of a self-reported assessment and an audit assessment. In this case, the type of assessment is the one most significantly contributing to the balance owed. We determined whether the IRS assigned a TDA liability to ACS, collection queue, or CFf by the Taxpayer Service Returns Processing Category (TRCAT) code, which differs depending on where a liability is located in the collection stream.
LimitationsInterest assessed amounts do not contain restricted interest assessments.15 Although it is a relatively small portion of abatements, dollars abated as a result of accepted offers in compromise (OIC) are included in total abatements.16
11 TDAs originating in 2005 will have been in notice status for several prior months. Therefore, the ten-year statute will have expired or be about to expire in 2014.
12 Payments include one of the following transaction codes: 610, 611, 612, 640, 641, 642, 660, 661, 662, 666, 667, 670, 671, 672, 673, 680, 681, 682, 683, 690, 691, 692, 693, 694, 695, 760, 762, and 763. Offsets include one of the fol-lowing transaction codes: 700, 701, 702, 703, 706, 710, 712, 713, 716, 720, 721, 722, 723, 730, 736, 740, and 742. Abatements include one of the following transaction codes: 161, 167, 171, 177, 181, 187, 191, 197, 235, 239, 241, 247, 271, 277, 281, 287, 291, 295, 299, 301, 305, 309, 321, 337, 341, 342, 351, 361, 538, and 549.
13 Interest includes the following transaction codes: 190 and 196. Penalties include the following transaction codes: 160, 166, 170, 176, 270, 276, 280, 286, 320, and 350.
14 A delinquent account can leave TDA status and enter into another status. For example, if the taxpayer enters into an install-ment agreement (IA) to repay the delinquency, the account leaves TDA status and enters into IA status. If the taxpayer subsequently defaults on the IA, the account will reenter TDA status.
15 Restricted interest is assessed by transaction code 340 (and abated by transaction code 341). Restricted interest arises when any portion of the interest on an overpayment or underpayment is calculated from a date other than the one that applies to the return as filed. This happens most often when there is a carryback of a loss or credit.
16 The FY 2014 liabilities compromised were 1.2 percent of the amount of TDAs at the beginning of FY 2014.

Taxpayer Advocate Service — 2015 Annual Report to Congress — Volume Two 37
Understanding the Hispanic Underserved Audit Impact Study Form 1023-EZIRS Collectibility Curve
FINDINGS
In this section, we present the findings for each of the objectives. In addition to providing the data pertinent to each objective, we also offer some insights on whether the results are changing over time and why the underlying trends are present.
Determine Amounts Collected From Subsequent Payments17 on Delinquencies for the Three Years After the Liability Reaches TDA Status For TDAs originating after 2003, our analysis showed that: (a) dollars collected decrease by more than 50 percent from the first year to the second year; and (b) in the third year, collections decrease by about one-third from the amount collected in the second year.18 In other words, collections are over twice as much during the first year as in the following year and over three times the collection in the third year. For TDAs originating in 2007, collections declined by about 64 percent during the second year after the cases entered TDA status. For 2009, the decrease in total dollars collected in the third year was only about 27 percent. Nevertheless, overall total collections for cases entering TDA status after 2003 decreased by about two-thirds from the first year to the third year after entering TDA status.
Figure 2.1 depicts these findings by the years elapsed since the initial liability reached TDA status:
FIGURE 2.1, Subsequent Payments Decrease as Time Elapses, Selected Years Assigned TDA
Year
s El
apse
d
2003 2005 2007 2009 2011
Sub
sequ
ent
Pay
men
ts (
$M
)
% D
ecre
ase
in C
olle
ctio
ns
from
Prior
Yea
r
Sub
sequ
ent
Pay
men
ts (
$M
)
% D
ecre
ase
in C
olle
ctio
ns
from
Prior
Yea
r
Sub
sequ
ent
Pay
men
ts (
$M
)
% D
ecre
ase
in C
olle
ctio
ns
from
Prior
Yea
r
Sub
sequ
ent
Pay
men
ts (
$M
)
% D
ecre
ase
in C
olle
ctio
ns
from
Prior
Yea
r
Sub
sequ
ent
Pay
men
ts (
$M
)
% D
ecre
ase
in C
olle
ctio
ns
from
Prior
Yea
r
1 $1,786.4 $2,990.8 $3,664.8 $3,631.9 $3,800.1
2 $1,166.8 -35% $1,344.1 -55% $1,330.4 -64% $1,675.5 -54% $1,748.1 -54%
3 $848.5 -27% $ 832.6 -38% $907.0 -32% $1,216.8 -27% $1,177.6 -33%
Despite accumulation of penalty and interest, as the IRS collects additional dollars, the balance due declines over time.19 Figure 2.2 shows the overall decline in total module balance over the first three years after the liability reached TDA status:
17 Subsequent payments include voluntary payments from taxpayers such as those from IAs and involuntary payments such as from an IRS levy.
18 In 2003, collections of new TDAs decreased by only about 35 percent from the first to the second year, even though the decrease from the second to the third year was similar to later years. See the Appendix for complete details on all years stud-ied.
19 This is true only if the dollars collected exceed penalty and interest accruals. In an earlier study examining only CNC cases, the module balance actually increase as time elapsed.

Section Two — IRS COLLECTIBILITY CURVE 38
Form 1023-EZ IRS Collectibility Curve Audit Impact Study Understanding the Hispanic Underserved
FIGURE 2.2, Rate of Module Balance Decline Slows, Selected Years Assigned TDA
Year
s El
apse
d
2003 2005 2007 2009 2011
Tota
l Mod
ule
Bal
ance
($
M)
% D
eclin
e in
M
odul
e B
alan
ce
Tota
l Mod
ule
Bal
ance
($
M)
% D
eclin
e in
M
odul
e B
alan
ce
Tota
l Mod
ule
Bal
ance
($
M)
% D
eclin
e in
M
odul
e B
alan
ce
Tota
l Mod
ule
Bal
ance
($
M)
% D
eclin
e in
M
odul
e B
alan
ce
Tota
l Mod
ule
Bal
ance
($
M)
% D
eclin
e in
M
odul
e B
alan
ce
0 $15,326.2 $25,996.1 $40,678.5 $41,987.7 $42,926.2
1 $12,321.3 -20% $20,872.6 -20% $32,783.3 -19% $35,332.5 -16% $34,795.8 -19%
2 $10,370.3 -16% $17,657.4 -15% $28,948.3 -12% $31,581.2 -11% $29,792.6 -14%
3 $8,841.3 -15% $15,759.1 -11% $26,531.7 -8% $28,767.3 -9% $27,132.4 -9%
Comparing the two previous figures, one notices that the module balance decreases more rapidly than the dollars collected would indicate. This occurs because of the complete or partial abatement of some liabilities, particularly during the first two years of a delinquency. We will explore abatements in greater detail in a subsequent section.
On a percentage basis, the dollars collected drops significantly from the first year to the second year, but the decrease slows in the third year. We will explore this issue further in the next study objective when we look at the entire ten-year statutory period to collect delinquent tax liabilities.
Even though the original module balance is declining, the percent collected of the balance is also declin-ing as illustrated in Figure 2.3:
FIGURE 2.3
Decline in Dollars Collected as Percentage of Module Balance
2%
4%
6%
8%
10%
12%
14%
1 2 3
Years Elapsed
2003
2005
200720092011

Taxpayer Advocate Service — 2015 Annual Report to Congress — Volume Two 39
Understanding the Hispanic Underserved Audit Impact Study Form 1023-EZIRS Collectibility Curve
In summary, an analysis of the data shows that dollars collected decrease as a liability ages. Dollars col-lected as a percentage of the prior year dollars collected also decline significantly. Finally, the percent of the original TDA liability, including penalties and interest, being collected decreases significantly from the first year to the second year, and then continues to decline, but at a slower rate. Accordingly, the rate at which the total amount of the delinquency decreases slows as time progresses.
Quantify the Dollars From Subsequent Payments Collected During the Entire Ten-Year Statutory Collection Period In the first objective, we looked at the first three years of collections after a liability reached TDA status. We looked at a period of three years because private collection agencies believe that nearly all monies on delinquent debts are collected within the first three years after the debt becomes due.20 Next, we will examine what happens over the entire statutory ten-year collection period.
Figure 2.4 depicts the subsequent payments by years elapsed since TDA issuance and the percent of the total dollars collected in each year:
FIGURE 2.4, Subsequent Payments21 as a Percent of Total Subsequent Payments Collected Per Year, Selected Years Assigned TDA
2003 2005 2007 2009 2011
Years Elapsed
Amount Paid
($ Millions)% of Total
Amount Paid
($ Millions)% of Total
Amount Paid
($ Millions)% of Total
Amount Paid
($ Millions)% of Total
Amount Paid
($ Millions)% of Total
1 $1,786.4 31% $2,990.8 41% $3,664.8 43% $3,631.9 42% $3,800.1 51%
2 $1,166.8 20% $1,344.1 18% $1,330.4 16% $1,675.5 19% $1,748.1 24%
3 $848.5 15% $832.6 11% $907.0 11% $1,216.8 14% $1,177.6 16%
4 $615.1 11% $535.8 7% $720.3 9% $944.8 11% $688.5 9%
5 $402.9 7% $394.7 5% $600.3 7% $746.6 9%
6 $254.2 4% $341.3 5% $517.4 6% $379.5 4%
7 $196.6 3% $289.5 4% $417.4 5%
8 $166.0 3% $252.3 3% $272.5 3%
9 $141.4 2% $209.5 3% $7.8 0%
10 $123.3 2% $123.6 2%
Total $5,701.2 100% $7,314.3 100% $8,437.9 100% $8,595.2 100% $7,414.3 100%
20 Treasury Inspector General for Tax Administration, Ref. No. 2011-30-112, Reducing the Processing Time Between Balance Due Notices Could Increase Collections 11 (Sept. 26, 2011).
21 Subsequent payments include voluntary payments from taxpayers such as those from IAs and involuntary payments such as from an IRS levy.

Section Two — IRS COLLECTIBILITY CURVE 40
Form 1023-EZ IRS Collectibility Curve Audit Impact Study Understanding the Hispanic Underserved
Figure 2.5 illustrates this same information:
FIGURE 2.5
Percent Collected by Years Elapsed
10%
20%
30%
40%
50%
60%
1 2 3 4 5 6 7 8 9 10
Years Elapsed
20032003
20052005
20072007
20092009
20112011
Figure 2.5 clearly shows a decline in the dollars collected as time elapses throughout the collection statute period. Dollars collected level off at about two percent in the last year of the collection statute. As we saw in the first objective, the total balance due also declines, although much more slowly in the latter years. This trend is also illustrated in Figure 2.6.

Taxpayer Advocate Service — 2015 Annual Report to Congress — Volume Two 41
Understanding the Hispanic Underserved Audit Impact Study Form 1023-EZIRS Collectibility Curve
FIGURE 2.6, Decline in Total Balance Owed Within Ten Years After TDA Origination,22 Selected Years Assigned TDA
Year
s El
apse
d2003 2005 2007 2009 2011
Tota
l Mod
ule
Bal
ance
($
M)
% D
eclin
e in
M
odul
e B
alan
ce
Tota
l Mod
ule
Bal
ance
($
M)
% D
eclin
e in
M
odul
e B
alan
ce
Tota
l Mod
ule
Bal
ance
($
M)
% D
eclin
e in
M
odul
e B
alan
ce
Tota
l Mod
ule
Bal
ance
($
M)
% D
eclin
e in
M
odul
e B
alan
ce
Tota
l Mod
ule
Bal
ance
($
M)
% D
eclin
e in
M
odul
e B
alan
ce
0 $15,326.2 $25,996.1 $40,678.5 $41,987.7 $42,926.2
1 $12,202.9 20% $20,955.2 19% $32,849.0 19% $34,910.1 17% $34,032.3 21%
2 $10,705.9 12% $18,585.0 11% $29,935.1 9% $31,718.6 9% $29,319.0 14%
3 $9,603.3 10% $17,390.0 6% $28,301.1 5% $29,367.1 7% $27,055.1 8%
4 $8,947.3 7% $16,596.2 5% $26,943.5 5% $27,478.0 6% $26,304.4 3%
5 $8,477.7 5% $15,982.9 4% $25,668.2 5% $26,092.4 5%
6 $8,148.7 4% $15,505.7 3% $24,806.1 3% $25,649.1 2%
7 $7,835.7 4% $15,067.6 3% $24,032.8 3%
8 $7,522.2 4% $14,613.4 3% $23,740.4 1%
9 $7,139.4 5% $14,138.7 3%
We should note that the total module balance continues to decline because some accounts are paid in full as time progresses. However, for those accounts that are not resolved, their penalties and interest continue to rise. A larger decrease in Year Ten occurs because the collection statute has ended for a majority of the liabilities, and the IRS then clears the previous balance due.
As dollars are collected, the balance due declines over time. Abatements also decrease the liabilities. However, penalties and interest increase the total amount due. We examined the amount of dollars collected by subsequent payments as a percent of the module balance at the beginning of each one-year period. Even though the total balance due generally decreases as taxpayers make subsequent payments and offsets and the IRS abates some portion of the assessment, the percent decrease also shows a similar decline in each year during the study period, as illustrated in Figure 2.7.
22 The ending balance after ten years is not shown. Since the ten-year collection statute generally expires in the tenth year after the IRS assigns a case to TDA status, the module balance becomes significantly reduced by the abatements of liabilities that the IRS is no longer permitted to collect.

Section Two — IRS COLLECTIBILITY CURVE 42
Form 1023-EZ IRS Collectibility Curve Audit Impact Study Understanding the Hispanic Underserved
FIGURE 2.7, Year-to-Year Percent Decline in Total Balance Due, Selected Years Assigned TDA
Years Elapsed 2003 2005 2007 2009 2011
1 12% 12% 9% 9% 9%
2 10% 6% 4% 5% 5%
3 8% 4% 3% 4% 4%
4 6% 3% 3% 3% 3%
5 5% 2% 2% 3%
6 3% 2% 2% 1%
7 2% 2% 2%
8 2% 2% 1%
9 2% 1%
10 2% 1%
As a percentage of the balance due, dollars collected generally drop most precipitously from the first to the second year. As the figure indicates, the ratio of dollars collected to balances due drops as elapsed time increases.
Determine the Dollars Collected From Offsets of Other Overpayments and Compare to Collections From Other Subsequent PaymentsAnalysis of the collection activity reports for a number of years shows that a significant percentage of the total dollars collected come from refund offsets, particularly in ACS. Therefore, we distinguished between dollars collected through subsequent payments23 and dollars collected through offsets from overpayments on other tax modules. Figure 2.8 compares the amount and percent of the initial balance due collected by subsequent payments to collections by offsets from overpayments (refunds) on other tax accounts (gener-ally other tax years).
FIGURE 2.8, Dollars Collected and Offset, Selected Years (Dollars in Millions)
Year Assigned
TDA Balance DueSubsequent Payments
% Collected Amount Offset % Offset
Total % Collected
2003 $15,326.2 $5,701.2 37.2% $ 2,150.7 14.0% 51.2%
2005 $25,996.1 $7,314.3 28.1% $ 3,086.5 11.9% 40.0%
2007 $40,678.5 $8,437.9 20.7% $ 4,493.5 11.0% 31.8%
2009 $41,987.7 $8,595.2 20.5% $ 4,173.6 9.9% 30.4%
2011 $42,926.2 $7,435.1 17.3% $ 3,583.2 8.3% 25.7%
For delinquencies reaching TDA status in 2003, the amount collected from subsequent payments is nearly three times the amount offset. However, for delinquencies reaching TDA status in later years, subsequent payments are only about twice the amount offset. On a percent basis to the amount initially owed, sub-sequent payments have decreased significantly from TDAs first assigned in 2003 to TDAs first assigned
23 Subsequent payments include voluntary payments from taxpayers such as those from IAs and involuntary payments such as from an IRS levy.

Taxpayer Advocate Service — 2015 Annual Report to Congress — Volume Two 43
Understanding the Hispanic Underserved Audit Impact Study Form 1023-EZIRS Collectibility Curve
in 2011; however, offsets have remained relatively stable, decreasing by only a few percent. While it is true that delinquencies reaching TDA status since 2006 still have some years remaining on the collection statute, the dollars collected increased by less than ten percent during the last six years of the ten-year collection statute for TDAs issued in 2003 and 2005. Therefore, it is unlikely that dollars collected from TDAs issued in later years will increase sufficiently to realize the same proportion of dollars collected to dollars offset as in earlier years. Since offsets are relatively flat over the period examined, we generally see the same trends in total dollars collected as we saw when examining only subsequent payments.
Determine How the Collection of Liabilities Varies by the Amount of the DelinquencyIn addition to comparing the dollars collected by subsequent payments and the offsets of overpayments, we also compare the dollars collected by subsequent payments and offsets in six ranges of the balance due. As one might expect, the IRS collects a greater percentage of the liability when it is not more than $5,000.
As illustrated in Figure 2.9, an analysis of the TDA modules clearly shows that the majority of delin-quency amounts do not exceed $5,000. However, higher dollar ranges contain the highest percentage of the delinquent dollars, even though these categories contain only a small percentage of the delinquent modules. For example, in 2003, about three-quarters of the TDA modules were under $5,000, while over 80 percent of the delinquent dollars were in the highest three balance due ranges, i.e., the categories greater than $5,000. In fact, over half of the overall delinquent dollars were on modules with more than $25,000 due. Interestingly, however, from 2003 to 2011, the percent of delinquent TDA modules under $5,000 fell from over 75 percent to under 68 percent while the percent of dollars in the highest three dol-lar ranges increased from under 82 percent to over 88 percent. This trend indicates that more taxpayers owe liabilities over $5,000.24 Inflation undoubtedly accounts for part of this increase, rising by about 17 percent during this period, but the combined initial TDA balance for modules with balances greater than $5,000 is nearly three times as high in 2011 as in 2003.25 This increase in balance due is a disturbing trend for the IRS, particularly when considering that although the IRS is relatively effective at collecting low dollar liabilities, it is not as effective at collecting liabilities over $25,000.
24 For liabilities entering TDA status in 2009, only about 60 percent of the delinquent modules had liabilities of $5,000 or less. This situation may be attributable to the depressed economic conditions in 2008.
25 Bureau of Labor Standards Consumer Price Index inflation calculator, available at http://www.bls.gov/data/inflation_calculator.htm.
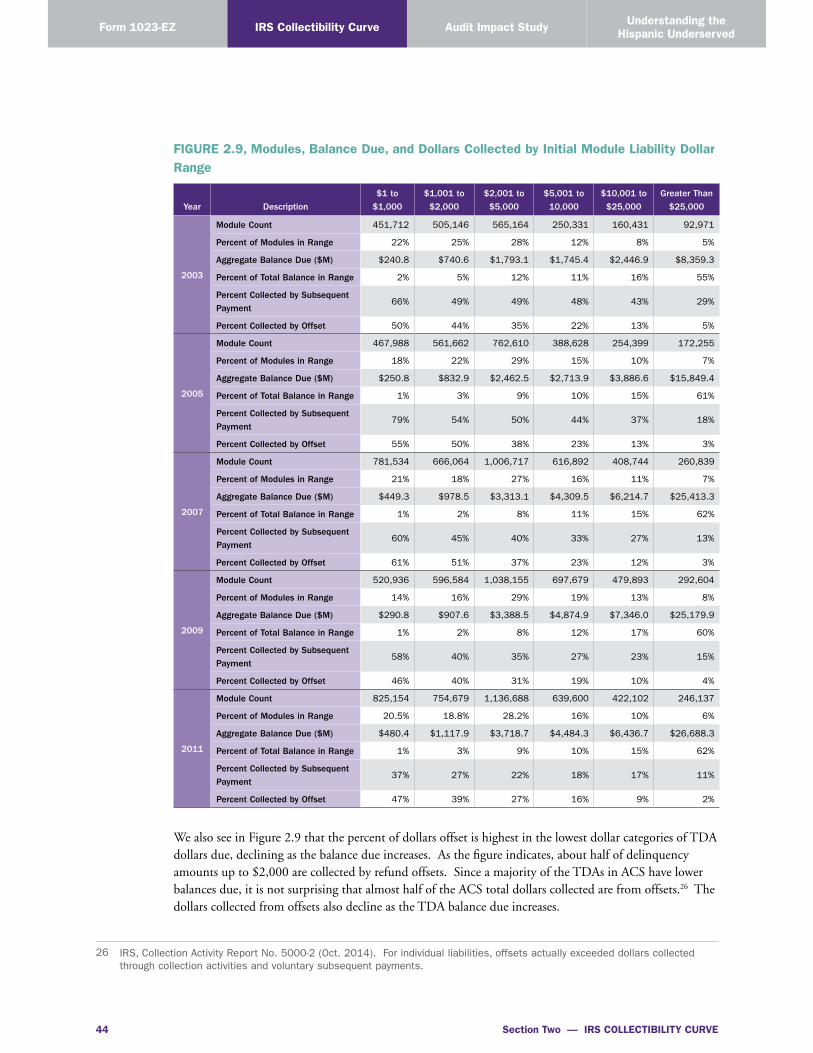
Section Two — IRS COLLECTIBILITY CURVE 44
Form 1023-EZ IRS Collectibility Curve Audit Impact Study Understanding the Hispanic Underserved
FIGURE 2.9, Modules, Balance Due, and Dollars Collected by Initial Module Liability Dollar Range
Year Description
$1 to
$1,000
$1,001 to
$2,000
$2,001 to
$5,000
$5,001 to
10,000
$10,001 to
$25,000
Greater Than
$25,000
2003
Module Count 451,712 505,146 565,164 250,331 160,431 92,971
Percent of Modules in Range 22% 25% 28% 12% 8% 5%
Aggregate Balance Due ($M) $240.8 $740.6 $1,793.1 $1,745.4 $2,446.9 $8,359.3
Percent of Total Balance in Range 2% 5% 12% 11% 16% 55%
Percent Collected by Subsequent
Payment66% 49% 49% 48% 43% 29%
Percent Collected by Offset 50% 44% 35% 22% 13% 5%
2005
Module Count 467,988 561,662 762,610 388,628 254,399 172,255
Percent of Modules in Range 18% 22% 29% 15% 10% 7%
Aggregate Balance Due ($M) $250.8 $832.9 $2,462.5 $2,713.9 $3,886.6 $15,849.4
Percent of Total Balance in Range 1% 3% 9% 10% 15% 61%
Percent Collected by Subsequent
Payment79% 54% 50% 44% 37% 18%
Percent Collected by Offset 55% 50% 38% 23% 13% 3%
2007
Module Count 781,534 666,064 1,006,717 616,892 408,744 260,839
Percent of Modules in Range 21% 18% 27% 16% 11% 7%
Aggregate Balance Due ($M) $449.3 $978.5 $3,313.1 $4,309.5 $6,214.7 $25,413.3
Percent of Total Balance in Range 1% 2% 8% 11% 15% 62%
Percent Collected by Subsequent
Payment60% 45% 40% 33% 27% 13%
Percent Collected by Offset 61% 51% 37% 23% 12% 3%
2009
Module Count 520,936 596,584 1,038,155 697,679 479,893 292,604
Percent of Modules in Range 14% 16% 29% 19% 13% 8%
Aggregate Balance Due ($M) $290.8 $907.6 $3,388.5 $4,874.9 $7,346.0 $25,179.9
Percent of Total Balance in Range 1% 2% 8% 12% 17% 60%
Percent Collected by Subsequent
Payment58% 40% 35% 27% 23% 15%
Percent Collected by Offset 46% 40% 31% 19% 10% 4%
2011
Module Count 825,154 754,679 1,136,688 639,600 422,102 246,137
Percent of Modules in Range 20.5% 18.8% 28.2% 16% 10% 6%
Aggregate Balance Due ($M) $480.4 $1,117.9 $3,718.7 $4,484.3 $6,436.7 $26,688.3
Percent of Total Balance in Range 1% 3% 9% 10% 15% 62%
Percent Collected by Subsequent
Payment37% 27% 22% 18% 17% 11%
Percent Collected by Offset 47% 39% 27% 16% 9% 2%
We also see in Figure 2.9 that the percent of dollars offset is highest in the lowest dollar categories of TDA dollars due, declining as the balance due increases. As the figure indicates, about half of delinquency amounts up to $2,000 are collected by refund offsets. Since a majority of the TDAs in ACS have lower balances due, it is not surprising that almost half of the ACS total dollars collected are from offsets.26 The dollars collected from offsets also decline as the TDA balance due increases.
26 IRS, Collection Activity Report No. 5000-2 (Oct. 2014). For individual liabilities, offsets actually exceeded dollars collected through collection activities and voluntary subsequent payments.
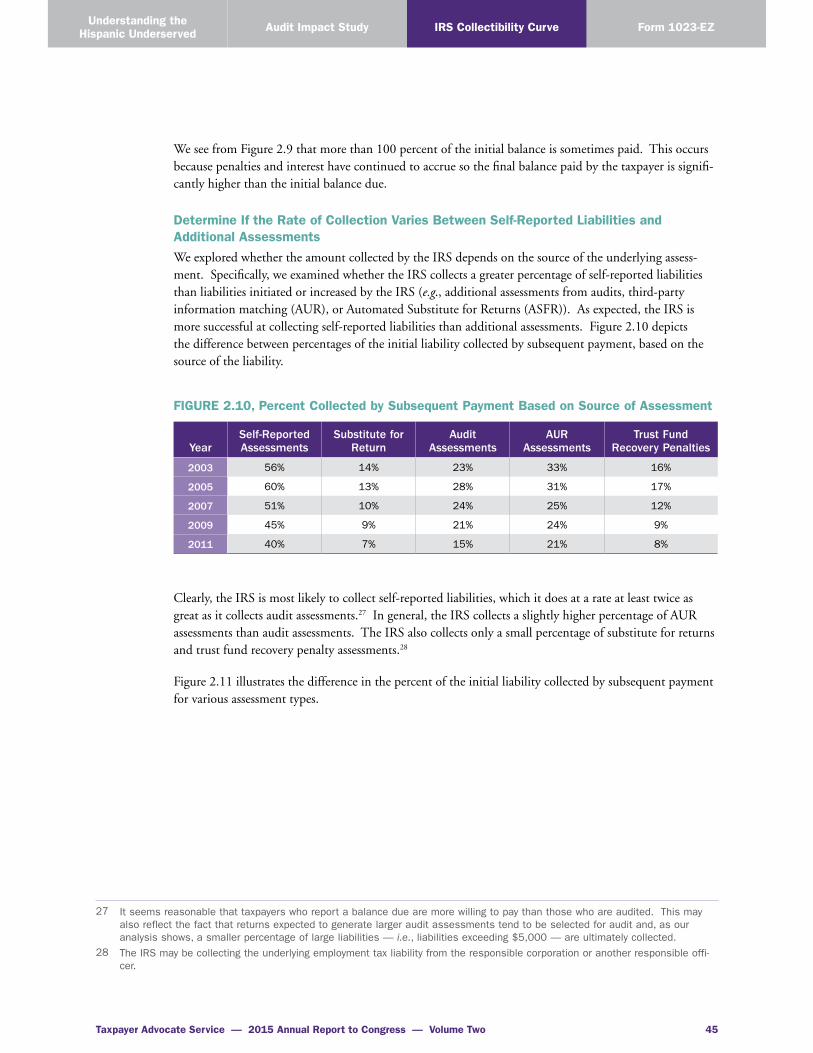
Taxpayer Advocate Service — 2015 Annual Report to Congress — Volume Two 45
Understanding the Hispanic Underserved Audit Impact Study Form 1023-EZIRS Collectibility Curve
We see from Figure 2.9 that more than 100 percent of the initial balance is sometimes paid. This occurs because penalties and interest have continued to accrue so the final balance paid by the taxpayer is signifi-cantly higher than the initial balance due.
Determine If the Rate of Collection Varies Between Self-Reported Liabilities and Additional AssessmentsWe explored whether the amount collected by the IRS depends on the source of the underlying assess-ment. Specifically, we examined whether the IRS collects a greater percentage of self-reported liabilities than liabilities initiated or increased by the IRS (e.g., additional assessments from audits, third-party information matching (AUR), or Automated Substitute for Returns (ASFR)). As expected, the IRS is more successful at collecting self-reported liabilities than additional assessments. Figure 2.10 depicts the difference between percentages of the initial liability collected by subsequent payment, based on the source of the liability.
FIGURE 2.10, Percent Collected by Subsequent Payment Based on Source of Assessment
YearSelf-Reported Assessments
Substitute for Return
Audit Assessments
AUR Assessments
Trust Fund Recovery Penalties
2003 56% 14% 23% 33% 16%
2005 60% 13% 28% 31% 17%
2007 51% 10% 24% 25% 12%
2009 45% 9% 21% 24% 9%
2011 40% 7% 15% 21% 8%
Clearly, the IRS is most likely to collect self-reported liabilities, which it does at a rate at least twice as great as it collects audit assessments.27 In general, the IRS collects a slightly higher percentage of AUR assessments than audit assessments. The IRS also collects only a small percentage of substitute for returns and trust fund recovery penalty assessments.28
Figure 2.11 illustrates the difference in the percent of the initial liability collected by subsequent payment for various assessment types.
27 It seems reasonable that taxpayers who report a balance due are more willing to pay than those who are audited. This may also reflect the fact that returns expected to generate larger audit assessments tend to be selected for audit and, as our analysis shows, a smaller percentage of large liabilities — i.e., liabilities exceeding $5,000 — are ultimately collected.
28 The IRS may be collecting the underlying employment tax liability from the responsible corporation or another responsible offi-cer.

Section Two — IRS COLLECTIBILITY CURVE 46
Form 1023-EZ IRS Collectibility Curve Audit Impact Study Understanding the Hispanic Underserved
FIGURE 2.11
Percent of Initial TDA Liability Collected by Subsequent Payment, Based of Assessment Type
10%
20%
30%
40%
50%
60%
70%
2003 2005 2007 2009 2011Initial TDA Year
Self-Reported Assessments Substitute for Return Audit Assessments AUR Assessments Trust Fund Recovery Penalties
Interestingly, the dollars collected on all of these types except audits have declined significantly since 2005. This disturbing trend merits additional investigation.29
We also broke out offsets from the total dollars collected and explored the dollars collected due to offsets. The IRS collects a higher percentage of AUR assessments through offsets than any other type of assess-ment, even self-reported assessments. Figure 2.12 displays the percent of the initial TDA balance offset by source of assessment.
FIGURE 2.12, Percent Collected by Offsets Based on Source of Assessment
YearSelf-Reported Assessments
Substitute for Return
Audit Assessments
AUR Assessments
Trust Fund Recovery Penalties
2003 18% 4% 12% 34% 6%
2005 20% 5% 20% 32% 6%
2007 20% 5% 25% 36% 6%
2009 15% 4% 20% 28% 6%
2011 10% 2% 12% 25% 4%
Also, the difference in offset dollars collected between audit and self-reported assessments is not as great as the difference of offset dollars collected between audit and AUR additional assessments. In fact, AUR assessments actually resulted in the highest percentage of the liabilities paid by offset — almost twice that of self-reported liabilities.
29 Since the statutory collection period has not expired for cases reaching TDA status in the latter years shown in the chart, more monies will be collected; however, as we have shown, we do not expect the IRS to collect many more dollars on these liabilities in the last half of the statutory collection period.

Taxpayer Advocate Service — 2015 Annual Report to Congress — Volume Two 47
Understanding the Hispanic Underserved Audit Impact Study Form 1023-EZIRS Collectibility Curve
AUR liabilities also account for three times the percent of dollars offset to audit liabilities in 2003. While the gap in dollars offset between AUR and audit liabilities has narrowed by 2011, it is still significant. Perhaps the reason AUR assessments see such a high percentage of their initial TDA balance offset, even compared to self-reported liabilities, is because a much higher percentage of self-reported liabilities are collected through subsequent payments. Taxpayers who receive AUR assessments may also be more likely to receive future refunds, since these taxpayers are often wage earners who have their income tax withheld by the payer.30
Quantify How Penalty and Interest Cause the Liability From a Tax Assessment to Increase the Total Balance DueAt first glance, it appears that penalties and interest have been declining since 2003. However, the signifi-cant abatement rate of the initial liability masks the increase in the balance due attributable to penalties and interest. Specifically, abatements have increased so the original TDA balance has experienced a greater decrease. Therefore, penalties and interest comprise a greater percentage of the amount actually determined due by the IRS. When one considers the amounts of abatement from the initial TDA assess-ment, the percentage of the liability actually due to penalties and interest is generally rising.31 As the years progress from 2003 to 2007, the ratio of assessed penalty and interest (as of the end of 2014) to the initial TDA balance (after abatements) has increased. For 2009 and 2011, sufficient time has not elapsed to re-alize the significant effect of penalties and interest. Figure 2.13 illustrates this fact, showing that through 2007, the ratio of assessed penalties and interest to the initial assessed TDA liability has continued to rise.
FIGURE 2.13
Ratio of Assessed Penalty and Interest to Initial TDA Liability(after 3 years and cumulative)
16%
21%
24%
17%
11%
7% 7%6% 6% 6%
2003 2005 2007 2009 2011
Cumulative
After 3 years
30 Since taxpayers with AUR assessments often are entitled to refunds, obtaining information return data in real time would allevi-ate the need for the IRS to subsequently collect many of these assessments.
31 The initial TDA balance includes the original tax assessment in addition to assessed penalties and interest less abatements. The IRS generally assesses penalty and interest due at the time of tax assessment, but additional penalties and interest are likely to accrue and will be periodically assessed.

Section Two — IRS COLLECTIBILITY CURVE 48
Form 1023-EZ IRS Collectibility Curve Audit Impact Study Understanding the Hispanic Underserved
For later years, the ratio of assessed penalties and interest to the initial TDA balance is likely to become even higher, although sufficient time has not elapsed to experience the full impact of penalties and interest.
As the IRS takes longer to collect liabilities, taxpayer burden will continue to increase, as taxpayers pay even larger amounts of penalties and interest. Figure 2.13 also shows that through the first three years after TDA assignment, assessed penalties and interest remain relatively constant. However, as the IRS continues to resolve fewer TDAs, the ratio of assessed penalty and interest to the initial liability will con-tinue to grow. By the tenth year of the collection statute, taxpayers with TDAs originating in 2003 and 2004 owed more than twice the amount of assessed penalties and interest as they owed three years after TDA assignment. For TDAs originating in 2005, taxpayers owed more than three times the penalty and interest in 2014 than they did in three years after the initial TDA.
We see a similar trend with total interest and penalties (including accruals) as we do with assessed penal-ties and interest. However, the ratio of interest and penalties to the initial liability is even higher. Figure 2.14 illustrates the ratio of total penalties and interest (assessed and accrued) to the initial TDA liability.
FIGURE 2.14
Ratio of Total Penalties and Interest (Including Accruals) to Initial Liability Balance
44%
40%
32%
23%
17%
2003 2005 2007 2009 2011
Total penalties and interest decline as less time has elapsed for additional penalties and interest to accrue. For those years in which the statutory period of collection has generally expired, we see that the total assessed penalties and interest as of the end of 2014 is 40 percent or more of the original liability. For more recent years, where the statutory period of collection has not tolled, total interest and penalties are a smaller percent of the initial TDA balance. However, as time progresses, this ratio will likely increase. It should also be noted that taxpayers with liabilities remaining in the latter part of the statutory period of collection (i.e., those who have not stopped the accrual of penalties and interest by paying off the original tax assessment) often have penalty and interest amounts exceeding 50 percent of their initial liability.32
32 See National Taxpayer Advocate 2012 Annual Report to Congress vol. 2, 123.

Taxpayer Advocate Service — 2015 Annual Report to Congress — Volume Two 49
Understanding the Hispanic Underserved Audit Impact Study Form 1023-EZIRS Collectibility Curve
Determine the Percent of Liabilities Abated by the IRS and If the Percentage Abated Varies by the Source of AssessmentFor years after 2003, both dollars abated from the initial TDA assessment33 and the percent of the initial balance abated have continued to be higher than the 2003 rate, and they remain at an overall higher level, as indicated in Figure 2.15.
FIGURE 2.15, Percent of Initial TDA Balance Abated34
Year Initial TDA Balance Amount Abated Percent Abated
2003 $15,326,191,192 $2,985,977,270 19%
2005 $25,996,084,845 $8,066,761,341 31%
2007 $40,678,451,308 $13,086,103,480 32%
2009 $41,987,700,518 $10,716,623,485 26%
2011 $42,926,217,917 $11,990,870,525 28%
The dollars abated continue to increase. The rate of abatement for 2007 is higher than in 2003 and 2005, even though the TDAs in 2007 have about two more years remaining on the collection statute. The abatement rate is down slightly since 2007; however, less time has elapsed. The data suggest that Collection is continuing to focus significant resources on bad assessments.
We also explored the TDA dollars abated by the source of assessment, as indicated in Figure 2.16.
FIGURE 2.16, Percent of TDA Amount Abated, by Source of Assessment
YearSelf-Reported Assessments
Substitute for Return
Audit Assessments
AUR Assessments
Trust Fund Recovery Penalties
2003 6% 49% 15% 15% 39%
2005 6% 47% 12% 29% 40%
2007 12% 43% 14% 28% 35%
2009 9% 36% 13% 27% 28%
2011 16% 40% 19% 18% 29%
IRS substitute for return assessments are the most likely to be abated.35 For 2003 and 2005, where ten years have elapsed since assignment to a TDA, almost half of liability amounts have been abated.
Obviously, substitute for return assessments are generating considerable rework for the IRS and may be preventing the IRS from collecting additional subsequent payments on more productive work. IRS
33 Dollars abated may include tax, penalty, and interest.34 For TDAs initially assigned in 2003 and 2005, abatements are also attributable to the expiration of the ten-year collection stat-
ute.35 This is presumably due to the fact that SFR assessments are based on the assumption that the taxpayer is single, claiming
the standard deduction. That assessment prompts some taxpayers to file a delinquent return, which documents a lower tax liability — thus, the abatement of the overstated liability. However, the remaining assessment could still be very cost-effective to collect.

Section Two — IRS COLLECTIBILITY CURVE 50
Form 1023-EZ IRS Collectibility Curve Audit Impact Study Understanding the Hispanic Underserved
should ensure substitute for return assessments are at least as cost-effective as other types of assessments and review current procedures to identify revisions that could improve productivity.36
The abatement rate of AUR assessments has also increased significantly since 2003, possibly implying that the IRS is selecting more cases for AUR assessments, even though it is less certain that the taxpayer is liable for the additional tax. Trust Fund Recovery Penalties (TFRP) have an abatement rate almost as high as that of substitute for return assessments. However, TFRP assessments may have necessarily high abatement rates because the IRS abates the liability, as it is paid by the underlying corporation or other responsible officers.
Examine the Percentage of Cases Resolved During the Ten-Year Collection StatuteWe examined the percentage of cases completely resolved within the usual ten-year statutory collection period. Overall, the IRS completely resolved nearly 80 percent of the cases reaching TDA status in 2003 and 2005 by the ninth year of the collection statute.37 The percentage of cases closed in the tenth year of collection statute increases significantly because liabilities are being abated in full as the collection statute expires.38 Although more time remains on the collection statute for TDAs assigned in more recent years through equivalent periods of elapsed time, the percent of the balance due collected has been declining from earlier years.39 This information is illustrated by Figure 2.17.
FIGURE 2.17, Cumulative Closure Rate
Elapsed Years 2003 2005 2007 2009 2011
1 23% 25% 27% 21% 25%
2 38% 39% 40% 33% 37%
3 50% 49% 47% 41% 45%
4 58% 56% 53% 48% 48%
5 65% 61% 58% 52%
6 69% 65% 62% 54%
7 73% 68% 65%
8 76% 71% 66%
9 80% 74%
10 95% 80%
36 National Taxpayer Advocate 2011 Annual Report to Congress 93 (Most Serious Problem: Automated “Enforcement Assessments” Gone Wild: IRS Efforts to Address the Non-Filer Population Have Produced Questionable Business Results for the IRS, While Creating Serious Burden for Many Taxpayers). See also National Taxpayer Advocate 2007 Annual Report to Congress 246 (Most Serious Problem: Nonfiler Program).
37 The liability may be completely resolved because: (a) the taxpayer paid the liability in full, including penalties and interest; (b) the IRS may have determined the liability was incorrect and abated all or part of it; or (c) the IRS may have accepted an offer to compromise the tax liability for less than the full amount.
38 The closure rates depicted are for TDA liabilities. Since time has elapsed between the assessment of a liability and when the IRS assigns it to TDA status, the collection period generally expires during the tenth year since the liability reached TDA status (rather than at the end of the tenth year). Certain actions, such as the consideration of an installment agreement, OIC, or bankruptcy proceeding may extend the collection statute. Additionally, the taxpayer may voluntarily extend the collection stat-ute, usually to pursue a long-term installment agreement.
39 The closure rate for 2011 is higher than the rate in 2009 until the fourth year.

Taxpayer Advocate Service — 2015 Annual Report to Congress — Volume Two 51
Understanding the Hispanic Underserved Audit Impact Study Form 1023-EZIRS Collectibility Curve
Though the IRS resolves most TDA modules, over half of the total dollar amount of the liabilities remains four years40 after a delinquency reaches TDA status, as illustrated in Figure 2.18.
FIGURE 2.18
Decline in TDA Module Balance Four Years After TDA Issued
2003 2005 2007 2009 2011
Initial Year of TDA Assignment
42%
36%34% 35%
39%
The overall high closure rate is undoubtedly because, as discussed earlier, the vast majority of modules owe no more than $5,000. The IRS is generally effective at collecting these smaller liabilities through subsequent payments and offsets. The data also indicate that the percentage of the total liability collected, including penalties and interest, has been declining since 2003, although the rate of liability growth due to penalties and interest has increased.
As the closure rate has generally declined from 2003 to 2009, the volume of TDA cases remaining open has continued to increase. Figure 2.19 shows the volume of cases still open since the liability was assigned to TDA status.
40 We used the fourth year of the collection statute for an even comparison.

Section Two — IRS COLLECTIBILITY CURVE 52
Form 1023-EZ IRS Collectibility Curve Audit Impact Study Understanding the Hispanic Underserved
FIGURE 2.19, Percent of Cases Remaining Open by Years Since Becoming a TDA
Year Since TDA Issued 2003 2005 2007 2009 2011
1 77% 75% 73% 79% 75%
2 62% 61% 60% 67% 63%
3 50% 51% 53% 59% 55%
4 42% 44% 47% 52% 52%
5 35% 39% 42% 48%
6 31% 35% 38% 46%
7 27% 32% 35%
8 24% 29% 34%
9 20% 26%
10 5% 20%
The volume of open cases in 2011 is many times larger than in 2003. A significant reason for this is that the volume of new TDAs has increased so dramatically; another might be the declining trend of Collection staffing. The figure demonstrates that the closure rate drops as the years progress after a mod-ule reaches TDA status. While one-fifth or less of the cases remained unresolved at the time of collection statute expiration for new TDAs from 2003 to 2005, it is likely that nearly a third of the new TDAs since 2007 will remain unresolved at the time of collection statute expiration.
Determine If the Percentage of TDA Dollars Collected Varies by Collection Channel The dollars collected and abated do vary by Collection channel. Figure 2.20 shows that the largest per-centage of dollars collected by subsequent payments and refund offsets were garnered by ACS.
FIGURE 2.20, Percent of Initial Balance Satisfied by Payments, Offsets, or Abatements
Year
ACS Queue Collection Field Function
Percent of Initial Balance Percent of Initial Balance Percent of Initial Balance
Collected by Subsequent Payments
Collected by Offsets Abated
Collected by Subsequent Payments
Collected by Offsets Abated
Collected by Subsequent Payments
Collected by Offsets Abated
2003 44% 22% 14% 29% 6% 23% 32% 6% 28%
2005 40% 21% 21% 17% 5% 37% 21% 6% 39%
2007 39% 25% 19% 11% 4% 36% 13% 5% 41%
2009 30% 16% 20% 9% 4% 27% 13% 5% 32%
2011 26% 15% 16% 8% 3% 37% 12% 2% 42%
The figure shows that ACS dollars collected from subsequent payments have continued to decrease since 2003. For liabilities reaching TDA status since 2005, additional time remains to receive subsequent payments and offsets; however, the percent of the liability collected has increased by no more than ten percent in the final six years of the collection statute. Therefore, it seems likely ACS will collect a

Taxpayer Advocate Service — 2015 Annual Report to Congress — Volume Two 53
Understanding the Hispanic Underserved Audit Impact Study Form 1023-EZIRS Collectibility Curve
significantly smaller percentage of the initial TDA balance than in 2003. The trend of the IRS collecting fewer dollars through subsequent payments is even stronger for the cases assigned to the queue and CFf.
Offsets as a percentage of the initial TDA balance due actually increased slightly for new ACS TDAs from 2003 to 2007, but then drastically decreased in 2009 and 2011. For TDAs assigned to the queue or CFf, offsets as a percent of the initial TDA balance have generally remained constant, though garnering a relatively small percent of the initial TDA balance.
Abatements of at least some of the initial TDA balance are relatively high in all three functions with TDA inventory. However, the percentage of the initial TDA balance abated is higher in the queue than in ACS and even higher in CFf. In fact, about a third of the initial balances of the TDAs assigned to CFf are abated. This means that CFf personnel are spending a significant portion of their time resolving incorrect assessments. Accordingly, a review of current procedures might identify ways that these cases could be worked more effectively.
After removing abatements from the initial balance due and when considering only the first six years since the case reached TDA status,41 the percent of initial TDA dollars collected is significantly higher, as indicated by Figure 2.21.
FIGURE 2.21, Percent of Initial TDA Balance After Abatements Collected by Payments and Offsets After First Six Years in TDA Status
Year ACS Queue CFf
2003 67% 39% 45%
2005 69% 28% 35%
2007 73% 20% 26%
2009 58% 19% 26%
Although Figure 2.21 combines dollars collected through subsequent payments and offsets, the total amount collected becomes a larger percent of the actual balance due, since abatements are excluded. This is particularly noticeable in CFf, which consistently has the highest percentage of abatements when com-pared to the other TDA collection channels. In general, the percent of the initial TDA balance collected has declined since 2003.
OTHER CONSIDERATIONS
Some have suggested that a reason why collections decline as time elapses is because those taxpayers who are going to pay resolve their liabilities relatively quickly. Accordingly, as time progresses, the IRS’s remaining TDA inventory is comprised of the TDAs belonging to taxpayers who are unable to satisfy their liabilities or who the IRS cannot compel to satisfy their liabilities. To examine this possibility, we stratified the dollars collected based on whether the IRS had reported the account as CNC. The following figure shows the amount owed and dollars collected by the expiration of the statutory collection period
41 We have removed TDAs originating in 2011 since sufficient time has not elapsed to examine collections six years later.
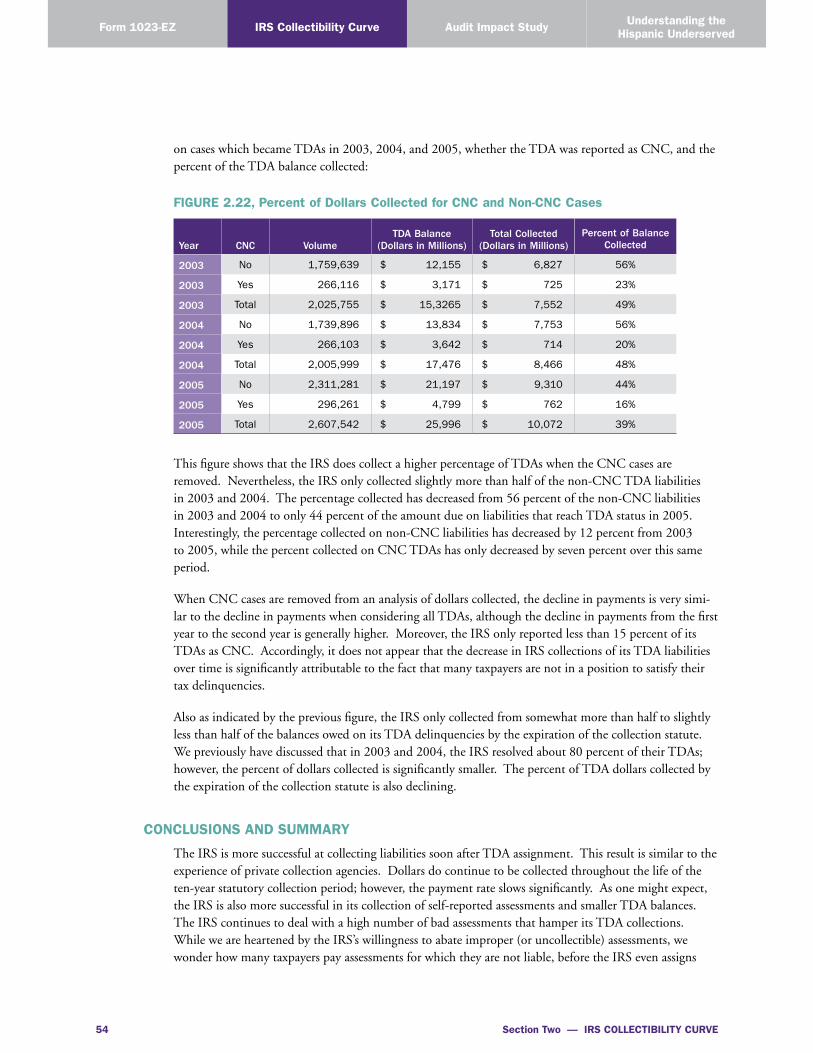
Section Two — IRS COLLECTIBILITY CURVE 54
Form 1023-EZ IRS Collectibility Curve Audit Impact Study Understanding the Hispanic Underserved
on cases which became TDAs in 2003, 2004, and 2005, whether the TDA was reported as CNC, and the percent of the TDA balance collected:
FIGURE 2.22, Percent of Dollars Collected for CNC and Non-CNC Cases
Year CNC VolumeTDA Balance
(Dollars in Millions)Total Collected
(Dollars in Millions)Percent of Balance
Collected
2003 No 1,759,639 $ 12,155 $ 6,827 56%
2003 Yes 266,116 $ 3,171 $ 725 23%
2003 Total 2,025,755 $ 15,3265 $ 7,552 49%
2004 No 1,739,896 $ 13,834 $ 7,753 56%
2004 Yes 266,103 $ 3,642 $ 714 20%
2004 Total 2,005,999 $ 17,476 $ 8,466 48%
2005 No 2,311,281 $ 21,197 $ 9,310 44%
2005 Yes 296,261 $ 4,799 $ 762 16%
2005 Total 2,607,542 $ 25,996 $ 10,072 39%
This figure shows that the IRS does collect a higher percentage of TDAs when the CNC cases are removed. Nevertheless, the IRS only collected slightly more than half of the non-CNC TDA liabilities in 2003 and 2004. The percentage collected has decreased from 56 percent of the non-CNC liabilities in 2003 and 2004 to only 44 percent of the amount due on liabilities that reach TDA status in 2005. Interestingly, the percentage collected on non-CNC liabilities has decreased by 12 percent from 2003 to 2005, while the percent collected on CNC TDAs has only decreased by seven percent over this same period.
When CNC cases are removed from an analysis of dollars collected, the decline in payments is very simi-lar to the decline in payments when considering all TDAs, although the decline in payments from the first year to the second year is generally higher. Moreover, the IRS only reported less than 15 percent of its TDAs as CNC. Accordingly, it does not appear that the decrease in IRS collections of its TDA liabilities over time is significantly attributable to the fact that many taxpayers are not in a position to satisfy their tax delinquencies.
Also as indicated by the previous figure, the IRS only collected from somewhat more than half to slightly less than half of the balances owed on its TDA delinquencies by the expiration of the collection statute. We previously have discussed that in 2003 and 2004, the IRS resolved about 80 percent of their TDAs; however, the percent of dollars collected is significantly smaller. The percent of TDA dollars collected by the expiration of the collection statute is also declining.
CONCLUSIONS AND SUMMARY
The IRS is more successful at collecting liabilities soon after TDA assignment. This result is similar to the experience of private collection agencies. Dollars do continue to be collected throughout the life of the ten-year statutory collection period; however, the payment rate slows significantly. As one might expect, the IRS is also more successful in its collection of self-reported assessments and smaller TDA balances. The IRS continues to deal with a high number of bad assessments that hamper its TDA collections. While we are heartened by the IRS’s willingness to abate improper (or uncollectible) assessments, we wonder how many taxpayers pay assessments for which they are not liable, before the IRS even assigns

Taxpayer Advocate Service — 2015 Annual Report to Congress — Volume Two 55
Understanding the Hispanic Underserved Audit Impact Study Form 1023-EZIRS Collectibility Curve
the delinquency to TDA status. We have distilled the findings from the nine objectives into nine specific conclusions.
1. Dollars collected in aggregate and as a percentage of the balance due decrease significantly during the first three years after the IRS assigns a liability to TDA status. The decline in the module bal-ance also slows significantly during these first three years.
2. When continuing to look at the collection of liabilities after the third year of the initial TDA assignment, collections continue to dwindle, and the reduction in the module balance declines almost completely by the expiration of the collection statute.
3. Overall, dollars collected through the offsets of other overpayments are significantly less than dol-lars collected through subsequent payments. However, dollars collected through offsets decrease much less precipitously than dollars collected from subsequent payments as time elapses from the initial TDA assignment.
4. Delinquent modules with balances due not in excess of $5,000 comprise the vast majority of TDAs. However, over 80 percent of the total amount due resides with TDAs with balances greater than $5,000. The IRS collects both a higher percentage of subsequent payments and offsets in the lowest balance due categories. Collections and offsets as a percentage of the balance due progres-sively decrease as the balance due rises.
5. The percentage of the TDA balance collected is significantly greater for self-reported liabilities than when the IRS makes additional assessments. However, AUR assessments result in a greater percentage of dollars collected through offsets.
6. Penalty and interest significantly increase the balance owed by taxpayers, particularly when the underlying balance remains unresolved for several years.
7. The IRS abates between a quarter and a third of TDA liabilities and 40 to 50 percent of its substi-tute for return assessments. It also abates a high proportion of AUR assessments.
8. The IRS completely resolves most of its TDA modules within the ten-year collection statute, with a resolution rate of about 80 percent for TDAs assigned in 2003 and 2005. Unfortunately, the percent of TDAs resolved has generally declined thereafter. Additionally, the balance owed on these delinquencies has been reduced by less than 50 percent.
9. ACS realizes the largest percentage of TDA balances collected by subsequent payment and offset. While the percentage of dollars abated is high in all TDA collection channels, the abatement rates are significantly higher in the queue and CFf than in ACS. However, even controlling for abate-ments, ACS collects a greater percentage of the liabilities assigned to it compared to the other TDA functions.42
Possible Future AnalysesWe hope to perform a similar analysis on Business Master File (BMF) TDAs. A proper examination of the TDA process must include both IMF and BMF delinquencies. We also want to explore dollars collected and abated, which are generated by IRS additional assessments prior to TDA assignment. IRS TDA collections occur within a complex and dynamic environment, and this subject will undoubtedly benefit from many other avenues of study.
42 No active collection occurs on cases in the collection queue; however, offsets still occur and previous IRS notices may continue to generate payments even while the TDA is assigned to the collection queue.

Section Two — IRS COLLECTIBILITY CURVE 56
Form 1023-EZ IRS Collectibility Curve Audit Impact Study Understanding the Hispanic Underserved
TAB
LE A
-1, T
DA
Mod
ules
, Bal
ance
s D
ue, D
olla
rs C
olle
cted
by
Sub
sequ
ent
Pay
men
ts a
nd O
ffse
ts,
Ass
esse
d Pen
alti
es, A
sses
sed
Inte
rest
, and
Aba
tem
ents
Calendar Year
Bal
ance
at
TDA
A
ssig
nmen
tCou
nt o
f In
itial
TD
As
Elapsed Years
TDA
s O
pen
at
End
of
Year
Initi
al B
alan
ce
of T
DA
s O
pen
at E
nd o
f Ye
ar
Endi
ng B
alan
ce
of T
DA
s O
pen
at
End
of Y
ear
Sub
sequ
ent
Pay
men
tsO
ffse
tsPen
alty
Inte
rest
Aba
ted
20
03
$1
5,3
26
,19
1,1
92
2,0
25
,75
5
11,5
58,5
04
$12,2
02,8
54,7
42
$12,3
21,3
33,6
46
($1,7
86,4
25,8
08)
($611,8
20,1
28)
$8
9,1
19
,65
6
$8
2,7
01
,61
7
($1
,10
6,5
42
,94
5)
21,2
49,0
51
$10,7
05,8
78,1
92
$10,3
70,2
95,0
98
($2,9
53,1
92,0
68)
($1,0
04,3
64,2
48)
$2
69
,67
0,6
62
$
20
1,0
12
,22
9
($1
,82
9,9
14
,15
5)
31,0
16,9
96
$9,6
03,2
54,4
59
$8,8
41,3
46,7
57
($3,8
01,6
79,2
11)
($1,2
77,3
19,1
34)
$5
85
,33
7,4
06
$
32
6,1
53
,66
0
($2
,22
4,6
84
,77
2)
4847,9
27
$8,9
47,2
77,1
80
$7,6
87,3
19,2
74
($4,4
16,8
06,9
33)
($1,4
83,6
18,4
43)
$7
39
,00
2,1
05
$
45
2,9
49
,42
4
($2
,48
8,5
70
,54
2)
5714,5
07
$8,4
77,6
50,2
76
$6,8
77,2
86,1
49
($4,8
19,7
28,7
94)
($1,6
84,1
30,9
06)
$8
31
,81
9,2
82
$
57
6,6
98
,44
5
($2
,68
4,0
22
,51
6)
6619,0
11
$8,1
48,6
90,2
14
$6,2
97,4
81,4
88
($5,0
73,9
40,2
95)
($1,8
29,2
21,4
28)
$8
89
,24
8,5
36
$
67
1,6
04
,64
6
($2
,77
8,3
70
,13
3)
7548,0
04
$7,8
35,6
54,5
29
$5,8
00,6
13,9
47
($5,2
70,5
06,8
89)
($1,9
33,5
92,4
77)
$9
27
,72
7,1
94
$
75
3,4
09
,76
0
($2
,86
2,1
89
,72
0)
8483,7
27
$7,5
22,1
86,5
32
$5,3
80,8
80,1
43
($5,4
36,5
25,7
49)
($2,0
24,8
68,9
88)
$9
58
,85
6,9
95
$
82
4,5
97
,63
2
($2
,91
9,7
30
,57
0)
9414,7
57
$7,1
39,3
50,4
98
$4,9
56,8
81,9
09
($5,5
77,9
01,2
84)
($2,1
01,1
41,3
58)
$9
76
,32
7,0
65
$
88
6,7
88
,55
5
($2
,95
7,5
00
,65
7)
10
103,9
59
$2,7
15,5
23,0
09
$1,8
49,4
67,7
41
($5,7
01,2
45,9
81)
($2,1
50,7
46,2
45)
$9
86
,07
6,2
44
$
1,0
35
,69
1,8
69
($
2,9
85
,97
7,2
70
)
20
04
$1
7,4
76
,05
1,7
16
2,0
06
,00
0
11,5
06,5
93
$14,1
53,8
44,8
59
$14,1
43,1
37,6
43
($2,5
01,8
99,0
78)
($747,3
49,7
55)
$1
49
,37
6,2
00
$
10
5,4
52
,46
0
($1
,58
4,9
20
,91
7)
21,2
03,0
22
$12,5
49,6
60,8
91
$11,9
75,4
98,9
39
($3,7
54,8
05,1
43)
($1,1
54,9
90,4
32)
$4
52
,80
8,9
38
$
22
6,8
18
,88
4
($2
,56
9,6
60
,33
6)
3992,0
48
$11,5
21,8
80,2
41
$10,4
36,9
48,9
36
($4,5
96,3
20,3
88)
($1,4
39,7
30,3
92)
$6
69
,61
8,3
62
$
36
0,4
78
,20
4
($3
,18
7,9
25
,79
0)
4828,8
92
$10,8
78,6
54,1
48
$9,3
36,4
49,7
27
($5,1
48,6
78,2
96)
($1,7
02,3
63,5
49)
$8
01
,49
1,9
59
$
49
6,6
24
,07
8
($3
,53
8,3
38
,13
4)
5715,6
65
$10,3
51,9
52,7
53
$8,5
04,2
13,7
14
($5,5
03,7
93,0
70)
($1,8
94,3
49,7
84)
$8
83
,25
0,5
92
$
60
8,2
66
,87
9
($3
,73
9,3
17
,88
1)
6633,5
69
$10,0
03,8
13,6
74
$7,9
01,6
89,3
12
($5,7
72,2
19,0
32)
($2,0
22,7
86,1
86)
$9
38
,66
0,8
71
$
70
3,0
39
,21
9
($3
,86
2,2
72
,26
2)
7566,2
07
$9,7
00,1
68,6
02
$7,3
85,2
15,2
77
($5,9
88,5
99,8
85)
($2,1
35,6
79,6
20)
$9
82
,06
2,2
68
$
78
6,2
24
,96
2
($3
,95
7,6
35
,60
8)
8505,3
48
$9,4
03,1
51,0
87
$6,9
52,0
37,3
21
($6,1
72,2
25,8
08)
($2,2
28,2
08,0
53)
$1
,00
7,0
15
,97
5
$8
61
,74
5,7
67
($
4,0
37
,65
8,2
21
)
9439,8
49
$8,9
50,9
89,4
08
$6,4
27,9
25,8
14
($6,3
40,4
70,2
92)
($2,3
02,1
66,0
02)
$1
,03
7,3
47
,82
3
$1
,28
1,8
90
,85
6
($4
,09
4,8
26
,94
2)
10
112,3
88
$2,9
58,7
25,0
02
$2,1
61,3
05,3
13
($6,4
60,9
97,6
98)
($2,3
54,5
40,3
05)
$1
,04
7,9
75
,39
0
$2
,04
2,6
54
,00
2
($4
,15
0,0
04
,99
2)
20
05
$2
5,9
96
,08
4,8
45
2,6
07
,54
2
11,9
55,6
38
$20,9
55,1
72,3
57
$20,8
72,6
16,2
07
($2,9
90,8
40,0
93)
($936,8
38,8
72)
$3
07
,55
7,3
42
$
14
5,2
16
,76
4
($3
,51
3,2
28
,09
2)
21,5
92,0
45
$18,5
85,0
20,7
38
$17,6
57,4
16,6
04
($4,3
34,9
74,3
44)
($1,4
46,8
37,2
31)
$6
70
,50
4,1
87
$
30
2,5
27
,49
4
($5
,50
7,7
89
,89
2)
31,3
26,0
84
$17,3
90,0
16,7
57
$15,7
59,1
06,6
85
($5,1
67,6
17,5
07)
($1,9
08,9
89,0
84)
$9
02
,56
4,4
84
$
47
0,4
56
,00
1
($6
,39
9,5
31
,56
7)
41,1
46,0
71
$16,5
96,2
17,9
70
$14,4
23,4
64,4
46
($5,7
03,4
05,8
17)
($2,2
39,5
61,5
50)
$1
,03
6,6
94
,48
5
$6
20
,04
9,0
22
($
6,8
80
,71
6,8
07
)
51,0
21,7
77
$15,9
82,9
34,9
58
$13,4
40,5
85,5
75
($6,0
98,0
77,1
84)
($2,4
62,1
84,8
85)
$1
,12
5,5
12
,27
2
$7
47
,67
5,3
02
($
7,2
35
,93
2,9
55
)
6920,4
43
$15,5
05,7
12,7
48
$12,6
29,9
90,6
19
($6,4
39,3
93,5
80)
($2,6
53,4
38,2
07)
$1
,19
5,3
01
,64
9
$8
66
,79
2,9
03
($
7,5
85
,20
8,0
18
)
7835,6
87
$15,0
67,5
68,5
27
$11,9
45,6
67,3
25
($6,7
28,8
67,2
00)
($2,8
14,7
97,2
86)
$1
,23
8,5
66
,72
3
$9
75
,71
1,9
54
($
7,7
62
,86
1,0
68
)
8759,8
18
$14,6
13,4
28,1
03
$11,2
90,9
87,8
93
($6,9
81,1
87,5
87)
($2,9
40,3
82,6
49)
$1
,26
7,2
69
,37
4
$1
,57
4,3
19
,15
0
($7
,93
4,9
58
,41
7)
9672,6
06
$14,1
38,6
85,0
88
$10,6
36,2
64,9
45
($7,1
90,6
38,6
76)
($3,0
41,4
30,8
18)
$1
,28
7,9
87
,43
7
$3
,39
5,8
28
,36
6
($8
,01
9,2
44
,73
0)
10
509,9
36
$10,3
46,3
07,0
42
$7,7
90,6
16,3
36
($7,3
14,2
58,2
18)
($3,0
86,5
29,4
97)
$1
,29
7,0
81
,11
7
$3
,72
8,4
01
,94
8
($8
,06
6,7
61
,34
1)

Taxpayer Advocate Service — 2015 Annual Report to Congress — Volume Two 57
Understanding the Hispanic Underserved Audit Impact Study Form 1023-EZIRS Collectibility Curve
Calendar Year
Bal
ance
at
TDA
A
ssig
nmen
tCou
nt o
f In
itial
TD
As
Elapsed Years
TDA
s O
pen
at
End
of
Year
Initi
al B
alan
ce
of T
DA
s O
pen
at E
nd o
f Ye
ar
Endi
ng B
alan
ce
of T
DA
s O
pen
at
End
of Y
ear
Sub
sequ
ent
Pay
men
tsO
ffse
tsPen
alty
Inte
rest
Aba
ted
20
06
$3
0,3
51
,73
6,5
52
2,9
57
,59
0
12,2
03,5
45
$24,2
84,6
99,4
86
$24,3
82,4
28,2
97
($3,7
81,4
36,0
23)
($1,2
05,2
26,8
94)
$3
09
,23
0,1
89
$
20
9,8
87
,34
0
($4
,02
8,5
43
,95
5)
21,7
80,4
05
$22,0
47,1
22,6
24
$21,1
34,9
76,8
27
($5,0
87,1
88,5
74)
($1,9
63,8
12,8
46)
$7
09
,21
6,7
45
$
40
7,1
85
,85
2
($6
,08
2,0
17
,99
6)
31,5
09,5
12
$20,8
20,8
96,4
93
$19,2
11,3
20,0
24
($5,8
69,9
08,5
34)
($2,4
87,1
04,5
15)
$9
46
,57
4,1
28
$
58
2,9
51
,56
5
($6
,95
4,9
56
,35
7)
41,3
28,5
95
$19,8
61,9
06,6
45
$17,7
96,9
78,4
67
($6,4
19,3
25,4
85)
($2,8
27,9
75,0
36)
$1
,09
4,2
43
,02
7
$7
32
,78
6,1
43
($
7,5
63
,74
4,2
03
)
51,1
86,1
08
$19,0
80,5
18,2
37
$16,6
50,1
19,6
57
($6,8
94,8
84,5
36)
($3,1
16,8
09,4
35)
$1
,21
2,4
32
,15
4
$8
76
,72
0,3
66
($
8,0
37
,93
1,4
74
)
61,0
69,2
54
$18,4
50,0
44,2
75
$15,6
50,4
53,2
62
($7,2
75,7
30,5
44)
($3,3
48,6
58,9
25)
$1
,28
4,2
28
,92
8
$1
,00
3,7
55
,55
1
($8
,32
3,6
94
,66
3)
7972,4
78
$17,8
05,3
47,3
94
$14,7
41,9
86,9
13
($7,6
09,5
46,7
92)
($3,5
22,1
36,3
83)
$1
,33
2,5
57
,51
4
$1
,63
9,0
89
,77
8
($8
,63
4,8
38
,75
9)
8884,5
75
$17,2
71,4
68,6
16
$13,9
32,3
32,1
31
($7,8
83,7
37,0
61)
($3,6
67,6
49,4
12)
$1
,36
4,8
01
,58
0
$3
,67
5,2
41
,13
7
($8
,83
2,8
44
,82
9)
9846,8
17
$17,0
53,9
47,0
88
$13,5
89,2
43,3
27
($8,0
56,5
43,0
80)
($3,7
41,2
38,5
20)
$1
,37
8,7
20
,59
0
$4
,24
8,9
93
,11
3
($8
,94
1,3
04
,37
7)
10
846,8
17
$17,0
53,9
47,0
88
$13,5
89,2
43,3
27
($8,0
63,9
91,5
33)
($3,7
46,1
60,5
29)
$1
,37
9,2
11
,90
5
$4
,25
8,9
74
,45
9
($8
,94
4,7
17
,30
8)
20
07
$4
0,6
78
,45
1,3
08
3,7
40
,79
0
12,7
40,8
24
$32,8
49,0
20,5
98
$32,7
83,2
85,1
29
($3,6
64,8
16,2
62)
($1,7
04,6
05,0
08)
$4
09
,68
9,7
10
$
24
4,8
45
,10
0
($6
,15
3,9
64
,02
9)
22,2
63,1
45
$29,9
35,1
48,4
23
$28,9
48,2
79,7
52
($4,9
95,2
56,2
77)
($2,5
78,7
89,1
50)
$9
28
,40
7,0
71
$
44
2,2
46
,28
7
($8
,83
5,0
26
,27
2)
31,9
64,8
27
$28,3
01,1
34,5
33
$26,5
31,7
18,8
98
($5,9
02,2
53,2
82)
($3,1
23,5
31,0
76)
$1
,22
5,5
42
,21
4
$6
19
,23
4,8
00
($
10
,24
8,5
79
,98
5)
41,7
40,2
83
$26,9
43,4
62,3
91
$24,5
61,5
83,8
82
($6,6
22,5
50,7
32)
($3,5
57,4
88,5
09)
$1
,43
9,7
33
,28
3
$7
84
,18
5,9
32
($
11
,22
6,5
17
,58
7)
51,5
63,4
77
$25,6
68,2
40,7
55
$22,9
40,2
59,1
64
($7,2
22,8
64,0
85)
($3,9
09,1
44,4
83)
$1
,56
4,4
79
,63
8
$9
39
,93
1,8
27
($
11
,99
0,0
04
,66
0)
61,4
23,3
12
$24,8
06,1
06,2
19
$21,6
17,5
58,0
53
($7,7
40,2
23,0
75)
($4,1
71,1
60,3
48)
$1
,65
8,9
92
,87
4
$1
,57
8,5
74
,74
5
($1
2,4
33
,76
2,0
35
)
71,3
09,3
49
$24,0
32,8
49,4
48
$20,5
02,3
16,7
40
($8,1
57,6
36,6
02)
($4,3
76,9
59,6
58)
$1
,72
2,4
29
,52
4
$4
,08
5,3
68
,50
1
($1
2,8
78
,25
4,0
66
)
81,2
66,2
94
$23,7
40,4
26,8
22
$20,0
17,1
41,7
06
($8,4
30,1
13,2
49)
($4,4
87,8
71,9
26)
$1
,75
3,8
35
,88
8
$4
,86
0,0
34
,84
2
($1
3,0
76
,87
0,3
19
)
91,2
66,2
94
$23,7
40,4
26,8
22
$20,0
17,1
41,7
06
($8,4
37,9
45,8
03)
($4,4
93,5
00,6
87)
$1
,76
0,0
82
,41
5
$4
,88
4,0
33
,47
8
($1
3,0
86
,10
3,4
80
)
10
1,2
66,2
94
$23,7
40,4
26,8
22
$20,0
17,1
41,7
06
($8,4
37,9
45,8
03)
($4,4
93,5
00,6
87)
$1
,76
0,0
82
,41
5
$4
,88
4,0
33
,47
8
($1
3,0
86
,10
3,4
80
)
20
08
$3
6,4
83
,19
3,5
83
3,5
90
,83
1
12,6
49,3
11
$29,3
35,3
25,2
17
$29,5
14,2
74,9
45
($3,4
13,5
45,8
09)
($1,8
78,4
05,3
31)
$4
03
,29
1,5
35
$
20
2,2
09
,49
0
($4
,82
3,4
70
,10
2)
22,2
08,3
74
$26,7
73,8
21,0
08
$26,2
30,4
69,5
76
($4,8
11,8
13,3
96)
($2,7
01,8
02,9
14)
$8
90
,50
3,9
10
$
37
0,6
26
,08
3
($6
,86
4,9
23
,88
8)
31,9
01,0
82
$24,9
35,7
84,0
88
$23,8
76,2
51,2
93
($5,8
16,5
81,3
81)
($3,2
95,8
41,6
46)
$1
,26
9,4
11
,58
3
$5
28
,30
7,6
55
($
8,0
35
,06
5,5
77
)
41,6
70,8
37
$23,3
66,0
11,3
00
$21,9
93,8
50,9
51
($6,6
00,4
50,6
45)
($3,7
44,5
21,7
67)
$1
,49
5,4
74
,85
9
$6
81
,36
5,5
25
($
8,7
80
,83
3,4
12
)
51,4
96,2
20
$22,2
07,4
14,5
17
$20,4
47,5
70,9
75
($7,2
55,7
16,0
53)
($4,0
64,9
95,1
30)
$1
,63
2,0
99
,72
1
$1
,17
3,6
86
,87
8
($9
,28
1,9
79
,28
7)
61,3
59,7
59
$21,0
73,2
71,2
06
$18,9
80,1
16,8
72
($7,7
61,0
69,6
16)
($4,3
06,9
86,4
32)
$1
,72
0,2
57
,08
7
$2
,87
3,8
81
,17
8
($9
,74
1,2
62
,88
2)
71,3
12,6
93
$20,7
40,0
05,5
90
$18,4
78,2
20,7
02
($8,0
46,5
13,0
83)
($4,4
11,1
25,8
62)
$1
,75
5,9
43
,12
9
$3
,45
8,1
26
,78
8
($9
,93
7,1
04
,10
0)
81,3
12,6
93
$20,7
40,0
05,5
90
$18,4
78,2
20,7
02
($8,0
42,7
88,7
04)
($4,4
13,2
44,3
89)
$1
,75
6,3
34
,24
3
$3
,46
1,0
84
,06
8
($9
,93
9,4
86
,39
8)
91,3
12,6
93
$20,7
40,0
05,5
90
$18,4
78,2
20,7
02
($8,0
42,7
88,7
04)
($4,4
13,2
44,3
89)
$1
,75
6,3
34
,24
3
$3
,46
1,0
84
,06
8
($9
,93
9,4
86
,39
8)
10
1,3
12,6
93
$20,7
40,0
05,5
90
$18,4
78,2
20,7
02
($8,0
42,7
88,7
04)
($4,4
13,2
44,3
89)
$1
,75
6,3
34
,24
3
$3
,46
1,0
84
,06
8
($9
,93
9,4
86
,39
8)
Tabl
e A-
1, T
DA
Mod
ules
, Bal
ance
s D
ue, D
olla
rs C
olle
cted
by
Sub
sequ
ent
Paym
ents
and
Off
sets
, Ass
esse
d Pe
nalti
es,
Asse
ssed
Inte
rest
, and
Aba
tem
ents
(co
ntin
ued)

Section Two — IRS COLLECTIBILITY CURVE 58
Form 1023-EZ IRS Collectibility Curve Audit Impact Study Understanding the Hispanic Underserved
Calendar Year
Bal
ance
at
TDA
A
ssig
nmen
tCou
nt o
f In
itial
TD
As
Elapsed Years
TDA
s O
pen
at
End
of
Year
Initi
al B
alan
ce
of T
DA
s O
pen
at E
nd o
f Ye
ar
Endi
ng B
alan
ce
of T
DA
s O
pen
at
End
of Y
ear
Sub
sequ
ent
Pay
men
tsO
ffse
tsPen
alty
Inte
rest
Aba
ted
20
09
$4
1,9
87
,70
0,5
18
3,6
25
,85
3
12,8
55,0
31
$34,9
10,0
79,8
84
$35,3
32,5
22,2
91
($3,6
31,9
38,6
74)
($1,7
25,4
67,6
81)
$5
34
,92
0,6
65
$
15
3,4
33
,42
7
($5
,00
3,8
14
,84
1)
22,4
36,3
01
$31,7
18,6
37,3
29
$31,5
81,1
77,3
84
($5,3
07,4
44,5
29)
($2,6
21,4
30,4
30)
$1
,10
7,1
07
,55
0
$2
96
,76
9,6
92
($
7,4
90
,66
2,8
03
)
32,1
32,3
68
$29,3
67,1
16,9
87
$28,7
67,2
91,9
89
($6,5
24,2
63,2
63)
($3,2
51,6
23,7
53)
$1
,56
1,7
92
,80
4
$4
47
,22
2,0
02
($
8,8
52
,15
1,2
80
)
41,9
02,9
42
$27,4
78,0
19,2
14
$26,4
95,8
24,5
96
($7,4
69,0
86,9
00)
($3,6
98,5
07,8
04)
$1
,82
4,6
80
,81
8
$9
51
,47
5,4
33
($
9,7
84
,25
8,2
43
)
51,7
27,8
94
$26,0
92,4
08,8
73
$24,6
08,5
25,5
44
($8,2
15,6
63,5
86)
($4,0
37,1
87,1
65)
$1
,99
6,1
45
,24
6
$2
,66
7,4
10
,51
0
($1
0,4
33
,40
1,8
57
)
61,6
74,7
74
$25,6
49,1
01,7
21
$23,9
22,4
24,3
54
($8,5
95,1
96,4
69)
($4,1
71,6
91,8
09)
$2
,07
1,6
26
,15
8
$3
,23
4,7
30
,63
9
($1
0,7
15
,47
1,9
60
)
71,6
74,7
74
$25,6
49,1
01,7
21
$23,9
22,4
24,3
54
($8,5
98,4
77,7
60)
($4,1
73,5
53,6
36)
$2
,07
1,9
42
,89
1
$3
,23
6,4
09
,71
7
($1
0,7
16
,62
3,4
85
)
81,6
74,7
74
$25,6
49,1
01,7
21
$23,9
22,4
24,3
54
($8,5
98,4
77,7
60)
($4,1
73,5
53,6
36)
$2
,07
1,9
42
,89
1
$3
,23
6,4
09
,71
7
($1
0,7
16
,62
3,4
85
)
91,6
74,7
74
$25,6
49,1
01,7
21
$23,9
22,4
24,3
54
($8,5
98,4
77,7
60)
($4,1
73,5
53,6
36)
$2
,07
1,9
42
,89
1
$3
,23
6,4
09
,71
7
($1
0,7
16
,62
3,4
85
)
10
1,6
74,7
74
$25,6
49,1
01,7
21
$23,9
22,4
24,3
54
($8,5
98,4
77,7
60)
($4,1
73,5
53,6
36)
$2
,07
1,9
42
,89
1
$3
,23
6,4
09
,71
7
($1
0,7
16
,62
3,4
85
)
20
10
$4
5,7
04
,39
2,1
88
4,1
50
,28
3
13,1
04,9
02
$36,2
25,9
46,3
33
$36,7
70,1
45,5
99
($3,9
00,2
20,4
31)
($2,0
03,2
51,8
96)
$5
77
,83
6,9
01
$
14
5,0
97
,15
8
($6
,85
6,7
57
,91
8)
22,5
76,0
11
$32,6
24,3
72,4
20
$32,5
14,6
34,4
53
($5,6
61,5
80,1
07)
($2,9
41,6
01,4
79)
$1
,17
8,1
34
,28
0
$2
81
,16
2,6
28
($
9,4
88
,14
1,7
86
)
32,2
31,8
53
$29,8
63,8
54,2
05
$29,4
68,5
92,1
63
($6,9
25,5
40,4
07)
($3,5
56,5
25,1
64)
$1
,67
6,1
16
,93
7
$6
52
,06
3,3
33
($
11
,20
4,9
40
,75
1)
41,9
84,3
79
$28,1
00,8
21,4
06
$27,1
93,7
87,0
60
($7,8
71,8
84,6
38)
($4,0
03,1
21,5
92)
$1
,94
8,3
03
,58
8
$1
,94
2,0
72
,45
5
($1
2,0
79
,32
6,2
37
)
51,9
07,4
17
$27,5
27,9
77,9
64
$26,3
69,1
10,9
84
($8,4
43,6
68,6
73)
($4,2
28,0
19,9
65)
$2
,07
1,0
93
,18
4
$2
,53
5,6
73
,60
2
($1
2,4
84
,57
8,5
01
)
61,9
07,4
17
$27,5
27,9
77,9
64
$26,3
69,1
10,9
84
($8,4
60,8
65,5
13)
($4,2
40,0
11,3
58)
$2
,07
3,8
29
,92
0
$2
,54
5,3
81
,55
7
($1
2,4
92
,49
1,6
33
)
71,9
07,4
17
$27,5
27,9
77,9
64
$26,3
69,1
10,9
84
($8,4
60,8
65,5
13)
($4,2
40,0
11,3
58)
$2
,07
3,8
29
,92
0
$2
,54
5,3
81
,55
7
($1
2,4
92
,49
1,6
33
)
81,9
07,4
17
$27,5
27,9
77,9
64
$26,3
69,1
10,9
84
($8,4
60,8
65,5
13)
($4,2
40,0
11,3
58)
$2
,07
3,8
29
,92
0
$2
,54
5,3
81
,55
7
($1
2,4
92
,49
1,6
33
)
91,9
07,4
17
$27,5
27,9
77,9
64
$26,3
69,1
10,9
84
($8,4
60,8
65,5
13)
($4,2
40,0
11,3
58)
$2
,07
3,8
29
,92
0
$2
,54
5,3
81
,55
7
($1
2,4
92
,49
1,6
33
)
10
1,9
07,4
17
$27,5
27,9
77,9
64
$26,3
69,1
10,9
84
($8,4
60,8
65,5
13)
($4,2
40,0
11,3
58)
$2
,07
3,8
29
,92
0
$2
,54
5,3
81
,55
7
($1
2,4
92
,49
1,6
33
)
20
11
$4
2,9
26
,21
7,9
17
4,0
24
,36
0
13,0
20,1
50
$34,0
32,3
16,6
93
$34,7
95,7
49,8
49
($3,8
00,1
44,1
48)
($1,7
97,9
02,8
91)
$5
16
,33
0,7
47
$
12
6,7
28
,71
9
($6
,75
5,7
04
,39
2)
22,5
22,2
71
$29,3
19,0
68,3
18
$29,7
92,6
46,4
89
($5,5
48,2
47,6
12)
($2,6
76,9
41,0
31)
$1
,07
8,4
38
,73
6
$3
87
,51
6,9
60
($
10
,28
9,5
91
,48
0)
32,1
96,2
29
$27,0
55,0
74,3
85
$27,1
32,3
75,8
63
($6,7
25,8
46,4
04)
($3,2
73,2
38,1
13)
$1
,51
1,6
75
,02
5
$1
,26
5,0
63
,88
0
($1
1,4
84
,50
1,8
95
)
42,0
97,8
38
$26,3
04,3
98,7
11
$26,0
94,6
55,8
03
($7,4
14,3
05,8
09)
($3,5
69,7
53,9
14)
$1
,69
1,9
74
,66
1
$1
,74
9,9
69
,48
2
($1
1,9
81
,92
4,7
04
)
52,0
97,8
38
$26,3
04,3
98,7
11
$26,0
94,6
55,8
03
($7,4
35,1
21,6
89)
($3,5
83,1
72,0
56)
$1
,69
7,3
42
,41
3
$1
,76
0,6
93
,86
4
($1
1,9
90
,87
0,5
25
)
62,0
97,8
38
$26,3
04,3
98,7
11
$26,0
94,6
55,8
03
($7,4
35,1
21,6
89)
($3,5
83,1
72,0
56)
$1
,69
7,3
42
,41
3
$1
,76
0,6
93
,86
4
($1
1,9
90
,87
0,5
25
)
72,0
97,8
38
$26,3
04,3
98,7
11
$26,0
94,6
55,8
03
($7,4
35,1
21,6
89)
($3,5
83,1
72,0
56)
$1
,69
7,3
42
,41
3
$1
,76
0,6
93
,86
4
($1
1,9
90
,87
0,5
25
)
82,0
97,8
38
$26,3
04,3
98,7
11
$26,0
94,6
55,8
03
($7,4
35,1
21,6
89)
($3,5
83,1
72,0
56)
$1
,69
7,3
42
,41
3
$1
,76
0,6
93
,86
4
($1
1,9
90
,87
0,5
25
)
92,0
97,8
38
$26,3
04,3
98,7
11
$26,0
94,6
55,8
03
($7,4
35,1
21,6
89)
($3,5
83,1
72,0
56)
$1
,69
7,3
42
,41
3
$1
,76
0,6
93
,86
4
($1
1,9
90
,87
0,5
25
)
10
2,0
97,8
38
$26,3
04,3
98,7
11
$26,0
94,6
55,8
03
($7,4
35,1
21,6
89)
($3,5
83,1
72,0
56)
$1
,69
7,3
42
,41
3
$1
,76
0,6
93
,86
4
($1
1,9
90
,87
0,5
25
)
Tabl
e A-
1, T
DA
Mod
ules
, Bal
ance
s D
ue, D
olla
rs C
olle
cted
by
Sub
sequ
ent
Paym
ents
and
Off
sets
, Ass
esse
d Pe
nalti
es,
Asse
ssed
Inte
rest
, and
Aba
tem
ents
(co
ntin
ued)

Taxpayer Advocate Service — 2015 Annual Report to Congress — Volume Two 59
Understanding the Hispanic Underserved Audit Impact Study Form 1023-EZIRS Collectibility Curve
Calendar Year
Bal
ance
at
TDA
A
ssig
nmen
tCou
nt o
f In
itial
TD
As
Elapsed Years
TDA
s O
pen
at
End
of
Year
Initi
al B
alan
ce
of T
DA
s O
pen
at E
nd o
f Ye
ar
Endi
ng B
alan
ce
of T
DA
s O
pen
at
End
of Y
ear
Sub
sequ
ent
Pay
men
tsO
ffse
tsPen
alty
Inte
rest
Aba
ted
20
12
$4
0,5
71
,78
3,9
15
3,9
58
,80
1
13,0
42,3
37
$32,7
42,7
25,0
29
$33,7
39,7
86,8
46
($3,6
03,0
72,7
13)
($1,7
63,7
79,9
47)
$5
43
,96
4,0
69
$
18
0,6
83
,70
5
($5
,18
3,9
70
,51
9)
22,5
60,9
58
$28,8
55,4
02,2
33
$29,3
85,3
15,0
74
($5,2
93,7
58,9
85)
($2,6
75,6
62,4
62)
$1
,07
5,1
08
,30
7
$7
58
,14
9,9
18
($
7,9
45
,45
1,4
95
)
32,4
31,2
27
$27,7
00,1
78,0
97
$28,0
84,9
91,8
30
($6,2
64,1
44,3
64)
($3,1
08,3
50,6
89)
$1
,40
1,4
87
,63
5
$1
,26
9,9
16
,08
4
($8
,84
2,6
82
,96
7)
42,4
31,2
27
$27,7
00,1
78,0
97
$28,0
84,9
91,8
30
($6,2
90,9
18,5
13)
($3,1
22,3
70,8
72)
$1
,40
5,4
04
,17
9
$1
,27
6,9
93
,55
0
($8
,85
6,7
49
,35
1)
52,4
31,2
27
$27,7
00,1
78,0
97
$28,0
84,9
91,8
30
($6,2
90,9
18,5
13)
($3,1
22,3
70,8
72)
$1
,40
5,4
04
,17
9
$1
,27
6,9
93
,55
0
($8
,85
6,7
49
,35
1)
62,4
31,2
27
$27,7
00,1
78,0
97
$28,0
84,9
91,8
30
($6,2
90,9
18,5
13)
($3,1
22,3
70,8
72)
$1
,40
5,4
04
,17
9
$1
,27
6,9
93
,55
0
($8
,85
6,7
49
,35
1)
72,4
31,2
27
$27,7
00,1
78,0
97
$28,0
84,9
91,8
30
($6,2
90,9
18,5
13)
($3,1
22,3
70,8
72)
$1
,40
5,4
04
,17
9
$1
,27
6,9
93
,55
0
($8
,85
6,7
49
,35
1)
82,4
31,2
27
$27,7
00,1
78,0
97
$28,0
84,9
91,8
30
($6,2
90,9
18,5
13)
($3,1
22,3
70,8
72)
$1
,40
5,4
04
,17
9
$1
,27
6,9
93
,55
0
($8
,85
6,7
49
,35
1)
92,4
31,2
27
$27,7
00,1
78,0
97
$28,0
84,9
91,8
30
($6,2
90,9
18,5
13)
($3,1
22,3
70,8
72)
$1
,40
5,4
04
,17
9
$1
,27
6,9
93
,55
0
($8
,85
6,7
49
,35
1)
10
2,4
31,2
27
$27,7
00,1
78,0
97
$28,0
84,9
91,8
30
($6,2
90,9
18,5
13)
($3,1
22,3
70,8
72)
$1
,40
5,4
04
,17
9
$1
,27
6,9
93
,55
0
($8
,85
6,7
49
,35
1)
Tabl
e A-
1, T
DA
Mod
ules
, Bal
ance
s D
ue, D
olla
rs C
olle
cted
by
Sub
sequ
ent
Paym
ents
and
Off
sets
, Ass
esse
d Pe
nalti
es,
Asse
ssed
Inte
rest
, and
Aba
tem
ents
(co
ntin
ued)

Section Two — IRS COLLECTIBILITY CURVE 60
Form 1023-EZ IRS Collectibility Curve Audit Impact Study Understanding the Hispanic Underserved
TABLE A-2, TDA Modules, Balances Due, Dollars Collected by Subsequent Payments and Offsets, Assessed Penalties, Assessed Interest, and Abatements by Balance Due Ranges
Calendar Year Description $1 to $1,000 $1,001 to $2,000 $2,001 to $5,000
$5,001 to $10,000
$10,001 to $25,000
Greater Than $25,000
2003
TDA Count 451,712 505,146 565,164 250,331 160,431 92,971
Initial Balance Due
$240,828,346 $740,649,611 $1,793,135,994 $1,745,405,984 $2,446,859,748 $8,359,311,510
Subsequent Payments
($159,645,920) ($359,532,161) ($886,819,407) ($845,113,111) ($1,054,887,316) ($2,395,248,066)
Offset ($120,551,135) ($323,517,417) ($625,523,335) ($382,757,722) ($316,904,898) ($381,491,738)
Penalty $33,446,962 $78,987,494 $172,236,063 $141,164,346 $168,647,485 $391,593,894
Interest $45,822,418 $91,605,397 $204,538,984 $171,753,801 $186,241,347 $335,729,923
Abated ($27,475,487) ($43,593,443) ($146,029,262) ($188,258,429) ($333,475,486) ($2,247,145,162)
2004
TDA Count 423,322 454,156 576,996 259,361 175,488 116,677
Initial Balance Due
$226,310,020 $677,561,180 $1,825,708,766 $1,813,925,576 $2,685,068,369 $10,247,477,805
Subsequent Payments
($175,904,106) ($375,205,472) ($982,626,633) ($934,209,391) ($1,225,047,057) ($2,768,005,039)
Offset ($121,702,024) ($321,705,919) ($694,321,067) ($425,213,207) ($369,848,986) ($421,749,103)
Penalty $31,504,743 $75,081,251 $176,833,442 $144,534,463 $180,793,631 $439,227,860
Interest $49,458,179 $105,365,867 $277,857,329 $269,972,536 $358,344,029 $981,656,061
Abated ($23,945,856) ($47,587,534) ($162,623,959) ($224,236,892) ($456,718,448) ($3,234,892,303)
2005
TDA Count 467,988 561,662 762,610 388,628 254,399 172,255
Initial Balance Due
$250,772,306 $832,921,777 $2,462,466,838 $2,713,904,406 $3,886,596,037 $15,849,423,481
Subsequent Payments
($197,408,638) ($453,485,724) ($1,226,197,456) ($1,188,786,059) ($1,422,684,108) ($2,825,696,234)
Offset ($138,643,683) ($412,526,218) ($935,264,928) ($616,224,119) ($496,862,712) ($487,007,838)
Penalty $35,438,062 $86,715,864 $216,494,334 $189,194,145 $232,769,822 $536,468,890
Interest $59,999,279 $140,495,631 $436,422,558 $502,988,977 $683,406,500 $1,905,089,002
Abated ($30,966,042) ($62,829,089) ($266,610,631) ($409,931,148) ($766,502,708) ($6,529,921,723)
2006
TDA Count 509,337 615,280 867,067 474,879 299,498 191,529
Initial Balance Due
$271,505,543 $909,001,299 $2,834,634,772 $3,307,189,504 $4,562,501,833 $18,466,903,602
Subsequent Payments
($252,565,017) ($472,447,644) ($1,296,013,518) ($1,308,078,558) ($1,546,630,399) ($3,188,256,398)
Offset ($150,453,775) ($458,496,094) ($1,109,332,469) ($813,619,177) ($606,206,985) ($608,052,027)
Penalty $36,272,026 $87,550,652 $235,367,768 $217,417,225 $250,427,660 $552,176,574
Interest $69,173,136 $151,472,115 $476,431,996 $576,607,004 $768,858,956 $2,216,431,253
Abated ($46,693,380) ($77,413,359) ($308,977,379) ($480,897,741) ($847,379,103) ($7,183,356,346)
2007
TDA Count 781,534 666,064 1,006,717 616,892 408,744 260,839
Initial Balance Due
$449,269,937 $978,486,020 $3,313,143,007 $4,309,521,457 $6,214,721,121 $25,413,309,766
Subsequent Payments
($271,255,779) ($440,895,663) ($1,317,912,732) ($1,436,890,739) ($1,656,381,839) ($3,314,609,051)
Offset ($275,425,703) ($501,704,901) ($1,240,557,318) ($1,002,620,280) ($735,452,110) ($737,740,375)
Penalty $52,681,418 $88,781,235 $249,790,312 $252,451,642 $304,732,788 $811,645,020
Interest $86,193,479 $145,245,793 $486,817,479 $630,865,633 $884,120,071 $2,650,791,023
Abated ($129,967,848) ($94,765,806) ($402,625,097) ($679,848,856) ($1,203,496,891) ($10,575,398,982)

Taxpayer Advocate Service — 2015 Annual Report to Congress — Volume Two 61
Understanding the Hispanic Underserved Audit Impact Study Form 1023-EZIRS Collectibility Curve
Calendar Year Description $1 to $1,000 $1,001 to $2,000 $2,001 to $5,000
$5,001 to $10,000
$10,001 to $25,000
Greater Than $25,000
2008
TDA Count 731,451 670,937 1,016,335 550,220 385,289 236,599
Initial Balance Due
$414,830,731 $990,497,117 $3,284,041,388 $3,845,368,753 $5,906,630,325 $22,041,825,269
Subsequent Payments
($233,650,205) ($403,601,852) ($1,205,681,275) ($1,232,376,624) ($1,579,199,205) ($3,388,279,541)
Offset ($243,479,900) ($497,742,738) ($1,214,494,488) ($881,503,108) ($721,414,352) ($854,609,803)
Penalty $48,985,319 $87,949,930 $244,002,549 $246,084,994 $317,910,922 $811,400,529
Interest $69,958,224 $121,666,892 $380,821,867 $454,035,901 $670,573,651 $1,764,027,532
Abated ($74,950,472) ($84,664,150) ($337,726,625) ($498,468,833) ($991,149,552) ($7,952,526,766)
2009
TDA Count 520,936 596,584 1,038,156 697,680 479,893 292,604
Initial Balance Due
$290,826,653 $907,622,403 $3,388,475,005 $4,874,905,595 $7,345,952,997 $25,179,917,864
Subsequent Payments
($168,308,125) ($365,851,165) ($1,169,531,683) ($1,324,853,213) ($1,714,583,628) ($3,855,349,945)
Offset ($133,042,345) ($362,615,410) ($1,039,704,190) ($936,893,572) ($753,063,838) ($948,234,281)
Penalty $35,240,420 $77,982,626 $246,319,981 $277,035,867 $375,311,428 $1,060,052,569
Interest $43,615,381 $87,002,543 $304,084,837 $412,359,663 $623,590,625 $1,765,756,667
Abated ($58,131,912) ($79,760,319) ($365,636,375) ($663,016,312) ($1,322,675,570) ($8,227,402,996)
2010
TDA Count 840,148 808,468 1,121,844 647,137 453,016 279,670
Initial Balance Due
$490,472,989 $1,199,142,789 $3,618,771,867 $4,555,543,493 $6,918,572,956 $28,921,888,093
Subsequent Payments
($254,834,586) ($456,192,529) ($1,168,128,274) ($1,194,754,484) ($1,618,245,117) ($3,768,710,523)
Offset ($240,509,528) ($508,265,653) ($1,143,358,182) ($810,941,332) ($678,453,146) ($858,483,517)
Penalty $56,440,339 $101,938,493 $258,977,602 $252,636,859 $349,515,692 $1,054,320,934
Interest $47,796,130 $86,595,116 $244,066,722 $302,628,434 $445,969,685 $1,418,325,469
Abated ($51,894,751) ($87,114,213) ($305,230,442) ($536,651,544) ($1,096,370,320) ($10,415,230,363)
2011
TDA Count 825,154 754,679 1,136,688 639,600 422,102 246,137
Initial Balance Due
$480,421,472 $1,117,857,159 $3,718,666,067 $4,484,256,769 $6,436,680,632 $26,688,335,819
Subsequent Payments
($218,477,840) ($383,128,439) ($1,047,791,886) ($1,060,125,297) ($1,423,029,355) ($3,302,568,871)
Offset ($224,505,778) ($430,557,063) ($1,011,715,750) ($706,990,836) ($567,489,241) ($641,913,390)
Penalty $46,648,243 $81,026,407 $226,937,654 $209,268,186 $285,370,582 $848,091,340
Interest $36,845,747 $62,819,645 $182,749,854 $215,524,482 $308,187,021 $954,567,115
Abated ($78,541,023) ($83,847,322) ($322,574,937) ($595,578,698) ($922,707,731) ($9,987,620,814)
2012
TDA Count 797,290 747,214 1,171,478 612,676 396,654 233,489
Initial Balance Due
$461,112,482 $1,110,719,485 $3,825,438,842 $4,282,481,148 $5,990,784,717 $24,901,247,241
Subsequent Payments
($177,373,252) ($303,891,260) ($820,145,806) ($813,093,192) ($1,122,292,940) ($3,054,122,063)
Offset ($179,411,721) ($380,643,270) ($941,082,680) ($607,840,547) ($465,246,196) ($548,146,459)
Penalty $39,838,543 $63,657,332 $175,282,006 $165,586,345 $227,507,301 $733,532,652
Interest $25,497,597 $42,359,620 $121,513,641 $136,305,066 $198,745,472 $752,572,154
Abated ($57,897,841) ($69,743,692) ($281,809,666) ($399,235,354) ($749,409,440) ($7,298,653,359)
Table A-2, TDA Modules, Balances Due, Dollars Collected by Subsequent Payments and Offsets, Assessed Penalties, Assessed Interest, and Abatements by Balance Due Ranges (continued)

Section Two — IRS COLLECTIBILITY CURVE 62
Form 1023-EZ IRS Collectibility Curve Audit Impact Study Understanding the Hispanic Underserved
TABLE A-3, TDA Modules, Balances Due, Dollars Collected by Subsequent Payments and Offsets, Assessed Penalties, Assessed Interest, and Abatements by Source of Assessment
Calendar Year Description
Self-Reported Assessments Substitute for Return Audit Assessments AUR Assessments
Trust Fund Recovery Penalties
2003
TDA Count 76,305 127,153 248,863 1,115,474 110,324
Initial Balance Due $2,755,702,547 $1,641,819,169 $955,455,897 $5,935,437,250 $1,636,660,799
Subsequent Payments
($397,863,606) ($381,301,366) ($317,247,600) ($3,352,551,156) ($267,458,821)
Offset ($109,821,313) ($198,452,772) ($323,382,148) ($1,076,177,894) ($103,027,521)
Penalty $57,352,147 $104,629,310 $87,347,519 $594,619,903 $34,505
Interest $66,142,201 $72,386,963 $65,165,077 $542,889,882 $115,653,487
Abated ($1,347,079,999) ($245,313,974) ($145,199,035) ($362,429,282) ($638,341,982)
2004
TDA Count 148,322 130,994 256,753 1,028,470 114,071
Initial Balance Due $5,064,578,631 $1,790,767,383 $1,096,964,103 $5,585,456,769 $1,767,559,350
Subsequent Payments
($784,223,463) ($474,730,184) ($366,381,883) ($3,505,764,852) ($289,675,909)
Offset ($229,042,168) ($220,626,090) ($395,625,962) ($1,055,677,394) ($106,505,103)
Penalty $126,340,535 $120,222,356 $95,416,239 $556,173,822 $29,803
Interest $453,442,683 $182,694,977 $108,691,313 $728,528,130 $296,995,659
Abated ($2,340,659,814) ($231,996,225) ($232,552,410) ($380,021,768) ($767,861,296)
2005
TDA Count 512,705 224,899 301,903 1,104,554 101,588
Initial Balance Due $13,362,507,090 $2,034,842,462 $1,347,565,321 $5,544,297,832 $1,500,995,601
Subsequent Payments
($1,719,278,819) ($563,315,839) ($423,463,099) ($3,328,886,959) ($248,869,759)
Offset ($682,672,073) ($398,246,119) ($431,513,171) ($1,096,714,008) ($94,913,229)
Penalty $372,356,726 $150,049,224 $102,910,162 $534,072,724 $45,906
Interest $1,754,673,244 $272,574,120 $140,684,401 $901,732,852 $294,428,237
Abated ($6,251,321,458) ($240,489,498) ($384,254,445) ($338,857,989) ($604,296,121)
2006
TDA Count 588,943 273,576 374,373 1,214,361 102,374
Initial Balance Due $15,272,022,052.9 $2,699,929,404.0 $1,546,702,949.2 $6,662,831,209.9 $1,555,671,271.1
Subsequent Payments
($1,657,436,219.2) ($708,090,013.6) ($483,120,497.2) ($3,904,703,877.4) ($220,079,883.5)
Offset ($798,615,902.5) ($568,757,077.8) ($559,941,489.1) ($1,279,736,554.8) ($96,242,450.3)
Penalty $313,100,522.7 $185,710,811.0 $110,596,640.4 $616,339,300.9 $35,150.0
Interest $2,000,147,374.8 $396,544,510.4 $161,928,187.0 $1,022,051,805.4 $282,864,102.1
Abated ($6,571,418,753.8) ($368,654,726.7) ($396,185,415.2) ($576,039,465.8) ($641,631,939.2)
2007
TDA Count 1,043,966 328,809 491,988 1,330,059 104,034
Initial Balance Due $24,497,035,199.50 $2,852,164,654.01 $1,874,553,318.62 $7,150,372,177.98 $1,471,575,406.52
Subsequent Payments
($2,406,444,052.86) ($674,618,290.74) ($476,662,500.63) ($3,656,970,935.55) ($173,447,577.30)
Offset ($1,135,157,789.35) ($718,330,580.74) ($679,509,112.51) ($1,396,911,300.99) ($92,287,027.64)
Penalty $559,551,263.81 $219,753,090.56 $127,434,963.11 $679,524,580.41 $36,854.73
Interest $2,693,063,064.29 $396,338,868.59 $163,748,874.45 $1,008,328,975.43 $226,404,885.33
Abated ($10,482,352,227.22) ($397,787,490.46) ($532,432,329.44) ($826,537,704.52) ($509,468,588.88)
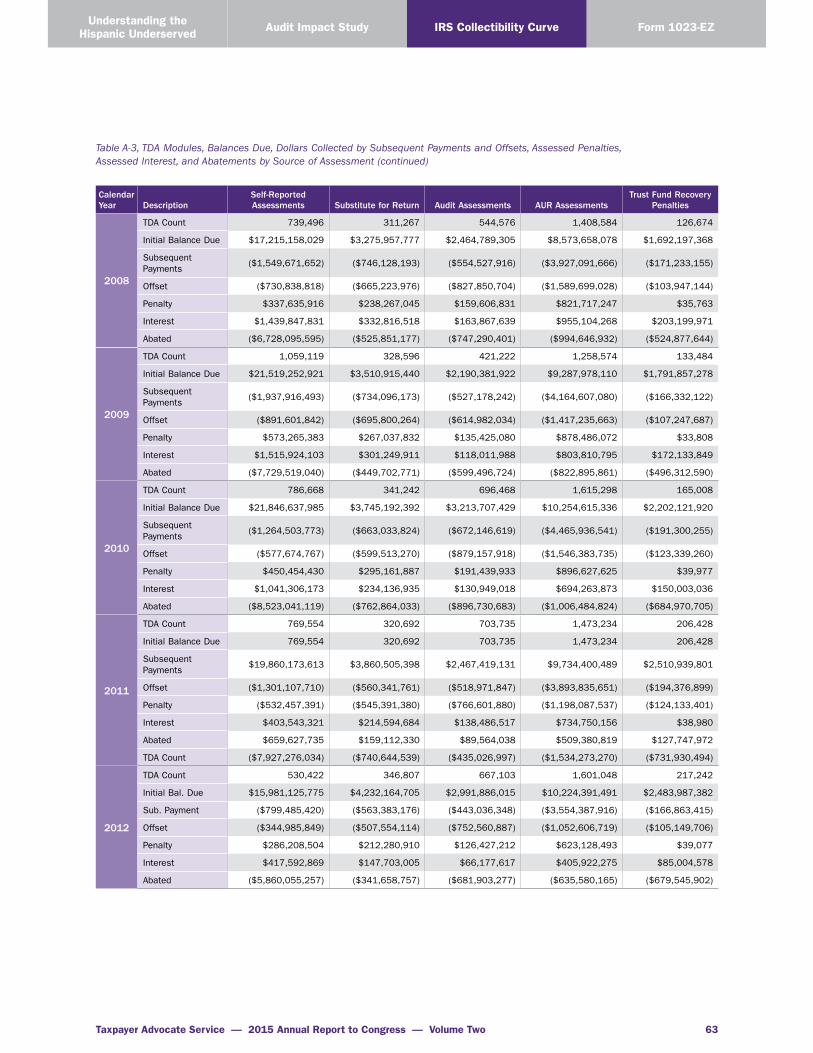
Taxpayer Advocate Service — 2015 Annual Report to Congress — Volume Two 63
Understanding the Hispanic Underserved Audit Impact Study Form 1023-EZIRS Collectibility Curve
Calendar Year Description
Self-Reported Assessments Substitute for Return Audit Assessments AUR Assessments
Trust Fund Recovery Penalties
2008
TDA Count 739,496 311,267 544,576 1,408,584 126,674
Initial Balance Due $17,215,158,029 $3,275,957,777 $2,464,789,305 $8,573,658,078 $1,692,197,368
Subsequent Payments
($1,549,671,652) ($746,128,193) ($554,527,916) ($3,927,091,666) ($171,233,155)
Offset ($730,838,818) ($665,223,976) ($827,850,704) ($1,589,699,028) ($103,947,144)
Penalty $337,635,916 $238,267,045 $159,606,831 $821,717,247 $35,763
Interest $1,439,847,831 $332,816,518 $163,867,639 $955,104,268 $203,199,971
Abated ($6,728,095,595) ($525,851,177) ($747,290,401) ($994,646,932) ($524,877,644)
2009
TDA Count 1,059,119 328,596 421,222 1,258,574 133,484
Initial Balance Due $21,519,252,921 $3,510,915,440 $2,190,381,922 $9,287,978,110 $1,791,857,278
Subsequent Payments
($1,937,916,493) ($734,096,173) ($527,178,242) ($4,164,607,080) ($166,332,122)
Offset ($891,601,842) ($695,800,264) ($614,982,034) ($1,417,235,663) ($107,247,687)
Penalty $573,265,383 $267,037,832 $135,425,080 $878,486,072 $33,808
Interest $1,515,924,103 $301,249,911 $118,011,988 $803,810,795 $172,133,849
Abated ($7,729,519,040) ($449,702,771) ($599,496,724) ($822,895,861) ($496,312,590)
2010
TDA Count 786,668 341,242 696,468 1,615,298 165,008
Initial Balance Due $21,846,637,985 $3,745,192,392 $3,213,707,429 $10,254,615,336 $2,202,121,920
Subsequent Payments
($1,264,503,773) ($663,033,824) ($672,146,619) ($4,465,936,541) ($191,300,255)
Offset ($577,674,767) ($599,513,270) ($879,157,918) ($1,546,383,735) ($123,339,260)
Penalty $450,454,430 $295,161,887 $191,439,933 $896,627,625 $39,977
Interest $1,041,306,173 $234,136,935 $130,949,018 $694,263,873 $150,003,036
Abated ($8,523,041,119) ($762,864,033) ($896,730,683) ($1,006,484,824) ($684,970,705)
2011
TDA Count 769,554 320,692 703,735 1,473,234 206,428
Initial Balance Due 769,554 320,692 703,735 1,473,234 206,428
Subsequent Payments
$19,860,173,613 $3,860,505,398 $2,467,419,131 $9,734,400,489 $2,510,939,801
Offset ($1,301,107,710) ($560,341,761) ($518,971,847) ($3,893,835,651) ($194,376,899)
Penalty ($532,457,391) ($545,391,380) ($766,601,880) ($1,198,087,537) ($124,133,401)
Interest $403,543,321 $214,594,684 $138,486,517 $734,750,156 $38,980
Abated $659,627,735 $159,112,330 $89,564,038 $509,380,819 $127,747,972
TDA Count ($7,927,276,034) ($740,644,539) ($435,026,997) ($1,534,273,270) ($731,930,494)
2012
TDA Count 530,422 346,807 667,103 1,601,048 217,242
Initial Bal. Due $15,981,125,775 $4,232,164,705 $2,991,886,015 $10,224,391,491 $2,483,987,382
Sub. Payment ($799,485,420) ($563,383,176) ($443,036,348) ($3,554,387,916) ($166,863,415)
Offset ($344,985,849) ($507,554,114) ($752,560,887) ($1,052,606,719) ($105,149,706)
Penalty $286,208,504 $212,280,910 $126,427,212 $623,128,493 $39,077
Interest $417,592,869 $147,703,005 $66,177,617 $405,922,275 $85,004,578
Abated ($5,860,055,257) ($341,658,757) ($681,903,277) ($635,580,165) ($679,545,902)
Table A-3, TDA Modules, Balances Due, Dollars Collected by Subsequent Payments and Offsets, Assessed Penalties, Assessed Interest, and Abatements by Source of Assessment (continued)
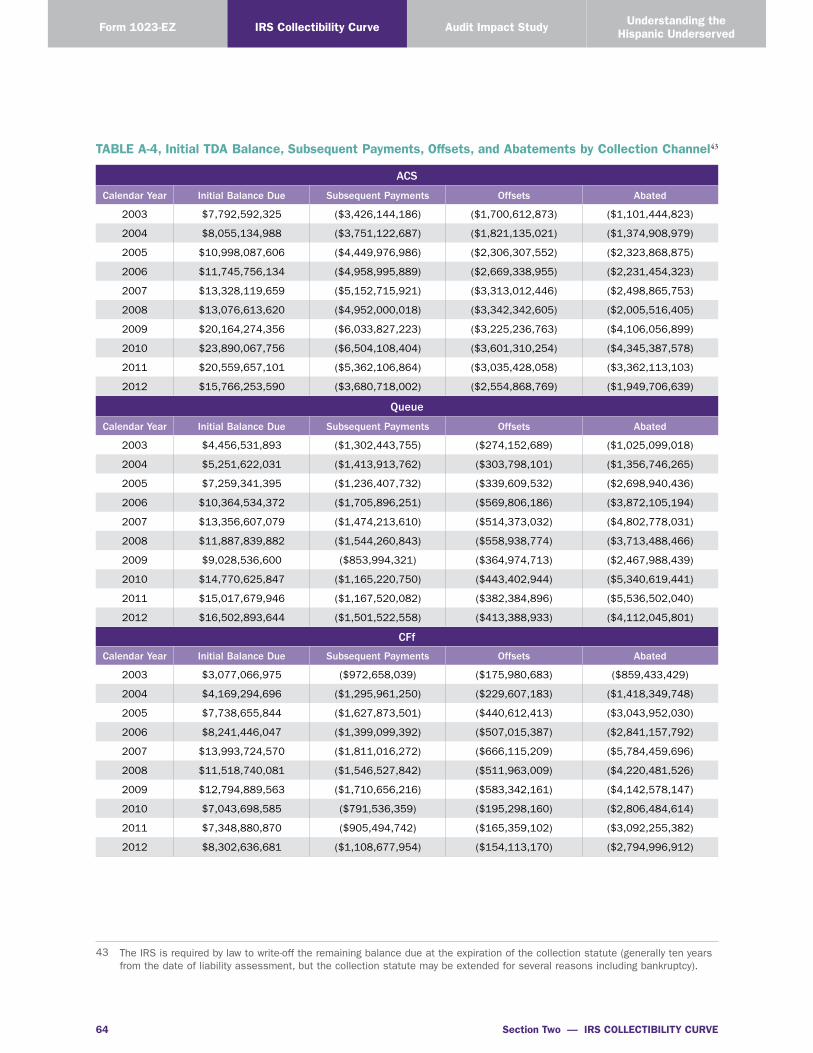
Section Two — IRS COLLECTIBILITY CURVE 64
Form 1023-EZ IRS Collectibility Curve Audit Impact Study Understanding the Hispanic Underserved
TABLE A-4, Initial TDA Balance, Subsequent Payments, Offsets, and Abatements by Collection Channel43
ACS
Calendar Year Initial Balance Due Subsequent Payments Offsets Abated
2003 $7,792,592,325 ($3,426,144,186) ($1,700,612,873) ($1,101,444,823)
2004 $8,055,134,988 ($3,751,122,687) ($1,821,135,021) ($1,374,908,979)
2005 $10,998,087,606 ($4,449,976,986) ($2,306,307,552) ($2,323,868,875)
2006 $11,745,756,134 ($4,958,995,889) ($2,669,338,955) ($2,231,454,323)
2007 $13,328,119,659 ($5,152,715,921) ($3,313,012,446) ($2,498,865,753)
2008 $13,076,613,620 ($4,952,000,018) ($3,342,342,605) ($2,005,516,405)
2009 $20,164,274,356 ($6,033,827,223) ($3,225,236,763) ($4,106,056,899)
2010 $23,890,067,756 ($6,504,108,404) ($3,601,310,254) ($4,345,387,578)
2011 $20,559,657,101 ($5,362,106,864) ($3,035,428,058) ($3,362,113,103)
2012 $15,766,253,590 ($3,680,718,002) ($2,554,868,769) ($1,949,706,639)
Queue
Calendar Year Initial Balance Due Subsequent Payments Offsets Abated
2003 $4,456,531,893 ($1,302,443,755) ($274,152,689) ($1,025,099,018)
2004 $5,251,622,031 ($1,413,913,762) ($303,798,101) ($1,356,746,265)
2005 $7,259,341,395 ($1,236,407,732) ($339,609,532) ($2,698,940,436)
2006 $10,364,534,372 ($1,705,896,251) ($569,806,186) ($3,872,105,194)
2007 $13,356,607,079 ($1,474,213,610) ($514,373,032) ($4,802,778,031)
2008 $11,887,839,882 ($1,544,260,843) ($558,938,774) ($3,713,488,466)
2009 $9,028,536,600 ($853,994,321) ($364,974,713) ($2,467,988,439)
2010 $14,770,625,847 ($1,165,220,750) ($443,402,944) ($5,340,619,441)
2011 $15,017,679,946 ($1,167,520,082) ($382,384,896) ($5,536,502,040)
2012 $16,502,893,644 ($1,501,522,558) ($413,388,933) ($4,112,045,801)
CFf
Calendar Year Initial Balance Due Subsequent Payments Offsets Abated
2003 $3,077,066,975 ($972,658,039) ($175,980,683) ($859,433,429)
2004 $4,169,294,696 ($1,295,961,250) ($229,607,183) ($1,418,349,748)
2005 $7,738,655,844 ($1,627,873,501) ($440,612,413) ($3,043,952,030)
2006 $8,241,446,047 ($1,399,099,392) ($507,015,387) ($2,841,157,792)
2007 $13,993,724,570 ($1,811,016,272) ($666,115,209) ($5,784,459,696)
2008 $11,518,740,081 ($1,546,527,842) ($511,963,009) ($4,220,481,526)
2009 $12,794,889,563 ($1,710,656,216) ($583,342,161) ($4,142,578,147)
2010 $7,043,698,585 ($791,536,359) ($195,298,160) ($2,806,484,614)
2011 $7,348,880,870 ($905,494,742) ($165,359,102) ($3,092,255,382)
2012 $8,302,636,681 ($1,108,677,954) ($154,113,170) ($2,794,996,912)
43 The IRS is required by law to write-off the remaining balance due at the expiration of the collection statute (generally ten years from the date of liability assessment, but the collection statute may be extended for several reasons including bankruptcy).

Taxpayer Advocate Service — 2015 Annual Report to Congress — Volume Two 65
Understanding the Hispanic Underserved Audit Impact Study Form 1023-EZIRS Collectibility Curve
TABLE A-5, Initial TDA Balance, Subsequent Payments, Offsets, and Abatements by Collection Channel After Six Years
ACS
Calendar Year Initial Balance Due Subsequent Payments Offsets Abated
2003 $7,792,592,325 ($3,073,090,254) ($1,462,600,955) ($1,027,367,242)
2004 $8,055,134,988 ($3,401,366,362) ($1,591,054,713) ($1,298,468,755)
2005 $10,998,087,606 ($4,033,340,814) ($2,034,143,955) ($2,201,007,908)
2006 $11,745,756,134 ($4,582,308,923) ($2,433,892,394) ($2,123,881,197)
2007 $13,328,119,659 ($4,848,687,675) ($3,125,283,670) ($2,413,837,112)
2008 $13,076,613,620 ($4,814,247,019) ($3,277,483,164) ($1,979,716,054)
2009 $20,164,274,356 ($6,032,295,430) ($3,223,772,255) ($4,105,339,235)
2010 $23,890,067,756 ($6,504,108,404) ($3,601,310,254) ($4,345,387,578)
2011 $20,559,657,101 ($5,362,106,864) ($3,035,428,058) ($3,362,113,103)
2012 $15,766,253,590 ($3,680,718,002) ($2,554,868,769) ($1,949,706,639)
Queue
Calendar Year Initial Balance Due Subsequent Payments Offsets Abated
2003 $4,456,531,893 ($1,133,286,932) ($221,764,929) ($947,606,322)
2004 $5,251,622,031 ($1,227,076,427) ($246,025,904) ($1,261,716,412)
2005 $7,259,341,395 ($1,030,055,031) ($271,314,994) ($2,534,957,190)
2006 $10,364,534,372 ($1,505,558,020) ($492,056,484) ($3,568,299,367)
2007 $13,356,607,079 ($1,291,060,172) ($456,578,391) ($4,566,614,755)
2008 $11,887,839,882 ($1,472,606,814) ($537,914,978) ($3,625,718,411)
2009 $9,028,536,600 ($853,546,234) ($364,865,502) ($2,467,952,050)
2010 $14,770,625,847 ($1,165,220,750) ($443,402,944) ($5,340,619,441)
2011 $15,017,679,946 ($1,167,520,082) ($382,384,896) ($5,536,502,040)
2012 $16,502,893,644 ($1,501,522,558) ($413,388,933) ($4,112,045,801)
CFf
Calendar Year Initial Balance Due Subsequent Payments Offsets Abated
2003 $3,077,066,975 ($867,563,109) ($144,855,544) ($803,396,569)
2004 $4,169,294,696 ($1,143,776,243) ($185,705,568) ($1,302,087,094)
2005 $7,738,655,844 ($1,375,997,735) ($347,979,258) ($2,849,242,920)
2006 $8,241,446,047 ($1,187,863,602) ($422,710,047) ($2,631,514,099)
2007 $13,993,724,570 ($1,600,475,227) ($589,298,287) ($5,453,310,168)
2008 $11,518,740,081 ($1,474,215,783) ($491,588,290) ($4,135,828,417)
2009 $12,794,889,563 ($1,709,354,805) ($583,054,052) ($4,142,180,675)
2010 $7,043,698,585 ($791,536,359) ($195,298,160) ($2,806,484,614)
2011 $7,348,880,870 ($905,494,742) ($165,359,102) ($3,092,255,382)
2012 $8,302,636,681 ($1,108,677,954) ($154,113,170) ($2,794,996,912)

Section Two — IRS COLLECTIBILITY CURVE 66
Form 1023-EZ IRS Collectibility Curve Audit Impact Study Understanding the Hispanic Underserved
This page intentionally left blank.

Volume 2 TAS Research and Related Studies
Audit Impact Study1
1 This research was conducted for the National Taxpayer Advocate (NTA) by B. Erard and Associates under contract TIRNO-14-E-00030. This study was conducted by Sebastian Beer, Matthias Kasper, Erich Kirchler, and Brian Erard with technical support from NTA Technical Advisors Tom Beers and Jeff Wilson. Any opinions expressed in this report are those of the authors and do not necessarily reflect the views of the National Taxpayer Advocate.

Section Three — AUDIT IMPACT STUDY 68
Form 1023-EZ IRS Collectibility Curve Audit Impact Study Understanding the Hispanic Underserved
EXECUTIVE SUMMARY
IntroductionThe IRS audits roughly 1.5 percent of all self-employed individual income taxpayers annually. In fiscal year 2014, the direct effect of these audits was over $3 billion in recommended additional tax assessments, although not all of the recommended amount will ultimately be collected (Internal Revenue Service, 2015).2 Less is known, however, about the indirect long-term effect of audits on subsequent taxpayer reporting behavior. Behavioral changes may either undermine immediate gains in tax collections or further increase the revenue returns of audits. Depending on risk attitudes, norms, moral perceptions, and perhaps most importantly, the subjective appraisal of the audit, enforcement activity has the potential to increase or decrease the willingness to comply with the law and to cooperate with the IRS in the future.
This report evaluates the impact of enforcement activity on the subsequent compliance behavior of nonfarm self-employed taxpayers. Through a statistical comparison of administrative data for a ran-dom sample of 2,204 Schedule C filers with under $200,000 in total gross receipts who were audited subsequent to filing their tax year (TY) 2007 returns with data for a control sample of 4,705 who were not audited, we are able to estimate the short- and long-term impact of audits on tax collections. In our empirical analysis, we distinguish between (seemingly) compliant and (seemingly) noncompliant taxpayers, as the audit response likely differs between these groups. A “direct deterrent effect” (Alm et al., 2009) of additional tax assessments potentially increases the compliance of caught evaders. The response of compliant taxpayers to enforcement activity is ambiguous, however. Audits could be seen as a justified means to enforce the law, increasing the trust in the state and the willingness to comply voluntarily. A coercive experience might have the opposite outcome.
Empirical ResultsFollowing Gemmel and Ratto (2012) we distinguish compliant taxpayers from evaders on the basis of their audit outcomes. More specifically, we classify taxpayers as compliant if the examination did not result in a recommended additional tax assessment and noncompliant otherwise. This categorization procedure has two important drawbacks. One is that we may only classify audited taxpayers. The second is related to classification errors. Some truly noncompliant taxpayers are likely not detected during an audit and not assessed additional tax. Conversely, some additional tax assessments may be unwarranted and disputed later on. Accordingly, the examination result does not unambiguously signal the subjective inclination to pay taxes voluntarily. We address related concerns below in our discussion of the results.
FIGURE 0, Impact of Audits
Matched Sample
7.0
7.5
8.0
8.5
log income
2005 2006 2007 2008 2009 2010 2011Year
Experimental Group Control E-PC E-NC
2 These figures include both farm and nonfarm business returns; however, returns claiming the Earned Income Credit are exclud-ed as audit coverage statistics for this category do not distinguish between business and nonbusiness returns.

Taxpayer Advocate Service — 2015 Annual Report to Congress — Volume Two 69
Understanding the Hispanic Underserved Audit Impact Study Form 1023-EZIRS Collectibility Curve
Figure 0 illustrates the impact of audits, conducted between the filing of the TY 2007 and TY 2008 returns, on the income reporting trends of compliant (purple line) and noncompliant (orange line) self-employed taxpayers. The green line depicts the trend in reported taxable income for an unaudited control group, serving as a benchmark. We rely on a range of non-experimental estimators to refine this comparison and quantify the magnitude of the short- and long-run audit impact. These include the difference-in-differences estimator, variants of this method that account for sample selection and attrition,3 as well as less parametric propensity score matching methods. While propensity score matching overcomes observable differences between our experimental groups, the difference-in-differences approach accounts for unobservable, time-constant effects. It is reassuring that these two alternative approaches yield similar results.
The estimates indicate an enduring effect of audits on taxpayers who receive a positive recommended ad-ditional tax assessment. On average, such taxpayers increase their reported taxable income by 250 percent following an audit. Three years after the audit, the effect is still substantial with an average increase of 120 percent. Importantly, the results also indicate that audits have a detrimental long-term impact on the reporting behavior of taxpayers who do not experience an additional tax assessment. Three years after having undergone enforcement activity, compliant taxpayers report around 35 percent less in taxable income than the control group. The difference is significant at the one percent level. When we employ a less nuanced model that does not distinguish compliant from noncompliant audited taxpayers, we find that, on net, reported taxable income for this combined group increases by roughly 20 percent three years after an audit.
DiscussionOur empirical results provide robust evidence that audits have important long-term revenue implications. Three years after an audit, the average small business taxpayer reports around 20 percent more income.4 The indirect long-term effects thus clearly add to the static gain of additional tax assessments. However, by differentiating the response of compliant and noncompliant taxpayers, we find that there is scope for improving the revenue efficiency of audits.
Our more nuanced analysis of the behavioral response to an audit shows that taxpayers who receive a positive additional recommended tax assessment increase their subsequent reporting of taxable income dramatically (+120 percent), while those who receive no additional tax assessment actually report less (-35 percent). There are several plausible explanations for this finding. The positive impact of audits on the former (seemingly noncompliant) group is likely due to some kind of specific deterrent effect (Alm et al., 2009).
Understanding the observed reduction in reported income among taxpayers in the latter (seemingly compliant) group is probably even more important. There are several plausible explanations for this finding. First, an experience of coercive enforcement activity could reduce tax morale among (seemingly) compliant taxpayers, leading to the observed detrimental impact of audits within this group. Second, even if tax morale were unaffected by the examination experience, the audit process might provide currently compliant taxpayers with a “window” on potential opportunities for both legal and illegal tax avoidance. In addition, such taxpayers may infer that the risk of a future examination is low given that no
3 We find that enforcement activity reduces the future likelihood of filing Schedule C by almost seven percent among taxpayers who receive a positive recommended additional tax assessment.
4 This estimate is substantially larger than that obtained by DeBacker et al., (2015), perhaps owing to our focus on operational rather than random audits.

Section Three — AUDIT IMPACT STUDY 70
Form 1023-EZ IRS Collectibility Curve Audit Impact Study Understanding the Hispanic Underserved
adjustments were made during the recent audit. This newfound awareness of opportunities for reporting and paying lower taxes combined with a low perceived future audit risk could drive some taxpayers to report less income on subsequent returns. A third possibility is that the observed reduction in reported income may be attributable to noncompliant taxpayers whose misreporting was not detected during the audit. Experiencing an audit that results in no recommended additional tax assessment may embolden such taxpayers to become even more noncompliant in the future.
Based on the available data, we are unable to pinpoint which of these explanations prevails. The observed reduction in compliance behavior suggests, in any case, that there is scope for improving the efficiency of audits. On the one hand, improved targeting of noncompliant returns and an improved capacity to detect noncompliance would seem likely to improve deterrence among cheaters. On the other hand, a better understanding of the psychological impact of audits on compliant taxpayers may lead to enhanced examination approaches that mitigate the erosion of tax morale and maintain their incentives to comply.
Limitations and Scope for Future WorkWe conclude by noting a range of limitations of and possible refinements to the current research design. First, we cannot rule out that our estimates are influenced by the economic downturn in 2008. Repeating the analysis for another, less turbulent, timespan would strengthen the credibility of the results. Second, the relatively short time horizon impairs the estimation of a dynamic model, which would allow a more accurate quantification of the decay rate of audit effects. Third, a range of additional analyses, looking at, for instance, the differential impact of audit types or the differential response of low and high income taxpayers, could provide important insights. Fourth, more sophisticated propensity score matching methods would allow assessing the robustness of our results and could improve the representativeness of our findings.
ReferencesAlm, J., B. R. Jackson, and M. McKee (2009, April). Getting the word out: Enforcement information
dissemination and compliance behavior. Journal of Public Economics 93 (3-4), 392–402.
DeBacker, J., B.T. Heim, A. Tran, and A. Yuskavage (2015, March). Once Bitten, Twice Shy? The Lasting Impact of IRS Audits on Individual Tax Reporting. Working paper, Indiana University.
Gemmel, N. and M. Ratto (2012, March). Behavioral responses to taxpayer audits: evidence from random taxpayer inquiries. National Tax Journal 65 (1), 33–58.
Internal Revenue Service (2015, November). Internal Revenue Service Data Book, 2014.

Taxpayer Advocate Service — 2015 Annual Report to Congress — Volume Two 71
Understanding the Hispanic Underserved Audit Impact Study Form 1023-EZIRS Collectibility Curve
INTRODUCTION
The IRS audits roughly 1.5 percent of all self-employed individual income taxpayers annually. In fiscal year 2014, the direct effect of these audits was over $3 billion in recommended additional tax assessments, although not all of the recommended amount will ultimately be collected (Internal Revenue Service, 2015).5 Less is known, however, about the indirect long-term effect of audits on subsequent taxpayer reporting behavior. Behavioral changes may either undermine immediate gains in tax collections or further increase the revenue returns of audits. Depending on risk attitudes, norms, moral perceptions, and perhaps most importantly, the subjective appraisal of the audit, enforcement activity has the potential to increase or decrease the willingness of taxpayers to comply with the law and to cooperate with the IRS in the future.
This report evaluates the impact of enforcement activity on the subsequent compliance behavior of nonfarm self-employed taxpayers. Through a statistical comparison of administrative data for a random sample of 2,204 Schedule C filers with under $200,000 in total positive income who were audited subsequent to filing their TY 2007 returns with data for a control sample of 4,705 who were not audited, we are able to estimate the short- and long-term impact of audits on tax collections.6
In contrast to other recently published studies (e.g., DeBacker and Yuskavage, 2015; Advani and Shaw, 2015) that have examined the subsequent reporting behavior of taxpayers who were randomly selected for audit, the focus of this study is on taxpayers selected through an ordinary operational audit process. Our focus on operational rather than random audits allows us to identify the average treatment effect on the treated (ATT), rather than the average treatment effect (ATE) in the general population. Operational audits tend to be targeted towards tax returns with a high potential for noncompliance. Given that the response of compliant taxpayers to an audit likely differs from the response of noncompliant taxpayers, the ATT is unlikely to coincide with the ATE. Furthermore, in the random audit studies, taxpayers were aware that they had been chosen at random for a special study, which is unlikely to elicit the same sort of reaction as knowledge of having been targeted through the usual operational audit process.
In our theoretical analysis, we distinguish between compliant and noncompliant taxpayers.7 A “direct deterrent effect” (Alm et al., 2009) of additional tax assessments potentially increases the compliance of caught evaders. The response of compliant taxpayers to enforcement activity is ambiguous, however. While audits could be seen as a justified means to enforce the law, increasing the trust in the state and the willingness to comply voluntarily, a coercive experience might have the opposite outcome.
Empirically, we implement this theoretical distinction between compliant and noncompliant taxpayers by employing information on actual examination results (for a similar approach see Gemmel and Ratto, 2012). More specifically, we classify taxpayers as noncompliant if the examination resulted in an additional recommended tax assessment and as compliant otherwise. This categorization procedure has two drawbacks. One is that we may only classify audited taxpayers. This impedes, for instance, selecting two separate control groups, one for compliant and one for noncompliant taxpayers. The second is that we cannot rule out classification errors among audited taxpayers. Some instances of noncompliance
5 These figures include both farm and nonfarm business returns; however, returns claiming the Earned Income Credit are exclud-ed as audit coverage statistics for this category do not distinguish between business and non-business returns.
6 Total positive income is computed by summing only the positive reported values for the following income sources (negative reported amounts are treated as zero): wages, interest, dividends, distributions, other income, Schedule C net profit, and Schedule F net profit.
7 Note that our impact analysis covers only three years. We therefore take the subjective inclination to avoid taxes to be a per-sonality trait (i.e., a time-constant characteristic) in our empirical analysis.

Section Three — AUDIT IMPACT STUDY 72
Form 1023-EZ IRS Collectibility Curve Audit Impact Study Understanding the Hispanic Underserved
may go undetected during an audit, resulting in a noncompliant taxpayer being classified as compliant. Conversely, some additional recommended tax assessments may be unwarranted and disputed later on. The examination result therefore does not unambiguously signal the subjective inclination to pay taxes voluntarily. To avoid confusion between our theoretical concepts and empirical findings, we will refer to the subsample of audited taxpayers who receive an additional recommended tax assessment as the positive-tax-change experimental group “E-PC” and the subsample that does not receive an additional recommended tax assessment as the no-tax-change experimental group “E-NC,” rather than as “noncompliant” and “compliant,” respectively.
To identify the impact of audits on reporting behavior, we rely on several alternative econometric ap-proaches, including a standard difference-in-differences estimator, variants of this method that account for sample selection and attrition, and propensity score matching methods. While propensity score matching should overcome observable differences between our experimental groups, the difference-in-differences approach also accounts for unobservable, time-constant effects. Depending on the data generating process, one or the other method provides consistent estimates of the treatment effect. Our main dependent variables are Schedule C net profit and taxable income. We obtain similar estimates from our alternative estimation approaches when examining the impact of enforcement activity on taxable income. Our estimates are less robust when focusing on Schedule C net profit.
Our empirical results indicate that audits lead to improved reporting compliance among members of the positive-tax-change experimental group (E-PC). Compared with earlier studies, the estimated effect is dramatic. Our preferred specifications are based on the natural logarithm of reported taxable income as they attach less weight to returns in the sample with very high income reports. The findings based on these specifications indicate that, one year after having undergone enforcement activity, taxpayers in group E-PC report approximately 250 percent more in taxable income than taxpayers in the control group. Three years after the audit, the estimated differential remains quite high at 120 percent. Looked at another way, these estimates imply that roughly 55 percent of the income reported among members of the positive-tax-change experimental group on their TY 2010 returns is a direct result of their audit experience three years earlier. We find a more substantial response of reported taxable income to an audit than we do for reported Schedule C net profit, suggesting that other components of taxable income are also affected by audits.
Importantly, we also find that audits have a detrimental long-term impact on the reporting behavior of taxpayers in our no-tax-change experimental group (E-NC). Three years after having undergone an audit, taxpayers that were not assessed additional taxes report around 35 percent less in taxable income than the control group. This difference is significant at the one percent level. Note that although the audit was initiated prior to the filing of the TY 2008 return, it generally did not conclude until sometime in 2009 or later, often after the date the TY 2008 return was filed. It is therefore not surprising that we find a weaker response when assessing the short-term impact of audits (i.e., the change in reported income between TY 2007 and TY 2008).8
8 Our short-term findings are consistent with our hypothesis of a differential impact among the no-tax-change and positive-tax-change experimental groups. The initiation of an audit prior to the TY 2008 return filing date may have immediately driven noncompliant taxpayers to report more income on their TY 2008 returns. On the other hand, the audits ultimately may have prompted compliant taxpayers to engage in more legal tax avoidance (particularly if the audit made them aware of such oppor-tunities). However, since the audit typically did not start until late in 2008 or early in 2009, there would have been limited opportunity to identify and execute legal avoidance strategies for TY 2008. Further, to the extent that the audit experience prompted those in the no-tax-change group to become less compliant, this may not have taken root until the completion of the audit, by which time the TY 2008 return already would have been filed in most cases.

Taxpayer Advocate Service — 2015 Annual Report to Congress — Volume Two 73
Understanding the Hispanic Underserved Audit Impact Study Form 1023-EZIRS Collectibility Curve
We also have estimated a more restrictive specification that does not allow the audit impact to vary in ac-cordance with the outcome of the audit. In this specification, all audited taxpayers are treated as a single treatment group, making no distinction between taxpayers with and without a recommended additional tax assessment. The findings for this more restrictive model indicate that audits have an enduring positive effect on income reporting within the combined treatment group: on net, reported taxable income remains 20 percent higher three years after an audit.
Our results are qualitatively similar when we estimate alternative specifications involving the level of taxable income as the dependent variable rather than the natural logarithm, although the estimated effects are somewhat less dramatic. Among members of our positive-tax-change experimental group (E-PC), reported taxable income under these specifications is estimated to increase by approximately $13,000 (43 percent) relative to the control group in the year following the audit. Three years later, this differential remains substantial at $8,000 to $9,000. In the case of our no-tax-change experimental group (E-NC), the estimated impact of an audit on reported taxable income remains negative under these specifications, but it is less precisely estimated.
We also have investigated how audits impact one’s long-term prospects for remaining self-employed. We find that experiencing an audit that results in an additional recommended tax assessment sharply reduces one’s likelihood of filing a Schedule C return in the year following the audit (by approximately seven percentage points). In contrast, audits that do not result in an additional recommended tax assessment do not significantly impact one’s prospects for remaining self-employed.
THEORETICAL CONSIDERATIONS
Our objective is to identify the causal impact of audits on reported income. This analysis is complicated by the fact that enforcement activity is likely triggered by both observable and unobservable factors that are not independent of reported income. Examples of such endogenous factors (i.e., variables that are jointly determined with reported income) include the history of reported gross receipts, claimed deduc-tions, and the structure of business expenses. If taxpayers who are audited differ in important ways from unaudited taxpayers, simple comparisons between these groups might not reflect the causal impact of audits.
The literature on modern treatment evaluation, comprehensively summarized by Wooldridge (2010) and Blundell and Costa Dias (2000), provides useful empirical techniques for addressing this issue. The ge-neric problem of this literature is readily applied to our context. Specifically, we characterize taxpayers by three variables: the outcome in the absence of a treatment, Y0, the outcome in the presence of a treatment, Y1, and a dummy variable, D, indicating treatment assignment. In our context, the treatment in question is an audit, the outcome variable is a measure of reported income, and the assignment indicator identifies whether a taxpayer was audited prior to making the income report. We seek to identify the average treat-ment effect on the treated, which in our case translates into the impact of audits on audited taxpayers:
Equation 1
This measure differs, in general, from the average treatment effect (the expected impact of an audit on a taxpayer who is randomly drawn from the entire population). The two measures coincide only if treatments are randomly assigned, or the impact of a treatment is constant across the entire population (Heckman and Robb, 1986). Both assumptions are unlikely to hold in the present context for two

Section Three — AUDIT IMPACT STUDY 74
Form 1023-EZ IRS Collectibility Curve Audit Impact Study Understanding the Hispanic Underserved
reasons. First, operational audit selection at IRS is guided by sophisticated algorithms (such as the Discriminant Index Function score, or DIF score) that are meant to identify tax returns with a high potential for noncompliance. Second, the response of compliant taxpayers to an audit is likely to differ from the response of noncompliant taxpayers. Under our empirical strategy, we account for the possibil-ity that audits impact compliant and noncompliant taxpayers differently.
We expect that audits enforce the compliance of tax evaders. The impact on a compliant taxpayer, how-ever, is uncertain and could depend on the interaction with the tax administration as well as the taxpayer’s motivational posture (Braithwaite et al., 2007). On the one hand, audits may increase a taxpayer’s trust in the state, and therefore, serve to reinforce the social norm of voluntary compliance. On the other hand, audits could be perceived as unjustified measures, thereby undermining one’s willingness to comply voluntarily.
To account for potential differences among compliant and noncompliant taxpayers in response to an audit, we assume that each taxpayer is characterized by a personal propensity to evade, denoted by e. For simplicity, we assume that this variable only takes on two values. Noncompliant taxpayers are character-ized by e = 1, while compliant taxpayers are characterized by e = 0.
EMPIRICAL STRATEGY, SAMPLE SELECTION, AND DESCRIPTIVE STATISTICS
The focus of this report is on nonfarm self-employed taxpayers reporting less than $200,000 in total positive income in TY 2007; that is, on taxpayers who were assigned to IRS examination activity classes (EACs) 274 through 277 in that year. After describing our empirical strategy and treatment definition, we present our sample selection criteria, which are aimed at obtaining a relatively homogenous baseline sample of audited and unaudited taxpayers. The fourth subsection discusses some descriptive statistics and explores the trends in our main dependent variables.
Empirical StrategyBelow, we introduce some variants of the difference-in-differences estimation approach that we employ to measure the impact of audits on future taxpayer reporting behavior. A more detailed discussion of our econometric methodology is provided in Appendix B. Our Baseline Difference-in-Differences specifica-tion takes the following form:
Equation 2
The dependent variable is the difference between taxpayer i’s reported income (yik) in post-audit tax
year k (either TY 2008 or TY 2010) and the taxpayer’s reported income (yi0) in the pre-audit base year 0
(TY 2007). Our main reported income measures are taxable income and Schedule C net profit. We include a constant term (α) in all regressions to account for a common impact of macro-shocks across all taxpayers. The audit group dummy (D
i) takes the value of one for taxpayers in the audit group and
zero for those in the control group. The regression disturbance (εik) represents the impact of unobserved
individual-specific and time-varying factors, which are assumed to be independent of the audit group dummy. The impact of an audit on period k reporting is equal to β
1 for taxpayers in the no-tax-change
experimental group (E-NC). Our specification allows for the possibility that those receiving a positive recommended tax assessment (experimental group E-PC) respond differently to the audit. In particular, the coefficient β
2 of the interaction term e
iD
i represents the difference in the magnitude of the reporting

Taxpayer Advocate Service — 2015 Annual Report to Congress — Volume Two 75
Understanding the Hispanic Underserved Audit Impact Study Form 1023-EZIRS Collectibility Curve
response between experimental groups E-PC and E-NC. The full impact of an audit on taxpayers receiv-ing a positive additional recommended tax assessment is equal to (β
1 + β
2).
Taking the change in reported income as the dependent variable, rather than the level, removes the poten-tial correlation between the treatment group dummy D
i and unobserved time-constant components in the
income process (i.e., individual-specific fixed effects), such as the personal propensity to evade. However, to ensure consistent estimation of the audit impact, two additional conditions need to be satisfied. One is that the experimental groups would have had similar income reporting trends in the absence of any audits (i.e., the common trend assumption).9 The second is that the audit indicator is not correlated with the regression disturbance (i.e., that there are no unobserved factors, other than the fixed effect that has been differenced out, that influence both the audit selection process and taxpayer reporting behavior). We check the plausibility of the first assumption by investigating the trends in our dependent variables prior to TY 2007 graphically. To address the second, we extend the Baseline Difference-in-Differences approach in various ways to control for the role of unobserved factors.
A negative income shock is one important factor that is potentially associated with audit selection. For instance, a taxpayer may be selected for audit as a result of experiencing and reporting an unusually low level of income in a given year. In such a case, a rise in income in subsequent years may not be fully attributable to the impact of the audit: a rebound in income likely would have come about even in its absence (through a phenomenon known as “mean reversion”). Accordingly, the Baseline Difference-in-Differences approach would fail to identify the causal impact of the audit in this case, owing to the correlation between the transitory income shock (captured by the disturbance term) and the audit group dummy in the regression equation. In the treatment effects literature, this problem is referred to as “Ashenfelter’s dip” (see Ashenfelter, 1978).
The matching estimator addresses differences between audited and unaudited taxpayers by comparing members of the audit group against a matched control group of unaudited taxpayers with comparable observed characteristics (see, for example, Heckman and Smith, 1999). If the characteristics employed in the matching process include the recent income history of taxpayers, any mean reversion among members of the audit group should also be present among their matched counterparts in the control group (who have experienced similar transitory income shocks as indicated by their lagged income reports). The post-audit difference in income reporting behavior between the audit group and the matched control group will therefore measure the audit impact even when audit selection is influenced by the presence of temporary negative income shocks.
Three related points are worth stressing. First, a regression specification also may be used to consistently estimate the audit impact in this case. Specifically, by incorporating lagged levels of income as additional explanatory variables in our Baseline Difference-in-Differences regression specification, the linear regres-sion model achieves a similar result to the matching estimator: the audit impact is estimated conditional on past income shocks, thereby ensuring that the estimate is not biased in the presence of mean reversion. We refer to this estimation strategy as an Unrestricted Difference-in-Differences estimator. Note, however, that the linear regression framework imposes a linear functional form on the covariates. The matching estimator is more flexible as it does not rely on any parametric assumptions regarding functional form.
9 If this condition is not satisfied, the treatment dummy also captures the difference in trends between the audit group and the control group. Accordingly, the causal impact of audits would be confounded with the differential income reporting trend across the groups.

Section Three — AUDIT IMPACT STUDY 76
Form 1023-EZ IRS Collectibility Curve Audit Impact Study Understanding the Hispanic Underserved
Second, consistency of the matching estimator in the presence of recent temporary income shocks requires that unobserved time-invariant factors in the income process (i.e., individual-specific fixed effects) do not also influence audit selection. Under the matching process, audited taxpayers are matched with unaudited taxpayers with similar observed characteristics, including their recent past income reports. Thus, while the audited taxpayers and their matched controls are observationally similar, they do differ in that the latter were not selected for audit. If the reason that the matched controls were not selected is that they had different fixed effects, which made auditing them less attractive (e.g., they had a lower personal propensity to evade), one would expect reported income levels across the two experimental groups to differ in subsequent periods even in the absence of any enforcement effect. In particular, the controls would be more likely to have experienced a deeper recent transitory income shock and, therefore, would tend to exhibit a greater level of mean reversion in subsequent periods than the audited taxpayers. The Unrestricted Difference-in-Differences estimator, which includes controls for lagged levels of income, would fail for the same reason.
Third, given that we expect the audit response to vary depending on one’s personal propensity to evade, the simple matching estimator will not, in general, produce consistent estimates of the differential impact of audits on those who experience an additional recommended tax assessment and those who do not. The source of this problem is that we are unable to assess whether an unaudited taxpayer would have received an additional recommended tax assessment if that taxpayer had been audited. Consequently, the matched control group does not account for the differences in the income reporting trajectories for these two cat-egories of taxpayers in the absence of an audit. To address this problem, we rely on a Matched Difference-in-Differences estimator, as proposed by Heckman, Ichimura, Smith, and Todd (1998). In particular, we separately compare the change in reported income between period 0 and period k for our matched control group against the change in reported income for experimental group E-PC (i.e., those receiving a positive recommended audit assessment) and for experimental group E-NC (i.e., those receiving no recommended audit assessment). By subtracting the income report in period 0 from the report in period k, we are able to effectively account for any permanent differences in reporting postures (i.e., fixed effects) among the experimental groups (i.e., the differencing operation sweeps away the fixed effects).
To summarize, none of our above estimators are able to simultaneously control for audit selection based on time-varying shocks (such as recent transitory income changes prior to an audit) and audit selec-tion based on individual fixed effects. Our Matched Difference-in-Differences estimator as well as our Unrestricted Difference-in-Differences estimator can address the former potential issue, but not the latter. In contrast, the Baseline Difference-in-Differences estimator can address the latter potential issue, but not the former.10 We therefore compare results from a range of alternative estimators to assess the potential sources of bias and the robustness of our estimates. Our alternative estimation approaches include some extensions of the aforementioned methodologies to account for sample selection and sample attrition. Overall, we employ six alternative estimation approaches.
Our first two approaches, Baseline Difference-in-Differences (DD) and Dynamic DD, are robust to unobservable time-constant shocks, such as the propensity to evade.
Baseline DD: The first set of estimates is based on the Baseline Difference-in-Differences approach described by Equation 2. This methodology produces unbiased predictors of the impact of audits on the reporting behavior of taxpayers in both the positive-tax-change and
10 For a detailed discussion of the consistency of alternative estimators in the presence of fixed effects and transitory shocks, refer to Chabe-Ferret (2014).

Taxpayer Advocate Service — 2015 Annual Report to Congress — Volume Two 77
Understanding the Hispanic Underserved Audit Impact Study Form 1023-EZIRS Collectibility Curve
the no-tax-change experimental group, so long as audit selection is based only on time-constant variables.
Dynamic DD: To account for other taxpayer characteristics that influence both taxpayer reporting behavior and audit selection, this methodology incorporates lagged changes of reported income and a variety of indicators as additional explanatory variables in the Baseline DD regression specification. Note that recent changes in income are independent of taxpayer fixed effects, thus not introducing bias if audit selection is based on these effects. The set of indicator variables reflects attributes of the tax return, other than reported income, which might increase the likelihood of an audit. The Dynamic DD approach gives unbiased estimates of the audit impact if audit selection is triggered by time-constant variables, recent changes in reported income, or any of the included indicators.
Our third and fourth estimators, Unrestricted DD and Matched DD, control for audit selection based on recent transitory income changes (i.e., Ashenfelter’s dip).
Unrestricted DD: Under the Unrestricted DD approach,11 we substitute lagged changes in income with lagged levels of income (one and two lags). Otherwise, this specification resembles the Dynamic DD approach. By including lagged income levels, we control for recent shocks that potentially drive audit selection. The Unrestricted DD specification returns unbiased estimates of the treatment impact if audit selection is based on any linear function of past income, including its change, or if it is triggered by any of the variables included in the set of indicators. Importantly, the Unrestricted DD specification is not robust to selection on time-constant unobservable variables (i.e., taxpayer fixed effects).
Matched DD: The Matched DD Estimator builds on the assumptions of the Unrestricted DD estimator: it thus provides unbiased predictions of the audit impact if audit selection is based on any linear function of past income or any of the included indicators. We imple-ment this approach by comparing changes in reported income among our two experimental audit groups (E-PC and E-NC) with changes in reported income among our matched control group (see Propensity Score Matching below for details). The Matched DD estima-tor is less parametric than the Unrestricted DD estimator as it does not assume a specific functional form for the covariates. However, this improved flexibility comes at the expense of a smaller sample size.
Our two remaining estimators, Dynamic DD Plus Sample Selection and Dynamic DD Plus Attrition, control for sample selection on unobservables and sample attrition, respectively. Both specifications build on the Dynamic DD approach.
Dynamic DD Plus Sample Selection: The IRS might rely on certain time-varying variables when deciding which returns to audit that are correlated with the income process but not observable to us. To control for the implied bias, we follow Heckman (1978) by including a synthetic control variable that captures the residual correlation (see Appendix B for details). The Dynamic DD Plus Sample Selection estimator yields consistent estimates of the audit impact if the assumptions of the Dynamic DD approach are satisfied and if certain addi-tional distributional assumptions also hold.
11 For a similar approach, see LaLonde (1986, 1984).

Section Three — AUDIT IMPACT STUDY 78
Form 1023-EZ IRS Collectibility Curve Audit Impact Study Understanding the Hispanic Underserved
Dynamic DD Plus Attrition: The sixth specification includes another control variable ( λ2)
to account for sample attrition. Roughly eight percent of the baseline sample does not file a Schedule C return after TY 2007. If the dropout rate is correlated with the treatment, our estimates might not be valid. The Dynamic DD Plus Attrition estimator yields consistent predictions of the audit impact if the assumptions of the Dynamic DD approach are valid and if certain additional distributional assumptions are also satisfied.
Definition of TreatmentWe assign taxpayers to the treatment group if they were audited prior to filing their TY 2008 return but had no audits open or close in the three years preceding their TY 2007 return filing date. Our control group consists of taxpayers who had no audits open or close in the three years preceding their TY 2008 filing date. The requirement of having been audit-free for three years aims at enhancing the comparabil-ity of the two experimental groups and facilitates the assessment of whether income reports among the treatment and control groups follow common trends prior to the audit.
We operationalize this definition by combining three variables: (i.) information on the date an audit started, (ii.) information on a return’s recorded transaction date, and (iii.) information on the date a return was posted to the master file. The audit start date is accurately recorded for each taxpayer and each year. The effective filing date, however, is in some cases uncertain. We thus rely on a two-step procedure to infer when the return was filed. In the first step, we assign the recorded transaction date. However, if a return was filed in a timely manner, April 15 is often recorded as a transaction date even if the actual transaction was received well before this date or, sometimes, even after it. In this common situation, we turn to information on the date the return was posted to the master file. This second proxy for the effective filing date is also imperfect: there might be a considerable gap between the date a return is sent to the IRS and the date this return is posted to the master file, especially if the return is sent by mail. To minimize measurement error we drop taxpayers if the recorded audit start date lies within 14 days of the filing date as determined by our two-step procedure.
Sample SelectionThe preliminary audit data sample drawn for this project included information on a random sample of 6,451 nonfarm self-employed taxpayers (from examination activity classes 274 through 281 in TY 2007) who were recorded as having an audit open prior to filing their TY 2008 return. Taxpayers were excluded if they had an audit open or close at any time in the three years prior to their approximate TY 2007 return filing date.12
Also drawn for this project was a preliminary control sample of 11,218 taxpayers who had no audits open or close in the three years preceding their approximate TY 2008 return filing date. The control sample was selected so that the distribution of taxpayers across the TY 2007 DIF-score ventile categories for each examination activity class (based on the audit data sample) was comparable to that of the audit data sample. Specifically, taxpayers were randomly sampled in such a way that there were approximately 15 control sample taxpayers in each TY 2007 examination activity code and DIF-score ventile category for every ten audited taxpayers in this category.
As discussed above, we have refined our initial audit and control samples to more precisely classify treatments and controls for our empirical analysis. Table 1 summarizes our sample selection process.
12 Also excluded from the audit data sample as well as the control sample were taxpayers reporting total income of more than $10 million in any tax year between 2005 and 2011.

Taxpayer Advocate Service — 2015 Annual Report to Congress — Volume Two 79
Understanding the Hispanic Underserved Audit Impact Study Form 1023-EZIRS Collectibility Curve
The number of taxpayers is depicted separately for each experimental group to illustrate the impact of our selection requirements on the sample composition. The preliminary project data sample consists of 17,669 taxpayers. Around 25 percent of this sample was drawn from EAC class 280 or 281 (nonfarm self-employed taxpayers with over $200,000 in total positive income). We exclude these classes from our analysis, because high income cases often present unique compliance issues. After excluding taxpayers from these classes as well as those that could not be definitively assigned to a treatment or control group on the basis of our two-step procedure for assigning a filing date, there are 12,707 taxpayers remaining in our sample.
In the second step, we require that all taxpayers filed Schedule C income in both TY 2006 and TY 2007. This step is necessary to allow matching on the basis of variables for TY 2006. The third step eliminates taxpayers who did not file their returns chronologically. Such cases preclude an analysis of long term effects. Furthermore, in order to effectively capture macro-economic trends in our empirical analysis, we require that returns were filed timely. If we included taxpayers who filed their return for TY 2007 in, say, TY 2012, our constants included in the difference-in-differences regressions would not capture common trends. We increase homogeneity in our treatment group by dropping taxpayers whose returns for TY 2005 were audited (subsequent to filing their TY 2008 returns). Accordingly, the treatment group consists only of taxpayers who were audited in relation to their TY 2006 and/or TY 2007 return.13 Finally, we exclude taxpayers reporting extreme values (the top 2.5 percent and the bottom 2.5 percent of the distribution) of our main dependent variables, to ensure that our results are not driven by outliers and are thus representative of the overall sample. The final baseline sample consists of 6,909 taxpayers, including a treatment group of 2,204 taxpayers who were audited prior to filing their TY 2008 return and a control group of 4,705 taxpayers who were not audited prior to filing their TY 2008 return.
TABLE 1, Impact of Sample Selection Process
Subsample Control Treatment Total
Step Description Ind.% Step (x-1) Ind.
% Step (x-1) Ind.
% Step (x-1)
0 Initial working sample 11,218 — 6,451 — 17,669 —
1 New definition 8,313 0.74 4,394 0.70 12,707 0.72
2 Schedule C filed 2006 and 2007 6,998 0.84 3,695 0.84 10,693 0.84
3 Chronological filers 5,974 0.85 3,087 0.84 9,061 0.85
4 Not late before 2008 4,921 0.82 2,425 0.79 7,346 0.81
5 TY 2005 not audited 4,920 1.00 2,379 0.98 7,299 0.99
6 Outliers 4,705 0.96 2,204 0.93 6,909 0.95
Descriptive Statistics Table 2 presents descriptive statistics separately for the treatment and control groups, with the last column showing the probability of equal means between groups. In order to achieve comparability of DIF scores between the control and treatment groups while protecting the confidentiality of the underlying DIF algorithm, we worked with ventiles of the DIF distribution. Our ventile measure takes values between
13 All of the members of the preliminary audit sample were recorded as undergoing an audit of their TY 2007 return prior to the approximate filing date for their TY 2008 return. However, some of these taxpayers were later determined to have actually filed their TY 2008 return prior to the TY 2007 audit. Such taxpayers were retained in the control group if their TY 2006 return was audited subsequent to the TY 2007 return filing date but prior to the TY 2008 return filing date.

Section Three — AUDIT IMPACT STUDY 80
Form 1023-EZ IRS Collectibility Curve Audit Impact Study Understanding the Hispanic Underserved
1 and 20, with 20 reflecting the most extreme five percent of DIF scores within a given EAC class in our sample. Although the preliminary control group was selected to have approximately the same distribution across TY 2007 DIF score ventiles as the treatment group, the latter tended to have higher relative DIF scores in TY 2006.
TABLE 2, Descriptive Statistics
Subsample Control group (N=4705) Treatment group (N=2204)
Measure Min. Mean Max. Min. Mean Max. p-value
Variable (1) (2) (3) (4) (5) (6) (7)
DIF ventile 2006 1 8.82 20 1 10.64 20 0.000
DIF ventile 2007 1 10.02 20 1 10.45 20 0.004
Taxable income 0 30,810 290,200 0 30,570 242,400 0.773
Log taxable income 0 7.72 12.25 0 7.76 12.28 0.722
Schedule C Net Profit -95,900 19,010 194,100 -101,400 19,850 200,200 0.382
Profit ratio -34,990 -305 24.71 -51,200 -524.3 16.33 0.004
e 0 0 0 0 0.5 1 0.000
Penalty 0 155.4 72,650 0 1,218 97,980 0.000
Schedule C Filed 2008 0 0.94 1 0 0.9 1 0.000
Schedule C Filed 2010 0 0.84 1 0 0.8 1 0.000
Change in log taxable income 2007–2008
-11.44 -0.36 11.65 -11.53 0.11 11.59 0.000
Change in log taxable income 2007–2010
-11.55 0.09 12.07 -11.54 0.23 12.13 0.273
Change in profit ratio 2007–2008
-39,350 -17.54 50,360 -36,230 81.77 39,660 0.184
Change in profit ratio 2007–2010
-47,680 11.47 50,370 -53,420 70.07 50,070 0.496
Table depicts average values between 2006 and 2007 unless a year is mentioned in the variable name.
The experimental groups do not differ significantly in terms of taxable income before TY 2008.14 Reported Schedule C net profit is somewhat higher in the treatment group. The ratio of net profit to total gross receipts (profit ratio), on the other hand, is significantly lower in the treatment group. To account for a differential response to audits, we define the binary variable e to take the value of one if an audit resulted in an additional tax assessment. According to this classification, approximately one-half of all taxpayers in the treatment group fall into the additional tax assessment category. The two indicator variables, Schedule C Filed 2008 and Schedule C Filed 2010, take the value one if a taxpayer filed Schedule C income in the given year. About 94 percent of the taxpayers in the control group filed Schedule C income in TY 2008. In the treatment group, the percentage is significantly lower (90 percent). Three years after the audit, the share of taxpayers still filing Schedule C is 80 percent in the treatment group and 84 percent in the control group.
Finally, the last four rows present the change in two income measures one and three years after the audit, respectively. Control group members experienced a 36 percent decrease in reported income one year
14 We add $1 to the level of taxable income before transforming this variable in order for the natural log transformation to be valid for returns that report zero reported taxable income.

Taxpayer Advocate Service — 2015 Annual Report to Congress — Volume Two 81
Understanding the Hispanic Underserved Audit Impact Study Form 1023-EZIRS Collectibility Curve
after the audit,15 likely reflecting the economic downturn in TY 2008. In the treatment group, average reported income increased by 11 percent over this same period. The difference across groups, amounting to 25 percent, is significant at the one percent level. Three years after the audit, however, the difference in the trends in reported taxable income across groups is no longer statistically significant. The one- and three-year changes in the profit ratio show a similar pattern, although even the one-year change is not significant across groups for this variable, likely due to its high degree of variation within the sample.
Trends in IncomeOur empirical strategy rests on the assumption that income reporting trends for each of the experimental groups would have been similar in the absence of audits. While this assumption is not testable, the similarity of the reporting trends across these groups prior to TY 2008 demonstrates the plausibility of this premise. Figure 1 depicts average reported values in the treatment and the control group between TY 2005 and TY 2011.
FIGURE 1, Trends in income
Baseline Sample Matched Sample
30000
35000
40000
45000
7.27.47.67.88.0
1750020000225002500027500
-600-500-400-300-200
income
log income
profitprofitratio
2005 2006 2007 2008 2009 2010 2011 2005 2006 2007 2008 2009 2010 2011
Experimental Group Control Treatment
The left panel presents average values of taxable income, the natural logarithm of taxable income, Schedule C net profit, and the ratio of Schedule C net profit to Schedule C gross receipts, our main dependent variables, within the baseline sample. The right panel gives average values for the same variables within the matched sample (refer to Propensity Score Matching section below for details on our matching procedure). The level of reported taxable income clearly follows a similar trend in the treatment and control groups prior to TY 2008 (top panel). The trend in reported Schedule C net profit is also similar across groups (third panel from top). The main focus in our empirical analysis, however, is on the natural logarithm of taxable income and the profit ratio, because these measures are more robust to the presence of outliers. The natural logarithm of taxable income developed comparably in each group between TY 2005 and TY 2006, supporting the assumption of a common trend. However, relative to the treatment group, the average value of this variable shows a modest decline in the control group between TY 2006 and TY 2007. This may signify an association between recent changes in reported taxable in-come and audit selection. Our matched samples, which account for recent income changes, demonstrate
15 This follows from noting that ln (Income2008) − ln (Income2007) = x implies (Income2008 − Income2007)/Income2007 ≈ x for a small x.

Section Three — AUDIT IMPACT STUDY 82
Form 1023-EZ IRS Collectibility Curve Audit Impact Study Understanding the Hispanic Underserved
that the similarity of the trends in the natural logarithm of reported income improves after accounting for such changes.
When examining trends in the profit ratio (the last panel in Figure 1), the treatment group clearly differs from the control group in the baseline sample. The dip in TY 2007 implies that the Baseline Difference-in-Differences estimation approach might not identify the causal impact of audits (Ashenfelter, 1978). The reporting trends prior to TY 2008 look much more similar in the matched sample, suggesting that the Matched Difference-in-Differences procedure may hold more promise for this variable.
EMPIRICAL RESULTS
This section presents our empirical findings, beginning with our results concerning the determinants of audits. These results are then used in the Propensity Score Matching section to construct a matched control group. The third subsection investigates factors driving the likelihood of reporting Schedule C income in TY 2008 and TY 2010. In the fourth subsection, we present our main results on the impact of audits.
The Determinants of AuditsTo uncover factors driving the relative likelihood of audit selection within our sample, we estimate a bi-nary choice model (probit) with a dummy for treatment assignment (equal to 1 for audit group members and 0 for controls) as the dependent variable. We incorporate a variety of explanatory variables to explain group assignment.16
Propensity Score MatchingWe construct the propensity score (i.e., the estimated probability of assignment to the treatment group for each taxpayer in our sample, conditional on a wide range of explanatory variables) using the results of our probit specification for group assignment. Taxpayers with similar propensity scores are comparable in terms of their observed characteristics. Accordingly, any difference in subsequent reporting behavior between matched audited and unaudited taxpayers should be attributable to the audit impact (see, for example, Smith and Todd, 2005).17
Figure 2 illustrates the distribution of propensity scores among the treatment and control group members. Taxpayers in the treatment group are, as expected, more likely to be audited than taxpayers in the control group. The highest estimated probability of treatment assignment is 0.9993 in the treatment group and 0.9741 in the control group. To find an unaudited counterpart for each member of the treatment group, the experimental groups need to be trimmed to the region of common support. The figure shows that there are practically no valid control observations for propensity scores above 0.60. Accordingly, we ex-clude observations with propensity scores above this threshold (representing approximately 15 percent of our treatment sample) from the analysis. Consequently, our estimates based on the Matched Difference-in-Differences approach will not necessarily be representative of the impact of audits on taxpayers with very large propensity scores.
16 We had access to over 40 indicator variables and selected a subset of these based on prediction quality. Specifically, we ran a stepwise (backward) probit regression, which included all variables from the second column as well as the entire set of indi-cator variables. The algorithm then removed indicators until the Akaike Information Criterion was maximized.
17 As discussed in the Empirical Strategy section, this conclusion also rests on the assumption that audit selection is not attrib-utable to any unobserved factors that are associated with taxpayer reporting behavior.

Taxpayer Advocate Service — 2015 Annual Report to Congress — Volume Two 83
Understanding the Hispanic Underserved Audit Impact Study Form 1023-EZIRS Collectibility Curve
FIGURE 2, Estimated Probability of Treatment Assignment
0
1
2
3
4
5
0.25 0.50 0.75 1.00Predicted prob. of audit
Den
sity
Experimental Group Control Treatment
After excluding those observations with propensity scores above 0.6, we match each audited return in our sample to an unaudited control using a nearest neighbor matching algorithm (without replacement). This method pairs taxpayers based on the similarity of their propensity scores. Table 3 presents the results of this exercise. Our matched experimental sample consists of 1,980 taxpayer pairs.18 The table depicts the distribution of propensity scores, separately for the treatment and matched control group, across the deciles of the matched treatment group. The last column presents t-tests comparing mean values between the two groups. As expected, we find more comparable pairs at the bottom of the propensity distribution. The weakest matches are reported in the highest decile covering propensity scores between 0.47 and 0.58.
TABLE 3, Distribution of Propensity Scores in Matched Experimental Groups
Subsample Matched control group (N=1980) Matched treatment group (N=1980)
Measure Observations Min. Mean Max. Observations Min. Mean Max. p-value
Decile of treated (1) (2) (3) (4) (5) (6) (7) (8) (9)
1 197 0.1095 0.1858 0.2129 198 0.1099 0.1860 0.2129 0.95
2 199 0.2130 0.2272 0.2393 198 0.2135 0.2273 0.2394 0.91
3 198 0.2394 0.2526 0.2636 198 0.2394 0.2526 0.2636 0.99
4 197 0.2636 0.2752 0.2866 198 0.2636 0.2753 0.2866 0.89
5 198 0.2866 0.3007 0.3150 198 0.2869 0.3008 0.3151 0.84
6 198 0.3152 0.3286 0.3447 198 0.3152 0.3288 0.3448 0.83
7 198 0.3449 0.3616 0.3786 198 0.3451 0.3618 0.3793 0.81
8 200 0.3793 0.3969 0.4169 198 0.3794 0.3970 0.4172 0.90
9 197 0.4173 0.4431 0.4739 198 0.4174 0.4435 0.4741 0.83
10 196 0.4742 0.5182 0.5790 198 0.4743 0.5233 0.5795 0.11
18 Note that only 1,978 observations of the control group are reported in the left column of Table 3 as two observations in the control group have a propensity score above 0.5795.

Section Three — AUDIT IMPACT STUDY 84
Form 1023-EZ IRS Collectibility Curve Audit Impact Study Understanding the Hispanic Underserved
The Determinants of Filing Schedule C IncomeWe now turn to examining whether audits impact the future likelihood of filing Schedule C. Table 4 below presents the estimation results of a binary choice model (probit) where dummy indicators for the presence of Schedule C earnings in TY 2008 and TY 2010 serve as the dependent variables.
The first and second specifications in Table 4 examine the probability of filing Schedule C income in TY 2008. Controlling for pre-treatment income and DIF scores, we find that audits decrease the likeli-hood of continued filing of Schedule C in the following year by approximately seven percentage points among taxpayers in the positive-tax-change experimental group (E-PC). Audits do not have a statistically significant effect on the likelihood of a subsequent Schedule C filing among members of the no-tax-change experimental group (E-NC). Income measures have the anticipated effects on future Schedule C filing behavior: the more profitable a business is (relative to other income sources) the higher the likelihood of filing Schedule C in TY 2008.
We add a variety of additional control variables in the second specification. Following the stepwise variable selection strategy described above, we select the subset of all indicator variables that maximizes the model fit. With a magnitude of -12.5 percent, the largest absolute estimated marginal effect is associated with the moving expense indicator: taxpayers just having moved are significantly less likely to report Schedule C income. Depreciation expenses in TY 2007, signaling the presence of valuable assets, increase the likelihood of filing Schedule C in TY 2008 by almost five percent. Other pre-audit expenses that increase the likelihood of a subsequent Schedule C filing include expenses on entertainment, legal consulting, wages, and using one’s home for business purposes. The other income sources in this specifi-cation, with the exception of wage income, have a positive impact on the probability of filing Schedule C income.
The third and fourth specifications investigate determinants of filing Schedule C income in 2010. Three years after having been audited and subjected to an additional recommended tax assessment, the prob-ability of filing Schedule C is estimated to be approximately seven percentage points lower than if the audit had not transpired. This estimate is quite similar to the estimated impact in TY 2008, suggesting that audits may immediately lead some taxpayers with a positive recommended tax change (members of E-PC) to exit self-employment for an extended period of time. The estimated marginal effect of other explanatory variables is similar to their impact in TY 2008: taxpayers owning highly profitable businesses that allow spending on investments, entertainment, wages, legal advice and travel, are more likely to report Schedule C income in TY 2010. On the negative side, owning a startup, receiving wage income and reporting moving expenses are the most informative predictors of not filing Schedule C in TY 2010.

Taxpayer Advocate Service — 2015 Annual Report to Congress — Volume Two 85
Understanding the Hispanic Underserved Audit Impact Study Form 1023-EZIRS Collectibility Curve
TABLE 4, Determinants of Filing Schedule C Past TY 2007
Estimation of sample selection (probit estimation)
Dependent variable Filed C in 2008 Filed C in 2010
Model cont. (2) (4)Model (1) (2) (3) (4)
Explanatory variables Explanatory variables cont.
Treatment -0.005 (0.009)
-0.005 (0.008)
-0.003 (0.013)
-0.002 (0.013)
Schedule E indicator
0.025***(0.008)
-0.001 (0.018)
Treatment: e -0.067***(0.015)
-0.053***(0.013)
-0.072***(0.019)
-0.065***(0.018)
Start up 2006 -0.017*(0.009)
-0.042**(0.017)
DIF vent. 2006 0.004**(0.001)
0.003*(0.001)
0.007***(0.002)
0.005**(0.002)
Depreciation exp. 2006
-0.01 (0.007)
-0.003 (0.013)
DIF vent. 2007 0.002 (0.001)
0.000 (0.001)
0.002 (0.002)
-0.001 (0.002)
Meal and enter.exp 2006
-0.01 (0.006)
-0.014 (0.012)
DIF vent. squared 2006
-0.000**(0.000)
-0.000*(0.000)
-0.000**(0.000)
-0.000**(0.000)
Wage indicator 2007
-0.034***(0.006)
-0.047***(0.011)
DIF vent. squared 2007
0.000*(0.000)
0.000(0.000)
0.000*(0.000)
0.000(0.000)
Capital gains ind. 2007
0.019**(0.008)
-0.017 (0.014)
DIF vent. 2006: DIF vent. 2007
0.000(0.000)
0.000(0.000)
-0.000*(0.000)
0.000(0.000)
Other gains ind. 2007
-0.026*(0.013)
-0.028 (0.021)
Sch C Net Profit 2006
0.000***(0.000)
0.000***(0.000)
0.000***(0.000)
0.000**(0.000)
Schedule E ind. 2006
-0.027**(0.011)
-0.001 (0.018)
Sch C Net Profit 2007
0.000(0.000)
0.000(0.000)
0.000***(0.000)
0.000*(0.000)
Other income ind. 2007
0.016**(0.006)
0.005 (0.014)
Profit ratio 2006 0.000***(0.000)
0.000**(0.000)
0.000***(0.000)
0.000***(0.000)
Moving expenses ind. 2007
-0.125**(0.048)
-0.199***(0.067)
Profit ratio 2007 0.000(0.000)
0.000(0.000)
0.000**(0.000)
0.000**(0.000)
Simple account cont.
0.015(0.009)
0.009(0.019)
Log Taxable Income 2006
-0.002**(0.001)
0.000(0.001)
-0.006***(0.002)
-0.004**(0.002)
Car truck expenses 2007
0.010(0.006)
0.027**(0.012)
Log Taxable Income 2007
0.000(0.001)
0.001(0.001)
-0.001(0.002)
0.000(0.002)
Depreciation expenses 2007
0.046***(0.008)
0.071***(0.013)
Taxable Income 2006
-0.000***(0.000)
-0.000***(0.000)
0.000(0.000)
0.000(0.000)
Legal expenses 2007
0.014**(0.005)
0.038***(0.010)
Taxable Income 2007
0.000**(0.000)
0.000(0.000)
0.000*(0.000)
0.000(0.000)
Travel expenses 2007
0.010*(0.006)
0.029**(0.011)
Profit/Taxable Income 2006
0.000(0.000)
0.000(0.000)
0.000(0.000)
0.000*(0.000)
Meal and ent. expenses 2007
0.021***(0.007)
0.045***(0.014)
Profit/Taxable Income 2007
0.000(0.000)
0.000*(0.000)
0.000(0.000)
0.000(0.000)
Wage expenses 2007
0.016**(0.006)
0.016(0.013)
Interest income ind. 2006
0.028***(0.006)
0.033***(0.010)
Business home expenses 2007
0.016***(0.005)
0.018*(0.011)
Capital gains ind. 2006
0.016**(0.007)
0.028**(0.013)
Observations 6,971 – 6,971 – 6,971 6,971
AIC 3,461 – 6,060 – 3,230 5,856
Notes: *, **, and *** indicate significance at the 10%, 5%, and 1% level. Robust standard errors (bootstrapped) in parentheses.
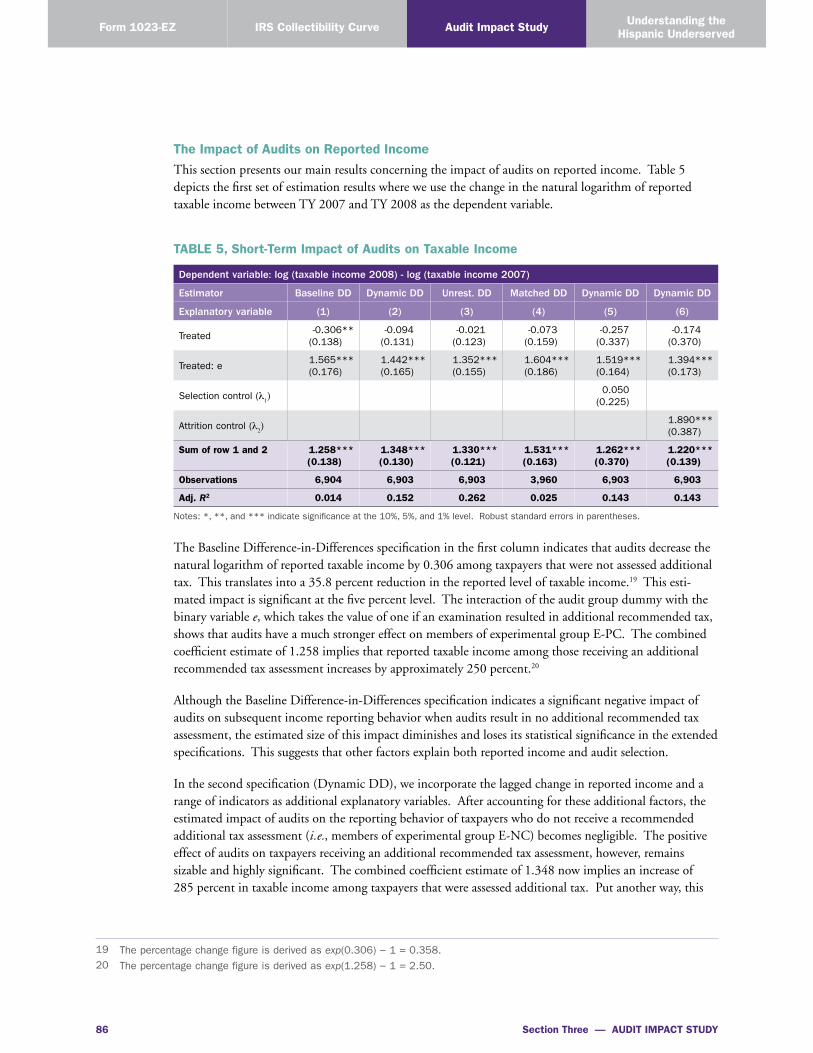
Section Three — AUDIT IMPACT STUDY 86
Form 1023-EZ IRS Collectibility Curve Audit Impact Study Understanding the Hispanic Underserved
The Impact of Audits on Reported IncomeThis section presents our main results concerning the impact of audits on reported income. Table 5 depicts the first set of estimation results where we use the change in the natural logarithm of reported taxable income between TY 2007 and TY 2008 as the dependent variable.
TABLE 5, Short-Term Impact of Audits on Taxable Income
Dependent variable: log (taxable income 2008) - log (taxable income 2007)
Estimator Baseline DD Dynamic DD Unrest. DD Matched DD Dynamic DD Dynamic DD
Explanatory variable (1) (2) (3) (4) (5) (6)
Treated-0.306**
(0.138)-0.094
(0.131)-0.021
(0.123)-0.073
(0.159)-0.257
(0.337)-0.174
(0.370)
Treated: e1.565***(0.176)
1.442***(0.165)
1.352***(0.155)
1.604***(0.186)
1.519***(0.164)
1.394***(0.173)
Selection control (λ1)
0.050(0.225)
Attrition control (λ2)
1.890***(0.387)
Sum of row 1 and 2 1.258***(0.138)
1.348***(0.130)
1.330***(0.121)
1.531***(0.163)
1.262***(0.370)
1.220***(0.139)
Observations 6,904 6,903 6,903 3,960 6,903 6,903
Adj. R2 0.014 0.152 0.262 0.025 0.143 0.143
Notes: *, **, and *** indicate significance at the 10%, 5%, and 1% level. Robust standard errors in parentheses.
The Baseline Difference-in-Differences specification in the first column indicates that audits decrease the natural logarithm of reported taxable income by 0.306 among taxpayers that were not assessed additional tax. This translates into a 35.8 percent reduction in the reported level of taxable income.19 This esti-mated impact is significant at the five percent level. The interaction of the audit group dummy with the binary variable e, which takes the value of one if an examination resulted in additional recommended tax, shows that audits have a much stronger effect on members of experimental group E-PC. The combined coefficient estimate of 1.258 implies that reported taxable income among those receiving an additional recommended tax assessment increases by approximately 250 percent.20
Although the Baseline Difference-in-Differences specification indicates a significant negative impact of audits on subsequent income reporting behavior when audits result in no additional recommended tax assessment, the estimated size of this impact diminishes and loses its statistical significance in the extended specifications. This suggests that other factors explain both reported income and audit selection.
In the second specification (Dynamic DD), we incorporate the lagged change in reported income and a range of indicators as additional explanatory variables. After accounting for these additional factors, the estimated impact of audits on the reporting behavior of taxpayers who do not receive a recommended additional tax assessment (i.e., members of experimental group E-NC) becomes negligible. The positive effect of audits on taxpayers receiving an additional recommended tax assessment, however, remains sizable and highly significant. The combined coefficient estimate of 1.348 now implies an increase of 285 percent in taxable income among taxpayers that were assessed additional tax. Put another way, this
19 The percentage change figure is derived as exp(0.306) − 1 = 0.358. 20 The percentage change figure is derived as exp(1.258) − 1 = 2.50.

Taxpayer Advocate Service — 2015 Annual Report to Congress — Volume Two 87
Understanding the Hispanic Underserved Audit Impact Study Form 1023-EZIRS Collectibility Curve
estimate implies that roughly 75 percent21 of the income reported among members of experimental group E-PC in TY 2008 is the direct result of enforcement activity. In the third and fourth specification, weallow for selection on time-varying observables. Both sets of estimates indicate no significant impact ofaudits on income reporting among members of experimental group E-NC but a large and significantpositive impact among members of E-PC. The quantitative prediction of the Unrestricted DD approachis smaller in magnitude and closer to the estimates presented in Columns (1) and (2). The MatchedDifference-in-Differences estimator indicates that approximately 80 percent of the income reported inTY 2008 among members of experimental group E-PC is a direct result of audits.
We control for selection on unobservables and for attrition in the fifth and sixth columns of Table 6, respectively. The estimated coefficient on the first control function is not significant, indicating the absence of sample selection bias. Including a control for sample attrition (Column (6)), slightly reduces the estimated audit impact on taxpayers receiving a positive recommended audit assessment, while the estimated impact on those receiving no audit assessment remains statistically insignificant.
Table 6 explores the long-term impact of audits on reported income. The dependent variable is now the change in the natural logarithm of reported taxable income between TY 2007 and TY 2010. Three years after having undergone an audit, we find that members of the positive-tax-change experimental group (E-PC) still report 120 percent more in taxable income than before the audit. This translates into a direct enforcement effect (i.e., the percentage contribution of an audit to the level of reported income in 2010) of 55 percent. The estimated audit impact varies only marginally across specifications.
TABLE 6, Long-Term Impact of Audits on Taxable Income
Dependent variable: log (taxable income 2010) - log (taxable income 2007)
Estimator Baseline DD Dynamic DD Unrest. DD Matched DD Dynamic DD Dynamic DD
Explanatory variable (1) (2) (3) (4) (5) (6)
Treated-0.476***(0.156)
-0.296**(0.147)
-0.191(0.132)
-0.405**(0.180)
-0.064(0.418)
-0.318**(0.146)
Treated: e 1.223***(0.199)
1.144***(0.185)
0.985***(0.167)
1.224***(0.212)
1.171***(0.185)
1.064***(0.192)
Selection control (λ1)
-0.172(0.254)
Attrition control (λ2)
0.775**(0.350)
Sum of row 1 and 2 0.747***(0.157)
0.849***(0.145)
0.794***(0.131)
0.819***(0.186)
1.107**(0.418)
0.746***(0.152)
Observations 6,904 6,903 6,903 3,960 6,903 6,903
Adj. R2 0.005 0.163 0.324 0.008 0.138 0.139
Notes: *, **, and *** indicate significance at the 10%, 5%, and 1% level. Robust standard errors in parentheses.
21 On average, the income reported in TY 2007 is roughly 25% = 1/3.85 of its TY 2008 value.

Section Three — AUDIT IMPACT STUDY 88
Form 1023-EZ IRS Collectibility Curve Audit Impact Study Understanding the Hispanic Underserved
Importantly, we now find a significant negative impact of audits among taxpayers in the no-tax-change experimental group (E-NC). Those audited but not assessed additional tax report approximately 35 percent less income as a result of the enforcement activity. The estimated impact of audits on income reporting among compliant taxpayers is not statistically significant in two of our specifications. The first is the Unrestricted Difference-in-Differences model, which includes lagged income levels and various other control variables. Given that the Matched Difference-in-Differences estimator relies on a similar set of assumptions while not imposing a linear functional form, we attach more weight to the latter estimator (which does indicate a significant negative impact of audits). The second is based on the control func-tion model in column (5), which attempts to account for both observable and unobservable differences between the treatment and control groups. The coefficient on the control function is, however, not statistically significant and the inflated standard errors point at a potential problem of multicollinearity in this specification. We thus conclude that, overall, our estimates point to a negative long-term impact of audits on income amounts reported by taxpayers in the no-change-tax group. Our preferred specification (column (6)) suggests that such taxpayers reduce their reported income by 37 percent three years after having undergone an audit.
We have also estimated a more restrictive model that does not allow the audit impact to vary in accor-dance with the audit outcome. In this specification, all audited taxpayers are treated as a single treatment group, making no distinction between taxpayers with and without a recommended additional tax assess-ment. The findings for this more restrictive model indicate that audits have an enduring positive effect on income reporting within the combined treatment group: on net, reported taxable income remains 20 percent higher three years after an audit.
We present estimates for some alternative specifications involving the change in the level of reported taxable income (rather than the change in its natural logarithm) as the dependent variable in Appendix A (Table 8 and Table 9). One year after the audit, we find that reported income among the positive-tax-change experimental group (E-PC) is increased by around $13,000 (or by about 42 percent); we do not find a statistically significant impact of audits among members of the no-tax-change experimental group (E-NC). Three years after the audit, taxpayers that were assessed additional tax still report around $8,000 to $9,000 more than control group members. The estimated long-run impact on income reporting among members of the no-tax-change experimental group is negative in all specifications. However, the estimated effect is statistically significant only when using the Matched Difference-in-Differences estima-tor. Thus, while the results based on the change in the level of reported taxable income are qualitatively similar to those based on the change in its natural logarithm, the latter imply a much larger percentage change in income reporting among the positive-tax-change experimental group as a result of the audits.
Figure 3 illustrates these findings. The distance between the positive-tax-change experimental group (orange line) and the control group (green line) widens steeply in TY 2008 and shrinks gradually there-after. The graph also indicates a negative impact of audits on the no-tax-change group (blue line). This effect is most visible in the matched sample when looking at the logarithm of reported income (bottom right panel).
Table 7 presents estimates of the impact of audits on the level of reported Schedule C net profit. We focus on profit levels rather than profit ratios first, because this variable seems to better satisfy the assump-tions needed for consistent identification of the treatment impact.

Taxpayer Advocate Service — 2015 Annual Report to Congress — Volume Two 89
Understanding the Hispanic Underserved Audit Impact Study Form 1023-EZIRS Collectibility Curve
FIGURE 3, Impact of Audits on Reported Taxable Income
Baseline Sample Matched Sample
30000
35000
40000
45000
7.0
7.5
8.0
8.5
income
log income
2005 2006 2007 2008 2009 2010 2011 2005 2006 2007 2008 2009 2010 2011
Year
Experimental Group Control E-PC E-NC
TABLE 7, Short-Term Impact of Audits on Schedule C Net Profit
Dependent variable: Schedule C net profit 2008 - Schedule C net profit 2007
Estimator Baseline DD Dynamic DD Unrest. DD Matched DD Dynamic DD Dynamic DD
Explanatory variable (1) (2) (3) (4) (5) (6)
Treated-854.695
(943.370)496.032
(940.915)1,121.631(919.618)
-876.488(1,142.702)
-7,347.371***(2,690.039)
-152.709(919.323)
Treated: e11,319.136***(1,233.504)
10,439.312***(1,211.675)
9,062.906***(1,186.069)
13,412.048***(1,376.111)
10,924.824***(1,200.277)
10,166.602***(1,258.110)
Selection control (λ1)
4,643.215**(1,640.058)
Attrition control (λ2)
6,195.364**(3,058.939)
Sum of row 1 and 2 10,464.442***(986.009)
10,935.345***(964.414)
10,184.537***(943.067)
12,535.560***(1,219.835)
3,577.453***(2,705.077)
10,013.892***(1,023.932)
Observations 6,386 6,385 6,385 3,629 6,385 6,385
Adj. R2 0.018 0.077 0.120 0.033 0.072 0.071
Notes: *, **, and *** indicate significance at the 10%, 5%, and 1% level. Robust standard errors in parentheses.
The Baseline Difference-in-Differences specification depicted in Column (1) suggests that members of experimental group E-NC decreased the amount of reported Schedule C net profit by $855 in response to the audit. However, the estimated effect is not statistically significant. Combining this estimate with the coefficient estimate of the interaction, we find that members of experimental group E-PC increased their reported net profit by approximately $10,500 the year after being audited. This latter coefficient is significant at the one percent level.
After controlling for lagged changes in the dependent variable and other additional explanatory fac-tors in the second specification, the estimated audit impact on the positive-tax-change experimental group (E-PC) increases slightly. In the case of the no-tax-change group (E-NC), the estimated change in reported income shifts from a negative to a positive value, but it remains statistically insignificant. Including lagged levels of reported net profit as explanatory variables instead of lagged changes in net profit (Unrestricted DD in Column (3)) only modestly changes the estimated audit impact within the

Section Three — AUDIT IMPACT STUDY 90
Form 1023-EZ IRS Collectibility Curve Audit Impact Study Understanding the Hispanic Underserved
positive-tax-change experimental group, but it doubles the estimated impact on the no-tax-change group. The latter estimate, however, remains statistically insignificant. The Matched Difference-in-Differences estimator points to a slightly larger audit impact on the positive-tax-change group. Similar to the Baseline Difference-in-Differences approach, this approach estimates a modest, but statistically insignificant, impact of audits on net profit reporting within the no-tax-change experimental group. In the fifth speci-fication, we control for potential unobservable factors that are associated with both the income process and the audit rule. The estimated impact of an audit on members of experimental group E-PC decreases to $3,577, while the effect on taxpayers who were not assessed additional tax is now equal to -$7,347 and is statistically significant. As a robustness check, we have re-estimated this model after including DIF ventiles in TY 2006 and TY 2007 as additional explanatory variables. The estimated coefficient on the control variable is not significant in this specification and the estimated audit impact on the positive-tax-change and no-tax-change experimental groups is more comparable to the results presented in the other specifications. We therefore suspect that the estimates in Column (5) are biased. The estimates in the last column control for attrition. They confirm the positive impact of audits on taxpayers who were assessed additional tax and the negligible effect on those who were not.
We examine the long-term impact of audits on reported Schedule C net profit in Table 10 in Appendix A. The estimated impact on members of experimental group E-PC remains at approximately $6,500 (and statistically significant) three years after the audit. Similar to the estimation results on the long-term impact of audits on reported taxable income, we find a negative impact of audits on reported Schedule C net profit among members of experimental group E-NC in most of our specifications. The Baseline Difference-in-Differences approach suggests that members of the no-tax-change experimental group decreased their level of reported net profit by $2,400 in 2010. This reduction is statistically significant. However, after controlling for lagged changes in net profit, the estimated audit impact falls to -$1,000 and becomes statistically insignificant. Similar to the above reported results, we find unintuitive estimates when attempting to control for unobservable factors that are associated with both audit selection and profit reporting behavior. Overall, we conclude that audits seem to have a strong impact on reported net profit among those receiving an additional recommended tax assessment and a relatively small impact, possibly negative, on those receiving no additional assessment.
The estimated impact of an audit on the net profit ratio is indeterminate, switching signs depending on the specification used. We do not report these results; instead, we illustrate the impact on different measures of net profit in Figure 4. The impact on members of experimental group E-PC seems to be positive throughout all graphs. The impact on members of experimental group E-NC, however, is not clear. Furthermore, the lower left panel, illustrating the pre-audit period trend in the profit ratio, suggests that taxpayers who were assessed additional tax were selected into treatment due to a negative shock to profitability in the year prior to the audit. The difference-in-differences approach is thus not suitable in this context.

Taxpayer Advocate Service — 2015 Annual Report to Congress — Volume Two 91
Understanding the Hispanic Underserved Audit Impact Study Form 1023-EZIRS Collectibility Curve
FIGURE 4, Impact of Audits on Schedule C Net Profit
Baseline Sample Matched Sample
15000
20000
25000
-750
-500
-250
profitprofit ratio
2005 2006 2007 2008 2009 2010 2011 2005 2006 2007 2008 2009 2010 2011Year
Experimental Group CP-E CN-EControl
DISCUSSION AND LIMITATIONS
Using a range of non-experimental estimators, we find that audits have a significant impact on reported income: taxpayers receiving a positive recommended additional tax assessment increase their reports of taxable income dramatically (+120 percent), while those receiving no additional assessment respond by reporting less income in future years (-35 percent). The positive impact on members of experimental group E-PC (i.e., taxpayers that were assessed additional recommended tax) is likely due to some kind of deterrent effect (Alm et al., 2009).
Understanding the observed reduction in reported income among taxpayers in experimental group E-NC (i.e., taxpayers that were not assessed additional tax) is probably even more important. There are several plausible explanations for this finding. First, an experience of coercive enforcement activity could reduce tax morale among honest taxpayers, leading to the observed detrimental impact of audits on compli-ance among members of experimental group E-NC. Second, even if tax morale were unaffected by the examination experience, the audit process might provide currently compliant taxpayers with a “window” on potential opportunities for both legal and illegal tax avoidance. In addition, such taxpayers may infer that the risk of a future examination is low given that no adjustments were made during the recent audit. This newfound awareness of opportunities for reporting and paying lower taxes combined with a low perceived future audit risk could drive some taxpayers to report less income on subsequent returns. A third possibility is that the observed reduction in reported income might be attributable to dishonest taxpayers within this group whose misreporting was not detected during the audit. The experience of having undergone an audit without experiencing any sanction for noncompliance may have emboldened such taxpayers, resulting in even more aggressive future reporting behavior. Based on the available data, we are unable to pinpoint which of these explanations prevails. The observed reduction in compliance behavior suggests, in any case, that there is scope for improving the efficiency of audits. On the one hand, improved targeting of noncompliant returns and an improved capacity to detect noncompliance would seem likely to improve deterrence among cheaters. On the other hand, a better understanding of the psychological impact of audits on compliant taxpayers may lead to enhanced examination approaches that mitigate the erosion of tax morale and maintain their incentives to comply.
It is constructive to consider limitations and potential extensions of the above analysis. First, we cannot rule out that our estimates are influenced by the economic downturn in 2008. Repeating the analysis for another, less turbulent, timespan would strengthen the credibility of the results. Second, the relatively

Section Three — AUDIT IMPACT STUDY 92
Form 1023-EZ IRS Collectibility Curve Audit Impact Study Understanding the Hispanic Underserved
short time horizon impairs the estimation of a dynamic model, which would allow a more accurate quan-tification of the decay rate of audit effects. Third, a range of additional analyses, looking at, for instance, the differential impact of alternative audit techniques (such as face-to-face vs. correspondence) or the differential response of low income and high income taxpayers, could provide important insights. Fourth, the existing propensity score matching approach relies on matching without replacement, meaning that a given control group member can be matched to at most one treatment group member. Although this approach can lead to improved precision in estimation, it can also result in increased bias. Intuitively, restricting control group members to no more than one match can adversely impact the quality of the matches to some treatment group members. Therefore, it may be productive to explore whether similar estimation results are achieved when one employs matching with replacement. In addition, the current Matched Difference-in-Differences approach compares the reporting behavior of each subset of the audit group (E-PC and E-NC) to the full set of matched controls. It may be worthwhile to compare the report-ing behavior of experimental group E-PC just to the matched controls for this subset of taxpayers and, likewise, the reporting behavior of group E-NC just to the matched controls for this subset of taxpayers. Finally, it may be worth considering estimating the models separately for each examination activity class to see if the results are robust across classes.

Taxpayer Advocate Service — 2015 Annual Report to Congress — Volume Two 93
Understanding the Hispanic Underserved Audit Impact Study Form 1023-EZIRS Collectibility Curve
REFERENCES
Advani, Arun, W. E. and J. Shaw (2015). How Long-lasting are the Effects of Audits? Technical report, Discussion Paper No. 011-15, Tax Administration Research Center, University of Exeter.
Alm, J., B. R. Jackson, and M. McKee (2009, April). Getting the Word Out: Enforcement Information Dissemination and Compliance Behavior. Journal of Public Economics 93 (3-4), 392–402.
Ashenfelter, O. (1978, February). Estimating the Effect of Training Programs on Earnings. The Review of Economics and Statistics 60 (1), 47–57.
Blundell, R. and M. Costa Dias (2000, December). Evaluation Methods for Non-Experimental Data. Fiscal Studies 21 (4), 427–468.
Braithwaite, V., K. Murphy, and M. Reinhart (2007, January). Taxation Threat, Motivational Postures, and Responsive Regulation. Law & Policy 29 (1), 137–158.
Chabe-Ferret, S. (2014, August). Why Does Difference in Difference Matching Work? Technical report.
DeBacker, J., B. T. Heim, and A. Yuskavage (2015, March). Once Bitten, Twice Shy? The Lasting Impact of IRS Audits on Individual Tax Reporting. Working paper, Indiana University.
Gemmel, N. and M. Ratto (2012, March). Behavioral Responses to Taxpayer Audits: Evidence from Random Taxpayer Inquiries. National Tax Journal 65 (1), 33–58.
Heckman, J. J. (1978). Dummy Endogenous Variables in a Simultaneous Equation System. Econometrica 46 (4), 931–959.
Heckman, J. J. (1979, January). Sample Selection Bias as a Specification Error. Econometrica 47 (1), 153–161.
Heckman, J. J., H. Ichimura, J. Smith, and P. Todd (1998). Characterizing Selection Bias Using Experimental Data. Econometrica 66 (5), 1017–1098.
Heckman, J. J. and R. Robb (1986). Alternative Methods for Solving the Problem of Selection Bias in Evaluating the Impact of Treatments on Outcomes. In H. Wainer (Ed.), Drawing Inferences from Self-Selected Samples. New York: Springer-Verlag.
Heckman, J. J. and J. A. Smith (1999, July). The Pre-Programme Earnings Dip and the Determinants of Participation in a Social Programme. Implications for Simple Programme Evaluation Strategies. The Economic Journal 109 (457), 313–348.
Internal Revenue Service (2015, March). Internal Revenue Service Data Book, 2014.
LaLonde, R. J. (1984). Evaluating the Econometric Evaluations of Training Programs with Experimental Data. Technical report, Industrial Relations Center, Princeton University, Working Paper No. 183.
LaLonde, R. J. (1986). Evaluating the Econometric Evaluations of Training Programs with Experimental Data. The American Economic Review 76 (4), 604–620.
Rosenbaum, P. R. and D. B. Rubin (1983, April). The Central Role of the Propensity Score in Observational Studies for Causal Effects. Biometrika 70 (1), 41–55.
Smith, J. A. and P. E. Todd (2005, March). Does Matching Overcome Lalonde’s Critique of Nonexperimental Estimators? Journal of Econometrics 125 (1-2), 305–353.
Wooldridge, J. M. (2010, October). Econometric Analysis of Cross Section and Panel Data. Cambridge, MA: MIT Press.

Section Three — AUDIT IMPACT STUDY 94
Form 1023-EZ IRS Collectibility Curve Audit Impact Study Understanding the Hispanic Underserved
APPENDIX A. ADDITIONAL TABLES
TABLE 8, Short-Term Impact of Audits on Taxable Income (Levels Specification)
Dependent variable: taxable income 2008 - taxable income 2007
Estimator Baseline DD Dynamic DD Unrest. DD Matched DD Dynamic DD Dynamic DD
Explanatory variable (1) (2) (3) (4) (5) (6)
Treated109.151
(903.361)637.189
(911.577)695.058
(902.420)-67.036
(1,108.523)-3,172.458
(2,563.045)118.234
(893.239)
Treated: e12,762.614***(1,151.681)
12,130.803***(1,148.279)
11,616.740***(1,139.743)
13,383.543***(1,299.849)
12,914.715***(1,137.809)
12,368.663***(1,198.948
Selection control (λ1)
2,118.879(1,559.561)
Attrition control (λ2)
3,887.346(2,684.980)
Sum of row 1 and 2 12,871.765***(906.024)
12,767.992***(899.115)
12,311.798***(892.084)
13,316.507***(1,141.892)
9,742.257***(2,564.537)
12,486.897***(964.360)
Observations 6,904 6,903 6,903 3,960 6,903 6,903
Adj. R2 0.029 0.061 0.082 0.037 0.054 0.054
Notes: *, **, and *** indicate significance at the 10%, 5%, and 1% level. Robust standard errors in parentheses.
TABLE 9, Long-Term Impact of Audits on Taxable Income (Levels Specification)
Dependent variable: taxable income 2010 - taxable income 2007
Estimator Baseline DD Dynamic DD Unrest. DD Matched DD Dynamic DD Dynamic DD
Explanatory variable (1) (2) (3) (4) (5) (6)
Treated-627.405
(1,227.175)-524.020
(1,235.941)-360.786
(1,224.295)-2,481.577*(1,431.889)
615.384(3,488.932)
-489.323(1,216.307)
Treated: e9,646.843***
(1,564.506)9,266.843***
(1,556.867)8,424.823***
(1,546.266)9,556.641***
(1,679.025)9,717.567***
(1,548.837)9,239.317***
(1,600.607)
Selection control (λ1)
-749.637(2,122.944)
Attrition control (λ2)
3,452.438(2,921.670)
Sum of row 1 and 2 9,019.439***(1,230.793)
8,742.823***(1,219.045)
8,064.037***(1,210.272)
7,075.064***(1,474.992)
10,332.951**(3,490.962)
8,749.994***(1,270.600)
Observations 6,904 6,903 6,903 3,960 6,903 6,903
Adj. R2 0.008 0.044 0.064 0.008 0.030 0.030
Notes: *, **, and *** indicate significance at the 10%, 5%, and 1% level. Robust standard errors in parentheses.
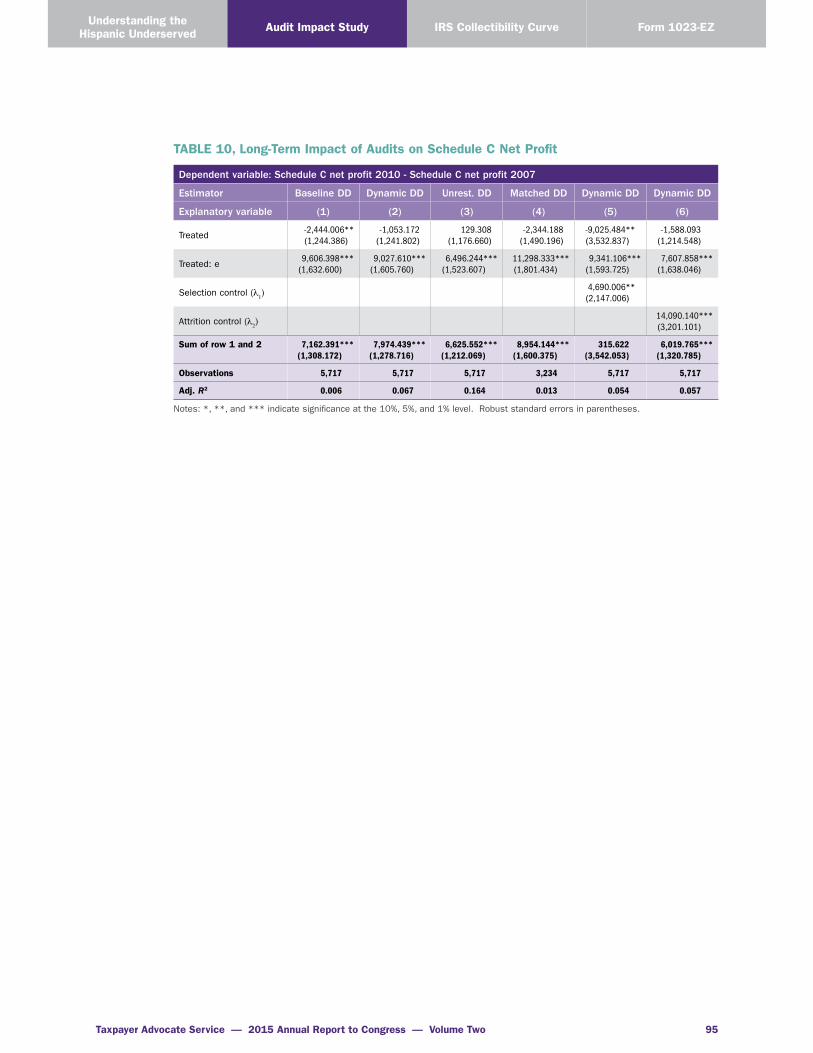
Taxpayer Advocate Service — 2015 Annual Report to Congress — Volume Two 95
Understanding the Hispanic Underserved Audit Impact Study Form 1023-EZIRS Collectibility Curve
TABLE 10, Long-Term Impact of Audits on Schedule C Net Profit
Dependent variable: Schedule C net profit 2010 - Schedule C net profit 2007
Estimator Baseline DD Dynamic DD Unrest. DD Matched DD Dynamic DD Dynamic DD
Explanatory variable (1) (2) (3) (4) (5) (6)
Treated-2,444.006**(1,244.386)
-1,053.172(1,241.802)
129.308(1,176.660)
-2,344.188(1,490.196)
-9,025.484**(3,532.837)
-1,588.093(1,214.548)
Treated: e9,606.398***
(1,632.600)9,027.610***
(1,605.760)6,496.244***
(1,523.607)11,298.333***(1,801.434)
9,341.106***(1,593.725)
7,607.858***(1,638.046)
Selection control (λ1)
4,690.006**(2,147.006)
Attrition control (λ2)
14,090.140***(3,201.101)
Sum of row 1 and 2 7,162.391***(1,308.172)
7,974.439***(1,278.716)
6,625.552***(1,212.069)
8,954.144***(1,600.375)
315.622(3,542.053)
6,019.765***(1,320.785)
Observations 5,717 5,717 5,717 3,234 5,717 5,717
Adj. R2 0.006 0.067 0.164 0.013 0.054 0.057
Notes: *, **, and *** indicate significance at the 10%, 5%, and 1% level. Robust standard errors in parentheses.

Section Three — AUDIT IMPACT STUDY 96
Form 1023-EZ IRS Collectibility Curve Audit Impact Study Understanding the Hispanic Underserved
APPENDIX B. TECHNICAL DETAILS ON ESTIMATION STRATEGY
The Data Generating Process. We assume that reported income is described by the following process in the absence of an audit:
Equation 3
where δt is a macro shock affecting all taxpayers i in year t, individual-specific fixed effects are captured by
μi, and μ
it is a serially correlated error with zero mean. The unobservable propensity to evade is assumed
to be constant over time and is therefore subsumed within μi. The impact of enforcement activity is given
by
Equation 4
where Y1it represents reported income following an audit, and e
i is a 1/0 indicator for individuals with a
high propensity to evade. Reported income within the combined sample may therefore be expressed as:
Equation 5
where is Dit equal to 1 if taxpayer i was audited prior to period t and zero otherwise.
Difference-in-Differences Regression Approach. The difference-in-differences estimator exploits the longitudinal structure of panel data to eliminate individual-specific fixed effects. Subtracting reported income in period 0 (the baseline tax reporting period, prior to which no taxpayers have been audited) from reported income in a subsequent reporting period k (prior to which all taxpayers in the treatment group have been audited) yields:
Equation 6
where Di is a 1/0 dummy for members of the treatment group, α = (δ
k – δ
0), β
1 = α
ne , β
2 = (α
e – α
ne),
εik = (ρk – 1)ui0 + v
ik , ρ is the first-order serial correlation coefficient, and v
ik is a white noise disturbance.
The above equation summarizes our Baseline Difference-in-Differences model for quantifying the impact of an audit on taxpayer reporting behavior. In this specification, β
1 represents the impact of an audit on
taxpayers with a low propensity to evade, while β2 captures the differential impact on taxpayers with a
high propensity to evade. The total impact for the latter group is computed as the sum (β1 + β
2). The
interaction term eiD
i is operationalized in our sample by setting this term equal to 1 in period k for those
audit group members who received a positive additional recommended tax assessment (members of experimental group E-PC) and 0 otherwise.

Taxpayer Advocate Service — 2015 Annual Report to Congress — Volume Two 97
Understanding the Hispanic Underserved Audit Impact Study Form 1023-EZIRS Collectibility Curve
By modeling the change in reported income between period 0 and period k, our baseline methodology effectively controls for unobserved fixed effects that impact the level of reported income and are also po-tentially associated with audit selection. It will thus return an unbiased estimate of the treatment impact if audit selection is independent of the remaining unobserved components of the differenced equation (i.e., the disturbance term ε
ik). As discussed below in the main text, this assumption is unlikely to hold in
practice. Generally speaking, bias may arise due to selection on observables or selection on unobservables.
Selection on Observables. The Baseline Difference-in-Differences approach fails to produce consistent estimates of the impact of an audit if audit selection depends on taxpayer characteristics that also influ-ence reporting behavior. This problem is straightforward to address, however, if such characteristics are all observable. Specifically, one may consistently estimate the treatment impact by relying on the following “Unrestricted” Difference-in-Differences regression specification:
Equation 7
where Zik is a vector of observable factors that are associated with both income reporting and audit
selection.22 This approach yields unbiased estimates of impact of an audit if: (i) all relevant determi-nants of audits are observable, so that [equation 7.2]; and (ii) the conditional expectation of the error E[ε|e, D, Z] = E[ε|e, Z] has a linear representation.
The Matched Difference-in-Differences methodology provides an attractive alternative to the Unrestricted Difference-in-Differences approach. The method also assumes that selection is on observables only. It does not, however, assume anything about the functional form of the error term. The matched approach therefore requires fewer parametric assumptions. The validity of this approach rests on the assumption that knowledge about one’s audit status does not provide additional information about the income process once all observables are accounted for. More formally, it is required that (see, for example, Heckman et al., 1998):23
Equation 8
This condition implies that the reporting behavior of those taxpayers in the control group who are observationally equivalent to the taxpayers in the audit group serves as a measure of how those in the latter group would have reported in the counterfactual state (i.e., of the subsequent reports that the audited taxpayers would have made had the audits not taken place). A challenge under this approach is to find controls that are observationally similar to audited taxpayers when the conditioning set is large. Rosenbaum and Rubin (1983) have shown that the dimensionality of the matching problem can be reduced by relying on the propensity score, the probability of treatment assignment conditional on the observables. Under the propensity scoring approach, treated subjects are matched to controls with comparable propensity scores. In practice, it is common to have some treatment subjects with propensity
22 The specification is unrestricted in the sense that it allows for more complex dynamics in the income generating and report-ing process. The Baseline Difference-in-Differences approach assumes that the change in reported income is independent of lagged reports. This assumption is relaxed in the unrestricted specification by directly including lagged income reports and other factors as additional regressors.
23 Under the linearity assumptions of the Unrestricted Difference-in-Differences estimator, this condition would be equivalent to the requirement for that model that E [ε|e, D, Z] = E[ε|e, Z], as we required for the Unrestricted Difference-in-Differences estimator .

Section Three — AUDIT IMPACT STUDY 98
Form 1023-EZ IRS Collectibility Curve Audit Impact Study Understanding the Hispanic Underserved
scores that are outside the range observed for untreated subjects. In such cases, the treatment subjects with these relatively extreme scores are excluded from the analysis, with the implication that the estima-tion results may not be representative of the excluded subjects.
The Matched Difference-in-Differences estimators for the impact of an audit for the positive-tax-change and no-tax-change experimental groups in our analysis are constructed as follows:
Equation 9
where Nx is the number of taxpayers in group x; x takes the value c for the matched control group (of
unaudited taxpayers), pc for the positive-tax-change experimental group, and nc for the no-tax-change experimental group.
Selection on Unobservables. The above-sketched techniques build on the assumption that selection is only on observables; i.e., that there are no unobserved factors that influence both the likelihood of an audit and the magnitude of reported income. Heckman (1978) proposed a technique to deal with selec-tion on unobservables. This method attempts to address the lack of observability by imposing stronger distributional assumptions. For simplicity of exposition, we assume that there are no relevant observed determinants of taxpayer reporting behavior in the absence of an audit.24 The stronger distributional assumption imposed by Heckman’s approach is that the regression disturbance (ε
ik) in the specification
describing income reporting behavior and the disturbance term in a separate (probit) equation describ-ing the probability of an audit prior to the reporting period follow the bivariate normal distribution with correlation coefficient ρ; the standard error of the former disturbance is represented by σε and the standard error for the latter disturbance is normalized to one. Conditional on the audit group indicator (D
i) and the set of explanatory variables (Z
i) in the probit equation describing the likelihood of an audit,
the expectation of the regression disturbance (εik) is then equal to:
Equation 10
where φ(x) and Φ(x) denote values of the probability density function and the cumulative distribution function of the standard normal distribution, respectively, when evaluated at x, and ϒ is the vector of coefficients in the probit specification for the likelihood of an audit. In our empirical approach we rely on a two-step estimation procedure. In the first stage, we estimate the coefficient vector ϒ using a probit model for the likelihood of an audit in period 0. We then use this estimate to construct a measure of λ
id
for each taxpayer in our sample, where λid is defined as:
24 To incorporate such factors in the analysis described in this section, one would simply include them as additional explanatory variables in the regression specification.
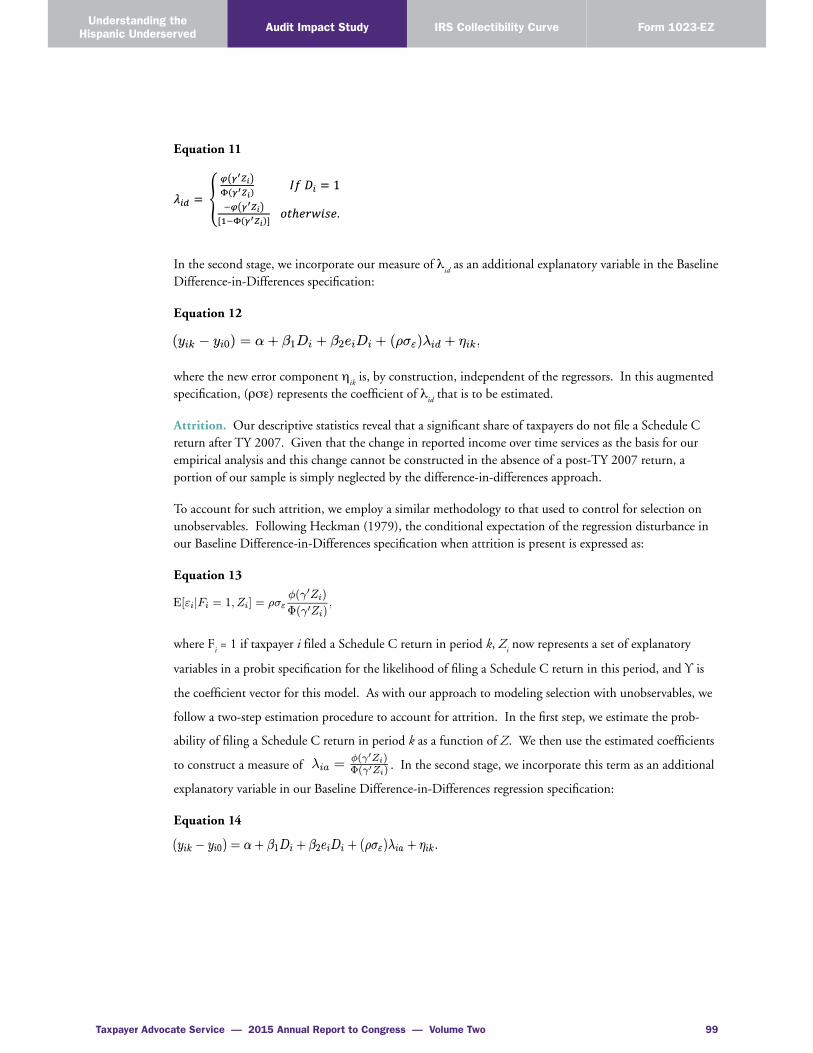
Taxpayer Advocate Service — 2015 Annual Report to Congress — Volume Two 99
Understanding the Hispanic Underserved Audit Impact Study Form 1023-EZIRS Collectibility Curve
Equation 11
In the second stage, we incorporate our measure of λid as an additional explanatory variable in the Baseline
Difference-in-Differences specification:
Equation 12
where the new error component ηik is, by construction, independent of the regressors. In this augmented
specification, (ρσε) represents the coefficient of λid that is to be estimated.
Attrition. Our descriptive statistics reveal that a significant share of taxpayers do not file a Schedule C return after TY 2007. Given that the change in reported income over time services as the basis for our empirical analysis and this change cannot be constructed in the absence of a post-TY 2007 return, a portion of our sample is simply neglected by the difference-in-differences approach.
To account for such attrition, we employ a similar methodology to that used to control for selection on unobservables. Following Heckman (1979), the conditional expectation of the regression disturbance in our Baseline Difference-in-Differences specification when attrition is present is expressed as:
Equation 13
where Fi = 1 if taxpayer i filed a Schedule C return in period k, Z
i now represents a set of explanatory
variables in a probit specification for the likelihood of filing a Schedule C return in this period, and ϒ is
the coefficient vector for this model. As with our approach to modeling selection with unobservables, we
follow a two-step estimation procedure to account for attrition. In the first step, we estimate the prob-
ability of filing a Schedule C return in period k as a function of Z. We then use the estimated coefficients
to construct a measure of . In the second stage, we incorporate this term as an additional
explanatory variable in our Baseline Difference-in-Differences regression specification:
Equation 14

Section Three — AUDIT IMPACT STUDY 100
Form 1023-EZ IRS Collectibility Curve Audit Impact Study Understanding the Hispanic Underserved
This page intentionally left blank.

Volume 2 TAS Research and Related Studies
Understanding the Hispanic Underserved Population1
1 The principal author of this article is Amanda Bartmann, Attorney Advisor to the National Taxpayer Advocate.

Section Four — UNDERSTANDING THE HISPANIC UNDERSERVED POPULATION102
Form 1023-EZ IRS Collectibility Curve Audit Impact Study Understanding the Hispanic Underserved
INTRODUCTION
Hispanics are a growing population within the United States.2 In 1960, Hispanics comprised only 3.5 percent of the U.S. population with 6.3 million persons.3 In 2013, Hispanics made up 17.1 percent of the U.S. population, with 54 million individuals.4 Based on the latest projections from the U.S. Census Bureau, there will be 119 million Hispanics by 2060.5 Although Asians are expected to overtake Hispanics as the largest group of immigrants by 2055, Hispanics currently make up almost half of all immigrants.6 Thus, studying their characteristics and the ways in which they interact with the tax system may provide valuable information about the needs and preferences of other groups of taxpayers sharing common characteristics, e.g., taxpayers whose families have recently immigrated from other countries or who have limited English proficiency.
Since 2002, TAS has worked with outside research organizations to identify and understand the demo-graphics and needs of taxpayers who are underserved by TAS. In 2012, TAS employed Forrester Research to update its 2011 Omnibus Survey conducted on behalf of TAS, to provide detailed and updated information on the underserved with views of the data by poverty level.7 To complement this research and ensure that TAS and the IRS are effectively serving U.S. Hispanics with limited English proficiency, TAS commissioned a new survey from Forrester Research to learn about the characteristics of Hispanic taxpayers who may have limited English proficiency (LEP) and may qualify for TAS assistance. TAS wanted to determine the extent to which eligible LEP taxpayers are either not aware of or are not using TAS’s services (i.e., are “underserved”). This information was not readily available from existing sources.8
OBJECTIVES
The primary purpose of this study was to quantify and analyze the Hispanic population potentially underserved by TAS, for which information was not available in prior Forrester Omnibus surveys. The survey aimed to understand the current Hispanic population, with specific objectives to:
■■ Obtain a detailed analysis of the current Hispanic population based on demographics, behavior, and attitudes;
■■ Evaluate Hispanic taxpayers’ knowledge, beliefs, and perceptions of TAS and the IRS; and
■■ Provide an understanding of U.S. Hispanic taxpayers in poverty level groups through a holistic profile of their demographics and tax-related behaviors.
2 As used in this article, the term “Hispanic” refers to persons who identify themselves as being from Hispanic or Latino origin.3 Renee Stepler & Anna Brown, Pew Research Center, Statistical Portrait of Hispanics in the United States, 1980–2013
(May 12, 2015), available at http://www.pewhispanic.org/2015/05/12/statistical-portrait-of-hispanics-in-the-united-states-2013-key-charts/.
4 Id.5 U.S. Census Bureau, Projections of the Population by Sex, Hispanic Origin, and Race for the United States: 2015 to 2060
(NP2014-T10) (Dec. 2014), available at http://www.census.gov/population/projections/data/national/2014/summarytables.html.
6 Pew Research Center, Modern Immigration Wave Brings 59 Million to U.S., Driving Population Growth and Change Through 2065 (Sept. 28, 2015), available at http://www.pewhispanic.org/2015/09/28/modern-immigration-wave-brings-59-million-to-u-s-driving-population-growth-and-change-through-2065/.
7 Forrester Research, Omnibus Mail Survey for the Taxpayer Advocate Service, Q2/Q3 2012, 20 (Sept. 17, 2012).8 The original Forrester survey was also not conducted in Spanish, leading TAS to conduct a specific Spanish language survey.
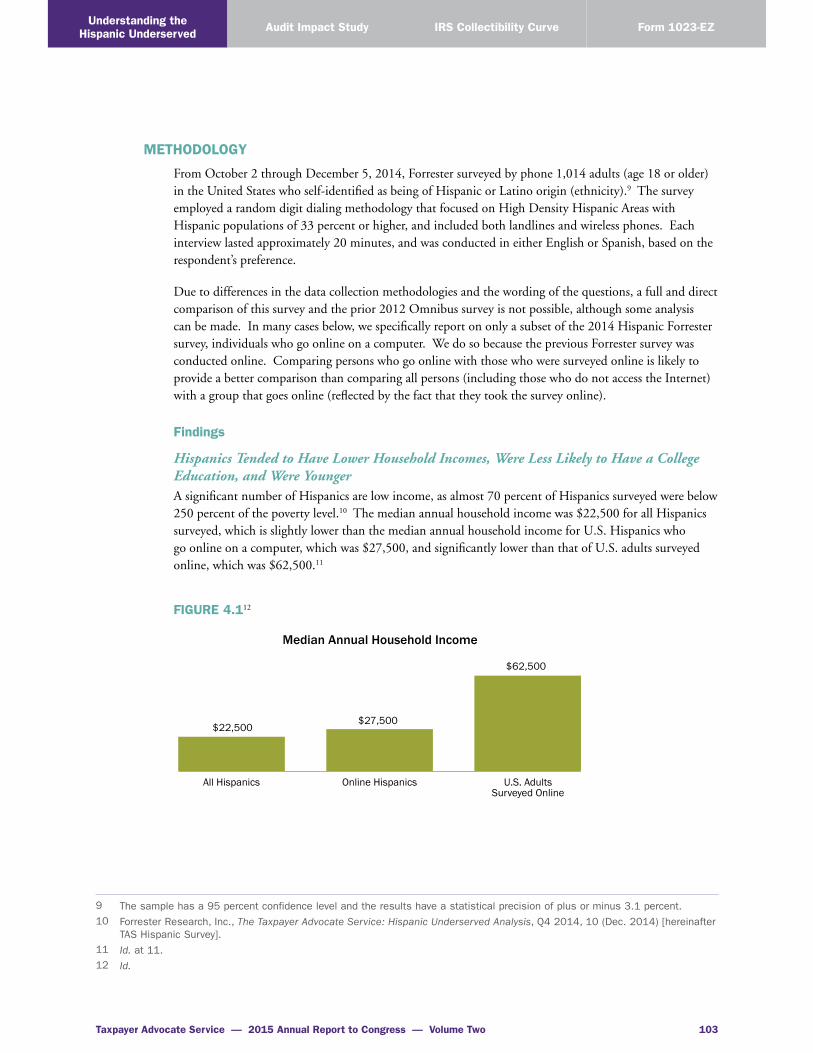
Taxpayer Advocate Service — 2015 Annual Report to Congress — Volume Two 103
Understanding the Hispanic Underserved Audit Impact Study Form 1023-EZIRS Collectibility Curve
METHODOLOGY
From October 2 through December 5, 2014, Forrester surveyed by phone 1,014 adults (age 18 or older) in the United States who self-identified as being of Hispanic or Latino origin (ethnicity).9 The survey employed a random digit dialing methodology that focused on High Density Hispanic Areas with Hispanic populations of 33 percent or higher, and included both landlines and wireless phones. Each interview lasted approximately 20 minutes, and was conducted in either English or Spanish, based on the respondent’s preference.
Due to differences in the data collection methodologies and the wording of the questions, a full and direct comparison of this survey and the prior 2012 Omnibus survey is not possible, although some analysis can be made. In many cases below, we specifically report on only a subset of the 2014 Hispanic Forrester survey, individuals who go online on a computer. We do so because the previous Forrester survey was conducted online. Comparing persons who go online with those who were surveyed online is likely to provide a better comparison than comparing all persons (including those who do not access the Internet) with a group that goes online (reflected by the fact that they took the survey online).
Findings
Hispanics Tended to Have Lower Household Incomes, Were Less Likely to Have a College Education, and Were Younger A significant number of Hispanics are low income, as almost 70 percent of Hispanics surveyed were below 250 percent of the poverty level.10 The median annual household income was $22,500 for all Hispanics surveyed, which is slightly lower than the median annual household income for U.S. Hispanics who go online on a computer, which was $27,500, and significantly lower than that of U.S. adults surveyed online, which was $62,500.11
FIGURE 4.112
Median Annual Household Income
All Hispanics Online Hispanics
$22,500
U.S. Adults Surveyed Online
$27,500
$62,500
9 The sample has a 95 percent confidence level and the results have a statistical precision of plus or minus 3.1 percent.10 Forrester Research, Inc., The Taxpayer Advocate Service: Hispanic Underserved Analysis, Q4 2014, 10 (Dec. 2014) [hereinafter
TAS Hispanic Survey].11 Id. at 11.12 Id.

Section Four — UNDERSTANDING THE HISPANIC UNDERSERVED POPULATION104
Form 1023-EZ IRS Collectibility Curve Audit Impact Study Understanding the Hispanic Underserved
A little over half of U.S. Hispanics who go online on a computer had no college education, compared to only 17 percent of U.S. adults surveyed online.13 The mean age of Hispanics who go online on a computer was 36 years, compared to 44 years for U.S. online adults.14
The Majority of Hispanics Spoke Spanish at Home and Owned a Smart PhoneHispanics may have different needs than other U.S. taxpayers based upon language barriers and the way they access the Internet. More than half of all Hispanics speak exclusively Spanish at home. However, Hispanics who were taxpayers15 were less likely to speak exclusively Spanish at home and more likely to speak both Spanish and English, or exclusively English, than all U.S. Hispanic respondents, which includes taxpayers and non-taxpayers. Furthermore, Hispanics who were below 400 percent of the poverty level were more likely to speak exclusively Spanish at home compared to all Hispanic respondents. Although recent research shows a decline in the number of Hispanics who speak Spanish at home paired with an increase in the number of English proficient speakers,16 the Forrester data suggest that language barriers are more likely to exist for Hispanics who have not filed tax returns in the past three years or who are within 400 percent of the poverty level.17
FIGURE 4.218
Hispanics Who Speak Exclusively Spanish or English at Home
Spanish All the Time
English All the Time
20%
20%
19%
23%
51%
58%
56%
54%
All US Hispanic Respondents
Hispanics up to 250% of Poverty Level
Hispanics up to 400% of Poverty Level
Hispanic Taxpayers
Thus, there is a need for Spanish language public outreach regarding return filing requirements.
13 TAS Hispanic Survey 11.14 Id. U.S. online adults’ data are from the Online Omnibus Survey, which used a different methodology from the rest of the
Hispanic survey, which collected data by phone.15 Although individuals may pay taxes without filing a return, such as through the withholding of taxes on income, in this article
the term “Hispanic taxpayer” refers to Hispanics who reported filing at least one tax return within the last three years.16 Jens Manuel Krogstad, Renee Stepler & Mark Hugo Lopez, Pew Research Center, English Proficiency on the Rise Among Latinos
(May 12, 2015), available at http://www.pewhispanic.org/2015/05/12/english-proficiency-on-the-rise-among-latinos/.17 TAS Hispanic Survey 13. All Hispanic respondents were more likely to speak exclusively Spanish at home than Hispanic
taxpayers. Furthermore, Hispanics under either 250 or 400 percent of the poverty level were even more likely to speak exclu-sively Spanish at home than all Hispanic respondents.
18 Id.

Taxpayer Advocate Service — 2015 Annual Report to Congress — Volume Two 105
Understanding the Hispanic Underserved Audit Impact Study Form 1023-EZIRS Collectibility Curve
Although direct comparisons cannot be made between U.S. Hispanics who go online on a computer and U.S. adults who were surveyed online, indirect comparisons suggest U.S. Hispanics may be more likely to use mobile devices, such as smartphones, to access the Internet. For all U.S. Hispanic respondents, 85 percent own a mobile phone, and over two-thirds of those used a smartphone as their primary mobile phone.19
FIGURE 4.320
Hispanic Mobile Phone Ownership
Hispanics Mobile Phone Ownership 85% own a mobile phone
Hispanic Primary Mobile Phone Type
15% do not own a mobile phone
68% primary mobile phone is a smart phone
32% primary mobile
phone is not a smart phone
Of U.S. Hispanics who access the Internet using a computer, only 75 percent reported going online at least daily, compared to 98 percent of U.S. adults surveyed online.21 Hispanics are less likely than other U.S. adults to have broadband Internet access at home, which may require them to rely more on mobile devices to access the internet.22 Less than two-thirds of Hispanics who go online on a computer have broadband Internet access at home.23 These data suggest the need for additional mobile resources for Hispanic taxpayers, such as mobile-friendly webpages and applications for smartphones.
Hispanics May Have Limited Interaction With the IRS Due To Their Reliance on Unenrolled Tax Return Preparers to Prepare Returns and Answer IRS Questions, and Based on Their Few Reported Problems With the IRSBased on their limited interaction with the IRS, Hispanics may receive most of their information about the tax system from unregulated return preparers.24 Hispanics were much more likely to use an un-regulated return preparer than U.S. taxpayers as a whole. Sixty percent of Hispanic taxpayers reported using a paid tax return preparer other than an attorney, Certified Public Accountant (CPA) or Enrolled
19 TAS Hispanic Survey 12.20 Id.21 Id.22 While 87 percent of U.S. adults surveyed online had broadband Internet access at home, only 62 percent of U.S. Hispanics
who go online on a computer had broadband Internet access at home. Id.23 Id.24 “Unregulated return preparers” as used in this article means return preparers who are not attorneys, certified public accoun-
tants (CPAs), enrolled agents, or enrolled retirement plan agents. Treasury Department Circular 230, Regulations Governing Practice before the Internal Revenue Service (June 2014), provides rules governing the recognition of attorneys, CPAs, enrolled agents, enrolled retirement plan agents, registered tax return preparers, and other persons representing taxpayers before the IRS. In 2011, the IRS issued regulations requiring return preparers to meet testing and continuing education standards. 76 Fed. Reg. 32286, 32301-32303 (to be codified at 31 C.F.R. §§ 10.4(c), 10.6(e)). However, Loving v. IRS, 742 F.3d 1013 (D.C. Cir. 2014) upheld the D.C. District Court’s decision to enjoin the IRS from enforcing mandatory testing and continuing educa-tion for tax return preparers.

Section Four — UNDERSTANDING THE HISPANIC UNDERSERVED POPULATION106
Form 1023-EZ IRS Collectibility Curve Audit Impact Study Understanding the Hispanic Underserved
Agent, compared to only 18 percent of all U.S. taxpayers.25 Given language barriers and less education, Hispanics may be especially vulnerable to unscrupulous return preparers who promote high interest loans and charge high fees.26 Furthermore, in the absence of minimum competency and ethics standards, Hispanics who use unregulated preparers run the risk of having their returns prepared incorrectly, either as a result of incompetency or willful misconduct.
FIGURE 4.427
Hispanic Taxpayers
All U.S. Taxpayers
A paid tax return preparer other than an attorney, CPA
or enrolled agent
You, a friend, or family member
An attorney, a CPA, or enrolled agent
A free tax preparation service by a trained volunteer
(e.g. VITA)
Other
No Answer
Return Preparation Characteristics of Hispanics and U.S. RespondentsWho Prepared Your Federal Tax Return Last Year?
60%
16%
16%
5%
6%
3%
1%
0%
0%
24%
50%
18%
Because return preparer fraud has been a concern for taxpayers in recent years,28 it is encouraging that 99 percent of Hispanic taxpayers reported receiving a copy of their return from their preparer and 95 percent reported that their preparer signed their return.29 However, only 88 percent of Hispanic taxpayers reported that their return preparers provided a Preparer Tax Identification Number (PTIN) when signing their returns.30
In addition to using unregulated return preparers, Hispanic taxpayers were less likely to prepare their own tax returns as opposed to using any kind of preparer. Approximately 50 percent of U.S. taxpayers prepared their own returns for tax year (TY) 2013, compared to only 16 percent of Hispanic taxpayers in
25 Forrester Research, Omnibus Mail Survey for the Taxpayer Advocate Service, IRS TAS Follow-up Data Comparisons (Oct. 20, 2015).
26 For a detailed discussion regarding the need for regulation of return preparers, see Nina E. Olson, More Than a ‘Mere’ Preparer: Loving and Return Preparation, 2013 TNT 92-31, tax notes toDay (May 13, 2013).
27 TAS Hispanic Survey 15. The numbers for all U.S. taxpayers were from a 2012 survey conducted by mail, while the numbers for Hispanics come from the 2014 survey conducted by telephone.
28 See, e.g., National Taxpayer Advocate 2013 Annual Report to Congress 94-102 (Most Serious Problem: Return Preparer Fraud: The IRS Still Refuses to Issue Refunds to Victims of Return Preparer Misconduct Despite Ample Guidance Allowing the Payment of Such Refunds).
29 TAS Hispanic Survey 17-18.30 Id. at 17.

Taxpayer Advocate Service — 2015 Annual Report to Congress — Volume Two 107
Understanding the Hispanic Underserved Audit Impact Study Form 1023-EZIRS Collectibility Curve
calendar year 2014.31 This data suggests Hispanics may pay a higher cost to meet their basic return filing obligations and may have less direct interaction with the IRS.
Even after filing, Hispanics are likely to continue to rely on their preparers for their interactions with the IRS. When asked, “If the IRS has questions about your return, does your tax preparer answer them, or do you answer questions from the IRS yourself?,” 77 percent of Hispanic taxpayers reported that their preparers answered IRS questions.32 The survey did not ask how many Hispanics had actually received questions from the IRS; however, relatively few Hispanics have reported “problems” with the IRS. Only three percent of Hispanics reported that they or a member of their household “encountered any problem with the IRS related to filing or payment of Federal income taxes” in the last three years,33 which was slightly less than that reported for both all U.S. taxpayers and low income U.S. taxpayers.34
FIGURE 4.535
Respondents Reporting a Problem With the IRS Within the Last Three Years
In the Last Three Years, Have You, or Any Member of Your Household, Encountered Any Problem With the IRS Related to Filing or Payment of Federal Income Taxes?
All Hispanics
3% 3% 3%
5%6%
5%
Hispanics up to 250% of the Poverty
Level
Hispanics up to 400% of the Poverty
Level
All U.S. Respondents
U.S. Respondents up to 250% of
the Poverty Level
U.S. Respondents
Between 250% to 400% of the Poverty
Level
Thus, Hispanics may have less direct interaction with the tax system both during the filing process and after, relying on unregulated return preparers for information and dealings with the IRS.
Hispanics Had Greater Awareness of Their Rights and Trust in the IRS, Compared With Other U.S. PersonsDespite having limited interaction with the IRS, Hispanics actually had greater awareness of their rights and trust in the IRS, a finding which raises questions about how well IRS employees communicate
31 Forrester Research, Omnibus Mail Survey for the Taxpayer Advocate Service, IRS TAS Follow-up Data Comparisons (Oct. 20, 2015). In TY 2013, 42.4 percent were self-prepared. IRS, Individual Returns Transaction File for TY 2013.
32 TAS Hispanic Survey 16.33 Id. at 14.34 Five percent of U.S. taxpayers and six percent of U.S. taxpayers between 250 and 400 percent of the poverty level reported
a problem with the IRS related to filing or paying federal income taxes in the prior three years. Forrester Research, 2012 U.S. Mail Omnibus Survey, Data by Underserved Poverty Level (Aug. 23, 2012).
35 TAS Hispanic Survey 16; Forrester Research, 2012 U.S. Mail Omnibus Survey, Data by Underserved Poverty Level (Aug. 23, 2012).

Section Four — UNDERSTANDING THE HISPANIC UNDERSERVED POPULATION108
Form 1023-EZ IRS Collectibility Curve Audit Impact Study Understanding the Hispanic Underserved
taxpayer rights information and how the IRS’s interactions with taxpayers may decrease taxpayer trust. To provide a closer comparison between the Hispanics in this survey and U.S. adults in the prior Forrester survey who were surveyed entirely online, much of this section focuses specifically on Hispanic respon-dents who report going online as opposed to all Hispanic respondents.
Ninety-one percent of Hispanic taxpayers reported that they believe they have rights before the IRS versus 65 percent of U.S. taxpayers.36 This was the case even though fewer Hispanics received Publication 1, Your Rights as a Taxpayer — nine percent of U.S. Hispanics surveyed online reported receiving it com-pared to 17 percent of U.S. adults surveyed online.37 Publication 1 is printed in a number of languages, including Spanish, and so the lower likelihood of Hispanics receiving Publication 1 may be attributable to them reporting fewer problems with the IRS, not language barriers.38
Hispanics were more likely to want to learn about their rights by a separate letter included with an IRS notice than other U.S. adults,39 which may be influenced by their lack of access to broadband Internet at home and the smaller percentage of Hispanics who go online daily. There may also be barriers for Hispanic taxpayers to navigate the IRS website, reflected by the finding that a similar number of Hispanics surveyed online and U.S. adults who go online wanted to learn about their rights through the irs.gov homepage, but far fewer Hispanics online wanted to learn about their rights on another page on the irs.gov website.40 When asked “Do you think the tax laws should include a ‘Bill of Rights’ that clearly defines your rights as a taxpayer?,” 95 percent of Hispanics answered “yes,” compared to only 81 percent of U.S. adults surveyed online.41
At the same time as having a greater belief in their rights, Hispanics were more likely to trust the IRS to handle a tax problem, suggesting a relationship between awareness of rights and trust. Sixty percent of Hispanic taxpayers said they generally trust the IRS and how it would handle a tax problem, compared to only 21 percent of U.S. taxpayers.42
36 TAS Hispanic Survey 20; Forrester Research, Omnibus Mail Survey for the Taxpayer Advocate Service, Q2/Q3 2012, 21 (Sept. 17, 2012). The Hispanic survey was conducted in 2014 and the survey of U.S. adults was conducted in 2011, so it is pos-sible that this difference in timing affected the responses. The 2011 data regarding taxpayer rights was recalibrated to match the question in the 2014 Hispanic survey. We used the 2011 data to be consistent with the data in our subsequent discus-sion about trust in the IRS, of which data is only available for the U.S. population from the 2011 survey. A subsequent survey of U.S. adults surveyed online in 2014 found that 72 percent said they believe they have rights before the IRS. See Forrester Research, The Taxpayer Advocate Service: 2014 and 2015 US Omnibus Analysis (Oct. 2015).
37 TAS Hispanic Survey 21.38 The IRS uses Publication 1 to comply with the Omnibus Taxpayer Bill of Rights (TBOR 1), which requires it to prepare
a statement of taxpayer rights and IRS obligations and distribute it to taxpayers when contacting them regarding the determination of tax or collection of tax. Technical and Miscellaneous Revenue Act of 1988, Pub. L. No. 100-647, § 6227, 102 Stat. 3342, 3730-31 (1988).
39 TAS Hispanic Survey 21.40 Only 13 percent of U.S. Hispanics surveyed online wanted to learn about their rights through a page on the IRS website versus
40 percent of U.S. taxpayers who go online on a computer. Id.41 Id.42 Id. at 19; Forrester Research, 2012 U.S. Mail Omnibus Survey, Data by Underserved Poverty Level (Aug. 23, 2012).

Taxpayer Advocate Service — 2015 Annual Report to Congress — Volume Two 109
Understanding the Hispanic Underserved Audit Impact Study Form 1023-EZIRS Collectibility Curve
FIGURE 4.643
Awareness of Taxpayer Rights and Trust in the IRS
As a taxpayer, do you believe
you have rights before the IRS?
I generally trust the IRS and how it would handle
a tax problem
Hispanic RespondentsU.S. Respondents Surveyed Online
42%
21%
88%
57%
Regarding the statement about trust, taxpayers were asked, “Please indicate how strongly you agree or disagree with the following statements.” Percents shown are respondents who answered with a 4 or 5 on a scale of 1 (strongly disagree) to 5 (strongly agree).
Including a Taxpayer Bill of Rights (TBOR) in the law may further increase taxpayer trust by improving taxpayers’ awareness of their rights.
TAS Has Opportunities for Creating Greater Awareness About TAS Among Hispanics and Boosting Their Overall Impression of the IRSOnly four percent of Hispanics surveyed are considered TAS underserved, meaning they were experienc-ing significant hardship44 and had not used TAS services within the past year.45 However, Hispanics were less likely than U.S. respondents overall to be aware of a specific department in the IRS that handles taxpayer problems,46 despite their greater awareness of their rights. It is possible that Hispanics believe they have rights, but lack an understanding of what they mean, such as the right to receive assistance from TAS, which is part of the fundamental right to a fair and just tax system. Hispanics’ limited interaction with the IRS may contribute to their lack of knowledge about TAS. The vast majority of Hispanics who were aware of TAS did not know its name.47
When provided with a description of TAS, over half of Hispanics said they were likely to use it and almost two-thirds said they felt more positively about the IRS because an organization like TAS exists within it.48 Thus, creating greater awareness of TAS has the potential to increase trust in the IRS and may have a posi-tive impact on compliance among Hispanics as a result.49 TAS could accomplish this by creating further
43 TAS Hispanic Survey 19, 20; Forrester Research, 2012 U.S. Mail Omnibus Survey, Data by Underserved Poverty Level (Aug. 23, 2012); Forrester Research, Omnibus Mail Survey for the Taxpayer Advocate Service, Q2/Q3 2012, 21 (Sept. 17, 2012).
44 See IRC § 7811(a)(2). See also IRM 13.1.7.2, TAS Case Criteria (Feb. 4, 2015).45 TAS Hispanic Survey 10.46 Nineteen percent of Hispanics were aware of a specific department within the IRS that handles taxpayer problems, compared
to 31 percent of U.S. respondents. TAS Hispanic Survey 24; Forrester Research, 2012 U.S. Mail Omnibus Survey, Data by Underserved Poverty Level (Aug. 23, 2012).
47 TAS Hispanic Survey 24.48 Id. at 25-26.49 Research shows a correlation between trust in the IRS and increased compliance. National Taxpayer Advocate 2012 Annual
Report to Congress vol. 2, 1-70 (Factors Influencing Voluntary Compliance by Small Businesses: Preliminary Survey Results).
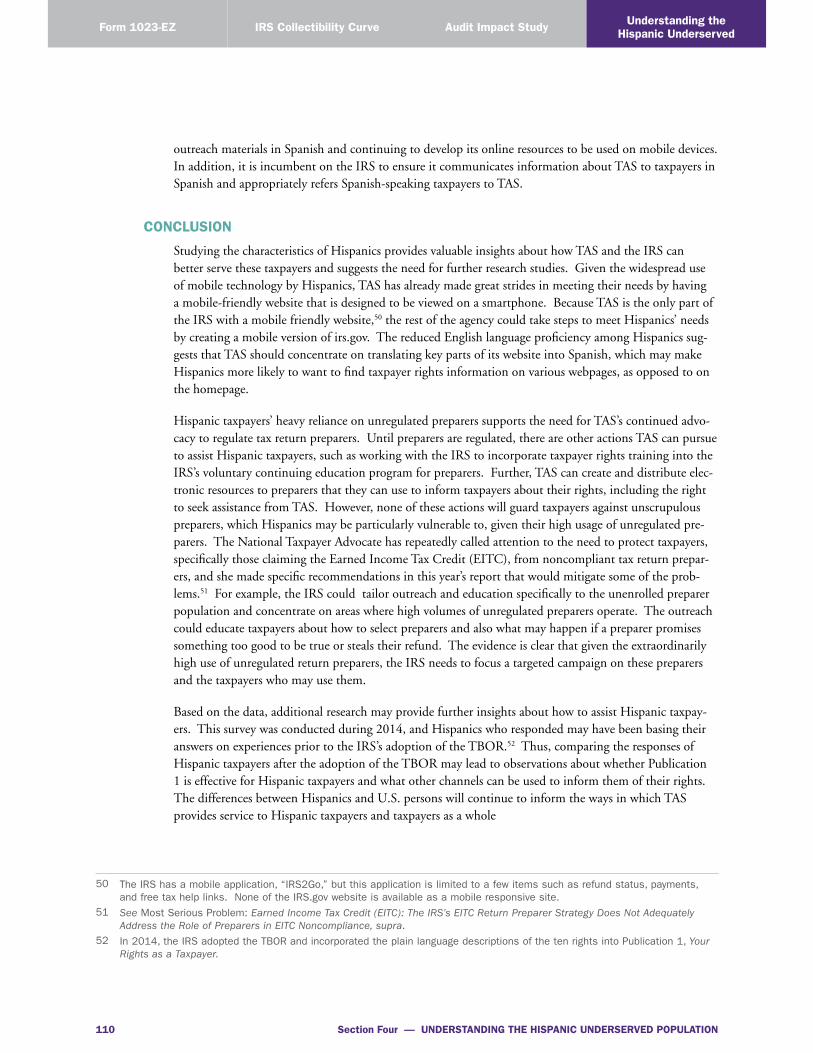
Section Four — UNDERSTANDING THE HISPANIC UNDERSERVED POPULATION110
Form 1023-EZ IRS Collectibility Curve Audit Impact Study Understanding the Hispanic Underserved
outreach materials in Spanish and continuing to develop its online resources to be used on mobile devices. In addition, it is incumbent on the IRS to ensure it communicates information about TAS to taxpayers in Spanish and appropriately refers Spanish-speaking taxpayers to TAS.
CONCLUSION
Studying the characteristics of Hispanics provides valuable insights about how TAS and the IRS can better serve these taxpayers and suggests the need for further research studies. Given the widespread use of mobile technology by Hispanics, TAS has already made great strides in meeting their needs by having a mobile-friendly website that is designed to be viewed on a smartphone. Because TAS is the only part of the IRS with a mobile friendly website,50 the rest of the agency could take steps to meet Hispanics’ needs by creating a mobile version of irs.gov. The reduced English language proficiency among Hispanics sug-gests that TAS should concentrate on translating key parts of its website into Spanish, which may make Hispanics more likely to want to find taxpayer rights information on various webpages, as opposed to on the homepage.
Hispanic taxpayers’ heavy reliance on unregulated preparers supports the need for TAS’s continued advo-cacy to regulate tax return preparers. Until preparers are regulated, there are other actions TAS can pursue to assist Hispanic taxpayers, such as working with the IRS to incorporate taxpayer rights training into the IRS’s voluntary continuing education program for preparers. Further, TAS can create and distribute elec-tronic resources to preparers that they can use to inform taxpayers about their rights, including the right to seek assistance from TAS. However, none of these actions will guard taxpayers against unscrupulous preparers, which Hispanics may be particularly vulnerable to, given their high usage of unregulated pre-parers. The National Taxpayer Advocate has repeatedly called attention to the need to protect taxpayers, specifically those claiming the Earned Income Tax Credit (EITC), from noncompliant tax return prepar-ers, and she made specific recommendations in this year’s report that would mitigate some of the prob-lems.51 For example, the IRS could tailor outreach and education specifically to the unenrolled preparer population and concentrate on areas where high volumes of unregulated preparers operate. The outreach could educate taxpayers about how to select preparers and also what may happen if a preparer promises something too good to be true or steals their refund. The evidence is clear that given the extraordinarily high use of unregulated return preparers, the IRS needs to focus a targeted campaign on these preparers and the taxpayers who may use them.
Based on the data, additional research may provide further insights about how to assist Hispanic taxpay-ers. This survey was conducted during 2014, and Hispanics who responded may have been basing their answers on experiences prior to the IRS’s adoption of the TBOR.52 Thus, comparing the responses of Hispanic taxpayers after the adoption of the TBOR may lead to observations about whether Publication 1 is effective for Hispanic taxpayers and what other channels can be used to inform them of their rights. The differences between Hispanics and U.S. persons will continue to inform the ways in which TAS provides service to Hispanic taxpayers and taxpayers as a whole
50 The IRS has a mobile application, “IRS2Go,” but this application is limited to a few items such as refund status, payments, and free tax help links. None of the IRS.gov website is available as a mobile responsive site.
51 See Most Serious Problem: Earned Income Tax Credit (EITC): The IRS’s EITC Return Preparer Strategy Does Not Adequately Address the Role of Preparers in EITC Noncompliance, supra.
52 In 2014, the IRS adopted the TBOR and incorporated the plain language descriptions of the ten rights into Publication 1, Your Rights as a Taxpayer.


IRSPublication 2104B (Rev. 12-2015) Catalog Number 39588J Department of the Treasury Internal Revenue Service www.irs.gov