annual report - tecan
TRANSCRIPT

2012AnnuAl RepoRt
Developing solutions together

4 Examples of Partnerships 14 Letter to the Shareholders 18 Interview with CEO David Martyr 22 Markets and Market Position 26 Life Sciences Business
67 Financial Report 2012 68 Chief Financial Officer’s Report 72 Five-year consolidated data 73 Consolidated financial statements 120 Financial statements of Tecan Group Ltd. 132 The Tecan Share 134 Locations and contacts
Contents
Adding value through partnershipsOur solutions and services are as versatile as they are application-oriented. For over 30 years, we have used our knowledge to develop and improve labo-ratory instruments and automation solutions. This, we believe, has allowed us to make a long-term contribution to safeguarding and improving the qual-ity of life of many people.
Laboratories, research institutes and companies trust in our expertise because of the high quality, flexibility and reliability of our automation solutions. To date, numerous applications have come about as a result of joint partner-ships and other cooperations.
We would like to introduce you to five of them.
32 Partnering Business 38 Sustainability 46 Corporate Governance 58 Compensation Report

2010 2012
13.615.1
2010 2012
51.356.0
2010 2012
377.0370.5 391.1
2011 2011 2011
13.452.3
2012 at a GlanceKey figures
Financial summary*
Life Sciences Business 60 % Partnering Business 40 %
Europe 42 % North America 41 % Asia 14 % Others 3 %
Instruments 69 % Services and spare parts 22 % Consumables 9 %
Sales(CHF million)
Sales by business segments(in % of sales)
Sales by regions(in % of sales)
Sales by product groups(in % of sales)
Operating profit (EBIT)(CHF million)
Operating profit margin(in % of sales)
* Key figures and financial summary from continuing operations
CHF million 2011 2012 ˚ 2011 / 2012
Sales 377.0 391.1 3.8 %Gross profit in % of sales
191.7 50. 9%
198.3 50. 7 %
3.4 %
OPEX in % of sales
141.4 37.5%
147.0 37.6 %
4.0 %
Operating profit/EBIT in % of sales
51.3 13.6%
52.3 13.4 %
2.0 %
Net profit in % of sales
44.9 11.9%
42.2 10.8 %
-6.1 %
EPS from continuing operations (CHF) 4.18 3.90 -6.7 %EPS including discontinued operation (CHF) 4.42 3.90 -11.8 %
3Tecan Annual Report 2012
Common goal: Life-sustaining increases in yield in all areas under cultivationRice, soya, maize – life depends on access to healthy foodstuffs. In the 1950s, one hectare of cultivated land was sufficient to feed two people. This ratio has chan-ged as a result of the rapid global popu-lation increase. By 2030, five people will have to live off the yield of one hectare of land. In future, there will be more and more regions where demand exceeds what the resources are able to provide. There is an urgent need for innovative solutions to substantially increase agri-cultural yields. Syngenta and Tecan can both play an important role here.
A challenge we tackle together
Syngenta is one of the leading research companies in the area of plant protection and seed development. The company is con-ducting numerous tests to produce higher-yielding, hardier crops and effective products to combat pests and weeds. From the results come targeted application scenarios. In the search for new ways to increase agricultural productivity and meet the demand for food and fodder, the company requires solu-tions that both process samples quickly and efficiently and are easy to configure to the requirements of the tests.
The company’s enduring, close cooperation with Tecan grew out of this search for high-performance instruments and tech-nologies for automated analytical procedures. Our project man-agers have been working with Syngenta since 1995 to develop application solutions for our customers’ specific research ob-jectives.
Various Tecan liquid handling platforms have been implemented in global locations of Syngenta, which allow complex test se-ries or repetitive, high-volume work steps such as dilution, multi-well plate replication and format application to be per-formed automatically.
Both sides’ ideas and expertise flow into an optimally auto-mated infrastructure and continue to be developed via regu-lar, intense exchanges about customer support and training.
To obtain new resources from nature, we need to research and understand it
Our partnership with Syngenta achieves the desired results: Tecan is able to fill the gaps in expertise that Syngenta needs for its highly varied activities.
The excellent cooperation between Syngenta and Tecan prom-ises to bring about fruitful solutions for agriculture both now and in the future.
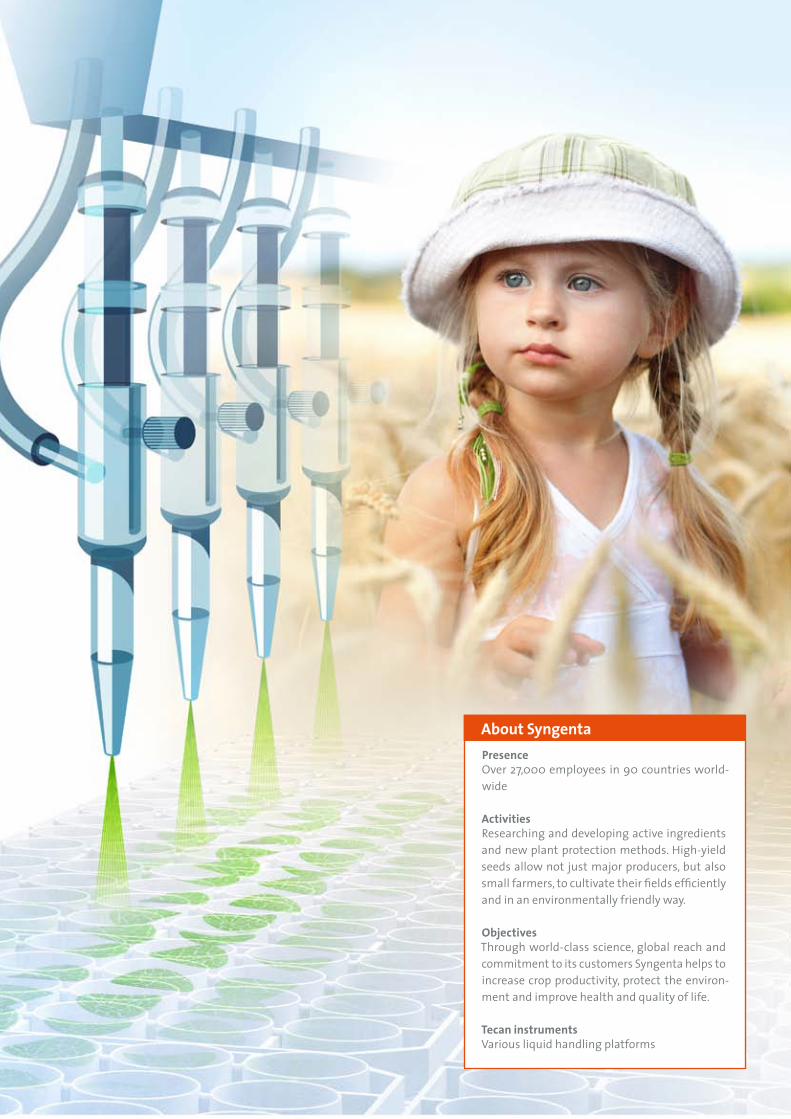
About Syngenta PresenceOver 27,000 employees in 90 countries world-wide
ActivitiesResearching and developing active ingredients and new plant protection methods. High-yield seeds allow not just major producers, but also small farmers, to cultivate their fields efficiently and in an environmentally friendly way.
ObjectivesThrough world-class science, global reach and commitment to its customers Syngenta helps to increase crop productivity, protect the environ-ment and improve health and quality of life.
Tecan instruments Various liquid handling platforms


One small prick in the heel, one giant leap for the health of newborns
Many diseases are of genetic origin. The earlier they are recognized, the better the chances of achieving a cure or a marked improvement in quality of life. For the majority of genetic illnesses, the state of health of the parents does not allow us to infer medical conclusi-ons or indications of the outlook for the child. That is why blood is taken from the heels of millions of children imme-diately after their birth. Early screening gives clues to their state of health. Appropriate treatment can markedly improve their start in life.
Innovative melting pot
In 2010 we further stepped up our cooperation with Luminex to develop a new automation solution. Luminex: “Automation is a particular priority for us and our customers. The high vol-ume of tests in the neonatal screening market requires com-plete automation of all work steps from the sample to the test result, to enable our customers to process the many thousands of samples they receive each day.”
In the OEM partnership, we developed a unique screening sys-tem for Luminex that can meet the increased requirements: Luminex’s xMAP® Technology and our highly versatile, reliable Freedom EVO liquid handling platform and HydroFlexTM washer allow different biological tests to be performed in one go and a large number of samples to be analyzed quickly, cost-effec-tively and precisely.
The next generation of newborn screening
The solution, initially launched by Luminex in Europe in 2012, is called NeoPlex® System. It brings together multiplexing and automation technologies in a new type of system. As a fully automated test platform for newborn screenings, it reduces the need for supervision by laboratory personnel while the tests are running. The high-volume screening assays test the blood of newborns for various biomarkers linked to serious dis-eases. Laboratories are now able to perform four tests on one sample, which permits faster diagnoses and makes it possible to obtain results quicker and thus save the laboratories valu-able time and resources.
About Luminex
CompanyFounded in 1995 and based in Austin, Texas.
ActivitiesLuminex transforms the way laboratories per-form biological testing. Luminex pioneers com-prehensive yet simple solutions to improve out-comes and reduce overall costs. Every day they work to enhance the health safety and quality of life for all.
ObjectivesTo develop breakthrough solutions to improve health and advance science.
Integrated Tecan instrumentsFreedom EVO® liquid handling platformHydroFlexTM washer

Armed for the fight against infections
In a globalized world, infectious diseases soon spread across borders. For examp-le, one in three people worldwide is in-fected with tuberculosis (TB) pathogens; that figure amounts to a total of more than two billion people. The TB rate in Russia is particularly high. In the mean time, ever more resistant bacteria have been discovered, which make the deve-lopment of vaccines and therapies har-der. Medical research to treat and com-bat TB is increasingly carried out on an international level.
A reliable diagnosis within hours
Tackling TB is a medical challenge. The pathogens can spend a long time spreading throughout the body unnoticed and the disease may progress in different ways, depending on the in-fected person’s genetic disposition, general health and living conditions. The Central TB Research Institute of the Russian Academy of Medical Sciences in Moscow is a leader in research into the dis-ease, and only by means of a substantial reduction in the six to 14 weeks it normally takes to reach a diagnosis can the rapid spread of TB in Russia and its neighboring states be prevented. The Institute is investigating new approaches to achieve this ob-jective, including a novel genetic technique based on polymer-ase chain reactions. International exchanges with scientists and companies have led to tangible progress in TB diagnosis.
The Institute, in cooperation with the Moscow-based company Syntol, has developed an automated protocol that allows safe and effective handling of potentially highly contagious sam-ples on our Freedom EVO platform. The new system now al-lows molecular diagnosis of TB infection within a few hours.
The integrated solution allows pathogens to be detected much faster, with 48 samples to be tested in no more than 95 minutes. This means that it is now possible to test 144 samples for TB in a day, more securely and more effectively.
About the Russian Central TB Research Institute
PartnerLeading institute in the development and application of innovative methods to effectively control TB; based in Moscow
ActivitiesResearch into tuberculosis, development of vaccines and medications to treat the disease
ObjectivesTo achieve a breakthrough in the effective combating of the disease and develop new treatment methods and vaccines
Tecan instrumentFreedom EVO® liquid handling platform


About our partnerPartnerLeading global pharmaceutical company
ActivitiesDiscovery and development of novel medications
ObjectivesTo extend lives, alleviate suffering and sustaina-bly improve the quality of life of humankind
Tecan instrumentsNumerous Tecan platforms and detection instru-ments, e.g. Freedom EVO® liquid handling plat-form with MultiChannel Arm TM

How many test series does a market-ready medication need?
Making a blanket prediction about the amount of work required between initial tests and the final medication would be pure speculation. The fact is, though, that achieving medical progress to safe-guard quality of life involves the schedu-ling of innumerable test series in the laboratories of pharmaceutical and bio-technology companies. Every medication launched onto the market begins with an understanding of how the chemical or biological substances work. Without flexible laboratory systems and automa-ted test procedures, it would be impos-sible to develop new medications. For example, a leading global pharma-ceuti-cal company wanted to optimize its workflows and was seeking a technolo-gy partner capable of providing complex automated infrastructures for the high-volume test procedures. It was looking to Tecan to provide an all-in-one infra-structure solution.
Versatility and speed in a single system
In the early stages of drug development, the pharmaceutical company investigates hundreds of thousands of chemical compounds. A few years ago our partner decided upon fur-ther optimization measures. The liquid handling module in
use at the time was to be replaced by an automated system. Objective: To put in place a system employing automated pro-cesses to manufacture dose-response plates.
The team generates the desired output using Tecan systems adapted to the partner’s requirements. The new hardware combines the powerful technologies of our Freedom EVO plat-form with a MultiChannel ArmTM.
Our cooperations are characterized by the full commitment of both parties to the common project and its requirements. Among other things, the team responsible, Tecan Integration Group (TIG) worked with our partner on special adaptors that allow greater volumes to be processed.
Transcontinental cooperation
The system, which is equipped with new features, combines various dosing technologies and is flexible when using 96- and 384-microplate reaction wells. The MCA 384 adapter plate sim-plifies switching between 96- and 384-well formats. The coop-eration also produced a safe, cost-effective method of clean-ing the pipette tips and heads.
For our partner, producing 10,000 compounds per day is the new standard, around five to six times more than before. Our solution is also far more flexible than the previous system: the software is user-friendly and allows the workflow to be ad-justed and adapted to the test procedure, while implement-ing new protocols is also simple.
Our partnership is therefore built on successful foundations, based on common principles such as quality, usability, efficiency and flexibility. The new system is ideal for extensive test series, which are the norm in the early phase of developing pharma-ceutical active substances. So good, that an additional system will soon support our partner’s research at a second site.

Further improvement in quality standards in China
The Chinese government has estab-lished systematic structures to make the process of giving blood, transpor-ting the donations, screening stocks and the transfusions themselves safer. In line with this objective, the Chinese Society of Blood Transfusion has held regular discussions with Tecan since the beginning of the 1990s.
Since our first liquid handling platform at the Kunming Blood Center in Yunnan province began employing local laboratory processes, a close professional dialog has been established between the society’s committees and our specialists. We are working together on new solutions to allow capacities to be continually expanded and ensure the high quality of the blood screening services. Transcontinental dialog with China’s blood centers
Our collaboration with the Chinese Society of Blood Transfu-sion extends across all levels, including the transfer of technol-ogy as well as knowledge. The interest shown by Chinese blood banks and hospitals in our laboratory systems has fostered di-alog between us.
The collaboration began in 2007 at the annual conference of the 16 blood centers and blood banks of Yunnan province with a speech by Tecan on the use of quality control systems. In 2012 we were visited by a delegation of representatives of blood banks and hospitals from the People’s Republic of China, with whom we discussed risk management approaches and meth-ods in blood banks
An important topic was the raised requirements for automated laboratory systems in Chinese hospitals and blood centers. The delegation was particularly interested in our Freedom EVOlyzer platform, which allows high throughput ELISA testing for infec-tious diseases.
Following the presentation on application scenarios, our Chi-nese partners were given the opportunity to visit the Tecan pro-duction locations in Männedorf (Switzerland) and Salzburg (Austria). The program also included workshops and a brief visit to a blood bank in Zurich, which allowed experts working in the same field to exchange experiences with users of our systems.

Tecan as a partner
PartnerChinese Society of Blood Transfusion
ActivitiesCollaboration with the Chinese Society of Blood TransfusionEstablishment of communications platforms for scientific dialog
ObjectivesDevelopment of awareness and implementation scenarios for quality standards and control mechanisms.Improvement of blood stock safety through au-tomated test procedures in Chinese blood banks and hospitals
Tecan instrumentsFreedom EVOlyzer® liquid handling platform for ELISA tests

14 Tecan Annual Report 2012 Letter to the Shareholders
Dear Shareholders
Rolf A. ClassonChairman of the Board
Dr. David MartyrChief Executive Officer

15Tecan Annual Report 2012
In a continuing difficult market environ-ment, the Tecan Group closed 2012 with a solid business performance and a sig-nificant acceleration in sales growth in the second half. We are particularly pleased by the strong growth in China, where we increased sales by a clearly double-digit growth rate. Our compo-nent business also posted double-digit growth, thanks to a number of newly acquired customers. We intend to conti-nue to increase our sales and profitabili-ty in 2013 and beyond. Overall, we are well on track to bring Tecan to the next level of business development.
Key figures for 2012
Sales increased by 3.8 % to CHF 391.1 million in 2012 (2011: CHF 377.0 million) and were up by 1.9 % in local currency terms. Following low growth in the first six months, sales were signif-icantly more dynamic in the second half and were 7.1 % higher than in the prior-year period. This equates to an increase of 3.3 % in local currencies. Order entry in 2012 was only slightly below the prior-year figure at CHF 382.3 million (2011: CHF 383.9 mil-lion). Advance orders in 2011 resulted in a significant decline in order entry in the first six months of 2012. However, this decline was almost fully offset in the second half by growth in order entry of 7.9 % (4.1 % in local currencies).
Operating profit before interest and taxes (EBIT) increased by 2.0 % to CHF 52.3 million in 2012 (2011: CHF 51.3 million). At 13.4% of sales, the operating profit margin exceeded the expected range of 12.2 % to 13.2 %, and was only slightly below the prior-year level (2011: 13.6 %), although research and development spending increased by 0.7 percentage points year-on-year. Net profit from continuing operations amounted to CHF 42.2 mil-
lion in 2012 (2011: CHF 44.9 million). Net profit in 2011 benefited from a significantly better financial result, which was largely attributable to currency hedging measures. The net profit mar-gin was 10.8 % of sales in 2012 (2011: 11.9 %). Earnings per share from continuing operations were CHF 3.90 (2011: CHF 4.18). Cash flow from operating activities totaled CHF 2.4 million (2011: CHF 45.1 million). Excluding prefinancing of an OEM develop-ment project, cash flow from operating activities amounted to CHF 45.0 million.
Details on the course of business of the Life Sciences Business and Partnering Business segments can be found in the relevant sections on pages 26 and 32.
Strong balance sheet – distribution to shareholders increased again
Tecan’s equity ratio increased during the reporting period and reached 71.9 % as of December 31, 2012 (December 31, 2011: 69.1 %). Net liquidity (cash and cash equivalents minus bank liabilities and loans) amounted to CHF 141.3 million (December 31, 2011: CHF 163.0 million) despite increased investment in development programs.
On the basis of a strong balance sheet and a sustainable good business outlook, Tecan intends to increase its profit distribu-tion to shareholders again. The Board of Directors will therefore propose a 20 % increase in the dividend from CHF 1.25 to CHF 1.50 per share to the shareholders at the Company’s Annual General Meeting on April 17, 2013. The dividend will be paid out in part from the available capital contribution reserve, and this portion of CHF 1.00 will therefore not be subject to withholding tax.
Strengthening the management team
In Tecan’s senior management, 2012 was also a year of change.In October, Dr. David Martyr took up his position as CEO. He has extensive experience of managing technology companies, hav-ing spent 13 years in various management positions in the life sciences sector and the market for analytical instruments. Most recently, David Martyr had been Group President of Leica Mi-crosystems since 2007 and, concurrently, Vice President at Dan-aher Corporation, with responsibility for Danaher’s Life Science businesses since 2009.
16 Tecan Annual Report 2012 Letter to the Shareholders
The Board of Directors appointed Gérard Vaillant as interim CEO to cover the period between the departure of Thomas Bachmann and the arrival of David Martyr (February to Octo-ber). Gérard Vaillant has been a member of the Board of Direc-tors of Tecan since 2004 and until his retirement was Com-pany Group Chairman Diagnostics Worldwide at Johnson & Johnson. Tecan considered itself extremely fortunate to be able to appoint a leader with such extensive management and sector-specific experience during this transitional phase. The Board of Directors would like to extend their heartfelt thanks to Gérard Vaillant for his enormous commitment and impor-tant accomplishments.
At the beginning of 2013, David Martyr took the opportunity to restructure the management team and strengthen it in a targeted way to implement the growth strategy. Having the right management team, with comprehensive, sector-specific experience and abilities, is of critical importance to the me-dium- and long-term development of the company. At the end of February, we announced that Dr. Stefan Traeger has been ap-pointed as a member of the Management Board. As Head of the Life Sciences Business division Stefan Traeger will be re-sponsible for the Group’s global end-customer business. He will take up his new post at Tecan on July 1, 2013. Stefan Trae-ger has extensive domain experience in a variety of manage-ment positions in the life science industry. At Leica Microsys-tems, he resolutely aligned the Life Science division to the needs of the market, increased sales considerably and raised profita-bility significantly. He also very successfully integrated two ac-quired companies into the existing business.
Searches for a Head of the Partnering Business division and a Head of Corporate Development are underway.
Priorities for 2013
We have defined five company-wide business priorities for 2013. These priorities have been selected to ensure full alignment across the organisation on these important goals, which will each have key influence on our success in 2013 and the follow-ing years.
The first two priorities relate to the successful conclusion of the OEM programs under development (P14 and P16) in Part-
nering Business. We made great progress in both programs in 2012 and have achieved significant milestones. They are at an advanced stage and we expect to be able to start commercial instrument deliveries to our partners in 2013, with a substan-tial contribution to sales being made from 2014 onwards.
In March, we were able to announce that our OEM partner Dako, an Agilent Technologies Company and worldwide pro-vider of cancer diagnostics, unveiled the new platform previ-ously referred to as P16, at a global congress. We are delighted to work with Dako, a global leader in the fast growing area of tissue-based cancer diagnostics. The Dako Omnis instrument, developed and manufactured by Tecan, sets new standards in automated advanced tissue staining. Based on our partnership today, we look forward to further intensify our relationship with Dako in the future.
A further priority concerns the field of innovation as a whole, where we want to make the development process more effi-cient and launch new products on the market with greater fre-quency. In addition to establishing a systematic innovation pro-cess with a well-structured, detailed roadmap for the coming years, we will press ahead with the current development pro-grams. We continue to expect the market launch of the most important development project in the Life Sciences Business, the next generation of liquid-handling platforms, to take place in 2014.
China is currently investing considerable amounts in health-care and life science research. We achieved high double-digit growth in this market in 2012, generating sales of more than CHF 20 million for the first time. We are also continuing to in-vest in our own market and service organization. Measured by the number of staff employed in the market organization, China is set to occupy second place in Tecan’s international league table by the end of 2013.
Our component business supplies manufacturers of labora-tory instruments with essential components and robotic mod-ules. Here too, we were able to post double-digit growth in 2012, and this business therefore remains a priority in 2013. We want to continue this sales growth via several customers gained over the past year and further success in promising sales ac-tivities.

17Tecan Annual Report 2012
to sales from 2014 onwards mean that the Company already has significant growth drivers for the near future. Furthermore, the targeted implementation of the growth strategy should make a substantial contribution to sales growth, for example in growth markets such as China.
Our aims for 2015 at current exchange rates are sales of around CHF 500 million and increased profitability.
Our gratitude
The Board of Directors and the Group Management Board would like to thank all the employees who contributed to our success in 2012 and to the progress achieved in our develop-ment programs, our customers for their loyalty, and our share-holders and business partners for their trust.
Männedorf, March 5, 2013
Rolf A. Classon Dr. David MartyrChairman of the Board Chief Executive Officer
Outlook for 2013
We expect the challenging economic environment to continue in 2013 for the Life Sciences Business, but again expect busi-ness performance across the regions to be mixed. The estab-lished markets in Europe and North America will continue to be affected by austerity measures and budget cuts. We anti- cipate continuing sales growth in Asia, driven primarily by China. Overall, we expect the Life Sciences Business segment to achieve moderate growth in local currencies in 2013.
Our Partnering Business primarily serves customers in the field of diagnostics, an end market which is less influenced by the current economic situation. In addition, growth in this segment will depend to a large degree on when we can start delivering new instruments to our partners. Based on customer forecasts for existing products and new instruments scheduled to be launched in 2013 as well as the anticipated continuation of sales growth in the component business, we expect good sales growth for the Partnering Business segment in 2013.
Overall, we expect sales growth for the full-year 2013 to be in the mid-single-digit percentage range in local currencies. We anticipate a moderate increase in sales in the first six months, followed by stronger growth in the second half, similar to the trend in 2012. This is primarily based on the expected start of instrument supply under a significant OEM program, which should begin contributing to sales in the second half.
We expect a further improvement in profitability in 2013. As planned, research and development spending will be reduced as a proportion of sales, which will have a positive effect on the operating profit margin; however, we expect lower average ex-change rates to have a negative impact compared with 2012.Overall, we expect the operating profit margin to grow by around 50 basis points in 2013 compared with 2012.
Medium-term targets for 2015
Overall, we are well on track to bring Tecan to the next level of business development. The start this year of commercial in-strument deliveries under two significant OEM programs to partners and the resulting expected substantial contribution

18 Tecan Annual Report 2012 Interview with CEO David Martyr
Introducing David Martyr, CEO of Tecan
Dr. David MartyrCEO
Tecan is a very strong brand in our industry which forms an excel-lent basis for future accelerated growth.
19Tecan Annual Report 2012
New Tecan Group CEO Dr. David Martyr joined the company in October 2012. He spent many years in various manage-ment positions in the life sciences sector and the market for analytical instru-ments and took the opportunity to talk about his previous roles and experience, and look ahead to an exciting future with Tecan.
Please tell us a little about your background in technology and life sciences.
I actually studied naval architecture and ship building at university, which is a bit of a strange route into life sciences, but I have always been fascinated by all forms of technol-ogy and engineering. After a year working as a naval archi-tect I went back to university to do my PhD, and took the opportunity to change disciplines slightly, looking at the applications of laser technology in ship building and heavy industry. This eventually led me into the laser industry, where I found that I really enjoyed interacting with cus-tomers and learning about their applications. I have switched fields several times since then, but throughout my career I have always been drawn to learning about new applications and technologies.
My background in lasers and optical technologies eventu-ally led me into life sciences, when I joined Leica’s confo-cal laser microscopy and image analysis business in 1998. I did not have a huge amount of experience in the life sci-ences sector at that time, but was fascinated by the sheer breadth of technologies and applications, which ranged from cutting-edge microscopy hardware for academic cent-ers to genotyping software development for clinical appli-cations. This was also my first exposure to Tecan, as part of a collaborative project to develop an early version of the GenePaint™ software.
What was your initial impression of Tecan?
Tecan is a business that I have known and observed for sev-eral years and I have developed a huge amount of respect for the Company. Tecan has a much larger market impact and reputation than most companies of its size, and that was something that interested me from the start. I have had extensive dealings with Tecan’s OEM business over several years – as a custormer at Leica Biosystems – and I have always found it a fascinating company. Tecan has con-tinually focused on innovation and has built a strong rep-utation for quality, both attributes that are very important and attractive to me personally. I have followed the Com-pany’s progress with interest, knowing that I would be very proud and pleased to perhaps one day be involved in its future development.
What changes do you see for the Company?
Tecan has always been a pioneer in laboratory automa-tion, but the market does not stand still, and we need to reaffirm our reputation as a leading-edge supplier of best-in-class equipment. We already have a good sense of the opportunities within the market, how we can develop and what products and technologies we need to focus on and expand into. My challenge is to raise the organic growth of the business by bringing new products to market more frequently and in a repeatable, consistent way. Our ability to work in partnership with other companies will also be key to this. Open innovation, collaborating with other lead-ing technology companies, will also help to drive forward development of new technologies and provide us with new opportunities.
Our aims for 2015 at current exchange rates are sales of around CHF 500 million and increased profitability.
20 Tecan Annual Report 2012 Interview with CEO David Martyr
For the mid- and long-term development of our business it is essential that we have the right leadership team with extensive domain knowledge, experience and capabilities. Through a renewal process of the management team in various positions, I am taking the opportunity to strengthen the capabilities of the leadership team in a targeted man-ner. We want to attract enthusiastic and talented individ-uals and we need to make sure that we harness their skills to complement the Company’s established team, striking out ahead to develop strong technologies and innovative products which will make Tecan the obvious choice for cut-ting-edge laboratory automation solutions.
Will you change the strategic direction for Tecan?
I intend to refine the strategy, not change the direction. Refinement will include sharpening prioritization, focus and especially execution planning and delivery.
Tecan has a clearly defined strategy for organic develop-ment in the Life Sciences Business and Partnering Busi-ness divisions.
For the Life Sciences Business, this strategy includes re-gional expansion especially in China; strengthening our innovation delivery; and expanding into adjacent markets through product development.
In Partnering Business the strategy is focused on expand-ing our OEM customer base; deepening our relationship and supply agreements with existing customers; and driv-ing growth in our service and consumables business.
In addition to these initiatives, I see greater potential from our component business, where we are a strong player in the building blocks for Diagnostics and Life Science instru-ment construction; opportunities for our Partnering Busi-ness division in Asia as well as a whole new range of stra-tegic opportunities in terms of non-organic growth.
What is your vision for Tecan in the next two and five years?
Tecan is a very strong brand in our industry which forms an excellent basis for future accelerated growth. My vision is to transform Tecan from a highly specialised instrument company, playing in just two narrow niches – automated liquid handling and microplate readers – into a solutions

Before joining Tecan, David Martyr was Group President of Leica Microsystems since 2007 and concurrently Vice President at Danaher Corpo-ration, with responsibility for Danaher’s Life Sci-ence businesses since 2009. During the period 2007 to 2011 at Leica Microsystems, the compa-ny’s business grew from around USD 500 mil-lion annual sales to over USD 1.2 billion, through driving organic growth, the introduction of rea-gents and consumables to complement its in-struments, significantly expanding sales in China; and through the acquisition and integration of several companies. David Martyr is 55 years old and a British citizen.
21Tecan Annual Report 2012
business, serving a broader range of applications in both Life Science Research and Clinical Laboratories.
The market has changed significantly over the last few years, becoming more and more application focused. Cus-tomers are looking for far more than a straightforward pur-chase of capital equipment; it has become a consultative selling process, with manufacturers now expected to pro-vide exceptional hands-on technical and applications sup-port – and complete solutions.
To achieve this I want to improve our execution of projects and organic growth within the core businesses, to lift our market-share, global coverage and customer penetration. Additionally, I intend to expand the company in-organi-cally through highly selective acquisitions and collabora-tions. My solutions ambitions clearly imply that we will be seeking to acquire or partner for selected reagents and consumables to enable us to offer performance optimized and potentially closed systems. Other in-organic moves could include geographic expansion, to quickly bring es-tablished sales channel capabilities; or even for localized products for certain markets, especially in Asia. Instruments to broaden our range including into adjacent market seg-
ments or fill in some gaps in our current offering are also strongly of interest.
Two years from now we should have closed our first M&A deals and there should be clear evidence of a much more consistent delivery of innovative new products to the mar-ketplace and we will have outgrown our current size of CHF 400 million in sales. Our Asian businesses will have expanded their share of our sales by at least some percent-age points; and new major OEM customer development projects should be at an advanced stage. Our aims for 2015 at current exchange rates are sales of around CHF 500 mil-lion and increased profitability.
Five years from now, Tecan will be well on it’s way to deliv-ery of the vision! My aim is that we should be recognized as the “gold standard” in our industry for Quality and In-novation. I would hope that the Tecan brand will be de-lighting, in similar measure, both our customers and our investors!
About David Martyr

Tecan is the market leader in laboratory automation. The Company provides life science research and the diagnostic industry with laboratory instruments and comprehensive automation solutions. Tecan also of-fers solutions for other applied markets such as foren-sics, the food industry, crop research, the cosmetic industry and veterinary applications. Automation so-lutions include instruments, software packages, nu-merous configurable modules and special application expertise as well as regulatory and quality consulting, service and consumables.
Markets and Market Position

23Tecan Annual Report 2012
Tecan’s solutions automate all types of repetitive work steps in the laboratory and make procedures more precise, more ef-ficient and safer. They also pipette the smallest volumes of dif-ferent fluids with optimum precision. By automating these work steps, laboratories can significantly increase the volume of samples they process, obtain test results sooner and ensure reproducible output. The instruments can also perform neces-sary work overnight without supervision, allowing laboratory personnel to evaluate the results or continue with the next step upon returning the following morning. Tecan also offers a wide range of detection devices. This includes analytical de-vices such as microplate readers and microarray systems, which analyze reactions on a microtiter plate or a microarray, as well as washers, which perform the washing and purification oper-ations of a test procedure.
The Company serves some customers directly, but is also a leader in developing and manufacturing OEM instruments and com-ponents that are distributed by partner companies under their own names. Life science research and the various applied mar-kets operate mainly under the Tecan brand using Tecan’s own sales and service organization, while the needs of the diagnos-tic market are largely addressed via the OEM sales channel. The Tecan Group can count on two strong pillars in the Life Sciences Business (end-customer business) and Partnering Business (OEM
Life-Science-Forschung
Diagnostik
Angewandte Märkte
Life-Science-Forschung
Diagnostik
Angewandte Märkte
Life Science Research
Diagnostics
Applied Markets
Life-Science-ForschungDiagnostikAngewandte Märkte
Life-Science-ForschungDiagnostikAngewandte Märkte
Life-Science-Forschung
Diagnostik
Angewandte Märkte
Life SciencesBusiness
61.6%
PartneringBusiness
38.4%
Development &Operations
Science &Technolgy
Life-Science-Forschung
Diagnostik
Angewandte Märkte
Life SciencesBusiness
61.6%
PartneringBusiness
38.4%
Development &Operations
Science &Technolgy
Development &Operations
Life ScienceBusiness
Life SciencesBusiness
61.6%
PartneringBusiness
38.4%
Life-Science-Forschung
Diagnostik
Angewandte Märkte
Life-Science-Forschung
Diagnostik
Angewandte Märkte
PartneringBusiness
Science &Technolgy
Development &Operations
Science &Technolgy
Life SciencesBusiness
61.6%
PartneringBusiness
38.4%
Life-Science-Forschung
Diagnostik
Angewandte Märkte
Development &Operations
Science &Technolgy
Development &Operations
Science &Technology
Life SciencesBusiness
60%
PartneringBusiness
40%Development &
Operations
Life SciencesBusiness
61.6%
PartneringBusiness
38.4%
Development &Operations
Science &Technolgy
Life SciencesBusiness
61.6%
PartneringBusiness
38.4%
Development &Operations
Science &Technolgy
Life SciencesBusiness
61.6%
Life SciencesBusiness
61.6%
PartneringBusiness
38.4%
PartneringBusiness
38.4%
Life-Science-Forschung
Life-Science-Forschung
Diagnostik
Diagnostik
Angewandte Märkte
Angewandte Märkte
Development &Operations
Science &Technolgy
Development &Operations
Science &Technolgy Life Sciences
Business
61.6%
PartneringBusiness
38.4%
Development &Operations
Science &Technolgy
Life-Science-Forschung
Diagnostik
Angewandte Märkte
Life SciencesBusiness
61.6%
PartneringBusiness
38.4%
Development &Operations
Science &Technolgy
Life Sciences Business
Partnering Business38.4%
61.6%
Development &Operations
Science &Technolgy
Life-Science-Forschung
Diagnostik AngewandteMärkte
Development &OperationsLife Sciences
Business
60.1%
PartneringBusiness
39.9%
business) segments. Its segment-specific strategies for sustained profitable growth allow the Company to drive forward customer projects via both business models and to provide independent resources for this purpose. Group-wide functions are combined in the Development & Operations division, to better unlock syn-ergies in research, development, procurement and production across different locations.
Brand management
Tecan is a leading brand in laboratory automation. It stands for quality, innovation and reliability. These are decisive success factors in this sector for building up a brand on a sustainable basis and strengthening it. A carefully selected and nurtured portfolio of several brands is of prime importance to Tecan and is a necessity if it is to differentiate itself from its competitors. The Company’s most important brand is the Tecan umbrella brand, followed by various brand names for product platforms, such as Freedom EVO®, Infinite® and Cavro®. Employees, who actively embody the values of the Tecan brand, are a key factor in the success of the brand.
Tecan performs various brand management activities through product marketing and advertising in specialist circles and be-yond. These offer added value for different partners and play a

24 Tecan Annual Report 2012 Markets and Market Position
role in strengthening and improving awareness of the Tecan brand. For example, the Company organizes the annual Tecan Symposium, which examines a current topic in depth and pro-vides an opportunity for experts in the field to exchange infor-mation. The Tecan Award, a prize that is given to innovative customers, is a further tool. In the year under review, Tecan also sponsored projects such as the Cornell Cup, in which it sup-ported a successful team from the Massachusetts Institute of Technology (MIT) Weiss Laboratory for Synthetic Biology in the development of a new type of liquid handling system.
Customer satisfaction and customer loyalty are also key fac-tors for a strong brand. The Company regularly measures cus-
tomer satisfaction and is strongly committed to maintaining it at a high level and further improving it. As a result, Tecan is recommended by its customers and the positive perception of the brand is continually increased. An external market re-search institute again measured and evaluated customer loy-alty and satisfaction in the year under review. Compared with the 2009 results, Tecan was able to maintain its very high level and, in some categories, further improve it. Customer satis-faction rose significantly in the component business, which translates into a significant competitive advantage. Other fac-tors that were seen as particular strengths of Tecan include quality, reliability and flexibility in configuration. Tecan’s con-sumables were also evaluated as being of above-average qual-
Liquid handling platforms
Detection instruments
Components Consumables
- Freedom EVO®75- Freedom EVO®100- Freedom EVO®150- Freedom EVO®200- Freedom EVOlyzer®
- Infinite®M1000- Infinite®F500- Infinite®200PRO- Infinite®F50/Robotic- SunriseTM
- Cavro®Centris Pump- Cavro®XCalibur Pump- Cavro®XE 1000 Pump- Cavro®Omni Robot
- MCA 96 disposable tips
- ProfiBlot™ trays- FE500 consumables- QC Kit
- MultiChannel ArmTM 384, MultiChannel ArmTM 96- Te-ShakeTM
- Te-VacSTM
- GenePaintTM
- Quad4 MonochromatorsTM
Product level(examples)
Technology level (examples)
Corporate level

25Tecan Annual Report 2012
ity. Tecan’s status as the top corporate brand in the industry was confirmed. Customers rated Tecan as considerably better than its competitors and it is seen as a very strong brand with a rate of recommendation that is significantly higher than the average for the industry. The survey did, however, also identify room for improvement. While customers rated the Company as innovative and technologically superior, they expressed the desire for more frequent product launches. Tecan took this and other critical feedback on board and will devise and imple-ment suitable measures to further improve its products and services.
Patents and protection of intellectual property
Tecan makes above-average investments in research and de-velopment to maintain and reinforce its position as market leader. In the year under review, such expenditure amounted to over 13 % of sales. Protecting its intellectual property is of major importance in ensuring that the development of new products and technologies gives the Company a sustainable advantage in the market. Tecan registers patents on relevant developments for the most important markets in a timely man-ner. In 2012, the Company had several hundred patents in var-ious patent families. Tecan also files for design protection for important products to protect them from imitations. To secure its market position, the Company will attach even greater im-portance to patent and design protection in the future.
Core competences
Tecan’s success is based on core competences that the Com-pany has systematically acquired and expanded over the years. In robotics, Tecan is the market leader in the automation of a wide range of the repetitive work steps that have to be con-ducted in laboratories. Its core competences cover both instru-ments and the software packages needed for their operation. The Company is an expert at handling various test formats, from microtiter plates through test tubes. Tecan offers a wide-ranging portfolio of different modules to automate applica-tions and work processes, such as examining DNA or cells. To enable the entire workflow to be automated, Tecan also inte-grates third-party devices. Customers benefit from the Tecan specialists’ enormous application know-how, even in strictly regulated areas such as clinical diagnostics.
Tecan has particular expertise in liquid handling and detection. Liquid handling involves the high-precision handling of fluids, even in the smallest quantities. This process includes the aspi-ration and dispensing of liquids with differing physical and chemical properties, such as reagents and blood (both whole blood and serum). Tecan also has the necessary sensor tech-nology to monitor processes, for example to ascertain whether a liquid transfer has actually taken place.
In the area of detection, Tecan specializes in analytical devices that use a variety of optical methods to detect reactions in a test procedure, such as the binding of an antibody to a target molecule. This may be done using fluorescence, luminescence or absorption techniques, for example. Tecan also uses pat-ented technologies here to lower the detection limit or reduce stray light and thereby increase the sensitivity. Tecan detection instruments are able to process varying wavelengths quickly and flexibly, even in parallel.

Total sales Life Sciences Business1
(CHF million)
EBIT Life Sciences Business(CHF million)
EBIT margin Life Sciences Business(in % of sales)
Liquid Handling Biopharma 36 % Liquid Handling Diagnostics 13 % Detection 17 % Services and spare parts 23 % Consumables 11 %
Europe 37 % North America 37 % Asia 20 % Others 6 %
1 Sales to third parties + intersegment sales
Sales by products(in % of sales)
Sales by regions(in % of sales)
26 Tecan Annual Report 2012 Life Sciences Business
Life Sciences Business(end-customer business)
248.1242.5
23.826.3 9.6
10.9
2010 2011 20122010 2011 2012 2010 2011 2012
250.5
29.011.6

27Tecan Annual Report 2012
In its end-user business, Tecan offers a wide range of laboratory instruments and automated workflow solutions for use by pharmaceutical and biotechno-logy companies, government research institutions and universities, diagnostic laboratories, as well as scientists from numerous applied markets. Most of these customers work in the field of life science research.
Tecan distributes its products through its own market organi-zation and distributors in more than 50 countries worldwide. Sales and application specialists communicate with end cus-tomers to discuss their various requirements in terms of auto-mating highly diverse laboratory procedures and service engi-neers and helpdesk and expertline specialists work to ensure a high degree of customer loyalty and satisfaction. In 2012, the Life Sciences Business segment represented 60.1 % of total sales of the Tecan Group.
Product Portfolio
Within the Life Sciences Business, the largest product group is the scalable liquid handling platforms, which are used to pi-pette fluids with optimum precision and automate laborious and repetitive manual procedures. These platforms can be con-figured with an array of additional modules and devices to pro-vide a high degree of flexibility and easy adaptability for a di-verse range of applications. Highly complex customized offerings are also provided to a smaller group of customers. Tecan also provides a wide range of bioanalytical instruments such as microplate readers and washers which allow reactions to be monitored or specific analytes to be measured and are often integrated within the liquid handling platforms to en-sure a complete customer solution. Tecan also works with nu-merous partner companies to integrate their test procedures or devices to provide comprehensive workflow solutions. Such workflow solutions include instruments, software packages
and special application know-how as well as consulting, ser-vice and consumables. Tecan’s consumables business is con-tinuing to show strong growth. New, value added consuma-bles products that have been launched during the past years, are the driving forces behind this growth.
Strengthening the core businessTecan is the market leader in the field of laboratory automa-tion, and intends to consolidate this position as well as grow its market share, especially in emerging economies. A detailed awareness of understanding customer needs are a decisive factor in achieving this success, ranging from new instruments, software, applications and workflow solutions, to modules and components, plastic consumables and customer service. Dur-ing 2012 Tecan introduced air displacement technology as an addition to its existing liquid handling technology. This tech-nology complements the existing product line by offering cus-tomers the best of both worlds. Tecan is the only provider that offers automation solutions with both technologies, allowing the company to better address its customers’ specific prefer-ences and expand its target market. In order to address the growing need to provide validation and regulatory compliance, Tecan introduced the QC Kit in 2012. The QC Kit is a turnkey so-lution for liquid handling performance verification testing, based on Artel’s proprietary ratiometric technology. It consists of an integrated solution with dedicated software, microplate reader and a range of customized consumables. The kit also al-lows users to compare performance across multiple systems as well as multiple international locations.

28 Tecan Annual Report 2012 Life Sciences Business28
Opening up global growth marketsMany countries are currently investing considerable amounts in healthcare and life science research. Tecan is focusing on ex-panding its business in China. The company has been operat-ing in China for a number of years and is achieving healthy growth rates in this market. In order to exploit the potential of new and existing products, Tecan is investing heavily in its mar-keting and service organization. With the opening of two ad-ditional locations Tecan will be operating out of four economic centers. Tecan is increasingly selling its products directly, rather than via distributors. In terms of the number of staff employed in the market organization, China occupied the third place in Tecan’s international league table at the end of 2012. By the end of 2013, only the US will have a bigger market organization. Sales are set to increase significantly over the next three years.
Working with innovative partner companiesTecan is working with innovative partner companies to the benefit of customers by supplementing Tecan’s broad product portfolio in the Life Sciences Business.
This includes for example a partnership with Hewlett-Packard for the distribution of the HP D300 digital titration system for drug discovery.
In 2012 Tecan has also continued to increase its ability to pro-vide customers with solutions for their life science business by partnering with high quality providers of reagents and kits. Two examples of this are in the area of 3D cell culture and biobanking. In order to enable customers to benefit from the unrivaled advantages offered by 3D cell biology Tecan has de-cided to automate the best 3D techniques on the market. Fo-cusing on technologies enabling in vivo like growth Tecan pro-vides real 3D applications where cells grow in complex tissue like structures. Partnering with TAP biosystems and Reinner-vate, two unique 3D cell culture approaches have been auto-mated including the analysis by Tecan’s microplate readers. Tecan has significantly increased its installed base in biobank-ing by providing innovative sample preparation automation solutions for standardization in biobanks. In 2012 Tecan and Promega launched a turnkey workstation for fully automated extraction of gDNA from large volume blood samples. The Free-dom EVO® HSM workstation has been specifically designed to
meet the needs of biobank customers to extract as much gDNA from samples as available for long term storage. Tecan also col-laborated with Integrated Biobank Luxembourg (IBBL) to bring out an automated process with optimized buffy coat yield (white blood cell layer) to replace the tedious manual process. Automation of these techniques increases standardization of the sample treatment prior to long-term storage and helps to build up high quality biobank repositories.
During the year under review Tecan recorded a clearly double-digit growth rate in all product groups in Asia Pacific.
29Tecan Annual Report 2012
Performance
Sales in the Life Sciences Business segment rose by 1.3 % to CHF 235.2 million in 2012 (2011: CHF 232.2 million). In local cur-rencies, sales were 1.1 % below the prior-year period. The Life Sciences Business constituted 60.1 % of total Group sales (2011: 61.6 %). In the second half of the year, sales increased by 3.4 %, and in local currency terms were 1.1 % below the prior-year level. In local currencies, sales generated by liquid handling platforms in 2012 were close to the previous year’s level, while those of detection devices were down slightly compared to 2011. Tecan posted high double-digit growth in all product groups in Asia Pacific. Order entry in the Life Sciences Business remained slightly below the previous year’s figure in local currencies, but improved during the second half.
Operating profit in the segment rose 21.8 % to CHF 29.0 million in the year under review (2011: CHF 23.8 million). Operating profit margin rose two percentage points to 11.6 % of sales (2011: 9.6 %), mainly due to a higher gross margin.

30 Tecan Annual Report 2012 Life Sciences Business
Selection of the current most important products and product groups
Liquid handling platforms
Workflow solutions
Freedom EVO® The Freedom EVO liquid handling platform is a flexible and highly configurable platform for the precise pipetting of small and large volumes of various liquids. Various modules can be incorporated within this platform to address a wide range of laboratory applications and customer analytical workflows. This makes it possible to automate a wide range of repetitive work steps and ensure that the procedures are more reproducible, ef-ficient and safer.
With the Air Liquid Handling Arm Tecan introduced an alterna-tive pipetting technology to better address its customers’ spe-cific preferences and expand its target market.
Freedom EVOlyzer® Liquid handling platform with integrated detection devices. The Freedom EVOlyzer is used by clinical laboratories to ana-lyze blood samples for infectious diseases.
In collaboration with a variety of partners, Tecan provides stand-ardized workflow solutions. Our partners provide specific chem-istries or sample preparation devices and Tecan automates and integrates the various procedures of the given application via a combination of hardware devices but also customized soft-ware and an intuitive user interface. This provides customers
with a pretested, ready-to-use solution that enables them to begin routine work quickly. As an example, together with the leading manufacturer of DNA testing systems, Tecan offers law enforcement agencies the validated HID EVOlution™ system.
In 2012, Tecan and Promega launched a turnkey workstation for fully automated extraction of gDNA from large volume blood samples.
In some cases customers require highly complex, individual tailored solutions to achieve full automation of a specific ap-plication or workflow. Tecan provides these services and inte-grates existing modules and technologies, both from Tecan and third-party suppliers along with the development of new modules and custom software.

31Tecan Annual Report 2012
Consumables Customer service
Microplate readers and washers
Consumables, such as certified pipette tips, are an important com-ponent of a complete laboratory automation solution. Tecan’s strategy is to develop and distribute high quality consumables which are a prerequisite for high productivity and reliable assay results when working with Tecan automation platforms.
The QC Kit is a turnkey solution for liquid handling performance verification testing.
Customer service is a key factor for customer satisfaction and retention. Tecan supports customers across the entire life cy-cle of its instruments and automation solutions and maintains a service network in over 50 countries.
Tecan offers a wide spectrum of analytical devices such as mi-croplate readers and microarray systems, which analyze reac-tions on a microtiter plate or a microarray, as well as plate wash-
ers, which perform the washing and purification operations of a test procedure.

32 Tecan Annual Report 2012 Partnering Business
Partnering Business(OEM business)
Total sales Partnering Business1
(CHF million)
EBIT Partnering Business(CHF million)
EBIT margin Partnering Business(in % of sales)
Liquid Handling 55 % Components 32 % Detection 7 % Development funding 6 %
Instruments 42 % Components 26 % Services and spare parts 21 % Consumables 5 % Development funding 6 %
1 Sales to third parties + intersegment sales
Sales by products(in % of sales)
Sales by product groups(in % of sales)
2010 2011
150.4145.535.636.8
23.725.3
2012
160.3
2010 2011 2012
30.6
2010 2011 2012
19.1

33Tecan Annual Report 2012
Tecan not only provides end customers with automation solutions, but is also a leading developer and manufacturer of OEM instruments and components which partner companies sell under their own name. Tecan’s position as a leading developer and manufacturer of OEM instrumentation will be a key con-tributor to growth in 2013 and beyond.
Tecan expanded its OEM business in the year under review. The share of the Partnering Business segment in the total sales of the Tecan Group was 39.9 % (2011: 38.4 %). Tecan currently of-fers more than 20 different instruments in the OEM business and supplies components to several hundred customers. Most OEM customers work in the field of diagnostics. During 2012, sales of components was particularly strong, driven by growth of existing customer relationships and new business in China.
Product portfolio
OEM customers benefit from Tecan’s 30 years of technology ex-perience in a wide range of instruments and modules. Tecan’s solutions are also able to grow with the needs of the customer.
ComponentsTecan’s Cavro® brand is the market leader in laboratory auto-mation components. The Company supplies laboratory instru-ment manufacturers with essential components such as pre-cision pumps, valves, robotic arms and software. They are used in systems that have a wide range of applications in life sci-ence research, diagnostics, forensics and numerous other in-dustries. In customers’ product ranges, Tecan components gen-erally remain an indispensable element over the entire life cycle of a device.
Platform-based solutionsIn recognition of OEM customer needs for fast time to market and low development costs, Tecan adapts the products and platforms it develops for its own end customers to the specific needs of OEM customers. These adapted and standardized plat-forms are distributed as system solutions under the custom-ers own brand name that combine Tecan’s automation exper-tise with their own specific tests. Detection instruments from Tecan can also be modified or integrated into fully-automated laboratory solutions. Platform based development thus ena-bles flexible automation and rapid prototype development.
Tecan’s position as a leading developer and manufacturer of OEM instrumentation and com-ponents will be a key contributor to growth in 2013 and beyond.

34 Tecan Annual Report 2012 Partnering Business
Dedicated solutionsWhen an OEM customer is looking for a specific product, de-signed and manufactured to a specific functionality and cost, a dedicated system development can be the answer. Dedicated systems are usually most appropriate when the product life-cycle is longer, maybe many years, and the specific functional-ity and total cost-of-ownership are the key decision criteria.
Tecan supports OEM customers in their make or buy decisions for such complex systems. By choosing to partner with Tecan, the customer gets access to Tecan’s full range of technologies, modules and software as well as Tecan’s expertise in system integration. If the system will be sold in the clinical diagnos-tics market, Tecan’s regulatory and quality processes ensure the system will comply with the rigorous demands of even the most regulated markets.
Customer service and consumablesTecan’s support for OEM customers does not end once the in-strument development is finished. Tecan can also offer OEM customers a range of services after the product is launched via its global service infrastructure. Tecan can install instruments directly at the end customer’s location, provide a helpdesk fa-cility, train the OEM customer’s service team and even handle customer service itself. In addition, Tecan maximises instru-ment operation-time by providing a global spare parts service. OEM customers active in the diagnostics market may also ben-efit from Tecan’s high-quality consumables such as certified pipette tips, which are an important component of a validated system solution.
Growth drivers
Tecan has a broad base of OEM customers and is continuously increasing the number of supply agreements. On the basis of OEM agreements concluded over the last three years, Tecan ex-pects to ship major new analysis systems in 2013 and beyond. In particular, Tecan expects two important projects involving dedicated diagnostics instruments currently nearing comple-tion, to make a significant contribution to future sales. Sales of components will drive growth due to a number of major cus-tomers embarking on new developments that incorporate Tecan’s pumps and valves. Tecan’s focus on attractive, growing segments of the clinical diagnostics and life science markets has resulted in the pipeline of OEM projects that Tecan is in-tensively working to acquire remaining full.
Sales of components will drive growth due to a number of major customers embarking on new developments that incorporate Tecan’s pumps and valves.

35Tecan Annual Report 2012
Performance
The Partnering Business generated sales of CHF 156.0 million in the year under review (2011: CHF 144.7 million), which corre-sponds to an increase of 7.8 % in Swiss francs and 6.7 % in lo-cal currencies. The OEM business accounted for 39.9 % of total Group sales (2011: 38.4 %). Sales growth accelerated further in the second half, and was 14.4 % higher than 2011 in Swiss francs, and 12.1 % higher in local currency terms. Components, services and consumables posted double-digit growth in 2012.
Order entry in the Partnering Business was below the prior-year period in the first six months, due to advance orders made by customers in December 2011 rather than in the first quarter of 2012. In the second half, however, order entry was up sub-stantially on the same period of 2011, and was down only slightly year-on-year for 2012 as a whole.
The Partnering Business segment achieved an operating profit margin of 19.1 % of sales in 2012 (2011: 23.7 %). The main reason for the lower operating profit margin was costs booked under a development program for an OEM customer. At CHF 30.6 mil-lion, operating profit was therefore below that of the previous year (2011: CHF 35.6 million).
36 Tecan Annual Report 2012 Partnering Business
Selection of the current most important products and product groups
Liquid handling systems
Detection instruments
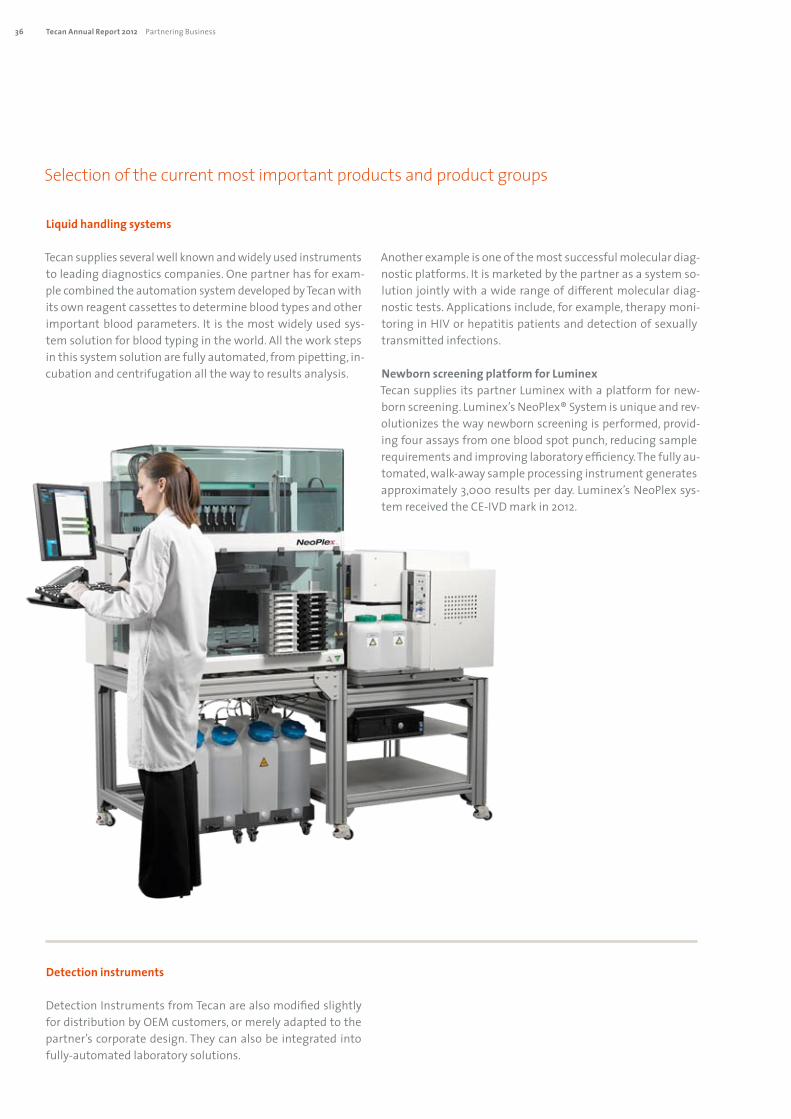
Tecan supplies several well known and widely used instruments to leading diagnostics companies. One partner has for exam-ple combined the automation system developed by Tecan with its own reagent cassettes to determine blood types and other important blood parameters. It is the most widely used sys-tem solution for blood typing in the world. All the work steps in this system solution are fully automated, from pipetting, in-cubation and centrifugation all the way to results analysis.
Detection Instruments from Tecan are also modified slightly for distribution by OEM customers, or merely adapted to the partner’s corporate design. They can also be integrated into fully-automated laboratory solutions.
Another example is one of the most successful molecular diag-nostic platforms. It is marketed by the partner as a system so-lution jointly with a wide range of different molecular diag-nostic tests. Applications include, for example, therapy moni-toring in HIV or hepatitis patients and detection of sexually transmitted infections.
Newborn screening platform for LuminexTecan supplies its partner Luminex with a platform for new-born screening. Luminex’s NeoPlex® System is unique and rev-olutionizes the way newborn screening is performed, provid-ing four assays from one blood spot punch, reducing sample requirements and improving laboratory efficiency. The fully au-tomated, walk-away sample processing instrument generates approximately 3,000 results per day. Luminex’s NeoPlex sys-tem received the CE-IVD mark in 2012.

37Tecan Annual Report 2012
Components
Consumables Customer service
Tecan supplies laboratory instrument manufac-turers with essential components such as preci-sion pumps, valves, robotic arms and software. A large selection of precision pumps can be used in various applications, covering a wide range of pi-petting volumes.
Consumables, such as certified pipette tips, are an important component of a validated workflow solution for OEM custom-ers active in the diagnostics market. Only high-quality consum-ables can help ensure a high level of quality and reproducibil-ity in tests.
The Cavro® Omni Robot is a liquid-handling component that can be integrated, for example, in life science research and clin-ical diagnostics applications by an instrument manufacturer. This small robot is very reliable and features a modular design and software concept.
Tecan also offers OEM customers services via its existing infra-structure. Tecan can install instruments at the end customer’s location, provide a helpdesk facility, train the OEM customer’s service team and even handle customer service itself.

38 Tecan Annual Report 2012 Sustainability
Delivering value to people
By pursuing sustainable corporate practices, Tecan is looking to secure the long-term expansion and prosperity of the Company for the benefit of all interested parties. Tecan sees sustain- able corporate practices as more than just a series of individual measures. In-stead it is a basic mindset that shapes all corporate processes and unites economic, ecological and social aspects.
Customer loyalty and satisfaction
At Tecan, strong customer loyalty and a high degree of cus-tomer satisfaction are key factors for sustainable business growth. Tecan generated pleasing results in 2012 through con-tinuous improvements in customer satisfaction in the service business. In customer surveys, the helpdesk and field service team, for example, were rated as very good. Other results of the comprehensive customer survey, which is carried out every three years, are discussed on page 24.
Safety and quality are of the utmost importance in laborato-ries. Tecan helps customers and specialists in emerging mar-kets to implement and establish high quality and safety stand-ards, which apply whatever the Tecan product being used. For example, Tecan once again held a presentation at a major blood bank conference in China in 2012. In Kunming, China, Tecan sup-ported the province of Yunnan in introducing a risk manage-ment system for a blood bank. The project attracted interest from several other regions of China.
The annual Tecan Symposium was held in Boston in 2012, and looked at the importance of mass spectrometry in life science research and diagnostics. Scientists from around the world came together at the Symposium to discuss various aspects of this topic and share their knowledge. By holding this Sympo-sium, Tecan is making a contribution to the global exchange of information in the sector.
Business processes
At Tecan, prudent corporate activity founded on clearly struc-tured, transparent business processes is the permeating theme of the daily routine of both employees and management. It is important that Tecan employees are familiar with globally bind-ing internal corporate guidelines, business processes, and coun-try-specific laws and regulations. They can access the most up-to-date version of these, including guiding principles on the intangible values of the corporate culture, at any time in the Tecan Management System (TMS). The TMS is rated as a model tool by customers and external partners alike. Tecan develops the technology and content of the TMS on a continuous basis.
Sustainability

39Tecan Annual Report 2012
Tecan has had a continual improvement process (CIP) in place for a number of years. Employees in all areas of the Company should identify potential improvements at a day-to-day level, put forward solutions and contribute to their rapid implemen-tation. The aim of the CIP is to increase the Company’s profit-ability, enhance both efficiency and quality, and improve inter-nal collaboration. Where possible, the success of the CIP is measured using key performance indicators, for example pro-ductivity, throughput time and inventories in production.
Tecan developed and installed the production and logistics sys-tem PULS specifically for continual process improvements as part of just-in-time manufacturing. This integrated system en-ables Tecan to eliminate weaknesses and to better achieve the required, ever-stricter quality standards. The sustainability of the improvements is ensured by means of an audit system, which covers the relevant areas from occupational safety and environmental protection through management and collabo-ration. One of the guiding principles of PULS is avoiding waste, for example caused by overproduction, standby time, exces-sive inventories and defective units.
Risk management
Tecan has a well-established global risk management process that allows it to detect risks in any area of corporate activity early on, categorize them according to likelihood of occurrence and impact, and limit them with an appropriate action plan. The process encompasses, among other factors, strategic risks, environmental and product risks, market and customer risks as well as occupational safety risks. It also focuses on political and economic developments as well as the possible impacts certain events may have on Tecan’s external partners such as customers or suppliers.
Tecan continuously adjusts its risk management system in line with changes to the environment and takes current events into account in its risk assessment. Under the business continuity plan, for example, in the event of natural disasters such as earthquakes and flooding, direct suppliers in the affected re-gion are examined, and information gathered on their subcon-tractors. The aim is to ensure Tecan’s ability to supply, even in this type of exceptional situation. The Board of Directors re-views annually whether the risk assessment of business activ-
ities is appropriate and whether it takes into account both in-ternal and external changes. Where necessary, new measures to mitigate risk are implemented.
In the financial area, Tecan uses an internal, self-managed treasury system and in doing so, is taking a pioneering role. Tecan executes all money transfers for all Group companies centrally, and manages their cash reserves. This has enabled Tecan to reduce the number of banks it uses in connection with its business activities, and transfer cash reserves to banks at lower risk of failure. The treasury system has also improved short-term financial planning and ensured an interest rate benefit compared with decentralized management.
Tecan uses an IT-based control system in the financial area. The system automatically recognizes and flags potential areas of con-flict with regard to employees entrusted with a range of duties, which when combined could result in a risk of manipulation.
In 2012, Tecan completed the outsourcing started the previous year of all IT services offered by the Group worldwide to the server of an external service provider. By using redundant data backup and physically separating the different data centers from one another and from the production sites, Tecan has further minimized the risk of a critical data loss and increased data security. Global round-the-clock IT support is also now available to Group companies, thereby reducing outages.
Tecan has established several organizational control mecha-nisms with the aim of ensuring correct corporate behavior. These include an internal auditor, who reports directly to the Board of Directors. Tecan also brought into effect a formalized Code of Conduct in 2012, which is binding for all employees, managers and Board members. In this Code, Tecan undertakes to maintain the highest standards in its business activities and to respect ethical values. Tecan aims to document inter-nally and externally that the Company is a credible and relia-ble business partner and employer in all situations through the Code. The Code of Conduct also brings together key guide-lines which are already included in other tools, such as the em-ployment regulations or the Tecan Management System, in a comprehensible form. It instructs employees how to orient themselves within the Company, and to seek further informa-tion or support in cases of doubt. Although Tecan only gener-

40 Tecan Annual Report 2012 Sustainability
In 2012 Tecan organized again the Tecan Symposium and hence made an important contribution to the global exchange of infor-mation.
Safety and QualitySharing knowledge
ates a relatively small portion of its sales in countries with an increased risk of corruption, the Code of Conduct has a zero-tolerance policy toward bribery and corruption. It promotes compliance with standards on occupational health, safety and the environment. It provides instructions on ensuring data protection and handling confidential information, and requires accurate and timely communication of information and care-ful logging of meetings and processes by Tecan staff. The Code also stipulates compliance with competition law as well as national and international trade law for the import and ex-port of products. It guarantees anonymity for whistleblowers, but also does not tolerate abusive suspicions. Line managers are responsible for ensuring that all of their staff know and understand the content of the Code of Conduct. All employ-ees must attend and successfully complete a training course on the Code.
Safety and regulatory requirements
Tecan has established processes Group-wide and at its individ-ual business locations to ensure compliance with national laws and regulations as well as with internal guidelines on safety and environmental protection. The Company invests substan-tial amounts each year in pursuit of further improvement. Tecan cooperates closely with public authorities and standard-setting bodies around the world to recognize new trends in regulation, occupational safety and environmental protection as early as possible and to integrate them into its corporate pro-cesses. The Company actively shapes these developments in significant economic regions by participating in key industry associations.
Internal and external experts regularly inspect whether Tecan’s locations comply with country-specific regulations and the Company’s internal standards for product and occupational safety as well as health and environmental protection. These inspections also cover measures that Tecan has to implement if it fails to meet any requirements. Each year, the locations are subject to a number of audits conducted by regulatory author-ities, testing, monitoring and certification agencies, custom-ers and Tecan’s own specialist teams. In the year under review, Tecan was subject to a number of sometimes extremely exten-sive audits by customers. These included leading diagnostics companies that Tecan supplies with instruments through its

41Tecan Annual Report 2012
OEM business in the Partnering Business, or will supply in the future. The audits covered areas including processes, quality management systems, product design, validation and docu-mentation. The customers again attested a high standard at Tecan with regard to the relevant requirements and did not find any critical deviations from the guidelines.
Tecan put together an ISO 14971-certified product risk manage-ment process for medical devices that covers the entire life- span of a product and evaluates all possible risks, especially those pertinent to patients and users. The Tecan parent company, all production sites and most sales subsidiaries are now ISO 13485 certified. With global certification to this standard by TÜV, Tecan has established a stringent system of control, which has a very good reputation in the life science industry worldwide.
Tecan launched a major initiative in 2012 to obtain a Group-wide matrix certificate based on ISO 13485 as part of its certi-fication strategy. It wants to ensure that all units worldwide work according to the same processes and strive together to continuously improve their products and services. The matrix certificate will also accommodate the current and future Group structure, with an increasing number of subsidiaries. In support of this initiative, Tecan commissioned the certification company TÜV Süd and an internal, cross-border project team. The aim in Europe is a main certificate for the sales office in Germany, with sub-certificates for subsidiaries in other countries. Sales sub-sidiaries in European national markets were certified for the first time under the new method in 2012, with further regions to follow. The goal of full matrix certification should be achieved during 2013. The new method of coordinated certification has benefits for customers and Tecan alike: greater transparency; the possibility to systematically monitor processes worldwide; and harmonized, standardized systems that also accommodate differences in the markets. The matrix certificate results in con-siderable simplifications and increased safety compared to in-dividual certificates. TÜV Süd will verify the certification annu-ally with sample checks at different branch offices.
A customer also carried out a social compliance audit at Tecan for the first time in 2012. The international pharma company performed the audit at Tecan in collaboration with an external specialist. In response to the small number of deficiencies un-covered by the audit, Tecan rapidly initiated corrective meas-
ures, which were largely implemented during the year under review. Tecan is also aiming to obtain certification for compli-ance with social standards.
Tecan products must also satisfy the following important re-quirements, among many others: US QSR (Quality System Reg-ulation)/21 CFR 820, CMDCAS (Canadian Medical Device Con-formity Assessment System), JPAL (Japanese Pharmaceutical Affairs Law) and CCC (Chinese Compulsory Certification). New opportunities are developing for Tecan in emerging markets, which will place additional requirements on the Company.
Regulatory requirements are increasing around the world. To ensure that the current versions of these requirements are un-derstood and satisfied everywhere, Tecan is in constant contact with local organizations and authorities. Several online appli-cations provide Tecan’s technical staff with the necessary tech-nical support for managing product registrations and clarify-ing regulatory requirements in more than 60 countries.
Tecan has a central Quality & Regulatory organization at Group level to ensure ongoing improvements in the high quality stand-ards worldwide. In Europe, all of the quality systems of the na-tional subsidiaries and organizations have been harmonized and processes standardized, including sales, service and com-plaint processes, for example. Tecan operates a Central Com-plaint Unit for customer complaints.
Tecan performs a global management review every year in which relevant data from all Group companies are reviewed centrally. The process assesses whether quality management is still op-timized to the legal requirements and regulations for the prod-ucts and services supplied by Tecan. Tecan undertakes this re-view with regard to the individual national markets as well as from a Group-level perspective.
Tecan’s approach to product development is also characterized by an awareness of quality and regulatory requirements. Spe-cialists collaborate from an early stage, supporting the process in a series of structured stages that span the product’s entire life up to the point where it is withdrawn from the market.

42 Tecan Annual Report 2012 Sustainability
Environment
The Company attaches great importance to acting responsi-bly and in an environmentally friendly manner in the devel-opment, manufacture and global distribution of Tecan prod-ucts as well as in all services it provides. All Tecan production locations and the majority of suppliers are located in strin-gently regulated markets in Europe and the US, while a small portion operate in Asia. Direct suppliers are also subject to an audit program in order to ensure sustainable business. In the production process, Tecan focuses on the final assembly of a relatively small number of items of laboratory equipment. In comparison with companies with extensive production pro-cesses, Tecan therefore emits only very low levels of pollutants. For this reason, emission values such as CO2 are not measured. Tecan implemented numerous controls as part of the ISO 13485 certification, which applies to all production sites and sales subsidiaries. ISO 14001 certification has not been applied for as the production sites do not emit gases or other environ-mental pollutants. Nonetheless, Tecan attaches great impor-tance to using the most environmentally friendly materials and ecologically efficient processes. Employees receive regu-lar training and are familiar with the latest developments in this area. Tecan disposes of waste in accordance with the WEEE Directive1. It also supports the aims of the EU’s RoHS Directive2 on the prohibition of toxic, not readily biodegradable sub-stances in electrical and electronic devices. Tecan incorporated the RoHS requirements into product development from an early stage to comply with this directive, even though exemp-tions apply to in-vitro-diagnostics products for the time be-ing. Tecan also complies with this directive in its local form in emerging markets such as China. Through the reliable, robust and sustainable design of its products, Tecan continuously tar-gets progress in their environmental sustainability. The PULS program set up by the Company also includes targets and measures to avoid wasting materials and energy.
Tecan also makes its administrative processes as environmen-tally friendly as possible. For example, the Company is hold-ing more and more video conferences in order to reduce the number of flights. Customer service staff use tools that ena-ble completely paper-free processes. Tecan also pays attention
For innovations such as the Infinite F50 Reader, CO2 efficiency is a key criterion.
Environmental responsibilityEfficient use of resources
1 WEEE = Waste Electrical and Electronic Equipment2 RoHS = Restriction of Hazardous Substances

43Tecan Annual Report 2012
to modern, energy-efficient technology for the infrastructure of its buildings. For example, hot and cold water lines in the ceiling are the sole source of heating and cooling at Tecan’s corporate headquarters in Männedorf, Switzerland – the Com-pany’s largest location worldwide. Processed wastewater from the Männedorf wastewater treatment plant supplies the heat pumps with a source of energy.
For innovations such as the Infinite F50 Reader, CO2 efficiency is a key criterion. This Tecan product makes a sustainable con-tribution to the reduction of CO2 emissions. Compared to the previous model, the F50 Reader is around 65 % lighter and more compact. This results in reductions of almost 60% in CO2 emis-sions from transport of the product alone. Innovative LED lamps also reduce energy consumption by 50 % compared to previous components. The F50 Reader also meets the Chinese and EU RoHS Directives.
Employees
Tecan has a strong sense of responsibility for its employees, which is reflected in its personnel policies that are binding at all of its companies around the globe. National hiring rules en-sure compliance with laws on, for example, gender equality and non-discrimination. Both Tecan managers and employees are also held to strict ethical guidelines. These are firmly estab-lished in the Code of Conduct and form part of the training re-quirements for all employees.
Tecan employees appreciate especially the supportive environment and paths to personal growth.
Responsibility to employeesGood atmosphere in the workplace
Employees by region * in %
Switzerland 39 % Europe 30 % USA 23 % Asia-Pacific 8 %
Employees by activity ** in %
Manufacturing and logistic 18 % Sales and marketing 26 % Customer service 19 % Research and development 25 % General and administration 12 %
* in % of all employees
**in % of all FTEs
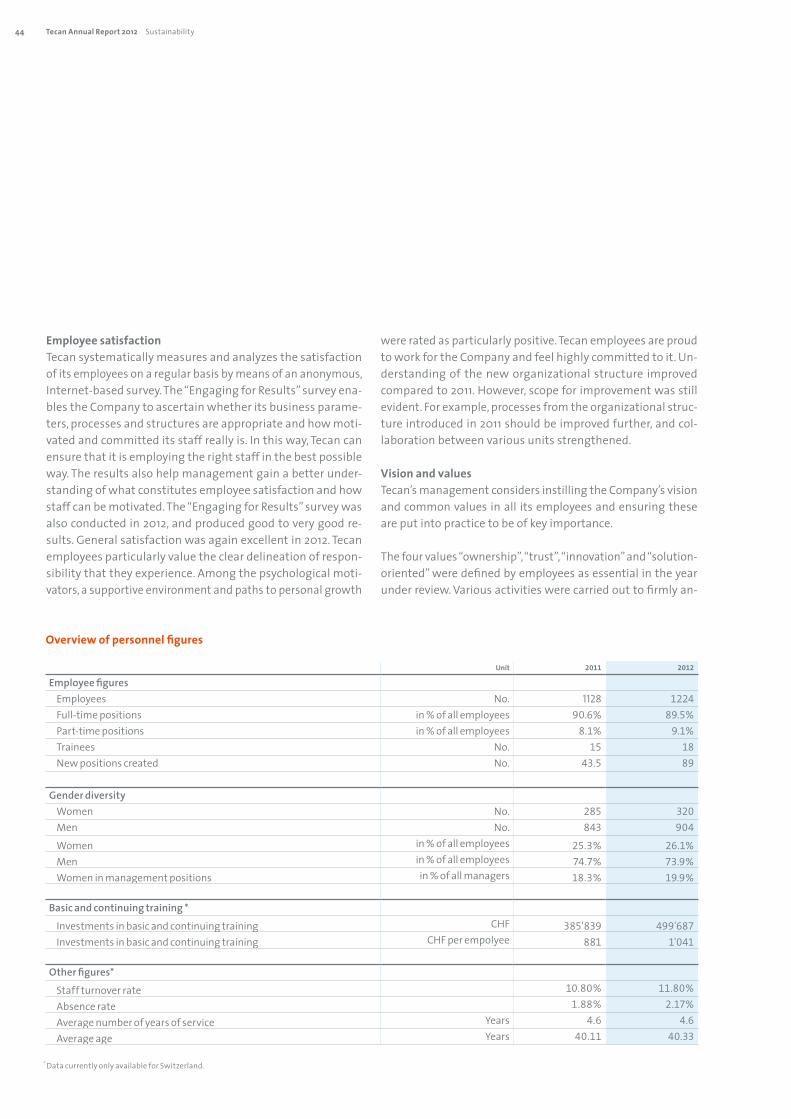
44 Tecan Annual Report 2012 Sustainability
Employee satisfactionTecan systematically measures and analyzes the satisfaction of its employees on a regular basis by means of an anonymous, Internet-based survey. The “Engaging for Results” survey ena-bles the Company to ascertain whether its business parame-ters, processes and structures are appropriate and how moti-vated and committed its staff really is. In this way, Tecan can ensure that it is employing the right staff in the best possible way. The results also help management gain a better under-standing of what constitutes employee satisfaction and how staff can be motivated. The “Engaging for Results” survey was also conducted in 2012, and produced good to very good re-sults. General satisfaction was again excellent in 2012. Tecan employees particularly value the clear delineation of respon-sibility that they experience. Among the psychological moti-vators, a supportive environment and paths to personal growth
were rated as particularly positive. Tecan employees are proud to work for the Company and feel highly committed to it. Un-derstanding of the new organizational structure improved compared to 2011. However, scope for improvement was still evident. For example, processes from the organizational struc-ture introduced in 2011 should be improved further, and col-laboration between various units strengthened.
Vision and valuesTecan’s management considers instilling the Company’s vision and common values in all its employees and ensuring these are put into practice to be of key importance.
The four values “ownership”, “trust”, “innovation” and “solution-oriented” were defined by employees as essential in the year under review. Various activities were carried out to firmly an-
Unit 2011 2012
Employee figuresEmployees No. 1128 1224Full-time positions in % of all employees 90.6% 89.5%Part-time positions in % of all employees 8.1% 9.1%Trainees No. 15 18New positions created No. 43.5 89
Gender diversityWomen No. 285 320Men No. 843 904
Women in % of all employees 25.3% 26.1%Men in % of all employees 74.7% 73.9%Women in management positions in % of all managers 18.3% 19.9%
Basic and continuing training *
Investments in basic and continuing training CHF 385'839 499'687Investments in basic and continuing training CHF per empolyee 881 1'041
Other figures*
Staff turnover rate 10.80% 11.80%
Absence rate 1.88% 2.17%
Average number of years of service Years 4.6 4.6
Average age Years 40.11 40.33
Overview of personnel figures
* Data currently only available for Switzerland.

45Tecan Annual Report 2012
Tecan attaches great importance to social responsibility and sup-ports projects serving the com-mon good at its various locations.
Social responsibilityProjects serving the common good
chor the values in the Company and the employees’ attitude to work. The four Tecan values are particularly important in ensuring the Company is a partner of choice for customers. “Ownership” is intended to ensure that employees take re-sponsibility, make decisions and complete their tasks respon-sibly. “Trust” lays the foundation for successful collaboration. It aims to ensure that employees are reliable and deal openly with others. “Innovation” is essential to the Company’s suc-cess and to ensure sustainable growth. This principle means that employees are able to contribute and implement specific value-generating ideas. “Solution-oriented” primarily refers to an attitude that all Tecan employees should adopt. It also aims to encourage staff to continually improve and develop them-selves. The vision “Tecan will be in every laboratory” seeks to make Tecan the preferred supplier for leading life science compa-nies and laboratories.
Tecan has a very cosmopolitan workforce comprising employ-ees from over 40 countries. The average age of Tecan employ-ees is around 40. The high degree of Company loyalty is re-flected in the staff turnover rate of under 12 %, and an absence rate of around 2 %. Tecan also created 89 new positions in the year under review. New hires were made in all areas, but mainly in research and development.
Basic and continuing trainingAt Tecan, ongoing professional and external basic and contin-uing training is a key requirement critical to business. Due to strict industry-specific requirements, Tecan puts tremendous efforts into training, as the Company has to meet the regula-tions and guidelines of various supervisory authorities and must also be able to demonstrate that its employees possess the required knowledge. Aided by an SAP-based system, Tecan ensures that training processes are being carried out ade-quately throughout the Company. Each individual employee receives a personalized training profile. This enables employ-ees and line managers to check and update the current train-ing status. It also ensures that information on training levels is available electronically at all times for audits. Tecan is work-ing continuously to develop and improve this learning system. It should provide an effective performance record and offer employees the best possible training opportunities.
The Te-Wiki is a tool available to Tecan employees for the pur-pose of exchanging information and experience. This platform includes general information describing Tecan products, as well as experiences of employees in sales and customer services from direct contact with customers. All Tecan employees can also benefit from the knowledge of their colleagues by asking questions or outlining issues via “tickets”.
In countries employing a dual education system, Tecan instructs trainees from various vocational and professional groups.
Social responsibility
Tecan offers a wide range of healthcare initiatives for its em-ployees including medical courses, vaccination programs and various sporting activities. The Company supports chronically ill employees, taking efforts to ensure they remain integrated in the workplace as far as possible.
Tecan attaches great importance to good cooperation with the people and authorities where it does business. The Company also supports projects serving the common good at its various locations.

46 Tecan Annual Report 2012 Corporate Governance
Major shareholdersAs at December 31, 2012, the following shareholders held more than 3 % of Tecan’s shares:
The Company does not have any cross-shareholdings exceeding 5 % of the capital or voting rights on both sides.
Corporate Governance
2011 2012
Aktien % Aktien %
Chase Nominees Ltd., London (UK) 1,546,910 13.5 % 1,546,910 13.5 %ING Groep N.V., Amsterdam (NL) 1,051,540 9.2 % 1,051,540 9.2 %UBS Fund Management (Switzerland) AG, Basel (CH) 584,374 5.1 % 584,374 5.1 %Pictet Funds SA, Geneva (CH) 573,325 5.0 % 573,325 5.0 %Tecan Group Ltd., Männedorf (CH) 639,631 5.6 % 572,134 4.9 %Credit Suisse Asset Management Funds AG, Zurich (CH) <3.0 % 368,034 3.2 %SUVA, Schweizerische Versicherungsgesellschaft, Lucerne (CH) 362,000 3.2 % 362,000 3.2 %Norges Bank (the Central Bank of Norway), Oslo (NO) 350,520 3.1 % 350,520 3.1 %TIAA-CREF Investment Management LLCC, New York (US) 1,197,637 10.5 % <3.0 %
Numbers of shares according to the most recent shareholder notifications to SIX; the percentages are adjusted to the actual share capital as at the end of the reporting period.
Information pursuant to the SIX Swiss Ex-change Directive on Information Relating to Corporate Governance.
1 Group structure and shareholders
Group structureTecan Group Ltd. (the Company), Seestrasse 103, 8708 Männedorf, Zurich, Switzerland, is the parent company of the Tecan Group.
The Company is listed on the SIX Swiss Exchange.
Symbol: TECNSecurity number: 1,210,019ISIN: CH0012100191Telekurs Financial: TECNBloomberg: TECN SWReuters: TECN.S
As at December 31, 2012, the Company’s market capitalization was CHF 834 million (shares outstanding). The list of consoli-dated subsidiaries, none of which is publicly listed, is presented in the financial section on page 122 of this Annual Report. The operational Group structure is based on a customer-oriented division into the business segments Life Sciences Business (end customers) and Partnering Business (OEM customers). The seg-ment reporting based on this structure is presented in the fi-nancial section on page 112 of this Annual Report.
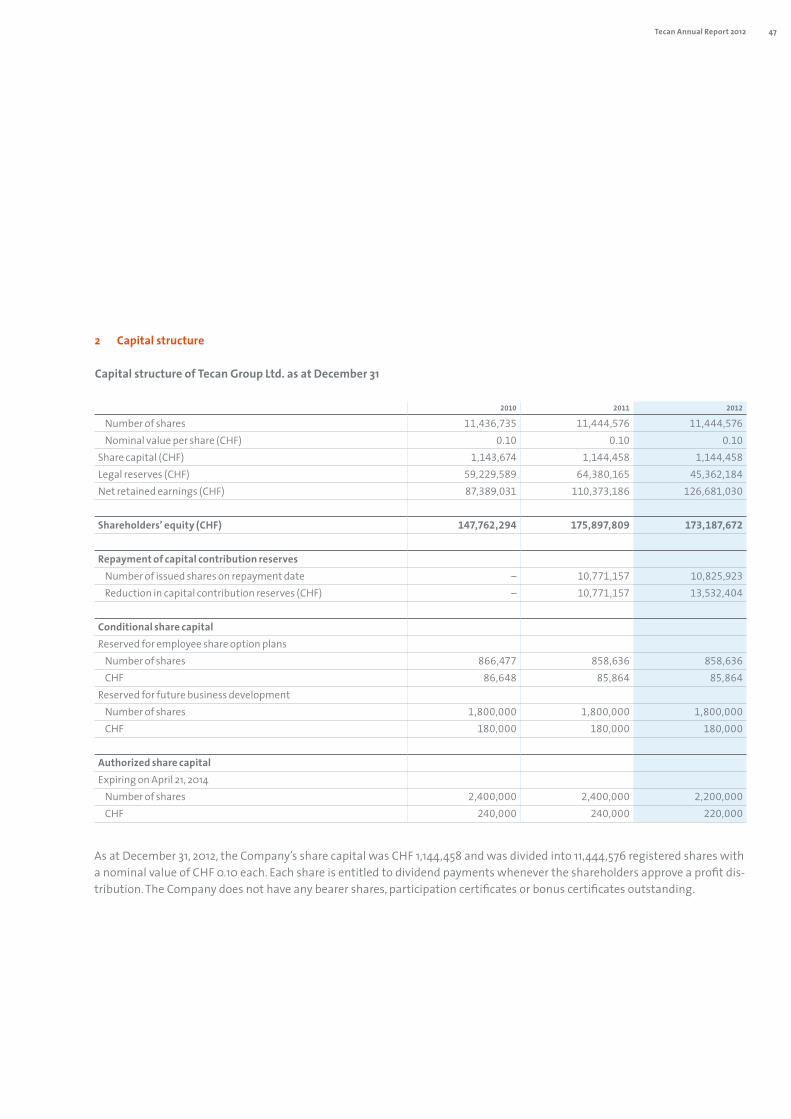
47Tecan Annual Report 2012
As at December 31, 2012, the Company’s share capital was CHF 1,144,458 and was divided into 11,444,576 registered shares with a nominal value of CHF 0.10 each. Each share is entitled to dividend payments whenever the shareholders approve a profit dis-tribution. The Company does not have any bearer shares, participation certificates or bonus certificates outstanding.
2 Capital structure
Capital structure of Tecan Group Ltd. as at December 31
2010 2011 2012
Number of shares 11,436,735 11,444,576 11,444,576 Nominal value per share (CHF) 0.10 0.10 0.10Share capital (CHF) 1,143,674 1,144,458 1,144,458Legal reserves (CHF) 59,229,589 64,380,165 45,362,184Net retained earnings (CHF) 87,389,031 110,373,186 126,681,030
Shareholders’ equity (CHF) 147,762,294 175,897,809 173,187,672
Repayment of capital contribution reserves Number of issued shares on repayment date – 10,771,157 10,825,923 Reduction in capital contribution reserves (CHF) – 10,771,157 13,532,404
Conditional share capitalReserved for employee share option plans
Number of shares 866,477 858,636 858,636 CHF 86,648 85,864 85,864Reserved for future business development
Number of shares 1,800,000 1,800,000 1,800,000 CHF 180,000 180,000 180,000
Authorized share capital Expiring on April 21, 2014
Number of shares 2,400,000 2,400,000 2,200,000 CHF 240,000 240,000 220,000

48 Tecan Annual Report 2012 Corporate Governance
Conditional share capital – changes in capital In 1997, the Company’s shareholders approved the creation of conditional share capital of CHF 1,300,000 (consisting of 1,300,000 registered shares with a nominal value of CHF 1.00 each) for the purpose of employee stock options. Several em-ployee stock option plans were adopted based on this condi-tional share capital. Details of these plans are given in the con-solidated financial statements under Note 14 “Employee benefits.” A total of 0 options were exercised in fiscal year 2012 (2011: 7,841 options; 2010: 24,145 options), increasing the Com-pany’s share capital by CHF 0 (2011: CHF 784; 2010: CHF 2,415) and decreasing the Company’s conditional capital by 0 shares (2011: 7,841 shares; 2010: 24,145 shares). As of December 31, 2012, 264,769 shares of the conditional share capital were reserved for outstanding employee stock options and 170,993 for out-standing employee shares in connection with the Performance Share Matching Plan (PSMP). These shares correspond to a share capital of CHF 43,576. On April 26, 2006, the sharehold-ers approved the creation of additional conditional share cap-ital. The Company’s share capital may be increased by a maxi-mum of CHF 180,000 through the issue of a maximum of 1,800,000 registered shares to be paid in full with a nominal value of CHF 0.10 each. This increase shall be achieved through the exercise of conversion or option rights granted in connec-tion with bonds or similar instruments issued by the Company or Group companies or through the exercise of option rights granted to shareholders. Shareholders’ pre-emptive rights are excluded. The acquisition of registered shares through the ex-ercise of conversion or option rights and any further transfer of registered shares is subject to the restrictions specified in Article 5 of the Articles of Incorporation. In the case of convert-ible bonds or warrant-linked bonds, the preferred subscription rights of the shareholders may be restricted or excluded by res-olution of the Board of Directors 1) in order to finance or refi-nance the acquisition of companies, parts of companies or eq-uity investments, or 2) to issue warrant-linked or convertible bonds on international capital markets. If preferred subscrip-tion rights are excluded, then 1) the bonds must be placed at market conditions; 2) the exercise period for warrants must be limited to five years and the exercise period for conversion rights must be limited to ten years from the date the bond was issued; and 3) the conversion or exercise price for the new shares must be set at least in line with the market conditions prevail-ing on the bond issue date.
Authorized share capitalOn April 26, 2006 (for the first time), and on April 21, 2012, the shareholders approved the creation of authorized share capi-tal, which authorizes the Board of Directors to increase the share capital at any time up to April 21, 2014, by a maximum of CHF 220,000 through the issue of not more than 2,200,000 registered shares to be paid in full with a nominal value of CHF 0.10. Increases by way of firm commitment underwriting as well as partial increases are permitted. The respective issue amount, the dividend entitlement date, the type of contribu-tions and potential acquisitions of tangible assets will be de-termined by the Board of Directors. Following acquisition, the new registered shares are subject to the restrictions specified in Article 5 of the Company’s Articles of Incorporation. The pre-emption rights of the shareholders may be restricted, excluded and allocated to third parties by resolution of the Board of Di-rectors if the new shares are intended to be used 1) to pay for the acquisition of companies, parts of companies or equity in-vestments; 2) to finance or re-finance the acquisition of com-panies, parts of companies or equity investments; or 3) for an international placement of shares. Shares for which subscrip-tion rights were granted but not exercised must be used by the Board of Directors in the interest of the Company. The Com-pany does not have convertible bonds or any options outstand-ing other than the aforementioned employee stock options.
Additional requirements to increase the share capital under the authorized and conditional share capital In order to improve corporate governance, some of the provi-sions in the Articles of Incorporation were amended in 2012. The new provisions require that the conditional capital for con-vertible bonds, warrant-linked bonds, similar securities or other financial market instruments shall be reduced if and to the ex-tent authorized capital is used, and that the authorized capi-tal shall be reduced if and to the extent new shares are created under the respective conditional capital. As a result of these two provisions, the total authorization will be reduced to ap-proximately 20 % of the share capital. Due to the existing em-ployee option and share programs, the possibility of creating employee shares and stock options is not affected by this change.
Entry in the share register and nominee regulationsRegistration of voting rights in the Company’s share register is conditional on shareholders declaring that they have ac-

49Tecan Annual Report 2012
quired the shares in their own name and for their own account. The Company’s Board of Directors may register nominees for not more than 2 % of the share capital as shareholders with voting rights in the share register. Nominees are shareholders who do not explicitly declare in the registration application that they hold the shares for their own account and with whom the Company has entered into a corresponding agreement. In addition, for shares in excess of 2 % of the share capital, the Board of Directors may register nominees with voting rights in the share register if such nominees disclose the names, ad-dresses, nationalities and shareholdings of those persons for whose account they hold 2 % or more of the share capital. Le-gal entities and companies that are linked to one another in terms of capital and voting power through uniform manage-ment or otherwise, as well as individuals, legal entities or com-panies coordinating their actions to circumvent the registra-tion limitations, are considered to be one person. The Board of Directors is entitled to grant exceptions to the registration lim-itations in special cases. No such exceptions were granted in the year under review. The procedures and conditions for cance-ling these limitations on transferability are described in sec-tion 6.
3 Board of Directors
Board of DirectorsBrief profiles of the members of the Board of Directors can be found on pages 50 and 51.
IndependenceAll the members of the Board of Directors are non-executive members. Gérard Vaillant served as acting CEO and was a mem-ber of the Management Board from February to October 2012. None of the other Board members was formerly a member of the management of Tecan Group or any Group company dur-ing the period under review or the three preceding periods.
Election, term of office, organization and responsibilitiesPursuant to the Company’s Articles of Incorporation, the Board of Directors is composed of a minimum of one and a maximum of seven members, who are elected for a term of one year. Ree-lection after the end of the term is permitted. The Board of Di-rectors is responsible for the ultimate supervision and man-agement of the Company, including the development of general
strategies and guidelines, and for all other duties that are non-transferable under applicable law. To the extent permitted by law and provided that there is no conflict with the Company’s Articles of Incorporation and the Organizational Regulations adopted by the Board of Directors, management of the Com-pany’s affairs is delegated to the Management Board pursu-ant to the Organizational Regulations. The Board of Directors meets as often as business matters require. The Board meets at least five times a year upon invitation of the Chairman or, in his absence, upon invitation of another Board member. Any member of the Board of Directors may call a meeting by spec-ifying the reasons for the meeting. The meetings usually last one whole day. As a general rule, the CEO and CFO attend the Board meetings in their entirety, and any other members of the Management Board or senior management invited by the Chairman attend for certain portions. Meetings may also be held by videoconference or by telephone. The Board of Direc-tors passes its resolutions by an absolute majority of votes of Board members present. In the event of a tie, the Chairman of the Board has the deciding vote. Resolutions may be passed by postal vote unless a member requests oral deliberation. Five full-day Board meetings and two extended conference calls were held in the year under review. Four meetings of the Au-dit Committee lasting about four hours each were also held. In addition, there were three meetings of the Compensation Committee and two conference call meetings of the Nomina-tion and Governance Committee.

50 Tecan Annual Report 2012 Corporate Governance
Dr. Oliver Fetzer
Chairman of the Compensation Committee Since 2011, elected until 2013 1964 US citizen, MBA, Carnegie Mellon University, Pittsburgh, USA, Ph.D. Pharmaceutical Sciences (Major: Medicinal Chemistry), Medical University of South Carolina, USA Professional background: 1993 to 2002 The Boston Consulting Group, USA, between 2000 and 2002 Managing Director and Partner; 2002 to 2007 Cubist Pharmaceuticals USA, various management positions, including Senior Vice President, Corporate Develop-ment and Research and Develop-ment; 2007 to 2008 Sabbatical; since 2009 President and Chief Executive Officer, member of the Board of Directors of Cerulean Pharma Inc., USA. Other activities: Auxilium Pharmaceuticals, USA, member of the Board
Rolf A. Classon Chairman of the Board Chairman of the Nomination and Governance Committee Since 2009, elected until 2013 1945 Swedish citizen, Chemical Engineer; Gothenburg School of Engineering, Pol. Mag. University of Gothenburg Professional background: 1969 to 1974 Pharmacia AB, Director, Organization Develop-ment; 1974 to 1978 Asbjorn Habberstad AB, Consultant; 1979 to 1984 Pharmacia AB Hospital Products Division, President; 1984 to 1990 Pharmacia Devel-opment Company, Inc., President; 1990 to 1991 Pharmacia Biosys-tems AB, President and COO; 1991 to 1995 Bayer Diagnostics, Executive Vice President; 1995 to 2002 Bayer Diagnostics, Presi-dent; 2002 to 2004 Bayer Health Care, CEO and Chairman of the Executive Committee; 2005 to 2006 Hillenbrand Industries, interim President and CEO. Other activities: Auxilium Pharmaceuticals, USA, Non-executive Chairman; Hill-Rom Holdings, USA, Non- executive Chairman; Fresenius Medical Care AG, Germany, member of the Board
Heinrich Fischer
Vice Chairman of the Board Chairman of the Audit Committee Since 2007, elected until 2013 1950 Swiss citizen, Master of Applied Physics & Electrical Engineering (ETH Zurich), MBA (University of Zurich) Professional background: Four years R&D in electronics (ETH Zurich, IBM); 1980 to 1990 Director of Staff Technology and Executive Vice President, Balzers Division of Oerlikon-Bührle Group; 1991 to 1996 Executive Vice President, Corporate Development, Oerlikon-Bührle Group; 1994 to 2005 Co-founder and Chairman of ISE (Integrated Systems Engineering); 1996 to 2007 Delegate of the Board and Chief Executive Officer, Saurer Group. Since 2007 DiamondScull AG, owner and Chairman of the Board. Other activities: Orell Füssli Holding AG, Chair-man of the Board; Schweiter AG, member of the Board; Hilti AG, member of the Board; CAMOX Fund, member of the Board; Zhoulang Textile Machinery Ltd, China, Chairman of the Board; Sensirion Holding AG, member of the Board
Board of Directors
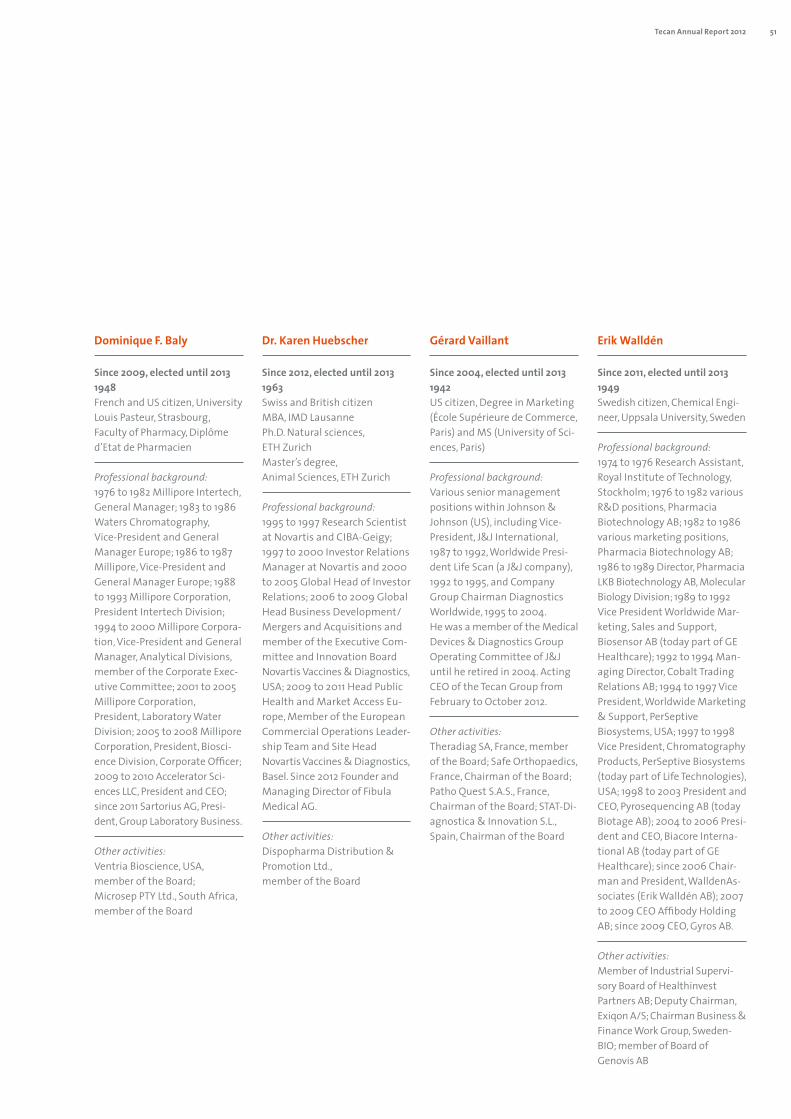
51Tecan Annual Report 2012
Dr. Karen Huebscher
Since 2012, elected until 2013 1963 Swiss and British citizen MBA, IMD Lausanne Ph.D. Natural sciences, ETH Zurich Master’s degree, Animal Sciences, ETH Zurich Professional background: 1995 to 1997 Research Scientist at Novartis and CIBA-Geigy; 1997 to 2000 Investor Relations Manager at Novartis and 2000 to 2005 Global Head of Investor Relations; 2006 to 2009 Global Head Business Development/Mergers and Acquisitions and member of the Executive Com-mittee and Innovation Board Novartis Vaccines & Diagnostics, USA; 2009 to 2011 Head Public Health and Market Access Eu-rope, Member of the European Commercial Operations Leader-ship Team and Site Head Novartis Vaccines & Diagnostics, Basel. Since 2012 Founder and Managing Director of Fibula Medical AG. Other activities: Dispopharma Distribution & Promotion Ltd., member of the Board
Dominique F. Baly
Since 2009, elected until 2013 1948 French and US citizen, University Louis Pasteur, Strasbourg, Faculty of Pharmacy, Diplôme d’Etat de Pharmacien Professional background: 1976 to 1982 Millipore Intertech, General Manager; 1983 to 1986 Waters Chromatography, Vice-President and General Manager Europe; 1986 to 1987 Millipore, Vice-President and General Manager Europe; 1988 to 1993 Millipore Corporation, President Intertech Division; 1994 to 2000 Millipore Corpora-tion, Vice-President and General Manager, Analytical Divisions, member of the Corporate Exec-utive Committee; 2001 to 2005 Millipore Corporation, President, Laboratory Water Division; 2005 to 2008 Millipore Corporation, President, Biosci-ence Division, Corporate Officer; 2009 to 2010 Accelerator Sci-ences LLC, President and CEO; since 2011 Sartorius AG, Presi-dent, Group Laboratory Business. Other activities: Ventria Bioscience, USA, member of the Board; Microsep PTY Ltd., South Africa, member of the Board
Gérard Vaillant
Since 2004, elected until 2013 1942 US citizen, Degree in Marketing (École Supérieure de Commerce, Paris) and MS (University of Sci-ences, Paris) Professional background: Various senior management positions within Johnson & Johnson (US), including Vice-President, J&J International, 1987 to 1992, Worldwide Presi-dent Life Scan (a J&J company), 1992 to 1995, and Company Group Chairman Diagnostics Worldwide, 1995 to 2004. He was a member of the Medical Devices & Diagnostics Group Operating Committee of J&J until he retired in 2004. Acting CEO of the Tecan Group from February to October 2012. Other activities: Theradiag SA, France, member of the Board; Safe Orthopaedics, France, Chairman of the Board; Patho Quest S.A.S., France, Chairman of the Board; STAT-Di-agnostica & Innovation S.L., Spain, Chairman of the Board
Erik Walldén
Since 2011, elected until 2013 1949 Swedish citizen, Chemical Engi-neer, Uppsala University, Sweden Professional background: 1974 to 1976 Research Assistant, Royal Institute of Technology, Stockholm; 1976 to 1982 various R&D positions, Pharmacia Biotechnology AB; 1982 to 1986 various marketing positions, Pharmacia Biotechnology AB; 1986 to 1989 Director, Pharmacia LKB Biotechnology AB, Molecular Biology Division; 1989 to 1992 Vice President Worldwide Mar-keting, Sales and Support, Biosensor AB (today part of GE Healthcare); 1992 to 1994 Man-aging Director, Cobalt Trading Relations AB; 1994 to 1997 Vice President, Worldwide Marketing & Support, PerSeptive Biosystems, USA; 1997 to 1998 Vice President, Chromatography Products, PerSeptive Biosystems (today part of Life Technologies), USA; 1998 to 2003 President and CEO, Pyrosequencing AB (today Biotage AB); 2004 to 2006 Presi-dent and CEO, Biacore Interna-tional AB (today part of GE Healthcare); since 2006 Chair-man and President, WalldenAs-sociates (Erik Walldén AB); 2007 to 2009 CEO Affibody Holding AB; since 2009 CEO, Gyros AB. Other activities: Member of Industrial Supervi-sory Board of Healthinvest Partners AB; Deputy Chairman, Exiqon A/S; Chairman Business & Finance Work Group, Sweden-BIO; member of Board of Genovis AB

52 Tecan Annual Report 2012 Corporate Governance
CommitteesThe Board of Directors may appoint committees composed of members of the Board to prepare and implement its resolu-tions and to exercise its supervisory function. The committees meet upon invitation of the respective chairman and as often as business requires, but at least twice a year. The committee meetings usually last between two and three hours. Commit-tee resolutions and proposals for consideration by the entire Board of Directors are passed by a majority of votes cast, pro-vided that there is a quorum of at least two committee mem-bers present. Resolutions may also be passed by postal vote. The Board of Directors has established three committees that are composed as follows:
Audit CommitteeThe Audit Committee is composed of at least two members. The Committee’s principal duties and responsibilities are to form an opinion regarding internal and external audits and to monitor cooperation between the external statutory auditors and the Company; to assess the quality of internal audits and compliance; to review the annual financial statements (both consolidated and single-entity) and interim financial state-ments destined for publication and report on them to the full Board of Directors; to make recommendations to the full Board of Directors, especially with regard to the approval of annual and interim financial statements; and to monitor the inde-pendence, performance and fees of the statutory auditors and propose that they be appointed or reappointed by vote of the Annual General Meeting. Representatives of the external stat-utory auditors and the internal auditor may attend meetings of this Committee at the invitation of the Chairman.
Compensation CommitteeThe majority of members of the Compensation Committee must be non-executive and independent members of the Board of Directors. The principal duties and responsibilities of the Compensation Committee are to submit proposals to the full Board of Directors regarding the amount and type of remuner-ation for the members of the Board of Directors, the CEO and the other members of senior management. The Compensation Committee reviews reports on salary structure and trends, and monitors the disclosure requirements pertaining to compen-sation for senior management and the Board of Directors.
Nomination and Governance Committee The majority of members of the Nomination and Governance Committee must be independent and non-executive members of the Board of Directors. The Committee consists of three members. It is chaired by the Chairman of the Board. The other members are the chairmen of the Audit Committee and the Compensation Committee. The most important duties of this Committee include succession planning at the level of the
Audit Committee Compensation Committee
Nomination and Governance Committee
Rolf Classon Chairman Heinrich Fischer Chairman Member Gérard VaillantDr. Oliver Fetzer Chairman MemberErik Walldén Member Dominique F. Baly Member Karen Hübscher Member

53Tecan Annual Report 2012
Board of Directors and the Management Board; defining the selection criteria for members of the Board of Directors and the Management Board; and regular review of the performance of the Board of Directors, its committees and its individual members based on a defined evaluation plan. This Committee is also charged with monitoring risk management and corpo-rate governance.
Information and control instrumentsThe members of the Management Board are actively involved in the various committees of the Board of Directors. The CEO, CFO, the internal auditors and sometimes the external statu-tory auditors attend the meetings of the Audit Committee, for example. In addition, members of the Management Board meet with individual Board members on an ad hoc basis to discuss and delve more deeply into specific topics. The Board of Directors receives monthly reports from the Group’s management information system so that it can monitor finan-cial and operational performance. All relevant guidelines are presented to the Board of Directors or the appropriate com-mittees for approval to ensure shared responsibility for all ma-jor decisions.
Internal Audit: Tecan has had its own internal audit department since 2007. Since the internal auditors report to the Audit Com-mittee, their independence is assured. All companies are audited every three years on the basis of a risk analysis. The annual au-dit plan consists of audits of all major companies and is approved by the Audit Committee. A summary of significant findings and recommendations is submitted directly to the Audit Commit-tee with copies to the CEO and CFO. The reports are also made available to the external statutory auditors. During the year un-der review, Internal Audit focused its efforts on strengthening the internal control system for financial reporting. Other areas audited include compliance with laws and standards, and the efficiency and effectiveness of business processes. Additional information on risk management is given in Note 29 to the con-solidated financial statements.
4 Management
Management BoardInformation on the members of the Management Board can be found on pages 54 and 55.
Management contractsNo agreements between the Company and third parties that are not part of the Tecan Group were entered into or renewed in the year under review for the purpose of delegating man-agement responsibilities.
5 Content and method of determining compensation and stock option plans
For more information on compensation and stock option plans, please refer to the Compensation Report on pages 58 to 65.

54 Tecan Annual Report 2012 Corporate Governance
Management Board
Dr. David Martyr
Since 10/2012 CEO of Tecan 1957 British citizen B.Sc. and doctorate in Engineer-ing (University of Newcastle-upon-Tyne, United Kingdom) Professional background: 1984 to 1988 sales and market-ing management positions at Ferranti plc; 1989 to 1998 vari-ety of management and sales-related positions at Lumonics Inc., including Managing Direc-tor Europe; 1998 to 2007 vari-ous senior management and professional positions at Leica Microsystems, including Execu-tive Vice President Worldwide Sales and Marketing and Man-aging Director Europe; 2009 to 2011 Group Executive and Vice President of Danaher Corpora-tion (NYSE: DHR), the share-holder of Leica Microsystems Group, overseeing the develop-ment of Danaher’s Life Sciences businesses; 2007 to 2011 Group President of Leica Microsystems Group with full responsibility for Leica Microsystems, Leica Bi-osystems and Invetech. Other activities: None
Dr. Rudolf Eugster
Chief Financial Officer of the Tecan Group Member since 2002 Joined Tecan in 2002 1965 Swiss citizen, Degree in Chemistry (ETH Zurich), PhD in Technical Science (ETH Zurich), Postgraduate degree in Business Administration (ETH Zurich) Professional background: 1993 to 1994 Strategic planning/controlling at Novartis; 1994 to 2002 several positions at Von Roll, the last of which was CFO of Isola Composites, a joint venture between Von Roll and Isola AG. Other activities: None
Dr. Martin Brusdeilins
Executive Vice President Head Development & Operations and Chief Science Officer Member since 2011 Joined Tecan in 2011 1952 German citizen, Dr. rer. nat. in Biochemistry (equiv. Ph.D., University of Tübingen and Max Planck Institute for Biology in Tübingen, Germany) Professional background: 1982 to 1984 research assistant at Robert Bosch Hospital, Insti-tute for Clinical Pharmacology, Stuttgart; 1985 to 2003 various management and professional positions at Roche Diagnostics in Europe and the US, including Vice President Research & De-velopment Near Patient Testing and Vice President and General Manager Business Unit Labora-tory Systems, Roche Diagnos-tics USA, several senior posi-tions at Boehringer Mannheim GmbH (acquired by Roche Di-agnostics in 1998), including Senior Vice President Global Marketing & Technology Man-agement, Senior Vice President Global Marketing Laboratory Diagnostics, Vice President Pro-ject Management Laboratory Diagnostics and Vice President System Development; 2003 to 2011 Vice President Product De-velopment and Vice President Research & Development, Or-tho-Clinical Diagnostics Inc., in Rochester, NY, USA. Other activities: None

55Tecan Annual Report 2012
Andreas Wilhelm
Executive Vice President General Counsel and Secretary of the Board of Directors of Tecan Group Ltd. Member since 2012, joining Tecan in 2004 1969 Swiss citizen Studies of law (University Berne, Switzerland), Postgraduate studies, Master of Law Program (Boston University, USA), Admitted to the Swiss Bar Professional background: 1993 Judicial Clerk at District Court of Nidau; 1994 to 1995 Le-gal Internship at Notter&Partner in Berne; 1996 to 1999 attorney-at-law at Grüninger Hunziker Roth Rechtsanwälte in Berne; 2000 to 2004 attorney-at-law at Bär & Karrer in Zurich; since 2004 Head Legal Affairs and Secretary of the Board of Directors of Tecan Group Ltd. Other activities: None
Markus Schmid
Executive Vice President Head of Corporate Human Resources & Internal Communications Member since 2011 Joined Tecan in 2011 1968 Swiss citizen, teacher, Master in Psychology and Journalism (University of Freiburg, Switzerland) Professional background: 1990 to 1993 consultant for oc-cupational pension funds at an insurance company; 1994 to 1998 teacher and instructor at various educational levels, vari-ous consulting positions; 1998 to 2011 partner and operations manager, MANRES AG, Zurich. Other activities: None
Members who left Tecan
Thomas Bachmann
Until February 2012, Chief Executive OfficerMember from 2005 until February 2012With Tecan from 2005 until February 2012
Dr. Bernhard Grob
Until January 2013, Head of Division Partnering BusinessMember from 2011 until January 2013 With Tecan from 2010 until January 2013
Frederic Vanderhaegen
Until May 2012, Head of Division Life Sciences Business Member from 2008 until May 2012With Tecan from 2008 until May 2012

56 Tecan Annual Report 2012 Corporate Governance
6 Shareholders’ participation rights
Each share entitles the bearer to one vote. Shareholders may only be represented at the Annual General Meeting by their le-gal representative, another shareholder with voting rights, the independent proxy, the Company-appointed proxy or a proxy appointed by a custodial institution. Proxy representation re-quires a written power of attorney that is only valid for the meeting for which it is issued. Article 13 paragraph 2 of the Company’s Articles of Incorporation stipulates the matters for which a majority greater than that prescribed by law is required in order to pass a shareholders’ resolution, namely a qualified majority of at least two-thirds of the votes represented and an absolute majority of the nominal stock value represented.
The types of transaction covered by this provision are as follows: • The conversion of registered shares into bearer shares; • The cancelation or modification of transferability restrictions
(Article 5 of the Articles of Incorporation); • The dissolution and liquidation of the Company and the re-
moval of Article 13 paragraph 2 itself from the Articles of In-corporation, and the elimination or modification of the quo-rum specified in this provision.
Shareholders who together hold shares of at least 1 % of the share capital may request in writing no later than 56 days prior to a General Meeting that a specific item be included on the agenda. Shareholders who together represent at least 10 % of the share capital may request that a General Meeting be con-vened. Shareholders registered as having voting rights are in-formed by mail of the convening of a General Meeting at least 20 days prior to the meeting. The notice is also published in the Swiss Official Gazette of Commerce. As a rule, the share register is closed for new entries from around ten days before the day of the Annual General Meeting until the day of the An-nual General Meeting.
7 Change of control and defense measures
The Company’s Articles of Incorporation do not contain any rules on opting-out or opting-up in order to cancel or restrict the obligation to submit an offer pursuant to the Federal Act on Stock Exchanges and Securities Trading. One-third of the options that were issued from 2007 to 2012 in conjunction with ESOP (for details see consolidated financial statements, Note 14.4 “Share-based payment”) vest each year (vesting period). During this vesting period, these options generally cannot be exercised. When there is a change of control, these options vest immediately and may be exercised immediately (accelerated vesting period). In the event of a change of control, the three-year blocking period for the shares allotted under PSMP will be lifted (see “Stock option plans” above). There are otherwise no change-of-control clauses included in agreements or com-pensation plans that benefit members of the Board of Direc-tors, the Company’s Management Board, or the Tecan Group.
8 Statutory auditors
Date on which KPMG AG took over the existing auditing mandate
May 28, 1997
Date on which the lead auditor took up his position 2011
Fees paid
CHF 1,000 2011 2012
Total auditing fees 557 596Total tax consulting fees (KPMG) 60 69Total other consulting fees (KPMG) 19 1
The auditors are appointed by vote of the Annual General Meet-ing of Shareholders for a one-year term. The external audit has been reviewed by the Audit Committee since 2003. The audi-tors attend the meetings of the Audit Committee at which the
57Tecan Annual Report 2012
annual and semi-annual financial statements are discussed and preparations are made for approval by the Board of Direc-tors. The auditors report on the audit focus and summarize the audit findings. The auditors submit recommendations regard-ing the scope of the audit and its focus for the upcoming au-dit period. At year’s end, the Audit Committee reviews the per-formance of the auditors as well as the audit costs and submits a proposal to the Board of Directors regarding reappointment of the auditors. As a rule, the Company issues a new request for audit proposals every four years. The lead auditor must be changed every seven years.
9 Information policy
Tecan informs shareholders and the financial community on a continuous basis about significant developments in the Com-pany’s business operations. This policy is implemented primar-ily through regular press releases, interim and annual reports, and information provided on the Company’s website (www. tecan.com). In addition, the Company gives regular presenta-tions to institutional investors at its headquarters and at sev-eral conferences, and holds numerous individual and group meet-ings with members of the international financial community. Company publications are available in printed form on request. They can also be downloaded from the Tecan website.
Important dates for investors
Date Location Event
March 7, 2013 Zurich Full Year Results 2012, Press Briefing on Annual Results and Analysts’ Conference
April 17, 2013 Zurich Annual General MeetingAugust 14, 2013 Conference Call
with WebcastHalf Year Results 2013
For mail or phone inquiries, please contact:
Tecan Group Ltd.Martin BrändleHead of Corporate Communications & Investor RelationsSeestrasse 1038708 MännedorfSwitzerlandT+41 (0)44 922 84 30F+41 (0)44 922 88 [email protected]
58 Tecan Annual Report 2012 Compensation Report
Compensation Report
This Compensation Report sets out the compensation system and the compen-sation paid to the members of the Board of Directors and the Management Board of Tecan Group Ltd. It will be put to the Annual General Meeting on April 17, 2013, for an advisory vote. The report is based on Section 5 of the Annex to the SIX Swiss Exchange Directive on Information Relat-ing to Corporate Governance.
Policies
The Tecan Group has a set of uniform compensation policies, which are systematic, transparent and have a long-term focus. Compensation is determined on the basis of four factors: the Company’s success, individual performance, function and the labor market. The ultimate goal of the compensation system is to attract highly qualified and motivated specialists and man-agers to join the Company and commit to it for the long term, and to reconcile the interests of employees and shareholders. The variable performance component is a complementary man-agement tool designed to promote the achievement of over-riding objectives. In addition, the Performance Share Match-ing Plan (PSMP) – the share plan in place for all members of the Board of Directors (since 2011) and the Management Board (since 2010) – guarantees direct financial participation in the long-term performance of Tecan shares. The amount and com-position of the compensation paid to both the Board of Direc-tors and the Management Board is assessed and determined by the Compensation Committee. In the year under review, the Committee, whose members are appointed by the Board of Di-rectors, comprised Oliver Fetzer (Chairman) and Dominique F. Baly (member). The Chairman of the Board of Directors, Rolf Classon, attends the Committee’s meetings whenever possi-ble but does not have voting rights. The CEO, CFO and Corpo-rate Head of Human Resources participate in the meetings reg-
ularly in an advisory capacity. They do not take part in discussions on agenda items concerning the Board of Directors or them-selves. Minutes are kept of the meetings. The Compensation Committee proposes motions to the Board of Directors, which in turn must approve the HR and salary policies for the entire Group as well as the general conditions of employment for the members of the Management Board.
The Board of Directors reviews the target achievement of the CEO and of all members of the Management Board and de-fines the actual bonus to be paid. The Compensation Commit-tee defines the compensation amounts to be paid to the mem-bers of the Management Board. The amount and type of remuneration to be paid to the Board of Directors are reviewed annually by the Compensation Committee and must be ap-proved by the full Board of Directors. All employees of Tecan Group go through a formalized target and performance review process, which generally takes place at least once a year shortly after the end of the fiscal year. This process forms the basis for the calculation of individual employees’ performance-based remuneration for the previous year. It also ensures consistent objectives are set across the Group for the fiscal year which has just begun, and promotes the development of both indi-vidual employees and the Group. Personal objectives are de-fined in the performance review process as part of an individ-ual meeting with the employee’s supervisor.
In 2012, a comparison was made of the salaries of the Manage-ment Board members. This included, for example, a compari-son of the compensation paid at Tecan with that of other Swiss companies with sales figures ranging from half to twice those of Tecan. Overall, the total compensation paid to the Manage-ment Board members is in line with that of the Swiss reference companies. Looking at the composition of total compensation, the results also show that long-term remuneration at Tecan is above the average and the cash component below the aver-age in comparison with the reference companies.

59Tecan Annual Report 2012
The system
The remuneration system for the Management Board of Tecan Group Ltd. is based on three central pillars: a fixed cash com-ponent (fixed or base salary), a variable cash component (bo-nus) and a variable long-term share plan (Performance Share Matching Plan). For senior management (excluding members of the Management Board) at the Tecan Group, the third pillar consists not of a share plan but a performance-based option plan. The remuneration system for middle management is com-posed of two pillars: a base salary (fixed or base salary) and a variable component (bonus) based on the performance review. In addition, exceptional achievements may be rewarded with single premiums in the form of options. Employees are paid a fixed salary and individual, performance-based, single premi-ums paid out periodically in cash.
Cash compensation
The management compensation structure is based on the Var-iable Pay Regulations, which have been approved by the Board of Directors. These provide for the definition of a target salary. For the members of the Management Board, this consists of a fixed or basic salary (70 % of the target salary) and a variable component (30 % of the target salary). In the case of the CEO, the fixed or basic salary accounts for 60 % and the variable component 40 % of the target salary. The amount of the vari-able component is based on the degree to which the follow-ing targets are met: firstly, the Company’s financial targets and secondly, individual quantitative and qualitative targets. The financial targets (sales and EBIT) are set annually by the Board of Directors in December for the following year. The distribu-tion of the variable component differs depending on function and management responsibility. For senior management, Group targets account for the majority of the variable component (up to 80 %), whereas at lower management levels the percentage share falls to 20 %. If the target achievement for the quantita-tive objectives defined by the Board of Directors in the previ-ous year is less than 80 %, no variable component is paid for these objectives. If the targets are exceeded, the maximum amount of the variable component is 200%. In 2012, results at Group level fell short of the financial targets.
Employee participation plans
In addition to cash compensation, the members of the Board of Directors and the Management Board participated in the Performance Share Matching Plan in the year under review. This share plan is a long-term incentive program which involves the allotment of registered shares in Tecan Group Ltd. to the members of the Board of Directors, the Management Board and the extended Management Board. When the share plan was launched, the previous allotment value under the option plans in place until 2009 was taken as the basis for the initial grant of shares. The shares are blocked for three years from the allotment date, and must be returned on a pro rata basis in the event of termination by the employee before expiration of the three-year period. The variable cash component is also tied to this long-term incentive program: If the variable component of the bonus paid to the Management Board and the extended Management Board exceeds 100 % of the target bonus based on the achievement of the Company’s financial objectives, then the portion in excess of 100 % is also allocated in the form of shares (the number of shares allocated to the Board of Direc-tors remains unchanged). In addition, a claim for allotment of additional shares (called matching shares) will exist if specific financial targets based on an economic profit of the Tecan Group are reached three years after the allotment of shares. This ensures that the Company’s shareholders also benefit as the value of the Company increases. The economic profit tar-get is based on sales growth and EBIT targets that were com-pared with companies in the life science sector that are also active globally in the instrument business. The factor used to calculate this matching share portion for the Management Board is between 0 and 2.5, depending on the degree to which the economic profit target is attained. For the Board of Direc-tors, the matching factor has been set at 50 % of that applied for the Management Board (i.e. between 0 and 1.25). This means that a member of the Management Board will be able to claim a maximum of 2.5 matching shares per originally allotted share. Under the same conditions, the maximum matching share fac-tor for a member of the Board of Directors will be 1.25. A ma-trix formula incorporating the two components of sales growth in Swiss francs and EBIT margin has been devised for the cal-culation of the matching share factor provided that a certain

60 Tecan Annual Report 2012 Compensation Report
capital turnover is reached. The two parameters are linked, i.e. in order to achieve a specific factor in the case of low growth, the EBIT margin has to be higher. Likewise, if the EBIT margin is low then high growth must be generated. The sales growth component has been given a higher weighting, and accounts for two-thirds for the purposes of calculating the matching share factor.
The size of the initial allotment of PSMP shares is approved an-nually by the Board of Directors based on a proposal by the Compensation Committee. In 2012, the members of the Man-agement Board on average received an initial allotment of 17 % of the total remuneration.
Termination benefitsMembers of the Board of Directors and the Management Board have no contractual entitlement to termination benefits.

61Tecan Annual Report 2012
CHF 1,000
Year Fixed fee
Committee fee
Total cash
compensation
Social benefits1
PSMP: Initial shares
granted (number)2
Fair value of initial
shares3
PSMP: Total matching shares
granted (number)4
Fair value of matching shares PSMP
2011 earned in period5/6
Fair value of matching shares PSMP
2012 earned in period5/7
Total compen
sation
Rolf Classon (Chairman)
2011 150 18 168 13 808 45 1,010 13 – 239 2012 150 18 168 – 739 44 924 4 16 232
Heinrich Fischer (Vice Chairman)
2011 85 20 105 8 404 23 505 6 – 142 2012 85 20 105 8 370 22 463 2 8 145
Dominique F. Baly 2011 75 20 95 8 404 23 505 6 – 132 2012 75 20 95 9 370 22 463 2 8 136
Dr. Oliver S. Fetzer(since April 2011)
2011 50 13 63 6 404 23 505 6 – 98 2012 75 27 102 – 370 22 463 2 8 134
Dr. Karen Hübscher (since April 2012)
2011 – – – – – – – – – – 2012 50 7 57 5 370 22 463 – 8 92
Gérard Vaillant 2011 75 20 95 7 404 23 505 6 – 131 2012 75 13 88 8 370 22 463 2 8 128
Erik Walldén (since April 2011)
2011 50 7 57 5 404 23 505 6 – 91 2012 75 10 85 8 370 22 463 2 8 125
Dr. Lukas Braunschweiler (until April 2012)
2011 75 20 95 8 404 23 505 6 – 132 2012 25 7 32 2 – – – 2 – 36
Dr. Jürg Meier (until April 2011)
2011 25 3 28 2 – – – – – 30 2012 – – – – – – – – – –
Prof. Dr. Peter Ryser (until April 2011)
2011 25 3 28 2 – – – – – 30 2012 – – – – – – – – – –
Total 2011 610 124 734 59 3,232 183 4,040 49 – 1,025 2012 610 122 732 40 2,959 176 3,702 16 64 1,028
1 Employer’s contribution to social security including social security on share options exercised and shares transferred during the reporting period.2 Vesting conditions: Graded vesting from May 1, 2011 to April 30, 2014 (PSMP 2011) and May 1, 2012 to April 30, 2015 (PSMP 2012). Vested shares are blocked until the end of the performance
period (April 30, 2014 and 2015 respectively). The shares are fully included in the amount of fair value of initial shares.3 Formula for 2011: Shares granted in 2011 * fair value at grant (CHF 61.95) * [1 - estimated labor turnover rate (10%)] and formula for 2012: Shares granted in 2012 * fair value at grant (CHF
65.75) * [1 - estimated labor turnover rate (10%)]4 Vesting conditions: Three years of service and performance target. The terms and conditions are disclosed in note 14.4.2 of the consolidated financial statements.5 The matching shares granted represent the maximum of potential shares granted in connection with Performance Share Matching Plans (PSMP). Due to the performance target, only a
pro rata amount of the potential matching shares granted is included in the fair value of matching shares earned in the period. Fair values of matching shares earned in future periods will be reported in future total compensation amounts with true-ups for fluctuation, matching share factor and share price.
6 Formula for 2011: {initial shares granted in 2011, that qualify for matching shares [total 3,232 shares] * estimated matching share factor of 1.12} * individual service period pro rata * share price at year-end 2011 [CHF 63.50] = fair value of matching shares PSMP 2011 earned in period 2011; and formula for 2012: {initial shares granted in 2011, that qualify for matching shares [total 3,232 shares] * estimated matching share factor of 0.18} * individual service period pro rata * share price at year-end 2012 [CHF 76.50] = fair value of matching shares PSMP 2011 earned in period 2012.
7 Formula for 2012: {initial shares granted in 2012, that qualify for matching shares [total 2,959 shares] * estimated matching share factor of 1.25} * individual service period pro rata * share price at year-end 2012 [CHF 76.50] = fair value of matching shares PSMP 2012 earned in period 2012.
Compensation and loans granted to members of the Board of Directors and Management Board
Compensation to the Board of Directors
Gérard Vaillant held the function of an interim CEO during the period from February to October 2012. The corresponding compensa-tion is reported in the table of note 10.2 “Compensation to the Management Board”. His total compensation in 2012 was kCHF 1,139.
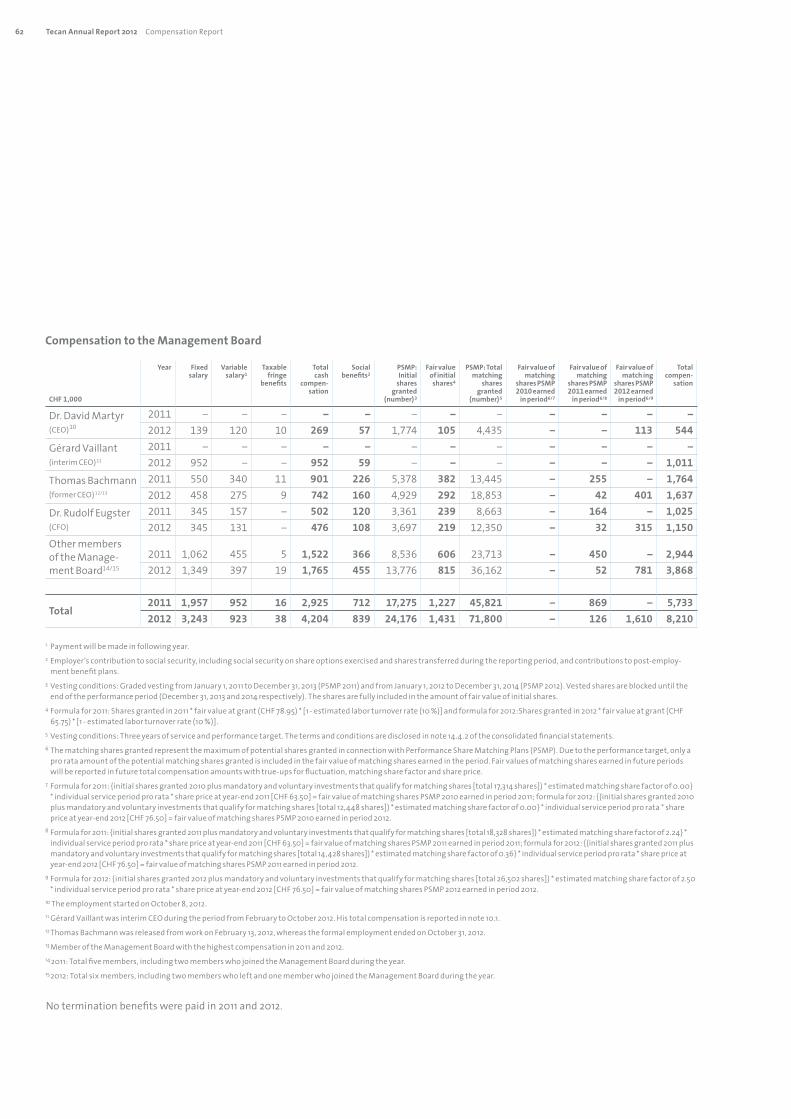
62 Tecan Annual Report 2012 Compensation Report
CHF 1,000
Year Fixed salary
Variable salary1
Taxable fringe
benefits
Total cash
compen-sation
Social benefits2
PSMP: Initial
shares granted
(number)3
Fair value of initial shares4
PSMP: Total matching
shares granted
(number)5
Fair value of matching
shares PSMP 2010 earned
in period6/7
Fair value of matching
shares PSMP 2011 earned
in period6/8
Fair value of match ing
shares PSMP 2012 earned
in period6/9
Total compen-
sation
Dr. David Martyr (CEO)10
2011 – – – – – – – – – – – – 2012 139 120 10 269 57 1,774 105 4,435 – – 113 544
Gérard Vaillant (interim CEO)11
2011 – – – – – – – – – – – – 2012 952 – – 952 59 – – – – – – 1,011
Thomas Bachmann (former CEO)12/13
2011 550 340 11 901 226 5,378 382 13,445 – 255 – 1,764 2012 458 275 9 742 160 4,929 292 18,853 – 42 401 1,637
Dr. Rudolf Eugster (CFO)
2011 345 157 – 502 120 3,361 239 8,663 – 164 – 1,025 2012 345 131 – 476 108 3,697 219 12,350 – 32 315 1,150
Other members of the Manage-ment Board14/15
2011 1,062 455 5 1,522 366 8,536 606 23,713 – 450 – 2,944 2012 1,349 397 19 1,765 455 13,776 815 36,162 – 52 781 3,868
Total2011 1,957 952 16 2,925 712 17,275 1,227 45,821 – 869 – 5,733 2012 3,243 923 38 4,204 839 24,176 1,431 71,800 – 126 1,610 8,210
1 Payment will be made in following year.2 Employer’s contribution to social security, including social security on share options exercised and shares transferred during the reporting period, and contributions to post-employ-
ment benefit plans.3 Vesting conditions: Graded vesting from January 1, 2011 to December 31, 2013 (PSMP 2011) and from January 1, 2012 to December 31, 2014 (PSMP 2012). Vested shares are blocked until the
end of the performance period (December 31, 2013 and 2014 respectively). The shares are fully included in the amount of fair value of initial shares.4 Formula for 2011: Shares granted in 2011 * fair value at grant (CHF 78.95) * [1 - estimated labor turnover rate (10 %)] and formula for 2012:Shares granted in 2012 * fair value at grant (CHF
65.75) * [1 - estimated labor turnover rate (10 %)].5 Vesting conditions: Three years of service and performance target. The terms and conditions are disclosed in note 14.4.2 of the consolidated financial statements.6 The matching shares granted represent the maximum of potential shares granted in connection with Performance Share Matching Plans (PSMP). Due to the performance target, only a
pro rata amount of the potential matching shares granted is included in the fair value of matching shares earned in the period. Fair values of matching shares earned in future periods will be reported in future total compensation amounts with true-ups for fluctuation, matching share factor and share price.
7 Formula for 2011: {initial shares granted 2010 plus mandatory and voluntary investments that qualify for matching shares [total 17,314 shares]) * estimated matching share factor of 0.00} * individual service period pro rata * share price at year-end 2011 [CHF 63.50] = fair value of matching shares PSMP 2010 earned in period 2011; formula for 2012: {(initial shares granted 2010 plus mandatory and voluntary investments that qualify for matching shares [total 12,448 shares]) * estimated matching share factor of 0.00} * individual service period pro rata * share price at year-end 2012 [CHF 76.50] = fair value of matching shares PSMP 2010 earned in period 2012.
8 Formula for 2011: {initial shares granted 2011 plus mandatory and voluntary investments that qualify for matching shares [total 18,328 shares]) * estimated matching share factor of 2.24} * individual service period pro rata * share price at year-end 2011 [CHF 63.50] = fair value of matching shares PSMP 2011 earned in period 2011; formula for 2012: {(initial shares granted 2011 plus mandatory and voluntary investments that qualify for matching shares [total 14,428 shares]) * estimated matching share factor of 0.36} * individual service period pro rata * share price at year-end 2012 [CHF 76.50] = fair value of matching shares PSMP 2011 earned in period 2012.
9 Formula for 2012: {initial shares granted 2012 plus mandatory and voluntary investments that qualify for matching shares [total 26,502 shares]) * estimated matching share factor of 2.50 * individual service period pro rata * share price at year-end 2012 [CHF 76.50] = fair value of matching shares PSMP 2012 earned in period 2012.
10 The employment started on October 8, 2012.11 Gérard Vaillant was interim CEO during the period from February to October 2012. His total compensation is reported in note 10.1.12 Thomas Bachmann was released from work on February 13, 2012, whereas the formal employment ended on October 31, 2012.13 Member of the Management Board with the highest compensation in 2011 and 2012.14 2011: Total five members, including two members who joined the Management Board during the year.15 2012: Total six members, including two members who left and one member who joined the Management Board during the year.
Compensation to the Management Board
No termination benefits were paid in 2011 and 2012.

63Tecan Annual Report 2012
Loans granted to the Management BoardThe following loans were granted to the management at year-end:
In 2007, 2008 and 2009, members of the management were offered the possibility to purchase American-type call options on Tecan shares issued by a bank at market rates. The number purchased by each individual was restricted. At the same time, the members of the Management Board who participated in this transaction received advance facilities from Tecan Group Ltd. to finance the purchase of these share options. The ad-
CHF 1,000 2011 2012
Thomas Bachmann (former CEO) 267 – Dr. Rudolf Eugster (CFO) 133 – Other member of the Management Board 133 –
Balance at December 31 533 –
vance facilities in the form of interest-free and unsecured loans are part of a long-term retention bonus to mature in 2010, 2011 and 2012 respectively, and are limited to two-thirds of the pur-chase price of the share options. One-third was paid privately by the members of the Management Board. At December 31, 2012, all advance facilities were paid back.
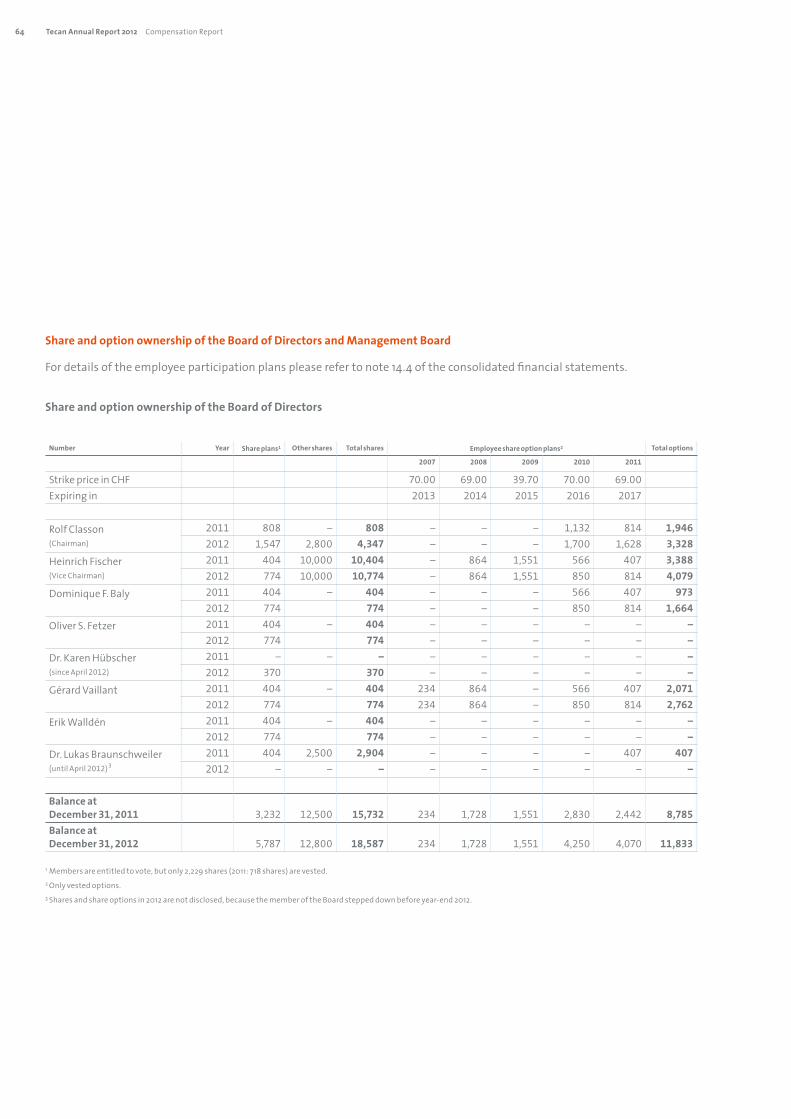
64 Tecan Annual Report 2012 Compensation Report
Share and option ownership of the Board of Directors and Management Board
For details of the employee participation plans please refer to note 14.4 of the consolidated financial statements.
Share and option ownership of the Board of Directors
Number Year Share plans1 Other shares Total shares Employee share option plans2 Total options
2007 2008 2009 2010 2011
Strike price in CHF 70.00 69.00 39.70 70.00 69.00Expiring in 2013 2014 2015 2016 2017
Rolf Classon (Chairman)
2011 808 – 808 – – – 1,132 814 1,946 2012 1,547 2,800 4,347 – – – 1,700 1,628 3,328
Heinrich Fischer (Vice Chairman)
2011 404 10,000 10,404 – 864 1,551 566 407 3,388 2012 774 10,000 10,774 – 864 1,551 850 814 4,079
Dominique F. Baly 2011 404 – 404 – – – 566 407 973 2012 774 774 – – – 850 814 1,664
Oliver S. Fetzer 2011 404 – 404 – – – – – – 2012 774 774 – – – – – –
Dr. Karen Hübscher (since April 2012)
2011 – – – – – – – – – 2012 370 370 – – – – – –
Gérard Vaillant 2011 404 – 404 234 864 – 566 407 2,071 2012 774 774 234 864 – 850 814 2,762
Erik Walldén 2011 404 – 404 – – – – – – 2012 774 774 – – – – – –
Dr. Lukas Braunschweiler (until April 2012)3
2011 404 2,500 2,904 – – – – 407 407 2012 – – – – – – – – –
Balance at December 31, 2011 3,232 12,500 15,732 234 1,728 1,551 2,830 2,442 8,785 Balance at December 31, 2012 5,787 12,800 18,587 234 1,728 1,551 4,250 4,070 11,833
1 Members are entitled to vote, but only 2,229 shares (2011: 718 shares) are vested.2 Only vested options.3 Shares and share options in 2012 are not disclosed, because the member of the Board stepped down before year-end 2012.
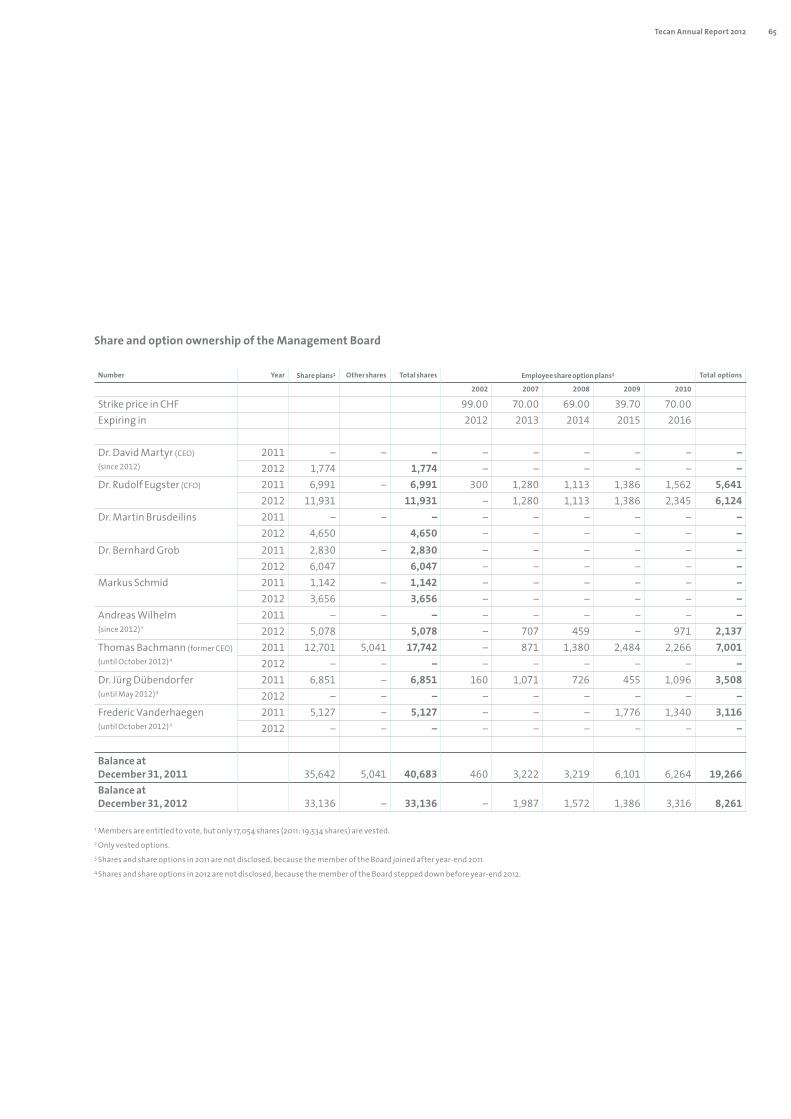
65Tecan Annual Report 2012
Number Year Share plans1 Other shares Total shares Employee share option plans2 Total options
2002 2007 2008 2009 2010
Strike price in CHF 99.00 70.00 69.00 39.70 70.00Expiring in 2012 2013 2014 2015 2016
Dr. David Martyr (CEO)(since 2012)
2011 – – – – – – – – – 2012 1,774 1,774 – – – – – –
Dr. Rudolf Eugster (CFO) 2011 6,991 – 6,991 300 1,280 1,113 1,386 1,562 5,641 2012 11,931 11,931 – 1,280 1,113 1,386 2,345 6,124
Dr. Martin Brusdeilins 2011 – – – – – – – – – 2012 4,650 4,650 – – – – – –
Dr. Bernhard Grob 2011 2,830 – 2,830 – – – – – – 2012 6,047 6,047 – – – – – –
Markus Schmid 2011 1,142 – 1,142 – – – – – – 2012 3,656 3,656 – – – – – –
Andreas Wilhelm(since 2012)3
2011 – – – – – – – – – 2012 5,078 5,078 – 707 459 – 971 2,137
Thomas Bachmann (former CEO) (until October 2012)4
2011 12,701 5,041 17,742 – 871 1,380 2,484 2,266 7,001 2012 – – – – – – – – –
Dr. Jürg Dübendorfer (until May 2012)4
2011 6,851 – 6,851 160 1,071 726 455 1,096 3,508 2012 – – – – – – – – –
Frederic Vanderhaegen (until October 2012)4
2011 5,127 – 5,127 – – – 1,776 1,340 3,116 2012 – – – – – – – – –
Balance at December 31, 2011 35,642 5,041 40,683 460 3,222 3,219 6,101 6,264 19,266 Balance at December 31, 2012 33,136 – 33,136 – 1,987 1,572 1,386 3,316 8,261
1 Members are entitled to vote, but only 17,054 shares (2011: 19,534 shares) are vested.2 Only vested options.3 Shares and share options in 2011 are not disclosed, because the member of the Board joined after year-end 2011.4 Shares and share options in 2012 are not disclosed, because the member of the Board stepped down before year-end 2012.
Share and option ownership of the Management Board


68 ChiefFinancialOfficer'sReport 72 Five-yearconsolidateddata 73 Consolidatedfinancialstatements120 FinancialstatementsofTecanGroupLtd.
Financial Report 2012
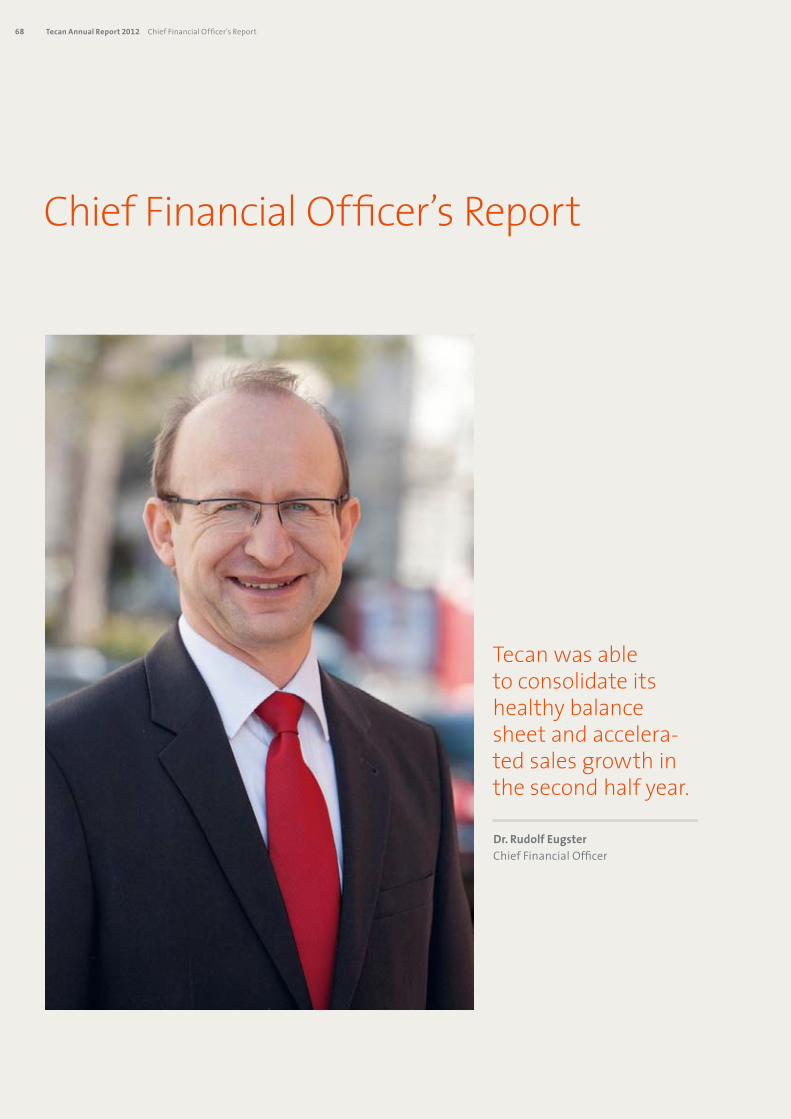
68 TecanAnnualReport2012 ChiefFinancialOfficer'sReport
Chief Financial Officer’s Report
Dr.RudolfEugsterChiefFinancialOfficer
Tecan was able to consolidate its healthy balance sheet and accelera-ted sales growth in the second half year.

69Tecan Annual Report 2012
izationsarestartingtopayoff,particularlyinChina.DrivenbytheLifeSciencesBusiness,salesinChinaincreasedatahighdouble-digitpercentagerate.Inthesecondhalfoftheyear,salesinAsiaincreasedby19.2%,or14.2%inlocalcurrencies.Recurringsalesofconsumablesandservicesincreasedby6.0%intheyearunderreview,orby4.0%inlocalcurrencyterms,andaccountedfor30.6%oftotalsales(2011:30.0%).Salesofconsumablesgrewby17.9%inSwissfrancsandby15.4%inlo-calcurrenciestoashareof9.1%oftotalsales(2011:8.0%)
Thereaderisreferredtothe“LifeSciencesBusiness”and“Part-neringBusiness”sectionsofthisAnnualReportforadetaileddescriptionofthebusinessperformanceoftheindividualseg-ments.
Orderentryin2012wasonlyslightlybelowtheprior-yearfig-ureatCHF382.3million(2011:CHF383.9million).Advanceor-dersin2011resultedinasignificantdeclineinorderentryinthefirstsixmonthsof2012,butthisdeclinewasalmostfullyoffsetinthesecondhalfbygrowthinorderentryof7.9%(+4.1%inlocalcurrencies).
Grossprofit
GrossprofitincreasedtoCHF198.3millionin2012,whichwasCHF6.6millionor3.4%abovetheprior-yearfigure.There-portedgrossprofitmarginwas50.7%,slightlybelowtheprior-yearfigure(2011:50.9%).
Thisisthenetimpactofthefollowingeffectsonthegrossprofitmargin:Currencyeffectsandcostsavingsmadeapositivecontribution,whiletheproductmixandcostsbookedinconnectionwithadevelopmentprogramforanOEMcustomerhadanegativeef-fectonthegrossprofitmargin.
Operatingexpenseslesscostofsales
Operatingexpenseslesscostofsalesincreasedatthesamerateassales.OperatingexpensestotaledCHF147.0million,comparedwithCHF141.4millionintheprioryear.
The Tecan Group closed 2012 with a solid business performance and acceler-ation in sales growth in the second half. Tecan has a healthy balance sheet and the equity ratio continued to increase in the reporting period.
Sales
Sales increasedby3.8%toCHF391.1millionin2012(2011:CHF377.0million)andwereupby1.9%inlocalcurrencies.Fol-lowinglowgrowthinthefirstsixmonths,salesweremoredy-namicinthesecondhalfandwere7.1%higherthanintheprior-yearperiod.Thiscorrespondstoanincreaseof3.3%inlocalcurrencies.
InEurope,salesinSwissfrancswere7.8%belowthepreviousyear,whichequatestoadecreaseof7.2%inlocalcurrencies.ThisdecreaseisduetolowersalesinthePartneringBusiness,assales-relateddevelopmentcostsunderanOEMprojectlargelydeclined.AsaresultofthechallengingeconomicsituationinsomeEuropeancountries,salesintheLifeSciencesBusinesswerealsobelowtheprior-yearlevel.SalesinEuropewere1.8%below2011inSwissfrancs,and2.5%lowerinlocalcurrencytermsinthesecondhalf.
InNorthAmerica,Tecanachievedsalesgrowthof10.4%inSwissfrancsand5.4%inlocalcurrencies.GrowthinthisregionwasdrivenbythestrongperformanceofthePartneringBusiness,primarilyaconsiderableincreaseinsalesinthecomponentbusiness.LifeSciencesBusinesssalestoendcustomerswerealsobelowtheprior-yearlevelinNorthAmericaduetothecon-tinuingstrainedeconomicenvironment.Inthesecondhalfoftheyear,salesinNorthAmericaincreasedby9.4%,or2.4%inlocalcurrencies.
SalesinAsiawerestrong,growingby24.5%inSwissfrancsandby20.2%inlocalcurrencies.Investmentsinthemarketorgan-

70 TecanAnnualReport2012 ChiefFinancialOfficer'sReport
Salesandmarketingexpensesalsoincreasedinproportiontosalesgrowth,withfurtherinvestmentsbeingmadeinthemar-ketorganizationsintheAsiaPacificregion.
Researchanddevelopmentspendingin2012amountedto13.2%ofsales(2011:12.5%)orCHF51.5million(2011:CHF47.0million).Alltold,researchanddevelopmentactivitiesamountedtoCHF114.7milliongross(2011:CHF90.6million).ThesefiguresalsoincludethedevelopmentcostscapitalizedinthebalancesheetofCHF4.0milliongrossanddevelopmentcostsforOEMpartnersofCHF61.9million.
Generalandadministrationexpensesfellby2.9%,asthecostsoftwostrategyprojectshadbeenbookedin2011.
Operatingprofit
Operatingprofitbeforeinterestandtaxes(EBIT)increasedby2.0%toCHF52.3millionin2012(2011:CHF51.3million).At13.4%ofsales,theoperatingprofitmarginexceededtheex-pectedrangeof12.2%to13.2%,andwasonlyslightlybelowtheprior-yearlevel(2011:13.6%),despitethefactthatresearchanddevelopmentspendingincreasedby0.7percentagepointsyear-on-year.
Financialresultandtaxes
ThefinancialresultdeclinedtoCHF0.2million(2011:CHF2.3mil-lion).Exchangeratesfluctuatedsharplyinthepreviousyearandprofitsweregeneratedfromcurrencyhedgingmeasures.Tecanincursforeigncurrencyrisksonsales,purchasesandborrow-ingsdenominatedinacurrencyotherthanthefunctionalcur-rencyoftherespectivesubsidiaries.Onaconsolidatedbasis,Te-canisalsoexposedtocurrencyfluctuationsbetweentheSwissfranc(CHF)andthefunctionalcurrenciesofitssubsidiaries.Thetwomajorcurrenciesgivingrisetocurrencyrisksaretheeuro(EUR)andtheUSdollar(USD).Tecancentralizesitsforeigncur-rencyexposureinafewlocationsonly.
Thehedgingpolicyistocovertheforeigncurrencyexposuretoacertainpercentageoftheoperatingactivities(forecastsalesandpurchases).Tecanusesforwardexchangecontracts,cur-rencyoptionsandswapstohedgeitsforeigncurrencyriskonspecificfutureforeigncurrencycashflows.Thesecontractshavematuritiesofupto18months.Tecandoesnothedgeitsnetin-vestmentinforeignentitiesandtherelatedforeigncurrencytranslationoflocalearnings.
Thetaxrateincreasedto19.7%(2011:16.1%).Thetaxratehadbeenunusuallylowintheprioryear,asithadbeenpossibletoclosetaxauditsandcapitalizeataxcredit.
Netprofit
NetprofitfromcontinuingoperationsamountedtoCHF42.2mil-lionin2012(2011:CHF44.9million).Netprofitin2011benefitedfromasignificantlybetterfinancialresult,whichwaslargelyattributabletocurrencyhedgingmeasures.Thenetprofitmar-ginamountedto10.8%ofsalesin2012(2011:11.9%).EarningspersharefromcontinuingoperationswereCHF3.90(2011:CHF4.18).Onaverage,atotalof10.81millionshareswereout-standingin2012(2011:10.75millionshares).
Balancesheetandequityratio
Tecan’sequityratioincreasedduringthereportingperiodandreached71.9%asofDecember31,2012(December31,2011:69.1%).TheCompany’ssharecapitalstoodatCHF1,144,458atthereportingdate(December31,2012),consistingof11,444,576registeredshareswithanominalvalueofCHF0.10each.
Cashflowfromoperatingactivities
CashflowfromoperatingactivitiestotaledCHF2.4million(2011:CHF45.1million).ExcludingprefinancingofanOEMde-velopmentprojectbyTecan,cashflowfromoperatingactivi-tiesamountedtoCHF45.0million.

71Tecan Annual Report 2012
Investmentsin2012amountedtoCHF14.0million(2011:CHF14.1million),comparedtoCHF10.3millionforamortizationanddepreciation(2011:CHF9.2million).
Netliquidity(cashandcashequivalentslessbankliabilitiesandloans)amountedtoCHF141.3million(December31,2011:CHF163.0million)despiteincreasedinvestmentsindevelop-mentprograms.
Dr.RudolfEugsterChiefFinancialOfficer

72 TecanAnnualReport2012 Five-yearconsolidateddata
CHF1,000 2008 2009 2010 2011 2012
IncomestatementSales 396,042 356,248 370,548 376,970 391,108Operatingprofit 31,191 59,521 55,971 51,271 52,306Financialresult 1,301 689 2,100 2,289 181Incometaxes (6,869) (12,869) (11,137) (8,645) (10,332)Profitfromcontinuingoperations1 47,341 46,934 44,915 42,155Resultfromdiscontinuedoperation,netofincometaxes1 1,999 (30,730) 2,644 –Profitfortheperiod 25,623 49,340 16,204 47,559 42,155
Researchanddevelopment,gross (41,869) (33,747) (37,372) (47,004) (51,475)Personnelexpenses (131,990) (123,051) (128,525) (131,666) (138,865)Depreciationofproperty,plantandequipment (7,649) (6,441) (6,024) (5,952) (6,251)Amortizationofintangibleassets (3,570) (725) (1,738) (3,147) (3,967)Impairmentlosses (28,879) – – – –
BalancesheetCurrentassets 237,018 258,963 274,760 322,980 351,968Non-currentassets 88,846 89,656 63,741 66,961 69,333Totalassets 325,864 348,619 338,501 389,941 421,301Currentliabilities 113,840 131,439 98,669 107,263 103,696Non-currentliabilities 52,838 14,247 11,792 13,365 14,767Totalliabilities 166,678 145,686 110,461 120,628 118,463Shareholders’equity 159,186 202,933 228,040 269,313 302,838
CashflowstatementCashinflowsfromoperatingactivities 58,929 66,150 62,520 45,116 2,405Capitalexpenditureinproperty,plantandequipmentandintangibleassets (7,543) (10,896) (12,585) (14,080) (13,978)AcquisitionofTecanAustraliaPtyLtd,netofcashacquired – – – – (119)Disposalofdiscontinuedoperation,netofcashdisposedof – – (2,370) 5,480 –Changeintreasuryshares(net) (55,353) 1,939 21,244 1,154 3,403Dividendspaid (5,001) (9,681) (10,412) (10,771) (13,532)
OtherinformationNumberofemployees(endofperiod) 1,116 1,014 1,059 1,107 1,185Numberofemployees(average) 1,110 1,001 1,031 1,079 1,163
Researchanddevelopmentin%ofsales 10.6% 9.5% 10.1% 12.5% 13.2%Salesperemployee 357 356 359 349 336
InformationpershareBasicearningspersharefromcontinuingoperations(CHF)1 2.35 4.58 4.50 4.18 3.90Basicearningspershareincludingdiscontinuedoperation(CHF)1 2.35 4.77 1.55 4.42 3.90Grossdividend(CHF)2 0.90 1.00 – – 0.50Payoutfromstatutorycapitalcontributionreserve(CHF)2 – – 1.00 1.25 1.00Totalpayout(CHF)2 0.90 1.00 1.00 1.25 1.50Totalpayoutratio4 38.3% 21.0% 64.5% 28.3% 38.5%
1Seenote4“Discontinuedoperation”oftheconsolidatedfinancialstatements.2008isnotre-presentedfordiscontinuedoperation.2Paymentismadeinfollowingyear.3ProposaltotheAnnualGeneralMeetingofShareholdersonApril17,20134Basedonbasicearningspershareincludingdiscontinuedoperation
Five-year consolidated data
3
3
3

73Tecan Annual Report 2012
CHF1,000 Notes 2011 2012
Cashandcashequivalents 5 165,089 144,528Currentloansandderivatives 6 4,974 834Tradeaccountsreceivable 7 71,909 82,392Otheraccountsreceivable 8,727 10,778Inventories 8 67,918 109,424Incometaxreceivables 1,044 982Prepaidexpenses 3,319 3,030
Currentassets 322,980 351,968
Non-currentfinancialassets 9 842 1,531Property,plantandequipment 10 17,045 19,544Intangibleassets 11 38,606 39,864Deferredtaxassets 25 10,468 8,394
Non-currentassets 66,961 69,333
Assets 389,941 421,301
CHF1,000 Notes 2011 2012
Currentbankliabilitiesandderivatives 12 1,261 1,571Tradeaccountspayable 12,264 10,691Otheraccountspayable 16,107 17,674Deferredrevenue 13 19,872 18,420Incometaxpayables 10,150 7,798Accruedexpenses 36,194 36,849Currentprovisions 15 11,415 10,693Currentliabilities 107,263 103,696
Non-currentbankliabilitiesandderivatives 12 3,128 3,325Liabilityforpost-employmentbenefits 14 5,720 6,384Non-currentprovisions 15 1,581 2,060Deferredtaxliabilities 25 2,936 2,998
Non-currentliabilities 13,365 14,767
Totalliabilities 120,628 118,463
Sharecapital 1,144 1,144Capitalreserve 11,521 9,359Treasuryshares (29,011) (23,527)Retainedearnings 314,005 345,663Translationdifferences (28,346) (29,801)
Shareholders’equity 19 269,313 302,838
Liabilitiesandequity 389,941 421,301
Consolidated balance sheet at December 31
Assets
Liabilitiesandequity

74 Tecan Annual Report 2012 Consolidated financial statements
CHF1,000 Notes 2011 2012
Sales 20 376,970 391,108
Costofsales (185,242) (192,833)
Grossprofit 191,728 198,275
Salesandmarketing (57,832) (59,894)Researchanddevelopment 22 (47,004) (51,475)Generalandadministration (36,627) (35,583)Otheroperatingincome 23 1,006 983
Operatingprofit 20 51,271 52,306
Financialincome 853 143Financecost (130) (202)Foreignexchangegains,net 1,566 240Financial result 24 2,289 181
Profitbeforetaxes 53,560 52,487
Incometaxes 25 (8,645) (10,332)
Profitfromcontinuingoperations 44,915 42,155
CHF1,000 Notes 2011 2012
Profitfromdiscontinuedoperation,netofincometaxes 4 2,644 –
Profitfortheperiod 47,559 42,155
Earnings per share from continuing operations Basicearningspershare(CHF/share) 27 4.18 3.90 Dilutedearningspershare(CHF/share) 27 4.12 3.84
Earnings per share Basicearningspershare(CHF/share) 27 4.42 3.90 Dilutedearningspershare(CHF/share) 27 4.36 3.84
Consolidated statement of profit or loss
Continuingoperations
Discontinuedoperation
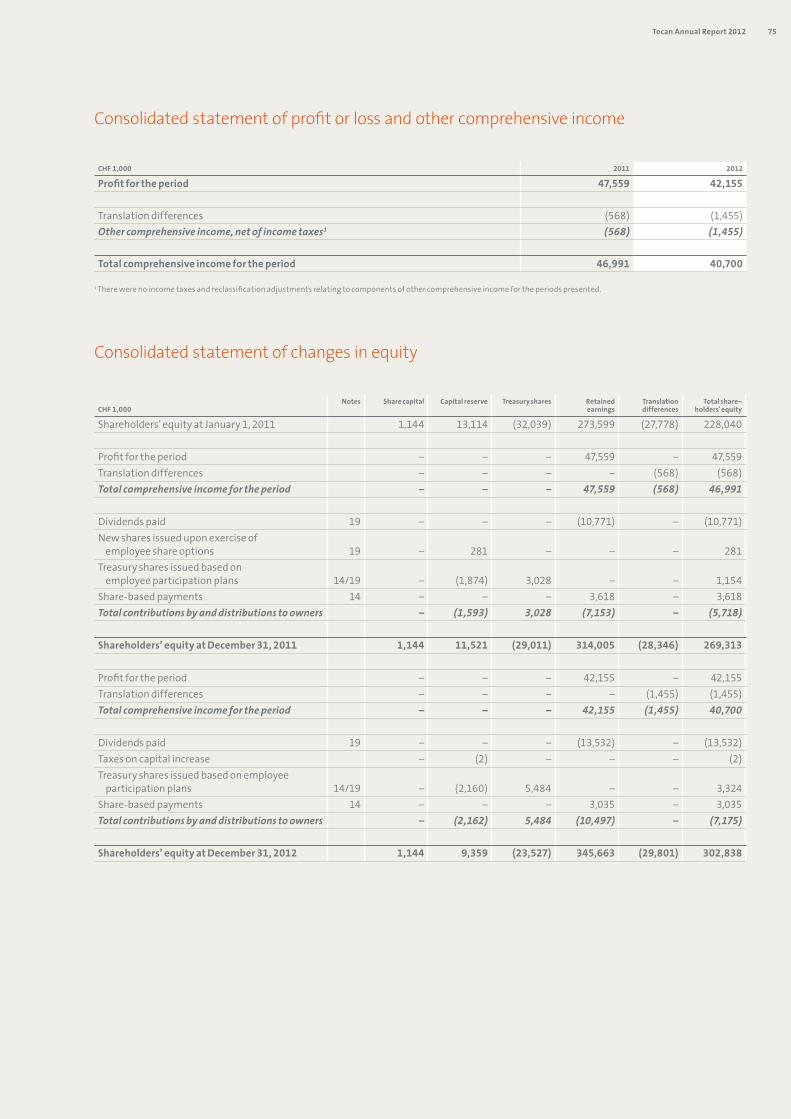
75Tecan Annual Report 2012
Consolidated statement of profit or loss and other comprehensive income
Consolidated statement of changes in equity
CHF 1,000 2011 2012
Profitfortheperiod 47,559 42,155
Translationdifferences (568) (1,455)Other comprehensive income, net of income taxes1 (568) (1,455)
Totalcomprehensiveincomefortheperiod 46,991 40,700
1Therewerenoincometaxesandreclassificationadjustmentsrelatingtocomponentsofothercomprehensiveincomefortheperiodspresented.
CHF1,000Notes Sharecapital Capitalreserve Treasuryshares Retained
earningsTranslationdifferences
Totalshare–holders'equity
Shareholders’equityatJanuary1,2011 1,144 13,114 (32,039) 273,599 (27,778) 228,040
Profitfortheperiod – – – 47,559 – 47,559Translationdifferences – – – – (568) (568)Total comprehensive income for the period – – – 47,559 (568) 46,991
Dividendspaid 19 – – – (10,771) – (10,771)Newsharesissueduponexerciseof employeeshareoptions 19 – 281 – – – 281Treasurysharesissuedbasedon employeeparticipationplans 14/19 – (1,874) 3,028 – – 1,154Share-basedpayments 14 – – – 3,618 – 3,618Total contributions by and distributions to owners – (1,593) 3,028 (7,153) – (5,718)
Shareholders’equityatDecember31,2011 1,144 11,521 (29,011) 314,005 (28,346) 269,313
Profitfortheperiod – – – 42,155 – 42,155Translationdifferences – – – – (1,455) (1,455)Total comprehensive income for the period – – – 42,155 (1,455) 40,700
Dividendspaid 19 – – – (13,532) – (13,532)Taxesoncapitalincrease – (2) – – – (2)Treasurysharesissuedbasedonemployee participationplans 14/19 – (2,160) 5,484 – – 3,324Share-basedpayments 14 – – – 3,035 – 3,035Total contributions by and distributions to owners – (2,162) 5,484 (10,497) – (7,175)
Shareholders’equityatDecember31,2012 1,144 9,359 (23,527) 345,663 (29,801) 302,838

76 Tecan Annual Report 2012 Consolidated financial statements
Consolidated statement of cash flows
CHF1,000 Notes 2011 2012
Profitfortheperiod 47,559 42,155
Adjustments for: Depreciationandamortization 10/ 11 9,099 10,262 Changeinprovisionsandliabilityforpost-employmentbenefits 14/15 1,985 577 Interestincome 24 (703) (143) Interestexpenses 24 101 84 Incometaxes 25 8,645 10,332 Gainonsaleofdiscontinuedoperation 4 (2,644) – Equity-settledshare-basedpaymenttransactions 14 3,618 3,035 Othernon-cashitems (119) 1,206
Change in working capital: Tradeaccountsreceivable 7 (6,477) (10,959) Inventories 8 (24,928) (41,270) Tradeaccountspayable 2,647 (2,079) Otherchangesinworkingcapital(net) 13,774 239
Incometaxespaid (7,441) (11,034)
Cashinflowsfromoperatingactivities 45,116 2,405
Repaymentoftimedepositsandcurrentloans 20,200 533Interestreceived 668 139AcquisitionofTecanAustraliaPtyLtd,netofcashacquired 4 – (119)Deferredandcontingentconsiderationfromdisposalofdiscontinuedoperation 4 5,480 –Purchaseofproperty,plantandequipment 10 (9,605) (9,091)Proceedsfromsalesofproperty,plantandequipment 10 178 80Investmentinintangibleassets 11 (4,475) (4,887)
Cashin/(out)flowsfrominvestingactivities 12,446 (13,345)
Newsharesissueduponexerciseofemployeeshareoptions 19 281 (2)Dividendspaid 19 (10,771) (13,532)Proceedsfromsalesoftreasuryshares 19 1,154 3,403Changeincurrentbankliabilities 12 (16) (11)Increaseinbankloans 12 1,055 1,036Repaymentofbankloans 12 (492) –Interestpaid (89) (83)
Cashoutflowsfromfinancingactivities (8,878) (9,189)
Effectofexchangeratefluctuationsoncashheld (474) (440)
Increase/(decrease)incashandcashequivalents 48,210 (20,569)
CashandcashequivalentsatJanuary1 116,879 165,089CashandcashequivalentsatDecember31 165,089 144,520
Cash and cash equivalents as per cash flow statement comprise:Cashandcashequivalentsasperbalancesheet 5 165,089 144,528./.Bankoverdraftsunderbankpoolingarrangements 12 – (8)=Cashandcashequivalentsaspercashflowstatement 165,089 144,520

77Tecan Annual Report 2012
Notes to the consolidated financial statements
1 Reportingentity
Thesefinancialstatementsaretheconsolidatedfinancialstate-mentsofTecanGroupLtd.,acompanyregisteredinSwitzerland,anditssubsidiaries(togetherreferredtoasthe“Group”)fortheyearendedDecember31,2012.Tecanisaleadingglobalprovideroflaboratoryinstrumentsandsolutionsinbiopharmaceuticals,forensicsandclinicaldiagnostics.TheGroupspecializesinthedevelopment,productionanddistributionofautomationsolu-tionsforlaboratoriesinthelifesciencessector.Itsclientsincludepharmaceuticalandbiotechnologycompanies,universityresearchdepartments,forensicanddiagnosticlaboratories.Asanoriginalequipmentmanufacturer,theGroupalsodevelopsandmanufac-turesOEMinstrumentsandcomponentsthatarethendistributedbypartnercompanies.FoundedinSwitzerlandin1980,theCompanyhasmanufacturing,researchanddevelopmentsitesinbothEuropeandNorthAmericaandmaintainsasalesandservicenetworkin52countries.
Theconsolidatedfinancialstatementswereauthorizedforissu-ancebytheBoardofDirectorsonMarch5,2013.FinalapprovalissubjecttoacceptancebytheAnnualGeneralMeetingofShare-holdersonApril17,2013.
2 Summaryofsignificantaccountingpolicies
2.1 BasisofpreparationTheconsolidatedfinancialstatementshavebeenpreparedinaccordancewithInternationalFinancialReportingStandards(IFRS)andtheirinterpretationsadoptedbytheInternationalAccountingStandardsBoard(IASB).
ThefinancialstatementsarepresentedinSwissfrancs(CHF),roundedtothenearestthousand.Theyarepreparedonthehis-toricalcostbasisexceptforderivativefinancialinstruments,whicharestatedattheirfairvalue.
2.2 CriticalaccountingestimatesandjudgmentsThepreparationoftheseconsolidatedfinancialstatementsre-quiresmanagementtomakeassumptionsandestimatesthataffectthereportedamountsofrevenues,expenses,assets,li-abilitiesanddisclosureofcontingentliabilitiesatthedateofthesefinancialstatements.Ifinthefuturesuchassumptionsandestimatesdeviatefromtheactualcircumstances,theoriginalassumptionsandestimateswillbemodifiedasappropriateintheyearinwhichthecircumstanceschange.
Thevaluationofthefollowingmaterialpositionsisbasedoncriticalaccountingestimatesandjudgments:
2.2.1 Inventories – capitalized development costsIn2010,theGroupenteredintoanOEMagreementwithaglobaldiagnosticscompany.Theagreementcomprisesthedevelop-mentandsupplyofadedicateddiagnosticinstrument.There-
latedcustomer-specificdevelopmentcostsarecurrentlycapi-talizedinthepositioninventoriesaspartoftheproductioncostsandamountedtoCHF73.7millionattheendof2012.Oncetheinstrumentislaunchedandthecustomercallstheunitswithindividualpurchaseorders,thecorrespondingdevelop-mentcostswillberecognizedincostofsales.
Additionalcostsarisingasaresultofprojectdelaysmaynotbecoveredbyfuturecashinflowsassociatedwiththeagree-ment.AtDecember31,2012,thenetrealizablevalueofthepositionwashigherthanthecapitalizeddevelopmentcosts.However,theassessmentishighlydependentonthebestestimateofthefuturesalesquantity.Adecreaseinestimatecouldrequirewrite-downsinfutureperiods.
2.2.2 Impairment test on goodwill AtDecember31,2012thegoodwill“LifeSciencesBusiness”wasCHF26.8million.TheGroupperformedthemandatoryannualimpairmenttestinJuly2012.Basedonthistest,therewasnoneedfortherecognitionofanyimpairment.However,thecalculationoftherecoverableamountofintangibleassetsrequirestheuseofestimatesandassumptions.Thekeyas-sumptionsaredisclosedinnote11.
2.2.3 Intangible assets – capitalized development costsAfterthetechnicalfeasibilityofin-housedevelopedproductshasbeendemonstrated,theGroupstartstocapitalizethere-lateddevelopmentcostsuntiltheproductisreadyformarketlaunch.However,therecanbenoguaranteethatsuchproductswillcompletethedevelopmentphaseorwillbecommercial-ized,orthatmarketconditionswillnotchangeinthefuture,requiringarevisionofmanagement’sassessmentoffuturecashflowsrelatedtothoseproducts.Suchchangescouldleadtoadditionalamortizationandimpairmentcharges.Attheendof2012,theGrouphascapitalizeddevelopmentcostsintheamountofCHF7.8millionasdisclosedinnote11.
2.2.4 Revenue recognition – percentage of completion method
TheGroupappliesthepercentageofcompletionmethod(POC)inaccountingforconstructioncontractsasoutlinedintheac-countingandvaluationprinciples(seenote2.7.3).TheuseofthePOCmethodrequiresthemanagementtodeterminethestageofcompletionbyreferencetothecontractcostsincurredforworkperformedtodateinproportiontotheestimatedtotalcontractcosts(cost-to-costmethod).Basedontheestimatedstageofcompletion,arespectiveportionoftheexpectedreve-nueisrecognized.Ifcircumstancesarisethatmaychangetheoriginalestimatesofrevenues,costsorextentofprogresstowardscompletion,estimatesarerevised.Theserevisionsmayresultinincreasesordecreasesinestimatedrevenuesorcostsandarereflectedinthestatementofprofitorlossintheperiodinwhichthecircumstancesthatgiverisetotherevisionbecomeknowntothemanagement.Seenote7formoredetails.

78 Tecan Annual Report 2012 Consolidated financial statements
2.2.5 Performance share matching plan (PSMP) – matching share factorTheGroupestablishedperformancesharematchingplans.Thenumberofmatchingsharesisdeterminedbasedonthefollowingformula:numberofsharesfrominitialgrantplusnumberofsharesfrommandatoryandvoluntaryinvestmentstimesthematchingsharefactor.Thematchingsharefactorisdepend-ent on the achievement of specific performance targets.Inanycase,thematchingsharefactorwillnotbelowerthan0.0orhigherthan1.25(BoardofDirectors)and2.5(extendedManagementBoard)respectively.Achangeinestimateofthematchingsharefactorsappliedincurrentperiod,willimpacttheresultsoffutureperiods.Seenote14.4.2formoredetails.
2.2.6 Income taxesAtDecember31,2012,thenetliabilityforcurrentincometaxeswasCHF6.8millionandthenetassetfordeferredtaxeswasCHF5.4million.Significantestimatesarerequiredindetermin-ingthecurrentanddeferredassetsandliabilitiesforincometaxes.Variousinternalandexternalfactorsmayhavefavora-bleorunfavorableeffectsontheincometaxassetsandliabil-ities.Thesefactorsinclude,butarenotlimitedto,changesintaxlaws,regulationsand/orrates,changinginterpretationsofexistingtaxlawsorregulations(particularlyinrelationtotheacceptanceofintra-Grouptransferprices),andchangesinover-alllevelsofpre-taxearnings.Suchchangescouldimpacttheassetsandliabilitiesrecognizedinthebalancesheetinfutureperiods.
2.3 Introductionofnewandamendedaccountingstandardsandinterpretations
Theaccountingpoliciesareconsistentwiththoseappliedinthepreviousyear,exceptfortheintroductionofthefollowingamendedstandards,effectiveasfromJanuary1,2012:
Standard1
IFRS7amended“FinancialInstruments:Disclosures”–TransfersofFinancialAssetsIAS12amended“Incometaxes”–DeferredTax:RecoveryofUnder-lyingAssets
1IAS=InternationalAccountingStandard,IFRS=InternationalFinancialReportingStandard
TheadoptionoftheseamendedstandardsdidnotresultinsubstantialchangestotheGroup’saccountingpolicies.
2.4 NewstandardsandinterpretationsnotyetappliedThefollowingnewandrevised/amendedstandardsandinter-pretationshavebeenissued,butarenotyeteffectiveandarenotappliedearlyintheseconsolidatedfinancialstatements:
Standard/interpretation1 EffectivedatefortheGroup
IFRS7amended“FinancialInstruments:Disclosures”–OffsettingFinancialAssetsandLiabilities
Reportingyear2013
IFRS10“ConsolidatedFinancialStatements” Reportingyear2013IFRS11“JointArrangements” Reportingyear2013
IFRS12“DisclosureofInterestsinOtherEntities”
Reportingyear2013
“ConsolidatedFinancialStatements”,“JointArrangements”and“DisclosureofInterestsinOtherEntities”:TransitionGuidance(AmendmentstoIFRS10,IFRS11andIFRS12)
Reportingyear2013
IFRS13“FairValueMeasurement” Reportingyear2013IAS1amended“PresentationofFinancialStatements”–PresentationofItemsofOtherComprehensiveIncome
Reportingyear2013
IAS19revised“EmployeeBenefits” Reportingyear2013IAS27revised“SeparateFinancialStatements” Reportingyear2013IAS28revised“InvestmentsinAssociatesandJointVentures”
Reportingyear2013
IFRIC20“StrippingCostsintheProductionPhaseofaSurfaceMine”
Reportingyear2013
AnnualImprovementstoIFRSs–2009–2011Cycle
Reportingyear2013
IAS32amended“FinancialInstruments:Presentation”–OffsettingFinancialAssetsandLiabilities
Reportingyear2014
“InvestmentEntities”(AmendmentstoIFRS10,IFRS12andIAS27)
Reportingyear2014
IFRS9“FinancialInstruments” Reportingyear2015
1IAS=InternationalAccountingStandard,IFRS=InternationalFinancialReportingStandard,IFRIC=InterpretationsasbytheIFRSInterpretationsCommittee(formerlyInternationalFinancialReportingInterpretationsCommittee)
ThesechangesarenotexpectedtohaveasignificantimpactontheconsolidatedfinancialstatementsexceptfortherevisedversionofIAS19“EmployeeBenefits”.Neverthelesstheirintro-ductionmayrequireadditionaldisclosuresinthenotesoftheconsolidatedfinancialstatements.
TherevisedversionofIAS19“EmployeeBenefits”eliminatesthe“corridormethod”thatiscurrentlyappliedbytheGroup.Inthefuture,allchangesinthepresentvalueofthedefinedbenefitobligationandinthefairvalueoftheplanassetswillberecognizedinthefinancialstatementsimmediatelyintheperiodtheyoccur.Inaddition,therevisedstandardstatesthatrisksharingarrangementsshallbereflectedinthecalculationofthedefinedbenefitobligation.UndercurrentIAS19,theem-ployer’snetservicecostsaredeterminedasthegrossservicecostsfortheplanlessthecashcontributionspaidbytheem-ployee.UnderIAS19revisedtheemployer’snetservicecostswillbedeterminedasthegrossservicecostslesstheemployeecontributionscalculatedusingtheProjectedUnitCreditMethod.Thenewrequirementtoallocateemployeecontributionstoperiodsofserviceinthesamewayasbenefitsareallocatedtoemployee’sserviceisexpectedtoimpactthedefinedbenefitobligationandservicecostsforallpensionplansforwhichem-ployeecontributionsincreasewithage.
Furthermore,theinterestcostandexpectedreturnonplanassetsusedinthecurrentversionofIAS19arereplacedwithanet-interestamount,whichiscalculatedbyapplyingthedis-countratetothenetdefinedbenefitobligation.ThischangewillincreasetheemployeebenefitexpensesoftheGroupthatarerecognizedinprofitorloss.

79Tecan Annual Report 2012
Finallytherevisedstandardspecifiesthepresentationofthechangesinthenetdefinedbenefitliability.Servicecostsandnet-interestamountonthenetdefinedbenefitobligationarerecognizedinprofitorloss,whereastheremeasurementofthenetdefinedbenefitliabilityisrecognizedinothercomprehen-siveincome.Currentlyallrecognizablechangesarerecognizedinprofitorloss.
TheGroupwillapplythischangeinaccountingpolicyretro-spectivelyinaccordancewithIAS8“AccountingPolicies,ChangesinAccountingEstimatesandErrors”,affectingboththenetdefinedbenefitliabilityinthebalancesheetandtheamountsrecognizedinprofitorloss.Iftherevisedstandardwasintro-ducedalreadyin2012,theimpactonthefinancialstatementswouldhavebeenasfollows:
2.5 ConsolidationprinciplesSubsidiariesarethosecompaniescontrolled,directlyorindi-rectly,byTecanGroupLtd.,wherecontrolisdefinedasthepowertogovernthefinancialandoperatingpoliciesofanenterprisesoastoobtainbenefitsfromitsactivities.Thiscontrolisnor-mallyevidencedwhentheGroupowns,eitherdirectlyorindi-rectly,morethan50%ofthevotingpowerofacompany.NewlyacquiredcompaniesareconsolidatedfromthedateonwhichcontrolistransferredtotheGroup,usingtheacquisitionmethod.Currently,therearenonon-controllinginterests.
Thecompanieswhichareincludedintheconsolidatedfinan-cialstatementsarelistedinthenotestothestatutoryfinancialstatementsofTecanGroupLtd.
Intra-Groupbalancesandtransactions,andanyunrealizedprof-itsarisingfromintra-Grouptransactions,areeliminatedinpre-paringtheconsolidatedfinancialstatements.
2.6 ForeigncurrencytranslationAllGroupcompanieshaveidentifiedtheirlocalcurrencyastheirfunctionalcurrency.Transactionsinothercurrenciesareinitiallyreportedusingtheexchangerateatthedateofthetransaction.Gainsandlossesfromthesettlementofsuchtrans-actions,aswellasgainsandlossesontranslationofmonetary
assetsandliabilitiesdenominatedinothercurrencies,arein-cludedinnetprofit.
Translationdifferencesarisingonintra-Grouploansthat,insubstance,arepartofTecanGroupLtd.’snetinvestmentinaforeignoperationarerecognizedinitiallyinothercomprehen-siveincomeandreclassifiedfromequitytoprofitorlossondisposaloftheforeignoperation.
Uponconsolidation,assetsandliabilitiesofGroupcompaniesusingfunctionalcurrenciesotherthanSwissfrancs(foreignen-tities)aretranslatedintoSwissfrancs(presentationcurrency)usingyear-endexchangerates.Revenues,expensesandcashflowsaretranslatedattheaverageexchangeratesfortheyear.Translationdifferencesduetothechangesinexchangeratesbetweenthebeginningandtheendoftheyearandthediffer-encebetweennetprofitstranslatedattheaverageandyear-endexchangeratesarerecognizedinothercomprehensiveincome.Onthedisposalofaforeignoperation,theidentifiedcumulativecurrencytranslationdifferencesrelatingtothatfor-eignoperation,recognizedinothercomprehensiveincomeandaccumulatedintheseparatecomponentofequity,arereclas-sifiedfromequitytoprofitorloss(asareclassificationadjust-ment)whenthegainorlossondisposalisrecognized.
2012 2012
CurrentIAS191 RevisedIAS191
CHFmillion Presentation Amount Presentation Amount
Balance sheet at December 31Netdefinedbenefitobligation,calculated 20.8 17.6Liabilityforpost-employmentbenefits recognizedatyear-end 6.4 17.6Unrecognizedactuariallosses 14.4 –
Statement of profit or lossNetcurrentservicecosts Operatingprofit 5.2 Operatingprofit 5.2Netinterestcostandexpectedreturnonplanassets2 Operatingprofit 0.4 n/a –Amortizationofactuariallosses Operatingprofit p.m. n/a –Netinterestcosts2 n/a – Financialresult 0.2Expensesrecognizedinprofitorloss 5.6 5.4
Remeasurement n/a–
Othercomprehen- siveincome 9.4
Expensesrecognisedinothercomprehensiveincome – 9.4
Totalemployeebenefitcosts 5.6 14.8
1Taxeffectnotconsidered.2AnticipatedvoluntarychangeinpresentationduetohigherfinancingcharacterunderIAS19Rcomparedtocurrentstandard.

80 Tecan Annual Report 2012 Consolidated financial statements
2.7 Accountingandvaluationprinciples
2.7.1 Cash and cash equivalentsCashandcashequivalentscomprisecashbalancesandtimedepositswithatermofthreemonthsorlessfromthedateofacquisition.BankoverdraftsthatarerepayableondemandandformanintegralpartoftheGroup’scashmanagementarein-cludedasacomponentofcashandcashequivalentsforthepurposeofthestatementofcashflows.
2.7.2 Trade and other accounts receivableTradeandotheraccountsreceivablearestatedattheiramor-tizedcostlessimpairmentlosses.Forshort-termreceivables,nominalvalueequalsamortizedcost.
TheallowanceaccountinrespectofaccountsreceivableisusedtorecordimpairmentlossesunlesstheGroupdecidesthatnorecoveryoftheamountowingispossible;atthatpointtheamountconsideredirrecoverableiswrittenoffagainstthefinancialassetdirectly.
TheGroupestablishesanallowanceforimpairmentthatrep-resentsitsestimateofincurredlossesinrespectoftradeandotherreceivables.Themaincomponentsofthisallowanceareaspecificlosscomponentthatrelatestoindividuallysignifi-cantexposures,andacollectivelosscomponentestablishedforgroupsofsimilarassetsinrespectoflossesthathavebeenincurredbutnotyetidentified.Thecollectivelossallowanceisdeterminedbasedonhistoricaldataofpaymentstatisticsforsimilarassets.
2.7.3 Construction contractsSomesalescategoriesoftheoperatingsegments“LifeSciencesBusiness”(saleofinstrumentswithexceptionallyhighportionofinstallationandapplicationwork)and“PartneringBusiness”(saleofdevelopmentservices)areaccountedforusingthe“per-centageofcompletion”methodofIAS11.Therespectivestageofcompletionisdeterminedbyreferencetothecontractcostsincurredforworkperformedtodateinproportiontotheesti-matedtotalcontractcosts(cost-to-costmethod).Accordingtothestageofcompletion,proratasalesarerecog-nizedinthestatementofprofitorloss.Inthebalancesheet,projectsinprogress–nettedagainstcustomers”advances–arerecognizedasnetassets(includedintheposition“tradeaccountsreceivable”)ornetliabilities(includedintheposition“deferredrevenue”)fromconstructioncontracts.Whenitisprobablethattotalcontractcostswillexceedtotalcontractrevenue,theexpectedlossisrecognizedasanexpenseimme-diately.
2.7.4 Borrowing costsTheGroupcapitalizesborrowingcoststhataredirectlyattrib-utabletotheacquisition,constructionorproductionofaqual-ifyingassetaspartofthecostofthatasset.Otherborrowingcostsareexpensed.Duringthereportingperiod,noassetqual-ifiedforcapitalizationofborrowingcosts(2011:none).
2.7.5 InventoriesInventoriesarestatedatthelowerofpurchaseorproductioncostandnetrealizablevalue.Productioncostsincluderawma-terials,componentsandsemi-finishedproducts,directproduc-tioncosts(internallaborandexternalservices)andproductionoverheads.TheGroupappliestheweightedaveragecostmethod.Netrealizablevalueistheestimatedsellingpriceintheordinarycourseofbusinesslesstheestimatedcostsofcompletionandtheestimatedcostsnecessarytomakethesale.Provisionsaremadeforslow-movingitemsandobsoleteitemsarewrittenoff.
2.7.6 Property, plant and equipmentProperty,plantandequipmentarestatedatcostlessaccu-mulateddepreciation(seebelow)andimpairmentlosses(seeseparateaccountingpolicy).Thecostofself-constructedassetsincludesthecostofmaterials,directlaborandanappropriateproportionofproductionoverheadsandborrowingcosts,iftheyaredirectlyattributabletoaqualifyingasset.
Assetsacquiredunderleasecontracts,whichprovidetheGroupwithsubstantiallyallbenefitsandrisksofownershipareclas-sifiedasfinanceleasesandcapitalizedatamountsequivalenttotheirfairvalueor,iflower,theestimatedpresentvalueoftheunderlyingminimumleasepayments.Thecorrespondingrentalobligations,netoffinancecharges,areincludedinlia-bilities.Leasedassetsaredepreciatedovertheirestimateduse-fullives.Therewerenoitemsofproperty,plantandequipmentunderfinanceleaseasperthebalancesheetdate(2011:none).Paymentsmadeunderoperatingleasesarechargedagainstincomeonastraight-linebasisovertheperiodofthelease.
Depreciationischargedtothestatementofprofitorlossonastraight-linebasisovertheestimatedusefullivesofitemsofproperty,plantandequipmentfromthedatetheyareavaila-bleforuse.Theestimatedusefullivesareasfollows:
Leaseholdimprovements shorterofusefullifeorleaseterm
Furnitureandfittings 4–8yearsMachinesandmotorvehicles 2–8yearsEDPequipment 3–5years
Depreciationmethods,usefullivesandresidualvaluesarere-viewedateachfinancialyear-endandadjustedifappropriate.
Wherepartsofanitemofproperty,plantandequipmenthavedifferentusefullives,theyareaccountedforasseparateitemsofproperty,plantandequipment(componentapproach).
Costsforrepairandmaintenancearerecognizedasanexpenseasincurred.
2.7.7 GoodwillGoodwillrepresentsthefutureeconomicbenefitsarisingfromassetsacquiredinabusinesscombinationthatarenotcapa-bleofbeingindividuallyidentifiedandseparatelyrecognized.

81Tecan Annual Report 2012
Foracquisitions,theGroupmeasuresgoodwillattheacquisi-tiondateas:
• thefairvalueoftheconsiderationtransferred,plus• therecognizedamountofanynon-controllinginterestsin
theacquiree,plus• ifthebusinesscombinationisachievedinstages,thefair
valueofexistingequityinterestintheacquiree,less• thenetrecognizedamountoftheidentifiablenetassets
acquired.
Whentheexcessisnegative,abargainpurchasegainisrecog-nizedimmediatelyinprofitorloss.
Afterinitialrecognition,theGroupmeasuresgoodwillatcostlessanyaccumulatedimpairmentlosses.InaccordancewithIFRS3,IAS36andIAS38,theGroupdoesnotamortizegood-will.Instead,goodwillistestedforimpairmentannuallyormorefrequentlyifeventsorchangesincircumstancesindicatethattheintangibleassetmightbeimpaired.
2.7.8 Other intangible assets
Research costs–Expenditureonresearchactivities,undertakenwiththeprospectofgainingnewscientificortechnicalknowl-edgeandunderstanding,isrecognizedinprofitorlossasin-curred.
Development costs–Developmentactivitiesinvolveaplanordesignfortheproductionofneworsubstantiallyimprovedproductsandprocesses.Developmentexpenditureiscapital-izedonlyifdevelopmentcostscanbemeasuredreliably,theproductistechnicallyandcommerciallyfeasible,futureeco-nomicbenefitsareprobable,andtheGroupintendstoandhassufficientresourcestocompletedevelopmentandtouseorselltheasset.Theexpenditurecapitalizedincludesthecostofmaterials,externalservices,personnel,temporaryemployees,overheadandborrowingcosts,iftheyaredirectlyattributabletoaqualifyingasset.Otherdevelopmentexpenditureisrecog-nizedinprofitorlossasincurred.
Software –Expenditureontheimplementationofsoftware,in-cludinglicensesandexternalconsultingfees,iscapitalized.
Intangible assets acquired in a business combination–Alliden-tifiableintangibleassetsthatarerecognizedapplyingtheac-quisitionmethodinaccordancewithIFRSarestatedinitiallyatfairvalue.Thefollowingvaluationmethodsareusedinor-dertodeterminethefairvaluesattheacquisitiondate:multi-periodexcessearningsmethod,relieffromroyaltymethodandreplacementcostapproach.
Intangibleassetsaremeasuredatcostlessaccumulatedamor-tization(seebelow)andimpairmentlosses(seeseparateac-countingpolicy).Amortizationischargedtothestatementofprofitorlossonastraight-linebasisovertheestimatedusefullivesofintangibleassets.Intangibleassetsareamortizedfrom
thedatetheyareavailableforuse.Theestimatedusefullivesareasfollows:
Developmentcosts 3–5yearsSoftware 3–5yearsAcquiredclientrelationships 5–15years
Depreciationmethods,usefullivesandresidualvaluesarere-viewedateachfinancialyear-endandadjustedifappropriate.
2.7.9 ImpairmentThecarryingamountoftheGroup’snon-financialassetsotherthaninventories,assetsarisingfromconstructioncontractsanddeferredtaxassets,isreviewedateachbalancesheetdatetodeterminewhetherthereisanyindicationofimpairment.Ifsuchindicationexists,theasset’srecoverableamount,beingthehigherofitsfairvaluelesscosttosellanditsvalueinuse,isestimated.Goodwill,intangibleassetswithindefiniteuse-fullivesandintangibleassetsnotyetavailableforusearetestedforimpairmentatleastannually.Animpairmentlossisrecog-nizedinthestatementofprofitorlosswheneverthecarryingamountofanassetoritscash-generatingunitexceedsitsre-coverableamount.
Impairmentlossesrecognizedinpriorperiodsareassessedateachreportingdateforanyindicationsthatthelosshasde-creasedornolongerexists.Animpairmentlossisreviewediftherehasbeenachangeintheestimatesusedtodeterminetherecoverableamount.Animpairmentlossisreversedonlytotheextentthattheasset’scarryingamountdoesnotexceedthecarryingamountthatwouldhavebeendetermined,netofdepreciationoramortization,ifnoimpairmentlosshadbeenrecognized.Animpairmentlossinrespectofgoodwillisnotreversed.
2.7.10 Interest-bearing loans and borrowingsInterest-bearingloansandborrowingsarerecognizedinitiallyatfairvalue,lessattributabletransactioncosts.Subsequenttoinitialrecognition,interest-bearingloansandborrowingsarestatedatamortizedcostwithanydifferencebetweencostandredemptionvaluebeingrecognizedinthestatementofprofitorlossovertheperiodoftheborrowingsonaneffectiveinter-estbasis.
2.7.11 Trade and other accounts payableTradeandotheraccountspayablearestatedattheiramortizedcost,whichequalsthenominalamountforshort-termpayables.
2.7.12 Employee benefits – liability for post-employment benefits (IAS 19)
WithintheGroup,variouspost-employmentbenefitplansex-ist,whichdifferintheirpurposeandfinancingaccordingtolo-calneeds.Theliabilityforpost-employmentbenefitsrelatestodefinedbenefitpensionplansandlong-serviceleavebenefits.

82 Tecan Annual Report 2012 Consolidated financial statements
TheGroup’sliabilityinrespectofdefinedbenefitpensionplansiscalculatedseparatelyforeachplanbyestimatingtheamountoffuturebenefitthatemployeeshaveearnedinreturnfortheirserviceinthecurrentandpriorperiods;thatbenefitisdis-countedtodeterminethepresentvalue,andthefairvalueforanyplanassetsisdeducted.Thecalculationisperformedbyaprofessionallyqualifiedindependentactuaryusingthepro-jectedunitcreditmethod.
Currentservicecostsarechargedtothestatementofprofitorlossintheperiodsinwhichtheservicesarerenderedbytheemployees.
Actuarialgainsandlossescomprise:• Experienceadjustments(theeffectsofdifferencesbetween
thepreviousactuarialassumptionsandwhathasactuallyoccurred),and
• Theeffectsofchangesinactuarialassumptions.
Actuarialgainsandlossesarerecognizedasincomeorexpensewhenthenetcumulativeunrecognizedactuarialgainsorlossesforeachindividualplanattheendofthepreviousreportingperiodexceed10%ofthehigherofthedefinedbenefitobliga-tionandthefairvalueofplanassetsatthatdate.Thesegainsorlossesarerecognizedovertheexpectedaverageremainingworkinglivesoftheparticipatingemployees.
Pastservicecostsattributabletoplanamendmentsarerecog-nizedasanexpenseonastraight-linebasisovertheaverageperioduntilthebenefitsbecomevested.Totheextentthatthebenefitsarealreadyvestedimmediatelyfollowingtheintro-ductionof,orchangesto,adefinedbenefitpensionplan,pastservicecostsarerecognizedimmediately.
Anetpensionassetisrecordedonlytotheextentthatitdoesnotexceedthepresentvalueofanyeconomicbenefitsavaila-bleintheformofrefundsfromtheplanorreductionsinthefuturecontributionstotheplan,andanyunrecognizedactu-ariallossesandpastservicecosts.
Long-serviceleavebenefits:Themethodofaccountingforlia-bilitiesconcerninglong-serviceleavebenefitsissimilartotheoneusedfordefinedbenefitpensionplans.
2.7.13 Employee benefits – share-based payment (IFRS 2)TheGrouphasseveralequity-andcash-settledshare-basedcompensationplans:
Equity-settled plans –Thefairvalueofsharesorshareoptionsgrantedisrecognizedasapersonnelexpensewithacorre-spondingincreaseinequity.Thefairvalueismeasuredatgrantdateandspreadovertheperiodduringwhichtheemployeesbecomeunconditionallyentitledtothesharesorshareoptions(vestingperiod).ThefairvalueofthesharesgrantedrepresentsthemarketvalueofoneTecanshareadjustedforexpecteddiv-idendpaymentsduringthevestingperiod.Thefairvalueoftheshareoptionsgrantedismeasuredusingabinominalmodel,takingintoaccountthetermsandconditionsuponwhichthe
shareoptionsweregranted.Theamountrecognizedasanex-penseisadjustedbyanexpectedlaborturnoverratetoreflecttheexpectednumberofsharesorshareoptionsthatwillvest.
Cash-settled plans–Thefairvalueoftheamountpayabletotheemployeeisrecognizedasapersonnelexpensewithacor-respondingincreaseinprovisions.Thefairvalueisinitiallymeas-uredatgrantdateandspreadovertheperiodduringwhichtheemployeesbecomeunconditionallyentitledtopayment(vest-ingperiod).Thefairvalueofthestockappreciationrights(SARs)ismeasuredbasedonabinominalmodel,takingintoaccountthetermsandconditionsuponwhichtheinstrumentsweregranted.Theprovisionisremeasuredateachbalancesheetdateandatsettlementdate.Anychangesinthefairvalueoftheprovisionarerecognizedinthefinancialresult.
2.7.14 ProvisionsProvisionsarerecognizedwhentheGrouphasapresentlegalorconstructiveobligationasaresultofpastevents,itisprob-ablethatanoutflowofresourceswillberequiredtosettletheobligation,andareliableestimateoftheamountcanbemade.Iftheeffectofthetimevalueofmoneyismaterial,provisionsaredeterminedbydiscountingtheexpectedfuturecashflows.
Aprovisionforwarrantiesisrecognizedwhentheunderlyingproductsorservicesaresold.Theprovisionisbasedonhistor-icaldata.
2.7.15 DerivativesTheGroupusesderivativefinancialinstrumentstoeconomi-callyhedgecertainexposurestoforeignexchangeraterisks.Hedgeaccountingisnotapplied.Derivativefinancialinstru-mentsarerecognizedinitiallyatfairvalue.Subsequenttoini-tialrecognition,derivativefinancialinstrumentsarealsostatedatfairvalue.Anyresultinggainorlossisrecognizeddirectlyinthestatementofprofitorloss.
2.7.16 Treasury sharesInthecasetheGrouppurchasesownshares,theconsiderationpaidisrecognizedastreasurysharesandpresentedasade-ductionfromequityuntilthesesharesarecancelledorsold.Anyconsiderationreceivedfromthesaleofthesesharesisrec-ognizedinequity.
2.7.17 Segment reportingSegmentinformationispresentedinthesamemannerasintheinternalreportingtothechiefoperatingdecisionmaker.Thechiefoperatingdecisionmaker,responsibleforstrategicdecisions,fortheassessmentofthesegments’performanceandfortheallocationofresourcestothesegments,istheBoardofDirectorsofTecanGroupLtd.
Thefollowingreportablesegmentswereidentified:• Life Sciences Business(end-customerbusiness):Thebusiness
segment“LifeSciencesBusiness”suppliesenduserswithau-tomatedworkflowsolutionsdirectly.Thesesolutionsincludelaboratoryinstruments,softwarepackages,applicationknow-how,services,consumablesandspareparts.

83Tecan Annual Report 2012
• Partnering Business(OEMbusiness):Thebusinesssegment“PartneringBusiness”developsandmanufacturesOEMin-strumentsandcomponentsthataredistributedbypartnercompaniesundertheirownnames.
Theoperatingsegmentsareequivalenttothereportableseg-ments.Nooperatingsegmentshavebeenaggregated.Seg-mentassets,purchasesofproperty,plantandequipmentandintangibleassetsaswellassegmentliabilitiesarenotreportedtothechiefoperatingdecisionmaker.Thebusinesssegment“SampleManagement”wasdisposedofSeptember1,2010.
2.7.18 Sales – revenue recognitionGoods sold and services rendered–Salesarerecordednetofsalestaxesanddiscounts,atthetimetherisksandbenefitsofownershiparesubstantiallytransferredtocustomers.Revenuerecognitionfromproductswithmaterialapplicationandin-stallationworkrequiresawrittenacceptancebythecustomer.Revenuefromservicecontractsisrecognizedinthestatementofprofitorlossaccordingtotheproportionofthefullcontractperiodthathasalreadyelapsedatthebalancesheetdate.
Construction contracts–Assoonastheoutcomeofaconstruc-tioncontractcanbeestimatedreliably,contractrevenueandexpensesarerecognizedinthestatementofprofitorlossinproportiontothestageofcompletionofthecontract(seenote2.7.3“Constructioncontracts”).
2.7.19 Government research subsidiesTheGroupreceivesgovernmentgrantsforresearchactivities,whichareunconditional.Theyarerecognizedasincomewhenreceived.
2.7.20 Income taxesIncometaxontheprofitorlossfortheyearcomprisescurrentanddeferredtax.Incometaxisrecognizedinthestatementofprofitorlossexcepttotheextentthatitrelatestoitemsrec-ognizedinothercomprehensiveincomeordirectlyinequity(transactionswithowners),inwhichcaseitisrecognizedinothercomprehensiveincomeorequity.
Deferredtaxesareprovidedusingthebalancesheetliabilitymethod,providingfortemporarydifferencesbetweenthecar-ryingamountsofassetsandliabilitiesforfinancialreportingpurposesandtheamountsusedfortaxationpurposes.Thefol-lowingtemporarydifferencesarenotprovidedfor:goodwillnotdeductiblefortaxpurposes,theinitialrecognitionofas-setsorliabilitiesthataffectsneitheraccountingprofitnortax-ableprofit,anddifferencesrelatingtoinvestmentsinsubsidi-ariestotheextentthattheywillprobablynotreverseintheforeseeablefuture.Theamountofdeferredtaxprovidedisbasedontheexpectedmannerofrealizationorsettlementofthecarryingamountofassetsandliabilities,usingtaxratesenactedorsubstantiallyenactedatthebalancesheetdate.
Deferredtaxassetsresultingfromtemporarydifferencesandtaxlosscarry-forwardsarerecognizedonlytotheextentthatitisprobablethatfuturetaxableprofitswillbeavailableagainstwhichtheassetcanbeutilized.Deferredtaxassetsarereducedtotheextentthatitisnolongerprobablethattherelatedtaxbenefitwillberealized.
Inaddition,deferredtaxesareprovidedonexpecteddividenddistributionsfromsubsidiarycompanies(non-recoverablewith-holdingtaxes).
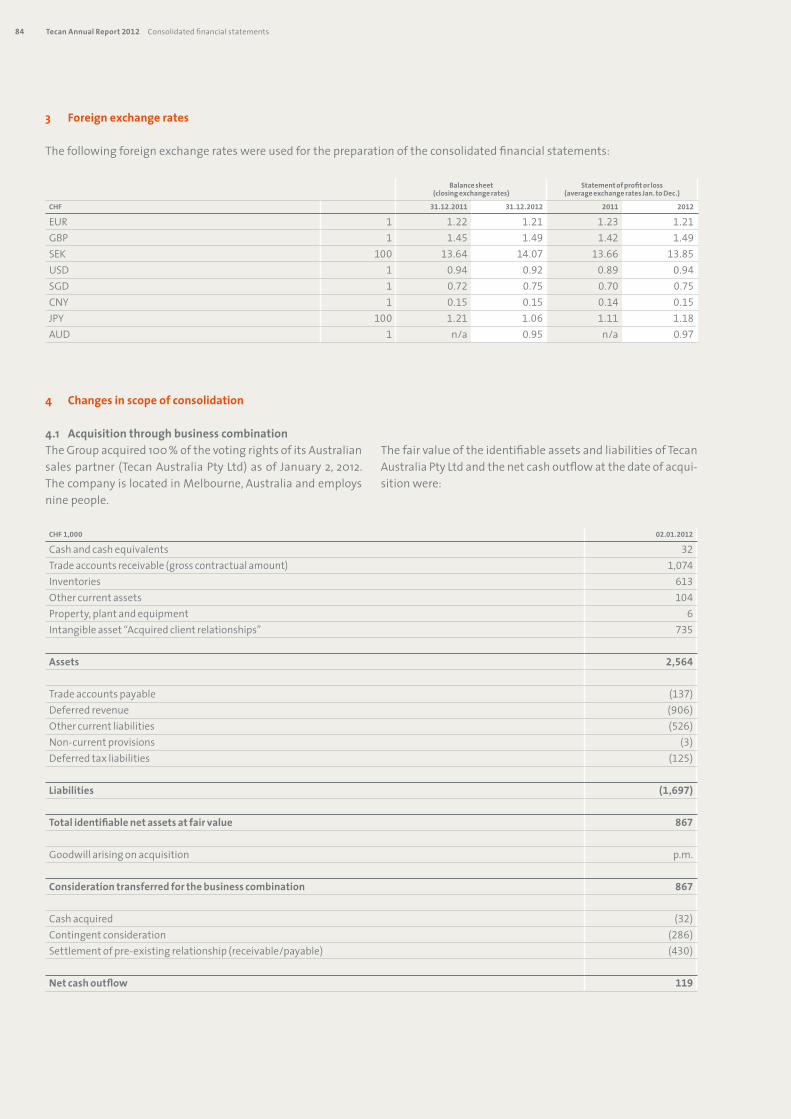
84 Tecan Annual Report 2012 Consolidated financial statements
3 Foreignexchangerates
Thefollowingforeignexchangerateswereusedforthepreparationoftheconsolidatedfinancialstatements:
4 Changesinscopeofconsolidation
4.1 AcquisitionthroughbusinesscombinationTheGroupacquired100%ofthevotingrightsofitsAustraliansalespartner(TecanAustraliaPtyLtd)asofJanuary2,2012.ThecompanyislocatedinMelbourne,Australiaandemploysninepeople.
ThefairvalueoftheidentifiableassetsandliabilitiesofTecanAustraliaPtyLtdandthenetcashoutflowatthedateofacqui-sitionwere:
CHF1,000 02.01.2012
Cashandcashequivalents 32Tradeaccountsreceivable(grosscontractualamount) 1,074Inventories 613Othercurrentassets 104Property,plantandequipment 6Intangibleasset“Acquiredclientrelationships” 735
Assets 2,564
Tradeaccountspayable (137)Deferredrevenue (906)Othercurrentliabilities (526)Non-currentprovisions (3)Deferredtaxliabilities (125)
Liabilities (1,697)
Totalidentifiablenetassetsatfairvalue 867
Goodwillarisingonacquisition p.m.
Considerationtransferredforthebusinesscombination 867
Cashacquired (32)Contingentconsideration (286)Settlementofpre-existingrelationship(receivable/payable) (430)
Netcashoutflow 119
Balancesheet(closingexchangerates)
Statementofprofitorloss(averageexchangeratesJan.toDec.)
CHF 31.12.2011 31.12.2012 2011 2012
EUR 1 1.22 1.21 1.23 1.21GBP 1 1.45 1.49 1.42 1.49SEK 100 13.64 14.07 13.66 13.85USD 1 0.94 0.92 0.89 0.94SGD 1 0.72 0.75 0.70 0.75CNY 1 0.15 0.15 0.14 0.15JPY 100 1.21 1.06 1.11 1.18AUD 1 n/a 0.95 n/a 0.97

85Tecan Annual Report 2012
Theacquisitionwasaccountedforusingtheacquisitionmethod.Howevernogoodwillresultedfromthepurchasepricealloca-tion.ThecontingentpaymentintheamountofCHF0.3mil-liondependsontherealizationoftheexistingorderbacklog.Itfallsdueendof2012(50%)andendof2013(50%)respectivelyandisexpectedtobepaidinfull,withoutanyreductions.The
acquisition-relatedcostsofCHF0.1millionwerealreadyin-curredandrecognizedin2011.
Forthetwelve-monthperiodfromthedateofacquisition,TecanAustraliahascontributedCHF3.8millionofsalesandCHF-0.2milliontotheoperatingprofitoftheGroup.
Resultfromdiscontinuedoperation
4.2 DiscontinuedoperationOnJune30,2010theBoardofDirectorsdecidedtosellthebusi-nesssegment“SampleManagement”,comprisingthesubsid-iaryRempAGandspecificassetsandliabilitiesrelatedtothebusinesssegmentheldbyothersubsidiaries.OnJuly15,2010afinalsharepurchaseagreementwithNexusBiosystems,Inc.,basedinPoway(California,USA),wassigned.TheclosingofthetransactionwasonSeptember1,2010.
Inthesecondhalfof2011,theGroupagreedwithNexusBio-sytemsInc.onafinalpurchasepricepaymentintheamountofUSD6.0millionthatsettledalloutstandingdeferredandcontingentconsiderationobligations.AtotalconsiderationofCHF15.4millionresultedfromthesaleofthebusinessseg-ment“SampleManagement”.
CHF1,000 2011 2012
Resultfromoperatingactivities,netofincometaxes – –
Gainonsettlementofdeferredandcontingentconsiderations 2,644 –Relatedincometaxes – –
Profitfromdiscontinuedoperation,netofincometaxes 2,644 –
EarningspersharefromdiscontinuedoperationBasicearningspershare(CHF/share) 0.24 –Dilutedearningspershare(CHF/share) 0.24 –
CHF1,000 2011 2012
Netcashflowfromoperatingactivities – –Netcashinflowfrominvestingactivities 5,480 –Netcashflowfromfinancingactivities – –
Netcashinflowfromdiscontinuedoperation 5,480 –
Cashinflowfromdiscontinuedoperation

86 Tecan Annual Report 2012 Consolidated financial statements
CHF1,000 2011 2012
Cash and cash equivalents denominatedinCHF 125,957 110,855denominatedinEUR 26,006 12,965denominatedinGBP 1,123 1,850denominatedinUSD 7,336 12,536denominatedinJPY 1,909 1,660denominatedinothercurrencies 2,758 4,662
BalanceatDecember31 165,089 144,528
Thereoftimedepositswithmaturitiesoflessthanthreemonthsfromthedateofacquisition 4,676 82,316
Effectiveinterestrate 0.2% 0.1%
5 Cashandcashequivalents
6 Currentloansandderivatives
Thederivativescompriseforeigncurrencyforwardsandoptionswithpositivefairvalues.Fordetaileddisclosuresseenote16.
CHF1,000 2011 2012
Currentderivatives 4,441 834Currentloanstoemployees(seenote26) 533 –
BalanceatDecember31 4,974 834

87Tecan Annual Report 2012
CHF1,000 2011 2012
Switzerland(domestic) 3,046 2,817Euro-zonecountries 24,122 28,245OtherEuropeancountries 2,442 2,280NorthAmerica 28,774 35,307Asia 8,099 9,531Other 1,300 1,980
BalanceatDecember31 67,783 80,160
Themaximumexposuretocreditriskfortradeaccountsreceivableatthereportingdatebygeographicregionwas:
TheGroup’smostsignificantcustomeraccountsfor6.1%ofthetradeaccountsreceivablecarryingamountatDecember31,2012(December31,2011:4.7%).
CHF1,000 2011 2012
Trade accounts receivabledenominatedinCHF 7,445 18,288denominatedinEUR 26,779 22,046denominatedinGBP 941 1,095denominatedinUSD 27,569 29,961denominatedinJPY 3,354 3,862denominatedinothercurrencies 1,695 4,908Subtotal trade accounts receivable 67,783 80,160
Allowance for doubtful accounts Individualimpairmentallowanceaccount (1,396) (2,152) Collectiveimpairmentallowanceaccount (47) (58) Subtotal allowance for doubtful accounts (1,443) (2,210)
Construction contracts in progressAggregateamountofcostincurredandrecognizedprofits 14,743 19,553Amountsofadvancesreceived (9,174) (15,111)Subtotal construction contracts in progress 5,569 4,442
BalanceatDecember31 71,909 82,392
Increase 6,477 10,959Acquisitionthroughbusinesscombination – 1,074Translationdifferences (84) (1,550)Total change compared with previous year 6,393 10,483
Amountofcontractrevenuerecognizedassalesinthe statementofprofitorlossrelatingtoconstructioncontracts 9,688 4,810
7 Tradeaccountsreceivable

88 Tecan Annual Report 2012 Consolidated financial statements
CHF1,000 2011 2012
IndividualimpairmentallowanceaccountBalanceatJanuary1 (1,456) (1,396)Changeinimpairmentlosses 49 (1,118)Write-offs 2 336Translationdifferences 9 26
BalanceatDecember31 (1,396) (2,152)
Amountoftradeaccountsreceivablewithindividualimpairment(gross) 1,662 2,174
CollectiveimpairmentallowanceaccountBalanceatJanuary1 (55) (47)Changeinimpairmentlosses 7 (12)Translationdifferences 1 1
BalanceatDecember31 (47) (58)
Themovementintheallowanceforimpairmentinrespectoftradeaccountsreceivableduringtheyearwasasfollows:
Theduedatesoftradeaccountsreceivablethatarenotindividuallyimpairedwere:
TheGroupdidnotexperienceanyseverefinancialdifficultieswithitsdebtorsinthepast.Thesumofallrecognizedfinalwrite-offsoftradeaccountsreceivablein2011and2012representslessthan1%ofsales.
2011 2012
CHF1,000 Gross Impairment Gross Impairment
Notpastdue 54,490 (40) 60,285 (41)Pastdue1–30days 6,700 – 11,852 (14)Pastdue31–90days 2,882 (1) 3,970 (3)Pastdue91–360days 1,747 (2) 1,837 –Pastduemorethanoneyear 302 (4) 42 –
BalanceatDecember31 66,121 (47) 77,986 (58)

89Tecan Annual Report 2012
CHF1,000 2011 2012
Rawmaterials,semi-finishedandfinishedgoods 40,517 41,098Allowanceforslow-movinginventories (7,314) (8,006)Workinprogress 3,611 2,643Capitalizedcustomer-specificdevelopmentcosts 31,104 73,689
BalanceatDecember31 67,918 109,424
Increase 24,928 41,270Acquisitionthroughbusinesscombination – 613Translationdifferences (94) (377)Total change compared with previous year 24,834 41,506
Amountofinventoriesstatedatfairvaluelesscoststosell 3,248 4,018
Amountofwrite-offsduetoslow-movinginventorieschargedtothe incomestatement 2,322 1,062
CHF1,000 2011 2012
Non-currentderivatives 10 720Rentdeposits 832 811
BalanceatDecember31 842 1,531
Thederivativescompriseforeigncurrencyforwardsandoptionswithpositivefairvalues.Fordetaileddisclosuresseenote16.
8 Inventories
9 Non-currentfinancialassets

90 Tecan Annual Report 2012 Consolidated financial statements
10 Property,plantandequipment
CHF1,000Leasehold
improvementsFurnitureand
fittingsMachinesand
motorvehiclesEDPequipment Total
2011
AtcostBalanceatJanuary1,2011 7,148 10,887 23,477 18,644 60,156Additions 181 1,686 5,645 2,093 9,605Disposals (11) (4) (613) (437) (1,065)ReclassificationbetweentheclassesofPPEandtopositioninventories – 18 (252) (46) (280)Translationdifferences 5 (50) (163) (101) (309)
BalanceatDecember31,2011 7,323 12,537 28,094 20,153 68,107
AccumulateddepreciationandimpairmentlossesBalanceatJanuary1,2011 6,353 8,241 16,794 15,096 46,484Annualdepreciation 417 964 2,529 2,042 5,952Disposals (11) (4) (480) (430) (925)ReclassificationbetweentheclassesofPPEandtopositioninventories – 15 (148) (47) (180)Translationdifferences 12 (48) (146) (87) (269)
BalanceatDecember31,2011 6,771 9,168 18,549 16,574 51,062
Netbookvalue 552 3,369 9,545 3,579 17,045
CHF1,000Leasehold
improvementsFurnitureand
fittingsMachinesand
motorvehiclesEDPequipment Total
2012
AtcostBalanceatJanuary1,2012 7,323 12,537 28,094 20,153 68,107Acquisitionthroughbusinesscombination – 1 – 5 6Additions 1,713 1,606 3,836 1,936 9,091Disposals (569) (952) (1,661) (1,478) (4,660)ReclassificationbetweentheclassesofPPEandtopositioninventories – – (178) 2 (176)Translationdifferences (79) (75) (285) (189) (628)
BalanceatDecember31,2012 8,388 13,117 29,806 20,429 71,740
AccumulateddepreciationandimpairmentlossesBalanceatJanuary1,2012 6,771 9,168 18,549 16,574 51,062Annualdepreciation 400 1,115 2,601 2,135 6,251Disposals (558) (900) (1,536) (1,462) (4,456)ReclassificationbetweentheclassesofPPEandtopositioninventories – – (177) 1 (176)Translationdifferences (62) (50) (214) (159) (485)
BalanceatDecember31,2012 6,551 9,333 19,223 17,089 52,196
Netbookvalue 1,837 3,784 10,583 3,340 19,544
Therewerenomaterialpurchasecommitmentsasofyear-end2011and2012.
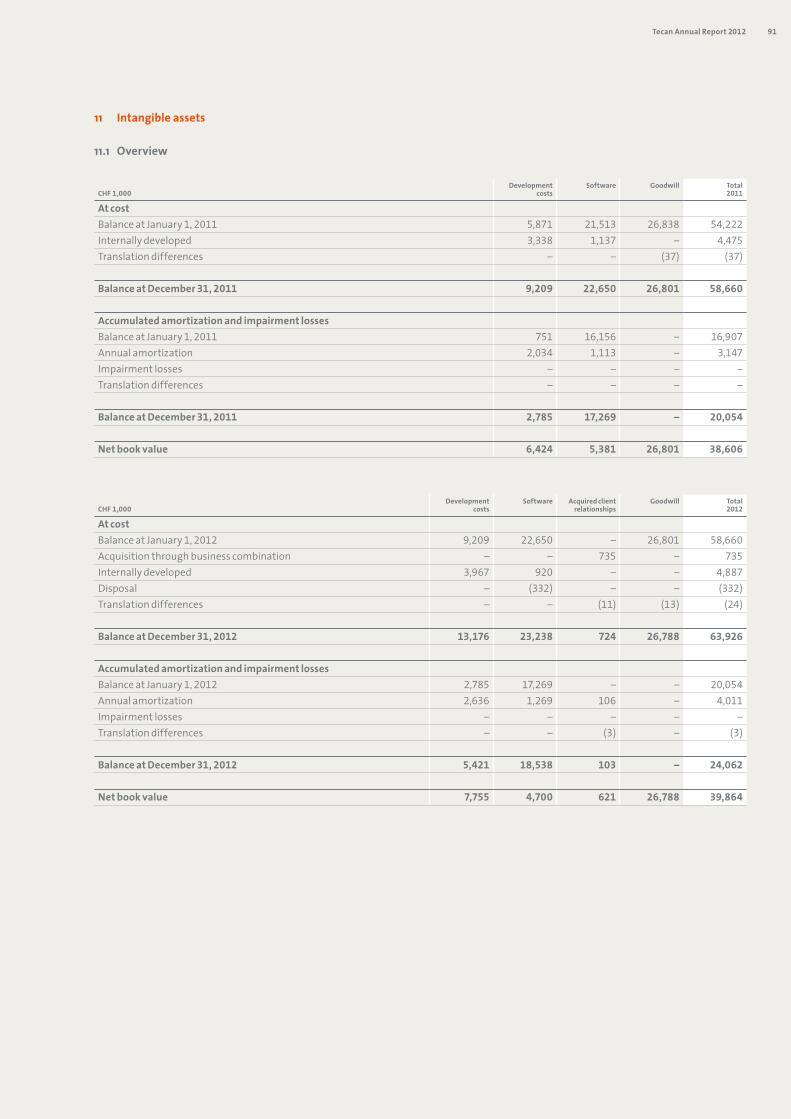
91Tecan Annual Report 2012
CHF1,000Development
costsSoftware Acquiredclient
relationshipsGoodwill Total
2012
AtcostBalanceatJanuary1,2012 9,209 22,650 – 26,801 58,660Acquisitionthroughbusinesscombination – – 735 – 735Internallydeveloped 3,967 920 – – 4,887Disposal – (332) – – (332)Translationdifferences – – (11) (13) (24)
BalanceatDecember31,2012 13,176 23,238 724 26,788 63,926
AccumulatedamortizationandimpairmentlossesBalanceatJanuary1,2012 2,785 17,269 – – 20,054Annualamortization 2,636 1,269 106 – 4,011Impairmentlosses – – – – –Translationdifferences – – (3) – (3)
BalanceatDecember31,2012 5,421 18,538 103 – 24,062
Netbookvalue 7,755 4,700 621 26,788 39,864
11 Intangibleassets
11.1 Overview
CHF1,000Development
costsSoftware Goodwill Total
2011
Atcost BalanceatJanuary1,2011 5,871 21,513 26,838 54,222Internallydeveloped 3,338 1,137 – 4,475Translationdifferences – – (37) (37)
BalanceatDecember31,2011 9,209 22,650 26,801 58,660
AccumulatedamortizationandimpairmentlossesBalanceatJanuary1,2011 751 16,156 – 16,907Annualamortization 2,034 1,113 – 3,147Impairmentlosses – – – –Translationdifferences – – – –
BalanceatDecember31,2011 2,785 17,269 – 20,054
Netbookvalue 6,424 5,381 26,801 38,606

92 Tecan Annual Report 2012 Consolidated financial statements
Theamortizationchargeisrecognizedinthefollowinglineitemsofthestatementofprofitorloss:
11.2.1 Financial year 2012TheGroupperformedimpairmenttestsoncash-generatingunitscontaininggoodwillinJuly2012,usingthefollowingkeyas-sumptions:
Inaddition,theGrouppreparedmandatoryimpairmenttestsforcapitalizeddevelopmentcostsrelatingtoproductsthatarenotyetlaunchedonthemarket,onSeptember30,2012.
CHF1,000 2011 2012
Costofsales – –Salesandmarketing – 106Researchanddevelopment 2,024 2,636Generalandadministration 1,113 1,269
Totalamortization 3,137 4,011
11.2 ImpairmenttestsForthepurposeofimpairmenttesting,goodwillisallocatedtoacash-generatingunitortoagroupofcash-generatingunitsthatareexpectedtobenefitfromthesynergiesofthecorre-spondingbusinesscombination.Subsequently,therecovera-bleamountofthecash-generatingunit(higheroffairvaluelesscoststosellandvalueinuse)iscomparedtoitscarryingamount.Animpairmentlossisonlyrecognizedifthecarryingamountofthecash-generatingunitexceedsitsrecoverableamount.Valueinuseisnormallyassumedtobehigherthanthefairvaluelesscoststosell;therefore,fairvaluelesscoststosellisonlyinvestigatedwhenvalueinuseislowerthanthecarryingamountofthecash-generatingunit.
IntangibleassetCash-generatingunit
Method Carryingamount(CHF1,000)
Testdate Basisforrecovera-bleamount
Pre-taxdiscountrate
Projectionperiod
Long-termgrowthrate
GoodwillLifeSciencesBusinessLifeSciencesBusiness
DCF-method 26,788 July2012 Valueinuse 9.2% 5years 0.0%
ValueinuseiscalculatedaccordingtotheDCF-method.Thecashflowprojectionsarebasedonafive-yearfinancialplan-ningperiod.Cashflowsbeyondthefive-yearperiodareextrap-olatedapplyingtheestimatedlong-termgrowthratesstatedbelow.Theexpectedgrowthinsalesisbasedonexternalmar-ketstudiesandinternalassessmentspreparedbymanage-ment.Futurecashflowsarediscountedusingtheweightedaveragecostofcapital(WACC).Thediscountratesappliedarepre-tax.
Basedontheimpairmenttests2012,therewasnoneedfortherecognitionofanyimpairment.Managementbelievesthatnoreasonablypossiblechangeinanyoftheabovekeyassump-tionswouldcausethecarryingamountofthecash-generat-ingunittomateriallyexceeditsrecoverableamount.

93Tecan Annual Report 2012
12 Bankliabilitiesandderivatives
CHF1,000
Bankoverdraftsunderbank
poolingarrangements
Othercurrentbankliabilities
Currentderivatives
(seenote16)
Currentportionsof
non-currentbankloans
Totalcurrent
Bankloans Non-currentderivatives
(seenote16)
Totalnon-current
BalanceatJanuary1,2011 1,161 86 4,586 499 6,332 1,088 – 1,088Decrease (1,161) (16) – – (1,177) – – –Changeinfairvalue – – (3,395) – (3,395) – 1,025 1,025Increaseinbankloans – – – – – 1,055 – 1,055Repaymentofbankloans – – – (492) (492) – – –Transfertocurrent – – – – – – – –Translationdifferences – – – (7) (7) (40) – (40)
BalanceatDecember31,2011 – 70 1,191 – 1,261 2,103 1,025 3,128
Analysis by currency DenominatedinCHF – – DenominatedinEUR – 2,103 DenominatedinUSD 1,261 1,025 DenominatedinJPY – –Total 1,261 3,128
Analysis by interest rates Interest-free 1,261 1,025 Variableinterestratesdepending onLIBOR – – Fixedinterestrate:
0%–2% – 2,103 2%–4% – – 4%–6% – –
Total 1,261 3,128
11.2.2 Financial year 2011TheGroupperformedimpairmenttestsoncash-generatingunitscontaininggoodwillinJuly2011,usingthefollowingkeyassumptions:
Inaddition,theGrouppreparedmandatoryimpairmenttestsforcapitalizeddevelopmentcostsrelatingtoproductsthatarenotyetlaunchedonthemarket,onSeptember30,2011.
IntangibleassetCash-generatingunit
Method Carryingamount(CHF1,000)
Testdate Basisforrecovera-bleamount
Pre-taxdiscountrate
Projectionperiod
Long-termgrowthrate
GoodwillLifeSciencesBusinessLifeSciencesBusiness
DCF-method 26,801 July2011 Valueinuse 11.0% 5years 0.0%
Basedontheimpairmenttests2011,therewasnoneedfortherecognitionofanyimpairment.
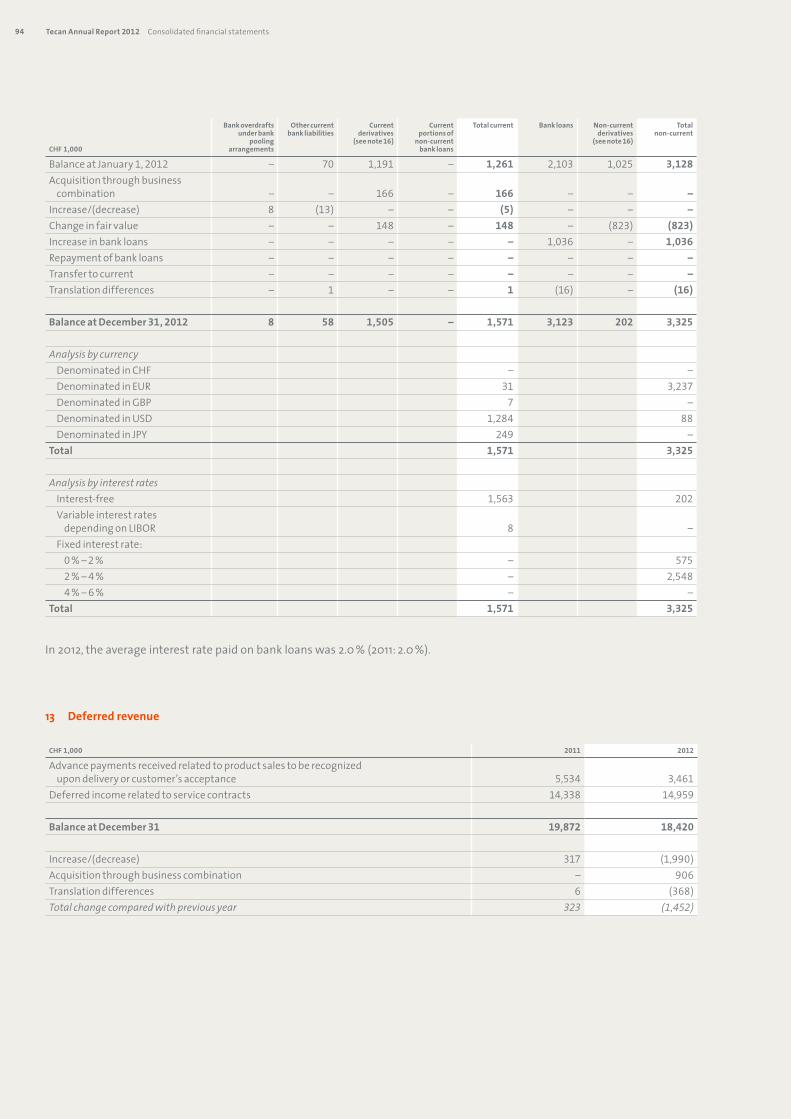
94 Tecan Annual Report 2012 Consolidated financial statements
13 Deferredrevenue
CHF1,000 2011 2012
Advancepaymentsreceivedrelatedtoproductsalestoberecognized upondeliveryorcustomer’sacceptance 5,534 3,461Deferredincomerelatedtoservicecontracts 14,338 14,959
BalanceatDecember31 19,872 18,420
Increase/(decrease) 317 (1,990)Acquisitionthroughbusinesscombination – 906Translationdifferences 6 (368)Total change compared with previous year 323 (1,452)
CHF1,000
Bankoverdraftsunderbank
poolingarrangements
Othercurrentbankliabilities
Currentderivatives
(seenote16)
Currentportionsof
non-currentbankloans
Totalcurrent Bankloans Non-currentderivatives
(seenote16)
Totalnon-current
BalanceatJanuary1,2012 – 70 1,191 – 1,261 2,103 1,025 3,128Acquisitionthroughbusiness combination – – 166 – 166 – – –Increase/(decrease) 8 (13) – – (5) – – –Changeinfairvalue – – 148 – 148 – (823) (823)Increaseinbankloans – – – – – 1,036 – 1,036Repaymentofbankloans – – – – – – – –Transfertocurrent – – – – – – – –Translationdifferences – 1 – – 1 (16) – (16)
BalanceatDecember31,2012 8 58 1,505 – 1,571 3,123 202 3,325
Analysis by currency DenominatedinCHF – – DenominatedinEUR 31 3,237 DenominatedinGBP 7 – DenominatedinUSD 1,284 88 DenominatedinJPY 249 –Total 1,571 3,325
Analysis by interest rates Interest-free 1,563 202 Variableinterestrates dependingonLIBOR 8 – Fixedinterestrate:
0%–2% – 575 2%–4% – 2,548 4%–6% – –
Total 1,571 3,325
In2012,theaverageinterestratepaidonbankloanswas2.0%(2011:2.0%).

95Tecan Annual Report 2012
14 Employeebenefits
14.1 Numberofemployees
14.2Personnelexpenses
Personnelexpensesincludethefollowing:
FTE1 2011 2012
Employees–year-end 1,107 1,185Employees–average 1,079 1,163
1FTE=Fulltimeequivalent
CHF1,000 2011 2012
Salariesandwages 105,792 111,534Socialsecurity 13,255 14,145Post-employmentbenefits•definedcontributionplans 929 1,245•definedbenefitplans 5,237 5,607Share-basedpayment 3,618 3,035Otherpersonnelexpenses 2,835 3,299
Totalpersonnelexpenses 131,666 138,865
14.3.Liabilityforpost-employmentbenefits:definedbenefitplans(IAS19)
Theliabilityforpost-employmentbenefitsrelatestothefollowingplans:
Theamountsrecognizedinthebalancesheetareasfollows:
2011 2012
Number of plansFundedplans 4 4Unfundedplans 3 3
Number of people coveredParticipatingemployees 514 557Retirees 5 11
Expectedaverageremainingworkinglivesoftheparticipatingemployees(years) 11.8 11.5
CHF1,000 2011 2012
Presentvalueoffundedobligations 65,647 80,737Fairvalueofplanassets (59,199) (63,921)Subtotal 6,448 16,816
Presentvalueofunfundedobligations 3,193 4,027Unrecognizednetactuariallosses (3,921) (14,459)
NetliabilityatDecember31 5,720 6,384

96 Tecan Annual Report 2012 Consolidated financial statements
CHF1,000 2011 2012
Currentservicecosts 7,733 8,345Employeecontributions (2,887) (3,143)Interestexpenseonobligation 1,626 1,886Expectedreturnonplanassets (1,249) (1,495)Amortizationofactuariallosses 14 14
Total,includedinpersonnelexpenses 5,237 5,607
Actualreturnonplanassets 415 1,959
CHF1,000 2011 2012
BalanceatJanuary1 66,347 68,840Currentservicecosts 7,733 8,345Insurancepremiums (1,489) (1,674)Benefitspaid (3,590) (3,525)Interestexpenseonobligation 1,626 1,886Actuarial(gains)/losses (1,770) 11,024Translationdifferences (17) (132)
BalanceatDecember31 68,840 84,764
CHF1,000 2011 2012
BalanceatJanuary1 56,594 59,199Employercontributions 4,382 4,819Employeecontributions 2,887 3,143Insurancepremiums (1,489) (1,674)Benefitspaid (3,590) (3,525)Expectedreturnonplanassets 1,249 1,495Actuarial(losses)/gains (834) 464
BalanceatDecember31 59,199 63,921
Theamountsrecognizedinthestatementofprofitorlossareasfollows:
Changesinthepresentvalueofthedefinedbenefitobligationareasfollows:
Changesinthefairvalueofplanassetsareasfollows:
TheGroupexpectstocontributeCHF5.0milliontoitsdefinedbenefitplansin2013.

97Tecan Annual Report 2012
Themajorcategoriesofplanassetsasapercentageoftotalplanassetsareasfollows:
2011 2012
Equitysecurities 1.3% 2.9%Debtsecurities 84.1% 78.9%Realestate 11.4% 11.6%Other 3.2% 6.7%
Total 100.0% 100.0%
ThereareneitherownfinancialinstrumentsoftheGroupnoranypropertyoccupiedbytheGroupincludedintheplanassets.
Principalactuarialassumptionsatthebalancesheetdate(expressedasweightedaverages):
Historyofexperienceadjustments:
2011 2012
DiscountrateatDecember31 2.8% 2.2%ExpectedreturnonplanassetsatDecember31 2.4% 2.1%Futuresalaryincreases 1.8% 2.1%Futurepensionincreases 0.3% 0.3%
Theexpectedreturnonplanassetsisbasedontheinvestmentstrategyofthelifeinsurancecompany.
CHF1,000 2008 2009 2010 2011 2012
Definedbenefitobligation 59,518 67,492 66,347 68,840 84,764Planassets (54,923) (57,804) (56,594) (59,199) (63,921)Deficit 4,595 9,688 9,753 9,641 20,843
Experiencegains/(losses)onplanliabilitiesin% 2.2% -2.3% 2.7% -1.0% 0.2%Experiencegains/(losses)onplanassetsin% -1.1% -1.2% -0.3% -1.4% 0.7%
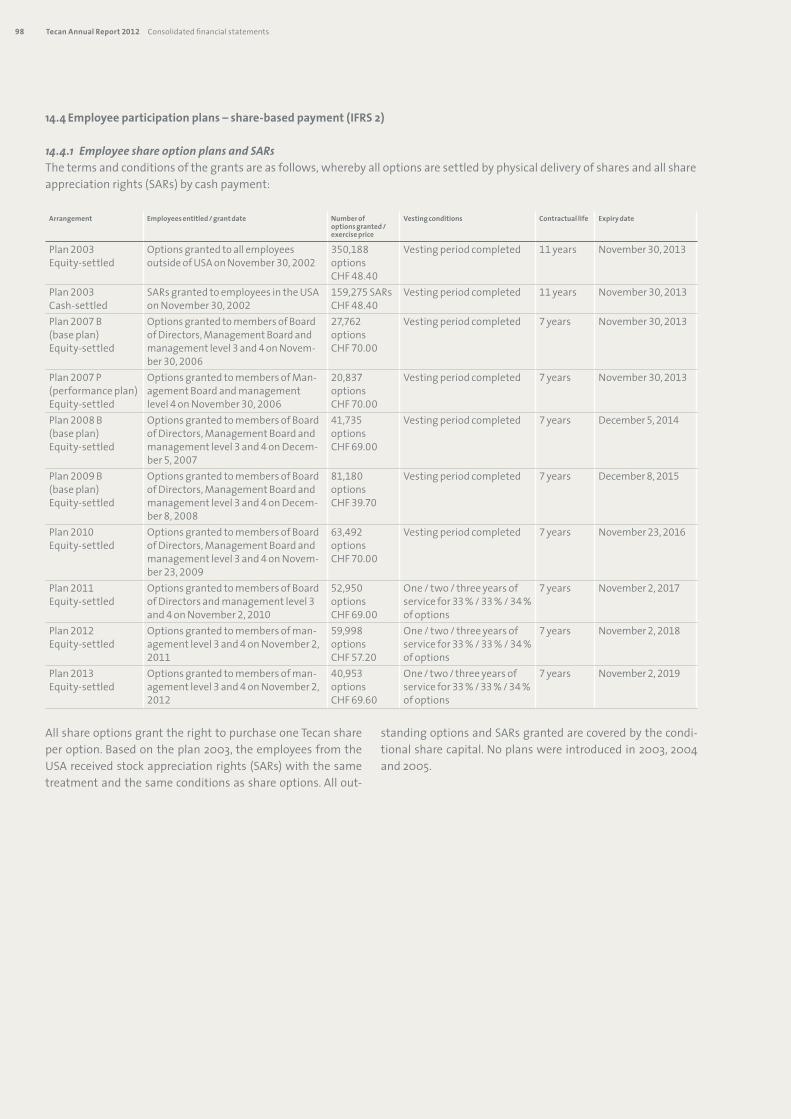
98 Tecan Annual Report 2012 Consolidated financial statements
14.4Employeeparticipationplans–share-basedpayment(IFRS2)
14.4.1 Employee share option plans and SARsThetermsandconditionsofthegrantsareasfollows,wherebyalloptionsaresettledbyphysicaldeliveryofsharesandallshareappreciationrights(SARs)bycashpayment:
Arrangement Employeesentitled/grantdate Numberofoptionsgranted/exerciseprice
Vestingconditions Contractuallife Expirydate
Plan2003Equity-settled
OptionsgrantedtoallemployeesoutsideofUSAonNovember30,2002
350,188optionsCHF48.40
Vestingperiodcompleted 11years November30,2013
Plan2003Cash-settled
SARsgrantedtoemployeesintheUSAonNovember30,2002
159,275SARsCHF48.40
Vestingperiodcompleted 11years November30,2013
Plan2007B(baseplan)Equity-settled
OptionsgrantedtomembersofBoardofDirectors,ManagementBoardandmanagementlevel3and4onNovem-ber30,2006
27,762optionsCHF70.00
Vestingperiodcompleted 7years November30,2013
Plan2007P(performanceplan)Equity-settled
OptionsgrantedtomembersofMan-agementBoardandmanagementlevel4onNovember30,2006
20,837optionsCHF70.00
Vestingperiodcompleted 7years November30,2013
Plan2008B(baseplan)Equity-settled
OptionsgrantedtomembersofBoardofDirectors,ManagementBoardandmanagementlevel3and4onDecem-ber5,2007
41,735optionsCHF69.00
Vestingperiodcompleted 7years December5,2014
Plan2009B(baseplan)Equity-settled
OptionsgrantedtomembersofBoardofDirectors,ManagementBoardandmanagementlevel3and4onDecem-ber8,2008
81,180optionsCHF39.70
Vestingperiodcompleted 7years December8,2015
Plan2010Equity-settled
OptionsgrantedtomembersofBoardofDirectors,ManagementBoardandmanagementlevel3and4onNovem-ber23,2009
63,492optionsCHF70.00
Vestingperiodcompleted 7years November23,2016
Plan2011Equity-settled
OptionsgrantedtomembersofBoardofDirectorsandmanagementlevel3and4onNovember2,2010
52,950optionsCHF69.00
One/two/threeyearsofservicefor33%/33%/34%ofoptions
7years November2,2017
Plan2012Equity-settled
Optionsgrantedtomembersofman-agementlevel3and4onNovember2,2011
59,998optionsCHF57.20
One/two/threeyearsofservicefor33%/33%/34%ofoptions
7years November2,2018
Plan2013Equity-settled
Optionsgrantedtomembersofman-agementlevel3and4onNovember2,2012
40,953optionsCHF69.60
One/two/threeyearsofservicefor33%/33%/34%ofoptions
7years November2,2019
AllshareoptionsgranttherighttopurchaseoneTecanshareperoption.Basedontheplan2003,theemployeesfromtheUSAreceivedstockappreciationrights(SARs)withthesametreatmentandthesameconditionsasshareoptions.Allout-
standingoptionsandSARsgrantedarecoveredbythecondi-tionalsharecapital.Noplanswereintroducedin2003,2004and2005.

99Tecan Annual Report 2012
2011 2012
Weightedaverageexerciseprice(CHF)
Number Weightedaverageexerciseprice(CHF)
Number
Options SARs Options SARs Options SARs Options SARs
BalanceatJanuary1 63.34 87.22 418,507 23,701 63.20 87.67 400,666 23,440Granted 57.20 – 59,998 – 69.60 – 40,953 –Exercised 53.81 48.40 (27,814) (270) 55.43 48.80 (54,270) (1,170)Forfeited 61.38 – (48,550) – 42.65 – (59,846) –Expired 93.71 99.00 (1,475) 9 96.33 99.00 (66,814) (18,190)BalanceatDecember31 63.20 87.67 400,666 23,440 62.05 48.40 260,689 4,080
2011 2012
Exerciseprice Remainingcontractuallife(years)
Number Remainingcontractuallife(years)
Number
Options SARs Options SARs Options SARs Options SARs
Plan2002 99.0 0.9 0.9 61,770 18,190 – – – –Plan2003 48.4 1.9 1.9 37,674 5,250 0.9 0.9 26,321 4,080Plan2007B 70.0 1.9 – 14,526 – 0.9 – 11,148 –Plan2007P 70.0 1.9 – 5,009 – 0.9 – 3,971 –Plan2008B 69.0 2.9 – 25,858 – 1.9 – 20,608 –Plan2009B 39.7 3.9 – 41,601 – 2.9 – 24,699 –Plan2009P 39.7 3.9 – 52,732 – – – – –Plan2010 70.0 4.9 – 52,408 – 3.9 – 39,741 –Plan2011 69.0 5.8 – 49,090 – 4.8 – 40,335 –Plan2012 57.2 6.8 – 59,998 – 5.8 – 52,913 –Plan2013 69.6 6.8 – 40,953 –BalanceatDecember31 3.9 1.1 400,666 23,440 4.2 0.9 260,689 4,080
Exercisableatperiod-end 237,286 23,440 166,476 4,080
TheweightedaveragesharepriceatthedatesofexercisewasCHF75.13in2011andCHF70.20in2012.
ThenumberandweightedaverageexercisepricesofshareoptionsandSARsareasfollows:
OutstandingshareoptionsandSARsattheendoftheperiodindetail:
Equity-settled share-based paymentThefairvalueofservicesreceivedinreturnfortheshareop-tionsgrantedismeasuredbyreferencetotheshareoptionsvestedmultipliedbytheirfairvalueatgrantdate(measure-mentdate).Theestimateofthefairvalueisbasedonabinom-
inalmodel.Changesinthefairvalueoftheoptionafterthegrantdatedonotchangethefairvalueoftheservicesreceived.
Theexpenses,recognizedintheconsolidatedstatementofprofitorloss,arecalculatedasfollows:
Fairvalueofshareoptionsandkeyassumptions(notyetvestedshareoptionplans):
Grant Shareprice Exerciseprice Expectedvolatility1
Optionlife Expecteddividends
Risk-freeinterestrate
Fairvalue
Plan2011 CHF69.00 CHF69.00 32.09% 7.0years 1.83% 1.54% CHF20.47Plan2012 CHF57.20 CHF57.20 33.19% 7.0years 2.32% 1.11% CHF16.29Plan2013 CHF69.60 CHF69.60 31.79% 7.0years 1.91% 0.57% CHF19.13
1Historicvolatilitywithanunderlyingperiodthatdependsontheoptionlife
Datasource:Bloomberg

100 Tecan Annual Report 2012 Consolidated financial statements
Shareprice Exerciseprice Expectedvolatility1
Optionlife Expecteddividends
Risk-freeinterestrate
Fairvalue
GrantDatePlan2003 CHF48.40 CHF48.40 38.00% 11.0years 0.84% 2.83% CHF23.372011Plan2003 CHF63.50 CHF48.40 31.70% 1.9years 2.06% 0.09% CHF17.792012Plan2003 CHF76.50 CHF48.80 27.70% 0.9years 1.79% 0.05% CHF28.17
1Historicvolatilitywithanunderlyingperiodthatdependsontheoptionlife
Datasource:Bloomberg
Cash-settled share-based paymentThefairvalueofservicesreceivedinreturnfortheSARsgrantedismeasuredbyreferencetotheSARsvestedmultipliedbytheirfairvalueatgrantdate(measurementdate).Theestimateofthefairvalueisbasedonabinominalmodel.Changesinthe
fairvalueoftheSARsafterthegrantdatehaveanimpactontheprovisionforcash-settledshare-basedpaymentandarepostedtothefinancialresult.
FairvalueofSARsandkeyassumptions:
14.4.2 Employee share plansThetermsandconditionsofthegrantsareasfollows,wherebyallsharesaredeliveredphysicallyandfreeofcharge(exceptformandatoryinvestment):
Arrangement Employeesentitled/grantdate Numberofsharesgranted Fairvalueatgrant Vestingperiod Vestingconditions
Initialgrant ExtendedManagementBoardonApril6,2010
28,466shares CHF80.25 GradedvestingfromJanuary1,2010toDecember31,20121
Threeyearsofservice
MandatoryinvestmentAnnualbonus2009inexcessof100%ofthetargetcashbonuswasgrantedinformofshares
ExtendedManagementBoardonApril6,2010
1,054shares CHF80.25 Immediatevesting1 None
Matchingshares ExtendedManagementBoardonApril6,2010
83,000shares(maximumofpoten-tialsharesgranted)
CHF77.25 January1,2010toDecember31,2012
Threeyearsofserviceandperformancetarget
1Vestedsharesareblockeduntiltheendoftheperformanceperiod(December31,2012).
Arrangement Employeesentitled/grantdate Numberofsharesgranted Fairvalueatgrant Vestingperiod Vestingconditions
Additionalgrant1 CEOonJanuary15,2010
20,000shares CHF77.00–CHF73.00
March1,2010toMarch1,2012andMarch1,2015respectively
Two/fiveyearsofservicefor50%/50%ofshares
1Theadditionalgrantisnon-recurringinthefutureandnotincludedinthecalculationofthematchingshares.
Performancesharematchingplan(PSMP)2010–ManagementBoard
Additionalgrant2010

101Tecan Annual Report 2012
Arrangement Employeesentitled/grantdate Numberofsharesgranted Fairvalueatgrant Vestingperiod Vestingconditions
Initialgrant BoardofDirectorsonDecember13,2011
3,232shares CHF61.95 GradedvestingfromMay1,2011toApril30,20141
Threeyearsofservice
Matchingshares BoardofDirectorsonDecember13,2011
4,040shares(maximumofpoten-tialsharesgranted)
CHF58.95 May1,2011toApril30,2014
Threeyearsofserviceandperformancetarget
1Vestedsharesareblockeduntiltheendoftheperformanceperiod(April30,2014).
Arrangement Employeesentitled/grantdate Numberofsharesgranted Fairvalueatgrant Vestingperiod Vestingconditions
Initialgrant BoardofDirectorsonMarch21,2012
2,959shares CHF65.75 GradedvestingfromMay1,2012toApril30,20151
Threeyearsofservice
Matchingshares BoardofDirectorsonMarch21,2012
3,699shares(maximumofpoten-tialsharesgranted)
CHF62.00 May1,2012toApril30,2015
Threeyearsofserviceandperformancetarget
1Vestedsharesareblockeduntiltheendoftheperformanceperiod(April30,2015).
Arrangement Employeesentitled/grantdate Numberofsharesgranted Fairvalueatgrant Vestingperiod Vestingconditions
Initialgrant ExtendedManagementBoardonFebruary28,2011
22,114shares CHF78.95 GradedvestingfromJanuary1,2011toDecember31,20131
Threeyearsofservice
MandatoryinvestmentAnnualbonus2010inexcessof100%ofthetargetcashbonuswasgrantedinformofshares
ExtendedManagementBoardonFebruary28,2011
264shares CHF78.95 Immediatevesting1 None
Matchingshares ExtendedManagementBoardonFebruary28,2011
58,040shares(maximumofpoten-tialsharesgranted)
CHF75.95 January1,2011toDecember31,2013
Threeyearsofserviceandperformancetarget
1Vestedsharesareblockeduntiltheendoftheperformanceperiod(December31,2013).
Arrangement Employeesentitled/grantdate Numberofsharesgranted Fairvalueatgrant Vestingperiod Vestingconditions
Initialgrant ExtendedManagementBoardonMarch21,2012
29,498shares CHF65.75 GradedvestingfromJanuary1,2012toDecember31,20141
Threeyearsofservice
MandatoryinvestmentAnnualbonus2011inexcessof100%ofthetargetcashbonuswasgrantedinformofshares
ExtendedManagementBoardonMarch21,2012
806shares CHF65.75 Immediatevesting1 None
Matchingshares ExtendedManagementBoardonMarch21,2012
85,258shares(maximumofpoten-tialsharesgranted)
CHF62.00 January1,2012toDecember31,2014
Threeyearsofserviceandperformancetarget
1Vestedsharesareblockeduntiltheendoftheperformanceperiod(December31,2014).
Performancesharematchingplan(PSMP)2011–BoardofDirectors
Performancesharematchingplan(PSMP)2012–BoardofDirectors
Performancesharematchingplan(PSMP)2011–ManagementBoard
Performancesharematchingplan(PSMP)2012–ManagementBoard
Inadditiontothegrantslistedabove,theextendedManage-mentBoardwasentitledtoinvestvoluntarilyupto50%ofitstargetcashbonus2009/2010/2011inTecansharesatmarketprices (average market value from January 1 to April 30,
2010/2011/2012).Thevoluntaryinvestmentcouldnotexceedtherealizedcashbonus.Thesharesareblockeduntiltheendoftheperformanceperiodandareincludedinthecalculationofthematchingshares.

102 Tecan Annual Report 2012 Consolidated financial statements
Year/plan Initialgrant1 Mandatoryinvestment1 Voluntaryinvestment1 Totalbaseshares Matchingsharefactorapplied
Matchingsharesexpectedtovest2
2011PSMP2010–MB 24,982 1,054 3,334 29,370 0.00 –PSMP2011–BoD 3,232 n/a n/a 3,232 1.12 3,620PSMP2011–MB 22,114 264 838 23,216 2.24 52,004
2012PSMP2010–MB 19,442 887 2,169 22,498 0.00 –PSMP2011–BoD 2,962 n/a n/a 2,962 0.18 533PSMP2011–MB 15,317 153 141 15,611 0.36 5,620PSMP2012–BoD 2,959 n/a n/a 2,959 1.25 3,699PSMP2012–MB 23,720 682 2,037 26,439 2.50 66,097
1Onlysharesthatqualifyformatchingshares2Notadjustedforexpectedfluctuation
Thefairvalueofservicesreceivedinreturnforthesharesgrantedismeasuredbyreferencetothesharesvestedmultipliedbytheirfairvalueatgrantdate(measurementdate).ThefairvalueatgrantrepresentsthemarketvalueofoneTecansharead-
Theexpenses,recognizedintheconsolidatedstatementofprofitorloss,arecalculatedasfollows:
justedforexpecteddividendpaymentsduringthevestingpe-riod.Changesinthefairvalueofthesharesafterthegrantdatedonotchangethefairvalueoftheservicesreceived.
Number of matching shares expected to vest at December 31
Thenumberofmatchingsharesisdeterminedbasedonthefollowingformula:numberofsharesfrominitialgrantplusnumberofsharesfrommandatoryandvoluntaryinvestments(ifapplicable)timesthematchingsharefactor.Thematching
sharefactorisdependentontheachievementofspecificeco-nomicprofittargets.Inanycase,thematchingsharefactorwillnotbelowerthan0.0andnothigherthan1.25(BoardofDirec-tors)and2.5(extendedManagementBoard)respectively.
Numberofsharesoutstandingattheendoftheperiod:
Shares(excludingvoluntaryinvestments) 2011 2012
BalanceatJanuary1 123,600 204,323Granted 87,690 122,220De-blockedandtransferredtoemployee (5,000) (35,953)Forfeited (1,967) (67,930)
BalanceatDecember31 204,323 222,660
Thereofvested,butblockeduntiltheendoftheperformanceperiod 29,172 29,198

103Tecan Annual Report 2012
15 Provisions
CHF1,000Cash-settledshare-based
paymenttransactions(seenote14)Restructuring Warranties
andreturnsWEEE1 Legalcases Other Total
2011
BalanceatJanuary1,2011 263 395 7,090 669 – 3,493 11,910Provisionsmade – – 3,879 65 752 795 5,491Provisionsused (9) (248) (2,155) – – (55) (2,467)Provisionsreversed (150) (99) (227) (3) (1,418) (1,897)Unwindofdiscounts – – – – – – –Translationdifferences – (5) – (16) 10 (30) (41)
BalanceatDecember31,2011 104 43 8,587 715 762 2,785 12,996
Thereofcurrent 11 43 8,587 – 762 2,012 11,415Thereofnon–current 93 – – 715 – 773 1,581
CHF1,000Cash-settledshare-based
paymenttransactions(seenote14)Restructuring Warranties
andreturnsWEEE1 Legalcases Other Total
2012
BalanceatJanuary1,2012 104 43 8,587 715 762 2,785 12,996Acquisitionthroughbusiness combination – – 38 – – 3 41Provisionsmade 37 1,795 140 3 883 2,858Provisionsused (27) (14) (1,790) (2) (190) 149 (1,874)Provisionsreversed – (29) (21) – – (1,146) (1,196)Unwindofdiscounts – – – – – – –Translationdifferences – – (76) (1) 14 (9) (72)
BalanceatDecember31,2012 114 – 8,533 852 589 2,665 12,753
Thereofcurrent 114 – 8,533 – 589 1,457 10,693Thereofnon-current – – – 852 – 1,208 2,060
1WEEE=wasteelectricalandelectronicequipment(directive2002/96/EC)
Theprovisionforlegalcases(2012:CHF0.6millionand2011:CHF0.8million)relatestoseverallegalcaseswithformercus-tomersandemployeesindifferentsubsidiaries,forwhichthetimingofsettlementwasuncertainatyear-end.
Theposition“other”containsprovisionstocovercommitmentsrelatingtopartsandmaterialfordiscontinuedproducts(2012:CHF0.9millionand2011:CHF0.9million),tocontroversialim-
portdutypositions(2012:CHF0millionand2011:CHF0.5mil-lion),toothernon-currentemployeebenefits(2012:CHF1.1mil-lionand2011:CHF0.7million)andtoseveralminoritems(2012:CHF0.7millionand2011:CHF0.7million).
14.4.3 Total expenses recognized
CHF1,000 2011 2012
Expensesarisingfromequity-settledshareoptionplans 867 412Expensesarisingfromperformancesharematchingplans 2,751 2,623Total personnel expenses recognized with impact on operating profit 3,618 3,035
EffectofchangesinthefairvalueofSARswithimpactonthefinancialresult (150) 37
Totalexpenses 3,468 3,072
Theprovisionforcash-settledshare-basedpaymenttransactionsamountstoCHF0.1millionatDecember31,2012(2011:CHF0.1million,seenote15).
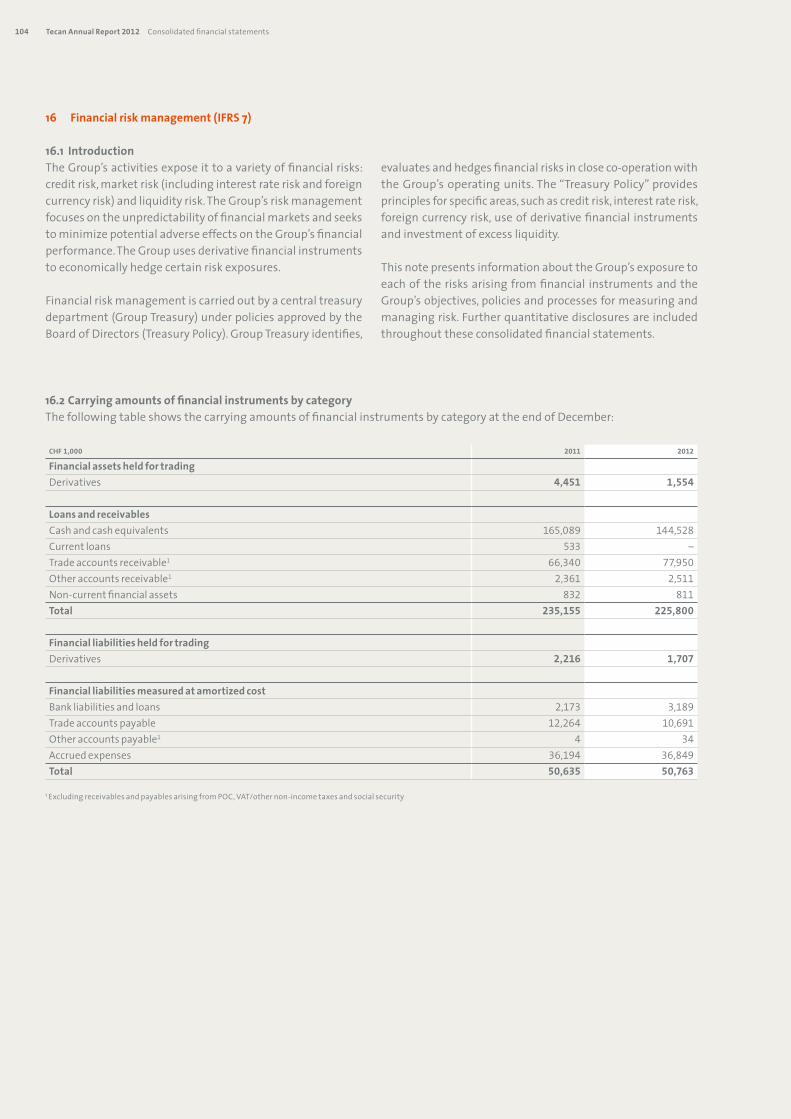
104 Tecan Annual Report 2012 Consolidated financial statements
16 Financialriskmanagement(IFRS7)
16.1 IntroductionTheGroup’sactivitiesexposeittoavarietyoffinancialrisks:creditrisk,marketrisk(includinginterestrateriskandforeigncurrencyrisk)andliquidityrisk.TheGroup’sriskmanagementfocusesontheunpredictabilityoffinancialmarketsandseekstominimizepotentialadverseeffectsontheGroup’sfinancialperformance.TheGroupusesderivativefinancialinstrumentstoeconomicallyhedgecertainriskexposures.
Financialriskmanagementiscarriedoutbyacentraltreasurydepartment(GroupTreasury)underpoliciesapprovedbytheBoardofDirectors(TreasuryPolicy).GroupTreasuryidentifies,
16.2CarryingamountsoffinancialinstrumentsbycategoryThefollowingtableshowsthecarryingamountsoffinancialinstrumentsbycategoryattheendofDecember:
evaluatesandhedgesfinancialrisksincloseco-operationwiththeGroup’soperatingunits.The“TreasuryPolicy”providesprinciplesforspecificareas,suchascreditrisk,interestraterisk,foreigncurrencyrisk,useofderivativefinancialinstrumentsandinvestmentofexcessliquidity.
ThisnotepresentsinformationabouttheGroup’sexposuretoeachoftherisksarisingfromfinancialinstrumentsandtheGroup’sobjectives,policiesandprocessesformeasuringandmanagingrisk.Furtherquantitativedisclosuresareincludedthroughouttheseconsolidatedfinancialstatements.
CHF1,000 2011 2012
FinancialassetsheldfortradingDerivatives 4,451 1,554
LoansandreceivablesCashandcashequivalents 165,089 144,528Currentloans 533 –Tradeaccountsreceivable1 66,340 77,950Otheraccountsreceivable1 2,361 2,511Non-currentfinancialassets 832 811Total 235,155 225,800
FinancialliabilitiesheldfortradingDerivatives 2,216 1,707
FinancialliabilitiesmeasuredatamortizedcostBankliabilitiesandloans 2,173 3,189Tradeaccountspayable 12,264 10,691Otheraccountspayable1 4 34Accruedexpenses 36,194 36,849Total 50,635 50,763
1ExcludingreceivablesandpayablesarisingfromPOC,VAT/othernon-incometaxesandsocialsecurity

105Tecan Annual Report 2012
16.3CreditrisksCreditriskistheriskoffinanciallosstotheGroupifacustomerorcounterpartytofinancialinstrumentsfailstomeetitscon-tractualobligations,andarisesprincipallyfromcashandcashequivalents,timedepositsandtradeaccountsreceivable.
AlldomesticandinternationalbankrelationshipsareselectedbyCFOandGroupTreasury.Onlybanksandfinancialinstitu-tionsthatarerankedinthetopclassoftherespectivecountryareaccepted.
Thecreditriskwithtradeaccountsreceivable(seenote7)islimited,astheGrouphasnumerousclientslocatedinvariousgeographicalregions.TheGroup’sexposuretocreditriskisin-fluencedmainlybytheindividualcharacteristicsofeachcus-tomer.Forthepurposeofriskcontrol,thecustomersaregroupedasfollows(riskgroups):governmentalorganizations,listedpubliclimitedcompaniesandothercustomers.Creditlimitsareestablishedforeachcustomer,wherebythecreditlimitrep-resentsthemaximumopenamountwithoutrequiringpay-mentsinadvanceorlettersofcredit;theselimitsarereviewedregularly(creditcheck).
Themaximumexposuretocreditriskisrepresentedbythecar-ryingamountofeachfinancialasset, includingderivativefinancialinstruments,inthebalancesheet.Therearenocom-mitmentsthatcouldincreasethisexposuretomorethanthecarryingamounts.
16.4MarketrisksMarketriskistheriskthatchangesinmarketprices,suchasinterestrates,foreignexchangeratesandotherpriceswillaf-fecttheGroup’sresultorthevalueofitsholdingsoffinancialinstruments.Theobjectiveofmarketriskmanagementistomanageandcontrolmarketriskexposureswithinacceptableparameters,whileoptimizingthereturnonrisk.
16.4.1 Interest rate risksAtthereportingdatetheGrouphadthefollowinginterest-bearingfinancialinstruments:cashandcashequivalents,timedeposits,rentdepositsandbankliabilities.Allcashandcashequivalentsmatureorrepriseintheshort-term,nolongerthanthreemonths.
Borrowingsmainlybearinterestatfixedrates.CashandcashequivalentsandborrowingsissuedatvariableratesexposetheGrouptocashflowinterestraterisk.FortheinterestrateprofileoftheGroup’sinterest-bearingfinancialliabilitiesrefertonote12.
TheGroupdoesnotaccountforanyfixedrateborrowingsatfairvaluethroughprofitorloss.Thereforeachangeininterestratesatthereportingdatewouldnotaffectprofitorloss.
TheGroupTreasurymanagestheinterestrateriskinordertoreducethevolatilityofthefinancialresultasaconsequenceofinterestratemovements.Forthedecisionwhethernewbor-rowingsshallbearrangedatavariableorfixedinterestrate,theGroupTreasuryfocusesonaninternallong-termbench-markinterestrateandconsiderstheamountofcashandcashequivalentsheldatavariableinterestrate.Currentlytheinter-estrateexposureisnothedged.
AtDecember31,2012,ifinterestrateshadbeen50basispointshigher/lowerwithallothervariablesheldconstant,post-taxprofitfortheyearwouldhavebeenCHF0.5million(2011:CHF0.7million)higher/lower,mainlyasaresultofcashpositionsheldatvariablerates.
16.4.2 Foreign currency risksTheGroupincursforeigncurrencyrisksonsales,purchasesandborrowingsdenominatedinacurrencyotherthanthefunc-tionalcurrencyoftherespectiveGroupcompanies.Onacon-solidatedbasis,theGroupisalsoexposedtocurrencyfluctua-tions between the Swiss franc (CHF) and the functionalcurrenciesofitsGroupcompanies.Thetwomajorcurrenciesgivingrisetocurrencyrisksareeuro(EUR)andUSdollar(USD).
TheGroupcentralizesitsforeigncurrencyexposureinafewlo-cationsonly.ThehedgingpolicyoftheGroupistocovertheforeigncurrencyexposuretoacertainpercentageoftheoper-atingactivities(forecastsalesandpurchases).TheGroupusesforwardexchangecontracts,currencyoptionsandswapstohedgeitsforeigncurrencyriskonspecificfutureforeigncur-rencycashflows.Thesecontractshavematuritiesofupto18months.
TheGroupdoesnothedgeitsnetinvestmentinforeignentitiesandtherelatedforeigncurrencytranslationoflocalearnings.

106 Tecan Annual Report 2012 Consolidated financial statements
2011 2012
CHF1,000 CHF EUR USD Other CHF EUR USD Other
Cashandcashequivalents 55 15,397 1,494 1,574 88 6,180 8,123 3,772Currentloans – – – – – – – –Tradeaccountsreceivable1 1 1,923 1,817 501 2,175 1,387 981 1,045Otheraccountsreceivable1 – – – – – – – –Non-currentfinancialassets – 30 – – – 30 – –Currentbankliabilities – – – – – – – –Tradeaccountspayable (16) (2,787) (957) (197) – (1,647) (517) (45)Otheraccountspayable1 – – – – – – – –Accruedexpenses – – – (48) – (215) – (27)Non-currentbankliabilities – – – – – – – –
Foreigncurrencyforwards – 369 1,866 – – – (202) 94Foreigncurrencyoptions – – – – – (44) – –
NetexposuretocurrencyatDecember31 40 14,932 4,220 1,830 2,263 5,691 8,385 4,839
1ExcludingreceivablesandpayablesarisingfromPOC,VAT/othernon-incometaxesandsocialsecurity
AttheendofDecember,iftheCHFhadmovedagainsttheUSDandEURwithallothervariablesheldconstant,post-taxprofitfortheyearwouldhavebeen:
CHF1,0002011
higher/(lower)2012
higher/(lower)
IfCHFhadweakenedagainstEURby10% 1,122 (356)IfCHFhadstrengthenedagainstEURby10% (1,122) 525IfCHFhadweakenedagainstUSDby10% (3,519) (3,934)IfCHFhadstrengthenedagainstUSDby10% 3,509 3,942
ForeigncurrencyrisksfromfinancialinstrumentsprimarilyrelatetoCHF/EURandCHF/USDforwardsandoptions.
TheGroup’sexposuretoforeigncurrencyriskarisingonfinancialinstrumentsdenominatedinacurrencydifferentfromthefunctionalcurrencyoftheentityholdingtheinstrumentswasasfollows:

107Tecan Annual Report 2012
Thederivativefinancialinstrumentsusedaseconomichedgesofforeigncurrenciesaresummarizedinthetablebelow:
Fairvalue Contractvalue
CHF1,000 Positive Negative Total Duewithin
Between1and90days
Between91and360days
Between1and2years
Foreign currency forwardsSaleUSD 1,752 (2,128) 74,276 20,684 34,788 18,804PurchaseUSD 2,329 (88) (28,206) (20,684) (7,522) –SaleEUR 256 – 5,483 3,046 2,437 –PurchaseEUR 114 – (5,483) (3,046) (2,437) –
BalanceatDecember31,2011 4,451 (2,216) 46,070 – 27,266 18,804
Fairvalue Contractvalue
CHF1,000 Positive Negative Total Duewithin
Between1and90days
Between91and360days
Between1and2years
Foreign currency forwardsSaleGBP – (7) 1,487 – 1,487 –PurchaseGBP 13 – (1,487) – (1,487) –SaleUSD 1,109 (1,073) 70,486 8,239 38,447 23,800PurchaseUSD 3 (240) (14,647) (8,239) (6,408) –SaleJPY 338 – 2,638 – 2,638 –PurchaseJPY – (250) (2,638) – (2,638) –
Foreign currency optionsCallshortEUR – (137) 4,831 – 4,831 –PutlongEUR 91 – (4,831) – (4,831) –
BalanceatDecember31,2012 1,554 (1,707) 55,839 – 32,039 23,800
16.5LiquidityriskLiquidityriskistheriskthattheGroupwillnotbeabletomeetitsfinancialobligationsastheyfalldue.GroupTreasuryman-agestheGroup’sliquiditytoensuresufficientliquiditytomeetallliabilitieswhendue,underbothnormalandstressedcon-ditions,withoutfacingunacceptablelossesorriskingdamagetotheGroup’sreputation.
ItistheGroup’stargettohaveacashreserveorcommittedcreditlineintheamountof10%ofitsannualsalesthirdbudgetcentralizedatTecanGroupLtd.andTecanTradingAG.ChangestothistargetaresubjecttotheBoardofDirectors’approval.AllcashinTecanGroupLtd.andTecanTradingAGwhichdoesnotcountagainstsuchacashreserveisconsideredasexcessliquidity.Excessliquiditycanbeinvestedininstrumentssuchastimedeposits,governmentandcorporatebonds,sharesofpubliclylistedcompaniesandcapitalprotectedinstruments.

108 Tecan Annual Report 2012 Consolidated financial statements
Thefollowingarethecontractualmaturitiesoffinancialliabilities,includinginterestpayments:
UnusedlinesofcreditamountingtoCHF44.5millionwereavailabletotheGroupatDecember31,2012(2011:CHF44.4million).
CHF1,000Carryingamount Contractual
cashflowsBetween1
and90daysBetween91
and360daysBetween1and2years
Over2years
Non-derivativefinancialliabilitiesCurrentbankliabilities 70 70 70 – – –Tradeaccountspayable 12,264 12,264 12,264 – – –Otheraccountspayable1 4 4 4 – – –Accruedexpenses 36,194 36,194 19,134 17,060 – –Non-currentbankliabilities 2,103 2,176 7 20 27 2,122
DerivativefinancialliabilitiesForeign currency forwards 2,216
Outflow 45,112 5,714 23,505 15,893 –Inflow (42,541) (5,606) (22,256) (14,679) –
BalanceatDecember31,2011 52,851 53,279 31,587 18,329 1,241 2,122
CHF1,000Carryingamount Contractual
cashflowsBetween1
and90daysBetween91
and360daysBetween1and2years
Over2years
Non-derivativefinancialliabilitiesCurrentbankliabilities 66 66 66 – – –Tradeaccountspayable 10,691 10,691 10,550 141 – –Otheraccountspayable1 34 34 34 – – –Accruedexpenses 36,849 38,742 19,937 18,805 – –Non-currentbankliabilities 3,123 3,234 – 57 2,598 579
DerivativefinancialliabilitiesForeign currency forwards 1,570
Outflow 50,364 16,660 30,042 3,662 –Inflow (48,680) (15,963) (29,184) (3,533) –
Foreign currency options 137 Outflow – – – – – Inflow – – – – –
BalanceatDecember31,2012 52,470 54,451 31,284 19,861 2,727 579
1ExcludingpayablesarisingfromVAT/othernon-incometaxesandsocialsecurity

109Tecan Annual Report 2012
17 Rentalandleasecommitments
Infinancialyear2012,CHF7.7million(2011:CHF6.7million)wererecognizedasexpensesforleasesintheconsolidatedstate-mentofprofitorloss.
TheGroupdidnotenterintoanyfinanceleasecontracts.
Therehavebeennotransfersbetweenthelevelsin2011and2012.
Thetablebelowanalysesfinancialinstrumentscarriedatfairvalue,byvaluationmethod(fairvaluehierarchy):
Thecommitmentsarisingfromoperatingleasesarelargelyrentalpaymentsforbuildings.Commitmentsundernon-cancellableoperatingleases:
CHF1,000 2011 2012
Due date1styear 6,003 6,4612ndyear 4,792 5,1593rdyear 3,656 4,2614thyear 2,961 2,5795thyear 1,261 1,5996thyearorbeyond 5,301 4,216
BalanceatDecember31 23,974 24,275
Financialinstrument Netcarryingamount(CHF1,000) Level Datasource Model
2011 2012
Currencyforwards 2,235 (107) Level2 Bloomberg (forwardrate–[spotrate+/-forwardpoints])*
amountinforeigncurrencyCurrencyoptions – (45) Level2 Bloomberg Black-Scholesmodel
Level1:Quotedpricesinactivemarketsforidenticalassetsorliabilities
Level2:Inputsotherthanquotedpricesincludedwithinlevel1thatareobservablefortheassetandliability
Level3:Inputsfortheassetorliabilitythatarenotbasedonobservablemarketdata(unobservable)
16.6FairvaluesThecarryingamountslessimpairmentallowanceoftradeandotheraccountsreceivableandtradeandotheraccountspaya-bleareassumedtoapproximatetheirfairvaluesduetotheirshort-termnature.
At year-end, the fair value of all bank loans amounted toCHF3.0million(2011:CHF2.1million)comparedtoacarryingamountofCHF3.1million(2011:CHF2.1million).ThefairvalueisestimatedbydiscountingthefuturecontractualcashflowsatthecurrentmarketinterestratethatisavailabletotheGroupforsimilarfinancialinstruments.
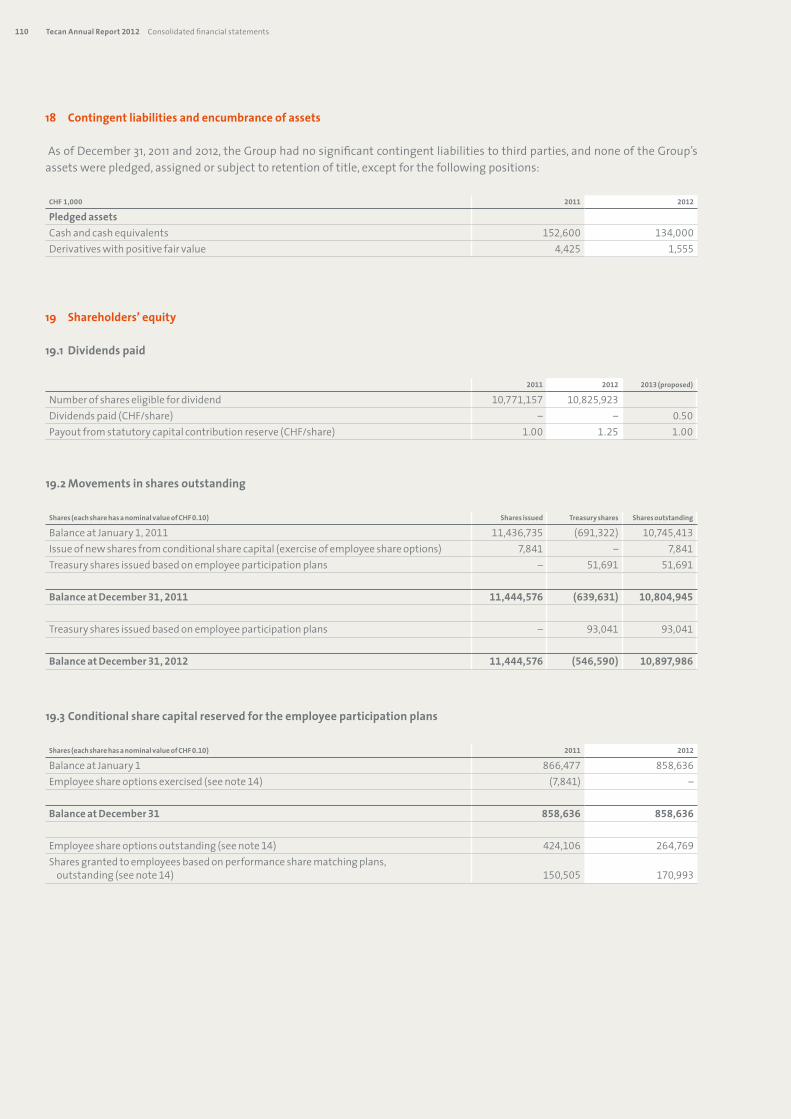
110 Tecan Annual Report 2012 Consolidated financial statements
18 Contingentliabilitiesandencumbranceofassets
AsofDecember31,2011and2012,theGrouphadnosignificantcontingentliabilitiestothirdparties,andnoneoftheGroup’sassetswerepledged,assignedorsubjecttoretentionoftitle,exceptforthefollowingpositions:
CHF1,000 2011 2012
PledgedassetsCashandcashequivalents 152,600 134,000Derivativeswithpositivefairvalue 4,425 1,555
2011 2012 2013(proposed)
Numberofshareseligiblefordividend 10,771,157 10,825,923Dividendspaid(CHF/share) – – 0.50Payoutfromstatutorycapitalcontributionreserve(CHF/share) 1.00 1.25 1.00
19 Shareholders’equity
19.1 Dividendspaid
Shares(eachsharehasanominalvalueofCHF0.10) Sharesissued Treasuryshares Sharesoutstanding
BalanceatJanuary1,2011 11,436,735 (691,322) 10,745,413Issueofnewsharesfromconditionalsharecapital(exerciseofemployeeshareoptions) 7,841 – 7,841Treasurysharesissuedbasedonemployeeparticipationplans – 51,691 51,691
BalanceatDecember31,2011 11,444,576 (639,631) 10,804,945
Treasurysharesissuedbasedonemployeeparticipationplans – 93,041 93,041
BalanceatDecember31,2012 11,444,576 (546,590) 10,897,986
19.2Movementsinsharesoutstanding
19.3Conditionalsharecapitalreservedfortheemployeeparticipationplans
Shares(eachsharehasanominalvalueofCHF0.10) 2011 2012
BalanceatJanuary1 866,477 858,636Employeeshareoptionsexercised(seenote14) (7,841) –
BalanceatDecember31 858,636 858,636
Employeeshareoptionsoutstanding(seenote14) 424,106 264,769Sharesgrantedtoemployeesbasedonperformancesharematchingplans, outstanding(seenote14) 150,505 170,993

111Tecan Annual Report 2012
19.4Conditionalandauthorizedsharecapitalforthepurposeoffuturebusinessdevelopment
19.5CapitalmanagementTheBoard’spolicyistomaintainastrongcapitalbaseinordertoensureinvestor,creditorandmarketconfidenceandtosus-tainfuturedevelopmentofbusiness.ItistheGroup’stargettokeepaminimumequityratioof30%,whichlimitsthelevelofborrowings.ChangestothistargetaresubjecttotheBoardofDirectors’approval.Inaddition,allcovenantsrelatingtobankliabilitiesmustbesatisfiedatanytime.TheBoardofDirectorsmonitorsboththeearningspershareandtheabilityoftheGrouptoundertakefuturebusinessdevelopment.AmongstothersitmayinitiatesharebuybackprogramsinordertorebalancethepositionoftheGroupinre-lationtothesetargets.
TheArticlesofIncorporationofTecanGroupLtd.(theultimateholdingcompany)requirethattheexistingconditionalsharecapitalforfuturebusinessdevelopmentshallbereducedifandtotheextentauthorizedcapitalisusedandthattheauthorized
capitalshallbereducedifandtotheextentnewsharesarecre-atedundertherespectiveconditionalcapital.However,thecon-ditionalcapitalforemployeeparticipationplansisnotaffectedbythisrule.
Thelevelofdividendpaymentstoshareholdersshallbekeptonaconstantandongoinglevel.TherewerenochangesintheGroup’sapproachtocapitalman-agementduringtheyear.
2011 2012
Conditional share capital Shares 1,800,000 1,800,000 CHF 180,000 180,000
Authorized share capital Expirydate 21.04.2012 21.04.2014 Shares 2,400,000 2,200,000 CHF 240,000 220,000

112 Tecan Annual Report 2012 Consolidated financial statements
20 Segmentinformation
20.1Segmentinformationbybusinesssegments
20.2Entity-widedisclosures
Products and services
CHF1,000 2011 2012
Reconciliation of reportable segment sales: Totalsalesforreportablesegments 398,511 410,803 Eliminationofintersegmentsales (21,541) (19,695)Totalconsolidatedsales 376,970 391,108
Reconciliation of reportable segment profit: Totaloperatingprofitforreportablesegments 59,486 59,649 Unallocatedcosts(businessdevelopment,investor relationsandothercorporatecosts)andconsolidationentries (8,215) (7,343) Financialresult 2,289 181Totalconsolidatedprofitbeforetaxesfromcontinuingoperations 53,560 52,487
CHF1,000 2011 2012
Products 263,964 271,305Services 113,006 119,803
Totalsalesthird 376,970 391,108
LifeSciencesBusiness PartneringBusiness Corporate/consolidation Group
CHF1,000 2011 2012 2011 2012 2011 2012 2011 2012
Salesthird 232,240 235,152 144,730 155,956 – 376,970 391,108Intersegmentsales1 15,887 15,356 5,654 4,339 (21,541) (19,695) – –Totalsales 248,127 250,508 150,384 160,295 (21,541) (19,695) 376,970 391,108
Operatingprofit 23,840 29,030 35,646 30,619 (8,215) (7,343) 51,271 52,306
Depreciationand amortization2 (6,260) (6,633) (2,839) (3,629) – – (9,099) (10,262)Impairmentlosses – – – – – – – –
1Intersegmenttransactionsareconductedatarm’slength.2Nosignificantnon-cashitemsotherthandepreciationofproperty,plantandequipmentandamortizationofintangibleassetswereincurred.
Sales by regions (by location of customers)
CHF1,000 2011 2012
Switzerland 11,763 10,648OtherEurope 166,201 153,361NorthAmerica 144,349 159,379Asia 43,579 54,255Others 11,078 13,465
Totalsalesthird 376,970 391,108

113Tecan Annual Report 2012
Non-current assets by regions (by location of assets)
Information about major customersTheGrouphasalargenumberofcustomers.Therearenosalestoindividualcustomersthataccumulatedexceed10%oftotalsales.
Property,plantandequipment Intangibleassets
CHF1,000 2011 2012 2011 2012
Switzerland 10,327 11,811 37,197 37,847OtherEurope 3,617 3,805 1,409 1,396UnitedStates 2,772 3,273 – –Asia 329 655 – 621
Total 17,045 19,544 38,606 39,864
CHF1,000 2011 2012
Materialcosts 119,817 112,803Personnelcosts 131,666 138,865Depreciationofproperty,plantandequipment 5,952 6,251Amortizationofintangibleassets 3,147 4,011Otheroperatingcosts(net) 96,011 123,424
Totaloperatingcostsincurred(gross) 356,593 385,354
Capitalizationofdevelopmentcostsinpositioninventories(seenote8) (27,556) (42,585)Capitalizationofdevelopmentcostsinpositionintangibleassets(seenote11) (3,338) (3,967)
Totaloperatingexpenses,accordingtostatementofprofitorloss 325,699 338,802
21 Operatingexpensesbynature
CHF1,000 2011 2012
Grossresearchanddevelopmentcostsincurred1 90,617 114,694Reclassificationtocostofsalestomatchwithrevenuefromdevelopmentservices (14,753) (19,303)Capitalizationofdevelopmentcostsinpositioninventories(seenote8) (27,556) (42,585)Capitalizationofdevelopmentcostsinpositionintangibleassets(seenote11) (3,338) (3,967)Amortizationofdevelopmentcosts 2,034 2,636
Totalresearchanddevelopment(gross,accordingtostatementofprofitorloss) 47,004 51,475
Governmentresearchsubsidies (965) (983)
Totalresearchanddevelopment(net) 46,039 50,492
1Theamountincludesthecostofmaterials,externalservices,personnel,temporaryemployeesandoverhead.
22 Researchanddevelopment
Costsforresearchandthedevelopmentofnewproducts(gross)amountedto13.2%ofsales(2011:12.5%).

114 Tecan Annual Report 2012 Consolidated financial statements
CHF1,000 2011 2012
Governmentresearchsubsidies 965 983Otheroperatingincome(miscellaneous) 41 –
Totalotheroperatingincome 1,006 983
23 Otheroperatingincome
CHF1,000 2011 2012
Interestincome 703 143Fairvalueadjustmentsoncash-settledshare-basedpaymentplans 150 –Finance income 853 143
Interestexpenses (101) (84)Fairvalueadjustmentsoncash-settledshare-basedpaymentplans – (37)Other (29) (81)Finance cost (130) (202)
Resultfromderivatives 2,332 672Otherforeignexchangelosses (766) (432)Foreign exchange gains 1,566 240
Totalfinancialresult 2,289 181
24 Financialresult
CHF1,000 2011 2012
Currentincometaxes 10,409 8,622Deferredtaxes (1,764) 1,710
Totalincometaxesoncontinuingoperations 8,645 10,332
25 Incometaxes

115Tecan Annual Report 2012
CHF1,000 2011 2012
Profitbeforetaxesfromcontinuingoperations 53,560 52,487
Tax expense based on the Group’s weighted average rate of 22.1% (2011: 21.5%) 11,520 11,603
Non-deductibleexpensesandadditionaltaxableincome 770 380Tax-freeincomeandtaxreductions (2,264) (2,288)Changeinrecognitionoftaxlosses (1,526) –Unrecoverablewithholdingtax 166 10(Over)/underprovidedinprioryears (76) 479Effectoftaxratechangeonopeningdeferredtaxes 55 148
Taxexpensereportedforcontinuingoperations 8,645 10,332
Theincometaxexpensecanbeanalyzedasfollows:
ThetaxrateoftheGroupistheweightedaveragetaxrateob-tainedbyapplyingthecurrentlyeffectiverateforeachindivid-ualjurisdictiontoitsrespectiveprofitbeforetaxes.Asaresultofchangesinthecountrymixoftheprofitbeforetaxes,theGroup’sexpectedtaxratefor2012increasedto22.1%.
AttheendofJune2011,theGroupcapitalizedtaxbenefitsfromaccumulatedformertaxlossesintheamountofCHF1.5million.Theexistenceofthesetaxlosseswasinitiallydisputedbythetaxauthoritiesduringtheiraudit.Thischangeinrecognitionoftaxlossesreducedthetaxexpensereportedintheprioryear.
CHF1,000 2011 Change2012 2012
Receivables 1,700 (1,694) 6Inventories 1,680 294 1,974Property,plantandequipment (640) (68) (708)Intangibleassets (594) (309) (903)Liabilitiesandaccruedexpenses 4,367 (304) 4063Provisions 1,215 (692) 523Other (468) 831 363Total net deferred tax assets arising from temporary differences 7,260 (1,942) 5,318
Deferredtaxesprovidedonexpecteddividendsfromsubsidiaries (1,062) 2 (1,060)Potentialtaxbenefitsfromtaxlosscarry-forwards 1,334 (196) 1,138
Totalnetdeferredtaxassets 7,532 (2,136) 5,396
Deferredtaxesrecognizedinprofitorlossrelatingtocontinuingoperations 1,764 (1,710)Deferredtaxesrecognizedinprofitorlossrelatingtodiscontinuedoperation – –Acquisitionthroughbusinesscombination – (125)Translationdifferences 55 (301)Total change compared with previous year 1,819 (2,136)
Deferredtaxassetsandliabilitiesareattributabletothefollowing:
Temporarydifferencesoninventoriesprimarilyrelatedtoincomeonintra-Groupprofiteliminatedforconsolidationpurposes.

116 Tecan Annual Report 2012 Consolidated financial statements
Potentialtaxbenefits
CHF1,000 2011 2012
Expiring in1st–5thyear – –6thyearorbeyond – –Unlimited 1,334 1,138
Totaltaxlosscarry-forwardcapitalized 1,334 1,138
CHF1,000 2011 2012
Deferredtaxassets 10,468 8,394Deferredtaxliabilities (2,936) (2,998)
Total(net) 7,532 5,396
Taxlosscarry-forwards:
Thepotentialtaxbenefitsofallavailabletaxlosscarry-forwardswerecapitalizedatyear-end2011and2012.
Deferredtaxesareincludedinthebalancesheetasfollows:
26 Relatedparties
TheGrouphasarelatedpartyrelationshipwithitssubsidiariesandwithkeymanagementpersonnel(membersoftheBoardofDirectorsandtheManagementBoard).
Thetotalcompensationpaidtothekeymanagementpersonnelwas:
CHF1,000 2011 2012
Short-termemployeebenefits 4,068 4,640Post-employmentbenefits 361 374Otherlong-termbenefits1 301 16Terminationbenefits – 799Share-basedpayment2 2,784 2,093
Totalcompensation 7,514 7,922
1Settlementoflong-termretentionbonus2Seenote14.4formoredetails
TheGrouprecognized terminationbenefitsamountingtoCHF0.8millionin2012.TheyrelatetocontractuallyagreedfixedandvariablesalariesaswellascontributionstosocialsecuritythatarepayablefortheperiodinwhichtheformerCEOwasre-leasedfromworkpriortotheterminationofhisemployment.
In2007,2008and2009,membersofthemanagementwereofferedthepossibilitytopurchaseAmerican-typecalloptionsonTecansharesissuedbyabankatmarketrates.Thenumberpurchasedbyeachindividualwasrestricted.Atthesametime,themembersoftheManagementBoardwhoparticipatedinthistransactionreceivedadvancefacilitiesfromTecanGroupLtd.tofinancethepurchaseoftheseshareoptions.Thead-vancefacilitiesintheformofinterest-freeandunsecuredloansarepartofalong-termretentionbonustomaturein2010,2011and2012respectivelyandarelimitedtotwo-thirdsofthepur-
chasepriceoftheshareoptions.One-thirdwaspaidprivatelybythemembersoftheManagementBoard.AtDecember31,2012,alladvancefacilitieswerepaidback.
Forfurtherdetailsconcerningcompensation,ownershipofsharesandoptionsandloansgranted,pleaserefertonotes10and11ofthestatutoryfinancialstatementsofTecanGroupLtd.,theultimateparentcompany.Theinformationreportedinthisnoteandtheinformationprovidedinthenotesofthestatu-toryfinancialstatementsmaydifferduetodifferentrecogni-tionandvaluationprinciples.

117Tecan Annual Report 2012
27 Earningspershare
TheearningspersharearebasedontheconsolidatedprofitoftheGroupandtheaveragenumberofsharesoutstanding,excludingtreasuryshares.
2011 2012
Numberofsharesissued 11,444,576 11,444,576
Numberoftreasuryshares (639,631) (546,590)
Average number of shares outstanding 10,756,118 10,817,668
Basicearningspersharefromcontinuingoperations(CHF/share) 4.18 3.90Basicearningspershare(CHF/share) 4.42 3.90
Employee share option plans:Averagenumberofsharesunderoptiontotal 413,026 337,462Averagenumberofsharesunderoptiondilutive 255,692 297,482Averageexerciseprice 52.74 58.60
Numberofsharesthatwouldhavebeenissuedataveragemarketprice fortheyearofCHF68.11(2011:CHF69.17). 194,947 255,947
Adjustmentfordilutiveshareoptions 60,745 41,535
Employee share plans:Adjustmentfornotvestedshares(initialandadditionalgrant) 45,279 33,095Adjustmentforcontingentlyissuableshares(matchingshares) 55,624 76,007
Average number of shares outstanding after dilution 10,917,766 10,968,306
Dilutedearningspersharefromcontinuingoperations(CHF/share) 4.12 3.84Dilutedearningspershare(CHF/share) 4.36 3.84
28 Subsequentevents
Therewerenoeventssubsequenttothebalancesheetdatewhichwouldrequireadjustmentstoordisclosuresintheseconsol-idatedfinancialstatements.
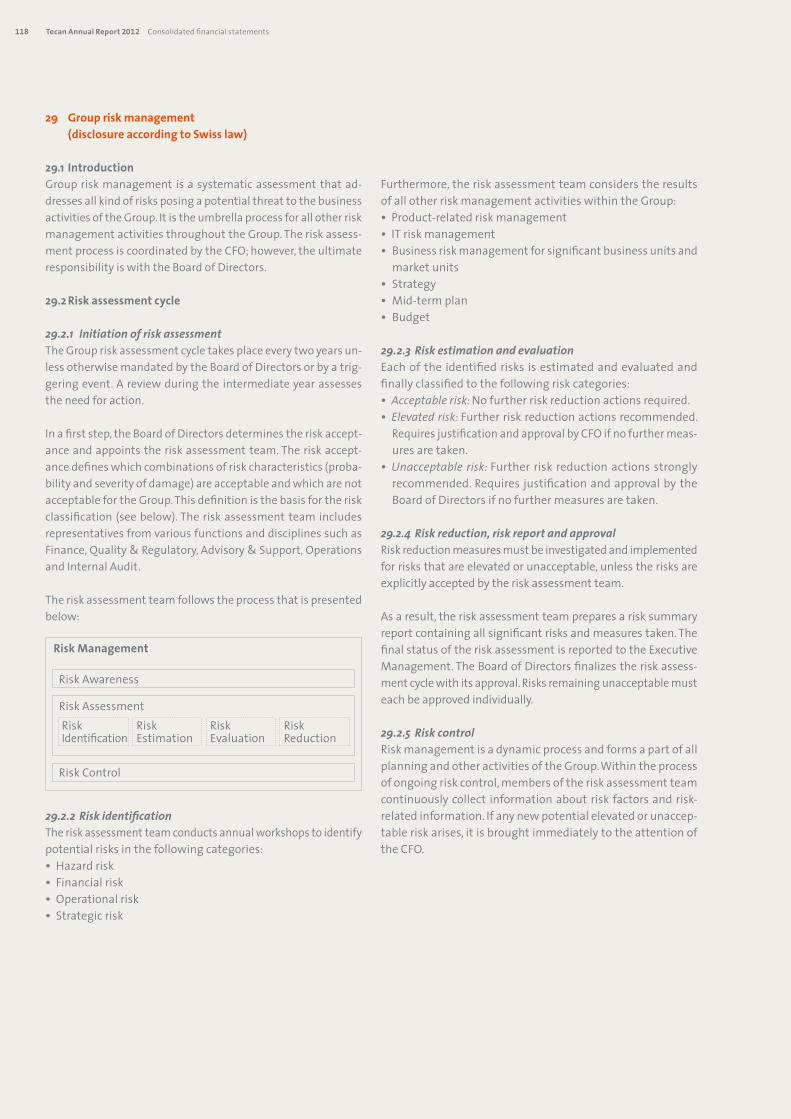
118 Tecan Annual Report 2012 Consolidated financial statements
29 Groupriskmanagement (disclosureaccordingtoSwisslaw)
29.1 IntroductionGroupriskmanagementisasystematicassessmentthatad-dressesallkindofrisksposingapotentialthreattothebusinessactivitiesoftheGroup.ItistheumbrellaprocessforallotherriskmanagementactivitiesthroughouttheGroup.Theriskassess-mentprocessiscoordinatedbytheCFO;however,theultimateresponsibilityiswiththeBoardofDirectors.
29.2Riskassessmentcycle
29.2.1 Initiation of risk assessmentTheGroupriskassessmentcycletakesplaceeverytwoyearsun-lessotherwisemandatedbytheBoardofDirectorsorbyatrig-geringevent.Areviewduringtheintermediateyearassessestheneedforaction.
Inafirststep,theBoardofDirectorsdeterminestheriskaccept-anceandappointstheriskassessmentteam.Theriskaccept-ancedefineswhichcombinationsofriskcharacteristics(proba-bilityandseverityofdamage)areacceptableandwhicharenotacceptablefortheGroup.Thisdefinitionisthebasisfortheriskclassification(seebelow).TheriskassessmentteamincludesrepresentativesfromvariousfunctionsanddisciplinessuchasFinance,Quality&Regulatory,Advisory&Support,OperationsandInternalAudit.
Theriskassessmentteamfollowstheprocessthatispresentedbelow:
29.2.2 Risk identificationTheriskassessmentteamconductsannualworkshopstoidentifypotentialrisksinthefollowingcategories:
• Hazardrisk• Financialrisk• Operationalrisk• Strategicrisk
Furthermore,theriskassessmentteamconsiderstheresultsofallotherriskmanagementactivitieswithintheGroup:
• Product-relatedriskmanagement• ITriskmanagement• Businessriskmanagementforsignificantbusinessunitsand
marketunits• Strategy• Mid-termplan• Budget
29.2.3 Risk estimation and evaluationEachoftheidentifiedrisksisestimatedandevaluatedandfinallyclassifiedtothefollowingriskcategories:
• Acceptable risk: Nofurtherriskreductionactionsrequired.• Elevated risk: Furtherriskreductionactionsrecommended.
RequiresjustificationandapprovalbyCFOifnofurthermeas-uresaretaken.
• Unacceptable risk: Furtherriskreductionactionsstronglyrecommended.RequiresjustificationandapprovalbytheBoardofDirectorsifnofurthermeasuresaretaken.
29.2.4 Risk reduction, risk report and approvalRiskreductionmeasuresmustbeinvestigatedandimplementedforrisksthatareelevatedorunacceptable,unlesstherisksareexplicitlyacceptedbytheriskassessmentteam.
Asaresult,theriskassessmentteampreparesarisksummaryreportcontainingallsignificantrisksandmeasurestaken.ThefinalstatusoftheriskassessmentisreportedtotheExecutiveManagement.TheBoardofDirectorsfinalizestheriskassess-mentcyclewithitsapproval.Risksremainingunacceptablemusteachbeapprovedindividually.
29.2.5 Risk controlRiskmanagementisadynamicprocessandformsapartofallplanningandotheractivitiesoftheGroup.Withintheprocessofongoingriskcontrol,membersoftheriskassessmentteamcontinuouslycollectinformationaboutriskfactorsandrisk-relatedinformation.Ifanynewpotentialelevatedorunaccep-tableriskarises,itisbroughtimmediatelytotheattentionoftheCFO.
RiskManagement
RiskAwareness
RiskControl
RiskAssessmentRiskIdentification
RiskEstimation
RiskEvaluation
RiskReduction

119Tecan Annual Report 2012
ReportoftheStatutoryAuditorontheConsolidatedFinancialStatementstotheGeneralMeetingofShareholdersof
Tecan Group Ltd., Männedorf
Asstatutoryauditor,wehaveauditedtheconsolidatedfinancialstatementsofTecanGroupLtd.,presentedonpages73to118,whichcomprisethebalancesheet,statementofprofitorloss,statementofprofitorlossandothercomprehensiveincome,state-mentofchangesinequity,statementofcashflowsandnotesfortheyearendedDecember31,2012.
Board of Directors’ ResponsibilityTheBoardofDirectorsisresponsibleforthepreparationandfairpresentationoftheconsolidatedfinancialstatementsinac-cordancewithInternationalFinancialReportingStandards(IFRS)andtherequirementsofSwisslaw.Thisresponsibilityincludesdesigning,implementingandmaintaininganinternalcontrolsystemrelevanttothepreparationandfairpresentationofcon-solidatedfinancialstatementsthatarefreefrommaterialmisstatement,whetherduetofraudorerror.TheBoardofDirectorsisfurtherresponsibleforselectingandapplyingappropriateaccountingpoliciesandmakingaccountingestimatesthatarerea-sonableinthecircumstances.
Auditor’s ResponsibilityOurresponsibilityistoexpressanopinionontheseconsolidatedfinancialstatementsbasedonouraudit.Weconductedourau-ditinaccordancewithSwisslawandSwissAuditingStandards,aswellasInternationalStandardsonAuditing.Thosestandardsrequirethatweplanandperformtheaudittoobtainreasonableassurancewhethertheconsolidatedfinancialstatementsarefreefrommaterialmisstatement.
Anauditinvolvesperformingprocedurestoobtainauditevidenceabouttheamountsanddisclosuresintheconsolidatedfinan-cialstatements.Theproceduresselecteddependontheauditor’sjudgment,includingtheassessmentoftherisksofmaterialmisstatementoftheconsolidatedfinancialstatements,whetherduetofraudorerror.Inmakingthoseriskassessments,theau-ditorconsiderstheinternalcontrolsystemrelevanttotheentity’spreparationandfairpresentationoftheconsolidatedfinan-cialstatementsinordertodesignauditproceduresthatareappropriateinthecircumstances,butnotforthepurposeofex-pressing an opinion on the effectiveness of the entity’s internal control system. An audit also includes evaluating theappropriatenessoftheaccountingpoliciesusedandthereasonablenessofaccountingestimatesmade,aswellasevaluatingtheoverallpresentationoftheconsolidatedfinancialstatements.Webelievethattheauditevidencewehaveobtainedissuffi-cientandappropriatetoprovideabasisforourauditopinion.
OpinionInouropinion,theconsolidatedfinancialstatementsfortheyearendedDecember31,2012giveatrueandfairviewofthefinan-cialposition,theresultsofoperationsandthecashflowsinaccordancewithInternationalFinancialReportingStandards(IFRS)andcomplywithSwisslaw.
ReportonOtherLegalRequirements
WeconfirmthatwemeetthelegalrequirementsonlicensingaccordingtotheAuditorOversightAct(AOA)andindependence(article728COandarticle11AOA),andthattherearenocircumstancesincompatiblewithourindependence.
Inaccordancewitharticle728aparagraph1item3COandSwissAuditingStandard890,weconfirmthataninternalcontrolsys-temexists,whichhasbeendesignedforthepreparationofconsolidatedfinancialstatementsaccordingtotheinstructionsoftheBoardofDirectors.
Werecommendthattheconsolidatedfinancialstatementssubmittedtoyoubeapproved.
KPMGAG
ThomasAffolter PatrikSalmLicensed Audit Expert Licensed Audit ExpertAuditor in Charge
Zurich,March5,2013

120 Tecan Annual Report 2012 Tecan Group Ltd.
Balance sheet of Tecan Group Ltd. at December 31
Assets
Liabilitiesandequity
CHF1,000 Notes 2011 2012
Cashandcashequivalents 114,353 83,085CurrentloanstoGroupcompanies – 36,000Otheraccountsreceivablefromthirdparties 101 34OtheraccountsreceivablefromGroupcompanies 3,749 2,044Prepaidexpenses 116 –
Currentassets 118,319 121,163
Investmentsinsubsidiaries 2 52,562 52,997Treasuryshares 3 36,258 30,774Property,plantandequipment 2 1
Non-currentassets 88,822 83,772
Assets 207,141 204,935
CHF1,000 Notes 2011 2012
Otherliabilitiestothirdparties 87 463OtherliabilitiestoGroupcompanies 10 27Currenttaxliabilities – 80Accruedexpenses 1,118 1,115
Currentliabilities 1,215 1,685
Provisionforgeneralbusinessrisks 4 30,000 30,000Othernon-currentprovisions 29 63
Non-currentliabilities 30,029 30,063
Sharecapital 1,144 1,144Legalreserves 64,381 45,363Retainedearnings 110,372 126,680
Shareholders’equity 5 175,897 173,187
Liabilitiesandequity 207,141 204,935

121Tecan Annual Report 2012
Income statement of Tecan Group Ltd.
CHF1,000 2011 2012
RoyaltiesfromGroupcompanies 3,770 1,320DividendincomefromGroupcompanies 33,731 10,402Interestincomefromthirdparties 551 88InterestincomefromGroupcompanies 646 398GainonsaleofinvestmentREMPAG(settlementofdeferredandcontingentconsiderations) 2,644 –Gainonsaleoftreasuryshares 711 1,013
Income 42,053 13,221
Personnelexpenses (1,264) (1,197)Depreciationofproperty,plantandequipment (1) (1)Otherexpenses (1,455) (1,109)Foreignexchangelosses,net (928) (10)
Expenses (3,648) (2,317)
Profitbeforetaxes 38,405 10,904
Incometaxes 50 (80)
Netprofit 38,455 10,824

122 Tecan Annual Report 2012 Tecan Group Ltd.
2 Investmentsinsubsidiaries2.1 Overview(directandindirect)
Notes to the financial statements of Tecan Group Ltd.
1 Reportingbasis
ThefinancialstatementsofTecanGroupLtd.havebeenpre-paredinaccordancewiththeSwissCodeofObligations.Theyareasupplementtotheconsolidatedfinancialstatements(pages73through118)preparedaccordingtoInternationalFinancialReportingStandards(IFRS).WhiletheconsolidatedfinancialstatementsreflecttheeconomicsituationoftheGroup
asawhole,theinformationcontainedintheTecanGroupLtd.financialstatements(pages120through129)relatestotheul-timateparentcompanyalone.TheretainedearningsreportedinthesefinancialstatementsprovidethebasisforthedecisionregardingthedistributionofearningstobemadeduringtheAnnualGeneralMeetingofShareholders.
Company Domicile Currency Sharecapital(LC1,000)
Activities
TecanSchweizAG Männedorf/Zurich(CH) CHF 5,000 R/PTecanTradingAG Männedorf/Zurich(CH) CHF 300 S/DTecanSalesSwitzerlandAG Männedorf/Zurich(CH) CHF 250 DTecanAustriaGmbH Grödig/Salzburg(AT) EUR 1,460 R/PTecanSalesAustriaGmbH Grödig/Salzburg(AT) EUR 35 DTecanSalesInternationalGmbH Grödig/Salzburg(AT) EUR 35 DTecanLandesholdingGmbH Crailsheim/Stuttgart(DE) EUR 25 S•TecanDeutschlandGmbH Crailsheim/Stuttgart(DE) EUR 51 D•TecanSoftwareCompetenceCenterGmbH Mainz-Kastel(DE) EUR 103 RTecanBeneluxB.V.B.A. Mechelen(BE) EUR 137 DTecanFranceS.A.S. Lyon(FR) EUR 2,760 DTecanIbericaInstrumentacionS.L. Barcelona(ES) EUR 30 DTecanItaliaS.r.l. Milano(IT) EUR 77 DTecanUKLtd. Reading(UK) GBP 500 DTecanNordicAB Mölndal/Gothenburg(SE) SEK 100 DTecanUSGroup,Inc. Morrisville,NC(US) USD 1,500 S•TecanUS,Inc. Morrisville,NC(US) USD 400 D•TecanSystems,Inc. SanJose,CA(US) USD 26 R/PTecanAsia(Pte.)Ltd. Singapore(SG) SGD 800 DTecan(Shanghai)TradingCo.,Ltd. Shanghai(CN) CNY 3,417 DTecanJapanCo.,Ltd. Kawasaki(JP) JPY 125,000 DTecanAustraliaPtyLtd Melbourne(AU) AUD 0 D
S=services,holdingfunctions
R=researchanddevelopment
P=production
D=distribution
Allsubsidiarieswere100%ownedasofDecember31,2011and2012.
2.2 ChangeininvestmentsTheCompanyacquired100%ofthevotingrightsofitsAustraliansalespartner(TecanAustraliaPtyLtd)asofJanuary2,2012.ThecompanyislocatedinMelbourneandemploysninepeople.
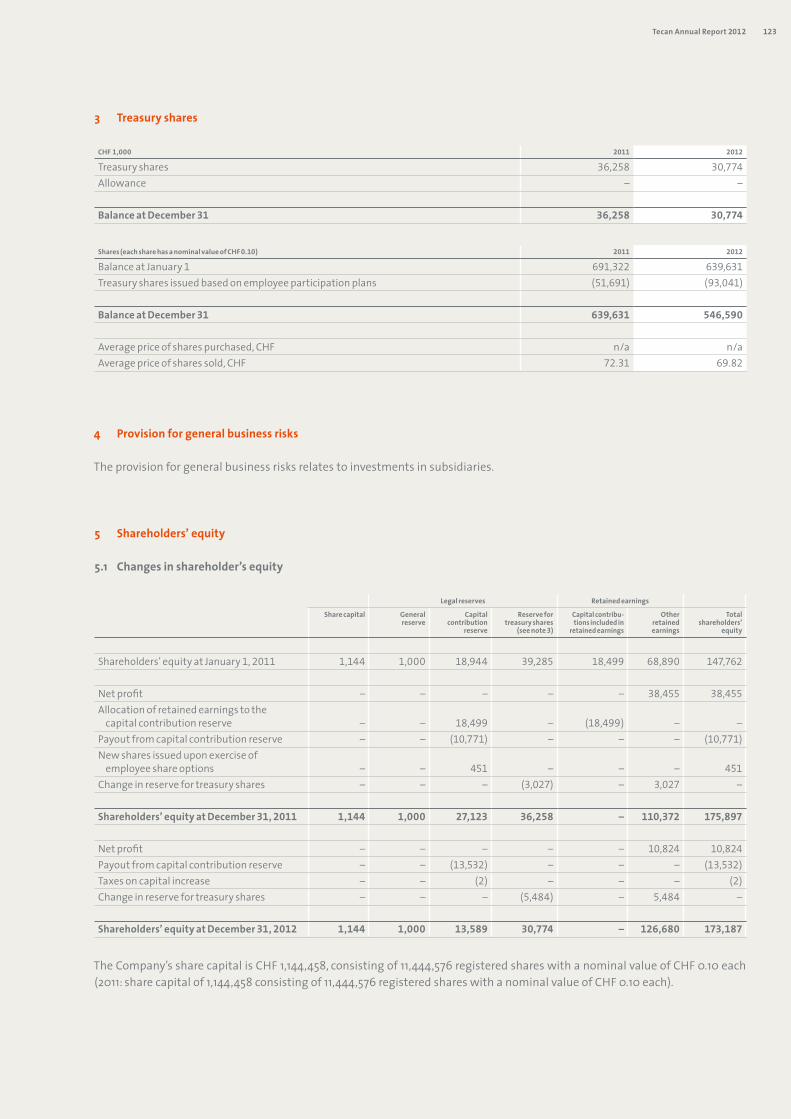
123Tecan Annual Report 2012
CHF1,000 2011 2012
Treasuryshares 36,258 30,774Allowance – –
BalanceatDecember31 36,258 30,774
3 Treasuryshares
Shares(eachsharehasanominalvalueofCHF0.10) 2011 2012
BalanceatJanuary1 691,322 639,631Treasurysharesissuedbasedonemployeeparticipationplans (51,691) (93,041)
BalanceatDecember31 639,631 546,590
Averagepriceofsharespurchased,CHF n/a n/aAveragepriceofsharessold,CHF 72.31 69.82
TheCompany’ssharecapitalisCHF1,144,458,consistingof11,444,576registeredshareswithanominalvalueofCHF0.10each(2011:sharecapitalof1,144,458consistingof11,444,576registeredshareswithanominalvalueofCHF0.10each).
4 Provisionforgeneralbusinessrisks
Theprovisionforgeneralbusinessrisksrelatestoinvestmentsinsubsidiaries.
5 Shareholders’equity
5.1 Changesinshareholder’sequity
Legalreserves Retainedearnings
Sharecapital Generalreserve
Capitalcontribution
reserve
Reservefortreasuryshares
(seenote3)
Capitalcontribu-tionsincludedin
retainedearnings
Otherretainedearnings
Totalshareholders’
equity
Shareholders’equityatJanuary1,2011 1,144 1,000 18,944 39,285 18,499 68,890 147,762
Netprofit – – – – – 38,455 38,455Allocationofretainedearningstothe capitalcontributionreserve – – 18,499 – (18,499) – –Payoutfromcapitalcontributionreserve – – (10,771) – – – (10,771)Newsharesissueduponexerciseof employeeshareoptions – – 451 – – – 451Changeinreservefortreasuryshares – – – (3,027) – 3,027 –
Shareholders’equityatDecember31,2011 1,144 1,000 27,123 36,258 – 110,372 175,897
Netprofit – – – – – 10,824 10,824Payoutfromcapitalcontributionreserve – – (13,532) – – – (13,532)Taxesoncapitalincrease – – (2) – – – (2)Changeinreservefortreasuryshares – – – (5,484) – 5,484 –
Shareholders’equityatDecember31,2012 1,144 1,000 13,589 30,774 – 126,680 173,187

124 Tecan Annual Report 2012 Tecan Group Ltd.
2011 2012
ConditionalsharecapitalReserved for employee participation plans Shares 858,636 858,636 CHF 85,864 85,864
Employeeshareoptions,outstanding 424,106 264,769Sharesgrantedtoemployeesbasedonperformancesharematchingplans(PSMP),outstanding 150,505 170,993
Reserved for future business development Shares 1,800,000 1,800,000 CHF 180,000 180,000
AuthorizedsharecapitalReserved for future business development (expiring on April 21, 2014) Shares 2,400,000 2,200,000 CHF 240,000 220,000
2011 2012
ChaseNomineesLtd.,London(UK) 13.5% 13.5%INGGroepN.V.,Amsterdam(NL) 9.2% 9.2%UBSFundManagement(Switzerland)AG,Basel(CH) 5.1% 5.1%PictetFundsSA,Geneva(CH) 5.0% 5.0%TecanGroupLtd.,Männedorf(CH) 5.6% 5.0%SUVA,SchweizerischeVersicherungsgesellschaft,Lucerne(CH) 3.2% 3.2%NorgesBank(theCentralBankofNorway),Oslo(NO) 3.1% 3.1%TIAA-CREFInvestmentManagementLLCC,NewYork(US) 10.5% <3.0%
5.2 ConditionalandauthorizedsharecapitalIn1997,aconditionalsharecapitalofCHF1,300,000reservedforemployeeparticipationplanswasapproved.Theconditionalsharecapitalconsistsof1,300,000registeredshareswithanominalvalueofCHF1.00each.Since1999,severalemployeeparticipationplanshavebeenintroducedbasedonthiscondi-tionalcapital.AtDecember31,2012,theconditionalsharecap-italamountedtoCHF85,864,consistingof858,636registeredshareswithanominalvalueof0.10each(2011:CHF85,864con-
sistingof858,636registeredshareswithanominalvalueofCHF0.10each).OnApril26,2006andonApril18,2012,theAnnualGeneralMeetingofShareholdersapprovedthecreationofadditionalconditionalandauthorizedsharecapitalforthepurposeoffuturebusinessdevelopment.
5.3 ImportantshareholdersTheCompanyhasknowledgeofthefollowingimportantshareholderswithshareholdingsinexcessof3%oftheissuedsharecapitalatDecember31:
TheArticlesofIncorporationofTecanGroupLtd.requirethattheexistingconditionalsharecapitalforfuturebusinessdevelop-mentshallbereducedifandtotheextentauthorizedcapitalisusedandthattheauthorizedcapitalshallbereducedifandtotheextentnewsharesarecreatedundertherespectiveconditionalcapital.However,theconditionalcapitalforemployeepar-ticipationplansisnotaffectedbythisrule.

125Tecan Annual Report 2012
6 Guaranteesinfavorofthirdparties
ThetotalamountofguaranteesinfavorofitssubsidiarieswasCHF31.1millionatDecember31,2012(2011:CHF39.2million).
CHF1,000 2011 2012
PledgedassetsCashandcashequivalents 114,353 83,084
7 Pledgedassets
AtDecember31,thefollowingassetswerepledged,assignedforthesecuringofownliabilities,orsubjecttoretentionoftitle:
8 Fireinsurancevalueofproperty,plantandequipment
Theinsuredvalueofproperty,plantandequipmentintheeventoffirewasCHF0.0millionatDecember31,2012(2011:CHF0.0million).
9 Disclosuresconcerningtheconductionofariskassessment
Seenote29oftheconsolidatedfinancialstatements.

126 Tecan Annual Report 2012 Tecan Group Ltd.
10 CompensationandloansgrantedtomembersoftheBoardofDirectorsandManagementBoard
10.1 CompensationtotheBoardofDirectors
CHF1,000
Year Fixedfee
Committeefee
Totalcash
compen-sation
Socialbenefits1
PSMP:Initialshares
granted(number)2
Fairvalueofinitial
shares3
PSMP:Totalmatchingshares
granted(number)4
FairvalueofmatchingsharesPSMP
2011earnedinperiod5/6
FairvalueofmatchingsharesPSMP
2012earnedinperiod5/7
Totalcompen-
sation
RolfClasson(Chairman)
2011 150 18 168 13 808 45 1,010 13 – 2392012 150 18 168 – 739 44 924 4 16 232
HeinrichFischer(ViceChairman)
2011 85 20 105 8 404 23 505 6 – 1422012 85 20 105 8 370 22 463 2 8 145
DominiqueF.Baly 2011 75 20 95 8 404 23 505 6 – 1322012 75 20 95 9 370 22 463 2 8 136
Dr.OliverS.Fetzer(sinceApril2011)
2011 50 13 63 6 404 23 505 6 – 982012 75 27 102 – 370 22 463 2 8 134
Dr.KarenHübscher(sinceApril2012)
2011 – – – – – – – – – –2012 50 7 57 5 370 22 463 – 8 92
GérardVaillant 2011 75 20 95 7 404 23 505 6 – 1312012 75 13 88 8 370 22 463 2 8 128
ErikWalldén(sinceApril2011)
2011 50 7 57 5 404 23 505 6 – 912012 75 10 85 8 370 22 463 2 8 125
Dr.LukasBraunschweiler(untilApril2012)
2011 75 20 95 8 404 23 505 6 – 1322012 25 7 32 2 – – – 2 – 36
Dr.JürgMeier(untilApril2011)
2011 25 3 28 2 – – – – – 302012 – – – – – – – – – –
Prof.Dr.PeterRyser(untilApril2011)
2011 25 3 28 2 – – – – – 302012 – – – – – – – – – –
Total2011 610 124 734 59 3,232 183 4,040 49 – 1,0252012 610 122 732 40 2,959 176 3,702 16 64 1,028
1Employer’scontributiontosocialsecurityincludingsocialsecurityonshareoptionsexercisedandsharestransferredduringthereportingperiod2Vestingconditions:GradedvestingfromMay1,2011toApril30,2014(PSMP2011)andMay1,2012toApril30,2015(PSMP2012).Vestedsharesareblockeduntiltheendoftheperformance
period(April30,2014and2015respectively).Thesharesarefullyincludedintheamountoffairvalueofinitialshares.3Formulafor2011:Sharesgrantedin2011*fairvalueatgrant(CHF61.95)*[1-estimatedlaborturnoverrate(10%)]andformulafor2012:Sharesgrantedin2012*fairvalueatgrant(CHF
65.75)*[1-estimatedlaborturnoverrate(10%)]4Vestingconditions:Threeyearsofserviceandperformancetarget.Thetermsandconditionsaredisclosedinnote14.4.2oftheconsolidatedfinancialstatements.5ThematchingsharesgrantedrepresentthemaximumofpotentialsharesgrantedinconnectionwithPerformanceShareMatchingPlans(PSMP).Duetotheperformancetarget,onlya
prorataamountofthepotentialmatchingsharesgrantedisincludedinthefairvalueofmatchingsharesearnedintheperiod.Fairvaluesofmatchingsharesearnedinfutureperiodswillbereportedinfuturetotalcompensationamountswithtrue-upsforfluctuation,matchingsharefactorandshareprice.
6Formulafor2011:{initialsharesgrantedin2011,thatqualifyformatchingshares[total3,232shares]*estimatedmatchingsharefactorof1.12}*individualserviceperiodprorata*sharepriceatyear-end2011[CHF63.50]=fairvalueofmatchingsharesPSMP2011earnedinperiod2011;andformulafor2012:{initialsharesgrantedin2011,thatqualifyformatchingshares[total3,232shares]*estimatedmatchingsharefactorof0.18}*individualserviceperiodprorata*sharepriceatyear-end2012[CHF76.50]=fairvalueofmatchingsharesPSMP2011earnedinperiod2012.
7Formulafor2012:{initialsharesgrantedin2012,thatqualifyformatchingshares[total2,959shares]*estimatedmatchingsharefactorof1.25}*individualserviceperiodprorata*sharepriceatyear-end2012[CHF76.50]=fairvalueofmatchingsharesPSMP2012earnedinperiod2012.
Mr.G.VaillantheldthefunctionofaninterimCEOduringtheperiodfromFebruarytoOctober2012.Thecorrespondingcompensa-tionisreportedinthetableofnote10.2“CompensationtotheManagementBoard”.Histotalcompensationin2012waskCHF1,139.

127Tecan Annual Report 2012
CHF1,000
Year Fixedsalary
Variablesalary1
Taxablefringe
benefits
Totalcash
compen-sation
Socialbenefits2
PSMP:Initial
sharesgranted
(number)3
Fairvalueofinitialshares4
PSMP:Totalmatching
sharesgranted
(number)5
Fairvalueofmatching
sharesPSMP2010earned
inperiod6/7
Fairvalueofmatching
sharesPSMP2011earned
inperiod6/8
Fairvalueofmatching
sharesPSMP2012earned
inperiod6/9
Totalcompen-
sation
Dr.DavidMartyr(CEO)10
2011 – – – – – – – – – – – –2012 139 120 10 269 57 1,774 105 4,435 – – 113 544
GérardVaillant(interimCEO)11
2011 – – – – – – – – – – – –2012 952 – – 952 59 – – – – – – 1,011
ThomasBachmann(formerCEO)12/13
2011 550 340 11 901 226 5,378 382 13,445 – 255 – 1,7642012 458 275 9 742 160 4,929 292 18,853 – 42 401 1,637
Dr.RudolfEugster(CFO)
2011 345 157 – 502 120 3,361 239 8,663 – 164 – 1,0252012 345 131 – 476 108 3,697 219 12,350 – 32 315 1,150
OthermembersoftheManage-mentBoard14/15
2011 1,062 455 5 1,522 366 8,536 606 23,713 – 450 – 2,9442012 1,349 397 19 1,765 455 13,776 815 36,162 – 52 781 3,868
Total2011 1,957 952 16 2,925 712 17,275 1,227 45,821 – 869 – 5,7332012 3,243 923 38 4,204 839 24,176 1,431 71,800 – 126 1,610 8,210
1Paymentwillbemadeinfollowingyear.2Employer’scontributiontosocialsecurity,includingsocialsecurityonshareoptionsexercisedandsharestransferredduringthereportingperiod,andcontributionstopost-employ-
mentbenefitplans3Vestingconditions:GradedvestingfromJanuary1,2011toDecember31,2013(PSMP2011)andfromJanuary1,2012toDecember31,2014(PSMP2012).Vestedsharesareblockeduntilthe
endoftheperformanceperiod(December31,2013and2014respectively).Thesharesarefullyincludedintheamountoffairvalueofinitialshares.4Formulafor2011:Sharesgrantedin2011*fairvalueatgrant(CHF78.95)*[1-estimatedlaborturnoverrate(10%)]andformulafor2012:Sharesgrantedin2012*fairvalueatgrant(CHF
65.75)*[1-estimatedlaborturnoverrate(10%)].5Vestingconditions:Threeyearsofserviceandperformancetarget.Thetermsandconditionsaredisclosedinnote14.4.2oftheconsolidatedfinancialstatements.6ThematchingsharesgrantedrepresentthemaximumofpotentialsharesgrantedinconnectionwithPerformanceShareMatchingPlans(PSMP).Duetotheperformancetarget,onlya
prorataamountofthepotentialmatchingsharesgrantedisincludedinthefairvalueofmatchingsharesearnedintheperiod.Fairvaluesofmatchingsharesearnedinfutureperiodswillbereportedinfuturetotalcompensationamountswithtrue-upsforfluctuation,matchingsharefactorandshareprice.
7Formulafor2011:{initialsharesgranted2010plusmandatoryandvoluntaryinvestmentsthatqualifyformatchingshares[total17,314shares])*estimatedmatchingsharefactorof0.00}*individualserviceperiodprorata*sharepriceatyear-end2011[CHF63.50]=fairvalueofmatchingsharesPSMP2010earnedinperiod2011;formulafor2012:{(initialsharesgranted2010plusmandatoryandvoluntaryinvestmentsthatqualifyformatchingshares[total12,448shares])*estimatedmatchingsharefactorof0.00}*individualserviceperiodprorata*sharepriceatyear-end2012[CHF76.50]=fairvalueofmatchingsharesPSMP2010earnedinperiod2012.
8Formulafor2011:{initialsharesgranted2011plusmandatoryandvoluntaryinvestmentsthatqualifyformatchingshares[total18,328shares])*estimatedmatchingsharefactorof2.24}*individualserviceperiodprorata*sharepriceatyear-end2011[CHF63.50]=fairvalueofmatchingsharesPSMP2011earnedinperiod2011;formulafor2012:{(initialsharesgranted2011plusmandatoryandvoluntaryinvestmentsthatqualifyformatchingshares[total14,428shares])*estimatedmatchingsharefactorof0.36}*individualserviceperiodprorata*sharepriceatyear-end2012[CHF76.50]=fairvalueofmatchingsharesPSMP2011earnedinperiod2012.
9Formulafor2012:{initialsharesgranted2012plusmandatoryandvoluntaryinvestmentsthatqualifyformatchingshares[total26,502shares])*estimatedmatchingsharefactorof2.50*individualserviceperiodprorata*sharepriceatyear-end2012[CHF76.50]=fairvalueofmatchingsharesPSMP2012earnedinperiod2012.
10TheemploymentstartedonOctober8,2012.11Mr.G.VaillantwasinterimCEOduringtheperiodfromFebruarytoOctober2012.Histotalcompensationisreportedinnote10.1.12Mr.T.BachmannwasreleasedfromworkonFebruary13,2012,whereastheformalemploymentendedonOctober31,2012.13MemberoftheManagementBoardwiththehighestcompensationin2011and2012.142011:Totalfivemembers,includingtwomemberswhojoinedtheManagementBoardduringtheyear.152012:Totalsixmembers,includingtwomemberswholeftandonememberwhojoinedtheManagementBoardduringtheyear.
10.2CompensationtotheManagementBoard
Noterminationbenefitswerepaidin2011and2012.
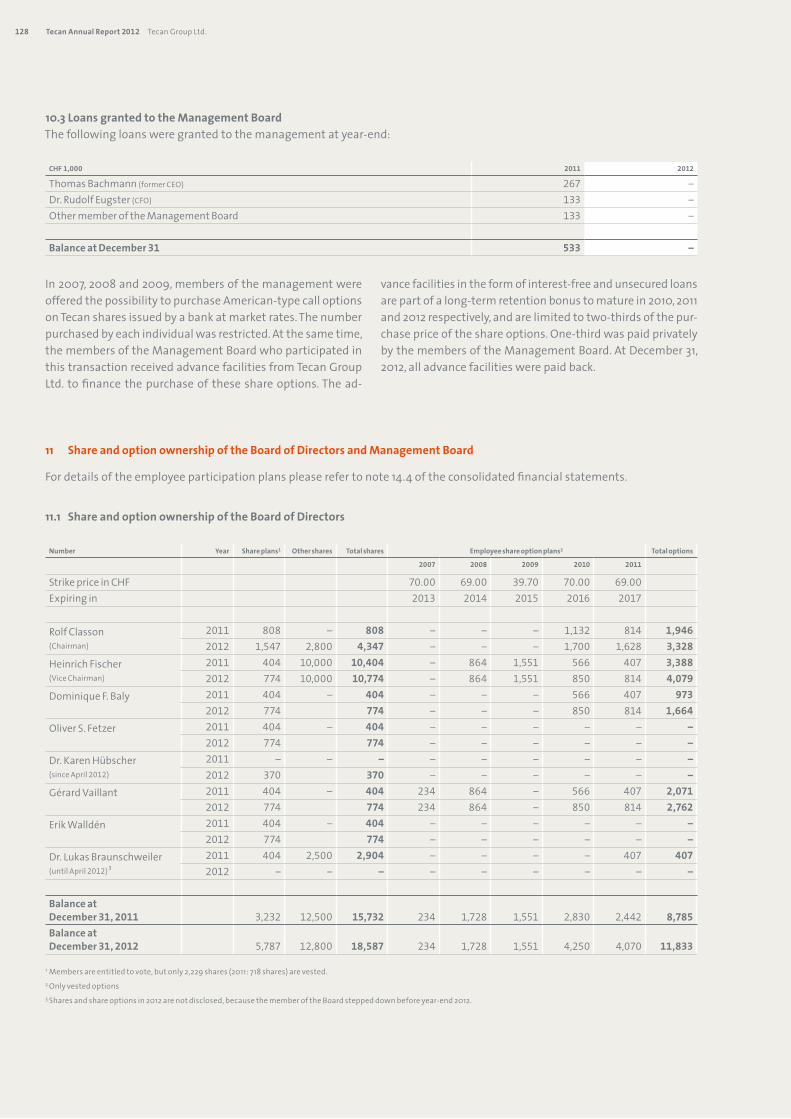
128 Tecan Annual Report 2012 Tecan Group Ltd.
11 ShareandoptionownershipoftheBoardofDirectorsandManagementBoard
Fordetailsoftheemployeeparticipationplanspleaserefertonote14.4oftheconsolidatedfinancialstatements.
11.1 ShareandoptionownershipoftheBoardofDirectors
Number Year Shareplans1 Othershares Totalshares Employeeshareoptionplans2 Totaloptions
2007 2008 2009 2010 2011
StrikepriceinCHF 70.00 69.00 39.70 70.00 69.00Expiringin 2013 2014 2015 2016 2017
RolfClasson(Chairman)
2011 808 – 808 – – – 1,132 814 1,9462012 1,547 2,800 4,347 – – – 1,700 1,628 3,328
HeinrichFischer(ViceChairman)
2011 404 10,000 10,404 – 864 1,551 566 407 3,3882012 774 10,000 10,774 – 864 1,551 850 814 4,079
DominiqueF.Baly 2011 404 – 404 – – – 566 407 9732012 774 774 – – – 850 814 1,664
OliverS.Fetzer 2011 404 – 404 – – – – – –2012 774 774 – – – – – –
Dr.KarenHübscher(sinceApril2012)
2011 – – – – – – – – –2012 370 370 – – – – – –
GérardVaillant 2011 404 – 404 234 864 – 566 407 2,0712012 774 774 234 864 – 850 814 2,762
ErikWalldén 2011 404 – 404 – – – – – –2012 774 774 – – – – – –
Dr.LukasBraunschweiler(untilApril2012)3
2011 404 2,500 2,904 – – – – 407 4072012 – – – – – – – – –
BalanceatDecember31,2011 3,232 12,500 15,732 234 1,728 1,551 2,830 2,442 8,785BalanceatDecember31,2012 5,787 12,800 18,587 234 1,728 1,551 4,250 4,070 11,833
1Membersareentitledtovote,butonly2,229shares(2011:718shares)arevested.2Onlyvestedoptions3Sharesandshareoptionsin2012arenotdisclosed,becausethememberoftheBoardsteppeddownbeforeyear-end2012.
10.3LoansgrantedtotheManagementBoardThefollowingloansweregrantedtothemanagementatyear-end:
In2007,2008and2009,membersofthemanagementwereofferedthepossibilitytopurchaseAmerican-typecalloptionsonTecansharesissuedbyabankatmarketrates.Thenumberpurchasedbyeachindividualwasrestricted.Atthesametime,themembersoftheManagementBoardwhoparticipatedinthistransactionreceivedadvancefacilitiesfromTecanGroupLtd.tofinancethepurchaseoftheseshareoptions.Thead-
CHF1,000 2011 2012
ThomasBachmann(formerCEO) 267 –Dr.RudolfEugster(CFO) 133 –OthermemberoftheManagementBoard 133 –
BalanceatDecember31 533 –
vancefacilitiesintheformofinterest-freeandunsecuredloansarepartofalong-termretentionbonustomaturein2010,2011and2012respectively,andarelimitedtotwo-thirdsofthepur-chasepriceoftheshareoptions.One-thirdwaspaidprivatelybythemembersoftheManagementBoard.AtDecember31,2012,alladvancefacilitieswerepaidback.

129Tecan Annual Report 2012
Number Year Shareplans1 Othershares Totalshares Employeeshareoptionplans2 Totaloptions
2002 2007 2008 2009 2010
StrikepriceinCHF 99.00 70.00 69.00 39.70 70.00Expiringin 2012 2013 2014 2015 2016
Dr.DavidMartyr(CEO)(since2012)
2011 – – – – – – – – –2012 1,774 1,774 – – – – – –
Dr.RudolfEugster(CFO) 2011 6,991 – 6,991 300 1,280 1,113 1,386 1,562 5,6412012 11,931 11,931 – 1,280 1,113 1,386 2,345 6,124
Dr.MartinBrusdeilins 2011 – – – – – – – – –2012 4,650 4,650 – – – – – –
Dr.BernhardGrob 2011 2,830 – 2,830 – – – – – –2012 6,047 6,047 – – – – – –
MarkusSchmid 2011 1,142 – 1,142 – – – – – –2012 3,656 3,656 – – – – – –
AndreasWilhelm(since2012)3
2011 – – – – – – – – –2012 5,078 5,078 – 707 459 – 971 2,137
ThomasBachmann(formerCEO)(untilOctober2012)4
2011 12,701 5,041 17,742 – 871 1,380 2,484 2,266 7,0012012 – – – – – – – – –
Dr.JürgDübendorfer(untilMay2012)4
2011 6,851 – 6,851 160 1,071 726 455 1,096 3,5082012 – – – – – – – – –
FredericVanderhaegen(untilOctober2012)4
2011 5,127 – 5,127 – – – 1,776 1,340 3,1162012 – – – – – – – – –
BalanceatDecember31,2011 35,642 5,041 40,683 460 3,222 3,219 6,101 6,264 19,266BalanceatDecember31,2012 33,136 – 33,136 – 1,987 1,572 1,386 3,316 8,261
1Membersareentitledtovote,butonly17,054shares(2011:19,534shares)arevested.2Onlyvestedoptions3Sharesandshareoptionsin2011arenotdisclosed,becausethememberoftheBoardjoinedafteryear-end2011.4Sharesandshareoptionsin2012arenotdisclosed,becausethememberoftheBoardsteppeddownbeforeyear-end2012.
11.2 ShareandoptionownershipoftheManagementBoard
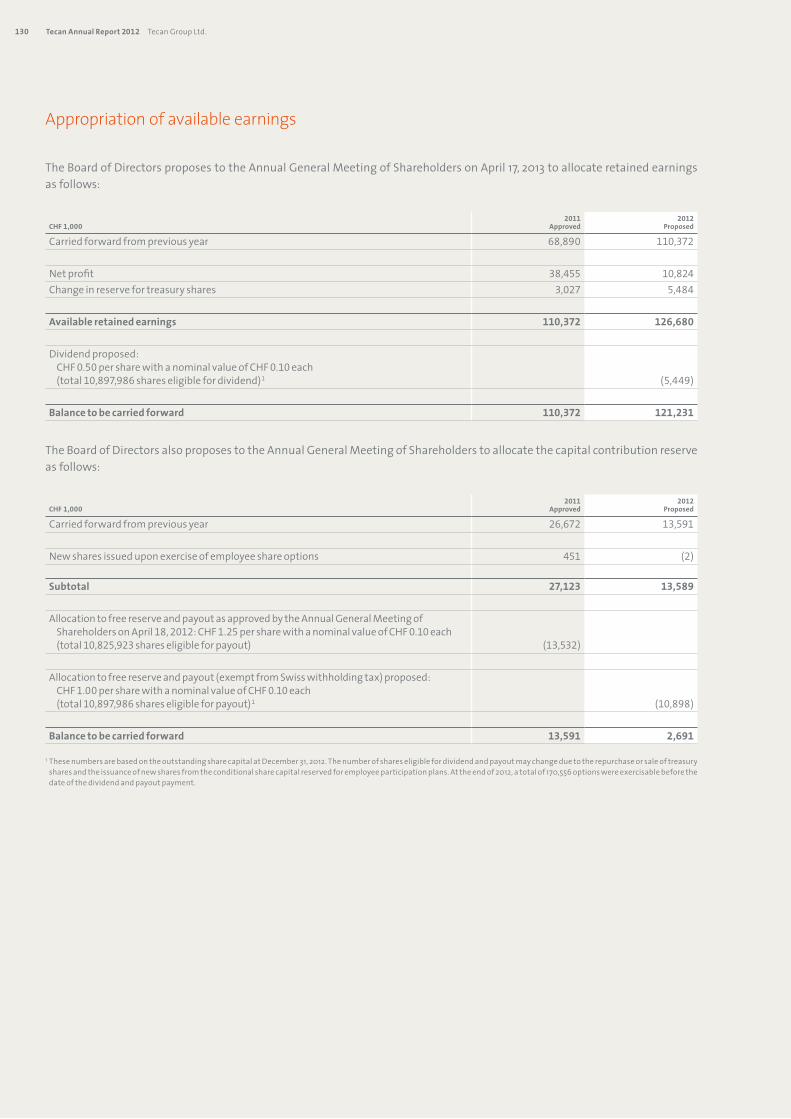
130 Tecan Annual Report 2012 Tecan Group Ltd.
Appropriation of available earnings
TheBoardofDirectorsproposestotheAnnualGeneralMeetingofShareholdersonApril17,2013toallocateretainedearningsasfollows:
TheBoardofDirectorsalsoproposestotheAnnualGeneralMeetingofShareholderstoallocatethecapitalcontributionreserveasfollows:
CHF1,0002011
Approved2012
Proposed
Carriedforwardfrompreviousyear 68,890 110,372
Netprofit 38,455 10,824Changeinreservefortreasuryshares 3,027 5,484
Availableretainedearnings 110,372 126,680
Dividendproposed: CHF0.50persharewithanominalvalueofCHF0.10each
(total10,897,986shareseligiblefordividend)1 (5,449)
Balancetobecarriedforward 110,372 121,231
CHF1,0002011
Approved2012
Proposed
Carriedforwardfrompreviousyear 26,672 13,591
Newsharesissueduponexerciseofemployeeshareoptions 451 (2)
Subtotal 27,123 13,589
AllocationtofreereserveandpayoutasapprovedbytheAnnualGeneralMeetingof ShareholdersonApril18,2012:CHF1.25persharewithanominalvalueofCHF0.10each (total10,825,923shareseligibleforpayout) (13,532)
Allocationtofreereserveandpayout(exemptfromSwisswithholdingtax)proposed: CHF1.00persharewithanominalvalueofCHF0.10each (total10,897,986shareseligibleforpayout)1 (10,898)
Balancetobecarriedforward 13,591 2,691
1ThesenumbersarebasedontheoutstandingsharecapitalatDecember31,2012.Thenumberofshareseligiblefordividendandpayoutmaychangeduetotherepurchaseorsaleoftreasurysharesandtheissuanceofnewsharesfromtheconditionalsharecapitalreservedforemployeeparticipationplans.Attheendof2012,atotalof170,556optionswereexercisablebeforethedateofthedividendandpayoutpayment.

131Tecan Annual Report 2012
ReportoftheStatutoryAuditorontheFinancialStatementstotheGeneralMeetingofShareholdersof
Tecan Group Ltd., Männedorf
Asstatutoryauditor,wehaveauditedthefinancialstatementsofTecanGroupLtd.,presentedonpages120to129,whichcom-prisethebalancesheet,incomestatementandnotesfortheyearendedDecember31,2012.
Board of Directors’ ResponsibilityTheBoardofDirectorsisresponsibleforthepreparationofthefinancialstatementsinaccordancewiththerequirementsofSwisslawandtheCompany’sArticlesofIncorporation.Thisresponsibilityincludesdesigning,implementingandmaintaininganinternalcontrolsystemrelevanttothepreparationoffinancialstatementsthatarefreefrommaterialmisstatement,whetherduetofraudorerror.TheBoardofDirectorsisfurtherresponsibleforselectingandapplyingappropriateaccountingpoliciesandmakingaccountingestimatesthatarereasonableinthecircumstances.
Auditor’s ResponsibilityOurresponsibilityistoexpressanopiniononthesefinancialstatementsbasedonouraudit.Weconductedourauditinaccord-ancewithSwisslawandSwissAuditingStandards.Thosestandardsrequirethatweplanandperformtheaudittoobtainrea-sonableassurancewhetherthefinancialstatementsarefreefrommaterialmisstatement.
Anauditinvolvesperformingprocedurestoobtainauditevidenceabouttheamountsanddisclosuresinthefinancialstate-ments.Theproceduresselecteddependontheauditor’sjudgment,includingtheassessmentoftherisksofmaterialmisstate-mentofthefinancialstatements,whetherduetofraudorerror.Inmakingthoseriskassessments,theauditorconsiderstheinternalcontrolsystemrelevanttotheentity’spreparationofthefinancialstatementsinordertodesignauditproceduresthatareappropriateinthecircumstances,butnotforthepurposeofexpressinganopinionontheeffectivenessoftheentity’sinter-nalcontrolsystem.Anauditalsoincludesevaluatingtheappropriatenessoftheaccountingpoliciesusedandthereasonable-nessofaccountingestimatesmade,aswellasevaluatingtheoverallpresentationofthefinancialstatements.Webelievethattheauditevidencewehaveobtainedissufficientandappropriatetoprovideabasisforourauditopinion.
OpinionInouropinion,thefinancialstatementsfortheyearendedDecember31,2012complywithSwisslawandtheCompany’sArti-clesofIncorporation.
ReportonOtherLegalRequirements
WeconfirmthatwemeetthelegalrequirementsonlicensingaccordingtotheAuditorOversightAct(AOA)andindependence(article728COandarticle11AOA)andthattherearenocircumstancesincompatiblewithourindependence.
Inaccordancewitharticle728aparagraph1item3COandSwissAuditingStandard890,weconfirmthataninternalcontrolsystemexistswhichhasbeendesignedforthepreparationoffinancialstatementsaccordingtotheinstructionsoftheBoardofDirectors.
WefurtherconfirmthattheproposedappropriationofavailableearningscomplieswithSwisslawandtheCompany’sArticlesofIncorporation.Werecommendthatthefinancialstatementssubmittedtoyoubeapproved.
KPMGAG
ThomasAffolter PatrikSalmLicensed Audit Expert Licensed Audit Expert Auditor in Charge
Zurich,March5,2013
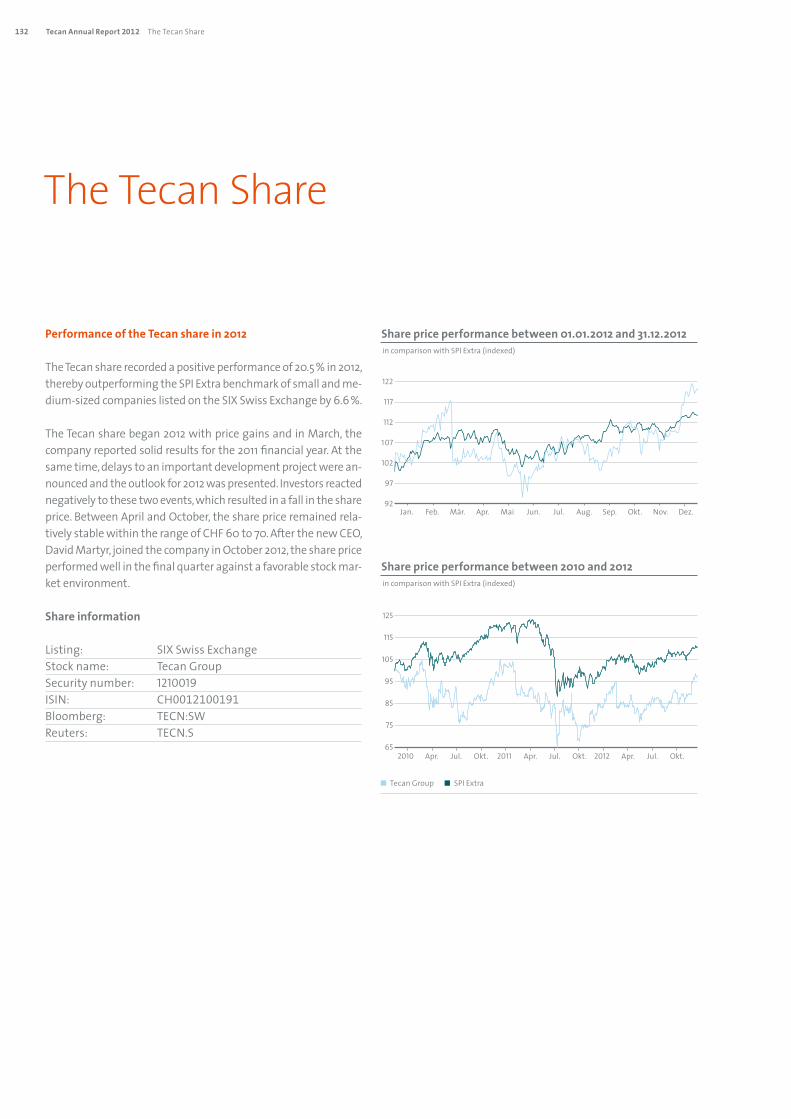
132 TecanAnnualReport2012 TheTecanShare
PerformanceoftheTecansharein2012
TheTecansharerecordedapositiveperformanceof20.5%in2012,therebyoutperformingtheSPIExtrabenchmarkofsmallandme-dium-sizedcompanieslistedontheSIXSwissExchangeby6.6%.
TheTecansharebegan2012withpricegainsandinMarch,thecompanyreportedsolidresultsforthe2011financialyear.Atthesametime,delaystoanimportantdevelopmentprojectwerean-nouncedandtheoutlookfor2012waspresented.Investorsreactednegativelytothesetwoevents,whichresultedinafallintheshareprice.BetweenAprilandOctober,thesharepriceremainedrela-tivelystablewithintherangeofCHF60to70.AfterthenewCEO,DavidMartyr,joinedthecompanyinOctober2012,thesharepriceperformedwellinthefinalquarteragainstafavorablestockmar-ketenvironment.
Shareinformation
Listing: SIXSwissExchangeStockname: TecanGroupSecuritynumber: 1210019ISIN: CH0012100191Bloomberg: TECN:SWReuters: TECN.S
The Tecan Share
TecanGroup SPIExtra
Sharepriceperformancebetween01.01.2012and31.12.2012incomparisonwithSPIExtra(indexed)
Sharepriceperformancebetween2010and2012incomparisonwithSPIExtra(indexed)
125
115
105
95
85
75
652010 2011 2012Apr. Apr. Apr.Jul. Jul. Jul.Okt. Okt. Okt.
122
117
112
107
102
97
92Jan. Mai Sep.Feb. Jun. Okt.Mär. Jul. Nov.Apr. Aug. Dez.
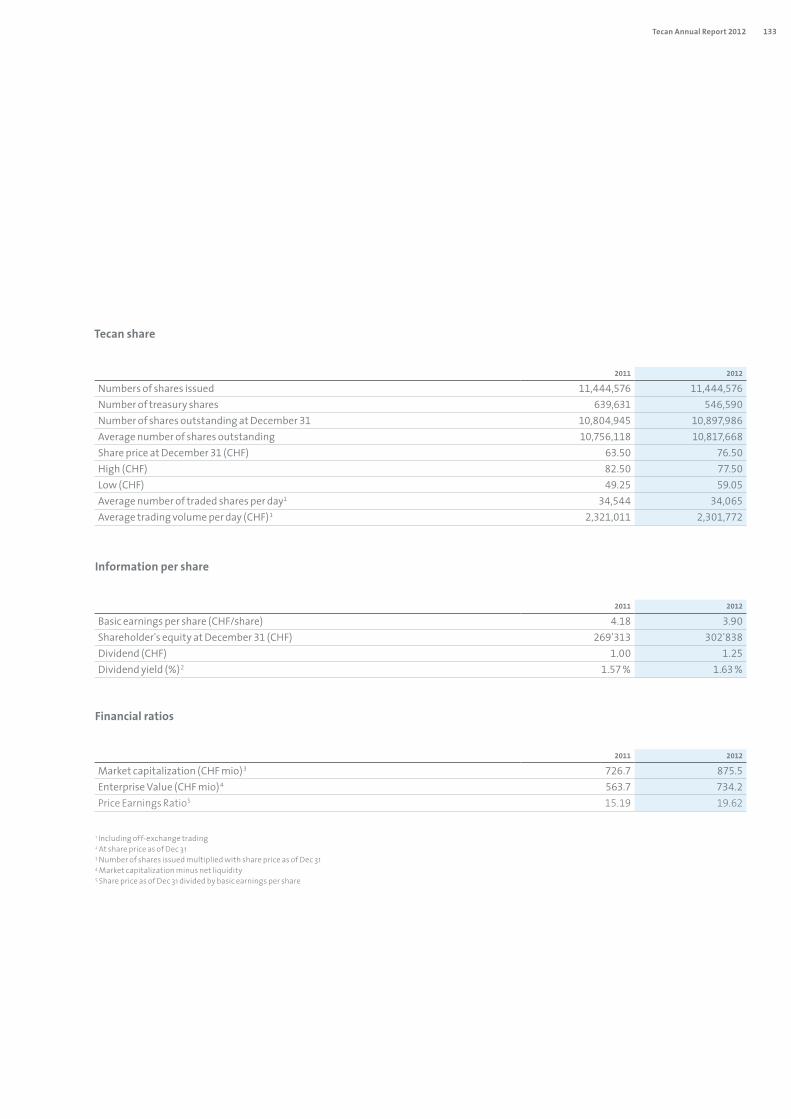
133Tecan Annual Report 2012
Tecanshare
Informationpershare
Financialratios
2011 2012
Numbersofsharesissued 11,444,576 11,444,576Numberoftreasuryshares 639,631 546,590NumberofsharesoutstandingatDecember31 10,804,945 10,897,986Averagenumberofsharesoutstanding 10,756,118 10,817,668SharepriceatDecember31(CHF) 63.50 76.50High(CHF) 82.50 77.50Low(CHF) 49.25 59.05Averagenumberoftradedsharesperday1 34,544 34,065Averagetradingvolumeperday(CHF)1 2,321,011 2,301,772
2011 2012
Basicearningspershare(CHF/share) 4.18 3.90Shareholder'sequityatDecember31(CHF) 269'313 302'838Dividend(CHF) 1.00 1.25Dividendyield(%)2 1.57% 1.63%
2011 2012
Marketcapitalization(CHFmio)3 726.7 875.5EnterpriseValue(CHFmio)4 563.7 734.2Price Earnings Ratio5 15.19 19.62
1 Including off-exchange trading 2 At share price as of Dec 31 3 Number of shares issued multiplied with share price as of Dec 31 4 Market capitalization minus net liquidity 5 Share price as of Dec 31 divided by basic earnings per share

Tecan locations
TecanGroup
CorporateHeadquartersTecanGroupLtd.Seestrasse103CH-8708MännedorfSwitzerlandT+ 41 44 922 88 88F + 41 44 922 88 89
TecanSwitzerlandLtd.Seestrasse103CH-8708MännedorfSwitzerlandT+ 41 44 922 81 11F+ 41 44 922 81 12
Australia+61738971616Austria+43 62 46 89 330Belgium+32 15 42 13 19 China +86 21 2898 6333France+33 4 72 76 04 80Germany+49 79 51 94 170 Italy+39 02 92 44 790Japan+81 44 556 73 11Netherlands+31 18 34 48 17 4
Singapore+65 644 41 886Spain+34 93 490 01 74 Sweden+46 31 75 44 000Switzerland+41 44 922 81 11 UK+44 118 9300 300USA+1 919 361 5200ROW+41 44 922 81 25
TecanAustriaGmbHUntersbergstrasse1aA-5082Grödig/SalzburgAustriaT+ 43 62 46 89 33F+ 43 62 46 72 770
TecanSystems,Inc.2450ZankerRoadSanJoseCA95131,USAT+ 1 408 953 3100F+ 1 408 953 3101
ManufacturingandDevelopmentSites
SalesandServiceLocations
Tecansalesoffice R&Dandmanufacturingsite

Publication data
Project Lead / Editorial TeamTecan Group Ltd., Männedorf Martin Brändle Head of Corporate Communications & Investor Relations
Design Concept and RealizationW4 Marketing AG, Zurich
ImagesPortraits: Gerry Nitsch, Zurich Wolfgang Flamisch, DusseldorfPages 4 to 13: Getty Images
TranslationCLS Communication AG, Zurich/Basel
PrintingSuterKeller Druck AG, Oberentfelden
All statements in this Annual Report not referring to historical facts are predictions of the future and constitute no guarantee whatsoever of future performance. They are subject to risks and uncertainties including, but not limited to, future global economic conditions, exchange rates, legal regulations, market conditions, activities of competitors and other factors outside the Company’s control.
This Annual Report is available in English and German and can also be found at the website www.tecan.com. For the Financial Report, the English report is the authoritative version.
PublisherTecan Group Ltd.Seestrasse 103CH-8708 Männedorf Switzerland T +41 44 922 88 88F +41 44 922 88 [email protected]

Tecan Group Ltd. Seestrasse 103 CH-8708 Männedorf Switzerland www.tecan.com