annual report - seb · table of contents 1 page organisation 2 general information 4 management...
TRANSCRIPT

Annual Report SEB Strategy Fund Status: For the period from 1 November 2016 to 31 December 2017
R.C.S. K 62

Notice The sole legally binding basis for the purchase of units of the Fund described in this report is the latest valid Sales Prospectus with its terms of contract.

Table of Contents
1
Page
Organisation 2
General Information 4
Management Report 6
Schedule of Investments:
SEB Strategy Fund - SEB Strategy Balanced 8
SEB Strategy Fund - SEB Strategy Defensive 33
SEB Strategy Fund - SEB Strategy Growth 59
SEB Strategy Fund - SEB Strategy Opportunity 81
Combined Statement of Operations 106
Combined Statement of Changes in Net Assets 108
Combined Statement of Net Assets 110
Statistical Information 112
Additional information on Management Fees 114
Notes to the Financial Statements 116
Audit Report 120
Risk Disclosure (unaudited) 123
Remuneration Disclosure (unaudited) 124

Organisation
2
Management Company: SEB Investment Management AB (since 2 November 2016) Stjärntorget 4 SE-169 79 Solna, Sweden
SEB Asset Management S.A. (until 2 November 2016) 4, rue Peternelchen L-2370 Howald, Luxembourg Board of Directors of
the Management Company:
Chairperson Johan Wigh Advokat, Törngren Magnell Sandemarsvägen 18 122 60 Enskede Sweden
Members Magnus Wallberg Chief Financial Officer Life and Investment Management Division Skandinaviska Enskilda Banken AB (publ) Sweden Karin S. Thorburn Professor in Finance at the Norwegian School of Economics Starefossveien 58 A 5019 Bergen, Norway Jenny Askfelt Ruud (since 18 May 2017) Advisor Ratos AB Äppelviksv 5 167 53 Bromma Sweden
Branch of the Management Company: SEB Investment Management AB, Luxembourg Branch (since 2 November 2016) 4, rue Peternelchen L-2370 Howald, Luxembourg
Central Administration (including the
administrative, registrar and transfer
agent function) and Paying Agent in
Luxembourg:
The Bank of New York Mellon SA/NV, Luxembourg Branch 2-4, rue Eugène Ruppert L-2453 Luxembourg
Investment Manager: SEB Investment Management AB
Stjärntorget 4 SE-169 79 Solna, Sweden
Depositary: Skandinaviska Enskilda Banken S.A.
4, rue Peternelchen L-2370 Howald, Luxembourg
Auditor of the Fund: PricewaterhouseCoopers, Société coopérative
2, rue Gerhard Mercator L-2182 Luxembourg
Auditor of the Management Company: PricewaterhouseCoopers AB
Torsgatan 21 SE-113 97 Stockholm, Sweden

able of Contents
3
Global Distributor: Skandinaviska Enskilda Banken AB (publ) Kungsträdgårdsgatan 8 SE-106 40 Stockholm, Sweden
Representatives and Paying
Agents outside Luxembourg: The full list of representatives and paying agents outside Luxembourg can be obtained, free of any charge, at the address of the Management Company, at the address of the Branch and on the website of the Branch.

General Information
4
SEB Strategy Fund is an open-ended common fund (“FCP” - “Fonds Commun de Placement”) governed by Part I of the
Luxembourg Law on Undertakings for Collective Investment of 17 December 2010 as amended (the “Law”). The Fund
qualifies as an Undertaking for Collective Investment in Transferable Securities (UCITS). The Fund was set up on 17
November 2008 for an undetermined duration. The Management Regulations lastly modified with effect from 14 August
2017, have been published in the Recueil Electronique des Sociétés et Associations (RESA) on 4 October 2017. The Fund is
registered in Luxembourg at the Luxembourg Register of Commerce under the number K 62. The Management Company was
established on 19 May 1978 in the form of a Swedish limited liability company (AB). The Management Company is
authorised by Finansinspektionen for the management of UCITS and for the discretionary management of financial
instruments and investment portfolios under the Swedish UCITS Act (SFS 2004:46). The Management Company is also
authorised as an alternative investment fund manager to manage alternative investment funds under the Swedish AIFM Act
(SFS 2013:561). The Management Company has delegated parts of the Central Administration as further detailed hereafter, including the administrative, registrar and transfer agent functions - under its continued responsibility and control - at its own expenses to
The Bank of New York Mellon SA/NV, Luxembourg Branch, 2-4, rue Eugène Ruppert, L-2453 Luxembourg. This company was incorporated in Luxembourg as a “société anonyme” on 15 December 1998 and is an indirect wholly-owned subsidiary of
The Bank of New York Mellon Corporation. It is registered with the Luxembourg Trade and Companies' Register under
Corporate Identity Number B 67654 (the “Administrative Agent” and "Registrar and Transfer Agent”). In the capacity of Administrative Agent, it carries out certain administrative duties related to the administration of the Fund,
including the calculation of the NAV of the Units and the provision of account services for the Fund.
In its capacity as Registrar and Transfer Agent, it will process all subscriptions, redemptions and transfers of units, and will
register these transactions in the Unitholders’ register of the Fund. The main objective of each Sub-Fund will be to invest directly and/or indirectly in transferable securities and other Eligible
Assets, with the purpose of spreading investment risks and achieving long-term capital growth. The investment objectives of
the Sub-Funds will be carried out in compliance with the investment restrictions set forth in the latest prospectus. At present, four Sub-Funds are at the Unitholders’ disposal:
• SEB Strategy Fund - SEB Strategy Balanced • SEB Strategy Fund - SEB Strategy Defensive • SEB Strategy Fund - SEB Strategy Growth • SEB Strategy Fund - SEB Strategy Opportunity
Unless otherwise laid down in part II of the Prospectus, "The Sub-Funds", the Management Company may decide to issue, for each Sub-Fund, capitalisation Units ("C" Units) and distribution Units ("D" Units).
The "C" Units will reinvest their income, if any. The "D" Units may pay a dividend to its Unitholders, upon decision of the
Management Company. Dividends are paid annually, except for those Sub-Fund’s where the Management Company would
decide on a monthly, quarterly or semi-annual dividend payment.
The Management Company may issue Unit Classes whose Reference Currency is not the Base Currency of the respective
Sub-Fund. With regard to such Unit Classes, the Management Company has the ambition to hedge the currency exposure
from the Base Currency into the currency exposure of the Reference Currency. Considering the practical challenges of doing
so, the Management Company does not guarantee how successful such currency hedging of Unit Classes will be. For Unit
Classes where the Management Company has an ambition to currency-hedge the Unit Class, an “H-” will precede the
currency denomination of the Unit Class. For example “(H-EUR)” means that there is an ambition by the Management
Company to hedge the currency exposure from a Base Currency into a EUR- exposure for the Unit Class. The ambition of such
hedging activity is to limit the performance impact related to fluctuations in the exchange rate between the Base Currency
and the Reference Currency of the Unit Class. The profit and loss effects related to currency hedging of a particular Unit
Class, will be allocated to the relevant Unit Class.

able of Contents
5
Currently, the following unit classes are offered for the Sub-Funds:
o SEB Strategy Fund - SEB Strategy Balanced o Capitalisation units (“C (H-EUR)” units) LU0660786715 o Capitalisation units (“C (H-NOK)” units) LU1156545359 o Capitalisation units (“C (SEK)” units) LU0394669880 o Capitalisation units (“HNWC (H-NOK)” units) LU1156545276 o Capitalisation units (“HNWCB (H-EUR)” units) LU1124616985 o Capitalisation units (“ICP (H-EUR)” units) LU1124617017 o SEB Strategy Fund - SEB Strategy Defensive o Capitalisation units (“C (H-EUR)” units) LU0486618746 o Capitalisation units (“C (H-NOK)” units) LU1156545193 o Capitalisation units (“C (SEK)” units) LU0486619397 o Capitalisation units (“HNWC (H-NOK)” units) LU1156544972 o Capitalisation units (“HNWCB (H-EUR)” units) LU1124617280 o Capitalisation units (“ICP (H-EUR)” units) LU1124617793
o SEB Strategy Fund - SEB Strategy Growth o Capitalisation units (“C (H-EUR)” units) LU0660787010 o Capitalisation units (“C (H-NOK)” units) LU1156545516 o Capitalisation units (“C (SEK)” units) LU0394670037 o Capitalisation units (“HNWC (H-NOK)” units) LU1156545433 o Capitalisation units (“HNWCB (H-EUR)” units) LU1124617363 o Capitalisation units (“ICP (H-EUR)” units) LU1124617959
o SEB Strategy Fund - SEB Strategy Opportunity o Capitalisation units (“C (H-EUR)” units) LU0660786806 o Capitalisation units (“C (H-NOK)” units) LU1156545789 o Capitalisation units (“C (SEK)” units) LU0394669963 o Capitalisation units (“HNWC (H-NOK)” units) LU1156545607 o Capitalisation units (“HNWCB (H-EUR)” units) LU1124617520 o Capitalisation units (“ICP (H-EUR)” units) LU1124618171
The base currency of the Fund and the Sub-Funds is Swedish Krona.
The issue and redemption prices, which are computed daily on bank business days in Luxembourg, except 24 December and
31 December ("Valuation date"), can be obtained from the registered offices of the Management Company, the Depositary
and the Paying Agent.
In addition, the Net Asset Value, fact sheets and other informational material is published on the SEB Luxembourg website
www.sebgroup.lu ("website"). When registered in other countries, the publication media might differ according to the
regulatory requirements. Information about ongoing charges can be found in the Key Investor Information
Document ("KIID").
The audited annual and un-audited semi-annual reports of the Fund may be obtained, free of charge at the registered office of the Management Company, at the address of its Branch and on the website. These reports as well as copies of the
Prospectus, the Management Regulations and the KIID are available, free of charge, at the registered office of the
Management Company, at the address of the Branch and on the website.

Management Report
6
Dear Unitholders,
With this report, we want to give you an overview of the general economic environment, the development of the most
important capital markets of our Fund SEB Strategy Fund.
This annual report covers the financial period from 1 November 2016 to 31 December 2017.
We would like to thank you for your confidence and will do everything within our power to justify your decision of investing in
our Fund.
Recovery at last
Looking back at the past ten years, the perhaps most interesting tendency has been how the market’s expectations for future
growth has consistently been too optimistic. Every year has started with high expectations which then are revised lower as
either a political crisis or a pre-mature - in hindsight - tightening of monetary policy has negatively affected growth. It is in this
context that 2017 stands out. For the first time since the financial crisis we have seen a strong and broad-based recovery in
growth. We regard it as broad-based in the sense that all sectors and all regions showed gains in unison. It is strong in the
sense that a range of major leading indicators ended higher than in decades.
The economy’s strength did not go un-noticed in the financial markets. As investors embraced the idea that growth was
finally gaining speed, and the likelihood for another disappointment fell, equities began to rally. So much in fact, that
valuations started to reach levels which in recent history have only been surpassed during the IT bubble of the late 90s.
At the time of writing, this is one of the few potential negatives for 2018. The fact that the equity markets have already
discounted much of the good macroeconomic news means we expect to see somewhat lower equity returns than 2017.
Furthermore, we also expect volatility to start rising as central banks continue to tighten monetary policy.
In the following paragraphs we describe the developments and our outlook for the financial markets, global growth and
monetary policy.
Financial markets
As stated, 2017 was a strong year for risky assets in general and equities in particular. Global equities, measured in local
currency, rose by nearly 20%, driven in large part by a strong recovery in earnings.
Despite the improving growth outlook, inflation expectations and longer dated yields ended up largely where they started at
the beginning of 2017. This disconnect was caused by a string of surprisingly weak inflation numbers coming out of the US
throughout 2017. As the labour market continued to tighten, however, the US Federal Reserve continued to hike rates in
2017 which ensured that the US yield curve flattened significantly. This development contrasted the strong growth outlook
as a flattening, inverted, yield curve traditionally is seen as a sign of an imminent recession.
In a broader asset allocation context, the most interesting feature of 2017 was the low levels of volatility. The US S&P 500
implied equity volatility Index (VIX) ended up averaging the lowest levels since the inception of the index and the S&P 500
had only eight days when the index either fell or rose by more than 1%. We have to go all the way back to 1965 to find a
year which replicates this pattern.
Global growth
During the summer of 2017, global growth started to accelerate significantly. All major PMIs (Purchasing Manager Index)
and consumer confidence indicators started to rise in unison for the first time since the financial crisis. Not only was the
strength concerted in the sense that all major leading indicators started to rise, it was also very strong. For example, US
consumer confidence rose to the highest levels since 2001 and IFO, the leading indicator for Germany, posted its highest
levels on record.

able of Contents
7
Given the strength in the economy over the second half of 2017, we are at a point where growth seems finally to have
consolidated. The likelihood of a slowdown in growth has fallen significantly and if leading indicators are to be trusted the
momentum seems set to continue going into 2018.
Finally, it is also worth noting that global trade has once more started to rise. The growth rate in trade for large global
exporters such as South Korea has left the single digit range which has dominated since 2011. This development will be
especially beneficial for the Emerging Market space in particular.
Monetary policy
As growth strengthened in 2017, global central banks continued to tighten monetary policy. In contrast to the last five years
this tightening fortunately did not have a negative impact on financial markets.
The US Federal Reserve hiked rates three times in 2017. This was in line with their projection, but more than what the
market was pricing. This decision to hike was largely motivated by the strong labour market, which is projected to result in
higher wage inflation, and a view that the low inflation readings of 2017 were caused by temporary factors. At the time of
writing, early 2018, there has been no material change in the Fed’s outlook and it is aiming for three hikes over the next 12
months.
The ECB announced it will continue to withdraw support through its purchases of bonds. There was some anxiety that this
announcement would have a negative effect on the broader financial markets, but this didn’t happen and the strong growth
theme dominated. The development regarding the ECB announcement illustrated that central banks in general had less
impact on financial markets in 2017 than they have had in the last couple of years.
Outlook for financial markets & economic growth
As of writing, we find it hard not to be constructive on the outlook for the global economy. We expect that all the positive
leading indicators (questionnaires for firms and consumers) will translate into even higher growth rates for consumption and
production in the coming months.
In line with the growing economy, we expect central banks to continue to tighten monetary policy. As the US economy is
farthest ahead in the economic cycle, we expect this tightening to be driven by the Fed. We expect the ECB to follow the
announced plan of reducing their bond purchases.
In terms of the financial markets, the outlook is more uncertain. As stated, much of the good news from 2017 has already
been discounted and, as such, valuations are at levels from which we do not expect to see further multiple expansion. With
that said, we believe the growth environment will remain conducive to earnings growth. We expect equities to deliver a
higher return than all major fixed income alternatives; albeit lower than 2017.
Luxembourg, 17 January 2018 SEB Investment Management AB
The Board of Directors

Schedule of Investments As at 31 December 2017
8
SEB Strategy Fund - SEB Strategy Balanced
Security description Maturity Total holdings Market % of
value in Net
SEK Assets
Bonds indicated in 1,000 currency units
Transferable securities admitted to an official stock exchange listing and/or dealt within another regulated market
Bonds
Australia 9.75 % FMG Resources August 2006 Pty Ltd 01/03/22 68 618,168.39 0.00 2.00 % National Australia Bank Ltd FRN 12/11/24 260 2,624,283.04 0.02
Total Australia 3,242,451.43 0.02
Austria 7.50 % Sappi Papier Holding GmbH 15/06/32 87 731,570.75 0.01 6.88 % UNIQA Insurance Group AG FRN 31/07/43 100 1,235,118.66 0.01
Total Austria 1,966,689.41 0.02
Belgium 5.63 % KBC Group NV FRN Perpetual 126 1,293,026.01 0.01
Total Belgium 1,293,026.01 0.01
Bermuda 4.13 % Aircastle Ltd 01/05/24 110 914,707.42 0.01 5.13 % Aircastle Ltd 15/03/21 65 559,460.06 0.00 5.50 % Aircastle Ltd 15/02/22 68 596,115.61 0.01 5.00 % IHS Markit Ltd 01/11/22 118 1,046,068.01 0.01 6.25 % Viking Cruises Ltd 15/05/25 23 194,765.25 0.00
Total Bermuda 3,311,116.35 0.03
Canada 4.25 % 1011778 BC ULC / New Red Finance Inc 15/05/24 110 899,712.07 0.01 7.75 % Air Canada 15/04/21 241 2,250,234.50 0.02 6.00 % Bombardier Inc 15/10/22 43 344,977.74 0.00 7.75 % Bombardier Inc 15/03/20 55 484,210.25 0.00 8.75 % Bombardier Inc 01/12/21 145 1,303,277.79 0.01 6.88 % Clearwater Seafoods Inc 01/05/25 133 1,096,599.60 0.01 5.50 % Cott Corp 01/07/24 156 1,659,525.43 0.01 7.00 % First Quantum Minerals Ltd 15/02/21 216 1,831,717.16 0.02 5.88 % Lions Gate Entertainment Corp 01/11/24 90 780,465.66 0.01 6.88 % Mattamy Group Corp 15/12/23 43 373,318.66 0.00 6.50 % MDC Partners Inc 01/05/24 88 723,537.86 0.01 6.25 % New Gold Inc 15/11/22 87 736,685.13 0.01 5.63 % Open Text Corp 15/01/23 125 1,066,315.62 0.01 5.75 % Quebecor Media Inc 15/01/23 126 1,094,735.80 0.01 8.88 % Telesat Canada / Telesat LLC 15/11/24 173 1,581,290.86 0.01 5.50 % Valeant Pharmaceuticals International Inc 01/11/25 4 33,429.11 0.00 6.50 % Valeant Pharmaceuticals International Inc 15/03/22 66 568,558.87 0.00 7.00 % Valeant Pharmaceuticals International Inc 15/03/24 66 581,214.41 0.01 7.50 % Valeant Pharmaceuticals International Inc 15/07/21 116 969,729.18 0.01 5.13 % Videotron Ltd 15/04/27 32 272,979.42 0.00
Total Canada 18,652,515.12 0.16
Cayman Islands 5.25 % Park Aerospace Holdings Ltd 15/08/22 133 1,082,966.15 0.01
Total Cayman Islands 1,082,966.15 0.01
Denmark 0.75 % Danske Bank A/S 02/06/23 260 2,590,335.57 0.03

Schedule of Investments
As at 31 October 2016
9
SEB Strategy Fund - SEB Strategy Balanced
Security description Maturity Total holdings Market % of
value in Net
SEK Assets
5.75 % Danske Bank A/S FRN Perpetual 137 1,458,184.98 0.01 3.50 % TDC A/S FRN Perpetual 100 1,027,489.26 0.01
Total Denmark 5,076,009.81 0.05
Finland 0.88 % Elisa OYJ 17/03/24 260 2,536,858.07 0.02 1.13 % Metso OYJ 13/06/24 260 2,570,754.71 0.02 1.00 % Sampo Oyj 18/09/23 260 2,601,225.35 0.03
Total Finland 7,708,838.13 0.07
France 4.13 % Accor SA FRN Perpetual 100 1,047,290.65 0.01 4.00 % Banijay Group SAS 01/07/22 100 1,028,728.08 0.01 4.87 % Casino Guichard Perrachon SA FRN Perpetual 100 1,001,012.04 0.01 5.38 % Constantin Investissement 3 SASU 15/04/25 137 1,365,096.16 0.01 2.63 % Credit Agricole SA 17/03/27 260 2,765,108.83 0.02 6.50 % Credit Agricole SA FRN Perpetual 100 1,113,459.12 0.01 2.25 % Danone SA 15/11/21 300 3,172,399.89 0.03 6.38 % Groupama SA FRN Perpetual 100 1,180,807.42 0.01 7.13 % Lafarge SA 15/07/36 99 1,067,636.59 0.01 6.00 % Loxam SAS 15/04/25 100 1,072,391.41 0.01 3.00 % Orange SA 15/06/22 300 3,295,101.61 0.03 5.00 % Orange SA FRN Perpetual 103 1,201,264.20 0.01 2.50 % Sanofi 14/11/23 300 3,296,812.35 0.03 7.38 % SFR Group SA 01/05/26 220 1,843,248.39 0.02 4.00 % Societe Generale SA 07/06/23 300 3,408,010.79 0.03 2.88 % SPCM SA 15/06/23 200 2,002,908.95 0.02
Total France 29,861,276.48 0.27
Germany 4.75 % Allianz SE FRN Perpetual 300 3,505,051.33 0.03 1.40 % Daimler AG 12/01/24 260 2,682,694.18 0.03 2.38 % Deutsche Bank AG 11/01/23 300 3,171,662.50 0.03 3.25 % IHO Verwaltungs GmbH 15/09/23 100 1,026,486.41 0.01 6.25 % Muenchener Rueckversicherungs-Gesellschaft AG in Muenchen FRN 26/05/42 300 3,636,513.25 0.03 3.88 % Senvion Holding GmbH 25/10/22 100 939,385.89 0.01 1.38 % thyssenkrupp AG 03/03/22 21 209,671.58 0.00 2.50 % thyssenkrupp AG 25/02/25 21 223,296.48 0.00 2.75 % thyssenkrupp AG 08/03/21 127 1,328,385.93 0.01 3.75 % Unitymedia GmbH 15/01/27 100 1,003,361.86 0.01 6.25 % Unitymedia Hessen GmbH & Co KG / Unitymedia NRW GmbH 15/01/29 114 1,259,625.78 0.01 8.50 % Wittur International Holding GmbH 15/02/23 142 1,454,427.54 0.01
Total Germany 20,440,562.73 0.18
Iceland 1.63 % Arion Banki HF 01/12/21 260 2,645,806.97 0.02
Total Iceland 2,645,806.97 0.02
Ireland 4.25 % Bank of Ireland FRN 11/06/24 137 1,419,486.65 0.01 2.63 % GE Capital European Funding Unlimited Co 15/03/23 260 2,834,026.30 0.03
Total Ireland 4,253,512.95 0.04
Italy 7.75 % Assicurazioni Generali SpA FRN 12/12/42 300 3,805,464.08 0.03 2.13 % Buzzi Unicem SpA 28/04/23 101 1,045,847.33 0.01

10
SEB Strategy Fund - SEB Strategy Balanced
Security description Maturity Total holdings Market % of
value in Net
SEK Assets
6.00 % Cooperativa Muratori & Cementisti-CMC di Ravenna SC 15/02/23 100 977,749.84 0.01
2.00 % Intesa Sanpaolo SpA 18/06/21 300 3,117,066.13 0.03 8.38 % Intesa Sanpaolo SpA FRN Perpetual 50 556,316.62 0.00 3.63 % Telecom Italia SpA/Milano 19/01/24 100 1,097,600.32 0.01 3.63 % Telecom Italia SpA/Milano 25/05/26 100 1,100,058.28 0.01 5.88 % Telecom Italia SpA/Milano 19/05/23 50 648,221.64 0.01 4.38 % UniCredit SpA FRN 03/01/27 103 1,098,345.28 0.01 5.75 % UnipolSai Assicurazioni SpA FRN Perpetual 100 1,050,544.99 0.01 3.13 % Wind Tre SpA 20/01/25 100 956,591.66 0.01
Total Italy 15,453,806.17 0.14
Japan 5.25 % SoftBank Group Corp 30/07/27 100 1,103,165.15 0.01
Total Japan 1,103,165.15 0.01
Luxembourg 7.50 % Altice Financing SA 15/05/26 200 1,743,767.35 0.02 7.63 % Altice Finco SA 15/02/25 200 1,643,339.85 0.02 7.75 % Altice Luxembourg SA 15/05/22 200 1,613,111.71 0.01 6.63 % ARD Finance SA 15/09/23 148 1,557,573.97 0.01 8.00 % Auris Luxembourg II SA 15/01/23 123 1,261,393.15 0.01 7.50 % Cabot Financial Luxembourg SA 01/10/23 100 1,158,817.88 0.01 8.50 % eDreams ODIGEO SA 01/08/21 98 1,029,295.47 0.01 4.75 % Fiat Chrysler Finance Europe SA 15/07/22 260 2,889,523.26 0.03 8.50 % Garfunkelux Holdco 3 SA 01/11/22 100 1,157,433.43 0.01 7.38 % Greif Nevada Holdings Inc SCS 15/07/21 100 1,178,968.86 0.01 2.25 % Holcim Finance Luxembourg SA 26/05/28 260 2,716,667.21 0.02 5.50 % Intelsat Jackson Holdings SA 01/08/23 32 213,901.26 0.00 7.25 % Intelsat Jackson Holdings SA 15/10/20 156 1,195,910.33 0.01 7.50 % Intelsat Jackson Holdings SA 01/04/21 68 507,019.23 0.00 8.00 % Intelsat Jackson Holdings SA 15/02/24 134 1,156,244.83 0.01 9.50 % Intelsat Jackson Holdings SA 30/09/22 94 887,482.12 0.01 9.75 % Intelsat Jackson Holdings SA 15/07/25 46 361,279.97 0.00 7.75 % LSF9 Balta Issuer SARL 15/09/22 81 854,923.35 0.01 4.75 % Mallinckrodt International Finance SA 15/04/23 22 140,859.03 0.00 5.63 % Mallinckrodt International Finance SA / Mallinckrodt CB LLC 15/10/23 111 775,286.92 0.01 3.88 % Matterhorn Telecom SA 01/05/22 100 1,000,746.58 0.01 5.63 % SES SA FRN Perpetual 100 1,093,529.92 0.01 7.75 % SIG Combibloc Holdings SCA 15/02/23 100 1,027,302.46 0.01 9.75 % Swissport Financing Sarl 15/12/22 100 1,025,749.02 0.01 6.00 % Telecom Italia Capital SA 30/09/34 21 192,282.16 0.00 7.20 % Telecom Italia Capital SA 18/07/36 43 438,488.71 0.00 7.72 % Telecom Italia Capital SA 04/06/38 55 583,769.47 0.01 7.75 % Telecom Italia Finance SA 24/01/33 59 891,786.37 0.01
Total Luxembourg 30,296,453.87 0.27
Mexico 3.26 % America Movil SAB de CV 22/07/23 260 2,896,834.24 0.02 7.75 % Cemex SAB de CV 16/04/26 200 1,857,393.06 0.02
Total Mexico 4,754,227.30 0.04
Netherlands 2.88 % ABN AMRO Bank NV FRN 18/01/28 300 3,210,390.23 0.03 5.00 % ASR Nederland NV FRN Perpetual 100 1,147,231.59 0.01 5.25 % Atradius Finance BV FRN 23/09/44 100 1,148,244.27 0.01

Schedule of Investments
As at 31 October 2016
11
SEB Strategy Fund - SEB Strategy Balanced
Security description Maturity Total holdings Market % of
value in Net
SEK Assets
1.25 % BMW Finance NV 05/09/22 260 2,664,851.30 0.02 4.50 % CNH Industrial NV 15/08/23 87 742,291.01 0.01 4.63 % Constellium NV 15/05/21 204 2,047,700.58 0.02 5.88 % Cooperatieve Rabobank UA 20/05/19 260 2,762,731.49 0.03 4.50 % ELM BV for Swiss Life Insurance & Pension Group FRN Perpetual 260 2,943,000.76 0.03 4.60 % Generali Finance BV FRN Perpetual 114 1,228,713.20 0.01 4.88 % ING Bank NV 18/01/21 260 2,925,950.34 0.03 1.25 % innogy Finance BV 19/10/27 260 2,559,174.44 0.02 7.00 % Koninklijke KPN NV FRN 28/03/73 200 1,855,526.32 0.02 8.50 % Nyrstar Netherlands Holdings BV 15/09/19 253 2,749,691.09 0.02 9.00 % SRLEV NV FRN 15/04/41 100 1,181,053.22 0.01 7.63 % Telefonica Europe BV FRN Perpetual 200 2,356,639.92 0.02 0.88 % Volkswagen International Finance NV 16/01/23 260 2,592,150.53 0.02 7.13 % Ziggo Bond Co BV 15/05/24 100 1,080,178.25 0.01
Total Netherlands 35,195,518.54 0.32
Portugal 5.38 % EDP - Energias de Portugal SA FRN 16/09/75 100 1,098,809.64 0.01
Total Portugal 1,098,809.64 0.01
Spain 3.50 % Banco Bilbao Vizcaya Argentaria SA 10/02/27 200 2,212,760.35 0.02 1.38 % Banco Santander SA 09/02/22 200 2,027,940.89 0.02 6.25 % Banco Santander SA FRN Perpetual 100 1,027,430.27 0.01 3.38 % Bankia SA FRN 15/03/27 100 1,032,415.03 0.01 3.20 % Grifols SA 01/05/25 100 1,000,392.63 0.01 1.00 % Iberdrola Finanzas SA 07/03/25 300 2,965,753.67 0.02 1.63 % Mapfre SA 19/05/26 300 3,018,550.81 0.03 5.50 % Obrascon Huarte Lain SA 15/03/23 189 1,904,604.42 0.02 7.63 % Obrascon Huarte Lain SA 15/03/20 100 998,386.93 0.01 1.93 % Telefonica Emisiones SAU 17/10/31 300 2,915,581.65 0.02
Total Spain 19,103,816.65 0.17
Sweden 3.63 % Com Hem Sweden AB 23/06/21 1,000 1,031,150.00 0.01 2.75 % Intrum Justitia AB 15/07/22 100 988,761.53 0.01 3.13 % Intrum Justitia AB 15/07/24 100 987,483.39 0.01 2.25 % Kommuninvest I Sverige AB 12/03/19 45,300 46,798,524.00 0.42 2.50 % Kommuninvest I Sverige AB 01/12/20 114,100 122,578,771.00 1.10 1.75 % Lansforsakringar Hypotek AB 15/09/21 171,700 180,195,716.00 1.62 2.25 % Lansforsakringar Hypotek AB 21/09/22 90,000 96,383,700.00 0.86 3.25 % Lansforsakringar Hypotek AB 16/09/20 104,500 113,436,840.00 1.02 1.00 % Nordea Bank AB FRN 07/09/26 300 2,975,398.74 0.03 5.50 % Nordea Bank AB FRN Perpetual 200 1,682,459.58 0.01 1.25 % Nordea Hypotek AB 19/05/21 20,000 20,634,000.00 0.18 2.25 % Nordea Hypotek AB 19/06/19 69,700 72,291,446.00 0.65 3.25 % Nordea Hypotek AB 17/06/20 268,400 289,743,168.00 2.60 5.00 % Ovako AB 05/10/22 100 1,005,072.60 0.01 1.50 % Skandinaviska Enskilda Banken AB 17/06/20 80,000 82,924,800.00 0.74 1.50 % Skandinaviska Enskilda Banken AB 15/12/21 219,000 227,762,190.00 2.04 1.88 % Skandinaviska Enskilda Banken AB 14/11/19 260 2,653,910.40 0.02 3.00 % Skandinaviska Enskilda Banken AB 19/06/19 47,000 49,264,460.00 0.44 5.75 % Skandinaviska Enskilda Banken AB FRN Perpetual 200 1,695,035.53 0.02 1.63 % SKF AB 02/12/22 260 2,663,700.97 0.02 1.50 % Stadshypotek AB 17/03/21 87,000 90,481,740.00 0.81 1.50 % Stadshypotek AB 15/12/21 80,000 83,200,800.00 0.75

12
SEB Strategy Fund - SEB Strategy Balanced
Security description Maturity Total holdings Market % of
value in Net
SEK Assets
2.50 % Stadshypotek AB 18/09/19 87,000 91,055,070.00 0.82 4.25 % Stadshypotek AB 17/06/20 60,000 66,244,200.00 0.59 4.50 % Stadshypotek AB 21/09/22 100,000 117,541,000.00 1.05 1.00 % Sveriges Sakerstallda Obligationer AB 17/03/21 40,000 40,956,400.00 0.37 1.25 % Sveriges Sakerstallda Obligationer AB 15/06/22 120,000 123,174,000.00 1.10 2.00 % Sveriges Sakerstallda Obligationer AB 17/06/20 174,000 182,484,240.00 1.64 4.00 % Sveriges Sakerstallda Obligationer AB 18/09/19 40,000 42,892,800.00 0.38 5.50 % Swedbank AB FRN Perpetual 200 1,693,021.42 0.02 1.00 % Swedbank Hypotek AB 15/09/21 139,400 142,465,406.00 1.28 1.00 % Swedbank Hypotek AB 15/06/22 61,000 61,986,980.00 0.56 3.75 % Swedbank Hypotek AB 19/06/19 60,000 63,550,800.00 0.57 5.70 % Swedbank Hypotek AB 12/05/20 104,500 118,614,815.00 1.06 0.75 % Sweden Government Bond 12/05/28 172,000 171,487,440.00 1.54 1.00 % Sweden Government Bond 12/11/26 35,000 36,327,200.00 0.33 1.50 % Sweden Government Bond 13/11/23 183,000 197,070,870.00 1.77 2.50 % Sweden Government Bond 12/05/25 102,800 118,624,004.00 1.06 3.50 % Sweden Government Bond 01/06/22 149,700 173,464,875.00 1.56 3.50 % Sweden Government Bond 30/03/39 91,800 125,333,163.00 1.12 4.25 % Sweden Government Bond 12/03/19 10,000 10,604,200.00 0.10 5.00 % Sweden Government Bond 01/12/20 236,700 274,164,876.00 2.46 6.00 % Verisure Holding AB 01/11/22 90 943,260.63 0.01 4.20 % Volvo Treasury AB FRN 10/06/75 100 1,057,515.79 0.01
Total Sweden 3,653,115,264.58 32.77
Switzerland 6.50 % Credit Suisse AG 08/08/23 200 1,833,829.52 0.02 4.75 % UBS AG FRN 22/05/23 200 1,651,150.69 0.02 1.75 % UBS Group Funding Switzerland AG 16/11/22 260 2,708,998.36 0.02
Total Switzerland 6,193,978.57 0.06
United Kingdom 3.50 % Adient Global Holdings Ltd 15/08/24 100 1,050,672.81 0.01 5.75 % Aston Martin Capital Holdings Ltd 15/04/22 100 1,161,985.50 0.01 6.88 % Aviva Plc FRN 22/05/38 260 2,621,317.75 0.02 1.88 % Barclays Plc 08/12/23 260 2,688,139.06 0.03 6.50 % Barclays Plc FRN Perpetual 200 2,101,561.92 0.02 4.88 % CPUK Finance Ltd 28/08/25 100 1,125,746.14 0.01 1.25 % Credit Suisse Group Funding Guernsey Ltd 14/04/22 300 3,044,447.95 0.03 6.46 % HBOS Capital Funding LP FRN Perpetual 107 1,234,566.67 0.01 3.38 % HSBC Holdings Plc FRN 10/01/24 260 2,640,004.20 0.02 6.75 % Iceland Bondco Plc 15/07/24 100 1,162,151.63 0.01 5.00 % Jaguar Land Rover Automotive Plc 15/02/22 100 1,204,593.33 0.01 1.00 % Lloyds Banking Group Plc 09/11/23 260 2,580,775.06 0.02 6.75 % Melton Renewable Energy UK Plc 01/02/20 80 903,999.33 0.01 7.13 % Mercury Bondco Plc 30/05/21 100 1,015,995.81 0.01 3.63 % Royal Bank of Scotland Group Plc FRN 25/03/24 114 1,157,540.30 0.01 0.88 % SSE Plc 06/09/25 260 2,527,783.25 0.02 8.25 % Synlab Unsecured Bondco Plc 01/07/23 100 1,066,934.72 0.01 6.00 % Tesco Plc 14/12/29 43 581,464.13 0.01 6.13 % Tesco Plc 24/02/22 50 639,333.47 0.01 6.75 % Thomas Cook Finance Plc 15/06/21 100 1,018,237.47 0.01 7.00 % Virgin Media Finance Plc 15/04/23 200 2,322,575.47 0.02 1.00 % Vodafone Group Plc 11/09/20 260 2,611,527.18 0.02
Total United Kingdom 36,461,353.15 0.33

Schedule of Investments
As at 31 October 2016
13
SEB Strategy Fund - SEB Strategy Balanced
Security description Maturity Total holdings Market % of
value in Net
SEK Assets
United States of America 8.00 % 24 Hour Fitness Worldwide Inc 01/06/22 44 348,526.19 0.00 4.13 % ADT Corp/The 15/06/23 43 353,268.78 0.00 7.00 % Advanced Micro Devices Inc 01/07/24 43 364,411.52 0.00 7.50 % Advanced Micro Devices Inc 15/08/22 34 306,848.85 0.00 6.63 % Albertsons Cos LLC / Safeway Inc / New Albertson's Inc /
Albertson's LLC 15/06/24 181 1,408,887.63 0.01 7.88 % Aleris International Inc 01/11/20 141 1,146,040.54 0.01 4.13 % Ally Financial Inc 30/03/20 133 1,109,851.92 0.01 4.63 % Ally Financial Inc 19/05/22 66 565,170.74 0.01 4.75 % Ally Financial Inc 10/09/18 110 912,068.60 0.01 8.00 % Ally Financial Inc 15/03/20 76 687,988.19 0.01 5.75 % AMC Entertainment Holdings Inc 15/06/25 21 170,255.33 0.00 5.88 % AMC Entertainment Holdings Inc 15/02/22 21 174,326.79 0.00 6.13 % AMC Entertainment Holdings Inc 15/05/27 21 171,065.15 0.00 5.00 % AMC Networks Inc 01/04/24 87 720,002.83 0.01 6.25 % American Axle & Manufacturing Inc 01/04/25 43 371,487.95 0.00 6.63 % American Axle & Manufacturing Inc 15/10/22 78 662,596.55 0.01 7.88 % American Greetings Corp 15/02/25 109 964,409.05 0.01 6.38 % Amkor Technology Inc 01/10/22 61 515,277.77 0.01 6.38 % APX Group Inc 01/12/19 5 41,488.37 0.00 7.88 % APX Group Inc 01/12/22 68 595,709.18 0.01 8.75 % APX Group Inc 01/12/20 43 358,845.43 0.00 6.15 % Arconic Inc 15/08/20 68 601,265.52 0.01 6.75 % Arconic Inc 15/01/28 65 627,883.15 0.01 6.00 % Avantor Inc 01/10/24 32 261,794.68 0.00 0.75 % Bank of America Corp 26/07/23 260 2,567,686.88 0.02 9.63 % BCD Acquisition Inc 15/09/23 21 189,235.44 0.00 5.75 % Beazer Homes USA Inc 15/06/19 24 202,856.03 0.00 7.25 % Beazer Homes USA Inc 01/02/23 2 17,021.26 0.00 8.75 % Beazer Homes USA Inc 15/03/22 43 387,841.19 0.00 7.75 % Belo Corp 01/06/27 21 192,130.85 0.00 9.75 % Blackboard Inc 15/10/21 67 499,442.38 0.01 5.63 % Boise Cascade Co 01/09/24 110 951,092.54 0.01 5.88 % Cablevision Systems Corp 15/09/22 43 344,231.37 0.00 7.75 % Cablevision Systems Corp 15/04/18 37 306,823.06 0.00 8.00 % Cablevision Systems Corp 15/04/20 110 967,195.65 0.01 5.00 % CalAtlantic Group Inc 15/06/27 43 364,140.43 0.00 6.25 % CalAtlantic Group Inc 15/12/21 21 187,110.30 0.00 5.25 % Calpine Corp 01/06/26 46 369,057.25 0.00 5.75 % Calpine Corp 15/01/25 88 682,664.04 0.01 5.88 % Calpine Corp 15/01/24 66 549,635.01 0.01 6.75 % Carlson Travel Inc 15/12/23 200 1,494,278.77 0.01 8.00 % CB Escrow Corp 15/10/25 43 356,208.49 0.00 7.25 % CBS Radio Inc 01/11/24 80 691,389.26 0.01 5.50 % CCO Holdings LLC / CCO Holdings Capital Corp 01/05/26 24 200,140.41 0.00 5.75 % CCO Holdings LLC / CCO Holdings Capital Corp 01/09/23 120 1,005,152.76 0.01 5.75 % CCO Holdings LLC / CCO Holdings Capital Corp 15/01/24 68 573,266.67 0.01 5.75 % CCO Holdings LLC / CCO Holdings Capital Corp 15/02/26 87 738,658.23 0.01 5.88 % CCO Holdings LLC / CCO Holdings Capital Corp 01/04/24 103 879,774.11 0.01 5.88 % CCO Holdings LLC / CCO Holdings Capital Corp 01/05/27 68 572,760.03 0.01 5.38 % Cedar Fair LP / Canada's Wonderland Co / Magnum Management Corp /
Millennium Op 15/04/27 22 189,733.97 0.00 5.80 % CenturyLink Inc 15/03/22 99 793,837.68 0.01

14
SEB Strategy Fund - SEB Strategy Balanced
Security description Maturity Total holdings Market % of
value in Net
SEK Assets
6.75 % CenturyLink Inc 01/12/23 40 321,433.52 0.00 7.50 % CenturyLink Inc 01/04/24 68 555,701.27 0.01 5.13 % Cequel Communications Holdings I LLC / Cequel Capital Corp 15/12/21 43 350,096.71 0.00 6.25 % CHS/Community Health Systems Inc 31/03/23 43 317,055.76 0.00 7.13 % CHS/Community Health Systems Inc 15/07/20 25 152,751.58 0.00 8.00 % CHS/Community Health Systems Inc 15/11/19 102 704,684.24 0.01 4.88 % Cinemark USA Inc 01/06/23 21 174,550.31 0.00 0.75 % Citigroup Inc 26/10/23 260 2,562,932.48 0.02 6.50 % Clear Channel Worldwide Holdings Inc 15/11/22 67 553,645.64 0.01 7.63 % Clear Channel Worldwide Holdings Inc 15/03/20 65 522,616.85 0.01 7.63 % Clear Channel Worldwide Holdings Inc 15/03/20 43 342,386.57 0.00 5.75 % Cleveland-Cliffs Inc 01/03/25 113 880,608.74 0.01 10.13% Cloud Crane LLC 01/08/24 111 1,024,773.22 0.01 5.50 % CommScope Inc 15/06/24 21 179,244.19 0.00 6.00 % CommScope Technologies LLC 15/06/25 87 758,097.17 0.01 6.50 % Consolidated Communications Inc 01/10/22 43 317,798.61 0.00 8.50 % Constellation Merger Sub Inc 15/09/25 21 168,145.66 0.00 5.63 % Cooper-Standard Automotive Inc 15/11/26 90 756,104.66 0.01 4.50 % Crown Americas LLC / Crown Americas Capital Corp IV 15/01/23 98 818,588.00 0.01 4.25 % Crown Americas LLC / Crown Americas Capital Corp V 30/09/26 21 170,463.37 0.00 10.13% CSC Holdings LLC 15/01/23 200 1,843,179.61 0.02 10.88% CSC Holdings LLC 15/10/25 200 1,943,738.12 0.02 6.00 % Dana Inc 15/09/23 156 1,335,692.06 0.01 5.00 % DaVita Inc 01/05/25 131 1,071,893.58 0.01 5.88 % Dell International LLC / EMC Corp 15/06/21 87 739,299.31 0.01 7.13 % Dell International LLC / EMC Corp 15/06/24 167 1,492,648.56 0.01 7.75 % Diamond Resorts International Inc 01/09/23 21 186,493.04 0.00 10.75% Diamond Resorts International Inc 01/09/24 22 192,495.28 0.00 6.75 % DISH DBS Corp 01/06/21 178 1,541,022.67 0.01 7.75 % DISH DBS Corp 01/07/26 90 777,805.55 0.01 5.75 % Dollar Tree Inc 01/03/23 135 1,159,081.70 0.01 5.88 % Dynegy Inc 01/06/23 57 473,359.40 0.00 7.38 % Dynegy Inc 01/11/22 157 1,357,442.73 0.01 5.13 % Encompass Health Corp 15/03/23 76 637,561.23 0.01 5.75 % Encompass Health Corp 01/11/24 122 1,023,513.49 0.01 5.38 % Endo Finance LLC / Endo Finco Inc 15/01/23 121 769,236.30 0.01 7.25 % Endo Finance LLC / Endo Finco Inc 15/01/22 33 235,232.48 0.00 8.50 % Enova International Inc 01/09/24 21 176,512.11 0.00 5.38 % Equinix Inc 01/04/23 43 363,939.75 0.00 5.38 % Equinix Inc 15/05/27 43 376,420.32 0.00 5.75 % Equinix Inc 01/01/25 21 182,921.92 0.00 5.88 % Equinix Inc 15/01/26 43 378,620.71 0.00 5.38 % First Data Corp 15/08/23 21 179,171.97 0.00 5.75 % First Data Corp 15/01/24 43 364,436.16 0.00 7.00 % First Data Corp 01/12/23 202 1,749,495.64 0.02 7.13 % Frontier Communications Corp 15/01/23 43 230,600.09 0.00 7.63 % Frontier Communications Corp 15/04/24 46 248,112.11 0.00 8.75 % Frontier Communications Corp 15/04/22 39 229,635.94 0.00 9.25 % Frontier Communications Corp 01/07/21 55 354,457.68 0.00 10.50% Frontier Communications Corp 15/09/22 44 272,657.81 0.00 11.00% Frontier Communications Corp 15/09/25 59 355,296.00 0.00 12.50% Gogo Intermediate Holdings LLC / Gogo Finance Co Inc 01/07/22 89 824,740.06 0.01 3.25 % Goldman Sachs Group Inc/The 01/02/23 260 2,872,728.47 0.03 5.00 % Goodyear Tire & Rubber Co/The 31/05/26 88 740,728.92 0.01 5.88 % Gray Television Inc 15/07/26 111 931,393.07 0.01

Schedule of Investments
As at 31 October 2016
15
SEB Strategy Fund - SEB Strategy Balanced
Security description Maturity Total holdings Market % of
value in Net
SEK Assets
7.75 % Greif Inc 01/08/19 77 675,082.61 0.01 4.63 % Hanesbrands Inc 15/05/24 65 544,766.41 0.01 4.88 % Hanesbrands Inc 15/05/26 99 831,942.09 0.01 5.00 % HCA Inc 15/03/24 43 368,210.26 0.00 5.25 % HCA Inc 15/04/25 43 373,677.77 0.00 5.38 % HCA Inc 01/02/25 61 518,239.42 0.00 5.88 % HCA Inc 15/03/22 100 879,252.40 0.01 5.88 % HCA Inc 01/05/23 112 983,662.29 0.01 5.88 % HCA Inc 15/02/26 156 1,351,185.05 0.01 7.50 % HCA Inc 15/02/22 202 1,868,838.82 0.02 8.36 % HCA Inc 15/04/24 14 136,162.54 0.00 7.75 % Herc Rentals Inc 01/06/24 117 1,054,560.79 0.01 5.88 % Hertz Corp/The 15/10/20 87 712,416.73 0.01 10.00% Hexion Inc 15/04/20 135 1,055,237.97 0.01 4.63 % Hilton Worldwide Finance LLC / Hilton Worldwide Finance Corp 01/04/25 76 640,572.91 0.01 4.88 % Hilton Worldwide Finance LLC / Hilton Worldwide Finance Corp 01/04/27 23 197,154.93 0.00 7.13 % Infor Software Parent LLC / Infor Software Parent Inc 01/05/21 43 359,373.52 0.00 6.50 % Infor US Inc 15/05/22 43 365,281.11 0.00 8.25 % International Lease Finance Corp 15/12/20 43 404,261.32 0.00 5.75 % Iron Mountain Inc 15/08/24 96 794,399.43 0.01 5.38 % Iron Mountain US Holdings Inc 01/06/26 32 271,572.48 0.00 5.00 % iStar Inc 01/07/19 67 552,713.09 0.00 6.00 % iStar Inc 01/04/22 43 365,252.94 0.00 5.65 % JC Penney Corp Inc 01/06/20 21 158,345.26 0.00 5.88 % JC Penney Corp Inc 01/07/23 60 463,974.10 0.00 1.50 % JPMorgan Chase & Co 29/10/26 260 2,645,602.47 0.02 10.00% K Hovnanian Enterprises Inc 15/07/22 17 151,555.15 0.00 10.50% K Hovnanian Enterprises Inc 15/07/24 15 141,238.77 0.00 5.88 % Kaiser Aluminum Corp 15/05/24 88 768,230.31 0.01 4.75 % KFC Holding Co/Pizza Hut Holdings LLC/Taco Bell of America LLC 01/06/27 66 552,023.46 0.01 5.00 % KFC Holding Co/Pizza Hut Holdings LLC/Taco Bell of America LLC 01/06/24 68 576,133.92 0.01 5.25 % KFC Holding Co/Pizza Hut Holdings LLC/Taco Bell of America LLC 01/06/26 65 561,482.36 0.01 7.00 % Kraton Polymers LLC / Kraton Polymers Capital Corp 15/04/25 21 185,120.99 0.00 10.50% Kraton Polymers LLC / Kraton Polymers Capital Corp 15/04/23 97 898,929.59 0.01 9.00 % Kronos Acquisition Holdings Inc 15/08/23 109 839,173.75 0.01 5.63 % L Brands Inc 15/02/22 134 1,169,103.08 0.01 6.63 % L Brands Inc 01/04/21 63 565,410.96 0.01 8.50 % L Brands Inc 15/06/19 41 362,826.50 0.00 4.63 % Lamb Weston Holdings Inc 01/11/24 102 858,555.46 0.01 4.13 % Lennar Corp 15/01/22 43 358,496.89 0.00 4.50 % Lennar Corp 15/11/19 24 201,276.18 0.00 4.50 % Lennar Corp 30/04/24 22 184,465.34 0.00 5.25 % Level 3 Financing Inc 15/03/26 44 352,388.05 0.00 5.38 % Level 3 Financing Inc 15/01/24 43 351,670.42 0.00 5.63 % Level 3 Financing Inc 01/02/23 21 173,695.78 0.00 5.00 % Levi Strauss & Co 01/05/25 176 1,502,755.75 0.01 5.88 % LIN Television Corp 15/11/22 43 365,122.68 0.00 4.88 % Live Nation Entertainment Inc 01/11/24 107 900,203.48 0.01 7.00 % Men's Wearhouse Inc/The 01/07/22 21 173,018.35 0.00 6.25 % Meritor Inc 15/02/24 109 939,447.66 0.01 5.50 % Micron Technology Inc 01/02/25 112 960,388.92 0.01 5.63 % Micron Technology Inc 15/01/26 61 524,242.64 0.01 1.75 % Morgan Stanley 30/01/25 300 3,082,172.83 0.03 6.50 % Nationstar Mortgage LLC / Nationstar Capital Corp 01/08/18 87 713,136.17 0.01 6.50 % Nationstar Mortgage LLC / Nationstar Capital Corp 01/07/21 21 174,515.92 0.00

16
SEB Strategy Fund - SEB Strategy Balanced
Security description Maturity Total holdings Market % of
value in Net
SEK Assets
5.88 % Navient Corp 25/03/21 142 1,203,975.16 0.01 6.75 % Navient Corp 25/06/25 43 363,563.05 0.00 8.00 % Navient Corp 25/03/20 156 1,378,530.87 0.01 3.63 % Netflix Inc 15/05/27 102 1,009,108.39 0.01 5.63 % Nexstar Broadcasting Inc 01/08/24 65 548,954.71 0.01 5.00 % Nielsen Finance LLC / Nielsen Finance Co 15/04/22 66 556,503.15 0.01 5.75 % NRG Energy Inc 15/01/28 10 82,710.64 0.00 6.25 % NRG Energy Inc 15/07/22 21 178,979.40 0.00 7.95 % Pactiv LLC 15/12/25 65 603,849.65 0.01 5.88 % PetSmart Inc 01/06/25 44 274,635.58 0.00 7.13 % PetSmart Inc 15/03/23 46 223,066.64 0.00 8.88 % PetSmart Inc 01/06/25 21 103,837.83 0.00 5.50 % Post Holdings Inc 01/03/25 76 645,911.80 0.01 5.63 % Post Holdings Inc 15/01/28 25 205,585.32 0.00 9.25 % Prime Security Services Borrower LLC / Prime Finance Inc 15/05/23 90 816,417.66 0.01 5.63 % Prudential Financial Inc FRN 15/06/43 76 675,468.56 0.01 4.25 % PulteGroup Inc 01/03/21 21 177,517.94 0.00 5.00 % PulteGroup Inc 15/01/27 22 188,628.01 0.00 7.88 % PulteGroup Inc 15/06/32 21 216,147.00 0.00 7.00 % Qorvo Inc 01/12/25 57 521,694.04 0.01 7.00 % Quad/Graphics Inc 01/05/22 55 465,481.82 0.00 3.50 % Quintiles IMS Inc 15/10/24 100 1,028,000.52 0.01 4.88 % Quintiles IMS Inc 15/05/23 43 364,217.88 0.00 7.75 % Qwest Capital Funding Inc 15/02/31 21 150,962.29 0.00 8.63 % Rackspace Hosting Inc 15/11/24 89 777,069.50 0.01 8.50 % Rain CII Carbon LLC / CII Carbon Corp 15/01/21 275 2,765,436.72 0.02 5.50 % Rayonier AM Products Inc 01/06/24 154 1,252,309.07 0.01 5.75 % Regal Entertainment Group 01/02/25 21 174,584.70 0.00 5.75 % Reynolds Group Issuer Inc / Reynolds Group Issuer LLC /
Reynolds Group Issuer Lu 15/10/20 124 1,031,830.49 0.01 6.13 % Rite Aid Corp 01/04/23 44 324,915.49 0.00 6.75 % Rite Aid Corp 15/06/21 43 350,072.06 0.00 5.63 % Sally Holdings LLC / Sally Capital Inc 01/12/25 157 1,278,272.92 0.01 5.63 % Sinclair Television Group Inc 01/08/24 87 734,113.69 0.01 5.00 % Sirius XM Radio Inc 01/08/27 27 221,578.97 0.00 5.38 % Sirius XM Radio Inc 15/04/25 66 562,755.27 0.01 5.38 % Sirius XM Radio Inc 15/07/26 87 736,535.55 0.01 6.00 % Sirius XM Radio Inc 15/07/24 43 372,146.30 0.00 4.88 % Six Flags Entertainment Corp 31/07/24 176 1,462,148.52 0.01 10.50% Solera LLC / Solera Finance Inc 01/03/24 134 1,238,111.99 0.01 6.13 % Spectrum Brands Inc 15/12/24 22 190,866.95 0.00 6.63 % Spectrum Brands Inc 15/11/22 118 1,002,466.95 0.01 6.13 % Springleaf Finance Corp 15/05/22 44 373,977.76 0.00 8.25 % Springleaf Finance Corp 15/12/20 65 587,660.57 0.01 8.75 % Sprint Capital Corp 15/03/32 65 605,691.02 0.01 7.00 % Sprint Communications Inc 15/08/20 117 1,020,238.01 0.01 11.50% Sprint Communications Inc 15/11/21 76 748,153.32 0.01 7.13 % Sprint Corp 15/06/24 67 560,135.11 0.01 7.25 % Sprint Corp 15/09/21 143 1,239,757.10 0.01 7.63 % Sprint Corp 15/02/25 43 367,921.57 0.00 7.88 % Sprint Corp 15/09/23 202 1,759,650.39 0.02 8.50 % Staples Inc 15/09/25 21 158,649.59 0.00 9.13 % Syniverse Foreign Holdings Corp 15/01/22 137 1,133,928.81 0.01 9.50 % Talen Energy Supply LLC 15/07/22 145 1,219,913.78 0.01 5.50 % TEGNA Inc 15/09/24 43 370,980.98 0.00

Schedule of Investments
As at 31 October 2016
17
SEB Strategy Fund - SEB Strategy Balanced
Security description Maturity Total holdings Market % of
value in Net
SEK Assets
6.38 % Telecom Italia Capital SA 15/11/33 21 200,012.44 0.00 5.63 % Tempur Sealy International Inc 15/10/23 68 581,072.28 0.01 4.50 % Tenet Healthcare Corp 01/04/21 65 536,613.33 0.00 4.63 % Tenet Healthcare Corp 15/07/24 55 439,895.16 0.00 6.75 % Tenet Healthcare Corp 15/06/23 23 181,832.00 0.00 7.00 % Tenet Healthcare Corp 01/08/25 10 77,458.38 0.00 8.13 % Tenet Healthcare Corp 01/04/22 209 1,747,543.82 0.02 5.00 % Tenneco Inc 15/07/26 22 185,587.51 0.00 5.30 % Tesla Inc 15/08/25 43 338,932.85 0.00 8.75 % TPC Group Inc 15/12/20 170 1,395,363.49 0.01 4.63 % United Rentals North America Inc 15/07/23 67 566,399.67 0.01 8.25 % Uniti Group LP / Uniti Group Finance Inc / CSL Capital LLC 15/10/23 57 448,289.03 0.00 7.63 % Universal Hospital Services Inc 15/08/20 87 713,107.67 0.01 5.13 % Univision Communications Inc 15/05/23 43 352,092.89 0.00 5.13 % Univision Communications Inc 15/02/25 25 199,778.36 0.00 6.38 % US Concrete Inc 01/06/24 109 958,518.98 0.01 6.38 % Valeant Pharmaceuticals International 15/10/20 132 1,093,261.08 0.01 6.75 % Valeant Pharmaceuticals International 15/08/21 134 1,107,368.09 0.01 7.25 % Valeant Pharmaceuticals International 15/07/22 156 1,291,793.14 0.01 4.75 % VeriSign Inc 15/07/27 55 460,393.31 0.00 5.25 % VeriSign Inc 01/04/25 26 231,013.23 0.00 7.50 % Veritas US Inc / Veritas Bermuda Ltd 01/02/23 100 1,046,051.83 0.01 1.63 % Verizon Communications Inc 01/03/24 300 3,084,856.93 0.03 1.38 % Wells Fargo & Co 26/10/26 300 3,007,047.52 0.03 10.50% Western Digital Corp 01/04/24 87 825,617.02 0.01 5.88 % William Lyon Homes Inc 31/01/25 134 1,119,699.73 0.01 7.75 % Windstream Services LLC / Windstream Finance Corp 15/10/20 24 165,890.59 0.00 7.75 % Windstream Services LLC / Windstream Finance Corp 01/10/21 45 275,973.41 0.00 4.88 % WMG Acquisition Corp 01/11/24 88 741,816.87 0.01 5.00 % Wolverine World Wide Inc 01/09/26 120 983,586.97 0.01 6.13 % XPO Logistics Inc 01/09/23 93 806,458.34 0.01 6.38 % Zayo Group LLC / Zayo Capital Inc 15/05/25 87 754,649.59 0.01
Total United States of America 168,638,193.80 1.51
Total Bonds 4,070,949,358.96 36.51
Shares
Australia APA Group 17,191 917,023.11 0.01 Australia & New Zealand Banking Group Ltd 9,364 1,723,385.00 0.02 Commonwealth Bank of Australia 4,938 2,540,487.45 0.02 CSL Ltd 1,295 1,171,779.97 0.01 Domino's Pizza Enterprises Ltd 452 135,172.85 0.00 Flight Centre Travel Group Ltd 445 126,069.28 0.00 GPT Group/The 256,622 8,397,479.00 0.08 Harvey Norman Holdings Ltd 7,815 208,688.82 0.00 Healthscope Ltd 15,048 202,363.52 0.00 Mirvac Group 947,723 14,262,098.24 0.13 National Australia Bank Ltd 9,020 1,708,016.27 0.02 QBE Insurance Group Ltd 4,730 323,494.23 0.00 REA Group Ltd 694 340,647.94 0.00 TPG Telecom Ltd 4,795 201,738.19 0.00 Transurban Group 10,188 810,950.24 0.01 Westfield Corp 16,689 1,014,216.49 0.01

18
SEB Strategy Fund - SEB Strategy Balanced
Security description Maturity Total holdings Market % of
value in Net
SEK Assets
Westpac Banking Corp 10,341 2,076,032.86 0.02
Total Australia 36,159,643.46 0.33
Austria voestalpine AG 657 321,975.70 0.00
Total Austria 321,975.70 0.00
Belgium Colruyt SA 937 399,452.30 0.01 KBC Group NV 23,995 16,775,964.54 0.15 Proximus SADP 54,559 14,671,002.76 0.13 Solvay SA 1,164 1,326,393.80 0.01
Total Belgium 33,172,813.40 0.30
Bermuda Arch Capital Group Ltd 454 337,402.20 0.00 Bunge Ltd 710 389,942.99 0.00 IHS Markit Ltd 1,500 554,496.40 0.01 Kerry Properties Ltd 199,500 7,344,483.79 0.07 Norwegian Cruise Line Holdings Ltd 815 355,325.96 0.00 XL Group Ltd 1,171 337,097.46 0.00 Yue Yuen Industrial Holdings Ltd 434,480 13,970,154.60 0.13
Total Bermuda 23,288,903.40 0.21
Canada Bank of Montreal 1,694 1,113,503.01 0.01 Bank of Nova Scotia/The 3,341 1,771,036.86 0.02 BCE Inc 34,300 13,533,508.86 0.12 Canadian Imperial Bank of Commerce 52,871 42,336,854.06 0.38 Canadian National Railway Co 2,601 1,761,703.60 0.02 Canadian Pacific Railway Ltd 788 1,182,591.52 0.01 CI Financial Corp 14,800 2,879,146.30 0.03 Constellation Software Inc/Canada 120 597,545.25 0.01 Fairfax Financial Holdings Ltd 118 516,121.52 0.00 Great-West Lifeco Inc 2,138 490,385.93 0.00 H&R Real Estate Investment Trust 7,621 1,063,742.21 0.01 Magna International Inc 17,348 8,076,003.66 0.07 National Bank of Canada 2,069 847,988.03 0.01 Open Text Corp 1,900 555,113.07 0.00 Power Corp of Canada 63,600 13,453,119.44 0.12 Power Financial Corp 28,155 6,354,787.72 0.06 Restaurant Brands International Inc 1,185 598,346.07 0.01 RioCan Real Estate Investment Trust 7,982 1,270,609.77 0.01 Rogers Communications Inc 2,500 1,046,362.88 0.01 Royal Bank of Canada 3,874 2,598,613.88 0.02 SmartCentres Real Estate Investment Trust 6,379 1,288,471.42 0.01 Sun Life Financial Inc 59,773 20,264,141.25 0.18 Toronto-Dominion Bank/The 45,604 21,948,198.09 0.20
Total Canada 145,547,894.40 1.31
Cayman Islands CK Asset Holdings Ltd 16,471 1,178,239.88 0.01 WH Group Ltd 34,422 317,978.48 0.00
Total Cayman Islands 1,496,218.36 0.01
Denmark Danske Bank A/S 2,323 741,102.50 0.01

Schedule of Investments
As at 31 October 2016
19
SEB Strategy Fund - SEB Strategy Balanced
Security description Maturity Total holdings Market % of
value in Net
SEK Assets
Novo Nordisk A/S 4,766 2,105,146.39 0.02 Pandora A/S 422 376,417.62 0.00 Tryg A/S 1,850 379,136.49 0.00 William Demant Holding A/S 1,843 422,237.65 0.01
Total Denmark 4,024,040.65 0.04
Finland Elisa OYJ 1,905 612,836.10 0.00 Kone OYJ 2,124 935,135.77 0.01 Sampo Oyj 1,754 789,825.47 0.01 UPM-Kymmene OYJ 3,058 779,006.28 0.01
Total Finland 3,116,803.62 0.03
France Air Liquide SA 1,709 1,765,119.80 0.02 Arkema SA 873 871,626.12 0.01 AXA SA 4,822 1,172,668.31 0.01 BNP Paribas SA 2,705 1,655,551.49 0.01 Capgemini SE 826 803,097.90 0.01 Carrefour SA 1,976 350,477.01 0.00 Casino Guichard Perrachon SA 775 385,251.94 0.00 Cie de Saint-Gobain 3,022 1,366,153.48 0.01 Cie Generale des Etablissements Michelin 803 943,846.11 0.01 CNP Assurances 29,769 5,635,647.74 0.05 Danone SA 1,684 1,158,152.83 0.01 Dassault Systemes SE 535 465,987.80 0.00 Eiffage SA 844 757,948.19 0.01 Eurazeo SA 9,632 7,291,943.01 0.07 Fonciere Des Regions 6,888 6,398,366.16 0.06 ICADE 722 581,589.05 0.01 JCDecaux SA 552 182,380.77 0.00 Klepierre SA 74,117 26,718,101.11 0.24 Lagardere SCA 1,171 307,745.65 0.00 Legrand SA 2,172 1,370,765.81 0.01 L'Oreal SA 703 1,278,338.08 0.01 Natixis SA 23,119 1,499,290.35 0.01 Publicis Groupe SA 690 384,313.00 0.00 Sanofi 2,864 2,023,186.19 0.02 Schneider Electric SE 2,224 1,549,430.13 0.01 SCOR SE 12,216 4,028,959.36 0.04 Societe Generale SA 1,992 843,137.79 0.01 Veolia Environnement SA 3,134 655,548.20 0.01 Vinci SA 1,788 1,496,884.30 0.01
Total France 73,941,507.68 0.66
Germany adidas AG 569 935,092.80 0.01 Allianz SE 24,118 45,409,438.91 0.41 Bayer AG 2,226 2,276,116.91 0.02 Bayerische Motoren Werke AG 1,541 1,315,553.48 0.01 Daimler AG 3,131 2,179,477.51 0.02 Deutsche Bank AG 6,342 989,865.16 0.01 Deutsche Boerse AG 777 739,490.23 0.01 Deutsche Post AG 3,374 1,318,615.81 0.01 Deutsche Wohnen SE 2,093 750,277.56 0.01 Evonik Industries AG 2,511 774,456.98 0.01 Fresenius Medical Care AG & Co KGaA 836 721,502.63 0.01

20
SEB Strategy Fund - SEB Strategy Balanced
Security description Maturity Total holdings Market % of
value in Net
SEK Assets
GEA Group AG 1,219 479,521.76 0.00 Hannover Rueck SE 6,621 6,828,654.54 0.06 Henkel AG & Co KGaA 787 773,768.06 0.01 Linde AG 509 907,801.99 0.01 Merck KGaA 470 414,732.80 0.00 Muenchener Rueckversicherungs-Gesellschaft AG in Muenchen 3,018 5,363,318.74 0.05 SAP SE 2,829 2,599,251.60 0.02 United Internet AG 943 531,625.06 0.00 Wuestenrot & Wuerttembergische AG 605 138,951.83 0.00
Total Germany 75,447,514.36 0.68
Hong Kong AIA Group Ltd 35,600 2,485,096.16 0.02 HKT Trust & HKT Ltd 1,219,000 12,716,163.14 0.11 Link REIT 15,000 1,138,210.78 0.01 PCCW Ltd 155,000 737,022.25 0.01 Sun Hung Kai Properties Ltd 8,000 1,092,598.56 0.01 Wharf Holdings Ltd/The 70,000 1,979,497.02 0.02
Total Hong Kong 20,148,587.91 0.18
Ireland Accenture Plc 3,094 3,878,080.79 0.04 Allergan Plc 900 1,205,375.70 0.01 CRH Plc 3,673 1,081,748.59 0.01 DCC Plc 855 706,908.48 0.01 Jazz Pharmaceuticals Plc 342 377,035.45 0.00 Johnson Controls International Plc 2,929 913,919.70 0.01 Medtronic Plc 3,604 2,382,742.07 0.02 Pentair Plc 1,827 1,056,369.81 0.01 Perrigo Co Plc 458 326,837.91 0.00 Seagate Technology Plc 105,585 36,169,592.86 0.32
Total Ireland 48,098,611.36 0.43
Israel Teva Pharmaceutical Industries Ltd ADR 1,700 263,759.35 0.00
Total Israel 263,759.35 0.00
Italy Ferrari NV 572 491,803.83 0.00 Intesa Sanpaolo SpA 35,661 971,201.52 0.01 Poste Italiane SpA 3,858 238,019.22 0.00 Prysmian SpA 2,398 641,053.76 0.01 Telecom Italia SpA/Milano RSP 90,381 529,614.05 0.00 UniCredit SpA 5,740 879,256.15 0.01
Total Italy 3,750,948.53 0.03
Japan ABC-Mart Inc 1,300 611,316.50 0.01 AEON Financial Service Co Ltd 2,800 533,998.89 0.01 Aeon Mall Co Ltd 4,400 704,827.36 0.01 Asahi Kasei Corp 13,100 1,383,900.35 0.01 Asics Corp 2,300 300,229.01 0.00 Benesse Holdings Inc 1,000 288,905.37 0.00 Bridgestone Corp 29,800 11,344,888.88 0.10 Brother Industries Ltd 65,400 13,214,204.77 0.12 Calbee Inc 700 186,462.07 0.00 Canon Inc 5,000 1,526,292.55 0.01

Schedule of Investments
As at 31 October 2016
21
SEB Strategy Fund - SEB Strategy Balanced
Security description Maturity Total holdings Market % of
value in Net
SEK Assets
Central Japan Railway Co 12,900 18,920,358.48 0.17 Concordia Financial Group Ltd 14,900 736,399.81 0.01 Daiichi Sankyo Co Ltd 3,100 661,735.04 0.01 Daito Trust Construction Co Ltd 3,600 6,011,412.21 0.05 Daiwa House Industry Co Ltd 150,300 47,267,688.43 0.42 DeNA Co Ltd 1,800 303,906.65 0.00 DTS Corp 1,300 346,759.13 0.00 Eisai Co Ltd 2,000 932,637.43 0.01 FANUC Corp 1,100 2,163,410.66 0.02 Fujitsu Ltd 117,000 6,825,863.72 0.06 Hachijuni Bank Ltd/The 10,400 489,053.20 0.00 Hakuhodo DY Holdings Inc 2,400 255,196.11 0.00 Hamamatsu Photonics KK 2,000 550,918.93 0.01 Hino Motors Ltd 11,800 1,252,141.33 0.01 Hitachi Ltd 542,000 34,583,012.68 0.31 Honda Motor Co Ltd 13,400 3,761,279.06 0.03 Hoya Corp 1,700 695,378.88 0.01 Isuzu Motors Ltd 4,700 644,596.95 0.01 Japan Airlines Co Ltd 600 192,225.64 0.00 Japan Airport Terminal Co Ltd 800 243,043.92 0.00 Japan Exchange Group Inc 4,900 698,380.59 0.01 Japan Prime Realty Investment Corp 19 494,373.42 0.00 JTEKT Corp 6,100 858,328.78 0.01 Kakaku.com Inc 2,300 318,450.04 0.00 Kamigumi Co Ltd 17,500 3,170,872.76 0.03 KDDI Corp 73,200 14,920,556.23 0.13 Keyence Corp 300 1,376,279.79 0.01 Komatsu Ltd 5,200 1,541,235.68 0.01 Kubota Corp 4,700 754,762.57 0.01 Kuraray Co Ltd 5,000 772,594.75 0.01 Kyushu Financial Group Inc 8,900 441,156.69 0.00 LINE Corp 600 200,380.41 0.00 LIXIL Group Corp 3,300 731,530.21 0.01 Makita Corp 2,300 791,528.05 0.01 Maruichi Steel Tube Ltd 2,900 695,553.32 0.01 McDonald's Holdings Co Japan Ltd 1,000 360,132.36 0.00 Miraca Holdings Inc 37,900 13,290,919.15 0.12 Mitsubishi Chemical Holdings Corp 8,200 736,930.38 0.01 Mitsubishi UFJ Financial Group Inc 45,700 2,744,890.33 0.02 Mitsui Fudosan Co Ltd 4,700 862,536.99 0.01 Mixi Inc 47,200 17,358,452.44 0.16 Mizuho Financial Group Inc 182,000 2,706,421.94 0.02 NEC Corp 3,000 662,847.05 0.01 Nintendo Co Ltd 400 1,197,485.52 0.01 Nissan Chemical Industries Ltd 2,300 751,408.36 0.01 Nissin Foods Holdings Co Ltd 700 418,712.92 0.00 Nitori Holdings Co Ltd 300 350,284.14 0.00 NTT DOCOMO Inc 161,000 31,137,894.22 0.28 Ono Pharmaceutical Co Ltd 2,300 438,976.27 0.00 Otsuka Holdings Co Ltd 2,000 719,247.19 0.01 Panasonic Corp 8,400 1,007,047.82 0.01 Park24 Co Ltd 2,600 509,650.89 0.00 Recruit Holdings Co Ltd 3,500 712,269.85 0.01 Rinnai Corp 700 518,939.47 0.01 Sekisui Chemical Co Ltd 4,800 789,136.85 0.01 Seven Bank Ltd 13,300 373,127.65 0.00

22
SEB Strategy Fund - SEB Strategy Balanced
Security description Maturity Total holdings Market % of
value in Net
SEK Assets
Shimadzu Corp 2,600 484,140.00 0.00 Shimamura Co Ltd 600 540,743.64 0.01 Shinsei Bank Ltd 3,500 495,790.70 0.00 Shiseido Co Ltd 1,200 474,982.24 0.00 Shizuoka Bank Ltd/The 10,000 846,002.15 0.01 SoftBank Group Corp 2,100 1,361,452.95 0.01 Sony Corp 3,000 1,108,306.43 0.01 Stanley Electric Co Ltd 2,400 798,032.96 0.01 Sumitomo Dainippon Pharma Co Ltd 3,100 377,168.69 0.00 Sumitomo Electric Industries Ltd 6,200 858,430.54 0.01 Sumitomo Mitsui Financial Group Inc 7,800 2,759,711.36 0.03 Sumitomo Rubber Industries Ltd 3,200 487,483.30 0.00 Sundrug Co Ltd 1,300 495,100.23 0.00 Suzuken Co Ltd/Aichi Japan 1,200 404,249.48 0.00 Suzuki Motor Corp 1,500 712,342.54 0.01 Taisho Pharmaceutical Holdings Co Ltd 800 523,300.30 0.01 Taiyo Nippon Sanso Corp 4,800 550,163.05 0.01 Tokyo Electron Ltd 700 1,037,878.93 0.01 Toppan Printing Co Ltd 16,000 1,184,984.46 0.01 Toray Industries Inc 10,800 834,009.86 0.01 Unicharm Corp 1,900 404,543.84 0.00 West Japan Railway Co 700 418,560.29 0.00 Yamaguchi Financial Group Inc 9,000 875,873.88 0.01 Yamazaki Baking Co Ltd 2,700 431,134.04 0.00 Yokohama Rubber Co Ltd/The 2,600 522,122.88 0.01
Total Japan 281,331,847.83 2.52
Liberia Royal Caribbean Cruises Ltd 34,657 33,846,075.34 0.30
Total Liberia 33,846,075.34 0.30
Luxembourg Eurofins Scientific SE 62 309,420.70 0.00 RTL Group SA 515 339,603.07 0.00
Total Luxembourg 649,023.77 0.00
Mauritius Golden Agri-Resources Ltd 80,700 182,927.98 0.00
Total Mauritius 182,927.98 0.00
Netherlands Aegon NV 7,206 376,559.49 0.00 AerCap Holdings NV 1,921 827,456.91 0.01 ASML Holding NV 1,310 1,869,495.41 0.02 ING Groep NV 53,617 8,078,655.02 0.07 Koninklijke Ahold Delhaize NV 11,021 1,986,726.09 0.02 Koninklijke KPN NV 17,154 490,451.26 0.00 Mylan NV 1,447 501,257.95 0.00 QIAGEN NV 2,046 526,838.12 0.01 Sensata Technologies Holding NV 1,900 795,077.02 0.01 Unilever NV 4,550 2,100,532.03 0.02 Wolters Kluwer NV 2,289 978,523.80 0.01
Total Netherlands 18,531,573.10 0.17
New Zealand Mercury NZ Ltd 7,524 147,642.91 0.00 Meridian Energy Ltd 36,542 622,374.94 0.01

Schedule of Investments
As at 31 October 2016
23
SEB Strategy Fund - SEB Strategy Balanced
Security description Maturity Total holdings Market % of
value in Net
SEK Assets
Ryman Healthcare Ltd 5,846 360,486.24 0.00 Spark New Zealand Ltd 372,584 7,875,257.14 0.07
Total New Zealand 9,005,761.23 0.08
Norway DNB ASA 3,819 581,447.38 0.01 Norsk Hydro ASA 17,622 1,099,824.02 0.01 Telenor ASA 81,677 14,381,267.41 0.13
Total Norway 16,062,538.81 0.15
Panama Carnival Corp 1,300 706,423.10 0.01
Total Panama 706,423.10 0.01
Singapore Broadcom Ltd 1,136 2,389,418.14 0.02 Flex Ltd 4,454 656,041.17 0.01 Hutchison Port Holdings Trust 45,600 154,939.68 0.00 Oversea-Chinese Banking Corp Ltd 164,600 12,494,129.59 0.11 SATS Ltd 11,700 372,729.76 0.00 StarHub Ltd 199,400 3,481,568.01 0.03 Suntec Real Estate Investment Trust 72,200 951,000.02 0.01 United Overseas Bank Ltd 6,900 1,118,097.40 0.01
Total Singapore 21,617,923.77 0.19
Spain Amadeus IT Group SA 1,253 740,515.01 0.01 Banco Bilbao Vizcaya Argentaria SA 17,820 1,246,050.13 0.01 Banco Santander SA 38,325 2,064,522.12 0.02 Bankinter SA 3,452 268,258.70 0.00 CaixaBank SA 12,099 462,619.01 0.00 Ferrovial SA 3,413 635,050.52 0.01 Grifols SA 1,732 415,928.35 0.00 Iberdrola SA 19,020 1,208,033.83 0.01 Industria de Diseno Textil SA 3,227 921,523.55 0.01 Telefonica SA 13,322 1,064,213.75 0.01
Total Spain 9,026,714.97 0.08
Sweden Assa Abloy AB 5,124 873,129.60 0.01 Atlas Copco AB A 3,532 1,251,034.40 0.01 Electrolux AB 29,094 7,689,544.20 0.07 Essity AB 1,889 440,137.00 0.00 Hennes & Mauritz AB 3,198 541,421.40 0.01 Hexagon AB 1,493 613,473.70 0.01 ICA Gruppen AB 696 207,338.40 0.00 Industrivarden AB 75,441 15,276,802.50 0.14 Investor AB 2,466 922,530.60 0.01 L E Lundbergforetagen AB 603 369,639.00 0.00 Nobina AB 2,925 157,950.00 0.00 Nordea Bank AB 7,228 717,740.40 0.01 Securitas AB 3,383 484,445.60 0.00 SKF AB 100,062 18,231,296.40 0.16 Telefonaktiebolaget LM Ericsson 9,985 537,692.25 0.00
Total Sweden 48,314,175.45 0.43
24
SEB Strategy Fund - SEB Strategy Balanced
Security description Maturity Total holdings Market % of
value in Net
SEK Assets
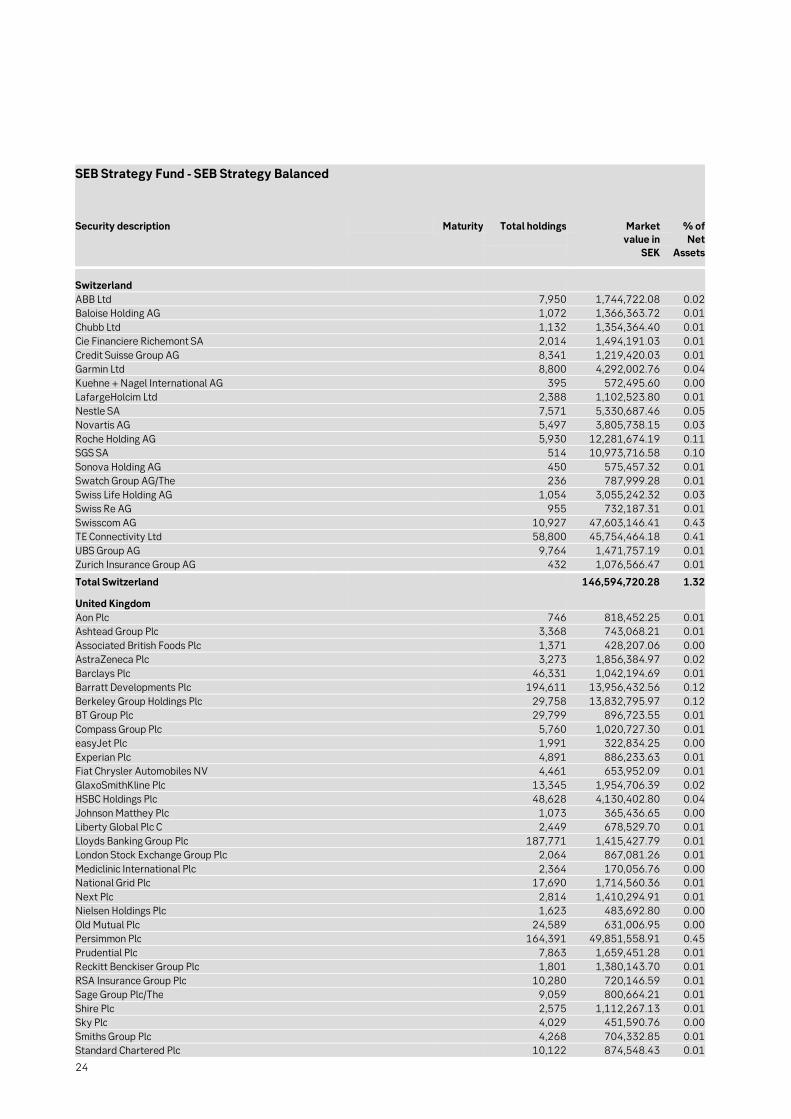
Switzerland ABB Ltd 7,950 1,744,722.08 0.02 Baloise Holding AG 1,072 1,366,363.72 0.01 Chubb Ltd 1,132 1,354,364.40 0.01 Cie Financiere Richemont SA 2,014 1,494,191.03 0.01 Credit Suisse Group AG 8,341 1,219,420.03 0.01 Garmin Ltd 8,800 4,292,002.76 0.04 Kuehne + Nagel International AG 395 572,495.60 0.00 LafargeHolcim Ltd 2,388 1,102,523.80 0.01 Nestle SA 7,571 5,330,687.46 0.05 Novartis AG 5,497 3,805,738.15 0.03 Roche Holding AG 5,930 12,281,674.19 0.11 SGS SA 514 10,973,716.58 0.10 Sonova Holding AG 450 575,457.32 0.01 Swatch Group AG/The 236 787,999.28 0.01 Swiss Life Holding AG 1,054 3,055,242.32 0.03 Swiss Re AG 955 732,187.31 0.01 Swisscom AG 10,927 47,603,146.41 0.43 TE Connectivity Ltd 58,800 45,754,464.18 0.41 UBS Group AG 9,764 1,471,757.19 0.01 Zurich Insurance Group AG 432 1,076,566.47 0.01
Total Switzerland 146,594,720.28 1.32
United Kingdom Aon Plc 746 818,452.25 0.01 Ashtead Group Plc 3,368 743,068.21 0.01 Associated British Foods Plc 1,371 428,207.06 0.00 AstraZeneca Plc 3,273 1,856,384.97 0.02 Barclays Plc 46,331 1,042,194.69 0.01 Barratt Developments Plc 194,611 13,956,432.56 0.12 Berkeley Group Holdings Plc 29,758 13,832,795.97 0.12 BT Group Plc 29,799 896,723.55 0.01 Compass Group Plc 5,760 1,020,727.30 0.01 easyJet Plc 1,991 322,834.25 0.00 Experian Plc 4,891 886,233.63 0.01 Fiat Chrysler Automobiles NV 4,461 653,952.09 0.01 GlaxoSmithKline Plc 13,345 1,954,706.39 0.02 HSBC Holdings Plc 48,628 4,130,402.80 0.04 Johnson Matthey Plc 1,073 365,436.65 0.00 Liberty Global Plc C 2,449 678,529.70 0.01 Lloyds Banking Group Plc 187,771 1,415,427.79 0.01 London Stock Exchange Group Plc 2,064 867,081.26 0.01 Mediclinic International Plc 2,364 170,056.76 0.00 National Grid Plc 17,690 1,714,560.36 0.01 Next Plc 2,814 1,410,294.91 0.01 Nielsen Holdings Plc 1,623 483,692.80 0.00 Old Mutual Plc 24,589 631,006.95 0.00 Persimmon Plc 164,391 49,851,558.91 0.45 Prudential Plc 7,863 1,659,451.28 0.01 Reckitt Benckiser Group Plc 1,801 1,380,143.70 0.01 RSA Insurance Group Plc 10,280 720,146.59 0.01 Sage Group Plc/The 9,059 800,664.21 0.01 Shire Plc 2,575 1,112,267.13 0.01 Sky Plc 4,029 451,590.76 0.00 Smiths Group Plc 4,268 704,332.85 0.01 Standard Chartered Plc 10,122 874,548.43 0.01

Schedule of Investments
As at 31 October 2016
25
SEB Strategy Fund - SEB Strategy Balanced
Security description Maturity Total holdings Market % of
value in Net
SEK Assets
Standard Life Aberdeen Plc 16,067 776,936.95 0.01 Taylor Wimpey Plc 1,870,186 42,752,523.73 0.38 Tesco Plc 30,810 714,043.16 0.01 Unilever Plc 4,079 1,863,792.55 0.02 Vodafone Group Plc 75,857 1,974,380.20 0.02 Worldpay Group Plc 7,661 361,461.73 0.00 WPP Plc 4,217 626,324.85 0.00
Total United Kingdom 156,903,369.93 1.40
United States of America 3M Co 1,504 2,898,335.55 0.03 Abbott Laboratories 5,492 2,566,185.94 0.02 AbbVie Inc 3,954 3,130,817.61 0.03 Activision Blizzard Inc 2,214 1,147,805.34 0.01 Adobe Systems Inc 1,285 1,843,682.33 0.02 Advanced Micro Devices Inc 3,200 269,335.01 0.00 Aetna Inc 1,002 1,479,891.58 0.01 Aflac Inc 62,364 44,820,764.45 0.40 Agilent Technologies Inc 1,880 1,030,831.94 0.01 AGNC Investment Corp 4,867 804,539.53 0.01 Air Products & Chemicals Inc 1,004 1,348,773.67 0.01 Albemarle Corp 646 676,423.72 0.01 Alexion Pharmaceuticals Inc 707 692,251.65 0.01 Alleghany Corp 100 488,046.90 0.00 Alliance Data Systems Corp 257 533,367.49 0.00 Allstate Corp/The 1,085 930,181.33 0.01 Alphabet Inc A 1,460 12,592,034.06 0.11 Amazon.com Inc 986 9,440,950.50 0.08 American Express Co 2,328 1,892,891.31 0.02 American Financial Group Inc/OH 400 355,467.20 0.00 American International Group Inc 2,451 1,195,620.99 0.01 American Tower Corp 1,294 1,511,529.60 0.01 AmerisourceBergen Corp 584 439,035.72 0.00 AMETEK Inc 2,253 1,336,808.42 0.01 Amgen Inc 1,793 2,552,875.24 0.02 Annaly Capital Management Inc 483,275 47,046,346.64 0.42 Anthem Inc 771 1,420,384.48 0.01 Apple Inc 12,500 17,319,569.29 0.16 Applied Materials Inc 3,616 1,513,453.17 0.01 Aramark 1,200 419,918.96 0.00 Arista Networks Inc 237 457,126.59 0.00 Arrow Electronics Inc 900 592,519.01 0.01 Arthur J Gallagher & Co 1,074 556,442.73 0.01 AT&T Inc 15,088 4,802,945.42 0.04 Atmos Energy Corp 1,224 860,743.48 0.01 Autodesk Inc 744 638,569.60 0.01 Autoliv Inc 392 407,861.76 0.00 Automatic Data Processing Inc 1,142 1,095,737.13 0.01 AutoZone Inc 127 739,688.71 0.01 Avery Dennison Corp 50,698 47,677,048.17 0.43 Avnet Inc 1,700 551,458.85 0.00 Bank of America Corp 24,669 5,962,352.09 0.05 Bank of New York Mellon Corp/The 3,149 1,388,636.99 0.01 Baxter International Inc 27,474 14,540,286.43 0.13 BB&T Corp 2,377 967,631.55 0.01 Becton Dickinson and Co 700 1,226,826.88 0.01

26
SEB Strategy Fund - SEB Strategy Balanced
Security description Maturity Total holdings Market % of
value in Net
SEK Assets
Best Buy Co Inc 30,500 17,098,180.10 0.15 Biogen Inc 553 1,442,380.12 0.01 BioMarin Pharmaceutical Inc 659 481,120.54 0.00 BlackRock Inc 355 1,493,124.75 0.01 Boston Scientific Corp 4,224 857,334.22 0.01 Bristol-Myers Squibb Co 29,329 14,715,185.20 0.13 Broadridge Financial Solutions Inc 990 734,204.82 0.01 CA Inc 73,500 20,027,206.54 0.18 Capital One Financial Corp 1,500 1,222,962.39 0.01 Cardinal Health Inc 1,221 612,510.11 0.01 CBRE Group Inc 1,797 637,214.99 0.01 CBS Corp 1,500 724,591.09 0.01 CDW Corp/DE 1,100 625,842.02 0.01 Celgene Corp 1,936 1,654,204.29 0.01 Centene Corp 667 550,909.96 0.00 CenterPoint Energy Inc 4,968 1,153,552.95 0.01 CenturyLink Inc 3,500 477,984.50 0.00 CF Industries Holdings Inc 1,330 463,232.31 0.00 Charles Schwab Corp/The 3,549 1,492,675.09 0.01 Charter Communications Inc 525 1,444,097.77 0.01 Chipotle Mexican Grill Inc 116 274,505.24 0.00 Cigna Corp 808 1,343,536.97 0.01 Cisco Systems Inc 113,425 35,567,822.82 0.32 Citigroup Inc 6,726 4,097,678.56 0.04 Clorox Co/The 479 583,328.25 0.01 CME Group Inc 1,036 1,238,828.07 0.01 CMS Energy Corp 3,800 1,471,615.85 0.01 Coca-Cola Co/The 9,714 3,648,977.86 0.03 Cognizant Technology Solutions Corp 1,941 1,128,641.26 0.01 Colgate-Palmolive Co 2,077 1,283,055.55 0.01 Comcast Corp 11,706 3,838,493.06 0.03 Conagra Brands Inc 4,149 1,279,642.85 0.01 Corning Inc 3,194 836,563.42 0.01 Costco Wholesale Corp 1,173 1,787,478.29 0.02 Crown Castle International Corp 1,307 1,187,920.59 0.01 CSX Corp 2,731 1,230,022.53 0.01 Cummins Inc 33,547 48,516,835.32 0.44 CVS Health Corp 2,684 1,593,199.78 0.01 Danaher Corp 1,776 1,349,690.67 0.01 Deere & Co 1,012 1,296,797.98 0.01 Delta Air Lines Inc 1,100 504,348.15 0.00 DENTSPLY SIRONA Inc 920 495,862.66 0.00 Discovery Communications Inc C 2,100 363,990.35 0.00 Dollar General Corp 1,291 983,117.91 0.01 DowDuPont Inc 6,335 3,694,012.06 0.03 DR Horton Inc 2,434 1,017,738.38 0.01 Dr Pepper Snapple Group Inc 804 638,919.37 0.01 Duke Energy Corp 2,541 1,749,854.82 0.02 E*TRADE Financial Corp 1,643 666,816.29 0.01 Eaton Vance Corp 1,800 831,044.58 0.01 eBay Inc 3,286 1,015,357.95 0.01 Ecolab Inc 1,168 1,283,158.63 0.01 Edison International 1,100 569,553.16 0.01 Edwards Lifesciences Corp 800 738,247.79 0.01 Eli Lilly & Co 2,550 1,763,359.97 0.02 Emerson Electric Co 63,898 36,459,226.41 0.33

Schedule of Investments
As at 31 October 2016
27
SEB Strategy Fund - SEB Strategy Balanced
Security description Maturity Total holdings Market % of
value in Net
SEK Assets
Equifax Inc 401 387,152.05 0.00 Equinix Inc 278 1,031,581.59 0.01 Equity Residential 1,586 828,074.33 0.01 Expeditors International of Washington Inc 800 423,717.95 0.00 Express Scripts Holding Co 1,775 1,084,725.15 0.01 F5 Networks Inc 444 477,015.76 0.00 Facebook Inc 5,730 8,278,480.25 0.07 FedEx Corp 780 1,593,618.98 0.01 Fidelity National Information Services Inc 1,200 924,430.86 0.01 FleetCor Technologies Inc 354 557,732.26 0.01 FMC Corp 902 699,073.37 0.01 Foot Locker Inc 52,900 20,304,532.52 0.18 Ford Motor Co 14,000 1,431,661.00 0.01 Franklin Resources Inc 12,879 4,568,993.63 0.04 Gap Inc/The 107,153 29,881,245.68 0.27 General Motors Co 4,269 1,432,695.16 0.01 Gilead Sciences Inc 72,897 42,757,760.76 0.38 Global Payments Inc 801 657,390.30 0.01 Goldman Sachs Group Inc/The 1,130 2,356,999.03 0.02 Hershey Co/The 615 571,556.23 0.01 Hilton Worldwide Holdings Inc 829 542,042.77 0.00 Home Depot Inc/The 3,087 4,790,317.64 0.04 HP Inc 251,492 43,261,337.98 0.39 Humana Inc 478 970,849.39 0.01 IDEX Corp 1,143 1,235,011.97 0.01 IDEXX Laboratories Inc 440 563,356.88 0.01 Illinois Tool Works Inc 1,294 1,767,706.70 0.02 Illumina Inc 400 715,552.13 0.01 Incyte Corp 500 387,717.64 0.00 Ingredion Inc 400 457,843.32 0.00 Intel Corp 169,998 64,247,958.47 0.58 Intercontinental Exchange Inc 1,752 1,012,144.21 0.01 International Business Machines Corp 2,161 2,714,478.87 0.02 International Flavors & Fragrances Inc 700 874,642.85 0.01 International Paper Co 1,400 664,134.81 0.01 Intuit Inc 836 1,079,960.69 0.01 IQVIA Holdings Inc 646 517,803.44 0.00 Iron Mountain Inc 1,800 556,043.84 0.01 Jack Henry & Associates Inc 500 478,803.24 0.00 Johnson & Johnson 36,805 42,103,201.36 0.38 JPMorgan Chase & Co 8,434 7,384,540.84 0.07 Kellogg Co 1,115 620,591.39 0.01 KeyCorp 4,781 789,540.41 0.01 Kimberly-Clark Corp 1,043 1,030,379.83 0.01 KLA-Tencor Corp 36,699 31,570,588.88 0.28 Kohl's Corp 84,401 37,474,592.30 0.34 Kraft Heinz Co/The 1,500 954,986.50 0.01 Kroger Co/The 5,100 1,146,204.86 0.01 L Brands Inc 927 457,056.83 0.00 Laboratory Corp of America Holdings 533 696,089.12 0.01 Lam Research Corp 700 1,054,947.32 0.01 Liberty Broadband Corp 407 283,778.69 0.00 Liberty Interactive Corp QVC Group 1,927 385,280.56 0.00 Liberty Media Corp-Liberty SiriusXM A 1,274 413,686.99 0.00 Lincoln National Corp 1,053 662,727.47 0.01 LKQ Corp 2,000 665,968.81 0.01

28
SEB Strategy Fund - SEB Strategy Balanced
Security description Maturity Total holdings Market % of
value in Net
SEK Assets
Lowe's Cos Inc 2,528 1,923,665.06 0.02 ManpowerGroup Inc 42,547 43,930,706.63 0.39 Markel Corp 50 466,329.63 0.00 Marriott International Inc/MD 1,122 1,246,862.11 0.01 Marsh & McLennan Cos Inc 1,300 866,291.64 0.01 Martin Marietta Materials Inc 352 637,034.94 0.01 Mastercard Inc 2,405 2,980,409.37 0.03 McCormick & Co Inc/MD 622 518,987.51 0.00 McDonald's Corp 2,053 2,893,143.71 0.03 MercadoLibre Inc 116 298,847.24 0.00 Merck & Co Inc 6,604 3,042,521.81 0.03 MetLife Inc 2,431 1,006,333.07 0.01 Micron Technology Inc 3,229 1,087,103.44 0.01 Microsoft Corp 17,702 12,397,705.12 0.11 Mondelez International Inc 4,013 1,406,250.37 0.01 Monster Beverage Corp 1,276 661,204.03 0.01 Moody's Corp 773 934,211.04 0.01 Morgan Stanley 4,089 1,756,620.29 0.02 Netflix Inc 1,152 1,810,560.08 0.02 NextEra Energy Inc 1,529 1,955,286.63 0.02 NIKE Inc 3,371 1,726,377.58 0.02 Norfolk Southern Corp 1,140 1,352,455.41 0.01 NVIDIA Corp 1,658 2,626,728.68 0.02 OGE Energy Corp 2,800 754,458.98 0.01 Omnicom Group Inc 1,000 596,293.44 0.01 Oracle Corp 7,672 2,969,858.67 0.03 O'Reilly Automotive Inc 328 645,967.80 0.01 Packaging Corp of America 583 575,420.71 0.01 Palo Alto Networks Inc 518 614,706.40 0.01 Paychex Inc 1,218 678,916.80 0.01 PepsiCo Inc 46,576 45,730,244.99 0.41 Pfizer Inc 13,963 4,140,729.92 0.04 PG&E Corp 1,509 553,869.82 0.00 PNC Financial Services Group Inc/The 1,193 1,409,374.46 0.01 PPL Corp 3,517 891,215.52 0.01 Praxair Inc 1,311 1,660,300.03 0.01 Principal Financial Group Inc 50,071 28,926,411.31 0.26 Procter & Gamble Co/The 18,230 13,713,786.22 0.12 Progressive Corp/The 1,751 807,418.16 0.01 Prologis Inc 2,300 1,214,799.48 0.01 Prudential Financial Inc 8,310 7,822,994.92 0.07 Public Storage 500 855,590.61 0.01 PVH Corp 687 771,777.69 0.01 QUALCOMM Inc 3,805 1,994,435.75 0.02 Raymond James Financial Inc 930 679,961.19 0.01 Regeneron Pharmaceuticals Inc 270 831,103.53 0.01 Regions Financial Corp 5,360 758,330.02 0.01 Republic Services Inc 1,252 693,050.67 0.01 ResMed Inc 774 536,689.15 0.00 Roper Technologies Inc 530 1,123,894.00 0.01 S&P Global Inc 845 1,171,979.01 0.01 salesforce.com Inc 2,440 2,042,292.33 0.02 SCANA Corp 898 292,476.40 0.00 SEI Investments Co 1,300 764,857.07 0.01 Sherwin-Williams Co/The 375 1,258,946.32 0.01 Simon Property Group Inc 973 1,368,150.96 0.01

Schedule of Investments
As at 31 October 2016
29
SEB Strategy Fund - SEB Strategy Balanced
Security description Maturity Total holdings Market % of
value in Net
SEK Assets
Sirius XM Holdings Inc 7,700 337,913.26 0.00 Southwest Airlines Co 644 345,100.22 0.00 Spectrum Brands Holdings Inc 300 276,081.49 0.00 Starbucks Corp 3,547 1,667,822.10 0.01 State Street Corp 1,489 1,189,977.45 0.01 Stryker Corp 1,105 1,400,861.37 0.01 SVB Financial Group 185 354,087.20 0.00 Sysco Corp 1,603 797,051.76 0.01 T Rowe Price Group Inc 39,013 33,516,506.18 0.30 Tapestry Inc 1,476 534,506.53 0.00 Target Corp 96,680 51,649,589.93 0.46 TD Ameritrade Holding Corp 1,192 499,001.40 0.00 Tesla Inc 390 994,175.82 0.01 Texas Instruments Inc 64,832 55,437,801.94 0.50 Thermo Fisher Scientific Inc 1,070 1,663,461.37 0.01 Time Warner Inc 2,265 1,696,276.34 0.02 TJX Cos Inc/The 2,548 1,595,083.55 0.01 Torchmark Corp 800 594,148.32 0.01 Trimble Inc 2,105 700,415.13 0.01 Twenty-First Century Fox Inc B 4,292 1,198,997.99 0.01 Twitter Inc 2,003 393,752.05 0.00 Ulta Beauty Inc 289 529,219.56 0.00 Under Armour Inc 2,500 272,642.75 0.00 Union Pacific Corp 2,234 2,452,797.34 0.02 United Parcel Service Inc 1,813 1,768,648.67 0.02 United Rentals Inc 619 871,247.43 0.01 United Therapeutics Corp 16,100 19,502,512.53 0.17 UnitedHealth Group Inc 2,398 4,328,413.09 0.04 Universal Health Services Inc 464 430,615.07 0.00 Unum Group 4,100 1,842,581.93 0.02 US Bancorp 3,775 1,656,034.52 0.01 Verisk Analytics Inc 600 471,598.27 0.00 Verizon Communications Inc 9,919 4,298,525.47 0.04 VF Corp 1,317 797,934.45 0.01 Visa Inc 4,630 4,322,268.56 0.04 Vulcan Materials Co 666 699,983.00 0.01 Walgreens Boots Alliance Inc 7,664 4,556,815.67 0.04 Walt Disney Co/The 3,802 3,346,653.08 0.03 Waste Management Inc 1,482 1,047,149.57 0.01 Waters Corp 405 640,603.62 0.01 Wells Fargo & Co 11,319 5,622,529.92 0.05 Welltower Inc 1,700 887,595.43 0.01 Westar Energy Inc 1,401 605,650.08 0.01 Western Digital Corp 1,000 651,149.49 0.01 Western Union Co/The 296,270 46,112,589.84 0.41 WestRock Co 1,019 527,363.05 0.00 Weyerhaeuser Co 2,700 779,463.52 0.01 Workday Inc 664 553,107.48 0.00 Xcel Energy Inc 2,874 1,132,066.24 0.01 Xilinx Inc 1,369 755,686.94 0.01 Yum! Brands Inc 1,100 734,997.37 0.01 Zimmer Biomet Holdings Inc 800 790,385.60 0.01
Total United States of America 1,341,389,436.69 12.03
Total Shares 2,552,941,734.43 22.89

30
SEB Strategy Fund - SEB Strategy Balanced
Security description Maturity Total holdings Market % of
value in Net
SEK Assets
Investment Funds
Alternative Investment Fund
Ireland IPM Systematic Macro UCITS Fund I 23,738 254,680,570.12 2.28
Total Ireland 254,680,570.12 2.28
Total Alternative Investment Fund 254,680,570.12 2.28
Asset Allocation Fund
Luxembourg SEB Fund 1 - SEB Asset Selection C 3,935,522 693,221,735.59 6.22
Total Luxembourg 693,221,735.59 6.22
Total Asset Allocation Fund 693,221,735.59 6.22
Commodity Funds
Luxembourg Threadneedle Lux - Enhanced Commodities Portfolio IKH 1,519,973 163,442,723.57 1.47 Vontobel Fund - Commodity HI 303,020 166,176,168.00 1.49
Total Luxembourg 329,618,891.57 2.96
Total Commodity Funds 329,618,891.57 2.96
Debt Funds
Ireland iShares JP Morgan EM Local Government Bond UCITS ETF 203,503 111,300,470.03 1.00 iShares USD Corp Bond UCITS ETF 460,282 439,826,893.05 3.95 Neuberger Berman Emerging Markets Debt - Local Currency Fund A Acc 2,956,532 336,157,688.40 3.01
Total Ireland 887,285,051.48 7.96
Luxembourg SEB Fund 5 - SEB Danish Mortgage Bond Fund C 206,176 295,041,903.00 2.65 SEB High Yield - SEB High Yield Fund C (H SEK) 542,912 102,764,663.59 0.92 SEB SICAV 2 - SEB Alternative Fixed Income C 2,841,939 310,646,384.02 2.79
Total Luxembourg 708,452,950.61 6.36
Total Debt Funds 1,595,738,002.09 14.32
Equity Funds
Ireland Artisan Partners Global Funds Plc - Global Value Fund I 42,421 7,290,260.73 0.07
Total Ireland 7,290,260.73 0.07
Luxembourg BlackRock Strategic Funds - Americas Diversified Equity Absolute Return A2 1,669,310 208,697,136.20 1.87 BlackRock Strategic Funds - European Diversified Equity Absolute Return A2 1,769,614 215,946,054.99 1.94 Pictet TR - Agora I 119,784 141,547,829.20 1.27
Total Luxembourg 566,191,020.39 5.08
Sweden SEB Emerging Marketsfond A 13,701,464 361,603,552.29 3.24 SEB Hallbarhetsfond Global A 13,781,459 235,317,034.28 2.11
Total Sweden 596,920,586.57 5.35
Total Equity Funds 1,170,401,867.69 10.50

Schedule of Investments
As at 31 October 2016
31
SEB Strategy Fund - SEB Strategy Balanced
Security description Maturity Total holdings Market % of
value in Net
SEK Assets
Exchange traded fund
Ireland iShares USD High Yield Corp Bond UCITS ETF 120,000 101,904,526.22 0.91
Total Ireland 101,904,526.22 0.91
Total Exchange traded fund 101,904,526.22 0.91
Total Investment Funds 4,145,565,593.28 37.19
Total Transferable securities admitted to an official stock exchange listing
and/or dealt within another regulated market 10,769,456,686.67 96.59
Total Portfolio 10,769,456,686.67 96.59
Financial futures cleared with Skandinaviska Enskilda Banken AB (publ)
Purchased financial futures contracts Commitment in SEK CBOT Five Year Treasury Note Future 208,288,659.45 29/03/18 219 (154,091.62) (0.00) Eurex Dow Jones Euro Stoxx 50 Future 172,743,866.96 16/03/18 503 (4,203,615.43) (0.04) ICE MSCI Emerging Markets Mini Index Future 140,058,054.40 16/03/18 294 6,011,774.68 0.06
Sold financial futures contracts Commitment in SEK CME Standard And Poors 500 E-Mini Future (301,257,957.51) 16/03/18 (275) (1,300,272.57) (0.01) Eurex Euro Bund Future (79,480,825.92) 08/03/18 (50) 673,483.00 0.01 Swedish Government 5-year Bond Future (203,611,440.00) 15/03/18 (158) 183,912.00 0.00
Total financial futures contracts (total net unrealised) 1,211,190.06 0.02
An amount of SEK 34,372,559.07 is held as cash collateral for these positions. Forward foreign exchange contracts open with Skandinaviska Enskilda Banken S.A. *
Buy 21,997,115 EUR Sell 218,637,971 SEK 19/01/18 (2,376,218.12) (0.02)Buy 75,494,085 NOK Sell 76,101,473 SEK 19/01/18 (575,829.19) (0.01)Buy 438,210,518 SEK Sell 44,159,312 EUR 19/01/18 4,064,030.92 0.04Buy 865,276,812 SEK Sell 102,700,000 USD 19/01/18 25,353,955.35 0.23Buy 1 325,280,725 SEK Sell 1 38,500,000 USD 19/01/18 10,411,883.90 0.09Buy 10,955,949 USD Sell 9,225,854 EUR 12/03/18 (1,372,200.12) (0.01)Buy 1,781,796 USD Sell 1,327,611 GBP 12/03/18 (148,201.24) (0.00)Buy 125,092 USD Sell 1,052,245 SEK 12/03/18 (32,350.23) (0.00)
Total forward foreign exchange contracts (total net unrealised) 35,325,071.27 0.32

32
SEB Strategy Fund - SEB Strategy Balanced
Market
value in
SEK
% of
Net
Assets
Cash at bank and at broker Cash at bank and at broker 349,225,701.05 3.13
Total Cash at bank and at broker 349,225,701.05 3.13
Other assets Dividends receivable 3,289,989.06 0.03Interest receivable on bonds 40,266,429.25 0.36Receivable on subscriptions 23,223,509.90 0.21Retrocession fees receivable 7,807,392.08 0.07Other assets 16,167.29 0.00
Total other assets 74,603,487.58 0.67
Liabilities Management fees (11,151,558.08) (0.10)Payable on redemptions (68,633,910.60) (0.62)Bank interest payable on cash accounts (860,649.68) (0.01)Other liabilities (84,110.96) (0.00)
Total liabilities (80,730,229.32) (0.73)
Total Net Assets as at 31 December 2017 11,149,091,907.31 100.00
* Forwards foreign exchange contracts open with Skandinaviska Enskilda Banken S.A., except for the following: 1Nordea Bank AB (publ) A list of changes in the assets held during the financial period under review is available free of charge from SEB Investment Management AB.
The accompanying notes are an integral part of these financial statements.

Schedule of Investments As at 31 December 2017
33
SEB Strategy Fund - SEB Strategy Defensive
Security description Maturity Total holdings Market % of
value in Net
SEK Assets
Bonds indicated in 1,000 currency units
Transferable securities admitted to an official stock exchange listing and/or dealt within another regulated market
Bonds
Australia 9.75 % FMG Resources August 2006 Pty Ltd 01/03/22 117 1,063,613.26 0.01 2.00 % National Australia Bank Ltd FRN 12/11/24 400 4,037,358.53 0.02
Total Australia 5,100,971.79 0.03
Austria 7.50 % Sappi Papier Holding GmbH 15/06/32 156 1,311,782.03 0.01 6.88 % UNIQA Insurance Group AG FRN 31/07/43 100 1,235,118.66 0.01
Total Austria 2,546,900.69 0.02
Belgium 5.63 % KBC Group NV FRN Perpetual 212 2,175,567.57 0.01
Total Belgium 2,175,567.57 0.01
Bermuda 4.13 % Aircastle Ltd 01/05/24 193 1,604,895.75 0.01 5.13 % Aircastle Ltd 15/03/21 117 1,007,028.10 0.00 5.50 % Aircastle Ltd 15/02/22 117 1,025,669.50 0.01 5.00 % IHS Markit Ltd 01/11/22 209 1,852,781.47 0.01 6.25 % Viking Cruises Ltd 15/05/25 39 330,254.13 0.00
Total Bermuda 5,820,628.95 0.03
Canada 4.25 % 1011778 BC ULC / New Red Finance Inc 15/05/24 193 1,578,585.72 0.01 7.75 % Air Canada 15/04/21 420 3,921,570.50 0.02 6.00 % Bombardier Inc 15/10/22 78 625,773.57 0.00 7.75 % Bombardier Inc 15/03/20 97 853,970.80 0.01 8.75 % Bombardier Inc 01/12/21 251 2,256,018.79 0.01 6.88 % Clearwater Seafoods Inc 01/05/25 232 1,912,865.46 0.01 5.50 % Cott Corp 01/07/24 262 2,787,151.68 0.02 7.00 % First Quantum Minerals Ltd 15/02/21 116 983,699.95 0.01 7.25 % First Quantum Minerals Ltd 01/04/23 200 1,749,973.46 0.01 5.95 % Kinross Gold Corp 15/03/24 200 1,797,542.66 0.01 5.88 % Lions Gate Entertainment Corp 01/11/24 159 1,378,822.67 0.01 6.88 % Mattamy Group Corp 15/12/23 78 677,182.69 0.00 6.50 % MDC Partners Inc 01/05/24 156 1,282,635.29 0.01 6.25 % New Gold Inc 15/11/22 157 1,329,420.30 0.01 5.63 % Open Text Corp 15/01/23 220 1,876,715.49 0.01 5.75 % Quebecor Media Inc 15/01/23 215 1,868,001.57 0.01 8.88 % Telesat Canada / Telesat LLC 15/11/24 306 2,796,965.34 0.02 5.50 % Valeant Pharmaceuticals International Inc 01/11/25 9 75,215.50 0.00 6.50 % Valeant Pharmaceuticals International Inc 15/03/22 117 1,007,899.82 0.01 7.00 % Valeant Pharmaceuticals International Inc 15/03/24 116 1,021,528.36 0.01 7.50 % Valeant Pharmaceuticals International Inc 15/07/21 198 1,655,227.40 0.01 5.13 % Videotron Ltd 15/04/27 58 494,775.20 0.00
Total Canada 33,931,542.22 0.21
Cayman Islands 5.25 % Park Aerospace Holdings Ltd 15/08/22 232 1,889,083.81 0.01
Total Cayman Islands 1,889,083.81 0.01

34
SEB Strategy Fund - SEB Strategy Defensive
Security description Maturity Total holdings Market % of
value in Net
SEK Assets
Denmark 0.75 % Danske Bank A/S 02/06/23 400 3,985,131.64 0.02 5.75 % Danske Bank A/S FRN Perpetual 231 2,458,691.47 0.02 3.50 % TDC A/S FRN Perpetual 132 1,356,285.83 0.01
Total Denmark 7,800,108.94 0.05
Finland 0.88 % Elisa OYJ 17/03/24 400 3,902,858.57 0.02 1.13 % Metso OYJ 13/06/24 400 3,955,007.19 0.02 1.00 % Sampo Oyj 18/09/23 400 4,001,885.15 0.03 2.50 % Stora Enso OYJ 07/06/27 200 2,016,614.57 0.01 2.63 % Teollisuuden Voima Oyj 13/01/23 100 1,025,454.07 0.01
Total Finland 14,901,819.55 0.09
France 4.13 % Accor SA FRN Perpetual 100 1,047,290.65 0.01 4.00 % Banijay Group SAS 01/07/22 126 1,296,197.38 0.01 3.58 % Casino Guichard Perrachon SA 07/02/25 100 1,034,804.17 0.01 4.87 % Casino Guichard Perrachon SA FRN Perpetual 200 2,002,024.08 0.01 5.38 % Constantin Investissement 3 SASU 15/04/25 231 2,301,731.49 0.01 2.63 % Credit Agricole SA 17/03/27 400 4,254,013.59 0.02 6.50 % Credit Agricole SA FRN Perpetual 100 1,113,459.12 0.01 6.63 % Credit Agricole SA FRN Perpetual 200 1,699,997.14 0.01 2.25 % Danone SA 15/11/21 500 5,287,333.15 0.03 4.13 % Electricite de France SA FRN Perpetual 100 1,050,662.98 0.01 5.63 % Electricite de France SA FRN Perpetual 100 846,494.33 0.00 6.38 % Groupama SA FRN Perpetual 100 1,180,807.42 0.01 7.13 % Lafarge SA 15/07/36 168 1,811,746.93 0.01 6.00 % Loxam SAS 15/04/25 143 1,533,519.71 0.01 7.00 % Loxam SAS 23/07/22 100 1,037,675.08 0.01 3.00 % Orange SA 15/06/22 400 4,393,468.81 0.03 5.00 % Orange SA FRN Perpetual 173 2,017,657.34 0.01 2.50 % Sanofi 14/11/23 500 5,494,687.26 0.03 6.25 % SFR Group SA 15/05/24 200 1,637,493.99 0.01 7.38 % SFR Group SA 01/05/26 367 3,074,873.45 0.02 4.00 % Societe Generale SA 07/06/23 400 4,544,014.38 0.03 2.88 % SPCM SA 15/06/23 143 1,432,079.90 0.01 4.88 % SPCM SA 15/09/25 233 1,922,369.64 0.01
Total France 52,014,401.99 0.32
Germany 4.75 % Allianz SE FRN Perpetual 400 4,673,401.77 0.03 1.40 % Daimler AG 12/01/24 400 4,127,221.81 0.03 2.38 % Deutsche Bank AG 11/01/23 500 5,286,104.16 0.03 3.25 % IHO Verwaltungs GmbH 15/09/23 127 1,301,800.36 0.01 6.25 % Muenchener Rueckversicherungs-Gesellschaft AG in Muenchen FRN 26/05/42 400 4,848,684.33 0.03 3.88 % Senvion Holding GmbH 25/10/22 135 1,268,170.95 0.01 1.38 % thyssenkrupp AG 03/03/22 39 389,390.08 0.00 2.50 % thyssenkrupp AG 25/02/25 39 414,693.47 0.00 2.75 % thyssenkrupp AG 08/03/21 224 2,342,979.91 0.01 3.75 % Unitymedia GmbH 15/01/27 116 1,163,899.75 0.01 6.25 % Unitymedia Hessen GmbH & Co KG / Unitymedia NRW GmbH 15/01/29 192 2,121,474.99 0.01 8.50 % Wittur International Holding GmbH 15/02/23 239 2,447,944.94 0.02
Total Germany 30,385,766.52 0.19

35
SEB Strategy Fund - SEB Strategy Defensive
Security description Maturity Total holdings Market % of
value in Net
SEK Assets
Iceland 1.63 % Arion Banki HF 01/12/21 400 4,070,472.26 0.02
Total Iceland 4,070,472.26 0.02
Ireland 6.75 % Ardagh Packaging Finance Plc / Ardagh Holdings USA Inc 15/05/24 100 1,083,540.75 0.01 4.25 % Bank of Ireland FRN 11/06/24 231 2,393,440.99 0.01 8.25 % Cloverie Plc for Zurich Insurance Co Ltd FRN Perpetual 100 821,940.11 0.01 2.63 % GE Capital European Funding Unlimited Co 15/03/23 400 4,360,040.46 0.03 2.75 % Smurfit Kappa Acquisitions ULC 01/02/25 200 2,084,356.15 0.01
Total Ireland 10,743,318.46 0.07
Italy 7.75 % Assicurazioni Generali SpA FRN 12/12/42 600 7,610,928.15 0.05 2.13 % Buzzi Unicem SpA 28/04/23 169 1,749,982.16 0.01 6.00 % Cooperativa Muratori & Cementisti-CMC di
Ravenna SC 15/02/23 155 1,515,512.25 0.01 2.00 % Intesa Sanpaolo SpA 18/06/21 400 4,156,088.18 0.02 7.00 % Intesa Sanpaolo SpA FRN Perpetual 200 2,177,110.00 0.01 8.38 % Intesa Sanpaolo SpA FRN Perpetual 150 1,668,949.87 0.01 3.63 % Telecom Italia SpA/Milano 19/01/24 100 1,097,600.32 0.01 3.63 % Telecom Italia SpA/Milano 25/05/26 128 1,408,074.60 0.01 5.88 % Telecom Italia SpA/Milano 19/05/23 50 648,221.64 0.00 4.38 % UniCredit SpA FRN 03/01/27 173 1,844,793.52 0.01 5.75 % UnipolSai Assicurazioni SpA FRN Perpetual 155 1,628,344.74 0.01 2.63 % Wind Tre SpA 20/01/23 100 962,392.46 0.01 3.13 % Wind Tre SpA 20/01/25 112 1,071,382.66 0.01
Total Italy 27,539,380.55 0.17
Japan 5.38 % SoftBank Group Corp 30/07/22 200 1,704,762.25 0.01
Total Japan 1,704,762.25 0.01
Luxembourg 7.50 % Altice Financing SA 15/05/26 200 1,743,767.35 0.01 7.63 % Altice Finco SA 15/02/25 286 2,349,975.98 0.01 8.13 % Altice Finco SA 15/01/24 200 1,711,213.97 0.01 6.25 % Altice Luxembourg SA 15/02/25 116 1,119,169.47 0.01 7.63 % Altice Luxembourg SA 15/02/25 200 1,561,874.52 0.01 7.75 % Altice Luxembourg SA 15/05/22 232 1,871,209.58 0.01 6.63 % ARD Finance SA 15/09/23 250 2,623,474.28 0.02 8.00 % Auris Luxembourg II SA 15/01/23 208 2,133,087.61 0.01 7.50 % Cabot Financial Luxembourg SA 01/10/23 118 1,367,405.09 0.01 8.50 % eDreams ODIGEO SA 01/08/21 105 1,101,346.16 0.01 4.75 % Fiat Chrysler Finance Europe SA 15/07/22 269 2,989,545.22 0.02 8.50 % Garfunkelux Holdco 3 SA 01/11/22 156 1,805,596.15 0.01 7.38 % Greif Nevada Holdings Inc SCS 15/07/21 100 1,178,968.86 0.01 2.25 % Holcim Finance Luxembourg SA 26/05/28 400 4,179,488.02 0.02 5.50 % Intelsat Jackson Holdings SA 01/08/23 58 387,696.03 0.00 7.25 % Intelsat Jackson Holdings SA 15/10/20 270 2,069,844.81 0.01 7.50 % Intelsat Jackson Holdings SA 01/04/21 116 864,915.16 0.00 8.00 % Intelsat Jackson Holdings SA 15/02/24 231 1,993,228.02 0.01 9.50 % Intelsat Jackson Holdings SA 30/09/22 164 1,548,373.06 0.01 9.75 % Intelsat Jackson Holdings SA 15/07/25 79 620,459.08 0.01 6.50 % Lecta SA 01/08/23 100 1,016,044.97 0.01 7.75 % LSF9 Balta Issuer SARL 15/09/22 95 1,000,260.30 0.01

36
SEB Strategy Fund - SEB Strategy Defensive
Security description Maturity Total holdings Market % of
value in Net
SEK Assets
4.75 % Mallinckrodt International Finance SA 15/04/23 39 249,704.65 0.00 5.63 % Mallinckrodt International Finance SA / Mallinckrodt CB LLC 15/10/23 192 1,341,036.84 0.01 3.88 % Matterhorn Telecom SA 01/05/22 100 1,000,746.58 0.01 5.63 % SES SA FRN Perpetual 147 1,607,488.99 0.01 7.75 % SIG Combibloc Holdings SCA 15/02/23 143 1,469,042.51 0.01 9.75 % Swissport Financing Sarl 15/12/22 114 1,169,353.88 0.01 6.00 % Telecom Italia Capital SA 30/09/34 39 357,095.44 0.00 7.20 % Telecom Italia Capital SA 18/07/36 78 795,398.13 0.00 7.72 % Telecom Italia Capital SA 04/06/38 98 1,040,171.06 0.01 7.75 % Telecom Italia Finance SA 24/01/33 105 1,587,077.44 0.01 5.50 % Telenet Finance Luxembourg Notes Sarl 01/03/28 200 1,638,885.86 0.01
Total Luxembourg 49,492,945.07 0.31
Mexico 3.26 % America Movil SAB de CV 22/07/23 400 4,456,668.06 0.03 7.75 % Cemex SAB de CV 16/04/26 200 1,857,393.06 0.01
Total Mexico 6,314,061.12 0.04
Netherlands 2.88 % ABN AMRO Bank NV FRN 18/01/28 400 4,280,520.30 0.03 6.75 % Alcoa Nederland Holding BV 30/09/24 200 1,784,753.83 0.01 5.00 % ASR Nederland NV FRN Perpetual 100 1,147,231.59 0.01 1.25 % BMW Finance NV 05/09/22 400 4,099,771.23 0.02 4.50 % CNH Industrial NV 15/08/23 156 1,331,004.57 0.01 4.63 % Constellium NV 15/05/21 165 1,656,228.41 0.01 5.88 % Cooperatieve Rabobank UA 20/05/19 400 4,250,356.13 0.02 4.63 % Demeter Investments BV for Swiss Re Ltd FRN Perpetual 200 1,658,060.92 0.01 4.50 % ELM BV for Swiss Life Insurance & Pension Group FRN Perpetual 400 4,527,693.48 0.03 4.50 % Fiat Chrysler Automobiles NV 15/04/20 200 1,681,984.71 0.01 4.60 % Generali Finance BV FRN Perpetual 192 2,069,411.71 0.01 4.88 % ING Bank NV 18/01/21 400 4,501,462.06 0.03 1.25 % innogy Finance BV 19/10/27 400 3,937,191.45 0.02 8.50 % Nyrstar Netherlands Holdings BV 15/09/19 443 4,814,676.48 0.03 9.00 % SRLEV NV FRN 15/04/41 116 1,370,021.73 0.01 2.63 % Telefonica Europe BV FRN Perpetual 100 979,735.88 0.00 3.75 % Telefonica Europe BV FRN Perpetual 100 1,035,964.33 0.01 5.88 % Telefonica Europe BV FRN Perpetual 100 1,141,725.74 0.01 7.63 % Telefonica Europe BV FRN Perpetual 100 1,178,319.96 0.01 3.88 % UPC Holding BV 15/06/29 100 944,744.26 0.00 0.88 % Volkswagen International Finance NV 16/01/23 400 3,987,923.89 0.02 7.13 % Ziggo Bond Co BV 15/05/24 116 1,253,006.77 0.01 4.63 % Ziggo Bond Finance BV 15/01/25 100 1,014,324.39 0.01 6.00 % Ziggo Bond Finance BV 15/01/27 150 1,199,431.60 0.01
Total Netherlands 55,845,545.42 0.34
Portugal 5.38 % EDP - Energias de Portugal SA FRN 16/09/75 100 1,098,809.64 0.01
Total Portugal 1,098,809.64 0.01
Spain 3.50 % Banco Bilbao Vizcaya Argentaria SA 10/02/27 400 4,425,520.70 0.03 6.75 % Banco Bilbao Vizcaya Argentaria SA FRN Perpetual 200 2,127,065.78 0.01 7.00 % Banco Bilbao Vizcaya Argentaria SA FRN Perpetual 200 2,069,293.72 0.01 1.38 % Banco Santander SA 09/02/22 400 4,055,881.77 0.03 6.25 % Banco Santander SA FRN Perpetual 100 1,027,430.27 0.01 6.38 % Banco Santander SA FRN Perpetual 400 3,353,096.45 0.02

37
SEB Strategy Fund - SEB Strategy Defensive
Security description Maturity Total holdings Market % of
value in Net
SEK Assets
3.38 % Bankia SA FRN 15/03/27 100 1,032,415.03 0.01 3.20 % Grifols SA 01/05/25 135 1,350,530.05 0.01 1.00 % Iberdrola Finanzas SA 07/03/25 500 4,942,922.79 0.03 1.63 % Mapfre SA 19/05/26 400 4,024,734.41 0.02 5.50 % Obrascon Huarte Lain SA 15/03/23 318 3,204,572.52 0.02 7.63 % Obrascon Huarte Lain SA 15/03/20 155 1,547,499.74 0.01 1.93 % Telefonica Emisiones SAU 17/10/31 400 3,887,442.20 0.02
Total Spain 37,048,405.43 0.23
Sweden 3.50 % Com Hem Sweden AB 25/02/22 1,000 1,036,860.00 0.01 3.63 % Com Hem Sweden AB 23/06/21 2,000 2,062,300.00 0.01 2.75 % Intrum Justitia AB 15/07/22 147 1,453,479.45 0.01 3.13 % Intrum Justitia AB 15/07/24 139 1,372,601.91 0.01 2.25 % Kommuninvest I Sverige AB 12/03/19 70,100 72,418,908.00 0.45 2.50 % Kommuninvest I Sverige AB 01/12/20 154,700 166,195,757.00 1.02 1.75 % Lansforsakringar Hypotek AB 15/09/21 237,800 249,566,344.00 1.53 2.25 % Lansforsakringar Hypotek AB 21/09/22 55,000 58,901,150.00 0.36 2.50 % Lansforsakringar Hypotek AB 19/06/19 330,000 343,477,200.00 2.11 3.25 % Lansforsakringar Hypotek AB 16/09/20 161,700 175,528,584.00 1.08 1.00 % Nordea Bank AB FRN 07/09/26 400 3,967,198.32 0.02 5.50 % Nordea Bank AB FRN Perpetual 200 1,682,459.58 0.01 1.00 % Nordea Hypotek AB 08/04/22 154,000 156,715,020.00 0.96 1.25 % Nordea Hypotek AB 19/05/21 50,000 51,585,000.00 0.32 2.00 % Nordea Hypotek AB 20/06/18 450,000 455,332,500.00 2.80 2.25 % Nordea Hypotek AB 19/06/19 107,800 111,808,004.00 0.69 3.25 % Nordea Hypotek AB 17/06/20 215,500 232,636,560.00 1.43 5.00 % Ovako AB 05/10/22 100 1,005,072.60 0.01 1.50 % Skandinaviska Enskilda Banken AB 17/06/20 215,000 222,860,400.00 1.37 1.50 % Skandinaviska Enskilda Banken AB 15/12/21 216,000 224,642,160.00 1.38 1.88 % Skandinaviska Enskilda Banken AB 14/11/19 400 4,082,939.07 0.02 3.00 % Skandinaviska Enskilda Banken AB 19/06/19 54,000 56,601,720.00 0.35 5.75 % Skandinaviska Enskilda Banken AB FRN Perpetual 200 1,695,035.53 0.01 1.63 % SKF AB 02/12/22 400 4,098,001.50 0.03 1.50 % Stadshypotek AB 17/03/21 54,000 56,161,080.00 0.35 1.50 % Stadshypotek AB 15/12/21 145,000 150,801,450.00 0.93 2.50 % Stadshypotek AB 18/09/19 135,000 141,292,350.00 0.87 3.00 % Stadshypotek AB 21/03/18 313,000 315,447,660.00 1.94 3.00 % Stadshypotek AB 19/12/18 230,000 237,652,100.00 1.46 4.25 % Stadshypotek AB 17/06/20 70,000 77,284,900.00 0.47 4.50 % Stadshypotek AB 21/09/22 171,000 200,995,110.00 1.24 1.00 % Sveriges Sakerstallda Obligationer AB 17/03/21 65,000 66,554,150.00 0.41 1.25 % Sveriges Sakerstallda Obligationer AB 15/06/22 130,000 133,438,500.00 0.82 2.00 % Sveriges Sakerstallda Obligationer AB 17/06/20 269,000 282,116,440.00 1.73 4.00 % Sveriges Sakerstallda Obligationer AB 19/12/18 610,000 636,175,100.00 3.91 4.00 % Sveriges Sakerstallda Obligationer AB 18/09/19 55,000 58,977,600.00 0.36 5.50 % Swedbank AB FRN Perpetual 200 1,693,021.42 0.01 1.00 % Swedbank Hypotek AB 16/12/20 100,000 102,443,000.00 0.63 1.00 % Swedbank Hypotek AB 15/09/21 215,500 220,238,845.00 1.35 5.70 % Swedbank Hypotek AB 12/05/20 541,700 614,867,419.00 3.78 0.75 % Sweden Government Bond 12/05/28 258,600 257,829,372.00 1.58 1.00 % Sweden Government Bond 12/11/26 40,000 41,516,800.00 0.26 1.50 % Sweden Government Bond 13/11/23 248,000 267,068,720.00 1.64 2.50 % Sweden Government Bond 12/05/25 154,000 177,705,220.00 1.09 3.50 % Sweden Government Bond 01/06/22 217,800 252,375,750.00 1.55

38
SEB Strategy Fund - SEB Strategy Defensive
Security description Maturity Total holdings Market % of
value in Net
SEK Assets
3.50 % Sweden Government Bond 30/03/39 122,700 167,520,469.50 1.03 4.25 % Sweden Government Bond 12/03/19 32,000 33,933,440.00 0.21 5.00 % Sweden Government Bond 01/12/20 318,800 369,259,664.00 2.27 6.00 % Verisure Holding AB 01/11/22 185 1,933,684.33 0.01 4.20 % Volvo Treasury AB FRN 10/06/75 155 1,639,149.47 0.01
Total Sweden 7,467,646,249.68 45.90
Switzerland 6.50 % Credit Suisse AG 08/08/23 200 1,833,829.52 0.01 4.75 % UBS AG FRN 22/05/23 200 1,651,150.69 0.01 1.75 % UBS Group Funding Switzerland AG 16/11/22 400 4,167,689.78 0.03
Total Switzerland 7,652,669.99 0.05
United Kingdom 3.50 % Adient Global Holdings Ltd 15/08/24 100 1,050,672.81 0.00 5.75 % Aston Martin Capital Holdings Ltd 15/04/22 103 1,196,845.06 0.01 6.88 % Aviva Plc FRN 22/05/38 400 4,032,796.54 0.02 1.88 % Barclays Plc 08/12/23 400 4,135,598.56 0.03 6.50 % Barclays Plc FRN Perpetual 200 2,101,561.92 0.01 4.25 % CPUK Finance Ltd 28/08/22 100 1,128,659.02 0.01 1.25 % Credit Suisse Group Funding Guernsey Ltd 14/04/22 400 4,059,263.93 0.02 6.46 % HBOS Capital Funding LP FRN Perpetual 186 2,146,069.17 0.01 3.38 % HSBC Holdings Plc FRN 10/01/24 400 4,061,544.93 0.02 5.25 % HSBC Holdings Plc FRN Perpetual 200 2,172,842.97 0.01 6.75 % Iceland Bondco Plc 15/07/24 116 1,348,095.89 0.01 3.88 % Iron Mountain UK Plc 15/11/25 104 1,126,740.28 0.01 3.50 % Jaguar Land Rover Automotive Plc 15/03/20 200 1,651,887.57 0.01 1.00 % Lloyds Banking Group Plc 09/11/23 400 3,970,423.17 0.02 6.75 % Melton Renewable Energy UK Plc 01/02/20 96 1,084,799.20 0.01 7.13 % Mercury Bondco Plc 30/05/21 135 1,366,859.80 0.01 8.00 % Old Mutual Plc 03/06/21 100 1,289,421.35 0.01 6.63 % Pizzaexpress Financing 2 Plc 01/08/21 100 1,065,539.17 0.01 3.63 % Royal Bank of Scotland Group Plc FRN 25/03/24 192 1,949,541.56 0.01 6.25 % Sensata Technologies UK Financing Co Plc 15/02/26 200 1,781,134.97 0.01 0.88 % SSE Plc 06/09/25 400 3,888,897.31 0.02 8.25 % Synlab Unsecured Bondco Plc 01/07/23 155 1,653,748.81 0.01 6.00 % Tesco Plc 14/12/29 78 1,054,748.88 0.01 6.13 % Tesco Plc 24/02/22 50 639,333.47 0.00 6.75 % Thomas Cook Finance Plc 15/06/21 107 1,089,514.10 0.01 6.25 % Thomas Cook Group Plc 15/06/22 100 1,063,621.38 0.01 6.00 % Virgin Media Finance Plc 15/10/24 200 1,681,477.08 0.01 6.38 % Virgin Media Finance Plc 15/10/24 100 1,188,168.22 0.01 7.00 % Virgin Media Finance Plc 15/04/23 113 1,312,255.14 0.01 1.00 % Vodafone Group Plc 11/09/20 400 4,017,734.12 0.02 4.13 % Wagamama Finance Plc 01/07/22 100 1,090,658.63 0.01
Total United Kingdom 61,400,455.01 0.37
United States of America 8.00 % 24 Hour Fitness Worldwide Inc 01/06/22 79 625,762.93 0.00 4.13 % ADT Corp/The 15/06/23 78 640,813.13 0.00 7.00 % Advanced Micro Devices Inc 01/07/24 78 661,025.54 0.00 7.50 % Advanced Micro Devices Inc 15/08/22 58 523,448.04 0.00 6.50 % AerCap Global Aviation Trust FRN 15/06/45 200 1,784,246.21 0.01 6.63 % Albertsons Cos LLC / Safeway Inc / New Albertson's Inc /
Albertson's LLC 15/06/24 317 2,467,499.34 0.02 7.88 % Aleris International Inc 01/11/20 244 1,983,219.08 0.01

39
SEB Strategy Fund - SEB Strategy Defensive
Security description Maturity Total holdings Market % of
value in Net
SEK Assets
4.13 % Ally Financial Inc 30/03/20 233 1,944,327.05 0.01 4.63 % Ally Financial Inc 19/05/22 116 993,330.38 0.01 4.75 % Ally Financial Inc 10/09/18 193 1,600,265.81 0.01 8.00 % Ally Financial Inc 15/03/20 135 1,222,084.28 0.01 5.75 % AMC Entertainment Holdings Inc 15/06/25 41 332,403.26 0.00 5.88 % AMC Entertainment Holdings Inc 15/02/22 39 323,749.76 0.00 6.13 % AMC Entertainment Holdings Inc 15/05/27 39 317,692.42 0.00 5.00 % AMC Networks Inc 01/04/24 155 1,282,763.67 0.01 6.25 % American Axle & Manufacturing Inc 01/04/25 78 673,861.86 0.01 6.63 % American Axle & Manufacturing Inc 15/10/22 138 1,172,286.21 0.01 7.88 % American Greetings Corp 15/02/25 193 1,707,623.36 0.01 6.38 % Amkor Technology Inc 01/10/22 108 912,295.06 0.01 6.38 % APX Group Inc 01/12/19 10 82,976.73 0.00 7.88 % APX Group Inc 01/12/22 116 1,016,209.78 0.01 8.75 % APX Group Inc 01/12/20 78 650,928.92 0.00 6.15 % Arconic Inc 15/08/20 118 1,043,372.53 0.01 6.75 % Arconic Inc 15/01/28 117 1,130,189.68 0.01 6.00 % Avantor Inc 01/10/24 58 474,502.86 0.00 4.25 % Axalta Coating Systems LLC 15/08/24 200 2,104,747.44 0.01 0.75 % Bank of America Corp 26/07/23 400 3,950,287.50 0.02 9.63 % BCD Acquisition Inc 15/09/23 39 351,437.24 0.00 5.75 % Beazer Homes USA Inc 15/06/19 43 363,450.39 0.00 7.25 % Beazer Homes USA Inc 01/02/23 2 17,021.26 0.00 8.75 % Beazer Homes USA Inc 15/03/22 78 703,525.88 0.00 7.75 % Belo Corp 01/06/27 39 356,814.44 0.00 9.75 % Blackboard Inc 15/10/21 116 864,706.21 0.01 5.63 % Boise Cascade Co 01/09/24 193 1,668,735.09 0.01 5.88 % Cablevision Systems Corp 15/09/22 79 632,425.07 0.00 7.75 % Cablevision Systems Corp 15/04/18 67 555,598.52 0.00 8.00 % Cablevision Systems Corp 15/04/20 193 1,696,988.74 0.01 5.00 % CalAtlantic Group Inc 15/06/27 78 660,533.80 0.00 6.25 % CalAtlantic Group Inc 15/12/21 39 347,490.55 0.00 5.25 % Calpine Corp 01/06/26 79 633,815.71 0.00 5.75 % Calpine Corp 15/01/25 156 1,210,177.16 0.01 5.88 % Calpine Corp 15/01/24 117 974,352.97 0.01 6.75 % Carlson Travel Inc 15/12/23 200 1,494,278.77 0.01 8.00 % CB Escrow Corp 15/10/25 78 646,145.63 0.00 5.50 % CCO Holdings LLC / CCO Holdings Capital Corp 01/05/26 39 325,228.17 0.00 5.75 % CCO Holdings LLC / CCO Holdings Capital Corp 01/09/23 209 1,750,641.06 0.01 5.75 % CCO Holdings LLC / CCO Holdings Capital Corp 15/01/24 117 986,355.89 0.01 5.75 % CCO Holdings LLC / CCO Holdings Capital Corp 15/02/26 156 1,324,490.62 0.01 5.88 % CCO Holdings LLC / CCO Holdings Capital Corp 01/04/24 178 1,520,386.32 0.01 5.88 % CCO Holdings LLC / CCO Holdings Capital Corp 01/05/27 117 985,484.17 0.01 5.38 % Cedar Fair LP / Canada's Wonderland Co / Magnum Management Corp /
Millennium Op 15/04/27 39 336,346.59 0.00 5.80 % CenturyLink Inc 15/03/22 171 1,371,174.18 0.01 6.75 % CenturyLink Inc 01/12/23 67 538,401.15 0.00 7.50 % CenturyLink Inc 01/04/24 117 956,133.07 0.01 5.13 % Cequel Communications Holdings I LLC / Cequel Capital Corp 15/12/21 78 635,059.14 0.00 6.25 % CHS/Community Health Systems Inc 31/03/23 78 575,124.41 0.00 7.13 % CHS/Community Health Systems Inc 15/07/20 39 238,292.47 0.00 8.00 % CHS/Community Health Systems Inc 15/11/19 178 1,229,743.09 0.01 4.88 % Cinemark USA Inc 01/06/23 39 324,164.86 0.00 0.75 % Citigroup Inc 26/10/23 400 3,942,972.98 0.02 6.50 % Clear Channel Worldwide Holdings Inc 15/11/22 117 966,814.03 0.01

40
SEB Strategy Fund - SEB Strategy Defensive
Security description Maturity Total holdings Market % of
value in Net
SEK Assets
7.63 % Clear Channel Worldwide Holdings Inc 15/03/20 78 621,073.31 0.00 7.63 % Clear Channel Worldwide Holdings Inc 15/03/20 117 940,710.33 0.01 5.75 % Cleveland-Cliffs Inc 01/03/25 196 1,527,427.54 0.01 10.13% Cloud Crane LLC 01/08/24 193 1,781,812.89 0.01 5.50 % CommScope Inc 15/06/24 39 332,882.06 0.00 6.00 % CommScope Technologies LLC 15/06/25 156 1,359,346.64 0.01 6.50 % Consolidated Communications Inc 01/10/22 79 583,862.57 0.00 8.50 % Constellation Merger Sub Inc 15/09/25 40 320,277.45 0.00 5.63 % Cooper-Standard Automotive Inc 15/11/26 159 1,335,784.91 0.01 4.50 % Crown Americas LLC / Crown Americas Capital Corp IV 15/01/23 172 1,436,705.46 0.01 4.25 % Crown Americas LLC / Crown Americas Capital Corp V 30/09/26 39 316,574.83 0.00 10.13% CSC Holdings LLC 15/01/23 200 1,843,179.61 0.01 10.88% CSC Holdings LLC 15/10/25 267 2,594,890.39 0.02 6.00 % Dana Inc 15/09/23 270 2,311,774.72 0.01 5.00 % DaVita Inc 01/05/25 232 1,898,315.35 0.01 5.88 % Dell International LLC / EMC Corp 15/06/21 155 1,317,142.45 0.01 7.13 % Dell International LLC / EMC Corp 15/06/24 289 2,583,086.43 0.02 7.75 % Diamond Resorts International Inc 01/09/23 39 346,344.23 0.00 10.75% Diamond Resorts International Inc 01/09/24 38 332,491.85 0.00 6.75 % DISH DBS Corp 01/06/21 309 2,675,146.10 0.02 7.75 % DISH DBS Corp 01/07/26 156 1,348,196.29 0.01 5.75 % Dollar Tree Inc 01/03/23 231 1,983,317.58 0.01 5.88 % Dynegy Inc 01/06/23 97 805,541.43 0.01 7.38 % Dynegy Inc 01/11/22 270 2,334,455.65 0.02 5.13 % Encompass Health Corp 15/03/23 136 1,140,899.05 0.01 5.75 % Encompass Health Corp 01/11/24 212 1,778,564.43 0.01 5.38 % Endo Finance LLC / Endo Finco Inc 15/01/23 214 1,360,467.51 0.01 7.25 % Endo Finance LLC / Endo Finco Inc 15/01/22 59 420,567.16 0.00 8.50 % Enova International Inc 01/09/24 39 327,808.20 0.00 5.38 % Equinix Inc 01/04/23 79 668,633.50 0.00 5.38 % Equinix Inc 15/05/27 78 682,808.96 0.01 5.75 % Equinix Inc 01/01/25 41 357,133.26 0.00 5.88 % Equinix Inc 15/01/26 78 686,800.35 0.01 5.38 % First Data Corp 15/08/23 39 332,747.95 0.00 5.75 % First Data Corp 15/01/24 78 661,070.24 0.00 7.00 % First Data Corp 01/12/23 351 3,039,965.19 0.02 7.13 % Frontier Communications Corp 15/01/23 78 418,297.84 0.00 7.63 % Frontier Communications Corp 15/04/24 78 420,711.83 0.00 9.25 % Frontier Communications Corp 01/07/21 97 625,134.46 0.00 10.50% Frontier Communications Corp 15/09/22 77 477,151.18 0.00 11.00% Frontier Communications Corp 15/09/25 105 632,306.43 0.00 12.50% Gogo Intermediate Holdings LLC / Gogo Finance Co Inc 01/07/22 157 1,454,878.53 0.01 3.25 % Goldman Sachs Group Inc/The 01/02/23 400 4,419,582.25 0.03 5.00 % Goodyear Tire & Rubber Co/The 31/05/26 156 1,313,110.36 0.01 5.88 % Gray Television Inc 15/07/26 193 1,619,449.22 0.01 7.75 % Greif Inc 01/08/19 137 1,201,121.00 0.01 4.63 % Hanesbrands Inc 15/05/24 117 980,579.55 0.01 4.88 % Hanesbrands Inc 15/05/26 174 1,462,201.24 0.01 5.00 % HCA Inc 15/03/24 78 667,916.28 0.00 5.25 % HCA Inc 15/04/25 78 677,834.09 0.00 5.38 % HCA Inc 01/02/25 107 909,042.92 0.01 5.88 % HCA Inc 15/03/22 40 351,700.96 0.00 5.88 % HCA Inc 01/05/23 193 1,695,060.91 0.01 5.88 % HCA Inc 15/02/26 271 2,347,250.95 0.02

41
SEB Strategy Fund - SEB Strategy Defensive
Security description Maturity Total holdings Market % of
value in Net
SEK Assets
7.50 % HCA Inc 15/02/22 355 3,284,345.45 0.02 8.36 % HCA Inc 15/04/24 26 252,873.28 0.00 7.75 % Herc Rentals Inc 01/06/24 201 1,811,681.35 0.01 5.88 % Hertz Corp/The 15/10/20 156 1,277,436.90 0.01 10.00% Hexion Inc 15/04/20 237 1,852,528.89 0.01 4.63 % Hilton Worldwide Finance LLC / Hilton Worldwide Finance Corp 01/04/25 136 1,146,288.37 0.01 4.88 % Hilton Worldwide Finance LLC / Hilton Worldwide Finance Corp 01/04/27 39 334,306.19 0.00 7.13 % Infor Software Parent LLC / Infor Software Parent Inc 01/05/21 78 651,886.85 0.00 5.75 % Infor US Inc 15/05/22 155 1,563,485.87 0.01 6.50 % Infor US Inc 15/05/22 78 662,602.94 0.00 8.25 % International Lease Finance Corp 15/12/20 78 733,311.24 0.01 5.75 % Iron Mountain Inc 15/08/24 168 1,390,199.00 0.01 5.38 % Iron Mountain US Holdings Inc 01/06/26 58 492,225.13 0.00 5.00 % iStar Inc 01/07/19 116 956,936.10 0.01 6.00 % iStar Inc 01/04/22 78 662,551.85 0.00 5.65 % JC Penney Corp Inc 01/06/20 41 309,150.27 0.00 5.88 % JC Penney Corp Inc 01/07/23 103 796,488.87 0.01 1.50 % JPMorgan Chase & Co 29/10/26 400 4,070,157.64 0.03 10.00% K Hovnanian Enterprises Inc 15/07/22 33 294,195.28 0.00 10.50% K Hovnanian Enterprises Inc 15/07/24 27 254,229.79 0.00 5.88 % Kaiser Aluminum Corp 15/05/24 157 1,370,592.71 0.01 4.75 % KFC Holding Co/Pizza Hut Holdings LLC/Taco Bell of America LLC 01/06/27 116 970,223.05 0.01 5.00 % KFC Holding Co/Pizza Hut Holdings LLC/Taco Bell of America LLC 01/06/24 116 982,816.69 0.01 5.25 % KFC Holding Co/Pizza Hut Holdings LLC/Taco Bell of America LLC 01/06/26 117 1,010,668.25 0.01 7.00 % Kraton Polymers LLC / Kraton Polymers Capital Corp 15/04/25 39 343,796.12 0.00 10.50% Kraton Polymers LLC / Kraton Polymers Capital Corp 15/04/23 170 1,575,443.62 0.01 9.00 % Kronos Acquisition Holdings Inc 15/08/23 193 1,485,876.46 0.01 5.63 % L Brands Inc 15/02/22 232 2,024,118.77 0.01 6.63 % L Brands Inc 01/04/21 112 1,005,175.03 0.01 8.50 % L Brands Inc 15/06/19 73 646,008.16 0.00 4.63 % Lamb Weston Holdings Inc 01/11/24 178 1,498,263.45 0.01 4.13 % Lennar Corp 15/01/22 78 650,296.68 0.00 4.50 % Lennar Corp 15/11/19 41 343,846.80 0.00 4.50 % Lennar Corp 30/04/24 38 318,621.94 0.00 5.25 % Level 3 Financing Inc 15/03/26 78 624,687.91 0.00 5.38 % Level 3 Financing Inc 15/01/24 78 637,913.79 0.00 5.63 % Level 3 Financing Inc 01/02/23 39 322,577.88 0.00 5.00 % Levi Strauss & Co 01/05/25 308 2,629,822.56 0.02 5.88 % LIN Television Corp 15/11/22 78 662,315.56 0.00 4.88 % Live Nation Entertainment Inc 01/11/24 187 1,573,252.81 0.01 7.00 % Men's Wearhouse Inc/The 01/07/22 39 321,319.80 0.00 6.25 % Meritor Inc 15/02/24 193 1,663,425.68 0.01 5.50 % Micron Technology Inc 01/02/25 194 1,663,530.80 0.01 5.63 % Micron Technology Inc 15/01/26 108 928,167.29 0.01 1.75 % Morgan Stanley 30/01/25 400 4,109,563.77 0.03 6.50 % Nationstar Mortgage LLC / Nationstar Capital Corp 01/08/18 155 1,270,529.95 0.01 6.50 % Nationstar Mortgage LLC / Nationstar Capital Corp 01/07/21 39 324,101.00 0.00 5.88 % Navient Corp 25/03/21 249 2,111,195.87 0.01 6.75 % Navient Corp 25/06/25 78 659,486.46 0.00 8.00 % Navient Corp 25/03/20 270 2,385,918.81 0.02 3.63 % Netflix Inc 15/05/27 161 1,592,808.34 0.01 5.63 % Nexstar Broadcasting Inc 01/08/24 117 988,118.49 0.01 5.00 % Nielsen Finance LLC / Nielsen Finance Co 15/04/22 116 978,096.45 0.01 6.25 % Novelis Corp 15/08/24 200 1,716,028.21 0.01 5.75 % NRG Energy Inc 15/01/28 19 157,150.22 0.00

42
SEB Strategy Fund - SEB Strategy Defensive
Security description Maturity Total holdings Market % of
value in Net
SEK Assets
6.25 % NRG Energy Inc 15/07/22 39 332,390.32 0.00 7.95 % Pactiv LLC 15/12/25 118 1,096,219.37 0.01 5.88 % PetSmart Inc 01/06/25 78 486,853.98 0.00 7.13 % PetSmart Inc 15/03/23 79 383,092.70 0.00 8.88 % PetSmart Inc 01/06/25 39 192,841.69 0.00 5.88 % Platform Specialty Products Corp 01/12/25 200 1,621,839.55 0.01 5.50 % Post Holdings Inc 01/03/25 136 1,155,842.17 0.01 5.63 % Post Holdings Inc 15/01/28 39 320,713.11 0.00 9.25 % Prime Security Services Borrower LLC / Prime Finance Inc 15/05/23 155 1,406,052.64 0.01 5.63 % Prudential Financial Inc FRN 15/06/43 136 1,208,733.22 0.01 4.25 % PulteGroup Inc 01/03/21 39 329,676.17 0.00 5.00 % PulteGroup Inc 15/01/27 39 334,386.02 0.00 7.88 % PulteGroup Inc 15/06/32 39 401,415.85 0.00 7.00 % Qorvo Inc 01/12/25 102 933,557.76 0.01 7.00 % Quad/Graphics Inc 01/05/22 98 829,403.97 0.01 3.25 % Quintiles IMS Inc 15/03/25 103 1,046,121.24 0.01 3.50 % Quintiles IMS Inc 15/10/24 100 1,028,000.52 0.01 4.88 % Quintiles IMS Inc 15/05/23 78 660,674.30 0.00 7.75 % Qwest Capital Funding Inc 15/02/31 39 280,358.54 0.00 8.63 % Rackspace Hosting Inc 15/11/24 155 1,353,323.29 0.01 8.50 % Rain CII Carbon LLC / CII Carbon Corp 15/01/21 482 4,847,056.37 0.03 5.50 % Rayonier AM Products Inc 01/06/24 269 2,187,474.93 0.01 5.75 % Regal Entertainment Group 01/02/25 39 324,228.72 0.00 5.75 % Reynolds Group Issuer Inc / Reynolds Group Issuer LLC /
Reynolds Group Issuer Lu 15/10/20 218 1,813,764.57 0.01 6.13 % Rite Aid Corp 01/04/23 78 575,986.55 0.00 6.75 % Rite Aid Corp 15/06/21 78 635,014.44 0.00 5.63 % Sally Holdings LLC / Sally Capital Inc 01/12/25 270 2,198,303.76 0.01 5.63 % Sinclair Television Group Inc 01/08/24 155 1,307,903.71 0.01 5.00 % Sirius XM Radio Inc 01/08/27 48 393,918.18 0.00 5.38 % Sirius XM Radio Inc 15/04/25 116 989,085.02 0.01 5.38 % Sirius XM Radio Inc 15/07/26 155 1,312,218.50 0.01 6.00 % Sirius XM Radio Inc 15/07/24 79 683,710.65 0.01 4.88 % Six Flags Entertainment Corp 31/07/24 309 2,567,067.57 0.02 10.50% Solera LLC / Solera Finance Inc 01/03/24 235 2,171,315.81 0.01 6.13 % Spectrum Brands Inc 15/12/24 38 329,679.29 0.00 6.63 % Spectrum Brands Inc 15/11/22 207 1,758,564.90 0.01 6.13 % Springleaf Finance Corp 15/05/22 78 662,960.57 0.00 8.25 % Springleaf Finance Corp 15/12/20 118 1,066,829.96 0.01 8.75 % Sprint Capital Corp 15/03/32 117 1,090,243.83 0.01 7.00 % Sprint Communications Inc 15/08/20 202 1,761,436.57 0.01 11.50% Sprint Communications Inc 15/11/21 136 1,338,800.68 0.01 7.13 % Sprint Corp 15/06/24 116 969,786.17 0.01 7.25 % Sprint Corp 15/09/21 247 2,141,398.63 0.01 7.63 % Sprint Corp 15/02/25 78 667,392.61 0.00 7.88 % Sprint Corp 15/09/23 347 3,022,765.77 0.02 8.50 % Staples Inc 15/09/25 39 294,634.95 0.00 9.13 % Syniverse Foreign Holdings Corp 15/01/22 240 1,992,474.94 0.01 9.50 % Talen Energy Supply LLC 15/07/22 201 1,691,052.90 0.01 5.50 % TEGNA Inc 15/09/24 78 672,942.24 0.01 6.38 % Telecom Italia Capital SA 15/11/33 39 371,451.68 0.00 5.63 % Tempur Sealy International Inc 15/10/23 117 999,786.12 0.01 4.50 % Tenet Healthcare Corp 01/04/21 118 974,159.59 0.01 4.63 % Tenet Healthcare Corp 15/07/24 97 775,815.10 0.01 6.75 % Tenet Healthcare Corp 15/06/23 38 300,418.09 0.00

43
SEB Strategy Fund - SEB Strategy Defensive
Security description Maturity Total holdings Market % of
value in Net
SEK Assets
7.00 % Tenet Healthcare Corp 01/08/25 19 147,170.92 0.00 8.13 % Tenet Healthcare Corp 01/04/22 364 3,043,569.15 0.02 5.00 % Tenneco Inc 15/07/26 38 320,560.25 0.00 5.30 % Tesla Inc 15/08/25 79 622,690.58 0.00 8.75 % TPC Group Inc 15/12/20 295 2,421,366.05 0.02 4.63 % United Rentals North America Inc 15/07/23 116 980,632.27 0.01 6.65 % United States Steel Corp 01/06/37 200 1,606,790.98 0.01 8.25 % Uniti Group LP / Uniti Group Finance Inc / CSL Capital LLC 15/10/23 97 762,877.83 0.01 7.63 % Universal Hospital Services Inc 15/08/20 155 1,270,479.19 0.01 5.13 % Univision Communications Inc 15/05/23 78 638,680.13 0.00 5.13 % Univision Communications Inc 15/02/25 39 311,654.24 0.00 6.38 % US Concrete Inc 01/06/24 193 1,697,194.16 0.01 6.38 % Valeant Pharmaceuticals International 15/10/20 224 1,855,230.92 0.01 6.75 % Valeant Pharmaceuticals International 15/08/21 233 1,925,498.24 0.01 7.25 % Valeant Pharmaceuticals International 15/07/22 270 2,235,795.82 0.01 4.75 % VeriSign Inc 15/07/27 97 811,966.38 0.01 5.25 % VeriSign Inc 01/04/25 46 408,715.72 0.00 7.50 % Veritas US Inc / Veritas Bermuda Ltd 01/02/23 118 1,234,341.16 0.01 1.63 % Verizon Communications Inc 01/03/24 500 5,141,428.22 0.03 1.38 % Wells Fargo & Co 26/10/26 400 4,009,396.70 0.03 10.50% Western Digital Corp 01/04/24 156 1,480,416.73 0.01 5.88 % William Lyon Homes Inc 31/01/25 231 1,930,228.63 0.01 7.75 % Windstream Services LLC / Windstream Finance Corp 15/10/20 40 276,484.31 0.00 7.75 % Windstream Services LLC / Windstream Finance Corp 01/10/21 78 478,353.92 0.00 4.88 % WMG Acquisition Corp 01/11/24 155 1,306,609.27 0.01 5.00 % Wolverine World Wide Inc 01/09/26 212 1,737,670.31 0.01 6.13 % XPO Logistics Inc 01/09/23 163 1,413,470.00 0.01 6.38 % Zayo Group LLC / Zayo Capital Inc 15/05/25 155 1,344,490.64 0.01 4.75 % ZF North America Capital Inc 29/04/25 150 1,301,144.54 0.01
Total United States of America 296,216,046.01 1.82
Total Bonds 8,183,339,912.92 50.30
Shares
Australia APA Group 7,929 422,958.31 0.00 Australia & New Zealand Banking Group Ltd 4,669 859,299.93 0.01 Commonwealth Bank of Australia 2,521 1,296,996.53 0.01 CSL Ltd 672 608,058.80 0.00 Domino's Pizza Enterprises Ltd 279 83,436.34 0.00 Flight Centre Travel Group Ltd 287 81,307.60 0.00 GPT Group/The 158,483 5,186,062.24 0.03 Harvey Norman Holdings Ltd 5,546 148,098.30 0.00 Healthscope Ltd 11,004 147,980.34 0.00 Mirvac Group 585,291 8,807,929.89 0.06 National Australia Bank Ltd 4,383 829,959.57 0.01 QBE Insurance Group Ltd 3,027 207,022.63 0.00 REA Group Ltd 466 228,734.79 0.00 TPG Telecom Ltd 3,702 155,752.82 0.00 Transurban Group 6,446 513,092.39 0.00 Westfield Corp 6,501 395,075.88 0.00 Westpac Banking Corp 5,126 1,029,082.73 0.01
Total Australia 21,000,849.09 0.13

44
SEB Strategy Fund - SEB Strategy Defensive
Security description Maturity Total holdings Market % of
value in Net
SEK Assets
Austria voestalpine AG 406 198,968.21 0.00
Total Austria 198,968.21 0.00
Belgium Colruyt SA 456 194,397.28 0.00 KBC Group NV 14,827 10,366,210.72 0.06 Proximus SADP 33,694 9,060,370.74 0.06 Solvay SA 588 670,033.98 0.00
Total Belgium 20,291,012.72 0.12
Bermuda Arch Capital Group Ltd 220 163,498.86 0.00 Bunge Ltd 332 182,339.54 0.00 IHS Markit Ltd 710 262,461.63 0.00 Kerry Properties Ltd 123,000 4,528,177.97 0.03 Norwegian Cruise Line Holdings Ltd 387 168,725.33 0.00 XL Group Ltd 599 172,435.00 0.00 Yue Yuen Industrial Holdings Ltd 268,390 8,629,740.82 0.06
Total Bermuda 14,107,379.15 0.09
Canada Bank of Montreal 856 562,667.40 0.00 Bank of Nova Scotia/The 1,673 886,843.66 0.01 BCE Inc 21,200 8,364,734.34 0.05 Canadian Imperial Bank of Commerce 32,679 26,167,956.99 0.16 Canadian National Railway Co 1,300 880,513.14 0.01 Canadian Pacific Railway Ltd 398 597,298.76 0.00 CI Financial Corp 9,100 1,770,285.90 0.01 Constellation Software Inc/Canada 58 288,813.54 0.00 Fairfax Financial Holdings Ltd 56 244,939.03 0.00 Great-West Lifeco Inc 960 220,192.00 0.00 H&R Real Estate Investment Trust 3,824 533,755.44 0.00 Magna International Inc 10,466 4,872,230.48 0.03 National Bank of Canada 1,013 415,182.15 0.00 Open Text Corp 916 267,622.93 0.00 Power Corp of Canada 39,300 8,313,012.48 0.05 Power Financial Corp 17,823 4,022,780.38 0.03 Restaurant Brands International Inc 558 281,752.83 0.00 RioCan Real Estate Investment Trust 3,987 634,668.15 0.01 Rogers Communications Inc 1,278 534,900.71 0.00 Royal Bank of Canada 1,962 1,316,076.52 0.01 SmartCentres Real Estate Investment Trust 3,161 638,479.10 0.01 Sun Life Financial Inc 36,934 12,521,302.14 0.08 Toronto-Dominion Bank/The 27,639 13,302,040.32 0.08
Total Canada 87,638,048.39 0.54
Cayman Islands CK Asset Holdings Ltd 7,492 535,934.26 0.00 WH Group Ltd 22,975 212,235.07 0.00
Total Cayman Islands 748,169.33 0.00
Denmark Danske Bank A/S 1,135 362,097.00 0.00 Novo Nordisk A/S 2,432 1,074,216.54 0.01 Pandora A/S 216 192,668.73 0.00

45
SEB Strategy Fund - SEB Strategy Defensive
Security description Maturity Total holdings Market % of
value in Net
SEK Assets
Tryg A/S 830 170,099.07 0.00 William Demant Holding A/S 889 203,672.96 0.00
Total Denmark 2,002,754.30 0.01
Finland Elisa OYJ 925 297,571.34 0.00 Kone OYJ 1,043 459,202.73 0.00 Sampo Oyj 867 390,409.74 0.00 UPM-Kymmene OYJ 1,888 480,956.14 0.01
Total Finland 1,628,139.95 0.01
France Air Liquide SA 846 873,780.78 0.01 Arkema SA 424 423,332.73 0.00 AXA SA 2,353 572,229.11 0.00 BNP Paribas SA 1,369 837,874.30 0.01 Capgemini SE 421 409,327.14 0.00 Carrefour SA 928 164,596.49 0.00 Casino Guichard Perrachon SA 395 196,354.21 0.00 Cie de Saint-Gobain 1,543 697,542.96 0.01 Cie Generale des Etablissements Michelin 397 466,633.76 0.00 CNP Assurances 18,314 3,467,071.51 0.02 Danone SA 859 590,767.98 0.00 Dassault Systemes SE 249 216,880.31 0.00 Eiffage SA 410 368,197.58 0.00 Eurazeo SA 5,850 4,428,765.22 0.03 Fonciere Des Regions 4,162 3,866,144.01 0.02 ICADE 345 277,906.12 0.00 JCDecaux SA 244 80,617.59 0.00 Klepierre SA 45,773 16,500,501.14 0.10 Lagardere SCA 597 156,895.09 0.00 Legrand SA 1,084 684,120.69 0.00 L'Oreal SA 347 630,986.22 0.00 Natixis SA 14,278 925,942.68 0.01 Publicis Groupe SA 322 179,346.07 0.00 Sanofi 1,447 1,022,189.39 0.01 Schneider Electric SE 1,108 771,928.32 0.01 SCOR SE 7,549 2,489,735.99 0.02 Societe Generale SA 1,017 430,457.40 0.00 Veolia Environnement SA 1,537 321,498.96 0.00 Vinci SA 905 757,651.17 0.01
Total France 42,809,274.92 0.26
Germany adidas AG 285 468,368.10 0.00 Allianz SE 14,616 27,519,046.32 0.17 Bayer AG 1,136 1,161,576.29 0.01 Bayerische Motoren Werke AG 768 655,642.48 0.01 Covestro AG 430 363,709.33 0.00 Daimler AG 1,579 1,099,136.06 0.01 Deutsche Bank AG 3,099 483,694.80 0.00 Deutsche Boerse AG 396 376,883.05 0.00 Deutsche Post AG 1,722 672,986.49 0.01 Deutsche Wohnen SE 1,029 368,865.56 0.00 Evonik Industries AG 1,227 378,438.36 0.00 Fresenius Medical Care AG & Co KGaA 427 368,518.69 0.00 GEA Group AG 622 244,678.05 0.00

46
SEB Strategy Fund - SEB Strategy Defensive
Security description Maturity Total holdings Market % of
value in Net
SEK Assets
Hannover Rueck SE 4,053 4,180,114.31 0.03 Henkel AG & Co KGaA 378 371,644.63 0.00 Linde AG 266 474,411.26 0.00 Merck KGaA 240 211,778.45 0.00 Muenchener Rueckversicherungs-Gesellschaft AG in Muenchen 1,865 3,314,310.62 0.02 SAP SE 1,428 1,312,029.44 0.01 United Internet AG 455 256,510.50 0.00 Wuestenrot & Wuerttembergische AG 964 221,404.24 0.00
Total Germany 44,503,747.03 0.27
Hong Kong AIA Group Ltd 18,600 1,298,392.94 0.01 HKT Trust & HKT Ltd 753,000 7,855,021.20 0.05 Link REIT 28,500 2,162,600.49 0.01 PCCW Ltd 55,000 261,524.02 0.00 Sun Hung Kai Properties Ltd 5,000 682,874.10 0.00 Wharf Holdings Ltd/The 32,000 904,912.92 0.01
Total Hong Kong 13,165,325.67 0.08
Ireland Accenture Plc 1,725 2,162,149.12 0.01 Allergan Plc 460 616,080.92 0.01 CRH Plc 1,834 540,137.99 0.00 DCC Plc 417 344,772.91 0.00 Jazz Pharmaceuticals Plc 168 185,210.40 0.00 Johnson Controls International Plc 1,451 452,747.52 0.00 Medtronic Plc 1,830 1,209,882.91 0.01 Pentair Plc 944 545,819.98 0.01 Perrigo Co Plc 228 162,705.33 0.00 Seagate Technology Plc 64,873 22,223,137.73 0.14
Total Ireland 28,442,644.81 0.18
Italy Ferrari NV 292 251,060.70 0.00 Intesa Sanpaolo SpA 17,237 469,437.22 0.01 Poste Italiane SpA 1,651 101,858.45 0.00 Prysmian SpA 1,224 327,210.09 0.00 Telecom Italia SpA/Milano RSP 44,434 260,374.03 0.00 UniCredit SpA 2,930 448,818.90 0.00
Total Italy 1,858,759.39 0.01
Japan ABC-Mart Inc 800 376,194.77 0.00 AEON Financial Service Co Ltd 1,800 343,285.00 0.00 Aeon Mall Co Ltd 2,800 448,526.50 0.00 Asahi Kasei Corp 8,300 876,822.36 0.01 Asics Corp 1,600 208,854.96 0.00 Benesse Holdings Inc 700 202,233.76 0.00 Bridgestone Corp 18,400 7,004,897.83 0.04 Brother Industries Ltd 40,400 8,162,903.26 0.05 Calbee Inc 500 133,187.19 0.00 Canon Inc 2,600 793,672.12 0.01 Central Japan Railway Co 8,000 11,733,555.64 0.07 Concordia Financial Group Ltd 9,300 459,632.10 0.00 Daiichi Sankyo Co Ltd 2,000 426,925.83 0.00 Daito Trust Construction Co Ltd 2,200 3,673,640.80 0.02 Daiwa House Industry Co Ltd 92,800 29,184,574.09 0.18

47
SEB Strategy Fund - SEB Strategy Defensive
Security description Maturity Total holdings Market % of
value in Net
SEK Assets
DeNA Co Ltd 1,300 219,488.14 0.00 Eisai Co Ltd 1,300 606,214.33 0.01 FANUC Corp 500 983,368.48 0.01 Fujitsu Ltd 72,000 4,200,531.52 0.03 Hachijuni Bank Ltd/The 6,600 310,360.69 0.00 Hakuhodo DY Holdings Inc 1,700 180,763.91 0.00 Hamamatsu Photonics KK 1,200 330,551.36 0.00 Hino Motors Ltd 7,300 774,629.81 0.01 Hitachi Ltd 335,000 21,375,109.31 0.13 Honda Motor Co Ltd 8,900 2,498,162.96 0.02 Hoya Corp 1,100 449,951.04 0.00 Isuzu Motors Ltd 3,100 425,159.69 0.00 Japan Airlines Co Ltd 400 128,150.43 0.00 Japan Airport Terminal Co Ltd 600 182,282.94 0.00 Japan Exchange Group Inc 3,300 470,337.95 0.00 Japan Prime Realty Investment Corp 12 312,235.85 0.00 JTEKT Corp 3,800 534,696.62 0.01 Kakaku.com Inc 1,500 207,684.81 0.00 Kamigumi Co Ltd 10,800 1,956,881.48 0.01 KDDI Corp 45,900 9,355,922.56 0.06 Keyence Corp 200 917,519.86 0.01 Komatsu Ltd 2,400 711,339.54 0.01 Kubota Corp 3,000 481,763.34 0.00 Kuraray Co Ltd 3,200 494,460.64 0.00 Kyushu Financial Group Inc 5,600 277,581.74 0.00 LINE Corp 400 133,586.94 0.00 LIXIL Group Corp 2,100 465,519.23 0.00 Makita Corp 1,500 516,213.94 0.01 Maruichi Steel Tube Ltd 1,900 455,707.35 0.00 McDonald's Holdings Co Japan Ltd 700 252,092.65 0.00 Miraca Holdings Inc 23,400 8,206,002.85 0.05 Mitsubishi Chemical Holdings Corp 5,100 458,334.75 0.00 Mitsubishi UFJ Financial Group Inc 22,500 1,351,423.03 0.01 Mitsui Fudosan Co Ltd 2,900 532,203.67 0.01 Mixi Inc 28,900 10,628,374.48 0.07 Mizuho Financial Group Inc 89,400 1,329,418.25 0.01 NEC Corp 3,000 662,847.05 0.01 Nintendo Co Ltd 210 628,679.90 0.01 Nippon Telegraph & Telephone Corp 400 154,111.94 0.00 Nissan Chemical Industries Ltd 1,500 490,048.93 0.00 Nissin Foods Holdings Co Ltd 400 239,264.53 0.00 Nitori Holdings Co Ltd 200 233,522.76 0.00 NTT DOCOMO Inc 99,400 19,224,265.13 0.12 Ono Pharmaceutical Co Ltd 1,600 305,374.80 0.00 Otsuka Holdings Co Ltd 1,300 467,510.67 0.00 Panasonic Corp 5,400 647,387.89 0.01 Park24 Co Ltd 1,600 313,631.31 0.00 Recruit Holdings Co Ltd 2,200 447,712.48 0.00 Rinnai Corp 500 370,671.05 0.00 Sekisui Chemical Co Ltd 3,100 509,650.89 0.00 Seven Bank Ltd 9,600 269,325.22 0.00 Shimadzu Corp 2,500 465,519.23 0.00 Shimamura Co Ltd 400 360,495.76 0.00 Shinsei Bank Ltd 2,300 325,805.31 0.00 Shiseido Co Ltd 800 316,654.83 0.00 Shizuoka Bank Ltd/The 6,000 507,601.29 0.00

48
SEB Strategy Fund - SEB Strategy Defensive
Security description Maturity Total holdings Market % of
value in Net
SEK Assets
SoftBank Group Corp 1,600 1,037,297.49 0.01 Sony Corp 2,100 775,814.50 0.01 Stanley Electric Co Ltd 1,500 498,770.60 0.00 Sumitomo Dainippon Pharma Co Ltd 2,100 255,501.37 0.00 Sumitomo Electric Industries Ltd 3,900 539,980.50 0.01 Sumitomo Mitsui Financial Group Inc 3,800 1,344,474.76 0.01 Sumitomo Rubber Industries Ltd 2,100 319,910.92 0.00 Sundrug Co Ltd 1,300 495,100.23 0.00 Suzuken Co Ltd/Aichi Japan 800 269,499.66 0.00 Suzuki Motor Corp 1,000 474,895.02 0.00 Taisho Pharmaceutical Holdings Co Ltd 500 327,062.69 0.00 Taiyo Nippon Sanso Corp 3,000 343,851.91 0.00 Tokyo Electron Ltd 300 444,805.26 0.00 Toppan Printing Co Ltd 7,000 518,430.70 0.01 Toray Industries Inc 6,900 532,839.63 0.01 Unicharm Corp 1,300 276,793.15 0.00 Yamaguchi Financial Group Inc 6,000 583,915.92 0.01 Yamazaki Baking Co Ltd 1,800 287,422.69 0.00 Yokohama Rubber Co Ltd/The 1,700 341,388.03 0.00
Total Japan 173,350,768.35 1.07
Liberia Royal Caribbean Cruises Ltd 21,421 20,919,778.97 0.13
Total Liberia 20,919,778.97 0.13
Luxembourg Eurofins Scientific SE 29 144,729.04 0.00 RTL Group SA 256 168,812.40 0.00
Total Luxembourg 313,541.44 0.00
Mauritius Golden Agri-Resources Ltd 52,900 119,911.89 0.00
Total Mauritius 119,911.89 0.00
Netherlands Aegon NV 3,677 192,146.76 0.00 AerCap Holdings NV 951 409,636.40 0.00 ASML Holding NV 657 937,601.89 0.01 ING Groep NV 32,342 4,873,078.67 0.03 Koninklijke Ahold Delhaize NV 6,313 1,138,027.58 0.01 Koninklijke KPN NV 8,317 237,792.00 0.00 Mylan NV 670 232,095.94 0.00 QIAGEN NV 957 246,424.28 0.00 Sensata Technologies Holding NV 905 378,707.74 0.00 Unilever NV 2,322 1,071,963.82 0.01 Wolters Kluwer NV 1,112 475,368.49 0.00
Total Netherlands 10,192,843.57 0.06
New Zealand Mercury NZ Ltd 5,681 111,477.86 0.00 Meridian Energy Ltd 10,098 171,986.81 0.00 Ryman Healthcare Ltd 2,888 178,084.89 0.00 Spark New Zealand Ltd 230,099 4,863,571.15 0.03
Total New Zealand 5,325,120.71 0.03
Norway DNB ASA 1,949 296,737.61 0.00

49
SEB Strategy Fund - SEB Strategy Defensive
Security description Maturity Total holdings Market % of
value in Net
SEK Assets
Norsk Hydro ASA 8,744 545,730.41 0.00 Telenor ASA 50,442 8,881,568.75 0.06
Total Norway 9,724,036.77 0.06
Panama Carnival Corp 615 334,192.46 0.00
Total Panama 334,192.46 0.00
Singapore Broadcom Ltd 560 1,177,882.18 0.01 Flex Ltd 2,100 309,314.43 0.00 Hutchison Port Holdings Trust 17,100 58,102.38 0.00 Oversea-Chinese Banking Corp Ltd 102,000 7,742,413.24 0.05 SATS Ltd 7,700 245,300.78 0.00 StarHub Ltd 123,200 2,151,099.19 0.02 Suntec Real Estate Investment Trust 33,900 446,522.17 0.00 United Overseas Bank Ltd 3,100 502,333.61 0.00
Total Singapore 12,632,967.98 0.08
Spain Amadeus IT Group SA 603 356,369.15 0.00 Banco Bilbao Vizcaya Argentaria SA 8,876 620,647.62 0.01 Banco Santander SA 19,359 1,042,846.25 0.01 Bankinter SA 1,463 113,691.30 0.00 CaixaBank SA 6,053 231,443.37 0.00 Ferrovial SA 1,647 306,454.23 0.00 Grifols SA 792 190,193.57 0.00 Iberdrola SA 9,633 611,829.12 0.01 Industria de Diseno Textil SA 1,579 450,909.75 0.00 Telefonica SA 6,572 524,997.20 0.00
Total Spain 4,449,381.56 0.03
Sweden Assa Abloy AB 2,517 428,896.80 0.00 Atlas Copco AB A 1,765 625,163.00 0.01 Electrolux AB 17,968 4,748,942.40 0.03 Essity AB 899 209,467.00 0.00 Hennes & Mauritz AB 1,536 260,044.80 0.00 Hexagon AB 706 290,095.40 0.00 ICA Gruppen AB 305 90,859.50 0.00 Industrivarden AB 46,590 9,434,475.00 0.06 Investor AB 1,258 470,617.80 0.01 L E Lundbergforetagen AB 308 188,804.00 0.00 Nobina AB 4,658 251,532.00 0.00 Nordea Bank AB 3,592 356,685.60 0.00 Securitas AB 1,474 211,076.80 0.00 SKF AB 61,796 11,259,231.20 0.07 Telefonaktiebolaget LM Ericsson 4,998 269,142.30 0.00
Total Sweden 29,095,033.60 0.18
Switzerland ABB Ltd 3,974 872,141.58 0.01 Baloise Holding AG 677 862,899.48 0.01 Chubb Ltd 555 664,021.42 0.00 Cie Financiere Richemont SA 998 740,418.40 0.01 Credit Suisse Group AG 4,190 612,560.84 0.00 Garmin Ltd 5,400 2,633,728.96 0.02

50
SEB Strategy Fund - SEB Strategy Defensive
Security description Maturity Total holdings Market % of
value in Net
SEK Assets
Kuehne + Nagel International AG 190 275,377.63 0.00 LafargeHolcim Ltd 1,191 549,876.82 0.00 Nestle SA 3,839 2,703,012.70 0.02 Novartis AG 2,797 1,936,447.08 0.01 Roche Holding AG 3,473 7,192,960.28 0.05 SGS SA 318 6,789,186.52 0.04 Sonova Holding AG 216 276,219.52 0.00 Swatch Group AG/The 116 387,321.68 0.00 Swiss Life Holding AG 618 1,791,403.94 0.01 Swiss Re AG 475 364,176.94 0.00 Swisscom AG 6,748 29,397,458.77 0.18 TE Connectivity Ltd 35,779 27,840,968.94 0.17 UBS Group AG 4,864 733,165.40 0.01 Zurich Insurance Group AG 214 533,299.13 0.00
Total Switzerland 87,156,646.03 0.54
United Kingdom Aon Plc 370 405,934.76 0.00 Ashtead Group Plc 1,658 365,797.83 0.00 Associated British Foods Plc 655 204,577.41 0.00 AstraZeneca Plc 1,661 942,088.43 0.01 Barclays Plc 22,964 516,564.65 0.01 Barratt Developments Plc 120,505 8,641,957.08 0.05 Berkeley Group Holdings Plc 18,378 8,542,883.40 0.05 BT Group Plc 14,714 442,779.67 0.00 Compass Group Plc 2,831 501,680.38 0.00 easyJet Plc 923 149,661.48 0.00 Experian Plc 2,387 432,516.80 0.00 Fiat Chrysler Automobiles NV 2,225 326,169.78 0.00 GlaxoSmithKline Plc 6,753 989,144.45 0.01 HSBC Holdings Plc 24,673 2,095,694.46 0.01 Johnson Matthey Plc 504 171,649.65 0.00 Liberty Global Plc C 1,209 334,970.36 0.00 Lloyds Banking Group Plc 92,936 700,556.51 0.01 London Stock Exchange Group Plc 1,023 429,759.75 0.00 Mediclinic International Plc 1,199 86,251.35 0.00 National Grid Plc 8,796 852,531.02 0.01 Next Plc 1,738 871,035.02 0.01 Nielsen Holdings Plc 810 241,399.36 0.00 Old Mutual Plc 12,153 311,872.28 0.00 Persimmon Plc 101,524 30,787,145.69 0.19 Prudential Plc 3,983 840,594.51 0.01 Reckitt Benckiser Group Plc 900 689,688.69 0.01 RSA Insurance Group Plc 4,991 349,635.43 0.00 Sage Group Plc/The 4,623 408,595.94 0.00 Shire Plc 1,262 545,118.88 0.01 Sky Plc 1,898 212,737.47 0.00 Smiths Group Plc 2,082 343,585.05 0.00 Standard Chartered Plc 5,028 434,423.02 0.00 Standard Life Aberdeen Plc 7,789 376,645.38 0.00 Taylor Wimpey Plc 1,154,982 26,402,932.89 0.16 Tesco Plc 14,870 344,622.61 0.00 Unilever Plc 2,041 932,581.69 0.01 Vodafone Group Plc 38,399 999,436.12 0.01 Worldpay Group Plc 3,910 184,481.84 0.00

51
SEB Strategy Fund - SEB Strategy Defensive
Security description Maturity Total holdings Market % of
value in Net
SEK Assets
WPP Plc 2,046 303,879.69 0.00
Total United Kingdom 92,713,580.78 0.57
United States of America 3M Co 767 1,478,074.05 0.01 Abbott Laboratories 2,738 1,279,354.90 0.01 AbbVie Inc 1,980 1,567,784.24 0.01 Activision Blizzard Inc 1,105 572,865.81 0.00 Adobe Systems Inc 652 935,471.50 0.01 Advanced Micro Devices Inc 1,530 128,775.80 0.00 Aetna Inc 499 736,991.92 0.01 Aflac Inc 38,016 27,321,951.47 0.17 Agilent Technologies Inc 936 513,222.71 0.00 AGNC Investment Corp 2,456 405,989.13 0.00 Air Products & Chemicals Inc 497 667,669.84 0.01 Albemarle Corp 313 327,740.90 0.00 Alexion Pharmaceuticals Inc 353 345,636.26 0.00 Alleghany Corp 48 234,262.51 0.00 Alliance Data Systems Corp 111 230,364.95 0.00 Allstate Corp/The 531 455,231.60 0.00 Alphabet Inc A 739 6,373,639.16 0.04 Amazon.com Inc 503 4,816,225.25 0.03 American Express Co 1,170 951,324.24 0.01 American Financial Group Inc/OH 182 161,737.57 0.00 American International Group Inc 1,223 596,590.97 0.00 American Tower Corp 641 748,756.16 0.01 AmerisourceBergen Corp 292 219,517.86 0.00 AMETEK Inc 1,111 659,207.35 0.01 Amgen Inc 900 1,281,420.92 0.01 Annaly Capital Management Inc 296,961 28,908,861.71 0.18 Anthem Inc 377 694,533.01 0.01 Apple Inc 6,348 8,795,570.07 0.06 Applied Materials Inc 1,816 760,074.93 0.01 Aramark 544 190,363.26 0.00 Arista Networks Inc 100 192,880.42 0.00 Arrow Electronics Inc 434 285,725.84 0.00 Arthur J Gallagher & Co 521 269,931.71 0.00 AT&T Inc 7,601 2,419,617.46 0.02 Atmos Energy Corp 619 435,294.29 0.00 Autodesk Inc 368 315,851.63 0.00 Autoliv Inc 180 187,283.46 0.00 Automatic Data Processing Inc 570 546,909.08 0.00 AutoZone Inc 62 361,107.87 0.00 Avery Dennison Corp 31,336 29,468,775.52 0.18 Avnet Inc 876 284,163.50 0.00 Bank of America Corp 12,502 3,021,659.81 0.02 Bank of New York Mellon Corp/The 1,566 690,570.19 0.01 Baxter International Inc 16,975 8,983,816.05 0.06 BB&T Corp 1,192 485,240.56 0.00 Becton Dickinson and Co 350 613,413.44 0.00 Best Buy Co Inc 18,800 10,539,206.09 0.07 Biogen Inc 276 719,885.92 0.01 BioMarin Pharmaceutical Inc 308 224,863.62 0.00 BlackRock Inc 181 761,283.32 0.01 Boston Scientific Corp 2,093 424,810.73 0.00 Bristol-Myers Squibb Co 17,652 8,856,505.48 0.06

52
SEB Strategy Fund - SEB Strategy Defensive
Security description Maturity Total holdings Market % of
value in Net
SEK Assets
Broadridge Financial Solutions Inc 485 359,686.20 0.00 CA Inc 45,400 12,370,546.63 0.08 Capital One Financial Corp 740 603,328.11 0.00 Cardinal Health Inc 573 287,443.32 0.00 CBRE Group Inc 881 312,402.00 0.00 CBS Corp 758 366,160.03 0.00 CDW Corp/DE 532 302,679.96 0.00 Celgene Corp 977 834,792.15 0.01 Centene Corp 320 264,304.63 0.00 CenterPoint Energy Inc 2,470 573,525.72 0.00 CenturyLink Inc 1,610 219,872.87 0.00 CF Industries Holdings Inc 650 226,391.73 0.00 Charles Schwab Corp/The 1,788 752,015.51 0.01 Charter Communications Inc 249 684,914.94 0.01 Chipotle Mexican Grill Inc 60 141,985.47 0.00 Cigna Corp 403 670,105.69 0.01 Cisco Systems Inc 68,336 21,428,809.70 0.13 Citigroup Inc 3,410 2,077,473.07 0.01 Clorox Co/The 240 292,273.03 0.00 CME Group Inc 522 624,197.15 0.00 CMS Energy Corp 1,926 745,876.88 0.01 Coca-Cola Co/The 4,925 1,850,032.53 0.01 Cognizant Technology Solutions Corp 958 557,052.20 0.00 Colgate-Palmolive Co 1,065 657,898.01 0.01 Comcast Corp 5,852 1,918,918.62 0.01 Conagra Brands Inc 2,355 726,333.80 0.01 Corning Inc 1,623 425,091.56 0.00 Costco Wholesale Corp 590 899,072.63 0.01 Crown Castle International Corp 664 603,503.65 0.00 CSX Corp 1,374 618,839.60 0.00 Cummins Inc 20,735 29,987,676.41 0.19 CVS Health Corp 1,337 793,631.93 0.01 Danaher Corp 878 667,245.73 0.01 Deere & Co 510 653,524.67 0.01 Delta Air Lines Inc 510 233,834.14 0.00 DENTSPLY SIRONA Inc 434 233,917.82 0.00 Discovery Communications Inc C 960 166,395.59 0.00 Dollar General Corp 657 500,316.39 0.00 DowDuPont Inc 3,221 1,878,202.50 0.01 DR Horton Inc 1,201 502,179.04 0.00 Dr Pepper Snapple Group Inc 399 317,075.66 0.00 Duke Energy Corp 1,248 859,432.83 0.01 E*TRADE Financial Corp 849 344,569.10 0.00 Eaton Vance Corp 900 415,522.29 0.00 eBay Inc 1,650 509,841.94 0.00 Ecolab Inc 574 630,593.37 0.00 Edison International 563 291,507.66 0.00 Edwards Lifesciences Corp 383 353,436.13 0.00 Eli Lilly & Co 1,300 898,967.83 0.01 Emerson Electric Co 39,300 22,423,981.94 0.14 Equifax Inc 187 180,542.23 0.00 Equinix Inc 135 500,947.89 0.00 Equity Residential 780 407,249.67 0.00 Expeditors International of Washington Inc 361 191,202.72 0.00 Express Scripts Holding Co 879 537,168.11 0.00 F5 Networks Inc 218 234,210.44 0.00

53
SEB Strategy Fund - SEB Strategy Defensive
Security description Maturity Total holdings Market % of
value in Net
SEK Assets
Facebook Inc 2,915 4,211,478.17 0.03 FedEx Corp 395 807,025.00 0.01 Fidelity National Information Services Inc 569 438,334.30 0.00 FleetCor Technologies Inc 165 259,959.95 0.00 FMC Corp 430 333,261.14 0.00 Foot Locker Inc 32,700 12,551,194.96 0.08 Ford Motor Co 7,021 717,977.99 0.01 Franklin Resources Inc 7,905 2,804,402.10 0.02 Gap Inc/The 65,900 18,377,218.47 0.11 General Motors Co 2,110 708,125.27 0.01 Gilead Sciences Inc 44,711 26,225,252.64 0.16 Global Payments Inc 403 330,746.93 0.00 Goldman Sachs Group Inc/The 572 1,193,100.39 0.01 Hershey Co/The 300 278,807.91 0.00 Hilton Worldwide Holdings Inc 395 258,271.28 0.00 Home Depot Inc/The 1,566 2,430,073.67 0.02 HP Inc 155,444 26,739,281.65 0.17 Humana Inc 232 471,207.24 0.00 IDEX Corp 550 594,275.23 0.00 IDEXX Laboratories Inc 210 268,874.88 0.00 Illinois Tool Works Inc 631 861,996.08 0.01 Illumina Inc 200 357,776.06 0.00 Incyte Corp 243 188,430.77 0.00 Ingredion Inc 300 343,382.49 0.00 Intel Corp 103,776 39,220,438.70 0.24 Intercontinental Exchange Inc 883 510,116.06 0.00 International Business Machines Corp 1,098 1,379,221.56 0.01 International Flavors & Fragrances Inc 347 433,572.96 0.00 International Paper Co 730 346,298.87 0.00 Intuit Inc 415 536,104.89 0.00 IQVIA Holdings Inc 317 254,092.40 0.00 Iron Mountain Inc 855 264,120.82 0.00 Jack Henry & Associates Inc 250 239,401.62 0.00 Johnson & Johnson 22,020 25,189,851.76 0.16 JPMorgan Chase & Co 4,302 3,766,693.70 0.02 Kellogg Co 526 292,763.29 0.00 KeyCorp 2,293 378,668.93 0.00 Kimberly-Clark Corp 510 503,829.06 0.00 KLA-Tencor Corp 22,671 19,502,897.09 0.12 Kohl's Corp 51,900 23,043,937.16 0.14 Kraft Heinz Co/The 740 471,126.67 0.00 Kroger Co/The 3,200 719,187.36 0.01 L Brands Inc 450 221,872.25 0.00 Laboratory Corp of America Holdings 239 312,130.02 0.00 Lam Research Corp 354 533,501.93 0.00 Liberty Broadband Corp 205 142,935.21 0.00 Liberty Interactive Corp QVC Group 846 169,147.56 0.00 Liberty Media Corp-Liberty SiriusXM A 574 186,386.44 0.00 Lincoln National Corp 520 327,272.82 0.00 LKQ Corp 977 325,325.76 0.00 Lowe's Cos Inc 1,284 977,051.40 0.01 ManpowerGroup Inc 26,298 27,153,259.29 0.17 Markel Corp 23 214,511.63 0.00 Marriott International Inc/MD 550 611,206.91 0.00 Marsh & McLennan Cos Inc 630 419,818.25 0.00 Martin Marietta Materials Inc 170 307,658.92 0.00

54
SEB Strategy Fund - SEB Strategy Defensive
Security description Maturity Total holdings Market % of
value in Net
SEK Assets
Mastercard Inc 1,210 1,499,499.10 0.01 McCormick & Co Inc/MD 290 241,971.67 0.00 McDonald's Corp 1,015 1,430,365.74 0.01 MercadoLibre Inc 59 151,999.89 0.00 Merck & Co Inc 3,366 1,550,746.28 0.01 MetLife Inc 1,197 495,508.30 0.00 Micron Technology Inc 1,609 541,700.04 0.00 Microsoft Corp 9,014 6,313,010.62 0.04 Mondelez International Inc 1,978 693,138.11 0.01 Monster Beverage Corp 602 311,947.35 0.00 Moody's Corp 377 455,624.27 0.00 Morgan Stanley 2,070 889,264.86 0.01 Netflix Inc 585 919,425.04 0.01 NextEra Energy Inc 750 959,100.70 0.01 NIKE Inc 1,683 861,908.47 0.01 Norfolk Southern Corp 543 644,195.87 0.01 NVIDIA Corp 836 1,324,454.27 0.01 OGE Energy Corp 1,402 377,768.39 0.00 Omnicom Group Inc 497 296,357.84 0.00 Oracle Corp 3,865 1,496,155.34 0.01 O'Reilly Automotive Inc 145 285,565.03 0.00 Packaging Corp of America 270 266,489.87 0.00 Palo Alto Networks Inc 237 281,245.98 0.00 Paychex Inc 589 328,310.34 0.00 PepsiCo Inc 28,403 27,887,241.25 0.17 Pfizer Inc 7,024 2,082,968.34 0.01 PG&E Corp 760 278,953.65 0.00 PNC Financial Services Group Inc/The 601 710,003.40 0.01 PPL Corp 1,750 443,453.84 0.00 Praxair Inc 663 839,648.30 0.01 Principal Financial Group Inc 30,791 17,788,203.36 0.11 Procter & Gamble Co/The 10,662 8,020,646.67 0.05 Progressive Corp/The 905 417,312.07 0.00 Prologis Inc 1,194 630,639.38 0.00 Prudential Financial Inc 4,960 4,669,320.67 0.03 Public Storage 250 427,795.31 0.00 PVH Corp 310 348,254.85 0.00 QUALCOMM Inc 1,917 1,004,818.22 0.01 Raymond James Financial Inc 475 347,292.01 0.00 Regeneron Pharmaceuticals Inc 113 347,832.22 0.00 Regions Financial Corp 2,720 384,824.19 0.00 Republic Services Inc 596 329,918.69 0.00 ResMed Inc 368 255,170.03 0.00 Roper Technologies Inc 265 561,947.00 0.00 S&P Global Inc 420 582,522.11 0.00 salesforce.com Inc 1,240 1,037,886.27 0.01 SCANA Corp 417 135,815.88 0.00 SEI Investments Co 670 394,195.57 0.00 Sherwin-Williams Co/The 190 637,866.14 0.01 Simon Property Group Inc 485 681,966.30 0.01 Sirius XM Holdings Inc 3,787 166,191.89 0.00 Southwest Airlines Co 336 180,052.29 0.00 Spectrum Brands Holdings Inc 135 124,236.67 0.00 Starbucks Corp 1,785 839,318.42 0.01 State Street Corp 742 592,990.78 0.00 Stryker Corp 540 684,583.84 0.01

55
SEB Strategy Fund - SEB Strategy Defensive
Security description Maturity Total holdings Market % of
value in Net
SEK Assets
SVB Financial Group 90 172,258.64 0.00 Sysco Corp 790 392,807.79 0.00 T Rowe Price Group Inc 23,973 20,595,473.37 0.13 Tapestry Inc 711 257,475.71 0.00 Target Corp 59,757 31,924,126.45 0.20 TD Ameritrade Holding Corp 589 246,570.32 0.00 Tesla Inc 190 484,342.07 0.00 Texas Instruments Inc 39,718 33,962,836.52 0.21 Thermo Fisher Scientific Inc 540 839,503.87 0.01 Time Warner Inc 1,134 849,261.53 0.01 TJX Cos Inc/The 1,289 806,931.99 0.01 Torchmark Corp 393 291,875.36 0.00 Trimble Inc 1,061 353,035.85 0.00 Twenty-First Century Fox Inc B 2,172 606,762.26 0.00 Twitter Inc 941 184,982.87 0.00 Ulta Beauty Inc 126 230,732.40 0.00 Under Armour Inc 1,230 134,140.23 0.00 Union Pacific Corp 1,106 1,214,321.33 0.01 United Parcel Service Inc 910 887,738.71 0.01 United Rentals Inc 293 412,399.83 0.00 United Therapeutics Corp 10,000 12,113,361.82 0.08 UnitedHealth Group Inc 1,220 2,202,111.75 0.01 Universal Health Services Inc 216 200,458.74 0.00 Unum Group 2,500 1,123,525.57 0.01 US Bancorp 1,910 837,887.66 0.01 Verisk Analytics Inc 304 238,943.12 0.00 Verizon Communications Inc 5,004 2,168,547.38 0.01 VF Corp 648 392,605.56 0.00 Visa Inc 2,350 2,193,808.02 0.01 Vulcan Materials Co 340 357,348.68 0.00 Walgreens Boots Alliance Inc 4,437 2,638,125.14 0.02 Walt Disney Co/The 1,900 1,672,446.30 0.01 Waste Management Inc 717 506,616.90 0.00 Waters Corp 190 300,530.09 0.00 Wells Fargo & Co 5,754 2,858,206.30 0.02 Welltower Inc 832 434,399.65 0.00 Westar Energy Inc 710 306,931.87 0.00 Western Digital Corp 492 320,365.55 0.00 Western Union Co/The 183,121 28,501,649.05 0.18 WestRock Co 522 270,150.65 0.00 Weyerhaeuser Co 1,356 391,463.90 0.00 Workday Inc 320 266,557.82 0.00 Xcel Energy Inc 1,430 563,275.83 0.00 Xilinx Inc 655 361,559.49 0.00 Yum! Brands Inc 550 367,498.68 0.00 Zimmer Biomet Holdings Inc 401 396,180.78 0.00
Total United States of America 783,543,319.70 4.82
Total Shares 1,508,266,196.77 9.27

56
SEB Strategy Fund - SEB Strategy Defensive
Security description Maturity Total holdings Market % of
value in Net
SEK Assets
Investment Funds
Alternative Investment Fund
Ireland IPM Systematic Macro UCITS Fund I 36,378 390,292,770.23 2.40
Total Ireland 390,292,770.23 2.40
Total Alternative Investment Fund 390,292,770.23 2.40
Asset Allocation Fund
Luxembourg SEB Fund 1 - SEB Asset Selection C 5,225,792 920,496,086.68 5.66
Total Luxembourg 920,496,086.68 5.66
Total Asset Allocation Fund 920,496,086.68 5.66
Commodity Funds
Luxembourg Threadneedle Lux - Enhanced Commodities Portfolio IKH 1,980,923 213,008,693.74 1.31 Vontobel Fund - Commodity HI 389,718 213,721,351.20 1.31
Total Luxembourg 426,730,044.94 2.62
Total Commodity Funds 426,730,044.94 2.62
Debt Funds
Ireland iShares JP Morgan EM Local Government Bond UCITS ETF 297,403 162,656,539.16 1.00 iShares USD Corp Bond UCITS ETF 519,407 496,324,355.59 3.05 Neuberger Berman Emerging Markets Debt - Local Currency Fund A Acc 3,497,741 397,693,151.70 2.45
Total Ireland 1,056,674,046.45 6.50
Luxembourg SEB Fund 5 - SEB Danish Mortgage Bond Fund C 308,893 442,031,946.28 2.72 SEB High Yield - SEB High Yield Fund C (H SEK) 933,817 176,756,737.73 1.09 SEB SICAV 2 - SEB Alternative Fixed Income C 7,134,613 779,869,564.34 4.79
Total Luxembourg 1,398,658,248.35 8.60
Total Debt Funds 2,455,332,294.80 15.10
Equity Funds
Luxembourg BlackRock Strategic Funds - Americas Diversified Equity Absolute Return A2 2,313,169 289,192,388.38 1.78 BlackRock Strategic Funds - European Diversified Equity Absolute Return A2 2,694,856 328,853,277.68 2.02 Pictet TR - Agora I 284,448 336,130,008.35 2.06
Total Luxembourg 954,175,674.41 5.86
Sweden SEB Emerging Marketsfond A 8,116,096 214,196,753.11 1.32 SEB Hallbarhetsfond Global A 8,911,399 152,161,246.79 0.93
Total Sweden 366,357,999.90 2.25
Total Equity Funds 1,320,533,674.31 8.11

57
SEB Strategy Fund - SEB Strategy Defensive
Security description Maturity Total holdings Market % of
value in Net
SEK Assets
Exchange traded fund
Ireland iShares USD High Yield Corp Bond UCITS ETF 100,000 84,920,438.52 0.52
Total Ireland 84,920,438.52 0.52
Total Exchange traded fund 84,920,438.52 0.52
Real Estate Funds
Germany Credit Suisse - CS EUROREAL* 1,071 108,458.29 0.00 KanAm Grundinvest Fonds* 1,125 146,224.47 0.00 SEB ImmoInvest P* 1,141 97,822.37 0.00
Total Germany 352,505.13 0.00
Total Real Estate Funds 352,505.13 0.00
Total Investment Funds 5,598,657,814.61 34.41
Total Transferable securities admitted to an official stock exchange listing
and/or dealt within another regulated market 15,290,263,924.30 93.98
Total Portfolio 15,290,263,924.30 93.98
Financial futures cleared with Skandinaviska Enskilda Banken AB (publ)
Purchased financial futures contracts Commitment in SEK CBOT Five Year Treasury Note Future 291,033,469.33 29/03/18 306 (215,306.14) (0.00) Eurex Dow Jones Euro Stoxx 50 Future 182,703,254.92 16/03/18 532 (4,445,970.99) (0.03) ICE MSCI Emerging Markets Mini Index Future 90,037,320.69 16/03/18 189 3,864,712.29 0.02
Sold financial futures contracts Commitment in SEK CME Standard And Poors 500 E-Mini Future (98,593,513.37) 16/03/18 (90) (425,543.75) (0.00) Eurex Euro Bobl Futures (163,040,500.86) 08/03/18 (126) 929,111.58 0.00 Eurex Euro Bund Future (111,273,156.29) 08/03/18 (70) 942,876.20 0.01 Swedish Government 2-year Bond Future (564,055,000.00) 15/03/18 (500) 772,550.00 0.01 Swedish Government 5-year Bond Future (283,509,600.00) 15/03/18 (220) 256,080.00 0.00
Total financial futures contracts (total net unrealised) 1,678,509.19 0.01
An amount of SEK 33,994,698.23 is held as cash collateral for these positions.

Schedule of Investments
As at 31 October 2016
58
SEB Strategy Fund - SEB Strategy Defensive
Security description Maturity Market % of
value in Net
SEK Assets
Forward foreign exchange contracts open with Skandinaviska Enskilda Banken S.A.**
Buy 32,980,686 EUR Sell 327,864,702 SEK 19/01/18 (3,619,411.17) (0.02)Buy 3,983,603 NOK Sell 4,015,647 SEK 19/01/18 (30,378.81) (0.00)Buy 913,852,507 SEK Sell 92,096,037 EUR 19/01/18 8,422,391.42 0.05Buy 785,645,110 SEK Sell 93,250,000 USD 19/01/18 23,008,241.62 0.14Buy 1 576,211,570 SEK Sell 1 68,200,000 USD 19/01/18 18,443,908.63 0.11Buy 18,417,008 USD Sell 15,510,556 EUR 12/03/18 (2,324,828.65) (0.01)Buy 2,396,791 USD Sell 1,787,320 GBP 12/03/18 (215,693.36) (0.00)Buy 377,323 USD Sell 3,173,963 SEK 12/03/18 (97,580.39) (0.00)
Total forward foreign exchange contracts (total net unrealised) 43,586,649.29 0.27 Cash at bank and at broker Cash at bank and at broker 845,646,245.18 5.20Total Cash at bank and at broker 845,646,245.18 5.20
Other assets Dividends receivable 1,975,818.65 0.01Interest receivable on bonds 86,961,082.81 0.54Receivable on subscriptions 14,704,721.01 0.09Retrocession fees receivable 10,107,925.04 0.06Other assets 24,214.44 0.00Total other assets 113,773,761.95 0.70
Liabilities Management fees (13,013,716.30) (0.08)Payable on redemptions (10,652,629.80) (0.07)Bank interest payable on cash accounts (1,032,396.16) (0.01)Other liabilities (157,669.58) (0.00)
Total liabilities (24,856,411.84) (0.16)
Total Net Assets as at 31 December 2017 16,270,092,678.07 100.00
* Positions which are in liquidation or suspended. Please refer to note 7.
** Forwards foreign exchange contracts open with Skandinaviska Enskilda Banken S.A., except for the following: 1Nordea Bank AB (publ) A list of changes in the assets held during the financial period under review is available free of charge from SEB Investment Management AB.
The accompanying notes are an integral part of these financial statements.

Schedule of Investments As at 31 December 2017
59
SEB Strategy Fund - SEB Strategy Growth
Security description Maturity Total holdings Market % of
value in Net
SEK Assets
Bonds indicated in 1,000 currency units
Transferable securities admitted to an official stock exchange listing and/or dealt within another regulated market
Bonds
Australia 9.75 % FMG Resources August 2006 Pty Ltd 01/03/22 35 318,174.91 0.01
Total Australia 318,174.91 0.01
Austria 7.50 % Sappi Papier Holding GmbH 15/06/32 47 395,216.38 0.01 6.88 % UNIQA Insurance Group AG FRN 31/07/43 100 1,235,118.66 0.03
Total Austria 1,630,335.04 0.04
Bermuda 4.13 % Aircastle Ltd 01/05/24 58 482,300.28 0.01 5.13 % Aircastle Ltd 15/03/21 35 301,247.72 0.00 5.50 % Aircastle Ltd 15/02/22 35 306,824.21 0.01 5.00 % IHS Markit Ltd 01/11/22 63 558,493.94 0.01 6.25 % Viking Cruises Ltd 15/05/25 12 101,616.65 0.00
Total Bermuda 1,750,482.80 0.03
Canada 4.25 % 1011778 BC ULC / New Red Finance Inc 15/05/24 58 474,393.64 0.01 7.75 % Air Canada 15/04/21 128 1,195,145.30 0.02 6.00 % Bombardier Inc 15/10/22 24 192,545.71 0.00 7.75 % Bombardier Inc 15/03/20 29 255,310.86 0.01 8.75 % Bombardier Inc 01/12/21 76 683,097.32 0.01 6.88 % Clearwater Seafoods Inc 01/05/25 70 577,157.68 0.01 7.00 % First Quantum Minerals Ltd 15/02/21 35 296,806.02 0.01 5.88 % Lions Gate Entertainment Corp 01/11/24 48 416,248.35 0.01 6.88 % Mattamy Group Corp 15/12/23 23 199,682.08 0.00 6.50 % MDC Partners Inc 01/05/24 47 386,434.99 0.01 6.25 % New Gold Inc 15/11/22 47 397,979.32 0.01 5.63 % Open Text Corp 15/01/23 66 563,014.65 0.01 5.75 % Quebecor Media Inc 15/01/23 65 564,744.66 0.01 8.88 % Telesat Canada / Telesat LLC 15/11/24 92 840,917.68 0.02 5.50 % Valeant Pharmaceuticals International Inc 01/11/25 3 25,071.83 0.00 6.50 % Valeant Pharmaceuticals International Inc 15/03/22 35 301,508.49 0.01 7.00 % Valeant Pharmaceuticals International Inc 15/03/24 35 308,219.76 0.01 7.50 % Valeant Pharmaceuticals International Inc 15/07/21 60 501,584.06 0.01 5.13 % Videotron Ltd 15/04/27 18 153,550.92 0.00
Total Canada 8,333,413.32 0.17
Cayman Islands 5.25 % Park Aerospace Holdings Ltd 15/08/22 70 569,982.18 0.01
Total Cayman Islands 569,982.18 0.01
Denmark 5.75 % Danske Bank A/S FRN Perpetual 100 1,064,368.60 0.02
Total Denmark 1,064,368.60 0.02
France 4.87 % Casino Guichard Perrachon SA FRN Perpetual 100 1,001,012.04 0.02 6.50 % Credit Agricole SA FRN Perpetual 100 1,113,459.12 0.03

60
SEB Strategy Fund - SEB Strategy Growth
Security description Maturity Total holdings Market % of
value in Net
SEK Assets
7.13 % Lafarge SA 15/07/36 51 549,994.61 0.01
Total France 2,664,465.77 0.06
Germany 1.38 % thyssenkrupp AG 03/03/22 12 119,812.33 0.00 2.50 % thyssenkrupp AG 25/02/25 12 127,597.99 0.00 2.75 % thyssenkrupp AG 08/03/21 68 711,261.76 0.02 6.25 % Unitymedia Hessen GmbH & Co KG / Unitymedia NRW GmbH 15/01/29 100 1,104,934.89 0.02
Total Germany 2,063,606.97 0.04
Ireland 4.13 % Ardagh Packaging Finance Plc / Ardagh Holdings USA Inc 15/05/23 100 1,042,178.07 0.02
Total Ireland 1,042,178.07 0.02
Italy 7.75 % Assicurazioni Generali SpA FRN 12/12/42 100 1,268,488.03 0.03 8.38 % Intesa Sanpaolo SpA FRN Perpetual 100 1,112,633.24 0.02 5.88 % Telecom Italia SpA/Milano 19/05/23 50 648,221.64 0.01
Total Italy 3,029,342.91 0.06
Luxembourg 4.75 % Altice Finco SA 15/01/28 100 938,058.59 0.02 6.25 % Altice Luxembourg SA 15/02/25 100 964,801.27 0.02 5.50 % Intelsat Jackson Holdings SA 01/08/23 18 120,319.46 0.00 7.25 % Intelsat Jackson Holdings SA 15/10/20 82 628,619.53 0.01 8.00 % Intelsat Jackson Holdings SA 15/02/24 70 604,008.49 0.01 4.75 % Mallinckrodt International Finance SA 15/04/23 12 76,832.20 0.00 5.63 % Mallinckrodt International Finance SA / Mallinckrodt CB LLC 15/10/23 30 209,537.01 0.01 6.00 % Telecom Italia Capital SA 30/09/34 12 109,875.52 0.00 7.20 % Telecom Italia Capital SA 18/07/36 23 234,540.48 0.01 7.72 % Telecom Italia Capital SA 04/06/38 29 307,805.72 0.01 7.75 % Telecom Italia Finance SA 24/01/33 32 483,680.74 0.01
Total Luxembourg 4,678,079.01 0.10
Netherlands 4.50 % CNH Industrial NV 15/08/23 47 401,007.79 0.01 8.50 % Nyrstar Netherlands Holdings BV 15/09/19 134 1,456,358.12 0.03 7.63 % Telefonica Europe BV FRN Perpetual 100 1,178,319.96 0.03 7.13 % Ziggo Bond Co BV 15/05/24 100 1,080,178.25 0.02
Total Netherlands 4,115,864.12 0.09
Portugal 5.38 % EDP - Energias de Portugal SA FRN 16/09/75 100 1,098,809.64 0.02
Total Portugal 1,098,809.64 0.02
Spain 6.25 % Banco Santander SA FRN Perpetual 100 1,027,430.27 0.02 3.38 % Bankia SA FRN 15/03/27 100 1,032,415.03 0.03 5.50 % Obrascon Huarte Lain SA 15/03/23 100 1,007,727.21 0.02
Total Spain 3,067,572.51 0.07
Sweden 1.75 % Lansforsakringar Hypotek AB 15/09/21 15,000 15,742,200.00 0.33 2.50 % Lansforsakringar Hypotek AB 19/06/19 5,000 5,204,200.00 0.11 1.25 % Nordea Hypotek AB 19/05/21 14,000 14,443,800.00 0.30 3.25 % Nordea Hypotek AB 17/06/20 5,000 5,397,600.00 0.11 1.50 % Skandinaviska Enskilda Banken AB 17/06/20 15,000 15,548,400.00 0.32

61
SEB Strategy Fund - SEB Strategy Growth
Security description Maturity Total holdings Market % of
value in Net
SEK Assets
1.50 % Skandinaviska Enskilda Banken AB 15/12/21 7,000 7,280,070.00 0.15 1.50 % Stadshypotek AB 15/12/21 2,000 2,080,020.00 0.04 4.25 % Stadshypotek AB 17/06/20 10,000 11,040,700.00 0.23 4.50 % Stadshypotek AB 21/09/22 9,000 10,578,690.00 0.22 1.00 % Sveriges Sakerstallda Obligationer AB 17/03/21 5,000 5,119,550.00 0.11 1.25 % Sveriges Sakerstallda Obligationer AB 15/06/22 10,000 10,264,500.00 0.21 4.00 % Sveriges Sakerstallda Obligationer AB 18/09/19 10,000 10,723,200.00 0.22 1.00 % Swedbank Hypotek AB 15/09/21 3,000 3,065,970.00 0.07 5.70 % Swedbank Hypotek AB 12/05/20 14,000 15,890,980.00 0.33 0.75 % Sweden Government Bond 12/05/28 8,500 8,474,670.00 0.18 1.00 % Sweden Government Bond 12/11/26 4,300 4,463,056.00 0.09 1.50 % Sweden Government Bond 13/11/23 9,500 10,230,455.00 0.21 2.25 % Sweden Government Bond 01/06/32 2,000 2,284,860.00 0.05 2.50 % Sweden Government Bond 12/05/25 5,000 5,769,650.00 0.12 3.50 % Sweden Government Bond 01/06/22 10,400 12,051,000.00 0.25 3.50 % Sweden Government Bond 30/03/39 5,000 6,826,425.00 0.14 5.00 % Sweden Government Bond 01/12/20 15,000 17,374,200.00 0.36
Total Sweden 199,854,196.00 4.15
Switzerland 1.25 % Credit Suisse Group AG FRN 17/07/25 100 992,733.51 0.02
Total Switzerland 992,733.51 0.02
United Kingdom 2.00 % Barclays Plc FRN 07/02/28 100 979,627.73 0.02 6.46 % HBOS Capital Funding LP FRN Perpetual 56 646,128.35 0.01 3.63 % Royal Bank of Scotland Group Plc FRN 25/03/24 100 1,015,386.23 0.02 6.00 % Tesco Plc 14/12/29 23 311,015.70 0.01
Total United Kingdom 2,952,158.01 0.06
United States of America 4.13 % ADT Corp/The 15/06/23 25 205,388.82 0.01 7.00 % Advanced Micro Devices Inc 01/07/24 24 203,392.47 0.01 7.50 % Advanced Micro Devices Inc 15/08/22 18 162,449.39 0.00 6.63 % Albertsons Cos LLC / Safeway Inc / New Albertson's Inc /
Albertson's LLC 15/06/24 96 747,255.32 0.02 7.88 % Aleris International Inc 01/11/20 74 601,468.08 0.01 4.13 % Ally Financial Inc 30/03/20 70 584,132.59 0.01 4.63 % Ally Financial Inc 19/05/22 35 299,711.75 0.01 4.75 % Ally Financial Inc 10/09/18 58 480,908.90 0.01 8.00 % Ally Financial Inc 15/03/20 41 371,151.52 0.01 5.75 % AMC Entertainment Holdings Inc 15/06/25 12 97,288.76 0.00 5.88 % AMC Entertainment Holdings Inc 15/02/22 12 99,615.31 0.00 6.13 % AMC Entertainment Holdings Inc 15/05/27 12 97,751.51 0.00 5.00 % AMC Networks Inc 01/04/24 47 388,967.05 0.01 6.25 % American Axle & Manufacturing Inc 01/04/25 23 198,702.85 0.00 6.63 % American Axle & Manufacturing Inc 15/10/22 41 348,287.93 0.01 7.88 % American Greetings Corp 15/02/25 58 513,171.79 0.01 6.38 % Amkor Technology Inc 01/10/22 34 287,204.00 0.01 6.38 % APX Group Inc 01/12/19 4 33,190.69 0.00 7.88 % APX Group Inc 01/12/22 35 306,615.02 0.01 8.75 % APX Group Inc 01/12/20 24 200,285.82 0.00 6.15 % Arconic Inc 15/08/20 35 309,474.90 0.01 6.75 % Arconic Inc 15/01/28 35 338,090.93 0.01 6.00 % Avantor Inc 01/10/24 18 147,259.51 0.00 9.63 % BCD Acquisition Inc 15/09/23 12 108,134.54 0.00

62
SEB Strategy Fund - SEB Strategy Growth
Security description Maturity Total holdings Market % of
value in Net
SEK Assets
5.75 % Beazer Homes USA Inc 15/06/19 13 109,880.35 0.00 8.75 % Beazer Homes USA Inc 15/03/22 23 207,449.94 0.01 7.75 % Belo Corp 01/06/27 12 109,789.06 0.00 9.75 % Blackboard Inc 15/10/21 25 186,359.10 0.00 5.63 % Boise Cascade Co 01/09/24 58 501,485.16 0.01 5.88 % Cablevision Systems Corp 15/09/22 33 264,177.56 0.01 7.75 % Cablevision Systems Corp 15/04/18 40 331,700.61 0.01 8.00 % Cablevision Systems Corp 15/04/20 58 509,975.89 0.01 5.00 % CalAtlantic Group Inc 15/06/27 23 194,772.79 0.00 6.25 % CalAtlantic Group Inc 15/12/21 12 106,920.17 0.00 5.25 % Calpine Corp 01/06/26 23 184,528.63 0.00 5.75 % Calpine Corp 15/01/25 47 364,604.66 0.01 5.88 % Calpine Corp 15/01/24 35 291,473.11 0.01 8.00 % CB Escrow Corp 15/10/25 23 190,530.12 0.00 5.50 % CCO Holdings LLC / CCO Holdings Capital Corp 01/05/26 12 100,070.21 0.00 5.75 % CCO Holdings LLC / CCO Holdings Capital Corp 01/09/23 63 527,705.20 0.01 5.75 % CCO Holdings LLC / CCO Holdings Capital Corp 15/01/24 35 295,063.73 0.01 5.75 % CCO Holdings LLC / CCO Holdings Capital Corp 15/02/26 47 399,045.25 0.01 5.88 % CCO Holdings LLC / CCO Holdings Capital Corp 01/04/24 54 461,240.79 0.01 5.88 % CCO Holdings LLC / CCO Holdings Capital Corp 01/05/27 35 294,802.96 0.01 5.38 % Cedar Fair LP / Canada's Wonderland Co / Magnum Management Corp /
Millennium Op 15/04/27 12 103,491.26 0.00 5.80 % CenturyLink Inc 15/03/22 52 416,965.25 0.01 6.75 % CenturyLink Inc 01/12/23 20 160,716.76 0.00 7.50 % CenturyLink Inc 01/04/24 35 286,022.71 0.01 5.13 % Cequel Communications Holdings I LLC / Cequel Capital Corp 15/12/21 23 187,261.03 0.00 6.25 % CHS/Community Health Systems Inc 31/03/23 23 169,587.97 0.00 7.13 % CHS/Community Health Systems Inc 15/07/20 12 73,320.76 0.00 8.00 % CHS/Community Health Systems Inc 15/11/19 34 234,894.75 0.01 4.88 % Cinemark USA Inc 01/06/23 12 99,743.03 0.00 6.50 % Clear Channel Worldwide Holdings Inc 15/11/22 36 297,481.24 0.01 7.63 % Clear Channel Worldwide Holdings Inc 15/03/20 35 281,409.07 0.01 7.63 % Clear Channel Worldwide Holdings Inc 15/03/20 24 191,099.48 0.00 5.75 % Cleveland-Cliffs Inc 01/03/25 60 467,579.86 0.01 10.13 % Cloud Crane LLC 01/08/24 59 544,699.28 0.01 5.50 % CommScope Inc 15/06/24 12 102,425.25 0.00 6.00 % CommScope Technologies LLC 15/06/25 47 409,546.75 0.01 6.50 % Consolidated Communications Inc 01/10/22 24 177,375.97 0.00 8.50 % Constellation Merger Sub Inc 15/09/25 12 96,083.24 0.00 5.63 % Cooper-Standard Automotive Inc 15/11/26 48 403,255.82 0.01 4.50 % Crown Americas LLC / Crown Americas Capital Corp IV 15/01/23 52 434,352.81 0.01 4.25 % Crown Americas LLC / Crown Americas Capital Corp V 30/09/26 12 97,407.64 0.00 6.00 % Dana Inc 15/09/23 82 702,094.54 0.02 5.00 % DaVita Inc 01/05/25 70 572,767.56 0.01 5.88 % Dell International LLC / EMC Corp 15/06/21 47 399,391.58 0.01 7.13 % Dell International LLC / EMC Corp 15/06/24 88 786,545.35 0.02 7.75 % Diamond Resorts International Inc 01/09/23 12 106,567.45 0.00 10.75 % Diamond Resorts International Inc 01/09/24 12 104,997.42 0.00 6.75 % DISH DBS Corp 01/06/21 94 813,798.49 0.02 7.75 % DISH DBS Corp 01/07/26 47 406,187.34 0.01 5.75 % Dollar Tree Inc 01/03/23 70 601,005.33 0.01 5.88 % Dynegy Inc 01/06/23 29 240,831.97 0.01 7.38 % Dynegy Inc 01/11/22 82 708,982.83 0.02 5.13 % Encompass Health Corp 15/03/23 42 352,336.47 0.01 5.75 % Encompass Health Corp 01/11/24 64 536,925.11 0.01

63
SEB Strategy Fund - SEB Strategy Growth
Security description Maturity Total holdings Market % of
value in Net
SEK Assets
5.38 % Endo Finance LLC / Endo Finco Inc 15/01/23 44 279,722.29 0.01 7.25 % Endo Finance LLC / Endo Finco Inc 15/01/22 18 128,308.63 0.00 8.50 % Enova International Inc 01/09/24 12 100,864.06 0.00 5.38 % Equinix Inc 01/04/23 23 194,665.45 0.00 5.38 % Equinix Inc 15/05/27 23 201,341.10 0.00 5.75 % Equinix Inc 01/01/25 12 104,526.81 0.00 5.88 % Equinix Inc 15/01/26 23 202,518.05 0.00 5.38 % First Data Corp 15/08/23 12 102,383.98 0.00 5.75 % First Data Corp 15/01/24 23 194,930.97 0.00 7.00 % First Data Corp 01/12/23 106 918,052.17 0.02 9.25 % Frontier Communications Corp 01/07/21 29 186,895.87 0.00 10.50 % Frontier Communications Corp 15/09/22 24 148,722.44 0.00 11.00 % Frontier Communications Corp 15/09/25 32 192,702.91 0.00 12.50 % Gogo Intermediate Holdings LLC / Gogo Finance Co Inc 01/07/22 47 435,536.89 0.01 5.00 % Goodyear Tire & Rubber Co/The 31/05/26 47 395,616.58 0.01 5.88 % Gray Television Inc 15/07/26 58 486,673.86 0.01 7.75 % Greif Inc 01/08/19 41 359,459.57 0.01 4.88 % Hanesbrands Inc 15/05/26 53 445,383.14 0.01 5.00 % HCA Inc 15/03/24 23 196,949.67 0.00 5.38 % HCA Inc 01/02/25 32 271,863.30 0.01 5.88 % HCA Inc 01/05/23 38 333,742.56 0.01 5.88 % HCA Inc 15/02/26 52 450,395.02 0.01 7.50 % HCA Inc 15/02/22 52 481,087.22 0.01 8.36 % HCA Inc 15/04/24 8 77,807.16 0.00 7.75 % Herc Rentals Inc 01/06/24 62 558,827.08 0.01 5.88 % Hertz Corp/The 15/10/20 47 384,868.81 0.01 10.00 % Hexion Inc 15/04/20 72 562,793.59 0.01 4.63 % Hilton Worldwide Finance LLC / Hilton Worldwide Finance Corp 01/04/25 41 345,572.23 0.01 4.88 % Hilton Worldwide Finance LLC / Hilton Worldwide Finance Corp 01/04/27 12 102,863.44 0.00 7.13 % Infor Software Parent LLC / Infor Software Parent Inc 01/05/21 23 192,223.05 0.00 6.50 % Infor US Inc 15/05/22 24 203,877.83 0.01 8.25 % International Lease Finance Corp 15/12/20 23 216,232.80 0.01 5.75 % Iron Mountain Inc 15/08/24 51 422,024.70 0.01 5.38 % Iron Mountain US Holdings Inc 01/06/26 18 152,759.52 0.00 5.00 % iStar Inc 01/07/19 35 288,730.72 0.01 6.00 % iStar Inc 01/04/22 23 195,367.85 0.00 5.65 % JC Penney Corp Inc 01/06/20 12 90,483.01 0.00 5.88 % JC Penney Corp Inc 01/07/23 31 239,719.95 0.01 10.00 % K Hovnanian Enterprises Inc 15/07/22 10 89,150.09 0.00 10.50 % K Hovnanian Enterprises Inc 15/07/24 9 84,743.26 0.00 5.88 % Kaiser Aluminum Corp 15/05/24 47 410,304.82 0.01 4.75 % KFC Holding Co/Pizza Hut Holdings LLC/Taco Bell of America LLC 01/06/27 35 292,739.71 0.01 5.00 % KFC Holding Co/Pizza Hut Holdings LLC/Taco Bell of America LLC 01/06/24 35 296,539.52 0.01 5.25 % KFC Holding Co/Pizza Hut Holdings LLC/Taco Bell of America LLC 01/06/26 35 302,336.66 0.01 7.00 % Kraton Polymers LLC / Kraton Polymers Capital Corp 15/04/25 12 105,783.42 0.00 10.50 % Kraton Polymers LLC / Kraton Polymers Capital Corp 15/04/23 51 472,633.08 0.01 9.00 % Kronos Acquisition Holdings Inc 15/08/23 44 338,749.04 0.01 5.63 % L Brands Inc 15/02/22 70 610,725.49 0.01 6.63 % L Brands Inc 01/04/21 35 314,117.20 0.01 8.50 % L Brands Inc 15/06/19 22 194,687.39 0.00 4.63 % Lamb Weston Holdings Inc 01/11/24 54 454,529.36 0.01 4.13 % Lennar Corp 15/01/22 23 191,754.15 0.00 4.50 % Lennar Corp 15/11/19 12 100,638.09 0.00 4.50 % Lennar Corp 30/04/24 12 100,617.46 0.00 5.25 % Level 3 Financing Inc 15/03/26 24 192,211.66 0.00

64
SEB Strategy Fund - SEB Strategy Growth
Security description Maturity Total holdings Market % of
value in Net
SEK Assets
5.38 % Level 3 Financing Inc 15/01/24 23 188,102.78 0.00 5.63 % Level 3 Financing Inc 01/02/23 12 99,254.73 0.00 5.00 % Levi Strauss & Co 01/05/25 95 811,146.57 0.02 5.88 % LIN Television Corp 15/11/22 23 195,298.18 0.00 4.88 % Live Nation Entertainment Inc 01/11/24 57 479,547.65 0.01 7.00 % Men's Wearhouse Inc/The 01/07/22 12 98,867.63 0.00 6.25 % Meritor Inc 15/02/24 58 499,889.58 0.01 5.50 % Micron Technology Inc 01/02/25 58 497,344.26 0.01 5.63 % Micron Technology Inc 15/01/26 32 275,012.53 0.01 6.50 % Nationstar Mortgage LLC / Nationstar Capital Corp 01/08/18 47 385,257.47 0.01 6.50 % Nationstar Mortgage LLC / Nationstar Capital Corp 01/07/21 12 99,723.38 0.00 5.88 % Navient Corp 25/03/21 76 644,381.07 0.01 6.75 % Navient Corp 25/06/25 23 194,463.96 0.00 8.00 % Navient Corp 25/03/20 82 724,612.38 0.02 5.63 % Nexstar Broadcasting Inc 01/08/24 35 295,591.00 0.01 5.00 % Nielsen Finance LLC / Nielsen Finance Co 15/04/22 35 295,115.31 0.01 5.75 % NRG Energy Inc 15/01/28 6 49,626.38 0.00 6.25 % NRG Energy Inc 15/07/22 12 102,273.94 0.00 7.95 % Pactiv LLC 15/12/25 35 325,149.81 0.01 5.88 % PetSmart Inc 01/06/25 24 149,801.23 0.00 8.88 % PetSmart Inc 01/06/25 12 59,335.90 0.00 5.50 % Post Holdings Inc 01/03/25 41 348,452.42 0.01 5.63 % Post Holdings Inc 15/01/28 12 98,680.96 0.00 9.25 % Prime Security Services Borrower LLC / Prime Finance Inc 15/05/23 47 426,351.45 0.01 5.63 % Prudential Financial Inc FRN 15/06/43 41 364,397.52 0.01 4.25 % PulteGroup Inc 01/03/21 13 109,892.06 0.00 5.00 % PulteGroup Inc 15/01/27 12 102,888.01 0.00 7.00 % Qorvo Inc 01/12/25 31 283,728.34 0.01 7.00 % Quad/Graphics Inc 01/05/22 29 245,435.87 0.01 4.88 % Quintiles IMS Inc 15/05/23 24 203,284.40 0.00 7.75 % Qwest Capital Funding Inc 15/02/31 12 86,264.17 0.00 8.63 % Rackspace Hosting Inc 15/11/24 47 410,362.54 0.01 8.50 % Rain CII Carbon LLC / CII Carbon Corp 15/01/21 147 1,478,251.63 0.03 5.50 % Rayonier AM Products Inc 01/06/24 83 674,945.79 0.01 5.75 % Regal Entertainment Group 01/02/25 12 99,762.68 0.00 5.75 % Reynolds Group Issuer Inc / Reynolds Group Issuer LLC /
Reynolds Group Issuer Lu 15/10/20 66 548,159.88 0.01 6.13 % Rite Aid Corp 01/04/23 24 177,226.63 0.00 6.75 % Rite Aid Corp 15/06/21 24 195,389.06 0.00 5.63 % Sally Holdings LLC / Sally Capital Inc 01/12/25 52 423,377.02 0.01 5.63 % Sinclair Television Group Inc 01/08/24 47 396,590.16 0.01 5.00 % Sirius XM Radio Inc 01/08/27 15 123,099.43 0.00 5.38 % Sirius XM Radio Inc 15/04/25 35 298,430.82 0.01 5.38 % Sirius XM Radio Inc 15/07/26 47 397,898.51 0.01 6.00 % Sirius XM Radio Inc 15/07/24 24 207,709.56 0.01 4.88 % Six Flags Entertainment Corp 31/07/24 70 581,536.34 0.01 10.50 % Solera LLC / Solera Finance Inc 01/03/24 71 656,014.56 0.01 6.13 % Spectrum Brands Inc 15/12/24 12 104,109.25 0.00 6.63 % Spectrum Brands Inc 15/11/22 63 535,215.40 0.01 6.13 % Springleaf Finance Corp 15/05/22 23 195,488.37 0.00 8.25 % Springleaf Finance Corp 15/12/20 35 316,432.61 0.01 8.75 % Sprint Capital Corp 15/03/32 20 186,366.47 0.00 7.00 % Sprint Communications Inc 15/08/20 61 531,918.96 0.01 11.50 % Sprint Communications Inc 15/11/21 20 196,882.45 0.00 7.13 % Sprint Corp 15/06/24 35 292,607.90 0.01

65
SEB Strategy Fund - SEB Strategy Growth
Security description Maturity Total holdings Market % of
value in Net
SEK Assets
7.25 % Sprint Corp 15/09/21 100 866,963.01 0.02 7.63 % Sprint Corp 15/02/25 23 196,795.26 0.00 8.50 % Staples Inc 15/09/25 12 90,656.91 0.00 9.13 % Syniverse Foreign Holdings Corp 15/01/22 43 357,208.34 0.01 9.50 % Talen Energy Supply LLC 15/07/22 61 513,205.11 0.01 5.50 % TEGNA Inc 15/09/24 23 198,431.69 0.00 6.38 % Telecom Italia Capital SA 15/11/33 12 114,292.82 0.00 5.63 % Tempur Sealy International Inc 15/10/23 35 299,081.32 0.01 4.50 % Tenet Healthcare Corp 01/04/21 35 288,945.64 0.01 4.63 % Tenet Healthcare Corp 15/07/24 29 231,944.72 0.01 6.75 % Tenet Healthcare Corp 15/06/23 12 94,868.87 0.00 7.00 % Tenet Healthcare Corp 01/08/25 6 46,475.03 0.00 8.13 % Tenet Healthcare Corp 01/04/22 60 501,687.22 0.01 5.00 % Tenneco Inc 15/07/26 12 101,229.55 0.00 5.30 % Tesla Inc 15/08/25 23 181,289.66 0.00 8.75 % TPC Group Inc 15/12/20 89 730,513.83 0.02 4.63 % United Rentals North America Inc 15/07/23 35 295,880.43 0.01 8.25 % Uniti Group LP / Uniti Group Finance Inc / CSL Capital LLC 15/10/23 29 228,076.88 0.01 7.63 % Universal Hospital Services Inc 15/08/20 47 385,242.08 0.01 5.13 % Univision Communications Inc 15/05/23 24 196,516.96 0.00 5.13 % Univision Communications Inc 15/02/25 12 95,893.61 0.00 6.38 % US Concrete Inc 01/06/24 58 510,037.62 0.01 6.38 % Valeant Pharmaceuticals International 15/10/20 68 563,195.10 0.01 6.75 % Valeant Pharmaceuticals International 15/08/21 70 578,475.87 0.01 7.25 % Valeant Pharmaceuticals International 15/07/22 32 264,983.21 0.01 4.75 % VeriSign Inc 15/07/27 29 242,752.84 0.01 5.25 % VeriSign Inc 01/04/25 14 124,391.74 0.00 10.50 % Western Digital Corp 01/04/24 47 446,022.99 0.01 5.88 % William Lyon Homes Inc 31/01/25 50 417,798.41 0.01 7.75 % Windstream Services LLC / Windstream Finance Corp 15/10/20 12 82,945.29 0.00 7.75 % Windstream Services LLC / Windstream Finance Corp 01/10/21 23 141,053.08 0.00 4.88 % WMG Acquisition Corp 01/11/24 47 396,197.65 0.01 5.00 % Wolverine World Wide Inc 01/09/26 35 286,879.53 0.01 6.13 % XPO Logistics Inc 01/09/23 50 433,579.75 0.01 6.38 % Zayo Group LLC / Zayo Capital Inc 15/05/25 47 407,684.26 0.01
Total United States of America 68,405,524.03 1.42
Total Bonds 307,631,287.40 6.39
Shares
Australia APA Group 20,136 1,074,118.87 0.02 Australia & New Zealand Banking Group Ltd 11,019 2,027,977.29 0.04 Commonwealth Bank of Australia 5,824 2,996,314.08 0.06 CSL Ltd 1,634 1,478,523.92 0.03 Domino's Pizza Enterprises Ltd 572 171,059.44 0.00 Flight Centre Travel Group Ltd 563 159,498.89 0.00 GPT Group/The 311,748 10,201,375.11 0.21 Harvey Norman Holdings Ltd 9,892 264,152.24 0.01 Healthscope Ltd 19,047 256,141.54 0.01 Mirvac Group 1,151,307 17,325,794.08 0.36 National Australia Bank Ltd 10,615 2,010,043.54 0.04 QBE Insurance Group Ltd 5,718 391,065.54 0.01 REA Group Ltd 878 430,963.82 0.01 TPG Telecom Ltd 6,070 255,380.78 0.01

66
SEB Strategy Fund - SEB Strategy Growth
Security description Maturity Total holdings Market % of
value in Net
SEK Assets
Transurban Group 12,317 980,415.60 0.02 Westfield Corp 19,515 1,185,956.91 0.03 Westpac Banking Corp 12,185 2,446,229.62 0.05
Total Australia 43,655,011.27 0.91
Austria voestalpine AG 798 391,075.45 0.01
Total Austria 391,075.45 0.01
Belgium Colruyt SA 1,107 471,924.97 0.01 KBC Group NV 28,690 20,058,446.45 0.42 Proximus SADP 66,279 17,822,529.59 0.37 Solvay SA 1,376 1,567,970.68 0.03
Total Belgium 39,920,871.69 0.83
Bermuda Arch Capital Group Ltd 528 392,397.27 0.01 Bunge Ltd 817 448,709.05 0.01 IHS Markit Ltd 1,730 639,519.19 0.01 Kerry Properties Ltd 242,500 8,927,505.35 0.18 Norwegian Cruise Line Holdings Ltd 1,043 454,730.04 0.01 XL Group Ltd 1,374 395,535.36 0.01 Yue Yuen Industrial Holdings Ltd 510,062 16,400,398.17 0.34
Total Bermuda 27,658,794.43 0.57
Canada Bank of Montreal 2,006 1,318,587.39 0.03 Bank of Nova Scotia/The 3,955 2,096,513.26 0.04 BCE Inc 41,700 16,453,274.62 0.34 Canadian Imperial Bank of Commerce 64,203 51,411,038.97 1.07 Canadian National Railway Co 3,119 2,112,554.22 0.05 Canadian Pacific Railway Ltd 931 1,397,198.87 0.03 CI Financial Corp 18,000 3,501,664.41 0.07 Constellation Software Inc/Canada 140 697,136.13 0.02 Fairfax Financial Holdings Ltd 139 607,973.66 0.01 Great-West Lifeco Inc 2,446 561,030.86 0.01 H&R Real Estate Investment Trust 8,929 1,246,313.37 0.03 Magna International Inc 21,030 9,790,082.83 0.20 National Bank of Canada 2,397 982,420.16 0.02 Open Text Corp 2,200 642,762.50 0.01 Power Corp of Canada 77,300 16,351,039.82 0.34 Power Financial Corp 35,638 8,043,755.10 0.17 Restaurant Brands International Inc 1,400 706,906.75 0.02 RioCan Real Estate Investment Trust 9,402 1,496,651.60 0.03 Rogers Communications Inc 3,000 1,255,635.46 0.03 Royal Bank of Canada 4,579 3,071,515.99 0.06 SmartCentres Real Estate Investment Trust 7,522 1,519,341.91 0.03 Sun Life Financial Inc 71,366 24,194,380.47 0.50 Toronto-Dominion Bank/The 64,320 30,955,795.56 0.64
Total Canada 180,413,573.91 3.75
Cayman Islands CK Asset Holdings Ltd 19,471 1,392,842.49 0.03 WH Group Ltd 42,206 389,884.37 0.01
Total Cayman Islands 1,782,726.86 0.04

67
SEB Strategy Fund - SEB Strategy Growth
Security description Maturity Total holdings Market % of
value in Net
SEK Assets
Denmark Danske Bank A/S 2,745 875,732.40 0.02 Novo Nordisk A/S 5,631 2,487,217.64 0.05 Pandora A/S 499 445,100.46 0.01 Tryg A/S 2,185 447,790.94 0.01 William Demant Holding A/S 2,178 498,987.30 0.01
Total Denmark 4,754,828.74 0.10
Finland Elisa OYJ 2,251 724,143.87 0.02 Kone OYJ 2,510 1,105,080.40 0.02 Sampo Oyj 2,072 933,020.74 0.02 UPM-Kymmene OYJ 3,715 946,372.90 0.02
Total Finland 3,708,617.91 0.08
France Air Liquide SA 2,019 2,085,299.52 0.04 Arkema SA 1,031 1,029,377.47 0.02 AXA SA 5,697 1,385,460.72 0.03 BNP Paribas SA 3,196 1,956,060.09 0.04 Capgemini SE 976 948,938.92 0.02 Carrefour SA 2,335 414,151.73 0.01 Casino Guichard Perrachon SA 915 454,845.84 0.01 Cie de Saint-Gobain 3,571 1,614,339.54 0.03 Cie Generale des Etablissements Michelin 948 1,114,279.10 0.02 CNP Assurances 31,678 5,997,045.50 0.13 Danone SA 1,989 1,367,913.29 0.03 Dassault Systemes SE 678 590,541.55 0.01 Eiffage SA 998 896,246.79 0.02 Eurazeo SA 11,336 8,581,962.83 0.18 Fonciere Des Regions 8,345 7,751,795.23 0.16 ICADE 853 687,112.82 0.01 JCDecaux SA 652 215,420.76 0.00 Klepierre SA 90,038 32,457,390.11 0.67 Lagardere SCA 1,383 363,460.49 0.01 Legrand SA 2,567 1,620,053.33 0.03 L'Oreal SA 830 1,509,275.40 0.03 Natixis SA 28,086 1,821,405.38 0.04 Publicis Groupe SA 815 453,934.92 0.01 Sanofi 3,384 2,390,524.47 0.05 Schneider Electric SE 2,628 1,830,891.36 0.04 SCOR SE 12,986 4,282,913.09 0.09 Societe Generale SA 2,354 996,358.62 0.02 Veolia Environnement SA 3,703 774,567.69 0.02 Vinci SA 2,113 1,768,968.97 0.04
Total France 87,360,535.53 1.81
Germany adidas AG 672 1,104,362.68 0.02 Allianz SE 28,987 54,576,805.94 1.13 Bayer AG 2,630 2,689,212.70 0.06 Bayerische Motoren Werke AG 1,821 1,554,589.80 0.03 Covestro AG 846 715,576.97 0.02 Daimler AG 3,699 2,574,860.21 0.05 Deutsche Bank AG 7,493 1,169,514.34 0.03 Deutsche Boerse AG 918 873,683.44 0.02

68
SEB Strategy Fund - SEB Strategy Growth
Security description Maturity Total holdings Market % of
value in Net
SEK Assets
Deutsche Post AG 3,986 1,557,795.68 0.03 Deutsche Wohnen SE 2,472 886,137.67 0.02 Evonik Industries AG 2,966 914,790.68 0.02 Fresenius Medical Care AG & Co KGaA 988 852,684.93 0.02 GEA Group AG 1,440 566,457.21 0.01 Hannover Rueck SE 8,033 8,284,939.13 0.17 Henkel AG & Co KGaA 930 914,363.78 0.02 Linde AG 603 1,075,451.08 0.02 Merck KGaA 512 451,794.03 0.01 Muenchener Rueckversicherungs-Gesellschaft AG in Muenchen 3,664 6,511,331.97 0.14 SAP SE 3,342 3,070,589.91 0.06 United Internet AG 1,114 628,027.91 0.01 Wuestenrot & Wuerttembergische AG 597 137,114.45 0.00
Total Germany 91,110,084.51 1.89
Hong Kong AIA Group Ltd 42,000 2,931,855.02 0.06 HKT Trust & HKT Ltd 1,481,001 15,449,261.96 0.32 Link REIT 61,500 4,666,664.21 0.10 PCCW Ltd 181,000 860,651.79 0.02 Sun Hung Kai Properties Ltd 9,000 1,229,173.38 0.02 Wharf Holdings Ltd/The 85,000 2,403,674.95 0.05
Total Hong Kong 27,541,281.31 0.57
Ireland Accenture Plc 3,511 4,400,756.84 0.09 Allergan Plc 1,100 1,473,236.97 0.03 CRH Plc 4,340 1,278,189.13 0.02 DCC Plc 1,010 835,061.48 0.02 Jazz Pharmaceuticals Plc 422 465,230.87 0.01 Johnson Controls International Plc 3,474 1,083,973.05 0.02 Medtronic Plc 4,289 2,835,621.74 0.06 Pentair Plc 2,218 1,282,445.67 0.03 Perrigo Co Plc 509 363,232.52 0.01 Seagate Technology Plc 127,641 43,725,178.78 0.91
Total Ireland 57,742,927.05 1.20
Israel Teva Pharmaceutical Industries Ltd ADR 2,200 341,335.62 0.01
Total Israel 341,335.62 0.01
Italy Ferrari NV 676 581,222.71 0.01 Intesa Sanpaolo SpA 42,132 1,147,434.52 0.02 Poste Italiane SpA 4,665 287,807.11 0.01 Prysmian SpA 2,833 757,341.66 0.02 Telecom Italia SpA/Milano RSP 106,782 625,720.47 0.01 UniCredit SpA 6,782 1,038,870.24 0.02
Total Italy 4,438,396.71 0.09
Japan ABC-Mart Inc 1,500 705,365.20 0.01 AEON Financial Service Co Ltd 3,400 648,427.22 0.01 Aeon Mall Co Ltd 4,900 784,921.38 0.02 Asahi Kasei Corp 16,000 1,690,259.97 0.03 Asics Corp 2,400 313,282.45 0.01 Benesse Holdings Inc 1,200 346,686.45 0.01

69
SEB Strategy Fund - SEB Strategy Growth
Security description Maturity Total holdings Market % of
value in Net
SEK Assets
Bridgestone Corp 36,200 13,781,375.08 0.29 Brother Industries Ltd 79,500 16,063,138.83 0.33 Calbee Inc 800 213,099.51 0.00 Canon Inc 6,000 1,831,551.05 0.04 Central Japan Railway Co 15,400 22,587,094.62 0.47 Concordia Financial Group Ltd 18,000 889,610.51 0.02 Daiichi Sankyo Co Ltd 3,600 768,466.49 0.02 Daito Trust Construction Co Ltd 3,900 6,512,363.23 0.14 Daiwa House Industry Co Ltd 186,400 58,620,739.34 1.22 DeNA Co Ltd 2,300 388,325.16 0.01 DTS Corp 2,400 640,170.70 0.01 Eisai Co Ltd 2,400 1,119,164.91 0.02 FANUC Corp 1,300 2,556,758.06 0.05 Fujitsu Ltd 137,000 7,992,678.03 0.17 Hachijuni Bank Ltd/The 12,000 564,292.16 0.01 Hakuhodo DY Holdings Inc 2,900 308,361.97 0.01 Hamamatsu Photonics KK 2,500 688,648.66 0.01 Hino Motors Ltd 14,300 1,517,425.51 0.03 Hitachi Ltd 658,000 41,984,543.07 0.87 Honda Motor Co Ltd 16,300 4,575,287.21 0.09 Hoya Corp 2,000 818,092.80 0.02 Isuzu Motors Ltd 5,700 781,745.24 0.02 Japan Airlines Co Ltd 500 160,188.04 0.00 Japan Airport Terminal Co Ltd 1,000 303,804.90 0.01 Japan Exchange Group Inc 5,900 840,907.24 0.02 Japan Prime Realty Investment Corp 24 624,471.69 0.01 JTEKT Corp 7,400 1,041,251.31 0.02 Kakaku.com Inc 2,900 401,523.96 0.01 Kamigumi Co Ltd 21,200 3,841,285.86 0.08 KDDI Corp 87,100 17,753,831.25 0.37 Keyence Corp 370 1,697,411.74 0.04 Komatsu Ltd 6,100 1,807,988.00 0.04 Kubota Corp 5,500 883,232.79 0.02 Kuraray Co Ltd 6,000 927,113.70 0.02 Kyushu Financial Group Inc 10,300 510,552.12 0.01 LINE Corp 700 233,777.14 0.00 LIXIL Group Corp 4,000 886,703.29 0.02 Makita Corp 2,800 963,599.36 0.02 Maruichi Steel Tube Ltd 3,600 863,445.50 0.02 McDonald's Holdings Co Japan Ltd 1,200 432,158.83 0.01 Miraca Holdings Inc 46,000 16,131,458.59 0.33 Mitsubishi Chemical Holdings Corp 10,000 898,695.59 0.02 Mitsubishi UFJ Financial Group Inc 53,900 3,237,408.94 0.07 Mitsui Fudosan Co Ltd 5,600 1,027,703.65 0.02 Mixi Inc 40,400 14,857,658.44 0.31 Mizuho Financial Group Inc 214,800 3,194,172.71 0.07 NEC Corp 3,600 795,416.46 0.02 Nihon Unisys Ltd 4,000 682,034.73 0.01 Nintendo Co Ltd 500 1,496,856.90 0.03 Nissan Chemical Industries Ltd 2,700 882,088.07 0.02 Nissin Foods Holdings Co Ltd 800 478,529.05 0.01 Nitori Holdings Co Ltd 400 467,045.52 0.01 NTT DOCOMO Inc 195,600 37,829,640.43 0.79 Ono Pharmaceutical Co Ltd 2,800 534,405.90 0.01 Otsuka Holdings Co Ltd 2,400 863,096.63 0.02 Panasonic Corp 10,200 1,222,843.78 0.03

70
SEB Strategy Fund - SEB Strategy Growth
Security description Maturity Total holdings Market % of
value in Net
SEK Assets
Park24 Co Ltd 3,100 607,660.67 0.01 Recruit Holdings Co Ltd 4,200 854,723.83 0.02 Rinnai Corp 900 667,207.88 0.01 Sekisui Chemical Co Ltd 5,900 969,980.72 0.02 Seven Bank Ltd 16,000 448,875.37 0.01 Shimadzu Corp 2,800 521,381.53 0.01 Shimamura Co Ltd 700 630,867.59 0.01 Shinsei Bank Ltd 4,100 580,783.39 0.01 Shiseido Co Ltd 1,400 554,145.95 0.01 Shizuoka Bank Ltd/The 12,000 1,015,202.58 0.02 SoftBank Group Corp 2,500 1,620,777.32 0.03 Sony Corp 3,600 1,329,967.72 0.03 Stanley Electric Co Ltd 2,900 964,289.83 0.02 Sumitomo Dainippon Pharma Co Ltd 3,600 438,002.35 0.01 Sumitomo Electric Industries Ltd 7,500 1,038,424.04 0.02 Sumitomo Mitsui Financial Group Inc 9,100 3,219,663.25 0.07 Sumitomo Rubber Industries Ltd 4,000 609,354.13 0.01 Sundrug Co Ltd 1,600 609,354.13 0.01 Suzuken Co Ltd/Aichi Japan 1,500 505,311.85 0.01 Suzuki Motor Corp 1,800 854,811.04 0.02 Taisho Pharmaceutical Holdings Co Ltd 1,000 654,125.38 0.01 Taiyo Nippon Sanso Corp 5,500 630,395.16 0.01 Tokyo Electron Ltd 800 1,186,147.35 0.02 Toppan Printing Co Ltd 18,000 1,333,107.52 0.03 Toray Industries Inc 13,000 1,003,900.75 0.02 Unicharm Corp 2,300 489,710.96 0.01 West Japan Railway Co 600 358,765.96 0.01 Yamaguchi Financial Group Inc 6,000 583,915.92 0.01 Yamazaki Baking Co Ltd 3,100 495,005.74 0.01 Yokohama Rubber Co Ltd/The 3,100 622,531.12 0.01
Total Japan 333,862,567.95 6.93
Liberia Royal Caribbean Cruises Ltd 41,906 40,925,459.02 0.85
Total Liberia 40,925,459.02 0.85
Luxembourg Eurofins Scientific SE 79 394,261.86 0.01 RTL Group SA 608 400,929.44 0.01
Total Luxembourg 795,191.30 0.02
Mauritius Golden Agri-Resources Ltd 102,200 231,663.43 0.00
Total Mauritius 231,663.43 0.00
Netherlands Aegon NV 8,513 444,858.63 0.01 AerCap Holdings NV 2,353 1,013,537.80 0.02 ASML Holding NV 1,547 2,207,717.09 0.05 ING Groep NV 64,741 9,754,745.77 0.20 Koninklijke Ahold Delhaize NV 13,266 2,391,426.15 0.05 Koninklijke KPN NV 20,267 579,455.34 0.01 Mylan NV 1,700 588,900.15 0.01 QIAGEN NV 2,596 668,461.28 0.01 Sensata Technologies Holding NV 2,200 920,615.50 0.02 Unilever NV 5,376 2,481,859.38 0.05

71
SEB Strategy Fund - SEB Strategy Growth
Security description Maturity Total holdings Market % of
value in Net
SEK Assets
Wolters Kluwer NV 2,704 1,155,932.01 0.03
Total Netherlands 22,207,509.10 0.46
New Zealand Mercury NZ Ltd 8,612 168,992.66 0.00 Meridian Energy Ltd 42,470 723,339.28 0.02 Ryman Healthcare Ltd 7,358 453,721.81 0.01 Spark New Zealand Ltd 452,619 9,566,946.00 0.20
Total New Zealand 10,912,999.75 0.23
Norway DNB ASA 4,512 686,957.47 0.01 Norsk Hydro ASA 20,820 1,299,417.55 0.03 Telenor ASA 99,222 17,470,501.06 0.36
Total Norway 19,456,876.08 0.40
Panama Carnival Corp 1,500 815,103.57 0.02
Total Panama 815,103.57 0.02
Singapore Broadcom Ltd 1,311 2,757,506.32 0.06 Flex Ltd 5,288 778,883.19 0.02 Hutchison Port Holdings Trust 57,800 196,392.84 0.00 Oversea-Chinese Banking Corp Ltd 199,900 15,173,611.82 0.31 SATS Ltd 14,800 471,487.22 0.01 StarHub Ltd 242,200 4,228,865.45 0.09 Suntec Real Estate Investment Trust 84,500 1,113,012.49 0.02 United Overseas Bank Ltd 8,100 1,312,549.12 0.03 Yanlord Land Group Ltd 31,800 315,607.27 0.01
Total Singapore 26,347,915.72 0.55
Spain Amadeus IT Group SA 1,481 875,261.56 0.02 Banco Bilbao Vizcaya Argentaria SA 21,054 1,472,185.17 0.03 Banco Santander SA 45,280 2,439,179.63 0.05 Bankinter SA 4,366 339,286.58 0.01 CaixaBank SA 14,294 546,547.38 0.01 Ferrovial SA 4,032 750,226.63 0.01 Grifols SA 2,198 527,835.17 0.01 Iberdrola SA 22,471 1,427,220.20 0.03 Industria de Diseno Textil SA 3,812 1,088,579.97 0.02 Telefonica SA 15,739 1,257,293.26 0.03
Total Spain 10,723,615.55 0.22
Sweden Assa Abloy AB 6,054 1,031,601.60 0.02 Atlas Copco AB A 4,173 1,478,076.60 0.03 Electrolux AB 35,344 9,341,419.20 0.19 Essity AB 2,232 520,056.00 0.01 Hemfosa Fastigheter AB 3,827 420,587.30 0.01 Hennes & Mauritz AB 3,779 639,784.70 0.01 Hexagon AB 1,764 724,827.60 0.02 ICA Gruppen AB 823 245,171.70 0.01 Industrivarden AB 91,646 18,558,315.00 0.39 Investor AB 2,913 1,089,753.30 0.02 L E Lundbergforetagen AB 712 436,456.00 0.01

72
SEB Strategy Fund - SEB Strategy Growth
Security description Maturity Total holdings Market % of
value in Net
SEK Assets
Nobina AB 8,707 470,178.00 0.01 Nordea Bank AB 8,540 848,022.00 0.02 Securitas AB 3,997 572,370.40 0.01 SKF AB 121,557 22,147,685.40 0.46 Telefonaktiebolaget LM Ericsson 11,797 635,268.45 0.01
Total Sweden 59,159,573.25 1.23
Switzerland ABB Ltd 9,392 2,061,186.13 0.04 Baloise Holding AG 1,331 1,696,483.31 0.03 Chubb Ltd 1,301 1,556,561.92 0.03 Cie Financiere Richemont SA 2,380 1,765,727.24 0.04 Credit Suisse Group AG 9,854 1,440,614.43 0.03 Garmin Ltd 10,600 5,169,912.41 0.11 Kuehne + Nagel International AG 466 675,399.87 0.01 LafargeHolcim Ltd 2,821 1,302,437.04 0.03 Nestle SA 8,945 6,298,111.12 0.13 Novartis AG 6,494 4,495,991.19 0.09 Roche Holding AG 7,146 14,800,142.29 0.31 SGS SA 625 13,343,526.97 0.28 Sonova Holding AG 532 680,318.44 0.01 Swatch Group AG/The 279 931,575.42 0.02 Swiss Life Holding AG 1,272 3,687,161.51 0.08 Swiss Re AG 1,128 864,824.39 0.02 Swisscom AG 13,553 59,043,236.33 1.23 TE Connectivity Ltd 71,574 55,694,388.08 1.16 UBS Group AG 11,536 1,738,856.09 0.03 Zurich Insurance Group AG 510 1,270,946.53 0.03
Total Switzerland 178,517,400.71 3.71
United Kingdom Aon Plc 894 980,826.15 0.02 Ashtead Group Plc 3,980 878,091.29 0.02 Associated British Foods Plc 1,620 505,977.71 0.01 AstraZeneca Plc 3,867 2,193,290.77 0.05 Barclays Plc 54,739 1,231,328.83 0.03 Barratt Developments Plc 232,698 16,687,823.05 0.35 Bellway Plc 525 207,177.40 0.00 Berkeley Group Holdings Plc 36,151 16,804,536.83 0.35 BT Group Plc 35,207 1,059,463.32 0.02 Compass Group Plc 6,805 1,205,911.33 0.02 easyJet Plc 2,352 381,369.24 0.01 Experian Plc 5,778 1,046,955.20 0.02 Fiat Chrysler Automobiles NV 5,271 772,692.55 0.02 GlaxoSmithKline Plc 15,766 2,309,321.85 0.05 HSBC Holdings Plc 57,452 4,879,902.60 0.10 Johnson Matthey Plc 1,268 431,848.72 0.01 Liberty Global Plc C 2,857 791,571.80 0.02 Lloyds Banking Group Plc 221,845 1,672,279.48 0.03 London Stock Exchange Group Plc 2,438 1,024,197.72 0.02 Mediclinic International Plc 2,995 215,448.44 0.00 National Grid Plc 20,900 2,025,681.83 0.04 Next Plc 3,418 1,713,002.14 0.04 Nielsen Holdings Plc 1,879 559,986.92 0.01 Old Mutual Plc 29,051 745,511.59 0.01 Persimmon Plc 203,902 61,833,266.82 1.28

73
SEB Strategy Fund - SEB Strategy Growth
Security description Maturity Total holdings Market % of
value in Net
SEK Assets
Prudential Plc 9,290 1,960,613.23 0.04 Reckitt Benckiser Group Plc 2,128 1,630,730.59 0.03 RSA Insurance Group Plc 12,145 850,795.81 0.02 Sage Group Plc/The 10,703 945,966.33 0.02 Shire Plc 3,043 1,314,418.98 0.03 Sky Plc 4,761 533,637.03 0.01 Smiths Group Plc 5,043 832,228.34 0.02 Standard Chartered Plc 11,959 1,033,266.65 0.02 Standard Life Aberdeen Plc 18,982 917,894.89 0.02 Taylor Wimpey Plc 2,271,927 51,936,338.48 1.08 Tesco Plc 36,401 843,618.37 0.02 Unilever Plc 4,820 2,202,373.09 0.05 Vodafone Group Plc 89,623 2,332,676.97 0.05 Worldpay Group Plc 9,051 427,044.79 0.01 WPP Plc 4,983 740,094.08 0.01
Total United Kingdom 190,659,161.21 3.96
United States of America 3M Co 1,782 3,434,065.13 0.07 Abbott Laboratories 6,447 3,012,418.20 0.06 AbbVie Inc 4,672 3,699,337.35 0.08 Activision Blizzard Inc 2,672 1,385,246.56 0.03 Adobe Systems Inc 1,518 2,177,984.26 0.05 Advanced Micro Devices Inc 3,826 322,023.67 0.01 Aetna Inc 1,149 1,697,001.43 0.04 Aflac Inc 75,957 54,590,000.72 1.13 Agilent Technologies Inc 2,262 1,240,288.22 0.03 AGNC Investment Corp 5,775 954,636.48 0.02 Air Products & Chemicals Inc 1,150 1,544,910.08 0.03 Albemarle Corp 804 841,864.81 0.02 Alexion Pharmaceuticals Inc 852 834,226.88 0.02 Alleghany Corp 117 571,014.87 0.01 Alliance Data Systems Corp 282 585,251.49 0.01 Allstate Corp/The 1,269 1,087,926.37 0.02 Alphabet Inc A 1,720 14,834,451.09 0.31 Amazon.com Inc 1,165 11,154,875.59 0.23 American Express Co 2,752 2,237,644.71 0.05 American Financial Group Inc/OH 600 533,200.79 0.01 American International Group Inc 2,864 1,397,086.30 0.03 American Tower Corp 1,553 1,814,069.15 0.04 AmerisourceBergen Corp 685 514,964.84 0.01 AMETEK Inc 2,577 1,529,052.51 0.03 Amgen Inc 2,084 2,967,201.34 0.06 Annaly Capital Management Inc 596,541 58,072,680.51 1.21 Anthem Inc 882 1,624,875.63 0.03 Apple Inc 14,757 20,446,790.72 0.42 Applied Materials Inc 4,262 1,783,832.25 0.04 Aramark 1,500 524,898.70 0.01 Arista Networks Inc 232 447,482.57 0.01 Arrow Electronics Inc 1,100 724,189.91 0.02 Arthur J Gallagher & Co 1,285 665,762.48 0.01 AT&T Inc 17,788 5,662,433.27 0.12 Atmos Energy Corp 1,475 1,037,252.15 0.02 Autodesk Inc 899 771,604.94 0.02 Autoliv Inc 463 481,734.69 0.01 Automatic Data Processing Inc 1,346 1,291,473.01 0.03

74
SEB Strategy Fund - SEB Strategy Growth
Security description Maturity Total holdings Market % of
value in Net
SEK Assets
AutoZone Inc 150 873,648.08 0.02 Avery Dennison Corp 62,588 58,858,556.37 1.22 Avnet Inc 2,000 648,775.12 0.01 Bank of America Corp 29,190 7,055,051.17 0.15 Bank of New York Mellon Corp/The 3,700 1,631,615.39 0.03 Baxter International Inc 32,762 17,338,897.28 0.36 BB&T Corp 2,869 1,167,915.41 0.02 Becton Dickinson and Co 820 1,437,140.05 0.03 Best Buy Co Inc 37,000 20,742,054.54 0.43 Biogen Inc 653 1,703,208.35 0.04 BioMarin Pharmaceutical Inc 755 551,207.91 0.01 BlackRock Inc 420 1,766,513.78 0.04 Boston Scientific Corp 4,981 1,010,980.52 0.02 Bristol-Myers Squibb Co 35,483 17,802,820.29 0.37 Broadridge Financial Solutions Inc 1,200 889,945.24 0.02 CA Inc 89,300 24,332,374.75 0.51 Capital One Financial Corp 1,700 1,386,024.04 0.03 Cardinal Health Inc 1,413 708,826.20 0.01 CBRE Group Inc 2,068 733,311.40 0.02 CBS Corp 1,800 869,509.31 0.02 CDW Corp/DE 1,300 739,631.47 0.02 Celgene Corp 2,299 1,964,367.60 0.04 Centene Corp 765 631,853.26 0.01 CenterPoint Energy Inc 5,871 1,363,226.52 0.03 CenturyLink Inc 4,100 559,924.70 0.01 CF Industries Holdings Inc 1,624 565,631.04 0.01 Charles Schwab Corp/The 4,244 1,784,985.37 0.04 Charter Communications Inc 613 1,686,156.06 0.04 Chipotle Mexican Grill Inc 138 326,566.57 0.01 Cigna Corp 955 1,587,967.58 0.03 Cisco Systems Inc 136,779 42,891,172.47 0.89 Citigroup Inc 7,939 4,836,674.12 0.10 Clorox Co/The 559 680,752.59 0.01 CME Group Inc 1,234 1,475,592.51 0.03 CMS Energy Corp 4,700 1,820,156.45 0.04 Coca-Cola Co/The 11,384 4,276,298.53 0.09 Cognizant Technology Solutions Corp 2,342 1,361,812.38 0.03 Colgate-Palmolive Co 2,506 1,548,067.99 0.03 Comcast Corp 13,867 4,547,102.62 0.09 Conagra Brands Inc 5,031 1,551,671.05 0.03 Corning Inc 3,731 977,212.94 0.02 Costco Wholesale Corp 1,356 2,066,343.19 0.04 Crown Castle International Corp 1,540 1,399,692.20 0.03 CSX Corp 3,276 1,475,486.56 0.03 Cummins Inc 48,065 69,513,270.63 1.44 CVS Health Corp 3,219 1,910,771.27 0.04 Danaher Corp 2,128 1,617,196.93 0.03 Deere & Co 1,203 1,541,549.37 0.03 Delta Air Lines Inc 1,400 641,897.65 0.01 DENTSPLY SIRONA Inc 1,071 577,248.81 0.01 Discovery Communications Inc C 2,500 433,321.85 0.01 Dollar General Corp 1,577 1,200,911.65 0.02 DowDuPont Inc 7,503 4,375,086.42 0.09 DR Horton Inc 2,875 1,202,135.51 0.02 Dr Pepper Snapple Group Inc 992 788,318.43 0.02 Duke Energy Corp 2,946 2,028,757.30 0.04

75
SEB Strategy Fund - SEB Strategy Growth
Security description Maturity Total holdings Market % of
value in Net
SEK Assets
E*TRADE Financial Corp 1,944 788,978.01 0.02 Eaton Vance Corp 2,200 1,015,721.15 0.02 eBay Inc 3,867 1,194,884.12 0.02 Ecolab Inc 1,365 1,499,581.79 0.03 Edison International 1,400 724,885.84 0.02 Edwards Lifesciences Corp 900 830,528.77 0.02 Eli Lilly & Co 3,000 2,074,541.14 0.04 Emerson Electric Co 77,200 44,049,145.18 0.91 Equifax Inc 437 421,908.84 0.01 Equinix Inc 329 1,220,828.57 0.03 Equity Residential 1,934 1,009,770.33 0.02 Expeditors International of Washington Inc 1,000 529,647.43 0.01 Express Scripts Holding Co 2,084 1,273,558.99 0.03 F5 Networks Inc 516 554,369.66 0.01 Facebook Inc 6,785 9,802,703.05 0.20 FedEx Corp 923 1,885,782.46 0.04 Fidelity National Information Services Inc 1,300 1,001,466.76 0.02 FleetCor Technologies Inc 407 641,234.54 0.01 FMC Corp 1,087 842,453.16 0.02 Foot Locker Inc 64,300 24,680,178.48 0.51 Ford Motor Co 16,500 1,687,314.75 0.04 Franklin Resources Inc 15,585 5,528,982.50 0.11 Gap Inc/The 129,500 36,113,046.92 0.75 General Motors Co 5,039 1,691,110.54 0.04 Gilead Sciences Inc 88,097 51,673,326.06 1.07 Global Payments Inc 963 790,345.65 0.02 Goldman Sachs Group Inc/The 1,335 2,784,596.20 0.06 Hershey Co/The 723 671,927.07 0.01 Hilton Worldwide Holdings Inc 960 627,697.30 0.01 Home Depot Inc/The 3,665 5,687,241.39 0.12 HP Inc 307,955 52,974,032.32 1.10 Humana Inc 568 1,153,645.30 0.02 IDEX Corp 1,315 1,420,858.04 0.03 IDEXX Laboratories Inc 518 663,224.69 0.01 Illinois Tool Works Inc 1,522 2,079,172.79 0.04 Illumina Inc 470 840,773.75 0.02 Incyte Corp 600 465,261.17 0.01 Ingredion Inc 500 572,304.15 0.01 Intel Corp 209,266 79,088,655.62 1.64 Intercontinental Exchange Inc 2,155 1,244,960.48 0.03 International Business Machines Corp 2,563 3,219,439.77 0.07 International Flavors & Fragrances Inc 800 999,591.83 0.02 International Paper Co 1,700 806,449.42 0.02 Intuit Inc 992 1,281,484.46 0.03 IQVIA Holdings Inc 760 609,180.52 0.01 Iron Mountain Inc 2,100 648,717.81 0.01 Jack Henry & Associates Inc 600 574,563.89 0.01 Johnson & Johnson 44,493 50,897,914.36 1.06 JPMorgan Chase & Co 9,959 8,719,782.10 0.18 Kellogg Co 1,306 726,898.98 0.02 KeyCorp 5,671 936,516.14 0.02 Kimberly-Clark Corp 1,219 1,204,250.25 0.03 KLA-Tencor Corp 44,499 38,280,597.14 0.80 Kohl's Corp 102,000 45,288,662.63 0.94 Kraft Heinz Co/The 1,730 1,101,417.76 0.02 Kroger Co/The 6,200 1,393,425.51 0.03

76
SEB Strategy Fund - SEB Strategy Growth
Security description Maturity Total holdings Market % of
value in Net
SEK Assets
L Brands Inc 1,079 532,000.35 0.01 Laboratory Corp of America Holdings 602 786,201.97 0.02 Lam Research Corp 840 1,265,936.78 0.03 Liberty Broadband Corp 483 336,769.31 0.01 Liberty Interactive Corp QVC Group 2,225 444,862.09 0.01 Liberty Media Corp-Liberty SiriusXM A 1,470 477,331.14 0.01 Lincoln National Corp 1,211 762,168.06 0.02 LKQ Corp 2,300 765,864.13 0.02 Lowe's Cos Inc 2,978 2,266,089.62 0.05 ManpowerGroup Inc 52,099 53,793,355.23 1.12 Markel Corp 60 559,595.56 0.01 Marriott International Inc/MD 1,276 1,418,000.04 0.03 Marsh & McLennan Cos Inc 1,500 999,567.27 0.02 Martin Marietta Materials Inc 416 752,859.48 0.02 Mastercard Inc 2,854 3,536,835.07 0.07 McCormick & Co Inc/MD 711 593,247.78 0.01 McDonald's Corp 2,378 3,351,142.59 0.07 MercadoLibre Inc 137 352,948.89 0.01 Merck & Co Inc 7,850 3,616,565.14 0.08 MetLife Inc 2,813 1,164,465.21 0.02 Micron Technology Inc 3,864 1,300,888.11 0.03 Microsoft Corp 20,922 14,652,852.02 0.30 Mondelez International Inc 4,658 1,632,273.66 0.03 Monster Beverage Corp 1,459 756,031.88 0.02 Moody's Corp 900 1,087,697.20 0.02 Morgan Stanley 4,797 2,060,774.65 0.04 Netflix Inc 1,370 2,153,183.43 0.04 NextEra Energy Inc 1,764 2,255,804.85 0.05 NIKE Inc 4,008 2,052,602.00 0.04 Norfolk Southern Corp 1,316 1,561,255.55 0.03 NVIDIA Corp 1,973 3,125,775.44 0.06 OGE Energy Corp 3,300 889,183.80 0.02 Omnicom Group Inc 1,200 715,552.13 0.01 Oracle Corp 9,078 3,514,126.30 0.07 O'Reilly Automotive Inc 375 738,530.26 0.02 Packaging Corp of America 663 654,380.67 0.01 Palo Alto Networks Inc 584 693,028.07 0.01 Paychex Inc 1,388 773,675.30 0.02 PepsiCo Inc 56,896 55,862,848.22 1.16 Pfizer Inc 16,495 4,891,594.93 0.10 PG&E Corp 1,841 675,728.52 0.01 PNC Financial Services Group Inc/The 1,400 1,653,918.06 0.03 PPL Corp 4,199 1,064,035.82 0.02 Praxair Inc 1,549 1,961,712.24 0.04 Principal Financial Group Inc 60,800 35,124,639.17 0.73 Procter & Gamble Co/The 21,935 16,500,927.09 0.34 Progressive Corp/The 2,155 993,709.96 0.02 Prologis Inc 2,700 1,426,068.96 0.03 Prudential Financial Inc 10,011 9,424,308.32 0.20 Public Storage 600 1,026,708.73 0.02 PVH Corp 768 862,773.32 0.02 QUALCOMM Inc 4,512 2,365,018.17 0.05 Raymond James Financial Inc 1,124 821,802.56 0.02 Regeneron Pharmaceuticals Inc 268 824,947.20 0.02 Regions Financial Corp 6,271 887,217.83 0.02 Republic Services Inc 1,451 803,208.08 0.02

77
SEB Strategy Fund - SEB Strategy Growth
Security description Maturity Total holdings Market % of
value in Net
SEK Assets
ResMed Inc 894 619,896.77 0.01 Roper Technologies Inc 630 1,335,949.47 0.03 S&P Global Inc 996 1,381,409.58 0.03 salesforce.com Inc 2,900 2,427,314.66 0.05 SCANA Corp 1,144 372,598.00 0.01 SEI Investments Co 1,500 882,527.39 0.02 Sherwin-Williams Co/The 440 1,477,163.68 0.03 Simon Property Group Inc 1,149 1,615,627.39 0.03 Sirius XM Holdings Inc 9,100 399,352.04 0.01 Southwest Airlines Co 758 406,189.39 0.01 Spectrum Brands Holdings Inc 400 368,108.65 0.01 Starbucks Corp 4,220 1,984,271.01 0.04 State Street Corp 1,779 1,421,739.34 0.03 Stryker Corp 1,273 1,613,843.01 0.03 SVB Financial Group 217 415,334.71 0.01 Sysco Corp 1,920 954,672.10 0.02 T Rowe Price Group Inc 47,153 40,509,671.54 0.84 Tapestry Inc 1,700 615,624.05 0.01 Target Corp 119,300 63,733,927.17 1.32 TD Ameritrade Holding Corp 1,379 577,284.34 0.01 Tesla Inc 460 1,172,617.64 0.02 Texas Instruments Inc 79,935 68,352,367.63 1.42 Thermo Fisher Scientific Inc 1,270 1,974,388.73 0.04 Time Warner Inc 2,669 1,998,835.13 0.04 TJX Cos Inc/The 3,011 1,884,928.01 0.04 Torchmark Corp 1,100 816,953.94 0.02 Trimble Inc 2,515 836,838.03 0.02 Twenty-First Century Fox Inc B 5,100 1,424,718.02 0.03 Twitter Inc 2,407 473,170.84 0.01 Ulta Beauty Inc 328 600,636.73 0.01 Under Armour Inc 3,000 327,171.30 0.01 Union Pacific Corp 2,596 2,850,251.52 0.06 United Parcel Service Inc 2,129 2,076,918.37 0.04 United Rentals Inc 706 993,700.62 0.02 United Therapeutics Corp 19,600 23,742,189.17 0.49 UnitedHealth Group Inc 2,846 5,137,057.41 0.11 Universal Health Services Inc 540 501,146.85 0.01 Unum Group 4,900 2,202,110.11 0.05 US Bancorp 4,491 1,970,132.72 0.04 Verisk Analytics Inc 800 628,797.69 0.01 Verizon Communications Inc 11,718 5,078,145.12 0.11 VF Corp 1,509 914,262.02 0.02 Visa Inc 5,473 5,109,238.84 0.11 Vulcan Materials Co 812 853,432.72 0.02 Walgreens Boots Alliance Inc 9,274 5,514,079.92 0.11 Walt Disney Co/The 4,469 3,933,769.75 0.08 Waste Management Inc 1,690 1,194,117.93 0.02 Waters Corp 469 741,834.80 0.02 Wells Fargo & Co 13,340 6,626,428.93 0.14 Welltower Inc 2,000 1,044,229.92 0.02 Westar Energy Inc 1,669 721,506.05 0.01 Western Digital Corp 1,246 811,332.26 0.02 Western Union Co/The 365,667 56,913,802.92 1.18 WestRock Co 1,269 656,745.54 0.01 Weyerhaeuser Co 3,200 923,808.61 0.02 Workday Inc 782 651,400.68 0.01

78
SEB Strategy Fund - SEB Strategy Growth
Security description Maturity Total holdings Market % of
value in Net
SEK Assets
Xcel Energy Inc 3,443 1,356,194.88 0.03 Xilinx Inc 1,572 867,742.78 0.02 Yum! Brands Inc 1,300 868,633.25 0.02 Zimmer Biomet Holdings Inc 900 889,183.80 0.02
Total United States of America 1,632,754,391.67 33.91
Total Shares 3,098,189,489.30 64.35
Investment Funds
Alternative Investment
Ireland IPM Systematic Macro UCITS Fund I 7,997 85,798,319.96 1.78
Total Ireland 85,798,319.96 1.78
Total Alternative Investment Fund 85,798,319.96 1.78
Asset Allocation Fund
Luxembourg SEB SICAV 3 - SEB Asset Selection Opportunistic C 1,004,349 151,941,331.51 3.15
Total Luxembourg 151,941,331.51 3.15
Total Asset Allocation Fund Fund 151,941,331.51 3.15
Commodity Funds
Luxembourg Threadneedle Lux - Enhanced Commodities Portfolio IKH 616,458 66,287,688.52 1.38 Vontobel Fund - Commodity HI 121,279 66,509,403.60 1.38
Total Luxembourg 132,797,092.12 2.76
Total Commodity Funds 132,797,092.12 2.76
Debt Funds
Ireland iShares JP Morgan EM Local Government Bond UCITS ETF 87,865 48,055,388.86 1.00 Neuberger Berman Emerging Markets Debt - Local Currency Fund A Acc 1,228,756 139,709,557.20 2.90
Total Ireland 187,764,946.06 3.90
Luxembourg SEB High Yield - SEB High Yield Fund C (H SEK) 255,634 48,387,477.18 1.01
Total Luxembourg 48,387,477.18 1.01
Total Debt Funds 236,152,423.24 4.91
Equity Funds
Ireland Artisan Partners Global Funds Plc - Global Value Fund I 57,118 9,816,013.58 0.20
Total Ireland 9,816,013.58 0.20
Sweden SEB Emerging Marketsfond A 15,427,116 407,146,267.24 8.45

79
SEB Strategy Fund - SEB Strategy Growth
Security description Maturity Total holdings Market % of
value in Net
SEK Assets
SEB Hallbarhetsfond Global A 12,430,569 212,250,722.62 4.41
Total Sweden 619,396,989.86 12.86
Total Equity Funds 629,213,003.44 13.06
Total Investment Funds 1,235,902,170.27 25.66
Total Transferable securities admitted to an official stock exchange listing
and/or dealt within another regulated market 4,641,722,946.97 96.40
Total Portfolio 4,641,722,946.97 96.40
Financial futures cleared with Skandinaviska Enskilda Banken AB (publ)
Purchased financial futures contracts Commitment in SEK CBOT Five Year Treasury Note Future 11,413,077.20 29/03/18 12 (8,443.41) (0.00) Eurex Dow Jones Euro Stoxx 50 Future 72,463,133.06 16/03/18 211 (1,763,345.64) (0.04) ICE MSCI Emerging Markets Mini Index Future 63,835,983.98 16/03/18 134 2,740,060.54 0.06
Sold financial futures contracts Commitment in SEK CME Standard And Poors 500 E-Mini Future (124,885,116.93) 16/03/18 (114) (539,022.09) (0.01) Eurex Euro Bund Future (4,768,849.56) 08/03/18 (3) 40,408.98 0.00 Swedish Government 5-year Bond Future (11,598,120.00) 15/03/18 (9) 10,476.00 0.00
Total financial futures contracts (total net unrealised) 480,134.38 0.01
An amount of SEK 13,879,431.78 is held as cash collateral for these positions. Forward foreign exchange contracts open with Skandinaviska Enskilda Banken S.A.*
Buy 26,803,836 EUR Sell 266,300,262 SEK 19/01/18 (2,781,861.37) (0.06)Buy 34,142,917 NOK Sell 34,417,562 SEK 19/01/18 (260,372.53) (0.00)Buy 6,754,558 SEK Sell 677,721 EUR 19/01/18 91,632.70 0.00Buy 120,047,700 SEK Sell 14,250,000 USD 19/01/18 3,505,336.74 0.07Buy 1 118,283,900 SEK Sell 1 14,000,000 USD 19/01/18 3,786,139.60 0.08Buy 3,019,039 USD Sell 2,543,135 EUR 12/03/18 (386,420.98) (0.01)Buy 198,154 USD Sell 147,766 GBP 12/03/18 (17,829.07) (0.00)
Total forward foreign exchange contracts (total net unrealised) 3,936,625.09 0.08

80
SEB Strategy Fund - SEB Strategy Growth
Market
value in
SEK
% of
Net
Assets
Cash at bank and at broker
Cash at bank and at broker 158,375,856.48 3.29
Total Cash at bank and at broker 158,375,856.48 3.29
Other assets
Dividends receivable 3,981,802.97 0.08Interest receivable on bonds 3,849,623.66 0.08Receivable on subscriptions 7,726,896.49 0.16Retrocession fees receivable 5,191,894.62 0.11Other assets 7,258.34 0.00
Total other assets 20,757,476.08 0.43
Liabilities
Management fees (5,607,611.64) (0.12)Payable on redemptions (4,210,104.67) (0.09)Bank interest payable on cash accounts (193,948.58) (0.00)Other liabilities (38,232.56) (0.00)
Total liabilities (10,049,897.45) (0.21)
Total Net Assets as at 31 December 2017 4,815,223,141.55 100.00
* Forwards foreign exchange contracts open with Skandinaviska Enskilda Banken S.A., except for the following: 1Nordea Bank AB (publ) A list of changes in the assets held during the financial period under review is available free of charge from SEB Investment Management AB.
The accompanying notes are an integral part of these financial statements.

Schedule of Investments As at 31 December 2017
81
SEB Strategy Fund - SEB Strategy Opportunity
Security description Maturity Total holdings Market % of
value in Net
SEK Assets
Bonds indicated in 1,000 currency units
Transferable securities admitted to an official stock exchange listing and/or dealt within another regulated market
Bonds
Australia 9.75 % FMG Resources August 2006 Pty Ltd 01/03/22 156 1,418,151.02 0.02 2.00 % National Australia Bank Ltd FRN 12/11/24 340 3,431,754.75 0.04
Total Australia 4,849,905.77 0.06
Austria 7.50 % Sappi Papier Holding GmbH 15/06/32 208 1,749,042.70 0.02 6.88 % UNIQA Insurance Group AG FRN 31/07/43 200 2,470,237.33 0.03
Total Austria 4,219,280.03 0.05
Belgium 5.63 % KBC Group NV FRN Perpetual 285 2,924,701.69 0.03
Total Belgium 2,924,701.69 0.03
Bermuda 4.13 % Aircastle Ltd 01/05/24 259 2,153,720.20 0.02 5.13 % Aircastle Ltd 15/03/21 156 1,342,704.14 0.02 5.50 % Aircastle Ltd 15/02/22 156 1,367,559.33 0.02 5.00 % IHS Markit Ltd 01/11/22 279 2,473,330.29 0.03 6.25 % Viking Cruises Ltd 15/05/25 52 440,338.84 0.00
Total Bermuda 7,777,652.80 0.09
Canada 4.25 % 1011778 BC ULC / New Red Finance Inc 15/05/24 259 2,118,412.96 0.02 7.75 % Air Canada 15/04/21 564 5,266,108.96 0.06 6.00 % Bombardier Inc 15/10/22 105 842,387.50 0.01 7.75 % Bombardier Inc 15/03/20 130 1,144,496.95 0.01 8.75 % Bombardier Inc 01/12/21 337 3,028,997.34 0.03 6.88 % Clearwater Seafoods Inc 01/05/25 311 2,564,229.13 0.03 5.50 % Cott Corp 01/07/24 353 3,755,208.19 0.04 7.00 % First Quantum Minerals Ltd 15/02/21 376 3,188,544.68 0.04 5.88 % Lions Gate Entertainment Corp 01/11/24 213 1,847,102.07 0.02 6.88 % Mattamy Group Corp 15/12/23 104 902,910.26 0.01 6.50 % MDC Partners Inc 01/05/24 208 1,710,180.39 0.02 6.25 % New Gold Inc 15/11/22 208 1,761,270.20 0.02 5.63 % Open Text Corp 15/01/23 292 2,490,913.29 0.03 5.75 % Quebecor Media Inc 15/01/23 290 2,519,630.02 0.03 8.88 % Telesat Canada / Telesat LLC 15/11/24 406 3,711,006.30 0.04 5.50 % Valeant Pharmaceuticals International Inc 01/11/25 12 100,287.34 0.00 6.50 % Valeant Pharmaceuticals International Inc 15/03/22 156 1,343,866.43 0.02 7.00 % Valeant Pharmaceuticals International Inc 15/03/24 156 1,373,779.52 0.02 7.50 % Valeant Pharmaceuticals International Inc 15/07/21 263 2,198,610.13 0.03 5.13 % Videotron Ltd 15/04/27 78 665,387.33 0.01
Total Canada 42,533,328.99 0.49
Cayman Islands 5.25 % Park Aerospace Holdings Ltd 15/08/22 311 2,532,349.42 0.03
Total Cayman Islands 2,532,349.42 0.03
Denmark 0.75 % Danske Bank A/S 02/06/23 340 3,387,361.90 0.04

82
SEB Strategy Fund - SEB Strategy Opportunity
Security description Maturity Total holdings Market % of
value in Net
SEK Assets
5.75 % Danske Bank A/S FRN Perpetual 311 3,310,186.35 0.04 3.50 % TDC A/S FRN Perpetual 176 1,808,381.10 0.02
Total Denmark 8,505,929.35 0.10
Finland 0.88 % Elisa OYJ 17/03/24 340 3,317,429.78 0.04 1.13 % Metso OYJ 13/06/24 340 3,361,756.07 0.04 1.00 % Sampo Oyj 18/09/23 340 3,401,602.38 0.04 2.63 % Teollisuuden Voima Oyj 13/01/23 130 1,333,090.28 0.01
Total Finland 11,413,878.51 0.13
France 4.13 % Accor SA FRN Perpetual 100 1,047,290.65 0.01 4.00 % Banijay Group SAS 01/07/22 169 1,738,550.45 0.02 3.58 % Casino Guichard Perrachon SA 07/02/25 100 1,034,804.17 0.01 4.87 % Casino Guichard Perrachon SA FRN Perpetual 300 3,003,036.12 0.04 5.38 % Constantin Investissement 3 SASU 15/04/25 311 3,098,867.93 0.04 2.63 % Credit Agricole SA 17/03/27 340 3,615,911.55 0.04 6.50 % Credit Agricole SA FRN Perpetual 103 1,146,862.89 0.01 2.25 % Danone SA 15/11/21 200 2,114,933.26 0.02 4.13 % Electricite de France SA FRN Perpetual 100 1,050,662.98 0.01 5.63 % Electricite de France SA FRN Perpetual 103 871,889.16 0.01 6.38 % Groupama SA FRN Perpetual 100 1,180,807.42 0.01 7.13 % Lafarge SA 15/07/36 225 2,426,446.79 0.03 6.00 % Loxam SAS 15/04/25 292 3,131,382.91 0.04 3.00 % Orange SA 15/06/22 300 3,295,101.61 0.04 5.00 % Orange SA FRN Perpetual 234 2,729,085.65 0.03 2.50 % Sanofi 14/11/23 200 2,197,874.90 0.03 6.25 % SFR Group SA 15/05/24 206 1,686,618.81 0.02 7.38 % SFR Group SA 01/05/26 488 4,088,660.06 0.05 4.00 % Societe Generale SA 07/06/23 300 3,408,010.79 0.04 2.88 % SPCM SA 15/06/23 192 1,922,792.59 0.02 4.88 % SPCM SA 15/09/25 311 2,565,909.69 0.03
Total France 47,355,500.38 0.55
Germany 4.75 % Allianz SE FRN Perpetual 300 3,505,051.33 0.04 1.40 % Daimler AG 12/01/24 340 3,508,138.54 0.04 2.38 % Deutsche Bank AG 11/01/23 200 2,114,441.67 0.02 3.25 % IHO Verwaltungs GmbH 15/09/23 271 2,784,857.61 0.03 6.25 % Muenchener Rueckversicherungs-Gesellschaft AG in Muenchen FRN 26/05/42 300 3,636,513.25 0.04 3.88 % Senvion Holding GmbH 25/10/22 180 1,690,894.60 0.02 1.38 % thyssenkrupp AG 03/03/22 51 509,202.41 0.01 2.50 % thyssenkrupp AG 25/02/25 52 552,924.63 0.01 2.75 % thyssenkrupp AG 08/03/21 301 3,148,379.26 0.04 3.75 % Unitymedia GmbH 15/01/27 156 1,565,244.50 0.02 6.25 % Unitymedia Hessen GmbH & Co KG / Unitymedia NRW GmbH 15/01/29 260 2,872,830.72 0.03 8.50 % Wittur International Holding GmbH 15/02/23 322 3,298,068.08 0.04
Total Germany 29,186,546.60 0.34
Iceland 1.63 % Arion Banki HF 01/12/21 340 3,459,901.42 0.04
Total Iceland 3,459,901.42 0.04
Ireland 4.25 % Bank of Ireland FRN 11/06/24 311 3,222,338.31 0.04

83
SEB Strategy Fund - SEB Strategy Opportunity
Security description Maturity Total holdings Market % of
value in Net
SEK Assets
8.25 % Cloverie Plc for Zurich Insurance Co Ltd FRN Perpetual 103 846,598.31 0.01 2.63 % GE Capital European Funding Unlimited Co 15/03/23 340 3,706,034.39 0.04
Total Ireland 7,774,971.01 0.09
Italy 7.75 % Assicurazioni Generali SpA FRN 12/12/42 300 3,805,464.08 0.04 2.13 % Buzzi Unicem SpA 28/04/23 228 2,360,922.68 0.03 6.00 % Cooperativa Muratori & Cementisti-CMC di
Ravenna SC 15/02/23 208 2,033,719.66 0.02 2.00 % Intesa Sanpaolo SpA 18/06/21 300 3,117,066.13 0.04 7.00 % Intesa Sanpaolo SpA FRN Perpetual 210 2,285,965.50 0.03 8.38 % Intesa Sanpaolo SpA FRN Perpetual 200 2,225,266.49 0.03 3.63 % Telecom Italia SpA/Milano 19/01/24 104 1,141,504.33 0.01 3.63 % Telecom Italia SpA/Milano 25/05/26 171 1,881,099.67 0.02 5.88 % Telecom Italia SpA/Milano 19/05/23 50 648,221.64 0.01 4.38 % UniCredit SpA FRN 03/01/27 234 2,495,269.85 0.03 5.75 % UnipolSai Assicurazioni SpA FRN Perpetual 208 2,185,133.59 0.02 3.13 % Wind Tre SpA 20/01/25 151 1,444,453.40 0.02
Total Italy 25,624,087.02 0.30
Japan 4.75 % SoftBank Group Corp 30/07/25 210 2,269,447.96 0.03
Total Japan 2,269,447.96 0.03
Luxembourg 7.63 % Altice Finco SA 15/02/25 384 3,155,212.51 0.04 8.13 % Altice Finco SA 15/01/24 418 3,576,437.20 0.04 6.25 % Altice Luxembourg SA 15/02/25 156 1,505,089.98 0.02 7.63 % Altice Luxembourg SA 15/02/25 260 2,030,436.88 0.02 7.75 % Altice Luxembourg SA 15/05/22 309 2,492,257.59 0.03 6.63 % ARD Finance SA 15/09/23 537 5,642,912.51 0.07 8.00 % Auris Luxembourg II SA 15/01/23 280 2,871,464.09 0.03 7.50 % Cabot Financial Luxembourg SA 01/10/23 155 1,796,167.71 0.02 8.50 % eDreams ODIGEO SA 01/08/21 287 3,026,128.82 0.03 4.75 % Fiat Chrysler Finance Europe SA 15/07/22 363 4,034,219.02 0.05 8.50 % Garfunkelux Holdco 3 SA 01/11/22 206 2,384,312.86 0.03 7.38 % Greif Nevada Holdings Inc SCS 15/07/21 115 1,355,814.19 0.02 2.25 % Holcim Finance Luxembourg SA 26/05/28 340 3,552,564.82 0.04 5.50 % Intelsat Jackson Holdings SA 01/08/23 77 514,699.90 0.01 7.25 % Intelsat Jackson Holdings SA 15/10/20 364 2,790,457.44 0.03 7.50 % Intelsat Jackson Holdings SA 01/04/21 155 1,155,705.60 0.01 8.00 % Intelsat Jackson Holdings SA 15/02/24 312 2,692,152.13 0.03 9.50 % Intelsat Jackson Holdings SA 30/09/22 219 2,067,644.51 0.03 9.75 % Intelsat Jackson Holdings SA 15/07/25 103 808,952.98 0.01 6.50 % Lecta SA 01/08/23 109 1,107,489.01 0.01 7.75 % LSF9 Balta Issuer SARL 15/09/22 248 2,616,065.47 0.03 4.75 % Mallinckrodt International Finance SA 15/04/23 53 339,342.22 0.00 5.63 % Mallinckrodt International Finance SA / Mallinckrodt CB LLC 15/10/23 259 1,809,002.82 0.02 4.88 % Matterhorn Telecom Holding SA 01/05/23 150 1,495,692.68 0.02 5.63 % SES SA FRN Perpetual 197 2,154,253.95 0.02 7.75 % SIG Combibloc Holdings SCA 15/02/23 192 1,972,420.72 0.02 9.75 % Swissport Financing Sarl 15/12/22 152 1,559,138.51 0.02 6.00 % Telecom Italia Capital SA 30/09/34 52 476,127.25 0.01 7.20 % Telecom Italia Capital SA 18/07/36 105 1,070,728.26 0.01 7.72 % Telecom Italia Capital SA 04/06/38 130 1,379,818.76 0.02 7.75 % Telecom Italia Finance SA 24/01/33 140 2,116,103.25 0.02

84
SEB Strategy Fund - SEB Strategy Opportunity
Security description Maturity Total holdings Market % of
value in Net
SEK Assets
5.50 % Telenet Finance Luxembourg Notes Sarl 01/03/28 200 1,638,885.86 0.02
Total Luxembourg 67,187,699.50 0.78
Mexico 3.26 % America Movil SAB de CV 22/07/23 340 3,788,167.85 0.05 7.75 % Cemex SAB de CV 16/04/26 207 1,922,401.82 0.02
Total Mexico 5,710,569.67 0.07
Netherlands 2.88 % ABN AMRO Bank NV FRN 18/01/28 300 3,210,390.23 0.04 6.00 % Achmea BV FRN 04/04/43 100 1,166,610.20 0.01 5.00 % ASR Nederland NV FRN Perpetual 104 1,193,120.85 0.01 1.25 % BMW Finance NV 05/09/22 340 3,484,805.55 0.04 4.50 % CNH Industrial NV 15/08/23 207 1,766,140.68 0.02 4.63 % Constellium NV 15/05/21 422 4,235,929.63 0.05 5.88 % Cooperatieve Rabobank UA 20/05/19 340 3,612,802.71 0.04 4.63 % Demeter Investments BV for Swiss Re Ltd FRN Perpetual 231 1,915,060.36 0.02 4.50 % ELM BV for Swiss Life Insurance & Pension Group FRN Perpetual 340 3,848,539.46 0.05 4.50 % Fiat Chrysler Automobiles NV 15/04/20 258 2,169,760.27 0.03 4.60 % Generali Finance BV FRN Perpetual 260 2,802,328.35 0.03 4.88 % ING Bank NV 18/01/21 340 3,826,242.75 0.04 1.25 % innogy Finance BV 19/10/27 340 3,346,612.73 0.04 8.50 % Nyrstar Netherlands Holdings BV 15/09/19 597 6,488,401.49 0.08 9.00 % SRLEV NV FRN 15/04/41 156 1,842,443.02 0.02 2.63 % Telefonica Europe BV FRN Perpetual 100 979,735.88 0.01 3.75 % Telefonica Europe BV FRN Perpetual 100 1,035,964.33 0.01 5.88 % Telefonica Europe BV FRN Perpetual 100 1,141,725.74 0.01 7.63 % Telefonica Europe BV FRN Perpetual 200 2,356,639.92 0.03 3.88 % UPC Holding BV 15/06/29 104 982,534.03 0.01 0.88 % Volkswagen International Finance NV 16/01/23 340 3,389,735.31 0.04 7.13 % Ziggo Bond Co BV 15/05/24 154 1,663,474.50 0.02 6.00 % Ziggo Bond Finance BV 15/01/27 306 2,446,840.47 0.03
Total Netherlands 58,905,838.46 0.68
Portugal 5.38 % EDP - Energias de Portugal SA FRN 16/09/75 300 3,296,428.91 0.04
Total Portugal 3,296,428.91 0.04
Spain 3.50 % Banco Bilbao Vizcaya Argentaria SA 10/02/27 400 4,425,520.70 0.05 6.75 % Banco Bilbao Vizcaya Argentaria SA FRN Perpetual 200 2,127,065.78 0.03 7.00 % Banco Bilbao Vizcaya Argentaria SA FRN Perpetual 200 2,069,293.72 0.03 1.38 % Banco Santander SA 09/02/22 400 4,055,881.77 0.05 6.25 % Banco Santander SA FRN Perpetual 100 1,027,430.27 0.01 6.38 % Banco Santander SA FRN Perpetual 400 3,353,096.45 0.04 3.38 % Bankia SA FRN 15/03/27 200 2,064,830.06 0.02 3.20 % Grifols SA 01/05/25 180 1,800,706.74 0.02 1.00 % Iberdrola Finanzas SA 07/03/25 200 1,977,169.12 0.02 1.63 % Mapfre SA 19/05/26 300 3,018,550.81 0.04 5.50 % Obrascon Huarte Lain SA 15/03/23 428 4,313,072.44 0.05 7.63 % Obrascon Huarte Lain SA 15/03/20 206 2,056,677.08 0.02 1.93 % Telefonica Emisiones SAU 17/10/31 300 2,915,581.65 0.03
Total Spain 35,204,876.59 0.41
Sweden 3.50 % Com Hem Sweden AB 25/02/22 1,000 1,036,860.00 0.01

85
SEB Strategy Fund - SEB Strategy Opportunity
Security description Maturity Total holdings Market % of
value in Net
SEK Assets
3.63 % Com Hem Sweden AB 23/06/21 2,000 2,062,300.00 0.02 2.75 % Intrum Justitia AB 15/07/22 197 1,947,860.22 0.02 3.13 % Intrum Justitia AB 15/07/24 187 1,846,593.94 0.02 2.25 % Kommuninvest I Sverige AB 12/03/19 14,600 15,082,968.00 0.18 2.50 % Kommuninvest I Sverige AB 01/12/20 28,200 30,295,542.00 0.35 1.75 % Lansforsakringar Hypotek AB 15/09/21 52,500 55,097,700.00 0.64 2.25 % Lansforsakringar Hypotek AB 21/09/22 4,000 4,283,720.00 0.05 3.25 % Lansforsakringar Hypotek AB 16/09/20 33,800 36,690,576.00 0.43 1.00 % Nordea Bank AB FRN 07/09/26 300 2,975,398.74 0.03 5.50 % Nordea Bank AB FRN Perpetual 206 1,732,933.37 0.02 1.25 % Nordea Hypotek AB 19/05/21 20,000 20,634,000.00 0.24 2.25 % Nordea Hypotek AB 19/06/19 22,500 23,336,550.00 0.27 3.25 % Nordea Hypotek AB 17/06/20 45,100 48,686,352.00 0.57 5.00 % Ovako AB 05/10/22 100 1,005,072.60 0.01 1.50 % Skandinaviska Enskilda Banken AB 17/06/20 32,000 33,169,920.00 0.39 1.50 % Skandinaviska Enskilda Banken AB 15/12/21 45,000 46,800,450.00 0.54 1.88 % Skandinaviska Enskilda Banken AB 14/11/19 340 3,470,498.21 0.04 3.00 % Skandinaviska Enskilda Banken AB 19/06/19 11,000 11,529,980.00 0.13 5.75 % Skandinaviska Enskilda Banken AB FRN Perpetual 257 2,178,120.66 0.03 1.63 % SKF AB 02/12/22 340 3,483,301.27 0.04 1.50 % Stadshypotek AB 17/03/21 9,000 9,360,180.00 0.11 1.50 % Stadshypotek AB 15/12/21 21,000 21,840,210.00 0.25 2.50 % Stadshypotek AB 18/09/19 28,000 29,305,080.00 0.34 4.25 % Stadshypotek AB 17/06/20 30,000 33,122,100.00 0.38 4.50 % Stadshypotek AB 21/09/22 22,000 25,859,020.00 0.30 1.00 % Sveriges Sakerstallda Obligationer AB 17/03/21 10,000 10,239,100.00 0.12 1.25 % Sveriges Sakerstallda Obligationer AB 15/06/22 35,000 35,925,750.00 0.42 2.00 % Sveriges Sakerstallda Obligationer AB 17/06/20 57,000 59,779,320.00 0.69 4.00 % Sveriges Sakerstallda Obligationer AB 18/09/19 14,000 15,012,480.00 0.17 5.50 % Swedbank AB FRN Perpetual 200 1,693,021.42 0.02 1.00 % Swedbank Hypotek AB 15/09/21 45,100 46,091,749.00 0.54 1.00 % Swedbank Hypotek AB 15/06/22 20,000 20,323,600.00 0.24 5.70 % Swedbank Hypotek AB 12/05/20 33,800 38,365,366.00 0.45 0.75 % Sweden Government Bond 12/05/28 54,400 54,237,888.00 0.63 1.00 % Sweden Government Bond 12/11/26 4,000 4,151,680.00 0.05 1.50 % Sweden Government Bond 13/11/23 45,000 48,460,050.00 0.56 2.50 % Sweden Government Bond 12/05/25 26,200 30,232,966.00 0.35 3.50 % Sweden Government Bond 01/06/22 46,500 53,881,875.00 0.63 3.50 % Sweden Government Bond 30/03/39 23,500 32,084,197.50 0.37 5.00 % Sweden Government Bond 01/12/20 50,500 58,493,140.00 0.68 6.00 % Verisure Holding AB 01/11/22 248 2,603,399.37 0.03 4.20 % Volvo Treasury AB FRN 10/06/75 206 2,178,482.52 0.03
Total Sweden 980,587,351.82 11.39
Switzerland 6.50 % Credit Suisse AG 08/08/23 207 1,898,013.56 0.02 6.25 % Credit Suisse Group AG FRN Perpetual 200 1,775,223.61 0.02 4.75 % UBS AG FRN 22/05/23 206 1,700,685.21 0.02 1.75 % UBS Group Funding Switzerland AG 16/11/22 340 3,542,536.31 0.04
Total Switzerland 8,916,458.69 0.10
United Kingdom 3.50 % Adient Global Holdings Ltd 15/08/24 204 2,143,372.53 0.03 5.75 % Aston Martin Capital Holdings Ltd 15/04/22 135 1,568,680.42 0.02 6.88 % Aviva Plc FRN 22/05/38 340 3,427,877.06 0.04

86
SEB Strategy Fund - SEB Strategy Opportunity
Security description Maturity Total holdings Market % of
value in Net
SEK Assets
1.88 % Barclays Plc 08/12/23 340 3,515,258.78 0.04 6.50 % Barclays Plc FRN Perpetual 240 2,521,874.30 0.03 4.25 % CPUK Finance Ltd 28/08/22 130 1,467,256.72 0.02 1.25 % Credit Suisse Group Funding Guernsey Ltd 14/04/22 300 3,044,447.95 0.04 6.46 % HBOS Capital Funding LP FRN Perpetual 249 2,872,963.57 0.03 3.38 % HSBC Holdings Plc FRN 10/01/24 340 3,452,313.19 0.04 5.25 % HSBC Holdings Plc FRN Perpetual 233 2,531,362.05 0.03 6.75 % Iceland Bondco Plc 15/07/24 155 1,801,335.03 0.02 3.88 % Iron Mountain UK Plc 15/11/25 104 1,126,740.28 0.01 3.50 % Jaguar Land Rover Automotive Plc 15/03/20 258 2,130,934.96 0.02 1.00 % Lloyds Banking Group Plc 09/11/23 340 3,374,859.69 0.04 6.75 % Melton Renewable Energy UK Plc 01/02/20 129 1,455,438.95 0.02 7.13 % Mercury Bondco Plc 30/05/21 182 1,845,851.04 0.02 8.00 % Old Mutual Plc 03/06/21 120 1,547,305.62 0.02 3.63 % Royal Bank of Scotland Group Plc FRN 25/03/24 257 2,609,542.62 0.03 7.50 % Royal Bank of Scotland Group Plc FRN Perpetual 200 1,731,748.15 0.02 6.25 % Sensata Technologies UK Financing Co Plc 15/02/26 212 1,888,003.06 0.02 0.88 % SSE Plc 06/09/25 340 3,305,562.72 0.04 8.25 % Synlab Unsecured Bondco Plc 01/07/23 208 2,219,224.22 0.02 6.00 % Tesco Plc 14/12/29 104 1,406,331.84 0.02 6.13 % Tesco Plc 24/02/22 62 792,773.51 0.01 6.75 % Thomas Cook Finance Plc 15/06/21 142 1,445,897.21 0.02 6.00 % Virgin Media Finance Plc 15/10/24 432 3,631,990.50 0.04 7.00 % Virgin Media Finance Plc 15/04/23 150 1,741,931.60 0.02 1.00 % Vodafone Group Plc 11/09/20 340 3,415,074.00 0.04 4.13 % Wagamama Finance Plc 01/07/22 103 1,123,378.39 0.01
Total United Kingdom 65,139,329.96 0.76
United States of America 8.00 % 24 Hour Fitness Worldwide Inc 01/06/22 104 823,789.17 0.01 4.13 % ADT Corp/The 15/06/23 105 862,633.06 0.01 7.00 % Advanced Micro Devices Inc 01/07/24 104 881,367.39 0.01 7.50 % Advanced Micro Devices Inc 15/08/22 77 694,922.40 0.01 6.63 % Albertsons Cos LLC / Safeway Inc / New Albertson's Inc /
Albertson's LLC 15/06/24 423 3,292,593.75 0.04 7.88 % Aleris International Inc 01/11/20 325 2,641,582.80 0.03 4.13 % Ally Financial Inc 30/03/20 311 2,595,217.64 0.03 4.63 % Ally Financial Inc 19/05/22 155 1,327,294.91 0.02 4.75 % Ally Financial Inc 10/09/18 259 2,147,506.97 0.02 8.00 % Ally Financial Inc 15/03/20 180 1,629,445.71 0.02 5.75 % AMC Entertainment Holdings Inc 15/06/25 122 989,102.37 0.01 5.88 % AMC Entertainment Holdings Inc 15/02/22 52 431,666.34 0.00 6.13 % AMC Entertainment Holdings Inc 15/05/27 52 423,589.89 0.00 5.00 % AMC Networks Inc 01/04/24 208 1,721,386.09 0.02 6.25 % American Axle & Manufacturing Inc 01/04/25 104 898,482.47 0.01 6.63 % American Axle & Manufacturing Inc 15/10/22 183 1,554,553.45 0.02 7.88 % American Greetings Corp 15/02/25 260 2,300,425.25 0.03 6.38 % Amkor Technology Inc 01/10/22 146 1,233,287.77 0.01 6.38 % APX Group Inc 01/12/19 14 116,167.43 0.00 7.88 % APX Group Inc 01/12/22 156 1,366,626.94 0.02 8.75 % APX Group Inc 01/12/20 103 859,559.98 0.01 6.15 % Arconic Inc 15/08/20 156 1,379,373.85 0.02 6.75 % Arconic Inc 15/01/28 154 1,487,600.09 0.02 6.00 % Avantor Inc 01/10/24 79 646,305.62 0.01 0.75 % Bank of America Corp 26/07/23 340 3,357,744.38 0.04

87
SEB Strategy Fund - SEB Strategy Opportunity
Security description Maturity Total holdings Market % of
value in Net
SEK Assets
9.63 % BCD Acquisition Inc 15/09/23 51 459,571.78 0.01 5.75 % Beazer Homes USA Inc 15/06/19 58 490,235.41 0.01 7.25 % Beazer Homes USA Inc 01/02/23 3 25,531.89 0.00 8.75 % Beazer Homes USA Inc 15/03/22 103 929,014.94 0.01 7.75 % Belo Corp 01/06/27 51 466,603.50 0.01 9.75 % Blackboard Inc 15/10/21 156 1,162,880.77 0.01 5.63 % Boise Cascade Co 01/09/24 260 2,248,036.90 0.03 5.88 % Cablevision Systems Corp 15/09/22 104 832,559.59 0.01 7.75 % Cablevision Systems Corp 15/04/18 89 738,033.85 0.01 8.00 % Cablevision Systems Corp 15/04/20 257 2,259,720.75 0.03 5.00 % CalAtlantic Group Inc 15/06/27 103 872,243.35 0.01 6.25 % CalAtlantic Group Inc 15/12/21 51 454,410.72 0.01 5.25 % Calpine Corp 01/06/26 103 826,367.32 0.01 5.75 % Calpine Corp 15/01/25 206 1,598,054.46 0.02 5.88 % Calpine Corp 15/01/24 155 1,290,809.50 0.01 8.00 % CB Escrow Corp 15/10/25 103 853,243.59 0.01 7.25 % CBS Radio Inc 01/11/24 170 1,469,202.19 0.02 5.50 % CCO Holdings LLC / CCO Holdings Capital Corp 01/05/26 52 433,637.56 0.00 5.75 % CCO Holdings LLC / CCO Holdings Capital Corp 01/09/23 281 2,353,732.72 0.03 5.75 % CCO Holdings LLC / CCO Holdings Capital Corp 15/01/24 155 1,306,710.79 0.02 5.75 % CCO Holdings LLC / CCO Holdings Capital Corp 15/02/26 207 1,757,497.17 0.02 5.88 % CCO Holdings LLC / CCO Holdings Capital Corp 01/04/24 239 2,041,417.58 0.02 5.88 % CCO Holdings LLC / CCO Holdings Capital Corp 01/05/27 155 1,305,555.95 0.02 5.38 % Cedar Fair LP / Canada's Wonderland Co / Magnum Management Corp /
Millennium Op 15/04/27 51 439,837.85 0.00 5.80 % CenturyLink Inc 15/03/22 229 1,836,250.80 0.02 6.75 % CenturyLink Inc 01/12/23 90 723,225.42 0.01 7.50 % CenturyLink Inc 01/04/24 156 1,274,844.09 0.01 5.13 % Cequel Communications Holdings I LLC / Cequel Capital Corp 15/12/21 103 838,603.74 0.01 6.25 % CHS/Community Health Systems Inc 31/03/23 103 759,459.15 0.01 7.13 % CHS/Community Health Systems Inc 15/07/20 52 317,723.29 0.00 8.00 % CHS/Community Health Systems Inc 15/11/19 238 1,644,263.23 0.02 4.88 % Cinemark USA Inc 01/06/23 53 440,531.73 0.01 0.75 % Citigroup Inc 26/10/23 340 3,351,527.00 0.04 6.50 % Clear Channel Worldwide Holdings Inc 15/11/22 156 1,289,085.38 0.01 7.63 % Clear Channel Worldwide Holdings Inc 15/03/20 155 1,246,240.19 0.01 7.63 % Clear Channel Worldwide Holdings Inc 15/03/20 104 828,097.74 0.01 5.75 % Cleveland-Cliffs Inc 01/03/25 264 2,057,351.38 0.02 10.13 % Cloud Crane LLC 01/08/24 258 2,381,905.31 0.03 5.50 % CommScope Inc 15/06/24 52 443,842.75 0.01 6.00 % CommScope Technologies LLC 15/06/25 207 1,803,748.43 0.02 6.50 % Consolidated Communications Inc 01/10/22 103 761,238.54 0.01 8.50 % Constellation Merger Sub Inc 15/09/25 52 416,360.69 0.00 5.63 % Cooper-Standard Automotive Inc 15/11/26 213 1,789,447.71 0.02 4.50 % Crown Americas LLC / Crown Americas Capital Corp IV 15/01/23 231 1,929,528.85 0.02 4.25 % Crown Americas LLC / Crown Americas Capital Corp V 30/09/26 52 422,099.77 0.00 10.13 % CSC Holdings LLC 15/01/23 208 1,916,906.80 0.02 10.88 % CSC Holdings LLC 15/10/25 358 3,479,291.24 0.04 6.00 % Dana Inc 15/09/23 363 3,108,052.68 0.04 5.00 % DaVita Inc 01/05/25 308 2,520,177.27 0.03 5.88 % Dell International LLC / EMC Corp 15/06/21 206 1,750,524.80 0.02 7.13 % Dell International LLC / EMC Corp 15/06/24 389 3,476,887.97 0.04 7.75 % Diamond Resorts International Inc 01/09/23 51 452,911.68 0.01 10.75 % Diamond Resorts International Inc 01/09/24 51 446,239.06 0.01 6.75 % DISH DBS Corp 01/06/21 415 3,592,833.76 0.04

88
SEB Strategy Fund - SEB Strategy Opportunity
Security description Maturity Total holdings Market % of
value in Net
SEK Assets
7.75 % DISH DBS Corp 01/07/26 207 1,788,952.77 0.02 5.75 % Dollar Tree Inc 01/03/23 311 2,670,180.81 0.03 5.88 % Dynegy Inc 01/06/23 130 1,079,591.60 0.01 7.38 % Dynegy Inc 01/11/22 363 3,138,545.93 0.04 5.13 % Encompass Health Corp 15/03/23 182 1,526,791.38 0.02 5.75 % Encompass Health Corp 01/11/24 285 2,390,994.63 0.03 5.38 % Endo Finance LLC / Endo Finco Inc 15/01/23 285 1,811,837.57 0.02 7.25 % Endo Finance LLC / Endo Finco Inc 15/01/22 77 548,875.79 0.01 8.50 % Enova International Inc 01/09/24 51 428,672.27 0.00 5.38 % Equinix Inc 01/04/23 103 871,762.67 0.01 5.38 % Equinix Inc 15/05/27 103 901,657.98 0.01 5.75 % Equinix Inc 01/01/25 53 461,660.07 0.01 5.88 % Equinix Inc 15/01/26 103 906,928.67 0.01 5.38 % First Data Corp 15/08/23 51 435,131.93 0.00 5.75 % First Data Corp 15/01/24 104 881,426.99 0.01 7.00 % First Data Corp 01/12/23 473 4,096,591.27 0.05 7.13 % Frontier Communications Corp 15/01/23 103 552,367.66 0.01 7.63 % Frontier Communications Corp 15/04/24 103 555,555.37 0.01 8.75 % Frontier Communications Corp 15/04/22 93 547,593.38 0.01 10.50 % Frontier Communications Corp 15/09/22 103 638,267.16 0.01 11.00 % Frontier Communications Corp 15/09/25 140 843,075.25 0.01 12.50 % Gogo Intermediate Holdings LLC / Gogo Finance Co Inc 01/07/22 210 1,946,015.87 0.02 3.25 % Goldman Sachs Group Inc/The 01/02/23 340 3,756,644.92 0.04 5.00 % Goodyear Tire & Rubber Co/The 31/05/26 208 1,750,813.82 0.02 5.88 % Gray Television Inc 15/07/26 259 2,173,250.51 0.03 7.75 % Greif Inc 01/08/19 182 1,595,649.80 0.02 4.63 % Hanesbrands Inc 15/05/24 154 1,290,677.35 0.01 4.88 % Hanesbrands Inc 15/05/26 232 1,949,601.66 0.02 5.00 % HCA Inc 15/03/24 104 890,555.04 0.01 5.25 % HCA Inc 15/04/25 303 2,633,124.73 0.03 5.38 % HCA Inc 01/02/25 145 1,231,880.59 0.01 5.88 % HCA Inc 15/03/22 52 457,211.25 0.01 5.88 % HCA Inc 15/02/26 361 3,126,780.78 0.04 7.50 % HCA Inc 15/02/22 477 4,413,050.08 0.05 8.36 % HCA Inc 15/04/24 35 340,406.35 0.00 7.75 % Herc Rentals Inc 01/06/24 270 2,433,601.82 0.03 5.88 % Hertz Corp/The 15/10/20 206 1,686,871.81 0.02 10.00 % Hexion Inc 15/04/20 319 2,493,488.25 0.03 4.63 % Hilton Worldwide Finance LLC / Hilton Worldwide Finance Corp 01/04/25 182 1,534,003.55 0.02 4.88 % Hilton Worldwide Finance LLC / Hilton Worldwide Finance Corp 01/04/27 52 445,741.59 0.01 7.13 % Infor Software Parent LLC / Infor Software Parent Inc 01/05/21 105 877,539.99 0.01 5.75 % Infor US Inc 15/05/22 208 2,098,097.17 0.02 6.50 % Infor US Inc 15/05/22 105 891,965.49 0.01 8.25 % International Lease Finance Corp 15/12/20 104 977,748.32 0.01 5.75 % Iron Mountain Inc 15/08/24 226 1,870,148.65 0.02 5.38 % Iron Mountain US Holdings Inc 01/06/26 77 653,471.29 0.01 5.00 % iStar Inc 01/07/19 155 1,278,664.61 0.01 6.00 % iStar Inc 01/04/22 103 874,908.21 0.01 5.65 % JC Penney Corp Inc 01/06/20 52 392,093.02 0.00 5.88 % JC Penney Corp Inc 01/07/23 137 1,059,407.52 0.01 1.50 % JPMorgan Chase & Co 29/10/26 340 3,459,634.00 0.04 10.00 % K Hovnanian Enterprises Inc 15/07/22 43 383,345.37 0.00 10.50 % K Hovnanian Enterprises Inc 15/07/24 36 338,973.05 0.00 5.88 % Kaiser Aluminum Corp 15/05/24 206 1,798,357.31 0.02 4.75 % KFC Holding Co/Pizza Hut Holdings LLC/Taco Bell of America LLC 01/06/27 155 1,296,418.73 0.01

89
SEB Strategy Fund - SEB Strategy Opportunity
Security description Maturity Total holdings Market % of
value in Net
SEK Assets
5.00 % KFC Holding Co/Pizza Hut Holdings LLC/Taco Bell of America LLC 01/06/24 154 1,304,773.88 0.02 5.25 % KFC Holding Co/Pizza Hut Holdings LLC/Taco Bell of America LLC 01/06/26 155 1,338,919.48 0.02 7.00 % Kraton Polymers LLC / Kraton Polymers Capital Corp 15/04/25 52 458,394.83 0.01 10.50 % Kraton Polymers LLC / Kraton Polymers Capital Corp 15/04/23 229 2,122,215.22 0.02 9.00 % Kronos Acquisition Holdings Inc 15/08/23 260 2,001,698.86 0.02 5.63 % L Brands Inc 15/02/22 311 2,713,366.11 0.03 6.63 % L Brands Inc 01/04/21 149 1,337,241.79 0.02 8.50 % L Brands Inc 15/06/19 98 867,243.84 0.01 4.63 % Lamb Weston Holdings Inc 01/11/24 237 1,994,878.86 0.02 4.13 % Lennar Corp 15/01/22 103 858,725.10 0.01 4.50 % Lennar Corp 15/11/19 51 427,711.88 0.00 4.50 % Lennar Corp 30/04/24 52 436,008.98 0.01 5.25 % Level 3 Financing Inc 15/03/26 103 824,908.40 0.01 5.38 % Level 3 Financing Inc 15/01/24 104 850,551.72 0.01 5.63 % Level 3 Financing Inc 01/02/23 52 430,103.84 0.00 5.00 % Levi Strauss & Co 01/05/25 412 3,517,814.59 0.04 5.88 % LIN Television Corp 15/11/22 105 891,578.64 0.01 4.88 % Live Nation Entertainment Inc 01/11/24 248 2,086,452.93 0.02 7.00 % Men's Wearhouse Inc/The 01/07/22 53 436,665.37 0.01 6.25 % Meritor Inc 15/02/24 260 2,240,884.33 0.03 5.50 % Micron Technology Inc 01/02/25 258 2,212,324.47 0.03 5.63 % Micron Technology Inc 15/01/26 144 1,237,556.39 0.01 1.75 % Morgan Stanley 30/01/25 300 3,082,172.83 0.04 6.50 % Nationstar Mortgage LLC / Nationstar Capital Corp 01/08/18 207 1,696,772.26 0.02 6.50 % Nationstar Mortgage LLC / Nationstar Capital Corp 01/07/21 51 423,824.38 0.00 5.88 % Navient Corp 25/03/21 333 2,823,406.53 0.03 6.75 % Navient Corp 25/06/25 103 870,860.33 0.01 8.00 % Navient Corp 25/03/20 360 3,181,225.08 0.04 3.63 % Netflix Inc 15/05/27 218 2,156,721.85 0.03 5.63 % Nexstar Broadcasting Inc 01/08/24 154 1,300,600.40 0.01 5.00 % Nielsen Finance LLC / Nielsen Finance Co 15/04/22 156 1,315,371.09 0.02 5.75 % NRG Energy Inc 15/01/28 26 215,047.66 0.00 6.25 % NRG Energy Inc 15/07/22 52 443,187.09 0.01 7.95 % Pactiv LLC 15/12/25 155 1,439,949.17 0.02 5.88 % PetSmart Inc 01/06/25 104 649,138.64 0.01 7.13 % PetSmart Inc 15/03/23 104 504,324.57 0.01 8.88 % PetSmart Inc 01/06/25 52 257,122.25 0.00 5.50 % Post Holdings Inc 01/03/25 181 1,538,289.94 0.02 5.63 % Post Holdings Inc 15/01/28 51 419,394.06 0.00 9.25 % Prime Security Services Borrower LLC / Prime Finance Inc 15/05/23 208 1,886,831.93 0.02 5.63 % Prudential Financial Inc FRN 15/06/43 182 1,617,569.46 0.02 4.25 % PulteGroup Inc 01/03/21 52 439,568.23 0.01 5.00 % PulteGroup Inc 15/01/27 52 445,848.02 0.01 7.88 % PulteGroup Inc 15/06/32 51 524,928.42 0.01 7.00 % Qorvo Inc 01/12/25 137 1,253,896.21 0.01 7.00 % Quad/Graphics Inc 01/05/22 129 1,091,766.45 0.01 3.25 % Quintiles IMS Inc 15/03/25 103 1,046,121.24 0.01 3.50 % Quintiles IMS Inc 15/10/24 104 1,069,120.54 0.01 4.88 % Quintiles IMS Inc 15/05/23 103 872,428.88 0.01 7.75 % Qwest Capital Funding Inc 15/02/31 52 373,811.39 0.00 8.63 % Rackspace Hosting Inc 15/11/24 206 1,798,610.30 0.02 8.50 % Rain CII Carbon LLC / CII Carbon Corp 15/01/21 651 6,546,542.94 0.08 5.50 % Rayonier AM Products Inc 01/06/24 361 2,935,607.61 0.03 5.75 % Regal Entertainment Group 01/02/25 52 432,304.96 0.00

90
SEB Strategy Fund - SEB Strategy Opportunity
Security description Maturity Total holdings Market % of
value in Net
SEK Assets
5.75 % Reynolds Group Issuer Inc / Reynolds Group Issuer LLC / Reynolds Group Issuer Lu 15/10/20 292 2,426,413.79 0.03
6.13 % Rite Aid Corp 01/04/23 105 775,366.51 0.01 6.75 % Rite Aid Corp 15/06/21 104 846,685.92 0.01 5.63 % Sally Holdings LLC / Sally Capital Inc 01/12/25 363 2,955,497.27 0.03 5.63 % Sinclair Television Group Inc 01/08/24 208 1,755,122.39 0.02 5.00 % Sirius XM Radio Inc 01/08/27 65 533,430.86 0.01 5.38 % Sirius XM Radio Inc 15/04/25 154 1,313,095.63 0.02 5.38 % Sirius XM Radio Inc 15/07/26 207 1,752,446.65 0.02 6.00 % Sirius XM Radio Inc 15/07/24 103 891,420.21 0.01 4.88 % Six Flags Entertainment Corp 31/07/24 415 3,447,679.74 0.04 10.50 % Solera LLC / Solera Finance Inc 01/03/24 317 2,928,966.43 0.03 6.13 % Spectrum Brands Inc 15/12/24 51 442,464.30 0.01 6.63 % Spectrum Brands Inc 15/11/22 278 2,361,744.16 0.03 6.13 % Springleaf Finance Corp 15/05/22 104 883,947.42 0.01 8.25 % Springleaf Finance Corp 15/12/20 155 1,401,344.43 0.02 8.75 % Sprint Capital Corp 15/03/32 155 1,444,340.11 0.02 7.00 % Sprint Communications Inc 15/08/20 270 2,354,395.41 0.03 11.50 % Sprint Communications Inc 15/11/21 182 1,791,630.32 0.02 7.13 % Sprint Corp 15/06/24 154 1,287,474.74 0.01 7.25 % Sprint Corp 15/09/21 331 2,869,647.55 0.03 7.63 % Sprint Corp 15/02/25 103 881,300.50 0.01 7.88 % Sprint Corp 15/09/23 467 4,068,102.64 0.05 8.50 % Staples Inc 15/09/25 52 392,846.60 0.00 9.13 % Syniverse Foreign Holdings Corp 15/01/22 324 2,689,861.93 0.03 9.50 % Talen Energy Supply LLC 15/07/22 370 3,112,883.45 0.04 5.50 % TEGNA Inc 15/09/24 103 888,628.85 0.01 6.38 % Telecom Italia Capital SA 15/11/33 152 1,447,709.09 0.02 5.63 % Tempur Sealy International Inc 15/10/23 156 1,333,048.16 0.02 4.50 % Tenet Healthcare Corp 01/04/21 154 1,271,360.82 0.01 6.75 % Tenet Healthcare Corp 15/06/23 52 411,098.43 0.00 7.00 % Tenet Healthcare Corp 01/08/25 26 201,391.78 0.00 8.13 % Tenet Healthcare Corp 01/04/22 488 4,080,389.41 0.05 5.00 % Tenneco Inc 15/07/26 51 430,225.59 0.00 5.30 % Tesla Inc 15/08/25 104 819,744.56 0.01 8.75 % TPC Group Inc 15/12/20 397 3,258,584.15 0.04 4.63 % United Rentals North America Inc 15/07/23 155 1,310,327.61 0.02 8.25 % Uniti Group LP / Uniti Group Finance Inc / CSL Capital LLC 15/10/23 131 1,030,278.31 0.01 7.63 % Universal Hospital Services Inc 15/08/20 208 1,704,901.11 0.02 5.13 % Univision Communications Inc 15/05/23 104 851,573.51 0.01 5.13 % Univision Communications Inc 15/02/25 52 415,538.99 0.00 6.38 % US Concrete Inc 01/06/24 258 2,268,788.05 0.03 6.38 % Valeant Pharmaceuticals International 15/10/20 302 2,501,248.82 0.03 6.75 % Valeant Pharmaceuticals International 15/08/21 312 2,578,349.57 0.03 7.25 % Valeant Pharmaceuticals International 15/07/22 363 3,005,903.27 0.03 4.75 % VeriSign Inc 15/07/27 130 1,088,202.36 0.01 5.25 % VeriSign Inc 01/04/25 62 550,877.71 0.01 7.50 % Veritas US Inc / Veritas Bermuda Ltd 01/02/23 159 1,663,222.41 0.02 1.63 % Verizon Communications Inc 01/03/24 200 2,056,571.29 0.02 1.38 % Wells Fargo & Co 26/10/26 300 3,007,047.52 0.03 10.50 % Western Digital Corp 01/04/24 207 1,964,399.12 0.02 5.88 % William Lyon Homes Inc 31/01/25 311 2,598,706.08 0.03 7.75 % Windstream Services LLC / Windstream Finance Corp 15/10/20 53 366,341.71 0.00 7.75 % Windstream Services LLC / Windstream Finance Corp 01/10/21 103 631,672.48 0.01 4.88 % WMG Acquisition Corp 01/11/24 207 1,744,955.60 0.02

91
SEB Strategy Fund - SEB Strategy Opportunity
Security description Maturity Total holdings Market % of
value in Net
SEK Assets
5.00 % Wolverine World Wide Inc 01/09/26 285 2,336,019.05 0.03 6.13 % XPO Logistics Inc 01/09/23 218 1,890,407.72 0.02 6.38 % Zayo Group LLC / Zayo Capital Inc 15/05/25 208 1,804,219.70 0.02 4.75 % ZF North America Capital Inc 29/04/25 155 1,344,516.02 0.02
Total United States of America 364,759,681.98 4.24
Total Bonds 1,790,135,716.53 20.80
Shares
Australia APA Group 21,959 1,171,363.54 0.01 Australia & New Zealand Banking Group Ltd 12,007 2,209,812.45 0.03 Commonwealth Bank of Australia 6,343 3,263,327.64 0.04 CSL Ltd 1,804 1,632,348.32 0.02 Domino's Pizza Enterprises Ltd 620 185,414.08 0.00 Flight Centre Travel Group Ltd 611 173,097.37 0.00 GPT Group/The 370,023 12,108,316.40 0.14 Harvey Norman Holdings Ltd 10,731 286,556.58 0.00 Healthscope Ltd 20,662 277,859.85 0.00 Mirvac Group 1,366,521 20,564,507.51 0.24 National Australia Bank Ltd 11,566 2,190,123.74 0.03 QBE Insurance Group Ltd 6,218 425,261.54 0.00 REA Group Ltd 953 467,777.36 0.01 TPG Telecom Ltd 6,584 277,006.10 0.00 Transurban Group 13,395 1,066,222.85 0.01 Westfield Corp 21,289 1,293,765.65 0.02 Westpac Banking Corp 13,273 2,664,653.73 0.03
Total Australia 50,257,414.71 0.58
Austria voestalpine AG 947 464,095.86 0.00
Total Austria 464,095.86 0.00
Belgium Colruyt SA 1,206 514,129.65 0.01 KBC Group NV 34,054 23,808,655.82 0.28 Proximus SADP 78,669 21,154,220.50 0.24 Solvay SA 1,499 1,708,130.85 0.02
Total Belgium 47,185,136.82 0.55
Bermuda Arch Capital Group Ltd 565 419,894.81 0.00 Bunge Ltd 971 533,288.24 0.01 IHS Markit Ltd 1,947 719,736.33 0.01 Kerry Properties Ltd 287,500 10,584,155.83 0.12 Norwegian Cruise Line Holdings Ltd 1,108 483,068.92 0.01 XL Group Ltd 1,477 425,186.12 0.01 Yue Yuen Industrial Holdings Ltd 623,568 20,050,039.97 0.23
Total Bermuda 33,215,370.22 0.39
Canada Bank of Montreal 2,265 1,488,833.72 0.02 Bank of Nova Scotia/The 4,367 2,314,911.10 0.03 BCE Inc 49,500 19,530,865.56 0.23 Canadian Imperial Bank of Commerce 76,249 61,056,964.79 0.71 Canadian National Railway Co 3,331 2,256,145.59 0.03 Canadian Pacific Railway Ltd 1,051 1,577,288.95 0.02

92
SEB Strategy Fund - SEB Strategy Opportunity
Security description Maturity Total holdings Market % of
value in Net
SEK Assets
CI Financial Corp 21,300 4,143,636.22 0.05 Constellation Software Inc/Canada 155 771,829.28 0.01 Fairfax Financial Holdings Ltd 152 664,834.50 0.01 Great-West Lifeco Inc 2,746 629,840.86 0.01 H&R Real Estate Investment Trust 9,800 1,367,887.90 0.01 Magna International Inc 24,672 11,485,540.83 0.13 National Bank of Canada 2,663 1,091,441.34 0.01 Open Text Corp 2,400 701,195.46 0.01 Power Corp of Canada 91,800 19,418,181.83 0.22 Power Financial Corp 40,282 9,091,939.59 0.10 Restaurant Brands International Inc 1,500 757,400.09 0.01 RioCan Real Estate Investment Trust 10,267 1,634,346.09 0.02 Rogers Communications Inc 3,300 1,381,199.01 0.02 Royal Bank of Canada 4,936 3,310,985.57 0.04 SmartCentres Real Estate Investment Trust 8,148 1,645,785.41 0.02 Sun Life Financial Inc 84,760 28,735,191.67 0.33 Toronto-Dominion Bank/The 64,933 31,250,818.93 0.36
Total Canada 206,307,064.29 2.40
Cayman Islands CK Asset Holdings Ltd 21,066 1,506,939.55 0.02 WH Group Ltd 45,897 423,980.55 0.00 Wharf Real Estate Investment Co Ltd 15,000 816,935.28 0.01
Total Cayman Islands 2,747,855.38 0.03
Denmark Danske Bank A/S 2,990 953,894.31 0.01 Novo Nordisk A/S 6,133 2,708,951.49 0.03 Pandora A/S 544 485,239.78 0.00 Tryg A/S 2,381 487,958.91 0.01 William Demant Holding A/S 2,372 543,433.37 0.01
Total Denmark 5,179,477.86 0.06
Finland Elisa OYJ 2,452 788,805.31 0.01 Kone OYJ 2,734 1,203,701.12 0.02 Sampo Oyj 2,257 1,016,326.16 0.01 UPM-Kymmene OYJ 4,409 1,123,165.04 0.01
Total Finland 4,131,997.63 0.05
France Air Liquide SA 2,200 2,272,243.16 0.03 Arkema SA 1,123 1,121,232.69 0.01 AXA SA 6,205 1,509,001.88 0.02 BNP Paribas SA 3,481 2,130,489.73 0.02 Capgemini SE 1,063 1,033,526.72 0.01 Carrefour SA 2,543 451,044.05 0.01 Casino Guichard Perrachon SA 997 495,607.98 0.01 Cie de Saint-Gobain 3,890 1,758,549.65 0.02 Cie Generale des Etablissements Michelin 1,033 1,214,188.09 0.01 CNP Assurances 38,566 7,301,030.90 0.08 Danone SA 2,167 1,490,330.87 0.02 Dassault Systemes SE 739 643,672.87 0.01 Eiffage SA 1,087 976,172.61 0.01 Eurazeo SA 12,498 9,461,659.44 0.11 Fonciere Des Regions 9,827 9,128,447.19 0.11 ICADE 929 748,332.72 0.01

93
SEB Strategy Fund - SEB Strategy Opportunity
Security description Maturity Total holdings Market % of
value in Net
SEK Assets
JCDecaux SA 710 234,583.96 0.00 Klepierre SA 106,869 38,524,720.99 0.45 Lagardere SCA 1,506 395,785.61 0.00 Legrand SA 2,796 1,764,576.98 0.02 L'Oreal SA 905 1,645,655.71 0.02 Natixis SA 33,336 2,161,873.16 0.03 Publicis Groupe SA 888 494,594.12 0.01 Sanofi 3,686 2,603,863.24 0.03 Schneider Electric SE 2,862 1,993,915.93 0.02 SCOR SE 15,875 5,235,734.32 0.06 Societe Generale SA 2,564 1,085,243.62 0.01 Veolia Environnement SA 4,033 843,594.78 0.01 Vinci SA 2,302 1,927,196.68 0.02
Total France 100,646,869.65 1.17
Germany adidas AG 732 1,202,966.49 0.01 Allianz SE 34,255 64,495,411.31 0.75 Bayer AG 2,865 2,929,503.57 0.04 Bayerische Motoren Werke AG 1,984 1,693,743.09 0.02 Daimler AG 4,029 2,804,571.99 0.03 Deutsche Bank AG 8,162 1,273,932.42 0.02 Deutsche Boerse AG 999 950,773.16 0.01 Deutsche Post AG 4,342 1,696,926.45 0.02 Deutsche Wohnen SE 2,693 965,359.52 0.01 Evonik Industries AG 3,231 996,523.50 0.01 Fresenius Medical Care AG & Co KGaA 1,076 928,632.58 0.01 GEA Group AG 1,569 617,202.34 0.01 Hannover Rueck SE 9,499 9,796,917.31 0.11 Henkel AG & Co KGaA 1,013 995,968.29 0.01 Linde AG 669 1,193,162.15 0.01 Merck KGaA 557 491,502.49 0.01 Muenchener Rueckversicherungs-Gesellschaft AG in Muenchen 3,930 6,984,043.29 0.08 SAP SE 3,640 3,344,388.77 0.04 United Internet AG 1,214 684,403.85 0.01 Wuestenrot & Wuerttembergische AG 474 108,864.74 0.00
Total Germany 104,154,797.31 1.21
Hong Kong AIA Group Ltd 45,400 3,169,195.67 0.04 HKT Trust & HKT Ltd 1,757,000 18,328,382.81 0.21 Link REIT 19,500 1,479,674.02 0.02 PCCW Ltd 197,000 936,731.50 0.01 Sun Hung Kai Properties Ltd 10,000 1,365,748.21 0.02 Wharf Holdings Ltd/The 101,000 2,856,131.41 0.03
Total Hong Kong 28,135,863.62 0.33
Ireland Accenture Plc 4,027 5,047,521.44 0.06 Allergan Plc 1,200 1,607,167.61 0.02 CRH Plc 4,727 1,392,165.95 0.02 DCC Plc 1,100 909,472.89 0.01 Jazz Pharmaceuticals Plc 418 460,821.10 0.01 Johnson Controls International Plc 3,800 1,185,693.03 0.01 Medtronic Plc 4,686 3,098,093.61 0.04 Pentair Plc 2,374 1,372,644.73 0.02 Perrigo Co Plc 570 406,763.33 0.00

94
SEB Strategy Fund - SEB Strategy Opportunity
Security description Maturity Total holdings Market % of
value in Net
SEK Assets
Seagate Technology Plc 151,499 51,898,064.58 0.60
Total Ireland 67,378,408.27 0.79
Israel Teva Pharmaceutical Industries Ltd ADR 2,400 372,366.13 0.00
Total Israel 372,366.13 0.00
Italy Ferrari NV 736 632,810.53 0.01 Intesa Sanpaolo SpA 45,894 1,249,889.87 0.02 Poste Italiane SpA 5,073 312,978.66 0.00 Prysmian SpA 3,086 824,975.78 0.01 Telecom Italia SpA/Milano RSP 116,315 681,581.90 0.01 UniCredit SpA 7,388 1,131,697.63 0.01
Total Italy 4,833,934.37 0.06
Japan ABC-Mart Inc 1,600 752,389.54 0.01 AEON Financial Service Co Ltd 3,700 705,641.38 0.01 Aeon Mall Co Ltd 5,700 913,071.81 0.01 Asahi Kasei Corp 18,200 1,922,670.72 0.02 Asics Corp 2,600 339,389.32 0.00 Benesse Holdings Inc 1,300 375,576.99 0.00 Bridgestone Corp 43,000 16,370,141.67 0.19 Brother Industries Ltd 94,300 19,053,509.33 0.22 Calbee Inc 900 239,736.95 0.00 Canon Inc 6,600 2,014,706.16 0.02 Central Japan Railway Co 18,300 26,840,508.54 0.31 Concordia Financial Group Ltd 19,600 968,687.00 0.01 Daiichi Sankyo Co Ltd 4,100 875,197.95 0.01 Daito Trust Construction Co Ltd 4,700 7,848,232.61 0.09 Daiwa House Industry Co Ltd 216,700 68,149,754.37 0.79 DeNA Co Ltd 2,500 422,092.57 0.01 Dowa Holdings Co Ltd 300 100,299.22 0.00 DTS Corp 2,900 773,539.60 0.01 Eisai Co Ltd 2,700 1,259,060.52 0.01 FANUC Corp 1,400 2,753,431.75 0.03 Fujitsu Ltd 169,000 9,859,580.93 0.11 Hachijuni Bank Ltd/The 12,900 606,614.07 0.01 Hakuhodo DY Holdings Inc 2,900 308,361.97 0.00 Hamamatsu Photonics KK 2,700 743,740.55 0.01 Hino Motors Ltd 17,000 1,803,932.43 0.02 Hitachi Ltd 780,000 49,768,911.24 0.58 Honda Motor Co Ltd 18,700 5,248,949.14 0.06 Hoya Corp 2,200 899,902.08 0.01 Isuzu Motors Ltd 6,200 850,319.38 0.01 Japan Airlines Co Ltd 700 224,263.25 0.00 Japan Airport Terminal Co Ltd 1,000 303,804.90 0.00 Japan Exchange Group Inc 6,400 912,170.57 0.01 Japan Prime Realty Investment Corp 26 676,511.00 0.01 JTEKT Corp 8,800 1,238,244.80 0.01 Kakaku.com Inc 3,200 443,060.92 0.01 Kamigumi Co Ltd 24,900 4,511,698.96 0.05 KDDI Corp 102,600 20,913,238.65 0.24 Keyence Corp 400 1,835,039.72 0.02 Komatsu Ltd 6,600 1,956,183.74 0.02 Kubota Corp 5,900 947,467.90 0.01

95
SEB Strategy Fund - SEB Strategy Opportunity
Security description Maturity Total holdings Market % of
value in Net
SEK Assets
Kuraray Co Ltd 6,600 1,019,825.07 0.01 Kyushu Financial Group Inc 11,000 545,249.84 0.01 LINE Corp 600 200,380.41 0.00 LIXIL Group Corp 4,400 975,373.62 0.01 Makita Corp 3,100 1,066,842.15 0.01 Maruichi Steel Tube Ltd 3,900 935,399.29 0.01 McDonald's Holdings Co Japan Ltd 1,200 432,158.83 0.01 Miraca Holdings Inc 54,600 19,147,339.98 0.22 Mitsubishi Chemical Holdings Corp 11,800 1,060,460.79 0.01 Mitsubishi UFJ Financial Group Inc 58,700 3,525,712.52 0.04 Mitsui Fudosan Co Ltd 6,100 1,119,462.90 0.01 Mixi Inc 62,400 22,948,462.55 0.27 Mizuho Financial Group Inc 233,900 3,478,198.31 0.04 NEC Corp 3,900 861,701.16 0.01 Nintendo Co Ltd 600 1,796,228.28 0.02 Nissan Chemical Industries Ltd 2,900 947,427.93 0.01 Nissin Foods Holdings Co Ltd 900 538,345.18 0.01 Nitori Holdings Co Ltd 400 467,045.52 0.01 NTT DOCOMO Inc 232,200 44,908,192.78 0.52 Ono Pharmaceutical Co Ltd 3,100 591,663.67 0.01 Otsuka Holdings Co Ltd 2,600 935,021.35 0.01 Panasonic Corp 11,100 1,330,741.76 0.02 Park24 Co Ltd 3,300 646,864.58 0.01 Recruit Holdings Co Ltd 4,600 936,126.09 0.01 Rinnai Corp 900 667,207.88 0.01 Sekisui Chemical Co Ltd 6,400 1,052,182.47 0.01 Seven Bank Ltd 17,400 488,151.96 0.01 Shimadzu Corp 3,300 614,485.38 0.01 Shimamura Co Ltd 800 720,991.53 0.01 Shinsei Bank Ltd 4,500 637,445.18 0.01 Shiseido Co Ltd 1,600 633,309.65 0.01 Shizuoka Bank Ltd/The 13,000 1,099,802.80 0.01 SoftBank Group Corp 2,800 1,815,270.60 0.02 Sony Corp 3,900 1,440,798.36 0.02 Stanley Electric Co Ltd 3,200 1,064,043.95 0.01 Sumitomo Dainippon Pharma Co Ltd 3,600 438,002.35 0.01 Sumitomo Electric Industries Ltd 8,100 1,121,497.96 0.01 Sumitomo Mitsui Financial Group Inc 10,000 3,538,091.48 0.04 Sumitomo Rubber Industries Ltd 4,400 670,289.54 0.01 Sundrug Co Ltd 1,700 647,438.76 0.01 Suzuken Co Ltd/Aichi Japan 1,600 538,999.31 0.01 Suzuki Motor Corp 2,000 949,790.05 0.01 Taisho Pharmaceutical Holdings Co Ltd 1,000 654,125.38 0.01 Taiyo Nippon Sanso Corp 6,300 722,089.00 0.01 Tokyo Electron Ltd 1,000 1,482,684.19 0.02 Toppan Printing Co Ltd 20,000 1,481,230.58 0.02 Toray Industries Inc 14,200 1,096,568.51 0.01 Unicharm Corp 2,500 532,294.53 0.01 West Japan Railway Co 500 298,971.64 0.00 Yamaguchi Financial Group Inc 7,000 681,235.24 0.01 Yamazaki Baking Co Ltd 3,500 558,877.45 0.01 Yokohama Rubber Co Ltd/The 3,400 682,776.07 0.01
Total Japan 393,472,510.56 4.57

96
SEB Strategy Fund - SEB Strategy Opportunity
Security description Maturity Total holdings Market % of
value in Net
SEK Assets
Liberia Royal Caribbean Cruises Ltd 49,777 48,612,288.78 0.56
Total Liberia 48,612,288.78 0.56
Luxembourg Eurofins Scientific SE 86 429,196.46 0.00 RTL Group SA 663 437,197.73 0.00
Total Luxembourg 866,394.19 0.00
Mauritius Golden Agri-Resources Ltd 110,900 251,384.29 0.00
Total Mauritius 251,384.29 0.00
Netherlands Aegon NV 9,273 484,573.48 0.01 AerCap Holdings NV 2,553 1,099,686.36 0.01 ASML Holding NV 1,686 2,406,083.40 0.03 ING Groep NV 75,855 11,429,329.79 0.13 Koninklijke Ahold Delhaize NV 15,321 2,761,875.52 0.03 Koninklijke KPN NV 22,076 631,176.57 0.01 Mylan NV 1,800 623,541.34 0.01 QIAGEN NV 2,816 725,110.54 0.01 Sensata Technologies Holding NV 2,400 1,004,307.82 0.01 Unilever NV 5,856 2,703,453.97 0.03 Wolters Kluwer NV 2,945 1,258,957.01 0.01
Total Netherlands 25,128,095.80 0.29
New Zealand Mercury NZ Ltd 9,595 188,282.00 0.00 Meridian Energy Ltd 46,384 790,001.63 0.01 Ryman Healthcare Ltd 7,700 474,810.81 0.01 Spark New Zealand Ltd 537,228 11,355,314.89 0.13
Total New Zealand 12,808,409.33 0.15
Norway DNB ASA 4,914 748,162.46 0.01 Norsk Hydro ASA 22,679 1,415,441.43 0.02 Telenor ASA 117,769 20,736,161.73 0.24
Total Norway 22,899,765.62 0.27
Panama Carnival Corp 1,600 869,443.81 0.01
Total Panama 869,443.81 0.01
Singapore Broadcom Ltd 1,430 3,007,806.28 0.03 Flex Ltd 5,758 848,110.70 0.01 Hutchison Port Holdings Trust 62,700 213,042.06 0.00 Oversea-Chinese Banking Corp Ltd 236,000 17,913,818.86 0.21 SATS Ltd 16,000 509,715.92 0.01 StarHub Ltd 287,500 5,019,813.45 0.06 Suntec Real Estate Investment Trust 92,100 1,213,117.76 0.01 United Overseas Bank Ltd 8,900 1,442,183.60 0.02 Yanlord Land Group Ltd 72,900 723,514.79 0.01
Total Singapore 30,891,123.42 0.36

97
SEB Strategy Fund - SEB Strategy Opportunity
Security description Maturity Total holdings Market % of
value in Net
SEK Assets
Spain Amadeus IT Group SA 1,613 953,272.71 0.01 Banco Bilbao Vizcaya Argentaria SA 22,934 1,603,642.76 0.02 Banco Santander SA 49,323 2,656,971.25 0.03 Bankinter SA 4,732 367,728.90 0.00 CaixaBank SA 15,570 595,336.65 0.01 Ferrovial SA 4,392 817,211.16 0.01 Grifols SA 2,369 568,899.74 0.01 Iberdrola SA 24,478 1,554,692.54 0.02 Industria de Diseno Textil SA 4,153 1,185,958.24 0.01 Telefonica SA 17,144 1,369,530.14 0.02
Total Spain 11,673,244.09 0.14
Sweden Assa Abloy AB 6,595 1,123,788.00 0.01 Atlas Copco AB A 4,545 1,609,839.00 0.02 Electrolux AB 41,950 11,087,385.00 0.13 Essity AB 2,431 566,423.00 0.01 Hemfosa Fastigheter AB 2,304 253,209.60 0.00 Hennes & Mauritz AB 4,116 696,838.80 0.01 Hexagon AB 1,921 789,338.90 0.01 ICA Gruppen AB 896 266,918.40 0.00 Industrivarden AB 108,778 22,027,545.00 0.26 Investor AB 3,173 1,187,019.30 0.01 L E Lundbergforetagen AB 776 475,688.00 0.01 Nobina AB 5,798 313,092.00 0.00 Nordea Bank AB 9,303 923,787.90 0.01 Securitas AB 4,353 623,349.60 0.01 SKF AB 144,280 26,287,816.00 0.30 Telefonaktiebolaget LM Ericsson 12,850 691,972.50 0.01
Total Sweden 68,924,011.00 0.80
Switzerland ABB Ltd 10,231 2,245,314.66 0.03 Baloise Holding AG 1,580 2,013,856.97 0.02 Chubb Ltd 1,422 1,701,330.55 0.02 Cie Financiere Richemont SA 2,592 1,923,010.50 0.02 Credit Suisse Group AG 10,734 1,569,266.83 0.02 Garmin Ltd 12,000 5,852,731.03 0.07 Kuehne + Nagel International AG 508 736,272.82 0.01 LafargeHolcim Ltd 3,073 1,418,783.77 0.02 Nestle SA 9,743 6,859,977.27 0.08 Novartis AG 7,074 4,897,542.60 0.06 Orior AG 34 22,039.45 0.00 Roche Holding AG 8,286 17,161,206.13 0.20 SGS SA 741 15,820,085.57 0.18 Sonova Holding AG 579 740,421.76 0.01 Swatch Group AG/The 304 1,015,049.92 0.01 Swiss Life Holding AG 1,479 4,287,194.87 0.05 Swiss Re AG 1,229 942,259.90 0.01 Swisscom AG 16,077 70,038,966.31 0.81 TE Connectivity Ltd 84,198 65,517,591.41 0.76 UBS Group AG 12,565 1,893,960.37 0.02 Zurich Insurance Group AG 556 1,385,580.92 0.02
Total Switzerland 208,042,443.61 2.42

98
SEB Strategy Fund - SEB Strategy Opportunity
Security description Maturity Total holdings Market % of
value in Net
SEK Assets
United Kingdom Aon Plc 1,018 1,116,869.15 0.01 Ashtead Group Plc 4,335 956,413.50 0.01 Associated British Foods Plc 1,765 551,265.84 0.01 AstraZeneca Plc 4,212 2,388,968.38 0.03 Barclays Plc 59,626 1,341,259.70 0.02 Barratt Developments Plc 276,196 19,807,260.80 0.23 Bellway Plc 316 124,701.07 0.00 Berkeley Group Holdings Plc 42,908 19,945,480.53 0.23 BT Group Plc 38,350 1,154,043.74 0.01 Compass Group Plc 7,413 1,313,654.76 0.02 easyJet Plc 2,562 415,420.06 0.00 Experian Plc 6,294 1,140,452.76 0.01 Fiat Chrysler Automobiles NV 5,742 841,737.93 0.01 GlaxoSmithKline Plc 17,174 2,515,558.39 0.03 HSBC Holdings Plc 62,582 5,315,638.53 0.06 Johnson Matthey Plc 1,381 470,333.66 0.01 Liberty Global Plc C 3,163 876,353.38 0.01 Lloyds Banking Group Plc 241,652 1,821,585.66 0.02 London Stock Exchange Group Plc 2,656 1,115,778.98 0.01 Mediclinic International Plc 3,244 233,360.46 0.00 National Grid Plc 22,766 2,206,539.40 0.03 Next Plc 4,057 2,033,250.34 0.02 Nielsen Holdings Plc 2,008 598,432.00 0.01 Old Mutual Plc 31,645 812,079.27 0.01 Persimmon Plc 241,878 73,349,486.08 0.85 Prudential Plc 10,119 2,135,570.06 0.02 Reckitt Benckiser Group Plc 2,318 1,776,331.53 0.02 RSA Insurance Group Plc 13,229 926,733.44 0.01 Sage Group Plc/The 11,658 1,030,372.37 0.01 Shire Plc 3,314 1,431,477.00 0.02 Sky Plc 5,186 581,273.18 0.01 Smiths Group Plc 5,493 906,490.23 0.01 Standard Chartered Plc 13,026 1,125,456.29 0.01 Standard Life Aberdeen Plc 20,677 999,858.43 0.01 Taylor Wimpey Plc 2,696,618 61,644,791.01 0.72 Tesco Plc 39,651 918,939.43 0.01 Unilever Plc 5,250 2,398,850.36 0.03 Vodafone Group Plc 97,625 2,540,950.31 0.03 Worldpay Group Plc 9,859 465,167.89 0.01 WPP Plc 5,427 806,038.64 0.01
Total United Kingdom 222,134,224.54 2.58
United States of America 3M Co 1,940 3,738,544.52 0.04 Abbott Laboratories 6,980 3,261,467.20 0.04 AbbVie Inc 5,084 4,025,563.16 0.05 Activision Blizzard Inc 2,854 1,479,600.93 0.02 Adobe Systems Inc 1,693 2,429,069.40 0.03 Advanced Micro Devices Inc 4,093 344,496.31 0.00 Aetna Inc 1,261 1,862,418.45 0.02 Aflac Inc 89,447 64,285,211.30 0.75 Agilent Technologies Inc 2,425 1,329,663.54 0.02 AGNC Investment Corp 6,284 1,038,776.74 0.01 Air Products & Chemicals Inc 1,294 1,738,359.69 0.02 Albemarle Corp 848 887,937.01 0.01

99
SEB Strategy Fund - SEB Strategy Opportunity
Security description Maturity Total holdings Market % of
value in Net
SEK Assets
Alexion Pharmaceuticals Inc 966 945,848.79 0.01 Alleghany Corp 122 595,417.21 0.01 Alliance Data Systems Corp 306 635,060.13 0.01 Allstate Corp/The 1,363 1,168,513.50 0.01 Alphabet Inc A 1,873 16,154,027.26 0.19 Amazon.com Inc 1,270 12,160,250.64 0.14 AMERCO 27 83,541.42 0.00 American Express Co 2,967 2,412,460.71 0.03 American Financial Group Inc/OH 600 533,200.79 0.01 American International Group Inc 3,204 1,562,941.51 0.02 American Tower Corp 1,654 1,932,047.89 0.02 AmerisourceBergen Corp 737 554,057.06 0.01 AMETEK Inc 2,842 1,686,289.19 0.02 Amgen Inc 2,331 3,318,880.20 0.04 Annaly Capital Management Inc 707,547 68,879,005.59 0.80 Anthem Inc 969 1,785,152.48 0.02 Apple Inc 16,075 22,272,966.10 0.26 Applied Materials Inc 4,591 1,921,533.05 0.02 Aramark 1,600 559,891.95 0.01 Arista Networks Inc 275 530,421.15 0.01 Arrow Electronics Inc 1,200 790,025.35 0.01 Arthur J Gallagher & Co 1,385 717,572.79 0.01 AT&T Inc 19,447 6,190,540.80 0.07 Atmos Energy Corp 1,552 1,091,400.23 0.01 Autodesk Inc 978 839,410.04 0.01 Autoliv Inc 497 517,110.45 0.01 Automatic Data Processing Inc 1,465 1,405,652.27 0.02 AutoZone Inc 163 949,364.24 0.01 Avery Dennison Corp 74,242 69,818,127.15 0.81 Avnet Inc 2,200 713,652.63 0.01 Bank of America Corp 31,777 7,680,313.84 0.09 Bank of New York Mellon Corp/The 4,000 1,763,908.53 0.02 Baxter International Inc 38,902 20,588,418.96 0.24 BB&T Corp 3,068 1,248,924.53 0.01 Becton Dickinson and Co 900 1,577,348.84 0.02 Best Buy Co Inc 43,900 24,610,167.42 0.29 Biogen Inc 711 1,854,488.72 0.02 BioMarin Pharmaceutical Inc 804 586,981.66 0.01 BlackRock Inc 460 1,934,753.19 0.02 Boston Scientific Corp 5,365 1,088,920.00 0.01 Bristol-Myers Squibb Co 41,734 20,939,123.02 0.24 Broadridge Financial Solutions Inc 1,300 964,107.34 0.01 CA Inc 106,000 28,882,774.06 0.34 Capital One Financial Corp 1,900 1,549,085.69 0.02 Cardinal Health Inc 1,510 757,485.89 0.01 CBRE Group Inc 2,305 817,351.44 0.01 CBS Corp 1,900 917,815.38 0.01 CDW Corp/DE 1,400 796,526.20 0.01 Celgene Corp 2,457 2,099,369.81 0.02 Centene Corp 814 672,324.90 0.01 CenterPoint Energy Inc 6,428 1,492,560.06 0.02 CenturyLink Inc 4,400 600,894.80 0.01 CF Industries Holdings Inc 1,723 600,112.24 0.01 Charles Schwab Corp/The 4,545 1,911,583.06 0.02 Charter Communications Inc 658 1,809,935.87 0.02 Chipotle Mexican Grill Inc 110 260,306.69 0.00

100
SEB Strategy Fund - SEB Strategy Opportunity
Security description Maturity Total holdings Market % of
value in Net
SEK Assets
Cigna Corp 1,042 1,732,630.59 0.02 Cisco Systems Inc 160,828 50,432,460.29 0.59 Citigroup Inc 8,703 5,302,125.56 0.06 Clorox Co/The 599 729,464.77 0.01 CME Group Inc 1,300 1,554,513.99 0.02 CMS Energy Corp 4,900 1,897,609.91 0.02 Coca-Cola Co/The 12,480 4,688,001.20 0.05 Cognizant Technology Solutions Corp 2,495 1,450,777.92 0.02 Colgate-Palmolive Co 2,651 1,637,640.96 0.02 Comcast Corp 15,010 4,921,901.67 0.06 Conagra Brands Inc 5,674 1,749,986.39 0.02 Corning Inc 4,053 1,061,550.27 0.01 Costco Wholesale Corp 1,495 2,278,158.61 0.03 Crown Castle International Corp 1,700 1,545,114.77 0.02 CSX Corp 3,501 1,576,824.92 0.02 Cummins Inc 49,113 71,028,924.59 0.83 CVS Health Corp 3,440 2,041,955.01 0.02 Danaher Corp 2,291 1,741,070.57 0.02 Deere & Co 1,267 1,623,560.31 0.02 Delta Air Lines Inc 1,500 687,747.48 0.01 DENTSPLY SIRONA Inc 1,147 618,211.38 0.01 Discovery Communications Inc C 2,700 467,987.60 0.01 Dollar General Corp 1,672 1,273,255.72 0.01 DowDuPont Inc 8,141 4,747,111.63 0.05 DR Horton Inc 3,148 1,316,286.12 0.02 Dr Pepper Snapple Group Inc 1,053 836,793.65 0.01 Duke Energy Corp 3,252 2,239,483.62 0.03 E*TRADE Financial Corp 2,197 891,658.79 0.01 Eaton Vance Corp 2,400 1,108,059.44 0.01 eBay Inc 4,162 1,286,037.68 0.01 Ecolab Inc 1,510 1,658,878.03 0.02 Edison International 1,500 776,663.40 0.01 Edwards Lifesciences Corp 1,000 922,809.74 0.01 Eli Lilly & Co 3,300 2,281,995.25 0.03 Emerson Electric Co 91,700 52,322,624.52 0.61 Equifax Inc 465 448,941.90 0.00 Equinix Inc 365 1,354,414.68 0.02 Equity Residential 2,060 1,075,556.82 0.01 Expeditors International of Washington Inc 1,100 582,612.18 0.01 Express Scripts Holding Co 2,240 1,368,892.58 0.02 F5 Networks Inc 553 594,120.97 0.01 Facebook Inc 7,393 10,681,117.71 0.12 FedEx Corp 967 1,975,678.91 0.02 Fidelity National Information Services Inc 1,500 1,155,538.57 0.01 FleetCor Technologies Inc 434 683,773.44 0.01 FMC Corp 1,147 888,954.72 0.01 Foot Locker Inc 76,300 29,286,121.58 0.34 Ford Motor Co 18,100 1,850,933.15 0.02 Franklin Resources Inc 18,562 6,585,112.18 0.08 Gap Inc/The 153,700 42,861,585.41 0.50 General Motors Co 5,407 1,814,612.96 0.02 Gilead Sciences Inc 104,841 61,494,525.10 0.71 Global Payments Inc 1,090 894,576.07 0.01 Goldman Sachs Group Inc/The 1,454 3,032,811.14 0.03 Hershey Co/The 778 723,041.86 0.01 Hilton Worldwide Holdings Inc 1,027 671,505.34 0.01

101
SEB Strategy Fund - SEB Strategy Opportunity
Security description Maturity Total holdings Market % of
value in Net
SEK Assets
Home Depot Inc/The 4,007 6,217,947.13 0.07 HP Inc 363,186 62,474,799.58 0.73 Humana Inc 645 1,310,037.36 0.01 IDEX Corp 1,392 1,504,056.57 0.02 IDEXX Laboratories Inc 614 786,138.92 0.01 Illinois Tool Works Inc 1,638 2,237,638.00 0.03 Illumina Inc 500 894,440.16 0.01 Incyte Corp 700 542,804.70 0.01 Ingredion Inc 600 686,764.98 0.01 Intel Corp 246,836 93,287,621.49 1.08 Intercontinental Exchange Inc 2,309 1,333,927.50 0.02 International Business Machines Corp 2,784 3,497,042.65 0.04 International Flavors & Fragrances Inc 900 1,124,540.81 0.01 International Paper Co 1,800 853,887.62 0.01 Intuit Inc 1,036 1,338,324.50 0.02 IQVIA Holdings Inc 818 655,670.61 0.01 Iron Mountain Inc 2,300 710,500.46 0.01 Jack Henry & Associates Inc 700 670,324.54 0.01 Johnson & Johnson 52,102 59,602,255.05 0.69 JPMorgan Chase & Co 10,855 9,504,291.06 0.11 Kellogg Co 1,403 780,887.64 0.01 KeyCorp 6,172 1,019,251.91 0.01 Kimberly-Clark Corp 1,308 1,292,173.37 0.01 KLA-Tencor Corp 52,895 45,503,318.86 0.53 Kohl's Corp 121,885 54,117,731.82 0.63 Kraft Heinz Co/The 1,900 1,209,649.56 0.01 Kroger Co/The 7,400 1,663,120.77 0.02 L Brands Inc 1,256 619,270.10 0.01 Laboratory Corp of America Holdings 638 833,217.37 0.01 Lam Research Corp 900 1,356,360.84 0.02 Liberty Broadband Corp 503 350,714.21 0.00 Liberty Interactive Corp QVC Group 2,476 495,046.53 0.01 Liberty Media Corp-Liberty SiriusXM A 1,544 501,360.05 0.01 Lincoln National Corp 1,390 874,825.43 0.01 LKQ Corp 2,500 832,461.01 0.01 Lowe's Cos Inc 3,278 2,494,372.66 0.03 ManpowerGroup Inc 61,443 63,441,239.28 0.74 Markel Corp 60 559,595.56 0.01 Marriott International Inc/MD 1,376 1,529,128.57 0.02 Marsh & McLennan Cos Inc 1,700 1,132,842.91 0.01 Martin Marietta Materials Inc 453 819,820.54 0.01 Mastercard Inc 3,094 3,834,256.38 0.04 McCormick & Co Inc/MD 755 629,960.72 0.01 McDonald's Corp 2,642 3,723,178.61 0.04 MercadoLibre Inc 100 257,626.93 0.00 Merck & Co Inc 8,579 3,952,421.95 0.05 MetLife Inc 3,107 1,286,169.00 0.01 Micron Technology Inc 4,194 1,411,988.80 0.02 Microsoft Corp 22,790 15,961,117.37 0.19 Mondelez International Inc 5,125 1,795,921.54 0.02 Monster Beverage Corp 1,552 804,223.08 0.01 Moody's Corp 1,000 1,208,552.44 0.01 Morgan Stanley 5,256 2,257,959.46 0.03 Netflix Inc 1,520 2,388,933.44 0.03 NextEra Energy Inc 1,924 2,460,413.00 0.03 NIKE Inc 4,380 2,243,112.96 0.03

102
SEB Strategy Fund - SEB Strategy Opportunity
Security description Maturity Total holdings Market % of
value in Net
SEK Assets
Norfolk Southern Corp 1,404 1,665,655.62 0.02 NVIDIA Corp 2,137 3,385,596.61 0.04 OGE Energy Corp 3,600 970,018.69 0.01 Omnicom Group Inc 1,300 775,181.47 0.01 Oracle Corp 9,889 3,828,067.30 0.04 O'Reilly Automotive Inc 399 785,796.20 0.01 Packaging Corp of America 704 694,847.65 0.01 Palo Alto Networks Inc 618 733,375.59 0.01 Paychex Inc 1,575 877,909.65 0.01 PepsiCo Inc 66,755 65,542,822.57 0.76 Pfizer Inc 17,976 5,330,785.72 0.06 PG&E Corp 1,958 718,672.70 0.01 PNC Financial Services Group Inc/The 1,500 1,772,055.06 0.02 PPL Corp 4,566 1,157,034.42 0.01 Praxair Inc 1,666 2,109,885.47 0.02 Principal Financial Group Inc 71,996 41,592,656.60 0.48 Procter & Gamble Co/The 25,493 19,177,485.04 0.22 Progressive Corp/The 2,308 1,064,261.06 0.01 Prologis Inc 3,000 1,584,521.06 0.02 Prudential Financial Inc 11,858 11,163,065.43 0.13 Public Storage 700 1,197,826.86 0.01 PVH Corp 809 908,832.83 0.01 QUALCOMM Inc 4,919 2,578,352.03 0.03 Raymond James Financial Inc 1,260 921,237.75 0.01 Regeneron Pharmaceuticals Inc 292 898,823.07 0.01 Regions Financial Corp 6,832 966,587.81 0.01 Republic Services Inc 1,552 859,117.12 0.01 ResMed Inc 955 662,193.97 0.01 Roper Technologies Inc 644 1,365,637.24 0.02 S&P Global Inc 1,127 1,563,101.00 0.02 salesforce.com Inc 3,100 2,594,715.67 0.03 SCANA Corp 1,218 396,699.62 0.00 SEI Investments Co 1,700 1,000,197.71 0.01 Sherwin-Williams Co/The 484 1,624,880.05 0.02 Simon Property Group Inc 1,269 1,784,361.32 0.02 Sirius XM Holdings Inc 9,900 434,459.91 0.00 Southwest Airlines Co 815 436,733.98 0.00 Spectrum Brands Holdings Inc 400 368,108.65 0.00 Starbucks Corp 4,611 2,168,121.71 0.02 State Street Corp 1,964 1,569,587.45 0.02 Stryker Corp 1,358 1,721,601.58 0.02 SVB Financial Group 235 449,786.44 0.00 Sysco Corp 2,054 1,021,300.26 0.01 T Rowe Price Group Inc 55,970 48,084,455.20 0.56 Tapestry Inc 1,914 693,120.26 0.01 Target Corp 141,600 75,647,310.03 0.88 TD Ameritrade Holding Corp 1,473 616,635.13 0.01 Tesla Inc 505 1,287,330.23 0.01 Texas Instruments Inc 94,406 80,726,510.52 0.94 Thermo Fisher Scientific Inc 1,400 2,176,491.52 0.02 Time Warner Inc 2,881 2,157,603.60 0.02 TJX Cos Inc/The 3,236 2,025,781.15 0.02 Torchmark Corp 1,100 816,953.94 0.01 Trimble Inc 2,722 905,714.96 0.01 Twenty-First Century Fox Inc B 5,600 1,564,396.26 0.02 Twitter Inc 2,607 512,487.07 0.01

103
SEB Strategy Fund - SEB Strategy Opportunity
Security description Maturity Total holdings Market % of
value in Net
SEK Assets
Ulta Beauty Inc 348 637,260.92 0.01 Under Armour Inc 3,200 348,982.72 0.00 Union Pacific Corp 2,879 3,160,968.46 0.04 United Parcel Service Inc 2,390 2,331,533.54 0.03 United Rentals Inc 750 1,055,630.97 0.01 United Therapeutics Corp 23,300 28,224,133.04 0.33 UnitedHealth Group Inc 3,100 5,595,529.85 0.06 Universal Health Services Inc 579 537,340.79 0.01 Unum Group 5,900 2,651,520.34 0.03 US Bancorp 4,833 2,120,162.87 0.02 Verisk Analytics Inc 790 620,937.72 0.01 Verizon Communications Inc 12,807 5,550,077.19 0.06 VF Corp 1,606 973,031.68 0.01 Visa Inc 5,975 5,577,873.57 0.06 Vulcan Materials Co 912 958,535.27 0.01 Walgreens Boots Alliance Inc 10,682 6,351,240.21 0.07 Walt Disney Co/The 4,916 4,327,234.75 0.05 Waste Management Inc 1,850 1,307,170.52 0.01 Waters Corp 501 792,450.40 0.01 Wells Fargo & Co 14,563 7,233,934.37 0.08 Welltower Inc 2,100 1,096,441.42 0.01 Westar Energy Inc 1,815 784,621.62 0.01 Western Digital Corp 1,320 859,517.32 0.01 Western Union Co/The 427,851 66,592,357.23 0.77 WestRock Co 1,345 696,077.82 0.01 Weyerhaeuser Co 3,500 1,010,415.67 0.01 Workday Inc 841 700,547.28 0.01 Xcel Energy Inc 3,690 1,453,487.97 0.02 Xilinx Inc 1,674 924,046.70 0.01 Yum! Brands Inc 1,400 935,451.19 0.01 Zimmer Biomet Holdings Inc 1,000 987,982.00 0.01
Total United States of America 1,880,513,838.15 21.85
Total Shares 3,582,097,829.31 41.62
Investment Funds
Alternative Investment Fund
Ireland IPM Systematic Macro UCITS Fund I 18,113 194,330,995.30 2.26
Total Ireland 194,330,995.30 2.26
Total Alternative Investment Fund 194,330,995.30 2.26
Asset Allocation Fund
Luxembourg SEB SICAV 3 - SEB Asset Selection Opportunistic C 2,741,018 414,670,522.50 4.82
Total Luxembourg 414,670,522.50 4.82
Total Asset Allocation Fund 414,670,522.50 4.82
Commodity Funds
Luxembourg Threadneedle Lux - Enhanced Commodities Portfolio IKH 1,119,947 120,427,885.10 1.40

104
SEB Strategy Fund - SEB Strategy Opportunity
Security description Maturity Total holdings Market % of
value in Net
SEK Assets
Vontobel Fund - Commodity HI 220,333 120,830,617.20 1.41
Total Luxembourg 241,258,502.30 2.81
Total Commodity Funds 241,258,502.30 2.81
Debt Funds
Ireland iShares JP Morgan EM Local Government Bond UCITS ETF 156,593 85,644,312.39 0.99 iShares USD Corp Bond UCITS ETF 388,743 371,467,113.39 4.32 Neuberger Berman Emerging Markets Debt - Local Currency Fund A Acc 2,723,826 309,699,016.20 3.60
Total Ireland 766,810,441.98 8.91
Luxembourg SEB High Yield - SEB High Yield Fund C (H SEK) 405,666 76,786,070.58 0.89 SEB SICAV 2 - SEB Alternative Fixed Income C 738,493 80,723,118.99 0.94
Total Luxembourg 157,509,189.57 1.83
Sweden SEB Obligationsfond Flexibel SEK 4,689,612 48,304,410.48 0.56
Total Sweden 48,304,410.48 0.56
Total Debt Funds 972,624,042.03 11.30
Equity Funds
Ireland Artisan Partners Global Funds Plc - Global Value Fund I 46,898 8,059,655.54 0.09
Total Ireland 8,059,655.54 0.09
Luxembourg BlackRock Strategic Funds - Americas Diversified Equity Absolute Return A2 609,292 76,173,685.84 0.89 BlackRock Strategic Funds - European Diversified Equity Absolute Return A2 636,080 77,620,842.40 0.90
Total Luxembourg 153,794,528.24 1.79
Sweden SEB Emerging Marketsfond A 21,056,126 555,704,854.55 6.46 SEB Hallbarhetsfond Global A 15,639,061 267,035,402.67 3.10
Total Sweden 822,740,257.22 9.56
Total Equity Funds 984,594,441.00 11.44
Total Investment Funds 2,807,478,503.13 32.63
Total Transferable securities admitted to an official stock exchange listing
and/or dealt within another regulated market 8,179,712,048.97 95.05
Total Portfolio 8,179,712,048.97 95.05
Financial futures cleared with Skandinaviska Enskilda Banken AB (publ)
Purchased financial futures contracts Commitment in SEK CBOT Five Year Treasury Note Future 55,163,206.64 29/03/18 58 (40,809.63) (0.00) Eurex Dow Jones Euro Stoxx 50 Future 130,158,897.77 16/03/18 379 (3,167,336.48) (0.04) ICE MSCI Emerging Markets Mini Index Future 141,963,606.16 16/03/18 298 6,093,567.51 0.07
Sold financial futures contracts Commitment in SEK CME Standard And Poors 500 E-Mini Future (260,725,068.68) 16/03/18 (238) (1,125,326.81) (0.01) Eurex Euro Bund Future (20,665,014.74) 08/03/18 (13) 175,105.58 0.00

105
SEB Strategy Fund - SEB Strategy Opportunity
Security description Maturity Total holdings Market % of
value in Net
SEK Assets
Financial futures cleared with Skandinaviska Enskilda Banken AB (publ)
Sold financial futures contracts Commitment in SEK Swedish Government 5-year Bond Future (52,835,880.00) 15/03/18 (41) 47,724.00 0.00
Total financial futures contracts (total net unrealised) 1,982,924.17 0.02
An amount of SEK 28,254,451.55 is held as cash collateral for these positions. Forward foreign exchange contracts open with Skandinaviska Enskilda Banken S.A.*
Buy 35,426,848 EUR Sell 352,113,300 SEK 19/01/18 (3,818,888.07) (0.04)Buy 2,861,458 NOK Sell 2,884,476 SEK 19/01/18 (21,821.38) (0.00)Buy 72,962,669 SEK Sell 7,341,514 EUR 19/01/18 785,536.41 0.01Buy 614,981,200 SEK Sell 73,000,000 USD 19/01/18 17,957,163.63 0.21Buy 1 739,274,375 SEK Sell 1 87,500,000 USD 19/01/18 23,663,372.50 0.27Buy 23,978,564 USD Sell 20,189,678 EUR 12/03/18 (2,980,222.74) (0.04)Buy 2,707,760 USD Sell 2,018,409 GBP 12/03/18 (234,784.43) (0.00)Buy 377,327 USD Sell 3,174,000 SEK 12/03/18 (97,581.53) (0.00)
Total forward foreign exchange contracts (total net unrealised) 35,252,774.39 0.41 Cash at bank and at broker
Cash at bank and at broker 353,076,169.14 4.10Total Cash at bank and at broker 353,076,169.14 4.10
Other assets Dividends receivable 4,566,925.69 0.06Interest receivable on bonds 22,575,197.12 0.26Receivable on subscriptions 18,994,434.97 0.22Retrocession fees receivable 7,931,897.10 0.09Other assets 37,243.89 0.00Total other assets 54,105,698.77 0.63
Liabilities Management fees (9,298,471.05) (0.11)Payable on redemptions (8,576,982.55) (0.10)Bank interest payable on cash accounts (214,000.67) (0.00)Other liabilities (60,777.79) (0.00)
Total liabilities (18,150,232.06) (0.21)
Total Net Assets as at 31 December 2017 8,605,979,383.38 100.00
* Forwards foreign exchange contracts open with Skandinaviska Enskilda Banken S.A., except for the following: 1Nordea Bank AB (publ) A list of changes in the assets held during the financial period under review is available free of charge from SEB Investment Management AB.
The accompanying notes are an integral part of these financial statements.

Combined Statement of Operations For the period from 1 November 2016 to 31 December 2017heading
The accompanying notes are an integral part of these financial statements. 106
SEB Strategy Fund - SEB Strategy Fund - SEB Strategy Fund -
SEB Strategy SEB Strategy SEB Strategy
Balanced Defensive Growth
SEK SEK SEK
Income Investment income (note 1) 53,553,062.93 62,106,509.16 15,451,639.38Interest on bonds (note 1) 9,600,620.39 22,948,503.87 493,085.74Bank interest on cash accounts 178,956.85 202,261.07 83,255.10Retrocession fees (note 3) 77,235,512.25 106,063,293.75 41,757,951.53Total income 140,568,152.42 191,320,567.85 57,785,931.75
Expenses
Management fees (note 2) 151,682,211.45 198,369,571.30 72,912,229.60Taxe d'abonnement (note 4) 2,244,075.14 4,719,916.95 937,392.81Bank interest on cash accounts 1,264,401.81 1,805,753.85 385,411.92Other expenses 629,582.75 731,950.11 488,020.72Total expenses 155,820,271.15 205,627,192.21 74,723,055.05
Net loss for the period (15,252,118.73) (14,306,624.36) (16,937,123.30)

Combined Statement of Operations heading
For the year ended heading
The accompanying notes are an integral part of these financial statements.
107
SEB Strategy Fund - SEB Strategy Fund -
SEB Strategy Combined
Opportunity
SEK SEK
Income Investment income (note 1) 36,607,293.22 167,718,504.69Interest on bonds (note 1) 4,139,741.53 37,181,951.53Bank interest on cash accounts 163,427.09 627,900.11Retrocession fees (note 3) 71,854,453.13 296,911,210.66Total income 112,764,914.97 502,439,566.99
Expenses
Management fees (note 2) 120,822,344.44 543,786,356.79Taxe d'abonnement (note 4) 1,411,242.87 9,312,627.77Bank interest on cash accounts 550,588.70 4,006,156.28Other expenses 566,575.56 2,416,129.14Total expenses 123,350,751.57 559,521,269.98
Net loss for the period (10,585,836.60) (57,081,702.99)

Combined Statement of Changes in Net Assets For the period from 1 November 2016 to 31 December 2017
The accompanying notes are an integral part of these financial statements. 108
SEB Strategy Fund - SEB Strategy Fund - SEB Strategy Fund -
SEB Strategy SEB Strategy SEB Strategy
Balanced Defensive Growth
SEK SEK SEK
Net Assets at the beginning of the period 9,775,003,548.90 18,277,215,292.73 3,861,953,353.50
Net (loss) for the period (15,252,118.73) (14,306,624.36) (16,937,123.30)
Net realised gain / (loss) on:
- sales of securities 467,213,212.15 281,809,753.56 563,407,635.64- foreign exchange (90,067,614.12) (142,961,854.75) (4,845,842.09)- financial futures contracts (46,723,440.31) (32,536,517.39) (1,483,710.59)
Total net realised gain 330,422,157.72 106,311,381.42 557,078,082.96
Change in net unrealised appreciation / (depreciation) on:
- securities (159,102,458.59) (165,148,540.23) (97,674,686.88)- forward foreign exchange contracts 189,500,750.96 266,611,701.74 27,857,314.91- financial futures contracts 5,887,311.91 3,631,950.23 1,156,832.63
Total change in net unrealised appreciation / (depreciation) 36,285,604.28 105,095,111.74 (68,660,539.34)
Increase in Net Assets as a result of operations 351,455,643.27 197,099,868.80 471,480,420.32
Proceeds on issues of units 3,286,903,256.34 3,008,055,093.24 1,257,561,054.69
Payment on redemptions of units (2,264,270,541.20) (5,212,277,576.70) (775,771,686.96)
Total Net Assets as at 31 December 2017 11,149,091,907.31 16,270,092,678.07 4,815,223,141.55

Combined Statement of Net Assets
As at
The accompanying notes are an integral part of these financial statements.
109
SEB Strategy Fund - SEB Strategy Fund -
SEB Strategy Combined
Opportunity
SEK SEK
Net Assets at the beginning of the period 6,814,816,923.31 38,728,989,118.44
Net (loss) for the period (10,585,836.60) (57,081,702.99)
Net realised gain / (loss) on:
- sales of securities 778,473,702.78 2,090,904,304.13- foreign exchange 737,542.79 (237,137,768.17)- financial futures contracts (19,688,626.81) (100,432,295.10)
Total net realised gain 759,522,618.76 1,753,334,240.86
Change in net unrealised appreciation / (depreciation) on:
- securities (245,672,887.40) (667,598,573.10)- forward foreign exchange contracts 102,015,713.56 585,985,481.17- financial futures contracts 4,350,218.12 15,026,312.89
Total change in net unrealised depreciation (139,306,955.72) (66,586,779.04)
Increase in Net Assets as a result of operations 609,629,826.44 1,629,665,758.83
Proceeds on issues of units 2,488,917,210.07 10,041,436,614.34
Payment on redemptions of units (1,307,384,576.44) (9,559,704,381.30)
Total Net Assets as at 31 December 2017 8,605,979,383.38 40,840,387,110.31

Combined Statement of Net Assets As at 31 December 2017
The accompanying notes are an integral part of these financial statements. 110
SEB Strategy Fund - SEB Strategy Fund - SEB Strategy Fund -
SEB Strategy SEB Strategy SEB Strategy
Balanced Defensive Growth
SEK SEK SEK
Assets
Portfolio at cost 10,729,635,589.77 15,238,813,405.90 4,620,512,323.70Unrealised appreciation 39,821,096.90 51,450,518.40 21,210,623.27Portfolio at market value (note 1) 10,769,456,686.67 15,290,263,924.30 4,641,722,946.97
Unrealised appreciation on financial futures contracts 1,211,190.06 1,678,509.19 480,134.38Unrealised appreciation on forward foreign exchange contracts 35,325,071.27 43,586,649.29 3,936,625.09Receivable interest and / or dividends 43,556,418.31 88,936,901.46 7,831,426.63Cash at bank and at broker 349,225,701.05 845,646,245.18 158,375,856.48Other assets 31,047,069.27 24,836,860.49 12,926,049.45Total Assets 11,229,822,136.63 16,294,949,089.91 4,825,273,039.00
Liabilities Other liabilities (80,730,229.32) (24,856,411.84) (10,049,897.45)Total Liabilities (80,730,229.32) (24,856,411.84) (10,049,897.45)
Total Net Assets as at 31 December 2017 11,149,091,907.31 16,270,092,678.07 4,815,223,141.55
"C (H-EUR)" units outstanding as at 31 December 2017 167,744.3910 230,393.0490 127,738.1040
"C (H-NOK)" units outstanding as at 31 December 2017 25,857.9720 100.0020 2,004.3850
"C (SEK)" units outstanding as at 31 December 2017 74,029,926.8630 135,260,884.8210 22,561,270.2960
"HNWC (H-NOK)" units outstanding as at 31 December 2017 679,083.8210 37,536.3120 296,578.9120
"HNWCB (H-EUR)" units outstanding as at 31 December 2017 7,911.9380 7,730.3100 1,972.4670
"ICP (H-EUR)" units outstanding as at 31 December 2017 10.0000 10.0000 10.0000
Net Asset Value per "C (H-EUR)" unit as at 31 December 2017 122.126 115.297 145.719
Net Asset Value per "C (H-NOK)" unit as at 31 December 2017 105.744 104.667 112.210
Net Asset Value per "C (SEK)" unit as at 31 December 2017 146.758 118.269 203.725
Net Asset Value per "HNWC (H-NOK)" unit as at 31 December 2017 106.554 105.563 113.003
Net Asset Value per "HNWCB (H-EUR)" unit as at 31 December 2017 103.002 101.668 109.814
Net Asset Value per "ICP (H-EUR)" unit as at 31 December 2017 103.850 102.463 111.083

Combined Statement of Net Assets
As at
The accompanying notes are an integral part of these financial statements.
111
SEB Strategy Fund - SEB Strategy Fund -
SEB Strategy Combined
Opportunity
SEK SEK
Assets
Portfolio at cost 8,204,462,082.44 38,793,423,401.81 Unrealised appreciation / (depreciation) (24,750,033.47) 87,732,205.10 Portfolio at market value (note 1) 8,179,712,048.97 38,881,155,606.91
Unrealised appreciation on financial futures contracts 1,982,924.17 5,352,757.80 Unrealised appreciation on forward foreign exchange contracts 35,252,774.39 118,101,120.04 Receivable interest and / or dividends 27,142,122.81 167,466,869.21 Cash at bank and at broker 353,076,169.14 1,706,323,971.85 Other assets 26,963,575.96 95,773,555.17 Total Assets 8,624,129,615.44 40,974,173,880.98
Liabilities Other liabilities (18,150,232.06) (133,786,770.67) Total Liabilities (18,150,232.06) (133,786,770.67)
Total Net Assets as at 31 December 2017 8,605,979,383.38 40,840,387,110.31
"C (H-EUR)" units outstanding as at 31 December 2017 241,255.8620 –
"C (H-NOK)" units outstanding as at 31 December 2017 3,270.4040 –
"C (SEK)" units outstanding as at 31 December 2017 48,612,708.7850 –
"HNWC (H-NOK)" units outstanding as at 31 December 2017 22,311.7870 –
"HNWCB (H-EUR)" units outstanding as at 31 December 2017 1,053.7400 –
"ICP (H-EUR)" units outstanding as at 31 December 2017 10.0000 –
Net Asset Value per "C (H-EUR)" unit as at 31 December 2017 134.426 –
Net Asset Value per "C (H-NOK)" unit as at 31 December 2017 110.230 –
Net Asset Value per "C (SEK)" unit as at 31 December 2017 170.391 –
Net Asset Value per "HNWC (H-NOK)" unit as at 31 December 2017 111.073 –
Net Asset Value per "HNWCB (H-EUR)" unit as at 31 December 2017 107.554 –
Net Asset Value per "ICP (H-EUR)" unit as at 31 December 2017 108.612 –

Statistical Information As at 31 December 2017
The accompanying notes are an integral part of these financial statements. 112
SEB Strategy Fund - SEB Strategy Fund - SEB Strategy Fund -
SEB Strategy SEB Strategy SEB Strategy
0 Balanced Defensive Growth
SEK SEK SEK
Number of "C (H-EUR)" units outstanding
as at 31 December 2017 167,744.3910 230,393.0490 127,738.1040as at 31 October 2016 122,495.5780 174,554.4550 83,998.4820as at 31 October 2015 90,177.9760 129,183.6510 71,364.9930
Number of "C (H-NOK)" units outstanding
as at 31 December 2017 25,857.9720 100.0020 2,004.3850as at 31 October 2016 494.3390 100.0000 348.1580as at 31 October 2015 1,614.8940 100.0000 3,530.2060
Number of "C (SEK)" units outstanding
as at 31 December 2017 74,029,926.8630 135,260,884.8210 22,561,270.2960as at 31 October 2016 67,159,059.6760 154,595,530.8370 20,461,515.9980as at 31 October 2015 58,593,150.3880 143,209,005.6320 19,008,555.4640
Number of "HNWC (H-NOK)" units outstanding
as at 31 December 2017 679,083.8210 37,536.3120 296,578.9120as at 31 October 2016 763,235.5610 83,409.4730 83,440.9900as at 31 October 2015 84,144.0800 73,441.5700 15,932.6740
Number of "HNWCB (H-EUR)" units outstanding
as at 31 December 2017 7,911.9380 7,730.3100 1,972.4670as at 31 October 2016 15,995.6450 7,254.8300 2,823.6020as at 31 October 2015 14,862.7490 4,526.0890 2,949.3210
Number of "ICP (H-EUR)" units outstanding
as at 31 December 2017 10.0000 10.0000 10.0000as at 31 October 2016 10.0000 10.0000 10.0000as at 31 October 2015 10.0000 10.0000 10.0000
Total Net Assets 0 0 0as at 31 December 2017 11,149,091,907.31 16,270,092,678.07 4,815,223,141.55as at 31 October 2016 9,775,003,548.90 18,277,215,292.73 3,861,953,353.50as at 31 October 2015 8,407,068,861.91 16,828,614,268.02 3,443,223,319.62
Net Asset Value per "C (H-EUR)" unit
as at 31 December 2017 122.126 115.297 145.719as at 31 October 2016 118.059 113.863 130.759as at 31 October 2015 117.454 113.343 125.927
Net Asset Value per "C (H-NOK)" unit
as at 31 December 2017 105.744 104.667 112.210as at 31 October 2016 100.741 101.795 99.283as at 31 October 2015 99.010 100.071 94.643
Net Asset Value per "C (SEK)" unit
as at 31 December 2017 146.758 118.269 203.725as at 31 October 2016 141.928 116.848 182.853as at 31 October 2015 141.406 116.471 176.471
Net Asset Value per "HNWC (H-NOK)" unit
as at 31 December 2017 106.554 105.563 113.003as at 31 October 2016 101.196 102.309 99.703as at 31 October 2015 99.238 100.281 94.827
Net Asset Value per "HNWCB (H-EUR)" unit
as at 31 December 2017 103.002 101.668 109.814as at 31 October 2016 99.287 100.115 98.265as at 31 October 2015 98.495 99.393 94.433
Net Asset Value per "ICP (H-EUR)" unit
as at 31 December 2017 103.850 102.463 111.083as at 31 October 2016 99.795 100.582 99.983as at 31 October 2015 98.754 99.584 94.751

As at
The accompanying notes are an integral part of these financial statements.
113
SEB Strategy Fund - SEB Strategy Fund -
SEB Strategy Combined
0 Opportunity
SEK SEK
Number of "C (H-EUR)" units outstanding
as at 31 December 2017 241,255.8620 –as at 31 October 2016 146,296.4160 –as at 31 October 2015 84,276.2510 –
Number of "C (H-NOK)" units outstanding
as at 31 December 2017 3,270.4040 –as at 31 October 2016 4,320.7030 –as at 31 October 2015 3,381.7150 –
Number of "C (SEK)" units outstanding
as at 31 December 2017 48,612,708.7850 –as at 31 October 2016 42,043,386.1710 –as at 31 October 2015 37,372,183.1900 –
Number of "HNWC (H-NOK)" units outstanding
as at 31 December 2017 22,311.7870 –as at 31 October 2016 28,823.1170 –as at 31 October 2015 34,078.1770 –
Number of "HNWCB (H-EUR)" units outstanding
as at 31 December 2017 1,053.7400 –as at 31 October 2016 2,041.9390 –as at 31 October 2015 2,651.9600 –
Number of "ICP (H-EUR)" units outstanding
as at 31 December 2017 10.0000 –as at 31 October 2016 10.0000 –as at 31 October 2015 10.0000 –
Total Net Assets 0 0as at 31 December 2017 8,605,979,383.38 40,840,387,110.31as at 31 October 2016 6,814,816,923.31 38,728,989,118.44as at 31 October 2015 5,855,401,535.73 34,534,307,985.28
Net Asset Value per "C (H-EUR)" unit
as at 31 December 2017 134.426 –as at 31 October 2016 124.366 –as at 31 October 2015 121.230 –
Net Asset Value per "C (H-NOK)" unit
as at 31 December 2017 110.230 –as at 31 October 2016 100.467 –as at 31 October 2015 96.843 –
Net Asset Value per "C (SEK)" unit
as at 31 December 2017 170.391 –as at 31 October 2016 157.676 –as at 31 October 2015 153.952 –
Net Asset Value per "HNWC (H-NOK)" unit
as at 31 December 2017 111.073 –as at 31 October 2016 100.925 –as at 31 October 2015 97.066 –
Net Asset Value per "HNWCB (H-EUR)" unit
as at 31 December 2017 107.554 –as at 31 October 2016 99.227 –as at 31 October 2015 96.491 –
Net Asset Value per "ICP (H-EUR)" unit
as at 31 December 2017 108.612 –as at 31 October 2016 99.835 –as at 31 October 2015 96.775 –

Additional Information on Management Fees
The accompanying notes are an integral part of these financial statements. 114
SEB Strategy Fund - SEB Strategy Balanced
ISIN Code Fund Name Management fees in
%
SE0000984155 SEB Emerging Marketsfond A 1.75 LU0256625632 SEB Fund 1 - SEB Asset Selection C 1.10 LU0337316391 SEB Fund 5 - SEB Danish Mortgage Bond Fund C 0.75 SE0000434151 SEB Hallbarhetsfond Global A 1.50 LU0413134395 SEB High Yield - SEB High Yield Fund C (H SEK) 1.20 LU0920714721 SEB SICAV 2 - SEB Alternative Fixed Income C 1.10
SEB Strategy Fund - SEB Strategy Defensive
ISIN Code Fund Name Management fees in
%
SE0000984155 SEB Emerging Marketsfond A 1.75 LU0256625632 SEB Fund 1 - SEB Asset Selection C 1.10 LU0337316391 SEB Fund 5 - SEB Danish Mortgage Bond Fund C 0.75 SE0000434151 SEB Hallbarhetsfond Global A 1.50 LU0413134395 SEB High Yield - SEB High Yield Fund C (H SEK) 1.20 DE0009802306 SEB ImmoInvest P* 0.65 LU0920714721 SEB SICAV 2 - SEB Alternative Fixed Income C 1.10
*Fund under liquidation (see Note 7)

The accompanying notes are an integral part of these financial statements.
115
SEB Strategy Fund - SEB Strategy Growth
ISIN Code Fund Name Management fees in
%
SE0000984155 SEB Emerging Marketsfond A 1.75 SE0000434151 SEB Hallbarhetsfond Global A 1.50 LU0413134395 SEB High Yield - SEB High Yield Fund C (H SEK) 1.20 LU0425994331 SEB SICAV 3 - SEB Asset Selection Opportunistic C 1.50
SEB Strategy Fund - SEB Strategy Opportunity
ISIN Code Fund Name Management fees in
%
SE0000984155 SEB Emerging Marketsfond A 1.75 SE0000434151 SEB Hallbarhetsfond Global A 1.50 LU0413134395 SEB High Yield - SEB High Yield Fund C (H SEK) 1.20 SE0000577454 SEB Obligationsfond Flexibel SEK 0.50 LU0920714721 SEB SICAV 2 - SEB Alternative Fixed Income C 1.10 LU0425994331 SEB SICAV 3 - SEB Asset Selection Opportunistic C 1.50

Notes to the Financial Statements As at 31 December 2017
116
Note 1. Significant Accounting Policies
The financial statements have been prepared in accordance with Luxembourg regulations relating to Undertakings for
Collective Investment.
The financial statements have been prepared based on last Net Asset Value of the period which has been calculated on 29
December 2017 with the prices of that date; the valuation at 29 December 2017 has been presented for the purpose of
these Financial Statements.
Investments:
a) Transferable securities and money market instruments, which are officially listed on a stock exchange, are valued at the
last available price.
b) Transferable securities and money market instruments, which are not officially listed on a stock exchange, but which are
traded on another regulated market are valued at a price no lower than the bid price and no higher than the ask price at the
time of the valuation and at which the Management Company considers to be an appropriate market price.
c) Transferable securities and money market instruments quoted or traded on several markets are valued on the basis of the
last available price on the principal market for the transferable securities or money market instruments in question, unless
these prices are not representative.
d) In the event that such prices are not in line with market conditions, or for securities and money market instruments other
than those covered in a), b) and c) above for which there are no fixed prices, these securities and money market instruments,
as well as other assets, will be valued at the current market value as determined in good faith by the Management Company, following generally accepted valuation principles.
e) Units or shares of UCI(TS) are valued at the last available Net Asset Value obtained from the Administrative Agent of such
UCI(TS) except for Exchange Traded Funds which are valued at the latest available price found on the main stock exchange
on which they are listed.
f) Derivatives instruments traded on regulated markets or stock exchanges are valued at last available settlement prices of
these contracts on regulated markets or stock exchanges on which the derivative instruments are traded by the Fund.
Derivatives instruments not traded on regulated markets or on stock exchanges are valued at their net liquidating value
determined, pursuant to the policies established in good faith by the Board of Directors of the Management Company on a
basis consistently applied for each different variety of contracts, in accordance with generally recognised principles, taking
into consideration the generally accepted accounting practices, the customary practices in line with the market and the
interests of the Unitholders.
g) Forward foreign exchange contracts are valued based on the latest available forward exchange rates.
h) Financial futures contracts, which are not matured, are valued at valuation date at market rates prevailing at this date and
resulting unrealised appreciation or depreciation are posted as change in net unrealised appreciation/(depreciation) on
financial future contracts to the Combined Statement of Changes in Net Assets.
In the case that extraordinary circumstances occur which make it impossible or even wrong to make a valuation in
accordance with the above-mentioned criteria, the Management Company is entitled to temporarily apply other generally
accepted valuation procedures, which are determined by it in good faith, in order to make an appropriate valuation of the
Fund's Assets.
Gains and losses on the sale of securities are determined using the average cost method.

117
Currency translation:
All assets denominated in a different currency to the respective Sub-Funds' currency are converted into this respective Sub-Funds' currency at the last available exchange rate. Separate accounts are maintained for the Sub-Fund in the currency in which the Net Asset Value per unit to which it relates is expressed (the "accounting currency"). Transactions denominated in a currency other than the accounting currency are recorded on the basis of exchange rates prevailing on the date they occur or accrue to the Sub-Fund. Assets and liabilities, expressed in a currency other than the accounting currency, are translated on the basis of exchange rates ruling at the balance sheet date. The consolidated total is translated into SEK at the period end date exchange rate. The Sub-Funds are priced at either intraday or close of business. The exchange rates are presented in line with when these Sub-Funds are priced.
As at 29 December 2017, the close of business exchange rates were as follows
1 AUD = 6.403746632 SEK 1 JPY = 0.072680597 SEK
1 CAD = 6.534662818 SEK 1 NOK = 1.000994161 SEK
1 CHF = 8.402063402 SEK 1 NZD = 5.822827410 SEK
1 DKK = 1.320480951 SEK 1 SGD = 6.126393239 SEK
1 EUR = 9.831868655 SEK 1 USD = 8.187469940 SEK
1 GBP = 11.075600030 SEK 1 ZAR = 0.661346327 SEK
1 HKD = 1.047352918 SEK Income:
Interest income and bank interest income are recognised on an accrual basis. Dividends are recorded on the ex-dividend
date. This income is shown net of any withholding taxes and adjusted accordingly when tax reclaims apply. Note 2. Management Fees
In payment for its services, the Management Company receives an annual rate of:
• 1.25% is charged on SEB Strategy Balanced “C (H-EUR)” units (maximum rate: 1.25%)
• 1.25% is charged on SEB Strategy Balanced “C (H-NOK)” units (maximum rate: 1.25%)
• 1.25 % is charged on SEB Strategy Balanced “C (SEK)” units (maximum rate: 1.25%)
• 1.00% is charged on SEB Strategy Balanced “HNWCB (H-EUR)” units (maximum rate: 1.00%)
• 1.00% is charged on SEB Strategy Balanced “HNWC (H-NOK)” units (maximum rate: 1.00%)
• 0.75% is charged on SEB Strategy Balanced “ICP (H-EUR)” units (maximum rate: 0.75%)
• 1.00% is charged on SEB Strategy Defensive “C (H-EUR)” units (maximum rate: 1.00%)
• 1.00% is charged on SEB Strategy Defensive “C (H-NOK)” units (maximum rate: 1.00%)
• 1.00% is charged on SEB Strategy Defensive “C (SEK)” units (maximum rate: 1.00%)
• 0.75% is charged on SEB Strategy Defensive “HNWCB (H-EUR)” units (maximum rate: 0.75%)
• 0.70% is charged on SEB Strategy Defensive “HNWC (H-NOK)” units (maximum rate: 0.70%)
• 0.50% is charged on SEB Strategy Defensive “ICP (H-EUR)” units (maximum rate: 0.50%)
• 1.45% is charged on SEB Strategy Growth “C (H-EUR)” units (maximum rate: 1.45%)
• 1.45% is charged on SEB Strategy Growth “C (H-NOK)” units (maximum rate: 1.45%)
• 1.45 % is charged on SEB Strategy Growth “C (SEK)” units (maximum rate: 1.45%)
• 1.20% is charged on SEB Strategy Growth “HNWCB (H-EUR)” units (maximum rate: 1.20%)
• 1.20% is charged on SEB Strategy Growth “HNWC (H-NOK)” units (maximum rate: 1.20%)

118
• 0.85% is charged on SEB Strategy Growth “ICP (H-EUR)” units (maximum rate: 0.85%)
• 1.35 % is charged on SEB Strategy Opportunity “C (H-EUR)” units (maximum rate: 1.35%)
• 1.35 % is charged on SEB Strategy Opportunity “C (H-NOK)” units (maximum rate: 1.35%)
• 1.35 % is charged on SEB Strategy Opportunity “C (SEK)” units (maximum rate: 1.35%)
• 1.10 % is charged on SEB Strategy Opportunity “HNWCB (H-EUR)” units (maximum rate: 1.10%)
• 1.10 % is charged on SEB Strategy Opportunity “HNWC (H-NOK)” units (maximum rate: 1.10%)
• 0.80 % is charged on SEB Strategy Opportunity “ICP (H-EUR)” units (maximum rate: 0.80%) A twelfth of this rate is being payable at the end of each month and based on the average Net Assets of each Sub-Fund calculated daily during the relevant month.
The Management Company pays accounting, administration and depositary fees on behalf of the Fund.
Note 3. Retrocession fees
Retrocession of management fees received by the Sub-Fund related to investments made in underlying investment funds are
recorded in the caption "Retrocession fees" in the Combined Statement of Operations.
Note 4. Taxation
The Fund is liable in Luxembourg to a subscription tax ("taxe d'abonnement") of 0.05% or 0.01% (as applicable) per annum
of its NAV, such tax being payable quarterly on the basis of the value of the aggregate Net Assets of the Sub-Funds at the
end of the relevant calendar quarter. Investments by a Sub-Fund in shares or units of another Luxembourg undertaking for
collective investment which are also subject to the taxe d’abonnement are excluded from the NAV of the Sub-Fund serving
as basis for the calculation of this tax to be paid by the Sub-Fund.
No stamp duty or other tax is payable in Luxembourg on the issue of units.
Interest, dividend and other income realised by a Sub-Fund on the sale of securities of non-Luxembourg issuers, may be
subject to withholding and other taxes levied by the jurisdictions in which the income is sourced. Note 5. Transaction Fee
Transaction fees incurred by the Fund relating to the purchase or sale of transferable securities, money market instruments, derivatives or other eligible assets are mainly composed of depositary fees and broker fees. Most of the transaction fees are included in the transaction price used to calculate the realised and unrealised gain/(loss) on securities.
In line with bond market practice, a bid-offer spread is applied when buying or selling securities and other financial instruments. Consequently, in any given transaction, there will be a difference between the purchase and sale prices quoted by the broker, which represents the broker's remuneration.
As at 31 December 2017, these transaction fees were as follows:
SEB Strategy Fund - SEB Strategy Balanced 3,200,598.86 SEK
SEB Strategy Fund - SEB Strategy Defensive 1,731,940.34 SEK
SEB Strategy Fund - SEB Strategy Growth 3,007,580.39 SEK
SEB Strategy Fund - SEB Strategy Opportunity 3,908,133.57 SEK
Note 6. Significant Events during the period
Prospectus
A new Prospectus was issued in October 2017.

119
Directors
There were changes to the Board of Directors of the Management Company during the period. Please refer to the Organisation section on page 2 and 3 for details. Branch
SEB Asset Management S.A. (SEB AM) was merged with SEB Investment Management AB (SEB IM AB) as of 2 November 2016.
Effective 1 April 2017, BNY Mellon has merged its legal entity The Bank of New York Mellon (Luxembourg) S.A., into The Bank of New York Mellon SA/NV, Luxembourg Branch.
Financial year end change
The financial year changed, this report covers the period from 1 November 2016 to 31 December 2017. Effective from January 2018, the financial year of the Fund will start on 1 January and end on 31 December of the same year.
Change in strategy
There were changes to the four Sub-Funds’ investment process during the period. The Investment process was modernised and further developed to include direct investments. This is in line with the current investment policies for the Sub-Funds in the prospectus which permit investments in investment funds as well as direct investments in stocks, bonds and other securities. The changes in the fund’s investment process started in autumn 2017 and will be gradually implemented for the best possible execution. The respective risk levels of the Sub-Funds will not change due to the change in the investment process. Once the changes are implemented, the majority of the Sub-Funds’ holdings will be directly invested in individual securities. This larger portion of direct investment will make it easier for the management team to take sustainability factors into account when investing.
Note 7. Investment in target fund in liquidation
As at 31 December 2017, SEB Strategy Fund - SEB Strategy Defensive invests in the below mentioned Real Estate Funds which are in liquidation. Target funds in liquidation: Credit Suisse - CS EUROREAL KanAm Grundinvest Fonds SEB ImmoInvest
The exposure to real estate funds in liquidation represents 0.0002% of the NAV of SEB Strategy Fund - SEB Strategy
Defensive as at 31 December 2017. Credit Suisse - CS EUROREAL, KanAm Grundinvest Fonds and SEB ImmoInvest are traded on a secondary market at a price significantly lower than their NAV per unit. The below table shows their official NAV per unit, their weighting in the portfolio, their last traded price on a secondary market, the difference between NAV and traded price and its potential impact on the NAV of SEB Strategy Fund - SEB Strategy Defensive as at 31 December 2017. Similar to prior years and based on a continuous review of the situation, the Board of Directors of the Management Company decided to take the official NAV as basis for valuation as they believe that such price is representative of the fair market value of these target funds. There is no intention to sell these target funds before the end of the liquidation.
Target Fund NAV
per unit
Portfolio
weighting
Last price on
secondary
market
Price difference
in %
Potential impact
on NAV
Credit Suisse - CS EUROREAL EUR 10.30 0.00% EUR 8.36 9.49% 0.00%
KanAm Grundinvest Fonds EUR 13.22 0.00% EUR 10.40 12.43% 0.00%
SEB ImmoInvest EUR 8.72 0.00% EUR 6.46 7.98% 0.00%
Total 0.00% 0.00%
Note 8. Subsequent Events after the period end
There were no subsequent events after the period end.

120
Audit Report
To the Unitholders of SEB Strategy Fund
Our opinion
In our opinion, the accompanying financial statements give a true and fair view of the financial position of SEB Strategy Fund
(the “Fund”) and of each of its Sub-Funds as at 31 December 2017, and of the results of their operations and changes in their
net assets for the period from 1 November 2016 to 31 December 2017 in accordance with Luxembourg legal and
regulatory requirements relating to the preparation and presentation of the financial statements.
What we have audited
The Fund’s financial statements comprise:
• the combined statement of net assets as at 31 December 2017;
• the schedule of investments as at 31 December 2017;
• the combined statement of operations for the period from 1 November 2016 to 31 December 2017;
• the combined statement of changes in net assets for the period from 1 November 2016 to 31 December 2017; and
• the notes to the financial statements, which include a summary of significant accounting policies.
Basis for opinion
We conducted our audit in accordance with the Law of 23 July 2016 on the audit profession (Law of 23 July 2016) and with
International Standards on Auditing (ISAs) as adopted for Luxembourg by the “Commission de Surveillance du Secteur
Financier” (CSSF). Our responsibilities under those Law and standards are further described in the “Responsibilities of the
“Réviseur d’entreprises agréé” for the audit of the financial statements” section of our report.
We believe that the audit evidence we have obtained is sufficient and appropriate to provide a basis for our opinion.
............................................................................................................................................................................................................................................................................ PricewaterhouseCoopers, Société coopérative, 2 rue Gerhard Mercator, BP 1443, L-1014 Luxembourg T: +352 4948481, F:+352 494848 2900, www.pwc.lu Cabinet de révision agréé. Expert-comptable (autorisation gouvernementale n°10028256) R.C.S. Luxembourg B 65 477 - TVA LU25482518

121
We are independent of the Fund in accordance with the International Ethics Standards Board for Accountants’ Code of Ethics for Professional Accountants (IESBA Code) as adopted for Luxembourg by the CSSF together with the ethical requirements that are relevant to our audit of the financial statements. We have fulfilled our other ethical responsibilities under those ethical requirements.
Other information
The Board of Directors of the Management Company is responsible for the other information. The other information comprises the information stated in the annual report but does not include the financial statements and our audit report thereon. Our opinion on the financial statements does not cover the other information and we do not express any form of assurance conclusion thereon. In connection with our audit of the financial statements, our responsibility is to read the other information identified above and, in doing so, consider whether the other information is materially inconsistent with the financial statements or our knowledge obtained in the audit, or otherwise appears to be materially misstated. If, based on the work we have performed, we conclude that there is a material misstatement of this other information, we are required to report that fact. We have nothing to report in this regard.
Responsibilities of the Board of Directors of the Management Company for the financial statements
The Board of Directors of the Management Company is responsible for the preparation and fair presentation of the financial statements in accordance with Luxembourg legal and regulatory requirements relating to the preparation and presentation of the financial statements, and for such internal control as the Board of Directors of the Management Company determines is necessary to enable the preparation of financial statements that are free from material misstatement, whether due to fraud or error. In preparing the financial statements, the Board of Directors of the Management Company is responsible for assessing the Fund’s ability to continue as a going concern, disclosing, as applicable, matters related to going concern and using the going concern basis of accounting unless the Board of Directors of the Management Company either intends to liquidate the Fund or to cease operations, or has no realistic alternative but to do so.

_.-pwcResponsibilities of the "Reviseur d’entreprises agree” for the audit of the financial statements
The objectives of our audit are to obtain reasonable assurance about whether the financial statements as a whole are freefrom material misstatement, whether due to fraud or error, and to issue an audit report that includes our opinion. Reasonableassurance is a high level of assurance, but is not a guarantee that an audit conducted in accordance with the Law of 25 July2016 and with |SAs as adopted for Luxembourg by the CSSF will always detect a material misstatement when it exists.Misstatements can arise from fraud or error and are considered material if, individually or in the aggregate, they couldreasonably be expected to influence the economic decisions of users taken on the basis of these financial statements.
As part of an audit in accordance with the Law of 23 July 2016 and with |SAs as adopted for Luxembourg by the CSSF, weexercise professional judgment and maintain professional scepticism throughout the audit.
We also:
o identify and assess the risks of material misstatement of the financial statements, whether due to fraud or error, designand perform audit procedures responsive to those risks, and obtain audit evidence that is sufficient and appropriate toprovide a basis for our opinion. The risk of not detecting a material misstatement resulting from fraud is higher than forone resulting from error, as fraud may involve collusion, forgery, intentional omissions, misrepresentations, or theoverride of internal control;
o obtain an understanding of internal control relevant to the audit in order to design audit procedures that are appropriatein the circumstances, but not for the purpose of expressing an opinion on the effectiveness of the Funds internal control;
- evaluate the appropriateness of accounting policies used and the reasonableness of accounting estimates and relateddisclosures made by the Board of Directors of the Management Company;
- conclude on the appropriateness of the Board of Directors of the Management Company's use of the going concern basisof accounting and, based on the audit evidence obtained, whether a material uncertainty exists related to events orconditions that may cast significant doubt on the Fund's ability to continue as a going concern. If we conclude that amaterial uncertainty exists, we are required to draw attention in our audit report to the related disclosures in thefinancial statements or, if such disclosures are inadequate, to modify our opinion. Our conclusions are based on the auditevidence obtained up to the date of our audit report. However, future events or conditions may cause the Fund to ceaseto continue as a going concern;
o evaluate the overall presentation, structure and content of the financial statements, including the disclosures, andwhether the financial statements represent the underlying transactions and events in a manner that achieves fairpresentation.
We communicate with those charged with governance regarding, among other matters, the planned scope and timing of theaudit and significant audit findings, including any significant deficiencies in internal control that we identify during our audit.
Pricewaterhousecoopers, Société cooperative Luxembourg, 12 April 2018
Emmanuel Chataignier
122

Risk Disclosure (unaudited)
123
In the context of risk measurement and in accordance with CSSF Circular 11/512 a UCITS must calculate its global exposure
on at least a daily basis.
For SEB Strategy Fund - SEB Strategy Balanced, the global exposure is calculated and monitored daily by using the
calculation methodology Value at Risk (VaR) or the commitment methodology. The VaR model used is parametric VaR. The
observation period is at least 250 days.
The VaR methodology provides an estimate of the maximum potential loss over a specific time period and at a given
confidence level, i.e. probability level. Usually for UCITS, the time period is 1 month/20 business days and the confidence
level is 99%.
For example, a VaR estimate of 3% on a 20-days’ time period with a 99% confidence level means that, with 99% certainty,
the percentage the Fund can expect to lose over the next 20 days’ period should be a maximum of 3%.
In case of the VaR methodology, the Fund can use either the “relative” or the “absolute” VaR approach.
According to CSSF Circular 11/512, the absolute VaR approach must not be greater than 20% based on a 99% confidence
level and a holding period of 1 month/20 business days. In the case of the relative VaR approach, the VaR of the Fund must
not be greater than twice the VaR of its reference portfolio. Nevertheless, lower limitations than those ones set by the
regulator can be set in accordance with the investment policy/strategy of the Fund.
In addition to the VaR, the level of leverage generated through the use of derivatives and the use of collateral in relation to
efficient portfolio management transactions (i.e. securities lending or repurchase agreements) is monitored twice a month.
Leverage is measured as the sum of the absolute notional exposures of the financial derivative instruments (i.e. the absolute
sum of all long and short notional positions in derivatives compared to the Net Asset Value of the Fund) and the reinvestment
of collateral related to securities lending or repurchase agreement used by the Fund.
The Investment Manager calculates the leverage on a gross or on a commitment method. The gross method converts all
positions on derivative financial instruments into equivalent positions in the underlying assets, while the commitment method
applies the same while allowing netting and hedging arrangements.
The below overview summarises the Fund indicating the VaR or commitment approach, the reference portfolio (in the case of relative VaR), the VaR limit, the lowest/highest and average utilisation of VaR (expressed as a percentage of the respective absolute or relative VaR limit) as well as the average level of leverage for the year ended 31 December 2017. Or in other cases, the minimum, maximum and average leverage within the commitment method:
Fund Relative/
Absolute
VaR
Reference
portfolio
Lowest
utilisation
of VaR
Highest
utilisation
of VaR
Average
utilisation
of VaR
Average
Leverage (FX
forwards
serving the
purposes of
unit-class(es)
hedging, if any,
are not
included in the
leverage
calculation)
Average
Leverage
(including
FX forwards
for unit-class
hedging) SEB Strategy Fund -
SEB Strategy Balanced Absolute N/A 13.90% 19.23% 16.72% 56.92% 62.01%
SEB Strategy Fund -
SEB Strategy Defensive Absolute N/A 7.57% 10.05% 8.69% 50.22% 53.19%
SEB Strategy Fund -
SEB Strategy Growth Absolute N/A 32.38% 44.39% 38.99% 16.49% 24.89%
SEB Strategy Fund -
SEB Strategy Opportunity Absolute N/A 23.57% 31.37% 28.34% 36.04% 43.05%

Remuneration Disclosure (unaudited)
124
SEB Investment Management AB (the Management Company) wishes to encourage and incite good performance and sound behaviour, as well as to endeavour to achieve balanced risk-taking that is aligned with the interests of fund unitholders.
The Management Company has a long-term vision regarding the employment conditions of its staff. Total remuneration shall contribute to developing the Management Company's competitiveness and profitability through the Company being able to attract, retain, motivate and reward competent and skilful employees. In order to achieve this objective, the Management Company's board of directors has adopted a remuneration policy based on Swedish and international regulations. The purpose of the remuneration policy is to ensure that the Management Company has a remuneration system that is adapted to the fund unitholders' long-term interests and the Management Company's strategy and values.
The remuneration policy is based on the remuneration model that is applied at Group level, and is built on SEB's values. The Management Company's remuneration policy is reviewed at least annually. The Management Company's current remuneration policy is based on a risk analysis that has been prepared by the Management Company's risk control department.
The Management Company’s remuneration structure is based on three components: • Fixed remuneration (basic salary) • Variable remuneration • Pensions and other benefits
The remuneration components are used to achieve a competitive individual level of remuneration with an appropriate balance between fixed and variable remuneration.
The fixed remuneration component is individually adapted further to predetermined internal and external appraisals. The level of the fixed remuneration is based on the employee's experience, long-term performance and behaviour.
All employees at the Management Company are embraced by SEB's collective profit sharing model that has a predetermined maximum outcome. The remuneration is established based on SEB's earnings and customer satisfaction.
Remuneration to employees in control departments (internal audit, risk control, and observance of regulations) is established by the board of directors further to proposals from the Management Company's remuneration committee. Remuneration shall be based on objective grounds related to the employee's role and tasks, and be independent of the business unit that the control department scrutinises.
Employees in departments that have a monitoring function, such as internal auditing, risk control or compliance, are not to receive any other variable remuneration over and above SEB's profit sharing.
The Management Company applies the grandfather principle to all remuneration, which means all decisions are to be approved by, at the least, the manager for the manager of the employee concerned.
Variable remuneration The Management Company uses variable remuneration in order to develop and reward performance and behaviour that create both short-term and long-term value for the fund unitholders and the Management Company. Variable remuneration is an important aspect of designing a flexible remuneration system. Variable remuneration is composed of both cash and units/shares in investment funds or financial instruments which achieve the equivalent common interests as units/shares in the relevant investment funds.
The principles for variable remuneration adopted by the Management Company are established with the objective of reflecting the Management Company's low risk tolerance and being compatible with the Fund's prevailing risk profiles, fund rules, discretionary mandates, as well as internal and external regulations. The variable remuneration shall be based on the employee's performance and behaviour from a several-year perspective, as well as the performance and economic results of the employee's team, the Management Company and SEB as a whole.
At the same time as obtaining a sound balance between fixed and variable remuneration, the payment of variable remuneration shall be related to the Management Company's risk policy and creation of value for the fund unitholders. This implies that certain maximum levels and deferment of payment shall apply to different personnel categories.

125
For employees in positions that have a significant influence on the Management Company's or the managed funds’ risk profile, the maximum variable remuneration may not exceed 100 percent of the fixed remuneration. The variable remuneration is to be deferred by 40 to 60 percent for a minimum of three years. At least 50 percent of the variable remuneration is to consist of shares in investment funds or instruments which achieve the same common interests as shares in the relevant securities funds. Variable remuneration in the form of fund units/shares will be subject to retention policy for at least one year. This retention policy applies to variable compensation whether or not it is deferred.
The Management Company also applies a special remuneration model for certain employees who manage funds and discretionary mandates. The remuneration model for these persons is based on a structure with distinct rules for maximum outcome of remuneration, deferment of remuneration as well as rules regarding downward adjustment/reduction of remuneration.
Payment of deferred remuneration shall only be made if such is motivated based on the Management Company's economic situation and the performance of the Management Company, the relevant division and the employee.
Reduction or downward adjustment of deferred variable remuneration shall apply should losses, increased risks and costs arise during the deferment period, which includes for example taking into consideration the employee's observance of external and internal regulations. Reduction or downward adjustment shall also take place should payment be deemed unwarrantable in view of the Management Company's financial situation.
The variable remuneration system shall be continuously reviewed in order to ensure that it does not create any unsuitable behaviour and contribute to excessive risk-taking.
The remuneration committee The Management Company has appointed a remuneration committee with the task of independently appraising the remuneration policy. The remuneration committee shall be responsible for preparing decisions regarding remuneration that are to be adopted by the board of directors, and intervene if a decision could imply consequences for the Management Company's risks and risk management. The remuneration committee is an independent body composed of the board of directors' independent members.
Follow up The CEO, the deputy CEO and the board of directors shall ensure that the remuneration policy is operationally applied. The remuneration policy shall be reviewed annually by the internal audit department or by an independent auditing firm. In order to ensure that the Management Company's remuneration system is applied in accordance with the remuneration policy, the remuneration system and the payment of remuneration shall be reviewed annually by internal or external auditors.
Regulated staff Paid remuneration and benefits, 2017
(thousand) EUR
- Employees in leading strategic positions 2,389 - Employees responsible for control 429 - Risk-takers 9,070 - Employees whose total remuneration amounts to or exceeds the total remuneration to any of the Executive Board
–
Total remuneration paid (thousand)
EUR
- All employees (fixed remuneration) 14,954 - All employees (variable remuneration) 3,642 Number of employees during the period 134

SEB Investment Management AB, Luxembourg Branch 4, rue Peternelchen, L-2370 Howald, Luxembourg Postal address: PO Box 2053, L-1020 Luxembourg Phone +352 - 26 23 1; Fax +352 - 26 23 25 55 www.sebgroup.lu