annual report - murata.co.jp · annual report. 1 date of ... of monolithic ceramic capacitors and...
TRANSCRIPT

Murata Manufacturing Co., Ltd.
2000
ANNUALREPORT
1
Date of Incorporation : December 23, 1950
Head Office :26-10, Tenjin 2-chome, Nagaokakyo,Kyoto 617-8555Phone : (075) 955-6502Fax : (075) 955-6526
Stock Exchange Listings :Tokyo Stock ExchangeOsaka Securities ExchangeKyoto Securities ExchangeStock Exchange of Singapore (DRSs)
Transfer Agent :The Dai-lchi Kangyo Fuji Trust & Banking CO., Ltd.6-2, Marunouchi 1-chome, Chiyoda-ku, Tokyo100-0005
(As of March 31, 2000)
Contents
Message from the President ............. 3
Financial Review ........................... 5
Selected Financial Data................ 10
Consolidated Balance Sheets ........ 15
Consolidated Statements of Income .... 17
Consolidated Statements of Comprehensive IncomeConsolidated Statements of Shareholders' Equity ................ 18
Consolidated Statements of Cash Flows ............................ 19
Notes to Consolidated Financial Statements ............................. 20
Independent Auditors' Report ......... 34

2
Murata Manufacturing Co., Ltd. is a world
leader in electronic components. The Com-
pany claims leading world market shares
in ceramic capacitors, ceramic filters, and
various indispensable electronic compo-
nents.
Since its founding in 1944, Murata has
followed a balanced strategy based on
consistent investment in R & D and a global
network of manufacturing and marketing
subsidiaries.

3
Message from the President
Overview of Business PerformanceFor the fiscal year ended March 2000, our consolidated sales reached ¥459,125 million (US$
4,331,368 thousand), up 25.1% from the previous term, and the income before income taxes and cumu-lative effect of a change in accounting principle was ¥108,074 million (US$ 1,019,566 thousand), up75.4% from the previous term. The net income was ¥61,626 million (US$ 581,377 thousand), up113.4% from the previous term. The significant increase in income was partly due to a sharp rise in ordersfrom the cellular phone market, comparatively swift establishment of a supply system and the substantialincrease in sales.
Market OverviewDuring the term under review, the industrial electronics market experienced high growth and surpassed
the previous year's growth rate. The performance reflected a global expansion of demand for informationand telecommunications equipment.
Driven by a demand for cellular phones that exceeded expectations, the telecommunications equipmentmarket showed high growth throughout the United States, Europe and Asia. Factors contributing to this highgrowth included a rapidly growing market for digital phones in the U.S., full-scale penetration of dual-bandphones in the European market and the increased dispersion of cellular phones in Asia, especially in Chinaand South Korea. Meanwhile, the Japanese market for cellular phones showed significant growth due togrowing prevalence and strong replacement demand for new models that support data communications.The global production volume of cellular phones saw significant growth. Demand for cellular phone compo-nents also grew remarkably as an increasing number of components per phone are now required due to theadoption of the dual-band system and functional improvements.
The computers and peripheral equipment market performed well on a worldwide basis owing to in-creased demand for personal computers and peripherals, declining prices, a growing Internet populationand increased investment in information technology.
Overall, the worldwide production of consumer electronics was solid as digital audio-video (AV) ma-chines penetrated the world's markets, including digital video cameras, digital versatile disc (DVD) players,and mini disc (MD) players.
Management Strategy We concentrated investment of its resources in products for high-growth markets, including microwave
components, chip monolithic ceramic capacitors for mobile telecommunications equipment, which includescellular phones, and noise reduction components for digital equipment to increase the Company’s capacityto meet growing demand and develop new products in these markets.
Overseas, the Company established subsidiaries in Tianjin and Shenzehn, China, to sell componentsfor AV and information and telecommunications equipment, for which demand is growing rapidly in China.For distribution of these components in North America, the Company switched from a conventional agencysystem to direct selling to important customers to ensure quick delivery to satisfy customer needs. In additionto these efforts for better customer service, we remain attentive to the latest market trends within and outsideJapan, using our information network system for sales promotion, to develop new products and improve oursupply system as swiftly as possible.
Outlook for the FutureThe world's electronics market is expected to grow continuously, chiefly in the fields of information and
telecommunications equipment and digital consumer electronics. In particular, the cellular phone market isexpected to grow further owing to a multitude of factors, including extended migration into digital and dual-
4
Yasutaka MurataPresident
band phones, wider dispersion of cellular phones in Asia, a growing market in cellular phones for datacommunications and the introduction of next-generation cellular phones on the IMT (International MobileTelecommunications) - 2000 system. The progressive introduction of various systems using high-frequencywireless technology will also boost demand for microwave components.
Meanwhile, the computers and peripheral equipment market is expected to continue growing steadilyas declining computer prices and advances in IT technologies are expected to expand the Internet popula-tion and corporate investments in IT systems. The consumer electronics market is also likely to grow in viewof the increasing demand for digital AV equipment, such as DVD players and digital video cameras.
Our development emphasis in the coming years will be put on microwave devices, from microwavethrough millimeter-wave, and EMI suppression components to respond to the digitalization of equipment,which will serve the more important markets to the Company.
To accommodate the rapidly growing demand for electronic components, we will increase the produc-tion capacity of our domestic and overseas subsidiaries based on careful studies of market trends, ensuringa timely and steady product supply.
We will continue to promote the strategy of replacing rare metals with base metals for internal electrodesof monolithic ceramic capacitors and to improve our ceramic material and firing technologies to offset thenegative impact of rising palladium prices.
To address our responsibility for global environmental protection, we have completed the acquisition ofISO14001 certification - international environmental management standards - at all of our major businessplaces, including subsidiaries. As well as further reducing the use of lead and other regulated materials, wewill continue to make efforts to preserve or improve the global environment through voluntary resource andenergy saving, waste reduction and recycling.
Policy on DividendsIn recognition of the steady growth of earnings and internal reserves, the Company paid a dividend of
¥28.5 per share, an increase of ¥6.5 per share.Despite increased funding demands such as capital investments, in consideration of internal reserves at
fiscal year-end and projected earnings for the fiscal 2001 (year ended March 2001), the Companyexpects to pay a dividend of ¥37.5 per share for the fiscal 2001. Projected dividends per share for thefiscal 2001 are based on the current operating environment and estimated results for the fiscal 2001.

5
Sales
For the fiscal year ended March 2000, our consolidated sales reached ¥459,125 million (US$
4,331,368 thousand), up 25.1% from the previous term, and the income before income taxes and
cumulative effect of a change in accounting principle was ¥108,074 million (US$ 1,019,566 thou-
sand), up 75.4% from the previous term. The net income was ¥61,626 million (US$ 581,377
thousand), up 113.4% from the previous term. The significant increase in income was partly due to a
sharp rise in orders from the cellular phone market, comparatively swift establishment of a supply
system and the substantial increase in sales.
Sales by Product
To better reflect changes in the mix of our sales, we adjusted our product categories as follows.
The microwave devices category was added, reflecting the growing importance of this business, whereas
the coil products category was almost transferred to other products after its sales volume fell dramatically
following the transfer of the deflection yoke business in 1997.
<Capacitors>This product category includes monolithic ceramic, disc ceramic and trimmer capacitors.
Sales of chip monolithic ceramic capacitors - the key products in this category - grew significantly
owing to a global expansion of the cellular phone market. In particular, increasingly higher signal
speed resulted in a remarkable increase in the sales of capacitors with large capacitance and their
applications.
Overall sales of capacitors increased 23.3% year-on-year to ¥181,995 million.
<Resistors>This product category includes thermistors, trimmer potentiometers, resistor networks and high-volt-
age resistors.
Sales of negative temperature coefficient thermistors grew substantially in the cellular phone and
computers and peripheral equipment markets.
Overall sales of resistors increased 6.9% year-on-year to ¥15,129 million.
Financial Review
Years ended March 31
CapacitorsResistorsPiezoelectric componentsMicrowave DevicesModule ProductsOther productsNet sales*1 Ratio to net sales
Millions of yen
2000 Amount *1¥181,995 39.6%
15,129 3.3%88,293 19.3%65,707 14.3%56,368 12.3%51,633 11.2%
¥459,125 100.0%
1999 Amount *1¥147,548 40.2%
14,159 3.9%76,398 20.8%41,906 11.4%46,078 12.6%40,959 11.1%
¥367,048 100.0%
Growth Amount¥34,447 23.3%
970 6.9%11,895 15.6%23,801 56.8%10,290 22.3%10,674 26.1%
¥92,077 25.1%

6
<Piezoelectric Components>This product category includes ceramic filters, ceramic resonators, surface acoustic wave filters,
and piezoelectric buzzers.
Sales of surface acoustic wave filters increased immensely in the cellular phone market. Sales of
ceramic resonators also showed high growth, reflecting a further increasing number of microprocessor-
embedded electronics. Remarkable growth in the export of ceramic filters for the U.S., European and
South Korean cellular phone markets resulted in significant year-on-year sales increases.
Overall sales of piezoelectric components rose 15.6% year-on-year to ¥88,293 million.
<Microwave Devices>This product category includes microwave filters, multilayer ceramic devices and isolators.
Driven by the increasing size of the cellular phone market on a global basis, this product category
grew dramatically. In particular, the growth of CDMA cellular phone markets resulted in a boost in
sales of microwave filters and isolators especially in the United States, Japan and South Korea. There
was also significant growth in sales of multilayer ceramic devices globally, due partly to increased
variety of the devices.
Overall sales of microwave devices jumped 56.8% year-on-year to ¥65,707 million.
<Module Products>This product category includes circuit modules, various types of power supplies and fly back trans-
formers.
For microwave modules, sales of voltage-control oscillators (VCOs) grew substantially owing to
favorable to cellular phone markets. Sales of power supplies grew substantially in the audio-video (AV)
equipment and computers and peripheral equipment markets.
Overall sales of module products increased 22.3% year-on-year to ¥56,368 million.
<Other Products>This product category includes EMI suppression filters and various types of coils and sensors.
The current term's performance for this category was characterized by remarkable growth in sales
of EMI suppression filters and chip coils for the cellular phone market, as well as sales to the consumer
digital equipment and computers and peripheral equipment markets.
Overall sales of other products advanced 26.1% year-on-year to ¥51,633 million.

7
Sales by Application
<Consumer Electronics Equipment>For consumer electronics, favorable growth in sales for digital devices such as DVD players, digital
video cameras and MD players, together with a recovery in production of consumer electronics in
ASEAN countries, resulted in a 4.8% increase in sales in this sector compared to the previous year.
<Industrial Electronics Equipment>In the industrial equipment sector, substantial growth in sales of products for cellular phones led to
a sharp increase of 57.6% in sales for telecommunications equipment. Sales for computers and periph-
eral equipment and other industrial equipment grew by 14.2%. As a result, overall sales for the sector
rose a substantial 41.2% year-on-year.
<Home Electrical Appliances and Other Products>The home electrical appliances and other products sector expanded 7.1% compared with the
previous year, with sales growth centered on products for automobiles.
Sales by Area
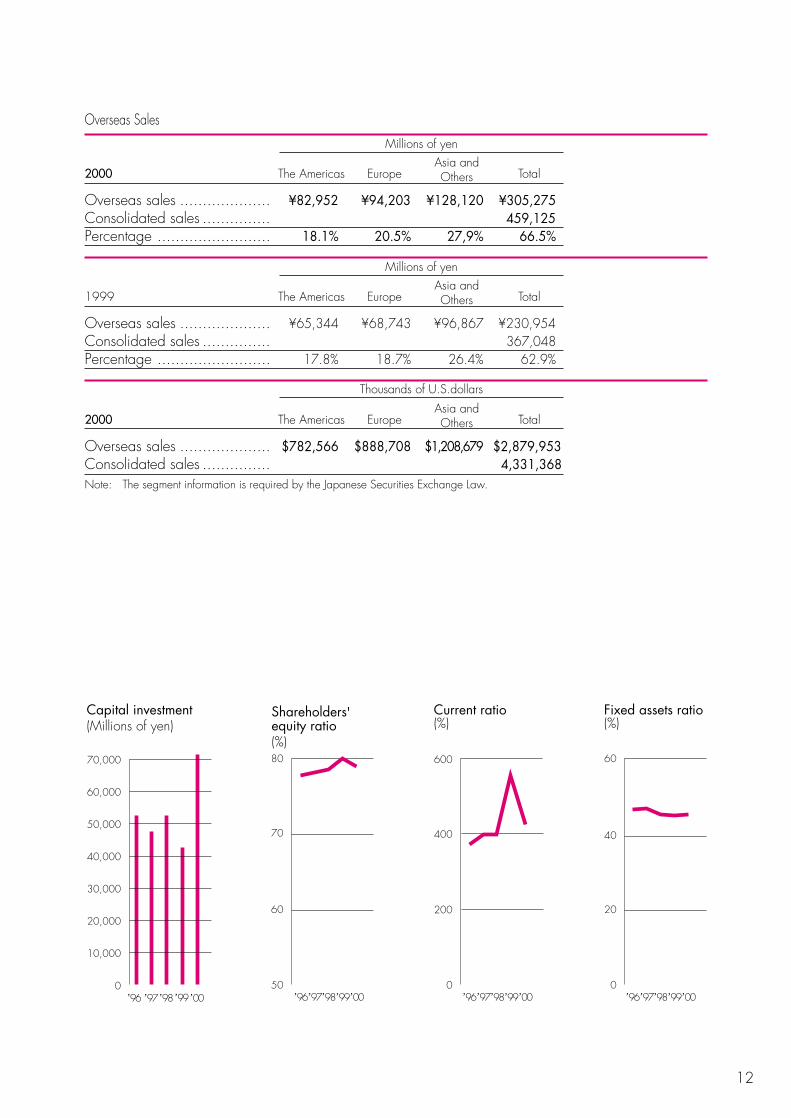
Overseas sales rose 32.2% year-on-year due to strong growth in Europe, Asia and the Americas.
As a result, overseas sales accounted for 66.5% of total sales, up from 62.9% the previous year.
<North and South America>In the Americas, significantly expanded sales of telecommunications equipment, in tandem with
solid growth in other product markets, contributed to a 26.9% increase in sales over the previous year.
Years ended March 31
North and South AmericaEuropeAsia and OthersOverseas TotalJapanNet sales*1 Ratio to net sales
Millions of yen
2000 Amount *1¥ 82,952 18.1%
94,203 20.5%128,120 27.9%305,275 66.5%153,850 33.5%
¥459,125 100.0%
1999 Amount *1¥ 65,344 17.8%
68,743 18.7%96,867 26.4%
230,954 62.9%136,094 37.1%
¥367,048 100.0%
Growth Amount¥17,608 26.9%
25,460 37.0%31,253 32.3%74,321 32.2%17,756 13.0%
¥92,077 25.1%
Years ended March 31
VideoAudioConsumer TotalCommunicationEDP and OthersIndustrial TotalHome and OthersNet sales*1 Ratio to net sales
Millions of yen
2000 Amount *1¥ 51,428 11.2%
24,712 5.4%76,140 16.6%
194,760 42.4%86,092 18.8%
280,852 61.2%102,133 22.2%
¥459,125 100.0%
1999 Amount *1¥ 48,342 13.2%
24,342 6.6%72,684 19.8%
123,579 33.7%75,388 20.5%
198,967 54.2%95,397 26.0%
¥367,048 100.0%
Growth Amount
¥3,086 6.4%370 1.5%
3,456 4.8%71,181 57.6%10,704 14.2%81,885 41.2%6,736 7.1%
¥92,077 25.1%

8
<Europe>In Europe, sales of products for telecommunications equipment increased by a wide margin and
sales of consumer electronics equipment rose favorably. As a result, sales increased 37.0% year-on-
year.
<Asia and Others>In Asia, a substantial increase in sales of telecommunications equipment and favorable growth in
sales of computers and peripheral equipment, combined with a recovery in production of consumer
electronics, led to an overall year-on-year increase in sales of 32.3% for the region.
<Japan>In Japan, although sales of consumer electronics equipment were flat, a significant increase in
sales of telecommunications equipment and favorable growth in sales of computers and periph-
eral equipment supported an overall increase of 13.0% compared with the previous fiscal year.
Costs, Expenses and Income
Operating income increased 76.6% over the previous year to ¥100,767 million (US$950,632
thousand). Although factors such as the strong yen, lower sales prices and increased depreciation and
amortization expenses exerted a negative influence on earnings, they were offset by a sharp rise in
orders from the cellular phone industry, comparatively swift establishment of a supply system and the
substantial increase in net sales.
Higher operating income led to a 75.4% increase in income before income taxes and cumulative
effect of a change in accounting principle to ¥108,074 million (US$1,019,566 thousand). Net in-
come was ¥61,626 million (US$581,377 thousand), an increase of 113.4% over the previous year.
Years ended March 31
Net salesCost of salesSelling,general and administrative expensesResearch and development expensesOperating incomeOther income —netIncome before income taxes and cumulativeeffect of a change in accounting principleIncome taxesIncome before cumulative effect of achange in accounting principleCumulative effect of a change in accountigfor termination and retirement benefitsNet income*1 Ratio to net sales
Millions of yen
2000 Amount *1¥459,125 100.0%265,122 57.7%
64,196 14.0%29,040 6.3%
100,767 22.0%7,307 1.5%
108,074 23.5%44,817 9.8%63,257 13.7%
(1,631) (0.3)%
¥ 61,626 13.4%
1999 Amount *1¥367,048 100.0%225,869 61.5%
58,111 15.8%26,007 7.1%57,061 15.6%4,566 1.2%
61,627 16.8%32,743 8.9%28,884 7.9%
— —
¥ 28,884 7.9%
Growth Amount¥92,077 25.1%
39,253 17.4%6,085 10.5%3,033 11.7%
43,706 76.6%2,741 60.0%
46,447 75.4%12,074 36.9%34,373 119.0%
(1,631 ) —
¥32,742 113.4%

9
Capital Investment, Depreciation and Amortization
Capital investment totaled ¥71,459 million (US$674,142 thousand), an increase of ¥28,661
million (US$270,387 thousand) over the previous year. As orders increased, the Company made its
highest level of investment ever to expand its production system for mainstay products such as chip
monolithic ceramic capacitors, microwave components and noise suppression components.
In tandem with the high level of capital investment, depreciation and amortization increased 12.7%
year-on-year to ¥44,452 million (US$419,358 thousand).
Financial Position
Total assets increased 14.1% compared with the previous year to ¥755,212 million (US$7,124,642
thousand). Shareholders' equity rose 10.1% year-on-year to ¥585,325 million (US$5,521,934 thou-
sand).
Capital increased because of a larger amount of deferred taxes following the substantial increase
in earnings and obligations related to purchases of equipment and raw materials due to the rapid
expansion of production facilities. Consequently, the shareholders' equity ratio decreased from 80.3%
in the previous year to 77.5%.
Years ended March 31
Capital investmentDepreciation and amortization
Millions of yen
2000¥ 71,459
44,452
1999¥ 42,798
39,426
1998¥ 52,603
35,347
Years ended March 31
Shareholder’s Equity Ratio(%)Return on Shareholdes’ Equity(%)Income before taxes* on Total Assets(%)Shareholder’s Equity per Share(yen)* Income before taxes stands for Income bofore income taxes and cumulative effect of a change in
accounting principle.
200077.511.015.3
2,433.63
199980.35.59.2
2,216.96
199876.3
7.810.9
2,178.73

10
Net sales ............................Operating costs and expensesOperating income ................Other income ......................Income before income taxes andcumulative effect of a change inaccounting principle...............Net income.........................Amounts per share:
Net income per shareBasic ...........................Diluted .........................
Cash dividends .................Pro forma amounts assumingaccounting change appliedretroactively
Net income ......................Basic ...........................Diluted .........................
Current assets ......................Property, plant and equipment
less accumulateddepreciation .....................
Total assets .........................Shareholders' equity .............Capital investment ................Number of employees ...........Notes: 1. The U.S. dollar amounts in this report represent translation of Japanese yen for convenience only at the rate of ¥106=U.S.$1.
2. Pro forma data reflect the effect of accounting change of termination and retirement benefits described in Note 6 of Notes toConsolidated Financial Statements.
0
500,000
7
14
13
12
11
10
9
8
0
800,000
700,000
600,000
500,000
400,000
300,000
200,000
100,000
400,000
300,000
200,000
100,000
0
60,000
50,000
40,000
30,000
20,000
10,000
,96
,97
,98
,99
,00
,96
,97
,98
,99
,00
,96
,97
,98
,99
,00
,96
,97
,98
,99
,00
SELECTED FINANCIAL DATAMurata Manufacturing Co., Ltd. and SubsidiariesYears ended March 31, 1996-2000
¥459,125358,358100,767
7,307
108,07461,626
¥256.5252.7
28.5
63,257263.3259.4
491,494
235,649755,212585,325
71,459
25,427
¥367,048309,98757,061
4,566
61,62728,884
¥120.5118.622.0
28,208117.7115.9
423,278
213,688662,050531,74542,798
23,536
¥362,252294,634
67,6185,076
72,69439,397
¥164.6161.7
22.0
38,940162.7159.8
446,603
214,279684,142521,835
52,603
23,768
¥330,612269,023
61,5893,816
65,40532,590
¥136.4133.9
17.0
32,092134.3131.8
420,894
200,800649,536490,630
47,947
23,588
¥321,859252,23069,629
4,039
73,66837,242
¥156.0152.917.0
37,242156.0152.9
405,220
179,750617,888456,88352,760
23,400
$4,331,3683,380,736
950,63268,934
1,019,566581,377
$2.422.390.27
596,7642.482.45
4,636,736
2,223,1047,124,6425,521,934
674,142
Millions of yen except per share amounts2000 1999 1998 1997 1996
Thousands ofU.S. dollars exceptper share amounts
(Note 1)2000
Net sales(Millions of yen)
Net income(Millions of yen)
Return on net sales(%)
Total assets(Millions of yen)

11
300
0
200
100
600,000
0 0 0
10 3,000
5
500,000
400,000
300,000
200,000
100,000
2,000
1,000
,96
,97
,98 ,
99,00
,96
,97
,98,
99,00,
96,97
,98 ,
99,00
,96
,97
,98 ,
99,00
Return on shareholders'equity*2
(%)
*1 Based on the number of common and common equivalent shares outstanding, adjusted retroactively for share distributions without consideration.
*2 Net income divided by average shareholders' equity for the year.
*3 Based on the number of common shares outstanding, adjusted retroactively for share distributions without consideration.
Shareholders' equityper share*3
(yen)
Diluted net incomeper share*1
(Yen)
Shareholders' equity(Millions of yen)
Segment Information
Geographic Segment Information
¥178,166105,400283,566241,71841,848
307,346
¥55,775466
56,24153,607
2,63423,720
¥367,048–
367,048309,98757,061
662,050
Unaffiliated customers .....Intersegment ..................
Total revenue....................Operating expenses ..........Operating income ............Assets .............................
Millions of yen
¥61,61862
61,68056,172
5,50824,030
¥71,4898,537
80,02673,448
6,57843,767
¥ , –(114,465)(114,465)(114,958)
493263,187
Japan The Americas Europe AsiaCorporate and
eliminations Consolidated1999
Unaffiliated customers .....Intersegment ..................
Total revenue....................Operating expenses ..........Operating income ............Assets .............................
$2,056,5381,455,6603,512,1982,772,679
739,5193,462,604
$634,9724,566
639,538604,802
34,736245,453
$4,331,368–
4,331,3683,380,736
950,6327,124,642
Thousands of U.S.dollars
$807,972406
808,377733,708
74,670344,792
$831,88795,066
926,953830,462
96,491453,236
$ –(1,555,698)(1,555,698)(1,560,915)
5,2172,618,557
Japan The Americas Europe AsiaCorporate and
eliminations Consolidated2000
¥217,993154,300372,293293,904
78,389367,036
¥67,307484
67,79164,1093,682
26,018
¥459,125–
459,125358,358100,767755,212
Unaffiliated customers .....Intersegment ..................
Total revenue....................Operating expenses ..........Operating income ............Assets .............................
Millions of yen
¥85,64543
85,68877,7737,915
36,548
¥88,18010,07798,25788,02910,22848,043
¥ , –(164,904)(164,904)(165,457)
553277,567
Japan The Americas Europe AsiaCorporate and
eliminations Consolidated2000
12
0
70,000
60,000
50,000
40,000
30,000
20,000
10,000
50
60
70
80
0
20
40
60
0 ,96
,97
,98
,99
,00
,96
,97
,98
,99
,00
,96,
96,97,
97,98,
98,99,
99,00,
00
600
400
200
Shareholders'equity ratio(%)
Current ratio(%)
Fixed assets ratio(%)
Capital investment(Millions of yen)
Overseas Sales
¥82,952
18.1%
¥94,203
20.5%
Overseas sales ....................Consolidated sales ...............Percentage .........................
Millions of yen
¥128,120
27,9%
¥305,275459,125
66.5%
The Americas EuropeAsia andOthers Total2000
¥65,344
17.8%
¥68,743
18.7%
Overseas sales ....................Consolidated sales ...............Percentage .........................
Millions of yen
¥96,867
26.4%
¥230,954367,048
62.9%
The Americas EuropeAsia andOthers Total1999
$782,566 $888,708
Thousands of U.S.dollars
$1,208,679
The Americas EuropeAsia andOthers Total2000
Note: The segment information is required by the Japanese Securities Exchange Law.
$2,879,9534,331,368
Overseas sales ....................Consolidated sales ...............

13
Production by ProductCapacitors ................................................Resistors ...................................................Piezoelectric Components ............................Microwave Devices ....................................Module Products ........................................Other Products ...........................................Total ........................................................
PRODUCTION AND ORDER BY PRODUCTMurata Manufacturing Co., Ltd. and SubsidiariesYears ended March 31, 2000
¥186,99214,65890,28667,98957,70852,917
¥470,550
%39.73.1
19.214.512.311.2
100.0
*1 Figures are based on production quantity and sales price to customers.*2 Exclusive of consumption taxes
Millions of yen
2000
Order and Backlog by ProductCapacitors ................................................Resistors ...................................................Piezoelectric Components ............................Microwave Devices ....................................Module Products ........................................Other Products ...........................................Total ........................................................
¥220,03916,09293,55574,71663,45158,710
¥526,563
%46.3
2.213.615.312.610.0
100.0
* Exclusive of consumption taxes
Millions of yen
%41.83.1
17.714.212.111.1
100.0
¥ 53,0772,510
15,60217,56114,37411,495
¥114,619
Order2000
Backlog2000

14
Parent CompanyPlant, Office and other
Head Office in Kyoto ................Yokaichi Plant in Shiga ..............Yasu Plant in Shiga ...................Yokohama Plant in Kanagawa ....Tokyo Branch ...........................Other .....................................
CAPITAL INVESTMENTMurata Manufacturing Co., Ltd. and SubsidiariesYears ended March 31, 2000
¥4,837275
7,2351,7974,1948,218
¥ 7,70320,48030,8894,2128,733
10,794
Millions of yen
1) Capital Investment for the fiscal year ended March 2000 amounted to ¥71,459 million (US$674,142 Thousand).Major capital investment included the expansion of Domestic subsidiaries, and R&D facility.
2) Major property, plant and equipment in book value basis
¥ 8347,294
15,6171,8884,3941,075
¥ 1,08510,9066,059
375143
1,495
¥ 9472,0051,978
15226
Land TotalBuildings Machineryand equipment
Constructionin progress
Domestic subsidiariesCompany Name
Fukui Murata Manufacturing Co.,Ltd. ...........Izumo Murata Manufacturing Co.,Ltd. ..........Kanazawa Murata Manufacturing Co.,Ltd. ...Toyama Murata Manufacturing Co.,Ltd.........Komatsu Murata Manufacturing Co.,Ltd. .......Okayama Murata Manufacturing Co.,Ltd. ....Sabae Murata Manufacturing Co.,Ltd. .........Kanazu Murata Manufacturing Co.,Ltd. ........
¥2,0251,0111,2261,4711,553
–299296
¥33,82628,28321,86110,8886,9068,3163,2572,067
Millions of yen
¥7,1188,7465,5303,0951,1013,0231,105
573
¥22,59617,64012,8725,8454,0722,2701,2331,193
¥2,087886
2,233477180
3,023620
5
Land TotalBuildings Machineryand equipment
Constructionin progress
Foreign subsidiariesCompany Name
Murata Electronics Singapore (Pte.) Ltd. ....Murata Electronics North America, Inc. ....Murata Electronics (Thailand), Ltd. ...........Beijing Murata Electronics Co., Ltd. .........Murata Electronics (Malaysia) Sdn. Bhd. ..Taiwan Murata Electronics Co., Ltd. ........
¥ –152146
–9327
¥6,7053,5752,8611,8171,606
510
Millions of yen
¥2,2881,2721,295
9291,034
194
¥4,1412,0241,414
882478289
¥276127
661–
Land TotalBuildings Machineryand equipment
Constructionin progress
2000
2000
2000
15
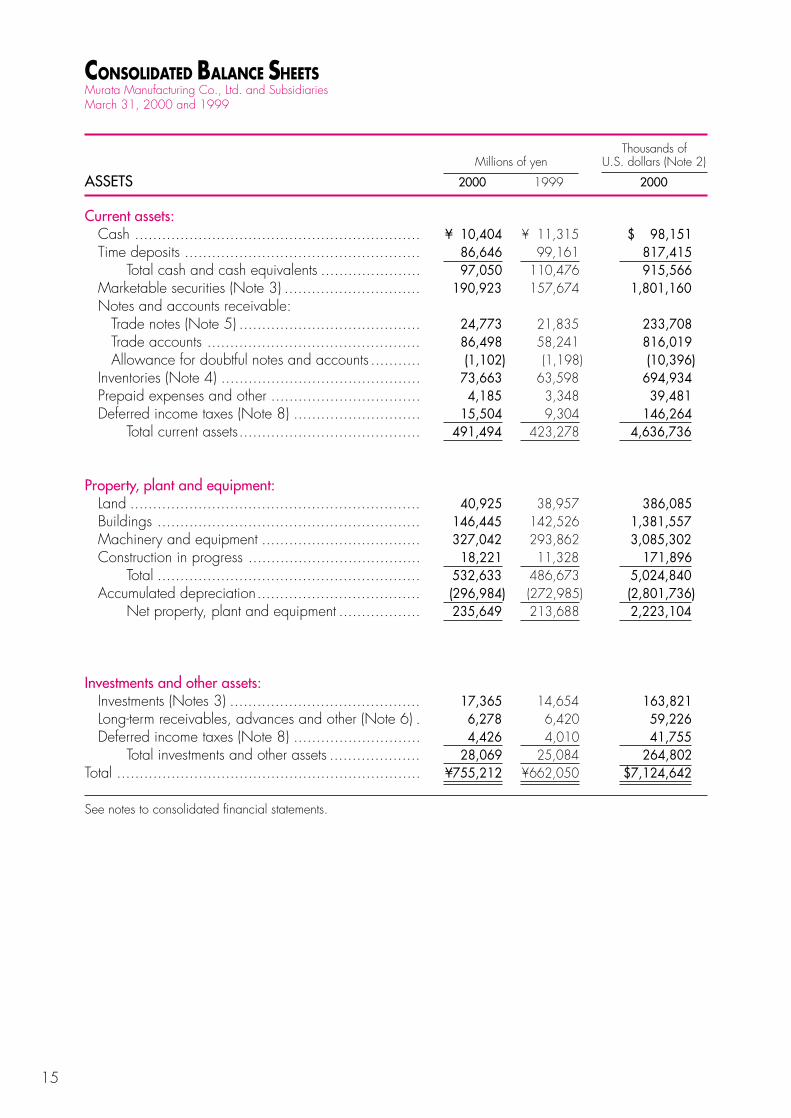
CONSOLIDATED BALANCE SHEETSMurata Manufacturing Co., Ltd. and SubsidiariesMarch 31, 2000 and 1999
Millions of yen
2000 1999
Thousands ofU.S. dollars (Note 2)
2000ASSETS
¥ 10,40486,64697,050
190,923
24,77386,498(1,102)
73,6634,185
15,504491,494
40,925146,445327,042
18,221532,633(296,984)235,649
17,3656,2784,426
28,069¥755,212
¥ 11,31599,161
110,476157,674
21,83558,241(1,198)
63,5983,3489,304
423,278
38,957142,526293,86211,328
486,673(272,985)213,688
14,6546,4204,010
25,084¥662,050
$ 98,151817,415915,566
1,801,160
233,708816,019(10,396)
694,93439,481
146,2644,636,736
386,0851,381,5573,085,302
171,8965,024,840(2,801,736)2,223,104
163,82159,22641,755
264,802$7,124,642
Current assets:Cash ...............................................................Time deposits ....................................................
Total cash and cash equivalents ......................Marketable securities (Note 3) ..............................Notes and accounts receivable:
Trade notes (Note 5) ........................................Trade accounts ...............................................Allowance for doubtful notes and accounts ...........
Inventories (Note 4) ............................................Prepaid expenses and other .................................Deferred income taxes (Note 8) ............................
Total current assets........................................
Property, plant and equipment:Land ................................................................Buildings ..........................................................Machinery and equipment ...................................Construction in progress ......................................
Total ..........................................................Accumulated depreciation....................................
Net property, plant and equipment ..................
Investments and other assets:Investments (Notes 3) ..........................................Long-term receivables, advances and other (Note 6) .Deferred income taxes (Note 8) ............................
Total investments and other assets ....................Total ...................................................................
See notes to consolidated financial statements.

16
Thousands ofU.S. dollars (Note 2)
2000LIABILITIES AND SHAREHOLDERS' EQUITY
¥ 6,3141,489
25,49817,13338,52626,184
208115,352
8,64536,6289,262
54,535
65,56797,9748,119
433,728
3,275(1,129)
(22,209)(20,063)
585,325¥755,212
¥ 7,5762,538
17,31015,18415,70717,814
10476,233
9,74738,281
6,04454,072
64,89097,302
7,208379,854
1,346(8,131)
(10,724)(17,509)
531,745¥662,050
$ 59,56614,047
240,547161,632363,453247,020
1,9621,088,227
81,557345,54787,377
514,481
618,557924,28376,594
4,091,774
30,896(10,651)
(209,519)(189,274)
5,521,934$7,124,642
Current liabilities:Short-term borrowings (Note 5) .............................Trade notes payable ...........................................Trade accounts payable ......................................Accrued payroll and bonuses ...............................Income taxes payable .........................................Accrued expenses and other ................................Current portion of long-term debt (Note 5)...............
Total current liabilities ....................................
Long-term liabilities:Long-term debt (Note 5) .......................................Termination and retirement benefits (Note 6) ............Deferred income taxes (Note 8) ............................
Total long-term liabilities .................................
Commitments (Note 12)
Shareholders' equity (Notes 7 and 14):Common stock with ¥50 par value (authorized
600,000,000 shares; issued and outstanding 240,514,713 shares in 2000 and 239,853,072 shares in 1999) .........................
Additional paid-in capital ....................................Legal reserve .....................................................Retained earnings ..............................................Accumulated other comprehensive income (loss):
Unrealized gains on securities ............................Minimum pension liability adjustments .................Cumulative translation adjustments ......................
Total shareholders' equity ...............................Total ...................................................................
Millions of yen
2000 1999

17
Net sales .....................................................Operating costs and expenses:
Cost of sales .............................................Selling, general and administrative ................Research and development ..........................
Total operating costs and expenses .........Operating income .........................................Other income (expenses):
Interest and dividend income ........................Interest expense .........................................Foreign currency exchange gain ...................Othe–net ..................................................
Other income–net ................................Income before income taxes and cumulativeeffect of a change in accounting principle .........Income taxes (Note 8) ...................................Income before cumulative effect of a change inaccounting principle ......................................Cumulative effect of a change in accounting fortermination and retirement benefits (Note 6) ......Net income ..................................................
Amounts per share (Note 10):Basic earnings per share:
Income before cumulative effect of a changein accounting principle ............................Cumulative effect of a change in accounting principle ......
Net income ...............................................
Diluted earnings per share:Income before cumulative effect of a changein accounting principle ............................Cumulative effect of a change in accounting principle ...
Net income ...............................................
Cash dividends per share ............................
Pro forma amounts assuming accounting changeapplied retroactively:
Net income ...............................................Basic earning per share ........................Diluted earnings per share .....................
See notes to consolidated financial statements.
CONSOLIDATED STATEMENTS OF INCOMEMurata Manufacturing Co., Ltd. and SubsidiariesYears ended March 31, 2000, 1999 and 1998
Millions of yen
2000 1999 1998
Thousands ofU.S. dollars (Note 2)
2000
¥459,125
265,12264,19629,040
358,358100,767
3,141(537)
2,8761,8277,307
108,07444,817
63,257
(1,631)¥ 61,626
¥263.3(6.8)
¥256.5
¥259.4(6.7)
¥252.7
¥ 28.5
¥63,257¥ 263.3¥ 259.4
¥367,048
225,86958,11126,007
309,98757,061
4,529(796)
2,607(1,774)4,566
61,62732,743
28,884
–¥ 28,884
¥120.5–
¥120.5
¥118.6–
¥118.6
¥ 22.0
¥28,208¥ 117.7¥ 115.9
$4,331,368
2,501,151605,623273,962
3,380,736950,632
29,632(5,066)
27,13217,23668,934
1,019,566422,802
596,764
(15,387)$ 581,377
$2.48(0.06)
$2.42
$2.45(0.06)
$2.39
$0.27
$596,764$ 2.48$ 2.45
¥362,252
213,65456,89124,089
294,63467,618
5,075(988)288701
5,076
72,69433,297
39,397
–¥ 39,397
¥164.6–
¥164.6
¥161.7–
¥161.7
¥ 22.0
¥38,940¥ 162.7¥ 159.8
Yen U.S. dollars
Millions of yenExcept per Share Information
Thousands ofU.S. dollars
Except per ShareInformation

18
Balance at April 1, 1997 .........Shares issued upon conversion of debt .....Net income .......................Cash dividends, ¥22.0 per share ..Transfer to legal reserve .......Other comprehensive
loss,net of tax .................Balance at March 31, 1998 .....
Shares issued upon conversion of debt .....Net income .......................Cash dividends, ¥22.0 per share ..Transfer to legal reserve .......Other comprehensive
loss,net of tax .................Balance at March 31, 1999 .....
Shares issued upon conversion of debt .....Net income .......................Cash dividends, ¥28.5 per share ..Transfer to legal reserve .......Other comprehensive
loss,net of tax .................Balance at March 31, 2000 .....
Balance at March 31, 1999 .....Shares issued upon conversion of debt .....Net income .......................Cash dividends, $0.27 per share ..Transfer to legal reserve .......Other comprehensive
loss,net of tax .................Balance at March 31, 2000 .....
See notes to consolidated financial statements.
CONSOLIDATED STATEMENTS OF SHAREHOLDERS' EQUITYMurata Manufacturing Co., Ltd. and SubsidiariesYears ended March 31, 2000, 1999 and 1998
Millions of yen
239,207,059 306,159
239,513,218 339,854
239,853,072661,641
240,514,713
¥64,228 314
64,542 348
64,890677
¥65,567
$612,170 6,387
$618,557
¥96,646 311
96,957 345
97,302672
¥97,974
$917,943 6,340
$924,283
¥5,829
625
6,454
754
7,208
911
¥8,119
$68,000
8,594
$76,594
¥323,487
39,397 (5,264)
(625)
356,995
28,884(5,271)
(754)
379,854
61,626(6,841)
(911)
¥433,728
$3,583,529
581,377 (64,538)
(8,594)
$4,091,774
¥ 440
(3,553)(3,113)
(14,396)(17,509)
(2,554)¥(20,063)
$(165,180)
(24,094) $(189,274)
Number ofcommonsharesissued
Commonstock
Additionalpaid-incapital
Legalreserve
Accumulated othercomprehensiveincome (loss)
Retainedearnings
Thousands of U.S. dollars (Note 2)
Commonstock
Additionalpaid-incapital
Legalreserve
Accumulated othercomprehensive
lossRetainedearnings
CONSOLIDATED STATEMENTS OF COMPREHENSIVE INCOMEMurata Manufacturing Co., Ltd. and SubsidiariesYears ended March 31, 2000, 1999 and 1998
Net income ..................................................Other comprehensive income (loss), net of tax (Note 11):
Unrealized gains (losses) on securities ............Minimum pension liability abjustments ............Foreign currency translation adjustments ..........
Other comprehensive income (loss) ..........Comprehensive income ..................................
See notes to consolidated financial statements.
Millions of yen
2000 1999 1998
Thousands ofU.S. dollars (Note 2)
2000
¥ 61,626
1,9297,002
(11,485)(2,554)
¥ 59,072
¥ 28,884
921(6,474)(8,843)
(14,396)¥ 14,488
$581,377
18,19866,057
(108,349)(24,094)
$ 557,283
¥39,397
(1,915)(180)
(1,458)(3,553)
¥35,844

19
Operating activities:Net income .............................................................Adjustments to reconcile net income to net cash provided
by operating activities:Depreciation and amortization ....................................Losses on sales and disposal of property, plant and equipment .....Losses (gains) on sales of investment securities ................Provision for termination and retirement benefits, less payments .....Deferred income taxes ..............................................Cumulative effect of accounting change .......................Changes in assets and liabilities:
Increase in trade notes and accounts receivable ........Increase in inventories ...........................................Decrease (increase) in prepaid expenses and other ....Increase (decrease) in trade notes and accounts payable .Increase in accrued payroll and bonuses ..................Increase (decrease) in income taxes payable ............Increase in accrued expenses and other ...................Other–net ...........................................................
Net cash provided by operating activities ..............
Investing activities:Capital expenditures .................................................Payment for purchases of investments ...........................Net decrease (increase) in marketable securities .............Increase in loans receivable .......................................Proceeds from sales of property, plant and equipment .....Proceeds from sales of investments ...............................Collection of loans receivable .....................................
Net cash provided by (used in) investing activities ...
Financing activities:Net decrease in short–term borrowings ........................Increase in long–term debt .........................................Repayments of long–term debt ....................................Dividends paid ........................................................
Net cash used in financing activities .............................
Effect of exchange rate change on cash and cash equivalents .....Net increase (decrease) in cash and cash equivalents .......Cash and cash equivalents at beginning of year ..............Cash and cash equivalents at end of year .......................
Additional cash flow information:Interest paid ............................................................Income taxes paid ....................................................
Non-cash financing activities:Convertible debt converted into common stock ..............
See notes to consolidated financial statements.
CONSOLIDATED STATEMENTS OF CASH FLOWSMurata Manufacturing Co., Ltd. and SubsidiariesYears ended March 31, 2000, 1999 and 1998
Millions of yen
2000 1999 1998
Thousands ofU.S. dollars (Note 2)
2000
¥ 61,626
44,4521,266
178,899(6,715)1,631
(37,452)(13,804)
(615)7,3581,949
22,8198,435
8099,946
(71,459)(61)
(33,578)(1,070)
351127831
(104,859)
(1,263)543(117)
(6,841)(7,678)
(835)(13,426)110,476
¥ 97,050
¥ 49828,713
¥ 1,355
¥ 28,884
39,426952
4772,187(1,181)
–
(4,425)(1,900)
–(31,126)
484(3,896)1,839
16131,882
(42,798)(1,538)
57,946(252)259131635
14,383
(3,205)174(212)
(5,271)(8,514)
(1,780)35,97174,505
¥110,476
¥ 84737,820
¥ 696
¥39,397
35,347 865
(44)878
(1,203)–
(4,583)(10,626)
4812,443
4872,6052,766 (985)
77,395
(52,603)(35)
(11,791)(1,116)1,484
43676
(63,549)
(10,661)215
(1,201)(5,264)
(16,911)
221(2,844)
77,349¥74,505
¥ 1,00131,894
¥ 627
$ 581,377
419,358 11,943
16083,953(63,349)15,387
(353,320)(130,226)
(5,802)69,41518,387
215,27479,575
755942,887
(674,142)(575)
(316,774)(10,094)
3,3111,1987,840
(989,236)
(11,915)5,123(1,104)
(64,538)(72,434)
(7,877)(126,660)
1,042,226$ 915,566
$ 4,698270,887
$ 12,783

20
NOTES TO CONSOLIDATED FINANCIAL STATEMENTSMurata Manufacturing Co., Ltd. and Subsidiaries
1. Summary of SignificantAccounting Policies
(a) Nature of operations Murata Manufacturing Co., Ltd. (the "Company") and subsidiaries (together the "Com-panies") are engaged in the development, manufacture and sale of electronic compo-nents in numerous countries, with Japan, North America and certain other Asian andEuropean countries as its primary markets. The Companies' major product groups areceramic capacitors, resistors, piezoelectric components, microwave devices and moduleproducts, which are sold mainly to electronics companies for use as components in tele-communication, computer, audio, video and other electronic products.
(b) Basis of financial statements The consolidated financial statements, stated in Japanese yen, reflect certain adjust-ments, not recorded on the books of account, to present these statements in accordancewith accounting principles generally accepted in the United States, except for the omis-sion of certain presentation of segment information required by Statement of FinancialAccounting Standards ("SFAS") No.131, "Disclosures about Segments of an Enterpriseand Related Information". The principal adjustments include the measurement of net periodic cost for definedbenefit retirement plans, the accrual of compensated absences, the provision for deferredincome taxes relating to these adjustments.
(c) Principles of consolidation The consolidated financial statements include the accounts of the Company and itsmajority-owned subsidiaries. All significant intercompany items have been eliminated inconsolidation.
(d) Cash and cash equivalents In reporting cash flows, the Companies include cash and time deposits in Japanesebanks as cash and cash equivalents. Such time deposits may be withdrawn on demandwithout diminution of principal.
(e) Marketable securities and investments Under SFAS No. 115, "Accounting for Certain Investments in Debt and Equity Securi-ties", the Company classifies all its debt securities and marketable equity securities asavailable-for-sale and carries them at market value with a corresponding recognition ofthe net unrealized holding gain or loss (net of tax) as a separate component of othercomprehensive income. Gains and losses on sales of investments are computed on anaverage cost basis. Equity securities which do not have a readily determinable fair value are recorded ataverage cost (See Note 3). Losses from other-than-temporary inpairment on marketable and non marketable secu-rities, if any, are charged to income as incurred.
(f) Inventories Inventories are stated at the lower of cost or market. The average cost method is usedto determine costs for approximately 90% of the inventories, and the first-in, first-out (FIFO)method is used for substantially all other inventories.
(g) Property, plant and equipment Property, plant and equipment is stated at cost. Depreciation of plant and equipmenthas been principally computed using the declining-balance method (straight-line methodfor certain overseas subsidiaries) based upon the estimated useful lives of the assets.

21
(h) Termination and retirement benefits Termination and retirement benefits are accounted for in accordance with SFAS No.87, "Employers' Accounting for Pensions". The provision for termination and retirementbenefits includes those for directors and corporate auditors of the Company.
(i) Advertising expenses Advertising costs are expensed as incurred. Advertising expenses for the three yearsended March 31, 2000 were ¥1,502 million ($14,170 thousand), ¥1,601 million and¥1,480 million, respectively.
(j) Taxes on Income The Companies follow the provisions of SFAS No. 109, "Accounting for Income Taxes"to account for income taxes. Under SFAS No. 109, deferred tax assets or liabilities arecomputed based on the difference between the financial statement and the income taxbasis of assets and liabilities using the enacted tax rates. Deferred income tax expenses orcredits are based on the change in the deferred tax assets and liabilities from period toperiod, subject to an ongoing assessment of realization. The effect on deferred tax assetsand liabilities of a change in tax rates is recognized in the period which includes theenactment date. Provisions are made for taxes on unremitted earnings of all foreign subsidiaries as suchearnings are not deemed to be permanently invested.
(k) Amounts per share The Company accounts for its earnings per share in accordance with SFAS No. 128,"Earnings per Share". Diluted net income per share reflects the potential dilution frompotential shares outstanding such as those related to the Company's convertible bonds. Areconciliation of the numerator and denominator of the basic and diluted net income pershare computation is included in Note 10.
(l) Derivatives Derivative financial instruments are comprised of foreign exchange contracts which areused to manage currency exposures of existing assets, liabilities or future commitmentsdenominated in foreign currencies. Gains and losses on derivatives used to hedge exist-ing assets or liabilities are recognized in income currently, as are the offsetting foreignexchange losses and gains on the items hedged. Gains and losses related to qualifyinghedges of future firm commitments are deferred and recognized in income when thehedged transactions occur.
(m) Use of estimates The preparation of financial statements in conformity with generally accepted account-ing principles requires management to make estimates and assumptions that affect thereported amounts of assets and liabilities and disclosure of contingent assets and liabilitiesat the date of the financial statements and reported amounts of revenues and expensesduring the reporting period. Actual results could differ from those estimates.

22
2. Translation of JapaneseYen Statements to U.S.Dollar Statements
(n) New Accounting Standards In June 1998, the Financial Accounting Standards Board issued SFAS No. 133 "Ac-counting for Derivative Instruments and Hedging Activities". SFAS No.133 establishesaccounting and reporting standards for derivative instruments and for hedging activities,and requires that an entity recognize all derivatives as either assets or liabilities in thebalance sheet and measure those instruments at fair value. SFAS No.133, as amended,is effective for fiscal years beginning after June 15, 2000. The Company will adopt SFASNo.133 for the year beginning April 1, 2001, and is in the process of evaluating theeffect of the adoption of this statement.
(o) Reclassifications Certain items for prior years' financial statements have been reclassified to conform tothe 2000 presentation.
The consolidated financial statements are stated in Japanese yen, the currency of thecountry in which the Company is incorporated and operates. The translations of Japaneseyen amounts into U.S. dollar amounts are included solely for convenience and have beenmade at the rate of ¥106 to $1, the approximate free rate of exchange at March 31,2000. Such translations should not be construed as representations that the Japanese yenamounts could be converted into U.S. dollars at the above or any other rate.

23
Current:Governmental debt
securities ................Private debt securities ..Total ........................
Non-current:Private debt securities ..Equity securities ..........Total ........................
The cost, gross unrealized gains, gross unrealized losses and fair value for available-for-sale securities by major security type, including the effect of related foreign currencyhedge transactions, at March 31, 2000 and 1999 were as follows:
Millions of yen1999
Cost
¥ 10,721146,051
¥156,772
¥ 18412,231
¥ 12,415
GrossUnrealized
Gains
¥ 391,006
¥1,045
¥ –3,903
¥3,903
GrossUnrealized
Losses
¥ 7469
¥ 143
¥ 762,169
¥2,245
FairValue
¥ 10,686146,988
¥157,674
¥ 10813,965
¥ 14,073
Current:Governmental debt
securities ................Private debt securities ..Total ........................
Non-current:Private debt securities ..Equity securities ..........Total ........................
Millions of yen2000
Cost
¥ 8,961181,390
¥190,351
¥ 18411,263
¥ 11,447
GrossUnrealized
Gains
¥ 31776
¥ 807
¥ –6,549
¥6,549
GrossUnrealized
Losses
¥ 10225
¥ 235
¥ 831,170
¥1,253
FairValue
¥ 8,982181,941
¥190,923
¥ 10116,642
¥ 16,743
3. Marketable Securities and Investments

24
Millions of yen
Thousands ofU.S. dollarsMillions of yen
Contractual maturities of debt securities as of March 31, 2000 were as follows:
Sales of available-for-sale securities were as follows:
Inventories at March 31,2000 and 1999 consisted of the following:
Proceeds from sales ..........Gross realized gains ........Gross realized losses ........
Finished products .................................Work-in-process ...................................Materials and supplies ..........................Total ..................................................
Thousands ofU.S. dollars
Within one year ..............After one year through five
years .......................After five years ................Total ...........................
Current:Governmental debt
securities ................Private debt securities ..Total ........................
Non-current:Private debt securities ..Equity securities ..........Total ........................
Thousands of U.S. dollars
2000
Cost
$ 84,5381,711,226
$1,795,764
$ 1,736106,255
$ 107,991
GrossUnrealized
Losses
$ 942,123
$ 2,217
$ 78311,038
$11,821
FairValue
$ 84,7361,716,424
$1,801,160
$ 953157,000
$ 157,953
Cost
¥119,573
61,4889,474
¥190,535
FairValue
¥119,742
61,5349,748
¥191,024
Cost
$1,128,048
580,07589,377
$1,797,500
FairValue
$1,129,642
580,50991,962
$1,802,113
4. Inventories
Millions of yen
2000¥28,992
30,29414,377
¥73,663
1999¥24,581
27,29811,719
¥63,598
2000$273,509
285,793135,632
$694,934
Thousands ofU.S. dollars
GrossUnrealized
Gains
$ 2927,321
$ 7,613
$ –61,783
$61,783
1998¥14,337
20533
2000$70,557
3,10419
1999¥460
83477
2000¥7,479
3292

25
5. Short-Term Borrowings andLong-Term Debt
Short-term borrowings at March 31, 2000 and 1999 consisted of the following:
The weighted average annual interest rates of short-term borrowings at March 31,
2000 and 1999 were 4.0% and 4.7%, respectively. Long-term debt at March 31, 2000 and 1999 consisted of the following:
The 1.8% yen debentures may be redeemed beginning March 21, 1995 at 106%,declining by 1% each year. Conversion price per share of the Company's common stockof the 1.8% yen debentures at March 31, 2000 is ¥2,047.9 ($19.32), which is subjectto anti-dilutive provisions. Outstanding convertible debt at March 31, 2000 is convertibleinto 3,719 thousand shares of the Company's common stock. The 1.8% yen debentureagreement contains a restriction with respect to payment of dividends and other matters(see Note 7). At March 31, 2000, aggregate maturities of long-term debt during the next five yearsending March 31 were as follows :
Bank loans..........................................Foreign trade financing .........................Total ..................................................
Millions of yen
2000¥5,661
653¥6,314
1999¥7,025
551¥7,576
2000$53,406
6,160$59,566
Thousands ofU.S. dollars
1.8% unsecured yen convertible debentures,due 2002 ........................................
Other .................................................Total ................................................
Less: Portion due within one year ............Total ..................................................
Millions of yen
2000
¥7,6171,2368,853
208¥8,645
1999
¥8,972879
9,851 104
¥9,747
2000
$71,85811,66183,519
1,962$81,557
Thousands ofU.S. dollars
2001 ..................................................2002 ..................................................2003 ..................................................2004 ..................................................2005 ..................................................
$ 1,96277,755
666666
Thousands ofU.S. dollars
¥ 2088,242
777
Millionsof yenYear ending March 31

26
Banks have a right to offset cash deposited with them against any debt or obligationthat becomes due and, in case of default and certain other specified events, against allother debt payable to the banks. None of the Companies' lenders have ever exercisedthis right against the debt of the Companies.
The Companies sponsor termination and retirement benefit plans which cover substan-tially all employees. Benefits are based on the employees' years of service, with someplans also considering compensation and other factors. If the termination is involuntary orcaused by death, the employee or their beneficiary is usually entitled to greater paymentsthan in the case of voluntary termination. The Companies fund a portion of the obligation under these plans. The general fund-ing policy is to contribute amounts computed in accordance with accepted actuarialmethods.
Contributory termination and retirement plans The Company and a domestic subsidiary have contributory termination and retirementplans that are interrelated with the Japanese government social welfare program whichconsists of a basic portion requiring employee and employer contributions, plus an addi-tional portion established by the employers. Periodic pension payments required underthe basic portion are prescribed by the Japanese Ministry of Health and Welfare. Benefitsunder the additional portion are usually paid in a lump sum at the earlier of termination orretirement although periodic payments are available under certain conditions.
Noncontributory Termination and Retirement Plans The Companies have several noncontributory termination and retirement plans, somepartially funded and administered by independent trustees, others unfunded and adminis-tered by the Companies. These plans provide lump sum termination and retirement ben-efits and are paid at the earlier of the employee's termination or the mandatory retirementage, except for payments to directors and corporate auditors which require approval bythe shareholders before payment. The following table summarizes the financial status of the contributory and noncontribu-tory termination and retirement plans and the amounts recognized in the financial state-ments at March 31:
Change in benefit obligation:Benefit obligation at beginning of year ..Service cost .....................................Interest cost ......................................Plan participants' contributions .............Actuarial (gain) or loss .......................Benefits paid ...................................Benefit obligation at end of year ..........
Change in plan assets:Fair value of plan assets at beginning of yearActual return on plan assets ................Employer contribution ........................Plan participants' contributions .............Benefits paid ...................................Fair value of plan assets at end of year .......
Funded status .....................................Unrecognized actuarial loss ..................Unrecognized transition obligation .........Net amount recognized .......................
6. Termination andRetirement Benefits
Millions of yen
2000
¥100,8186,6372,999
557(1,496)(1,965)
107,550
44,3375,1136,863
557(1,179)55,691
(51,859)18,917
534¥ (32,408)
1999
¥ 78,3995,2703,105
51815,595(2,069)
100,818
40,865(47)
4,224518
(1,223)44,337
(56,481)33,897
669¥(21,915)
2000
$ 951,11362,61328,292
5,255(14,113)(18,537)
1,014,623
418,27448,23664,745
5,255(11,123)525,387
(489,236)178,462
5,038$(305,736)
Thousands ofU.S. dollars

27
The expense recorded for the contributory and noncontributory termination and retire-ment plans included the following components for the years ended March 31:
The following assumptions were utilized to calculate the actuarial present value of thebenefit obligation as of March 31 and expected return on plan assets for the period thenended:
Service cost, net of plan participants’ contributions .....Interest cost ........................................Expected return on plan assets ...............Amortization of transition obligation ........Recognized actuarial loss .....................Net periodic cost ................................
Millions of yen
1999¥5,270
3,105(1,328)
133584
¥7,764
2000$ 62,613
28,292(13,646)
1,26458,043
$136,566
Thousands ofU.S. dollars
2000¥ 6,637
2,999(1,447)
1346,153
¥14,476
Discount rate .......................................Compensation increase rate ...................Expected long-term rate of return on plan assets .........................
2000
3.0%3.5%
3.0%
1999
3.0%3.5%
3.0%
1998
4.0%4.0%
4.0%
Amounts recognized in the consolidatedbalance sheet consist of:Termination and retirement benefits ......Intangible asset ................................Minimum pension liability adjustments,
gross of tax ..................................Net amount recognized .......................
Accumulated benefit obligation at end of year .....
Accumulated benefit obligations for all of the above Companies' termination and re-tirement plans were in excess of their plan assets at March 31,2000 and 1999.
2000
¥(36,628)534
3,686¥(32,408)
¥ 92,319
1999
¥(38,281)669
15,697¥(21,915)
¥ 82,618
2000
$(345,547)5,038
34,773$(305,736)
$ 870,934
Millions of yenThousands ofU.S. dollars

28
Effective the beginning of the current year, the Company changed its method of amor-tizing unrecognized actuarial gains and losses related to its obligations for terminationand retirement benefits to amortize any unrecognized gains and losses in excess 10percent of the larger of the benefit obligation or plan assets over five years. The methodpreviously used was to amortize the unrecognized gains and losses in excess 10 percentof the larger of the benefit obligation or plan assets over the average remaining servicelife of active participants (approximately in the range from 13 years to 17 years). Thischange in accounting principle was made to accelerate the recognition of the unrecog-nized gains and losses, because the Company believes that the method directs the re-corded liability more rapidly toward the economic liability. The cumulative effect of thischange as of the beginning of the current year was ¥1,631 million ($ 15,387 thousand),and adoption of the new method decreased net income for fiscal 2000 by ¥3,191million ($30,104 thousand), or ¥13 ($0.1) per share.
The Japanese Commercial Code (the "Code") requires at least 50% of the issue priceof new shares, with a minimum of the par value, to be designated as stated capital asdetermined by resolution of the Board of Directors. Proceeds in excess of amounts desig-nated as stated capital are credited to additional paid-in capital. Under the Code, the Company is required to record an amount at least equal to 10%of amounts paid as an appropriation of retained earnings, including dividends and otherdistributions, to be appropriated and set aside as a legal reserve until such reserve equals25% of common stock. This reserve is not available for dividends but may be used toeliminate or reduce a deficit by resolution of the shareholders or may be transferred tocommon stock by resolution of the Board of Directors. The Company may transfer portions of additional paid-in capital to common stock byresolution of the Board of Directors. The Company may also transfer portions of unappro-priated retained earnings, available for dividends, to common stock by resolution of theshareholders. Under the Code, the amount legally available for dividends is based upon retainedearnings as recorded on the domestic books of the Company. As described in Note 1,certain adjustments reflected in the consolidated financial statements are not recorded onthe Company's books of account. At March 31, 2000, retained earnings recorded onthe Company's books free from restriction with respect to the debenture agreement amountedto ¥184,706 million ($1,742,509 thousand), which are available for future dividendssubject to legal reserve requirements. Interim cash dividends are paid to shareholders of record at the end of the first six-month period with resolution of the Board of Directors and year-end cash dividends arepaid to shareholders of record at the end of the year with resolution of the shareholders. Cash dividends charged to retained earnings were dividends paid during the period,which represent the year-end cash dividends for the preceding period and the interimcash dividends for the current period. As permitted by the Code, pursuant to a resolution of an annual general meeting of theshareholders, the Company may purchase its own issued shares for their retirement. Inaddition, pursuant to a resolution of the Board of Directors, the Company may purchaseits own shares for their retirement, not exceeding 23 million shares, in accordance with itsarticles of incorporation. Any shares of common stock, in whole or in part, are subject tosuch purchases made for purpose of retirement.
7. Shareholders' Equity

29
The provision for income taxes for the years ended March 31, 2000, 1999 and1998, consisted of the following:
Current income tax expense for the year ended March 31, 1999 includes ¥8,250million which relates to prior years' income. This amount was imposed by the JapaneseNational Tax Authority based on their examination of the Company's transfer prices chargedfor sales of products to the Company's subsidiaries outside Japan between years endedMarch 31, 1992 through 1996 .
The effective income tax rates of the Company and subsidiaries differ from the normalJapanese statutory rates as follows for the years ended March 31:
Under the provisions of SFAS No.109, the effect of a change in tax laws or rates isincluded in income in the period the change is enacted and includes a cumulative recal-culation of deferred tax balances based on the new tax laws or rates in effect. Suchchanges occurred at March 1999 and 1998, which decreased the normal statutory taxrate from 47.4% to 41.7% effective April 1, 1999 and from 51.1% to 47.4% effectiveApril 1, 1998, respectively. The provision for income tax-deferred for the years endedMarch 31, 1999 and 1998 includes a credit of ¥3,327 million and ¥3,220 million,respectively, for the effect of the tax rate decrease on net deferred tax balances.
Normal Japanese statutory rates ..............Increase (decrease) in taxes resulting from:
Tax credits ....................................Permanently non-deductible items .........Net change in valuation
allowance for deferred tax assets ...Effect of enacted future tax rate reduction
of deferred taxes ..............................Additional tax related to prior years' income ....Other- net .....................................
Effective tax rates .................................
8. Income Taxes
Current ...........................Deferred .........................Provision for income taxes ......
Millions of yen
1999¥33,924
(1,181)¥32,743
1998¥34,500
(1,203)¥33,297
2000$486,151
(63,349)$422,802
Thousands ofU.S. dollars
2000¥51,532
(6,715)¥44,817
200041.7%
(1.1)0.2
(0.0)
––
0.741.5%
199947.4%
(2.4)0.3
(0.1)
(5.4)13.4(0.1)
53.1%
199851.1%
(2.1)0.7
(2.1)
(4.4)–
2.645.8%

30
The approximate effect of temporary differences and tax loss carryforwards that gaverise to deferred tax balances at March 31, 2000 and 1999 were as follows:
The total valuation allowance decreased ¥171 million ($1,613 thousand) for the yearended March 31, 2000 and decreased ¥82 million for the year ended March 31,1999. Certain subsidiaries have tax loss carryforwards approximating ¥933 million($8,801 thousand) available to reduce future taxable income at March 31, 2000. These loss carryforwards expire as follows:
Deferred tax assets:Intercompany profits ...........................Termination and retirement benefits .......Enterprise taxes .................................Compensated absences .....................Inventory valuation ............................Depreciation ....................................Accured bonuses ..............................Other temporary differences ................Tax loss carryforwards ........................
Total ............................................Valuation allowance ..........................Total ...............................................
Deferred tax liabilities:Undistributed earnings of foreign
subsidiaries ...................................Marketable securities and investment
adjustments ...................................Depreciation ....................................Other temporary differences ................Total ...............................................
Millions of yenThousands ofU.S. dollars
2000
¥ 6,90711,6762,8281,4841,4463,2191,9863,796
32433,666
(289)¥33,377
¥13,713
3,878990
4,254¥22,835
1999
¥ 4,97013,6761,2801,3761,3972,351
6712,066
45628,243
(460)¥27,783
¥13,487
2,9021,1363,177
¥20,702
2000
$ 65,160110,15126,67914,00013,64230,36818,73635,8113,057
317,604(2,727)
$314,877
$129,368
36,5859,340
40,132$215,425
2001 ..................................................2002 ..................................................2003 ..................................................2004 ..................................................Thereafter .............................................
$ 1,0751,0092,5002,5941,623
Thousands ofU.S. dollars
¥ 114107265275172
Millionsof yenYear ending March 31

31
Net sales and net assets of foreign subsidiaries were as follows:
A reconciliation of the basic and diluted net income per share computation is as follows:
The changes in the components of accumulated other comprehensive income (loss),including the before- and net-of-tax components of other comprehensive income, are asfollows:
Income before cumulative effect ofa change in accounting principleper share: Basic .......................... Diluted ........................
1999
¥28,884
94
¥28,978
Unrealized gains or losses on securities:Unrealized holding gains (losses) arising during period .....Reclassification adjustment for gains or losses included in net income ................................
Minimum pension liability adjustments .....Foreign currency translation adjustments...Other comprehensive income (loss) .........
Millions of yen
2000Tax
(Expense) orBenefit
¥(1,137)
(242)(1,379)(5,010)2,100
¥(4,289)
Average common shares outstandingDilutive effect of 1.8% convertible debenturesDiluted common shares outstanding
1999239,670,938
4,563,213244,234,151
1998239,390,697
4,843,462244,234,159
2000240,216,527
4,017,618244,234,145
1999
¥120.5118.6
1998
¥164.6161.7
2000
$2.482.45
2000
¥263.3259.4
Income before cumulative effect ofa change in accounting principle ...Effect of dilutive securities 1.8% convertible debenturesDiluted income before cumulative effectof a change in accounting principle ....
9. Foreign Operations
10. Amounts per Share
11. Comprehensive Income
Net sales........................Net assets ......................
Millions of yen
1999¥188,882
96,101
1998¥186,547
98,194
2000$2,274,830
911,292
Thousands ofU.S. dollars
2000¥241,132
96,597
Millions of yenThousands ofU.S. dollars
Numbers of shares
Yen U.S. dollars
2000
¥63,257
92
¥63,349
1998
¥39,397
93
¥39,490
2000
$596,764
868
$597,632
Before-TaxAmount
¥ 2,727
5813,308
12,012(13,585)
¥ 1,735
Net-of-TaxAmount
¥ 1,590
3391,9297,002
(11,485)¥ (2,554)

32
13. Financial Instrumentsand Concentration ofCredit Risk
In the normal course of its business, the Companies invest in various financial assetsand incur various financial liabilities. The Companies also enter into agreements involvingoff-balance-sheet financial instruments to manage their exposure to fluctuations in foreigncurrency exchange rates. The Companies do not use derivative financial instruments fortrading purposes. The fair value estimates of financial instruments presented below are notnecessarily indicative of the amounts the Companies might pay or receive from actualmarket transactions. The Companies had the following financial assets and liabilities atMarch 31, 2000 and 1999 :
Unrealized gains or losses on securities:Unrealized holding gains (losses) arising during period .....Reclassification adjustment for gains or losses included in net income ................................
Minimum pension liability adjustments .....Foreign currency translation adjustments ...Other comprehensive income (loss) .........
Thousands of U.S. Dollars
2000
Before-TaxAmount
$ 25,726
5,48131,207
113,321(128,160)
$ 16,368
Net-of-TaxAmount
$ 15,000
3,19818,19866,057
(108,349)$ (24,094)
Tax(Expense) or
Benefit
$(10,726)
(2,283)(13,009)(47,264)19,811
$(40,462)
12. Commitments Outstanding commitments at March 31, 2000 for the purchase of raw materials andproperty, plant and equipment approximated ¥27,627 million ($260,632 thousand).
Unrealized gains or losses on securities:Unrealized holding gains (losses) arising during period ....Reclassification adjustment for gains or losses included in net income ...............................
Minimum pension liability adjustments .....Foreign currency translation adjustments...Other comprehensive income (loss) .........
Millions of yen
1999
Before-TaxAmount
¥ 222
1,5301,752
(12,308)(11,153)
¥(21,709)
Net-of-TaxAmount
¥ 116
805921
(6,474)(8,843)
¥(14,396)
Tax(Expense) or
Benefit
¥ (106)
(725)(831)
5,8342,310
¥7,313
Unrealized gains or losses on securities:Unrealized holding gains (losses) arising during period .....Reclassification adjustment for gains or losses included in net income ................................
Minimum pension liability adjustments .....Foreign currency translation adjustments...Other comprehensive income (loss) .........
Millions of yen
1998
Before-TaxAmount
¥(3,806)
(172)(3,978)
(369)(1,957)
¥(6,304)
Net-of-TaxAmount
¥(1,831)
(84)(1,915)
(180)(1,458)
¥(3,553)
Tax(Expense) or
Benefit
¥1,975
882,063
189499
¥2,751

33
Financial assets and liabilities(1) Cash and cash equivalents, notes and accounts receivable, short-term borrowings
and notes and accounts payable Fair value approximates carrying amounts indicated on the balance sheets at March31, 2000 and 1999.
(2) Marketable securities Fair value is primarily based on quoted market prices or estimated using discountedcash flow analysis, based on the market interest rates currently available to the Com-panies for instruments with similar terms and maturities. The fair values of marketablesecurities are presented in Note 3.
(3) Investments, long-term receivables, advances and other assets Fair value is primarily based on quoted market prices or dealer quotes for the sameor similar instruments. The fair values of applicable investments, long-term receivables,advances and other assets at March 31,2000 and 1999 were ¥23,579 million($222,443 thousand) and ¥21,017 million, compared with carrying amounts of¥23,643 million ($223,047 thousand) and ¥21,074 million, respectively.
(4) Long-term debt Fair value is primarily based on quoted market prices or estimated using discountedcash flow analysis, based on the borrowing rates currently available to the Compa-nies for bank loans with similar terms and maturities. The fair values of long-term debt,including debt due within one year, at March 31,2000 and 1999 were ¥90,355million ($852,406 thousand) and ¥26,989 million, compared with carrying amountsof ¥8,853 million ($83,519 thousand) and ¥9,851 million, respectively.
Forward exchange contracts The Companies had ¥18,111 million ($170,858 thousand) and ¥10,993 million innotional amounts of forward exchange contracts outstanding as of March 31, 2000 and1999, respectively, in order to hedge the foreign currency risk of various intercompanysupply contracts, foreign currency denominated securities, accounts receivable, accountspayable and short-term bank borrowings, which transactions are expected to occur withinthe next twelve months. The fair values of such contracts, which were the replacement values, represented netunrealized losses of ¥94 million ($887 thousand) and ¥174 million as of March 31,2000 and 1999, respectively, based on quoted market prices. The exposure to credit risk is minimal since the counterparties are major financialinstitutions. The Companies do not anticipate nonperformance by any of the counterparties.The gains or losses arising from these contracts are applied to offset gains or losses onrelated hedged assets, liabilities or future commitments.
Concentration of credit risk A significant portion of the Companies' sales are concentrated in the electronics andcommunication industry. The Companies generally extend credit to its customers, there-fore, collection of receivables is affected by the electronics and communication industry.However, the Companies closely monitor extensions of credit and have never experi-enced significant credit losses.
The Board of Directors of the Company intends to propose for approval at the share-holders' meeting in June 2000:(1) the payment of a cash dividend of ¥17.5 ($0.17) per share to holders of record as ofMarch 31, 2000, or a total of ¥4,209 million ($39,708 thousand); and,(2) the transfer from retained earnings to the legal reserve of ¥435 million ($4,104thousand).
14. Subsequent Events

34
To the Board of Directors and Shareholders ofMurata Manufacturing Co., Ltd.Nagaokakyo-shiKyoto, Japan.
We have audited the accompanying consolidated balance sheets of Murata Manufacturing Co., Ltd. and subsidiaries asof March 31, 2000 and 1999, and the related consolidated statements of income, comprehensive income, shareholders'equity, and cash flows for each of the three years in the period ended March 31, 2000, all expressed in Japanese yen.These financial statements are the responsibility of the Company's management. Our responsibility is to express an opinionon these financial statements based on our audits.
We conducted our audits in accordance with auditing standards generally accepted in the United States of America. Thosestandards require that we plan and perform the audit to obtain reasonable assurance about whether the financial state-ments are free of material misstatement. An audit includes examining, on a test basis, evidence supporting the amounts anddisclosures in the financial statements. An audit also includes assessing the accounting principles used and significantestimates made by management, as well as evaluating the overall financial statement presentation. We believe that ouraudits provide a reasonable basis for our opinion.
Certain information required by Statement of Financial Accounting Standards ("SFAS") No. 131, "Disclosures about Seg-ments of an Enterprise and Related Information" has not been presented in the accompanying consolidated financialstatements. In our opinion, presentation of various segment information regarding operations is required for a completepresentation of the Company's consolidated financial statements in accordance with accounting principles generally ac-cepted in the United States of America.
In our opinion, except for the omission of certain segment information as discussed in the preceding paragraph, theconsolidated financial statements referred to above present fairly, in all material respects, the financial position of MurataManufacturing Co., Ltd. and subsidiaries as of March 31, 2000 and 1999, and the results of their operations and theircash flows for each of the three years in the period ended March 31, 2000, in conformity with accounting principlesgenerally accepted in the United States of America.
As discussed in Note 6 to the consolidated financial statements, the Company changed its method of amortizing unrecog-nized gains and losses related to accounting for termination and retirement benefits effective April 1, 1999.
Our audits also comprehended the translation of Japanese yen amounts into U. S. dollar amounts and, in our opinion,such translation has been made in conformity with the basis stated in Note 2. The translation of the financial statementamounts into U. S. dollars has been made solely for convenience.
Osaka, JapanJune 5, 2000
INDEPENDENT AUDITORS' REPORT

Murata Manufacturing Co., Ltd.
Printed in Japan,00/7/6K