annual report on development impact - overseas … report on development impact 5 executive summary...
TRANSCRIPT
Report of the
OVERSEAS PRIVATE INVESTMENT CORPORATION
AnnuAl RepoRton Development ImpAct
FISCAL YEAR 2013
Submitted Pursuant to Section 240A of the
Foreign Assistance Act of 1961,As Amended
September 2014

Annual Report on Development Impact 3
TABLE OF CONTENTS
eXecutIve SummARY
I. FIScAl YeAR oveRvIeW
II. pRoJecteD Development ImpActSRenewable ResourcesImpact InvestingSub-Saharan AfricaAssessing Development Impact
III. envIRonmentAl, HeAltH, SAFetY & SocIAl ImpActSProject Screening and AssessmentMitigating Climate Change
Iv. lABoR AnD HumAn RIGHtSCountry EligibilityProject Screening and AssessmentHuman Rights
v. SuppoRt FoR tHe u.S. economY
vI. monItoRInG oF ActIve pRoJectSSite-MonitoringSelf-Monitoring Questionnaire (SMQ)Compliance with OPIC Conditions and Covenants
vII. clIent SAtISFActIon SuRveY ReSultS AnD otHeR InItIAtIveS
vIII. eXHIBItSExhibit 1: U.S. Employment and Associated Effects of OPIC-Supported ProjectsExhibit 2: Destination of Sales to Third Party Markets of OPIC-Supported Projects Fiscal Year 2013 (Projections)Exhibit 3: U.S. Employment Effects and Host Country Location of OPIC-Supported Projects Fiscal Year 2013 (Projections)Exhibit 4: Methodology for Calculating U.S. Employment EffectsExhibit 5: OPIC’s Revised Development Matrix ExplainedExhibit 6: OPIC’s Greenhouse Gas Policy and Current InventoryExhibit 7: OPIC Site Monitoring Methodology
5
7
910101112
131314
16161617
18
20202223
25
2728
29
3132333438

Annual Report on Development Impact 5
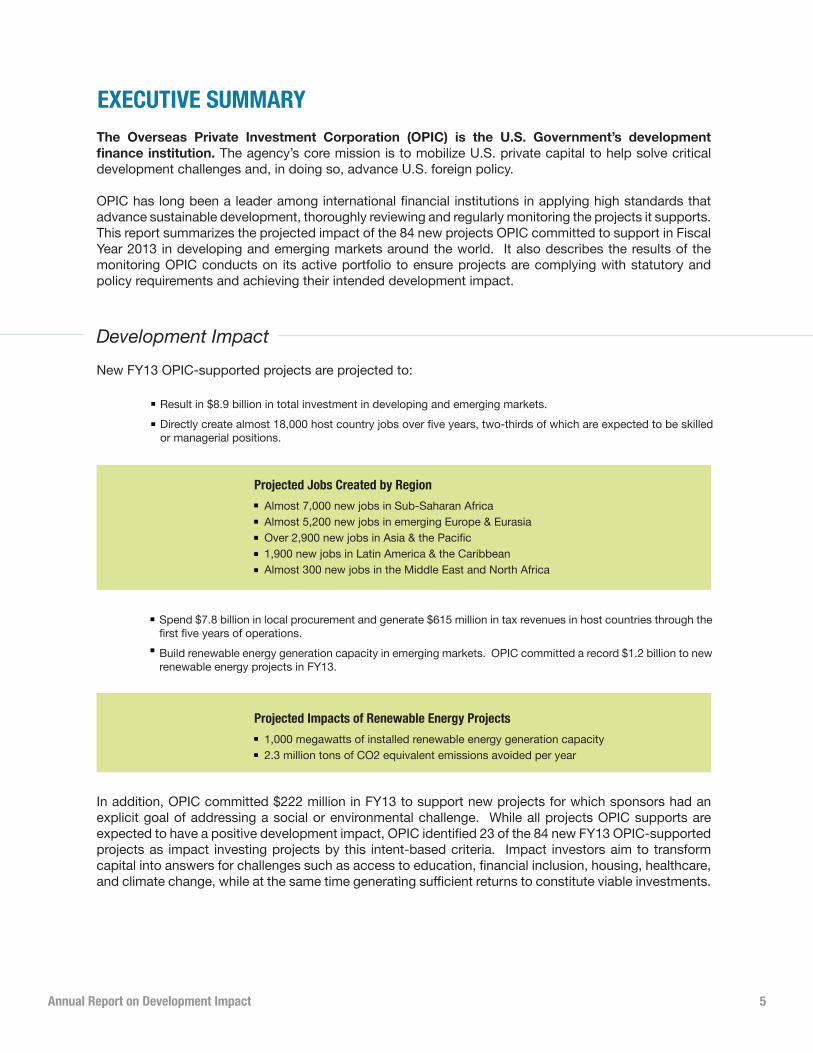
eXecutIve SummARYThe Overseas Private Investment Corporation (OPIC) is the U.S. Government’s development finance institution. The agency’s core mission is to mobilize U.S. private capital to help solve critical development challenges and, in doing so, advance U.S. foreign policy.
OPIC has long been a leader among international financial institutions in applying high standards that advance sustainable development, thoroughly reviewing and regularly monitoring the projects it supports. This report summarizes the projected impact of the 84 new projects OPIC committed to support in Fiscal Year 2013 in developing and emerging markets around the world. It also describes the results of the monitoring OPIC conducts on its active portfolio to ensure projects are complying with statutory and policy requirements and achieving their intended development impact.
Development ImpactNew FY13 OPIC-supported projects are projected to:
In addition, OPIC committed $222 million in FY13 to support new projects for which sponsors had an explicit goal of addressing a social or environmental challenge. While all projects OPIC supports are expected to have a positive development impact, OPIC identified 23 of the 84 new FY13 OPIC-supported projects as impact investing projects by this intent-based criteria. Impact investors aim to transform capital into answers for challenges such as access to education, financial inclusion, housing, healthcare, and climate change, while at the same time generating sufficient returns to constitute viable investments.
projected Jobs created by Region
projected Impacts of Renewable energy projects
Almost 7,000 new jobs in Sub-Saharan AfricaAlmost 5,200 new jobs in emerging Europe & EurasiaOver 2,900 new jobs in Asia & the Pacific1,900 new jobs in Latin America & the CaribbeanAlmost 300 new jobs in the Middle East and North Africa
1,000 megawatts of installed renewable energy generation capacity2.3 million tons of CO2 equivalent emissions avoided per year
Result in $8.9 billion in total investment in developing and emerging markets.Directly create almost 18,000 host country jobs over five years, two-thirds of which are expected to be skilled or managerial positions.
Spend $7.8 billion in local procurement and generate $615 million in tax revenues in host countries through the first five years of operations.Build renewable energy generation capacity in emerging markets. OPIC committed a record $1.2 billion to new renewable energy projects in FY13.

Annual Report on Development Impact 6
Environment, Social, Labor, and Human Rights Impact
OPIC supports projects that are environmentally and socially sustainable and respect workers’ and human rights. All of the 84 new projects OPIC supported in FY13 were screened to identify and mitigate potential adverse impacts in these areas, with some projects requiring a more intensive review.
OPIC also tracks the direct greenhouse gas (GHG) emissions from active projects in its portfolio.Since 2008, direct GHG emissions from OPIC’s active portfolio have been cut by 81%.
Support for U.S. EconomyNew FY13 OPIC-supported projects are projected to support 1,244 U.S. jobs over the next five years by procuring up to $833 million in goods and services from the United States. Over 40 percent of this projected U.S. job support comes from renewable resources projects. And, as it does with all projects it supports, OPIC reviewed all FY13 projects to ensure that they were not expected to result in the loss of any U.S. jobs.
U.S. small businesses were significant partners in three-quarters of new OPIC-supported projects in FY13. In addition, new FY13 projects are expected to procure $56 million in goods and services from U.S. small businesses located in 11 states and the District of Columbia.
Project MonitoringOPIC monitors the policy compliance and development impact of every active project from inception to conclusion through an annual self-monitoring questionnaire and randomized as well as risk-based site monitoring. In FY13, active OPIC clients reported that their businesses support almost 250,000 local jobs, equivalent to more than 1,000 local jobs per OPIC employee.
Client Satisfaction Survey and Other InitiativesIn 2012, OPIC began collecting client satisfaction data through a voluntary survey. Almost 90 percent of the respondents who completed the survey expressed positive experience working with OPIC and would work with OPIC again. Almost 90 percent of OPIC clients also found OPIC staff engagement helpful and professional. Eighty-five percent of respondents reported overall satisfaction in working with OPIC.
OPIC is also undertaking several initiatives to improve its methodology for assessing and monitoring development impact. For example, OPIC is participating voluntarily in targeted working groups with other DFIs to develop standardized development impact indicators. Adoption of standardized indicators by multiple DFIs will reduce reporting burdens on clients and allow for more efficient reporting by DFIs. OPIC is also improving its data infrastructure and processes to make development impact data more accessible.
OPIC classified four new projects as “Category A” (likely to have heightened environmental and social risks), and three were designated as “Special Consideration” (entailing increased labor rights risks). OPIC requires additional oversight for these projects.

Annual Report on Development Impact 7
I. FIScAl YeAR oveRvIeWIn FY13, OPIC committed to support 84 new projects in 41 countries. Total projected debt and equity investment in these projects by OPIC and its fellow investors is $8.9 billion.
OPIC offers its clients project financing and guarantees, political risk insurance, and loan guarantees to private equity investment funds. The 84 new projects1 which OPIC committed to support in FY13 included:
Figures 1 and 2 illustrate the regional and sectoral breakdown of these projects, and Figure 3 offers a breakdown of the sources of the $8.9 billion total projected project finance.
1These projects include new finance and insurance projects that have not been included in previous editions of this report to Congress, as well as downstream investments made by OPIC-supported investment funds and through framework agreements.
58 finance projects14 insurance projects; and12 investments in portfolio companies by OPIC-supported investment funds.
Figure 1Regional Distribution of FY13 Projects

Annual Report on Development Impact 8
2Other services include projects in water supply, advertising, food services, medical, schools, and equipment rental & leasing.3All of the energy projects OPIC committed to support in FY13 were renewable energy projects.
Figure 2Sectoral Distribution of FY13 Projects
Figure 3Sources of Debt and Equity Investment in New FY13 Projects

Annual Report on Development Impact 9
II. pRoJecteD Development ImpActS
OPIC’s core mission is to mobilize U.S. private capital and skills to help solve critical development challenges. OPIC selects projects to support that will serve as foundations for long-term economic growth, provide new products and services, and deliver significant economic and social benefits to developing and emerging economies. While direct job creation is perhaps the most visible and important of these benefits, OPIC-supported projects also generate additional local economic activity by procuring goods and services from local suppliers, pay taxes to host country governments that provide public services, and may contribute to developing a country’s export base, which in turn is often a key driver of economic growth.
While OPIC is demand-driven in responding to the needs of eligible U.S. investors, OPIC also prioritizes projects in key sectors and regions. The following sections describe the results of these efforts in renewable resources, impact investing, and Sub-Saharan Africa.
Number of host country jobs created over five years
Technical and managementUnskilled laborTotal
Annual host country current account impact1
Exports generated & imports replacedProject-related importsNet impact
Initial host country procurementAnnual host country operational procurement1
Net annual taxes, revenues and duties paid to the host country1
11,7935,92217,715
$302 million$104 million$198 million
$5.3 billion$2.5 billion
$123 million
table 1: projected Development Impacts of new FY13 projects
1Average annual amount projected over a 5-year period.
Supporting Host country Job creation in FY13Almost 18,000 new jobs projected in 41 countries and 5 regions67% of these jobs are managerial or professional/technical

Annual Report on Development Impact 10
Renewable Resources
Impact Investing
In FY13 OPIC made record commitments to projects that advance a sustainable, lower-carbon economy, greater resource efficiency, and a cleaner and more secure energy supply.
OPIC has a long history of transforming private capital into solutions for social and environmental challenges around the world. Today, OPIC is the U.S. Government’s largest impact investor supporting projects in various sectors including education, food security, healthcare, clean water, and small business lending. All projects OPIC supports are expected to have a positive development impact, and many of them are in high-impact sectors such as housing for the poor and renewable energy. OPIC also specifically identifies investments distinguished by being “impactful with intent,” meaning that the explicit aim of the project is to address a social or environmental challenge while generating sustainable financial returns.
OPIC supported renewable resource projects in a broad range of countries including Tanzania, Uruguay, El Salvador, Pakistan, Mexico, and Iraq. These projects will also have an impact at home: over 40% of the 1,244 jobs expected to be supported in the United States by new FY13 OPIC-supported projects are due to renewable resources projects. For a solar project in Latin America, for example, SunPower, a California-based company, will supply solar PV modules valued at $118 million, as well as ongoing operations and maintenance services.
In Chile, OPIC agreed to provide over $200 million to build two separate solar photovoltaic plants in Latin America. The projects are sponsored by SunEdison LLC in support of a Chilean government initiative to diversify away from traditional energy sources. The plants will have an installed capacity of approximately 100 MW and 50 MW respectively. The projects will involve the transfer of advanced solar generation and operation technologies, as well as modern management practices. The projects will increase the country’s access to solar energy and create local jobs in the Atacama desert region of Chile. The technical jobs will involve extensive training in plant operation, management, and maintenance.
Amanecer Solar SpA and San Andres Solar SpA – chile
opIc and Renewable Resources in FY13New OPIC commitments: $1.2 billion Projected CO2e equivalent emission avoided: 2.3 million short tonsProjected installed energy generation capacity: 1,000 megawatts

Annual Report on Development Impact 11
Sub-Saharan African (SSA) remains a priority region for OPIC: 18 of the 84 new OPIC-supported projects in FY13 are located in SSA. Many of these projects address the most critical host country development needs.
In 2013, OPIC committed a $45 million loan to FINCA Microfinance Holding Company LLC to support lending to its microfinance subsidiaries in 23 developing countries. With an average loan size of $750 across the FINCA network, OPIC’s financing is expected to support an additional 60,000 loans when fully disbursed, and several times this amount over the seven year duration of the loan. These loans, the majority of which go to women, support FINCA’s mission of helping the world’s lowest-income entrepreneurs create jobs, build assets, and improve their standard of living. Given FINCA’s mission, OPIC considers this investment to be impactful with intent.
FINCA Microfinance Holding – Multiple OPIC Countries
In 2013, OPIC provided $19.4 million in political risk insurance coverage to the Rwanda Trading Company, Limited (RTC) to support its investment in the acquisition and refurbishment of a coffee milling and processing plant in Kigali; an agricultural extension loan program with technical assistance programs in support of local farmers and cooperatives; and the acquisition of “washing stations” across Rwanda for better access by coffee growers. As part of its business model, RTC, a subsidiary of Westrock Coffee Holdings, LLC (Westrock) of Little Rock, Arkansas, supports local farmers by providing agricultural extension loans, training farmers in modern techniques, and distributing free seedlings, compost, and fertilizer. Additionally, RTC has developed a new computer network to inform farmers, cooperatives and aggregators of market price trends to assist them in deciding when to sell and to whom, thereby leading to overall higher and more stable coffee prices for farmers across Rwanda. RTC also connects small farmers with international coffee buyers.
Rwanda trading company – Rwanda
Impactful with Intent
opIc in Sub-Saharan Africa
23 new FY13 projects met the strictest criteria of impact investingOPIC committed $222 million to these projectsThese projects are projected to: Create 6,300 local jobs Generate $349 million in initial local procurement
Almost 7,000 local jobs projected to be created in Sub-Saharan Africa $533 million projected in initial local procurement$36 million projected in annual taxes and other government revenue
Sub-Saharan Africa

Annual Report on Development Impact 12
OPIC recently reviewed and revised the model it uses to assess development impact, drawing on internal lessons learned and best practices from the development finance community and other public and private initiatives. In FY13 OPIC implemented this improved model.
The model contains indicators in the following five categories:
OPIC takes projected development impact into account operationally in several ways. Projects with high development returns, for example, might justify investment of more OPIC staff resources than other projects and OPIC project officers are likewise incentivized to pursue more highly developmental projects. More broadly, OPIC sets an annual target for average development impact scores of newly committed projects.
Exhibit 5 provides a more detailed description of the methodology and indicator categories used to assess development impact.
Each project receives a score ranging from 0 to 100, which is the sum of scores given for individual indicators. A project must score at least 25 points to be considered developmental and therefore clearly eligible for OPIC support. Projects scoring above 60 points are considered highly developmental.
OPIC uses a spider graph4, like the generic version shown here to depict a project’s development impact profile. The graph shows the percentage of potential points achieved in each impact category.
4This spider graph is a generic example of how a project may score. It does not represent OPIC’s aggregate portfolio.
Job creation and human capacity building;Demonstration effects;Host country impact;Environmental and community benefits; andDevelopment reach.
OPIC agreed to provide a $10 million loan to Bridge International Academies, which is building 237 schools throughout Kenya under an innovative curriculum and business model designed to reach large numbers of low income students. These schools provide a single, standard curriculum that instructors access from a tablet. By keeping tuition below $6 per month per student, Bridge International expects to educate 300,000 children by 2022. This project is projected to create 5,300 jobs, support extensive professional development training for teachers, and help develop Kenya’s educational sector. As such, it is expected to have a strong and multifaceted development impact across the variety of indicators OPIC’s model tracks.
Bridge International Academies is the world’s largest network of nursery and primary schools, offering high-quality and affordable education to impoverished families. Its innovative for-profit model has been designed and successfully tested to provide a sustainable, scalable approach to education.
Bridge International Academies – Kenya
Assessing Development Impact

Annual Report on Development Impact 13
III. envIRonmentAl, HeAltH, SAFetY & SocIAl ImpActS OPIC strives to ensure the projects it supports are environmentally and socially sustainable and are compatible with low and no-carbon economic development. This section reports on environmental, health, safety, and social impact screening and assessment of potential OPIC projects in FY13 and provides information on the annual greenhouse gas emissions of projects in OPIC’s portfolio.
5Projects in a prohibited category have potential environmental or social impacts that preclude the project from receiving OPIC support. They are listed in Appendix B of the OPIC Environmental and Social Policy Statement, available on OPIC’s website.
OPIC screens all potential projects to identify the risk of adverse environmental and social impacts and to identify impacts that could preclude OPIC support. If a project is determined to be ineligible because it is within a prohibited category,5 OPIC immediately informs the applicant so as to avoid unnecessary effort or expense. If the project is eligible, OPIC classifies the project to determine the requirements for documentation, analysis, disclosure, consultation, reporting, and post-commitment monitoring. Projects may be categorized as A, B, C, or D depending on potential risks and impacts of a particular project. Category A represents the greatest potential for adverse environmental and/or social impacts, whereas Category C represents the least potential for adverse impact. Category D is reserved for certain projects involving financial intermediaries.
OPIC uses a rigorous methodology to assess potential environmental and social impacts.
OPIC evaluates the potential environmental and social impacts of each potential project and identifies means to improve the project by preventing, minimizing, remediating, or compensating for potential adverse impacts as a condition of OPIC support. The process includes the following:
Thirty nine new FY13 projects were screened as Category B. Category B projects are likely to have environmental and/or social impacts that are few in number, generally site-specific, largely reversible, and readily addressed through effective management systems.
Forty one new FY13 projects were screened as Category C projects. Category C projects are likely to have minimal adverse environmental and/or social impacts.
Four of the 84 new OPIC-supported FY13 projects were screened as Category A given their potential to have significant adverse environmental and/or social impacts. The Category A projects are:
Identification of potential adverse environmental and social impacts;Disclosure of the project’s environmental and social impact assessment (ESIA) for 60 days of public review and comment if the project has been screened as Category A;Comparison of the project’s performance in relation to internationally-accepted standards and alternative approaches;Evaluation or design of mitigation measures; andEvaluation or design of associated management and monitoring measures.
A hydroelectric power project in ChileAn expansion of an oil recovery project in ColombiaAn ammonia urea plant in NigeriaA health campus in Turkey
Project Screening and Assessment
Annual Report on Development Impact 14
6The U.S. Environmental Protection Agency’s threshold criterion for significant GHG emissions is 25,000 metric tons. To maintain consistency with units, OPIC uses 25,000 short tons, which is conservative since 25,000 metric tons converted to short tons equals approximately 27,500 short tons.
Since 2008, direct greenhouse gas emissions from OPIC’s active portfolio have been cut by 81%.
OPIC has committed to reducing the direct GHG emissions associated with projects in OPIC’s active portfolio by 30% over a ten-year period and 50% over a 15-year period, using the direct GHG emissions of OPIC’s active portfolio on June 30, 2008 as a baseline.
For the purpose of tracking progress in achieving its GHG reduction goals, OPIC procured the services of an outside environmental auditor to develop a baseline GHG inventory of OPIC-supported projects. The emission sources and activities (organizational boundary) for the inventory was defined as 100% of on-site direct emissions from the calendar year 2007 for all projects within OPIC’s active portfolio as of June 30, 2008 (“2008 baseline emissions”). Accounting for 100% of project emissions is more conservative than the equity or operational control approach that accounts for only a portion of emissions based on percentage of ownership, financing, or related criteria. OPIC accounts for direct emissions because these emissions are verifiable and directly attributable to the project activity that is benefiting from OPIC’s support.
OPIC estimates greenhouse gas emissions from all projects that have “significant” direct emissions of more than 25,000 tons per year (tpy) of CO2 equivalent (CO2e). The 25,000 tpy of CO2e threshold was selected to be consistent with the U.S. Environmental Protection Agency’s threshold criteria for significant GHG emissions6.
The 2008 baseline emissions were estimated to be 51,949,179 tons of CO2e. Subsequent annual estimates, also calculated by an outside auditor, are based on investor-provided data indicative of actual operating conditions and internationally recognized algorithms. A buffer is added to the total to account for GHG emissions from active projects in OPIC’s portfolio that have emissions less than 25,000 tons of CO2e. This buffer is calculated such that the buffer plus the estimated emissions for projects that emit between 25,000 and 100,000 tons of CO2e is equal to five percent of estimated emissions for projects that emit over 100,000 tons.
The total inventory of GHG emissions during calendar year 2012 for projects active as of September 30, 2013 (FY13 emissions) was 10,013,867 tons of CO2e. This represents an 81% reduction in portfolio emissions from the 2008 baseline. The large decrease in emissions relative to previous GHG inventories was primarily due to seven power generation projects making final payments on loans or terminating insurance coverage during FY13, while only much smaller sources became active in the same time period. Figure 4 shows the development of OPIC’s portfolio GHG emissions profile as compared to the 2008 portfolio emissions baseline and the 30% and 50% reduction targets. For a more complete explanation of OPIC’s GHG policy and current inventory, please refer to Exhibit 6.
Mitigating Climate Change

Annual Report on Development Impact 15
Scope 1 Emissions(Direct Emissions - OPIC)
Scope 2 Emissions(Purchased Electricity)
Scope 3 Emissions(Direct Emissions – Active Portfolio)
0
1,183 tons CO2e
10,013,867 tons CO2e
opIc Fiscal Year 2013 co2e emissions
Fiscal Year 2013 Reporting
As illustrated in the table below, OPIC reports no direct (Scope 1) emissions associated with its activities. OPIC reports indirect (Scope 2) emissions totaling 1,183 short tons of CO2e associated with its purchase of electricity. The Scope 3 emissions that OPIC reports for FY13 are those direct GHG emissions for calendar year 2012 associated with projects in OPIC’s active portfolio as of September 30, 2013, calculated according to the methodology mentioned above.
On a transactional basis, OPIC considers reduction and control alternatives for all projects, including opportunities to enhance energy and operational efficiency; protect and enhance sinks and reservoirs of greenhouse gases, such as natural forests; and apply emerging technologies for capture, storage, and recovery of greenhouse gases.
Figure 4OPIC’s Portfolio GHG Emissions Profile
Annual Report on Development Impact 16
Iv. lABoR AnD HumAn RIGHtS
OPIC tracks countries’ eligibility as part of its worker rights statutory obligations.
OPIC’s Environmental and Social Policy Statement outlines OPIC’s policies on country eligibility for OPIC-supported projects based on labor-related statutory obligations. To maintain consistency across the U.S. Government, where available OPIC follows the worker rights determinations made by the President of the United States for the purpose of the Generalized System of Preferences (GSP) program, a trade benefits program overseen by the Office of the U.S. Trade Representative (USTR). During FY13, no countries regained their GSP benefits on worker rights grounds, and Bangladesh became ineligible for OPIC programs when the USTR suspended GSP benefits to Bangladesh as a result of serious worker rights issues.
For its FY13 GSP Annual Review, USTR continued to formally review the GSP eligibility of the following countries on worker rights grounds: Georgia, Niger, Uzbekistan, the Philippines, Iraq, and Fiji. OPIC will adjust country eligibility status as necessary on the basis of USTR’s final determination in these countries.
OPIC implements policies consistent with its statutory requirements related to respect for human rights and the rights of workers. OPIC screens all potential projects to identify labor-related and human rights impacts to determine eligibility. If a potential project is not determined to be ineligible because it falls within a prohibited category, it undergoes a full labor review. None of the potential projects reviewed in FY13 were determined to be categorically prohibited on labor-related grounds7, and three of the new FY13 projects were classified as “Special Consideration,” a designation that requires additional oversight in the form of an independent audit and annual reporting for projects with a heightened potential for labor rights violations.
The Special Consideration Projects are:
OPIC uses a rigorous methodology to assess potential labor-related risks.
OPIC uses its labor assessment to evaluate the potential risks to workers at the project and to identify means to improve the project by preventing and minimizing such risks as a condition of OPIC support.
The process includes the following:
Country Eligibility
Project Screening and Assessment
An ammonia urea plant in NigeriaConstruction of a health campus in Turkey Construction of a health campus in Malaysia
Identification of potential risks to workers, including the project’s potential to infringe upon internationally recognized worker rights;Comparison of the project’s expected performance in relation to internationally-accepted standards and practices;Evaluation or design of project requirements necessary to enable OPIC support;Evaluation or design of associated management and monitoring measures.
7Projects in a prohibited category have potential environmental or social impacts that preclude the project from receiving OPIC support. They are listed in Appendix B of the OPIC Environmental and Social Policy Statement, available on OPIC’s website.

Annual Report on Development Impact 17
OPIC subjects every potential project to a human rights review process to ensure all OPIC-supported projects meet the statutory requirements of the Foreign Assistance Act. OPIC consults with the U.S. Department of State’s Bureau for Democracy, Human Rights, and Labor (DRL) on this review to ensure consistency between OPIC and DRL regarding relevant human rights matters in OPIC eligible countries. OPIC did not decline support for any projects in FY13 as a result of the human rights review process.
In response to concerns related to labor issues in Guatemala and in an effort to further support U.S. Government action under the Central America Free Trade Agreement dispute resolution framework, OPIC included enhanced labor requirements in its agreement with Banco Industrial, a leading Guatemalan bank engaged in SME lending. With OPIC’s guidance, BI has taken significant steps to develop an internal labor management system which includes assessing and monitoring labor-related risks at downstream SME clients who benefit from OPIC financing. BI has greatly improved its capacity as an organization, providing labor-related training to its loan credit officers, dedicating a full-time labor coordinator, and developing a labor management policy and procedures. OPIC is pleased with BI’s progress toward becoming a leader in the region on this issue.
Banco Industrial - Guatemala
All new 84 FY13 OPIC-supported projects were subjected to a full worker rights review, and OPIC support was conditioned upon adherence to OPIC’s worker rights requirements.
Human Rights
Annual Report on Development Impact 18
v. SuppoRt FoR tHe u.S. economY, eSpecIAllY SmAll BuSIneSSU.S. small businesses were significant partners in three-quarters of new OPIC-supported projects in FY13.
OPIC recognizes the importance of small businesses as a key driver of U.S. economic growth, and actively partners with these firms to enable their expansion into developing markets.
Over the last five years, OPIC has committed $6.2 billion in finance and insurance to more than 390 new projects with significant involvement of U.S. small businesses.
OPIC’s efforts to reach out to U.S. small businesses continued to yield positive results in FY13. OPIC supported 62 new projects that involved U.S. small businesses, representing 74% of all new FY13 projects:
In addition to financing and insurance received from OPIC, U.S. small businesses also benefit through procurement: new FY13 projects are expected to procure $56 million over the next five years from 24 small businesses located in 11 states and the District of Columbia.
FY13 projects are expected to support 1,244 US jobs over the next five years. No FY13 project is expected to result in the loss of any U.S. jobs. Potential OPIC projects are carefully screened for their effect on employment in the United States. OPIC does not support projects projected to harm the U.S. economy or result in the loss of U.S. jobs. Based on projected procurement from the United States of $833 million in goods and services over five years, new FY13 OPIC projects are expected to support 1,244 U.S. jobs. Over 40 percent of the 1,244 jobs expected to be supported in the United States by new OPIC-supported projects are due to renewable resources projects.
27 U.S. small businesses received OPIC investment guarantees directly or through investment funds or financial intermediaries;25 U.S. small businesses received direct loans from OPIC;10 U.S. small businesses received OPIC political risk insurance coverage.

Annual Report on Development Impact 19
Total project investmentU.S. investment in projectsU.S. percent of total
U.S. exports1
Initial procurementOperational procurement1
U.S. jobs supported
$8.9 billion$5.1 billion58%
$833 million$469 million$364 million
1,244
Table 2: Projected U.S. Economic Benefits of New FY13 Projects
Exhibits 1-3 to this report provide detailed information on OPIC-supported projects and their impact on the U.S. economy. Exhibit 4 provides a detailed description of the methodology used to calculate the U.S. employment effects.
OPIC also committed to providing approximately $66 million in financing and insurance to women-and/or minority-owned U.S. businesses in connection with four new FY13 projects.
1Total amount over a 5-year period.
Supporting U.S. Small Businesses
Note: All data projections for new FY13 projects based on information provided by OPIC clients.

Annual Report on Development Impact 20
vI. monItoRInG oF ActIve pRoJectSOPIC monitors the policy compliance and development impact of every active project from inception to conclusion through an annual self-monitoring questionnaire and randomized as well as risk-based site monitoring. This section discusses these monitoring processes and reports findings related to development impact and compliance with policy covenants.8
8This section refers only to monitoring of development impact and compliance with OPIC’s investment policy requirements. The financial performance of loans and guaranties is monitored separately within OPIC.9The set of issues OPIC staff examine during site monitoring varies from project to project. In some cases, a team of OPIC analysts may review the entire gamut of policy and development impact issues. In cases where there is a specific policy issue that OPIC needs to monitor, the OPIC team may focus on that issue. For more detail on OPIC’s site monitoring methodology, see Exhibit 7.
Site monitoring allows OPIC staff to ensure compliance and understand why a project succeeded or struggled. Yet its value extends beyond these functions. Through gathering, analyzing, and verifying information about projects, OPIC continually improves its development impact methodology, policy compliance practices, and investment strategy, which means better outcomes for U.S. investors and host country economies.
Projects selected for site-monitoring include projects randomly selected from OPIC’s active portfolio and projects designated as sensitive given potential impact on the U.S. economy, labor, human rights, environment, and/or local communities. Projects with particular sensitivities may also be subject to audits conducted by a third party.
In FY13, OPIC site-monitored 32 projects.9 Figures 5, 6, and 7 provide a breakdown of the sectors, products, and locations of these projects.
Site-Monitoring
Figure 5FY13 Site Monitoring by Sector

Annual Report on Development Impact 21
Two examples drawn from FY13 site monitoring visits, show some of the ways in which OPIC-supported projects are having a substantial developmental impact.
In 2009, OPIC provided a $7.3 million investment guarantee on WorldBusiness Capital (WBC)’s $7.5 million loan to TuranBank OJSC in Azerbaijan. TuranBank used the proceeds of the loan to expand its SME lending portfolio. OPIC’s July 2013 monitoring trip found that the project allowed the bank to provide longer-tenor loans, develop innovative marketing practices, and expand its service offerings. TuranBank has also expanded its corporate social responsibility initiatives, continues to offer workshops to clients who wish to learn more about the bank, and actively engages in environmental and social monitoring of its borrowers.
OPIC’s May 2013 monitoring of Banca de Finante Si Comert S.A. (“FinComBank”) in Moldova showed the development impact of OPIC’s support for micro and small and medium enterprises through financial intermediaries. OPIC’s $6 million loan to FinComBank in 2009 enabled the bank to make approximately 200 loans to 170 micro and SME borrowers throughout the country who had not been previously served by traditional lending institutions.
WBc-turanBank oJSc – Azerbaijan
Banca de Finante si comert S.A. (FincomBank) – moldova
Figure 7FY13 Site Monitoring by Region
Figure 6FY13 Site Monitoring by Product

Annual Report on Development Impact 22
Active OPIC-supported projects are required to report annually on U.S. economic and host country development impact and relevant environmental, social, health & safety, and labor issues by completing an online Self-Monitoring Questionnaire (SMQ).
In 2013, OPIC received and reviewed 315 SMQs from 346 projects for which SMQs were required, a response rate of 91%. The development impacts reported below are based on data obtained from 281 SMQs.10
10OPIC did not include development impact data from 34 SMQs because they did not meet data reporting quality standards.
Demonstration effects
OPIC-supported projects support good quality jobs, helping to increase overall skill level and labor productivity with training and benefit packages that go beyond local requirements.
Projects supported by OPIC increase economic development by helping local enterprises acquire knowledge and technology, both of which increase productivity, and by supporting reform efforts in their sector. Among SMQ respondents,
Self-Monitoring Questionnaire (SMQ)
Jobs and Human capacity Building
66% include local ownership. Of this local ownership, 32% is comprised of SMEs and 15% of women or women-owned enterprises.53% provide technology or knowledge transfer.10% participate in legal or regulatory reform efforts.
Host country Impact
By procuring goods and services locally from host country businesses, foreign investors can strengthen existing local businesses, help launch new local businesses, and increase the diffusion of technology transfer. Among SMQ respondents,
66% procure locally, injecting roughly $3 billion into local economies in a one-year period.
Note: Numbers reported by SMQ respondents at the project or organizational level.
Annual Report on Development Impact 23
Environmental and Community Benefits
Development Reach
Community benefits, such as Corporate Social Responsibility (CSR) activities, demonstrate how companies can be good corporate citizens. Among SMQ respondents,
OPIC supports projects that have a significant development reach to poor, underdeveloped, and/or rural areas of the host country. When support for a financial intermediary increases lending in low income or rural areas, for example, it can increase access to finance for previously underserved populations. More than half of OPIC-supported financial intermediaries reported that their portfolio included loans to individuals and businesses in rural areas. Other examples of development reach reported by financial intermediaries who are active OPIC clients include:
65% are involved in at least one type of community outreach program.40% participate in initiatives to improve the environment or mitigate negative impacts.
A microfinance organization in Georgia reported serving over 95,000 customers with an average loan size of $600. A microfinance institution in Romania specializing in SME and microfinance reported a portfolio of loans to over 12,000 farmers and small entrepreneurs with an average loan size of $5,500.A financial institution in Peru reported providing loans to over 52,000 low-income entrepreneurs, most of them previously unbanked, with an average loan size of $1,400.
Ensuring compliance with OPIC policy conditions and covenants is a critical aspect of OPIC’s monitoring programs.
OPIC scrutinizes compliance intensively during the site-monitoring process.
Compliance with OPIC Conditions and Covenants
U.S. economic effects: In FY13 no projects were found to be out of compliance with OPIC conditions and covenants related to ensuring no harm to the U.S. economy and no loss of U.S. jobs.Environment and social impact: In FY13, environmental and social impact monitoring focused on those projects with the potential for greatest environmental and social risk, with 14 of 16 site visits involving Category A or B projects.
Three projects had issues related to policy updates, site housekeeping, or insufficient life and fire safety equipment. In each of these cases, OPIC’s environmental and social impact group informed the project investor of the deficiency, required implementation of corrective actions and is actively working with the investor to strengthen E&S management as necessary.
For the fourth project, the investor did not have sufficient resources to implement the necessary corrective actions, thus OPIC support to the project was terminated.
The fifth project originated prior to OPIC’s current environmental procedures. The sponsor is requesting renewal of OPIC support and is collaborating with OPIC’s environmental and social group on required corrective actions for newly applicable standards.
11 projects monitored for environmental and social compliance were found to be fully in compliance with all relevant OPIC covenants and conditions.Of the five site-monitored projects that were not fully in compliance with OPIC covenants related to environmental and social impacts:

Annual Report on Development Impact 24
Labor and human rights: In FY13, OPIC’s labor and human rights specialists site-monitored 15 projects. These projects were found to be fully in compliance with all relevant OPIC covenants and conditions, and many extended their commitments to support workers and their local communities above and beyond OPIC requirements.
However, reviews by third party consultants and labor auditors did uncover compliance issues at two OPIC projects.
A scheduled third-party labor audit identified several issues of labor non-compliance at a project. The deficiencies were rectifiable, including the need for management improvements at the subcontractor level to ensure the timely and appropriate payment of wages. The project sponsor demonstrated strong cooperation and support for the remediation efforts.The third-party auditor oversaw the successful remediation process and continues to monitor the project through completion of the construction phase. A third-party due diligence review initiated by an equity fund receiving OPIC financing identified gaps at a portfolio company with respect to compliance with local labor law and OPIC worker rights requirements. The fund established an action plan to remediate these gaps, and the project will receive ongoing attention.
OPIC also requires self-reporting of policy compliance by clients in the SMQ.
Two projects reported that they were not compliant with OPIC conditions related to environment, health and workers’ safety. Both projects submitted information describing the steps they are taking to remedy the non-compliance, and OPIC is monitoring them on an ongoing basis. One project acknowledged a non-compliance infraction in the host country related to environmental, health, and safety laws. The project paid a fine and is working to implement the required changes.

Annual Report on Development Impact 25
vII. clIent SAtISFActIon SuRveY ReSultS AnD otHeR InItIAtIveSIn 2012, OPIC began collecting client satisfaction data through a voluntary survey clients have the option to complete upon submission of their SMQ. The survey contains eight questions which ask clients to rate their satisfaction with OPIC in the following areas:
Of the 315 SMQ respondents, only 44 chose to complete the survey in FY13, and their responses therefore cannot be considered statistically representative of all OPIC clients. The table below provides the percentage of respondents who reported they were satisfied with OPIC in each area.
Overall Satisfaction of Working with OPICHelpfulnessProfessionalismTimely Response to QuestionsClarity of CommunicationsUnderstanding of Business NeedsReasonable Decision TimeLikelihood of Working with OPIC Again
Overall SatisfactionHelpfulnessProfessionalismTimely ResponseClarityBusiness NeedsDecision TimeLikelihood of Working with OPIC Again
85%
89%
84%
79%
84%
81%
70%
89%

Annual Report on Development Impact 26
To better fulfill its mission of helping to solve critical development challenges, ensure compliance with statutory and policy requirements, and meet the needs of its clients, OPIC is undertaking a number of initiatives to improve its monitoring and reporting processes and its assessment of development impact.
These include:
Harmonizing indicators with other development finance institutions (DFIs).
OPIC is participating voluntarily in targeted working groups with other DFIs to develop standardized development impact indicators. Adoption of standardized indicators by multiple DFIs will reduce reporting burdens on clients and allow for more efficient reporting by DFIs.
Refining indicators used to assess development impact.
With over a year’s experience in using a revised model to assess development impact, OPIC is reviewing the results of its assessments and plans to refine its definition of several of the indicators to improve implementation.
Reviewing the SMQ.
Using feedback from investors and other stakeholders and incorporating results from the indicator harmonization process noted above as appropriate, OPIC is in the process of reviewing the SMQ to better accomplish OPIC’s monitoring and reporting goals, make it more client-friendly, and further improve response rates.
Improving accessibility of data.
OPIC is improving its data infrastructure and processes to make development impact data more accessible within the agency and to external stakeholders to the extent permitted by business confidentiality requirements.

Annual Report on Development Impact 27
vIII. eXHIBItS
eXHIBIt 1:U.S. Employment and Associated Effects of OPIC-Supported Projects
eXHIBIt 2:Destination of Sales to Third Party Markets of OPIC-Supported Projects Fiscal Year 2013 (Projections)
eXHIBIt 3:U.S. Employment Effects and Host Country Location of OPIC-Supported Projects Fiscal Year 2013 (Projections)
eXHIBIt 4:Methodology for Calculating U.S. Employment Effects
eXHIBIt 5:OPIC’s Revised Development Matrix Explained
eXHIBIt 6:OPIC’s Greenhouse Gas Policy and Current Inventory
eXHIBIt 7:OPIC Site Monitoring Methodology
28
29
31
32
33
34
38

Annual Report on Development Impact 28
eXHIBIt 1u.S. employment and Associated effects of opIc-Supported projectsFiscal Year 2013 (projections)
(All Dollar Figures are in Thousands)
* Foreign Assistance Act of 1961 (P.L. 87-195), Sec. 240A (2) (b)
Average annual effect during first 5 years of project operation.
Total effect during first 5 years of project operation
Projects with a U.S. employment effect of more than two jobs (10 person years or more of employment during the first 5 years of project operation).
100 percent of the energy projects OPIC committed to in FY13 were renewable energy projects
Projects with a U.S. employment effect of 2 or fewer jobs (10 person years or less of employment during the first 5 years of project operation).
There were no projects supported in FY13 that projected the loss of any U.S. employment.
1/
2/
3/
4/
5/
6/

Annual Report on Development Impact 29
Agribusiness Multiple Regions $100,000,000Sector Total $100,000,000
Services Asia Regional
TOTAL SALES FOR PROJECTS WITH POSITIVE U.S. EFFECTS
$132,000,000Sector Total $132,000,000
$232,000,000
Sector Destination Annual Sales ($)
projects With positive effects on u.S. employment2/
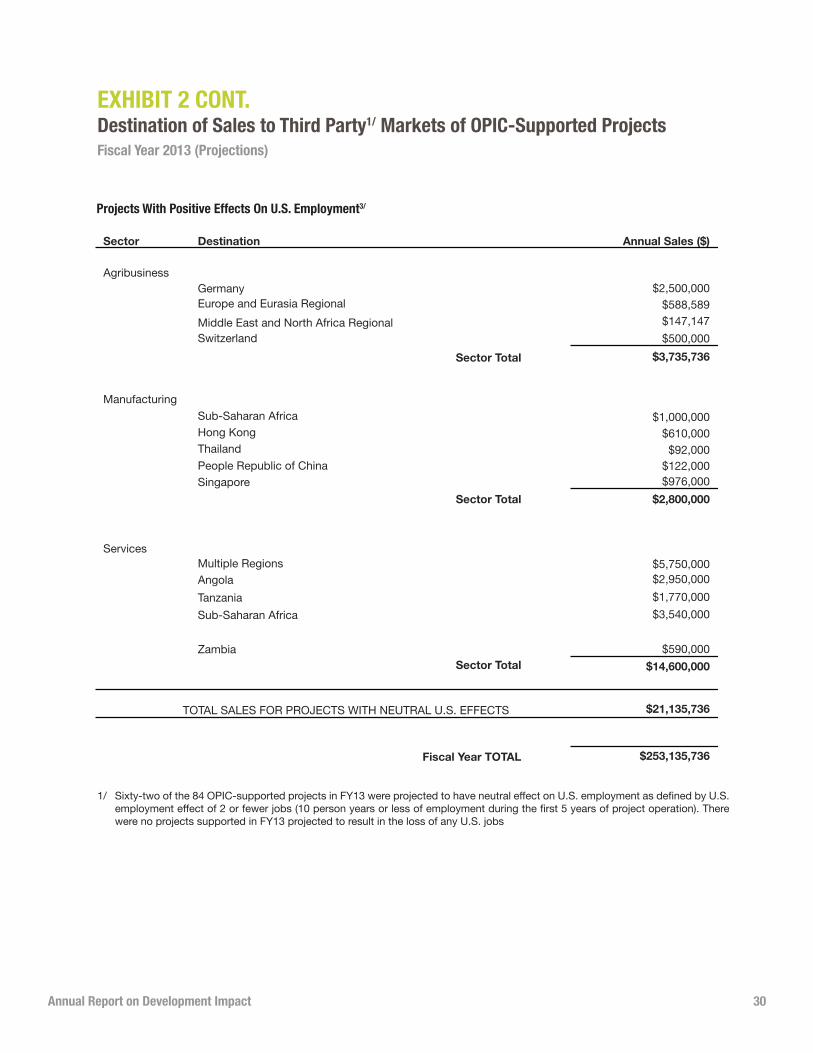
eXHIBIt 2Destination of Sales to third party1/ markets of opIc-Supported projects Fiscal Year 2013 (projections)
* Foreign Assistance Act of 1961 (P.L. 87-195), Sec. 240A (2) (A)
“Third party” refers to countries that are neither the U.S. nor the host country.
Twenty-two of the 84 OPIC-supported projects in FY13 had positive effect on U.S. employment defined as U.S. employment effect of more than two jobs (10 person years or more of employment during the first 5 years of project operation). There were no projects supported in FY13 projected to result in the loss of any U.S. jobs.
1/
2/
Annual Report on Development Impact 30
eXHIBIt 2 cont.Destination of Sales to third party1/ markets of opIc-Supported projects Fiscal Year 2013 (projections)
projects With positive effects on u.S. employment3/
Sixty-two of the 84 OPIC-supported projects in FY13 were projected to have neutral effect on U.S. employment as defined by U.S. employment effect of 2 or fewer jobs (10 person years or less of employment during the first 5 years of project operation). There were no projects supported in FY13 projected to result in the loss of any U.S. jobs
1/

Annual Report on Development Impact 31
eXHIBIt 3u.S. employment effects and Host country location of opIc-Supported projectsFiscal Year 2013 (projections)
of those 84 projects, 22 had a positive impact on u.S. jobs:1/
of those 84 projects, 62 had a neutral impact on u.S. jobs:2/
Regional breakdown:
In FY13, OPIC supported 84 new projects in 41 countries and five regions around the world.
8 in minerals & energy: Chile, Colombia, Uruguay, Pakistan and Tanzania5 in manufacturing: Africa region, Iraq, Jamaica, Mexico and Nigeria 9 in the services sector: Brazil, Cambodia, Georgia, Iraq, Malaysia, Latin America Regional, Pakistan and Turkey
Of these 53 projects, 38 were financial services, 2 pertained to construction, one pertains to communication, 3 with tourism and 9 with other services.
2 in the agricultural sector: Rwanda and West Bank 4 in the minerals & energy sector: El Salvador, Peru, Pakistan and Tanzania 3 in manufacturing: Philippines, Nigeria and Tanzania 53 in the service sector: Africa Regional, Armenia, Azerbaijan, Brazil, Costa Rica, Egypt, El Salvador, Georgia, Guatemala, Honduras, India, Indonesia, Israel, Jordan, Kenya, Latin America Regional, Mexico, Mongolia, Mozambique, Multiple regions, Nicaragua, Nigeria, Romania, Russia, South Africa, South Sudan, Tajikistan, Tanzania, Uganda, Ukraine, West Bank and Zambia.
18 in Sub-Saharan Africa (3 with positive U.S. job impacts and 15 with neutral U.S. job impacts )15 in Europe & Eurasia (2 with positive U.S. job impacts and 13 with neutral U.S. job impacts)25 in Latin America & Caribbean (10 with positive U.S. job impacts and 15 with neutral U.S. job impacts)10 in Asia & Pacific (4 with positive U.S. job impacts and 6 with neutral U.S. job impacts)14 in Middle East and North Africa (3 with positive U.S. job impacts and 11 with neutral U.S. job impacts)2 in multiple regions (one with positive effect and one with neutral U.S. job impacts)
* Foreign Assistance Act of 1961 (P.L. 87-195), Sec. 240A (3) (C)
Projects with a U.S. employment effect of more than 2 jobs (10 person years or more of employment during the first 5years of operations).
Projects with a U.S. employment effect of two or fewer jobs (10 person years or less of employment during the first 5 years of project operation). The majority of the projects were in the services sector. No projects that OPIC supported in FY13 resulted in the loss of any U.S. jobs.
1/
2/

Annual Report on Development Impact 32
eXHIBIt 4methodology for calculating u.S. employment effects
Each project seeking OPIC support is individually reviewed to estimate the potential impact on employment in the United States. OPIC uses procurement estimates provided by the investor to calculate expected initial and operational procurement from the United States by value and specific type of good or service. The U.S. employment generated by a project’s projected initial and five year operational procurement of goods and services is then estimated by considering the direct and indirect employment necessary to produce those goods and services. That is, the employment effects incorporate the direct employment necessary to produce the procured goods and services, as well as the indirect employment required for the production of the associated intermediate inputs.
OPIC details each type of U.S. good or service expected to be procured for each project and, using industry-specific data from the U.S. Bureau of Labor Statistics (BLS), OPIC calculates the employment effect in that industrial sector as well as in the sectors that supply necessary components or inputs. By using this standard employment effect methodology, OPIC is able to ascertain employment generation with greater precision than if it used an average for all U.S. exports. By including indirect effects, OPIC’s employment figures present a more accurate picture of the benefits accruing to U.S. workers from the projected procurement of goods and services by OPIC-supported projects. Finally, to confirm employment effect estimates, OPIC monitors actual economic effects after project start up and throughout the life of the OPIC’s involvement with the project. OPIC’s monitoring is described in further detail in the Monitoring section of this report.

Annual Report on Development Impact 33
eXHIBIt 5opIc’s Revised Development matrix explainedOPIC supports projects that are expected to serve as foundations for long-term economic growth, especially those that improve upon the host country’s physical and financial infrastructure and provide the basic human necessities of shelter, food, water and health care. Since its inception in 1971, OPIC has collected direct and indirect developmental impact data for each of its projects. In 2004, OPIC implemented a development impact assessment tool – the Developmental Impact Matrix – enabling OPIC to compare projects across the portfolio and over time. A new model was developed in 2007 that was specifically tailored to assess the development impacts of financial intermediaries projects. These matrices incorporated between 27 and 34 developmental indicators that were used to evaluate and score every proposed project.
In October 2012, OPIC revised its Development Impact Matrices with the goal of simplifying the indicators for more accurate and relevant data collection. The new matrices are also more harmonized with the developmental impact assessment tools used by other development finance institutions. As before, OPIC has two matrices: one tailored for financial services projects and the other for all other projects. Both matrices are comprised of the following five broad categories that measure a project’s developmental impact, regardless of the project’s industry sector or the host country’s level of development:
Job Creation and Human Capacity Building, which includes the number of new jobs to be created as well as training and employee benefits that go beyond local law.
Demonstration Effects, which includes technology and knowledge transfer, technical assistance to suppliers or borrowers, the introduction of new products (including financial products), the project’s impact on regulatory and legal reform, and the adoption of internationally-recognized quality or performance standards.
Host Country Impact, which measures local procurement and fiscal and foreign exchange impacts. For projects involving financial services, this factor measures the amount of funds to be disbursed, as well as the impact on micro, small, and medium-sized enterprises, entrepreneurship, and home ownership.
Environmental and Community Benefits, which assesses a project’s improvement of the environment and philanthropic activities that benefit the local community.
Development Reach, which measures a project’s impact on basic infrastructure and/or its potential benefits to the poor and other underserved populations. For projects involving financial services, this factor measures the extent to which underdeveloped areas or underserved, poor populations will be targeted by the financial institution.
Every proposed project is evaluated and scored based on a scale of 1 to 100. A project must score at least 25 to 60 points on the matrix to be considered developmental and clearly eligible for OPIC support. A score of over 60 to 100 qualifies a project as highly developmental.
Annual Report on Development Impact 34
eXHIBIt 6opIc’s Greenhouse Gas policy and current Inventory
OPIC estimates the GHG emissions for all projects that have the potential to emit (PTE) more than 25,000 tons per year (tpy) of CO2e equivalent. These projects are divided into three tiers. Tier A projects are fossil fuel-fired power generation projects that emit more than 100,000 tpy of CO2e. Tier B projects are projects in the oil & gas, mining, transportation, manufacturing, construction, or other sectors which have a PTE of more than 100,000 tpy CO2e. Tier C projects are those projects that have a PTE of less than 100,000 tpy CO2e, but more than 25,000 tpy CO2e. Annual independent GHG audit reports for projects that are expected to emit more than 25,000 tons of CO2e are available at www.opic.gov.
In order to account for GHG emissions from active projects in OPIC’s portfolio that emit less than 25,000 tons of CO2e, OPIC incorporates a buffer into its estimate for total emissions from active OPIC projects. The sum of Tier C emissions and the buffer equals 5% of the total emissions from OPIC projects emitting more than 100,000 short tons of CO2e per year11. In the FY 2013 inventory (i.e., emissions during calendar year 2012 from projects in OPIC’s active portfolio as of 9/30/2013), Tier C emissions and the buffer for additional sources amounted to 0.9 and 4.1 percent respectively. This methodology to account for such sources is consistent with the GHG accounting methodology of The Climate Registry12.
OPIC calculates GHG emissions from projects in its active portfolio using methodologies and algorithms that rely on activity data such as fuel consumption or gas/oil throughput. In most cases, OPIC uses methodologies approved by The Climate Registry. For emissions from sources without Registry-approved methodologies, OPIC uses emission estimate methodologies provided by the U.S. Environmental Protection Agency.
Following the completion of an independent GHG audit of the FY 2013 emissions by SC&A Inc., OPIC provided investors the opportunity to comment on the Independent Auditor’s estimates, activity data, and methodology. The following table contains the final auditor estimates after consideration of investor input.
11Prior to the FY10 GHG analysis, OPIC estimated emissions from projects that had the potential to emit more than 100,000 tons per year (tpy) of CO2e (i.e., Tier A and Tier B projects). To account for GHG emissions from projects in OPIC’s portfolio that were estimated to have generated less than 100,000 tpy of CO2e, OPIC added a 5% buffer to the estimated total emissions from projects emitting more than 100,000 tpy of CO2e. Starting with the FY11 GHG analysis, OPIC lowered the minimum reporting threshold to include projects that emit between 25,000 and 100,000 tpy CO2e (i.e., Tier C projects). To maintain a consistent methodology, since FY10, the buffer has been reduced such that the buffer plus the Tier C emissions equals 5% of the total emissions from OPIC projects emitting more than 100,000 tpy of CO2e.
12All THE CLIMATE REGISTRY is a nonprofit collaboration among North American states, provinces, territories, and Native Sovereign Nations that sets consistent and transparent standards to calculate, verify and publicly report greenhouse gas emissions into a single registry. The Registry supports both voluntary and mandatory reporting programs and provides comprehensive, accurate data to reduce greenhouse gas emissions. The 5% value is from The Climate Registry’s General Reporting Protocol, Version 1.1, May 2008, p.58.Available online at: http://www.theclimateregistry.org/downloads/GRP.pdf.

Annual Report on Development Impact 35
opIc GHG emissions Inventory estimate by project
Tier A Project Emissions (Short Tons CO2e)
[1] Maximum potential to emit (PTE) was calculated on the basis of a projects maximum operating capacity. When maximum operating capacity could not be determined, the maximum PTE was set equal to the highest annual emission level assessed in this or prior OPIC GHG inventories.
[2] Sharp emission increase due to ramped-up energy production from 10,103,603 in 2008 to 22,536,748 MMBtu in 2009.
[3] 2009 emissions are significantly lower due to fewer reported operating hours.
[4] 2009 emissions are significantly higher due to increased reported operating hours
Annual Report on Development Impact 36
opIc GHG emissions Inventory estimate by project
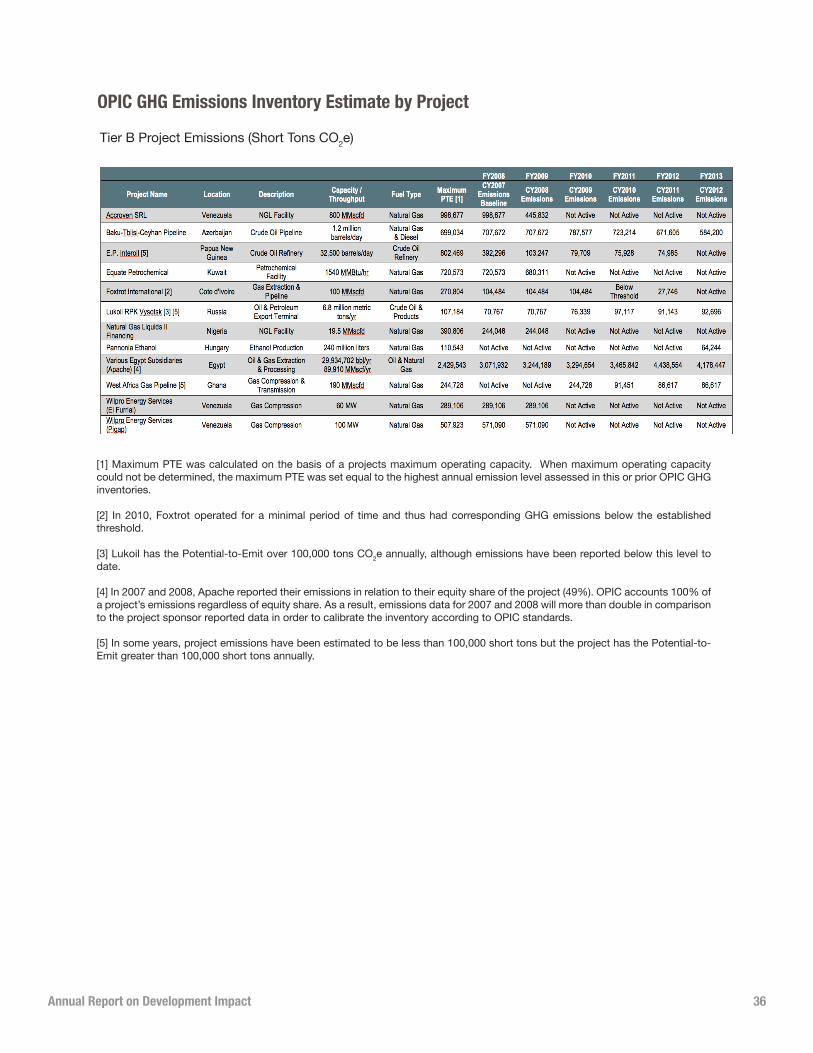
Tier B Project Emissions (Short Tons CO2e)
[1] Maximum PTE was calculated on the basis of a projects maximum operating capacity. When maximum operating capacity could not be determined, the maximum PTE was set equal to the highest annual emission level assessed in this or prior OPIC GHG inventories.
[2] In 2010, Foxtrot operated for a minimal period of time and thus had corresponding GHG emissions below the established threshold.
[3] Lukoil has the Potential-to-Emit over 100,000 tons CO2e annually, although emissions have been reported below this level to date.
[4] In 2007 and 2008, Apache reported their emissions in relation to their equity share of the project (49%). OPIC accounts 100% of a project’s emissions regardless of equity share. As a result, emissions data for 2007 and 2008 will more than double in comparison to the project sponsor reported data in order to calibrate the inventory according to OPIC standards.
[5] In some years, project emissions have been estimated to be less than 100,000 short tons but the project has the Potential-to-Emit greater than 100,000 short tons annually.

Annual Report on Development Impact 37
opIc GHG emissions Inventory estimate by project
Tier C Project Emissions (Short Tons CO2e)
Summary of OPIC Portfolio Emissions (Short Tons CO2e)
[1] Per agreement between Latin American Power III and OPIC, the Fund agreed to “not make an investment in a Portfolio Company if after such investment, the assets and operations of all Portfolio Companies then held by the Fund would emit (in the aggregate and on a calendar year basis) in excess of 2,077,500 short tons CO2e as calculated in accordance with the IPCC”.
[2] The buffer was originally set as five percent of the sum of Tier A and Tier B emissions
[3] Since 2009, the buffer is set so that the sum of Tier C emissions and the buffer equal five percent of the sum of Tier A and Tier B emissions.
[1] Maximum PTE was calculated on the basis of a projects maximum operating capacity. When maximum operating capacity could not be determined, the maximum PTE was set equal to the highest annual emission level assessed in this or prior OPIC GHG inventories.
Annual Report on Development Impact 38
eXHIBIt 7opIc Site monitoring methodology
OPIC performs comprehensive and integrated monitoring to evaluate the US and host-country economic effects as well as the environmental, social, health and safety, and general working conditions of the projects it supports. OPIC’s integrated project monitoring is designed to ensure that each project complies with statutory and contractual requirements in these areas. Project monitoring consists of site visits to projects, in addition to the analysis of information submitted annually by investors in the form of an online “Self Monitoring Questionnaire.” As of 1993, SMQs are required of all investors per the OPIC finance agreement or insurance contract.
Using a statistical sampling methodology combined with risk-based monitoring, OPIC identifies projects that staff from one or more disciplines will site monitor. The projects selected for site monitoring include: (1) a random sample of projects that have been active for five or more years and have not been monitored previously; (2) projects that are sensitive with respect to U.S. economic effects, labor or environment, social, health and safety issues; and (3) projects that fit in logistically with randomly selected or sensitive projects.
(Statutory Disciplines: environment, u.S. economic Impact, labor, and Host country Developmental Impact)
OPIC monitors projects for compliance with contractual worker rights requirements through a combination of annual reporting by companies as well as site visits to both random and selected samples of projects. OPIC targets its worker rights monitoring efforts toward countries and sectors with a higher potential for possible worker rights violations.
Because certain areas of worker rights violations may be difficult to identify from a typical project site monitoring visit, in instances when OPIC determines further investigation is warranted for a project, OPIC may employ trained and certified labor auditors, often recruited from the NGO community with reputations for impartiality and credibility among both the labor and business communities, to perform a full project audit. The auditors spend as much time as necessary to investigate thoroughly potential violations. At a minimum, an audit would include independent and confidential interviews with employees and management. Interviews may also include relevant entities such as government officials, knowledgeable local NGOs and organized labor groups.
With respect to E&S issues, projects selected for site monitoring in a given year are prioritized based on an environmental and social risk rating. Environmental and social risk ratings are based on several factors including project sensitivity, host country context, project-level environmental and social management system, and investor experience in implementing projects of similar complexity. OPIC assesses the E&S performance of a project against applicable benchmarks including contract conditions, international standards and guidelines, and industry best practices. Factors included in the performance assessment include an evaluation of the project’s environmental and social management systems, the effectiveness of mitigation, including pollution controls in risk reduction, and the efficiency of the operations, including energy efficiency.
Labor
Environment, Social, Health, and Safety (E&S)
Annual Report on Development Impact 39
All projects visited by OPIC’s Economic Impact Analysis Group are evaluated for their actual impact on the U.S. economy, including the U.S. employment generation effects of the investments. OPIC analysts ensure that projects do not negatively impact the U.S. economy. The analysis includes verifying export levels to the U.S. (if any) or to other countries, calculating the U.S. balance of payments impact, and verifying compliance with any restrictions put forward in the OPIC loan agreement or insurance contract (e.g. restrictions on exporting to the United States. or significant U.S. export markets).
U.S. Economic Impact
Regarding host country development impact, projects are reviewed using the same criteria as at the time of project approval. Thus, an “apples-to-apples” comparison can be made between original estimates and actual operations. For example, if a project originally expected to hire 100 local workers, actual employment numbers are verified and compared to this forecast. Additionally, if a project is expected, for example, to build a school for the children of its employees, this will be verified. Other developmental impacts not identified or anticipated at the time of application are also evaluated and quantified during site monitoring. Finally, the project is re-scored using actual findings of the same criteria used in the project’s original OPIC review.
Development Impact