annual report of orlen group for the year...
TRANSCRIPT

ANNUAL REPORT OF ORLEN GROUP FOR THE YEAR 2015
1. LETTER OF THE PRESIDENT OF THE BOARD
2. OPINION AND REPORT OF THE INDEPENDENT AUDITOR
3. SELECTED FINANCIAL DATA
4. FINANCIAL STATEMENTS OF ORLEN GROUP
5. MANAGEMENT BOARD REPORT ON THE OPERATIONS OF ORLEN GROUP
ORLEN GROUP
CONSOLIDATED FINANCIAL STATEMENTS FOR THE YEAR 2015
(Translation of a document originally issued in Polish)
3
TABLE OF CONTENTS
1. INTRODUCTION 4
1.1. PRINCIPAL ACTIVITY OF THE ORLEN GROUP 4
1.2. PRINCIPLES OF PREPARATION OF FINANCIAL STATEMENTS 4
2. CONSOLIDATED STATEMENT OF PROFIT OR
LOSS AND OTHER COMPREHENSIVE INCOME 5
3. CONSOLIDATED STATEMENT OF FINANCIAL
POSITION 6
4. CONSOLIDATED STATEMENT OF CHANGES IN
EQUITY 7
5. CONSOLIDATED STATEMENT OF CASH FLOWS 8
6. SEGMENTS’ DATA 9
6.1. REVENUES, COSTS, FINANCIAL RESULTS, INVESTMENT EXPENDITURES 9
6.2. ASSETS BY OPERATING SEGMENTS 10
6.3. NON-CURRENT ASSETS BY GEOGRAPHICAL ALLOCATION 10
7. DESCRIPTION OF SIGNIFICANT FACTORS
INFLUENCING THE FINANCIAL DATA FOR THE
YEAR 2015 11
8. EXPLANATORY NOTES TO THE CONSOLIDATED
FINANCIAL STATEMENTS 12
8.1. EXPLANATORY NOTES TO THE STATEMENT OF PROFIT OR LOSS AND OTHER COMPREHENSIVE INCOME 12
8.2. EXPLANATORY NOTES TO THE STATEMENT OF FINANCIAL POSITION 15
8.3. EXPLANATORY NOTES TO THE STATEMENT OF CASH FLOWS 26
8.4. EXPLANATORY NOTES TO THE FINANCIAL INSTRUMENTS AND FINANCIAL RISKS 27
8.5. OTHER EXPLANATORY NOTES 34
8.6. ACCOUNTING PRINCIPLES 37
8.7. SIGNIFICANT VALUES BASED ON PROFESSIONAL JUDGEMENT AND ESTIMATES 42
8.8. INFORMATION CONCERNING SIGNIFICANT PROCEEDINGS IN FRONT OF COURT, BODY APPROPRIATE FOR ARBITRATION PROCEEDINGS OR IN FRONT OF PUBLIC ADMINISTRATION BODIES 43
9. ORLEN GROUP STRUCTURE AND JOINT
ARRANGEMENTS 46
9.1. ORGANIZATION OF THE GROUP 46
9.2. SUBSIDARIES 48
9.3. INVESTMENTS IN JOINT ARRANGEMENTS 50
10. EVENTS AFTER THE END OF REPORTING PERIOD 51
11. STATEMENTS OF THE MANAGEMENT BOARD AND
APPROVAL OF THE FINANCIAL STATEMENTS 52
ORLEN GROUP (PLN million)
CONSOLIDATED FINANCIAL STATEMENTS FOR THE YEAR 2015
(Translation of a document originally issued in Polish)
1. INTRODUCTION
4
1. INTRODUCTION
1.1. Principal activity of the ORLEN Group
1.2. Principles of preparation of financial statements
1.1. PRINCIPAL ACTIVITY OF THE ORLEN GROUP
Polski Koncern Naftowy ORLEN Spółka Akcyjna seated in Płock, 7 Chemików Street (“Company”, “PKN ORLEN”, “Issuer”, “Parent Company”) was founded by incorporation of Petrochemia Płock S.A. with Centrala Produktów Naftowych S.A., on 7 September 1999. PKN ORLEN along with the entities forming the Capital Group of Polski Koncern Naftowy ORLEN S.A. (“ORLEN Group”, “ORLEN Capital Group”, “Group”, “Capital Group”) is one of the biggest and most modern fuel and power companies in Central Europe, operating on the Polish, Lithuanian, Czech and German market. The Group also possesses entities located in Malta, Sweden, the Netherlands, Slovakia, Hungary, Estonia, Latvia, USA and Canada. The core business of the ORLEN Group is crude oil processing, production of fuel, petrochemical and chemical goods, as well as, retail and wholesale of fuel products. The ORLEN Group conducts also exploration, recognition and extraction of hydrocarbons, and generates, distributes and trades of electricity and heat. The activity of the ORLEN Group companies is also service-related activity: storage of crude oil and fuels, road and rail transport, maintenance and overhaul services, laboratory, security, design, administrative, insurance and financial services. PKN ORLEN shares are quoted on the main market of the Warsaw Stock Exchange (WSE) in the continuous trading system. The first quotation of the shares were held on 26 November 1999. One of the subsidiaries of PKN ORLEN – Unipetrol a.s. is also present on the capital market. The shares are listed on the Stock Exchange in Prague. Additional information is presented in note 9.1.
1.2. PRINCIPLES OF PREPARATION OF FINANCIAL STATEMENTS The consolidated financial statements have been prepared in accordance with accounting principles contained in the International Financial Reporting Standards (IFRS), comprising International Accounting Standards (IAS) as well as Interpretations of Standing Interpretation Committee (SIC) and the International Financial Reporting Standards Interpretations Committee (IFRIC), which were adopted by the European Union (EU) and entered in force till the end 2015. The consolidated financial statements have been prepared on a historical cost basis, except derivative financial instruments, financial assets available for sale and investment properties, which have been measured at fair value. The foregoing financial statements have been prepared using the accrual basis of accounting except from the consolidated financial statement of cash flows. The scope of consolidated financial statements is compliant with Minister of Finance Regulation of 19 February 2009 on current and periodic information provided by issuers of securities and conditions for recognition as equivalent information required by the law of a non-Member state (uniform text Official Journal 2014, item 133) and covers the annual period from 1 January to 31 December 2015 and the comparative period from 1 January to 31 December 2014. Presented consolidated financial statements present a true and fair view of the ORLEN Group’s financial position as at 31 December 2015, results of its operations and cash flows for the year ended 31 December 2015. The consolidated financial statements have been prepared assuming that the ORLEN Group will continue to operate as a going concern in the foreseeable future. As at the date of approval of these consolidated financial statements, there is no evidence indicating that the ORLEN Group will not be able to continue its operations as a going concern. Duration of the Parent Company and the entities comprising the ORLEN Group is unlimited. The foregoing consolidated financial statements have been prepared with earlier taking into consideration changes in IAS1 standard - Presentation of Financial Statements: Disclosure initiative. Key elements of the modification of the scope and format of disclosures related to:
issues of significance - immaterial disclosures have not been presented even if they were part of the requirement of the standard;
aggregation / disaggregation of selected items in order to increase transparency and usefulness;
accounting principles – presented those principles, which have a significant impact on the presentation of results of operations and the situation of the Group.
Other changes to IFRS applied by the Group in accordance with their effective date as of 1 January 2015 to 31 December 2015, had no material impact on these consolidated financial statements.
ORLEN GROUP (PLN million)
CONSOLIDATED FINANCIAL STATEMENTS FOR THE YEAR 2015
(Translation of a document originally issued in Polish)
2. CONSOLIDATED STATEMENT OF PROFIT OR LOSS AND OTHER COMPREHENSIVE INCOME
5
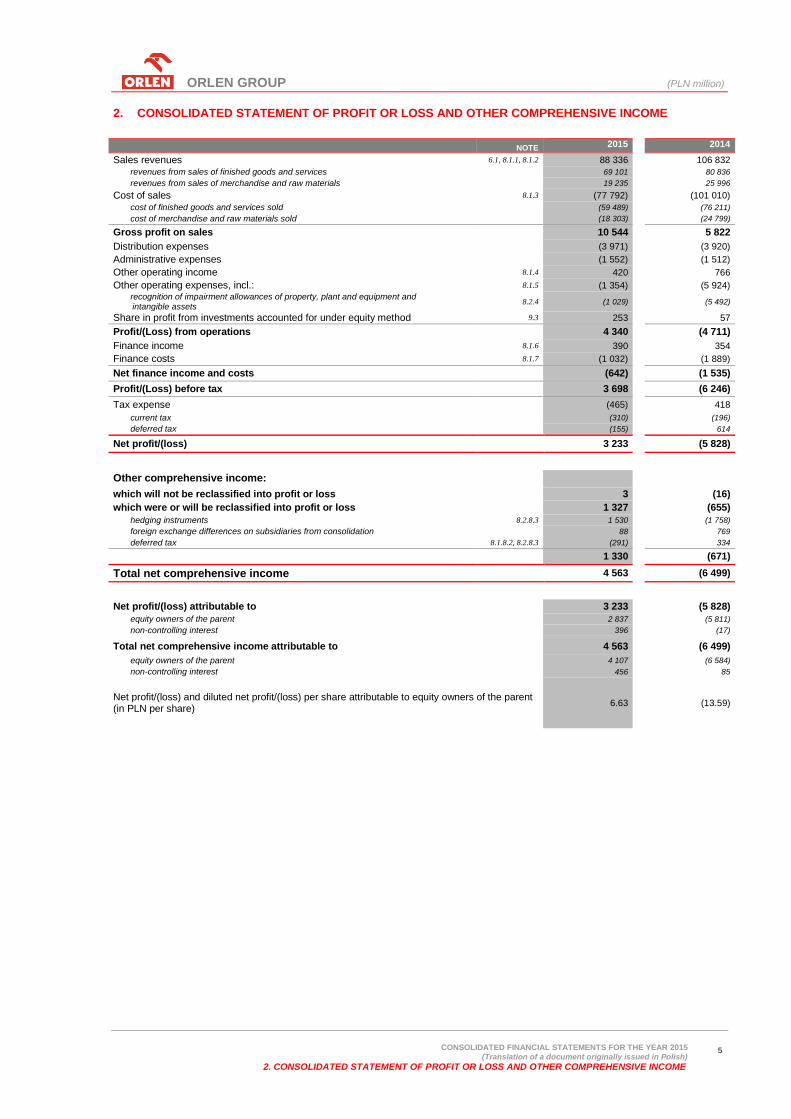
2. CONSOLIDATED STATEMENT OF PROFIT OR LOSS AND OTHER COMPREHENSIVE INCOME
NOTE 2015 2014
Sales revenues 6.1, 8.1.1, 8.1.2 88 336 106 832
revenues from sales of finished goods and services 69 101 80 836
revenues from sales of merchandise and raw materials 19 235 25 996
Cost of sales 8.1.3 (77 792) (101 010)
cost of finished goods and services sold (59 489) (76 211)
cost of merchandise and raw materials sold (18 303) (24 799)
Gross profit on sales 10 544 5 822
Distribution expenses (3 971) (3 920)
Administrative expenses (1 552) (1 512)
Other operating income 8.1.4 420 766
Other operating expenses, incl.: 8.1.5 (1 354) (5 924)
recognition of impairment allowances of property, plant and equipment and intangible assets
8.2.4 (1 029) (5 492)
Share in profit from investments accounted for under equity method 9.3 253 57
Profit/(Loss) from operations 4 340 (4 711)
Finance income 8.1.6 390 354
Finance costs 8.1.7 (1 032) (1 889)
Net finance income and costs (642) (1 535)
Profit/(Loss) before tax 3 698 (6 246)
Tax expense (465) 418
current tax (310) (196)
deferred tax (155) 614
Net profit/(loss) 3 233 (5 828)
Other comprehensive income:
which will not be reclassified into profit or loss 3 (16)
which were or will be reclassified into profit or loss 1 327 (655)
hedging instruments 8.2.8.3 1 530 (1 758)
foreign exchange differences on subsidiaries from consolidation 88 769
deferred tax 8.1.8.2, 8.2.8.3 (291) 334
1 330 (671)
Total net comprehensive income 4 563 (6 499)
Net profit/(loss) attributable to 3 233 (5 828)
equity owners of the parent 2 837 (5 811)
non-controlling interest 396 (17)
Total net comprehensive income attributable to 4 563 (6 499)
equity owners of the parent 4 107 (6 584)
non-controlling interest 456 85
Net profit/(loss) and diluted net profit/(loss) per share attributable to equity owners of the parent (in PLN per share)
6.63
(13.59)

ORLEN GROUP (PLN million)
CONSOLIDATED FINANCIAL STATEMENTS FOR THE YEAR 2015
(Translation of a document originally issued in Polish)
3. CONSOLIDATED STATEMENT OF FINANCIAL POSITION
6
3. CONSOLIDATED STATEMENT OF FINANCIAL POSITION
NOTE
31/12/2015
31/12/2014
ASSETS
Non-current assets
Property, plant and equipment 8.2.1 24 536 22 644
Intangible assets 8.2.2 1 298 703
Investments accounted for under equity method 9.3 774 672
Deferred tax assets 8.1.8.2 365 385
Other financial assets 8.2.3 147 327
Other assets 8.2.5 242 240
27 362 24 971
Current assets
Inventories 8.2.6 10 715 9 829
Trade and other receivables 8.2.7 6 641 7 092
Other financial assets 8.2.3 974 862
Cash and cash equivalents 2 348 3 937
Non-current assets classified as held for sale 97 34
20 775 21 754
Total assets 48 137 46 725
EQUITY AND LIABILITIES
EQUITY
Share capital 8.2.8.1 1 058 1 058
Share premium 8.2.8.2 1 227 1 227
Hedging reserve 8.2.8.3 (80) (1 319)
Foreign exchange differences on subsidiaries from consolidation 537 509
Retained earnings 8.2.8.4 19 431 17 296
Total equity attributable to equity owners of the parent 22 173 18 771
Non-controlling interest 8.2.8.5 2 071 1 615
Total equity 24 244 20 386
LIABILITIES
Non-current liabilities
Loans, borrowings and bonds 8.2.9 8 131 9 670
Provisions 8.2.10 710 709
Deferred tax liabilities 8.1.8.2 674 75
Other financial liabilities 8.2.11 712 1 851
10 227 12 305
Current liabilities Trade and other liabilities 8.2.12 10 820 11 257
Loans and borrowings 8.2.9 1 027 987
Provisions 8.2.10 749 648
Other financial liabilities 8.2.11 870 1 020
Other liabilities 8.2.13 200 122
13 666 14 034
Total liabilities 23 893 26 339
Total equity and liabilities 48 137 46 725
ORLEN GROUP (PLN million)
CONSOLIDATED FINANCIAL STATEMENTS FOR THE YEAR 2015
(Translation of a document originally issued in Polish)
4. CONSOLIDATED STATEMENT OF CHANGES IN EQUITY
7
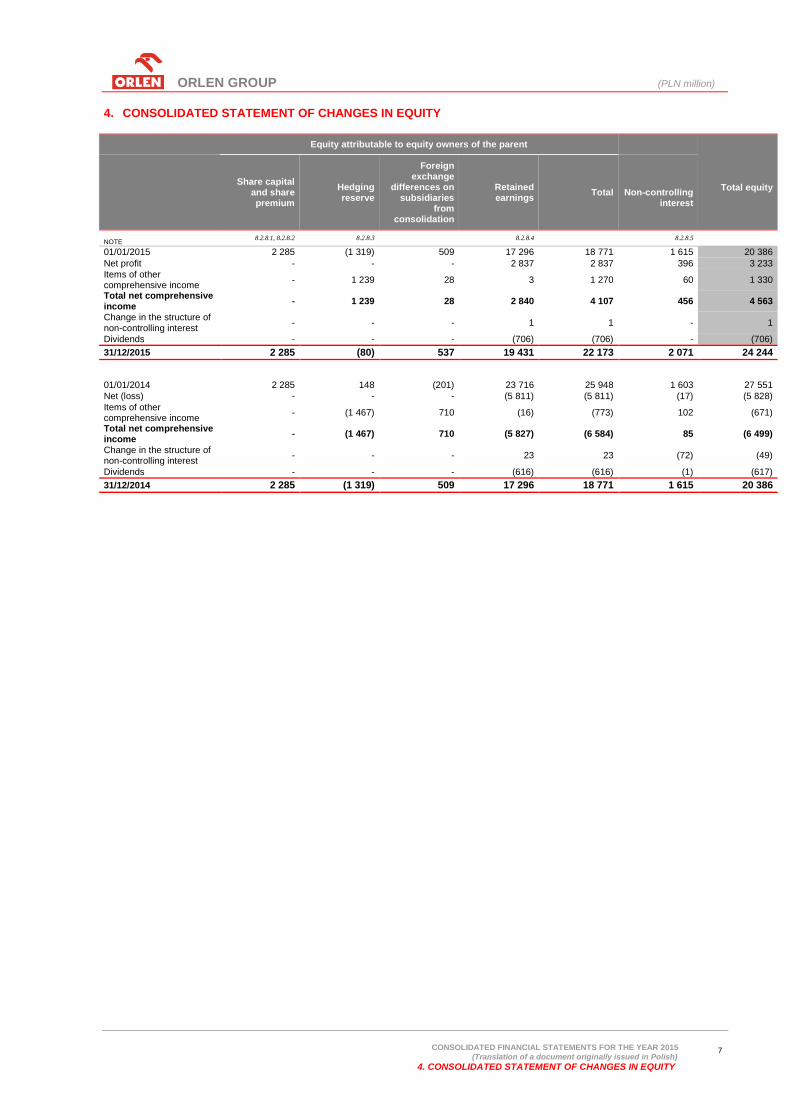
4. CONSOLIDATED STATEMENT OF CHANGES IN EQUITY
Equity attributable to equity owners of the parent
Total equity
Share capital and share premium
Hedging reserve
Foreign exchange
differences on subsidiaries
from consolidation
Retained earnings
Total
Non-controlling interest
NOTE
8.2.8.1, 8.2.8.2 8.2.8.3 8.2.8.4
8.2.8.5
01/01/2015 2 285 (1 319) 509 17 296 18 771 1 615 20 386
Net profit - - - 2 837 2 837 396 3 233
Items of other comprehensive income
- 1 239 28 3 1 270 60 1 330
Total net comprehensive income
- 1 239 28 2 840 4 107 456 4 563
Change in the structure of non-controlling interest
- - - 1 1 - 1
Dividends - - - (706) (706) - (706)
31/12/2015 2 285 (80) 537 19 431 22 173 2 071 24 244
01/01/2014 2 285 148 (201) 23 716 25 948 1 603 27 551
Net (loss) - - - (5 811) (5 811) (17) (5 828)
Items of other comprehensive income
- (1 467) 710 (16) (773) 102 (671)
Total net comprehensive income
- (1 467) 710 (5 827) (6 584) 85 (6 499)
Change in the structure of non-controlling interest
- - - 23 23 (72) (49)
Dividends - - - (616) (616) (1) (617)
31/12/2014 2 285 (1 319) 509 17 296 18 771 1 615 20 386

ORLEN GROUP (PLN million)
CONSOLIDATED FINANCIAL STATEMENTS FOR THE YEAR 2015
(Translation of a document originally issued in Polish)
5. CONSOLIDATED STATEMENT OF CASH FLOWS
8
5. CONSOLIDATED STATEMENT OF CASH FLOWS
NOTE 2015 2014
Cash flows from operating activities
Net profit/(loss) 3 233 (5 828)
Adjustments for:
Share in profit from investments accounted for under equity method 9.3 (253) (57)
Depreciation and amortisation 8.1.3 1 895 1 991
Foreign exchange loss 8.3 24 880
Interest, net 8.3 199 241
Dividends (2) (2)
Loss on investing activities, incl.: 1 106 5 015
recognition/(reversal) of impairment allowances of property, plant and equipment and intangible assets
8.1.4, 8.1.5,
8.2.4 993 5 360
Tax expense on profit/(loss) before tax 465 (418)
Change in provisions 8.3 463 141
Change in working capital 8.3 (1 320) 1 752
inventories (655) 4 106
receivables 1 258 924
liabilities (1 923) (3 278)
Other adjustments (252) (360)
Income tax (paid) 8.3 (204) (168)
Net cash provided by operating activities 5 354 3 187
Cash flows from investing activities
Acquisition of property, plant and equipment, intangible assets and perpetual usufruct of land
(3 079)
(3 700)
Acquisition of shares adjusted for received cash (1 195) (792)
Disposal of property, plant and equipment, intangible assets and perpetual usufruct of land
131
400
Dividends received 192 2
Other (145) 70
Net cash (used) in investing activities (4 096) (4 020)
Cash flows from financing activities
Proceeds from loans and borrowings received 1 896 9 639
Bonds issued - 2 350
Repayments of loans and borrowings (3 771) (9 023)
Interest paid 8.3 (258) (245)
Dividends paid 8.2.8.7 (706) (617)
Other (27) (21)
Net cash provided by / (used in) financing activities (2 866) 2 083
Net increase/(decrease) in cash and cash equivalents (1 608) 1 250
Effect of exchange rate changes 19 (2)
Cash and cash equivalents, beginning of the period 3 937 2 689
Cash and cash equivalents, end of the period 2 348 3 937
including restricted cash 22 37
ORLEN GROUP (PLN million)
CONSOLIDATED FINANCIAL STATEMENTS FOR THE YEAR 2015
(Translation of a document originally issued in Polish)
6. SEGMENTS’ DATA
9
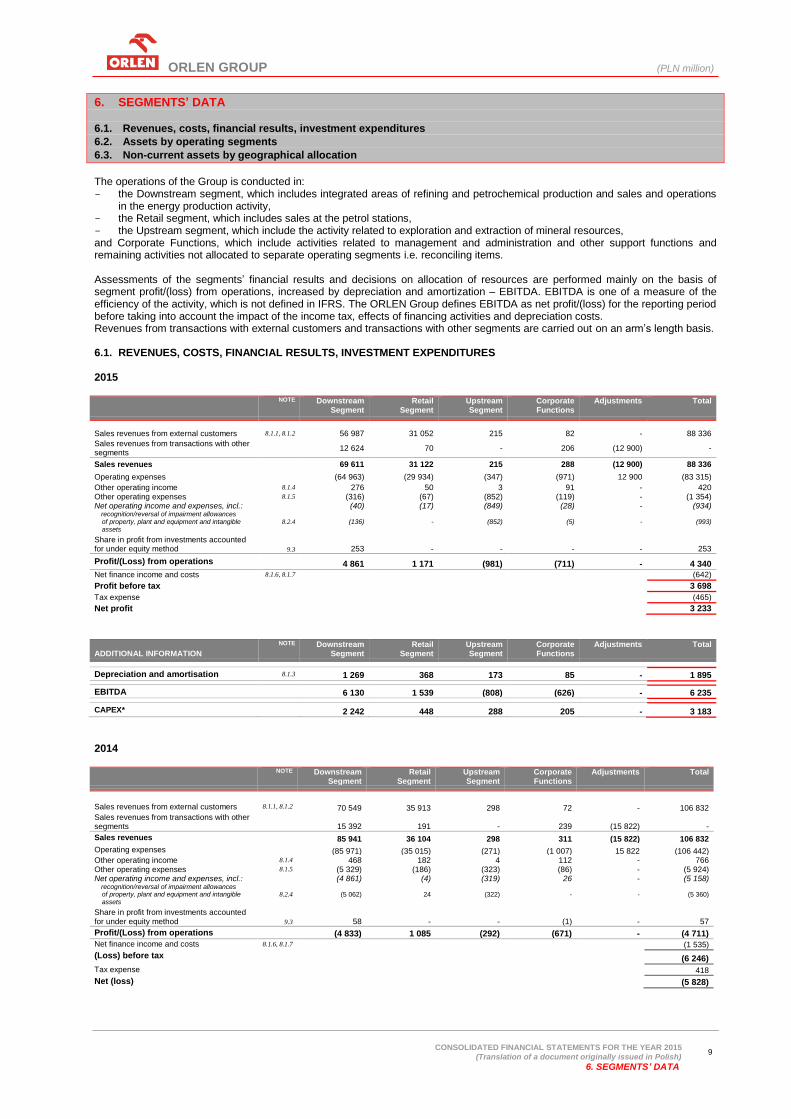
6. SEGMENTS’ DATA
6.1. Revenues, costs, financial results, investment expenditures
6.2. Assets by operating segments
6.3. Non-current assets by geographical allocation
The operations of the Group is conducted in: - the Downstream segment, which includes integrated areas of refining and petrochemical production and sales and operations
in the energy production activity, - the Retail segment, which includes sales at the petrol stations, - the Upstream segment, which include the activity related to exploration and extraction of mineral resources, and Corporate Functions, which include activities related to management and administration and other support functions and remaining activities not allocated to separate operating segments i.e. reconciling items. Assessments of the segments’ financial results and decisions on allocation of resources are performed mainly on the basis of segment profit/(loss) from operations, increased by depreciation and amortization – EBITDA. EBITDA is one of a measure of the efficiency of the activity, which is not defined in IFRS. The ORLEN Group defines EBITDA as net profit/(loss) for the reporting period before taking into account the impact of the income tax, effects of financing activities and depreciation costs. Revenues from transactions with external customers and transactions with other segments are carried out on an arm’s length basis. 6.1. REVENUES, COSTS, FINANCIAL RESULTS, INVESTMENT EXPENDITURES 2015
NOTE Downstream Segment
Retail Segment
Upstream Segment
Corporate Functions
Adjustments Total
Sales revenues from external customers 8.1.1, 8.1.2 56 987 31 052 215 82 - 88 336
Sales revenues from transactions with other segments
12 624 70 - 206 (12 900) -
Sales revenues 69 611 31 122 215 288 (12 900) 88 336
Operating expenses (64 963) (29 934) (347) (971) 12 900 (83 315)
Other operating income 8.1.4 276 50 3 91 - 420 Other operating expenses 8.1.5 (316) (67) (852) (119) - (1 354) Net operating income and expenses, incl.: (40) (17) (849) (28) - (934)
recognition/reversal of impairment allowances of property, plant and equipment and intangible assets
8.2.4 (136) - (852) (5) - (993)
Share in profit from investments accounted for under equity method 9.3 253 - - - - 253
Profit/(Loss) from operations 4 861 1 171 (981) (711) - 4 340
Net finance income and costs 8.1.6, 8.1.7 (642)
Profit before tax 3 698
Tax expense (465)
Net profit 3 233
ADDITIONAL INFORMATION
NOTE Downstream Segment
Retail Segment
Upstream Segment
Corporate Functions
Adjustments Total
Depreciation and amortisation 8.1.3 1 269 368 173 85 - 1 895
EBITDA 6 130 1 539 (808) (626) - 6 235
CAPEX* 2 242 448 288 205 - 3 183
2014
NOTE Downstream Segment
Retail Segment
Upstream Segment
Corporate Functions
Adjustments Total
Sales revenues from external customers 8.1.1, 8.1.2 70 549 35 913 298 72 - 106 832 Sales revenues from transactions with other segments
15 392 191 - 239 (15 822) -
Sales revenues 85 941 36 104 298 311 (15 822) 106 832
Operating expenses (85 971) (35 015) (271) (1 007) 15 822 (106 442) Other operating income 8.1.4 468 182 4 112 - 766 Other operating expenses 8.1.5 (5 329) (186) (323) (86) - (5 924) Net operating income and expenses, incl.: (4 861) (4) (319) 26 - (5 158)
recognition/reversal of impairment allowances of property, plant and equipment and intangible assets
8.2.4 (5 062) 24 (322) - - (5 360)
Share in profit from investments accounted for under equity method 9.3 58 - - (1) - 57
Profit/(Loss) from operations (4 833) 1 085 (292) (671) - (4 711)
Net finance income and costs 8.1.6, 8.1.7 (1 535)
(Loss) before tax
(6 246)
Tax expense 418
Net (loss) (5 828)
ORLEN GROUP (PLN million)
CONSOLIDATED FINANCIAL STATEMENTS FOR THE YEAR 2015
(Translation of a document originally issued in Polish)
6. SEGMENTS’ DATA
10
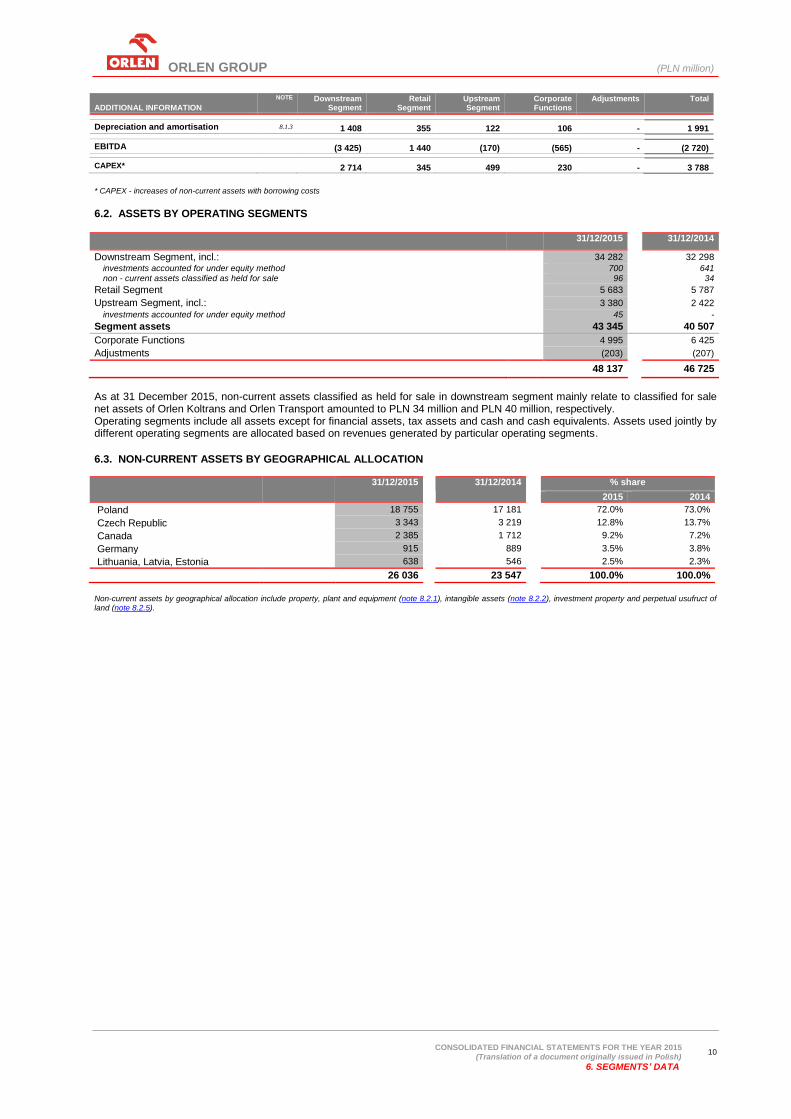
ADDITIONAL INFORMATION
NOTE Downstream Segment
Retail Segment
Upstream Segment
Corporate Functions
Adjustments Total
Depreciation and amortisation 8.1.3 1 408 355 122 106 - 1 991
EBITDA (3 425) 1 440 (170) (565) - (2 720)
CAPEX* 2 714 345 499 230 - 3 788
* CAPEX - increases of non-current assets with borrowing costs
6.2. ASSETS BY OPERATING SEGMENTS
31/12/2015
31/12/2014
Downstream Segment, incl.: 34 282 32 298
investments accounted for under equity method 700 641 non - current assets classified as held for sale 96 34
Retail Segment 5 683 5 787
Upstream Segment, incl.: 3 380 2 422
investments accounted for under equity method 45 -
Segment assets 43 345 40 507
Corporate Functions 4 995 6 425
Adjustments (203) (207)
48 137 46 725
As at 31 December 2015, non-current assets classified as held for sale in downstream segment mainly relate to classified for sale net assets of Orlen Koltrans and Orlen Transport amounted to PLN 34 million and PLN 40 million, respectively. Operating segments include all assets except for financial assets, tax assets and cash and cash equivalents. Assets used jointly by different operating segments are allocated based on revenues generated by particular operating segments.
6.3. NON-CURRENT ASSETS BY GEOGRAPHICAL ALLOCATION
31/12/2015
31/12/2014
% share
2015 2014
Poland 18 755 17 181 72.0% 73.0%
Czech Republic 3 343 3 219 12.8% 13.7%
Canada 2 385 1 712 9.2% 7.2%
Germany 915 889 3.5% 3.8%
Lithuania, Latvia, Estonia 638 546 2.5% 2.3%
26 036 23 547 100.0% 100.0%
Non-current assets by geographical allocation include property, plant and equipment (note 8.2.1), intangible assets (note 8.2.2), investment property and perpetual usufruct of land (note 8.2.5).
ORLEN GROUP (PLN million)
CONSOLIDATED FINANCIAL STATEMENTS FOR THE YEAR 2015
(Translation of a document originally issued in Polish)
7. DESCRIPTION OF SIGINIFICANT FACTORS INFLUENCING THE FINANCIAL DATA FOR THE YEAR 2015
11
7. DESCRIPTION OF SIGNIFICANT FACTORS INFLUENCING THE FINANCIAL DATA FOR THE YEAR 2015
OPERATING AND FINANCIAL RESULTS
In 2015 the Group achieved record-high sales volumes of 38.7 million tonnes, which were higher by 8.1% in comparison with previous year. Sales volumes were higher in all operating segments of the Group. In value terms, sales revenues were lower by PLN (18,496) million due to the decrease in crude oil prices and therefore lower trading of the majority of products manufactured by the Group.
Crude oil processing in 2015 reached a record-high level of 30.9 million tonnes and was higher by 13.3% in comparison with the previous year. Higher crude oil processing was mainly the result of a positive macroeconomic environment and an increase of capacities by 2.8 million t/year after acquisition of shares of Česká Rafinérská by Unipetrol from ENI in 2015. As a result, EBITDA profit before recognition of impairment allowances of property, plant and equipment and intangible assets for 2015, amounted to PLN 7,228 million and was higher by PLN 4,588 million in comparison with the previous year. This increase resulted mainly from positive changes of macroeconomic factors reflected in particular by an increase of model margin downstream (MMD*) by USD/bbl 2.4 and from the depreciation of average PLN exchange rate versus the USD and an increase in sales volumes.
Net impairment allowances of property, plant and equipment and intangible assets for 2015 amounted to PLN (993) million and concerned mainly exploration assets of the ORLEN Upstream Group in Poland of PLN (429) million as a result of narrowing the search area, petrochemical assets of Unipetrol Group related to the accident at the ethylene production installation in August 2015 in the amount of PLN (93) million and impairment allowances of extraction assets in Canada of PLN (423) million. Additional information is presented in note 8.2.4. After consideration of the above mentioned impairment allowances, EBITDA profit of the ORLEN Group in 2015 amounted to PLN 6,235 million.
The negative balance on financing activities in 2015 amounted to PLN (642) million and consisted mainly of negative foreign exchange differences from revaluation of loans and other items in foreign currencies of PLN (317) million, settlement and valuation of net financial instruments of PLN (177) million and net interest of PLN (123) million.
After consideration of tax charges of PLN (465) million, the net profit of the Group for 2015 amounted to PLN 3,233 million.
CASH FLOWS AND INDEBTEDNESS
The net cash flows provided by operating activities in 2015 amounted to PLN 5,354 million and comprised mainly of the EBITDA profit before impairment allowances of property, plant and equipment and intangible assets in the amount PLN 7,228 million as well as the negative impact of a net working capital increase of PLN (1,320) million, negative net exchange differences in the amount PLN (293) million and paid income taxes in the amount PLN (204) million. The increase in net working capital resulted mainly from an increase in the value of inventories, including the repurchase of 2 tranches of mandatory reserves for the total amount of PLN (3,644) million in part offset by a decrease in crude oil prices and therefore, the prices of petroleum products. Additional information is presented in note 8.2.6. Net cash used in investing activities in 2015 amounted to PLN (4,096) million and included mainly net expenses for the acquisition of property, plant and equipment, intangible assets and the perpetual usufruct of land of PLN (2,948) million, acquisition of shares of Česká Rafinérská a.s. from ENI decreased by acquired cash and cash equivalents of PLN (35) million and acquisition of shares of upstream companies, Kicking Horse Energy Inc. and FX Energy Inc., in the total amount of PLN (1,161) million. Additional information regarding the acquisition of exploration assets in Canada and Poland is presented in note 9.2.1.
After consideration of interest paid in the amount PLN (258) million, dividends paid in the amount PLN (706) million (additional information is presented in note 8.2.8.7), the effect of exchange rate changes in the amount PLN 19 million and other factors included in other financing activity in the total amount PLN (29) million, net indebtedness of the Group, at the end of 2015, was higher by PLN (90) million and resulted mainly from including the net indebtedness of purchased upstream companies in the total amount of PLN (374) million and amounted to PLN 6,810 million.
Net financial leverage in 2015 amounted to 28.1%. Additional information is presented in note 8.2.8.8. Detailed information on operating and finance results of the Group is presented in chapter 2 and 3 of the Management Board Report on the operations of the ORLEN Capital Group. * The integration of high-class production assets and the extended value chain through the full integration of the refining, petrochemical and power activities of ORLEN Group were the basis for determining the index - Model Margin Downstream (MMD), which reflects the base structure of the input basket and refinery and petrochemical products. The indicator’s changes permit to estimate the impact of typical macroeconomic factors on operating results of the downstream segment.
ORLEN GROUP (PLN million)
CONSOLIDATED FINANCIAL STATEMENTS FOR THE YEAR 2015
(Translation of a document originally issued in Polish)
8. EXPLANATORY NOTES TO THE CONSOLIDATED FINANCIAL STATEMENTS
12
8. EXPLANATORY NOTES TO THE CONSOLIDATED FINANCIAL STATEMENTS
8.1. Explanatory notes to the statement of profit or loss and other comprehensive income
8.2. Explanatory notes to the statement of financial position
8.3. Explanatory notes to the statement of cash flows
8.4. Explanatory notes to the financial instruments and financial risks
8.5. Other explanatory notes
8.6. Accounting principles
8.7. Significant values based on professional judgement and estimates
8.8. Information concerning significant proceedings in front of court, body appropriate for arbitration proceedings or in
front of public administration bodies
8.1. EXPLANATORY NOTES TO THE STATEMENT OF PROFIT OR LOSS AND OTHER COMPREHENSIVE INCOME
8.1.1. Sales revenues by assortments
2015
2014 % share
2015 2014
Downstream Segment
Medium distillates 25 062
28 976
28.4% 27.1%
Light distillates 11 528
13 270
13.1% 12.4%
Heavy fractions 4 610 7 701 5.2% 7.2%
Monomers 2 978 3 447 3.4% 3.2%
Polymers 2 341 2 953 2.7% 2.8%
PTA 1 532 1 767 1.7% 1.7%
Plastics 1 492 1 424 1.7% 1.3%
Fertilizers 1 057 1 065 1.2% 1,0%
Aromas 930 1 662 1.1% 1.6%
Other 5 457 8 284 6.0% 7.6%
56 987 70 549 64.5% 65.9%
Retail Segment
Medium distillates 15 567
18 659
17.6% 17.5%
Light distillates 12 084
13 951
13.7% 13.1%
Other 3 401 3 303 3.9% 3.1%
31 052 35 913 35.2% 33.7%
Upstream Segment 215 298 0.2% 0.3%
Corporate Functions 82 72 0.1% 0.1%
88 336 106 832 100.0% 100.0%
In 2015 and 2014 no leading customers were identified in the Group, for which turnover would exceeded 10% of total revenues from sale of the ORLEN Group.
8.1.2. Sales revenues geographical division - disclosed by customer’s premises countries
2015
2014
% share
2015 2014
Poland 36 223 45 095 41.0% 42.2%
Germany 17 073 19 310 19.3% 18.1%
Czech Republic 10 671 12 669 12.1% 11.9%
Lithuania, Latvia, Estonia 6 886 8 802 7.8% 8.2%
Other countries 17 483 20 956 19.8% 19.6%
88 336 106 832 100.0% 100.0%
The line “Other countries” comprises mainly sales to customers from Switzerland, Ukraine, Hungary, Slovakia, Great Britain, the Netherlands and Austria.
ORLEN GROUP (PLN million)
CONSOLIDATED FINANCIAL STATEMENTS FOR THE YEAR 2015
(Translation of a document originally issued in Polish)
8. EXPLANATORY NOTES TO THE CONSOLIDATED FINANCIAL STATEMENTS
13
8.1.3. Cost by nature
2015
2014 % share
2015 2014
Materials and energy (54 542) (70 586) 70.1% 69.9%
Cost of merchandise and raw materials sold (18 303) (24 799) 23.5% 24.6%
External services (4 352) (4 316) 5.6% 4.3%
Employee benefits (2 110) (2 059) 2.7% 2.0%
payroll expenses (1 700) (1 667) 2.2% 1.7%
social security expenses (354) (347) 0.4% 0.3%
other (56) (45) 0.1% 0.0%
Depreciation and amortisation (1 895) (1 991) 2.4% 2.0%
Taxes and charges (1 152) (653) 1.5% 0.6%
Other (1 835) (6 383) 2.4% 6.3%
(84 189)
(110 787)
108.2% 109.7%
Change in inventories (693) (1 783)
0.9% 1.8%
Cost of products and services for own use 213 204
(0.3%) (0.2%)
Operating expenses (84 669)
(112 366)
108.8% 111.3%
Distribution expenses 3 971 3 920
(5.1%) (3.9%)
Administrative expenses 1 552 1 512
(2.0)% (1.5%)
Other operating expenses 1 354 5 924
(1.7)% (5.9%)
Cost of sales (77 792)
(101 010)
100.0% 100.0%
8.1.4. Other operating income
NOTE 2015 2014
Profit on sale of non-current non-financial assets 59 61
Gain on bargain purchase of shares 63 180
Reversal of provisions 32 63
Reversal of receivables impairment allowances 17 38
Reversal of impairment allowances of property, plant and equipment and intangible assets
8.2.4 36
132
Penalties and compensation 74 91
Other 139 201
420 766
8.1.5. Other operating expenses
NOTE 2015 2014
Loss on sale of non-current non-financial assets (38) (55)
Recognition of provisions (101) (173)
Recognition of receivables impairment allowances (47) (69)
Recognition of impairment allowances of property, plant and equipment and intangible assets
8.2.4 (1 029)
(5 492)
Penalties, damages and compensation (53) (22)
Other (86) (113)
(1 354) (5 924)
8.1.6. Finance income
2015 2014
Interest 82 75
Settlement and valuation of derivative financial instruments 270 235
Other 38 44
390 354
8.1.7. Finance costs
2015 2014
Interest (205) (242)
Foreign exchange loss surplus (317) (1 459)
Settlement and valuation of derivative financial instruments (447) (138)
Other (63) (50)
(1 032) (1 889)
ORLEN GROUP (PLN million)
CONSOLIDATED FINANCIAL STATEMENTS FOR THE YEAR 2015
(Translation of a document originally issued in Polish)
8. EXPLANATORY NOTES TO THE CONSOLIDATED FINANCIAL STATEMENTS
14
8.1.8. Tax expense 8.1.8.1. The differences between tax expense recognized in profit or loss and the amount calculated based on the rate
from profit/(loss) before tax
2015 2014
Profit/(Loss) before tax 3 698 (6 246)
Tax expense for 2015 and 2014 by the valid tax rate in Poland (19%) (703) 1 187
Differences between tax rates 57 (182)
Lithuania (15%) 34 (184)
Germany (29%) (14) (13)
Canada (26%), (2014 - 25%) 37 15
Impairment allowances of property, plant and equipment and intangible assets - (896)
Tax losses 135 250
Investments accounted for under equity method 48 11
Other (2) 48
Tax expense (465) 418
Effective tax rate 13% 7%
As at 31 December 2015 and as at 31 December 2014, the Group had unsettled tax losses mainly relating to the ORLEN Lietuva Group, the Unipetrol Group and the Anwil Group of PLN 1,155 million and PLN 2,095 million respectively, for which no deferred tax asset was recognized due to the lack of certainty regarding the possibility of their realization in the future. 8.1.8.2. Deferred tax
31/12/2014
Deferred tax recognized in profit
or loss
Deferred tax recognized in other
comprehensive income
Acquisition of subsidiary
Foreign exchange differences on
subsidiaries from consolidation
recognized in other comprehensive income
31/12/2015
Deferred tax assets Impairment allowances 359 420 - - - 779
Provisions and accruals 298 8 (1) - 1 306
Tax loss 438 (256) - 7 - 189
Valuation of financial instruments 297 4 (291) - - 10
Other 120 (55) - 66 7 138
1 512 121 (292) 73 8 1 422
Deferred tax liabilities
Temporary differences related to non-current assets
1 068 221 - 239 14 1 542
Other 134 55 - - - 189
1 202 276 - 239 14 1 731
310 (155) (292) (166) (6) (309)
The above positions of deferred tax assets and liabilities are netted on the level of particular financial statements of the Group companies. As at 31 December 2015 deferred tax assets and liabilities amounted to PLN 365 million and PLN 674 million, respectively.
ORLEN GROUP (PLN million)
CONSOLIDATED FINANCIAL STATEMENTS FOR THE YEAR 2015
(Translation of a document originally issued in Polish)
8. EXPLANATORY NOTES TO THE CONSOLIDATED FINANCIAL STATEMENTS
15
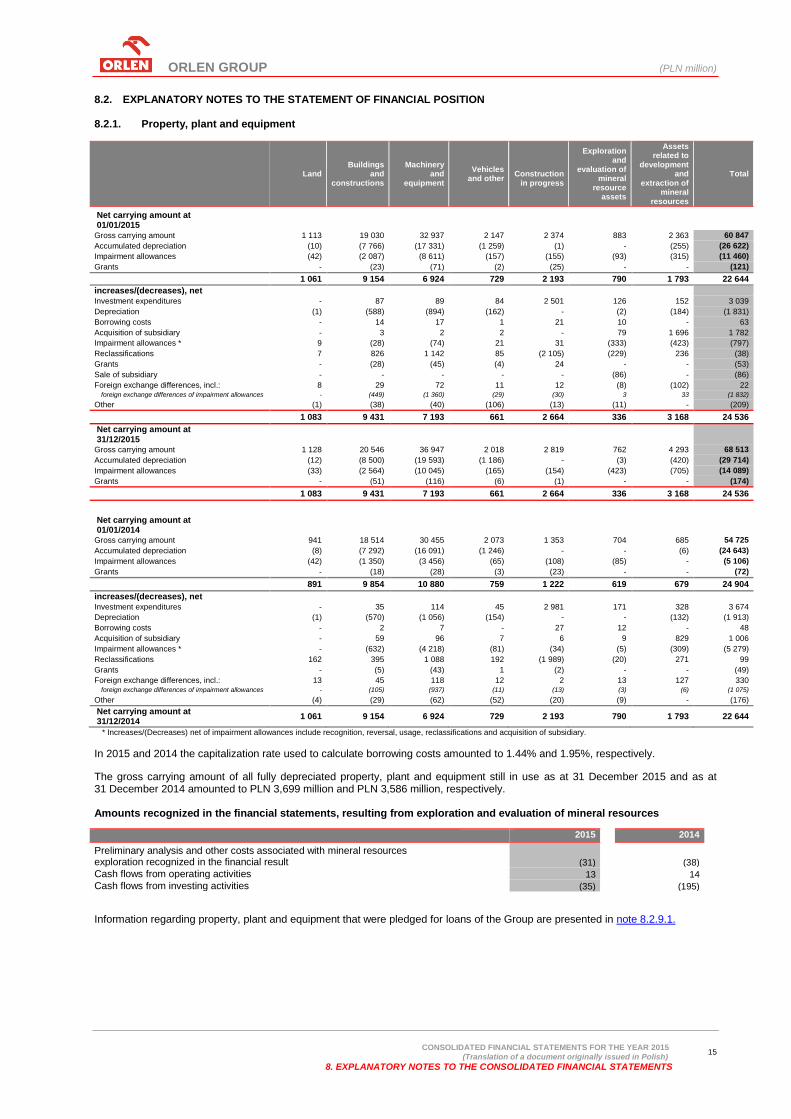
8.2. EXPLANATORY NOTES TO THE STATEMENT OF FINANCIAL POSITION 8.2.1. Property, plant and equipment
Land Buildings
and constructions
Machinery and
equipment
Vehicles and other
Construction
in progress
Exploration and
evaluation of mineral
resource assets
Assets related to
development and
extraction of mineral
resources
Total
Net carrying amount at 01/01/2015
Gross carrying amount 1 113 19 030 32 937 2 147 2 374 883 2 363 60 847
Accumulated depreciation (10) (7 766) (17 331) (1 259) (1) - (255) (26 622)
Impairment allowances (42) (2 087) (8 611) (157) (155) (93) (315) (11 460)
Grants - (23) (71) (2) (25) - - (121)
1 061 9 154 6 924 729 2 193 790 1 793 22 644
increases/(decreases), net
Investment expenditures - 87 89 84 2 501 126 152 3 039
Depreciation (1) (588) (894) (162) - (2) (184) (1 831)
Borrowing costs - 14 17 1 21 10 - 63
Acquisition of subsidiary - 3 2 2 - 79 1 696 1 782
Impairment allowances * 9 (28) (74) 21 31 (333) (423) (797)
Reclassifications 7 826 1 142 85 (2 105) (229) 236 (38)
Grants - (28) (45) (4) 24 - - (53)
Sale of subsidiary - - - - - (86) - (86)
Foreign exchange differences, incl.: 8 29 72 11 12 (8) (102) 22 foreign exchange differences of impairment allowances - (449) (1 360) (29) (30) 3 33 (1 832)
Other (1) (38) (40) (106) (13) (11) - (209)
1 083 9 431 7 193 661 2 664 336 3 168 24 536
Net carrying amount at 31/12/2015
Gross carrying amount 1 128 20 546 36 947 2 018 2 819 762 4 293 68 513
Accumulated depreciation (12) (8 500) (19 593) (1 186) - (3) (420) (29 714)
Impairment allowances (33) (2 564) (10 045) (165) (154) (423) (705) (14 089)
Grants - (51) (116) (6) (1) - - (174)
1 083 9 431 7 193 661 2 664 336 3 168 24 536
Net carrying amount at 01/01/2014 Gross carrying amount 941 18 514 30 455 2 073 1 353 704 685 54 725
Accumulated depreciation (8) (7 292) (16 091) (1 246) - - (6) (24 643)
Impairment allowances (42) (1 350) (3 456) (65) (108) (85) - (5 106)
Grants - (18) (28) (3) (23) - - (72)
891 9 854 10 880 759 1 222 619 679 24 904
increases/(decreases), net
Investment expenditures - 35 114 45 2 981 171 328 3 674
Depreciation (1) (570) (1 056) (154) - - (132) (1 913)
Borrowing costs - 2 7 - 27 12 - 48
Acquisition of subsidiary - 59 96 7 6 9 829 1 006
Impairment allowances * - (632) (4 218) (81) (34) (5) (309) (5 279)
Reclassifications 162 395 1 088 192 (1 989) (20) 271 99
Grants - (5) (43) 1 (2) - - (49)
Foreign exchange differences, incl.: 13 45 118 12 2 13 127 330 foreign exchange differences of impairment allowances - (105) (937) (11) (13) (3) (6) (1 075)
Other (4) (29) (62) (52) (20) (9) - (176)
Net carrying amount at 31/12/2014
1 061 9 154 6 924 729 2 193 790 1 793 22 644
* Increases/(Decreases) net of impairment allowances include recognition, reversal, usage, reclassifications and acquisition of subsidiary.
In 2015 and 2014 the capitalization rate used to calculate borrowing costs amounted to 1.44% and 1.95%, respectively.
The gross carrying amount of all fully depreciated property, plant and equipment still in use as at 31 December 2015 and as at 31 December 2014 amounted to PLN 3,699 million and PLN 3,586 million, respectively. Amounts recognized in the financial statements, resulting from exploration and evaluation of mineral resources
2015 2014
Preliminary analysis and other costs associated with mineral resources exploration recognized in the financial result (31) (38)
Cash flows from operating activities 13 14
Cash flows from investing activities (35) (195)
Information regarding property, plant and equipment that were pledged for loans of the Group are presented in note 8.2.9.1.
ORLEN GROUP (PLN million)
CONSOLIDATED FINANCIAL STATEMENTS FOR THE YEAR 2015
(Translation of a document originally issued in Polish)
8. EXPLANATORY NOTES TO THE CONSOLIDATED FINANCIAL STATEMENTS
16
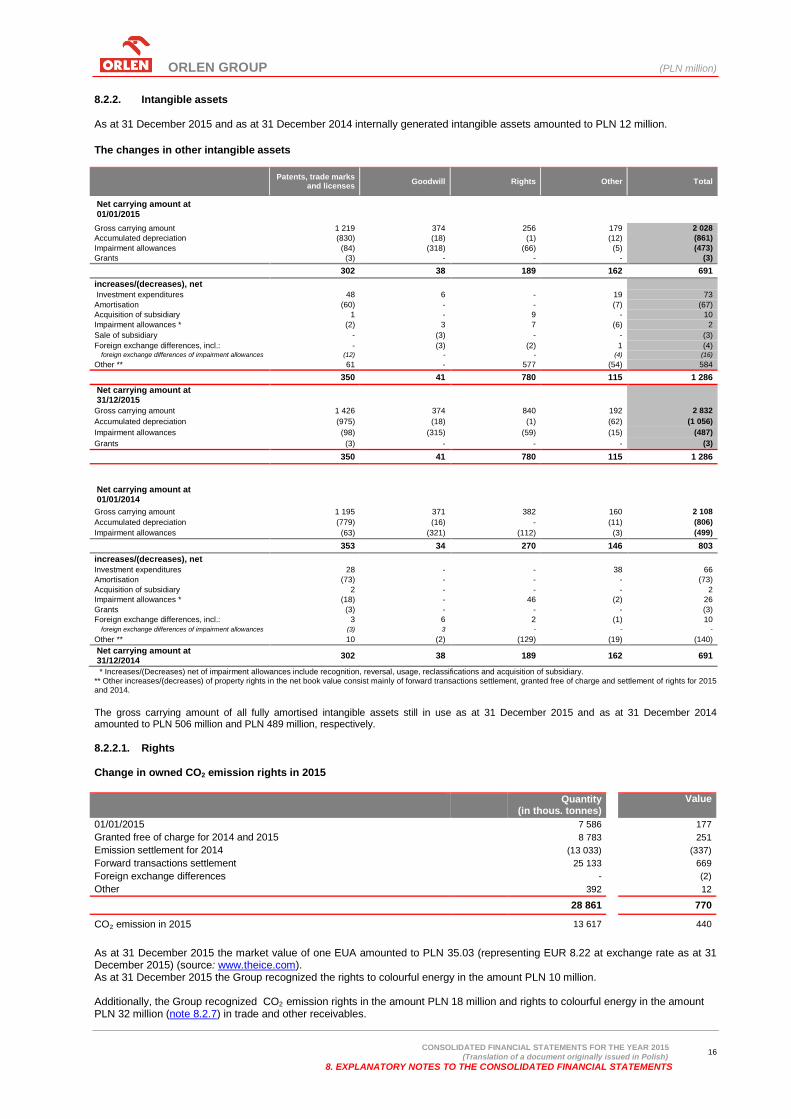
8.2.2. Intangible assets As at 31 December 2015 and as at 31 December 2014 internally generated intangible assets amounted to PLN 12 million.
The changes in other intangible assets
Patents, trade marks
and licenses Goodwill Rights Other Total
Net carrying amount at 01/01/2015
Gross carrying amount 1 219 374 256 179 2 028
Accumulated depreciation (830) (18) (1) (12) (861)
Impairment allowances (84) (318) (66) (5) (473)
Grants (3) - - - (3)
302 38 189 162 691
increases/(decreases), net
Investment expenditures 48 6 - 19 73
Amortisation (60) - - (7) (67)
Acquisition of subsidiary 1 - 9 - 10
Impairment allowances * (2) 3 7 (6) 2
Sale of subsidiary - (3) - - (3)
Foreign exchange differences, incl.: - (3) (2) 1 (4) foreign exchange differences of impairment allowances (12) - - (4) (16)
Other ** 61 - 577 (54) 584
350 41 780 115 1 286
Net carrying amount at 31/12/2015
Gross carrying amount 1 426 374 840 192 2 832
Accumulated depreciation (975) (18) (1) (62) (1 056)
Impairment allowances (98) (315) (59) (15) (487)
Grants (3) - - - (3)
350 41 780 115 1 286
Net carrying amount at 01/01/2014
Gross carrying amount 1 195 371 382 160 2 108
Accumulated depreciation (779) (16) - (11) (806)
Impairment allowances (63) (321) (112) (3) (499)
353 34 270 146 803
increases/(decreases), net
Investment expenditures 28 - - 38 66
Amortisation (73) - - - (73)
Acquisition of subsidiary 2 - - - 2
Impairment allowances * (18) - 46 (2) 26
Grants (3) - - - (3)
Foreign exchange differences, incl.: 3 6 2 (1) 10
foreign exchange differences of impairment allowances (3) 3 - - -
Other ** 10 (2) (129) (19) (140)
Net carrying amount at 31/12/2014
302 38 189 162 691
* Increases/(Decreases) net of impairment allowances include recognition, reversal, usage, reclassifications and acquisition of subsidiary. ** Other increases/(decreases) of property rights in the net book value consist mainly of forward transactions settlement, granted free of charge and settlement of rights for 2015 and 2014.
The gross carrying amount of all fully amortised intangible assets still in use as at 31 December 2015 and as at 31 December 2014 amounted to PLN 506 million and PLN 489 million, respectively. 8.2.2.1. Rights Change in owned CO2 emission rights in 2015
Quantity (in thous. tonnes)
Value
01/01/2015 7 586 177
Granted free of charge for 2014 and 2015 8 783 251
Emission settlement for 2014 (13 033) (337)
Forward transactions settlement
25 133
669
Foreign exchange differences - (2)
Other 392 12
28 861 770
CO₂ emission in 2015 13 617 440
As at 31 December 2015 the market value of one EUA amounted to PLN 35.03 (representing EUR 8.22 at exchange rate as at 31 December 2015) (source: www.theice.com). As at 31 December 2015 the Group recognized the rights to colourful energy in the amount PLN 10 million.
Additionally, the Group recognized CO2 emission rights in the amount PLN 18 million and rights to colourful energy in the amount PLN 32 million (note 8.2.7) in trade and other receivables.
ORLEN GROUP (PLN million)
CONSOLIDATED FINANCIAL STATEMENTS FOR THE YEAR 2015
(Translation of a document originally issued in Polish)
8. EXPLANATORY NOTES TO THE CONSOLIDATED FINANCIAL STATEMENTS
17
8.2.3. Other financial assets
Non-current Current Total
31/12/2015 31/12/2014 31/12/2015 31/12/2014 31/12/2015 31/12/2014
Cash flows hedge instruments 135 302 797 692 932 994
currency forwards 45 16 78 180 123 196
commodity swaps 90 286 719 512 809 798
Derivatives not designated as hedge accounting
- - 8 43 8 43
currency forwards - - 2 8 2 8
commodity swaps - - 6 35 6 35
Embedded derivatives - - 1 1 1 1
currency swaps - - 1 1 1 1
Receivables on cash flows settled hedge instruments
- - 159 101 159 101
Other 12 25 9 25 21 50
147 327 974 862 1 121 1 189
The line “Other” includes deposits and loans granted.
8.2.4. Impairment of property, plant and equipment and intangible assets Net impairment allowances of property, plant and equipment and intangible assets
NOTE 2015
2014
ORLEN Upstream Canada (423)
(311)
ORLEN Upstream (429)
(11)
ORLEN Lietuva Group
1
(4 181)
UNIPETROL Group (111)
(752)
Rafineria Nafty Jedlicze Group
-
(42)
Anwil Group - Spolana (7)
(64)
(969)
(5 361)
Other impairment allowances (24)
1
8.1.4, 8.1.5 (993) (5 360)
While determining the value in use, the expected cash flows based on the most recent and approved financial plan, and thereafter the Group assumed constant rate of cash flow growth, estimated at the level of long-term inflation. Expected cash flows were discounted to their present value using a discount rate calculated as a weighted average cost of engaged equity and debt, before tax, which reflected the current market estimation of time value of money and the risk specific to the asset. ORLEN Upstream Canada An observed decline in crude oil prices on global markets affects the upstream segment results of ORLEN Group. As a result of impairment testing carried out at the end of 2015 in accordance with IAS 36 - impairment of assets, an impairment allowance of development and extraction of mineral resources assets of the ORLEN Upstream Canada within the ORLEN Upstream Group of PLN (423) million was recognized. As at 31 December 2015 the value in use of development and extraction of mineral resources assets in Canada was based on the estimated crude oil prices and reserves evaluation prepared by an independent company in accordance with professional standards for the Canadian market (APEGA - the Code of Ethics of the Association of Professional Engineers and Geoscientists of Alberta). Net cash flow projections used for the purposes of estimating the value in use of assets were discounted to their present value using a base discount rate before tax at 9% which reflects the current market value of money and the specific risks to the assets on the Canadian market. Future financial performance was based on a number of assumptions, a part of which concern macroeconomic factors, including: commodity prices, product quotations on global markets, foreign exchange rates or interest rates, remain beyond the control of the Group. Changes in these assumptions can affect impairment tests results of property, plant and equipment and intangible assets and as a result may lead to changes in the financial standing and financial results of the Group.
Sensitivity analysis of the ORLEN Upstream Canada assets value in use within an impairment test performed as at 31 December 2015
PLN million HYDROCARBONS PRICES
DIS
CO
UN
T R
AT
E
change -5% 0% 5%
- 0.5 p.p. increase in allowance decrease in allowance decrease in allowance
(14) 34 81
0.0 p.p. increase in allowance - decrease in allowance
(46) 46
+ 0.5 p.p. increase in allowance increase in allowance decrease in allowance
(76) (32) 12
ORLEN GROUP (PLN million)
CONSOLIDATED FINANCIAL STATEMENTS FOR THE YEAR 2015
(Translation of a document originally issued in Polish)
8. EXPLANATORY NOTES TO THE CONSOLIDATED FINANCIAL STATEMENTS
18
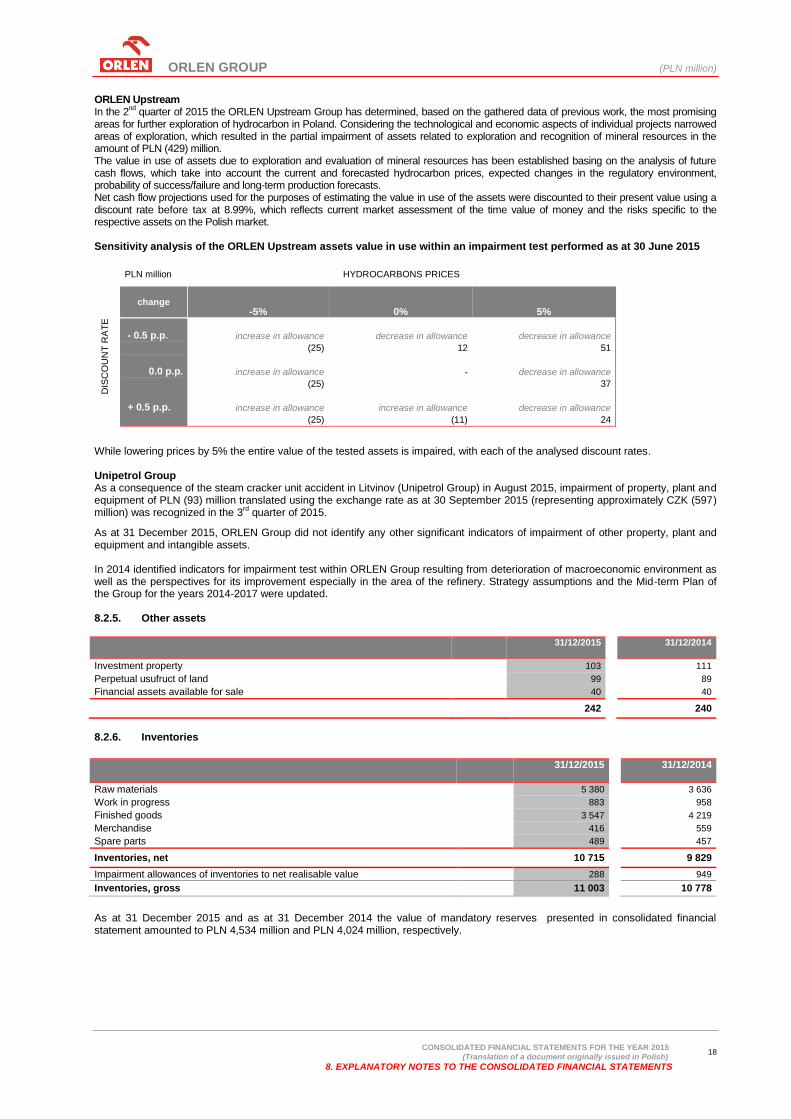
ORLEN Upstream In the 2
nd quarter of 2015 the ORLEN Upstream Group has determined, based on the gathered data of previous work, the most promising
areas for further exploration of hydrocarbon in Poland. Considering the technological and economic aspects of individual projects narrowed areas of exploration, which resulted in the partial impairment of assets related to exploration and recognition of mineral resources in the amount of PLN (429) million. The value in use of assets due to exploration and evaluation of mineral resources has been established basing on the analysis of future cash flows, which take into account the current and forecasted hydrocarbon prices, expected changes in the regulatory environment, probability of success/failure and long-term production forecasts. Net cash flow projections used for the purposes of estimating the value in use of the assets were discounted to their present value using a discount rate before tax at 8.99%, which reflects current market assessment of the time value of money and the risks specific to the respective assets on the Polish market. Sensitivity analysis of the ORLEN Upstream assets value in use within an impairment test performed as at 30 June 2015
PLN million HYDROCARBONS PRICES
DIS
CO
UN
T R
AT
E
change -5% 0% 5%
- 0.5 p.p. increase in allowance decrease in allowance decrease in allowance
(25) 12 51
0.0 p.p. increase in allowance - decrease in allowance
(25) 37
+ 0.5 p.p. increase in allowance increase in allowance decrease in allowance
(25) (11) 24
While lowering prices by 5% the entire value of the tested assets is impaired, with each of the analysed discount rates. Unipetrol Group As a consequence of the steam cracker unit accident in Litvinov (Unipetrol Group) in August 2015, impairment of property, plant and equipment of PLN (93) million translated using the exchange rate as at 30 September 2015 (representing approximately CZK (597) million) was recognized in the 3
rd quarter of 2015.
As at 31 December 2015, ORLEN Group did not identify any other significant indicators of impairment of other property, plant and equipment and intangible assets. In 2014 identified indicators for impairment test within ORLEN Group resulting from deterioration of macroeconomic environment as well as the perspectives for its improvement especially in the area of the refinery. Strategy assumptions and the Mid-term Plan of the Group for the years 2014-2017 were updated. 8.2.5. Other assets
31/12/2015
31/12/2014
Investment property 103 111
Perpetual usufruct of land 99 89
Financial assets available for sale 40 40
242 240
8.2.6. Inventories
31/12/2015 31/12/2014
Raw materials 5 380 3 636
Work in progress 883 958
Finished goods 3 547 4 219
Merchandise 416 559
Spare parts 489 457
Inventories, net 10 715 9 829
Impairment allowances of inventories to net realisable value 288 949
Inventories, gross 11 003 10 778
As at 31 December 2015 and as at 31 December 2014 the value of mandatory reserves presented in consolidated financial statement amounted to PLN 4,534 million and PLN 4,024 million, respectively.

ORLEN GROUP (PLN million)
CONSOLIDATED FINANCIAL STATEMENTS FOR THE YEAR 2015
(Translation of a document originally issued in Polish)
8. EXPLANATORY NOTES TO THE CONSOLIDATED FINANCIAL STATEMENTS
19
Repurchase of mandatory reserves
Transaction date Parties of the transaction Value of the transaction
Seller Buyer million USD million PLN
29 January 2015 Neon PKN ORLEN 257 957
including hedging transaction settlement
112 417
12 August 2015 Cranbell PKN ORLEN 707 2 687
including hedging transaction settlement
406 1 541
Change in impairment allowances of inventories to net realizable value
2015 2014
At the beginning of the period 949 202
Recognition 238 872
Reversal (67) (83)
Usage (858) (69)
Acquisition of subsidiary
- 7
Foreign exchange differences 26 20
288 949
The impairment allowances of inventories to net realizable value, which was mainly made in 4th quarter of 2014, were used in 2015.
The usage was the result of a decrease in crude oil and petroleum products prices. In 2015 and in 2014 the recognition and reversal of impairment allowances of inventories to net realizable value related mainly to the downstream segment and amounted to PLN (170) million and PLN (787) million, respectively. 8.2.7. Trade and other receivables
NOTE
31/12/2015 31/12/2014
Trade receivables 5 397 5 938
Other 24 18
Financial assets 5 421 5 956
Excise tax and fuel charge receivables 151 182
Other taxation, duties, social security and other benefits 187 367
Tax expense 44 35
Advances for non-current non-financial assets 544 378
Rights 50 14
Prepayments for deliveries 26 26
Prepayments 218 134
Non-financial assets 1 220 1 136
Receivables, net 6 641 7 092
Receivables impairment allowance 8.4.5.4 477 509
Receivables, gross 7 118 7 601
As at 31 December 2015 and as at 31 December 2014 trade and other receivables denominated in foreign currencies amounted to PLN 3,255 million and PLN 3,669 million. Division of financial assets denominated in foreign currencies is presented in note 8.4.5.2. Division of receivables from related parties is presented in note 8.5.6. 8.2.8. Equity 8.2.8.1. Share capital
31/12/2015 31/12/2014
Share capital 535 535
Share capital revaluation adjustment 523 523
1 058 1 058
In accordance with the Polish Commercial Register, the share capital of Polski Koncern Naftowy ORLEN S.A. as at 31 December 2015 and as at 31 December 2014 amounted to PLN 535 million and is divided into 427,709,061 ordinary shares with nominal value of PLN 1.25 each.
Number of shares issued
A Series B Series C Series D Series Total
336 000 000 6 971 496 77 205 641 7 531 924 427 709 061
In Poland, each new issue of shares is labelled as a new series of shares. All of the above series have the exact same rights. As at 31 December 2015 and 31 December 2014, the number of shares issued and the number of shares approved for issuance is equal.
ORLEN GROUP (PLN million)
CONSOLIDATED FINANCIAL STATEMENTS FOR THE YEAR 2015
(Translation of a document originally issued in Polish)
8. EXPLANATORY NOTES TO THE CONSOLIDATED FINANCIAL STATEMENTS
20
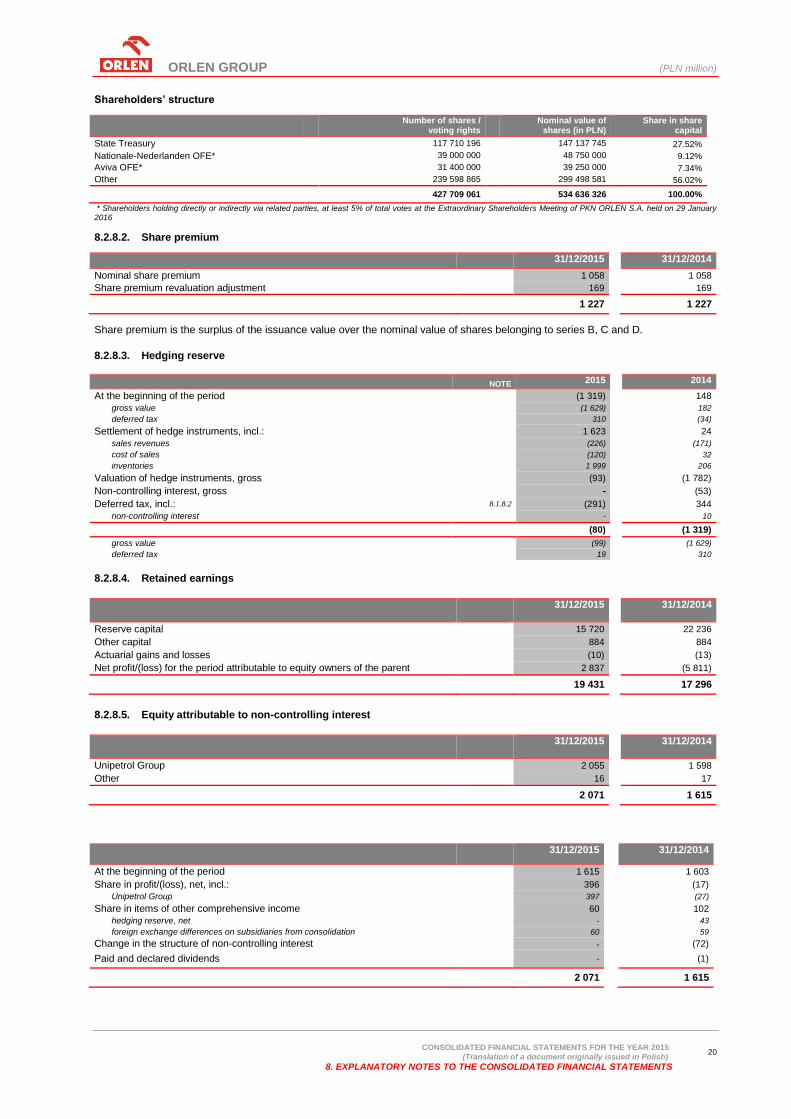
Shareholders’ structure
Number of shares / voting rights
Nominal value of shares (in PLN)
Share in share capital
State Treasury 117 710 196 147 137 745 27.52%
Nationale-Nederlanden OFE* 39 000 000 48 750 000 9.12%
Aviva OFE* 31 400 000 39 250 000 7.34%
Other 239 598 865 299 498 581 56.02%
427 709 061 534 636 326 100.00%
* Shareholders holding directly or indirectly via related parties, at least 5% of total votes at the Extraordinary Shareholders Meeting of PKN ORLEN S.A. held on 29 January 2016
8.2.8.2. Share premium
31/12/2015 31/12/2014
Nominal share premium 1 058 1 058
Share premium revaluation adjustment 169 169
1 227 1 227
Share premium is the surplus of the issuance value over the nominal value of shares belonging to series B, C and D.
8.2.8.3. Hedging reserve
NOTE 2015 2014
At the beginning of the period (1 319) 148
gross value (1 629) 182
deferred tax 310 (34)
Settlement of hedge instruments, incl.: 1 623 24
sales revenues (226) (171)
cost of sales (120) 32
inventories 1 999 206
Valuation of hedge instruments, gross (93) (1 782)
Non-controlling interest, gross - (53)
Deferred tax, incl.: 8.1.8.2 (291) 344
non-controlling interest - 10
(80) (1 319)
gross value (99) (1 629)
deferred tax 19 310
8.2.8.4. Retained earnings
31/12/2015 31/12/2014
Reserve capital 15 720 22 236
Other capital 884 884
Actuarial gains and losses (10) (13)
Net profit/(loss) for the period attributable to equity owners of the parent 2 837 (5 811)
19 431 17 296
8.2.8.5. Equity attributable to non-controlling interest
31/12/2015 31/12/2014
Unipetrol Group 2 055 1 598
Other 16 17
2 071 1 615
31/12/2015
31/12/2014
At the beginning of the period 1 615 1 603
Share in profit/(loss), net, incl.: 396 (17)
Unipetrol Group 397 (27)
Share in items of other comprehensive income 60 102
hedging reserve, net - 43
foreign exchange differences on subsidiaries from consolidation 60 59
Change in the structure of non-controlling interest - (72)
Paid and declared dividends - (1)
2 071 1 615
ORLEN GROUP (PLN million)
CONSOLIDATED FINANCIAL STATEMENTS FOR THE YEAR 2015
(Translation of a document originally issued in Polish)
8. EXPLANATORY NOTES TO THE CONSOLIDATED FINANCIAL STATEMENTS
21
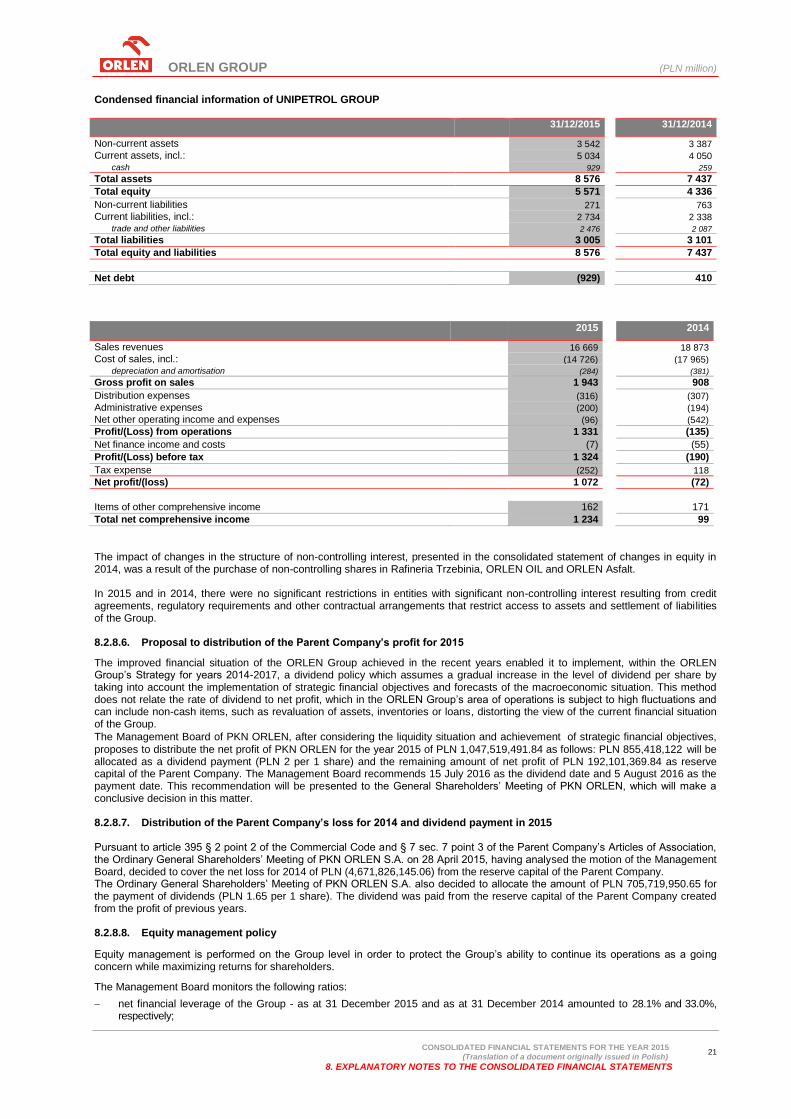
Condensed financial information of UNIPETROL GROUP
31/12/2015
31/12/2014
Non-current assets 3 542 3 387
Current assets, incl.: 5 034 4 050
cash 929 259
Total assets 8 576 7 437
Total equity 5 571 4 336
Non-current liabilities 271 763
Current liabilities, incl.: 2 734 2 338
trade and other liabilities 2 476 2 087
Total liabilities 3 005 3 101
Total equity and liabilities 8 576 7 437
Net debt (929) 410
2015 2014
Sales revenues 16 669 18 873
Cost of sales, incl.: (14 726) (17 965)
depreciation and amortisation (284) (381)
Gross profit on sales 1 943 908
Distribution expenses (316) (307)
Administrative expenses (200) (194)
Net other operating income and expenses (96) (542)
Profit/(Loss) from operations 1 331 (135)
Net finance income and costs (7) (55)
Profit/(Loss) before tax 1 324 (190)
Tax expense (252) 118
Net profit/(loss) 1 072 (72)
Items of other comprehensive income 162 171
Total net comprehensive income 1 234 99
The impact of changes in the structure of non-controlling interest, presented in the consolidated statement of changes in equity in 2014, was a result of the purchase of non-controlling shares in Rafineria Trzebinia, ORLEN OIL and ORLEN Asfalt. In 2015 and in 2014, there were no significant restrictions in entities with significant non-controlling interest resulting from credit agreements, regulatory requirements and other contractual arrangements that restrict access to assets and settlement of liabilities of the Group. 8.2.8.6. Proposal to distribution of the Parent Company’s profit for 2015
The improved financial situation of the ORLEN Group achieved in the recent years enabled it to implement, within the ORLEN Group’s Strategy for years 2014-2017, a dividend policy which assumes a gradual increase in the level of dividend per share by taking into account the implementation of strategic financial objectives and forecasts of the macroeconomic situation. This method does not relate the rate of dividend to net profit, which in the ORLEN Group’s area of operations is subject to high fluctuations and can include non-cash items, such as revaluation of assets, inventories or loans, distorting the view of the current financial situation of the Group.
The Management Board of PKN ORLEN, after considering the liquidity situation and achievement of strategic financial objectives,
proposes to distribute the net profit of PKN ORLEN for the year 2015 of PLN 1,047,519,491.84 as follows: PLN 855,418,122 will be allocated as a dividend payment (PLN 2 per 1 share) and the remaining amount of net profit of PLN 192,101,369.84 as reserve capital of the Parent Company. The Management Board recommends 15 July 2016 as the dividend date and 5 August 2016 as the payment date. This recommendation will be presented to the General Shareholders’ Meeting of PKN ORLEN, which will make a conclusive decision in this matter. 8.2.8.7. Distribution of the Parent Company’s loss for 2014 and dividend payment in 2015 Pursuant to article 395 § 2 point 2 of the Commercial Code and § 7 sec. 7 point 3 of the Parent Company’s Articles of Association, the Ordinary General Shareholders’ Meeting of PKN ORLEN S.A. on 28 April 2015, having analysed the motion of the Management Board, decided to cover the net loss for 2014 of PLN (4,671,826,145.06) from the reserve capital of the Parent Company. The Ordinary General Shareholders’ Meeting of PKN ORLEN S.A. also decided to allocate the amount of PLN 705,719,950.65 for the payment of dividends (PLN 1.65 per 1 share). The dividend was paid from the reserve capital of the Parent Company created from the profit of previous years. 8.2.8.8. Equity management policy
Equity management is performed on the Group level in order to protect the Group’s ability to continue its operations as a going concern while maximizing returns for shareholders.
The Management Board monitors the following ratios:
net financial leverage of the Group - as at 31 December 2015 and as at 31 December 2014 amounted to 28.1% and 33.0%, respectively;
ORLEN GROUP (PLN million)
CONSOLIDATED FINANCIAL STATEMENTS FOR THE YEAR 2015
(Translation of a document originally issued in Polish)
8. EXPLANATORY NOTES TO THE CONSOLIDATED FINANCIAL STATEMENTS
22
dividend per ordinary shares – depends on current financial position of the Group. In 2015 and in 2014 the dividend of PLN 1.65 per share and PLN 1.44 per share was paid, respectively.
Net financial leverage: net debt/equity (calculated as at the end of the period) x 100% Net debt: non-current loans, borrowings and bonds + current loans and borrowings – cash and cash equivalents
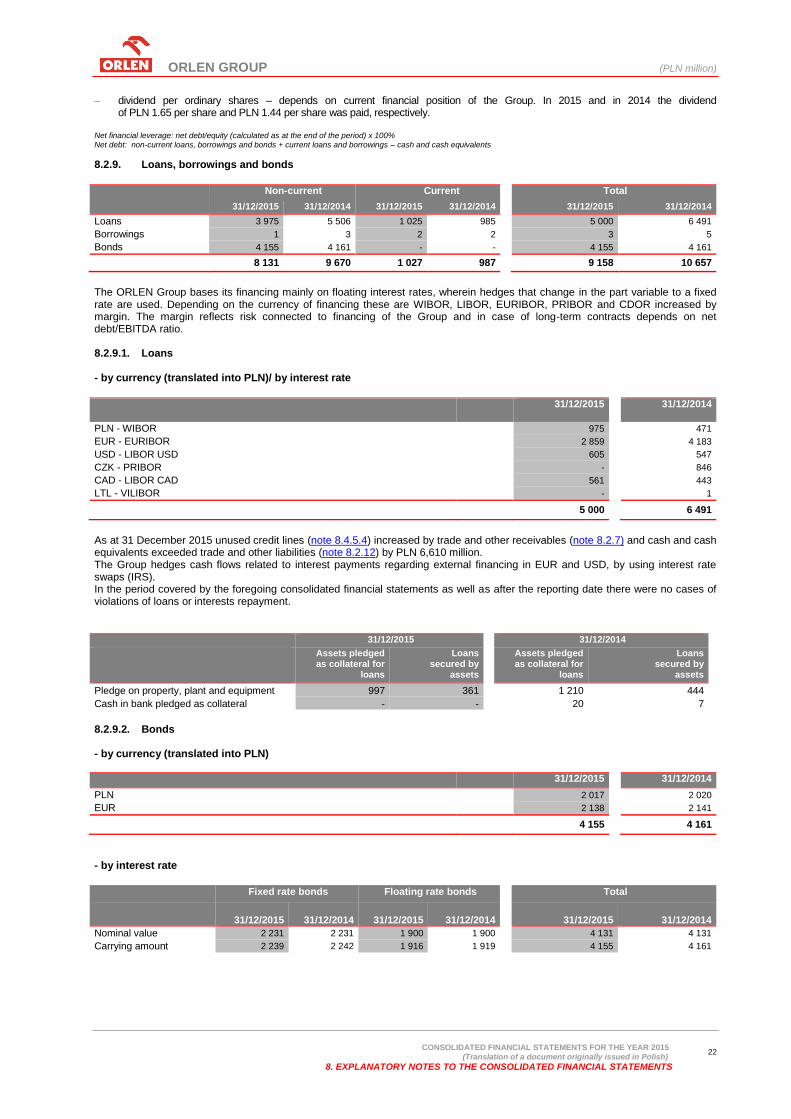
8.2.9. Loans, borrowings and bonds
Non-current Current Total
31/12/2015 31/12/2014 31/12/2015 31/12/2014 31/12/2015 31/12/2014
Loans 3 975 5 506 1 025 985 5 000 6 491
Borrowings 1 3 2 2 3 5
Bonds 4 155 4 161 - - 4 155 4 161
8 131 9 670 1 027 987 9 158 10 657
The ORLEN Group bases its financing mainly on floating interest rates, wherein hedges that change in the part variable to a fixed rate are used. Depending on the currency of financing these are WIBOR, LIBOR, EURIBOR, PRIBOR and CDOR increased by margin. The margin reflects risk connected to financing of the Group and in case of long-term contracts depends on net debt/EBITDA ratio. 8.2.9.1. Loans - by currency (translated into PLN)/ by interest rate
31/12/2015 31/12/2014
PLN - WIBOR 975 471
EUR - EURIBOR 2 859 4 183
USD - LIBOR USD 605 547
CZK - PRIBOR - 846
CAD - LIBOR CAD 561 443
LTL - VILIBOR - 1
5 000 6 491
As at 31 December 2015 unused credit lines (note 8.4.5.4) increased by trade and other receivables (note 8.2.7) and cash and cash equivalents exceeded trade and other liabilities (note 8.2.12) by PLN 6,610 million. The Group hedges cash flows related to interest payments regarding external financing in EUR and USD, by using interest rate swaps (IRS). In the period covered by the foregoing consolidated financial statements as well as after the reporting date there were no cases of violations of loans or interests repayment.
31/12/2015 31/12/2014
Assets pledged as collateral for
loans
Loans secured by
assets
Assets pledged as collateral for
loans
Loans secured by
assets
Pledge on property, plant and equipment 997 361 1 210 444
Cash in bank pledged as collateral - - 20 7
8.2.9.2. Bonds - by currency (translated into PLN)
31/12/2015 31/12/2014
PLN 2 017 2 020
EUR 2 138 2 141
4 155 4 161
- by interest rate
Fixed rate bonds Floating rate bonds Total
31/12/2015 31/12/2014 31/12/2015 31/12/2014
31/12/2015
31/12/2014
Nominal value 2 231 2 231 1 900 1 900 4 131 4 131
Carrying amount 2 239 2 242 1 916 1 919 4 155 4 161
ORLEN GROUP (PLN million)
CONSOLIDATED FINANCIAL STATEMENTS FOR THE YEAR 2015
(Translation of a document originally issued in Polish)
8. EXPLANATORY NOTES TO THE CONSOLIDATED FINANCIAL STATEMENTS
23
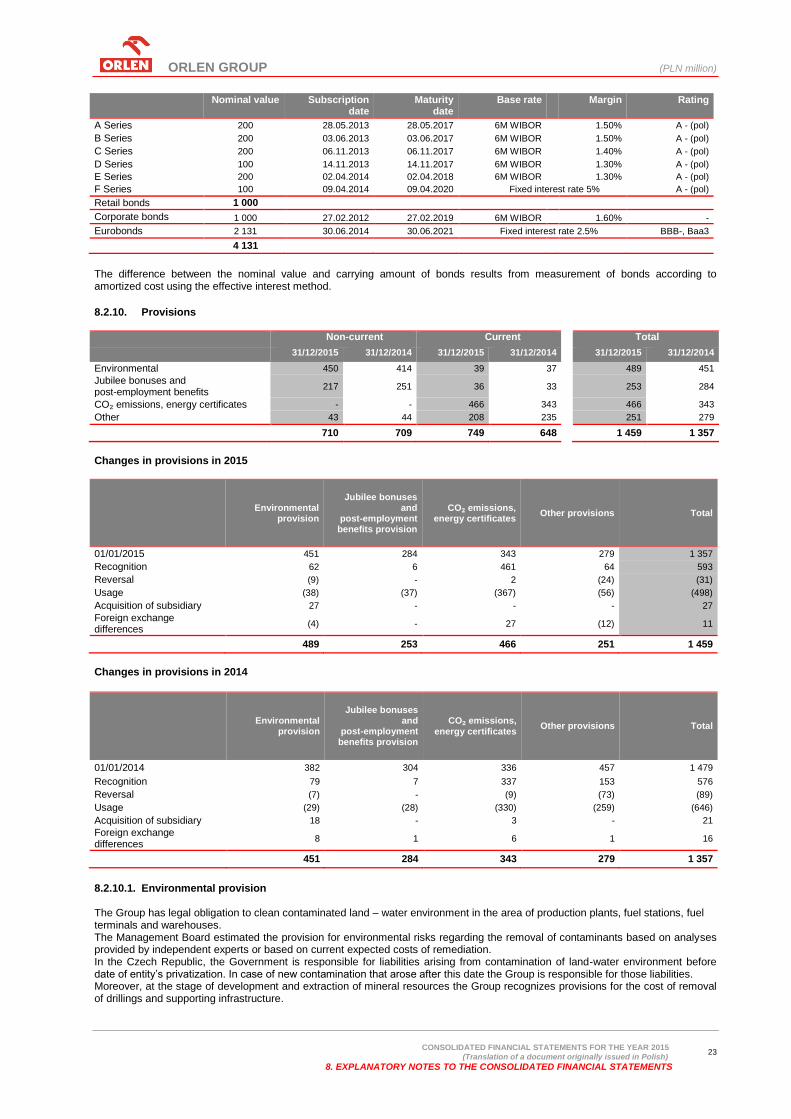
Nominal value Subscription date
Maturity date
Base rate Margin Rating
A Series 200 28.05.2013 28.05.2017 6M WIBOR 1.50% A - (pol)
B Series 200 03.06.2013 03.06.2017 6M WIBOR 1.50% A - (pol)
C Series 200 06.11.2013 06.11.2017 6M WIBOR 1.40% A - (pol)
D Series 100 14.11.2013 14.11.2017 6M WIBOR 1.30% A - (pol)
E Series 200 02.04.2014 02.04.2018 6M WIBOR 1.30% A - (pol)
F Series 100 09.04.2014 09.04.2020 Fixed interest rate 5% A - (pol)
Retail bonds 1 000
Corporate bonds 1 000 27.02.2012 27.02.2019 6M WIBOR 1.60% -
Eurobonds 2 131 30.06.2014 30.06.2021 Fixed interest rate 2.5% BBB-, Baa3
4 131
The difference between the nominal value and carrying amount of bonds results from measurement of bonds according to amortized cost using the effective interest method.
8.2.10. Provisions
Non-current Current Total
31/12/2015 31/12/2014 31/12/2015 31/12/2014 31/12/2015 31/12/2014
Environmental 450 414 39 37 489 451
Jubilee bonuses and post-employment benefits
217 251 36 33 253 284
CO₂ emissions, energy certificates - - 466 343 466 343
Other 43 44 208 235 251 279
710 709 749 648 1 459 1 357
Changes in provisions in 2015
Environmental
provision
Jubilee bonuses and
post-employment benefits provision
CO₂ emissions, energy certificates
Other provisions Total
01/01/2015 451 284 343 279 1 357
Recognition 62 6 461 64 593
Reversal (9) - 2 (24) (31)
Usage (38) (37) (367) (56) (498)
Acquisition of subsidiary 27 - - - 27
Foreign exchange differences
(4) - 27 (12) 11
489 253 466 251 1 459
Changes in provisions in 2014
Environmental provision
Jubilee bonuses and
post-employment benefits provision
CO₂ emissions, energy certificates
Other provisions Total
01/01/2014 382 304 336 457 1 479
Recognition 79 7 337 153 576
Reversal (7) - (9) (73) (89)
Usage (29) (28) (330) (259) (646)
Acquisition of subsidiary 18 - 3 - 21
Foreign exchange differences
8 1 6 1 16
451 284 343 279 1 357
8.2.10.1. Environmental provision The Group has legal obligation to clean contaminated land – water environment in the area of production plants, fuel stations, fuel terminals and warehouses. The Management Board estimated the provision for environmental risks regarding the removal of contaminants based on analyses provided by independent experts or based on current expected costs of remediation. In the Czech Republic, the Government is responsible for liabilities arising from contamination of land-water environment before date of entity’s privatization. In case of new contamination that arose after this date the Group is responsible for those liabilities. Moreover, at the stage of development and extraction of mineral resources the Group recognizes provisions for the cost of removal of drillings and supporting infrastructure.
ORLEN GROUP (PLN million)
CONSOLIDATED FINANCIAL STATEMENTS FOR THE YEAR 2015
(Translation of a document originally issued in Polish)
8. EXPLANATORY NOTES TO THE CONSOLIDATED FINANCIAL STATEMENTS
24
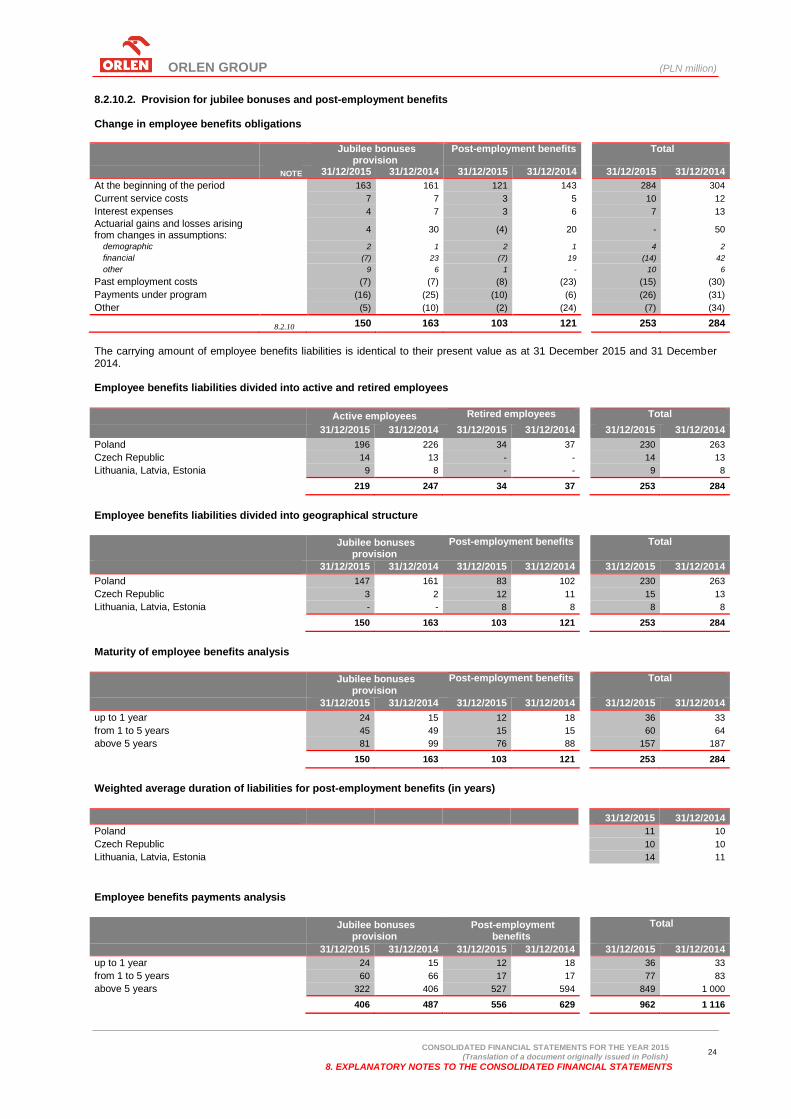
8.2.10.2. Provision for jubilee bonuses and post-employment benefits Change in employee benefits obligations
Jubilee bonuses provision
Post-employment benefits
Total
NOTE 31/12/2015 31/12/2014 31/12/2015 31/12/2014 31/12/2015 31/12/2014
At the beginning of the period 163 161 121 143 284 304
Current service costs 7 7 3 5 10 12
Interest expenses 4 7 3 6 7 13
Actuarial gains and losses arising from changes in assumptions:
4 30 (4) 20 - 50
demographic 2 1 2 1 4 2
financial (7) 23 (7) 19 (14) 42
other 9 6 1 - 10 6
Past employment costs (7) (7) (8) (23) (15) (30)
Payments under program (16) (25) (10) (6) (26) (31)
Other (5) (10) (2) (24) (7) (34)
8.2.10 150 163 103 121 253 284
The carrying amount of employee benefits liabilities is identical to their present value as at 31 December 2015 and 31 December 2014. Employee benefits liabilities divided into active and retired employees
Active employees Retired employees Total
31/12/2015 31/12/2014 31/12/2015 31/12/2014 31/12/2015 31/12/2014
Poland 196 226 34 37 230 263
Czech Republic 14 13 - - 14 13
Lithuania, Latvia, Estonia 9 8 - - 9 8
219 247 34 37 253 284
Employee benefits liabilities divided into geographical structure
Jubilee bonuses provision
Post-employment benefits
Total
31/12/2015 31/12/2014 31/12/2015 31/12/2014 31/12/2015 31/12/2014
Poland 147 161 83 102 230 263
Czech Republic 3 2 12 11 15 13
Lithuania, Latvia, Estonia - - 8 8 8 8
150 163 103 121 253 284
Maturity of employee benefits analysis
Jubilee bonuses provision
Post-employment benefits
Total
31/12/2015 31/12/2014 31/12/2015 31/12/2014 31/12/2015 31/12/2014
up to 1 year 24 15 12 18 36 33
from 1 to 5 years 45 49 15 15 60 64
above 5 years 81 99 76 88 157 187
150 163 103 121 253 284
Weighted average duration of liabilities for post-employment benefits (in years)
31/12/2015 31/12/2014
Poland 11 10
Czech Republic 10 10
Lithuania, Latvia, Estonia 14 11
Employee benefits payments analysis
Jubilee bonuses provision
Post-employment benefits
Total
31/12/2015 31/12/2014 31/12/2015 31/12/2014 31/12/2015 31/12/2014
up to 1 year 24 15 12 18 36 33
from 1 to 5 years 60 66 17 17 77 83
above 5 years 322 406 527 594 849 1 000
406 487 556 629 962 1 116
ORLEN GROUP (PLN million)
CONSOLIDATED FINANCIAL STATEMENTS FOR THE YEAR 2015
(Translation of a document originally issued in Polish)
8. EXPLANATORY NOTES TO THE CONSOLIDATED FINANCIAL STATEMENTS
25
In 2015 the amount of provision for employee benefits changed as the result of update of assumptions, mainly in relation to discount rate, projected inflation and expected remuneration increase ratio. Should the 2014 assumptions be used, the provision for the employee benefits would be lower by PLN (11) million.
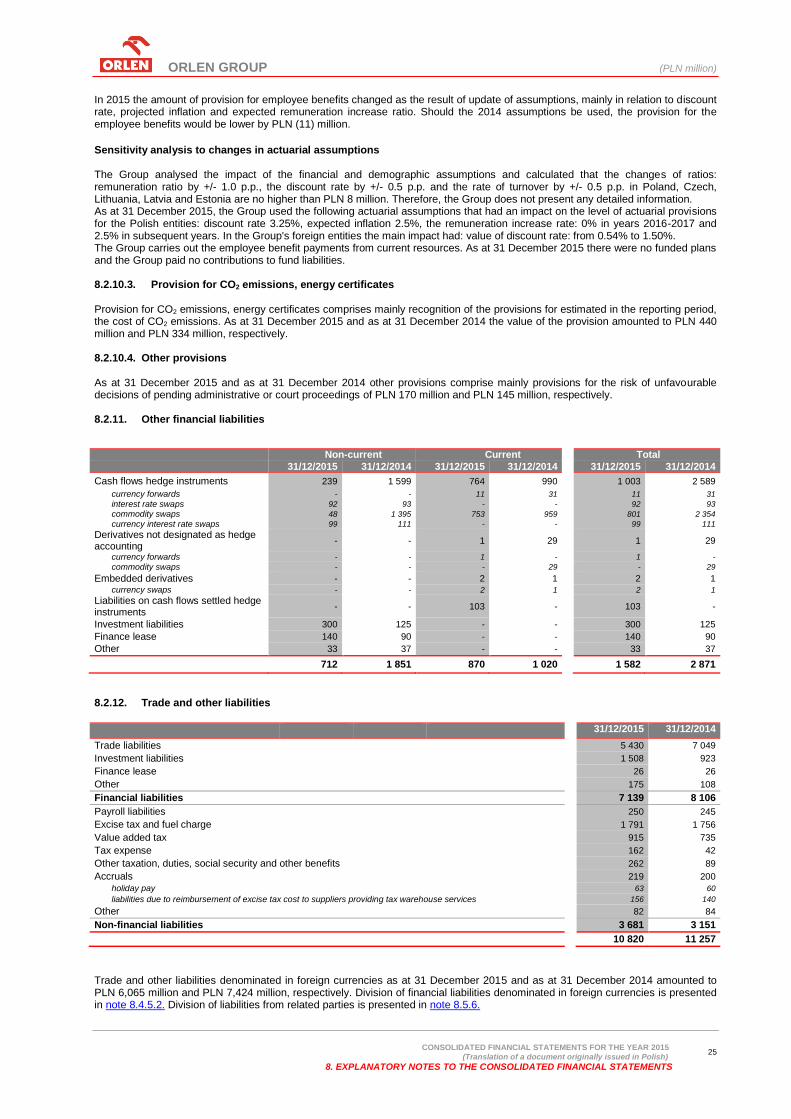
Sensitivity analysis to changes in actuarial assumptions The Group analysed the impact of the financial and demographic assumptions and calculated that the changes of ratios: remuneration ratio by +/- 1.0 p.p., the discount rate by +/- 0.5 p.p. and the rate of turnover by +/- 0.5 p.p. in Poland, Czech, Lithuania, Latvia and Estonia are no higher than PLN 8 million. Therefore, the Group does not present any detailed information. As at 31 December 2015, the Group used the following actuarial assumptions that had an impact on the level of actuarial provisions for the Polish entities: discount rate 3.25%, expected inflation 2.5%, the remuneration increase rate: 0% in years 2016-2017 and 2.5% in subsequent years. In the Group's foreign entities the main impact had: value of discount rate: from 0.54% to 1.50%. The Group carries out the employee benefit payments from current resources. As at 31 December 2015 there were no funded plans and the Group paid no contributions to fund liabilities. 8.2.10.3. Provision for CO2 emissions, energy certificates Provision for CO2 emissions, energy certificates comprises mainly recognition of the provisions for estimated in the reporting period, the cost of CO2 emissions. As at 31 December 2015 and as at 31 December 2014 the value of the provision amounted to PLN 440 million and PLN 334 million, respectively. 8.2.10.4. Other provisions As at 31 December 2015 and as at 31 December 2014 other provisions comprise mainly provisions for the risk of unfavourable decisions of pending administrative or court proceedings of PLN 170 million and PLN 145 million, respectively. 8.2.11. Other financial liabilities
Non-current Current Total
31/12/2015 31/12/2014 31/12/2015 31/12/2014 31/12/2015 31/12/2014
Cash flows hedge instruments 239 1 599 764 990 1 003 2 589
currency forwards - - 11 31 11 31
interest rate swaps 92 93 - - 92 93
commodity swaps 48 1 395 753 959 801 2 354
currency interest rate swaps 99 111 - - 99 111
Derivatives not designated as hedge accounting
- - 1 29 1 29
currency forwards - - 1 - 1 -
commodity swaps - - - 29 - 29
Embedded derivatives - - 2 1 2 1
currency swaps - - 2 1 2 1
Liabilities on cash flows settled hedge instruments
- - 103 - 103 -
Investment liabilities 300 125 - - 300 125
Finance lease 140 90 - - 140 90
Other 33 37 - - 33 37
712 1 851 870 1 020 1 582 2 871
8.2.12. Trade and other liabilities
31/12/2015 31/12/2014
Trade liabilities 5 430 7 049
Investment liabilities 1 508 923
Finance lease 26 26
Other 175 108
Financial liabilities 7 139 8 106
Payroll liabilities 250 245
Excise tax and fuel charge 1 791 1 756
Value added tax 915 735
Tax expense 162 42
Other taxation, duties, social security and other benefits 262 89
Accruals 219 200
holiday pay 63 60
liabilities due to reimbursement of excise tax cost to suppliers providing tax warehouse services 156 140
Other 82 84
Non-financial liabilities 3 681 3 151
10 820 11 257
Trade and other liabilities denominated in foreign currencies as at 31 December 2015 and as at 31 December 2014 amounted to PLN 6,065 million and PLN 7,424 million, respectively. Division of financial liabilities denominated in foreign currencies is presented in note 8.4.5.2. Division of liabilities from related parties is presented in note 8.5.6.
ORLEN GROUP (PLN million)
CONSOLIDATED FINANCIAL STATEMENTS FOR THE YEAR 2015
(Translation of a document originally issued in Polish)
8. EXPLANATORY NOTES TO THE CONSOLIDATED FINANCIAL STATEMENTS
26
8.2.13. Other liabilities
31/12/2015
31/12/2014
Deferred income 128 122
Liabilities directly associated with assets classified as held for sale
72
-
200 122
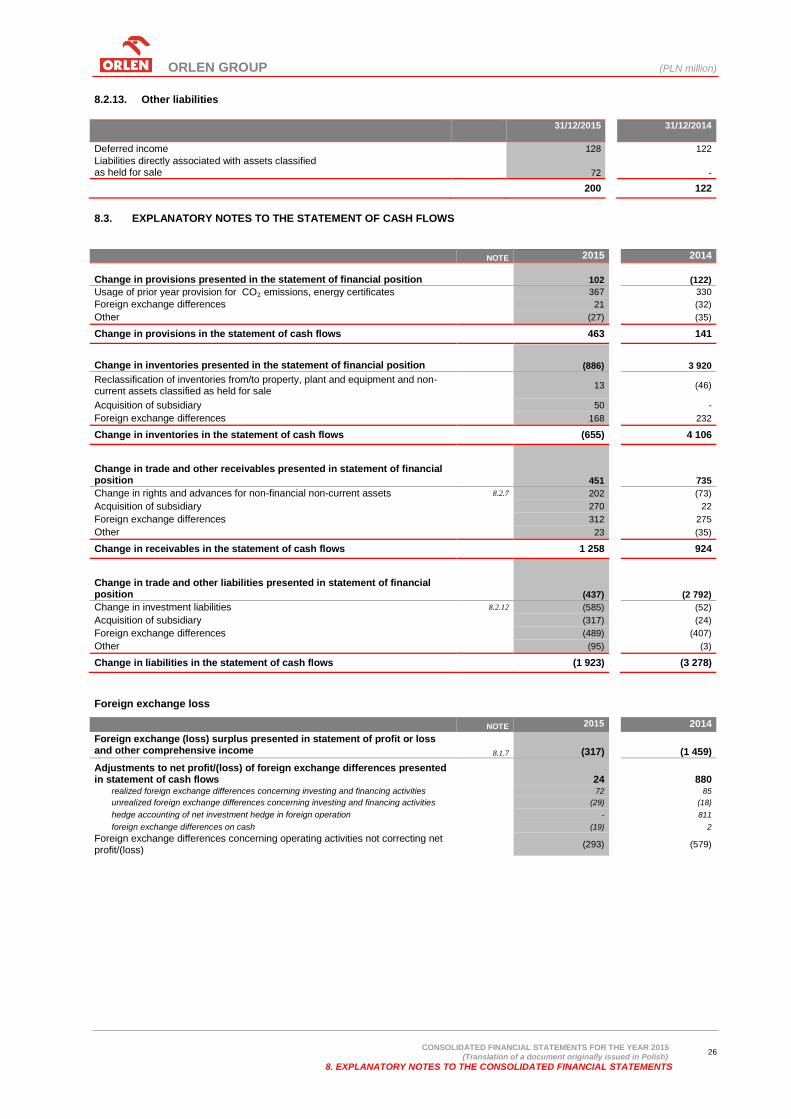
8.3. EXPLANATORY NOTES TO THE STATEMENT OF CASH FLOWS
NOTE 2015 2014
Change in provisions presented in the statement of financial position 102
(122)
Usage of prior year provision for CO₂ emissions, energy certificates 367 330
Foreign exchange differences 21 (32)
Other (27) (35)
Change in provisions in the statement of cash flows 463 141
Change in inventories presented in the statement of financial position (886)
3 920
Reclassification of inventories from/to property, plant and equipment and non-current assets classified as held for sale
13
(46)
Acquisition of subsidiary 50 -
Foreign exchange differences 168 232
Change in inventories in the statement of cash flows (655) 4 106
Change in trade and other receivables presented in statement of financial position 451
735
Change in rights and advances for non-financial non-current assets 8.2.7 202 (73)
Acquisition of subsidiary 270 22
Foreign exchange differences 312 275
Other 23 (35)
Change in receivables in the statement of cash flows 1 258 924
Change in trade and other liabilities presented in statement of financial position
(437)
(2 792)
Change in investment liabilities 8.2.12 (585) (52)
Acquisition of subsidiary (317) (24)
Foreign exchange differences (489) (407)
Other (95) (3)
Change in liabilities in the statement of cash flows (1 923) (3 278)
Foreign exchange loss
NOTE 2015 2014
Foreign exchange (loss) surplus presented in statement of profit or loss and other comprehensive income 8.1.7 (317)
(1 459)
Adjustments to net profit/(loss) of foreign exchange differences presented in statement of cash flows 24
880 realized foreign exchange differences concerning investing and financing activities 72 85
unrealized foreign exchange differences concerning investing and financing activities (29) (18)
hedge accounting of net investment hedge in foreign operation - 811
foreign exchange differences on cash (19) 2
Foreign exchange differences concerning operating activities not correcting net profit/(loss)
(293)
(579)

ORLEN GROUP (PLN million)
CONSOLIDATED FINANCIAL STATEMENTS FOR THE YEAR 2015
(Translation of a document originally issued in Polish)
8. EXPLANATORY NOTES TO THE CONSOLIDATED FINANCIAL STATEMENTS
27
Interest, net
NOTE 2015 2014
Finance income and costs of net interest presented in statement of profit or loss and other comprehensive income 8.1.6, 8.1.7 (123)
(167)
Adjustments to net profit/(loss) of net interest presented in statement of cash flows 199
241
interest paid concerning financing activities 258 245
accrued interest concerning investing and financing activities (59) (4)
Net interest concerning operating activities not correcting net profit/(loss) (76) (74)
Income tax (paid)
NOTE 2015 2014
Tax expense on profit/(loss) before tax 8.1.8.1 (465) 418
Change in deferred tax asset and liabilities 619 (697)
Change in current tax receivables and liabilities 111 30
Deferred tax recognized in other comprehensive income 8.1.8.2 (292) 338
Acquisition of subsidiary 8.1.8.2 (166) (117)
Foreign exchange differences (11) (140)
(204) (168)
8.4. EXPLANATORY NOTES TO THE FINANCIAL INSTRUMENTS AND FINANCIAL RISKS
8.4.1. Financial instruments by category and class
Financial instruments by class NOTE
31/12/2015 31/12/2014 Financial instruments by category
ASSETS
Unquoted shares 8.2.5 40 40 Available for sale Embedded derivatives and derivatives not designated as hedge accounting
8.2.3 9 44 At fair value through profit or loss
Hedging instruments 8.2.3 932 994 Hedging financial instruments
7 949 10 044 Loans and receivables
Trade receivables 8.2.7 5 397 5 938 Loans and receivables
Cash and cash equivalents 2 348 3 937 Loans and receivables
Receivables on cash flows settled hedge instruments
8.2.3 159 101 Loans and receivables
Other 8.2.3, 8.2.7 45 68 Loans and receivables
8 930 11 122
LIABILITIES
Embedded derivatives and derivatives not designated as hedge accounting
8.2.11 3 30 At fair value through profit or loss
Hedging instruments 8.2.11 1 003 2 589 Hedging financial instruments
Finance lease 8.2.11, 8.2.12 166 116 Excluded from the scope of IAS 39
16 707 18 899 Measured at amortised cost
Bonds 8.2.9.2 4 155 4 161 Measured at amortised cost Loans 8.2.9.1 5 000 6 491 Measured at amortised cost
Borrowings 8.2.9 3 5 Measured at amortised cost Trade liabilities 8.2.12 5 430 7 049 Measured at amortised cost
Investment liabilities 8.2.11, 8.2.12 1 808 1 048 Measured at amortised cost
Liabilities on cash flows settled hedge instruments 8.2.11 103 - Measured at amortised cost
Other 8.2.11, 8.2.12 208 145 Measured at amortised cost
17 879 21 634
8.4.2. Income, expense, profit and loss in the consolidated statement of profit or loss and other comprehensive income
NOTE
31/12/2015 31/12/2014 Financial instruments by category
Interest income 8.1.6 82 75 Loans and receivables
Interest costs 8.1.7 (205) (242)
(194) (236) Measured at amortised cost
(4) - Hedging financial instruments
(7) (6) Excluded from the scope of IAS 39
Recognition/reversal of receivables impairment allowances (27) (26) Loans and receivables other operating income/expenses 8.1.4, 8.1.5 (30) (31) Loans and receivables
finance income/costs 3 5 Loans and receivables
Financial instruments gains/(losses) (518) (1 371)
186 (182) Loans and receivables
(529) (1 288) Measured at amortised cost
(175) 102 At fair value through profit or loss
(2) (5) Hedging financial instruments
2 2 Available for sale
(668) (1 564)
other, excluded from the scope of IFRS 7 (4) (2)
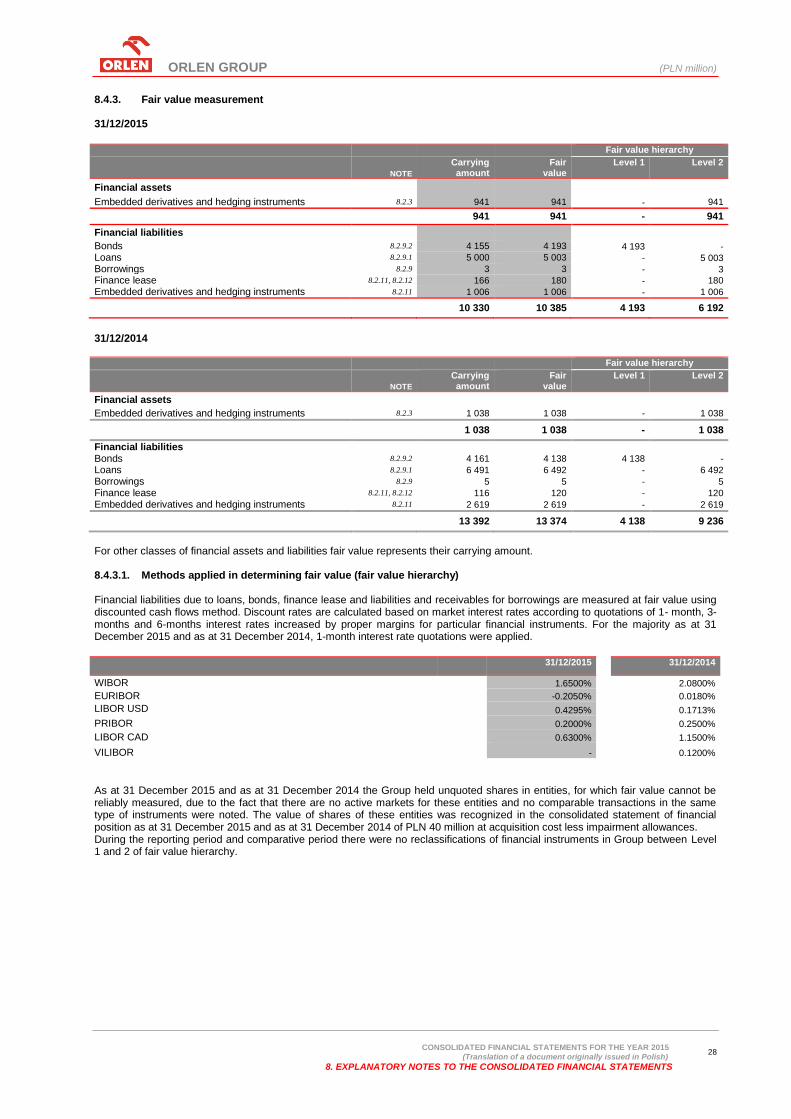
ORLEN GROUP (PLN million)
CONSOLIDATED FINANCIAL STATEMENTS FOR THE YEAR 2015
(Translation of a document originally issued in Polish)
8. EXPLANATORY NOTES TO THE CONSOLIDATED FINANCIAL STATEMENTS
28
8.4.3. Fair value measurement
31/12/2015
Fair value hierarchy
NOTE
Carrying amount
Fair value
Level 1 Level 2
Financial assets Embedded derivatives and hedging instruments 8.2.3 941 941 - 941
941 941 - 941
Financial liabilities
Bonds 8.2.9.2 4 155 4 193 4 193 -
Loans 8.2.9.1 5 000 5 003 - 5 003
Borrowings 8.2.9 3 3 - 3
Finance lease 8.2.11, 8.2.12 166 180 - 180
Embedded derivatives and hedging instruments 8.2.11 1 006 1 006 - 1 006
10 330 10 385 4 193 6 192
31/12/2014
Fair value hierarchy
NOTE
Carrying amount
Fair value
Level 1 Level 2
Financial assets Embedded derivatives and hedging instruments 8.2.3 1 038 1 038 - 1 038
1 038 1 038 - 1 038
Financial liabilities
Bonds 8.2.9.2 4 161 4 138 4 138 -
Loans 8.2.9.1 6 491 6 492 - 6 492
Borrowings 8.2.9 5 5 - 5
Finance lease 8.2.11, 8.2.12 116 120 - 120
Embedded derivatives and hedging instruments 8.2.11 2 619 2 619 - 2 619
13 392 13 374 4 138 9 236
For other classes of financial assets and liabilities fair value represents their carrying amount. 8.4.3.1. Methods applied in determining fair value (fair value hierarchy) Financial liabilities due to loans, bonds, finance lease and liabilities and receivables for borrowings are measured at fair value using discounted cash flows method. Discount rates are calculated based on market interest rates according to quotations of 1- month, 3-months and 6-months interest rates increased by proper margins for particular financial instruments. For the majority as at 31 December 2015 and as at 31 December 2014, 1-month interest rate quotations were applied.
31/12/2015 31/12/2014
WIBOR 1.6500% 2.0800%
EURIBOR
-0.2050% 0.0180%
LIBOR USD 0.4295% 0.1713%
PRIBOR 0.2000% 0.2500%
LIBOR CAD 0.6300% 1.1500%
VILIBOR - 0.1200%
As at 31 December 2015 and as at 31 December 2014 the Group held unquoted shares in entities, for which fair value cannot be reliably measured, due to the fact that there are no active markets for these entities and no comparable transactions in the same type of instruments were noted. The value of shares of these entities was recognized in the consolidated statement of financial position as at 31 December 2015 and as at 31 December 2014 of PLN 40 million at acquisition cost less impairment allowances. During the reporting period and comparative period there were no reclassifications of financial instruments in Group between Level 1 and 2 of fair value hierarchy.
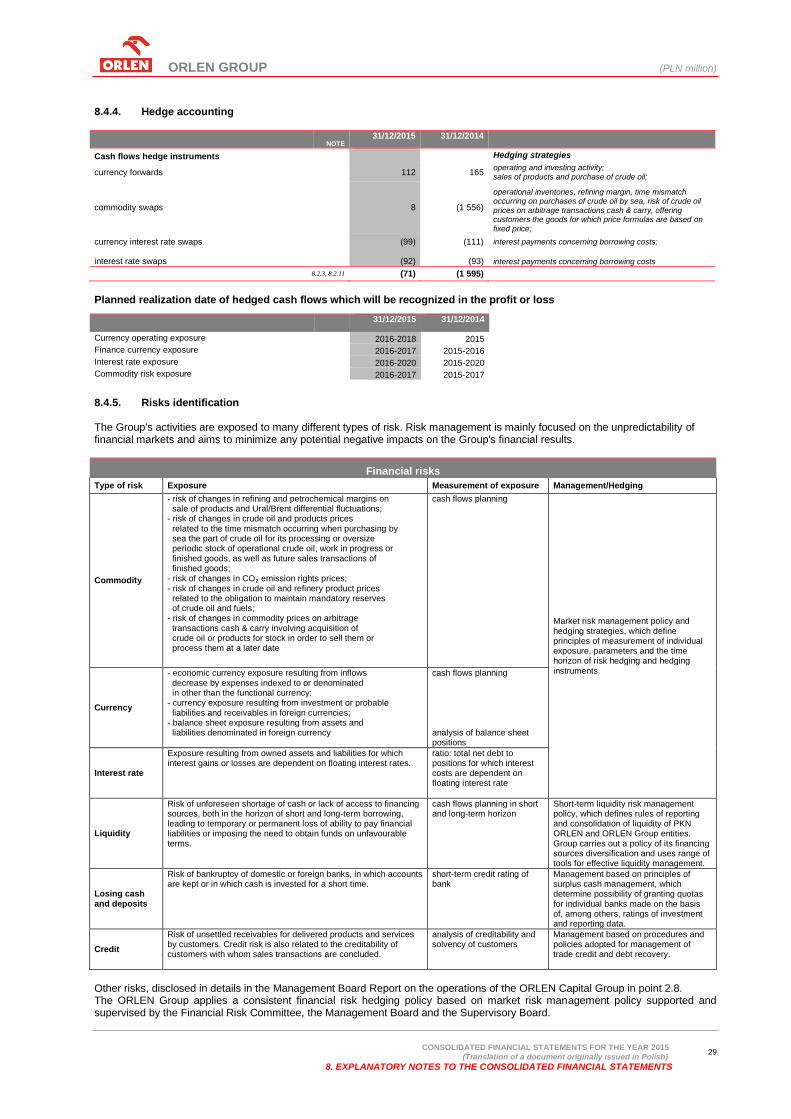
ORLEN GROUP (PLN million)
CONSOLIDATED FINANCIAL STATEMENTS FOR THE YEAR 2015
(Translation of a document originally issued in Polish)
8. EXPLANATORY NOTES TO THE CONSOLIDATED FINANCIAL STATEMENTS
29
8.4.4. Hedge accounting
NOTE
31/12/2015 31/12/2014
Cash flows hedge instruments Hedging strategies
currency forwards
112 165 operating and investing activity; sales of products and purchase of crude oil;
commodity swaps
8 (1 556)
operational inventories, refining margin, time mismatch occurring on purchases of crude oil by sea, risk of crude oil prices on arbitrage transactions cash & carry, offering customers the goods for which price formulas are based on fixed price;
currency interest rate swaps
(99) (111) interest payments concerning borrowing costs;
interest rate swaps (92) (93) interest payments concerning borrowing costs
8.2.3, 8.2.11 (71) (1 595)
Planned realization date of hedged cash flows which will be recognized in the profit or loss
31/12/2015 31/12/2014
Currency operating exposure 2016-2018 2015
Finance currency exposure 2016-2017 2015-2016
Interest rate exposure 2016-2020 2015-2020
Commodity risk exposure 2016-2017 2015-2017
8.4.5. Risks identification The Group's activities are exposed to many different types of risk. Risk management is mainly focused on the unpredictability of financial markets and aims to minimize any potential negative impacts on the Group's financial results.
Financial risks
Type of risk Exposure Measurement of exposure Management/Hedging
Commodity
- risk of changes in refining and petrochemical margins on sale of products and Ural/Brent differential fluctuations; - risk of changes in crude oil and products prices related to the time mismatch occurring when purchasing by sea the part of crude oil for its processing or oversize periodic stock of operational crude oil, work in progress or finished goods, as well as future sales transactions of finished goods; - risk of changes in CO₂ emission rights prices; - risk of changes in crude oil and refinery product prices related to the obligation to maintain mandatory reserves of crude oil and fuels; - risk of changes in commodity prices on arbitrage transactions cash & carry involving acquisition of crude oil or products for stock in order to sell them or process them at a later date
cash flows planning
Market risk management policy and hedging strategies, which define principles of measurement of individual exposure, parameters and the time horizon of risk hedging and hedging instruments.
Currency
- economic currency exposure resulting from inflows decrease by expenses indexed to or denominated in other than the functional currency; - currency exposure resulting from investment or probable liabilities and receivables in foreign currencies; - balance sheet exposure resulting from assets and liabilities denominated in foreign currency
cash flows planning analysis of balance sheet positions
Interest rate
Exposure resulting from owned assets and liabilities for which interest gains or losses are dependent on floating interest rates.
ratio: total net debt to positions for which interest costs are dependent on floating interest rate
Liquidity
Risk of unforeseen shortage of cash or lack of access to financing sources, both in the horizon of short and long-term borrowing, leading to temporary or permanent loss of ability to pay financial liabilities or imposing the need to obtain funds on unfavourable terms.
cash flows planning in short and long-term horizon
Short-term liquidity risk management policy, which defines rules of reporting and consolidation of liquidity of PKN ORLEN and ORLEN Group entities. Group carries out a policy of its financing sources diversification and uses range of tools for effective liquidity management.
Losing cash and deposits
Risk of bankruptcy of domestic or foreign banks, in which accounts are kept or in which cash is invested for a short time.
short-term credit rating of bank
Management based on principles of surplus cash management, which determine possibility of granting quotas for individual banks made on the basis of, among others, ratings of investment and reporting data.
Credit
Risk of unsettled receivables for delivered products and services by customers. Credit risk is also related to the creditability of customers with whom sales transactions are concluded.
analysis of creditability and solvency of customers
Management based on procedures and policies adopted for management of trade credit and debt recovery.
Other risks, disclosed in details in the Management Board Report on the operations of the ORLEN Capital Group in point 2.8. The ORLEN Group applies a consistent financial risk hedging policy based on market risk management policy supported and supervised by the Financial Risk Committee, the Management Board and the Supervisory Board.
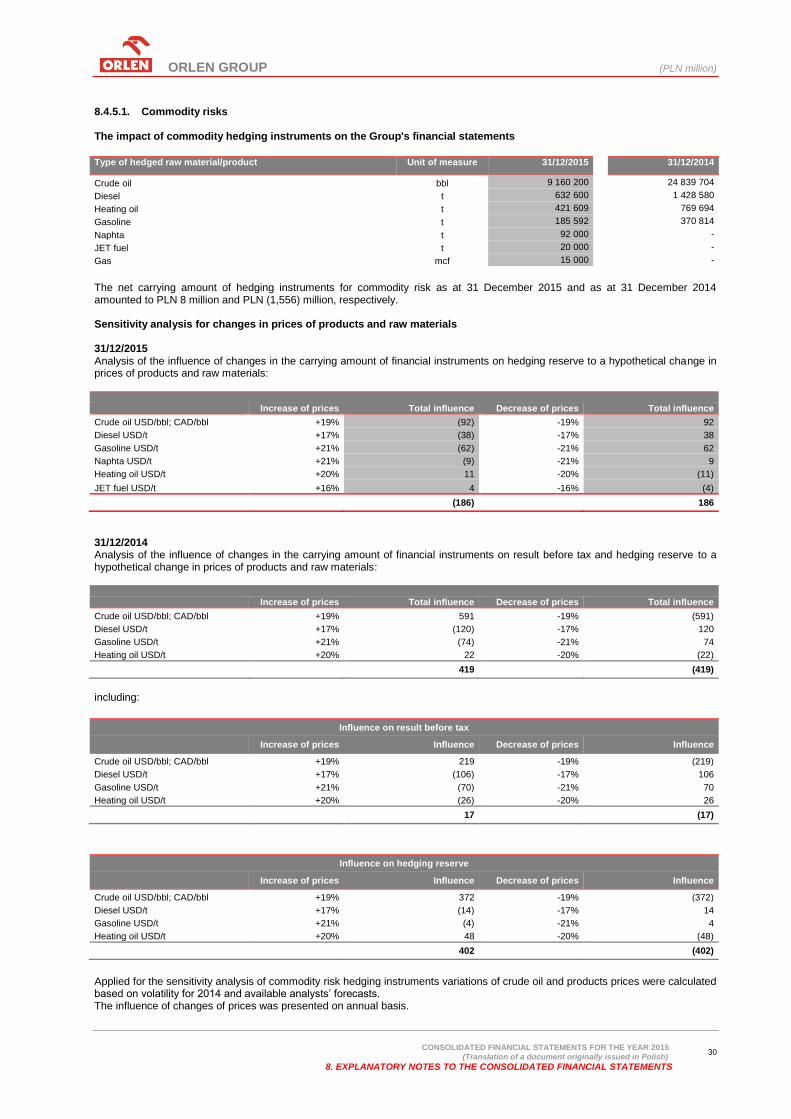
ORLEN GROUP (PLN million)
CONSOLIDATED FINANCIAL STATEMENTS FOR THE YEAR 2015
(Translation of a document originally issued in Polish)
8. EXPLANATORY NOTES TO THE CONSOLIDATED FINANCIAL STATEMENTS
30
8.4.5.1. Commodity risks The impact of commodity hedging instruments on the Group's financial statements
Type of hedged raw material/product Unit of measure 31/12/2015 31/12/2014
Crude oil bbl 9 160 200 24 839 704
Diesel t 632 600 1 428 580
Heating oil t 421 609 769 694
Gasoline t 185 592 370 814
Naphta t 92 000 -
JET fuel t 20 000 -
Gas mcf 15 000 -
The net carrying amount of hedging instruments for commodity risk as at 31 December 2015 and as at 31 December 2014 amounted to PLN 8 million and PLN (1,556) million, respectively. Sensitivity analysis for changes in prices of products and raw materials 31/12/2015 Analysis of the influence of changes in the carrying amount of financial instruments on hedging reserve to a hypothetical change in prices of products and raw materials:
Increase of prices Total influence Decrease of prices Total influence
Crude oil USD/bbl; CAD/bbl +19% (92) -19% 92
Diesel USD/t +17% (38) -17% 38
Gasoline USD/t +21% (62) -21% 62
Naphta USD/t +21% (9) -21% 9
Heating oil USD/t +20% 11 -20% (11)
JET fuel USD/t +16% 4 -16% (4)
(186) 186
31/12/2014 Analysis of the influence of changes in the carrying amount of financial instruments on result before tax and hedging reserve to a hypothetical change in prices of products and raw materials:
Increase of prices Total influence Decrease of prices Total influence
Crude oil USD/bbl; CAD/bbl +19% 591 -19% (591)
Diesel USD/t +17% (120) -17% 120
Gasoline USD/t +21% (74) -21% 74
Heating oil USD/t +20% 22 -20% (22)
419 (419)
including:
Influence on result before tax
Increase of prices Influence Decrease of prices Influence
Crude oil USD/bbl; CAD/bbl +19% 219 -19% (219)
Diesel USD/t +17% (106) -17% 106
Gasoline USD/t +21% (70) -21% 70
Heating oil USD/t +20% (26) -20% 26
17 (17)
Influence on hedging reserve
Increase of prices Influence Decrease of prices Influence
Crude oil USD/bbl; CAD/bbl +19% 372 -19% (372)
Diesel USD/t +17% (14) -17% 14
Gasoline USD/t +21% (4) -21% 4
Heating oil USD/t +20% 48 -20% (48)
402 (402)
Applied for the sensitivity analysis of commodity risk hedging instruments variations of crude oil and products prices were calculated based on volatility for 2014 and available analysts’ forecasts. The influence of changes of prices was presented on annual basis.
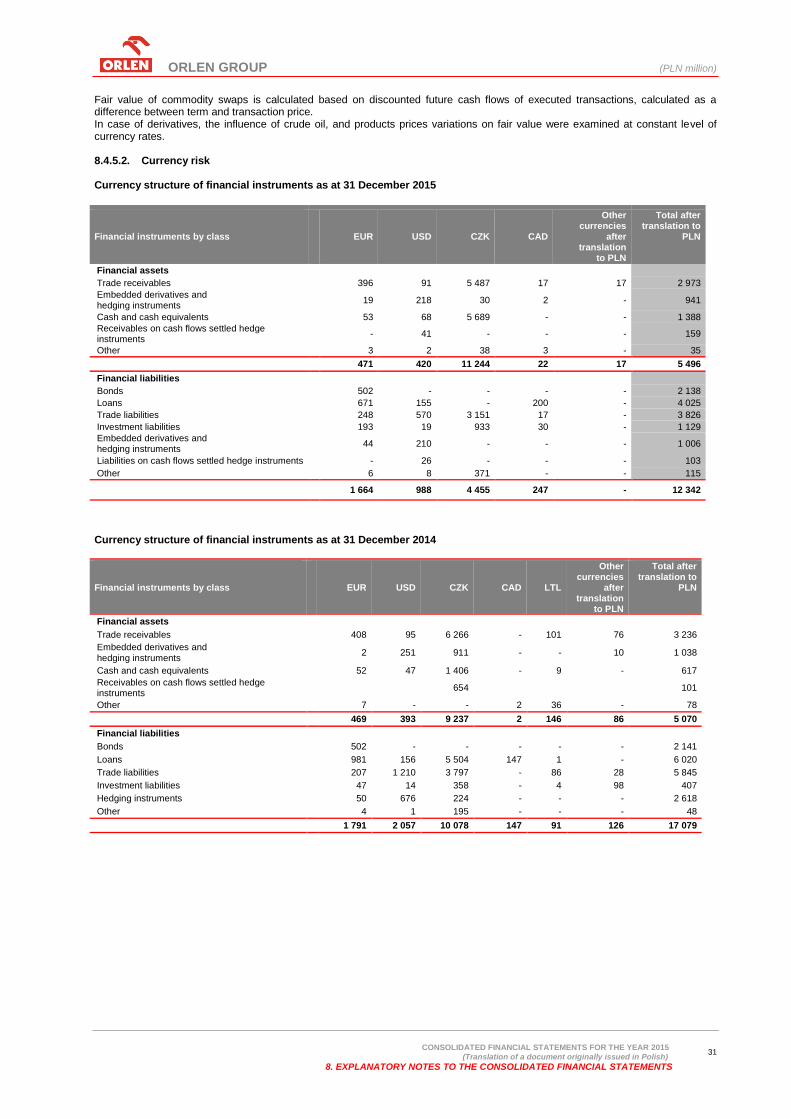
ORLEN GROUP (PLN million)
CONSOLIDATED FINANCIAL STATEMENTS FOR THE YEAR 2015
(Translation of a document originally issued in Polish)
8. EXPLANATORY NOTES TO THE CONSOLIDATED FINANCIAL STATEMENTS
31
Fair value of commodity swaps is calculated based on discounted future cash flows of executed transactions, calculated as a difference between term and transaction price. In case of derivatives, the influence of crude oil, and products prices variations on fair value were examined at constant level of currency rates. 8.4.5.2. Currency risk Currency structure of financial instruments as at 31 December 2015
Financial instruments by class EUR USD CZK CAD
Other currencies
after translation
to PLN
Total after translation to
PLN
Financial assets
Trade receivables 396 91 5 487 17 17 2 973
Embedded derivatives and hedging instruments
19 218 30 2 - 941
Cash and cash equivalents 53 68 5 689 - - 1 388
Receivables on cash flows settled hedge instruments
- 41 - - - 159
Other 3 2 38 3 - 35
471 420 11 244 22 17 5 496
Financial liabilities
Bonds 502 - - - - 2 138
Loans 671 155 - 200 - 4 025
Trade liabilities 248 570 3 151 17 - 3 826
Investment liabilities 193 19 933 30 - 1 129
Embedded derivatives and hedging instruments
44 210 - - - 1 006
Liabilities on cash flows settled hedge instruments - 26 - - - 103
Other 6 8 371 - - 115
1 664 988 4 455 247 - 12 342
Currency structure of financial instruments as at 31 December 2014
Financial instruments by class EUR USD CZK CAD LTL
Other currencies
after translation
to PLN
Total after translation to
PLN
Financial assets
Trade receivables 408 95 6 266 - 101 76 3 236
Embedded derivatives and hedging instruments
2 251 911 - - 10 1 038
Cash and cash equivalents 52 47 1 406 - 9 - 617
Receivables on cash flows settled hedge instruments
654 101
Other 7 - - 2 36 - 78
469 393 9 237 2 146 86 5 070
Financial liabilities
Bonds 502 - - - - - 2 141
Loans 981 156 5 504 147 1 - 6 020
Trade liabilities 207 1 210 3 797 - 86 28 5 845
Investment liabilities 47 14 358 - 4 98 407
Hedging instruments 50 676 224 - - - 2 618
Other 4 1 195 - - - 48
1 791 2 057 10 078 147 91 126 17 079
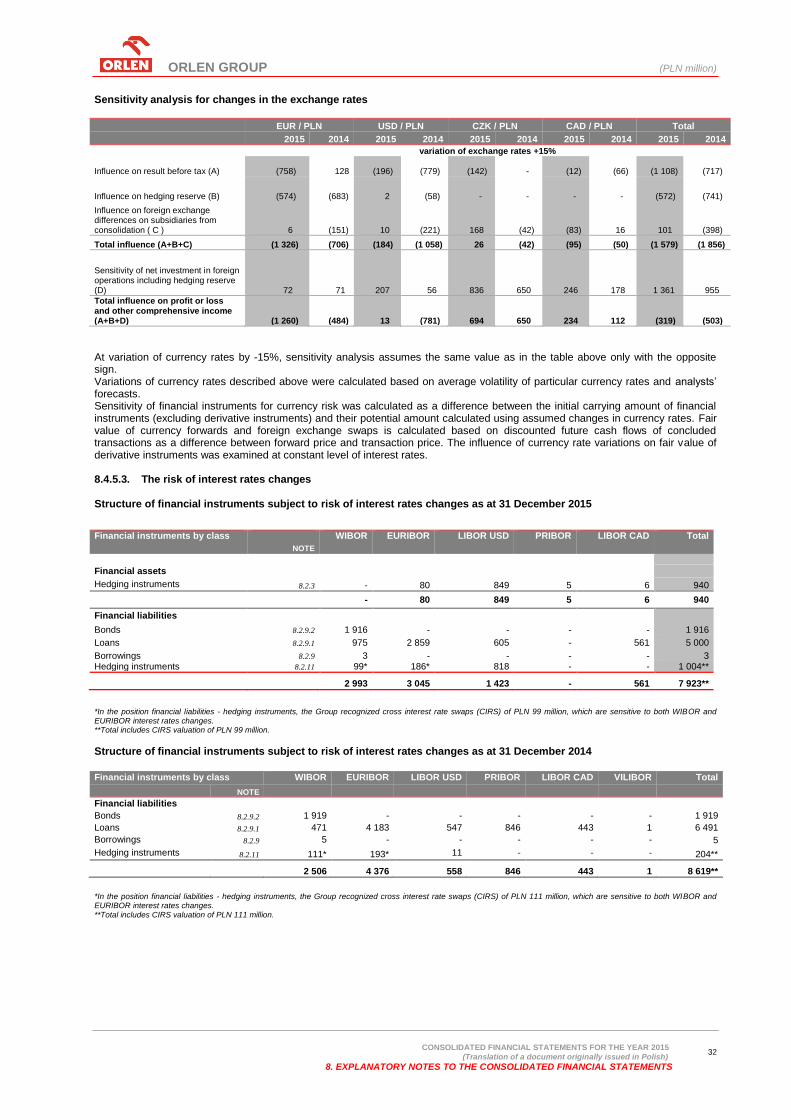
ORLEN GROUP (PLN million)
CONSOLIDATED FINANCIAL STATEMENTS FOR THE YEAR 2015
(Translation of a document originally issued in Polish)
8. EXPLANATORY NOTES TO THE CONSOLIDATED FINANCIAL STATEMENTS
32
Sensitivity analysis for changes in the exchange rates
EUR / PLN USD / PLN CZK / PLN CAD / PLN Total
2015 2014 2015 2014 2015 2014 2015 2014 2015 2014
variation of exchange rates +15%
Influence on result before tax (A) (758) 128 (196) (779) (142) - (12) (66) (1 108) (717)
Influence on hedging reserve (B) (574) (683) 2 (58) - - - - (572) (741)
Influence on foreign exchange differences on subsidiaries from consolidation ( C ) 6 (151) 10 (221) 168 (42) (83) 16 101 (398)
Total influence (A+B+C) (1 326) (706) (184) (1 058) 26 (42) (95) (50) (1 579) (1 856)
Sensitivity of net investment in foreign operations including hedging reserve (D) 72 71 207 56 836 650 246 178 1 361 955
Total influence on profit or loss and other comprehensive income (A+B+D) (1 260) (484) 13 (781) 694 650 234 112 (319) (503)
At variation of currency rates by -15%, sensitivity analysis assumes the same value as in the table above only with the opposite sign. Variations of currency rates described above were calculated based on average volatility of particular currency rates and analysts’ forecasts. Sensitivity of financial instruments for currency risk was calculated as a difference between the initial carrying amount of financial instruments (excluding derivative instruments) and their potential amount calculated using assumed changes in currency rates. Fair value of currency forwards and foreign exchange swaps is calculated based on discounted future cash flows of concluded transactions as a difference between forward price and transaction price. The influence of currency rate variations on fair value of derivative instruments was examined at constant level of interest rates. 8.4.5.3. The risk of interest rates changes Structure of financial instruments subject to risk of interest rates changes as at 31 December 2015
Financial instruments by class WIBOR EURIBOR LIBOR USD PRIBOR LIBOR CAD Total
NOTE
Financial assets
Hedging instruments 8.2.3 - 80 849 5 6 940
- 80 849 5 6 940
Financial liabilities
Bonds 8.2.9.2 1 916 - - - - 1 916
Loans 8.2.9.1 975 2 859 605 - 561 5 000
Borrowings 8.2.9 3 - - - - 3 Hedging instruments 8.2.11 99* 186* 818 - - 1 004**
2 993 3 045 1 423 - 561 7 923**
*In the position financial liabilities - hedging instruments, the Group recognized cross interest rate swaps (CIRS) of PLN 99 million, which are sensitive to both WIBOR and EURIBOR interest rates changes. **Total includes CIRS valuation of PLN 99 million.
Structure of financial instruments subject to risk of interest rates changes as at 31 December 2014
Financial instruments by class WIBOR EURIBOR LIBOR USD PRIBOR LIBOR CAD VILIBOR Total
NOTE
Financial liabilities
Bonds 8.2.9.2 1 919 - - - - - 1 919
Loans 8.2.9.1 471 4 183 547 846 443 1 6 491
Borrowings 8.2.9 5 - - - - - 5
Hedging instruments 8.2.11 111* 193* 11 - - - 204**
2 506 4 376 558 846 443 1 8 619**
*In the position financial liabilities - hedging instruments, the Group recognized cross interest rate swaps (CIRS) of PLN 111 million, which are sensitive to both WIBOR and EURIBOR interest rates changes. **Total includes CIRS valuation of PLN 111 million.
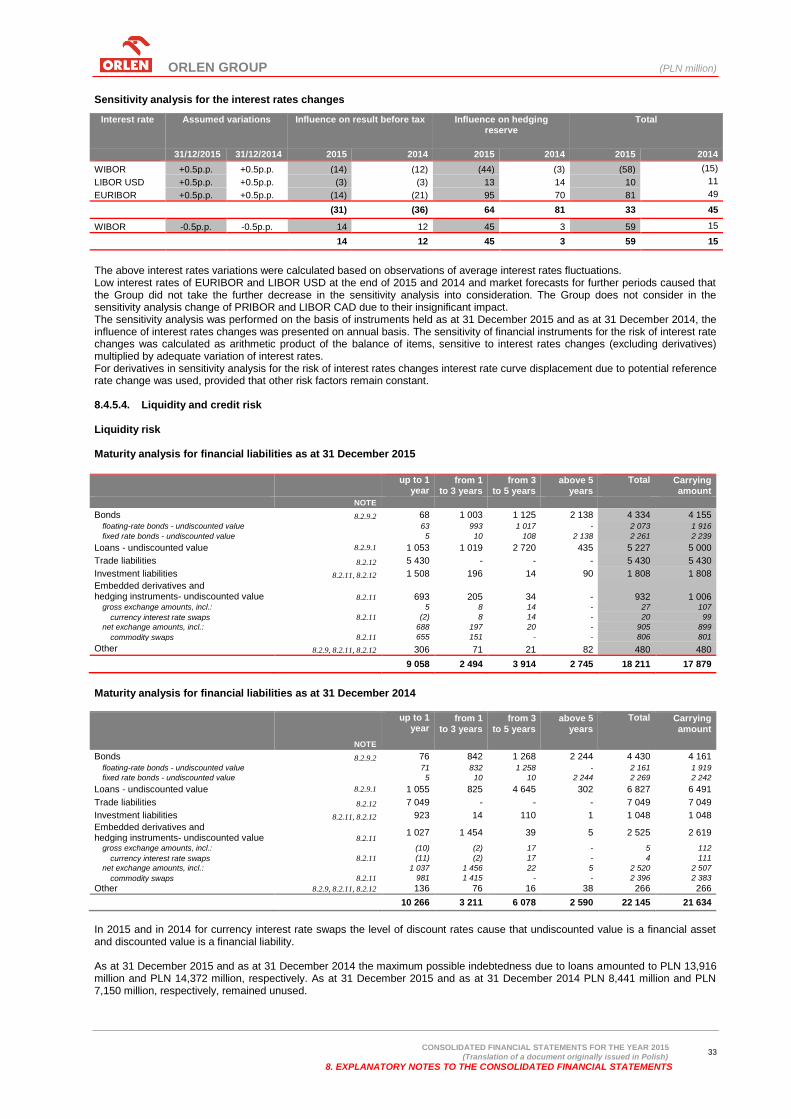
ORLEN GROUP (PLN million)
CONSOLIDATED FINANCIAL STATEMENTS FOR THE YEAR 2015
(Translation of a document originally issued in Polish)
8. EXPLANATORY NOTES TO THE CONSOLIDATED FINANCIAL STATEMENTS
33
Sensitivity analysis for the interest rates changes
Interest rate Assumed variations Influence on result before tax Influence on hedging reserve
Total
31/12/2015 31/12/2014 2015 2014 2015 2014 2015 2014
WIBOR +0.5p.p. +0.5p.p. (14) (12) (44) (3) (58) (15)
LIBOR USD +0.5p.p. +0.5p.p. (3) (3) 13 14 10 11
EURIBOR +0.5p.p. +0.5p.p. (14) (21) 95 70 81 49
(31) (36) 64 81 33 45
WIBOR -0.5p.p. -0.5p.p. 14 12 45 3 59 15
14 12 45 3 59 15
The above interest rates variations were calculated based on observations of average interest rates fluctuations. Low interest rates of EURIBOR and LIBOR USD at the end of 2015 and 2014 and market forecasts for further periods caused that the Group did not take the further decrease in the sensitivity analysis into consideration. The Group does not consider in the sensitivity analysis change of PRIBOR and LIBOR CAD due to their insignificant impact. The sensitivity analysis was performed on the basis of instruments held as at 31 December 2015 and as at 31 December 2014, the influence of interest rates changes was presented on annual basis. The sensitivity of financial instruments for the risk of interest rate changes was calculated as arithmetic product of the balance of items, sensitive to interest rates changes (excluding derivatives) multiplied by adequate variation of interest rates. For derivatives in sensitivity analysis for the risk of interest rates changes interest rate curve displacement due to potential reference rate change was used, provided that other risk factors remain constant. 8.4.5.4. Liquidity and credit risk Liquidity risk Maturity analysis for financial liabilities as at 31 December 2015
up to 1
year from 1
to 3 years from 3
to 5 years above 5
years
Total Carrying amount
NOTE
Bonds 8.2.9.2 68 1 003 1 125 2 138 4 334 4 155 floating-rate bonds - undiscounted value 63 993 1 017 - 2 073 1 916
fixed rate bonds - undiscounted value 5 10 108 2 138 2 261 2 239
Loans - undiscounted value 8.2.9.1 1 053 1 019 2 720 435 5 227 5 000
Trade liabilities 8.2.12 5 430 - - - 5 430 5 430
Investment liabilities 8.2.11, 8.2.12 1 508 196 14 90 1 808 1 808
Embedded derivatives and hedging instruments- undiscounted value 8.2.11 693 205 34 - 932 1 006
gross exchange amounts, incl.: 5 8 14 - 27 107
currency interest rate swaps 8.2.11 (2) 8 14 - 20 99
net exchange amounts, incl.: 688 197 20 - 905 899
commodity swaps 8.2.11 655 151 - - 806 801
Other 8.2.9, 8.2.11, 8.2.12 306 71 21 82 480 480
9 058 2 494 3 914 2 745 18 211 17 879
Maturity analysis for financial liabilities as at 31 December 2014
up to 1
year from 1
to 3 years from 3
to 5 years above 5
years
Total Carrying amount
NOTE
Bonds 8.2.9.2 76 842 1 268 2 244 4 430 4 161
floating-rate bonds - undiscounted value 71 832 1 258 - 2 161 1 919
fixed rate bonds - undiscounted value 5 10 10 2 244 2 269 2 242
Loans - undiscounted value 8.2.9.1 1 055 825 4 645 302 6 827 6 491
Trade liabilities 8.2.12 7 049 - - - 7 049 7 049
Investment liabilities 8.2.11, 8.2.12 923 14 110 1 1 048 1 048
Embedded derivatives and hedging instruments- undiscounted value 8.2.11
1 027 1 454 39 5 2 525 2 619
gross exchange amounts, incl.: (10) (2) 17 - 5 112
currency interest rate swaps 8.2.11 (11) (2) 17 - 4 111
net exchange amounts, incl.: 1 037 1 456 22 5 2 520 2 507
commodity swaps 8.2.11 981 1 415 - - 2 396 2 383
Other 8.2.9, 8.2.11, 8.2.12 136 76 16 38 266 266
10 266 3 211 6 078 2 590 22 145 21 634
In 2015 and in 2014 for currency interest rate swaps the level of discount rates cause that undiscounted value is a financial asset and discounted value is a financial liability. As at 31 December 2015 and as at 31 December 2014 the maximum possible indebtedness due to loans amounted to PLN 13,916 million and PLN 14,372 million, respectively. As at 31 December 2015 and as at 31 December 2014 PLN 8,441 million and PLN 7,150 million, respectively, remained unused.
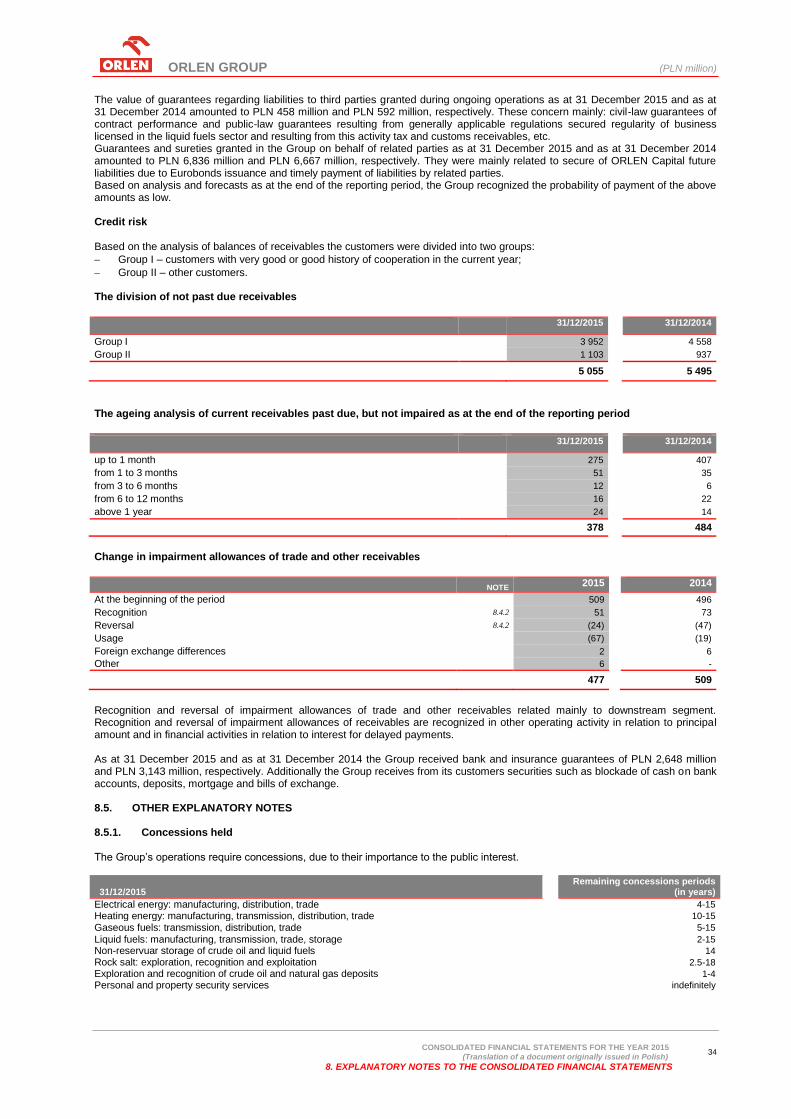
ORLEN GROUP (PLN million)
CONSOLIDATED FINANCIAL STATEMENTS FOR THE YEAR 2015
(Translation of a document originally issued in Polish)
8. EXPLANATORY NOTES TO THE CONSOLIDATED FINANCIAL STATEMENTS
34
The value of guarantees regarding liabilities to third parties granted during ongoing operations as at 31 December 2015 and as at 31 December 2014 amounted to PLN 458 million and PLN 592 million, respectively. These concern mainly: civil-law guarantees of contract performance and public-law guarantees resulting from generally applicable regulations secured regularity of business licensed in the liquid fuels sector and resulting from this activity tax and customs receivables, etc. Guarantees and sureties granted in the Group on behalf of related parties as at 31 December 2015 and as at 31 December 2014 amounted to PLN 6,836 million and PLN 6,667 million, respectively. They were mainly related to secure of ORLEN Capital future liabilities due to Eurobonds issuance and timely payment of liabilities by related parties. Based on analysis and forecasts as at the end of the reporting period, the Group recognized the probability of payment of the above amounts as low. Credit risk Based on the analysis of balances of receivables the customers were divided into two groups:
Group I – customers with very good or good history of cooperation in the current year;
Group II – other customers. The division of not past due receivables
31/12/2015 31/12/2014
Group I 3 952 4 558
Group II 1 103 937
5 055 5 495
The ageing analysis of current receivables past due, but not impaired as at the end of the reporting period
31/12/2015 31/12/2014
up to 1 month 275 407
from 1 to 3 months 51 35
from 3 to 6 months 12 6
from 6 to 12 months 16 22
above 1 year 24 14
378 484
Change in impairment allowances of trade and other receivables
NOTE 2015 2014
At the beginning of the period 509 496
Recognition 8.4.2 51 73
Reversal 8.4.2 (24) (47)
Usage (67) (19)
Foreign exchange differences 2 6
Other 6 -
477 509
Recognition and reversal of impairment allowances of trade and other receivables related mainly to downstream segment. Recognition and reversal of impairment allowances of receivables are recognized in other operating activity in relation to principal amount and in financial activities in relation to interest for delayed payments. As at 31 December 2015 and as at 31 December 2014 the Group received bank and insurance guarantees of PLN 2,648 million and PLN 3,143 million, respectively. Additionally the Group receives from its customers securities such as blockade of cash on bank accounts, deposits, mortgage and bills of exchange. 8.5. OTHER EXPLANATORY NOTES 8.5.1. Concessions held The Group’s operations require concessions, due to their importance to the public interest. 31/12/2015
Remaining concessions periods (in years)
Electrical energy: manufacturing, distribution, trade 4-15
Heating energy: manufacturing, transmission, distribution, trade 10-15
Gaseous fuels: transmission, distribution, trade 5-15
Liquid fuels: manufacturing, transmission, trade, storage 2-15
Non-reservuar storage of crude oil and liquid fuels
14
Rock salt: exploration, recognition and exploitation
2.5-18
Exploration and recognition of crude oil and natural gas deposits
1-4
Personal and property security services
indefinitely

ORLEN GROUP (PLN million)
CONSOLIDATED FINANCIAL STATEMENTS FOR THE YEAR 2015
(Translation of a document originally issued in Polish)
8. EXPLANATORY NOTES TO THE CONSOLIDATED FINANCIAL STATEMENTS
35
As at 31 December 2015 and as at 31 December 2014 the Group had no liabilities related to concession services in scope of IFRIC 12 – Service concession arrangements.
8.5.2. Leases 8.5.2.1. Group as a lessee Operating lease As at 31 December 2015 and as at 31 December 2014 the Group was a lessee under non-cancellable operating lease agreements (tenancy, rent), which regard mainly the lease of petrol stations, means of transportation and computer equipment. Agreements include clauses concerning contingent rent payables. In most cases they can be extended. The total lease payments, resulting from non-cancellable operating lease agreements recognized as expenses in 2015 and in 2014 amounted to PLN (85) million and PLN (83) million, respectively.
Future minimum lease payments under non-cancellable operating lease agreements:
31/12/2015 31/12/2014
up to 1 year 73 76
from 1 to 5 years 207 254
above 5 years 474 488
754 818
Finance lease As at 31 December 2015 and as at 31 December 2014 the Group was a lessee under finance lease agreements, which relate to buildings and constructions, machinery and equipment and vehicles. In concluded lease agreements, the general conditions of finance lease are effective, they do not contain any clauses concerning contingent rent payables, give the possibility to purchase the leased equipment and eventually can be extended.
Present value of future minimum
lease payments Value of future minimum lease payments
NOTE
31/12/2015 31/12/2014
31/12/2015 31/12/2014
up to 1 year 26 27 33 32
from 1 to 5 years 58 51 77 63
above 5 years 82 38 112 47
8.2.11, 8.2.12 166 116 222 142
The difference between the total value of future minimum lease payments and their present value results from discounting of lease payments by the interest rate implicit in the proper agreement.
8.5.3. Investment expenditures incurred and future commitments resulting from signed investment contracts The total amount of investment expenditures together with borrowing costs incurred in 2015 and in 2014 amounted to PLN 3,183 million and PLN 3,788 million, respectively, including PLN 306 million and PLN 521 million of investments relating to environmental protection. As at 31 December 2015 and as at 31 December 2014 the value of future commitments resulting from contracts signed until this date amounted to PLN 3,054 million and PLN 2,005 million, respectively. 8.5.4. Contingent assets and liabilities Contingent assets On 13 August 2015 the steam cracker unit accident in Unipetrol Group took place. In relation to damaged petrochemical assets, an impairment of PLN (93) million, translated using the exchange rate as at 30 September 2015 (representing approximately CZK (597) million), was recognized. Based on the insurance policies and the estimates made at the end of 2015, Unipetrol Group expects insurers to cover reconstruction costs of repair, in the amount of approximately PLN 647 million translated using the exchange rate as at 31 December 2015 (representing CZK 4.1 billion), as well as lost business profits in 2015 in the amount of approximately PLN 378 million translated using the exchange rate as at 31 December 2015 (representing CZK 2.4 billion) and other costs incurred in connection with the accident in the amount of approximately PLN 25 million translated using the exchange rate as at 31 December 2015 (representing CZK 156 million). Unipetrol Group received advance payments on account of the loss in amount of approximately PLN 43 million translated using the exchange rate as at 31 December 2015 (representing CZK 276 million), which was recognized under trade and other liabilities in the statement of financial position of the Group. Contingent liabilities Spolana a.s. currently produces chlorine using the mercury electrolysis. In case of production ceases, the company is required to present a reclamation program after it stops to use its fixed assets. On 9 September 2013, as a result of administrative proceedings, Spolana a.s. received a consent of Mid-Czech Regional Body to extend the integrated pollution prevention and control license from the end of 2014 until 30 June 2017. At the same time, the company is obliged to submit an action plan aiming to cease the production of chlorine using the mercury electrolysis until 31 March 2017. Information on significant court proceedings is presented in note 8.8.

ORLEN GROUP (PLN million)
CONSOLIDATED FINANCIAL STATEMENTS FOR THE YEAR 2015
(Translation of a document originally issued in Polish)
8. EXPLANATORY NOTES TO THE CONSOLIDATED FINANCIAL STATEMENTS
36
8.5.5. Excise tax guarantees Excise tax guarantees and excise tax on goods and merchandise under the excise tax suspension procedure as at 31 December 2015 and as at 31 December 2014 amounted to PLN 1,815 million and PLN 1,637 million, respectively.
8.5.6. Related party transactions As at 31 December 2015 and as at 31 December 2014 and in 2015 and in 2014 were no material transactions of related parties with:
members of the Management Board and the Supervisory Board of the Parent Company and their relatives,
key executive personnel of the Parent Company and ORLEN Group companies. ORLEN Group companies’ transactions and balances of settlements with related parties Sales Purchases
2015 2014 2015 2014
Jointly- controlled entities 2 954 3 295 (213) (507) joint ventures 2 806 2 927 (37) (30) joint operations 148 368 (176) (477)
Associates 48 60 (32) (47)
3 002 3 355 (245) (554)
Trade and other receivables Trade and other liabilities
31/12/2015 31/12/2014 31/12/2015 31/12/2014
Jointly- controlled entities 509 620 5 225 joint ventures 508 575 4 4 joint operations 1 45 1 221
Associates 17 17 8 9
526 637 13 234
The above transactions with related parties include mainly sales and purchases of refinery and petrochemicals products and sales and purchases of services. In 2015 and in 2014 there were no material related party transactions in the Group concluded on other than an arm’s length basis. 8.5.7. Remuneration together with profit-sharing paid and due or potentially due to the members of the Management
Board, the Supervisory Board of the Parent Company and other members of key executive personnel of the Parent Company and the ORLEN Group companies
2015 2014
Remuneration of the Management Board Members of the Parent Company performing duties in the current year
13.5
11.7
remuneration and other benefits 7.2 6.8
bonus paid for the previous year 6.3 4.9
Bonuses potentially due to the Management Board Members of the Parent Company performing duties in the current year , to be paid in the next year
6.7
6.4
Remuneration and other benefits paid and due to the former Management Board Members of the Parent Company *
3.4 1.4
Remuneration and other benefits of the key executive personnel 177.5 174.9
remuneration and other benefits of the key executive personnel of the Parent Company 37.1 35.0
key executive personnel of the subsidiaries belonging of the ORLEN Group 140.4 139.9
Remuneration of the Supervisory Board Members of the Parent Company 1.5 1.3
* In 2015, remuneration paid due to severance payment and for non-competition, remuneration due for non-competition; in 2014 severance payment and bonus paid for the year 2011.
The Management Board’s, the Supervisory Board’s and other key executive personnel’s remuneration includes short-term employee benefits, post-employment benefits, other long-term employee benefits and termination benefits paid, due and potentially due during the period. Bonus systems for key executive personnel of the ORLEN Group The regulations applicable to PKN ORLEN Management Board, directors directly reporting to the Management Board of PKN ORLEN and other key positions of the ORLEN Group have certain common features. The persons subject to the above mentioned systems are remunerated for the accomplishment of specific goals set at the beginning of the bonus period, by the Supervisory Board for the Management Board Members and by the Management Board for the key executive personnel. The Bonus Systems are consistent with the Concern’s Values, so as to promote the cooperation between individual employees in view to achieve the best possible results for the ORLEN Group. The goals so-said are qualitative or quantitative and are accounted for the end of the year for which they were set. Regulation gives the possibility to promote employees, who significantly contribute to the achieved results.

ORLEN GROUP (PLN million)
CONSOLIDATED FINANCIAL STATEMENTS FOR THE YEAR 2015
(Translation of a document originally issued in Polish)
8. EXPLANATORY NOTES TO THE CONSOLIDATED FINANCIAL STATEMENTS
37
Remuneration regarding non-competition clause and dissolution of the contract as a result of dismissal from the position held According to agreements, Members of the PKN ORLEN Management Board are obliged to obey a non-competition clause for 6 or 12 months, starting from the date of termination or expiration of the contract. In the period, they are entitled to receive remuneration in the amount of six or twelve basic monthly remuneration, payable in equal monthly instalments. In addition, agreements include remuneration payments in case of dissolution of the contract because of dismissal from the position held. Remuneration in such a case is six or twelve basic monthly remuneration. Directors directly subordinate to the Management Board of PKN ORLEN and Management Board members are typically obliged to obey a non-competition clause for 6 months, starting from the date of termination or expiration of the contract. In the period, they receive remuneration in the amount of 50% of six-month basic remuneration, payable in 6 equal monthly instalments. Furthermore, severance pay for termination of contract by the Employer amounts to three or six times basic monthly remuneration.
Information on remuneration is presented in details in point 2.12 of the Management Board Report on the operations of ORLEN Capital Group.
8.5.8. Remuneration arising from the agreement with the entity authorized to conduct audit of the financial statements
2015
2014
Remuneration of KPMG Audyt Sp. z o.o. in respect of the Parent Company 1.3 3.0 audit and reviews of the financial statements 1.1 1.3
additional services 0.2 1.7
Remuneration of KPMG Audyt Sp. z o.o. and KPMG member firms in respect of subsidiaries of the Capital Group
4.4
3.9
audit of the annual financial statements and verification procedures 3.9 3.5
additional services 0.5 0.4
5.7 6.9
In the period covered by this consolidated financial statements the entity authorized to conduct audit of the ORLEN Group’s financial statements was KPMG Audyt Sp. z o.o. According to the agreement concluded on 30 May 2005 with subsequent amendments KPMG Audyt Sp. z o.o. executes the interim reviews and audits of separate and consolidated financial statements in years 2005-2016. 8.6. ACCOUNTING PRINCIPLES 8.6.1. Impact of IFRSs amendments and interpretations on consolidated financial statements of the ORLEN Group IFRSs and their interpretations, announced and adopted by the European Union, not yet effective The Group intends to adopt listed below new standards and amendments to the standards and interpretations to IFRSs that are published by the International Accounting Standards Board, but not effective as at the date of publication of these financial statements, in accordance with their effective date.
Possible impact on financial
statements
Amendments to IAS 16 - Property, Plant and Equipment and IAS 41 - Agriculture: Agriculture - Bearer Plants
no impact expected
Amendments to IAS 16 - Property, Plant and Equipment and IAS 38 - Intangible Assets: Clarification of Acceptable Methods of Depreciation and Amortisation
no impact expected
Amendments to IAS 19 Employee Benefits entitled Defined Benefit Plans: Employee Contributions
no impact expected
Improvements to International Financial Reporting Standards 2012-2014 no impact expected
Amendments to IAS 27 - Separate Financial Statements: Equity Method in Separate Financial Statements no impact expected
Amendments to IFRS 11 - Joint Arrangements: Accounting for Acquisitions of Interests in Joint Operations no impact expected
Standards and Interpretations adopted by International Accounting Standards Board (IASB), waiting for approval of EU
Possible impact on financial
statements
New standard IFRS 9 - Financial Instruments impact*
New standard IFRS 15 - Revenue from Contracts with Customers impact*
IFRS 16 - Leasing impact*
Amendments to IAS 7 - Statement of Cash Flows - Disclosure initiative no impact expected
Amendments to IAS 12 - Income Taxes - Recognition of Deferred Tax Assets for Unrealized Losses no impact expected
Amendments to IFRS 10 - Consolidated Financial Statements and IAS 28 - Investments in Associates: Sale or Contribution of Assets between an Investor and its Associate or Joint Venture no impact expected
Amendments to IFRS 10 - Consolidated Financial Statements, IFRS 12 - Disclosure of Interests in Other Entities and IAS 28 - Investments in Associates and Joint Ventures: Investment Entities: Applying the Consolidation Exception
no impact expected
New standard IFRS 14 - Regulatory Deferral Accounts no impact expected
* At the time of the initial implementation, the impact of the new standards will depend on specific facts and circumstances relating to the changes. The Group plans to finalize the analysis of the impact of the new standards IFRS 9 and IFRS 15 at the latest by 2017. The impact of the new IFRS 16 will result in the recognition in the consolidated statement of financial position the Group as a lessee under rent, tenancy, use and lease, which until the first application of the standard is not qualified as a finance lease. The Group plans to finalize the analysis of the impact of the standard IFRS 16 at the latest by 2018.
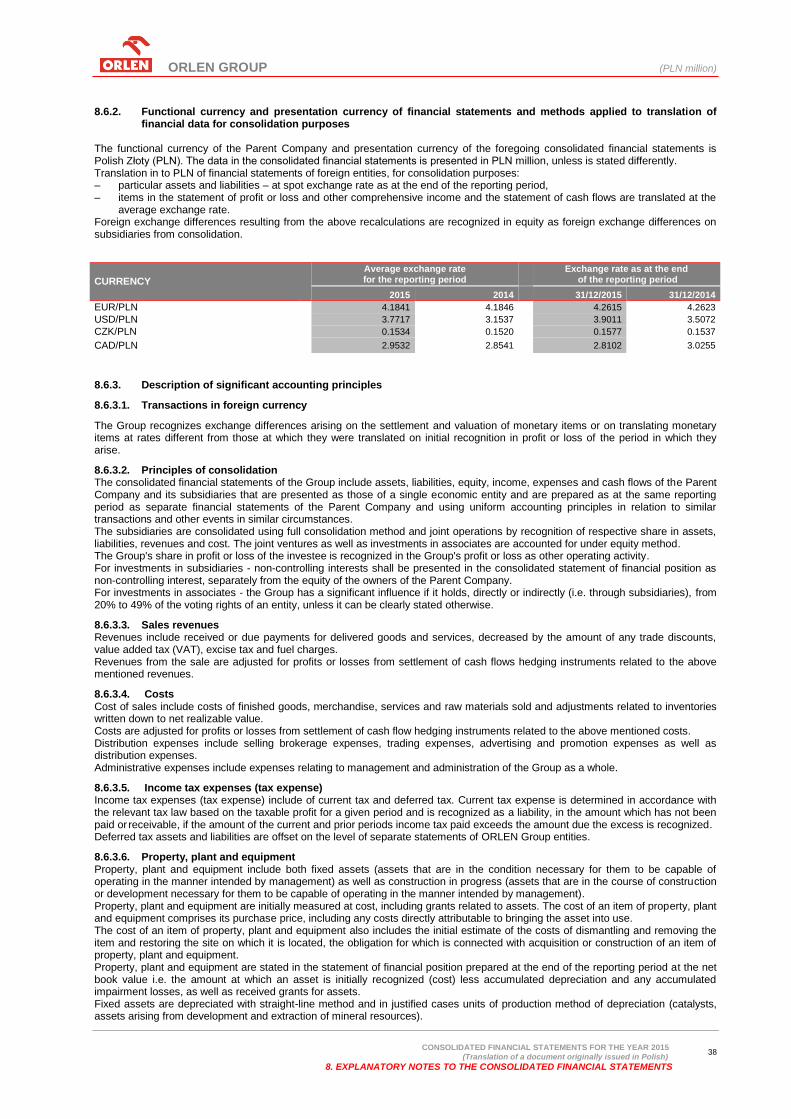
ORLEN GROUP (PLN million)
CONSOLIDATED FINANCIAL STATEMENTS FOR THE YEAR 2015
(Translation of a document originally issued in Polish)
8. EXPLANATORY NOTES TO THE CONSOLIDATED FINANCIAL STATEMENTS
38
8.6.2. Functional currency and presentation currency of financial statements and methods applied to translation of
financial data for consolidation purposes The functional currency of the Parent Company and presentation currency of the foregoing consolidated financial statements is
Polish Złoty (PLN). The data in the consolidated financial statements is presented in PLN million, unless is stated differently. Translation in to PLN of financial statements of foreign entities, for consolidation purposes: – particular assets and liabilities – at spot exchange rate as at the end of the reporting period, – items in the statement of profit or loss and other comprehensive income and the statement of cash flows are translated at the
average exchange rate. Foreign exchange differences resulting from the above recalculations are recognized in equity as foreign exchange differences on subsidiaries from consolidation.
CURRENCY
Average exchange rate for the reporting period
Exchange rate as at the end
of the reporting period
2015 2014 31/12/2015 31/12/2014
EUR/PLN 4.1841 4.1846 4.2615 4.2623
USD/PLN 3.7717 3.1537 3.9011 3.5072
CZK/PLN 0.1534 0.1520 0.1577 0.1537
CAD/PLN 2.9532 2.8541 2.8102 3.0255
8.6.3. Description of significant accounting principles
8.6.3.1. Transactions in foreign currency
The Group recognizes exchange differences arising on the settlement and valuation of monetary items or on translating monetary items at rates different from those at which they were translated on initial recognition in profit or loss of the period in which they arise.
8.6.3.2. Principles of consolidation The consolidated financial statements of the Group include assets, liabilities, equity, income, expenses and cash flows of the Parent Company and its subsidiaries that are presented as those of a single economic entity and are prepared as at the same reporting period as separate financial statements of the Parent Company and using uniform accounting principles in relation to similar transactions and other events in similar circumstances. The subsidiaries are consolidated using full consolidation method and joint operations by recognition of respective share in assets, liabilities, revenues and cost. The joint ventures as well as investments in associates are accounted for under equity method. The Group's share in profit or loss of the investee is recognized in the Group's profit or loss as other operating activity. For investments in subsidiaries - non-controlling interests shall be presented in the consolidated statement of financial position as non-controlling interest, separately from the equity of the owners of the Parent Company. For investments in associates - the Group has a significant influence if it holds, directly or indirectly (i.e. through subsidiaries), from 20% to 49% of the voting rights of an entity, unless it can be clearly stated otherwise.
8.6.3.3. Sales revenues Revenues include received or due payments for delivered goods and services, decreased by the amount of any trade discounts, value added tax (VAT), excise tax and fuel charges. Revenues from the sale are adjusted for profits or losses from settlement of cash flows hedging instruments related to the above mentioned revenues.
8.6.3.4. Costs Cost of sales include costs of finished goods, merchandise, services and raw materials sold and adjustments related to inventories written down to net realizable value. Costs are adjusted for profits or losses from settlement of cash flow hedging instruments related to the above mentioned costs. Distribution expenses include selling brokerage expenses, trading expenses, advertising and promotion expenses as well as distribution expenses. Administrative expenses include expenses relating to management and administration of the Group as a whole.
8.6.3.5. Income tax expenses (tax expense) Income tax expenses (tax expense) include of current tax and deferred tax. Current tax expense is determined in accordance with the relevant tax law based on the taxable profit for a given period and is recognized as a liability, in the amount which has not been paid or receivable, if the amount of the current and prior periods income tax paid exceeds the amount due the excess is recognized. Deferred tax assets and liabilities are offset on the level of separate statements of ORLEN Group entities.
8.6.3.6. Property, plant and equipment Property, plant and equipment include both fixed assets (assets that are in the condition necessary for them to be capable of operating in the manner intended by management) as well as construction in progress (assets that are in the course of construction or development necessary for them to be capable of operating in the manner intended by management). Property, plant and equipment are initially measured at cost, including grants related to assets. The cost of an item of property, plant and equipment comprises its purchase price, including any costs directly attributable to bringing the asset into use. The cost of an item of property, plant and equipment also includes the initial estimate of the costs of dismantling and removing the item and restoring the site on which it is located, the obligation for which is connected with acquisition or construction of an item of property, plant and equipment. Property, plant and equipment are stated in the statement of financial position prepared at the end of the reporting period at the net book value i.e. the amount at which an asset is initially recognized (cost) less accumulated depreciation and any accumulated impairment losses, as well as received grants for assets. Fixed assets are depreciated with straight-line method and in justified cases units of production method of depreciation (catalysts, assets arising from development and extraction of mineral resources).
ORLEN GROUP (PLN million)
CONSOLIDATED FINANCIAL STATEMENTS FOR THE YEAR 2015
(Translation of a document originally issued in Polish)
8. EXPLANATORY NOTES TO THE CONSOLIDATED FINANCIAL STATEMENTS
39
Each part of an item of property, plant and equipment with a cost that is significant in relation to the total cost of the item is depreciated separately over the period reflecting its useful lives. The following standard useful lives are used for property, plant and equipment: Buildings and constructions 10-40 years Machinery and equipment 4-35 years Vehicles and other 2-20 years The method of depreciation, residual value and useful life of an asset are reviewed at least at the end of each year. When it is necessary adjustments of depreciation are carried out in subsequent periods (prospectively). The costs of significant repairs and regular maintenance programs are recognized as property, plant and equipment and depreciated in accordance with their useful lives. The costs of current maintenance of property, plant and equipment are changed profit or loss in the period in which they are incurred. Property, plant and equipment is tested for impairment, when there are indicators or events that may imply that the carrying amount of those assets may not be recoverable. Recognition and reversal of impairment allowances of property, plant and equipment is recognized in other operating activities.
8.6.3.7. Exploration and extraction of mineral resources Within the framework of exploration and extraction of mineral resources, the following classification of stage was made: Stage of exploration and assessment of mineral resources include: - Acquisition of rights to explore and extract, exploration and recognition of resources are recognized according to the successful
efforts method, - expenditures for exploratory and recognition drillings and other expenditures (including acquisition of seismic data, their
processing, interpretation of geological and geophysical data), - other expenditures which are directly attributable to the phase of exploration and recognition and are subject for capitalization.
If the direct attribution is not possible, other costs are recognized in profit or loss when incurred. The Group shall review annually expenditures incurred in the stage of exploration and recognition of mineral resources in order to confirm the intention of further work. If the work of the exploration and recognition is unsuccessful, the cost previously recognized as an asset are recognized as cost of a current period. Expenditure incurred in the exploration and recognition of resources (including unsuccessful drillings) are transferred from assets related to exploration and evaluation of mineral resources and are recognized as assets related to planning and extraction of mineral resources within property, plant and equipment at the moment of the conclusion of their technical feasibility and economic viability of mining. Stage of site planning and of extraction of mineral resources Expenditures incurred for mineral resource sites planning and extraction of resources are capitalized and amortised in line with general principles for property, plant and equipment and borrowing costs. Depreciation of assets related to exploration and extraction of mineral resources recognized by applying unit of production method that means proportionally to the forecast amount of extraction of mineral resources. Similarly, property, plant and equipment included in the extractive infrastructure are depreciated by unit of production method based on recognition as cost the depreciation amount per unit of extracted mineral resources. In case of significant change in estimated mineral resources, at the reporting date potential impairment allowances are recognized or reversed. In case of performance of exploratory drillings on already extracted resource, the Group analyses, if costs incurred enable rising new boreholes – expenditures are recognized in non-current assets at the date of put into use. If despite the expenditures, new boreholes do not rise, expenditures are recognized in costs of the current period.
8.6.3.8. Intangible assets An intangible asset shall be measured initially at acquisition or production cost and shall be presented in the financial statements in its net carrying amount, including grants related to assets. Intangible assets with the finite useful life are amortised using straight-line method. Amortization shall begin when the asset is available for use, i.e. when it is in the location and condition necessary for it to be capable of operating in the manner intended by management. The asset shall be amortised over the period reflecting its estimated useful live. Standard useful lives of intangible assets are from 2 to 15 years for concessions, licenses, patents and similar and from 2 to 10 years for software. The amortization method and useful life of intangible asset item are verified at least at the end of each year. When necessary, the adjustments to amortization expense are accounted for in the future periods (prospectively). Intangible assets with an indefinite useful life shall not be amortised. Their value is decreased by the eventual impairment allowances. Additionally, the useful life of an intangible asset that is not being amortised shall be reviewed each period to determine whether events and circumstances continue to support an indefinite useful life assessment for that asset. Recognition and reversal of impairment allowances on intangible assets is recognized in other operating activities. 8.6.3.8.1. Goodwill Goodwill acquired in a business combination shall, from the acquisition date, be allocated to each of the acquirer's cash-generating units, (CGU), that is expected to benefit from the synergies of the combination, irrespective of whether other assets or liabilities of the acquire are assigned to those units or groups of units. The acquirer shall measure goodwill in the amount recognized at the acquisition date less any accumulated impairment allowances. A cash-generating unit to which goodwill has been allocated shall be tested for impairment annually, and whenever there is an indication that the unit may be impaired. An impairment loss recognized for goodwill shall not be reversed in a subsequent period. 8.6.3.8.2. Rights The main item of rights is CO2 emission rights, which are initially recognized as intangible assets, not amortised (assuming the high residual value), but tested for impairment. Granted emission allowances should be presented as intangible assets in correspondence with deferred income at fair value as at the date of registration. Purchased allowances should be presented as intangible assets at purchase price and are not amortised (assuming the high residual value) but tested for impairment. For the estimated CO2 emission during the reporting period, a provision should be created (taxes and charges).
ORLEN GROUP (PLN million)
CONSOLIDATED FINANCIAL STATEMENTS FOR THE YEAR 2015
(Translation of a document originally issued in Polish)
8. EXPLANATORY NOTES TO THE CONSOLIDATED FINANCIAL STATEMENTS
40
Grants should be recognized on a systematic basis to ensure proportionality with the related costs which the grants are intended to compensate. Outgoing of allowances is recognized using FIFO method (First In, First Out) within the individual types of rights (EUA, ERU, CER). Rights also include rights to so called colourful energy.
8.6.3.9. Impairment of property, plant and equipment and intangible assets At the end of the reporting period, the Group assesses whether there are indicators that an asset or cash-generating unit (CGU) may be impaired or any indicators that the previously recognized impairment should be reversed. If any indicator exists, the Group estimates the recoverable amount of asset or CGU by determining the greater of its fair value less costs of disposal or value in use by applying the proper discount rate. Assets that do not generate the independent cash flows are grouped on the lowest level on which cash flows, independent from cash flows from other assets, are generated (CGU). If such case occurs, the recoverable amount is determined on the CGU level, to which the asset belongs.
8.6.3.10. Inventories Inventories, including mandatory reserves comprise products, semi-finished products and work in progress, merchandise and materials. Finished goods, semi-finished products and work in progress are measured initially at production cost. Production costs include costs of materials and costs of conversion for the production period. Costs of production also include a systematic allocation of fixed and variable production overheads estimated for normal production level. Finished goods, semi-finished products and work in progress shall be measured at the end of the reporting period at the lower of cost or net realizable value. Outgoings of finished goods, semi-finished products and work in progress are determined based on the weighted average cost of production. Merchandise and materials are measured initially at acquisition cost, while as at the end of the reporting period merchandise and raw materials are measured at the lower of cost or net realizable value. The initial value of inventories is adjusted for profits or losses from settlement of cash flow hedging instruments related to the above mentioned. Outgoings of merchandise and raw materials are determined based on the weighted average acquisition cost. Impairment tests for specific items of inventories are carried out on a current basis during a reporting period. Write-down to net realizable value concerns inventories that are damaged or obsolete and the selling price have fallen. Raw materials held for use in the production are not written down below acquisition or production cost if the products in which they will be incorporated are expected to be sold at or above cost. However, when a decline in the price of materials indicates that the cost of the products exceeds net realizable value, the materials are written down to net realizable value. Recognition and reversal of impairment allowances of inventories is recognized in cost of sales.
8.6.3.11. Receivables Receivables, including trade receivables, are recognized initially at a fair value increased by transaction costs and subsequently, at amortised cost using the effective interest method less impairment allowances. Impairment allowances of receivables are based on an individual analysis of the value of held collaterals, and based on the possible compensation of debts, allowances. Recognition and reversal of impairment allowances of receivables are recognized in other operating activity in relation to principal amount and in financial activities in relation to interest for delayed payments.
8.6.3.12. Cash and cash equivalents Cash comprises cash on hand and in a bank accounts. Cash equivalents are short-term, highly liquid investments (of initial maturity up to three months), that are readily convertible to known amounts of cash and which are subject to an insignificant risk of change in value. Valuation and outflows of cash and cash equivalents in foreign currencies are based on FIFO (First In First Out) method.
8.6.3.13. Equity 8.6.3.13.1. Share capital The share capital is an equity paid by shareholders and is stated at nominal value in accordance with the Parent Company’s of association and the entry in the Commercial Register. Share capital as at 31 December 1996, in accordance with IAS 29, § 24 and 25, was revalued based on monthly price indices of consumer goods and services. 8.6.3.13.2. Share premium The share premium is created by the surplus of the issuance value in excess of the nominal value of shares decreased by issuance costs. Capital from issue of shares above their nominal value as at 31 December 1996, in accordance with IAS 29, § 24 and 25, was revalued based on monthly price indices of consumer goods and services. 8.6.3.13.3. Hedging reserve The hedging reserve relates to valuation and settlement of hedging instruments that meet the criteria of cash flow hedge accounting. The Group applies cash flow hedge accounting to hedge commodity risk, exchange rate risk and interest rate risk. Changes in fair value, which are an ineffective part of the hedge relationship, are recognized in profit or loss. 8.6.3.13.4. Foreign exchange differences on subsidiaries from consolidation Foreign exchange differences on subsidiaries from consolidation result mainly from translation of the financial statements of the foreign companies into PLN under consolidation procedures. 8.6.3.13.5. Retained earnings Retained earnings include: - reserve capital created and used in accordance with the Commercial Companies Code, - actuarial gains and losses from post-employment benefits, - the current reporting period profit/loss, - other capitals created and used according to the rules prescribed by law.
ORLEN GROUP (PLN million)
CONSOLIDATED FINANCIAL STATEMENTS FOR THE YEAR 2015
(Translation of a document originally issued in Polish)
8. EXPLANATORY NOTES TO THE CONSOLIDATED FINANCIAL STATEMENTS
41
8.6.3.14. Liabilities Liabilities, including trade liabilities, are initially measured at fair value, increased by, in the case of financial liability not qualified as those measured at fair value through profit or loss, transaction cost and subsequently, at amortised cost using the effective interest rate method.
8.6.3.15. Provisions The amount recognized as a provision is the best estimate of the expenditure required to settle the present obligation at the end of the reporting period. The provisions are reviewed on a regular basis during reporting period and adjusted to reflect the current best estimate.
8.6.3.15.1. Environmental provision The Group creates provisions for future liabilities due to reclamation of contaminated land or water or elimination of harmful substances if there is such a legal or constructive obligation. Environmental provision for reclamation is periodically reviewed on the basis of contaminated assessment. 8.6.3.15.2. Jubilee bonuses and post-employment benefits Under the remuneration plans employees of the Group are entitled to jubilee bonuses, paid to employees after an elapse of a defined number of years in service as well as retirement and pension benefits, paid once at retirement or pension. The amount of retirement and pension benefits as well as jubilee bonuses depends on the number of years in service and an employee’s average remuneration. The jubilee bonuses are other long-term employee benefits, whereas retirement and pension benefits are classified as post-employment defined benefit plans. Provisions are determined by an independent actuary and revalued if there are any indications impacting their value, taking into account the staff turnover and planned growth of wages. Actuarial gains and losses from post-employment benefits are recognized in components of other comprehensive income and from other employment benefits are recognized in profit or loss. 8.6.3.15.3. CO2 emissions, energy certificates The main item is the estimated CO2 emissions costs during the reporting period for which the Group recognizes provision in operating activity costs (taxes and charges). Provision is recognized based on the value of allowances recognized in the statement of financial position, taking into account the principle of FIFO. In case of a shortage of allowances, the provision is created based on the purchase price of allowance concluded in forward contracts or market quotations at the reporting date. 8.6.3.15.4. Other provisions Other provisions include mainly provisions for legal proceedings and are recognized after consideration of all available information, including the opinions of independent experts. The Group recognizes provisions if at the end of the reporting period the Group is an obligation arising from past events that can be reliably estimated and it is probable that fulfilment of this obligation will cause an outflow of resources embodying economic benefits. If it is more likely that no obligation exists at the end of the reporting period, the Group discloses a contingent liability, unless the possibility of an outflow of resources embodying economic benefits is remote.
8.6.3.16. Government grants Government grants are transfers of resources to the Group by the government, government agencies and similar bodies in return for past or future compliance with certain conditions. Government grants are recognized if there is reasonable assurance that the grants will be received and the entity will comply with the conditions attaching to them. Grants for cost position (e.g. the cost of CO2 emissions) are recognized as a reduction of costs as they are incurred. Surplus of received grants over the value of the relevant costs are recognized in other operating income. Government grants related to assets are recognized as a decrease of a carrying amount of an asset and as a revenue over the useful life of the amortised asset through the decreased depreciation and amortisation charges.
8.6.3.17. Consolidated statement of cash flows The Group has chosen the presentation within the statement of cash flows and applies the following rules: - cash flows from operating activities using the indirect method, - the components of cash and cash equivalents in the consolidated statement of cash flows and consolidated statement of
financial position are the same, - dividends received are presented in cash flows from investing activities, - dividends paid to shareholders of the parent company and non-controlling interest are presented in cash flows from financing
activities, - interest and commissions paid on bank loans and borrowings received, debt securities issued, finance leases are presented in
cash flows from financing activities, other interest paid is presented in cash flows from operating activities, - inflows and outflows from the settlement of derivative financial instruments, which are not recognized as a hedging position are
presented in investing activities.
8.6.3.18. Financial instruments 8.6.3.18.1. Measurement of financial assets and liabilities At initial recognition, the Group measures financial assets and liabilities at their fair value plus, in the case of a financial asset or a financial liability not at fair value through profit or loss (i.e. held for trading), transaction costs that are directly attributable to the acquisition or issue of the financial asset or financial liability. At the end of the reporting period, the Group measures item of financial assets and liabilities at amortised cost using effective interest rate method, except for derivatives, which are measured at fair value. Gains and losses resulting from changes in fair value of derivative instruments, for which hedge accounting is not applicable, are recognized in the current year profit or loss.

ORLEN GROUP (PLN million)
CONSOLIDATED FINANCIAL STATEMENTS FOR THE YEAR 2015
(Translation of a document originally issued in Polish)
8. EXPLANATORY NOTES TO THE CONSOLIDATED FINANCIAL STATEMENTS
42
8.6.3.18.2. Hedge accounting Derivatives designated as hedging instruments whose cash flows are expected to offset changes in the cash flows of a hedged item are accounted for in accordance with the cash flow hedge accounting. The Group assess effectiveness of cash flow hedge at the inception of the hedge and later, at minimum, at each reporting date. In case of cash flow hedge accounting, the Group recognizes in other comprehensive income part of profits and losses connected with the effective part of the hedge, whereas profits or losses connected with the ineffective part - under profit or loss. The Group uses statistical methods, in particular regression analysis, to assess effectiveness of the hedge. If a hedge of a forecast transaction subsequently results in the recognition of a financial asset or a financial liability, the associated gains or losses that were recognized in other comprehensive income are reclassified to profit or loss in the same period or periods during which the asset acquired, or liability assumed, affects profit or loss. However, if the Group expects that all or a portion of a loss recognized in other comprehensive income will not be recovered in one or more future periods, it reclassifies the amount that is not expected to be recovered to profit or loss. If a hedge of a forecast transaction subsequently results in the recognition of a non-financial asset or a non-financial liability, or a forecast transaction for a non-financial asset or non-financial liability becomes a firm commitment for which fair value hedge accounting is applied, the Group removes the associated gains and losses that were recognized in the other comprehensive income and includes them in the initial cost or other carrying amount of the asset or liability. If a hedge of a forecast transaction results in the recognition of revenue from sales of products, merchandise, materials or services, the Group removes the associated gains or losses that were recognized in the other comprehensive income and adjusts these revenues.
8.6.3.19. Fair value measurement The Group maximizes the use of relevant observable inputs and minimizes the use of unobservable inputs to meet the objective of fair value measurement, which is to estimate the price at which an orderly transaction to transfer the liability or equity instrument would take place between market participants as at the measurement date under current market conditions. The Group measures derivative instruments at fair value using valuation models for financial instruments based on generally available exchange rates, interest rates, forward and volatility curves, for currencies and commodities quoted on active markets. The fair value of derivatives is based on discounted future flows related to contracted transactions as the difference between term price and transaction price. Forward exchange rates are not modelled as a separate risk factor, but derives from the spot rate and the respective forward interest rate for foreign currency in relation to PLN. Derivative instruments are presented as assets, when their valuation is positive and as liabilities, when their valuation is negative.
8.6.3.20. Lease A lease is an agreement whereby a lessor conveys to the lessee in return for a payment or series of payments the right to use an asset for an agreed period of time. Assets used under the finance lease, that is under agreement which transfers substantially all the risks and rewards incidental to ownership of an asset to the lessee, are recognized as assets of the lessee. Assets used under the operating lease, that is under the agreement that does not transfer substantially all the risks and rewards incidental to ownership of an asset to the lessee, are recognized as assets of the lessor. Determining whether the transfer of risks and rewards exists depends on the assessment of essence of the economic substance of the transaction.
8.6.3.21. Contingent assets and liabilities The Group discloses at the end of reporting period information on contingent assets if the inflow of economic benefits is practically certain. If it is practicable the Group estimates the financial impact of contingent assets valuing them according to the principles of valuation provisions. The Group discloses at the end of reporting period information on contingent liabilities if the outflow of economic benefits is probable, unless the possibility of outflow of economic benefits is remote. 8.7. SIGNIFICANT VALUES BASED ON PROFESSIONAL JUDGEMENT AND ESTIMATES The preparation of consolidated financial statements in accordance with IFRSs requires that the Management Board makes expert estimates and assumptions that affect the presented amounts of assets, liabilities and equity, revenues and expenses. The estimates and related assumptions are based on historical expertise and other factors regarded as reliable in given circumstances and their effects provide grounds for professional judgment of the carrying amount of assets and liabilities which is not based directly on any other factors. In the matters of considerable weight, the Management Board might base its judgments, estimates or assumptions on opinions of independent experts. The judgments, estimates and related assumptions are verified on a regular basis. 8.7.1. Professional judgements Expenditures for exploration and evaluation of mineral resources Application of the Group’s accounting policy for expenditures for exploration and evaluation of mineral resources requires an assessment, whether future economic benefits resulting from extraction or sale are possible or if indications allowing to estimate the resources does not yet exist. When estimating the resources, the Group assesses future events and circumstances, including the assessment whether the extraction will be economically feasible. Financial instruments The Management Board assesses the classification of financial instruments, nature and extent of risks related to financial instruments and application of the cash flow hedge accounting. The financial instruments are classified into different categories depending on the purpose of the purchase and nature of acquired assets. Additional information is presented in note 8.4.
ORLEN GROUP (PLN million)
CONSOLIDATED FINANCIAL STATEMENTS FOR THE YEAR 2015
(Translation of a document originally issued in Polish)
8. EXPLANATORY NOTES TO THE CONSOLIDATED FINANCIAL STATEMENTS
43
Investments in subsidiaries and jointly controlled entities The Group, regardless of the nature of its involvement in the entity (the entity in which it invested) defines its status by assessment, whether it controls the entity in which the investment was made, and assess whether it has a joint control in a joint venture, after consideration of all the facts and circumstances. Additional information is presented in note 9. 8.7.2. Estimates Exploration and evaluation of mineral resources The Group estimates resources based on interpretation of available geological data and verifies then on a the current basis, based on further exploration and recognition wells, trial exploitation, actual extraction (production) and economic factors such as: hydrocarbons’ prices, contractual terms or investment plans. At the end of each reporting period the Group analyses cost of removal of wells and supporting infrastructure. Estimated useful lives of property, plant and equipment and intangible assets As described in 8.6.3.6 and 8.6.3.8 the Group verifies useful lives of property, plant and equipment and intangible assets at least once at year end. Should the economic useful lives of properties, plant and equipment and intangible assets from 2014 be applied in 2015, the depreciation expense would not change significantly. Impairment of property, plant and equipment and intangible assets The Management Board assesses whether there is any indicator for impairment of an asset or cash generating unit. If there is an impairment, the estimation of recoverable amount of an asset is made. Additional information, including the sensitivity analysis of value in use and description of assumptions used, is presented in notes 8.2.1,8.2.2,8.2.4. Net realizable values from sale of inventories
The inventory allowances required estimation of the net realizable value based on the most recent sales prices at the moment of
estimation. Additional information is presented in note 8.2.6. Impairment of trade and other receivables The Management Board assesses whether there is any indicator for impairment of trade and other receivables taking into account the adopted internal procedures as individual assessed of each customer with regard to credit risk. Additional information is presented in note 8.4.5.4. Contingent assets On the basis of the insurance policies held the Group estimates the value of the compensation related to accident on installation for ethylene production in Unipetrol Group. Additional information is presented in note 8.5.4. 8.8. INFORMATION CONCERNING SIGNIFICANT PROCEEDINGS IN FRONT OF COURT, BODY APPROPRIATE FOR
ARBITRATION PROCEEDINGS OR IN FRONT OF PUBLIC ADMINISTRATION BODIES As at 31 December 2015 the ORLEN Group entities were parties in the following significant proceedings in front of court, body appropriate for arbitration proceedings or in front of public administration bodies: 8.8.1. Proceedings in which the ORLEN Group entities act as the defendant
8.8.1.1. Proceedings with the total value exceeding 10% of the Issuer’s equity
Risk connected with the disposal of assets and liabilities related to purchase of Unipetrol shares The claim regarding the payment of compensation for losses related among others, to alleged unfair competition of PKN ORLEN included in Agrofert Holding a.s.’ (Agrofert) claim and alleged illegal violation of reputation of Agrofert in relation to purchase by PKN ORLEN of UNIPETROL a.s. shares. On 21 October 2010 the Court of Arbitration in Prague dismissed the entire claim of Agrofert against PKN ORLEN regarding the payment of PLN 3,069 million translated using the exchange rate as at 31 December 2015 (representing CZK 19,464 million) with interest and obliged Agrofert to cover the cost of proceedings born by PKN ORLEN. On 3 October 2011 PKN ORLEN received from the common court in Prague (Czech Republic) Agrofert’s claim which repealed the sentence of the Arbitration Court attached to the Economic Chamber of the Czech Republic and Agricultural Chamber of the Czech Republic in Prague issued on 21 October 2010. The complaint was dismissed by the court in Prague with the ruling of 24 January 2014. On 7 April 2014 Agrofert appealed the above decision. On 7 April 2015 the court of appeals dismissed the appeal of Agrofert and therefore confirms the earlier judgment of the court of 24 January 2014 dismissing Agrofert’s claim which overruled the sentence of the Arbitration Court attached to the Economic Chamber of the Czech Republic and Agricultural Chamber of the Czech Republic in Prague of 21 October 2010. On 4 September 2015 Agrofert appealed to the Supreme Court against the judgment of the court dismissing the appeal. The appeal proceedings are pending. In the opinion of PKN ORLEN, the decision included in the judgment of the Arbitration Court dated 21 October 2010, in the judgment of the common court in Prague dated 24 January 2014 and in the judgment of the court of appeals dated 7 April 2015 are correct and the company will take all necessary means to retain the judgment in force. 8.8.1.2. Other significant proceedings with the total value not exceeding 10% of the Issuer’s equity Tax proceedings in ORLEN Południe S.A. (previously Rafineria Trzebinia S.A.) On 14 May 2014 and 20 May 2014 the company received the decisions of the Head of the Customs Office in Kraków determining excise tax liabilities for the months: May - August 2004 in the amount of PLN 132 million. Rafineria Trzebinia S.A. paid the entire liability with interest. At the same time, provisions recognized for this purpose in prior years were used. Rafineria Trzebnia S.A. appealed to the Voivodship Administrative Court (VAC) in Kraków the decisions of tax liability for the months: May – August 2004. On 26 February 2015 the VAC in Kraków announced a judgment dismissing the company’s claim. On 5 May 2015 the company submitted to the Supreme Administrative Court in Warsaw annulment claims against the judgement of the VAC, that were not recognized until the date of approval of the foregoing financial statements.
ORLEN GROUP (PLN million)
CONSOLIDATED FINANCIAL STATEMENTS FOR THE YEAR 2015
(Translation of a document originally issued in Polish)
8. EXPLANATORY NOTES TO THE CONSOLIDATED FINANCIAL STATEMENTS
44
In view of the issue by the European Court of Justice in Luxembourg judgement in a similar case the company has submitted applications for renewal of administrative proceedings. Director of the Customs Chamber in Kraków by a decision issued on 23 July 2015 refused to reopen the proceedings due to the ongoing proceedings before the Supreme Administrative Court in the cases final decisions for May - August. Since the decision of the Director of the Customs Chamber in Kraków refusing to reopen the proceedings the company filed an appeal, that was dismissed. The company filed complaints against these decisions on 16 November 2015, which the Voivodship Administrative Court in Kraków dismissed on 11 February 2016. Until the date of approval of the foregoing consolidated financial statements, the company has not received the written reasons for the judgment. Power transfer fee in settlements with ENERGA – OPERATOR S.A. (legal successor of Zakład Energetyczny Płock S.A.) Court proceeding concerning the settlement of a disputed system fee of PKN ORLEN with ENERGA – OPERATOR S.A. for the period from 5 July 2001 to 30 June 2002. ENERGA – OPERATOR S.A. claims from PKN ORLEN payment of PLN 46 million plus statutory interest. During the retrial, an opinion was prepared by an expert witness for the variant damages calculation. The District Court in Warsaw (as the initial court) by its judgment from 27 October 2014 ordered PKN ORLEN to pay to ENERGA - OPERATOR S.A. the amount of PLN 46 million, together with statutory interest from 30 June 2004 to the date of payment. This judgment is not binding. PKN ORLEN filed an appeal against this judgment. On 12 November 2015 the first hearing before the Court of Appeal was held. The consecutive hearing date is expected to be announced. On 29 June 2015 PKN ORLEN received consecutive claim on this case, in which ENERGA-OPERATOR S.A. requests approximately PLN 13.3 million in addition. The case is pending in front of the District Court in Łódź. On 10 July 2015 a response to the lawsuit was filed, which questioned the claim as unfounded. On 22 December 2015 the District Court in Łódź issued a judgement, which overruled the request of ENERGA-OPERATOR S.A. that PKN ORLEN is ordered to pay PLN 13 million and adjudged the return of proceeding’s expenses by ENERGA-OPERATOR S.A to PKN ORLEN. On 29 January 2016 ENERGA-OPERATOR S.A. appealed against the judgment of the District Court in Łódź. I.P.-95 s.r.o. compensation claim against UNIPETROL RPA s.r.o. On 23 May 2012, UNIPETROL RPA s.r.o. received from the District Court in Ostrava a claim brought by I.P.-95 s.r.o. for compensation related to the filing by UNIPETROL RPA s.r.o. a motion for bankruptcy of the company I.P.-95 s.r.o. in November 2009. The total amount of the claim is approximately PLN 282 million, translated using the exchange rate as at 31 December 2015 (representing CZK 1,789 million). UNIPETROL RPA s.r.o. is one of 8 defendants against which the claim was brought. According to UNIPETROL RPA s.r.o the claim is without merit. The court in Ostrava shall give further procedural issues. Claim of OBR S.A. for compensation On 5 September 2014, the company OBR S.A. filed an action against PKN ORLEN with the District Court in Łódź for a claim for payment in respect of an alleged breach by PKN ORLEN of patent rights: ‘The technique of the separation of hydrodesulfurization products of heavy residue after extractive distillation of crude oil’. The amount of the claim in the lawsuit has been estimated by the OBR S.A. of approximately PLN 83 million. The claim covers the adjudged sum of money from PKN ORLEN for the OBR S.A. in the amount corresponding to the market value of the license fee for the use of the solution under the above patent and adjudge the obligation to repay the benefits derived from the use of this solution. On 16 October 2014, PKN ORLEN responded to the lawsuit. The value of the dispute was referred to by the plaintiff in a procedural document from 11 December 2014 in the amount of PLN 247 million. By the court order from 21 May 2015 the parties were directed to mediation. Mediation is ongoing. In the opinion of PKN ORLEN the claim of patent infringement is without merit. 8.8.2. Court proceedings in which the ORLEN Group entities act as a plaintiff
Compensations due to damages suffered by ORLEN Południe S.A (previously Rafineria Trzebinia S.A.) ORLEN Południe S.A. acts as an auxiliary prosecutor in proceedings started in 2010 concerning abuses associated with the realization of an investment - installation for the esterification of biodiesel oils, in which Rafineria Trzebinia S.A. claims to have incurred a loss of approximately PLN 79 million. The company filed a motion requesting to oblige the defendants to compensate the incurred damages. Criminal proceedings concerning the accused who acted against the company’s interest are ongoing. Further hearings is held during which one of the accused filed an explanations. The court set the next date of hearing on 31 March 2016 to continue the interrogation of the accused. Proceeding of ORLEN Lietuva for compensation in respect of an accident at the Terminal in Butingė AB ORLEN Lietuva is a plaintiff in a court proceeding against RESORT MARITIME S.A., The London Steamship Owners’ Mutual Insurance Association Limited, Sigma Tankers Inc., Cardiff Maritime Inc., Heidenreich Marine, Heidenreich Maritime Inc. and Heidmar Inc. regarding compensation payment for damage caused by a collision of a tanker ship into a terminal buoy in Butinge Terminal on 29 December 2005. The proceedings were initiated in December 2006. The total compensation claim amounts to approximately PLN 74 million, translated using the exchange rate as at 31 December 2015 (representing approximately EUR 17.26 million). On October 2014 the parties agreed to change the jurisdiction to English courts. The company expects the next hearing date to be announced. Tax proceedings in UNIPETROL RPA UNIPETROL RPA s.r.o., acting as a legal successor of CHEMOPETROL a.s. acted in 2010 to the tax office for a refund of taxes paid for the year 2005 by CHEMOPETROL a.s.. The claim concerns unused investment relief attributable to CHEMOPETROL a.s.. The value of the claim amounts to approximately PLN 52 million, translated using the exchange rate as at 31 December 2015 (representing approximately CZK 325 million). The case was examined several times by the tax authorities and courts in the course of instances of appeal. On 14 October 2015 the Czech supreme administrative court after recognizing the annulment claim of UNIPETROL RPA s.r.o overruled the judgment of the Court in Usti by the Elbe River of 25 February 2015 and decided to refer the case to the same Court for its reconsideration. A decision is expected by the Court in Usti by the Elbe River. Arbitration proceedings against Basell Europe Holdings B.V. On 20 December 2012 PKN ORLEN sent an arbitration request to Basell Europe Holdings B.V. regarding an ad hoc proceeding before the Court of Arbitration in London on compensation relating to Joint Venture Agreement signed in 2002 between PKN ORLEN and Basell Europe Holdings B.V. The claims follow from the use by Basell Sales & Marketing Company so-called Cash Discounts which effectively led to a lower product price payable to Basell ORLEN Polyolefins Sp. z o.o. On 27 February 2014 PKN ORLEN submitted its statement on this case, according to which, inter alia, it requests payments from Basell Europe Holdings B.V. to Basell ORLEN Polyolefins Sp. z o.o. in the amount of approximately PLN 128 million, translated using the exchange rate as at 31

ORLEN GROUP (PLN million)
CONSOLIDATED FINANCIAL STATEMENTS FOR THE YEAR 2015
(Translation of a document originally issued in Polish)
8. EXPLANATORY NOTES TO THE CONSOLIDATED FINANCIAL STATEMENTS
45
December 2015 (representing approximately EUR 30 million) plus interest, or alternatively, from Basell Europe Holdings B.V. to PKN ORLEN the amount of approximately PLN 57 million, provided that the amounts may be adjusted during arbitration proceedings. On 10 April 2014 PKN ORLEN submitted an application for suspension of the arbitration proceedings until 1 November 2014. Basell Europe Holdings B.V. accepted this request. On 23 April 2014 the parties received the Tribunal’s decision regarding the suspension of the proceeding until 1 November 2014. On 1 November 2014, the arbitration proceedings were resumed. On 24-26 March 2015 an evidentiary hearing was held in London in which the parties summarized their case positions and some witnesses and experts were interviewed. On 27 March 2015, the Court of Arbitration issued a procedural ordinance which established the schedule for further proceedings, including the order of submission of further pleadings by the parties. On 29 May 2015 the two parties submitted letters in which referred to the position of the opposing party in terms of summaries of the case. Additionally, the parties requested expenditures and costs incurred in arbitration proceedings. Further proceedings are not envisaged. Parties awaiting a judgment.
The dispute between ORLEN Lietuva and Lietuvos Geležinkeliai On 31 December 2014, ORLEN Lietuva filed a motion for arbitration against the company Lietuvos Gelezinkeliai (“LG”) in the court of arbitration in Vilnius. Currently in this proceeding ORLEN Lietuva calls for the conversion of tariffs for rail transport in line with the contract with LG. Consideration of the request of ORLEN Lietuva would lead to savings for the company (compensation) in the amount estimated as at 31 December 2015 not lower than PLN 162 million translated using the exchange rate as at 31 December 2015 (representing EUR 38 million) due to breach of contract of rail transport by LG by the use of excessive rates. The amount of the claim will be updated in accordance with the activity on the base of the contract. Simultaneously, by 31 December 2015, 4 court proceedings were initiated in which LG demands from ORLEN Lietuva a payment of approximately PLN 77 million translated using the exchange rate as at 31 December 2015 (representing approximately EUR 18 million) from fees for rail transport. Three of the above described proceedings were combined and then the court decided that the combined case will not be considered by the state court since the priority of the arbitral tribunal. Proceedings in the fourth case was suspended by the court until the court of arbitration will decide on the claim of ORLEN Lietuva. LG appealed against the above decisions of state courts. The hearing date on appeal is expected to be announced.
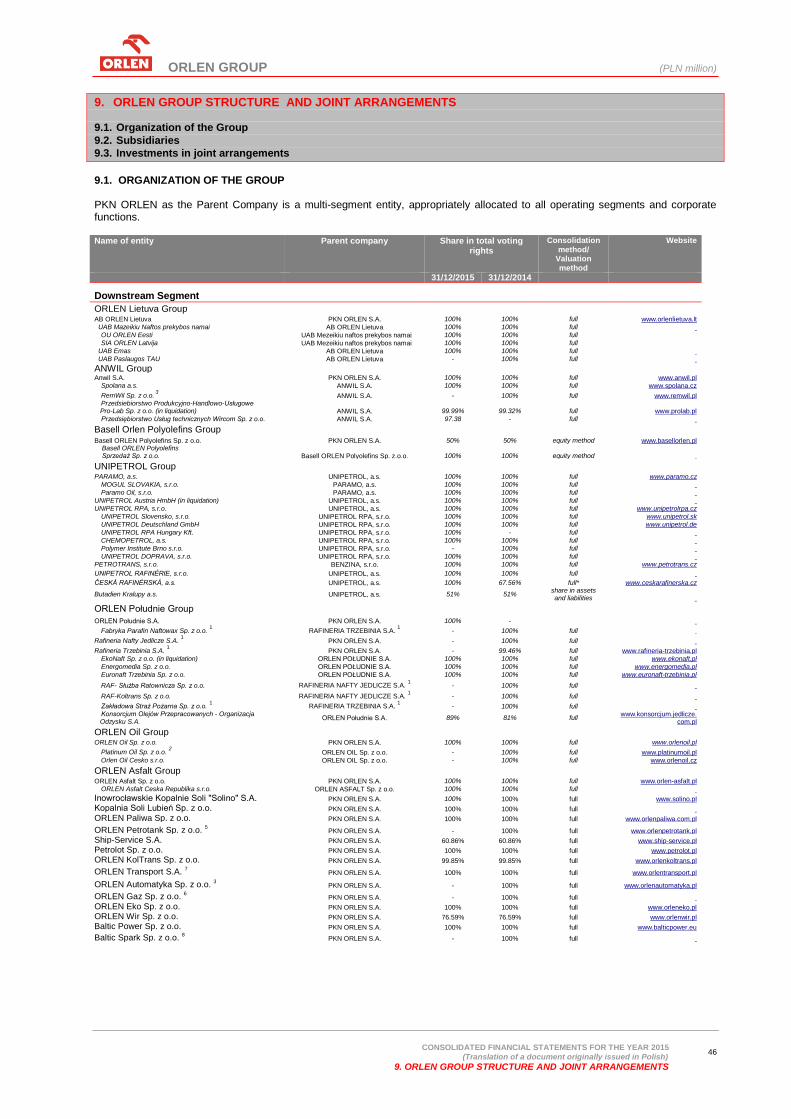
ORLEN GROUP (PLN million)
CONSOLIDATED FINANCIAL STATEMENTS FOR THE YEAR 2015
(Translation of a document originally issued in Polish)
9. ORLEN GROUP STRUCTURE AND JOINT ARRANGEMENTS
46
9. ORLEN GROUP STRUCTURE AND JOINT ARRANGEMENTS 9.1. Organization of the Group
9.2. Subsidiaries
9.3. Investments in joint arrangements
9.1. ORGANIZATION OF THE GROUP
PKN ORLEN as the Parent Company is a multi-segment entity, appropriately allocated to all operating segments and corporate functions. Name of entity Parent company Share in total voting
rights
Consolidation method/
Valuation method
Website
31/12/2015 31/12/2014
Downstream Segment
ORLEN Lietuva Group AB ORLEN Lietuva PKN ORLEN S.A. 100% 100% full www.orlenlietuva.lt
UAB Mazeikiu Naftos prekybos namai AB ORLEN Lietuva 100% 100% full OU ORLEN Eesti UAB Mezeikiu naftos prekybos namai 100% 100% full SIA ORLEN Latvija UAB Mezeikiu naftos prekybos namai 100% 100% full
UAB Emas AB ORLEN Lietuva 100% 100% full UAB Paslaugos TAU AB ORLEN Lietuva - 100% full
ANWIL Group Anwil S.A. PKN ORLEN S.A. 100% 100% full www.anwil.pl
Spolana a.s. ANWIL S.A. 100% 100% full www.spolana.cz
RemWil Sp. z o.o. 3
ANWIL S.A. - 100% full www.remwil.pl
Przedsiebiorstwo Produkcyjno-Handlowo-Usługowe Pro-Lab Sp. z o.o. (in liquidation) ANWIL S.A. 99.99% 99.32% full www.prolab.pl
Przedsiębiorstwo Usług technicznych Wircom Sp. z o.o. ANWIL S.A. 97.38 - full
Basell Orlen Polyolefins Group Basell ORLEN Polyolefins Sp. z o.o. PKN ORLEN S.A. 50% 50% equity method www.basellorlen.pl
Basell ORLEN Polyolefins Sprzedaż Sp. z o.o. Basell ORLEN Polyolefins Sp. z.o.o. 100% 100% equity method
UNIPETROL Group PARAMO, a.s. UNIPETROL, a.s. 100% 100% full www.paramo.cz
MOGUL SLOVAKIA, s.r.o. PARAMO, a.s. 100% 100% full
Paramo Oil, s.r.o. PARAMO, a.s. 100% 100% full
UNIPETROL Austria HmbH (in liquidation) UNIPETROL, a.s. 100% 100% full
UNIPETROL RPA, s.r.o. UNIPETROL, a.s. 100% 100% full www.unipetrolrpa.cz
UNIPETROL Slovensko, s.r.o. UNIPETROL RPA, s.r.o. 100% 100% full www.unipetrol.sk
UNIPETROL Deutschland GmbH UNIPETROL RPA, s.r.o. 100% 100% full www.unipetrol.de
UNIPETROL RPA Hungary Kft. UNIPETROL RPA, s.r.o. 100% - full
CHEMOPETROL, a.s. UNIPETROL RPA, s.r.o. 100% 100% full
Polymer Institute Brno s.r.o. UNIPETROL RPA, s.r.o. - 100% full UNIPETROL DOPRAVA, s.r.o. UNIPETROL RPA, s.r.o. 100% 100% full
PETROTRANS, s.r.o. BENZINA, s.r.o. 100% 100% full www.petrotrans.cz
UNIPETROL RAFINÉRIE, s.r.o. UNIPETROL, a.s. 100% 100% full
ČESKÁ RAFINÉRSKÁ, a.s. UNIPETROL, a.s. 100% 67.56% full* www.ceskarafinerska.cz
Butadien Kralupy a.s. UNIPETROL, a.s. 51% 51% share in assets and liabilities
ORLEN Południe Group ORLEN Południe S.A. PKN ORLEN S.A. 100% -
Fabryka Parafin Naftowax Sp. z o.o. 1 RAFINERIA TRZEBINIA S.A.
1 - 100% full
Rafineria Nafty Jedlicze S.A. 1 PKN ORLEN S.A. - 100% full
Rafineria Trzebinia S.A. 1 PKN ORLEN S.A. - 99.46% full www.rafineria-trzebinia.pl
EkoNaft Sp. z o.o. (in liquidation) ORLEN POŁUDNIE S.A. 100% 100% full www.ekonaft.pl
Energomedia Sp. z o.o. ORLEN POŁUDNIE S.A. 100% 100% full www.energomedia.pl
Euronaft Trzebinia Sp. z o.o. ORLEN POŁUDNIE S.A. 100% 100% full www.euronaft-trzebinia.pl
RAF- Służba Ratownicza Sp. z o.o. RAFINERIA NAFTY JEDLICZE S.A. 1 - 100% full
RAF-Koltrans Sp. z o.o. RAFINERIA NAFTY JEDLICZE S.A. 1 - 100% full
Zakładowa Straż Pożarna Sp. z o.o. 1
RAFINERIA TRZEBINIA S.A. 1 - 100% full
Konsorcjum Olejów Przepracowanych - Organizacja Odzysku S.A.
ORLEN Południe S.A. 89% 81% full www.konsorcjum.jedlicze.
com.pl
ORLEN Oil Group ORLEN Oil Sp. z o.o. PKN ORLEN S.A. 100% 100% full www.orlenoil.pl
Platinum Oil Sp. z o.o. 2 ORLEN OIL Sp. z o.o. - 100% full www.platinumoil.pl
Orlen Oil Cesko s.r.o. ORLEN OIL Sp. z o.o. - 100% full www.orlenoil.cz
ORLEN Asfalt Group ORLEN Asfalt Sp. z o.o. PKN ORLEN S.A. 100% 100% full www.orlen-asfalt.pl
ORLEN Asfalt Ceska Republika s.r.o. ORLEN ASFALT Sp. z o.o. 100% 100% full
Inowrocławskie Kopalnie Soli "Solino" S.A. PKN ORLEN S.A. 100% 100% full www.solino.pl
Kopalnia Soli Lubień Sp. z o.o. PKN ORLEN S.A. 100% 100% full
ORLEN Paliwa Sp. z o.o. PKN ORLEN S.A. 100% 100% full www.orlenpaliwa.com.pl
ORLEN Petrotank Sp. z o.o. 5 PKN ORLEN S.A. - 100% full www.orlenpetrotank.pl
Ship-Service S.A. PKN ORLEN S.A. 60.86% 60.86% full www.ship-service.pl
Petrolot Sp. z o.o. PKN ORLEN S.A. 100% 100% full www.petrolot.pl
ORLEN KolTrans Sp. z o.o. PKN ORLEN S.A. 99.85% 99.85% full www.orlenkoltrans.pl
ORLEN Transport S.A. 7 PKN ORLEN S.A. 100% 100% full www.orlentransport.pl
ORLEN Automatyka Sp. z o.o. 3 PKN ORLEN S.A. - 100% full www.orlenautomatyka.pl
ORLEN Gaz Sp. z o.o. 6 PKN ORLEN S.A. - 100% full
ORLEN Eko Sp. z o.o. PKN ORLEN S.A. 100% 100% full www.orleneko.pl
ORLEN Wir Sp. z o.o. PKN ORLEN S.A. 76.59% 76.59% full www.orlenwir.pl
Baltic Power Sp. z o.o. PKN ORLEN S.A. 100% 100% full www.balticpower.eu
Baltic Spark Sp. z o.o. 8 PKN ORLEN S.A. - 100% full
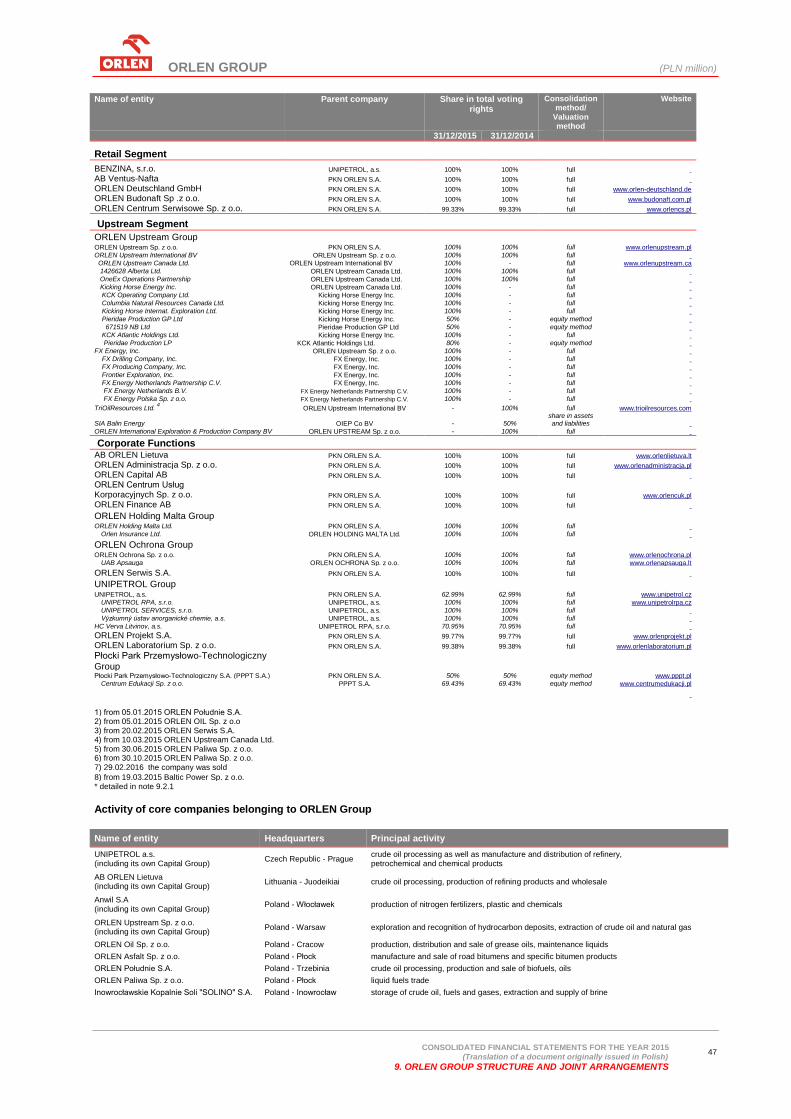
ORLEN GROUP (PLN million)
CONSOLIDATED FINANCIAL STATEMENTS FOR THE YEAR 2015
(Translation of a document originally issued in Polish)
9. ORLEN GROUP STRUCTURE AND JOINT ARRANGEMENTS
47
Name of entity Parent company Share in total voting rights
Consolidation method/
Valuation method
Website
31/12/2015 31/12/2014
Retail Segment
BENZINA, s.r.o. UNIPETROL, a.s. 100% 100% full
AB Ventus-Nafta PKN ORLEN S.A. 100% 100% full
ORLEN Deutschland GmbH PKN ORLEN S.A. 100% 100% full www.orlen-deutschland.de
ORLEN Budonaft Sp .z o.o. PKN ORLEN S.A. 100% 100% full www.budonaft.com.pl
ORLEN Centrum Serwisowe Sp. z o.o. PKN ORLEN S.A. 99.33% 99.33% full www.orlencs.pl
Upstream Segment
ORLEN Upstream Group ORLEN Upstream Sp. z o.o. PKN ORLEN S.A. 100% 100% full www.orlenupstream.pl
ORLEN Upstream International BV ORLEN Upstream Sp. z o.o. 100% 100% full ORLEN Upstream Canada Ltd. ORLEN Upstream International BV 100% - full www.orlenupstream.ca
1426628 Alberta Ltd. ORLEN Upstream Canada Ltd. 100% 100% full
OneEx Operations Partnership ORLEN Upstream Canada Ltd. 100% 100% full
Kicking Horse Energy Inc. ORLEN Upstream Canada Ltd. 100% - full
KCK Operating Company Ltd. Kicking Horse Energy Inc. 100% - full
Columbia Natural Resources Canada Ltd. Kicking Horse Energy Inc. 100% - full
Kicking Horse Internat. Exploration Ltd. Kicking Horse Energy Inc. 100% - full
Pieridae Production GP Ltd Kicking Horse Energy Inc. 50% - equity method
671519 NB Ltd Pieridae Production GP Ltd 50% - equity method
KCK Atlantic Holdings Ltd. Kicking Horse Energy Inc. 100% - full
Pieridae Production LP KCK Atlantic Holdings Ltd. 80% - equity method
FX Energy, Inc. ORLEN Upstream Sp. z o.o. 100% - full
FX Drilling Company, Inc. FX Energy, Inc. 100% - full
FX Producing Company, Inc. FX Energy, Inc. 100% - full
Frontier Exploration, Inc. FX Energy, Inc. 100% - full
FX Energy Netherlands Partnership C.V. FX Energy, Inc. 100% - full
FX Energy Netherlands B.V. FX Energy Netherlands Partnership C.V. 100% - full
FX Energy Polska Sp. z o.o. FX Energy Netherlands Partnership C.V. 100% - full
TriOilResources Ltd. 4 ORLEN Upstream International BV - 100% full www.trioilresources.com
SIA Balin Energy OIEP Co BV - 50% share in assets and liabilities
ORLEN International Exploration & Production Company BV ORLEN UPSTREAM Sp. z o.o. - 100% full
Corporate Functions
AB ORLEN Lietuva PKN ORLEN S.A. 100% 100% full www.orlenlietuva.lt
ORLEN Administracja Sp. z o.o. PKN ORLEN S.A. 100% 100% full www.orlenadministracja.pl
ORLEN Capital AB PKN ORLEN S.A. 100% 100% full
ORLEN Centrum Usług Korporacyjnych Sp. z o.o. PKN ORLEN S.A. 100% 100% full www.orlencuk.pl
ORLEN Finance AB PKN ORLEN S.A. 100% 100% full
ORLEN Holding Malta Group ORLEN Holding Malta Ltd. PKN ORLEN S.A. 100% 100% full
Orlen Insurance Ltd. ORLEN HOLDING MALTA Ltd. 100% 100% full
ORLEN Ochrona Group ORLEN Ochrona Sp. z o.o. PKN ORLEN S.A. 100% 100% full www.orlenochrona.pl
UAB Apsauga ORLEN OCHRONA Sp. z o.o. 100% 100% full www.orlenapsauga.lt
ORLEN Serwis S.A. PKN ORLEN S.A. 100% 100% full
UNIPETROL Group UNIPETROL, a.s. PKN ORLEN S.A. 62.99% 62.99% full www.unipetrol.cz
UNIPETROL RPA, s.r.o. UNIPETROL, a.s. 100% 100% full www.unipetrolrpa.cz
UNIPETROL SERVICES, s.r.o. UNIPETROL, a.s. 100% 100% full Výzkumný ústav anorganické chemie, a.s. UNIPETROL, a.s. 100% 100% full
HC Verva Litvinov, a.s. UNIPETROL RPA, s.r.o. 70.95% 70.95% full
ORLEN Projekt S.A. PKN ORLEN S.A. 99.77% 99.77% full www.orlenprojekt.pl
ORLEN Laboratorium Sp. z o.o. PKN ORLEN S.A. 99.38% 99.38% full www.orlenlaboratorium.pl
Płocki Park Przemysłowo-Technologiczny Group Płocki Park Przemysłowo-Technologiczny S.A. (PPPT S.A.) PKN ORLEN S.A. 50% 50% equity method www.pppt.pl
Centrum Edukacji Sp. z o.o. PPPT S.A. 69.43% 69.43% equity method www.centrumedukacji.pl
1) from 05.01.2015 ORLEN Południe S.A. 2) from 05.01.2015 ORLEN OIL Sp. z o.o 3) from 20.02.2015 ORLEN Serwis S.A. 4) from 10.03.2015 ORLEN Upstream Canada Ltd. 5) from 30.06.2015 ORLEN Paliwa Sp. z o.o. 6) from 30.10.2015 ORLEN Paliwa Sp. z o.o.
7) 29.02.2016 the company was sold
8) from 19.03.2015 Baltic Power Sp. z o.o.
* detailed in note 9.2.1
Activity of core companies belonging to ORLEN Group
Name of entity Headquarters Principal activity
UNIPETROL a.s. (including its own Capital Group)
Czech Republic - Prague crude oil processing as well as manufacture and distribution of refinery, petrochemical and chemical products
AB ORLEN Lietuva (including its own Capital Group)
Lithuania - Juodeikiai crude oil processing, production of refining products and wholesale
Anwil S.A (including its own Capital Group)
Poland - Włocławek production of nitrogen fertilizers, plastic and chemicals
ORLEN Upstream Sp. z o.o. (including its own Capital Group)
Poland - Warsaw exploration and recognition of hydrocarbon deposits, extraction of crude oil and natural gas
ORLEN Oil Sp. z o.o. Poland - Cracow production, distribution and sale of grease oils, maintenance liquids
ORLEN Asfalt Sp. z o.o. Poland - Płock manufacture and sale of road bitumens and specific bitumen products
ORLEN Południe S.A. Poland - Trzebinia crude oil processing, production and sale of biofuels, oils
ORLEN Paliwa Sp. z o.o. Poland - Płock liquid fuels trade
Inowrocławskie Kopalnie Soli "SOLINO" S.A. Poland - Inowrocław storage of crude oil, fuels and gases, extraction and supply of brine
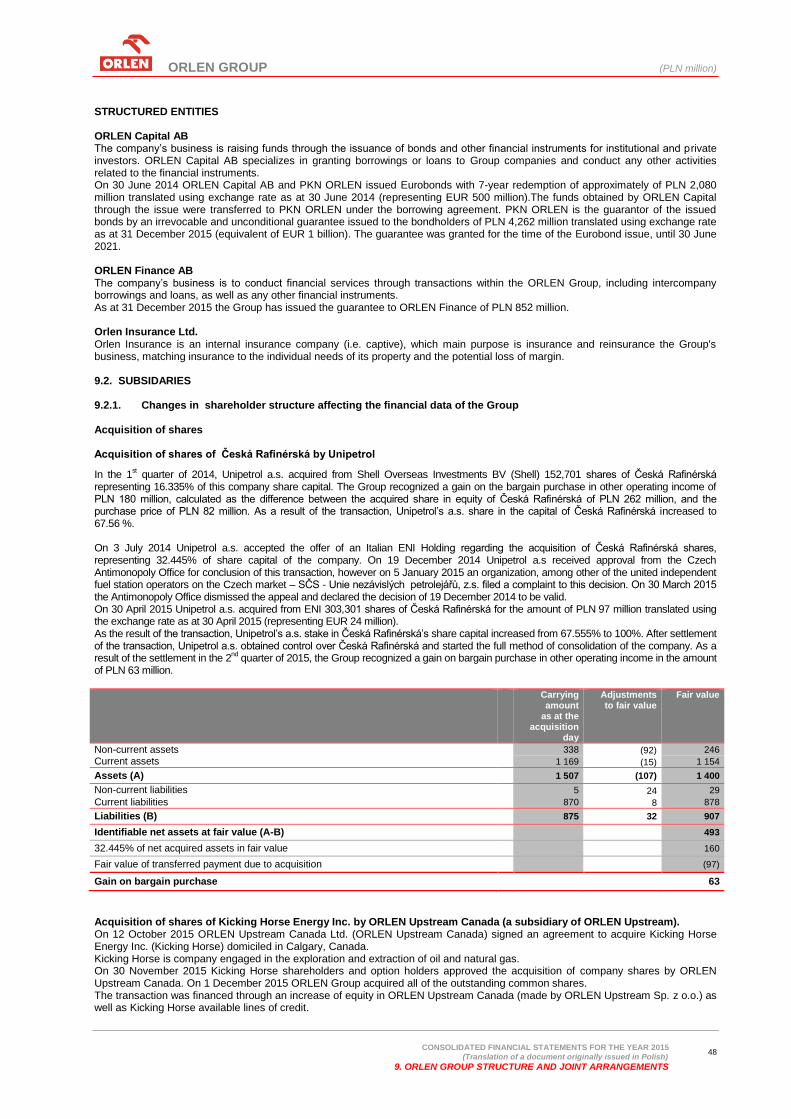
ORLEN GROUP (PLN million)
CONSOLIDATED FINANCIAL STATEMENTS FOR THE YEAR 2015
(Translation of a document originally issued in Polish)
9. ORLEN GROUP STRUCTURE AND JOINT ARRANGEMENTS
48
STRUCTURED ENTITIES
ORLEN Capital AB The company’s business is raising funds through the issuance of bonds and other financial instruments for institutional and private investors. ORLEN Capital AB specializes in granting borrowings or loans to Group companies and conduct any other activities related to the financial instruments. On 30 June 2014 ORLEN Capital AB and PKN ORLEN issued Eurobonds with 7-year redemption of approximately of PLN 2,080 million translated using exchange rate as at 30 June 2014 (representing EUR 500 million).The funds obtained by ORLEN Capital through the issue were transferred to PKN ORLEN under the borrowing agreement. PKN ORLEN is the guarantor of the issued bonds by an irrevocable and unconditional guarantee issued to the bondholders of PLN 4,262 million translated using exchange rate as at 31 December 2015 (equivalent of EUR 1 billion). The guarantee was granted for the time of the Eurobond issue, until 30 June 2021. ORLEN Finance AB The company’s business is to conduct financial services through transactions within the ORLEN Group, including intercompany borrowings and loans, as well as any other financial instruments. As at 31 December 2015 the Group has issued the guarantee to ORLEN Finance of PLN 852 million. Orlen Insurance Ltd. Orlen Insurance is an internal insurance company (i.e. captive), which main purpose is insurance and reinsurance the Group's business, matching insurance to the individual needs of its property and the potential loss of margin. 9.2. SUBSIDARIES
9.2.1. Changes in shareholder structure affecting the financial data of the Group Acquisition of shares Acquisition of shares of Česká Rafinérská by Unipetrol
In the 1st quarter of 2014, Unipetrol a.s. acquired from Shell Overseas Investments BV (Shell) 152,701 shares of Česká Rafinérská
representing 16.335% of this company share capital. The Group recognized a gain on the bargain purchase in other operating income of PLN 180 million, calculated as the difference between the acquired share in equity of Česká Rafinérská of PLN 262 million, and the purchase price of PLN 82 million. As a result of the transaction, Unipetrol’s a.s. share in the capital of Česká Rafinérská increased to 67.56 %. On 3 July 2014 Unipetrol a.s. accepted the offer of an Italian ENI Holding regarding the acquisition of Česká Rafinérská shares, representing 32.445% of share capital of the company. On 19 December 2014 Unipetrol a.s received approval from the Czech Antimonopoly Office for conclusion of this transaction, however on 5 January 2015 an organization, among other of the united independent fuel station operators on the Czech market – SČS - Unie nezávislých petrolejářů, z.s. filed a complaint to this decision. On 30 March 2015 the Antimonopoly Office dismissed the appeal and declared the decision of 19 December 2014 to be valid. On 30 April 2015 Unipetrol a.s. acquired from ENI 303,301 shares of Česká Rafinérská for the amount of PLN 97 million translated using the exchange rate as at 30 April 2015 (representing EUR 24 million). As the result of the transaction, Unipetrol’s a.s. stake in Česká Rafinérská’s share capital increased from 67.555% to 100%. After settlement of the transaction, Unipetrol a.s. obtained control over Česká Rafinérská and started the full method of consolidation of the company. As a result of the settlement in the 2
nd quarter of 2015, the Group recognized a gain on bargain purchase in other operating income in the amount
of PLN 63 million.
Carrying amount
as at the acquisition
day
Adjustments to fair value
Fair value
Non-current assets
338 (92) 246
Current assets 1 169 (15) 1 154
Assets (A) 1 507 (107) 1 400
Non-current liabilities 5 24 29
Current liabilities 870 8 878
Liabilities (B) 875 32 907
Identifiable net assets at fair value (A-B) 493
32.445% of net acquired assets in fair value 160
Fair value of transferred payment due to acquisition (97)
Gain on bargain purchase 63
Acquisition of shares of Kicking Horse Energy Inc. by ORLEN Upstream Canada (a subsidiary of ORLEN Upstream). On 12 October 2015 ORLEN Upstream Canada Ltd. (ORLEN Upstream Canada) signed an agreement to acquire Kicking Horse Energy Inc. (Kicking Horse) domiciled in Calgary, Canada. Kicking Horse is company engaged in the exploration and extraction of oil and natural gas. On 30 November 2015 Kicking Horse shareholders and option holders approved the acquisition of company shares by ORLEN Upstream Canada. On 1 December 2015 ORLEN Group acquired all of the outstanding common shares. The transaction was financed through an increase of equity in ORLEN Upstream Canada (made by ORLEN Upstream Sp. z o.o.) as well as Kicking Horse available lines of credit.

ORLEN GROUP (PLN million)
CONSOLIDATED FINANCIAL STATEMENTS FOR THE YEAR 2015
(Translation of a document originally issued in Polish)
9. ORLEN GROUP STRUCTURE AND JOINT ARRANGEMENTS
49
The fair value of the identifiable assets and liabilities of Kicking Horse at the acquisition date:
Carrying amount
as at the acquisition
day
Adjustments to fair value
Fair value
Exploration and evaluation of mineral resources assets
38 3 41
Assets related to development and extraction of mineral resources 668 474 1 142
Non-current financial assets 44 - 44
Trade and other receivables 26 - 26
Assets (A) 776 477 1 253
Provision for decommissioning costs of drillings and supporting infrastructure 14 - 14
Deferred tax liabilities 53 129 182
Other financial liabilities 196 - 196
Trade and other liabilities 31 - 31
Liabilities (B) 294 129 423
Identifiable net assets at fair value 482 348 830
(A-B)
Fair value of transferred payment due to acquisition adjusted by transaction costs (830)
Acquisition of shares of FX Energy Inc. by ORLEN Upstream On 13 October 2015 ORLEN Upstream Sp. z o.o. (ORLEN Upstream) signed an agreement to acquire American company FX Energy, Inc. (FX Energy) domiciled in Salt Lake City, Utah, USA. FX Energy is engaged in the exploration and extraction of oil and natural gas mainly in Poland. As a result, on 31 December 2015 ORLEN Group acquired 100% of the common shares and 100% of preferred shares of FX Energy. The transaction was approved by the Office of Competition and Consumer Protection. Financing of the transaction was provided from own resources of PKN ORLEN as well as available lines of credit. The fair value of the identifiable assets and liabilities of FX Energy at the acquisition date:
Carrying amount
as at the acquisition
day
Adjustments to fair value
Fair value
Exploration and evaluation of mineral resources assets
7 31 38
Assets related to development and extraction of mineral resources 175 379 554
Other property, plant and equipment 3 - 3
Cash and cash equivalents 30 - 30
Trade and other receivables 12 - 12
Assets (A) 227 410 637
Provision for decommissioning costs of drillings and supporting infrastructure 13 - 13
Deferred tax liabilities - 57 57
Loans 197 - 197
Trade and other liabilities 39 - 39
Liabilities (B) 249 57 306
Identifiable net assets at fair value (22) 353 331
(A-B)
Fair value of transferred payment due to acquisition adjusted by transaction costs (331)
In 2014, the main changes in the shareholder structure of the Group, besides the acquisition of shares in Česká Rafinérská as described above, related also to the acquisition of 100% of shares in Birchill Exploration Limited Partnership for the amount of PLN 707 million. The settlement of executed transaction did not influence the consolidated statement of profit or loss and other comprehensive income, because fair value of net assets acquired was equal to price paid.
9.2.2. Other changes in the structure of the ORLEN Group
On 5 January 2015, a merger of Rafineria Trzebinia S.A. and the companies: Rafineria Nafty Jedlicze S.A., Fabryka Parafin Naftowax Sp. z o.o. and Zakładowa Straż Pożarna Sp. z o.o. took place. The company operates under the new name of ORLEN Południe S.A. since 5 January 2015;
On 5 January 2015, a merger of ORLEN OIL Sp. z o.o and Platinum Oil Sp. z o.o. took place;
On 22 January 2015 acquisition by PKN ORLEN from Anwil S.A. shares of Przedsiębiorstwo Inwestycyjno-Remontowe “RemWil” Sp. z o.o, domiciled in Włocławek took place;
On 20 February 2015 a merger of ORLEN Serwis S.A. with ORLEN Automatyka Sp. z o.o. and Przedsiębiorstwo Inwestycyjno-Remontowe RemWil Sp. z o.o. took place;
On 19 March 2015 a merger of Baltic Power and Baltic Spark took place;
On 1 June 2015 winding-up proceedings of EkoNaft Sp. z o.o. domiciled in Trzebinia began;
On 26 June 2015 winding-up proceedings of ORLEN International Exploration & Production Company BV due to closure of the exploration and extraction project on the Latvian shelf began;
On 30 June 2015 the District Court in Rzeszów made an entry of a merger of ORLEN PetroTank Sp. z o.o. and ORLEN Paliwa Sp. z o.o. into a single entity operating under the name ORLEN Paliwa Sp. z o.o. domiciled in Widełka. PKN ORLEN share in the share capital of ORLEN Paliwa Sp. z o.o. (formerly ORLEN PetroTank Sp. z o.o.) remained unchanged at 100%;
On 2 July 2015 winding-up procedures of the SIA Balin Energy terminated;
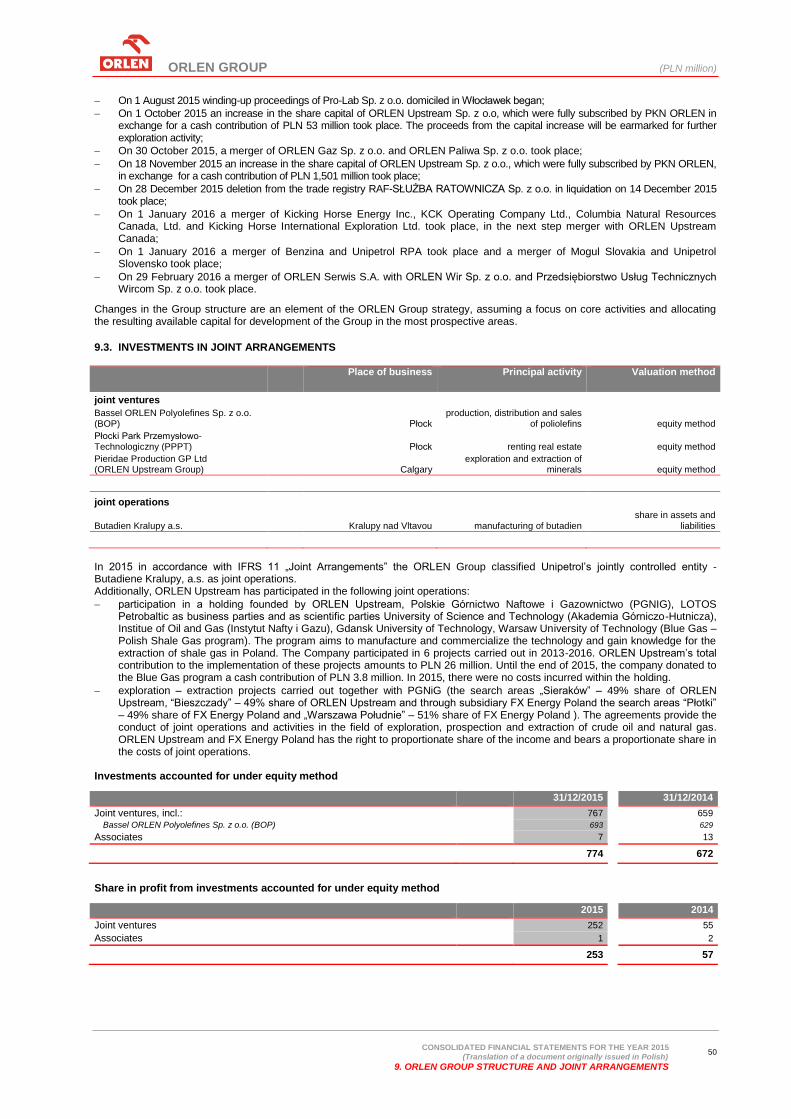
ORLEN GROUP (PLN million)
CONSOLIDATED FINANCIAL STATEMENTS FOR THE YEAR 2015
(Translation of a document originally issued in Polish)
9. ORLEN GROUP STRUCTURE AND JOINT ARRANGEMENTS
50
On 1 August 2015 winding-up proceedings of Pro-Lab Sp. z o.o. domiciled in Włocławek began;
On 1 October 2015 an increase in the share capital of ORLEN Upstream Sp. z o.o, which were fully subscribed by PKN ORLEN in exchange for a cash contribution of PLN 53 million took place. The proceeds from the capital increase will be earmarked for further exploration activity;
On 30 October 2015, a merger of ORLEN Gaz Sp. z o.o. and ORLEN Paliwa Sp. z o.o. took place;
On 18 November 2015 an increase in the share capital of ORLEN Upstream Sp. z o.o., which were fully subscribed by PKN ORLEN, in exchange for a cash contribution of PLN 1,501 million took place;
On 28 December 2015 deletion from the trade registry RAF-SŁUŻBA RATOWNICZA Sp. z o.o. in liquidation on 14 December 2015 took place;
On 1 January 2016 a merger of Kicking Horse Energy Inc., KCK Operating Company Ltd., Columbia Natural Resources Canada, Ltd. and Kicking Horse International Exploration Ltd. took place, in the next step merger with ORLEN Upstream Canada;
On 1 January 2016 a merger of Benzina and Unipetrol RPA took place and a merger of Mogul Slovakia and Unipetrol Slovensko took place;
On 29 February 2016 a merger of ORLEN Serwis S.A. with ORLEN Wir Sp. z o.o. and Przedsiębiorstwo Usług Technicznych Wircom Sp. z o.o. took place.
Changes in the Group structure are an element of the ORLEN Group strategy, assuming a focus on core activities and allocating the resulting available capital for development of the Group in the most prospective areas.
9.3. INVESTMENTS IN JOINT ARRANGEMENTS
Place of business Principal activity Valuation method
joint ventures
Bassel ORLEN Polyolefines Sp. z o.o. (BOP) Płock
production, distribution and sales of poliolefins equity method
Płocki Park Przemysłowo-Technologiczny (PPPT) Płock renting real estate equity method
Pieridae Production GP Ltd (ORLEN Upstream Group) Calgary
exploration and extraction of minerals equity method
joint operations
Butadien Kralupy a.s.
Kralupy nad Vltavou manufacturing of butadien share in assets and
liabilities
In 2015 in accordance with IFRS 11 „Joint Arrangements” the ORLEN Group classified Unipetrol’s jointly controlled entity - Butadiene Kralupy, a.s. as joint operations. Additionally, ORLEN Upstream has participated in the following joint operations:
participation in a holding founded by ORLEN Upstream, Polskie Górnictwo Naftowe i Gazownictwo (PGNIG), LOTOS Petrobaltic as business parties and as scientific parties University of Science and Technology (Akademia Górniczo-Hutnicza), Institue of Oil and Gas (Instytut Nafty i Gazu), Gdansk University of Technology, Warsaw University of Technology (Blue Gas – Polish Shale Gas program). The program aims to manufacture and commercialize the technology and gain knowledge for the extraction of shale gas in Poland. The Company participated in 6 projects carried out in 2013-2016. ORLEN Upstream’s total contribution to the implementation of these projects amounts to PLN 26 million. Until the end of 2015, the company donated to the Blue Gas program a cash contribution of PLN 3.8 million. In 2015, there were no costs incurred within the holding.
exploration – extraction projects carried out together with PGNiG (the search areas „Sieraków” – 49% share of ORLEN Upstream, “Bieszczady” – 49% share of ORLEN Upstream and through subsidiary FX Energy Poland the search areas “Płotki” – 49% share of FX Energy Poland and „Warszawa Południe” – 51% share of FX Energy Poland ). The agreements provide the conduct of joint operations and activities in the field of exploration, prospection and extraction of crude oil and natural gas. ORLEN Upstream and FX Energy Poland has the right to proportionate share of the income and bears a proportionate share in the costs of joint operations.
Investments accounted for under equity method
31/12/2015 31/12/2014
Joint ventures, incl.: 767 659
Bassel ORLEN Polyolefines Sp. z o.o. (BOP) 693 629
Associates 7 13
774 672
Share in profit from investments accounted for under equity method
2015 2014
Joint ventures 252 55
Associates 1 2
253 57
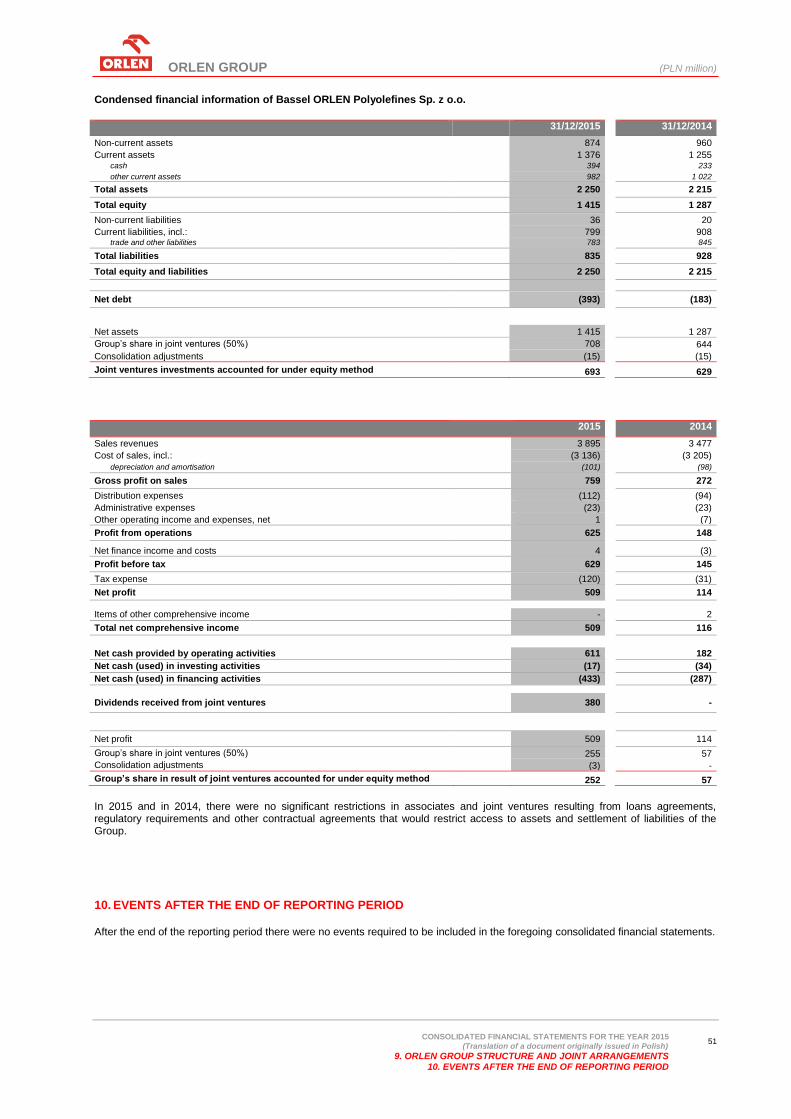
ORLEN GROUP (PLN million)
CONSOLIDATED FINANCIAL STATEMENTS FOR THE YEAR 2015
(Translation of a document originally issued in Polish)
9. ORLEN GROUP STRUCTURE AND JOINT ARRANGEMENTS 10. EVENTS AFTER THE END OF REPORTING PERIOD
51
Condensed financial information of Bassel ORLEN Polyolefines Sp. z o.o.
31/12/2015
31/12/2014
Non-current assets 874 960
Current assets 1 376 1 255 cash 394 233
other current assets 982 1 022
Total assets 2 250
2 215
Total equity 1 415
1 287
Non-current liabilities 36 20
Current liabilities, incl.: 799 908 trade and other liabilities 783 845
Total liabilities 835
928
Total equity and liabilities 2 250
2 215
Net debt (393)
(183)
Net assets 1 415 1 287
Group’s share in joint ventures (50%) 708 644
Consolidation adjustments (15) (15)
Joint ventures investments accounted for under equity method 693 629
2015
2014
Sales revenues 3 895 3 477
Cost of sales, incl.: (3 136) (3 205)
depreciation and amortisation (101) (98)
Gross profit on sales 759
272
Distribution expenses (112) (94)
Administrative expenses (23) (23)
Other operating income and expenses, net 1 (7)
Profit from operations 625
148
Net finance income and costs 4 (3)
Profit before tax 629
145
Tax expense (120) (31)
Net profit 509
114
Items of other comprehensive income - 2
Total net comprehensive income 509
116
Net cash provided by operating activities 611 182
Net cash (used) in investing activities (17) (34)
Net cash (used) in financing activities (433) (287)
Dividends received from joint ventures 380
-
Net profit 509
114
Group’s share in joint ventures (50%) 255 57
Consolidation adjustments (3) -
Group’s share in result of joint ventures accounted for under equity method 252 57
In 2015 and in 2014, there were no significant restrictions in associates and joint ventures resulting from loans agreements, regulatory requirements and other contractual agreements that would restrict access to assets and settlement of liabilities of the Group.
10. EVENTS AFTER THE END OF REPORTING PERIOD
After the end of the reporting period there were no events required to be included in the foregoing consolidated financial statements.
ORLEN GROUP
CONSOLIDATED FINANCIAL STATEMENTS FOR THE YEAR 2015
(Translation of a document originally issued in Polish)
52
11. STATEMENTS OF THE MANAGEMENT BOARD AND APPROVAL OF THE FINANCIAL STATEMENTS
In respect of the reliability of preparation of consolidated financial statements The Management Board of PKN ORLEN herby declares that to the best of its knowledge the foregoing consolidated financial statements and comparative data were prepared in compliance with the accounting principles applicable to the ORLEN Group in force and that they reflect true and fair view on financial position and financial result of the ORLEN Group and that the Management Board Report on the Operations presents true overview of business situation of the ORLEN Group, including basic risks and exposures. In respect of the entity authorized to conduct audit of financial statements The Management Board of PKN ORLEN declares that the entity authorized to conduct audit was selected in compliance with the law and that the entity and auditors conducting the audit met the conditions to issue an independent opinion in compliance with relevant regulations. The foregoing consolidated financial statements were approved by the Management Board of the Parent Company on 23 March 2016.