annual report - namibia breweries limited · annual report. 2 it’s in ur thinking & it’s in...
TRANSCRIPT

ANNUAL REPORT

2
IT’S IN UR THINKING & IT’S IN WHAT WE DO ON A DAILY BASIS IT’S WHERE WE NEED T GO TO BECOME A WORLD-CLASS LEADER ABS LUTELY NO LIMITS AND BORDERLESS B UNDARIES BREAKING THR UGH IS WHAT WE DO NAMIBIA BREWERIES LIMITED IS BEY ND
www.nambrew.com/AnnualReport2015
TAKE A JOURNEY THROUGH OUR ONLINE ANNUAL REPORT
AND EXPERIENCE EVERYTHING BEYOND

3
COMPANY PROFILE5
7
23
39
45
51
59
LEADERS
BEYOND SUSTAINABILITY
BRANDS AND BEYOND
REMUNERATION REPORT
CORPORATE GOVERNANCE
FINANCIAL STATEMENTS

4

5
C MPANY PR FILE
Established on 29 October 1920, Namibia Breweries Limited (NBL) is one of the leading beverage manufacturing companies in Namibia and, indeed, in Southern Africa. In 1920, the Kronen Brauerei (Swakopmund), the Omaruru Brewery (Omaruru), the Klein Windhoek Brewery (Windhoek), and the Felsenkeller Brewery (Windhoek) were acquired by Messrs Carl List and Hermann Ohlthaver, who consolidated them to formSouth West Breweries Limited. When, in 1967, South West Breweries Ltd acquired the Hansa Brauerei in Swakopmund, the company became the only remaining independent commercial brewery in Southern Africa. With Namibia’s independence in 1990, South West Breweries Limited changed to its current name of Namibia Breweries Limited (NBL).
Today, with the stated vision To Be the Most Progressive and Inspiring Company, NBL leads the domestic beer market and has a significant share of the premium beer category in South Africa. NBL’s total exports account for more than half of total production output.
In May 1996, NBL listed on the Namibian Stock Exchange (NSX) and became a publicly owned company. The Ohlthaver & List Group of Companies (O & L Group), a major Namibian group, is the controlling shareholder in NBL. In 2003, leading drinks company Diageo and brewer Heineken became NBL’s strategic partners. Brandhouse Beverages (Proprietary) Limited serves as a vehicle for NBL’s joint venture with Heineken and Diageo in South Africa. This partnership has enabled NBL to further penetrate the lucrative South African market, simultaneously allowing growth in beer volumes to be persuaded in countries such as Botswana, Zambia and Zimbabwe. At present, Windhoek Lager is brewed under licence in Gauteng for the South African market and distributed by DHN Drinks Proprietary Limited.
Brewed by choice according to the German Reinheitsgebot (“Purity Law”) of 1516, Windhoek Lager, Windhoek Light, Windhoek Draught and Tafel Lager enjoy a reputation of quality and purity for which the brands have earned international recognition – including winning gold medals from the prestigious Deutsche Landwirtschafts-Gesellschaft (DLG) ), among its awards in 2005, 2007, 2008, 2009, 2010, 2011, 2012, 2013 and 2014.
Established
Acquired
Hansa Brauerie
Formation of DHN
Drinks Pty
Changed
name to NBL
Listed on stock
exchange
Heiniken
& Diageo joins
1967 20081996

6

7
“BREAKTHROUGH LEADERS CREATE LEADERS, NOT FOLLOWERS”
8
EXECUTIVE DIRECTORSH van der WesthuizenAppointed to the Board as Managing Director on 2 April 2012.G MoutonAppointed to the Board on 17 September 2013.
NON-EXECUTIVE DIRECTORSE EnderJoined the Group in 1975. Appointed to the Board 1 February 1983.S ThiemeAppointed to the Board in 2002. Elected Chairperson of the Board on 11 July 2002.NB Blazquez1
Appointed to the Board on 2 September 2004.PJ Jenkins1
Alternate director to N Blazquez. Appointed to the Board on 3 December 2013.H-B GerdesAppointed to the Board on 28 July 2000.P GrüttemeyerAppointed to the Board on 3 June 2004.C-L ListAppointed to the Board on 28 June 1979.L van der Borght5
Alternate Director to S Hiemstra. Appointed to the Board on 2 December 2010.S Hiemstra4
Appointed to the Board on 31 August 2011.J Milliken1
Appointed to the Board on 17 September 2013. M Kromat2
Alternate Director to J Milliken.Appointed to the Board on 30 November 2011.DFM Leleu3
Appointed to the Board on 2 April 2012.L McLeod-Katjirua Appointed to the Board on 2 April 2012.R Pirmez5
Appointed to the Board on 8 September 2015.
COMMITTEESRemuneration and Nominations CommitteeN-B Blazquez (Chairperson)S HiemstraP GrüttemeyerAudit CommitteeH-B Gerdes (Chairperson)P GrüttemeyerM Kromat DFM LeleuRisk CommitteeH van der Westhuizen (Chairperson)G MoutonNBL Senior Leadership TeamO&L Group Risk Manager
ADMINISTRATIONCompany Registration Number2/1920 (Incorporated in Namibia)1979/001528/10 (Externally registered in South Africa)SecretariesOhlthaver and List Centre (Proprietary) LimitedAlexander Forbes House, 23–33 Fidel Castro StreetPO Box 16, Windhoek, NamibiaAuditorsDeloitte & TouchePO Box 47, Windhoek, NamibiaSponsorPSG KonsultPO Box 196, Windhoek, NamibiaTransfer SecretariesTransfer Secretaries (Proprietary) LimitedPO Box 2401, Windhoek, NamibiaPrincipal BankersFirst National Bank of Namibia LimitedPO Box 285, WindhoekAttorneysEngling, Stritter & PartnersPO Box 43, Windhoek, Namibia
Nationalities: 1 British 2 South African 3 French 4 Dutch 5 Belgian
DIRECTORATEAND ADMINISTRATION
LEADERS

Nationalities: 1 British 2 South African 3 French 4 Dutch 5 Belgian

10
CHAIRMAN &EXECUTIVE DIRECT RS
2
8 9
121110
14
15
16
4 5 6
1
3
7
13

11
9. Carl-Ludwig ListBorn to Werner and Margarete List, raised in Midgard
and schooled in Swakopmund, he matriculated in Cape Town and
completed his banking education in Germany in 1971 after attending
the University of Stellenbosch. After having devoted twenty years (1972-
1992) of his career to the Ohlthaver & List Group, he remains a dedicated
director of the Group and Namibia Breweries.
6. Philip JenkinsPhilip joined Diageo Plc in 2008 and was appointed Finance
Director, Africa, Eastern Europe and Turkey in February 2012.
He sits on the Global Finance and Risk Committee, Diageo Africa
Executive and represents Africa on the Audit Committee.
Phillip has an honours degree in Accounting
and Financial Analysis from the University of Newcastle-Upon-Tyne.
4.Ernst EnderErnst was appointed as executive director in 1983,
he took over responsibility of the Company’s marketing and sales
function until 2002 when he became responsible for the development
of the export markets. Ernst retired in 2008 but remains on the NBL
Board as non-executive director. He was also appointed to the
Ohlthaver & List Board in June 2008 as a non-executive director.
7. Hans-Bruno GerdesManaging partner of the attorneys firm Engling, Stritter
& Partners, Habo is also an associate of the Institute of Chartered
Secretaries and holds a B.Proc. degree from the University of Cape
Town. He currently practices as a commercial/corporate attorney, holds
numerous directorships and is actively involved in the organised legal
profession. Presently, he serves as chairman of the audit committee.
10. Lieven van der BorghtLieven holds Masters Degrees in Law and Business Administration from
the Catholic University of Leuven, Belgium. With many years of experience
within the Heineken Group and other reputable international corporates, he
holds the position of Heineken Regional Commercial Director Africa and
Middle East. He serves as a non-executive Director of Heineken
Sirocco Dubai and DHN Drinks (Pty) Ltd at present.
5. Nick BlazquezNick is President for Diageo with accountability for Africa, Turkey, Russia,
Central and Eastern Europe and Global Sales. Prior to that he led Diageo’s
businesses in Asia and held various other senior positions in
Great Britain. He is also a non-executive Director of
Mercy Corps. He is the chairman of the NBL
remuneration committee.
8. Peter GrüttemeyerJoined the Ohlthaver & List Group of Companies (O&L) in October
2003 as chief executive officer where he is responsible for
formulating and executing strategy. He is a qualified Chartered
Accountant and prior to joining O&L, he held the position
of partner-in-charge of the Deloitte Namibia practice.
11. Sijbe HiemstraAppointed in August 2011, Sijbe has over 30 years
experience and has held several senior positions in
the Heineken Group ranging from Portfolio Manager to Heineken
Regional President Africa and Middle East. Based at the Heineken
Headquarters in Amsterdam, Sijbe also holds a BBA degree
from the Rotterdam School of Higher Education Studies.
12. Jeff Milliken As Managing Director for Brandhouse, Jeff Milliken is responsible for
the total beverage alcohol joint venture between Diageo, Heineken and
Namibia Breweries in South Africa. Jeff has over 23 years experience
with Diageo, having initially joined as a newly qualified chartered
accountant. Jeff progressed through his Diageo career by holding senior
positions in finance and supply in the UK, Asia and Latin America.
13. Martin Kromat Martin holds a combined Master’s degree in business administration and
electronic engineering from the Darmstadt University of Technology.
With 13 years’ experience in fast-moving consumer goods
with Procter & Gamble, he brings a wealth of knowledge and
insight to the NBL Board and DHN Drinks (Pty) Ltd, the latter
being where he currently serves as the Finance Director.
16. Roland Pirmez In 2015, Roland was appointed President of Heineken Africa,
Middle East and Eastern Europe. From 2013 until 2015 he was
President of Aisa, Pacific and CEO APB. Roland joined Heineken
in 1995. From 1995 to 1998, he was Managing Director of
Heineken Angola. In 1998 he was appointed General Manager
of Thai Asia, Pacific Brewery co. Ltd, Thailand and in 2002,
he became Chief Executive Officer of Heineken in Russia.
14. Didier LeleuDidier is a graduate of the French Business School. He held the post of
Finance Director for Heineken France from 2003 until his appointment
in 2012 as Senior Heineken Director Regional Finance Africa
Middle East. He sits on the boards of various joint
ventures and participations on behalf of the
Heineken Group.
15. Governor Laura Mcleod-Katjirua Governor Mcleod-Katjirua has a long history of serving the people of
Namibia. She has been active in the promotion of gender equality
and education in Namibia. She is currently the Appointed Governor
of Omaheke Region where she continues to support various initiatives
that support the development and wellbeing of Namibians.
1. Sven Thieme Sven was appointed in March 2002. He is the Executive Chairman of
the Ohlthaver & List Group (O&L). He joined O&L in 1998, after four
years working as a Chartered Accountant in Luxembourg. He was also
the architect of several joint ventures entered into by O&L, including
the deal between Heineken, Diageo and Namibia Breweries.
2. Graeme MoutonGraeme is a qualified Chartered Accountant with a wealth of experience.
He joined O&L Group of Companies in 2005. Prior to his current role,
he held the position of Finance Director at Model Pick n Pay Namibia
3.. Hendrik van der Westhuizen Wessie, a graduate of the University of Cape Town, has been with
the O&L Group of Companies since 2003. In 2006 he was appointed
to the board of Hangana Seafood (Pty) Ltd and became its Managing
Director in 2009. He played an integral role in successfully placing Hangana
Seafood (Pty) Ltd on the road of sustained profitability and has
over 19 years of experience in the Food and Beverage Industry.

12
SENI R LEADERSHIP TEAM
Anton Goosen National Sales Manager, Hendrik van der Westhuizen Managing Director, Abrie du Plooy Logistics Manager, Rosemary Shippiki Marketing Manager,Thomas Hochreiter Export/Global Partners Manager, Terence Makari Human Capital Manager, Hans Hermann Supply Chain Manager, Graeme Mouton Finance Director

13

14
CHAIRMAN’S STATEMENT
Namibia has made significant progress in addressing many development challenges. We are proud to be a corporate citizen of a 25 year old independent nation on the African continent that has inherited a well-functioning physical infrastructure; a market economy; rich natural resources; and a relatively strong public administration. However, Namibia remains vulnerable to the short- and long-term environmental shocks such as the negative impact of drought conditions and a weak global demand for mineral exports, as all major sources of growth depend heavily on our fragile ecosystem. These and other factors have made a huge impact on employment creation, poverty and inequality which remain unacceptably high, while the shortage of skilled labour continues to be a major obstacle.
In respect of maintaining our track record of consistent economic growth, the emergence of global value chains is perceived as an opportunity for Namibia. This is particularly true for our abundant natural resources, as there is an urgent need to implement innovative measures to enable the country to make the most of her comparative and competitive advantages, including policies to reduce the high cost of doing business, removing various bottlenecks in infrastructure and investing in skills as part of a broader diversification strategy.
Consequently, as a business, NBL has continued to embrace our breakthrough leadership philosophy: it has presented us with many opportunities that contribute positively to our purpose, namely Creating a Future, Enhancing Life and our vision, which is To be the most progressive and inspiring company, while reducing our environmental impact and increasing our positive social impact. In positioning Namibia’s leading brewer for competitive growth and extending our premium quality beers into more premium market segments, we have increased our presence in the rest of the African continent and beyond. While these developments show that we are making good progress in driving bigger innovations faster; we are cognisant to continuing to raise the bar in order to retain our leadership in the beverages industry. I believe that, like other contributors to the Namibian economy, NBL has made great strides with its national competitiveness worldwide by supporting dialogue between the Government, business and civil society in order to improve levels of productivity. These, in turn, set the level of economic prosperity. I am, therefore, proud of the investment we have made in our people to address the need for innovation and skills as the key drivers of economic growth. While these increasingly influence competitiveness, significant risks remain, resulting from rising income
inequality and the potential tightening of financial conditions. However, we are committed to address these structural challenges to ensure more sustainable and inclusive growth. More than ever, cooperative leadership among business, the Government and civil society is needed to re-establish sustainable growth and raise living standards throughout the world.
As Chairman, I am extremely proud of an organisation full of world- class people with world- class commitment. Providing service is more than just a job: it is a source of pride - and NBL employees do it excellently. Our diverse workforce is a key competitive advantage for the business as they contribute to the quality, speed, and efficiency in seizing growth and other business opportunities. Therefore, our commitment to our world class people is to acknowledge them for their outstanding service, teamwork, individuality, and creativity by providing a rewarding environment within which to work as well as competitive reward initiatives like our Value Star Programme and coaching and development opportunities. In so doing, we showcase to the community, the country and the world who we are - not just what we do. Our organisation is very fortunate to have employees who take pride in their work, who care about this community, and who see their job as a way to make a difference in NBL and the country at large.

15
“NBL HAS CONTINUED TO EMBRACE OUR
BREAKTHROUGH LEADERSHIP PHILOSOPHY THAT HAS
PRESENTED US WITH MANY OPPORTUNITIES”
As part of the O&L Group and inspired by our purpose of Creating a Future, Enhancing Life, NBL embraces its obligations as a corporate citizen in respect of the society within which we operate - as well as towards our shareholders, employees, stakeholders and the environment. We are committed to operating our business in a sustainable and responsible way. As leader in the domestic beer market, we are committed to promote the responsible use of alcohol in business and industry after working hours by communicating relevant information and educating consumers about alcohol abuse through effective programmes and policies; self-regulatory efforts; responsible drinking campaigns and by supporting the upliftment of communities in Namibia through various initiatives aimed at enhancing their health and well-being.

16
Sven ThiemeChairman
As the pace of globalisation has accelerated, we are increasingly aware of the strain that active international trade places on the environment. In actively promoting Namibia’s world-famous biodiversity and by utilising natural resources on a sustainable basis, we are committed to being a key player in environmental sustainability by optimising our water and energy consumption; recovering carbon dioxide (CO2) from emissions; managing waste and constantly introducing innovative, environment - friendly packaging materials and methods.
Good governance remains the foundation on which our structures are based. While the Board empowers the Senior Leadership Team to execute NBL’s strategies and holds it accountable for delivering against them, the Board itself also needs to provide responsible leadership to our Senior Leadership Team.
As Chairman responsible for leading the Board and for fostering a culture of openness and constructive debate that allows for all views to be heard, enabling us to deliver a sustainable economic, social and environmental performance. As such, therefore, I am pleased to report that Board Members expressed their satisfaction with the Company’s positive ethical tone during the year under review as well as with our approach, which is focused more on creating a value-based culture than a compliance-driven one.
On behalf of the Board of Directors, I would like to extend my heartfelt gratitude to all our employees, shareholders, investors; to the Government; and to our business partners, associates, customers and consumers for another remarkable contribution towards our purpose, vision and objectives.
May 2016 be another year of great success!

17

18
MANAGING DIRECT R’S REP RT
The year under review proved to be another outstanding one for our business, with NBL delivering a solid financial performance. This can be attributed to local volume growth and our revised pricing strategy, despite sharp undulations in the competitive landscape, volume migration to South Africa, and increased losses in share of Associate. The performance for 2015 showed an operating profit of N$507 million and revenues of N$2,434 million, while we continue to focus on the execution of our strategy and on delivering value to shareholders. However, the industry was confronted with significant increases in utility costs. These included the imposition of new rates for effluent charges, which reduced savings generated through procurement and efficiencies, while losses in DHN Drinks (Proprietary) Limited, our South African joint venture with Heineken and Diageo, increased compared with the previous reporting year, mainly due to timing differences relating to marketing and operational spend.
World-class breakthrough employees, World-class breakthrough culture
While many associate innovation with new products, it is actually people that are the most important drivers of breakthrough innovation. I am extremely proud of our employees: not only do they represent the rich and diverse cultures of Namibia, but they also embody the Company’s self-
sustaining patterns that complement our innovation and leadership strategies. We are passionate about our people because they truly make a difference when it comes to the elements that make up our innovative Company and corporate culture. These elements include a focused innovation strategy, a winning overall business strategy, deep consumer and customer insight, great talent, and the right set of capabilities to achieve successful execution. Our focus on business growth, people development, an empowering and supportive culture, providing innovative tools and processes for effectiveness and executional excellence have resulted in optimal outcomes that has seen our employees channel their creativity and actions to great effect. Strengthening our consumer and customer focus and trust, accountability for results, teamwork, a sense of urgency, and instilling an entrepreneurial, winning spirit have been key to achieving another successful year. I believe NBL’s culture of constant innovation has energised people to engage with enthusiasm and has inspired them to take risks in a safe environment in which we foster learning and encourage independent thinking.
World-class brands and innovations
Innovation has always been integral to NBL’s DNA; it is fundamental to the unique
and differentiated value propositions that we have crafted over the years. NBL’s strong portfolio of world-class beer and non-alcoholic brands is supported by well-defined research and development strategies executed by our state-of-the-art brewing plant and its passionate people. Since 1928, when the Hansa Brewery in Swakopmund first opened its doors, NBL has played a crucial role in building its capability, creating products that sustain the company’s competitive advantage. NBL’s ambitious agenda of sharpening its competitive edge in an enormously challenging marketplace demands better products that can positively impact products that are world-class and a byword for excellence. We endeavour to develop path-breaking solutions that blend science, research and technology to enhance product experience.
As such, NBL continues to lead the beer market with an estimated 85% market share. Windhoek Draught saw the launch of the 360° For Real campaign which was aired on television across the Southern -African region. The brand also saw a renovation of its primary, secondary and tertiary packaging to maintain its relevance to its target consumers. Tafel Lager continued to lead the NBL portfolio of National pride while Windhoek Lager continued to solidify its position as NBL’s premium offering. Other strong advances were exhibited

19
in the ready-to-drink and non-alcoholic catagories, both of which recorded double -digit growth.
Windhoek Draught hosted the African pop duo P Square on Namibian soil for the first time, whereas Windhoek Lager welcomed Ivorian football legend Didier Drogba to our part of the world. In so doing, our brands continue to deliver amazing experiences to consumers, setting standards for consumer engagement and excitement.
Caring for the community
In addition to its contributions to the economy and to enhancing lives through our role as an employer of choice, NBL has also continued to enhance the lives of the communities in which we operate. Our corporate social investment portfolio supports health, education, alcohol harm-reduction and environmental preservation projects to this end.
As an industry leader when it comes to alcohol harm-reduction, NBL takes a proactive approach to educating consumers on responsible drinking by various means, such as our Stay Cool, Enjoy Responsibility campaign. To us, the notion of responsibility entails much more than one’s drinking patterns; the campaign therefore sends a clear message about the benefits of being responsible, while further engaging consumers on the need for social change and responsible behaviour in all facets of life.
“PEOPLE ARE THE MOST
IMPORTANT DRIVERS OF
BREAKTHROUGH INNOVATION”

20
Hendrik van der WesthuizenManaging Director
Since 2009, NBL has invested heavily in the DRINKiQ training programme, which aims to empower participants with knowledge and equip them with facts about alcohol so that they are able to make responsible choices when dealing with this potentially dangerous drug. NBL also participated in various collaborative programmes such as road safety initiatives by the Motor Vehicle Accident Fund and the National Road Safety Council of Namibia. Through our lead role in the Self-regulating Alcohol Industry Forum (SAIF), a body consisting of alcohol manufacturers and distributors working together since 2007 to regulate the alcohol industry, we continued to take great strides forward not only as regards self-regulation, but also with respect to programmes that target alcohol harm-reduction. Highlights from within SAIF include the Alcohol Traders’ Programme, by means of which approximately 320 shebeen owners underwent training in responsible server practice, while young people from disadvantaged backgrounds benefited from exposure to the Physically Active Youth Programme which aims to prevent underage drinking.
I look forward to taking our consumer and customer experiences to even greater heights through our commitment to innovation and an unyielding pursuit of perfection. I am confident that, through our continuously improving and sustainable operations, we will keep producing the
quality consumers have come to know and love, and will overcome the challenges facing our industry while delivering further volume growth as we build on sustaining consumer confidence.
I am immensely grateful to be part of such a dynamic team of passionate employees who are inspired by our purpose Creating a Future, Enhancing Life. A heartfelt “Thank You!” to our Board of Directors, suppliers, customers, consumers and, of course, our valued employees for your great support.

21

22

23
“SUSTAINABILITY SHOULD BE AT THE CORE OF ANY BUSINESS STRATEGY. IT HAS THE POTENTIAL TO BECOME A COST-SAVING, MONEY-EARNING AND VALUE-CREATING EXERCISE THAT MAKES BUSINESS SENSE.”

24
BEY ND SUSTAINABILITY
CORPORATE SOCIAL INVESTMENT
NBL embraces its obligations as a responsible and caring corporate citizen. Thus, we not only manage our environmental and social impacts and invest heavily in mitigating our effects on externalities, but we also continue to contribute significantly to enhancing the lives of the people in communities within which we operate.
Local pride
As a proudly Namibian manufacturer, NBL supports Namibia’s missions abroad by way of numerous trade and tourism promotion initiatives, providing them with Africa’s World Class Windhoek Lager beer, which is highly regarded as one of Namibia’s prime exports. In addition, NBL supports other local trade and tourism enhancement initiatives such as the Hospitality Association of Namibia (HAN). For the past 28 years of it’s existence, HAN has been a leading player in the Namibian tourism industry. Furthermore, through NBL initiatives such as the Windhoek Lager Ambassador Awards, which we launched in 2010, we have showcased and celebrated inspirational Namibians who have made a difference in the lives of others. NBL specifically supports Namibians who go the extra mile in building a prosperous nation. Indeed, during the fourth Windhoek Lager Ambassador Awards, which were held
in the reporting year, following a public voting process, NBL Ambassadors were awarded in the categories of Education, Community Development, Sport, Health–Science–Technology, Business Success, Conservation, and the Arts.
The Ambassador Awards not only celebrates Namibians who have made a positive contribution to society, but also places the spotlight on deserving causes and charities, while supporting the efforts of the Namibian Government to enhance national pride.
Local procurement
NBL is committed to contributing to communities by, amongst other things, hiring and procuring locally wherever possible. Therefore, NBL gives preference to local businesses and to small- and medium-scale enterprises. During the year under review, local procurement spent by NBL amounted to more than N$490 million, thus constituting 37% of all goods and services procured by us.
Following the successful barley trials initiated by NBL in 2010, the company and various other stakeholders are now taking the next steps to see the establishment of large- scale barley production in Namibia. Not only will this enable NBL to procure barley locally, while establishing an entirely new industry in Namibia, it will also further
support socio-economic development in the country. The first successful barley trials, which were concluded in 2011, were followed-up with further trials in 2012, 2013 and 2014. These attempts ascertain whether brewing barley could be grown in Namibia, and to examine the commercial viability of such an enterprise. A positive outcome in this respect will support our drive to procure locally while creating numerous employment opportunities and secondary benefits for the country.
Caring for our community
In living our purpose, Creating a Future, Enhancing Life, NBL supports long-term, actively-managed projects and initiatives that enhance the living standards of communities wherever we operate. More specifically, NBL cares for the community through our investment in health and education, amongst other things, as outlined in more detail below.

25
HEALTH
A public-private partnership between NBL, The Ministry of Health and Social Services, and the German Government’s Gesellschaft für Internationale Zusammenarbeit (GIZ), was launched in March 2014, to pilot the impact such collaboration would have in supporting Namibia’s fight against the spread of HIV/AIDS. The year-long Condom Distribution Pilot Project proved to be extremely successful: through NBL’s distribution network, we delivered 1, 337 million Smile condoms, primarily in the Ohangwena Region. It is estimated (by applying the John Stover measure) that approximately 2,700 new HIV infections were prevented as a result of this initiative. Following these positive outcomes, we will implement a staggered roll-out of the project to ensure it’s extension to other regions of Namibia and, thus, broaden it’s impact.
For the past five years, NBL has supported the Mister Sister Initiative – a mobile clinic service administered by PharmAccess and sponsored by the Heineken Africa Foundation. Mister Sister has significantly enhanced access to primary health care services and health education in rural and remote populations in the Khomas, Omaheke and Otjozondjupa Regions, in Namibia.
“NBL IS COMMITTED TO
CONTRIBUTING TO COMMUNITIES
BY, AMONGST OTHERS, HIRING AND
PROCURING LOCALLY WHEREVER
POSSIBLE”
26
In addition to administering primary health care services to remote populations, the Mister Sister programme also conducted numerous education sessions with patients, and drives awareness through direct engagement and SMSs, covering topics such as maternal child and infant care, family planning, diabetes, high blood pressure and hygiene - to mention but a few.
NBL’s long-standing support to the Cancer Association of Namibia is but another example of our commitment to enhancing the health of Namibians. Cancer is a major public health disease, impacting a significant number of Namibians each year. The Dr AB May Oncology Clinic in Windhoek offers free treatment to all cancer patients. This service is made possible by donors such as NBL, who also support the Cancer Association of Namibia’s awareness-raising programme to promote early detection and treatment.
Education
NBL again continued with its support of The Office of the Prime Minister’s Back to School Programme, which aims to enhance education and the living conditions among the marginalised in Namibian society, in this case the Ovatjimba, Ovatue and San communities.
Together with other companies in the O&L Group, NBL contributed towards the
construction of the Etunda Farm School and Clinic in Otavi District, while we continued our support to the School of the Visually and Hearing Impaired. Other support was directed at the Môreson school and the Lebensschule, both of which assist in teaching children with mental and learning challenges. The Moses Garoëb Project School, which has a very high incidence of orphaned and vulnerable children (OVC), was another school which benefited from the NBL and other members in the O&L Group support. The Moses Garoëb Project School was the beneficiary of the annual O&L OVC Christmas Party in the year under review, which is hosted by NBL to brighten the lives of these children. In addition, NBL employees gave up their time and own money to make up beautifully decorated gift boxes and spent the fun-filled day with the children.
Promoting responsible drinking
We believe that efforts to reduce alcohol abuse are most effective when all stakeholders-inclusive of the Government, the community and the industry-work together in addressing common goals.We have fostered a number of partnerships to this end in our quest to reduce alcohol- related harm and promote only the responsible. In addition to establishing industry-wide commitment to responsible trade and alcohol-harm reduction amongst all players, NBL also continued to make
significant investments in alcohol harm-reduction programmes of its own.During the year under review, in taking the notion of responsibility to the next level, NBL launched the Stay Cool, Enjoy Responsibility Campaign to instil a sense of accountability amongst consumers, appealing for moderation as well as consideration of their roles - be the leaders, role models, parents, carers, or employees - while enjoying the benefits that are derived from a society whose members act responsibly. Therefore, while the campaign was born out of need to address alcohol related harm, it also addressed numerous other social issues raised by our stakeholders.
The DRINKiQ training programme was again a key driver in engaging employees of the O&L Group, as well as external stakeholders, on the issue of responsible drinking. During the period under review, more than 800 persons attended the DRINKiQ programme. The participants were not only equipped with the facts about alcohol, they also participated in extensive dialogue to equip them as ambassadors for responsible drinking. To date, more than 2,500 individuals, including opinion leaders, decision makers, community elders, members of law enforcement, and social workers, have attended the DRINKiQ programme.

27
In addressing drinking and driving, which is considered to be one of a number of contributors to road fatalities, we continuously seek ways to address road safety through collaboration with our strategic partners. These include the Namibian Police, the Motor Vehicle Accident Fund, National Road Safety Council of Namibia, the Roads Authority and other stakeholders such as the West Coast Safety Initiative and the Private Sector Road Safety Forum. Togther we raise awareness, increase law enforcement and enhance compliance to the rule of the road. These efforts were also complemented by our Stay Cool, Enjoy Responsibility campaign as well as the DRINKiQ training programme, which also address drunk-driving.
Having been instrumental in the establishment of the Self-regulating Alcohol Industry Forum (SAIF) in 2007, NBL prides itself with the impact SAIF has had over the years in ensuring voluntary compliance by all major liquor industry players, to world class standards in self-regulation, and in leading targeted interventions that address alcohol-related harm. The year under review revealed that the Alcohol Traders Programme (ATP) was yet again one of the SAIF highlights as it provided basic business skills and responsible server training to approximately 320 shebeen owners.

28
Another SAIF highlight was the Underage Drinking Programme in partnership with Physically Active Youth Programme that was launched in June 2014. These programmes engaged young people from disadvantaged communities on the dangers of underage drinking, while introducing them to healthy alternative recreation and equipping them with various life skills. Interviews with the beneficiaries confirmed that through intervention there is marked change in attitude and behaviour, with a greater ability to resist social pressures.
Caring for our environment
NBL embraces its responsibility towards the environment -in and beyond- our operations. As such, in addition to continuously innovating and investing in new technologies and practices to reduce our environmental impact, NBL also supports numerous campaigns to create public awareness of good environmental practices. This has seen NBL sponsoring numerous community awareness and clean-up campaigns such as Project Shine, which has successfully engaged the Erongo community for the past eight years by empowering and educating learners and community groups, which earn revenue through their voluntary clean-up work. NBL’s depots in the northern Namibia continued to assist partners such as the Namibia Wildlife Resorts with transporting paper, glass, plastic and tins from Okaukuejo and Namutoni rest camps to recycling depots in Windhoek.
In 2009, NBL led the establishment of the Recycle Namibia Forum (RNF). The Vision of the RNF is to- “make Namibia the country in Africa that achieves the highest success in promoting the 3R’s of Reducing, Reusing and Recycling”.The RNF sees numerous corporates and non-governmental organisations working together to achieve this audacious vision. Under our chairmanship, the RNF continued to lead various successful initiatives, including the 2014/2015 Schools Recycling Competition, which support the RNF’s vision. Schools participating in this environmental initiative collected an astounding 183 metric tons of recyclables during the year under review.

29

30
OUR ENVIRONMENT
Environmental sustainability includes making decisions and taking action that are in the interests of protecting all our natural resources. It focuses especially on preserving the ability of the environment to support human life for generations to come. Environmental sustainability is one of the foremost topics world-wide, as people are realising the full impact that businesses and individuals have on the environment. Presently, this issue receives highly focused attention in Namibia, from the media and from various Government Offices, Ministries and Agencies. Researchers and environmentalists do not yet fully understand the long- term implications of the various issues at hand, but it is generally agreed that the risk of the depletion of our natural resources, climate change, global warming, pollution, and other impacts of the environment is high enough to merit an immediate response. Nowadays, businesses are expected to lead in the area of environmental sustainability as they are considered to be the biggest contributors, both directly and indirectly to environmental degradation and are in a position to make a significant difference.
NBL acknowledge that, for businesses, environmental sustainability is about making responsible decisions that will reduce the negative impact on the environment. Thus, we are not only concerned about reducing the amount of waste we produce
or our consumption of water and energy: we also attempt to develop processes that will lead the business to become entirely sustainable in the future while reducing and even eliminating any negative environmental impact we have. By following a strategy of environmental sustainability, we are forced to look beyond making short- term gains and consider our long- term impact on the natural world. In respect of brewing beer, therefore, we take the environmental impact of the product’s entire life cycle into account:, from the development to the disposal of the product and its materials.
Furthermore, we include the concept amongst our employees that the state of our environment is influenced by our behaviour, and that we have the opportunity to make a positive impact on the future. In the same vein, preserving the environment also forms an integral part of our values, one of which proclaims– Naturally Namibia, Today for Tomorrow. NBL’s values are our guiding principles, and constitute the cornerstone of our Company’s purpose and vision metric in supporting our long- term goals of 20% Reduction in our Carbon Footprint and Employer of Choice. We at NBL are passionate about living and leading our values, and are deeply committed to the growth and sustainability of our operations in accordance with those values. We also promote the concept of breakthrough thinking with our employees in order to engage them in contributing towards creating new ideas and innovations to
enhance our processes and achieve a world- class, sustainable operation.
Thus, we focus on areas such as water conservation, energy efficiency, waste reduction and carbon emission reduction in order to minimise any negative impact our business has on the environment. In addition to the programmes and tools we have developed to address this environmental impact, we also monitor our progress in respect of mitigating actions taken, and always promote good practice.
“THE EARTH WILL NOT CONTINUE TO OFFER ITS HARVEST, EXCEPT WITH
FAITHFUL STEWARDSHIP. WE CANNOT SAY WE LOVE THE LAND AND THEN TAKE
STEPS TO DESTROY IT FOR USE BY FUTURE GENERATIONS”

31
Environmental Management Systems and Projects
The goal of the NBL’s Environmental Management System is to improve our environmental performance. This means we concentrate on:
• optimisingourwaterconsumption• optimisingourenergyconsumption• recoveringourcarbondioxide• managingourwaste,and• innovating our packaging materials andmethods.
Some of our projects, aimed at both economic and environmental sustainability of the business will continue to receive attention in the coming financial year. These are the following: •Developmentofanautomaticwater-balancing tool•Constructionofanewbiomassboiler•Developmentofanautomated,computerised line- monitoring system for the Packaging Plant via a centralised platform, allowing up-to-date information on more than 100 individual machines, and •Developmentofanewdata-managementsystem for the Packaging Plant, including, dashboards and constantly updated reports on productivity and the consumption of water, electricity and other utilities.
32
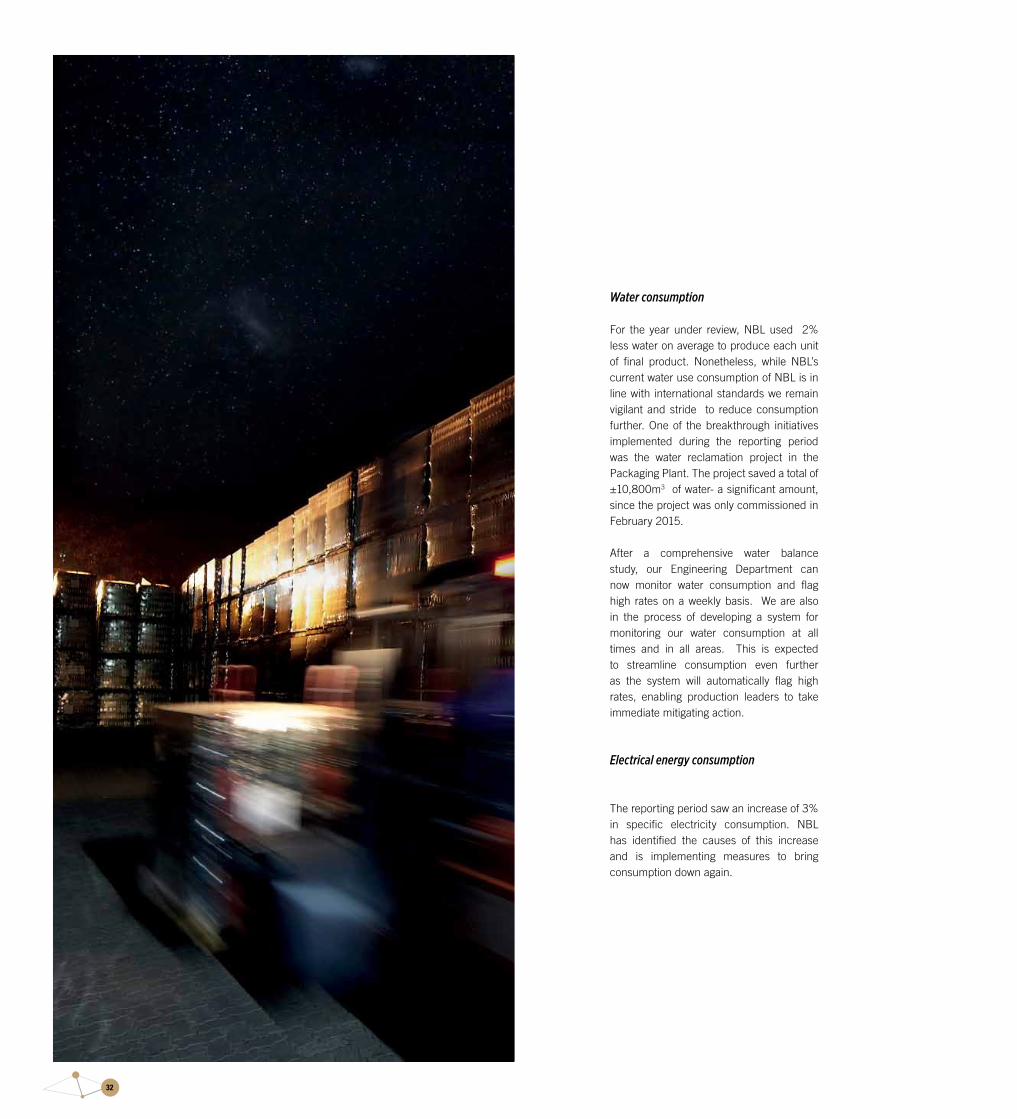
Water consumption
For the year under review, NBL used 2% less water on average to produce each unit of final product. Nonetheless, while NBL’s current water use consumption of NBL is in line with international standards we remain vigilant and stride to reduce consumption further. One of the breakthrough initiatives implemented during the reporting period was the water reclamation project in the Packaging Plant. The project saved a total of ±10,800m3 of water- a significant amount, since the project was only commissioned in February 2015.
After a comprehensive water balance study, our Engineering Department can now monitor water consumption and flag high rates on a weekly basis. We are also in the process of developing a system for monitoring our water consumption at all times and in all areas. This is expected to streamline consumption even further as the system will automatically flag high rates, enabling production leaders to take immediate mitigating action.
Electrical energy consumption
The reporting period saw an increase of 3% in specific electricity consumption. NBL has identified the causes of this increase and is implementing measures to bring consumption down again.

33
On average, the rooftop solar plant provided 9%, of total NBL electricity demand during the reporting year. Overall, the solar plant has provided NBL with approximately 2.7 million kWh of green energy to date, saving 1,950 tons of CO2 emissions. Another measure aimed at curbing electrical energy usage by at least by 3% is the ongoing replacement of conventional lighting with more efficient light-emitting diodes (LEDs). In addition, we have begun installing motion-activated lighting in some production areas such as the Fermentation Cellar in order to further reduce electricity consumption.
Thermal energy consumption
The financial year under review saw further efficiencies in NBL’s thermal energy consumption, which was reduced by 0.5% when compared with the previous financial year. This makes NBL a real industry leader in thermal efficiency, and has resulted in a saving of 17 tons of heavy furnace oil (HFO) compared with the previous year, with an equivalent 53.6- tons reduction in CO2 emissions. The good performance of the previous reporting period was sustained, and will be maintained while we continuously improve.
Our thermal energy consumption will be further enhanced once the new biomass boiler project is complete. The boilers will have fewer energy peaks to cope with due
to two buffer vessels being installed. These will enable the boilers to run more efficiently and thus save energy.
Environmental performance indicators
Environmental management projects
Development of an automatic water- balancing tool
NBL is in the process of developing an automatic water- balancing tool which will be able to-:• checkwaterconsumptionsinrealtime• produce daily, weekly and monthlyconsumption reports and trends, and • flag high consumptions, leakages andfaulty meters immediately.NBL is also in the process of installing new equipment to record the required data for the tool. The principle benefit from this tool is that up-to-date reports will enable managers to react immediately to any leakages or high consumptions.
Construction of a new Biomass Boiler
Construction of the new biomass boiler is in progress. The main objective of the plant is to provide 90% of NBL’s thermal energy requirements, currently being supplied by burning oil. The biomass boilers will greatly reduce NBL’s carbon footprint as it uses wood chips from invader bush.Various environmental studies have shown that Namibia has a big problem with invader bush, so it makes sense to use this energy resource. Not only is using invader bush as a fuel more environmentally friendly than fossil fuels, the agricultural potential of the land is also enhanced by removing such invasive species.
reflects NBL’s environmental performance indicators from 2012 to the current reporting year, along with the benchmarks against which we measure ourselves.
Environmental Parameters at a glance
Water consumption (hl per hl of product)
Total electrical energy consumption( kWh per hl of product)
Thermal energy consumption (MJ per hl of product)
Unit of measure:
hl/hl
KWh/hl
MJ/hl
4.5
68.6 65.2 64.0
8.3
4.9
9.0
4.8
9.2
5.0 0 (Industry average)
77.0 (Global standard)
Benchmarks2012-2013 2013-2014 2014-2015

34
Development of data management systems
A crucial element when it comes to making our business sustainable is measuring and reporting on key parameters, such as water and electricity usage. Up- to-the-minute information is made available from the shop-floor to the Senior Leadership Team, allowing employees on all levels to make informed decisions that could enhance efficiency, save money, conserve already scarce water resources, or reduce the load on an already stressed electrical energy grid. A Company- wide Information Dashboard System has been developed, allowing the entire business- (from Executive level to Middle Management-), to work more efficiently, and in an integrated fashion, to reduce, re-use, and recycle NBL waste and, ultimately make the Company greener, more efficient and, of course, more profitable.
NBL as an HPO: A high-performance organization
A high-performance organisation (HPO) looks at ways of going beyond the ordinary to improve the profitability of every aspect of itself. Known internally as Project Hercules after the legendary Greek hero, testing NBL as an HPO means regarding the performance of each and every Manager, Department and individual as being of profound importance. Thus, our HPO project looks at each activity in the entire brewery from procurement to brewing, to packaging and sales.; We are identifying ways of improving the utilisation of resources in each such process, often by means of small changes. Even a small saving, when repeated many times, has a big influence on an organisation’s bottom line.Sustainability is about making the most of your one’s resources. A business that does this has the opportunity to not only make more profit, but also to minimise its impact on the environment by reducing usage and wastage.An intense study and analysis of all the processes in the brewery during the year resulted in the identification of a total of 201 gaps. A total of 108 gaps were successfully closed and the expected savings realised.
Waste management
Reduction
Apart from reducing water, electricity and thermal energy consumption, NBL also focuses on reducing:• beerlosses• theuseofchemical,and• thewastageofrawmaterials,as these also have an environmental impact once they end up in the effluent stream.
As regards chemicals, the usage per hectolitre of lye-based detergents was reduced by 14% during the year under review in comparison with the 2015 financial year. This brings NBL in line with best practices, without any detriment to our cleaning regimes.Similarly, beer losses were reduced by 26% when measured against the previous financial year’s figures. Beer is an oxygen scavenger, thus reducing the amount of waste beer flowing of drain reduces biological stress on ecosystems that are affected by waste water streams.
Packaging material wastage is also closely monitored. The environmental impact of waste packaging is mitigated as any on-site wastage is immediately collected for recycling. In fact, NBL remains within international standards at an overall on-site production loss of 1.4% for primary packaging.

35
Reuse
Reusing waste water is a top priority at NBL. For example, the Packaging Plant employs a partial water reclamation system, whereby rinse-water is reclaimed for use in other washing processes in the Packaging Hall. Further studies have been done to identify other possible reclamation points; those that are feasible will be considered in greater depth.The caustic soda lye used in cleaning-in-place (CIP) systems is reused until it loses its effectiveness. After that, the lye is pumped into a sedimentation tank where the dirty sediments settle and are removed. The remaining liquid is still usable: it is refreshed with new lye to the correct cleaning concentration, and reused.
Recycling
NBL is a founding and active member of the Recycle Namibia Forum, which vigorously promotes recycling throughout the country. In keeping with this philosophy, an accredited waste contractor removes and sorts waste for recycling at NBL. Much of the waste is already sorted on-site into plastic, glass (colour-sorted where possible), steel, aluminium and paper. Over 80% of all inorganic solid waste produced on-site is recycled in this manner.The waste contractor also provides so-called “File 13” containers for NBL’s offices, where paper waste is collected for recycling.

36
Non-recycled industrial waste
Not everything can be reduced, re-used or recycled. However, with less than 150 g of non-recycled waste generated per hectolitre, NBL is an industry leader when it comes to waste reduction. Over 80% of all inorganic waste produced on- site is recycled. Organic solid waste from production operations, i.e. spent grain and used yeast, are sold as valuable animal feed.
Managing our environmental Impact
Efficient recovery of carbon dioxide emissions
The production of fermented alcoholic products such as beer produces carbon dioxide (CO2) as the main by-product. On its own the CO2 from beer fermentation is considered “carbon neutral”, as it originates from CO2 sequestered on a continuous basis by growing barley, rather than from a fossil fuel. Instead of releasing it to atmosphere, though, a brewery can recover, purify and re-use this CO2, sequestering it as the “fizz” in your favourite beverage.
Our new CO2 recovery plant is operating as expected, making NBL completely independent of external CO2 suppliers. In fact, no CO2 have been purchased since the plant was commissioned in December 2013. NBL produces a number of soft drinks and ready-to drink products which require CO2.NBL is able to produce these beverages without importing CO2 from South Africa, where CO2 is mostly produced through burning fossil fuels.
NBL has sold 400 tons of excess CO2 to external customers during the review period. Moreover, NBL is in the process of becoming an accredited CO2 supplier, which guarantees the quality of the CO2. NBL is one of only a handful of breweries in the southern hemisphere that are self-sufficient with regards to CO2 and that sell their surplus CO2 to external customers.
Reducing the carbon footprint of incoming materials
One of the main contributors to a manufacturer’s carbon footprint is the transport of incoming materials and of outgoing finished product. Thus, every effort is taken to maximise loads and, once the trucks have distributed finished product, to have them return with new packaging material or empty returnable bottles and crates.
NBL canned products utilise aluminium cans. These cans are much lighter, which greatly reduces the fuel usage of both incoming and outgoing trucks. In a country with long routes from manufacturer to consumer, this makes a sizable difference to NBL’s carbon footprint.
Reducing the impact of effluent
Effluent at NBL is collected in large tanks where harmful acids and alkalis neutralise into less harmful salts, and solids are removed. Only then is the effluent released into the City of Windhoek’s effluent stream, thus reducing the impact of these otherwise dangerous chemicals on the environment.
In addition, NBL uses disinfection media such as peracetic acid and hydrogen peroxide, which naturally break down into water and dissolved carbon dioxide, further reducing environmental impact.Initial analyses of NBL’s effluent entering the recently upgraded Ujams Industrial Effluent Treatment Plant in Windhoek shows that NBL is within industry norms for effluent quality.
This technology is well established in European countries and this will be the first plant of its kind in Namibia which will burn wood-chips on a large scale.
Conclusion
Although it is often difficult to find a balance between achieving production targets, driving down costs and minimising or even reversing environmental impact, NBL has made significant steps towards building a production entity that is not only financially sustainable, contributing to national economic growth, but also economically sustainable, protecting the fragile ecosystems that make growth possible. The significant capital expenditure measures demand in the short term, but is more than adequately compensated in the long-term because the solutions benefit everyone.

37

38

39
“IT’S NOT JUST ABOUT CONSUMPTION, IT’S ABOUT POSITIVE ENGAGEMENTS TO LEAVE LASTING IMPRESSIONS”

40
BRANDS AND BEY ND
Our marketing strategy is anchored on the commitment of creating amazing experiences and enduring impact to our consumers. The delivery of this strategy is primarily enabled by a robust process of profiling our consumer groups and really understanding their motivations, needs and aspirations. This deep understanding and oneness with our consumers allow us to create breakthrough marketing solutions and innovations that deliver shared value and sustainable growth.
The financial year under review started off with a new look for the McKane mixer range which was unveiled for the tonic water and soda water variants in a 330 ml slender can. The fresh rebranding is expected to create new found excitement for this high-quality mixer range in the NBL stable.
The period also saw the birth of a new, vibrant and unique look for the world-class Windhoek Draught brand in order to remain current for its consumers. The renovation showcased contemporary and premium packaging, including an embossed bottle with pressure-sensitive labels on the 440-ml non-returnable bottle as well as a trendy black 440-ml can.
In celebration of our national pride and NBL’s commitment to Namibia’s growth as a nation, the Team Namibia product endorsement was rolled out across back labels of the Windhoek Lager, Windhoek Draught and Tafel Lager brands. The Team Namibia logo, featured on NBL products, marks our contribution to the local economy and aims to educate consumers on how they can support the economic and social development of our nation through the single purchase of a local product.
Our commitment to consumer satisfaction motivated the introduction of the 330-ml Windhoek Draught can into the Mozambican market. This follows the preference of consumers for smaller serving sizes of Windhoek Draught in Mozambique, providing customers and consumers alike with more choice in respect of this premium offering.
Staying true to the brand’s brewing credentials and authenticity and in maintaining its rightful place in the premium segment, Windhoek Lager is now also presented as an on-tap offering in selected outlets, as well as a 440-ml can offering to provide choice for consumers who wish to enjoy a premium experience in any social setting.
A uniquely refreshing flavour which offers consumers another exotic alternative to enjoy was introduced by the Vigo brand with the launch of Vigo Kiwano - its third variant in the range to Namibian customers and consumers in non-returnable bottles and cans.
BRANDS
Tafel Lager Records Exceptional Performance in Volume and Brand Equity
Tafel Lager continued to spearhead the growth of NBL volume in the 2014/15 financial year, and remains the biggest mainstream brand in Namibia. It contributes 51% of total beer volume and the strongest equity scores of all brands tested in the F15 Brand Barometer. In addition, the brand’s quality continued to receive endorsement by international judges when it added another DLG Gold Medal to its trophy collection in Germany in 2014.
The year under review also saw Tafel Lager refreshing its National Pride communication platform with the launch of a new TV campaign that celebrates uniquely Namibian moments. The TV advertisement continues to receive rave reviews, and was awarded “Ad of the Week” in South Africa, along with a considerable number of views on YouTube.
To celebrate Namibia’s 25 years of independence, Tafel Lager launched an exciting promotion, awarding its loyal consumers with grand prizes.
Tafel Lager continues to invest in our national soccer team, the Brave Warriors, as their official sponsors. This investment reaped considerable pride when the Tafel Lager Brave Warriors eliminated tough opponents and beat Mozambique in the final to win the prestigious 2015 COSAFA Cup – an international football competition consisting of national teams of member nations of the Council of Southern Africa Football Associations. The brilliant win was a truly magical moment for Namibia, and a great ending to a fantastic year for the brand.
NBL launched the maiden Windhoek Draught communication campaign “For Real” in September 2014. The campaign was developed to create a compelling brand proposition that resonates with the core target consumer and simultaneously solidifies Windhoek Draught’s position in the upper mainstream segment.

41
“NBL REMAINS INVOLVED AND
COMMITTED TO ENSURE THAT OUR
CONSUMERS ARE CONNECTED TO
OUR BRANDS”
The 360° communication campaign focused on different characters within a group of friends, who, whilst having fun, live by the ‘Bro Code’ of being true to themselves and their values – just like Windhoek Draught lives by the Reinheitsgebot of 1516 and is 100% “For Real”.
To create a memorable consumer experience at Namibia’s biggest jazz festival – the Windhoek Jazz Festival - Windhoek Lager introduced a limited-edition can to complement the brand’s premium positioning at the event.
The limited-edition pack was launched in a 440-ml can to provide consumers with a distinctive value proposition that resonates with the target audience and celebrates the brand’s support for experiences that deepen the consumer’s affinity for Windhoek Lager.

42
NBL delivers amazing experiences and enduring impact
By creating amazing and memorable experiences through our sponsorship and events portfolio, NBL remains involved and committed to ensuring that our consumers are connected to our brands. The portfolio covers a wide range of activities, including sporting, cultural and musical events.
Tafel Lager is the proud sponsor of the Brave Warriors National football team that brought the coveted COSAFA cup home to Namibia in 2015 while Windhoek Draught’s sponsorship of the national rugby team was instrumental in helping them qualify for the 2015 Rugby World Cup.
The Windhoek Lager Africa Jacket Golf Championship was praised in the Southern Africa Golf Hall of Fame magazine as being one of the best golf tournaments in Africa.
The two Windhoek Light adventure events, namely the Windhoek Light Namib Quest mountain bike event and the Windhoek Light Fish River Marathon have attracted international participants. All these events have been screened on popular DSTV channels, the largest broadcast network on the continent.
On the music front, Windhoek Draught hosted the very successful music concert by the international Nigerian music duo, P-Square, in Namibia. It attracted over 10,000 excited consumers, customers and fans who were treated to an electric performance which many will remember for years to come. Music events such as these, along with the Hart van Windhoek Festival, the Windhoek Jazz Festival, the Tafel Lager Namrock Festival and the growing annual Oktoberfest, afford the consumer the ideal platform to connect with our brands.

43

44
45
“WHEN INNER EXPECTATIONS MEET YOUR TRUE VALUE, REMUNERATION HAS THE ABILITY TO REWARD, MOTIVATE AND INSPIRE TO KEEP DOING BETTER AND MORE”

46
REP RT REMUNERATION
The Remuneration and Nominations Committee
The Remuneration and Nominations Committee is a formal NBL Board Sub-committee. This report and its recommendations were prepared by the Remuneration and Nominations Committee and approved by the NBL Board.
Composition of the Committee
For the year ended 30 June 2015, the following Non-executive Directors were members of the Committee:
• MrNickBlazquez(Chairman)• MrSjibeHiemstra,and• MrPeterGrüttemeyer.
The Chairman, Managing Director and the Manager for Human Capital are also invited to meetings in an advisory capacity, except when their own remuneration is discussed. From time to time, independent remuneration consultancies are instructed to provide advice on executive remuneration matters to the Committee. The Committee’s responsibilities are set out below and are in its terms of reference, as approved by the Board.
Remuneration
To monitor the Company’s remuneration policy, including policies relating to:
- parameters used in determining senior leadership remuneration scales- Executive remuneration, including remuneration packages for Senior Management- the structure of the remuneration of Executive Directors, Non-executive Directors, the Chairperson and, where applicable, Board Committee members- the design of Executive incentives, inclusive of the Board criteria on which performance-related elements are based with regard to the trading period, if applicable, and- senior employee recruitment, retention and termination.• To ensure that there is a formal,transparent and objective method to recommend to shareholders regarding Director remuneration packages, including pension benefits• To ensure that the fees paid to Non-executive Directors are a fair reflection of the contribution they make to the Company• To advise on, and monitor, a suitableperformance-related formula, inclusive of the Board criteria on which performance-related elements are based with regard to the trading period, if applicable, and• To separate the review andrecommendation of Non-executive fees from the review and recommendation of Executive remuneration, each with its own motivation and basis for the recommendation.
Nominations
To ensure a formal and transparent process for the appointment of new Directors to the Board. In fulfilling this function, the Committee is required to:- assess the necessary and desirable competencies of prospective Board members based on merit and objective criteria. In doing so, candidates from a wide range of backgrounds are to be considered, in keeping with the dynamics and diversity of the country- review Board nominations from shareholders and to provide recommendations to the Board in respect of such nominations- ensure that, on appointment to the Board, Non-executive Directors receive a formal letter of appointment setting out clearly what is expected of them in terms of their time commitment, Committee service (if any), and involvement outside Board meetings- define and implement procedures for the annual statement of disclosure of any conflict of interest and the annual statement of compliance- give full consideration to succession planning in the course of its work, taking into account the challenges and opportunities facing the Company and, therefore, what skills and expertise are needed on the Board in the future

47
“ACHIEVE CLEAR ALIGNMENT BETWEEN
TOTAL REMUNERATION ON THE ONE HAND,
AND DELIVERED BUSINESS AND PERSONAL
PERFORMANCE ON THE OTHER”
- keep under review the structure, size and composition (including the skills, knowledge and experience) of the Board, and make recommendations to the Board with regard to any changes, subject to the provisions of the Company’s Articles of Association and the Companies Act, 2004 (No. 28 of 2004)- consider and, if appropriate, make recommendations to the Board regarding –- the tenure of Non-executive Directors on the Board, and- the reappointment of any Non-executive Director at the conclusion of his or her specified term of office- approve and, if in the interest of the Company, ensure that all employment agreements between the Company and the Directors are limited to three- or five-year periods, if applicable, provided such agreements are renewable, and- action any other duties or responsibilities expressly delegated to the Committee by the Board.

48
Review of the Company’s remuneration policy
NBL has a Remuneration Policy that applies to its Executives. This Policy is geared specifically to supporting its business goals by enabling it to attract, acquire, retain and appropriately reward Executives of the calibre necessary to deliver the required high levels of performance. The Policy is reviewed periodically to take account of changing circumstances in the market, the industry and the economy. The main principles of the Company’s Remuneration Policy for Executives are to:• provide total remuneration which iscompetitive in structure and quantum with comparator companies’ practices within the Southern African Development Community (SADC) Region• achieve clear alignment between totalremuneration on the one hand, and delivered business and personal performance on the other• linkvariableelementsofremunerationtothe achievement of challenging performance criteria that are consistent with the best interest of the Company• provide an appropriate balance of fixedand variable remuneration, and• provideinternalequityamongExecutivesand facilitate the movement of Executives within the O&L Group.
Directors’ Emoluments
The Director’s emoluments are available on p 116 of the Annual Report.
REMUNERATION COMPONENTS
Base Salary
The fixed element of remuneration is referred to as base salary. Its purpose is to provide a competitive level of remuneration for each grade of manager. The base salary is set to be competitive at the median level, with reference to market practice in companies that are comparable in terms of size, market sector, business complexity and international scope.
The fixed element of remuneration is referred to as base salary. Its purpose is to provide a competitive level of remuneration for each grade of manager. The base salary is subject to annual review. It is set to be competitive at the median level, with reference to market practice in companies that are comparable in terms of size, market sector, business complexity and international scope.
Base salaries are reviewed annually and adjusted as necessary at the beginning of the financial year, taking into account external market trends, and business and personal performance.
Benefits
Benefits provide security for employees and their families and include membership of a retirement fund and a medical aid scheme to which contributions are made. The retirement fund is a defined contribution fund.
Short-Term incentive Scheme
Executive Directors and the rest of the Senior Leadership Team participate in an annual Short-term Incentive Scheme. The Scheme is a cash bonus plan designed to support the overall Remuneration Policy by:• motivating participants to focus onachieving financial year performance goals which contribute to sustainable shareholder value, and • providing significant bonus differentialsbased on performance against predetermined Company financial targets, as well as strategic and divisional or personal performance objectives.
Executive Directors and members of the Senior Leadership Team may earn a bonus of up to 41.67% of their total annual package. The Senior Leadership Team’s functional targets are based on their respective critical success factors, and include both financial and non-financial targets. Financial targets comprise 50% of the Scheme’s bonus potential, while strategic and divisional/personal targets, including leadership competency assessments, make up the remaining 50%.
The Remuneration Committee reviews the performance of Executive Directors and the Senior Leadership Team every year. The Committee also approves individual performance against relevant targets and objectives once a year.

49

50

51
“SUCCESS LIES IN HAVING THE RIGHT PEOPLE TO OVERSEE A COMPANY’S GREATER GOAL AND MANAGE THE MOST IMPORTANT COMPONENTS WITH TRANSPARENCY AND PURPOSE”

52
C RP RATE G VERNANCE
Good corporate governance is fundamental to the success of any organisation and NBL is no exception to this rule.The NBL Board of Directors is committed to the highest standards of corporate governance. To this end, the Board has put processes in place to ensure that NBL continuously strives to meet Namibia and international best practice in corporate governance. The following report outlines the way the Directors control and govern the Company.
The board of directors
Compliance
NBL is subject to all applicable Namibian legislation as well as the listing requirements of the Namibian Stock Exchange (NSX). The NSX requires NBL to comply with the Corporate Governance Code for Namibia (NamCode) which is based on the principles of South Africa’s 2009 King Report on Corporate Governance (King III) recommendations as well as Namibian legislation. The NBL Board believes that, while best recommended practice is being applied, further enhancements will be made over time in line with its objective to continuously improve corporate governance. In addition, all members of the Board have a fiduciary responsibility to represent the best interests of NBL and all of its stakeholders.
The Remuneration and Nominations Committee’s main responsibilities as set out in the committees Terms and References as approved by the Board amongst others, is to monitor the Company’s remuneration policy and to ensure a formal and transparent process for the appointment of new Directors to the Board. The Committee also has to ensure the careful selection of individual directors, to ensure the most appropriate combination of expertise, knowledge and experience, underpins the effectiveness of the board in fulfilling its role to benefit NBL. The Remuneration and Nominations committee has the duty to ensure that succession planning is implemented and monitored regularly.
The Board’s Remuneration and Nominations Committee’s main responsibilities, as set out in the Committee’s terms and references as approved by the Board, is, among other things, to- • monitor the Company’s RemunerationPolicy • ensureaformalandtransparentprocessfor the appointment of new Directors to the Board. • ensurethecarefulselectionof individualDirectors, • ensurethemostappropriatecombinationof expertise, knowledge and experience, underpins the effectiveness of the Board in fulfilling its role to benefit NBL, and• ensure that succession planning isimplemented and monitored regularly.
King III and the NamCode recommend that the majority of Directors be independent. In this regard, the NBL Board continues to depart from the recommendations in respect of the number of independent Directors serving on NBL’s statutory committees. NBL Directors, including the chairman to the board, continue to be appointed based on their experience, competency, leadership skills and strong business ethics, and it is these attributes that are regarded as the main criteria for appointment.

53
“NBL DIRECTORS ARE APPOINTED BASED
ON THEIR EXPERIENCE, COMPETENCY,
LEADERSHIP SKILLS AND STRONG
BUSINESS ETHICS, AND IT IS THESE
ATTRIBUTES THAT ARE REGARDED AS THE
MAIN CRITERIA FOR APPOINTMENT.”
The Board currently consists of 2 Executive Directors and 10 Non-executive Directors, with 3 Alternate Directors. There were no resignations or appointments among the current incumbents during the year under review.
The NBL Board of Directors’ governance philosophy entails keeping the responsibilities of the Chairman’s and the Chief Executive Officer’s separate, as recommended by King III and the NamCode.

54
The various established Board Committees are set out below.
Board of Directors
During the reporting year, three Board meetings were held. Attendance was as set out in Table 1:
NBL’s Board of Directors’ key purpose is to ensure the Company’s prosperity by collectively directing its affairs, whilst meeting the appropriate interests of its shareholders and stakeholders. In addition to business and financial issues, the Board deals with challenges and issues relating to corporate governance, corporate social responsibility and corporate ethics. A Senior Leadership Team is charged with implementing the Company’s strategies and objectives.
This Team is also responsible for ensuring that internal controls are in place and function effectively in order for the Company to operate and to mitigate risk to such operation. The Board holds the Senior Leadership Team accountable for their activities, which are monitored and controlled through regular reports and performance measurements.
Established procedures requires all Directors to inform the Board timeously of any actual or potential conflicts of interest they may have in relation to particular items of the business. Directors are obliged to recuse themselves from discussions or decisions on matters in which they have a conflict of interest. In general, Directors are required to avoid any direct or indirect interest that conflicts or may conflict with the Company’s interest.
Mr Sven Thieme was re-elected as the Chairman of the Board at the prior year’s Annual General Meeting held on 27 November 2014, and therefore continued to serve as a non-executive Director, with Messrs Hendrik (Wessie) van der Westhuizen and Graeme Mouton being the two Executive Directors required for its proper constitution. At the Annual General Meeting held on 27 November 2014, these three Directors resigned from the Board, but made themselves available to be re-elected for the next term. All Directors were re-elected by majority vote.
Committees
The Board of Directors is responsible for NBL’s performance and affairs. In order to assist it with properly discharging its duties,. the Board delegates certain functions to the various Board Committees and to the Senior Leadership Team. Each such Board Committee acts within agreed, written terms of reference. The minutes of Board Committee meetings are provided to the Board.
In discharging their responsibilities, under appropriate circumstances all Directors are entitled to seek independent advice at Company expense.
The Company Secretary is responsible for verifying that all Board Committees comply with statutory, regulatory, NSX listing and best practice requirements. Directors have access to the Company Secretary at all times.
The various established Board Committees are set out below.
Audit Committee
During the year under review, the Audit Committee comprise four Directors,. Messrs Hans-Bruno (Habo) Gerdes (Chairman), Peter Grüttemeyer (the O&L’s Group’s Chief Executive Officer), Mr Martin Kromat (Brandhouse), and Didier Leleu (Heineken). All are non-executive Directors.
The NBL Audit committee continues to depart from the recommendations in respect of the number of independent Directors serving on the committee. The Audit committee members, including the chairman, are appointed based on their experience, competency, leadership skills and strong business ethics, and it is these attributes that are regarded as the main criteria for appointment.
The Committee’s terms and reference, as set out in an Audit Committee Charter approved by the Board is to review the Company’s financial statements, the appropriateness of the Company’s accounting and disclosurepolicies, compliance with International Financial Reporting Standards, and the effectiveness of internal controls.
Board memBers20 august 2014
26 NovemBer 2014
5 march 2015
N Blazquez ° ° •
e ender ° • •
hB gerdes • • •
P grüttemeyer • • •
s hiemstra • ° •
m Kromat ° ° °d Leleu ° ° °cL List ° • •
Lv mcLeod-Katjirua ° • °s thieme (chairman) • • •
L van den Borght ° ° °h van der Westhuizen • • •
J milliken • • •
P Jenkins ° • °g mouton • • •
• Presento apology
Attendance at Board meetings, 2014/15

55
The Company’s external and internal auditors, the O&L Group’s Managing Director, Group Finance Director and the Managing Director attend Audit Committee meetings by invitation. The Committee invites other members of NBL Senior Leadership Team as required. The auditors, both internal and external, attended all Audit Committee meetings during the year under review.
memBer1 august 2014
18 NovemBer 2014
23 FeBruary 2015
hB gerdes (chairman) • • •
P grüttemeyer • ° •
m Kromat • • °d Leleu ° ° °
• Presento apology
The Audit Committee roles include:
• assisting the Board to discharge its responsibilityto-:- safeguard NBL’s assets,- operate adequate and effective systems of internal control, financial risk management and governance- reviewing financial information and shareholder reporting- monitor compliance with laws and regulations- provide oversight of the external and internal audit functions and appointments• monitoringtheintegrityoffinancialstatementsandmaking recommendations to the Board• ensuringintegratedreportingtakesplace• reviewingandmonitoringtheinternalauditplan• reviewing internal and external audit reports andmonitoring that corrective actions are performed• providing a communication channel between theBoard, the internal and external auditors and other assurance providers• assisting the Board, in conjunction with the RiskCommittee, to monitor the effectiveness of the risk management process, including fraud and corruption, information –technology- related items, and compliance with risk standards adopted by the O&L Group, and• reviewingNBL’spoliciesandpracticesconcerningbusiness conduct and ethics, including whistle- blowing reports received via the Tip offs anonymous hotline.

56
Remuneration and Nominations Committee
The Remuneration and Nominations Committee’s main responsibilities as set out in its Board-approved terms of reference includes monitoring the appropriateness of the Company’s Remuneration Policy and ensuring a formal and transparent process exist in respect of appointmenting new Directors to the Board. The Committee is chaired by Mr Nick Blazquez, a Non-executive Director. Other members of this committee are Messrs Peter Grüttemeyer (the O&L’s Group’s Chief Executive Officer) and Sijbe Hiemstra (Heineken), also Non-executive Directors,
Remuneration and Nominations Committee meeting attendance is detailed in Table 3.:
Risk Committee
The Committee has an independent and advisory role with accountability to the Audit Committee. The purpose of the Risk Committee is to assist the Board of Directors to fulfil its corporate governance responsibilities relating to the governance of risk.; the assessment and review of credit, market, fiduciary, liquidity, reputational, operational, fraud, strategic, technology, data-security, and business-continuity risks; and monitoring the overall risk profile.
The Directors who serve on the Risk Committee are ultimately responsible for the Company’s risk management system. The system is designed to manage risk rather than to eliminate it. On a monthly basis, risks are identified, assessed and discussed within the different business functions. These risks are closely managed, monitored and mitigated. Reports on the top key risks, along with their respective mitigation plans,are delivered at each Board meeting as well as at Audit Committee meetings and monthly business review meetings.
As stated earlier, the Risk Committee reports to the Audit Committee. The minutes of this Committee are made available to and discussed at Audit Committee meetings as well.
Risk Committee MembersH van der Westhuizen (Chairperson)G MoutonNBL Senior Leadership TeamO&L Group Risk Manager
Four Risk Committee meetings were held during the year under review, as set out in Table 4.
Internal Controls NBL’s internal controls are designed and operated to support the identification, evaluation and management of risks affecting the Company, as well as the business environment in which it operates. Internal control systems are in place to provide the Senior Management Team and the Board with reasonable assurance as to the integrity and reliability of the financial statements.
Testing whether the business complies with internal control procedures and policies is achieved by continuous Management reviews, a review of internal financial controls, and a review of external parties providing internal audits.
Experienced and qualified employees are appointed as control champions throughout the business functions in order to review and evaluate financial as well as technical controls.
memBer1 august 2014
N Blazquez (chairman) °P grüttemeyer •
s hiemstra •
• Presento apology
Table 3: Attendance at Remuneration and Nominations Committee meetings, 2014/15
memBer9 JuLy 2014 15 octoBer
20144 FeBruary 2015
11 may 2015
h van der Westhuizen • • • •
g mouton • • • °t makari • • • •
r shippiki • • ° •
d Welman • ° • •
h hermann • • • •
g tredoux ° • ° •
a du Plooy ° ° • •
s ashipala • • • °t hochreiter • • • •
a goosen • • • •
• Presento apology

57
Any deficiencies are recorded, monitored regularly, and reported to the Senior Leadership Team. This has proven to be a very successful approach in respect to critically evaluating and improving internal control policies and procedures. The internal audit function was outsourced to the auditing firm Ernst & Young. The internal audit programme is founded on a three-year risk-based approach. The internal audit plan is approved by the Audit Committee and regularly reviewed by the Risk and Compliance Department.
During the reporting year, the following internal audits were performed:
• Procurement• SalesandRevenue• Treasury,and• WarehouseandDistribution
Medium risk findings were reported and resolved. All findings and recommendations are recorded on an audit tracker and closely monitored by the Senior Leadership Team. The Risk and Compliance Department is responsible for ensuring that corrective actions are taken and recommendations implemented.
Ernst & Young also performs internal follow- up audits and reports independently to the Audit Committee and then to the Senior Management Team on the findings and recommendations it identifies. Both the internal and external auditors have unlimited access to the Chairperson of the Audit Committee.
There is a strong drive within NBL to uphold the highest technical and operational standards. Fire and safety policies and procedures are regularly reviewed and tested so that they continue to be compliant with the highest standards. Each Manager within his/her function is evaluated constantly on the health and safety ratings achieved during these audits. By strictly following this programme, NBL has managed to improve its health and safety standards not only for staff, but also with respect to contractors, suppliers and other providers of service to NBL.
For the past three financial years, an annual insurance audit has been performed by Alexander Forbes Insurers. The main plant is audited on a yearly basis, while depots are audited on a rotational basis. During the reporting year, the Oshakati and Swakopmund depots were audited. NBL received a three- star rating (81%) by Alexander Forbes Insurance in respect of its overall compliance with local and international insurance standard.
Stakeholder Communications, Ethics and the Tip-Offs Anonymous Hotline
NBL Board is aware of the importance of communicating the company’s activities to all stakeholders in a balanced and comprehensive manner, and strives to clearly present any matters material to a proper appreciation of NBL’s position. Each key stakeholder group therefore has a business owner who is the individual in NBL primarily accountable for managing the relationship and regularly engaging with the stakeholder or stakeholder group concerned
Other stakeholder communications are affected via analyst presentations where NBLs announces its interim and final financial results.) The Company also publishes and reports on details of its performance (including its interim and final financial results) in two local daily newspapers. Other Company notices and publications occur, on its website, www.nambrew.com. where its most recent financial and historical information is available, including its annual reports.
The Audit Committee is responsible for embedding a culture of high ethical standards. To this end, the Committee periodically reviews the Company’s Code of Ethics and the Company’s programme to monitor compliance therewith
Employees have several means to them available to raise their concerns and make recommendations or obtain feedback from the Senior Leadership Teams. Once such avenue is the workplace forum within the different functions, which is held on a weekly or fortnightly basis. At these forums, members of staff have the opportunity to discuss matters of concern to them. If an employee is not comfortable with airing his or her views at these forums, they can contact the Tip-offs Anonymous hotline. The hotline is administrated by an independent service provider, Deloitte. These initiatives are supported by communication of our core value We do the right things right.
NBL invites all shareholders to attend its annual general meeting and also facilitates participation by way of focused proxy solicitation.

58

59
“RESULTS DO NOT COME FROM MAKING MONEY, IT’S WHEN AN EFFECTIVE TEAM DRIVES TOWARDS A VISION WITH GREAT AFFINITY. THERE’S POWER IN RESULTS MADE FROM THIS”

60
FINANCIAL STATEMENTS
30 June 2015N$ 000’s
30 June 2014 N$ 000’s
%Change
Revenue 2 434 177 2 316 932 5.1
Profit attributable to ordinary shareholders 258 982 205 529 26.0
Earnings per share (cents) 125.4 99.5 26.0
Headline earnings per ordinary share (cents) 187.1 159.1 17.6
Dividends declared per ordinary share (cents) 71.0 65.0 9.2
Net asset value per ordinary share (cents) 505.5 451.1 12.1
Return on ordinary shareholders' funds (%) 26.2 22.9 14.5
GROUP SALIENT FEATURES

61
Notes30 June 2015
N$ 000’s30 June 2014
N$ 000’s
WEALTH CREATEDRevenue 2 434 177 2 316 932
Paid to suppliers for materials and services (1 927 663) (1 462 815)
VALUE ADDED 506 514 854 117
Income from investments 22 000 12 338
TOTAL WEALTH CREATED 528 514 866 455
WEALTH DISTRIBUTIONSalaries, wages and other employment costs 1 268 714 231 702
Providers of capital
Dividends to shareholders 146 636 134 244
Finance costs on borrowings 8 847 14 932
Central and local governments 2 135 869 91 020
Reinvested in Group to maintain and develop operations
Amortisation 3 745 4 395
Depreciation 112 817 103 826
Retained earnings 112 346 71 285
Deferred taxation 2 057 32 831
TOTAL WEALTH DISTRIBUTED 791 031 684 235
NOTES TO THE VALUE ADDED STATEMENT1. Salaries, wages and other employment costs
Salaries, wages, overtime payments, commissions,
bonuses and allowances 242 951 194 495
Total contributions to medical aid and pension fund 25 763 37 207
268 714 231 702
2. Central and local governments
Normal corporate taxation 134 035 90 036
Rates and taxes paid on properties 1 834 984
135 869 91 020
3. Additional amounts collected on behalf of central and
local governments
Customs and excise duties including import surcharges 605 367 557 749
Value added tax collected on revenue 73 927 258 591
PAYE deducted from remuneration paid 32 983 37 006
Witholding taxes 7 531 10 764
719 808 864 110
Number of employees 786 740
GROUP VALUE ADDED STATEMENT

62
N$ 000’s 30 June 2015 30 June 2014 30 June 2013 30 June 2012 30 June 2011
CONSOLIDATED STATEMENTS OF FINANCIAL POSITIONProperty, plant and equipment 871 133 874 932 827 683 799 762 668 574
Investment in joint venture 28 325 0 13 635 118 071 121 359
Non-current assets held for sale 4 500 5 925 0 0 0
Other non-current assets 16 762 11 508 12 258 6 450 17 479
Current assets 816 429 648 834 860 598 748 238 599 310
Total Assets 1 737 149 1 541 199 1 714 174 1 672 521 1 406 722
Issued capital 1 024 1 024 1 024 1 024 1 024
Foreign currency translation reserve (3) (126) 0 0 0
Retained income 1 043 078 930 732 859 447 906 289 790 680
Ordinary shareholders' equity 1 044 099 931 630 860 471 907 313 791 704
Interest-bearing loans and borrowings (non-current) 13 821 8 786 9 231 265 693 185 268
Other non-current liabilities 207 274 203 634 171 702 143 458 124 825
Current liabilities 471 955 397 149 672 770 356 057 304 925
Total equity and liabilities 1 737 149 1 541 199 1 714 174 1 672 521 1 406 722
CONSOLIDATED STATEMENTS OF COMPREHENSIVE INCOMETurnover 2 434 177 2 316 932 2 383 384 2 160 067 1 797 071
Operating expenses (1 927 663) (1 865 601) (1 883 295) (1 731 052) (1 421 757)
Operating profit 506 514 451 331 500 089 429 015 375 314
Finance costs (8 847) (14 932) (23 648) (23 233) (14 281)
Finance income 22 000 12 338 20 392 22 346 21 155
Equity loss from joint venture (on-going operations) (124 593) (120 341) (109 002) (92 147) (74 867)
Equity loss from joint venture (deferred tax asset write down) 0 0 (188 089) 0 0
Profit before income tax 395 074 328 396 199 742 335 981 307 321
Income tax expense (136 092) (122 867) (126 797) (114 027) (96 034)
Profit attributable to ordinary shareholders 258 982 205 529 72 945 221 954 211 287
CONSOLIDATED STATEMENTS OF CASH FLOWSCash generated by operations 736 481 502 637 706 776 363 084 401 347
Dividends paid (146 636) (134 244) (119 787) (106 345) (97 117)
Taxation paid (123 516) (102 521) (105 696) (109 442) (81 061)
Net cash flow from operating activities 466 329 265 872 481 293 147 297 223 169
Net cash flow applied to investing activities (253 872) (258 937) (287 402) (204 537) (324 626)
Net cash flow from financing activities (4 179) (218 795) (17 989) 57 488 16 085
Net (decrease) / increase in cash and cash equivalents 208 278 (211 860) 175 902 248 (85 372)
FIVE-YEAR SUMMARY OF RESULTS

63
30 June 2015 30 June 2014 30 June 2013 30 June 2012 30 June 2011
ORDINARY SHARE PERFORMANCEWeighted average number of shares in issue (000's) 206 529 206 529 206 529 206 529 206 529
Earnings per ordinary share (cents) 125.4 99.5 35.3 107.5 102.3
Headline earnings per ordinary share (cents) 187.1 159.1 177.8 149.5 139.8
Dividends paid per ordinary share (cents) 71.0 65.0 58.0 51.5 47.0
Dividend cover (times) 1.8 1.5 0.6 2.1 2.2
Net asset value per ordinary share (cents) 505.5 451.1 416.6 439.3 383.3
PROFITABILITY AND ASSET MANAGEMENTOperating margin (%) 20.8 19.5 21.0 19.9 20.9
Return on total assets (%) 32.6 28.6 32.0 31.8 33.9
Return on ordinary shareholders' funds (%) 26.2 22.9 8.3 26.1 28.8
LIQUIDITY AND LEVERAGETotal liabilities to total shareholders' funds (%) 48.5 45.5 81.5 70.3 63.9
Financial gearing ratio (%) 11.4 12.3 32.0 29.8 23.9
Interest cover 59.7 31.1 22.0 19.4 27.8
Current ratio 1.7 1.6 1.3 2.1 2.0
DEFINITIONS
Dividend cover: Profit attributable to ordinary shareholders divided by dividends paid in the year. Net asset value per share: Ordinary shareholders' equity divided by the total number of ordinary shares in issue.Operating margin: Operating profit expressed as a percentage of revenue. Total assets: Property, plant and equipment, current and non-current assets.Return on total assets: Operating profit plus finance income expressed as a percentage of average total assets (excluding investment in joint venture).Return on ordinary shareholders' funds: Profit attributable to ordinary shareholders expressed as a percentage of average ordinary shareholders' equity.Total liabilities: Interest-bearing loans and borrowings other current and non-current liabilities. Deferred taxation and income is excluded.Financial gearing ratio (%): Interest-bearing loans and borrowings expressed as a percentage of ordinary shareholders' equity.Interest cover: Operating profit plus finance income divided by finance costs. Current ratio: Current assets divided by current liabilities.
SUMMARY OF STATISTICS

64
Number ofShareholders %
Number ofShares %
HOLDINGS1 - 99 21 1.54 1 024 0.00
100 - 499 411 30.18 97 873 0.05
500 - 999 226 16.59 137 132 0.07
1 000 - 1 999 295 21.66 346 305 0.17
2 000 - 2 999 143 10.50 315 246 0.15
3 000 - 3 999 26 1.91 87 167 0.04
4 000 - 4 999 20 1.47 84 886 0.04
5 000 - 9 999 103 7.56 620 507 0.30
10 000 shares and above 117 8.59 204 838 860 99.18
1 362 100.00 206 529 000 100.00
CATEGORYCorporate bodies 32 2.35 123 528 084 59.81
Nominee companies 42 3.08 74 812 730 36.22
Private individuals 1 263 92.73 6 976 537 3.38
Trusts 25 1.84 1 211 649 0.59
1 362 100.00 206 529 000 100.00
SHAREHOLDER SPREAD
The spread of shares held by non-public and public shareholders was as follows: at 30 June
2015 %
at 30 June2014
%
Non - public shareholders
- holding company 52.6 52.6
- directors and their associates and trustees of the Company's share purchase trust 0.1 0.2
Public shareholders 47.3 47.2
100.0 100.0
MAJOR INDIVIDUAL HOLDINGSWith the exception of nominee holdings, the register of members does not reflect individual beneficial shareholdings at 30 June 2015 in excess of 1% of the total issued capital of the Company.
ORDINARY SHARE OF OWNERSHIP

65
Accounting policiesNBL’s accounting policies comply with International Financial Reporting Standards and are consistent with those of the previous reporting year.
RevenueConsolidated revenue increased by 5% from N$2,317 million to N$2,434 million for the year ended 30 June 2015. The increase in revenue is primarily driven by the performance in the local market.
Operating profitThe Group’s operating profit for the year ended 30 June 2015 showed an increase of 12% over the previous reporting period. This translates into an operating margin of 21% compared with 20% registered for the previous financial year.
TaxationThe taxation charge for the year ended 30 June 2015 was N$136 million, while the previous reporting period reflected a slightly lower charge of N$123 million. The accumulated tax losses of the Group’s wholly owned South African subsidiary have not been recognised, due to uncertainty regarding future taxable income.
Profit after tax and earnings per share Profit attributable to shareholders increased from N$206 million in the previous financial year to N$259 million in the year under review. This represents an upsurge of 26%, resulting in the earnings per share for the year ended 30 June 2015 increasing to 125.4 cents (2014: 99.5 cents).
Financial positionThe net debt to equity ratio, which decreased from 6% in the previous financial year to -14% in the year under review, leaving sufficient headroom for the financing of the Group’s expected investments in the 2016 financial year.
Namibian marketThe Namibian market continues to remain a significant contributor to total revenues and earnings, with Tafel Lager spear-heading the overall beer growth. Sales in the ready-to-drink category decreased compared with the prior year, however the soft drink category continued its double-digit growth.
South AfricaThe South African joint venture, DHN Drinks (Proprietary) Limited, delivered an increase in its overall volumes. Its operating loss increased during the period under review when compared with the prior year. However, taking royalties and production margins into account, we continued to make positive returns from the operations of our South African business. Nonetheless, the loss from continuing operations recorded from DHN Drinks (Pty) was N$125 million, which is N$4 million higher than the previous financial year.
Exports (excluding South Africa)Total beer volumes sold to export markets declined in comparison with the prior reporting year, and no ready-to-drink volumes were sold to these markets. Although Tanzania saw good growth, sales in Botswana, Mozambique and Zambia decreased. Alcohol levies in Botswana and Zambia continue to put pressure on volumes there.
Cash flowsNet cash flow from operating activities increased from N$266 million in the previous financial year to N$466 million (per SOCF) in 2014/15, despite increased in dividend payments. The increase cash flow was mainly due to more efficient working capital management and less sales to South Africa. Net cash outflow from investing activities decreased from N$259 million in the previous year to N$254 million in the 2014/15 financial year, due to a decrease in capital expenditure. Net cash flow from financing activities decreased from a net outflow of N$219 million in the previous financial year to N$4 million in 2014/15. The upsurge was mainly due to the medium-term loan repayment in the prior year. (See Annexure A to this Annual Report)
FINANCIAL REVIEW

66
Directors’ responsibility statement The Company’s Directors are responsible for the preparation and fair presentation of the consolidated and separate financial statements, comprising the statements of financial position as at 30 June 2015, and the statements of comprehensive income, the statements of changes in equity, and cash flow statements for the year then ended, as well as the notes to the financial statements, which include a summary of significant accounting policies and other explanatory notes, in accordance with International Financial Reporting Standards and in terms of Namibia’s Companies Act.
The Directors’ responsibility includes designing, implementing and maintaining internal control relevant to the preparation and fair presentation of these financial statements that are free from material misstatement, whether due to fraud or error; selecting and applying appropriate accounting policies; and making accounting estimates that are reasonable in the circumstances. The Directors’ responsibility also includes maintaining adequate accounting records and an effective system of risk management.
After due assessment of the Group and Company’s ability to continue as a going concern, the Directors believe there is no reason for the business not to continue as such going concern in the financial year ahead.
The external auditor is responsible for reporting on whether the consolidated and separate annual financial statements are fairly presented in accordance with International Financial Reporting Standards and the Companies Act. Their unmodified report is available on p67.
Approval of consolidated and separate financial statements
The consolidated and separate financial statements of the Group and Company, as indicated above, were approved by the Board of Directors on 9 October 2015 and signed on their behalf by
APPROVAL OFFINANCIAL STATEMENTS
S ThiemeChairman
H van der Westhuizen Managing Director
67
To the members of Namibia Breweries LimitedWe have audited the consolidated and separate annual financial statements of Namibia Breweries Limited, set out on pages 68 to 116 which comprise the statements of financial position as at 30 June 2015, statements of comprehensive income, statements of changes in equity and the statements of cash flows for the year then ended, a summary of significant accounting policies and other explanatory notes and the report of the directors.
Directors’ Responsibility for the Financial StatementsThe company’s directors are responsible for the preparation and fair presentation of these consolidated and separate financial statements in accordance with International Financial Reporting Standards, and in the manner required by the Companies Act in Namibia and for such internal control as the directors determine is necessary to enable the preparation of consolidated and separate financial statements that are free from material misstatement, whether due to fraud or error.
Auditor’s ResponsibilityOur responsibility is to express an opinion on these consolidated and separate financial statements based on our audit. We conducted our audit in accordance with International Standards on Auditing. Those standards require that we comply with ethical requirements and plan and perform the audit to obtain reasonable assurance about whether the financial statements are free of material misstatement. An audit involves performing procedures to obtain audit evidence about the amounts and disclosures in the financial statements. The procedures selected depend on the auditor’s judgement, including the assessment of the risks of material misstatement of the financial statements, whether due to fraud or error. In making those risk assessments, the auditor considers internal control relevant to the entity’s preparation and fair presentation of the financial statements in order to design audit procedures that are appropriate in the circumstances, but not for the purpose of expressing an opinion on the effectiveness of the entity’s internal control. An audit also includes evaluating the appropriateness of accounting principles used and reasonableness of accounting estimates made by the directors, as well as evaluating the overall financial statements presentation.
We believe that the audit evidence we have obtained is sufficient and appropriate to provide a basis for our audit opinion.
OpinionIn our opinion, the consolidated and separate financial statements present fairly, in all material respects, the consolidated and separate financial position of Namibia Breweries Limited as at 30 June 2015 and of its consolidated and separate financial performance and consolidated and separate cash flows for the year then ended in accordance with International Financial Reporting Standards, and in the manner required by the Companies Act in Namibia.
Deloitte & ToucheRegistered Accountants and AuditorsChartered Accountants (Namibia)
J CronjéPartnerWindhoek9 October 2015
Deloitte BuildingMaerua Mall ComplexPO Box 47Jan Jonker RoadWindhoek Namibia
ICAN practice number: 9407
Regional Executives: LL Bam (Chief Executive), A Swiegers (Chief Operating Officer), GM Pinnock
Resident Partners: E Tjipuka (Managing Partner),RH McDonald, A Matenda, H de Bruin, J Cronjé, A Akayombokwa
Director: G Brand
INDEPENDENT AUDITOR’S REPORT

68
Founded in 1920, NBL is principally engaged in the brewing and distribution of beer and is also active in the manufacturing of soft drinks.
Accounting policies NBL’s accounting policies comply with International Financial Reporting Standards and are consistent with those of the previous financial year.
Financial resultsThe Group’s operating profit for the year ended 30 June 2015 showed an increase of 12% over the previous financial year. This translates into an operating margin of 21%.
Dividends paidDetails of the ordinary dividends declared, paid and payable in respect of the 2014/15 financial year are reflected in note 26 to the financial statements. Total dividend paid for the year amounted to 71 cents per share.
Dividend declarationIn addition to the interim dividend of 34 cents per ordinary share paid in May 2015, the Board of Directors declared a final dividend of 37 cents per ordinary share, at its meeting of 8 September 2015. Payment will be effected to the shareholders of ordinary shares in the books of the Company registered at the close of business on 23 October 2015 and will be paid on 13 November 2015.
Capital expenditureCapital expenditure for the reporting year amounted to N$115.1 million (2014: N$184.1 million).
Issued capitalFull details of the authorised and issued capital of the Company as at 30 June 2015 are set out in note 13 to the financial statements. The 92,471,000 unissued shares of the Company are under the control of the Directors in terms of a members’ resolution dated 27 November 2014. In terms of the Companies Act, this authority expires at the forthcoming Annual General Meeting, at which point the members will accordingly be asked to extend this said authority until the Annual General Meeting to be held on 3 December 2015.
Directorate and secretaryThe names of the Directors as well as the name and address of the Company’s Secretary appear on page 8 herein.
SubsidiariesDetails of the Company’s subsidiaries are set out in Annexure C of this report.
Holding companyThe Company’s holding company is Namibia Breweries Investment Holdings Limited, of which the shareholding is held by Ohlthaver & List Finance and Trading Corporation Limited, Heineken International BV (“Heineken”) and Diageo Plc (“Diageo”). The Company’s ultimate holding company is the List Trust Company (Proprietary) Limited.
Events subsequent to reporting dateOn 27 July 2015, Namibia Breweries Limited entered into an agreement to acquire 25% of the issued share capital of Sedibeng Brewing (Pty) Ltd and an additional 9.5% of the issued share capital of DHN Drinks (Pty) Ltd from Diageo Highlands Holdings B.V. The total estimated investment required is N$610 million, which will be financed out of operations and by way of a medium term loan.
The transaction is a non-adjusting subsequent event, having been confirmed after the financial year end, but before the financial statements were authorised for issue. The resulting effects have not been adjusted in the figures presented. As part of the financing agreement, inventories, trade receivables and property, plant and equipment may be encumbered.
The directors are not aware of any other significant events subsequent to the reporting date, other than as indicated above.
REPORT OF THE DIRECTORS

69
STATEMENTS OF FINANCIAL POSITION
COMPANY GROUP
at 30 June2014
N$ 000's
at 30 June2015
N$ 000's Notes
at 30 June2015
N$ 000's
at 30 June2014
N$ 000's
ASSETSNon-current assets
844 709 836 263 Property, plant and equipment 4 871 133 874 932
11 494 16 747 Intangible assets 5 16 747 11 494
29 672 34 936 Investment in subsidiaries 6 0 0
0 28 325 Investment in a joint venture 7 28 325 0
14 15 Available-for-sale investments 8 15 14
885 889 916 286 916 220 886 440
Current assets 208 807 226 604 Inventories 9 226 607 209 571
389 971 329 029 Trade and other receivables 10 325 603 383 322
49 284 260 557 Cash and cash equivalents 11 264 219 55 941
648 062 816 190 816 429 648 834
5 925 4 500 Non-current assets held for sale 12 4 500 5 925
1 539 876 1 736 976 Total assets 1 737 149 1 541 199
EQUITY AND LIABILITIESEquity
1 024 1 024 Share capital 13 1 024 1 024
0 0 Reserves (3) (126)
931 542 1 046 825 Retained earnings 1 043 078 930 732
932 566 1 047 849 Ordinary shareholders' equity 1 044 099 931 630
Non-current liabilities 8 672 13 811 Interest bearing loans and borrowings 14 13 821 8 786
18 046 19 630 Post employment medical aid and severence pay benefit plan 15 19 630 18 046
185 380 187 611 Deferred taxation liability 16 187 644 185 588
212 098 221 052 221 095 212 420
Current liabilities 106 614 106 446 Interest bearing loans and borrowings 14 105 711 105 822
286 847 358 753 Trade and other payables 17 363 368 289 576
680 300 Derivative financial instruments 18 300 680
1 071 2 576 Income tax payable 2 576 1 071
395 212 468 075 471 955 397 149
1 539 876 1 736 976 Total equity and liabilities 1 737 149 1 541 199

70
COMPANY GROUPfor the year
ended 30 June 2014
N$ 000's
for the year ended 30 June
2015
N$ 000's Notes
for the year ended 30 June
2015
N$ 000's
for the year ended 30 June
2014
N$ 000's
2 314 573 2 425 233 Revenue 19 2 434 177 2 316 932
(1 861 137) (1 915 723) Operating expenses 20 (1 927 663) (1 865 601)
453 436 509 510 Operating profit 21 506 514 451 331
(14 910) (8 807) Finance costs 22 (8 847) (14 932)
12 305 21 896 Finance income 23 22 000 12 338
(120 341) (124 593) Impairment of investment 7 0 0
0 0 Equity loss from joint venture (on-going operations) 7 (124 593) (120 341)
330 490 398 006 Profit before income tax 395 074 328 396
(122 825) (136 087) Income tax expense 24 (136 092) (122 867)
207 665 261 919 Profit for the year 258 982 205 529
Items that may be reclassified subsequently to profit or loss
0 0 Foreign currency translation reserve (“FCTR”) 123 (126)
207 665 261 919 Other comprehensive income for the year net of taxation 259 105 205 403
100.6 126.8 Basic earnings per ordinary share (cents) 25.1 125.4 99.5
Headline earnings per ordinary share (cents) 25.1 187.1 159.1
STATEMENTS OF COMPREHENSIVE INCOME

71
COMPANY GROUPfor the year
ended 30 June 2014
N$ 000's
for the year ended 30 June
2015
N$ 000's Notes
for the year ended 30 June
2015
N$ 000's
for the year ended 30 June
2014
N$ 000's
CASH FLOW FROM OPERATING ACTIVITIES 2 244 138 2 486 175 Cash receipts from customers 2 483 215 2 253 768
(1 739 850) (1 731 681) Cash paid to suppliers and employees (1 746 734) (1 751 131)
504 288 754 494 Cash generated by operations 27.1 736 481 502 637
(134 244) (146 636) Dividends paid 27.2 (146 636) (134 244)
(102 479) (123 099) Income tax paid 27.3 (123 516) (102 521)
267 565 484 759 466 329 265 872
CASH FLOW FROM INVESTING ACTIVITIES 12 305 21 896 Finance income 22 000 12 338
(104 625) (155 000) Purchase of shares in joint venture (155 000) (104 625)
0 (15 405) Loans advanced to subsidiaries 0 0
(28 844) (5 264) Acquisition of subsidiary 0 0
(155 023) (109 684) Acquisition of property, plant and equipment (115 065) (184 181)
(3 701) (8 151) Acquisition of intangible assets (8 151) (3 701)
21 232 2 338 Proceeds on sale of assets 2 344 21 232
(258 656) (269 270) (253 872) (258 937)
CASH FLOW FROM FINANCING ACTIVITIES (14 910) (8 807) Finance costs (8 847) (14 932)
(211 539) (2 848) Repayment of interest bearing loans and borrowings (2 771) (203 863)
0 7 439 Proceeds from borrowings 7 439 0
(226 449) (4 216) (4 179) (218 795)
(217 540) 211 273 Net increase/(decrease) in cash and cash equivalents 208 278 (211 860)
266 824 49 284 Cash and cash equivalents at beginning of the year 55 941 267 801
49 284 260 557 CASH AND CASH EQUIVALENTS AT END OF THE YEAR 11 264 219 55 941
STATEMENTS OF CASH FLOWS

72
Notes
Issued Capital
N$ 000's
Foreign currencytranslation
reserve
Retained Earnings
N$ 000's
Total
N$ 000's
GROUPBalance at 30 June 2013 1 024 0 859 447 860 471
Profit for the year 0 0 205 403 205 403
Other comprehensive income for the year 0 (126) 126 0Total comprehensive income for the year attributable to equity holders of the parent 0 (126) 205 529 205 403
Dividends to equity holders 27.2 0 0 (134 244) (134 244)
Balance at 30 June 2014 1 024 (126) 930 732 931 630
Profit for the year 0 0 259 105 259 105
Other comprehensive income for the year 0 123 (123) 0Total comprehensive income for the year attributable to equity holders of the parent 0 123 258 982 259 105
Dividends to equity holders 27.2 0 0 (146 636) (146 636)
Balance at 30 June 2015 1 024 (3) 1 043 078 1 044 099
COMPANYBalance at 30 June 2013 1 024 0 858 121 859 145
Profit for the year 0 0 207 665 207 665
Other comprehensive income for the year 0 0 0 0 Total comprehensive income for the year attributable to equity holders of the parent 0 0 207 665 207 665
Dividends to equity holders 27.2 0 0 (134 244) (134 244)
Balance at 30 June 2014 1 024 0 931 542 932 566
Profit for the year 0 0 261 919 261 919
Other comprehensive income for the year 0 0 0 0 Total comprehensive income for the year attributable to equity holders of the parent 0 0 261 919 261 919
Dividends to equity holders 27.2 0 0 (146 636) (146 636)
Balance at 30 June 2015 1 024 0 1 046 825 1 047 849
STATEMENTS OF CHANGES IN EQUITY

73
1. Reporting entityNamibia Breweries Limited (the “Company”) is a company domiciled in Namibia. The consolidated financial statements of the Company as at and for the year ended 30 June 2015 comprise the Company and its subsidiaries and the Group’s interest in Joint Ventures (together referred to as the “Group” and individually as “Group entities”).
2. Basis of preparation(a) Statement of complianceThe Company and Group financial statements have been prepared in accordance with International Financial Reporting Standards (IFRSs) and the requirements of the Namibian Companies Act.
The financial statements were approved by the Board of Directors on9 October 2015.
(b) Basis of measurement The Company and Group financial statements are prepared on the historical cost basis, modified for the fair value treatment of financial instruments.
(c) Functional and presentation currencyThese financial statements are presented in Namibia Dollars (NAD), which is the Company’s and Group’s functional and presentation currency. Each entity in the Group determines its own functional currency and items included in the financial statements of each entity are measured using that functional currency. All information presented in NAD has been rounded to the nearest thousand.
(d) Use of estimates and judgementsThe preparation of financial statements in conformity with IFRSs requires management to make judgements, estimates and assumptions that affect the application of policies and reported amounts of assets and liabilities, income and expenses. The estimates and associated assumptions are based on historical experience and various other factors that are believed to be reasonable under the circumstances, the results of which form the basis of making the judgements about carrying values of assets and liabilities that are not readily apparent from other sources. Actual results may differ from these estimates.
Estimates and underlying assumptions are reviewed on an ongoing basis. Revisions to accounting estimates are recognised in the period in which the estimate is revised if the revision affects only that period, or in the period of the revision and future periods if the revision affects both current and future periods.
In particular, information about significant areas of estimation uncertainty and critical judgements in applying accounting policies that have the most significant effect on the amounts recognised in the financial statements is included below:
Deferred tax assetsDeferred tax assets are recognised for all unused tax losses to the extent that it is probable that taxable profit will be available against which the losses can be utilised. Significant management judgement is required to determine the amount of deferred tax assets that can be recognised, based upon the likely timing and level of future taxable profits together with future tax planning strategies. The carrying amount of recognised and unrecognised tax losses are disclosed in note 16 and 24 and management’s judgement with regards to the recoverability of deferred tax asset in its joint venture in note 7.
Post employment benefitsThe cost of post employment medical benefits is determined using actuarial valuations. The actuarial valuation involves making assumptions about discount rates, medical inflation, expected return on assets and mortality rates. Due to the long term nature of these plans, such estimates are subject to significant uncertainty. Further details are given in note 15.
Severance benefit obligationsSeverance pay has been provided for all employees. Actuarial valuations are based on assumptions which include employee turnover, mortality rates, the discount rate, the inflation rate and rates of increases in compensation costs. Further details are given in note 15.
Property, plant, equipment and intangible assetsThe Group and Company depreciates and amortises items of property, plant, equipment and intangible assets down to residual value over the useful life of the assets. Management makes and applies assumptions about the expected useful life and residual value of these assets in determining the annual depreciation charge. Further details are given in the accounting policy note on depreciation.
In particular management have assumed a depreciation rate of 20% (2014: 20%) on returnable containers, this being management’s best estimate of breakage rate and useful life. The majority of returnable containers are with customers and the estimate of cost along with the corresponding returnable deposit liability is based on management’s judgement. Any change to these assumptions could have a significant impact on both the asset and corresponding liability.
NOTES TO THE ANNUAL FINANCIAL STATEMENTS

74
2. Basis of preparation (continued)Recoverability of investment in Jointly controlled entityThe Company’s investment in the jointly controlled entity is carried at cost less impairment. The directors again re-evaluated the value of the DHN investment and have, as in the two preceeding years, considered this to approximate the company’s share of DHN’s net asset value at year end. Changes in the assumptions impacting expected future cash generation could affect the recoverability of the valuation of the investment in the jointly controlled entity.
The Directors have again considered the recoverability of the deferred tax asset in DHN and, as in the previous year, continue with the view to impair the Group’s full portion of the deferred tax asset. Should circumstances change this judgement may also change with consequential impact to the financial statements.
See note 7 for further details on these assumptions.
3. Significant accounting policiesThe accounting policies set out below have been applied consistently to all periods presented in the Company’s and Group’s financial statements.
(a) Basis of consolidation(i) SubsidiariesSubsidiaries are those entities over whose financial and operating policies the Group has the power to exercise control, so as to obtain benefits from their activities. In assessing control potential voting rights that presently are exercisable are taken into account. The financial statements of subsidiaries are included in the consolidated financial statements from the date that control commences until the date that control ceases. The financial statements of the subsidiaries are prepared for the same reporting year as the parent company, using consistent accounting policies.
Investment in subsidiaries are shown at cost in the Company’s financial statements.
(ii) Jointly controlled entitiesThe Group’s interest in jointly controlled entities are accounted for using the equity method of accounting. Under the equity method, the interest in a jointly controlled operation is carried in the statement of financial position at cost plus post acquisition changes in the Group’s net share of the assets. The statement of comprehensive income reflects the share of the results of the operations of the jointly controlled entity. Profits and losses resulting from transactions between the Group and the jointly controlled operation are eliminated to the extent of the interest in the jointly controlled entity.
(iii) Transactions eliminated on consolidationIntra-group balances and transactions and any unrealised income and expenses arising from intra-group transactions, are eliminated in preparing the consolidated financial statements. Unrealised gains from transactions with equity accounted investees are eliminated against the investment to the extent of the Group’s interest in the investee. Unrealised losses are eliminated in the same way as unrealised gains, but only to the extent there is no evidence of impairment.
(b) Foreign currencyTransactions denominated in foreign currencies are initially recorded at the functional currency rate ruling at the transaction date. Monetary assets and liabilities denominated in foreign currencies are re-translated at the functional currency rate of exchange ruling at the reporting date. All differences are taken to profit or loss. Non-monetary items that are measured in terms of historical cost in a foreign currency are translated using the exchange rate at the date of the transaction.
(c) Property, plant and equipment(i) Recognition and measurementItems of property, plant and equipment are measured at cost less accumulated depreciation and accumulated impairment losses. Cost includes expenditure that is directly attributable to the acquisition of the asset. The cost of self-constructed assets includes the cost of material and direct labour and other costs directly attributable to bringing the asset to a working condition for its intended use.
When parts of an item of property, plant and equipment have different useful lives, they are accounted for as separate items (major components) of property, plant and equipment.
Gains and losses on disposal of an item of property, plant and equipment are determined by comparing the proceeds from disposal with the carrying amount of property, plant and equipment and are recognised in profit or loss.

75
3. Significant accounting policies (continued)(c) Property, plant and equipment (continued)(ii) Subsequent costsSubsequent expenditure relating to an item of property, plant and equipment is capitalised when it is probable that future economic benefits from the use of the asset will be increased and its cost can be reliably measured. All other subsequent expenditure is recognised as an expense in the period in which it is incurred.
(iii) DepreciationDepreciation is recognised in profit or loss on a straight-line basis over the estimated useful lives of each of the items of property, plant and equipment. Leased assets are depreciated over the shorter of the lease term and their useful life’s unless it is reasonably certain that the Group and Company will obtain ownership by the end of the lease term.
The depreciation rates for the current and comparative periods are as follows: 2015 2014Freehold buildings 2 - 12% 2 - 12%Leasehold land and buildings 4% 4%Plant and machinery 4 - 20% 4 - 20%Vehicles 20% 20%Furniture and equipment 10% 10%Returnable containers 20% 20%
The asset’s residual values, useful lives and methods of depreciation are reviewed, and adjusted if appropriate, at each financial year-end. Land is not depreciated. The carrying values are reviewed for impairment when events or changes in circumstances indicate that the carrying value may not be recoverable.
An item of property, plant and equipment is derecognised upon disposal or when no future economic benefits are expected from its use or disposal. Any gain or loss arising on derecognition of the asset is included in profit or loss in the year the asset is derecognised. Depreciation is not provided on assets during the time of construction.
(d) Intangible assets(i) Research and developmentExpenditure on research activities, undertaken with the prospect of gaining new scientific or technical knowledge and understanding, and expenditure on internally generated goodwill and brands is recognised in profit or loss as an expense as incurred.
Expenditure on development activities, whereby research findings are applied to a plan or design for the production of new or substantially improved products and processes, is capitalised if the product or process is technically feasible, costs can be reliably measured, future economic benefits are feasible and the Group or Company intends to and has sufficient resources to complete development and to use or sell the asset. The expenditure capitalised includes the cost of materials, direct labour and an appropriate proportion of overheads. Other development expenditure is recognised in profit or loss as an expense as incurred.
Capitalised development expenditure is measured at cost less accumulated amortisation and impairment losses.
(ii) Other intangible assetsOther intangible assets acquired by the Group or Company, which have finite useful lives, are measured at cost less accumulated amortisation and impairment losses.
(iii) Subsequent expenditureSubsequent development expenditure on capitalised intangible assets is capitalised only when it increases the future economic benefit embodied in the specific assets to which it relates. All other subsequent expenditure is expensed as incurred.
(iv) AmortisationThe useful lives of intangible assets are assessed to be either finite or infinite. Intangible assets with finite lives are amortised on a straight line basis over the estimated useful economic life and assessed for impairment whenever there is an indication that the intangible asset may be impaired. Intangible assets with indefinite useful lives are tested for impairment annually and are not amortised. If the carrying amount exceeds the recoverable amount, an impairment loss will be recognised. Amortisation and impairment charges on intangible assets are charged to profit or loss. If an intangible asset with an indefinite life has changed to a finite life the change is made on a prospective basis. See Annexure B for amoritisation rates.
76
3. Significant accounting policies (continued)(e) Leased assetsThe determination of whether an arrangement is, or contains a lease is based on the substance of the arrangement and requires an assessment of whether the fulfilment of the arrangement is dependent on the use of a specific asset or assets and the arrangement conveys a right to use the asset.
Leases are classified as finance leases where substantially all the risks and rewards associated with ownership of an asset are transferred to the Group or Company.
Operating leases are those leases which do not fall within the scope of the above definition. Payments made under leases are recognised in profit or loss on a straight line basis over the term of the lease.
(f) Non‑current assets held for saleNon-current assets (or disposal groups) are classified as held for sale if their carrying amount will be recovered through a sale transaction rather than through continuing use.
This condition is regarded as met only when the sale is highly probable and the asset is available for immediate sale in its present condition. Management must be committed to the sale, which should be expected to qualify for recognition as a completed sale within one year from the date of classification.
Non-current assets held for sale are measured at the lower of their carrying amount and fair value less costs to sell.
A non-current asset is not depreciated while it is classified as held for sale.
(g) InventoriesInventories are carried at the lower of cost and net realisable value. The cost of inventories comprises all costs of purchase, conversion and other costs incurred in bringing the inventories to their present location and condition, and is determined as follows:
Raw materials, merchandise and consumable stores:• Purchase cost on the weighted average basis.
Finished goods and work in progress:• Cost of direct materials and labour and a proportion of
manufacturing overheads based on normal operating capacity but excluding borrowing costs.
Obsolete, redundant and slow moving inventories are identified on a regular basis and are written down to their estimated net realisable values.
Net realisable value is the estimated selling price in the ordinary course of the business, less estimated costs of completion and the estimated costs necessary to make the sale.
(h) Impairment(i) Financial assetsA financial asset not carried at fair value through profit or loss, is assessed at each reporting date to determine whether there is any objective evidence that it is impaired. A financial asset is considered to be impaired if objective evidence indicates that one or more events have had a negative effect on the estimated future cash flows of the assets that can be estimated reliably.
An impairment loss in respect of a financial asset measured at amortised cost is calculated as the difference between the carrying amount, and the present value of the estimated future cash flows discounted at the asset’s original effective interest rate. An impairment loss in respect of an available-for-sale financial asset is calculated by reference to its fair value.
All impairment losses are recognised in profit or loss. Any cumulative loss in respect of an available-for-sale financial asset recognised previously in equity is transferred to profit or loss.
An impairment loss is reversed if the reversal can be related objectively to an event occurring after the impairment loss was recognised. Impairment loss reversals are recognised in profit or loss except for impairment reversals of available-for-sale equity securities which are recognised in other comprehensive income.
(ii) Non‑financial assetsThe carrying amounts of the Company’s and the Group’s non-financial assets, other than inventories and deferred tax assets, are reviewed at each reporting date to determine whether there is any indication of impairment. If any such indication exists, then the asset’s recoverable amount is estimated.
The recoverable amount of an asset or cash-generating unit is the greater of its value in use and its fair value less costs to sell. In assessing value in use, the estimated future cash flows are discounted to their present value using a pre-tax discount rate that reflects current market assessments of the time value of money and the risks specific to the asset.

77
3. Significant accounting policies (continued)(h) Impairment (continued)(ii) Non‑financial assets (continued)An impairment loss is recognised if the carrying amount of an asset or its cash-generating unit exceeds its estimated recoverable amount. Impairment losses are recognised in profit or loss.
An impairment loss is reversed if there has been a change in the estimates used to determine the recoverable amount. An impairment loss is reversed only to the extent that the asset’s carrying amount does not exceed the carrying amount that would have been determined, net of depreciation or amortisation, if no impairment loss had been recognised.
(i) Financial instruments(i) Non‑derivative financial instrumentsNon-derivative financial instruments comprise trade and other receivables, cash and cash equivalents, interest-bearing borrowings, trade and other payables.
Non-derivative financial instruments are recognised initially at fair value plus, for instruments not at fair value through profit and loss, any directly attributable transaction costs. Subsequent to initial recognition, non-derivative financial instruments are measured as described below.
Accounting for finance income and costs is discussed in note 3(m) and 3(l).
All regular way purchases and sales of financial assets are recognised on the trade date i.e. the date that the Company and Group commits to purchase the asset.
(ii) Financial assets or liabilities at fair value through profit or loss Included in this category are derivative financial instruments. Financial assets or liabilities classified as at fair value through profit or loss, are subsequent to initial recognition, measured at fair value with changes in fair value recognised in profit or loss.
(iii) Loans and receivablesIncluded in this category are the loans to the share purchase trust as well as to holding company and fellow subsidiaries. Loans and receivables are non-derivative financial assets with fixed or determinable payments that are not quoted in an active market. Such assets are carried at amortised cost using the effective interest method. Amortised cost is computed as the amount initially recognised minus principle repayments, plus or minus the cumulative amortisation using the effective interest method of any difference between the initially recognised amount and the maturity amount. This calculation includes all fees and points paid or received between parties to the contract that are an integral part of the effective interest rate, transaction costs and all other premiums and discounts. Gains and losses are recognised in profit or loss when the loans and receivables are derecognised or impaired, as well as through the amortisation process.
(iv) Trade and other receivables Trade receivables, which generally have 30-60 day terms, are subsequent to initial recognition, recognised at amortised cost, less impairment losses.
(v) Cash and cash equivalents For the purpose of the statements of cash flows, cash and cash equivalents comprise cash on hand, deposits held on call with banks, net of bank overdrafts, all of which are available for use by the Company and Group unless otherwise stated.
(vi) Interest bearing loans and borrowings Included in this category are long and medium term financing and short term borrowings. Non-derivative financial liabilities are recognised at amortised cost, using the effective interest method.
Interest-bearing bank loans and overdrafts are recorded at the value of proceeds received, net of direct issue costs. Finance charges are accounted for on an accrual basis and are added to the carrying amount of the instrument to the extent that they are not settled in the period in which they arise.
(vii) Derecognition of financial assets and liabilities Financial assets - A financial asset is derecognised where the rights to receive cash flows from the asset have expired.
Financial liabilities - A financial liability is derecognised when the obligation under the liability is discharged or cancelled or expires.

78
3. Significant accounting policies (continued)(i) Financial instruments (continued)(viii) Non‑interest bearing financial liabilities Non-interest bearing financial liabilities are recognised at amortised cost.
(j) ProvisionsProvisions are recognised when the Company or Group has a present legal or constructive obligation, as a result of past events, for which it is probable that an outflow of economic benefits will be required to settle the obligation, and a reliable estimate can be made for the amount of the obligation. Provisions are determined by discounting the expected future cash flows at a pre-tax rate that reflects the current market assessments of the time value of money and the risks specific to the liability.
A provision for restructuring is recognised when the Company and Group has approved a detailed and formal restructuring plan, and the restructuring has either commenced or has been announced publicly. Future operating losses are not provided for.
(k) RevenueRevenue comprises royalty and rental income and the sales of beer, soft drinks and by-products, less indirect taxes, excise duty and discounts.
Revenue is recognised to the extent that it is probable that the economic benefits will flow to the Company or Group and the revenue can be reliably measured. The following specific recognition criteria must also be met before revenue is recognised:
(i) Sale of GoodsRevenue is recognised when the significant risks and rewards of ownership of the goods have passed to the buyer, recovery of the consideration is probable, the associated costs can be estimated reliably, there is no continuing management involvement with the goods, and the amount of revenue can be measured reliably.
(ii) Rental incomeRental income is recognised on a straight-line basis over the term of the lease.
(iii) Royalty incomeRoyalty income is recognised on an accrual basis in accordance with the substance of the relevant agreement.
(l) Finance incomeFinance income comprises interest income on funds. Interest income is recognised in the year as it accrues in profit or loss, using the effective interest method.
(m) Finance costsFinance costs comprise interest expense on borrowings. Borrowing costs are recognised in profit or loss using the effective interest method. Finance costs on qualifying assets are capitalised.
(n) Income taxIncome tax expense comprises current and deferred tax. Income tax expense is recognised in profit or loss except to the extent that it relates to items recognised directly in equity, in which case it is recognised in other comprehensive income.
Current tax comprises tax payable calculated on the basis of the expected taxable income for the year, using the tax rates and tax laws enacted or substantively enacted at the reporting date and any adjustment of tax payable for previous years.
Deferred tax is provided on temporary differences at the reporting date between the tax bases of assets and liabilities and their carrying amounts for financial reporting purposes.
Deferred tax is not recognised for the following temporary differences:
• The initial recognition of an asset or liability in a transaction that is not a business combination and, at the time of the transaction, affects neither the accounting profit not taxable profit or loss;
• Investments in subsidiaries and jointly controlled entities to the extent that it is probable that the temporary differences will not reverse in the foreseeable future; and
• Taxable temporary differences arising on the initial recognition of goodwill.
The carrying amount of deferred tax assets are reviewed at each reporting date to determine that sufficient taxable profit will be available to allow all or part of the deferred tax asset to be utilised. Unrecognised deferred tax assets are reassessed at the reporting date and are recognised to the extent that it has become probable that future taxable profit will allow the deferred tax asset to be recovered.
Deferred tax assets and liabilities are measured at the tax rates that are expected to apply to the year when the asset is realised or the liability settled, based on tax rates (and tax laws) that have been enacted or substantively enacted at the reporting date.

79
3. Significant accounting policies (continued)(n) Income tax (continued)Deferred tax assets and deferred liabilities are offset, if a legally enforceable right exists to set off current tax assets against current tax liabilities and the deferred taxes relate to the same taxable entity and the same taxation authority.
(o) Value added taxRevenues, expenses and assets are recognised net of the amount of value added tax except:
• Where the value added tax incurred on a purchase of assets or services is not recoverable from the taxation authority, in which case the value added tax is recognised as part of the cost of acquisition of the asset or as part of the expense item as applicable; and
• Receivables and payables that are stated with the amount of value added tax included.
The net amount of value added tax recoverable from, or payable to, the taxation authority is included as part of receivables or payables in the statement of financial position.
(p) Earnings per shareThe calculation of earnings per share is based on earnings attributable to ordinary shareholders. Account is taken of the weighted average number of ordinary shares in issue for the period during which they have participated in the income of the Group. The Group has no dilutive potential ordinary shares.
Earnings is defined as the, profit for the year after taxation and non-controlling interest.
(q) Employee benefits(i) Short term benefitsThe cost of all short term employee benefits is recognised during the period in which the employee renders the related service, on an undiscounted basis. A liability is recognised for the amount expected to be paid if the Company or Group has a present legal or constructive obligation to pay this amount as a result of past service provided by the employee and the obligation can be estimated reliably.
(ii) Retirement benefitsThe policy of the Group and Company is to provide retirement benefits for its employees. The contribution paid by the Group and Company to fund obligations for the payment of retirement benefits are recognised as an expense in profit or loss when they are due. The Ohlthaver & List Retirement Fund, which is a defined contribution fund, covers all the Group’s employees and is governed by the Pension Funds Act.
(iii) Equity compensation benefitsThe Group and Company grants share options to certain employees under an employee share plan controlled by the ultimate holding company.
(iv) Post employment medical benefitsThe Group and Company provides for post employment healthcare benefits to qualifying employees and retired personnel by subsidising a portion of their medical aid contributions. This scheme operates as a defined benefit plan and the cost of providing benefits under the plan is determined using the projected credit unit method.
Actuarial gains and losses are recognised in profit or loss in full. The past service cost is recognised as an expense on a straight line basis over the average period until the benefits become vested. If the benefits are already vested immediately following the introduction of, or changes to pension plan, past service cost is recognised as an expense immediately.
The entitlement to the benefits is usually based on the employee remaining in service up to retirement age and completing a minimum service period.
(v) Severance benefit obligationIn accordance with the Namibia Labour Act, 2007, severance benefits are payable to an employee, if the employee is dismissed, dies while employed or resigns/retires on reaching the age of 65 years. The obligation for severance benefits to current employees is actuarially determined in respect of all Group employees and is provided for in full. The cost of providing benefits is determined using the projected-unit-credit method, with actuarial valuations being carried out at the end of each reporting period. The movement for the year is recognised in profit or loss in the year in which it occurs.

80
3. Significant accounting policies (continued)(r) Operating segmentThe Chief Operating Decision Maker reviews the financial results of the Group as a whole. Therefore the Group, in terms of IFRS 8, only has one segment. Further divisional information has been provided as additional information.
The Group’s operations are located in Namibia, Botswana and South Africa. The Group’s products are sold on the local market and are exported to South Africa and other countries.
(s) New and amended IFRS and IFRIC interpretations adoptedThe Group and Company has adopted the following new and amended IFRS and IFRIC interpretations during the year. Adoption of these revised standards and interpretations did not have any effect on the financial performance or position of the Group and company.

81
Adoption of new and revised Standards and Interpretations effective in current year:The following Standards and Interpretations issued by the International Financial Reporting Interpretations Committee are effective for the current year:
New/Revised International Financial Reporting StandardsIssued/ Revised
Effective for annual periods beginning on or after
IFRS 2Amendments resulting from Annual Improvements 2010-2012 Cycle (definition of ‘vesting condition’)
December 2013
Annual periods beginning on or after 1 July 2014
IFRS 3Amendments resulting from Annual Improvements 2010-2012 Cycle (accounting for contingent consideration)
December 2013
Annual periods beginning on or after 1 July 2014
IFRS 3Amendments resulting from Annual Improvements 2011-2013 Cycle(scope exception for joint ventures)
December 2013
Annual periods beginning on or after 1 July 2014
IFRS 7Additional hedge accounting disclosures (and consequential amendments)resulting from the introduction of the hedge accounting chapter in IFRS 9
November 2013
Applies when IFRS 9 is applied(At the time of issue of the revised version of IFRS 9 including the hedge accounting chapter, IFRS 9 had no stated mandatory effective date, see below)
IFRS 8Amendments resulting from Annual Improvements 2010-2012 Cycle (aggregation of segments, reconciliation of segment assets)
December 2013
Annual periods beginning on or after 1 July 2014
IFRS 9
Reissue to incorporate a hedge accounting chapter and permit the early application of the requirements for presenting in other comprehensive income the ‘own credit’ gains or losses on financial liabilities designated under the fair value option without early applying the other requirements of IFRS 9
November 2013
Contains no stated effective date and includes consequential amendments which remove the mandatory effective date of IFRS 9 (2010) and IFRS 9 (2009), leaving the effective date open but allowing each version of the standard to be available for applicationNote: IFRS 9 (2014) supersedes IFRS 9 (2013), but this standard remains available for application if the relevant date of initial application is before 1 February 2015.
IFRS 13Amendments resulting from Annual Improvements 2010-2012 Cycle(short-term receivables and payables)
December 2013
Annual periods beginning on or after 1 July 2014
IAS 16Amendments resulting from Annual Improvements 2010-2012 Cycle (proportionate restatement of accumulated depreciation on revaluation)
December 2013
Annual periods beginning on or after 1 July 2014
IAS 19Amended to clarify the requirements that relate to how contributions from employees or third parties that are linked to service should be attributed to periods of service
November 2013
Annual periods beginning on or after 1 July 2014
IAS 24Amendments resulting from Annual Improvements 2010-2012 Cycle (management entities)
December 2013
Annual periods beginning on or after 1 July 2014
IAS 27 Amendments for investment entitiesOctober 2012
Annual periods beginning on or after 1 January 2014
IAS 32 Amendments relating to the offsetting of assets and liabilitiesDecember 2011
Annual periods beginning on or after 1 January 2014
IAS 36 Amendments arising from Recoverable Amount Disclosures for Non-Financial Assets May 2013Annual periods beginning on or after 1 January 2014
IAS 38Amendments resulting from Annual Improvements 2010-2012 Cycle(proportionate restatement of accumulated depreciation on revaluation)
December 2013
Annual periods beginning on or after 1 July 2014
IAS 40Amendments resulting from Annual Improvements 2011-2013 Cycle (interrelationship between IFRS 3 and IAS 40)
December 2013
Annual periods beginning on or after 1 July 2014

82
New/Revised International Financial Reporting Standards (continued)Issued/ Revised
Effective for annual periods beginning on or after
IFRIC 21 Levies May 2013Annual periods beginning on or after 1 January 2014
The adoptions of the above Standards and Interpretations have introduced a number of terminology changes and have resulted in a number of changes in presentation and disclosure. The revised Standard and Interpretations had no impact on the reported results or financial position of the company.
IFRS 5 Amendments resulting from September 2014 Annual Improvements to IFRSsSeptember 2014
Annual periods beginning on or after 1 January 2016
IFRS 7Financial Instruments: Disclosure - Deferral of mandatory effective date of IFRS 9 and amendments to transition disclosures
December 2011 1 January 2015
IFRS 7 Amendments resulting from September 2014 Annual Improvements to IFRSsSeptember 2014
Annual periods beginning on or after 1 January 2016
IFRS 9
Reissue to incorporate a hedge accounting chapter and permit the early application of the requirements for presenting in other comprehensive income the ‘own credit’ gains or losses on financial liabilities designated under the fair value option without early applying the other requirements of IFRS 9 July 2014
Annual periods beginning on or after 1 January 2018
IFRS 9Deferral of mandatory effective date of IFRS 9 and amendments to transition disclosures
December 2011
Annual periods beginning on or after 1 January 2015(Effective date subsequently removed. This version of the standard is superseded by IFRS 9 (2014), but remains available for application if the relevant date of initial application is before 1 February 2015
IFRS 9Finalised version, incorporating requirements for classification and measurement, impairment, general hedge accounting and derecognition. July 2014
Effective for annual periods beginning on or after 1 January 2018Note: IFRS 9 (2014) supersedes IFRS 9 (2009), IFRS 9 (2010) and IFRS 9 (2013), but these standards remain available for application if the relevant date of initial application is before 1 February 2015.
IFRS 10
Amendments regarding the sale or contribution of assets between an investor and its associate or joint ventureAmendments regarding the sale or contribution of assets between an investor and its associate or joint venture
September 2014
Annual periods beginning on or after 1 January 2016
The following table contains effective dates of IFRS’s, IFRIC’s and recently revised IAS’s, which have not been early adopted by the company and that might affect future financial periods.

83
New/Revised International Financial Reporting Standards (continued)Issued/ Revised
Effective for annual periods beginning on or after
IFRS 10 Amendments regarding the application of the consolidation exceptionDecember 2014
Annual periods beginning on or after 1 January 2016
IFRS 11 Amendments regarding the accounting for acquisitions of an interest in a joint operation May 2014Annual periods beginning on or after 1 January 2016
IFRS 12 Amendments regarding the application of the consolidation exceptionDecember 2014
Annual periods beginning on or after 1 January 2016
IFRS 14 Regulatory Deferral AccountsJanuary 2014
Applies to an entity’s first annual IFRS financial statements for a period beginning on or after 1 January 2016
IFRS 15 Revenue from Contracts with Customers May 2014
Applies to an entity’s first annual IFRS financial statements for a period beginning on or after 1 January 2018
IAS 1 Amendments resulting from the disclosure initiativeDecember 2014
Annual periods beginning on or after 1 January 2016
IAS 16Amendments regarding the clarification of acceptable methods of depreciation and amortisation May 2014
Annual periods beginning on or after 1 January 2016
IAS 16 Amendments bringing bearer plants into the scope of IAS 16 rather than IAS 41 June 2014Annual periods beginning on or after 1 January 2016
IAS 19 Amendments resulting from September 2014 Annual Improvements to IFRSsSeptember 2014
Annual periods beginning on or after 1 January 2016
IAS 27Amendments reinstating the equity method as an accounting option for investments in in subsidiaries, joint ventures and associates in an entity’s separate financial statements
August 2014
Annual periods beginning on or after 1 January 2016
IAS 28Amendments regarding the sale or contribution of assets between an investor and its associate or joint venture
September 2014
Annual periods beginning on or after 1 January 2016
IAS 28 Amendments regarding the application of the consolidation exceptionDecember 2014
Annual periods beginning on or after 1 January 2016
IAS 34 Amendments resulting from September SeptemberAnnual periods beginning on or after 1 January 2016
IAS 38Amendments regarding the clarification of acceptable methods of depreciation and amortisation May 2014
Annual periods beginning on or after 1 January 2016
IAS 39
Amendments to permit an entity to elect to continue to apply the hedge accounting requirements in IAS 39 for a fair value hedge of the interest rate exposure of a portion of a portfolio of financial assets or financial liabilities when IFRS 9 is applied, and to extend the fair value option to certain contracts that meet the ‘own use’ scope exception July 2014
Annual periods beginning on or after 1 January 2018
IAS 41 Amendments bringing bearer plants into the scope of IAS 16 June 2014Annual periods beginning on or after 1 January 2016

84
COMPANY GROUPfor the year
ended 30 June 2014
N$ 000's
for the year ended 30 June
2015
N$ 000's
for the year ended 30 June
2015
N$ 000's
for the year ended 30 June
2014
N$ 000's
4. PROPERTY, PLANT AND EQUIPMENTAt cost
148 087 150 362 Freehold land and buildings 184 470 176 931
3 892 3 892 Leasehold land and buildings 6 050 6 050
960 790 993 926 Plant and machinery 994 071 960 790
64 809 73 992 Vehicles 74 261 65 069
46 616 50 053 Furniture and equipment 50 252 46 669
206 059 193 026 Returnable containers 207 923 206 059
9 227 11 042 Assets under construction 11 042 9 227
1 439 480 1 476 293 1 528 069 1 470 795
Accumulated depreciation and impairment losses 28 392 29 246 Freehold land and buildings 29 246 28 392
2 656 3 138 Leasehold land and buildings 4 753 3 665
388 602 438 027 Plant and machinery 438 150 388 602
37 781 44 151 Vehicles 44 319 37 859
30 782 35 167 Furniture and equipment 35 269 30 788
106 558 90 301 Returnable containers 105 199 106 557
594 771 640 030 656 936 595 863
Carrying value
119 695 121 116 Freehold land and buildings 155 224 148 539
1 236 754 Leasehold land and buildings 1 297 2 385
572 188 555 899 Plant and machinery 555 921 572 188
27 028 29 841 Vehicles 29 942 27 210
15 834 14 886 Furniture and equipment 14 983 15 881
99 501 102 725 Returnable containers 102 724 99 502
9 227 11 042 Assets under construction 11 042 9 227
844 709 836 263 871 133 874 932
Movement of property, plant and equipment has been detailed in Annexure B.
Leased assets
Included above are leased vehicles under a number of finance lease agreements, details of which are set out below:
Vehicles
24 699 26 106 - at cost 26 106 24 699
(9 574) (12 371) - accumulated depreciation (12 371) (9 574)
15 125 13 735 Carrying value 13 735 15 125
The leased assets are encumbered in terms of finance lease agreements (see notes 14 & 29).
Land and buildings The Group’s land and buildings are not encumbered. Details of the Group’s land and leasehold land and buildings are maintained at the registered office of the Company.

85
COMPANY GROUPfor the year
ended 30 June 2014
N$ 000's
for the year ended 30 June
2015
N$ 000's
for the year ended 30 June
2015
N$ 000's
for the year ended 30 June
2014
N$ 000's
5. INTANGIBLE ASSETSAt cost
11 016 10 971 Automation processes 10 971 11 016
2 000 9 000 Trademarks 9 000 2 000
9 917 11 960 Software licences 11 960 9 917
22 933 31 931 31 931 22 933
Accumulated amortisation
5 447 7 700 Automation processes 7 700 5 447
0 0 Trademarks 0 0
5 992 7 484 Software licences 7 484 5 992
11 439 15 184 15 184 11 439
Carrying value
5 569 3 271 Automation processes 3 271 5 569
2 000 9 000 Trademarks 9 000 2 000
3 925 4 476 Software licences 4 476 3 925
11 494 16 747 16 747 11 494
Movement of intangible assets has been detailed in Annexure B.
6. INVESTMENT IN SUBSIDIARIES (ANNEXURE C) 29 832 35 096 Shares at cost
(1 028) (995) Loan from subsidiary
28 804 34 101
0 0 Loan to subsidiaries
28 804 34 101
(868) (835) Current
29 672 34 936 Non-current
28 804 34 101 Net investment in subsidiaries
Aggregated losses of subsidiaries amounted to N$ 54.7 million (2014 N$38.6 million). Losses incurred by subsidiaries for the year amounted to N$17.8 million (2014: N$0.3 million).
The loans are interest free and have no fixed repayment terms.

86
COMPANY GROUPfor the year
ended 30 June 2014
N$ 000's
for the year ended 30 June
2015
N$ 000's
for the year ended 30 June
2015
N$ 000's
for the year ended 30 June
2014
N$ 000's
7. INVESTMENT IN A JOINT VENTURE 644 507 784 007 Shares at cost 784 007 644 507
(704 713) ( 829 307) Impairment in investment 0 0
60 206 73 625 Loan to Joint Venture 73 625 60 206
0 0 Accumulated equity accounted losses ( 829 307) (704 713)
0 28 325 Carrying amount of the investment 28 325 0
Disclosed as0 0 Current 0 0
0 28 325 Non-current 28 325 0
0 28 325 28 325 0
Included in accumulated equity-accounted losses is an impairment of the loan to DHN Drinks (Proprietary) Limited amounting to N$48 million(2014: N$ 60.2 million). The loan was impaired as management considers it probable that this portion of the loan will be capitalised to offset losses incurred during 2015. The loan to the Joint Venture was unsecured and bears interest at JIBAR +2% and has no fixed repayment terms.
The full equity injection in the current year was in the form of loan funding N$ 155 million (2014: N$ 104.6 million) of which N$ 139.5 million (2014: N$ 46.5 million) was capitalised during the year.
Trade receivables from the Joint Venture are disclosed in note 10.
Refer to Note 32 for details on the proposed transaction between NBL, Diageo and Heineken. Upon conclusion of the proposed transaction, the current joint venture arrangement will be replaced by a new arrangement between NBL and Heineken.
The summarised financial information of material joint ventures at 30 June and for the years then ended is as follows:
Summarised Statement of Financial Position
Current assets 784 295 1 024 000
Non-current assets 356 849 356 000
1 141 144 1 380 000
Current liabilities 1 073 345 1 428 000
1 073 345 1 428 000
Revenue 4 743 766 4 552 411
Net interest expense (100 726) (42 219)
Other income and expenses (5 424 531) (5 308 500)
Loss before income tax (781 491) (798 308)
Income tax expense 0 0
Loss from continuing operations (781 491) (798 308)
Total comprehensive income (781 491) (798 308)
Royalties received from joint venture 79 067 72 508

87
COMPANY GROUPfor the year
ended 30 June 2014
N$ 000's
for the year ended 30 June
2015
N$ 000's
for the year ended 30 June
2015
N$ 000's
for the year ended 30 June
2014
N$ 000's
8. AVAILABLE-FOR-SALE INVESTMENTSUnlisted investments
14 15 L&T Ventures (Proprietary) Limited 15 14
14 15 Directors' valuation of unlisted investments 15 14
9. INVENTORIES 48 097 58 577 Raw materials 58 577 48 097
18 099 17 631 Work in progress 17 631 18 099
64 752 55 127 Finished products 55 869 65 516
76 191 89 821 Consumable stores 89 082 76 191
1 668 5 448 Merchandise 5 448 1 668
208 807 226 604 226 607 209 571
On 30 June 2015 the impairment to inventories amounted to N$9.1 million (2014 : N$5.2 million) . The impairment is included in operating expenses in the income statement and is mainly due to redundant spares and changes in packaging design.
10. TRADE AND OTHER RECEIVABLES 162 501 174 756 Trade receivables 173 275 163 567
(563) (1 860) Allowance for credit losses (1 860) (563)
146 658 62 911 Receivables from Joint Ventures 62 911 147 079
9 830 3 671 Receivables from holding company and fellow subsidiaries (Note 28.1) 740 1 853
11 138 323 Receivables from other related parties (Note 28.2) 323 11 138
18 547 13 700 Value added taxation 14 503 18 389
13 497 4 244 Receiver of revenue tax receivable 4 482 13 497
10 530 10 830 Refundable deposits 10 830 10 530
10 100 30 549 Prepayments 30 549 10 100
7 733 29 905 Other receivables 29 850 7 732
389 971 329 029 325 603 383 322
Trade receivables is shown net of impairment of N$1.9 million (2014: N$0.6 million). The impairment is included in operating expenses in the statement of comprehensive income.
Trade receivables are non-interest bearing and are generally on 30-60 days’ terms.
For terms and conditions relating to related party receivables, refer to note 28. Trade receivables are pledged as security for the medium term loan disclosed in note 14 and annexure A.
The Directors consider that the carrying amount of trade and other receivables approximate their fair value.
The average credit period on sales of goods of the company is 45 days (2014: 45 days). No interest is charged on trade receivables. At 30 June 2015, receivables of N$57 179 993 (2014:N$ 153 504 196) were past due but not impaired. The company has not provided for these as there has not been a significant change in credit quality.

88
COMPANY GROUPfor the year
ended 30 June 2014
N$ 000's
for the year ended 30 June
2015
N$ 000's
for the year ended 30 June
2015
N$ 000's
for the year ended 30 June
2014
N$ 000's
10. TRADE AND OTHER RECEIVABLES (Continued)
Movement in the allowance account for impairment losses: (725) (563) Balance at the beginning of the year (563) (725)
(575) (1 865) Charge for the year (1 865) (575)
14 568 Utilised 568 14
723 0 Unused/recovered amounts reversed 0 723
(563) (1 860) Balance at the end of the year (1 860) (563)
Analysed as follows: (563) (1 860) Individually impaired trade receivables (1 860) (563)
0 0 Collectively impaired trade receivables 0 0
(563) (1 860) (1 860) (563)
In determining the recoverability of a trade receivable, the Company and Group considers any change in the credit quality of the trade receivable from the date credit was initially granted up to the reporting date.
The concentration of credit risk is limited and is fully detailed in note 30.3. The directors believe that there is no further credit provision required in excess of the allowance for doubtful debts.
The impairment recognised represents the difference between the carrying amount of these trade receivable and the present value of the expected liquidation proceeds. The group does not hold any collateral over these balances.
11. CASH AND CASH EQUIVALENTS 47 248 31 805 Cash and bank 32 154 53 185
2 036 228 752 Funds on call 232 065 2 756
49 284 260 557 Cash and cash equivalents at end of the year 264 219 55 941
The carrying amount of these assets approximate their fair value.
The undrawn facilities at 30 June 2015 were N$ 30.2 million.
12. NON-CURRENT ASSETS HELD FOR SALE
The major classes of assets and liabilities comprising the disposal group classified as held for sale are as follows:
Net assets of disposal group: Non-current assets held for sale
5 925 4 500 Property, Plant & Equipment 4 500 5 925
5 925 4 500 4 500 5 925
Included in non-current assets held for sale are Camelthorn Brewing assets. The brewing assets were classified as held for sale on 30 April 2014 as the company intended to sell the assets within the next 12 months.
The assets were impaired by N$1 425 000 (2014: N$ nil) during the year. The impairment was determined as the difference between the recoverable amount of the assets which was lower than the book value of the assets. The recoverable amount was based on the amount a buyer was willing to offer for the assets at 30 June 2015. There were delays with the previous buyer which resulted in the sale not going through in the last financial year however, a new contract for the sale of these assets was concluded subsequent to year end.
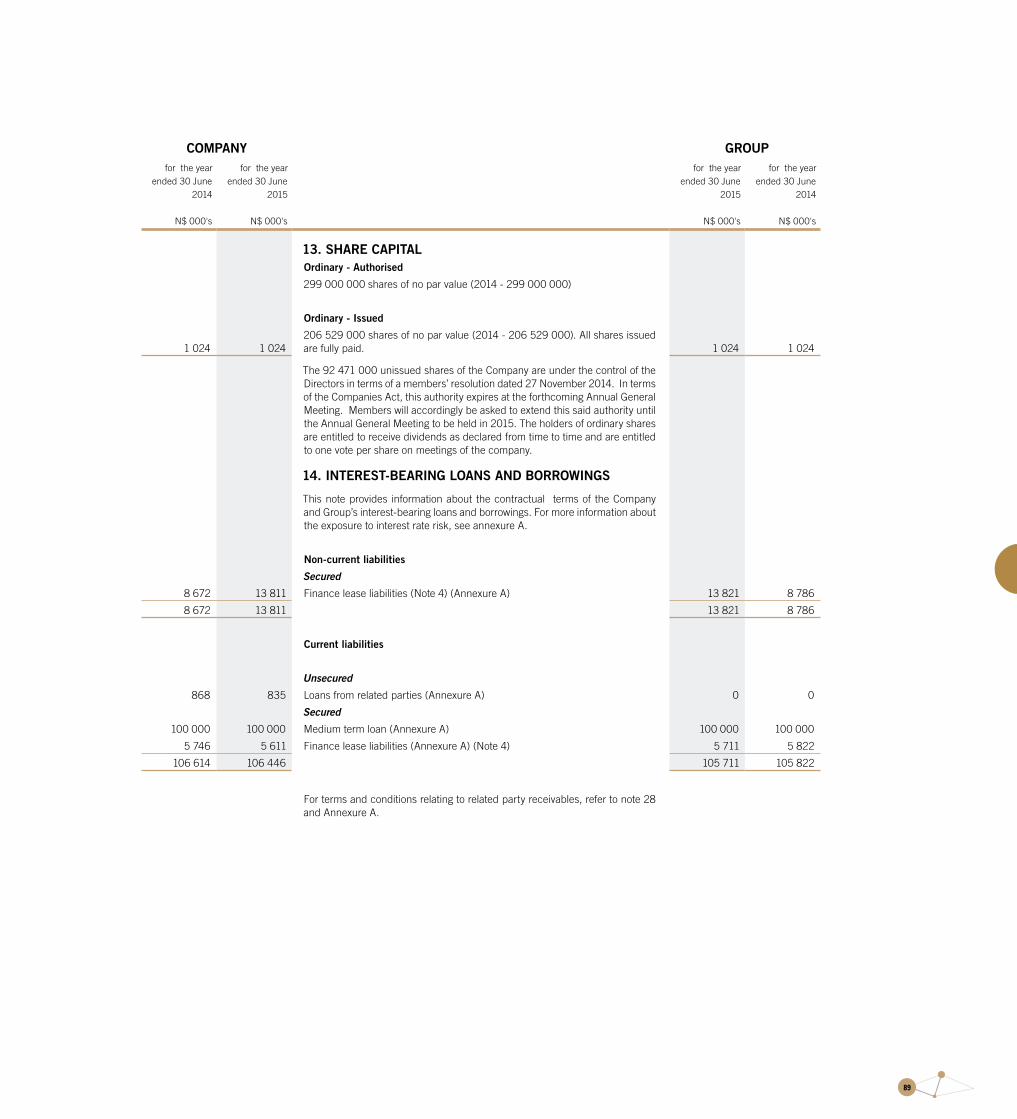
89
COMPANY GROUPfor the year
ended 30 June 2014
N$ 000's
for the year ended 30 June
2015
N$ 000's
for the year ended 30 June
2015
N$ 000's
for the year ended 30 June
2014
N$ 000's
13. SHARE CAPITALOrdinary - Authorised
299 000 000 shares of no par value (2014 - 299 000 000)
Ordinary - Issued
1 024 1 024206 529 000 shares of no par value (2014 - 206 529 000). All shares issued are fully paid. 1 024 1 024
The 92 471 000 unissued shares of the Company are under the control of the Directors in terms of a members’ resolution dated 27 November 2014. In terms of the Companies Act, this authority expires at the forthcoming Annual General Meeting. Members will accordingly be asked to extend this said authority until the Annual General Meeting to be held in 2015. The holders of ordinary shares are entitled to receive dividends as declared from time to time and are entitled to one vote per share on meetings of the company.
14. INTEREST-BEARING LOANS AND BORROWINGS
This note provides information about the contractual terms of the Company and Group’s interest-bearing loans and borrowings. For more information about the exposure to interest rate risk, see annexure A.
Non-current liabilities
Secured
8 672 13 811 Finance lease liabilities (Note 4) (Annexure A) 13 821 8 786
8 672 13 811 13 821 8 786
Current liabilities
Unsecured
868 835 Loans from related parties (Annexure A) 0 0
Secured
100 000 100 000 Medium term loan (Annexure A) 100 000 100 000
5 746 5 611 Finance lease liabilities (Annexure A) (Note 4) 5 711 5 822
106 614 106 446 105 711 105 822
For terms and conditions relating to related party receivables, refer to note 28 and Annexure A.

90
COMPANY GROUPfor the year
ended 30 June 2014
N$ 000's
for the year ended 30 June
2015
N$ 000's
for the year ended 30 June
2015
N$ 000's
for the year ended 30 June
2014
N$ 000's
15. RETIREMENT BENEFIT INFORMATION15.1 Retirement fund
The total value of contributions to the Ohlthaver & List Retirement Fund during the period amounted to:
9 690 7 014 Members contributions 7 014 9 690
14 522 18 749 Employer contributions 18 749 14 522
24 212 25 763 25 763 24 212
This is a defined contribution plan and is regulated by the Pension Fund Act. The fund is valued at intervals of not more than three years. The fund was valued by an independent consulting actuary at 30 June 2015 and its assets were found to exceed its actuarially calculated liabilities.
15.2 Post employment medical aid benefit plan 10 609 8 882 Balance at the beginning of the year 8 882 10 609
787 732 Interest cost 732 787
(1 773) 566 Actuarial (gain)/loss 566 (1 773)
(741) (696) Benefits paid (696) (741)
8 882 9 484 Balance at the end of the year 9 484 8 882
The Ohlthaver & List group provides for post employment medical aid benefits in respect of retired employees. The present value of the provision at 30 June 2015, as determined by using projected unit credit method was N$9.5 million (2014: N$8.8 million). Future benefits valued are projected using specific actuarial assumptions and the liability for in-service members is accrued over the expected working lifetime.
The principle actuarial assumptions used in determining post employment medical aid benefit obligations for the Group’s plan are as follows:
8.60% 8.30% Discount rate 8.30% 8.60%
8.50% 8.20% Healthcare cost inflation 8.20% 8.50%
25 24 Members 24 25
Sensitivity of results1% increase in medical inflation assumption
888 927 Accrued liability 927 888
10% 9.8% % increase 9.8% 10%
808 770 Current service + interest cost in next year 770 808
10.4% 10.2% % increase 10.2% 10.4%
1% decrease in medical inflation assumption
(764) (800) Accrued liability (800) (764)
(8.6%) (8.4%) % decrease (8.4%) (8.6%)
(667) (660) Current service + interest cost in next year (660) (667)
(8.9%) (8.8%) % decrease (8.8%) (8.9%)

91
COMPANY GROUPfor the year
ended 30 June 2014
N$ 000's
for the year ended 30 June
2015
N$ 000's
for the year ended 30 June
2015
N$ 000's
for the year ended 30 June
2014
N$ 000's
15. RETIREMENT BENEFIT INFORMATION (Continued)15.3 Severence benefit
8 336 9 164 Balance at the beginning of the year 9 164 8 336
701 730 Current service costs 730 701
722 867 Interest cost 867 722
(132) (549) Actuarial gain (549) (132)
(463) (66) Benefits paid (66) (463)
9 164 10 146 Non-current balance at the end of the year 10 146 9 164
18 046 19 630 19 630 18 046
The principle actuarial assumptions used in determining severance pay obligations for the Group is as follows:
8.80% 8.60% Discount rate 8.60% 8.80%
6.10% 5.70% Inflation rate 5.70% 6.10%
6.10% 5.70% Salary increase rate 5.70% 6.10%
16. DEFERRED TAXATIONDeferred taxation liability
152 549 185 380 Balance at beginning of the year 185 588 152 757
27 968 11 502 Accelerated depreciation for tax purposes 11 327 27 968
(989) (650) Consumables (650) (989)
(4 155) 1 723 Customer deposits 1 723 (4 155)
5 989 (10 016) Other provisions (10 016) 5 989
492 174 Other leases 174 492
(581) 1 915 Prepayments 1 915 (581)
486 (523) Retirement and severance pay benefit obligations (523) 486
(1 002) (476) Intangible asset (476) (1 002)
4 623 (1 418) Prior period adjustment (1 418) 4 623 32 831 2 231 Movement during the year 2 056 32 831
185 380 187 611 Balance at the end of the year 187 644 185 588
Analysis of deferred taxation liability:206 177 217 679 Accelerated depreciation for tax purposes 217 712 206 385
5 178 4 528 Consumables 4 528 5 178
(15 273) (13 550) Customer deposits (13 550) (15 273)
(4 392) (14 408) Other provisions (14 408) (4 392)
(4 758) (4 584) Other leases (4 584) (4 758)
1 243 3 158 Prepayments 3 158 1 243
(5 955) (6 478) Retirement benefit obligations (6 478) (5 955)
3 160 2 684 Intangible assets 2 684 3 160
0 (1 418) Prior period adjustment (1 418) 0
185 380 187 611 187 644 185 588
The deferred tax assets and the deferred tax liability relate to income tax in the same jurisdiction, and the law allows net settlement.
Unused tax losses not recognised as deferred tax assets as a result of uncertainty with regards to the recoverability thereof amount to N$ 53.7 million (2014: N$ 35.9 million).

92
COMPANY GROUPfor the year
ended 30 June 2014
N$ 000's
for the year ended 30 June
2015
N$ 000's
for the year ended 30 June
2015
N$ 000's
for the year ended 30 June
2014
N$ 000's
17. TRADE AND OTHER PAYABLES 123 001 158 362 Trade and other payables 162 161 125 723
39 306 45 685 Excise duties 45 685 39 306
88 616 119 161 Accruals 119 332 88 623
32 010 28 195 Returnable packaging deposits 28 195 32 010
0 2 656 Value added taxation 3 301 0
3 914 4 694 Payables to related parties (Note 28) 4 694 3 914
286 847 358 753 363 368 289 576
Terms and conditions of the above financial liabilities:
For terms and conditions and balances owing to relating to related parties refer to note 28.
Trade and other payables comprise amounts outstanding for trade purchases and ongoing costs. The Directors consider the carrying amount of trade and other payables approximates their fair value.
Trade payables are non-interest bearing and are normally settled on 30-60 day terms.
Accruals relates to leave, medical, bonus, electricity and management fee accruals.
18. DERIVATIVE FINANCIAL INSTRUMENTS (680) (300) Forward foreign exchange contract liability (300) (680)
Refer to note 31.2 for details for outstanding forward exchange contracts at year end.
19. REVENUE2 311 817 2 421 961 Sale of goods 2 432 806 2 315 627
(69 752) (75 795) Discounts allowed (77 696) (71 517)
72 508 79 067 Royalty income 79 067 72 508
0 0 Rent received 0 314
2 314 573 2 425 233 2 434 177 2 316 932
The amount included in revenue arising from export sales amounts to N$ 912 million (2014: N$ 916 million).
20. OPERATING EXPENSESCosts by nature
927 394 858 531 Raw material and consumables 860 587 927 394
230 007 266 365 Employment costs 268 714 231 702
365 281 442 587 Administration and marketing expenses 448 969 367 681
174 065 177 930 Railage and transport 177 930 174 065
52 775 50 147 Repairs and maintenance 50 572 52 994
111 615 120 163 Depreciation, amortisation and impairments 120 891 111 765
1 861 137 1 915 723 1 927 663 1 865 601

93
COMPANY GROUPfor the year
ended 30 June 2014
N$ 000's
for the year ended 30 June
2015
N$ 000's
for the year ended 30 June
2015
N$ 000's
for the year ended 30 June
2014
N$ 000's
21. OPERATING PROFITis arrived at after taking account of
Income
(4 004) (2 856) Net loss on disposal of plant and equipment (2 856) (4 004)
Expenses
Audit fees
1 325 1 404 - for statutory audit 1 404 1 325
432 500 - for other services 623 432
103 676 112 089 Depreciation 112 817 103 826
4 395 3 745 Amortisation - intangible asset 3 745 4 395
7 088 6 678 Directors' emoluments (Annexure D) 6 678 7 088
26 858 46 846 Management fees 46 846 26 858
4 115 1 731 Royalties 1 731 4 115
(733) 3 158 Realised profit/(loss) on foreign exchange transactions 4 050 (733)
Operating lease payments
7 179 7 290 - land and buildings 7 479 7 324
100 1 607 Impairment of inventories 1 607 100
575 1 297 Impairment of trade receivables 1 297 1 754
0 1 425 Impairment of Non-Current Assets Held for Sale 1 425 0
0 15 405 Impairment of loans to subsidiaries 0 0
22. FINANCE COSTS 13 282 7 430 Interest bearing loans 7 455 13 282
1 628 1 377 Finance leases 1 392 1 650 14 910 8 807 Total finance costs 8 847 14 932
23. FINANCE INCOME 8 081 7 033 Interest - bank and funds on call 7 137 8 114
4 224 14 863 - jointly controlled entities 14 863 4 224
0 0 - holding company, fellow subsidiaries and other related parties 0 0
12 305 21 896 Total finance income 22 000 12 338

94
COMPANY GROUPfor the year
ended 30 June 2014
N$ 000's
for the year ended 30 June
2015
N$ 000's
for the year ended 30 June
2015
N$ 000's
for the year ended 30 June
2014
N$ 000's
24. INCOME TAX EXPENSE
The major components of income tax expense for the years ended 30 June 2015 and 2014 are:
(102 536) (113 963) Namibian taxation (113 968) (102 578)
(20 289) (22 124) South African taxation (22 124) (20 289)
(122 825) (136 087) Total income tax expense in income statement (136 092) (122 867)
Comprising
(69 705) (111 733) Normal taxation - current period: Namibia (111 911) (69 747)
(20 289) (22 124) - current period: South Africa (22 124) (20 289)
(32 831) (2 230) Deferred taxation - current period: Namibia (2 057) (32 831)
(122 825) (136 087) Income tax expense (136 092) (122 867)
No provision for normal taxation has been made for certain subsidiaries which have estimated tax losses of N$53.8 million (2014: N$35.9 million). No deferred tax asset has been recognised for these calculated tax losses as it is uncertain that future taxable profits will be available against which the associated unused tax losses can be utilised.
Estimated tax losses available for
0 0 Set-off against future taxable income 53 776 35 916
0 0 Less: Applied to offset any deferred taxation liability 0 0
0 0 Utilised to create deferred tax asset 53 776 35 916
0 0 Available to reduce future taxable income 53 776 35 916
% Reconciliation of effective tax rate %
33.0 33.0 Namibian normal tax rate 33.0 33.0
(Reduction)/ increase in rate of taxation
(7.1) (9.2) - manufacturing allowances (9.3) (6.9)
0.1 1.2 - disallowable expenditure 0.1 0.0
(1.1) (1.0) - effect of rate differential between tax jurisdictions (1.2) (1.1)
12.4 10.2 - impairment of investment in joint venture 0.0 0.0
0.0 0.0 - equity loss in joint venture 10.4 12.4
0.0 0.0 - deferred tax asset not recognised 1.5 0.0
37.2 34.2 Effective rate of taxation 34.4 37.4

95
COMPANY GROUPfor the year
ended 30 June 2014
N$ 000's
for the year ended 30 June
2015
N$ 000's
for the year ended 30 June
2015
N$ 000's
for the year ended 30 June
2014
N$ 000's
25. BASIC AND HEADLINE EARNINGS PER ORDINARY SHAREBasic earnings per share amounts are calculated by dividing profit for the year attributable to ordinary equity holders of the parent by weighted average number of ordinary shares outstanding during the year.
Calculation of weighted average number of shares for basic earnings per share and dilutive earnings per share:
206 529 206 529 Shares issued at beginning of period 206 529 206 529
206 529 206 529 Weighted average number of shares 206 529 206 529
Profit attributable to ordinary shareholders 258 982 205 529
Accumulated equity accounted losses from ongoing operations 124 593 120 341
Net loss on the sale of property, plant and equipment (after tax) 1 914 2 682
Impairment loss on Non-Current Assets Held for Sale (after tax) 955 0
Headline earnings 386 444 328 552
25.1 Basic earnings per ordinary share (cents) 207 665 261 919 Profit attributable to ordinary shareholders 258 982 205 529
206 529 206 529 Weighted number of shares in issue (000's) 206 529 206 529
100.6 126.8 Basic earnings per ordinary share (cents) 125.4 99.5
25.2 Headline earnings per ordinary share (cents)Headline earnings 386 444 328 552
Weighted average number of shares in issue (000's) 206 529 206 529
Headline earnings per ordinary share (cents) 187.1 159.1
26. DIVIDENDS PAID AND PROPOSEDIn respect of the 2015 financial year
0 76 416 - interim (37 cents per share, paid 8 May 2015) 76 416 0
0 0 - final (37 cents per share, proposed) 0 0
In respect of the 2014 financial year
70 220 0 - interim (34 cents per share, paid 9 May 2014) 0 70 220
0 70 220 - final (34 cents per share, paid 21 November 2014) 70 220 0
In respect of the 2013 financial year
0 0 - interim (31 cents per share, paid 10 May 2013) 0 0
64 024 0 - final (31 cents per share, paid 23 November 2013) 0 64 024
134 244 146 636 Dividends to equity holders 146 636 134 244
Dividend paid per ordinary share
31.0 34.0 Final dividend (cents) 34.0 31.0
34.0 37.0 Interim dividend (cents) 37.0 34.0
65.0 71.0 71.0 65.0

96
COMPANY GROUPfor the year
ended 30 June 2014
N$ 000's
for the year ended 30 June
2015
N$ 000's
for the year ended 30 June
2015
N$ 000's
for the year ended 30 June
2014
N$ 000's
26. DIVIDENDS PAID AND PROPOSED (Continued)
Proposed dividend
70 220 76 416
On 19 August 2015 the directors declared a final dividend of 37 cents (20 August 2014: 34 cents) per ordinary share. This dividend will be paid on 13 November 2015. 76 416 70 220
27. NOTES TO THE CASH FLOW STATEMENTS27.1 Cash generated by operations
330 490 398 006 Profit before income tax 395 074 328 396
Adjustments for:
103 676 112 089 Depreciation 112 817 103 826
4 395 3 745 Amortisation 3 745 4 395
4 004 2 856 Loss on disposal of property, plant and equipment 2 856 4 004
723 0 Net impairment (reversals)/losses 0 723
(899) 1 584 Increase/ (decrease) in provisions 1 584 (899)
120 341 124 593 Impairment of investment in joint venture 0
0 0 Accumulated equity accounted losses from on-going operations 124 593 120 341
0 15 405 Impairment loss on subsidiary loans 0 0
0 1 425 Impairment loss on Non-Current Assets Held for Sale 1 425 0
0 2 081 Accrued interest on DHN loan 2 081 0
(12 305) (21 896) Finance income (22 000) (12 338)
14 910 8 807 Finance costs 8 847 14 932
565 335 648 695 Operating profit before working capital changes 631 022 563 380
77 084 (17 797) Inventories (17 036) 76 319
(17 615) 51 689 Trade and other receivables 48 161 (18 629)
(120 516) 71 907 Trade and other payables 74 334 (118 433)
504 288 754 494 Cash generated by operations 736 481 502 637
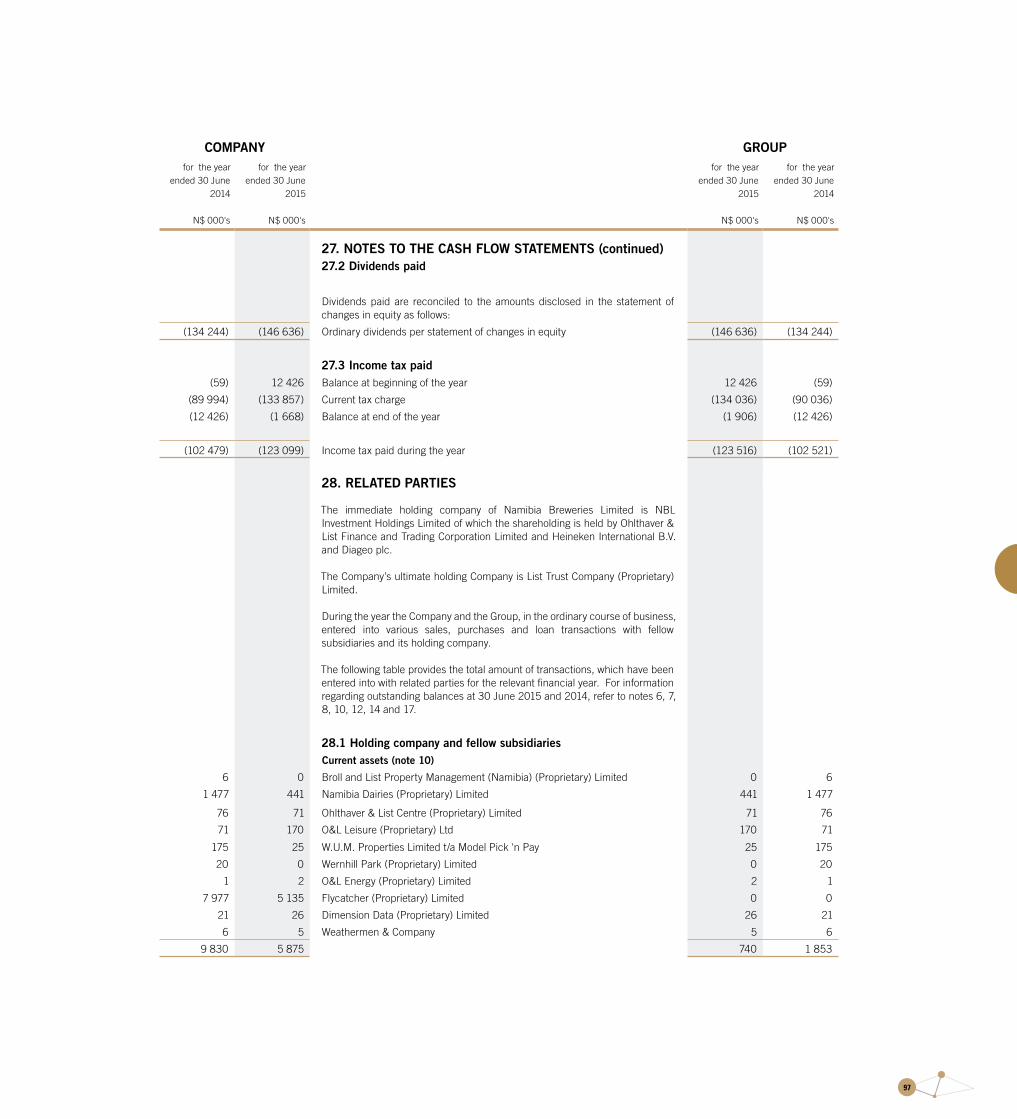
97
COMPANY GROUPfor the year
ended 30 June 2014
N$ 000's
for the year ended 30 June
2015
N$ 000's
for the year ended 30 June
2015
N$ 000's
for the year ended 30 June
2014
N$ 000's
27. NOTES TO THE CASH FLOW STATEMENTS (continued)27.2 Dividends paid
Dividends paid are reconciled to the amounts disclosed in the statement of changes in equity as follows:
(134 244) (146 636) Ordinary dividends per statement of changes in equity (146 636) (134 244)
27.3 Income tax paid (59) 12 426 Balance at beginning of the year 12 426 (59)
(89 994) (133 857) Current tax charge (134 036) (90 036)
(12 426) (1 668) Balance at end of the year (1 906) (12 426)
(102 479) (123 099) Income tax paid during the year (123 516) (102 521)
28. RELATED PARTIES
The immediate holding company of Namibia Breweries Limited is NBL Investment Holdings Limited of which the shareholding is held by Ohlthaver & List Finance and Trading Corporation Limited and Heineken International B.V. and Diageo plc.
The Company’s ultimate holding Company is List Trust Company (Proprietary) Limited.
During the year the Company and the Group, in the ordinary course of business, entered into various sales, purchases and loan transactions with fellow subsidiaries and its holding company.
The following table provides the total amount of transactions, which have been entered into with related parties for the relevant financial year. For information regarding outstanding balances at 30 June 2015 and 2014, refer to notes 6, 7, 8, 10, 12, 14 and 17.
28.1 Holding company and fellow subsidiariesCurrent assets (note 10)
6 0 Broll and List Property Management (Namibia) (Proprietary) Limited 0 6
1 477 441 Namibia Dairies (Proprietary) Limited 441 1 477
76 71 Ohlthaver & List Centre (Proprietary) Limited 71 76
71 170 O&L Leisure (Proprietary) Ltd 170 71
175 25 W.U.M. Properties Limited t/a Model Pick 'n Pay 25 175
20 0 Wernhill Park (Proprietary) Limited 0 20
1 2 O&L Energy (Proprietary) Limited 2 1
7 977 5 135 Flycatcher (Proprietary) Limited 0 0
21 26 Dimension Data (Proprietary) Limited 26 21
6 5 Weathermen & Company 5 6
9 830 5 875 740 1 853

98
COMPANY GROUPfor the year
ended 30 June 2014
N$ 000's
for the year ended 30 June
2015
N$ 000's
for the year ended 30 June
2015
N$ 000's
for the year ended 30 June
2014
N$ 000's
28. RELATED PARTIES (Continued)28.1 Holding company and fellow subsidiaries (Continued)Revenue
Sales during the year
135 78 Broll and List Property Management (Namibia) (Proprietary) Limited 78 135
41 3 Hangana Seafood (Proprietary) Limited 3 41
208 22 Weathermen & Co Advertising (Proprietary) Limited 22 208
2 0 Kraatz Marine (Proprietary) Limited 0 2
2 620 3 372 Namibia Dairies (Proprietary) Limited 3 372 2 620
440 599 O&L Leisure (Proprietary) Limited 599 440
391 290 Ohlthaver & List Centre (Proprietary) Limited 290 391
0 0 Olifa Hotels & Resorts Namibia (Pty) Limited 0 0
70 72 Wernhill Park (Proprietary) Limited 72 70
5 10 O&L Energy (Proprietary) Limited 10 5
0 0 W.U.M. Properties Limited t/a Kraatz Steel Division 0 0
288 398 W.U.M. Properties Limited t/a Model Pick ‘n Pay 398 288
0 0 W.U.M. Properties Limited t/a Namib Sun Hotels 0 0 4 200 4 844 4 844 4 200
Rent received
0 0 W.U.M. Properties Limited t/a Model Pick 'n Pay 0 395
4 200 4 844 Total Revenue from related parties 4 844 4 595
Current liabilities (note 17)
641 79 Dimension Data (Proprietary) Limited 79 641
0 0 Hangana Seafood (Proprietary) Limited 0 0
238 124 ICT Holdings (Proprietary) Limited 124 238
4 1 626 Namibia Dairies (Proprietary) Limited 1 626 4
1 411 1 395 Ohlthaver & List Centre (Proprietary) Limited 1 395 1 411
0 0 Broll and List Property Management (Namibia) (Proprietary) Limited 0 0
1 565 1 186 Weathermen & Co Advertising (Proprietary) Limited 1 186 1 565
0 0 O&L Energy (Proprietary) Limited 0 0
46 231 Kraatz Marine (Proprietary) Limited 231 46
0 0 W.U.M. Properties Limited t/a Namib Sun Hotels 0 0
9 53 W.U.M. Properties Limited t/a Model Pick 'n Pay 53 9
3 914 4 694 4 694 3 914
Purchases during the year
435 547 Eros Air (Proprietary) Limited 547 435
1 240 1 300 ICT Holdings (Proprietary) Limited 1 300 1 240
36 1 414 Namibia Dairies (Proprietary) Limited 1 414 36
17 246 O&L Leisure (Proprietary) Limited 246 17
0 0 W.U.M. Properties Limited t/a Namib Sun Division 0 0
303 1 568 Kraatz Marine (Proprietary) Limited 1 568 303
5 814 15 755 Weatherman & Co Advertising (Proprietary) Limited 15 755 5 814
0 0 W.U.M. Properties Limited t/a O&L Properties Division 0 0
161 178 W.U.M. Properties Limited t/a Model Pick 'n Pay 178 161
8 006 21 008 21 008 8 006

99
Key management personnel
Key management are the directors of the group. For Directors emoluments refer to Annexure D.
Interest paid
0 3 O&L Centre (Proprietary) Limited 3 0
0 3 3 0
Management and shared service fees paid
20 844 40 320 Ohlthaver & List Trust Company Limited 40 320 20 844
Directors’ fees
380 360 Ohlthaver & List Trust Company Limited 360 380
28.2 Other related partiesManagement fees paid
3 007 3 263 Diageo Plc 3 263 3 007
3 007 3 263 Heineken International B.V. 3 263 3 007
6 014 6 526 6 526 6 014
Royalties received
72 507 79 067 DHN Drinks (Proprietary) Limited 79 067 72 507
Sales
885 128 912 228 DHN Drinks (Proprietary) Limited 912 228 885 128
0 0 Diageo Great Britain Limited 0 0
36 870 0 Diageo South Africa (Proprietary) Limited 0 36 870
108 078 26 089 Heineken South Africa Export Company (Proprietary) Limited 26 089 108 078
1 030 076 938 317 938 317 1 030 076
Royalty expense
4 115 1 731 Heineken International B.V. 1 731 4 115
Directors’ fees
135 125 Engling, Stritter & Partners 125 135
275 225 Diageo Plc 225 275
225 190 Heineken International B.V. 190 225
635 540 540 635
Current assets (note 10)
11 138 323 Heineken South Africa Export Company (Proprietary) Limited 323 11 138
11 138 323 323 11 138
COMPANY GROUPfor the year
ended 30 June 2014
N$ 000's
for the year ended 30 June
2015
N$ 000's
for the year ended 30 June
2015
N$ 000's
for the year ended 30 June
2014
N$ 000's
28. RELATED PARTIES (Continued)28.1 Holding company and fellow subsidiaries (Continued)
Interest received
483 249 O&L Centre (Proprietary) Limited 249 483
4 224 14 863 DHN Drinks (Proprietary) Limited 14 863 4 224
4 707 15 112 15 112 4 707

100
COMPANY GROUPfor the year
ended 30 June 2014
N$ 000's
for the year ended 30 June
2015
N$ 000's
for the year ended 30 June
2015
N$ 000's
for the year ended 30 June
2014
N$ 000's
28. RELATED PARTIES (Continued)28.2 Other related parties (Continued)Legal fees
6 997 859 Engling, Stritter & Partners 859 6 997
Subsidiaries
Details of the subsidiaries are disclosed in Annexure C.
Joint Venture
Details of the Joint Venture are disclosed in note 7.
Retirement benefit information and post employment medical aid benefit plan
Details of the above are disclosed in note 15.
Terms and conditions of transactions with related parties
The sales to and purchases from related parties are made at normal market prices. Outstanding balances at year-end are unsecured, on 30-90 day terms, interest free and settlement occurs in cash. For the year ended 30 June 2015, the Company impaired an amount of N$ 15.4 million (2014: N$ nil) with respect to a loan advanced to a subsidary. Also refer to Note 7.
Directors’ interest
At the financial year end the directors were directly interested in the Groupsissued shares as follows:
% %
Ordinary shares
Directly 0.07 0.07
0.07 0.07
No individual director has a direct shareholding in excess of 1% of the issued shares of the Company.
The Company has not been informed of any material changes in these holdings between year end and the date of this report.

101
COMPANY GROUPfor the year
ended 30 June 2013
N$ 000's
for the year ended 30 June
2014
N$ 000's
for the year ended 30 June
2014
N$ 000's
for the year ended 30 June
2013
N$ 000's
29. CAPITAL COMMITMENTS AND CONTINGENCIESAuthorised
18 657 55 883 Contracted for 55 883 18 657
205 125 248 117 Not contracted for 248 117 205 125
223 782 304 000 304 000 223 782
These capital commitments are mainly for the acquisition of new plant and machinery.
This proposed capital expenditure above is to be financed by own funds, and is expected to be settled in the following year. This excludes amounts related to the agreement with regards to DHN and Sedibeng disclosed in Note 32.
6 500 5 675 Guarantees and suretyship 5 675 6 500
The suretyships are issued by First Rand Bank Limited in favour of the South African Revenue Services.
Finance lease liabilitiesThe Group has entered into finance leases on certain motor vehicles. These leases have fixed terms of repayment and purchase options. Lease payments are linked to prime variable interest rates. Future minimum lease payments under finance leases together with the present value of the net minimum lease payments are as follows:
Minimum lease payments
6 867 6 712 Within one year 6 819 6 867
9 615 14 754 After one year but not more than five years 14 763 9 615
16 482 21 466 Total minimum lease payments 21 582 16 482
(2 064) (2 044) Less amounts representing finance charges (2 050) (2 064)
14 418 19 422 Principal minimum lease payments 19 532 14 418
Joint Venture - proposed transaction (note 5) A potential repurchase obligation exists relating to the Group’s Joint Venture in South Africa. The potential obligation arises from a change in product mix or the Joint Venture agreement terminating, necessitating a repurchase of the distribution rights by the Group. The Directors are of the opinion that in substance this obligation is derivative of a non-financial asset and as such is assessed in terms of IAS 37: Provisions, Contingent Liabilities and Contingent Assets. The obligation only arises upon termination of the agreement and, in the opinion of the Directors cannot be reliably measured at the reporting date. The agreement concluded subsequent to year end will not result in the repurchase obligation being triggered.

102
30. FINANCIAL RISK MANAGEMENT OBJECTIVES AND POLICIES
The Group’s principal financial instruments, other than derivatives, comprise bank loans, loans to and from holding company and fellow subsidiaries, leases and cash and short term deposits. The main purpose of these financial instruments is to raise finance for the Group’s operations. The Group has various other financial assets and liabilities such as trade receivables and trade payables, which arise directly from its operations.
The Group also enters into derivative transactions such as forward exchange contracts. The reason for this is to manage the currency risk from the Group’s operations. As a matter of principle, the Group does not enter into derivative contracts for speculative purposes.
The fair value of foreign exchange forward contracts represents the estimated amounts that the company would receive, should the contracts be terminated at the reporting date, thereby taking into account the unrealised gains or losses. The main risks arising from the Group’s financial instruments are interest rate risk, liquidity risk, foreign currency risk and credit risk. The board reviews and agrees policies for managing each of these risks. 30.1 Foreign currency risk The Group has transactional currency exposures. Such exposures arise from purchases of raw materials and sales of the Group’s products in a currency other than the Group’s functional currency. The Group appropriately hedges foreign purchases in order to manage its foreign currency exposure. The Group does not apply hedge accounting. Forward exchange contracts are entered into in order to manage the Group’s exposure to fluctuations in foreign currency exchange rates on foreign transactions. Refer note 31.2 for unutilised forward exchange contracts and uncovered foreign trade receivables and payables at year end. 30.2 Interest rate riskThe Group is exposed to interest rate risk as it borrows and places funds at floating interest rates. The risk is managed by maintaining an appropriate mix between fixed and floating borrowings and placings within market expectations.
Refer to Annexure A and note 31.3 for further detail on interest rates.
30.3 Credit risk Financial assets which potentially subject the Group to a concentration of credit risk consist principally of cash, funds on call and trade receivables. The Group’s cash equivalents and funds on call are placed with high credit quality financial institutions. Trade receivables are stated at their cost less impairment losses. The Group’s single largest customer is DHN Drinks (Pty) Ltd. The Group has no significant concentration of credit risk or significant exposure to any individual customer or counterparty.
The Group’s exposure to credit risk arises from default of the counterparty, with a maximum exposure equal to the carrying amount of these instruments. In respect of possible default by a counterparty, the Group holds collateral as security in the amount of N$ Nil (2014: Nil). Management monitors adherence to payment terms by the joint venture, on a monthly basis. Financial performance and projected cash flows of the joint venture are monitored on a monthly basis to ensure recoverability of all amounts. The granting of credit is made on application and is approved by management. At year-end the company did not consider there to be any significant concentration of credit risk or significant exposure to any individual customer or counter party which has not been adequately provided for.

103
COMPANY GROUPfor the year
ended 30 June 2014
N$ 000's
for the year ended 30 June
2015
N$ 000's
for the year ended 30 June
2015
N$ 000's
for the year ended 30 June
2014
N$ 000's
30. FINANCIAL RISK MANAGEMENT OBJECTIVES AND POLICIES (Continued)30.3 Credit risk (Continued)
Financial assets exposed to credit risk at year end were as follows:
49 284 260 557 Cash and cash equivalents 264 219 55 941
167 626 66 905 Loans to related parties 63 974 160 070
14 15 Unlisted investments 15 14
162 501 174 756 Trade and other receivables 173 275 163 567
Major concentrations of credit risk that arise from the Group’s receivables in relation to the location of the customers by the percentage of total receivables from customers are:
Trading Industry % %
Namibia 59.60 45.70
South Africa 28.90 44.40
Other export markets 11.50 9.90
100.00 100.00
As at 30 June, the ageing of trade receivables is as follows:
30.4 Liquidity risk
The Group manages liquidity risk by monitoring forecast cash flows and ensuring that adequate unutilised borrowing facilities are maintained. Borrowing capacity is assessed by the directors of the Company. The Directors have re-evaluated the Company’s risk appetite and in the current year consider a ratio of not higher than 75% of shareholders' equity as appropriate.
466 283 785 887 75% (2014:50%) of Shareholder's Equity 783 074 465 815
(115 286) (120 257) Less total interest bearing borrowings (119 532) (114 608)
350 997 665 630 Unutilised borrowing capacity 663 542 351 207
Original terms Changed terms Past due but not impaired
Neither past due Neither past due
Total nor impaired nor impaired 0 - 60 days 60 - 120 days 120 + days
GROUP N$'000 N$'000 N$’000 N$'000 N$'000 N$'000
2015 235,389 178,209 0 22,259 6,353 28,5682014 323,074 169,570 0 72,473 48,764 32,267
COMPANY2015 239,801 182,621 0 22,259 6,353 28,5682014 329,564 176,060 0 72,473 48,764 32,267

104
COMPANY GROUPfor the year
ended 30 June 2014
N$ 000's
for the year ended 30 June
2015
N$ 000's
for the year ended 30 June
2015
N$ 000's
for the year ended 30 June
2014
N$ 000's
30. FINANCIAL RISK MANAGEMENT OBJECTIVES AND POLICIES (Continued)30.5 Capital risk managementThe Company and Group manages its capital to ensure that entities in the group will be able to continue as a going concern while maximising the return to stakeholders through the optimisation of the debt and equity balance. The company’s and group’s overall strategy remains unchanged from the prior year.
The capital structure of the company and group consists of debt, which includes the borrowings disclosed in note 14, cash and cash equivalents and equity attributable to equity holders of the parent, comprising issued capital reserves and retained earnings. Gearing ratioThe Company’s and Group’s management committee reviews the capital structure on a semi-annual basis. Consistent with others in the industry, the group monitors capital on the basis of the gearing ratio. This ratio is calculated as net debt divided by total capital. Net debt is calculated as total borrowings less cash and cash equivalents. Total capital is calculated as ‘equity’ as shown in the consolidated balance sheet plus net debt.
The gearing ratio at the year end was as follows:
115 286 120 257 Debt (i) 119 532 114 608
(49 284) (260 557) Less: Cash and cash equivalents (264 219) (55 941)
66 002 (140 300) Net debt (144 687) 58 667
932 566 1 047 849 Equity (ii) 1 044 099 931 630
7% (13%) Net debt to equity ratio (14%) 6%
(i) Debt is defined as long- and short-term borrowings.
(ii) Equity includes all capital and reserves of the company.
31. FINANCIAL INSTRUMENTS31.1 Fair values
The fair value of all financial instruments are substantially identical to the carrying amounts reflected in the balance sheet. Fair value hierarchyThe tabel below analyses assets and liabilities carried at fair value. The different levels are defined as follows:Level 1: Quoted unadjusted prices in active markets for identical assets or liabilities that the group can access at measurement date.Level 2: Inputs other than quoted prices included in level 1 that are observable for the asset or liability either directly or indirectly.Level 3: Unobservable inputs for the asset or liability.
Level 2LiabilitiesFinancial liabilities at fair value through profit or loss
680 300 Forward foreign exchange liability 300 680
Level 3
Non-recurring fair value measurements
Assets held for sale in accordance with IFRS 5
5 925 4 500 Non-current assets held for sale 4 500 5 925
Transfers of assets and liabilities within levels of fair value hierarchyThere are no transfers between level 1 and level 2 for the year ended 30 June 2015 and for the year ended 30 June 2014.

105
COMPANY GROUPfor the year
ended 30 June 2014
N$ 000's
for the year ended 30 June
2015
N$ 000's
for the year ended 30 June
2015
N$ 000's
for the year ended 30 June
2014
N$ 000's
31. FINANCIAL INSTRUMENTS (continued)31.2 Hedging activities and foreign currency risk (continued)
The Group is primarily exposed to the currency of the European Central Bank (Euro) and secondly to currency of the United States of America (US Dollar). The following table details the company’s sensitivity to a 10% increase and decrease in the Namibia Dollar (N$) against the relevant foreign currencies. 10% is the sensitivity rate used when reporting foreign currency risk internally to key management personnel an represents management’s assessment of the reasonably possible change in foreign exchange rates. Below, a positive number indicates an increase in profit, a negative number indicates a decrease in profit based on the Namibia Dollar strengthening 10% against the relevant currency. For a 10% weakening of the Namibia Dollar against the relevant currency, there would be an equal and opposite impact on the profit and other equity.
Effect on profit before taxation
(141) (1 469) Euro (1 469) (141)
2 23 British Sterling 23 2
554 1 618 US Dollars 1 618 554
14 0 Canadian Dollars 0 14
429 172 172 429
0 0 Effect on equity 0 0
31. FINANCIAL INSTRUMENTS (Continued)31.2 Hedging activities and foreign currency risk
Forward exchange contracts are entered into with banks but are not designated as hedges for specific purchases. If contract rates are more favourable than the spot rate, on the date of payment of foreign creditors, they will be used. The maturity date represents the date when the contract must be exercised if it is not exercised before this date. The following table summarises, by major currency, the unutilised forward exchange contracts and amounts to be paid/ received in foreign currency, for the Group and Company:
Maturity date Foreign amount Average rate Namibian Dollar amount
2015 2014 2015 2014 2015 2014
'000 '000 N$ '000 N$ '000
Forward exchange contracts:Bought:Euro 1 - 12 months 1 288 1 200 13.97 15.73 17 999 18 876
Foreign trade receivables:US Dollars 1 318 534 12.28 10.38 16 181 5 543Euro 0 19 13.62 14.45 0 275
British SterlingCanada Dollar-denominated receivables
12 12 19.30 17.36 233 2080 15 9.56 9.56 0 143
Botswana Pula 1 764 1.21 2 135 0
18 549 6 169
Foreign trade payables:Euro 1 078 117 13.62 14.45 14 686 1 691British Sterling 0 11 19.30 0 0 191
14 686 1 882

106
31. FINANCIAL INSTRUMENTS (Continued)31.3 Maturity profile
The following tables detail the Group and Company's remaining contractual maturity for its financial liabilities and assets. The tables have been drawn up based on the undiscounted cash flows based on the earliest date on which the Group and Company can be required/anticipate to incur and outflow/inflow. The table includes both interest and principal cash flows.
Effective interest rate
1 year 2 years 3-5 years 5 years + Total
N$ '000 N$ '000 N$ '000 N$ '000 N$ '000
2015 - GroupFinancial assetsCash and cash equivalents 6.75% 264 219 0 0 0 264 219Derivative financial instruments 0.00% 0 0 0 0 0Loans to joint venture JIBAR +2.0% 28 325 0 0 28 325Trade and other receivables 0.00% 278 472 0 0 0 278 472
Available -for-sale investments 0.00% 0 0 0 15 15
571 016 0 0 15 571 031
Financial liabilities
Interest-bearing liabilities Ref. Anex. A 105 711 4 702 9 119 0 119 532
Non-interest-bearing liabilities 0.00% 0 0 0 0 0
Trade and other payables 0.00% 195 050 0 0 0 195 050
Derivative financial instruments 0.00% 300 0 0 0 300
301 061 4 702 9 119 0 314 882
1 year 2 years 3-5 years 5 years + Total
2014 - GroupFinancial assetsCash and cash equivalents 6.75% 55 941 0 0 0 55 941Derivative financial instruments 0.00% 0 0 0 0 0Loans to joint venture JIBAR +2.0% 0 0 0 0 0Trade and other receivables 0.00% 341 899 0 0 0 341 899
Available -for-sale investments 0.00% 0 0 14 14
397 840 0 0 14 397 854
Financial liabilities
Interest-bearing liabilities Ref. Anex. A 105 822 4 225 4 561 0 114 608
Non-interest-bearing liabilities 0.00% 0 0 0 0 0
Derivative financial instruments 0.00% 680 0 0 0 680
Trade and other payables 0.00% 161 647 0 0 0 161 647
268 149 4 225 4 561 0 276 935

107
31. FINANCIAL INSTRUMENTS (Continued)31.3 Maturity profile (Continued)
Effective interest rate
1 year 2 years 3-5 years 5 years + Total
N$ '000 N$ '000 N$ '000 N$ '000 N$ '000
2015 - CompanyFinancial assets
Cash and cash equivalents 6.75% 260 557 0 0 0 260 557
Derivative financial instruments 0.00% 0 0 0 0 0
Loans to joint venture JIBAR +2.0% 28 325 0 0 0 28 325
Trade and other receivables 0.00% 282 396 0 0 0 282 396
Available -for-sale investments 0.00% 0 0 0 15 15
571 278 0 0 15 571 293
Financial liabilities
Interest-bearing liabilities Ref. Anex. A 106 446 4 692 9 119 0 120 257
Trade and other payables 0.00% 191 251 0 0 0 191 251
Derivative financial instruments 300 0 0 0 300
297 997 4 692 9 119 0 311 808
2014 - CompanyFinancial assets
Cash and cash equivalents 6.75% 49 284 0 0 0 49 284
Derivative financial instruments 0.00% 0 0 0 0 0
Loans to joint venture JIBAR +2.0% 0 0 0 0 0
Trade and other receivables 0.00% 348 389 0 0 0 348 389
Available -for-sale investments 0.00% 0 0 0 14 14
397 673 0 0 14 397 687
Financial liabilities
Interest-bearing liabilities Ref. Anex. A 106 614 4 111 4 561 0 115 286
Trade and other payables 0.00% 158 925 0 0 0 158 925
Derivative financial instruments 680 0 0 0 680
266 219 4 111 4 561 0 274 891
For Interest rate sensitivity analysis Refer to Annexure A.

108
COMPANY GROUPfor the year
ended 30 June 2014
N$ 000's
for the year ended 30 June
2015
N$ 000's
for the year ended 30 June
2015
N$ 000's
for the year ended 30 June
2014
N$ 000's
31. FINANCIAL INSTRUMENTS (Continued)
31.4 Carrying value of financial instruments
Financial assets
0 28 325 - Loans to joint venture (Note 7) 28 325 0
348 389 282 396 - Trade and other receivables (note 10) 278 472 341 899
49 284 260 557 - Cash and cash equivalents (note 11) 264 219 55 941
397 673 571 278 571 016 397 840
Available-for-sale financial assets
14 15 - Available-for-sale investments (note 9) 15 14
Financial liabilities
Derivative instruments at fair value through profit or loss
680 300 - Forward foreign exchange contracts (note 19) 300 680
Amortised cost
158 925 191 251 - Trade and other payables (note 18) 195 050 161 647
115 286 120 257 - Interest bearing loans and borrowings (note 14) 119 532 114 608
274 211 311 508 314 582 276 255
Fair values of financial instruments that are not the same as the carrying amounts are detailed in note 31.1.
32. EVENTS AFTER THE REPORTING PERIOD
On 27 July 2015, Namibia Breweries Limited entered into an agreement to acquire 25% of the issued share capital of Sedibeng Brewing (Pty) Ltd and an additional 9.5% of the issued share capital of DHN Drinks (Pty) Ltd from Diageo Highlands Holdings B.V. The total estimated investment required is N$610 million, which will be financed out of operations and by way of a medium term loan.
The transaction is a non-adjusting subsequent event, having been confirmed after the financial year end, but before the financial statements were authorised for issue. The resulting effects have not been adjusted in the figures presented. As part of the financing agreement, inventories, trade receivables and property, plant and equipment may be encumbered.
The directors are not aware of any other significant events subsequent to the reporting date, other than as indicated above.

109
BEER SOFTS READY-TO-DRINK OTHER TOTAL2015
N$ 000's
2014
N$ 000's
2015
N$ 000's
2014
N$ 000's
2015
N$ 000's
2014
N$ 000's
2015
N$ 000's
2014
N$ 000's
2015
N$ 000's
2014
N$ 000's
Division revenue 2 266 443 2 105 731 133 911 121 247 29 146 82 808 4 677 7 146 2 434 177 2 316 932
Division expenses 1 766 701 (1 677 423) 136 461 (115 315) 21 006 (68 732) 3 495 (4 131) (1 927 663) (1 865 601)
22% 20% 2% 5% 28% 17%
Division results 499 742 428 308 (2 550) 5 932 8 140 14 076 1 182 3 015 506 514 451 331
Unallocated corporate expenses 0 0
Operating profit 506 514 451 331
Finance costs (8 847) (14 932)
Finance income 22 000 12 338 Equity loss from Joint Venture (124 593) ( 120 341)
Profit before taxation 395 074 328 396
Taxation (136 092) (122 867)Profit attributable to ordinary shareholders
258 982 205 529
33. DIVISIONAL REPORTING
The Chief Operating Decision Maker reviews the financial results of the Group as a whole. Therefore the Group, in terms of IFRS 8, only has one segment. Further divisional information has been provided as additional information.
Information about these divisions is presented below:

110
EFFECTIVE INTEREST RATE COMPANY GROUP
2015%
2014%
Maturitydate
2015N$ 000's
2014N$ 000's
2015N$ 000's
2014N$ 000's
PREFERENCE SHARE CAPITALAuthorised
1 000 000 Variable rate redeemable preference shares of N$0.50 each 500 500 500 500
LOANS FROM RELATED PARTIESFixed rate instruments - Northgate Properties (Proprietary) Limited 0.00 0.00 835 868 0 0
Less: Current portion included in short-term interest-bearing borrowings (835) (868) 0 0
Long-term portion of loans from related parties 0 0 0 0
MEDIUM TERM LOANVariable rate instruments
- FirstRand Bank Limited repayable in 3 equal quarterly instalments of R26 666 667 commencing in September 2013. JIBAR +1.85% 01/06/2015 100 000 100 000 100 000 100 000
Less: Current portion included in short-term interest-bearing borrowings (100 000) (100 000) (100 000) (100 000)
Long-term portion of medium term loans 0 0 0 0
FINANCE LEASE LIABILITIESVariable rate instruments - Repayable in monthly instalments of N$500 000 (2014: N$565 000) 9.75 9.75 19 422 14 418 19 532 14 608
Less: Current portion included in short-term interest-bearing borrowings (5 611) (5 746) (5 711) (5 822)
Long-term portion of finance lease liabilities 13 811 8 672 13 821 8 786
TOTAL NON-CURRENT INTEREST-BEARING BORROWINGS 13 811 8 672 13 821 8 786
ANNEXURE ASECURED INTEREST-BEARING LOANS AND BORROWINGS

111
COMPANY GROUP
2015N$ 000's
2014N$ 000's
2015N$ 000's
2014N$ 000's
ANALYSIS OF REPAYMENTS INCLUDING INTERESTRepayable within:
year 1 105 611 105 746 105 711 105 822
year 2 4 692 4 111 4 702 4 225
year 3 2 383 3 461 2 383 3 461
year 4 1 079 1 011 1 079 1 011
Repayable thereafter 5 657 89 5 657 89
119 422 114 418 119 532 114 608
ANALYSIS BY CURRENCYSouth Africa Rands 100 000 100 000 100 000 100 000
Namibia Dollars 19 422 14 418 19 422 14 418
Botswana Pula 0 0 110 190
INTEREST RATE SENSITIVITY ANALYSIS
The sensitivity analyses have been determined based on the exposure to interest rates for non-derivative instruments at the balance sheet date. For variable rate liabilities, the analysis is prepared assuming the amount of liability outstanding at the balance sheet date was outstanding for the whole year. A 100 basis point increase or decrease represents management’s assessment of the reasonably possible change in interest rates. If interest rates had been 100 basis points higher or lower and all other variables were held constant:
Interest received:
- profit before tax for the year would decrease/increase by: 2 766 2 766 2 766 2 766
- other equity reserves would decrease/increase by: 0 0 0 0
Interest paid
- profit before tax for the year would decrease/increase by: (1 986) (1 986) (1 986) (1 986)
- other equity reserves would decrease/increase by: 0 0 0 0
ANNEXURE ASECURED INTEREST-BEARING LOANS AND BORROWINGS (CONT.)

112
Freeholdland and buildingsN$ 000's
Leaseholdland and buildingsN$ 000's
Plant andmachineryN$ 000's
VehiclesN$ 000's
Furniture and
equipmentN$ 000's
ReturnablecontainersN$ 000's
Assets underconstruction
N$ 000'sTotal
N$ 000's
GROUP
2015Cost
Balance at beginning of the year 176 931 6 050 960 790 65 069 46 669 206 059 9 227 1 470 795
Additions 7 438 0 40 096 15 194 3 794 39 942 8 601 115 065
Disposals 0 0 (11 700) (6 002) (211) (38 078) (908) (56 899)
Breakages and write-offs 0 0 0 0 0 0 0 0
Other movements 101 0 4 885 0 0 0 (5 878) (892)
Balance at end of the year 184 470 6 050 994 071 74 261 50 252 207 923 11 042 1 528 069
Accumulated depreciation
Balance at beginning of the year 28 392 3 665 388 602 37 859 30 788 106 557 0 595 863
Depreciation charges 854 1 088 60 334 10 171 4 688 35 682 0 112 817
Accumulated depreciation on disposals 0 0 (10 786) (3 711) (207) (37 040) 0 (51 744)
Balance at end of the year 29 246 4 753 438 150 44 319 35 269 105 199 0 656 936
Carrying amount at end of the year 155 224 1 297 555 921 29 942 14 983 102 724 11 042 871 133
2014Cost
Balance at beginning of the year 144 154 6 050 878 830 62 723 43 480 168 605 35 628 1 339 470
Additions 29 917 0 14 969 12 485 2 062 43 060 81 688 184 181
Disposals (120) 0 (17 778) (19 117) (176) (7 755) (40) (44 986)
Breakages and write-offs 0 0 0 0 0 0 0 0
Other movements 2 980 0 84 769 0 1 303 2 149 (108 049) (7 870)
Balance at end of the year 176 931 6 050 960 790 65 069 46 669 206 059 9 227 1 470 795
Accumulated depreciation
Balance at beginning of the year 27 573 3 119 340 746 35 551 26 348 78 450 0 511 787
Depreciation charges 939 546 55 310 10 514 4 508 32 009 0 103 826
Accumulated depreciation on disposals (120) 0 (7 454) (8 206) (68) (3 902) 0 (19 750)
Balance at end of the year 28 392 3 665 388 602 37 859 30 788 106 557 0 595 863
Carrying amount at end of the year 148 539 2 385 572 188 27 210 15 881 99 502 9 227 874 932
ANNEXURE BPROPERTY, PLANT & EQUIPMENT

113
Freeholdland and buildingsN$ 000's
Leaseholdland and buildingsN$ 000's
Plant andmachineryN$ 000's
VehiclesN$ 000's
Furniture and
equipmentN$ 000's
ReturnablecontainersN$ 000's
Assets underconstruction
N$ 000'sTotal
N$ 000's
COMPANY
2015Cost
Balance at beginning of the year 148 087 3 892 960 790 64 809 46 616 206 059 9 227 1 439 480
Additions 2 174 0 40 070 15 178 3 718 39 943 8 601 109 684
Additions through business combinations 0 0 0 0 0 0 0 0
Disposals 0 0 (11 819) (5 995) (281) 0 (908) (19 003)
Breakages and write-offs 0 0 0 0 0 (52 976) 0 (52 976)
Other movements 101 0 4 885 0 0 0 (5 878) (892)
Balance at end of the year 150 362 3 892 993 926 73 992 50 053 193 026 11 042 1 476 293
Accumulated depreciation
Balance at beginning of the year 28 392 2 656 388 602 37 781 30 782 106 558 0 594 771
Depreciation charges 854 482 60 330 10 080 4 661 35 682 0 112 089
Accumulated depreciation on disposals 0 0 (10 905) (3 710) (276) 0 0 (14 891)
Breakages and write-offs 0 0 0 0 0 (51 939) 0 (51 939)
Balance at end of the year 29 246 3 138 438 027 44 151 35 167 90 301 0 640 030
Carrying amount at end of the year 121 116 754 555 899 29 841 14 886 102 725 11 042 836 263
2014Cost
Balance at beginning of the year 144 154 3 892 878 830 62 723 43 480 168 605 35 628 1 337 312
Additions 1 073 0 14 969 12 225 2 009 43 060 81 688 155 024
Disposals (120) 0 (17 778) (19 117) (176) (7 755) (40) (44 986)
Breakages and write-offs 0 0 0 0 0 0 0 0
Other movements 2 980 0 84 769 8 978 1 303 2 149 (108 049) (7 870)
Balance at end of the year 148 087 3 892 960 790 64 809 46 616 206 059 9 227 1 439 480
Accumulated depreciation
Balance at beginning of the year 27 573 2 175 340 746 35 551 26 348 78 451 0 510 844
Depreciation charges 939 481 55 310 10 435 4 502 32 009 0 103 676
Accumulated depreciation on disposals (120) 0 (7 454) (8 205) (68) (3 902) 0 (19 749)
Balance at end of the year 28 392 2 656 388 602 37 781 30 782 106 558 0 594 771
Carrying amount at end of the year 119 695 1 236 572 188 27 028 15 834 99 501 9 227 844 709
GROUP & COMPANY The carrying amount of motor vehicles held under finance leases at 30 June 2015 was N$13 734 517 (2014 : N$15 124 363). Additions during the year include N$ 12 900 000 (2014: N$8 443 000) of motor vehicles held under finance leases.
ANNEXURE BPROPERTY, PLANT & EQUIPMENT (CONT.)

114
20%Automation processes
2015N$ 000's
33%Externally
purchased software licences
2015N$ 000's
0% Trademarks
2015N$ 000’s
Total
2015N$ 000's
20%Automationprocesses
2014N$ 000’s
33%Externally
purchased software licences
2014N$ 000's
% Trademarks
2014N$ 000
Total
2014N$ 000's
GROUP
Cost
Balance at beginning of the year 11 016 9 917 2 000 22 933 11 016 8 272 0 19 288
Disposals (45) 0 (45) 0 0 0 0
Additions 0 1 151 7 000 8 151 0 1 700 2 000 3 700
Transfers 0 892 0 892 0 (55) 0 (55)
Balance at end of the year 10 971 11 960 9 000 31 931 11 016 9 917 2 000 22 933
Accumulated amortisation
Balance at beginning of the year 5 447 5 992 0 11 439 3 243 3 801 0 7 044
Amortisation charges 2 253 1 492 0 3 745 2 204 2 191 0 4 395
Balance at end of the year 7 700 7 484 0 15 184 5 447 5 992 0 11 439
Carrying amount at end of the year 3 271 4 476 9 000 16 747 5 569 3 925 2 000 11 494
COMPANY
CostBalance at beginning of the year 11 016 9 917 2 000 22 933 11 016 8 272 0 19 288
Disposals (45) 0 0 (45) 0 0 0 0 Additions 0 1 151 7 000 8 151 0 1 700 2 000 3 700
Transfers 0 892 0 892 0 (55) 0 (55)
Balance at end of the year 10 971 11 960 9 000 31 931 11 016 9 917 2 000 22 933
Accumulated amortisation
Balance at beginning of the year 5 447 5 992 0 11 439 3 243 3 801 0 7 044
Amortisation charges 2 253 1 492 0 3 745 2 204 2 191 0 4 395
Balance at end of the year 7 700 7 484 0 15 184 5 447 5 992 0 11 439
Carrying amount at end of the year 3 271 4 476 9 000 16 747 5 569 3 925 2 000 11 494
Amortisation periods are reviewed at the end of each financial year. If the expected useful life of the asset differ from previous estimates, the amortisation period shall be changed accordingly. The amortisation charge is recognised in the operating expenses in the statement of comprehensive income.
ANNEXURE BINTANGIBLE ASSETS

115
Subsidiary CompanyCountry of
Incorporation
IssuedCapital
N$ 000's
Effective Holding Interest of Holding Company
2015%
2014%
Shares Indebtedness
2015N$ 000's
2014N$ 000's
2015N$ 000's
2014N$ 000's
BEVERAGES
Hansa Brauerei (Proprietary) Limited Namibia 0 100 100 160 160 (160) (160)
Namibia Breweries South Africa Proprietary Limited
South Africa 0 100 100 0 0 51 605 36 199
Flycatcher (Proprietary) Limited Botswana 0 100 100 0 0 0 0
PROPERTY
Northgate Properties
(Proprietary) Limited Namibia 0 100 100 828 828 (835) (868)
Hansa Properties(Proprietary) Limited Namibia 0 100 100 0 0 0 0
L&T Ventues Namibia 0 100 100 0 0 0 0
(Proprietary) Limited
Northgate Exports (Proprietary) Limited Namibia 0 100 100 0 0 0 0
Hallie Investments Number Four Hundred and Twenty Eight (Proprietary) Limited Namibia 0 100 100 34 108 28 844 0 0
Accumulated loan impairment (51 605) (36 199)
35 096 29 832 (995) (1 028)
ANNEXURE CINTEREST IN SUBSIDIARIES

116
ANNEXURE DDIRECTORS’ EMOLUMENTS
2015N$ 000's
2015N$ 000's
2015N$ 000's
2015N$ 000's
2015N$ 000's
2015N$ 000's
2014N$ 000's
Directors'fees Salary Bonuses
OtherBenefits
Pension/Medical Aid Total Total
Executive directorsB Kidner 0 0 0 0 0 0 330
G Mouton 0 870 138 828 317 2 153 1 575
H van der Westhuizen 0 1 542 226 1 199 443 3 410 3 928
Non-executive directorsCL List 80 0 0 0 0 80 95
E Ender 80 0 0 0 0 80 95
HB Gerdes 125 0 0 0 0 125 135
NB Blazquez 65 0 0 0 0 65 90
P Grüttemeyer 125 0 0 0 0 125 130
S Thieme 155 0 0 0 0 155 155
S Hiemstra 90 0 0 0 0 90 80
L van der Borght 50 0 0 0 0 50 80
M Kromat 70 0 0 0 0 70 105
D Leleu 50 0 0 0 0 50 65
L Mcleod-Katjirua 65 0 0 0 0 65 95
J Milliken 95 0 0 0 0 95 80
P Jenkins 65 0 0 0 0 65 50
Total emoluments 1 115 2 412 364 2 027 760 6 678 7 088

117
NOTICE TOSHAREHOLDERS
Notice is hereby given that the 94th Annual General Meeting of shareholders of the Company will be held in the auditorium of Namibia Breweries Limited, Namibia Breweries premises, Iscor Street, Northern Industrial Area, Windhoek on Thursday 3 December 2015 at 09h00 for the following purposes:
1. To receive and consider, and if approved, adopt the Group Annual Financial Statements and the Report of the Independent Auditors for the financial year ended 30 June 2015 as submitted, and to confirm all matters and things undertaken and discharged by the directors on behalf of the Company.
2. To elect directors in place of Messrs S Hiemstra, LV McLeod-Katjirua, and D Leleu who retire by rotation in accordance with the Company’s Articles of Association but, being eligible, offer themselves for re-election.
3. To approve the directors remuneration as set out in the financial report.
4. To confirm the appointment of directors since the previous AGM.
5. To authorise the directors to determine the auditors’ remuneration.
6. To place the unissued 92 471 000 ordinary shares of no par value of the Company under the control of the directors who shall be authorised to allot all or any of those shares at their discretion on such terms and conditions and at such times as they may deem fit.
7. To confirm the payment of a final dividend of 37.0 cents, which had been approved by the directors, to the holders of ordinary shares, registered in the books of the Company at the close of business on 23 October 2015 and payable on 13 November 2015.
8. To transact such other business as may be transacted at an Annual General Meeting. A member entitled to attend and vote at the meeting is entitled to appoint one or more proxies to attend and vote in his or her stead. A proxy need not also be a member of the Company. In order to be effective, proxy forms should be forwarded to reach the registered office of the Company not less than 48 hours prior to the time for the holding of the meeting.
By order of the Board Ohlthaver and List Centre (Proprietary) Limited Secretaries Windhoek 9 October 2015
Shareholders’ DiaryAnnual General Meeting: Thursday, 3 December 2015 at 09h00
Reports Published Interim Financial Report 20 March 2015 Abridged Financial Report 21 September 2015Annual Financial Statements 9 October 2015
Dividends Declared Paid/Payable Interim 5 March 2015 8 May 2015 Final 8 September 2015 13 November 2015

118
for the 94th Annual General Meeting of NAMIBIA BREWERIES LIMITED Registration number 2/1920
The Secretaries Namibia Breweries Limited P0 Box 16, Windhoek, Namibia
I/We.........................................................................................................................................................................................(name in full)of..............................................................................................................................................................................................(address) being a shareholder of.................................................................(no. of shares) of the above mentioned Company hereby appoint (a).................................................................................................(name); or failing him/her (b).................................................................................................(name); or failing him/her (c).................................................................................................(name).
or failing him/her, the chairman of the meeting as my/our proxy to vote for me/us on my/our behalf at the 94th Annual General Meeting of the Company to be held in the auditorium of Namibia Breweries Limited, Namibia Breweries premises, Iscor Street, Northern Industrial Area, Windhoek on Thursday 3 December 2015 at 09h00 and at any adjournment thereof, in particular to vote for/against/abstain* the resolutions contained in the notice of the meeting.
I/we desire as follows:
*Please indicate by inserting an (X’) in the appropriate block either “for/against/abstain”. If no indication is given, the proxy may vote as he/she deems fit.
Signed at........................................................this..............................day of 2015. Signature(s) of shareholder...................................................
NOTES TO THE PROXY1. A member entitled to attend and vote at the aforementioned meeting is entitled to appoint a proxy (who need not be a member of the
company) to attend, speak and, on a poll, to vote in his/her stead. 2. Shareholders who wish to appoint proxies must lodge their proxy forms at the registered office of the Company not later than 09h00
on Tuesday 1 December 2015. 3. In respect of shareholders which are companies, an extract of the relevant resolution of directors must be attached to the proxy form.
Item Number * For Against Abstain
1. Adoption of the annual financial statements
2. Re-election of retiring directors
S Hiemstra
LV McLeod-Katjirua
D Leleu
3. Confirm appointment of directors since previous AGM
4. Approval of director’s remuneration
5. Authorisation of directors to approve auditors’ remuneration
6. General authority to the directors to allot and issue shares
7. Confirmation of the final dividend
PROXY FORM

119

ISCOR STREET, NORTHERN INDUSTRIAL AREA, WINDHOEK, NAMIBIATEL: +264 61 320 4999. FAX: +264 61 263 327
WWW.NAMIBIABREWERIES.COM