annual report - home - standard life investments · s pplementary information included in the...
TRANSCRIPT

Annual ReportStandard Life Investments Global SICAV Societe d’Investissement a Capital VariableAudited Annual Report as at 31 December 2015
No subscription can be received on the basis of financial reports. Subscriptions are only valid if made on the basis of the current prospectus accompanied by the latest annual and the most recent semi-annual report, if published thereafter.R.C.S. Luxembourg B 78.797
Standard Life Investments Global SICAV
Société d'Investissement à Capital Variable
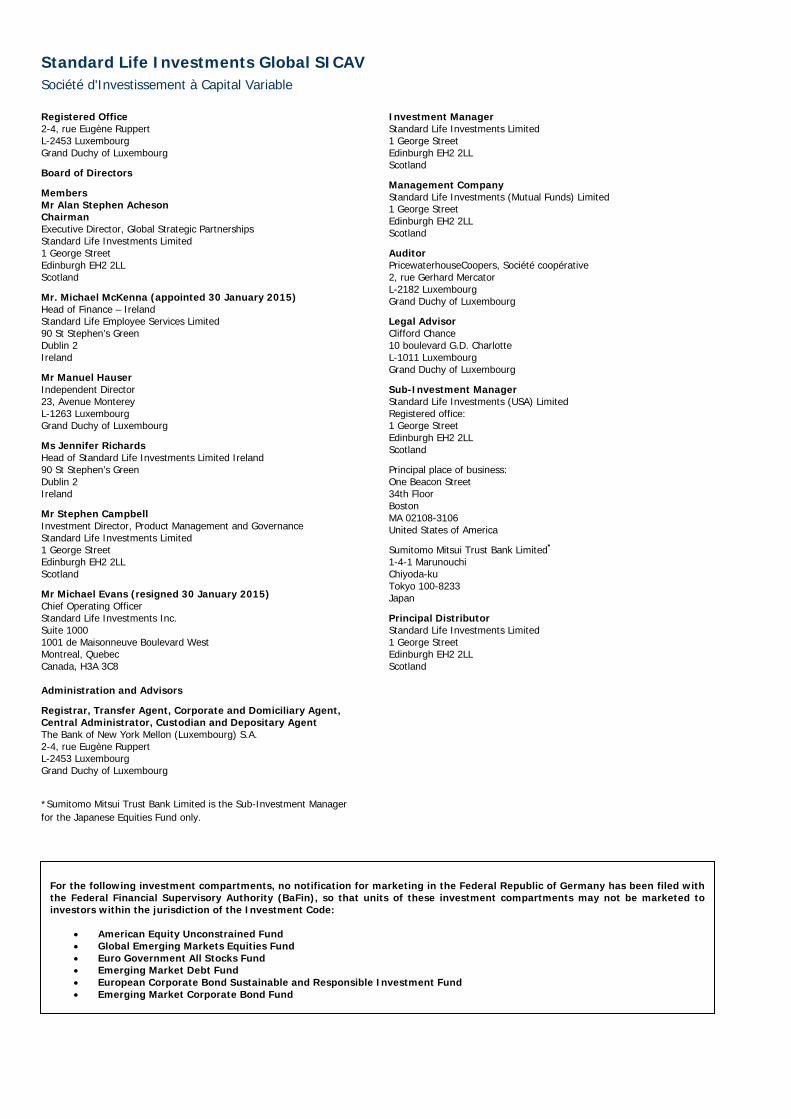
Registered Office 2-4, rue Eugène Ruppert L-2453 Luxembourg Grand Duchy of Luxembourg
Board of Directors
Members Mr Alan Stephen Acheson Chairman Executive Director, Global Strategic Partnerships Standard Life Investments Limited 1 George Street Edinburgh EH2 2LL Scotland
Mr. Michael McKenna (appointed 30 January 2015) Head of Finance – Ireland Standard Life Employee Services Limited 90 St Stephen’s Green Dublin 2 Ireland
Mr Manuel Hauser Independent Director 23, Avenue Monterey L-1263 Luxembourg Grand Duchy of Luxembourg
Ms Jennifer Richards Head of Standard Life Investments Limited Ireland 90 St Stephen’s Green Dublin 2 Ireland
Mr Stephen Campbell Investment Director, Product Management and Governance Standard Life Investments Limited 1 George Street Edinburgh EH2 2LL Scotland
Mr Michael Evans (resigned 30 January 2015) Chief Operating Officer Standard Life Investments Inc. Suite 1000 1001 de Maisonneuve Boulevard West Montreal, Quebec Canada, H3A 3C8 Administration and Advisors
Registrar, Transfer Agent, Corporate and Domiciliary Agent, Central Administrator, Custodian and Depositary Agent The Bank of New York Mellon (Luxembourg) S.A. 2-4, rue Eugène Ruppert L-2453 Luxembourg Grand Duchy of Luxembourg
*Sumitomo Mitsui Trust Bank Limited is the Sub-Investment Manager for the Japanese Equities Fund only.
Investment Manager Standard Life Investments Limited 1 George Street Edinburgh EH2 2LL Scotland
Management Company Standard Life Investments (Mutual Funds) Limited 1 George Street Edinburgh EH2 2LL Scotland
Auditor PricewaterhouseCoopers, Société coopérative 2, rue Gerhard Mercator L-2182 Luxembourg Grand Duchy of Luxembourg
Legal Advisor Clifford Chance 10 boulevard G.D. Charlotte L-1011 Luxembourg Grand Duchy of Luxembourg
Sub-Investment Manager Standard Life Investments (USA) Limited Registered office: 1 George Street Edinburgh EH2 2LL Scotland
Principal place of business: One Beacon Street 34th Floor Boston MA 02108-3106 United States of America
Sumitomo Mitsui Trust Bank Limited* 1-4-1 Marunouchi Chiyoda-ku Tokyo 100-8233 Japan
Principal Distributor Standard Life Investments Limited 1 George Street Edinburgh EH2 2LL Scotland
For the following investment compartments, no notification for marketing in the Federal Republic of Germany has been filed with the Federal Financial Supervisory Authority (BaFin), so that units of these investment compartments may not be marketed to investors within the jurisdiction of the Investment Code:
American Equity Unconstrained Fund Global Emerging Markets Equities Fund Euro Government All Stocks Fund Emerging Market Debt Fund European Corporate Bond Sustainable and Responsible Investment Fund Emerging Market Corporate Bond Fund
Standard Life Investments Global SICAV
Société d'Investissement à Capital Variable
1
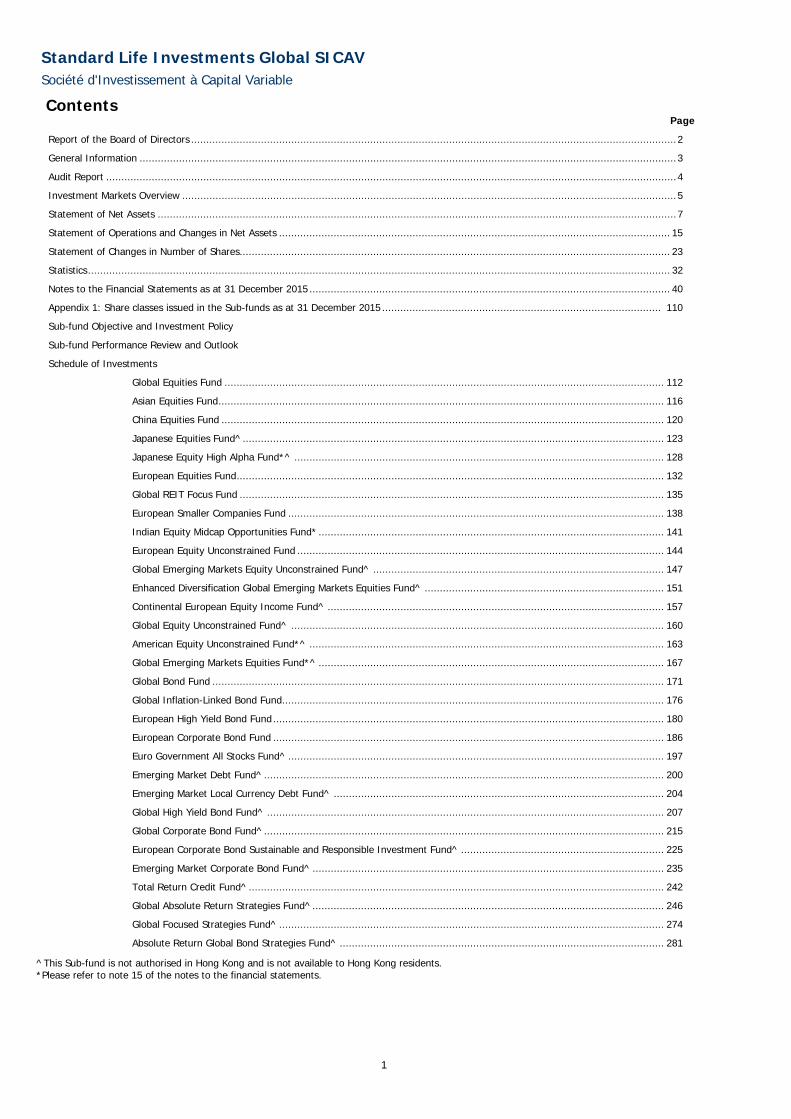
Contents Page
Report of the Board of Directors ................................................................................................................................................................2
General Information .................................................................................................................................................................................3
Audit Report ............................................................................................................................................................................................4
Investment Markets Overview ...................................................................................................................................................................5
Statement of Net Assets ...........................................................................................................................................................................7
Statement of Operations and Changes in Net Assets ................................................................................................................................. 15
Statement of Changes in Number of Shares.............................................................................................................................................. 23
Statistics................................................................................................................................................................................................ 32
Notes to the Financial Statements as at 31 December 2015 ....................................................................................................................... 40
Appendix 1: Share classes issued in the Sub-funds as at 31 December 2015 ............................................................................................ 110
Sub-fund Objective and Investment Policy
Sub-fund Performance Review and Outlook
Schedule of Investments
Global Equities Fund ................................................................................................................................................. 112
Asian Equities Fund................................................................................................................................................... 116
China Equities Fund .................................................................................................................................................. 120
Japanese Equities Fund^........................................................................................................................................... 123
Japanese Equity High Alpha Fund*^ .......................................................................................................................... 128
European Equities Fund............................................................................................................................................. 132
Global REIT Focus Fund ............................................................................................................................................ 135
European Smaller Companies Fund ............................................................................................................................ 138
Indian Equity Midcap Opportunities Fund* .................................................................................................................. 141
European Equity Unconstrained Fund ......................................................................................................................... 144
Global Emerging Markets Equity Unconstrained Fund^ ................................................................................................ 147
Enhanced Diversification Global Emerging Markets Equities Fund^ ............................................................................... 151
Continental European Equity Income Fund^ ............................................................................................................... 157
Global Equity Unconstrained Fund^ ........................................................................................................................... 160
American Equity Unconstrained Fund*^ ..................................................................................................................... 163
Global Emerging Markets Equities Fund*^.................................................................................................................. 167
Global Bond Fund ..................................................................................................................................................... 171
Global Inflation-Linked Bond Fund.............................................................................................................................. 176
European High Yield Bond Fund................................................................................................................................. 180
European Corporate Bond Fund ................................................................................................................................. 186
Euro Government All Stocks Fund^............................................................................................................................ 197
Emerging Market Debt Fund^.................................................................................................................................... 200
Emerging Market Local Currency Debt Fund^ ............................................................................................................. 204
Global High Yield Bond Fund^ ................................................................................................................................... 207
Global Corporate Bond Fund^.................................................................................................................................... 215
European Corporate Bond Sustainable and Responsible Investment Fund^ ................................................................... 225
Emerging Market Corporate Bond Fund^.................................................................................................................... 235
Total Return Credit Fund^......................................................................................................................................... 242
Global Absolute Return Strategies Fund^.................................................................................................................... 246
Global Focused Strategies Fund^............................................................................................................................... 274
Absolute Return Global Bond Strategies Fund^ ........................................................................................................... 281
^This Sub-fund is not authorised in Hong Kong and is not available to Hong Kong residents. *Please refer to note 15 of the notes to the financial statements.

Standard Life Investments Global SICAV
Société d'Investissement à Capital Variable
2
Report of the Board of Directors At the year end, the total net assets of Standard Life Investments Global SICAV (the “Company”) stood at USD 31,078,333,546.
The Company's objective continues to be to provide the shareholder with a choice of professionally managed sub-funds (the “Sub-funds”) investing in a wide range of transferable securities in order to achieve an optimum return from capital invested, while reducing investment risk through diversification.
The Board of Directors adheres to the Association of the Luxembourg Fund Industry (“ALFI”) code of conduct for Luxembourg investment funds (revised June 2013). The code of conduct sets a framework of high-level principles and best practice recommendations for the governance of Luxembourg investment funds. The Board of Directors Luxembourg, 21 April 2016 The figures stated in this report are historical and not necessarily indicative of future performance.

Standard Life Investments Global SICAV
Société d'Investissement à Capital Variable
3
General Information The Company's articles of incorporation may be amended from time to time by a meeting of shareholders, subject to the quorum and majority requirements provided by Luxembourg law. Any amendment thereto shall be published in the Recueil des Sociétés et Associations (the “Mémorial”), in a Luxembourg daily newspaper and, if necessary, in the official publications specified for the respective countries in which Company shares are sold. Such amendments become legally binding on all shareholders, following their approval by the general meeting of shareholders. Any amendments affecting the rights of the holders of shares of any class vis-à-vis those of any other class shall be subject further to the said quorum and majority requirements in respect of each relevant class. The Company is a single legal entity. However, each Sub-fund is regarded as being separate from the others and is liable for all of its own obligations, unless other terms have been specifically agreed with its creditors. The first annual general meeting of shareholders was held at the registered office of the Company on the first Thursday in May 2002 and will be held on the same day each year thereafter (unless such date falls on a legal bank holiday, in which case on the next Luxembourg business day) at midday. Notices of all general meetings are sent by mail to all registered shareholders at their registered address at least 8 days prior to each such meeting. Such notice will indicate the time and place of such meeting and the conditions of admission thereto, will contain the agenda and will refer to the requirements of Luxembourg law with regard to the necessary quorum and majorities at such meeting. To the extent required by Luxembourg law, further notices will be published in the Mémorial and in one Luxembourg newspaper. Audited annual reports and unaudited semi-annual reports will be made available on the Standard Life Investments Website (www.standardlifeinvestments.com) and at the registered office of the Company. The accounting year of the Company terminates on 31 December in each year. The net asset value per share and the issue and redemption price can be obtained from the registered office of the Company.
Statement of Changes in Portfolio
A statement giving the changes in the Schedule of Investments for the year ended 31 December 2015 can be obtained free of charge from the registered office of the Company.

Standard Life Investments Global SICAV Societe d'Investissement a Capital Variable
Audit Report To the Shareholders of
Standard Life Investments Global SICAV
We have audited the accompanying financial statements of Standprd Life Investments Global SICAV (the "SICAV") and of each of its Sub-funds, which comprise the Statement of Net Assets and the Schedule of Investments as at 31 December 2015 and the Statement of Operations and Ch'anges in Net Assets for the year then ended, and a summary of significant accounting policies and other explanatory notes to the financial statements.
Responsibility of the Board of Directors of the SICAV for the financial statements The Board of Directors of the SICAV is responsible for the preparation and fair presentation of these financial statements in accordance with Luxembourg legal and regulatory requirements relating to the preparation of the financial statements and for such intemal control as the Board of Directors of the SICAV determines is necessary to enable the preparation of financial statements that are free from material misstatement, whether due to fraud or error.
Responsibility of the "Reviseur d'entreprises agree" Our responsibility is to express an opinion on these financial statements based on our audit. We conducted our audit in accordance with International Standards on Auditing as adopted for Luxembourg by the "Commission de Surveillance du Secteur Financier". Those standards require that we comply with ethical requirements and plan and perform the audit to obtain reasonable assurance about whether the financial statements are free from material misstatement.
An audit involves performing procedures to obtain audit evidence about the amounts and disclosures in the financial statements. The procedures selected depend on the judgment of the "Reviseur d'entreprises agree", including the assessment of the risks of material misstatement of the financial statements, whether due to fraud or error. In making those risk assessments, the "Reviseur d'entreprises agree" considers internal control relevant to the entity's preparation and fair presentation of the financial statements in order to design audit procedures that are appropriate in the circumstances, but not for the purpose of expressing an opinion on the effectiveness of the entity's internal control. An audit also includes evaluating the appropriateness of accounting policies used and the reasonableness of accounting estimates made by the Board of Directors of the SICAV, as well as evaluating the overall presentation of the financial statements.
We believe that the audit evidence we have obtained is sufficient and appropriate to provide a basis for our audit opinion.
Opinion In our opinion, the financial statements give a true and fair view of the financial position of Standard Life Investments Global SICAV and of each of its Sub-funds as of 31 December 2015, and of the results of their operations and changes in their net assets for the year then ended in accordance with Luxembourg legal and regulatory requirements relating to the preparation of the financial statements.
Other matters S pplementary information included in the annual report has been reviewed in the context of our mandate but has not been subject to specific audit p icedures carried out in accordance with the standards described above. Consequently, we express no opinion on such information. However, we h.1 e no observation to make concerning such information in the context of the financial statements taken as a whole.
I
1111101151."
_ A me.
PricewaterhouseCoopers, Societe cooperative, 2 rue Gerhard Mercator, B.P. 1443, L-1014 T : +352 494848 1, F : +352 494848 2900, www.pwc.lu
Cabinet de revision agree. Expert-comptable (autorisation gouvernementale n° 10028256) R.C.S. Luxembourg B 65 477 — TVA-LU25482518
Pri Re
waterhouseCoopers, Societe cooperative Luxembourg, 21 April 2016 esented by
4

Standard Life Investments Global SICAV
Société d'Investissement à Capital Variable
5
Investment Markets Overview
Global overview Despite volatility, global equities generally gained over the year. Supportive monetary policy and the US economic recovery helped markets. Geopolitical concerns and fears over the Chinese economy proved detrimental.
Equities Overview It was a volatile year for global equities but markets generally finished 2015 ahead. Expansive monetary policy from the world’s major central banks originally supported markets, while the economic outlook also brightened (notably in the UK and US). Thereafter, investors faced a host of challenges. These included rising geopolitical tensions, the re-emergence of the Greek debt crisis, the sell-off in emerging markets and the prospect of a US Federal Reserve (the “Fed”) rate hike. The plunge in the oil price and rising US dollar also created winners and losers. Concerns about China took centre stage in the second half of 2015. Economic data was generally disappointing, leading policymakers to launch a series of stimulus measures. Worryingly, Chinese authorities’ decision to devalue the yuan in August led many to conclude that conditions were worse than the government would care to admit. This led to a huge self-off in Chinese equities, although markets rebounded in December as concerns eased somewhat. In general, the divergence of monetary policy was a pronounced theme during 2015. The central banks of China, Japan and Europe all expanded their operations in one form or another. By contrast, the Fed raised rates in December, while the Bank of England hinted that it might start to tighten at some point in 2016. United Kingdom UK equities barely made progress over the last 12 months, despite positive domestic economic data. For example, 2014 GDP grew at the fastest pace since 2007, which buoyed sentiment at the start of 2015. Uncertainty about the general election subsequently prompted some caution, but the clear result calmed fears and helped consumer confidence to hit a 15-year high. Evidence of UK economic resilience then continued throughout 2015, with signs of long-awaited wage inflation welcomed as an indication that pressures on consumers may be easing. However, concerns about global economic growth, particularly the outlook for China and emerging markets, proved a drag on UK equities. US interest rate policy was another area of intense investor focus and led to bouts of volatility. United States US equities delivered decent gains over the year, helped by ongoing evidence that the economic recovery was becoming increasingly sustainable. The market made a subdued start to the year, hindered by the strength of the dollar and a harsh winter. However, encouraging employment and wage-growth data cemented the view that the economic recovery was still on track. As the period progressed, there were definite signs of caution creeping into the market as investors became more mindful of the potential timing of interest rates rises. Despite nervousness, the interest rate rise that finally came during December had little material impact, having been well flagged by the Fed. Europe It was a positive 12 months for European equities, with European Central Bank (“ECB”) policy measures to stimulate growth and subsequently improving macroeconomic data supporting markets. Indeed, the period began with the ECB’s sovereign bond-buying programme exceeding expectations at EUR 60 billion per month. This buoyed European equities, which made a strong start to 2015. As the period continued, fears over Greece leaving the Eurozone and the geopolitical situation in Ukraine hindered further market progress. However, data from the Eurozone showed the economy was improving, largely driven by stronger exports and consumer spending. The prospect of further financial stimulus also drove markets higher, although the ECB’s announcement in December was ultimately viewed as disappointing by investors. Japan The Japanese equity market experienced another turbulent but ultimately positive 12 months. Central bank policy was a key driver of returns, with the Bank of Japan proving increasingly aggressive in its efforts to lift inflation and economic activity. Generally strong corporate results, with many companies reporting increased dividend payouts and share buybacks, also buoyed optimism. The market was not without its problems, as China-related concerns and falling oil prices caused volatility. GDP data also showed that Japan had been in a technical recession. Despite this and a number of other factures putting pressure on stocks as the year ended, the market proved robust and held firm. Asia Pacific Asian equities were down over the year, as investors contended with pronounced volatility. An economic slowdown in China grabbed the headlines, with the country facing intensifying deflationary pressures. In response, the People’s Bank of China launched a series of targeted measures, including cutting interest rates several times. A move to allow Chinese investors to snap up the Hong Kong-listed stocks of mainland firms at a discount was another key initiative and saw Chinese bourses rocket. Thereafter, fears that the market was entering bubble territory saw equities slump, wiping billions off the major stock exchanges. China’s problems also hurt several emerging economies in the region, as the country is a major export market for numerous nations. This led growth to stutter in the likes of Thailand and the Philippines. Bonds Overview Government bonds The commitment of central banks to maintain accommodative monetary policy, alongside increased geopolitical risks, initially provided support for government bonds. However, market volatility returned, generated by commodity price swings and a sudden devaluation of China’s currency. Markets reacted calmly to December’s 0.25% rise in US interest rates, the first increase for nearly a decade. However, a renewed fall in the oil price combined with a lacklustre extension of policy measures from the ECB proved more difficult for investors to shrug off. This prompted a broad weakening for core government bonds, although yields remained historically low.

Standard Life Investments Global SICAV
Société d'Investissement à Capital Variable
6
Investment Markets Overview (continued) Bonds Overview (Continued)
Corporate bonds It was another volatile 12 months for corporate bond markets. Geopolitical tensions, collapsing commodity prices and central bank policy speculation all vexed investors at various times. Concerns over Chinese growth and emerging markets also prompted a widespread sell-off in risk assets and corporate bonds were not immune. However, as these fears started to abate, asset prices were able to rebound strongly. This looked set to continue into the year-end until a renewed decline in commodity prices and a disappointing statement from the ECB (further monetary easing failed to meet market expectations) pricked investor confidence and increased risk aversion.

Standard Life Investments Global SICAV Société d'Investissement à Capital Variable
Statement of Net Assets As at 31 December 2015
7
GlobalEquities
Fund
AsianEquities
Fund
China Equities
Fund
JapaneseEquities
Fund^ (USD) (USD) (USD) (JPY)
Assets Investments in securities at market value (note 2b) 303,728,938 40,966,709 140,555,950 25,826,253,340Acquisition cost: 277,997,316 44,719,020 149,261,516 23,406,017,999Cash and cash equivalents 9,199,187 1,001,549 398,673 283,976,077Interest and dividends receivable, net 239,601 95,726 31,875 22,904,244Receivables resulting from sale of securities 251,734 5,766 57,993 –Receivables resulting from subscriptions – – 9,651 –Receivable from Investment Manager (note 3e) – 6,857 – –Other receivables – – – –Unrealised appreciation on swap contracts (notes 2g, 7) – – – –Unrealised appreciation on forward foreign exchange contracts (notes 2f, 6) – – – –Unrealised appreciation on future contracts (notes 2h, 8) – – – –Option contracts at market value (notes 2i, 9) – – – –Total assets 313,419,460 42,076,607 141,054,142 26,133,133,661 Liabilities Bank overdraft – – – 2,134Payables resulting from purchases of securities – 55,205 – –Payables resulting from redemptions – – 47,964 –Fees payable 94,454 72,690 157,998 14,147,064Unrealised depreciation on swap contracts (notes 2g, 7) – – – –Unrealised depreciation on forward foreign exchange contracts (notes 2f, 6) – 118 1 –Unrealised depreciation on future contracts (notes 2h, 8) – – – –Option contracts at market value (notes 2i, 9) – – – –Total liabilities 94,454 128,013 205,963 14,149,198 Total net assets prior to swing adjustment 313,325,006 41,948,594 140,848,179 26,118,984,463Adjustment due to swing pricing (note 12) (657,983) – (563,393) 39,178,476Total net assets after swing adjustment 312,667,023 41,948,594 140,284,786 26,158,162,939 ^This Sub-fund is not authorised in Hong Kong and is not available to Hong Kong residents. The accompanying notes form an integral part of these financial statements.

Standard Life Investments Global SICAV
Société d'Investissement à Capital Variable
Statement of Net Assets (continued) As at 31 December 2015
8
JapaneseEquity High
AlphaFund^1
EuropeanEquities
Fund
Global REIT
Focus Fund
EuropeanSmaller
CompaniesFund
(JPY) (EUR) (EUR) (EUR)
Assets Investments in securities at market value (note 2b) 5,333,185,070 79,308,976 111,185,022 328,799,360Acquisition cost: 5,368,670,569 75,231,198 99,456,080 250,491,450Cash and cash equivalents 106,811,207 1,740,477 1,073,678 17,681,549Interest and dividends receivable, net 3,841,312 79,703 380,955 –Receivables resulting from sale of securities 82,473,768 – 559,274 –Receivables resulting from subscriptions 14,150,966 – 180,000 579,435Receivable from Investment Manager (note 3e) 34,693 – – –Other receivables – – – 1,570Unrealised appreciation on swap contracts (notes 2g, 7) – – – –Unrealised appreciation on forward foreign exchange contracts (notes 2f, 6) 8,879,316 – 700,956 425,453Unrealised appreciation on future contracts (notes 2h, 8) – – – –Option contracts at market value (notes 2i, 9) – – – –Total assets 5,549,376,332 81,129,156 114,079,885 347,487,367 Liabilities Bank overdraft – – – –Payables resulting from purchases of securities 124,279,008 – 564,469 –Payables resulting from redemptions 139,591 – – 17,777Fees payable 4,916,273 62,098 68,128 300,498Unrealised depreciation on swap contracts (notes 2g, 7) – – – –Unrealised depreciation on forward foreign exchange contracts (notes 2f, 6) 115,047,787 – 31,087 168,854Unrealised depreciation on future contracts (notes 2h, 8) – – – –Option contracts at market value (notes 2i, 9) – – – –Total liabilities 244,382,659 62,098 663,684 487,129 Total net assets prior to swing adjustment 5,304,993,673 81,067,058 113,416,201 347,000,238Adjustment due to swing pricing (note 12) 7,957,490 – (226,833) 2,220,802Total net assets after swing adjustment 5,312,951,163 81,067,058 113,189,368 349,221,040
1This Sub-fund was launched on 12 May 2015.
^This Sub-fund is not authorised in Hong Kong and is not available to Hong Kong residents.
The accompanying notes form an integral part of these financial statements.

Standard Life Investments Global SICAV
Société d'Investissement à Capital Variable
Statement of Net Assets (continued) As at 31 December 2015
9
IndianEquity
MidcapOpportunities
Fund2
EuropeanEquity
UnconstrainedFund
Global
Emerging Markets
Equity Unconstrained
Fund^
EnhancedDiversification
GlobalEmerging
MarketsEquities
Fund^ (USD) (EUR) (USD) (USD)
Assets Investments in securities at market value (note 2b) 17,677,538 102,230,762 109,964,688 9,458,653Acquisition cost: 17,583,414 80,296,837 134,852,743 11,013,362Cash and cash equivalents 873,083 2,429,692 726,753 5,230,235Interest and dividends receivable, net 20,267 65,944 44,436 25,422Receivables resulting from sale of securities – – 37,389 2,876Receivables resulting from subscriptions 56,967 – 41,305 –Receivable from Investment Manager (note 3e) 6,479 – 1,944 4,102Other receivables 48,437 3,587 – –Unrealised appreciation on swap contracts (notes 2g, 7) – – – 175,918Unrealised appreciation on forward foreign exchange contracts (notes 2f, 6) 58 – – 72,511Unrealised appreciation on future contracts (notes 2h, 8) – – – 27,367Option contracts at market value (notes 2i, 9) – – – 49,019Total assets 18,682,829 104,729,985 110,816,515 15,046,103 Liabilities Bank overdraft – 5,009 1,345 –Payables resulting from purchases of securities 292,314 – 287,964 –Payables resulting from redemptions – – 37,048 –Fees payable 98,785 48,558 89,423 22,039Unrealised depreciation on swap contracts (notes 2g, 7) – – – 42,677Unrealised depreciation on forward foreign exchange contracts (notes 2f, 6) – – 597 156,216Unrealised depreciation on future contracts (notes 2h, 8) – – – 41,910Option contracts at market value (notes 2i, 9) – – – 152,536Total liabilities 391,099 53,567 416,377 415,378 Total net assets prior to swing adjustment 18,291,730 104,676,418 110,400,138 14,630,725Adjustment due to swing pricing (note 12) – 523,382 – 86,322Total net assets after swing adjustment 18,291,730 105,199,800 110,400,138 14,717,047 2Effective 14 December 2015, the Indian Equities Fund was renamed the Indian Equity Midcap Opportunities Fund.
^This Sub-fund is not authorised in Hong Kong and is not available to Hong Kong residents.
The accompanying notes form an integral part of these financial statements.

Standard Life Investments Global SICAV
Société d'Investissement à Capital Variable
Statement of Net Assets (continued) As at 31 December 2015
10
Continental European
EquityIncome
Fund^
GlobalEquity
UnconstrainedFund^
American Equity
Unconstrained Fund^3
Global Emerging MarketsEquitiesFund^3
(EUR) (USD) (USD) (USD)
Assets Investments in securities at market value (note 2b) 97,428,918 31,998,715 48,804,683 9,579,521Acquisition cost: 92,272,246 31,101,618 48,458,104 10,790,155Cash and cash equivalents 2,213,797 861,241 847,563 871,034Interest and dividends receivable, net 36,903 15,874 23,108 21,559Receivables resulting from sale of securities – 5,763 9,362 –Receivables resulting from subscriptions 69,292 – – –Receivable from Investment Manager (note 3e) – – – 7,993Other receivables – – – –Unrealised appreciation on swap contracts (notes 2g, 7) – – – –Unrealised appreciation on forward foreign exchange contracts (notes 2f, 6) 1,039,634 – – –Unrealised appreciation on future contracts (notes 2h, 8) – – – 7,001Option contracts at market value (notes 2i, 9) – – – –Total assets 100,788,544 32,881,593 49,684,716 10,487,108 Liabilities Bank overdraft 257,097 – – 36,409Payables resulting from purchases of securities 510,244 – – 18,553Payables resulting from redemptions 209,413 6,694 10,105 –Fees payable 92,660 55,631 84,588 41,700Unrealised depreciation on swap contracts (notes 2g, 7) – – – –Unrealised depreciation on forward foreign exchange contracts (notes 2f, 6) 607,888 32 – 40Unrealised depreciation on future contracts (notes 2h, 8) – – – –Option contracts at market value (notes 2i, 9) – – – –Total liabilities 1,677,302 62,357 94,693 96,702 Total net assets prior to swing adjustment 99,111,242 32,819,236 49,590,023 10,390,406Adjustment due to swing pricing (note 12) 336,978 – 74,385 49,874Total net assets after swing adjustment 99,448,220 32,819,236 49,664,408 10,440,280 3This Sub-fund was launched on 20 February 2015. ^This Sub-fund is not authorised in Hong Kong and is not available to Hong Kong residents. The accompanying notes form an integral part of these financial statements.

Standard Life Investments Global SICAV
Société d'Investissement à Capital Variable
Statement of Net Assets (continued) As at 31 December 2015
11
GlobalBondFund
GlobalInflation-
LinkedBondFund
European High Yield Bond Fund
EuropeanCorporate
BondFund
(USD) (USD) (EUR) (EUR)
Assets Investments in securities at market value (note 2b) 329,147,144 166,501,985 59,118,345 2,993,151,725Acquisition cost: 359,830,049 170,815,190 61,781,434 2,941,214,231Cash and cash equivalents 29,765,475 3,524,826 1,965,193 35,314,830Interest and dividends receivable, net 3,681,230 576,780 1,092,993 45,040,819Receivables resulting from sale of securities – – – –Receivables resulting from subscriptions – 22,228 – 679,190Receivable from Investment Manager (note 3e) – – – –Other receivables – – – –Unrealised appreciation on swap contracts (notes 2g, 7) 416,411 223,481 – 297,813Unrealised appreciation on forward foreign exchange contracts (notes 2f, 6) 446,731 2,909,080 172,215 8,354,998Unrealised appreciation on future contracts (notes 2h, 8) 372,678 62,601 – 314,460Option contracts at market value (notes 2i, 9) – – – –Total assets 363,829,669 173,820,981 62,348,746 3,083,153,835 Liabilities Bank overdraft 886 2,219,056 4,048 6,942,000Payables resulting from purchases of securities – – – –Payables resulting from redemptions – – – 338,371Fees payable 76,826 100,093 28,961 1,102,468Unrealised depreciation on swap contracts (notes 2g, 7) 1,017,626 131,070 81,868 79,116Unrealised depreciation on forward foreign exchange contracts (notes 2f, 6) 1,711,806 5,900,579 52,441 557,350Unrealised depreciation on future contracts (notes 2h, 8) 181,475 – – 2,453,615Option contracts at market value (notes 2i, 9) – – – –Total liabilities 2,988,619 8,350,798 167,318 11,472,920 Total net assets prior to swing adjustment 360,841,050 165,470,183 62,181,428 3,071,680,915Adjustment due to swing pricing (note 12) – 115,830 (379,307) –Total net assets after swing adjustment 360,841,050 165,586,013 61,802,121 3,071,680,915 The accompanying notes form an integral part of these financial statements.

Standard Life Investments Global SICAV
Société d'Investissement à Capital Variable
Statement of Net Assets (continued) As at 31 December 2015
12
EuroGovernment
AllStocksFund^
EmergingMarket
DebtFund^
Emerging
Market Local
Currency Debt
Fund^
GlobalHighYieldBond
Fund^ (EUR) (USD) (USD) (USD)
Assets Investments in securities at market value (note 2b) 3,507,150,907 47,799,988 82,705,196 745,448,658Acquisition cost: 3,279,306,675 50,401,784 98,646,030 797,504,494Cash and cash equivalents 104,083,805 5,357,806 1,823,577 60,874,754Interest and dividends receivable, net 46,800,149 839,756 1,513,150 14,119,309Receivables resulting from sale of securities – – – 366Receivables resulting from subscriptions – – 253 261,329Receivable from Investment Manager (note 3e) – – 662 –Other receivables – – – –Unrealised appreciation on swap contracts (notes 2g, 7) – – – –Unrealised appreciation on forward foreign exchange contracts (notes 2f, 6) 7,800 58,793 146,804 1,378,900Unrealised appreciation on future contracts (notes 2h, 8) 2,303,739 – – –Option contracts at market value (notes 2i, 9) – – – –Total assets 3,660,346,400 54,056,343 86,189,642 822,083,316 Liabilities Bank overdraft 140 – – 196,599Payables resulting from purchases of securities – – – 63,548Payables resulting from redemptions – – 7,021 –Fees payable 436,697 15,813 87,150 260,189Unrealised depreciation on swap contracts (notes 2g, 7) – – – –Unrealised depreciation on forward foreign exchange contracts (notes 2f, 6) 419,699 533,797 21,817 21,907,652Unrealised depreciation on future contracts (notes 2h, 8) 6,465,137 – – –Option contracts at market value (notes 2i, 9) – – – –Total liabilities 7,321,673 549,610 115,988 22,427,988 Total net assets prior to swing adjustment 3,653,024,727 53,506,733 86,073,654 799,655,328Adjustment due to swing pricing (note 12) – 101,662 301,258 5,117,794Total net assets after swing adjustment 3,653,024,727 53,608,395 86,374,912 804,773,122 ^This Sub-fund is not authorised in Hong Kong and is not available to Hong Kong residents. The accompanying notes form an integral part of these financial statements.

Standard Life Investments Global SICAV
Société d'Investissement à Capital Variable
Statement of Net Assets (continued) As at 31 December 2015
13
GlobalCorporate
BondFund^
EuropeanCorporate
BondSustainable
andResponsibleInvestment
Fund^
Emerging Market
Corporate Bond
Fund^
TotalReturnCreditFund^
(USD) (EUR) (USD) (GBP)
Assets Investments in securities at market value (note 2b) 449,846,243 380,425,348 50,575,060 10,450,160Acquisition cost: 470,093,877 377,769,688 52,915,606 10,562,595Cash and cash equivalents 16,942,951 1,355,456 2,325,665 1,763,566Interest and dividends receivable, net 5,191,332 5,301,643 650,927 179,379Receivables resulting from sale of securities 2,586,070 – – –Receivables resulting from subscriptions 2,290 215 – –Receivable from Investment Manager (note 3e) – – – 763Other receivables 35,722 – – –Unrealised appreciation on swap contracts (notes 2g, 7) 11,710 – – 14,657Unrealised appreciation on forward foreign exchange contracts (notes 2f, 6) 1,202,728 753,325 107,168 79,125Unrealised appreciation on future contracts (notes 2h, 8) 69,900 28,236 16,227 3,292Option contracts at market value (notes 2i, 9) – – – –Total assets 475,888,946 387,864,223 53,675,047 12,490,942 Liabilities Bank overdraft 978,896 700,000 – –Payables resulting from purchases of securities 4,211,817 – – –Payables resulting from redemptions 9,648 – – –Fees payable 94,258 240,157 11,445 6,693Unrealised depreciation on swap contracts (notes 2g, 7) 12,594 – – 15,750Unrealised depreciation on forward foreign exchange contracts (notes 2f, 6) 18,546,809 51,665 1,974,730 207,543Unrealised depreciation on future contracts (notes 2h, 8) 68,910 104,438 – 2,593Option contracts at market value (notes 2i, 9) – – – –Total liabilities 23,922,932 1,096,260 1,986,175 232,579 Total net assets prior to swing adjustment 451,966,014 386,767,963 51,688,872 12,258,363Adjustment due to swing pricing (note 12) (1,491,488) 1,160,303 – 58,840Total net assets after swing adjustment 450,474,526 387,928,266 51,688,872 12,317,203 ^This Sub-fund is not authorised in Hong Kong and is not available to Hong Kong residents. The accompanying notes form an integral part of these financial statements.

Standard Life Investments Global SICAV
Société d'Investissement à Capital Variable
Statement of Net Assets (continued) As at 31 December 2015
14
GlobalAbsolute
ReturnStrategies
Fund^
GlobalFocused
StrategiesFund^
Absolute
Return Global
Bond Strategies
Fund^
Combined (EUR) (EUR) (GBP) (USD)
Assets Investments in securities at market value (note 2b) 13,170,231,910 488,745,849 754,902,947 27,190,125,419Acquisition cost: 12,753,699,019 480,760,493 750,246,231 26,405,942,831Cash and cash equivalents 2,715,340,605 138,094,145 243,308,706 3,796,844,348Interest and dividends receivable, net 32,199,538 894,101 7,569,609 182,410,058Receivables resulting from sale of securities 1,024,300 11,885 – 5,379,738Receivables resulting from subscriptions 22,088,068 230,274 657,284 27,429,589Receivable from Investment Manager (note 3e) – – – 29,456Other receivables 53,677 – – 148,222Unrealised appreciation on swap contracts (notes 2g, 7) 192,218,067 11,980,001 15,238,839 246,101,462Unrealised appreciation on forward foreign exchange contracts (notes 2f, 6) 176,028,848 7,332,624 4,013,894 224,591,462Unrealised appreciation on future contracts (notes 2h, 8) 16,774,761 3,580,644 1,346,604 27,602,239Option contracts at market value (notes 2i, 9) 116,206,005 – 1,188,361 128,343,486Total assets 16,442,165,779 650,869,523 1,028,226,244 31,829,005,479 Liabilities Bank overdraft 7,938,814 7,168,959 3,172,035 33,195,392Payables resulting from purchases of securities 9,508,861 10,770 – 17,497,758Payables resulting from redemptions 13,042,964 40,904 375,765 15,538,963Fees payable 11,880,191 629,249 231,282 18,087,046Unrealised depreciation on swap contracts (notes 2g, 7) 232,581,849 6,706,951 9,172,757 275,550,520Unrealised depreciation on forward foreign exchange contracts (notes 2f, 6) 209,687,999 4,263,082 6,386,291 296,503,529Unrealised depreciation on future contracts (notes 2h, 8) 60,594,564 5,288,842 920,182 83,223,431Option contracts at market value (notes 2i, 9) 5,099,464 – 3,623,791 11,075,294Total liabilities 550,334,706 24,108,757 23,882,103 750,671,933 Total net assets prior to swing adjustment 15,891,831,073 626,760,766 1,004,344,141 31,078,333,546Adjustment due to swing pricing (note 12) 63,567,324 2,319,015 3,615,639 84,671,239Total net assets after swing adjustment 15,955,398,397 629,079,781 1,007,959,780 31,163,004,785 ^This Sub-fund is not authorised in Hong Kong and is not available to Hong Kong residents. The accompanying notes form an integral part of these financial statements
Standard Life Investments Global SICAV
Société d'Investissement à Capital Variable
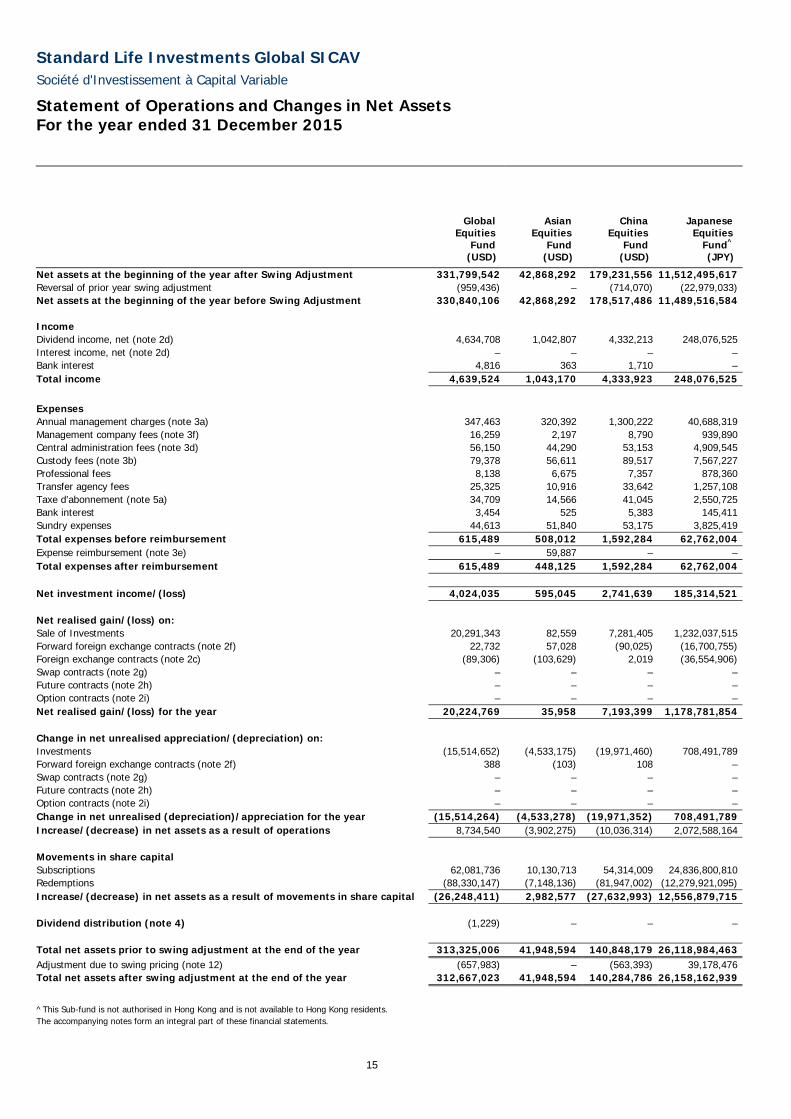
Statement of Operations and Changes in Net Assets For the year ended 31 December 2015
15
GlobalEquities
Fund
Asian Equities
Fund
China Equities
Fund
JapaneseEquities
Fund^ (USD) (USD) (USD) (JPY)
Net assets at the beginning of the year after Swing Adjustment 331,799,542 42,868,292 179,231,556 11,512,495,617Reversal of prior year swing adjustment (959,436) – (714,070) (22,979,033)Net assets at the beginning of the year before Swing Adjustment 330,840,106 42,868,292 178,517,486 11,489,516,584 Income Dividend income, net (note 2d) 4,634,708 1,042,807 4,332,213 248,076,525Interest income, net (note 2d) – – – –Bank interest 4,816 363 1,710 –Total income 4,639,524 1,043,170 4,333,923 248,076,525 Expenses Annual management charges (note 3a) 347,463 320,392 1,300,222 40,688,319Management company fees (note 3f) 16,259 2,197 8,790 939,890Central administration fees (note 3d) 56,150 44,290 53,153 4,909,545Custody fees (note 3b) 79,378 56,611 89,517 7,567,227Professional fees 8,138 6,675 7,357 878,360Transfer agency fees 25,325 10,916 33,642 1,257,108Taxe d'abonnement (note 5a) 34,709 14,566 41,045 2,550,725Bank interest 3,454 525 5,383 145,411Sundry expenses 44,613 51,840 53,175 3,825,419Total expenses before reimbursement 615,489 508,012 1,592,284 62,762,004Expense reimbursement (note 3e) – 59,887 – –Total expenses after reimbursement 615,489 448,125 1,592,284 62,762,004 Net investment income/(loss) 4,024,035 595,045 2,741,639 185,314,521 Net realised gain/(loss) on: Sale of Investments 20,291,343 82,559 7,281,405 1,232,037,515Forward foreign exchange contracts (note 2f) 22,732 57,028 (90,025) (16,700,755)Foreign exchange contracts (note 2c) (89,306) (103,629) 2,019 (36,554,906)Swap contracts (note 2g) – – – –Future contracts (note 2h) – – – –Option contracts (note 2i) – – – –Net realised gain/(loss) for the year 20,224,769 35,958 7,193,399 1,178,781,854 Change in net unrealised appreciation/(depreciation) on: Investments (15,514,652) (4,533,175) (19,971,460) 708,491,789Forward foreign exchange contracts (note 2f) 388 (103) 108 –Swap contracts (note 2g) – – – –Future contracts (note 2h) – – – –Option contracts (note 2i) – – – –Change in net unrealised (depreciation)/appreciation for the year (15,514,264) (4,533,278) (19,971,352) 708,491,789Increase/(decrease) in net assets as a result of operations 8,734,540 (3,902,275) (10,036,314) 2,072,588,164 Movements in share capital Subscriptions 62,081,736 10,130,713 54,314,009 24,836,800,810Redemptions (88,330,147) (7,148,136) (81,947,002) (12,279,921,095)Increase/(decrease) in net assets as a result of movements in share capital (26,248,411) 2,982,577 (27,632,993) 12,556,879,715 Dividend distribution (note 4) (1,229) – – – Total net assets prior to swing adjustment at the end of the year 313,325,006 41,948,594 140,848,179 26,118,984,463Adjustment due to swing pricing (note 12) (657,983) – (563,393) 39,178,476Total net assets after swing adjustment at the end of the year 312,667,023 41,948,594 140,284,786 26,158,162,939 ^This Sub-fund is not authorised in Hong Kong and is not available to Hong Kong residents. The accompanying notes form an integral part of these financial statements.

Standard Life Investments Global SICAV
Société d'Investissement à Capital Variable
Statement of Operations and Changes in Net Assets (continued) For the year ended 31 December 2015
16
JapaneseEquity High
AlphaFund^1
European Equities
Fund
GlobalREIT
FocusFund
EuropeanSmaller
CompaniesFund
(JPY) (EUR) (EUR) (EUR)
Net assets at the beginning of the year after Swing Adjustment – 51,840,494 122,764,262 173,425,790Reversal of prior year swing adjustment – – (391,593) 994,194Net assets at the beginning of the year before Swing Adjustment – 51,840,494 122,372,669 174,419,984 Income Dividend income, net (note 2d) 27,819,490 1,751,659 2,714,217 4,231,691Interest income, net (note 2d) – – – –Bank interest – 8 13 17Total income 27,819,490 1,751,667 2,714,230 4,231,708 Expenses Annual management charges (note 3a) 10,328,248 263,704 323,904 1,478,329Management company fees (note 3f) 101,962 3,735 6,075 11,222Central administration fees (note 3d) 2,800,199 29,700 38,765 46,779Custody fees (note 3b) 368,302 31,355 42,976 44,976Professional fees 797,100 6,200 6,443 6,979Transfer agency fees 1,151,314 5,000 17,300 44,023Taxe d'abonnement (note 5a) 249,856 15,383 16,708 41,537Bank interest 13,197 4,099 7,314 9,914Sundry expenses 1,382,718 37,680 47,085 60,058Total expenses before reimbursement 17,192,896 396,856 506,570 1,743,817Expense reimbursement (note 3e) 1,104,940 – – –Total expenses after reimbursement 16,087,956 396,856 506,570 1,743,817 Net investment income/(loss) 11,731,534 1,354,811 2,207,660 2,487,891 Net realised gain/(loss) on: Sale of Investments (199,504,309) 687,150 17,188,050 2,495,283Forward foreign exchange contracts (note 2f) (56,742,080) (41,077) 887,816 (1,404,297)Foreign exchange contracts (note 2c) 32,065,893 45,713 (208,325) (396,020)Swap contracts (note 2g) – – – –Future contracts (note 2h) – – – –Option contracts (note 2i) – – – –Net realised (loss)/gain for the year (224,180,496) 691,786 17,867,541 694,966 Change in net unrealised appreciation/(depreciation) on: Investments (35,485,499) 1,359,728 (6,842,084) 59,031,678Forward foreign exchange contracts (note 2f) (106,168,471) – 555,282 254,382Swap contracts (note 2g) – – – –Future contracts (note 2h) – – – –Option contracts (note 2i) – – – –Change in net unrealised (depreciation)/appreciation for the year (141,653,970) 1,359,728 (6,286,802) 59,286,060(Decrease)/increase in net assets as a result of operations (354,102,932) 3,406,325 13,788,399 62,468,917 Movements in share capital Subscriptions 7,244,817,906 30,349,091 50,141,284 220,480,809Redemptions (1,585,721,301) (4,528,852) (72,886,136) (110,369,470)Increase/(decrease) in net assets as a result of movements in share capital 5,659,096,605 25,820,239 (22,744,852) 110,111,339 Dividend distribution (note 4) – – (15) (2) Total net assets prior to swing adjustment at the end of the year 5,304,993,673 81,067,058 113,416,201 347,000,238Adjustment due to swing pricing (note 12) 7,957,490 – (226,833) 2,220,802Total net assets after swing adjustment at the end of the year 5,312,951,163 81,067,058 113,189,368 349,221,040 1This Sub-fund was launched on 12 May 2015. ^This Sub-fund is not authorised in Hong Kong and is not available to Hong Kong residents. The accompanying notes form an integral part of these financial statements.
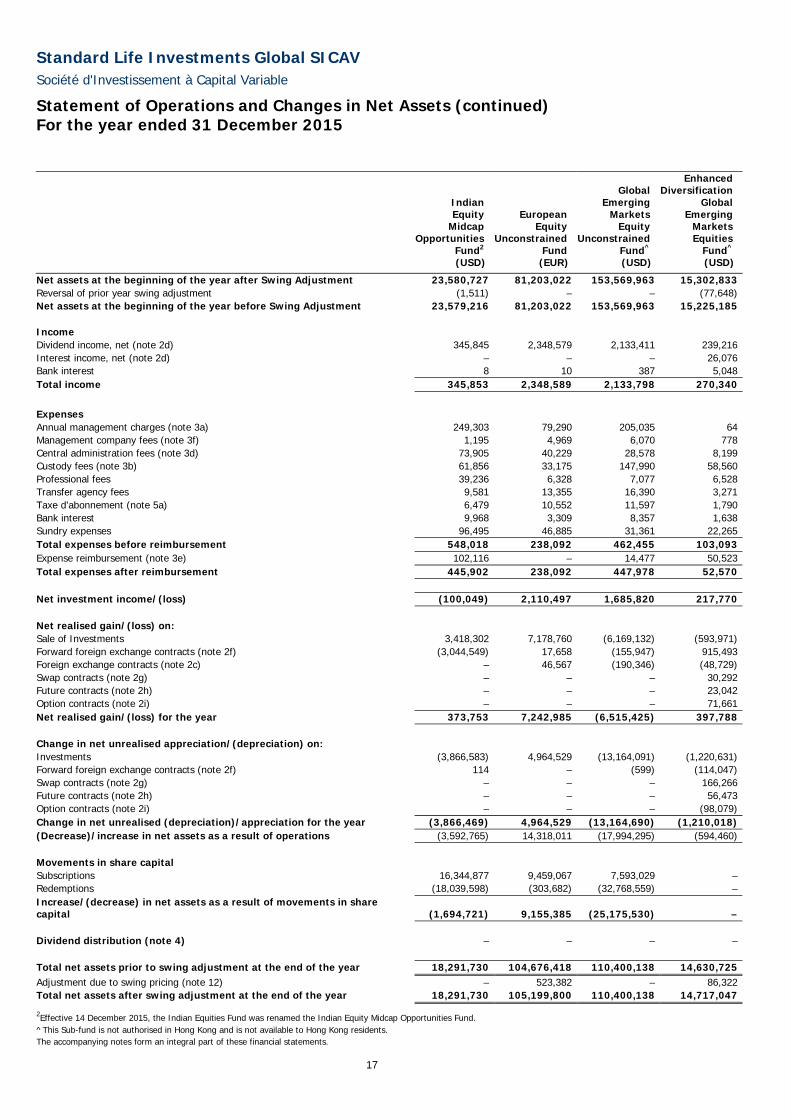
Standard Life Investments Global SICAV
Société d'Investissement à Capital Variable
Statement of Operations and Changes in Net Assets (continued) For the year ended 31 December 2015
17
IndianEquity
MidcapOpportunities
Fund2
European Equity
Unconstrained Fund
Global
Emerging Markets
Equity Unconstrained
Fund^
EnhancedDiversification
GlobalEmerging
MarketsEquities
Fund^ (USD) (EUR) (USD) (USD)
Net assets at the beginning of the year after Swing Adjustment 23,580,727 81,203,022 153,569,963 15,302,833Reversal of prior year swing adjustment (1,511) – – (77,648)Net assets at the beginning of the year before Swing Adjustment 23,579,216 81,203,022 153,569,963 15,225,185 Income Dividend income, net (note 2d) 345,845 2,348,579 2,133,411 239,216Interest income, net (note 2d) – – – 26,076Bank interest 8 10 387 5,048Total income 345,853 2,348,589 2,133,798 270,340 Expenses Annual management charges (note 3a) 249,303 79,290 205,035 64Management company fees (note 3f) 1,195 4,969 6,070 778Central administration fees (note 3d) 73,905 40,229 28,578 8,199Custody fees (note 3b) 61,856 33,175 147,990 58,560Professional fees 39,236 6,328 7,077 6,528Transfer agency fees 9,581 13,355 16,390 3,271Taxe d'abonnement (note 5a) 6,479 10,552 11,597 1,790Bank interest 9,968 3,309 8,357 1,638Sundry expenses 96,495 46,885 31,361 22,265Total expenses before reimbursement 548,018 238,092 462,455 103,093Expense reimbursement (note 3e) 102,116 – 14,477 50,523Total expenses after reimbursement 445,902 238,092 447,978 52,570 Net investment income/(loss) (100,049) 2,110,497 1,685,820 217,770 Net realised gain/(loss) on: Sale of Investments 3,418,302 7,178,760 (6,169,132) (593,971)Forward foreign exchange contracts (note 2f) (3,044,549) 17,658 (155,947) 915,493Foreign exchange contracts (note 2c) – 46,567 (190,346) (48,729)Swap contracts (note 2g) – – – 30,292Future contracts (note 2h) – – – 23,042Option contracts (note 2i) – – – 71,661Net realised gain/(loss) for the year 373,753 7,242,985 (6,515,425) 397,788 Change in net unrealised appreciation/(depreciation) on: Investments (3,866,583) 4,964,529 (13,164,091) (1,220,631)Forward foreign exchange contracts (note 2f) 114 – (599) (114,047)Swap contracts (note 2g) – – – 166,266Future contracts (note 2h) – – – 56,473Option contracts (note 2i) – – – (98,079)Change in net unrealised (depreciation)/appreciation for the year (3,866,469) 4,964,529 (13,164,690) (1,210,018)(Decrease)/increase in net assets as a result of operations (3,592,765) 14,318,011 (17,994,295) (594,460) Movements in share capital Subscriptions 16,344,877 9,459,067 7,593,029 –Redemptions (18,039,598) (303,682) (32,768,559) –Increase/(decrease) in net assets as a result of movements in share capital (1,694,721) 9,155,385 (25,175,530) – Dividend distribution (note 4) – – – – Total net assets prior to swing adjustment at the end of the year 18,291,730 104,676,418 110,400,138 14,630,725Adjustment due to swing pricing (note 12) – 523,382 – 86,322Total net assets after swing adjustment at the end of the year 18,291,730 105,199,800 110,400,138 14,717,047
2Effective 14 December 2015, the Indian Equities Fund was renamed the Indian Equity Midcap Opportunities Fund. ^This Sub-fund is not authorised in Hong Kong and is not available to Hong Kong residents. The accompanying notes form an integral part of these financial statements.

Standard Life Investments Global SICAV
Société d'Investissement à Capital Variable
Statement of Operations and Changes in Net Assets (continued) For the year ended 31 December 2015
18
Continental European
EquityIncome
Fund^
Global Equity
Unconstrained Fund^
AmericanEquity
Unconstrained Fund^3
Global Emerging
MarketsEquitiesFund^3
(EUR) (USD) (USD) (USD)
Net assets at the beginning of the year after Swing Adjustment 40,205,988 5,101,787 – –Reversal of prior year swing adjustment (156,194) (16,781) – –Net assets at the beginning of the year before Swing Adjustment 40,049,794 5,085,006 – – Income Dividend income, net (note 2d) 1,808,625 259,873 297,609 197,996Interest income, net (note 2d) 147,784 – – –Bank interest 364 314 228 760Total income 1,956,773 260,187 297,837 198,756 Expenses Annual management charges (note 3a) 516,399 312,712 518,304 112,033Management company fees (note 3f) 3,891 1,188 1,661 428Central administration fees (note 3d) 32,972 9,027 8,674 8,846Custody fees (note 3b) 37,441 17,961 7,761 45,872Professional fees 6,217 6,570 6,643 6,498Transfer agency fees 29,624 5,234 5,982 3,846Taxe d'abonnement (note 5a) 8,376 10,218 16,938 4,428Bank interest 5,637 672 88 1,943Sundry expenses 20,513 22,385 17,932 17,643Total expenses before reimbursement 661,070 385,967 583,983 201,537Expense reimbursement (note 3e) 2,175 8,983 5,839 38,609Total expenses after reimbursement 658,895 376,984 578,144 162,928 Net investment income/(loss) 1,297,878 (116,797) (280,307) 35,828 Net realised gain/(loss) on: Sale of Investments 1,481,279 (270,463) (846,814) (1,210,970)Forward foreign exchange contracts (note 2f) 474,029 (228,267) 75,598 16,096Foreign exchange contracts (note 2c) 195,400 282,948 (70,727) 26,498Swap contracts (note 2g) – – – –Future contracts (note 2h) – – – (97,575)Option contracts (note 2i) – – – –Net realised gain/(loss) for the year 2,150,708 (215,782) (841,943) (1,265,951) Change in net unrealised appreciation/(depreciation) on: Investments 3,005,362 815,645 346,579 (1,210,634)Forward foreign exchange contracts (note 2f) 302,966 (22) – (40)Swap contracts (note 2g) – – – –Future contracts (note 2h) – – – 7,001Option contracts (note 2i) – – – –Change in net unrealised appreciation/(depreciation) for the year 3,308,328 815,623 346,579 (1,203,673)Increase/(decrease) in net assets as a result of operations 6,756,914 483,044 (775,671) (2,433,796) Movements in share capital Subscriptions 106,115,759 29,787,911 59,275,858 24,745,109Redemptions (53,338,492) (2,536,725) (8,910,164) (11,920,907)Increase/(decrease) in net assets as a result of movements in share capital 52,777,267 27,251,186 50,365,694 12,824,202 Dividend distribution (note 4) (472,733) – – – Total net assets prior to swing adjustment at the end of the year 99,111,242 32,819,236 49,590,023 10,390,406Adjustment due to swing pricing (note 12) 336,978 – 74,385 49,874Total net assets after swing adjustment at the end of the year 99,448,220 32,819,236 49,664,408 10,440,280 3This Sub-fund was launched on 20 February 2015. ^This Sub-fund is not authorised in Hong Kong and is not available to Hong Kong residents. The accompanying notes form an integral part of these financial statements.

Standard Life Investments Global SICAV
Société d'Investissement à Capital Variable
Statement of Operations and Changes in Net Assets (continued) For the year ended 31 December 2015
19
GlobalBondFund
Global Inflation-
Linked Bond Fund
EuropeanHighYieldBondFund
EuropeanCorporate
BondFund
(USD) (USD) (EUR) (EUR)
Net assets at the beginning of the year after Swing Adjustment 407,922,086 138,323,333 67,143,851 3,052,390,619Reversal of prior year swing adjustment (285,346) – 391,706 –Net assets at the beginning of the year before Swing Adjustment 407,636,740 138,323,333 67,535,557 3,052,390,619 Income Dividend income, net (note 2d) – – 50,625 –Interest income, net (note 2d) 9,071,777 1,528,492 3,485,605 94,556,471Bank interest 24,668 3,912 41 37Total income 9,096,445 1,532,404 3,536,271 94,556,508 Expenses Annual management charges (note 3a) 36,679 492,601 7,816 8,824,430Management company fees (note 3f) 19,322 7,119 3,237 152,554Central administration fees (note 3d) 57,519 44,363 30,401 222,275Custody fees (note 3b) 108,827 61,341 24,839 367,146Professional fees 8,455 7,188 6,149 21,674Transfer agency fees 6,545 44,476 6,507 168,904Taxe d'abonnement (note 5a) 39,662 23,155 6,501 383,398Bank interest 17,764 2,203 2,611 45,712Sundry expenses 55,239 43,064 46,519 90,871Total expenses before reimbursement 350,012 725,510 134,580 10,276,964Expense reimbursement (note 3e) – – – –Total expenses after reimbursement 350,012 725,510 134,580 10,276,964 Net investment income/(loss) 8,746,433 806,894 3,401,691 84,279,544 Net realised gain/(loss) on: Sale of Investments (20,849,715) (2,326,702) 1,861,563 47,036,596Forward foreign exchange contracts (note 2f) 14,479,319 (9,178,325) (1,086,678) (23,451,980)Foreign exchange contracts (note 2c) (943,279) (15,158) 55,182 1,663,562Swap contracts (note 2g) 1,110,928 363,331 (359,690) 166,095Future contracts (note 2h) (426,467) (71,388) (39,364) 3,244,979Option contracts (note 2i) – – – –Net realised (loss)/gain for the year (6,629,214) (11,228,242) 431,013 28,659,252 Change in net unrealised appreciation/(depreciation) on: Investments (10,706,650) (6,912,499) (2,453,933) (129,095,171)Forward foreign exchange contracts (note 2f) (3,761,773) 1,913,828 252,520 10,054,833Swap contracts (note 2g) (799,901) (152,728) 197,612 (28,219)Future contracts (note 2h) (41,619) 6,054 11,400 (2,699,052)Option contracts (note 2i) – – – –Change in net unrealised (depreciation)/appreciation for the year (15,309,943) (5,145,345) (1,992,401) (121,767,609)(Decrease)/increase in net assets as a result of operations (13,192,724) (15,566,693) 1,840,303 (8,828,813) Movements in share capital Subscriptions 36,652,210 71,938,272 2,105,063 1,247,703,689Redemptions (70,255,176) (29,224,729) (9,299,495) (1,199,117,756)Increase/(decrease) in net assets as a result of movements in share capital (33,602,966) 42,713,543 (7,194,432) 48,585,933 Dividend distribution (note 4) – – – (20,466,824) Total net assets prior to swing adjustment at the end of the year 360,841,050 165,470,183 62,181,428 3,071,680,915Adjustment due to swing pricing (note 12) – 115,830 (379,307) –Total net assets after swing adjustment at the end of the year 360,841,050 165,586,013 61,802,121 3,071,680,915 The accompanying notes form an integral part of these financial statements.

Standard Life Investments Global SICAV
Société d'Investissement à Capital Variable
Statement of Operations and Changes in Net Assets (continued) For the year ended 31 December 2015
20
EuroGovernment
AllStocksFund^
Emerging Market
Debt Fund^
Emerging
MarketLocal
CurrencyDebt
Fund^
GlobalHighYieldBond
Fund^ (EUR) (USD) (USD) (USD)
Net assets at the beginning of the year after Swing Adjustment 4,645,769,848 55,373,740 95,158,533 597,062,738Reversal of prior year swing adjustment – (110,526) (331,893) 3,845,815Net assets at the beginning of the year before Swing Adjustment 4,645,769,848 55,263,214 94,826,640 600,908,553 Income Dividend income, net (note 2d) – – – –Interest income, net (note 2d) 114,578,761 2,783,254 5,599,954 43,174,926Bank interest 49,983 7,825 7,094 41,073Total income 114,628,744 2,791,079 5,607,048 43,215,999 Expenses Annual management charges (note 3a) 26 2,666 222,127 1,162,222Management company fees (note 3f) 214,866 2,790 4,796 34,340Central administration fees (note 3d) 266,935 13,660 21,024 75,087Custody fees (note 3b) 663,105 14,965 155,286 75,766Professional fees 28,132 6,737 6,944 10,009Transfer agency fees 5,776 8,438 19,204 20,617Taxe d'abonnement (note 5a) 416,904 5,439 9,934 72,612Bank interest 135,177 863 4,642 8,316Sundry expenses 62,357 22,675 23,076 49,811Total expenses before reimbursement 1,793,278 78,233 467,033 1,508,780Expense reimbursement (note 3e) – – 16,304 –Total expenses after reimbursement 1,793,278 78,233 450,729 1,508,780 Net investment income/(loss) 112,835,466 2,712,846 5,156,319 41,707,219 Net realised gain/(loss) on: Sale of Investments 32,560,913 (2,760,525) (7,744,096) (29,778,972)Forward foreign exchange contracts (note 2f) (515,851) (1,009,251) (755,562) (7,319,376)Foreign exchange contracts (note 2c) (23,048) (16,715) (756,427) (464,516)Swap contracts (note 2g) – – – –Future contracts (note 2h) 2,563,633 – – –Option contracts (note 2i) – – – –Net realised gain/(loss) for the year 34,585,647 (3,786,491) (9,256,085) (37,562,864) Change in net unrealised appreciation/(depreciation) on: Investments (133,211,922) (794,216) (10,953,703) (36,032,311)Forward foreign exchange contracts (note 2f) (1,058,582) (289,958) 516,415 (14,928,626)Swap contracts (note 2g) – – – –Future contracts (note 2h) (13,481,473) – – –Option contracts (note 2i) – – – –Change in net unrealised (depreciation)/appreciation for the year (147,751,977) (1,084,174) (10,437,288) (50,960,937)(Decrease)/increase in net assets as a result of operations (330,864) (2,157,819) (14,537,054) (46,816,582) Movements in share capital Subscriptions 360,346,151 1,484,240 34,702,971 683,091,395Redemptions (1,287,321,746) (1,082,902) (28,407,167) (435,865,686)Increase/(decrease) in net assets as a result of movements in share capital (926,975,595) 401,338 6,295,804 247,225,709 Dividend distribution (note 4) (65,438,662) – (511,736) (1,662,352) Total net assets prior to swing adjustment at the end of the year 3,653,024,727 53,506,733 86,073,654 799,655,328Adjustment due to swing pricing (note 12) – 101,662 301,258 5,117,794Total net assets after swing adjustment at the end of the year 3,653,024,727 53,608,395 86,374,912 804,773,122 ^This Sub-fund is not authorised in Hong Kong and is not available to Hong Kong residents. The accompanying notes form an integral part of these financial statements.

Standard Life Investments Global SICAV
Société d'Investissement à Capital Variable
Statement of Operations and Changes in Net Assets (continued) For the year ended 31 December 2015
21
GlobalCorporate
BondFund^
European Corporate
Bond Sustainable
and Responsible Investment
Fund^
Emerging Market
Corporate Bond
Fund^
TotalReturnCreditFund^
(USD) (EUR) (USD) (GBP)
Net assets at the beginning of the year after Swing Adjustment 562,041,953 296,881,246 60,232,471 10,091,151Reversal of prior year swing adjustment – (887,980) (299,664) (51,204)Net assets at the beginning of the year before Swing Adjustment 562,041,953 295,993,266 59,932,807 10,039,947 Income Dividend income, net (note 2d) – – – 12,093Interest income, net (note 2d) 19,573,698 10,259,175 2,839,159 646,277Bank interest 17,496 22 2,680 5,610Total income 19,591,194 10,259,197 2,841,839 663,980 Expenses Annual management charges (note 3a) 455,924 1,912,272 7 31Management company fees (note 3f) 25,137 17,377 2,928 561Central administration fees (note 3d) 48,722 45,437 6,734 2,982Custody fees (note 3b) 104,189 74,596 12,193 7,304Professional fees 9,055 7,617 6,751 4,278Transfer agency fees 19,405 11,853 (262) 513Taxe d'abonnement (note 5a) 50,856 35,402 5,664 1,126Bank interest 7,392 13,552 1,268 118Sundry expenses 35,235 23,235 33,866 14,460Total expenses before reimbursement 755,915 2,141,341 69,149 31,373Expense reimbursement (note 3e) – – – 9,473Total expenses after reimbursement 755,915 2,141,341 69,149 21,900 Net investment income/(loss) 18,835,279 8,117,856 2,772,690 642,080 Net realised gain/(loss) on: Sale of Investments (13,082,833) 2,202,838 (1,367,008) (142,095)Forward foreign exchange contracts (note 2f) 6,452,016 (2,562,782) (1,783,958) (31,871)Foreign exchange contracts (note 2c) (2,091,356) 177,000 (62,104) 5,440Swap contracts (note 2g) (260,884) – – 21,231Future contracts (note 2h) 56,960 (105,056) (55,793) 35,340Option contracts (note 2i) – – – 18,562Net realised (loss)/gain for the year (8,926,097) (288,000) (3,268,863) (93,393) Change in net unrealised appreciation/(depreciation) on: Investments (23,029,992) (11,194,665) (1,879,674) (193,503)Forward foreign exchange contracts (note 2f) (12,142,039) 958,684 (312,582) 8,393Swap contracts (note 2g) 227,858 – – (67,373)Future contracts (note 2h) 191,462 (11,362) 37,007 8,536Option contracts (note 2i) – – – (24,840)Change in net unrealised (depreciation)/appreciation for the year (34,752,711) (10,247,343) (2,155,249) (268,787)(Decrease)/increase in net assets as a result of operations (24,843,529) (2,417,487) (2,651,422) 279,900 Movements in share capital Subscriptions 155,575,102 119,751,364 – 1,938,516Redemptions (240,807,512) (26,559,162) (5,592,513) –Increase/(decrease) in net assets as a result of movements in share capital (85,232,410) 93,192,202 (5,592,513) 1,938,516 Dividend distribution (note 4) – (18) – – Total net assets prior to swing adjustment at the end of the year 451,966,014 386,767,963 51,688,872 12,258,363Adjustment due to swing pricing (note 12) (1,491,488) 1,160,303 – 58,840Total net assets after swing adjustment at the end of the year 450,474,526 387,928,266 51,688,872 12,317,203 ^This Sub-fund is not authorised in Hong Kong and is not available to Hong Kong residents. The accompanying notes form an integral part of these financial statements.
Standard Life Investments Global SICAV
Société d'Investissement à Capital Variable
Statement of Operations and Changes in Net Assets (continued) For the year ended 31 December 2015
22
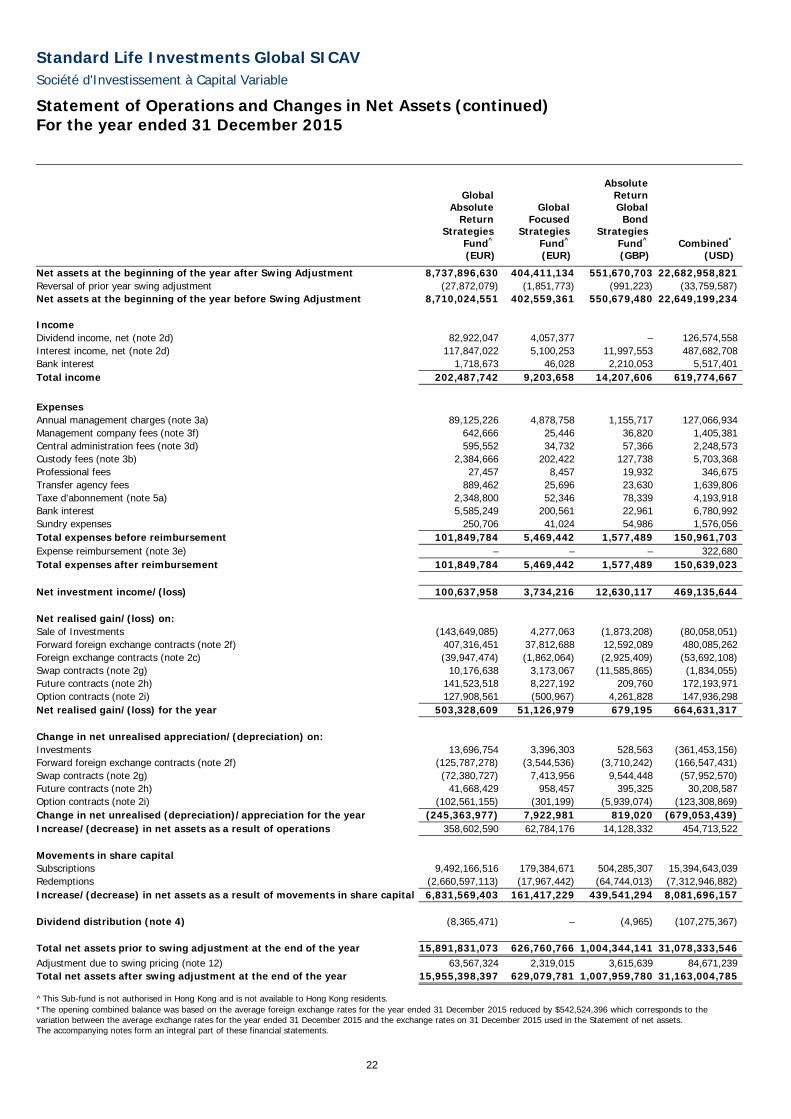
GlobalAbsolute
ReturnStrategies
Fund^
Global Focused
Strategies Fund^
Absolute
Return Global
Bond Strategies
Fund^
Combined* (EUR) (EUR) (GBP) (USD)
Net assets at the beginning of the year after Swing Adjustment 8,737,896,630 404,411,134 551,670,703 22,682,958,821Reversal of prior year swing adjustment (27,872,079) (1,851,773) (991,223) (33,759,587)Net assets at the beginning of the year before Swing Adjustment 8,710,024,551 402,559,361 550,679,480 22,649,199,234 Income Dividend income, net (note 2d) 82,922,047 4,057,377 – 126,574,558Interest income, net (note 2d) 117,847,022 5,100,253 11,997,553 487,682,708Bank interest 1,718,673 46,028 2,210,053 5,517,401Total income 202,487,742 9,203,658 14,207,606 619,774,667 Expenses Annual management charges (note 3a) 89,125,226 4,878,758 1,155,717 127,066,934Management company fees (note 3f) 642,666 25,446 36,820 1,405,381Central administration fees (note 3d) 595,552 34,732 57,366 2,248,573Custody fees (note 3b) 2,384,666 202,422 127,738 5,703,368Professional fees 27,457 8,457 19,932 346,675Transfer agency fees 889,462 25,696 23,630 1,639,806Taxe d'abonnement (note 5a) 2,348,800 52,346 78,339 4,193,918Bank interest 5,585,249 200,561 22,961 6,780,992Sundry expenses 250,706 41,024 54,986 1,576,056Total expenses before reimbursement 101,849,784 5,469,442 1,577,489 150,961,703Expense reimbursement (note 3e) – – – 322,680Total expenses after reimbursement 101,849,784 5,469,442 1,577,489 150,639,023 Net investment income/(loss) 100,637,958 3,734,216 12,630,117 469,135,644 Net realised gain/(loss) on: Sale of Investments (143,649,085) 4,277,063 (1,873,208) (80,058,051)Forward foreign exchange contracts (note 2f) 407,316,451 37,812,688 12,592,089 480,085,262Foreign exchange contracts (note 2c) (39,947,474) (1,862,064) (2,925,409) (53,692,108)Swap contracts (note 2g) 10,176,638 3,173,067 (11,585,865) (1,834,055)Future contracts (note 2h) 141,523,518 8,227,192 209,760 172,193,971Option contracts (note 2i) 127,908,561 (500,967) 4,261,828 147,936,298Net realised gain/(loss) for the year 503,328,609 51,126,979 679,195 664,631,317 Change in net unrealised appreciation/(depreciation) on: Investments 13,696,754 3,396,303 528,563 (361,453,156)Forward foreign exchange contracts (note 2f) (125,787,278) (3,544,536) (3,710,242) (166,547,431)Swap contracts (note 2g) (72,380,727) 7,413,956 9,544,448 (57,952,570)Future contracts (note 2h) 41,668,429 958,457 395,325 30,208,587Option contracts (note 2i) (102,561,155) (301,199) (5,939,074) (123,308,869)Change in net unrealised (depreciation)/appreciation for the year (245,363,977) 7,922,981 819,020 (679,053,439)Increase/(decrease) in net assets as a result of operations 358,602,590 62,784,176 14,128,332 454,713,522 Movements in share capital Subscriptions 9,492,166,516 179,384,671 504,285,307 15,394,643,039Redemptions (2,660,597,113) (17,967,442) (64,744,013) (7,312,946,882)Increase/(decrease) in net assets as a result of movements in share capital 6,831,569,403 161,417,229 439,541,294 8,081,696,157 Dividend distribution (note 4) (8,365,471) – (4,965) (107,275,367) Total net assets prior to swing adjustment at the end of the year 15,891,831,073 626,760,766 1,004,344,141 31,078,333,546Adjustment due to swing pricing (note 12) 63,567,324 2,319,015 3,615,639 84,671,239Total net assets after swing adjustment at the end of the year 15,955,398,397 629,079,781 1,007,959,780 31,163,004,785 ^This Sub-fund is not authorised in Hong Kong and is not available to Hong Kong residents. *The opening combined balance was based on the average foreign exchange rates for the year ended 31 December 2015 reduced by $542,524,396 which corresponds to the variation between the average exchange rates for the year ended 31 December 2015 and the exchange rates on 31 December 2015 used in the Statement of net assets. The accompanying notes form an integral part of these financial statements.
Standard Life Investments Global SICAV
Société d'Investissement à Capital Variable
Statement of Changes in Number of Shares For the year ended 31 December 2015
23
Number of shares
in issue at the beginning of
the year
Number ofshares
subscribed
Number of shares
redeemed
Number of sharesin issue at the
end ofthe year
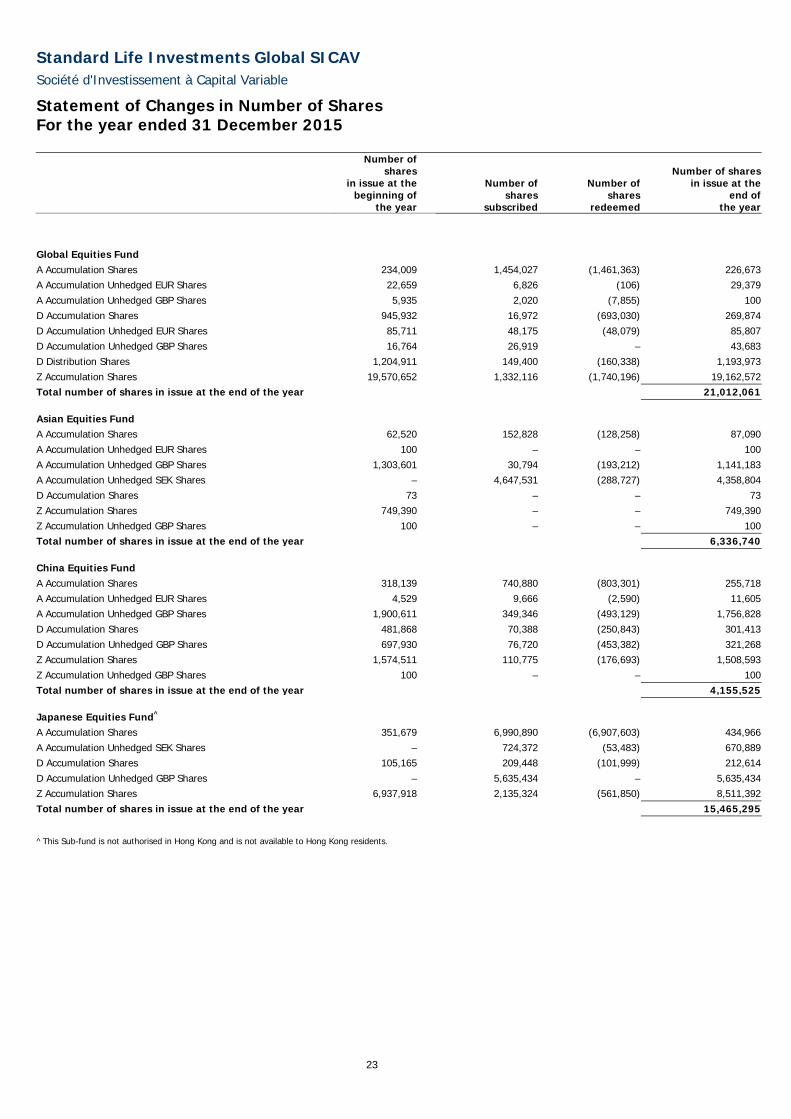
Global Equities Fund A Accumulation Shares 234,009 1,454,027 (1,461,363) 226,673A Accumulation Unhedged EUR Shares 22,659 6,826 (106) 29,379A Accumulation Unhedged GBP Shares 5,935 2,020 (7,855) 100D Accumulation Shares 945,932 16,972 (693,030) 269,874D Accumulation Unhedged EUR Shares 85,711 48,175 (48,079) 85,807D Accumulation Unhedged GBP Shares 16,764 26,919 – 43,683D Distribution Shares 1,204,911 149,400 (160,338) 1,193,973Z Accumulation Shares 19,570,652 1,332,116 (1,740,196) 19,162,572Total number of shares in issue at the end of the year 21,012,061
Asian Equities Fund A Accumulation Shares 62,520 152,828 (128,258) 87,090A Accumulation Unhedged EUR Shares 100 – – 100A Accumulation Unhedged GBP Shares 1,303,601 30,794 (193,212) 1,141,183A Accumulation Unhedged SEK Shares – 4,647,531 (288,727) 4,358,804D Accumulation Shares 73 – – 73Z Accumulation Shares 749,390 – – 749,390Z Accumulation Unhedged GBP Shares 100 – – 100Total number of shares in issue at the end of the year 6,336,740
China Equities Fund A Accumulation Shares 318,139 740,880 (803,301) 255,718A Accumulation Unhedged EUR Shares 4,529 9,666 (2,590) 11,605A Accumulation Unhedged GBP Shares 1,900,611 349,346 (493,129) 1,756,828D Accumulation Shares 481,868 70,388 (250,843) 301,413D Accumulation Unhedged GBP Shares 697,930 76,720 (453,382) 321,268Z Accumulation Shares 1,574,511 110,775 (176,693) 1,508,593Z Accumulation Unhedged GBP Shares 100 – – 100Total number of shares in issue at the end of the year 4,155,525
Japanese Equities Fund^ A Accumulation Shares 351,679 6,990,890 (6,907,603) 434,966A Accumulation Unhedged SEK Shares – 724,372 (53,483) 670,889D Accumulation Shares 105,165 209,448 (101,999) 212,614D Accumulation Unhedged GBP Shares – 5,635,434 – 5,635,434Z Accumulation Shares 6,937,918 2,135,324 (561,850) 8,511,392Total number of shares in issue at the end of the year 15,465,295
^This Sub-fund is not authorised in Hong Kong and is not available to Hong Kong residents.

Standard Life Investments Global SICAV
Société d'Investissement à Capital Variable
Statement of Changes in Number of Shares (continued) For the year ended 31 December 2015
24
Number of shares
in issue at the beginning of
the year
Number ofshares
subscribed
Number of shares
redeemed
Number of sharesin issue at the
end ofthe year
Japanese Equity High Alpha Fund^1 C Accumulation Unhedged EUR Shares – 100 – 100C Accumulation Hedged EUR Shares – 500 – 500C Accumulation Hedged USD Shares – 5,141 – 5,141C Accumulation Shares – 23,329 – 23,329C Accumulation Unhedged USD Shares – 100 – 100D Accumulation Shares – 100 – 100D Accumulation Hedged EUR Shares – 500 – 500D Accumulation Hedged USD Shares – 500 – 500J Distribution Unhedged GBP Shares – 100 – 100J Distribution Hedged GBP Shares – 500 – 500K Accumulation Unhedged EUR Shares – 24,905 – 24,905K Accumulation Shares – 718,595 (53,526) 665,069K Accumulation Unhedged USD Shares – 654 – 654K Accumulation Hedged EUR Shares – 2,273,851 (234,984) 2,038,867K Accumulation Hedged USD Shares – 960,859 (250) 960,609K Distribution Unhedged GBP Shares – 100 – 100K Distribution Hedged GBP Shares – 226,297 (3,869) 222,428Z Accumulation Shares – 773,433 (773,333) 100Total number of shares in issue at the end of the year 3,943,602
European Equities Fund A Accumulation Shares 43,541 2,302,682 (145,095) 2,201,128D Accumulation Shares 1,700 – (1,511) 189Z Accumulation Shares 2,176,655 38,608 (103,296) 2,111,967Total number of shares in issue at the end of the year 4,313,284
Global REIT Focus Fund A Accumulation Shares 1,035,061 1,942,119 (1,759,194) 1,217,986A Accumulation Hedged USD Shares 500 2,363 – 2,863D Accumulation Shares 1,022,942 1,929,832 (2,024,532) 928,242D Accumulation Hedged USD Shares 958,323 228,944 (1,183,003) 4,264D Distribution Shares 100 – – 100Z Accumulation Shares 8,144,492 390,978 (1,437,285) 7,098,185Total number of shares in issue at the end of the year 9,251,640
European Smaller Companies Fund A Accumulation Shares 1,712,066 3,210,002 (1,810,222) 3,111,846A Accumulation Unhedged CHF Shares – 100 – 100A Accumulation Unhedged SEK Shares – 100 – 100A Accumulation Unhedged GBP Shares 387,646 309,990 (147,793) 549,843A Distribution Shares 100 4,932 – 5,032D Accumulation Shares 1,094,102 3,323,071 (487,407) 3,929,766D Accumulation Unhedged CHF Shares – 100 – 100D Accumulation Unhedged SEK Shares – 100 – 100D Accumulation Hedged GBP Shares – 2,762,566 (23,427) 2,739,139D Distribution Shares – 100 – 100D Accumulation Unhedged GBP Shares 495,997 3,021 (485,946) 13,072Z Accumulation Shares 5,006,275 649,928 (1,767,655) 3,888,548Total number of shares in issue at the end of the year 14,237,746 1This Sub-fund was launched on 12 May 2015. ^This Sub-fund is not authorised in Hong Kong and is not available to Hong Kong residents.

Standard Life Investments Global SICAV
Société d'Investissement à Capital Variable
Statement of Changes in Number of Shares (continued) For the year ended 31 December 2015
25
Number of shares
in issue at the beginning of
the year
Number ofshares
subscribed
Number of shares
redeemed
Number of sharesin issue at the
end ofthe year
Indian Equity Midcap Opportunities Fund2 A Accumulation Shares 5,109 580 (174) 5,515A Accumulation Unhedged GBP Shares 825,968 629,817 (740,975) 714,810D Accumulation Shares 100 – – 100D Accumulation Unhedged GBP Shares 100 – – 100Z Accumulation Shares 1,347,860 901,574 (999,259) 1,250,175Total number of shares in issue at the end of the year 1,970,700
European Equity Unconstrained Fund A Accumulation Shares 12,723 8,994 (2,412) 19,305A Accumulation Unhedged GBP Shares 27,391 40,487 (9,618) 58,260D Accumulation Shares 90,100 475,228 – 565,328D Accumulation Unhedged GBP Shares 550 – – 550Z Accumulation Shares 5,000,000 – – 5,000,000Total number of shares in issue at the end of the year 5,643,443
Global Emerging Markets Equity Unconstrained Fund^ A Accumulation Shares 60,767 39,284 (72,579) 27,472D Accumulation Shares 2,185,165 300,410 (1,014,047) 1,471,528D Accumulation Unhedged GBP Shares 1,438,731 251,149 (1,299,050) 390,830Z Accumulation Unhedged GBP Shares 5,566,326 24,051 (27,222) 5,563,155Total number of shares in issue at the end of the year 7,452,985
Enhanced Diversification Global Emerging Markets Equities Fund^ D Accumulation Shares 100 – – 100D Accumulation Hedged GBP Shares 500 – – 500Z Accumulation Shares 1,560,000 – – 1,560,000Z Accumulation Hedged GBP Shares 500 – – 500Total number of shares in issue at the end of the year 1,561,100 2Effective 14 December 2015, the Indian Equities Fund was renamed the Indian Equity Midcap Opportunities Fund. ^This Sub-fund is not authorised in Hong Kong and is not available to Hong Kong residents.

Standard Life Investments Global SICAV
Société d'Investissement à Capital Variable
Statement of Changes in Number of Shares (continued) For the year ended 31 December 2015
26
Number of shares
in issue at the beginning of
the year
Number ofshares
subscribed
Number of shares
redeemed
Number of sharesin issue at the
end ofthe year
Continental European Equity Income Fund^ A Accumulation Shares – 100 – 100A Distribution Shares – 100 – 100C Accumulation Shares – 100 – 100C Accumulation Hedged USD Shares – 500 – 500C Accumulation Unhedged USD Shares – 100 – 100D Accumulation Shares 39,512 26,675 (12,650) 53,537D Accumulation Hedged GBP Shares 5,891 2,746,362 (476,434) 2,275,819D Accumulaton Unhedged GBP Shares 2,512,558 481 (2,512,558) 481D Distribution Shares 36,514 463,355 (122,180) 377,689D Distribution Hedged GBP Shares 22,938 326,597 (11,223) 338,312D Distribution Unhedged GBP Shares 16,987 5,623 (11,834) 10,776J Distribution Shares – 100 – 100J Distribution Unhedged GBP Shares – 100 – 100K Accumulation Shares – 100 – 100K Accumulation Unhedged GBP Shares 100 – – 100K Accumulation Hedged GBP Shares 8,950 5,163 (4,344) 9,769K Accumulation Hedged USD Shares – 500 – 500K Accumulation Unhedged USD Shares – 100 – 100K Distribution Shares – 100 – 100K Distribution Hedged GBP Shares 468,342 1,691,283 (530,220) 1,629,405K Distribution Unhedged GBP Shares 100 518,320 – 518,420Z Accumulation Unhedged GBP Shares – 1,253,164 – 1,253,164Total number of shares in issue at the end of the year 6,469,372
Global Equity Unconstrained Fund^ A Accumulation Shares 100 30,070 (18,711) 11,459A Accumulation Unhedged EUR Shares – 2,549,914 (207,974) 2,341,940D Accumulation Shares 100 95,640 – 95,740Z Accumulation Shares 500,000 – – 500,000Total number of shares in issue at the end of the year 2,949,139
American Equity Unconstrained Fund^3 A Accumulation Shares – 4,036,084 (324,089) 3,711,995A Accumulation Unhedged SEK Shares – 11,473,702 (508,639) 10,965,063D Accumulation Shares – 100 – 100D Accumulation Unhedged GBP Shares – 100 – 100Z Accumulation Shares – 500,099 (500,000) 99Total number of shares in issue at the end of the year 14,677,357
Global Emerging Markets Equities Fund^3 A Accumulation Shares – 100 – 100A Accumulation Unhedged EUR Shares – 1,208,952 (122,053) 1,086,899D Accumulation Shares – 630,785 (630,685) 100Z Accumulation Shares – 500,094 (500,000) 94Total number of shares in issue at the end of the year 1,087,193 3This Sub-fund was launched on 20 February 2015.
^This Sub-fund is not authorised in Hong Kong and is not available to Hong Kong residents.
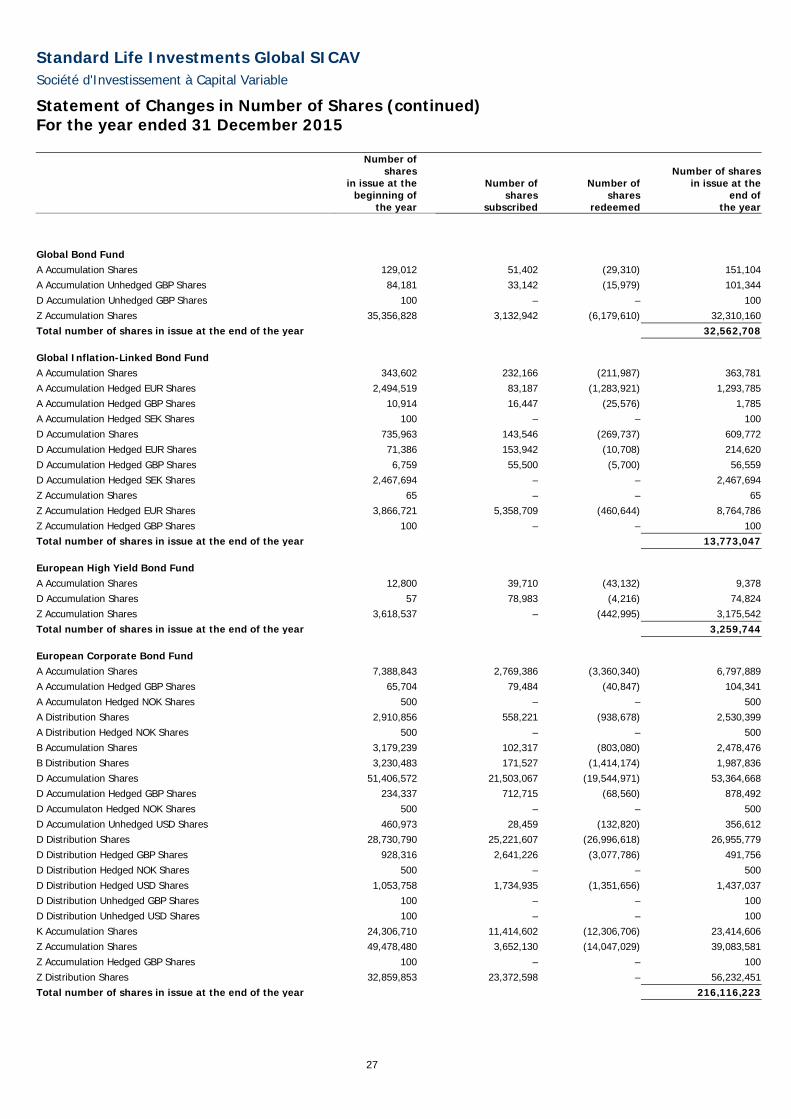
Standard Life Investments Global SICAV
Société d'Investissement à Capital Variable
Statement of Changes in Number of Shares (continued) For the year ended 31 December 2015
27
Number of shares
in issue at the beginning of
the year
Number ofshares
subscribed
Number of shares
redeemed
Number of sharesin issue at the
end ofthe year
Global Bond Fund A Accumulation Shares 129,012 51,402 (29,310) 151,104A Accumulation Unhedged GBP Shares 84,181 33,142 (15,979) 101,344D Accumulation Unhedged GBP Shares 100 – – 100Z Accumulation Shares 35,356,828 3,132,942 (6,179,610) 32,310,160Total number of shares in issue at the end of the year 32,562,708
Global Inflation-Linked Bond Fund A Accumulation Shares 343,602 232,166 (211,987) 363,781A Accumulation Hedged EUR Shares 2,494,519 83,187 (1,283,921) 1,293,785A Accumulation Hedged GBP Shares 10,914 16,447 (25,576) 1,785A Accumulation Hedged SEK Shares 100 – – 100D Accumulation Shares 735,963 143,546 (269,737) 609,772D Accumulation Hedged EUR Shares 71,386 153,942 (10,708) 214,620D Accumulation Hedged GBP Shares 6,759 55,500 (5,700) 56,559D Accumulation Hedged SEK Shares 2,467,694 – – 2,467,694Z Accumulation Shares 65 – – 65Z Accumulation Hedged EUR Shares 3,866,721 5,358,709 (460,644) 8,764,786Z Accumulation Hedged GBP Shares 100 – – 100Total number of shares in issue at the end of the year 13,773,047
European High Yield Bond Fund A Accumulation Shares 12,800 39,710 (43,132) 9,378D Accumulation Shares 57 78,983 (4,216) 74,824Z Accumulation Shares 3,618,537 – (442,995) 3,175,542Total number of shares in issue at the end of the year 3,259,744
European Corporate Bond Fund A Accumulation Shares 7,388,843 2,769,386 (3,360,340) 6,797,889A Accumulation Hedged GBP Shares 65,704 79,484 (40,847) 104,341A Accumulaton Hedged NOK Shares 500 – – 500A Distribution Shares 2,910,856 558,221 (938,678) 2,530,399A Distribution Hedged NOK Shares 500 – – 500B Accumulation Shares 3,179,239 102,317 (803,080) 2,478,476B Distribution Shares 3,230,483 171,527 (1,414,174) 1,987,836D Accumulation Shares 51,406,572 21,503,067 (19,544,971) 53,364,668D Accumulation Hedged GBP Shares 234,337 712,715 (68,560) 878,492D Accumulaton Hedged NOK Shares 500 – – 500D Accumulation Unhedged USD Shares 460,973 28,459 (132,820) 356,612D Distribution Shares 28,730,790 25,221,607 (26,996,618) 26,955,779D Distribution Hedged GBP Shares 928,316 2,641,226 (3,077,786) 491,756D Distribution Hedged NOK Shares 500 – – 500D Distribution Hedged USD Shares 1,053,758 1,734,935 (1,351,656) 1,437,037D Distribution Unhedged GBP Shares 100 – – 100D Distribution Unhedged USD Shares 100 – – 100K Accumulation Shares 24,306,710 11,414,602 (12,306,706) 23,414,606Z Accumulation Shares 49,478,480 3,652,130 (14,047,029) 39,083,581Z Accumulation Hedged GBP Shares 100 – – 100Z Distribution Shares 32,859,853 23,372,598 – 56,232,451Total number of shares in issue at the end of the year 216,116,223

Standard Life Investments Global SICAV
Société d'Investissement à Capital Variable
Statement of Changes in Number of Shares (continued) For the year ended 31 December 2015
28
Number of shares
in issue at the beginning of
the year
Number ofshares
subscribed
Number of shares
redeemed
Number of sharesin issue at the
end ofthe year
Euro Government All Stocks Fund^ A Accumulation Shares 100 – – 100D Accumulation Shares 100 – – 100Z Accumulation Shares 26,876,893 2,923,950 (1,995,258) 27,805,585Z Distribution Shares 376,988,243 28,150,966 (114,235,137) 290,904,072Total number of shares in issue at the end of the year 318,709,857
Emerging Market Debt Fund^ A Accumulation Shares 100 – – 100A Accumulation Hedged EUR Shares – 500 – 500D Accumulation Shares 100 141,019 (101,899) 39,220D Accumulation Hedged EUR Shares – 500 – 500Z Accumulation Shares 1,600,000 – – 1,600,000Z Accumulation Hedged GBP Shares 2,526,328 – – 2,526,328Total number of shares in issue at the end of the year 4,166,648
Emerging Market Local Currency Debt Fund^ A Accumulation Shares 500 – – 500A Accumulation Hedged GBP Shares 500 – – 500A Distribution Shares 500 – – 500A Distribution Hedged GBP Shares 500 – – 500D Accumulation Shares 500 – – 500D Accumulation Hedged GBP Shares 500 – – 500D Accumulation Unhedged GBP Shares 1,393,103 1,067,855 (462,266) 1,998,692D Distribution Shares 500 – – 500D Distribution Hedged GBP Shares 500 – – 500D Distribution Unhedged GBP Shares 597,285 461,607 (59,039) 999,853Z Accumulation Hedged GBP Shares 1,000,000 109 (1,000,000) 109Z Accumulation Unhedged EUR Shares 449,387 1,067,454 (204,639) 1,312,202Z Accumulation Unhedged GBP Shares 2,948,280 50,306 (307,293) 2,691,293Total number of shares in issue at the end of the year 7,006,149
Global High Yield Bond Fund^ A Accumulation Shares 7,753 1,344 (5,123) 3,974A Accumulation Hedged EUR Shares 33,474 – (32,974) 500A Accumulation Hedged GBP Shares 395 113 (408) 100D Accumulation Shares 100 – – 100D Accumulation Hedged EUR Shares 500 – – 500D Accumulation Hedged GBP Shares 100 16,614,521 (148,053) 16,466,568D Distribution Shares 2,550,100 4,640,771 (6,006,651) 1,184,220D Distribution Hedged CHF Shares – 4,606,571 (2,303,033) 2,303,538D Distribution Hedged GBP Shares – 1,091,689 (45,070) 1,046,619Z Accumulation Shares 27,396,714 8,672,532 (22,926,360) 13,142,886Z Accumulation Hedged EUR Shares 1,349,171 3,237,838 (57,088) 4,529,921Z Accumulation Hedged GBP Shares 8,201,512 4,250,475 (43,392) 12,408,595Total number of shares in issue at the end of the year 51,087,521 ^This Sub-fund is not authorised in Hong Kong and is not available to Hong Kong residents.
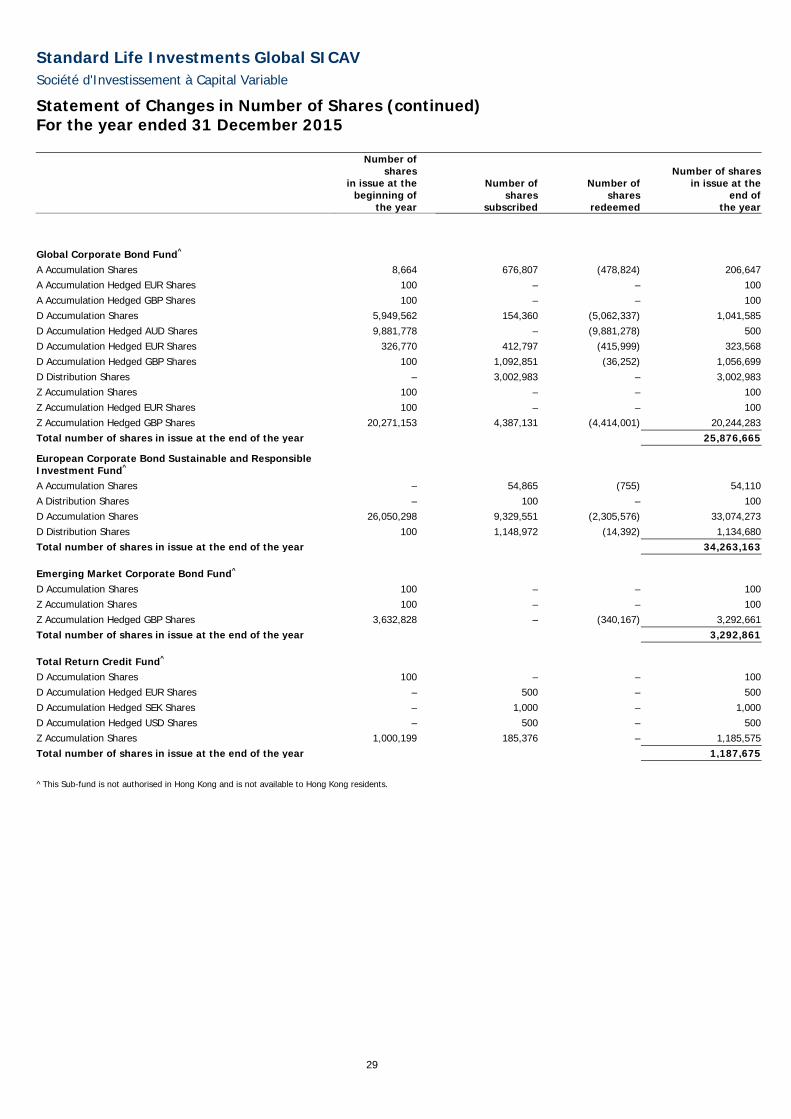
Standard Life Investments Global SICAV
Société d'Investissement à Capital Variable
Statement of Changes in Number of Shares (continued) For the year ended 31 December 2015
29
Number of shares
in issue at the beginning of
the year
Number ofshares
subscribed
Number of shares
redeemed
Number of sharesin issue at the
end ofthe year
Global Corporate Bond Fund^ A Accumulation Shares 8,664 676,807 (478,824) 206,647A Accumulation Hedged EUR Shares 100 – – 100A Accumulation Hedged GBP Shares 100 – – 100D Accumulation Shares 5,949,562 154,360 (5,062,337) 1,041,585D Accumulation Hedged AUD Shares 9,881,778 – (9,881,278) 500D Accumulation Hedged EUR Shares 326,770 412,797 (415,999) 323,568D Accumulation Hedged GBP Shares 100 1,092,851 (36,252) 1,056,699D Distribution Shares – 3,002,983 – 3,002,983Z Accumulation Shares 100 – – 100Z Accumulation Hedged EUR Shares 100 – – 100Z Accumulation Hedged GBP Shares 20,271,153 4,387,131 (4,414,001) 20,244,283Total number of shares in issue at the end of the year 25,876,665
European Corporate Bond Sustainable and Responsible Investment Fund^ A Accumulation Shares – 54,865 (755) 54,110A Distribution Shares – 100 – 100D Accumulation Shares 26,050,298 9,329,551 (2,305,576) 33,074,273D Distribution Shares 100 1,148,972 (14,392) 1,134,680Total number of shares in issue at the end of the year 34,263,163
Emerging Market Corporate Bond Fund^ D Accumulation Shares 100 – – 100Z Accumulation Shares 100 – – 100Z Accumulation Hedged GBP Shares 3,632,828 – (340,167) 3,292,661Total number of shares in issue at the end of the year 3,292,861
Total Return Credit Fund^ D Accumulation Shares 100 – – 100D Accumulation Hedged EUR Shares – 500 – 500D Accumulation Hedged SEK Shares – 1,000 – 1,000D Accumulation Hedged USD Shares – 500 – 500Z Accumulation Shares 1,000,199 185,376 – 1,185,575Total number of shares in issue at the end of the year 1,187,675 ^This Sub-fund is not authorised in Hong Kong and is not available to Hong Kong residents.

Standard Life Investments Global SICAV
Société d'Investissement à Capital Variable
Statement of Changes in Number of Shares (continued) For the year ended 31 December 2015
30
Number of shares
in issue at the beginning of
the year
Number ofshares
subscribed
Number of shares
redeemed
Number of sharesin issue at the
end ofthe year
Global Absolute Return Strategies Fund^ A Accumulation Shares 35,922,888 103,764,874 (37,796,350) 101,891,412A Accumulation Hedged AUD Shares – 581,970 – 581,970A Accumulation Hedged CHF Shares 653,080 2,516,506 (232,379) 2,937,207A Accumulation Hedged GBP Shares 1,280,921 2,527,591 (490,337) 3,318,175A Accumulation Hedged JPY Shares 38,096 7,025 – 45,121A Accumulation Hedged SEK Shares 38,382,055 18,824,806 (3,266,273) 53,940,588A Accumulation Hedged SGD Shares 646,652 3,209,568 (709,095) 3,147,125A Accumulation Hedged USD Shares 16,465,173 57,467,762 (10,663,797) 63,269,138A Distribution Shares 6,105,950 9,130,755 (1,563,635) 13,673,070B Accumulation Shares – 25,707 – 25,707B Accumulation Hedged GBP Shares – 38,595 – 38,595B Accumulation Hedged USD Shares – 331,227 – 331,227D Accumulation Shares 121,166,359 213,171,519 (68,693,685) 265,644,193D Accumulation Hedged AUD Shares 41,178 321,374 (46,339) 316,213D Accumulation Hedged CAD Shares 167,930 5,140,468 (49,472) 5,258,926D Accumulation Hedged CHF Shares 3,727,462 2,753,476 (582,971) 5,897,967D Accumulation Hedged GBP Shares 15,169,044 10,090,237 (4,224,636) 21,034,645D Accumulation Hedged JPY Shares 75,890,246 32,750,757 (9,733,898) 98,907,105D Accumulation Hedged NZD Shares 6,866,016 1,745,365 (1,227,597) 7,383,784D Accumulation Hedged SEK Shares 1,492,209 10,584,943 (1,309,475) 10,767,677D Accumulation Hedged SGD Shares 1,207,962 17,119,387 (286,919) 18,040,430D Accumulation Hedged USD Shares 59,443,275 141,181,161 (45,299,646) 155,324,790D Distribution Shares 32,933,365 14,815,753 (6,943,760) 40,805,358D Distribution Hedged CAD Shares 500 – – 500Z Accumulation Shares 226,994,785 50,672,746 (11,268,657) 266,398,874Z Accumulation Hedged AUD Shares 16,771,050 23,352,701 (1,610,190) 38,513,561Z Accumulation Hedged CAD Shares 14,183,275 15,530,715 (82,815) 29,631,175Z Accumulation Hedged JPY Shares 100 – – 100Z Accumulation Hedged USD Shares – 74,976 – 74,976Z Distribution Hedged CAD Shares 47,595,898 38,545,482 (7,349,783) 78,791,597Total number of shares in issue at the end of the year 1,285,991,206
Global Focused Strategies Fund^ A Accumulation Shares 100 9,088 – 9,188A Accumulation Hedged CHF Shares – 500 – 500A Accumulation Hedged SEK Shares – 100 – 100B Accumulation Hedged GBP Shares – 500 – 500D Accumulation Shares 386,391 4,422,160 (68,185) 4,740,366D Accumulation Hedged CAD Shares 500 – – 500D Accumulation Hedged CHF Shares 27,456 55,038 – 82,494D Accumulation Hedged GBP Shares 21,477,246 4,052,793 (799,247) 24,730,792D Accumulation Hedged SEK Shares 10,425,131 285,757 (1,975,974) 8,734,914D Accumulation Hedged USD Shares – 2,230,427 – 2,230,427K Accumulation Hedged GBP Shares 1,721,722 2,684,629 (186,413) 4,219,938K Accumulation Hedged USD Shares 1,336,652 234,322 (92,509) 1,478,465Z Accumulation Hedged AUD Shares – 18,647 (46) 18,601Z Accumulation Shares 100 757,878 – 757,978Z Accumulation Hedged GBP Shares 6,000,100 – – 6,000,100Total number of shares in issue at the end of the year 53,004,863 ^This Sub-fund is not authorised in Hong Kong and is not available to Hong Kong residents.

Standard Life Investments Global SICAV
Société d'Investissement à Capital Variable
Statement of Changes in Number of Shares (continued) For the year ended 31 December 2015
31
Number of shares
in issue at the beginning of
the year
Number ofshares
subscribed
Number of shares
redeemed
Number of sharesin issue at the
end ofthe year
Absolute Return Global Bond Strategies Fund^ A Accumulation Shares 40,716 116,553 (47,176) 110,093A Accumulation Hedged CHF Shares – 500 – 500A Accumulation Hedged EUR Shares 232,473 234,035 (297,590) 168,918A Accumulation Hedged SEK Shares – 605,513 (15,165) 590,348A Accumulation Hedged USD Shares 4,230 81,454 (10,090) 75,594D Accumulation Shares 12,521,384 3,933,972 (1,790,369) 14,664,987D Accumulation Hedged AUD Shares 500 – – 500D Accumulation Hedged CHF Shares – 500 – 500D Accumulation Hedged EUR Shares 1,546,783 5,718,676 (62,328) 7,203,131D Accumulation Hedged SEK Shares – 84,441,138 (40,689,453) 43,751,685D Accumulation Hedged USD Shares 85,930 30,250 (46,030) 70,150Z Accumulation Shares 30,466,900 24,411,672 (615,286) 54,263,286Z Accumulation Hedged AUD Shares 18,451 1,944,244 (27,704) 1,934,991Z Accumulation Hedged EUR Shares 7,496,658 8,096,052 (338,578) 15,254,132Z Distribution Hedged CAD Shares 98,731 5,811 (1,164) 103,378Total number of shares in issue at the end of the year 138,192,193 ^This Sub-fund is not authorised in Hong Kong and is not available to Hong Kong residents.
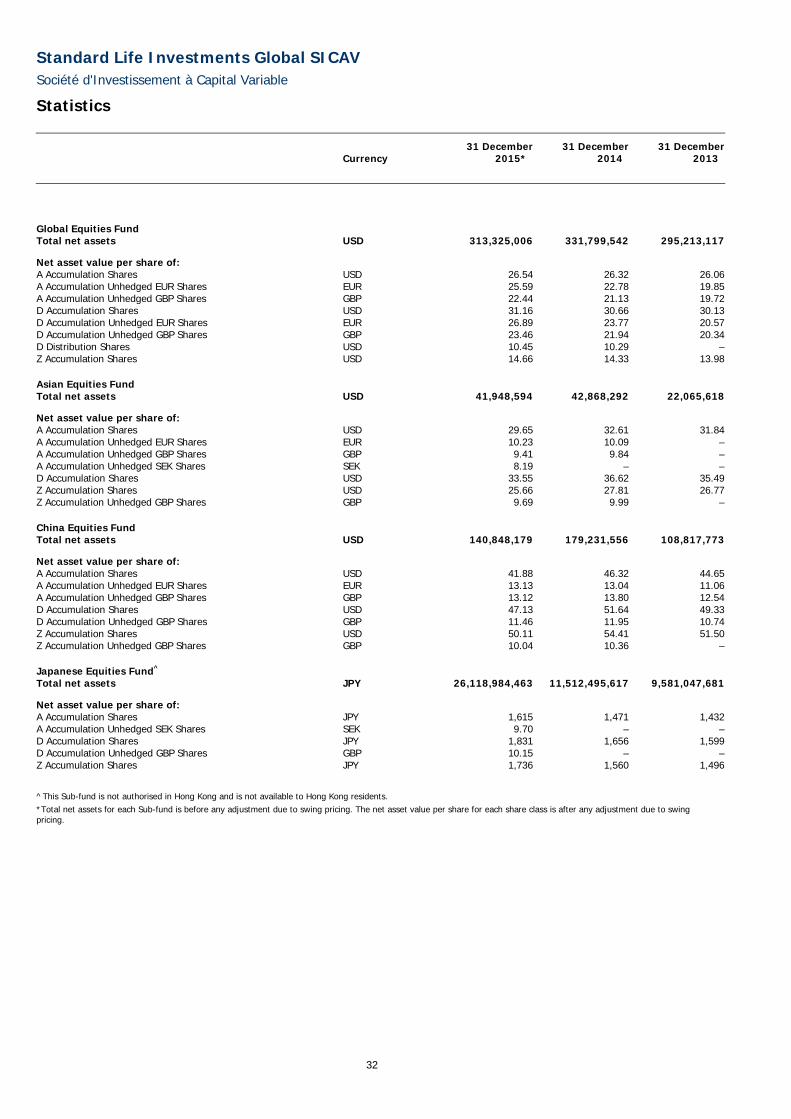
Standard Life Investments Global SICAV
Société d'Investissement à Capital Variable
Statistics
32
Currency 31 December
2015* 31 December
2014 31 December
2013
Global Equities Fund Total net assets USD 313,325,006 331,799,542 295,213,117
Net asset value per share of: A Accumulation Shares USD 26.54 26.32 26.06A Accumulation Unhedged EUR Shares EUR 25.59 22.78 19.85A Accumulation Unhedged GBP Shares GBP 22.44 21.13 19.72D Accumulation Shares USD 31.16 30.66 30.13D Accumulation Unhedged EUR Shares EUR 26.89 23.77 20.57D Accumulation Unhedged GBP Shares GBP 23.46 21.94 20.34D Distribution Shares USD 10.45 10.29 –Z Accumulation Shares USD 14.66 14.33 13.98
Asian Equities Fund Total net assets USD 41,948,594 42,868,292 22,065,618
Net asset value per share of: A Accumulation Shares USD 29.65 32.61 31.84A Accumulation Unhedged EUR Shares EUR 10.23 10.09 –A Accumulation Unhedged GBP Shares GBP 9.41 9.84 –A Accumulation Unhedged SEK Shares SEK 8.19 – –D Accumulation Shares USD 33.55 36.62 35.49Z Accumulation Shares USD 25.66 27.81 26.77Z Accumulation Unhedged GBP Shares GBP 9.69 9.99 –
China Equities Fund Total net assets USD 140,848,179 179,231,556 108,817,773
Net asset value per share of: A Accumulation Shares USD 41.88 46.32 44.65A Accumulation Unhedged EUR Shares EUR 13.13 13.04 11.06A Accumulation Unhedged GBP Shares GBP 13.12 13.80 12.54D Accumulation Shares USD 47.13 51.64 49.33D Accumulation Unhedged GBP Shares GBP 11.46 11.95 10.74Z Accumulation Shares USD 50.11 54.41 51.50Z Accumulation Unhedged GBP Shares GBP 10.04 10.36 –
Japanese Equities Fund^ Total net assets JPY 26,118,984,463 11,512,495,617 9,581,047,681
Net asset value per share of: A Accumulation Shares JPY 1,615 1,471 1,432A Accumulation Unhedged SEK Shares SEK 9.70 – –D Accumulation Shares JPY 1,831 1,656 1,599D Accumulation Unhedged GBP Shares GBP 10.15 – –Z Accumulation Shares JPY 1,736 1,560 1,496
^This Sub-fund is not authorised in Hong Kong and is not available to Hong Kong residents. *Total net assets for each Sub-fund is before any adjustment due to swing pricing. The net asset value per share for each share class is after any adjustment due to swing pricing.

Standard Life Investments Global SICAV
Société d'Investissement à Capital Variable
Statistics (continued)
33
Currency 31 December
2015* 31 December
2014 31 December
2013
Japanese Equity High Alpha Fund^1 Total net assets JPY 5,304,993,673 – –
Net asset value per share of: C Accumulation Shares JPY 1,499 – –C Accumulation Hedged EUR Shares EUR 9.98 – –C Accumulation Hedged USD Shares USD 9.94 – –C Accumulation Unhedged EUR Shares EUR 10.29 – –C Accumulation Unhedged USD Shares USD 9.97 – –D Accumulation Shares JPY 1,504 – –D Accumulation Hedged EUR Shares EUR 10.01 – –D Accumulation Hedged USD Shares USD 9.98 – –J Distribution Unhedged GBP Shares GBP 10.57 – –J Distribution Hedged GBP Shares GBP 10.03 – –K Accumulation Shares JPY 1,506 – –K Accumulation Unhedged EUR Shares EUR 10.34 – –K Accumulation Unhedged USD Shares USD 10.02 – –K Accumulation Hedged EUR Shares EUR 10.03 – –K Accumulation Hedged USD Shares USD 9.99 – –K Distribution Unhedged GBP Shares GBP 10.58 – –K Distribution Hedged GBP Shares GBP 10.03 – –Z Accumulation Shares JPY 1,511 – –
European Equities Fund Total net assets EUR 81,067,058 51,840,494 8,789,403
Net asset value per share of: A Accumulation Shares EUR 11.68 10.66 10.19D Accumulation Shares EUR 13.17 11.94 11.33Z Accumulation Shares EUR 26.22 23.59 22.24
Global REIT Focus Fund Total net assets EUR 113,416,201 122,764,262 74,718,507
Net asset value per share of: A Accumulation Shares EUR 10.79 9.96 7.91A Accumulation Hedged USD Shares USD 11.69 10.93 –D Accumulation Shares EUR 11.56 10.59 8.34D Accumulation Hedged USD Shares USD 11.81 10.95 –D Distribution Shares EUR 13.52 12.52 –Z Accumulation Shares EUR 12.57 11.42 8.92
European Smaller Companies Fund Total net assets EUR 347,000,238 173,425,790 193,892,401
Net asset value per share of: A Accumulation Shares EUR 24.45 17.98 17.37A Accumulation Unhedged CHF Shares CHF 10.18 – –A Accumulation Unhedged SEK Shares SEK 10.02 – –A Accumulation Unhedged GBP Shares GBP 16.61 12.95 13.40A Distribution Shares EUR 13.03 9.60 –D Accumulation Shares EUR 26.36 19.20 18.37D Accumulation Unhedged CHF Shares CHF 10.19 – –D Accumulation Unhedged SEK Shares SEK 10.03 – –D Accumulation Hedged GBP Shares GBP 12.33 – –D Distribution Shares EUR 10.15 – –D Accumulation Unhedged GBP Shares GBP 25.05 19.35 19.84Z Accumulation Shares EUR 28.45 20.54 19.48
1This Sub-fund was launched on 12 May 2015. ^This Sub-fund is not authorised in Hong Kong and is not available to Hong Kong residents. *Total net assets for each Sub-fund is before any adjustment due to swing pricing. The net asset value per share for each share class is after any adjustment due to swing pricing.

Standard Life Investments Global SICAV
Société d'Investissement à Capital Variable
Statistics (continued)
34
Currency 31 December
2015* 31 December
2014 31 December
2013
Indian Equity Midcap Opportunities Fund2 Total net assets USD 18,291,730 23,580,727 9,288,177
Net asset value per share of: A Accumulation Shares USD 6.59 7.66 5.78A Accumulation Unhedged GBP Shares GBP 8.46 9.37 6.68D Accumulation Shares USD 7.10 8.17 6.10D Accumulation Unhedged GBP Shares GBP 8.89 9.73 6.87Z Accumulation Shares USD 7.43 8.51 6.34
European Equity Unconstrained Fund Total net assets EUR 104,676,418 81,203,022 74,293,792
Net asset value per share of: A Accumulation Shares EUR 16.16 13.92 13.02A Accumulation Unhedged GBP Shares GBP 20.85 19.02 19.05D Accumulation Shares EUR 17.27 14.74 13.65D Accumulation Unhedged GBP Shares GBP 22.25 20.11 19.95Z Accumulation Shares EUR 18.69 15.80 14.51
Global Emerging Markets Equity Unconstrained Fund^ Total net assets USD 110,400,138 153,569,963 106,581,067
Net asset value per share of: A Accumulation Shares USD 9.56 11.32 11.87D Accumulation Shares USD 9.85 11.55 12.01D Accumulation Unhedged GBP Shares GBP 9.00 10.04 –Z Accumulation Unhedged GBP Shares GBP 10.97 12.12 11.77
Enhanced Diversification Global Emerging Markets Equities Fund^ Total net assets USD 14,630,725 15,302,833 –
Net asset value per share of: D Accumulation Shares USD 9.34 9.79 –D Accumulation Hedged GBP Shares GBP 9.38 9.80 –Z Accumulation Shares USD 9.42 9.80 –Z Accumulation Hedged GBP Shares GBP 9.46 9.80 –
Continental European Equity Income Fund^ Total net assets EUR 99,111,242 40,205,988 –
Net asset value per share of: A Accumulation Shares EUR 10.63 – –A Distribution Shares EUR 10.63 – –C Accumulation Shares EUR 9.92 – –C Accumulation Hedged USD Shares USD 9.84 – –C Accumulation Unhedged USD Shares USD 9.63 – –D Accumulation Shares EUR 12.24 10.74 –D Accumulation Hedged GBP Shares GBP 12.18 10.74 –D Accumulaton Unhedged GBP Shares GBP 10.78 10.02 –D Distribution Shares EUR 11.90 10.58 –D Distribution Hedged GBP Shares GBP 11.79 10.55 –D Distribution Unhedged GBP Shares GBP 10.43 9.83 –J Distribution Shares EUR 9.92 – –J Distribution Unhedged GBP Shares GBP 10.16 – –K Accumulation Shares EUR 9.97 – –K Accumulation Unhedged GBP Shares GBP 10.59 9.84 –K Accumulation Hedged GBP Shares GBP 12.23 10.78 –K Accumulation Hedged USD Shares USD 9.89 – –K Accumulation Unhedged USD Shares USD 9.66 – –K Distribution Shares EUR 9.92 – –K Distribution Hedged GBP Shares GBP 11.75 10.52 –K Distribution Unhedged GBP Shares GBP 10.24 9.66 –Z Accumulation Unhedged GBP Shares GBP 10.28 – –
^This Sub-fund is not authorised in Hong Kong and is not available to Hong Kong residents. 2Effective 14 December 2015, the Indian Equities Fund was renamed the Indian Equity Midcap Opportunities Fund. *Total net assets for each Sub-fund is before any adjustment due to swing pricing. The net asset value per share for each share class is after any adjustment due to swing pricing.

Standard Life Investments Global SICAV
Société d'Investissement à Capital Variable
Statistics (continued)
35
Currency 31 December
2015* 31 December
2014 31 December
2013
Global Equity Unconstrained Fund^ Total net assets USD 32,819,236 5,101,787 –
Net asset value per share of: A Accumulation Shares USD 10.64 10.19 –A Accumulation Unhedged EUR Shares EUR 10.29 – –D Accumulation Shares USD 10.73 10.19 –Z Accumulation Shares USD 10.84 10.20 –
American Equity Unconstrained Fund^3 Total net assets USD 49,590,023 – –
Net asset value per share of: A Accumulation Shares USD 9.97 – –A Accumulation Unhedged SEK Shares SEK 9.75 – –D Accumulation Shares USD 10.05 – –D Accumulation Unhedged GBP Shares GBP 10.04 – –Z Accumulation Shares USD 10.11 – –
Global Emerging Markets Equities Fund^3 Total net assets USD 10,390,406 – –
Net asset value per share of: A Accumulation Shares USD 8.49 – –A Accumulation Unhedged EUR Shares EUR 8.82 – –D Accumulation Shares USD 8.54 – –Z Accumulation Shares USD 8.60 – –
Global Bond Fund Total net assets USD 360,841,050 407,922,086 210,400,590
Net asset value per share of: A Accumulation Shares USD 16.79 17.57 17.60A Accumulation Unhedged GBP Shares GBP 10.04 9.99 9.46D Accumulation Unhedged GBP Shares GBP 10.37 10.26 9.63Z Accumulation Shares USD 11.04 11.44 11.34
Global Inflation-Linked Bond Fund Total net assets USD 165,470,183 138,323,333 133,713,022
Net asset value per share of: A Accumulation Shares USD 14.37 14.60 13.54A Accumulation Hedged EUR Shares EUR 11.06 11.30 10.48A Accumulation Hedged GBP Shares GBP 10.45 10.59 9.78A Accumulation Hedged SEK Shares SEK 114.41 117.00 108.13D Accumulation Shares USD 15.21 15.37 14.17D Accumulation Hedged EUR Shares EUR 11.32 11.50 10.62D Accumulation Hedged GBP Shares GBP 10.67 10.75 9.88D Accumulation Hedged SEK Shares SEK 117.17 119.14 109.44Z Accumulation Shares USD 16.10 16.18 14.83Z Accumulation Hedged EUR Shares EUR 10.24 10.35 9.50Z Accumulation Hedged GBP Shares GBP 10.85 10.89 9.97
3This Sub-fund was launched on 20 February 2015.
^This Sub-fund is not authorised in Hong Kong and is not available to Hong Kong residents. *Total net assets for each Sub-fund is before any adjustment due to swing pricing. The net asset value per share for each share class is after any adjustment due to swing pricing.
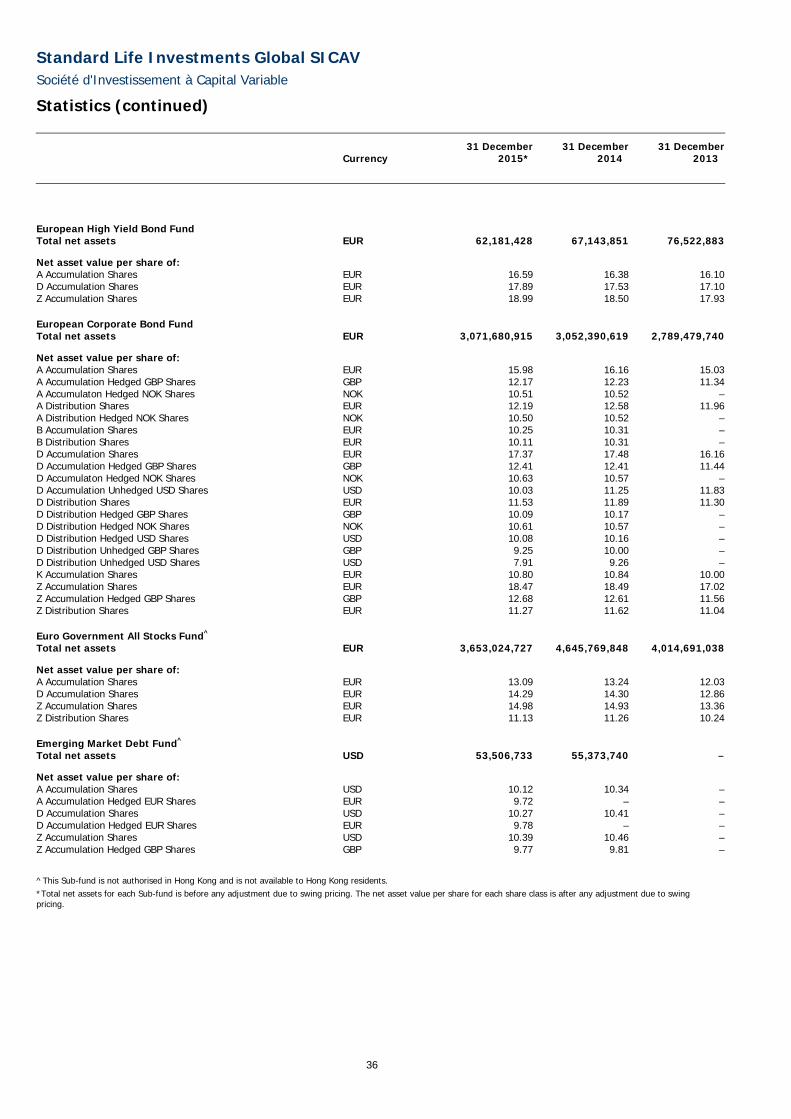
Standard Life Investments Global SICAV
Société d'Investissement à Capital Variable
Statistics (continued)
36
Currency 31 December
2015* 31 December
2014 31 December
2013
European High Yield Bond Fund Total net assets EUR 62,181,428 67,143,851 76,522,883
Net asset value per share of: A Accumulation Shares EUR 16.59 16.38 16.10D Accumulation Shares EUR 17.89 17.53 17.10Z Accumulation Shares EUR 18.99 18.50 17.93
European Corporate Bond Fund Total net assets EUR 3,071,680,915 3,052,390,619 2,789,479,740
Net asset value per share of: A Accumulation Shares EUR 15.98 16.16 15.03A Accumulation Hedged GBP Shares GBP 12.17 12.23 11.34A Accumulaton Hedged NOK Shares NOK 10.51 10.52 –A Distribution Shares EUR 12.19 12.58 11.96A Distribution Hedged NOK Shares NOK 10.50 10.52 –B Accumulation Shares EUR 10.25 10.31 –B Distribution Shares EUR 10.11 10.31 –D Accumulation Shares EUR 17.37 17.48 16.16D Accumulation Hedged GBP Shares GBP 12.41 12.41 11.44D Accumulaton Hedged NOK Shares NOK 10.63 10.57 –D Accumulation Unhedged USD Shares USD 10.03 11.25 11.83D Distribution Shares EUR 11.53 11.89 11.30D Distribution Hedged GBP Shares GBP 10.09 10.17 –D Distribution Hedged NOK Shares NOK 10.61 10.57 –D Distribution Hedged USD Shares USD 10.08 10.16 –D Distribution Unhedged GBP Shares GBP 9.25 10.00 –D Distribution Unhedged USD Shares USD 7.91 9.26 –K Accumulation Shares EUR 10.80 10.84 10.00Z Accumulation Shares EUR 18.47 18.49 17.02Z Accumulation Hedged GBP Shares GBP 12.68 12.61 11.56Z Distribution Shares EUR 11.27 11.62 11.04
Euro Government All Stocks Fund^ Total net assets EUR 3,653,024,727 4,645,769,848 4,014,691,038
Net asset value per share of: A Accumulation Shares EUR 13.09 13.24 12.03D Accumulation Shares EUR 14.29 14.30 12.86Z Accumulation Shares EUR 14.98 14.93 13.36Z Distribution Shares EUR 11.13 11.26 10.24
Emerging Market Debt Fund^ Total net assets USD 53,506,733 55,373,740 –
Net asset value per share of: A Accumulation Shares USD 10.12 10.34 –A Accumulation Hedged EUR Shares EUR 9.72 – –D Accumulation Shares USD 10.27 10.41 –D Accumulation Hedged EUR Shares EUR 9.78 – –Z Accumulation Shares USD 10.39 10.46 –Z Accumulation Hedged GBP Shares GBP 9.77 9.81 –
^This Sub-fund is not authorised in Hong Kong and is not available to Hong Kong residents. *Total net assets for each Sub-fund is before any adjustment due to swing pricing. The net asset value per share for each share class is after any adjustment due to swing pricing.

Standard Life Investments Global SICAV
Société d'Investissement à Capital Variable
Statistics (continued)
37
Currency 31 December
2015* 31 December
2014 31 December
2013
Emerging Market Local Currency Debt Fund^ Total net assets USD 86,073,654 95,158,533 21,540,835
Net asset value per share of: A Accumulation Shares USD 8.02 9.46 9.76A Accumulation Hedged GBP Shares GBP 8.05 9.49 9.77A Distribution Shares USD 7.69 9.35 9.76A Distribution Hedged GBP Shares GBP 7.50 9.32 9.77D Accumulation Shares USD 8.20 9.58 9.80D Accumulation Hedged GBP Shares GBP 8.21 9.61 9.81D Accumulation Unhedged GBP Shares GBP 8.65 9.62 9.27D Distribution Shares USD 7.75 9.42 9.80D Distribution Hedged GBP Shares GBP 7.50 9.37 9.81D Distribution Unhedged GBP Shares GBP 7.93 9.36 9.26Z Accumulation Hedged GBP Shares GBP 8.35 9.71 9.84Z Accumulation Unhedged EUR Shares EUR 9.57 9.99 –Z Accumulation Unhedged GBP Shares GBP 8.85 9.78 –
Global High Yield Bond Fund^ Total net assets USD 799,655,328 597,062,738 381,418,525
Net asset value per share of: A Accumulation Shares USD 13.18 13.58 13.85A Accumulation Hedged EUR Shares EUR 11.30 11.72 11.96A Accumulation Hedged GBP Shares GBP 11.68 12.02 12.22D Accumulation Shares USD 13.83 14.13 14.29D Accumulation Hedged EUR Shares EUR 11.62 11.96 12.11D Accumulation Hedged GBP Shares GBP 12.10 12.36 12.48D Distribution Shares USD 9.17 9.78 –D Distribution Hedged CHF Shares CHF 9.29 – –D Distribution Hedged GBP Shares GBP 9.42 – –Z Accumulation Shares USD 14.32 14.56 14.65Z Accumulation Hedged EUR Shares EUR 11.59 11.85 11.93Z Accumulation Hedged GBP Shares GBP 11.81 11.99 12.03
Global Corporate Bond Fund^ Total net assets USD 451,966,014 562,041,953 344,475,397
Net asset value per share of: A Accumulation Shares USD 11.91 12.05 11.26A Accumulation Hedged EUR Shares EUR 11.94 12.15 11.33A Accumulation Hedged GBP Shares GBP 12.16 12.27 11.42D Accumulation Shares USD 12.31 12.40 11.51D Accumulation Hedged AUD Shares AUD 10.26 10.11 –D Accumulation Hedged EUR Shares EUR 12.22 12.37 11.49D Accumulation Hedged GBP Shares GBP 12.46 12.51 11.59D Distribution Shares USD 9.91 – –Z Accumulation Shares USD 12.61 12.63 11.66Z Accumulation Hedged EUR Shares EUR 12.51 12.59 11.64Z Accumulation Hedged GBP Shares GBP 12.72 12.71 11.71
European Corporate Bond Sustainable and Responsible Investment Fund^ Total net assets EUR 386,767,963 296,881,246 201,053,584
Net asset value per share of: A Accumulation Shares EUR 9.86 – –A Distribution Shares EUR 9.71 – –D Accumulation Shares EUR 11.35 11.40 10.53D Distribution Shares EUR 10.51 10.73 –
^This Sub-fund is not authorised in Hong Kong and is not available to Hong Kong residents. *Total net assets for each Sub-fund is before any adjustment due to swing pricing. The net asset value per share for each share class is after any adjustment due to swing pricing.

Standard Life Investments Global SICAV
Société d'Investissement à Capital Variable
Statistics (continued)
38
Currency 31 December
2015* 31 December
2014 31 December
2013
Emerging Market Corporate Bond Fund^ Total net assets USD 51,688,872 60,232,471 –
Net asset value per share of: D Accumulation Shares USD 10.38 10.54 –Z Accumulation Shares USD 10.55 10.61 –Z Accumulation Hedged GBP Shares GBP 10.59 10.64 –
Total Return Credit Fund^ Total net assets GBP 12,258,363 10,091,151 –
Net asset value per share of: D Accumulation Shares GBP 10.28 10.07 –D Accumulation Hedged EUR Shares EUR 9.85 – –D Accumulation Hedged SEK Shares SEK 9.84 – –D Accumulation Hedged USD Shares USD 9.97 – –Z Accumulation Shares GBP 10.38 10.09 –
Global Absolute Return Strategies Fund^ Total net assets EUR 15,891,831,073 8,737,896,630 6,106,091,781
Net asset value per share of: A Accumulation Shares EUR 12.46 12.20 11.65A Accumulation Hedged AUD Shares AUD 10.01 – –A Accumulation Hedged CHF Shares CHF 11.36 11.24 10.76A Accumulation Hedged GBP Shares GBP 12.60 12.29 11.71A Accumulation Hedged JPY Shares JPY 1,846 1,816 1,735A Accumulation Hedged SEK Shares SEK 129.06 126.96 120.68A Accumulation Hedged SGD Shares SGD 11.13 10.80 10.32A Accumulation Hedged USD Shares USD 12.34 12.10 11.57A Distribution Shares EUR 12.29 12.06 11.51B Accumulation Shares EUR 9.87 – –B Accumulation Hedged GBP Shares GBP 9.89 – –B Accumulation Hedged USD Shares USD 9.87 – –D Accumulation Shares EUR 12.97 12.61 11.94D Accumulation Hedged AUD Shares AUD 12.63 12.01 11.07D Accumulation Hedged CAD Shares CAD 11.06 10.70 10.05D Accumulation Hedged CHF Shares CHF 11.66 11.46 10.88D Accumulation Hedged GBP Shares GBP 13.05 12.63 11.94D Accumulation Hedged JPY Shares JPY 1,911 1,865 1,769D Accumulation Hedged NZD Shares NZD 12.33 11.60 10.67D Accumulation Hedged SEK Shares SEK 133.84 130.59 123.11D Accumulation Hedged SGD Shares SGD 12.07 11.63 11.03D Accumulation Hedged USD Shares USD 12.79 12.45 11.80D Distribution Shares EUR 12.43 12.19 11.62D Distribution Hedged CAD Shares CAD 11.50 11.18 10.54Z Accumulation Shares EUR 13.51 13.02 12.23Z Accumulation Hedged AUD Shares AUD 15.24 14.37 13.16Z Accumulation Hedged CAD Shares CAD 13.73 13.16 12.26Z Accumulation Hedged JPY Shares JPY 1,822 1,761 1,655Z Accumulation Hedged USD Shares USD 10.16 – –Z Distribution Hedged CAD Shares CAD 11.67 11.31 10.63
^This Sub-fund is not authorised in Hong Kong and is not available to Hong Kong residents. *Total net assets for each Sub-fund is before any adjustment due to swing pricing. The net asset value per share for each share class is after any adjustment due to swing pricing.

Standard Life Investments Global SICAV
Société d'Investissement à Capital Variable
Statistics (continued)
39
Currency 31 December
2015* 31 December
2014 31 December
2013
Global Focused Strategies Fund^ Total net assets EUR 626,760,766 404,411,134 115,390,259
Net asset value per share of: A Accumulation Shares EUR 11.03 10.27 –A Accumulation Hedged CHF Shares CHF 10.02 – –A Accumulation Hedged SEK Shares SEK 10.02 – –B Accumulation Hedged GBP Shares GBP 10.03 – –D Accumulation Shares EUR 10.88 10.04 10.15D Accumulation Hedged CAD Shares CAD 11.01 10.11 10.16D Accumulation Hedged CHF Shares CHF 10.73 10.00 10.15D Accumulation Hedged GBP Shares GBP 10.92 10.05 10.15D Accumulation Hedged SEK Shares SEK 10.88 10.07 10.16D Accumulation Hedged USD Shares USD 10.45 – –K Accumulation Hedged GBP Shares GBP 10.96 10.07 10.16K Accumulation Hedged USD Shares USD 10.90 10.06 –Z Accumulation Hedged AUD Shares AUD 10.42 – –Z Accumulation Shares EUR 10.82 9.87 –Z Accumulation Hedged GBP Shares GBP 11.19 10.18 10.16
Absolute Return Global Bond Strategies Fund^ Total net assets GBP 1,004,344,141 551,670,703 477,498,539
Net asset value per share of: A Accumulation Shares GBP 10.73 10.58 10.55A Accumulation Hedged CHF Shares CHF 10.04 – –A Accumulation Hedged EUR Shares EUR 10.43 10.36 10.36A Accumulation Hedged SEK Shares SEK 10.02 – –A Accumulation Hedged USD Shares USD 10.16 10.06 10.04D Accumulation Shares GBP 11.05 10.83 10.72D Accumulation Hedged AUD Shares AUD 11.52 11.07 10.71D Accumulation Hedged CHF Shares CHF 10.05 – –D Accumulation Hedged EUR Shares EUR 10.78 10.63 10.56D Accumulation Hedged SEK Shares SEK 10.07 – –D Accumulation Hedged USD Shares USD 10.33 10.15 10.07Z Accumulation Shares GBP 11.37 11.07 10.90Z Accumulation Hedged AUD Shares AUD 10.56 10.10 –Z Accumulation Hedged EUR Shares EUR 10.89 10.68 10.54Z Distribution Hedged CAD Shares CAD 10.46 10.26 10.03
^This Sub-fund is not authorised in Hong Kong and is not available to Hong Kong residents. *Total net assets for each Sub-fund is before any adjustment due to swing pricing. The net asset value per share for each share class is after any adjustment due to swing pricing.

Standard Life Investments Global SICAV
Société d'Investissement à Capital Variable
Notes to the Financial Statements as at 31 December 2015
40
1. Organisation
Standard Life Investments Global SICAV (the "Company") was incorporated on 16 November 2000 under the laws of the Grand Duchy of Luxembourg as a "Société d'Investissement à Capital Variable" ("SICAV") with multiple Sub-funds for an unlimited period. The Company has received approval from the Luxembourg authorities for registration under Part I of the law of 17 December 2010, as amended, relating to Undertakings for Collective Investment in Transferable Securities (the "UCITS Law") in conformity with Directive 2009/65/EC (the “UCITS Directive”). The Company is not a self-managed SICAV. A management company was appointed on 1 July 2013.
The legal notice ("notice légale") required by Luxembourg laws in connection with the issue and sale of shares in the Company has been deposited with the Registrar of Companies of the District Court of Luxembourg (the "Registrar"). The Company's articles of incorporation have also been deposited with the Registrar and have been published in the Recueil des Sociétés et Associations (the "Mémorial") on 19 December 2000. The Company has been registered under number B 78.797 at the Luxembourg Commercial Register.
During the year ended 31 December 2015, there were 31 Sub-funds available for investment and 20 classes of shares were offered to investors: Class A, Class A Unhedged, Class A Hedged, Class B, Class B Hedged, Class C, Class C Unhedged, Class C Hedged, Class D, Class D Unhedged, Class D Hedged, Class J, Class J Unhedged, Class J Hedged, Class K, Class K Unhedged, Class K Hedged, Class Z, Class Z Hedged and Class Z Unhedged, which differ in the fee structure applying to them. Class D Shares are reserved for institutional investors.
Class Z Shares are reserved for members of the Standard Life group of companies and for any other institutional investors with whom separate arrangements have been made to remunerate Standard Life Investments Limited (the “Investment Manager”) and the relevant Sub-Investment Manager (as applicable) and to pay other costs.
Details of the classes of shares issued in the Sub-funds are noted in the Statistical Information on pages 32 to 39 and in Appendix 1 on pages 110 and 111 of the financial statements.
2. Significant Accounting Policies
a) General These financial statements are prepared in accordance with Luxembourg regulations applicable to Undertakings for Collective Investment Funds.
b) Investment valuation In determining the value of the assets of the Company each security which is quoted or dealt in on a stock exchange is valued at its latest available price on the stock exchange which is normally the principal market for such securities, and each security dealt in on an over-the-counter market is valued in a manner as near as possible to that for quoted securities.
The value of securities not quoted or dealt in on a stock exchange or an over-the-counter market, and of securities which are so quoted or dealt in but in respect of which no price quotation is available or the price quoted is not representative of the security's fair market value, is determined prudently and in good faith on the basis of their reasonably foreseeable sale prices. Suspended or delisted securities held at 31 December 2015 have been valued at fair value as instructed by the Investment Manager; details of these securities are included in the Schedule of Investments.
Short-term investments purchased and maturing within 90 days from the date of purchase are valued at amortised cost, which approximates market value. Any discount or premium is amortised on a straight-line basis to maturity. In the event of material changes in market conditions, the valuation basis of the investment is adjusted to the new market yields.
Shares or units in open-ended investment funds are valued at the latest price or total net assets as reported or provided by such undertakings or their agents.
c) Conversion of foreign currencies The books and records of each Sub-fund are denominated in the base currency of the corresponding Sub-fund. Amounts denominated in other currencies are translated into the base currency on the following basis:
(i) investment valuations and other assets and liabilities initially expressed in other currencies are converted on each business day into the base currency using exchange rates prevailing on each business day; and (ii) purchases and sales of foreign investments, income and expenses are converted into the base currency using currency exchange rates prevailing on the respective dates of such transactions.
Net realised gains and losses on foreign exchange represent:
(i) foreign exchange gains and losses from the sale and holding of foreign currencies; (ii) gains and losses between trade date and settlement date on securities transactions; and (iii) gains and losses arising from the difference between amounts of dividends and interest recorded and the amounts actually received.
The resulting gains and losses on transactions are included in the Statement of Operations and Changes in Net Assets.

Standard Life Investments Global SICAV
Société d'Investissement à Capital Variable
Notes to the Financial Statements as at 31 December 2015 (continued)
41
2. Significant Accounting Policies (continued)
c) Conversion of foreign currencies (continued) Main exchange rates used as at 31 December 2015 are as follow:
1 USD = 1.366961 AUD 1 USD = 1172.550037 KRW
1 USD = 3.956239 BRL 1 USD = 17.350260 MXN
1 USD = 1.388353 CAD 1 USD = 4.293508 MYR
1 USD = 0.996356 CHF 1 USD = 8.818949 NOK
1 USD = 710.730110 CLP 1 USD = 1.460591 NZD
1 USD = 6.493623 CNY 1 USD = 3.408496 PEN
1 USD = 3174.275693 COP 1 USD = 47.054997 PHP
1 USD = 24.816081 CZK 1 USD = 3.919968 PLN
1 USD = 6.853465 DKK 1 USD = 4.154835 RON
1 USD = 45.305048 DOP 1 USD = 73.950030 RUB
1 USD = 0.918382 EUR 1 USD = 8.442844 SEK
1 USD = 0.674809 GBP 1 USD = 1.415986 SGD
1 USD = 7.750219 HKD 1 USD = 35.984985 THB
1 USD = 290.118058 HUF 1 USD = 2.913186 TRY
1 USD = 13785.000675 IDR 1 USD = 32.846987 TWD
1 USD = 66.156252 INR 1 USD = 15.553749 ZAR
1 USD = 120.369998 JPY
d) Securities transactions and investment income Securities transactions are recorded on a trade date basis. Dividend income is accrued on the ex-dividend date. Realised gains and losses are determined on the basis of the average cost of securities sold. Interest income is accrued on a daily basis.
e) Formation expenses The formation expenses of the Company and each of the Sub-funds have been borne by the Standard Life group of companies.
f) Forward Foreign Exchange Contracts The forward foreign exchange contracts are valued on the basis of forward foreign exchange rates prevailing at the reporting date and the resulting net change in unrealised appreciation or depreciation is included in the Statement of Operations and Changes in Net Assets, under the heading “Change in net unrealised appreciation/(depreciation) on forward foreign exchange contracts”. The realised gain/(loss) on forward foreign exchange contracts is disclosed in the Statement of Operations and Changes in Net Assets, under the heading “Net realised gain/(loss) on forward foreign exchange contracts”.
g) Swap Contracts The interest rate swap contracts are valued at their fair value based on current market interest rates. The value of the interest rate swap includes the amount of accrued interest as at the date of valuation. The interest income/(expenses) on swap contracts is included in the Statement of Operations and Changes in Net Assets under the heading “Net realised gain/(loss) on swap contracts”.
The inflation linked swaps, credit default swaps and total return swaps are valued at their fair value daily based on broker prices.
The net change in unrealised appreciation/(depreciation) on swap contracts is included in the Statement of Operations and Changes in Net Assets, under the heading “Change in net unrealised appreciation/(depreciation) on swap contracts”. The receivable and payable for swap contracts is recorded in the Statement of Net Assets under the heading “Unrealised appreciation on swap contracts” and “Unrealised depreciation on swap contracts”, respectively. Realised gains/(losses) on swap contracts are disclosed in the Statement of Operations and Changes in Net Assets under the heading “Net realised gain/(loss) on swap contracts”.
h) Future Contracts The future contracts are valued on the basis of future contracts exchange rates prevailing on the reporting date and the resulting net change in unrealised appreciation/depreciation is included in the Statement of Operations and Changes in Net Assets, under the heading “Change in net unrealised appreciation/(depreciation) on future contracts”. The realised gain/(loss) on future contracts is disclosed in the Statement of Operations and Changes in Net Assets under the heading “Net realised gain/(loss) on future contracts”.
i) Option Contracts The option contracts are valued on the basis of option contracts exchange rates prevailing at the reporting date and the resulting net change in unrealised appreciation/depreciation is included in the Statement of Operations and Changes in Net Assets under the heading “Change in net unrealised appreciation/(depreciation) on option contracts”. The realised gain/(loss) on option contracts is disclosed in the Statement of Operations and Changes in Net Assets under the heading “Net realised gain/(loss) on option contracts”.
j) Consolidation The Company incorporated a Mauritian subsidiary, Standard Life Investments GS (Mauritius Holdings), on 11 June 2007 (on behalf of the Indian Equity Midcap Opportunities Fund (formerly the Indian Equities Fund)). The Mauritian subsidiary is wholly owned and makes investments according to the Company’s investment policy. Currently, the Mauritian subsidiary benefits from relief due to the India/Mauritius double tax treaty. There can be no assurance that this will not change in the future. The consolidated statements of the Indian Equity Midcap Opportunities Fund include the respective accounts of the subsidiary.

Standard Life Investments Global SICAV
Société d'Investissement à Capital Variable
Notes to the Financial Statements as at 31 December 2015 (continued)
42
3. Expenses
a) Annual Management Charges The Annual Management Charges are used to pay the Investment Manager, the Sub-Investment Managers, the principal distributor and any appointed sub-distributor.
Sub-fund Class A Class B Class C Class D Class J Class K Class Z Equity Sub-funds
Global Equities Fund 1.40 TBD† TBD† 0.70 TBD† TBD† 0.00
Asian Equities Fund 1.40 TBD† TBD† 0.70 TBD† TBD† 0.00 China Equities Fund 1.80 TBD† TBD† 0.90 TBD† TBD† 0.00 Japanese Equities Fund 1.40 TBD† TBD† 0.70 TBD† TBD† 0.00 Japanese Equity High Alpha Fund1 TBD† TBD† 1.25 0.80 0.60 0.60 0.00 European Equities Fund 1.40 TBD† TBD† 0.70 TBD† TBD† 0.00 Global REIT Focus Fund 1.60 TBD† TBD† 0.85 TBD† TBD† 0.00 European Smaller Companies Fund 1.80 TBD† TBD† 0.90 TBD† TBD† 0.00 Indian Equity Midcap Opportunities Fund2 1.80 TBD† TBD† 0.90 TBD† TBD† 0.40 European Equity Unconstrained Fund 1.80 TBD† TBD† 0.90 TBD† TBD† 0.00 Global Emerging Markets Equity Unconstrained Fund 1.80 TBD† TBD† 0.90 TBD† TBD† 0.00 Enhanced Diversification Global Emerging Markets Equities Fund TBD† TBD† TBD† 0.75 TBD† TBD† 0.00 Continental European Equity Income Fund 1.50 TBD† 1.40 0.75 0.70 0.70 0.00 Global Equity Unconstrained Fund 1.70 TBD† TBD† 0.90 TBD† TBD† 0.00 American Equity Unconstrained Fund3 1.60 TBD† TBD† 0.85 TBD† TBD† 0.00 Global Emerging Markets Equities Fund3 1.50 TBD† TBD† 0.75 TBD† TBD† 0.00 Bond Sub-funds
Global Bond Fund 1.00 TBD† TBD† 0.50 TBD† TBD† 0.00 Global Inflation-Linked Bond Fund 1.00 TBD† TBD† 0.50 TBD† TBD† 0.00 European High Yield Bond Fund 1.35 TBD† TBD† 0.60 TBD† TBD† 0.00 European Corporate Bond Fund 1.00 0.45 TBD† 0.50 TBD† 0.23 0.00 Euro Government All Stocks Fund 1.35 TBD† TBD† 0.50 TBD† TBD† 0.00 Emerging Market Debt Fund 1.40 TBD† TBD† 0.65 TBD† TBD† 0.00 Emerging Market Local Currency Debt Fund 1.40 TBD† TBD† 0.65 TBD† TBD† 0.00 Global High Yield Bond Fund 1.35 TBD† TBD† 0.60 TBD† TBD† 0.00 Global Corporate Bond Fund 1.00 TBD† TBD† 0.50 TBD† TBD† 0.00 European Corporate Bond Sustainable and Responsible .Investment Fund 1.10 TBD† TBD† 0.55 TBD† TBD† 0.00 Emerging Market Corporate Bond Fund 1.40 TBD† TBD† 0.65 TBD† TBD† 0.00 Total Return Credit Fund TBD† TBD† TBD† 0.80 TBD† TBD† 0.00 Absolute Return Sub-funds
Global Absolute Return Strategy Fund 1.60 0.90 TBD† 0.85 TBD† TBD† 0.00 Global Focused Strategies Fund 2.00 TBD† TBD† 1.20 TBD† 1.00 0.00 Absolute Return Global Bond Strategies Fund 1.25 TBD† TBD† 0.60 TBD† TBD† 0.00 1This Sub-fund was launched on 12 May 2015. 2Effective 14 December 2015, the Indian Equities Fund was renamed the Indian Equity Midcap Opportunities Fund. 3This Sub-fund was launched on 20 February 2015. †The Annual Management Charge will be determined at the launch of the classes of shares.
b) Custody fees The custodian fee is calculated at a rate determined by the territory or country in which the Sub-fund assets are invested. Currently, the lowest rate is 0.0025% and the highest rate is 0.50% of the net asset value of the relevant Sub-fund annually.
c) Transaction costs Transaction costs may arise on the acquisition and disposal of investments and these costs may include fees and commissions paid to agents, advisors, brokers and dealers. These are included in “Net realised gain/(loss) on sale of investments” in the Statement of Operations and Changes in Net Assets.
Dealing commission is usually paid for transactions in securities and derivatives over an exchange (eg. equities, futures and options). Transaction costs may not be separately identifiable for transactions that do not occur over an exchange as the costs may be included in the transaction price (eg. bonds and money market instruments).

Standard Life Investments Global SICAV
Société d'Investissement à Capital Variable
Notes to the Financial Statements as at 31 December 2015 (continued)
43
3. Expenses (continued)
c) Transaction costs (continued) For the year ended 31 December 2015, the Sub-funds incurred commission expenses relating to the sale and purchase of future contracts which have been included in the Statement of Operations and Changes in Net Assets as “Net realised gain/(loss) on futures contracts”. Similarly, during the year ended 31 December 2015, the Sub-funds incurred commission expenses relating to the sale and purchase of option contracts which have been included in the Statement of Operations and Changes in Net Assets as “Net realised gain/(loss) on options contracts”. During the year ended 31 December 2015, there were no transaction costs incurred relating to the trading of swaps.
An estimate of the identifiable costs related to equity transactions which have been included in “Net realised gain/(loss) on sale of investments” in the Statement of Operations and Changes in Net Assets are included in the table below:
Sub-Fund Currency Estimated Transaction Costs 2015
Global Equities Fund USD 528,235Asian Equities Fund USD 116,939China Equities Fund USD 569,226Japanese Equities Fund JPY 19,735,161Japanese Equity High Alpha Fund1 JPY 4,377,632European Equities Fund EUR 172,690Global REIT Focus Fund EUR 390,462European Smaller Companies Fund EUR 778,077Indian Equity Midcap Opportunities Fund2 USD 103,800European Equity Unconstrained Fund EUR 231,285Global Emerging Markets Equity Unconstrained Fund USD 546,261Enhanced Diversification Global Emerging Markets Equities Fund USD 20,565Continental European Equity Income Fund EUR 218,008Global Equity Unconstrained Fund USD 89,500American Equity Unconstrained Fund3 USD 32,270Global Emerging Markets Equities Fund3 USD 46,873Global Absolute Return Strategies Fund EUR 6,144,112Global Focused Strategies Fund EUR 769,998In addition to the transaction costs in the table above, there are identifiable transaction costs included in the Statement of Operations and
Changes in Net Assets as part of “Custody fees”. Estimates of these identifiable costs are included in the table below:
Sub-Fund Currency Estimated Transaction Costs 2015
Global Equities Fund USD 16,059 Asian Equities Fund USD 22,571 China Equities Fund USD 8,549 Japanese Equities Fund JPY 4,747,232 European Equities Fund EUR 3,824 Global REIT Focus Fund EUR 10,824 European Smaller Companies Fund EUR 8,653 European Equity Unconstrained Fund EUR 2,766 Global Emerging Markets Equity Unconstrained Fund USD 28,514 Enhanced Diversification Global Emerging Markets Equities Fund USD 25,130 Continental European Equity Income Fund EUR 20,773Global Equity Unconstrained Fund USD 10,083American Equity Unconstrained Fund3 USD 4,700Global Emerging Markets Equities Fund3 USD 33,589Global Bond Fund USD 16,000 Global Inflation-Linked Bond Fund USD 13,623 European High Yield Bond Fund EUR 2,834 European Corporate Bond Fund EUR 16,744 Euro Government All Stocks Fund EUR 9,558 Emerging Market Debt Fund USD 4,161 Emerging Market Local Currency Debt Fund USD 6,093 Global High Yield Bond Fund USD 12,604 Global Corporate Bond Fund USD 19,472 European Corporate Bond Sustainable and Responsible Investment Fund EUR 14,490 Emerging Market Corporate Bond Fund USD 3,719 Total Return Credit Fund GBP 1,071 Global Absolute Return Strategies Fund EUR 120,612 Global Focused Strategies Fund EUR 36,016 Absolute Return Global Bond Strategies Fund GBP 9,621 1This Sub-fund was launched on 12 May 2015. 2Effective 14 December 2015, the Indian Equities Fund was renamed the Indian Equity Midcap Opportunities Fund. 3This Sub-fund was launched on 20 February 2015.

Standard Life Investments Global SICAV
Société d'Investissement à Capital Variable
Notes to the Financial Statements as at 31 December 2015 (continued)
44
3. Expenses (continued)
d) Central Administration Fees The central administration fees are on a sliding scale based on the asset value. The fees are calculated as follows:
Asset value of EUR 0 to EUR 100 Million shall be charged at 0 basis points per annum.
Asset value of EUR 100 Million to 250 Million shall be charged at 1.25 basis points per annum.
Asset value of EUR 250 Million to 500 Million shall be charged at 0.75 basis points per annum.
Asset value of greater than EUR 500 Million shall be charged at 0.50 basis points per annum.
There is also a fixed fee of EUR 15,000 per Sub-fund per annum.
e) Expense Waiver Under the expense cap arrangement that is in place for all Sub-Funds, expenses of a Sub-fund (excluding the annual management charges and the taxe d'abonnement) exceeding 20 basis points of that Sub-fund's net asset value will be borne by the Investment Manager.
f) Management Company Charge Standard Life Investments (Mutual Funds) Limited has been appointed as management company (the “Management Company”) to the Company. The Company is entitled to pay an annual charge to the Management Company (the "Management Company Charge’’), up to a maximum of 5 basis points accrued daily and determined on the average daily net assets of each Sub-fund (before deduction of the Management Company Charge). The Management Company Charge is payable monthly in arrears.
During the year from 1 January 2015 to 31 December 2015 Management Company Charge was levied at a rate of 0.5 basis points.
The Management Company Charge shall be used to pay the Management Company for the services it provides to the Company (in particular the performance of its monitoring role) and shall include reimbursement for any additional regulatory capital costs incurred by the Management Company by reason of its appointment.
4. Dividend
The Board of Directors may decide to pay interim dividends in the form and under the conditions as provided by Luxembourg law.
During the year ended 31 December 2015, the Company has recorded the following dividends:
Distribution rates for the year ended 31 December 2015
Sub-fund Currency Ex-DateAmount per
Share
Global Equities Fund - Class D Distribution USD 02 January 2015 0.00102
Global REIT Focus Fund - Class D Distribution EUR 02 January 2015 0.14792
European Smaller Companies Fund - Class A Distribution EUR 02 January 2015 0.01691
Continental European Equity Income Fund – Class D Distribution EUR 01 April 2015 0.04234
Continental European Equity Income Fund – Class D Distribution Unhedged GBP 01 April 2015 0.04752
Continental European Equity Income Fund – Class D Distribution Hedged GBP 01 April 2015 0.05485
Continental European Equity Income Fund – Class K Distribution Unhedged GBP 01 April 2015 0.05434
Continental European Equity Income Fund – Class K Distribution Hedged GBP 01 April 2015 0.05736
Continental European Equity Income Fund – Class D Distribution EUR 01 July 2015 0.12241
Continental European Equity Income Fund – Class D Distribution Unhedged GBP 01 July 2015 0.10350
Continental European Equity Income Fund – Class D Distribution Hedged GBP 01 July 2015 0.12025
Continental European Equity Income Fund – Class K Distribution EUR 01 July 2015 0.04730
Continental European Equity Income Fund – Class K Distribution Unhedged GBP 01 July 2015 0.10100
Continental European Equity Income Fund – Class K Distribution Hedged GBP 01 July 2015 0.12057
Continental European Equity Income Fund – Class J Distribution EUR 01 July 2015 0.04730
Continental European Equity Income Fund – Class J Distribution Unhedged GBP 01 July 2015 0.04560
European Corporate Bond Fund – Class A Distribution EUR 02 January 2015 0.24185
European Corporate Bond Fund – Class A Distribution Hedged NOK 02 January 2015 0.01463
European Corporate Bond Fund – Class B Distribution EUR 02 January 2015 0.13338

Standard Life Investments Global SICAV
Société d'Investissement à Capital Variable
Notes to the Financial Statements as at 31 December 2015 (continued)
45
4. Dividend (continued)
Distribution rates for the year ended 31 December 2015
Sub-fund Currency Ex-DateAmount per
Share
European Corporate Bond Fund – Class D Distribution EUR 02 January 2015 0.28721
European Corporate Bond Fund – Class D Distribution Unhedged USD 02 January 2015 0.38722
European Corporate Bond Fund – Class D Distribution Unhedged GBP 02 January 2015 0.13395
European Corporate Bond Fund – Class D Distribution Hedged GBP 02 January 2015 0.07874
European Corporate Bond Fund – Class D Distribution Hedged NOK 02 January 2015 0.01967
European Corporate Bond Fund – Class D Distribution Hedged USD 02 January 2015 0.04975
European Corporate Bond Fund – Class Z Distribution EUR 02 January 2015 0.33310
Euro Government All Stocks Fund – Class Z Distribution EUR 02 January 2015 0.17358
Emerging Market Local Currency Debt Fund – Class A Distribution USD 02 January 2015 0.27917
Emerging Market Local Currency Debt Fund – Class A Distribution Hedged GBP 02 January 2015 0.45716
Emerging Market Local Currency Debt Fund – Class D Distribution USD 02 January 2015 0.35350
Emerging Market Local Currency Debt Fund – Class D Distribution Unhedged GBP 02 January 2015 0.54857
Emerging Market Local Currency Debt Fund – Class D Distribution Hedged GBP 02 January 2015 0.57872
Global High Yield Bond Fund - Class D Distribution USD 02 January 2015 0.03202
Global High Yield Bond Fund - Class D Distribution USD 01 April 2015 0.12504
Global High Yield Bond Fund - Class D Distribution Hedged GBP 01 April 2015 0.04185
Global High Yield Bond Fund - Class D Distribution Hedged CHF 01 April 2015 0.02877
Global High Yield Bond Fund - Class D Distribution USD 01 July 2015 0.12267
Global High Yield Bond Fund - Class D Distribution Hedged GBP 01 July 2015 0.12297
Global High Yield Bond Fund - Class D Distribution Hedged CHF 01 July 2015 0.12554
Global High Yield Bond Fund - Class D Distribution USD 01 October 2015 0.12130
Global High Yield Bond Fund - Class D Distribution Hedged GBP 01 October 2015 0.12712
Global High Yield Bond Fund - Class D Distribution Hedged CHF 01 October 2015 0.12503
European Corporate Bond Sustainable and Responsible Investment Fund - Class D Distribution EUR 02 January 2015 0.18164
Global Absolute Return Strategies Fund – Class A Distribution EUR 02 January 2015 0.02591
Global Absolute Return Strategies Fund – Class D Distribution EUR 02 January 2015 0.11447
Global Absolute Return Strategies Fund – Class D Distribution Hedged CAD 02 January 2015 0.07205
Global Absolute Return Strategies Fund – Class Z Distribution Hedged CAD 02 January 2015 0.13093
Absolute Return Global Bond Strategies Fund - Class Z Distribution Hedged CAD 02 January 2015 0.09088
The Global Equities Fund Class D Distribution shares have paid a total dividend of USD 1,229 to the shareholders during the year ended 31 December 2015. The Global REIT Focus Fund Class D Distribution shares have paid a total dividend of EUR 15 to the shareholders during the year ended 31 December 2015.
The European Smaller Companies Fund Class A Distribution shares have paid a total dividend of EUR 2 to the shareholders during the year ended 31 December 2015. The Continental European Equity Income Fund Class D, K and J Distribution shares have paid a total dividend of EUR 472,733 to the shareholders, during the year ended 31 December 2015. This Sub-fund distributes quarterly. The European Corporate Bond Fund Class A, B, D and Z Distribution shares have paid a total dividend of EUR 20,466,824 to the shareholders during the year ended 31 December 2015.

Standard Life Investments Global SICAV
Société d'Investissement à Capital Variable
Notes to the Financial Statements as at 31 December 2015 (continued)
46
4. Dividend (continued)
The Euro Government All Stocks Fund Class Z Distribution shares have paid a total dividend of EUR 65,438,662 to the shareholders during the year ended 31 December 2015.
The Emerging Market Local Currency Debt Fund Class A and D Distribution shares have paid a total dividend of USD 511,736 to the shareholders during the year ended 31 December 2015.
The Global High Yield Bond Fund Class D Distribution have paid a total dividend of USD 1,662,352 to the shareholders during the year ended 31 December 2015. This Sub-fund distributes quarterly.
The European Corporate Bond Sustainable and Responsible Investment Fund - Class D Distribution have paid a total dividend of EUR 18 to the shareholders during the year ended 31 December 2015
The Global Absolute Return Strategies Fund Class A, D and Z Distribution shares have paid a total dividend of EUR 8,365,471 to the shareholders duing the year ended 31 December 2015.
The Absolute Return Global Bond Strategies Fund Class Z Distribution Hedged shares have paid a total dividend of GBP 4,965 to the shareholders during the year ended 31 December 2015.
5. Taxation
a) Taxe d’abonnement Under current law and practice, the Company is not liable to any Luxembourg income tax, nor are dividends paid by the Company liable to any Luxembourg withholding tax. Under legislation and regulations prevailing in Luxembourg, the Sub-funds are subject to the "taxe d'abonnement" (subscription tax) at the rate of 0.05% per annum, except for the share classes which benefit from a reduced tax rate of 0.01% like the classes of shares dedicated to institutional investors. Class D shares are reserved for institutional investors (as such term is interpreted by the supervisory authority and any applicable laws and regulations from time to time in force in Luxembourg) and, for the avoidance of doubt, any institutional nominees acting on behalf of retail and institutional investors to whom the Directors offer such Class. Class Z shares are reserved for members of the Standard Life group of companies and for other institutional investors with whom separate arrangements have been made to remunerate the Investment Manager and the relevant Sub-Investment Manager (as applicable) and to pay other costs. The taxe d'abonnement is calculated and payable quarterly, at the rates set out below:
Class A 0.05% of total net assets of the Class Class B 0.05% of total net assets of the Class Class C 0.05% of total net assets of the Class Class D 0.01% of total net assets of the Class Class J 0.05% of total net assets of the Class Class K 0.01% of total net assets of the Class Class Z 0.01% of total net assets of the Class
b) Provision for foreign taxes Capital gains, dividends and interest on securities received from other countries may be subject to withholding or capital gains taxes imposed by such countries. It is the Company's policy to provide for any potential liability to foreign capital gains and income taxes.
6. Forward foreign exchange contracts
As at 31 December 2015, the Company had the following outstanding forward foreign exchange contracts: Asian Equities Fund
Purchase Sale Maturity Unrealised Appreciation/Currency Amount Currency Amount Date (Depreciation) in USD
KRW 42,898,850 USD (36,684) 04-Jan-2016 (118)
(118) Net USD (118)
China Equities Fund
Purchase Sale Maturity Unrealised Appreciation/Currency Amount Currency Amount Date (Depreciation) in USD
USD 57,994 HKD (449,458) 05-Jan-2016 (1)
(1) Net USD (1)
Japanese Equity High Alpha Fund
Purchase Sale Maturity Unrealised Appreciation/Currency Amount Currency Amount Date (Depreciation) in JPY
JPY 13,011,311 USD (108,027) 04-Jan-2016 9,275JPY 1,149,712 USD (9,535) 05-Jan-2016 2,084JPY 59,838,124 EUR (439,333) 15-Jan-2016 2,254,021JPY 65,348,111 EUR (492,156) 15-Jan-2016 840,431JPY 48,846,608 EUR (366,466) 15-Jan-2016 813,317JPY 37,041,632 EUR (276,786) 15-Jan-2016 762,891JPY 57,287,608 EUR (431,383) 15-Jan-2016 745,496
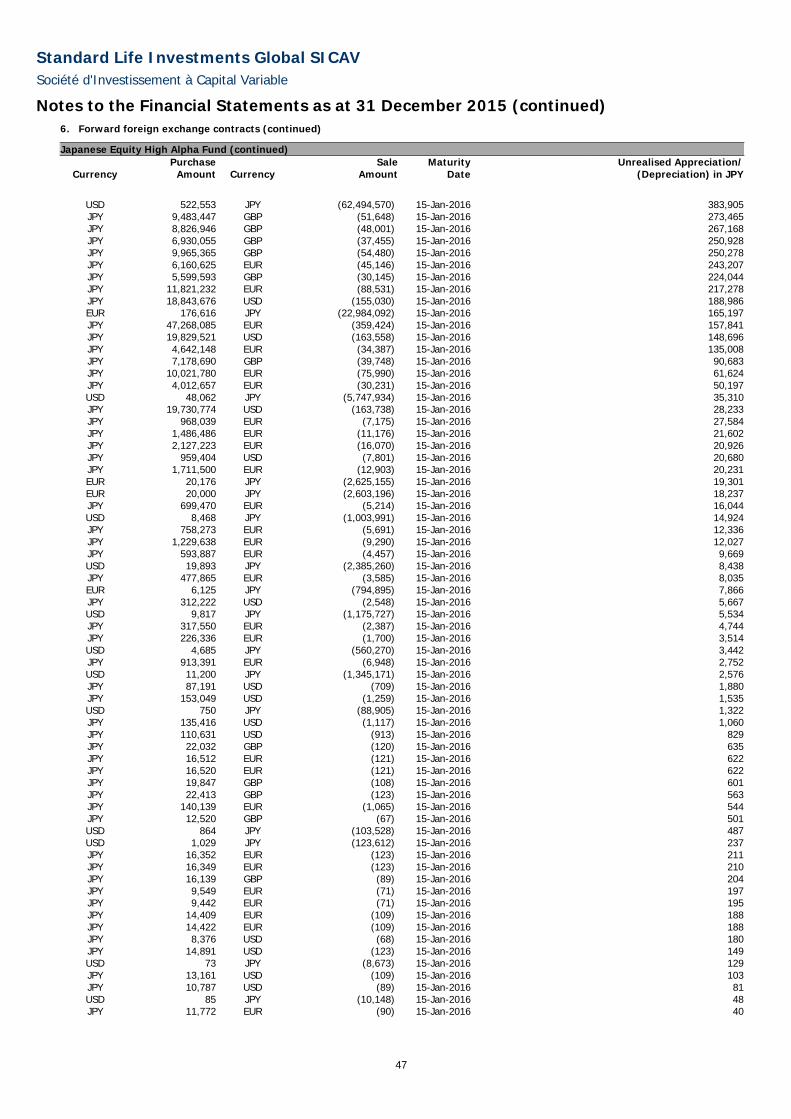
Standard Life Investments Global SICAV
Société d'Investissement à Capital Variable
Notes to the Financial Statements as at 31 December 2015 (continued)
47
6. Forward foreign exchange contracts (continued)
Japanese Equity High Alpha Fund (continued) Purchase Sale Maturity Unrealised Appreciation/
Currency Amount Currency Amount Date (Depreciation) in JPY
USD 522,553 JPY (62,494,570) 15-Jan-2016 383,905JPY 9,483,447 GBP (51,648) 15-Jan-2016 273,465JPY 8,826,946 GBP (48,001) 15-Jan-2016 267,168JPY 6,930,055 GBP (37,455) 15-Jan-2016 250,928JPY 9,965,365 GBP (54,480) 15-Jan-2016 250,278JPY 6,160,625 EUR (45,146) 15-Jan-2016 243,207JPY 5,599,593 GBP (30,145) 15-Jan-2016 224,044JPY 11,821,232 EUR (88,531) 15-Jan-2016 217,278JPY 18,843,676 USD (155,030) 15-Jan-2016 188,986EUR 176,616 JPY (22,984,092) 15-Jan-2016 165,197JPY 47,268,085 EUR (359,424) 15-Jan-2016 157,841JPY 19,829,521 USD (163,558) 15-Jan-2016 148,696JPY 4,642,148 EUR (34,387) 15-Jan-2016 135,008JPY 7,178,690 GBP (39,748) 15-Jan-2016 90,683JPY 10,021,780 EUR (75,990) 15-Jan-2016 61,624JPY 4,012,657 EUR (30,231) 15-Jan-2016 50,197USD 48,062 JPY (5,747,934) 15-Jan-2016 35,310JPY 19,730,774 USD (163,738) 15-Jan-2016 28,233JPY 968,039 EUR (7,175) 15-Jan-2016 27,584JPY 1,486,486 EUR (11,176) 15-Jan-2016 21,602JPY 2,127,223 EUR (16,070) 15-Jan-2016 20,926JPY 959,404 USD (7,801) 15-Jan-2016 20,680JPY 1,711,500 EUR (12,903) 15-Jan-2016 20,231EUR 20,176 JPY (2,625,155) 15-Jan-2016 19,301EUR 20,000 JPY (2,603,196) 15-Jan-2016 18,237JPY 699,470 EUR (5,214) 15-Jan-2016 16,044USD 8,468 JPY (1,003,991) 15-Jan-2016 14,924JPY 758,273 EUR (5,691) 15-Jan-2016 12,336JPY 1,229,638 EUR (9,290) 15-Jan-2016 12,027JPY 593,887 EUR (4,457) 15-Jan-2016 9,669USD 19,893 JPY (2,385,260) 15-Jan-2016 8,438JPY 477,865 EUR (3,585) 15-Jan-2016 8,035EUR 6,125 JPY (794,895) 15-Jan-2016 7,866JPY 312,222 USD (2,548) 15-Jan-2016 5,667USD 9,817 JPY (1,175,727) 15-Jan-2016 5,534JPY 317,550 EUR (2,387) 15-Jan-2016 4,744JPY 226,336 EUR (1,700) 15-Jan-2016 3,514USD 4,685 JPY (560,270) 15-Jan-2016 3,442JPY 913,391 EUR (6,948) 15-Jan-2016 2,752USD 11,200 JPY (1,345,171) 15-Jan-2016 2,576JPY 87,191 USD (709) 15-Jan-2016 1,880JPY 153,049 USD (1,259) 15-Jan-2016 1,535USD 750 JPY (88,905) 15-Jan-2016 1,322JPY 135,416 USD (1,117) 15-Jan-2016 1,060JPY 110,631 USD (913) 15-Jan-2016 829JPY 22,032 GBP (120) 15-Jan-2016 635JPY 16,512 EUR (121) 15-Jan-2016 622JPY 16,520 EUR (121) 15-Jan-2016 622JPY 19,847 GBP (108) 15-Jan-2016 601JPY 22,413 GBP (123) 15-Jan-2016 563JPY 140,139 EUR (1,065) 15-Jan-2016 544JPY 12,520 GBP (67) 15-Jan-2016 501USD 864 JPY (103,528) 15-Jan-2016 487USD 1,029 JPY (123,612) 15-Jan-2016 237JPY 16,352 EUR (123) 15-Jan-2016 211JPY 16,349 EUR (123) 15-Jan-2016 210JPY 16,139 GBP (89) 15-Jan-2016 204JPY 9,549 EUR (71) 15-Jan-2016 197JPY 9,442 EUR (71) 15-Jan-2016 195JPY 14,409 EUR (109) 15-Jan-2016 188JPY 14,422 EUR (109) 15-Jan-2016 188JPY 8,376 USD (68) 15-Jan-2016 180JPY 14,891 USD (123) 15-Jan-2016 149USD 73 JPY (8,673) 15-Jan-2016 129JPY 13,161 USD (109) 15-Jan-2016 103JPY 10,787 USD (89) 15-Jan-2016 81USD 85 JPY (10,148) 15-Jan-2016 48JPY 11,772 EUR (90) 15-Jan-2016 40

Standard Life Investments Global SICAV
Société d'Investissement à Capital Variable
Notes to the Financial Statements as at 31 December 2015 (continued)
48
6. Forward foreign exchange contracts (continued)
Japanese Equity High Alpha Fund (continued) Purchase Sale Maturity Unrealised Appreciation/
Currency Amount Currency Amount Date (Depreciation) in JPY
JPY 11,798 EUR (90) 15-Jan-2016 40USD 100 JPY (12,056) 15-Jan-2016 23
8,879,316
EUR 1,065 JPY (140,137) 04-Jan-2016 (545)EUR 65 JPY (8,638) 15-Jan-2016 (54)EUR 66 JPY (8,752) 15-Jan-2016 (55)USD 71 JPY (8,653) 15-Jan-2016 (71)USD 76 JPY (9,267) 15-Jan-2016 (100)EUR 75 JPY (9,943) 15-Jan-2016 (102)EUR 76 JPY (10,081) 15-Jan-2016 (104)EUR 79 JPY (10,427) 15-Jan-2016 (135)EUR 78 JPY (10,386) 15-Jan-2016 (135)EUR 102 JPY (13,452) 15-Jan-2016 (146)EUR 102 JPY (13,521) 15-Jan-2016 (146)USD 101 JPY (12,311) 15-Jan-2016 (151)USD 66 JPY (8,153) 15-Jan-2016 (161)JPY 14,376 USD (121) 15-Jan-2016 (181)USD 78 JPY (9,583) 15-Jan-2016 (186)EUR 72 JPY (9,689) 15-Jan-2016 (189)EUR 73 JPY (9,729) 15-Jan-2016 (190)EUR 101 JPY (13,424) 15-Jan-2016 (224)EUR 101 JPY (13,472) 15-Jan-2016 (225)USD 101 JPY (12,444) 15-Jan-2016 (262)EUR 73 JPY (9,909) 15-Jan-2016 (299)EUR 74 JPY (9,939) 15-Jan-2016 (300)GBP 79 JPY (14,489) 15-Jan-2016 (346)GBP 74 JPY (13,541) 15-Jan-2016 (379)EUR 85 JPY (11,506) 15-Jan-2016 (419)EUR 85 JPY (11,574) 15-Jan-2016 (421)GBP 102 JPY (18,601) 15-Jan-2016 (453)GBP 85 JPY (15,716) 15-Jan-2016 (509)GBP 72 JPY (13,407) 15-Jan-2016 (521)GBP 79 JPY (14,556) 15-Jan-2016 (529)EUR 100 JPY (13,630) 15-Jan-2016 (566)EUR 100 JPY (13,669) 15-Jan-2016 (568)GBP 100 JPY (18,437) 15-Jan-2016 (576)GBP 66 JPY (12,467) 15-Jan-2016 (626)USD 730 JPY (88,594) 15-Jan-2016 (727)GBP 103 JPY (19,158) 15-Jan-2016 (778)USD 772 JPY (93,949) 15-Jan-2016 (1,015)EUR 1,512 JPY (199,405) 15-Jan-2016 (1,226)EUR 2,839 JPY (373,550) 15-Jan-2016 (1,489)USD 1,035 JPY (126,102) 15-Jan-2016 (1,539)USD 674 JPY (82,752) 15-Jan-2016 (1,631)JPY 147,870 USD (1,244) 15-Jan-2016 (1,863)USD 800 JPY (98,153) 15-Jan-2016 (1,915)USD 9,535 JPY (1,149,438) 15-Jan-2016 (2,069)USD 1,036 JPY (127,291) 15-Jan-2016 (2,675)JPY 956,104 EUR (7,323) 15-Jan-2016 (3,696)EUR 3,103 JPY (411,437) 15-Jan-2016 (4,723)EUR 2,728 JPY (362,590) 15-Jan-2016 (5,025)EUR 2,743 JPY (365,007) 15-Jan-2016 (5,477)EUR 5,969 JPY (788,568) 15-Jan-2016 (6,258)USD 8,259 JPY (1,001,990) 15-Jan-2016 (8,227)EUR 11,127 JPY (1,467,525) 15-Jan-2016 (9,146)USD 25,000 JPY (3,017,833) 15-Jan-2016 (9,599)USD 108,027 JPY (13,008,902) 15-Jan-2016 (10,082)USD 8,853 JPY (1,076,889) 15-Jan-2016 (11,634)EUR 7,500 JPY (999,296) 15-Jan-2016 (16,259)USD 7,695 JPY (944,513) 15-Jan-2016 (18,611)EUR 4,697 JPY (635,305) 15-Jan-2016 (19,668)EUR 4,707 JPY (636,603) 15-Jan-2016 (19,708)EUR 5,870 JPY (789,573) 15-Jan-2016 (20,140)JPY 1,661,276 USD (13,980) 15-Jan-2016 (20,926)GBP 4,702 JPY (861,325) 15-Jan-2016 (22,849)USD 10,022 JPY (1,230,087) 15-Jan-2016 (24,200)

Standard Life Investments Global SICAV
Société d'Investissement à Capital Variable
Notes to the Financial Statements as at 31 December 2015 (continued)
49
6. Forward foreign exchange contracts (continued)
Japanese Equity High Alpha Fund (continued) Purchase Sale Maturity Unrealised Appreciation/
Currency Amount Currency Amount Date (Depreciation) in JPY
JPY 3,943,052 EUR (30,304) 15-Jan-2016 (28,990)USD 11,729 JPY (1,441,642) 15-Jan-2016 (30,300)EUR 8,696 JPY (1,175,616) 15-Jan-2016 (35,846)EUR 43,940 JPY (5,801,362) 15-Jan-2016 (42,027)EUR 35,738 JPY (4,740,569) 15-Jan-2016 (56,332)EUR 21,327 JPY (2,856,291) 15-Jan-2016 (60,953)USD 55,000 JPY (6,695,684) 15-Jan-2016 (77,569)USD 84,918 JPY (10,305,739) 15-Jan-2016 (87,595)EUR 41,263 JPY (5,500,915) 15-Jan-2016 (92,494)EUR 25,000 JPY (3,372,903) 15-Jan-2016 (96,112)JPY 11,553,333 EUR (89,017) 15-Jan-2016 (114,330)USD 55,000 JPY (6,732,979) 15-Jan-2016 (114,864)EUR 361,321 JPY (47,478,513) 15-Jan-2016 (119,544)EUR 314,165 JPY (41,302,533) 15-Jan-2016 (124,457)EUR 64,796 JPY (8,618,134) 15-Jan-2016 (125,240)USD 210,000 JPY (25,395,279) 15-Jan-2016 (126,111)EUR 47,509 JPY (6,373,305) 15-Jan-2016 (146,188)EUR 73,945 JPY (9,839,114) 15-Jan-2016 (146,970)GBP 35,272 JPY (6,444,052) 15-Jan-2016 (154,167)GBP 31,783 JPY (5,831,011) 15-Jan-2016 (163,375)EUR 35,000 JPY (4,768,498) 15-Jan-2016 (180,990)GBP 45,271 JPY (8,274,608) 15-Jan-2016 (201,725)GBP 35,568 JPY (6,549,642) 15-Jan-2016 (206,957)USD 206,485 JPY (25,057,496) 15-Jan-2016 (211,261)GBP 36,655 JPY (6,754,952) 15-Jan-2016 (218,534)GBP 30,566 JPY (5,670,866) 15-Jan-2016 (220,314)EUR 265,803 JPY (35,060,040) 15-Jan-2016 (220,790)GBP 34,081 JPY (6,306,702) 15-Jan-2016 (229,182)GBP 42,375 JPY (7,799,989) 15-Jan-2016 (243,563)EUR 101,479 JPY (13,550,084) 15-Jan-2016 (249,055)GBP 38,246 JPY (7,080,777) 15-Jan-2016 (260,569)GBP 28,579 JPY (5,365,688) 15-Jan-2016 (269,465)USD 183,415 JPY (22,342,993) 15-Jan-2016 (272,762)GBP 35,767 JPY (6,656,396) 15-Jan-2016 (278,379)EUR 151,588 JPY (20,182,196) 15-Jan-2016 (313,370)GBP 44,334 JPY (8,240,439) 15-Jan-2016 (334,563)USD 142,820 JPY (17,527,387) 15-Jan-2016 (341,902)GBP 38,114 JPY (7,160,012) 15-Jan-2016 (363,366)EUR 304,435 JPY (40,316,208) 15-Jan-2016 (413,408)USD 513,890 JPY (62,271,325) 15-Jan-2016 (435,229)EUR 314,789 JPY (41,801,427) 15-Jan-2016 (541,578)EUR 127,813 JPY (17,297,010) 15-Jan-2016 (544,324)EUR 405,051 JPY (53,672,668) 15-Jan-2016 (581,917)EUR 286,258 JPY (38,265,013) 15-Jan-2016 (744,743)EUR 405,217 JPY (54,011,539) 15-Jan-2016 (899,036)EUR 270,615 JPY (36,572,789) 15-Jan-2016 (1,102,877)EUR 274,074 JPY (37,399,739) 15-Jan-2016 (1,476,449)EUR 333,796 JPY (45,401,461) 15-Jan-2016 (1,650,303)EUR 362,059 JPY (49,513,386) 15-Jan-2016 (2,057,744)EUR 1,087,765 JPY (146,845,867) 15-Jan-2016 (4,270,730)GBP 1,989,156 JPY (364,379,803) 15-Jan-2016 (9,666,197)USD 7,769,813 JPY (947,465,754) 15-Jan-2016 (12,529,054)EUR 17,030,086 JPY (2,303,472,375) 15-Jan-2016 (71,310,958)
(115,047,787) Net JPY (106,168,471)
Global REIT Focus Fund
Purchase Sale Maturity Unrealised Appreciation/Currency Amount Currency Amount Date (Depreciation) in EUR
JPY 1,022,208 EUR (7,759) 04-Jan-2016 40JPY 991,013 EUR (7,536) 06-Jan-2016 25USD 11,616,139 EUR (10,275,950) 15-Jan-2016 388,162EUR 11,440,599 USD (12,148,303) 15-Jan-2016 287,938USD 189,692 EUR (166,462) 15-Jan-2016 7,683EUR 219,119 USD (234,649) 15-Jan-2016 3,701USD 183,008 EUR (164,399) 15-Jan-2016 3,610

Standard Life Investments Global SICAV
Société d'Investissement à Capital Variable
Notes to the Financial Statements as at 31 December 2015 (continued)
50
6. Forward foreign exchange contracts (continued)
Global REIT Focus Fund (continued) Purchase Sale Maturity Unrealised Appreciation/
Currency Amount Currency Amount Date (Depreciation) in EUR
USD 270,697 EUR (245,865) 15-Jan-2016 2,646USD 317,737 EUR (289,395) 15-Jan-2016 2,301EUR 224,544 USD (242,196) 15-Jan-2016 2,198EUR 48,711 USD (51,603) 15-Jan-2016 1,338USD 32,307 EUR (28,580) 15-Jan-2016 1,080EUR 10,239 USD (11,008) 15-Jan-2016 134EUR 2,656 USD (2,855) 15-Jan-2016 35USD 541 EUR (475) 15-Jan-2016 22EUR 615 USD (659) 15-Jan-2016 10USD 519 EUR (466) 15-Jan-2016 10USD 774 EUR (703) 15-Jan-2016 8EUR 627 USD (677) 15-Jan-2016 6USD 896 EUR (819) 15-Jan-2016 3USD 495 EUR (453) 15-Jan-2016 2USD 594 EUR (543) 15-Jan-2016 2USD 753 EUR (689) 15-Jan-2016 2EUR 757 USD (825) 15-Jan-2016 –EUR 1,136 USD (1,237) 15-Jan-2016 –
700,956
EUR 390 USD (425) 15-Jan-2016 –EUR 585 USD (638) 15-Jan-2016 (1)EUR 580 USD (634) 15-Jan-2016 (2)EUR 427 USD (468) 15-Jan-2016 (3)EUR 868 USD (949) 15-Jan-2016 (3)USD 818 EUR (755) 15-Jan-2016 (3)EUR 827 USD (905) 15-Jan-2016 (4)EUR 641 USD (702) 15-Jan-2016 (4)EUR 1,030 USD (1,128) 15-Jan-2016 (5)USD 1,234 EUR (1,138) 15-Jan-2016 (5)USD 699 EUR (647) 15-Jan-2016 (5)EUR 416 USD (459) 15-Jan-2016 (5)USD 1,053 EUR (974) 15-Jan-2016 (7)USD 543 EUR (505) 15-Jan-2016 (7)EUR 622 USD (686) 15-Jan-2016 (8)USD 479 EUR (450) 15-Jan-2016 (10)USD 563 EUR (530) 15-Jan-2016 (12)USD 540 EUR (507) 15-Jan-2016 (12)EUR 2,050 USD (2,250) 15-Jan-2016 (16)EUR 438 USD (503) 15-Jan-2016 (23)USD 196,386 EUR (182,636) 15-Jan-2016 (2,345)USD 102,495 EUR (96,919) 15-Jan-2016 (2,824)USD 172,654 EUR (161,987) 15-Jan-2016 (3,483)USD 193,924 EUR (182,172) 15-Jan-2016 (4,141)EUR 151,871 USD (174,205) 15-Jan-2016 (8,056)EUR 287,460 USD (324,128) 15-Jan-2016 (10,103)
(31,087) Net EUR 669,869
European Smaller Companies Fund
Purchase Sale Maturity Unrealised Appreciation/Currency Amount Currency Amount Date (Depreciation) in EUR
GBP 29,535,178 EUR (39,784,876) 21-Jan-2016 392,624GBP 632,267 EUR (850,009) 21-Jan-2016 10,081EUR 626,693 GBP (453,448) 21-Jan-2016 9,855EUR 835,220 GBP (607,750) 21-Jan-2016 8,481GBP 517,705 EUR (701,926) 21-Jan-2016 2,323GBP 457,558 EUR (620,339) 21-Jan-2016 2,089
425,453
EUR 317,746 GBP (234,081) 05-Jan-2016 (792)GBP 18,724 EUR (26,168) 21-Jan-2016 (697)GBP 91,764 EUR (127,423) 21-Jan-2016 (2,594)GBP 184,977 EUR (255,447) 21-Jan-2016 (3,818)GBP 488,386 EUR (670,180) 21-Jan-2016 (5,816)

Standard Life Investments Global SICAV
Société d'Investissement à Capital Variable
Notes to the Financial Statements as at 31 December 2015 (continued)
51
6. Forward foreign exchange contracts (continued)
European Smaller Companies Fund (continued) Purchase Sale Maturity Unrealised Appreciation/
Currency Amount Currency Amount Date (Depreciation) in EUR
EUR 700,378 GBP (519,497) 21-Jan-2016 (6,308)GBP 463,273 EUR (637,730) 21-Jan-2016 (7,528)GBP 185,218 EUR (263,869) 21-Jan-2016 (11,912)GBP 524,291 EUR (732,488) 21-Jan-2016 (19,280)GBP 827,262 EUR (1,150,675) 21-Jan-2016 (25,328)GBP 459,715 EUR (652,055) 21-Jan-2016 (26,693)GBP 411,799 EUR (588,218) 21-Jan-2016 (28,037)GBP 521,929 EUR (740,045) 21-Jan-2016 (30,051)
(168,854) Net EUR 256,599
Indian Equity Midcap Opportunities Fund
Purchase Sale Maturity Unrealised Appreciation/Currency Amount Currency Amount Date (Depreciation) in USD
USD 57,026 GBP (38,442) 05-Jan-2016 58
58
Net USD 58
Global Emerging Markets Equity Unconstrained Fund
Purchase Sale Maturity Unrealised Appreciation/Currency Amount Currency Amount Date (Depreciation) in USD
HKD 110,788 USD (14,295) 05-Jan-2016 –
–
GBP 15,000 USD (22,248) 04-Jan-2016 (19)KRW 203,928,630 USD (174,383) 04-Jan-2016 (563)GBP 10,000 USD (14,834) 05-Jan-2016 (15)
(597) Net USD (597)
Enhanced Diversification Global Emerging Markets Equities Fund
Purchase Sale Maturity Unrealised Appreciation/Currency Amount Currency Amount Date (Depreciation) in USD
INR 72,910,000 USD (1,085,859) 18-Feb-2016 8,010INR 50,723,607 USD (755,490) 18-Feb-2016 5,516USD 189,583 GBP (125,000) 18-Feb-2016 4,328INR 21,300,000 USD (315,649) 18-Feb-2016 3,915INR 29,300,000 USD (436,727) 18-Feb-2016 2,861USD 62,133 GBP (41,000) 18-Feb-2016 1,369USD 43,163 KRW (50,000,000) 18-Feb-2016 722AUD 61,400 USD (44,656) 18-Feb-2016 150USD 1,858,688 KRW (2,165,000,000) 19-Feb-2016 21,034USD 752,934 TWD (24,700,000) 19-Feb-2016 3,957USD 395,912 BRL (1,511,000) 23-Feb-2016 20,643USD 120 GBP (79) 15-Mar-2016 3USD 121 GBP (79) 15-Mar-2016 3
72,511
USD 39,706 KRW (47,000,000) 18-Feb-2016 (188)USD 16,111 EUR (15,000) 18-Feb-2016 (242)USD 38,246 EUR (36,000) 18-Feb-2016 (1,001)USD 52,954 JPY (6,500,000) 18-Feb-2016 (1,104)GBP 51,000 USD (77,858) 18-Feb-2016 (2,274)USD 312,222 EUR (289,000) 18-Feb-2016 (2,848)USD 61,849 NZD (95,000) 18-Feb-2016 (2,988)USD 86,513 AUD (123,000) 18-Feb-2016 (3,243)

Standard Life Investments Global SICAV
Société d'Investissement à Capital Variable
Notes to the Financial Statements as at 31 December 2015 (continued)
52
6. Forward foreign exchange contracts (continued)
Enhanced Diversification Global Emerging Markets Equities Fund (continued) Purchase Sale Maturity Unrealised Appreciation/
Currency Amount Currency Amount Date (Depreciation) in USD
BRL 1,560,000 USD (394,637) 18-Feb-2016 (6,660)USD 449,220 EUR (418,000) 19-Feb-2016 (6,499)USD 438,251 AUD (618,000) 19-Feb-2016 (12,696)MXN 7,305,000 USD (432,254) 19-Feb-2016 (12,754)USD 1,489,203 AUD (2,100,000) 19-Feb-2016 (43,140)USD 943,509 NZD (1,455,100) 19-Feb-2016 (49,547)BRL 1,511,000 USD (386,129) 23-Feb-2016 (10,859)GBP 102 USD (152) 15-Mar-2016 (1)GBP 104 USD (154) 15-Mar-2016 (1)GBP 4,707 USD (7,062) 15-Mar-2016 (85)GBP 4,744 USD (7,116) 15-Mar-2016 (86)
(156,216) Net USD (83,705)
Continental European Equity Income Fund
Purchase Sale Maturity Unrealised Appreciation/Currency Amount Currency Amount Date (Depreciation) in EUR
GBP 27,653,087 EUR (37,249,636) 21-Jan-2016 367,605GBP 20,468,304 EUR (27,571,493) 21-Jan-2016 272,094EUR 6,739,801 GBP (4,827,248) 21-Jan-2016 173,166GBP 3,178,902 EUR (4,282,088) 21-Jan-2016 42,259EUR 706,071 GBP (499,213) 21-Jan-2016 26,979EUR 518,321 GBP (366,636) 21-Jan-2016 19,576EUR 428,315 GBP (303,089) 21-Jan-2016 16,014EUR 700,681 GBP (505,313) 21-Jan-2016 13,290EUR 349,441 GBP (247,178) 21-Jan-2016 13,198EUR 824,949 GBP (596,898) 21-Jan-2016 12,973EUR 310,235 GBP (220,509) 21-Jan-2016 10,270EUR 470,870 GBP (339,580) 21-Jan-2016 8,931EUR 555,147 GBP (401,680) 21-Jan-2016 8,730EUR 554,337 GBP (401,644) 21-Jan-2016 7,969EUR 608,053 GBP (442,270) 21-Jan-2016 6,422EUR 373,899 GBP (270,908) 21-Jan-2016 5,375EUR 408,829 GBP (297,363) 21-Jan-2016 4,318EUR 96,877 GBP (68,495) 21-Jan-2016 3,702EUR 69,793 GBP (49,368) 21-Jan-2016 2,636EUR 57,903 GBP (41,007) 21-Jan-2016 2,120EUR 74,399 GBP (53,226) 21-Jan-2016 1,994EUR 99,384 GBP (71,673) 21-Jan-2016 1,885EUR 117,026 GBP (84,675) 21-Jan-2016 1,840GBP 409,751 EUR (555,557) 21-Jan-2016 1,838GBP 112,030 EUR (150,908) 21-Jan-2016 1,489GBP 282,254 EUR (382,691) 21-Jan-2016 1,266EUR 32,887 GBP (23,254) 21-Jan-2016 1,254EUR 45,828 GBP (32,791) 21-Jan-2016 1,221EUR 79,143 GBP (57,343) 21-Jan-2016 1,138EUR 86,377 GBP (62,827) 21-Jan-2016 912EUR 18,354 GBP (12,896) 21-Jan-2016 811GBP 344,730 EUR (468,264) 21-Jan-2016 681EUR 15,425 GBP (10,846) 21-Jan-2016 671GBP 293,182 EUR (398,243) 21-Jan-2016 579EUR 26,921 GBP (19,393) 21-Jan-2016 540EUR 31,298 GBP (22,732) 21-Jan-2016 375EUR 14,987 GBP (10,793) 21-Jan-2016 305EUR 26,181 GBP (19,038) 21-Jan-2016 283GBP 58,948 EUR (79,924) 21-Jan-2016 264EUR 6,052 GBP (4,289) 21-Jan-2016 218USD 4,641 EUR (4,046) 21-Jan-2016 214USD 4,627 EUR (4,033) 21-Jan-2016 214GBP 30,732 EUR (41,613) 21-Jan-2016 193EUR 15,793 GBP (11,479) 21-Jan-2016 178EUR 15,630 GBP (11,366) 21-Jan-2016 169EUR 9,762 GBP (7,072) 21-Jan-2016 142EUR 8,800 GBP (6,375) 21-Jan-2016 128EUR 3,285 GBP (2,323) 21-Jan-2016 126GBP 20,182 EUR (27,334) 21-Jan-2016 121

Standard Life Investments Global SICAV
Société d'Investissement à Capital Variable
Notes to the Financial Statements as at 31 December 2015 (continued)
53
6. Forward foreign exchange contracts (continued)
Continental European Equity Income Fund (continued) Purchase Sale Maturity Unrealised Appreciation/
Currency Amount Currency Amount Date (Depreciation) in EUR
EUR 9,280 GBP (6,744) 21-Jan-2016 106GBP 45,541 EUR (61,861) 21-Jan-2016 90EUR 2,260 GBP (1,598) 21-Jan-2016 85EUR 8,873 GBP (6,462) 21-Jan-2016 83EUR 7,162 GBP (5,205) 21-Jan-2016 82GBP 15,191 EUR (20,597) 21-Jan-2016 68EUR 12,706 GBP (9,292) 21-Jan-2016 67EUR 3,046 GBP (2,197) 21-Jan-2016 58EUR 3,586 GBP (2,595) 21-Jan-2016 56GBP 12,987 EUR (17,620) 21-Jan-2016 47EUR 2,418 GBP (1,752) 21-Jan-2016 35EUR 13,584 GBP (9,962) 21-Jan-2016 32GBP 11,892 EUR (16,146) 21-Jan-2016 31EUR 2,643 GBP (1,923) 21-Jan-2016 28GBP 10,313 EUR (14,001) 21-Jan-2016 27GBP 3,584 EUR (4,859) 21-Jan-2016 16GBP 15,842 EUR (21,536) 21-Jan-2016 14GBP 1,768 EUR (2,397) 21-Jan-2016 8GBP 4,302 EUR (5,848) 21-Jan-2016 4USD 67 EUR (58) 21-Jan-2016 3USD 66 EUR (58) 21-Jan-2016 3GBP 1,605 EUR (2,180) 21-Jan-2016 3USD 152 EUR (138) 21-Jan-2016 2USD 61 EUR (54) 21-Jan-2016 2USD 61 EUR (54) 21-Jan-2016 2USD 153 EUR (139) 21-Jan-2016 2EUR 62 USD (66) 21-Jan-2016 1EUR 91 USD (97) 21-Jan-2016 1EUR 91 USD (98) 21-Jan-2016 1EUR 63 USD (67) 21-Jan-2016 1USD 69 EUR (63) 21-Jan-2016 –USD 73 EUR (67) 21-Jan-2016 –EUR 84 USD (91) 21-Jan-2016 –EUR 83 USD (91) 21-Jan-2016 –USD 72 EUR (66) 21-Jan-2016 –USD 68 EUR (62) 21-Jan-2016 –USD 68 EUR (62) 21-Jan-2016 –USD 69 EUR (63) 21-Jan-2016 –
1,039,634
EUR 41,628 GBP (30,732) 04-Jan-2016 (193)EUR 27,343 GBP (20,182) 05-Jan-2016 (121)USD 76 EUR (70) 21-Jan-2016 –USD 63 EUR (58) 21-Jan-2016 –EUR 72 USD (79) 21-Jan-2016 –EUR 66 USD (73) 21-Jan-2016 –EUR 66 USD (72) 21-Jan-2016 –EUR 73 USD (79) 21-Jan-2016 –USD 76 EUR (70) 21-Jan-2016 –USD 62 EUR (58) 21-Jan-2016 –EUR 98 USD (108) 21-Jan-2016 (1)EUR 101 USD (111) 21-Jan-2016 (1)EUR 98 USD (108) 21-Jan-2016 (1)USD 67 EUR (63) 21-Jan-2016 (1)USD 69 EUR (64) 21-Jan-2016 (1)EUR 101 USD (111) 21-Jan-2016 (1)USD 70 EUR (66) 21-Jan-2016 (2)USD 83 EUR (79) 21-Jan-2016 (2)USD 106 EUR (99) 21-Jan-2016 (2)USD 83 EUR (78) 21-Jan-2016 (2)USD 105 EUR (98) 21-Jan-2016 (2)USD 71 EUR (67) 21-Jan-2016 (2)GBP 1,639 EUR (2,236) 21-Jan-2016 (7)GBP 1,472 EUR (2,009) 21-Jan-2016 (7)GBP 3,123 EUR (4,258) 21-Jan-2016 (10)GBP 1,697 EUR (2,328) 21-Jan-2016 (20)GBP 1,528 EUR (2,104) 21-Jan-2016 (25)

Standard Life Investments Global SICAV
Société d'Investissement à Capital Variable
Notes to the Financial Statements as at 31 December 2015 (continued)
54
6. Forward foreign exchange contracts (continued)
Continental European Equity Income Fund (continued) Purchase Sale Maturity Unrealised Appreciation/
Currency Amount Currency Amount Date (Depreciation) in EUR
EUR 10,036 GBP (7,397) 21-Jan-2016 (27)GBP 1,010 EUR (1,406) 21-Jan-2016 (32)EUR 3,622 GBP (2,686) 21-Jan-2016 (33)GBP 8,041 EUR (10,976) 21-Jan-2016 (38)GBP 1,849 EUR (2,566) 21-Jan-2016 (50)GBP 3,378 EUR (4,647) 21-Jan-2016 (52)GBP 2,329 EUR (3,221) 21-Jan-2016 (53)GBP 8,800 EUR (12,034) 21-Jan-2016 (63)GBP 1,751 EUR (2,445) 21-Jan-2016 (63)GBP 2,124 EUR (2,969) 21-Jan-2016 (79)EUR 7,076 GBP (5,263) 21-Jan-2016 (84)EUR 15,119 GBP (11,176) 21-Jan-2016 (84)GBP 4,240 EUR (5,855) 21-Jan-2016 (88)GBP 4,420 EUR (6,101) 21-Jan-2016 (89)GBP 7,723 EUR (10,604) 21-Jan-2016 (99)GBP 8,896 EUR (12,209) 21-Jan-2016 (107)GBP 1,723 EUR (2,453) 21-Jan-2016 (110)GBP 3,710 EUR (5,160) 21-Jan-2016 (114)GBP 2,004 EUR (2,854) 21-Jan-2016 (128)GBP 9,678 EUR (13,318) 21-Jan-2016 (153)GBP 50,772 EUR (69,232) 21-Jan-2016 (166)GBP 2,554 EUR (3,648) 21-Jan-2016 (174)GBP 41,756 EUR (56,990) 21-Jan-2016 (188)GBP 5,959 EUR (8,297) 21-Jan-2016 (190)GBP 6,000 EUR (8,353) 21-Jan-2016 (191)GBP 54,579 EUR (74,472) 21-Jan-2016 (226)GBP 6,151 EUR (8,597) 21-Jan-2016 (230)GBP 9,886 EUR (13,764) 21-Jan-2016 (316)GBP 16,865 EUR (23,280) 21-Jan-2016 (338)GBP 23,868 EUR (32,822) 21-Jan-2016 (354)GBP 7,558 EUR (10,688) 21-Jan-2016 (408)GBP 12,896 EUR (18,026) 21-Jan-2016 (483)GBP 8,994 EUR (12,784) 21-Jan-2016 (549)GBP 19,861 EUR (27,570) 21-Jan-2016 (553)GBP 9,504 EUR (13,503) 21-Jan-2016 (574)GBP 12,029 EUR (16,953) 21-Jan-2016 (589)GBP 56,248 EUR (77,186) 21-Jan-2016 (670)GBP 18,794 EUR (26,300) 21-Jan-2016 (734)GBP 47,563 EUR (65,486) 21-Jan-2016 (785)GBP 50,441 EUR (69,436) 21-Jan-2016 (820)GBP 30,540 EUR (42,412) 21-Jan-2016 (869)GBP 15,868 EUR (22,510) 21-Jan-2016 (925)GBP 14,859 EUR (21,148) 21-Jan-2016 (934)GBP 139,374 EUR (190,595) 21-Jan-2016 (1,001)GBP 15,841 EUR (22,569) 21-Jan-2016 (1,020)GBP 45,729 EUR (63,252) 21-Jan-2016 (1,045)GBP 257,188 EUR (350,924) 21-Jan-2016 (1,065)EUR 119,983 GBP (88,996) 21-Jan-2016 (1,081)GBP 34,968 EUR (48,679) 21-Jan-2016 (1,111)GBP 42,068 EUR (58,423) 21-Jan-2016 (1,197)GBP 268,773 EUR (366,831) 21-Jan-2016 (1,211)GBP 101,806 EUR (139,786) 21-Jan-2016 (1,297)GBP 37,769 EUR (52,784) 21-Jan-2016 (1,406)GBP 316,401 EUR (431,835) 21-Jan-2016 (1,426)GBP 28,121 EUR (39,760) 21-Jan-2016 (1,507)GBP 322,486 EUR (440,217) 21-Jan-2016 (1,531)GBP 38,983 EUR (54,565) 21-Jan-2016 (1,534)GBP 36,745 EUR (51,537) 21-Jan-2016 (1,553)GBP 380,118 EUR (518,660) 21-Jan-2016 (1,574)GBP 25,000 EUR (35,616) 21-Jan-2016 (1,608)GBP 28,334 EUR (40,183) 21-Jan-2016 (1,640)GBP 60,319 EUR (83,694) 21-Jan-2016 (1,641)GBP 50,238 EUR (70,142) 21-Jan-2016 (1,802)GBP 55,673 EUR (77,907) 21-Jan-2016 (2,174)GBP 99,666 EUR (138,395) 21-Jan-2016 (2,817)GBP 263,023 EUR (360,929) 21-Jan-2016 (3,132)GBP 104,951 EUR (145,981) 21-Jan-2016 (3,213)GBP 57,402 EUR (81,409) 21-Jan-2016 (3,323)

Standard Life Investments Global SICAV
Société d'Investissement à Capital Variable
Notes to the Financial Statements as at 31 December 2015 (continued)
55
6. Forward foreign exchange contracts (continued)
Continental European Equity Income Fund (continued) Purchase Sale Maturity Unrealised Appreciation/
Currency Amount Currency Amount Date (Depreciation) in EUR
GBP 53,916 EUR (76,770) 21-Jan-2016 (3,426)GBP 70,252 EUR (99,128) 21-Jan-2016 (3,563)GBP 59,691 EUR (84,843) 21-Jan-2016 (3,645)GBP 238,369 EUR (328,132) 21-Jan-2016 (3,873)GBP 61,755 EUR (87,958) 21-Jan-2016 (3,951)GBP 219,335 EUR (302,894) 21-Jan-2016 (4,527)GBP 392,773 EUR (538,977) 21-Jan-2016 (4,677)GBP 194,382 EUR (269,102) 21-Jan-2016 (4,679)EUR 566,451 GBP (420,158) 21-Jan-2016 (5,102)GBP 75,382 EUR (107,677) 21-Jan-2016 (5,132)GBP 354,428 EUR (487,897) 21-Jan-2016 (5,759)GBP 99,354 EUR (141,153) 21-Jan-2016 (6,000)GBP 119,377 EUR (169,349) 21-Jan-2016 (6,957)EUR 840,142 GBP (623,166) 21-Jan-2016 (7,567)GBP 285,872 EUR (396,657) 21-Jan-2016 (7,778)GBP 128,126 EUR (182,346) 21-Jan-2016 (8,053)GBP 162,232 EUR (229,760) 21-Jan-2016 (9,072)GBP 152,524 EUR (217,291) 21-Jan-2016 (9,809)GBP 425,234 EUR (590,026) 21-Jan-2016 (11,569)GBP 327,249 EUR (456,904) 21-Jan-2016 (11,739)GBP 375,710 EUR (524,567) 21-Jan-2016 (13,478)GBP 264,112 EUR (376,063) 21-Jan-2016 (16,784)GBP 247,310 EUR (353,260) 21-Jan-2016 (16,838)GBP 307,088 EUR (437,389) 21-Jan-2016 (19,649)GBP 679,922 EUR (945,733) 21-Jan-2016 (20,817)GBP 796,800 EUR (1,108,304) 21-Jan-2016 (24,396)GBP 394,684 EUR (561,981) 21-Jan-2016 (25,082)GBP 459,264 EUR (654,136) 21-Jan-2016 (29,386)GBP 548,534 EUR (783,531) 21-Jan-2016 (37,346)GBP 862,011 EUR (1,225,941) 21-Jan-2016 (53,325)EUR 4,823,150 GBP (3,587,633) 21-Jan-2016 (57,204)GBP 1,735,016 EUR (2,471,772) 21-Jan-2016 (111,583)
(607,888) Net EUR 431,746
Global Equity Unconstrained Fund
Purchase Sale Maturity Unrealised Appreciation/Currency Amount Currency Amount Date (Depreciation) in USD
EUR 6,148 USD (6,727) 04-Jan-2016 (32)
(32) Net USD (32)
Global Emerging Markets Equities Fund
Purchase Sale Maturity Unrealised Appreciation/Currency Amount Currency Amount Date (Depreciation) in USD
KRW 14,505,320 USD (12,404) 04-Jan-2016 (40)
(40) Net USD (40)
Global Bond Fund
Purchase Sale Maturity Unrealised Appreciation/Currency Amount Currency Amount Date (Depreciation) in USD
JPY 1,323,721,829 USD (10,773,788) 18-Feb-2016 234,941AUD 2,276,652 USD (1,599,965) 18-Feb-2016 61,365USD 2,076,678 GBP (1,373,875) 18-Feb-2016 40,539USD 508,206 ZAR (7,404,616) 18-Feb-2016 36,543MYR 5,378,681 USD (1,221,317) 18-Feb-2016 23,905DKK 9,205,044 USD (1,329,569) 18-Feb-2016 15,576AUD 317,000 USD (222,778) 18-Feb-2016 8,544

Standard Life Investments Global SICAV
Société d'Investissement à Capital Variable
Notes to the Financial Statements as at 31 December 2015 (continued)
56
6. Forward foreign exchange contracts (continued)
Global Bond Fund (continued) Purchase Sale Maturity Unrealised Appreciation/
Currency Amount Currency Amount Date (Depreciation) in USD
PLN 2,554,433 USD (643,635) 18-Feb-2016 7,295USD 144,237 CAD (191,501) 18-Feb-2016 6,285EUR 2,650,000 CHF (2,866,843) 18-Feb-2016 5,597SGD 1,317,654 USD (923,497) 18-Feb-2016 5,494EUR 30,136 USD (32,208) 18-Feb-2016 647
446,731
USD 94,700 CHF (94,651) 18-Feb-2016 (500)USD 47,650 NZD (73,175) 18-Feb-2016 (2,292)NOK 1,808,606 USD (208,300) 18-Feb-2016 (3,323)ZAR 7,404,616 USD (477,368) 18-Feb-2016 (5,706)CAD 419,395 USD (315,886) 18-Feb-2016 (13,764)USD 1,236,737 EUR (1,149,223) 18-Feb-2016 (16,155)MXN 14,237,251 USD (839,916) 18-Feb-2016 (22,263)USD 2,666,930 SEK (23,091,641) 18-Feb-2016 (72,081)USD 3,517,822 EUR (3,300,000) 18-Feb-2016 (79,865)USD 3,501,361 EUR (3,300,000) 18-Feb-2016 (96,326)EUR 4,630,000 JPY (620,613,348) 18-Feb-2016 (113,665)GBP 6,901,916 USD (10,432,575) 18-Feb-2016 (203,654)USD 79,079,811 EUR (73,529,085) 18-Feb-2016 (1,082,212)
(1,711,806) Net USD (1,265,075)
Global Inflation-Linked Bond Fund
Purchase Sale Maturity Unrealised Appreciation/Currency Amount Currency Amount Date (Depreciation) in USD
EUR 1,279,056 USD (1,359,367) 15-Jan-2016 33,876EUR 2,170,000 USD (2,331,437) 15-Jan-2016 32,287SEK 4,050,443 USD (464,835) 15-Jan-2016 15,131EUR 240,000 USD (254,183) 15-Jan-2016 7,242EUR 201,875 USD (214,550) 15-Jan-2016 5,347EUR 170,000 USD (180,113) 15-Jan-2016 5,064EUR 260,000 USD (278,209) 15-Jan-2016 5,002EUR 240,000 USD (257,073) 15-Jan-2016 4,353EUR 180,000 USD (192,175) 15-Jan-2016 3,894EUR 240,000 USD (257,786) 15-Jan-2016 3,639USD 1,431,705 EUR (1,311,269) 15-Jan-2016 3,374EUR 160,000 USD (171,989) 15-Jan-2016 2,295USD 219,655 EUR (200,000) 15-Jan-2016 1,800EUR 34,763 USD (36,945) 15-Jan-2016 921USD 109,796 EUR (100,000) 15-Jan-2016 869USD 654,366 EUR (600,000) 15-Jan-2016 802USD 240,038 EUR (219,846) 15-Jan-2016 566USD 13,077 GBP (8,694) 15-Jan-2016 193USD 39,908 EUR (36,551) 15-Jan-2016 94USD 5,003 GBP (3,325) 15-Jan-2016 76EUR 884 USD (939) 15-Jan-2016 24USD 426 GBP (283) 15-Jan-2016 6USD 419 GBP (278) 15-Jan-2016 6GBP 15,000 USD (22,225) 15-Jan-2016 5SEK 157 USD (18) 15-Jan-2016 1USD 24 GBP (16) 15-Jan-2016 –USD 24 GBP (16) 15-Jan-2016 –USD 46,496,535 GBP (30,054,377) 09-Feb-2016 1,954,946USD 30,042,829 EUR (27,229,529) 09-Feb-2016 363,834EUR 1,899,588 USD (2,019,509) 09-Feb-2016 50,959EUR 1,128,264 USD (1,196,583) 09-Feb-2016 33,176USD 2,378,826 DKK (16,058,980) 09-Feb-2016 32,774USD 1,009,949 GBP (663,027) 09-Feb-2016 27,321USD 581,145 GBP (383,279) 09-Feb-2016 13,113USD 593,353 GBP (392,141) 09-Feb-2016 12,186USD 549,450 GBP (364,490) 09-Feb-2016 9,264USD 712,247 GBP (474,729) 09-Feb-2016 8,682USD 431,254 GBP (285,578) 09-Feb-2016 8,018USD 551,238 GBP (367,214) 09-Feb-2016 7,014

Standard Life Investments Global SICAV
Société d'Investissement à Capital Variable
Notes to the Financial Statements as at 31 December 2015 (continued)
57
6. Forward foreign exchange contracts (continued)
Global Inflation-Linked Bond Fund (continued) Purchase Sale Maturity Unrealised Appreciation/
Currency Amount Currency Amount Date (Depreciation) in USD
USD 1,616,449 SEK (13,575,400) 09-Feb-2016 6,616USD 894,373 GBP (599,102) 09-Feb-2016 6,484USD 1,282,862 EUR (1,171,352) 09-Feb-2016 6,140USD 429,160 GBP (285,449) 09-Feb-2016 6,115USD 549,495 GBP (368,082) 09-Feb-2016 3,985USD 143,823 CAD (195,262) 09-Feb-2016 3,164SEK 6,055,646 USD (715,689) 09-Feb-2016 2,417SEK 6,285,249 USD (742,958) 09-Feb-2016 2,375USD 269,804 GBP (181,039) 09-Feb-2016 1,497EUR 536,964 USD (584,325) 09-Feb-2016 942USD 112,517 GBP (75,341) 09-Feb-2016 860SEK 206,066 USD (23,744) 09-Feb-2016 692DKK 221,144 USD (32,137) 09-Feb-2016 169USD 3,948,122 CAD (5,179,461) 11-Feb-2016 217,037USD 47,388 CAD (63,682) 11-Feb-2016 1,514AUD 31,907 USD (22,372) 11-Feb-2016 919
2,909,080
USD 22,224 GBP (15,000) 05-Jan-2016 (5)USD 20 SEK (173) 15-Jan-2016 –GBP 16 USD (24) 15-Jan-2016 (1)USD 22 SEK (189) 15-Jan-2016 (1)GBP 268 USD (404) 15-Jan-2016 (8)USD 536 EUR (502) 15-Jan-2016 (12)EUR 883 USD (976) 15-Jan-2016 (15)SEK 11,700 USD (1,423) 15-Jan-2016 (36)EUR 160,000 USD (174,339) 15-Jan-2016 (55)GBP 1,104 USD (1,693) 15-Jan-2016 (56)GBP 10,000 USD (14,999) 15-Jan-2016 (179)GBP 5,000 USD (7,602) 15-Jan-2016 (192)GBP 5,000 USD (7,606) 15-Jan-2016 (196)GBP 5,000 USD (7,642) 15-Jan-2016 (232)GBP 8,376 USD (12,650) 15-Jan-2016 (237)EUR 5,400 USD (6,143) 15-Jan-2016 (261)GBP 5,000 USD (7,685) 15-Jan-2016 (275)GBP 5,000 USD (7,739) 15-Jan-2016 (330)EUR 220,000 USD (240,001) 15-Jan-2016 (361)GBP 10,000 USD (15,198) 15-Jan-2016 (378)EUR 10,000 USD (11,370) 15-Jan-2016 (477)EUR 180,000 USD (196,595) 15-Jan-2016 (525)USD 40,897 EUR (38,034) 15-Jan-2016 (532)EUR 10,399 USD (11,914) 15-Jan-2016 (587)EUR 190,000 USD (207,653) 15-Jan-2016 (691)GBP 15,000 USD (23,157) 15-Jan-2016 (927)GBP 19,006 USD (29,135) 15-Jan-2016 (970)EUR 190,000 USD (207,964) 15-Jan-2016 (1,002)EUR 150,000 USD (164,694) 15-Jan-2016 (1,303)EUR 370,000 USD (405,695) 15-Jan-2016 (2,663)EUR 190,000 USD (210,107) 15-Jan-2016 (3,145)USD 249,133 EUR (231,690) 15-Jan-2016 (3,241)EUR 200,000 USD (221,712) 15-Jan-2016 (3,857)EUR 460,000 USD (505,143) 15-Jan-2016 (4,078)USD 505,835 SEK (4,303,499) 15-Jan-2016 (4,118)EUR 250,000 USD (276,507) 15-Jan-2016 (4,188)GBP 324,445 USD (488,095) 15-Jan-2016 (7,280)GBP 209,673 USD (321,424) 15-Jan-2016 (10,695)EUR 290,000 USD (330,565) 15-Jan-2016 (14,675)USD 530,925 SEK (4,622,758) 15-Jan-2016 (16,859)USD 1,363,196 EUR (1,267,752) 15-Jan-2016 (17,733)EUR 2,474,255 USD (2,801,030) 15-Jan-2016 (105,888)EUR 6,103,338 USD (6,943,151) 15-Jan-2016 (294,944)EUR 14,697,251 USD (16,638,317) 15-Jan-2016 (628,984)SEK 295,313,646 USD (35,911,293) 15-Jan-2016 (917,452)EUR 79,564,923 USD (90,073,062) 15-Jan-2016 (3,405,064)SEK 181,798 USD (21,559) 09-Feb-2016 (1)JPY 4,478,803 USD (37,245) 09-Feb-2016 (4)GBP 442,833 USD (656,401) 09-Feb-2016 (108)

Standard Life Investments Global SICAV
Société d'Investissement à Capital Variable
Notes to the Financial Statements as at 31 December 2015 (continued)
58
6. Forward foreign exchange contracts (continued)
Global Inflation-Linked Bond Fund (continued) Purchase Sale Maturity Unrealised Appreciation/
Currency Amount Currency Amount Date (Depreciation) in USD
SEK 186,982 USD (22,303) 09-Feb-2016 (130)USD 29,794 SEK (253,140) 09-Feb-2016 (224)USD 86,076 EUR (79,638) 09-Feb-2016 (726)USD 30,783 SEK (267,607) 09-Feb-2016 (951)USD 185,059 EUR (170,944) 09-Feb-2016 (1,262)USD 188,691 SEK (1,604,953) 09-Feb-2016 (1,632)EUR 352,433 USD (387,021) 09-Feb-2016 (2,885)USD 2,835,959 JPY (341,458,285) 09-Feb-2016 (3,265)USD 712,832 SEK (6,054,031) 09-Feb-2016 (5,082)SEK 11,378,431 USD (1,354,852) 09-Feb-2016 (5,546)GBP 335,809 USD (505,844) 09-Feb-2016 (8,164)USD 551,219 EUR (514,442) 09-Feb-2016 (9,500)USD 359,801 EUR (339,243) 09-Feb-2016 (9,959)USD 482,411 EUR (453,050) 09-Feb-2016 (11,393)USD 1,859,096 SEK (15,781,421) 09-Feb-2016 (12,337)GBP 391,273 USD (593,217) 09-Feb-2016 (13,337)GBP 378,991 USD (575,301) 09-Feb-2016 (13,623)USD 657,997 NZD (983,781) 09-Feb-2016 (13,766)GBP 479,115 USD (724,225) 09-Feb-2016 (14,161)USD 885,913 JPY (108,786,617) 09-Feb-2016 (18,648)GBP 337,737 USD (520,919) 09-Feb-2016 (20,381)GBP 357,285 USD (550,466) 09-Feb-2016 (20,958)GBP 635,257 USD (966,114) 09-Feb-2016 (24,641)USD 1,093,035 NZD (1,685,977) 09-Feb-2016 (58,213)USD 4,776,056 EUR (4,488,770) 09-Feb-2016 (116,507)USD 22,087 AUD (30,331) 11-Feb-2016 (54)GBP 517,715 USD (770,675) 11-Feb-2016 (3,403)GBP 366,976 USD (551,050) 11-Feb-2016 (7,179)USD 1,669,473 AUD (2,352,506) 11-Feb-2016 (47,831)
(5,900,579) Net USD (2,991,499)
European High Yield Bond Fund
Purchase Sale Maturity Unrealised Appreciation/Currency Amount Currency Amount Date (Depreciation) in EUR
EUR 6,716,402 GBP (4,829,260) 05-Feb-2016 149,308EUR 331,920 GBP (237,500) 05-Feb-2016 8,955EUR 375,863 GBP (270,000) 05-Feb-2016 8,702EUR 328,742 GBP (238,941) 05-Feb-2016 3,817EUR 224,372 USD (243,803) 05-Feb-2016 668EUR 486,481 USD (529,696) 05-Feb-2016 452EUR 121,902 USD (132,513) 05-Feb-2016 313
172,215
EUR 15,420 AUD (23,616) 05-Feb-2016 (403)EUR 538,512 USD (589,717) 05-Feb-2016 (2,589)GBP 105,048 EUR (145,886) 05-Feb-2016 (3,036)EUR 454,578 AUD (706,286) 05-Feb-2016 (18,646)EUR 3,889,064 USD (4,268,736) 05-Feb-2016 (27,767)
(52,441) Net EUR 119,774
European Corporate Bond Fund
Purchase Sale Maturity Unrealised Appreciation/Currency Amount Currency Amount Date (Depreciation) in EUR
USD 22,596,742 EUR (19,989,687) 15-Jan-2016 755,087EUR 16,409,667 GBP (11,591,378) 15-Jan-2016 639,539EUR 7,612,739 GBP (5,355,379) 15-Jan-2016 326,719GBP 30,690,379 EUR (41,598,618) 15-Jan-2016 155,796EUR 3,567,838 USD (3,780,082) 15-Jan-2016 97,562EUR 1,134,121 GBP (794,615) 15-Jan-2016 53,043GBP 10,178,306 EUR (13,795,968) 15-Jan-2016 51,669USD 1,354,350 EUR (1,208,158) 15-Jan-2016 35,193

Standard Life Investments Global SICAV
Société d'Investissement à Capital Variable
Notes to the Financial Statements as at 31 December 2015 (continued)
59
6. Forward foreign exchange contracts (continued)
European Corporate Bond Fund (continued) Purchase Sale Maturity Unrealised Appreciation/
Currency Amount Currency Amount Date (Depreciation) in EUR
EUR 923,881 USD (978,728) 15-Jan-2016 25,368EUR 1,417,347 GBP (1,030,511) 15-Jan-2016 15,332EUR 443,277 GBP (317,133) 15-Jan-2016 11,816EUR 227,189 GBP (159,356) 15-Jan-2016 10,385EUR 415,960 USD (442,209) 15-Jan-2016 9,993EUR 377,906 USD (400,768) 15-Jan-2016 9,983GBP 1,293,491 EUR (1,753,234) 15-Jan-2016 6,566EUR 147,477 GBP (104,368) 15-Jan-2016 5,484USD 109,790 EUR (96,464) 15-Jan-2016 4,329EUR 88,824 GBP (62,339) 15-Jan-2016 4,011EUR 63,144 GBP (44,438) 15-Jan-2016 2,686GBP 596,751 EUR (809,746) 15-Jan-2016 2,137EUR 98,395 USD (105,050) 15-Jan-2016 1,954EUR 42,476 GBP (30,037) 15-Jan-2016 1,611EUR 75,241 USD (80,208) 15-Jan-2016 1,607EUR 34,270 GBP (24,228) 15-Jan-2016 1,308EUR 65,518 GBP (47,319) 15-Jan-2016 1,139EUR 34,635 GBP (24,691) 15-Jan-2016 1,042EUR 44,907 GBP (32,254) 15-Jan-2016 1,026EUR 77,564 GBP (56,327) 15-Jan-2016 931EUR 56,319 GBP (40,848) 15-Jan-2016 745EUR 13,164 GBP (9,255) 15-Jan-2016 573EUR 15,087 GBP (10,777) 15-Jan-2016 424EUR 8,323 GBP (5,876) 15-Jan-2016 329EUR 5,974 GBP (4,193) 15-Jan-2016 270EUR 12,604 GBP (9,111) 15-Jan-2016 209GBP 11,275 EUR (15,160) 15-Jan-2016 179EUR 3,793 GBP (2,662) 15-Jan-2016 172EUR 3,252 GBP (2,323) 15-Jan-2016 91GBP 8,876 EUR (12,044) 15-Jan-2016 32GBP 6,857 EUR (9,298) 15-Jan-2016 30EUR 447 GBP (317) 15-Jan-2016 16GBP 596 EUR (803) 15-Jan-2016 8GBP 1,257 EUR (1,704) 15-Jan-2016 6GBP 100 EUR (133) 15-Jan-2016 3GBP 370 EUR (501) 15-Jan-2016 3EUR 71 GBP (51) 15-Jan-2016 2EUR 1 GBP (1) 15-Jan-2016 –EUR 4 GBP (3) 15-Jan-2016 –EUR 3 GBP (2) 15-Jan-2016 –EUR 3 GBP (2) 15-Jan-2016 –GBP 0 EUR (0) 15-Jan-2016 –EUR 34 GBP (25) 15-Jan-2016 –EUR 20 GBP (14) 15-Jan-2016 –EUR 20 GBP (14) 15-Jan-2016 –EUR 116,752,474 GBP (82,703,926) 19-Feb-2016 4,326,686EUR 122,369,566 USD (131,458,149) 19-Feb-2016 1,791,904
8,354,998
EUR 17 GBP (12) 15-Jan-2016 –NOK 72 EUR (8) 15-Jan-2016 –NOK 71 EUR (8) 15-Jan-2016 –GBP 1 EUR (1) 15-Jan-2016 –NOK 69 EUR (7) 15-Jan-2016 –NOK 69 EUR (7) 15-Jan-2016 –GBP 17 EUR (24) 15-Jan-2016 (1)GBP 13 EUR (19) 15-Jan-2016 (1)EUR 7,631 GBP (5,612) 15-Jan-2016 (5)EUR 4,906 USD (5,351) 15-Jan-2016 (7)GBP 2,548 EUR (3,475) 15-Jan-2016 (8)GBP 440 EUR (610) 15-Jan-2016 (12)NOK 5,220 EUR (567) 15-Jan-2016 (24)NOK 5,213 EUR (566) 15-Jan-2016 (24)NOK 5,258 EUR (571) 15-Jan-2016 (24)NOK 5,268 EUR (572) 15-Jan-2016 (24)GBP 2,121 EUR (2,918) 15-Jan-2016 (32)GBP 6,515 EUR (8,911) 15-Jan-2016 (47)
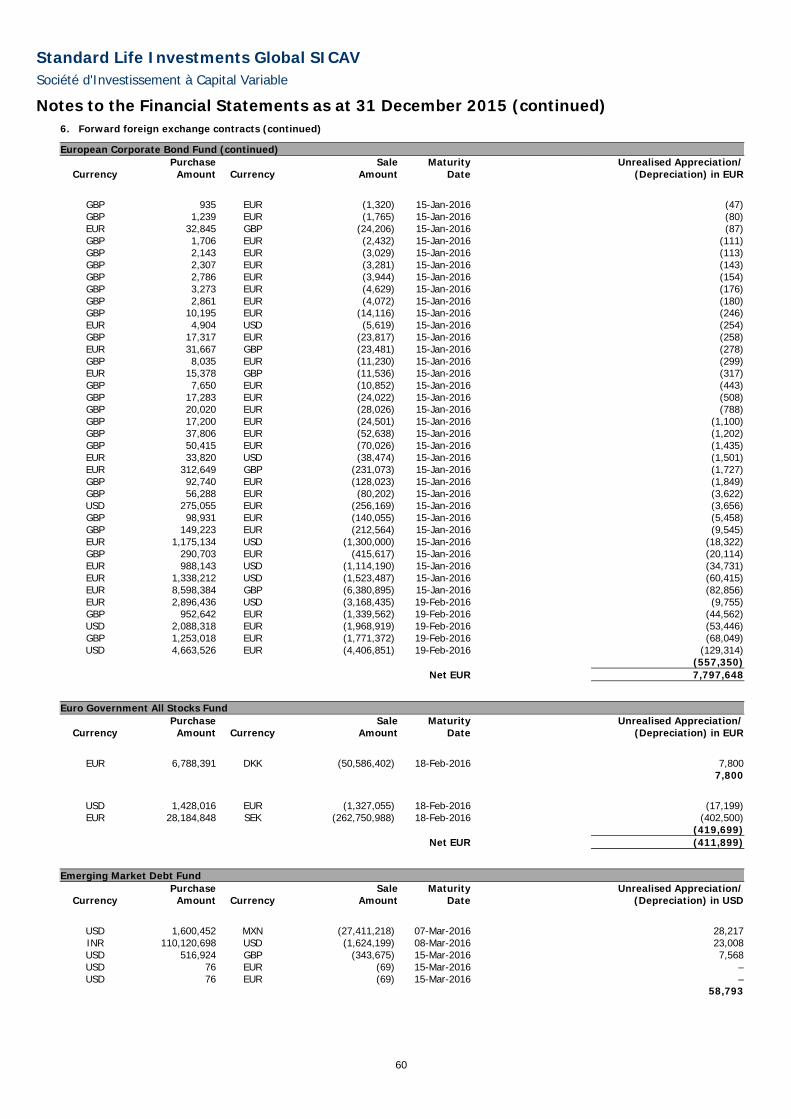
Standard Life Investments Global SICAV
Société d'Investissement à Capital Variable
Notes to the Financial Statements as at 31 December 2015 (continued)
60
6. Forward foreign exchange contracts (continued)
European Corporate Bond Fund (continued) Purchase Sale Maturity Unrealised Appreciation/
Currency Amount Currency Amount Date (Depreciation) in EUR
GBP 935 EUR (1,320) 15-Jan-2016 (47)GBP 1,239 EUR (1,765) 15-Jan-2016 (80)EUR 32,845 GBP (24,206) 15-Jan-2016 (87)GBP 1,706 EUR (2,432) 15-Jan-2016 (111)GBP 2,143 EUR (3,029) 15-Jan-2016 (113)GBP 2,307 EUR (3,281) 15-Jan-2016 (143)GBP 2,786 EUR (3,944) 15-Jan-2016 (154)GBP 3,273 EUR (4,629) 15-Jan-2016 (176)GBP 2,861 EUR (4,072) 15-Jan-2016 (180)GBP 10,195 EUR (14,116) 15-Jan-2016 (246)EUR 4,904 USD (5,619) 15-Jan-2016 (254)GBP 17,317 EUR (23,817) 15-Jan-2016 (258)EUR 31,667 GBP (23,481) 15-Jan-2016 (278)GBP 8,035 EUR (11,230) 15-Jan-2016 (299)EUR 15,378 GBP (11,536) 15-Jan-2016 (317)GBP 7,650 EUR (10,852) 15-Jan-2016 (443)GBP 17,283 EUR (24,022) 15-Jan-2016 (508)GBP 20,020 EUR (28,026) 15-Jan-2016 (788)GBP 17,200 EUR (24,501) 15-Jan-2016 (1,100)GBP 37,806 EUR (52,638) 15-Jan-2016 (1,202)GBP 50,415 EUR (70,026) 15-Jan-2016 (1,435)EUR 33,820 USD (38,474) 15-Jan-2016 (1,501)EUR 312,649 GBP (231,073) 15-Jan-2016 (1,727)GBP 92,740 EUR (128,023) 15-Jan-2016 (1,849)GBP 56,288 EUR (80,202) 15-Jan-2016 (3,622)USD 275,055 EUR (256,169) 15-Jan-2016 (3,656)GBP 98,931 EUR (140,055) 15-Jan-2016 (5,458)GBP 149,223 EUR (212,564) 15-Jan-2016 (9,545)EUR 1,175,134 USD (1,300,000) 15-Jan-2016 (18,322)GBP 290,703 EUR (415,617) 15-Jan-2016 (20,114)EUR 988,143 USD (1,114,190) 15-Jan-2016 (34,731)EUR 1,338,212 USD (1,523,487) 15-Jan-2016 (60,415)EUR 8,598,384 GBP (6,380,895) 15-Jan-2016 (82,856)EUR 2,896,436 USD (3,168,435) 19-Feb-2016 (9,755)GBP 952,642 EUR (1,339,562) 19-Feb-2016 (44,562)USD 2,088,318 EUR (1,968,919) 19-Feb-2016 (53,446)GBP 1,253,018 EUR (1,771,372) 19-Feb-2016 (68,049)USD 4,663,526 EUR (4,406,851) 19-Feb-2016 (129,314)
(557,350) Net EUR 7,797,648
Euro Government All Stocks Fund
Purchase Sale Maturity Unrealised Appreciation/Currency Amount Currency Amount Date (Depreciation) in EUR
EUR 6,788,391 DKK (50,586,402) 18-Feb-2016 7,800
7,800
USD 1,428,016 EUR (1,327,055) 18-Feb-2016 (17,199)EUR 28,184,848 SEK (262,750,988) 18-Feb-2016 (402,500)
(419,699) Net EUR (411,899)
Emerging Market Debt Fund
Purchase Sale Maturity Unrealised Appreciation/Currency Amount Currency Amount Date (Depreciation) in USD
USD 1,600,452 MXN (27,411,218) 07-Mar-2016 28,217INR 110,120,698 USD (1,624,199) 08-Mar-2016 23,008USD 516,924 GBP (343,675) 15-Mar-2016 7,568USD 76 EUR (69) 15-Mar-2016 –USD 76 EUR (69) 15-Mar-2016 –
58,793

Standard Life Investments Global SICAV
Société d'Investissement à Capital Variable
Notes to the Financial Statements as at 31 December 2015 (continued)
61
6. Forward foreign exchange contracts (continued)
Emerging Market Debt Fund (continued) Purchase Sale Maturity Unrealised Appreciation/
Currency Amount Currency Amount Date (Depreciation) in USD
EUR 1,216,257 USD (1,335,800) 07-Mar-2016 (9,194)USD 4,487,266 EUR (4,127,849) 07-Mar-2016 (15,094)EUR 2,943,760 USD (3,234,252) 07-Mar-2016 (23,411)MXN 27,411,218 USD (1,605,483) 07-Mar-2016 (33,248)USD 268,843 INR (18,214,100) 08-Mar-2016 (3,607)EUR 4,905 USD (5,356) 15-Mar-2016 (5)EUR 4,934 USD (5,388) 15-Mar-2016 (5)GBP 24,863,476 USD (37,299,018) 15-Mar-2016 (449,233)
(533,797) Net USD (475,004)
Emerging Market Local Currency Debt Fund
Purchase Sale Maturity Unrealised Appreciation/Currency Amount Currency Amount Date (Depreciation) in USD
USD 158 GBP (107) 04-Jan-2016 –USD 95 GBP (64) 05-Jan-2016 –USD 104 GBP (68) 15-Jan-2016 4USD 112 GBP (73) 15-Jan-2016 4USD 103 GBP (67) 15-Jan-2016 4USD 112 GBP (72) 15-Jan-2016 4USD 81 GBP (53) 15-Jan-2016 2USD 74 GBP (49) 15-Jan-2016 2USD 75 GBP (49) 15-Jan-2016 2USD 80 GBP (53) 15-Jan-2016 2USD 81 GBP (54) 15-Jan-2016 2USD 80 GBP (53) 15-Jan-2016 2USD 76 GBP (50) 15-Jan-2016 1USD 24 GBP (16) 15-Jan-2016 1USD 79 GBP (53) 15-Jan-2016 1USD 75 GBP (50) 15-Jan-2016 1USD 84 GBP (56) 15-Jan-2016 1USD 25 GBP (16) 15-Jan-2016 1USD 19 GBP (12) 15-Jan-2016 1USD 73 GBP (48) 15-Jan-2016 1USD 82 GBP (55) 15-Jan-2016 1USD 19 GBP (12) 15-Jan-2016 –PLN 16,750,000 USD (4,186,337) 07-Mar-2016 80,479USD 2,105,501 RON (8,700,000) 07-Mar-2016 11,289INR 288,833,500 USD (4,265,429) 08-Mar-2016 54,999
146,804
GBP 4,738 USD (7,028) 05-Jan-2016 (7)GBP 13 USD (20) 15-Jan-2016 –GBP 54 USD (79) 15-Jan-2016 –GBP 51 USD (76) 15-Jan-2016 –GBP 50 USD (74) 15-Jan-2016 –GBP 56 USD (84) 15-Jan-2016 –GBP 16 USD (24) 15-Jan-2016 (1)GBP 64 USD (99) 15-Jan-2016 (3)GBP 64 USD (99) 15-Jan-2016 (3)GBP 69 USD (106) 15-Jan-2016 (3)GBP 70 USD (108) 15-Jan-2016 (4)GBP 941 USD (1,443) 15-Jan-2016 (48)GBP 3,886 USD (5,957) 15-Jan-2016 (198)GBP 3,877 USD (5,943) 15-Jan-2016 (198)GBP 4,167 USD (6,387) 15-Jan-2016 (213)GBP 4,243 USD (6,505) 15-Jan-2016 (216)USD 2,226,999 THB (80,339,000) 07-Mar-2016 (1,772)USD 5,693,074 EUR (5,237,075) 07-Mar-2016 (19,151)
(21,817) Net USD 124,987

Standard Life Investments Global SICAV
Société d'Investissement à Capital Variable
Notes to the Financial Statements as at 31 December 2015 (continued)
62
6. Forward foreign exchange contracts (continued)
Global High Yield Bond Fund Purchase Sale Maturity Unrealised Appreciation/
Currency Amount Currency Amount Date (Depreciation) in USD
USD 262,452 EUR (240,000) 04-Jan-2016 1,097USD 3,727,251 GBP (2,450,324) 15-Jan-2016 95,963USD 3,807,653 GBP (2,504,915) 15-Jan-2016 95,463USD 3,208,316 GBP (2,110,586) 15-Jan-2016 80,507USD 3,823,524 GBP (2,526,030) 15-Jan-2016 80,041USD 5,101,002 GBP (3,391,288) 15-Jan-2016 75,241USD 4,074,660 GBP (2,707,773) 15-Jan-2016 61,841EUR 2,850,000 USD (3,062,026) 15-Jan-2016 42,405USD 735,395 EUR (668,860) 15-Jan-2016 6,824EUR 210,000 USD (222,467) 15-Jan-2016 6,281USD 191,501 GBP (125,894) 15-Jan-2016 4,930USD 189,709 GBP (124,803) 15-Jan-2016 4,756USD 302,203 CHF (296,824) 15-Jan-2016 4,100EUR 210,000 USD (224,861) 15-Jan-2016 3,886USD 253,810 GBP (168,740) 15-Jan-2016 3,744EUR 240,000 USD (257,984) 15-Jan-2016 3,442USD 225,729 GBP (150,046) 15-Jan-2016 3,367USD 211,659 GBP (140,656) 15-Jan-2016 3,212EUR 170,000 USD (182,754) 15-Jan-2016 2,422USD 980,552 EUR (898,067) 15-Jan-2016 2,311USD 375,744 CHF (372,172) 15-Jan-2016 1,969EUR 290,000 USD (314,231) 15-Jan-2016 1,658EUR 170,000 USD (184,112) 15-Jan-2016 1,065USD 381,714 EUR (350,000) 15-Jan-2016 468USD 82 EUR (75) 15-Jan-2016 1USD 119 EUR (108) 15-Jan-2016 1USD 28 GBP (19) 15-Jan-2016 1USD 33 GBP (22) 15-Jan-2016 1USD 108 EUR (99) 15-Jan-2016 –USD 104,734,581 EUR (95,996,940) 29-Jan-2016 131,576USD 36,715,463 GBP (24,755,024) 29-Jan-2016 28,002USD 63,598 GBP (42,883) 29-Jan-2016 45USD 10,266,582 GBP (6,756,500) 05-Feb-2016 253,246EUR 7,535,491 USD (8,088,096) 05-Feb-2016 124,416EUR 4,326,982 USD (4,606,959) 05-Feb-2016 108,777USD 3,345,117 GBP (2,219,118) 05-Feb-2016 56,318USD 2,636,290 GBP (1,742,306) 05-Feb-2016 54,140USD 3,150,206 EUR (2,875,401) 05-Feb-2016 16,467USD 11,714,050 EUR (10,734,918) 05-Feb-2016 14,661USD 1,789,582 GBP (1,204,650) 05-Feb-2016 4,255
1,378,900
GBP 42,883 USD (63,595) 04-Jan-2016 (46)EUR 75 USD (83) 15-Jan-2016 –GBP 16 USD (25) 15-Jan-2016 (1)USD 79 EUR (74) 15-Jan-2016 (1)USD 101 EUR (94) 15-Jan-2016 (1)USD 92 EUR (87) 15-Jan-2016 (3)EUR 81 USD (92) 15-Jan-2016 (4)EUR 78 USD (88) 15-Jan-2016 (4)GBP 1,189 USD (1,822) 15-Jan-2016 (61)GBP 128,859 USD (191,162) 15-Jan-2016 (197)EUR 5,765 USD (6,527) 15-Jan-2016 (247)EUR 5,916 USD (6,697) 15-Jan-2016 (253)EUR 190,000 USD (207,273) 15-Jan-2016 (311)GBP 7,380 USD (11,345) 15-Jan-2016 (408)GBP 145,534 USD (216,386) 15-Jan-2016 (710)CHF 277,434 USD (279,397) 15-Jan-2016 (768)EUR 300,000 USD (327,658) 15-Jan-2016 (876)EUR 240,000 USD (262,528) 15-Jan-2016 (1,103)EUR 220,000 USD (240,801) 15-Jan-2016 (1,160)EUR 180,000 USD (197,365) 15-Jan-2016 (1,296)EUR 170,000 USD (186,683) 15-Jan-2016 (1,507)USD 276,353 CHF (277,071) 15-Jan-2016 (1,912)EUR 657,552 USD (718,223) 15-Jan-2016 (1,969)GBP 275,168 USD (409,771) 15-Jan-2016 (1,983)GBP 50,087 USD (76,272) 15-Jan-2016 (2,044)

Standard Life Investments Global SICAV
Société d'Investissement à Capital Variable
Notes to the Financial Statements as at 31 December 2015 (continued)
63
6. Forward foreign exchange contracts (continued)
Global High Yield Bond Fund (continued) Purchase Sale Maturity Unrealised Appreciation/
Currency Amount Currency Amount Date (Depreciation) in USD
GBP 480,000 USD (713,684) 15-Jan-2016 (2,342)GBP 170,000 USD (254,488) 15-Jan-2016 (2,554)EUR 170,000 USD (187,991) 15-Jan-2016 (2,814)GBP 360,000 USD (536,751) 15-Jan-2016 (3,244)EUR 180,000 USD (199,541) 15-Jan-2016 (3,472)EUR 690,333 USD (755,870) 15-Jan-2016 (3,909)GBP 65,928 USD (101,651) 15-Jan-2016 (3,947)GBP 2,592,249 USD (3,845,585) 15-Jan-2016 (3,970)GBP 160,052 USD (241,350) 15-Jan-2016 (4,158)GBP 135,378 USD (204,793) 15-Jan-2016 (4,168)GBP 560,000 USD (834,340) 15-Jan-2016 (4,441)GBP 160,338 USD (242,799) 15-Jan-2016 (5,183)GBP 250,000 USD (375,740) 15-Jan-2016 (5,249)GBP 138,325 USD (210,716) 15-Jan-2016 (5,723)GBP 220,000 USD (332,538) 15-Jan-2016 (6,506)GBP 123,981 USD (190,260) 15-Jan-2016 (6,524)GBP 119,549 USD (184,381) 15-Jan-2016 (7,214)GBP 190,000 USD (289,019) 15-Jan-2016 (7,446)GBP 250,000 USD (377,962) 15-Jan-2016 (7,471)GBP 126,356 USD (195,066) 15-Jan-2016 (7,810)GBP 220,000 USD (334,158) 15-Jan-2016 (8,126)USD 303,239 CHF (310,555) 15-Jan-2016 (8,654)GBP 220,000 USD (335,133) 15-Jan-2016 (9,102)GBP 140,396 USD (217,256) 15-Jan-2016 (9,195)GBP 270,000 USD (409,519) 15-Jan-2016 (9,389)USD 697,567 EUR (649,075) 15-Jan-2016 (9,454)GBP 470,000 USD (706,023) 15-Jan-2016 (9,501)GBP 210,000 USD (320,725) 15-Jan-2016 (9,513)GBP 420,000 USD (632,056) 15-Jan-2016 (9,632)GBP 280,470 USD (425,365) 15-Jan-2016 (9,720)GBP 200,000 USD (306,238) 15-Jan-2016 (9,845)EUR 662,368 USD (731,618) 15-Jan-2016 (10,118)GBP 220,000 USD (336,221) 15-Jan-2016 (10,190)GBP 200,000 USD (307,214) 15-Jan-2016 (10,821)GBP 290,000 USD (440,926) 15-Jan-2016 (11,156)CHF 294,809 USD (308,845) 15-Jan-2016 (12,765)GBP 357,530 USD (543,366) 15-Jan-2016 (13,519)EUR 270,000 USD (307,767) 15-Jan-2016 (13,663)GBP 226,327 USD (349,977) 15-Jan-2016 (14,569)GBP 270,000 USD (414,968) 15-Jan-2016 (14,838)GBP 280,251 USD (430,722) 15-Jan-2016 (15,401)GBP 259,269 USD (399,854) 15-Jan-2016 (15,627)GBP 360,000 USD (549,882) 15-Jan-2016 (16,376)GBP 280,000 USD (433,410) 15-Jan-2016 (18,461)GBP 470,000 USD (715,707) 15-Jan-2016 (19,185)GBP 565,895 USD (858,314) 15-Jan-2016 (19,679)GBP 340,000 USD (524,884) 15-Jan-2016 (21,016)GBP 719,797 USD (1,088,039) 15-Jan-2016 (21,327)USD 772,670 EUR (730,631) 15-Jan-2016 (23,187)GBP 1,194,808 USD (1,794,814) 15-Jan-2016 (24,152)GBP 1,020,000 USD (1,537,090) 15-Jan-2016 (25,488)GBP 3,489,342 USD (5,198,746) 15-Jan-2016 (27,672)GBP 1,093,768 USD (1,653,269) 15-Jan-2016 (32,347)GBP 610,000 USD (937,705) 15-Jan-2016 (33,708)GBP 840,000 USD (1,280,239) 15-Jan-2016 (35,390)GBP 680,000 USD (1,051,508) 15-Jan-2016 (43,773)GBP 2,161,310 USD (3,252,544) 15-Jan-2016 (49,564)GBP 850,000 USD (1,310,560) 15-Jan-2016 (50,892)GBP 2,590,184 USD (3,918,303) 15-Jan-2016 (79,748)GBP 2,097,808 USD (3,191,089) 15-Jan-2016 (82,216)GBP 1,880,051 USD (2,898,713) 15-Jan-2016 (112,548)GBP 2,138,969 USD (3,295,103) 15-Jan-2016 (125,231)GBP 2,296,994 USD (3,530,517) 15-Jan-2016 (126,458)GBP 4,516,726 USD (6,861,223) 15-Jan-2016 (167,604)GBP 5,750,259 USD (8,716,806) 15-Jan-2016 (195,138)GBP 3,319,462 USD (5,118,063) 15-Jan-2016 (198,745)GBP 4,853,635 USD (7,491,818) 15-Jan-2016 (298,914)GBP 6,517,972 USD (9,991,868) 15-Jan-2016 (332,478)
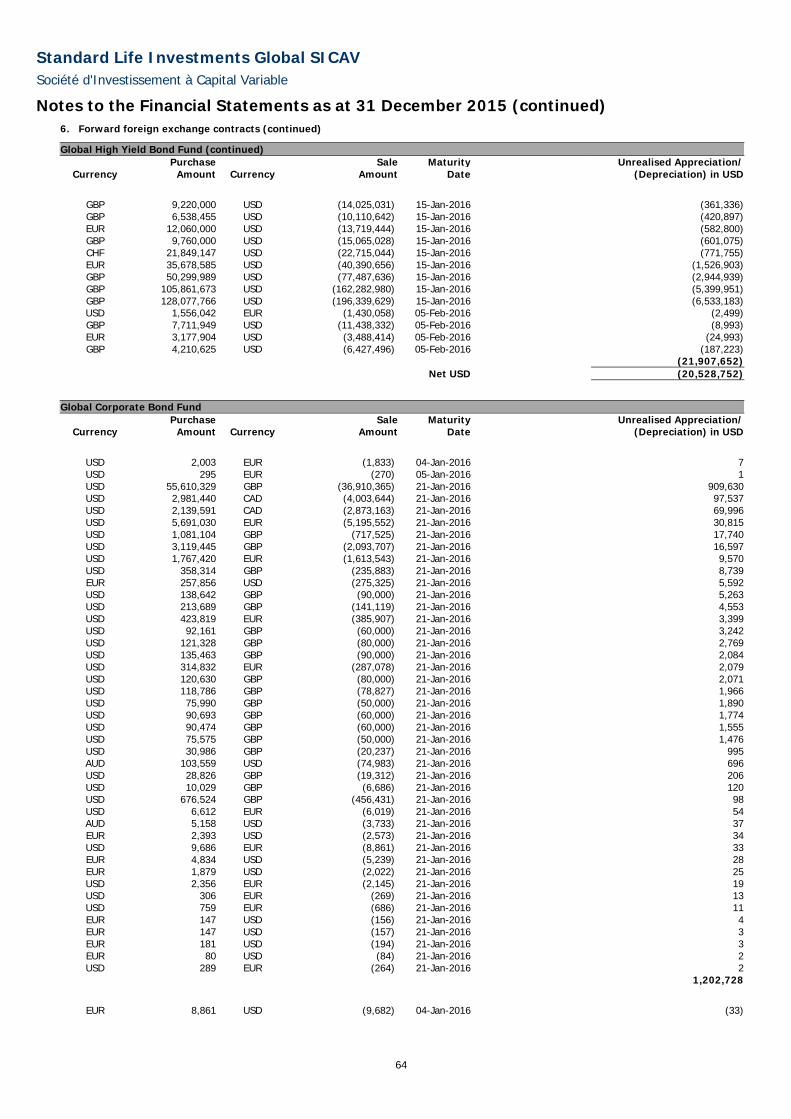
Standard Life Investments Global SICAV
Société d'Investissement à Capital Variable
Notes to the Financial Statements as at 31 December 2015 (continued)
64
6. Forward foreign exchange contracts (continued)
Global High Yield Bond Fund (continued) Purchase Sale Maturity Unrealised Appreciation/
Currency Amount Currency Amount Date (Depreciation) in USD
GBP 9,220,000 USD (14,025,031) 15-Jan-2016 (361,336)GBP 6,538,455 USD (10,110,642) 15-Jan-2016 (420,897)EUR 12,060,000 USD (13,719,444) 15-Jan-2016 (582,800)GBP 9,760,000 USD (15,065,028) 15-Jan-2016 (601,075)CHF 21,849,147 USD (22,715,044) 15-Jan-2016 (771,755)EUR 35,678,585 USD (40,390,656) 15-Jan-2016 (1,526,903)GBP 50,299,989 USD (77,487,636) 15-Jan-2016 (2,944,939)GBP 105,861,673 USD (162,282,980) 15-Jan-2016 (5,399,951)GBP 128,077,766 USD (196,339,629) 15-Jan-2016 (6,533,183)USD 1,556,042 EUR (1,430,058) 05-Feb-2016 (2,499)GBP 7,711,949 USD (11,438,332) 05-Feb-2016 (8,993)EUR 3,177,904 USD (3,488,414) 05-Feb-2016 (24,993)GBP 4,210,625 USD (6,427,496) 05-Feb-2016 (187,223)
(21,907,652) Net USD (20,528,752)
Global Corporate Bond Fund
Purchase Sale Maturity Unrealised Appreciation/Currency Amount Currency Amount Date (Depreciation) in USD
USD 2,003 EUR (1,833) 04-Jan-2016 7USD 295 EUR (270) 05-Jan-2016 1USD 55,610,329 GBP (36,910,365) 21-Jan-2016 909,630USD 2,981,440 CAD (4,003,644) 21-Jan-2016 97,537USD 2,139,591 CAD (2,873,163) 21-Jan-2016 69,996USD 5,691,030 EUR (5,195,552) 21-Jan-2016 30,815USD 1,081,104 GBP (717,525) 21-Jan-2016 17,740USD 3,119,445 GBP (2,093,707) 21-Jan-2016 16,597USD 1,767,420 EUR (1,613,543) 21-Jan-2016 9,570USD 358,314 GBP (235,883) 21-Jan-2016 8,739EUR 257,856 USD (275,325) 21-Jan-2016 5,592USD 138,642 GBP (90,000) 21-Jan-2016 5,263USD 213,689 GBP (141,119) 21-Jan-2016 4,553USD 423,819 EUR (385,907) 21-Jan-2016 3,399USD 92,161 GBP (60,000) 21-Jan-2016 3,242USD 121,328 GBP (80,000) 21-Jan-2016 2,769USD 135,463 GBP (90,000) 21-Jan-2016 2,084USD 314,832 EUR (287,078) 21-Jan-2016 2,079USD 120,630 GBP (80,000) 21-Jan-2016 2,071USD 118,786 GBP (78,827) 21-Jan-2016 1,966USD 75,990 GBP (50,000) 21-Jan-2016 1,890USD 90,693 GBP (60,000) 21-Jan-2016 1,774USD 90,474 GBP (60,000) 21-Jan-2016 1,555USD 75,575 GBP (50,000) 21-Jan-2016 1,476USD 30,986 GBP (20,237) 21-Jan-2016 995AUD 103,559 USD (74,983) 21-Jan-2016 696USD 28,826 GBP (19,312) 21-Jan-2016 206USD 10,029 GBP (6,686) 21-Jan-2016 120USD 676,524 GBP (456,431) 21-Jan-2016 98USD 6,612 EUR (6,019) 21-Jan-2016 54AUD 5,158 USD (3,733) 21-Jan-2016 37EUR 2,393 USD (2,573) 21-Jan-2016 34USD 9,686 EUR (8,861) 21-Jan-2016 33EUR 4,834 USD (5,239) 21-Jan-2016 28EUR 1,879 USD (2,022) 21-Jan-2016 25USD 2,356 EUR (2,145) 21-Jan-2016 19USD 306 EUR (269) 21-Jan-2016 13USD 759 EUR (686) 21-Jan-2016 11EUR 147 USD (156) 21-Jan-2016 4EUR 147 USD (157) 21-Jan-2016 3EUR 181 USD (194) 21-Jan-2016 3EUR 80 USD (84) 21-Jan-2016 2USD 289 EUR (264) 21-Jan-2016 2
1,202,728
EUR 8,861 USD (9,682) 04-Jan-2016 (33)

Standard Life Investments Global SICAV
Société d'Investissement à Capital Variable
Notes to the Financial Statements as at 31 December 2015 (continued)
65
6. Forward foreign exchange contracts (continued)
Global Corporate Bond Fund (continued) Purchase Sale Maturity Unrealised Appreciation/
Currency Amount Currency Amount Date (Depreciation) in USD
USD 25,856 GBP (17,473) 05-Jan-2016 (38)EUR 270 USD (295) 21-Jan-2016 (1)EUR 137 USD (151) 21-Jan-2016 (1)EUR 147 USD (163) 21-Jan-2016 (2)USD 509 EUR (470) 21-Jan-2016 (3)USD 211 EUR (197) 21-Jan-2016 (4)EUR 1,833 USD (2,004) 21-Jan-2016 (7)USD 999 EUR (929) 21-Jan-2016 (13)EUR 2,434 USD (2,673) 21-Jan-2016 (22)EUR 1,911 USD (2,113) 21-Jan-2016 (32)USD 2,954 EUR (2,748) 21-Jan-2016 (39)USD 1,653 EUR (1,560) 21-Jan-2016 (47)EUR 1,209 USD (1,387) 21-Jan-2016 (70)EUR 1,264 USD (1,450) 21-Jan-2016 (73)GBP 1,229 USD (1,900) 21-Jan-2016 (79)USD 3,409 EUR (3,209) 21-Jan-2016 (87)EUR 5,002 USD (5,546) 21-Jan-2016 (97)EUR 2,401 USD (2,725) 21-Jan-2016 (110)USD 23,235 EUR (21,440) 21-Jan-2016 (123)GBP 4,520 USD (6,834) 21-Jan-2016 (135)USD 11,981 EUR (11,144) 21-Jan-2016 (159)GBP 5,136 USD (7,889) 21-Jan-2016 (277)GBP 6,419 USD (9,907) 21-Jan-2016 (395)GBP 505,409 USD (749,639) 21-Jan-2016 (628)GBP 28,968 USD (43,601) 21-Jan-2016 (671)EUR 394,568 USD (431,766) 21-Jan-2016 (1,910)GBP 54,340 USD (82,777) 21-Jan-2016 (2,246)GBP 456,195 USD (679,087) 21-Jan-2016 (3,012)EUR 909,114 USD (993,931) 21-Jan-2016 (3,510)USD 1,325,971 EUR (1,221,058) 21-Jan-2016 (4,292)EUR 596,437 USD (654,945) 21-Jan-2016 (5,166)USD 3,460,453 AUD (4,748,230) 21-Jan-2016 (9,429)GBP 525,869 USD (789,652) 21-Jan-2016 (10,321)GBP 310,000 USD (469,925) 21-Jan-2016 (10,509)EUR 2,327,679 USD (2,554,093) 21-Jan-2016 (18,238)USD 6,911,535 EUR (6,387,391) 21-Jan-2016 (47,112)EUR 3,857,059 USD (4,424,795) 21-Jan-2016 (222,780)USD 86,075,675 EUR (79,548,035) 21-Jan-2016 (586,726)GBP 13,316,020 USD (20,591,573) 21-Jan-2016 (857,398)GBP 260,310,684 USD (402,538,194) 21-Jan-2016 (16,761,014)
(18,546,809) Net USD (17,344,081)
European Corporate Bond Sustainable and Responsible Investment Fund
Purchase Sale Maturity Unrealised Appreciation/Currency Amount Currency Amount Date (Depreciation) in EUR
EUR 15,390,856 GBP (10,902,417) 19-Feb-2016 570,364EUR 10,844,073 USD (11,681,636) 19-Feb-2016 129,299EUR 1,125,831 GBP (791,868) 19-Feb-2016 49,384EUR 361,999 USD (390,000) 19-Feb-2016 4,278
753,325
EUR 7,457 USD (8,191) 04-Jan-2016 (66)EUR 8,226 USD (9,000) 05-Jan-2016 (38)USD 43,426 EUR (40,964) 19-Feb-2016 (1,132)EUR 386,253 USD (422,525) 19-Feb-2016 (1,301)USD 302,661 EUR (279,532) 19-Feb-2016 (1,921)USD 266,594 EUR (251,286) 19-Feb-2016 (6,757)GBP 138,075 EUR (196,484) 19-Feb-2016 (8,788)GBP 190,528 EUR (267,904) 19-Feb-2016 (8,904)GBP 417,727 EUR (590,606) 19-Feb-2016 (22,758)
(51,665) Net EUR 701,660

Standard Life Investments Global SICAV
Société d'Investissement à Capital Variable
Notes to the Financial Statements as at 31 December 2015 (continued)
66
6. Forward foreign exchange contracts (continued)
Emerging Market Corporate Bond Fund Purchase Sale Maturity Unrealised Appreciation/
Currency Amount Currency Amount Date (Depreciation) in USD
USD 3,037,802 GBP (2,000,000) 15-Jan-2016 73,877USD 836,909 GBP (556,400) 15-Jan-2016 12,345USD 1,253,056 GBP (831,351) 03-Mar-2016 20,946
107,168
GBP 37,331,257 USD (57,227,772) 15-Jan-2016 (1,904,249)USD 399,665 EUR (375,883) 03-Mar-2016 (10,276)USD 2,341,676 EUR (2,202,334) 03-Mar-2016 (60,205)
(1,974,730) Net USD (1,867,562)
Total Return Credit Fund
Purchase Sale Maturity Unrealised Appreciation/Currency Amount Currency Amount Date (Depreciation) in GBP
USD 994,786 EUR (875,400) 21-Jan-2016 27,729GBP 2,692,471 EUR (3,646,071) 21-Jan-2016 12,180USD 233,250 GBP (152,539) 21-Jan-2016 4,851EUR 135,080 GBP (94,930) 21-Jan-2016 4,370USD 175,308 GBP (114,328) 21-Jan-2016 3,964USD 155,874 GBP (101,501) 21-Jan-2016 3,678EUR 121,324 GBP (85,860) 21-Jan-2016 3,328USD 181,154 GBP (118,977) 21-Jan-2016 3,260USD 202,623 GBP (134,067) 21-Jan-2016 2,656USD 171,650 GBP (113,225) 21-Jan-2016 2,599USD 49,221 GBP (32,258) 21-Jan-2016 954EUR 61,000 GBP (43,933) 21-Jan-2016 909USD 30,800 GBP (20,048) 21-Jan-2016 734GBP 136,692 EUR (185,125) 21-Jan-2016 604USD 65,781 GBP (43,977) 21-Jan-2016 410GBP 45,046 EUR (61,000) 21-Jan-2016 204USD 9,247 GBP (6,128) 21-Jan-2016 112USD 3,371 GBP (2,235) 21-Jan-2016 40USD 391,920 KRW (454,000,000) 18-Feb-2016 4,423USD 381,738 TWD (12,500,000) 18-Feb-2016 1,817EUR 4,963 GBP (3,481) 25-Feb-2016 171USD 5,016 GBP (3,298) 25-Feb-2016 87SEK 9,921 GBP (749) 25-Feb-2016 45
79,125
EUR 147,854 GBP (109,442) 21-Jan-2016 (752)GBP 84,968 EUR (116,615) 21-Jan-2016 (757)USD 478,767 AUD (657,150) 21-Jan-2016 (986)GBP 49,993 USD (75,698) 21-Jan-2016 (1,086)GBP 63,543 USD (95,922) 21-Jan-2016 (1,183)GBP 36,521 AUD (77,000) 21-Jan-2016 (1,448)EUR 446,000 USD (489,959) 21-Jan-2016 (2,747)GBP 93,943 USD (143,517) 21-Jan-2016 (2,897)GBP 131,553 USD (200,000) 21-Jan-2016 (3,401)GBP 124,670 AUD (262,851) 21-Jan-2016 (4,943)GBP 142,653 USD (218,740) 21-Jan-2016 (4,946)GBP 435,058 USD (668,371) 21-Jan-2016 (15,939)GBP 4,497,015 USD (6,908,683) 21-Jan-2016 (164,754)USD 377,489 SGD (539,000) 18-Feb-2016 (1,703)GBP 10 SEK (124) 25-Feb-2016 –GBP 45 EUR (62) 25-Feb-2016 (1)
(207,543) Net GBP (128,418)
Global Absolute Return Strategies Fund
Purchase Sale Maturity Unrealised Appreciation/Currency Amount Currency Amount Date (Depreciation) in EUR
EUR 7,259,427 SEK (66,396,537) 04-Jan-2016 36,892

Standard Life Investments Global SICAV
Société d'Investissement à Capital Variable
Notes to the Financial Statements as at 31 December 2015 (continued)
67
6. Forward foreign exchange contracts (continued)
Global Absolute Return Strategies Fund (continued) Purchase Sale Maturity Unrealised Appreciation/
Currency Amount Currency Amount Date (Depreciation) in EUR
USD 2,656,618 EUR (2,430,152) 04-Jan-2016 9,397EUR 949,954 SEK (8,729,784) 04-Jan-2016 339USD 97,789 EUR (89,492) 04-Jan-2016 306GBP 31,767 EUR (43,030) 04-Jan-2016 199CAD 36,135 EUR (23,778) 04-Jan-2016 123CAD 14,651 EUR (9,641) 04-Jan-2016 50GBP 15,009 EUR (20,376) 04-Jan-2016 49SGD 47,095 EUR (30,495) 04-Jan-2016 42GBP 253 EUR (343) 04-Jan-2016 2USD 339 EUR (310) 04-Jan-2016 1JPY 1,016,222,435 EUR (7,707,121) 05-Jan-2016 46,226USD 196,174 EUR (179,387) 05-Jan-2016 754GBP 83,434 EUR (113,036) 05-Jan-2016 502USD 10,087 EUR (9,224) 05-Jan-2016 39SEK 257,308 EUR (27,977) 05-Jan-2016 12USD 810 EUR (741) 05-Jan-2016 3EUR 1,031,555 GBP (727,263) 13-Jan-2016 42,067EUR 1,032,910 GBP (729,850) 13-Jan-2016 39,902EUR 889,061 GBP (626,396) 13-Jan-2016 36,808USD 1,814,108 EUR (1,650,060) 13-Jan-2016 15,450USD 625,618 EUR (566,258) 13-Jan-2016 8,115USD 164,189 EUR (148,401) 13-Jan-2016 2,339EUR 1,141,956 GBP (839,101) 13-Jan-2016 305EUR 1,444,281 GBP (1,046,291) 15-Jan-2016 20,797EUR 1,061,489 GBP (767,322) 15-Jan-2016 17,544USD 428,889 EUR (388,166) 15-Jan-2016 5,572EUR 297,616 USD (321,340) 15-Jan-2016 2,613USD 178,344,162 EUR (158,120,446) 19-Jan-2016 5,590,989USD 73,158,921 EUR (64,971,880) 19-Jan-2016 2,184,521INR 6,740,000,000 USD (101,521,313) 19-Jan-2016 49,765USD 186,356,193 KRW (213,677,874,914) 21-Jan-2016 4,286,210EUR 29,749,637 USD (31,617,082) 22-Jan-2016 728,807EUR 3,365,629 GBP (2,404,466) 22-Jan-2016 94,840USD 1,820,700 EUR (1,596,244) 22-Jan-2016 74,948USD 9,939,510 EUR (9,062,969) 22-Jan-2016 60,353EUR 3,224,709 USD (3,448,165) 22-Jan-2016 59,692EUR 1,932,673 USD (2,043,608) 22-Jan-2016 56,876EUR 1,293,650 GBP (911,229) 22-Jan-2016 54,108USD 1,092,611 EUR (955,753) 22-Jan-2016 47,138EUR 3,340,961 USD (3,594,400) 22-Jan-2016 41,717EUR 2,656,477 USD (2,858,864) 22-Jan-2016 32,371EUR 1,360,636 USD (1,449,280) 22-Jan-2016 30,364EUR 1,116,310 USD (1,186,262) 22-Jan-2016 27,459EUR 1,605,739 USD (1,724,288) 22-Jan-2016 23,042EUR 1,352,501 USD (1,448,867) 22-Jan-2016 22,609EUR 540,973 GBP (383,690) 22-Jan-2016 19,041USD 977,587 EUR (878,511) 22-Jan-2016 18,801EUR 1,292,615 USD (1,394,730) 22-Jan-2016 12,414EUR 919,247 GBP (667,393) 22-Jan-2016 11,394EUR 1,138,976 USD (1,230,000) 22-Jan-2016 9,978EUR 288,108 GBP (204,617) 22-Jan-2016 9,768EUR 444,885 GBP (321,072) 22-Jan-2016 8,132EUR 4,702,332 USD (5,115,782) 22-Jan-2016 6,636EUR 527,925 USD (570,000) 22-Jan-2016 4,731EUR 527,872 USD (570,000) 22-Jan-2016 4,677EUR 480,196 USD (518,222) 22-Jan-2016 4,528EUR 347,690 USD (374,203) 22-Jan-2016 4,214GBP 337,087 EUR (454,762) 22-Jan-2016 3,776EUR 136,184 USD (145,870) 22-Jan-2016 2,292USD 255,967 EUR (233,660) 22-Jan-2016 1,289EUR 836,852 USD (910,434) 22-Jan-2016 1,179EUR 160,479 GBP (117,863) 22-Jan-2016 151EUR 724,518 GBP (532,552) 22-Jan-2016 89USD 300,000,000 EUR (262,970,586) 27-Jan-2016 12,360,887USD 282,708,843 EUR (247,800,885) 27-Jan-2016 11,661,256USD 296,638,290 EUR (260,779,309) 28-Jan-2016 11,460,181USD 178,633,526 KRW (201,007,375,028) 28-Jan-2016 7,242,774EUR 129,784,958 GBP (94,100,000) 04-Feb-2016 1,819,388

Standard Life Investments Global SICAV
Société d'Investissement à Capital Variable
Notes to the Financial Statements as at 31 December 2015 (continued)
68
6. Forward foreign exchange contracts (continued)
Global Absolute Return Strategies Fund (continued) Purchase Sale Maturity Unrealised Appreciation/
Currency Amount Currency Amount Date (Depreciation) in EUR
AUD 58,000,000 EUR (37,860,256) 04-Feb-2016 1,003,782EUR 58,310,495 USD (63,000,000) 04-Feb-2016 502,584EUR 9,538,690 CAD (14,000,000) 04-Feb-2016 284,964USD 1,669,490,273 EUR (1,519,306,797) 05-Feb-2016 12,554,562USD 176,515,807 KRW (201,007,375,029) 05-Feb-2016 5,364,541USD 50,721,463 EUR (46,160,568) 05-Feb-2016 379,535USD 105,362,956 EUR (96,431,650) 05-Feb-2016 245,428USD 15,861,171 EUR (14,335,242) 05-Feb-2016 218,371EUR 6,840,342 USD (7,259,101) 05-Feb-2016 179,665EUR 11,502,816 USD (12,370,818) 05-Feb-2016 151,819EUR 10,108,647 USD (10,873,649) 05-Feb-2016 131,396USD 20,106,725 EUR (18,361,535) 05-Feb-2016 87,639EUR 3,764,994 USD (4,034,922) 05-Feb-2016 62,702EUR 2,418,275 USD (2,573,488) 05-Feb-2016 56,940EUR 2,695,472 USD (2,879,157) 05-Feb-2016 53,665EUR 2,220,034 USD (2,370,328) 05-Feb-2016 45,110EUR 1,668,908 USD (1,773,661) 05-Feb-2016 41,464EUR 2,270,080 USD (2,430,497) 05-Feb-2016 39,947USD 5,078,594 EUR (4,623,086) 05-Feb-2016 36,841EUR 1,271,626 USD (1,352,867) 05-Feb-2016 30,287USD 20,722,603 EUR (18,989,263) 05-Feb-2016 25,017USD 3,153,752 EUR (2,870,573) 05-Feb-2016 23,191EUR 600,455 USD (636,319) 05-Feb-2016 16,593USD 1,524,375 EUR (1,385,423) 05-Feb-2016 13,286USD 829,623 EUR (749,624) 05-Feb-2016 11,606EUR 844,909 USD (908,255) 05-Feb-2016 11,528USD 3,668,971 EUR (3,355,574) 05-Feb-2016 10,936EUR 658,828 USD (708,628) 05-Feb-2016 8,618EUR 277,261 USD (293,879) 05-Feb-2016 7,608USD 1,047,459 EUR (954,854) 05-Feb-2016 6,255USD 850,878 EUR (774,641) 05-Feb-2016 6,093EUR 301,464 USD (322,071) 05-Feb-2016 5,944USD 765,744 EUR (696,860) 05-Feb-2016 5,758EUR 270,172 USD (288,195) 05-Feb-2016 5,735EUR 128,941 USD (136,684) 05-Feb-2016 3,524EUR 213,919 USD (230,251) 05-Feb-2016 2,650USD 432,387 EUR (394,099) 05-Feb-2016 2,644EUR 189,933 USD (204,115) 05-Feb-2016 2,644EUR 427,465 USD (463,165) 05-Feb-2016 2,483EUR 109,931 USD (117,782) 05-Feb-2016 1,858USD 380,616 EUR (347,797) 05-Feb-2016 1,442USD 176,342 EUR (160,491) 05-Feb-2016 1,313EUR 51,358 USD (54,618) 05-Feb-2016 1,243USD 884,240 EUR (810,120) 05-Feb-2016 1,226EUR 533,974 USD (580,678) 05-Feb-2016 1,166EUR 213,457 USD (231,401) 05-Feb-2016 1,132USD 577,989 EUR (529,697) 05-Feb-2016 643USD 89,000 EUR (81,045) 05-Feb-2016 618USD 176,161 EUR (161,093) 05-Feb-2016 546USD 196,174 EUR (179,522) 05-Feb-2016 481USD 1,022,624 EUR (938,073) 05-Feb-2016 249USD 994 EUR (905) 05-Feb-2016 8EUR 41,646 USD (45,379) 05-Feb-2016 7EUR 58 USD (62) 05-Feb-2016 –USD 65,960,700 EUR (59,772,024) 08-Feb-2016 746,363EUR 62,424 CAD (89,099) 10-Feb-2016 3,539EUR 183,971 CAD (277,289) 10-Feb-2016 713EUR 5,557 CAD (7,904) 10-Feb-2016 334CAD 45,822 EUR (29,958) 10-Feb-2016 325EUR 5,729 CAD (8,275) 10-Feb-2016 260EUR 2,858 CAD (4,090) 10-Feb-2016 155EUR 1,585 CAD (2,265) 10-Feb-2016 88EUR 1,458 CAD (2,078) 10-Feb-2016 85EUR 1,352 CAD (2,033) 10-Feb-2016 8EUR 74 CAD (105) 10-Feb-2016 5EUR 755 CAD (1,137) 10-Feb-2016 4EUR 43 CAD (61) 10-Feb-2016 3EUR 47 CAD (69) 10-Feb-2016 2

Standard Life Investments Global SICAV
Société d'Investissement à Capital Variable
Notes to the Financial Statements as at 31 December 2015 (continued)
69
6. Forward foreign exchange contracts (continued)
Global Absolute Return Strategies Fund (continued) Purchase Sale Maturity Unrealised Appreciation/
Currency Amount Currency Amount Date (Depreciation) in EUR
EUR 11 CAD (16) 10-Feb-2016 –EUR 971 CAD (1,470) 10-Feb-2016 –EUR 267,484,324 GBP (190,000,000) 12-Feb-2016 9,157,316EUR 38,180,812 GBP (27,000,000) 12-Feb-2016 1,471,184EUR 45,871,732 GBP (33,000,000) 12-Feb-2016 1,004,409EUR 12,459,595 CAD (17,826,366) 12-Feb-2016 678,871EUR 6,034,053 RUB (444,498,550) 12-Feb-2016 575,040EUR 10,170,180 NOK (95,000,000) 12-Feb-2016 292,192EUR 69,662,465 CHF (75,250,906) 12-Feb-2016 245,661EUR 25,662,534 DKK (191,216,074) 12-Feb-2016 32,878JPY 189,722,705,510 EUR (1,434,091,506) 15-Feb-2016 13,205,084JPY 1,556,420,000 EUR (11,679,714) 15-Feb-2016 193,411JPY 729,190,000 EUR (5,444,642) 15-Feb-2016 117,972JPY 349,671,794 EUR (2,637,066) 15-Feb-2016 30,400JPY 309,060,000 EUR (2,339,152) 15-Feb-2016 18,507JPY 530,276,667 EUR (4,029,657) 15-Feb-2016 15,550JPY 65,873,000 EUR (492,360) 15-Feb-2016 10,151EUR 1,907,176 JPY (248,940,000) 15-Feb-2016 8,141JPY 124,873,000 EUR (944,724) 15-Feb-2016 7,868JPY 44,330,000 EUR (330,396) 15-Feb-2016 7,774JPY 48,626,000 EUR (364,167) 15-Feb-2016 6,776JPY 84,625,252 EUR (639,672) 15-Feb-2016 5,890JPY 30,245,000 EUR (226,871) 15-Feb-2016 3,853JPY 68,159,000 EUR (516,607) 15-Feb-2016 3,343JPY 112,000,000 EUR (851,066) 15-Feb-2016 3,324JPY 32,520,000 EUR (244,936) 15-Feb-2016 3,142JPY 25,846,667 EUR (194,184) 15-Feb-2016 2,987JPY 61,170,000 EUR (463,763) 15-Feb-2016 2,872JPY 34,400,000 EUR (260,528) 15-Feb-2016 1,891JPY 15,240,000 EUR (114,583) 15-Feb-2016 1,675JPY 35,000,000 EUR (265,381) 15-Feb-2016 1,616JPY 9,287,000 EUR (70,009) 15-Feb-2016 836JPY 23,280,000 EUR (177,087) 15-Feb-2016 504JPY 15,708,000 EUR (119,358) 15-Feb-2016 470JPY 4,081,000 EUR (30,670) 15-Feb-2016 462JPY 3,960,000 EUR (29,755) 15-Feb-2016 454JPY 20,015,000 EUR (152,283) 15-Feb-2016 401JPY 11,450,000 EUR (87,183) 15-Feb-2016 164JPY 3,000,000 EUR (22,743) 15-Feb-2016 143EUR 13,709 JPY (1,790,000) 15-Feb-2016 54EUR 7,658 JPY (1,000,000) 15-Feb-2016 29JPY 184,686 EUR (1,396) 15-Feb-2016 13EUR 298,980,679 MXN (5,470,300,000) 17-Feb-2016 10,785,608EUR 45,830,190 MXN (830,000,000) 17-Feb-2016 2,102,806EUR 35,176,869 MXN (640,000,000) 17-Feb-2016 1,459,368MXN 790,000,000 EUR (41,418,071) 17-Feb-2016 201,969INR 38,400,000,000 USD (569,200,895) 18-Feb-2016 6,342,194USD 310,704,216 EUR (282,000,000) 19-Feb-2016 2,987,944SEK 6,674,561,261 EUR (714,785,429) 22-Feb-2016 11,415,645SEK 390,225,367 EUR (41,789,624) 22-Feb-2016 667,411SEK 1,063,000,000 EUR (115,071,498) 22-Feb-2016 584,305SEK 126,090,881 EUR (13,494,337) 22-Feb-2016 224,517SEK 106,501,663 EUR (11,515,616) 22-Feb-2016 71,906SEK 19,467,298 EUR (2,101,564) 22-Feb-2016 16,504SEK 13,386,870 EUR (1,440,326) 22-Feb-2016 16,183SEK 10,149,580 EUR (1,088,443) 22-Feb-2016 15,844SEK 10,000,000 EUR (1,073,343) 22-Feb-2016 14,670SEK 19,060,521 EUR (2,060,577) 22-Feb-2016 13,233SEK 10,665,795 EUR (1,149,774) 22-Feb-2016 10,678SEK 17,369,145 EUR (1,880,091) 22-Feb-2016 9,695SEK 10,000,000 EUR (1,078,594) 22-Feb-2016 9,419SEK 16,642,793 EUR (1,801,610) 22-Feb-2016 9,148SEK 10,988,561 EUR (1,186,854) 22-Feb-2016 8,716SEK 7,706,628 EUR (830,620) 22-Feb-2016 7,871SEK 5,472,677 EUR (588,613) 22-Feb-2016 6,822SEK 4,588,662 EUR (493,422) 22-Feb-2016 5,830SEK 10,761,261 EUR (1,165,025) 22-Feb-2016 5,814SEK 3,064,762 EUR (328,732) 22-Feb-2016 4,718

Standard Life Investments Global SICAV
Société d'Investissement à Capital Variable
Notes to the Financial Statements as at 31 December 2015 (continued)
70
6. Forward foreign exchange contracts (continued)
Global Absolute Return Strategies Fund (continued) Purchase Sale Maturity Unrealised Appreciation/
Currency Amount Currency Amount Date (Depreciation) in EUR
SEK 3,760,944 EUR (404,779) 22-Feb-2016 4,416SEK 4,651,933 EUR (501,755) 22-Feb-2016 4,382SEK 6,301,703 EUR (681,379) 22-Feb-2016 4,255SEK 5,214,766 EUR (563,157) 22-Feb-2016 4,216SEK 3,050,948 EUR (328,111) 22-Feb-2016 3,836SEK 4,284,705 EUR (462,655) 22-Feb-2016 3,526SEK 2,383,770 EUR (255,860) 22-Feb-2016 3,497SEK 16,730,249 EUR (1,816,857) 22-Feb-2016 3,416SEK 3,564,931 EUR (384,546) 22-Feb-2016 3,324SEK 2,719,290 EUR (292,891) 22-Feb-2016 2,971SEK 2,944,396 EUR (317,424) 22-Feb-2016 2,931SEK 2,717,437 EUR (293,492) 22-Feb-2016 2,168SEK 2,373,433 EUR (256,766) 22-Feb-2016 1,466SEK 2,614,758 EUR (283,542) 22-Feb-2016 947SEK 6,111,636 EUR (664,066) 22-Feb-2016 888SEK 7,210,060 EUR (783,905) 22-Feb-2016 559SEK 7,407,698 EUR (805,474) 22-Feb-2016 493EUR 83,970 SEK (767,810) 22-Feb-2016 431SEK 7,275,146 EUR (791,260) 22-Feb-2016 286EUR 134,100 SEK (1,231,829) 22-Feb-2016 75INR 10,500,000,000 USD (155,520,995) 23-Feb-2016 1,739,005INR 4,000,000,000 USD (59,695,256) 23-Feb-2016 250,535AUD 484,213,036 EUR (320,258,155) 25-Feb-2016 3,671,785USD 96,085,791 SGD (134,400,000) 25-Feb-2016 1,237,134AUD 50,140,223 EUR (32,841,557) 25-Feb-2016 701,364USD 97,898,030 SGD (138,000,000) 25-Feb-2016 571,918AUD 40,021,862 EUR (26,261,650) 25-Feb-2016 512,266USD 32,002,972 SGD (44,800,000) 25-Feb-2016 388,877EUR 14,430,716 AUD (21,251,221) 25-Feb-2016 214,026AUD 13,148,969 EUR (8,617,985) 25-Feb-2016 178,442AUD 4,516,936 EUR (2,959,777) 25-Feb-2016 61,973AUD 4,605,883 EUR (3,033,447) 25-Feb-2016 47,807AUD 5,899,589 EUR (3,901,984) 25-Feb-2016 44,737AUD 4,465,320 EUR (2,942,896) 25-Feb-2016 44,325AUD 3,938,473 EUR (2,604,903) 25-Feb-2016 29,865AUD 2,294,381 EUR (1,505,492) 25-Feb-2016 29,409AUD 2,208,585 EUR (1,459,373) 25-Feb-2016 18,132EUR 4,314,713 AUD (6,436,081) 25-Feb-2016 9,089AUD 1,442,767 EUR (957,450) 25-Feb-2016 7,735AUD 565,090 EUR (373,981) 25-Feb-2016 4,055AUD 227,507 EUR (148,872) 25-Feb-2016 3,326AUD 199,878 EUR (130,919) 25-Feb-2016 2,796AUD 163,380 EUR (107,463) 25-Feb-2016 1,836AUD 986,682 EUR (658,282) 25-Feb-2016 1,791AUD 344,872 EUR (228,962) 25-Feb-2016 1,752AUD 378,247 EUR (251,460) 25-Feb-2016 1,580AUD 106,372 EUR (69,601) 25-Feb-2016 1,559AUD 52,613 EUR (34,608) 25-Feb-2016 589EUR 53,472 AUD (79,591) 25-Feb-2016 226EUR 11,220 AUD (16,523) 25-Feb-2016 166EUR 56,165 AUD (83,779) 25-Feb-2016 118EUR 36,165 AUD (53,946) 25-Feb-2016 76AUD 235,240 EUR (157,344) 25-Feb-2016 27USD 44,790,402 SGD (62,720,000) 26-Feb-2016 532,999USD 53,775,401 SGD (75,712,000) 26-Feb-2016 374,693USD 28,975,124 SGD (40,768,000) 26-Feb-2016 219,310USD 127,618,057 SGD (179,200,000) 29-Feb-2016 1,207,950USD 127,845,672 SGD (179,200,000) 01-Mar-2016 1,420,485USD 127,030,035 SGD (179,200,000) 02-Mar-2016 676,403USD 104,927,060 EUR (95,200,000) 04-Mar-2016 1,007,104EUR 6,210,181 GBP (4,530,022) 07-Mar-2016 54,847EUR 425,113 GBP (300,168) 07-Mar-2016 17,249EUR 369,667 GBP (260,923) 07-Mar-2016 15,128EUR 952,079 GBP (694,495) 07-Mar-2016 8,409EUR 296,508 GBP (213,787) 07-Mar-2016 6,018EUR 337,282 GBP (244,666) 07-Mar-2016 4,834EUR 503,429 GBP (367,272) 07-Mar-2016 4,384EUR 766,131 GBP (560,935) 07-Mar-2016 3,940

Standard Life Investments Global SICAV
Société d'Investissement à Capital Variable
Notes to the Financial Statements as at 31 December 2015 (continued)
71
6. Forward foreign exchange contracts (continued)
Global Absolute Return Strategies Fund (continued) Purchase Sale Maturity Unrealised Appreciation/
Currency Amount Currency Amount Date (Depreciation) in EUR
EUR 215,911 GBP (156,346) 07-Mar-2016 3,471EUR 267,733 GBP (194,806) 07-Mar-2016 3,033EUR 130,306 GBP (93,701) 07-Mar-2016 2,987EUR 75,138 GBP (53,154) 07-Mar-2016 2,913EUR 794,247 CHF (857,554) 07-Mar-2016 2,851EUR 197,843 GBP (144,272) 07-Mar-2016 1,808EUR 155,295 GBP (113,134) 07-Mar-2016 1,570EUR 109,564 GBP (79,704) 07-Mar-2016 1,263EUR 102,174 GBP (74,297) 07-Mar-2016 1,220SGD 316,370 EUR (203,415) 07-Mar-2016 968EUR 21,823 GBP (15,404) 07-Mar-2016 893GBP 305,411 EUR (414,151) 07-Mar-2016 837EUR 41,814 GBP (30,332) 07-Mar-2016 599SGD 392,157 EUR (252,771) 07-Mar-2016 573GBP 122,682 EUR (166,156) 07-Mar-2016 543EUR 35,085 GBP (25,435) 07-Mar-2016 525CHF 153,148 EUR (140,832) 07-Mar-2016 501EUR 383,705 CHF (415,255) 07-Mar-2016 486GBP 79,481 EUR (107,517) 07-Mar-2016 481EUR 55,639 GBP (40,601) 07-Mar-2016 471CHF 1,614,526 EUR (1,489,549) 07-Mar-2016 421EUR 35,598 GBP (25,955) 07-Mar-2016 330EUR 12,359 GBP (8,946) 07-Mar-2016 204GBP 25,977 EUR (35,182) 07-Mar-2016 115EUR 24,635 CHF (26,588) 07-Mar-2016 99EUR 28,877 SGD (44,550) 07-Mar-2016 96GBP 13,535 EUR (18,305) 07-Mar-2016 86CHF 16,043 EUR (14,744) 07-Mar-2016 61EUR 13,099 CHF (14,134) 07-Mar-2016 56CHF 15,000 EUR (13,794) 07-Mar-2016 49EUR 21,864 SGD (33,779) 07-Mar-2016 42EUR 51,091 SGD (79,030) 07-Mar-2016 36EUR 9,855 GBP (7,227) 07-Mar-2016 35EUR 1,710 GBP (1,233) 07-Mar-2016 35EUR 6,455 CHF (6,965) 07-Mar-2016 27EUR 7,081 CHF (7,647) 07-Mar-2016 24EUR 5,192 SGD (8,000) 07-Mar-2016 24EUR 2,228 CHF (2,401) 07-Mar-2016 13EUR 1,347 CHF (1,448) 07-Mar-2016 11EUR 1 GBP (1) 07-Mar-2016 –EUR 5,381 CHF (5,830) 07-Mar-2016 –EUR 231,943,989 USD (246,331,475) 09-Mar-2016 6,115,166EUR 28,370,850 JPY (3,700,000,000) 09-Mar-2016 144,373EUR 26,833,643 DKK (200,000,000) 09-Mar-2016 22,817USD 779,834,963 EUR (711,294,614) 10-Mar-2016 3,613,345EUR 1,695,612 USD (1,838,447) 10-Mar-2016 10,229USD 1,859,758 EUR (1,696,930) 10-Mar-2016 7,990EUR 1,073,522 USD (1,164,200) 10-Mar-2016 6,250USD 1,006,099 EUR (916,305) 10-Mar-2016 6,029USD 787,604 EUR (716,167) 10-Mar-2016 5,863USD 603,475 EUR (548,837) 10-Mar-2016 4,394USD 1,270,685 EUR (1,161,187) 10-Mar-2016 3,704USD 476,572 EUR (433,415) 10-Mar-2016 3,478USD 306,881 EUR (278,693) 10-Mar-2016 2,638USD 329,009 EUR (299,668) 10-Mar-2016 1,948USD 447,584 EUR (408,640) 10-Mar-2016 1,680USD 1,430,139 EUR (1,309,435) 10-Mar-2016 1,635USD 1,494,241 EUR (1,368,346) 10-Mar-2016 1,488USD 1,142,448 EUR (1,045,876) 10-Mar-2016 1,455EUR 153,942 USD (167,024) 10-Mar-2016 824USD 90,447 EUR (82,251) 10-Mar-2016 665USD 100,022 EUR (91,391) 10-Mar-2016 303EUR 63,918 USD (69,566) 10-Mar-2016 144USD 10,960 EUR (10,011) 10-Mar-2016 36USD 29,631 EUR (27,143) 10-Mar-2016 21NZD 100,207,048 EUR (59,779,528) 16-Mar-2016 2,812,447EUR 189,810,222 GBP (138,075,187) 16-Mar-2016 2,239,637EUR 125,319,802 CHF (135,400,000) 16-Mar-2016 348,213

Standard Life Investments Global SICAV
Société d'Investissement à Capital Variable
Notes to the Financial Statements as at 31 December 2015 (continued)
72
6. Forward foreign exchange contracts (continued)
Global Absolute Return Strategies Fund (continued) Purchase Sale Maturity Unrealised Appreciation/
Currency Amount Currency Amount Date (Depreciation) in EUR
EUR 39,806,411 CHF (43,000,000) 16-Mar-2016 118,241EUR 3,358,996 CAD (5,000,000) 16-Mar-2016 57,316EUR 4,491,858 NOK (43,000,000) 16-Mar-2016 25,958CAD 2,321,340 EUR (1,516,416) 16-Mar-2016 16,449CAD 1,076,328 EUR (705,073) 16-Mar-2016 5,665EUR 5,501,026 DKK (41,000,000) 16-Mar-2016 4,626CAD 1,235,426 EUR (811,689) 16-Mar-2016 4,107CAD 1,384,296 EUR (910,523) 16-Mar-2016 3,578CAD 1,057,585 EUR (695,033) 16-Mar-2016 3,328EUR 123,753 CAD (184,597) 16-Mar-2016 1,856EUR 11,704 CAD (17,719) 16-Mar-2016 3USD 31,628,367 SGD (44,800,000) 05-Apr-2016 81,905
176,028,848
EUR 3,943 USD (4,331) 04-Jan-2016 (35)EUR 17,057 GBP (12,565) 04-Jan-2016 (42)SEK 1,231,829 EUR (134,045) 04-Jan-2016 (48)EUR 8,573 GBP (6,348) 04-Jan-2016 (66)EUR 7,603 USD (8,352) 04-Jan-2016 (67)EUR 18,334 GBP (13,535) 04-Jan-2016 (85)EUR 19,919 GBP (14,749) 04-Jan-2016 (152)EUR 20,258 GBP (15,000) 04-Jan-2016 (155)EUR 20,396 USD (22,405) 04-Jan-2016 (179)EUR 24,273 USD (26,664) 04-Jan-2016 (213)EUR 91,536 USD (100,022) 04-Jan-2016 (313)SEK 767,810 EUR (83,948) 04-Jan-2016 (427)EUR 161,215 USD (176,161) 04-Jan-2016 (552)EUR 89,693 USD (98,531) 04-Jan-2016 (786)EUR 412,063 USD (450,463) 04-Jan-2016 (1,593)EUR 229,823 AUD (344,872) 04-Jan-2016 (1,807)EUR 851,193 JPY (112,000,000) 04-Jan-2016 (3,321)EUR 812,941 CAD (1,235,426) 04-Jan-2016 (4,210)EUR 944,850 JPY (124,873,000) 04-Jan-2016 (7,880)EUR 10,155 GBP (7,500) 05-Jan-2016 (51)EUR 11,421 GBP (8,435) 05-Jan-2016 (57)EUR 11,827 GBP (8,735) 05-Jan-2016 (59)EUR 12,008 GBP (8,869) 05-Jan-2016 (60)EUR 14,462 USD (15,822) 05-Jan-2016 (67)EUR 16,391 GBP (12,106) 05-Jan-2016 (82)EUR 19,033 GBP (14,057) 05-Jan-2016 (96)EUR 25,710 USD (28,128) 05-Jan-2016 (119)EUR 33,913 USD (37,102) 05-Jan-2016 (157)EUR 46,496 USD (50,869) 05-Jan-2016 (215)EUR 48,297 GBP (35,670) 05-Jan-2016 (243)EUR 57,284 GBP (42,307) 05-Jan-2016 (288)EUR 66,763 GBP (49,308) 05-Jan-2016 (336)EUR 791,035 SEK (7,275,146) 05-Jan-2016 (351)EUR 107,680 GBP (79,481) 05-Jan-2016 (478)EUR 179,387 USD (196,174) 05-Jan-2016 (754)EUR 192,078 GBP (141,861) 05-Jan-2016 (966)EUR 348,045 USD (380,616) 05-Jan-2016 (1,463)EUR 265,443 JPY (35,000,000) 05-Jan-2016 (1,592)EUR 409,283 USD (447,584) 05-Jan-2016 (1,720)EUR 966,444 USD (1,056,144) 13-Jan-2016 (3,189)GBP 145,534 EUR (207,274) 13-Jan-2016 (9,265)GBP 322,419 EUR (460,537) 13-Jan-2016 (21,865)GBP 518,851 EUR (736,523) 13-Jan-2016 (30,593)GBP 579,251 EUR (821,905) 13-Jan-2016 (33,797)EUR 20,089,280 USD (22,611,047) 13-Jan-2016 (669,649)EUR 373,454,189 GBP (275,107,642) 13-Jan-2016 (847,457)USD 117,706,407 KRW (140,000,000,000) 13-Jan-2016 (1,349,350)USD 169,562,086 KRW (201,007,375,029) 13-Jan-2016 (1,420,362)EUR 482,974 USD (527,915) 15-Jan-2016 (1,675)USD 403,548 EUR (372,929) 15-Jan-2016 (2,455)GBP 95,264 EUR (134,057) 15-Jan-2016 (4,449)USD 275,682 EUR (260,148) 15-Jan-2016 (7,060)EUR 8,517,683 GBP (6,290,321) 15-Jan-2016 (40,330)

Standard Life Investments Global SICAV
Société d'Investissement à Capital Variable
Notes to the Financial Statements as at 31 December 2015 (continued)
73
6. Forward foreign exchange contracts (continued)
Global Absolute Return Strategies Fund (continued) Purchase Sale Maturity Unrealised Appreciation/
Currency Amount Currency Amount Date (Depreciation) in EUR
EUR 10,668,048 USD (11,933,521) 15-Jan-2016 (287,435)GBP 124,863 EUR (169,912) 22-Jan-2016 (62)USD 122,919 EUR (113,907) 22-Jan-2016 (1,082)USD 48,043 EUR (45,203) 22-Jan-2016 (1,105)USD 815,384 EUR (749,544) 22-Jan-2016 (1,116)EUR 588,964 GBP (433,814) 22-Jan-2016 (1,153)EUR 583,828 GBP (430,211) 22-Jan-2016 (1,388)EUR 1,429,433 GBP (1,052,003) 22-Jan-2016 (1,603)USD 143,747 EUR (135,510) 22-Jan-2016 (3,567)EUR 136,340 USD (155,079) 22-Jan-2016 (6,005)EUR 2,823,725 GBP (2,080,844) 22-Jan-2016 (6,842)EUR 2,186,603 GBP (1,614,953) 22-Jan-2016 (10,213)EUR 2,712,687 GBP (2,002,565) 22-Jan-2016 (11,397)EUR 360,957 USD (410,000) 22-Jan-2016 (15,375)EUR 1,743,677 GBP (1,295,634) 22-Jan-2016 (18,771)EUR 3,122,016 GBP (2,313,333) 22-Jan-2016 (24,804)USD 1,294,677 EUR (1,214,374) 22-Jan-2016 (26,010)EUR 630,425 USD (716,099) 22-Jan-2016 (26,872)USD 1,612,540 EUR (1,512,522) 22-Jan-2016 (32,396)EUR 9,106,928 GBP (6,724,169) 22-Jan-2016 (39,941)EUR 9,434,050 USD (10,322,364) 22-Jan-2016 (40,688)EUR 1,082,850 USD (1,225,679) 22-Jan-2016 (42,182)EUR 999,961 USD (1,138,016) 22-Jan-2016 (44,606)EUR 7,579,707 GBP (5,606,466) 22-Jan-2016 (46,755)EUR 1,429,010 USD (1,623,167) 22-Jan-2016 (60,870)EUR 10,000,000 USD (10,967,167) 22-Jan-2016 (66,593)EUR 2,344,976 USD (2,675,414) 22-Jan-2016 (110,746)EUR 4,369,833 USD (4,887,522) 22-Jan-2016 (116,348)EUR 2,312,542 USD (2,651,486) 22-Jan-2016 (121,215)EUR 2,409,840 USD (2,763,043) 22-Jan-2016 (126,315)EUR 14,030,570 USD (15,612,896) 22-Jan-2016 (300,265)EUR 8,612,622 USD (9,783,074) 22-Jan-2016 (367,109)EUR 9,944,678 USD (11,347,704) 22-Jan-2016 (471,204)EUR 12,187,862 USD (13,863,022) 22-Jan-2016 (536,792)EUR 14,743,850 USD (16,706,585) 22-Jan-2016 (590,866)EUR 20,826,612 USD (23,399,636) 22-Jan-2016 (651,552)EUR 14,862,422 USD (16,914,774) 22-Jan-2016 (663,387)EUR 23,084,404 USD (26,002,272) 22-Jan-2016 (782,680)EUR 18,503,335 USD (21,051,004) 22-Jan-2016 (819,056)EUR 22,108,651 USD (25,111,050) 22-Jan-2016 (940,393)EUR 26,187,251 USD (29,641,371) 22-Jan-2016 (1,020,104)EUR 46,781,100 USD (52,761,522) 22-Jan-2016 (1,647,884)EUR 69,603,886 USD (77,752,859) 22-Jan-2016 (1,764,260)EUR 83,920,140 USD (94,350,515) 22-Jan-2016 (2,682,738)EUR 103,381,148 USD (115,595,083) 22-Jan-2016 (2,721,790)EUR 92,438,924 USD (104,049,632) 22-Jan-2016 (3,066,623)EUR 65,770,818 USD (75,188,778) 22-Jan-2016 (3,243,798)EUR 201,548,991 USD (228,951,975) 22-Jan-2016 (8,602,484)USD 160,643,340 AUD (220,000,000) 25-Jan-2016 (86,611)USD 149,018,461 AUD (204,149,532) 25-Jan-2016 (127,101)USD 100,338,539 AUD (138,313,146) 29-Jan-2016 (638,913)USD 284,221,683 AUD (395,301,367) 01-Feb-2016 (4,122,958)USD 181,427,083 AUD (252,423,801) 02-Feb-2016 (2,684,184)MXN 2,660,000,000 USD (158,569,300) 02-Feb-2016 (5,165,772)USD 192,966,240 AUD (267,000,000) 03-Feb-2016 (1,854,768)USD 128,039,422 AUD (180,435,971) 03-Feb-2016 (3,423,822)USD 131,308,745 AUD (185,000,000) 03-Feb-2016 (3,482,313)USD 64,000,000 EUR (58,882,358) 04-Feb-2016 (156,860)EUR 40,906,711 USD (45,000,000) 04-Feb-2016 (384,654)GBP 29,000,000 EUR (39,946,747) 04-Feb-2016 (509,961)EUR 34,350,932 HKD (295,000,000) 04-Feb-2016 (586,585)EUR 57,249,431 AUD (89,393,492) 04-Feb-2016 (2,650,432)EUR 523,909,574 USD (581,000,000) 04-Feb-2016 (9,207,831)EUR 9,218 USD (10,087) 05-Feb-2016 (38)USD 13,188 EUR (12,261) 05-Feb-2016 (160)EUR 89,424 USD (97,789) 05-Feb-2016 (303)EUR 45,072 USD (49,513) 05-Feb-2016 (359)EUR 86,099 USD (94,449) 05-Feb-2016 (564)

Standard Life Investments Global SICAV
Société d'Investissement à Capital Variable
Notes to the Financial Statements as at 31 December 2015 (continued)
74
6. Forward foreign exchange contracts (continued)
Global Absolute Return Strategies Fund (continued) Purchase Sale Maturity Unrealised Appreciation/
Currency Amount Currency Amount Date (Depreciation) in EUR
EUR 205,213 USD (224,379) 05-Feb-2016 (669)USD 166,623 EUR (153,822) 05-Feb-2016 (935)USD 100,000 EUR (93,334) 05-Feb-2016 (1,578)USD 73,707 EUR (69,309) 05-Feb-2016 (1,678)EUR 230,334 USD (253,056) 05-Feb-2016 (1,861)USD 158,361 EUR (147,220) 05-Feb-2016 (1,914)USD 448,335 EUR (413,569) 05-Feb-2016 (2,193)EUR 528,177 USD (578,378) 05-Feb-2016 (2,521)EUR 353,980 USD (388,818) 05-Feb-2016 (2,784)USD 1,454,375 EUR (1,337,399) 05-Feb-2016 (2,920)USD 240,000 EUR (223,160) 05-Feb-2016 (2,945)EUR 2,953,162 USD (3,222,396) 05-Feb-2016 (3,587)USD 205,722 EUR (192,678) 05-Feb-2016 (3,915)USD 175,226 EUR (165,118) 05-Feb-2016 (4,337)EUR 3,510,750 USD (3,831,211) 05-Feb-2016 (4,625)EUR 344,504 USD (381,269) 05-Feb-2016 (5,334)USD 324,309 EUR (303,619) 05-Feb-2016 (6,045)EUR 4,083,810 USD (4,457,450) 05-Feb-2016 (6,178)USD 357,087 EUR (334,756) 05-Feb-2016 (7,106)EUR 1,235,600 USD (1,356,886) 05-Feb-2016 (9,428)USD 805,207 EUR (748,709) 05-Feb-2016 (9,882)USD 860,130 EUR (800,140) 05-Feb-2016 (10,917)EUR 47,377,773 USD (51,648,073) 05-Feb-2016 (12,553)USD 498,222 EUR (470,141) 05-Feb-2016 (12,992)USD 566,823 EUR (533,346) 05-Feb-2016 (13,251)USD 675,000 EUR (632,787) 05-Feb-2016 (13,433)USD 920,726 EUR (859,131) 05-Feb-2016 (14,308)USD 688,762 EUR (647,401) 05-Feb-2016 (15,419)EUR 2,951,178 USD (3,242,769) 05-Feb-2016 (24,265)USD 2,019,380 EUR (1,884,768) 05-Feb-2016 (31,861)EUR 2,286,424 USD (2,529,805) 05-Feb-2016 (34,829)EUR 6,090,761 USD (6,682,509) 05-Feb-2016 (40,857)USD 2,300,000 EUR (2,153,264) 05-Feb-2016 (42,870)USD 11,073,548 EUR (10,220,023) 05-Feb-2016 (59,352)USD 8,500,745 EUR (7,897,781) 05-Feb-2016 (97,818)EUR 10,356,669 USD (11,395,402) 05-Feb-2016 (99,322)EUR 12,750,705 USD (14,009,990) 05-Feb-2016 (104,334)EUR 47,696,875 USD (52,114,464) 05-Feb-2016 (121,393)USD 5,059,970 EUR (4,773,832) 05-Feb-2016 (130,994)USD 79,996,610 KRW (94,400,000,000) 05-Feb-2016 (142,754)USD 11,955,347 EUR (11,124,657) 05-Feb-2016 (154,882)USD 9,659,909 EUR (9,041,853) 05-Feb-2016 (178,285)USD 30,226,787 EUR (27,941,300) 05-Feb-2016 (206,340)EUR 25,263,453 USD (27,880,494) 05-Feb-2016 (318,638)USD 51,261,414 EUR (48,357,270) 05-Feb-2016 (1,321,728)USD 202,257,775 EUR (188,908,376) 05-Feb-2016 (3,324,264)CAD 833 EUR (553) 10-Feb-2016 (2)CAD 3,093 EUR (2,050) 10-Feb-2016 (6)CAD 354 EUR (250) 10-Feb-2016 (16)EUR 4,504 CAD (6,843) 10-Feb-2016 (19)EUR 2,398 CAD (3,658) 10-Feb-2016 (20)CAD 584 EUR (407) 10-Feb-2016 (22)CAD 636 EUR (447) 10-Feb-2016 (26)CAD 1,137 EUR (778) 10-Feb-2016 (27)EUR 9,633 CAD (14,651) 10-Feb-2016 (50)CAD 2,426 EUR (1,703) 10-Feb-2016 (100)CAD 9,683 EUR (6,516) 10-Feb-2016 (117)CAD 4,352 EUR (3,033) 10-Feb-2016 (156)CAD 4,407 EUR (3,101) 10-Feb-2016 (188)CAD 9,308 EUR (6,524) 10-Feb-2016 (373)CAD 58,741,811 EUR (41,036,149) 10-Feb-2016 (2,214,287)CAD 408,592,675 EUR (285,436,720) 10-Feb-2016 (15,402,002)EUR 40,461,407 CHF (44,000,000) 12-Feb-2016 (127,331)EUR 35,013,254 JPY (4,641,185,363) 12-Feb-2016 (392,553)EUR 39,176,113 SEK (366,155,944) 12-Feb-2016 (661,070)EUR 33,495,556 AUD (51,238,946) 12-Feb-2016 (816,873)EUR 18 JPY (2,363) 15-Feb-2016 –EUR 1,369 JPY (180,000) 15-Feb-2016 (4)

Standard Life Investments Global SICAV
Société d'Investissement à Capital Variable
Notes to the Financial Statements as at 31 December 2015 (continued)
75
6. Forward foreign exchange contracts (continued)
Global Absolute Return Strategies Fund (continued) Purchase Sale Maturity Unrealised Appreciation/
Currency Amount Currency Amount Date (Depreciation) in EUR
EUR 3,833 JPY (510,000) 15-Feb-2016 (58)EUR 18,237 JPY (2,400,000) 15-Feb-2016 (72)EUR 13,519 JPY (1,785,000) 15-Feb-2016 (98)EUR 15,077 JPY (2,000,000) 15-Feb-2016 (180)EUR 8,785 JPY (1,177,874) 15-Feb-2016 (201)JPY 8,780,000 EUR (67,242) 15-Feb-2016 (264)EUR 578,679 JPY (76,000,000) 15-Feb-2016 (1,085)JPY 20,000,000 EUR (153,675) 15-Feb-2016 (1,105)EUR 293,438 JPY (38,614,480) 15-Feb-2016 (1,132)JPY 27,390,000 EUR (210,992) 15-Feb-2016 (2,048)JPY 37,992,000 EUR (291,919) 15-Feb-2016 (2,097)JPY 42,630,000 EUR (327,598) 15-Feb-2016 (2,395)EUR 913,014 JPY (120,000,000) 15-Feb-2016 (2,404)EUR 194,758 JPY (25,923,070) 15-Feb-2016 (2,996)JPY 110,730,000 EUR (847,935) 15-Feb-2016 (3,233)EUR 758,879 JPY (100,000,000) 15-Feb-2016 (3,970)EUR 768,170 JPY (101,330,000) 15-Feb-2016 (4,824)EUR 770,105 JPY (101,750,000) 15-Feb-2016 (6,093)EUR 479,629 JPY (63,680,000) 15-Feb-2016 (6,153)EUR 1,023,508 JPY (135,000,000) 15-Feb-2016 (6,337)EUR 1,131,232 JPY (150,000,000) 15-Feb-2016 (13,041)EUR 754,659 JPY (101,070,000) 15-Feb-2016 (16,352)JPY 624,560,000 EUR (4,784,870) 15-Feb-2016 (20,424)EUR 901,826 JPY (121,000,000) 15-Feb-2016 (21,220)EUR 2,071,914 JPY (276,100,000) 15-Feb-2016 (34,310)EUR 2,509,607 JPY (333,993,532) 15-Feb-2016 (38,257)EUR 7,705,321 JPY (1,016,222,435) 15-Feb-2016 (46,915)EUR 19,023,065 JPY (2,550,663,950) 15-Feb-2016 (434,633)GBP 163,346,614 CHF (246,000,000) 16-Feb-2016 (4,877,930)EUR 27,985 SEK (257,308) 22-Feb-2016 (10)EUR 73,105 SEK (672,320) 22-Feb-2016 (45)EUR 100,206 SEK (922,230) 22-Feb-2016 (134)EUR 382,916 SEK (3,521,918) 22-Feb-2016 (273)EUR 150,226 SEK (1,383,329) 22-Feb-2016 (282)EUR 25,502 SEK (237,157) 22-Feb-2016 (301)EUR 41,181 SEK (381,768) 22-Feb-2016 (356)EUR 55,948 SEK (517,523) 22-Feb-2016 (359)EUR 61,614 SEK (570,747) 22-Feb-2016 (484)EUR 99,634 SEK (920,391) 22-Feb-2016 (506)SEK 8,729,784 EUR (950,343) 22-Feb-2016 (531)EUR 75,131 SEK (695,701) 22-Feb-2016 (562)EUR 50,077 SEK (465,642) 22-Feb-2016 (585)EUR 116,435 SEK (1,075,684) 22-Feb-2016 (600)EUR 58,778 SEK (548,097) 22-Feb-2016 (856)EUR 85,258 SEK (792,418) 22-Feb-2016 (958)EUR 102,393 SEK (950,018) 22-Feb-2016 (970)EUR 111,873 SEK (1,039,452) 22-Feb-2016 (1,221)EUR 268,188 SEK (2,477,234) 22-Feb-2016 (1,338)EUR 265,553 SEK (2,454,652) 22-Feb-2016 (1,517)EUR 215,637 SEK (1,996,490) 22-Feb-2016 (1,584)EUR 536,539 SEK (4,947,839) 22-Feb-2016 (1,793)EUR 191,289 SEK (1,774,814) 22-Feb-2016 (1,813)EUR 178,371 SEK (1,662,943) 22-Feb-2016 (2,560)EUR 271,536 SEK (2,521,018) 22-Feb-2016 (2,754)EUR 250,589 SEK (2,329,872) 22-Feb-2016 (2,904)EUR 437,498 SEK (4,058,195) 22-Feb-2016 (4,039)EUR 482,302 SEK (4,474,037) 22-Feb-2016 (4,479)EUR 386,031 SEK (3,596,525) 22-Feb-2016 (5,276)EUR 623,392 SEK (5,779,669) 22-Feb-2016 (5,444)EUR 373,843 SEK (3,493,184) 22-Feb-2016 (6,220)EUR 1,154,831 SEK (10,695,031) 22-Feb-2016 (8,802)EUR 722,346 SEK (6,756,034) 22-Feb-2016 (12,720)EUR 2,894,874 SEK (26,742,080) 22-Feb-2016 (14,699)SEK 66,396,537 EUR (7,261,310) 22-Feb-2016 (37,280)EUR 12,417,710 SEK (116,141,690) 22-Feb-2016 (218,659)MXN 3,597,600,000 USD (212,860,625) 22-Feb-2016 (5,785,151)MXN 4,147,000,000 USD (245,711,746) 23-Feb-2016 (7,000,059)MXN 4,068,400,000 USD (240,949,014) 24-Feb-2016 (6,785,632)

Standard Life Investments Global SICAV
Société d'Investissement à Capital Variable
Notes to the Financial Statements as at 31 December 2015 (continued)
76
6. Forward foreign exchange contracts (continued)
Global Absolute Return Strategies Fund (continued) Purchase Sale Maturity Unrealised Appreciation/
Currency Amount Currency Amount Date (Depreciation) in EUR
AUD 8,016 EUR (5,405) 25-Feb-2016 (43)AUD 48,193 EUR (32,498) 25-Feb-2016 (257)AUD 176,833 EUR (118,626) 25-Feb-2016 (327)AUD 146,903 EUR (98,694) 25-Feb-2016 (418)AUD 53,471 EUR (36,268) 25-Feb-2016 (497)EUR 41,411 AUD (63,298) 25-Feb-2016 (935)AUD 77,151 EUR (52,629) 25-Feb-2016 (1,017)AUD 223,579 EUR (153,562) 25-Feb-2016 (3,991)AUD 607,819 EUR (410,872) 25-Feb-2016 (4,252)AUD 695,155 EUR (469,721) 25-Feb-2016 (4,675)AUD 1,844,033 EUR (1,238,612) 25-Feb-2016 (4,987)MXN 1,805,000,000 USD (107,664,778) 25-Feb-2016 (3,718,396)GBP 171,241,830 CHF (262,000,000) 29-Feb-2016 (9,037,604)GBP 70,635,721 CHF (105,000,000) 02-Mar-2016 (900,638)GBP 171,129,980 CHF (262,000,000) 02-Mar-2016 (9,209,228)MXN 1,432,000,000 USD (83,131,600) 03-Mar-2016 (892,117)MXN 2,918,000,000 USD (169,174,131) 03-Mar-2016 (1,612,559)MXN 2,449,000,000 USD (147,047,345) 03-Mar-2016 (5,996,648)USD 200,000,000 EUR (188,597,045) 04-Mar-2016 (5,218,031)USD 210,000,000 EUR (198,066,550) 04-Mar-2016 (5,518,584)USD 213,185,105 EUR (201,069,653) 04-Mar-2016 (5,601,280)GBP 8 EUR (12) 07-Mar-2016 –EUR 68,548 SGD (106,109) 07-Mar-2016 (2)EUR 343 GBP (253) 07-Mar-2016 (2)EUR 25,125 CHF (27,233) 07-Mar-2016 (7)SGD 40,000 EUR (25,859) 07-Mar-2016 (18)EUR 7,011 SGD (10,889) 07-Mar-2016 (23)CHF 14,736 EUR (13,646) 07-Mar-2016 (47)SGD 51,000 EUR (32,997) 07-Mar-2016 (49)EUR 30,375 SGD (47,095) 07-Mar-2016 (50)GBP 999 EUR (1,421) 07-Mar-2016 (63)EUR 19,060 CHF (20,727) 07-Mar-2016 (68)EUR 26,841 GBP (19,818) 07-Mar-2016 (88)GBP 6,678 EUR (9,177) 07-Mar-2016 (104)EUR 74,687 GBP (55,077) 07-Mar-2016 (151)GBP 7,217 EUR (9,962) 07-Mar-2016 (157)EUR 42,962 GBP (31,767) 07-Mar-2016 (203)SGD 70,000 EUR (45,433) 07-Mar-2016 (211)EUR 70,976 GBP (52,405) 07-Mar-2016 (232)GBP 8,567 EUR (11,882) 07-Mar-2016 (241)GBP 10,991 EUR (15,178) 07-Mar-2016 (244)SGD 35,000 EUR (22,900) 07-Mar-2016 (289)GBP 60,223 EUR (82,121) 07-Mar-2016 (291)CHF 77,165 EUR (71,516) 07-Mar-2016 (304)CHF 82,447 EUR (76,411) 07-Mar-2016 (325)GBP 33,082 EUR (45,347) 07-Mar-2016 (395)EUR 112,864 GBP (83,434) 07-Mar-2016 (505)GBP 42,494 EUR (58,248) 07-Mar-2016 (507)CHF 179,059 EUR (165,811) 07-Mar-2016 (566)GBP 82,768 EUR (113,045) 07-Mar-2016 (581)GBP 50,233 EUR (68,885) 07-Mar-2016 (629)SGD 98,500 EUR (64,351) 07-Mar-2016 (718)CHF 99,632 EUR (92,720) 07-Mar-2016 (774)GBP 111,849 EUR (152,765) 07-Mar-2016 (786)CHF 259,642 EUR (240,482) 07-Mar-2016 (871)EUR 450,031 GBP (331,870) 07-Mar-2016 (909)GBP 56,148 EUR (77,215) 07-Mar-2016 (922)GBP 79,512 EUR (109,036) 07-Mar-2016 (996)GBP 39,066 EUR (54,182) 07-Mar-2016 (1,100)GBP 84,854 EUR (116,693) 07-Mar-2016 (1,394)GBP 71,000 EUR (98,090) 07-Mar-2016 (1,616)SGD 538,652 EUR (349,761) 07-Mar-2016 (1,777)GBP 147,291 EUR (202,010) 07-Mar-2016 (1,874)CHF 561,749 EUR (520,295) 07-Mar-2016 (1,884)GBP 121,991 EUR (168,170) 07-Mar-2016 (2,410)GBP 546,440 EUR (745,133) 07-Mar-2016 (2,637)GBP 123,253 EUR (170,280) 07-Mar-2016 (2,806)GBP 193,848 EUR (266,415) 07-Mar-2016 (3,018)

Standard Life Investments Global SICAV
Société d'Investissement à Capital Variable
Notes to the Financial Statements as at 31 December 2015 (continued)
77
6. Forward foreign exchange contracts (continued)
Global Absolute Return Strategies Fund (continued) Purchase Sale Maturity Unrealised Appreciation/
Currency Amount Currency Amount Date (Depreciation) in EUR
EUR 357,772 SGD (558,597) 07-Mar-2016 (3,096)GBP 147,142 EUR (203,200) 07-Mar-2016 (3,266)GBP 354,248 EUR (486,960) 07-Mar-2016 (5,614)GBP 344,226 EUR (474,836) 07-Mar-2016 (7,106)GBP 127,848 EUR (181,066) 07-Mar-2016 (7,347)GBP 287,675 EUR (400,059) 07-Mar-2016 (9,170)GBP 492,763 EUR (679,732) 07-Mar-2016 (10,172)GBP 652,031 EUR (896,573) 07-Mar-2016 (10,602)GBP 382,090 EUR (529,934) 07-Mar-2016 (10,755)SGD 3,403,814 EUR (2,210,186) 07-Mar-2016 (11,231)GBP 850,957 EUR (1,169,753) 07-Mar-2016 (13,485)EUR 2,205,084 SGD (3,442,840) 07-Mar-2016 (19,082)GBP 533,801 EUR (754,574) 07-Mar-2016 (29,253)GBP 803,109 EUR (1,137,817) 07-Mar-2016 (46,564)GBP 4,312,436 EUR (5,929,801) 07-Mar-2016 (70,121)CHF 31,594,140 EUR (29,232,288) 07-Mar-2016 (75,555)CHF 68,942,985 EUR (63,789,082) 07-Mar-2016 (164,872)SGD 34,943,771 EUR (23,317,299) 07-Mar-2016 (742,695)GBP 41,505,426 EUR (59,022,217) 07-Mar-2016 (2,625,204)SGD 219,513,159 EUR (146,476,865) 07-Mar-2016 (4,665,531)GBP 275,152,004 EUR (391,276,098) 07-Mar-2016 (17,403,270)EUR 59,582,102 SEK (550,000,000) 09-Mar-2016 (261,165)EUR 110,460,824 CHF (120,000,000) 09-Mar-2016 (284,901)KRW 38,200,000,000 EUR (30,843,763) 09-Mar-2016 (1,128,455)EUR 309 USD (339) 10-Mar-2016 (1)EUR 2,267 USD (2,476) 10-Mar-2016 (3)EUR 739 USD (810) 10-Mar-2016 (3)USD 5,478 EUR (5,060) 10-Mar-2016 (38)EUR 64,728 USD (70,705) 10-Mar-2016 (90)EUR 45,545 USD (49,840) 10-Mar-2016 (145)EUR 186,795 USD (203,981) 10-Mar-2016 (203)USD 60,476 EUR (55,705) 10-Mar-2016 (265)EUR 179,347 USD (196,174) 10-Mar-2016 (494)EUR 79,416 USD (87,192) 10-Mar-2016 (516)EUR 71,489 USD (78,720) 10-Mar-2016 (677)USD 189,927 EUR (175,133) 10-Mar-2016 (1,020)EUR 134,158 USD (147,526) 10-Mar-2016 (1,085)EUR 138,748 USD (152,563) 10-Mar-2016 (1,114)EUR 291,530 USD (320,099) 10-Mar-2016 (1,918)USD 413,125 EUR (380,768) 10-Mar-2016 (2,039)USD 621,636 EUR (573,339) 10-Mar-2016 (3,459)USD 1,986,972 EUR (1,825,658) 10-Mar-2016 (4,117)EUR 2,054,631 USD (2,259,578) 10-Mar-2016 (16,821)EUR 2,979,780 USD (3,276,423) 10-Mar-2016 (23,857)USD 86,547,704 SGD (123,800,000) 14-Mar-2016 (610,777)USD 86,677,986 SGD (123,800,000) 15-Mar-2016 (488,682)CAD 5,757 EUR (3,832) 16-Mar-2016 (31)EUR 23,741 CAD (36,135) 16-Mar-2016 (120)CAD 1,447,602 EUR (956,129) 16-Mar-2016 (226)EUR 65,340 CAD (99,423) 16-Mar-2016 (313)CAD 1,686,188 EUR (1,117,894) 16-Mar-2016 (4,444)CAD 1,895,363 EUR (1,257,773) 16-Mar-2016 (6,197)CAD 3,240,875 EUR (2,146,733) 16-Mar-2016 (6,666)CAD 1,305,340 EUR (869,663) 16-Mar-2016 (7,700)CAD 3,315,147 EUR (2,203,054) 16-Mar-2016 (13,943)EUR 2,702,216 SEK (25,000,000) 16-Mar-2016 (17,982)CAD 4,282,546 EUR (2,868,766) 16-Mar-2016 (40,847)EUR 13,695,491 USD (15,000,000) 16-Mar-2016 (53,363)CAD 6,387,612 EUR (4,282,208) 16-Mar-2016 (64,238)EUR 16,406,164 USD (18,000,000) 16-Mar-2016 (92,460)EUR 5,593,660 NZD (9,125,317) 16-Mar-2016 (106,255)EUR 51,370,768 GBP (38,000,000) 16-Mar-2016 (250,978)EUR 155,121,803 USD (170,000,000) 16-Mar-2016 (698,539)EUR 171,444,528 USD (188,000,000) 16-Mar-2016 (874,438)EUR 191,514,416 USD (210,000,000) 16-Mar-2016 (969,536)CAD 889,578,530 EUR (592,131,786) 16-Mar-2016 (4,711,049)USD 86,755,431 SGD (123,800,000) 17-Mar-2016 (412,350)USD 86,725,287 SGD (123,800,000) 18-Mar-2016 (437,307)

Standard Life Investments Global SICAV
Société d'Investissement à Capital Variable
Notes to the Financial Statements as at 31 December 2015 (continued)
78
6. Forward foreign exchange contracts (continued)
Global Absolute Return Strategies Fund (continued) Purchase Sale Maturity Unrealised Appreciation/
Currency Amount Currency Amount Date (Depreciation) in EUR
USD 31,388,487 SGD (44,800,000) 29-Mar-2016 (143,161)USD 31,397,667 SGD (44,800,000) 30-Mar-2016 (133,783)USD 59,008,820 SGD (84,300,000) 31-Mar-2016 (316,394)USD 58,959,295 SGD (84,300,000) 31-Mar-2016 (361,769)USD 31,513,054 SGD (44,800,000) 01-Apr-2016 (26,617)
(209,687,999) Net EUR (33,659,151)
Global Focused Strategies Fund
Purchase Sale Maturity Unrealised Appreciation/Currency Amount Currency Amount Date (Depreciation) in EUR
GBP 12,650 EUR (17,135) 04-Jan-2016 79GBP 17,179 EUR (23,274) 05-Jan-2016 103GBP 227 EUR (307) 05-Jan-2016 1EUR 5,250,941 HKD (43,261,376) 14-Jan-2016 125,674HKD 18,300,000 EUR (2,067,831) 14-Jan-2016 100,209HKD 9,710,000 EUR (1,109,354) 14-Jan-2016 41,010EUR 5,005,494 GBP (3,650,000) 14-Jan-2016 39,543EUR 729,623 GBP (510,788) 14-Jan-2016 34,678EUR 1,389,626 HKD (11,500,000) 14-Jan-2016 27,197HKD 29,000,000 EUR (3,424,704) 14-Jan-2016 10,987EUR 691,064 GBP (500,340) 14-Jan-2016 10,334EUR 392,071 HKD (3,227,609) 14-Jan-2016 9,689GBP 818,942 EUR (1,108,886) 14-Jan-2016 5,313EUR 1,782,269 HKD (15,000,000) 14-Jan-2016 5,187EUR 1,804,847 HKD (15,208,632) 14-Jan-2016 3,048EUR 41,751 GBP (30,181) 14-Jan-2016 689EUR 57,078 GBP (41,807) 14-Jan-2016 197EUR 61,711 GBP (45,333) 14-Jan-2016 35GBP 259,420,176 EUR (351,625,533) 15-Jan-2016 1,316,914USD 15,421,479 EUR (13,642,256) 15-Jan-2016 515,320GBP 64,701,136 EUR (87,697,773) 15-Jan-2016 328,447USD 20,000,000 EUR (18,084,000) 15-Jan-2016 276,854GBP 25,581,683 EUR (34,674,145) 15-Jan-2016 129,862SEK 95,403,763 EUR (10,258,017) 15-Jan-2016 120,528EUR 1,659,578 GBP (1,183,113) 15-Jan-2016 49,947GBP 900,572 EUR (1,221,239) 15-Jan-2016 3,994USD 3,000,000 EUR (2,750,376) 15-Jan-2016 3,752CHF 857,740 EUR (787,106) 15-Jan-2016 3,729SEK 1,844,998 EUR (197,242) 15-Jan-2016 3,467USD 299,808 EUR (272,306) 15-Jan-2016 2,931USD 55,000 EUR (48,311) 15-Jan-2016 2,181EUR 62,799 GBP (45,099) 15-Jan-2016 1,441EUR 25,339 GBP (17,783) 15-Jan-2016 1,146GBP 300,072 EUR (407,174) 15-Jan-2016 1,075EUR 28,081 GBP (19,852) 15-Jan-2016 1,072SEK 1,432,714 EUR (154,882) 15-Jan-2016 976EUR 22,347 GBP (15,727) 15-Jan-2016 950USD 57,500 EUR (51,872) 15-Jan-2016 915GBP 69,676 EUR (93,890) 15-Jan-2016 905EUR 20,919 GBP (14,768) 15-Jan-2016 827EUR 21,329 GBP (15,083) 15-Jan-2016 809GBP 121,492 EUR (164,564) 15-Jan-2016 726EUR 15,895 GBP (11,237) 15-Jan-2016 607GBP 34,239 EUR (46,037) 15-Jan-2016 545GBP 68,373 EUR (92,510) 15-Jan-2016 511EUR 11,801 GBP (8,302) 15-Jan-2016 506SEK 1,490,234 EUR (161,719) 15-Jan-2016 397AUD 187,000 EUR (125,139) 15-Jan-2016 354GBP 131,213 EUR (178,164) 15-Jan-2016 351EUR 21,599 GBP (15,638) 15-Jan-2016 323EUR 10,287 GBP (7,348) 15-Jan-2016 289EUR 7,084 GBP (4,994) 15-Jan-2016 289EUR 13,898 GBP (10,006) 15-Jan-2016 285GBP 41,666 EUR (56,426) 15-Jan-2016 260GBP 9,355 EUR (12,471) 15-Jan-2016 257

Standard Life Investments Global SICAV
Société d'Investissement à Capital Variable
Notes to the Financial Statements as at 31 December 2015 (continued)
79
6. Forward foreign exchange contracts (continued)
Global Focused Strategies Fund (continued) Purchase Sale Maturity Unrealised Appreciation/
Currency Amount Currency Amount Date (Depreciation) in EUR
EUR 5,595 GBP (3,952) 15-Jan-2016 218EUR 9,775 GBP (7,033) 15-Jan-2016 207GBP 34,468 EUR (46,695) 15-Jan-2016 199GBP 15,074 EUR (20,313) 15-Jan-2016 196EUR 3,974 GBP (2,788) 15-Jan-2016 182EUR 7,936 GBP (5,700) 15-Jan-2016 181EUR 7,621 GBP (5,473) 15-Jan-2016 175AUD 5,000 EUR (3,183) 15-Jan-2016 172USD 5,053 EUR (4,470) 15-Jan-2016 169EUR 3,542 GBP (2,486) 15-Jan-2016 160EUR 27,104 GBP (19,817) 15-Jan-2016 143EUR 11,926 GBP (8,661) 15-Jan-2016 143GBP 11,683 EUR (15,757) 15-Jan-2016 139EUR 5,367 USD (5,700) 15-Jan-2016 134GBP 38,166 EUR (51,824) 15-Jan-2016 101EUR 6,254 GBP (4,545) 15-Jan-2016 71EUR 1,601 GBP (1,126) 15-Jan-2016 70EUR 1,249 GBP (875) 15-Jan-2016 58EUR 3,356 GBP (2,426) 15-Jan-2016 56EUR 1,204 GBP (846) 15-Jan-2016 53EUR 22,104 GBP (16,208) 15-Jan-2016 53EUR 5,490 GBP (3,998) 15-Jan-2016 51EUR 3,067 GBP (2,218) 15-Jan-2016 50EUR 3,858 GBP (2,803) 15-Jan-2016 44EUR 892 GBP (625) 15-Jan-2016 41GBP 6,043 EUR (8,184) 15-Jan-2016 38GBP 1,187 EUR (1,583) 15-Jan-2016 33AUD 2,459 EUR (1,618) 15-Jan-2016 33EUR 3,423 GBP (2,492) 15-Jan-2016 32GBP 31,652 EUR (43,035) 15-Jan-2016 28EUR 663 GBP (468) 15-Jan-2016 25EUR 586 GBP (413) 15-Jan-2016 24EUR 1,811 GBP (1,316) 15-Jan-2016 21SEK 19,317 EUR (2,082) 15-Jan-2016 19CHF 11,096 EUR (10,211) 15-Jan-2016 19EUR 668 GBP (481) 15-Jan-2016 14EUR 366 GBP (259) 15-Jan-2016 13EUR 657 GBP (473) 15-Jan-2016 13GBP 14,938 EUR (20,310) 15-Jan-2016 13GBP 3,023 EUR (4,103) 15-Jan-2016 11EUR 696 GBP (504) 15-Jan-2016 10EUR 347 GBP (248) 15-Jan-2016 9EUR 232 GBP (164) 15-Jan-2016 9EUR 212 GBP (151) 15-Jan-2016 6EUR 107 GBP (75) 15-Jan-2016 5EUR 111 GBP (78) 15-Jan-2016 5EUR 129 GBP (92) 15-Jan-2016 5EUR 331 GBP (240) 15-Jan-2016 4EUR 76 GBP (54) 15-Jan-2016 3GBP 1,095 EUR (1,487) 15-Jan-2016 3EUR 36 GBP (25) 15-Jan-2016 2AUD 108 EUR (71) 15-Jan-2016 2EUR 91 GBP (66) 15-Jan-2016 2EUR 141 GBP (102) 15-Jan-2016 2EUR 19 GBP (14) 15-Jan-2016 1EUR 82 GBP (59) 15-Jan-2016 1EUR 131 GBP (96) 15-Jan-2016 1EUR 43 GBP (31) 15-Jan-2016 1EUR 430 GBP (315) 15-Jan-2016 1EUR 78 GBP (57) 15-Jan-2016 1USD 97 EUR (88) 15-Jan-2016 1EUR 27 GBP (19) 15-Jan-2016 1EUR 20 GBP (15) 15-Jan-2016 1EUR 47 GBP (34) 15-Jan-2016 1SEK 1,000 EUR (108) 15-Jan-2016 1EUR 3 GBP (2) 15-Jan-2016 –EUR 6 GBP (4) 15-Jan-2016 –EUR 9 GBP (6) 15-Jan-2016 –
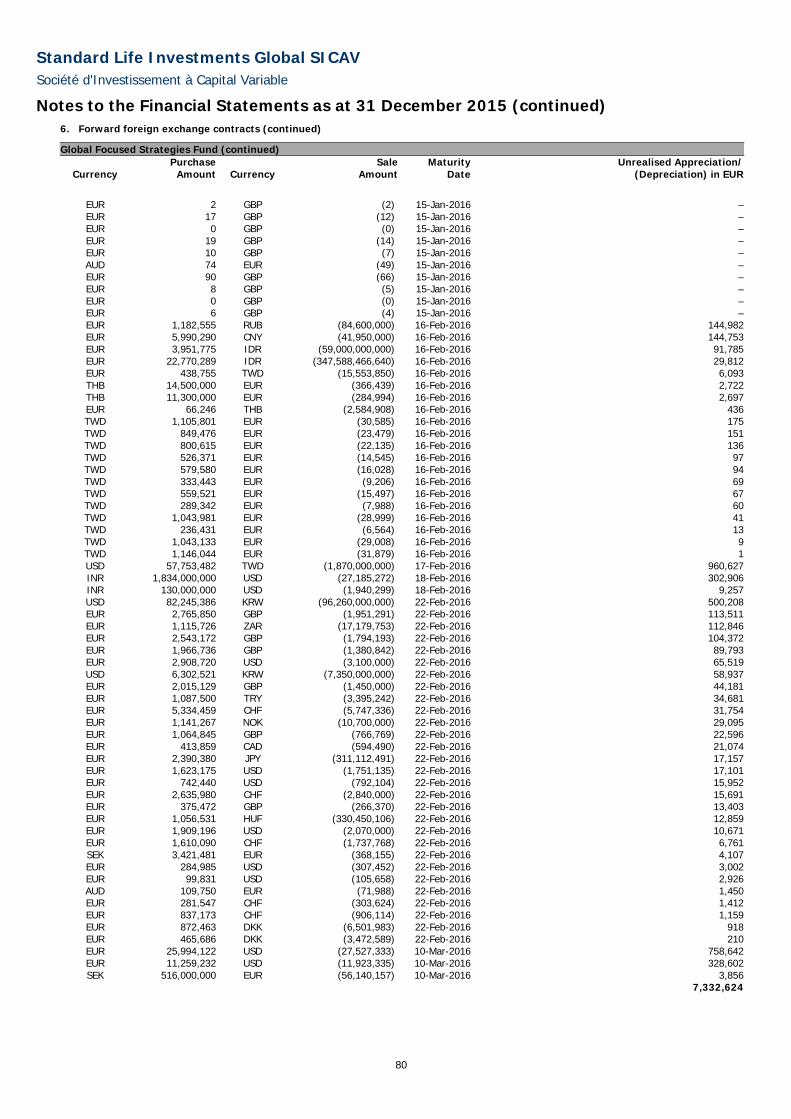
Standard Life Investments Global SICAV
Société d'Investissement à Capital Variable
Notes to the Financial Statements as at 31 December 2015 (continued)
80
6. Forward foreign exchange contracts (continued)
Global Focused Strategies Fund (continued) Purchase Sale Maturity Unrealised Appreciation/
Currency Amount Currency Amount Date (Depreciation) in EUR
EUR 2 GBP (2) 15-Jan-2016 –EUR 17 GBP (12) 15-Jan-2016 –EUR 0 GBP (0) 15-Jan-2016 –EUR 19 GBP (14) 15-Jan-2016 –EUR 10 GBP (7) 15-Jan-2016 –AUD 74 EUR (49) 15-Jan-2016 –EUR 90 GBP (66) 15-Jan-2016 –EUR 8 GBP (5) 15-Jan-2016 –EUR 0 GBP (0) 15-Jan-2016 –EUR 6 GBP (4) 15-Jan-2016 –EUR 1,182,555 RUB (84,600,000) 16-Feb-2016 144,982EUR 5,990,290 CNY (41,950,000) 16-Feb-2016 144,753EUR 3,951,775 IDR (59,000,000,000) 16-Feb-2016 91,785EUR 22,770,289 IDR (347,588,466,640) 16-Feb-2016 29,812EUR 438,755 TWD (15,553,850) 16-Feb-2016 6,093THB 14,500,000 EUR (366,439) 16-Feb-2016 2,722THB 11,300,000 EUR (284,994) 16-Feb-2016 2,697EUR 66,246 THB (2,584,908) 16-Feb-2016 436TWD 1,105,801 EUR (30,585) 16-Feb-2016 175TWD 849,476 EUR (23,479) 16-Feb-2016 151TWD 800,615 EUR (22,135) 16-Feb-2016 136TWD 526,371 EUR (14,545) 16-Feb-2016 97TWD 579,580 EUR (16,028) 16-Feb-2016 94TWD 333,443 EUR (9,206) 16-Feb-2016 69TWD 559,521 EUR (15,497) 16-Feb-2016 67TWD 289,342 EUR (7,988) 16-Feb-2016 60TWD 1,043,981 EUR (28,999) 16-Feb-2016 41TWD 236,431 EUR (6,564) 16-Feb-2016 13TWD 1,043,133 EUR (29,008) 16-Feb-2016 9TWD 1,146,044 EUR (31,879) 16-Feb-2016 1USD 57,753,482 TWD (1,870,000,000) 17-Feb-2016 960,627INR 1,834,000,000 USD (27,185,272) 18-Feb-2016 302,906INR 130,000,000 USD (1,940,299) 18-Feb-2016 9,257USD 82,245,386 KRW (96,260,000,000) 22-Feb-2016 500,208EUR 2,765,850 GBP (1,951,291) 22-Feb-2016 113,511EUR 1,115,726 ZAR (17,179,753) 22-Feb-2016 112,846EUR 2,543,172 GBP (1,794,193) 22-Feb-2016 104,372EUR 1,966,736 GBP (1,380,842) 22-Feb-2016 89,793EUR 2,908,720 USD (3,100,000) 22-Feb-2016 65,519USD 6,302,521 KRW (7,350,000,000) 22-Feb-2016 58,937EUR 2,015,129 GBP (1,450,000) 22-Feb-2016 44,181EUR 1,087,500 TRY (3,395,242) 22-Feb-2016 34,681EUR 5,334,459 CHF (5,747,336) 22-Feb-2016 31,754EUR 1,141,267 NOK (10,700,000) 22-Feb-2016 29,095EUR 1,064,845 GBP (766,769) 22-Feb-2016 22,596EUR 413,859 CAD (594,490) 22-Feb-2016 21,074EUR 2,390,380 JPY (311,112,491) 22-Feb-2016 17,157EUR 1,623,175 USD (1,751,135) 22-Feb-2016 17,101EUR 742,440 USD (792,104) 22-Feb-2016 15,952EUR 2,635,980 CHF (2,840,000) 22-Feb-2016 15,691EUR 375,472 GBP (266,370) 22-Feb-2016 13,403EUR 1,056,531 HUF (330,450,106) 22-Feb-2016 12,859EUR 1,909,196 USD (2,070,000) 22-Feb-2016 10,671EUR 1,610,090 CHF (1,737,768) 22-Feb-2016 6,761SEK 3,421,481 EUR (368,155) 22-Feb-2016 4,107EUR 284,985 USD (307,452) 22-Feb-2016 3,002EUR 99,831 USD (105,658) 22-Feb-2016 2,926AUD 109,750 EUR (71,988) 22-Feb-2016 1,450EUR 281,547 CHF (303,624) 22-Feb-2016 1,412EUR 837,173 CHF (906,114) 22-Feb-2016 1,159EUR 872,463 DKK (6,501,983) 22-Feb-2016 918EUR 465,686 DKK (3,472,589) 22-Feb-2016 210EUR 25,994,122 USD (27,527,333) 10-Mar-2016 758,642EUR 11,259,232 USD (11,923,335) 10-Mar-2016 328,602SEK 516,000,000 EUR (56,140,157) 10-Mar-2016 3,856
7,332,624

Standard Life Investments Global SICAV
Société d'Investissement à Capital Variable
Notes to the Financial Statements as at 31 December 2015 (continued)
81
6. Forward foreign exchange contracts (continued)
Global Focused Strategies Fund (continued) Purchase Sale Maturity Unrealised Appreciation/
Currency Amount Currency Amount Date (Depreciation) in EUR
IDR 66,660,715 EUR (4,436) 04-Jan-2016 (2)EUR 8,186 GBP (6,043) 04-Jan-2016 (38)EUR 56,439 GBP (41,666) 04-Jan-2016 (261)EUR 11,575 USD (12,664) 05-Jan-2016 (53)EUR 41,132 USD (45,000) 05-Jan-2016 (190)EUR 164,596 GBP (121,492) 05-Jan-2016 (731)EUR 24,033 GBP (17,670) 14-Jan-2016 (8)EUR 265,680 GBP (195,502) 14-Jan-2016 (306)EUR 1,174,643 HKD (9,969,586) 14-Jan-2016 (6,475)EUR 1,165,342 USD (1,279,739) 14-Jan-2016 (9,542)EUR 1,572,863 HKD (13,400,000) 14-Jan-2016 (14,664)HKD 15,700,000 EUR (1,903,680) 14-Jan-2016 (43,667)GBP 1,000,000 EUR (1,419,759) 14-Jan-2016 (59,225)EUR 1,521,451 HKD (13,500,000) 14-Jan-2016 (77,923)EUR 17,456,205 GBP (12,975,000) 14-Jan-2016 (196,732)EUR 27,818,703 GBP (20,677,327) 14-Jan-2016 (313,518)EUR 12,809,938 HKD (112,123,365) 14-Jan-2016 (473,556)EUR 20 GBP (15) 15-Jan-2016 –EUR 2 GBP (2) 15-Jan-2016 –GBP 150 EUR (205) 15-Jan-2016 (1)EUR 242 GBP (179) 15-Jan-2016 (1)EUR 367 GBP (270) 15-Jan-2016 (1)EUR 307 GBP (227) 15-Jan-2016 (1)EUR 154 GBP (114) 15-Jan-2016 (2)GBP 610 EUR (831) 15-Jan-2016 (2)GBP 125 EUR (171) 15-Jan-2016 (2)EUR 743 GBP (548) 15-Jan-2016 (2)CAD 102 EUR (70) 15-Jan-2016 (3)CAD 71 EUR (50) 15-Jan-2016 (3)EUR 4,030 GBP (2,964) 15-Jan-2016 (3)EUR 467 GBP (347) 15-Jan-2016 (5)EUR 307 AUD (467) 15-Jan-2016 (6)GBP 150 EUR (213) 15-Jan-2016 (9)EUR 4,385 GBP (3,229) 15-Jan-2016 (9)GBP 1,219 EUR (1,678) 15-Jan-2016 (19)CHF 5,000 EUR (4,630) 15-Jan-2016 (20)EUR 7,091 GBP (5,229) 15-Jan-2016 (23)EUR 1,121 GBP (841) 15-Jan-2016 (23)EUR 11,492 GBP (8,469) 15-Jan-2016 (30)GBP 610 EUR (862) 15-Jan-2016 (33)GBP 568 EUR (809) 15-Jan-2016 (36)EUR 6,450 GBP (4,787) 15-Jan-2016 (62)GBP 5,000 EUR (6,866) 15-Jan-2016 (64)EUR 17,131 GBP (12,650) 15-Jan-2016 (79)GBP 1,250 EUR (1,782) 15-Jan-2016 (81)EUR 4,946 USD (5,483) 15-Jan-2016 (87)GBP 3,454 EUR (4,798) 15-Jan-2016 (98)CAD 5,323 EUR (3,621) 15-Jan-2016 (101)EUR 23,269 GBP (17,179) 15-Jan-2016 (103)GBP 2,101 EUR (2,974) 15-Jan-2016 (116)CHF 16,330 EUR (15,182) 15-Jan-2016 (126)GBP 2,193 EUR (3,117) 15-Jan-2016 (134)GBP 5,026 EUR (6,978) 15-Jan-2016 (140)GBP 5,141 EUR (7,145) 15-Jan-2016 (151)GBP 4,991 EUR (6,948) 15-Jan-2016 (159)EUR 217,402 SEK (2,000,000) 15-Jan-2016 (169)GBP 4,990 EUR (6,976) 15-Jan-2016 (187)GBP 17,022 EUR (23,376) 15-Jan-2016 (217)EUR 41,733 GBP (30,844) 15-Jan-2016 (231)GBP 12,837 EUR (17,699) 15-Jan-2016 (234)GBP 20,486 EUR (28,365) 15-Jan-2016 (493)GBP 24,358 EUR (33,684) 15-Jan-2016 (544)EUR 162,623 SEK (1,500,000) 15-Jan-2016 (555)USD 54,356 EUR (50,569) 15-Jan-2016 (668)GBP 38,217 EUR (52,692) 15-Jan-2016 (697)GBP 108,763 EUR (148,756) 15-Jan-2016 (784)GBP 20,104 EUR (28,144) 15-Jan-2016 (792)GBP 64,293 EUR (88,291) 15-Jan-2016 (820)

Standard Life Investments Global SICAV
Société d'Investissement à Capital Variable
Notes to the Financial Statements as at 31 December 2015 (continued)
82
6. Forward foreign exchange contracts (continued)
Global Focused Strategies Fund (continued) Purchase Sale Maturity Unrealised Appreciation/
Currency Amount Currency Amount Date (Depreciation) in EUR
GBP 12,863 EUR (18,329) 15-Jan-2016 (829)GBP 29,684 EUR (41,230) 15-Jan-2016 (845)GBP 16,996 EUR (24,004) 15-Jan-2016 (881)GBP 268,721 EUR (366,477) 15-Jan-2016 (881)GBP 26,186 EUR (36,610) 15-Jan-2016 (983)GBP 87,913 EUR (120,669) 15-Jan-2016 (1,062)GBP 16,806 EUR (23,946) 15-Jan-2016 (1,081)GBP 19,993 EUR (28,367) 15-Jan-2016 (1,166)GBP 18,650 EUR (26,575) 15-Jan-2016 (1,202)GBP 30,782 EUR (43,388) 15-Jan-2016 (1,509)GBP 31,152 EUR (43,963) 15-Jan-2016 (1,580)GBP 27,191 EUR (38,637) 15-Jan-2016 (1,643)GBP 30,663 EUR (43,646) 15-Jan-2016 (1,929)GBP 39,867 EUR (56,391) 15-Jan-2016 (2,152)GBP 457,842 EUR (625,077) 15-Jan-2016 (2,180)GBP 140,650 EUR (193,678) 15-Jan-2016 (2,324)EUR 139,978 SEK (1,309,347) 15-Jan-2016 (2,460)GBP 79,100 EUR (110,143) 15-Jan-2016 (2,527)GBP 64,915 EUR (90,853) 15-Jan-2016 (2,536)GBP 80,726 EUR (112,395) 15-Jan-2016 (2,567)GBP 47,647 EUR (67,584) 15-Jan-2016 (2,761)GBP 75,547 EUR (105,757) 15-Jan-2016 (2,975)GBP 55,922 EUR (79,082) 15-Jan-2016 (3,000)GBP 80,969 EUR (113,577) 15-Jan-2016 (3,418)GBP 215,833 EUR (297,064) 15-Jan-2016 (3,422)GBP 167,640 EUR (231,537) 15-Jan-2016 (3,462)GBP 196,549 EUR (271,351) 15-Jan-2016 (3,944)USD 203,199 EUR (190,885) 15-Jan-2016 (4,339)GBP 73,906 EUR (105,126) 15-Jan-2016 (4,577)GBP 83,801 EUR (118,868) 15-Jan-2016 (4,856)USD 255,865 EUR (240,358) 15-Jan-2016 (5,464)GBP 374,404 EUR (515,225) 15-Jan-2016 (5,846)GBP 117,399 EUR (166,818) 15-Jan-2016 (7,095)GBP 257,835 EUR (358,082) 15-Jan-2016 (7,296)GBP 343,572 EUR (475,299) 15-Jan-2016 (7,868)GBP 118,367 EUR (168,940) 15-Jan-2016 (7,901)GBP 203,235 EUR (286,462) 15-Jan-2016 (9,960)GBP 181,854 EUR (257,591) 15-Jan-2016 (10,178)GBP 179,258 EUR (254,818) 15-Jan-2016 (10,936)GBP 339,785 EUR (474,938) 15-Jan-2016 (12,660)GBP 211,874 EUR (302,063) 15-Jan-2016 (13,807)GBP 507,944 EUR (706,634) 15-Jan-2016 (15,574)GBP 285,234 EUR (403,800) 15-Jan-2016 (15,737)GBP 454,143 EUR (641,728) 15-Jan-2016 (23,865)GBP 368,929 EUR (527,061) 15-Jan-2016 (25,131)GBP 1,286,676 EUR (1,789,979) 15-Jan-2016 (39,450)GBP 924,514 EUR (1,320,781) 15-Jan-2016 (62,976)GBP 1,783,716 EUR (2,519,199) 15-Jan-2016 (92,444)GBP 2,070,610 EUR (2,928,138) 15-Jan-2016 (111,064)GBP 1,779,800 EUR (2,535,953) 15-Jan-2016 (114,526)GBP 9,471,931 EUR (13,007,696) 15-Jan-2016 (121,086)GBP 5,038,158 EUR (7,008,909) 15-Jan-2016 (154,470)GBP 3,492,457 EUR (4,989,402) 15-Jan-2016 (237,897)TWD 732,738 EUR (20,411) 16-Feb-2016 (28)TWD 851,202 EUR (23,777) 16-Feb-2016 (99)TWD 893,810 EUR (24,974) 16-Feb-2016 (111)TWD 992,025 EUR (27,710) 16-Feb-2016 (115)TWD 903,216 EUR (25,272) 16-Feb-2016 (147)TWD 1,057,121 EUR (29,703) 16-Feb-2016 (297)TWD 1,352,287 EUR (37,932) 16-Feb-2016 (316)EUR 97,934 THB (3,903,161) 16-Feb-2016 (1,438)THB 9,500,000 EUR (243,715) 16-Feb-2016 (1,851)EUR 612,977 IDR (9,400,000,000) 16-Feb-2016 (2,005)EUR 989,748 PHP (50,991,795) 16-Feb-2016 (2,662)EUR 186,135 THB (7,423,064) 16-Feb-2016 (2,852)EUR 2,214,599 INR (161,400,000) 16-Feb-2016 (7,280)EUR 6,523,157 IDR (100,000,000,000) 16-Feb-2016 (19,199)KRW 4,845,809,940 EUR (3,872,620) 16-Feb-2016 (99,379)

Standard Life Investments Global SICAV
Société d'Investissement à Capital Variable
Notes to the Financial Statements as at 31 December 2015 (continued)
83
6. Forward foreign exchange contracts (continued)
Global Focused Strategies Fund (continued) Purchase Sale Maturity Unrealised Appreciation/
Currency Amount Currency Amount Date (Depreciation) in EUR
CNY 22,200,000 EUR (3,223,465) 16-Feb-2016 (129,998)USD 964,071 EUR (885,384) 22-Feb-2016 (1,175)EUR 256,875 SEK (2,382,033) 22-Feb-2016 (2,294)NOK 1,486,920 EUR (158,596) 22-Feb-2016 (4,043)GBP 266,370 EUR (379,391) 22-Feb-2016 (17,321)USD 695,266 EUR (656,875) 22-Feb-2016 (19,204)EUR 2,985,117 JPY (394,736,000) 22-Feb-2016 (26,002)CHF 5,154,008 EUR (4,782,659) 22-Feb-2016 (27,380)GBP 533,839 EUR (756,689) 22-Feb-2016 (31,055)EUR 2,969,787 SEK (27,600,000) 22-Feb-2016 (33,130)GBP 1,650,000 EUR (2,279,140) 22-Feb-2016 (36,337)EUR 2,593,959 AUD (3,954,635) 22-Feb-2016 (52,236)ZAR 10,000,000 EUR (636,906) 22-Feb-2016 (53,149)GBP 3,123,690 EUR (4,300,402) 22-Feb-2016 (54,452)GBP 1,380,842 EUR (1,946,421) 22-Feb-2016 (69,479)EUR 5,194,743 JPY (690,652,047) 22-Feb-2016 (73,678)EUR 31,682,755 JPY (4,189,559,544) 22-Feb-2016 (275,974)USD 31,595,867 EUR (29,801,152) 04-Mar-2016 (831,057)
(4,263,082) Net EUR 3,069,542
Absolute Return Global Bond Strategies Fund
Purchase Sale Maturity Unrealised Appreciation/Currency Amount Currency Amount Date (Depreciation) in GBP
GBP 597,861 EUR (810,000) 04-Jan-2016 2,637USD 348,866 GBP (226,390) 13-Jan-2016 9,020GBP 1,980,788 EUR (2,689,633) 13-Jan-2016 3,937GBP 126,816 EUR (169,645) 13-Jan-2016 2,129USD 29,441 GBP (19,207) 13-Jan-2016 659USD 39,007,551 KRW (45,200,000,000) 14-Jan-2016 361,818USD 4,094,903 KRW (4,660,000,000) 14-Jan-2016 86,783INR 331,000,000 USD (4,975,199) 14-Jan-2016 11,532AUD 16,312,809 GBP (7,684,572) 15-Jan-2016 361,913EUR 10,923,261 GBP (7,724,505) 15-Jan-2016 304,325SEK 423,227,593 GBP (33,591,624) 15-Jan-2016 249,506SEK 5,000,000 GBP (378,219) 15-Jan-2016 21,579USD 859,022 GBP (560,382) 15-Jan-2016 19,270USD 717,132 GBP (467,820) 15-Jan-2016 16,087EUR 570,000 GBP (402,975) 15-Jan-2016 15,988SEK 7,000,000 GBP (543,921) 15-Jan-2016 15,796AUD 750,000 GBP (355,060) 15-Jan-2016 14,886EUR 540,000 GBP (383,147) 15-Jan-2016 13,764SEK 2,400,000 GBP (181,903) 15-Jan-2016 10,001EUR 320,000 GBP (225,213) 15-Jan-2016 9,993EUR 1,050,000 GBP (762,546) 15-Jan-2016 9,227EUR 530,000 GBP (380,641) 15-Jan-2016 8,920EUR 590,000 GBP (424,786) 15-Jan-2016 8,876AUD 350,000 GBP (164,100) 15-Jan-2016 8,542AUD 250,000 GBP (115,009) 15-Jan-2016 8,306EUR 250,000 GBP (175,456) 15-Jan-2016 8,300EUR 240,000 GBP (168,155) 15-Jan-2016 8,251EUR 290,000 GBP (205,077) 15-Jan-2016 8,079EUR 220,000 GBP (154,671) 15-Jan-2016 7,033EUR 210,000 GBP (147,389) 15-Jan-2016 6,966SEK 2,000,000 GBP (153,424) 15-Jan-2016 6,495AUD 229,439 GBP (106,746) 15-Jan-2016 6,428EUR 300,000 GBP (214,367) 15-Jan-2016 6,140AUD 218,095 GBP (101,821) 15-Jan-2016 5,757EUR 190,000 GBP (133,957) 15-Jan-2016 5,697AUD 182,599 GBP (84,373) 15-Jan-2016 5,696GBP 1,135,141 EUR (1,537,567) 15-Jan-2016 4,997EUR 220,000 GBP (156,838) 15-Jan-2016 4,867AUD 162,931 GBP (75,539) 15-Jan-2016 4,828AUD 171,817 GBP (80,605) 15-Jan-2016 4,146EUR 150,000 GBP (106,158) 15-Jan-2016 4,095EUR 130,000 GBP (91,627) 15-Jan-2016 3,926
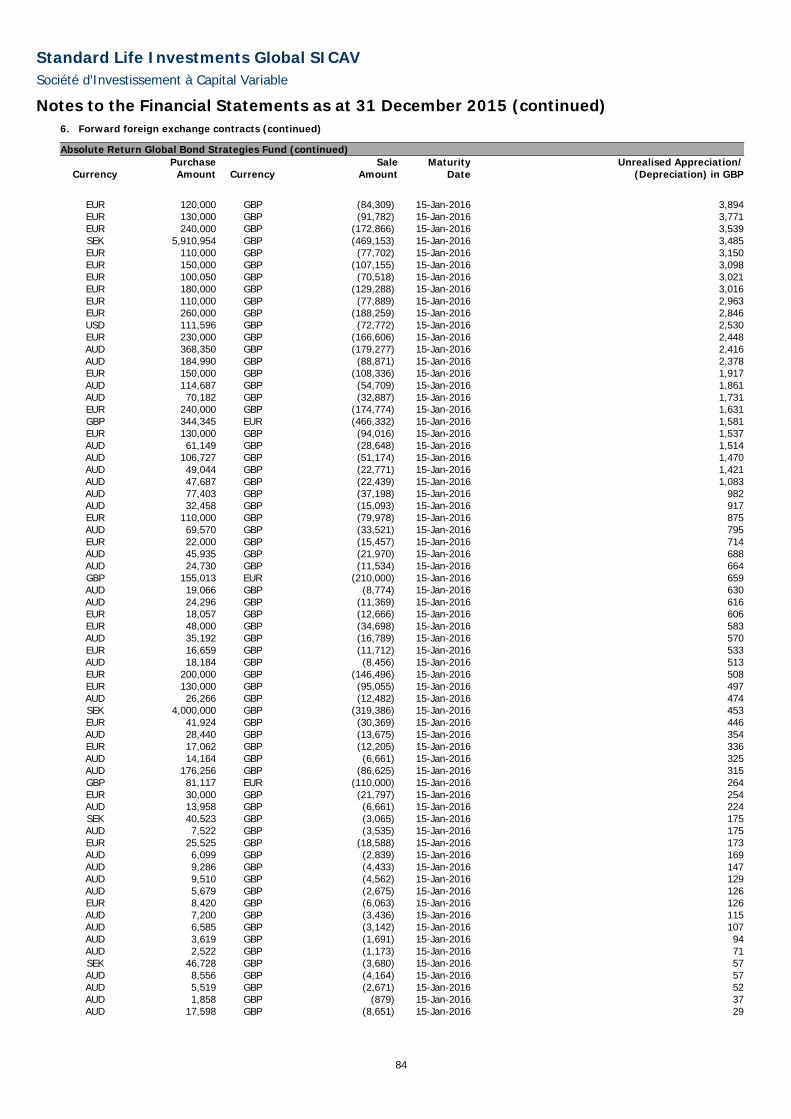
Standard Life Investments Global SICAV
Société d'Investissement à Capital Variable
Notes to the Financial Statements as at 31 December 2015 (continued)
84
6. Forward foreign exchange contracts (continued)
Absolute Return Global Bond Strategies Fund (continued) Purchase Sale Maturity Unrealised Appreciation/
Currency Amount Currency Amount Date (Depreciation) in GBP
EUR 120,000 GBP (84,309) 15-Jan-2016 3,894EUR 130,000 GBP (91,782) 15-Jan-2016 3,771EUR 240,000 GBP (172,866) 15-Jan-2016 3,539SEK 5,910,954 GBP (469,153) 15-Jan-2016 3,485EUR 110,000 GBP (77,702) 15-Jan-2016 3,150EUR 150,000 GBP (107,155) 15-Jan-2016 3,098EUR 100,050 GBP (70,518) 15-Jan-2016 3,021EUR 180,000 GBP (129,288) 15-Jan-2016 3,016EUR 110,000 GBP (77,889) 15-Jan-2016 2,963EUR 260,000 GBP (188,259) 15-Jan-2016 2,846USD 111,596 GBP (72,772) 15-Jan-2016 2,530EUR 230,000 GBP (166,606) 15-Jan-2016 2,448AUD 368,350 GBP (179,277) 15-Jan-2016 2,416AUD 184,990 GBP (88,871) 15-Jan-2016 2,378EUR 150,000 GBP (108,336) 15-Jan-2016 1,917AUD 114,687 GBP (54,709) 15-Jan-2016 1,861AUD 70,182 GBP (32,887) 15-Jan-2016 1,731EUR 240,000 GBP (174,774) 15-Jan-2016 1,631GBP 344,345 EUR (466,332) 15-Jan-2016 1,581EUR 130,000 GBP (94,016) 15-Jan-2016 1,537AUD 61,149 GBP (28,648) 15-Jan-2016 1,514AUD 106,727 GBP (51,174) 15-Jan-2016 1,470AUD 49,044 GBP (22,771) 15-Jan-2016 1,421AUD 47,687 GBP (22,439) 15-Jan-2016 1,083AUD 77,403 GBP (37,198) 15-Jan-2016 982AUD 32,458 GBP (15,093) 15-Jan-2016 917EUR 110,000 GBP (79,978) 15-Jan-2016 875AUD 69,570 GBP (33,521) 15-Jan-2016 795EUR 22,000 GBP (15,457) 15-Jan-2016 714AUD 45,935 GBP (21,970) 15-Jan-2016 688AUD 24,730 GBP (11,534) 15-Jan-2016 664GBP 155,013 EUR (210,000) 15-Jan-2016 659AUD 19,066 GBP (8,774) 15-Jan-2016 630AUD 24,296 GBP (11,369) 15-Jan-2016 616EUR 18,057 GBP (12,666) 15-Jan-2016 606EUR 48,000 GBP (34,698) 15-Jan-2016 583AUD 35,192 GBP (16,789) 15-Jan-2016 570EUR 16,659 GBP (11,712) 15-Jan-2016 533AUD 18,184 GBP (8,456) 15-Jan-2016 513EUR 200,000 GBP (146,496) 15-Jan-2016 508EUR 130,000 GBP (95,055) 15-Jan-2016 497AUD 26,266 GBP (12,482) 15-Jan-2016 474SEK 4,000,000 GBP (319,386) 15-Jan-2016 453EUR 41,924 GBP (30,369) 15-Jan-2016 446AUD 28,440 GBP (13,675) 15-Jan-2016 354EUR 17,062 GBP (12,205) 15-Jan-2016 336AUD 14,164 GBP (6,661) 15-Jan-2016 325AUD 176,256 GBP (86,625) 15-Jan-2016 315GBP 81,117 EUR (110,000) 15-Jan-2016 264EUR 30,000 GBP (21,797) 15-Jan-2016 254AUD 13,958 GBP (6,661) 15-Jan-2016 224SEK 40,523 GBP (3,065) 15-Jan-2016 175AUD 7,522 GBP (3,535) 15-Jan-2016 175EUR 25,525 GBP (18,588) 15-Jan-2016 173AUD 6,099 GBP (2,839) 15-Jan-2016 169AUD 9,286 GBP (4,433) 15-Jan-2016 147AUD 9,510 GBP (4,562) 15-Jan-2016 129AUD 5,679 GBP (2,675) 15-Jan-2016 126EUR 8,420 GBP (6,063) 15-Jan-2016 126AUD 7,200 GBP (3,436) 15-Jan-2016 115AUD 6,585 GBP (3,142) 15-Jan-2016 107AUD 3,619 GBP (1,691) 15-Jan-2016 94AUD 2,522 GBP (1,173) 15-Jan-2016 71SEK 46,728 GBP (3,680) 15-Jan-2016 57AUD 8,556 GBP (4,164) 15-Jan-2016 57AUD 5,519 GBP (2,671) 15-Jan-2016 52AUD 1,858 GBP (879) 15-Jan-2016 37AUD 17,598 GBP (8,651) 15-Jan-2016 29

Standard Life Investments Global SICAV
Société d'Investissement à Capital Variable
Notes to the Financial Statements as at 31 December 2015 (continued)
85
6. Forward foreign exchange contracts (continued)
Absolute Return Global Bond Strategies Fund (continued) Purchase Sale Maturity Unrealised Appreciation/
Currency Amount Currency Amount Date (Depreciation) in GBP
EUR 8,724 GBP (6,390) 15-Jan-2016 22EUR 3,000 GBP (2,185) 15-Jan-2016 20CHF 5,000 GBP (3,372) 15-Jan-2016 16CHF 5,000 GBP (3,372) 15-Jan-2016 16AUD 1,372 GBP (662) 15-Jan-2016 15USD 2,950 GBP (1,980) 15-Jan-2016 11SEK 2,204 GBP (168) 15-Jan-2016 9AUD 500 GBP (239) 15-Jan-2016 8SEK 2,136 GBP (164) 15-Jan-2016 7CAD 1,339 GBP (646) 15-Jan-2016 5GBP 131 CAD (265) 15-Jan-2016 2GBP 53 CAD (106) 15-Jan-2016 2AUD 36 GBP (17) 15-Jan-2016 1EUR 50 GBP (36) 15-Jan-2016 1GBP 16 CAD (31) 15-Jan-2016 –GBP 24 CAD (49) 15-Jan-2016 –GBP 17,050,597 MXN (435,000,000) 10-Feb-2016 184,214GBP 16,768,909 MXN (427,850,000) 10-Feb-2016 179,755GBP 16,655,912 MXN (425,000,000) 10-Feb-2016 177,261GBP 14,869,352 MXN (379,000,000) 10-Feb-2016 174,273EUR 4,940,000 GBP (3,561,429) 10-Feb-2016 71,768USD 4,670,000 GBP (3,100,347) 10-Feb-2016 50,727EUR 4,090,000 GBP (2,983,888) 10-Feb-2016 24,164USD 52,702,895 SGD (73,900,000) 12-Feb-2016 399,221USD 5,742,607 SGD (8,070,000) 12-Feb-2016 35,071USD 24,367,646 TWD (789,000,000) 17-Feb-2016 298,146USD 30,409,001 TWD (1,000,000,000) 17-Feb-2016 57,229USD 5,012,300 TWD (163,000,000) 17-Feb-2016 46,866JPY 9,004,076,800 CHF (73,600,000) 18-Mar-2016 562,934
4,013,894
GBP 8,656 AUD (17,598) 04-Jan-2016 (30)EUR 466,332 GBP (344,268) 04-Jan-2016 (1,586)GBP 91,076 USD (135,188) 05-Jan-2016 (149)EUR 207,078 GBP (152,639) 13-Jan-2016 (439)GBP 346,683 EUR (475,351) 13-Jan-2016 (2,694)GBP 288,430 EUR (399,408) 13-Jan-2016 (5,130)GBP 134,367 USD (206,809) 13-Jan-2016 (5,185)GBP 141,412 USD (217,942) 13-Jan-2016 (5,652)GBP 146,004 EUR (206,361) 13-Jan-2016 (5,669)GBP 192,582 USD (293,860) 13-Jan-2016 (5,710)GBP 215,121 EUR (303,304) 13-Jan-2016 (7,804)GBP 3,064,456 USD (4,683,543) 13-Jan-2016 (95,927)GBP 370,746 USD (561,742) 14-Jan-2016 (8,308)GBP 633,500 USD (956,503) 14-Jan-2016 (11,932)GBP 931,407 USD (1,418,674) 14-Jan-2016 (25,890)USD 24,477,536 KRW (28,930,000,000) 14-Jan-2016 (98,404)INR 2,550,000,000 USD (38,727,314) 14-Jan-2016 (180,225)KRW 28,930,000,000 USD (24,966,559) 14-Jan-2016 (231,580)GBP 16,227,889 USD (25,003,064) 14-Jan-2016 (643,748)GBP 77,400,655 USD (117,211,798) 14-Jan-2016 (1,691,851)CAD 229 GBP (113) 15-Jan-2016 (1)GBP 29 AUD (62) 15-Jan-2016 (1)GBP 164 CAD (340) 15-Jan-2016 (2)EUR 634 GBP (472) 15-Jan-2016 (5)GBP 239 EUR (338) 15-Jan-2016 (9)GBP 2,036 EUR (2,802) 15-Jan-2016 (24)GBP 1,082 SEK (13,862) 15-Jan-2016 (27)GBP 2,241 SEK (28,426) 15-Jan-2016 (32)GBP 2,336 SEK (29,663) 15-Jan-2016 (36)GBP 879 EUR (1,249) 15-Jan-2016 (39)GBP 1,864 SEK (23,935) 15-Jan-2016 (50)GBP 1,685 AUD (3,576) 15-Jan-2016 (79)CAD 9,261 GBP (4,598) 15-Jan-2016 (97)GBP 2,185 SEK (28,932) 15-Jan-2016 (129)GBP 2,083 AUD (4,492) 15-Jan-2016 (133)GBP 4,404 AUD (9,215) 15-Jan-2016 (142)

Standard Life Investments Global SICAV
Société d'Investissement à Capital Variable
Notes to the Financial Statements as at 31 December 2015 (continued)
86
6. Forward foreign exchange contracts (continued)
Absolute Return Global Bond Strategies Fund (continued) Purchase Sale Maturity Unrealised Appreciation/
Currency Amount Currency Amount Date (Depreciation) in GBP
CAD 11,608 GBP (5,788) 15-Jan-2016 (146)EUR 340,000 GBP (250,074) 15-Jan-2016 (167)EUR 150,000 GBP (110,550) 15-Jan-2016 (297)GBP 17,209 USD (26,017) 15-Jan-2016 (347)GBP 12,725 EUR (18,091) 15-Jan-2016 (572)GBP 21,474 AUD (44,993) 15-Jan-2016 (719)GBP 13,527 AUD (28,996) 15-Jan-2016 (776)GBP 20,756 EUR (29,542) 15-Jan-2016 (959)GBP 87,186 EUR (120,000) 15-Jan-2016 (1,016)EUR 258,624 GBP (191,766) 15-Jan-2016 (1,672)GBP 34,105 AUD (72,989) 15-Jan-2016 (1,898)GBP 218,565 EUR (300,000) 15-Jan-2016 (1,941)GBP 48,419 USD (74,674) 15-Jan-2016 (1,969)GBP 174,403 EUR (240,000) 15-Jan-2016 (2,002)EUR 1,530,000 GBP (1,126,850) 15-Jan-2016 (2,267)EUR 150,000 GBP (112,523) 15-Jan-2016 (2,269)EUR 810,000 GBP (598,026) 15-Jan-2016 (2,659)EUR 440,000 GBP (326,253) 15-Jan-2016 (2,844)EUR 460,000 GBP (342,118) 15-Jan-2016 (4,008)EUR 1,492,913 GBP (1,101,432) 15-Jan-2016 (4,110)GBP 187,575 USD (287,663) 15-Jan-2016 (6,534)EUR 2,850,000 GBP (2,106,384) 15-Jan-2016 (11,573)GBP 522,603 SEK (6,693,267) 15-Jan-2016 (12,588)CAD 1,046,926 GBP (525,852) 15-Jan-2016 (16,994)GBP 1,733,331 USD (2,626,801) 15-Jan-2016 (39,184)GBP 2,100,101 USD (3,181,967) 15-Jan-2016 (47,030)GBP 3,300,699 USD (4,997,200) 15-Jan-2016 (71,316)GBP 1,432,207 AUD (3,103,100) 15-Jan-2016 (98,434)EUR 66,254,965 GBP (48,881,190) 15-Jan-2016 (182,382)EUR 150,403,154 GBP (110,963,537) 15-Jan-2016 (414,020)GBP 2,677,524 EUR (3,700,000) 10-Feb-2016 (43,697)GBP 2,709,976 USD (4,090,000) 10-Feb-2016 (49,745)GBP 1,399,564 JPY (260,000,000) 10-Feb-2016 (59,203)GBP 2,165,632 AUD (4,670,000) 10-Feb-2016 (134,736)GBP 4,859,195 EUR (6,850,000) 10-Feb-2016 (178,741)GBP 6,256,293 USD (9,650,000) 10-Feb-2016 (255,028)GBP 19,296,380 EUR (27,003,693) 10-Feb-2016 (563,891)GBP 21,588,662 USD (33,274,907) 10-Feb-2016 (863,524)USD 59,697,434 EUR (55,100,000) 03-Mar-2016 (266,534)USD 59,466,530 AUD (81,600,000) 11-Mar-2016 (9,780)
(6,386,291) Net GBP (2,372,397)
The following entities were counterparties to the above forward foreign exchange contracts at 31 December 2015: Barclays Bank plc, BNP Paribas, Bank of New York Mellon, Citigroup Global Markets Limited, Credit Agricole, Deutsche Bank AG, Goldman Sachs International Bank, HSBC Bank plc, JP Morgan Securities plc, Merrill Lynch International, Morgan Stanley & Co. International plc, State Street Bank and Trust Company, Royal Bank of Scotland plc, Royal Bank of Canada, Societe Generale and UBS AG.
7. Swap Contracts
As at 31 December 2015, the Company had the following swap contracts: Enhanced Diversification Global Emerging Markets Equities Fund Unrealised Appreciation/Termination Notional (Depreciation)Date Contract Currency Amount in USD Amount
22-Aug-2016 Pays performance on equity index, receives USD-LIBOR + 0.150% USD 434,107 70,361
05-Feb-2019 Pays floating France CPI ex-tobacco Index, receives fixed 0.759% EUR 3,040,000 25,636
19-Jun-2019 Pays floating AUD-BBR, receives fixed 2.800% AUD 2,750,000 10,67319-Jun-2019 Pays floating AUD-BBR, receives fixed 2.800% AUD 8,250,000 32,02007-Dec-2019 Pays floating AUD-BBR, receives fixed 2.650% AUD 2,730,000 1,416
11-Mar-2020 Pays floating U.S. Consumer Price Index, receives fixed 1.755% USD 360,000 6,500
18-Sep-2020 Pays floating USD-LIBOR, receives fixed 1.633% USD 611,000 16512-Nov-2020 Pays floating USD-LIBOR, receives fixed 1.713% USD 296,000 10220-Dec-2020 CDS (sell) - CDX North America Series 25 5Y USD (357,000) 3,823

Standard Life Investments Global SICAV
Société d'Investissement à Capital Variable
Notes to the Financial Statements as at 31 December 2015 (continued)
87
7. Swap Contracts (continued)
Enhanced Diversification Global Emerging Markets Equities Fund (continued) Unrealised Appreciation/Termination Notional (Depreciation)Date Contract Currency Amount in USD Amount 20-Dec-2020 CDS (sell) - CDX North America Series 25 5Y USD (615,000) 6,58517-Aug-2021 Pays floating EUR-EURIBOR, receives fixed 0.881% EUR 3,390,000 12,03717-Aug-2048 Pays fixed 1.720%, receives floating EUR-EURIBOR EUR 413,000 6,600 175,918
05-Feb-2017 Pays fixed 0.280%, receives France CPI ex-tobacco Index EUR 3,040,000 (4,714)
03-Dec-2024 Pays fixed 2.570%, receives floating GBP-LIBOR GBP 1,550,000 (20,609)
11-Mar-2045 Pays fixed 2.183%, receives U.S. Consumer Price Index USD 360,000 (17,354)
(42,677) Net USD 133,241
Global Bond Fund Unrealised Appreciation/Termination Notional (Depreciation)Date Contract Currency Amount in USD Amount 14-Oct-2016 Pays floating GBP-LIBOR, receives fixed 1.248% GBP 51,617,812 346,476
02-Mar-2020 Pays floating U.S. Consumer Price Index, receives fixed 1.743% USD 3,580,000 69,935
416,411
14-Oct-2017 Pays fixed 1.753%, receives floating GBP-LIBOR GBP 52,210,000 (373,509)31-Jan-2019 Pays fixed 1.084%, receives floating EUR-EURIBOR EUR 9,700,000 (434,422)
02-Mar-2045 Pays fixed 2.213%, receives U.S. Consumer Price Index USD 3,580,000 (209,695)
(1,017,626) Net USD (601,215)
Global Inflation-Linked Bond Fund Unrealised Appreciation/Termination Notional (Depreciation)Date Contract Currency Amount in USD Amount
14-Oct-2020 Pays floating U.S. Consumer Price Index, receives fixed 1.505% USD 1,480,000 1,513
10-Oct-2021 Pays fixed 1.730%, receives floating GBP-LIBOR GBP 5,340,000 39,17913-Oct-2021 Pays floating EUR-EURIBOR, receives fixed 0.584% EUR 6,390,000 22,51214-Jul-2025 Pays floating USD-LIBOR, receives fixed 3.157% USD 4,200,000 83,52118-Sep-2025 Pays fixed 2.355%, receives floating GBP-LIBOR GBP 4,310,000 26,89922-Sep-2025 Pays floating USD-LIBOR, receives fixed 2.903% USD 3,390,000 26,57722-Sep-2025 Pays floating EUR-EURIBOR, receives fixed 1.659% EUR 2,715,000 5,80807-Aug-2029 Pays floating EUR-EURIBOR, receives fixed 1.773% EUR 2,300,000 3,115
14-Oct-2045 Pays fixed 1.998%, receives U.S. Consumer Price Index USD 1,480,000 8,955
07-Aug-2049 Pays fixed 1.810%, receives floating EUR-EURIBOR EUR 920,000 5,402 223,481
10-Oct-2018 Pays floating GBP-LIBOR, receives fixed 1.313% GBP 13,100,000 (56,097)13-Oct-2018 Pays fixed 0.180%, receives floating EUR-EURIBOR EUR 14,050,000 (33,845)14-Jul-2035 Pays fixed 3.285%, receives floating USD-LIBOR USD 2,600,000 (41,128) (131,070) Net USD 92,411
European High Yield Bond Fund Unrealised Appreciation/Termination Notional (Depreciation)Date Contract Currency Amount in EUR Amount 20-Dec-2020 CDS (buy) - iTraxx Europe Crossover Series 24 5Y EUR 1,000,000 (81,868) (81,868) Net EUR (81,868)
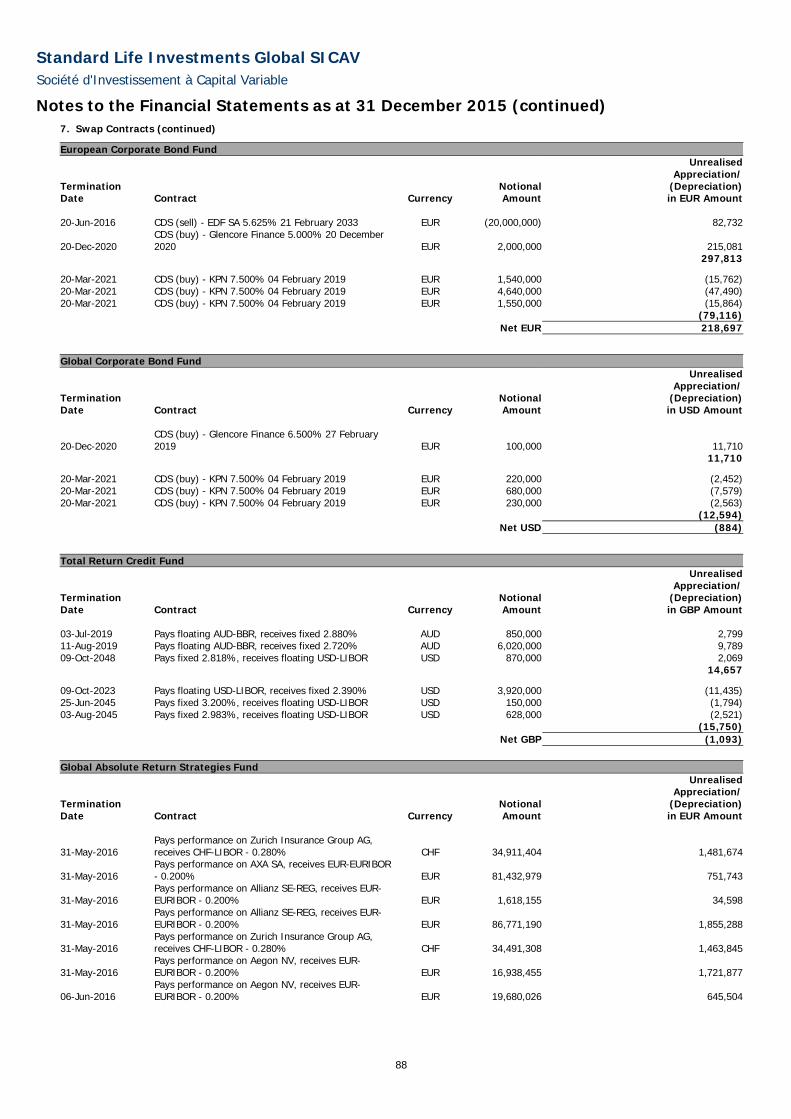
Standard Life Investments Global SICAV
Société d'Investissement à Capital Variable
Notes to the Financial Statements as at 31 December 2015 (continued)
88
7. Swap Contracts (continued)
European Corporate Bond Fund Unrealised Appreciation/Termination Notional (Depreciation)Date Contract Currency Amount in EUR Amount 20-Jun-2016 CDS (sell) - EDF SA 5.625% 21 February 2033 EUR (20,000,000) 82,732
20-Dec-2020 CDS (buy) - Glencore Finance 5.000% 20 December 2020 EUR 2,000,000 215,081
297,813
20-Mar-2021 CDS (buy) - KPN 7.500% 04 February 2019 EUR 1,540,000 (15,762)20-Mar-2021 CDS (buy) - KPN 7.500% 04 February 2019 EUR 4,640,000 (47,490)20-Mar-2021 CDS (buy) - KPN 7.500% 04 February 2019 EUR 1,550,000 (15,864) (79,116) Net EUR 218,697
Global Corporate Bond Fund Unrealised Appreciation/Termination Notional (Depreciation)Date Contract Currency Amount in USD Amount
20-Dec-2020 CDS (buy) - Glencore Finance 6.500% 27 February 2019 EUR 100,000 11,710
11,710
20-Mar-2021 CDS (buy) - KPN 7.500% 04 February 2019 EUR 220,000 (2,452)20-Mar-2021 CDS (buy) - KPN 7.500% 04 February 2019 EUR 680,000 (7,579)20-Mar-2021 CDS (buy) - KPN 7.500% 04 February 2019 EUR 230,000 (2,563) (12,594) Net USD (884)
Total Return Credit Fund Unrealised Appreciation/Termination Notional (Depreciation)Date Contract Currency Amount in GBP Amount 03-Jul-2019 Pays floating AUD-BBR, receives fixed 2.880% AUD 850,000 2,79911-Aug-2019 Pays floating AUD-BBR, receives fixed 2.720% AUD 6,020,000 9,78909-Oct-2048 Pays fixed 2.818%, receives floating USD-LIBOR USD 870,000 2,069 14,657
09-Oct-2023 Pays floating USD-LIBOR, receives fixed 2.390% USD 3,920,000 (11,435)25-Jun-2045 Pays fixed 3.200%, receives floating USD-LIBOR USD 150,000 (1,794)03-Aug-2045 Pays fixed 2.983%, receives floating USD-LIBOR USD 628,000 (2,521) (15,750) Net GBP (1,093)
g Global Absolute Return Strategies Fund Unrealised Appreciation/Termination Notional (Depreciation)Date Contract Currency Amount in EUR Amount
31-May-2016 Pays performance on Zurich Insurance Group AG, receives CHF-LIBOR - 0.280% CHF 34,911,404 1,481,674
31-May-2016 Pays performance on AXA SA, receives EUR-EURIBOR - 0.200% EUR 81,432,979 751,743
31-May-2016 Pays performance on Allianz SE-REG, receives EUR-EURIBOR - 0.200% EUR 1,618,155 34,598
31-May-2016 Pays performance on Allianz SE-REG, receives EUR-EURIBOR - 0.200% EUR 86,771,190 1,855,288
31-May-2016 Pays performance on Zurich Insurance Group AG, receives CHF-LIBOR - 0.280% CHF 34,491,308 1,463,845
31-May-2016 Pays performance on Aegon NV, receives EUR-EURIBOR - 0.200% EUR 16,938,455 1,721,877
06-Jun-2016 Pays performance on Aegon NV, receives EUR-EURIBOR - 0.200% EUR 19,680,026 645,504

Standard Life Investments Global SICAV
Société d'Investissement à Capital Variable
Notes to the Financial Statements as at 31 December 2015 (continued)
89
7. Swap Contracts (continued)
Global Absolute Return Strategies Fund (continued) Unrealised Appreciation/Termination Notional (Depreciation)Date Contract Currency Amount in EUR Amount
06-Jun-2016 Pays performance on Assicurazoni Generali, receives EUR-EURIBOR - 0.200% EUR 55,172,724 910,218
06-Jun-2016 Pays performance on Muenchener Rueckver AG-Reg, receives EUR-EURIBOR - 0.200% EUR 26,204,958 145,268
06-Jun-2016 Pays performance on Muenchener Rueckver AG-Reg, receives EUR-EURIBOR - 0.200% EUR 61,192,098 339,221
06-Jun-2016 Pays performance on Assicurazoni Generali, receives EUR-EURIBOR - 0.200% EUR 22,519,458 371,517
20-Jun-2016 CDS (sell) - EDF SA EDF 5.625% 21 February 2033 EUR (700,000) 2,896
28-Jul-2016 Pays performance on Hang Seng Index Total Return, receives HKD-HIBOR + 0.790% HKD 578,999,310 2,332,107
06-Oct-2016 Pays performance on Aegon NV, receives EUR-EURIBOR - 0.200% EUR 12,214,516 400,636
06-Oct-2016 Pays performance on Aegon NV, receives EUR-EURIBOR - 0.200% EUR 4,639,745 152,183
06-Oct-2016 Pays performance on Assicurazoni Generali, receives EUR-EURIBOR - 0.200% EUR 9,997,498 164,935
06-Oct-2016 Pays performance on Assicurazoni Generali, receives EUR-EURIBOR - 0.200% EUR 3,469,439 57,237
06-Oct-2016 Pays performance on Muenchener Rueckver AG-Reg, receives EUR-EURIBOR - 0.200% EUR 10,035,981 55,635
16-Dec-2016 Pays floating S&P 500 , receives fixed USD 256,000 442,69716-Dec-2016 Pays floating S&P 500 , receives fixed USD 500,000 195,73616-Dec-2016 Pays floating S&P 500, receives fixed USD 325,000 1,271,91616-Dec-2016 Pays floating S&P 500, receives fixed USD 150,000 595,51416-Dec-2016 Pays floating FTSE 100, receives fixed GBP 26,000 48,59316-Dec-2016 Pays floating S&P 500, receives fixed USD 73,000 120,73216-Dec-2016 Pays floating S&P 500 , receives fixed USD 250,000 535,16416-Dec-2016 Pays floating FTSE 100 , receives fixed GBP 141,000 1416-Dec-2016 Pays floating S&P 500 , receives fixed USD 163,000 264,41016-Dec-2016 Pays floating FTSE 100 , receives fixed GBP 200,000 17,65816-Dec-2016 Pays floating S&P 500 , receives fixed USD 295,700 509,55916-Dec-2016 Pays floating S&P 500 , receives fixed USD 200,000 349,78316-Dec-2016 Pays floating S&P 500, receives fixed USD 65,000 106,78416-Dec-2016 Pays floating FTSE 100, receives fixed GBP 45,000 20,96616-Dec-2016 Pays floating S&P 500 , receives fixed USD 250,000 263,28916-Dec-2016 Pays floating S&P 500 , receives fixed USD 300,000 414,89916-Dec-2016 Pays floating S&P 500 , receives fixed USD 200,000 300,38616-Dec-2016 Pays floating FTSE 100, receives fixed GBP 52,000 19,05616-Dec-2016 Pays floating S&P 500, receives fixed USD 85,000 141,53316-Dec-2016 Pays floating S&P 500, receives fixed USD 145,000 359,67016-Dec-2016 Pays floating S&P 500, receives fixed USD 140,350 261,65516-Dec-2016 Pays floating FTSE 100, receives fixed GBP 100,000 23,68516-Dec-2016 Pays floating S&P 500, receives fixed USD 137,000 385,79616-Dec-2016 Pays floating S&P 500, receives fixed USD 300,000 407,46216-Dec-2016 Pays floating S&P 500, receives fixed USD 192,000 521,72816-Dec-2016 Pays floating FTSE 100, receives fixed GBP 80,000 55,02516-Dec-2016 Pays floating S&P 500, receives fixed USD 307,000 775,28916-Dec-2016 Pays floating FTSE 100, receives fixed GBP 126,000 205,96516-Dec-2016 Pays floating FTSE 100, receives fixed GBP 43,000 33,52916-Dec-2016 Pays floating FTSE 100, receives fixed GBP 60,000 75,29516-Dec-2016 Pays floating FTSE 100, receives fixed GBP 75,000 97,298
29-Dec-2016 Pays fixed, receives floating China Ent. Index (Hang Seng) HKD 600,000 18,679
29-Dec-2016 Pays fixed, receives floating China Ent. Index (Hang Seng) HKD 1,250,000 80,575
29-Dec-2016 Pays fixed, receives floating China Ent. Index (Hang Seng) HKD 1,715,000 220,985
29-Dec-2016 Pays fixed, receives floating China Ent. Index (Hang Seng) HKD 2,175,000 291,324
29-Dec-2016 Pays fixed, receives floating China Ent. Index (Hang Seng) HKD 500,000 19,431
29-Dec-2016 Pays fixed, receives floating China Ent. Index (Hang Seng) HKD 655,000 28,485
29-Dec-2016 Pays fixed, receives floating China Ent. Index (Hang Seng) HKD 2,325,000 609,819

Standard Life Investments Global SICAV
Société d'Investissement à Capital Variable
Notes to the Financial Statements as at 31 December 2015 (continued)
90
7. Swap Contracts (continued)
Global Absolute Return Strategies Fund (continued) Unrealised Appreciation/Termination Notional (Depreciation)Date Contract Currency Amount in EUR Amount
29-Dec-2016 Pays fixed, receives floating China Ent. Index (Hang Seng) HKD 750,000 166,947
29-Dec-2016 Pays fixed, receives floating China Ent. Index (Hang Seng) HKD 1,000,000 60,355
29-Dec-2016 Pays fixed, receives floating China Ent. Index (Hang Seng) HKD 990,000 1,232
29-Dec-2016 Pays fixed, receives floating China Ent. Index (Hang Seng) HKD 700,000 6,487
29-Dec-2016 Pays fixed, receives floating China Ent. Index (Hang Seng) HKD 1,621,250 388,448
29-Dec-2016 Pays fixed, receives floating China Ent. Index (Hang Seng) HKD 2,076,400 393,846
29-Dec-2016 Pays fixed, receives floating China Ent. Index (Hang Seng) HKD 1,400,000 287,065
15-Dec-2017 Pays fixed, receives Euro Stoxx 50 EUR 490,000 423,00515-Dec-2017 Pays floating S&P 500 , receives fixed USD 540,000 662,290
28-Dec-2017 Pays fixed, receives floating China Ent. Index (Hang Seng) HKD 3,500,000 1,364,216
28-Dec-2017 Pays fixed, receives floating China Ent. Index (Hang Seng) HKD 3,000,000 1,226,905
19-Mar-2018 Pays fixed 1.083%, receives floating GBP-LIBOR GBP 25,000,000 26,09621-Mar-2018 Pays floating AUD-BBR, receives fixed 4.040% AUD 55,500,000 1,195,92824-Mar-2018 Pays floating AUD-BBR, receives fixed 4.010% AUD 55,500,000 1,177,21824-Mar-2018 Pays floating AUD-BBR, receives fixed 4.018% AUD 27,750,000 591,31629-Mar-2018 Pays floating AUD-BBR, receives fixed 4.008% AUD 55,500,000 1,172,78929-Mar-2018 Pays floating AUD-BBR, receives fixed 4.043% AUD 55,500,000 1,197,98204-Apr-2018 Pays floating AUD-BBR, receives fixed 4.033% AUD 18,500,000 396,97607-Apr-2018 Pays floating AUD-BBR, receives fixed 4.058% AUD 110,000,000 2,402,20004-Oct-2018 Pays floating AUD-BBR, receives fixed 3.483% AUD 78,837,000 1,087,66407-Oct-2018 Pays floating AUD-BBR, receives fixed 3.445% AUD 240,891,000 3,206,82819-Oct-2018 Pays fixed 1.110%, receives floating GBP-LIBOR GBP 50,000,000 267,78731-Oct-2018 Pays floating AUD-BBR, receives fixed 3.278% AUD 86,866,000 957,00410-Nov-2018 Pays floating AUD-BBR, receives fixed 3.275% AUD 52,463,000 574,32614-Nov-2018 Pays floating AUD-BBR, receives fixed 3.270% AUD 52,463,000 568,48014-Nov-2018 Pays floating AUD-BBR, receives fixed 3.288% AUD 52,463,000 580,20814-Nov-2018 Pays floating AUD-BBR, receives fixed 3.265% AUD 50,714,000 546,28914-Nov-2018 Pays floating AUD-BBR, receives fixed 3.275% AUD 87,438,000 953,04817-Nov-2018 Pays floating AUD-BBR, receives fixed 3.253% AUD 87,438,000 928,35818-Nov-2018 Pays floating AUD-BBR, receives fixed 3.228% AUD 87,438,000 899,33921-Nov-2018 Pays floating AUD-BBR, receives fixed 3.200% AUD 87,438,000 865,66621-Nov-2018 Pays floating AUD-BBR, receives fixed 3.230% AUD 87,438,000 899,16121-Nov-2018 Pays floating AUD-BBR, receives fixed 3.235% AUD 49,840,000 515,70721-Nov-2018 Pays floating AUD-BBR, receives fixed 3.203% AUD 87,438,000 868,45814-Dec-2018 Pays fixed 1.166%, receives floating GBP-LIBOR GBP 28,000,000 140,78708-May-2019 Pays floating AUD-BBR, receives fixed 2.890% AUD 227,307,000 1,127,13008-May-2019 Pays floating AUD-BBR, receives fixed 2.775% AUD 151,538,000 531,43108-May-2019 Pays floating AUD-BBR, receives fixed 2.775% AUD 40,000,000 140,27708-May-2019 Pays floating AUD-BBR, receives fixed 2.908% AUD 227,307,000 1,177,34508-May-2019 Pays floating AUD-BBR, receives fixed 2.785% AUD 185,000,000 672,13311-May-2019 Pays floating AUD-BBR, receives fixed 2.835% AUD 75,769,000 321,88411-May-2019 Pays floating AUD-BBR, receives fixed 2.833% AUD 151,538,000 638,97312-May-2019 Pays floating AUD-BBR, receives fixed 2.823% AUD 75,769,000 309,21015-May-2019 Pays floating AUD-BBR, receives fixed 2.961% AUD 125,772,000 731,32913-Jun-2019 Pays floating AUD-BBR, receives fixed 2.998% AUD 104,025,000 634,44816-Jun-2019 Pays floating AUD-BBR, receives fixed 2.901% AUD 104,004,000 504,73219-Jun-2019 Pays floating AUD-BBR, receives fixed 2.900% AUD 34,668,000 167,20826-Jun-2019 Pays floating AUD-BBR, receives fixed 2.900% AUD 59,935,470 286,26826-Jun-2019 Pays floating AUD-BBR, receives fixed 2.903% AUD 34,668,000 166,67426-Jun-2019 Pays floating AUD-BBR, receives fixed 2.900% AUD 104,004,000 496,75126-Jun-2019 Pays floating AUD-BBR, receives fixed 2.900% AUD 34,668,000 165,58429-Jun-2019 Pays floating AUD-BBR, receives fixed 2.904% AUD 346,679,910 1,666,51703-Jul-2019 Pays floating AUD-BBR, receives fixed 2.900% AUD 69,336,000 328,18314-Aug-2019 Pays floating AUD-BBR, receives fixed 2.750% AUD 69,336,000 178,43710-Nov-2019 Pays floating AUD-BBR, receives fixed 2.598% AUD 56,383,000 1,87027-Nov-2019 Pays floating AUD-BBR, receives fixed 2.650% AUD 141,840,000 79,87507-Dec-2019 Pays floating AUD-BBR, receives fixed 2.650% AUD 70,920,000 33,77407-Dec-2019 Pays floating AUD-BBR, receives fixed 2.670% AUD 70,920,000 51,458

Standard Life Investments Global SICAV
Société d'Investissement à Capital Variable
Notes to the Financial Statements as at 31 December 2015 (continued)
91
7. Swap Contracts (continued)
Global Absolute Return Strategies Fund (continued) Unrealised Appreciation/Termination Notional (Depreciation)Date Contract Currency Amount in EUR Amount 07-Dec-2019 Pays floating AUD-BBR, receives fixed 2.650% AUD 70,920,000 33,77407-Dec-2019 Pays floating AUD-BBR, receives fixed 2.650% AUD 70,275,000 33,46708-Dec-2019 Pays floating AUD-BBR, receives fixed 2.650% AUD 70,920,000 33,26914-Dec-2019 Pays floating AUD-BBR, receives fixed 2.652% AUD 211,767,000 93,26818-Dec-2019 Pays floating AUD-BBR, receives fixed 2.650% AUD 141,178,000 55,98918-Dec-2019 Pays floating AUD-BBR, receives fixed 2.650% AUD 70,589,000 27,99518-Dec-2019 Pays floating AUD-BBR, receives fixed 2.650% AUD 211,767,000 83,98420-Dec-2020 CDS (sell) - iTraxx Europe Crossover Series 24 5Y EUR (48,006,555) 3,930,20420-Dec-2020 CDS (sell) - iTraxx Europe Crossover Series 24 5Y EUR (48,006,555) 3,930,20420-Dec-2020 CDS (sell) - CDX North America Series 25 5Y USD (326,700,000) 3,212,64620-Dec-2020 CDS (sell) - iTraxx Europe Crossover Series 24 5Y EUR (77,986,890) 6,384,63719-Oct-2022 Pays fixed 1.645%, receives floating GBP-LIBOR GBP 30,000,000 318,95511-Dec-2024 Pays floating USD-LIBOR, receives fixed 2.965% USD 39,178,000 517,97912-Dec-2024 Pays floating USD-LIBOR, receives fixed 2.976% USD 99,634,000 1,362,09912-Dec-2024 Pays floating USD-LIBOR, receives fixed 2.978% USD 99,634,000 1,367,19916-Dec-2024 Pays floating USD-LIBOR, receives fixed 2.875% USD 199,268,000 1,887,70416-Dec-2024 Pays floating USD-LIBOR, receives fixed 2.875% USD 99,634,000 943,85217-Dec-2024 Pays floating USD-LIBOR, receives fixed 2.855% USD 99,634,000 861,07017-Dec-2024 Pays floating USD-LIBOR, receives fixed 2.860% USD 99,634,000 881,46418-Dec-2024 Pays floating USD-LIBOR, receives fixed 2.780% USD 99,634,000 553,30818-Dec-2024 Pays floating USD-LIBOR, receives fixed 2.780% USD 99,634,000 553,30819-Dec-2024 Pays floating USD-LIBOR, receives fixed 2.785% USD 99,634,000 572,65023-Dec-2024 Pays floating USD-LIBOR, receives fixed 2.900% USD 99,634,000 1,036,36323-Dec-2024 Pays floating USD-LIBOR, receives fixed 2.920% USD 97,410,000 1,092,95423-Dec-2024 Pays floating USD-LIBOR, receives fixed 2.910% USD 97,410,000 1,053,09224-Dec-2024 Pays floating USD-LIBOR, receives fixed 2.880% USD 194,820,000 1,864,68904-Mar-2025 Pays floating USD-LIBOR, receives fixed 2.687% USD 138,726,000 115,69605-Mar-2025 Pays floating USD-LIBOR, receives fixed 2.752% USD 184,968,000 644,14410-Mar-2025 Pays floating USD-LIBOR, receives fixed 2.911% USD 92,484,000 914,33411-Mar-2025 Pays floating USD-LIBOR, receives fixed 2.806% USD 92,484,000 517,28813-Mar-2025 Pays floating USD-LIBOR, receives fixed 2.785% USD 92,484,000 437,13816-Jun-2025 Pays floating USD-LIBOR, receives fixed 3.154% USD 287,650,000 5,323,60514-Jul-2025 Pays floating USD-LIBOR, receives fixed 3.284% USD 145,357,000 3,401,09115-Jul-2025 Pays floating USD-LIBOR, receives fixed 3.314% USD 194,361,000 4,777,13016-Jul-2025 Pays floating USD-LIBOR, receives fixed 3.291% USD 291,542,000 6,891,73717-Jul-2025 Pays floating USD-LIBOR, receives fixed 3.256% USD 242,951,000 5,398,63420-Jul-2025 Pays floating USD-LIBOR, receives fixed 3.206% USD 98,576,000 1,989,36122-Jul-2025 Pays floating USD-LIBOR, receives fixed 3.161% USD 95,113,000 1,743,45923-Jul-2025 Pays floating USD-LIBOR, receives fixed 3.177% USD 388,722,000 7,365,85910-Aug-2025 Pays floating USD-LIBOR, receives fixed 3.006% USD 154,101,000 1,823,64101-Sep-2025 Pays floating USD-LIBOR, receives fixed 2.941% USD 354,938,000 3,191,36702-Sep-2025 Pays floating USD-LIBOR, receives fixed 2.908% USD 111,654,000 849,90303-Sep-2025 Pays floating USD-LIBOR, receives fixed 2.894% USD 237,782,000 1,676,10204-Sep-2025 Pays floating USD-LIBOR, receives fixed 2.888% USD 191,903,000 1,303,38801-Oct-2025 Pays fixed 2.277%, receives floating GBP-LIBOR GBP 71,788,500 762,62001-Oct-2025 Pays fixed 2.298%, receives floating GBP-LIBOR GBP 215,365,500 2,015,85201-Oct-2025 Pays floating USD-LIBOR, receives fixed 2.746% USD 165,560,400 126,50402-Oct-2025 Pays fixed 2.203%, receives floating GBP-LIBOR GBP 119,647,500 1,815,73605-Oct-2025 Pays fixed 2.015%, receives floating USD-LIBOR USD 120,000,000 1,557,40606-Oct-2025 Pays fixed 2.309%, receives floating GBP-LIBOR GBP 143,577,000 1,258,46807-Oct-2025 Pays fixed 2.336%, receives floating GBP-LIBOR GBP 47,859,000 343,23908-Oct-2025 Pays fixed 2.305%, receives floating GBP-LIBOR GBP 95,718,000 867,79008-Oct-2025 Pays floating USD-LIBOR, receives fixed 2.743% USD 110,373,600 62,88409-Oct-2025 Pays floating USD-LIBOR, receives fixed 2.759% USD 36,791,200 44,10009-Oct-2025 Pays fixed 2.365%, receives floating GBP-LIBOR GBP 71,788,500 386,91713-Oct-2025 Pays floating USD-LIBOR, receives fixed 2.774% USD 55,186,800 98,09013-Oct-2025 Pays fixed 2.310%, receives floating GBP-LIBOR GBP 215,365,500 1,894,70314-Oct-2025 Pays fixed 2.292%, receives floating GBP-LIBOR GBP 47,859,000 475,40915-Oct-2025 Pays fixed 2.264%, receives floating GBP-LIBOR GBP 23,929,500 278,00416-Oct-2025 Pays fixed 2.001%, receives floating USD-LIBOR USD 152,000,000 2,237,84220-Oct-2025 Pays fixed 2.394%, receives floating GBP-LIBOR GBP 95,718,000 366,22021-Oct-2025 Pays fixed 2.356%, receives floating GBP-LIBOR GBP 191,436,000 1,168,99422-Oct-2025 Pays floating EUR-EURIBOR, receives fixed 1.646% EUR 60,056,800 25,19922-Oct-2025 Pays fixed 2.332%, receives floating GBP-LIBOR GBP 23,929,500 181,43904-Nov-2025 Pays fixed 2.453%, receives floating GBP-LIBOR GBP 71,788,500 32,42905-Nov-2025 Pays fixed 2.429%, receives floating GBP-LIBOR GBP 95,718,000 178,73106-Nov-2025 Pays fixed 2.449%, receives floating GBP-LIBOR GBP 95,718,000 65,870

Standard Life Investments Global SICAV
Société d'Investissement à Capital Variable
Notes to the Financial Statements as at 31 December 2015 (continued)
92
7. Swap Contracts (continued)
Global Absolute Return Strategies Fund (continued) Unrealised Appreciation/Termination Notional (Depreciation)Date Contract Currency Amount in EUR Amount 10-Nov-2025 Pays floating EUR-EURIBOR, receives fixed 1.663% EUR 60,056,800 39,21410-Nov-2025 Pays floating USD-LIBOR, receives fixed 2.775% USD 73,582,400 110,65812-Nov-2025 Pays floating USD-LIBOR, receives fixed 2.836% USD 72,750,800 286,11812-Nov-2025 Pays floating EUR-EURIBOR, receives fixed 1.688% EUR 59,375,200 107,57413-Nov-2025 Pays fixed 2.436%, receives floating GBP-LIBOR GBP 94,636,400 147,49516-Nov-2025 Pays floating EUR-EURIBOR, receives fixed 1.666% EUR 59,375,200 37,12316-Nov-2025 Pays floating USD-LIBOR, receives fixed 2.832% USD 72,750,800 271,45217-Nov-2025 Pays floating USD-LIBOR, receives fixed 2.764% USD 72,750,800 73,17517-Nov-2025 Pays fixed 2.443%, receives floating GBP-LIBOR GBP 55,862,400 68,56318-Nov-2025 Pays fixed 2.384%, receives floating GBP-LIBOR GBP 111,724,800 536,13619-Nov-2025 Pays floating USD-LIBOR, receives fixed 2.758% USD 42,943,800 32,01319-Nov-2025 Pays fixed 2.329%, receives floating GBP-LIBOR GBP 55,862,400 454,94520-Nov-2025 Pays fixed 2.303%, receives floating GBP-LIBOR GBP 55,862,400 544,53524-Nov-2025 Pays fixed 2.256%, receives floating GBP-LIBOR GBP 131,146,500 1,651,88925-Nov-2025 Pays fixed 2.292%, receives floating GBP-LIBOR GBP 78,687,900 821,73625-Nov-2025 Pays fixed 2.320%, receives floating GBP-LIBOR GBP 52,458,600 458,92327-Nov-2025 Pays fixed 2.275%, receives floating GBP-LIBOR GBP 104,917,200 1,206,81530-Nov-2025 Pays fixed 2.316%, receives floating GBP-LIBOR GBP 26,229,300 236,94130-Nov-2025 Pays fixed 2.309%, receives floating GBP-LIBOR GBP 78,687,900 744,11801-Dec-2025 Pays fixed 2.339%, receives floating GBP-LIBOR GBP 104,917,200 802,32402-Dec-2025 Pays fixed 2.286%, receives floating GBP-LIBOR GBP 131,146,500 1,427,47903-Dec-2025 Pays fixed 2.322%, receives floating GBP-LIBOR GBP 78,687,900 685,12707-Dec-2025 Pays fixed 2.399%, receives floating GBP-LIBOR GBP 104,917,200 432,54608-Dec-2025 Pays floating USD-LIBOR, receives fixed 2.789% USD 122,337,000 213,32708-Dec-2025 Pays floating EUR-EURIBOR, receives fixed 1.702% EUR 107,490,000 182,46708-Dec-2025 Pays fixed 2.349%, receives floating GBP-LIBOR GBP 75,540,600 541,30309-Dec-2025 Pays fixed 2.373%, receives floating GBP-LIBOR GBP 100,720,800 573,78210-Dec-2025 Pays fixed 2.392%, receives floating GBP-LIBOR GBP 151,081,200 696,27211-Dec-2025 Pays fixed 2.367%, receives floating GBP-LIBOR GBP 75,540,600 459,63414-Dec-2025 Pays fixed 2.391%, receives floating GBP-LIBOR GBP 75,540,600 355,98815-Dec-2025 Pays fixed 2.467%, receives floating GBP-LIBOR GBP 75,540,600 8,95816-Dec-2025 Pays fixed 2.458%, receives floating GBP-LIBOR GBP 75,540,600 51,03517-Dec-2025 Pays fixed 2.396%, receives floating GBP-LIBOR GBP 75,540,600 334,17317-Dec-2025 Pays floating EUR-EURIBOR, receives fixed 1.674% EUR 51,595,800 5,37218-Dec-2025 Pays floating EUR-EURIBOR, receives fixed 1.679% EUR 51,595,800 14,72718-Dec-2025 Pays fixed 2.358%, receives floating GBP-LIBOR GBP 75,540,600 510,90819-Mar-2030 Pays fixed 1.830%, receives floating GBP-LIBOR GBP 17,000,000 922,63005-Oct-2035 Pays fixed 2.420%, receives floating USD-LIBOR USD 69,000,000 1,479,04616-Oct-2035 Pays fixed 2.417%, receives floating USD-LIBOR USD 86,100,000 1,937,20014-Jan-2045 Pays fixed 2.815%, receives floating USD-LIBOR USD 17,142,000 224,37814-Jan-2045 Pays fixed 2.800%, receives floating USD-LIBOR USD 17,142,000 245,60515-Jan-2045 Pays fixed 2.717%, receives floating USD-LIBOR USD 5,296,000 112,14416-Jan-2045 Pays fixed 2.648%, receives floating USD-LIBOR USD 9,704,000 260,56921-Jan-2045 Pays fixed 2.655%, receives floating USD-LIBOR USD 23,457,000 615,59922-Jan-2045 Pays fixed 2.599%, receives floating USD-LIBOR USD 23,457,000 724,47825-Jan-2045 Pays fixed 2.575%, receives floating USD-LIBOR USD 15,638,000 513,42728-Jan-2045 Pays fixed 2.703%, receives floating USD-LIBOR USD 15,638,000 348,08006-Feb-2045 Pays fixed 2.527%, receives floating USD-LIBOR USD 6,970,000 255,87420-Feb-2045 Pays fixed 2.820%, receives floating USD-LIBOR USD 6,970,000 87,14020-Feb-2045 Pays fixed 2.820%, receives floating USD-LIBOR USD 37,940,000 474,33325-Feb-2045 Pays fixed 2.827%, receives floating USD-LIBOR USD 13,783,000 164,04225-Feb-2045 Pays fixed 2.889%, receives floating USD-LIBOR USD 30,352,000 207,01425-Feb-2045 Pays fixed 2.850%, receives floating USD-LIBOR USD 8,829,000 88,37126-Feb-2045 Pays fixed 2.820%, receives floating USD-LIBOR USD 27,566,000 343,88404-Mar-2045 Pays fixed 2.776%, receives floating USD-LIBOR USD 41,349,000 664,83404-Mar-2045 Pays fixed 2.764%, receives floating USD-LIBOR USD 27,566,000 470,65305-Mar-2045 Pays fixed 2.836%, receives floating USD-LIBOR USD 55,132,000 613,59511-Mar-2045 Pays fixed 2.863%, receives floating USD-LIBOR USD 27,566,000 244,75711-Mar-2045 Pays fixed 2.956%, receives floating USD-LIBOR USD 27,566,000 34,60512-Mar-2045 Pays fixed 2.868%, receives floating USD-LIBOR USD 95,400,000 116,53412-Mar-2045 Pays fixed 2.883%, receives floating USD-LIBOR USD 95,400,000 43,48212-Mar-2045 Pays fixed 2.817%, receives floating USD-LIBOR USD 190,800,000 724,94713-Mar-2045 Pays fixed 2.830%, receives floating USD-LIBOR USD 27,566,000 321,09618-Mar-2045 Pays fixed 2.766%, receives floating USD-LIBOR USD 33,077,000 558,22619-Mar-2045 Pays fixed 1.975%, receives floating GBP-LIBOR GBP 5,300,000 294,38505-Oct-2045 Pays fixed 2.527%, receives floating USD-LIBOR USD 161,000,000 3,597,806

Standard Life Investments Global SICAV
Société d'Investissement à Capital Variable
Notes to the Financial Statements as at 31 December 2015 (continued)
93
7. Swap Contracts (continued)
Global Absolute Return Strategies Fund (continued) Unrealised Appreciation/Termination Notional (Depreciation)Date Contract Currency Amount in EUR Amount 16-Oct-2045 Pays fixed 2.518%, receives floating USD-LIBOR USD 110,000,000 2,721,374 192,218,067
31-May-2016 Pays performance on Storebrand ASA, receives NOK-NIBOR - 0.260% NOK 20,367,747 (179,162)
31-May-2016 Pays performance on Swiss Life holding AG-Reg, receives CHF-LIBOR - 0.280% CHF 13,312,062 (545,290)
06-Jun-2016 Pays performance on Delta Lloyd NV, receives EUR-EURIBOR - 0.200% EUR 706,421 (4,487)
06-Jun-2016 Pays performance on NN Group NV, receives EUR-EURIBOR - 0.200% EUR 8,656,386 (340,649)
06-Jun-2016 Pays performance on Swiss Life holding AG-Reg, receives CHF-LIBOR - 0.200% CHF 15,436,220 (380,204)
06-Jun-2016 Pays performance on Storebrand ASA, receives NOK-NIBOR - 0.200% NOK 28,499,367 (137,272)
06-Jun-2016 Pays performance on Swiss Life holding AG-Reg, receives CHF-LIBOR - 0.200% CHF 4,538,820 (111,794)
06-Jun-2016 Pays performance on Delta Lloyd NV, receives EUR-EURIBOR - 0.200% EUR 1,355,378 (8,609)
06-Jun-2016 Pays performance on Delta Lloyd NV, receives EUR-EURIBOR - 0.200% EUR 2,560,027 (16,260)
06-Jun-2016 Pays performance on Baloise Holding AG-Reg, receives CHF-LIBOR - 0.200% CHF 11,698,019 (174,117)
06-Jun-2016 Pays performance on Baloise Holding AG-Reg, receives CHF-LIBOR - 0.200% CHF 11,383,392 (169,434)
06-Jun-2016 Pays performance on Delta Lloyd NV, receives EUR-EURIBOR - 0.200% EUR 2,560,000 (16,260)
06-Jun-2016 Pays performance on NN Group NV, receives EUR-EURIBOR - 0.200% EUR 4,295,681 (169,045)
17-Jun-2016 Pays performance on Russell 2000 Total Return Index, receives USD-LIBOR - 0.620% USD 180,320,406 (3,819,838)
06-Sep-2016 Pays performance on Consumer Staples Select Sector Index, receives USD-LIBOR + 0.310% USD 75,541,036 (1,394,833)
06-Sep-2016 Pays performance on Consumer Staples Select Sector Index, receives USD-LIBOR + 0.310% USD 86,170,663 (1,591,104)
06-Sep-2016 Pays performance on Consumer Staples Select Sector Index, receives USD-LIBOR + 0.310% USD 107,642,791 (1,987,578)
06-Sep-2016 Pays performance on Consumer Staples Select Sector Index, receives USD-LIBOR + 0.290% USD 108,588,769 (2,006,153)
06-Sep-2016 Pays performance on Consumer Staples Select Sector Index, receives USD-LIBOR + 0.260% USD 135,469,065 (2,504,834)
17-Sep-2016 Pays fixed 1.230%, receives floating GBP-LIBOR GBP 46,200,000 (280,533)02-Oct-2016 Pays fixed 1.118%, receives floating GBP-LIBOR GBP 21,000,000 (94,180)
06-Oct-2016 Pays performance on Zurich Insurance Group AG, receives CHF-LIBOR - 0.200% CHF 17,399,582 (41,240)
06-Oct-2016 Pays performance on Storebrand ASA, receives NOK-NIBOR - 0.200% NOK 9,234,810 (33,775)
06-Oct-2016 Pays performance on Delta Lloyd NV, receives EUR-EURIBOR - 0.200% EUR 1,513,500 (9,613)
06-Oct-2016 Pays performance on NN Group NV, receives EUR-EURIBOR - 0.200% EUR 890,449 (35,041)
06-Oct-2016 Pays performance on Swiss Life holding AG-Reg, receives CHF-LIBOR - 0.200% CHF 4,700,165 (115,768)
06-Oct-2016 Pays performance on Delta Lloyd NV, receives EUR-EURIBOR - 0.200% EUR 944,392 (5,998)
06-Oct-2016 Pays performance on Baloise Holding AG-Reg, receives CHF-LIBOR - 0.200% CHF 2,901,785 (43,191)
06-Oct-2016 Pays performance on Delta Lloyd NV, receives EUR-EURIBOR - 0.200% EUR 2,107,064 (13,383)
06-Oct-2016 Pays performance on AXA SA, receives EUR-EURIBOR - 0.200% EUR 17,907,805 (87,393)
06-Oct-2016 Pays performance on Allianz SE-REG, receives EUR-EURIBOR - 0.200% EUR 11,992,795 (130,145)
06-Oct-2016 Pays performance on Baloise Holding AG-Reg, receives CHF-LIBOR - 0.200% CHF 2,023,142 (30,113)
06-Oct-2016 Pays performance on Zurich Insurance Group AG, receives CHF-LIBOR - 0.200% CHF 13,617,984 (32,277)

Standard Life Investments Global SICAV
Société d'Investissement à Capital Variable
Notes to the Financial Statements as at 31 December 2015 (continued)
94
7. Swap Contracts (continued)
Global Absolute Return Strategies Fund (continued) Unrealised Appreciation/Termination Notional (Depreciation)Date Contract Currency Amount in EUR Amount
06-Oct-2016 Pays performance on Storebrand ASA, receives NOK-NIBOR - 0.200% NOK 7,056,509 (33,989)
08-Dec-2016 Pays fixed, receives floating Kospi 200 Index KRW 277,000,000 (604,967)08-Dec-2016 Pays fixed, receives floating Kospi 200 Index KRW 177,833,760 (334,394)08-Dec-2016 Pays fixed, receives floating Kospi 200 Index KRW 334,600,000 (654,643)08-Dec-2016 Pays fixed, receives floating Kospi 200 Index KRW 218,350,000 (431,482)08-Dec-2016 Pays fixed, receives floating Kospi 200 Index KRW 559,250,000 (460,596)08-Dec-2016 Pays fixed, receives floating Kospi 200 Index KRW 271,462,500 (367,349)08-Dec-2016 Pays fixed, receives floating Kospi 200 Index KRW 324,735,000 (585,943)08-Dec-2016 Pays fixed, receives floating Kospi 200 Index KRW 289,000,000 (544,459)08-Dec-2016 Pays fixed, receives floating Kospi 200 Index KRW 308,737,000 (930,212)08-Dec-2016 Pays fixed, receives floating Kospi 200 Index KRW 75,000,000 (240,123)08-Dec-2016 Pays fixed, receives floating Kospi 200 Index KRW 88,000,000 (282,097)08-Dec-2016 Pays fixed, receives floating Kospi 200 Index KRW 150,000,000 (467,393)08-Dec-2016 Pays fixed, receives floating Kospi 200 Index KRW 329,300,000 (1,185,537)08-Dec-2016 Pays fixed, receives floating Kospi 200 Index KRW 330,000,000 (1,041,381)08-Dec-2016 Pays fixed, receives floating Kospi 200 Index KRW 200,000,000 (654,347)11-Dec-2016 Pays fixed 1.240%, receives floating USD-LIBOR USD 83,440,000 (328,293)14-Dec-2016 Pays fixed 1.273%, receives floating USD-LIBOR USD 211,438,000 (882,498)14-Dec-2016 Pays fixed 1.273%, receives floating USD-LIBOR USD 211,438,000 (882,498)16-Dec-2016 Pays floating FTSE 100 , receives fixed GBP 120,000 (49,340)16-Dec-2016 Pays floating FTSE 100 , receives fixed GBP 65,000 (28,633)
16-Dec-2016 Pays performance on Russell 2000 Total Return Index, receives USD-LIBOR - 0.620% USD 420,341,644 (13,935,000)
16-Dec-2016 Pays performance on Russell 2000 Total Return Index, receives USD-LIBOR - 0.690% USD 218,699,764 (7,252,982)
16-Dec-2016 Pays fixed 1.228%, receives floating USD-LIBOR USD 422,876,000 (1,567,713)16-Dec-2016 Pays floating FTSE 100, receives fixed GBP 165,000 (8,666)16-Dec-2016 Pays floating FTSE 100, receives fixed GBP 134,000 (33,636)16-Dec-2016 Pays fixed 1.228%, receives floating USD-LIBOR USD 211,438,000 (783,857)16-Dec-2016 Pays floating FTSE 100, receives fixed GBP 171,600 (40,827)17-Dec-2016 Pays fixed 1.225%, receives floating USD-LIBOR USD 211,438,000 (772,493)17-Dec-2016 Pays fixed 1.225%, receives floating USD-LIBOR USD 211,438,000 (772,493)18-Dec-2016 Pays fixed 1.158%, receives floating USD-LIBOR USD 211,438,000 (635,103)18-Dec-2016 Pays fixed 1.185%, receives floating USD-LIBOR USD 211,438,000 (688,434)21-Dec-2016 Pays fixed 1.205%, receives floating USD-LIBOR USD 211,438,000 (702,168)22-Dec-2016 Pays fixed 1.285%, receives floating USD-LIBOR USD 211,438,000 (846,705)23-Dec-2016 Pays fixed 1.300%, receives floating USD-LIBOR USD 208,494,000 (857,555)23-Dec-2016 Pays fixed 1.285%, receives floating USD-LIBOR USD 208,494,000 (828,953)24-Dec-2016 Pays fixed 1.330%, receives floating USD-LIBOR USD 416,988,000 (1,830,579)29-Dec-2016 Pays fixed, receives floating Hang Seng Index HKD 640,000 (172,071)29-Dec-2016 Pays fixed, receives floating Hang Seng Index HKD 1,500,000 (464,181)29-Dec-2016 Pays fixed, receives floating Hang Seng Index HKD 1,750,000 (573,138)
29-Dec-2016 Pays fixed, receives floating China Ent. Index (Hang Seng) HKD 1,570,000 (18,199)
29-Dec-2016 Pays fixed, receives floating Hang Seng Index HKD 1,000,000 (188,828)
29-Dec-2016 Pays fixed, receives floating China Ent. Index (Hang Seng) HKD 537,525 (5,777)
29-Dec-2016 Pays fixed, receives floating Hang Seng Index HKD 1,088,000 (64,241)12-Jan-2017 Pays fixed 1.245%, receives floating USD-LIBOR USD 233,012,000 (762,544)12-Jan-2017 Pays fixed 1.270%, receives floating USD-LIBOR USD 233,012,000 (815,798)15-Jan-2017 Pays fixed 1.148%, receives floating USD-LIBOR USD 229,119,000 (531,852)19-Jan-2017 Pays fixed 1.076%, receives floating USD-LIBOR USD 420,881,000 (673,812)20-Jan-2017 Pays fixed 1.038%, receives floating USD-LIBOR USD 297,477,000 (366,192)22-Jan-2017 Pays fixed 1.043%, receives floating USD-LIBOR USD 297,477,000 (366,663)25-Jan-2017 Pays fixed 1.058%, receives floating USD-LIBOR USD 198,318,000 (261,779)26-Jan-2017 Pays fixed 1.125%, receives floating USD-LIBOR USD 198,318,000 (380,645)08-Feb-2017 Pays fixed 1.083%, receives floating USD-LIBOR USD 89,211,000 (117,220)22-Feb-2017 Pays fixed 1.370%, receives floating USD-LIBOR USD 417,096,000 (1,548,453)22-Feb-2017 Pays fixed 1.410%, receives floating USD-LIBOR USD 89,211,000 (363,784)23-Feb-2017 Pays fixed 1.308%, receives floating USD-LIBOR USD 333,677,000 (1,043,831)25-Feb-2017 Pays fixed 1.317%, receives floating USD-LIBOR USD 85,138,000 (271,225)25-Feb-2017 Pays fixed 1.325%, receives floating USD-LIBOR USD 101,715,000 (331,507)26-Feb-2017 Pays fixed 1.285%, receives floating USD-LIBOR USD 170,276,000 (489,377)02-Mar-2017 Pays fixed 1.262%, receives floating USD-LIBOR USD 170,276,000 (445,489)04-Mar-2017 Pays fixed 1.307%, receives floating USD-LIBOR USD 255,414,000 (766,154)07-Mar-2017 Pays fixed 1.348%, receives floating USD-LIBOR USD 340,552,000 (1,133,675)

Standard Life Investments Global SICAV
Société d'Investissement à Capital Variable
Notes to the Financial Statements as at 31 December 2015 (continued)
95
7. Swap Contracts (continued)
Global Absolute Return Strategies Fund (continued) Unrealised Appreciation/Termination Notional (Depreciation)Date Contract Currency Amount in EUR Amount 09-Mar-2017 Pays fixed 1.330%, receives floating USD-LIBOR USD 170,276,000 (533,594)10-Mar-2017 Pays fixed 1.411%, receives floating USD-LIBOR USD 170,276,000 (655,843)14-Mar-2017 Pays fixed 1.407%, receives floating USD-LIBOR USD 170,276,000 (640,477)16-Mar-2017 Pays fixed 1.352%, receives floating USD-LIBOR USD 265,801,000 (857,446)31-May-2017 Pays fixed 1.298%, receives floating USD-LIBOR USD 1,500,000,000 (2,236,014)16-Jun-2017 Pays fixed 1.415%, receives floating USD-LIBOR USD 771,500,000 (1,766,092)15-Dec-2017 Pays floating FTSE 100 , receives fixed GBP 200,000 (593,193)15-Dec-2017 Pays floating FTSE 100 , receives fixed GBP 280,000 (673,671)09-Oct-2019 Pays floating AUD-BBR, receives fixed 2.460% AUD 66,245,000 (95,342)12-Oct-2019 Pays floating AUD-BBR, receives fixed 2.508% AUD 132,491,000 (116,502)12-Oct-2019 Pays floating AUD-BBR, receives fixed 2.533% AUD 66,245,000 (37,519)13-Oct-2019 Pays floating AUD-BBR, receives fixed 2.520% AUD 66,022,000 (47,926)14-Oct-2019 Pays floating AUD-BBR, receives fixed 2.480% AUD 133,383,000 (163,617)15-Oct-2019 Pays floating AUD-BBR, receives fixed 2.420% AUD 133,383,000 (264,236)20-Oct-2019 Pays floating AUD-BBR, receives fixed 2.450% AUD 133,160,000 (220,072)20-Oct-2019 Pays floating AUD-BBR, receives fixed 2.470% AUD 132,491,000 (185,859)23-Oct-2019 Pays floating AUD-BBR, receives fixed 2.445% AUD 66,468,000 (114,734)30-Oct-2019 Pays floating AUD-BBR, receives fixed 2.438% AUD 112,766,000 (210,212)02-Nov-2019 Pays floating AUD-BBR, receives fixed 2.404% AUD 112,766,000 (262,647)03-Nov-2019 Pays floating AUD-BBR, receives fixed 2.413% AUD 112,766,000 (250,695)06-Nov-2019 Pays floating AUD-BBR, receives fixed 2.490% AUD 56,383,000 (71,542)06-Nov-2019 Pays floating AUD-BBR, receives fixed 2.455% AUD 112,766,000 (192,272)06-Nov-2019 Pays floating AUD-BBR, receives fixed 2.445% AUD 56,383,000 (103,163)13-Nov-2019 Pays floating AUD-BBR, receives fixed 2.590% AUD 164,423,055 (12,425)13-Nov-2019 Pays floating AUD-BBR, receives fixed 2.500% AUD 61,153,800 (73,178)17-Sep-2020 Pays fixed 2.386%, receives floating GBP-LIBOR GBP 24,200,000 (1,392,987)02-Oct-2020 Pays fixed 2.200%, receives floating GBP-LIBOR GBP 23,000,000 (1,022,965)10-Aug-2021 Pays fixed 2.270%, receives floating GBP-LIBOR GBP 75,242,000 (611,164)13-Aug-2021 Pays fixed 2.135%, receives floating GBP-LIBOR GBP 75,242,000 (212,678)13-Aug-2021 Pays fixed 2.275%, receives floating GBP-LIBOR GBP 225,727,000 (1,863,286)21-Aug-2021 Pays fixed 2.139%, receives floating GBP-LIBOR GBP 198,067,200 (555,792)12-May-2022 Pays fixed 1.860%, receives floating GBP-LIBOR GBP 10,500,000 (118,203)01-Oct-2025 Pays floating EUR-EURIBOR, receives fixed 1.608% EUR 135,127,800 (105,328)05-Oct-2025 Pays floating EUR-EURIBOR, receives fixed 1.613% EUR 45,042,600 (29,098)05-Oct-2025 Pays floating USD-LIBOR, receives fixed 2.698% USD 55,186,800 (66,246)06-Oct-2025 Pays floating EUR-EURIBOR, receives fixed 1.527% EUR 75,071,000 (360,408)06-Oct-2025 Pays floating USD-LIBOR, receives fixed 2.648% USD 91,978,000 (293,036)08-Oct-2025 Pays floating EUR-EURIBOR, receives fixed 1.594% EUR 90,085,200 (151,150)09-Oct-2025 Pays floating EUR-EURIBOR, receives fixed 1.625% EUR 30,028,400 (6,575)12-Oct-2025 Pays floating EUR-EURIBOR, receives fixed 1.573% EUR 60,056,800 (168,444)13-Oct-2025 Pays floating EUR-EURIBOR, receives fixed 1.623% EUR 45,042,600 (19,150)13-Oct-2025 Pays floating USD-LIBOR, receives fixed 2.717% USD 73,582,400 (37,605)15-Oct-2025 Pays floating EUR-EURIBOR, receives fixed 1.576% EUR 135,127,800 (368,761)15-Oct-2025 Pays floating USD-LIBOR, receives fixed 2.711% USD 165,560,400 (126,784)16-Oct-2025 Pays floating EUR-EURIBOR, receives fixed 1.560% EUR 30,028,400 (106,034)16-Oct-2025 Pays floating USD-LIBOR, receives fixed 2.676% USD 36,791,200 (81,181)19-Oct-2025 Pays floating EUR-EURIBOR, receives fixed 1.552% EUR 15,014,200 (60,324)19-Oct-2025 Pays floating USD-LIBOR, receives fixed 2.613% USD 18,395,600 (87,405)22-Oct-2025 Pays floating USD-LIBOR, receives fixed 2.719% USD 73,582,400 (40,416)23-Oct-2025 Pays floating USD-LIBOR, receives fixed 2.685% USD 147,164,800 (280,046)23-Oct-2025 Pays floating EUR-EURIBOR, receives fixed 1.615% EUR 120,113,600 (132,811)26-Oct-2025 Pays floating USD-LIBOR, receives fixed 2.672% USD 18,395,600 (45,231)26-Oct-2025 Pays floating EUR-EURIBOR, receives fixed 1.582% EUR 15,014,200 (41,840)06-Nov-2025 Pays floating USD-LIBOR, receives fixed 2.731% USD 55,186,800 (11,634)06-Nov-2025 Pays floating EUR-EURIBOR, receives fixed 1.619% EUR 45,042,600 (60,163)09-Nov-2025 Pays floating USD-LIBOR, receives fixed 2.708% USD 73,582,400 (85,388)09-Nov-2025 Pays floating EUR-EURIBOR, receives fixed 1.637% EUR 60,056,800 (34,897)10-Nov-2025 Pays fixed 2.523%, receives floating GBP-LIBOR GBP 94,636,400 (356,370)12-Nov-2025 Pays fixed 2.493%, receives floating GBP-LIBOR GBP 94,636,400 (176,370)17-Nov-2025 Pays floating EUR-EURIBOR, receives fixed 1.620% EUR 59,375,200 (97,030)19-Nov-2025 Pays floating EUR-EURIBOR, receives fixed 1.597% EUR 35,049,200 (97,359)20-Nov-2025 Pays floating USD-LIBOR, receives fixed 2.724% USD 85,887,600 (55,870)20-Nov-2025 Pays floating EUR-EURIBOR, receives fixed 1.571% EUR 70,098,400 (285,214)23-Nov-2025 Pays floating USD-LIBOR, receives fixed 2.659% USD 42,943,800 (141,287)23-Nov-2025 Pays floating EUR-EURIBOR, receives fixed 1.540% EUR 35,049,200 (198,680)24-Nov-2025 Pays floating USD-LIBOR, receives fixed 2.629% USD 42,943,800 (192,138)24-Nov-2025 Pays floating EUR-EURIBOR, receives fixed 1.506% EUR 35,049,200 (255,363)

Standard Life Investments Global SICAV
Société d'Investissement à Capital Variable
Notes to the Financial Statements as at 31 December 2015 (continued)
96
7. Swap Contracts (continued)
Global Absolute Return Strategies Fund (continued) Unrealised Appreciation/Termination Notional (Depreciation)Date Contract Currency Amount in EUR Amount 26-Nov-2025 Pays floating EUR-EURIBOR, receives fixed 1.517% EUR 89,575,271 (609,357)27-Nov-2025 Pays floating EUR-EURIBOR, receives fixed 1.512% EUR 35,830,000 (254,150)27-Nov-2025 Pays floating USD-LIBOR, receives fixed 2.662% USD 40,779,000 (130,493)27-Nov-2025 Pays floating USD-LIBOR, receives fixed 2.647% USD 101,947,652 (388,260)27-Nov-2025 Pays floating EUR-EURIBOR, receives fixed 1.504% EUR 53,745,000 (402,616)27-Nov-2025 Pays floating USD-LIBOR, receives fixed 2.648% USD 61,168,500 (230,018)01-Dec-2025 Pays floating EUR-EURIBOR, receives fixed 1.501% EUR 71,660,000 (554,046)01-Dec-2025 Pays floating USD-LIBOR, receives fixed 2.630% USD 81,558,000 (368,550)02-Dec-2025 Pays floating EUR-EURIBOR, receives fixed 1.527% EUR 17,915,000 (116,715)02-Dec-2025 Pays floating USD-LIBOR, receives fixed 2.614% USD 20,389,500 (105,817)02-Dec-2025 Pays floating EUR-EURIBOR, receives fixed 1.529% EUR 53,745,000 (344,993)02-Dec-2025 Pays floating USD-LIBOR, receives fixed 2.645% USD 61,168,500 (240,395)03-Dec-2025 Pays floating EUR-EURIBOR, receives fixed 1.550% EUR 71,660,000 (389,961)03-Dec-2025 Pays floating USD-LIBOR, receives fixed 2.642% USD 81,558,000 (331,827)04-Dec-2025 Pays floating USD-LIBOR, receives fixed 2.604% USD 101,947,500 (568,733)04-Dec-2025 Pays floating EUR-EURIBOR, receives fixed 1.522% EUR 89,575,000 (609,470)04-Dec-2025 Pays fixed 2.476%, receives floating GBP-LIBOR GBP 157,375,800 (91,008)07-Dec-2025 Pays floating USD-LIBOR, receives fixed 2.658% USD 61,168,500 (213,159)07-Dec-2025 Pays floating EUR-EURIBOR, receives fixed 1.563% EUR 53,745,000 (264,935)09-Dec-2025 Pays floating USD-LIBOR, receives fixed 2.726% USD 81,558,000 (62,431)09-Dec-2025 Pays floating EUR-EURIBOR, receives fixed 1.629% EUR 71,660,000 (132,951)10-Dec-2025 Pays floating USD-LIBOR, receives fixed 2.644% USD 58,722,000 (237,240)10-Dec-2025 Pays floating EUR-EURIBOR, receives fixed 1.576% EUR 51,595,800 (226,329)11-Dec-2025 Pays floating EUR-EURIBOR, receives fixed 1.579% EUR 68,794,400 (294,895)11-Dec-2025 Pays floating USD-LIBOR, receives fixed 2.681% USD 78,296,000 (204,005)14-Dec-2025 Pays floating USD-LIBOR, receives fixed 2.691% USD 117,444,000 (259,255)14-Dec-2025 Pays floating EUR-EURIBOR, receives fixed 1.598% EUR 103,191,600 (361,121)15-Dec-2025 Pays floating USD-LIBOR, receives fixed 2.667% USD 58,722,000 (187,872)15-Dec-2025 Pays floating EUR-EURIBOR, receives fixed 1.559% EUR 51,595,800 (275,867)16-Dec-2025 Pays floating USD-LIBOR, receives fixed 2.676% USD 58,722,000 (166,673)16-Dec-2025 Pays floating EUR-EURIBOR, receives fixed 1.572% EUR 51,595,800 (245,263)17-Dec-2025 Pays floating USD-LIBOR, receives fixed 2.723% USD 58,722,000 (58,109)18-Dec-2025 Pays floating USD-LIBOR, receives fixed 2.735% USD 58,722,000 (29,034)21-Dec-2025 Pays floating USD-LIBOR, receives fixed 2.704% USD 58,722,000 (104,437)21-Dec-2025 Pays floating EUR-EURIBOR, receives fixed 1.620% EUR 51,595,800 (134,725)22-Dec-2025 Pays floating USD-LIBOR, receives fixed 2.646% USD 58,722,000 (240,760)22-Dec-2025 Pays floating EUR-EURIBOR, receives fixed 1.552% EUR 51,595,800 (303,676)17-Sep-2028 Pays fixed 3.258%, receives floating GBP-LIBOR GBP 4,792,373 (894,422)17-Sep-2028 Pays fixed 3.250%, receives floating GBP-LIBOR GBP 11,915,254 (2,209,453)02-Oct-2028 Pays fixed 3.073%, receives floating GBP-LIBOR GBP 17,000,000 (2,650,724)08-May-2029 Pays fixed 3.065%, receives floating GBP-LIBOR GBP 2,800,000 (433,051)02-Oct-2043 Pays fixed 3.308%, receives floating GBP-LIBOR GBP 1,200,000 (407,380)08-May-2044 Pays fixed 3.252%, receives floating GBP-LIBOR GBP 28,000,000 (9,109,202)18-Sep-2044 Pays fixed 3.736%, receives floating USD-LIBOR USD 107,000,000 (4,554,428)18-Sep-2044 Pays fixed 3.735%, receives floating USD-LIBOR USD 53,500,000 (2,274,448)18-Sep-2044 Pays fixed 3.698%, receives floating USD-LIBOR USD 107,000,000 (4,341,439)18-Sep-2044 Pays fixed 3.715%, receives floating USD-LIBOR USD 107,000,000 (4,438,252)19-Sep-2044 Pays fixed 3.755%, receives floating USD-LIBOR USD 53,500,000 (2,329,194)19-Sep-2044 Pays fixed 3.745%, receives floating USD-LIBOR USD 107,000,000 (4,600,318)22-Sep-2044 Pays fixed 3.736%, receives floating USD-LIBOR USD 69,625,000 (2,962,661)22-Sep-2044 Pays fixed 3.736%, receives floating USD-LIBOR USD 267,500,000 (11,382,574)25-Sep-2044 Pays fixed 3.650%, receives floating USD-LIBOR USD 107,000,000 (4,078,461)25-Sep-2044 Pays fixed 3.741%, receives floating USD-LIBOR USD 55,700,000 (2,387,178)25-Sep-2044 Pays fixed 3.645%, receives floating USD-LIBOR USD 13,925,000 (527,533)25-Sep-2044 Pays fixed 3.741%, receives floating USD-LIBOR USD 214,000,000 (9,171,565)25-Sep-2044 Pays fixed 3.645%, receives floating USD-LIBOR USD 53,500,000 (2,026,789)25-Sep-2044 Pays fixed 3.645%, receives floating USD-LIBOR USD 107,000,000 (4,053,578)26-Sep-2044 Pays fixed 3.619%, receives floating USD-LIBOR USD 160,500,000 (5,864,910)29-Sep-2044 Pays fixed 3.632%, receives floating USD-LIBOR USD 160,500,000 (5,987,153)06-Oct-2044 Pays fixed 3.508%, receives floating USD-LIBOR USD 48,750,000 (1,501,972)06-Oct-2044 Pays fixed 3.475%, receives floating USD-LIBOR USD 48,750,000 (1,420,185)11-Dec-2044 Pays fixed 3.205%, receives floating USD-LIBOR USD 10,073,000 (191,380)12-Dec-2044 Pays fixed 3.200%, receives floating USD-LIBOR USD 26,206,000 (486,939)12-Dec-2044 Pays fixed 3.200%, receives floating USD-LIBOR USD 26,206,000 (486,939)17-Dec-2044 Pays fixed 3.085%, receives floating USD-LIBOR USD 26,206,000 (238,379)17-Dec-2044 Pays fixed 3.085%, receives floating USD-LIBOR USD 26,206,000 (238,379)17-Dec-2044 Pays fixed 3.122%, receives floating USD-LIBOR USD 26,206,000 (318,575)

Standard Life Investments Global SICAV
Société d'Investissement à Capital Variable
Notes to the Financial Statements as at 31 December 2015 (continued)
97
7. Swap Contracts (continued)
Global Absolute Return Strategies Fund (continued) Unrealised Appreciation/Termination Notional (Depreciation)Date Contract Currency Amount in EUR Amount 17-Dec-2044 Pays fixed 3.122%, receives floating USD-LIBOR USD 52,412,000 (637,149)18-Dec-2044 Pays fixed 3.015%, receives floating USD-LIBOR USD 26,206,000 (86,618)18-Dec-2044 Pays fixed 2.990%, receives floating USD-LIBOR USD 26,206,000 (32,444)19-Dec-2044 Pays fixed 3.000%, receives floating USD-LIBOR USD 26,206,000 (54,094)24-Dec-2044 Pays fixed 3.070%, receives floating USD-LIBOR USD 21,429,000 (169,051)24-Dec-2044 Pays fixed 3.040%, receives floating USD-LIBOR USD 42,858,000 (231,783)24-Dec-2044 Pays fixed 3.040%, receives floating USD-LIBOR USD 26,206,000 (141,727)24-Dec-2044 Pays fixed 3.095%, receives floating USD-LIBOR USD 21,429,000 (213,350)12-Mar-2045 Pays fixed 2.901%, receives floating USD-LIBOR USD 95,400,000 (47,832)28-May-2045 Pays fixed 2.980%, receives floating USD-LIBOR USD 210,000,000 (236,708)08-Jun-2045 Pays fixed 2.370%, receives floating GBP-LIBOR GBP 6,200,000 (387,706)08-Jun-2045 Pays fixed 3.093%, receives floating USD-LIBOR USD 103,375,000 (1,109,871)08-Jun-2045 Pays fixed 3.100%, receives floating USD-LIBOR USD 103,375,000 (1,149,193)11-Jun-2045 Pays fixed 3.138%, receives floating USD-LIBOR USD 155,062,500 (2,024,506)11-Jun-2045 Pays fixed 3.083%, receives floating USD-LIBOR USD 103,375,000 (1,059,664)11-Jun-2045 Pays fixed 3.098%, receives floating USD-LIBOR USD 206,750,000 (2,276,618)12-Jun-2045 Pays fixed 3.226%, receives floating USD-LIBOR USD 155,062,500 (2,717,124)15-Jun-2045 Pays fixed 3.180%, receives floating USD-LIBOR USD 180,000,000 (2,737,529)17-Jun-2045 Pays fixed 3.187%, receives floating USD-LIBOR USD 196,300,000 (3,538,008)25-Jun-2045 Pays fixed 3.236%, receives floating USD-LIBOR USD 265,300,000 (4,795,013)26-Jun-2045 Pays fixed 3.252%, receives floating USD-LIBOR USD 274,100,000 (5,188,169)29-Jun-2045 Pays fixed 3.245%, receives floating USD-LIBOR USD 132,700,000 (2,476,740)02-Jul-2045 Pays fixed 3.250%, receives floating USD-LIBOR USD 33,200,000 (625,398)02-Jul-2045 Pays fixed 3.223%, receives floating USD-LIBOR USD 165,800,000 (2,893,167)02-Jul-2045 Pays fixed 3.208%, receives floating USD-LIBOR USD 99,500,000 (1,664,347)09-Jul-2045 Pays fixed 3.170%, receives floating USD-LIBOR USD 50,000,000 (740,996)17-Dec-2045 Pays fixed 2.925%, receives floating USD-LIBOR USD 612,000,000 (2,016,109) (232,581,849) Net EUR (40,363,782)
g Global Focused Strategies Fund Unrealised Appreciation/Termination Notional (Depreciation)Date Contract Currency Amount in EUR Amount
15-Jun-2016 Pays performance on basket of equity, receives EUR-EURIBOR - 0.500% EUR 512,114 5,897
15-Jun-2016 Pays performance on basket of equity, receives EUR-EURIBOR + 0.400% EUR 155,895 1,798
15-Jun-2016 Pays performance on Anhui Conch Cement Co Ltd, receives HKD-HIBOR - 0.500% HKD 9,762,700 10,983
15-Jun-2016 Pays performance on Anhui Conch Cement Co Ltd, receives HKD-HIBOR - 0.625% HKD 17,430,400 19,582
15-Jun-2016 Pays performance on China National Building MA-H, receives HKD-HIBOR - 0.300% HKD 16,983,720 44,757
15-Jun-2016 Pays performance on Equity Index, receives EUR-EURIBOR - 0.350% EUR 2,829,112 32,647
15-Jun-2016 Pays performance on China National Building MA-H, receives HKD-HIBOR - 0.500% HKD 8,159,520 21,463
08-Jul-2016 Pays performance on Topix Retail Trade Index, receives JPY-LIBOR JPY 395,001,146 99,679
21-Sep-2016 Pays performance on Debenhams plc, receives GBP-LIBOR - 0.250% GBP 1,568,043 9,528
03-Oct-2016 Pays performance on Dover Corp, receives USD-LIBOR + 0.100% USD 1,304,578 48,538
03-Oct-2016 Pays performance on Wharf Holdings Ltd, receives HKD-HIBOR - 0.300% HKD 8,531,000 39,332
03-Oct-2016 Pays performance on Kerry Properties Ltd, receives HKD-HIBOR - 0.300% HKD 15,714,375 25,558
03-Oct-2016 Pays performance on Sino Land Co., receives HKD-HIBOR - 0.300% HKD 7,953,200 21,500
03-Oct-2016 Pays performance on Sun Hung Kai Properties, receives HKD-HIBOR - 0.300% HKD 3,232,350 16,110
03-Oct-2016 Pays performance on Wharf Holdings LTD, receives HKD-HIBOR - 0.300% HKD 14,637,400 67,485

Standard Life Investments Global SICAV
Société d'Investissement à Capital Variable
Notes to the Financial Statements as at 31 December 2015 (continued)
98
7. Swap Contracts (continued)
Global Focused Strategies Fund (continued) Unrealised Appreciation/Termination Notional (Depreciation)Date Contract Currency Amount in EUR Amount
03-Oct-2016 Pays performance on Henderson Land Development, receives HKD-HIBOR - 0.300% HKD 15,631,000 52,821
03-Oct-2016 Pays performance on Kerry Properties Ltd, receives HKD-HIBOR - 0.300% HKD 3,045,000 4,957
03-Oct-2016 Pays performance on Hong Kong Land Holdings Ltd, receives USD-LIBOR - 0.300% USD 1,732,989 58,791
03-Oct-2016 Pays performance on Kerry Properties Ltd, receives HKD-HIBOR - 0.300% HKD 4,273,875 6,951
03-Oct-2016 Pays performance on Henderson Land Development, receives HKD-HIBOR - 0.300% HKD 8,232,000 27,804
03-Oct-2016 Pays performance on Sun Hung Kai Properties, receives HKD-HIBOR - 0.300% HKD 18,610,500 92,722
03-Oct-2016 Pays performance on Sino Land Co., receives HKD-HIBOR - 0.300% HKD 9,534,400 25,790
03-Oct-2016 Pays performance on Nordson Corp, receives USD-LIBOR + 0.100% USD 1,308,905 131,253
03-Oct-2016 Pays performance on Deere & Co, receives USD-LIBOR + 0.100% USD 1,252,779 11,221
03-Oct-2016 Pays performance on Donaldson Co Inc, receives USD-LIBOR + 0.100% USD 1,239,900 44,137
03-Oct-2016 Pays performance on Sino Land Co., receives HKD-HIBOR - 0.300% HKD 5,074,000 13,717
03-Oct-2016 Pays performance on Hong Kong Land Holdings Ltd, receives USD-LIBOR - 0.300% USD 1,333,620 45,242
03-Oct-2016 Pays performance on Ingersoll-Rand Plc, receives USD-LIBOR + 0.100% USD 1,312,633 31,958
03-Oct-2016 Pays performance on Parker Hannifin Corp, receives USD-LIBOR + 0.100% USD 1,207,394 31,585
03-Oct-2016 Pays performance on Caterpillar Inc, receives USD-LIBOR + 0.100% USD 1,256,805 27,572
03-Oct-2016 Pays performance on Paccar Inc, receives USD-LIBOR + 0.100% USD 1,140,620 33,665
03-Oct-2016 Pays performance on Eaton Corp, receives USD-LIBOR + 0.100% USD 1,293,080 87,687
01-Dec-2016 Pays performance on WM Morrison Supermarkets, receives GBP-LIBOR - 0.400% GBP 301,660 3,830
01-Dec-2016 Pays performance on Kingfisher plc, receives GBP-LIBOR - 0.300% GBP 181,302 14,480
01-Dec-2016 Pays performance on Home Retail Group, receives GBP-LIBOR - 0.400% GBP 505,233 49,337
01-Dec-2016 Pays performance on Marks & Spencer Group plc, receives GBP-LIBOR - 0.300% GBP 157,721 21,835
01-Dec-2016 Pays performance on Debenhams plc, receives GBP-LIBOR - 0.300% GBP 17,540 2,395
01-Dec-2016 Pays performance on Tesco plc, receives GBP-LIBOR - 0.300% GBP 284,588 38,824
23-Nov-2017 Pays fixed 1.275%, receives floating USD-LIBOR USD 589,000,000 869,24715-Dec-2017 Pays floating S&P 500 , receives fixed USD 290,000 210,96515-Dec-2017 Pays fixed, receives Euro Stoxx 50 EUR 254,000 235,82406-Aug-2021 Pays floating EUR-EURIBOR, receives fixed 0.868% EUR 261,000,000 824,41215-Oct-2024 Pays floating USD-LIBOR, receives fixed 3.235% USD 116,900,000 2,933,77809-Mar-2025 Pays floating AUD-BBR, receives fixed 3.545% AUD 147,000,000 212,92410-Mar-2025 Pays floating KRW-KORIBOR, receives fixed 2.215% KRW 47,500,000,000 1,015,21113-May-2025 Pays floating AUD-BBR, receives fixed 3.940% AUD 22,300,000 256,92314-May-2025 Pays floating KRW-KORIBOR, receives fixed 2.320% KRW 6,180,000,000 179,67413-Jul-2025 Pays floating AUD-BBR, receives fixed 4.075% AUD 16,800,000 243,23214-Jul-2025 Pays floating USD-LIBOR, receives fixed 3.284% USD 7,885,000 184,49515-Jul-2025 Pays floating KRW-KORIBOR, receives fixed 2.275% KRW 4,370,000,000 114,87615-Jul-2025 Pays floating USD-LIBOR, receives fixed 3.314% USD 10,544,000 259,15716-Jul-2025 Pays floating USD-LIBOR, receives fixed 3.291% USD 15,816,000 373,87317-Jul-2025 Pays floating USD-LIBOR, receives fixed 3.256% USD 13,180,000 292,87420-Jul-2025 Pays floating USD-LIBOR, receives fixed 3.206% USD 5,348,000 107,92822-Jul-2025 Pays floating USD-LIBOR, receives fixed 3.161% USD 5,160,000 94,58523-Jul-2025 Pays floating USD-LIBOR, receives fixed 3.177% USD 21,087,000 399,57610-Aug-2025 Pays floating USD-LIBOR, receives fixed 3.006% USD 8,360,000 98,93311-Aug-2025 Pays fixed 2.371%, receives floating GBP-LIBOR GBP 39,200,000 165,27912-Aug-2025 Pays floating AUD-BBR, receives fixed 3.688% AUD 94,000,000 336,589

Standard Life Investments Global SICAV
Société d'Investissement à Capital Variable
Notes to the Financial Statements as at 31 December 2015 (continued)
99
7. Swap Contracts (continued)
Global Focused Strategies Fund (continued) Unrealised Appreciation/Termination Notional (Depreciation)Date Contract Currency Amount in EUR Amount 01-Sep-2025 Pays floating USD-LIBOR, receives fixed 2.941% USD 19,255,000 173,12802-Sep-2025 Pays floating USD-LIBOR, receives fixed 2.908% USD 6,057,000 46,10503-Sep-2025 Pays floating USD-LIBOR, receives fixed 2.894% USD 12,899,000 90,92404-Sep-2025 Pays floating USD-LIBOR, receives fixed 2.888% USD 10,409,000 70,69703-Dec-2025 Pays floating KRW-KORIBOR, receives fixed 2.055% KRW 10,900,000,000 100,79306-Aug-2048 Pays fixed 1.693%, receives floating EUR-EURIBOR EUR 31,800,000 658,36603-Dec-2048 Pays fixed 1.688%, receives floating EUR-EURIBOR EUR 4,050,000 106,202 11,980,001
15-Jun-2016 Pays performance on Angang Steel Co Ltd-H, receives HKD-HIBOR - 0.125% HKD 3,017,400 (46,410)
15-Jun-2016 Pays performance on Angang Steel Co Ltd-H, receives HKD-HIBOR - 1.750% HKD 2,219,520 (26,924)
15-Jun-2016 Pays performance on Angang Steel Co Ltd-H, receives HKD-HIBOR - 1.750% HKD 653,140 (7,923)
15-Jun-2016 Pays performance on Anhui Conch Cement Co. Ltd, receives HKD-HIBOR - 0.300% HKD 2,870,350 (1,656)
15-Jun-2016 Pays performance on China Resources Cement, receives HKD-HIBOR - 0.300% HKD 3,088,800 (7,831)
15-Jun-2016 Pays performance on China National Building MA-H, receives HKD-HIBOR - 0.300% HKD 3,384,360 (18,546)
15-Jun-2016 Pays performance on BBMG Corp-H, receives HKD-HIBOR - 0.300% HKD 2,696,710 (24,315)
15-Jun-2016 Pays performance on BBMG Corp-H, receives HKD-HIBOR - 0.300% HKD 21,334,575 (192,365)
15-Jun-2016 Pays performance on Maanshan Iron & Steel, receives HKD-HIBOR - 0.500% HKD 9,194,640 (76,927)
15-Jun-2016 Pays performance on Angang Steel Co Ltd-H, receives HKD-HIBOR - 1.000% HKD 13,665,720 (210,012)
15-Jun-2016 Pays performance on China National Building MA-H, receives HKD-HIBOR - 0.300% HKD 15,969,060 (15,992)
15-Jun-2016 Pays performance on Angang Steel Co Ltd-H, receives HKD-HIBOR - 1.750% HKD 4,271,420 (51,814)
15-Jun-2016 Pays performance on China Resources Cement, receives HKD-HIBOR - 0.500% HKD 9,674,340 (9,735)
15-Jun-2016 Pays performance on BBMG Corp-H, receives HKD-HIBOR - 0.500% HKD 4,924,370 (31,933)
08-Jul-2016 Pays performance on Topix Retail Trade Index, receives JPY-LIBOR JPY 3,274,655,007 (698,744)
25-Jul-2016 Pays performance on Angang Steel Co Ltd-H, receives HKD-HIBOR - 0.700% HKD 5,250,080 (8,932)
21-Sep-2016 Pays performance on Kingfisher plc, receives GBP-LIBOR - 0.250% GBP 1,498,449 (47,741)
21-Sep-2016 Pays performance on Tesco plc, receives GBP-LIBOR - 0.250% GBP 1,315,304 (67,979)
21-Sep-2016 Pays performance on Marks & Spencer Group plc, receives GBP-LIBOR - 0.250% GBP 1,449,423 (36,702)
21-Sep-2016 Pays performance on WM Morrison Supermarkets, receives GBP-LIBOR - 0.250% GBP 1,465,055 (30,972)
21-Sep-2016 Pays performance on Sainsbury plc, receives GBP-LIBOR - 0.250% GBP 1,791,235 (51,059)
21-Sep-2016 Pays performance on Home Retail Group, receives GBP-LIBOR - 0.250% GBP 1,166,995 (37,423)
03-Oct-2016 Pays performance on City Developments Ltd, receives SGD-SIBOR - 0.300% SGD 1,961,280 (95,757)
03-Oct-2016 Pays performance on New World Development, receives HKD-HIBOR - 0.300% HKD 11,360,640 (36,522)
03-Oct-2016 Pays performance on UOL Group Ltd, receives SGD-SIBOR - 0.300% SGD 1,894,804 (16,501)
03-Oct-2016 Pays performance on City Developments Ltd, receives SGD-SIBOR - 0.300% SGD 750,960 (36,665)
03-Oct-2016 Pays performance on Illinois Tool Works, receives USD-LIBOR + 0.100% USD 1,311,896 (19,005)
03-Oct-2016 Pays performance on UOL Group Ltd, receives SGD-SIBOR - 0.300% SGD 1,005,118 (8,753)
03-Oct-2016 Pays performance on Capitaland Ltd, receives SGD-SIBOR - 0.300% SGD 4,846,320 (191,435)

Standard Life Investments Global SICAV
Société d'Investissement à Capital Variable
Notes to the Financial Statements as at 31 December 2015 (continued)
100
7. Swap Contracts (continued)
Global Focused Strategies Fund (continued) Unrealised Appreciation/Termination Notional (Depreciation)Date Contract Currency Amount in EUR Amount
03-Oct-2016 Pays performance on City Developments Ltd, receives SGD-SIBOR - 0.300% SGD 1,129,680 (55,155)
03-Oct-2016 Pays performance on New World Development, receives HKD-HIBOR - 0.300% HKD 11,865,040 (38,144)
03-Oct-2016 Pays performance on UOL Group Ltd, receives SGD-SIBOR - 0.300% SGD 1,355,098 (11,801)
01-Dec-2016 Pays performance on Sainsbury plc, receives GBP-LIBOR - 0.400% GBP 72,490 (3,252)
03-Dec-2021 Pays floating EUR-EURIBOR, receives fixed 0.653% EUR 30,600,000 (194,200)08-Dec-2022 Pays floating MXN-TIIE , receives fixed 6.620% MXN 1,050,000,000 (437,029)06-Mar-2025 Pays fixed 2.503%, receives floating GBP-LIBOR GBP 71,000,000 (450,958)12-May-2025 Pays fixed 2.560%, receives floating GBP-LIBOR GBP 6,010,000 (52,536)10-Jul-2025 Pays fixed 2.740%, receives floating GBP-LIBOR GBP 5,700,000 (107,000)15-Oct-2044 Pays fixed 3.470%, receives floating USD-LIBOR USD 54,800,000 (2,240,832)18-Dec-2044 Pays fixed 3.045%, receives floating USD-LIBOR USD 86,500,000 (637,573)12-Mar-2045 Pays fixed 2.939%, receives floating USD-LIBOR USD 16,600,000 (40,313)14-May-2045 Pays fixed 3.088%, receives floating USD-LIBOR USD 24,800,000 (256,672)25-Jun-2045 Pays fixed 3.090%, receives floating USD-LIBOR USD 7,000,000 (74,913) (6,706,951) Net EUR 5,273,050
Absolute Return Global Bond Strategies Fund Unrealised Appreciation/Termination Notional (Depreciation)Date Contract Currency Amount in GBP Amount 03-Oct-2017 Pays fixed 1.021%, receives floating USD-LIBOR USD 148,000,000 326,34204-Nov-2017 Pays fixed 1.173%, receives floating USD-LIBOR USD 426,000,000 669,99325-Nov-2017 Pays fixed 1.285%, receives floating USD-LIBOR USD 375,000,000 395,81202-Nov-2018 Pays fixed 0.070%, receives floating EUR-EURIBOR EUR 169,000,000 26,81319-May-2019 Pays floating AUD-BBR, receives fixed 2.818% AUD 331,700,000 968,82923-Jun-2019 Pays floating AUD-BBR, receives fixed 2.828% AUD 48,300,000 137,69631-Jul-2019 Pays floating AUD-BBR, receives fixed 2.716% AUD 108,000,000 177,983
15-Oct-2019 Pays floating France CPI ex-tobacco Index, receives fixed 0.932% EUR 92,736,000 617,232
15-Nov-2019 Pays floating France CPI ex-tobacco Index, receives fixed 0.928% EUR 347,000,000 1,807,331
27-Nov-2019 Pays floating AUD-BBR, receives fixed 2.650% AUD 10,610,000 4,39007-Dec-2019 Pays floating AUD-BBR, receives fixed 2.650% AUD 5,305,000 1,85607-Dec-2019 Pays floating AUD-BBR, receives fixed 2.650% AUD 5,305,000 1,85607-Dec-2019 Pays floating AUD-BBR, receives fixed 2.670% AUD 5,305,000 2,82807-Dec-2019 Pays floating AUD-BBR, receives fixed 2.650% AUD 5,256,000 1,83908-Dec-2019 Pays floating AUD-BBR, receives fixed 2.650% AUD 5,305,000 1,82914-Dec-2019 Pays floating AUD-BBR, receives fixed 2.652% AUD 15,840,000 5,12618-Dec-2019 Pays floating AUD-BBR, receives fixed 2.650% AUD 10,560,000 3,07718-Dec-2019 Pays floating AUD-BBR, receives fixed 2.650% AUD 15,840,000 4,61618-Dec-2019 Pays floating AUD-BBR, receives fixed 2.650% AUD 5,280,000 1,539
11-May-2020 Pays floating U.S. Consumer Price Index, receives fixed 1.838% USD 1,930,000 20,899
08-Jul-2020 Pays floating U.S. Consumer Price Index, receives fixed 1.853% USD 3,450,000 36,793
07-Aug-2020 Pays floating U.S. Consumer Price Index, receives fixed 1.605% USD 18,200,000 66,626
19-Oct-2021 Pays fixed 1.700%, receives floating GBP-LIBOR GBP 83,300,000 557,52821-Oct-2021 Pays floating EUR-EURIBOR, receives fixed 0.539% EUR 109,000,000 54,97031-Oct-2021 Pays fixed 1.790%, receives floating GBP-LIBOR GBP 47,400,000 130,16702-Nov-2021 Pays fixed 1.814%, receives floating GBP-LIBOR GBP 20,400,000 34,60616-Feb-2022 Pays fixed 1.618%, receives floating GBP-LIBOR GBP 2,900,000 9,26814-Jul-2025 Pays floating USD-LIBOR, receives fixed 3.235% USD 248,000,000 3,901,79321-Sep-2025 Pays fixed 2.386%, receives floating GBP-LIBOR GBP 133,670,000 382,44721-Sep-2025 Pays fixed 2.384%, receives floating GBP-LIBOR GBP 153,330,000 452,39423-Sep-2025 Pays floating EUR-EURIBOR, receives fixed 1.685% EUR 83,780,000 195,90623-Sep-2025 Pays floating USD-LIBOR, receives fixed 2.887% USD 121,070,000 581,87023-Sep-2025 Pays floating EUR-EURIBOR, receives fixed 1.678% EUR 97,220,000 203,28823-Sep-2025 Pays floating USD-LIBOR, receives fixed 2.886% USD 104,930,000 501,478

Standard Life Investments Global SICAV
Société d'Investissement à Capital Variable
Notes to the Financial Statements as at 31 December 2015 (continued)
101
7. Swap Contracts (continued)
Absolute Return Global Bond Strategies Fund (continued) Unrealised Appreciation/Termination Notional (Depreciation)Date Contract Currency Amount in GBP Amount 02-Nov-2025 Pays fixed 2.459%, receives floating GBP-LIBOR GBP 46,400,000 1,34327-Nov-2025 Pays floating KRW-KORIBOR, receives fixed 1.990% KRW 76,900,000,000 262,33807-Aug-2029 Pays floating EUR-EURIBOR, receives fixed 1.777% EUR 175,000,000 214,104
26-May-2030 Pays floating U.K. Retail Price Index, receives fixed 3.290% GBP 60,000,000 949,772
22-Jul-2030 Pays floating U.K. Retail Price Index, receives fixed 3.365% GBP 5,100,000 131,339
23-Sep-2030 Pays fixed 2.058%, receives floating GBP-LIBOR GBP 2,690,000 32,86430-Sep-2030 Pays fixed 2.011%, receives floating GBP-LIBOR GBP 3,680,000 69,19202-Nov-2030 Pays fixed 2.128%, receives floating GBP-LIBOR GBP 6,540,000 30,68309-Mar-2045 Pays fixed 2.805%, receives floating USD-LIBOR USD 16,600,000 54,07608-Apr-2045 Pays fixed 2.656%, receives floating USD-LIBOR USD 8,400,000 158,86304-Nov-2045 Pays fixed 2.885%, receives floating USD-LIBOR USD 47,100,000 204,436
04-Nov-2045 Pays fixed 2.003%, receives U.S. Consumer Price Index USD 4,020,000 18,317
05-Nov-2045 Pays fixed 2.843%, receives floating USD-LIBOR USD 21,800,000 16,72525-Nov-2045 Pays fixed 2.820%, receives floating USD-LIBOR USD 38,800,000 314,75126-Nov-2045 Pays fixed 2.768%, receives floating USD-LIBOR USD 62,500,000 213,99607-Aug-2049 Pays fixed 1.818%, receives floating EUR-EURIBOR EUR 68,600,000 177,25304-Nov-2049 Pays fixed 1.801%, receives floating EUR-EURIBOR EUR 13,800,000 101,767 15,238,839
16-Oct-2016 Pays fixed 1.219%, receives floating GBP-LIBOR GBP 5,600,000 (23,729)07-Apr-2017 Pays fixed 1.110%, receives floating USD-LIBOR USD 316,000,000 (156,491)11-May-2017 Pays fixed 1.310%, receives floating USD-LIBOR USD 201,000,000 (286,349)
15-Oct-2017 Pays fixed 0.675%, receives France CPI ex-tobacco Index EUR 92,736,000 (380,924)
15-Nov-2017 Pays fixed 0.668%, receives France CPI ex-tobacco Index EUR 347,000,000 (992,493)
12-Jan-2018 Pays fixed 3.343%, receives floating GBP-LIBOR GBP 2,040,000 (116,767)03-Feb-2018 Pays fixed 3.513, receives floating GBP-LIBOR GBP 2,100,000 (128,002)16-Feb-2018 Pays fixed 1.156%, receives floating GBP-LIBOR GBP 8,600,000 (16,039)23-Jul-2018 Pays fixed 1.424%, receives floating GBP-LIBOR GBP 3,680,000 (29,037)28-Aug-2018 Pays fixed 1.239%, receives floating GBP-LIBOR GBP 7,100,000 (9,438)19-Oct-2018 Pays floating GBP-LIBOR, receives fixed 1.263% GBP 207,000,000 (839,234)21-Oct-2018 Pays fixed 0.150%, receives floating EUR-EURIBOR EUR 277,000,000 (309,128)31-Oct-2018 Pays floating GBP-LIBOR, receives fixed 1.355% GBP 116,000,000 (289,298)02-Nov-2018 Pays floating GBP-LIBOR, receives fixed 1.382% GBP 48,200,000 (96,582)04-Nov-2018 Pays fixed 0.100%, receives floating EUR-EURIBOR EUR 73,100,000 (18,996)03-Nov-2019 Pays floating AUD-BBR, receives fixed 2.440% AUD 46,600,000 (64,369)
04-Nov-2020 Pays floating U.S. Consumer Price Index, receives fixed 1.488% USD 4,020,000 (5,033)
20-Dec-2020 CDS (buy) - CDX North America Series 25 5Y USD 10,400,000 (38,653)20-Dec-2020 CDS (buy) - CDX North America Series 25 5Y USD 82,300,000 (305,876)11-Jun-2021 Pays fixed 2.440%, receives floating GBP-LIBOR GBP 500,000 (21,328)02-Nov-2021 Pays floating EUR-EURIBOR, receives fixed 0.477% EUR 67,000,000 (140,509)04-Nov-2021 Pays floating EUR-EURIBOR, receives fixed 0.521% EUR 30,500,000 (16,358)13-Jul-2022 Pays fixed 2.008%, receives floating GBP-LIBOR GBP 1,640,000 (34,736)28-Aug-2022 Pays fixed 1.840%, receives floating GBP-LIBOR GBP 10,500,000 (79,413)28-Aug-2022 Pays fixed 1.787%, receives floating GBP-LIBOR GBP 3,870,000 (15,457)06-Nov-2022 Pays fixed 1.818%, receives floating GBP-LIBOR GBP 4,700,000 (14,374)02-Oct-2025 Pays floating USD-LIBOR, receives fixed 2.688% USD 37,000,000 (42,799)04-Nov-2025 Pays floating EUR-EURIBOR, receives fixed 1.612% EUR 32,900,000 (38,830)04-Nov-2025 Pays floating USD-LIBOR, receives fixed 2.729% USD 30,400,000 (5,905)04-Nov-2025 Pays floating USD-LIBOR, receives fixed 2.732% USD 191,000,000 (23,041)25-Nov-2025 Pays floating USD-LIBOR, receives fixed 2.655% USD 168,000,000 (426,826)12-Jan-2026 Pays fixed 4.115%, receives floating GBP-LIBOR GBP 1,000,000 (211,576)03-Feb-2026 Pays fixed 2.340%, receives floating GBP-LIBOR GBP 650,000 (23,700)03-Feb-2026 Pays fixed 4.240%, receives floating GBP-LIBOR GBP 925,000 (205,787)16-Oct-2028 Pays fixed 3.197%, receives floating GBP-LIBOR GBP 2,900,000 (372,681)19-Feb-2029 Pays fixed 3.140%, receives floating GBP-LIBOR GBP 1,450,000 (184,264)11-Jun-2029 Pays fixed 3.090%, receives floating GBP-LIBOR GBP 1,400,000 (161,128)04-Nov-2029 Pays floating EUR-EURIBOR, receives fixed 1.746% EUR 37,000,000 (140,627)08-May-2030 Pays fixed 2.155%, receives floating GBP-LIBOR GBP 2,470,000 (83)12-May-2030 Pays fixed 2.285%, receives floating GBP-LIBOR GBP 1,450,000 (24,119)26-May-2030 Pays fixed 2.183%, receives floating GBP-LIBOR GBP 40,000,000 (114,067)22-Jul-2030 Pays fixed 2.343%, receives floating GBP-LIBOR GBP 4,870,000 (139,909)

Standard Life Investments Global SICAV
Société d'Investissement à Capital Variable
Notes to the Financial Statements as at 31 December 2015 (continued)
102
7. Swap Contracts (continued)
Absolute Return Global Bond Strategies Fund (continued) Unrealised Appreciation/Termination Notional (Depreciation)Date Contract Currency Amount in GBP Amount
30-Sep-2030 Pays floating U.K. Retail Price Index, receives fixed 3.210% GBP 7,310,000 (19,093)
02-Nov-2030 Pays floating U.K. Retail Price Index, receives fixed 3.245% GBP 10,300,000 (38,495)
06-Nov-2030 Pays fixed 2.205%, receives floating GBP-LIBOR GBP 5,200,000 (28,538)16-Oct-2043 Pays fixed 3.397%, receives floating GBP-LIBOR GBP 184,000 (49,341)19-Feb-2044 Pays fixed 3.298%, receives floating GBP-LIBOR GBP 1,400,000 (354,286)11-Jun-2044 Pays fixed 3.284%, receives floating GBP-LIBOR GBP 700,000 (171,193)11-May-2045 Pays fixed 2.973%, receives floating USD-LIBOR USD 37,400,000 (9,393)
11-May-2045 Pays fixed 2.215%, receives U.S. Consumer Price Index USD 1,930,000 (66,977)
11-May-2045 Pays fixed 2.934%, receives floating USD-LIBOR USD 48,700,000 (90,462)12-May-2045 Pays fixed 2.381%, receives floating GBP-LIBOR GBP 1,620,000 (79,826)14-May-2045 Pays fixed 3.082%, receives floating USD-LIBOR USD 9,740,000 (72,070)21-May-2045 Pays fixed 3.023%, receives floating USD-LIBOR USD 43,100,000 (224,373)08-Jul-2045 Pays fixed 3.285%, receives floating USD-LIBOR USD 21,200,000 (405,988)
08-Jul-2045 Pays fixed 2.298%, receives U.S. Consumer Price Index USD 3,450,000 (169,667)
09-Jul-2045 Pays fixed 3.240%, receives floating USD-LIBOR USD 39,500,000 (532,963)
07-Aug-2045 Pays fixed 2.118%, receives U.S. Consumer Price Index USD 18,200,000 (309,913)
24-Dec-2045 Pays fixed 2.860%, receives floating USD-LIBOR USD 80,400,000 (6,224) (9,172,757) Net GBP 6,066,082
The following entities were counterparties to the above swap contracts at 31 December 2015: Barclays Bank Plc, BNP Paribas, Citigroup Global Markets Limited, Credit Suisse, Deutsche Bank AG, Goldman Sachs International Bank, HSBC Bank plc, JPMorgan Chase Bank, Merrill Lynch International, Morgan Stanley & Co. International Plc, Nomura International plc, Royal Bank of Scotland plc, Societe Generale and UBS AG. 8. Future contracts
As at 31 December 2015, the Company held the following outstanding future contracts:
Enhanced Diversification Global Emerging Markets Equities Fund Number of Unrealised Purchases/ Notional Appreciation/ Maturity (Sales) Amount (Depreciation)Description Date Currency Contracts (in Future's Currency) in USD Amount SGX CNX Nifty Index Future 28-Jan-2016 USD 52 826,592 7,914Korea 3 Year Bond Future 15-Mar-2016 KRW 22 2,056,185 4,878MSCI World Index Future 18-Mar-2016 USD 10 455,600 3,500NASDAQ 100 E-Mini Future 18-Mar-2016 USD 13 1,203,865 8,925Mini MSCI Emerging Markets Index Future 18-Mar-2016 USD (14) (553,700) 2,150
27,367
Nikkei 225 Index Future 10-Mar-2016 JPY 3 474,288 (17,023)Russell 2000 Mini Index Future 18-Mar-2016 USD (10) (1,139,900) (13,290)Dax Index Future 18-Mar-2016 EUR 2 586,466 (11,597) (41,910) Net USD (14,543)
Global Emerging Markets Equities Fund Number of Unrealised Purchases/ Notional Appreciation/ Maturity (Sales) Amount (Depreciation)Description Date Currency Contracts (in Future's Currency) in USD Amount SGX CNX Nifty Index Future 28-Jan-2016 USD 46 731,216 7,001
7,001
Net USD 7,001

Standard Life Investments Global SICAV
Société d'Investissement à Capital Variable
Notes to the Financial Statements as at 31 December 2015 (continued)
103
8. Future contracts (continued)
Global Bond Fund Number of Unrealised Purchases/ Notional Appreciation/ Maturity (Sales) Amount (Depreciation)Description Date Currency Contracts (in Future's Currency) in USD Amount Euro Bobl Future 08-Mar-2016 EUR (77) (10,955,781) 95,581Euro Buxl 30 Year Bond Future 08-Mar-2016 EUR (42) (6,923,918) 141,231Euro Schatz Future 08-Mar-2016 EUR (51) (6,192,425) 13,050Euro BTP Future 08-Mar-2016 EUR 152 22,826,933 41,426Australia 10 Year Bond Future 16-Mar-2016 AUD 199 18,472,780 36,214U.S. 10 Year Note (CBT) Future 21-Mar-2016 USD (98) (12,337,281) 45,176
372,678
Euro Bund Future 08-Mar-2016 EUR (124) (21,322,374) (52,883)Japan 10 Year Bond Future 14-Mar-2016 JPY (2) (2,476,365) (4,985)U.S. Ultra Bond (CBT) Future 21-Mar-2016 USD 27 4,149,563 (8,648)Long Gilt Future 29-Mar-2016 GBP 25 4,324,184 (24,318)U.S. 5 Year Note (CBT) Future 31-Mar-2016 USD 73 8,635,102 (27,378)U.S. 2 Year Note (CBT) Future 31-Mar-2016 USD 145 31,492,188 (63,263) (181,475) Net USD 191,203
Global Inflation-Linked Bond Fund Number of Unrealised Purchases/ Notional Appreciation/ Maturity (Sales) Amount (Depreciation)Description Date Currency Contracts (in Future's Currency) in USD Amount Australia 3 Year Bond Future 15-Mar-2016 AUD 87 7,094,306 26,512Long Gilt Future 29-Mar-2016 GBP (25) (4,324,184) 20,465U.S. 5 Year Note (CBT) Future 31-Mar-2016 USD (34) (4,021,828) 15,624
62,601
Net USD 62,601
European Corporate Bond Fund Number of Unrealised Purchases/ Notional Appreciation/ Maturity (Sales) Amount (Depreciation)Description Date Currency Contracts (in Future's Currency) in EUR Amount U.S. 10 Year Note (CBT) Future 21-Mar-2016 USD (359) (41,506,022) 151,983Long Gilt Future 29-Mar-2016 GBP (160) (25,416,013) 120,286U.S. 5 Year Note (CBT) Future 31-Mar-2016 USD (120) (13,036,143) 42,191
314,460
Euro Bund Future 08-Mar-2016 EUR 1,120 176,870,400 (2,378,740)Euro BTP Future 08-Mar-2016 EUR (228) (31,445,760) (74,875) (2,453,615) Net EUR (2,139,155)
Euro Government All Stocks Fund Number of Unrealised Purchases/ Notional Appreciation/ Maturity (Sales) Amount (Depreciation)Description Date Currency Contracts (in Future's Currency) in EUR Amount Euro Buxl 30 Year Bond Future 08-Mar-2016 EUR 642 97,198,800 174,829Euro Bobl Future 08-Mar-2016 EUR (978) (127,795,260) 1,114,920Australia 10 Year Bond Future 16-Mar-2016 AUD 859 73,231,109 143,562U.S. 10 Year Note (CBT) Future 21-Mar-2016 USD (655) (75,728,257) 277,295Long Gilt Future 29-Mar-2016 GBP (311) (49,402,376) 233,806U.S. 5 Year Note (CBT) Future 31-Mar-2016 USD (1,022) (111,024,482) 359,327
2,303,739
Euro Oat Future 08-Mar-2016 EUR 2,436 365,521,800 (5,683,047)Euro Bund Future 08-Mar-2016 EUR (1,131) (178,607,520) (380,216)Euro Schatz Future 08-Mar-2016 EUR 128 14,273,280 (30,080)

Standard Life Investments Global SICAV
Société d'Investissement à Capital Variable
Notes to the Financial Statements as at 31 December 2015 (continued)
104
8. Future contracts (continued)
Euro Government All Stocks Fund (continued) Number of Unrealised Purchases/ Notional Appreciation/ Maturity (Sales) Amount (Depreciation)Description Date Currency Contracts (in Future's Currency) in EUR Amount Euro BTP Future 08-Mar-2016 EUR 1,305 179,985,600 (369,790)U.S. 2 Year Note (CBT) Future 31-Mar-2016 USD 5 997,305 (2,004) (6,465,137) Net EUR (4,161,398)
Global Corporate Bond Fund Number of Unrealised Purchases/ Notional Appreciation/ Maturity (Sales) Amount (Depreciation)Description Date Currency Contracts (in Future's Currency) in USD Amount Japan 10 Year Bond Future 14-Mar-2016 JPY 4 4,952,729 9,637U.S. 10 Year Note (CBT) Future 21-Mar-2016 USD (115) (14,477,422) 34,886Long Gilt Future 29-Mar-2016 GBP (31) (5,361,988) 25,377
69,900
Euro Bund Future 08-Mar-2016 EUR 8 1,375,637 (9,440)Euro BTP Future 08-Mar-2016 EUR (17) (2,553,012) (6,079)U.S. Ultra Bond (CBT) Future 21-Mar-2016 USD (37) (5,851,781) (9,793)U.S. 5 Year Note (CBT) Future 31-Mar-2016 USD 120 14,194,687 (43,598) (68,910) Net USD 990
European Corporate Bond Sustainable and Responsible Investment Fund Number of Unrealised Purchases/ Notional Appreciation/ Maturity (Sales) Amount (Depreciation)Description Date Currency Contracts (in Future's Currency) in EUR Amount U.S. 10 Year Note (CBT) Future 21-Mar-2016 USD (27) (3,121,623) 11,431Long Gilt Future 29-Mar-2016 GBP (13) (2,065,051) 9,773U.S. 5 Year Note (CBT) Future 31-Mar-2016 USD (20) (2,172,690) 7,032
28,236
Euro Bund Future 08-Mar-2016 EUR 54 8,527,680 (95,243)Euro BTP Future 08-Mar-2016 EUR (28) (3,861,760) (9,195) (104,438) Net EUR (76,202)
Emerging Market Corporate Bond Fund Number of Unrealised Purchases/ Notional Appreciation/ Maturity (Sales) Amount (Depreciation)Description Date Currency Contracts (in Future's Currency) in USD Amount Euro Bund Future 08-Mar-2016 EUR (4) (687,818) 10,453U.S. Ultra Bond (CBT) Future 21-Mar-2016 USD (5) (768,438) 1,563U.S. 5 Year Note (CBT) Future 31-Mar-2016 USD (11) (1,301,180) 4,211
16,227
Net USD 16,227

Standard Life Investments Global SICAV
Société d'Investissement à Capital Variable
Notes to the Financial Statements as at 31 December 2015 (continued)
105
8. Future contracts (continued) ?# Future contracts (continued) Total Return Credit Fund Number of Unrealised Purchases/ Notional Appreciation/ Maturity (Sales) Amount (Depreciation)Description Date Currency Contracts (in Future's Currency) in GBP Amount Korea 3 Year Bond Future 15-Mar-2016 KRW 22 1,387,533 3,292
3,292
VSTOXX Mini Future 16-Mar-2016 EUR 110 189,133 (1,947)U.S. Ultra Bond (CBT) Future 21-Mar-2016 USD (3) (320,176) (646) (2,593) Net GBP 699
Global Absolute Return Strategies Fund Number of Unrealised Purchases/ Notional Appreciation/ Maturity (Sales) Amount (Depreciation)Description Date Currency Contracts (in Future's Currency) in EUR Amount Hang Seng Index Future 28-Jan-2016 HKD 454 58,935,573 233,940Australia 10 Year Bond Future 16-Mar-2016 AUD 12,425 1,059,250,910 1,724,699Euro Stoxx 50 Index Future 18-Mar-2016 EUR 11,492 377,167,440 2,178,387Euro Stoxx Banks Index Future 18-Mar-2016 EUR 3,270 21,009,750 454,530NASDAQ 100 E-Mini Future 18-Mar-2016 USD 19,320 1,643,103,157 12,171,725U.S. Ultra Bond (CBT) Future 21-Mar-2016 USD (40) (5,645,752) 11,480
16,774,761
OMXS30 Index Future 15-Jan-2016 SEK (10,511) (165,556,838) (4,717,200)Euro Bobl Future 08-Mar-2016 EUR 3,864 504,908,880 (4,558,450)Nikkei 225 Index Future 10-Mar-2016 JPY 2,451 355,866,505 (13,010,986)SPI 200 Future 17-Mar-2016 AUD (214) (18,895,518) (1,126,776)FTSE 100 Index Future 18-Mar-2016 GBP (3,179) (268,327,052) (7,289,036)FTSE 250 MID Index Future 18-Mar-2016 GBP (1,980) (93,791,067) (2,208,887)Swiss Market Index Future 18-Mar-2016 CHF (3,933) (317,060,499) (9,060,628)S&P 500 Emini Index Future 18-Mar-2016 USD (1,737) (163,371,410) (1,626,368)Russell 2000 Mini Index Future 18-Mar-2016 USD (14,078) (1,473,774,325) (16,920,517)Long Gilt Future 29-Mar-2016 GBP 120 19,062,010 (75,716) (60,594,564) Net EUR (43,819,803)
Global Focused Strategies Fund Number of Unrealised Purchases/ Notional Appreciation/ Maturity (Sales) Amount (Depreciation)Description Date Currency Contracts (in Future's Currency) in EUR Amount Hang Seng Index Future 28-Jan-2016 HKD 125 16,226,755 64,605MSCI Singapore IX ETS Future 28-Jan-2016 SGD 532 11,165,660 190,637Korea 3 Year Bond Future 15-Mar-2016 KRW 421 36,136,418 85,733NASDAQ 100 E-Mini Future 18-Mar-2016 USD 776 65,996,276 444,683Mini MSCI Emerging Markets Index Future 18-Mar-2016 USD (443) (16,090,646) 62,475Stoxx Europe 600 Index Future 18-Mar-2016 EUR 2,300 39,870,500 425,455Nikkei Dividend Index Future 30-Mar-2018 JPY 475 13,724,418 1,424,266SX5e Dividend Future 21-Dec-2018 EUR 1,883 20,035,120 882,790
3,580,644
SGX CNX Nifty Index Future 28-Jan-2016 USD (1,873) (27,343,173) (288,014)TOPIX Index Future 10-Mar-2016 JPY 245 28,926,891 (811,458)FTSE 250 MID Index Future 18-Mar-2016 GBP (255) (12,079,153) (284,390)FTSE 100 Index Future 18-Mar-2016 GBP (70) (5,908,428) (160,336)Russell 2000 Mini Index Future 18-Mar-2016 USD (636) (66,580,514) (830,338)CBOE VIX Future 18-May-2016 USD 332 5,976,094 (331,744)SX5e Dividend Future 15-Dec-2017 EUR 3,027 33,175,920 (778,820)Nikkei Dividend Index Future 29-Mar-2019 JPY 466 13,805,697 (1,803,742) (5,288,842) Net EUR (1,708,198)
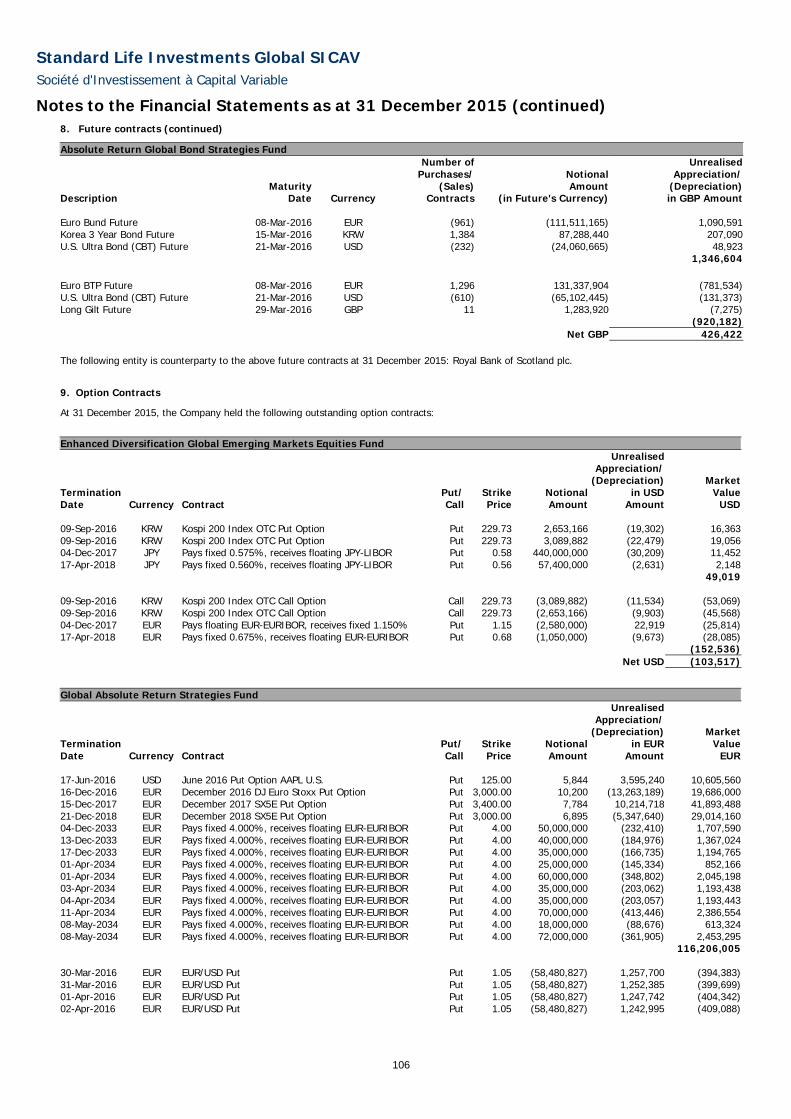
Standard Life Investments Global SICAV
Société d'Investissement à Capital Variable
Notes to the Financial Statements as at 31 December 2015 (continued)
106
8. Future contracts (continued)
Absolute Return Global Bond Strategies Fund Number of Unrealised Purchases/ Notional Appreciation/ Maturity (Sales) Amount (Depreciation)Description Date Currency Contracts (in Future's Currency) in GBP Amount Euro Bund Future 08-Mar-2016 EUR (961) (111,511,165) 1,090,591Korea 3 Year Bond Future 15-Mar-2016 KRW 1,384 87,288,440 207,090U.S. Ultra Bond (CBT) Future 21-Mar-2016 USD (232) (24,060,665) 48,923
1,346,604
Euro BTP Future 08-Mar-2016 EUR 1,296 131,337,904 (781,534)U.S. Ultra Bond (CBT) Future 21-Mar-2016 USD (610) (65,102,445) (131,373)Long Gilt Future 29-Mar-2016 GBP 11 1,283,920 (7,275) (920,182) Net GBP 426,422
The following entity is counterparty to the above future contracts at 31 December 2015: Royal Bank of Scotland plc.
9. Option Contracts
At 31 December 2015, the Company held the following outstanding option contracts:
Enhanced Diversification Global Emerging Markets Equities Fund Unrealised Appreciation/ (Depreciation) MarketTermination Put/ Strike Notional in USD ValueDate Currency Contract Call Price Amount Amount USD 09-Sep-2016 KRW Kospi 200 Index OTC Put Option Put 229.73 2,653,166 (19,302) 16,36309-Sep-2016 KRW Kospi 200 Index OTC Put Option Put 229.73 3,089,882 (22,479) 19,05604-Dec-2017 JPY Pays fixed 0.575%, receives floating JPY-LIBOR Put 0.58 440,000,000 (30,209) 11,45217-Apr-2018 JPY Pays fixed 0.560%, receives floating JPY-LIBOR Put 0.56 57,400,000 (2,631) 2,148
49,019
09-Sep-2016 KRW Kospi 200 Index OTC Call Option Call 229.73 (3,089,882) (11,534) (53,069)09-Sep-2016 KRW Kospi 200 Index OTC Call Option Call 229.73 (2,653,166) (9,903) (45,568)04-Dec-2017 EUR Pays floating EUR-EURIBOR, receives fixed 1.150% Put 1.15 (2,580,000) 22,919 (25,814)17-Apr-2018 EUR Pays fixed 0.675%, receives floating EUR-EURIBOR Put 0.68 (1,050,000) (9,673) (28,085)
(152,536) Net USD (103,517)
Global Absolute Return Strategies Fund Unrealised Appreciation/ (Depreciation) MarketTermination Put/ Strike Notional in EUR ValueDate Currency Contract Call Price Amount Amount EUR 17-Jun-2016 USD June 2016 Put Option AAPL U.S. Put 125.00 5,844 3,595,240 10,605,56016-Dec-2016 EUR December 2016 DJ Euro Stoxx Put Option Put 3,000.00 10,200 (13,263,189) 19,686,00015-Dec-2017 EUR December 2017 SX5E Put Option Put 3,400.00 7,784 10,214,718 41,893,48821-Dec-2018 EUR December 2018 SX5E Put Option Put 3,000.00 6,895 (5,347,640) 29,014,16004-Dec-2033 EUR Pays fixed 4.000%, receives floating EUR-EURIBOR Put 4.00 50,000,000 (232,410) 1,707,59013-Dec-2033 EUR Pays fixed 4.000%, receives floating EUR-EURIBOR Put 4.00 40,000,000 (184,976) 1,367,02417-Dec-2033 EUR Pays fixed 4.000%, receives floating EUR-EURIBOR Put 4.00 35,000,000 (166,735) 1,194,76501-Apr-2034 EUR Pays fixed 4.000%, receives floating EUR-EURIBOR Put 4.00 25,000,000 (145,334) 852,16601-Apr-2034 EUR Pays fixed 4.000%, receives floating EUR-EURIBOR Put 4.00 60,000,000 (348,802) 2,045,19803-Apr-2034 EUR Pays fixed 4.000%, receives floating EUR-EURIBOR Put 4.00 35,000,000 (203,062) 1,193,43804-Apr-2034 EUR Pays fixed 4.000%, receives floating EUR-EURIBOR Put 4.00 35,000,000 (203,057) 1,193,44311-Apr-2034 EUR Pays fixed 4.000%, receives floating EUR-EURIBOR Put 4.00 70,000,000 (413,446) 2,386,55408-May-2034 EUR Pays fixed 4.000%, receives floating EUR-EURIBOR Put 4.00 18,000,000 (88,676) 613,32408-May-2034 EUR Pays fixed 4.000%, receives floating EUR-EURIBOR Put 4.00 72,000,000 (361,905) 2,453,295
116,206,005
30-Mar-2016 EUR EUR/USD Put Put 1.05 (58,480,827) 1,257,700 (394,383)31-Mar-2016 EUR EUR/USD Put Put 1.05 (58,480,827) 1,252,385 (399,699)01-Apr-2016 EUR EUR/USD Put Put 1.05 (58,480,827) 1,247,742 (404,342)02-Apr-2016 EUR EUR/USD Put Put 1.05 (58,480,827) 1,242,995 (409,088)

Standard Life Investments Global SICAV
Société d'Investissement à Capital Variable
Notes to the Financial Statements as at 31 December 2015 (continued)
107
9. Option Contracts (continued)
Global Absolute Return Strategies Fund (continued) Unrealised Appreciation/ (Depreciation) MarketTermination Put/ Strike Notional in EUR ValueDate Currency Contract Call Price Amount Amount EUR05-Apr-2016 EUR EUR/USD Put Put 1.05 (58,480,827) 1,228,120 (423,963)12-Apr-2016 EUR EUR/USD Put Put 1.05 (202,000,000) 4,670,215 (1,591,785)14-Apr-2016 EUR EUR/USD Put Put 1.05 (75,000,000) 1,878,183 (596,817)17-Jun-2016 USD June 2016 Call on AAPL U.S. Call 125.00 (5,844) 4,929,825 (879,387)
(5,099,464) Net EUR 111,106,541
Absolute Return Global Bond Strategies Fund Unrealised Appreciation/ (Depreciation) MarketTermination Put/ Strike Notional in GBP ValueDate Currency Contract Call Price Amount Amount GBP 15-Oct-2017 JPY Pays fixed 0.613%, receives floating JPY-LIBOR Put 0.61 26,700,000,000 (1,441,262) 377,69409-May-2018 JPY Pays fixed 0.715%, receives floating JPY-LIBOR Put 0.72 11,800,000,000 (562,278) 236,56201-Oct-2018 JPY Pays fixed 0.514%, receives floating JPY-LIBOR Put 0.51 7,790,000,000 (204,764) 299,88905-Nov-2018 JPY Pays fixed 0.510%, receives floating JPY-LIBOR Put 0.51 6,670,000,000 (82,651) 274,216
1,188,361
15-Oct-2017 EUR Pays floating EUR-EURIBOR, receives fixed 1.108% Put 1.11 (195,000,000) 1,446,632 (1,212,535)09-May-2018 EUR Pays fixed 1.253%, receives floating EUR-EURIBOR Put 1.25 (88,400,000) 401,192 (779,881)01-Oct-2018 EUR Pays fixed 1.115%, receives floating EUR-EURIBOR Put 1.12 (58,800,000) 76,864 (824,717)05-Nov-2018 EUR Pays fixed 1.105%, receives floating EUR-EURIBOR Put 1.11 (53,700,000) (48,726) (806,658)
(3,623,791) Net GBP (2,435,430)
The following entities were counterparties to the above options contracts at 31 December 2015: BNP Paribas, Citigroup Global Markets Limited, Morgan Stanley & Co. International Plc and UBS AG.
10. Soft Commission
The Investment Manager did not enter any soft commission arrangements in relation to the Company. Neither the Investment Manager nor any of its connected persons have, or are entitled to, retain any cash rebates from any broker or dealer in consideration of directing transactions on behalf of the Sub-funds to that broker or dealer. In any such cases rebates received shall be held for the accounts of the relevant Sub-funds.
11. Related parties
There are no related parties other than the Directors, the Investment Manager, the Management Company and the Principal Distributor.
Mr. Alan Stephen Acheson serves as a Director of the Management Company and as a Director of the Investment Manager and the Principal Distributor. Mr. Michael Evans was an employee of Standard Life Investments Inc., a company related to the Investment Manager until 30 January 2015 when it was sold to Manulife. Ms. Jennifer Richards and Mr. Stephen Campbell are employees of the Investment Manager and the Principal Distributor. Mr. Michael McKenna is an employee of Standard Life Employee Services Limited, a company related to the Investment Manager.
At 31 December 2015, the Enhanced Diversification Global Emerging Markets Equities Fund had holdings valued at EUR 0.17 million in Standard Life Investments Higher Income Fund. This amount represented 1.15% of the net assets of the Sub-fund. At 31 December 2015, the Global Absolute Return Strategies Fund had holdings valued at EUR 297 million in Standard Life Investments European Equity Income Fund. This amount represented 1.87% of the net assets of the Sub-fund. At 31 December 2015, the Absolute Return Global Bond Strategies Fund had holdings valued at GBP 41 million in Standard Life Investments Higher Income Fund. This amount represented 4.06% of the net assets of the Sub-fund. Standard Life Investments European Equity Income Fund and Standard Life Investments Higher Income Fund are both managed by Standard Life Investments Limited, the Investment Manager. All relevant transactions were made under normal market conditions.
12. Swing Price Adjustment
The net asset value per share of each class and/or category within each Sub-fund on any valuation day is determined by dividing the value of the total assets of that Sub-fund properly allocable to such class and/or category less the liabilities of such Sub-fund properly allocable to such class and/or category by the total number of shares of such class and/or category outstanding on such valuation day.
If, however, on any valuation day the aggregate transactions in shares of all classes and categories of a Sub-fund results in a net increase or decrease of the number of shares which exceeds a threshold set by the Directors from time to time for that Sub-fund (based on the Sub-fund’s subscription, redemption, conversion and related costs), the net asset value per share of the relevant Sub-fund will be adjusted by an amount which reflects the estimated fiscal and/or dealing costs which may be incurred by the Sub-fund. The adjustment will be an addition when the net movement results in an increase of all shares of the Sub-fund and a deduction when it results in a decrease. The adjustment is recorded in the Statement of Net Assets as “adjustment due to swing pricing”.

Standard Life Investments Global SICAV
Société d'Investissement à Capital Variable
Notes to the Financial Statements as at 31 December 2015 (continued)
108
13. Collateral
The table below provides the cash collateral posted in relation to derivative contracts held as at 31 December 2015:
Sub-fund Counterparty Currency Collateral posted
Collateral expressed as a percentage of total net assets
European High Yield Bond Fund Barclays Bank plc EUR (101,000) 0.16%
Global High Yield Bond Fund Royal Bank of Scotland plc USD (140,000) 0.02%
Total Return Credit Fund UBS AG GBP (150,000) 1.22%
Global Absolute Return Strategies Fund Merrill Lynch International EUR (1,640,000) 0.01%
Global Absolute Return Strategies Fund Societe Generale EUR (4,210,000) 0.03%
Global Absolute Return Strategies Fund State Street Bank and Trust Company EUR (19,715,000) 0.12%
Global Absolute Return Strategies Fund Royal Bank of Scotland plc EUR (23,230,000) 0.15%
Global Absolute Return Strategies Fund HSBC Bank plc EUR (6,680,000) 0.04%
Global Absolute Return Strategies Fund Goldman Sachs International Bank EUR (23,368,000) 0.15%
Global Absolute Return Strategies Fund Deutsche Bank AG EUR (26,918,000) 0.17%
Global Absolute Return Strategies Fund Citigroup Global Markets Limited EUR (16,778,148) 0.11%
Global Absolute Return Strategies Fund UBS AG EUR (4,770,000) 0.03%
Global Absolute Return Strategies Fund JP Morgan Securities plc EUR (38,051,665) 0.24%
Global Focused Strategies Fund UBS AG EUR (310,000) 0.05%
Global Focused Strategies Fund Societe Generale EUR (190,000) 0.03%
Global Focused Strategies Fund Royal Bank of Canada EUR (210,000) 0.03%
Global Focused Strategies Fund HSBC Bank plc EUR (1,310,000) 0.21%
Global Focused Strategies Fund Goldman Sachs International Bank EUR (440,000) 0.07%
Absolute Return Global Bond Strategies Fund Societe Generale GBP (800,000) 0.08%
Absolute Return Global Bond Strategies Fund State Street Bank and Trust Company GBP (570,000) 0.06%
Absolute Return Global Bond Strategies Fund Royal Bank of Scotland plc GBP (218,000) 0.02%
Absolute Return Global Bond Strategies Fund Royal Bank of Canada GBP (120,000) 0.01%
Absolute Return Global Bond Strategies Fund Nomura International plc GBP (130,000) 0.01%
Absolute Return Global Bond Strategies Fund Goldman Sachs International Bank GBP (1,720,000) 0.17%
Absolute Return Global Bond Strategies Fund Barclays Bank plc GBP (1,260,000) 0.13%
Absolute Return Global Bond Strategies Fund Merrill Lynch International GBP (2,189,000) 0.22%
The table below provides the cash collateral received in relation to derivative contracts held as at 31 December 2015:
Sub-fund Counterparty Currency Collateralreceived
Collateralexpressed as apercentage of
total net assetsEuropean Corporate Bond Sustainable and Responsible Investment Fund Royal Bank of Scotland plc EUR 530,000 0.14%European Corporate Bond Sustainable and Responsible Investment Fund UBS AG EUR 170,000 0.04%Global High Yield Bond Fund BNP Paribas USD 195,611 0.02%
Global Corporate Bond Fund HSBC Bank plc USD 978,741 0.22%
European Corporate Bond Fund Royal Bank of Scotland plc EUR 4,490,000 0.15%
European Corporate Bond Fund Goldman Sachs International Bank EUR 2,013,000 0.07%
European Corporate Bond Fund Barclays Bank plc EUR 219,000 0.01%
Global Inflation-Linked Bond Fund BNP Paribas USD 275,441 0.17%
Global Inflation-Linked Bond Fund State Street Bank and Trust Company USD 1,936,000 1.17%
Global Absolute Return Strategies Fund Royal Bank of Canada EUR 11,290,000 0.07%
Global Absolute Return Strategies Fund Nomura International plc EUR 14,790,000 0.09%
Global Absolute Return Strategies Fund Morgan Stanley & Co. International plc EUR 35,270,000 0.22%
Global Absolute Return Strategies Fund BNP Paribas EUR 20,432,000 0.13%
Global Absolute Return Strategies Fund Credit Agricole Corporate & Investment Bank EUR 19,787,000 0.12%
Global Absolute Return Strategies Fund Barclays Bank plc EUR 14,080,000 0.09%
Global Focused Strategies Fund Nomura International plc EUR 370,000 0.06%
Global Focused Strategies Fund BNP Paribas EUR 321,000 0.05%
Global Focused Strategies Fund Royal Bank of Scotland plc EUR 1,180,000 0.19%
Global Focused Strategies Fund Merrill Lynch International EUR 1,058,000 0.17%
Global Focused Strategies Fund JP Morgan Securities plc EUR 150,000 0.02%
Global Focused Strategies Fund Deutsche Bank AG EUR 4,294,000 0.69%
Global Focused Strategies Fund Credit Agricole Corporate & Investment Bank EUR 160,000 0.03%

Standard Life Investments Global SICAV
Société d'Investissement à Capital Variable
Notes to the Financial Statements as at 31 December 2015 (continued)
109
13. Collateral (continued)
Sub-fund Counterparty Currency Collateralreceived
Collateralexpressed as apercentage of
total net assetsGlobal Focused Strategies Fund Citigroup Global Markets Limited EUR 2,368,427 0.38%
Absolute Return Global Bond Strategies Fund BNP Paribas GBP 202,033 0.02%
Absolute Return Global Bond Strategies Fund HSBC Bank plc GBP 780,949 0.08%
Absolute Return Global Bond Strategies Fund Deutsche Bank AG GBP 1,291,541 0.13%
Absolute Return Global Bond Strategies Fund Citigroup Global Markets Limited GBP 1,957,118 0.19%
Absolute Return Global Bond Strategies Fund Morgan Stanley & Co. International plc GBP 3,000,000 0.30%
14. Directors’ remuneration
The Company pays Directors’ fees of EUR 25,000 per annum. These fees are accrued across all Sub-funds at share class level and are paid semi-annually. During the year ended 31 December 2015, these were the only Directors’ fees charged to the Company.
15. Significant events
On 30 January 2015, Mr. Michael Evans resigned as a Director of the Company and Mr. Michael McKenna was appointed as a Director of the Company.
On 20 February 2015, the American Equity Unconstrained Fund and Global Emerging Markets Equities Fund were launched.
On 12 May 2015, the Japanese Equity High Alpha Fund was launched.
Effective 14 December 2015, the Indian Equities Fund was renamed the Indian Equity Midcap Opportunities Fund.
There were new share classes launched during the year. Please refer to the Statistics table on pages 32 to 39 and to Appendix 1 on pages 110 and 111 for further details.
There were no other significant events affecting the Company during the year.
16. Subsequent Events
There were no subsequent events affecting the Company since the year end.

Standard Life Investments Global SICAV
Société d'Investissement à Capital Variable
Appendix 1: Share classes issued in the Sub-funds as at 31 December 2015
110
Equity Sub-funds Share class1 A A Unhedged A Hedged C C Unhedged C Hedged D D Unhedged D Hedged J J Un-
hedged J
Hedged K K Unhedged K Hedged Z Z Un-
hedged Z
Hedged Sub-fund Global Equities Fund USD EUR GBP - - - - - - - USD EUR GBP - - - - - - - - - - - - USD - -
Asian Equities Fund USD EUR GBP SEK* - - - - - - USD - - - - - - - - - - - - - - USD GBP -
China Equities Fund USD EUR GBP - - - - - - USD GBP - - - - - - - - - - - - - USD GBP -
Japanese Equities Fund
JPY - - SEK* - - - - - - JPY GBP* - - - - - - - - - - - - - JPY - -
Japanese Equity High Alpha Fund2
- - - - - JPY* EUR* USD* EUR* USD* JPY* - - EUR* USD* - GBP* GBP* JPY* EUR* GBP* USD* EUR* GBP* USD* JPY* - -
European Equities Fund
EUR - - - - - - - - - EUR - - - - - - - - - - - - - - EUR - -
Global REIT Focus Fund
EUR - - - USD - - - - - EUR - - - USD - - - - - - - - - - EUR - -
European Smaller Companies Fund
EUR CHF* GBP SEK* - - - - - - EUR GBP CHF* SEK* GBP* - - - - - - - - - - EUR - -
Indian Equitiy Midcap Opportunities Fund3
USD - GBP - - - - - - - USD GBP - - - - - - - - - - - - - USD - -
European Equity Unconstrained Fund
EUR - GBP - - - - - - - EUR GBP - - - - - - - - - - - - - EUR - -
Global Emerging Markets Equity Unconstrained Fund
USD - - - - - - - - - USD GBP - - - - - - - - - - - - - - GBP -
Enhanced Diversification Global Emerging Markets Equities Fund
- - - - - - - - - - USD - - GBP - - - - - - - - - - - USD - GBP
Continental European Equity Income Fund
EUR* - - - - EUR* - USD* - USD* EUR GBP - GBP - EUR* GBP* - EUR* GBP USD* GBP - USD* - GBP* -
Global Equity Unconstrained Fund
USD EUR* - - - - - - - USD - - - - - - - - - - - - - - USD - -
American Equity Unconstrained Fund4
USD* - - SEK* - - - - - USD* GBP* - - - - - - - - - - - - - USD* - -
Global Emerging Markets Equities Fund4
USD* EUR* - - - - - - - USD* - - - - - - - - - - - - - - USD* - -
1The share classes represented above for a particular currency may be accumulation share classes, distribution share classes or both.
2This Sub-fund was launched on 12 May 2015. 3Effective 14 December 2015, the Indian Equities Fund was renamed the Indian Equity Midcap Opportunities Fund. 4This Sub-fund was launched on 20 February 2015.
*New share class issued during the year.

Standard Life Investments Global SICAV
Société d'Investissement à Capital Variable
Appendix 1: Share classes issued in the Sub-funds as at 31 December 2015 (continued)
111
Bond Sub-funds Share class1 A A Unhedged A Hedged B D D Unhedged D Hedged K Z Z Unhedged Z Hedged
Sub-fund Global Bond Fund USD - GBP - - - - - GBP - - - - - USD - - - -
Global Inflation Linked Bond Fund
USD - - EUR GBP SEK - USD - - EUR GBP SEK - USD - - EUR GBP
European High Yield Bond Fund
EUR - - - - - - EUR - - - - - - EUR - - - -
European Corporate Bond Fund
EUR - - - GBP NOK EUR EUR GBP USD GBP NOK USD EUR EUR - - - GBP
Euro Government All Stocks Fund
EUR - - - - - - EUR - - - - - - EUR - - - -
Emerging Market Debt Fund
USD - - EUR* - - - USD - - EUR* - - - USD - - - GBP
Emerging Market Local Currency Debt Fund
USD - - - GBP - - USD GBP - GBP - - - - EUR GBP - GBP
Global High Yield Bond Fund
USD - - EUR GBP - - USD* - - EUR GBP* CHF* - USD - - EUR GBP
Global Corporate Bond Fund
USD - - EUR GBP - - USD - - AUD EUR GBP - USD - - EUR GBP
European Corporate Bond Sustainable and Responsible Investment Fund
EUR* - - - - - - EUR - - - - - - - - - - -
Emerging Market Corporate Bond Fund
- - - - - - - USD - - - - - - USD - - - GBP
Total Return Credit Fund
- - - - - - - GBP - - EUR* SEK* USD* - GBP - - - -
Absolute Return Sub-funds Share class A A Hedged B B Hedged D D Hedged K Hedged Z
Z Hedged
Sub-fund Global Absolute Return Strategies Fund
EUR AUD* CHF GBP JPY SEK SGD USD EUR* GBP* USD* EUR AUD CAD CHF GBP JPY NZD SEK SGD USD - - EUR USD* AUD CAD JPY
Global Focused Strategies Fund
EUR - CHF* GBP* SEK* - - - - - EUR USD* CAD CHF GBP - - SEK - - GBP USD EUR -
AUD* - GBP
Absolute Return Global Bond Strategies Fund
GBP EUR CHF* - - SEK* - USD - - GBP AUD EUR CHF* - - - SEK* - USD - - GBP - AUD CAD EUR
1The share classes represented above for a particular currency may be accumulation share classes, distribution share classes or both.
*New share class issued during the year.

Standard Life Investments Global SICAV Société d'Investissement à Capital Variable
112
Global Equities Fund
Sub-fund Objective The objective of the Sub-fund is to achieve long-term growth in the share price through capital appreciation of the underlying equity portfolio.
In accordance with the investment objective described above, the Sub-fund may invest in equity related securities, which may include preference shares, debt securities convertible into common shares, warrants on transferable securities and other equity linked securities.
Investment Policy The current policy is to invest in equities and equity related securities of corporations registered on a recognised stock exchange.
Performance Review The Sub-fund returned 1.6% over the review period in dollar terms (performance is calculated based on the D Accumulation Shares), beating its benchmark, the MSCI AC World Index, which fell -1.8%.
Stock-specific alpha generated the vast majority of returns in 2015. Both sector and regional allocations had little impact on the Sub-fund’s overall return. Although strong style rotations in the market throughout the year did impact some individual months’ performance, stocks selection more than offset this over the course of 12 months.
From a specific stock point of view, our holdings in gaming software companies Activision Blizzard and Electronic Arts were two of the top outperformers. They consistently surpassed expectations given the strength of the console cycle and digital content. Ryanair was the next largest positive contributor to returns. The company has consistently beaten forecasts, as it held onto more of fuel price decreases than expected and also continued to expand faster than predicted. We continue to see significant growth opportunities which are not reflected in either forecasts or the firm’s rating.
On the downside, a holding in hard-disk drive manufacturer Western Digital hurt the Sub-fund’s performance after investors reacted negatively to the company’s announced takeover of Sandisk. Investors are questioning whether the deal makes strategic sense. We agree and have subsequently sold our holding. Elsewhere, Samsung Engineering, an energy and petrochemical engineering construction company, struggled. The company surprised investors – including ourselves – after it announced heavy losses on some overseas contracts (it had previously assured us were not problematic) and a heavily dilutive rights issue. We therefore exited the holding. Further negatives included First Quantum Minerals, Tianhe Chemicals and Rocket Internet. Outlook As we move into 2016, there is increasing uncertainty around the outlook for global equities. Valuations are not stretched, but they are above average and it will therefore take earnings growth to drive the market higher. While economic growth in the US is robust and Europe is on an improving trend, the big risk is China and the pace of its economic slowdown. Rising interest rates in the US, widening credit spreads and increased M&A activity all point towards the equity bull market maturing. However, we are not yet at the end of the cycle.
Our central case remains one of a modest slowdown in Chinese growth which, when coupled with improving growth elsewhere, leads to similar or slightly improved global GDP. We therefore expect corporate earnings growth to remain in-line with long-term averages of around 7-8% – but the corridor of uncertainty is increasing.
Please note that the commitment approach has been used for risk measurement and calculation of global exposure for this Sub-fund.

Standard Life Investments Global SICAV Société d'Investissement à Capital Variable
113
Global Equities Fund Schedule of Investments (expressed in USD) as at 31 December 2015
Quantity/ Market Value % of
Nominal Value Currency Name of Securities USD Net Assets
Transferable securities and money market instruments admitted to an official exchange listing
Bermuda 69,335 USD Lazard Ltd 3,146,422 1.00%
Total for Bermuda 3,146,422 1.00%
British Virgin Islands 127,100 USD Hollysys Automation Technologies Ltd 2,822,891 0.90%
13,890,000 HKD Tianhe Chemicals Group Ltd1 519,740 0.17% Total for British Virgin Islands 3,342,631 1.07%
Canada 793,334 SEK Africa Oil Corp 1,119,126 0.36% 92,896 CAD Alimentation Couche-Tard Inc 4,147,810 1.32%
202,116 CAD Element Financial Corp 2,453,018 0.78% 179,800 CAD First Quantum Minerals Ltd 673,431 0.22%
Total for Canada 8,393,385 2.68%
Cayman Islands 22,463 USD Baidu Inc 4,315,816 1.38%
7,250,000 HKD Geely Automobile Holdings Ltd 3,863,439 1.23% 73,300 USD JD.com Inc 2,351,464 0.75%
716,800 HKD Sands China Ltd 2,455,549 0.78% Total for Cayman Islands 12,986,268 4.14%
Curaçao 7,657 USD Magnit OJS Warrant, expires 12 July 2018 1,162,580 0.37%
Total for Curaçao 1,162,580 0.37%
Denmark 126,745 DKK Danske Bank A/S 3,425,008 1.09%
Total for Denmark 3,425,008 1.09%
Finland 573,412 EUR Nokia OYJ 4,117,734 1.31%
Total for Finland 4,117,734 1.31%
France 59,272 EUR Orpea 4,761,732 1.52%
Total for France 4,761,732 1.52%
Germany 90,804 EUR Covestro AG 3,325,624 1.06%
109,028 EUR Deutsche Post AG 3,081,313 0.98% 301,322 EUR Deutsche Telekom AG 5,476,006 1.75% 62,756 EUR Rocket Internet SE 1,929,730 0.62%
Total for Germany 13,812,673 4.41%
Hong Kong 1,485,616 HKD Shun Tak Holdings Ltd 559,726 0.18%
Total for Hong Kong 559,726 0.18%
Ireland 66,800 USD Allegion Plc 4,449,548 1.42%
248,744 EUR Glanbia Plc 4,590,913 1.47% 353,089 EUR Ryanair Holdings Plc 5,770,874 1.84%
Total for Ireland 14,811,335 4.73%
Italy 2,442,926 EUR Banca Popolare di Milano Scarl 2,449,891 0.78%
815,913 EUR Intesa Sanpaolo SpA 2,743,455 0.88% 470,183 EUR Mediobanca SpA 4,548,844 1.45%
Total for Italy 9,742,190 3.11%
Japan 1,486,000 JPY Kumagai Gumi Co Ltd 4,308,499 1.38%

Standard Life Investments Global SICAV Société d'Investissement à Capital Variable
114
Global Equities Fund Schedule of Investments (expressed in USD) (continued) as at 31 December 2015
Quantity/ Market Value % of
Nominal Value Currency Name of Securities USD Net Assets
Transferable securities and money market instruments admitted to an official exchange listing (continued)
Japan (continued) 541,500 JPY Mitsubishi UFJ Financial Group Inc 3,405,912 1.09% 103,000 JPY Mitsui Fudosan Co Ltd 2,615,004 0.83% 130,500 JPY Resorttrust Inc 3,474,724 1.11% 76,800 JPY Seven & I Holdings Co Ltd 3,541,081 1.13%
Total for Japan 17,345,220 5.54%
Netherlands 35,898 USD LyondellBasell Industries NV 3,150,409 1.01%
Total for Netherlands 3,150,409 1.01%
Papua New Guinea 860,048 AUD Oil Search Ltd 4,215,424 1.34%
Total for Papua New Guinea 4,215,424 1.34%
Portugal 391,996 EUR Galp Energia SGPS SA 4,575,654 1.46%
Total for Portugal 4,575,654 1.46%
Singapore 40,536 USD Avago Technologies Ltd 5,973,790 1.91%
Total for Singapore 5,973,790 1.91%
South Korea 38,467 KRW Hyundai Development Co-Engineering & Construction 1,272,884 0.41%
172,000 USD KT Corp 2,050,240 0.65% Total for South Korea 3,323,124 1.06%
Spain 404,169 EUR Bankinter SA 2,879,937 0.92% 466,388 GBP International Consolidated Airlines Group SA 4,219,412 1.35%
Total for Spain 7,099,349 2.27%
Sweden 159,867 SEK Lundin Petroleum AB 2,321,456 0.74% 206,185 SEK Securitas AB 3,174,766 1.01%
Total for Sweden 5,496,222 1.75%
Switzerland 23,477 CHF Roche Holding AG 6,512,775 2.08%
248,816 CHF UBS Group AG 4,874,652 1.56% 11,622 CHF Zurich Insurance Group AG 3,014,108 0.96%
Total for Switzerland 14,401,535 4.60%
Taiwan 798,447 TWD Chipbond Technology Corp 1,155,849 0.37%
Total for Taiwan 1,155,849 0.37%
United Kingdom 268,682 GBP ARM Holdings Plc 4,136,881 1.32% 214,630 GBP Ashtead Group Plc 3,559,094 1.14% 293,274 GBP Babcock International Group Plc 4,415,564 1.41% 69,023 GBP Bellway Plc 2,900,808 0.93%
638,400 GBP BT Group Plc 4,462,494 1.42% 900,097 GBP McCarthy & Stone Plc 3,387,988 1.08% 841,551 GBP Sophos Group Plc 3,267,387 1.04% 154,685 GBP SuperGroup Plc 3,773,088 1.20%
1,060,628 GBP Vodafone Group Plc 3,473,556 1.11% Total for United Kingdom 33,376,860 10.65%
United States 87,326 USD Activision Blizzard Inc 3,443,264 1.10% 15,016 USD Acuity Brands Inc 3,542,725 1.13% 20,629 USD Advance Auto Parts Inc 3,123,230 1.00%

Standard Life Investments Global SICAV Société d'Investissement à Capital Variable
115
Global Equities Fund Schedule of Investments (expressed in USD) (continued) as at 31 December 2015
Quantity/ Market Value % of
Nominal Value Currency Name of Securities USD Net Assets
Transferable securities and money market instruments admitted to an official exchange listing (continued)
United States (continued) 17,361 USD Alliance Data Systems Corp 4,805,004 1.53% 5,233 USD Alphabet Inc A 4,135,640 1.32% 5,299 USD Alphabet Inc C 4,085,529 1.30%
26,000 USD Amgen Inc 4,245,540 1.36% 49,218 USD Avis Budget Group Inc 1,769,387 0.56% 70,217 USD Blackhawk Network Holdings Inc 3,177,319 1.01% 53,186 USD BorgWarner Inc 2,335,929 0.75%
188,985 USD Boston Scientific Corp 3,517,011 1.12% 32,156 USD Cardinal Health Inc 2,911,404 0.93% 46,022 USD Cavium Inc 3,066,446 0.98% 94,941 USD CBRE Group Inc 3,288,756 1.05% 31,360 USD Celgene Corp 3,784,525 1.21% 98,340 USD Citigroup Inc 5,143,182 1.64% 48,267 USD CVS Health Corp 4,765,883 1.52% 99,545 USD Delta Air Lines Inc 5,093,718 1.63% 45,289 USD Electronic Arts Inc 3,154,379 1.01% 64,426 USD Facebook Inc 6,843,330 2.18% 93,825 USD First Republic Bank 6,216,844 1.98%
110,567 USD Fortune Brands Home & Security Inc 6,219,394 1.98% 62,247 USD Halliburton Co 2,124,490 0.68%
105,909 USD Hanesbrands Inc 3,079,834 0.98% 70,400 USD Hartford Financial Services Group Inc 3,086,336 0.99%
177,632 USD Hewlett Packard Enterprise Co 2,714,217 0.87% 48,389 USD Kraft Heinz Co 3,568,689 1.14% 23,797 USD Martin Marietta Materials Inc 3,267,090 1.04% 14,173 USD McKesson Corp 2,816,742 0.90% 72,185 USD Newell Rubbermaid Inc 3,158,094 1.01%
163,804 USD Stillwater Mining Co 1,430,009 0.46% 51,113 USD TJX Cos Inc 3,647,424 1.16% 49,849 USD Visteon Corp 5,792,454 1.85%
Total for United States 123,353,818 39.37%
Total transferable securities and money market instruments admitted to an official exchange listing 303,728,938 96.94%
Transferable securities and money market instruments dealt in on another regulated market
Cayman Islands 1,291,200 HKD China Metal Recycling Holdings Ltd1 – –%
Total for Cayman Islands – –%
Total transferable securities and money market instruments dealt in on another regulated market – –%
Total investments 303,728,938 96.94% Cash and cash equivalents 9,199,187 2.94% Other net assets 396,881 0.12% Total net assets 313,325,006 100.00%
1 suspended/delisted security
Analysis of Investments as % of total assets Transferable securities and money market instruments admitted to an official exchange listing 96.91%Other assets 3.09%Total assets 100.00% The accompanying notes form an integral part of these financial statements.

Standard Life Investments Global SICAV Société d'Investissement à Capital Variable
116
Asian Equities Fund Sub-fund Objective The objective of the Sub-fund is to achieve long-term growth in the share price through capital appreciation of the underlying equity portfolio.
In accordance with the investment objective described above, the Sub-fund may invest in equity related securities, which may include preference shares, debt securities convertible into common shares, warrants on transferable securities and other equity linked securities.
Investment Policy The current policy is to invest in equities and equity related securities of corporations domiciled in Asia, or companies that derive a significant proportion of their revenues or profits from Asian operations or have a significant proportion of their assets there.
Performance Review The Asian Equities Fund fell by 8.4% over the period, compared with the MSCI Far East Free Ex-Japan Index, which was down by 9.2%.* The Sub-fund outperformed its benchmark index during the period.
The Sub-fund’s performance was helped in the initial stages of the year by Chinese yarn producer Texhong. In particular, stabilising cotton prices raised the prospect of a revival in margins and a material rebound in profitability. A holding in Geely Automobile was also supportive. The stock rose strongly as investors are becoming increasingly confident about the company’s new model line-up and the positive impact this will have on medium-term sales. Less helpful was Macau casino operator Sands China, which disappointed amid the ongoing crackdown on graft in China. AirAsia, the Malaysian airline, saw its shares slump on growing concerns about its balance sheet. The turnaround in its loss-making Indonesian and Philippines subsidiaries was also slower than expected. Moving deeper into 2015, and despite turbulent markets it was two of the Sub-fund’s Chinese stocks that contributed most to performance. JD.com, which is aspiring to be ‘the Amazon of China’, received a boost after it was included in the MSCI Index. Its shares were given further impetus after the company announced solid results, while investor sentiment toward the company also brightened. China State Construction outperformed due to improving conditions in its major markets: China (infrastructure), Hong Kong (airports), and Macau (land reclamations). *Sub-fund performance has been calculated over the stated period on the share price performance basis, based on the D Accumulation Shares and net of fees. Please note the index return is quoted gross and contains no adjustment for fees. Outlook In general, from a long-term perspective we continue to believe that Asia Pacific is in a strong position. Demographics remain supportive and the ongoing reorientation of economies away from exports towards consumption should help create more stable growth. These factors will help to bolster Asian equities over the coming years, helping underlying cashflows, reducing earnings volatility and working to spur dividend growth. This makes Asia Pacific an attractive investment for those seeking both capital gains and income. Valuations are also appealing. Further, Asia’s ‘brand’ story is a structural one that will persist for years, while there are a number of companies that look well-placed to gain considerable market share. The increasing attractiveness of these businesses will become apparent as corporate profits consistently exceed expectations. Please note that the commitment approach has been used for risk measurement and calculation of global exposure for this Sub-fund.
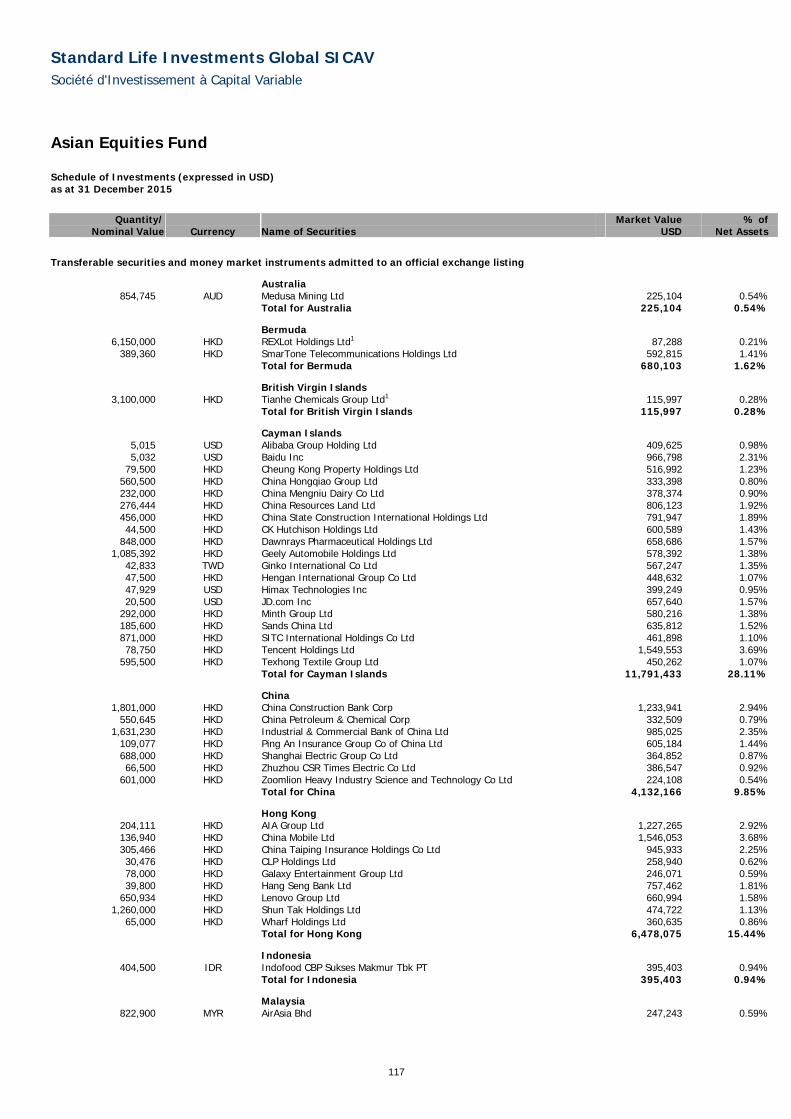
Standard Life Investments Global SICAV Société d'Investissement à Capital Variable
117
Asian Equities Fund Schedule of Investments (expressed in USD) as at 31 December 2015
Quantity/ Market Value % of
Nominal Value Currency Name of Securities USD Net Assets
Transferable securities and money market instruments admitted to an official exchange listing
Australia 854,745 AUD Medusa Mining Ltd 225,104 0.54%
Total for Australia 225,104 0.54%
Bermuda 6,150,000 HKD REXLot Holdings Ltd1 87,288 0.21%
389,360 HKD SmarTone Telecommunications Holdings Ltd 592,815 1.41% Total for Bermuda 680,103 1.62%
British Virgin Islands 3,100,000 HKD Tianhe Chemicals Group Ltd1 115,997 0.28%
Total for British Virgin Islands 115,997 0.28%
Cayman Islands 5,015 USD Alibaba Group Holding Ltd 409,625 0.98% 5,032 USD Baidu Inc 966,798 2.31%
79,500 HKD Cheung Kong Property Holdings Ltd 516,992 1.23% 560,500 HKD China Hongqiao Group Ltd 333,398 0.80% 232,000 HKD China Mengniu Dairy Co Ltd 378,374 0.90% 276,444 HKD China Resources Land Ltd 806,123 1.92% 456,000 HKD China State Construction International Holdings Ltd 791,947 1.89% 44,500 HKD CK Hutchison Holdings Ltd 600,589 1.43%
848,000 HKD Dawnrays Pharmaceutical Holdings Ltd 658,686 1.57% 1,085,392 HKD Geely Automobile Holdings Ltd 578,392 1.38%
42,833 TWD Ginko International Co Ltd 567,247 1.35% 47,500 HKD Hengan International Group Co Ltd 448,632 1.07% 47,929 USD Himax Technologies Inc 399,249 0.95% 20,500 USD JD.com Inc 657,640 1.57%
292,000 HKD Minth Group Ltd 580,216 1.38% 185,600 HKD Sands China Ltd 635,812 1.52% 871,000 HKD SITC International Holdings Co Ltd 461,898 1.10% 78,750 HKD Tencent Holdings Ltd 1,549,553 3.69%
595,500 HKD Texhong Textile Group Ltd 450,262 1.07% Total for Cayman Islands 11,791,433 28.11%
China 1,801,000 HKD China Construction Bank Corp 1,233,941 2.94%
550,645 HKD China Petroleum & Chemical Corp 332,509 0.79% 1,631,230 HKD Industrial & Commercial Bank of China Ltd 985,025 2.35%
109,077 HKD Ping An Insurance Group Co of China Ltd 605,184 1.44% 688,000 HKD Shanghai Electric Group Co Ltd 364,852 0.87% 66,500 HKD Zhuzhou CSR Times Electric Co Ltd 386,547 0.92%
601,000 HKD Zoomlion Heavy Industry Science and Technology Co Ltd 224,108 0.54% Total for China 4,132,166 9.85%
Hong Kong 204,111 HKD AIA Group Ltd 1,227,265 2.92% 136,940 HKD China Mobile Ltd 1,546,053 3.68% 305,466 HKD China Taiping Insurance Holdings Co Ltd 945,933 2.25% 30,476 HKD CLP Holdings Ltd 258,940 0.62% 78,000 HKD Galaxy Entertainment Group Ltd 246,071 0.59% 39,800 HKD Hang Seng Bank Ltd 757,462 1.81%
650,934 HKD Lenovo Group Ltd 660,994 1.58% 1,260,000 HKD Shun Tak Holdings Ltd 474,722 1.13%
65,000 HKD Wharf Holdings Ltd 360,635 0.86% Total for Hong Kong 6,478,075 15.44%
Indonesia 404,500 IDR Indofood CBP Sukses Makmur Tbk PT 395,403 0.94%
Total for Indonesia 395,403 0.94%
Malaysia 822,900 MYR AirAsia Bhd 247,243 0.59%

Standard Life Investments Global SICAV Société d'Investissement à Capital Variable
118
Asian Equities Fund Schedule of Investments (expressed in USD) (continued) as at 31 December 2015
Quantity/ Market Value % of
Nominal Value Currency Name of Securities USD Net Assets
Transferable securities and money market instruments admitted to an official exchange listing (continued)
Malaysia (continued) 153,676 MYR Cahya Mata Sarawak Bhd 183,616 0.44% 798,100 MYR My EG Services Bhd 803,025 1.91%
Total for Malaysia 1,233,884 2.94%
Papua New Guinea 77,800 AUD Oil Search Ltd 381,327 0.91%
Total for Papua New Guinea 381,327 0.91%
Philippines 804,600 PHP Ayala Land Inc 589,065 1.40%
Total for Philippines 589,065 1.40%
Singapore 247,600 SGD CapitaLand Ltd 585,783 1.40% 65,800 SGD DBS Group Holdings Ltd 775,574 1.85%
141,000 SGD Singapore Telecommunications Ltd 365,448 0.87% Total for Singapore 1,726,805 4.12%
South Korea 3,936 KRW Hyundai Department Store Co Ltd 424,633 1.01%
13,743 KRW Hyundai Development Co-Engineering & Construction 454,760 1.08% 2,488 KRW Hyundai Mobis Co Ltd 523,041 1.25%
44,400 USD KT Corp 529,248 1.26% 2,109 KRW LG Chem Ltd - Pref 444,265 1.06% 2,342 KRW POSCO 332,560 0.79% 3,335 KRW S&T Motiv Co Ltd 244,035 0.58% 2,269 KRW Samsung Electronics Co Ltd 2,438,224 5.81%
425 KRW Samsung Electronics Co Ltd - Pref 395,442 0.94% 13,171 KRW Samsung Securities Co Ltd 468,969 1.12% 23,975 KRW Shinhan Financial Group Co Ltd 808,674 1.93% 1,289 KRW SK Telecom Co Ltd 236,902 0.57%
18,205 KRW Woory Industrial Co Ltd 434,728 1.04% Total for South Korea 7,735,481 18.44%
Taiwan 109,826 TWD Chipbond Technology Corp 158,986 0.38% 123,000 TWD Formosa Plastics Corp 288,337 0.69%
8,000 TWD Hermes Microvision Inc 291,047 0.69% 466,878 TWD Hon Hai Precision Industry Co Ltd 1,148,469 2.74% 39,887 TWD PChome Online Inc 399,514 0.95%
173,935 TWD Taiwan Fertilizer Co Ltd 227,963 0.54% 532,313 TWD Taiwan Semiconductor Manufacturing Co Ltd 2,317,435 5.53%
Total for Taiwan 4,831,751 11.52%
Thailand 102,863 THB Bangkok Bank PCL 441,638 1.05% 412,200 THB Supalai PCL 208,477 0.50%
Total for Thailand 650,115 1.55%
Total transferable securities and money market instruments admitted to an official exchange listing 40,966,709 97.66%

Standard Life Investments Global SICAV Société d'Investissement à Capital Variable
119
Asian Equities Fund Schedule of Investments (expressed in USD) (continued) as at 31 December 2015
Quantity/ Market Value % of
Nominal Value Currency Name of Securities USD Net Assets
Transferable securities and money market instruments dealt in on another regulated market
Cayman Islands 216,000 HKD China Metal Recycling Holdings Ltd1 – –%
Total for Cayman Islands – –%
Total transferable securities and money market instruments dealt in on another regulated market – –%
Total investments 40,966,709 97.66% Cash and cash equivalents 1,001,549 2.39% Other net liabilities (19,664) (0.05%) Total net assets 41,948,594 100.00%
1 suspended/delisted security
Analysis of Investments as % of total assets Transferable securities and money market instruments admitted to an official exchange listing 97.36%Other assets 2.64%Total assets 100.00% The accompanying notes form an integral part of these financial statements.

Standard Life Investments Global SICAV Société d'Investissement à Capital Variable
120
China Equities Fund Sub-fund Objective The objective of the Sub-fund is to achieve long-term growth in the share price through capital appreciation of the underlying equity portfolio.
In accordance with the investment objective described above, the Sub-fund may invest in equity related securities, which may included preference shares, debt securities convertible into common shares, warrants on transferable securities and other equity linked securities.
Investment Policy The current policy is to invest in equities and equity related securities of corporations domiciled in the People’s Republic of China or companies that derive a significant proportion of their revenues or profits from Chinese operations or have a significant proportion of their assets there.
Performance Review The China Equities Fund returned -8.7% over the period, compared with the MSCI China index return of -7.6%.* The Sub-fund underperformed its benchmark index during the period. Detractors from performance included VIPShop, whose shares were impacted by a short seller’s report combined with slight top-line growth deceleration. Gaming firm Rexlot also fell when the Chinese government began its clean-up of the internet lottery sector – this included the suspension of all web-based betting in China. The timing of when internet licences will be given out is still uncertain, but we believe Rexlot should be well-placed to benefit. Construction machinery firm Zoomlion had a negative impact, as demand remained lacklustre. The market was also unsettled by the weak nature of the company’s balance sheet. More positively, the Sub-fund’s position in knitwear manufacturer Shenzou International added value. Its positive progress in Cambodia and Vietnam reiterated its ability to garner new clients and improve product mix. Owning shares in railway rolling stock manufacturer Zhuzhou CSR was also beneficial, as new business continued to flow through. JD.com also made a positive contribution. *Sub-fund performance has been calculated over the stated period on the share price performance basis, based on the D Accumulation Shares in Euro and net of fees. Please note the index return is quoted gross and contains no adjustment for fees.
Outlook China continues to experience numerous changes, including government initiatives to promote market-driven resource allocation, SOE reforms to encourage mixed ownership and interest-rate cuts aimed at lessening the debt burden of corporates and reinvigorating the stock market. Meanwhile, the remedial measures taken to combat recent bouts of market volatility are not much different from those adopted by developed markets during similar periods, notably in the US and Japan. With the economy becoming increasingly consumption-driven, monetary policy looks set to be loosened further, while liquidity will be injected into the economy in order to boost growth. Against this backdrop, and once the market begins to understand a more flexible currency is part of the government’s financial liberalisation agenda, there are plenty of opportunities to invest in companies that are improving profitability, opening up new markets and moving up the value chain. As reforms gain momentum, investors should be willing to pay a much higher multiple for an emerging-market growth story - especially as the entrepreneurial spirit in China is still very much alive. Please note that the commitment approach has been used for risk measurement and calculation of global exposure for this Sub-fund.

Standard Life Investments Global SICAV Société d'Investissement à Capital Variable
121
China Equities Fund Schedule of Investments (expressed in USD) as at 31 December 2015
Quantity/ Market Value % of
Nominal Value Currency Name of Securities USD Net Assets
Transferable securities and money market instruments admitted to an official exchange listing
Bermuda 2,333,200 HKD China Gas Holdings Ltd 3,365,734 2.39%
40,225,000 HKD REXLot Holdings Ltd1 570,919 0.40% Total for Bermuda 3,936,653 2.79%
British Virgin Islands 20,186,000 HKD Tianhe Chemicals Group Ltd1 755,326 0.54%
Total for British Virgin Islands 755,326 0.54%
Cayman Islands 43,573 USD Alibaba Group Holding Ltd 3,559,043 2.53% 28,428 USD Baidu Inc 5,461,872 3.88%
2,386,000 HKD Best Pacific International Holdings Ltd 1,139,090 0.81% 2,930,928 HKD China Hongqiao Group Ltd 1,743,380 1.24%
46,875 USD China Lodging Group Ltd 1,467,187 1.04% 666,000 HKD China Mengniu Dairy Co Ltd 1,086,194 0.77%
1,886,707 HKD China Resources Land Ltd 5,501,725 3.91% 2,320,252 HKD China State Construction International Holdings Ltd 4,029,640 2.86% 6,394,674 HKD Geely Automobile Holdings Ltd 3,407,646 2.42%
263,500 HKD Hengan International Group Co Ltd 2,488,730 1.77% 119,136 USD JD.com Inc 3,821,883 2.71%
1,333,566 HKD Minth Group Ltd 2,649,850 1.88% 764,332 HKD Sands China Ltd 2,618,379 1.86% 179,000 HKD Shenzhou International Group Holdings Ltd 1,028,932 0.73%
5,578,958 HKD SITC International Holdings Co Ltd 2,958,564 2.10% 687,445 HKD Tencent Holdings Ltd 13,526,761 9.60%
5,310,000 HKD TK Group Holdings Ltd 1,507,312 1.07% Total for Cayman Islands 57,996,188 41.18%
China 3,000,000 HKD Angang Steel Co Ltd 1,215,450 0.86% 6,069,000 HKD Bank of China Ltd 2,709,438 1.92% 8,967,150 HKD China Construction Bank Corp 6,143,770 4.36%
853,000 HKD China Life Insurance Co Ltd 2,757,038 1.96% 6,102,369 HKD China Telecom Corp Ltd 2,866,064 2.04%
925,168 HKD CITIC Securities Co Ltd 2,163,041 1.54% 13,763,570 HKD Industrial & Commercial Bank of China Ltd 8,311,185 5.90% 1,555,500 HKD Ping An Insurance Group Co of China Ltd 8,630,272 6.13%
556,000 HKD Zhuzhou CSR Times Electric Co Ltd 3,231,883 2.29% 3,627,624 HKD Zoomlion Heavy Industry Science and Technology Co Ltd 1,352,714 0.96%
Total for China 39,380,855 27.96%
Hong Kong 629,342 HKD China Merchants Holdings International Co Ltd 2,001,657 1.42% 948,917 HKD China Mobile Ltd 10,713,276 7.60%
1,778,741 HKD China Overseas Land & Investment Ltd 6,242,630 4.43% 2,430,000 HKD China Traditional Chinese Medicine Co Ltd 1,642,947 1.17% 2,879,970 HKD China Unicom Hong Kong Ltd 3,511,606 2.49% 5,583,000 HKD CNOOC Ltd 5,813,359 4.13% 2,600,000 HKD CSPC Pharmaceutical Group Ltd 2,656,957 1.89%
805,923 HKD Galaxy Entertainment Group Ltd 2,542,485 1.80%

Standard Life Investments Global SICAV Société d'Investissement à Capital Variable
122
China Equities Fund Schedule of Investments (expressed in USD) (continued) as at 31 December 2015
Quantity/ Market Value % of
Nominal Value Currency Name of Securities USD Net Assets
Transferable securities and money market instruments admitted to an official exchange listing (continued)
Hong Kong (continued) 3,310,841 HKD Lenovo Group Ltd 3,362,011 2.39%
Total for Hong Kong 38,486,928 27.32%
Total transferable securities and money market instruments admitted to an official exchange listing 140,555,950 99.79%
Total investments 140,555,950 99.79% Cash and cash equivalents 398,673 0.28% Other net liabilities (106,444) (0.07%) Total net assets 140,848,179 100.00%
1 suspended/delisted security
Analysis of Investments as % of total assets Transferable securities and money market instruments admitted to an official exchange listing 99.65%Other assets 0.35%Total assets 100.00% The accompanying notes form an integral part of these financial statements.

Standard Life Investments Global SICAV Société d'Investissement à Capital Variable
123
Japanese Equities Fund Sub-fund Objective The objective of the Sub-fund is to achieve long-term growth in the share price through capital appreciation of the underlying equity portfolio.
In accordance with the investment objective described above, the Sub-fund may invest in equity related securities, which may include preference shares, debt securities convertible into common shares, warrants on transferable securities and other equity linked securities.
Investment Policy The current policy is to invest in equities and equity related securities of corporations domiciled in Japan, or companies that derive a significant proportion of their revenues or profits from Japanese operations or have a significant proportion of their assets there.
Performance Review The Japanese Equities Fund returned 10.6% (performance is calculated based on the D Accumulation Shares) over the period compared with the MSCI Japan Index, which returned 10.3%. The Sub-fund outperformed its benchmark index during the period. In the first half of the review period, the Sub-fund’s performance was supported by an overweight position in Murata Manufacturing. In particular, investors welcomed good earnings that were propelled higher by robust demand for its electric parts destined for products ranging from high-performance smartphones to automobiles. Leading retailer Ryohin Keikaku also added value after it announced a joint venture with India’s Reliance Brands. This will see the company open up stores across the country, selling a complete range of lifestyle products, including clothing, furniture and kitchen utensils. Less positively, NGK Spark Plug underperformed mainly due to an increase in the inventory of its gas emission filters for the auto sector in emerging markets, where demand has slowed. Elsewhere, Seiko Epson fell as the market was concerned about weaker guidance and a possible price war in the domestic printer market. As the year progressed, Nomura Research boosted returns. This followed the release of upbeat earnings numbers and an increase in its dividend, which were underpinned by rising domestic demand for IT services. Meiji Holdings also added value given strong sales and a successful price rise. In other developments, Yamaha benefited from rising earnings growth that was driven by cost reductions and improving emerging-market demand for musical instruments. Meanwhile, Mitsui Chemical gained value when it became clear that the fall in the oil price will be positive for its earnings. Detractors from overall returns included Rohm, as Chinese demand for smartphones, PCs and automobile slowed. Mitsui Fudosan was negatively affected by a construction scandal in Yokohama, a slowdown in housing starts and declining expectations for another round of QQE. Outlook Geopolitical matters, concerns over emerging-market and China growth, and tensions around North Korea will mean that the early months of 2016 are likely
to be volatile for Japanese equities. Other issues, such as Federal Reserve policy, will also influence equity prices. However, the long-term view for Japanese equities remains positive. Improving profitability driven by changing corporate attitudes and robust government policy should create opportunities.
Please note that the commitment approach has been used for risk measurement and calculation of global exposure for this Sub-fund.
This Sub-fund is not authorised in Hong Kong and is not available to Hong Kong residents.

Standard Life Investments Global SICAV Société d'Investissement à Capital Variable
124
Japanese Equities Fund Schedule of Investments (expressed in JPY) as at 31 December 2015
Quantity/ Market Value % of
Nominal Value Currency Name of Securities JPY Net Assets
Transferable securities and money market instruments admitted to an official exchange listing
Advertising 62,400 JPY Dentsu Inc 416,832,000 1.60%
Total for advertising 416,832,000 1.60%
Airlines
570,000 JPY ANA Holdings Inc 199,500,000 0.76% Total for airlines 199,500,000 0.76%
Auto manufacturers
138,600 JPY Fuji Heavy Industries Ltd 696,742,200 2.67% 145,300 JPY Mazda Motor Corp 366,737,200 1.40% 301,500 JPY Nissan Motor Co Ltd 385,769,250 1.48% 131,900 JPY Toyota Motor Corp 987,667,200 3.78%
Total for auto manufacturers 2,436,915,850 9.33%
Auto parts and equipment
70,600 JPY Nifco Inc 397,478,000 1.52% 23,900 JPY Toyota Industries Corp 156,067,000 0.60%
Total for auto parts and equipment 553,545,000 2.12%
Banks
408,000 JPY Fukuoka Financial Group Inc 246,840,000 0.95% 1,223,500 JPY Mitsubishi UFJ Financial Group Inc 926,311,850 3.55%
51,000 JPY Sumitomo Mitsui Financial Group Inc 234,906,000 0.90% Total for banks 1,408,057,850 5.40%
Building materials
67,500 JPY Daikin Industries Ltd 600,817,500 2.30% Total for building materials 600,817,500 2.30%
Chemicals
170,100 JPY Mitsubishi Chemical Holdings Corp 131,708,430 0.50% 506,000 JPY Mitsui Chemicals Inc 274,252,000 1.05% 461,000 JPY Toray Industries Inc 520,930,000 2.00%
Total for chemicals 926,890,430 3.55%
Commercial services
26,300 JPY GMO Payment Gateway Inc 152,277,000 0.58% 116,700 JPY Park24 Co Ltd 341,814,300 1.31% 25,400 JPY Sohgo Security Services Co Ltd 144,780,000 0.55%
Total for commercial services 638,871,300 2.44%
Computers
93,930 JPY Nomura Research Institute Ltd 438,653,100 1.68% 33,400 JPY NS Solutions Corp 92,518,000 0.35%
Total for computers 531,171,100 2.03%
Cosmetics and personal Care
97,500 JPY Kao Corp 609,862,500 2.33% 102,300 JPY Pigeon Corp 303,319,500 1.16% 46,300 JPY Pola Orbis Holdings Inc 371,326,000 1.42%
Total for Cosmetics and personal Care 1,284,508,000 4.91%

Standard Life Investments Global SICAV Société d'Investissement à Capital Variable
125
Japanese Equities Fund Schedule of Investments (expressed in JPY) (continued) as at 31 December 2015
Quantity/ Market Value % of
Nominal Value Currency Name of Securities JPY Net Assets
Transferable securities and money market instruments admitted to an official exchange listing (continued)
Distribution and wholesale 164,500 JPY Mitsubishi Corp 333,606,000 1.28%
Total for distribution and wholesale 333,606,000 1.28%
Diversified financial services
286,100 JPY ORIX Corp 490,804,550 1.88% Total for diversified financial services 490,804,550 1.88%
Electrical components and equipment
114,500 JPY Electric Power Development Co Ltd 495,212,500 1.90% 712,000 JPY Furukawa Electric Co Ltd 182,984,000 0.70% 70,200 JPY Nidec Corp 620,357,400 2.37%
Total for electrical components and equipment 1,298,553,900 4.97%
Electrical equipment
10,600 JPY Keyence Corp 711,048,000 2.72% 39,800 JPY Murata Manufacturing Co Ltd 699,286,000 2.68%
Total for electrical equipment 1,410,334,000 5.40%
Electronics
7,500 JPY Alps Electric Co Ltd 24,862,500 0.10% 24,200 JPY Hamamatsu Photonics KK 80,707,000 0.31% 75,600 JPY Hoya Corp 376,563,600 1.44%
Total for electronics 482,133,100 1.85%
Engineering and construction
331,000 JPY Kumagai Gumi Co Ltd 115,519,000 0.44% 113,000 JPY Taisei Corp 90,400,000 0.35%
Total for engineering and construction 205,919,000 0.79%
Financial services
105,700 JPY Hitachi Capital Corp 346,167,500 1.33% 135,600 JPY Nomura Holdings Inc 92,085,960 0.35%
Total for financial services 438,253,460 1.68%
Food
212,000 JPY Ajinomoto Co Inc 610,454,000 2.34% 46,600 JPY Calbee Inc 239,524,000 0.92% 33,000 JPY Ezaki Glico Co Ltd 216,150,000 0.83% 29,100 JPY MEIJI Holdings Co Ltd 292,455,000 1.12%
121,500 JPY Seven & I Holdings Co Ltd 674,325,000 2.58% 19,300 JPY Yakult Honsha Co Ltd 115,028,000 0.44%
Total for food 2,147,936,000 8.23%
Hand and machine tools
19,100 JPY Disco Corp 219,650,000 0.84% 14,100 JPY SMC Corp 447,957,000 1.71%
Total for hand and machine tools 667,607,000 2.55%
Healthcare-products
122,000 JPY Shimadzu Corp 249,490,000 0.96% Total for healthcare-products 249,490,000 0.96%

Standard Life Investments Global SICAV Société d'Investissement à Capital Variable
126
Japanese Equities Fund Schedule of Investments (expressed in JPY) (continued) as at 31 December 2015
Quantity/ Market Value % of
Nominal Value Currency Name of Securities JPY Net Assets
Transferable securities and money market instruments admitted to an official exchange listing (continued)
Home builders 97,100 JPY Daiwa House Industry Co Ltd 340,141,300 1.30%
Total for home builders 340,141,300 1.30%
Home furnishings
45,400 JPY Hoshizaki Electric Co Ltd 343,224,000 1.31% Total for Home Furnishings 343,224,000 1.31%
Insurance
186,600 JPY Dai-ichi Life Insurance Co Ltd 379,731,000 1.45% Total for insurance 379,731,000 1.45%
Internet
157,900 JPY M3 Inc 398,223,800 1.52% 334,400 JPY Rakuten Inc 469,163,200 1.80%
Total for internet 867,387,000 3.32%
Leisure time
113,900 JPY HIS Co Ltd 463,003,500 1.77% 136,300 JPY Yamaha Corp 401,948,700 1.54% 128,800 JPY Yamaha Motor Co Ltd 353,427,200 1.35%
Total for leisure time 1,218,379,400 4.66%
Lodging
72,300 JPY Resorttrust Inc 231,721,500 0.89% Total for lodging 231,721,500 0.89%
Machinery
29,300 JPY FANUC Corp 617,644,000 2.36% Total for machinery 617,644,000 2.36%
Machinery-construction & mining
206,000 JPY Mitsubishi Electric Corp 264,195,000 1.01% Total for machinery-construction & mining 264,195,000 1.01%
Metal fabricate/hardware
219,300 JPY MISUMI Group Inc 369,739,800 1.42% Total for metal fabricate and hardware 369,739,800 1.42%
Mining (non precious)
400 JPY Dowa Holdings Co Ltd 350,400 0.00% 157,000 JPY Sumitomo Metal Mining Co Ltd 232,281,500 0.89%
Total for mining (non precious) 232,631,900 0.89%
Pharmaceuticals
138,600 JPY Chugai Pharmaceutical Co Ltd 587,664,000 2.25% 39,900 JPY Shionogi & Co Ltd 219,569,700 0.84%
Total for pharmaceuticals 807,233,700 3.09%
Real estate
126,000 JPY Mitsui Fudosan Co Ltd 385,056,000 1.47% Total for real estate 385,056,000 1.47%
Retail
14,200 JPY Cosmos Pharmaceutical Corp 271,220,000 1.04%

Standard Life Investments Global SICAV Société d'Investissement à Capital Variable
127
Japanese Equities Fund Schedule of Investments (expressed in JPY) (continued) as at 31 December 2015
Quantity/ Market Value % of
Nominal Value Currency Name of Securities JPY Net Assets
Transferable securities and money market instruments admitted to an official exchange listing (continued)
Retail (continued) 85,600 JPY Don Quijote Holdings Co Ltd 365,940,000 1.40% 14,700 JPY Ryohin Keikaku Co Ltd 362,208,000 1.39%
Total for retail 999,368,000 3.83%
Software
115,000 JPY COLOPL Inc 275,540,000 1.06% Total for software 275,540,000 1.06%
Telecommunications
143,700 JPY Nippon Telegraph & Telephone Corp 694,933,200 2.66% 40,000 JPY SoftBank Group Corp 245,560,000 0.94%
Total for telecommunications 940,493,200 3.60%
Toys/Games/Hobbies
4,800 JPY Nintendo Co Ltd 80,424,000 0.31% Total for Toys/Games/Hobbies 80,424,000 0.31%
Transportation
21,300 JPY Central Japan Railway Co 460,080,000 1.76% 117,500 JPY Seibu Holdings Inc 291,517,500 1.12%
Total for transportation 751,597,500 2.88%
Total of transferable securities and money market instruments admitted to an official exchange listing 25,826,253,340 98.88%
Total investments 25,826,253,340 98.88% Cash and cash equivalents 283,976,077 1.09% Bank overdraft and other net assets 8,755,046 0.03% Total net assets 26,118,984,463 100.00%
Analysis of Investments as % of total assets Transferable securities and money market instruments admitted to an official exchange listing 98.83%Other assets 1.17%Total assets 100.00% The accompanying notes form an integral part of these financial statements.

Standard Life Investments Global SICAV Société d'Investissement à Capital Variable
128
Japanese Equity High Alpha Fund Sub-fund Objective The objective of the Sub-fund is to achieve long-term growth in the share price through capital appreciation of the underlying equity portfolio.
Investment Policy The Sub-fund will achieve this objective primarily through investment in equities and equity related securities of corporations domiciled in Japan, or companies that derive a significant proportion of their revenues or profits from Japanese operations or have a significant proportion of their assets there.
Performance Review The Sub-fund launched on 12 May 2015 and was designed to mirror the philosophy and process of the Japanese Equity Growth Fund. Since its inception, the Sub-fund has risen by 0.3% (performance is calculated based on the D Accumulation Shares) compared with a -3.9% return for the MSCI Japan Index. In the initial stages of the review period, the Sub-fund’s holding in Murata Manufacturing boosted returns. The company, which makes electric parts used in everything from high-end smartphones to automobiles, was rewarded after it announced better-than-expected results, propelled by increased demand for its products. Leading retailer Ryohin Keikaku found its shares in demand after it announced a joint venture with India’s Reliance Brands. This will see the company open up stores across the country, selling a complete range of lifestyle products, including clothing, furniture and kitchen utensils. Less positively, NGK Spark Plug underperformed mainly due to an increase in the inventory of its gas emission filters for the auto market in emerging markets, where demand has slowed. Mazda Motor also adversely affected the Sub-fund’s performance. This came in the wake of lower-than-expected quarterly results that were driven by euro and rouble weakness, as well as slowing US sales momentum. As the year progressed, Mitsui Chemical added value, as the fall in the oil price has been recognised as positive for its earnings. Meiji Holdings also proved supportive given strong sales and a successful price rise. Yamaha benefited from rising earnings growth that was driven by cost reductions and improving emerging-market demand for musical instruments. Rohm was negative for returns, as Chinese demand for smartphones, PCs and automobile slowed. There was a similar story at Murata, which also underperformed due to weaker smartphone sales. In other developments, consumer goods company Pigeon was impacted by its large business exposure to China. Outlook Geopolitical matters, concerns over emerging-market and China growth, and tensions around North Korea will mean that the early months of 2016 are likely to be volatile for Japanese equities. Other issues, such as Federal Reserve policy, will also influence equity prices. However, the long-term view for Japanese equities remains positive. Improving profitability driven by changing corporate attitudes and robust government policy should create opportunities
Please note that the commitment approach has been used for risk measurement and calculation of global exposure for this Sub-fund. This Sub-fund is not authorised in Hong Kong and is not available to Hong Kong residents.

Standard Life Investments Global SICAV Société d'Investissement à Capital Variable
129
Japanese Equity High Alpha Fund Schedule of Investments (expressed in JPY) as at 31 December 2015
Quantity/ Market Value % of
Nominal Value Currency Name of Securities JPY Net Assets
Transferable securities and money market instruments admitted to an official exchange listing
Advertising 8,300 JPY Dentsu Inc 55,444,000 1.05%
Total for advertising 55,444,000 1.05%
Auto manufacturers
59,400 JPY Mazda Motor Corp 149,925,600 2.83% 118,100 JPY Nissan Motor Co Ltd 151,108,950 2.85%
Total for auto manufacturers 301,034,550 5.68%
Auto parts and equipment
17,800 JPY Nifco Inc 100,214,000 1.89% Total for auto parts and equipment 100,214,000 1.89%
Banks
298,200 JPY Mitsubishi UFJ Financial Group Inc 225,767,220 4.26% Total for banks 225,767,220 4.26%
Building materials
15,000 JPY Daikin Industries Ltd 133,515,000 2.52% Total for building materials 133,515,000 2.52%
Chemicals
274,000 JPY Mitsui Chemicals Inc 148,508,000 2.80% 121,000 JPY Toray Industries Inc 136,730,000 2.58%
Total for chemicals 285,238,000 5.38%
Commercial services
9,800 JPY GMO Payment Gateway Inc 56,742,000 1.07% Total for commercial services 56,742,000 1.07%
Computers
24,870 JPY Nomura Research Institute Ltd 116,142,900 2.19% Total for computers 116,142,900 2.19%
Cosmetics and personal Care
25,700 JPY Kao Corp 160,753,500 3.03% 34,000 JPY Pigeon Corp 100,810,000 1.90%
Total for Cosmetics and personal Care 261,563,500 4.93%
Electrical components and equipment
106,000 JPY Fujikura Ltd 69,854,000 1.32% 15,900 JPY Nidec Corp 140,508,300 2.65%
Total for electrical components and equipment 210,362,300 3.97%
Electrical equipment
2,700 JPY Keyence Corp 181,116,000 3.41% 6,300 JPY Murata Manufacturing Co Ltd 110,691,000 2.09%
Total for electrical equipment 291,807,000 5.50%
Electronics
17,300 JPY Alps Electric Co Ltd 57,349,500 1.08% 23,000 JPY Horiba Ltd 107,985,000 2.04%
Total for electronics 165,334,500 3.12%
Engineering and construction
27,000 JPY JGC Corp 50,301,000 0.95%

Standard Life Investments Global SICAV Société d'Investissement à Capital Variable
130
Japanese Equity High Alpha Fund Schedule of Investments (expressed in JPY) (continued) as at 31 December 2015
Quantity/ Market Value % of
Nominal Value Currency Name of Securities JPY Net Assets
Transferable securities and money market instruments admitted to an official exchange listing (continued)
Engineering and construction (continued) 23,000 JPY Kumagai Gumi Co Ltd 8,027,000 0.15%
148,000 JPY Taisei Corp 118,400,000 2.23% Total for engineering and construction 176,728,000 3.33%
Financial services
41,700 JPY Hitachi Capital Corp 136,567,500 2.57% Total for financial services 136,567,500 2.57%
Food
62,000 JPY Ajinomoto Co Inc 178,529,000 3.37% 28,100 JPY Seven & I Holdings Co Ltd 155,955,000 2.94%
Total for food 334,484,000 6.31%
Hand and machine tools
5,000 JPY Disco Corp 57,500,000 1.08% Total for hand and machine tools 57,500,000 1.08%
Healthcare-products
14,800 JPY Asahi Intecc Co Ltd 82,732,000 1.56% Total for healthcare-products 82,732,000 1.56%
Home builders
23,000 JPY Daiwa House Industry Co Ltd 80,569,000 1.52% Total for home builders 80,569,000 1.52%
Home furnishings
14,100 JPY Hoshizaki Electric Co Ltd 106,596,000 2.01% Total for Home Furnishings 106,596,000 2.01%
Insurance
64,300 JPY Dai-ichi Life Insurance Co Ltd 130,850,500 2.47% Total for insurance 130,850,500 2.47%
Internet
52,200 JPY M3 Inc 131,648,400 2.48% Total for internet 131,648,400 2.48%
Leisure time
23,300 JPY HIS Co Ltd 94,714,500 1.78% 42,000 JPY Yamaha Motor Co Ltd 115,248,000 2.17%
Total for leisure time 209,962,500 3.95%
Lodging
26,200 JPY Resorttrust Inc 83,971,000 1.58% Total for lodging 83,971,000 1.58%
Machinery
7,400 JPY FANUC Corp 155,992,000 2.94% Total for machinery 155,992,000 2.94%
Machinery-construction & mining
46,600 JPY Hitachi Construction Machinery Co Ltd 88,446,800 1.67% Total for machinery-construction & mining 88,446,800 1.67%

Standard Life Investments Global SICAV Société d'Investissement à Capital Variable
131
Japanese Equity High Alpha Fund Schedule of Investments (expressed in JPY) (continued) as at 31 December 2015
Quantity/ Market Value % of
Nominal Value Currency Name of Securities JPY Net Assets
Transferable securities and money market instruments admitted to an official exchange listing (continued)
Machinery-diversified 19,100 JPY Harmonic Drive Systems Inc 50,347,600 0.95%
Total for machinery-diversified 50,347,600 0.95%
Metal fabricate/hardware
70,300 JPY MISUMI Group Inc 118,525,800 2.23% Total for metal fabricate and hardware 118,525,800 2.23%
Pharmaceuticals
18,900 JPY Chugai Pharmaceutical Co Ltd 80,136,000 1.51% 14,800 JPY Shionogi & Co Ltd 81,444,400 1.53%
Total for pharmaceuticals 161,580,400 3.04%
Real estate
69,000 JPY Mitsui Fudosan Co Ltd 210,864,000 3.97% Total for real estate 210,864,000 3.97%
Retail
9,800 JPY Kusuri No Aoki Co Ltd 58,016,000 1.09% 44,000 JPY Marui Group Co Ltd 87,032,000 1.64% 5,400 JPY Ryohin Keikaku Co Ltd 133,056,000 2.51%
15,900 JPY Valor Holdings Co Ltd 45,394,500 0.86% Total for retail 323,498,500 6.10%
Telecommunications
39,200 JPY Nippon Telegraph & Telephone Corp 189,571,200 3.57% Total for telecommunications 189,571,200 3.57%
Toys/Games/Hobbies
4,700 JPY Nintendo Co Ltd 78,748,500 1.48% Total for Toys/Games/Hobbies 78,748,500 1.48%
Transportation
4,300 JPY Central Japan Railway Co 92,880,000 1.75% 25,000 JPY Nishi-Nippon Railroad Co Ltd 17,800,000 0.33% 44,400 JPY Seibu Holdings Inc 110,156,400 2.08%
Total for transportation 220,836,400 4.16%
Total of transferable securities and money market instruments admitted to an official exchange listing 5,333,185,070 100.53%
Total investments 5,333,185,070 100.53% Cash and cash equivalents 106,811,207 2.01% Other net liabilities (135,002,604) (2.54%) Total net assets 5,304,993,673 100.00%
Analysis of Investments as % of total assets Transferable securities and money market instruments admitted to an official exchange listing 96.10%Other assets 3.90%Total assets 100.00% The accompanying notes form an integral part of these financial statements.

Standard Life Investments Global SICAV Société d'Investissement à Capital Variable
132
European Equities Fund Sub-fund Objective The objective of the Sub-fund is to achieve long-term growth in the share price through capital appreciation of the underlying equity portfolio.
In accordance with the investment objective described above, the Sub-fund may invest in equity related securities, which may include preference shares, debt securities convertible into common shares, warrants on transferable securities and other equity linked securities.
Investment Policy The current policy is to invest in equities and equity related securities of corporations domiciled in European countries (which might include emerging markets of Europe), or companies that derive a significant proportion of their revenues or profits from European operations or have a significant proportion of their assets there.
Performance Review The European Equities Fund returned 10.3% over the period, compared with MSCI Europe index return of 8.8%.* In the first half of the review period, the Sub-fund’s performance helped by its position in pharmaceutical manufacturer Novo Nordisk, when it gained approval for a key new drug. The Sub-fund’s performance was also supported by its zero weighting in Royal Dutch Shell. Our lack of exposure to this oil major was dictated by the uncertain environment for oil prices, which put pressure on cashflow, capital expenditure and dividends. Other contributors included French firm Ingenico, which manufactures card readers and associated processing services. The company’s share price rose as it benefited from the shift towards cashless payments. Notable detractors at this time included Rio Tinto, which was under pressure due to the lower iron-ore price; and bakery products company Aryzta, given lower-than-expected growth in the US. Deeper into the year Assa Abloy boosted returns as organic revenue growth was more resilient than its peers. A positive contribution to performance also came from the Sub-fund’s overweight position in Ryanair. The airline is benefiting from both oil-price weakness and strong passenger data. Wirecard was strong as its second quarter results showed an improvement in cash conversion and the feared bid for Worldpay did not materialise. On the downside, the market looked positively on brewer ABI’s takeover of SAB and the potential for synergies thereafter, which was negative for the Sub-fund as we had no exposure to the stock. LafargeHolcim was a weak performer when market doubts over emerging-market exposure outweighed the company’s positive attributes. *Sub-fund Performance has been calculated over the stated period on the share price performance basis, based on the D Accumulation Shares in Euro and net of fees. Please note the index return is quoted gross and contains no adjustment for fees. Outlook Despite the recent disappointment following the European Central Bank’s (ECB) latest monetary policy decision, the outlook for European equities remains positive. Economic data continues to be relatively robust with improving GDP and falling unemployment across the region. As a significant net importer of oil, Europe should continue to gain from low oil prices as consumers benefit from cheaper petrol and manufacturing costs. Interest rate rises also seem a
long way off which should remain supportive of a recovering economy. Although we have experienced an anaemic recovery in earnings over the last few years, European companies are now in a better shape. This coupled with the potential for further monetary easing and a weaker Euro should help drive earnings growth. That said, the political landscape remains a significant concern which could create short-term volatility as populist politics continues to increase. Ultimately, we believe that company fundamentals will be the key drivers of returns and that European equities currently represent good value and are attractively priced in a global context. As always, we will navigate any periods of macroeconomic uncertainty by focusing on our bottom-up stock picking approach. Please note that the commitment approach has been used for risk measurement and calculation of global exposure for this Sub-fund.
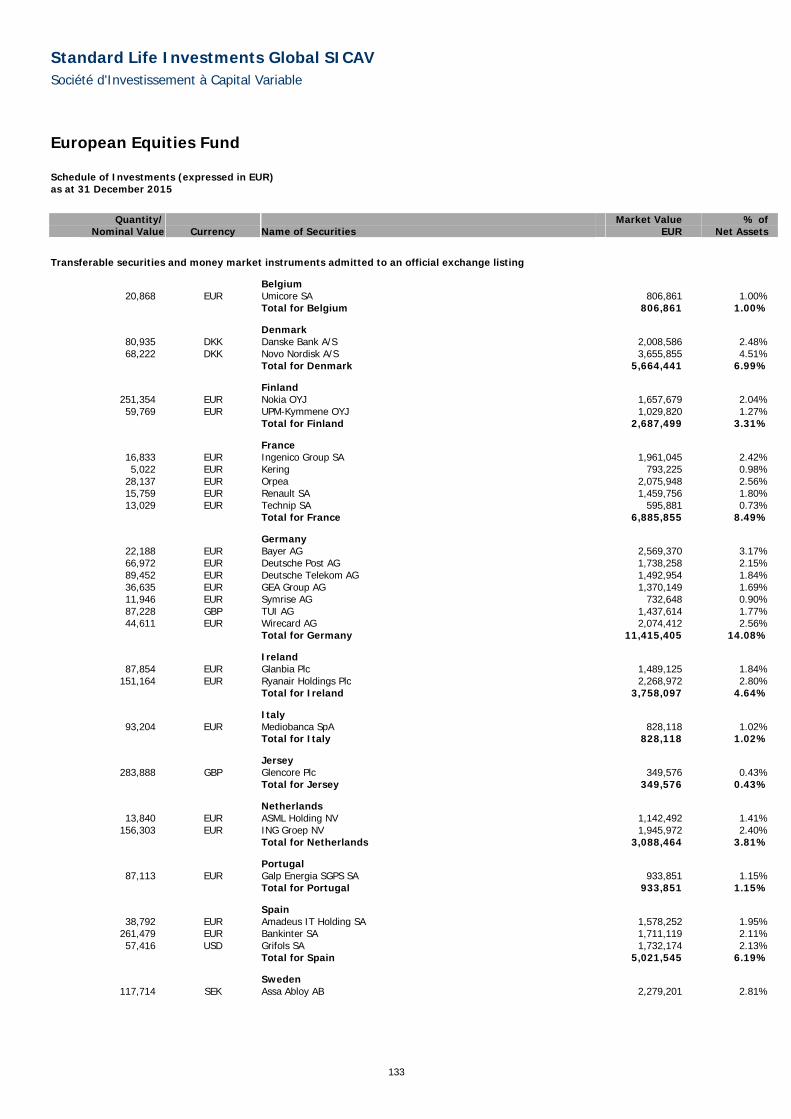
Standard Life Investments Global SICAV Société d'Investissement à Capital Variable
133
European Equities Fund Schedule of Investments (expressed in EUR) as at 31 December 2015
Quantity/ Market Value % of
Nominal Value Currency Name of Securities EUR Net Assets
Transferable securities and money market instruments admitted to an official exchange listing
Belgium 20,868 EUR Umicore SA 806,861 1.00%
Total for Belgium 806,861 1.00%
Denmark 80,935 DKK Danske Bank A/S 2,008,586 2.48% 68,222 DKK Novo Nordisk A/S 3,655,855 4.51%
Total for Denmark 5,664,441 6.99%
Finland 251,354 EUR Nokia OYJ 1,657,679 2.04% 59,769 EUR UPM-Kymmene OYJ 1,029,820 1.27%
Total for Finland 2,687,499 3.31%
France 16,833 EUR Ingenico Group SA 1,961,045 2.42% 5,022 EUR Kering 793,225 0.98%
28,137 EUR Orpea 2,075,948 2.56% 15,759 EUR Renault SA 1,459,756 1.80% 13,029 EUR Technip SA 595,881 0.73%
Total for France 6,885,855 8.49%
Germany 22,188 EUR Bayer AG 2,569,370 3.17% 66,972 EUR Deutsche Post AG 1,738,258 2.15% 89,452 EUR Deutsche Telekom AG 1,492,954 1.84% 36,635 EUR GEA Group AG 1,370,149 1.69% 11,946 EUR Symrise AG 732,648 0.90% 87,228 GBP TUI AG 1,437,614 1.77% 44,611 EUR Wirecard AG 2,074,412 2.56%
Total for Germany 11,415,405 14.08%
Ireland 87,854 EUR Glanbia Plc 1,489,125 1.84%
151,164 EUR Ryanair Holdings Plc 2,268,972 2.80% Total for Ireland 3,758,097 4.64%
Italy 93,204 EUR Mediobanca SpA 828,118 1.02%
Total for Italy 828,118 1.02%
Jersey 283,888 GBP Glencore Plc 349,576 0.43%
Total for Jersey 349,576 0.43%
Netherlands 13,840 EUR ASML Holding NV 1,142,492 1.41%
156,303 EUR ING Groep NV 1,945,972 2.40% Total for Netherlands 3,088,464 3.81%
Portugal 87,113 EUR Galp Energia SGPS SA 933,851 1.15%
Total for Portugal 933,851 1.15%
Spain 38,792 EUR Amadeus IT Holding SA 1,578,252 1.95%
261,479 EUR Bankinter SA 1,711,119 2.11% 57,416 USD Grifols SA 1,732,174 2.13%
Total for Spain 5,021,545 6.19%
Sweden 117,714 SEK Assa Abloy AB 2,279,201 2.81%

Standard Life Investments Global SICAV Société d'Investissement à Capital Variable
134
European Equities Fund Schedule of Investments (expressed in EUR) (continued) as at 31 December 2015
Quantity/ Market Value % of
Nominal Value Currency Name of Securities EUR Net Assets
Transferable securities and money market instruments admitted to an official exchange listing (continued)
Sweden (continued) 104,315 SEK Nordea Bank AB 1,058,676 1.31%
Total for Sweden 3,337,877 4.12%
Switzerland 15,454 EUR Aryzta AG 730,147 0.90% 27,879 EUR LafargeHolcim Ltd 1,302,507 1.61% 47,040 CHF Nestle SA 3,232,390 3.99% 12,400 CHF Roche Holding AG 3,159,137 3.90% 5,766 CHF Zurich Insurance Group AG 1,373,333 1.69%
Total for Switzerland 9,797,514 12.09%
United Kingdom 163,069 GBP ARM Holdings Plc 2,305,840 2.84% 107,710 GBP Ashtead Group Plc 1,640,319 2.02% 145,425 GBP Aviva Plc 1,021,247 1.26% 129,038 GBP Babcock International Group Plc 1,784,241 2.20% 243,721 GBP Barratt Developments Plc 2,076,392 2.56% 11,727 GBP Bellway Plc 452,622 0.56%
363,949 GBP BP Plc 1,753,420 2.16% 320,566 GBP BT Group Plc 2,057,906 2.54% 72,623 GBP IMI Plc 851,474 1.05%
117,556 GBP Inchcape Plc 1,255,905 1.55% 2,526,987 GBP Lloyds Banking Group Plc 2,512,952 3.10%
50,988 GBP Rio Tinto Plc 1,373,617 1.70% 243,866 GBP Sage Group Plc 2,002,953 2.47% 28,819 GBP Unilever Plc 1,147,809 1.42%
830,261 GBP Vodafone Group Plc 2,497,176 3.08% Total for United Kingdom 24,733,873 30.51%
Total transferable securities and money market instruments admitted to an official exchange listing 79,308,976 97.83%
Transferable securities and money market instruments dealt in on another regulated market
Belgium 4,342 EUR Anheuser-Busch InBev NV1 – –%
Total for Belgium – –%
Total transferable securities and money market instruments dealt in on another regulated market – –%
Total investments 79,308,976 97.83% Cash and cash equivalents 1,740,477 2.15% Other net assets 17,605 0.02% Total net assets 81,067,058 100.00%
1 suspended/delisted security
Analysis of Investments as % of total assets Transferable securities and money market instruments admitted to an official exchange listing 97.76%Other assets 2.24%Total assets 100.00% The accompanying notes form an integral part of these financial statements.

Standard Life Investments Global SICAV Société d'Investissement à Capital Variable
135
Global REIT Focus Fund Sub-fund Objective The investment objective of the Sub-fund is to maximise total return from income and capital appreciation by investing primarily in listed closed ended real estate investment trusts (“REITs”) or securities and companies principally engaged in real estate activities on a global basis.
In accordance with the investment objective described above, the Sub-fund may invest in equity related securities, which may include preference shares, debt securities, convertible into common shares, warrants on transferable securities and other equity linked securities.
Investment Policy A REIT is a company usually listed on a stock exchange that owns and manages predominantly income-producing property, either commercial or residential. Most of its taxable income is distributed to shareholders through dividends, in return for which the company is largely exempt from corporation tax. REITs are designed to offer investors income and capital appreciation from rented property assets in a tax-efficient way, with a return over the time more closely aligned with direct property investment. This is achieved by taking away the “double-taxation” (corporation tax plus the tax on dividends) of real estate funds. REITs allow investors to invest in property as an asset class by creating a more liquid and tax-efficient vehicle than solely investing in the direct property markets.
Performance Review The Sub-fund returned 8.3% over the period, compared to a total return of 11.5% from the FTSE EPRA NAREIT Developed Index*.
An off-benchmark position in US C-corp hotels, particularly Starwood Hotels, was negative for performance, with headwinds affecting the sector outweighing gains resulting from a takeover bid for Starwood. A preference for US hotel REITs also proved detrimental, as concerns around global economic growth had a negative impact on the sector. Finally, an overweight holding in US CBD office REITs was negative, as was stock selection within the sector.
On the upside, stock selection within the Japanese REIT (JREIT) market made the largest positive contribution towards returns over the period, particularly our holdings in hotel JREIT Invincible. Elsewhere, an underweight position (compared to the benchmark index) in Canada boosted relative returns, as worries over the domestic economy hindered the listed real estate market. In Hong Kong, a slight underweight position in developers was a further positive, as the sector delivered negative performance.
*Sub-fund performance has been calculated over the stated period on the share price performance basis, based on the A Accumulation Shares and net of fees. Please note the index return is quoted gross and contains no adjustment for fees.
Outlook While investors continue to search for yield, the conditions remain in place to benefit real estate as an asset class. We are mindful of the potential impact a steepening interest rate curve could have on real estate markets. However, we expect stronger real estate fundamentals to play more of a role as the asset class enjoys higher levels of rental growth and development gains in most markets.
At a regional level, pricing in European real estate markets will continue to recover thanks to the European Central Bank’s accommodative stance. However, we do still have concerns around unresolved structural problems within the Eurozone. In Asia, we believe that a looser monetary policy in Japan will remain in place and the limited construction supply pipeline will prove beneficial for real estate securities. Finally, fundamentals in the UK market should remain strong but we are aware of the potential impact that future interest rate rises will have on REITs.
Please note that the commitment approach has been used for risk measurement and calculation of global exposure for this Sub-fund.

Standard Life Investments Global SICAV Société d'Investissement à Capital Variable
136
Global REIT Focus Fund Schedule of Investments (expressed in EUR) as at 31 December 2015
Quantity/ Market Value % of
Nominal Value Currency Name of Securities EUR Net Assets
Transferable securities and money market instruments admitted to an official exchange listing
Australia 487,021 AUD Goodman Group 2,051,551 1.81% 948,584 AUD Mirvac Group 1,261,851 1.11% 628,019 AUD Stockland 1,729,910 1.53% 124,864 AUD Westfield Corp 797,783 0.70%
Total for Australia 5,841,095 5.15%
Cayman Islands 1,180,000 HKD China Resources Land Ltd 3,160,092 2.79%
Total for Cayman Islands 3,160,092 2.79%
France 10,432 EUR Gecina SA 1,169,427 1.03%
106,184 EUR Klepierre 4,352,482 3.84% 14,644 EUR Unibail-Rodamco SE 3,432,554 3.02%
Total for France 8,954,463 7.89%
Hong Kong 972,000 HKD China Overseas Land & Investment Ltd 3,132,885 2.76%
Total for Hong Kong 3,132,885 2.76%
Japan 380,751 JPY Hulic Co Ltd 3,105,444 2.74%
87 JPY Industrial & Infrastructure Fund Investment Corp 382,337 0.34% 5,372 JPY Invincible Investment Corp 2,885,451 2.54%
251,855 JPY Mitsui Fudosan Co Ltd 5,872,310 5.18% 376 JPY Nippon Prologis REIT Inc 626,822 0.55%
373,498 JPY Nishimatsu Construction Co Ltd 1,310,844 1.15% 498,424 JPY Takara Leben Co Ltd 2,570,696 2.27%
Total for Japan 16,753,904 14.77%
Spain 76,976 EUR Hispania Activos Inmobiliarios SA 1,008,386 0.89%
228,817 EUR Merlin Properties Socimi SA 2,641,692 2.33% Total for Spain 3,650,078 3.22%
Sweden 134,816 SEK Fabege AB 2,054,537 1.81% 130,141 SEK Pandox AB 2,206,962 1.95%
Total for Sweden 4,261,499 3.76%
United Kingdom 16,133 GBP Derwent London Plc 806,232 0.71%
116,277 GBP Land Securities Group Plc 1,862,569 1.64% 283,270 GBP Segro Plc 1,655,407 1.46% 155,403 GBP UNITE Group Plc 1,387,412 1.22% 81,396 GBP Workspace Group Plc 1,061,787 0.94%
Total for United Kingdom 6,773,407 5.97%
United States 26,822 USD AvalonBay Communities Inc 4,564,957 4.03% 10,765 USD Boston Properties Inc 1,271,389 1.12%
102,025 USD CBRE Group Inc 3,245,695 2.86% 50,585 USD DCT Industrial Trust Inc 1,744,900 1.54%
154,216 USD DDR Corp 2,393,533 2.11% 71,073 USD Douglas Emmett Inc 2,056,073 1.81% 94,263 USD Duke Realty Corp 1,837,003 1.62%
111,028 USD Empire State Realty Trust Inc 1,841,508 1.62% 32,789 USD Equity LifeStyle Properties Inc 2,009,429 1.77% 15,926 USD Essex Property Trust Inc 3,558,103 3.14% 17,514 USD Federal Realty Investment Trust 2,382,603 2.10%
140,359 USD General Growth Properties Inc 3,533,236 3.12% 117,418 USD Hilton Worldwide Holdings Inc 2,329,226 2.05%

Standard Life Investments Global SICAV Société d'Investissement à Capital Variable
137
Global REIT Focus Fund Schedule of Investments (expressed in EUR) (continued) as at 31 December 2015
Quantity/ Market Value % of
Nominal Value Currency Name of Securities EUR Net Assets
Transferable securities and money market instruments admitted to an official exchange listing (continued)
United States (continued) 79,855 USD Host Hotels & Resorts Inc 1,155,797 1.02% 62,810 USD Hudson Pacific Properties Inc 1,632,445 1.44% 19,941 USD Kilroy Realty Corp 1,170,962 1.03%
148,239 USD Kimco Realty Corp 3,633,576 3.21% 24,214 USD Public Storage 5,569,654 4.91% 38,401 USD Simon Property Group Inc 6,882,665 6.07% 17,842 USD Starwood Hotels & Resorts Worldwide Inc 1,148,970 1.01% 93,097 USD Sunstone Hotel Investors Inc 1,084,122 0.96% 62,422 USD Urban Edge Properties 1,362,095 1.20% 24,215 USD Vornado Realty Trust 2,249,658 1.98%
Total for United States 58,657,599 51.72%
Total transferable securities and money market instruments admitted to an official exchange listing 111,185,022 98.03%
Total investments 111,185,022 98.03% Cash and cash equivalents 1,073,678 0.95% Other net assets 1,157,501 1.02% Total net assets 113,416,201 100.00%
Analysis of Investments as % of total assets Transferable securities and money market instruments admitted to an official exchange listing 97.46%Other assets 2.54%Total assets 100.00% The accompanying notes form an integral part of these financial statements.

Standard Life Investments Global SICAV Société d'Investissement à Capital Variable
138
European Smaller Companies Fund Sub-fund Objective The investment objective of the Sub-fund is to achieve long-term growth in the share price through capital appreciation of the underlying portfolio.
In accordance with the investment objective described above, the Sub-fund may invest in equity related securities, which may include preference shares, debt securities convertible into common shares, warrants on transferable securities and other equity linked securities.
Investment Policy It will achieve this objective primarily through investment in small cap European equities and equity related securities of corporations domiciled or listed in European countries (which include the United Kingdom and the emerging markets of Europe) or companies that derive a significant proportion of their revenues or profits from European operations or have a significant proportion of their assets there.
Performance Review The European Smaller Companies Fund returned 37.3% over the period, compared with the FTSE Small Cap Developed Europe Index return of 13.3%.*
Our holding in Patrizia Immobiliare was relatively strong over the course of the year. The company completed the acquisition of 14,000 residential properties on attractive terms and with the potential to add significant value. As a result of the acquisition, the company upgraded guidance for both this year and next. Later in the year it announced the disposal of the entire portfolio to Deutsche Wohnen for a very attractive price. Furthermore, we continue to like the growth prospects for the business given its move towards third-party asset management. Grenkeleasing also contributed to returns after announcing positive results that showed growth ahead of previously stated guidance. The business continues to benefit from strong loan growth as it expands outside Germany and takes advantage of its strong business model to compete effectively against traditional lenders. The business has excellent growth prospects as it moves to markets outside Europe. The internationalisation of the business continues to progress well and is a key element of our non-consensus view.
However, our holding in Loomis performed poorly over the period. The company’s highly respected CEO announced he was resigning from his position to look at opportunities in other market areas. While he has given a commitment not to join a competing business, this announcement was unexpected and disappointing given the excellent job he has done since appointment. Our holding in Diploma was also relatively weak over the period. The business reported that trading conditions in the North American businesses had become more challenging with health budgets in Canada coming under pressure. *Sub-fund performance has been calculated over the stated period on the share price performance basis, based on the D Accumulation Shares and net of fees. Please note the index return is quoted gross and contains no adjustment for fees Outlook Market conditions are likely to remain more volatile as the slowdown in Chinese growth unsettles investors and commodity prices remain under pressure. Stock-picking is likely to be even more important in 2016 as the economic cycle matures and the potential for further central bank intervention starts to weaken. We believe that we are well positioned for more difficult market conditions given our focus on higher quality growth businesses. We will remain focused on the bottom-up fundamentals of our holdings and believe that our process will continue to add value in the current market environment.
Please note that the commitment approach has been used for risk measurement and calculation of global exposure for this Sub-fund.

Standard Life Investments Global SICAV Société d'Investissement à Capital Variable
139
European Smaller Companies Fund Schedule of Investments (expressed in EUR) as at 31 December 2015
Quantity/ Market Value % of
Nominal Value Currency Name of Securities EUR Net Assets
Transferable securities and money market instruments admitted to an official exchange listing
Denmark 250,000 DKK Matas A/S 4,455,585 1.28% 191,833 DKK SimCorp A/S 9,973,971 2.88%
Total for Denmark 14,429,556 4.16%
Finland 306,089 EUR Huhtamaki OYJ 10,253,982 2.95% 52,128 EUR Kesko OYJ 1,687,383 0.49%
Total for Finland 11,941,365 3.44%
France 79,375 EUR LISI 1,980,406 0.57%
146,144 EUR NextRadioTV 5,389,791 1.55% 119,466 EUR Orpea 8,814,201 2.54% 297,090 EUR Plastic Omnium SA 8,713,650 2.51%
1,492,620 EUR Technicolor SA 11,164,798 3.22% 144,717 EUR Teleperformance 11,215,567 3.23%
Total for France 47,278,413 13.62%
Germany 73,939 EUR Amadeus Fire AG 5,544,686 1.60% 67,947 EUR Grenkeleasing AG 12,543,016 3.61%
141,803 EUR Jungheinrich AG - Pref 10,811,061 3.12% 193,596 EUR Norma Group SE 9,902,435 2.85% 542,665 EUR Patrizia Immobilien AG 14,651,955 4.22%
6,652 EUR Rational AG 2,793,175 0.81% 573,690 EUR Takkt AG 10,581,712 3.05% 46,013 EUR XING AG 7,854,419 2.26%
Total for Germany 74,682,459 21.52%
Ireland 861,804 GBP Grafton Group Plc 8,679,254 2.50%
7,569,073 EUR Hibernia REIT plc 10,657,255 3.07% 2,430,992 EUR Irish Continental Group Plc 12,859,947 3.71%
Total for Ireland 32,196,456 9.28%
Italy 9,401,525 EUR Banca Popolare di Milano Scarl 8,658,805 2.49%
570,319 EUR MARR SpA 10,881,686 3.14% Total for Italy 19,540,491 5.63%
Norway 572,402 NOK Borregaard ASA 2,944,656 0.85%
Total for Norway 2,944,656 0.85%
Spain 134,546 EUR Bolsas y Mercados Espanoles SHMSF SA 4,178,999 1.20% 626,194 EUR Gamesa Corp Tecnologica SA 9,906,389 2.86%
Total for Spain 14,085,388 4.06%
Sweden 311,805 SEK Intrum Justitia AB 9,788,450 2.82%
Total for Sweden 9,788,450 2.82%
Switzerland 107,712 CHF Implenia AG 5,073,337 1.46% 53,988 CHF Komax Holding AG 9,698,795 2.80% 4,261 CHF Tecan Group AG 639,796 0.18%
Total for Switzerland 15,411,928 4.44%
United Kingdom 828,618 GBP Crest Nicholson Holdings plc 6,281,332 1.81% 319,419 GBP Dignity Plc 11,106,925 3.20%

Standard Life Investments Global SICAV Société d'Investissement à Capital Variable
140
European Smaller Companies Fund Schedule of Investments (expressed in EUR) (continued) as at 31 December 2015
Quantity/ Market Value % of
Nominal Value Currency Name of Securities EUR Net Assets
Transferable securities and money market instruments admitted to an official exchange listing (continued)
United Kingdom (continued) 771,944 GBP Dunelm Group Plc 9,906,943 2.86% 947,031 GBP FDM Group Holdings Plc 6,734,303 1.94% 117,244 GBP Fevertree Drinks Plc 955,784 0.28% 609,968 GBP Greggs Plc 10,907,986 3.14%
4,518,139 GBP Hansteen Holdings Plc 7,077,454 2.04% 707,176 GBP Howden Joinery Group Plc 5,067,200 1.46%
2,290,986 GBP Marshalls Plc 10,133,232 2.92% 565,021 GBP Morgan Sindall Group Plc 5,690,343 1.64% 641,352 GBP Restaurant Group Plc 5,983,373 1.72%
3,360,965 GBP YouGov Plc 6,655,323 1.92% Total for United Kingdom 86,500,198 24.93%
Total transferable securities and money market instruments admitted to an official exchange listing 328,799,360 94.75%
Total investments 328,799,360 94.75% Cash and cash equivalents 17,681,549 5.10% Other net assets 519,329 0.15% Total net assets 347,000,238 100.00%
Analysis of Investments as % of total assets Transferable securities and money market instruments admitted to an official exchange listing 94.62%Other assets 5.38%Total assets 100.00% The accompanying notes form an integral part of these financial statements.

Standard Life Investments Global SICAV Société d'Investissement à Capital Variable
141
Indian Equity Midcap Opportunities Fund
Effective 14 December 2015, the Indian Equities Fund was renamed the Indian Equity Midcap Opportunities Fund. Sub-fund Objective The objective of the Sub-fund is to achieve long-term growth in the share price through capital appreciation.
Investment Policy Up to 14 December 2015, the policy was to invest in Indian equities.
From 15 December 2015, the investment policy is to achieve the above objective mainly through investment in mid-capitalisation equities (i.e., equity of companies that have a market capitalisation within the range of the market capitalisation in the CNX Midcap Index) and equity related securities of corporations domiciled or listed in India or companies that derive a significant proportion of their revenues or profits from Indian operations or have a significant proportion of their assets there.
The Sub-fund intends to invest part or all of its assets in Standard Life Investments GS (Mauritius Holdings) Limited (the “Subsidiary”). The Subsidiary is wholly owned by the Company and is incorporated as an open-ended investment company under the law of Mauritius. The sole object of the Subsidiary is to carry out investment activities on behalf of the Sub-fund and the Subsidiary will apply the investment powers and restrictions of the Company as set out in Appendix A of the Prospectus.
We repositioned the Sub-fund to its new midcap mandate. This will still be managed by Dr Mark Vincent, and he will be advised in his stock selection by Chirag Setalvad of HDFC AMC, the Mumbai-based portfolio manager of the Indian HDFC Midcap Opportunities Fund.* Chirag’s Fund has delivered excellent returns since inception, outperforming its benchmark by 7% per annum. (For more detailed and up-to-date information on Chirag’s track record, please visit the HDFC mutual fund website).**
This took place from 14 December, and by the end of the year the transition was effectively complete.
Performance Review The Sub-fund returned -13.1% (performance is calculated based on the D Accumulation Shares) for the period, trailing its benchmark, which returned -4.2%. This underperformance was around 50% due to stock selection and 50% due to sector allocation.
Note: the Sub-fund transition (selling about 80-85% of the Fund and buying mid-cap stocks) only impacted performance by about 10 basis points.
Our bank holdings were the main negative contributors at the stock level - State Bank of India, ICICI Bank, Punjab National Bank and Canara Bank (we no longer hold these stocks). Our underweight in healthcare was a positive, and stock selection in industrials was strong. However, this was more than offset by positions in a number of financials and energy stocks, as well as our allocation to utilities.
Outlook India is one of the biggest beneficiaries of lower commodity prices, especially crude oil. Further, low inflation, an improving current account deficit and fiscal outlook, as well as rising order backlogs in some key infrastructure-related industries, point to the steadily improving growth prospects of the economy. Equity markets are also likely to be supported in the medium-to long-term by the improving margin outlook of corporates, likely lower interest rates, soft commodity prices and reasonable valuations.
The Sub-fund is overweight in financials & industrials, primarily due to our conviction in an imminent economic recovery driven by higher government capital spending and lower interest rates. We are underweight in consumer staples and healthcare due to rich valuations there and overall risk-aversion in the market.
*The HDFC Midcap Opportunities Fund is a local Indian fund on the HDFC Mutual Fund platform. It is not a Standard Life Investments fund and it is not available for distribution outside India.
**Source HDFC AMC, benchmark CNX Midcap Index as at 31 December 2015. Inception date is 25 June 2007. Past performance is not indicative of future results. We are using the performance of the HDFC Fund to showcase the credentials and experience of the HDFC AMC adviser to the Standard Life Investments Indian Equity Midcap Opportunities Portfolio. We are not using the performance of the HDFC Fund to solicit investment in it. The performance of the Standard Life Investments Indian Equity Midcap Opportunities Portfolio may be very different from that of the HDFC Fund.
Please note that the commitment approach has been used for risk measurement and calculation of global exposure for this Sub-fund.
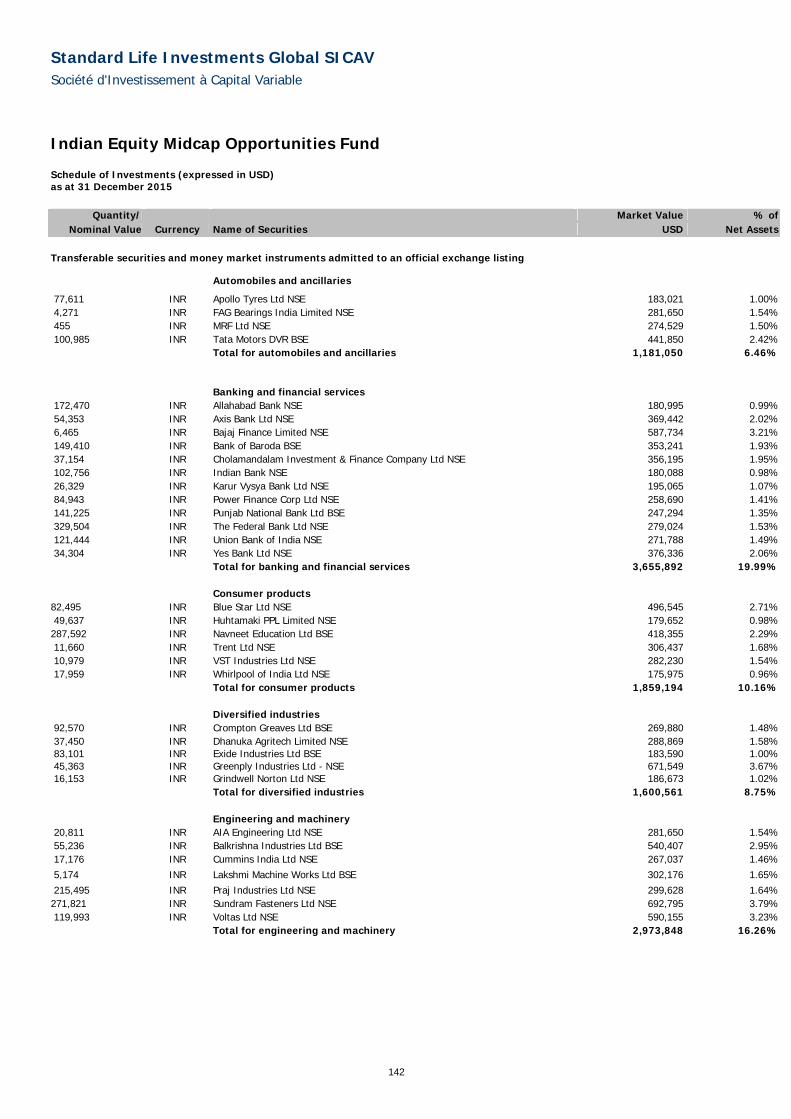
Standard Life Investments Global SICAV Société d'Investissement à Capital Variable
142
Indian Equity Midcap Opportunities Fund
Schedule of Investments (expressed in USD) as at 31 December 2015
Quantity/ Market Value % of Nominal Value Currency Name of Securities USD Net Assets
Transferable securities and money market instruments admitted to an official exchange listing
Automobiles and ancillaries 77,611 INR Apollo Tyres Ltd NSE 183,021 1.00% 4,271 INR FAG Bearings India Limited NSE 281,650 1.54% 455 INR MRF Ltd NSE 274,529 1.50% 100,985 INR Tata Motors DVR BSE 441,850 2.42% Total for automobiles and ancillaries 1,181,050 6.46% Banking and financial services 172,470 INR Allahabad Bank NSE 180,995 0.99% 54,353 INR Axis Bank Ltd NSE 369,442 2.02% 6,465 INR Bajaj Finance Limited NSE 587,734 3.21% 149,410 INR Bank of Baroda BSE 353,241 1.93% 37,154 INR Cholamandalam Investment & Finance Company Ltd NSE 356,195 1.95% 102,756 INR Indian Bank NSE 180,088 0.98% 26,329 INR Karur Vysya Bank Ltd NSE 195,065 1.07% 84,943 INR Power Finance Corp Ltd NSE 258,690 1.41% 141,225 INR Punjab National Bank Ltd BSE 247,294 1.35% 329,504 INR The Federal Bank Ltd NSE 279,024 1.53% 121,444 INR Union Bank of India NSE 271,788 1.49% 34,304 INR Yes Bank Ltd NSE 376,336 2.06% Total for banking and financial services 3,655,892 19.99% Consumer products 82,495 INR Blue Star Ltd NSE 496,545 2.71% 49,637 INR Huhtamaki PPL Limited NSE 179,652 0.98%287,592 INR Navneet Education Ltd BSE 418,355 2.29% 11,660 INR Trent Ltd NSE 306,437 1.68% 10,979 INR VST Industries Ltd NSE 282,230 1.54% 17,959 INR Whirlpool of India Ltd NSE 175,975 0.96% Total for consumer products 1,859,194 10.16% Diversified industries 92,570 INR Crompton Greaves Ltd BSE 269,880 1.48% 37,450 INR Dhanuka Agritech Limited NSE 288,869 1.58% 83,101 INR Exide Industries Ltd BSE 183,590 1.00% 45,363 INR Greenply Industries Ltd - NSE 671,549 3.67% 16,153 INR Grindwell Norton Ltd NSE 186,673 1.02% Total for diversified industries 1,600,561 8.75% Engineering and machinery 20,811 INR AIA Engineering Ltd NSE 281,650 1.54% 55,236 INR Balkrishna Industries Ltd BSE 540,407 2.95% 17,176 INR Cummins India Ltd NSE 267,037 1.46% 5,174 INR Lakshmi Machine Works Ltd BSE 302,176 1.65% 215,495 INR Praj Industries Ltd NSE 299,628 1.64%271,821 INR Sundram Fasteners Ltd NSE 692,795 3.79% 119,993 INR Voltas Ltd NSE 590,155 3.23% Total for engineering and machinery 2,973,848 16.26%
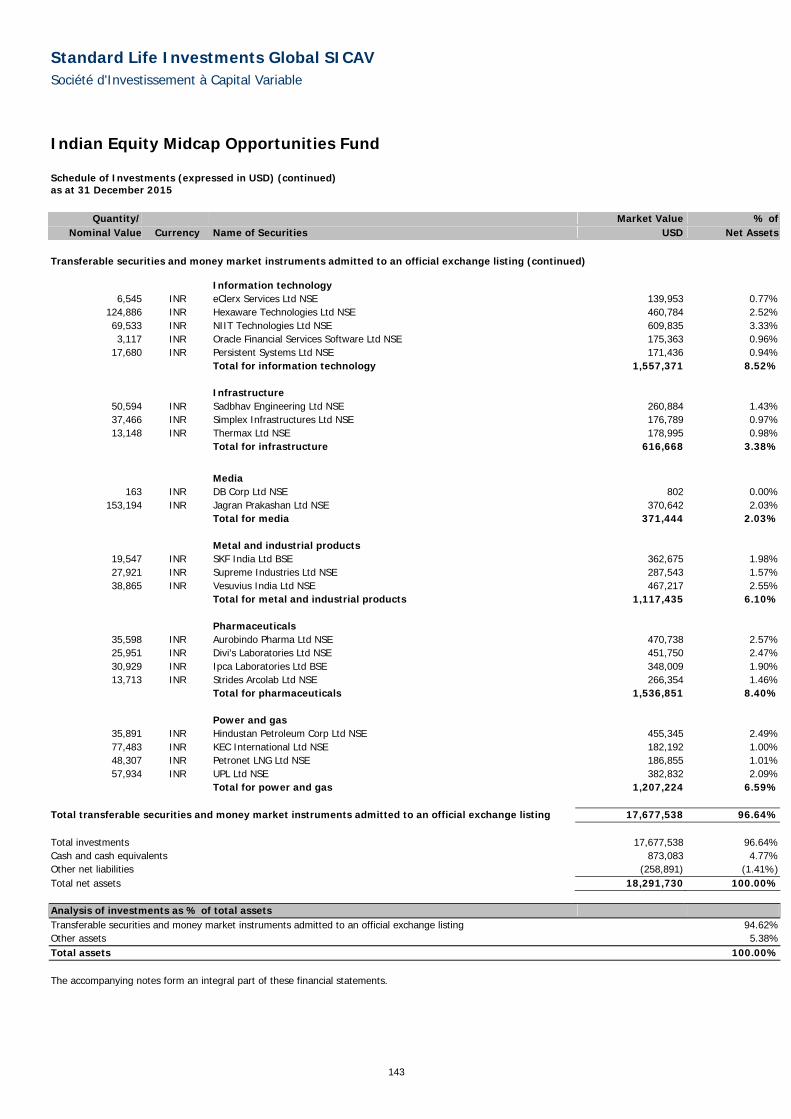
Standard Life Investments Global SICAV Société d'Investissement à Capital Variable
143
Indian Equity Midcap Opportunities Fund Schedule of Investments (expressed in USD) (continued) as at 31 December 2015
Quantity/ Market Value % of Nominal Value Currency Name of Securities USD Net Assets
Transferable securities and money market instruments admitted to an official exchange listing (continued) Information technology
6,545 INR eClerx Services Ltd NSE 139,953 0.77%124,886 INR Hexaware Technologies Ltd NSE 460,784 2.52% 69,533 INR NIIT Technologies Ltd NSE 609,835 3.33% 3,117 INR Oracle Financial Services Software Ltd NSE 175,363 0.96%
17,680 INR Persistent Systems Ltd NSE 171,436 0.94% Total for information technology 1,557,371 8.52% Infrastructure
50,594 INR Sadbhav Engineering Ltd NSE 260,884 1.43% 37,466 INR Simplex Infrastructures Ltd NSE 176,789 0.97% 13,148 INR Thermax Ltd NSE 178,995 0.98%
Total for infrastructure 616,668 3.38%
Media
163 INR DB Corp Ltd NSE 802 0.00% 153,194 INR Jagran Prakashan Ltd NSE 370,642 2.03%
Total for media 371,444 2.03% Metal and industrial products
19,547 INR SKF India Ltd BSE 362,675 1.98% 27,921 INR Supreme Industries Ltd NSE 287,543 1.57% 38,865 INR Vesuvius India Ltd NSE 467,217 2.55%
Total for metal and industrial products 1,117,435 6.10% Pharmaceuticals
35,598 INR Aurobindo Pharma Ltd NSE 470,738 2.57%25,951 INR Divi's Laboratories Ltd NSE 451,750 2.47%30,929 INR Ipca Laboratories Ltd BSE 348,009 1.90%13,713 INR Strides Arcolab Ltd NSE 266,354 1.46%
Total for pharmaceuticals 1,536,851 8.40% Power and gas
35,891 INR Hindustan Petroleum Corp Ltd NSE 455,345 2.49% 77,483 INR KEC International Ltd NSE 182,192 1.00% 48,307 INR Petronet LNG Ltd NSE 186,855 1.01% 57,934 INR UPL Ltd NSE 382,832 2.09%
Total for power and gas 1,207,224 6.59% Total transferable securities and money market instruments admitted to an official exchange listing 17,677,538 96.64% Total investments 17,677,538 96.64%Cash and cash equivalents 873,083 4.77%Other net liabilities (258,891) (1.41%)Total net assets 18,291,730 100.00% Analysis of investments as % of total assets Transferable securities and money market instruments admitted to an official exchange listing 94.62%Other assets 5.38%Total assets 100.00%
The accompanying notes form an integral part of these financial statements.

Standard Life Investments Global SICAV Société d'Investissement à Capital Variable
144
European Equity Unconstrained Fund Sub-fund Objective The objective of the Sub-fund is to achieve long-term growth in the share price through capital appreciation of the underlying equity portfolio.
In accordance with the investment objective described above, the Sub-fund may invest in equity related securities, which may included preference shares, debt securities convertible into common shares, warrants on transferable securities and other equity linked securities.
Investment Policy The current policy is to invest primarily through investment in equities and equity related securities of corporations domiciled in European countries (which might include emerging markets of Europe) or companies that derive a significant proportion of their revenues or profits from European operations or have a significant proportion of their assets there. The Sub-fund will not be restricted by index weightings, sector constraints or company size.
Performance Review The Sub-fund returned 17.2% over the period, compared with the MSCI Europe Index return of 8.8%.*
Among individual stock holdings, Assa Abloy performed well. The lock manufacturer continues to exhibit robust organic revenue growth relative to its peers. Sage Group also performed well as its full year results showed the new management team continued to make good progress. Meanwhile, Ryanair enjoyed the benefits of a falling oil price and supportive passenger data.
Renault was a significant underperformer over the period as emerging market concerns combined with collateral damage from the Volkswagen emissions scandal. AA also proved a drag on returns as it emerged that the costs of restructuring the business would be higher, resulting in near-term downgrades. Finally, an underweight exposure to Nestle cost performance as the stock outperformed on expectations that the fortunes of its US business have improved.
*Sub-fund performance has been calculated over the stated period on the share price performance basis, based on the D Accumulation Shares and net of fees. Please note the index return is quoted gross and contains no adjustment for fees.
Outlook Many concerns remain for investors. Growth is improving only modestly, political developments are uncertain, fiscal policy remains a drag (although monetary policy is still broadly supportive). In this environment, investors will find much to worry about. However, corporate activity should offer support and a weak oil price is not all negative.
Against this backdrop, stock selection will remain important. At present, valuations are not without relative attractions and are not extreme in absolute terms. We will continue to focus on a relatively small number of stocks that can weather the uncertain environment and deliver profit growth that is currently underappreciated by the market. We will maintain diversity at both a sector and country level.
Please note that the commitment approach has been used for risk measurement and calculation of global exposure for this Sub-fund.

Standard Life Investments Global SICAV Société d'Investissement à Capital Variable
145
European Equity Unconstrained Fund Schedule of Investments (expressed in EUR) as at 31 December 2015
Quantity/ Market Value % of
Nominal Value Currency Name of Securities EUR Net Assets
Transferable securities and money market instruments admitted to an official exchange listing
Belgium 70,667 EUR Umicore SA 2,732,340 2.61%
Total for Belgium 2,732,340 2.61%
Denmark 154,007 DKK Danske Bank A/S 3,822,034 3.65% 46,243 DKK Novo Nordisk A/S 2,478,052 2.37%
Total for Denmark 6,300,086 6.02%
Finland 613,587 EUR Nokia OYJ 4,046,606 3.87%
Total for Finland 4,046,606 3.87%
France 57,936 EUR JCDecaux SA 2,045,141 1.95% 52,476 EUR Orpea 3,871,679 3.70% 43,698 EUR Total SA 1,803,198 1.72%
Total for France 7,720,018 7.37%
Germany 31,952 EUR Bayer AG 3,700,042 3.53% 14,334 EUR Continental AG 3,218,700 3.07%
213,051 EUR Deutsche Telekom AG 3,555,821 3.40% 211,924 GBP TUI AG 3,492,741 3.34%
Total for Germany 13,967,304 13.34%
Ireland 341,764 EUR Ryanair Holdings Plc 5,129,878 4.90%
Total for Ireland 5,129,878 4.90%
Italy 950,240 EUR Intesa Sanpaolo SpA 2,934,341 2.80%
1,807,303 EUR Telecom Italia SpA 2,123,581 2.03% Total for Italy 5,057,922 4.83%
Netherlands 32,223 EUR ASML Holding NV 2,660,009 2.54%
Total for Netherlands 2,660,009 2.54%
Portugal 290,854 EUR Galp Energia SGPS SA 3,117,955 2.98%
Total for Portugal 3,117,955 2.98%
Spain 459,342 EUR Bankinter SA 3,005,934 2.87% 107,361 EUR Industria de Diseno Textil SA 3,402,270 3.25%
Total for Spain 6,408,204 6.12%
Sweden 204,066 SEK Assa Abloy AB 3,951,165 3.78% 182,478 SEK Svenska Handelsbanken AB 2,240,985 2.14%
Total for Sweden 6,192,150 5.92%
Switzerland 63,016 CHF LafargeHolcim Ltd 2,921,646 2.79% 11,770 CHF Roche Holding AG 2,998,632 2.86%
170,332 CHF UBS Group AG 3,064,677 2.93% 12,306 CHF Zurich Insurance Group AG 2,931,016 2.80%
Total for Switzerland 11,915,971 11.38%
United Kingdom 542,468 GBP AA Plc 2,318,174 2.21% 147,212 GBP ARM Holdings Plc 2,081,617 1.99% 140,217 GBP Ashtead Group Plc 2,135,369 2.04%

Standard Life Investments Global SICAV Société d'Investissement à Capital Variable
146
European Equity Unconstrained Fund Schedule of Investments (expressed in EUR) (continued) as at 31 December 2015
Quantity/ Market Value % of
Nominal Value Currency Name of Securities EUR Net Assets
Transferable securities and money market instruments admitted to an official exchange listing (continued)
United Kingdom (continued) 440,616 GBP Aviva Plc 3,094,227 2.96% 205,156 GBP Babcock International Group Plc 2,836,744 2.71% 236,912 GBP Barratt Developments Plc 2,018,383 1.93% 485,285 GBP BT Group Plc 3,115,336 2.98% 228,726 GBP Essentra Plc 2,577,437 2.46%
3,080,004 GBP Lloyds Banking Group Plc 3,062,898 2.93% 455,617 GBP Sage Group Plc 3,742,134 3.57%
Total for United Kingdom 26,982,319 25.78%
Total transferable securities and money market instruments admitted to an official exchange listing 102,230,762 97.66%
Total investments 102,230,762 97.66% Cash and cash equivalents 2,429,692 2.32% Bank overdraft and other net assets 15,964 0.02% Total net assets 104,676,418 100.00%
Analysis of Investments as % of total assets Transferable securities and money market instruments admitted to an official exchange listing 97.61%Other assets 2.39%Total assets 100.00% The accompanying notes form an integral part of these financial statements.
Standard Life Investments Global SICAV Société d'Investissement à Capital Variable
147
Global Emerging Markets Equity Unconstrained Fund Sub-fund Objective The objective of the Sub-fund is to achieve long-term growth in the share price through capital appreciation of the underlying equity portfolio.
Investment Policy It will achieve this objective primarily through investment in equities and equity related securities of corporations domiciled in emerging markets or companies that derive a significant proportion of their revenues and profits from Asian, Eastern European, Middle Eastern, African or Latin American operations or have a significant proportion of their assets there. The Sub-fund will not be restricted by index weightings, sector constraints or company size.
Performance Review The Sub-fund fell 14.7% over the review period (performance is calculated based on the D Accumulation Shares), underperforming its benchmark, the MSCI EMF (Emerging Markets) Index, which was down 14.6%.
It was an extremely tough year for emerging markets (“EM”) investors. This was due to a multitude of factors, including: slowing growth in the major emerging economies, decelerating activity in global technology end-markets, uncertainty over policy in China, currency falls and a slump in commodity prices. As a result, many stocks in the portfolio sold-off as investors exited EM en masse. More specifically, Tianhe Chemicals continued to struggle as its shares remain suspended. A holding in Thai mobile telecoms firm Total Access Communication also disappointed. The recent auctions for 4G licences were more expensive than many had forecast, while there is also the potential for a new player to enter the fray. Positions in AirAsia, Rexlot Holdings and Ciputra Property also hurt performance.
There were positives, however. Rising internet adoption continued to be a major structural force for change across most emerging economies, and we had generally strong returns from our holdings in this space. Names to highlight include Chinese e-commerce play JD.com, Russian social network operator Mail.ru and Malaysian government e-services outsourcing company My EG. Equally, in the auto sector, we are seeing dramatic changes in engine technology and competitive positioning. Here, we enjoyed excellent returns from our Korean electric vehicle components specialist Woory and the Chinese automaker Geely.
Outlook As we have already witnessed so far in 2016, the short-term outlook for EM and the Sub-fund remains inexorably tied to the performance of China. Investor uncertainty over the extent and impact of the country’s economic slowdown, coupled with the erratic tone of policymaking, is causing extreme volatility. From our bottom-up perspective, we get the impression that the consumer and services components of the Chinese economy remain reasonably robust, and that a hard landing is unlikely. Nonetheless, China is the main EM risk at present. Looking further out, we are still extremely positive about the multitude of interesting stock stories within the EM universe, many of which are not in the mainstream EM equity indices. When markets settle, we would expect to see these companies come to the fore.
Please note that the commitment approach has been used for risk measurement and calculation of global exposure for this Sub-fund.
This Sub-fund is not authorised in Hong Kong and is not available to Hong Kong residents.

Standard Life Investments Global SICAV Société d'Investissement à Capital Variable
148
Global Emerging Markets Equity Unconstrained Fund Schedule of Investments (expressed in USD) as at 31 December 2015
Quantity/ Market Value % of
Nominal Value Currency Name of Securities USD Net Assets
Transferable securities and money market instruments admitted to an official exchange listing
Australia 3,943,651 AUD Medusa Mining Ltd 1,038,592 0.94% 1,318,599 AUD Syrah Resources Ltd 3,762,020 3.41%
Total for Australia 4,800,612 4.35%
Bermuda 21,950,000 HKD REXLot Holdings Ltd1 311,540 0.28%
Total for Bermuda 311,540 0.28%
Brazil 479,100 BRL CVC Brasil Operadora e Agencia de Viagens SA 1,634,848 1.48% 436,100 BRL Ser Educacional SA 848,779 0.77%
1,883,900 BRL T4F Entretenimento SA 1,476,172 1.34%
186,100 BRL Valid Solucoes e Servicos de Seguranca em Meios de Pagamento e Identificacao SA 1,999,184 1.81%
Total for Brazil 5,958,983 5.40%
British Virgin Islands 120,094 USD Hollysys Automation Technologies Ltd 2,667,288 2.42% 121,568 USD Mail.Ru Group Ltd 2,741,358 2.48%
21,596,000 HKD Tianhe Chemicals Group Ltd1 808,086 0.73% Total for British Virgin Islands 6,216,732 5.63%
Cayman Islands 18,041 USD Baidu Inc 3,466,217 3.14% 52,600 USD Bitauto Holdings Ltd 1,440,188 1.31%
1,147,000 HKD China Mengniu Dairy Co Ltd 1,870,667 1.69% 797,545 HKD China Resources Land Ltd 2,325,678 2.11%
1,436,000 HKD China State Construction International Holdings Ltd 2,493,937 2.26% 5,080,000 HKD Geely Automobile Holdings Ltd 2,707,072 2.45%
313,000 USD Himax Technologies Inc 2,607,290 2.36% 106,600 USD JD.com Inc 3,419,728 3.10%
1,370,000 HKD Minth Group Ltd 2,722,246 2.47% 394,000 HKD Sands China Ltd 1,349,730 1.22%
2,484,000 HKD SITC International Holdings Co Ltd 1,317,284 1.19% 677,500 HKD Stella International Holdings Ltd 1,687,146 1.53%
Total for Cayman Islands 27,407,183 24.83%
China 3,174,000 HKD Shanghai Electric Group Co Ltd 1,683,196 1.52% 2,812,416 HKD Zoomlion Heavy Industry Science and Technology Co Ltd 1,048,729 0.95%
Total for China 2,731,925 2.47%
Cyprus 333,693 USD Globaltrans Investment Plc 1,518,303 1.38%
Total for Cyprus 1,518,303 1.38%
Germany 47,022 EUR Rocket Internet SE 1,445,914 1.31%
Total for Germany 1,445,914 1.31%
Hong Kong 1,568,000 HKD China Unicom Hong Kong Ltd 1,911,894 1.73%
339,313 HKD Lenovo Group Ltd 344,557 0.31% Total for Hong Kong 2,256,451 2.04%
Hungary 145,583 HUF OTP Bank Plc 3,010,836 2.73%
Total for Hungary 3,010,836 2.73%
India 94,039 INR Bajaj Holdings & Investment Ltd 2,358,500 2.14%
863,340 INR Bharat Heavy Electricals Ltd 2,207,410 2.00%

Standard Life Investments Global SICAV Société d'Investissement à Capital Variable
149
Global Emerging Markets Equity Unconstrained Fund Schedule of Investments (expressed in USD) (continued) as at 31 December 2015
Quantity/ Market Value % of
Nominal Value Currency Name of Securities USD Net Assets
Transferable securities and money market instruments admitted to an official exchange listing (continued)
India (continued) 147,670 INR Bharat Petroleum Corp Ltd 1,991,738 1.80% 275,630 INR Bharti Infratel Ltd 1,783,614 1.62% 465,478 INR Coal India Ltd 2,320,486 2.10% 467,299 INR IRB Infrastructure Developers Ltd 1,721,037 1.56%
Total for India 12,382,785 11.22%
Indonesia 43,100,041 IDR Ciputra Property Tbk PT 1,281,902 1.16%
Total for Indonesia 1,281,902 1.16%
Malaysia 4,981,100 MYR AirAsia Bhd 1,496,590 1.36% 3,396,400 MYR My EG Services Bhd 3,417,356 3.09%
Total for Malaysia 4,913,946 4.45%
Mexico 249,400 MXN Fomento Economico Mexicano SAB de CV 2,301,058 2.09% 691,786 MXN Unifin Financiera SAPI de CV SOFOM ENR 2,133,938 1.93%
Total for Mexico 4,434,996 4.02%
Nigeria 1,057,628 GBP SEPLAT Petroleum Development Co Plc 1,155,883 1.05%
Total for Nigeria 1,155,883 1.05%
Papua New Guinea 287,963 AUD Oil Search Ltd 1,411,417 1.28%
Total for Papua New Guinea 1,411,417 1.28%
Philippines 3,836,500 PHP Ayala Land Inc 2,808,786 2.54%
Total for Philippines 2,808,786 2.54%
Russia 41,408,000 RUB Inter RAO UES PJSC 619,300 0.56%
Total for Russia 619,300 0.56%
South Korea 54,209 KRW Hyundai Development Co-Engineering & Construction 1,793,790 1.63%
344,000 USD KT Corp 4,100,480 3.71% 15,974 KRW S&T Motiv Co Ltd 1,168,879 1.06% 72,384 KRW SK Hynix Inc 1,898,263 1.72%
193,199 KRW Woory Industrial Co Ltd 4,613,511 4.18% Total for South Korea 13,574,923 12.30%
Taiwan 805,360 TWD Chipbond Technology Corp 1,165,856 1.06%
1,009,000 TWD Chroma ATE Inc 1,962,893 1.78% 52,000 TWD Hermes Microvision Inc 1,891,802 1.71%
248,723 TWD Makalot Industrial Co Ltd 1,764,316 1.60% Total for Taiwan 6,784,867 6.15%
Thailand 1,555,646 THB Total Access Communication PCL 1,307,720 1.18%
Total for Thailand 1,307,720 1.18%
Turkey 68,409 TRY Tupras Turkiye Petrol Rafinerileri AS 1,683,698 1.52%
Total for Turkey 1,683,698 1.52%

Standard Life Investments Global SICAV Société d'Investissement à Capital Variable
150
Global Emerging Markets Equity Unconstrained Fund Schedule of Investments (expressed in USD) (continued) as at 31 December 2015
Quantity/ Market Value % of
Nominal Value Currency Name of Securities USD Net Assets
Transferable securities and money market instruments admitted to an official exchange listing (continued)
United Kingdom 68,969 GBP BGEO Group Plc 1,945,986 1.76%
Total for United Kingdom 1,945,986 1.76%
Total transferable securities and money market instruments admitted to an official exchange listing 109,964,688 99.61%
Transferable securities and money market instruments dealt in on another regulated market
Cayman Islands 201,000 HKD China Metal Recycling Holdings Ltd1 – –%
Total for Cayman Islands – –%
Total transferable securities and money market instruments dealt in on another regulated market – –%
Total investments 109,964,688 99.61% Cash and cash equivalents 726,753 0.66% Bank overdraft and other net liabilities (291,303) (0.27%) Total net assets 110,400,138 100.00%
1 suspended/delisted security
Analysis of Investments as % of total assets Transferable securities and money market instruments admitted to an official exchange listing 99.23%Other assets 0.77%Total assets 100.00% The accompanying notes form an integral part of these financial statements.

Standard Life Investments Global SICAV Société d'Investissement à Capital Variable
151
Enhanced Diversification Global Emerging Markets Equities Fund Sub-fund Objective The objective of the Sub-fund is to achieve a long term total return consistent with emerging market equities (as compared to the performance benchmark MSCI Emerging Markets) while producing a lower volatility of returns (comparable to the volatility of a blend of 70% MSCI Emerging Markets/30% Cash (defined as 1 month US LIBID)).
Investment Policy The Sub-fund will achieve this objective through investment in equities and equity related securities of corporations domiciled in global emerging markets or companies that derive a significant proportion of their revenues and profits from global emerging markets including Asian, Eastern European, Middle Eastern, African or Latin American operations or have a significant proportion of their assets there. In combination it will seek to reduce the volatility of these assets and generate additional returns by investing in a portfolio of permitted derivative contracts (including futures, options, swaps, forward currency contracts and other derivatives) as well as traditional assets (such as equities and bonds) located anywhere in the world. Performance Review It at was an extremely challenging year for emerging markets, the Sub-fund returned -3.8% (performance is calculated based on the Z Accumulation Shares) over the review period in dollar terms, beating its benchmark, the MSCI EMF (Emerging Markets) Index, which returned -14.6%. Enhanced diversifiers Looking at recent strategies, our US equity technology versus small-cap relative value strategy was a positive. Tech stocks, as represented by the NASDAQ 100 Index, outperformed the Russell 2000 Index during the broad equity market rally at the beginning of the fourth quarter. In addition, small-cap stocks suffered most at the end of 2015 as the retreat in commodities, exacerbated by the strengthening US dollar, reignited fears of a slowdown in the global economy. Less successful was our long Indian rupee versus New Zealand dollar currency pair. The strategy struggled as the latter currency strengthened after the Bank of New Zealand eased monetary policy but tempered hopes that another cut would be forthcoming. Equity contributions Looking at specific stocks, rising internet adoption continued to be a major structural force for change across most emerging economies, and we had generally strong returns from our holdings in this space. Names to highlight include Chinese e-commerce firm JD.com and Russian social network operator Mail.ru. Equally, in the auto sector we are seeing dramatic changes in engine technology and competitive positioning. Here, we enjoyed excellent returns from Chinese automaker Geely. On the downside, Vipshop struggled after it issued worse-than-expected third-quarter results, with management citing bad weather. We feel that our previous non-consensus views on Vipshop of open-ended growth opportunity and defensible competitive niche have dissipated, with the company now struggling for active user growth. We therefore sold the holding. A position in AirAsia also hurt performance. Despite being a robust company, its shares sold-off as investors worried about balance-sheet risks in its Indonesian subsidiary. A change in local regulation further weighed on the stock.
Outlook Our central expectation is still for a modest global recovery, albeit with regional variations. A growing divergence in the monetary policies of central banks will be an important driver of asset returns. On the one hand, the US is moving to a tighter monetary policy environment, whereas regions such as Japan and Europe continue on a loose path. Geopolitical tensions remain elevated and on many metrics asset prices look expensive. We will seek to exploit the opportunities that these conditions present by implementing a diversified range of strategies using multiple asset classes. Please note that the relative Value at Risk (“VaR”) approach has been used for risk measurement and calculation of global exposure for this Sub-fund. Measurement of 1 month 99% VaR is based on a parametric calculation with an additional upwards scaling factor applied. Parametric risk model uses 180 weeks of equally weighted data with which to forecast risk. On the above basis the VaR has been as follows:
Highest: 12.34% Average: 8.30% Lowest: 6.39% Leverage is calculated as the sum of the notionals of the derivatives used. The level of leverage employed during the relevant period was 450%. This Sub-fund is not authorized in Hong Kong and is not available to Hong Kong residents.

Standard Life Investments Global SICAV Société d'Investissement à Capital Variable
152
Enhanced Diversification Global Emerging Markets Equities Fund Schedule of Investments (expressed in USD) as at 31 December 2015
Quantity/ Market Value % of
Nominal Value Currency Name of Securities USD Net Assets
Transferable securities and money market instruments admitted to an official exchange listing
Bermuda 200 USD Credicorp Ltd 19,492 0.13%
28,000 HKD Hanergy Thin Film Power Group Ltd1 777 0.01% Total for Bermuda 20,269 0.14%
Brazil 13,000 BRL Ambev SA 58,654 0.40% 3,080 BRL Banco Bradesco SA 15,960 0.11% 7,500 BRL Banco Bradesco SA - Pref 36,550 0.25%
345 BRL Banco Bradesco SA Rights 161 0.00% 5,000 BRL Banco do Brasil SA 18,629 0.13% 2,900 BRL BB Seguridade Participacoes SA 17,834 0.12% 7,700 BRL BM&FBovespa SA - Bolsa de Valores Mercadorias e Futuros 21,195 0.15% 1,900 BRL BRF SA 26,606 0.18% 2,020 BRL Cielo SA 17,151 0.12% 9,280 BRL Itau Unibanco Holding SA - Pref 61,761 0.42%
10,772 BRL Itausa - Investimentos Itau SA - Pref 18,733 0.13% 8,141 BRL Kroton Educacional SA 19,610 0.13%
13,479 BRL Petroleo Brasileiro SA 29,198 0.20% 15,082 BRL Petroleo Brasileiro SA - Pref 25,542 0.17% 5,200 BRL Vale SA 17,126 0.12% 5,800 BRL Vale SA - Pref 15,027 0.10%
16,700 BRL Valid Solucoes e Servicos de Seguranca em Meios de Pagamento e Identificacao SA 179,400 1.23%
6,300 BRL WEG SA 23,807 0.16% Total for Brazil 602,944 4.12%
British Virgin Islands 5,876 USD Mail.Ru Group Ltd 132,504 0.91%
Total for British Virgin Islands 132,504 0.91%
Cayman Islands 4,000 HKD AAC Technologies Holdings Inc 26,090 0.18%
694 USD Baidu Inc 133,338 0.91% 49,777 HKD China Resources Land Ltd 145,152 0.99%
103,044 HKD China State Construction International Holdings Ltd 178,959 1.22% 246,418 HKD Geely Automobile Holdings Ltd 131,313 0.90%
9,450 TWD Ginko International Co Ltd 125,148 0.85% 10,161 USD Himax Technologies Inc 84,641 0.58% 4,900 USD JD.com Inc 157,192 1.08% 1,060 USD New Oriental Education & Technology Group Inc 33,496 0.23%
13,132 HKD Tencent Holdings Ltd 258,397 1.77% 32,000 HKD Want Want China Holdings Ltd 23,824 0.16%
Total for Cayman Islands 1,297,550 8.87%
Chile 484,388 CLP Corpbanca SA 3,883 0.03%
Total for Chile 3,883 0.03%
China 73,000 HKD Agricultural Bank of China Ltd 29,858 0.20%
241,000 HKD Bank of China Ltd 107,592 0.73% 33,000 HKD Bank of Communications Co Ltd 23,248 0.16% 32,000 HKD China CITIC Bank Corp Ltd 20,727 0.14% 14,000 HKD China Communications Construction Co Ltd 14,307 0.10%
223,000 HKD China Construction Bank Corp 152,787 1.04% 45,000 HKD China Everbright Bank Co Ltd 21,890 0.15% 30,500 HKD China Galaxy Securities Co Ltd 27,941 0.19% 25,000 HKD China Life Insurance Co Ltd 80,804 0.55% 14,500 HKD China Merchants Bank Co Ltd 34,238 0.23% 24,000 HKD China Minsheng Banking Corp Ltd 23,783 0.16% 8,200 HKD China Pacific Insurance Group Co Ltd 33,751 0.23%
60,330 HKD China Petroleum & Chemical Corp 36,430 0.25%

Standard Life Investments Global SICAV Société d'Investissement à Capital Variable
153
Enhanced Diversification Global Emerging Markets Equities Fund Schedule of Investments (expressed in USD) (continued) as at 31 December 2015
Quantity/ Market Value % of
Nominal Value Currency Name of Securities USD Net Assets
Transferable securities and money market instruments admitted to an official exchange listing (continued)
China (continued) 12,000 HKD China Shenhua Energy Co Ltd 18,859 0.13% 56,000 HKD China Telecom Corp Ltd 26,301 0.18% 12,500 HKD CITIC Securities Co Ltd 29,225 0.20% 15,000 HKD CRRC Corp Ltd 18,541 0.13% 18,800 HKD Haitong Securities Co Ltd 33,233 0.23%
215,000 HKD Industrial & Commercial Bank of China Ltd 129,829 0.89% 7,700 HKD New China Life Insurance Co Ltd 32,339 0.22%
64,000 HKD PetroChina Co Ltd 41,950 0.29% 10,000 HKD PICC Property & Casualty Co Ltd 19,896 0.14% 11,000 HKD Ping An Insurance Group Co of China Ltd 61,030 0.42% 88,000 HKD Zijin Mining Group Co Ltd 23,050 0.16%
Total for China 1,041,609 7.12%
Colombia 6,513 COP Almacenes Exito SA 27,699 0.19% 3,537 COP Banco Davivienda SA - Pref 24,291 0.16% 1,664 COP Corp Financiera Colombiana SA 20,365 0.14% 2,060 COP Grupo de Inversiones Suramericana SA 23,168 0.16%
Total for Colombia 95,523 0.65%
Curaçao 882 USD Almarai Co. Warrant, expires 02 March 2017 18,382 0.12%
1,388 USD Fawaz Abdulaziz Al Hokair & Co. Warrant, expires 02 March 2017 26,126 0.18% Total for Curaçao 44,508 0.30%
Hong Kong 16,000 HKD China Mobile Ltd 180,640 1.24% 37,000 HKD CNOOC Ltd 38,526 0.26%
107,712 HKD Lenovo Group Ltd 109,377 0.75% Total for Hong Kong 328,543 2.25%
Hungary 9,009 HUF OTP Bank Plc 186,317 1.27%
Total for Hungary 186,317 1.27%
Indonesia 56,900 IDR Astra International Tbk PT 24,766 0.17% 53,800 IDR Bank Central Asia Tbk PT 51,907 0.35% 55,394 IDR Bank Negara Indonesia Persero Tbk PT 20,052 0.14% 25,124 IDR Bank Rakyat Indonesia Persero Tbk PT 20,823 0.14% 89,941 IDR Charoen Pokphand Indonesia Tbk PT 16,964 0.12%
143,603 IDR Perusahaan Gas Negara Persero Tbk 28,595 0.19% 48,705 IDR Tambang Batubara Bukit Asam Persero Tbk PT 15,988 0.11%
202,300 IDR Telekomunikasi Indonesia Persero Tbk PT 45,567 0.31% 8,500 IDR Unilever Indonesia Tbk PT 22,815 0.16%
Total for Indonesia 247,477 1.69%
Malaysia 26,000 MYR Alliance Financial Group Bhd 21,558 0.15% 16,472 MYR Axiata Group Bhd 24,592 0.17% 1,200 MYR British American Tobacco Malaysia Bhd 15,674 0.11%
14,800 MYR CIMB Group Holdings Bhd 15,650 0.11% 20,300 MYR DiGi.Com Bhd 25,531 0.17% 10,324 MYR Hong Leong Bank Bhd 32,317 0.22% 16,700 MYR IOI Corp Bhd 17,348 0.12% 23,900 MYR Malayan Banking Bhd 46,759 0.32% 10,500 MYR Public Bank Bhd 45,292 0.31% 18,000 MYR Telekom Malaysia Bhd 28,424 0.19% 8,300 MYR Tenaga Nasional Bhd 25,750 0.18%
77,000 MYR YTL Corp Bhd 28,156 0.19% Total for Malaysia 327,051 2.24%

Standard Life Investments Global SICAV Société d'Investissement à Capital Variable
154
Enhanced Diversification Global Emerging Markets Equities Fund Schedule of Investments (expressed in USD) (continued) as at 31 December 2015
Quantity/ Market Value % of
Nominal Value Currency Name of Securities USD Net Assets
Transferable securities and money market instruments admitted to an official exchange listing (continued)
Mexico 103,000 MXN America Movil SAB de CV 74,325 0.51% 47,463 MXN Cemex SAB de CV 25,331 0.17% 8,300 MXN Fomento Economico Mexicano SAB de CV 76,579 0.52% 6,500 MXN Grupo Financiero Banorte SAB de CV 35,275 0.24%
11,200 MXN Grupo Mexico SAB de CV 23,917 0.17% 5,100 MXN Grupo Televisa SAB 28,166 0.19% 5,150 MXN Telesites SAB 3,304 0.02%
11,400 MXN Wal-Mart de Mexico SAB de CV 28,496 0.20% Total for Mexico 295,393 2.02%
Papua New Guinea 46,589 AUD Oil Search Ltd 228,351 1.56%
Total for Papua New Guinea 228,351 1.56%
Philippines 1,510 PHP Ayala Corp 24,260 0.17%
322,100 PHP Ayala Land Inc 235,817 1.61% Total for Philippines 260,077 1.78%
Russia 12,310 USD Gazprom PAO 45,455 0.31% 1,314 USD Lukoil PJSC 42,311 0.29% 3,177 USD Magnit PJSC 127,779 0.87% 2,606 USD MMC Norilsk Nickel PJSC 33,005 0.23%
253 USD Novatek OAO 20,784 0.14% 11,288 USD Sberbank of Russia PJSC 66,373 0.45%
Total for Russia 335,707 2.29%
South Africa 1,179 ZAR Aspen Pharmacare Holdings Ltd 23,459 0.16% 1,369 ZAR Bidvest Group Ltd 28,888 0.20% 2,594 ZAR Discovery Ltd 22,173 0.15%
12,022 ZAR FirstRand Ltd 32,749 0.22% 8,407 ZAR Gold Fields Ltd 22,810 0.16%
10,074 ZAR Life Healthcare Group Holdings Ltd 22,714 0.16% 5,713 ZAR MTN Group Ltd 48,811 0.33% 1,101 ZAR Naspers Ltd 150,068 1.03% 1,055 ZAR Remgro Ltd 16,632 0.11% 4,312 ZAR RMB Holdings Ltd 15,417 0.11% 1,509 ZAR Sasol Ltd 40,690 0.28% 2,420 ZAR Shoprite Holdings Ltd 22,290 0.15% 3,901 ZAR Standard Bank Group Ltd 28,467 0.19% 4,456 ZAR Steinhoff International Holdings Ltd 22,492 0.15%
26,977 ZAR Woolworths Holdings Ltd 173,704 1.19% Total for South Africa 671,364 4.59%
South Korea 140 KRW Amorepacific Corp 49,490 0.34% 216 KRW AMOREPACIFIC Group 27,264 0.19% 350 KRW Dongbu Insurance Co Ltd 20,984 0.14% 174 KRW E-MART Inc 28,047 0.19% 953 KRW Hana Financial Group Inc 19,181 0.13% 358 KRW Hyundai Development Co-Engineering & Construction 11,846 0.08% 175 KRW Hyundai Mobis Co Ltd 36,789 0.25% 393 KRW Hyundai Motor Co 49,940 0.34% 219 KRW Hyundai Motor Co - Pref 19,611 0.13% 814 KRW Kangwon Land Inc 26,658 0.18% 970 KRW KB Financial Group Inc 27,424 0.19% 629 KRW Kia Motors Corp 28,217 0.19% 911 KRW Korea Electric Power Corp 38,847 0.27%
8,160 KRW KT Corp 196,597 1.34% 592 KRW KT&G Corp 52,760 0.36%

Standard Life Investments Global SICAV Société d'Investissement à Capital Variable
155
Enhanced Diversification Global Emerging Markets Equities Fund Schedule of Investments (expressed in USD) (continued) as at 31 December 2015
Quantity/ Market Value % of
Nominal Value Currency Name of Securities USD Net Assets
Transferable securities and money market instruments admitted to an official exchange listing (continued)
South Korea (continued) 105 KRW LG Chem Ltd 29,417 0.20% 613 KRW LG Corp 37,014 0.25%
1,214 KRW LG Display Co Ltd 25,418 0.17% 41 KRW LG Household & Health Care Ltd 36,715 0.25% 73 KRW NAVER Corp 40,965 0.28%
290 KRW POSCO 41,180 0.28% 178 KRW Samsung C&T Corp 21,253 0.15% 56 KRW Samsung Electronics Co Ltd - Pref 52,105 0.36%
429 KRW Samsung Electronics Co Ltd 460,995 3.15% 209 KRW Samsung Fire & Marine Insurance Co Ltd 54,810 0.38% 334 KRW Samsung Life Insurance Co Ltd 31,333 0.22% 85 KRW Samsung SDS Co Ltd 18,413 0.13%
1,466 KRW Shinhan Financial Group Co Ltd 49,448 0.34% 1,691 KRW SK Hynix Inc 44,346 0.30%
Total for South Korea 1,577,067 10.78%
Taiwan 22,000 TWD Cathay Financial Holding Co Ltd 31,010 0.21% 42,000 TWD China Steel Corp 22,952 0.16% 41,611 TWD Chipbond Technology Corp 60,237 0.41% 8,000 TWD Chunghwa Telecom Co Ltd 24,136 0.17%
39,997 TWD CTBC Financial Holding Co Ltd 20,579 0.14% 15,000 TWD CTCI Corp 16,371 0.11% 15,000 TWD Fubon Financial Holding Co Ltd 20,550 0.14% 2,625 TWD Hermes Microvision Inc 95,500 0.65%
137,088 TWD Hon Hai Precision Industry Co Ltd 337,222 2.30% 302 TWD Largan Precision Co Ltd 20,871 0.14%
4,000 TWD MediaTek Inc 30,444 0.21% 12,000 TWD Nan Ya Plastics Corp 22,285 0.15% 70,000 TWD Taiwan Semiconductor Manufacturing Co Ltd 304,746 2.08% 23,920 TWD Uni-President Enterprises Corp 39,980 0.28%
Total for Taiwan 1,046,883 7.15%
Thailand 4,900 THB Advanced Info Service PCL 20,698 0.14% 2,800 THB Airports of Thailand PCL 26,922 0.18% 4,500 THB Bumrungrad Hospital PCL 26,386 0.18% 6,101 THB Kasikornbank PCL 25,347 0.17% 7,400 THB Siam Commercial Bank PCL 24,574 0.17% 3,086 THB Total Access Communication PCL 2,594 0.02%
Total for Thailand 126,521 0.86%
Turkey 8,330 TRY Akbank TAS 19,472 0.13% 4,096 TRY KOC Holding AS 15,621 0.11% 7,208 TRY Tupras Turkiye Petrol Rafinerileri AS 177,405 1.21%
12,237 TRY Turk Telekomunikasyon AS 23,397 0.16% 5,673 TRY Turkcell Iletisim Hizmetleri AS 19,746 0.14% 8,453 TRY Turkiye Garanti Bankasi AS 20,863 0.14% 8,839 TRY Turkiye Is Bankasi 14,200 0.10%
Total for Turkey 290,704 1.99%
United Kingdom 4,633 GBP BGEO Group Plc 130,722 0.89%
Total for United Kingdom 130,722 0.89%
Total transferable securities and money market instruments admitted to an official exchange listing 9,290,967 63.50%

Standard Life Investments Global SICAV Société d'Investissement à Capital Variable
156
Enhanced Diversification Global Emerging Markets Equities Fund Schedule of Investments (expressed in USD) (continued) as at 31 December 2015
Quantity/ Market Value % of
Nominal Value Currency Name of Securities USD Net Assets
Open-ended investment funds
United Kingdom 115,453 GBP Standard Life Investments Higher Income Fund* 167,686 1.15%
Total for United Kingdom 167,686 1.15%
Total open-ended investment funds 167,686 1.15% Total investments 9,458,653 64.65% Cash and cash equivalents 5,230,235 35.75% Other net liabilities (58,163) (0.40%) Total net assets 14,630,725 100.00%
1 suspended/delisted security. *This open-ended investment fund is an affiliated entity of the Company. Please refer to note 11 to the financial statements for further details.
Analysis of Investments as % of total assets Transferable securities and money market instruments admitted to an official exchange listing 62.86%Other assets 37.14%Total assets 100.00% The accompanying notes form an integral part of these financial statements.

Standard Life Investments Global SICAV Société d'Investissement à Capital Variable
157
Continental European Equity Income Fund Sub-fund Objective The objective of the Sub-fund is to provide a high level of income with some capital appreciation over the longer term.
Investment Policy The current policy is to invest in high yielding equities and equity related securities of corporations domiciled in European countries (which might include emerging markets of Europe), excluding the UK, or companies that derives a significant proportion of their revenues or profits from European operations or have a significant proportion of their assets there. A significant proportion may be invested in fixed interest securities.
Performance Review The Continental European Equity Income Fund returned 14.0% to 31 December 2015, compared with the FTSE World Europe ex UK Index return of 10.9%.*
Holdings that contributed to performance included Euronext. This is the leading exchange in the Eurozone and its average daily transaction value rose strongly. In particular, improving volumes in European equity markets and broker upgrades proved positive for the stock. Danish pharmaceutical company Novo Nordisk also added value over the period. The company is a leader in insulin and diabetes care, and had its new diabetes drug Tresiba approved by the US Food & Drug Administration in September. Another significant contributor to returns was Veolia. The market appreciated its cost restructuring and ability achieve it sales targets in the current climate.
Not owning Nestle during the volatility of the third quarter was a drag on performance; the company is seen as a defensive stock and proved well-supported at this time. Meanwhile, questions over the strategic direction of Zurich Insurance meant our holding in the company performed poorly. Lastly, some weaker-than-expected numbers from Vivendi weighed on our position in the French mass media company. *Sub-fund performance has been calculated over the stated period on the share price performance basis, based on the D Accumulation Shares and net of fees. Please note the index return is quoted gross and contains no adjustment for fees. Outlook Despite the recent disappointment following the European Central Bank’s latest monetary policy decision, the outlook for European equities remains positive. Economic data continues to be relatively robust with improving GDP and falling unemployment across the region. As a significant net importer of oil, Europe should continue to gain from low oil prices as consumers benefit from cheaper petrol and manufacturing costs. Interest rate rises also seem a long way off which should remain supportive of a recovering economy. Although we have experienced an anaemic recovery in earnings over the last few years, European companies are now in a better shape. This coupled with the potential for further monetary easing and a weaker Euro should help drive earnings growth. That said, the political landscape remains a significant concern which could create short-term volatility as populist politics continues to increase. Ultimately, we believe that company fundamentals will be the key drivers of returns and that European equities currently represent good value and are attractively priced in a global context. Please note that the commitment approach has been used for risk measurement and calculation of global exposure for this Sub-fund. This Sub-fund is not authorised in Hong Kong and is not available to Hong Kong residents.

Standard Life Investments Global SICAV Société d'Investissement à Capital Variable
158
Continental European Equity Income Fund Schedule of Investments (expressed in EUR) as at 31 December 2015
Quantity/ Market Value % of
Nominal Value Currency Name of Securities EUR Net Assets
Transferable securities and money market instruments admitted to an official exchange listing
Austria 19,710 EUR Oesterreichische Post AG 662,847 0.67%
Total for Austria 662,847 0.67%
Belgium 24,546 EUR Anheuser-Busch InBev SA/NV 2,808,062 2.83% 39,541 EUR Umicore SA 1,528,853 1.54%
Total for Belgium 4,336,915 4.37%
Denmark 20,326 DKK Coloplast A/S 1,517,121 1.53%
113,405 DKK Danske Bank A/S 2,814,403 2.84% 44,682 DKK ISS A/S 1,489,092 1.50% 67,059 DKK Novo Nordisk A/S 3,593,532 3.63%
Total for Denmark 9,414,148 9.50%
Finland 21,700 EUR Kesko OYJ 702,429 0.71% 46,678 EUR Kone OYJ 1,828,377 1.85%
509,443 EUR Nokia OYJ 3,359,777 3.39% 49,340 EUR Sampo Oyj 2,318,980 2.34%
118,300 EUR Stora Enso OYJ 992,537 1.00% 37,015 EUR Wartsila OYJ Abp 1,560,182 1.57%
Total for Finland 10,762,282 10.86%
France 101,062 EUR AXA SA 2,549,794 2.57% 31,582 EUR Klepierre 1,294,546 1.31%
160,844 EUR Orange SA 2,490,670 2.51% 14,945 EUR Societe BIC SA 2,266,409 2.29% 60,472 EUR Total SA 2,495,377 2.52%
115,874 EUR Veolia Environnement SA 2,533,585 2.56% 103,512 EUR Vivendi SA 2,055,748 2.07%
Total for France 15,686,129 15.83%
Germany 8,882 EUR Allianz SE 1,452,651 1.47%
15,100 EUR Bayer AG 1,748,580 1.76% 40,008 EUR Covestro AG 1,345,669 1.36% 32,592 EUR Deutsche Post AG 845,925 0.85%
109,347 EUR Deutsche Telekom AG 1,825,002 1.84% 63,095 EUR Tui AG-Di Npv 1,059,050 1.07%
Total for Germany 8,276,877 8.35%
Ireland 71,541 EUR CRH Plc 1,910,145 1.93% 83,408 EUR Ryanair Holdings Plc 1,251,954 1.26%
Total for Ireland 3,162,099 3.19%
Italy 70,702 EUR Atlantia SpA 1,732,199 1.75%
334,339 EUR Enel SpA 1,301,247 1.31% 441,741 EUR Intesa Sanpaolo SpA 1,364,096 1.38% 72,799 EUR MARR SpA 1,389,005 1.40%
121,082 EUR Mediobanca SpA 1,075,814 1.08% Total for Italy 6,862,361 6.92%
Luxembourg 1,200,000 EUR Telecom Italia Finance SA 6.125% 15 November 2016 1,771,416 1.79%
Total for Luxembourg 1,771,416 1.79%
Netherlands 21,013 EUR Euronext NV 993,599 1.00%

Standard Life Investments Global SICAV Société d'Investissement à Capital Variable
159
Continental European Equity Income Fund Schedule of Investments (expressed in EUR) (continued) as at 31 December 2015
Quantity/ Market Value % of
Nominal Value Currency Name of Securities EUR Net Assets
Transferable securities and money market instruments admitted to an official exchange listing (continued)
Netherlands (continued) 117,731 EUR ING Groep NV 1,465,751 1.48% 685,025 EUR Koninklijke KPN NV 2,392,107 2.41% 36,587 EUR NN Group NV 1,190,907 1.20% 33,418 EUR RELX NV 519,316 0.53%
Total for Netherlands 6,561,680 6.62%
Portugal 151,674 EUR CTT-Correios de Portugal SA 1,342,922 1.36% 116,811 EUR Jeronimo Martins SGPS SA 1,401,148 1.41% 128,435 EUR NOS SGPS SA 930,640 0.94%
Total for Portugal 3,674,710 3.71%
Spain 31,506 EUR ACS Actividades de Construccion y Servicios SA 851,135 0.86% 24,423 EUR Amadeus IT Holding SA 993,650 1.00%
194,870 EUR Bankinter SA 1,275,229 1.28% 136,798 EUR Endesa SA 2,534,183 2.56%
Total for Spain 5,654,197 5.70%
Sweden 25,977 SEK Investor AB 883,309 0.89% 75,624 SEK Securitas AB 1,069,393 1.08% 71,704 SEK Svenska Handelsbanken AB 880,586 0.89%
122,994 SEK Swedbank AB 2,503,181 2.52% 67,862 SEK Swedish Match AB 2,216,011 2.24%
Total for Sweden 7,552,480 7.62%
Switzerland 8,728 CHF Novartis AG 698,302 0.70% 6,225 CHF Partners Group Holding AG 2,072,793 2.09%
13,793 CHF Roche Holding AG 3,514,030 3.55% 4,682 CHF Syngenta AG 1,693,006 1.71%
110,849 CHF UBS Group AG 1,994,437 2.01% 12,924 CHF Zurich Insurance Group AG 3,078,209 3.11%
Total for Switzerland 13,050,777 13.17%
Total transferable securities and money market instruments admitted to an official exchange listing 97,428,918 98.30%
Total investments 97,428,918 98.30% Cash and cash equivalents 2,213,797 2.23% Bank overdraft and other net liabilities (531,473) (0.53%) Total net assets 99,111,242 100.00%
Analysis of Investments as % of total assets Transferable securities and money market instruments admitted to an official exchange listing 96.67%Other assets 3.33%Total assets 100.00% The accompanying notes form an integral part of these financial statements.

Standard Life Investments Global SICAV Société d'Investissement à Capital Variable
160
Global Equity Unconstrained Fund Sub-fund Objective The objective of the Sub-fund is to achieve long-term growth in the share price through capital appreciation of the underlying equity portfolio.
Investment Policy The Sub-fund will achieve this objective primarily through investment in equities and equity related securities of corporations registered on recognised stock exchanges. The Sub-fund will not be restricted by index weightings, sector constraints or company size.
Performance Review The Sub-fund was up 5.3% over the review period (performance is calculated based on the D Accumulation Shares), outperforming its benchmark, the Morningstar Offshore Global Large-Cap Blend Equity Sector, which returned -1.8%.
From a specific stock point of view, our holdings in gaming software companies Activision Blizzard and Electronics Arts were two of the top outperformers. They consistently surpassed expectations given the strength of the console cycle and digital content. Ryanair was the next largest positive contributor to returns. The company has consistently beaten forecasts, as it held onto more of fuel price decreases than expected and also continued to expand faster than predicted. We continue to see significant growth opportunities which are not reflected in either forecasts or the firm’s rating. Additional highlights included SuperGroup, Avago Technologies and Fortune Brands Home & Security.
On the downside, a holding in hard-disk drive manufacturer Western Digital hurt the Sub-fund’s performance after investors reacted negatively to the company’s announced takeover of Sandisk. Investors are questioning whether the deal makes strategic sense. We agree and have subsequently sold our holding. Elsewhere, shares in Australia’s Oil Search tumbled after Woodside said it was no longer considering a takeover of the company. The weakness in the oil price has also called into question Oil Search’s future growth prospects. Positions in Rocket Internet, Sands China and Kansas City Southern also adversely affected the Sub-fund’s performance. We no longer hold these stocks.
Outlook As we move into 2016, there is increasing uncertainty around the outlook for global equities. Valuations are not stretched, but they are above average and it will therefore take earnings growth to drive the market higher. While economic growth in the US is robust and Europe is on an improving trend, the big risk is China and the pace of its economic slowdown. Rising interest rates in the US, widening credit spreads and increased M&A activity all point towards the equity bull market maturing. However, we are not yet at the end of the cycle.
Our central case remains one of a modest slowdown in Chinese growth which, when coupled with improving growth elsewhere, leads to similar or slightly improved global GDP. We therefore expect corporate earnings growth to remain in-line with long-term averages of around 7-8% – but the corridor of uncertainty is increasing.
Please note that the commitment approach has been used for risk measurement and calculation of global exposure for this Sub-fund.
This Sub-fund is not authorized in Hong Kong and is not available to Hong Kong residents.

Standard Life Investments Global SICAV Société d'Investissement à Capital Variable
161
Global Equity Unconstrained Fund Schedule of Investments (expressed in USD) as at 31 December 2015
Quantity/ Market Value % of
Nominal Value Currency Name of Securities USD Net Assets
Transferable securities and money market instruments admitted to an official exchange listing
Bermuda 11,571 USD Lazard Ltd 525,092 1.60%
Total for Bermuda 525,092 1.60%
British Virgin Islands 20,100 USD Hollysys Automation Technologies Ltd 446,421 1.36%
414,000 HKD Tianhe Chemicals Group Ltd1 15,491 0.05% Total for British Virgin Islands 461,912 1.41%
Cayman Islands 4,184 USD Baidu Inc 803,872 2.45%
1,155,000 HKD Geely Automobile Holdings Ltd 615,486 1.88% 12,200 USD JD.com Inc 391,376 1.19%
Total for Cayman Islands 1,810,734 5.52%
Finland 89,315 EUR Nokia OYJ 641,381 1.95%
Total for Finland 641,381 1.95%
France 9,901 EUR Orpea 795,416 2.42%
Total for France 795,416 2.42%
Germany 18,757 EUR Covestro AG 686,960 2.10% 43,576 EUR Deutsche Telekom AG 791,919 2.41%
Total for Germany 1,478,879 4.51%
Ireland 10,400 USD Allegion Plc 692,744 2.11% 41,885 EUR Glanbia Plc 773,046 2.36% 60,443 EUR Ryanair Holdings Plc 987,878 3.01%
Total for Ireland 2,453,668 7.48%
Italy 443,896 EUR Banca Popolare di Milano Scarl 445,161 1.35% 151,397 EUR Intesa Sanpaolo SpA 509,063 1.55% 84,752 EUR Mediobanca SpA 819,944 2.50%
Total for Italy 1,774,168 5.40%
Japan 256,000 JPY Kumagai Gumi Co Ltd 742,245 2.26% 101,400 JPY Mitsubishi UFJ Financial Group Inc 637,783 1.94% 24,100 JPY Resorttrust Inc 641,692 1.96%
Total for Japan 2,021,720 6.16%
Papua New Guinea 185,806 AUD Oil Search Ltd 910,706 2.77%
Total for Papua New Guinea 910,706 2.77%
Portugal 63,233 EUR Galp Energia SGPS SA 738,100 2.25%
Total for Portugal 738,100 2.25%
Singapore 6,075 USD Avago Technologies Ltd 895,273 2.73%
Total for Singapore 895,273 2.73%
Spain 66,269 GBP International Consolidated Airlines Group SA 599,536 1.83%
Total for Spain 599,536 1.83%

Standard Life Investments Global SICAV Société d'Investissement à Capital Variable
162
Global Equity Unconstrained Fund Schedule of Investments (expressed in USD) (continued) as at 31 December 2015
Quantity/ Market Value % of
Nominal Value Currency Name of Securities USD Net Assets
Transferable securities and money market instruments admitted to an official exchange listing (continued)
Sweden 42,777 SEK Securitas AB 658,665 2.01%
Total for Sweden 658,665 2.01%
Switzerland 2,933 CHF Roche Holding AG 813,646 2.48%
41,538 CHF UBS Group AG 813,787 2.48% Total for Switzerland 1,627,433 4.96%
Taiwan 118,847 TWD Chipbond Technology Corp 172,045 0.52%
Total for Taiwan 172,045 0.52%
United Kingdom 51,922 GBP ARM Holdings Plc 799,440 2.44% 43,532 GBP Ashtead Group Plc 721,868 2.20% 55,223 GBP Babcock International Group Plc 831,443 2.53% 91,630 GBP BT Group Plc 640,505 1.95% 90,010 GBP McCarthy & Stone Plc 338,800 1.03%
134,069 GBP Sophos Group Plc 520,533 1.59% 27,348 GBP SuperGroup Plc 667,075 2.03%
Total for United Kingdom 4,519,664 13.77%
United States 12,928 USD Activision Blizzard Inc 509,751 1.55% 3,007 USD Alliance Data Systems Corp 832,247 2.54%
868 USD Alphabet Inc C 669,228 2.04% 7,522 USD Cardinal Health Inc 681,042 2.07% 9,465 USD Cavium Inc 630,653 1.92% 6,178 USD CVS Health Corp 610,016 1.86%
13,357 USD Delta Air Lines Inc 683,478 2.08% 7,001 USD Electronic Arts Inc 487,620 1.49% 7,560 USD Facebook Inc 803,023 2.45%
11,859 USD First Republic Bank 785,777 2.39% 15,967 USD Fortune Brands Home & Security Inc 898,144 2.74% 8,212 USD Kraft Heinz Co 605,635 1.85% 4,098 USD Martin Marietta Materials Inc 562,614 1.71%
33,936 USD Stillwater Mining Co 296,261 0.90% 7,391 USD Visteon Corp 858,834 2.62%
Total for United States 9,914,323 30.21%
Total transferable securities and money market instruments admitted to an official exchange listing 31,998,715 97.50%
Total investments 31,998,715 97.50% Cash and cash equivalents 861,241 2.62% Other net liabilities (40,720) (0.12%) Total net assets 32,819,236 100.00%
1 suspended/delisted security
Analysis of Investments as % of total assets Transferable securities and money market instruments admitted to an official exchange listing 97.31%Other assets 2.69%Total assets 100.00% The accompanying notes form an integral part of these financial statements.

Standard Life Investments Global SICAV Société d'Investissement à Capital Variable
163
American Equity Unconstrained Fund Sub-fund Objective The objective of the Sub-fund is to achieve long-term growth in the share price through capital appreciation of the underlying equity portfolio.
Investment Policy The Sub-fund will achieve this objective primarily through investment in equities and equity related securities of corporations domiciled in the US, or companies that derive a significant proportion of their revenues or profits from US operations or have a significant proportion of their assets there.
Performance Review The American Equity Unconstrained Fund has returned 0.5% since its launch on 20 February 2015, compared with S&P 500 index return of -1.4%.* In the early stages of the reporting period, the top-performing area of the market was financial services, with two themes running through the key contributing stocks: leverage to higher interest rates and M&A exposure. Charles Schwab and First Republic are two firms that have excelled in gathering wealth-management assets, but also stand to benefit from higher interest rates toward the end of this year. Lazard and Evercore provide M&A advisory services and are well positioned to benefit from the step-up in market-wide deal activity. Less positively, PC component maker Western Digital hurt the Sub-fund’s performance. Industry data suggest that the PC market weakened in the first quarter with little likelihood of a pick-up in the near term. Traders consequently sold shares in Western Digital and similar PC-related companies.
As the year progressed, niche retailers such as Advance Auto Parts and TJX companies added value. Security products specialist Allegion also boosted returns when it released solid results that reflected the company’s broad-based strength in both commercial and residential markets. Elsewhere, auto supplier Visteon enjoyed stronger-than-expected operating results. The Sub-fund’s performance was negatively affected by its exposure to Advance Auto Parts, as its share price declined amid market concerns over the impact of its acquisition of General Parts International. Our holding in Martin Marietta also proved detrimental to performance as the pace of construction growth, particularly in Texas, unsettled investors. *Sub-fund Performance has been calculated over the stated period on the share price performance basis, based on the D Accumulation Shares in USD and net of fees. Please note the index return is quoted gross and contains no adjustment for fees. Outlook The path of interest rates, the strength of the dollar and developments in commodity prices will be key drivers of equity prices in 2016. The US is now very much in a different part of the cycle than other major markets; policy makers in both Europe and China seem committed to further monetary loosening. However, an improving labour market and robust consumer confidence point to a positive if still volatile year for US equities. Please note that the commitment approach has been used for risk measurement and calculation of global exposure for this Sub-fund.
This Sub-fund is not authorized in Hong Kong and is not available to Hong Kong residents.

Standard Life Investments Global SICAV Société d'Investissement à Capital Variable
164
American Equity Unconstrained Fund Schedule of Investments (expressed in USD) as at 31 December 2015
Quantity/ Market Value % of
Nominal Value Currency Name of Securities USD Net Assets
Transferable securities and money market instruments admitted to an official exchange listing
Advertising 6,957 USD Alliance Data Systems Corp 1,925,489 3.88%
Total for advertising 1,925,489 3.88%
Aerospace/Defense
5,646 USD Rockwell Collins Inc 526,602 1.06% Total for Aerospace/Defense 526,602 1.06%
Airlines
7,575 USD Delta Air Lines Inc 387,613 0.78% Total for airlines 387,613 0.78%
Auto parts and equipment
12,372 USD Allison Transmission Holdings Inc 321,796 0.65% 7,000 USD Mobileye NV 290,990 0.59% 3,394 USD Visteon Corp 394,383 0.79%
Total for auto parts and equipment 1,007,169 2.03%
Banks
35,335 USD Citigroup Inc 1,848,020 3.73% 28,572 USD First Republic Bank 1,893,181 3.82%
Total for banks 3,741,201 7.55%
Biotechnology
8,640 USD Celgene Corp 1,042,675 2.10% 4,272 USD Gilead Sciences Inc 436,427 0.88% 2,084 USD Vertex Pharmaceuticals Inc 263,418 0.53%
Total for biotechnology 1,742,520 3.51%
Building materials
31,713 USD Fortune Brands Home & Security Inc 1,783,856 3.60% 11,559 USD Martin Marietta Materials Inc 1,586,935 3.20%
Total for building materials 3,370,791 6.80%
Commercial services
2,610 USD Equifax Inc 294,330 0.60% 10,122 USD FleetCor Technologies Inc 1,448,661 2.92%
Total for commercial services 1,742,991 3.52%
Computers
29,839 USD Hewlett Packard Enterprise Co 455,940 0.92% Total for computers 455,940 0.92%
Cosmetics and personal Care
10,234 USD Colgate-Palmolive Co 691,102 1.40% Total for Cosmetics and personal Care 691,102 1.40%
Diversified financial services
59,090 USD Charles Schwab Corp 1,964,742 3.96% 31,552 CAD Element Financial Corp 382,937 0.77% 9,499 USD Evercore Partners Inc 518,645 1.05%
35,500 USD Lazard Ltd 1,610,990 3.25% 8,365 USD OneMain Holdings Inc 344,638 0.69%
Total for diversified financial services 4,821,952 9.72%

Standard Life Investments Global SICAV Société d'Investissement à Capital Variable
165
American Equity Unconstrained Fund Schedule of Investments (expressed in USD) (continued) as at 31 December 2015
Quantity/ Market Value % of
Nominal Value Currency Name of Securities USD Net Assets
Transferable securities and money market instruments admitted to an official exchange listing (continued)
Electric 18,785 USD CMS Energy Corp 689,034 1.39%
Total for electric 689,034 1.39%
Electronics
29,100 USD Allegion Plc 1,938,351 3.91% 13,611 USD FLIR Systems Inc 385,668 0.78%
Total for electronics 2,324,019 4.69%
Food
26,206 USD Kraft Heinz Co 1,932,692 3.90% 14,074 USD Mondelez International Inc 640,508 1.29%
Total for food 2,573,200 5.19%
Healthcare-products
104,414 USD Boston Scientific Corp 1,943,145 3.92% Total for healthcare-products 1,943,145 3.92%
Housewares
42,335 USD Newell Rubbermaid Inc 1,852,156 3.73% Total for Housewares 1,852,156 3.73%
Insurance
29,660 USD American International Group Inc 1,854,047 3.74% 8,756 USD Hartford Financial Services Group Inc 383,863 0.77%
Total for insurance 2,237,910 4.51%
Internet
824 USD Alphabet Inc C 635,304 1.28% 10,180 USD Facebook Inc 1,081,319 2.18%
Total for internet 1,716,623 3.46%
Oil and gas
5,813 USD EOG Resources Inc 410,456 0.83% 9,524 USD Gulfport Energy Corp 219,814 0.44% 8,217 USD Hess Corp 395,813 0.80%
Total for oil and gas 1,026,083 2.07%
Oil and gas services
9,696 USD Halliburton Co 330,924 0.67% Total for oil and gas services 330,924 0.67%
Pharmaceuticals
9,809 USD AbbVie Inc 586,578 1.18% 5,595 USD Cardinal Health Inc 506,571 1.02%
14,856 USD Pfizer Inc 486,534 0.98% Total for pharmaceuticals 1,579,683 3.18%
REITS
16,117 USD American Tower Corp 1,581,078 3.19% 6,456 USD Equinix Inc 1,954,167 3.94%
Total for REITS 3,535,245 7.13%
Retail
66,346 USD Hanesbrands Inc 1,929,342 3.89%

Standard Life Investments Global SICAV Société d'Investissement à Capital Variable
166
American Equity Unconstrained Fund Schedule of Investments (expressed in USD) (continued) as at 31 December 2015
Quantity/ Market Value % of
Nominal Value Currency Name of Securities USD Net Assets
Transferable securities and money market instruments admitted to an official exchange listing (continued)
Retail (continued) 5,459 USD TJX Cos Inc 389,554 0.79%
Total for retail 2,318,896 4.68%
Semiconductors
13,000 USD Avago Technologies Ltd 1,915,810 3.86% 6,108 USD Cavium Inc 406,976 0.82%
Total for semiconductors 2,322,786 4.68%
Software
9,656 USD Activision Blizzard Inc 380,736 0.77% 24,391 USD Electronic Arts Inc 1,698,833 3.43% 4,413 USD Salesforce.com inc 349,245 0.70%
Total for software 2,428,814 4.90%
Telecommunications
2,629 USD Palo Alto Networks Inc 464,781 0.94% 16,040 USD Verizon Communications Inc 750,191 1.51%
Total for telecommunications 1,214,972 2.45%
Transportation
4,010 USD Kansas City Southern 297,823 0.60% Total for transportation 297,823 0.60%
Total of transferable securities and money market instruments admitted to an official exchange listing 48,804,683 98.42%
Total investments 48,804,683 98.42% Cash and cash equivalents 847,563 1.71% Other net liabilities (62,223) (0.13%) Total net assets 49,590,023 100.00%
Analysis of Investments as % of total assets Transferable securities and money market instruments admitted to an official exchange listing 98.23%Other assets 1.77%Total assets 100.00% The accompanying notes form an integral part of these financial statements.

Standard Life Investments Global SICAV Société d'Investissement à Capital Variable
167
Global Emerging Markets Equities Fund Sub-fund Objective The objective of the Sub-fund is to achieve long term growth in the share price through capital appreciation of the underlying equity portfolio.
Investment Policy The Sub-fund will achieve this objective primarily through investment in equities and equity related securities of corporations domiciled in emerging markets or companies that derive a significant proportion of their revenues or profits from Asian, Eastern European, Middle Eastern, African or Latin American operations or have a significant proportion of their assets there.
Performance Review The Sub-fund returned -14.6% (performance is calculated based on the D Accumulation Shares) over the review period in dollar terms, leading its benchmark, the MSCI EMF (Emerging Markets) Index, which was down -17.2%. The Sub-fund launched on 20 February 2015 (share class D).
Digging deeper, a holding in Malaysian government services outsourcing firm MyEG Services did well. The company is growing earnings rapidly as it expands its reach into new areas, such as illegal foreign worker registration. The stock is consequently re-rating as the brokerage community starts to reappraise MyEG. Towards the other end of the market cap spectrum, Chinese internet search giant Baidu had a good review period after it was included in the MSCI Index and delivered better-than-expected third-quarter results. Another positive contributor was Woory Industrial, which continues to benefit from its relationship with electric car manufacturer Tesla. By contrast, Vipshop struggled after it issued worse-than-expected third-quarter results, with management citing bad weather. We feel that our previous non-consensus views on Vipshop of open-ended growth opportunity and defensible competitive niche have evaporated, with the company now struggling for active user growth. We therefore sold the holding. Taiwanese tech group Hermes Microvision also had a tough review period after large hardware companies, such Intel, cut capex spending and deferred new orders. Holdings in Total Access Communications PChome Online and CVC Brasil also hurt performance.
Outlook As we have already witnessed so far in 2016, the short-term outlook for global emerging markets (GEM) and the Sub-fund remains inexorably tied to the performance of China. Investor uncertainty over the extent and impact of the country’s economic slowdown, coupled with the erratic tone of policymaking, is causing extreme volatility. From our bottom-up perspective, we get the impression that the consumer and services components of the Chinese economy remain reasonably robust, and that a hard landing is unlikely. Nonetheless, China is the main GEM risk at present. Looking further out, we are still extremely positive about the multitude of interesting stock stories within the GEM universe, many of which are not in the mainstream GEM equity indices. When markets settle, we would expect to see these companies come to the fore. Please note that the commitment approach has been used for risk measurement and calculation of global exposure for this Sub-fund.
This Sub-fund is not authorized in Hong Kong and is not available to Hong Kong residents.

Standard Life Investments Global SICAV Société d'Investissement à Capital Variable
168
Global Emerging Markets Equities Fund Schedule of Investments (expressed in USD) as at 31 December 2015
Quantity/ Market Value % of
Nominal Value Currency Name of Securities USD Net Assets
Transferable securities and money market instruments admitted to an official exchange listing
Australia 49,635 AUD Syrah Resources Ltd 141,611 1.36%
Total for Australia 141,611 1.36%
Bermuda 1,020 USD Credicorp Ltd 99,409 0.96%
825,000 HKD REXLot Holdings Ltd1 11,710 0.11% Total for Bermuda 111,119 1.07%
Brazil 18,381 BRL Banco Bradesco SA - Pref 89,576 0.86%
602 BRL Banco Bradesco SA 315 0.00% 26,521 BRL CVC Brasil Operadora e Agencia de Viagens SA 90,498 0.87% 72,323 BRL Gerdau SA - Pref 85,006 0.82% 25,604 BRL JBS SA 79,927 0.77% 22,700 BRL Ser Educacional SA 44,181 0.43% 26,623 BRL Vale SA - Pref 68,976 0.67%
13,556 BRL Valid Solucoes e Servicos de Seguranca em Meios de Pagamento e Identificacao SA 145,626 1.40%
Total for Brazil 604,105 5.82%
British Virgin Islands 5,523 USD Hollysys Automation Technologies Ltd 122,666 1.18% 7,636 USD Mail.Ru Group Ltd 172,192 1.66%
146,000 HKD Tianhe Chemicals Group Ltd1 5,463 0.05% Total for British Virgin Islands 300,321 2.89%
Canada 20,300 CAD First Quantum Minerals Ltd 76,033 0.73%
Total for Canada 76,033 0.73%
Cayman Islands 1,059 USD Baidu Inc 203,466 1.96% 2,754 USD Bitauto Holdings Ltd 75,404 0.73%
134,141 HKD China Hongqiao Group Ltd 79,790 0.77% 71,405 HKD China Mengniu Dairy Co Ltd 116,456 1.12% 59,164 HKD China Resources Land Ltd 172,525 1.66% 97,584 HKD China State Construction International Holdings Ltd 169,476 1.63%
199,561 HKD Geely Automobile Holdings Ltd 106,344 1.02% 10,000 TWD Ginko International Co Ltd 132,432 1.27% 9,690 HKD Hengan International Group Co Ltd 91,521 0.88%
18,672 USD Himax Technologies Inc 155,538 1.50% 6,976 USD JD.com Inc 223,790 2.15%
75,858 HKD Minth Group Ltd 150,733 1.45% 16,031 HKD Tencent Holdings Ltd 315,440 3.04%
Total for Cayman Islands 1,992,915 19.18%
Chile 11,638,761 CLP Corpbanca SA 93,309 0.90%
Total for Chile 93,309 0.90%
China 36,383 HKD CITIC Securities Co Ltd 85,063 0.82%
176,228 HKD Industrial & Commercial Bank of China Ltd 106,416 1.02% 195,855 HKD Shanghai Electric Group Co Ltd 103,864 1.00% 17,851 HKD Zhuzhou CSR Times Electric Co Ltd 103,763 1.00% 84,338 HKD Zoomlion Heavy Industry Science and Technology Co Ltd 31,449 0.30%
Total for China 430,555 4.14%
Curaçao 239,130 USD Air Arabia PJSC Warrant, expires 06 September 2018 88,543 0.85%
3,466 USD Almarai Co. Warrant, expires 02 March 2017 72,237 0.69% 2,790 USD Fawaz Abdulaziz Al Hokair & Co. Warrant, expires 02 March 2017 52,515 0.51%

Standard Life Investments Global SICAV Société d'Investissement à Capital Variable
169
Global Emerging Markets Equities Fund Schedule of Investments (expressed in USD) (continued) as at 31 December 2015
Quantity/ Market Value % of
Nominal Value Currency Name of Securities USD Net Assets
Transferable securities and money market instruments admitted to an official exchange listing (continued)
Curaçao (continued) 1,929 USD Halwani Brothers Co. Warrant, expires 30 March 2016 36,175 0.35%
Total for Curaçao 249,470 2.40%
Germany 3,309 EUR Rocket Internet SE 101,751 0.98%
Total for Germany 101,751 0.98%
Hong Kong 28,052 HKD China Mobile Ltd 316,707 3.05% 40,190 HKD China Taiping Insurance Holdings Co Ltd 124,456 1.20% 81,191 HKD Lenovo Group Ltd 82,446 0.79%
Total for Hong Kong 523,609 5.04%
Hungary 6,730 HUF OTP Bank Plc 139,185 1.34%
Total for Hungary 139,185 1.34%
Indonesia 123,327 IDR Indofood CBP Sukses Makmur Tbk PT 120,554 1.16%
Total for Indonesia 120,554 1.16%
Malaysia 202,675 MYR AirAsia Bhd 60,894 0.59% 197,691 MYR My EG Services Bhd 198,911 1.91%
Total for Malaysia 259,805 2.50%
Mexico 11,489 MXN Fomento Economico Mexicano SAB de CV 106,002 1.02% 54,471 MXN Grupo Financiero Santander Mexico SAB de CV 95,064 0.92% 69,365 MXN PLA Administradora Industrial S de RL de CV 110,182 1.06% 37,436 MXN Unifin Financiera SAPI de CV SOFOM ENR 115,478 1.11%
Total for Mexico 426,726 4.11%
Nigeria 61,661 GBP SEPLAT Petroleum Development Co Plc 67,389 0.65%
Total for Nigeria 67,389 0.65%
Papua New Guinea 15,986 AUD Oil Search Ltd 78,353 0.76%
Total for Papua New Guinea 78,353 0.76%
Philippines 188,204 PHP Ayala Land Inc 137,788 1.33%
Total for Philippines 137,788 1.33%
Russia 2,244 USD Magnit PJSC 90,254 0.87%
Total for Russia 90,254 0.87%
South Africa 6,546 ZAR MTN Group Ltd 55,929 0.54%
42,681 ZAR Nampak Ltd 68,191 0.65% 1,942 ZAR Naspers Ltd 264,698 2.55% 5,404 ZAR Sasol Ltd 145,716 1.40%
17,891 ZAR Woolworths Holdings Ltd 115,199 1.11% Total for South Africa 649,733 6.25%
South Korea 708 KRW Hyundai Department Store Co Ltd 76,382 0.73%
2,664 KRW Hyundai Development Co-Engineering & Construction 88,153 0.85% 6,497 KRW KT Corp 156,531 1.51%
461 KRW LG Chem Ltd - Pref 97,111 0.93% 921 KRW S&T Motiv Co Ltd 67,393 0.65%

Standard Life Investments Global SICAV Société d'Investissement à Capital Variable
170
Global Emerging Markets Equities Fund Schedule of Investments (expressed in USD) (continued) as at 31 December 2015
Quantity/ Market Value % of
Nominal Value Currency Name of Securities USD Net Assets
Transferable securities and money market instruments admitted to an official exchange listing (continued)
South Korea (continued) 344 KRW Samsung Electronics Co Ltd 369,656 3.56%
1,113 KRW Samsung SDI Co Ltd 108,210 1.04% 2,656 KRW Samsung Securities Co Ltd 94,570 0.91% 5,038 KRW Shinhan Financial Group Co Ltd 169,931 1.64%
470 KRW SK Telecom Co Ltd 86,380 0.83% 6,899 KRW Woory Industrial Co Ltd 164,745 1.59%
Total for South Korea 1,479,062 14.24%
Taiwan 47,235 TWD Chicony Electronics Co Ltd 103,826 1.00% 83,000 TWD Chipbond Technology Corp 120,153 1.15% 3,000 TWD Hermes Microvision Inc 109,142 1.05%
59,300 TWD Hon Hai Precision Industry Co Ltd 145,872 1.40% 10,856 TWD PChome Online Inc 108,735 1.05% 90,000 TWD Taiwan Semiconductor Manufacturing Co Ltd 391,817 3.77%
Total for Taiwan 979,545 9.42%
Thailand 10,500 THB Bangkok Bank PCL 45,081 0.43% 9,827 THB Bangkok Bank PCL - NVDR 41,646 0.40%
54,198 THB Total Access Communication PCL 45,560 0.44% Total for Thailand 132,287 1.27%
Turkey 35,727 TRY Akbank TAS 83,517 0.81% 5,621 TRY Tupras Turkiye Petrol Rafinerileri AS 138,345 1.33%
Total for Turkey 221,862 2.14%
United Kingdom 2,260 GBP BGEO Group Plc 63,767 0.61%
Total for United Kingdom 63,767 0.61%
United States 948 USD MercadoLibre Inc 108,413 1.04%
Total for United States 108,413 1.04%
Total transferable securities and money market instruments admitted to an official exchange listing 9,579,521 92.20%
Total investments 9,579,521 92.20% Cash and cash equivalents 871,034 8.38% Bank overdraft and other net liabilities (60,149) (0.58%) Total net assets 10,390,406 100.00%
1 suspended/delisted security
Analysis of Investments as % of total assets Transferable securities and money market instruments admitted to an official exchange listing 91.35%Other assets 8.65%Total assets 100.00% The accompanying notes form an integral part of these financial statements.

Standard Life Investments Global SICAV Société d'Investissement à Capital Variable
171
Global Bond Fund Sub-fund Objective The objective of the Sub-fund is to achieve long term growth in the share price.
Investment Policy The current policy is to invest in debt securities issued by sovereign and non-governmental agencies and corporate transferable debt securities in the Organisation for Economic Co-operation and Development member countries. Holdings will principally be of investment grade bonds. Returns on the Sub-fund will be both through the reinvestment of income and from capital gains.
Performance Review The Sub-fund returned -4.4% over the period, compared to the Citigroup World Government Bond Index return of -3.6%.*
Inflation-linked positions in the US proved detrimental in the first quarter as the oil price continued to fall. Overweight positions in core Europe versus the US and Japan added to returns as the European Central Bank’s (the “ECB”) quantitative easing (the “QE”) announcement was particularly positive for our positioning here. Bond yields rose in most major markets in the second quarter. The main negative contributor to performance was being long of European duration in April and early-May (our decision to close this position mid-May proved correct). Positioning on the US yield curve, as a quasi-duration strategy, benefited returns and was particularly successful in early June.
While July was a strong month for performance, August and September were more difficult, as our short duration positions detracted from returns in the face of more dovish statements from central bank policymakers. Overweight positions in peripheral European government bonds contributed positively. The improving political environment, with agreement from the Greeks and their European creditors, helped peripheral spreads perform. Elections in Catalonia and in Portugal passed without serious market disruption. In the final quarter, overweight positions in peripheral European government bonds again proved beneficial as the market began to move towards our view that inflation in Europe will be hard to generate. This requirement to generate inflation should lead to further tranches of QE from the ECB.
*Sub-fund performance has been calculated over the stated period on the share price performance basis, based on the A Accumulation Shares and net of fees. Please note the index return is quoted gross and contains no adjustment for fees.
Outlook Commodity weakness continues to offer greater longevity to zero interest rate policy. However, the fourth quarter highlights the extent of policy divergence. The US Federal Reserve’s rate hike is a leap of faith on longer-term inflation, yet to be fully reflected in bonds.
Whether there is enough uncertainty left in the global economy to support the current thin margin for error in government bond valuations (at low term premiums) remains to be seen. All core bond markets remain expensive on a number of historical relationships. The US rate hike is a crucial first step that has the capacity to question valuations.
Please note that the commitment approach has been used for risk measurement and calculation of global exposure for this Sub-fund.

Standard Life Investments Global SICAV Société d'Investissement à Capital Variable
172
Global Bond Fund Schedule of Investments (expressed in USD) as at 31 December 2015
Quantity/ Market Value % of
Nominal Value Currency Name of Securities USD Net Assets
Transferable securities and money market instruments admitted to an official exchange listing
Australia 260,000 AUD Australia Government Bond 3.250% 21 April 2029 194,563 0.06% 277,000 AUD Queensland Treasury Corp 4.750% 21 July 2025 225,344 0.06%
Total for Australia 419,907 0.12%
Austria 197,000 EUR Austria Government Bond 4.650% 15 January 2018 236,083 0.07% 525,000 EUR Austria Government Bond 3.900% 15 July 2020 675,442 0.19% 710,000 EUR Austria Government Bond 1.750% 20 October 2023 846,795 0.23% 384,000 EUR Austria Government Bond 6.250% 15 July 2027 654,987 0.18% 271,000 EUR Austria Government Bond 4.150% 15 March 2037 428,663 0.12% 129,000 EUR Austria Government Bond 3.150% 20 June 2044 183,830 0.05% 98,000 EUR Austria Government Bond 3.800% 26 January 2062 169,188 0.05%
Total for Austria 3,194,988 0.89%
Belgium 1,596,000 EUR Anheuser-Busch InBev SA/NV 4.000% 02 June 2021 2,006,587 0.56% 1,877,000 EUR Belgium Government Bond 3.250% 28 September 2016 2,099,077 0.58%
306,000 EUR Belgium Government Bond 1.250% 22 June 2018 345,973 0.10% 166,000 EUR Belgium Government Bond 4.250% 28 September 2022 227,879 0.06% 741,000 EUR Belgium Government Bond 5.000% 28 March 2035 1,235,864 0.34% 339,000 EUR Belgium Government Bond 4.250% 28 March 2041 541,741 0.15%
Total for Belgium 6,457,121 1.79%
Canada 765,000 EUR Canada Government International Bond 3.500% 13 January 2020 950,293 0.26%
Total for Canada 950,293 0.26%
Denmark 2,093,000 DKK Denmark Government Bond 4.500% 15 November 2039 483,336 0.13%
Total for Denmark 483,336 0.13%
Finland 799,000 EUR Finland Government Bond 4.000% 04 July 2025 1,121,313 0.31%
Total for Finland 1,121,313 0.31%
France 1,217,000 EUR France Government Bond OAT 4.250% 25 October 2017 1,439,041 0.40% 2,352,000 EUR France Government Bond OAT 1.000% 25 May 2019 2,658,217 0.74% 2,567,000 EUR France Government Bond OAT 3.750% 25 April 2021 3,332,594 0.92%
457,000 EUR France Government Bond OAT 3.250% 25 October 2021 585,083 0.16% 439,000 EUR France Government Bond OAT 2.250% 25 May 2024 539,117 0.15%
2,755,000 EUR France Government Bond OAT 1.750% 25 November 2024 3,249,878 0.90% 1,598,000 EUR France Government Bond OAT 5.500% 25 April 2029 2,620,313 0.73% 1,339,000 EUR France Government Bond OAT 4.000% 25 October 2038 2,042,347 0.57%
606,000 EUR France Government Bond OAT 4.500% 25 April 2041 1,003,313 0.28% 469,000 EUR France Government Bond OAT 4.000% 25 April 2060 774,867 0.21%
5,500,000 EUR French Treasury Note BTAN 2.500% 25 July 2016 6,081,920 1.68% Total for France 24,326,690 6.74%
Germany 1 EUR Bundesobligation 0.500% 07 April 2017 1 0.00%
6,391,000 EUR Bundesobligation 0.500% 13 October 2017 7,063,935 1.96% 5,903,000 EUR Bundesrepublik Deutschland 3.500% 04 July 2019 7,269,145 2.02%
523,000 EUR Bundesrepublik Deutschland 3.000% 04 July 2020 650,280 0.18% 457,000 EUR Bundesrepublik Deutschland 2.500% 04 January 2021 561,595 0.16%
21,018,014 EUR Bundesrepublik Deutschland 1.750% 04 July 2022 25,257,350 7.00% 6,476,000 EUR Bundesrepublik Deutschland 6.250% 04 January 2024 10,327,235 2.86%
751,000 EUR Bundesrepublik Deutschland 4.750% 04 July 2028 1,192,668 0.33% 3,783,615 EUR Bundesrepublik Deutschland 5.500% 04 January 2031 6,646,537 1.84% 1,185,000 EUR Bundesrepublik Deutschland 4.250% 04 July 2039 2,029,711 0.56%

Standard Life Investments Global SICAV Société d'Investissement à Capital Variable
173
Global Bond Fund Schedule of Investments (expressed in USD) (continued) as at 31 December 2015
Quantity/ Market Value % of
Nominal Value Currency Name of Securities USD Net Assets
Transferable securities and money market instruments admitted to an official exchange listing (continued)
Germany (continued) 882,000 EUR Bundesrepublik Deutschland 4.750% 04 July 2040 1,627,960 0.45%
Total for Germany 62,626,417 17.36%
Ireland 3,267,000 EUR Ireland Government Bond 4.500% 18 October 2018 4,027,708 1.12% 2,185,000 EUR Ireland Government Bond 4.500% 18 April 2020 2,827,831 0.78%
116,000 EUR Ireland Government Bond 3.900% 20 March 2023 154,545 0.04% 5,063,828 EUR Ireland Government Bond 2.000% 18 February 2045 5,284,483 1.47%
Total for Ireland 12,294,567 3.41%
Italy 2,678,000 EUR Italy Buoni Poliennali Del Tesoro 3.750% 01 August 2016 2,979,713 0.83% 1,837,000 EUR Italy Buoni Poliennali Del Tesoro 4.000% 01 February 2017 2,093,581 0.58% 8,200,000 EUR Italy Buoni Poliennali Del Tesoro 0.750% 15 January 2018 9,053,304 2.51% 1,218,000 EUR Italy Buoni Poliennali Del Tesoro 4.500% 01 August 2018 1,478,996 0.41%
370,000 EUR Italy Buoni Poliennali Del Tesoro 4.750% 01 September 2021 490,160 0.14% 2,446,000 EUR Italy Buoni Poliennali Del Tesoro 4.750% 01 August 2023 3,335,684 0.92%
767,000 EUR Italy Buoni Poliennali Del Tesoro 4.750% 01 September 2028 1,101,398 0.30% 2,214,000 EUR Italy Buoni Poliennali Del Tesoro 5.000% 01 August 2034 3,387,302 0.94%
351,000 EUR Italy Buoni Poliennali Del Tesoro 5.000% 01 August 2039 546,788 0.15% 379,000 EUR Italy Buoni Poliennali Del Tesoro 5.000% 01 September 2040 587,976 0.16% 251,000 EUR Italy Buoni Poliennali Del Tesoro 4.750% 01 September 2044 386,694 0.11%
Total for Italy 25,441,596 7.05%
Japan 1,542,750,000 JPY Japan Government Five Year Bond 0.200% 20 March 2019 12,903,130 3.58%
101,650,000 JPY Japan Government Ten Year Bond 1.700% 20 December 2016 858,650 0.24% 21,000,000 JPY Japan Government Ten Year Bond 1.400% 20 March 2018 179,949 0.05%
1,283,350,000 JPY Japan Government Ten Year Bond 1.300% 20 March 2018 10,974,018 3.04% 303,200,000 JPY Japan Government Ten Year Bond 1.100% 20 December 2021 2,678,642 0.74% 193,300,000 JPY Japan Government Thirty Year Bond 2.200% 20 September 2039 1,965,546 0.54% 229,500,000 JPY Japan Government Thirty Year Bond 1.700% 20 March 2044 2,112,725 0.59% 14,950,000 JPY Japan Government Twenty Year Bond 2.100% 20 December 2025 146,641 0.04%
679,350,000 JPY Japan Government Twenty Year Bond 2.200% 20 March 2026 6,735,676 1.87% 543,050,000 JPY Japan Government Twenty Year Bond 2.100% 20 June 2028 5,428,700 1.50%
2,512,900,000 JPY Japan Government Twenty Year Bond 2.100% 20 September 2029 25,256,232 7.00% Total for Japan 69,239,909 19.19%
Mexico 20,722,000 MXN Mexican Bonos 10.000% 05 December 2024 1,509,364 0.42%
Total for Mexico 1,509,364 0.42%
Netherlands 1,751,000 EUR Netherlands Government Bond 0.000% 15 April 2016 1,909,188 0.53% 2,474,000 EUR Netherlands Government Bond 4.000% 15 July 2018 2,986,260 0.83%
830,000 EUR Netherlands Government Bond 3.500% 15 July 2020 1,051,190 0.29% 2,285,000 EUR Netherlands Government Bond 2.250% 15 July 2022 2,810,464 0.78%
994,000 EUR Netherlands Government Bond 1.750% 15 July 2023 1,187,893 0.33% 3,588,000 EUR Netherlands Government Bond 0.250% 15 July 2025 3,710,942 1.03%
129,000 EUR Netherlands Government Bond 5.500% 15 January 2028 212,144 0.06% 1,330,000 EUR Netherlands Government Bond 2.500% 15 January 2033 1,708,706 0.47%
Total for Netherlands 15,576,787 4.32%
Norway 1,101,000 NOK Norway Government Bond 3.750% 25 May 2021 142,735 0.04%
Total for Norway 142,735 0.04%
Poland 3,725,000 PLN Poland Government Bond 5.750% 23 September 2022 1,130,252 0.31%
Total for Poland 1,130,252 0.31%
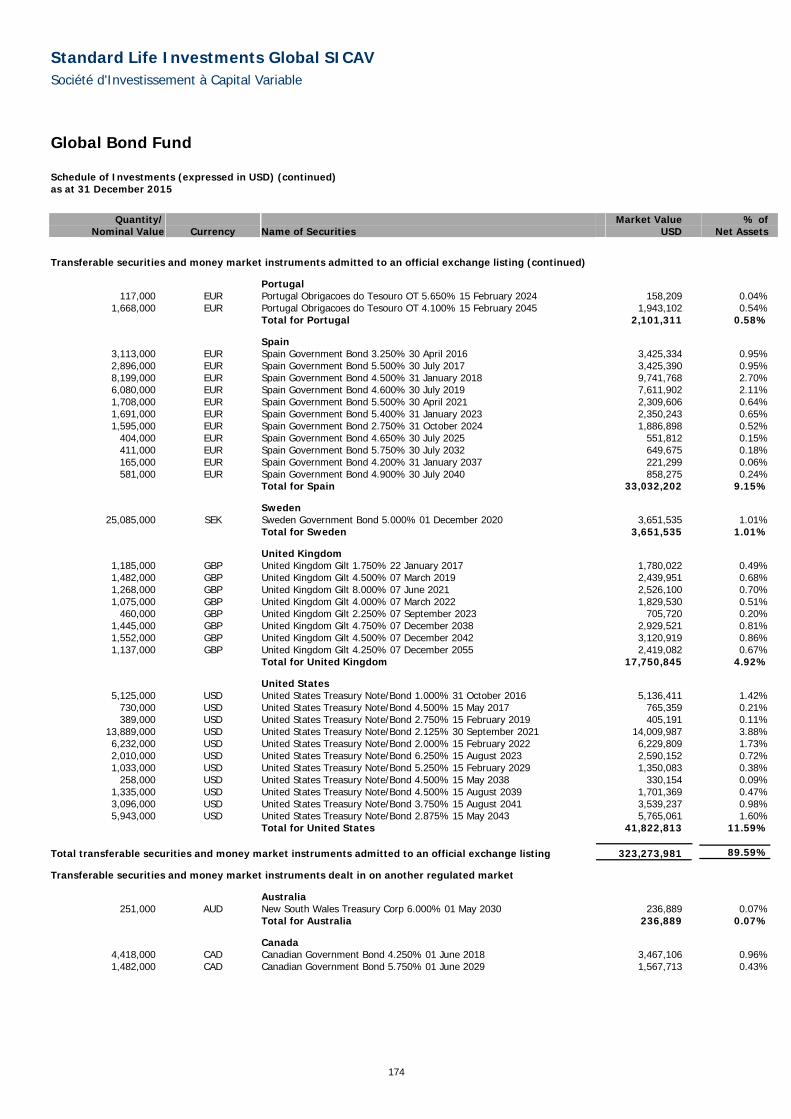
Standard Life Investments Global SICAV Société d'Investissement à Capital Variable
174
Global Bond Fund Schedule of Investments (expressed in USD) (continued) as at 31 December 2015
Quantity/ Market Value % of
Nominal Value Currency Name of Securities USD Net Assets
Transferable securities and money market instruments admitted to an official exchange listing (continued)
Portugal 117,000 EUR Portugal Obrigacoes do Tesouro OT 5.650% 15 February 2024 158,209 0.04%
1,668,000 EUR Portugal Obrigacoes do Tesouro OT 4.100% 15 February 2045 1,943,102 0.54% Total for Portugal 2,101,311 0.58%
Spain 3,113,000 EUR Spain Government Bond 3.250% 30 April 2016 3,425,334 0.95% 2,896,000 EUR Spain Government Bond 5.500% 30 July 2017 3,425,390 0.95% 8,199,000 EUR Spain Government Bond 4.500% 31 January 2018 9,741,768 2.70% 6,080,000 EUR Spain Government Bond 4.600% 30 July 2019 7,611,902 2.11% 1,708,000 EUR Spain Government Bond 5.500% 30 April 2021 2,309,606 0.64% 1,691,000 EUR Spain Government Bond 5.400% 31 January 2023 2,350,243 0.65% 1,595,000 EUR Spain Government Bond 2.750% 31 October 2024 1,886,898 0.52%
404,000 EUR Spain Government Bond 4.650% 30 July 2025 551,812 0.15% 411,000 EUR Spain Government Bond 5.750% 30 July 2032 649,675 0.18% 165,000 EUR Spain Government Bond 4.200% 31 January 2037 221,299 0.06% 581,000 EUR Spain Government Bond 4.900% 30 July 2040 858,275 0.24%
Total for Spain 33,032,202 9.15%
Sweden 25,085,000 SEK Sweden Government Bond 5.000% 01 December 2020 3,651,535 1.01%
Total for Sweden 3,651,535 1.01%
United Kingdom 1,185,000 GBP United Kingdom Gilt 1.750% 22 January 2017 1,780,022 0.49% 1,482,000 GBP United Kingdom Gilt 4.500% 07 March 2019 2,439,951 0.68% 1,268,000 GBP United Kingdom Gilt 8.000% 07 June 2021 2,526,100 0.70% 1,075,000 GBP United Kingdom Gilt 4.000% 07 March 2022 1,829,530 0.51%
460,000 GBP United Kingdom Gilt 2.250% 07 September 2023 705,720 0.20% 1,445,000 GBP United Kingdom Gilt 4.750% 07 December 2038 2,929,521 0.81% 1,552,000 GBP United Kingdom Gilt 4.500% 07 December 2042 3,120,919 0.86% 1,137,000 GBP United Kingdom Gilt 4.250% 07 December 2055 2,419,082 0.67%
Total for United Kingdom 17,750,845 4.92%
United States 5,125,000 USD United States Treasury Note/Bond 1.000% 31 October 2016 5,136,411 1.42%
730,000 USD United States Treasury Note/Bond 4.500% 15 May 2017 765,359 0.21% 389,000 USD United States Treasury Note/Bond 2.750% 15 February 2019 405,191 0.11%
13,889,000 USD United States Treasury Note/Bond 2.125% 30 September 2021 14,009,987 3.88% 6,232,000 USD United States Treasury Note/Bond 2.000% 15 February 2022 6,229,809 1.73% 2,010,000 USD United States Treasury Note/Bond 6.250% 15 August 2023 2,590,152 0.72% 1,033,000 USD United States Treasury Note/Bond 5.250% 15 February 2029 1,350,083 0.38%
258,000 USD United States Treasury Note/Bond 4.500% 15 May 2038 330,154 0.09% 1,335,000 USD United States Treasury Note/Bond 4.500% 15 August 2039 1,701,369 0.47% 3,096,000 USD United States Treasury Note/Bond 3.750% 15 August 2041 3,539,237 0.98% 5,943,000 USD United States Treasury Note/Bond 2.875% 15 May 2043 5,765,061 1.60%
Total for United States 41,822,813 11.59%
Total transferable securities and money market instruments admitted to an official exchange listing 323,273,981 89.59%
Transferable securities and money market instruments dealt in on another regulated market
Australia 251,000 AUD New South Wales Treasury Corp 6.000% 01 May 2030 236,889 0.07%
Total for Australia 236,889 0.07%
Canada 4,418,000 CAD Canadian Government Bond 4.250% 01 June 2018 3,467,106 0.96% 1,482,000 CAD Canadian Government Bond 5.750% 01 June 2029 1,567,713 0.43%

Standard Life Investments Global SICAV Société d'Investissement à Capital Variable
175
Global Bond Fund Schedule of Investments (expressed in USD) (continued) as at 31 December 2015
Quantity/ Market Value % of
Nominal Value Currency Name of Securities USD Net Assets
Transferable securities and money market instruments dealt in on another regulated market (continued)
Canada (continued) 616,000 CAD Canadian Government Bond 4.000% 01 June 2041 601,455 0.17%
Total for Canada 5,636,274 1.56%
Total transferable securities and money market instruments dealt in on another regulated market 5,873,163 1.63%
Total investments 329,147,144 91.22% Cash and cash equivalents 29,764,613 8.25% Bank overdraft and other net assets 1,929,293 0.53% Total net assets 360,841,050 100.00%
Analysis of Investments as % of total assets Transferable securities and money market instruments admitted to an official exchange listing 88.85%Transferable securities and money market instruments dealt in on another regulated market 1.61%Other assets 9.54%Total assets 100.00% The accompanying notes form an integral part of these financial statements.

Standard Life Investments Global SICAV Société d'Investissement à Capital Variable
176
Global Inflation-Linked Bond Fund Sub-fund Objective The objective of the Sub-fund is to provide a real return in USD over longer time periods.
Investment Policy The current policy is to invest primarily in sovereign issued and corporate inflation linked debt. The Sub-fund may also invest in conventional government bonds, investment grade corporate entities, and other interest bearing securities issued anywhere in the world. On an ancillary basis, the Sub-fund may hold cash and invest in other forms of transferable securities, in collective investment schemes, short term debt instruments, regularly traded money market instruments the residual maturity of which does not exceed 12 months.
Performance Review The Sub-fund returned -1.6% over the period, compared to the Barclays World Government Inflation-Linked Bond Index return of -1.1%.*
Long positions in French, Italian and New Zealand real yield duration contributed positively to Sub-fund performance early in the period. An underweight in US real yields was a negative contributor. In the second quarter, being short of 2-year French inflation 2-years forward was a negative contributor as inflation expectations increased in response to more optimism on the outlook for the European economy. On the upside, an underweight in ultra-long-dated UK real yields contributed positively. Holdings in Danish inflation linked bonds versus Germany added to returns.
Our positioning on the US yield curve proved beneficial in the third quarter. The curve steepened as US Treasuries rallied, led by the mid-section of the curve. Duration positioning between the US and UK markets also helped performance. A short position on UK inflation added to returns. On the downside, a long position in 25-year US break-evens with 5-years forward detracted from returns. The market continued to reappraise its pricing of future inflation and the appropriate term premium at the longer-dated end. In the final quarter, New Zealand inflation linked bonds outperformed their UK equivalents and our relative positioning here added to returns. Short duration positioning in the UK over the quarter benefited performance, as did overweight exposure to Australian 3-year rates. There was a negative contribution from our long position in US inflation break-evens. With commodity prices taking renewed falls, inflation expectations were dragged down across the curve. A curve steepening position between 10-year and 30-year European was also a negative contributor.
*Sub-fund performance has been calculated over the stated period on the share price performance basis, based on the A Accumulation Shares and net of fees. Please note the index return is quoted gross and contains no adjustment for fees.
Outlook If the US recovery remains largely on track, as we expect it to, further rate hikes in 2016 would seem the most likely scenario. In this environment, we expect bond yields to drift higher and inflation expectations to increase across the term structure. This will set the US on a different rate path to several other central banks, creating opportunities in cross market trades, such as those in Australia and New Zealand, as well as yield curve strategies across various markets. The European Central Bank is likely to expand its quantitative easing programme further in 2016 but we remain pessimistic on the central bank’s ability to generate inflation, given the structural problems that continue in Europe.
Please note that the commitment approach has been used for risk measurement and calculation of global exposure for this Sub-fund.

Standard Life Investments Global SICAV Société d'Investissement à Capital Variable
177
Global Inflation-Linked Bond Fund Schedule of Investments (expressed in USD) as at 31 December 2015
Quantity/ Market Value % of
Nominal Value Currency Name of Securities USD Net Assets
Transferable securities and money market instruments admitted to an official exchange listing
Australia 221,000 AUD Australia Government Bond 1.000% 21 November 2018 171,454 0.10% 403,000 AUD Australia Government Bond 4.000% 20 August 2020 562,108 0.34% 678,000 AUD Australia Government Bond 3.000% 20 September 2025 704,927 0.43% 263,000 AUD Australia Government Bond 2.500% 20 September 2030 265,534 0.16%
Total for Australia 1,704,023 1.03%
Cayman Islands 120,000 GBP Affinity Water Programme Finance Ltd 1.548% 01 June 2045 227,449 0.14% 200,000 GBP Southern Water Services Finance Ltd 3.706% 31 March 2034 621,968 0.37%
Total for Cayman Islands 849,417 0.51%
Denmark 14,666,000 DKK Denmark I/L Government Bond 0.100% 15 November 2023 2,295,414 1.39%
Total for Denmark 2,295,414 1.39%
France 2,235,000 EUR France Government Bond OAT 0.250% 25 July 2018 2,609,047 1.58% 2,260,000 EUR France Government Bond OAT 2.250% 25 July 2020 3,437,287 2.08%
273,000 EUR France Government Bond OAT 0.100% 25 July 2021 312,127 0.19% 5,000 EUR France Government Bond OAT 1.100% 25 July 2022 6,592 0.00%
923,000 EUR France Government Bond OAT 2.100% 25 July 2023 1,315,075 0.79% 1,562,000 EUR France Government Bond OAT 1.850% 25 July 2027 2,225,665 1.35%
550,000 EUR France Government Bond OAT 3.400% 25 July 2029 1,094,006 0.66% 779,000 EUR France Government Bond OAT 3.150% 25 July 2032 1,557,660 0.94% 746,000 EUR France Government Bond OAT 1.800% 25 July 2040 1,243,771 0.75%
Total for France 13,801,230 8.34%
Germany
1,233,000 EUR Bundesrepublik Deutschland Bundesobligation Inflation Linked Bond 0.750% 15 April 2018 1,467,055 0.89%
294,000 EUR Deutsche Bundesrepublik Inflation Linked Bond 1.750% 15 April 2020 387,261 0.23% 1,063,000 EUR Deutsche Bundesrepublik Inflation Linked Bond 0.100% 15 April 2023 1,257,806 0.76% 1,100,000 EUR Deutsche Bundesrepublik Inflation Linked Bond 0.500% 15 April 2030 1,326,620 0.80%
Total for Germany 4,438,742 2.68%
Italy 1,498,000 EUR Italy Buoni Poliennali Del Tesoro 1.700% 15 September 2018 1,741,367 1.05%
973,000 EUR Italy Buoni Poliennali Del Tesoro 2.350% 15 September 2019 1,284,952 0.78% 1,610,000 EUR Italy Buoni Poliennali Del Tesoro 2.100% 15 September 2021 2,118,599 1.28%
888,000 EUR Italy Buoni Poliennali Del Tesoro 2.600% 15 September 2023 1,299,328 0.78% 2,303,000 EUR Italy Buoni Poliennali Del Tesoro 2.350% 15 September 2024 2,913,363 1.76%
629,000 EUR Italy Buoni Poliennali Del Tesoro 3.100% 15 September 2026 906,702 0.55% 382,000 EUR Italy Buoni Poliennali Del Tesoro 2.350% 15 September 2035 612,564 0.37%
1,067,000 EUR Italy Buoni Poliennali Del Tesoro 2.550% 15 September 2041 1,590,481 0.96% Total for Italy 12,467,356 7.53%
Netherlands
115,000 GBP Cooperatieve Centrale Raiffeisen-Boerenleenbank BA 2.250% 22 November 2022 241,762 0.15%
Total for Netherlands 241,762 0.15%
New Zealand 876,000 NZD New Zealand Government Bond 2.000% 20 September 2025 590,018 0.36%
1,760,000 NZD New Zealand Government Bond 2.500% 20 September 2035 1,197,110 0.72% Total for New Zealand 1,787,128 1.08%
Spain 2,057,000 EUR Spain Government Inflation Linked Bond 1.800% 30 November 2024 2,464,557 1.49%
Total for Spain 2,464,557 1.49%

Standard Life Investments Global SICAV Société d'Investissement à Capital Variable
178
Global Inflation-Linked Bond Fund Schedule of Investments (expressed in USD) (continued) as at 31 December 2015
Quantity/ Market Value % of
Nominal Value Currency Name of Securities USD Net Assets
Transferable securities and money market instruments admitted to an official exchange listing (continued)
Sweden 11,700,000 SEK Sweden Government Bond 2.500% 12 May 2025 1,573,154 0.95%
Total for Sweden 1,573,154 0.95%
United Kingdom 53,000 GBP National Grid Gas Plc 4.188% 14 December 2022 151,405 0.09%
650,000 GBP Network Rail Infrastructure Finance Plc 1.750% 22 November 2027 1,517,496 0.92% 574,000 GBP Network Rail Infrastructure Finance Plc 1.375% 22 November 2037 1,527,857 0.92% 148,000 GBP Network Rail Infrastructure Finance Plc 1.125% 22 November 2047 418,564 0.25% 51,000 GBP Tesco Plc 1.982% 24 March 2036 84,440 0.05%
231,000 GBP United Kingdom Gilt Inflation Linked 2.500% 26 July 2016 1,101,283 0.66% 149,000 GBP United Kingdom Gilt Inflation Linked 1.250% 22 November 2017 309,291 0.19%
1,305,000 GBP United Kingdom Gilt Inflation Linked 1.875% 22 November 2022 2,896,222 1.75% 1,132,000 GBP United Kingdom Gilt Inflation Linked 0.125% 22 March 2024 1,906,072 1.15%
707,000 GBP United Kingdom Gilt Inflation Linked 2.500% 17 July 2024 3,486,207 2.11% 446,568 GBP United Kingdom Gilt Inflation Linked 1.250% 22 November 2027 1,086,295 0.66% 723,241 GBP United Kingdom Gilt Inflation Linked 0.125% 22 March 2029 1,285,234 0.78% 172,000 GBP United Kingdom Gilt Inflation Linked 4.125% 22 July 2030 831,033 0.50% 606,000 GBP United Kingdom Gilt Inflation Linked 1.250% 22 November 2032 1,433,437 0.87% 477,000 GBP United Kingdom Gilt Inflation Linked 0.750% 22 March 2034 994,469 0.60% 587,000 GBP United Kingdom Gilt Inflation Linked 2.000% 26 January 2035 1,956,197 1.18% 570,000 GBP United Kingdom Gilt Inflation Linked 1.125% 22 November 2037 1,536,395 0.93% 980,000 GBP United Kingdom Gilt Inflation Linked 0.625% 22 March 2040 2,324,616 1.40% 156,785 GBP United Kingdom Gilt Inflation Linked 0.625% 22 November 2042 392,340 0.24%
1,819,000 GBP United Kingdom Gilt Inflation Linked 0.125% 22 March 2044 3,575,287 2.16% 1,007,000 GBP United Kingdom Gilt Inflation Linked 0.750% 22 November 2047 2,820,679 1.70%
624,878 GBP United Kingdom Gilt Inflation Linked 0.500% 22 March 2050 1,652,861 1.00% 783,000 GBP United Kingdom Gilt Inflation Linked 0.250% 22 March 2052 1,740,448 1.05% 713,000 GBP United Kingdom Gilt Inflation Linked 1.250% 22 November 2055 2,748,240 1.66% 719,000 GBP United Kingdom Gilt Inflation Linked 0.125% 22 March 2058 1,549,469 0.94% 986,000 GBP United Kingdom Gilt Inflation Linked 0.375% 22 March 2062 2,650,964 1.60% 855,000 GBP United Kingdom Gilt Inflation Linked 0.125% 22 March 2068 2,113,445 1.28%
Total for United Kingdom 44,090,246 26.64%
United States 2,563,000 USD United States Treasury Inflation Indexed Bonds 1.625% 15 January 2018 2,999,322 1.81% 5,475,000 USD United States Treasury Inflation Indexed Bonds 0.125% 15 April 2018 5,617,860 3.40%
460,000 USD United States Treasury Inflation Indexed Bonds 1.375% 15 July 2018 524,809 0.32% 17,000 USD United States Treasury Inflation Indexed Bonds 2.125% 15 January 2019 19,906 0.01%
4,326,000 USD United States Treasury Inflation Indexed Bonds 0.125% 15 April 2019 4,357,887 2.63% 794,000 USD United States Treasury Inflation Indexed Bonds 1.875% 15 July 2019 936,569 0.57%
2,468,000 USD United States Treasury Inflation Indexed Bonds 1.375% 15 January 2020 2,817,677 1.70% 1,981,000 USD United States Treasury Inflation Indexed Bonds 0.125% 15 April 2020 1,982,425 1.20% 2,037,000 USD United States Treasury Inflation Indexed Bonds 1.250% 15 July 2020 2,306,169 1.39% 2,829,000 USD United States Treasury Inflation Indexed Bonds 1.125% 15 January 2021 3,165,850 1.91% 2,594,000 USD United States Treasury Inflation Indexed Bonds 0.625% 15 July 2021 2,749,650 1.66% 2,531,000 USD United States Treasury Inflation Indexed Bonds 0.125% 15 January 2022 2,572,146 1.55% 2,661,000 USD United States Treasury Inflation Indexed Bonds 0.125% 15 July 2022 2,662,488 1.61% 2,585,000 USD United States Treasury Inflation Indexed Bonds 0.125% 15 January 2023 2,547,354 1.54% 3,200,000 USD United States Treasury Inflation Indexed Bonds 0.375% 15 July 2023 3,186,701 1.93% 2,362,000 USD United States Treasury Inflation Indexed Bonds 0.625% 15 January 2024 2,374,411 1.44% 3,272,000 USD United States Treasury Inflation Indexed Bonds 0.125% 15 July 2024 3,104,608 1.88% 1,847,200 USD United States Treasury Inflation Indexed Bonds 2.375% 15 January 2025 2,643,122 1.60% 2,620,000 USD United States Treasury Inflation Indexed Bonds 0.250% 15 January 2025 2,503,541 1.51% 2,815,000 USD United States Treasury Inflation Indexed Bonds 0.375% 15 July 2025 2,723,928 1.65%
106,000 USD United States Treasury Inflation Indexed Bonds 2.000% 15 January 2026 140,801 0.09% 1,812,000 USD United States Treasury Inflation Indexed Bonds 2.375% 15 January 2027 2,465,474 1.49% 1,527,000 USD United States Treasury Inflation Indexed Bonds 1.750% 15 January 2028 1,890,700 1.14% 1,414,000 USD United States Treasury Inflation Indexed Bonds 3.625% 15 April 2028 2,713,628 1.64%
711,000 USD United States Treasury Inflation Indexed Bonds 2.500% 15 January 2029 931,562 0.56% 1,484,000 USD United States Treasury Inflation Indexed Bonds 3.875% 15 April 2029 2,912,583 1.76%
667,000 USD United States Treasury Inflation Indexed Bonds 3.375% 15 April 2032 1,206,587 0.73%

Standard Life Investments Global SICAV Société d'Investissement à Capital Variable
179
Global Inflation-Linked Bond Fund Schedule of Investments (expressed in USD) (continued) as at 31 December 2015
Quantity/ Market Value % of
Nominal Value Currency Name of Securities USD Net Assets
Transferable securities and money market instruments admitted to an official exchange listing (continued)
United States (continued) 841,000 USD United States Treasury Inflation Indexed Bonds 2.125% 15 February 2040 1,085,307 0.66%
1,319,000 USD United States Treasury Inflation Indexed Bonds 2.125% 15 February 2041 1,689,324 1.02% 2,016,400 USD United States Treasury Inflation Indexed Bonds 0.750% 15 February 2042 1,855,807 1.12% 1,583,000 USD United States Treasury Inflation Indexed Bonds 0.625% 15 February 2043 1,378,919 0.83% 1,575,000 USD United States Treasury Inflation Indexed Bonds 1.375% 15 February 2044 1,627,934 0.98% 1,677,000 USD United States Treasury Inflation Indexed Bonds 0.750% 15 February 2045 1,468,702 0.89%
Total for United States 73,163,751 44.22%
Total transferable securities and money market instruments admitted to an official exchange listing 158,876,780 96.01%
Transferable securities and money market instruments dealt in on another regulated market
Canada 243,000 CAD Canadian Government Real Return Bond 4.250% 01 December 2021 341,036 0.20% 315,000 CAD Canadian Government Real Return Bond 4.250% 01 December 2026 474,490 0.29%
1,491,000 CAD Canadian Government Real Return Bond 4.000% 01 December 2031 2,329,664 1.41% 672,000 CAD Canadian Government Real Return Bond 1.500% 01 December 2044 648,241 0.39% 147,000 CAD Canadian Government Real Return Bond 1.250% 01 December 2047 126,998 0.08%
Total for Canada 3,920,429 2.37%
Japan 55,000,000 JPY Japanese Government CPI Linked Bond 1.100% 10 December 2016 490,164 0.29% 86,400,000 JPY Japanese Government CPI Linked Bond 1.400% 10 June 2018 798,269 0.48% 12,200,000 JPY Japanese Government CPI Linked Bond 0.100% 10 September 2023 110,598 0.07% 81,900,000 JPY Japanese Government CPI Linked Bond 0.100% 10 March 2024 739,341 0.45% 48,900,000 JPY Japanese Government CPI Linked Bond 0.100% 10 September 2024 430,158 0.26%
128,700,000 JPY Japanese Government CPI Linked Bond 0.100% 10 March 2025 1,136,246 0.69% Total for Japan 3,704,776 2.24%
Total transferable securities and money market instruments dealt in on another regulated market 7,625,205 4.61%
Total investments 166,501,985 100.62% Cash and cash equivalents 3,524,826 2.13% Bank overdraft and other net liabilities (4,556,628) (2.75%) Total net assets 165,470,183 100.00%
Analysis of Investments as % of total assets Transferable securities and money market instruments admitted to an official exchange listing 91.40%Transferable securities and money market instruments dealt in on another regulated market 4.39%Other assets 4.21%Total assets 100.00% The accompanying notes form an integral part of these financial statements.

Standard Life Investments Global SICAV Société d'Investissement à Capital Variable
180
European High Yield Bond Fund Sub-fund Objective The objective of the Sub-fund is to achieve long-term growth in the share price of the Sub-fund.
Investment Policy The current policy is to invest primarily in Euro denominated high yielding debt securities, but may also invest in corporate bonds, government bonds and other interest bearing securities issued anywhere in the world. The Sub-fund may invest in both investment grade and sub-investment grade corporate entities. Returns of the Sub-fund will be both through the reinvestment of income and from capital gains.
Performance Review The European High Yield Bond Fund returned 1.3%, compared to the Bank of America Merrill Lynch Euro Non-Financial High Yield Constrained (USD Unhedged) return of 0.48%.*
Our underweight exposure to troubled Brazilian oil producer Petrobras early in the reporting period was a drag on returns. The very large size of the company – some 2.9% of the index – meant that the partial recovery in the price of its bonds following a downgrade to high yield had a significant impact on performance. Abengoa, the Spanish sustainable technology company, rallied in line with other peripheral European debt for much of the period. This meant our zero exposure to its bonds was detrimental to performance. Another zero exposure that proved negative for performance was Gazprom; the issuer performed strongly during the second quarter of the year as commodity prices began to stabilise. More positive for performance was our decision to hold no exposure to Greek telecom OTE, especially during June when the country’s debt negotiations were at the forefront of investors’ minds. Our holding in Spanish bus group Avanza also performed well following the news that it was tendering for its bonds. The tender for the bonds we owned reached a successful conclusion and we were part of a bond group which negotiated the tender price up from 95 to 102.
As we entered the third quarter, our heavy underweight in Brazilian telecom OI and Petrobras added to relative performance, as Brazilian corporate credit came under intense pressure. In addition, our zero weight in Spanish infrastructure builder and operator Abengoa began to benefit returns as the market questioned the viability of its business model. Our core holding in UK leisure operator Center Parcs also contributed to relative performance as the company refinanced bonds that we own at a premium. On the downside, our holding in Canadian copper miner First Quantum was impacted by weaker commodity prices. Our zero weighting in Greek telecom OTE also cost performance as the bonds recovered from the volatility of the previous quarter.
During the final three months of 2015, our zero weight in (now defaulting) Spanish infrastructure construction firm Abengoa added to relative performance. We gained 18 basis points (“bps”) of performance as its capital structure underperformed due to investors’ belated acknowledgement of a broken business model. The emissions scandal at Volkswagen, while serious and of damage to the brand, had a more severe reaction in the market than we thought was merited. Therefore, when its debt fell in price we established a position and have gained 9bps of performance since its bonds recovered. This was partially offset by our holding in aluminium cathode maker Rain Carbon, which underperformed.
*Sub-fund performance has been calculated over the stated period on the share price performance basis, based on the A Accumulation Shares and net of fees. Please note the index return is quoted gross and contains no adjustment for fees.
Outlook We remain cautious entering 2016, yet we believe current pricing is attractive. We note that risks from further emerging market and energy/commodity weakness is impacting market sentiment. However, we believe the combination of European Central Bank policy and a slowly recovering region will support valuations at current levels. We will monitor the volatility in US high yield and continue to take a more cautious approach to risk. We will retain a very underweight position in emerging markets.
Please note that the commitment approach has been used for risk measurement and calculation of global exposure for this Sub-fund.
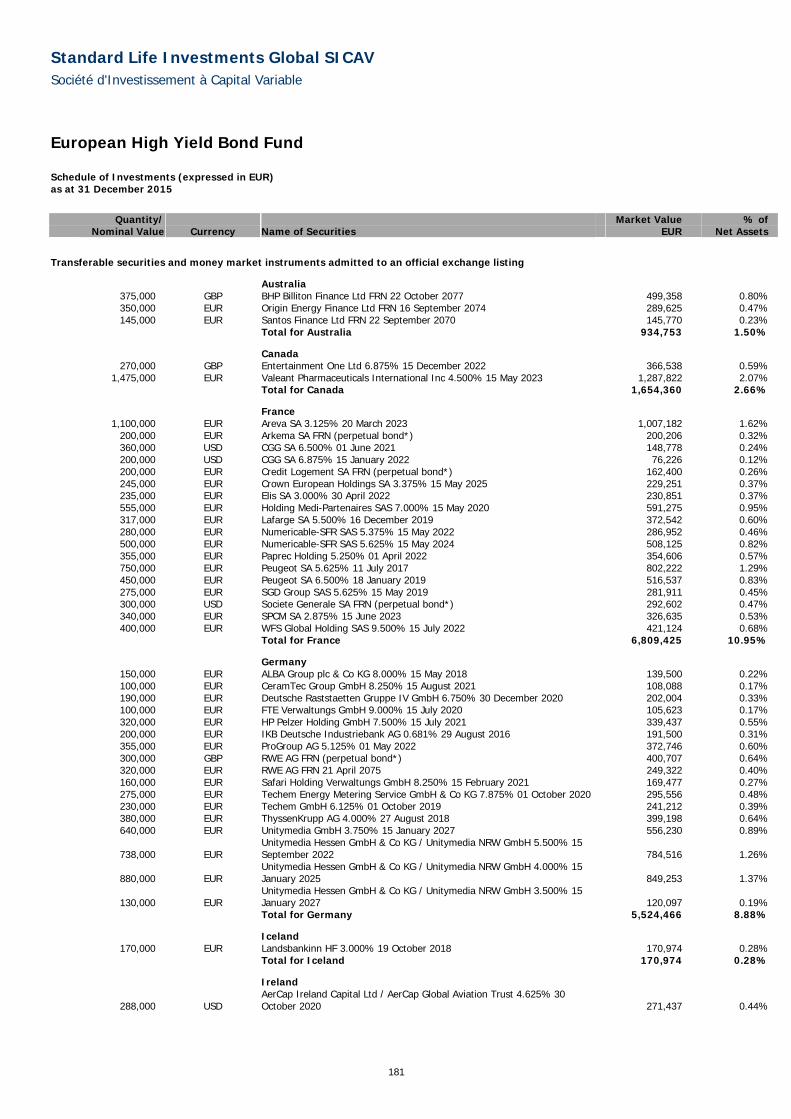
Standard Life Investments Global SICAV Société d'Investissement à Capital Variable
181
European High Yield Bond Fund Schedule of Investments (expressed in EUR) as at 31 December 2015
Quantity/ Market Value % of
Nominal Value Currency Name of Securities EUR Net Assets
Transferable securities and money market instruments admitted to an official exchange listing
Australia 375,000 GBP BHP Billiton Finance Ltd FRN 22 October 2077 499,358 0.80% 350,000 EUR Origin Energy Finance Ltd FRN 16 September 2074 289,625 0.47% 145,000 EUR Santos Finance Ltd FRN 22 September 2070 145,770 0.23%
Total for Australia 934,753 1.50%
Canada 270,000 GBP Entertainment One Ltd 6.875% 15 December 2022 366,538 0.59%
1,475,000 EUR Valeant Pharmaceuticals International Inc 4.500% 15 May 2023 1,287,822 2.07% Total for Canada 1,654,360 2.66%
France 1,100,000 EUR Areva SA 3.125% 20 March 2023 1,007,182 1.62%
200,000 EUR Arkema SA FRN (perpetual bond*) 200,206 0.32% 360,000 USD CGG SA 6.500% 01 June 2021 148,778 0.24% 200,000 USD CGG SA 6.875% 15 January 2022 76,226 0.12% 200,000 EUR Credit Logement SA FRN (perpetual bond*) 162,400 0.26% 245,000 EUR Crown European Holdings SA 3.375% 15 May 2025 229,251 0.37% 235,000 EUR Elis SA 3.000% 30 April 2022 230,851 0.37% 555,000 EUR Holding Medi-Partenaires SAS 7.000% 15 May 2020 591,275 0.95% 317,000 EUR Lafarge SA 5.500% 16 December 2019 372,542 0.60% 280,000 EUR Numericable-SFR SAS 5.375% 15 May 2022 286,952 0.46% 500,000 EUR Numericable-SFR SAS 5.625% 15 May 2024 508,125 0.82% 355,000 EUR Paprec Holding 5.250% 01 April 2022 354,606 0.57% 750,000 EUR Peugeot SA 5.625% 11 July 2017 802,222 1.29% 450,000 EUR Peugeot SA 6.500% 18 January 2019 516,537 0.83% 275,000 EUR SGD Group SAS 5.625% 15 May 2019 281,911 0.45% 300,000 USD Societe Generale SA FRN (perpetual bond*) 292,602 0.47% 340,000 EUR SPCM SA 2.875% 15 June 2023 326,635 0.53% 400,000 EUR WFS Global Holding SAS 9.500% 15 July 2022 421,124 0.68%
Total for France 6,809,425 10.95%
Germany 150,000 EUR ALBA Group plc & Co KG 8.000% 15 May 2018 139,500 0.22% 100,000 EUR CeramTec Group GmbH 8.250% 15 August 2021 108,088 0.17% 190,000 EUR Deutsche Raststaetten Gruppe IV GmbH 6.750% 30 December 2020 202,004 0.33% 100,000 EUR FTE Verwaltungs GmbH 9.000% 15 July 2020 105,623 0.17% 320,000 EUR HP Pelzer Holding GmbH 7.500% 15 July 2021 339,437 0.55% 200,000 EUR IKB Deutsche Industriebank AG 0.681% 29 August 2016 191,500 0.31% 355,000 EUR ProGroup AG 5.125% 01 May 2022 372,746 0.60% 300,000 GBP RWE AG FRN (perpetual bond*) 400,707 0.64% 320,000 EUR RWE AG FRN 21 April 2075 249,322 0.40% 160,000 EUR Safari Holding Verwaltungs GmbH 8.250% 15 February 2021 169,477 0.27% 275,000 EUR Techem Energy Metering Service GmbH & Co KG 7.875% 01 October 2020 295,556 0.48% 230,000 EUR Techem GmbH 6.125% 01 October 2019 241,212 0.39% 380,000 EUR ThyssenKrupp AG 4.000% 27 August 2018 399,198 0.64% 640,000 EUR Unitymedia GmbH 3.750% 15 January 2027 556,230 0.89%
738,000 EUR Unitymedia Hessen GmbH & Co KG / Unitymedia NRW GmbH 5.500% 15 September 2022 784,516 1.26%
880,000 EUR Unitymedia Hessen GmbH & Co KG / Unitymedia NRW GmbH 4.000% 15 January 2025 849,253 1.37%
130,000 EUR Unitymedia Hessen GmbH & Co KG / Unitymedia NRW GmbH 3.500% 15 January 2027 120,097 0.19%
Total for Germany 5,524,466 8.88%
Iceland 170,000 EUR Landsbankinn HF 3.000% 19 October 2018 170,974 0.28%
Total for Iceland 170,974 0.28%
Ireland
288,000 USD AerCap Ireland Capital Ltd / AerCap Global Aviation Trust 4.625% 30 October 2020 271,437 0.44%

Standard Life Investments Global SICAV Société d'Investissement à Capital Variable
182
European High Yield Bond Fund Schedule of Investments (expressed in EUR) (continued) as at 31 December 2015
Quantity/ Market Value % of
Nominal Value Currency Name of Securities EUR Net Assets
Transferable securities and money market instruments admitted to an official exchange listing (continued)
Ireland (continued) 250,000 GBP Allied Irish Banks Plc 12.500% 25 June 2035 315,930 0.51%
200,000 EUR Ardagh Packaging Finance Plc / Ardagh Holdings USA Inc 4.250% 15 January 2022 202,000 0.32%
200,000 EUR Bank of Ireland FRN (perpetual bond*) 209,750 0.34% 270,000 EUR Smurfit Kappa Acquisitions 4.125% 30 January 2020 292,374 0.47% 170,000 EUR Smurfit Kappa Acquisitions 2.750% 01 February 2025 163,896 0.26%
Total for Ireland 1,455,387 2.34%
Italy 270,000 EUR Autostrada Brescia Verona Vicenza Padova SpA 2.375% 20 March 2020 274,007 0.44% 290,000 EUR Enel SpA FRN 15 January 2075 303,385 0.49% 500,000 EUR Finmeccanica SpA 5.750% 12 December 2018 563,665 0.91% 240,000 EUR Rhino Bondco S.P.A 7.250% 15 November 2020 255,773 0.41% 900,000 EUR Telecom Italia SpA 5.375% 29 January 2019 1,010,272 1.62%
Total for Italy 2,407,102 3.87%
Japan 320,000 EUR SoftBank Group Corp 4.625% 15 April 2020 339,638 0.55% 260,000 EUR SoftBank Group Corp 4.000% 30 July 2022 264,189 0.42%
Total for Japan 603,827 0.97%
Jersey 210,000 EUR Avis Budget Finance Plc 6.000% 01 March 2021 216,831 0.35% 30,000 EUR British Airways Finance Jersey LP (perpetual bond*) - Pref 750,600 1.21%
790,000 GBP CPUK Finance Ltd 7.000% 28 August 2020 1,102,341 1.77% Total for Jersey 2,069,772 3.33%
Luxembourg 170,000 EUR Albea Beauty Holdings SA 8.750% 01 November 2019 180,625 0.29% 125,000 EUR Aldesa Financial Services SA 7.250% 01 April 2021 98,750 0.16% 300,000 EUR Altice Financing SA 6.500% 15 January 2022 315,057 0.51% 345,000 EUR Altice Financing SA 5.250% 15 February 2023 345,863 0.56% 630,000 EUR Altice Luxembourg SA 7.250% 15 May 2022 590,918 0.95% 350,000 EUR Altice Luxembourg SA 6.250% 15 February 2025 296,625 0.48% 600,000 USD ArcelorMittal 5.500% 25 February 2017 535,980 0.86% 277,270 EUR Ardagh Finance Holdings SA 8.375% 15 June 2019 282,655 0.45% 150,000 EUR Auris Luxembourg II SA 8.000% 15 January 2023 163,500 0.26% 185,000 EUR Befesa Zinc SAU Via Zinc Capital SA 8.875% 15 May 2018 181,383 0.29% 476,291 EUR Bilbao Luxembourg SA 10.500% 01 December 2018 454,882 0.73% 250,000 GBP Cabot Financial Luxembourg SA 8.375% 01 August 2020 352,166 0.57% 155,000 GBP Cabot Financial Luxembourg SA 6.500% 01 April 2021 203,426 0.33% 500,000 EUR Dufry Finance SCA 4.500% 15 July 2022 524,375 0.84% 180,000 EUR Fiat Chrysler Finance Europe 7.750% 17 October 2016 189,536 0.30% 600,000 EUR Fiat Chrysler Finance Europe 4.750% 15 July 2022 642,273 1.03% 350,000 EUR FMC Finance VIII SA 6.500% 15 September 2018 401,958 0.65% 700,000 EUR FMC Finance VIII SA 5.250% 31 July 2019 801,836 1.29% 165,000 GBP Garfunkelux Holdco 2 SA 11.000% 01 November 2023 226,840 0.36% 200,000 EUR Garfunkelux Holdco 3 SA 7.500% 01 August 2022 205,870 0.33% 245,000 GBP Garfunkelux Holdco 3 SA 8.500% 01 November 2022 338,061 0.54% 370,000 EUR Geo Debt Finance SCA 7.500% 01 August 2018 345,950 0.56% 243,257 EUR Geo Travel Finance SCA 10.375% 01 May 2019 216,499 0.35% 385,000 EUR Greif Nevada Holdings Inc SCS 7.375% 15 July 2021 448,525 0.72% 130,000 EUR HeidelbergCement Finance Luxembourg SA 8.000% 31 January 2017 139,855 0.23% 350,000 EUR HeidelbergCement Finance Luxembourg SA 9.500% 15 December 2018 430,686 0.69% 200,000 EUR INEOS Group Holdings SA 6.500% 15 August 2018 202,498 0.33% 420,000 EUR INEOS Group Holdings SA 5.750% 15 February 2019 421,281 0.68% 155,000 EUR JH-Holding Finance SA 8.250% 01 December 2022 162,758 0.26% 160,000 EUR Picard Bondco SA 7.750% 01 February 2020 171,283 0.28% 238,173 EUR Schmolz + Bickenbach Luxembourg SA 9.875% 15 May 2019 202,690 0.33% 600,000 EUR Telenet Finance III Luxembourg SCA 6.625% 15 February 2021 622,332 1.00% 775,000 EUR Wind Acquisition Finance SA 4.000% 15 July 2020 773,969 1.24%

Standard Life Investments Global SICAV Société d'Investissement à Capital Variable
183
European High Yield Bond Fund Schedule of Investments (expressed in EUR) (continued) as at 31 December 2015
Quantity/ Market Value % of
Nominal Value Currency Name of Securities EUR Net Assets
Transferable securities and money market instruments admitted to an official exchange listing (continued)
Luxembourg (continued) 300,000 EUR Wind Acquisition Finance SA 7.000% 23 April 2021 297,750 0.48%
Total for Luxembourg 11,768,655 18.93%
Netherlands 380,000 EUR Carlson Wagonlit BV 7.500% 15 June 2019 399,293 0.64% 803,000 USD Fiat Chrysler Automobiles NV 4.500% 15 April 2020 744,835 1.20% 270,000 EUR General Motors Financial International BV 1.875% 15 October 2019 274,172 0.44% 800,000 EUR LGE HoldCo VI BV 7.125% 15 May 2024 868,528 1.40% 275,000 EUR OI European Group BV 6.750% 15 September 2020 320,589 0.52% 320,000 EUR Petrobras Global Finance BV 2.750% 15 January 2018 261,888 0.42% 600,000 EUR Petrobras Global Finance BV 3.750% 14 January 2021 405,678 0.65% 700,000 EUR Portugal Telecom International Finance BV 5.875% 17 April 2018 360,486 0.58%
900,000 EUR Samvardhana Motherson Automotive Systems Group BV 4.125% 15 July 2021 877,248 1.41%
360,000 EUR Schaeffler Finance BV 3.250% 15 May 2019 365,393 0.59% 360,000 EUR Schaeffler Finance BV 2.750% 15 May 2019 364,687 0.59% 260,000 EUR Schaeffler Finance BV 2.500% 15 May 2020 262,603 0.42% 205,000 EUR Schaeffler Finance BV 3.250% 15 May 2025 199,178 0.32% 655,000 EUR Schaeffler Holding Finance BV 6.875% 15 August 2018 678,334 1.09% 110,000 EUR Schaeffler Holding Finance BV 5.750% 15 November 2021 117,764 0.19% 200,000 GBP Telefonica Europe BV FRN (perpetual bond*) 279,958 0.45% 100,000 EUR Telefonica Europe BV FRN (perpetual bond*) 98,761 0.16% 150,000 EUR United Group BV 7.875% 15 November 2020 158,328 0.26% 370,000 EUR UPC Holding BV 6.375% 15 September 2022 394,124 0.63% 510,000 EUR Volkswagen International Finance NV FRN (perpetual bond*) 493,425 0.79% 250,000 EUR Volkswagen International Finance NV FRN (perpetual bond*) 256,188 0.41% 200,000 EUR Vonovia Finance BV FRN (perpetual bond*) 194,548 0.31% 350,000 EUR Ziggo Secured Finance BV 3.750% 15 January 2025 324,338 0.52%
Total for Netherlands 8,700,346 13.99%
Norway 350,000 EUR Lock AS 7.000% 15 August 2021 369,250 0.59% 250,000 EUR Lock Lower Holding AS 9.500% 15 August 2022 259,393 0.42% 400,000 EUR Silk Bidco AS 7.500% 01 February 2022 416,000 0.67%
Total for Norway 1,044,643 1.68%
Spain 120,000 EUR Almirall SA 4.625% 01 April 2021 125,250 0.20%
Total for Spain 125,250 0.20%
Sweden 330,000 EUR Akelius Residential Property AB 3.375% 23 September 2020 333,919 0.54% 280,000 USD Skandinaviska Enskilda Banken AB FRN (perpetual bond*) 253,520 0.41% 150,000 EUR Unilabs Subholding AB 8.500% 15 July 2018 155,842 0.25%
Total for Sweden 743,281 1.20%
Switzerland 180,000 EUR UBS AG FRN 12 February 2026 192,218 0.31%
Total for Switzerland 192,218 0.31%
United Kingdom 350,000 EUR Alliance Automotive Finance Plc 6.250% 01 December 2021 366,272 0.59% 250,000 GBP Arqiva Broadcast Finance Plc 9.500% 31 March 2020 368,627 0.59% 100,000 EUR Arrow Global Finance Plc FRN 01 November 2021 101,273 0.16% 280,000 USD Barclays Bank Plc 7.625% 21 November 2022 293,308 0.47% 200,000 GBP Barclays Plc FRN (perpetual bond*) 271,880 0.44% 400,000 GBP BIBBY Offshore Services Plc 7.500% 15 June 2021 406,924 0.65% 220,000 EUR Boing Group Financing Plc 6.625% 15 July 2019 203,614 0.33% 105,000 GBP Care UK Health & Social Care Plc FRN 15 July 2019 130,515 0.21% 120,000 GBP Care UK Health & Social Care Plc FRN 15 January 2020 148,003 0.24% 100,000 GBP Cognita Financing Plc 7.750% 15 August 2021 140,858 0.23% 240,000 EUR International Game Technology Plc 4.125% 15 February 2020 241,032 0.39%

Standard Life Investments Global SICAV Société d'Investissement à Capital Variable
184
European High Yield Bond Fund Schedule of Investments (expressed in EUR) (continued) as at 31 December 2015
Quantity/ Market Value % of
Nominal Value Currency Name of Securities EUR Net Assets
Transferable securities and money market instruments admitted to an official exchange listing (continued)
United Kingdom (continued) 200,000 EUR International Game Technology Plc 4.750% 05 March 2020 201,624 0.32% 250,000 GBP Jaguar Land Rover Automotive Plc 5.000% 15 February 2022 350,986 0.56% 525,000 EUR Merlin Entertainments Plc 2.750% 15 March 2022 514,106 0.83% 400,000 EUR National Westminster Bank Plc FRN (perpetual bond*) 389,000 0.62% 240,000 EUR R&R Ice Cream Plc 4.750% 15 May 2020 247,810 0.40% 700,000 AUD R&R Ice Cream Plc 8.250% 15 May 2020 489,101 0.79% 200,000 USD Royal Bank of Scotland Group Plc FRN (perpetual bond*) 191,712 0.31% 200,000 GBP Santander UK Group Holdings Plc FRN (perpetual bond*) 277,530 0.45% 230,000 GBP Soho House Bond Ltd 9.125% 01 October 2018 322,409 0.52% 255,000 GBP Spirit Issuer Plc FRN 28 December 2021 321,378 0.52% 350,000 EUR Tesco Corporate Treasury Services Plc 2.125% 12 November 2020 338,256 0.54%
1,250,000 EUR Thomas Cook Finance Plc 7.750% 15 June 2020 1,307,013 2.10% 970,000 EUR Virgin Media Finance Plc 4.500% 15 January 2025 920,811 1.48% 240,000 GBP Virgin Media Secured Finance Plc 6.250% 28 March 2029 328,996 0.53%
Total for United Kingdom 8,873,038 14.27%
United States 170,000 EUR Ball Corp 3.500% 15 December 2020 175,136 0.28% 115,000 EUR Ball Corp 4.375% 15 December 2023 118,474 0.19% 200,000 EUR Gates Global LLC / Gates Global Co 5.750% 15 July 2022 146,824 0.24% 305,000 EUR Kloeckner Pentaplast of America Inc 7.125% 01 November 2020 311,571 0.50%
550,000 EUR MPT Operating Partnership LP / MPT Finance Corp 5.750% 01 October 2020 584,479 0.94%
300,000 USD MPT Operating Partnership LP / MPT Finance Corp 6.875% 01 May 2021 287,224 0.46% 100,000 EUR MPT Operating Partnership LP / MPT Finance Corp 4.000% 19 August 2022 102,036 0.16% 535,000 EUR Rain CII Carbon LLC / CII Carbon Corp 8.500% 15 January 2021 398,254 0.64% 310,000 EUR XPO Logistics Inc 5.750% 15 June 2021 289,416 0.47% 200,000 EUR ZF North America Capital Inc 2.250% 26 April 2019 199,976 0.32%
1,100,000 EUR ZF North America Capital Inc 2.750% 27 April 2023 1,049,813 1.69% Total for United States 3,663,203 5.89%
Total transferable securities and money market instruments admitted to an official exchange listing 56,740,700 91.25%
Transferable securities and money market instruments dealt in on another regulated market
Australia 350,000 USD BHP Billiton Finance USA Ltd FRN 19 October 2075 315,407 0.51%
Total for Australia 315,407 0.51%
Canada 610,000 USD First Quantum Minerals Ltd 7.250% 15 October 2019 365,539 0.59%
Total for Canada 365,539 0.59%
France 200,000 USD SPCM SA 6.000% 15 January 2022 187,809 0.30%
Total for France 187,809 0.30%
Germany 2,558 EUR Treofan Germany GmbH & Co1 – –%
Total for Germany – –%
Italy 200,000 USD Intesa Sanpaolo SpA FRN (perpetual bond*) 187,438 0.30% 250,000 EUR Kedrion SpA 4.625% 24 April 2019 254,186 0.41%
Total for Italy 441,624 0.71%
Luxembourg 200,000 USD Altice Finco SA 7.625% 15 February 2025 169,901 0.27%
Total for Luxembourg 169,901 0.27%
United Kingdom 560,000 USD Anglo American Capital Plc 4.125% 15 April 2021 345,470 0.56%
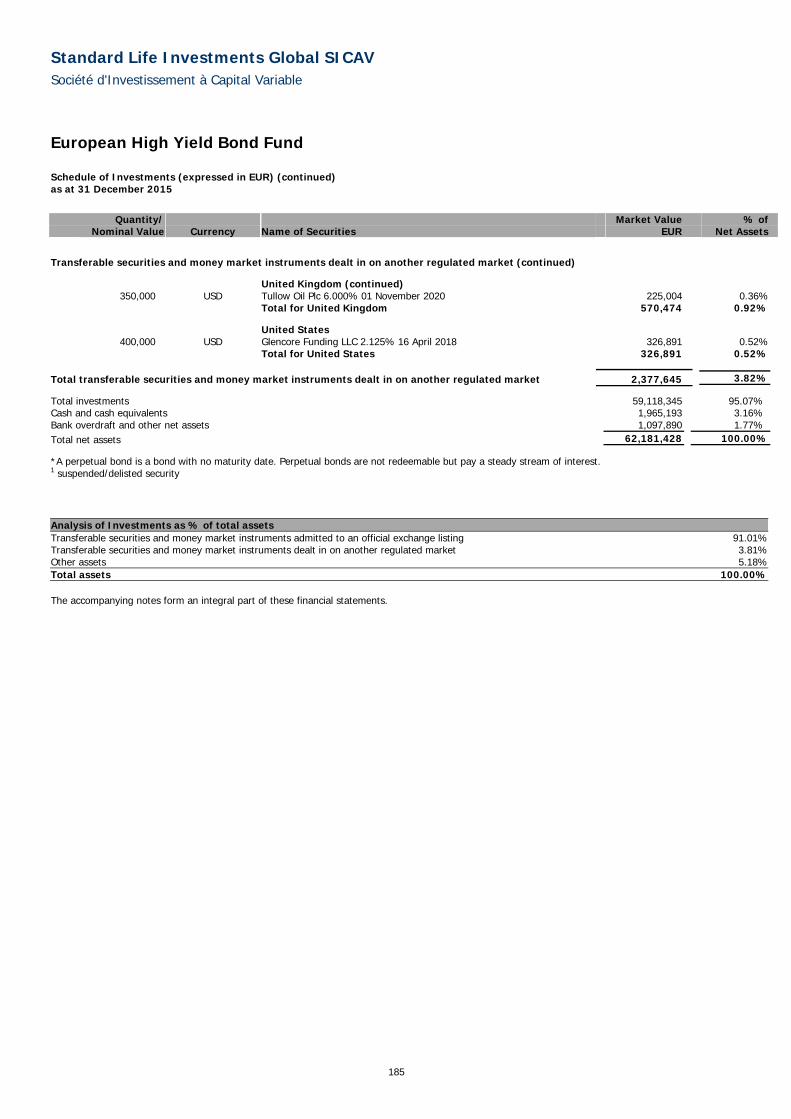
Standard Life Investments Global SICAV Société d'Investissement à Capital Variable
185
European High Yield Bond Fund Schedule of Investments (expressed in EUR) (continued) as at 31 December 2015
Quantity/ Market Value % of
Nominal Value Currency Name of Securities EUR Net Assets
Transferable securities and money market instruments dealt in on another regulated market (continued)
United Kingdom (continued) 350,000 USD Tullow Oil Plc 6.000% 01 November 2020 225,004 0.36%
Total for United Kingdom 570,474 0.92%
United States 400,000 USD Glencore Funding LLC 2.125% 16 April 2018 326,891 0.52%
Total for United States 326,891 0.52%
Total transferable securities and money market instruments dealt in on another regulated market 2,377,645 3.82%
Total investments 59,118,345 95.07% Cash and cash equivalents 1,965,193 3.16% Bank overdraft and other net assets 1,097,890 1.77% Total net assets 62,181,428 100.00%
*A perpetual bond is a bond with no maturity date. Perpetual bonds are not redeemable but pay a steady stream of interest. 1 suspended/delisted security
Analysis of Investments as % of total assets Transferable securities and money market instruments admitted to an official exchange listing 91.01%Transferable securities and money market instruments dealt in on another regulated market 3.81%Other assets 5.18%Total assets 100.00% The accompanying notes form an integral part of these financial statements.

Standard Life Investments Global SICAV Société d'Investissement à Capital Variable
186
European Corporate Bond Fund Sub-fund Objective The objective of the Sub-fund is to achieve long-term growth in the share price.
Investment Policy The current policy is to invest substantially in debt securities issued by corporations and agencies domiciled in European countries or whose securities are quoted in European stock exchanges. Holdings will principally be of investment grade bonds. The Sub-fund may also invest in government bonds, sub investment grade debt and other interest bearing securities issued anywhere in the world. Non-Euro denominated issues will generally be hedged back into that currency. Return on the Sub-fund will be both through the reinvestment of income and from capital gains.
Performance Review The Sub-fund returned -0.4% over the period, compared to the iBoxx Euro Corporate Bond Index which returned -0.7%.*
At the beginning of the period, our long duration bias and overweight exposure to financials and corporate hybrid debt helped performance. The subordinated debt of Aviva and Societe Generale performed well, as did our position in the shorter-dated bonds of Petrobras. Individual security selection and exposure to high yield compensated for our underperforming position in long-dated German bunds and an underweight exposure to BG Group. Our underweight holding in EDF was beneficial, while our higher-conviction holdings in Lloyds also performed well. As the year progressed, strong stock selection and our off-benchmark allocations to high yield helped to offset the fact that the sub-fund was moderately long credit risk as credit spreads widened. Within corporates, our conviction holding in Irish utility ESB performed well, as did our overweight exposure to Lloyds. Despite this, our conviction higher-risk holdings in subordinated debt from Allianz, Aviva and UBS, as well as corporate hybrids from Orange and Dong Energy cost relative performance.
In the risk-off market environment of the third quarter, our overweight exposure to subordinated bank debt, corporate hybrids and short-dated high yield issues all detracted from returns. Yet, our underweight exposure to RWE and not owning Brazilian Votorantim helped to buffer some of the underperforming positions. The market rebounded somewhat in September, with underperforming auto positions in VW, BMW and Tata Motors recovering. In addition, our overweight allocation to corporate hybrids and high yield contributed to overall performance. On the negative side, holding German bunds in a risk-on environment hurt relative performance. Within financials, our overweight positioning in subordinated bonds of Royal Bank of Scotland, Lloyds, Societe Generale and Commerzbank did well. Our overweight exposure to US car manufacturer Ford benefited the Sub-fund in December. Our Australian oil & gas exposure via names like Origin and Santos suffered, although this was partially offset by our underweight holdings in European oil majors like Repsol and BP.
*Sub-fund performance has been calculated over the stated period on the K Accumulation Shares on the share price performance basis. Please note the index return is quoted gross and contains no adjustment for fees.
Outlook 2016 will be a year of divergence in terms of central bank policy, growth outlooks and the credit cycle. The Federal Reserve will gradually tighten policy, whereas we expect further easing from the European Central Bank’s (the “ECB”) and Chinese authorities. The credit cycle for corporates is getting later for the US, whereas some parts of emerging markets are in a credit crunch. In our view, European corporates are more in the middle of the cycle, as they are still recovering from the Eurozone crisis and with much lower leverage than the US. By contrast, banks continue to heal (driven by regulation), especially in Europe. Developed market growth continues to be stable-to-improving, whereas emerging market (the “EM”) growth is slowing. China remains a source of uncertainty; its effect is felt most severely in commodity markets. Geopolitical tensions are rising. This combination could mean a period of higher volatility.
Valuations are cheap, and in line with a mild recession, but while ECB quantative easing should be supportive, technical factors could prove to be challenging if high debt supply estimates materialise. We therefore enter the year with a more moderate long credit position compared to last year. We like valuations, which are a lot cheaper year-on-year, but there are some current elevated risks. We have a preference for financials over corporates and have reduced our EM exposure. However, dispersion in single issuer performance has increased and we think this provides opportunities for security selection in 2016.
Please note that the commitment approach has been used for risk measurement and calculation of global exposure for this Sub-fund.

Standard Life Investments Global SICAV Société d'Investissement à Capital Variable
187
European Corporate Bond Fund Schedule of Investments (expressed in EUR) as at 31 December 2015
Quantity/ Market Value % of
Nominal Value Currency Name of Securities EUR Net Assets
Transferable securities and money market instruments admitted to an official exchange listing
Australia 9,670,000 EUR APT Pipelines Ltd 2.000% 22 March 2027 8,658,152 0.28% 8,920,000 EUR BHP Billiton Finance Ltd FRN 22 April 2076 8,773,088 0.28%
12,260,000 USD CNOOC Finance 2015 Australia Pty Ltd 2.625% 05 May 2020 11,019,908 0.36% 12,878,000 EUR National Australia Bank Ltd FRN 12 November 2024 12,803,372 0.42% 4,630,000 EUR Origin Energy Finance Ltd 3.500% 04 October 2021 4,462,070 0.14%
11,820,000 EUR Santos Finance Ltd FRN 22 September 2070 11,882,794 0.39% 9,480,000 EUR Scentre Group Trust 1 1.500% 16 July 2020 9,645,527 0.31%
10,630,000 EUR Scentre Group Trust 2 3.250% 11 September 2023 11,855,427 0.39% Total for Australia 79,100,338 2.57%
Austria 4,500,000 EUR UniCredit Bank Austria AG 2.625% 30 January 2018 4,653,376 0.15%
Total for Austria 4,653,376 0.15%
Belgium 4,900,000 EUR Belfius Bank SA/NV 1.125% 22 May 2017 4,955,368 0.16% 7,900,000 EUR Belfius Bank SA/NV 2.250% 26 September 2018 8,258,375 0.27%
Total for Belgium 13,213,743 0.43%
Bermuda 4,800,000 GBP Holcim GB Finance Ltd 8.750% 24 April 2017 7,121,699 0.23%
Total for Bermuda 7,121,699 0.23%
Brazil 1,350,000 EUR Vale SA 3.750% 10 January 2023 1,046,250 0.03%
Total for Brazil 1,046,250 0.03%
Canada 15,060,000 EUR Great-West Lifeco Inc 2.500% 18 April 2023 16,028,181 0.52%
Total for Canada 16,028,181 0.52%
Cayman Islands 6,020,000 EUR China Overseas Land International Cayman Ltd 1.750% 15 July 2019 6,007,087 0.20%
16,400,000 EUR Hutchison Whampoa Finance 14 Ltd 1.375% 31 October 2021 16,388,700 0.53% 13,163,000 EUR IPIC GMTN Ltd 4.875% 14 May 2016 13,343,070 0.43% 6,470,000 EUR IPIC GMTN Ltd 2.375% 30 May 2018 6,673,158 0.22% 4,150,000 EUR IPIC GMTN Ltd 5.875% 14 March 2021 5,101,199 0.17% 1,500,000 EUR IPIC GMTN Ltd 3.625% 30 May 2023 1,689,278 0.06% 9,583,000 GBP Thames Water Utilities Cayman Finance Ltd FRN 21 July 2025 13,619,831 0.44%
Total for Cayman Islands 62,822,323 2.05%
Curaçao 11,000,000 EUR Teva Pharmaceutical Finance IV BV 2.875% 15 April 2019 11,668,567 0.38%
Total for Curaçao 11,668,567 0.38%
Denmark 2,795,000 EUR Danske Bank A/S FRN 04 October 2023 2,979,811 0.10% 1,777,000 EUR DONG Energy A/S 4.875% 16 December 2021 2,145,571 0.07% 4,710,000 EUR DONG Energy A/S 2.625% 19 September 2022 5,064,878 0.16% 8,397,000 EUR DONG Energy A/S FRN 26 June 3013 9,079,256 0.30%
11,560,000 EUR Nykredit Realkredit A/S FRN 17 November 2027 11,454,862 0.37% Total for Denmark 30,724,378 1.00%
Finland 1,064,000 EUR Teollisuuden Voima Oyj 4.625% 04 February 2019 1,152,607 0.04%
Total for Finland 1,152,607 0.04%
France 2,800,000 EUR Aeroports de Paris 1.500% 24 July 2023 2,856,392 0.09% 8,900,000 EUR Aeroports de Paris 1.500% 07 April 2025 8,920,056 0.29% 1,800,000 EUR Aeroports de Paris 2.750% 05 June 2028 1,986,750 0.06%

Standard Life Investments Global SICAV Société d'Investissement à Capital Variable
188
European Corporate Bond Fund Schedule of Investments (expressed in EUR) (continued) as at 31 December 2015
Quantity/ Market Value % of
Nominal Value Currency Name of Securities EUR Net Assets
Transferable securities and money market instruments admitted to an official exchange listing (continued)
France (continued) 3,300,000 EUR Alstom SA 4.500% 18 March 2020 3,742,824 0.12% 6,000,000 EUR Areva SA 3.250% 04 September 2020 5,804,130 0.19% 3,550,000 EUR Areva SA 4.875% 23 September 2024 3,580,991 0.12% 2,700,000 EUR Arkema SA 1.500% 20 January 2025 2,609,574 0.08% 6,300,000 EUR Autoroutes du Sud de la France SA 4.125% 13 April 2020 7,186,689 0.23% 6,100,000 EUR Autoroutes du Sud de la France SA 2.950% 17 January 2024 6,762,307 0.22% 3,000,000 EUR Banque Federative du Credit Mutuel SA 3.000% 28 November 2023 3,360,830 0.11% 3,769,000 EUR BNP Paribas SA 1.500% 12 March 2018 3,877,077 0.13%
10,000,000 EUR BNP Paribas SA 2.500% 23 August 2019 10,733,347 0.35% 5,000,000 EUR BNP Paribas SA 2.250% 13 January 2021 5,330,757 0.17% 5,300,000 EUR BNP Paribas SA FRN (perpetual bond*) 5,995,588 0.20% 9,600,000 EUR BPCE SA 1.375% 22 May 2019 9,893,568 0.32% 7,300,000 EUR BPCE SA 2.125% 17 March 2021 7,726,407 0.25% 4,500,000 EUR BPCE SA 4.250% 06 February 2023 5,398,519 0.18% 5,000,000 EUR BPCE SA 4.625% 18 July 2023 5,747,063 0.19% 6,156,000 USD BPCE SA 5.150% 21 July 2024 5,700,610 0.19% 3,100,000 EUR Casino Guichard Perrachon SA 4.726% 26 May 2021 3,376,562 0.11% 5,600,000 EUR Casino Guichard Perrachon SA 3.311% 25 January 2023 5,498,780 0.18% 5,600,000 EUR Casino Guichard Perrachon SA 3.248% 07 March 2024 5,351,668 0.17% 5,900,000 EUR Casino Guichard Perrachon SA 2.798% 05 August 2026 5,216,248 0.17%
14,400,000 EUR Christian Dior SE 4.000% 12 May 2016 14,591,232 0.47% 8,200,000 EUR Christian Dior SE 1.375% 19 June 2019 8,366,214 0.27% 2,700,000 EUR Cie Financiere et Industrielle des Autoroutes SA 5.000% 24 May 2021 3,264,051 0.11% 5,820,000 EUR Credit Agricole SA 2.625% 17 March 2027 5,562,527 0.18% 8,370,000 USD Credit Agricole SA FRN 19 September 2033 8,497,342 0.28% 4,900,000 USD Credit Agricole SA FRN (perpetual bond*) 4,577,153 0.15% 6,000,000 EUR Credit Logement SA FRN (perpetual bond*) 4,872,000 0.16% 2,650,000 EUR Electricite de France SA 6.250% 25 January 2021 3,377,508 0.11%
10,000,000 EUR Electricite de France SA 2.250% 27 April 2021 10,732,598 0.35% 3,350,000 EUR Electricite de France SA 4.625% 26 April 2030 4,224,687 0.14% 2,990,000 EUR Electricite de France SA 5.625% 21 February 2033 4,179,898 0.14% 4,000,000 EUR Electricite de France SA FRN (perpetual bond*) 3,923,683 0.13% 1,800,000 EUR Electricite de France SA FRN (perpetual bond*) 1,762,725 0.06% 5,000,000 EUR Electricite de France SA FRN (perpetual bond*) 5,017,362 0.16% 4,500,000 EUR Engie SA 1.375% 19 May 2020 4,666,660 0.15% 3,600,000 EUR Engie SA 2.375% 19 May 2026 3,867,518 0.13% 8,000,000 EUR Engie SA 1.500% 13 March 2035 7,080,975 0.23% 8,600,000 EUR Engie SA FRN (perpetual bond*) 8,492,500 0.28%
10,900,000 EUR Eutelsat SA 5.000% 14 January 2019 12,280,339 0.40% 4,900,000 EUR Eutelsat SA 2.625% 13 January 2020 5,191,942 0.17%
400,000 EUR Holding d'Infrastructures de Transport SAS 5.750% 09 March 2018 445,620 0.01% 8,400,000 EUR Holding d'Infrastructures de Transport SAS 2.250% 24 March 2025 8,411,256 0.27% 8,000,000 EUR Infra Park SAS 1.250% 16 October 2020 8,070,964 0.26% 2,300,000 EUR Infra Park SAS 2.125% 16 April 2025 2,318,399 0.08%
12,400,000 EUR Ingenico Group SA 2.500% 20 May 2021 12,629,028 0.41% 2,300,000 EUR Klepierre 3.250% 26 February 2021 2,548,026 0.08% 5,700,000 EUR Klepierre 1.000% 17 April 2023 5,473,397 0.18% 6,000,000 EUR La Banque Postale SA FRN 23 April 2026 6,140,640 0.20% 7,200,000 EUR Lagardere SCA 4.125% 31 October 2017 7,551,756 0.25%
12,200,000 EUR Mercialys SA 1.787% 31 March 2023 11,734,997 0.38% 8,300,000 EUR Orange SA 1.875% 03 September 2018 8,636,901 0.28% 6,846,000 EUR Orange SA 8.125% 28 January 2033 11,396,940 0.37% 8,260,000 EUR Orange SA FRN (perpetual bond*) 8,259,428 0.27% 7,100,000 EUR Pernod Ricard SA 5.000% 15 March 2017 7,497,032 0.24% 3,425,000 EUR RCI Banque SA 4.250% 27 April 2017 3,594,964 0.12% 7,181,000 EUR RCI Banque SA 2.875% 22 January 2018 7,505,512 0.24% 4,000,000 EUR Renault SA 4.625% 18 September 2017 4,257,520 0.14% 2,000,000 EUR Renault SA 3.625% 19 September 2018 2,146,696 0.07% 9,400,000 EUR RTE Reseau de Transport d'Electricite SA 1.625% 27 November 2025 9,336,315 0.30%

Standard Life Investments Global SICAV Société d'Investissement à Capital Variable
189
European Corporate Bond Fund Schedule of Investments (expressed in EUR) (continued) as at 31 December 2015
Quantity/ Market Value % of
Nominal Value Currency Name of Securities EUR Net Assets
Transferable securities and money market instruments admitted to an official exchange listing (continued)
France (continued) 3,800,000 EUR SANEF SA 1.875% 16 March 2026 3,793,027 0.12% 6,000,000 EUR Sanofi 2.500% 14 November 2023 6,614,925 0.22% 3,700,000 EUR Societe Des Autoroutes Paris-Rhin-Rhone 1.125% 15 January 2021 3,721,756 0.12% 3,300,000 EUR Societe Des Autoroutes Paris-Rhin-Rhone 1.500% 15 January 2024 3,304,785 0.11% 4,800,000 EUR Societe Des Autoroutes Paris-Rhin-Rhone 1.875% 15 January 2025 4,878,554 0.16% 3,000,000 EUR Societe Fonciere Lyonnaise SA 1.875% 26 November 2021 2,995,657 0.10% 3,600,000 EUR Societe Fonciere Lyonnaise SA 2.250% 16 November 2022 3,626,964 0.12% 1,750,000 EUR Societe Generale SA FRN (perpetual bond*) 1,932,752 0.06% 6,300,000 EUR Societe Generale SA 2.375% 28 February 2018 6,587,769 0.21% 1,500,000 EUR Societe Generale SA 4.000% 07 June 2023 1,636,525 0.05% 9,600,000 EUR Societe Generale SA FRN 16 September 2026 9,476,136 0.31% 8,760,000 USD Societe Generale SA FRN (perpetual bond*) 8,543,977 0.28% 2,700,000 USD Societe Generale SA FRN (perpetual bond*) 2,476,655 0.08% 3,400,000 EUR Suez Environnement Co 1.750% 10 September 2025 3,430,141 0.11%
12,880,000 EUR Total SA FRN (perpetual bond*) 11,914,000 0.39% 1,590,000 EUR Total SA FRN (perpetual bond*) 1,407,346 0.05% 5,600,000 EUR Transport et Infrastructures Gaz France SA 2.200% 05 August 2025 5,626,152 0.18% 5,200,000 EUR Veolia Environnement SA 1.590% 10 January 2028 4,922,988 0.16% 2,800,000 EUR Vinci SA 4.125% 20 February 2017 2,925,201 0.10% 3,600,000 EUR Vinci SA 3.375% 30 March 2020 3,993,688 0.13%
Total for France 472,950,040 15.40%
Germany 13,300,000 EUR Allianz SE FRN 07 July 2045 12,268,917 0.40% 5,500,000 EUR Allianz SE FRN (perpetual bond*) 5,368,872 0.17%
12,400,000 EUR Allianz SE FRN (perpetual bond*) 13,359,140 0.44% 3,525,000 EUR Bayer AG FRN 02 April 2075 3,324,392 0.11%
15,000,000 EUR Bundesrepublik Deutschland 2.000% 04 January 2022 16,738,000 0.55% 10,000,000 EUR Bundesrepublik Deutschland 0.500% 15 February 2025 9,951,000 0.32% 10,000,000 EUR Bundesrepublik Deutschland 1.000% 15 August 2025 10,345,839 0.34% 8,446,356 EUR Bundesrepublik Deutschland 4.750% 04 July 2028 12,318,905 0.40% 9,000,000 EUR Bundesrepublik Deutschland 4.750% 04 July 2034 14,216,063 0.46% 9,400,000 EUR Commerzbank AG 7.750% 16 March 2021 11,465,274 0.37% 3,225,000 EUR Daimler AG 2.000% 07 April 2020 3,401,852 0.11% 1,000,000 EUR Daimler AG 2.375% 12 September 2022 1,083,284 0.04% 7,200,000 EUR Deutsche Bank AG 1.250% 08 September 2021 7,219,260 0.24%
10,240,000 EUR Merck Financial Services GmbH 0.750% 02 September 2019 10,352,640 0.34%
4,400,000 EUR Muenchener Rueckversicherungs-Gesellschaft AG in Muenchen FRN 26 May 2042 5,354,251 0.17%
1,500,000 EUR Volkswagen Leasing GmbH 3.250% 10 May 2018 1,568,014 0.05% 6,800,000 EUR Volkswagen Leasing GmbH 0.750% 11 August 2020 6,541,532 0.21% 1,582,000 EUR Volkswagen Leasing GmbH 2.625% 15 January 2024 1,632,050 0.05%
Total for Germany 146,509,285 4.77%
Guernsey 16,000,000 USD Credit Suisse Group Guernsey I Ltd FRN 24 February 2041 15,158,839 0.49%
Total for Guernsey 15,158,839 0.49%
Iceland 4,458,000 EUR Arion Banki HF 3.125% 12 March 2018 4,513,992 0.15% 4,560,000 EUR Landsbankinn HF 3.000% 19 October 2018 4,586,129 0.15%
Total for Iceland 9,100,121 0.30%
Ireland
4,864,000 EUR Aquarius & Investments Plc for Zurich Insurance Co Ltd FRN 02 October 2043 5,312,256 0.17%
17,882,000 EUR Bank of Ireland 2.000% 08 May 2017 18,228,642 0.59% 6,770,000 EUR Bank of Ireland 1.250% 09 April 2020 6,816,002 0.22% 2,277,587 EUR Bluestep Mortgage Securities No2 Ltd FRN 10 November 2055 2,279,444 0.07% 6,500,000 EUR Caterpillar International Finance Ltd 0.750% 13 October 2020 6,524,700 0.21%

Standard Life Investments Global SICAV Société d'Investissement à Capital Variable
190
European Corporate Bond Fund Schedule of Investments (expressed in EUR) (continued) as at 31 December 2015
Quantity/ Market Value % of
Nominal Value Currency Name of Securities EUR Net Assets
Transferable securities and money market instruments admitted to an official exchange listing (continued)
Ireland (continued) 3,790,000 EUR Cloverie Plc for Zurich Insurance Co Ltd 1.750% 16 September 2024 3,829,624 0.12% 1,903,000 EUR ESB Finance Ltd 6.250% 11 September 2017 2,093,386 0.07% 5,540,000 EUR ESB Finance Ltd 4.375% 21 November 2019 6,343,924 0.21% 7,750,000 EUR ESB Finance Ltd 2.125% 08 June 2027 7,855,710 0.25% 5,966,000 EUR FCA Capital Ireland Plc 4.000% 17 October 2018 6,392,748 0.21% 3,166,000 EUR FCA Capital Ireland Plc 2.625% 17 April 2019 3,287,298 0.11% 6,600,000 EUR FCA Capital Ireland Plc 2.000% 23 October 2019 6,718,733 0.22% 3,930,000 EUR FCA Capital Ireland Plc 1.375% 17 April 2020 3,898,639 0.13% 5,939,000 EUR GAS Networks Ireland 3.625% 04 December 2017 6,316,983 0.20% 6,713,000 EUR GE Capital European Funding 4.250% 01 March 2017 7,040,643 0.23% 4,000,000 EUR GE Capital European Funding 3.625% 15 June 2017 4,199,800 0.14%
21,960,000 EUR GE Capital European Funding 0.800% 21 January 2022 21,684,512 0.71% 8,616,000 EUR Willow No 2 Ireland Plc for Zurich Insurance Co Ltd 3.375% 27 June 2022 9,725,582 0.32%
Total for Ireland 128,548,626 4.18%
Italy 5,260,000 EUR 2i Rete Gas SpA 1.750% 16 July 2019 5,421,727 0.18% 7,243,000 EUR Assicurazioni Generali SpA 5.125% 16 September 2024 9,213,196 0.30%
10,300,000 EUR Assicurazioni Generali SpA FRN 12 December 2042 12,590,007 0.41% 5,561,000 EUR Edison SpA 3.875% 10 November 2017 5,916,364 0.19% 2,230,000 EUR Enel SpA 5.250% 20 June 2017 2,391,423 0.08% 6,329,000 EUR Enel SpA FRN 15 January 2075 6,621,115 0.22% 6,000,000 EUR Eni SpA 4.000% 29 June 2020 6,812,835 0.22% 9,970,000 EUR Eni SpA 1.750% 18 January 2024 10,033,908 0.33% 3,000,000 EUR Eni SpA 3.625% 29 January 2029 3,437,415 0.11% 2,600,000 USD Intesa Sanpaolo SpA 3.125% 15 January 2016 2,389,135 0.08%
12,000,000 EUR Intesa Sanpaolo SpA 5.000% 28 February 2017 12,653,772 0.41% 7,170,000 EUR Intesa Sanpaolo SpA 4.000% 09 November 2017 7,649,673 0.25% 4,400,000 EUR Intesa Sanpaolo SpA 6.625% 08 May 2018 4,728,636 0.15% 2,800,000 EUR Intesa Sanpaolo SpA 3.000% 28 January 2019 2,990,026 0.10% 2,000,000 EUR Intesa Sanpaolo SpA 4.375% 15 October 2019 2,257,445 0.07% 6,260,000 EUR Intesa Sanpaolo SpA 2.000% 18 June 2021 6,458,409 0.21% 7,840,000 EUR Intesa Sanpaolo SpA 1.125% 04 March 2022 7,641,197 0.25% 5,740,000 EUR Intesa Sanpaolo SpA 3.928% 15 September 2026 5,880,917 0.19% 7,340,000 EUR Snam SpA 1.375% 19 November 2023 7,306,897 0.24% 4,090,000 EUR UniCredit SpA 3.375% 11 January 2018 4,335,598 0.14% 5,800,000 EUR UniCredit SpA 5.650% 24 July 2018 6,478,600 0.21%
Total for Italy 133,208,295 4.34%
Japan 8,920,000 EUR Sumitomo Mitsui Banking Corp 1.000% 19 January 2022 8,804,263 0.29%
Total for Japan 8,804,263 0.29%
Jersey 8,823,000 GBP AA Bond Co Ltd 4.720% 31 July 2018 12,486,410 0.41% 6,650,000 GBP CPUK Finance Ltd 2.666% 28 February 2020 8,998,689 0.29% 1,768,000 GBP HBOS Capital Funding LP FRN (perpetual bond*) 2,565,784 0.08% 6,484,000 EUR Heathrow Funding Ltd 4.375% 25 January 2017 6,765,194 0.22%
12,047,000 EUR Heathrow Funding Ltd 4.600% 15 February 2018 13,097,739 0.43% 2,860,000 EUR Heathrow Funding Ltd 1.875% 23 May 2022 2,975,303 0.10% 8,420,000 EUR Heathrow Funding Ltd 1.500% 11 February 2030 7,523,059 0.24%
11,115,000 EUR ProSecure Funding LP 4.668% 30 June 2016 11,267,831 0.37% 7,150,000 EUR UBS Group Funding Jersey Ltd 1.750% 16 November 2022 7,159,581 0.23%
Total for Jersey 72,839,590 2.37%
Luxembourg 1,960,000 EUR Befesa Zinc SAU Via Zinc Capital SA 8.875% 15 May 2018 1,921,682 0.06% 4,304,000 EUR CNH Industrial Finance Europe SA 6.250% 09 March 2018 4,616,040 0.15% 8,911,000 EUR Fiat Chrysler Finance Europe 7.000% 23 March 2017 9,455,462 0.31% 7,638,000 EUR FMC Finance VIII SA 6.500% 15 September 2018 8,771,861 0.29%

Standard Life Investments Global SICAV Société d'Investissement à Capital Variable
191
European Corporate Bond Fund Schedule of Investments (expressed in EUR) (continued) as at 31 December 2015
Quantity/ Market Value % of
Nominal Value Currency Name of Securities EUR Net Assets
Transferable securities and money market instruments admitted to an official exchange listing (continued)
Luxembourg (continued) 8,240,000 EUR GELF Bond Issuer I SA 1.750% 22 November 2021 8,135,187 0.26% 6,400,000 EUR Glencore Finance Europe SA 5.250% 22 March 2017 6,294,267 0.21% 6,500,000 EUR Glencore Finance Europe SA 3.375% 30 September 2020 5,374,752 0.18%
14,650,000 EUR Glencore Finance Europe SA 1.250% 17 March 2021 10,701,092 0.35% 550,000 EUR Glencore Finance Europe SA 2.750% 01 April 2021 427,837 0.01%
7,000,000 EUR Novartis Finance SA 1.625% 09 November 2026 7,189,105 0.23% 4,945,000 EUR Prologis International Funding II SA 2.750% 23 October 2018 5,189,036 0.17% 4,850,000 EUR Prologis International Funding II SA 2.875% 04 April 2022 5,089,566 0.17% 4,000,000 EUR Talanx Finanz Luxembourg SA FRN 15 June 2042 5,063,175 0.16%
Total for Luxembourg 78,229,062 2.55%
Mexico 7,650,000 EUR America Movil SAB de CV FRN 06 September 2073 8,000,753 0.26% 8,500,000 USD Grupo Televisa SAB 6.000% 15 May 2018 8,363,646 0.27%
11,400,000 EUR Petroleos Mexicanos 6.375% 05 August 2016 11,722,620 0.38% 2,934,000 EUR Petroleos Mexicanos 5.500% 09 January 2017 3,030,010 0.10% 2,910,000 EUR Petroleos Mexicanos 3.125% 27 November 2020 2,812,151 0.09% 2,024,000 EUR Petroleos Mexicanos 5.500% 24 February 2025 2,088,262 0.07% 7,505,000 EUR Petroleos Mexicanos 2.750% 21 April 2027 5,526,232 0.18%
Total for Mexico 41,543,674 1.35%
Netherlands 6,190,000 EUR Achmea BV 2.500% 19 November 2020 6,582,581 0.21% 2,000,000 EUR Aegon NV 3.000% 18 July 2017 2,086,635 0.07% 3,000,000 EUR Alliander NV FRN (perpetual bond*) 3,124,680 0.10% 3,016,000 EUR Allianz Finance II BV FRN (perpetual bond*) 3,116,077 0.10% 1,600,000 EUR Allianz Finance II BV 3.000% 13 March 2028 1,822,730 0.06% 4,800,000 EUR Allianz Finance II BV FRN 08 July 2041 5,571,808 0.18% 4,400,000 EUR Amadeus Finance BV 0.625% 02 December 2017 4,406,886 0.14% 4,310,000 EUR BAT Netherlands Finance BV 3.125% 06 March 2029 4,664,584 0.15%
15,400,000 EUR Bharti Airtel International Netherlands BV 4.000% 10 December 2018 16,477,140 0.54% 5,000,000 EUR BMW Finance NV 2.625% 17 January 2024 5,469,580 0.18% 9,630,000 EUR BMW Finance NV 1.000% 21 January 2025 9,206,954 0.30% 4,654,000 EUR Coca-Cola HBC Finance BV 4.250% 16 November 2016 4,811,003 0.16%
18,640,000 EUR Cooperatieve Centrale Raiffeisen-Boerenleenbank BA FRN 26 May 2026 18,886,421 0.61% 6,550,000 EUR CRH Funding BV 1.875% 09 January 2024 6,609,540 0.22% 6,000,000 EUR Deutsche Bahn Finance BV 3.750% 09 July 2025 7,332,600 0.24% 1,236,000 EUR Deutsche Telekom International Finance BV 5.375% 27 July 2021 1,513,711 0.05% 5,050,000 GBP E.ON International Finance BV 6.000% 30 October 2019 7,683,584 0.25% 3,600,000 EUR EDP Finance BV 4.875% 14 September 2020 4,050,630 0.13% 7,860,000 EUR EDP Finance BV 4.125% 20 January 2021 8,522,205 0.28% 3,200,000 EUR EDP Finance BV 2.625% 18 January 2022 3,210,021 0.10% 4,546,000 EUR Enel Finance International NV 5.000% 14 September 2022 5,673,572 0.18% 8,779,000 EUR Enel Finance International NV 1.966% 27 January 2025 9,005,801 0.29%
100,000 EUR Gas Natural Fenosa Finance BV 3.875% 11 April 2022 114,598 0.00% 6,000,000 EUR Gas Natural Fenosa Finance BV FRN (perpetual bond*) 5,730,000 0.19%
11,450,000 EUR General Motors Financial International BV 0.850% 23 February 2018 11,406,032 0.37% 800,000 EUR General Motors Financial International BV 1.875% 15 October 2019 812,360 0.03%
3,200,000 EUR Iberdrola International BV 3.000% 31 January 2022 3,541,456 0.12% 6,395,000 EUR ING Bank NV 1.875% 27 February 2018 6,619,829 0.22% 7,460,000 EUR ING Bank NV 1.250% 13 December 2019 7,659,480 0.25% 1,909,000 EUR ING Bank NV FRN 29 May 2023 2,127,163 0.07% 7,099,000 EUR ING Bank NV FRN 21 November 2023 7,502,117 0.24% 8,500,000 EUR JAB Holdings BV 1.500% 24 November 2021 8,293,238 0.27% 4,500,000 EUR JAB Holdings BV 2.125% 16 September 2022 4,481,843 0.15% 6,900,000 EUR Koninklijke KPN NV FRN (perpetual bond*) 7,354,227 0.24% 1,790,000 EUR LeasePlan Corp NV 2.375% 23 April 2019 1,859,072 0.06%
12,781,000 EUR Linde Finance BV FRN 14 July 2066 13,191,206 0.43% 6,532,000 EUR NN Group NV FRN (perpetual bond*) 6,436,633 0.21%
10,000,000 EUR Petrobras Global Finance BV 2.750% 15 January 2018 8,184,000 0.27%

Standard Life Investments Global SICAV Société d'Investissement à Capital Variable
192
European Corporate Bond Fund Schedule of Investments (expressed in EUR) (continued) as at 31 December 2015
Quantity/ Market Value % of
Nominal Value Currency Name of Securities EUR Net Assets
Transferable securities and money market instruments admitted to an official exchange listing (continued)
Netherlands (continued) 500,000 EUR Portugal Telecom International Finance BV 5.875% 17 April 2018 257,490 0.01%
7,630,000 EUR Roche Finance Europe BV 0.875% 25 February 2025 7,496,530 0.24% 5,565,000 EUR RWE Finance BV 6.500% 10 August 2021 7,000,819 0.23% 6,240,000 EUR Schaeffler Finance BV 4.250% 15 May 2018 6,380,650 0.21% 7,540,000 EUR Shell International Finance BV 1.625% 20 January 2027 7,222,297 0.24% 2,100,000 EUR Swiss Reinsurance Co via ELM BV FRN (perpetual bond*) 2,149,875 0.07% 6,460,000 EUR Swiss Reinsurance Co via ELM BV FRN (perpetual bond*) 5,969,492 0.19%
10,500,000 EUR Telefonica Europe BV FRN (perpetual bond*) 10,369,905 0.34% 11,090,000 EUR Teva Pharmaceutical Finance Netherlands II BV 1.250% 31 March 2023 10,487,480 0.34% 7,000,000 EUR Urenco Finance NV 2.375% 02 December 2024 6,827,430 0.22% 2,100,000 EUR Volkswagen International Finance NV 3.250% 21 January 2019 2,217,387 0.07% 6,000,000 EUR Volkswagen International Finance NV 2.000% 14 January 2020 6,117,758 0.20% 3,402,000 EUR Volkswagen International Finance NV 2.000% 26 March 2021 3,450,746 0.11%
15,271,000 EUR Volkswagen International Finance NV 0.875% 16 January 2023 14,090,931 0.46% 988,000 EUR Volkswagen International Finance NV 1.625% 16 January 2030 856,578 0.03%
4,868,000 EUR Volkswagen International Finance NV FRN (perpetual bond*) 4,709,790 0.15% 7,700,000 EUR Volkswagen International Finance NV FRN (perpetual bond*) 7,498,427 0.24%
14,562,000 EUR Volkswagen International Finance NV FRN (perpetual bond*) 12,160,799 0.40% 7,800,000 EUR Vonovia Finance BV 3.125% 25 July 2019 8,323,575 0.27% 3,140,000 EUR Vonovia Finance BV 0.875% 30 March 2020 3,078,817 0.10% 2,560,000 EUR Vonovia Finance BV 3.625% 08 October 2021 2,811,302 0.09% 8,300,000 EUR Vonovia Finance BV 2.250% 15 December 2023 8,253,603 0.27% 9,300,000 EUR Vonovia Finance BV FRN (perpetual bond*) 9,046,482 0.29% 6,900,000 EUR Vonovia Finance BV FRN 08 April 2074 7,014,045 0.23%
Total for Netherlands 388,934,205 12.66%
Norway 14,625,000 EUR DNB Bank ASA 4.375% 24 February 2021 17,245,561 0.56% 3,220,000 EUR DNB Bank ASA FRN 26 September 2023 3,353,515 0.11% 6,625,000 EUR SpareBank 1 SR-Bank ASA 2.000% 14 May 2018 6,858,163 0.22% 3,913,000 EUR SpareBank 1 SR-Bank ASA 2.125% 03 February 2020 4,091,777 0.13% 3,797,000 EUR Statkraft AS 2.500% 28 November 2022 4,101,044 0.14% 6,470,000 EUR Statkraft AS 1.500% 21 September 2023 6,473,753 0.21%
Total for Norway 42,123,813 1.37%
Spain 6,000,000 EUR Banco Bilbao Vizcaya Argentaria SA FRN (perpetual bond*) 5,884,980 0.19% 6,000,000 EUR BBVA Senior Finance SAU 3.750% 17 January 2018 6,413,368 0.21%
11,900,000 EUR BBVA Subordinated Capital SAU FRN 11 April 2024 12,353,022 0.40% 2,500,000 EUR Cellnex Telecom SAU 3.125% 27 July 2022 2,397,125 0.08% 3,800,000 EUR Enagas Financiaciones SAU 1.250% 06 February 2025 3,670,002 0.12% 3,200,000 EUR Gas Natural Capital Markets SA 4.125% 26 January 2018 3,443,989 0.11% 5,100,000 EUR Gas Natural Capital Markets SA 6.000% 27 January 2020 6,143,674 0.20% 7,600,000 EUR Inmobiliaria Colonial SA 1.863% 05 June 2019 7,654,302 0.25% 4,600,000 EUR Santander Consumer Finance SA 1.100% 30 July 2018 4,657,638 0.15% 5,695,000 USD Telefonica Emisiones SAU 6.221% 03 July 2017 5,557,866 0.18% 5,500,000 EUR Telefonica Emisiones SAU 5.811% 05 September 2017 5,999,767 0.20% 4,500,000 EUR Telefonica Emisiones SAU 4.797% 21 February 2018 4,909,177 0.16% 7,300,000 EUR Telefonica Emisiones SAU 4.710% 20 January 2020 8,371,553 0.27% 6,000,000 EUR Telefonica Emisiones SAU 3.987% 23 January 2023 6,809,821 0.22%
Total for Spain 84,266,284 2.74%
Sweden 5,540,000 EUR Akelius Residential Property AB 3.375% 23 September 2020 5,605,787 0.18% 1,250,000 EUR Investor AB 4.875% 18 November 2021 1,528,883 0.05% 3,990,000 EUR Nordea Bank AB FRN 10 November 2025 3,960,275 0.13% 2,905,000 EUR Svenska Handelsbanken AB 2.250% 14 June 2018 3,047,476 0.10% 6,590,000 EUR Svenska Handelsbanken AB 2.250% 27 August 2020 7,058,642 0.23% 9,460,000 EUR Svenska Handelsbanken AB 1.125% 14 December 2022 9,391,273 0.31%
10,610,000 EUR Swedbank AB 0.625% 04 January 2021 10,513,502 0.34%

Standard Life Investments Global SICAV Société d'Investissement à Capital Variable
193
European Corporate Bond Fund Schedule of Investments (expressed in EUR) (continued) as at 31 December 2015
Quantity/ Market Value % of
Nominal Value Currency Name of Securities EUR Net Assets
Transferable securities and money market instruments admitted to an official exchange listing (continued)
Sweden (continued) 3,407,000 EUR Vattenfall AB FRN 19 March 2077 2,762,736 0.09%
Total for Sweden 43,868,574 1.43%
Switzerland 7,900,000 EUR Credit Suisse AG 0.500% 29 March 2018 7,932,145 0.26%
12,405,000 EUR Credit Suisse AG 0.625% 20 November 2018 12,493,671 0.41% 10,400,000 EUR Credit Suisse AG 1.125% 15 September 2020 10,556,052 0.34% 6,390,000 EUR Credit Suisse AG 1.375% 31 January 2022 6,502,892 0.21%
11,633,000 EUR UBS AG 0.500% 15 May 2018 11,685,349 0.38% 11,720,000 EUR UBS AG 1.250% 03 September 2021 11,977,327 0.39% 16,570,000 EUR UBS AG FRN 12 February 2026 17,694,772 0.58% 10,380,000 EUR Zuercher Kantonalbank FRN 15 June 2027 10,297,479 0.33%
Total for Switzerland 89,139,687 2.90%
United Kingdom 3,940,000 EUR Abbey National Treasury Services Plc 1.750% 15 January 2018 4,048,968 0.13% 6,890,000 EUR Abbey National Treasury Services Plc 2.000% 14 January 2019 7,166,635 0.23% 8,540,000 EUR Abbey National Treasury Services Plc 0.875% 13 January 2020 8,560,024 0.28% 6,670,000 EUR Abbey National Treasury Services Plc 2.625% 16 July 2020 7,171,553 0.23% 5,300,000 EUR Abbey National Treasury Services Plc 0.875% 25 November 2020 5,272,043 0.17% 8,000,000 EUR Abbey National Treasury Services Plc 1.125% 14 January 2022 7,909,160 0.26% 4,120,000 EUR Abbey National Treasury Services Plc 1.125% 10 March 2025 3,890,351 0.13% 3,151,000 EUR Anglo American Capital Plc 1.750% 03 April 2018 2,671,890 0.09% 3,500,000 EUR Anglo American Capital Plc 2.875% 20 November 2020 2,558,500 0.08% 7,690,000 EUR Anglo American Capital Plc 3.250% 03 April 2023 5,261,883 0.17% 7,570,000 EUR Aviva Plc FRN 05 July 2043 8,887,384 0.29% 6,967,000 EUR Aviva Plc FRN 03 July 2044 7,053,182 0.23% 2,100,000 EUR Aviva Plc FRN 04 December 2045 2,003,185 0.07% 6,622,000 EUR Babcock International Group Plc 1.750% 06 October 2022 6,614,484 0.22% 4,843,000 EUR Barclays Bank Plc 2.125% 24 February 2021 5,146,622 0.17% 7,495,000 EUR Barclays Bank Plc 6.625% 30 March 2022 9,432,283 0.31% 5,125,000 USD Barclays Bank Plc 7.625% 21 November 2022 5,368,587 0.17% 5,220,000 EUR Barclays Plc FRN 11 November 2025 5,211,700 0.17% 6,186,000 EUR BAT International Finance Plc 2.000% 13 March 2045 5,010,618 0.16% 5,680,000 EUR BP Capital Markets Plc 1.109% 16 February 2023 5,542,022 0.18% 5,868,000 EUR BP Capital Markets Plc 2.213% 25 September 2026 5,954,528 0.19% 5,330,000 EUR BP Capital Markets Plc 1.573% 16 February 2027 5,022,087 0.16% 5,630,000 EUR Brambles Finance Plc 4.625% 20 April 2018 6,154,099 0.20% 8,500,000 EUR Centrica Plc FRN 10 April 2076 7,847,002 0.26%
15,595,000 EUR Coventry Building Society 2.250% 04 December 2017 16,150,326 0.53% 7,910,000 EUR Coventry Building Society 2.500% 18 November 2020 8,457,284 0.28% 6,000,000 GBP Enterprise Inns Plc 6.500% 06 December 2018 8,771,187 0.29% 7,000,000 EUR Experian Finance Plc 4.750% 04 February 2020 8,072,471 0.26% 6,390,000 EUR FCE Bank Plc 1.625% 09 September 2016 6,439,842 0.21% 7,780,000 EUR FCE Bank Plc 2.875% 03 October 2017 8,100,367 0.26% 7,250,000 EUR FCE Bank Plc 1.528% 09 November 2020 7,317,063 0.24%
15,230,000 EUR FCE Bank Plc 1.875% 24 June 2021 15,498,733 0.50% 8,430,000 EUR FCE Bank Plc 1.134% 10 February 2022 8,166,571 0.27% 3,627,000 GBP Firstgroup Plc 8.125% 19 September 2018 5,624,869 0.18% 4,500,000 EUR G4S International Finance Plc 2.875% 02 May 2017 4,636,193 0.15% 7,708,000 EUR G4S International Finance Plc 2.625% 06 December 2018 8,108,058 0.26% 8,355,000 EUR Hammerson Plc 2.750% 26 September 2019 8,912,846 0.29% 3,720,000 EUR Hammerson Plc 2.000% 01 July 2022 3,796,390 0.12% 8,800,000 GBP Heathrow Finance Plc 7.125% 01 March 2017 12,663,084 0.41% 5,685,000 EUR Imperial Tobacco Finance Plc 4.500% 05 July 2018 6,269,727 0.20% 3,600,000 EUR Imperial Tobacco Finance Plc 2.250% 26 February 2021 3,788,334 0.12% 2,900,000 EUR International Game Technology Plc 4.750% 05 March 2020 2,923,548 0.09% 8,230,000 GBP Jaguar Land Rover Automotive Plc 3.875% 01 March 2023 10,548,519 0.34% 9,150,000 EUR LBG Capital No.2 Plc 15.000% 21 December 2019 13,094,519 0.43% 5,157,000 EUR Leeds Building Society 2.625% 01 April 2021 5,432,729 0.18%

Standard Life Investments Global SICAV Société d'Investissement à Capital Variable
194
European Corporate Bond Fund Schedule of Investments (expressed in EUR) (continued) as at 31 December 2015
Quantity/ Market Value % of
Nominal Value Currency Name of Securities EUR Net Assets
Transferable securities and money market instruments admitted to an official exchange listing (continued)
United Kingdom (continued) 9,270,000 EUR Leeds Building Society 1.375% 05 May 2022 9,046,037 0.29% 8,339,000 EUR Lloyds Bank Plc 6.500% 24 March 2020 10,091,260 0.33% 5,140,000 EUR Lloyds Bank Plc 1.000% 19 November 2021 5,122,575 0.17% 3,575,000 EUR Lloyds Bank Plc FRN 12 February 2024 4,504,500 0.15% 2,500,000 GBP Lloyds Bank Plc 7.625% 22 April 2025 4,361,930 0.14% 5,000,000 GBP Lloyds Bank Plc FRN 09 July 2025 7,363,428 0.24% 8,239,000 EUR Mondi Finance Plc 5.750% 03 April 2017 8,778,343 0.29% 6,905,000 EUR Mondi Finance Plc 3.375% 28 September 2020 7,605,167 0.25% 7,415,000 EUR Motability Operations Group Plc 3.250% 30 November 2018 8,052,456 0.26% 4,980,000 EUR Motability Operations Group Plc 1.625% 09 June 2023 5,117,946 0.17% 9,915,000 EUR Nationwide Building Society 3.125% 03 April 2017 10,279,950 0.33% 8,032,000 EUR Nationwide Building Society 6.750% 22 July 2020 9,878,103 0.32% 4,853,000 EUR NGG Finance Plc FRN 18 June 2076 5,086,551 0.17% 6,360,000 EUR Rentokil Initial Plc 3.250% 07 October 2021 6,934,562 0.23% 4,450,000 EUR Royal Bank of Scotland Group Plc 1.500% 28 November 2016 4,497,593 0.15% 7,070,000 EUR Royal Bank of Scotland Group Plc 1.625% 25 June 2019 7,204,368 0.23%
10,290,000 EUR Royal Bank of Scotland Group Plc FRN 25 March 2024 10,596,591 0.34% 3,730,000 USD Royal Bank of Scotland Group Plc FRN (perpetual bond*) 3,575,433 0.12% 3,925,000 EUR Royal Bank of Scotland Plc 6.934% 09 April 2018 4,403,968 0.14% 5,487,000 GBP Royal Bank of Scotland Plc 6.625% 17 September 2018 8,345,778 0.27%
14,076,000 EUR Royal Bank of Scotland Plc 5.375% 30 September 2019 16,528,041 0.54% 2,000,000 EUR Royal Bank of Scotland Plc 5.500% 23 March 2020 2,394,769 0.08% 6,412,000 EUR Royal Bank of Scotland Plc FRN 22 September 2021 6,552,743 0.21% 5,774,000 EUR Sky Plc 1.875% 24 November 2023 5,799,204 0.19% 6,930,000 EUR SSE Plc 1.750% 08 September 2023 7,011,289 0.23% 6,975,000 EUR SSE Plc FRN (perpetual bond*) 7,402,816 0.24% 5,200,000 EUR SSE Plc FRN (perpetual bond*) 4,933,058 0.16% 1,450,000 EUR Tesco Corporate Treasury Services Plc 1.375% 01 July 2019 1,394,298 0.05%
11,200,000 EUR Tesco Plc 3.375% 02 November 2018 11,583,824 0.38% 6,000,000 EUR Vodafone Group Plc 0.875% 17 November 2020 5,989,320 0.19% 3,000,000 EUR Vodafone Group Plc 4.650% 20 January 2022 3,586,312 0.12%
620,000 EUR Vodafone Group Plc 5.375% 06 June 2022 775,873 0.03% 2,650,000 EUR Wellcome Trust Ltd 1.125% 21 January 2027 2,525,410 0.08%
11,403,000 EUR Yorkshire Building Society 2.125% 18 March 2019 11,856,341 0.39% Total for United Kingdom 541,711,287 17.64%
United States 3,200,000 EUR American International Group Inc FRN 15 March 2067 3,227,920 0.11% 4,700,000 USD AT&T Inc 2.450% 30 June 2020 4,250,736 0.14% 8,410,000 EUR AT&T Inc 2.650% 17 December 2021 9,044,653 0.29%
10,890,000 EUR AT&T Inc 1.450% 01 June 2022 10,891,579 0.35% 4,690,000 EUR AT&T Inc 3.550% 17 December 2032 4,987,560 0.16% 6,100,000 EUR AT&T Inc 2.450% 15 March 2035 5,391,515 0.18% 5,450,000 EUR Bank of America Corp 4.750% 03 April 2017 5,757,198 0.19% 2,150,000 EUR Bank of America Corp 4.625% 07 August 2017 2,297,467 0.08% 7,250,000 EUR Bank of America Corp FRN 28 March 2018 7,192,616 0.23% 3,559,000 EUR Bank of America Corp 4.625% 14 September 2018 3,909,830 0.13% 9,940,000 EUR Bank of America Corp 2.500% 27 July 2020 10,596,935 0.35% 8,830,000 EUR Bank of America Corp 1.375% 10 September 2021 8,884,349 0.29%
11,510,000 EUR Bank of America Corp 1.625% 14 September 2022 11,550,458 0.38% 2,741,000 EUR Citigroup Inc FRN 31 May 2017 2,733,503 0.09% 3,610,000 EUR Citigroup Inc FRN 30 November 2017 3,615,595 0.12% 9,015,000 EUR Citigroup Inc FRN 10 February 2019 9,007,427 0.29% 2,704,000 EUR Citigroup Inc 7.375% 04 September 2019 3,359,201 0.11% 8,370,000 EUR Citigroup Inc 1.375% 27 October 2021 8,409,172 0.27% 3,610,000 EUR Citigroup Inc 1.750% 28 January 2025 3,558,975 0.12%
11,500,000 EUR DIRECTV Holdings LLC / DIRECTV Financing Co Inc 2.750% 19 May 2023 12,236,000 0.40% 4,680,000 EUR Eli Lilly & Co 1.625% 02 June 2026 4,664,673 0.15% 2,600,000 USD Energy Transfer Partners LP 2.500% 15 June 2018 2,287,859 0.07% 4,022,000 EUR GE Capital Trust II FRN 15 September 2067 4,231,468 0.14%

Standard Life Investments Global SICAV Société d'Investissement à Capital Variable
195
European Corporate Bond Fund Schedule of Investments (expressed in EUR) (continued) as at 31 December 2015
Quantity/ Market Value % of
Nominal Value Currency Name of Securities EUR Net Assets
Transferable securities and money market instruments admitted to an official exchange listing (continued)
United States (continued) 6,457,000 EUR GE Capital Trust IV FRN 15 September 2066 6,546,752 0.21%
16,080,000 EUR General Electric Co 1.250% 26 May 2023 16,105,889 0.52% 2,449,000 USD Halliburton Co 2.700% 15 November 2020 2,222,220 0.07%
17,850,000 EUR JPMorgan Chase & Co 2.625% 23 April 2021 19,316,783 0.63% 13,130,000 EUR JPMorgan Chase & Co 1.375% 16 September 2021 13,323,950 0.43% 5,950,000 EUR JPMorgan Chase & Co 1.500% 26 October 2022 6,009,351 0.20% 6,380,000 EUR JPMorgan Chase & Co 1.500% 27 January 2025 6,286,565 0.20%
12,117,000 USD Kinder Morgan Inc 3.050% 01 December 2019 10,298,682 0.34% 5,110,000 EUR Kinder Morgan Inc 1.500% 16 March 2022 4,189,893 0.14% 8,490,000 EUR Kraft Heinz Foods Co 2.000% 30 June 2023 8,589,800 0.28% 6,880,000 EUR Merck & Co Inc 1.875% 15 October 2026 7,052,241 0.23% 2,000,000 EUR Metropolitan Life Global Funding I 4.625% 16 May 2017 2,122,216 0.07%
12,944,000 EUR Metropolitan Life Global Funding I 2.375% 30 September 2019 13,838,221 0.45% 7,450,000 EUR Metropolitan Life Global Funding I 0.875% 20 January 2022 7,333,780 0.24%
10,340,000 EUR Metropolitan Life Global Funding I 2.375% 11 January 2023 11,115,875 0.36% 4,910,000 EUR Microsoft Corp 3.125% 06 December 2028 5,662,016 0.18% 2,130,000 EUR Moody's Corp 1.750% 09 March 2027 2,043,372 0.07% 8,114,000 EUR Morgan Stanley 5.500% 02 October 2017 8,846,395 0.29% 2,450,000 EUR Morgan Stanley 5.375% 10 August 2020 2,929,879 0.10% 4,000,000 EUR Morgan Stanley 2.375% 31 March 2021 4,237,820 0.14%
11,500,000 EUR Morgan Stanley 1.750% 30 January 2025 11,318,172 0.37% 4,100,000 EUR MPT Operating Partnership LP / MPT Finance Corp 4.000% 19 August 2022 4,183,466 0.14% 4,070,000 EUR Philip Morris International Inc 2.125% 30 May 2019 4,304,434 0.14% 3,410,000 EUR Philip Morris International Inc 1.875% 03 March 2021 3,582,989 0.12%
10,210,000 EUR Philip Morris International Inc 2.875% 03 March 2026 11,244,988 0.37% 7,760,000 EUR Praxair Inc 1.625% 01 December 2025 7,769,312 0.25% 1,920,000 EUR Procter & Gamble Co 4.875% 11 May 2027 2,554,120 0.08% 6,450,000 EUR Prologis LP 3.000% 18 January 2022 6,830,679 0.22% 2,940,000 EUR Prologis LP 3.375% 20 February 2024 3,174,730 0.10% 5,500,000 EUR Prologis LP 3.000% 02 June 2026 5,655,100 0.18% 9,873,000 EUR RELX Capital Inc 1.300% 12 May 2025 9,437,650 0.31% 2,790,000 EUR Thermo Fisher Scientific Inc 1.500% 01 December 2020 2,818,570 0.09%
10,450,000 EUR Toyota Motor Credit Corp 1.000% 09 March 2021 10,551,678 0.34% 4,046,000 EUR Verizon Communications Inc 2.375% 17 February 2022 4,319,160 0.14% 3,660,000 EUR Verizon Communications Inc 3.250% 17 February 2026 4,097,301 0.13% 5,350,000 EUR Verizon Communications Inc 2.625% 01 December 2031 5,353,112 0.17% 4,300,000 EUR Wachovia Corp 4.375% 27 November 2018 4,755,733 0.16% 8,000,000 EUR Wells Fargo & Co 2.250% 03 September 2020 8,534,696 0.28% 6,480,000 EUR Wells Fargo & Co 1.125% 29 October 2021 6,512,474 0.21% 2,385,000 EUR Wells Fargo & Co 2.625% 16 August 2022 2,594,422 0.08% 8,010,000 EUR Wells Fargo & Co 1.500% 12 September 2022 8,105,079 0.26% 5,335,000 EUR Wells Fargo & Co 2.250% 02 May 2023 5,653,998 0.18% 3,440,000 EUR Wells Fargo & Co 2.125% 04 June 2024 3,593,820 0.12%
10,900,000 EUR Wells Fargo & Co 2.000% 27 April 2026 11,050,038 0.36% 7,600,000 EUR ZF North America Capital Inc 2.250% 26 April 2019 7,599,088 0.25%
Total for United States 455,753,198 14.84%
Total transferable securities and money market instruments admitted to an official exchange listing 2,980,220,305 97.02%
Transferable securities and money market instruments dealt in on another regulated market
India 4,200,000 USD ICICI Bank Ltd 4.700% 21 February 2018 4,017,497 0.13%
Total for India 4,017,497 0.13%
Italy 5,500,000 USD Intesa Sanpaolo SpA 6.500% 24 February 2021 5,727,470 0.19%

Standard Life Investments Global SICAV Société d'Investissement à Capital Variable
196
European Corporate Bond Fund Schedule of Investments (expressed in EUR) (continued) as at 31 December 2015
Quantity/ Market Value % of
Nominal Value Currency Name of Securities EUR Net Assets
Transferable securities and money market instruments dealt in on another regulated market (continued)
Italy (continued) 3,400,000 USD Intesa Sanpaolo SpA FRN (perpetual bond*) 3,186,453 0.10%
Total for Italy 8,913,923 0.29%
Total transferable securities and money market instruments dealt in on another regulated market 12,931,420 0.42%
Total investments 2,993,151,725 97.44% Cash and cash equivalents 35,314,830 1.15% Bank overdraft and other net assets 43,214,360 1.41% Total net assets 3,071,680,915 100.00%
*A perpetual bond is a bond with no maturity date. Perpetual bonds are not redeemable but pay a steady stream of interest.
Analysis of Investments as % of total assets Transferable securities and money market instruments admitted to an official exchange listing 96.66%Transferable securities and money market instruments dealt in on another regulated market 0.42%Other assets 2.92%Total assets 100.00% The accompanying notes form an integral part of these financial statements.
Standard Life Investments Global SICAV Société d'Investissement à Capital Variable
197
Euro Government All Stocks Fund Sub-fund Objective The objective of the Sub-fund is to achieve long-term growth in the share price.
Investment Policy The current policy is to invest primarily in sovereign debt securities denominated in Euro. Returns from the Sub-fund will be both through the reinvestment of income and from capital gains.
Performance Review The Sub-fund returned -1.2% over the period, compared to the Merrill Lynch EMU Direct Government AA-AAA Index return of 0.3%.*
Inflation-linked positions in the US proved detrimental in the first quarter as the oil price continued to fall. Overweight positions in core Europe versus the US and Japan added to returns as the European Central Bank’s (“ECB”) quantitative easing (“QE”) announcement was particularly positive for our positioning here. Bond yields rose in most major markets in the second quarter. The main negative contributor to performance was being long of European duration in April and early-May (our decision to close this position mid-May proved correct). Positioning on the US yield curve, as a quasi-duration strategy, benefited returns and was particularly successful in early June.
While July was a strong month for performance, August and September were more difficult, as our short duration positions detracted from returns in the face of more dovish statements from central bank policymakers. Overweight positions in peripheral European government bonds contributed positively. The improving political environment, with agreement from the Greeks and their European creditors, helped peripheral spreads perform. Elections in Catalonia and in Portugal passed without serious market disruption. In the final quarter, peripheral European government bond positions in Italy proved beneficial as the market began to move towards our view that inflation in Europe will be hard to generate. This requirement to generate inflation should lead to further tranches of QE from the ECB.
*Sub-fund performance has been calculated over the stated period on the share price performance basis, based on the A Accumulation Shares and net of fees. Please note the index return is quoted gross and contains no adjustment for fees.
Outlook Commodity weakness continues to offer greater longevity to zero interest rate policy. However, the fourth quarter highlights the extent of policy divergence. The US Federal Reserve’s rate hike is a leap of faith on longer-term inflation, yet to be fully reflected in bonds.
Whether there is enough uncertainty left in the global economy to support the current thin margin for error in government bond valuations (at low term premiums) remains to be seen. All core bond markets remain expensive on a number of historical relationships. The US rate hike is a crucial first step that has the capacity to question valuations.
Please note that the commitment approach has been used for risk measurement and calculation of global exposure for this Sub-fund.
This Sub-fund is not authorised in Hong Kong and is not available to Hong Kong residents.

Standard Life Investments Global SICAV Société d'Investissement à Capital Variable
198
Euro Government All Stocks Fund Schedule of Investments (expressed in EUR) as at 31 December 2015
Quantity/ Market Value % of
Nominal Value Currency Name of Securities EUR Net Assets
Transferable securities and money market instruments admitted to an official exchange listing
Austria 31,049,000 EUR Austria Government Bond 3.200% 20 February 2017 32,369,528 0.89% 55,445,000 EUR Austria Government Bond 4.650% 15 January 2018 61,021,705 1.67% 15,248,000 EUR Austria Government Bond 3.650% 20 April 2022 18,538,137 0.51% 31,118,000 EUR Austria Government Bond 4.850% 15 March 2026 43,053,320 1.18% 23,287,000 EUR Austria Government Bond 4.150% 15 March 2037 33,828,584 0.92%
Total for Austria 188,811,274 5.17%
Belgium 59,880,000 EUR Belgium Government Bond 3.250% 28 September 2016 61,499,155 1.68% 66,969,000 EUR Belgium Government Bond 1.250% 22 June 2018 69,537,261 1.90% 35,882,000 EUR Belgium Government Bond 3.000% 28 September 2019 40,150,164 1.10% 15,155,000 EUR Belgium Government Bond 4.250% 28 September 2022 19,106,288 0.52% 49,222,000 EUR Belgium Government Bond 2.600% 22 June 2024 56,862,485 1.56% 18,647,000 EUR Belgium Government Bond 5.500% 28 March 2028 27,563,528 0.76% 43,187,000 EUR Belgium Government Bond 5.000% 28 March 2035 66,149,817 1.81% 19,373,000 EUR Belgium Government Bond 4.250% 28 March 2041 28,432,331 0.78%
Total for Belgium 369,301,029 10.11%
Denmark 35,690,000 DKK Denmark Government Bond 4.000% 15 November 2019 5,530,064 0.15%
Total for Denmark 5,530,064 0.15%
Finland 6,640,000 EUR Finland Government Bond 1.750% 15 April 2016 6,680,404 0.18% 4,355,000 EUR Finland Government Bond 3.875% 15 September 2017 4,667,499 0.13% 9,890,000 EUR Finland Government Bond 4.375% 04 July 2019 11,463,111 0.31% 9,382,000 EUR Finland Government Bond 2.750% 04 July 2028 11,151,773 0.31% 3,577,000 EUR Finland Government Bond 2.625% 04 July 2042 4,408,769 0.12%
Total for Finland 38,371,556 1.05%
France 104,422,000 EUR France Government Bond OAT 4.250% 25 October 2017 113,396,000 3.10% 136,765,000 EUR France Government Bond OAT 0.000% 25 February 2018 137,558,237 3.77% 104,543,000 EUR France Government Bond OAT 4.250% 25 October 2018 118,120,522 3.23% 29,603,000 EUR France Government Bond OAT 4.250% 25 April 2019 34,004,965 0.93% 18,633,000 EUR France Government Bond OAT 3.750% 25 October 2019 21,410,249 0.59% 25,955,000 EUR France Government Bond OAT 0.500% 25 November 2019 26,513,032 0.73%
181,745,000 EUR France Government Bond OAT 0.000% 25 May 2020 181,149,785 4.96% 143,936,000 EUR France Government Bond OAT 3.750% 25 April 2021 171,612,619 4.70% 29,053,000 EUR France Government Bond OAT 3.250% 25 October 2021 34,159,791 0.93% 44,824,000 EUR France Government Bond OAT 1.750% 25 May 2023 48,807,690 1.34% 56,856,000 EUR France Government Bond OAT 1.750% 25 November 2024 61,594,948 1.69% 79,000,000 EUR France Government Bond OAT 1.000% 25 November 2025 79,197,500 2.17% 54,293,000 EUR France Government Bond OAT 3.500% 25 April 2026 67,647,721 1.85% 53,944,000 EUR France Government Bond OAT 5.500% 25 April 2029 81,234,944 2.22% 12,825,000 EUR France Government Bond OAT 5.750% 25 October 2032 20,720,936 0.57% 5,688,000 EUR France Government Bond OAT 4.750% 25 April 2035 8,523,098 0.23%
59,444,000 EUR France Government Bond OAT 4.000% 25 October 2038 83,268,418 2.28% 22,697,000 EUR France Government Bond OAT 4.500% 25 April 2041 34,510,825 0.94% 13,055,000 EUR France Government Bond OAT 3.250% 25 May 2045 16,616,134 0.45% 16,707,590 EUR France Government Bond OAT 4.000% 25 April 2055 25,023,794 0.68% 9,551,000 EUR France Government Bond OAT 4.000% 25 April 2060 14,491,931 0.40% 5,175,000 EUR French Treasury Note BTAN 1.750% 25 February 2017 5,305,071 0.15%
Total for France 1,384,868,210 37.91%
Germany 75,405,000 EUR Bundesobligation 0.500% 13 October 2017 76,542,262 2.10% 24,914,000 EUR Bundesrepublik Deutschland 4.000% 04 July 2016 25,458,620 0.70%
344,872,000 EUR Bundesrepublik Deutschland 4.250% 04 July 2018 384,458,995 10.52% 54,734,500 EUR Bundesrepublik Deutschland 3.500% 04 July 2019 61,900,614 1.70%
103,069,000 EUR Bundesrepublik Deutschland 3.000% 04 July 2020 117,692,770 3.22%

Standard Life Investments Global SICAV Société d'Investissement à Capital Variable
199
Euro Government All Stocks Fund Schedule of Investments (expressed in EUR) (continued) as at 31 December 2015
Quantity/ Market Value % of
Nominal Value Currency Name of Securities EUR Net Assets
Transferable securities and money market instruments admitted to an official exchange listing (continued)
Germany (continued) 17,076,000 EUR Bundesrepublik Deutschland 2.000% 04 January 2022 19,054,539 0.52%
214,616,813 EUR Bundesrepublik Deutschland 1.750% 04 July 2022 236,855,311 6.48% 6,542,000 EUR Bundesrepublik Deutschland 6.250% 04 January 2024 9,581,004 0.26%
38,368,000 EUR Bundesrepublik Deutschland 4.750% 04 July 2028 55,959,248 1.53% 4,889,000 EUR Bundesrepublik Deutschland 5.500% 04 January 2031 7,887,362 0.22%
17,358,000 EUR Bundesrepublik Deutschland 4.750% 04 July 2034 27,418,047 0.75% 15,757,000 EUR Bundesrepublik Deutschland 4.000% 04 January 2037 23,377,675 0.64% 2,957,000 EUR Bundesrepublik Deutschland 4.250% 04 July 2039 4,651,472 0.13%
52,178,000 EUR Bundesrepublik Deutschland 2.500% 15 August 2046 65,131,841 1.78% 192,000,000 SEK KFW 3.500% 22 January 2021 23,423,954 0.64%
Total for Germany 1,139,393,714 31.19%
Netherlands 22,178,000 EUR Netherlands Government Bond 4.000% 15 July 2016 22,692,530 0.62% 50,030,000 EUR Netherlands Government Bond 4.000% 15 July 2018 55,460,226 1.52% 14,254,000 EUR Netherlands Government Bond 4.000% 15 July 2019 16,415,975 0.45% 50,455,000 EUR Netherlands Government Bond 3.500% 15 July 2020 58,685,472 1.61% 51,749,000 EUR Netherlands Government Bond 3.250% 15 July 2021 60,828,362 1.66% 47,313,000 EUR Netherlands Government Bond 3.750% 15 January 2023 58,643,281 1.60% 11,511,000 EUR Netherlands Government Bond 1.750% 15 July 2023 12,633,610 0.35% 13,311,370 EUR Netherlands Government Bond 5.500% 15 January 2028 20,104,180 0.55% 21,569,000 EUR Netherlands Government Bond 4.000% 15 January 2037 31,703,734 0.87% 19,284,000 EUR Netherlands Government Bond 2.750% 15 January 2047 24,804,431 0.68%
Total for Netherlands 361,971,801 9.91%
United States 20,484,000 USD United States Treasury Note/Bond 1.500% 30 June 2016 18,903,259 0.52%
Total for United States 18,903,259 0.52%
Total transferable securities and money market instruments admitted to an official exchange listing 3,507,150,907 96.01%
Total investments 3,507,150,907 96.01% Cash and cash equivalents 104,083,764 2.85% Bank overdraft and other net assets 41,790,056 1.14% Total net assets 3,653,024,727 100.00%
Analysis of Investments as % of total assets Transferable securities and money market instruments admitted to an official exchange listing 95.81%Other assets 4.19%Total assets 100.00% The accompanying notes form an integral part of these financial statements.

Standard Life Investments Global SICAV Société d'Investissement à Capital Variable
200
Emerging Market Debt Fund Sub-fund Objective The objective of the Sub-fund is to provide a return from capital appreciation and income.
Investment Policy The Sub-fund will invest generally in bond securities issued by Emerging Market countries and companies listed on an emerging market stock exchange or which carry out a substantial part of the operations in Emerging Market countries. The Sub-fund may also invest in other transferable securities, money-market instruments, deposits, cash and near cash, derivatives (including currency forwards, interest rate and credit default swaps) and collective investment schemes.
Performance Review The Sub-fund returned -1.3%, compared to the JP Morgan EMBI Global Diversified index return of 1.2%.*
Initially, having a zero weight in Ukraine was a positive contributor, as the market began to price in a more severe debt restructuring scenario in the region. Avoidance of Turkey also added to returns. Not holding Ecuador and Colombia boosted performance as these Latin American oil exporters struggled amid oil price volatility. An overweight in Mexico detracted from returns in March, due to our ultra-long end position underperforming when the market weakened. Our overweight exposure to oil-exporting Venezuela and Kazakhstan contributed to returns as spreads re-priced tighter to reflect higher global oil prices. However, this was offset by exposure to Hungary, when its bonds were caught up in the wider sell-off in European fixed income during the second quarter.
Oil credits Kazakhstan and Ecuador were the largest positive contributors in August. The Kazakh authorities followed the Chinese example by moving toward a more flexible exchange rate. This is credit positive because the central bank will refrain from selling FX reserves to support an unsustainably strong exchange rate. Ecuador is among the weakest of the oil credits having failed to build up buffers during times of high oil prices. Weakness in oil markets during the month triggered underperformance in its bonds, which was positive for our zero weight position. In September, avoidance of Russia and Ukraine was negative for performance. Russian sovereign credit was supported by a strong and ongoing bid from local investors, despite the wider global market weakness.
During the final quarter of 2015, our position in Egypt’s sovereign bonds was negative for returns. A number of countries halted flights to Sharm el Sheikh following a series of terrorist attacks. This puts at risk important FX revenues earned through the tourism sector. Yet, a zero weight in Turkey added significantly to performance when spreads sold off following the downing of a Russian jet. This has jeopardised Turkey’s economic relations with Russia. A zero weight in Chile also positively influenced performance as the price of copper, the country’s key export, continued to fall.
*Sub-fund performance has been calculated over the stated period on the share price performance basis, based on the D Accumulation Shares and net of fees. Please note the index return is quoted gross and contains no adjustment for fees.
Outlook In line with 2015, we expect global macro risks to play a key role in determining the direction of emerging markets asset markets in the year ahead. In the US, a shallow Federal Reserve hiking cycle is our base case given the wider challenges in the global economy, such as the still fragile recovery in Europe, slowdown in China and outright recession in some of the major EMs, including Brazil and Russia.
Meanwhile, commodity prices are likely to remain depressed in the short term, weighing on activity in Latin America and Africa, and in the Middle East where geopolitical tensions are also rising. The fall in the oil price during 2015 will continue to have an impact in 2016 as fiscal reform will be required again in many countries reliant on revenues from the sector. Across the major EM countries, policy credibility will also be a key theme in 2016.
Overall, given attractive asset class valuations and likely net issuance in 2016 of close to zero, we expect low-to-mid single digit returns from the asset class in the year ahead but with significant performance divergence at the country level.
Please note that the commitment approach has been used for risk measurement and calculation of global exposure for this Sub-fund.
This Sub-fund is not authorized in Hong Kong and is not available to Hong Kong residents.

Standard Life Investments Global SICAV Société d'Investissement à Capital Variable
201
Emerging Market Debt Fund Schedule of Investments (expressed in USD) as at 31 December 2015
Quantity/ Market Value % of
Nominal Value Currency Name of Securities USD Net Assets
Transferable securities and money market instruments admitted to an official exchange listing
Azerbaijan 1,190,000 USD Republic of Azerbaijan International Bond 4.750% 18 March 2024 1,115,982 2.08%
Total for Azerbaijan 1,115,982 2.08%
Brazil 1,300,000 USD Brazilian Government International Bond 4.250% 07 January 2025 1,048,125 1.96%
800,000 USD Brazilian Government International Bond 5.000% 27 January 2045 534,000 1.00% Total for Brazil 1,582,125 2.96%
Cameroon 575,000 USD Republic of Cameroon International Bond 9.500% 19 November 2025 536,188 1.00%
Total for Cameroon 536,188 1.00%
Colombia 1,900,000 USD Colombia Government International Bond 6.125% 18 January 2041 1,843,000 3.44%
Total for Colombia 1,843,000 3.44%
Croatia 790,000 USD Croatia Government International Bond 6.000% 26 January 2024 823,607 1.54%
Total for Croatia 823,607 1.54%
Dominican Republic 1,300,000 USD Dominican Republic International Bond 5.875% 18 April 2024 1,300,000 2.43% 1,230,000 USD Dominican Republic International Bond 7.450% 30 April 2044 1,245,375 2.33%
Total for Dominican Republic 2,545,375 4.76%
Egypt 1,090,000 USD Egypt Government International Bond 6.875% 30 April 2040 887,816 1.66%
Total for Egypt 887,816 1.66%
El Salvador 1,600,000 USD El Salvador Government International Bond 6.375% 18 January 2027 1,360,000 2.54%
Total for El Salvador 1,360,000 2.54%
Ghana 1,600,000 USD Ghana Government International Bond 8.125% 18 January 2026 1,256,000 2.35%
Total for Ghana 1,256,000 2.35%
Honduras 1,050,000 USD Honduras Government International Bond 7.500% 15 March 2024 1,111,688 2.08%
Total for Honduras 1,111,688 2.08%
Hungary 1,000,000 USD Hungary Government International Bond 4.125% 19 February 2018 1,043,193 1.95% 1,300,000 USD Hungary Government International Bond 5.750% 22 November 2023 1,457,989 2.73% 1,360,000 USD Hungary Government International Bond 5.375% 25 March 2024 1,494,436 2.79%
595,000 USD Magyar Export-Import Bank Zrt 4.000% 30 January 2020 600,725 1.12% Total for Hungary 4,596,343 8.59%
Indonesia 600,000 USD Indonesia Government International Bond 4.750% 08 January 2026 594,412 1.11% 580,000 USD Indonesia Government International Bond 5.250% 17 January 2042 526,595 0.98%
1,250,000 USD Indonesia Government International Bond 4.625% 15 April 2043 1,077,812 2.02% Total for Indonesia 2,198,819 4.11%
Iraq 2,150,000 USD Iraq International Bond 5.800% 15 January 2028 1,456,646 2.72%
Total for Iraq 1,456,646 2.72%
Ivory Coast 390,000 USD Ivory Coast Government International Bond 6.375% 03 March 2028 357,326 0.67%
1,770,000 USD Ivory Coast Government International Bond 5.750% 31 December 2032 1,582,734 2.96% Total for Ivory Coast 1,940,060 3.63%

Standard Life Investments Global SICAV Société d'Investissement à Capital Variable
202
Emerging Market Debt Fund Schedule of Investments (expressed in USD) (continued) as at 31 December 2015
Quantity/ Market Value % of
Nominal Value Currency Name of Securities USD Net Assets
Transferable securities and money market instruments admitted to an official exchange listing (continued)
Jamaica 1,200,000 USD Jamaica Government International Bond 6.750% 28 April 2028 1,192,500 2.23%
470,000 USD Jamaica Government International Bond 7.875% 28 July 2045 455,900 0.85% Total for Jamaica 1,648,400 3.08%
Jordan 1,360,000 USD Jordan Government International Bond 6.125% 29 January 2026 1,390,600 2.60%
Total for Jordan 1,390,600 2.60%
Kazakhstan 1,400,000 USD Kazakhstan Government International Bond 5.125% 21 July 2025 1,385,657 2.59% 1,950,000 USD Kazakhstan Government International Bond 4.875% 14 October 2044 1,634,529 3.05%
Total for Kazakhstan 3,020,186 5.64%
Kenya 1,596,000 USD Kenya Government International Bond 6.875% 24 June 2024 1,403,267 2.62%
Total for Kenya 1,403,267 2.62%
Lebanon 1,100,000 USD Lebanon Government International Bond 6.100% 04 October 2022 1,081,850 2.02% 1,100,000 USD Lebanon Government International Bond 6.000% 27 January 2023 1,071,026 2.00%
550,000 USD Lebanon Government International Bond 6.650% 26 February 2030 536,222 1.01% Total for Lebanon 2,689,098 5.03%
Mexico 25,500,000 MXN Mexican Bonos 6.500% 10 June 2021 1,531,298 2.86% 1,650,000 USD Mexico Government International Bond 3.600% 30 January 2025 1,612,050 3.01%
850,000 USD Mexico Government International Bond 5.750% 12 October 2110 796,875 1.49% Total for Mexico 3,940,223 7.36%
Morocco 1,125,000 USD Morocco Government International Bond 5.500% 11 December 2042 1,087,504 2.03%
Total for Morocco 1,087,504 2.03%
Namibia 325,000 USD Namibia International Bonds 5.250% 29 October 2025 303,443 0.57%
Total for Namibia 303,443 0.57%
Paraguay 1,321,000 USD Republic of Paraguay 4.625% 25 January 2023 1,287,975 2.41%
Total for Paraguay 1,287,975 2.41%
Serbia 1,500,000 USD Serbia International Bond 7.250% 28 September 2021 1,701,864 3.18%
Total for Serbia 1,701,864 3.18%
Sri Lanka 1,030,000 USD Sri Lanka Government International Bond 6.000% 14 January 2019 1,013,065 1.89%
610,000 USD Sri Lanka Government International Bond 6.250% 04 October 2020 592,664 1.11% 780,000 USD Sri Lanka Government International Bond 5.875% 25 July 2022 715,112 1.34%
Total for Sri Lanka 2,320,841 4.34%
Supernational 19,750,000 INR International Finance Corp 7.750% 03 December 2016 300,994 0.56%
Total for Supernational 300,994 0.56%
Uruguay 980,000 USD Uruguay Government International Bond 4.125% 20 November 2045 761,950 1.42%
Total for Uruguay 761,950 1.42%
Venezuela 1,500,000 USD Petroleos de Venezuela SA 5.500% 12 April 2037 548,250 1.03%

Standard Life Investments Global SICAV Société d'Investissement à Capital Variable
203
Emerging Market Debt Fund Schedule of Investments (expressed in USD) (continued) as at 31 December 2015
Quantity/ Market Value % of
Nominal Value Currency Name of Securities USD Net Assets
Transferable securities and money market instruments admitted to an official exchange listing (continued)
Venezuela (continued) 1,100,000 USD Venezuela Government International Bond 9.250% 15 September 2027 462,000 0.86%
Total for Venezuela 1,010,250 1.89%
Total transferable securities and money market instruments admitted to an official exchange listing 46,120,244 86.19%
Transferable securities and money market instruments dealt in on another regulated market
Paraguay 700,000 USD Republic of Paraguay 6.100% 11 August 2044 675,500 1.26%
Total for Paraguay 675,500 1.26%
Tanzania 1,060,000 USD Tanzania Government International Bond FRN 09 March 2020 1,004,244 1.88%
Total for Tanzania 1,004,244 1.88%
Total transferable securities and money market instruments dealt in on another regulated market 1,679,744 3.14%
Total investments 47,799,988 89.33% Cash and cash equivalents 5,357,806 10.01% Other net assets 348,939 0.66% Total net assets 53,506,733 100.00%
Analysis of Investments as % of total assets Transferable securities and money market instruments admitted to an official exchange listing 85.32%Transferable securities and money market instruments dealt in on another regulated market 3.11%Other assets 11.57%Total assets 100.00% The accompanying notes form an integral part of these financial statements.
Standard Life Investments Global SICAV Société d'Investissement à Capital Variable
204
Emerging Market Local Currency Debt Fund Sub-fund Objective The objective of the Sub-fund is to provide a return from capital appreciation, emerging market foreign currency appreciation and income.
Investment Policy The Sub-fund will invest in emerging market foreign currency and bond securities issued by Emerging Market countries and companies listed on an emerging market stock exchange or which carry out a substantial part of the operations in Emerging Market countries, denominated in local currency. The Sub-fund may also invest in other transferable securities, money-market instruments, deposits, cash and near cash, derivatives (including currency forwards, interest rate and credit default swaps) and collective investment schemes.
Performance Review The Sub-fund returned -15.2% over the period compared to the JP Morgan GBI-EM Global Diversified Composite index return of -14.9%.*
A long duration position in Brazil performed well early in the year, as global interest rate markets were strong and the country’s new economic team announced a suite of bondholder friendly policies. Our overweight in Thailand was a strong performer in March as the baht was stable and the bond market strong. The Russian market rallied strongly (20%) in April which impacted performance adversely as we had a zero weighting. However, we maintained our view that investing in Russia is poor value given the fiscal dynamics and geopolitical risk. An underweight in Turkish debt cost performance in May when both the lira and domestic bond market gave strong returns as investors closed underweight positions. An overweight in 5-year Mexican government bonds added to returns in June as this area of the Mexican yield curve outperformed.
An underweight position in the Columbian peso added to returns in both July and August. In Brazil, the deteriorating economic and political situation cost performance as the fiscal risks were priced into the local bond curve. The underweight position in Turkey, where we have concerns about leverage in the banking sector and the political outlook, was a negative contributor in October. The market rallied ahead of the election, as political uncertainty was priced out. Our overweight position in Indonesia added to returns after President Jokowi’s statement of intent to join the Trans-Pacific Partnership led to large scale covering of short positions in the market. Being underweight in South Africa was the largest contributor to performance in November and December as bond yields rose and the rand weakened. Holdings in Mexico were negative contributors towards the end of period as yields drifted higher on the Federal Reserve’s rate hike and the currency fell against the dollar.
*Sub-fund performance has been calculated over the stated period on the share price performance basis, based on the A Accumulation Shares and net of fees. Please note the index return is quoted gross and contains no adjustment for fees.
Outlook The headwinds to strong performance from emerging market (the “EM”) local bonds in the coming year appear as strong as they have been for some time. Growth in EMs is expected to remain muted, with Chinese growth likely to continue to detract from comparisons with past years. Very low commodity prices will keep global trade growth weak in US dollar terms, even if volumes are holding up well. To add to this, several EM central banks will be hiking rates in 2016: most countries in Latin America, along with South Africa, and probably Turkey in the EMEA. In the higher quality parts of Europe, rates are probably going to stay on hold at low levels. Only in Asia do we expect easing.
Against this backdrop, bond yields largely reflect the likely increases, especially in Latin America where curves are exceptionally weak. Currencies are in many cases at all-time lows (in real terms) and using more recent measures of performance, have depreciated aggressively in each of the prior three calendar years. The returns environment over the medium-term should be a big improvement on the recent past. Please note that the commitment approach has been used for risk measurement and calculation of global exposure for this Sub-fund.
This Sub-fund is not authorised in Hong Kong and is not available to Hong Kong residents.

Standard Life Investments Global SICAV Société d'Investissement à Capital Variable
205
Emerging Market Local Currency Debt Fund Schedule of Investments (expressed in USD) as at 31 December 2015
Quantity/ Market Value % of
Nominal Value Currency Name of Securities USD Net Assets
Transferable securities and money market instruments admitted to an official exchange listing
Brazil 22,125,000 BRL Brazil Notas do Tesouro Nacional Serie F 10.000% 01 January 2023 4,201,847 4.88%
Total for Brazil 4,201,847 4.88%
Colombia 4,900,000,000 COP Colombia Government International Bond 10.000% 24 July 2024 1,688,562 1.96%
12,192,300,000 COP Colombian TES 10.000% 24 July 2024 4,243,370 4.93% 5,000,000,000 COP Colombian TES 7.750% 18 September 2030 1,405,171 1.63%
Total for Colombia 7,337,103 8.52%
Croatia 1,250,000 USD Croatia Government International Bond 6.000% 26 January 2024 1,303,175 1.51% 1,350,000 EUR Croatia Government International Bond 3.000% 11 March 2025 1,340,597 1.56%
Total for Croatia 2,643,772 3.07%
Ghana 1,100,000 USD Ghana Government International Bond 8.125% 18 January 2026 863,500 1.00%
Total for Ghana 863,500 1.00%
Hungary 422,000,000 HUF Hungary Government Bond 6.750% 24 February 2017 1,547,055 1.80% 680,500,000 HUF Hungary Government Bond 7.500% 12 November 2020 2,859,634 3.32% 385,000,000 HUF Hungary Government Bond 3.000% 26 June 2024 1,292,875 1.50%
Total for Hungary 5,699,564 6.62%
Indonesia 79,600,000,000 IDR Indonesia Treasury Bond 7.875% 15 April 2019 5,626,106 6.54% 24,000,000,000 IDR Indonesia Treasury Bond 8.375% 15 September 2026 1,700,805 1.98% 40,720,000,000 IDR Indonesia Treasury Bond 9.000% 15 March 2029 2,956,239 3.43% 19,700,000,000 IDR Indonesia Treasury Bond 6.625% 15 May 2033 1,125,250 1.31%
Total for Indonesia 11,408,400 13.26%
Jamaica 770,000 USD Jamaica Government International Bond 7.875% 28 July 2045 746,900 0.87%
Total for Jamaica 746,900 0.87%
Mexico 157,167,000 MXN Mexican Bonos 8.000% 11 June 2020 9,997,280 11.61% 20,600,000 MXN Mexican Bonos 6.500% 10 June 2021 1,237,049 1.44% 27,000,000 MXN Mexican Bonos 7.750% 13 November 2042 1,702,458 1.98%
Total for Mexico 12,936,787 15.03%
Namibia 640,000 USD Namibia International Bonds 5.250% 29 October 2025 597,549 0.70%
Total for Namibia 597,549 0.70%
Philippines 74,000,000 PHP Philippine Government International Bond 4.950% 15 January 2021 1,601,723 1.86% 37,000,000 PHP Philippine Government International Bond 3.900% 26 November 2022 758,106 0.88%
Total for Philippines 2,359,829 2.74%
Poland 6,885,000 PLN Poland Government Bond 4.750% 25 October 2016 1,802,321 2.09% 9,275,000 PLN Poland Government Bond 4.750% 25 April 2017 2,462,604 2.86% 6,000,000 PLN Poland Government Bond 5.250% 25 October 2020 1,737,045 2.02% 8,500,000 PLN Poland Government Bond 4.000% 25 October 2023 2,349,619 2.73%
Total for Poland 8,351,589 9.70%
Romania 8,000,000 RON Romania Government Bond 4.750% 24 February 2025 2,079,235 2.42%
Total for Romania 2,079,235 2.42%
South Africa 22,319,000 ZAR South Africa Government Bond 8.000% 21 December 2018 1,402,940 1.63%

Standard Life Investments Global SICAV Société d'Investissement à Capital Variable
206
Emerging Market Local Currency Debt Fund Schedule of Investments (expressed in USD) (continued) as at 31 December 2015
Quantity/ Market Value % of
Nominal Value Currency Name of Securities USD Net Assets
Transferable securities and money market instruments admitted to an official exchange listing (continued)
South Africa (continued) 12,120,000 ZAR South Africa Government Bond 6.750% 31 March 2021 698,985 0.81% 9,670,000 ZAR South Africa Government Bond 10.500% 21 December 2026 657,899 0.77% 8,000,000 ZAR South Africa Government Bond 8.750% 28 February 2048 441,013 0.51%
Total for South Africa 3,200,837 3.72%
Thailand 50,500,000 THB Thailand Government Bond 3.450% 08 March 2019 1,478,341 1.72% 28,000,000 THB Thailand Government Bond 3.875% 13 June 2019 833,051 0.97% 19,838,000 THB Thailand Government Bond 3.625% 16 June 2023 597,021 0.69%
100,000,000 THB Thailand Government Bond 1.250% 12 March 2028 2,497,130 2.90% Total for Thailand 5,405,543 6.28%
Turkey 6,750,000 TRY Turkey Government Bond 8.200% 13 July 2016 2,286,489 2.65% 4,525,000 TRY Turkey Government Bond 3.000% 02 August 2023 1,934,416 2.25%
Total for Turkey 4,220,905 4.90%
Total transferable securities and money market instruments admitted to an official exchange listing 72,053,360 83.71%
Transferable securities and money market instruments dealt in on another regulated market
Dominican Republic 77,000,000 DOP Dominican Republic International Bond 15.950% 04 June 2021 2,082,847 2.42%
Total for Dominican Republic 2,082,847 2.42%
Malaysia 17,150,000 MYR Malaysia Government Bond 3.314% 31 October 2017 4,039,096 4.70% 13,736,000 MYR Malaysia Government Bond 3.795% 30 September 2022 3,159,690 3.67% 5,900,000 MYR Malaysia Government Bond 4.181% 15 July 2024 1,370,203 1.59%
Total for Malaysia 8,568,989 9.96%
Total transferable securities and money market instruments dealt in on another regulated market 10,651,836 12.38%
Total investments 82,705,196 96.09% Cash and cash equivalents 1,823,577 2.12% Other net assets 1,544,881 1.79% Total net assets 86,073,654 100.00%
Analysis of Investments as % of total assets Transferable securities and money market instruments admitted to an official exchange listing 83.60%Transferable securities and money market instruments dealt in on another regulated market 12.36%Other assets 4.04%Total assets 100.00% The accompanying notes form an integral part of these financial statements.
Standard Life Investments Global SICAV Société d'Investissement à Capital Variable
207
Global High Yield Bond Fund Sub-fund Objective The objective of the Sub-fund is to achieve long-term growth in the share price of the Sub-fund.
Investment Policy The Sub-fund will invest primarily in global high yielding debt securities, but also may invest in corporate bonds, government bonds and other interest bearing securities issued anywhere in the world. The Sub-fund may invest in both investment grade and sub-investment grade corporate entities. Returns of the Sub-fund will be both through the reinvestment of income and from capital gains.
Performance Review The Global High Yield Bond Fund returned -2.1% over the period, compared with the Barclays Capital Global HY Corp Index ex-Fin with 2% Issuer Cap return of -5.6%.*
Initially, the oil price collapse and volatility in the wider commodity complex meant that energy-related issuers dominated performance. However, our holding in First Quantum Minerals was a leading performer as commodity prices began to stabilise, while an equity offering aimed at reducing its debt was positive for bondholders. However, our overweight exposure to Frontier Communications detracted from performance as elevated supply and volatility in the telecoms sector had a negative impact. Meanwhile, our overweight holdings in Halcon Resources and Cloud Peak Energy suffered as, despite some stabilisation, low commodity prices continued to be detrimental for the energy and oil & gas sectors.
As the period progressed, our overweight position in Altice generated good performance in July, while not owning Sandridge Energy benefited returns, as this low-quality energy issuer traded down alongside the price of oil. However, our positions in Penn Virginia detracted from returns, as the diversified energy firm also struggled along with other high yield energy issuers. Furthermore, our holdings in XPO Logistics performed poorly. In September, it made an acquisition that was widely perceived as strategy altering. Its bonds faced additional headwinds as concerns about global growth resulted in general weakness of the overall sector (transportation services). After re-evaluating the credit, post-acquisition, we believe that valuations remain attractive; our views are supported by the overall quality of the business and we expected deleveraging over the next 12-18 months.
As we entered the final quarter, high yield bonds picked up as global growth concerns receded. Our overweight position in Sprint/Softbank contributed to performance as telecom bonds rallied in October. However, NRG bonds underperformed as natural gas prices slid on prospects of warmer weather. We have a significant overweight in the position, which magnified the underperformance versus the benchmark. However, our underweight exposure to Intelsat contributed to returns. Amid a weak technical backdrop, investors appear concerned about the sustainability of Intelsat’s current capital structure with the company leveraged close to eight times on a net basis (through the Luxembourg portion of its capital structure). While third-quarter results did not provide any negative surprises, expectations are for the company’s revenues and EBITDA to face continued downward pressure in the mid-single-digit range in 2016.
*Sub-fund performance has been calculated over the stated period on the share price performance basis, based on the D Accumulation Shares and net of fees. Please note the index return is quoted gross and contains no adjustment for fees.
Outlook
While default risk should remain contained for the time being, cracks in the fundamental picture have become more apparent. Companies are struggling with lower commodity prices, weaker global demand and elevated levels of inventory. While fundamentals outside the energy and retail sector may not deteriorate significantly from here, a new environment of increased volatility and greater dispersion between individual issuers is likely to persist over the coming months.
Please note that the commitment approach has been used for risk measurement and calculation of global exposure for this Sub-fund.
This Sub-fund is not authorised in Hong Kong and is not available to Hong Kong residents.

Standard Life Investments Global SICAV Société d'Investissement à Capital Variable
208
Global High Yield Bond Fund Schedule of Investments (expressed in USD) as at 31 December 2015
Quantity/ Market Value % of
Nominal Value Currency Name of Securities USD Net Assets
Transferable securities and money market instruments admitted to an official exchange listing
Australia 1,440,000 EUR BHP Billiton Finance Ltd FRN 22 April 2076 1,542,151 0.19%
880,000 GBP BHP Billiton Finance Ltd FRN 22 October 2077 1,275,969 0.16% Total for Australia 2,818,120 0.35%
Belgium 3,225,000 EUR KBC Groep NV FRN (perpetual bond*) 3,524,780 0.44%
Total for Belgium 3,524,780 0.44%
Bermuda 3,958,000 USD Fly Leasing Ltd 6.375% 15 October 2021 3,953,052 0.49%
Total for Bermuda 3,953,052 0.49%
Canada 220,000 GBP Entertainment One Ltd 6.875% 15 December 2022 325,203 0.04%
4,000,000 USD Novelis Inc 8.750% 15 December 2020 3,720,000 0.47% 2,950,000 EUR Valeant Pharmaceuticals International Inc 4.500% 15 May 2023 2,804,547 0.35%
Total for Canada 6,849,750 0.86%
France 3,550,000 EUR Credit Logement SA FRN (perpetual bond*) 3,138,781 0.39% 1,125,000 EUR Crown European Holdings SA 3.375% 15 May 2025 1,146,239 0.14%
150,000 EUR Dexia Credit Local SA FRN 10 July 2017 153,838 0.02% 930,000 EUR Numericable-SFR SAS 5.375% 15 May 2022 1,037,795 0.13% 615,000 EUR Numericable-SFR SAS 5.625% 15 May 2024 680,538 0.09%
2,395,000 EUR SGD Group SAS 5.625% 15 May 2019 2,673,383 0.34% 2,460,000 EUR Societe Generale SA FRN (perpetual bond*) 2,750,626 0.34% 2,460,000 EUR SPCM SA 2.875% 15 June 2023 2,573,328 0.32%
Total for France 14,154,528 1.77%
Germany 2,600,000 EUR Aareal Bank AG FRN (perpetual bond*) 2,852,300 0.36%
840,000 EUR HT1 Funding GmbH FRN (perpetual bond*) 926,085 0.12% 545,000 EUR ProGroup AG 5.125% 01 May 2022 626,074 0.08%
1,725,000 EUR Unitymedia GmbH 3.750% 15 January 2027 1,632,453 0.20%
315,000 EUR Unitymedia Hessen GmbH & Co KG / Unitymedia NRW GmbH 5.750% 15 January 2023 364,176 0.04%
3,340,000 EUR Unitymedia Hessen GmbH & Co KG / Unitymedia NRW GmbH 4.000% 15 January 2025 3,509,761 0.44%
265,000 EUR Unitymedia Hessen GmbH & Co KG / Unitymedia NRW GmbH 3.500% 15 January 2027 266,569 0.03%
Total for Germany 10,177,418 1.27%
Ireland
2,165,000 USD AerCap Ireland Capital Ltd / AerCap Global Aviation Trust 4.250% 01 July 2020 2,192,062 0.27%
2,060,000 USD AerCap Ireland Capital Ltd / AerCap Global Aviation Trust 4.625% 30 October 2020 2,114,075 0.27%
6,240,000 USD AerCap Ireland Capital Ltd / AerCap Global Aviation Trust 5.000% 01 October 2021 6,497,400 0.81%
1,175,000 EUR Ardagh Packaging Finance Plc / Ardagh Holdings USA Inc 4.250% 15 January 2022 1,292,219 0.16%
735,000 EUR Smurfit Kappa Acquisitions 4.125% 30 January 2020 866,639 0.11% 600,000 EUR Smurfit Kappa Acquisitions 3.250% 01 June 2021 683,990 0.09%
1,135,000 EUR Smurfit Kappa Acquisitions 2.750% 01 February 2025 1,191,496 0.15% Total for Ireland 14,837,881 1.86%
Italy 980,000 EUR Rhino Bondco S.P.A 7.250% 15 November 2020 1,137,224 0.14%
Total for Italy 1,137,224 0.14%
Japan 660,000 EUR SoftBank Group Corp 4.000% 30 July 2022 730,233 0.09%
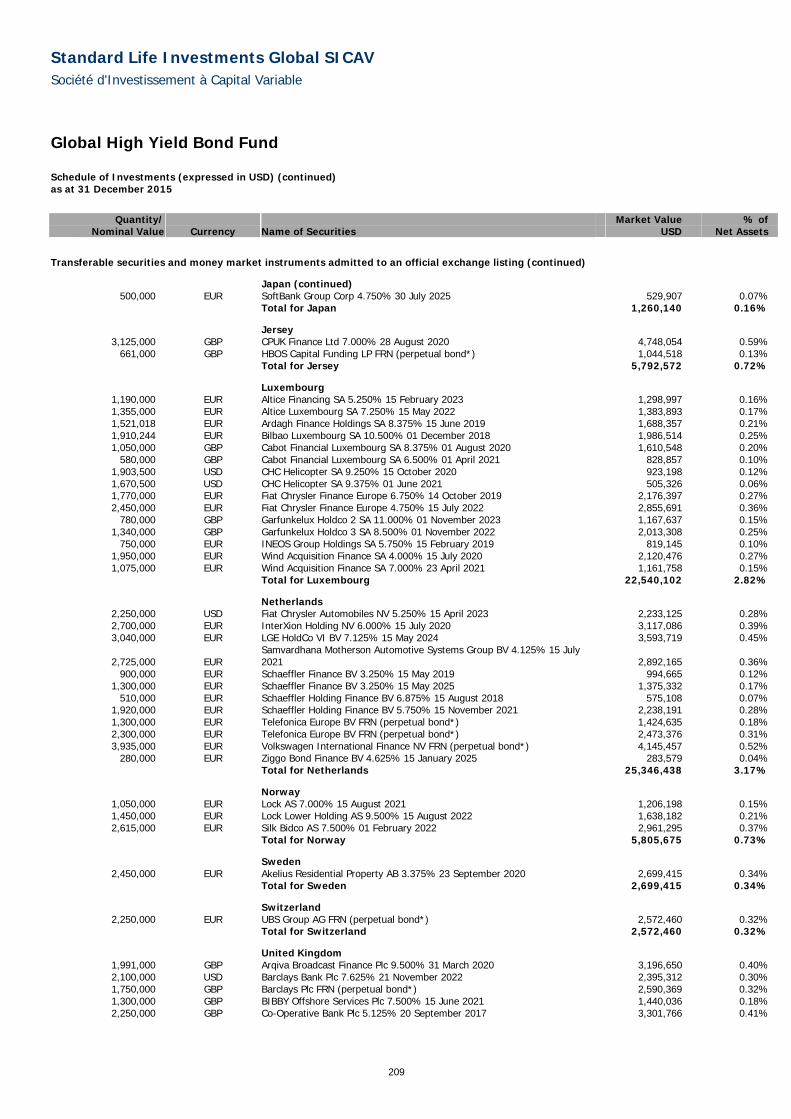
Standard Life Investments Global SICAV Société d'Investissement à Capital Variable
209
Global High Yield Bond Fund Schedule of Investments (expressed in USD) (continued) as at 31 December 2015
Quantity/ Market Value % of
Nominal Value Currency Name of Securities USD Net Assets
Transferable securities and money market instruments admitted to an official exchange listing (continued)
Japan (continued) 500,000 EUR SoftBank Group Corp 4.750% 30 July 2025 529,907 0.07%
Total for Japan 1,260,140 0.16%
Jersey 3,125,000 GBP CPUK Finance Ltd 7.000% 28 August 2020 4,748,054 0.59%
661,000 GBP HBOS Capital Funding LP FRN (perpetual bond*) 1,044,518 0.13% Total for Jersey 5,792,572 0.72%
Luxembourg 1,190,000 EUR Altice Financing SA 5.250% 15 February 2023 1,298,997 0.16% 1,355,000 EUR Altice Luxembourg SA 7.250% 15 May 2022 1,383,893 0.17% 1,521,018 EUR Ardagh Finance Holdings SA 8.375% 15 June 2019 1,688,357 0.21% 1,910,244 EUR Bilbao Luxembourg SA 10.500% 01 December 2018 1,986,514 0.25% 1,050,000 GBP Cabot Financial Luxembourg SA 8.375% 01 August 2020 1,610,548 0.20%
580,000 GBP Cabot Financial Luxembourg SA 6.500% 01 April 2021 828,857 0.10% 1,903,500 USD CHC Helicopter SA 9.250% 15 October 2020 923,198 0.12% 1,670,500 USD CHC Helicopter SA 9.375% 01 June 2021 505,326 0.06% 1,770,000 EUR Fiat Chrysler Finance Europe 6.750% 14 October 2019 2,176,397 0.27% 2,450,000 EUR Fiat Chrysler Finance Europe 4.750% 15 July 2022 2,855,691 0.36%
780,000 GBP Garfunkelux Holdco 2 SA 11.000% 01 November 2023 1,167,637 0.15% 1,340,000 GBP Garfunkelux Holdco 3 SA 8.500% 01 November 2022 2,013,308 0.25%
750,000 EUR INEOS Group Holdings SA 5.750% 15 February 2019 819,145 0.10% 1,950,000 EUR Wind Acquisition Finance SA 4.000% 15 July 2020 2,120,476 0.27% 1,075,000 EUR Wind Acquisition Finance SA 7.000% 23 April 2021 1,161,758 0.15%
Total for Luxembourg 22,540,102 2.82%
Netherlands 2,250,000 USD Fiat Chrysler Automobiles NV 5.250% 15 April 2023 2,233,125 0.28% 2,700,000 EUR InterXion Holding NV 6.000% 15 July 2020 3,117,086 0.39% 3,040,000 EUR LGE HoldCo VI BV 7.125% 15 May 2024 3,593,719 0.45%
2,725,000 EUR Samvardhana Motherson Automotive Systems Group BV 4.125% 15 July 2021 2,892,165 0.36%
900,000 EUR Schaeffler Finance BV 3.250% 15 May 2019 994,665 0.12% 1,300,000 EUR Schaeffler Finance BV 3.250% 15 May 2025 1,375,332 0.17%
510,000 EUR Schaeffler Holding Finance BV 6.875% 15 August 2018 575,108 0.07% 1,920,000 EUR Schaeffler Holding Finance BV 5.750% 15 November 2021 2,238,191 0.28% 1,300,000 EUR Telefonica Europe BV FRN (perpetual bond*) 1,424,635 0.18% 2,300,000 EUR Telefonica Europe BV FRN (perpetual bond*) 2,473,376 0.31% 3,935,000 EUR Volkswagen International Finance NV FRN (perpetual bond*) 4,145,457 0.52%
280,000 EUR Ziggo Bond Finance BV 4.625% 15 January 2025 283,579 0.04% Total for Netherlands 25,346,438 3.17%
Norway 1,050,000 EUR Lock AS 7.000% 15 August 2021 1,206,198 0.15% 1,450,000 EUR Lock Lower Holding AS 9.500% 15 August 2022 1,638,182 0.21% 2,615,000 EUR Silk Bidco AS 7.500% 01 February 2022 2,961,295 0.37%
Total for Norway 5,805,675 0.73%
Sweden 2,450,000 EUR Akelius Residential Property AB 3.375% 23 September 2020 2,699,415 0.34%
Total for Sweden 2,699,415 0.34%
Switzerland 2,250,000 EUR UBS Group AG FRN (perpetual bond*) 2,572,460 0.32%
Total for Switzerland 2,572,460 0.32%
United Kingdom 1,991,000 GBP Arqiva Broadcast Finance Plc 9.500% 31 March 2020 3,196,650 0.40% 2,100,000 USD Barclays Bank Plc 7.625% 21 November 2022 2,395,312 0.30% 1,750,000 GBP Barclays Plc FRN (perpetual bond*) 2,590,369 0.32% 1,300,000 GBP BIBBY Offshore Services Plc 7.500% 15 June 2021 1,440,036 0.18% 2,250,000 GBP Co-Operative Bank Plc 5.125% 20 September 2017 3,301,766 0.41%

Standard Life Investments Global SICAV Société d'Investissement à Capital Variable
210
Global High Yield Bond Fund Schedule of Investments (expressed in USD) (continued) as at 31 December 2015
Quantity/ Market Value % of
Nominal Value Currency Name of Securities USD Net Assets
Transferable securities and money market instruments admitted to an official exchange listing (continued)
United Kingdom (continued) 580,000 EUR International Game Technology Plc 4.125% 15 February 2020 634,261 0.08% 675,000 GBP Jaguar Land Rover Automotive Plc 5.000% 15 February 2022 1,031,881 0.13%
1,200,000 GBP Jaguar Land Rover Automotive Plc 3.875% 01 March 2023 1,674,749 0.21% 300,000 EUR LBG Capital No.2 Plc 15.000% 21 December 2019 467,484 0.06%
1,625,000 GBP Lloyds Banking Group Plc FRN (perpetual bond*) 2,455,238 0.31% 1,500,000 EUR R&R Ice Cream Plc 4.750% 15 May 2020 1,686,455 0.21%
875,000 GBP R&R Ice Cream Plc 5.500% 15 May 2020 1,338,428 0.17% 3,152,000 USD Royal Bank of Scotland Group Plc FRN (perpetual bond*) 3,289,900 0.41%
831,000 GBP Santander UK Group Holdings Plc FRN (perpetual bond*) 1,255,620 0.16% 1,740,000 GBP Thomas Cook Group Plc 7.750% 22 June 2017 2,709,623 0.34% 2,300,000 EUR Virgin Media Finance Plc 4.500% 15 January 2025 2,377,407 0.30%
750,000 GBP Virgin Media Secured Finance Plc 5.500% 15 January 2021 1,185,957 0.15% 615,000 GBP Virgin Media Secured Finance Plc 6.250% 28 March 2029 917,976 0.11%
Total for United Kingdom 33,949,112 4.25%
United States 4,484,000 USD ADT Corp 6.250% 15 October 2021 4,730,620 0.59% 3,081,000 USD Affinia Group Inc 7.750% 01 May 2021 3,151,247 0.39% 3,000,000 USD AK Steel Corp 7.625% 01 October 2021 1,230,000 0.15% 2,450,000 USD Alcoa Inc 5.125% 01 October 2024 2,241,750 0.28% 4,224,000 USD Alcoa Inc 5.900% 01 February 2027 3,896,640 0.49% 4,480,000 USD Allegiant Travel Co 5.500% 15 July 2019 4,558,400 0.57% 5,530,000 USD Amsurg Corp 5.625% 15 July 2022 5,467,787 0.68% 1,145,000 USD Approach Resources Inc 7.000% 15 June 2021 412,200 0.05% 2,150,000 USD Asbury Automotive Group Inc 6.000% 15 December 2024 2,236,000 0.28% 4,948,000 USD Ashland Inc 4.750% 15 August 2022 4,830,485 0.60%
6,255,000 USD Avis Budget Car Rental LLC / Avis Budget Finance Inc 5.500% 01 April 2023 6,294,094 0.79%
310,000 EUR Ball Corp 3.500% 15 December 2020 347,748 0.04% 2,450,000 USD Ball Corp 4.375% 15 December 2020 2,523,500 0.32%
275,000 EUR Ball Corp 4.375% 15 December 2023 308,486 0.04% 6,240,000 USD Casella Waste Systems Inc 7.750% 15 February 2019 6,224,400 0.78% 3,231,000 USD CCO Holdings LLC / CCO Holdings Capital Corp 5.750% 15 January 2024 3,336,007 0.42% 5,600,000 USD CenturyLink Inc 5.625% 01 April 2020 5,558,000 0.69% 3,600,000 USD CenturyLink Inc 7.600% 15 September 2039 2,772,000 0.35% 2,799,000 USD Chaparral Energy Inc 8.250% 01 September 2021 685,755 0.09% 3,605,000 USD CHS/Community Health Systems Inc 5.125% 01 August 2021 3,621,222 0.45% 7,988,000 USD Citigroup Inc FRN (perpetual bond*) 8,157,745 1.02% 2,920,000 USD Clear Channel Worldwide Holdings Inc 7.625% 15 March 2020 2,708,300 0.34%
2,867,000 USD Cloud Peak Energy Resources LLC / Cloud Peak Energy Finance Corp 6.375% 15 March 2024 860,100 0.11%
3,163,000 USD DISH DBS Corp 6.750% 01 June 2021 3,202,537 0.40% 765,000 USD DR Horton Inc 4.000% 15 February 2020 773,185 0.10%
4,088,000 USD DR Horton Inc 4.375% 15 September 2022 4,082,890 0.51% 5,242,000 USD Energy Transfer Equity LP 5.500% 01 June 2027 4,010,130 0.50%
4,540,000 USD EP Energy LLC / Everest Acquisition Finance Inc 7.750% 01 September 2022 2,338,100 0.29%
3,907,000 USD Equinix Inc 5.875% 15 January 2026 4,033,977 0.50% 4,650,000 USD Frontier Communications Corp 6.875% 15 January 2025 3,847,875 0.48% 2,600,000 USD Frontier Communications Corp 9.000% 15 August 2031 2,210,000 0.28% 7,300,000 USD GenOn Energy Inc 9.500% 15 October 2018 5,933,659 0.74% 3,970,000 USD Goodyear Tire & Rubber Co 5.125% 15 November 2023 4,059,325 0.51% 3,699,000 USD Graphic Packaging International Inc 4.875% 15 November 2022 3,754,485 0.47% 3,839,000 USD HCA Inc 5.250% 15 April 2025 3,886,988 0.49% 6,484,000 USD HCA Inc 7.500% 15 November 2095 6,289,480 0.79% 1,800,000 USD HealthSouth Corp 5.750% 01 November 2024 1,725,750 0.22% 5,525,000 USD Kinder Morgan Inc 5.550% 01 June 2045 4,305,912 0.54% 5,100,000 USD Kindred Healthcare Inc 8.750% 15 January 2023 4,704,750 0.59% 4,688,000 USD Kinetic Concepts Inc / KCI USA Inc 10.500% 01 November 2018 4,570,800 0.57%
1,677,000 USD McGraw-Hill Global Education Holdings LLC / McGraw-Hill Global Education Finance 9.750% 01 April 2021 1,786,005 0.22%

Standard Life Investments Global SICAV Société d'Investissement à Capital Variable
211
Global High Yield Bond Fund Schedule of Investments (expressed in USD) (continued) as at 31 December 2015
Quantity/ Market Value % of
Nominal Value Currency Name of Securities USD Net Assets
Transferable securities and money market instruments admitted to an official exchange listing (continued)
United States (continued) 2,891,000 USD Men's Wearhouse Inc 7.000% 01 July 2022 2,081,520 0.26% 3,100,000 USD Mercer International Inc 7.750% 01 December 2022 3,146,500 0.39% 1,634,000 USD MGM Resorts International 7.750% 15 March 2022 1,742,253 0.22% 4,470,000 USD MGM Resorts International 6.000% 15 March 2023 4,447,650 0.56% 8,486,000 USD Morgan Stanley FRN (perpetual bond*) 8,473,695 1.06% 2,130,000 USD MPG Holdco I Inc 7.375% 15 October 2022 2,156,625 0.27% 2,335,000 EUR MPT Operating Partnership LP / MPT Finance Corp 4.000% 19 August 2022 2,594,275 0.32%
3,444,000 USD NPC International Inc / NPC Quality Burgers Inc / NPC Operating Co B Inc 10.500% 15 January 2020 3,581,760 0.45%
2,800,000 USD NRG Energy Inc 8.250% 01 September 2020 2,714,656 0.34% 5,200,000 USD NRG Energy Inc 7.875% 15 May 2021 4,900,480 0.61% 4,275,000 USD Oasis Petroleum Inc 6.875% 15 March 2022 2,757,375 0.34% 1,918,000 USD PulteGroup Inc 7.875% 15 June 2032 2,181,725 0.27% 2,651,000 USD PulteGroup Inc 6.000% 15 February 2035 2,611,235 0.33% 2,403,000 USD Quad/Graphics Inc 7.000% 01 May 2022 1,519,898 0.19% 1,500,000 EUR Rain CII Carbon LLC / CII Carbon Corp 8.500% 15 January 2021 1,215,834 0.15% 6,927,000 USD Sabine Pass Liquefaction LLC 5.625% 01 February 2021 6,355,523 0.79% 5,725,000 USD Service Corp International 5.375% 15 May 2024 5,925,375 0.74% 3,818,000 USD Sinclair Television Group Inc 6.125% 01 October 2022 3,903,905 0.49% 7,908,000 USD Sprint Capital Corp 6.875% 15 November 2028 5,535,600 0.69% 4,678,000 USD Sprint Communications Inc 6.000% 15 November 2022 3,309,685 0.41% 5,420,000 USD Sprint Corp 7.250% 15 September 2021 4,104,024 0.51% 5,010,000 USD Sprint Corp 7.625% 15 February 2025 3,659,805 0.46% 4,139,000 USD Tenet Healthcare Corp 4.500% 01 April 2021 4,056,220 0.51% 3,880,000 USD Tenet Healthcare Corp 6.750% 15 June 2023 3,567,175 0.45% 8,193,000 USD T-Mobile USA Inc 6.125% 15 January 2022 8,438,790 1.05% 1,027,000 USD T-Mobile USA Inc 6.836% 28 April 2023 1,065,513 0.13%
640,000 USD T-Mobile USA Inc 6.500% 15 January 2026 646,400 0.08% 3,810,785 USD UAL 2007-1 Pass Through Trust 6.636% 02 July 2022 4,063,249 0.51% 2,365,060 USD United Airlines 2013-1 Class B Pass Through Trust 5.375% 15 August 2021 2,444,880 0.31% 5,906,000 USD United Rentals North America Inc 7.625% 15 April 2022 6,304,655 0.79% 5,190,000 USD Vector Group Ltd 7.750% 15 February 2021 5,494,913 0.69% 4,376,000 USD Williams Cos Inc 4.550% 24 June 2024 2,980,841 0.37% 7,729,000 USD Windstream Services LLC 6.375% 01 August 2023 5,574,541 0.70% 1,080,000 EUR XPO Logistics Inc 5.750% 15 June 2021 1,097,896 0.14%
500,000 EUR ZF North America Capital Inc 2.250% 26 April 2019 544,371 0.07% 3,000,000 EUR ZF North America Capital Inc 2.750% 27 April 2023 3,117,576 0.39%
Total for United States 269,984,752 33.76%
Total transferable securities and money market instruments admitted to an official exchange listing 427,403,419 53.45%
Transferable securities and money market instruments dealt in on another regulated market
Australia 1,025,000 USD BHP Billiton Finance USA Ltd FRN 19 October 2075 1,005,781 0.12% 1,475,000 USD FMG Resources August 2006 Pty Ltd 9.750% 01 March 2022 1,353,313 0.17%
Total for Australia 2,359,094 0.29%
Austria 2,753,000 USD JBS Investments GmbH 7.750% 28 October 2020 2,663,528 0.33%
925,000 USD JBS Investments GmbH 7.250% 03 April 2024 846,375 0.11% Total for Austria 3,509,903 0.44%
Bermuda 1,410,000 USD Digicel Group Ltd 8.250% 30 September 2020 1,177,350 0.15% 3,741,000 USD Digicel Ltd 6.750% 01 March 2023 3,147,116 0.39% 3,000,000 USD Viking Cruises Ltd 6.250% 15 May 2025 2,475,000 0.31%
Total for Bermuda 6,799,466 0.85%
Canada 4,955,000 USD 1011778 BC ULC / New Red Finance Inc 6.000% 01 April 2022 5,140,813 0.64%
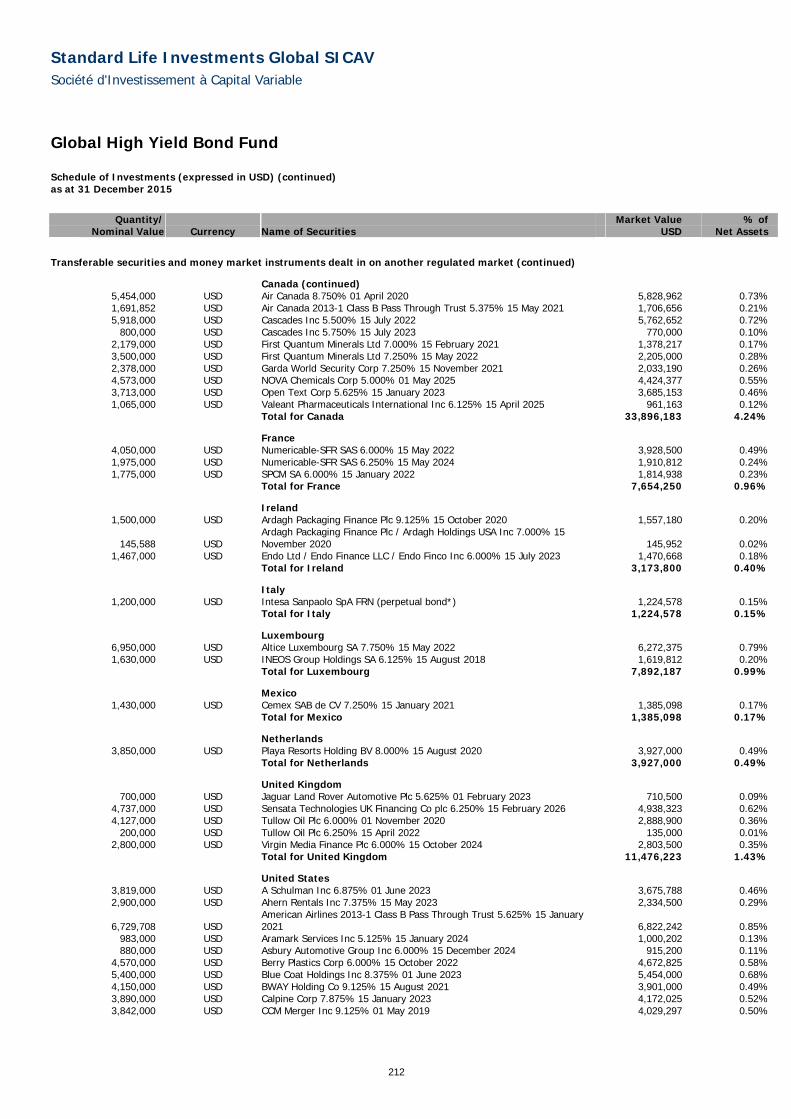
Standard Life Investments Global SICAV Société d'Investissement à Capital Variable
212
Global High Yield Bond Fund Schedule of Investments (expressed in USD) (continued) as at 31 December 2015
Quantity/ Market Value % of
Nominal Value Currency Name of Securities USD Net Assets
Transferable securities and money market instruments dealt in on another regulated market (continued)
Canada (continued) 5,454,000 USD Air Canada 8.750% 01 April 2020 5,828,962 0.73% 1,691,852 USD Air Canada 2013-1 Class B Pass Through Trust 5.375% 15 May 2021 1,706,656 0.21% 5,918,000 USD Cascades Inc 5.500% 15 July 2022 5,762,652 0.72%
800,000 USD Cascades Inc 5.750% 15 July 2023 770,000 0.10% 2,179,000 USD First Quantum Minerals Ltd 7.000% 15 February 2021 1,378,217 0.17% 3,500,000 USD First Quantum Minerals Ltd 7.250% 15 May 2022 2,205,000 0.28% 2,378,000 USD Garda World Security Corp 7.250% 15 November 2021 2,033,190 0.26% 4,573,000 USD NOVA Chemicals Corp 5.000% 01 May 2025 4,424,377 0.55% 3,713,000 USD Open Text Corp 5.625% 15 January 2023 3,685,153 0.46% 1,065,000 USD Valeant Pharmaceuticals International Inc 6.125% 15 April 2025 961,163 0.12%
Total for Canada 33,896,183 4.24%
France 4,050,000 USD Numericable-SFR SAS 6.000% 15 May 2022 3,928,500 0.49% 1,975,000 USD Numericable-SFR SAS 6.250% 15 May 2024 1,910,812 0.24% 1,775,000 USD SPCM SA 6.000% 15 January 2022 1,814,938 0.23%
Total for France 7,654,250 0.96%
Ireland 1,500,000 USD Ardagh Packaging Finance Plc 9.125% 15 October 2020 1,557,180 0.20%
145,588 USD Ardagh Packaging Finance Plc / Ardagh Holdings USA Inc 7.000% 15 November 2020 145,952 0.02%
1,467,000 USD Endo Ltd / Endo Finance LLC / Endo Finco Inc 6.000% 15 July 2023 1,470,668 0.18% Total for Ireland 3,173,800 0.40%
Italy 1,200,000 USD Intesa Sanpaolo SpA FRN (perpetual bond*) 1,224,578 0.15%
Total for Italy 1,224,578 0.15%
Luxembourg 6,950,000 USD Altice Luxembourg SA 7.750% 15 May 2022 6,272,375 0.79% 1,630,000 USD INEOS Group Holdings SA 6.125% 15 August 2018 1,619,812 0.20%
Total for Luxembourg 7,892,187 0.99%
Mexico 1,430,000 USD Cemex SAB de CV 7.250% 15 January 2021 1,385,098 0.17%
Total for Mexico 1,385,098 0.17%
Netherlands 3,850,000 USD Playa Resorts Holding BV 8.000% 15 August 2020 3,927,000 0.49%
Total for Netherlands 3,927,000 0.49%
United Kingdom 700,000 USD Jaguar Land Rover Automotive Plc 5.625% 01 February 2023 710,500 0.09%
4,737,000 USD Sensata Technologies UK Financing Co plc 6.250% 15 February 2026 4,938,323 0.62% 4,127,000 USD Tullow Oil Plc 6.000% 01 November 2020 2,888,900 0.36%
200,000 USD Tullow Oil Plc 6.250% 15 April 2022 135,000 0.01% 2,800,000 USD Virgin Media Finance Plc 6.000% 15 October 2024 2,803,500 0.35%
Total for United Kingdom 11,476,223 1.43%
United States 3,819,000 USD A Schulman Inc 6.875% 01 June 2023 3,675,788 0.46% 2,900,000 USD Ahern Rentals Inc 7.375% 15 May 2023 2,334,500 0.29%
6,729,708 USD American Airlines 2013-1 Class B Pass Through Trust 5.625% 15 January 2021 6,822,242 0.85%
983,000 USD Aramark Services Inc 5.125% 15 January 2024 1,000,202 0.13% 880,000 USD Asbury Automotive Group Inc 6.000% 15 December 2024 915,200 0.11%
4,570,000 USD Berry Plastics Corp 6.000% 15 October 2022 4,672,825 0.58% 5,400,000 USD Blue Coat Holdings Inc 8.375% 01 June 2023 5,454,000 0.68% 4,150,000 USD BWAY Holding Co 9.125% 15 August 2021 3,901,000 0.49% 3,890,000 USD Calpine Corp 7.875% 15 January 2023 4,172,025 0.52% 3,842,000 USD CCM Merger Inc 9.125% 01 May 2019 4,029,297 0.50%
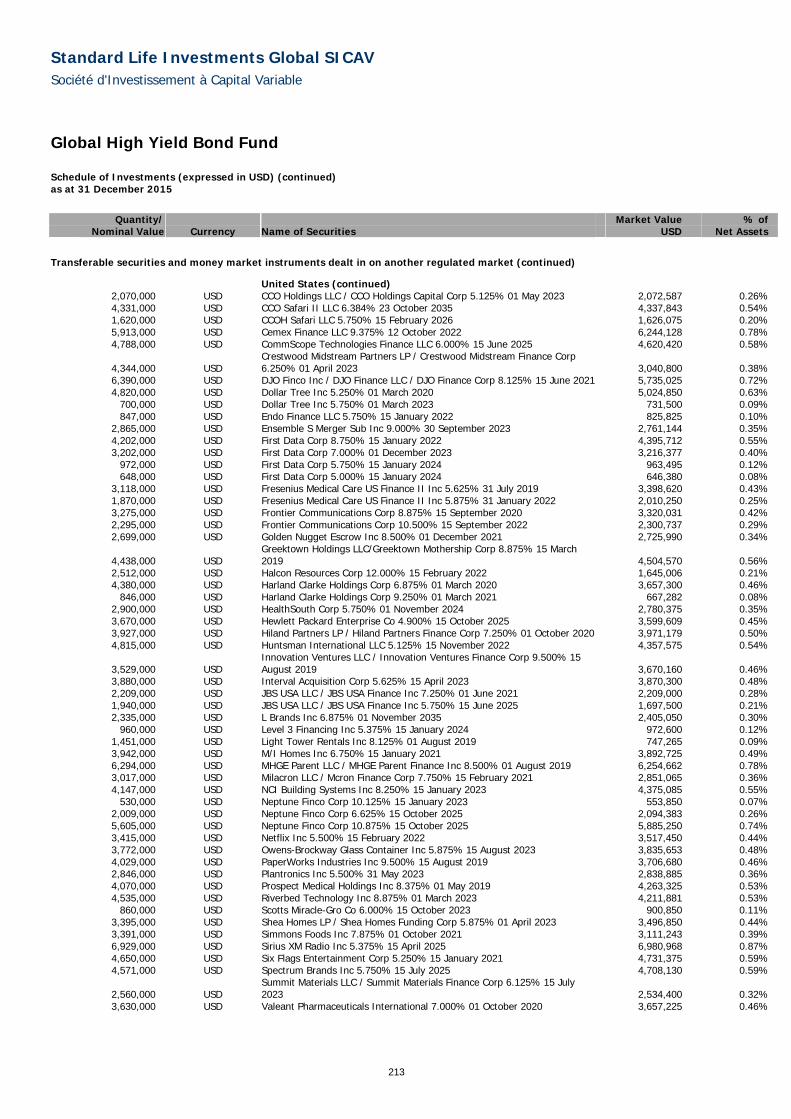
Standard Life Investments Global SICAV Société d'Investissement à Capital Variable
213
Global High Yield Bond Fund Schedule of Investments (expressed in USD) (continued) as at 31 December 2015
Quantity/ Market Value % of
Nominal Value Currency Name of Securities USD Net Assets
Transferable securities and money market instruments dealt in on another regulated market (continued)
United States (continued) 2,070,000 USD CCO Holdings LLC / CCO Holdings Capital Corp 5.125% 01 May 2023 2,072,587 0.26% 4,331,000 USD CCO Safari II LLC 6.384% 23 October 2035 4,337,843 0.54% 1,620,000 USD CCOH Safari LLC 5.750% 15 February 2026 1,626,075 0.20% 5,913,000 USD Cemex Finance LLC 9.375% 12 October 2022 6,244,128 0.78% 4,788,000 USD CommScope Technologies Finance LLC 6.000% 15 June 2025 4,620,420 0.58%
4,344,000 USD Crestwood Midstream Partners LP / Crestwood Midstream Finance Corp 6.250% 01 April 2023 3,040,800 0.38%
6,390,000 USD DJO Finco Inc / DJO Finance LLC / DJO Finance Corp 8.125% 15 June 2021 5,735,025 0.72% 4,820,000 USD Dollar Tree Inc 5.250% 01 March 2020 5,024,850 0.63%
700,000 USD Dollar Tree Inc 5.750% 01 March 2023 731,500 0.09% 847,000 USD Endo Finance LLC 5.750% 15 January 2022 825,825 0.10%
2,865,000 USD Ensemble S Merger Sub Inc 9.000% 30 September 2023 2,761,144 0.35% 4,202,000 USD First Data Corp 8.750% 15 January 2022 4,395,712 0.55% 3,202,000 USD First Data Corp 7.000% 01 December 2023 3,216,377 0.40%
972,000 USD First Data Corp 5.750% 15 January 2024 963,495 0.12% 648,000 USD First Data Corp 5.000% 15 January 2024 646,380 0.08%
3,118,000 USD Fresenius Medical Care US Finance II Inc 5.625% 31 July 2019 3,398,620 0.43% 1,870,000 USD Fresenius Medical Care US Finance II Inc 5.875% 31 January 2022 2,010,250 0.25% 3,275,000 USD Frontier Communications Corp 8.875% 15 September 2020 3,320,031 0.42% 2,295,000 USD Frontier Communications Corp 10.500% 15 September 2022 2,300,737 0.29% 2,699,000 USD Golden Nugget Escrow Inc 8.500% 01 December 2021 2,725,990 0.34%
4,438,000 USD Greektown Holdings LLC/Greektown Mothership Corp 8.875% 15 March 2019 4,504,570 0.56%
2,512,000 USD Halcon Resources Corp 12.000% 15 February 2022 1,645,006 0.21% 4,380,000 USD Harland Clarke Holdings Corp 6.875% 01 March 2020 3,657,300 0.46%
846,000 USD Harland Clarke Holdings Corp 9.250% 01 March 2021 667,282 0.08% 2,900,000 USD HealthSouth Corp 5.750% 01 November 2024 2,780,375 0.35% 3,670,000 USD Hewlett Packard Enterprise Co 4.900% 15 October 2025 3,599,609 0.45% 3,927,000 USD Hiland Partners LP / Hiland Partners Finance Corp 7.250% 01 October 2020 3,971,179 0.50% 4,815,000 USD Huntsman International LLC 5.125% 15 November 2022 4,357,575 0.54%
3,529,000 USD Innovation Ventures LLC / Innovation Ventures Finance Corp 9.500% 15 August 2019 3,670,160 0.46%
3,880,000 USD Interval Acquisition Corp 5.625% 15 April 2023 3,870,300 0.48% 2,209,000 USD JBS USA LLC / JBS USA Finance Inc 7.250% 01 June 2021 2,209,000 0.28% 1,940,000 USD JBS USA LLC / JBS USA Finance Inc 5.750% 15 June 2025 1,697,500 0.21% 2,335,000 USD L Brands Inc 6.875% 01 November 2035 2,405,050 0.30%
960,000 USD Level 3 Financing Inc 5.375% 15 January 2024 972,600 0.12% 1,451,000 USD Light Tower Rentals Inc 8.125% 01 August 2019 747,265 0.09% 3,942,000 USD M/I Homes Inc 6.750% 15 January 2021 3,892,725 0.49% 6,294,000 USD MHGE Parent LLC / MHGE Parent Finance Inc 8.500% 01 August 2019 6,254,662 0.78% 3,017,000 USD Milacron LLC / Mcron Finance Corp 7.750% 15 February 2021 2,851,065 0.36% 4,147,000 USD NCI Building Systems Inc 8.250% 15 January 2023 4,375,085 0.55%
530,000 USD Neptune Finco Corp 10.125% 15 January 2023 553,850 0.07% 2,009,000 USD Neptune Finco Corp 6.625% 15 October 2025 2,094,383 0.26% 5,605,000 USD Neptune Finco Corp 10.875% 15 October 2025 5,885,250 0.74% 3,415,000 USD Netflix Inc 5.500% 15 February 2022 3,517,450 0.44% 3,772,000 USD Owens-Brockway Glass Container Inc 5.875% 15 August 2023 3,835,653 0.48% 4,029,000 USD PaperWorks Industries Inc 9.500% 15 August 2019 3,706,680 0.46% 2,846,000 USD Plantronics Inc 5.500% 31 May 2023 2,838,885 0.36% 4,070,000 USD Prospect Medical Holdings Inc 8.375% 01 May 2019 4,263,325 0.53% 4,535,000 USD Riverbed Technology Inc 8.875% 01 March 2023 4,211,881 0.53%
860,000 USD Scotts Miracle-Gro Co 6.000% 15 October 2023 900,850 0.11% 3,395,000 USD Shea Homes LP / Shea Homes Funding Corp 5.875% 01 April 2023 3,496,850 0.44% 3,391,000 USD Simmons Foods Inc 7.875% 01 October 2021 3,111,243 0.39% 6,929,000 USD Sirius XM Radio Inc 5.375% 15 April 2025 6,980,968 0.87% 4,650,000 USD Six Flags Entertainment Corp 5.250% 15 January 2021 4,731,375 0.59% 4,571,000 USD Spectrum Brands Inc 5.750% 15 July 2025 4,708,130 0.59%
2,560,000 USD Summit Materials LLC / Summit Materials Finance Corp 6.125% 15 July 2023 2,534,400 0.32%
3,630,000 USD Valeant Pharmaceuticals International 7.000% 01 October 2020 3,657,225 0.46%

Standard Life Investments Global SICAV Société d'Investissement à Capital Variable
214
Global High Yield Bond Fund Schedule of Investments (expressed in USD) (continued) as at 31 December 2015
Quantity/ Market Value % of
Nominal Value Currency Name of Securities USD Net Assets
Transferable securities and money market instruments dealt in on another regulated market (continued)
United States (continued) 4,689,000 USD Valeant Pharmaceuticals International 6.750% 15 August 2021 4,548,330 0.57% 4,038,000 USD Vander Intermediate Holding II Corp 9.750% 01 February 2019 2,644,890 0.33% 3,660,000 USD Waterjet Holdings Inc 7.625% 01 February 2020 3,650,850 0.46% 6,350,000 USD XPO Logistics Inc 6.500% 15 June 2022 5,897,563 0.74% 1,960,000 USD ZF North America Capital Inc 4.750% 29 April 2025 1,874,250 0.23%
Total for United States 234,747,457 29.36%
Total transferable securities and money market instruments dealt in on another regulated market 318,045,239 39.77%
Total investments 745,448,658 93.22% Cash and cash equivalents 60,679,144 7.59% Bank overdraft and other net liabilities (6,472,474) (0.81%) Total net assets 799,655,328 100.00%
*A perpetual bond is a bond with no maturity date. Perpetual bonds are not redeemable but pay a steady stream of interest.
Analysis of Investments as % of total assets Transferable securities and money market instruments admitted to an official exchange listing 51.99%Transferable securities and money market instruments dealt in on another regulated market 38.69%Other assets 9.32%Total assets 100.00% The accompanying notes form an integral part of these financial statements.

Standard Life Investments Global SICAV Société d'Investissement à Capital Variable
215
Global Corporate Bond Fund Sub-fund Objective The objective of the Sub-fund is to achieve long-term growth in the share price of the Sub-fund.
Investment Policy The Sub-fund will invest primarily in global debt securities. Holdings will principally be of investment grade bonds. The Sub-fund may also invest in government bonds, sub-investment grade debt and other interest bearing securities issued anywhere in the world. Returns of the Sub-fund will be both through the reinvestment of income and from capital gains.
Performance Review The Sub-fund returned -0.7% (performance is calculated based on the D Accumulation Shares) compared to the Barclays Global Aggregate Corporates (Hedged to USD) Index which returned -0.2%*
Over the year, security selection was a significant positive for performance. There was also a positive contribution from sector allocation but this was offset by the negative impact of our curve positioning. Within ratings, our off-benchmark exposure to high yield debt was an important contributor to performance.
At an individual security level, the continuing decline in oil and commodity prices had a detrimental impact on our overweight holdings in Glencore, Energy Transfer Partners, Williams and Samarco Mineracao. The latter also struggled in the wake of a burst dam that caused significant human and environmental damage.
However, in a year when financials continued to perform well, we benefited from holding overweight positions in Morgan Stanley, Lloyds, QBE and Intesa Sanpaolo. It also proved beneficial to have an off-benchmark exposure to the Chinese property company Shimao; domestically, the property market is improving and there is also robust demand for dollar-denominated issuance from this kind of company.
*Sub-fund performance has been calculated over the stated period on the share price performance basis, based on the Institutional share class and net of fees. Please note the index return is quoted gross and contains no adjustment for fees.
Outlook 2016 will be the year of divergence in terms of central bank policy, growth outlooks and credit cycles. In the US, The Federal Reserve will continue to tighten gradually, whereas we expect further easing from both the European Central Bank and the Chinese authorities. The credit cycle for corporates is at a late stage in the US, whereas some parts of emerging markets are in a credit crunch. In contrast, many European corporates are, in our view, in the middle of the cycle and are still recovering from the Eurozone crises - European corporates have much lower leverage than their US counterparts. Banks, by contrast, continue to heal themselves. This is driven by regulation, especially in Europe.
Growth in developed markets continues to be stable-to-improving, whereas, in aggregate, emerging markets growth is slowing. China remains a source of uncertainty; its effect is felt most severely in commodity markets. Meanwhile, geopolitical tensions are rising. This combination should lead to a period of higher volatility.
Please note that the commitment approach has been used for risk measurement and calculation of global exposure for this Sub-fund.
This Sub-fund is not authorised in Hong Kong and is not available to Hong Kong residents.

Standard Life Investments Global SICAV Société d'Investissement à Capital Variable
216
Global Corporate Bond Fund Schedule of Investments (expressed in USD) as at 31 December 2015
Quantity/ Market Value % of
Nominal Value Currency Name of Securities USD Net Assets
Transferable securities and money market instruments admitted to an official exchange listing
Australia 1,300,000 USD BHP Billiton Finance USA Ltd 3.850% 30 September 2023 1,232,688 0.27% 1,540,000 AUD Holcim Finance Australia Pty Ltd 3.750% 19 March 2020 1,118,317 0.25%
900,000 EUR National Australia Bank Ltd FRN 12 November 2024 974,306 0.22% 1,695,000 USD QBE Insurance Group Ltd FRN 02 December 2044 1,775,512 0.39% 1,049,000 USD Rio Tinto Finance USA Ltd 9.000% 01 May 2019 1,224,581 0.27% 1,415,000 EUR Santos Finance Ltd FRN 22 September 2070 1,548,939 0.34%
Total for Australia 7,874,343 1.74%
Belgium 1,010,000 EUR KBC Groep NV FRN (perpetual bond*) 1,103,885 0.24%
Total for Belgium 1,103,885 0.24%
British Virgin Islands 1,300,000 USD Bestgain Real Estate Ltd 2.625% 13 March 2018 1,281,647 0.28%
Total for British Virgin Islands 1,281,647 0.28%
Canada 690,000 USD Enbridge Inc 4.500% 10 June 2044 467,607 0.10%
1,162,000 USD Potash Corp of Saskatchewan Inc 5.875% 01 December 2036 1,266,404 0.28% 860,000 USD Toronto-Dominion Bank 2.500% 14 December 2020 856,521 0.19%
Total for Canada 2,590,532 0.57%
Cayman Islands 200,000 USD China Overseas Finance Cayman III Ltd 6.375% 29 October 2043 211,323 0.05% 350,000 USD China Overseas Finance Cayman VI Ltd 6.450% 11 June 2034 378,263 0.08%
3,225,000 USD Hutchison Whampoa International 14 Ltd 1.625% 31 October 2017 3,210,252 0.71% 900,000 USD Shimao Property Holdings Ltd 8.375% 10 February 2022 968,234 0.21%
2,000,000 GBP Thames Water Utilities Cayman Finance Ltd FRN 21 July 2025 3,095,116 0.69% 474,878 GBP THPA Finance Ltd 7.127% 15 March 2024 822,425 0.18%
2,490,000 USD Vale Overseas Ltd 6.250% 23 January 2017 2,481,358 0.55% Total for Cayman Islands 11,166,971 2.47%
Denmark 1,026,000 EUR DONG Energy A/S FRN 26 June 3013 1,207,953 0.27%
Total for Denmark 1,207,953 0.27%
Finland 1,294,000 USD Nokia OYJ 5.375% 15 May 2019 1,379,223 0.31%
Total for Finland 1,379,223 0.31%
France 300,000 EUR Areva SA 4.625% 05 October 2017 337,548 0.07%
1,000,000 USD BPCE SA 5.150% 21 July 2024 1,008,322 0.22% 900,000 EUR Casino Guichard Perrachon SA 2.798% 05 August 2026 866,414 0.19%
1,200,000 EUR Christian Dior SE 1.375% 19 June 2019 1,333,132 0.30% 730,000 USD Credit Agricole SA FRN 19 September 2033 806,970 0.18% 500,000 GBP Electricite de France SA 6.125% 02 June 2034 900,103 0.20%
1,000,000 EUR Electricite de France SA FRN (perpetual bond*) 1,066,323 0.24% 500,000 EUR Holding d'Infrastructures de Transport SAS 2.250% 24 March 2025 545,165 0.12%
1,200,000 EUR Ingenico Group SA 2.500% 20 May 2021 1,330,780 0.29% 1,125,000 USD Orange SA 5.500% 06 February 2044 1,204,223 0.27%
600,000 GBP Orange SA 5.375% 22 November 2050 1,042,990 0.23% 1,000,000 EUR RTE Reseau de Transport d'Electricite SA 1.625% 27 November 2025 1,081,495 0.24%
500,000 EUR Societe Des Autoroutes Paris-Rhin-Rhone 1.500% 15 January 2024 545,225 0.12% 400,000 USD Societe Generale SA FRN (perpetual bond*) 399,520 0.09%
1,750,000 EUR Total SA FRN (perpetual bond*) 1,762,611 0.39% Total for France 14,230,821 3.15%
Germany 1,000,000 EUR Allianz SE FRN 07 July 2045 1,004,457 0.22%
900,000 EUR Allianz SE FRN (perpetual bond*) 1,055,786 0.23% 11,100,000 EUR Bundesrepublik Deutschland 1.000% 15 August 2025 12,504,474 2.77%

Standard Life Investments Global SICAV Société d'Investissement à Capital Variable
217
Global Corporate Bond Fund Schedule of Investments (expressed in USD) (continued) as at 31 December 2015
Quantity/ Market Value % of
Nominal Value Currency Name of Securities USD Net Assets
Transferable securities and money market instruments admitted to an official exchange listing (continued)
Germany (continued) 400,000 EUR Commerzbank AG 7.750% 16 March 2021 531,243 0.12%
1,370,000 EUR Volkswagen Leasing GmbH 0.750% 11 August 2020 1,435,053 0.32% Total for Germany 16,531,013 3.66%
Iceland 760,000 EUR Arion Banki HF 3.125% 12 March 2018 837,936 0.19% 420,000 EUR Landsbankinn HF 3.000% 19 October 2018 459,947 0.10%
Total for Iceland 1,297,883 0.29%
India 600,000 USD ICICI Bank Ltd 4.800% 22 May 2019 633,993 0.14%
1,200,000 USD ICICI Bank Ltd 3.500% 18 March 2020 1,211,794 0.27% Total for India 1,845,787 0.41%
Ireland
250,000 USD AerCap Ireland Capital Ltd / AerCap Global Aviation Trust 4.250% 01 July 2020 253,125 0.06%
983,000 USD AerCap Ireland Capital Ltd / AerCap Global Aviation Trust 5.000% 01 October 2021 1,023,549 0.23%
1,930,000 EUR Bank of Ireland 2.000% 08 May 2017 2,142,260 0.47% 1,000,000 EUR Bank of Ireland 3.250% 15 January 2019 1,166,376 0.26% 1,470,000 EUR Bank of Ireland 1.250% 09 April 2020 1,611,518 0.36%
770,000 EUR ESB Finance Ltd 4.375% 21 November 2019 960,098 0.21% 960,000 EUR ESB Finance Ltd 2.125% 08 June 2027 1,059,575 0.23% 317,000 EUR FCA Capital Ireland Plc 2.625% 17 April 2019 358,397 0.08% 950,000 EUR FCA Capital Ireland Plc 2.000% 23 October 2019 1,053,037 0.23% 650,000 EUR FCA Capital Ireland Plc 1.375% 17 April 2020 702,119 0.16% 725,000 EUR GE Capital European Funding 0.800% 21 January 2022 779,529 0.17%
Total for Ireland 11,109,583 2.46%
Italy 590,000 GBP Enel SpA FRN 15 September 2076 908,376 0.20%
1,295,000 USD Intesa Sanpaolo SpA 3.125% 15 January 2016 1,295,728 0.29% 1,495,000 USD Intesa Sanpaolo SpA 2.375% 13 January 2017 1,500,086 0.33%
600,000 EUR Intesa Sanpaolo SpA 6.625% 08 May 2018 702,119 0.15% 610,000 EUR Snam SpA 1.375% 19 November 2023 661,216 0.15%
Total for Italy 5,067,525 1.12%
Japan 1,020,000 EUR Sumitomo Mitsui Banking Corp 1.000% 19 January 2022 1,096,239 0.24%
Total for Japan 1,096,239 0.24%
Jersey 1,400,000 GBP AA Bond Co Ltd 3.781% 31 July 2019 2,102,818 0.46%
520,000 GBP ASIF III Jersey Ltd 5.375% 14 October 2016 795,825 0.18% 1,080,000 GBP CPUK Finance Ltd 2.666% 28 February 2020 1,591,322 0.35%
703,000 GBP HBOS Capital Funding LP FRN (perpetual bond*) 1,110,887 0.25% 600,000 GBP HBOS Sterling Finance Jersey LP FRN (perpetual bond*) 1,153,855 0.26% 250,000 EUR Heathrow Funding Ltd 4.600% 15 February 2018 295,961 0.07% 430,000 GBP Heathrow Funding Ltd 6.250% 10 September 2018 698,300 0.15%
1,041,000 GBP Heathrow Funding Ltd 6.750% 03 December 2026 2,010,473 0.44% 1,000,000 EUR Heathrow Funding Ltd 1.500% 11 February 2030 972,880 0.21%
980,000 EUR UBS Group Funding Jersey Ltd 1.750% 16 November 2022 1,068,524 0.24% Total for Jersey 11,800,845 2.61%
Luxembourg 690,000 EUR CNH Industrial Finance Europe SA 6.250% 09 March 2018 805,792 0.18% 800,000 EUR Fiat Chrysler Finance Europe 7.000% 23 March 2017 924,322 0.20%
Total for Luxembourg 1,730,114 0.38%
Mexico 765,000 EUR America Movil SAB de CV FRN 06 September 2073 871,179 0.19%

Standard Life Investments Global SICAV Société d'Investissement à Capital Variable
218
Global Corporate Bond Fund Schedule of Investments (expressed in USD) (continued) as at 31 December 2015
Quantity/ Market Value % of
Nominal Value Currency Name of Securities USD Net Assets
Transferable securities and money market instruments admitted to an official exchange listing (continued)
Mexico (continued) 1,080,000 USD Grupo Televisa SAB 6.625% 15 January 2040 1,123,483 0.25%
327,000 USD Grupo Televisa SAB 5.000% 13 May 2045 281,737 0.06% 345,000 USD Petroleos Mexicanos 5.500% 27 June 2044 261,282 0.06%
Total for Mexico 2,537,681 0.56%
Netherlands 690,000 GBP Aegon NV 6.625% 16 December 2039 1,444,288 0.32% 400,000 EUR BAT Netherlands Finance BV 3.125% 06 March 2029 471,381 0.11%
1,040,000 EUR Bharti Airtel International Netherlands BV 4.000% 10 December 2018 1,211,633 0.27% 1,000,000 EUR BMW Finance NV 2.625% 17 January 2024 1,191,134 0.26%
735,000 EUR Cooperatieve Centrale Raiffeisen-Boerenleenbank BA 4.125% 14 September 2022 895,845 0.20%
1,305,000 EUR Cooperatieve Centrale Raiffeisen-Boerenleenbank BA FRN 26 May 2026 1,439,763 0.32% 915,000 USD Deutsche Telekom International Finance BV 8.750% 15 June 2030 1,269,073 0.28% 450,000 GBP E.ON International Finance BV 6.750% 27 January 2039 837,360 0.19% 578,000 USD Embraer Netherlands Finance BV 5.050% 15 June 2025 521,645 0.12% 500,000 GBP Generali Finance BV FRN (perpetual bond*) 754,850 0.17%
1,015,000 EUR ING Bank NV FRN 25 February 2026 1,185,873 0.26% 1,100,000 EUR JAB Holdings BV 1.500% 24 November 2021 1,168,623 0.26% 1,150,000 USD Koninklijke KPN NV FRN 28 March 2073 1,217,563 0.27% 1,040,000 USD Koninklijke Philips NV 5.000% 15 March 2042 998,301 0.22%
865,000 EUR Linde Finance BV FRN 14 July 2066 972,104 0.22% 200,000 USD Oi Brasil Holdings Cooperatief UA 5.750% 10 February 2022 93,000 0.02% 924,000 USD Petrobras Global Finance BV 3.250% 17 March 2017 860,244 0.19% 420,000 GBP RWE Finance BV 6.250% 03 June 2030 683,273 0.15% 525,000 EUR Shell International Finance BV 1.625% 20 January 2027 547,571 0.12%
1,150,000 USD Shell International Finance BV 4.125% 11 May 2035 1,097,976 0.24% 600,000 GBP Swiss Reinsurance Co via ELM BV FRN (perpetual bond*) 946,943 0.21% 780,000 EUR Swiss Reinsurance Co via ELM BV FRN (perpetual bond*) 784,831 0.17% 330,000 USD Telefonica Europe BV 8.250% 15 September 2030 430,264 0.10% 600,000 EUR Telefonica Europe BV FRN (perpetual bond*) 654,558 0.15% 900,000 EUR Telefonica Europe BV FRN (perpetual bond*) 967,843 0.21%
1,770,000 EUR Teva Pharmaceutical Finance Netherlands II BV 1.250% 31 March 2023 1,822,593 0.40% 725,000 EUR Urenco Finance NV 2.375% 02 December 2024 769,970 0.17% 303,000 EUR Volkswagen International Finance NV FRN (perpetual bond*) 319,206 0.07% 865,000 EUR Volkswagen International Finance NV FRN (perpetual bond*) 917,217 0.20% 700,000 EUR Vonovia Finance BV 2.125% 25 July 2016 769,653 0.17%
1,100,000 EUR Vonovia Finance BV 3.125% 25 July 2019 1,278,159 0.28% 1,500,000 USD Vonovia Finance BV 5.000% 02 October 2023 1,548,648 0.34% 1,800,000 EUR Vonovia Finance BV FRN (perpetual bond*) 1,906,540 0.42%
Total for Netherlands 31,977,925 7.08%
Singapore 1,135,000 USD Flextronics International Ltd 4.625% 15 February 2020 1,177,563 0.26%
Total for Singapore 1,177,563 0.26%
Spain 400,000 EUR Banco Bilbao Vizcaya Argentaria SA FRN (perpetual bond*) 427,199 0.10% 300,000 EUR Cellnex Telecom SAU 3.125% 27 July 2022 313,219 0.07%
1,000,000 EUR Inmobiliaria Colonial SA 1.863% 05 June 2019 1,096,652 0.24% 950,000 USD Telefonica Emisiones SAU 5.134% 27 April 2020 1,037,324 0.23% 250,000 GBP Telefonica Emisiones SAU 5.289% 09 December 2022 408,452 0.09%
Total for Spain 3,282,846 0.73%
Sweden 550,000 EUR Nordea Bank AB FRN 10 November 2025 594,418 0.13%
1,230,000 EUR Svenska Handelsbanken AB 1.125% 14 December 2022 1,329,582 0.29% 1,450,000 EUR Swedbank AB 0.625% 04 January 2021 1,564,504 0.35%
Total for Sweden 3,488,504 0.77%

Standard Life Investments Global SICAV Société d'Investissement à Capital Variable
219
Global Corporate Bond Fund Schedule of Investments (expressed in USD) (continued) as at 31 December 2015
Quantity/ Market Value % of
Nominal Value Currency Name of Securities USD Net Assets
Transferable securities and money market instruments admitted to an official exchange listing (continued)
Switzerland 1,410,000 EUR Credit Suisse AG 1.125% 15 September 2020 1,558,346 0.34%
430,000 USD UBS AG 5.125% 15 May 2024 435,375 0.10% 650,000 EUR UBS AG FRN 12 February 2026 755,810 0.17%
Total for Switzerland 2,749,531 0.61%
United Kingdom 1,815,000 USD Abbey National Treasury Services Plc 1.650% 29 September 2017 1,817,071 0.40%
460,000 EUR Abbey National Treasury Services Plc 2.000% 14 January 2019 520,991 0.12% 970,000 EUR Abbey National Treasury Services Plc 0.875% 13 January 2020 1,058,682 0.23% 430,000 GBP Anglo American Capital Plc 6.875% 01 May 2018 584,852 0.13%
1,500,000 AUD Anglo American Capital Plc 5.750% 27 November 2018 945,263 0.21% 865,000 GBP Arqiva Financing Plc 4.040% 30 June 2020 1,331,448 0.29% 410,000 EUR Aviva Plc FRN 03 July 2044 451,960 0.10%
1,000,000 EUR Babcock International Group Plc 1.750% 06 October 2022 1,087,636 0.24% 700,000 USD Barclays Bank Plc 7.625% 21 November 2022 798,437 0.18% 650,000 USD Barclays Bank Plc 3.750% 15 May 2024 662,211 0.15%
1,745,000 USD Barclays Plc 2.750% 08 November 2019 1,741,312 0.39% 540,000 EUR BP Capital Markets Plc 1.109% 16 February 2023 573,707 0.13%
1,020,000 EUR BP Capital Markets Plc 1.573% 16 February 2027 1,046,487 0.23% 450,000 USD British Telecommunications Plc 9.625% 15 December 2030 657,110 0.15% 548,000 GBP Broadgate Financing Plc FRN 05 October 2023 804,521 0.18% 173,084 GBP Canary Wharf Finance II Plc 6.455% 22 October 2033 331,097 0.07%
1,125,000 EUR Coventry Building Society 2.250% 04 December 2017 1,268,601 0.28% 1,555,000 EUR Coventry Building Society 2.500% 18 November 2020 1,810,346 0.40% 1,090,000 GBP Enterprise Inns Plc 6.500% 06 December 2018 1,735,043 0.38%
850,000 EUR FCE Bank Plc 1.528% 09 November 2020 934,102 0.21% 1,080,000 GBP Firstgroup Plc 8.125% 19 September 2018 1,823,750 0.40%
700,000 GBP GlaxoSmithKline Capital Plc 6.375% 09 March 2039 1,438,179 0.32% 465,000 GBP Go-Ahead Group Plc 5.375% 29 September 2017 727,836 0.16% 911,455 GBP Greene King Finance Plc FRN 15 December 2033 1,367,411 0.30%
1,040,000 USD HSBC Holdings Plc 4.000% 30 March 2022 1,090,442 0.24% 850,000 GBP HSBC Holdings Plc FRN 18 October 2022 1,334,641 0.30% 800,000 EUR HSBC Holdings Plc FRN (perpetual bond*) 859,939 0.19%
1,000,000 GBP Imperial Tobacco Finance Plc 5.500% 22 November 2016 1,542,762 0.34% 1,515,000 GBP Intu Metrocentre Finance Plc 4.125% 06 December 2023 2,332,300 0.52% 1,500,000 EUR Leeds Building Society 1.375% 05 May 2022 1,593,847 0.35%
695,000 GBP Legal & General Group Plc FRN (perpetual bond*) 1,077,683 0.24% 520,000 GBP Lend Lease Europe Finance Plc 6.125% 12 October 2021 864,629 0.19%
1,945,000 USD Lloyds Bank Plc 2.000% 17 August 2018 1,946,120 0.43% 345,000 EUR Lloyds Bank Plc FRN 12 February 2024 473,333 0.11% 605,000 GBP Lloyds Bank Plc 7.625% 22 April 2025 1,149,399 0.25%
1,125,000 GBP Lloyds Bank Plc 6.000% 08 February 2029 2,200,596 0.49% 285,000 GBP Marstons Issuer Plc FRN 15 July 2032 459,695 0.10% 944,691 GBP Mitchells & Butlers Finance Plc 5.965% 15 December 2023 1,541,544 0.34%
1,080,000 EUR Nationwide Building Society 6.750% 22 July 2020 1,446,273 0.32% 950,000 GBP Pennon Group Plc FRN (perpetual bond*) 1,466,116 0.32% 578,571 GBP RMPA Services Plc 5.337% 30 September 2038 983,256 0.22% 600,000 EUR Royal Bank of Scotland Group Plc 1.500% 28 November 2016 660,310 0.15% 885,000 USD Royal Bank of Scotland Group Plc 6.000% 19 December 2023 952,892 0.21% 830,000 GBP Royal Bank of Scotland Plc 6.625% 17 September 2018 1,374,633 0.30% 330,000 EUR Royal Bank of Scotland Plc 5.375% 30 September 2019 421,923 0.09% 997,000 EUR Royal Bank of Scotland Plc FRN 22 September 2021 1,109,434 0.25% 390,000 GBP Spirit Issuer Plc 6.582% 28 December 2027 603,948 0.13% 630,000 GBP Spirit Issuer Plc FRN 28 December 2036 943,803 0.21% 800,000 USD SSE Plc FRN (perpetual bond*) 833,700 0.18% 370,000 GBP SSE Plc FRN (perpetual bond*) 526,108 0.12% 139,831 GBP Tesco Property Finance 1 Plc 7.623% 13 July 2039 218,086 0.05% 430,997 GBP Tesco Property Finance 2 Plc 6.052% 13 October 2039 599,172 0.13% 196,676 GBP Tesco Property Finance 3 Plc 5.744% 13 April 2040 254,801 0.06% 306,056 GBP Tesco Property Finance 4 Plc 5.801% 13 October 2040 395,718 0.09% 400,000 GBP United Kingdom Gilt 2.000% 07 September 2025 594,909 0.13%

Standard Life Investments Global SICAV Société d'Investissement à Capital Variable
220
Global Corporate Bond Fund Schedule of Investments (expressed in USD) (continued) as at 31 December 2015
Quantity/ Market Value % of
Nominal Value Currency Name of Securities USD Net Assets
Transferable securities and money market instruments admitted to an official exchange listing (continued)
United Kingdom (continued) 900,000 GBP United Kingdom Gilt 4.250% 07 March 2036 1,686,043 0.37% 600,000 GBP United Kingdom Gilt 3.500% 22 January 2045 1,038,271 0.23% 640,000 EUR Vodafone Group Plc 0.875% 17 November 2020 695,637 0.15%
1,400,000 USD Vodafone Group Plc 2.500% 26 September 2022 1,303,239 0.29% 1,040,000 USD WPP Finance 2010 5.625% 15 November 2043 1,056,265 0.23%
Total for United Kingdom 63,149,520 13.97%
United States 1,035,000 USD ACE Capital Trust II 9.700% 01 April 2030 1,498,163 0.33%
680,000 USD ACE INA Holdings Inc 4.350% 03 November 2045 690,485 0.15% 855,000 USD Actavis Inc 4.625% 01 October 2042 813,665 0.18%
1,100,000 USD Alcoa Inc 6.150% 15 August 2020 1,139,875 0.25% 105,000 USD Altria Group Inc 10.200% 06 February 2039 172,346 0.04%
1,705,000 USD Altria Group Inc 5.375% 31 January 2044 1,820,922 0.40%
711,077 USD American Airlines 2014-1 Class A Pass Through Trust 3.700% 01 October 2026 711,042 0.16%
810,000 USD American International Group Inc 4.500% 16 July 2044 745,263 0.17% 430,000 USD Amgen Inc 5.150% 15 November 2041 436,823 0.10% 780,000 USD Anadarko Petroleum Corp 8.700% 15 March 2019 886,208 0.20% 96,000 USD Anadarko Petroleum Corp 6.950% 15 June 2019 104,845 0.02%
650,000 USD AT&T Inc 2.450% 30 June 2020 640,113 0.14% 545,000 USD AT&T Inc 3.900% 11 March 2024 556,668 0.12%
1,125,000 USD AT&T Inc 5.550% 15 August 2041 1,131,249 0.25% 750,000 USD AT&T Inc 4.750% 15 May 2046 687,482 0.15%
1,175,000 USD Bank of America Corp 5.750% 15 August 2016 1,204,035 0.27% 260,000 EUR Bank of America Corp FRN 06 May 2019 284,430 0.06% 390,000 GBP Bank of America Corp 5.500% 04 December 2019 643,460 0.14%
2,015,000 USD Bank of America Corp 5.000% 13 May 2021 2,200,200 0.49% 900,000 USD Bank of America Corp 3.950% 21 April 2025 876,245 0.19% 600,000 GBP Bank of America Corp 7.000% 31 July 2028 1,195,071 0.26%
1,550,000 USD Bank of America Corp 7.750% 14 May 2038 2,104,177 0.47% 1,215,000 USD Bank of America NA 6.000% 15 June 2016 1,241,183 0.27% 1,935,000 USD Boston Scientific Corp 2.650% 01 October 2018 1,944,404 0.43% 1,750,000 USD Boston Scientific Corp 3.850% 15 May 2025 1,721,561 0.38% 1,125,000 USD Brixmor Operating Partnership LP 3.850% 01 February 2025 1,093,473 0.24% 1,175,000 USD Burlington Northern Santa Fe LLC 3.000% 01 April 2025 1,130,046 0.25%
765,000 USD Burlington Northern Santa Fe LLC 4.150% 01 April 2045 693,827 0.15% 1,080,000 USD Celgene Corp 2.300% 15 August 2018 1,087,478 0.24% 1,470,000 USD Celgene Corp 2.875% 15 August 2020 1,458,924 0.32% 1,075,000 USD Chevron Corp 1.961% 03 March 2020 1,058,889 0.23% 1,360,000 USD Cigna Corp 5.375% 15 February 2042 1,491,938 0.33% 1,275,000 USD Citigroup Inc 4.400% 10 June 2025 1,288,084 0.29% 1,440,000 USD Citigroup Inc 5.500% 13 September 2025 1,568,360 0.35%
925,000 USD Citigroup Inc 4.450% 29 September 2027 919,255 0.20% 418,000 USD Citigroup Inc 8.125% 15 July 2039 600,159 0.13% 725,000 USD CNH Industrial Capital LLC 3.625% 15 April 2018 717,388 0.16% 480,000 USD CNH Industrial Capital LLC 3.875% 16 July 2018 468,298 0.10% 416,000 USD Comcast Corp 4.650% 15 July 2042 423,008 0.09%
1,060,000 USD Corporate Office Properties LP 3.600% 15 May 2023 977,183 0.22% 580,000 USD CRH America Inc 8.125% 15 July 2018 659,951 0.15% 720,000 USD CVS Health Corp 5.300% 05 December 2043 774,174 0.17% 485,000 USD CVS Health Corp 5.125% 20 July 2045 511,501 0.11%
2,237,444 USD CVS Pass-Through Trust 6.036% 10 December 2028 2,457,965 0.54% 190,000 USD Daimler Finance North America LLC 2.250% 02 March 2020 185,603 0.04% 600,000 USD Daimler Finance North America LLC 8.500% 18 January 2031 870,080 0.19%
1,065,000 USD DDR Corp 7.875% 01 September 2020 1,274,212 0.28% 1,405,000 USD DIRECTV Holdings LLC / DIRECTV Financing Co Inc 5.150% 15 March 2042 1,310,874 0.29%
855,000 USD Dominion Gas Holdings LLC 3.600% 15 December 2024 845,820 0.19% 1,140,000 USD Dominion Resources Inc/VA 7.000% 15 June 2038 1,371,784 0.30%
951,000 USD Dow Chemical Co 4.625% 01 October 2044 860,137 0.19% 1,100,000 USD Dr Pepper Snapple Group Inc 3.400% 15 November 2025 1,081,812 0.24%

Standard Life Investments Global SICAV Société d'Investissement à Capital Variable
221
Global Corporate Bond Fund Schedule of Investments (expressed in USD) (continued) as at 31 December 2015
Quantity/ Market Value % of
Nominal Value Currency Name of Securities USD Net Assets
Transferable securities and money market instruments admitted to an official exchange listing (continued)
United States (continued) 1,000,000 USD Eastman Chemical Co 4.650% 15 October 2044 888,376 0.20% 1,340,000 USD Energy Transfer Partners LP 6.500% 01 February 2042 1,090,480 0.24%
260,000 USD Energy Transfer Partners LP 6.125% 15 December 2045 211,648 0.05% 865,000 USD Enterprise Products Operating LLC 5.200% 01 September 2020 907,279 0.20% 565,000 USD Enterprise Products Operating LLC 3.350% 15 March 2023 511,006 0.11%
1,200,000 USD Enterprise Products Operating LLC 4.900% 15 May 2046 981,601 0.22% 1,090,000 USD EPR Properties 5.750% 15 August 2022 1,145,673 0.25% 1,275,000 USD Essex Portfolio LP 3.250% 01 May 2023 1,236,829 0.27%
905,000 USD Essex Portfolio LP 3.875% 01 May 2024 904,091 0.20% 900,000 USD Exelon Corp 5.100% 15 June 2045 906,913 0.20% 535,000 USD Exelon Generation Co LLC 5.200% 01 October 2019 576,315 0.13%
1,580,000 USD Exelon Generation Co LLC 2.950% 15 January 2020 1,575,124 0.35% 910,000 USD FedEx Corp 4.750% 15 November 2045 902,074 0.20%
1,100,000 USD FirstMerit Bank NA/Akron OH 4.270% 25 November 2026 1,101,819 0.24% 1,535,000 USD Florida Power & Light Co 4.125% 01 February 2042 1,526,610 0.34% 1,959,000 USD Ford Motor Co 7.450% 16 July 2031 2,418,471 0.54%
360,000 USD Ford Motor Co 4.750% 15 January 2043 341,152 0.08% 1,730,000 USD Ford Motor Credit Co LLC 3.000% 12 June 2017 1,747,282 0.39% 1,015,000 USD Ford Motor Credit Co LLC 3.157% 04 August 2020 1,009,522 0.22%
535,000 USD Freeport-McMoRan Inc 2.300% 14 November 2017 458,094 0.10% 960,000 USD Frontier Communications Corp 8.125% 01 October 2018 998,400 0.22% 981,000 USD General Electric Capital Corp 6.750% 15 March 2032 1,281,574 0.28% 670,000 USD General Motors Co 6.250% 02 October 2043 707,654 0.16% 840,000 USD General Motors Financial Co Inc 3.100% 15 January 2019 838,832 0.19% 654,000 USD General Motors Financial Co Inc 3.200% 13 July 2020 643,660 0.14% 810,000 USD Gilead Sciences Inc 3.250% 01 September 2022 815,271 0.18% 469,000 USD Halliburton Co 5.000% 15 November 2045 464,122 0.10% 830,000 USD Hess Corp 5.600% 15 February 2041 700,065 0.16% 600,000 USD Hexcel Corp 4.700% 15 August 2025 594,406 0.13%
1,449,000 USD Host Hotels & Resorts LP 4.000% 15 June 2025 1,389,210 0.31% 630,000 USD HSBC Finance Corp 5.500% 19 January 2016 631,118 0.14%
1,450,000 USD Huntington National Bank 2.200% 06 November 2018 1,444,831 0.32% 280,000 USD International Paper Co 3.800% 15 January 2026 275,971 0.06%
1,080,000 USD International Paper Co 5.150% 15 May 2046 1,028,762 0.23% 900,000 USD JM Smucker Co 4.250% 15 March 2035 880,045 0.19%
1,575,000 USD Johnson & Johnson 5.850% 15 July 2038 2,022,644 0.45% 1,680,000 USD JPMorgan Chase & Co 6.000% 15 January 2018 1,814,222 0.40%
840,000 USD JPMorgan Chase & Co FRN (perpetual bond*) 853,919 0.19% 1,530,000 USD JPMorgan Chase & Co 2.250% 23 January 2020 1,504,555 0.33%
735,000 USD JPMorgan Chase & Co 6.400% 15 May 2038 924,125 0.20% 1,210,000 USD JPMorgan Chase & Co 5.625% 16 August 2043 1,319,055 0.29% 1,075,000 USD Kansas City Southern 2.350% 15 May 2020 1,037,818 0.23% 1,250,000 USD Kansas City Southern 3.000% 15 May 2023 1,182,922 0.26% 1,150,000 USD Kilroy Realty LP 4.250% 15 August 2029 1,126,610 0.25%
805,000 USD Kinder Morgan Energy Partners LP 4.250% 01 September 2024 684,994 0.15% 655,000 USD Kinder Morgan Energy Partners LP 5.500% 01 March 2044 511,427 0.11% 690,000 USD Kinder Morgan Inc 3.050% 01 December 2019 638,576 0.14%
1,090,000 USD Leggett & Platt Inc 3.800% 15 November 2024 1,095,611 0.24% 1,574,000 USD Lockheed Martin Corp 3.550% 15 January 2026 1,579,845 0.35%
890,000 USD Lockheed Martin Corp 4.700% 15 May 2046 912,670 0.20% 1,780,000 USD Marriott International Inc/MD 2.875% 01 March 2021 1,765,390 0.39%
500,000 USD McDonald's Corp 3.700% 30 January 2026 498,925 0.11% 540,000 USD McDonald's Corp 4.600% 26 May 2045 515,353 0.11% 380,000 USD McDonald's Corp 4.875% 09 December 2045 381,054 0.08% 900,000 USD McGraw Hill Financial Inc 4.000% 15 June 2025 902,341 0.20%
1,275,000 USD McKesson Corp 4.883% 15 March 2044 1,275,808 0.28% 1,475,000 USD MeadWestvaco Corp 8.200% 15 January 2030 1,911,868 0.42% 1,730,000 USD Medtronic Inc 3.500% 15 March 2025 1,745,384 0.39% 1,200,000 USD Medtronic Inc 4.625% 15 March 2045 1,236,655 0.27% 1,380,000 USD Merck & Co Inc 3.700% 10 February 2045 1,273,205 0.28%

Standard Life Investments Global SICAV Société d'Investissement à Capital Variable
222
Global Corporate Bond Fund Schedule of Investments (expressed in USD) (continued) as at 31 December 2015
Quantity/ Market Value % of
Nominal Value Currency Name of Securities USD Net Assets
Transferable securities and money market instruments admitted to an official exchange listing (continued)
United States (continued) 1,210,000 USD MetLife Inc 4.600% 13 May 2046 1,217,536 0.27% 1,040,000 EUR Metropolitan Life Global Funding I 2.375% 11 January 2023 1,217,400 0.27%
428,000 USD Microsoft Corp 4.450% 03 November 2045 441,220 0.10% 660,000 EUR Moody's Corp 1.750% 09 March 2027 689,427 0.15%
2,785,000 USD Morgan Stanley 6.625% 01 April 2018 3,054,140 0.68% 1,200,000 USD Morgan Stanley 2.650% 27 January 2020 1,188,648 0.26% 2,155,000 USD Morgan Stanley 5.750% 25 January 2021 2,419,680 0.54% 1,910,000 USD Morgan Stanley 4.000% 23 July 2025 1,967,065 0.44% 2,185,000 USD Morgan Stanley 5.000% 24 November 2025 2,317,679 0.51% 1,555,000 USD Morgan Stanley 4.350% 08 September 2026 1,560,632 0.35% 1,100,000 USD Oncor Electric Delivery Co LLC 3.750% 01 April 2045 915,545 0.20% 1,795,000 USD Pacific Gas & Electric Co 5.125% 15 November 2043 1,964,783 0.44% 1,100,000 USD Packaging Corp of America 4.500% 01 November 2023 1,155,384 0.26%
545,000 USD Petroleos Mexicanos 5.750% 01 March 2018 570,070 0.13% 600,000 EUR Prologis LP 3.000% 18 January 2022 691,882 0.15%
1,000,000 USD PulteGroup Inc 6.375% 15 May 2033 1,020,000 0.23% 500,000 EUR Rain CII Carbon LLC / CII Carbon Corp 8.500% 15 January 2021 405,278 0.09%
1,040,000 USD RELX Capital Inc 8.625% 15 January 2019 1,212,839 0.27% 1,993,000 USD Republic Services Inc 3.200% 15 March 2025 1,917,988 0.42% 1,500,000 USD Reynolds American Inc 8.125% 23 June 2019 1,765,182 0.39%
950,000 USD Southern Co 2.450% 01 September 2018 954,063 0.21% 1,300,000 USD Southern Copper Corp 5.250% 08 November 2042 940,825 0.21%
175,000 USD Southern Natural Gas Co LLC 8.000% 01 March 2032 171,964 0.04% 1,240,000 USD Synchrony Financial 2.600% 15 January 2019 1,235,428 0.27%
640,000 USD Time Warner Cos Inc 7.250% 15 October 2017 700,954 0.16% 975,000 USD Time Warner Inc 2.100% 01 June 2019 969,571 0.21%
2,500,000 USD Time Warner Inc 3.600% 15 July 2025 2,434,220 0.54% 904,387 USD United Airlines 2013-1 Class A Pass Through Trust 4.300% 15 August 2025 937,171 0.21%
7,500,000 USD United States Treasury Note/Bond 1.625% 30 November 2020 7,445,801 1.65% 4,200,000 USD United States Treasury Note/Bond 2.250% 15 November 2025 4,179,983 0.93% 2,000,000 USD United States Treasury Note/Bond 4.500% 15 February 2036 2,556,992 0.57% 1,120,000 USD United Technologies Corp 4.500% 01 June 2042 1,127,649 0.25%
395,000 USD UnitedHealth Group Inc 5.950% 15 February 2041 469,689 0.10% 230,000 USD UnitedHealth Group Inc 4.250% 15 March 2043 223,286 0.05% 487,540 USD US Airways 2012-2 Class A Pass Through Trust 4.625% 03 June 2025 507,651 0.11% 711,000 USD Verizon Communications Inc 3.500% 01 November 2024 702,400 0.16%
1,257,000 USD Verizon Communications Inc 6.550% 15 September 2043 1,488,153 0.33% 2,048,000 USD Verizon Communications Inc 5.012% 21 August 2054 1,877,451 0.42% 1,250,000 USD Wal-Mart Stores Inc 6.500% 15 August 2037 1,614,642 0.36% 2,700,000 USD Wal-Mart Stores Inc 5.000% 25 October 2040 2,967,889 0.66%
910,000 EUR Wells Fargo & Co 1.125% 29 October 2021 995,839 0.22% 1,070,000 USD Wells Fargo & Co 4.100% 03 June 2026 1,078,914 0.24%
950,000 USD Wells Fargo & Co 4.300% 22 July 2027 969,394 0.21% 935,000 USD Weyerhaeuser Co 7.125% 15 July 2023 1,107,258 0.25%
1,360,000 USD Williams Cos Inc 5.750% 24 June 2044 808,008 0.18% 1,095,000 USD Williams Partners LP 5.250% 15 March 2020 1,016,692 0.23% 1,100,000 EUR ZF North America Capital Inc 2.250% 26 April 2019 1,197,615 0.27%
Total for United States 182,851,274 40.46%
Total transferable securities and money market instruments admitted to an official exchange listing 382,529,208 84.64%
Transferable securities and money market instruments dealt in on another regulated market
Australia 350,000 USD BHP Billiton Finance USA Ltd FRN 19 October 2075 343,437 0.07%
1,305,000 USD Commonwealth Bank of Australia 4.500% 09 December 2025 1,293,630 0.29% 1,700,000 AUD Lend Lease Finance Ltd 5.500% 13 November 2018 1,282,868 0.28%
Total for Australia 2,919,935 0.64%
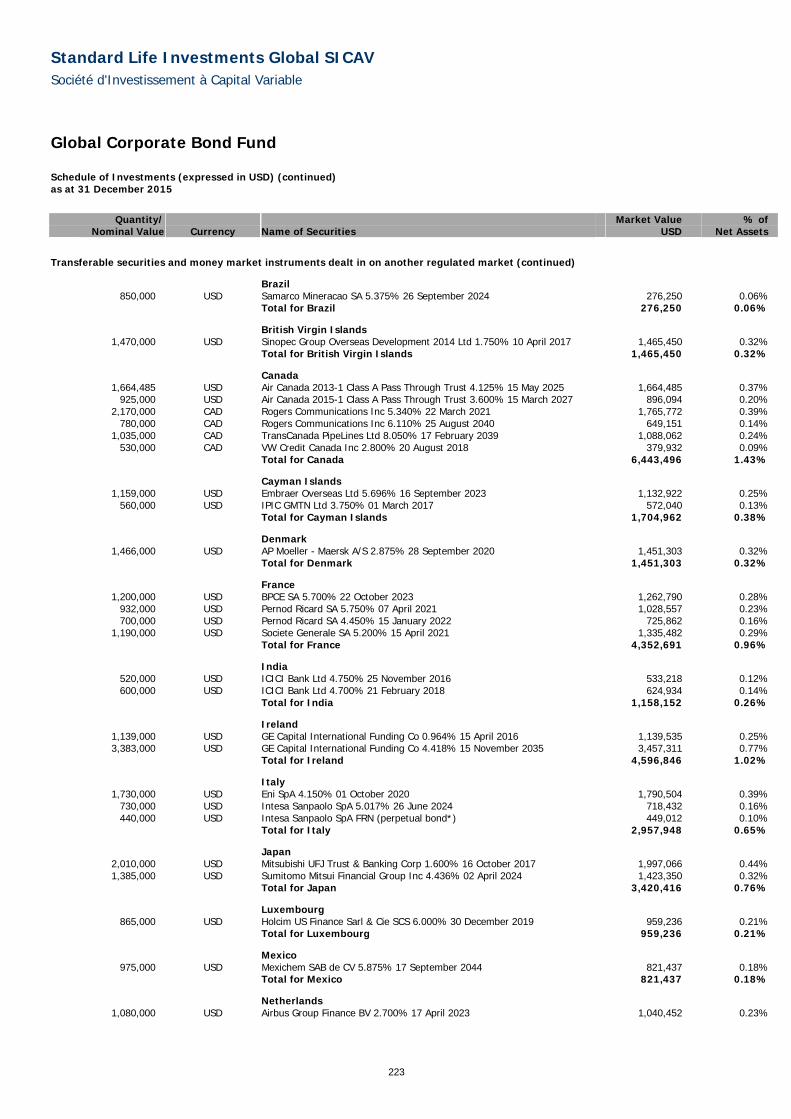
Standard Life Investments Global SICAV Société d'Investissement à Capital Variable
223
Global Corporate Bond Fund Schedule of Investments (expressed in USD) (continued) as at 31 December 2015
Quantity/ Market Value % of
Nominal Value Currency Name of Securities USD Net Assets
Transferable securities and money market instruments dealt in on another regulated market (continued)
Brazil 850,000 USD Samarco Mineracao SA 5.375% 26 September 2024 276,250 0.06%
Total for Brazil 276,250 0.06%
British Virgin Islands 1,470,000 USD Sinopec Group Overseas Development 2014 Ltd 1.750% 10 April 2017 1,465,450 0.32%
Total for British Virgin Islands 1,465,450 0.32%
Canada 1,664,485 USD Air Canada 2013-1 Class A Pass Through Trust 4.125% 15 May 2025 1,664,485 0.37%
925,000 USD Air Canada 2015-1 Class A Pass Through Trust 3.600% 15 March 2027 896,094 0.20% 2,170,000 CAD Rogers Communications Inc 5.340% 22 March 2021 1,765,772 0.39%
780,000 CAD Rogers Communications Inc 6.110% 25 August 2040 649,151 0.14% 1,035,000 CAD TransCanada PipeLines Ltd 8.050% 17 February 2039 1,088,062 0.24%
530,000 CAD VW Credit Canada Inc 2.800% 20 August 2018 379,932 0.09% Total for Canada 6,443,496 1.43%
Cayman Islands 1,159,000 USD Embraer Overseas Ltd 5.696% 16 September 2023 1,132,922 0.25%
560,000 USD IPIC GMTN Ltd 3.750% 01 March 2017 572,040 0.13% Total for Cayman Islands 1,704,962 0.38%
Denmark 1,466,000 USD AP Moeller - Maersk A/S 2.875% 28 September 2020 1,451,303 0.32%
Total for Denmark 1,451,303 0.32%
France 1,200,000 USD BPCE SA 5.700% 22 October 2023 1,262,790 0.28%
932,000 USD Pernod Ricard SA 5.750% 07 April 2021 1,028,557 0.23% 700,000 USD Pernod Ricard SA 4.450% 15 January 2022 725,862 0.16%
1,190,000 USD Societe Generale SA 5.200% 15 April 2021 1,335,482 0.29% Total for France 4,352,691 0.96%
India 520,000 USD ICICI Bank Ltd 4.750% 25 November 2016 533,218 0.12% 600,000 USD ICICI Bank Ltd 4.700% 21 February 2018 624,934 0.14%
Total for India 1,158,152 0.26%
Ireland 1,139,000 USD GE Capital International Funding Co 0.964% 15 April 2016 1,139,535 0.25% 3,383,000 USD GE Capital International Funding Co 4.418% 15 November 2035 3,457,311 0.77%
Total for Ireland 4,596,846 1.02%
Italy 1,730,000 USD Eni SpA 4.150% 01 October 2020 1,790,504 0.39%
730,000 USD Intesa Sanpaolo SpA 5.017% 26 June 2024 718,432 0.16% 440,000 USD Intesa Sanpaolo SpA FRN (perpetual bond*) 449,012 0.10%
Total for Italy 2,957,948 0.65%
Japan 2,010,000 USD Mitsubishi UFJ Trust & Banking Corp 1.600% 16 October 2017 1,997,066 0.44% 1,385,000 USD Sumitomo Mitsui Financial Group Inc 4.436% 02 April 2024 1,423,350 0.32%
Total for Japan 3,420,416 0.76%
Luxembourg 865,000 USD Holcim US Finance Sarl & Cie SCS 6.000% 30 December 2019 959,236 0.21%
Total for Luxembourg 959,236 0.21%
Mexico 975,000 USD Mexichem SAB de CV 5.875% 17 September 2044 821,437 0.18%
Total for Mexico 821,437 0.18%
Netherlands 1,080,000 USD Airbus Group Finance BV 2.700% 17 April 2023 1,040,452 0.23%

Standard Life Investments Global SICAV Société d'Investissement à Capital Variable
224
Global Corporate Bond Fund Schedule of Investments (expressed in USD) (continued) as at 31 December 2015
Quantity/ Market Value % of
Nominal Value Currency Name of Securities USD Net Assets
Transferable securities and money market instruments dealt in on another regulated market (continued)
Netherlands (continued) 865,000 USD E.ON International Finance BV 5.800% 30 April 2018 931,816 0.21%
1,570,000 USD EDP Finance BV 4.125% 15 January 2020 1,576,889 0.35% 260,000 USD Enel Finance International NV 6.800% 15 September 2037 317,671 0.07% 550,000 USD ING Bank NV 3.750% 07 March 2017 563,617 0.12%
1,117,000 USD Mylan NV 3.750% 15 December 2020 1,117,721 0.25% 1,125,000 USD Siemens Financieringsmaatschappij NV 6.125% 17 August 2026 1,379,029 0.30%
Total for Netherlands 6,927,195 1.53%
United Kingdom 1,295,000 USD Centrica Plc 4.000% 16 October 2023 1,285,756 0.29% 1,515,000 USD Experian Finance Plc 2.375% 15 June 2017 1,508,638 0.33%
515,000 USD Pearson Funding Five Plc 3.250% 08 May 2023 485,270 0.11% 1,130,000 USD Sky Plc 3.750% 16 September 2024 1,103,825 0.24%
Total for United Kingdom 4,383,489 0.97%
United States 1,500,000 USD Bayer US Finance LLC 3.000% 08 October 2021 1,511,955 0.34% 1,155,000 USD CCO Safari II LLC 4.464% 23 July 2022 1,149,853 0.25%
727,000 USD CCO Safari II LLC 6.384% 23 October 2035 728,149 0.16% 1,704,000 USD CRH America Inc 3.875% 18 May 2025 1,692,480 0.38% 1,080,000 USD Daimler Finance North America LLC 1.450% 01 August 2016 1,081,546 0.24%
500,000 USD Daimler Finance North America LLC 2.625% 15 September 2016 504,369 0.11% 450,000 USD Daimler Finance North America LLC 1.375% 01 August 2017 445,976 0.10%
1,675,000 USD Daimler Finance North America LLC 2.375% 01 August 2018 1,676,865 0.37% 650,000 USD Daimler Finance North America LLC 2.250% 03 September 2019 639,968 0.14% 910,000 USD Daimler Finance North America LLC 2.250% 02 March 2020 888,942 0.20%
1,179,000 USD Georgia-Pacific LLC 3.600% 01 March 2025 1,165,423 0.26% 420,000 USD Glencore Funding LLC 3.125% 29 April 2019 352,800 0.08%
1,105,000 USD Glencore Funding LLC 4.125% 30 May 2023 816,171 0.18% 1,100,000 USD Glencore Funding LLC 4.000% 16 April 2025 760,361 0.17% 1,640,000 USD Hewlett Packard Enterprise Co 4.400% 15 October 2022 1,632,786 0.36% 1,320,000 USD Molex Electronic Technologies LLC 3.900% 15 April 2025 1,235,567 0.27% 1,275,000 USD Niagara Mohawk Power Corp 3.508% 01 October 2024 1,279,248 0.28% 1,250,000 USD Pacific LifeCorp 5.125% 30 January 2043 1,279,193 0.28%
800,000 USD SABMiller Holdings Inc 2.450% 15 January 2017 806,207 0.18% 1,375,000 USD SABMiller Holdings Inc 4.950% 15 January 2042 1,395,578 0.31% 1,102,000 USD Schlumberger Holdings Corp 4.000% 21 December 2025 1,085,479 0.24%
865,000 USD Swiss Re Treasury US Corp 4.250% 06 December 2042 817,613 0.18% 520,000 USD ZFS Finance USA Trust V FRN 09 May 2037 531,700 0.12%
Total for United States 23,478,229 5.20%
Total transferable securities and money market instruments dealt in on another regulated market 67,317,035 14.89%
Total investments 449,846,243 99.53% Cash and cash equivalents 16,942,951 3.75% Bank overdraft and other net liabilities (14,823,180) (3.28%) Total net assets 451,966,014 100.00%
*A perpetual bond is a bond with no maturity date. Perpetual bonds are not redeemable but pay a steady stream of interest.
Analysis of Investments as % of total assets Transferable securities and money market instruments admitted to an official exchange listing 80.38%Transferable securities and money market instruments dealt in on another regulated market 14.15%Other assets 5.47%Total assets 100.00% The accompanying notes form an integral part of these financial statements.

Standard Life Investments Global SICAV Société d'Investissement à Capital Variable
225
European Corporate Bond Sustainable and Responsible Investment Fund Sub-fund Objective The objective of the Sub-fund is to achieve long term growth in the share price.
Investment Policy The Sub-fund will invest substantially in debt securities issued by corporations and agencies domiciled in European countries or whose securities are quoted on European stock exchanges. Holdings will principally be of investment grade bonds. The Sub-fund may also invest in government bonds, sub-investment grade debt and other interest bearing securities issued anywhere in the world. All investments will need to meet the sustainable and responsible criteria.
Performance Review The Sub-fund returned -0.4% over the period, compared to the iBoxx Euro Corporate Bond Index which returned -0.7%.*
At the beginning of the period, our long duration bias and overweight exposure to financials and corporate hybrid debt helped performance. The subordinated debt of Aviva and Societe Generale performed well, as did our position in the shorter-dated bonds of Petrobras. Individual security selection and exposure to high yield compensated for our underperforming position in long-dated German bunds and an underweight exposure to BG Group. Our underweight holding in EDF was beneficial, while our higher-conviction holdings in Lloyds also performed well. As the year progressed, strong stock selection and our off-benchmark allocations to high yield helped to offset the fact that the Sub-fund was moderately long credit risk as credit spreads widened. Within corporates, our conviction holding in Irish utility ESB performed well, as did our overweight exposure to Lloyds. Despite this, our conviction higher-risk holdings in subordinated debt from Allianz, Aviva and UBS, as well as corporate hybrids from Orange and Dong Energy cost relative performance.
In the risk-off market environment of the third quarter, our overweight exposure to subordinated bank debt, corporate hybrids and short-dated high yield issues all detracted from returns. Yet, our underweight exposure to RWE and not owning Brazilian Votorantim helped to buffer some of the underperforming positions. The market rebounded somewhat in September, with underperforming auto positions in VW, BMW and Tata Motors recovering. In addition, our overweight allocation to corporate hybrids and high yield contributed to overall performance. On the negative side, holding German bunds in a risk-on environment hurt relative performance. Within financials, our overweight positioning in subordinated bonds of Royal Bank of Scotland, Lloyds, Societe Generale and Commerzbank did well. Our overweight exposure to US car manufacturer Ford benefited the Sub-fund in December. Our Australian oil & gas exposure via names like Origin and Santos suffered, although this was partially offset by our underweight holdings in European oil majors like Repsol and BP.
*Sub-fund performance has been calculated over the stated period on D Accumulation Shares on the share price performance basis. Please note the index return is quoted gross and contains no adjustment for fees.
Outlook 2016 will be a year of divergence in terms of central bank policy, growth outlooks and the credit cycle. The Federal Reserve will gradually tighten policy, whereas we expect further easing from the European Central Bank (“ECB”) and Chinese authorities. The credit cycle for corporates is getting later for the US, whereas some parts of emerging markets are in a credit crunch. In our view, European corporates are more in the middle of the cycle, as they are still recovering from the Eurozone crisis and with much lower leverage than the US. By contrast, banks continue to heal (driven by regulation), especially in Europe. Developed market growth continues to be stable-to-improving, whereas emerging market (“EM”) growth is slowing. China remains a source of uncertainty; its effect is felt most severely in commodity markets. Geopolitical tensions are rising. This combination could mean a period of higher volatility.
Valuations are cheap, and in line with a mild recession, but while ECB QE should be supportive, technical factors could prove to be challenging if high debt supply estimates materialise. We therefore enter the year with a more moderate long credit position compared to last year. We like valuations, which are a lot cheaper year-on-year, but there are some current elevated risks. We have a preference for financials over corporates and have reduced our EM exposure. However, dispersion in single issuer performance has increased and we think this provides opportunities for security selection in 2016.
Please note that the commitment approach has been used for risk measurement and calculation of global exposure for this Sub-fund.
This Sub-fund is not authorised in Hong Kong and is not available to Hong Kong residents.

Standard Life Investments Global SICAV Société d'Investissement à Capital Variable
226
European Corporate Bond Sustainable and Responsible Investment Fund Schedule of Investments (expressed in EUR) as at 31 December 2015
Quantity/ Market Value % of
Nominal Value Currency Name of Securities EUR Net Assets
Transferable securities and money market instruments admitted to an official exchange listing
Australia 1,500,000 EUR APT Pipelines Ltd 1.375% 22 March 2022 1,428,943 0.37% 1,010,000 EUR APT Pipelines Ltd 2.000% 22 March 2027 904,316 0.23% 1,150,000 EUR BHP Billiton Finance Ltd FRN 22 April 2076 1,131,060 0.29% 1,809,000 EUR National Australia Bank Ltd FRN 12 November 2024 1,798,517 0.47% 1,070,000 EUR Origin Energy Finance Ltd 3.500% 04 October 2021 1,031,191 0.27% 1,600,000 EUR Santos Finance Ltd FRN 22 September 2070 1,608,500 0.42% 1,690,000 EUR Scentre Group Trust 1 1.500% 16 July 2020 1,719,508 0.44% 1,210,000 EUR Scentre Group Trust 2 3.250% 11 September 2023 1,349,489 0.35%
300,000 EUR Telstra Corp Ltd 2.500% 15 September 2023 324,844 0.08% Total for Australia 11,296,368 2.92%
Austria 700,000 EUR UniCredit Bank Austria AG 2.625% 30 January 2018 723,858 0.19%
Total for Austria 723,858 0.19%
Belgium 400,000 EUR Belfius Bank SA/NV 1.125% 22 May 2017 404,520 0.10% 800,000 EUR Belfius Bank SA/NV 2.250% 26 September 2018 836,291 0.22%
Total for Belgium 1,240,811 0.32%
Bermuda 500,000 GBP Holcim GB Finance Ltd 8.750% 24 April 2017 741,844 0.19%
Total for Bermuda 741,844 0.19%
Canada 2,700,000 EUR Great-West Lifeco Inc 2.500% 18 April 2023 2,873,578 0.74%
Total for Canada 2,873,578 0.74%
Cayman Islands 720,000 EUR China Overseas Land International Cayman Ltd 1.750% 15 July 2019 718,456 0.18% 340,000 EUR Thames Water Utilities Cayman Finance Ltd 3.250% 09 November 2016 348,882 0.09%
1,650,000 GBP Thames Water Utilities Cayman Finance Ltd FRN 21 July 2025 2,345,061 0.61% Total for Cayman Islands 3,412,399 0.88%
Denmark 440,000 EUR Danske Bank A/S FRN 04 October 2023 469,094 0.12% 190,000 EUR DONG Energy A/S 6.500% 07 May 2019 226,361 0.06% 252,000 EUR DONG Energy A/S 4.875% 16 December 2021 304,268 0.08%
1,031,000 EUR DONG Energy A/S FRN 26 June 3013 1,114,769 0.29% 200,000 EUR DONG Energy A/S FRN 08 July 3013 208,002 0.05%
1,520,000 EUR Nykredit Realkredit A/S FRN 17 November 2027 1,506,175 0.39% Total for Denmark 3,828,669 0.99%
Finland 141,000 EUR Teollisuuden Voima Oyj 4.625% 04 February 2019 152,742 0.04%
Total for Finland 152,742 0.04%
France 700,000 EUR Aeroports de Paris 1.500% 24 July 2023 714,098 0.18%
1,100,000 EUR Aeroports de Paris 1.500% 07 April 2025 1,102,479 0.29% 300,000 EUR Aeroports de Paris 2.750% 05 June 2028 331,125 0.09% 300,000 EUR Arkema SA 1.500% 20 January 2025 289,953 0.08% 200,000 EUR Autoroutes du Sud de la France SA 4.125% 13 April 2020 228,149 0.06% 400,000 EUR Autoroutes du Sud de la France SA 2.950% 17 January 2024 443,430 0.11% 300,000 EUR Banque Federative du Credit Mutuel SA 3.000% 28 November 2023 336,083 0.09% 500,000 EUR BNP Paribas SA 2.875% 27 November 2017 525,906 0.14%
2,290,000 EUR BNP Paribas SA 2.500% 23 August 2019 2,457,936 0.64% 500,000 EUR BNP Paribas SA 2.250% 13 January 2021 533,076 0.14% 550,000 EUR BNP Paribas SA FRN (perpetual bond*) 622,184 0.16% 600,000 EUR BPCE SA 1.375% 22 May 2019 618,348 0.16% 500,000 EUR BPCE SA 2.125% 17 March 2021 529,206 0.14% 300,000 EUR BPCE SA 4.250% 06 February 2023 359,901 0.09%

Standard Life Investments Global SICAV Société d'Investissement à Capital Variable
227
European Corporate Bond Sustainable and Responsible Investment Fund Schedule of Investments (expressed in EUR) (continued) as at 31 December 2015
Quantity/ Market Value % of
Nominal Value Currency Name of Securities EUR Net Assets
Transferable securities and money market instruments admitted to an official exchange listing (continued)
France (continued) 500,000 EUR BPCE SA 4.625% 18 July 2023 574,706 0.15% 640,000 USD BPCE SA 5.150% 21 July 2024 592,656 0.15% 600,000 EUR Casino Guichard Perrachon SA 4.726% 26 May 2021 653,528 0.17% 900,000 EUR Casino Guichard Perrachon SA 3.311% 25 January 2023 883,732 0.23% 300,000 EUR Casino Guichard Perrachon SA 3.248% 07 March 2024 286,696 0.07%
1,100,000 EUR Casino Guichard Perrachon SA 2.798% 05 August 2026 972,521 0.25% 900,000 EUR Christian Dior SE 4.000% 12 May 2016 911,952 0.24% 700,000 EUR Christian Dior SE 1.375% 19 June 2019 714,189 0.18% 300,000 GBP Cie de Saint-Gobain 5.625% 15 December 2016 424,681 0.11% 250,000 EUR Cie Financiere et Industrielle des Autoroutes SA 5.000% 24 May 2021 302,227 0.08%
1,020,000 EUR Credit Agricole SA 2.625% 17 March 2027 974,876 0.25% 1,270,000 USD Credit Agricole SA FRN 19 September 2033 1,289,322 0.33%
560,000 USD Credit Agricole SA FRN (perpetual bond*) 523,103 0.14% 600,000 EUR Credit Logement SA FRN (perpetual bond*) 487,200 0.13% 750,000 EUR Electricite de France SA 6.250% 25 January 2021 955,899 0.25% 300,000 EUR Electricite de France SA 4.625% 26 April 2030 378,330 0.10% 310,000 EUR Electricite de France SA 5.625% 21 February 2033 433,367 0.11% 300,000 EUR Electricite de France SA FRN (perpetual bond*) 294,276 0.08%
1,300,000 EUR Electricite de France SA FRN (perpetual bond*) 1,273,079 0.33% 200,000 EUR Electricite de France SA FRN (perpetual bond*) 200,694 0.05% 400,000 EUR Engie SA 1.375% 19 May 2020 414,814 0.11% 400,000 EUR Engie SA 2.375% 19 May 2026 429,724 0.11% 600,000 EUR Engie SA 1.500% 13 March 2035 531,073 0.14%
1,200,000 EUR Engie SA FRN (perpetual bond*) 1,185,000 0.31% 600,000 EUR Eutelsat SA 5.000% 14 January 2019 675,982 0.17%
1,800,000 EUR Eutelsat SA 2.625% 13 January 2020 1,907,244 0.49% 900,000 EUR Holding d'Infrastructures de Transport SAS 2.250% 24 March 2025 901,206 0.23%
1,100,000 EUR Infra Park SAS 1.250% 16 October 2020 1,109,758 0.29% 500,000 EUR Infra Park SAS 2.125% 16 April 2025 504,000 0.13%
1,300,000 EUR Ingenico Group SA 2.500% 20 May 2021 1,324,011 0.34% 1,500,000 EUR Klepierre 1.000% 17 April 2023 1,440,368 0.37%
800,000 EUR La Banque Postale SA FRN 23 April 2026 818,752 0.21% 600,000 EUR Lagardere SCA 4.125% 31 October 2017 629,313 0.16% 600,000 EUR Legrand SA 4.375% 21 March 2018 650,970 0.17%
1,400,000 EUR Mercialys SA 1.787% 31 March 2023 1,346,639 0.35% 861,000 EUR Orange SA 8.125% 28 January 2033 1,433,357 0.37%
1,780,000 EUR Orange SA FRN (perpetual bond*) 1,779,877 0.46% 600,000 EUR Pernod Ricard SA 5.000% 15 March 2017 633,552 0.16% 600,000 EUR RCI Banque SA 1.750% 06 July 2016 604,041 0.16% 505,000 EUR RCI Banque SA 4.250% 27 April 2017 530,060 0.14% 590,000 EUR RCI Banque SA 2.875% 22 January 2018 616,662 0.16%
1,300,000 EUR Renault SA 3.625% 19 September 2018 1,395,352 0.36% 150,000 EUR RTE Reseau de Transport d'Electricite SA 5.125% 12 September 2018 169,550 0.04%
1,700,000 EUR RTE Reseau de Transport d'Electricite SA 1.625% 27 November 2025 1,688,483 0.44% 500,000 EUR SANEF SA 1.875% 16 March 2026 499,083 0.13% 600,000 EUR Sanofi 2.500% 14 November 2023 661,492 0.17%
1,000,000 EUR Societe Des Autoroutes Paris-Rhin-Rhone 1.125% 15 January 2021 1,005,880 0.26% 400,000 EUR Societe Des Autoroutes Paris-Rhin-Rhone 1.500% 15 January 2024 400,580 0.10% 500,000 EUR Societe Des Autoroutes Paris-Rhin-Rhone 1.875% 15 January 2025 508,183 0.13%
1,000,000 EUR Societe Fonciere Lyonnaise SA 1.875% 26 November 2021 998,553 0.26% 500,000 EUR Societe Fonciere Lyonnaise SA 2.250% 16 November 2022 503,745 0.13% 100,000 EUR Societe Generale SA FRN (perpetual bond*) 110,443 0.03%
1,100,000 EUR Societe Generale SA 2.375% 28 February 2018 1,150,245 0.30% 300,000 EUR Societe Generale SA 4.000% 07 June 2023 327,305 0.08%
1,700,000 EUR Societe Generale SA FRN 16 September 2026 1,678,066 0.43% 1,220,000 USD Societe Generale SA FRN (perpetual bond*) 1,189,915 0.31%
200,000 USD Societe Generale SA FRN (perpetual bond*) 183,456 0.05% 400,000 EUR Suez Environnement Co 1.750% 10 September 2025 403,546 0.10%
2,070,000 EUR Total SA FRN (perpetual bond*) 1,914,750 0.50% 600,000 EUR Total SA FRN (perpetual bond*) 531,074 0.14%

Standard Life Investments Global SICAV Société d'Investissement à Capital Variable
228
European Corporate Bond Sustainable and Responsible Investment Fund Schedule of Investments (expressed in EUR) (continued) as at 31 December 2015
Quantity/ Market Value % of
Nominal Value Currency Name of Securities EUR Net Assets
Transferable securities and money market instruments admitted to an official exchange listing (continued)
France (continued) 1,400,000 EUR Transport et Infrastructures Gaz France SA 2.200% 05 August 2025 1,406,538 0.36%
490,000 EUR Unibail-Rodamco SE 1.375% 15 April 2030 437,029 0.11% 500,000 EUR Veolia Environnement SA 1.590% 10 January 2028 473,364 0.12% 200,000 EUR Vinci SA 4.125% 20 February 2017 208,943 0.05% 400,000 EUR Vinci SA 3.375% 30 March 2020 443,743 0.11% 927,000 EUR WPP Finance SA 2.250% 22 September 2026 938,749 0.24%
Total for France 60,913,378 15.75%
Germany 1,500,000 EUR Allianz SE FRN 07 July 2045 1,383,712 0.36% 1,200,000 EUR Allianz SE FRN (perpetual bond*) 1,171,390 0.30% 1,800,000 EUR Allianz SE FRN (perpetual bond*) 1,939,230 0.50%
534,000 EUR Bayer AG FRN 02 April 2075 503,610 0.13% 9,492,000 EUR Bundesrepublik Deutschland 0.500% 15 February 2025 9,445,489 2.44%
700,000 EUR Bundesrepublik Deutschland 4.750% 04 July 2034 1,105,694 0.29% 1,600,000 EUR Commerzbank AG 7.750% 16 March 2021 1,951,536 0.50%
100,000 EUR Daimler AG 1.750% 21 January 2020 104,398 0.03% 1,100,000 EUR Deutsche Bank AG 1.250% 08 September 2021 1,102,943 0.28% 1,290,000 EUR Merck Financial Services GmbH 0.750% 02 September 2019 1,304,190 0.34%
500,000 EUR Muenchener Rueckversicherungs-Gesellschaft AG in Muenchen FRN 26 May 2042 608,438 0.16%
Total for Germany 20,620,630 5.33%
Guernsey 2,000,000 USD Credit Suisse Group Guernsey I Ltd FRN 24 February 2041 1,894,855 0.49%
Total for Guernsey 1,894,855 0.49%
Iceland 530,000 EUR Arion Banki HF 3.125% 12 March 2018 536,657 0.14% 500,000 EUR Landsbankinn HF 3.000% 19 October 2018 502,865 0.13%
Total for Iceland 1,039,522 0.27%
India 426,000 USD ICICI Bank Ltd 3.125% 12 August 2020 388,922 0.10%
Total for India 388,922 0.10%
Ireland
356,000 EUR Aquarius & Investments Plc for Zurich Insurance Co Ltd FRN 02 October 2043 388,808 0.10%
3,050,000 EUR Bank of Ireland 2.000% 08 May 2017 3,109,124 0.80% 200,000 EUR Bank of Ireland 3.250% 15 January 2019 214,236 0.06%
1,560,000 EUR Bank of Ireland 1.250% 09 April 2020 1,570,600 0.41% 900,000 EUR Caterpillar International Finance Ltd 0.750% 13 October 2020 903,420 0.23% 390,000 EUR Cloverie Plc for Zurich Insurance Co Ltd 1.750% 16 September 2024 394,077 0.10% 123,000 EUR ESB Finance Ltd 6.250% 11 September 2017 135,306 0.04%
1,465,000 EUR ESB Finance Ltd 4.375% 21 November 2019 1,677,590 0.43% 2,670,000 EUR ESB Finance Ltd 2.125% 08 June 2027 2,706,419 0.70% 1,000,000 EUR FCA Capital Ireland Plc 4.000% 17 October 2018 1,071,530 0.28% 1,200,000 EUR FCA Capital Ireland Plc 2.000% 23 October 2019 1,221,588 0.32%
440,000 EUR GAS Networks Ireland 3.625% 04 December 2017 468,004 0.12% 2,914,000 EUR GE Capital European Funding 0.800% 21 January 2022 2,877,444 0.74% 1,600,000 EUR Lunar Funding V for Swisscom AG 2.000% 30 September 2020 1,696,512 0.44% 1,152,000 EUR Lunar Funding V for Swisscom AG 1.875% 08 September 2021 1,211,973 0.31% 2,045,000 EUR Willow No 2 Ireland Plc for Zurich Insurance Co Ltd 3.375% 27 June 2022 2,308,358 0.60%
Total for Ireland 21,954,989 5.68%
Italy 490,000 EUR 2i Rete Gas SpA 1.750% 16 July 2019 505,066 0.13% 950,000 EUR 2i Rete Gas SpA 1.125% 02 January 2020 952,709 0.25% 900,000 EUR Assicurazioni Generali SpA 5.125% 16 September 2024 1,144,812 0.30%
1,200,000 EUR Assicurazioni Generali SpA FRN 12 December 2042 1,466,797 0.38% 429,000 EUR Edison SpA 3.875% 10 November 2017 456,414 0.12%

Standard Life Investments Global SICAV Société d'Investissement à Capital Variable
229
European Corporate Bond Sustainable and Responsible Investment Fund Schedule of Investments (expressed in EUR) (continued) as at 31 December 2015
Quantity/ Market Value % of
Nominal Value Currency Name of Securities EUR Net Assets
Transferable securities and money market instruments admitted to an official exchange listing (continued)
Italy (continued) 640,000 EUR Enel SpA FRN 15 January 2075 669,539 0.17%
1,220,000 EUR Eni SpA 1.750% 18 January 2024 1,227,820 0.32% 279,000 EUR Eni SpA 3.625% 29 January 2029 319,680 0.08% 800,000 EUR Intesa Sanpaolo SpA 4.125% 19 September 2016 821,784 0.21% 600,000 EUR Intesa Sanpaolo SpA 5.000% 28 February 2017 632,689 0.16%
3,300,000 EUR Intesa Sanpaolo SpA 4.000% 09 November 2017 3,520,770 0.91% 400,000 EUR Intesa Sanpaolo SpA 6.625% 08 May 2018 429,876 0.11% 100,000 EUR Intesa Sanpaolo SpA 4.375% 15 October 2019 112,872 0.03%
1,440,000 EUR Intesa Sanpaolo SpA 2.000% 18 June 2021 1,485,640 0.38% 790,000 EUR Intesa Sanpaolo SpA 1.125% 04 March 2022 769,968 0.20% 880,000 EUR Intesa Sanpaolo SpA 3.928% 15 September 2026 901,604 0.23%
1,350,000 EUR Snam SpA 1.375% 19 November 2023 1,343,912 0.35% 190,000 EUR UniCredit SpA 3.375% 11 January 2018 201,409 0.05%
1,000,000 EUR UniCredit SpA 5.650% 24 July 2018 1,117,000 0.29% 437,000 EUR UniCredit SpA 1.500% 19 June 2019 446,292 0.12%
Total for Italy 18,526,653 4.79%
Japan 1,270,000 EUR Sumitomo Mitsui Banking Corp 1.000% 19 January 2022 1,253,522 0.32%
Total for Japan 1,253,522 0.32%
Jersey 1,100,000 GBP AA Bond Co Ltd 4.720% 31 July 2018 1,556,732 0.40%
860,000 GBP CPUK Finance Ltd 2.666% 28 February 2020 1,163,740 0.30% 204,000 GBP HBOS Capital Funding LP FRN (perpetual bond*) 296,052 0.08% 230,000 EUR Heathrow Funding Ltd 4.125% 12 October 2016 238,128 0.06% 320,000 EUR Heathrow Funding Ltd 4.375% 25 January 2017 333,878 0.09%
1,290,000 EUR Heathrow Funding Ltd 4.600% 15 February 2018 1,402,514 0.36% 1,280,000 EUR Heathrow Funding Ltd 1.875% 23 May 2022 1,331,604 0.35% 2,480,000 EUR Heathrow Funding Ltd 1.500% 11 February 2030 2,215,818 0.57% 1,200,000 EUR ProSecure Funding LP 4.668% 30 June 2016 1,216,500 0.32%
900,000 EUR UBS Group Funding Jersey Ltd 1.750% 16 November 2022 901,206 0.23% Total for Jersey 10,656,172 2.76%
Luxembourg 160,000 EUR Befesa Zinc SAU Via Zinc Capital SA 8.875% 15 May 2018 156,872 0.04% 455,000 EUR CNH Industrial Finance Europe SA 6.250% 09 March 2018 487,988 0.13%
1,100,000 EUR Fiat Chrysler Finance Europe 7.000% 23 March 2017 1,167,210 0.30% 1,450,000 EUR GELF Bond Issuer I SA 1.750% 22 November 2021 1,431,556 0.37%
840,000 EUR Novartis Finance SA 1.625% 09 November 2026 862,693 0.22% 1,125,000 EUR Prologis International Funding II SA 2.875% 04 April 2022 1,180,569 0.31%
800,000 EUR Talanx Finanz Luxembourg SA FRN 15 June 2042 1,012,635 0.26% Total for Luxembourg 6,299,523 1.63%
Mexico 600,000 EUR America Movil SAB de CV 4.125% 25 October 2019 673,655 0.17% 720,000 EUR America Movil SAB de CV 3.000% 12 July 2021 787,268 0.20% 425,000 EUR America Movil SAB de CV FRN 06 September 2073 465,984 0.12%
1,125,000 EUR America Movil SAB de CV FRN 06 September 2073 1,176,581 0.31% 1,100,000 USD Grupo Televisa SAB 6.000% 15 May 2018 1,082,354 0.28%
Total for Mexico 4,185,842 1.08%
Netherlands 1,490,000 EUR Achmea BV 2.500% 19 November 2020 1,584,498 0.41%
500,000 EUR Alliander NV FRN (perpetual bond*) 520,780 0.13% 164,000 EUR Allianz Finance II BV FRN (perpetual bond*) 169,442 0.04% 200,000 EUR Allianz Finance II BV 3.000% 13 March 2028 227,841 0.06% 300,000 EUR Allianz Finance II BV FRN 08 July 2041 348,238 0.09%
1,200,000 EUR Amadeus Finance BV 0.625% 02 December 2017 1,201,878 0.31% 2,270,000 EUR Bharti Airtel International Netherlands BV 4.000% 10 December 2018 2,428,773 0.63%
800,000 EUR BMW Finance NV 1.250% 05 September 2022 801,997 0.21%
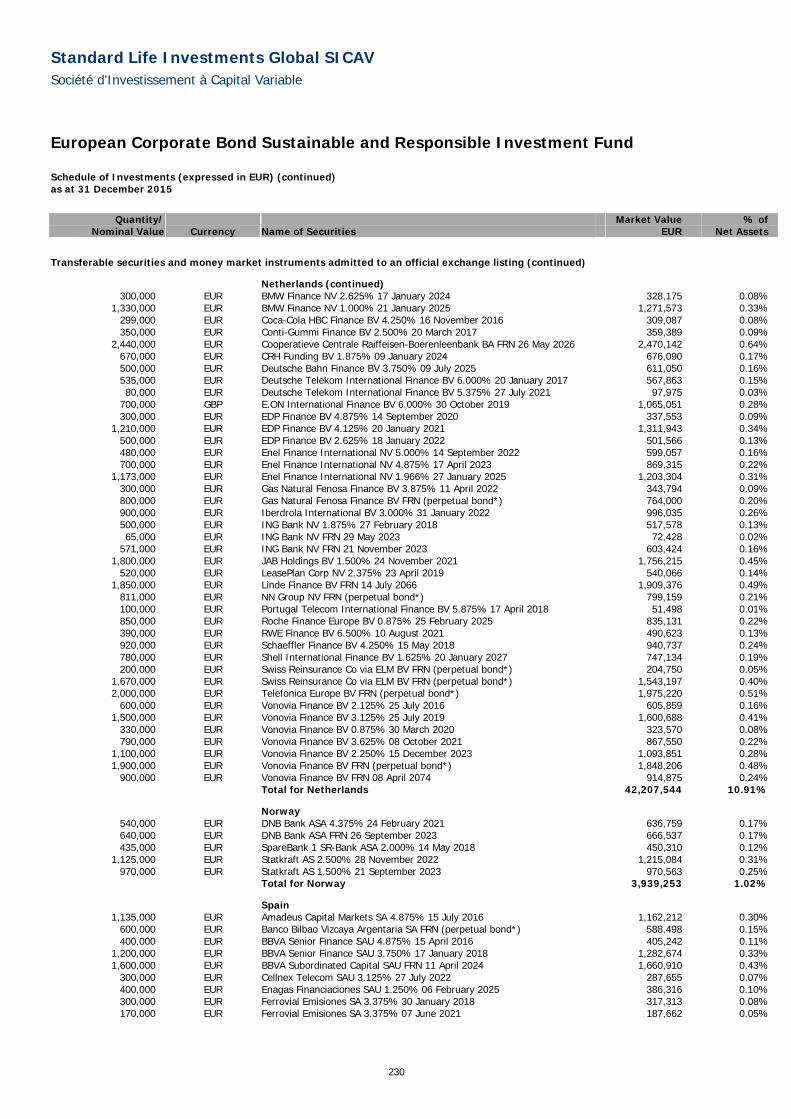
Standard Life Investments Global SICAV Société d'Investissement à Capital Variable
230
European Corporate Bond Sustainable and Responsible Investment Fund Schedule of Investments (expressed in EUR) (continued) as at 31 December 2015
Quantity/ Market Value % of
Nominal Value Currency Name of Securities EUR Net Assets
Transferable securities and money market instruments admitted to an official exchange listing (continued)
Netherlands (continued) 300,000 EUR BMW Finance NV 2.625% 17 January 2024 328,175 0.08%
1,330,000 EUR BMW Finance NV 1.000% 21 January 2025 1,271,573 0.33% 299,000 EUR Coca-Cola HBC Finance BV 4.250% 16 November 2016 309,087 0.08% 350,000 EUR Conti-Gummi Finance BV 2.500% 20 March 2017 359,389 0.09%
2,440,000 EUR Cooperatieve Centrale Raiffeisen-Boerenleenbank BA FRN 26 May 2026 2,470,142 0.64% 670,000 EUR CRH Funding BV 1.875% 09 January 2024 676,090 0.17% 500,000 EUR Deutsche Bahn Finance BV 3.750% 09 July 2025 611,050 0.16% 535,000 EUR Deutsche Telekom International Finance BV 6.000% 20 January 2017 567,863 0.15% 80,000 EUR Deutsche Telekom International Finance BV 5.375% 27 July 2021 97,975 0.03%
700,000 GBP E.ON International Finance BV 6.000% 30 October 2019 1,065,051 0.28% 300,000 EUR EDP Finance BV 4.875% 14 September 2020 337,553 0.09%
1,210,000 EUR EDP Finance BV 4.125% 20 January 2021 1,311,943 0.34% 500,000 EUR EDP Finance BV 2.625% 18 January 2022 501,566 0.13% 480,000 EUR Enel Finance International NV 5.000% 14 September 2022 599,057 0.16% 700,000 EUR Enel Finance International NV 4.875% 17 April 2023 869,315 0.22%
1,173,000 EUR Enel Finance International NV 1.966% 27 January 2025 1,203,304 0.31% 300,000 EUR Gas Natural Fenosa Finance BV 3.875% 11 April 2022 343,794 0.09% 800,000 EUR Gas Natural Fenosa Finance BV FRN (perpetual bond*) 764,000 0.20% 900,000 EUR Iberdrola International BV 3.000% 31 January 2022 996,035 0.26% 500,000 EUR ING Bank NV 1.875% 27 February 2018 517,578 0.13% 65,000 EUR ING Bank NV FRN 29 May 2023 72,428 0.02%
571,000 EUR ING Bank NV FRN 21 November 2023 603,424 0.16% 1,800,000 EUR JAB Holdings BV 1.500% 24 November 2021 1,756,215 0.45%
520,000 EUR LeasePlan Corp NV 2.375% 23 April 2019 540,066 0.14% 1,850,000 EUR Linde Finance BV FRN 14 July 2066 1,909,376 0.49%
811,000 EUR NN Group NV FRN (perpetual bond*) 799,159 0.21% 100,000 EUR Portugal Telecom International Finance BV 5.875% 17 April 2018 51,498 0.01% 850,000 EUR Roche Finance Europe BV 0.875% 25 February 2025 835,131 0.22% 390,000 EUR RWE Finance BV 6.500% 10 August 2021 490,623 0.13% 920,000 EUR Schaeffler Finance BV 4.250% 15 May 2018 940,737 0.24% 780,000 EUR Shell International Finance BV 1.625% 20 January 2027 747,134 0.19% 200,000 EUR Swiss Reinsurance Co via ELM BV FRN (perpetual bond*) 204,750 0.05%
1,670,000 EUR Swiss Reinsurance Co via ELM BV FRN (perpetual bond*) 1,543,197 0.40% 2,000,000 EUR Telefonica Europe BV FRN (perpetual bond*) 1,975,220 0.51%
600,000 EUR Vonovia Finance BV 2.125% 25 July 2016 605,859 0.16% 1,500,000 EUR Vonovia Finance BV 3.125% 25 July 2019 1,600,688 0.41%
330,000 EUR Vonovia Finance BV 0.875% 30 March 2020 323,570 0.08% 790,000 EUR Vonovia Finance BV 3.625% 08 October 2021 867,550 0.22%
1,100,000 EUR Vonovia Finance BV 2.250% 15 December 2023 1,093,851 0.28% 1,900,000 EUR Vonovia Finance BV FRN (perpetual bond*) 1,848,206 0.48%
900,000 EUR Vonovia Finance BV FRN 08 April 2074 914,875 0.24% Total for Netherlands 42,207,544 10.91%
Norway 540,000 EUR DNB Bank ASA 4.375% 24 February 2021 636,759 0.17% 640,000 EUR DNB Bank ASA FRN 26 September 2023 666,537 0.17% 435,000 EUR SpareBank 1 SR-Bank ASA 2.000% 14 May 2018 450,310 0.12%
1,125,000 EUR Statkraft AS 2.500% 28 November 2022 1,215,084 0.31% 970,000 EUR Statkraft AS 1.500% 21 September 2023 970,563 0.25%
Total for Norway 3,939,253 1.02%
Spain 1,135,000 EUR Amadeus Capital Markets SA 4.875% 15 July 2016 1,162,212 0.30%
600,000 EUR Banco Bilbao Vizcaya Argentaria SA FRN (perpetual bond*) 588,498 0.15% 400,000 EUR BBVA Senior Finance SAU 4.875% 15 April 2016 405,242 0.11%
1,200,000 EUR BBVA Senior Finance SAU 3.750% 17 January 2018 1,282,674 0.33% 1,600,000 EUR BBVA Subordinated Capital SAU FRN 11 April 2024 1,660,910 0.43%
300,000 EUR Cellnex Telecom SAU 3.125% 27 July 2022 287,655 0.07% 400,000 EUR Enagas Financiaciones SAU 1.250% 06 February 2025 386,316 0.10% 300,000 EUR Ferrovial Emisiones SA 3.375% 30 January 2018 317,313 0.08% 170,000 EUR Ferrovial Emisiones SA 3.375% 07 June 2021 187,662 0.05%

Standard Life Investments Global SICAV Société d'Investissement à Capital Variable
231
European Corporate Bond Sustainable and Responsible Investment Fund Schedule of Investments (expressed in EUR) (continued) as at 31 December 2015
Quantity/ Market Value % of
Nominal Value Currency Name of Securities EUR Net Assets
Transferable securities and money market instruments admitted to an official exchange listing (continued)
Spain (continued) 200,000 EUR Gas Natural Capital Markets SA 4.125% 26 January 2018 215,249 0.06% 600,000 EUR Gas Natural Capital Markets SA 6.000% 27 January 2020 722,785 0.19% 900,000 EUR Inmobiliaria Colonial SA 1.863% 05 June 2019 906,430 0.23% 500,000 EUR Santander Consumer Finance SA 1.100% 30 July 2018 506,265 0.13% 300,000 EUR Telefonica Emisiones SAU 5.496% 01 April 2016 303,768 0.08% 240,000 USD Telefonica Emisiones SAU 6.221% 03 July 2017 234,221 0.06% 400,000 EUR Telefonica Emisiones SAU 5.811% 05 September 2017 436,347 0.11% 350,000 EUR Telefonica Emisiones SAU 3.661% 18 September 2017 369,490 0.10% 800,000 EUR Telefonica Emisiones SAU 4.797% 21 February 2018 872,743 0.23%
1,000,000 EUR Telefonica Emisiones SAU 4.710% 20 January 2020 1,146,788 0.30% 900,000 EUR Telefonica Emisiones SAU 3.987% 23 January 2023 1,021,473 0.26%
Total for Spain 13,014,041 3.37%
Sweden 670,000 EUR Akelius Residential Property AB 3.375% 23 September 2020 677,956 0.17% 125,000 EUR Investor AB 4.875% 18 November 2021 152,888 0.04% 510,000 EUR Nordea Bank AB FRN 10 November 2025 506,201 0.13%
2,400,000 EUR Svenska Handelsbanken AB 1.125% 14 December 2022 2,382,564 0.62% 1,310,000 EUR Swedbank AB 0.625% 04 January 2021 1,298,086 0.34%
386,000 EUR Vattenfall AB FRN 19 March 2077 313,007 0.08% Total for Sweden 5,330,702 1.38%
Switzerland 1,120,000 EUR Credit Suisse AG 0.500% 29 March 2018 1,124,557 0.29% 3,100,000 EUR Credit Suisse AG 0.625% 20 November 2018 3,122,159 0.81% 1,420,000 EUR Credit Suisse AG 1.125% 15 September 2020 1,441,307 0.37%
680,000 EUR Credit Suisse AG 1.375% 31 January 2022 692,014 0.18% 1,850,000 EUR UBS AG 0.500% 15 May 2018 1,858,325 0.48% 1,120,000 EUR UBS AG 1.250% 03 September 2021 1,144,591 0.30% 2,040,000 EUR UBS AG FRN 12 February 2026 2,178,475 0.56% 1,950,000 EUR Zuercher Kantonalbank FRN 15 June 2027 1,934,498 0.50%
Total for Switzerland 13,495,926 3.49%
United Arab Emirates 800,000 EUR Emirates Telecommunications Group Co PJSC 1.750% 18 June 2021 818,167 0.21% 400,000 EUR Emirates Telecommunications Group Co PJSC 2.750% 18 June 2026 425,000 0.11%
Total for United Arab Emirates 1,243,167 0.32%
United Kingdom 600,000 EUR Abbey National Treasury Services Plc 1.750% 15 January 2018 616,594 0.16% 460,000 EUR Abbey National Treasury Services Plc 2.000% 14 January 2019 478,469 0.12%
2,070,000 EUR Abbey National Treasury Services Plc 0.875% 13 January 2020 2,074,854 0.54% 1,210,000 EUR Abbey National Treasury Services Plc 2.625% 16 July 2020 1,300,986 0.34%
670,000 EUR Abbey National Treasury Services Plc 0.875% 25 November 2020 666,466 0.17% 980,000 EUR Abbey National Treasury Services Plc 1.125% 14 January 2022 968,872 0.25% 810,000 EUR Abbey National Treasury Services Plc 1.125% 10 March 2025 764,851 0.20% 400,000 EUR Anglo American Capital Plc 1.750% 03 April 2018 339,180 0.09% 700,000 EUR Anglo American Capital Plc 2.750% 07 June 2019 553,000 0.14% 100,000 EUR Anglo American Capital Plc 2.875% 20 November 2020 73,100 0.02%
1,000,000 EUR Anglo American Capital Plc 3.250% 03 April 2023 684,250 0.18% 680,000 EUR Aviva Plc FRN 05 July 2043 798,338 0.21%
1,399,000 EUR Aviva Plc FRN 03 July 2044 1,416,306 0.37% 300,000 EUR Aviva Plc FRN 04 December 2045 286,169 0.07% 580,000 EUR Barclays Bank Plc 2.125% 24 February 2021 616,362 0.16%
1,030,000 EUR Barclays Bank Plc 6.625% 30 March 2022 1,296,231 0.34% 605,000 USD Barclays Bank Plc 7.625% 21 November 2022 633,755 0.16% 660,000 EUR Barclays Plc FRN 11 November 2025 658,951 0.17% 618,000 EUR BAT International Finance Plc 2.000% 13 March 2045 500,576 0.13%
1,400,000 EUR BP Capital Markets Plc 1.109% 16 February 2023 1,365,991 0.35% 400,000 EUR Brambles Finance Plc 4.625% 20 April 2018 437,236 0.11% 260,000 GBP British Telecommunications Plc 8.500% 07 December 2016 377,518 0.10%

Standard Life Investments Global SICAV Société d'Investissement à Capital Variable
232
European Corporate Bond Sustainable and Responsible Investment Fund Schedule of Investments (expressed in EUR) (continued) as at 31 December 2015
Quantity/ Market Value % of
Nominal Value Currency Name of Securities EUR Net Assets
Transferable securities and money market instruments admitted to an official exchange listing (continued)
United Kingdom (continued) 1,300,000 EUR Centrica Plc FRN 10 April 2076 1,200,130 0.31% 1,275,000 EUR Coventry Building Society 2.250% 04 December 2017 1,320,402 0.34% 1,100,000 EUR Coventry Building Society 2.500% 18 November 2020 1,176,108 0.30% 1,240,000 EUR Experian Finance Plc 4.750% 04 February 2020 1,429,981 0.37%
230,000 EUR FCE Bank Plc 1.875% 12 May 2016 231,351 0.06% 750,000 EUR FCE Bank Plc 1.625% 09 September 2016 755,850 0.20% 365,000 EUR FCE Bank Plc 2.875% 03 October 2017 380,030 0.10%
1,550,000 EUR FCE Bank Plc 1.875% 18 April 2019 1,598,752 0.41% 930,000 EUR FCE Bank Plc 1.528% 09 November 2020 938,602 0.24%
1,610,000 EUR FCE Bank Plc 1.875% 24 June 2021 1,638,408 0.42% 1,030,000 EUR FCE Bank Plc 1.134% 10 February 2022 997,814 0.26%
230,000 GBP Firstgroup Plc 8.125% 19 September 2018 356,691 0.09% 460,000 EUR Hammerson Plc 2.750% 26 September 2019 490,713 0.13%
1,230,000 EUR Hammerson Plc 2.000% 01 July 2022 1,255,258 0.32% 1,480,000 GBP Heathrow Finance Plc 7.125% 01 March 2017 2,129,701 0.55%
300,000 EUR International Game Technology Plc 4.750% 05 March 2020 302,436 0.08% 1,350,000 GBP Jaguar Land Rover Automotive Plc 3.875% 01 March 2023 1,730,316 0.45% 1,330,000 EUR LBG Capital No.2 Plc 15.000% 21 December 2019 1,903,356 0.49% 1,100,000 EUR Leeds Building Society 2.625% 01 April 2021 1,158,814 0.30% 1,480,000 EUR Leeds Building Society 1.375% 05 May 2022 1,444,243 0.37% 1,223,000 EUR Lloyds Bank Plc 6.500% 24 March 2020 1,479,987 0.38%
200,000 EUR Lloyds Bank Plc FRN 12 February 2024 252,000 0.07% 300,000 GBP Lloyds Bank Plc 7.625% 22 April 2025 523,432 0.14% 600,000 GBP Lloyds Bank Plc FRN 09 July 2025 883,611 0.23% 995,000 EUR Mondi Finance Plc 5.750% 03 April 2017 1,060,135 0.27% 490,000 EUR Mondi Finance Plc 3.375% 28 September 2020 539,686 0.14%
1,100,000 EUR Motability Operations Group Plc 3.250% 30 November 2018 1,194,565 0.31% 870,000 EUR Motability Operations Group Plc 1.625% 09 June 2023 894,099 0.23% 330,000 EUR National Grid Plc 5.000% 02 July 2018 367,659 0.10% 600,000 EUR Nationwide Building Society 6.750% 22 July 2020 737,906 0.19%
1,600,000 EUR Nationwide Building Society 1.125% 03 June 2022 1,594,760 0.41% 952,000 EUR NGG Finance Plc FRN 18 June 2076 997,815 0.26% 840,000 EUR Rentokil Initial Plc 3.250% 07 October 2021 915,886 0.24% 510,000 EUR Royal Bank of Scotland Group Plc 1.500% 28 November 2016 515,454 0.13% 830,000 EUR Royal Bank of Scotland Group Plc 1.625% 25 June 2019 845,774 0.22%
1,220,000 EUR Royal Bank of Scotland Group Plc FRN 25 March 2024 1,256,350 0.32% 480,000 USD Royal Bank of Scotland Group Plc FRN (perpetual bond*) 460,109 0.12% 546,000 EUR Royal Bank of Scotland Plc 6.934% 09 April 2018 612,628 0.16% 600,000 GBP Royal Bank of Scotland Plc 6.625% 17 September 2018 912,606 0.24%
1,398,000 EUR Royal Bank of Scotland Plc 5.375% 30 September 2019 1,641,532 0.42% 901,000 EUR Royal Bank of Scotland Plc FRN 22 September 2021 920,777 0.24% 600,000 EUR Sky Plc 1.500% 15 September 2021 602,715 0.16% 481,000 EUR Sky Plc 1.875% 24 November 2023 483,100 0.12% 880,000 EUR SSE Plc 1.750% 08 September 2023 890,322 0.23% 535,000 EUR SSE Plc FRN (perpetual bond*) 567,815 0.15% 620,000 EUR SSE Plc FRN (perpetual bond*) 588,172 0.15%
1,200,000 EUR Tesco Plc 3.375% 02 November 2018 1,241,124 0.32% 790,000 EUR Vodafone Group Plc 0.875% 17 November 2020 788,594 0.20% 300,000 EUR Vodafone Group Plc 4.650% 20 January 2022 358,631 0.09% 70,000 EUR Vodafone Group Plc 5.375% 06 June 2022 87,599 0.02%
260,000 EUR Wellcome Trust Ltd 1.125% 21 January 2027 247,776 0.06% 1,401,000 EUR Yorkshire Building Society 2.125% 18 March 2019 1,456,699 0.38%
Total for United Kingdom 65,266,329 16.87%
United States 300,000 EUR American International Group Inc FRN 15 March 2067 302,618 0.08% 510,000 USD AT&T Inc 2.450% 30 June 2020 461,250 0.12% 600,000 EUR AT&T Inc 2.650% 17 December 2021 645,278 0.17%
1,800,000 EUR AT&T Inc 1.450% 01 June 2022 1,800,261 0.46% 800,000 EUR AT&T Inc 2.500% 15 March 2023 846,401 0.22% 419,000 EUR AT&T Inc 2.400% 15 March 2024 434,897 0.11%

Standard Life Investments Global SICAV Société d'Investissement à Capital Variable
233
European Corporate Bond Sustainable and Responsible Investment Fund Schedule of Investments (expressed in EUR) (continued) as at 31 December 2015
Quantity/ Market Value % of
Nominal Value Currency Name of Securities EUR Net Assets
Transferable securities and money market instruments admitted to an official exchange listing (continued)
United States (continued) 350,000 EUR AT&T Inc 3.550% 17 December 2032 372,206 0.10% 610,000 EUR AT&T Inc 2.450% 15 March 2035 539,152 0.14% 400,000 EUR Bank of America Corp 7.000% 15 June 2016 412,158 0.11% 550,000 EUR Bank of America Corp 4.750% 03 April 2017 581,002 0.15%
1,300,000 EUR Bank of America Corp 4.625% 07 August 2017 1,389,166 0.36% 650,000 EUR Bank of America Corp FRN 28 March 2018 644,855 0.17% 100,000 GBP Bank of America Corp 7.750% 30 April 2018 153,847 0.04% 140,000 EUR Bank of America Corp 4.625% 14 September 2018 153,801 0.04%
1,270,000 EUR Bank of America Corp 2.500% 27 July 2020 1,353,934 0.35% 1,480,000 EUR Bank of America Corp 1.375% 10 September 2021 1,489,109 0.38% 1,550,000 EUR Bank of America Corp 1.625% 14 September 2022 1,555,448 0.40% 1,090,000 EUR BMW US Capital LLC 1.125% 18 September 2021 1,094,147 0.28%
180,000 EUR Citigroup Inc FRN 31 May 2017 179,508 0.05% 225,000 EUR Citigroup Inc FRN 30 November 2017 225,349 0.06% 700,000 EUR Citigroup Inc FRN 10 February 2019 699,412 0.18% 433,000 EUR Citigroup Inc 7.375% 04 September 2019 537,919 0.14%
1,910,000 EUR Citigroup Inc 1.375% 27 October 2021 1,918,939 0.50% 299,000 EUR Citigroup Inc 1.750% 28 January 2025 294,774 0.08%
1,360,000 EUR DIRECTV Holdings LLC / DIRECTV Financing Co Inc 2.750% 19 May 2023 1,447,040 0.37% 550,000 EUR Eli Lilly & Co 1.625% 02 June 2026 548,199 0.14% 750,000 EUR GE Capital Trust II FRN 15 September 2067 789,060 0.20%
1,060,000 EUR GE Capital Trust IV FRN 15 September 2066 1,074,734 0.28% 2,440,000 EUR General Electric Co 1.250% 26 May 2023 2,443,928 0.63%
313,000 USD Halliburton Co 2.700% 15 November 2020 284,016 0.07% 1,700,000 EUR JPMorgan Chase & Co 2.625% 23 April 2021 1,839,694 0.48% 2,400,000 EUR JPMorgan Chase & Co 1.375% 16 September 2021 2,435,452 0.63%
950,000 EUR JPMorgan Chase & Co 1.500% 26 October 2022 959,476 0.25% 620,000 EUR JPMorgan Chase & Co 1.500% 27 January 2025 610,920 0.16% 300,000 EUR JPMorgan Chase Bank NA FRN 30 November 2021 308,092 0.08%
1,500,000 EUR Kinder Morgan Inc 1.500% 16 March 2022 1,229,910 0.32% 980,000 EUR Kraft Heinz Foods Co 2.000% 30 June 2023 991,520 0.26%
1,130,000 EUR Merck & Co Inc 1.875% 15 October 2026 1,158,290 0.30% 1,395,000 EUR Metropolitan Life Global Funding I 2.375% 30 September 2019 1,491,372 0.39% 2,300,000 EUR Metropolitan Life Global Funding I 0.875% 20 January 2022 2,264,120 0.58% 1,440,000 EUR Metropolitan Life Global Funding I 2.375% 11 January 2023 1,548,052 0.40%
830,000 EUR Microsoft Corp 3.125% 06 December 2028 957,123 0.25% 340,000 EUR Moody's Corp 1.750% 09 March 2027 326,172 0.08% 330,000 EUR Morgan Stanley 4.500% 23 February 2016 331,983 0.09% 620,000 EUR Morgan Stanley 3.750% 21 September 2017 656,827 0.17% 800,000 EUR Morgan Stanley 5.500% 02 October 2017 872,211 0.22% 150,000 EUR Morgan Stanley 5.375% 10 August 2020 179,380 0.05% 800,000 EUR Morgan Stanley 2.375% 31 March 2021 847,564 0.22% 300,000 EUR Morgan Stanley 1.875% 30 March 2023 305,373 0.08%
1,280,000 EUR Morgan Stanley 1.750% 30 January 2025 1,259,762 0.33%
525,000 EUR MPT Operating Partnership LP / MPT Finance Corp 5.750% 01 October 2020 557,912 0.14%
200,000 EUR National Grid North America Inc 1.750% 20 February 2018 206,185 0.05% 1,320,000 EUR Praxair Inc 1.625% 01 December 2025 1,321,584 0.34%
230,000 EUR Procter & Gamble Co 4.875% 11 May 2027 305,962 0.08% 1,220,000 EUR Prologis LP 3.000% 18 January 2022 1,292,004 0.33%
270,000 EUR Prologis LP 3.375% 20 February 2024 291,557 0.07% 500,000 EUR Prologis LP 3.000% 02 June 2026 514,100 0.13%
2,200,000 EUR RELX Capital Inc 1.300% 12 May 2025 2,102,991 0.54% 1,300,000 EUR Toyota Motor Credit Corp 1.000% 09 March 2021 1,312,649 0.34%
455,000 EUR Verizon Communications Inc 2.375% 17 February 2022 485,719 0.13% 400,000 EUR Verizon Communications Inc 1.625% 01 March 2024 399,339 0.10% 390,000 EUR Verizon Communications Inc 3.250% 17 February 2026 436,598 0.11% 530,000 EUR Verizon Communications Inc 2.625% 01 December 2031 530,308 0.14% 200,000 EUR Wachovia Corp 4.375% 27 November 2018 221,197 0.06% 700,000 EUR Wells Fargo & Co 1.125% 29 October 2021 703,508 0.18%

Standard Life Investments Global SICAV Société d'Investissement à Capital Variable
234
European Corporate Bond Sustainable and Responsible Investment Fund Schedule of Investments (expressed in EUR) (continued) as at 31 December 2015
Quantity/ Market Value % of
Nominal Value Currency Name of Securities EUR Net Assets
Transferable securities and money market instruments admitted to an official exchange listing (continued)
United States (continued) 865,000 EUR Wells Fargo & Co 2.625% 16 August 2022 940,954 0.24% 950,000 EUR Wells Fargo & Co 1.500% 12 September 2022 961,277 0.25% 760,000 EUR Wells Fargo & Co 2.250% 02 May 2023 805,443 0.21% 580,000 EUR Wells Fargo & Co 2.125% 04 June 2024 605,935 0.16%
1,530,000 EUR Wells Fargo & Co 2.000% 27 April 2026 1,551,060 0.40% 1,400,000 EUR ZF North America Capital Inc 2.250% 26 April 2019 1,399,832 0.36%
Total for United States 62,191,815 16.08%
Total transferable securities and money market instruments admitted to an official exchange listing 378,693,054 97.91%
Transferable securities and money market instruments dealt in on another regulated market
India 800,000 USD ICICI Bank Ltd 4.700% 21 February 2018 765,238 0.20%
Total for India 765,238 0.20%
Italy 400,000 USD Intesa Sanpaolo SpA 6.500% 24 February 2021 416,543 0.11% 390,000 USD Intesa Sanpaolo SpA FRN (perpetual bond*) 365,505 0.09%
Total for Italy 782,048 0.20%
United States 180,000 EUR EMD Millipore Corp 5.875% 30 June 2016 185,008 0.05%
Total for United States 185,008 0.05%
Total transferable securities and money market instruments dealt in on another regulated market 1,732,294 0.45%
Total investments 380,425,348 98.36% Cash and cash equivalents 1,355,456 0.35% Bank overdraft and other net assets 4,987,159 1.29% Total net assets 386,767,963 100.00%
*A perpetual bond is a bond with no maturity date. Perpetual bonds are not redeemable but pay a steady stream of interest.
Analysis of Investments as % of total assets Transferable securities and money market instruments admitted to an official exchange listing 97.64%Transferable securities and money market instruments dealt in on another regulated market 0.45%Other assets 1.91%Total assets 100.00% The accompanying notes form an integral part of these financial statements.

Standard Life Investments Global SICAV Société d'Investissement à Capital Variable
235
Emerging Market Corporate Bond Fund
Sub-fund Objective The objective of the Sub-fund is to provide a return from capital appreciation and income.
Investment Policy The Sub-fund will achieve this through mainly investing in bonds issued by financial institution or companies in emerging markets. The majority of the Sub-fund will be invested in bonds denominated in US Dollars. The Sub-fund may also invest on other transferable securities, money market instruments, deposits, cash and near cash, derivatives (including currency forwards, interest rates and credit default swaps) and collective investment schemes.
Performance Review For the period covering 1 January to 31 December 2015, the Sub-fund returned -1.6%, compared with the JP Morgan EMBI Broad Diversified index return of 1.3%.*
Holding a significant overweight position in Chinese property company Shimao made a significant contribution to performance over the period. Signs that the Chinese property market was improving were beneficial, as was the strong demand among Asian investors for dollar-denominated bonds. Being underweight, and eventually exiting, the Colombian energy issuer Ecopetrol was positive for performance as the bonds struggled due to the falling oil price. Brazilian oil & gas company Odebrecht was another issuer that suffered on the back of the oil price decline so having a zero weighting proved positive.
However, overweight exposure to Tullow Oil and Petrobras was detrimental. As previously mentioned, oil price falls were damaging for oil & gas issuers but the latter also had a corruption scandal to contend with. Underweight exposure to a number of Russian entities was another position that weighed on performance.
*Sub-fund performance has been calculated over the stated period on the share price performance basis, based on the D Accumulation Shares and net of fees. Please note the index return is quoted gross and contains no adjustment for fees.
Outlook We believe 2016 will be a year of divergence in terms of central policy, growth outlooks and the credit cycle. The Fed will continue to tighten gradually whereas we expect further easing from both the ECB and Chinese authorities. The credit cycle for corporates is at a late stage in the US, whereas some parts of emerging markets are in a credit crunch. Developed markets’ growth continues to be stable-to-improving, whereas emerging markets growth in aggregate is struggling. China remains a source of uncertainty; its effect is felt most severely in commodity markets. Geopolitical tensions are rising. This combination should lead to a period of higher volatility.
Valuations are increasingly attractive, relative to long-term averages. Technical factors will be mixed with expectations of high issuance from the Middle East, while most other regions will continue trends from 2015. Therefore, we enter the year with a more neutral position, as valuations are much cheaper but risks are elevated. Dispersion in single issuer performance has increased, and we think this dispersion provides opportunities for security selection in 2016.
Please note that the commitment approach has been used for risk measurement and calculation of global exposure for this Sub-fund.
This Sub-fund is not authorised in Hong Kong and is not available to Hong Kong residents.
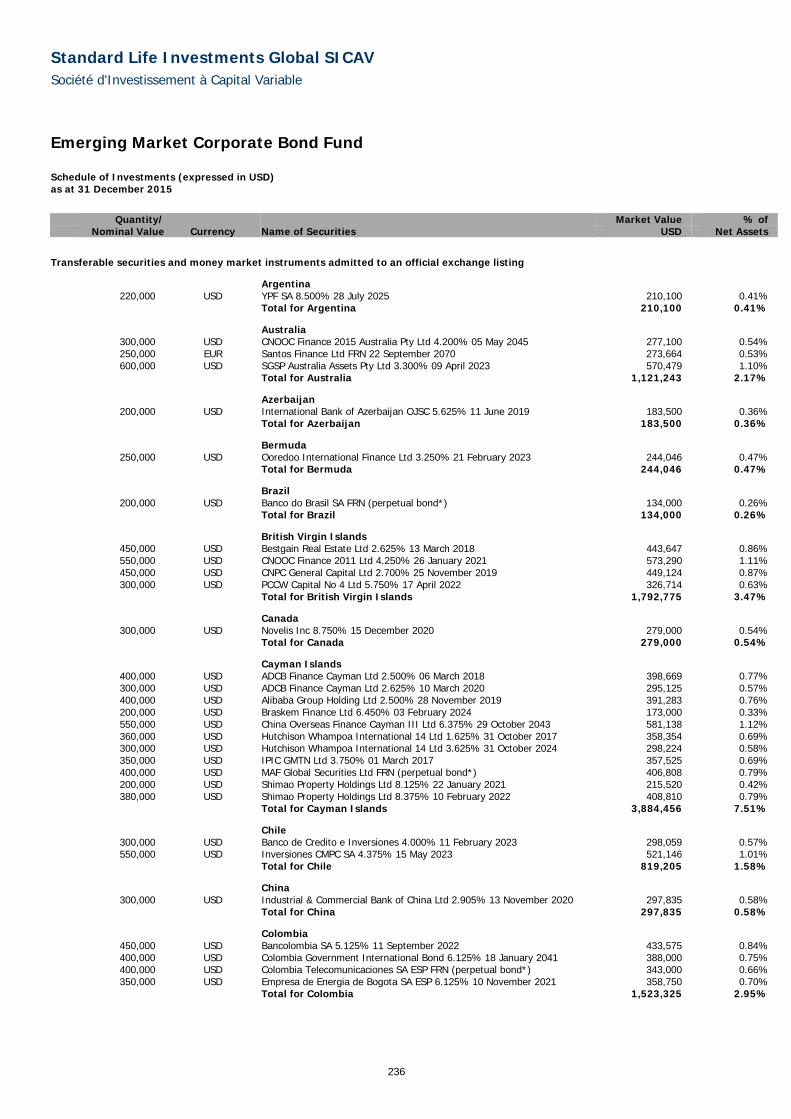
Standard Life Investments Global SICAV Société d'Investissement à Capital Variable
236
Emerging Market Corporate Bond Fund Schedule of Investments (expressed in USD) as at 31 December 2015
Quantity/ Market Value % of
Nominal Value Currency Name of Securities USD Net Assets
Transferable securities and money market instruments admitted to an official exchange listing
Argentina 220,000 USD YPF SA 8.500% 28 July 2025 210,100 0.41%
Total for Argentina 210,100 0.41%
Australia 300,000 USD CNOOC Finance 2015 Australia Pty Ltd 4.200% 05 May 2045 277,100 0.54%250,000 EUR Santos Finance Ltd FRN 22 September 2070 273,664 0.53%600,000 USD SGSP Australia Assets Pty Ltd 3.300% 09 April 2023 570,479 1.10%
Total for Australia 1,121,243 2.17%
Azerbaijan 200,000 USD International Bank of Azerbaijan OJSC 5.625% 11 June 2019 183,500 0.36%
Total for Azerbaijan 183,500 0.36%
Bermuda 250,000 USD Ooredoo International Finance Ltd 3.250% 21 February 2023 244,046 0.47%
Total for Bermuda 244,046 0.47%
Brazil 200,000 USD Banco do Brasil SA FRN (perpetual bond*) 134,000 0.26%
Total for Brazil 134,000 0.26%
British Virgin Islands 450,000 USD Bestgain Real Estate Ltd 2.625% 13 March 2018 443,647 0.86%550,000 USD CNOOC Finance 2011 Ltd 4.250% 26 January 2021 573,290 1.11%450,000 USD CNPC General Capital Ltd 2.700% 25 November 2019 449,124 0.87%300,000 USD PCCW Capital No 4 Ltd 5.750% 17 April 2022 326,714 0.63%
Total for British Virgin Islands 1,792,775 3.47%
Canada 300,000 USD Novelis Inc 8.750% 15 December 2020 279,000 0.54%
Total for Canada 279,000 0.54%
Cayman Islands 400,000 USD ADCB Finance Cayman Ltd 2.500% 06 March 2018 398,669 0.77%300,000 USD ADCB Finance Cayman Ltd 2.625% 10 March 2020 295,125 0.57%400,000 USD Alibaba Group Holding Ltd 2.500% 28 November 2019 391,283 0.76%200,000 USD Braskem Finance Ltd 6.450% 03 February 2024 173,000 0.33%550,000 USD China Overseas Finance Cayman III Ltd 6.375% 29 October 2043 581,138 1.12%360,000 USD Hutchison Whampoa International 14 Ltd 1.625% 31 October 2017 358,354 0.69%300,000 USD Hutchison Whampoa International 14 Ltd 3.625% 31 October 2024 298,224 0.58%350,000 USD IPIC GMTN Ltd 3.750% 01 March 2017 357,525 0.69%400,000 USD MAF Global Securities Ltd FRN (perpetual bond*) 406,808 0.79%200,000 USD Shimao Property Holdings Ltd 8.125% 22 January 2021 215,520 0.42%380,000 USD Shimao Property Holdings Ltd 8.375% 10 February 2022 408,810 0.79%
Total for Cayman Islands 3,884,456 7.51%
Chile 300,000 USD Banco de Credito e Inversiones 4.000% 11 February 2023 298,059 0.57%550,000 USD Inversiones CMPC SA 4.375% 15 May 2023 521,146 1.01%
Total for Chile 819,205 1.58%
China 300,000 USD Industrial & Commercial Bank of China Ltd 2.905% 13 November 2020 297,835 0.58%
Total for China 297,835 0.58%
Colombia 450,000 USD Bancolombia SA 5.125% 11 September 2022 433,575 0.84%400,000 USD Colombia Government International Bond 6.125% 18 January 2041 388,000 0.75%400,000 USD Colombia Telecomunicaciones SA ESP FRN (perpetual bond*) 343,000 0.66%350,000 USD Empresa de Energia de Bogota SA ESP 6.125% 10 November 2021 358,750 0.70%
Total for Colombia 1,523,325 2.95%

Standard Life Investments Global SICAV Société d'Investissement à Capital Variable
237
Emerging Market Corporate Bond Fund Schedule of Investments (expressed in USD) (continued) as at 31 December 2015
Quantity/ Market Value % of
Nominal Value Currency Name of Securities USD Net Assets
Transferable securities and money market instruments admitted to an official exchange listing (continued)
Curaçao 406,000 USD Teva Pharmaceutical Finance IV BV 3.650% 10 November 2021 411,740 0.80%
Total for Curaçao 411,740 0.80%
Dominican Republic 350,000 USD Dominican Republic International Bond 5.875% 18 April 2024 350,000 0.68%
Total for Dominican Republic 350,000 0.68%
France 350,000 EUR Total SA FRN (perpetual bond*) 352,522 0.68%
Total for France 352,522 0.68%
Hong Kong 400,000 USD AIA Group Ltd 3.125% 13 March 2023 389,163 0.75%300,000 USD Bank of China Hong Kong Ltd 5.550% 11 February 2020 326,388 0.63%
Total for Hong Kong 715,551 1.38%
Hungary 500,000 USD Hungary Government International Bond 6.375% 29 March 2021 570,895 1.10%310,000 USD Magyar Export-Import Bank Zrt 4.000% 30 January 2020 312,983 0.61%
Total for Hungary 883,878 1.71%
India 200,000 USD Axis Bank Ltd 3.250% 21 May 2020 200,978 0.39%400,000 USD Bharat Petroleum Corp Ltd 4.000% 08 May 2025 389,532 0.75%200,000 USD HDFC Bank Ltd 3.000% 06 March 2018 201,756 0.39%450,000 USD ICICI Bank Ltd 5.000% 15 January 2016 450,405 0.87%600,000 USD ICICI Bank Ltd 4.800% 22 May 2019 633,993 1.23%300,000 USD JSW Steel Ltd 4.750% 12 November 2019 227,732 0.44%
Total for India 2,104,396 4.07%
Indonesia 950,000 USD Bank Negara Indonesia Persero Tbk PT 4.125% 27 April 2017 965,390 1.87%650,000 USD Perusahaan Gas Negara Persero Tbk 5.125% 16 May 2024 625,805 1.21%
Total for Indonesia 1,591,195 3.08%
Ireland 300,000 USD MMC Norilsk Nickel OJSC via MMC Finance Ltd 6.625% 14 October 2022 306,600 0.59%
Total for Ireland 306,600 0.59%
Ivory Coast 300,000 USD Ivory Coast Government International Bond 5.750% 31 December 2032 268,260 0.52%
Total for Ivory Coast 268,260 0.52%
Jersey 200,000 GBP HBOS Capital Funding LP FRN (perpetual bond*) 316,042 0.61%
Total for Jersey 316,042 0.61%
Kazakhstan 300,000 USD Kazakhstan Government International Bond 5.125% 21 July 2025 296,926 0.57%
Total for Kazakhstan 296,926 0.57%
Luxembourg 500,000 USD Altice Finco SA 9.875% 15 December 2020 530,000 1.02%300,000 EUR Fiat Chrysler Finance Europe 7.000% 23 March 2017 346,621 0.67%600,000 USD Gazprom OAO Via Gaz Capital SA 5.999% 23 January 2021 599,615 1.16%300,000 USD Millicom International Cellular SA 6.000% 15 March 2025 256,500 0.50%300,000 USD Severstal OAO Via Steel Capital SA 5.900% 17 October 2022 291,060 0.56%
Total for Luxembourg 2,023,796 3.91%
Malaysia 700,000 USD Malayan Banking Bhd FRN 20 September 2022 699,710 1.35%
Total for Malaysia 699,710 1.35%
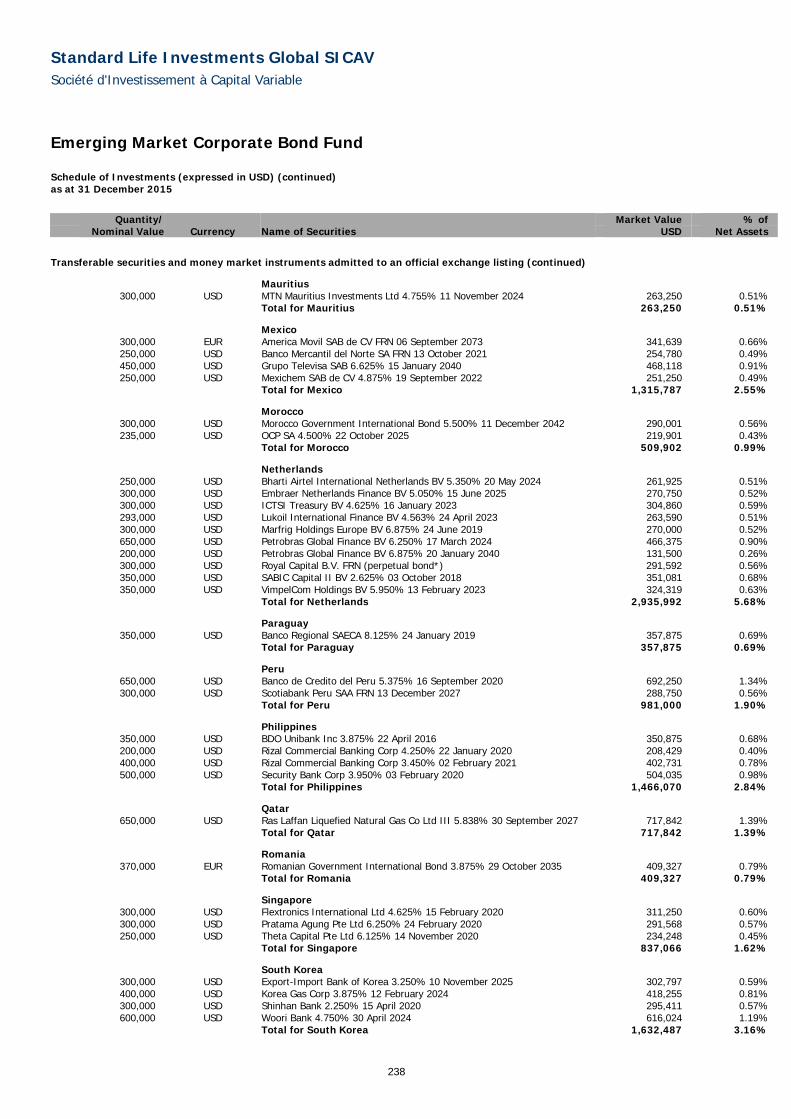
Standard Life Investments Global SICAV Société d'Investissement à Capital Variable
238
Emerging Market Corporate Bond Fund Schedule of Investments (expressed in USD) (continued) as at 31 December 2015
Quantity/ Market Value % of
Nominal Value Currency Name of Securities USD Net Assets
Transferable securities and money market instruments admitted to an official exchange listing (continued)
Mauritius 300,000 USD MTN Mauritius Investments Ltd 4.755% 11 November 2024 263,250 0.51%
Total for Mauritius 263,250 0.51%
Mexico 300,000 EUR America Movil SAB de CV FRN 06 September 2073 341,639 0.66%250,000 USD Banco Mercantil del Norte SA FRN 13 October 2021 254,780 0.49%450,000 USD Grupo Televisa SAB 6.625% 15 January 2040 468,118 0.91%250,000 USD Mexichem SAB de CV 4.875% 19 September 2022 251,250 0.49%
Total for Mexico 1,315,787 2.55%
Morocco 300,000 USD Morocco Government International Bond 5.500% 11 December 2042 290,001 0.56%235,000 USD OCP SA 4.500% 22 October 2025 219,901 0.43%
Total for Morocco 509,902 0.99%
Netherlands 250,000 USD Bharti Airtel International Netherlands BV 5.350% 20 May 2024 261,925 0.51%300,000 USD Embraer Netherlands Finance BV 5.050% 15 June 2025 270,750 0.52%300,000 USD ICTSI Treasury BV 4.625% 16 January 2023 304,860 0.59%293,000 USD Lukoil International Finance BV 4.563% 24 April 2023 263,590 0.51%300,000 USD Marfrig Holdings Europe BV 6.875% 24 June 2019 270,000 0.52%650,000 USD Petrobras Global Finance BV 6.250% 17 March 2024 466,375 0.90%200,000 USD Petrobras Global Finance BV 6.875% 20 January 2040 131,500 0.26%300,000 USD Royal Capital B.V. FRN (perpetual bond*) 291,592 0.56%350,000 USD SABIC Capital II BV 2.625% 03 October 2018 351,081 0.68%350,000 USD VimpelCom Holdings BV 5.950% 13 February 2023 324,319 0.63%
Total for Netherlands 2,935,992 5.68%
Paraguay 350,000 USD Banco Regional SAECA 8.125% 24 January 2019 357,875 0.69%
Total for Paraguay 357,875 0.69%
Peru 650,000 USD Banco de Credito del Peru 5.375% 16 September 2020 692,250 1.34%300,000 USD Scotiabank Peru SAA FRN 13 December 2027 288,750 0.56%
Total for Peru 981,000 1.90%
Philippines 350,000 USD BDO Unibank Inc 3.875% 22 April 2016 350,875 0.68%200,000 USD Rizal Commercial Banking Corp 4.250% 22 January 2020 208,429 0.40%400,000 USD Rizal Commercial Banking Corp 3.450% 02 February 2021 402,731 0.78%500,000 USD Security Bank Corp 3.950% 03 February 2020 504,035 0.98%
Total for Philippines 1,466,070 2.84%
Qatar 650,000 USD Ras Laffan Liquefied Natural Gas Co Ltd III 5.838% 30 September 2027 717,842 1.39%
Total for Qatar 717,842 1.39%
Romania 370,000 EUR Romanian Government International Bond 3.875% 29 October 2035 409,327 0.79%
Total for Romania 409,327 0.79%
Singapore 300,000 USD Flextronics International Ltd 4.625% 15 February 2020 311,250 0.60%300,000 USD Pratama Agung Pte Ltd 6.250% 24 February 2020 291,568 0.57%250,000 USD Theta Capital Pte Ltd 6.125% 14 November 2020 234,248 0.45%
Total for Singapore 837,066 1.62%
South Korea 300,000 USD Export-Import Bank of Korea 3.250% 10 November 2025 302,797 0.59%400,000 USD Korea Gas Corp 3.875% 12 February 2024 418,255 0.81%300,000 USD Shinhan Bank 2.250% 15 April 2020 295,411 0.57%600,000 USD Woori Bank 4.750% 30 April 2024 616,024 1.19%
Total for South Korea 1,632,487 3.16%

Standard Life Investments Global SICAV Société d'Investissement à Capital Variable
239
Emerging Market Corporate Bond Fund Schedule of Investments (expressed in USD) (continued) as at 31 December 2015
Quantity/ Market Value % of
Nominal Value Currency Name of Securities USD Net Assets
Transferable securities and money market instruments admitted to an official exchange listing (continued)
Sweden
650,000 EUR Powszechna Kasa Oszczednosci Bank Polski SA Via PKO Finance AB 2.324% 23 January 2019 729,973 1.41%
Total for Sweden 729,973 1.41%
Switzerland 200,000 USD UBS AG 5.125% 15 May 2024 202,500 0.39%
Total for Switzerland 202,500 0.39%
Thailand 800,000 USD Bangkok Bank PCL 3.875% 27 September 2022 820,977 1.59%420,000 USD Kasikornbank PCL 3.500% 25 October 2019 427,590 0.83%400,000 USD PTT PCL 3.375% 25 October 2022 394,480 0.76%
Total for Thailand 1,643,047 3.18%
Turkey 600,000 USD Turkiye Is Bankasi 5.000% 30 April 2020 595,809 1.15%
Total for Turkey 595,809 1.15%
United Arab Emirates 600,000 USD Emirates NBD PJSC 3.250% 19 November 2019 601,500 1.16%600,000 USD Emirates Telecommunications Group Co PJSC 2.375% 18 June 2019 598,946 1.16%500,000 USD Emirates Telecommunications Group Co PJSC 3.500% 18 June 2024 508,663 0.98%400,000 USD National Bank of Abu Dhabi PJSC FRN (perpetual bond*) 395,000 0.77%
Total for United Arab Emirates 2,104,109 4.07%
United Kingdom 200,000 GBP Enterprise Inns Plc 6.500% 06 December 2018 318,357 0.62%84,394 GBP Greene King Finance Plc FRN 15 December 2033 126,612 0.25%
300,000 GBP HSBC Holdings Plc FRN 18 October 2022 471,050 0.91%250,000 USD HSBC Holdings Plc FRN (perpetual bond*) 250,312 0.48%88,000 EUR Royal Bank of Scotland Plc FRN 22 September 2021 97,924 0.19%
800,000 USD Tullow Oil Plc 6.250% 15 April 2022 540,000 1.04% Total for United Kingdom 1,804,255 3.49%
United States 350,000 USD AK Steel Corp 7.625% 01 October 2021 143,500 0.28%315,000 USD Ford Motor Credit Co LLC 3.157% 04 August 2020 313,300 0.60%300,000 USD Freeport-McMoRan Inc 2.300% 14 November 2017 256,875 0.50%250,000 USD Frontier Communications Corp 7.625% 15 April 2024 211,250 0.41%432,000 USD Halliburton Co 3.800% 15 November 2025 420,399 0.81%300,000 USD MPG Holdco I Inc 7.375% 15 October 2022 303,750 0.59%250,000 EUR Rain CII Carbon LLC / CII Carbon Corp 8.500% 15 January 2021 202,639 0.39%500,000 USD Reliance Holding USA Inc 5.400% 14 February 2022 540,880 1.05%700,000 USD Southern Copper Corp 5.250% 08 November 2042 506,598 0.98%
Total for United States 2,899,191 5.61%
Vietnam 350,000 USD Vingroup JSC 11.625% 07 May 2018 377,137 0.73%
Total for Vietnam 377,137 0.73%
Total transferable securities and money market instruments admitted to an official exchange listing 42,592,720 82.40%
Transferable securities and money market instruments dealt in on another regulated market
Australia 200,000 USD BHP Billiton Finance USA Ltd FRN 19 October 2075 196,250 0.38%
Total for Australia 196,250 0.38%
Austria 200,000 USD JBS Investments GmbH 7.250% 03 April 2024 183,000 0.35%
Total for Austria 183,000 0.35%
Bermuda 1,200,000 USD Digicel Ltd 6.000% 15 April 2021 1,020,000 1.97%

Standard Life Investments Global SICAV Société d'Investissement à Capital Variable
240
Emerging Market Corporate Bond Fund Schedule of Investments (expressed in USD) (continued) as at 31 December 2015
Quantity/ Market Value % of
Nominal Value Currency Name of Securities USD Net Assets
Transferable securities and money market instruments dealt in on another regulated market (continued)
Bermuda (continued) 200,000 USD Digicel Ltd 6.750% 01 March 2023 168,250 0.33%
Total for Bermuda 1,188,250 2.30%
British Virgin Islands 200,000 USD Sinopec Group Overseas Development 2014 Ltd 1.750% 10 April 2017 199,381 0.39%400,000 USD Sinopec Group Overseas Development 2014 Ltd 4.375% 10 April 2024 414,754 0.80%
Total for British Virgin Islands 614,135 1.19%
Canada 165,000 USD First Quantum Minerals Ltd 6.750% 15 February 2020 107,250 0.21%315,000 USD First Quantum Minerals Ltd 7.000% 15 February 2021 199,237 0.39%178,000 USD NOVA Chemicals Corp 5.000% 01 May 2025 172,215 0.33%
Total for Canada 478,702 0.93%
Cayman Islands 300,000 USD Embraer Overseas Ltd 5.696% 16 September 2023 293,250 0.57%
Total for Cayman Islands 293,250 0.57%
Colombia 200,000 USD Banco Bilbao Vizcaya Argentaria Colombia SA 4.875% 21 April 2025 192,000 0.37%300,000 USD Oleoducto Central SA 4.000% 07 May 2021 288,750 0.56%
Total for Colombia 480,750 0.93%
Italy 200,000 USD Enel SpA FRN 24 September 2073 228,250 0.44%
Total for Italy 228,250 0.44%
Luxembourg 400,000 USD Klabin Finance SA 5.250% 16 July 2024 357,000 0.69%300,000 USD Tupy Overseas SA 6.625% 17 July 2024 265,500 0.52%
Total for Luxembourg 622,500 1.21%
Mexico 400,000 USD BBVA Bancomer SA 4.375% 10 April 2024 396,000 0.77%600,000 USD Cemex SAB de CV 5.875% 25 March 2019 578,250 1.12%650,000 USD Cemex SAB de CV 6.125% 05 May 2025 558,025 1.08%400,000 USD Mexichem SAB de CV 5.875% 17 September 2044 337,000 0.65%
Total for Mexico 1,869,275 3.62%
Netherlands 200,000 USD Marfrig Holdings Europe BV 6.875% 24 June 2019 180,000 0.35%700,000 USD VTR Finance BV 6.875% 15 January 2024 649,250 1.25%
Total for Netherlands 829,250 1.60%
Peru 300,000 USD InRetail Consumer 5.250% 10 October 2021 299,250 0.58%
Total for Peru 299,250 0.58%
Singapore 200,000 USD Flextronics International Ltd 4.750% 15 June 2025 195,250 0.38%
Total for Singapore 195,250 0.38%
South Korea 400,000 USD Korea East-West Power Co Ltd 2.500% 02 June 2020 399,228 0.77%
Total for South Korea 399,228 0.77%

Standard Life Investments Global SICAV Société d'Investissement à Capital Variable
241
Emerging Market Corporate Bond Fund Schedule of Investments (expressed in USD) (continued) as at 31 December 2015
Quantity/ Market Value % of
Nominal Value Currency Name of Securities USD Net Assets
Transferable securities and money market instruments dealt in on another regulated market (continued)
United States 120,000 USD JBS USA LLC / JBS USA Finance Inc 5.750% 15 June 2025 105,000 0.20%
Total for United States 105,000 0.20%
Total transferable securities and money market instruments dealt in on another regulated market 7,982,340 15.45%
Total investments 50,575,060 97.85%Cash and cash equivalents 2,325,665 4.50%Other net liabilities (1,211,853) (2.35%)Total net assets 51,688,872 100.00%
*A perpetual bond is a bond with no maturity date. Perpetual bonds are not redeemable but pay a steady stream of interest.
Analysis of Investments as % of total assets Transferable securities and money market instruments admitted to an official exchange listing 79.35%Transferable securities and money market instruments dealt in on another regulated market 14.87%Other assets 5.78%Total assets 100.00%
The accompanying notes form an integral part of these financial statements.

Standard Life Investments Global SICAV Société d'Investissement à Capital Variable
242
Total Return Credit Fund
Sub-fund Objective The objective of the Sub-fund is to provide a return from capital appreciation and income.
Investment Policy The Sub-fund will achieve this objective through investing mainly in higher yielding debt securities, including government and corporate bonds, asset backed securities, sub investment grade bonds and inflation linked bonds, that are listed or traded in either developed or emerging markets. The Sub-fund may also invest in other transferable securities, floating rate notes, money-market instruments, deposits, cash and near cash, derivatives (including currency forwards, interest rate and credit default swaps) and collective investment schemes. In combination it will seek to reduce the volatility of these assets and generate additional returns by investing in a portfolio of permitted derivative contracts (including futures, options, swaps, forward currency contracts and other derivatives) as well as traditional assets located anywhere in the world.
Performance Review The sub-fund returned 2.2% over the period.*
Initially, our exposure to financial issuers such as QBE, an Australian global insurer, and Barclays’ contingent convertible bonds, contributed to returns. Meanwhile, our short-dated high yield position in Enterprise Inns performed well, as pubs continued to make progress on restructuring and repairing balance sheets. Within core European high yield holdings, low-rated Lindor, a debt consolidator in Europe, and Wind, an Italian mobile company, added to returns. European high yield has generally been stable, a knock-on effect of the grab for yield due to European Central Bank’s quantative easing. Within the US, our exposure to healthcare issuers HCA and Kindred performed well. They are both single B rated hospital operators which continue to benefit from, among other things, ObamaCare.
Among less strong performing bonds, AK Steel had disappointing first quarter results and struggled in the general US lower-rated high yield sell-off. In addition, Frontier Communications is a BB rated US wireline company which suffered from results missing expectations and the prospect of future issuance. Our macro dampening strategies made a positive contribution to performance during this period. Our long US dollar positions versus the Canadian dollar, Australian dollar and euro were top performers. The euro underperformed around Greek news, while the other currencies were affected by continued commodity weakness. Our timed long duration strategies in Australia, Korea and Europe also added to returns.
Within our credit holdings, Soho House and Center Parcs were two very strong performers and benefited from having no exposure to global trade, emerging market (“EM”), China or commodities. Meanwhile, Reynolds and Pulte Group both performed well and were positive contributors within a weak market environment for weak US credit. Our holdings in commodity-related debt and companies impacted by global trade generally suffered. Ivory Coast, one of our top EM sovereign picks, also struggled amid the wider EM sell-off. Exposure to short-dated Australian duration was beneficial, as was our long US dollar-denominated position versus a basket of EM currencies. Being long equity volatility within our macro dampening positions provided excellent protection over the third quarter.
As the period came to a close, our credit positions (our top ideas from around the global fixed income business) provided the overwhelming majority of our performance. From the perspective of individual positions, there were a number of positive performers. Ivory Coast rebounded strongly after a weak third quarter. While EM as a whole is under pressure, Ivory Coast is an improving credit with little correlation to oil. Chinese property company Shimoa also proved beneficial for performance. Although investors are concerned about Chinese growth and the Chinese stock market, Chinese credit has been one of the best performing areas of the fixed income market. There is strong Asian demand for dollar-denominated bonds such as those issued by Shimoa and performance has been robust.
*Sub-fund performance has been calculated over the stated period on the share price performance basis, based on the D Accumulation Shares in sterling and net of fees.
Outlook As we are always 85-90% invested in our best credit ideas (the remaining capacity is used to fund macro dampening strategies), the Sub-fund can withstand greater volatility in its underlying bond holdings. However, in the short term we are cautious on the outlook for higher yielding credit, although it is clear that attractive valuations are now emerging. This caution is demonstrated by the fact we ended the year with our maximum cash allocation of 15% and have no credit derivative exposure in play that would allow us to be fully invested. We have also increased the average credit rating in the Sub-fund from BB- in late 2014 to BB+.
Through the addition of Anglo American and Williams, we can take advantage of our favoured issuers in the sectors that are under the most pressure. These particular purchases take our exposure to oil & gas and miners to just over 5% of the Sub-fund. We are happy with this exposure and are unlikely to add more without a further sell-off.
In a year that should exhibit further volatility, our favoured issuers are still coming from the banking sector (new style subordinated debt and legacy yield-to-call bonds) as well as short-dated investment grade debt where valuations are now more compelling. We also like high yield debt from consumer-facing issuers that have utility-like characteristics, such as Center Parcs and Virgin Media.
Please note that the absolute Value at Risk (“VaR”) approach has been used for risk measurement and calculation of global exposure for this Sub-fund. Measurement of 1 month 99% VaR is based on a parametric calculation with an additional upwards scaling factor applied. Parametric risk model uses 180 weeks of equally weighted data with which to forecast risk.
On the above basis the VaR has been as follows:
Highest: 4.13% Average: 3.66% Lowest: 2.78%
Leverage is calculated as the sum of the notionals of the derivatives used. The level of leverage employed during the relevant period was 187%.
This Sub-fund is not authorized in Hong Kong and is not available to Hong Kong residents.
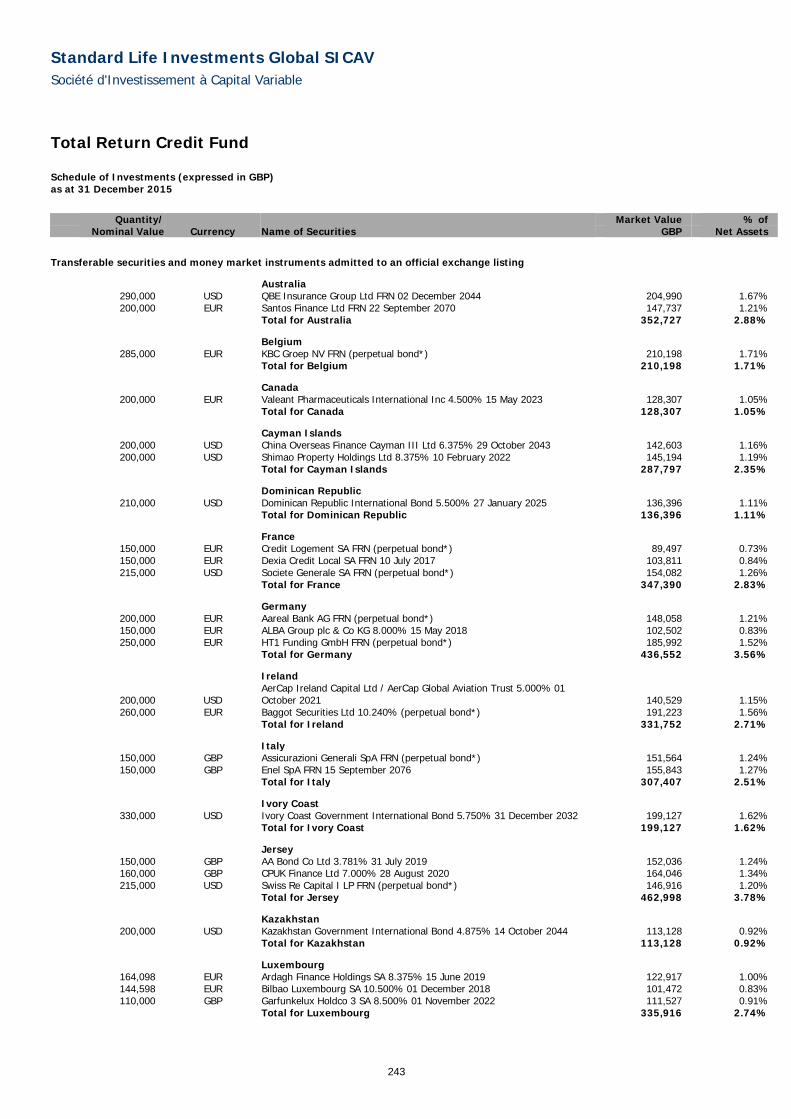
Standard Life Investments Global SICAV Société d'Investissement à Capital Variable
243
Total Return Credit Fund Schedule of Investments (expressed in GBP) as at 31 December 2015
Quantity/ Market Value % of
Nominal Value Currency Name of Securities GBP Net Assets
Transferable securities and money market instruments admitted to an official exchange listing
Australia 290,000 USD QBE Insurance Group Ltd FRN 02 December 2044 204,990 1.67%200,000 EUR Santos Finance Ltd FRN 22 September 2070 147,737 1.21%
Total for Australia 352,727 2.88%
Belgium 285,000 EUR KBC Groep NV FRN (perpetual bond*) 210,198 1.71%
Total for Belgium 210,198 1.71%
Canada 200,000 EUR Valeant Pharmaceuticals International Inc 4.500% 15 May 2023 128,307 1.05%
Total for Canada 128,307 1.05%
Cayman Islands 200,000 USD China Overseas Finance Cayman III Ltd 6.375% 29 October 2043 142,603 1.16%200,000 USD Shimao Property Holdings Ltd 8.375% 10 February 2022 145,194 1.19%
Total for Cayman Islands 287,797 2.35%
Dominican Republic 210,000 USD Dominican Republic International Bond 5.500% 27 January 2025 136,396 1.11%
Total for Dominican Republic 136,396 1.11%
France 150,000 EUR Credit Logement SA FRN (perpetual bond*) 89,497 0.73%150,000 EUR Dexia Credit Local SA FRN 10 July 2017 103,811 0.84%215,000 USD Societe Generale SA FRN (perpetual bond*) 154,082 1.26%
Total for France 347,390 2.83%
Germany 200,000 EUR Aareal Bank AG FRN (perpetual bond*) 148,058 1.21%150,000 EUR ALBA Group plc & Co KG 8.000% 15 May 2018 102,502 0.83%250,000 EUR HT1 Funding GmbH FRN (perpetual bond*) 185,992 1.52%
Total for Germany 436,552 3.56%
Ireland
200,000 USD AerCap Ireland Capital Ltd / AerCap Global Aviation Trust 5.000% 01 October 2021 140,529 1.15%
260,000 EUR Baggot Securities Ltd 10.240% (perpetual bond*) 191,223 1.56% Total for Ireland 331,752 2.71%
Italy 150,000 GBP Assicurazioni Generali SpA FRN (perpetual bond*) 151,564 1.24%150,000 GBP Enel SpA FRN 15 September 2076 155,843 1.27%
Total for Italy 307,407 2.51%
Ivory Coast 330,000 USD Ivory Coast Government International Bond 5.750% 31 December 2032 199,127 1.62%
Total for Ivory Coast 199,127 1.62%
Jersey 150,000 GBP AA Bond Co Ltd 3.781% 31 July 2019 152,036 1.24%160,000 GBP CPUK Finance Ltd 7.000% 28 August 2020 164,046 1.34%215,000 USD Swiss Re Capital I LP FRN (perpetual bond*) 146,916 1.20%
Total for Jersey 462,998 3.78%
Kazakhstan 200,000 USD Kazakhstan Government International Bond 4.875% 14 October 2044 113,128 0.92%
Total for Kazakhstan 113,128 0.92%
Luxembourg 164,098 EUR Ardagh Finance Holdings SA 8.375% 15 June 2019 122,917 1.00%144,598 EUR Bilbao Luxembourg SA 10.500% 01 December 2018 101,472 0.83%110,000 GBP Garfunkelux Holdco 3 SA 8.500% 01 November 2022 111,527 0.91%
Total for Luxembourg 335,916 2.74%
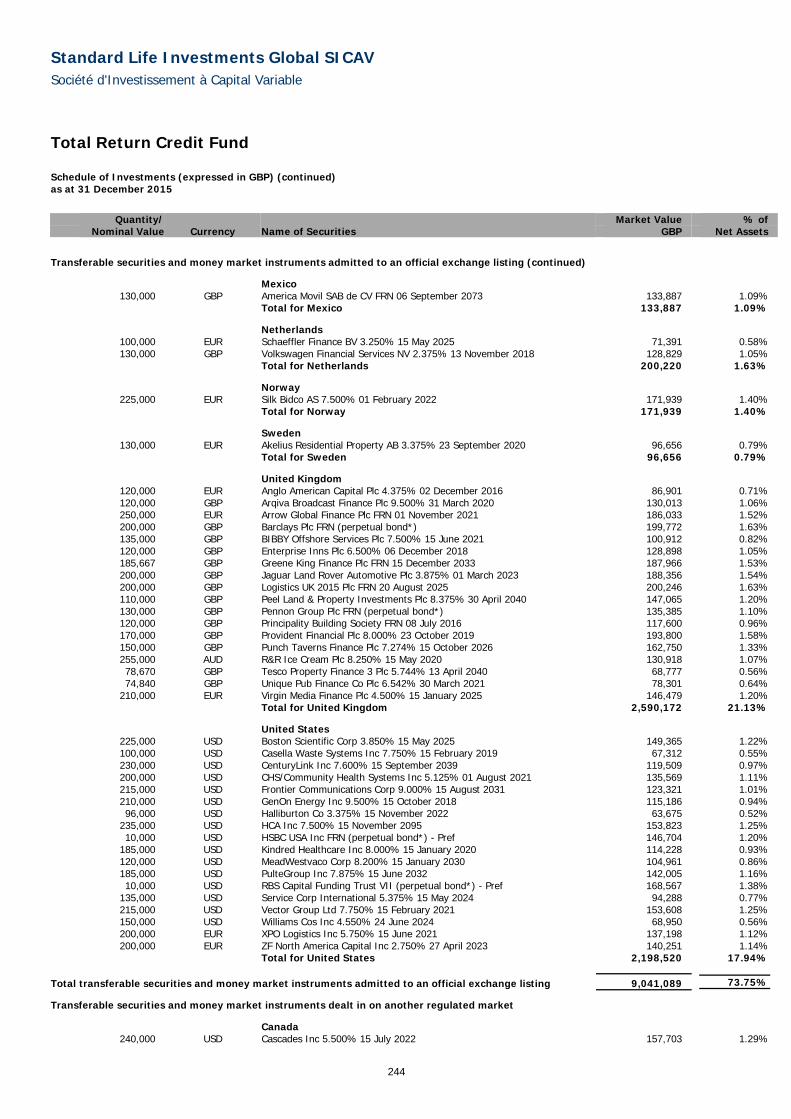
Standard Life Investments Global SICAV Société d'Investissement à Capital Variable
244
Total Return Credit Fund Schedule of Investments (expressed in GBP) (continued) as at 31 December 2015
Quantity/ Market Value % of
Nominal Value Currency Name of Securities GBP Net Assets
Transferable securities and money market instruments admitted to an official exchange listing (continued)
Mexico 130,000 GBP America Movil SAB de CV FRN 06 September 2073 133,887 1.09%
Total for Mexico 133,887 1.09%
Netherlands 100,000 EUR Schaeffler Finance BV 3.250% 15 May 2025 71,391 0.58%130,000 GBP Volkswagen Financial Services NV 2.375% 13 November 2018 128,829 1.05%
Total for Netherlands 200,220 1.63%
Norway 225,000 EUR Silk Bidco AS 7.500% 01 February 2022 171,939 1.40%
Total for Norway 171,939 1.40%
Sweden 130,000 EUR Akelius Residential Property AB 3.375% 23 September 2020 96,656 0.79%
Total for Sweden 96,656 0.79%
United Kingdom 120,000 EUR Anglo American Capital Plc 4.375% 02 December 2016 86,901 0.71%120,000 GBP Arqiva Broadcast Finance Plc 9.500% 31 March 2020 130,013 1.06%250,000 EUR Arrow Global Finance Plc FRN 01 November 2021 186,033 1.52%200,000 GBP Barclays Plc FRN (perpetual bond*) 199,772 1.63%135,000 GBP BIBBY Offshore Services Plc 7.500% 15 June 2021 100,912 0.82%120,000 GBP Enterprise Inns Plc 6.500% 06 December 2018 128,898 1.05%185,667 GBP Greene King Finance Plc FRN 15 December 2033 187,966 1.53%200,000 GBP Jaguar Land Rover Automotive Plc 3.875% 01 March 2023 188,356 1.54%200,000 GBP Logistics UK 2015 Plc FRN 20 August 2025 200,246 1.63%110,000 GBP Peel Land & Property Investments Plc 8.375% 30 April 2040 147,065 1.20%130,000 GBP Pennon Group Plc FRN (perpetual bond*) 135,385 1.10%120,000 GBP Principality Building Society FRN 08 July 2016 117,600 0.96%170,000 GBP Provident Financial Plc 8.000% 23 October 2019 193,800 1.58%150,000 GBP Punch Taverns Finance Plc 7.274% 15 October 2026 162,750 1.33%255,000 AUD R&R Ice Cream Plc 8.250% 15 May 2020 130,918 1.07%78,670 GBP Tesco Property Finance 3 Plc 5.744% 13 April 2040 68,777 0.56%74,840 GBP Unique Pub Finance Co Plc 6.542% 30 March 2021 78,301 0.64%
210,000 EUR Virgin Media Finance Plc 4.500% 15 January 2025 146,479 1.20% Total for United Kingdom 2,590,172 21.13%
United States 225,000 USD Boston Scientific Corp 3.850% 15 May 2025 149,365 1.22%100,000 USD Casella Waste Systems Inc 7.750% 15 February 2019 67,312 0.55%230,000 USD CenturyLink Inc 7.600% 15 September 2039 119,509 0.97%200,000 USD CHS/Community Health Systems Inc 5.125% 01 August 2021 135,569 1.11%215,000 USD Frontier Communications Corp 9.000% 15 August 2031 123,321 1.01%210,000 USD GenOn Energy Inc 9.500% 15 October 2018 115,186 0.94%96,000 USD Halliburton Co 3.375% 15 November 2022 63,675 0.52%
235,000 USD HCA Inc 7.500% 15 November 2095 153,823 1.25%10,000 USD HSBC USA Inc FRN (perpetual bond*) - Pref 146,704 1.20%
185,000 USD Kindred Healthcare Inc 8.000% 15 January 2020 114,228 0.93%120,000 USD MeadWestvaco Corp 8.200% 15 January 2030 104,961 0.86%185,000 USD PulteGroup Inc 7.875% 15 June 2032 142,005 1.16%10,000 USD RBS Capital Funding Trust VII (perpetual bond*) - Pref 168,567 1.38%
135,000 USD Service Corp International 5.375% 15 May 2024 94,288 0.77%215,000 USD Vector Group Ltd 7.750% 15 February 2021 153,608 1.25%150,000 USD Williams Cos Inc 4.550% 24 June 2024 68,950 0.56%200,000 EUR XPO Logistics Inc 5.750% 15 June 2021 137,198 1.12%200,000 EUR ZF North America Capital Inc 2.750% 27 April 2023 140,251 1.14%
Total for United States 2,198,520 17.94%
Total transferable securities and money market instruments admitted to an official exchange listing 9,041,089 73.75%
Transferable securities and money market instruments dealt in on another regulated market
Canada 240,000 USD Cascades Inc 5.500% 15 July 2022 157,703 1.29%

Standard Life Investments Global SICAV Société d'Investissement à Capital Variable
245
Total Return Credit Fund Schedule of Investments (expressed in GBP) (continued) as at 31 December 2015
Quantity/ Market Value % of
Nominal Value Currency Name of Securities GBP Net Assets
Transferable securities and money market instruments dealt in on another regulated market (continued)
Canada (continued) 250,000 USD First Quantum Minerals Ltd 7.000% 15 February 2021 106,704 0.87%
Total for Canada 264,407 2.16%
United Kingdom 230,000 USD CEVA Group Plc 7.000% 01 March 2021 129,597 1.06%200,000 USD Sensata Technologies UK Financing Co plc 6.250% 15 February 2026 140,698 1.15%200,000 USD Tullow Oil Plc 6.000% 01 November 2020 94,473 0.77%
Total for United Kingdom 364,768 2.98%
United States
176,981 USD American Airlines 2013-1 Class B Pass Through Trust 5.625% 15 January 2021 121,071 0.99%
180,000 USD Avis Budget Car Rental LLC / Avis Budget Finance Inc 5.250% 15 March 2025 115,848 0.95%
200,000 USD Cemex Finance LLC 9.375% 12 October 2022 142,520 1.16%160,000 USD Dollar Tree Inc 5.750% 01 March 2023 112,828 0.92%80,000 USD Golden Nugget Escrow Inc 8.500% 01 December 2021 54,524 0.44%30,000 USD Harland Clarke Holdings Corp 9.250% 01 March 2021 15,968 0.13%
175,000 USD Milacron LLC / Mcron Finance Corp 7.750% 15 February 2021 111,597 0.91%170,000 USD PaperWorks Industries Inc 9.500% 15 August 2019 105,540 0.86%
Total for United States 779,896 6.36%
Total transferable securities and money market instruments dealt in on another regulated market 1,409,071 11.50%
Total investments 10,450,160 85.25%Cash and cash equivalents 1,763,566 14.39%Other net assets 44,637 0.36%Total net assets 12,258,363 100.00%
*A perpetual bond is a bond with no maturity date. Perpetual bonds are not redeemable but pay a steady stream of interest.
Analysis of Investments as % of total assets Transferable securities and money market instruments admitted to an official exchange listing 72.38%Transferable securities and money market instruments dealt in on another regulated market 11.28%Other assets 16.34%Total assets 100.00%
The accompanying notes form an integral part of these financial statements.
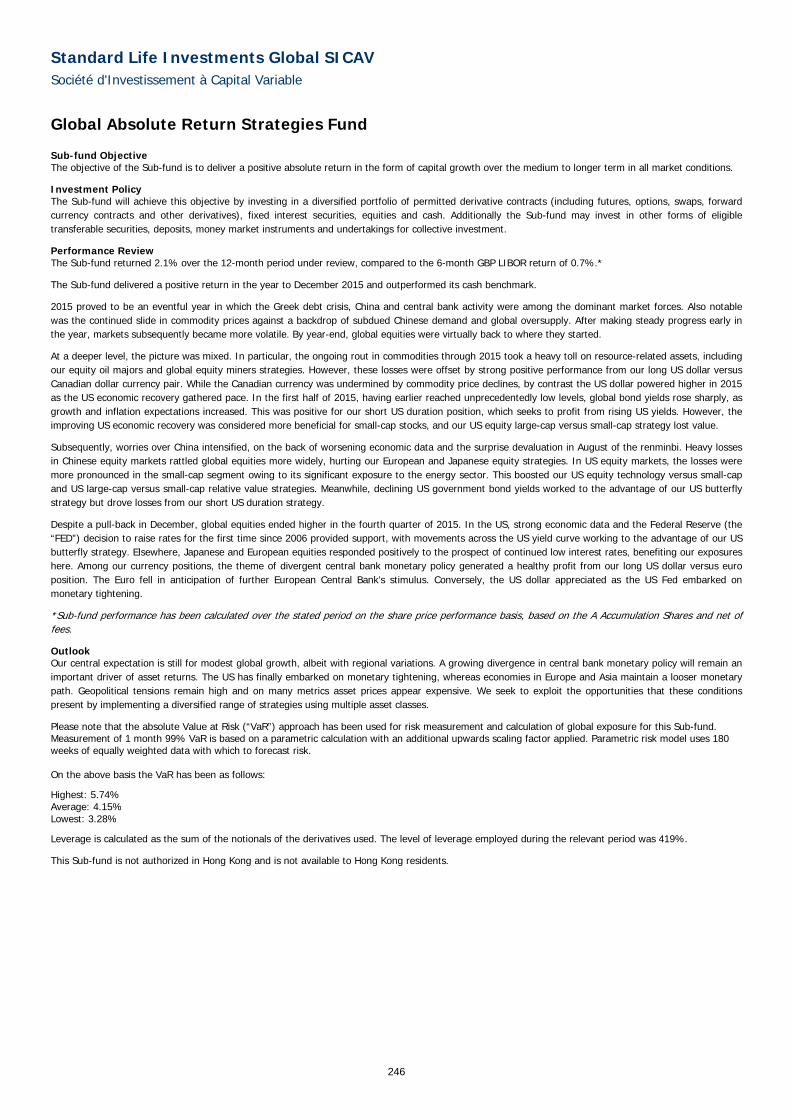
Standard Life Investments Global SICAV Société d'Investissement à Capital Variable
246
Global Absolute Return Strategies Fund
Sub-fund Objective The objective of the Sub-fund is to deliver a positive absolute return in the form of capital growth over the medium to longer term in all market conditions.
Investment Policy The Sub-fund will achieve this objective by investing in a diversified portfolio of permitted derivative contracts (including futures, options, swaps, forward currency contracts and other derivatives), fixed interest securities, equities and cash. Additionally the Sub-fund may invest in other forms of eligible transferable securities, deposits, money market instruments and undertakings for collective investment.
Performance Review The Sub-fund returned 2.1% over the 12-month period under review, compared to the 6-month GBP LIBOR return of 0.7%.*
The Sub-fund delivered a positive return in the year to December 2015 and outperformed its cash benchmark.
2015 proved to be an eventful year in which the Greek debt crisis, China and central bank activity were among the dominant market forces. Also notable was the continued slide in commodity prices against a backdrop of subdued Chinese demand and global oversupply. After making steady progress early in the year, markets subsequently became more volatile. By year-end, global equities were virtually back to where they started.
At a deeper level, the picture was mixed. In particular, the ongoing rout in commodities through 2015 took a heavy toll on resource-related assets, including our equity oil majors and global equity miners strategies. However, these losses were offset by strong positive performance from our long US dollar versus Canadian dollar currency pair. While the Canadian currency was undermined by commodity price declines, by contrast the US dollar powered higher in 2015 as the US economic recovery gathered pace. In the first half of 2015, having earlier reached unprecedentedly low levels, global bond yields rose sharply, as growth and inflation expectations increased. This was positive for our short US duration position, which seeks to profit from rising US yields. However, the improving US economic recovery was considered more beneficial for small-cap stocks, and our US equity large-cap versus small-cap strategy lost value.
Subsequently, worries over China intensified, on the back of worsening economic data and the surprise devaluation in August of the renminbi. Heavy losses in Chinese equity markets rattled global equities more widely, hurting our European and Japanese equity strategies. In US equity markets, the losses were more pronounced in the small-cap segment owing to its significant exposure to the energy sector. This boosted our US equity technology versus small-cap and US large-cap versus small-cap relative value strategies. Meanwhile, declining US government bond yields worked to the advantage of our US butterfly strategy but drove losses from our short US duration strategy.
Despite a pull-back in December, global equities ended higher in the fourth quarter of 2015. In the US, strong economic data and the Federal Reserve (the “FED”) decision to raise rates for the first time since 2006 provided support, with movements across the US yield curve working to the advantage of our US butterfly strategy. Elsewhere, Japanese and European equities responded positively to the prospect of continued low interest rates, benefiting our exposures here. Among our currency positions, the theme of divergent central bank monetary policy generated a healthy profit from our long US dollar versus euro position. The Euro fell in anticipation of further European Central Bank’s stimulus. Conversely, the US dollar appreciated as the US Fed embarked on monetary tightening.
*Sub-fund performance has been calculated over the stated period on the share price performance basis, based on the A Accumulation Shares and net of fees.
Outlook Our central expectation is still for modest global growth, albeit with regional variations. A growing divergence in central bank monetary policy will remain an important driver of asset returns. The US has finally embarked on monetary tightening, whereas economies in Europe and Asia maintain a looser monetary path. Geopolitical tensions remain high and on many metrics asset prices appear expensive. We seek to exploit the opportunities that these conditions present by implementing a diversified range of strategies using multiple asset classes.
Please note that the absolute Value at Risk (“VaR”) approach has been used for risk measurement and calculation of global exposure for this Sub-fund. Measurement of 1 month 99% VaR is based on a parametric calculation with an additional upwards scaling factor applied. Parametric risk model uses 180 weeks of equally weighted data with which to forecast risk. On the above basis the VaR has been as follows:
Highest: 5.74% Average: 4.15% Lowest: 3.28%
Leverage is calculated as the sum of the notionals of the derivatives used. The level of leverage employed during the relevant period was 419%.
This Sub-fund is not authorized in Hong Kong and is not available to Hong Kong residents.

Standard Life Investments Global SICAV Société d'Investissement à Capital Variable
247
Global Absolute Return Strategies Fund Schedule of Investments (expressed in EUR) as at 31 December 2015
Quantity/ Market Value % of
Nominal Value Currency Name of Securities EUR Net Assets
Transferable securities and money market instruments admitted to an official exchange listing
Australia 800,000 EUR APT Pipelines Ltd 1.375% 22 March 2022 762,103 0.00%500,000 GBP APT Pipelines Ltd 4.250% 26 November 2024 703,434 0.00%502,000 EUR APT Pipelines Ltd 2.000% 22 March 2027 449,472 0.00%150,000 GBP Asciano Finance Ltd 5.000% 19 September 2023 216,364 0.00%700,000 EUR Australia Pacific Airports Melbourne Pty Ltd 1.750% 15 October 2024 692,132 0.00%500,000 GBP BHP Billiton Finance Ltd 4.300% 25 September 2042 640,348 0.00%
1,130,000 EUR BHP Billiton Finance Ltd FRN 22 April 2076 1,111,389 0.01%7,920,000 USD BHP Billiton Finance USA Ltd 5.000% 30 September 2043 6,544,422 0.04%1,290,000 USD CNOOC Finance 2015 Australia Pty Ltd 2.625% 05 May 2020 1,159,517 0.01%
300,000 GBP National Australia Bank Ltd 3.625% 08 November 2017 423,990 0.00%1,333,000 EUR National Australia Bank Ltd FRN 12 November 2024 1,325,275 0.01%
950,000 EUR Origin Energy Finance Ltd 3.500% 04 October 2021 915,544 0.01%1,635,000 USD Rio Tinto Finance USA Ltd 5.200% 02 November 2040 1,378,666 0.01%1,710,000 EUR Santos Finance Ltd FRN 22 September 2070 1,719,084 0.01%1,730,000 EUR Scentre Group Trust 1 1.500% 16 July 2020 1,760,207 0.01%
550,000 GBP Scentre Group Trust 1 3.875% 16 July 2026 783,489 0.01%640,000 GBP Scentre Group Trust 1 / Scentre Group Trust 2 2.375% 08 April 2022 852,363 0.01%
1,080,000 EUR Scentre Group Trust 2 3.250% 11 September 2023 1,204,502 0.01% Total for Australia 22,642,301 0.14%
Austria 208,379 EUR Erste Group Bank AG 6,024,237 0.04%256,133 EUR Oesterreichische Post AG 8,613,753 0.05%168,527 EUR Raiffeisen Bank International AG 2,292,810 0.01%700,000 EUR UniCredit Bank Austria AG 2.625% 30 January 2018 723,858 0.01%
Total for Austria 17,654,658 0.11%
Belgium 242,652 EUR Anheuser-Busch InBev SA/NV 27,759,389 0.17%750,000 GBP Anheuser-Busch InBev SA/NV 9.750% 30 July 2024 1,474,498 0.01%500,000 EUR Belfius Bank SA/NV 1.125% 22 May 2017 505,650 0.00%
2,000,000 EUR Belfius Bank SA/NV 2.250% 26 September 2018 2,090,728 0.01%239,892 EUR KBC Groep NV 13,834,572 0.09%
2,350,000 EUR KBC Groep NV FRN (perpetual bond*) 2,358,812 0.02%460,169 EUR Umicore SA 17,792,434 0.11%
Total for Belgium 65,816,083 0.41%
Bermuda 1,454,000 USD Fly Leasing Ltd 6.375% 15 October 2021 1,333,658 0.01%
385,042 USD Lazard Ltd 16,047,074 0.10%6,850,000 HKD REXLot Holdings Ltd1 89,288 0.00%
87,900 USD Validus Holdings Ltd 3,782,002 0.02% Total for Bermuda 21,252,022 0.13%
Brazil 230,000 EUR Vale SA 4.375% 24 March 2018 215,337 0.00%
Total for Brazil 215,337 0.00%
British Virgin Islands 820,000 GBP Global Switch Holdings Ltd 4.375% 13 December 2022 1,171,806 0.01%
9,664,409 HKD Tianhe Chemicals Group Ltd1 332,110 0.00% Total for British Virgin Islands 1,503,916 0.01%
Canada 568,597 SEK Africa Oil Corp 736,632 0.00%390,806 CAD Alimentation Couche-Tard Inc 16,025,305 0.10%592,197 CAD Element Financial Corp 6,600,693 0.04%
1,000,000 GBP Glencore Canada Financial Corp 7.375% 27 May 2020 1,268,689 0.01%2,490,000 EUR Great-West Lifeco Inc 2.500% 18 April 2023 2,650,078 0.02%1,405,000 USD Novelis Inc 8.750% 15 December 2020 1,200,004 0.01%4,370,000 USD Potash Corp of Saskatchewan Inc 3.000% 01 April 2025 3,770,765 0.02%8,180,000 USD Rogers Communications Inc 5.000% 15 March 2044 7,568,334 0.05%5,133,000 USD TransCanada PipeLines Ltd 7.625% 15 January 2039 5,784,700 0.04%1,120,000 EUR Valeant Pharmaceuticals International Inc 4.500% 15 May 2023 977,872 0.00%
Total for Canada 46,583,072 0.29%

Standard Life Investments Global SICAV Société d'Investissement à Capital Variable
248
Global Absolute Return Strategies Fund Schedule of Investments (expressed in EUR) (continued) as at 31 December 2015
Quantity/ Market Value % of
Nominal Value Currency Name of Securities EUR Net Assets
Transferable securities and money market instruments admitted to an official exchange listing (continued)
Cayman Islands 500,000 GBP ASIF II 6.375% 05 October 2020 799,847 0.01%60,635 USD Baidu Inc 10,698,967 0.07%
567,000 HKD China Mengniu Dairy Co Ltd 849,257 0.01%790,000 EUR China Overseas Land International Cayman Ltd 1.750% 15 July 2019 788,305 0.00%288,666 HKD China Overseas Property Holdings Ltd 43,442 0.00%
1,000,000 GBP Dwr Cymru Financing Ltd 6.907% 31 March 2021 1,649,290 0.01%1,200,000 EUR Hutchison Whampoa Finance 09 Ltd 4.750% 14 November 2016 1,245,786 0.01%2,250,000 EUR Hutchison Whampoa Finance 14 Ltd 1.375% 31 October 2021 2,248,450 0.01%
620,000 EUR IPIC GMTN Ltd 2.375% 30 May 2018 639,468 0.00%1,660,000 EUR IPIC GMTN Ltd 5.875% 14 March 2021 2,040,479 0.01%
249,700 USD JD.com Inc 7,356,584 0.05%1,699,200 HKD Sands China Ltd 5,345,869 0.03%
500,000 GBP Southern Water Services Finance Ltd 6.125% 31 March 2019 764,284 0.00%900,000 GBP Southern Water Services Finance Ltd FRN 31 March 2038 1,269,817 0.01%
1,000,000 GBP Thames Water Utilities Cayman Finance Ltd 4.000% 19 June 2025 1,454,624 0.01%983,000 GBP Thames Water Utilities Cayman Finance Ltd FRN 21 July 2025 1,397,088 0.01%
1,104,000 GBP Thames Water Utilities Cayman Finance Ltd FRN 13 September 2030 1,680,147 0.01%950,000 GBP Thames Water Utilities Cayman Finance Ltd 4.375% 03 July 2034 1,382,593 0.01%728,340 GBP THPA Finance Ltd 7.127% 15 March 2024 1,158,435 0.01%535,319 GBP Trafford Centre Finance Ltd 6.500% 28 July 2033 941,127 0.01%
1,200,000 GBP Yorkshire Water Services Bradford Finance Ltd FRN 24 April 2025 1,710,967 0.01%300,000 GBP Yorkshire Water Services Bradford Finance Ltd 6.375% 19 August 2039 556,848 0.00%
Total for Cayman Islands 46,021,674 0.29%
Curaçao 790,000 EUR Teva Pharmaceutical Finance IV BV 2.875% 15 April 2019 838,015 0.01%
Total for Curaçao 838,015 0.01%
Denmark 580,000 GBP AP Moeller - Maersk A/S 4.000% 04 April 2025 799,691 0.01%238,094 DKK Coloplast A/S 17,771,198 0.11%
1,832,301 DKK Danske Bank A/S 45,472,713 0.29%480,000 GBP Danske Bank A/S FRN (perpetual bond*) 662,118 0.00%610,000 EUR DONG Energy A/S 6.500% 07 May 2019 726,738 0.00%585,000 EUR DONG Energy A/S 4.875% 16 December 2021 706,336 0.00%
3,570,000 GBP DONG Energy A/S 4.875% 12 January 2032 5,328,411 0.03%1,119,000 EUR DONG Energy A/S FRN 26 June 3013 1,209,919 0.01%
367,226 DKK ISS A/S 12,238,333 0.08%786,698 DKK Novo Nordisk A/S 42,157,273 0.27%
1,520,000 EUR Nykredit Realkredit A/S FRN 17 November 2027 1,506,176 0.01%650,000 GBP TDC A/S 5.625% 23 February 2023 957,822 0.01%
Total for Denmark 129,536,728 0.82%
Finland 800,000 EUR Fortum OYJ 6.000% 20 March 2019 932,997 0.01%500,000 EUR Fortum OYJ 4.000% 24 May 2021 571,564 0.00%336,700 EUR Kesko OYJ 10,898,979 0.07%449,085 EUR Kone OYJ 17,590,659 0.11%
7,076,264 EUR Nokia OYJ 46,667,961 0.29%790,000 GBP Pohjola Bank Oyj 2.500% 20 May 2022 1,068,509 0.01%639,370 EUR Sampo Oyj 30,050,390 0.19%
1,022,100 EUR Stora Enso OYJ 8,575,419 0.05%556,810 EUR Wartsila OYJ Abp 23,469,542 0.15%
Total for Finland 139,826,020 0.88%
France 400,000 EUR Aeroports de Paris 1.500% 24 July 2023 408,056 0.00%900,000 EUR Aeroports de Paris 2.750% 05 June 2028 993,375 0.01%200,000 EUR Alstom SA 3.625% 05 October 2018 215,675 0.00%250,000 EUR Alstom SA 4.500% 18 March 2020 283,547 0.00%200,000 EUR Areva SA 3.250% 04 September 2020 193,471 0.00%300,000 EUR Arkema SA 1.500% 20 January 2025 289,953 0.00%150,000 EUR Autoroutes du Sud de la France SA 7.375% 20 March 2019 182,591 0.00%300,000 EUR Autoroutes du Sud de la France SA 4.125% 13 April 2020 342,223 0.00%400,000 EUR Autoroutes du Sud de la France SA 2.950% 17 January 2024 443,430 0.00%

Standard Life Investments Global SICAV Société d'Investissement à Capital Variable
249
Global Absolute Return Strategies Fund Schedule of Investments (expressed in EUR) (continued) as at 31 December 2015
Quantity/ Market Value % of
Nominal Value Currency Name of Securities EUR Net Assets
Transferable securities and money market instruments admitted to an official exchange listing (continued)
France (continued) 3,214,626 EUR AXA SA 81,105,014 0.51%1,655,000 GBP AXA SA FRN (perpetual bond*) 2,270,155 0.01%
500,000 EUR Banque Federative du Credit Mutuel SA 3.000% 28 November 2023 560,138 0.00%608,501 EUR BNP Paribas SA 31,782,007 0.20%
1,480,000 EUR BNP Paribas SA 2.500% 23 August 2019 1,588,535 0.01%600,000 EUR BNP Paribas SA 2.250% 13 January 2021 639,691 0.00%100,000 EUR BNP Paribas SA FRN (perpetual bond*) 113,124 0.00%200,000 EUR Bouygues SA 4.000% 12 February 2018 214,803 0.00%300,000 EUR BPCE SA 2.000% 24 April 2018 311,950 0.00%
1,400,000 EUR BPCE SA 4.250% 06 February 2023 1,679,539 0.01%740,000 USD BPCE SA 5.150% 21 July 2024 685,259 0.00%400,000 EUR Casino Guichard Perrachon SA 4.472% 04 April 2016 403,564 0.00%
1,400,000 EUR Casino Guichard Perrachon SA 4.726% 26 May 2021 1,524,899 0.01%900,000 EUR Casino Guichard Perrachon SA 3.311% 25 January 2023 883,732 0.01%800,000 EUR Casino Guichard Perrachon SA 3.248% 07 March 2024 764,524 0.01%200,000 EUR Casino Guichard Perrachon SA 2.798% 05 August 2026 176,822 0.00%300,000 EUR Christian Dior SE 4.000% 12 May 2016 303,984 0.00%
3,000,000 EUR Christian Dior SE 1.375% 19 June 2019 3,060,810 0.02%900,000 GBP Cie de Saint-Gobain 5.625% 15 December 2016 1,274,043 0.01%400,000 GBP Cie de Saint-Gobain 5.625% 15 November 2024 627,188 0.00%400,000 EUR Cie Financiere et Industrielle des Autoroutes SA 5.000% 24 May 2021 483,563 0.00%
1,100,000 GBP CNP Assurances FRN 30 September 2041 1,675,193 0.01%300,000 GBP Credit Agricole SA 5.500% 17 December 2021 472,861 0.00%
1,000,000 GBP Credit Agricole SA 7.375% 18 December 2023 1,681,273 0.01%540,000 EUR Credit Agricole SA 2.625% 17 March 2027 516,111 0.00%480,000 USD Credit Agricole SA FRN 19 September 2033 487,303 0.00%420,000 EUR Credit Agricole SA FRN (perpetual bond*) 430,746 0.00%
1,484,643 EUR Credit Agricole SA 16,152,916 0.10%1,500,000 EUR Credit Logement SA FRN (perpetual bond*) 1,218,000 0.01%
440,000 EUR Crown European Holdings SA 3.375% 15 May 2025 411,717 0.00%50,000 EUR Dexia Credit Local SA FRN 10 July 2017 47,094 0.00%
500,000 EUR Electricite de France SA 4.625% 26 April 2030 630,550 0.00%1,700,000 GBP Electricite de France SA 5.875% 18 July 2031 2,781,395 0.02%
490,000 EUR Electricite de France SA 5.625% 21 February 2033 685,000 0.00%3,350,000 GBP Electricite de France SA 6.125% 02 June 2034 5,538,477 0.04%1,400,000 EUR Electricite de France SA FRN (perpetual bond*) 1,373,289 0.01%
800,000 EUR Electricite de France SA FRN (perpetual bond*) 783,433 0.01%1,200,000 GBP Electricite de France SA FRN (perpetual bond*) 1,520,247 0.01%
700,000 EUR Electricite de France SA FRN (perpetual bond*) 702,431 0.01%1,300,000 GBP Electricite de France SA 6.000% 23 January 2114 2,181,369 0.01%
800,000 EUR Engie SA 2.625% 20 July 2022 878,328 0.01%1,150,000 GBP Engie SA 7.000% 30 October 2028 2,150,640 0.01%
600,000 EUR Engie SA 1.500% 13 March 2035 531,073 0.00%600,000 EUR Engie SA FRN (perpetual bond*) 592,500 0.00%
1,100,000 EUR Eutelsat SA 4.125% 27 March 2017 1,152,134 0.01%100,000 EUR Eutelsat SA 5.000% 14 January 2019 112,664 0.00%
1,900,000 EUR Eutelsat SA 2.625% 13 January 2020 2,013,202 0.01%50,000,000 EUR France Treasury Bill BTF 0.000% 06 January 2016 50,000,500 0.32%50,000,000 EUR France Treasury Bill BTF 0.000% 20 January 2016 50,010,750 0.32%50,000,000 EUR France Treasury Bill BTF 0.000% 27 January 2016 50,013,500 0.32%50,000,000 EUR France Treasury Bill BTF 0.000% 17 February 2016 50,024,750 0.32%
100,000,000 EUR France Treasury Bill BTF 0.000% 24 February 2016 100,066,000 0.63%100,000 EUR Holding d'Infrastructures de Transport SAS 5.750% 09 March 2018 111,405 0.00%800,000 EUR Holding d'Infrastructures de Transport SAS 2.250% 24 March 2025 801,072 0.01%800,000 EUR Infra Park SAS 1.250% 16 October 2020 807,096 0.01%700,000 EUR Infra Park SAS 2.125% 16 April 2025 705,600 0.01%
2,800,000 EUR Ingenico Group SA 2.500% 20 May 2021 2,851,716 0.02%290,565 EUR Klepierre 11,910,259 0.08%800,000 EUR Klepierre 1.000% 17 April 2023 768,196 0.01%123,247 EUR Korian SA 4,150,959 0.03%800,000 EUR La Banque Postale SA FRN 23 April 2026 818,752 0.01%700,000 EUR Lafarge SA 4.750% 30 September 2020 813,214 0.01%
1,400,000 EUR Lagardere SCA 4.125% 31 October 2017 1,468,397 0.01%600,000 EUR Legrand SA 4.375% 21 March 2018 650,970 0.00%

Standard Life Investments Global SICAV Société d'Investissement à Capital Variable
250
Global Absolute Return Strategies Fund Schedule of Investments (expressed in EUR) (continued) as at 31 December 2015
Quantity/ Market Value % of
Nominal Value Currency Name of Securities EUR Net Assets
Transferable securities and money market instruments admitted to an official exchange listing (continued)
France (continued) 1,300,000 EUR Mercialys SA 1.787% 31 March 2023 1,250,451 0.01%1,024,160 EUR Natixis SA 5,343,043 0.03%
345,000 EUR Numericable-SFR SAS 5.375% 15 May 2022 353,566 0.00%370,000 EUR Numericable-SFR SAS 5.625% 15 May 2024 376,013 0.00%
1,368,699 EUR Orange SA 21,194,304 0.13%200,000 EUR Orange SA 4.125% 23 January 2019 221,986 0.00%
1,400,000 EUR Orange SA 3.875% 09 April 2020 1,583,923 0.01%1,000,000 GBP Orange SA 5.250% 05 December 2025 1,580,638 0.01%5,700,000 USD Orange SA 9.000% 01 March 2031 7,394,799 0.05%
595,000 EUR Orange SA 8.125% 28 January 2033 990,532 0.01%1,000,000 GBP Orange SA 5.625% 23 January 2034 1,616,555 0.01%1,000,000 GBP Orange SA FRN (perpetual bond*) 1,348,452 0.01%1,260,000 EUR Orange SA FRN (perpetual bond*) 1,259,913 0.01%
158,755 EUR Orpea 11,712,944 0.07%1,300,000 EUR Pernod Ricard SA 5.000% 15 March 2017 1,372,696 0.01%2,200,000 EUR RCI Banque SA 4.250% 27 April 2017 2,309,174 0.02%
508,000 EUR RCI Banque SA 2.875% 22 January 2018 530,957 0.00%1,500,000 GBP RCI Banque SA 3.250% 25 April 2018 2,094,242 0.01%2,300,000 EUR Renault SA 3.625% 19 September 2018 2,468,700 0.02%
250,000 EUR RTE Reseau de Transport d'Electricite SA 5.125% 12 September 2018 282,584 0.00%1,200,000 EUR RTE Reseau de Transport d'Electricite SA 1.625% 27 November 2025 1,191,870 0.01%
600,000 EUR SANEF SA 1.875% 16 March 2026 598,899 0.00%600,000 EUR Sanofi 2.500% 14 November 2023 661,492 0.00%685,000 EUR SGD Group SAS 5.625% 15 May 2019 702,214 0.00%550,000 GBP SNCF Reseau 5.250% 07 December 2028 936,281 0.01%170,239 EUR Societe BIC SA 25,816,744 0.16%
1,400,000 EUR Societe Des Autoroutes Paris-Rhin-Rhone 1.125% 15 January 2021 1,408,232 0.01%500,000 EUR Societe Des Autoroutes Paris-Rhin-Rhone 1.500% 15 January 2024 500,725 0.00%700,000 EUR Societe Des Autoroutes Paris-Rhin-Rhone 1.875% 15 January 2025 711,456 0.01%700,000 EUR Societe Fonciere Lyonnaise SA 1.875% 26 November 2021 698,987 0.00%500,000 EUR Societe Fonciere Lyonnaise SA 2.250% 16 November 2022 503,745 0.00%455,636 EUR Societe Generale SA 19,396,425 0.12%450,000 EUR Societe Generale SA FRN (perpetual bond*) 552,685 0.00%100,000 EUR Societe Generale SA 4.000% 07 June 2023 109,102 0.00%
1,300,000 EUR Societe Generale SA FRN 16 September 2026 1,283,227 0.01%490,000 EUR Societe Generale SA FRN (perpetual bond*) 503,171 0.00%
1,110,000 USD Societe Generale SA FRN (perpetual bond*) 1,082,627 0.01%400,000 USD Societe Generale SA FRN (perpetual bond*) 366,912 0.00%800,000 EUR SPCM SA 2.875% 15 June 2023 768,552 0.01%500,000 EUR Suez Environnement Co 1.750% 10 September 2025 504,433 0.00%581,756 EUR Total SA 24,006,161 0.15%200,000 EUR Total SA FRN (perpetual bond*) 177,025 0.00%
1,830,000 EUR Total SA FRN (perpetual bond*) 1,692,750 0.01%700,000 EUR Transport et Infrastructures Gaz France SA 2.200% 05 August 2025 703,269 0.01%500,000 EUR Unibail-Rodamco SE 1.375% 15 April 2030 445,948 0.00%
1,413,584 EUR Veolia Environnement SA 30,908,014 0.20%500,000 EUR Veolia Environnement SA 1.590% 10 January 2028 473,364 0.00%550,000 GBP Veolia Environnement SA 6.125% 29 October 2037 952,653 0.01%782,159 EUR Vivendi SA 15,533,678 0.10%315,000 EUR WPP Finance SA 2.250% 22 September 2026 318,992 0.00%
Total for France 705,293,852 4.44%
Germany 880,000 EUR Aareal Bank AG FRN 18 March 2026 920,176 0.01%461,565 EUR Allianz SE 75,488,956 0.48%
1,300,000 EUR Allianz SE FRN 07 July 2045 1,199,217 0.01%2,100,000 EUR Allianz SE FRN (perpetual bond*) 2,049,933 0.01%
800,000 EUR Allianz SE FRN (perpetual bond*) 861,880 0.01%214,091 EUR Bayer AG 24,791,738 0.16%403,000 EUR Bayer AG FRN 02 April 2075 380,065 0.00%611,000 EUR Bundesrepublik Deutschland 1.000% 15 August 2024 639,121 0.00%
7,164,000 EUR Bundesrepublik Deutschland 0.500% 15 February 2025 7,128,896 0.04%743,876 EUR Commerzbank AG 7,120,381 0.04%
1,000,000 EUR Commerzbank AG 7.750% 16 March 2021 1,219,710 0.01%

Standard Life Investments Global SICAV Société d'Investissement à Capital Variable
251
Global Absolute Return Strategies Fund Schedule of Investments (expressed in EUR) (continued) as at 31 December 2015
Quantity/ Market Value % of
Nominal Value Currency Name of Securities EUR Net Assets
Transferable securities and money market instruments admitted to an official exchange listing (continued)
Germany (continued) 250,000 EUR Continental AG 3.125% 09 September 2020 277,137 0.00%299,267 EUR Covestro AG 10,065,846 0.06%
1,000,000 GBP Daimler AG 2.375% 16 December 2021 1,350,409 0.01%200,000 EUR Daimler AG 2.250% 24 January 2022 214,883 0.00%817,954 EUR Deutsche Bank AG 18,424,414 0.12%600,000 EUR Deutsche Bank AG 1.250% 08 September 2021 601,605 0.00%804,702 EUR Deutsche Post AG 20,886,040 0.13%
2,432,173 EUR Deutsche Telekom AG 40,592,967 0.26%206,371 EUR GEA Group AG 7,718,275 0.05%
41,000,000 EUR German Treasury Bill 0.000% 13 January 2016 41,005,125 0.26%100,000,000 EUR German Treasury Bill 0.000% 10 February 2016 100,048,500 0.63%75,000,000 EUR German Treasury Bill 0.000% 13 April 2016 75,099,750 0.47%
300,000 EUR HT1 Funding GmbH FRN (perpetual bond*) 303,750 0.00%1,350,000 EUR Merck Financial Services GmbH 0.750% 02 September 2019 1,364,850 0.01%
247,530 EUR Muenchener Rueckversicherungs-Gesellschaft AG in Muenchen 45,681,662 0.29%
900,000 EUR Muenchener Rueckversicherungs-Gesellschaft AG in Muenchen FRN 26 May 2042 1,095,188 0.01%
1,000,000 GBP Muenchener Rueckversicherungs-Gesellschaft AG in Muenchen FRN 26 May 2042 1,542,970 0.01%
215,000 EUR ProGroup AG 5.125% 01 May 2022 226,825 0.00%411,222 GBP TUI AG 6,777,393 0.04%615,000 EUR Unitymedia GmbH 3.750% 15 January 2027 534,503 0.00%
180,000 EUR Unitymedia Hessen GmbH & Co KG / Unitymedia NRW GmbH 5.500% 15 September 2022 191,345 0.00%
666,000 EUR Unitymedia Hessen GmbH & Co KG / Unitymedia NRW GmbH 5.750% 15 January 2023 707,129 0.00%
980,000 EUR Unitymedia Hessen GmbH & Co KG / Unitymedia NRW GmbH 4.000% 15 January 2025 945,759 0.01%
120,000 EUR Unitymedia Hessen GmbH & Co KG / Unitymedia NRW GmbH 3.500% 15 January 2027 110,858 0.00%
390,000 EUR Volkswagen Financial Services AG 0.750% 14 October 2021 368,650 0.00%1,200,000 EUR Volkswagen Leasing GmbH 3.250% 10 May 2018 1,254,412 0.01%
850,000 EUR Volkswagen Leasing GmbH 0.750% 11 August 2020 817,692 0.01%600,000 EUR Volkswagen Leasing GmbH 2.625% 15 January 2024 618,982 0.00%
Total for Germany 500,626,992 3.15%
Greece 161,136 EUR National Bank of Greece SA 55,270 0.00%
Total for Greece 55,270 0.00%
Guernsey 800,000 GBP Credit Suisse Group Funding Guernsey Ltd 3.000% 27 May 2022 1,079,254 0.01%
3,500,000 USD Credit Suisse Group Guernsey I Ltd FRN 24 February 2041 3,315,996 0.02% Total for Guernsey 4,395,250 0.03%
Iceland 1,030,000 EUR Arion Banki HF 3.125% 12 March 2018 1,042,937 0.01%1,750,000 EUR Landsbankinn HF 3.000% 19 October 2018 1,760,027 0.01%
Total for Iceland 2,802,964 0.02%
India 617,000 USD ICICI Bank Ltd 3.125% 12 August 2020 563,298 0.00%
Total for India 563,298 0.00%
Ireland
1,193,000 USD AerCap Ireland Capital Ltd / AerCap Global Aviation Trust 4.250% 01 July 2020 1,109,325 0.01%
2,291,000 USD AerCap Ireland Capital Ltd / AerCap Global Aviation Trust 5.000% 01 October 2021 2,190,803 0.01%
305,025 USD Allegion Plc 18,659,420 0.12%
390,000 USD Aquarius & Investments Plc for Swiss Reinsurance Co Ltd FRN 01 September 2024 372,647 0.00%
977,000 EUR Aquarius & Investments Plc for Zurich Insurance Co Ltd FRN 02 October 2043 1,067,038 0.01%

Standard Life Investments Global SICAV Société d'Investissement à Capital Variable
252
Global Absolute Return Strategies Fund Schedule of Investments (expressed in EUR) (continued) as at 31 December 2015
Quantity/ Market Value % of
Nominal Value Currency Name of Securities EUR Net Assets
Transferable securities and money market instruments admitted to an official exchange listing (continued)
Ireland (continued)
450,000 EUR Ardagh Packaging Finance Plc / Ardagh Holdings USA Inc 4.250% 15 January 2022 454,500 0.00%
14,688,750 EUR Bank of Ireland 4,994,175 0.03%2,824,000 EUR Bank of Ireland 2.000% 08 May 2017 2,878,743 0.02%1,010,000 EUR Bank of Ireland 1.250% 09 April 2020 1,016,863 0.01%1,000,000 EUR Bank of Ireland FRN (perpetual bond*) 1,048,750 0.01%
260,000 EUR Bank of Ireland Mortgage Bank 3.625% 02 October 2020 297,415 0.00%0 EUR Bluestep Mortgage Securities No2 Ltd FRN 10 November 20551 0 –%
700,000 EUR Caterpillar International Finance Ltd 0.750% 13 October 2020 702,660 0.01%310,000 EUR Cloverie Plc for Zurich Insurance Co Ltd 1.750% 16 September 2024 313,241 0.00%441,224 EUR CRH Plc 11,780,681 0.07%590,000 EUR ESB Finance Ltd 4.375% 21 November 2019 675,617 0.01%830,000 EUR ESB Finance Ltd 3.494% 12 January 2024 952,612 0.01%970,000 EUR ESB Finance Ltd 2.125% 08 June 2027 983,231 0.01%295,000 EUR FCA Capital Ireland Plc 4.000% 17 October 2018 316,101 0.00%204,000 EUR FCA Capital Ireland Plc 2.625% 17 April 2019 211,816 0.00%
1,660,000 EUR FCA Capital Ireland Plc 2.000% 23 October 2019 1,689,863 0.01%420,000 EUR FCA Capital Ireland Plc 1.375% 17 April 2020 416,649 0.00%
2,288,000 EUR GE Capital European Funding 0.800% 21 January 2022 2,259,297 0.01%600,000 EUR GE Capital European Funding 2.625% 15 March 2023 657,884 0.00%
1,746,000 GBP GE Capital International Funding Co 1.363% 15 April 2016 2,380,745 0.02%1,400,000 GBP GE Capital UK Funding 5.625% 25 April 2019 2,127,259 0.01%
573,278 EUR Glanbia Plc 9,717,062 0.06%73,867 USD Ingersoll-Rand Plc 3,787,402 0.02%
2,195,897 EUR Ryanair Holdings Plc 32,960,414 0.21%125,000 EUR Smurfit Kappa Acquisitions 5.125% 15 September 2018 135,901 0.00%475,000 EUR Smurfit Kappa Acquisitions 4.125% 30 January 2020 514,361 0.00%140,000 EUR Smurfit Kappa Acquisitions 2.750% 01 February 2025 134,973 0.00%826,000 EUR Willow No 2 Ireland Plc for Zurich Insurance Co Ltd 3.375% 27 June 2022 932,374 0.01%
Total for Ireland 107,739,822 0.68%
Italy 640,000 EUR 2i Rete Gas SpA 1.750% 16 July 2019 659,678 0.00%
1,300,000 EUR 2i Rete Gas SpA 1.125% 02 January 2020 1,303,706 0.01%512,000 EUR Assicurazioni Generali SpA 5.125% 16 September 2024 651,271 0.00%
1,900,000 EUR Assicurazioni Generali SpA FRN 12 December 2042 2,322,429 0.01%750,000 GBP Assicurazioni Generali SpA FRN (perpetual bond*) 1,021,927 0.01%
2,513,201 EUR Assicurazioni Generali SpA 42,523,361 0.27%904,705 EUR Atlantia SpA 22,165,272 0.14%450,000 GBP Atlantia SpA 6.250% 09 June 2022 731,772 0.00%262,016 EUR Banca Popolare dell'Emilia Romagna SC 1,844,593 0.01%
10,286,824 EUR Banca Popolare di Milano Scarl 9,474,165 0.06%275,035 EUR Banca Popolare di Sondrio SCARL 1,141,945 0.01%216,233 EUR Banco Popolare SC 2,769,945 0.02%821,000 EUR Edison SpA 3.875% 10 November 2017 873,464 0.01%
5,537,531 EUR Enel SpA 21,552,071 0.14%450,000 EUR Enel SpA 5.250% 20 June 2017 482,574 0.00%
1,020,000 EUR Enel SpA FRN 15 January 2075 1,067,078 0.01%1,270,000 EUR Eni SpA 1.750% 18 January 2024 1,278,141 0.01%1,100,000 EUR Intesa Sanpaolo SpA 4.125% 19 September 2016 1,129,953 0.01%
200,000 EUR Intesa Sanpaolo SpA 5.000% 28 February 2017 210,896 0.00%782,000 EUR Intesa Sanpaolo SpA 4.000% 09 November 2017 834,316 0.01%300,000 EUR Intesa Sanpaolo SpA 4.375% 15 October 2019 338,617 0.00%
2,120,000 EUR Intesa Sanpaolo SpA 2.000% 18 June 2021 2,187,193 0.01%1,940,000 EUR Intesa Sanpaolo SpA 1.125% 04 March 2022 1,890,806 0.01%
760,000 EUR Intesa Sanpaolo SpA 3.928% 15 September 2026 778,658 0.01%17,695,382 EUR Intesa Sanpaolo SpA 54,643,340 0.34%2,440,131 EUR Mediobanca SpA 21,680,564 0.14%
520,000 EUR Rhino Bondco S.P.A 7.250% 15 November 2020 554,174 0.00%980,000 EUR Snam SpA 1.375% 19 November 2023 975,580 0.01%
24,700,722 EUR Telecom Italia SpA 23,490,387 0.15%500,000 GBP Telecom Italia SpA 6.375% 24 June 2019 742,915 0.00%
3,485,605 EUR UniCredit SpA 17,898,582 0.11%500,000 EUR UniCredit SpA 3.000% 31 December 2018 528,842 0.00%

Standard Life Investments Global SICAV Société d'Investissement à Capital Variable
253
Global Absolute Return Strategies Fund Schedule of Investments (expressed in EUR) (continued) as at 31 December 2015
Quantity/ Market Value % of
Nominal Value Currency Name of Securities EUR Net Assets
Transferable securities and money market instruments admitted to an official exchange listing (continued)
Italy (continued) 519,246 EUR Unione di Banche Italiane SpA 3,219,325 0.02%
Total for Italy 242,967,540 1.53%
Japan 881,000 JPY Kumagai Gumi Co Ltd 2,345,883 0.01%
1,490,200 JPY Mitsubishi UFJ Financial Group Inc 8,608,011 0.05%455,000 JPY Mitsui Fudosan Co Ltd 10,608,885 0.07%317,600 JPY Resorttrust Inc 7,766,289 0.05%228,800 JPY Seven & I Holdings Co Ltd 9,688,444 0.06%440,000 EUR SoftBank Group Corp 4.625% 15 April 2020 467,003 0.00%830,000 EUR SoftBank Group Corp 4.000% 30 July 2022 843,371 0.01%260,000 EUR SoftBank Group Corp 4.750% 30 July 2025 253,062 0.00%
2,110,000 EUR Sumitomo Mitsui Banking Corp 1.000% 19 January 2022 2,082,623 0.01%2,118,000 JPY Taiheiyo Cement Corp 5,720,503 0.04%
Total for Japan 48,384,074 0.30%
Jersey 1,100,000 GBP AA Bond Co Ltd 4.720% 31 July 2018 1,556,732 0.01%
600,000 GBP AA Bond Co Ltd 6.269% 31 July 2025 951,128 0.01%100,000 EUR Avis Budget Finance Plc 6.000% 01 March 2021 103,253 0.00%
1,920,000 GBP CPUK Finance Ltd 2.666% 28 February 2020 2,598,118 0.02%925,000 GBP CPUK Finance Ltd 7.000% 28 August 2020 1,290,716 0.01%
1,270,000 GBP CPUK Finance Ltd 7.239% 28 February 2024 2,132,192 0.01%1,200,000 GBP Gatwick Funding Ltd 4.625% 27 March 2034 1,769,476 0.01%
500,000 GBP Gatwick Funding Ltd 6.500% 02 March 2041 927,720 0.01%5,432,538 GBP Glencore Plc 6,689,560 0.04%1,245,000 GBP HBOS Capital Funding LP FRN (perpetual bond*) 1,806,788 0.01%
650,000 GBP HBOS Sterling Finance Jersey LP FRN (perpetual bond*) 1,147,986 0.01%672,000 EUR Heathrow Funding Ltd 4.125% 12 October 2016 695,748 0.00%316,000 EUR Heathrow Funding Ltd 4.375% 25 January 2017 329,704 0.00%397,000 EUR Heathrow Funding Ltd 4.600% 15 February 2018 431,626 0.00%
1,687,000 GBP Heathrow Funding Ltd 6.250% 10 September 2018 2,516,008 0.02%1,730,000 EUR Heathrow Funding Ltd 1.875% 23 May 2022 1,799,746 0.01%1,000,000 GBP Heathrow Funding Ltd 6.750% 03 December 2026 1,773,662 0.01%
750,000 EUR Heathrow Funding Ltd 1.500% 11 February 2030 670,106 0.00%3,000,000 GBP Heathrow Funding Ltd 6.450% 10 December 2031 5,417,158 0.03%1,050,000 GBP Heathrow Funding Ltd 4.625% 31 October 2046 1,563,579 0.01%1,000,000 GBP HSBC Bank Capital Funding Sterling 1 LP FRN (perpetual bond*) 1,487,396 0.01%
244,821 GBP Petrofac Ltd 2,652,186 0.02%790,000 GBP Porterbrook Rail Finance Ltd 4.625% 04 April 2029 1,181,187 0.01%920,000 EUR ProSecure Funding LP 4.668% 30 June 2016 932,650 0.01%
2,100,000 GBP QBE Capital Funding IV Ltd FRN 24 May 2041 3,122,267 0.02%129,921 GBP Shire Plc 8,306,815 0.05%930,000 EUR UBS Group Funding Jersey Ltd 1.750% 16 November 2022 931,246 0.01%
Total for Jersey 54,784,753 0.35%
Luxembourg 220,000 USD Actavis Funding SCS 3.000% 12 March 2020 202,480 0.00%
5,670,000 USD Actavis Funding SCS 4.750% 15 March 2045 5,084,134 0.03%160,000 EUR Altice Financing SA 6.500% 15 January 2022 168,030 0.00%540,000 EUR Altice Financing SA 5.250% 15 February 2023 541,350 0.00%545,000 EUR Altice Luxembourg SA 7.250% 15 May 2022 511,191 0.00%270,000 EUR Altice Luxembourg SA 6.250% 15 February 2025 228,825 0.00%516,270 EUR Ardagh Finance Holdings SA 8.375% 15 June 2019 526,296 0.00%789,106 EUR Bilbao Luxembourg SA 10.500% 01 December 2018 753,636 0.01%300,000 GBP Cabot Financial Luxembourg SA 8.375% 01 August 2020 422,599 0.00%300,000 GBP Cabot Financial Luxembourg SA 6.500% 01 April 2021 393,728 0.00%
1,125,000 USD CHC Helicopter SA 9.250% 15 October 2020 501,092 0.00%1,080,950 USD CHC Helicopter SA 9.375% 01 June 2021 300,299 0.00%
370,000 EUR CNH Industrial Finance Europe SA 6.250% 09 March 2018 396,825 0.00%1,100,000 EUR Fiat Chrysler Finance Europe 7.000% 23 March 2017 1,167,210 0.01%
525,000 EUR Fiat Chrysler Finance Europe 6.750% 14 October 2019 592,854 0.01%990,000 EUR Fiat Chrysler Finance Europe 4.750% 15 July 2022 1,059,750 0.01%915,000 EUR FMC Finance VIII SA 6.500% 15 September 2018 1,050,832 0.01%330,000 GBP Garfunkelux Holdco 2 SA 11.000% 01 November 2023 453,681 0.00%
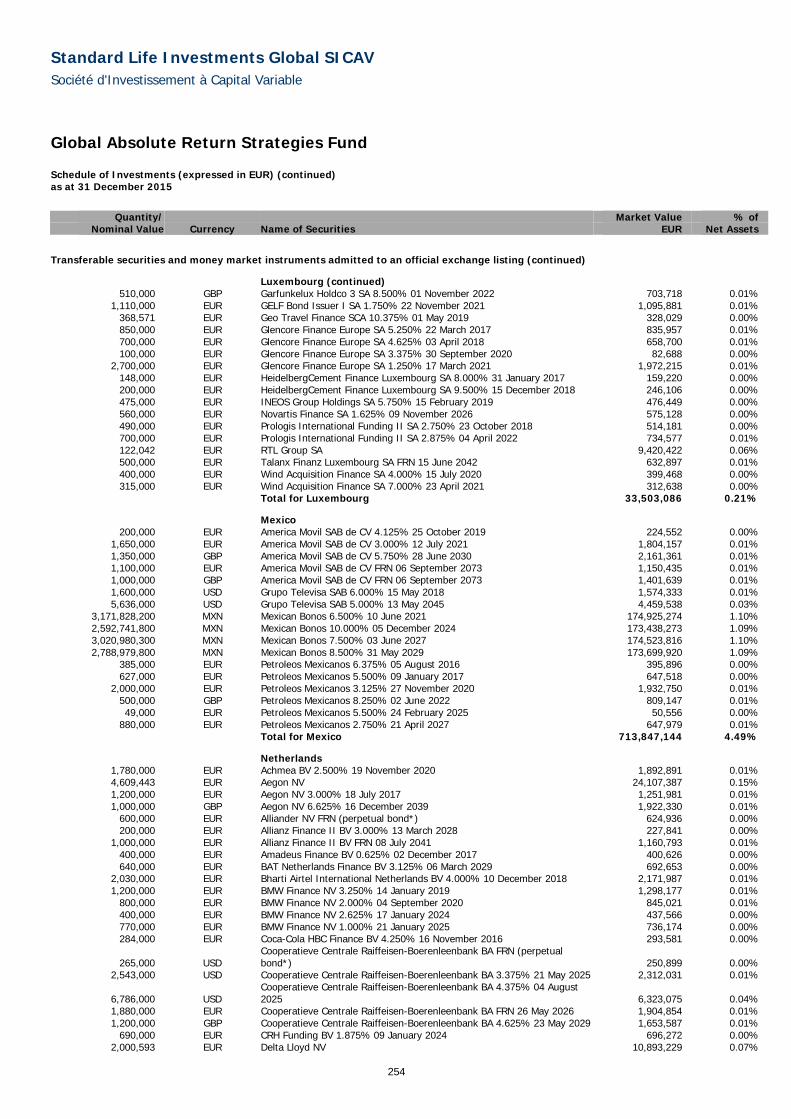
Standard Life Investments Global SICAV Société d'Investissement à Capital Variable
254
Global Absolute Return Strategies Fund Schedule of Investments (expressed in EUR) (continued) as at 31 December 2015
Quantity/ Market Value % of
Nominal Value Currency Name of Securities EUR Net Assets
Transferable securities and money market instruments admitted to an official exchange listing (continued)
Luxembourg (continued) 510,000 GBP Garfunkelux Holdco 3 SA 8.500% 01 November 2022 703,718 0.01%
1,110,000 EUR GELF Bond Issuer I SA 1.750% 22 November 2021 1,095,881 0.01%368,571 EUR Geo Travel Finance SCA 10.375% 01 May 2019 328,029 0.00%850,000 EUR Glencore Finance Europe SA 5.250% 22 March 2017 835,957 0.01%700,000 EUR Glencore Finance Europe SA 4.625% 03 April 2018 658,700 0.01%100,000 EUR Glencore Finance Europe SA 3.375% 30 September 2020 82,688 0.00%
2,700,000 EUR Glencore Finance Europe SA 1.250% 17 March 2021 1,972,215 0.01%148,000 EUR HeidelbergCement Finance Luxembourg SA 8.000% 31 January 2017 159,220 0.00%200,000 EUR HeidelbergCement Finance Luxembourg SA 9.500% 15 December 2018 246,106 0.00%475,000 EUR INEOS Group Holdings SA 5.750% 15 February 2019 476,449 0.00%560,000 EUR Novartis Finance SA 1.625% 09 November 2026 575,128 0.00%490,000 EUR Prologis International Funding II SA 2.750% 23 October 2018 514,181 0.00%700,000 EUR Prologis International Funding II SA 2.875% 04 April 2022 734,577 0.01%122,042 EUR RTL Group SA 9,420,422 0.06%500,000 EUR Talanx Finanz Luxembourg SA FRN 15 June 2042 632,897 0.01%400,000 EUR Wind Acquisition Finance SA 4.000% 15 July 2020 399,468 0.00%315,000 EUR Wind Acquisition Finance SA 7.000% 23 April 2021 312,638 0.00%
Total for Luxembourg 33,503,086 0.21%
Mexico 200,000 EUR America Movil SAB de CV 4.125% 25 October 2019 224,552 0.00%
1,650,000 EUR America Movil SAB de CV 3.000% 12 July 2021 1,804,157 0.01%1,350,000 GBP America Movil SAB de CV 5.750% 28 June 2030 2,161,361 0.01%1,100,000 EUR America Movil SAB de CV FRN 06 September 2073 1,150,435 0.01%1,000,000 GBP America Movil SAB de CV FRN 06 September 2073 1,401,639 0.01%1,600,000 USD Grupo Televisa SAB 6.000% 15 May 2018 1,574,333 0.01%5,636,000 USD Grupo Televisa SAB 5.000% 13 May 2045 4,459,538 0.03%
3,171,828,200 MXN Mexican Bonos 6.500% 10 June 2021 174,925,274 1.10%2,592,741,800 MXN Mexican Bonos 10.000% 05 December 2024 173,438,273 1.09%3,020,980,300 MXN Mexican Bonos 7.500% 03 June 2027 174,523,816 1.10%2,788,979,800 MXN Mexican Bonos 8.500% 31 May 2029 173,699,920 1.09%
385,000 EUR Petroleos Mexicanos 6.375% 05 August 2016 395,896 0.00%627,000 EUR Petroleos Mexicanos 5.500% 09 January 2017 647,518 0.00%
2,000,000 EUR Petroleos Mexicanos 3.125% 27 November 2020 1,932,750 0.01%500,000 GBP Petroleos Mexicanos 8.250% 02 June 2022 809,147 0.01%49,000 EUR Petroleos Mexicanos 5.500% 24 February 2025 50,556 0.00%
880,000 EUR Petroleos Mexicanos 2.750% 21 April 2027 647,979 0.01% Total for Mexico 713,847,144 4.49%
Netherlands 1,780,000 EUR Achmea BV 2.500% 19 November 2020 1,892,891 0.01%4,609,443 EUR Aegon NV 24,107,387 0.15%1,200,000 EUR Aegon NV 3.000% 18 July 2017 1,251,981 0.01%1,000,000 GBP Aegon NV 6.625% 16 December 2039 1,922,330 0.01%
600,000 EUR Alliander NV FRN (perpetual bond*) 624,936 0.00%200,000 EUR Allianz Finance II BV 3.000% 13 March 2028 227,841 0.00%
1,000,000 EUR Allianz Finance II BV FRN 08 July 2041 1,160,793 0.01%400,000 EUR Amadeus Finance BV 0.625% 02 December 2017 400,626 0.00%640,000 EUR BAT Netherlands Finance BV 3.125% 06 March 2029 692,653 0.00%
2,030,000 EUR Bharti Airtel International Netherlands BV 4.000% 10 December 2018 2,171,987 0.01%1,200,000 EUR BMW Finance NV 3.250% 14 January 2019 1,298,177 0.01%
800,000 EUR BMW Finance NV 2.000% 04 September 2020 845,021 0.01%400,000 EUR BMW Finance NV 2.625% 17 January 2024 437,566 0.00%770,000 EUR BMW Finance NV 1.000% 21 January 2025 736,174 0.00%284,000 EUR Coca-Cola HBC Finance BV 4.250% 16 November 2016 293,581 0.00%
265,000 USD Cooperatieve Centrale Raiffeisen-Boerenleenbank BA FRN (perpetual bond*) 250,899 0.00%
2,543,000 USD Cooperatieve Centrale Raiffeisen-Boerenleenbank BA 3.375% 21 May 2025 2,312,031 0.01%
6,786,000 USD Cooperatieve Centrale Raiffeisen-Boerenleenbank BA 4.375% 04 August 2025 6,323,075 0.04%
1,880,000 EUR Cooperatieve Centrale Raiffeisen-Boerenleenbank BA FRN 26 May 2026 1,904,854 0.01%1,200,000 GBP Cooperatieve Centrale Raiffeisen-Boerenleenbank BA 4.625% 23 May 2029 1,653,587 0.01%
690,000 EUR CRH Funding BV 1.875% 09 January 2024 696,272 0.00%2,000,593 EUR Delta Lloyd NV 10,893,229 0.07%

Standard Life Investments Global SICAV Société d'Investissement à Capital Variable
255
Global Absolute Return Strategies Fund Schedule of Investments (expressed in EUR) (continued) as at 31 December 2015
Quantity/ Market Value % of
Nominal Value Currency Name of Securities EUR Net Assets
Transferable securities and money market instruments admitted to an official exchange listing (continued)
Netherlands (continued) 180,000 EUR Deutsche Bahn Finance BV 3.000% 08 March 2024 207,231 0.00%200,000 EUR Deutsche Bahn Finance BV 3.750% 09 July 2025 244,420 0.00%
2,259,000 USD Deutsche Telekom International Finance BV 8.750% 15 June 2030 2,877,432 0.02%80,000,000 EUR Dutch Treasury Certificate 0.000% 29 January 2016 80,026,400 0.50%50,000,000 EUR Dutch Treasury Certificate 0.000% 29 February 2016 50,035,000 0.32%25,000,000 EUR Dutch Treasury Certificate 0.000% 29 April 2016 25,040,125 0.16%
600,000 GBP E.ON International Finance BV 6.000% 30 October 2019 912,901 0.01%158,000 EUR E.ON International Finance BV 5.750% 07 May 2020 189,290 0.00%
2,500,000 GBP E.ON International Finance BV 6.375% 07 June 2032 4,074,987 0.03%2,300,000 GBP E.ON International Finance BV 6.750% 27 January 2039 3,930,526 0.03%
200,000 EUR EDP Finance BV 4.875% 14 September 2020 225,035 0.00%1,310,000 EUR EDP Finance BV 4.125% 20 January 2021 1,420,367 0.01%
300,000 EUR EDP Finance BV 2.625% 18 January 2022 300,940 0.00%600,000 EUR Enel Finance International NV 3.625% 17 April 2018 644,612 0.00%158,000 EUR Enel Finance International NV 5.000% 14 September 2022 197,190 0.00%600,000 EUR Enel Finance International NV 4.875% 17 April 2023 745,127 0.01%
1,250,000 GBP Enel Finance International NV 5.625% 14 August 2024 1,992,245 0.01%723,000 EUR Enel Finance International NV 1.966% 27 January 2025 741,678 0.01%700,000 GBP Enel Finance International NV 5.750% 14 September 2040 1,127,249 0.01%600,000 USD Fiat Chrysler Automobiles NV 5.250% 15 April 2023 546,896 0.00%280,000 EUR Fresenius Finance BV 3.000% 01 February 2021 300,637 0.00%400,000 EUR Gas Natural Fenosa Finance BV 3.875% 11 April 2022 458,392 0.00%800,000 EUR Gas Natural Fenosa Finance BV FRN (perpetual bond*) 764,000 0.01%
1,420,000 EUR General Motors Financial International BV 0.850% 23 February 2018 1,414,547 0.01%350,000 EUR General Motors Financial International BV 1.875% 15 October 2019 355,408 0.00%400,000 EUR Iberdrola International BV 3.000% 31 January 2022 442,682 0.00%851,000 EUR ING Bank NV FRN 21 November 2023 899,324 0.01%
2,877,161 EUR ING Groep NV 35,820,654 0.23%925,000 EUR InterXion Holding NV 6.000% 15 July 2020 980,731 0.01%
1,500,000 EUR JAB Holdings BV 1.500% 24 November 2021 1,463,513 0.01%400,000 EUR JAB Holdings BV 2.125% 16 September 2022 398,386 0.00%
7,093,999 EUR Koninklijke KPN NV 24,772,245 0.16%513,000 EUR Koninklijke KPN NV 7.500% 04 February 2019 618,930 0.00%477,000 GBP Koninklijke KPN NV 5.750% 17 September 2029 742,505 0.01%750,000 GBP Koninklijke KPN NV FRN 14 March 2073 1,053,253 0.01%930,000 EUR LeasePlan Corp NV 2.375% 23 April 2019 965,887 0.01%890,000 EUR LGE HoldCo VI BV 7.125% 15 May 2024 966,237 0.01%814,000 EUR Linde Finance BV FRN 14 July 2066 840,125 0.01%104,156 USD LyondellBasell Industries NV 8,394,681 0.05%57,700 USD Mobileye NV 2,202,820 0.01%
299,824 EUR NN Group NV 9,759,271 0.06%891,000 EUR NN Group NV FRN (perpetual bond*) 877,991 0.01%440,000 GBP PACCAR Financial Europe BV 1.513% 29 May 2018 597,276 0.00%100,000 GBP Petrobras Global Finance BV 6.250% 14 December 2026 86,420 0.00%450,000 GBP Petrobras Global Finance BV 6.625% 16 January 2034 381,236 0.00%
1,850,000 EUR Roche Finance Europe BV 0.875% 25 February 2025 1,817,638 0.01%550,000 GBP RWE Finance BV 6.500% 20 April 2021 848,798 0.01%200,000 EUR RWE Finance BV 6.500% 10 August 2021 251,602 0.00%
1,100,000 GBP RWE Finance BV 6.125% 06 July 2039 1,589,979 0.01%
790,000 EUR Samvardhana Motherson Automotive Systems Group BV 4.125% 15 July 2021 770,029 0.01%
490,000 EUR Schaeffler Finance BV 4.250% 15 May 2018 501,045 0.00%290,000 EUR Schaeffler Finance BV 2.750% 15 May 2019 293,776 0.00%290,000 EUR Schaeffler Finance BV 3.250% 15 May 2019 294,344 0.00%185,000 EUR Schaeffler Finance BV 3.250% 15 May 2025 179,746 0.00%435,000 EUR Schaeffler Holding Finance BV 6.875% 15 August 2018 450,497 0.00%200,000 EUR Schaeffler Holding Finance BV 5.750% 15 November 2021 214,116 0.00%560,000 EUR Shell International Finance BV 1.625% 20 January 2027 536,404 0.00%
10,315,000 USD Shell International Finance BV 4.125% 11 May 2035 9,044,564 0.06%200,000 EUR Swiss Reinsurance Co via ELM BV FRN (perpetual bond*) 204,750 0.00%750,000 GBP Swiss Reinsurance Co via ELM BV FRN (perpetual bond*) 1,087,069 0.01%620,000 EUR Swiss Reinsurance Co via ELM BV FRN (perpetual bond*) 572,923 0.00%
6,250,000 USD Telefonica Europe BV 8.250% 15 September 2030 7,483,839 0.05%70,000 EUR Telefonica Europe BV 5.875% 14 February 2033 94,338 0.00%

Standard Life Investments Global SICAV Société d'Investissement à Capital Variable
256
Global Absolute Return Strategies Fund Schedule of Investments (expressed in EUR) (continued) as at 31 December 2015
Quantity/ Market Value % of
Nominal Value Currency Name of Securities EUR Net Assets
Transferable securities and money market instruments admitted to an official exchange listing (continued)
Netherlands (continued) 700,000 EUR Telefonica Europe BV FRN (perpetual bond*) 704,501 0.00%500,000 GBP Telefonica Europe BV FRN (perpetual bond*) 699,896 0.00%
3,500,000 EUR Telefonica Europe BV FRN (perpetual bond*) 3,456,635 0.02%2,100,000 EUR Teva Pharmaceutical Finance Netherlands II BV 1.250% 31 March 2023 1,985,907 0.01%
820,000 EUR Urenco Finance NV 2.375% 02 December 2024 799,785 0.01%1,150,000 GBP Volkswagen Financial Services NV 2.375% 13 November 2018 1,550,993 0.01%
900,000 GBP Volkswagen Financial Services NV 1.750% 17 April 2020 1,160,660 0.01%2,000,000 EUR Volkswagen International Finance NV 2.000% 14 January 2020 2,039,253 0.01%
314,000 EUR Volkswagen International Finance NV 2.000% 26 March 2021 318,499 0.00%2,943,000 EUR Volkswagen International Finance NV 0.875% 16 January 2023 2,715,579 0.02%1,267,000 EUR Volkswagen International Finance NV FRN (perpetual bond*) 1,225,822 0.01%
800,000 EUR Volkswagen International Finance NV FRN (perpetual bond*) 779,057 0.01%1,863,000 EUR Volkswagen International Finance NV FRN (perpetual bond*) 1,555,801 0.01%
900,000 EUR Vonovia Finance BV 2.125% 25 July 2016 908,788 0.01%1,700,000 EUR Vonovia Finance BV 3.125% 25 July 2019 1,814,112 0.01%
310,000 EUR Vonovia Finance BV 0.875% 30 March 2020 303,960 0.00%1,600,000 EUR Vonovia Finance BV 1.625% 15 December 2020 1,597,848 0.01%1,790,000 EUR Vonovia Finance BV 3.625% 08 October 2021 1,965,715 0.01%1,100,000 EUR Vonovia Finance BV 2.250% 15 December 2023 1,093,851 0.01%3,200,000 EUR Vonovia Finance BV FRN (perpetual bond*) 3,112,768 0.02%
500,000 EUR Vonovia Finance BV FRN 08 April 2074 508,264 0.00%145,000 EUR Ziggo Bond Finance BV 4.625% 15 January 2025 134,867 0.00%260,000 EUR Ziggo Secured Finance BV 3.750% 15 January 2025 240,937 0.00%
Total for Netherlands 390,043,648 2.45%
Norway 500,000 EUR DNB Bank ASA FRN 08 March 2022 522,227 0.00%540,000 EUR DNB Bank ASA FRN 26 September 2023 562,391 0.00%190,000 EUR Lock AS 7.000% 15 August 2021 200,450 0.00%525,000 EUR Lock Lower Holding AS 9.500% 15 August 2022 544,724 0.00%
1,050,000 EUR Silk Bidco AS 7.500% 01 February 2022 1,092,000 0.01%150,000 EUR Statkraft AS 6.625% 02 April 2019 178,990 0.00%
1,173,000 EUR Statkraft AS 2.500% 28 November 2022 1,266,928 0.01%840,000 EUR Statkraft AS 1.500% 21 September 2023 840,487 0.01%
1,134,352 NOK Storebrand ASA 4,128,587 0.03% Total for Norway 9,336,784 0.06%
Papua New Guinea 1,039,374 AUD Oil Search Ltd 4,678,576 0.03%
Total for Papua New Guinea 4,678,576 0.03%
Portugal 32,671,441 EUR Banco Comercial Portugues SA 1,597,633 0.01%1,228,193 EUR CTT-Correios de Portugal SA 10,874,421 0.07%1,026,679 EUR Galp Energia SGPS SA 11,005,999 0.07%
461,658 EUR Jeronimo Martins SGPS SA 5,537,588 0.03% Total for Portugal 29,015,641 0.18%
Singapore 223,933 USD Avago Technologies Ltd 30,307,524 0.19%
Total for Singapore 30,307,524 0.19%
Spain 410,270 EUR ACS Actividades de Construccion y Servicios SA 11,083,444 0.07%540,000 EUR Amadeus Capital Markets SA 4.875% 15 July 2016 552,946 0.00%245,009 EUR Amadeus IT Holding SA 9,968,191 0.06%
3,574,310 EUR Banco Bilbao Vizcaya Argentaria SA 24,087,275 0.15%800,000 EUR Banco Bilbao Vizcaya Argentaria SA FRN (perpetual bond*) 784,664 0.01%
2,783,794 EUR Banco de Sabadell SA 4,551,503 0.03%1,226,536 EUR Banco Popular Espanol SA 3,732,349 0.02%8,345,133 EUR Banco Santander SA 38,037,116 0.24%6,094,093 EUR Bankia SA 6,545,056 0.04%3,324,259 EUR Bankinter SA 21,753,951 0.14%1,000,000 EUR BBVA Senior Finance SAU 3.750% 17 January 2018 1,068,895 0.01%1,800,000 EUR BBVA Subordinated Capital SAU FRN 11 April 2024 1,868,524 0.01%

Standard Life Investments Global SICAV Société d'Investissement à Capital Variable
257
Global Absolute Return Strategies Fund Schedule of Investments (expressed in EUR) (continued) as at 31 December 2015
Quantity/ Market Value % of
Nominal Value Currency Name of Securities EUR Net Assets
Transferable securities and money market instruments admitted to an official exchange listing (continued)
Spain (continued) 3,084,359 EUR CaixaBank SA 9,913,130 0.06%
300,000 EUR Cellnex Telecom SAU 3.125% 27 July 2022 287,655 0.00%800,000 EUR Enagas Financiaciones SAU 1.250% 06 February 2025 772,632 0.01%
1,538,365 EUR Endesa SA 28,498,212 0.18%280,000 EUR Ferrovial Emisiones SA 3.375% 30 January 2018 296,159 0.00%180,000 EUR Ferrovial Emisiones SA 3.375% 07 June 2021 198,701 0.00%100,000 EUR Gas Natural Capital Markets SA 5.625% 09 February 2017 105,923 0.00%250,000 EUR Gas Natural Capital Markets SA 4.125% 26 January 2018 269,062 0.00%300,000 EUR Gas Natural Capital Markets SA 6.000% 27 January 2020 361,393 0.00%
1,000,000 GBP Iberdrola Finanzas SAU 6.000% 01 July 2022 1,613,318 0.01%377,018 EUR Industria de Diseno Textil SA 11,947,700 0.08%
1,000,000 EUR Inmobiliaria Colonial SA 1.863% 05 June 2019 1,007,145 0.01%2,212,140 GBP International Consolidated Airlines Group SA 18,379,786 0.12%
600,000 EUR Santander Consumer Finance SA 1.100% 30 July 2018 607,518 0.00%200,000 EUR Telefonica Emisiones SAU 5.496% 01 April 2016 202,512 0.00%100,000 EUR Telefonica Emisiones SAU 5.811% 05 September 2017 109,087 0.00%150,000 EUR Telefonica Emisiones SAU 3.661% 18 September 2017 158,353 0.00%100,000 EUR Telefonica Emisiones SAU 4.797% 21 February 2018 109,093 0.00%
1,200,000 EUR Telefonica Emisiones SAU 3.961% 26 March 2021 1,353,740 0.01%1,250,000 GBP Telefonica Emisiones SAU 5.289% 09 December 2022 1,875,575 0.01%
300,000 EUR Telefonica Emisiones SAU 3.987% 23 January 2023 340,491 0.00%1,000,000 GBP Telefonica Emisiones SAU 5.445% 08 October 2029 1,527,752 0.01%
Total for Spain 203,968,851 1.28%
Sweden 1,200,000 EUR Akelius Residential Property AB 3.375% 23 September 2020 1,214,250 0.01%
65,000 EUR Investor AB 4.875% 18 November 2021 79,502 0.00%277,589 SEK Lundin Petroleum AB 3,701,922 0.02%530,000 EUR Nordea Bank AB FRN 10 November 2025 526,051 0.00%
1,071,462 SEK Securitas AB 15,151,466 0.09%400,000 EUR Skandinaviska Enskilda Banken AB 2.000% 18 March 2019 420,250 0.00%
1,286,675 SEK Svenska Handelsbanken AB 15,801,464 0.10%1,230,000 EUR Svenska Handelsbanken AB 1.125% 14 December 2022 1,221,064 0.01%1,193,405 SEK Swedbank AB 24,288,247 0.15%
660,000 GBP Swedbank AB 1.625% 15 April 2019 892,110 0.01%1,380,000 EUR Swedbank AB 0.625% 04 January 2021 1,367,449 0.01%
809,884 SEK Swedish Match AB 26,446,490 0.17%600,000 GBP Vattenfall AB 6.875% 15 April 2039 1,074,677 0.01%358,000 EUR Vattenfall AB FRN 19 March 2077 290,302 0.00%
Total for Sweden 92,475,244 0.58%
Switzerland 102,898 CHF Baloise Holding AG 12,102,256 0.08%
1,380,000 EUR Credit Suisse AG 0.500% 29 March 2018 1,385,615 0.01%1,230,000 EUR Credit Suisse AG 0.625% 20 November 2018 1,238,792 0.01%
950,000 EUR Credit Suisse AG 1.125% 15 September 2020 964,255 0.01%840,000 EUR Credit Suisse AG 1.375% 31 January 2022 854,840 0.01%282,439 CHF Nestle SA 19,408,011 0.12%437,973 CHF Novartis AG 35,040,943 0.22%61,685 CHF Partners Group Holding AG 20,539,797 0.13%
221,541 CHF Roche Holding AG 56,441,802 0.35%57,179 CHF Swiss Life Holding AG 14,298,651 0.09%57,582 CHF Syngenta AG 20,821,584 0.13%
220,000 EUR UBS AG 6.000% 18 April 2018 249,326 0.00%2,290,000 EUR UBS AG 0.500% 15 May 2018 2,300,305 0.01%1,490,000 EUR UBS AG 1.250% 03 September 2021 1,522,715 0.01%1,560,000 USD UBS AG 5.125% 15 May 2024 1,450,584 0.01%
460,000 GBP UBS AG FRN 19 November 2024 711,018 0.00%2,790,000 EUR UBS AG FRN 12 February 2026 2,979,385 0.02%2,210,867 CHF UBS Group AG 39,778,751 0.25%
825,000 EUR UBS Group AG FRN (perpetual bond*) 866,250 0.01%1,340,000 EUR Zuercher Kantonalbank FRN 15 June 2027 1,329,347 0.01%
347,197 CHF Zurich Insurance Group AG 82,694,608 0.52% Total for Switzerland 316,978,835 2.00%
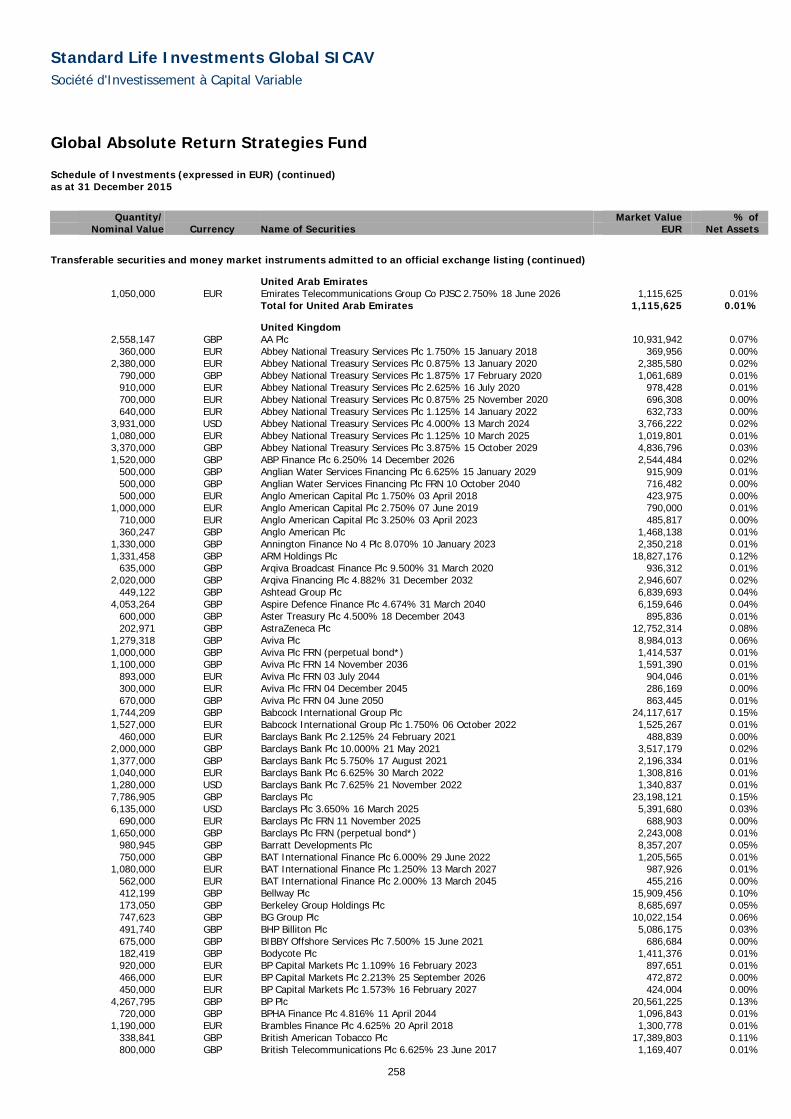
Standard Life Investments Global SICAV Société d'Investissement à Capital Variable
258
Global Absolute Return Strategies Fund Schedule of Investments (expressed in EUR) (continued) as at 31 December 2015
Quantity/ Market Value % of
Nominal Value Currency Name of Securities EUR Net Assets
Transferable securities and money market instruments admitted to an official exchange listing (continued)
United Arab Emirates 1,050,000 EUR Emirates Telecommunications Group Co PJSC 2.750% 18 June 2026 1,115,625 0.01%
Total for United Arab Emirates 1,115,625 0.01%
United Kingdom 2,558,147 GBP AA Plc 10,931,942 0.07%
360,000 EUR Abbey National Treasury Services Plc 1.750% 15 January 2018 369,956 0.00%2,380,000 EUR Abbey National Treasury Services Plc 0.875% 13 January 2020 2,385,580 0.02%
790,000 GBP Abbey National Treasury Services Plc 1.875% 17 February 2020 1,061,689 0.01%910,000 EUR Abbey National Treasury Services Plc 2.625% 16 July 2020 978,428 0.01%700,000 EUR Abbey National Treasury Services Plc 0.875% 25 November 2020 696,308 0.00%640,000 EUR Abbey National Treasury Services Plc 1.125% 14 January 2022 632,733 0.00%
3,931,000 USD Abbey National Treasury Services Plc 4.000% 13 March 2024 3,766,222 0.02%1,080,000 EUR Abbey National Treasury Services Plc 1.125% 10 March 2025 1,019,801 0.01%3,370,000 GBP Abbey National Treasury Services Plc 3.875% 15 October 2029 4,836,796 0.03%1,520,000 GBP ABP Finance Plc 6.250% 14 December 2026 2,544,484 0.02%
500,000 GBP Anglian Water Services Financing Plc 6.625% 15 January 2029 915,909 0.01%500,000 GBP Anglian Water Services Financing Plc FRN 10 October 2040 716,482 0.00%500,000 EUR Anglo American Capital Plc 1.750% 03 April 2018 423,975 0.00%
1,000,000 EUR Anglo American Capital Plc 2.750% 07 June 2019 790,000 0.01%710,000 EUR Anglo American Capital Plc 3.250% 03 April 2023 485,817 0.00%360,247 GBP Anglo American Plc 1,468,138 0.01%
1,330,000 GBP Annington Finance No 4 Plc 8.070% 10 January 2023 2,350,218 0.01%1,331,458 GBP ARM Holdings Plc 18,827,176 0.12%
635,000 GBP Arqiva Broadcast Finance Plc 9.500% 31 March 2020 936,312 0.01%2,020,000 GBP Arqiva Financing Plc 4.882% 31 December 2032 2,946,607 0.02%
449,122 GBP Ashtead Group Plc 6,839,693 0.04%4,053,264 GBP Aspire Defence Finance Plc 4.674% 31 March 2040 6,159,646 0.04%
600,000 GBP Aster Treasury Plc 4.500% 18 December 2043 895,836 0.01%202,971 GBP AstraZeneca Plc 12,752,314 0.08%
1,279,318 GBP Aviva Plc 8,984,013 0.06%1,000,000 GBP Aviva Plc FRN (perpetual bond*) 1,414,537 0.01%1,100,000 GBP Aviva Plc FRN 14 November 2036 1,591,390 0.01%
893,000 EUR Aviva Plc FRN 03 July 2044 904,046 0.01%300,000 EUR Aviva Plc FRN 04 December 2045 286,169 0.00%670,000 GBP Aviva Plc FRN 04 June 2050 863,445 0.01%
1,744,209 GBP Babcock International Group Plc 24,117,617 0.15%1,527,000 EUR Babcock International Group Plc 1.750% 06 October 2022 1,525,267 0.01%
460,000 EUR Barclays Bank Plc 2.125% 24 February 2021 488,839 0.00%2,000,000 GBP Barclays Bank Plc 10.000% 21 May 2021 3,517,179 0.02%1,377,000 GBP Barclays Bank Plc 5.750% 17 August 2021 2,196,334 0.01%1,040,000 EUR Barclays Bank Plc 6.625% 30 March 2022 1,308,816 0.01%1,280,000 USD Barclays Bank Plc 7.625% 21 November 2022 1,340,837 0.01%7,786,905 GBP Barclays Plc 23,198,121 0.15%6,135,000 USD Barclays Plc 3.650% 16 March 2025 5,391,680 0.03%
690,000 EUR Barclays Plc FRN 11 November 2025 688,903 0.00%1,650,000 GBP Barclays Plc FRN (perpetual bond*) 2,243,008 0.01%
980,945 GBP Barratt Developments Plc 8,357,207 0.05%750,000 GBP BAT International Finance Plc 6.000% 29 June 2022 1,205,565 0.01%
1,080,000 EUR BAT International Finance Plc 1.250% 13 March 2027 987,926 0.01%562,000 EUR BAT International Finance Plc 2.000% 13 March 2045 455,216 0.00%412,199 GBP Bellway Plc 15,909,456 0.10%173,050 GBP Berkeley Group Holdings Plc 8,685,697 0.05%747,623 GBP BG Group Plc 10,022,154 0.06%491,740 GBP BHP Billiton Plc 5,086,175 0.03%675,000 GBP BIBBY Offshore Services Plc 7.500% 15 June 2021 686,684 0.00%182,419 GBP Bodycote Plc 1,411,376 0.01%920,000 EUR BP Capital Markets Plc 1.109% 16 February 2023 897,651 0.01%466,000 EUR BP Capital Markets Plc 2.213% 25 September 2026 472,872 0.00%450,000 EUR BP Capital Markets Plc 1.573% 16 February 2027 424,004 0.00%
4,267,795 GBP BP Plc 20,561,225 0.13%720,000 GBP BPHA Finance Plc 4.816% 11 April 2044 1,096,843 0.01%
1,190,000 EUR Brambles Finance Plc 4.625% 20 April 2018 1,300,778 0.01%338,841 GBP British American Tobacco Plc 17,389,803 0.11%800,000 GBP British Telecommunications Plc 6.625% 23 June 2017 1,169,407 0.01%

Standard Life Investments Global SICAV Société d'Investissement à Capital Variable
259
Global Absolute Return Strategies Fund Schedule of Investments (expressed in EUR) (continued) as at 31 December 2015
Quantity/ Market Value % of
Nominal Value Currency Name of Securities EUR Net Assets
Transferable securities and money market instruments admitted to an official exchange listing (continued)
United Kingdom (continued) 1,000,000 GBP British Telecommunications Plc 5.750% 07 December 2028 1,645,625 0.01%5,162,000 USD British Telecommunications Plc 9.625% 15 December 2030 6,922,564 0.04%
130,000 GBP British Telecommunications Plc 6.375% 23 June 2037 231,295 0.00%1,278,900 GBP Broadgate Financing Plc 5.098% 05 April 2033 1,925,705 0.01%5,557,893 GBP BT Group Plc 35,679,456 0.22%
359,367 GBP BTG Plc 3,367,319 0.02%480,000 GBP BUPA Finance Plc 3.375% 17 June 2021 669,194 0.00%920,000 GBP BUPA Finance Plc 5.000% 25 April 2023 1,294,257 0.01%275,134 GBP Burberry Group Plc 4,474,601 0.03%412,103 GBP Canary Wharf Finance II Plc 6.455% 22 April 2030 723,980 0.00%365,871 GBP Capita Plc 6,015,020 0.04%230,000 GBP Care UK Health & Social Care Plc FRN 15 January 2020 283,673 0.00%991,826 GBP Carillion Plc 4,088,622 0.03%
2,000,000 GBP Centrica Plc 4.375% 13 March 2029 2,884,551 0.02%750,000 GBP Centrica Plc 7.000% 19 September 2033 1,387,593 0.01%600,000 GBP Centrica Plc 4.250% 12 September 2044 804,206 0.01%
1,000,000 EUR Centrica Plc FRN 10 April 2076 923,177 0.01%750,000 GBP Circle Anglia Social Housing Plc 5.200% 02 March 2044 1,222,530 0.01%
1,200,000 GBP Close Brothers Finance Plc 3.875% 27 June 2021 1,706,048 0.01%197,279 GBP Close Brothers Group Plc 3,589,669 0.02%
1,150,000 GBP Compass Group Plc 3.850% 26 June 2026 1,678,350 0.01%950,000 EUR Coventry Building Society 2.250% 04 December 2017 983,829 0.01%
2,100,000 EUR Coventry Building Society 2.500% 18 November 2020 2,245,297 0.01%1,000,000 GBP Coventry Building Society 5.875% 28 September 2022 1,622,647 0.01%
246,437 GBP Crest Nicholson Holdings plc 1,868,114 0.01%630,000 GBP Crh Finance UK Plc 4.125% 02 December 2029 858,886 0.01%250,000 GBP Delamare Finance Plc 5.546% 19 February 2029 330,255 0.00%492,721 GBP Dignity Finance Plc 3.546% 31 December 2034 688,839 0.00%
1,802,000 GBP Dignity Finance Plc 4.696% 31 December 2049 2,583,956 0.02%759,428 GBP Direct Line Insurance Group Plc 4,211,690 0.03%
1,050,000 GBP Direct Line Insurance Group Plc FRN 27 April 2042 1,758,106 0.01%499,309 GBP Dixons Carphone Plc 3,397,673 0.02%
2,230,206 GBP DS Smith Plc 12,040,634 0.08%500,000 GBP Eastern Power Networks Plc 4.750% 30 September 2021 756,217 0.00%400,000 GBP Eastern Power Networks Plc 6.250% 12 November 2036 721,180 0.00%795,000 GBP EE Finance Plc 4.375% 28 March 2019 1,151,450 0.01%717,466 GBP Enterprise Inns Plc 1,085,796 0.01%399,000 GBP Enterprise Inns Plc 6.500% 06 December 2018 583,284 0.00%800,000 GBP Enterprise Inns Plc 6.875% 15 February 2021 1,166,541 0.01%870,000 GBP ENW Finance Plc 6.125% 21 July 2021 1,388,631 0.01%369,012 GBP Essentra Plc 4,158,273 0.03%
1,147,313 GBP esure Group Plc 3,953,555 0.03%2,175,000 GBP Eversholt Funding Plc 6.359% 02 December 2025 3,660,555 0.02%
870,000 GBP Eversholt Funding Plc 6.697% 22 February 2035 1,528,063 0.01%1,000,000 GBP Experian Finance Plc 4.750% 23 November 2018 1,464,761 0.01%1,170,000 EUR Experian Finance Plc 4.750% 04 February 2020 1,349,256 0.01%
490,000 EUR FCE Bank Plc 1.875% 12 May 2016 492,879 0.00%550,000 EUR FCE Bank Plc 2.875% 03 October 2017 572,648 0.00%
1,230,000 EUR FCE Bank Plc 1.875% 18 April 2019 1,268,687 0.01%700,000 GBP FCE Bank Plc 2.759% 13 November 2019 959,788 0.01%950,000 EUR FCE Bank Plc 1.528% 09 November 2020 958,788 0.01%550,000 GBP FCE Bank Plc 3.250% 19 November 2020 764,970 0.00%
1,060,000 EUR FCE Bank Plc 1.875% 24 June 2021 1,078,704 0.01%1,320,000 EUR FCE Bank Plc 1.134% 10 February 2022 1,278,751 0.01%
800,000 GBP Firstgroup Plc 8.125% 19 September 2018 1,240,666 0.01%1,200,000 GBP Firstgroup Plc 8.750% 08 April 2021 2,021,045 0.01%
500,000 GBP Firstgroup Plc 6.875% 18 September 2024 813,159 0.01%800,000 GBP Friends Life Holdings Plc 8.250% 21 April 2022 1,317,315 0.01%910,000 EUR G4S International Finance Plc 2.875% 02 May 2017 937,541 0.01%
1,200,000 EUR G4S International Finance Plc 2.625% 06 December 2018 1,262,282 0.01%1,100,000 GBP G4S Plc 7.750% 13 May 2019 1,725,231 0.01%
265,116 GBP Galliford Try Plc 5,502,347 0.03%2,343,832 GBP GKN Plc 9,837,461 0.06%1,400,000 GBP GlaxoSmithKline Capital Plc 5.250% 19 December 2033 2,333,949 0.01%

Standard Life Investments Global SICAV Société d'Investissement à Capital Variable
260
Global Absolute Return Strategies Fund Schedule of Investments (expressed in EUR) (continued) as at 31 December 2015
Quantity/ Market Value % of
Nominal Value Currency Name of Securities EUR Net Assets
Transferable securities and money market instruments admitted to an official exchange listing (continued)
United Kingdom (continued) 1,500,000 GBP GlaxoSmithKline Capital Plc 6.375% 09 March 2039 2,830,280 0.02%1,049,440 GBP GlaxoSmithKline Plc 19,609,672 0.12%1,500,000 GBP Go-Ahead Group Plc 5.375% 29 September 2017 2,156,230 0.01%
392,200 GBP Great Portland Estates Plc 4,419,571 0.03%576,000 GBP Great Rolling Stock Co Ltd 6.500% 05 April 2031 986,401 0.01%476,925 GBP Greater Gabbard OFTO Plc 4.137% 29 November 2032 697,276 0.00%607,637 GBP Greene King Finance Plc FRN 15 December 2033 837,204 0.01%353,000 GBP Greene King Finance Plc 5.106% 15 March 2034 532,280 0.00%304,966 GBP Greene King Plc 3,859,904 0.02%797,680 GBP Gwynt y Mor OFTO Plc 2.778% 17 February 2034 1,036,901 0.01%210,000 EUR Hammerson Plc 2.750% 26 September 2019 224,021 0.00%
1,600,000 EUR Hammerson Plc 2.000% 01 July 2022 1,632,856 0.01%1,250,000 GBP Hammerson Plc 6.000% 23 February 2026 2,053,260 0.01%
710,000 GBP Heathrow Finance Plc 7.125% 01 March 2017 1,021,681 0.01%906,560 GBP Howden Joinery Group Plc 6,495,867 0.04%
4,385,002 GBP HSBC Holdings Plc 31,999,175 0.20%400,000 EUR HSBC Holdings Plc FRN 10 January 2024 420,325 0.00%
1,100,000 GBP HSBC Holdings Plc 5.750% 20 December 2027 1,667,830 0.01%600,000 GBP HSBC Holdings Plc 7.000% 07 April 2038 1,062,458 0.01%937,000 GBP HSBC Holdings Plc 6.000% 29 March 2040 1,492,239 0.01%626,249 GBP IMI Plc 7,342,509 0.05%280,000 EUR Imperial Tobacco Finance Plc 4.500% 05 July 2018 308,799 0.00%980,000 GBP Imperial Tobacco Finance Plc 7.750% 24 June 2019 1,575,008 0.01%
1,067,000 EUR Imperial Tobacco Finance Plc 5.000% 02 December 2019 1,240,272 0.01%900,000 EUR Imperial Tobacco Finance Plc 2.250% 26 February 2021 947,084 0.01%
1,500,000 GBP Imperial Tobacco Finance Plc 8.125% 15 March 2024 2,699,940 0.02%690,000 GBP Imperial Tobacco Finance Plc 4.875% 07 June 2032 1,017,917 0.01%288,922 GBP Imperial Tobacco Group Plc 14,102,419 0.09%954,854 GBP Inchcape Plc 10,201,142 0.06%737,255 GBP Integrated Accommodation Services Plc 6.480% 31 March 2029 1,229,853 0.01%908,510 EUR International Consolidated Airlines Group SA 7,517,920 0.05%285,000 EUR International Game Technology Plc 4.125% 15 February 2020 286,226 0.00%200,000 EUR International Game Technology Plc 4.750% 05 March 2020 201,624 0.00%330,318 GBP Interserve Plc 2,339,888 0.01%
2,000,000 GBP Intu Metrocentre Finance Plc 4.125% 06 December 2023 2,827,646 0.02%2,328,271 GBP ITV Plc 8,764,515 0.06%
400,000 GBP Jaguar Land Rover Automotive Plc 5.000% 15 February 2022 561,577 0.00%1,220,000 GBP Jaguar Land Rover Automotive Plc 3.875% 01 March 2023 1,563,693 0.01%
414,479 GBP Jardine Lloyd Thompson Group Plc 5,217,788 0.03%1,500,000 GBP John Lewis Plc 4.250% 18 December 2034 1,995,850 0.01%
54,591 GBP Kier Group Plc 1,033,452 0.01%1,500,000 GBP Land Securities Capital Markets Plc FRN 07 November 2019 2,162,492 0.01%1,000,000 GBP Land Securities Capital Markets Plc FRN 31 July 2032 1,670,140 0.01%
500,000 GBP LBG Capital No.2 Plc 15.000% 21 December 2019 928,848 0.01%1,001,000 EUR LBG Capital No.2 Plc 15.000% 21 December 2019 1,432,526 0.01%
400,000 GBP LCR Finance Plc 5.100% 07 March 2051 809,761 0.01%1,530,000 EUR Leeds Building Society 2.625% 01 April 2021 1,611,804 0.01%1,010,000 EUR Leeds Building Society 1.375% 05 May 2022 985,598 0.01%3,036,826 GBP Legal & General Group Plc 11,068,089 0.07%
350,000 GBP Legal & General Group Plc FRN 23 July 2041 606,433 0.00%840,000 GBP Legal & General Group Plc FRN 27 October 2045 1,150,286 0.01%
1,000,000 GBP Legal & General Group Plc FRN 27 June 2064 1,284,533 0.01%700,000 GBP Lend Lease Europe Finance Plc 6.125% 12 October 2021 1,068,926 0.01%
1,780,000 EUR Lloyds Bank Plc 6.500% 24 March 2020 2,154,028 0.01%1,000,000 GBP Lloyds Bank Plc 7.625% 22 April 2025 1,744,772 0.01%4,080,000 USD Lloyds Bank Plc 3.500% 14 May 2025 3,760,669 0.02%2,200,000 GBP Lloyds Bank Plc FRN 09 July 2025 3,239,909 0.02%2,030,000 GBP Lloyds Bank Plc 6.500% 17 September 2040 3,913,173 0.02%
13,707,961 GBP Lloyds Banking Group Plc 13,631,829 0.09%260,000 GBP Lloyds Banking Group Plc FRN (perpetual bond*) 360,775 0.00%500,000 GBP London & Quadrant Housing Trust 4.625% 05 December 2033 776,720 0.01%160,000 GBP London & Quadrant Housing Trust 5.500% 27 January 2040 275,660 0.00%
1,070,000 GBP London & Quadrant Housing Trust 3.750% 27 October 2049 1,461,532 0.01%1,110,000 GBP London Stock Exchange Group Plc 9.125% 18 October 2019 1,877,338 0.01%

Standard Life Investments Global SICAV Société d'Investissement à Capital Variable
261
Global Absolute Return Strategies Fund Schedule of Investments (expressed in EUR) (continued) as at 31 December 2015
Quantity/ Market Value % of
Nominal Value Currency Name of Securities EUR Net Assets
Transferable securities and money market instruments admitted to an official exchange listing (continued)
United Kingdom (continued) 1,520,000 GBP Marks & Spencer Plc 4.750% 12 June 2025 2,233,229 0.01%
500,000 GBP Marstons Issuer Plc FRN 15 October 2027 718,109 0.00%500,000 GBP Marstons Issuer Plc FRN 15 July 2035 639,646 0.00%382,639 GBP McCarthy & Stone Plc 1,322,711 0.01%36,915 GBP Mitchells & Butlers Finance Plc 5.965% 15 December 2023 55,321 0.00%
750,000 GBP Mitchells & Butlers Finance Plc 6.469% 15 September 2030 1,226,085 0.01%786,795 GBP Mitchells & Butlers Finance Plc 5.574% 15 December 2030 1,190,604 0.01%427,000 EUR Mondi Finance Plc 5.750% 03 April 2017 454,952 0.00%270,000 EUR Mondi Finance Plc 3.375% 28 September 2020 297,378 0.00%540,000 EUR Motability Operations Group Plc 1.625% 09 June 2023 554,958 0.00%500,000 GBP National Express Group Plc 6.250% 13 January 2017 711,671 0.00%
1,200,000 GBP National Express Group Plc 6.625% 17 June 2020 1,892,430 0.01%1,500,000 GBP National Grid Electricity Transmission Plc 7.375% 13 January 2031 2,997,140 0.02%
580,000 GBP National Grid Gas Plc 6.000% 13 May 2038 1,065,660 0.01%868,216 GBP National Grid Plc 11,077,487 0.07%
2,600,000 EUR Nationwide Building Society 6.750% 22 July 2020 3,197,593 0.02%940,000 GBP Nationwide Building Society 2.250% 29 April 2022 1,260,677 0.01%900,000 GBP Network Rail Infrastructure Finance Plc 4.750% 29 November 2035 1,574,859 0.01%
1,250,000 GBP NGG Finance Plc FRN 18 June 2073 1,758,923 0.01%949,000 EUR NGG Finance Plc FRN 18 June 2076 994,671 0.01%450,000 GBP Northern Powergrid Holdings Co 7.250% 15 December 2022 765,332 0.00%650,000 GBP Northumbrian Water Finance Plc 6.000% 11 October 2017 951,203 0.01%450,000 GBP Northumbrian Water Finance Plc 5.625% 29 April 2033 759,894 0.00%
1,200,000 GBP Notting Hill Housing Trust 5.250% 07 July 2042 1,957,216 0.01%240,000 GBP Notting Hill Housing Trust 4.375% 20 February 2054 354,840 0.00%
1,337,460 GBP Octagon Healthcare Funding Plc 5.333% 31 December 2035 2,127,784 0.01%1,160,000 GBP Peabody Capital Plc 5.250% 17 March 2043 1,878,766 0.01%1,000,000 GBP Provident Financial Plc 8.000% 23 October 2019 1,551,483 0.01%
801,916 GBP Prudential Plc 16,708,838 0.11%1,070,000 GBP Prudential Plc FRN 20 July 2055 1,358,679 0.01%1,500,000 GBP Prudential Plc FRN 19 December 2063 2,049,092 0.01%
44,000 GBP Punch Taverns Finance Plc 7.320% 15 October 2025 64,972 0.00%160,000 EUR R&R Ice Cream Plc 4.750% 15 May 2020 165,206 0.00%225,000 GBP R&R Ice Cream Plc 5.500% 15 May 2020 316,077 0.00%65,076 GBP Reckitt Benckiser Group Plc 5,562,779 0.04%
1,300,000 GBP Reed Elsevier Investments Plc 7.000% 11 December 2017 1,945,457 0.01%575,209 GBP RELX Plc 9,370,483 0.06%
1,510,000 EUR Rentokil Initial Plc 3.250% 07 October 2021 1,646,413 0.01%777,678 GBP Restaurant Group Plc 7,255,201 0.05%
1,000,000 GBP Rio Tinto Finance Plc 4.000% 11 December 2029 1,317,740 0.01%1,658,000 USD Rio Tinto Finance USA Plc 4.750% 22 March 2042 1,329,830 0.01%
411,883 GBP Rio Tinto Plc 11,096,130 0.07%980,000 GBP RL Finance Bonds No. 2 plc FRN 30 November 2043 1,377,580 0.01%
1,600,000 EUR Royal Bank of Scotland Group Plc 1.500% 28 November 2016 1,617,112 0.01%2,470,000 EUR Royal Bank of Scotland Group Plc 1.625% 25 June 2019 2,516,943 0.02%1,500,000 EUR Royal Bank of Scotland Group Plc FRN 25 March 2024 1,544,692 0.01%2,713,000 USD Royal Bank of Scotland Group Plc FRN (perpetual bond*) 2,600,576 0.02%
291,000 EUR Royal Bank of Scotland Plc 6.934% 09 April 2018 326,511 0.00%1,245,000 GBP Royal Bank of Scotland Plc 6.625% 17 September 2018 1,893,657 0.01%
793,000 EUR Royal Bank of Scotland Plc 5.375% 30 September 2019 931,141 0.01%732,000 EUR Royal Bank of Scotland Plc FRN 22 September 2021 748,067 0.00%886,211 GBP Royal Dutch Shell Plc 18,480,303 0.11%750,000 GBP RSA Insurance Group Plc FRN 20 May 2039 1,188,997 0.01%500,000 GBP RSA Insurance Group Plc FRN 10 October 2045 659,894 0.00%135,285 GBP SABMiller Plc 7,492,606 0.05%
2,103,217 GBP Sage Group Plc 17,274,422 0.11%1,000,000 GBP Sanctuary Capital Plc 6.697% 23 March 2039 1,936,469 0.01%1,085,000 GBP Santander UK Group Holdings Plc FRN (perpetual bond*) 1,505,602 0.01%
406,940 GBP Sceptre Funding No. 1 Plc 5.253% 09 February 2027 647,929 0.00%600,000 GBP Scottish Power UK Plc 8.375% 20 February 2017 880,475 0.01%500,000 GBP Segro Plc 5.625% 07 December 2020 772,013 0.01%500,000 GBP Segro Plc 6.750% 23 November 2021 823,368 0.01%419,000 GBP Segro Plc 6.750% 23 February 2024 708,733 0.00%628,521 GBP Senior Plc 1,964,821 0.01%

Standard Life Investments Global SICAV Société d'Investissement à Capital Variable
262
Global Absolute Return Strategies Fund Schedule of Investments (expressed in EUR) (continued) as at 31 December 2015
Quantity/ Market Value % of
Nominal Value Currency Name of Securities EUR Net Assets
Transferable securities and money market instruments admitted to an official exchange listing (continued)
United Kingdom (continued) 216,294 GBP Severn Trent Plc 6,408,333 0.04%650,000 GBP Severn Trent Utilities Finance Plc 6.250% 07 June 2029 1,146,073 0.01%
1,000,000 GBP Silverstone Master Issuer Plc FRN 21 January 2055 1,407,537 0.01%1,000,000 GBP Sky Plc 2.875% 24 November 2020 1,374,750 0.01%
367,000 EUR Sky Plc 1.875% 24 November 2023 368,602 0.00%700,000 GBP South Eastern Power Networks Plc 5.500% 05 June 2026 1,133,535 0.01%500,000 GBP Southern Electric Power Distribution Plc 5.500% 07 June 2032 821,822 0.01%
1,000,000 GBP Southern Gas Networks Plc 4.875% 05 October 2023 1,533,179 0.01%600,000 GBP Southern Gas Networks Plc 4.875% 21 March 2029 945,389 0.01%150,000 GBP Southern Gas Networks Plc 6.375% 15 May 2040 277,005 0.00%
1,000,000 GBP Sovereign Housing Capital Plc 5.705% 10 September 2039 1,739,829 0.01%550,000 EUR SSE Plc 2.000% 17 June 2020 577,490 0.00%880,000 EUR SSE Plc 1.750% 08 September 2023 890,322 0.01%900,000 GBP SSE Plc 6.250% 27 August 2038 1,586,718 0.01%130,000 EUR SSE Plc FRN (perpetual bond*) 137,974 0.00%580,000 GBP SSE Plc FRN (perpetual bond*) 757,398 0.00%500,000 EUR SSE Plc FRN (perpetual bond*) 474,332 0.00%740,000 GBP Stagecoach Group Plc 4.000% 29 September 2025 1,011,655 0.01%241,840 GBP Standard Chartered Plc 1,855,318 0.01%308,788 GBP SVG Capital Plc 2,070,547 0.01%198,966 GBP Telecom Plus Plc 2,900,084 0.02%
1,488,090 GBP Telereal Secured Finance Plc 4.010% 10 December 2031 1,973,410 0.01%849,075 GBP Telereal Securitisation Plc 5.565% 10 December 2031 1,312,513 0.01%
1,100,000 GBP Telereal Securitisation Plc FRN 10 December 2033 1,516,028 0.01%200,000 EUR Tesco Corporate Treasury Services Plc 1.375% 01 July 2019 192,317 0.00%
1,000,000 EUR Tesco Plc 3.375% 02 November 2018 1,034,270 0.01%1,332,825 GBP Tesco Property Finance 4 Plc 5.801% 13 October 2040 1,582,635 0.01%4,220,531 GBP Thomas Cook Group Plc 6,955,901 0.04%
520,000 GBP Thomas Cook Group Plc 7.750% 22 June 2017 743,680 0.00%286,514 GBP Tullow Oil Plc 646,116 0.00%138,803 GBP Unilever Plc 5,528,274 0.03%374,200 GBP Unique Pub Finance Co Plc 6.542% 30 March 2021 532,821 0.00%800,000 GBP Unique Pub Finance Co Plc 7.395% 28 March 2024 1,099,648 0.01%
1,000,000 GBP UNITE USAF II Plc 3.374% 30 June 2023 1,384,205 0.01%1,850,000 GBP United Kingdom Gilt 5.000% 07 March 2025 3,187,544 0.02%1,800,000 GBP United Kingdom Gilt 3.250% 22 January 2044 2,729,283 0.02%
533,456 GBP United Utilities Group Plc 6,791,795 0.04%300,000 EUR United Utilities Water Ltd 4.250% 24 January 2020 342,313 0.00%560,000 GBP University of Liverpool 3.375% 25 June 2055 785,501 0.01%421,551 GBP Vedanta Resources Plc 1,578,849 0.01%870,000 EUR Virgin Media Finance Plc 4.500% 15 January 2025 825,882 0.01%525,000 GBP Virgin Media Secured Finance Plc 5.500% 15 January 2021 762,413 0.00%445,500 GBP Virgin Media Secured Finance Plc 6.000% 15 April 2021 628,585 0.00%385,000 GBP Virgin Media Secured Finance Plc 6.250% 28 March 2029 527,764 0.00%
7,007,429 GBP Vodafone Group Plc 21,076,241 0.13%810,000 EUR Vodafone Group Plc 0.875% 17 November 2020 808,558 0.01%200,000 EUR Vodafone Group Plc 4.650% 20 January 2022 239,087 0.00%50,000 EUR Vodafone Group Plc 5.375% 06 June 2022 62,570 0.00%
123,293 GBP Weir Group Plc 1,677,956 0.01%1,000,000 EUR Wellcome Trust Ltd 1.125% 21 January 2027 952,985 0.01%
970,000 GBP Western Power Distribution Plc 3.625% 06 November 2023 1,315,805 0.01%2,287,000 GBP Western Power Distribution West Midlands Plc 5.750% 16 April 2032 3,856,320 0.02%
810,000 GBP Wheatley Group Capital Plc 4.375% 28 November 2044 1,160,586 0.01%115,638 GBP Whitbread Plc 6,926,185 0.04%
1,010,000 GBP Wods Transmission Plc 3.446% 24 August 2034 1,370,711 0.01%5,000,000 USD WPP Finance 2010 5.625% 15 November 2043 4,663,722 0.03%
270,532 GBP WS Atkins Plc 5,986,615 0.04%1,670,000 EUR Yorkshire Building Society 2.125% 18 March 2019 1,736,393 0.01%1,200,000 GBP Yorkshire Building Society FRN 20 November 2024 1,640,579 0.01%1,000,000 GBP Zurich Finance UK Plc FRN (perpetual bond*) 1,511,893 0.01%
Total for United Kingdom 950,055,105 5.98%
United States 4,160,000 USD 21st Century Fox America Inc 4.750% 15 September 2044 3,678,823 0.02%

Standard Life Investments Global SICAV Société d'Investissement à Capital Variable
263
Global Absolute Return Strategies Fund Schedule of Investments (expressed in EUR) (continued) as at 31 December 2015
Quantity/ Market Value % of
Nominal Value Currency Name of Securities EUR Net Assets
Transferable securities and money market instruments admitted to an official exchange listing (continued)
United States (continued) 88,397 USD AbbVie Inc 4,854,695 0.03%
1,800,000 USD ACE INA Holdings Inc 4.350% 03 November 2045 1,678,577 0.01%319,616 USD Activision Blizzard Inc 11,573,869 0.07%51,427 USD Acuity Brands Inc 11,142,885 0.07%
1,697,000 USD ADT Corp 6.250% 15 October 2021 1,644,211 0.01%91,092 USD Advance Auto Parts Inc 12,665,705 0.08%48,013 USD Aetna Inc 4,803,188 0.03%
1,809,000 USD Affinia Group Inc 7.750% 01 May 2021 1,699,232 0.01%1,000,000 USD AK Steel Corp 7.625% 01 October 2021 376,537 0.00%
156,000 USD Alcoa Inc 5.125% 01 October 2024 131,090 0.00%2,524,000 USD Alcoa Inc 5.900% 01 February 2027 2,138,351 0.01%
870,000 USD Allegiant Travel Co 5.500% 15 July 2019 812,975 0.01%72,901 USD Alliance Data Systems Corp 18,530,015 0.12%9,870 USD Alphabet Inc A 7,163,618 0.05%
28,296 USD Alphabet Inc C 20,035,616 0.13%121,143 USD Altria Group Inc 6,541,825 0.04%
8,870,000 USD Altria Group Inc 5.375% 31 January 2044 8,699,892 0.05%10,755 USD Amazon.com Inc 6,806,080 0.04%
1,788,000 USD American Airlines 2015-2 Class AA Pass Through Trust 3.600% 22 September 2027 1,660,540 0.01%
161,462 USD American International Group Inc 9,269,218 0.06%6,670,000 USD American International Group Inc 4.500% 16 July 2044 5,636,033 0.04%
250,000 EUR American International Group Inc FRN 15 March 2067 252,181 0.00%278,493 USD American Tower Corp 25,090,341 0.16%89,842 USD Amgen Inc 13,472,937 0.08%
2,817,000 USD Amgen Inc 3.125% 01 May 2025 2,456,941 0.02%1,500,000 GBP Amgen Inc 4.000% 13 September 2029 2,073,593 0.01%2,500,000 USD Amgen Inc 5.150% 15 November 2041 2,332,384 0.01%1,140,000 USD Amsurg Corp 5.625% 15 July 2022 1,035,177 0.01%5,500,000 USD Anadarko Petroleum Corp 6.450% 15 September 2036 4,870,798 0.03%6,210,000 USD Anthem Inc 3.500% 15 August 2024 5,567,735 0.03%
125,708 USD Apple Inc 12,389,873 0.08%872,000 USD Approach Resources Inc 7.000% 15 June 2021 288,298 0.00%116,679 USD Arthur J Gallagher & Co 4,434,110 0.03%
1,175,000 USD Asbury Automotive Group Inc 6.000% 15 December 2024 1,122,263 0.01%1,480,000 USD Ashland Inc 4.750% 15 August 2022 1,326,924 0.01%
520,000 USD AT&T Inc 2.450% 30 June 2020 470,294 0.00%300,000 EUR AT&T Inc 2.650% 17 December 2021 322,639 0.00%
1,170,000 EUR AT&T Inc 1.450% 01 June 2022 1,170,170 0.01%800,000 EUR AT&T Inc 2.500% 15 March 2023 846,401 0.01%380,000 EUR AT&T Inc 2.400% 15 March 2024 394,417 0.00%
10,470,000 USD AT&T Inc 3.400% 15 May 2025 9,220,104 0.06%540,000 EUR AT&T Inc 3.550% 17 December 2032 574,261 0.00%520,000 EUR AT&T Inc 2.450% 15 March 2035 459,605 0.00%
1,300,000 GBP AT&T Inc 4.250% 01 June 2043 1,639,893 0.01%1,000,000 GBP AT&T Inc 4.875% 01 June 2044 1,383,605 0.01%2,010,000 USD AT&T Inc 4.750% 15 May 2046 1,692,074 0.01%
2,077,000 USD Avis Budget Car Rental LLC / Avis Budget Finance Inc 5.500% 01 April 2023 1,919,401 0.01%
122,524 USD Avis Budget Group Inc 4,045,231 0.03%115,000 EUR Ball Corp 3.500% 15 December 2020 118,474 0.00%905,000 USD Ball Corp 4.375% 15 December 2020 856,070 0.01%100,000 EUR Ball Corp 4.375% 15 December 2023 103,021 0.00%
5,377,655 USD Bank of America Corp 84,205,526 0.53%850,000 EUR Bank of America Corp 7.000% 15 June 2016 875,836 0.01%900,000 EUR Bank of America Corp 4.750% 03 April 2017 950,730 0.01%350,000 EUR Bank of America Corp FRN 28 March 2018 347,230 0.00%600,000 GBP Bank of America Corp 7.750% 30 April 2018 923,084 0.01%400,000 EUR Bank of America Corp 4.625% 14 September 2018 439,430 0.00%440,000 EUR Bank of America Corp 2.500% 27 July 2020 469,080 0.00%
1,200,000 EUR Bank of America Corp 1.375% 10 September 2021 1,207,386 0.01%650,000 GBP Bank of America Corp 6.125% 15 September 2021 1,035,202 0.01%
2,000,000 GBP Bank of America Corp 5.500% 22 November 2021 3,017,397 0.02%1,490,000 EUR Bank of America Corp 1.625% 14 September 2022 1,495,237 0.01%

Standard Life Investments Global SICAV Société d'Investissement à Capital Variable
264
Global Absolute Return Strategies Fund Schedule of Investments (expressed in EUR) (continued) as at 31 December 2015
Quantity/ Market Value % of
Nominal Value Currency Name of Securities EUR Net Assets
Transferable securities and money market instruments admitted to an official exchange listing (continued)
United States (continued) 650,000 GBP Bank of America Corp 7.000% 31 July 2028 1,188,993 0.01%
7,432,000 USD Bank of America Corp 7.750% 14 May 2038 9,265,728 0.06%7,917,000 USD Bank of America Corp 5.875% 07 February 2042 8,493,204 0.05%
637,992 USD BB&T Corp 22,364,576 0.14%302,880 USD Blackhawk Network Holdings Inc 12,586,717 0.08%500,000 EUR BMW US Capital LLC 1.125% 18 September 2021 501,903 0.00%
1,167,000 USD Boeing Co 5.875% 15 February 2040 1,350,267 0.01%1,117,192 USD Boston Scientific Corp 19,094,024 0.12%5,370,000 USD Boston Scientific Corp 3.850% 15 May 2025 4,851,565 0.03%
90,528 USD Bristol-Myers Squibb Co 5,779,842 0.04%4,240,000 USD Brixmor Operating Partnership LP 3.850% 01 February 2025 3,784,815 0.02%8,890,000 USD Burlington Northern Santa Fe LLC 4.150% 01 April 2045 7,404,826 0.05%
154,694 USD CalAtlantic Group Inc 5,439,790 0.03%101,929 USD Cardinal Health Inc 8,475,426 0.05%
2,162,000 USD Cardinal Health Inc 4.900% 15 September 2045 2,013,787 0.01%2,655,000 USD Casella Waste Systems Inc 7.750% 15 February 2019 2,432,208 0.02%
165,087 USD Cavium Inc 10,101,967 0.06%453,616 USD CBRE Group Inc 14,430,770 0.09%750,000 USD CCO Holdings LLC / CCO Holdings Capital Corp 5.750% 15 January 2024 711,172 0.00%238,578 USD Celgene Corp 26,441,675 0.17%
4,050,000 USD Celgene Corp 5.000% 15 August 2045 3,736,634 0.02%1,509,000 USD CenturyLink Inc 5.625% 01 April 2020 1,375,444 0.01%
200,000 USD CenturyLink Inc 6.875% 15 January 2028 137,757 0.00%1,600,000 USD CenturyLink Inc 7.600% 15 September 2039 1,131,446 0.01%2,189,000 USD Chaparral Energy Inc 8.250% 01 September 2021 492,533 0.00%
689,867 USD Charles Schwab Corp 21,065,913 0.13%365,000 USD CHS/Community Health Systems Inc 5.125% 01 August 2021 336,718 0.00%
1,121,000 USD CHS/Community Health Systems Inc 6.875% 01 February 2022 980,604 0.01%2,013,041 USD Citigroup Inc 96,689,114 0.61%
95,000 EUR Citigroup Inc FRN 30 November 2017 95,147 0.00%1,000,000 GBP Citigroup Inc 5.125% 12 December 2018 1,455,264 0.01%
747,000 EUR Citigroup Inc FRN 10 February 2019 746,373 0.00%515,000 EUR Citigroup Inc 7.375% 04 September 2019 639,789 0.00%
1,980,000 EUR Citigroup Inc 1.375% 27 October 2021 1,989,266 0.01%1,200,000 GBP Citigroup Inc 5.875% 01 July 2024 1,892,462 0.01%
365,000 EUR Citigroup Inc 1.750% 28 January 2025 359,841 0.00%7,480,000 USD Citigroup Inc 5.500% 13 September 2025 7,481,836 0.05%3,086,000 USD Citigroup Inc 8.125% 15 July 2039 4,069,200 0.03%
500,000 GBP Citigroup Inc 7.375% 01 September 2039 1,017,205 0.01%2,373,000 USD Citigroup Inc FRN (perpetual bond*) 2,225,631 0.01%1,559,000 USD Clear Channel Worldwide Holdings Inc 7.625% 15 March 2020 1,327,955 0.01%
1,432,000 USD Cloud Peak Energy Resources LLC / Cloud Peak Energy Finance Corp 6.375% 15 March 2024 394,537 0.00%
371,448 USD CMS Energy Corp 12,512,688 0.08%97,943 USD Cognizant Technology Solutions Corp 5,486,893 0.03%
2,454,000 USD Comcast Corp 3.375% 15 August 2025 2,280,607 0.01%500,000 GBP Comcast Corp 5.500% 23 November 2029 827,945 0.01%
7,830,000 USD Comcast Corp 4.750% 01 March 2044 7,462,419 0.05%245,830 USD Comerica Inc 9,477,648 0.06%267,101 USD CVS Health Corp 24,220,991 0.15%
2,000,000 USD CVS Health Corp 3.500% 20 July 2022 1,868,699 0.01%7,550,000 USD CVS Health Corp 5.125% 20 July 2045 7,312,658 0.05%5,680,000 USD Daimler Finance North America LLC 8.500% 18 January 2031 7,564,486 0.05%
301,194 USD Delta Air Lines Inc 14,154,189 0.09%1,500,000 EUR DIRECTV Holdings LLC / DIRECTV Financing Co Inc 2.750% 19 May 2023 1,596,000 0.01%
6,470,000 USD DIRECTV Holdings LLC / DIRECTV Financing Co Inc 5.150% 15 March 2042 5,543,860 0.03%
1,300,000 USD DISH DBS Corp 6.750% 01 June 2021 1,208,820 0.01%2,149,000 USD Dominion Resources Inc/VA 7.000% 15 June 2038 2,374,874 0.01%5,530,000 USD Dow Chemical Co 3.500% 01 October 2024 4,925,561 0.03%
915,000 USD Dow Chemical Co 4.625% 01 October 2044 760,031 0.00%656,000 USD DR Horton Inc 4.000% 15 February 2020 608,905 0.00%
1,436,000 USD DR Horton Inc 4.375% 15 September 2022 1,317,148 0.01%1,870,000 USD Dr Pepper Snapple Group Inc 3.400% 15 November 2025 1,688,978 0.01%
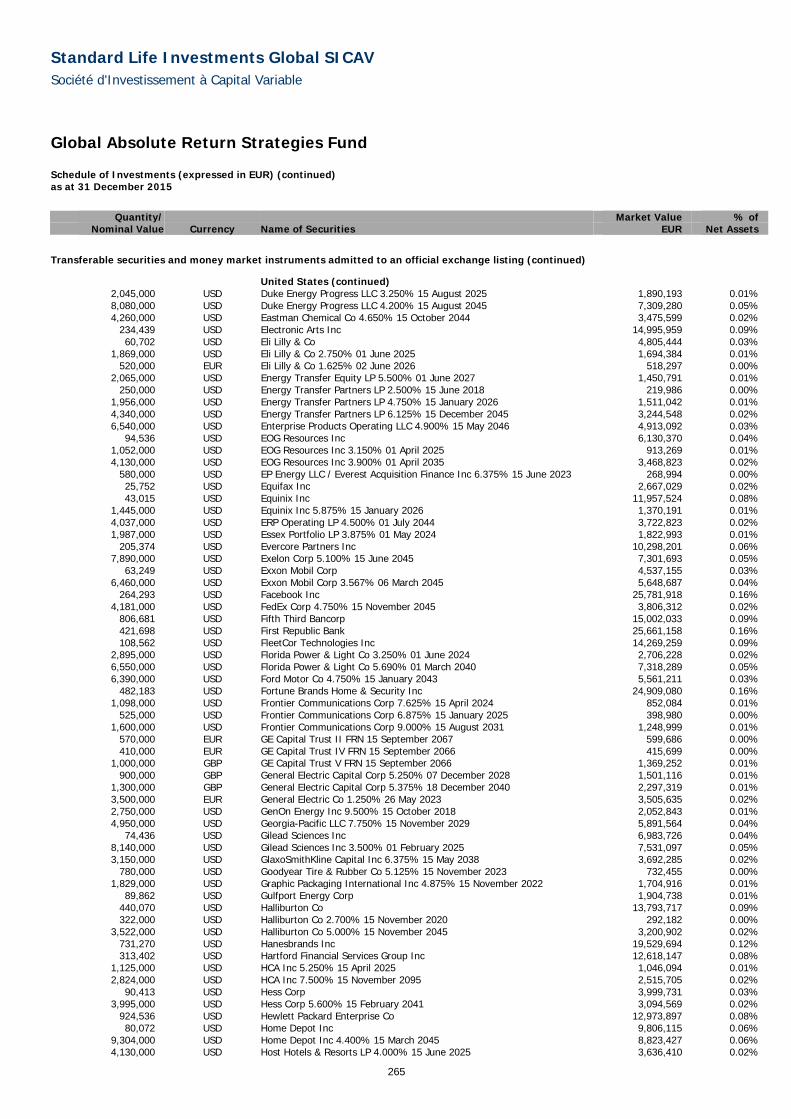
Standard Life Investments Global SICAV Société d'Investissement à Capital Variable
265
Global Absolute Return Strategies Fund Schedule of Investments (expressed in EUR) (continued) as at 31 December 2015
Quantity/ Market Value % of
Nominal Value Currency Name of Securities EUR Net Assets
Transferable securities and money market instruments admitted to an official exchange listing (continued)
United States (continued) 2,045,000 USD Duke Energy Progress LLC 3.250% 15 August 2025 1,890,193 0.01%8,080,000 USD Duke Energy Progress LLC 4.200% 15 August 2045 7,309,280 0.05%4,260,000 USD Eastman Chemical Co 4.650% 15 October 2044 3,475,599 0.02%
234,439 USD Electronic Arts Inc 14,995,959 0.09%60,702 USD Eli Lilly & Co 4,805,444 0.03%
1,869,000 USD Eli Lilly & Co 2.750% 01 June 2025 1,694,384 0.01%520,000 EUR Eli Lilly & Co 1.625% 02 June 2026 518,297 0.00%
2,065,000 USD Energy Transfer Equity LP 5.500% 01 June 2027 1,450,791 0.01%250,000 USD Energy Transfer Partners LP 2.500% 15 June 2018 219,986 0.00%
1,956,000 USD Energy Transfer Partners LP 4.750% 15 January 2026 1,511,042 0.01%4,340,000 USD Energy Transfer Partners LP 6.125% 15 December 2045 3,244,548 0.02%6,540,000 USD Enterprise Products Operating LLC 4.900% 15 May 2046 4,913,092 0.03%
94,536 USD EOG Resources Inc 6,130,370 0.04%1,052,000 USD EOG Resources Inc 3.150% 01 April 2025 913,269 0.01%4,130,000 USD EOG Resources Inc 3.900% 01 April 2035 3,468,823 0.02%
580,000 USD EP Energy LLC / Everest Acquisition Finance Inc 6.375% 15 June 2023 268,994 0.00%25,752 USD Equifax Inc 2,667,029 0.02%43,015 USD Equinix Inc 11,957,524 0.08%
1,445,000 USD Equinix Inc 5.875% 15 January 2026 1,370,191 0.01%4,037,000 USD ERP Operating LP 4.500% 01 July 2044 3,722,823 0.02%1,987,000 USD Essex Portfolio LP 3.875% 01 May 2024 1,822,993 0.01%
205,374 USD Evercore Partners Inc 10,298,201 0.06%7,890,000 USD Exelon Corp 5.100% 15 June 2045 7,301,693 0.05%
63,249 USD Exxon Mobil Corp 4,537,155 0.03%6,460,000 USD Exxon Mobil Corp 3.567% 06 March 2045 5,648,687 0.04%
264,293 USD Facebook Inc 25,781,918 0.16%4,181,000 USD FedEx Corp 4.750% 15 November 2045 3,806,312 0.02%
806,681 USD Fifth Third Bancorp 15,002,033 0.09%421,698 USD First Republic Bank 25,661,158 0.16%108,562 USD FleetCor Technologies Inc 14,269,259 0.09%
2,895,000 USD Florida Power & Light Co 3.250% 01 June 2024 2,706,228 0.02%6,550,000 USD Florida Power & Light Co 5.690% 01 March 2040 7,318,289 0.05%6,390,000 USD Ford Motor Co 4.750% 15 January 2043 5,561,211 0.03%
482,183 USD Fortune Brands Home & Security Inc 24,909,080 0.16%1,098,000 USD Frontier Communications Corp 7.625% 15 April 2024 852,084 0.01%
525,000 USD Frontier Communications Corp 6.875% 15 January 2025 398,980 0.00%1,600,000 USD Frontier Communications Corp 9.000% 15 August 2031 1,248,999 0.01%
570,000 EUR GE Capital Trust II FRN 15 September 2067 599,686 0.00%410,000 EUR GE Capital Trust IV FRN 15 September 2066 415,699 0.00%
1,000,000 GBP GE Capital Trust V FRN 15 September 2066 1,369,252 0.01%900,000 GBP General Electric Capital Corp 5.250% 07 December 2028 1,501,116 0.01%
1,300,000 GBP General Electric Capital Corp 5.375% 18 December 2040 2,297,319 0.01%3,500,000 EUR General Electric Co 1.250% 26 May 2023 3,505,635 0.02%2,750,000 USD GenOn Energy Inc 9.500% 15 October 2018 2,052,843 0.01%4,950,000 USD Georgia-Pacific LLC 7.750% 15 November 2029 5,891,564 0.04%
74,436 USD Gilead Sciences Inc 6,983,726 0.04%8,140,000 USD Gilead Sciences Inc 3.500% 01 February 2025 7,531,097 0.05%3,150,000 USD GlaxoSmithKline Capital Inc 6.375% 15 May 2038 3,692,285 0.02%
780,000 USD Goodyear Tire & Rubber Co 5.125% 15 November 2023 732,455 0.00%1,829,000 USD Graphic Packaging International Inc 4.875% 15 November 2022 1,704,916 0.01%
89,862 USD Gulfport Energy Corp 1,904,738 0.01%440,070 USD Halliburton Co 13,793,717 0.09%322,000 USD Halliburton Co 2.700% 15 November 2020 292,182 0.00%
3,522,000 USD Halliburton Co 5.000% 15 November 2045 3,200,902 0.02%731,270 USD Hanesbrands Inc 19,529,694 0.12%313,402 USD Hartford Financial Services Group Inc 12,618,147 0.08%
1,125,000 USD HCA Inc 5.250% 15 April 2025 1,046,094 0.01%2,824,000 USD HCA Inc 7.500% 15 November 2095 2,515,705 0.02%
90,413 USD Hess Corp 3,999,731 0.03%3,995,000 USD Hess Corp 5.600% 15 February 2041 3,094,569 0.02%
924,536 USD Hewlett Packard Enterprise Co 12,973,897 0.08%80,072 USD Home Depot Inc 9,806,115 0.06%
9,304,000 USD Home Depot Inc 4.400% 15 March 2045 8,823,427 0.06%4,130,000 USD Host Hotels & Resorts LP 4.000% 15 June 2025 3,636,410 0.02%

Standard Life Investments Global SICAV Société d'Investissement à Capital Variable
266
Global Absolute Return Strategies Fund Schedule of Investments (expressed in EUR) (continued) as at 31 December 2015
Quantity/ Market Value % of
Nominal Value Currency Name of Securities EUR Net Assets
Transferable securities and money market instruments admitted to an official exchange listing (continued)
United States (continued) 715,484 USD Huntington Bancshares Inc/OH 7,339,667 0.05%
7,980,000 USD Intel Corp 3.700% 29 July 2025 7,574,095 0.05%6,200,000 USD International Paper Co 5.150% 15 May 2046 5,423,828 0.03%8,560,000 USD JM Smucker Co 4.375% 15 March 2045 7,655,613 0.05%7,390,000 USD Johnson & Johnson 4.500% 05 December 2043 7,375,967 0.05%1,246,292 USD JPMorgan Chase & Co 76,217,043 0.48%
600,000 GBP JPMorgan Chase & Co 4.250% 25 January 2017 841,522 0.01%920,000 GBP JPMorgan Chase & Co 1.875% 10 February 2020 1,235,700 0.01%900,000 EUR JPMorgan Chase & Co 2.625% 23 April 2021 973,955 0.01%
3,350,000 EUR JPMorgan Chase & Co 1.375% 16 September 2021 3,399,485 0.02%800,000 EUR JPMorgan Chase & Co 1.500% 26 October 2022 807,980 0.01%840,000 EUR JPMorgan Chase & Co 1.500% 27 January 2025 827,698 0.01%
6,390,000 USD JPMorgan Chase & Co 6.400% 15 May 2038 7,378,494 0.05%5,590,000 USD JPMorgan Chase & Co 5.625% 16 August 2043 5,596,452 0.04%
200,000 GBP JPMorgan Chase Bank NA 5.375% 28 September 2016 280,572 0.00%74,359 USD Kansas City Southern 5,071,895 0.03%
1,176,866 USD KeyCorp 14,320,763 0.09%4,240,000 USD Kilroy Realty LP 4.250% 15 August 2029 3,814,738 0.02%2,150,000 EUR Kinder Morgan Inc 1.500% 16 March 2022 1,762,871 0.01%4,420,000 USD Kinder Morgan Inc 4.300% 01 June 2025 3,520,823 0.02%1,500,000 USD Kinder Morgan Inc 5.300% 01 December 2034 1,090,780 0.01%1,550,000 USD Kinder Morgan Inc 5.550% 01 June 2045 1,109,399 0.01%
575,000 USD Kindred Healthcare Inc 8.000% 15 January 2020 483,184 0.00%730,000 USD Kindred Healthcare Inc 8.750% 15 January 2023 618,461 0.00%
1,963,000 USD Kinetic Concepts Inc / KCI USA Inc 10.500% 01 November 2018 1,757,714 0.01%334,747 USD Kraft Heinz Co 22,672,635 0.14%
1,330,000 EUR Kraft Heinz Foods Co 2.000% 30 June 2023 1,345,634 0.01%1,500,000 GBP Kraft Heinz Foods Co 4.125% 01 July 2027 2,083,055 0.01%4,964,000 USD Lockheed Martin Corp 4.700% 15 May 2046 4,674,968 0.03%
107,121 USD M&T Bank Corp 12,065,075 0.08%1,844,000 USD Marriott International Inc/MD 3.750% 01 October 2025 1,665,183 0.01%
132,508 USD Martin Marietta Materials Inc 16,707,223 0.11%2,350,000 USD McDonald's Corp 3.375% 26 May 2025 2,114,181 0.01%2,600,000 USD McDonald's Corp 4.875% 09 December 2045 2,394,416 0.01%8,000,000 USD McGraw Hill Financial Inc 4.400% 15 February 2026 7,519,464 0.05%
1,230,000 USD McGraw-Hill Global Education Holdings LLC / McGraw-Hill Global Education Finance 9.750% 01 April 2021 1,203,034 0.01%
42,818 USD McKesson Corp 7,815,107 0.05%4,674,000 USD McKesson Corp 4.883% 15 March 2044 4,295,236 0.03%4,560,000 USD MeadWestvaco Corp 8.200% 15 January 2030 5,428,176 0.03%2,804,000 USD Medtronic Inc 3.500% 15 March 2025 2,598,042 0.02%5,373,000 USD Medtronic Inc 4.375% 15 March 2035 4,984,449 0.03%1,307,000 USD Men's Wearhouse Inc 7.000% 01 July 2022 864,234 0.01%
525,000 USD Mercer International Inc 7.000% 01 December 2019 485,767 0.00%1,060,000 USD Mercer International Inc 7.750% 01 December 2022 988,087 0.01%1,080,000 EUR Merck & Co Inc 1.875% 15 October 2026 1,107,038 0.01%8,090,000 USD Merck & Co Inc 4.150% 18 May 2043 7,366,330 0.05%5,130,000 USD MetLife Inc 5.875% 06 February 2041 5,527,651 0.03%2,850,000 USD MetLife Inc 4.600% 13 May 2046 2,633,689 0.02%2,290,000 EUR Metropolitan Life Global Funding I 2.375% 30 September 2019 2,448,202 0.02%
400,000 EUR Metropolitan Life Global Funding I 1.250% 17 September 2021 405,175 0.00%2,400,000 EUR Metropolitan Life Global Funding I 0.875% 20 January 2022 2,362,560 0.01%
730,000 GBP Metropolitan Life Global Funding I 2.625% 05 December 2022 990,528 0.01%340,000 EUR Metropolitan Life Global Funding I 2.375% 11 January 2023 365,512 0.00%790,000 GBP Metropolitan Life Global Funding I 3.500% 30 September 2026 1,125,773 0.01%
1,488,000 USD MGM Resorts International 6.000% 15 March 2023 1,359,719 0.01%260,000 EUR Microsoft Corp 3.125% 06 December 2028 299,822 0.00%
9,100,000 USD Microsoft Corp 3.750% 12 February 2045 7,700,322 0.05%1,232,000 USD Microsoft Corp 4.450% 03 November 2045 1,166,396 0.01%
196,911 USD Mondelez International Inc 8,230,005 0.05%420,000 EUR Moody's Corp 1.750% 09 March 2027 402,918 0.00%118,262 USD Morgan Stanley 3,500,490 0.02%360,000 EUR Morgan Stanley 4.500% 23 February 2016 362,164 0.00%
1,300,000 GBP Morgan Stanley 5.750% 14 February 2017 1,854,753 0.01%
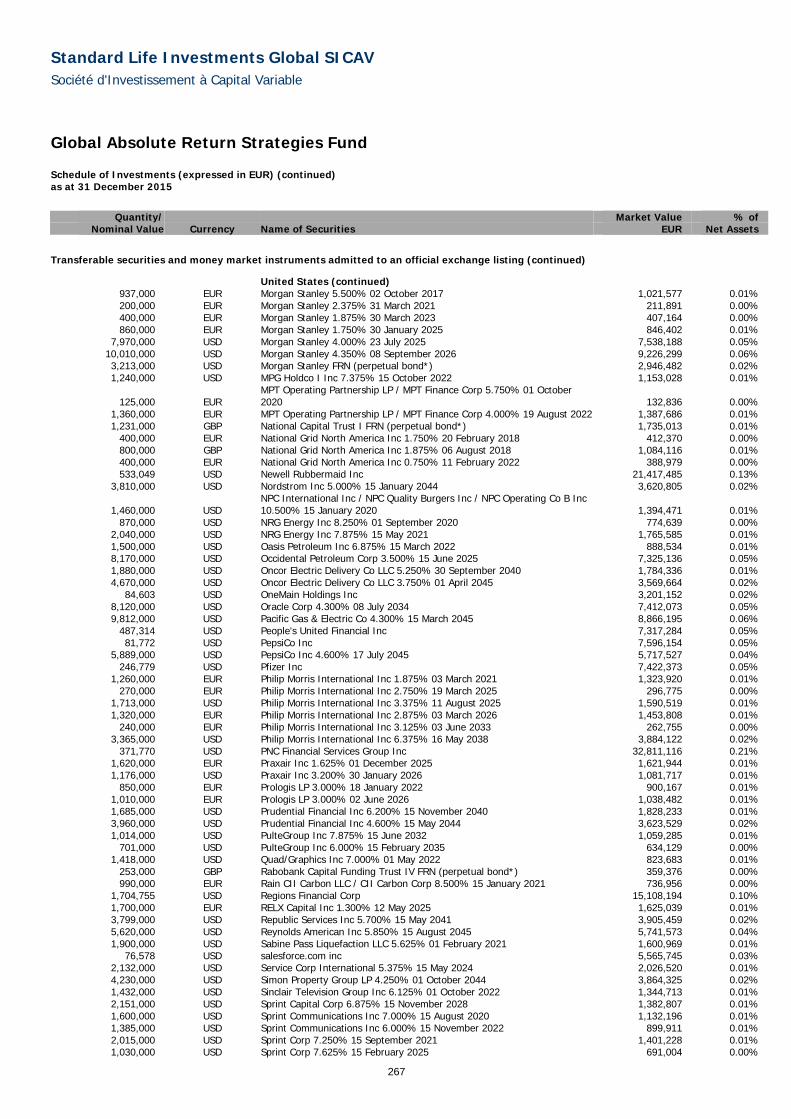
Standard Life Investments Global SICAV Société d'Investissement à Capital Variable
267
Global Absolute Return Strategies Fund Schedule of Investments (expressed in EUR) (continued) as at 31 December 2015
Quantity/ Market Value % of
Nominal Value Currency Name of Securities EUR Net Assets
Transferable securities and money market instruments admitted to an official exchange listing (continued)
United States (continued) 937,000 EUR Morgan Stanley 5.500% 02 October 2017 1,021,577 0.01%200,000 EUR Morgan Stanley 2.375% 31 March 2021 211,891 0.00%400,000 EUR Morgan Stanley 1.875% 30 March 2023 407,164 0.00%860,000 EUR Morgan Stanley 1.750% 30 January 2025 846,402 0.01%
7,970,000 USD Morgan Stanley 4.000% 23 July 2025 7,538,188 0.05%10,010,000 USD Morgan Stanley 4.350% 08 September 2026 9,226,299 0.06%3,213,000 USD Morgan Stanley FRN (perpetual bond*) 2,946,482 0.02%1,240,000 USD MPG Holdco I Inc 7.375% 15 October 2022 1,153,028 0.01%
125,000 EUR MPT Operating Partnership LP / MPT Finance Corp 5.750% 01 October 2020 132,836 0.00%
1,360,000 EUR MPT Operating Partnership LP / MPT Finance Corp 4.000% 19 August 2022 1,387,686 0.01%1,231,000 GBP National Capital Trust I FRN (perpetual bond*) 1,735,013 0.01%
400,000 EUR National Grid North America Inc 1.750% 20 February 2018 412,370 0.00%800,000 GBP National Grid North America Inc 1.875% 06 August 2018 1,084,116 0.01%400,000 EUR National Grid North America Inc 0.750% 11 February 2022 388,979 0.00%533,049 USD Newell Rubbermaid Inc 21,417,485 0.13%
3,810,000 USD Nordstrom Inc 5.000% 15 January 2044 3,620,805 0.02%
1,460,000 USD NPC International Inc / NPC Quality Burgers Inc / NPC Operating Co B Inc 10.500% 15 January 2020 1,394,471 0.01%
870,000 USD NRG Energy Inc 8.250% 01 September 2020 774,639 0.00%2,040,000 USD NRG Energy Inc 7.875% 15 May 2021 1,765,585 0.01%1,500,000 USD Oasis Petroleum Inc 6.875% 15 March 2022 888,534 0.01%8,170,000 USD Occidental Petroleum Corp 3.500% 15 June 2025 7,325,136 0.05%1,880,000 USD Oncor Electric Delivery Co LLC 5.250% 30 September 2040 1,784,336 0.01%4,670,000 USD Oncor Electric Delivery Co LLC 3.750% 01 April 2045 3,569,664 0.02%
84,603 USD OneMain Holdings Inc 3,201,152 0.02%8,120,000 USD Oracle Corp 4.300% 08 July 2034 7,412,073 0.05%9,812,000 USD Pacific Gas & Electric Co 4.300% 15 March 2045 8,866,195 0.06%
487,314 USD People's United Financial Inc 7,317,284 0.05%81,772 USD PepsiCo Inc 7,596,154 0.05%
5,889,000 USD PepsiCo Inc 4.600% 17 July 2045 5,717,527 0.04%246,779 USD Pfizer Inc 7,422,373 0.05%
1,260,000 EUR Philip Morris International Inc 1.875% 03 March 2021 1,323,920 0.01%270,000 EUR Philip Morris International Inc 2.750% 19 March 2025 296,775 0.00%
1,713,000 USD Philip Morris International Inc 3.375% 11 August 2025 1,590,519 0.01%1,320,000 EUR Philip Morris International Inc 2.875% 03 March 2026 1,453,808 0.01%
240,000 EUR Philip Morris International Inc 3.125% 03 June 2033 262,755 0.00%3,365,000 USD Philip Morris International Inc 6.375% 16 May 2038 3,884,122 0.02%
371,770 USD PNC Financial Services Group Inc 32,811,116 0.21%1,620,000 EUR Praxair Inc 1.625% 01 December 2025 1,621,944 0.01%1,176,000 USD Praxair Inc 3.200% 30 January 2026 1,081,717 0.01%
850,000 EUR Prologis LP 3.000% 18 January 2022 900,167 0.01%1,010,000 EUR Prologis LP 3.000% 02 June 2026 1,038,482 0.01%1,685,000 USD Prudential Financial Inc 6.200% 15 November 2040 1,828,233 0.01%3,960,000 USD Prudential Financial Inc 4.600% 15 May 2044 3,623,529 0.02%1,014,000 USD PulteGroup Inc 7.875% 15 June 2032 1,059,285 0.01%
701,000 USD PulteGroup Inc 6.000% 15 February 2035 634,129 0.00%1,418,000 USD Quad/Graphics Inc 7.000% 01 May 2022 823,683 0.01%
253,000 GBP Rabobank Capital Funding Trust IV FRN (perpetual bond*) 359,376 0.00%990,000 EUR Rain CII Carbon LLC / CII Carbon Corp 8.500% 15 January 2021 736,956 0.00%
1,704,755 USD Regions Financial Corp 15,108,194 0.10%1,700,000 EUR RELX Capital Inc 1.300% 12 May 2025 1,625,039 0.01%3,799,000 USD Republic Services Inc 5.700% 15 May 2041 3,905,459 0.02%5,620,000 USD Reynolds American Inc 5.850% 15 August 2045 5,741,573 0.04%1,900,000 USD Sabine Pass Liquefaction LLC 5.625% 01 February 2021 1,600,969 0.01%
76,578 USD salesforce.com inc 5,565,745 0.03%2,132,000 USD Service Corp International 5.375% 15 May 2024 2,026,520 0.01%4,230,000 USD Simon Property Group LP 4.250% 01 October 2044 3,864,325 0.02%1,432,000 USD Sinclair Television Group Inc 6.125% 01 October 2022 1,344,713 0.01%2,151,000 USD Sprint Capital Corp 6.875% 15 November 2028 1,382,807 0.01%1,600,000 USD Sprint Communications Inc 7.000% 15 August 2020 1,132,196 0.01%1,385,000 USD Sprint Communications Inc 6.000% 15 November 2022 899,911 0.01%2,015,000 USD Sprint Corp 7.250% 15 September 2021 1,401,228 0.01%1,030,000 USD Sprint Corp 7.625% 15 February 2025 691,004 0.00%

Standard Life Investments Global SICAV Société d'Investissement à Capital Variable
268
Global Absolute Return Strategies Fund Schedule of Investments (expressed in EUR) (continued) as at 31 December 2015
Quantity/ Market Value % of
Nominal Value Currency Name of Securities EUR Net Assets
Transferable securities and money market instruments admitted to an official exchange listing (continued)
United States (continued) 141,357 USD Steel Dynamics Inc 2,330,264 0.01%756,123 USD Stillwater Mining Co 6,062,196 0.04%462,841 USD SunTrust Banks Inc 18,409,554 0.12%
6,420,000 USD Target Corp 4.000% 01 July 2042 5,755,471 0.04%817,000 USD Tenet Healthcare Corp 8.000% 01 August 2020 756,020 0.00%
2,130,000 USD Tenet Healthcare Corp 6.750% 15 June 2023 1,798,438 0.01%350,000 EUR Thermo Fisher Scientific Inc 1.500% 01 December 2020 353,584 0.00%626,000 GBP Time Warner Cable Inc 5.750% 02 June 2031 851,213 0.01%
2,045,000 USD Time Warner Inc 3.600% 15 July 2025 1,828,674 0.01%4,130,000 USD Time Warner Inc 4.850% 15 July 2045 3,614,318 0.02%
264,222 USD TJX Cos Inc 17,315,981 0.11%566,000 USD T-Mobile USA Inc 6.625% 15 November 2020 539,297 0.00%
2,352,000 USD T-Mobile USA Inc 6.125% 15 January 2022 2,224,835 0.01%508,000 USD T-Mobile USA Inc 6.836% 28 April 2023 484,033 0.00%250,000 USD T-Mobile USA Inc 6.500% 15 January 2026 231,891 0.00%
1,380,000 EUR Toyota Motor Credit Corp 1.000% 09 March 2021 1,393,427 0.01%915,000 USD Travelers Cos Inc 4.600% 01 August 2043 882,509 0.01%
1,883,150 USD UAL 2007-1 Pass Through Trust 6.636% 02 July 2022 1,844,027 0.01%69,258 USD Union Pacific Corp 4,993,651 0.03%
7,639,000 USD Union Pacific Corp 4.821% 01 February 2044 7,624,115 0.05%909,638 USD United Airlines 2013-1 Class B Pass Through Trust 5.375% 15 August 2021 863,590 0.01%
2,289,000 USD United Airlines 2015-1 Class AA Pass Through Trust 3.450% 01 December 2027 2,114,001 0.01%
3,200,000 USD United Parcel Service Inc 6.200% 15 January 2038 3,766,435 0.02%2,427,000 USD United Rentals North America Inc 7.625% 15 April 2022 2,379,364 0.01%8,180,000 USD United Technologies Corp 4.500% 01 June 2042 7,563,669 0.05%
62,274 USD UnitedHealth Group Inc 6,801,190 0.04%1,637,000 USD UnitedHealth Group Inc 3.750% 15 July 2025 1,549,752 0.01%8,280,000 USD UnitedHealth Group Inc 4.750% 15 July 2045 8,001,871 0.05%
780,802 USD US Airways 2011-1 Class A Pass Through Trust 7.125% 22 October 2023 825,532 0.01%869,758 USD US Bancorp 34,355,094 0.22%
1,974,000 USD Vector Group Ltd 7.750% 15 February 2021 1,919,393 0.01%114,159 USD Verizon Communications Inc 4,903,439 0.03%479,000 EUR Verizon Communications Inc 2.375% 17 February 2022 511,339 0.00%
1,300,000 EUR Verizon Communications Inc 1.625% 01 March 2024 1,297,852 0.01%4,030,000 USD Verizon Communications Inc 3.500% 01 November 2024 3,656,314 0.02%
200,000 EUR Verizon Communications Inc 3.250% 17 February 2026 223,896 0.00%800,000 GBP Verizon Communications Inc 4.750% 17 February 2034 1,156,665 0.01%
6,422,000 USD Verizon Communications Inc 6.550% 15 September 2043 6,982,418 0.04%481,000 USD Verizon Communications Inc 5.012% 21 August 2054 404,955 0.00%
4,750,000 USD Verizon Communications Inc 4.672% 15 March 2055 3,770,221 0.02%29,087 USD Vertex Pharmaceuticals Inc 3,376,520 0.02%
5,224,000 USD Virginia Electric & Power Co 4.650% 15 August 2043 5,070,444 0.03%187,595 USD Visteon Corp 20,019,382 0.13%
3,560,000 USD Voya Financial Inc 5.700% 15 July 2043 3,713,991 0.02%350,000 EUR Wachovia Corp 4.375% 27 November 2018 387,095 0.00%
1,636,000 USD Wal-Mart Stores Inc 3.300% 22 April 2024 1,546,168 0.01%2,000,000 GBP Wal-Mart Stores Inc 5.625% 27 March 2034 3,452,427 0.02%3,560,000 USD Wal-Mart Stores Inc 5.250% 01 September 2035 3,722,371 0.02%9,280,000 USD Wal-Mart Stores Inc 6.500% 15 August 2037 11,008,736 0.07%3,822,000 USD Walt Disney Co 3.150% 17 September 2025 3,546,067 0.02%6,560,000 USD Waste Management Inc 4.100% 01 March 2045 5,604,403 0.04%1,474,908 USD Wells Fargo & Co 74,350,079 0.47%
900,000 EUR Wells Fargo & Co 1.125% 29 October 2021 904,510 0.01%460,000 EUR Wells Fargo & Co 2.625% 16 August 2022 500,392 0.00%
1,050,000 EUR Wells Fargo & Co 1.500% 12 September 2022 1,062,464 0.01%520,000 EUR Wells Fargo & Co 2.250% 02 May 2023 551,093 0.00%223,000 EUR Wells Fargo & Co 2.125% 04 June 2024 232,971 0.00%
1,160,000 EUR Wells Fargo & Co 2.000% 27 April 2026 1,175,967 0.01%9,438,000 USD Wells Fargo & Co 4.100% 03 June 2026 8,739,894 0.05%2,510,000 USD Wells Fargo & Co 5.375% 07 February 2035 2,637,841 0.02%
650,000 GBP Wells Fargo & Co 4.875% 29 November 2035 967,995 0.01%800,000 GBP Wells Fargo Bank NA 5.250% 01 August 2023 1,251,515 0.01%
2,052,000 USD Williams Cos Inc 4.550% 24 June 2024 1,283,696 0.01%
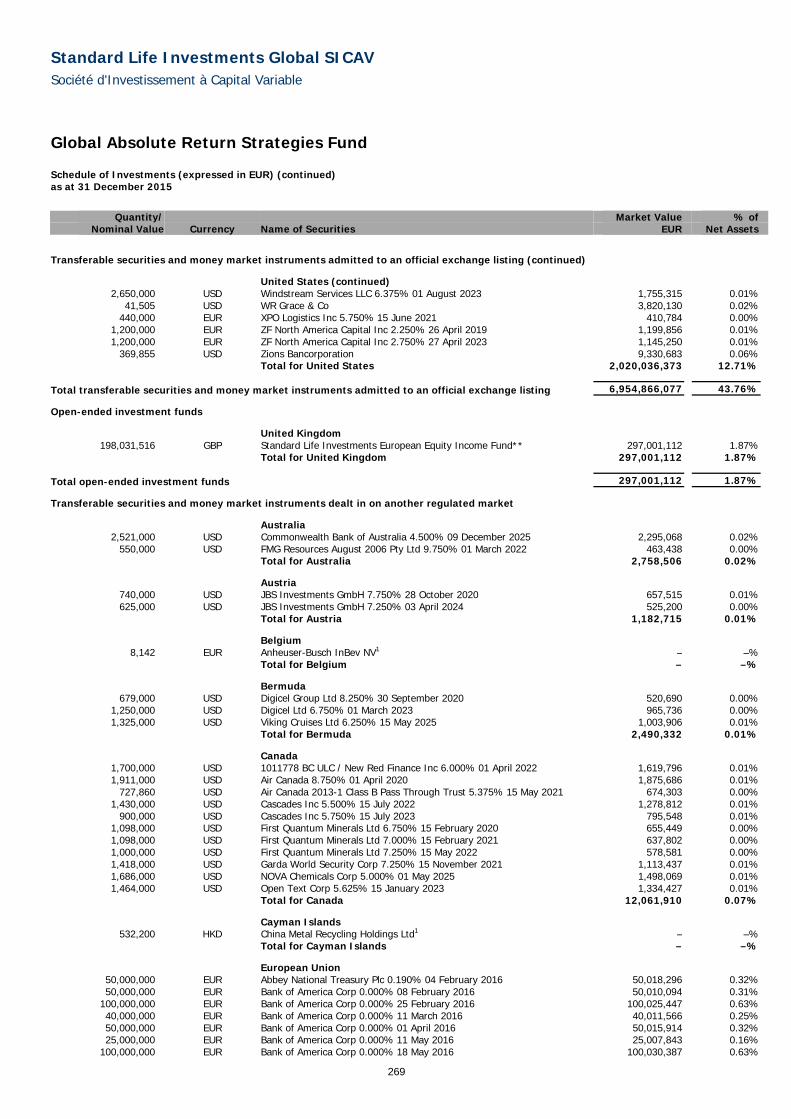
Standard Life Investments Global SICAV Société d'Investissement à Capital Variable
269
Global Absolute Return Strategies Fund Schedule of Investments (expressed in EUR) (continued) as at 31 December 2015
Quantity/ Market Value % of
Nominal Value Currency Name of Securities EUR Net Assets
Transferable securities and money market instruments admitted to an official exchange listing (continued)
United States (continued) 2,650,000 USD Windstream Services LLC 6.375% 01 August 2023 1,755,315 0.01%
41,505 USD WR Grace & Co 3,820,130 0.02%440,000 EUR XPO Logistics Inc 5.750% 15 June 2021 410,784 0.00%
1,200,000 EUR ZF North America Capital Inc 2.250% 26 April 2019 1,199,856 0.01%1,200,000 EUR ZF North America Capital Inc 2.750% 27 April 2023 1,145,250 0.01%
369,855 USD Zions Bancorporation 9,330,683 0.06% Total for United States 2,020,036,373 12.71%
Total transferable securities and money market instruments admitted to an official exchange listing 6,954,866,077 43.76%
Open-ended investment funds
United Kingdom 198,031,516 GBP Standard Life Investments European Equity Income Fund** 297,001,112 1.87%
Total for United Kingdom 297,001,112 1.87%
Total open-ended investment funds 297,001,112 1.87%
Transferable securities and money market instruments dealt in on another regulated market
Australia 2,521,000 USD Commonwealth Bank of Australia 4.500% 09 December 2025 2,295,068 0.02%
550,000 USD FMG Resources August 2006 Pty Ltd 9.750% 01 March 2022 463,438 0.00% Total for Australia 2,758,506 0.02%
Austria 740,000 USD JBS Investments GmbH 7.750% 28 October 2020 657,515 0.01%625,000 USD JBS Investments GmbH 7.250% 03 April 2024 525,200 0.00%
Total for Austria 1,182,715 0.01%
Belgium 8,142 EUR Anheuser-Busch InBev NV1 – –%
Total for Belgium – –%
Bermuda 679,000 USD Digicel Group Ltd 8.250% 30 September 2020 520,690 0.00%
1,250,000 USD Digicel Ltd 6.750% 01 March 2023 965,736 0.00%1,325,000 USD Viking Cruises Ltd 6.250% 15 May 2025 1,003,906 0.01%
Total for Bermuda 2,490,332 0.01%
Canada 1,700,000 USD 1011778 BC ULC / New Red Finance Inc 6.000% 01 April 2022 1,619,796 0.01%1,911,000 USD Air Canada 8.750% 01 April 2020 1,875,686 0.01%
727,860 USD Air Canada 2013-1 Class B Pass Through Trust 5.375% 15 May 2021 674,303 0.00%1,430,000 USD Cascades Inc 5.500% 15 July 2022 1,278,812 0.01%
900,000 USD Cascades Inc 5.750% 15 July 2023 795,548 0.01%1,098,000 USD First Quantum Minerals Ltd 6.750% 15 February 2020 655,449 0.00%1,098,000 USD First Quantum Minerals Ltd 7.000% 15 February 2021 637,802 0.00%1,000,000 USD First Quantum Minerals Ltd 7.250% 15 May 2022 578,581 0.00%1,418,000 USD Garda World Security Corp 7.250% 15 November 2021 1,113,437 0.01%1,686,000 USD NOVA Chemicals Corp 5.000% 01 May 2025 1,498,069 0.01%1,464,000 USD Open Text Corp 5.625% 15 January 2023 1,334,427 0.01%
Total for Canada 12,061,910 0.07%
Cayman Islands 532,200 HKD China Metal Recycling Holdings Ltd1 – –%
Total for Cayman Islands – –%
European Union 50,000,000 EUR Abbey National Treasury Plc 0.190% 04 February 2016 50,018,296 0.32%50,000,000 EUR Bank of America Corp 0.000% 08 February 2016 50,010,094 0.31%
100,000,000 EUR Bank of America Corp 0.000% 25 February 2016 100,025,447 0.63%40,000,000 EUR Bank of America Corp 0.000% 11 March 2016 40,011,566 0.25%50,000,000 EUR Bank of America Corp 0.000% 01 April 2016 50,015,914 0.32%25,000,000 EUR Bank of America Corp 0.000% 11 May 2016 25,007,843 0.16%
100,000,000 EUR Bank of America Corp 0.000% 18 May 2016 100,030,387 0.63%

Standard Life Investments Global SICAV Société d'Investissement à Capital Variable
270
Global Absolute Return Strategies Fund Schedule of Investments (expressed in EUR) (continued) as at 31 December 2015
Quantity/ Market Value % of
Nominal Value Currency Name of Securities EUR Net Assets
Transferable securities and money market instruments dealt in on another regulated market (continued)
European Union (continued) 45,000,000 EUR Bank of America Corp 0.000% 10 August 2016 45,004,392 0.28%91,500,000 EUR Barclays Bank plc 0.000% 14 January 2016 91,508,113 0.58%28,000,000 EUR Barclays Bank Plc 0.000% 29 February 2016 28,007,377 0.18%25,000,000 EUR Calyon - Credit Agricole 0.250% 12 January 2016 25,003,830 0.16%50,000,000 EUR Calyon - Credit Agricole 0.000% 04 February 2016 50,009,306 0.31%
100,000,000 EUR Calyon - Credit Agricole 0.000% 08 March 2016 100,028,288 0.63%50,000,000 EUR Calyon - Credit Agricole 0.100% 12 August 2016 50,035,710 0.32%50,000,000 EUR Calyon - Credit Agricole 0.100% 17 August 2016 50,035,665 0.32%50,000,000 EUR Citibank 0.000% 07 January 2016 50,002,196 0.31%
100,000,000 EUR Citibank 0.000% 12 January 2016 100,007,660 0.63%100,000,000 EUR Citibank 0.000% 22 January 2016 100,013,121 0.63%100,000,000 EUR Citibank 0.000% 26 January 2016 100,014,905 0.63%100,000,000 EUR Citibank 0.000% 27 January 2016 100,015,315 0.63%53,000,000 EUR Citibank 0.000% 28 January 2016 53,008,327 0.33%
100,000,000 EUR Citibank 0.000% 05 February 2016 100,019,018 0.63%50,000,000 EUR Citibank 0.000% 08 February 2016 50,010,094 0.31%50,000,000 EUR Citibank 0.000% 01 March 2016 50,013,305 0.31%50,000,000 EUR Citibank 0.000% 04 March 2016 50,013,683 0.31%50,000,000 EUR Citibank 0.000% 09 March 2016 50,014,251 0.31%
100,000,000 EUR Citibank 0.000% 21 March 2016 100,030,613 0.63%50,000,000 EUR Citibank 0.000% 05 August 2016 50,005,567 0.31%11,000,000 EUR Commerz Bank of China 0.000% 03 June 2016 11,002,983 0.07%
100,000,000 EUR Commerzbank AG 0.000% 11 January 2016 100,007,035 0.63%50,000,000 EUR Credit Agricole 0.010% 18 November 2016 49,987,896 0.31%33,500,000 EUR Credit Suisse 0.000% 19 April 2016 33,510,960 0.21%40,700,000 EUR Credit Suisse 0.000% 23 May 2016 40,712,013 0.26%
100,000,000 EUR Danske Bank 0.020% 04 January 2016 100,002,363 0.63%50,000,000 EUR Danske Bank 0.000% 08 January 2016 50,002,538 0.31%90,000,000 EUR Danske Bank 0.000% 29 January 2016 90,014,483 0.57%50,000,000 EUR Deutsche Bank 0.000% 08 February 2016 50,010,094 0.31%50,000,000 EUR Deutsche Bank 0.000% 03 March 2016 50,013,560 0.31%
100,000,000 EUR Goldman Sachs International 0.000% 25 January 2016 100,014,481 0.63%50,000,000 EUR Goldman Sachs International 0.000% 08 February 2016 50,010,094 0.31%50,000,000 EUR Goldman Sachs International 0.000% 10 February 2016 50,010,464 0.31%
100,000,000 EUR Goldman Sachs International 0.000% 23 February 2016 100,024,949 0.63%50,000,000 EUR Goldman Sachs International 0.000% 07 March 2016 50,014,033 0.31%31,000,000 EUR I&C Bank of China 0.000% 08 February 2016 31,006,258 0.20%21,000,000 EUR I&C Bank of China 0.000% 11 May 2016 21,006,589 0.13%
100,000,000 EUR ING Bank 0.000% 11 March 2016 100,028,915 0.63%50,000,000 EUR ING Bank 0.120% 22 July 2016 50,041,139 0.32%
100,000,000 EUR Mitsubishi UFJ Trust And Banking Corporation 0.000% 19 February 2016 100,023,857 0.63%100,000,000 EUR Mitsubishi UFJ Trust And Banking Corporation 0.000% 26 February 2016 100,025,684 0.63%100,000,000 EUR Mitsubishi UFJ Trust And Banking Corporation 0.000% 14 March 2016 100,029,489 0.63%100,000,000 EUR Mizuho Bank Ltd 0.000% 13 January 2016 100,008,271 0.63%100,000,000 EUR Mizuho Bank Ltd 0.000% 15 January 2016 100,009,449 0.63%100,000,000 EUR Mizuho Bank Ltd 0.000% 29 January 2016 100,016,092 0.63%50,000,000 EUR Mizuho Bank Ltd 0.000% 08 February 2016 50,010,094 0.31%25,000,000 EUR Natixis 0.100% 04 January 2016 25,000,758 0.16%
100,000,000 EUR Natixis 0.000% 18 January 2016 100,011,109 0.63%100,000,000 EUR Natixis 0.000% 20 January 2016 100,012,144 0.63%100,000,000 EUR Natixis 0.000% 01 February 2016 100,017,344 0.63%100,000,000 EUR Natixis 0.000% 01 June 2016 100,027,603 0.63%25,000,000 EUR Natixis 0.120% 15 July 2016 25,020,365 0.16%
100,000,000 EUR Natixis 0.000% 03 October 2016 99,990,233 0.63%100,000,000 EUR Rabobank 0.000% 25 May 2016 100,029,130 0.63%50,000,000 EUR Rabobank 0.000% 16 June 2016 50,011,710 0.31%30,000,000 EUR RBS Capital 0.000% 11 January 2016 30,002,111 0.19%8,600,000 EUR RBS Capital 0.000% 17 February 2016 8,602,001 0.05%
50,000,000 EUR RP Capital 0.000% 26 February 2016 50,012,842 0.31%100,000,000 EUR RP Capital 0.000% 23 March 2016 100,030,879 0.63%100,000,000 EUR Standard Chartered Bank 0.000% 15 February 2016 100,022,636 0.63%50,000,000 EUR Standard Chartered Bank 0.000% 14 March 2016 50,014,744 0.32%50,000,000 EUR Standard Chartered Bank 0.000% 12 April 2016 50,016,292 0.32%50,000,000 EUR Standard Chartered Bank 0.000% 19 April 2016 50,016,358 0.32%
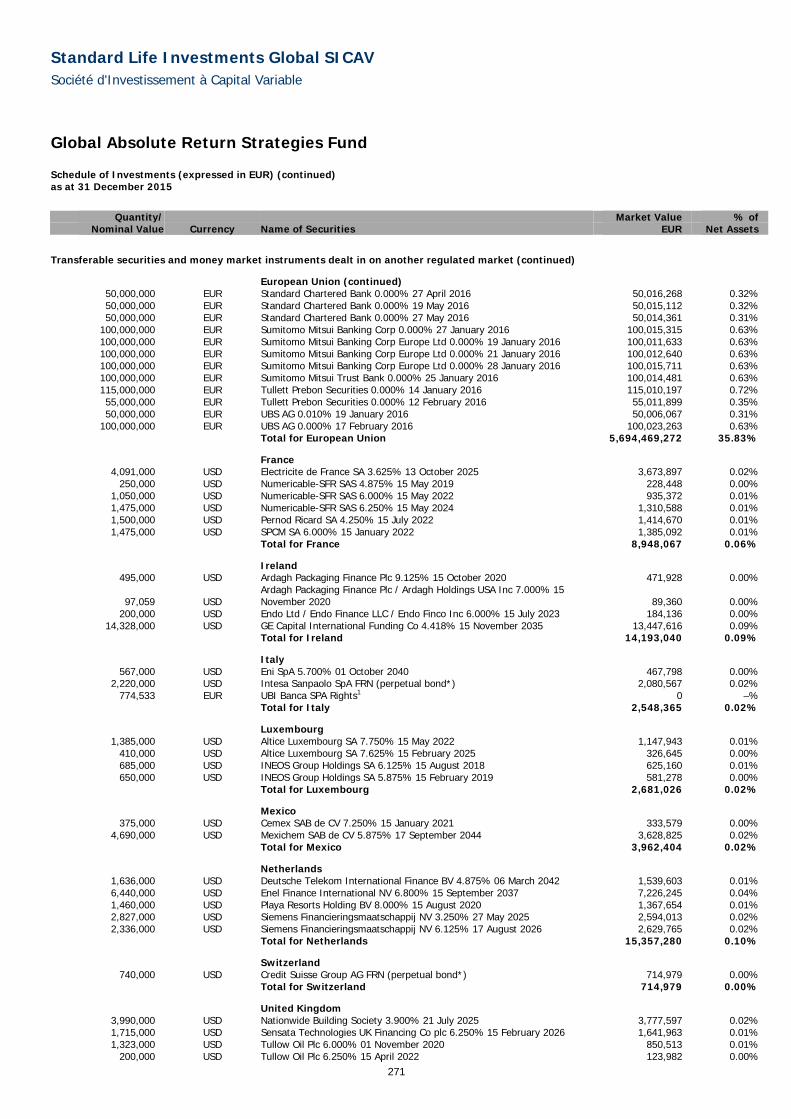
Standard Life Investments Global SICAV Société d'Investissement à Capital Variable
271
Global Absolute Return Strategies Fund Schedule of Investments (expressed in EUR) (continued) as at 31 December 2015
Quantity/ Market Value % of
Nominal Value Currency Name of Securities EUR Net Assets
Transferable securities and money market instruments dealt in on another regulated market (continued)
European Union (continued) 50,000,000 EUR Standard Chartered Bank 0.000% 27 April 2016 50,016,268 0.32%50,000,000 EUR Standard Chartered Bank 0.000% 19 May 2016 50,015,112 0.32%50,000,000 EUR Standard Chartered Bank 0.000% 27 May 2016 50,014,361 0.31%
100,000,000 EUR Sumitomo Mitsui Banking Corp 0.000% 27 January 2016 100,015,315 0.63%100,000,000 EUR Sumitomo Mitsui Banking Corp Europe Ltd 0.000% 19 January 2016 100,011,633 0.63%100,000,000 EUR Sumitomo Mitsui Banking Corp Europe Ltd 0.000% 21 January 2016 100,012,640 0.63%100,000,000 EUR Sumitomo Mitsui Banking Corp Europe Ltd 0.000% 28 January 2016 100,015,711 0.63%100,000,000 EUR Sumitomo Mitsui Trust Bank 0.000% 25 January 2016 100,014,481 0.63%115,000,000 EUR Tullett Prebon Securities 0.000% 14 January 2016 115,010,197 0.72%55,000,000 EUR Tullett Prebon Securities 0.000% 12 February 2016 55,011,899 0.35%50,000,000 EUR UBS AG 0.010% 19 January 2016 50,006,067 0.31%
100,000,000 EUR UBS AG 0.000% 17 February 2016 100,023,263 0.63% Total for European Union 5,694,469,272 35.83%
France 4,091,000 USD Electricite de France SA 3.625% 13 October 2025 3,673,897 0.02%
250,000 USD Numericable-SFR SAS 4.875% 15 May 2019 228,448 0.00%1,050,000 USD Numericable-SFR SAS 6.000% 15 May 2022 935,372 0.01%1,475,000 USD Numericable-SFR SAS 6.250% 15 May 2024 1,310,588 0.01%1,500,000 USD Pernod Ricard SA 4.250% 15 July 2022 1,414,670 0.01%1,475,000 USD SPCM SA 6.000% 15 January 2022 1,385,092 0.01%
Total for France 8,948,067 0.06%
Ireland 495,000 USD Ardagh Packaging Finance Plc 9.125% 15 October 2020 471,928 0.00%
97,059 USD Ardagh Packaging Finance Plc / Ardagh Holdings USA Inc 7.000% 15 November 2020 89,360 0.00%
200,000 USD Endo Ltd / Endo Finance LLC / Endo Finco Inc 6.000% 15 July 2023 184,136 0.00%14,328,000 USD GE Capital International Funding Co 4.418% 15 November 2035 13,447,616 0.09%
Total for Ireland 14,193,040 0.09%
Italy 567,000 USD Eni SpA 5.700% 01 October 2040 467,798 0.00%
2,220,000 USD Intesa Sanpaolo SpA FRN (perpetual bond*) 2,080,567 0.02%774,533 EUR UBI Banca SPA Rights1 0 –%
Total for Italy 2,548,365 0.02%
Luxembourg 1,385,000 USD Altice Luxembourg SA 7.750% 15 May 2022 1,147,943 0.01%
410,000 USD Altice Luxembourg SA 7.625% 15 February 2025 326,645 0.00%685,000 USD INEOS Group Holdings SA 6.125% 15 August 2018 625,160 0.01%650,000 USD INEOS Group Holdings SA 5.875% 15 February 2019 581,278 0.00%
Total for Luxembourg 2,681,026 0.02%
Mexico 375,000 USD Cemex SAB de CV 7.250% 15 January 2021 333,579 0.00%
4,690,000 USD Mexichem SAB de CV 5.875% 17 September 2044 3,628,825 0.02% Total for Mexico 3,962,404 0.02%
Netherlands 1,636,000 USD Deutsche Telekom International Finance BV 4.875% 06 March 2042 1,539,603 0.01%6,440,000 USD Enel Finance International NV 6.800% 15 September 2037 7,226,245 0.04%1,460,000 USD Playa Resorts Holding BV 8.000% 15 August 2020 1,367,654 0.01%2,827,000 USD Siemens Financieringsmaatschappij NV 3.250% 27 May 2025 2,594,013 0.02%2,336,000 USD Siemens Financieringsmaatschappij NV 6.125% 17 August 2026 2,629,765 0.02%
Total for Netherlands 15,357,280 0.10%
Switzerland 740,000 USD Credit Suisse Group AG FRN (perpetual bond*) 714,979 0.00%
Total for Switzerland 714,979 0.00%
United Kingdom 3,990,000 USD Nationwide Building Society 3.900% 21 July 2025 3,777,597 0.02%1,715,000 USD Sensata Technologies UK Financing Co plc 6.250% 15 February 2026 1,641,963 0.01%1,323,000 USD Tullow Oil Plc 6.000% 01 November 2020 850,513 0.01%
200,000 USD Tullow Oil Plc 6.250% 15 April 2022 123,982 0.00%

Standard Life Investments Global SICAV Société d'Investissement à Capital Variable
272
Global Absolute Return Strategies Fund Schedule of Investments (expressed in EUR) (continued) as at 31 December 2015
Quantity/ Market Value % of
Nominal Value Currency Name of Securities EUR Net Assets
Transferable securities and money market instruments dealt in on another regulated market (continued)
United Kingdom (continued) 1,100,000 USD Virgin Media Finance Plc 6.000% 15 October 2024 1,011,483 0.01%
Total for United Kingdom 7,405,538 0.05%
United States 1,192,000 USD A Schulman Inc 6.875% 01 June 2023 1,053,659 0.01%
310,000 USD Advanced Micro Devices Inc 7.000% 01 July 2024 186,477 0.00%1,330,000 USD Ahern Rentals Inc 7.375% 15 May 2023 983,265 0.01%
1,893,698 USD American Airlines 2013-1 Class B Pass Through Trust 5.625% 15 January 2021 1,763,051 0.01%
361,000 USD Aramark Services Inc 5.125% 15 January 2024 337,338 0.00%330,000 USD Asbury Automotive Group Inc 6.000% 15 December 2024 315,189 0.00%
7,940,000 USD Baxalta Inc 5.250% 23 June 2045 7,308,180 0.05%1,850,000 USD Berry Plastics Corp 6.000% 15 October 2022 1,737,234 0.01%2,400,000 USD Blue Coat Holdings Inc 8.375% 01 June 2023 2,226,157 0.01%1,775,000 USD BWAY Holding Co 9.125% 15 August 2021 1,532,320 0.01%1,490,000 USD Calpine Corp 7.875% 15 January 2023 1,467,597 0.01%2,156,000 USD CCM Merger Inc 9.125% 01 May 2019 2,076,558 0.01%1,223,000 USD CCO Holdings LLC / CCO Holdings Capital Corp 5.125% 01 May 2023 1,124,585 0.01%1,433,000 USD CCO Safari II LLC 6.384% 23 October 2035 1,318,120 0.01%
570,000 USD CCOH Safari LLC 5.750% 15 February 2026 525,441 0.00%2,199,000 USD Cemex Finance LLC 9.375% 12 October 2022 2,132,615 0.01%1,878,000 USD CommScope Technologies Finance LLC 6.000% 15 June 2025 1,664,356 0.01%
1,459,000 USD Crestwood Midstream Partners LP / Crestwood Midstream Finance Corp 6.250% 01 April 2023 937,943 0.01%
4,014,000 USD CRH America Inc 5.125% 18 May 2045 3,693,365 0.02%
1,250,000 GBP DIRECTV Holdings LLC / DIRECTV Financing Co Inc 4.375% 14 September 2029 1,739,422 0.01%
2,360,000 USD DJO Finco Inc / DJO Finance LLC / DJO Finance Corp 8.125% 15 June 2021 1,945,225 0.01%
1,426,000 USD Dollar Tree Inc 5.250% 01 March 2020 1,365,271 0.01%900,000 USD Dollar Tree Inc 5.750% 01 March 2023 863,738 0.01%
8,253,000 USD EMD Finance LLC 3.250% 19 March 2025 7,178,716 0.04%1,045,000 USD Ensemble S Merger Sub Inc 9.000% 30 September 2023 924,920 0.01%
1,000,000 USD EP Energy LLC / Everest Acquisition Finance Inc 7.750% 01 September 2022 472,967 0.00%
1,435,000 USD First Data Corp 8.750% 15 January 2022 1,378,632 0.01%1,226,000 USD First Data Corp 7.000% 01 December 2023 1,130,992 0.01%
342,000 USD First Data Corp 5.750% 15 January 2024 311,338 0.00%228,000 USD First Data Corp 5.000% 15 January 2024 208,868 0.00%
1,001,000 USD Fresenius Medical Care US Finance II Inc 5.625% 31 July 2019 1,002,037 0.01%935,000 USD Fresenius Medical Care US Finance II Inc 5.875% 31 January 2022 923,089 0.01%675,000 USD Frontier Communications Corp 8.875% 15 September 2020 628,431 0.00%805,000 USD Frontier Communications Corp 10.500% 15 September 2022 741,146 0.00%
1,635,000 USD Georgia-Pacific LLC 3.600% 01 March 2025 1,484,263 0.01%1,200,000 USD Glencore Funding LLC 4.125% 30 May 2023 813,998 0.00%1,164,000 USD Golden Nugget Escrow Inc 8.500% 01 December 2021 1,079,686 0.01%
1,237,000 USD Greektown Holdings LLC/Greektown Mothership Corp 8.875% 15 March 2019 1,153,079 0.01%
766,000 USD Halcon Resources Corp 12.000% 15 February 2022 460,681 0.00%1,655,000 USD Harland Clarke Holdings Corp 6.875% 01 March 2020 1,269,135 0.01%
440,000 USD Harland Clarke Holdings Corp 9.250% 01 March 2021 318,724 0.00%1,450,000 USD HealthSouth Corp 5.750% 01 November 2024 1,276,723 0.01%6,658,000 USD Hewlett Packard Enterprise Co 4.900% 15 October 2025 5,997,308 0.04%
2,680,000 USD Hiland Partners LP / Hiland Partners Finance Corp 7.250% 01 October 2020 2,488,952 0.02%
530,000 USD Hiland Partners LP / Hiland Partners Finance Corp 5.500% 15 May 2022 468,185 0.00%1,575,000 USD Huntsman International LLC 5.125% 15 November 2022 1,309,038 0.01%
1,250,000 USD Innovation Ventures LLC / Innovation Ventures Finance Corp 9.500% 15 August 2019 1,193,896 0.01%
1,175,000 USD Interval Acquisition Corp 5.625% 15 April 2023 1,076,401 0.01%276,000 USD JBS USA LLC / JBS USA Finance Inc 7.250% 01 June 2021 253,473 0.00%840,000 USD JBS USA LLC / JBS USA Finance Inc 5.750% 15 June 2025 675,011 0.00%
4,160,000 USD Kansas City Southern 4.950% 15 August 2045 3,743,900 0.02%3,960,000 USD Kraft Heinz Foods Co 3.950% 15 July 2025 3,665,341 0.02%
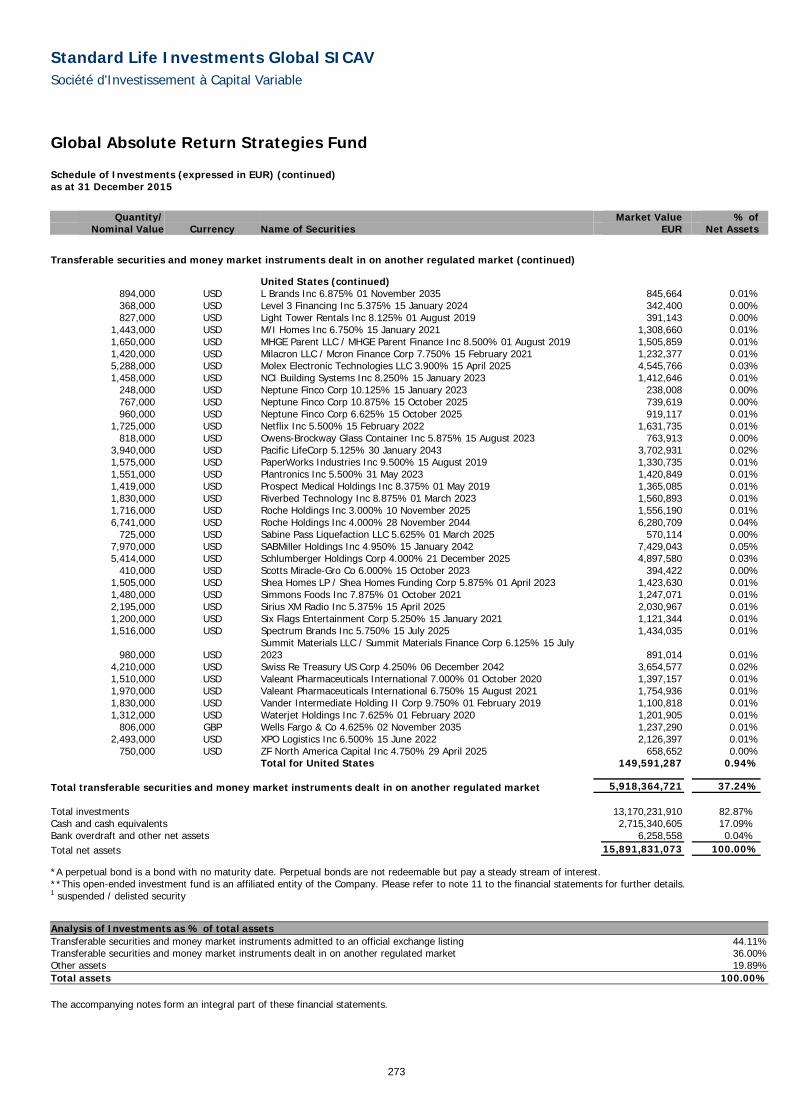
Standard Life Investments Global SICAV Société d'Investissement à Capital Variable
273
Global Absolute Return Strategies Fund Schedule of Investments (expressed in EUR) (continued) as at 31 December 2015
Quantity/ Market Value % of
Nominal Value Currency Name of Securities EUR Net Assets
Transferable securities and money market instruments dealt in on another regulated market (continued)
United States (continued) 894,000 USD L Brands Inc 6.875% 01 November 2035 845,664 0.01%368,000 USD Level 3 Financing Inc 5.375% 15 January 2024 342,400 0.00%827,000 USD Light Tower Rentals Inc 8.125% 01 August 2019 391,143 0.00%
1,443,000 USD M/I Homes Inc 6.750% 15 January 2021 1,308,660 0.01%1,650,000 USD MHGE Parent LLC / MHGE Parent Finance Inc 8.500% 01 August 2019 1,505,859 0.01%1,420,000 USD Milacron LLC / Mcron Finance Corp 7.750% 15 February 2021 1,232,377 0.01%5,288,000 USD Molex Electronic Technologies LLC 3.900% 15 April 2025 4,545,766 0.03%1,458,000 USD NCI Building Systems Inc 8.250% 15 January 2023 1,412,646 0.01%
248,000 USD Neptune Finco Corp 10.125% 15 January 2023 238,008 0.00%767,000 USD Neptune Finco Corp 10.875% 15 October 2025 739,619 0.00%960,000 USD Neptune Finco Corp 6.625% 15 October 2025 919,117 0.01%
1,725,000 USD Netflix Inc 5.500% 15 February 2022 1,631,735 0.01%818,000 USD Owens-Brockway Glass Container Inc 5.875% 15 August 2023 763,913 0.00%
3,940,000 USD Pacific LifeCorp 5.125% 30 January 2043 3,702,931 0.02%1,575,000 USD PaperWorks Industries Inc 9.500% 15 August 2019 1,330,735 0.01%1,551,000 USD Plantronics Inc 5.500% 31 May 2023 1,420,849 0.01%1,419,000 USD Prospect Medical Holdings Inc 8.375% 01 May 2019 1,365,085 0.01%1,830,000 USD Riverbed Technology Inc 8.875% 01 March 2023 1,560,893 0.01%1,716,000 USD Roche Holdings Inc 3.000% 10 November 2025 1,556,190 0.01%6,741,000 USD Roche Holdings Inc 4.000% 28 November 2044 6,280,709 0.04%
725,000 USD Sabine Pass Liquefaction LLC 5.625% 01 March 2025 570,114 0.00%7,970,000 USD SABMiller Holdings Inc 4.950% 15 January 2042 7,429,043 0.05%5,414,000 USD Schlumberger Holdings Corp 4.000% 21 December 2025 4,897,580 0.03%
410,000 USD Scotts Miracle-Gro Co 6.000% 15 October 2023 394,422 0.00%1,505,000 USD Shea Homes LP / Shea Homes Funding Corp 5.875% 01 April 2023 1,423,630 0.01%1,480,000 USD Simmons Foods Inc 7.875% 01 October 2021 1,247,071 0.01%2,195,000 USD Sirius XM Radio Inc 5.375% 15 April 2025 2,030,967 0.01%1,200,000 USD Six Flags Entertainment Corp 5.250% 15 January 2021 1,121,344 0.01%1,516,000 USD Spectrum Brands Inc 5.750% 15 July 2025 1,434,035 0.01%
980,000 USD Summit Materials LLC / Summit Materials Finance Corp 6.125% 15 July 2023 891,014 0.01%
4,210,000 USD Swiss Re Treasury US Corp 4.250% 06 December 2042 3,654,577 0.02%1,510,000 USD Valeant Pharmaceuticals International 7.000% 01 October 2020 1,397,157 0.01%1,970,000 USD Valeant Pharmaceuticals International 6.750% 15 August 2021 1,754,936 0.01%1,830,000 USD Vander Intermediate Holding II Corp 9.750% 01 February 2019 1,100,818 0.01%1,312,000 USD Waterjet Holdings Inc 7.625% 01 February 2020 1,201,905 0.01%
806,000 GBP Wells Fargo & Co 4.625% 02 November 2035 1,237,290 0.01%2,493,000 USD XPO Logistics Inc 6.500% 15 June 2022 2,126,397 0.01%
750,000 USD ZF North America Capital Inc 4.750% 29 April 2025 658,652 0.00% Total for United States 149,591,287 0.94%
Total transferable securities and money market instruments dealt in on another regulated market 5,918,364,721 37.24% Total investments 13,170,231,910 82.87%Cash and cash equivalents 2,715,340,605 17.09%Bank overdraft and other net assets 6,258,558 0.04%Total net assets 15,891,831,073 100.00%
*A perpetual bond is a bond with no maturity date. Perpetual bonds are not redeemable but pay a steady stream of interest. **This open-ended investment fund is an affiliated entity of the Company. Please refer to note 11 to the financial statements for further details.1 suspended / delisted security
Analysis of Investments as % of total assets Transferable securities and money market instruments admitted to an official exchange listing 44.11%Transferable securities and money market instruments dealt in on another regulated market 36.00%Other assets 19.89%Total assets 100.00%
The accompanying notes form an integral part of these financial statements.
Standard Life Investments Global SICAV Société d'Investissement à Capital Variable
274
Global Focused Strategies Fund
Sub-fund Objective The objective of the Sub-fund is to deliver a positive absolute return in the form of capital growth over the medium to longer term in all market conditions through a discretionary multi-asset approach.
Investment Policy The Sub-fund will achieve this objective by investing in a portfolio of equities, equity related investments, fixed interest securities, cash and permitted derivatives. “Equity related investments” may include depositary receipts, convertible stocks and any other such investments which entitle the holder to subscribe for or convert into the equity of the company and/or where the share price performance is influenced significantly by the stock market performance of the company’s ordinary shares. Additionally the Sub-fund may invest in other forms of eligible transferable securities, deposits, money market instruments and undertakings for collective investment.
Performance Review The Sub-fund returned 8.3%* over the 12-month period under review, compared to the 6-month EURIBOR return of 0.1%.*
Markets were turbulent in a year largely dominated by central bank policy. As the US recovery gathered pace, investors increasingly fixated on the likely timing of a US interest rate hike. Finally, in December, the Federal Reserve (the “Fed”) raised rates for the first time since 2006. By contrast, central banks in regions like the Eurozone and Japan maintained a loose monetary stance in an effort to revive growth.
We benefited from this divergence in central bank policy through our long US dollar versus euro and long US dollar versus Canadian dollar pairs, as well as our long Indian rupee versus euro strategy. In Japan, the central bank’s quantitative easing programme continued to support corporate profitability, resulting in gains for our Japanese real estate and Japanese dividends strategies. Elsewhere, European equities were buoyed by raised hopes for an acceleration in earnings growth, leading to healthy gains for our European autos and European investment banks strategies. Despite the broadly improving US economic backdrop, US Treasury yields in fact fell during the first three months of 2015, as investors sought out the relatively attractive yields available on US government bonds. Moreover, Fed rhetoric at one point suggested that a rate hike might occur later rather than sooner. The consequent fall in US rates hurt our short US duration position. Our US butterfly strategy was also loss-making, as movements across the US yield curve worked against this position.
In the second quarter of 2015, our UK equity housebuilders versus retailers strategy was among the strongest performers, as the Conservative Party’s surprise election victory heralded the prospect of continued support for home ownership. Meanwhile, UK retailers failed to improve their profitability in spite of management changes. European equities came under pressure, as successive failed attempts by the Greek government to raise new funding sparked renewed ‘Grexit’ fears. This resulted in losses for our European equity winners position. Elsewhere, our short duration positions in the US and Europe were profitable – US government bond yields moved higher as upbeat macroeconomic data raised the likelihood of the Fed raising rates. Meanwhile, European bond yields rose from their unprecedentedly low levels, driven by higher inflation expectations.
Worries over China subsequently intensified, owing to worsening economic data and the surprise devaluation of the renminbi in August. Heavy losses in Chinese equities and the government’s futile attempts to stave the selling rattled global equities more widely. This hurt our Japanese capital returns, global equity miners and European equity telecoms positions. At the same time, sentiment towards emerging markets soured, causing risk assets and currencies across the region to weaken as investors shifted into relatively safe-haven assets such as US Treasuries. As a result, our long US dollar versus Korean won currency pair was one of the strongest performers. However, the fall in Treasury yields drove losses from our short US duration strategy. Our long equity volatility strategy provided a solid positive return, as market volatility remained elevated. Similarly, our China equity infrastructure strategy favouring consumer-related stocks over heavy-industry stocks was rewarded. Meanwhile, losses in US equities were more pronounced in the small-cap segment owing to its significant exposure to the energy sector, which boosted our US equity technology versus small-cap strategy.
In the final three months of the year, our Indonesian versus Indian equity strategy posted a healthy return. Indonesian equities reacted positively to speculation of an interest rate cut after the central bank alluded to the possibility of further monetary easing. Meanwhile, Indian equities underperformed, as expectations of a successful and timely delivery of reform diminished. UK housebuilders again enjoyed strong performance, with robust housing data and improving profitability underscoring the benefits of the government’s home-ownership incentives. As a result, our UK equity housebuilders versus retailers strategy generated a positive return. Towards year-end, equity market volatility receded, which was negative for our long equity volatility position.
*Sub-fund performance has been calculated over the stated period on the share price performance basis, based on the D Accumulation Shares and net of fees. Please note the index return is quoted gross and contains no adjustment for fees.
Outlook Our central expectation is still for modest global growth, albeit with regional variations. A growing divergence in central bank monetary policy will remain an important driver of asset returns. The US has finally embarked on monetary tightening, whereas economies in Europe and Asia maintain a looser monetary path. Geopolitical tensions remain high and on many metrics asset prices appear expensive. We seek to exploit the opportunities that these conditions present by implementing a diversified range of strategies using multiple asset classes.
Please note that the absolute Value at Risk (“VaR”) approach has been used for risk measurement and calculation of global exposure for this Sub-fund. Measurement of 1 month 99% VaR is based on a parametric calculation with an additional upwards scaling factor applied. Parametric risk model uses 180 weeks of equally weighted data with which to forecast risk.
On the above basis the VaR has been as follows: Highest: 9.23% Average: 6.69% Lowest: 5.60%
Leverage is calculated as the sum of the notionals of the derivatives used. The level of leverage employed during the relevant period was 449%.
This Sub-fund is not authorized in Hong Kong and is not available to Hong Kong residents.

Standard Life Investments Global SICAV Société d'Investissement à Capital Variable
275
Global Focused Strategies Fund Schedule of Investments (expressed in EUR) as at 31 December 2015
Quantity/ Market Value % of
Nominal Value Currency Name of Securities EUR Net Assets
Transferable securities and money market instruments admitted to an official exchange listing
Austria 1,775,000 USD JBS Investments GmbH 7.750% 28 October 2020 1,577,149 0.25%
Total for Austria 1,577,149 0.25%
Belgium 2,186,000 EUR KBC Groep NV FRN (perpetual bond*) 2,194,198 0.35%
39,763 EUR Umicore SA 1,537,436 0.25% Total for Belgium 3,731,634 0.60%
Brazil 2,635,000 USD JBS SA 10.500% 04 August 2016 2,498,584 0.40%
73,800 BRL Valid Solucoes e Servicos de Seguranca em Meios de Pagamento e Identificacao SA 728,092 0.12%
Total for Brazil 3,226,676 0.52%
British Virgin Islands 59,907 USD Mail.Ru Group Ltd 1,240,645 0.20%
Total for British Virgin Islands 1,240,645 0.20%
Cayman Islands 5,714 USD Baidu Inc 1,008,228 0.16%
2,005,000 HKD China Mengniu Dairy Co Ltd 3,003,106 0.48%702,000 HKD China State Construction International Holdings Ltd 1,119,674 0.18%
2,450,000 HKD Geely Automobile Holdings Ltd 1,199,017 0.19%317,000 HKD Hengan International Group Co Ltd 2,749,664 0.44%140,900 USD Himax Technologies Inc 1,077,902 0.17%136,068 USD JD.com Inc 4,008,793 0.64%903,200 HKD Sands China Ltd 2,841,566 0.45%622,000 HKD Shenzhou International Group Holdings Ltd 3,283,578 0.52%
Total for Cayman Islands 20,291,528 3.23%
China 7,757,800 HKD Zoomlion Heavy Industry Science and Technology Co Ltd 2,656,720 0.42%
Total for China 2,656,720 0.42%
Denmark 60,889 DKK Danske Bank A/S 1,511,099 0.24%
Total for Denmark 1,511,099 0.24%
Finland 231,609 EUR Nokia OYJ 1,527,461 0.24%173,673 EUR Stora Enso OYJ 1,457,116 0.23%
Total for Finland 2,984,577 0.47%
France 1,109,000 USD Credit Agricole SA FRN 19 September 2033 1,125,872 0.18%
15,000,000 EUR France Treasury Bill BTF 0.000% 06 January 2016 15,000,150 2.39%20,137 EUR Orpea 1,485,708 0.24%
2,320,000 EUR Societe Generale SA FRN (perpetual bond*) 2,382,362 0.38%1,529,000 USD Societe Generale SA FRN (perpetual bond*) 1,491,295 0.24%
34,920 EUR Total SA 1,440,974 0.23% Total for France 22,926,361 3.66%
Germany 1,400,000 EUR Aareal Bank AG FRN (perpetual bond*) 1,410,500 0.22%
44,067 EUR Covestro AG 1,482,194 0.24%1,600,000 USD Deutsche Bank AG FRN (perpetual bond*) 1,396,682 0.22%
91,527 EUR Deutsche Telekom AG 1,527,586 0.24%69,734 GBP TUI AG 1,149,293 0.18%32,356 EUR Wirecard AG 1,504,554 0.24%
Total for Germany 8,470,809 1.34%

Standard Life Investments Global SICAV Société d'Investissement à Capital Variable
276
Global Focused Strategies Fund Schedule of Investments (expressed in EUR) (continued) as at 31 December 2015
Quantity/ Market Value % of
Nominal Value Currency Name of Securities EUR Net Assets
Transferable securities and money market instruments admitted to an official exchange listing (continued)
Guernsey 2,248,000 USD Credit Suisse Group Guernsey I Ltd FRN 24 February 2041 2,129,817 0.34%
Total for Guernsey 2,129,817 0.34%
Hong Kong 2,560,000 HKD China Unicom Hong Kong Ltd 2,866,692 0.46%1,031,000 HKD Galaxy Entertainment Group Ltd 2,987,080 0.48%1,222,110 HKD Lenovo Group Ltd 1,139,710 0.18%
Total for Hong Kong 6,993,482 1.12%
Hungary 56,419 HUF OTP Bank Plc 1,071,581 0.17%
Total for Hungary 1,071,581 0.17%
Indonesia 11,578,500 IDR Adhi Karya Persero Tbk PT 1,650,759 0.26%78,392,400 IDR Agung Podomoro Land Tbk PT 1,744,368 0.28%3,555,300 IDR AKR Corporindo Tbk PT 1,699,479 0.27%
73,568,300 IDR Alam Sutera Realty Tbk PT 1,681,135 0.27%1,825,200 IDR Bank Central Asia Tbk PT 1,617,260 0.26%2,732,500 IDR Bank Mandiri Persero Tbk PT 1,683,913 0.27%4,991,600 IDR Bank Negara Indonesia Persero Tbk PT 1,659,426 0.26%2,224,200 IDR Bank Rakyat Indonesia Persero Tbk PT 1,692,964 0.27%
18,679,400 IDR Bank Tabungan Negara Persero Tbk PT 1,611,574 0.26%83,019,800 IDR Bekasi Fajar Industrial Estate Tbk PT 1,626,098 0.26%14,804,800 IDR Bumi Serpong Damai Tbk PT 1,775,386 0.28%18,392,048 IDR Ciputra Development Tbk PT 1,788,960 0.29%4,889,500 IDR Indofood Sukses Makmur Tbk PT 1,685,747 0.27%
48,011,400 IDR Intiland Development Tbk PT 1,564,123 0.25%109,176,725 IDR Kawasan Industri Jababeka Tbk PT 1,796,572 0.29%21,253,100 IDR Lippo Karawaci Tbk PT 1,465,481 0.23%42,645,800 IDR Modernland Realty Tbk PT 1,326,816 0.21%56,927,800 IDR Pakuwon Jati Tbk PT 1,881,151 0.30%16,604,000 IDR Summarecon Agung Tbk PT 1,825,216 0.29%40,871,300 IDR Surya Semesta Internusa Tbk PT 1,946,893 0.31%1,547,600 IDR United Tractors Tbk PT 1,747,616 0.28%
Total for Indonesia 35,470,937 5.66%
Ireland 1,500,000 EUR Bank of Ireland FRN (perpetual bond*) 1,573,125 0.25%
87,174 EUR Glanbia Plc 1,477,599 0.24%100,883 EUR Ryanair Holdings Plc 1,514,254 0.24%
Total for Ireland 4,564,978 0.73%
Italy 410,360 EUR A2A SpA 514,591 0.08%15,166 EUR ACEA SpA 215,357 0.03%32,242 EUR Amplifon SpA 257,775 0.04%60,387 EUR Anima Holding SpA 484,304 0.08%38,387 EUR Ansaldo STS SpA 378,880 0.06%23,008 EUR Ascopiave SpA 50,802 0.01%24,936 EUR Astaldi SpA 140,016 0.02%42,835 EUR Autogrill SpA 377,805 0.06%41,302 EUR Azimut Holding SpA 952,424 0.15%
212,019 EUR Banca Carige SpA 267,568 0.04%19,853 EUR Banca Generali SpA 579,311 0.09%6,086 EUR Banca IFIS SpA 175,459 0.03%
70,175 EUR Banca Mediolanum SpA 512,979 0.08%177,035 EUR Banca Popolare dell'Emilia Romagna SC 1,246,326 0.20%
1,597,052 EUR Banca Popolare di Milano Scarl 1,470,885 0.23%162,814 EUR Banca Popolare di Sondrio SCARL 676,004 0.11%79,136 EUR Banca Profilo SpA 20,647 0.00%
350,913 EUR Beni Stabili SpA SIIQ 245,113 0.04%

Standard Life Investments Global SICAV Société d'Investissement à Capital Variable
277
Global Focused Strategies Fund Schedule of Investments (expressed in EUR) (continued) as at 31 December 2015
Quantity/ Market Value % of
Nominal Value Currency Name of Securities EUR Net Assets
Transferable securities and money market instruments admitted to an official exchange listing (continued)
Italy (continued) 9,518 EUR Brembo SpA 425,264 0.07%9,107 EUR Brunello Cucinelli SpA 148,626 0.02%
11,608 EUR Buzzi Unicem SpA 118,286 0.02%18,766 EUR Buzzi Unicem SpA 311,516 0.05%7,867 EUR Cairo Communication SpA 35,952 0.01%
16,672 EUR Cementir Holding SpA 98,448 0.02%29,677 EUR Cerved Information Solutions SpA 228,513 0.04%
110,005 EUR CIR-Compagnie Industriali Riunite SpA 106,705 0.02%32,664 EUR Credito Emiliano SpA 223,912 0.04%
415,386 EUR Credito Valtellinese SC 453,186 0.07%17,677 EUR Danieli & C Officine Meccaniche SpA 250,564 0.04%85,952 EUR Davide Campari-Milano SpA 687,616 0.11%15,996 EUR De' Longhi SpA 442,609 0.07%30,762 EUR DeA Capital SpA 43,497 0.01%6,496 EUR DiaSorin SpA 314,731 0.05%5,684 EUR Ei Towers SpA 338,482 0.05%
379,268 EUR Enel SpA 1,476,111 0.24%15,772 EUR ERG SpA 196,677 0.03%9,031 EUR Esprinet SpA 76,854 0.01%
41,414 EUR Falck Renewables SpA 45,804 0.01%66,636 EUR FinecoBank Banca Fineco SpA 508,100 0.08%23,185 EUR Geox SpA 94,641 0.01%43,069 EUR Gruppo Editoriale L'Espresso SpA 43,586 0.01%
209,959 EUR Hera SpA 514,400 0.08%101,141 EUR Immobiliare Grande Distribuzione SIIQ SpA 89,662 0.01%
4,944 EUR Industria Macchine Automatiche SpA 237,263 0.04%24,228 EUR Interpump Group SpA 346,945 0.06%
478,721 EUR Intesa Sanpaolo SpA 1,478,290 0.24%153,331 EUR Iren SpA 228,463 0.04%41,264 EUR Italcementi SpA 422,956 0.07%
146,684 EUR Juventus Football Club SpA 38,138 0.01%46,470 EUR Maire Tecnimont SpA 116,640 0.02%9,185 EUR MARR SpA 175,250 0.03%
289,615 EUR Mediaset SpA 1,109,805 0.18%30,141 EUR Moleskine SpA 51,300 0.01%42,959 EUR Moncler SpA 555,030 0.09%68,682 EUR Piaggio & C SpA 159,754 0.03%
133,085 EUR RCS MediaGroup SpA 82,579 0.01%27,842 EUR Recordati SpA 670,714 0.11%1,191 EUR Reply SpA 149,947 0.02%
10,268 EUR Safilo Group SpA 109,970 0.02%75,389 EUR Salini Impregilo SpA 302,310 0.05%21,566 EUR Salvatore Ferragamo SpA 469,061 0.07%86,948 EUR Saras SpA 155,115 0.02%48,582 EUR Societa Cattolica di Assicurazioni SCRL 356,592 0.06%22,524 EUR Societa Iniziative Autostradali e Servizi SpA 220,735 0.04%21,501 EUR Sogefi SpA 46,571 0.01%25,120 EUR Tamburi Investment Partners SpA 85,107 0.01%4,622 EUR Tod's SpA 337,637 0.05%
49,269 EUR Trevi Finanziaria Industriale SpA 90,162 0.01%3,686,000 EUR UniCredit SpA FRN (perpetual bond*) 3,476,045 0.55%
148,588 EUR Unipol Gruppo Finanziario SpA 707,873 0.11%17,252 EUR Yoox Net-A-Porter Group SpA 596,057 0.09%
Total for Italy 28,616,297 4.57%
Japan 154,300 JPY Aeon Mall Co Ltd 2,453,402 0.39%30,000 JPY Ajinomoto Co Inc 659,088 0.11%33,200 JPY Alfresa Holdings Corp 609,198 0.10%16,700 JPY Aoyama Trading Co Ltd 596,941 0.10%17,200 JPY ASKUL Corp 635,810 0.10%

Standard Life Investments Global SICAV Société d'Investissement à Capital Variable
278
Global Focused Strategies Fund Schedule of Investments (expressed in EUR) (continued) as at 31 December 2015
Quantity/ Market Value % of
Nominal Value Currency Name of Securities EUR Net Assets
Transferable securities and money market instruments admitted to an official exchange listing (continued)
Japan (continued) 46,500 JPY COMSYS Holdings Corp 606,317 0.10%32,700 JPY Credit Saison Co Ltd 599,025 0.10%32,200 JPY Daiichi Sankyo Co Ltd 616,767 0.10%54,300 JPY DMG Mori Co Ltd 590,364 0.09%16,700 JPY FUJIFILM Holdings Corp 647,270 0.10%
119,000 JPY Fujikura Ltd 598,325 0.10%16,500 JPY Hoya Corp 627,055 0.10%
297,900 JPY Hulic Co Ltd 2,429,703 0.39%45,200 JPY Ibiden Co Ltd 601,092 0.10%20,100 JPY Kobe Bussan Co Ltd 592,721 0.09%18,700 JPY K's Holdings Corp 589,246 0.09%30,800 JPY Kurita Water Industries Ltd 597,118 0.10%64,000 JPY Kyowa Exeo Corp 609,884 0.10%43,900 JPY Marui Group Co Ltd 662,515 0.11%14,900 JPY Miraca Holdings Inc 608,198 0.10%
121,000 JPY Mitsubishi Estate Co Ltd 2,329,666 0.37%101,000 JPY Mitsui Fudosan Co Ltd 2,354,939 0.38%32,100 JPY Nabtesco Corp 606,892 0.10%14,900 JPY Nifco Inc 640,029 0.10%59,000 JPY Nippon Kayaku Co Ltd 573,941 0.09%
130,500 JPY Nomura Real Estate Holdings Inc 2,245,236 0.36%127,800 JPY Park24 Co Ltd 2,855,981 0.46%17,100 JPY Sankyo Co Ltd 590,364 0.09%88,300 JPY Sanwa Holdings Corp 649,446 0.10%60,900 JPY SBI Holdings Inc 613,798 0.10%66,900 JPY Sega Sammy Holdings Inc 579,331 0.09%20,300 JPY Start Today Co Ltd 608,686 0.10%84,000 JPY Sumitomo Realty & Development Co Ltd 2,227,097 0.36%21,900 JPY Suzuki Motor Corp 618,732 0.10%27,800 JPY Toho Holdings Co Ltd 626,132 0.10%10,400 JPY Tokyo Electron Ltd 580,989 0.09%21,700 JPY Tokyo Ohka Kogyo Co Ltd 639,903 0.10%
213,800 JPY Tokyo Tatemono Co Ltd 2,158,105 0.34%381,100 JPY Tokyu Fudosan Holdings Corp 2,215,639 0.35%10,800 JPY Towa Pharmaceutical Co Ltd 622,946 0.10%16,000 JPY United Arrows Ltd 637,229 0.10%59,000 JPY Yamaguchi Financial Group Inc 648,216 0.10%32,900 JPY Yamato Holdings Co Ltd 646,616 0.10%
Total for Japan 42,199,952 6.75%
Luxembourg 1,800,000 USD Minerva Luxembourg SA 7.750% 31 January 2023 1,566,300 0.25%
Total for Luxembourg 1,566,300 0.25%
Netherlands 18,109 EUR ASML Holding NV 1,494,898 0.24%
2,823,000 USD Marfrig Holdings Europe BV 8.375% 09 May 2018 2,508,333 0.40% Total for Netherlands 4,003,231 0.64%
Papua New Guinea 218,206 AUD Oil Search Ltd 982,219 0.16%
Total for Papua New Guinea 982,219 0.16%
Philippines 1,394,600 PHP Ayala Land Inc 937,684 0.15%
Total for Philippines 937,684 0.15%
South Africa 172,024 ZAR Woolworths Holdings Ltd 1,017,251 0.16%
Total for South Africa 1,017,251 0.16%

Standard Life Investments Global SICAV Société d'Investissement à Capital Variable
279
Global Focused Strategies Fund Schedule of Investments (expressed in EUR) (continued) as at 31 December 2015
Quantity/ Market Value % of
Nominal Value Currency Name of Securities EUR Net Assets
Transferable securities and money market instruments admitted to an official exchange listing (continued)
South Korea 89,180 KRW KT Corp 1,973,231 0.31%
Total for South Korea 1,973,231 0.31%
Spain 55,519 EUR ACS Actividades de Construccion y Servicios SA 1,499,846 0.24%
221,070 EUR Bankinter SA 1,446,682 0.23%1,439,000 USD BBVA International Preferred SAU FRN (perpetual bond*) 1,339,723 0.21%
137,291 GBP International Consolidated Airlines Group SA 1,140,696 0.18% Total for Spain 5,426,947 0.86%
Sweden 76,775 SEK Assa Abloy AB 1,486,532 0.24%
Total for Sweden 1,486,532 0.24%
Switzerland 32,161 CHF LafargeHolcim Ltd 1,491,098 0.24%
2,528,000 USD UBS AG FRN 22 May 2023 2,359,844 0.38%1,119,000 EUR UBS AG FRN 12 February 2026 1,194,958 0.19%
86,472 CHF UBS Group AG 1,555,837 0.25%6,404 CHF Zurich Insurance Group AG 1,525,290 0.24%
Total for Switzerland 8,127,027 1.30%
Taiwan 284,586 TWD Chipbond Technology Corp 378,348 0.06%
Total for Taiwan 378,348 0.06%
Turkey 46,745 TRY Tupras Turkiye Petrol Rafinerileri AS 1,056,597 0.17%
Total for Turkey 1,056,597 0.17%
United Kingdom 69,857 GBP ARM Holdings Plc 987,797 0.16%
154,586 GBP Aviva Plc 1,085,581 0.17%75,523 GBP Babcock International Group Plc 1,044,276 0.17%
888,000 USD Barclays Bank Plc 7.625% 21 November 2022 930,206 0.15%1,684,000 GBP Barclays Plc FRN (perpetual bond*) 2,289,227 0.37%
415,339 GBP Barratt Developments Plc 3,538,500 0.56%29,992 GBP Bellway Plc 1,157,588 0.18%81,576 USD Bharat Petroleum Corp Ltd Warrant, expires 12 November 2019 1,010,475 0.16%
262,876 GBP Bovis Homes Group Plc 3,631,275 0.58%128,383 GBP BTG Plc 1,202,967 0.19%61,594 GBP Capita Plc 1,012,622 0.16%55,738 GBP Close Brothers Group Plc 1,014,203 0.16%
170,567 USD Coal India Ltd Warrant, expires 02 November 2020 780,905 0.12%161,990 GBP Dixons Carphone Plc 1,102,301 0.18%84,370 GBP Essentra Plc 950,737 0.15%
260,613 GBP GKN Plc 1,093,837 0.17%97,052 GBP Inchcape Plc 1,036,851 0.17%
290,558 GBP ITV Plc 1,093,773 0.17%131,030 GBP Persimmon Plc 3,614,653 0.58%553,211 GBP Redrow Plc 3,539,348 0.56%
2,400,000 USD Royal Bank of Scotland Group Plc FRN (perpetual bond*) 2,300,546 0.37%136,816 GBP Sage Group Plc 1,123,715 0.18%316,973 GBP Senior Plc 990,890 0.16%
1,285,674 GBP Taylor Wimpey Plc 3,553,718 0.57%49,592 GBP WS Atkins Plc 1,097,424 0.17%
Total for United Kingdom 41,183,415 6.56%

Standard Life Investments Global SICAV Société d'Investissement à Capital Variable
280
Global Focused Strategies Fund Schedule of Investments (expressed in EUR) (continued) as at 31 December 2015
Quantity/ Market Value % of
Nominal Value Currency Name of Securities EUR Net Assets
Transferable securities and money market instruments admitted to an official exchange listing (continued)
United States 33,325 USD RBS Capital Funding Trust VII - Pref (perpetual bond*) 764,515 0.12%
Total for United States 764,515 0.12%
Total transferable securities and money market instruments admitted to an official exchange listing 258,567,539 41.25%
Transferable securities and money market instruments dealt in on another regulated market
European Union 5,000,000 EUR Abbey National Plc 0.190% 04 February 2016 5,001,830 0.80%
10,000,000 EUR Bank of America Corp 0.000% 11 March 2016 10,002,892 1.59%7,500,000 EUR Bank of America Corp 0.000% 01 April 2016 7,502,387 1.20%
10,000,000 EUR Bank of America Corp 0.000% 11 May 2016 10,003,137 1.60%10,000,000 EUR Calyon - Credit Agricole 0.000% 04 February 2016 10,001,861 1.59%5,000,000 EUR Citibank 0.000% 12 January 2016 5,000,383 0.80%5,000,000 EUR Citibank 0.000% 27 January 2016 5,000,766 0.80%5,000,000 EUR Citibank 0.000% 16 February 2016 5,001,148 0.80%5,000,000 EUR Citibank 0.000% 04 March 2016 5,001,368 0.80%5,000,000 EUR Citibank 0.000% 09 March 2016 5,001,425 0.80%5,000,000 EUR Commerzbank AG 0.000% 11 January 2016 5,000,352 0.80%
10,000,000 EUR Commerzbank AG 0.000% 18 March 2016 10,003,017 1.60%7,500,000 EUR Credit Suisse 0.000% 19 April 2016 7,502,454 1.20%7,000,000 EUR Danske Bank 0.020% 04 January 2016 7,000,165 1.12%
10,000,000 EUR Danske Bank 0.000% 29 January 2016 10,001,609 1.59%5,000,000 EUR Deutsche Bank 0.000% 08 February 2016 5,001,009 0.80%5,000,000 EUR Deutsche Bank 0.000% 03 March 2016 5,001,356 0.80%7,500,000 EUR Goldman Sachs International 0.000% 08 February 2016 7,501,514 1.20%5,000,000 EUR Goldman Sachs International 0.000% 23 February 2016 5,001,247 0.80%5,000,000 EUR Goldman Sachs International 0.000% 07 March 2016 5,001,403 0.80%5,000,000 EUR ING Bank 0.000% 11 March 2016 5,001,446 0.80%5,000,000 EUR Natixis 0.000% 01 February 2016 5,000,867 0.80%
10,000,000 EUR Natixis 0.000% 17 March 2016 10,003,001 1.60%10,000,000 EUR Rabobank 0.000% 25 May 2016 10,002,913 1.59%10,000,000 EUR RBS 0.000% 11 January 2016 10,000,704 1.59%10,000,000 EUR Standard Life Investments Euro VNAV 0.000% 03 February 2016 10,001,820 1.59%10,000,000 EUR Standard Life Investments Euro VNAV 0.000% 10 August 2016 10,000,976 1.59%5,000,000 EUR Standard Life Investments Fund Tile 0.000% 12 April 2016 5,001,629 0.80%
10,000,000 EUR Tullett 0.000% 04 February 2016 10,001,861 1.59%5,000,000 EUR Tullett Prebon Securities 0.000% 14 January 2016 5,000,443 0.80%5,000,000 EUR Tullett Prebon Securities 0.000% 12 February 2016 5,001,082 0.80%
10,000,000 EUR UBS AG 0.000% 17 February 2016 10,002,326 1.59% Total for European Union 229,550,391 36.63%
Italy 670,000 USD Intesa Sanpaolo SpA FRN (perpetual bond*) 627,919 0.10%
Total for Italy 627,919 0.10%
Total transferable securities and money market instruments dealt in on another regulated market 230,178,310 36.73% Total investments 488,745,849 77.98%Cash and cash equivalents 138,094,145 22.03%Bank overdraft and other net liabilities (79,228) (0.01%)Total net assets 626,760,766 100.00%
*A perpetual bond is a bond with no maturity date. Perpetual bonds are not redeemable but pay a steady stream of interest.
Analysis of Investments as % of total assets Transferable securities and money market instruments admitted to an official exchange listing 39.73%Transferable securities and money market instruments dealt in on another regulated market 35.36%Other assets 24.91%Total assets 100.00%
The accompanying notes form an integral part of these financial statements.

Standard Life Investments Global SICAV Société d'Investissement à Capital Variable
281
Absolute Return Global Bond Strategies Fund
Sub-fund Objective The objective of the Sub-fund is to deliver a positive absolute return in the form of both income and capital growth over the medium to longer term in all market conditions.
Investment Policy It will achieve this objective by investing in a diversified portfolio of permitted derivative contracts (including futures, options, swaps, forward currency contracts and other derivatives), fixed interest securities and cash. Additionally the Sub-fund may invest in other forms of eligible transferable securities, deposits, money market instruments and undertakings for collective investment.
Performance Review The sub-fund returned 1.4% in the year to 31 December 2015, compared to the 3-month GBP LIBOR return of 0.6%.*
US dollar strength and euro weakness resulted in strong gains from a number of our currency pairs in the first quarter of 2015. These included the US dollar versus Euro, US dollar versus Canadian dollar, Indian rupee versus Euro and Mexican peso versus Euro positions. However, despite the broadly improving US economic backdrop, US interest rates in fact fell in the first quarter, as investors sought out the higher yields available on US government bonds relative to other regions. Moreover, Federal Reserve (the “Fed”) rhetoric at one point suggested that a rate hike might occur later rather than sooner. The consequent fall in US rates caused our short US duration position to lose value. Our US butterfly strategy was also loss-making, as movements across the US yield curve worked against this position.
The portfolio subsequently gave back some of the first quarter’s gains. European government bond yields rose sharply against the backdrop of the Greek debt crisis and the bond market sell-off. This environment negatively impacted both our Japanese versus European payer spread and Portuguese versus European duration strategies. Credit markets suffered losses as the bond market sell-off broadened across the credit spectrum, hurting our UK investment grade credit and high yield credit strategies. Our short US duration strategy, which seeks to benefit from rising Treasury yields, delivered positive returns. The long US forward-start inflation strategy also contributed positively, benefiting from upbeat consumer price data.
The third quarter proved challenging for capital markets. Risk assets sold off in volatile trading amid concerns that slowing growth in China would dampen global economic growth. US Treasury bonds rallied as investors sought safe-haven assets, which worked to the advantage of our US butterfly strategy. However, it was negative for our short US duration strategy which seeks to benefit from rising Treasury yields. Our long US inflation position also struggled as weak energy prices and a strong dollar weighed on inflation expectations. Similarly, our UK front-end steepener strategy was loss-making, as low headline inflation and the change in UK interest rate expectations flattened the yield curve. European rates fell during the quarter, supporting our Japanese versus European payer spread strategy. Credit markets lost value and consequently our high yield credit and US investment grade credit strategies contributed negatively. Elsewhere, our long US dollar versus Korean won currency pair made gains. While the US dollar was well-supported, the won was undermined by heightened geopolitical tensions and aggressive selling of local equities.
Bond markets were volatile in the final quarter amid confusing central bank statements and renewed falls in commodity prices. In the US, the Fed’s decision to raise interest rates proved advantageous for our US butterfly strategy. The UK yield curve flattened amid falling yields as the Bank of England hinted that it would likely defer any rate rise for another year. This hurt our UK steepener versus European flattener strategy. Elsewhere, our US and Europe versus UK duration strategy delivered positive returns. The spread between UK and European rates widened, reflecting the policy divergence between the two economies. Credit spreads tightened from the September levels on the back of increased flows into corporate bonds and other risk assets, benefiting our US investment grade credit, contingent capital bonds and high yield credit positions. Our long US dollar versus Australian dollar pair lost value, as improving labour market data buoyed the Australian dollar. Additionally, the Australian central bank decided to keep interest rates unchanged. This too supported the currency but was negative for government bonds, resulting in a loss for our Australian duration strategy. Also loss-making was our long US dollar versus Korean won strategy. The won rose as better-than-expected third-quarter growth ignited hopes of economic recovery.
*Sub-fund performance has been calculated over the stated period on the share price performance basis, based on the D Accumulation Hedged EUR Shares and net of fees.
Outlook Our central expectation is still for modest global growth, albeit with regional variations. A growing divergence in central bank monetary policy will remain an important driver of asset returns. The US has finally embarked on monetary tightening, whereas economies in Europe and Asia maintain a looser monetary path. Geopolitical tensions remain high and on many metrics asset prices appear expensive. We seek to exploit the opportunities that these conditions present by implementing a diversified range of strategies using multiple asset classes.
Please note that the absolute Value at Risk (“VaR”) approach has been used for risk measurement and calculation of global exposure for this Sub-fund. Measurement of 1 month 99% VaR is based on a parametric calculation with an additional upwards scaling factor applied. Parametric risk model uses 180 weeks of equally weighted data with which to forecast risk. On the above basis the VaR has been as follows:
Highest: 1.76% Average: 1.32% Lowest: 0.98%
Leverage is calculated as the sum of the notionals of the derivatives used. The level of leverage employed during the relevant period was 673%.
This Sub-fund is not authorized in Hong Kong and is not available to Hong Kong residents.

Standard Life Investments Global SICAV Société d'Investissement à Capital Variable
282
Absolute Return Global Bond Strategies Fund Schedule of Investments (expressed in GBP) as at 31 December 2015
Quantity/ Market Value % of
Nominal Value Currency Name of Securities GBP Net Assets
Transferable securities and money market instruments admitted to an official exchange listing
Australia 300,000 GBP APT Pipelines Ltd 4.250% 26 November 2024 310,122 0.03%300,000 GBP Asciano Finance Ltd 5.000% 19 September 2023 317,960 0.03%300,000 GBP BHP Billiton Finance Ltd 4.300% 25 September 2042 282,309 0.03%
1,000,000 AUD GE Capital Australia Funding Pty Ltd 4.750% 14 June 2016 497,105 0.05%1,000,000 AUD Mercedes-Benz Australia/Pacific Pty Ltd 4.000% 19 September 2016 495,827 0.05%2,500,000 GBP National Australia Bank Ltd 3.625% 08 November 2017 2,596,162 0.26%
400,000 GBP Scentre Group Trust 1 / Scentre Group Trust 2 2.375% 08 April 2022 391,438 0.04%200,000 GBP SGSP Australia Assets Pty Ltd 5.125% 11 February 2021 219,922 0.02%
Total for Australia 5,110,845 0.51%
Belgium 2,500,000 GBP Anheuser-Busch InBev SA/NV 6.500% 23 June 2017 2,677,357 0.27%
250,000 GBP Anheuser-Busch InBev SA/NV 9.750% 30 July 2024 361,144 0.03%6,906,000 EUR KBC Groep NV FRN (perpetual bond*) 5,093,426 0.51%
Total for Belgium 8,131,927 0.81%
British Virgin Islands 200,000 GBP Global Switch Holdings Ltd 4.375% 13 December 2022 210,005 0.02%
Total for British Virgin Islands 210,005 0.02%
Canada 3,140,000 USD Rogers Communications Inc 5.000% 15 March 2044 2,134,688 0.21%3,625,000 USD TransCanada PipeLines Ltd 7.625% 15 January 2039 3,001,757 0.30%
Total for Canada 5,136,445 0.51%
Cayman Islands 300,000 GBP Dwr Cymru Financing Ltd 6.907% 31 March 2021 363,560 0.04%200,000 GBP Southern Water Services Finance Ltd 6.192% 31 March 2029 256,601 0.03%150,000 GBP Southern Water Services Finance Ltd FRN 31 March 2038 155,506 0.02%400,000 GBP Thames Water Utilities Cayman Finance Ltd 4.000% 19 June 2025 427,532 0.04%200,000 GBP Thames Water Utilities Cayman Finance Ltd FRN 21 July 2025 208,862 0.02%100,000 GBP Thames Water Utilities Cayman Finance Ltd 4.625% 04 June 2046 111,283 0.01%187,831 GBP Trafford Centre Finance Ltd 6.500% 28 July 2033 242,639 0.02%
Total for Cayman Islands 1,765,983 0.18%
Denmark 230,000 GBP AP Moeller - Maersk A/S 4.000% 04 April 2025 233,013 0.02%85,000 GBP Danske Bank A/S FRN (perpetual bond*) 86,153 0.01%
6,561,000 EUR Danske Bank A/S FRN (perpetual bond*) 4,899,550 0.49%200,000 GBP DONG Energy A/S 5.750% 09 April 2040 241,563 0.02%250,000 GBP TDC A/S 5.625% 23 February 2023 270,688 0.03%
Total for Denmark 5,730,967 0.57%
Finland 140,000 GBP Pohjola Bank Oyj 2.500% 20 May 2022 139,135 0.01%
Total for Finland 139,135 0.01%
France 500,000 GBP AXA SA FRN (perpetual bond*) 503,948 0.05%
2,000,000 GBP BNP Paribas SA 3.500% 07 December 2016 2,043,800 0.20%200,000 GBP BPCE SA 5.250% 16 April 2029 208,786 0.02%
1,600,000 GBP Cie de Saint-Gobain 5.625% 15 December 2016 1,664,253 0.17%200,000 GBP CNP Assurances FRN 30 September 2041 223,800 0.02%100,000 GBP Credit Agricole SA 5.500% 17 December 2021 115,816 0.01%200,000 GBP Credit Agricole SA 7.375% 18 December 2023 247,073 0.03%600,000 GBP Electricite de France SA 6.125% 02 June 2034 728,878 0.07%300,000 GBP Electricite de France SA FRN (perpetual bond*) 279,262 0.03%200,000 GBP Electricite de France SA 5.125% 22 September 2050 218,577 0.02%300,000 GBP Electricite de France SA 6.000% 23 January 2114 369,884 0.04%300,000 GBP Engie SA 7.000% 30 October 2028 412,239 0.04%100,000 GBP Engie SA 5.000% 01 October 2060 121,643 0.01%
2,500,000 GBP Orange SA 8.000% 20 December 2017 2,805,238 0.28%

Standard Life Investments Global SICAV Société d'Investissement à Capital Variable
283
Absolute Return Global Bond Strategies Fund Schedule of Investments (expressed in GBP) (continued) as at 31 December 2015
Quantity/ Market Value % of
Nominal Value Currency Name of Securities GBP Net Assets
Transferable securities and money market instruments admitted to an official exchange listing (continued)
France (continued) 500,000 USD Orange SA 9.000% 01 March 2031 476,628 0.05%200,000 GBP Orange SA FRN (perpetual bond*) 198,163 0.02%
2,400,000 GBP RCI Banque SA 3.250% 25 April 2018 2,462,094 0.25%1,000,000 GBP SNCF Reseau 5.250% 07 December 2028 1,250,839 0.12%2,000,000 GBP Societe Generale SA 5.400% 30 January 2018 2,135,869 0.21%
150,000 GBP Societe Generale SA FRN (perpetual bond*) 166,153 0.02%6,724,000 USD Societe Generale SA FRN (perpetual bond*) 4,818,829 0.48%
200,000 GBP Veolia Environnement SA FRN (perpetual bond*) 202,446 0.02% Total for France 21,654,218 2.16%
Germany 6,400,000 EUR Aareal Bank AG FRN (perpetual bond*) 4,737,867 0.47%1,650,000 GBP Daimler AG 1.625% 02 December 2016 1,657,219 0.17%
900,000 GBP Daimler AG 1.250% 01 December 2017 895,843 0.09%230,000 GBP Daimler AG 2.375% 16 December 2021 228,219 0.02%
300,000 GBP Muenchener Rueckversicherungs-Gesellschaft AG in Muenchen FRN 26 May 2042 340,123 0.03%
Total for Germany 7,859,271 0.78%
Guernsey 6,982,000 USD Credit Suisse Group Guernsey I Ltd FRN 24 February 2041 4,860,530 0.48%
Total for Guernsey 4,860,530 0.48%
Iceland 900,000 EUR Arion Banki HF 3.125% 12 March 2018 669,609 0.07%170,000 EUR Landsbankinn HF 3.000% 19 October 2018 125,628 0.01%
Total for Iceland 795,237 0.08%
Ireland 200,000 EUR Bank of Ireland 2.000% 08 May 2017 149,805 0.01%
6,508,000 EUR Bank of Ireland FRN (perpetual bond*) 5,009,097 0.50%100,000 EUR Cloverie Plc for Swiss Reinsurance Co Ltd FRN 01 September 2042 92,131 0.01%
3,000,000 GBP GE Capital UK Funding 6.750% 06 August 2018 3,377,703 0.34%222,000 GBP GE Capital UK Funding 8.000% 14 January 2039 368,826 0.04%
Total for Ireland 8,997,562 0.90%
Italy 200,000 GBP Assicurazioni Generali SpA FRN (perpetual bond*) 200,238 0.02%100,000 GBP Atlantia SpA 6.250% 09 June 2022 119,487 0.01%204,000 GBP Enel SpA 6.250% 20 June 2019 230,561 0.02%250,000 GBP Intesa Sanpaolo SpA 5.250% 28 January 2022 276,607 0.03%200,000 GBP Telecom Italia SpA 6.375% 24 June 2019 218,352 0.02%
Total for Italy 1,045,245 0.10%
Jersey 1,500,000 GBP AA Bond Co Ltd 4.720% 31 July 2018 1,559,805 0.16%
300,000 GBP AA Bond Co Ltd 6.269% 31 July 2025 349,435 0.04%2,300,000 GBP ASIF III Jersey Ltd 5.375% 14 October 2016 2,375,325 0.24%1,000,000 GBP ASIF III Jersey Ltd 5.000% 18 December 2018 1,090,267 0.11%
300,000 GBP CPUK Finance Ltd 2.666% 28 February 2020 298,289 0.03%200,000 GBP CPUK Finance Ltd 7.239% 28 February 2024 246,723 0.02%500,000 GBP Gatwick Funding Ltd 5.750% 23 January 2037 618,645 0.06%300,000 GBP HBOS Capital Funding LP FRN (perpetual bond*) 319,902 0.03%150,000 GBP HBOS Sterling Finance Jersey LP FRN (perpetual bond*) 194,658 0.02%
1,250,000 GBP Heathrow Funding Ltd 12.450% 31 March 2016 1,289,137 0.13%1,300,000 GBP Heathrow Funding Ltd 6.250% 10 September 2018 1,424,617 0.14%
304,000 GBP Heathrow Funding Ltd 6.750% 03 December 2026 396,189 0.04%300,000 GBP Heathrow Funding Ltd 6.450% 10 December 2031 398,042 0.04%300,000 GBP Heathrow Funding Ltd 4.625% 31 October 2046 328,254 0.03%200,000 GBP HSBC Bank Capital Funding Sterling 1 LP FRN (perpetual bond*) 218,582 0.02%300,000 GBP Porterbrook Rail Finance Ltd 4.625% 04 April 2029 329,588 0.03%250,000 GBP QBE Capital Funding IV Ltd FRN 24 May 2041 273,117 0.03%

Standard Life Investments Global SICAV Société d'Investissement à Capital Variable
284
Absolute Return Global Bond Strategies Fund Schedule of Investments (expressed in GBP) (continued) as at 31 December 2015
Quantity/ Market Value % of
Nominal Value Currency Name of Securities GBP Net Assets
Transferable securities and money market instruments admitted to an official exchange listing (continued)
Jersey (continued) 2,500,000 GBP WPP Plc 6.000% 04 April 2017 2,636,273 0.26%
Total for Jersey 14,346,848 1.43%
Luxembourg 2,000,000 USD Actavis Funding SCS 4.750% 15 March 2045 1,317,716 0.13%
300,000 GBP Glencore Finance Europe SA 6.500% 27 February 2019 279,410 0.03% Total for Luxembourg 1,597,126 0.16%
Mexico 300,000 GBP America Movil SAB de CV 5.000% 27 October 2026 334,507 0.03%50,000 GBP America Movil SAB de CV 5.750% 28 June 2030 58,820 0.01%
200,000 GBP America Movil SAB de CV FRN 06 September 2073 205,980 0.02%3,150,000 USD Grupo Televisa SAB 5.000% 13 May 2045 1,831,417 0.18%
1,641,410,100 MXN Mexican Bonos 5.000% 11 December 2019 63,264,929 6.30%150,000 GBP Petroleos Mexicanos 8.250% 02 June 2022 178,364 0.02%
Total for Mexico 65,874,017 6.56%
Netherlands 100,000 GBP ABN AMRO Bank NV 4.875% 16 January 2019 108,564 0.01%200,000 GBP Aegon NV 6.625% 16 December 2039 282,498 0.03%400,000 EUR Allianz Finance II BV FRN 08 July 2041 341,172 0.03%100,000 GBP Bank Nederlandse Gemeenten NV 5.375% 07 June 2021 117,680 0.01%
1,000,000 GBP BAT Netherlands Finance BV 5.500% 15 September 2016 1,029,600 0.10%
100,000 GBP Cooperatieve Centrale Raiffeisen-Boerenleenbank BA 4.875% 10 January 2023 112,598 0.01%
500,000 GBP E.ON International Finance BV 6.375% 07 June 2032 598,844 0.06%250,000 GBP E.ON International Finance BV 6.750% 27 January 2039 313,921 0.03%317,000 GBP Enel Finance International NV 5.625% 14 August 2024 371,236 0.04%
2,500,000 GBP ING Bank NV 3.875% 23 December 2016 2,566,172 0.26%2,500,000 GBP Koninklijke KPN NV 5.750% 18 March 2016 2,522,175 0.25%
100,000 GBP Koninklijke KPN NV 5.750% 17 September 2029 114,377 0.01%2,700,000 GBP PACCAR Financial Europe BV 1.513% 29 May 2018 2,693,047 0.27%
100,000 GBP Petrobras Global Finance BV 6.625% 16 January 2034 62,250 0.01%300,000 GBP RWE Finance BV 5.500% 06 July 2022 327,991 0.03%150,000 GBP Siemens Financieringsmaatschappij NV FRN 14 September 2066 153,396 0.02%200,000 GBP Swiss Reinsurance Co via ELM BV FRN (perpetual bond*) 213,002 0.02%300,000 GBP Telefonica Europe BV FRN (perpetual bond*) 308,562 0.03%
2,200,000 GBP Volkswagen Financial Services NV 2.375% 13 November 2018 2,180,181 0.22%160,000 GBP Volkswagen Financial Services NV 1.750% 17 April 2020 151,614 0.01%300,000 EUR Vonovia Finance BV 3.125% 25 July 2019 235,231 0.02%400,000 EUR Vonovia Finance BV 1.625% 15 December 2020 293,517 0.03%300,000 EUR Vonovia Finance BV FRN (perpetual bond*) 214,425 0.02%
Total for Netherlands 15,312,053 1.52%
Spain 6,600,000 EUR Banco Bilbao Vizcaya Argentaria SA FRN (perpetual bond*) 4,788,934 0.48%2,500,000 GBP Telefonica Emisiones SAU 5.375% 02 February 2018 2,659,460 0.27%
300,000 GBP Telefonica Emisiones SAU 5.445% 08 October 2029 336,769 0.03% Total for Spain 7,785,163 0.78%
Sweden 120,000 GBP Swedbank AB 1.625% 15 April 2019 119,183 0.01%189,000 GBP Vattenfall AB 6.875% 15 April 2039 248,740 0.03%
Total for Sweden 367,923 0.04%
Switzerland 2,000,000 GBP UBS AG 6.625% 11 April 2018 2,234,572 0.22%7,250,000 USD UBS AG 5.125% 15 May 2024 4,953,523 0.49%
92,000 GBP UBS AG FRN 19 November 2024 104,488 0.01%100,000 EUR UBS AG FRN 12 February 2026 78,466 0.01%
Total for Switzerland 7,371,049 0.73%

Standard Life Investments Global SICAV Société d'Investissement à Capital Variable
285
Absolute Return Global Bond Strategies Fund Schedule of Investments (expressed in GBP) (continued) as at 31 December 2015
Quantity/ Market Value % of
Nominal Value Currency Name of Securities GBP Net Assets
Transferable securities and money market instruments admitted to an official exchange listing (continued)
United Arab Emirates 240,000 EUR Emirates Telecommunications Group Co PJSC 2.750% 18 June 2026 187,369 0.02%
Total for United Arab Emirates 187,369 0.02%
United Kingdom 2,200,000 GBP Abbey National Treasury Services Plc 4.125% 14 September 2017 2,296,894 0.23%
210,000 GBP Abbey National Treasury Services Plc 1.875% 17 February 2020 207,371 0.02%240,000 GBP Abbey National Treasury Services Plc 3.875% 15 October 2029 253,103 0.03%250,000 GBP ABP Finance Plc 6.250% 14 December 2026 307,506 0.03%300,000 GBP Affinity Sutton Capital Markets Plc 4.250% 08 October 2042 319,982 0.03%300,000 GBP Anglian Water Services Financing Plc 6.875% 21 August 2023 380,444 0.04%350,000 GBP Annington Finance No 4 Plc FRN 10 January 2023 349,710 0.04%100,000 GBP Arkle Master Issuer Plc 3.986% 17 August 2017 105,761 0.01%201,000 GBP Arqiva Financing Plc 4.040% 30 June 2020 208,778 0.02%200,000 GBP Arqiva Financing Plc 4.882% 31 December 2032 214,367 0.02%537,180 GBP Aspire Defence Finance Plc 4.674% 31 March 2040 599,783 0.06%200,000 GBP Aster Treasury Plc 4.500% 18 December 2043 219,414 0.02%200,000 GBP Aviva Plc FRN (perpetual bond*) 207,875 0.02%350,000 GBP Aviva Plc FRN 03 June 2041 380,301 0.04%140,000 GBP Aviva Plc FRN 04 June 2050 132,570 0.01%
1,000,000 GBP Bank of Scotland Plc 4.875% 08 November 2016 1,034,465 0.10%100,000 GBP Bank of Scotland Plc FRN (perpetual bond*) 118,515 0.01%400,000 GBP Barclays Bank Plc 10.000% 21 May 2021 516,871 0.05%
6,477,000 USD Barclays Bank Plc 7.625% 21 November 2022 4,985,376 0.50%250,000 GBP Barclays Bank Plc 5.750% 14 September 2026 280,007 0.03%206,000 GBP Barclays Plc FRN (perpetual bond*) 202,910 0.02%200,000 GBP Barclays Plc FRN (perpetual bond*) 199,772 0.02%290,000 EUR BAT International Finance Plc 1.250% 13 March 2027 194,920 0.02%210,000 GBP BPHA Finance Plc 4.816% 11 April 2044 235,066 0.02%
2,250,000 GBP British Telecommunications Plc 8.500% 07 December 2016 2,400,518 0.24%1,000,000 GBP British Telecommunications Plc 6.625% 23 June 2017 1,074,073 0.11%
386,000 GBP British Telecommunications Plc 5.750% 07 December 2028 466,741 0.05%13,600 GBP Broadgate Financing Plc FRN 05 October 2023 13,473 0.00%
300,000 GBP Broadgate Financing Plc 4.999% 05 October 2031 346,770 0.03%196,000 GBP Broadgate Financing Plc 5.098% 05 April 2033 216,854 0.02%
3,000,000 GBP BUPA Finance Plc 7.500% 04 July 2016 3,086,445 0.31%300,000 GBP BUPA Finance Plc 3.375% 17 June 2021 307,319 0.03%200,000 GBP BUPA Finance Plc 5.000% 25 April 2023 206,738 0.02%41,210 GBP Canary Wharf Finance II Plc 6.455% 22 October 2033 53,196 0.01%
3,000,000 GBP Centrica Plc 7.000% 19 September 2018 3,383,180 0.34%450,000 GBP Centrica Plc 7.000% 19 September 2033 611,746 0.06%200,000 GBP Centrica Plc 4.250% 12 September 2044 196,972 0.02%200,000 GBP Circle Anglia Social Housing Plc 7.250% 12 November 2038 297,813 0.03%410,000 GBP Close Brothers Finance Plc 3.875% 27 June 2021 428,304 0.04%
3,000,000 GBP Close Brothers Group Plc 6.500% 10 February 2017 3,160,098 0.31%300,000 GBP Compass Group Plc 3.850% 26 June 2026 321,710 0.03%300,000 GBP Coventry Building Society 5.875% 28 September 2022 357,687 0.04%160,000 GBP Crh Finance UK Plc 4.125% 02 December 2029 160,278 0.02%120,000 GBP Delamare Finance Plc 6.067% 19 February 2029 122,583 0.01%403,000 GBP Dignity Finance Plc 4.696% 31 December 2049 424,613 0.04%250,000 GBP Direct Line Insurance Group Plc FRN 27 April 2042 307,577 0.03%420,000 GBP Eastern Power Networks Plc 6.250% 12 November 2036 556,405 0.06%200,000 GBP EE Finance Plc 4.375% 28 March 2019 212,846 0.02%198,000 GBP Enterprise Inns Plc 6.500% 06 December 2018 212,682 0.02%300,000 GBP Eversholt Funding Plc 6.359% 02 December 2025 370,994 0.04%
3,400,000 GBP Experian Finance Plc 4.750% 23 November 2018 3,659,346 0.36%1,250,000 GBP FCE Bank Plc 4.825% 15 February 2017 1,291,874 0.13%
300,000 GBP FCE Bank Plc 2.759% 13 November 2019 302,243 0.03%3,300,000 GBP Firstgroup Plc 8.125% 19 September 2018 3,760,422 0.37%
300,000 GBP Firstgroup Plc 6.875% 18 September 2024 358,496 0.04%300,000 GBP Friends Life Holdings Plc 8.250% 21 April 2022 362,977 0.04%250,000 GBP G4S Plc 7.750% 13 May 2019 288,106 0.03%

Standard Life Investments Global SICAV Société d'Investissement à Capital Variable
286
Absolute Return Global Bond Strategies Fund Schedule of Investments (expressed in GBP) (continued) as at 31 December 2015
Quantity/ Market Value % of
Nominal Value Currency Name of Securities GBP Net Assets
Transferable securities and money market instruments admitted to an official exchange listing (continued)
United Kingdom (continued) 140,000 GBP GlaxoSmithKline Capital Plc 5.250% 19 December 2033 171,494 0.02%160,000 GBP GlaxoSmithKline Capital Plc 6.375% 09 March 2039 221,828 0.02%
3,350,000 GBP Go-Ahead Group Plc 5.375% 29 September 2017 3,538,396 0.35%192,000 GBP Great Rolling Stock Co Ltd 6.500% 05 April 2031 241,596 0.02%190,770 GBP Greater Gabbard OFTO Plc 4.137% 29 November 2032 204,938 0.02%346,015 GBP Greene King Finance Plc FRN 15 December 2033 350,300 0.04%194,556 GBP Gwynt y Mor OFTO Plc 2.778% 17 February 2034 185,828 0.02%200,000 GBP Hammerson Plc 6.000% 23 February 2026 241,391 0.02%
1,000,000 GBP Heathrow Finance Plc 7.125% 01 March 2017 1,057,340 0.11%500,000 GBP HSBC Bank Plc FRN 04 November 2030 541,389 0.05%550,000 GBP HSBC Holdings Plc 6.000% 29 March 2040 643,605 0.06%
3,000,000 GBP Imperial Tobacco Finance Plc 5.500% 22 November 2016 3,123,210 0.31%500,000 GBP Imperial Tobacco Finance Plc 8.125% 15 March 2024 661,288 0.07%281,000 GBP Imperial Tobacco Finance Plc 4.875% 07 June 2032 304,598 0.03%221,177 GBP Integrated Accommodation Services Plc 6.480% 31 March 2029 271,102 0.03%
1,000,000 GBP InterContinental Hotels Group Plc 6.000% 09 December 2016 1,042,606 0.10%500,000 GBP Intu Metrocentre Finance Plc 4.125% 06 December 2023 519,425 0.05%
2,500,000 GBP John Lewis Plc 8.375% 08 April 2019 2,947,200 0.29%300,000 GBP John Lewis Plc 4.250% 18 December 2034 293,303 0.03%
2,100,000 GBP Land Securities Capital Markets Plc FRN 07 November 2019 2,224,541 0.22%300,000 GBP Land Securities Capital Markets Plc FRN 31 July 2032 368,156 0.04%100,000 GBP LCR Finance Plc 5.100% 07 March 2051 148,749 0.02%150,000 GBP Legal & General Group Plc FRN 27 October 2045 150,930 0.02%350,000 GBP Legal & General Group Plc FRN 27 June 2064 330,348 0.03%350,000 GBP Lend Lease Europe Finance Plc 6.125% 12 October 2021 392,713 0.04%
2,000,000 GBP Lloyds Bank Plc 6.750% 24 October 2018 2,259,285 0.23%300,000 GBP Lloyds Bank Plc FRN 16 December 2021 326,271 0.03%400,000 GBP Lloyds Bank Plc 7.625% 22 April 2025 512,810 0.05%50,000 GBP Lloyds Bank Plc 6.500% 17 September 2040 70,821 0.01%
300,000 GBP London & Quadrant Housing Trust 5.500% 27 January 2040 379,781 0.04%3,000,000 GBP London Power Networks Plc 5.375% 11 November 2016 3,105,645 0.31%3,000,000 GBP London Stock Exchange Group Plc 5.875% 07 July 2016 3,063,345 0.31%
400,000 GBP London Stock Exchange Group Plc 4.750% 02 November 2021 434,474 0.04%50,000 GBP Marks & Spencer Plc 6.125% 02 December 2019 56,727 0.01%
300,000 GBP Marks & Spencer Plc 6.125% 06 December 2021 347,920 0.03%200,000 GBP Marstons Issuer Plc FRN 15 October 2027 211,061 0.02%176,186 GBP Mitchells & Butlers Finance Plc 5.965% 15 December 2023 194,007 0.02%176,000 GBP Mitchells & Butlers Finance Plc FRN 15 December 2028 154,105 0.02%251,000 GBP Motability Operations Group Plc 5.250% 28 September 2016 258,654 0.03%
3,000,000 GBP National Express Group Plc 6.250% 13 January 2017 3,137,534 0.31%350,000 GBP National Express Group Plc 6.625% 17 June 2020 405,569 0.04%200,000 GBP National Grid Electricity Transmission Plc 4.000% 08 June 2027 217,287 0.02%100,000 GBP National Grid Electricity Transmission Plc 6.500% 27 July 2028 134,035 0.01%
2,000,000 GBP National Grid Gas Plc 6.000% 07 June 2017 2,134,579 0.21%200,000 GBP National Grid Gas Plc 6.375% 03 March 2020 235,355 0.02%150,000 GBP National Grid Gas Plc 6.000% 13 May 2038 202,507 0.02%300,000 GBP National Westminster Bank Plc 6.500% 07 September 2021 339,939 0.03%
1,000,000 GBP Nationwide Building Society 8.625% 29 March 2018 1,128,849 0.11%200,000 EUR Nationwide Building Society 6.750% 22 July 2020 180,733 0.02%400,000 GBP Nationwide Building Society 2.250% 29 April 2022 394,179 0.04%
3,000,000 GBP Northern Ireland Electricity Ltd 6.875% 18 September 2018 3,382,065 0.34%2,500,000 GBP Northumbrian Water Finance Plc 6.000% 11 October 2017 2,688,176 0.27%
250,000 GBP Northumbrian Water Finance Plc 5.625% 29 April 2033 310,197 0.03%200,000 GBP Notting Hill Housing Trust 5.250% 07 July 2042 239,687 0.02%178,328 GBP Octagon Healthcare Funding Plc 5.333% 31 December 2035 208,461 0.02%320,000 GBP Peabody Capital Plc 5.250% 17 March 2043 380,822 0.04%103,000 GBP Peel Land & Property Investments Plc 8.375% 30 April 2040 137,707 0.01%300,000 GBP Provident Financial Plc 8.000% 23 October 2019 342,000 0.03%
3,000,000 GBP Prudential Plc 1.375% 19 January 2018 2,990,010 0.30%300,000 GBP Prudential Plc 6.875% 20 January 2023 377,526 0.04%350,000 GBP Prudential Plc FRN 19 December 2063 351,315 0.04%

Standard Life Investments Global SICAV Société d'Investissement à Capital Variable
287
Absolute Return Global Bond Strategies Fund Schedule of Investments (expressed in GBP) (continued) as at 31 December 2015
Quantity/ Market Value % of
Nominal Value Currency Name of Securities GBP Net Assets
Transferable securities and money market instruments admitted to an official exchange listing (continued)
United Kingdom (continued) 2,000,000 GBP Reed Elsevier Investments Plc 5.625% 20 October 2016 2,067,500 0.21%1,400,000 GBP Reed Elsevier Investments Plc 7.000% 11 December 2017 1,539,445 0.15%2,500,000 GBP Rentokil Initial Plc 5.750% 31 March 2016 2,526,375 0.25%
250,000 EUR Rentokil Initial Plc 3.250% 07 October 2021 200,290 0.02%100,000 GBP Rio Tinto Finance Plc 4.000% 11 December 2029 96,825 0.01%
4,025,000 USD Rio Tinto Finance USA Plc 4.125% 21 August 2042 2,126,845 0.21%230,000 GBP RL Finance Bonds No. 2 plc FRN 30 November 2043 237,562 0.02%760,000 EUR Royal Bank of Scotland Group Plc 1.500% 28 November 2016 564,406 0.06%
7,210,000 USD Royal Bank of Scotland Group Plc FRN (perpetual bond*) 5,078,236 0.51%666,000 GBP Royal Bank of Scotland Plc 6.625% 17 September 2018 744,327 0.07%200,000 GBP RSA Insurance Group Plc FRN 20 May 2039 232,974 0.02%300,000 GBP Sanctuary Capital Plc 6.697% 23 March 2039 426,864 0.04%
3,000,000 GBP Scottish Power UK Plc 8.375% 20 February 2017 3,234,781 0.32%400,000 GBP Scottish Power UK Plc 6.750% 29 May 2023 494,227 0.05%
2,500,000 GBP Segro Plc 5.500% 20 June 2018 2,708,097 0.27%200,000 GBP Segro Plc 6.000% 30 September 2019 225,282 0.02%300,000 GBP Segro Plc 6.750% 23 February 2024 372,862 0.04%200,000 GBP Severn Trent Utilities Finance Plc 6.125% 26 February 2024 242,842 0.02%
2,500,000 GBP Sky Group Finance Plc 5.750% 20 October 2017 2,673,386 0.27%450,000 GBP Sky Plc 2.875% 24 November 2020 454,563 0.05%400,000 GBP Southern Electric Power Distribution Plc 5.500% 07 June 2032 483,087 0.05%300,000 GBP Southern Gas Networks Plc 4.875% 05 October 2023 337,965 0.03%116,000 GBP Southern Gas Networks Plc 4.875% 21 March 2029 134,300 0.01%300,000 GBP Sovereign Housing Capital Plc 5.705% 10 September 2039 383,518 0.04%
3,000,000 GBP SSE Plc 5.000% 01 October 2018 3,241,446 0.32%150,000 GBP SSE Plc 6.250% 27 August 2038 194,315 0.02%100,000 GBP SSE Plc FRN (perpetual bond*) 95,952 0.01%400,000 GBP Stagecoach Group Plc 4.000% 29 September 2025 401,808 0.04%
2,000,000 GBP Standard Chartered Bank 7.750% 03 April 2018 2,216,375 0.22%88,350 GBP Telereal Securitisation Plc 4.974% 10 September 2027 97,257 0.01%
182,505 GBP Telereal Securitisation Plc 5.553% 10 December 2031 208,714 0.02%100,000 GBP Telereal Securitisation Plc FRN 10 December 2033 101,268 0.01%79,739 GBP Temese Funding 1 Plc FRN 21 November 2021 79,881 0.01%
177,008 GBP Tesco Property Finance 3 Plc 5.744% 13 April 2040 154,748 0.02%148,092 GBP Tesco Property Finance 4 Plc 5.801% 13 October 2040 129,210 0.01%149,680 GBP Unique Pub Finance Co Plc 6.542% 30 March 2021 156,603 0.02%200,000 GBP UNITE USAF II Plc 3.374% 30 June 2023 203,417 0.02%100,000 GBP United Kingdom Gilt 5.000% 07 March 2025 126,602 0.01%88,000 GBP United Kingdom Gilt 6.000% 07 December 2028 126,687 0.01%
1,000,000 GBP United Utilities Water Ltd 5.375% 14 May 2018 1,083,034 0.11%200,000 GBP United Utilities Water Ltd 5.625% 20 December 2027 243,604 0.02%110,000 GBP University of Liverpool 3.375% 25 June 2055 113,373 0.01%126,000 GBP Virgin Media Secured Finance Plc 5.500% 15 January 2025 123,375 0.01%
2,200,000 GBP Vodafone Group Plc 5.375% 05 December 2017 2,342,349 0.23%1,500,000 GBP Wales & West Utilities Finance Plc 5.125% 02 December 2016 1,554,056 0.15%
200,000 GBP Wales & West Utilities Finance Plc 6.250% 30 November 2021 238,628 0.02%200,000 GBP Wessex Water Services Finance Plc 5.750% 14 October 2033 253,382 0.03%300,000 GBP Western Power Distribution Plc 3.625% 06 November 2023 299,019 0.03%300,000 GBP Western Power Distribution West Midlands Plc 5.750% 16 April 2032 371,694 0.04%220,000 GBP Wheatley Group Capital Plc 4.375% 28 November 2044 231,618 0.02%100,000 GBP Wm Morrison Supermarkets Plc 3.500% 27 July 2026 90,334 0.01%300,000 USD WPP Finance 2010 5.625% 15 November 2043 205,609 0.02%200,000 GBP Yorkshire Building Society FRN 20 November 2024 200,911 0.02%300,000 GBP Yorkshire Water Services Finance Ltd 5.500% 28 May 2037 371,856 0.04%200,000 GBP Zurich Finance UK Plc FRN (perpetual bond*) 222,182 0.02%
Total for United Kingdom 137,808,418 13.72%
United States 3,125,000 USD 21st Century Fox America Inc 4.750% 15 September 2044 2,030,595 0.20%
600,000 GBP Ahold Finance USA LLC 6.500% 14 March 2017 634,348 0.06%81,000 USD Altria Group Inc 9.950% 10 November 2038 87,684 0.01%

Standard Life Investments Global SICAV Société d'Investissement à Capital Variable
288
Absolute Return Global Bond Strategies Fund Schedule of Investments (expressed in GBP) (continued) as at 31 December 2015
Quantity/ Market Value % of
Nominal Value Currency Name of Securities GBP Net Assets
Transferable securities and money market instruments admitted to an official exchange listing (continued)
United States (continued) 4,525,000 USD Altria Group Inc 5.375% 31 January 2044 3,261,119 0.33%
150,000 GBP American International Group Inc 5.000% 26 April 2023 167,296 0.02%300,000 GBP Amgen Inc 4.000% 13 September 2029 304,727 0.03%
3,230,000 USD Anadarko Petroleum Corp 4.500% 15 July 2044 1,670,764 0.17%3,000,000 GBP AT&T Inc 5.875% 28 April 2017 3,171,291 0.32%
200,000 GBP AT&T Inc 7.000% 30 April 2040 263,598 0.03%300,000 GBP AT&T Inc 4.250% 01 June 2043 278,068 0.03%390,000 USD AT&T Inc 4.750% 15 May 2046 241,238 0.02%
2,000,000 GBP Bank of America Corp 5.250% 09 November 2016 2,060,080 0.21%1,250,000 GBP Bank of America Corp 7.750% 30 April 2018 1,413,051 0.14%
200,000 GBP Bank of America Corp 6.125% 15 September 2021 234,045 0.02%300,000 GBP Bank of America Corp 8.125% 02 June 2028 413,683 0.04%250,000 GBP Bank of America Corp 7.000% 31 July 2028 336,019 0.03%
2,940,000 USD Bank of America Corp 7.750% 14 May 2038 2,693,264 0.26%2,680,000 USD Boston Scientific Corp 7.375% 15 January 2040 2,208,283 0.22%5,150,000 USD Burlington Northern Santa Fe LLC 4.150% 01 April 2045 3,151,941 0.31%4,780,000 USD Celgene Corp 4.625% 15 May 2044 3,048,404 0.30%1,000,000 AUD Citigroup Inc 6.500% 13 February 2017 511,351 0.05%2,154,000 GBP Citigroup Inc 7.625% 03 April 2018 2,423,272 0.24%
500,000 GBP Citigroup Inc 5.875% 01 July 2024 579,394 0.06%162,000 GBP Citigroup Inc 6.800% 25 June 2038 226,984 0.02%300,000 GBP Comcast Corp 5.500% 23 November 2029 365,015 0.04%
2,875,000 USD Comcast Corp 4.750% 01 March 2044 2,013,324 0.20%350,000 USD CVS Health Corp 3.500% 20 July 2022 240,290 0.02%
3,266,000 USD CVS Health Corp 5.125% 20 July 2045 2,324,354 0.23%3,210,000 USD DIRECTV Holdings LLC / DIRECTV Financing Co Inc 5.150% 15 March 2042 2,021,021 0.20%
470,000 USD Dow Chemical Co 4.625% 01 October 2044 286,857 0.03%4,830,000 USD Eastman Chemical Co 4.650% 15 October 2044 2,895,510 0.29%3,000,000 USD Energy Transfer Partners LP 2.500% 15 June 2018 1,939,702 0.19%
350,000 USD Energy Transfer Partners LP 3.600% 01 February 2023 194,510 0.02%3,140,000 USD Energy Transfer Partners LP 6.125% 15 December 2045 1,724,852 0.17%4,830,000 USD Enterprise Products Operating LLC 4.900% 15 May 2046 2,666,135 0.27%4,615,000 USD Exelon Corp 5.100% 15 June 2045 3,138,167 0.31%2,375,000 USD Ford Motor Co 4.750% 15 January 2043 1,518,763 0.15%
553,000 GBP General Electric Capital Corp 6.250% 29 September 2020 650,958 0.07%200,000 GBP General Electric Capital Corp 5.250% 07 December 2028 245,109 0.03%321,000 GBP General Electric Capital Corp 5.375% 18 December 2040 416,813 0.04%
3,713,000 USD General Motors Co 6.250% 02 October 2043 2,646,380 0.26%2,000,000 GBP Goldman Sachs Group Inc 6.125% 14 February 2017 2,105,159 0.21%
957,000 USD Halliburton Co 5.000% 15 November 2045 639,076 0.06%3,400,000 USD Hess Corp 5.600% 15 February 2041 1,935,174 0.19%3,140,000 USD Home Depot Inc 4.400% 15 March 2045 2,188,039 0.22%3,185,000 USD International Paper Co 5.150% 15 May 2046 2,047,300 0.20%3,230,000 USD JM Smucker Co 4.375% 15 March 2045 2,122,592 0.21%1,000,000 GBP JPMorgan Chase & Co 4.250% 25 January 2017 1,030,558 0.10%
350,000 GBP JPMorgan Chase & Co 1.875% 10 February 2020 345,423 0.03%2,150,000 GBP JPMorgan Chase Bank NA 5.375% 28 September 2016 2,216,209 0.22%
300,000 USD Kinder Morgan Inc 5.300% 01 December 2034 160,297 0.02%310,000 GBP Kraft Heinz Foods Co 4.125% 01 July 2027 316,322 0.03%
1,440,000 USD Lockheed Martin Corp 4.700% 15 May 2046 996,477 0.10%3,875,000 USD McKesson Corp 4.883% 15 March 2044 2,616,543 0.26%
400,000 GBP MetLife Inc 5.375% 09 December 2024 472,248 0.05%560,000 USD MetLife Inc 4.600% 13 May 2046 380,247 0.04%
2,350,000 GBP Morgan Stanley 5.750% 14 February 2017 2,463,591 0.25%1,850,000 USD Morgan Stanley 4.350% 08 September 2026 1,252,919 0.13%1,650,000 GBP National Grid North America Inc 1.875% 06 August 2018 1,642,963 0.16%3,485,000 USD Pacific Gas & Electric Co 4.300% 15 March 2045 2,313,877 0.23%
140,000 EUR Philip Morris International Inc 2.875% 03 March 2026 113,297 0.01%59,000 GBP Rabobank Capital Funding Trust IV FRN (perpetual bond*) 61,580 0.01%
3,045,000 USD Reynolds American Inc 5.850% 15 August 2045 2,285,808 0.23%100,000 GBP Time Warner Cable Inc 5.750% 02 June 2031 99,913 0.01%

Standard Life Investments Global SICAV Société d'Investissement à Capital Variable
289
Absolute Return Global Bond Strategies Fund Schedule of Investments (expressed in GBP) (continued) as at 31 December 2015
Quantity/ Market Value % of
Nominal Value Currency Name of Securities GBP Net Assets
Transferable securities and money market instruments admitted to an official exchange listing (continued)
United States (continued) 3,956,000 USD Time Warner Inc 4.850% 15 July 2045 2,543,844 0.25%2,875,000 USD UnitedHealth Group Inc 4.250% 15 March 2043 1,883,441 0.19%
251,000 GBP Verizon Communications Inc 4.073% 18 June 2024 266,005 0.03%100,000 GBP Verizon Communications Inc 4.750% 17 February 2034 106,237 0.01%
4,283,000 USD Verizon Communications Inc 6.550% 15 September 2043 3,421,696 0.34%167,000 USD Verizon Communications Inc 5.012% 21 August 2054 103,308 0.01%
3,685,000 USD Virginia Electric & Power Co 4.650% 15 August 2043 2,628,077 0.26%2,860,000 USD Voya Financial Inc 5.700% 15 July 2043 2,192,375 0.22%
310,000 GBP Wal-Mart Stores Inc 5.625% 27 March 2034 393,200 0.04%4,870,000 USD Waste Management Inc 4.100% 01 March 2045 3,057,119 0.30%
100,000 GBP Wells Fargo & Co 2.125% 22 April 2022 97,533 0.01%500,000 GBP Wells Fargo Bank NA 5.250% 01 August 2023 574,743 0.06%
Total for United States 103,771,449 10.33%
Total transferable securities and money market instruments admitted to an official exchange listing 425,858,785 42.40%
Open-ended investment funds
United Kingdom 41,586,850 GBP Standard Life Investments Higher Income Fund** 40,759,272 4.06%
Total for United Kingdom 40,759,272 4.06%
Total open-ended investment funds 40,759,272 4.06%
Transferable securities and money market instruments dealt in on another regulated market
European Union 20,000,000 GBP Bank of America Corp 0.640% 08 March 2016 20,002,969 1.99%20,000,000 GBP Barclays Bank Plc 0.790% 18 February 2016 20,006,770 1.99%20,000,000 GBP Calyon - Credit Agricole 0.630% 09 March 2016 20,002,589 1.99%20,000,000 GBP Citibank 0.000% 25 January 2016 19,993,468 1.99%20,000,000 GBP Commerzbank AG 0.740% 12 February 2016 20,004,999 1.99%20,000,000 GBP Credit Suisse 0.750% 12 April 2016 20,007,547 1.99%20,000,000 GBP DZ Bank 0.620% 15 April 2016 20,000,046 1.99%20,000,000 GBP Goldman Sachs International 0.750% 18 May 2016 20,005,362 1.99%20,000,000 GBP ING Bank 0.690% 01 March 2016 20,004,629 1.99%20,000,000 GBP ING Bank 0.770% 03 May 2016 20,007,944 2.00%20,000,000 GBP Natixis 0.810% 01 April 2016 20,010,691 2.00%10,000,000 GBP Societe Generale 0.810% 09 February 2016 10,003,102 1.00%20,000,000 GBP Tradition (UK) Limited 0.670% 10 February 2016 20,003,280 1.99%20,000,000 GBP Tradition (UK) Limited 0.600% 11 April 2016 19,999,330 1.99%
Total for European Union 270,052,726 26.89%
France 1,000,000 USD Pernod Ricard SA 2.950% 15 January 2017 683,368 0.07%
350,000 USD Pernod Ricard SA 4.250% 15 July 2022 242,543 0.02% Total for France 925,911 0.09%
Italy 2,351,000 USD Intesa Sanpaolo SpA FRN (perpetual bond*) 1,618,971 0.16%
Total for Italy 1,618,971 0.16%
Mexico 3,675,000 USD Mexichem SAB de CV 5.875% 17 September 2044 2,089,336 0.21%
Total for Mexico 2,089,336 0.21%
Netherlands 2,000,000 USD Deutsche Telekom International Finance BV 2.250% 06 March 2017 1,358,322 0.13%
Total for Netherlands 1,358,322 0.13%

Standard Life Investments Global SICAV Société d'Investissement à Capital Variable
290
Absolute Return Global Bond Strategies Fund Schedule of Investments (expressed in GBP) (continued) as at 31 December 2015
Quantity/ Market Value % of
Nominal Value Currency Name of Securities GBP Net Assets
Transferable securities and money market instruments dealt in on another regulated market (continued)
Switzerland 400,000 USD Credit Suisse Group AG FRN (perpetual bond*) 283,975 0.03%
Total for Switzerland 283,975 0.03%
United States 3,440,000 USD Baxalta Inc 5.250% 23 June 2045 2,326,510 0.23%2,375,000 USD CCO Safari II LLC 6.384% 23 October 2035 1,605,205 0.16%
400,000 GBP DIRECTV Holdings LLC / DIRECTV Financing Co Inc 4.375% 14 September 2029 408,990 0.04%
5,000,000 USD Hewlett Packard Enterprise Co 2.450% 05 October 2017 3,372,191 0.34%2,375,000 USD Pacific LifeCorp 5.125% 30 January 2043 1,640,102 0.16%3,800,000 USD SABMiller Holdings Inc 4.950% 15 January 2042 2,602,651 0.26%
Total for United States 11,955,649 1.19%
Total transferable securities and money market instruments dealt in on another regulated market 288,284,890 28.70% Total investments 754,902,947 75.16%Cash and cash equivalents 243,308,691 24.23%Bank overdraft and other net assets 6,132,503 0.61%Total net assets 1,004,344,141 100.00%
*A perpetual bond is a bond with no maturity date. Perpetual bonds are not redeemable but pay a steady stream of interest. **This open-ended investment fund is an affiliated entity of the Company. Please refer to note 11 to the financial statements for further details.
Analysis of Investments as % of total assets Transferable securities and money market instruments admitted to an official exchange listing 45.38%Transferable securities and money market instruments dealt in on another regulated market 28.04%Other assets 26.58%Total assets 100.00%
The accompanying notes form an integral part of these financial statements.

Standard Life Investments Global SICAV is an umbrella type investment company with variable capital registered in Luxembourg (no.B78797)at 2-4, rue Eugéne Ruppert, L-2453 Luxembourg, Grand Duchy of Luxembourg.www.standardlifeinvestments.com © 2015 Standard Life, images reproduced under licence