annual report - himachal pradesh state pollution control … · · 2011-03-16m parivesh, new...
TRANSCRIPT

[AR 2009‐10] Page 1
HPSPCB ANNUAL REPORT
2009‐10
HH.. PP.. SSTTAATTEE PPOOLLLLUUTTIIOONN CCOONNTTRROOLL BBOOAARRDD HHIIMM PPAARRIIVVEESSHH,, NNEEWW SSHHIIMMLLAA--117711 000099
PPhh..:: 00117777 22667733776666,, FFaaxx:: 00117777 22667733001188,, WWeebbssiittee:: wwwwww..hhppppccbb..nniicc..iinn

[AR 2009‐10] Page 2
CONTENTS
Sr. No.
TITLE PAGES
1. INTRODUCTION 3-5
2. CONSTITUTION OF THE STATE BOARD 6
3. MEETING OF THE STATE BOARD 7-9
4. ACTIVITIES OF THE STATE BOARD INCLUDING THE VARIOUS FUNCTIONS
10-68
5. PROSECUTIONS LAUNCHED AND CONVICTIONS SECURED FOR ENVIRONMENTAL POLLUTION CONTROL
69-70
6. FINANCE AND ACCOUNTS OF THE STATE BOARD FOR THE YEAR 2009-10
71
7. ANY OTHER IMPORTANT MATTER DEALT WITH BY THE STATE BOARD
72-74
8. ANNEXURE-I (ORGANIZATION STRUCTURE) 75
*****

[AR 2009‐10] Page 3
CHAPTER – 1
INTRODUCTION
The Himachal Pradesh State Pollution Control Board was constituted in the year 1974 under the provision of Water (Prevention and Control of Pollution) Act, 1974. Subsequently the implementation of the provision contained in Water (Prevention and Control of Pollution) Cess Act, 1977, Air (Prevention and Control of Pollution) Act, 1981 and Environmental Protection Act, 1986 in addition to Rules framed under these Acts were also entrusted to the State Board. The prime objective of all these Acts is maintaining, restoring and preserving the wholesomeness of quality of environment and prevention of hazards to human beings and terrestrial flora and fauna.
Himachal Pradesh State Pollution Control Board is a nodal agency in the administrative structure of the State Government for planning, coordination, prevention & control of pollution and so also protection of environment in the framework of environmental regulations. The State Board has always endeavoured to strike a rational balance between economic growth and environmental preservation. In the pursuit of attaining the objectives enshrined in the environmental legislations the State Board has followed the principles of sustainable development. Continuous efforts are being made by the board to expand its activities to fulfill the demands of emerging environmental concerns, challenges and new statutes.
The following legislative measures are significant and worth mentioning here vis-à-vis the
functions and duties of the State Board. • Water (Prevention & Control of Pollution) Act, 1974: The Parliament in the 25th year of
the Republic promulgated this legislation in pursuance to Clause-1 of Article 252 of the Constitution of India, with the objective of prevention and control of water pollution and maintenance and restoration of wholesomeness of water. The H.P. State Pollution Control Board was constituted in 1974 under the provisions of this Act.
• Water (Prevention & Control of Pollution) Cess Act, 1977: This Act provides for levy of cess on the water consumed for specific purposes with a view to dissuade wasteful and indiscreet use of water.
• Air (Prevention & Control of Pollution) Act, 1981: On the analogy of the Water
(Prevention & Control of Pollution) Act, 1974 the Union Government promulgated another identical legislation which was exclusively meant to deal with the problems of air quality and preservation and maintenance thereof.
• Environment (Protection) Act, 1986: In order to provide the existing legislation for control
of water and air pollution more effectively and to remove the deficiency of these legislations, the Union Government enacted umbrella legislation in 37th Year of Republic. The prime objective of the legislation was to plug the existing statutory gaps whereby tremendous responsibilities by way of functions have been entrusted to the State Board. The following prominent rules and notifications are significant in context to the role and functions of the H.P. State Pollution Control Board:
1. Manufacture, Storage and Import of Hazardous Chemical Rules, 1989.
[AR 2009‐10] Page 4
2. The Hazardous Waste (Management, Handling & Transboundary Movement) Rules, 2008.
3. Rules for Manufacture, Use, Import, Export and Storage of Hazardous Microorganism, Genetically Engineered Organisms or Cells, 1989.
4. Noise Pollution (Control and Regulation) Rules, 2000. 5. Bio-medical Wastes (Management & Handling) Rules, 1998. 6. Recycled Plastics Manufacture and Usage Rules, 1999/2003. 7. Municipal Solid Wastes (Management & Handling) Rules, 2000. 8. Ozone Depleting Substances (Regulation & Control) Rules, 2000. 9. Batteries (Management & Handling) Rules, 2000.
Other Areas/Acts/Rules Concerning General Public:
The following Rules, which have bearing on, the state of the environment and health of the society are also in existence/enactments. Under these Rules, the H.P. State Pollution Control Board is not the only agency responsible for the implementation of these Rules but nevertheless these Rules and enactments are of great significance. They are as under:
• Public Liability Insurance Act, 1991. • H.P. Non-Biodegradable Garbage (Control) Act, 1995. • Motor Vehicle Act, 1988.
MANDATE OF THE STATE BOARD:
The mandate of the State Board has increased manifold since its constitution. The State Board has adopted a major shift in its policy from purely regulatory set-up to an interactive scientific organization by performing various functions under the domain of pollution control.
Plan a comprehensive program for prevention, control or abatement of pollution of air, streams, rivers and wells in the state and to secure the execution thereof.
Advise the state government on any matter concerning the prevention, control or abatement of
water and air pollution.
Collect and disseminate information related to water and air pollution and prevention, control or abatement thereof.
Lay down or modify standards for quality of air, sewage and trade effluents.
Inspect any pollution control equipment, sewage or trade effluents, works and plants and takes
steps for the prevention.
Provide technical assistance and guidance in problems related to water and air pollution and control thereof.
To implement the provision of Environmental Impact Assessment (EIA) notification, 2006 for
specified categories of development project listed in its schedule.

[AR 2009‐10] Page 5
Delimitation of pollution control areas.
Creating mass-awareness and training programs relating to prevention, control or abatement of environmental pollution.
Encourage, conduct and participate in investigation and research relating to problems of water
& air pollution and prevention, control or abatement.
To perform such other functions as may be prescribed or as may, form time to time; be entrusted by the Central Board or the State Government.
Advise the State Government with respect to the location of any industry the carrying of
which is likely to pollute stream or well or cause air pollution.
To make, vary or revoke any order: –
i) For the prevention, control or abatement of discharge of waste into the stream or wells. ii) Requiring any person concerned to construct new systems for the disposal of sewage and
trade effluents or to modify, alter or extend any such existing system or to adopt such remedial measures as are necessary to prevent, control or abate water pollution etc.
iii) To integrate environmental aspects into development planning/activity through spatial
environmental planning. iv) To perform such other functions as may be prescribed by the State/Central Governments
from time to time. ADMINISTRATIVE STRUCTURE:
The Himachal Pradesh State Pollution Control Board as per the provisions of Water Act, 1974 is headed by the Chairman. The executive head of the State Board is Member Secretary. The State Board has ten Regional Offices at Shimla, Parwanoo, Paonta Sahib, Baddi, Una, Rampur, Jassur, Chamba, Kullu and Bilaspur and two Sub Regional Offices located at Nalagarh & Kala Amb to perform regulatory functions for prevention and control of pollution as prescribed under various environmental legislations. Another Regional Office is proposed to be established at Dharamshala. The State Board has one Central Laboratory located at Parwanoo and there Regional Laboratories at Paonta Sahib, Jassur and Sunder Nagar for providing scientific support to the regulatory functions. This administrative setup of the State Board caters to the diverse environmental matters in Himachal Pradesh. The Organizational Structure of the State Board is shown in Annexure-I.
*****

[AR 2009‐10] Page 6
CHAPTER-2
CONSTITUTION OF THE STATE BOARD The Government of Himachal Pradesh vide Notification No. STE-A (1)-4/2001-I dated
29.03.2008 appointed Principal Secretary (Env. & ST) to the Govt. of Himachal Pradesh as Ex-Officio Chairperson and reconstituted the State Board for a period of three years. Following are the members of the Board:-
I. Chairperson/Official Members:
i) The Principal Secretary (Env. S&T) to the Government of Himachal Pradesh, Shimla-2.
Chairperson
ii) The Principal Secretary (Industries) to the Government of Himachal Pradesh or Director (Industries), H.P. Shimla.
Member
iii) The Principal Secretary (Health) to the Government of Himachal Pradesh or Director (Health Services), H.P. Shimla-9.
Member
iv) The Principal Secretary (MPP & Power) to the Government of Himachal Pradesh, Shimla-2.
Member
v) The Principal Secretary (I & PH) to the Government of Himachal Pradesh or Engineer-in Chief (I & PH), Shimla.
Member
vi) The Managing Director, H.P. Road Transport Corporation, Shimla.
Member
vii) The Managing Director, H.P. Tourism Development Corporation, Shimla.
Member
viii) The Director, Department of Environment, Science & Technology, H.P. Shimla-2.
Member
II. Non Official Members:
i) Sh. Kashmiri Lal Handa, Councilor,
M.C. Hamirpur, Gandhi Chowk, Hamirpur, H.P. Member
ii) Sh. Narinder Thakur, Village & Post Office, Dangoh, Tehsil Amb, Distt. Una, H.P.
Member
iii) Smt. Kamla Patial, Sham Nagar, Dharamshala, Distt. Kangra, H.P.
Member
iv) Sh. Narinder Thakur, Village & Post Office, Deothi, Tehsil & Distt. Solan, H.P.
Member
*****
[AR 2009‐10] Page 7
CHAPTER – 3
MEETINGS OF THE STATE BOARD
The following major decisions were taken by the State Board in its 60th and 61st meetings held on 06.01.2010 and 20.03.2010 respectively:-
I The decisions taken by the State Board in its 60th meeting dated 06.01.2010
1. ADOPTION OF WEB ENABLED CONSENT & AUTHORISATION MECHANISM:
• The initiative taken for this online system was noted and appreciated by the State
Board. 2. TECHNOLOGICAL INTERVENTIONS AND ENSURING COMPLIANCE UNDER
WATER & AIR ACTS:
• Actions taken by the State Board for technological up-gradation of the existing pollution control systems and improvement in the operation & maintenance of the pollution control systems under the directory provisions of Water Act, 1974 and Air Act, 1981 were noted by the State Board.
3. REFUSAL OF CONSENT ON RECEIPT OF INCOMPLETE APPLICATION:
• Item was considered, deliberated and approved by the State Board as under:-
(1) Refuse the Consent applications within four months which remain pending
despite query raised by the State Board on account of incomplete information / documentation or non-compliance to the prescribed norms or directions.
(2) Such applicants whose applications are refused as in Sr. No. (i) above, shall,
however, be permitted to re-apply when the complete information/ documentation or compliance to the prescribed norms or directions is ensured by the applicants.
(3) At the reapplying the Consent refused as per Sr. No. (i) above, the consent
fees to be deposited by such applicant shall be determined as the difference of Consent fee due at the time of reapplying and the fee deposited by the applicant with application which was refused.
4. NON APPLICABILITY OF RELEASE OF MANDATORY 15% WATER:
• The item was considered and deferred. It was desired that this item may be placed
in the next meeting of the Board with detailed illustration of the Project layout and the Notification issued by the State Government.

[AR 2009‐10] Page 8
5. IMPLEMENTATION OF REVISED PAY SCALE IN THE BOARD: • The item was considered and approved by the Board.
6. PROVISION OF MEDICAL REIMBURSEMENT FACILITY TO THE RETIREES
OF THE BOARD:
• While the Board agreed for the need on adoption of the Government of H.P. pattern for medical reimbursement facility to its retirees it was decided that the matter be referred to the Finance Department for its concurrence through the Administrative Department.
7. RATIFICATION OF INTERIM ORDERS TO CARRY FORWARD THE
UNUTILIZED SURPLUS AMOUNT TO BE UTILIZED FOR THE OBJECTIVE OF THE BOARD IN THE SUCCEEDING YEARS FOR THE ASSESSMENT YEAR 2007-08 AND 2008-09:
• The item was considered and ratified by the Board.
II The decisions taken by the State Board in its 61st meeting dated 20.03.2010
1. DISPOSAL OF APPLICATIONS OF CONSENT TO ESTABLISH AND OPERATE
UNDER THE PROVISIONS OF WATER ACT, 1974 AND AIR ACT, 1981:
• After detailed deliberations, the State Board decided that: i) Applications for Consent to Establish/Consent to Operate may be received and
considered concurrently in all such cases where the industrial units have commenced the construction and installation work on their own on the basis of the permission / registration granted by the Industries Department without applying for/obtaining the prior consent to establish of the State Board. Such applications shall be accompanied by an attested affidavit (on approved format) by the applicant that the construction and installation of the project has been commenced on their own on the basis of registration/ permission granted by the Industries Department and the unit has completed the construction and plant installation including the pollution control devices on the date of application for Consent to Operate or concurrent grant of Consent to Establish and Consent to Operate.
ii) In all such cases where the applicant files an application for Consent to Operate or concurrent grant of Consent to Establish and Consent to Operate as provided under Sr. No. (i) above both the plant and machinery has not been installed as per observations by the field staff of the State Board, the concerned Regional Officer of the State Board shall not accept such applications for concurrent grant of Consent to Establish and Consent to Operate and will send a list of such cases on day to day basis to the concerned General Manager of DIC or Member-Secretary, Local Single Window Mechanism or any other officer designated by Industries Department for Registration/facilitating industrial development, intimating clearly reasons for not accepting such applications.

[AR 2009‐10] Page 9
iii) In all such cases where applications are accepted according to Sr. No. (i) above, the State Board will grant concurrent Consent to Establish and Consent to Operate though the competent officers authorized for this purpose by the State Board only up to 31-03-2010 and thereafter the Consent Mechanism shall be governed by the earlier established procedure for grant of separate Consent to Establish and Consent to Operate.
2. TECHNOLOGICAL INTERVENTIONS AND ENSURING COMPLIANCE UNDER
WATER & AIR ACTS:
• State Board took note of the improvements made due to interventions by the State Board.
3. STATUS OF INCOME TAX CASES:
• The status of each case was considered, discussed in details and action taken in each was approved by the Board.
4. CONSIDERATION OF INCENTIVE TO THE PROFESSIONALS ENGAGED
BY THE STATE BOARD:
• The item was considered and discussed in detail. The Board in principle agreed for grant of incentive for professionals on the approval of Chairperson but as regard quantum it was decided that the issue be addressed to a Sub Committee for examination and its recommendation for approval by the Chairperson of the State Board.
5. TORs FOR COMPREHENSIVE STUDY ON THE IMPACTS OF MOBILE
TELECOM TOWERS ON ENVIRONMENT ETC:
• Terms of Reference for the study with respect to the cellular telephone towers were approved with the condition that w.r.t TORs at Sr.No1, 2, 3 the specialist agency so hired undertakes the desk review of the available literature both in national and international spheres and w.r.t TORs at Sr. No.4, 5, 6 and 7 the specialist agency would conduct a study for Shimla town and make its specific recommendations including ‘Sitting and Sharing Guidelines’ with special reference to hill topography.
*****

[AR 2009‐10] Page 10
CHAPTER –4
ACTIVITIES OF THE STATE BOARD INCLUDING THE VARIOUS FUNCTIONS
4.1 AMBIENT AIR QUALITY MONITORING:
The monitoring of Ambient Air Quality was started in 1986-87 under the National Ambient Air Quality Monitoring Programme (NAMP) with the objective to find the current status of pollution and to study the trends as a result of increasing industrialization. The general objectives of the programme are:
1. To evaluate the general air quality conditions in the cities and to provide the basis for analyzing long term trends of pollution concentrations.
2. To provide the data for subsequent development of air quality standards and pollution prevention and control programme for the cities.
The Respirable Suspended Particulate Matter (RSPM) is monitored with the help of Respirable Dust Sampler on the basis of three days per station per week for 24 hours at 6 Towns/Cities covering 14 nos. of locations in the State. The State Board is about to start 4 nos. of air quality monitoring stations at 8 locations, two each at Dharamshala, Manali, Una & Sundernagar.
TABLE 4.1: NATIONAL AMBIENT AIR QUALITY STANDARDS (NAAQS)
Sr. No.
Pollutant Time Weighted Average
Concentration in Ambient air Industrial, Residential,
Rural and Other Area
Ecologically Sensitive Area
(Notified by Central Govt.)
Method of Measurement
1 Sulphur Dioxide
Annual* 50 µg/m3 20 µg/m3 -Improved West and Gaeke -Ultraviolet fluorescence 24hours** 80 µg/m3 80 µg/m3
2 Nitrogen Dioxide
Annual* 40 µg/m3 30 µg/m3 -Modified Jacob and Hochheiser (Na-Arsenite) -Chemiluminescence 24hours** 80 µg/m3 80 µg/m3
3
Particulate Matter (PM10) (size less than 10 micron)
Annual* 60 µg/m3 60 µg/m3 -Gravimetric -TOEM -Beta attenuation 24hours** 100 µg/m3 100 µg/m3
4
Particulate Matter (PM2.5) (size less than 2.5 micron)
Annual* 40 µg/m3 40 µg/m3 -Gravimetric -TOEM -Beta attenuation 24hours** 60 µg/m3 60 µg/m3
5 Ozone (O3) 8 hours** 100 µg/m3 100 µg/m3 -UV photometric
-Chemiluminescence -Chemical method 1 hour** 180 µg/m3 180 µg/m3
6 Lead (Pb) Annual* 0.50 µg/m3 0.50 µg/m3 -AAS/ICP method after sampling
on EPM 2000 or equivalent filter paper
-ED-XRF using Teflon filter 24hours** 1.0 µg/m3 1.0 µg/m3

[AR 2009‐10] Page 11
7 Carbon Monoxide (CO)
8 hours 2.0 mg/m3 2.0 mg/m3 -Non Dispersive Infra Red (NDIR) Spectroscopy 1 hour 4.0 mg/m3 4.0 mg/m3
8 Ammonia (NH3)
Annual* 100 µg/m3 100 µg/m3 -Chemiluminescence -Indophenol blue method 24hours** 400 µg/m3 400 µg/m3
9 Benzene (C6H6)
Annual* 5.0 µg/m3 5.0 µg/m3
-Gas Chromatography based continuous analyzer -Adsorption and desorption followed By GC analysis
10
Benzo(a) Pyrene (BaP)- Particulate phase only
Annual* 1.0 ng/m3 1.0 ng/m3 -Solvent extraction followed by HPLC/GC analysis
11 Arsenic (As) Annual* 6.0 ng/m3 6.0 ng/m3 -AAS/ICP method after sampling on EPM 2000 or equivalent filter paper
12 Nickel (Ni) Annual* 20.0 ng/m3 20.0 ng/m3 -AAS/ICP method after sampling on EPM 2000 or equivalent filter paper
* Annual arithmetic mean of minimum of 104 measurements in a year at a particular site taken twice a week 24 hourly at uniform intervals. ** 24 hourly or 08 hourly or 01 hourly monitored values, as applicable, shall be compiled with 98% of the time in a year. 2% of the time, they may exceed the limits but not on two consecutive days of monitoring.
4.1.1 AMBIENT AIR QUALITY SHIMLA:
Shimla is an important hill station at an elevation of 2000 meters from Mean Sea level. It has remained summer capital of India during British regime. In 1972 it became the capital of Himachal Pradesh. A large number of tourists visit the city in summer and Dussehra & Diwali holidays.
Ambient air quality is being monitored at 2 locations i.e. Station No 1 at Tekka Bench, Ridge and Station No. 2 at Bus Stand Shimla. Air quality standards fixed for 24 hour average is 100 μg/m3 for RSPM and 80 μg/m3 for SO2 & NOx and annual average standard is 60 μg/m3for RSPM, 50 μg/m3 for SO2 & 40 μg/m3 for NOx. The data collected for the year 2009-10 scrutinized for monthly average and peak values for both these locations and trends of monthly average of SO2,NOx and RSPM are shown below;

[AR 2009‐10] Page 12

[AR 2009‐10] Page 13
CONCLUSION:
Monthly mean average values of SO2 and NOx at both stations were observed well below the permissible limit for 24 hour average. The peak value of SO2 was observed as high as 10.4 μg/m3 and 24.9 μg/m3 for NOx in the month of May & December, 2009 respectively for Station No.1. The peak value of RSPM was observed as 386.0 μg/m3 in the month of December, 2009 at Station No. 1. However, for Station No. 2 the peak value of SO2 was observed as 14.6 μg/m3 and NOx as 37.9 μg/m3 in the month of May and December 2009 respectively. The peak value of RSPM for Station No. 2 was observed as 285.0 μg/m3 in the month of May, 2009. The monthly mean average value ranged between 2.1 μg/m3 to 4.6 μg/m3 for SO2 and 5.3 μg/m3 to 18.0 μg/m3 for NOx for both the Stations. Annual average value for RSPM at Station No. 1 observed as 60.0 μg/m3 which is within the permissible limit of 60 μg/m3 prescribed for industrial, residential, rural and other area where as annual average value of RSPM at Station No. 2 observed as 69.2 μg/m3
which is above the annual average value of 60 μg/m3 prescribed for industrial, residential, rural and other area. In comparison to previous year’s data, increase in the level of RSPM at both the locations is observed. SHIMLA
Table-4.2 Station-1 Tekka Bench (R)
SO2 in μg/ m3 NOX in μg/ m3 RSPM in μg/ m3 Month Monthly
Avg. Peak Monthly
Avg. Peak Monthly
Avg. Peak
April, 09 3.3 8.2 8.7 19.2 78 155
May, 09 2.8 10.4 7.5 15.5 79 165
June, 09 2.2 6.8 7.2 20.1 90 191
July, 09 2.1 6.3 5.3 16.0 49 116
August, 09 2.5 6.8 5.5 11.4 45 100
[AR 2009‐10] Page 14
September, 09 2.5 5.8 6.4 13.3 39 115
October, 09 2.5 6.8 6.6 15.5 48 110
November, 09 2.7 7.8 8.5 16.9 51 133
December 09 2.7 7.1 8.8 24.9 83 386
January, 10 2.6 7.8 6.5 12.8 41 107
February, 10 2.3 5.8 8.5 16.5 50 101
March, 10 2.1 7.3 8.5 19.2 67 114
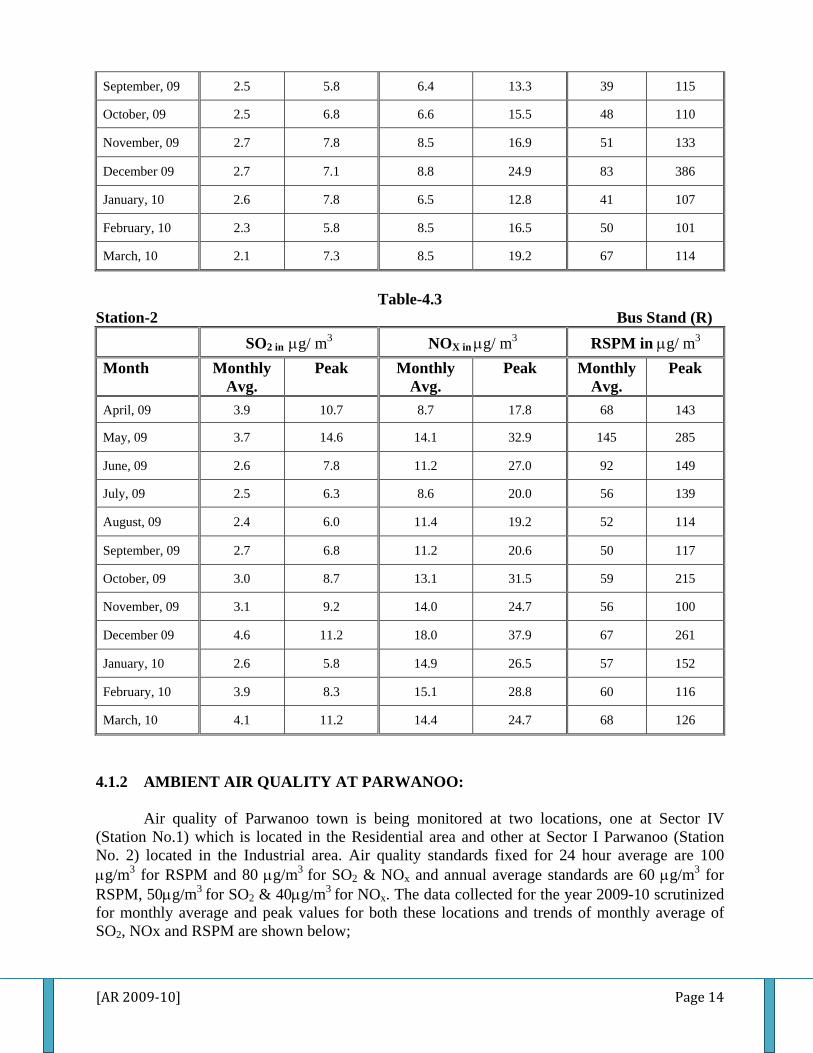
Table-4.3
Station-2 Bus Stand (R) SO2 in μg/ m3 NOX in μg/ m3 RSPM in μg/ m3
Month Monthly Avg.
Peak Monthly Avg.
Peak Monthly Avg.
Peak
April, 09 3.9 10.7 8.7 17.8 68 143
May, 09 3.7 14.6 14.1 32.9 145 285
June, 09 2.6 7.8 11.2 27.0 92 149
July, 09 2.5 6.3 8.6 20.0 56 139
August, 09 2.4 6.0 11.4 19.2 52 114
September, 09 2.7 6.8 11.2 20.6 50 117
October, 09 3.0 8.7 13.1 31.5 59 215
November, 09 3.1 9.2 14.0 24.7 56 100
December 09 4.6 11.2 18.0 37.9 67 261
January, 10 2.6 5.8 14.9 26.5 57 152
February, 10 3.9 8.3 15.1 28.8 60 116
March, 10 4.1 11.2 14.4 24.7 68 126
4.1.2 AMBIENT AIR QUALITY AT PARWANOO:
Air quality of Parwanoo town is being monitored at two locations, one at Sector IV (Station No.1) which is located in the Residential area and other at Sector I Parwanoo (Station No. 2) located in the Industrial area. Air quality standards fixed for 24 hour average are 100 μg/m3 for RSPM and 80 μg/m3 for SO2 & NOx and annual average standards are 60 μg/m3 for RSPM, 50μg/m3 for SO2 & 40μg/m3 for NOx. The data collected for the year 2009-10 scrutinized for monthly average and peak values for both these locations and trends of monthly average of SO2, NOx and RSPM are shown below;

[AR 2009‐10] Page 15
PARWANOO

[AR 2009‐10] Page 16
CONCLUSION:
At Station No. 1 & 2 the monthly mean average values of SO2 & NOx were observed well below the permissible limit for 24 hour average. However, the peak value of SO2 was observed as high as 9.1 μg/m3 respectively at both the stations and peak value for NOx observed as 29.3 μg/m3
at Station No.1 and 33.2 μg/m3 at Station No. 2. The peak value of RSPM was observed as high as 205.0 μg/m3 at Station No. 1 in the month of September, 2009 and 187 μg/m3 at Station No. 2 in the month of May and September, 2009. However, the monthly mean average values for RSPM ranged between 43.0 μg/m3 to 87.0 μg/m3 at Station No. 1 and 69.0 to 113.0 μg/m3 at Station No. 2. Annual average value for RSPM at Station No. 1 observed as 65.1 μg/m3 and annual average value of RSPM at Station No. 2 observed as 92.2 μg/m3 which is above the permissible limit of 60 μg/m3 prescribed for industrial, residential, rural and other area. It can be concluded from the above observations that quality of air at Station No.2 is comparatively poorer than Station No.1. In comparison to previous year’s data, slight increase in the level of RSPM at both the locations is observed.
PARWANOO
Table-4.4 Station –I Sector-IV (R)
SO2 in μg/ m3 NOX in μg/ m3 RSPM in μg/ m3
Month Monthly Avg.
Peak Monthly Avg.
Peak Monthly Avg.
Peak
April, 09 2.0 4.7 8.0 11.7 60 96
May, 09 3.2 6.2 10.6 13.7 78 135
June, 09 5.1 9.1 12.8 21.5 87 198
July, 09 4.1 7.9 11.9 21.1 55 128

[AR 2009‐10] Page 17
August, 09 4.1 6.2 12.2 17.6 43 99
September, 09 2.6 6.2 8.9 28.3 63 205
October, 09 2.8 6.3 12.3 26.1 50 120
November, 09 2.9 6.2 14.0 24.8 59 98
December 09 3.1 7.9 14.7 29.3 72 133
January, 10 3.1 7.4 13.1 25.5 86 159
February, 10 2.5 6.4 11.8 28.2 64 139
March, 10 3.8 8.5 13.2 29.3 65 196
Table-4.5
Station-2 Sector-I (I) SO2 in μg/ m3 NOX in μg/ m3 RSPM in μg/ m3
Month Monthly Avg.
Peak Monthly Avg.
Peak Monthly Avg.
Peak
April, 09 2.0 5.1 9.9 15.6 104 142
May, 09 3.6 8.5 11.8 19.7 90 187
June, 09 5.6 8.5 13.5 18.5 113 175
July, 09 5.5 9.1 13.3 18.5 90 173
August, 09 4.8 7.9 12.8 17.6 69 138
September, 09 3.3 7.9 10.7 30.2 93 187
October, 09 3.0 5.7 12.5 21.5 79 162
November, 09 3.2 6.2 14.7 23.9 87 146
December 09 3.8 8.5 15.4 28.8 90 155
January, 10 3.7 7.9 15.8 30.2 108 177
February, 10 3.0 6.8 17.3 33.2 92 154
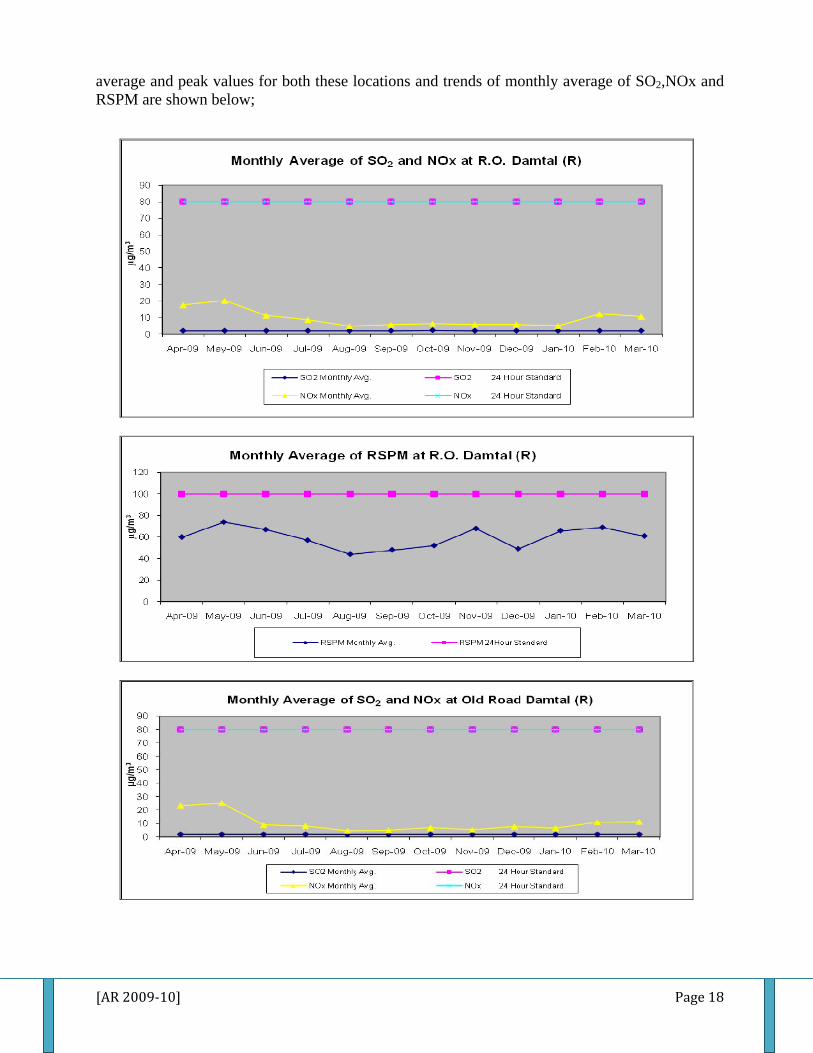
March, 10 3.6 7.9 15.5 29.8 93 174 4.1.3 AMBIENT AIR QUALITY AT DAMTAL:
Air quality of Damtal is being monitored at two different locations, wherein one near PCB Office, Jassur (Station No.1) and other at Old Road Damtal (Station No-2). Both these stations are located in the residential area, however, Station No.2 has large numbers of stone crushers in the vicinity. Air quality standards fixed for 24 hour average are 100 μg/m3 for RSPM and 80 μg/m3
for SO2 & NOx and annual average standards are 60 μg/m3 for RSPM, 50μg/m3 for SO2 & 40μg/m3 for NOx. The data collected for the year 2009-10 has been scrutinized for monthly
[AR 2009‐10] Page 18
average and peak values for both these locations and trends of monthly average of SO2,NOx and RSPM are shown below;

[AR 2009‐10] Page 19
CONCLUSION:
The monthly mean average values for SO2 observed between 2.0μg/ m3 to 2.3μg/ m3 at both the stations whereas monthly mean average values for NOx ranged between 4.8 μg/m3 to 25.2 μg/m3 at both the stations. These values are within the permissible limit prescribed for 24 hour average showing the good quality of air from gaseous point of view. The peak value of RSPM was observed as high as 198 μg/m3 in the month of February, 2010 at Station No. 1. However, the monthly mean average values of RSPM ranged between 44.0 μg/m3 to 74.0 μg/m3
for Station No. 1. The peak value of RSPM was observed as high as 176.0 μg/m3 in the month of June, 2009 at Station No.2. However, monthly mean average values of RSPM ranged between 46.0 μg/m3 to 105 μg/m3. It can be concluded from the above observations that quality of air at Station No.2 is comparatively poorer than Station No.1 with respect to values of RSPM observed. Annual average values for RSPM at Station No. 1 & 2 were observed as 59.6 μg/m3 & 73.5 μg/m3. The annual average value of RSPM at Station No 2 is above the permissible limit of 60 μg/m3 prescribed for industrial, residential, rural and other area.
DAMTAL Table-4.6
Station-1 Regional Office, Damtal SO2 in μg/ m3 NOX in μg/ m3 RSPM in μg/ m3
Month Monthly Avg.
Peak Monthly Avg.
Peak Monthly Avg.
Peak
April, 09 2.0 2.0 17.6 24.2 60 166
May, 09 2.0 2.0 20.2 28.1 74 126
June, 09 2.0 2.0 11.3 32.7 67 194
July, 09 2.0 2.0 8.7 15.4 57 169
August, 09 2.0 2.0 4.8 12.5 44 135
September, 09 2.0 2.0 5.7 12.8 48 146

[AR 2009‐10] Page 20
October, 09 2.3 7.9 6.4 61.2 52 159
November, 09 2.0 2.0 5.7 12.4 68 195
December 09 2.0 2.0 5.9 13.1 49 148
January, 10 2.0 2.0 5.0 10.9 66 188 February, 10 2.0 2.0 12.2 27.6 69 198
March, 10 2.0 2.0 10.7 21.9 61 179
Table-4.7 Station-2 Old Road, Damtal
SO2 in μg/ m3 NOX in μg/ m3 RSPM in μg/ m3
Month Monthly Avg.
Peak Monthly Avg.
Peak Monthly Avg.
Peak
April, 09 2.0 2.0 23.3 34.5 89 149
May, 09 2.0 2.0 25.2 41.9 105 170
June, 09 2.0 2.0 9.0 17.9 87 176
July, 09 2.0 2.0 8.3 12.6 65 100
August, 09 2.0 2.0 4.6 10.1 46 103
September, 09 2.0 2.0 4.9 10.6 56 145
October, 09 2.0 2.0 6.9 13.2 71 163
November, 09 2.0 2.0 5.3 11.2 78 136
December 09 2.0 2.0 7.8 14.8 62 122
January, 10 2.0 2.0 6.6 14.2 79 128
February, 10 2.0 2.0 10.9 21.8 65 132
March, 10 2.0 2.0 11.4 28.2 79 131
4.1.4 AMBIENT AIR QUALITY AT PAONTA SAHIB:
Ambient air quality of Paonta Sahib is being monitored at two different locations, one at Paonta Sahib town (Station No.1) located in residential area and other at industrial area Gondpur (Station No. 2). Air quality standards fixed for 24 hour average are 100 μg/m3 for RSPM and 80 μg/m3 for SO2 & NOx and annual average standards are 60 μg/m3 for RSPM, 50μg/m3 for SO2 & 40μg/m3 for NOx. The data collected for the year 2009-10 has been scrutinized for monthly average and peak values for both these locations and trends of monthly average of SO2,NOx and RSPM are shown below;

[AR 2009‐10] Page 21

[AR 2009‐10] Page 22
CONCLUSION:
All the values of SO2 and NOx remained below the permissible limit prescribed for 24 hour average of 80 μg/m3 at Station No.1 and Station No. 2. However, the peak value of SO2 were observed as 4.1μg/m3 and 5.6 μg/m3 respectively at Station 1 & 2 and peak values for NOx observed as 22.4 μg/m3 at Station No.1 and 24.0 μg/m3 at Station No.2. The peak value of RSPM was observed as high as 208.0 μg/m3 in the month of June, 2009 at Station No. 1, however the monthly average values of RSPM ranged between 57.0 μg/m3 to 129.0 μg/m3. At station No.2, the peak value of RSPM was observed as high as 411.0 μg/m3 in the month of December, 09, however monthly mean average values of RSPM ranged between 77.0 μg/m3 to 172.0 μg/m3. Annual average values for RSPM at Station No. 1 & 2 were observed as 94.5 μg/m3 & 142.7 μg/m3 respectively which are above the annual permissible limit of 60 μg/m3 prescribed for industrial, residential, rural and other area. In comparison to previous year’s data, there is an increase in the level of RSPM at Station No.1, however, decrease in the level of RSPM at Station No.2 is observed.
PAONTA SAHIB
Table-4.8 Station-1 Paonta Sahib (R)
SO2 in μg/ m3 NOX in μg/ m3 RSPM in μg/ m3 Month Monthly
Avg. Peak Monthly
Avg. Peak Monthly
Avg. Peak
April, 09 2.0 3.1 15.1 18.1 103 159 May, 09 2.0 3.1 14.8 17.7 96 157
June, 09 2.0 3.6 15.5 19.9 105 208
July, 09 2.0 3.1 13.6 17.7 68 127
August, 09 2.0 3.3 15.3 22.4 57 169
September, 09 2.0 3.1 13.9 16.3 60 107

[AR 2009‐10] Page 23
October, 09 2.0 3.1 14.7 21.3 72 152
November, 09 2.0 3.1 14.9 19.9 105 173
December 09 2.0 3.1 15.0 19.4 108 178
January, 10 2.0 3.6 15.6 20.6 110 167
February, 10 2.0 3.6 14.8 18.2 121 177
March, 10 2.0 4.1 15.5 19.0 129 201
Table- 4.9
Station-2 Gondpur (I) SO2 in μg/ m3 NOX in μg/ m3 RSPM in μg/ m3
Month Monthly Avg.
Peak Monthly Avg.
Peak Monthly Avg.
Peak
April, 09 3.0 5.6 18.6 24.0 159 281
May, 09 2.8 5.1 18.7 22.7 145 285
June, 09 2.9 5.1 18.9 23.2 166 367
July, 09 2.4 4.6 17.6 22.3 139 268 August, 09 2.2 4.1 17.7 22.3 77 215
September, 09 2.4 3.6 17.4 21.1 106 181
October, 09 2.5 4.1 17.2 20.6 147 208 November, 09 2.8 4.6 17.1 20.4 162 253
December 09 2.8 4.6 17.7 21.7 172 411
January, 10 2.9 4.6 17.6 21.7 164 269
February, 10 3.2 5.1 16.8 21.7 114 166
March, 10 2.7 5.1 17.6 22.4 161 358
4.1.5 AMBIENT AIR QUALITY AT KALA AMB:
Ambient air quality of Kala Amb is being monitored at two different locations, one at IADA, Kala Amb (Station No.1) located in Industrial area and other at Trilokpur (Station No.2) located in Residential area. Air quality standards fixed for 24 hour average are 100 μg/m3 for RSPM and 80 μg/m3 for SO2 & NOx and annual average standards are 60 μg/m3 for RSPM, 50μg/m3 for SO2 & 40μg/m3 for NOx. The data collected for the year 2009-10 has been scrutinized for monthly average and peak values for both these locations and trends of monthly average of SO2,NOx and RSPM are shown below;

[AR 2009‐10] Page 24
[AR 2009‐10] Page 25
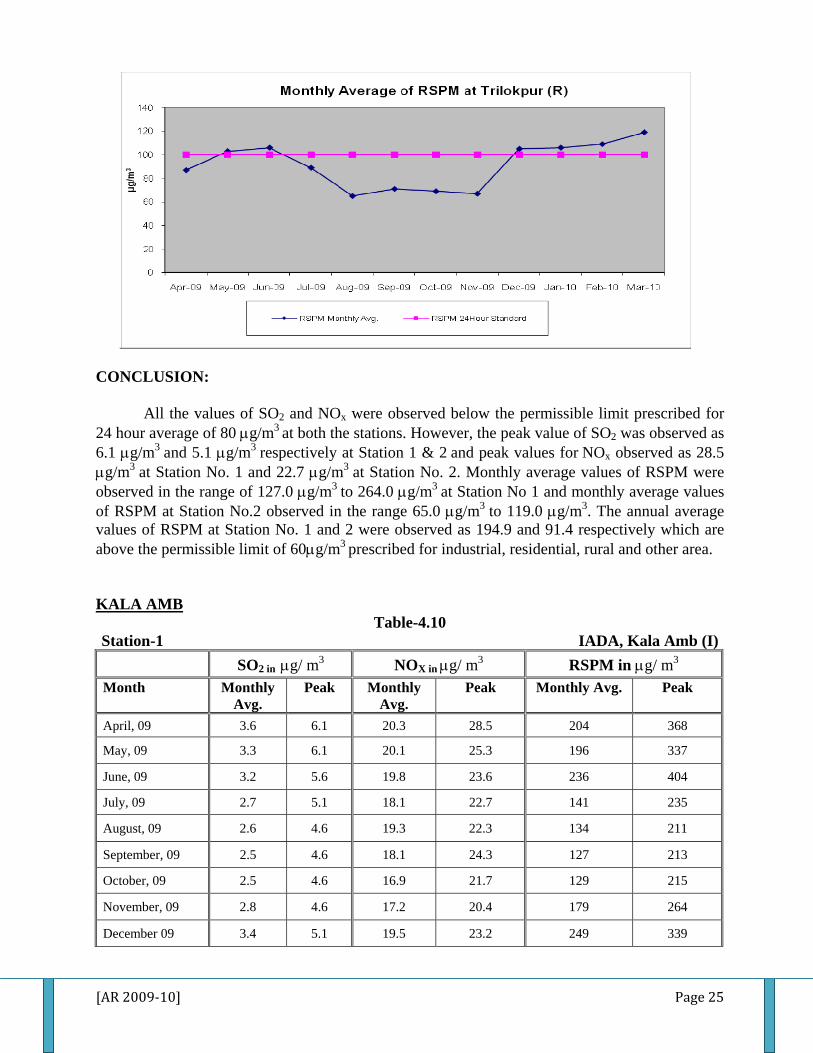
CONCLUSION:
All the values of SO2 and NOx were observed below the permissible limit prescribed for 24 hour average of 80 μg/m3 at both the stations. However, the peak value of SO2 was observed as 6.1 μg/m3 and 5.1 μg/m3 respectively at Station 1 & 2 and peak values for NOx observed as 28.5 μg/m3 at Station No. 1 and 22.7 μg/m3 at Station No. 2. Monthly average values of RSPM were observed in the range of 127.0 μg/m3 to 264.0 μg/m3 at Station No 1 and monthly average values of RSPM at Station No.2 observed in the range 65.0 μg/m3 to 119.0 μg/m3. The annual average values of RSPM at Station No. 1 and 2 were observed as 194.9 and 91.4 respectively which are above the permissible limit of 60μg/m3 prescribed for industrial, residential, rural and other area.
KALA AMB Table-4.10
Station-1 IADA, Kala Amb (I) SO2 in μg/ m3 NOX in μg/ m3 RSPM in μg/ m3
Month Monthly Avg.
Peak Monthly Avg.
Peak Monthly Avg. Peak
April, 09 3.6 6.1 20.3 28.5 204 368
May, 09 3.3 6.1 20.1 25.3 196 337
June, 09 3.2 5.6 19.8 23.6 236 404
July, 09 2.7 5.1 18.1 22.7 141 235
August, 09 2.6 4.6 19.3 22.3 134 211
September, 09 2.5 4.6 18.1 24.3 127 213
October, 09 2.5 4.6 16.9 21.7 129 215
November, 09 2.8 4.6 17.2 20.4 179 264
December 09 3.4 5.1 19.5 23.2 249 339

[AR 2009‐10] Page 26
January, 10 3.1 5.1 17.6 21.3 226 303
February, 10 3.6 6.1 18.2 23.6 254 343
March, 10 3.7 6.1 20.3 24.9 264 398
Table- 4.11
Station-2 Trilokpur (R) SO2 in μg/ m3 NOX in μg/ m3 RSPM in μg/ m3
Month Monthly Avg.
Peak Monthly Avg.
Peak Monthly Avg. Peak
April, 09 2.0 5.1 15.1 22.3 87 165
May, 09 2.0 4.6 15.0 22.7 103 176
June, 09 2.0 3.1 15.0 18.1 106 162
July, 09 2.0 3.1 14.7 18.1 89 140
August, 09 2.0 4.5 14.3 17.7 65 131
September, 09 2.0 3.1 14.9 19.5 71 119
October, 09 2.0 3.1 14.0 19.0 69 129
November, 09 2.0 3.1 13.6 18.2 67 131
December 09 2.0 3.1 14.6 19.4 105 165
January, 10 2.0 3.6 14.5 17.7 106 200
February, 10 2.0 3.1 14.1 18.1 109 149
March, 10 2.0 4.1 14.6 19.4 119 204
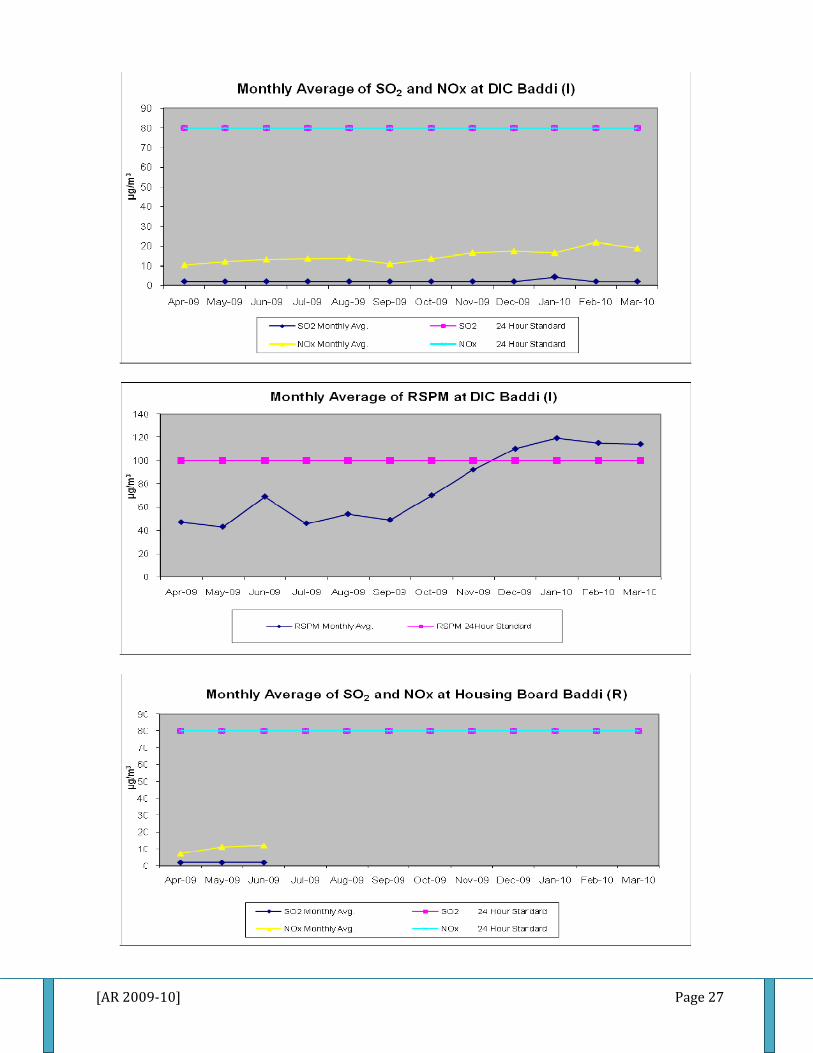
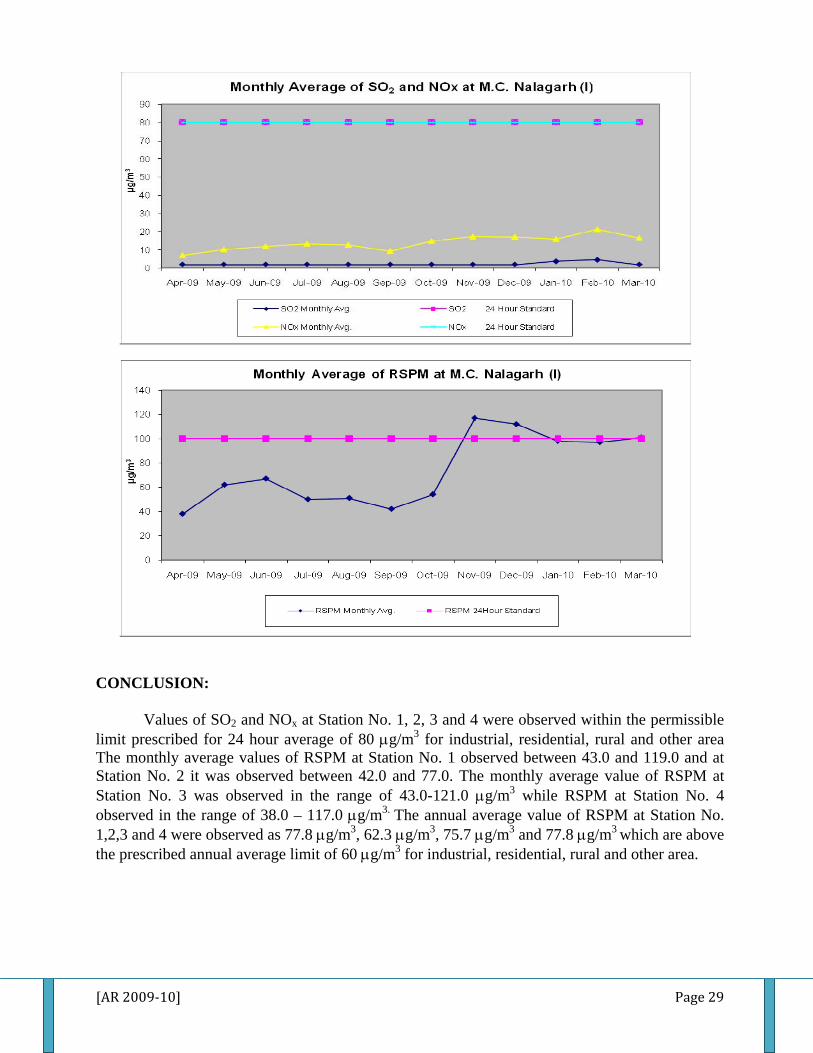
4.1.6 AMBIENT AIR QUALITY AT BADDI, BAROTIWALA AND NALAGARH:
Ambient air quality of Baddi, Barotiwala and Nalagarh is being monitored at 4 locations. Station No. 1 is located in Industrial area above office building of Industry Department Baddi, Station No. 2 is located in Residential area above Housing Board building at Baddi and Station No. 3 & 4 at A.H.C. Barotiwala and M.C. Nalagarh respectively which are located in Industrial area. Air quality standards fixed for 24 hour average are 100 μg/m3 for RSPM and 80 μg/m3 for SO2 & NOx and annual average standards are 60 μg/m3 for RSPM, 50μg/m3 for SO2 & 40μg/m3
for NOx. The data collected for the year 2009-10 has been scrutinized for monthly average and peak values for these locations and trends of monthly average of SO2, NOx and RSPM are shown below;
[AR 2009‐10] Page 27

[AR 2009‐10] Page 28
[AR 2009‐10] Page 29
CONCLUSION:
Values of SO2 and NOx at Station No. 1, 2, 3 and 4 were observed within the permissible limit prescribed for 24 hour average of 80 μg/m3 for industrial, residential, rural and other area The monthly average values of RSPM at Station No. 1 observed between 43.0 and 119.0 and at Station No. 2 it was observed between 42.0 and 77.0. The monthly average value of RSPM at Station No. 3 was observed in the range of 43.0-121.0 μg/m3 while RSPM at Station No. 4 observed in the range of 38.0 – 117.0 μg/m3. The annual average value of RSPM at Station No. 1,2,3 and 4 were observed as 77.8 μg/m3, 62.3 μg/m3, 75.7 μg/m3 and 77.8 μg/m3 which are above the prescribed annual average limit of 60 μg/m3 for industrial, residential, rural and other area.

[AR 2009‐10] Page 30
BADDI, BAROTIWALA AND NALAGARH
Table-4.12 Station-1 DIC Baddi (I)
SO2 in μg/ m3 NOX in μg/ m3 RSPM in μg/ m3
Month Monthly Avg.
Peak Monthly Avg.
Peak Monthly Avg.
Peak
April, 09 2.0 6.2 10.3 15.1 47 193
May, 09 2.0 8.5 12.0 17.1 43 81
June, 09 2.0 9.6 14.1 20.5 75 155
July, 09 2.0 9.1 13.7 19.5 46 89
August, 09 2.0 9.1 13.8 23.4 54 135
September, 09 2.0 6.8 10.9 21.5 49 176
October, 09 2.0 9.7 13.7 25.4 70 141
November, 09 2.0 7.9 16.7 29.8 92 149
December 09 2.0 9.1 17.4 31.2 110 182
January, 10 4.3 8.5 16.6 33.7 119 229
February, 10 2.0 9.1 22.0 41.5 115 171
March, 10 2.0 9.1 18.9 39.0 114 238
Table-4.13
Station-II Housing Board Baddi (R) SO2 in μg/ m3 NOX in μg/ m3 RSPM in μg/ m3
Month Monthly Avg.
Peak Monthly Avg.
Peak Monthly Avg.
Peak
April, 09 2.0 4.5 7.3 12.7 42 97 May, 09 2.0 7.9 11.2 15.6 68 214 June, 09 2.0 7.9 12.1 15.6 77 222 July, 09 - - - - - - August, 09 - - - - - - September, 09 - - - - - - October, 09 - - - - - - November, 09 - - - - - - December 09 - - - - - - January, 10 - - - - - - February, 10 - - - - - - March, 10 - - - - - -

[AR 2009‐10] Page 31
Table-4.14 Station-III A.H.C. Barotiwala (I)
SO2 in μg/ m3 NOX in μg/ m3 RSPM in μg/ m3 Month Monthly
Avg. Peak Monthly
Avg. Peak Monthly
Avg. Peak
April, 09 2.0 5.1 9.1 12.7 72 145
May, 09 2.0 5.7 10.9 14.1 43 68
June, 09 2.0 9.1 12.3 16.6 65 134
July, 09 2.0 8.5 12.9 17.6 50 83
August, 09 2.0 6.8 11.9 15.1 44 96
September, 09 2.0 6.2 9.3 15.6 55 137
October, 09 2.0 6.8 15.0 27.3 60 158
November, 09 2.0 8.5 18.9 28.8 102 190
December 09 2.0 8.5 18.5 30.7 108 256
January, 10 4.0 7.4 15.6 29.3 121 256
February, 10 2.0 9.1 19.2 41.5 93 158
March, 10 2.0 6.8 17.3 34.1 96 189
Table-4.15
Station-I M.C. Nalagarh (I) SO2 in μg/ m3 NOX in μg/ m3 RSPM in μg/ m3
Month Monthly Avg.
Peak Monthly Avg.
Peak Monthly Avg.
Peak
April, 09 2.0 5.1 7.1 12.2 38 106
May, 09 2.0 5.1 10.2 14.1 62 117
June, 09 2.0 7.9 11.9 15.6 67 160
July, 09 2.0 10.2 13.3 27.8 50 121
August, 09 2.0 6.8 12.7 16.6 95 125
September, 09 2.0 6.2 9.4 19.0 42 83
October, 09 2.0 7.9 14.9 34.1 54 95
November, 09 2.0 8.5 17.3 29.3 117 187
December 09 2.0 7.9 17.2 30.2 112 219
January, 10 3.8 9.63 15.9 29.3 98 238
February, 10 4.6 9.06 21.4 43.9 97 256
March, 10 2.0 8.5 16.5 40.0 101 220

[AR 2009‐10] Page 32
Recommendations: • Action is required for controlling the stack emission from induction furnace, brick kiln, stone
crushers etc. • Condition of roads is required to be improved. • Regular vehicular monitoring is required to be conducted. • Open burning of waste/papers/ MSW etc. to be discouraged • Forest fire is required to be prevented. • Construction activities like Road, Bridge, Building, Project etc. should be carried out in
planned manner and debris is required to be managed properly. • Regular air quality monitoring/ stack emission of industries is required to be carried out. • Air polluting industries should not be allowed to be set up in future at Baddi industrial area,
Parwanoo industrial area, Kala Amb industrial area and Gondpur industrial area (Paonta Sahib).
4.1.7 VEHICULAR MONITORING IN HIMACHAL PRADESH:
The State Board is carrying out vehicular monitoring camps in the State. A total number of 1882 vehicles were monitored/ checked during the year 2009-10. Out of which 231 vehicles were challaned/warned for non-compliance to the emission norms. Therefore, in order to implement the provisions of law, effective and efficient measures are required for vehicular pollution control in the State.
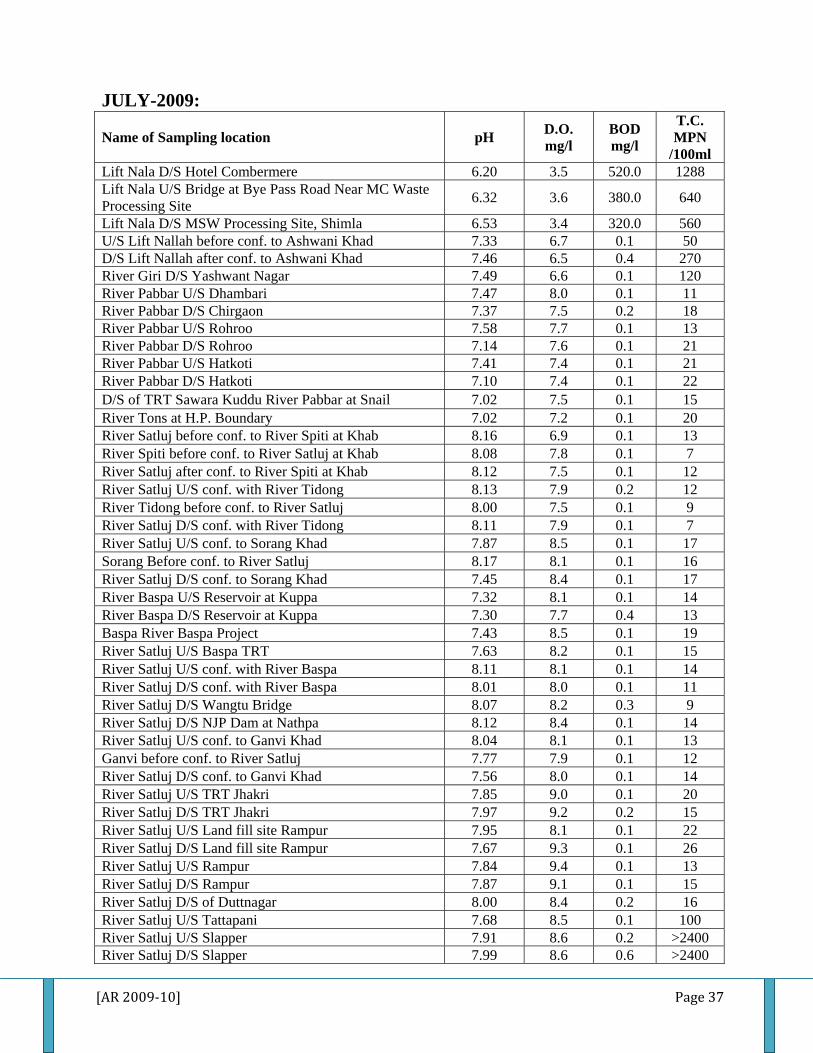
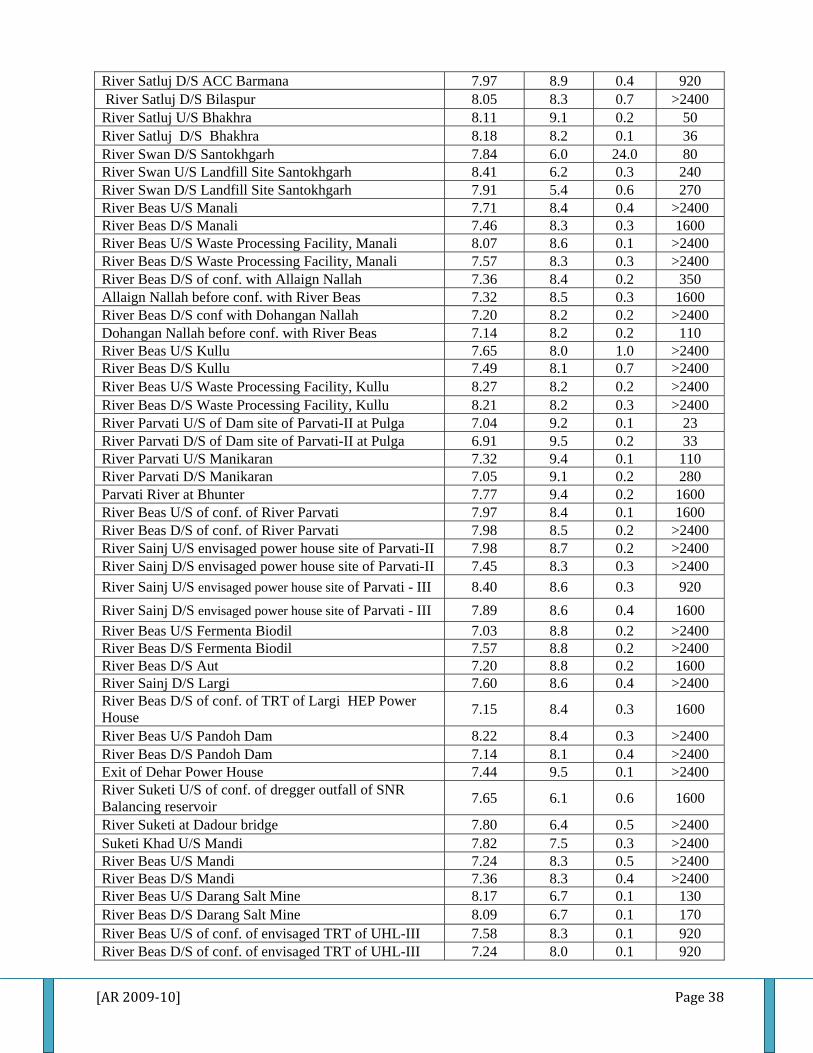
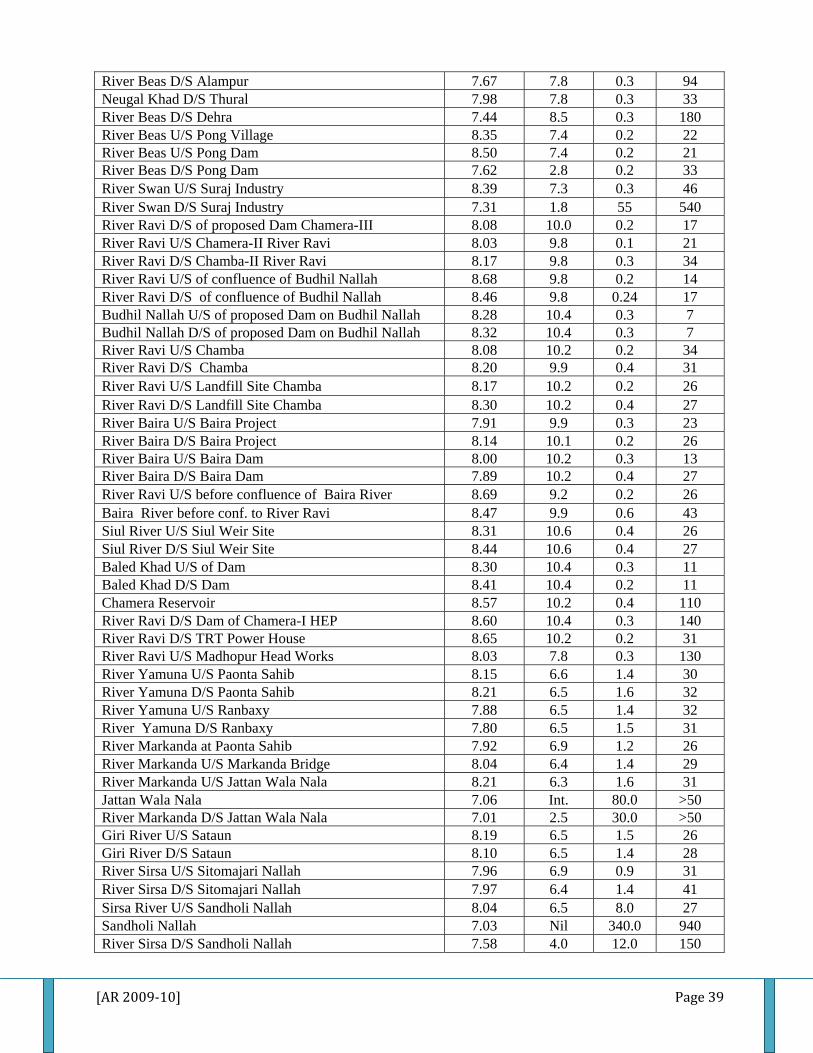
4.2 STATUS OF RIVER WATER QUALITY:
Assessment of the status of water quality of the natural water bodies is one of the most important activities of the Pollution Control Board. Water quality data not only help to ascertain the nature and extent of the requirement for pollution control measures but also indicates its impact on water quality. The Central Pollution Control Board under the National Programme: MONITORING OF NATIONAL AQUATIC RESOURCES (MINARS) is sponsoring the water quality monitoring of major rivers of the State. The monitoring has been carried out in the month of April, July, October and January every year. In all 219 points have been selected on major rivers Satluj, Beas, Ravi, Yamuna, Parvati, Sirsa, Markanda & Sukhna and their tributaries in the State. These 219 points include 104 points under MINARS project including 39 points in major industrial towns for the monitoring of ground water, 115 points of State monitoring includes 50 points on Hydel projects.
h The Samples are being analyzed for physico-chemical and bacteriological contents. The
results are shown below;
TABLE 4.16: PRIMARY WATER QUALITY CRITERIA Designated Best Use Class of
Water Criteria
Drinking water source without conventional treatment but after disinfection.
A 1. Total Coliform organism MPN/100ml. shall be 50 or less. 2. pH between 6.5 and 8.5. 3. Dissolved Oxygen 6 mg/l or more. 4. Biochemical Oxygen Demand 5 days 20oC 2 mg/l or less.

[AR 2009‐10] Page 33
Outdoor bathing (Organized)
B 1. Total Coliform organism MPN/100ml.shall be 500 or less. 2. pH between 6.5 and 8.5. 3. Dissolved Oxygen 5 mg/l or more. 4. Biochemical Oxygen Demand 5 days 20oC 3 mg/l or less.
Drinking Water Source after conventional treatment and disinfection
C 1. Total Coliform organism MPN/100ml.shall be 5000 or less. 2. pH between 6 and 9. 3. Dissolved Oxygen 4 mg/l or more. 4. Biochemical Oxygen Demand 5 days 20oC 3 mg/l or less.
Propagation of Wild Life & Fisheries
D 1. pH between 6.5 and 8.5. 2. Dissolved Oxygen 4 mg/l or more. 3. Free Ammonia (as N) 1.2 mg/l or less.
Irrigation, Industrial Cooling Controlled Waste Disposal
E 1. pH between 6.5 and 8.5. 2. Electrical Conductivity at 250C micro mhos /cm max. 2250. 3. Sodium absorption ratio Max. 26. 4. Boron Max 2 mg/l.
• If three parameters falls in category ‘A’ but fourth parameter falls in category C. The overall quality of river will fall under Class ‘C’.
Following conclusion were drawn from the above studies: In case of major rivers on the basis of Primary Water Quality Criteria, it can be concluded that quality of rivers fall under ‘A’ category of water with respect to pH, DO and BOD in general. The critical parameters observed is Total Coliform according to which category of river comes down to either category ‘B’ if the Total Coliform are more than 50 MPN/ 100 ml or category ‘C’ if the Total Coliform are more than 500 MPN/100ml. TABLE: 4.17 WATER QUALITY OF MAJOR RIVERS IN HIMACHAL PRADESH MONITORED UNDER MINARS AND STATE WATER QUALITY MONITORING PROGRAMME DURING 2009-10 April-2009:
Name of Sampling location pH D.O. mg/l BOD mg/l
T.C. MPN
/100ml Lift Nallah D/S Hotel Combermere Shimla 7.78 6.5 0.9 200 Lift Nallah U/S Bridge at Bye Pass Road Near MC Waste Processing Site 7.86 6.3 14.0 801
Lift Nala D/S MSW Processing Site Shimla 7.80 6.1 9.5 511 D/S Lift Nallah before conf. to Ashwani Khad 7.04 7.1 17.0 304 U/S Lift Nallah before conf. to Ashwani Khad 7.67 7.9 2.4 62 D/S Yashwant Nagar 7.82 7.3 0.8 171 River Pabbar U/S Dhambari 8.05 10.0 0.1 9 River Pabbar D/S Chirgaon 7.70 9.8 0.2 6 River Pabbar U/S Rohroo 8.23 9.6 0.8 8 River Pabbar D/S Rohroo 8.21 9.5 0.7 9 River Pabbar U/S Hatkoti 8.08 8.9 0.1 11 River Pabbar D/S Hatkoti 8.07 7.8 0.4 12 River Pabbar D/S of TRT of Sawara Kuddu 8.06 8.8 0.2 14 River Tons at H.P. Boundary 8.26 8.8 0.2 18 River Satluj Before conf. to River Spiti at Khab 7.97 8.0 0.1 5 River Spiti before conf. to River Satluj at Khab 7.87 7.9 0.1 11

[AR 2009‐10] Page 34
River Satluj after conf. to River Spiti at Khab 8.22 7.7 0.1 13 River Satluj U/S conf. of River Tidong 8.25 8.1 0.1 10 River Tidong before conf. to River Satluj 7.98 8.1 0.2 11 River Satluj D/S conf. of River Tidong 7.89 8.2 0.1 12 River Satluj U/S conf. with Sorang Khad 7.93 7.8 0.1 10 River Sorang Before conf. to River Satluj 7.92 8.9 0.2 4 River Satluj D/S conf. with Sorang Khad 8.02 8.1 0.3 8 Baspa River U/S Reservoir at Kuppa 8.09 8.3 0.1 11 Baspa River D/S Reservoir at Kuppa 8.01 8.2 0.2 10 Baspa Project Baspa Reservoir 7.88 8.2 0.2 12 River Satluj U/S Baspa TRT 8.30 8.0 0.2 14 River Satluj U/S conf. of River Baspa 8.20 8.7 0.1 12 River Satluj D/S conf. of River Baspa 8.19 8.5 0.1 10 River Satluj D/S Wangtu Bridge 8.24 8.2 0.1 7 River Satluj D/S NJPC Dam Nathpa 7.71 9.5 0.2 12 River Satluj U/S conf. with Ganvi Khad 7.83 8.5 0.1 8 Ganvi Khad Before conf. to River Satluj 7.66 7.9 0.1 10 River Satluj D/S conf. with Ganvi Khad 7.42 8.4 0.1 6 River Satluj U/S TRT of NJP at Jhakri 7.94 8.9 0.1 6 River Satluj D/S TRT of NJP at Jhakri 7.88 8.6 0.2 6 River Satluj D/S Landfill Site Rampur 7.64 8.0 0.4 16 River Satluj U/S Landfill Site Rampur 7.88 8.5 0.2 8 River Satluj U/S Rampur 7.73 8.2 0.1 11 River Satluj D/S Rampur 8.42 8.5 0.5 13 River Satluj D/S Dutt Nagar 7.91 8.3 0.3 10 River Satluj U/S Tattapani 8.18 9.2 0.5 22 River Satluj U/S Slapper 7.94 11.4 0.8 110 River Satluj D/S Slapper 7.26 11.0 0.9 280 River Satluj D/S ACC Barmana 7.80 10.2 0.7 920 River Satluj D/S Bilaspur 7.88 10.0 1.1 >2400 River Satluj U/S Bhakhra 8.32 8.8 0.2 18 River Satluj D/S Bhakhra 8.29 9.5 0.1 42 River Swan D/S Santokhgarh 8.27 8.6 0.5 32 River Swan U/S Landfill Site at Santokhgarh 7.45 8.4 0.8 92 River Swan D/S Landfill Site at Santokhgarh 7.56 8.9 1.2 102 River Beas U/S Manali 7.29 10.0 1.2 >2400 River Beas D/S Manali 7.33 9.0 0.9 >2400 River Beas U/S Waste Processing Facility, Manali 7.98 8.2 0.3 >2400 River Beas D/S Waste Processing Facility, Manali 7.69 8.0 0.4 >2400 River Beas D/S of confluence with Allaign Nallah 7.58 8.3 0.3 1600 Allaign Nallah before confluence with River Beas 7.50 9.0 1.0 >2400 River Beas D/S confluence with Dohangan Nallah 7.29 8.5 0.2 1600 Dohangan Nallah before confluence with River Beas 7.24 9.0 0.1 920 River Beas U/S Kullu 7.39 10.4 0.5 >2400 River Beas D/S Kullu 7.44 10.0 0.6 >2400 River Beas U/S Waste Processing Facility, Kullu 7.53 9.8 0.2 >2400 River Beas D/S Waste Processing Facility, Kullu 7.47 9.8 0.2 >2400 River Parvati U/S of Dam site of Parvati-II at Pulga 8.39 10.4 0.1 23 River Parvati D/S of Dam site of Parvati-II at Pulga 7.30 9.6 0.1 79 River Parvati U/S Manikaran 7.35 10.6 0.4 1600

[AR 2009‐10] Page 35
River Parvati D/S Manikaran 7.18 10.0 0.4 >2400 Parvati River at Bhunter 7.42 9.4 0.2 540 River Beas U/S of confluence of River Parvati 7.83 10.0 0.3 920 River Beas D/S of confluence of River Parvati 8.00 9.8 0.4 1600 River Beas U/S envisaged Power House site of Parvati-II 7.42 9.8 0.1 920 River Sainj D/S envisaged Power House site of Parvati-II 7.37 10.0 0.1 920 River Sainj U/S envisaged Power House site of Parvati - III 7.51 9.4 0.2 1600 River Sainj D/S envisaged Power House site of Parvati - III 7.49 9.4 0.3 >2400 River Beas U/S Fermenta Biodil 7.33 9.2 0.4 1600 River Beas D/S Fermenta Biodil. 7.97 9.2 0.6 >2400 River Beas D/S Aut 7.15 9.2 0.4 920 River Sainj D/S Largi 6.91 7.0 0.5 >2400 River Beas D/S conf. of TRT of Largi HEP Power House 7.69 10.0 0.6 >2400
River Beas U/S Pandoh Dam 7.89 9.0 1.0 >2400 River Beas D/S Pandoh Dam 7.31 9.0 0.2 >2400 Exit of Dehar Power House 7.85 11.8 1.1 1600 River Suketi U/S of conf. of dregger outfall of SNR Balancing reservoir 7.80 8.4 0.2 110
River Suketi at Dadour bridge 7.81 7.0 0.5 >2400 Suketi Khad U/S Mandi 7.92 9.6 0.3 1600 River Beas U/S Mandi 7.81 10.6 0.3 350 River Beas D/S Mandi 7.40 10.6 0.5 >2400 Nallah U/S Darang Salt Mine 8.22 8.5 0.1 33 Nallah D/S Darang Salt Mine 8.49 8.0 0.1 23 River Beas U/S of conf. of envisaged TRT of UHL-III 7.96 11.8 0.1 540 River Beas D/S of conf. of envisaged TRT of UHL-III 8.07 11.7 0.2 920 River Beas D/S Alampur 7.96 8.8 0.2 17 Neugal Khad D/S Thural 8.14 8.0 0.1 33 River Beas D/S Dehra 7.63 8.0 0.2 27 River Beas U/S Pong Village 7.77 9.1 0.4 22 River Beas U/S Pong Dam 8.69 9.2 0.1 26 River Beas D/S Pong Dam 8.34 6.4 0.1 21 Swan Khad U/S Suraj Industry Source Dry Swan Khad D/S Suraj Industry 6.43 1.9 410.0 >2400 River Ravi D/S Dam of proposed Dam of Chamera-III 7.97 9.3 0.1 9 River Ravi U/S Dam Chamera-II HEP 8.01 9.3 0.1 14 River Ravi D/S Dam Chamera-II HEP 7.98 7.8 0.1 17 River Ravi U/S of conf. of Budhil Nallah 8.08 9.4 0.2 9 Budhil Nallah U/S of Dam of proposed Budhil HEP 8.08 9.4 0.2 9 Budhil Nallah D/S of Dam of proposed Budhil HEP 8.06 9.4 0.1 7 River Ravi U/S Chamba 7.92 9.8 0.1 7 River Ravi D/S Chamba 7.99 9.1 0.1 8 River Ravi U/S Landfill Site Chamba 7.70 9.4 0.1 9 River Ravi D/S Landfill Site Chamba 7.90 8.8 0.1 7 River Ravi U/S of conf. with Baira River 8.12 9.3 0.2 26 Baira River U/S Dam on Baira HEP 7.80 9.3 0.1 4 Baira River D/S Dam on Baira HEP 7.93 7.8 0.1 6 Baira River U/S of conf of TRT of Power House of Baira Siul HEP 8.16 9.0 0.1 9 Baira River D/S of conf of TRT of Power House of Baira Siul HEP 8.05 9.3 0.1 7
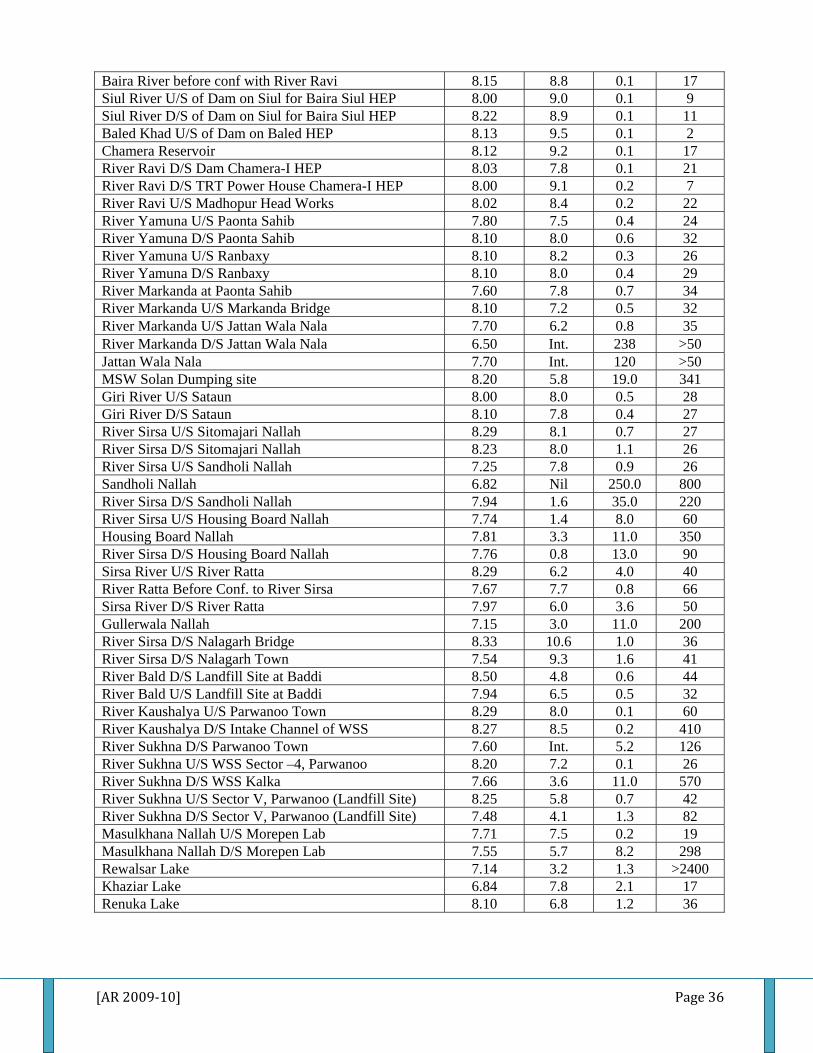
[AR 2009‐10] Page 36
Baira River before conf with River Ravi 8.15 8.8 0.1 17 Siul River U/S of Dam on Siul for Baira Siul HEP 8.00 9.0 0.1 9 Siul River D/S of Dam on Siul for Baira Siul HEP 8.22 8.9 0.1 11 Baled Khad U/S of Dam on Baled HEP 8.13 9.5 0.1 2 Chamera Reservoir 8.12 9.2 0.1 17 River Ravi D/S Dam Chamera-I HEP 8.03 7.8 0.1 21 River Ravi D/S TRT Power House Chamera-I HEP 8.00 9.1 0.2 7 River Ravi U/S Madhopur Head Works 8.02 8.4 0.2 22 River Yamuna U/S Paonta Sahib 7.80 7.5 0.4 24 River Yamuna D/S Paonta Sahib 8.10 8.0 0.6 32 River Yamuna U/S Ranbaxy 8.10 8.2 0.3 26 River Yamuna D/S Ranbaxy 8.10 8.0 0.4 29 River Markanda at Paonta Sahib 7.60 7.8 0.7 34 River Markanda U/S Markanda Bridge 8.10 7.2 0.5 32 River Markanda U/S Jattan Wala Nala 7.70 6.2 0.8 35 River Markanda D/S Jattan Wala Nala 6.50 Int. 238 >50 Jattan Wala Nala 7.70 Int. 120 >50 MSW Solan Dumping site 8.20 5.8 19.0 341 Giri River U/S Sataun 8.00 8.0 0.5 28 Giri River D/S Sataun 8.10 7.8 0.4 27 River Sirsa U/S Sitomajari Nallah 8.29 8.1 0.7 27 River Sirsa D/S Sitomajari Nallah 8.23 8.0 1.1 26 River Sirsa U/S Sandholi Nallah 7.25 7.8 0.9 26 Sandholi Nallah 6.82 Nil 250.0 800 River Sirsa D/S Sandholi Nallah 7.94 1.6 35.0 220 River Sirsa U/S Housing Board Nallah 7.74 1.4 8.0 60 Housing Board Nallah 7.81 3.3 11.0 350 River Sirsa D/S Housing Board Nallah 7.76 0.8 13.0 90 Sirsa River U/S River Ratta 8.29 6.2 4.0 40 River Ratta Before Conf. to River Sirsa 7.67 7.7 0.8 66 Sirsa River D/S River Ratta 7.97 6.0 3.6 50 Gullerwala Nallah 7.15 3.0 11.0 200 River Sirsa D/S Nalagarh Bridge 8.33 10.6 1.0 36 River Sirsa D/S Nalagarh Town 7.54 9.3 1.6 41 River Bald D/S Landfill Site at Baddi 8.50 4.8 0.6 44 River Bald U/S Landfill Site at Baddi 7.94 6.5 0.5 32 River Kaushalya U/S Parwanoo Town 8.29 8.0 0.1 60 River Kaushalya D/S Intake Channel of WSS 8.27 8.5 0.2 410 River Sukhna D/S Parwanoo Town 7.60 Int. 5.2 126 River Sukhna U/S WSS Sector –4, Parwanoo 8.20 7.2 0.1 26 River Sukhna D/S WSS Kalka 7.66 3.6 11.0 570 River Sukhna U/S Sector V, Parwanoo (Landfill Site) 8.25 5.8 0.7 42 River Sukhna D/S Sector V, Parwanoo (Landfill Site) 7.48 4.1 1.3 82 Masulkhana Nallah U/S Morepen Lab 7.71 7.5 0.2 19 Masulkhana Nallah D/S Morepen Lab 7.55 5.7 8.2 298 Rewalsar Lake 7.14 3.2 1.3 >2400 Khaziar Lake 6.84 7.8 2.1 17 Renuka Lake 8.10 6.8 1.2 36
[AR 2009‐10] Page 37
JULY-2009:
Name of Sampling location pH D.O. mg/l
BOD mg/l
T.C. MPN
/100ml Lift Nala D/S Hotel Combermere 6.20 3.5 520.0 1288 Lift Nala U/S Bridge at Bye Pass Road Near MC Waste Processing Site 6.32 3.6 380.0 640
Lift Nala D/S MSW Processing Site, Shimla 6.53 3.4 320.0 560 U/S Lift Nallah before conf. to Ashwani Khad 7.33 6.7 0.1 50 D/S Lift Nallah after conf. to Ashwani Khad 7.46 6.5 0.4 270 River Giri D/S Yashwant Nagar 7.49 6.6 0.1 120 River Pabbar U/S Dhambari 7.47 8.0 0.1 11 River Pabbar D/S Chirgaon 7.37 7.5 0.2 18 River Pabbar U/S Rohroo 7.58 7.7 0.1 13 River Pabbar D/S Rohroo 7.14 7.6 0.1 21 River Pabbar U/S Hatkoti 7.41 7.4 0.1 21 River Pabbar D/S Hatkoti 7.10 7.4 0.1 22 D/S of TRT Sawara Kuddu River Pabbar at Snail 7.02 7.5 0.1 15 River Tons at H.P. Boundary 7.02 7.2 0.1 20 River Satluj before conf. to River Spiti at Khab 8.16 6.9 0.1 13 River Spiti before conf. to River Satluj at Khab 8.08 7.8 0.1 7 River Satluj after conf. to River Spiti at Khab 8.12 7.5 0.1 12 River Satluj U/S conf. with River Tidong 8.13 7.9 0.2 12 River Tidong before conf. to River Satluj 8.00 7.5 0.1 9 River Satluj D/S conf. with River Tidong 8.11 7.9 0.1 7 River Satluj U/S conf. to Sorang Khad 7.87 8.5 0.1 17 Sorang Before conf. to River Satluj 8.17 8.1 0.1 16 River Satluj D/S conf. to Sorang Khad 7.45 8.4 0.1 17 River Baspa U/S Reservoir at Kuppa 7.32 8.1 0.1 14 River Baspa D/S Reservoir at Kuppa 7.30 7.7 0.4 13 Baspa River Baspa Project 7.43 8.5 0.1 19 River Satluj U/S Baspa TRT 7.63 8.2 0.1 15 River Satluj U/S conf. with River Baspa 8.11 8.1 0.1 14 River Satluj D/S conf. with River Baspa 8.01 8.0 0.1 11 River Satluj D/S Wangtu Bridge 8.07 8.2 0.3 9 River Satluj D/S NJP Dam at Nathpa 8.12 8.4 0.1 14 River Satluj U/S conf. to Ganvi Khad 8.04 8.1 0.1 13 Ganvi before conf. to River Satluj 7.77 7.9 0.1 12 River Satluj D/S conf. to Ganvi Khad 7.56 8.0 0.1 14 River Satluj U/S TRT Jhakri 7.85 9.0 0.1 20 River Satluj D/S TRT Jhakri 7.97 9.2 0.2 15 River Satluj U/S Land fill site Rampur 7.95 8.1 0.1 22 River Satluj D/S Land fill site Rampur 7.67 9.3 0.1 26 River Satluj U/S Rampur 7.84 9.4 0.1 13 River Satluj D/S Rampur 7.87 9.1 0.1 15 River Satluj D/S of Duttnagar 8.00 8.4 0.2 16 River Satluj U/S Tattapani 7.68 8.5 0.1 100 River Satluj U/S Slapper 7.91 8.6 0.2 >2400 River Satluj D/S Slapper 7.99 8.6 0.6 >2400
[AR 2009‐10] Page 38
River Satluj D/S ACC Barmana 7.97 8.9 0.4 920 River Satluj D/S Bilaspur 8.05 8.3 0.7 >2400 River Satluj U/S Bhakhra 8.11 9.1 0.2 50 River Satluj D/S Bhakhra 8.18 8.2 0.1 36 River Swan D/S Santokhgarh 7.84 6.0 24.0 80 River Swan U/S Landfill Site Santokhgarh 8.41 6.2 0.3 240 River Swan D/S Landfill Site Santokhgarh 7.91 5.4 0.6 270 River Beas U/S Manali 7.71 8.4 0.4 >2400 River Beas D/S Manali 7.46 8.3 0.3 1600 River Beas U/S Waste Processing Facility, Manali 8.07 8.6 0.1 >2400 River Beas D/S Waste Processing Facility, Manali 7.57 8.3 0.3 >2400 River Beas D/S of conf. with Allaign Nallah 7.36 8.4 0.2 350 Allaign Nallah before conf. with River Beas 7.32 8.5 0.3 1600 River Beas D/S conf with Dohangan Nallah 7.20 8.2 0.2 >2400 Dohangan Nallah before conf. with River Beas 7.14 8.2 0.2 110 River Beas U/S Kullu 7.65 8.0 1.0 >2400 River Beas D/S Kullu 7.49 8.1 0.7 >2400 River Beas U/S Waste Processing Facility, Kullu 8.27 8.2 0.2 >2400 River Beas D/S Waste Processing Facility, Kullu 8.21 8.2 0.3 >2400 River Parvati U/S of Dam site of Parvati-II at Pulga 7.04 9.2 0.1 23 River Parvati D/S of Dam site of Parvati-II at Pulga 6.91 9.5 0.2 33 River Parvati U/S Manikaran 7.32 9.4 0.1 110 River Parvati D/S Manikaran 7.05 9.1 0.2 280 Parvati River at Bhunter 7.77 9.4 0.2 1600 River Beas U/S of conf. of River Parvati 7.97 8.4 0.1 1600 River Beas D/S of conf. of River Parvati 7.98 8.5 0.2 >2400 River Sainj U/S envisaged power house site of Parvati-II 7.98 8.7 0.2 >2400 River Sainj D/S envisaged power house site of Parvati-II 7.45 8.3 0.3 >2400 River Sainj U/S envisaged power house site of Parvati - III 8.40 8.6 0.3 920 River Sainj D/S envisaged power house site of Parvati - III 7.89 8.6 0.4 1600 River Beas U/S Fermenta Biodil 7.03 8.8 0.2 >2400 River Beas D/S Fermenta Biodil 7.57 8.8 0.2 >2400 River Beas D/S Aut 7.20 8.8 0.2 1600 River Sainj D/S Largi 7.60 8.6 0.4 >2400 River Beas D/S of conf. of TRT of Largi HEP Power House 7.15 8.4 0.3 1600
River Beas U/S Pandoh Dam 8.22 8.4 0.3 >2400 River Beas D/S Pandoh Dam 7.14 8.1 0.4 >2400 Exit of Dehar Power House 7.44 9.5 0.1 >2400 River Suketi U/S of conf. of dregger outfall of SNR Balancing reservoir 7.65 6.1 0.6 1600
River Suketi at Dadour bridge 7.80 6.4 0.5 >2400 Suketi Khad U/S Mandi 7.82 7.5 0.3 >2400 River Beas U/S Mandi 7.24 8.3 0.5 >2400 River Beas D/S Mandi 7.36 8.3 0.4 >2400 River Beas U/S Darang Salt Mine 8.17 6.7 0.1 130 River Beas D/S Darang Salt Mine 8.09 6.7 0.1 170 River Beas U/S of conf. of envisaged TRT of UHL-III 7.58 8.3 0.1 920 River Beas D/S of conf. of envisaged TRT of UHL-III 7.24 8.0 0.1 920
[AR 2009‐10] Page 39
River Beas D/S Alampur 7.67 7.8 0.3 94 Neugal Khad D/S Thural 7.98 7.8 0.3 33 River Beas D/S Dehra 7.44 8.5 0.3 180 River Beas U/S Pong Village 8.35 7.4 0.2 22 River Beas U/S Pong Dam 8.50 7.4 0.2 21 River Beas D/S Pong Dam 7.62 2.8 0.2 33 River Swan U/S Suraj Industry 8.39 7.3 0.3 46 River Swan D/S Suraj Industry 7.31 1.8 55 540 River Ravi D/S of proposed Dam Chamera-III 8.08 10.0 0.2 17 River Ravi U/S Chamera-II River Ravi 8.03 9.8 0.1 21 River Ravi D/S Chamba-II River Ravi 8.17 9.8 0.3 34 River Ravi U/S of confluence of Budhil Nallah 8.68 9.8 0.2 14 River Ravi D/S of confluence of Budhil Nallah 8.46 9.8 0.24 17 Budhil Nallah U/S of proposed Dam on Budhil Nallah 8.28 10.4 0.3 7 Budhil Nallah D/S of proposed Dam on Budhil Nallah 8.32 10.4 0.3 7 River Ravi U/S Chamba 8.08 10.2 0.2 34 River Ravi D/S Chamba 8.20 9.9 0.4 31 River Ravi U/S Landfill Site Chamba 8.17 10.2 0.2 26 River Ravi D/S Landfill Site Chamba 8.30 10.2 0.4 27 River Baira U/S Baira Project 7.91 9.9 0.3 23 River Baira D/S Baira Project 8.14 10.1 0.2 26 River Baira U/S Baira Dam 8.00 10.2 0.3 13 River Baira D/S Baira Dam 7.89 10.2 0.4 27 River Ravi U/S before confluence of Baira River 8.69 9.2 0.2 26 Baira River before conf. to River Ravi 8.47 9.9 0.6 43 Siul River U/S Siul Weir Site 8.31 10.6 0.4 26 Siul River D/S Siul Weir Site 8.44 10.6 0.4 27 Baled Khad U/S of Dam 8.30 10.4 0.3 11 Baled Khad D/S Dam 8.41 10.4 0.2 11 Chamera Reservoir 8.57 10.2 0.4 110 River Ravi D/S Dam of Chamera-I HEP 8.60 10.4 0.3 140 River Ravi D/S TRT Power House 8.65 10.2 0.2 31 River Ravi U/S Madhopur Head Works 8.03 7.8 0.3 130 River Yamuna U/S Paonta Sahib 8.15 6.6 1.4 30 River Yamuna D/S Paonta Sahib 8.21 6.5 1.6 32 River Yamuna U/S Ranbaxy 7.88 6.5 1.4 32 River Yamuna D/S Ranbaxy 7.80 6.5 1.5 31 River Markanda at Paonta Sahib 7.92 6.9 1.2 26 River Markanda U/S Markanda Bridge 8.04 6.4 1.4 29 River Markanda U/S Jattan Wala Nala 8.21 6.3 1.6 31 Jattan Wala Nala 7.06 Int. 80.0 >50 River Markanda D/S Jattan Wala Nala 7.01 2.5 30.0 >50 Giri River U/S Sataun 8.19 6.5 1.5 26 Giri River D/S Sataun 8.10 6.5 1.4 28 River Sirsa U/S Sitomajari Nallah 7.96 6.9 0.9 31 River Sirsa D/S Sitomajari Nallah 7.97 6.4 1.4 41 Sirsa River U/S Sandholi Nallah 8.04 6.5 8.0 27 Sandholi Nallah 7.03 Nil 340.0 940 River Sirsa D/S Sandholi Nallah 7.58 4.0 12.0 150

[AR 2009‐10] Page 40
River Sirsa U/S Housing Board Nallah 7.51 4.9 8.0 36 Housing Board Nallah 7.59 4.8 20.0 410 River Sirsa D/S Housing Board Nallah 7.50 4.2 12.0 90 River Sirsa U/S River Ratta 7.99 5.7 3.2 70 River Ratta Before conf. to River Sirsa 7.82 6.5 9.6 40 River Sirsa D/S River Ratta 7.69 3.6 5.6 76 Gullerwala Nala 7.34 Nil 20.0 210 River Sirsa D/S Nalagarh Town 8.36 5.4 2.0 48 River Sirsa D/S Nalagarh Bridge 7.39 6.2 5.0 40 River Bald U/S Landfill Site at Baddi 7.71 5.7 0.4 27 River Bald D/S Landfill Site at Baddi 7.61 4.9 0.8 29 River Kaushalya U/S Parwanoo Town 8.37 6.9 0.2 35 River Kaushalya D/S Intake Channel of WSS 8.14 6.4 0.4 60 River Sukhna D/S Parwanoo 7.88 5.7 3.4 360 Sukhna Nallah U/S WSS Sector –4, Parwanoo 7.09 7.0 0.2 20 Sukhna Nallah D/S WSS Kalka 7.64 6.8 4.0 240 Sukhna Nallah U/S Sector–5, Landfill Site Parwanoo 7.85 6.6 0.8 230 Sukhna Nallah D/S Sector–5, Landfill Site Parwanoo 6.96 5.8 10.0 150 Masulkhana Nallah U/S Morepen 7.22 6.6 0.4 54 Masulkhana Nallah D/S Morepen 7.53 5.1 20.0 196 Rewalsar Lake 7.06 3.0 4.2 >2400 Khaziar Lake 6.70 3.6 3.7 12 Renuka Lake 8.06 6.2 1.9 34
October-2009:
Name of Sampling location pH D.O. mg/l
BOD mg/l
T.C. MPN
/100ml Lift Nala D/S Hotel Combermere, Shimla 7.52 5.0 4.2 80 Lift Nala U/S Bridge By-Pass road, Shimla 7.36 5.2 6.0 90 Lift Nala D/S MSW Processing Site, Shimla 7.13 6.9 5.0 140 U/S Lift Nala Before conf. to Ashwani Khad 7.47 7.5 2.0 86 D/S of Ashwani Khad after conf. to lift Nallah 7.69 7.0 1.2 44 River Giri D/S Yashwant Nagar 7.91 8.0 0.1 34 Ashwani Khad U/S Yashwant Nagar 7.98 8.0 0.4 24 River Pabbar U/S Dhambari 6.95 9.1 0.1 12 River Pabbar D/S Chirgaon 7.20 8.9 0.2 12 River Pabbar U/S Rohroo 8.33 8.6 0.1 22 River Pabbar D/S Rohroo 6.96 8.5 0.1 32 River Pabbar U/S Hatkoti 7.35 8.8 0.2 14 River Pabbar D/S Hatkoti 7.16 8.8 0.3 32 River Pabbar at Snail D/S of TRT of Swara Kuddu 6.64 8.7 0.3 22 River Tons at H.P. Boundary 7.31 9.2 0.2 36 River Satluj Before conf. to River Spiti at Khab 6.25 8.5 0.1 4 River Spiti Before conf. to River Satluj at Khab 8.21 9.2 0.1 8 River Satluj after conf. of River Spiti at Khab 7.86 8.9 0.2 4 River Satluj U/S conf. of River Tidong 8.35 9.3 0.1 6 River Tidong Before conf. to River Satluj 8.02 8.7 0.1 4 River Satluj D/S conf. with River Tidong 8.22 9.1 0.2 4

[AR 2009‐10] Page 41
River Satluj U/S conf. of River Sorang 8.16 8.9 0.1 32 River Sorang before conf. to River Satluj 8.05 9.3 0.1 48 River Satluj D/S after conf. with River Sorang 8.08 9.1 0.2 40 River Baspa U/S Reservoir at Kuppa 7.96 9.4 0.1 8 River Baspa D/S Reservoir at Kuppa 8.15 8.9 0.2 8 Baspa River Baspa Project Kuppa 7.94 9.2 0.1 12 River Satluj U/S TRT Baspa 8.37 9.3 0.1 8 River Satluj U/S conf. of River Baspa 8.24 9.5 0.1 7 River Satluj D/S conf. of River Baspa 8.28 9.5 0.1 12 River Satluj D/S Wangtu Bridge 8.38 8.2 0.1 20 River Satluj D/S NJP Dam Nathpa 7.99 8.7 0.2 22 River Satluj U/S conf. to Ganvi Khad 8.13 9.2 0.1 24 Ganvi Khad before conf. to River Satluj 8.51 8.3 0.2 14 River Satluj D/S Conf. to Ganvi Khad 7.85 8.9 0.2 16 River Satluj U/S TRT Jhakri 8.14 10.3 0.1 16 River Satluj D/S TRT Jhakri 8.05 9.6 0.2 18 River Satluj U/S Landfill Site Rampur 7.51 9.4 0.1 28 River Satluj D/S Landfill Site Rampur 7.75 9.7 0.3 26 River Satluj U/S Rampur 7.43 9.9 0.1 40 River Satluj D/S Rampur 7.46 9.8 0.2 60 River Satluj D/S Duttnagar 8.20 10.1 0.2 28 River Satluj U/S Tattapani 8.09 9.3 0.1 26 River Satluj U/S Slapper 7.31 9.0 0.1 >2400 River Satluj D/S Slapper 7.97 9.3 0.2 >2400 River Satluj D/S ACC Barmana 7.87 9.4 1.3 >2400 River Satluj D/S Bilaspur 7.96 7.8 0.4 >2400 River Satluj U/S Bhakhra 8.37 8.2 0.2 12 River Satluj D/S Bhakhra 8.28 9.0 0.1 16 River Swan D/S Santokhgarh 8.63 6.7 1.0 100 River Swan U/S Landfill Site Santokgarh 8.58 7.5 0.4 80 River Swan D/S Landfill Site Santokgarh 8.64 6.9 1.6 110 River Beas U/S Manali 7.49 9.4 0.3 >2400 River Beas D/S Manali 7.02 8.7 0.6 >2400River Beas U/S Waste Processing Facility, Manali 7.35 9.3 0.2 >2400River Beas D/S Waste Processing Facility, Manali 7.47 9.4 0.4 >2400River Beas D/S confluence with Allaign Nallah 7.69 9.3 0.2 >2400Allaign Nallah before confluence with River Beas 7.47 9.4 0.1 350 River Beas D/S confluence with Dohangan Nallah 7.19 9.4 0.3 2400 Dohangan Nallah before confluence with River Beas 7.58 9.5 0.1 220 River Beas U/S Kullu 7.87 9.8 0.5 >2400 River Beas D/S Kullu 7.62 9.8 0.4 >2400 River Beas U/S Waste Processing Facility, Kullu. 7.70 10.0 0.3 >2400River Beas D/S Waste Processing Facility, Kullu. 7.49 9.6 0.4 >2400River Parvati U/S of Dam site of Parvati-II at Pulga 7.56 10.2 0.1 22 River Parvati D/S of Dam site of Parvati-II at Pulga 6.87 10.0 0.1 220 River Parvati U/S Manikaran 7.40 10.3 0.4 >2400River Parvati D/S Manikaran 7.62 10.2 0.5 >2400Parvati River at Bhunter 7.56 9.8 0.2 920 River Beas U/S of conf. of River Parvati 7.83 9.8 0.3 >2400

[AR 2009‐10] Page 42
River Beas D/S of conf. of River Parvati 7.66 10.0 0.3 >2400River Sainj U/S envisaged Power House site of Parvati-II 8.14 9.8 0.1 540 River Sainj D/S envisaged Power House site of Parvati-II 7.52 9.8 0.1 920 River Sainj U/S envisaged Power House site of Parvati – III 7.92 9.8 0.1 220 River Sainj D/S envisaged Power House site of Parvati - III 7.84 9.8 0.2 1600 River Beas U/S Fermenta Biodil 7.41 9.6 0.2 >2400River Beas D/S Fermenta Biodil 7.49 9.6 0.3 >2400River Beas D/S Aut 7.50 9.6 0.4 >2400 River Sainj D/S Largi 7.35 9.6 0.3 >2400 River Beas D/S of conf. of TRT of Largi HEP Power House 8.10 9.8 0.3 920 River Beas U/S Pandoh Dam 8.06 9.5 0.2 220 River Beas D/S Pandoh Dam 7.61 9.5 0.3 920 Exit of Dehar Power House 7.91 9.3 0.5 >2400 River Suketi U/S dregger outfall of SNR Balancing reservoir 8.21 7.9 0.3 1600 River Suketi at Dadour bridge 7.97 8.4 0.2 >2400 Suketi Khad U/S Mandi 8.20 7.2 0.4 >2400 Suketi Khad D/S Mandi 8.14 7.9 0.4 >2400 River Beas U/S Mandi 7.90 8.4 0.1 >2400 River Beas D/S Mandi 7.35 8.6 0.2 >2400 River Beas U/S Darang Salt Mine 8.40 7.5 0.1 33 River Beas D/S Darang Salt Mine 8.40 7.0 0.1 70 River Beas U/S of conf. of envisaged TRT of UHL-III 7.72 9.3 0.1 23 River Beas D/S of conf. of envisaged TRT of UHL-III 7.95 8.9 0.1 33 River Beas D/S Alampur 8.21 8.3 0.4 7 River Beas D/S Jaisinghpur 8.15 8.4 0.3 17 Neugal at D/S Thural 8.22 8.2 0.2 9 River Binwa D/S Paprola/Baijnath 7.85 7.8 0.5 27 River Beas D/S Dehra 8.08 8.4 0.3 33 River Beas U/S Pong Village 8.21 7.8 0.2 8 River Beas U/S Pong Dam 8.20 8.0 0.4 14 River Beas D/S Pong Dam 8.23 6.4 0.3 9 Swan Khad U/S Suraj Industry 8.14 7.4 0.4 9 Swan Khad D/S Suraj Industry 6.74 3.0 920.0 >2400 River Ravi D/S Dam of proposed Dam of Chamera-III 8.27 10.2 0.3 14 River Ravi U/S Dam Chamera -II 8.34 10.2 0.2 26 River Ravi D/S Dam Chamera -II 8.27 9.7 0.2 14 River Ravi U/S Confluence of Budhil Nallah 8.44 10.2 0.2 12 Budhil Nala U/S of Dam of Proposed Budhil HEP 8.20 10.8 0.2 9 Budhil Nala D/S of Dam of Proposed Budhil HEP 8.23 10.7 0.2 14 River Ravi D/S of proposed TRT of Budhil HEP 8.43 10.3 0.3 14 River Ravi U/S Chamba 8.10 10.2 0.2 12 River Ravi D/S Chamba 8.12 9.7 0.2 14 River Ravi U/S Landfill Site Chamba 8.25 9.8 0.3 26 River Ravi D/S Landfill Site Chamba 8.13 10.2 0.3 17 Baira River before Confluence with River Ravi 7.99 10.2 0.2 7 River Ravi U/S of its Confluence with Baira River 7.58 9.8 0.2 14 River Ravi D/S of its Confluence with Baira River 7.96 10.0 0.2 14

[AR 2009‐10] Page 43
Baira River U/S of Dam on Baira for Baira Siul HEP 8.22 10.4 0.2 11 Baira River D/S of Dam on Baira for Baira Siul HEP 8.32 10.4 0.2 9 U/S Baira Project Dam 8.02 10.8 0.2 12 D/S Baira Project Dam 7.95 10.5 0.2 17 Baled Khad U/S of Dam on Baled for Baira Siul HEP 8.25 10.9 0.1 5 Baled Khad D/S of Dam on Baled for Baira Siul HEP 8.09 10.9 0.1 9 Ravi at Chamera Reservoir 7.97 10.1 0.4 27 River Ravi D/S Chamera-1 HEP 8.06 10.7 0.2 7 D/S River Baira Surgani 7.53 10.9 0.1 11 D/S Khairi River Ravi TRT 7.87 10.8 - 11 River Siul U/S Siul Project 7.72 10.8 0.2 17 River Siul D/S Surgani 8.53 10.8 0.2 17 River Ravi U/S Madhopur Head Works 7.31 8.5 0.6 26 D/S Chaunch Khad 7.21 7.4 0.6 94 River Yamuna U/S Paonta Sahib 7.85 7.2 1.2 24 River Yamuna D/S Paonta Sahib 8.10 7.3 1.0 26 River Yamuna U/S Ranbaxy 8.11 7.2 1.4 28 River Yamuna D/S Ranbaxy 8.12 7.1 1.4 27 River Bata U/S Paonta Sahib 7.93 7.1 1.2 25 River Bata before confluence to River Yamuna 8.19 7.0 1.2 27 River Markanda at Paonta Sahib 8.04 7.3 1.0 20 River Markanda U/S Markanda Bridge 8.03 6.9 1.6 26 River Markanda U/S of Kala-Amb 7.63 7.2 1.2 24 River Markanda D/S of Kala-Amb 7.84 6.9 1.8 28 River Markanda U/S Jattan Wala Nala 8.00 7.0 1.6 27 Jattan Wala Nala 7.14 Int. 68.0 >50 River Markanda D/S Jattan Wala Nala 7.69 2.4 4.8 >50 Giri River U/S Sataun 7.88 7.4 1.2 22 Giri River D/S Sataun 7.92 7.3 1.2 24 River Sirsa U/S Sitomajari Nallah 8.13 8.1 0.5 30 River Sirsa D/S Sitomajari Nallah 7.98 7.5 2.4 154 River Sirsa U/S Sandholi Nallah 8.47 8.6 1.8 120 Sandholi Nallah 7.69 Nil 280.0 1100 River Sirsa D/S Sandholi Nallah 8.23 6.8 16.0 120 River Sirsa U/S H.B. Nala 8.47 4.8 2.2 42 H.B. Nala 8.04 5.1 9.0 400 River Sirsa D/S H.B. Nala 8.55 4.6 16.0 120 River Sirsa U/S River Ratta 7.93 7.7 2.8 52 River Ratta bef. Conf. to River Sirsa 7.54 7.2 0.6 44 River Sirsa D/S River Ratta 7.98 7.0 1.8 42 Gullerwala Nala 7.73 Nil 26.0 220 River Sirsa D/S Nalagarh Bridge 8.56 12.2 2.4 32 River Sirsa D/S Nalagarh Town 8.63 8.4 1.2 36 Bald Khad U/S Landfill Site at Baddi 8.11 8.1 1.2 98 Bald Khad D/S Landfill Site at Baddi 8.22 6.0 0.5 34 River Kaushalya U/S Parwanoo Town 8.44 7.7 0.1 52 River Kaushalya D/S Intake Channel of WSS 8.50 7.9 0.1 20 River Sukhna D/S Parwanoo Town 8.28 6.2 4.0 98 River Sukhna U/S WSS Sector –4, Parwanoo 8.00 7.2 0.2 14 River Sukhna D/S WSS Kalka 8.09 6.6 0.9 342

[AR 2009‐10] Page 44
River Sukhna U/S Sec-V, Landfill Site Parwanoo 8.12 7.5 0.8 32 River Sukhna D/S Sec-V, Landfill Site Parwanoo 7.93 6.7 1.2 93 Masulkhana Nallah U/S Morepen Lab 8.23 8.6 0.3 24 Masulkhana Nallah D/S Morepen Lab 7.88 7.0 4.4 110 Rewalsar Lake 7.39 2.7 0.6 >2400 Khaziar Lake 6.46 2.6 13.0 63 Renuka Lake 8.24 6.7 1.8 30 JANUARY-2010:
Name of location pH D.O. mg/l
BOD mg/l
T.C. MPN
/100ml Lift Nala D/S Hotel Combermere, Shimla 7.51 8.3 6.8 120 Lift Nala U/S Bridge By-Pass road, Shimla 7.68 8.3 6.2 100 Lift Nala D/S MSW Processing Site, Shimla 7.54 8.2 7.2 120 U/S Lift Nala Before conf. to Ashwani Khad. 7.48 8.9 3.2 120 D/S of Ashwani Khad after conf to lift Nallah 7.97 9.7 1.6 22 River Giri D/S Yashwant Nagar 7.98 7.6 0.4 54 Ashwani Khad U/S Yashwant Nagar 8.10 8.0 0.4 36 MSW Solan Dumping site 7.12 7.1 0.8 140 River Pabbar U/S Dhambari 7.46 9.7 0.2 8 River Pabbar D/S Chirgaon 7.47 9.5 0.2 14 River Pabbar U/S Rohroo 8.15 9.5 0.1 40 River Pabbar D/S Rohroo 7.67 9.6 0.2 30 River Pabbar U/S Hatkoti 7.97 10.1 0.2 16 River Pabbar D/S Hatkoti 7.65 10.8 0.2 22 River Pabbar at Snail D/S of TRT 7.93 10.1 0.2 20 River Tons at H.P. Boundary 8.06 10.2 0.1 22 River Satluj Before conf. to River Spiti at Khab 8.18 9.7 0.1 12 River Spiti before conf. to River Satluj at Khab 8.04 9.9 0.2 12 River Satluj after conf. to River Spiti at Khab 8.12 9.7 0.1 13 River Satluj U/S conf. of River Tidong 7.84 9.6 0.1 16 River Tidong Before conf. to River Satluj 7.98 9.2 0.1 24 River Satluj D/S conf. with River Tidong 8.36 9.5 0.1 20 River Satluj before conf. of River Sorang 8.12 9.5 0.1 12 River Sorang before conf. to River Satluj 7.93 9.2 0.1 8 River Satluj D/S after conf. with River Sorang 8.12 9.4 0.1 10 River Baspa U/S Reservoir at Kuppa 7.65 9.9 0.2 22 Baspa River Baspa Project Kuppa 7.88 9.8 0.1 10 River Baspa D/S Reservoir at Kuppa 8.58 9.4 0.1 14 River Satluj U/S TRT Baspa 8.30 10.2 0.2 22 River Satluj U/S Conf. of River Baspa 8.27 10.1 0.2 18 River Satluj D/S conf. of River Baspa 7.40 10.0 0.2 14 River Satluj at Wangtu Bridge 8.13 9.8 0.1 16 River Satluj D/S NJP Dam Nathpa 8.16 9.5 0.1 16 River Satluj U/S conf. to Ganvi Khad 8.03 9.7 0.1 12 Ganvi Khad before conf. to River Satluj 8.10 9.2 0.2 17 River Satluj D/S conf. to Ganvi Khad 8.07 9.9 0.2 12 River Satluj U/S TRT Jhakri 8.06 9.6 0.2 11

[AR 2009‐10] Page 45
River Satluj D/S TRT Jhakri 8.22 9.8 0.1 14 River Satluj U/S Landfill Site Rampur 8.03 9.9 0.1 18 River Satluj D/S Landfill Site Rampur 7.91 9.7 0.4 36 River Satluj U/S Rampur 8.11 9.9 0.1 15 River Satluj D/S Rampur 8.22 9.8 0.2 16 River Satluj D/S Duttnagar 8.10 10.1 0.2 20 River Satluj U/S Tattapani 7.98 10.0 0.1 20 River Satluj U/S Slapper 7.82 11.1 0.3 350 River Satluj D/S Slapper 7.95 11.0 0.5 540 River Satluj D/S ACC Barmana 7.80 11.5 0.6 920 River Satluj D/S Bhakhra 7.80 9.3 0.1 26 River Satluj U/S Bhakhra 8.05 8.4 0.2 40 River Satluj D/S Bilaspur 7.89 11.1 0.7 >2400 River Swan D/S Santokhgarh 8.48 6.2 1.6 60 River Swan U/S Landfill Site Santokgarh. 8.70 7.6 0.5 120 River Swan D/S Landfill Site Santokgarh. 8.12 6.0 2.2 240 Beas River U/S Manali 7.31 10.6 0.20 540 River Beas D/S Manali 6.97 9.5 11.0 >2400 River Beas U/S Waste Processing Facility, Manali 7.08 10.8 0.4 >2400 River Beas D/S Waste Processing Facility, Manali 7.32 11.0 0.6 >2400 River Beas D/S of conf. with Allaign Nallah 7.35 11.1 0.5 >2400 Allaign Nallah bef. conf. with River Beas 7.71 10.4 0.3 1600 River Beas D/S conf with Dohangan Nallah 7.79 11.1 0.4 >2400 Dohangan Nallah before conf. with River Beas 7.82 10.6 0.2 46 River Beas U/S Kullu 7.45 10.6 0.6 >2400 River Beas D/S Kullu 7.54 10.6 0.70 >2400 River Beas U/S Waste Processing Facility Kullu 7.46 11.2 0.5 >2400 River Beas D/S Waste Processing Facility Kullu 7.40 11.0 0.7 >2400 River Parvati U/S of Dam site of Parvati-II at Pulga 7.54 11.4 0.1 33 River Parvati D/S of Dam site of Parvati-II at Pulga 7.64 11.1 0.2 49 River Parvati U/S Manikaran 7.70 10.8 0.1 49 River Parvati D/S Manikaran 7.40 10.2 0.5 1600 River Parvati before conf. to River Beas at Bhunter 7.57 10.6 0.4 1600 River Beas U/S of conf. of River Parvati 7.65 10.8 0.4 >2400 River Beas D/S of conf. of River Parvati 7.46 10.8 0.5 >2400
River Sainj U/S envisaged Power House site of Parvati-II 7.22 11.1 0.1 540
River Sainj D/S envisaged Power House site of Parvati-II 7.47 11.0 0.1 540
River Sainj U/S envisaged Power House site of Parvati - III 7.34 11.3 0.1 130
River Sainj D/S envisaged Power House site of Parvati - III 7.39 11.3 0.1 350 River Beas U/S Fermenta Biodil 7.62 11.4 0.3 540 River Beas D/S Fermenta Biodil 7.61 11.4 0.3 920 River Beas D/S Aut 7.51 10.9 0.30 350 River Sainj D/S Largi 7.21 10.4 0.2 220 River Beas D/S of conf. of TRT of Largi HEP Power House. 7.90 11.2 0.4 920 River Beas U/S Pandoh Dam 7.86 10.8 0.20 110 River Beas D/S Pandoh Dam 7.39 10.6 0.3 280

[AR 2009‐10] Page 46
Exit of Dehar Power House 7.01 11.2 0.2 110 River Suketi U/S of conf. of dregger outfall of SNR Balancing reservoir 7.89 10.2 0.2 23
River Suketi at Dadour bridge 7.63 8.0 0.5 >2400 Suketi Khad U/S Mandi 8.07 9.6 0.6 >2400 Suketi Khad D/S Mandi 7.92 10.0 0.7 >2400 River Beas U/S Mandi 7.76 10.8 0.1 33 River Beas D/S Mandi 7.25 10.7 0.8 >2400 River Beas U/S Darang Salt Mine 8.21 8.5 0.1 140 River Beas D/S Darang Salt Mine 8.14 7.9 0.1 79 River Beas U/S of conf. of envisaged TRT of UHL-III 7.63 10.5 0.1 170 River Beas D/S of conf. of envisaged TRT of UHL-III 7.81 11.2 0.2 220 River Beas D/S Alampur 8.43 8.4 0.6 9 River Beas D/S Jaisinghpur 8.61 8.6 0.1 7 Neugal at D/S Thural 8.64 8.0 0.6 6 River Binwa D/S Paprola/Baijnath 8.56 8.8 1.2 14 River Beas D/S Dehra 8.51 8.5 0.6 17 River Beas U/S Pong Village 8.56 8.2 0.2 14 River Beas U/S Pong Dam 8.34 8.2 0.6 17 River Beas D/S Pong Dam 8.42 7.8 1.8 11 Swan Khad U/S Suraj Industry 8.56 7.0 0.7 27 Swan Khad D/S Suraj Industry 7.87 6.4 3.2 >2400 River Ravi U/S Dam Chamera-II HEP 8.18 10.3 0.3 13 River Ravi D/S Dam Chamera-II HEP 8.20 9.9 0.3 11 River Ravi Before conf. of Budhil Nallah 8.27 10.8 0.3 26 Budhil Nallah U/S Dam Budhil HEP 7.72 10.9 0.2 14 Budhil Nallah D/S Dam Budhil HEP 8.1 10.9 0.3 8 River Ravi D/S Conf. of Budhil Nallah 7.98 10.8 0.2 22 River Ravi U/S Chamba 8.07 10.9 0.5 21 River Ravi D/S Chamba 6.92 10.8 0.4 27 River Ravi U/S Landfill Site Chamba 8.02 10.4 0.4 12 River Ravi D/S Landfill Site Chamba 7.92 9.8 0.5 11 Baira River U/S of Dam on Baira Siul HEP 8.44 10.2 0.2 17 Baira River D/S of Dam on Baira Siul HEP 8.22 8.9 0.2 26 Baira River U/S of conf. of TRT of Power House HEP Baira 8.38 10.2 0.3 4
Baira River D/S of Confluence of TRT of Power House of Baira Siul HEP 8.43 10.2 0.2 9
Baira River before conf. to River Ravi 8.36 9.8 0.2 4 River Ravi U/S conf. with Baira River 8.63 9.8 0.3 17 River Ravi D/S confluence of Baira River 8.34 9.8 0.2 17 Siul River U/S of Dam at Siul for Baira HEP 8.49 10.8 0.2 22 River Siul D/S Surgani 8.46 10.8 0.2 12 Baled Khad U/S of Dam at Baled 8.52 10.8 0.2 26 Baled Khad D/S of Dam at Baled 8.50 10.7 0.3 17 River Baira D/S Surgani 8.34 10.3 0.3 14 Ravi at Chamera Reservoir 8.42 9.9 0.6 9 Ravi at D/S Dam Chamera-III HEP 8.18 10.8 0.2 26 River Ravi D/S Dam Chamera-I HEP 8.46 10.4 0.2 6 River Ravi D/S TRT Power House Chamera-I HEP 8.34 10.5 0.3 12

[AR 2009‐10] Page 47
River Ravi U/S Madhopur Head Works 8.25 9.5 0.2 17 D/S Chaunch Khad 8.19 6.5 0.5 14 River Yamuna U/S Paonta Sahib 8.04 9.7 0.8 26 River Yamuna D/S Paonta Sahib 8.26 9.6 1.0 28 River Yamuna U/S Ranbaxy 8.01 9.8 0.6 24 River Yamuna D/S Ranbaxy 8.14 9.5 1.2 29 River Markanda at Paonta 8.10 10.8 0.6 20 River Bata U/S Paonta 8.06 10.8 0.6 22 River Bata D/S Paonta 8.03 10.6 0.8 23 River Markanda U/S at Kala Amb 8.35 10.5 1.0 26 River Markanda U/S Markanda Bridge 8.37 10.0 0.8 30 River Markanda U/S Jattan Wala Nala 7.98 9.7 1.4 28 Jattan Wala Nala 7.84 Int. 245 >50 River Markanda D/S Jattan Wala Nala 7.62 Int. 180 >50 River Markanda D/S at Kala Amb 7.90 9.8 1.2 27 River Giri U/S Sataun 8.00 10.0 1.2 18 River Giri D/S Sataun 8.08 10.0 1.2 19 River Sirsa U/S Sitomajari Nallah 7.95 9.6 0.4 32 River Sirsa D/S Sitomajari Nallah 8.16 8.8 3.0 140 River Sirsa U/S Sandholi Nallah 8.05 8.7 1.4 132 Sandholi Nallah 7.11 Nil 220.0 900 River Sirsa D/S Sandholi Nallah 7.75 7.5 22.0 180 River Sirsa U/S H.B. Nala 7.76 6.9 2.6 80 Housing Board Nala 7.69 3.4 14.0 220 River Sirsa D/S H.B. Nala 8.01 4.4 18.0 180 River Sirsa U/S of River Ratta 8.12 10.3 1.8 40 River Ratta bef. conf. to River Sirsa 7.93 7.9 0.8 32 River Sirsa D/S of River Ratta 7.89 7.4 2.2 48 Gullerwala Nala Source Dry River Sirsa D/S Nalagarh Town 8.17 9.5 1.8 40 River Sirsa D/S Nalagarh Bridge 7.89 7.4 1.8 44 River Bald U/S Landfill Site at Baddi 7.77 6.8 1.2 60 River Bald D/S Landfill Site at Baddi 7.59 5.6 1.6 68 River Kaushalya U/S Parwanoo Town 5.78 5.0 0.2 24 River Kaushalya D/S Intake Channel of WSS 8.10 6.9 0.2 40 River Sukhna at Parwanoo 6.20 6.1 2.2 140 River Sukhna U/S WSS Sector–4, Parwanoo 7.14 7.5 0.2 22 River Sukhna D/S WSS Kalka 6.01 5.6 3.6 26 River Sukhna U/S Sec-V Landfill Site Parwanoo 6.96 5.9 1.2 80 River Sukhna D/S Sec-V Landfill Site Parwanoo 8.21 7.2 1.0 32 Masulkhana Nallah U/S Morepen Lab 7.16 6.9 0.2 44 Masulkhana Nallah D/S Morepen Lab 6.90 5.2 12.0 96 Rewalsar lake 7.76 4.0 2.4 >2400 Khaziar Lake 6.76 9.8 0.4 220 Renuka Lake 8.27 8.1 1.4 32

[AR 2009‐10] Page 48
4.2.1 RECOMMENDATIONS (1) Frequent sampling be done if river water is used for drinking purpose and water should be
properly treated and disinfected. (2) All towns existing on the bank of rivers be provided the planned sewage treatment work
and should not be allowed to discharge the urban waste without treatment into or on the bank of river.
(3) Number of Hotels & Tourist Resorts are coming on the bank of rivers must have proper sewage treatment plants.
(4) All industrial units should not be allowed to discharge untreated effluent into rivers/khads/ nallahs.
(5) Urban waste affects water quality near towns, hence water resources are required to be treated and disinfected before it is used for drinking purpose.
(6) Regular monitoring and sampling of effluent discharge of industries located on the catchment of Jattawala Nala, Sandholi Nala, Housing Board Nala, Masulkhana Nala, Sukhna Nala is recommended.
4.2.2 SAMPLES ANALYSIS IN THE STATE BOARD LABORATORIES:
The State board has 5 laboratories for carrying out analysis of water, waste water, solid waste, air and bio-monitoring samples collected by the Board’s officers. The details of samples analyzed by the laboratories during the year 2009-10 are as follows;
Table – 4.18 Samples Analyzed in State Boards Laboratories
Sr. No.
Type of Samples Number of Samples Analyzed in State Boards Laboratories Parwano
o Paonta Sahib
Jassur Sunder Nagar
Shimla
1 Water & Waste Water
Trade Effluent 993 262 208 431 -
RM/GW/ Studyetc. watersamples
379 101 233 192 -
2 Soil/Solid Waste 21 65 10 7 - 3 Air Monitoring 90 34 96 247 - 4 Commercial 33 12 119 129 - 5 Complaint 16 1 2 5 6 Bio-Monitoring 25 12 - 6 - 7 Noise Monitoring - - - 56 - 7 Ambient Air Monitoring
under NAMP project SPM -1471 RSPM-1471 SO2 - 2841 NOx- 2841
SPM-1710 SPM-1710 SO2-3354 NOx-3354
SPM-748 RSPM- 748 SO2-1506 NOx-1506
SPM-28 RSPM-28 SO2-56 NOx-56
SPM -746 RSPM-746 SO2 -1475 NOx-1474

[AR 2009‐10] Page 49
4.3 POLLUTION CONTROL, SURVEILLANCE & MONITORING
The State Board, with the aim to achieve the objectives and in the pursuit of discharge of its functions under section 17 of the Water (Prevention & Control of Pollution) Act, 1974 and the Air (Prevention & Control of Pollution) Act, 1981 ensures that development takes place in harmony with the environmental considerations.
The State Board has a field network of 10 Regional Offices to exercise regular checks on the sources of pollution and regulation of the conditions of consent granted to the industries with the prime objective of controlling pollution at source. 4.3.1 CONSENT MECHANISM:
According to the provisions of the aforesaid Acts, Consent of the State Board is required by all the development projects, the industrial units, tourism projects, Hydel projects, mining units and sewage treatment systems.
The consent mechanism encompasses permission to establish and/or operate any development project which is governed by the provisions of sections 24 and/or 21 of the Water (Prevention & Control of Pollution) Act, 1974 and/or Air (Prevention & Control of Pollution) Act, 1981 respectively, as may be applicable to the development project under consideration. During the year the State Board also made the Consent Mechanism fully on-line with effect from the 5th June, 2009.The system called Him-XGN was inaugurated by Hon’ble Chief Minister and it has been widely acclaimed by the user entrepreneurs and Industries Associations. The different stages of the consent mechanism concurrent to the implementation of the projects are briefly discussed below:
Consent to Establish is granted to the industry after evaluation of the potential environmental pollution and after the examination of the engineering design and details of the systems proposed for controlling the pollution. The conditions consistent to control requirements are incorporated in Consent to Establish. These conditions are reviewed in terms of their compliance and ‘Consent to Establish’ is converted to ‘Consent to Operate’ after ensuring that the engineering systems for control of water and air pollution are fully implemented. The ‘Consent to Operate’ is usually valid for one year which is also granted subject to the condition that the control systems shall be so operated and maintained as to ensure compliance to the standards prescribed for emissions and/or effluents as the case may be. Consent to operate initially granted for one year and performance of the pollution control systems is regularly monitored. Actions are taken against the non-complying cases by issuing directions for suspension of production and disconnection of power supply till the unit improves the functioning of pollution control systems to comply norms. Depending upon the performance of the pollution control systems, further renewal of consent is granted.
The achievements made during 2009-10 in discharge of regulatory functions under the provisions of the Water (Prevention and Control of Pollution) Act, 1974, Water (Prevention and Control of Pollution) Cess Act, 1977 and Air (Prevention and Control of Pollution) Act, 1981 are given hereunder:

[AR 2009‐10] Page 50
Table: 19 CONSENT & CESS MANAGEMENT AT A GLANCE (2009-10) S. NO.
PARTICULARS GRANTED DURING THE YEAR 2009-10
REFUSED DURING THE YEAR 2009-10
CUMULATIVE AS ON 31.03.10
At HQ At ROS At HQ At ROS 1. Consent to Establish
(a) Water Act, 1974 (b) Air Act, 1981 ( c) Both Acts
5 5
392
72 56
835
- - -
- - -
1855 797
5718 2. Consent to Operate
(a) Water Act, 1974 (b) Air Act, 1981 (c) Both Acts
11 2
374
60 47
808
- - -
- - -
1788 707
5687 3. No objections to non-
polluting / exempted categories of industries
0 16 - - 992
3. Renewal of Consent (a) Water Act, 1974 (b) Air Act, 1981 (c) Both Acts
5 2
154
55 32
319
- -
- -
NA NA
NA NA
4. Consent Fees (in Rs.) 192553412.70* 5. Cess under Water Cess
Act, 1977 ( in Rs.)
Assessment Realisation
Remitted to Govt. of India
Received from Govt. of India
9260962.00 7128013.34* 4006682.00 2203816.00 6. Samples of industrial
wastes, solid wastes, and stack/ dust emissions, ground and surface water other than those under MINARS and NAAQM collected during the year.
No. of Samples Collected WATER/
EFFLUENTS
AIR / EMMISIONS
SOLID WASTES
VEHICLES CHECKED
1770
907
79
3050
7. Surveillance and Inspections under Water & Air Acts & Hazardous Wastes (Management & Handling) Rules, 1998/2003.
Number of Industries Actual Inspections done
8182
8131
8. Public complaints/ representations
Received Attended 247 232
9. Notices & Directions: Issued Implemented/Complied (i) Number of Notices
issued. (ii) Number of
directions issued U/S 33-A and 31 A of Water & Air Acts respectively.
617
66
617
66
10. Number of Industries which filed Environment Audit Reports
582
* Provisional subject to reconciliation after Audit.

[AR 2009‐10] Page 51
The State Board in its pursuit to introduce transparency and accountability in its functioning has delegated powers to the Environmental Engineers and Assistant Environmental Engineers in the Regional Offices of the Board. This step has not only led to the prompt disposal of the cases of the existing and prospective entrepreneurs but also increased the efficiency of the routine surveillance and monitoring of the State Board. 4.3.2 SURVEILLANCE & MONITORING:
The evaluation operational and qualitative efficiency of the pollution control devices installed in different industries largely depends on regular surveillance and monitoring of the pollution control equipment.
4.3.3 MONITORING OF INDUSTRIAL POLLUTION:
This activity is presently being conducted by a network of 10 Regional Offices of the Board headed by Environmental Engineers and Assistant Environmental Engineers. During the year 2009-10, the surveillance and monitoring was carried out and the salient achievements in the context are presented below:- (i) Number of Water Pollution Control Systems (Cumulative): 2797 (ii) Number of Air Pollution Control System (Cumulative): 2539 (iii) Number of Inspections conducted in 2009-10: 8131 (iv) Number of Samples of Water, Waste Water and emission 3823 including ambient air & noise in 2009-10: (v) Number of vehicles checked: 3050
4.3.4 MONITORING OF HYDEL PROJECTS:
State Board has embarked upon the photo monitoring of the Hydel Projects for reviewing and making required interventions in the management of muck. Some of the restoration works in hydro projects are depicted below:

[AR 2009‐10] Page 52
Figure – 4.1: Actual active dumping site with toe protection in a hydel project.
Figure – 4.2: Actual dumping site under restoration in a hydel project.

[AR 2009‐10] Page 53
State Board has also initiated the process to get the Real time on-line Continuous Flow Measurement & Data logging device for flow measurement to monitor the mandatory 15 % release of water from the Operational hydel projects. Some projects have already installed the device and the others are being directed through persuasion by the State Board.
Figure – 4.3: Water release from the dam of hydel project.
Figure – 4.4: Continuous online flow measurement for 15% mandatory release of water in hydel projects.

[AR 2009‐10] Page 54
4.3.5 POLLUTION PREVENTION & CONTROL:
As a result of surveillance & monitoring activities, constant pressure is maintained on the polluting industries for operation and maintenance of the pollution control equipment. During the year 723 new pollution control systems were got installed in the new industries to whom consents to operate were granted during the year.
Figure- 4.5: effluent treatment system for purification of industrial waste water.
In addition to the three conventional treatment comprising of physico-chemical and
biological treatment, State Board has also taken initiative to introduce tertiary level of treatment in the industrial units particularly those in Baddi-Barotiwala area.
Figure – 4.6: tertiary level treatment by provision of dual media filters.

[AR 2009‐10] Page 55
Figure: 4.7: Tertiary level treatment by provision of reverse osmosis.
Figure – 4.8: Air pollution control system in boiler.
Similarly improvements in the already existing control systems in respect of 144
industries were got incorporated including those, which were ordered closure for non-performance of the pollution control systems. In addition smooth functioning of the pollution control systems installed in the existing industries was ensured by exercising regular checks.
[AR 2009‐10] Page 56
4.3.6 ENVIRONMENTAL IMPACT ASSESSMENT:
Although the potential environmental impacts due to any proposed developmental activity are evaluated and the environmental management plans are got formulated and implemented while processing the cases for consent to establish/operate or renewal thereof under the provisions of the Water Act, 1974 and /or Air Act, 1986, the Government of India has specifically made Environmental Impact Assessment (EIA) and Environmental Management Plans (EMP) mandatory in respect of categories of projects specified in the Schedule of EIA Notification, 2006 issued by the Ministry of Environment and Forests, Government of India vide No.SO-1533(E) dated 14-09-2006 . Role of the State Board under this notification is to conduct the Public Hearing as part of the public consultation mechanism prescribed by the Government of India.
During the year, the State Board granted 1365 Consents to establish and 1302 consent to operate under Water and Air Acts to the new units after due examination of environmental impacts and management plans under Water and Air Acts. Similarly three new/expansion proposals of large industrial units/development projects were examined with reference to the EIA notification under Environment (Protection) Act, 1986 during the year and referred to State Govt. 4.3.7 ENVIRONMENTAL MONITORING OF HYDEL PROJECTS:
In view of the amount of work involved in the Environmental Monitoring of Hydroelectric Projects, the State Board has been finding it increasingly difficult to conduct the proper surveillance and monitoring of Hydroelectric Projects from its own resources in terms of manpower and mobility. At the same time in view of the public concerns and the requirement of mandatory provisions of the Water Act, 1974, Air Act, 1981 and Environmental Clearance; it is essential that the periodic monitoring is conducted and regular checks are exercised on the activities of Hydel Projects which have adverse impacts from Water & Air besides muck/debris management. In this regard the State Board at the time of evaluating the EIA/EMP of the proposed projects ensures that costs in respect of monitoring of Environmental Management Plan with reference to checking of muck management, restoration plan, water and air quality monitoring are in-built in the EIA/EMP. This approach has also been upheld and endorsed by the State Government. At present ten projects have been approved namely: 1. Parbati (Stage-II) Hydroelectric Project, Distt. Kullu; 2. Kol Dam Hydroelectric Project, Distt. Bilaspur; 3. Chamera ( Stage-III) Hydroelectric Project, Distt. Chambal; 4. Karcham Wangtu Hydroelectric Project, Distt. Kinnaur; 5 Rampur Hydel Project, Distt. Shimla/Kullu; 6 M/s Budhil Hydrolelctric Project, Chamba; 7. Sawda-Kuddu Hydroelectric Project, Distt. Shimla, 8. M/s Sorang Hydrelectric Project, Distt. Kinnaur; 9. M/s Tidong Hydroelectric Project, Kinnaur and 10. M/s Uhl Stage-III Hydroelectric Project, Distt. Mandi. 4.3.8 PUBLIC COMPLAINTS / REPRESENTATIONS:
The Regional Offices of the State Board are engaged not only in the activities of surveillance and monitoring of the industries, but also to maintain a constant vigil on the environmental quality and impact thereof on the people. The Regional Offices of the State Board not only keep liaison with the people but also take prompt action for mitigation of the public grievances. During the year 2009-10, the State Board took remedial action on 247 public complaints/representations that were received during the year.
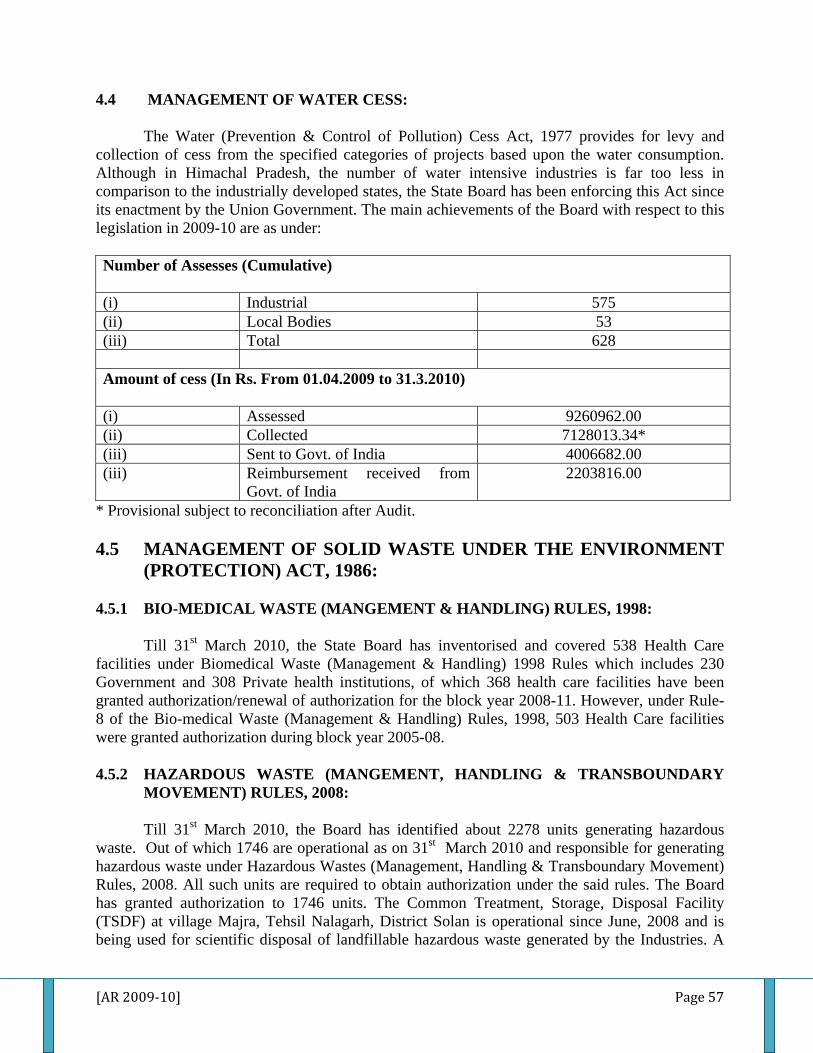
[AR 2009‐10] Page 57
4.4 MANAGEMENT OF WATER CESS:
The Water (Prevention & Control of Pollution) Cess Act, 1977 provides for levy and collection of cess from the specified categories of projects based upon the water consumption. Although in Himachal Pradesh, the number of water intensive industries is far too less in comparison to the industrially developed states, the State Board has been enforcing this Act since its enactment by the Union Government. The main achievements of the Board with respect to this legislation in 2009-10 are as under: Number of Assesses (Cumulative) (i) Industrial 575 (ii) Local Bodies 53 (iii) Total 628 Amount of cess (In Rs. From 01.04.2009 to 31.3.2010) (i) Assessed 9260962.00 (ii) Collected 7128013.34* (iii) Sent to Govt. of India 4006682.00 (iii) Reimbursement received from
Govt. of India 2203816.00
* Provisional subject to reconciliation after Audit. 4.5 MANAGEMENT OF SOLID WASTE UNDER THE ENVIRONMENT
(PROTECTION) ACT, 1986: 4.5.1 BIO-MEDICAL WASTE (MANGEMENT & HANDLING) RULES, 1998:
Till 31st March 2010, the State Board has inventorised and covered 538 Health Care facilities under Biomedical Waste (Management & Handling) 1998 Rules which includes 230 Government and 308 Private health institutions, of which 368 health care facilities have been granted authorization/renewal of authorization for the block year 2008-11. However, under Rule-8 of the Bio-medical Waste (Management & Handling) Rules, 1998, 503 Health Care facilities were granted authorization during block year 2005-08.
4.5.2 HAZARDOUS WASTE (MANGEMENT, HANDLING & TRANSBOUNDARY MOVEMENT) RULES, 2008:
Till 31st March 2010, the Board has identified about 2278 units generating hazardous waste. Out of which 1746 are operational as on 31st March 2010 and responsible for generating hazardous waste under Hazardous Wastes (Management, Handling & Transboundary Movement) Rules, 2008. All such units are required to obtain authorization under the said rules. The Board has granted authorization to 1746 units. The Common Treatment, Storage, Disposal Facility (TSDF) at village Majra, Tehsil Nalagarh, District Solan is operational since June, 2008 and is being used for scientific disposal of landfillable hazardous waste generated by the Industries. A

[AR 2009‐10] Page 58
total of 16439 MT of landfillable hazardous waste has been disposed off in TSDF by various landfillable hazardous waste generating industries in the State.
4.5.3 IMPLEMENTATION STATUS OF MUNICIPAL SOLID WASTE (MANAGEMENT & HANDLING) RULES, 2000
As required under the provisions of Municipal Solid Waste (Management & Handling)
Rules, 2000, the State Board performed all its functions and ensured compliance of all the provisions entrusted to it under the said Rules. The Annual Report was prepared and forwarded to Central Pollution Control Board within the stipulated time period. As per the Annual Report, the implementation status of Municipal Solid Waste (Management & Handling) Rules was not found very satisfactory. The compliance w.r.t collection / segregation / storage / transportation by all the 56 numbers of Municipal Authorities in the State of Himachal Pradesh was found partial. Although only Ten numbers of Municipal Authorities namely Shimla, Solan, Nahan, Kullu/ Bhunter, Manali, Una, Kangra/ Nagrota, Hamirpur, Dharamsala and Chamba had installed Waste Processing Facilities but the performance of these treatment facilities was also not found satisfactory. As regards Waste Disposal Facilities, none of the Municipal Authority had set up this facility.
The State Board had apprised senior authorities and A.D. of Department of Urban
Development, Director, Urban Development, and Deputy Commissioners about the status of implementation of Municipal Solid Waste (Management & Handling) Rules, 2000 for their intervention. Besides this, the State Board had regularly been pursuing Urban Local Bodies to comply with the provisions of these Rules. During the period 2009-10, the State Board received 12 numbers of applications for setting up and operation of waste processing facility and 21 numbers of applications for setting up and operation of waste disposal facility. The State Board processed all the applications received from various municipal authorities and granted 02 numbers of Authorizations for setting up and operation of waste processing facility and 03 numbers of Authorizations for setting up and operation of waste disposal facility. The Authorization status for the year 2009-10 is detailed in the following Table.
TABLE-4.20
S.No
Municipal Authority
Total No.
During the Period (2009-10)
Applications received for
Authorizations Status for
Waste Processing Facility
Waste Disposal Facility
Setting up/operation of Waste Processing Facility
Setting up/operation of Waste Disposal Facility
1. Municipal corporation
1 Nil Nil NA NA
2. Municipal Council
20
08
10
Granted to 02MCs (Mandi, Hamirpur)
Granted to 02 MCs (Mandi, Hamirpur)

[AR 2009‐10] Page 59
S.No
Municipal Authority
Total No.
During the Period (2009-10)
Applications received for
Authorizations Status for
Waste Processing Facility
Waste Disposal Facility
Setting up/operation of Waste Processing Facility
Setting up/operation of Waste Disposal Facility
3. Nagar Panchayat
28 02 10 Nil
Nil
4. Cantonment Board
7 02 01 Nil
Granted to 01Cant. Board (Jutog)
The remaining municipal authorities could not obtain authorization due to non submission
of complete information.
To assess likely impact of municipal solid waste, ground/ surface water quality was monitored as per the requirement. Besides this, the quality of compost produced in the bio-conversion plants was also monitored to ensure its proper application.
The State Board organized training programmes on “Municipal Solid Waste Management- Options for Hilly areas” on 28th April 2009 at Shimla and “Management of Municipal Solid Waste and Plastics Waste” on 5th October, 2009 at Mandi for various target groups including Department of Urban Development, Urban Local Bodies, NGO groups respectively.
Figure - 4.9 & 4.10: One day training programme on “Municipal Solid Waste Management - Options for Hilly Areas” was organized under the chairpersonship of Chief Secretary, GoHP in the Month of April,2009.
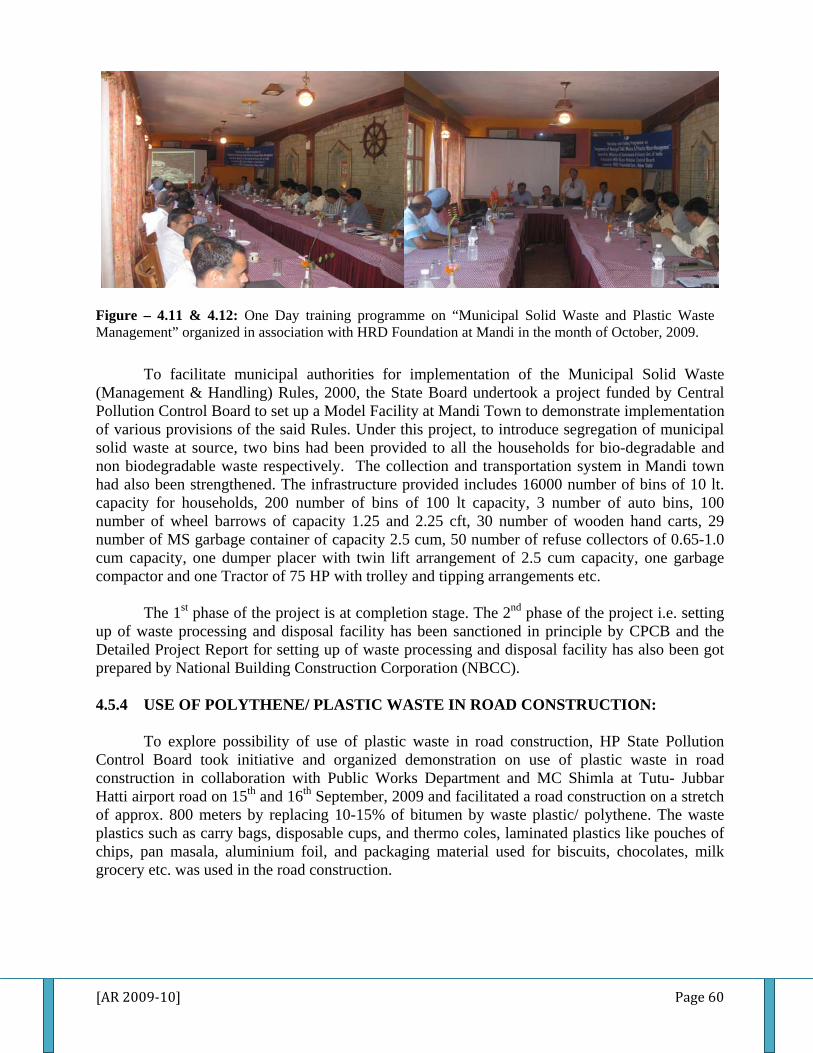
[AR 2009‐10] Page 60
Figure – 4.11 & 4.12: One Day training programme on “Municipal Solid Waste and Plastic Waste Management” organized in association with HRD Foundation at Mandi in the month of October, 2009.
To facilitate municipal authorities for implementation of the Municipal Solid Waste (Management & Handling) Rules, 2000, the State Board undertook a project funded by Central Pollution Control Board to set up a Model Facility at Mandi Town to demonstrate implementation of various provisions of the said Rules. Under this project, to introduce segregation of municipal solid waste at source, two bins had been provided to all the households for bio-degradable and non biodegradable waste respectively. The collection and transportation system in Mandi town had also been strengthened. The infrastructure provided includes 16000 number of bins of 10 lt. capacity for households, 200 number of bins of 100 lt capacity, 3 number of auto bins, 100 number of wheel barrows of capacity 1.25 and 2.25 cft, 30 number of wooden hand carts, 29 number of MS garbage container of capacity 2.5 cum, 50 number of refuse collectors of 0.65-1.0 cum capacity, one dumper placer with twin lift arrangement of 2.5 cum capacity, one garbage compactor and one Tractor of 75 HP with trolley and tipping arrangements etc. The 1st phase of the project is at completion stage. The 2nd phase of the project i.e. setting up of waste processing and disposal facility has been sanctioned in principle by CPCB and the Detailed Project Report for setting up of waste processing and disposal facility has also been got prepared by National Building Construction Corporation (NBCC). 4.5.4 USE OF POLYTHENE/ PLASTIC WASTE IN ROAD CONSTRUCTION:
To explore possibility of use of plastic waste in road construction, HP State Pollution Control Board took initiative and organized demonstration on use of plastic waste in road construction in collaboration with Public Works Department and MC Shimla at Tutu- Jubbar Hatti airport road on 15th and 16th September, 2009 and facilitated a road construction on a stretch of approx. 800 meters by replacing 10-15% of bitumen by waste plastic/ polythene. The waste plastics such as carry bags, disposable cups, and thermo coles, laminated plastics like pouches of chips, pan masala, aluminium foil, and packaging material used for biscuits, chocolates, milk grocery etc. was used in the road construction.

[AR 2009‐10] Page 61
Figure – 4.13: Plastic Waste Used Figure – 4.14: Shreeder Figure – 4.15: Shreeded Plastic
Waste
Figure -4.16 : Road Metalling using Plastic Mixed Bitumen
Figure – 4.17: Metalled Road using Plastic Mixed Bitumen
To replicate use of polythene/ plastic waste in road construction in other parts of the state, “Polythene Hatao - Paryavaran Bachao” Campaign was organized w.e.f 21-26 December, 2009 to collect the polythene/ plastic waste littered on the hill slopes, forest areas and near rivers and nallas etc. The campaign was launched by Hon’ble Chief Minister, Himachal Pradesh on 21st December, 2009 at Dharamsala and four vehicles full of plastic waste were flagged off to Nurpur for laying roads using plastic waste.

[AR 2009‐10] Page 62
Figure – 4.18: Hon’ble Chief Minister, Himachal Pradesh, inaugurating the “Polythene Hatao Paryavaran Bachao Campaign Phase- I” on 21st December at Dharmshala.
During this campaign, approximately 142 tons of polythene was collected as per the break-up given below:
Table – 4.21 District-wise Polythene Collection Status
S.No. Name of the District Polythene Collected in Tons1 Shimla 42.542 Kangra 18.803 Mandi 03.844 Chamba 11.945 Kinnaur Partially Snow Bound 00.89 6 Hamirpur 01.197 Bilaspur 03.008 Una 10.809 Kullu 13.6310 Solan 27.8011 Sirmour 07.2012 Lahaul & Spiti Snow Bound 00.00Total Polythene Collected (In Tons) 141.63

[AR 2009‐10] Page 63
4.5.5 MANAGEMENT OF SEWAGE A. Consent Status of Sewage Treatment Plants owned by I&PH Department and Discharge
of Sewage by Urban Local Bodies in H.P. under Water (Prevention & Control of Pollution) Act, 1974.
Water (Prevention & Control of Pollution) Act, 1974 provides for prevention & control of
water pollution and maintaining or restoring wholesomeness of water thus requiring provision of pollution control measures i.e. sewerage schemes and sewage treatment plants so as to check the entry of raw sewage in to recipient water bodies. As per Section 25/26 of the aforesaid Act, it is mandatory to obtain prior Consent of the Board to discharge Sewage/trade effluent.
Provision of Sewerage and Sewage Treatment Plants is the fundamental responsibility of I & PH Deptt. and Urban Development Department. The State Board has only regulatory function with regard to monitoring the performance of operational STPs as well as sewage management systems. The concerned departments are required to obtain consent to establish/operate and renewal thereof prior to establishing/operating STPs/ Sewage management systems.
The State Board processed all the 11 number of cases received for Consent to Establish/ Consent to Operate/Renewal of Sewage Treatment Plants owned by I&PH Department and granted consents to 06 number of STPs.
Table – 4.22 Consent to Establish/Operate/Renewal of STPs Particulars Total No. of applications
received No. of STPs granted consent
Consent to Establish/ Renewal 05 02 Consent to Operate/ Renewal 06 04
Besides this, the consent under the provisions of Water Act had also been granted to Cantonment Board Jutog.
In order to ensure speedy installation of Sewage Treatment Facilities and Sewerage Schemes and implementation of the provisions of Water (Prevention & Control of Pollution) the State Board had constantly been apprising Principal Secretary (I & PH), Engineer-in-Chief / Chief Engineers, I&PH department about the status of compliance of provisions of Water Act for their intervention and necessary directions and also to make adequate budgetary provisions for the same. The State Board had also asked I & PH Department to set up sewage treatment plants for the left out urban areas. The detail of Sewage Treatment Plants in H.P. is detailed in the following Table.
Table – 4.23 District-wise Location of STPs
District No. and Location of STPs in operation (up to 31.3.2010)
No. and Location of STPs proposed/ under construction (up to 31.3.2010)
Bilaspur (2) Ghumarwin, Naina Devi ji (1) Bilaspur Chamba (3) Bhagot, Barga, Sheetla,
Bridge --

[AR 2009‐10] Page 64
District No. and Location of STPs in operation (up to 31.3.2010)
No. and Location of STPs proposed/ under construction (up to 31.3.2010)
Hamirpur (3) Zone-I, II & III (Hamirpur) (3) Zone-I, Zone-II (Sujanpur), Nadaun
Kullu (3) Manali, Kullu (BhootNath) Badah
(5) Lanka Banker, Mela Ground, Jard, Sharabai, Hati-Than (Bhunter).
Kangra (4) Palampur, Jwalamukhi, Challian at Dharamsala, Medical College, Tanda,
(5) Zone-I, Zone-II, Zone-III (Kangra) Nagrota, Dehra.
Kinnaur (1) Reckong peo. -- Lahaul & Spiti
-- (3) Zone-I, Zone-II, Zone-III (Keylong)
Mandi (4) Khaliar, Raghunath Ka Padhar, Sunder Nagar, Joginder Nagar
(1) Sarkaghat.
Shimla (8) Sanjauli, Lalpani, North Disposal, Dhalli, Summer Hill, Snowdown, Rohroo, Rampur
(6) Jubbal, Narkanda, Zone-C, Rohroo), Zone-I, II ( Kotkhai), Suni
Solan (1) Arki (1) Solan, Sirmour -- (3) Zone-I,II &III (Paonta) Una (1) Zone-C (Una) (6) Zone-A, Zone-B, Zone-D (Una),
Mehatpur, Zone I & II, (Santokhgarh), Total 30 34
B. Monitoring Status of Sewage Treatment Plants during 2009-10
Out of the 88 number of water samples collected from final outlets of Sewage Treatment Plants during the year 2009-10, the 28 number of samples have not been found conforming to the prescribed standard limits. Show cause notices have been issued to I& PH Department to bring the effluent quality of the concerned STPs within the prescribed limits and to comply with all the provisions of Water (Prevention & Control of Pollution) Act, 1974. The district wise analysis results are detailed below in the following Table.
Table – 4.24 Monitoring of STPs
District Name of the STP Month of collection
Parameters pH
BOD
COD
TSS
TDS
Oil & grease
Prescribed limits
5.5-9.0
30 mg/I
250 mg/I
100 mg/ l
2100 mg/I
10mg/I
Kullu
STP Manali April 09 -- 7.0 52.0 26.0 -- --June 09 -- 34.0 168.0 65.0 -- --July 09 -- 14.0 84.0 16.0 -- 0.4Aug. 09 -- 21.0 104.0 39.0 -- 1.2Sep. 09 -- 18.0 92.0 19.0 -- 1.2Oct. 09 -- 19.0 128.0 44.0 -- 0.8Dec. 09 -- 13.0 76.0 20.0 -- 1.2

[AR 2009‐10] Page 65
District Name of the STP Month of collection
Parameters pH
BOD
COD
TSS
TDS
Oil & grease
Prescribed limits
5.5-9.0
30 mg/I
250 mg/I
100 mg/ l
2100 mg/I
10mg/I
Jan. 10 -- 10.0 68.0 31.0 -- 0.8March,10 -- 70.0 227.0 180.0 -- 2.4
STP Boot Nath (Kullu)
April 09 -- 6.0 44.0 12.0 -- 0.4Aug. 09 -- 12.0 80.0 8.0 -- --Oct. 09 -- 1.4 20.0 68.0 -- Nil
STP Badah (Kullu) June 09 -- 88.0 264.0 65.0 -- --March 10 -- 42.0 204 58.0 -- 1.2
Mandi STP Khaliar (Mandi)
April 09 7.61 8.0 56.0 34.0 -- 0.4May 09 7.15 6.0 36.0 21.0 166.0 NilJune 09 7.90 4.0 24.0 14.0 142.0 NilJuly 09 7.19 28.0 128.0 56.0 535.0 6.0Dec. 09 7.48 6.0 48.0 25.0 -- 1.2
STP RaghuNath ka Padhar (Mandi)
April 09 7.73 2.0 16.0 23.0 -- NilMay 09 7.18 10.0 48.0 24.0 174.0 0.4June 09 7.96 1.0 8.0 10.0 210.0 NilJuly 09 7.62 0.8 16.0 184.0 55.0 NilDec. 09 7.46 10.0 60.0 29.0 -- 3.6
STP Sunder Nagar May 09 7.49 20.0 88.0 39.0 -- 0.8July 09 7.53 17.0 96.0 12.0 514.0 1.2Sep. 09 7.43 19.5 132.0 41.0 898.0 2.8Jan. 10 7.35 24.0 120.0 77.0 604.0 4.4
STP Joginder Nagar Oct. 09 7.17 4.00 29.0 19.0 244.0 NilBilaspur STP Ghumarwin May 09 7.16 4.0 20.0 4.0 222.0 --
July 09 7.50 12.0 60.0 136.0 395.0 1.2Nov. 09 7.91 15.0 76.0 44.0 578.0 1.2Jan. 10 7.35 9.5 72.0 26.0 547.0 1.6
STP Naina Devi ji May 09 7.16 4.0 20.0 4.0 222.0 NilJuly 09 7.12 34.0 140.0 115.0 895.0 7.2Dec. 09 7.82 20.0 100.0 56.0 795.0 7.82
Shimla STP Sanjauli Maliana (Shimla)
May 09 7.55 2.8 72.0 46.0 436.0 NilJune 09 8.06 8.5 48.0 22.0 483.0 0.36Sep. 09 7.09 4.0 52.0 22.0 378.0 0.16Nov. 09 7.38 60.0 180.0 117.0 -- 1.2812th Jan.10 7.57 140.0 368.0 136.0 -- 1.419th Jan.10 7.80 60.0 288.0 110.0 760.0 0.60Feb. 10 8.04 60.0 240.0 221.0 777.0 2.32
STP Dhalli (Shimla)
June 09 7.92 6.2 36.0 27.0 506.0 0.96Sept. 09 7.25 6.0 72.0 10.0 476.0 NilOct. 09 7.47 21.0 72.0 44.0 -- 0.36Feb. 10 7.64 3.2 32.0 42.0 601.0 1.28
STP North disposal (Shimla)
June 09 7.34 11.0 76.0 25.0 483.0 0.72Sept. 09 7.34 7.0 44.0 16.0 342.0 NilNov. 09 7.12 15.0 52.0 24.0 - 0.16Feb. 10 8.92 4.2 24.0 69.0 648.0 1.08
STP Snowdon June 09 7.98 11.5 72.0 21.0 472.0 0.64

[AR 2009‐10] Page 66
District Name of the STP Month of collection
Parameters pH
BOD
COD
TSS
TDS
Oil & grease
Prescribed limits
5.5-9.0
30 mg/I
250 mg/I
100 mg/ l
2100 mg/I
10mg/I
(Shimla) Sept. 09 7.38 12.0 88.0 48.0 466.0 0.40Nov. 09 7.48 17.0 56.0 28.0 -- 0.20Feb. 10 7.67 10.8 96.0 38.0 596.0 7.67
STP Lalpani (Shimla)
June 09 8.01 22.0 136.0 32.0 917.0 1.12Sept. 09 6.80 15.0 92.0 80.0 580.0 0.92Nov. 09 6.82 16.0 52.0 28.0 -- 0.16March 10 7.32 17.0 168.0 60.0 522.0 4.08
STP Summer Hill (Shimla)
June 09 7.31 10.0 68.0 29.0 512.0 0.80Sept. 09 7.43 9.5 68.0 8.0 336.0 0.08Nov. 09 7.03 12.0 48.0 22.0 -- 0.08 Feb. 10 8.75 4.8 40.0 78.0 528.0 0.92
STP Rohroo June 09 7.57 6.0 72.0 32.0 -- 0.24Aug. 09 8.81 2.0 28.0 54.0 -- 0.28Dec. 09 8.03 22.0 140.0 130.0 -- 0.52March 10 7.88 9.5 92.0 38.0 268.0 7.88
Kangra STP Palampur Dec. 09 7.81 420.0 976.0 255.0 1830.0 6.24Feb.10 7.58 180.0 392.0 70.0 806.0 6.24March 10 7.43 190.0 480.0 180.0 1021.0 11.52
STP Jawalamukhi July 09 7.90 50.0 180 65.0 499.0 2.16STP Challian (Dharamsala)
July 09 6.88 21.0 64.0 19.0 330.0 --Feb. 10 8.18 50.0 104.0 17.0 288.0 1.04
STP Tanda Med. College
Sep. 09 7.90 85.0 232.0 95.0 405.0 2.88Dec. 09 8.10 32 224.0 63.0 529.0 3.16Feb. 10 7.36 95.0 240.0 15.0 478.0 3.92
Chamba STP Barga (Chamba)
Aug. 09 8.80 36.0 140.0 79.0 630.0 1.36Dec. 09 9.02 6.8 72.0 213.0 730.0 --
STP Bhagot (Chamba)
Aug. 09 8.08 8.0 56.0 27.0 379.0 0.36Dec. 09 7.30 20.0 152.0 34.0 795.0 3.92March 10 7.64 120.0 192.0 49.0 498.0 3.16
STP Sitla Bridge Aug. 09 7.52 60.0 368.0 94.0 1038.0 2.96Dec. 09 7.35 29.0 200.0 25.0 836.0 3.96
Hamirpur STP Hamirpur Zone-II
June 09 7.52 52.0 232.0 67.0 520.0 -- Nov.09 7.06 100.0 216.0 27.0 885.0 3.64 Jan.10 7.40 140.0 328.0 93.0 592.0 1.56 Feb. 10 7.33 60.0 152.0 29.0 480.0 3.40
Solan STP Arki July 09 9.03 1.6 28.0 1338 0.08 -- 4.5.6 IMPLEMENTATION STATUS OF RECYCLED PLASTICS MANUFACTURE AND USAGE RULES, 2003. As per the provisions of the Recycled Plastics Manufacture and Usage Rules, 2003, every occupier manufacturing carry bags or containers of virgin plastic or recycled plastic or both are

[AR 2009‐10] Page 67
required to get registered with the State Board. As on date, there are 93 numbers of Plastic manufacturing units operational in H.P out of the total 122 number of units inventorised. The State Board processed all the Registration applications received and granted registration to 21 numbers of Plastic Units during 2009-10. The cumulative number of units Registered with the State Board is 39. 4.6 SPATIAL ENVIRONMENTAL PLANNING:
The State Board had initiated several activities/programs on environmental and development with the objective to protect and improve the quality of environment, prevention and control of pollution. A brief summery of activities undertaken by the Center for Spatial Environmental Planning during the year 2009-10 are as listed below 4.6.1 DOCUMENT ON “STRENGTHENING OF STATE POLLUTION CONTROL
BOARD” – A PROJECT FUNDED BY THE CENTRAL POLLUTION CONTROL BOARD UNDER THE PROGRAM ‘ABATEMENT OF POLLUTION CONTROL’.
The State Board has prepared a document on the “Strengthening of State Pollution Control
Board” under the Central Pollution Control Board funded program ‘Abatement of Pollution control’. The report outlines the brief environmental conditions of the State based on the monitored data by the State Board in addition to the enlisting the mandate, functions, existing infrastructure and manpower of the State Board. In addition to the detailed information on the existing status of land pollution, the report also gives yearly status/picture of the air and water quality of various places and river systems of the State respectively along with the reasons thereof. It critically evaluates the divisional and field staff and infrastructural facilities and identifies the gaps. It also proposes additional infrastructural and manpower requirement to strengthen the State Board in view of the growing environmental challenges of the State along with the budgetary requirement. 4.6.2 PROPOSAL FOR A PILOT STUDY NAMELY ‘UPDATION OF
ENVIRONMENTAL DATA BASE OF ZONING ATLAS FOR SITING OF INDUSTRIES’ FOR ALL DISTRICTS OF HP ON A SCALE OF 1:25,000.
In view of the macro-scale of the Zoning Atlas for Siting of Industries (ZASI) on a scale of
1:2,50,000 and its implementation at micro level, the State Board formulated a project proposal on updation of environmental database on the Zoning Atlas for Siting of Industry on a higher scale ranging in a scale of 1:50,000 to 1:25,000 on the request of Ministry of Environment and Forests, Govt. of India. It is worthwhile to note that the State Board has already conducted the Zoning Atlas for Siting of Industry for all districts of the State at a scale of 1:2,50,000 under the World Bank funded Environment Management Technical Capacity Building Project and subsequently under the Ministry of Environment and Forests, Govt. of India. In view of the technical skills and in-house capabilities in Geographical Information System (GIS), the Ministry has also desired that the State Board should take up this study on a higher scale.

[AR 2009‐10] Page 68
4.6.3 ENVIRONMENTAL STATUS MAPPING OF SATLUJ CATCHMENT IN HIMACHAL PRADESH.
The State Board submitted the final report to the Ministry of Environment and Forests,
Govt. of India along with the GIS based maps and executive summary for their technical assessment and final approval. The main objective of this study was to prepare an environmental status report of the Satluj catchment and to identify the environmental issues and conservation measures required for resolving these problems. Besides, the outcome of this environmental resource inventory/spatial environmental information database would be helpful to the development agencies and user institutions of the State in their decision-making wherein, all aspects related to environment are considered in relation to the entire catchment system and to achieve the development targets which are compatible with the environmental setting of the catchment. 4.6.4 PREPARATION OF ANNUAL ADMINISTRATIVE REPORT 2008-09. The State Board compiled/prepared Annual Administrative Report for the year 2008-09 and got it approved from the Board.
*****

[AR 2009‐10] Page 69
CHAPTER-5
PROSECUTIONS LAUNCHED AND CONVICITIONS SECURED FOR ENVIRONMENTAL POLLUTION CONTROL
The H.P. State Pollution Control Board has a skeletal Legal Wing comprising of Law
Officer, Asstt. Law Officer (on contract) and a Data Entry Operator. With increasing awareness about environment and people’s right to clean air and water the overall legal workload has increased on account of increasing incidence of public interest litigation and judicial activism and as such the Board contemplates strengthen of legal staff. The Standing Counsels have been engaged in High Court, District Court and Supreme Court to the conduct the cases on behalf of the State Board. All type of assistance is rendered to Standing Counsels at different level. Their Counsels fee is paid as per fee approved by the State Board in its 60th Board meeting held on 06.01.2010.
Apart from this, assistance is being extended to the standing counsels of the Board from time to time for preparing reply/written statement and to produce evidence/record as and when required in the cases. Besides this, legal notices/directions are drafted under the Pollution Control Acts and vetted to facilitate the concerned branches. Legal opinion/advice is, rendered not only at Head Quarter level but also to Regional Officers on the clearance of cases/matters involving legal implications. Compliance from Industries has been sought through consultative approach with encouraging results thereby, saving time, cost and efforts and legal compliance has increase significantly through this co–operative efforts jointly with the industries. In addition to this the Board regularly issues directions to non-complying units under the provisions of Section 31-A of Water Act, 1974 or Section 31-A of Air Act, 1981 as the case may be which includes power disconnection. For resolution of conflicts and enviro-legal action, the Board has resorted to innovative approach, which includes opportunity of hearing to make the entrepreneur aware of their environment-responsibility through mediation of Board official to arrive at mutual agreed solution. Regular notices are issued to the offenders and as and when cognizance is taken, the hearings/opportunity are afforded to them by the Board, rather than immediate resort to filing of cases. The success rates of hearing have been phenomenal and resolutions have been possible in most of the cases. Apart from this, the legal wing also gives information/ comments in Court cases involving environmental matters to the State Government. Statistical indicators of court cases are as listed below:-

[AR 2009‐10] Page 70
Table - 5.1 Statistical Indicators of Court cases for the year-2009-2010 (upto 31-3-2010)
Courts Pending as on 31-3-09
New cases initiated during the year 2009-10
Total cases during 1-4-2009-10
Decided during the year 2009-10 (1-4-09 to 31-3-2010)
Total / Cumulative i.e. pending cases of previous years upto 31-3-2010
Supreme Court 4 2 6 0 6
High Court Cases/ PIL
69 59 128 38 90
District Courts 20 4 24 0 24
Human Right Commission
Nil Nil Nil Nil Nil
Service matters / cases in High Court (previously in Administrative Tribunal)
18 4 22 0 22
*****

[AR 2009‐10] Page 71
CHAPTER –6
FINANCE AND ACCOUNT OF THE STATE BOARD FOR THE YEAR 2009-10
The accounting structure of H.P. State Pollution Control Board is fully streamlined to the
extent that the books of accounts show position of cash, bank and short/long- term deposit, balance on day to day basis.
The accounts for the financial year 2008-2009 were prepared and got audited by the Statutory Auditors. The final account (Balance Sheet, Income & Expenditure Account and Receipt & Payment Account) will be placed in forthcoming Board meeting. The Accounts for the F.Y. 2009-10 are under compilation.
The total expenditure of the Board during 2009-2010 based upon un-audited accounts was Rs. 1004.32 Lakhs (Including Projects) as against the receipts of Rs.3012.88 Lakhs (Including Projects), the details are given below:
(Rs. In Lakhs) Opening Balance 5497.16Receipts (Board) 2984.79Receipts (Projects) 28.09Net Amount Available 8510.04Less Expenditure (Board) during this year Less Expenditure (Projects) during the year
882.87121.45
Closing Balance 7505.72
The above figures have been worked out on the basis of un-audited accounts. Figures are provisional and are subject to change after audit.
*****

[AR 2009‐10] Page 72
CHAPTER -7
ANY OTHER IMPORTANT MATTER DEALT WITH BY THE STATE BOARD
7.1 Environmental Training & Capacity Building:
Training is an important component for Human Resource Development of any Organization. In the area of pollution control, which is an interdisciplinary subject, imparting training is an imperative activity. The following Board Officers/Officials participated in various trainings/workshops/conferences during 2009-10.
Table: 7.1 Environmental Training & Capacity Building
Sr. No
Training Title
Training Institute
Training Schedule
Duration Trainee
1. 2nd phase Training Programme on “Bio Monitoring”
Madhya Pradesh Pollution Control Board, Bhopal
June, 16-17 2009 02 Days Sh. Vinod Kumar, Jr. Scientific Assistant, HPSPCB, Shimla 0177-2673032
Sh. Sunil Kumar Rana, Jr. Scientific Assistant, HPSPCB, Paonta Sahib 01704-223445
2. E -Waste Management Central PollutionControl Board, New Delhi
July 06, 2009 01 Day Sh. Sanjeev Sharma, Scientific Officer, HPSPCB, Shimla Ph. 0177-2673032
3. Waste Water Treatment Technology
IIT, Roorkee September 8-12, 2009
05 Days Sh. Pradeep Moudgil, Assistant Environmental Engineer, HPSPCB, Parwanoo Ph.01792 234081
Sh. Varun Gupta Assistant Environmental Engineer, HPSPCB, Chamba Ph. 01899 220326
4. Chemical Analysis of Water and Waste Water
IIT, Roorkee December 02-04, 2009
03 Days Sh. Avtar Singh, Jr. Scientific Officer, HPSPCB, Jassur 01893-227802
Sh. Ramakant Awasthi, Jr. Scientific Officer, HPSPCB, Shimla 0177-2673507
5. Determination of Dissolved Oxygen, Biological Oxygen, Chemical Oxygen, Demand Total Organic Carbon, relationship between BOD, COD, TOC
IIT, Roorkee December, 06-08, 2009
03 Days Miss Renu Bala, Jr. Scientific Assistant, HPSPCB, Parwanoo 01792-232540

[AR 2009‐10] Page 73
6. Sampling, Analytical Techniques of water Samples and Quality Control
NGRI, Hyderabad
December 14-18, 2009
05 Days Sh. Vinod Kumar, Jr. Scientific Assistant, HPSPCB, Shimla 0177-2673032
Ms. Anish Rani, Jr. Scientific Assistant, HPSPCB, Parwanoo 01792-232540
7. Environmental Impact Assessment
CENC, Patna December 19-21, 2009
03 Days Sh. Shashi Shekhar, Environmental Planner, HPSPCB, Shimla 0177-2673507
8. Water Quality Monitoring
IIPA, New Delhi
December 21-24, 2009
04 Days Sh. Sunil Kumar Rana, Jr. Scientific Assistant, HPSPCB, Paonta Sahib 01704-223445
9. Analytical Procedures and Trace Metal-Pesticides Analysis
IIPA, New Delhi
January 14-18, 2010
05 Days Sh. Praveen Sharma, Jr. Scientific Assistant, HPSPCB, Parwanoo 01792-232540
10. Laboratory Safety and Waste Management
IIT, Madras February 26-28, 2010
03 Days Sh. Anup Vaidya, Scientific Officer, HPSPCB, Sunder Nagar 01907-263940
11. Operation and maintenance of Sophisticated Instruments like GC-MS/GC, HPLC, CHNS, AOX Analyzer
IIT, Roorkee February 15-19, 2010
05 Days Sh. Sunil Kumar Rana, Jr. Scientific Officer HPSPCB, Paonta Sahib 01704-223445
Sh. Praveen Sharma, Jr. Scientific Officer, HPSPCB, Parwanoo 01792-232540
12. Management of E-Waste and remediation of contaminated sites
Indian Habitat Centre, New Delhi
February 2-3, 2010
02 Days Sh. Sanjeev Sharma, Scientific Officer, HPSPCB, Shimla 0177-2673032
13. Monitoring of Source Emissions
NPC, Chennai February, 08-12, 2010
05 Days Sh. Praveen Dhiman, Jr. Environmental Engineer, HPSPCB, Una 01975-223220
14 Pollution Control in Textile Dyeing Industries
IIT, New Delhi February, 25-27, 2010
03 Days Sh. Sunil Sharma, Jr. Environmental Engineer, HPSPCB, Shimla 0177-2673507
15. Cleaning, Preparation of Glassware, Sampling, Preservation, Transportation of Samples, Quality Management Tools, Assurance, Laboratory Audit
CENC, Patna February, 20-24, 2010
05 Days Ms. Kiran Rawat, Jr. Scientific Assistant, HPSPCB, Sunder Nagar 01907-263940
16. Measurement of uncertainty in Chemical and Biological Testing
ISI, New Delhi March 3-5, 2010 03 Days Sh. Prakash Sharma, Scientific Officer, HPSPCB, Sunder Nagar 01907-263940

[AR 2009‐10] Page 74
7.2 Environmental Awareness: In order to make the general masses aware
of the environmental issues the following activities were carried out during the year. a) World Environment Day 5th June, 2009:
On occasion of the World Environment Day, the State Board organized the following activities:
(i) Vehicular monitoring in the major
towns of the State. (ii) Activities like quiz competition,
drawing competition, slogan writing and debates were organized for the School children by field offices and laboratories. They have also participated in cleaning of natural springs (drinking water sources) campaign in their respective localities.
(iii) Rallies were taken out by the school children carrying banners and signboards on environmental slogans.
(iv) Distribution of pamphlets on vehicular pollution, air pollution and noise pollution amongst general public and students.
b) Advertisement and Publicity: During the
year 2009-10 the State Board intensified mass awareness campaign through publication of matter in the leading national, local newspapers, weekly & quarterly magazines.
c) Control of Noise Pollution: Campaign
against noise pollution due to firecrackers was also launched on the eve of Diwali festivals throughout the State by way of noise monitoring and advertisements in the newspapers.
*****

Ann
exur
e-1
[AR 2009‐10] Page 75