annual report 2019saifpower.com/wp-content/uploads/annual-report-2019.pdfhabib bank limited habib...
TRANSCRIPT

Annual Report 2019
SAIF POWER LIMITEDA Saif Group Company

Financials at a Glance
2019 2018
Rs. MillionTurnover 14,910 16,690 Gross profit 5,018 4,065 Financial cost 1,209 894 Net Profit 3,650 3,033
Shareholders Equity 14,808 12,047
Rs. Dividend per share 3.00 2.95

Annual Report 2019 1
Table of Contents
02 Basic Corporate Profile
Independent Auditors’ Review Report on Statement of Compliance
Vision & Mission
Independent Auditors' Report to the Members on Unconsolidated Financial Statements
Core Values
Unconsolidated Financial Statements
Corporate Social Responsibility
Pattern of Shareholding
Consolidated Financial Statements
Independent Auditors' Report to the Members on Consolidated Financial Statements
Report of the Board of Directors to Shareholders
Chairperson's Review
Notice of Annual General Meeting
Proxy Form
Statement of Compliance with Code of Corporate Governance
Electronic Transmission Consent Form
28
04
34
26
03
29
09
07
05
133
143
147
149
84
80

SPL 2
Board of Directors Mrs. Hoor Yousafzai ChairpersonMr. Javed Saifullah Khan DirectorMr. Osman Saifullah Khan DirectorMr. Jehangir Saifullah Khan DirectorMr. Assad Saifullah Khan DirectorMs. Jehannaz Saifullah Khan DirectorMr. Naved Abid Khan Independent Director
Audit Committee Mr. Naved Abid Khan ChairmanMr. Osman Saifullah Khan DirectorMr. Jehangir Saifullah Khan Director
Human Resource and Remuneration CommitteeMr. Naved Abid Khan ChairmanMr. Jehangir Saifullah Khan DirectorMr. Assad Saifullah Khan Director
Management Mr. Sohail H Hydari Chief Executive Officer
Mr. Hammad Mahmood Chief Financial Officer
Mr. Ghias Ul HassanGM Power Plant
Mr. Waseemullah Company Secretary
AuditorsM/s KPMG Taseer Hadi & Co.Chartered AccountantsState Life Building No. 6,Jinnah Avenue, Islamabad.
Legal AdvisorsM/s Cornelius, Lane & MuftiAdvocates & Solicitors
Registered/ Head Office1st Floor, Kashmir Commercial Complex, Fazal-ul-Haq Road Block E, Blue Area,Islamabad, Pakistan.Tel: +92-51-2271378-83Fax: +92-51-2277670Email: [email protected]
Websitehttp://www.saifpower.com
Share RegistrarTHK Associates (Private) Ltd. 1st Floor, 40-C, Block-6, P.E.C.H.S, Karachi 75400, P.O Box. No: 8533 Tel: +92-21-111-000-322 Fax: +91-21-34168271 Email: [email protected] [email protected]
Banks & Financial InstitutionsAllied Bank LimitedAlbaraka Bank (Pakistan) LimitedAskari Bank LimitedBank Alfalah LimitedBank Islami Pakistan LimitedDubai Islamic Bank LimitedFaysal Bank LimitedFirst Habib ModarabaHabib Bank LimitedHabib Metropolitan Bank LimitedJS Bank LimitedMeezan Bank LimitedNational Bank of PakistanPak Brunei Investment Company LimitedPak Oman Investment Company LimitedSaudi Pak Industrial and Agricultural -Investment Company LimitedSonari Bank LimitedSummit Bank LimitedThe Bank of PunjabUnited Bank Limited
Plant LocationChak 56/5L, Qadarabad,Multan Road, District Sahiwal,Punjab, Pakistan.
Basic Corporate Profile

Annual Report 2019 3
MissionBe looked up as an honest and reliable supplier
Strive to perform at our best under a professional, effective,transparent and cordial corporate culture
Add value to stakeholders' interests
VisionLet us light homes whatever it takes
And let us be an efficient, flexible but also a humble resource within the power generation industry

SPL 4
It is our objective to ensure that we:
Ethics
Adhere to high ethical standards and transparency in the conduct of our business Take ownership of our actions Give top most priority to Company’s image and integrity as a legal entity Do not allow our directors or employees to be placed in a situation of conflict of interest
People
Encourage and promote open communication and free enterprise Give attention to the health, safety and well being of our employees and provide a safe and secure environment Inculcate team work and sharing
Quality, Compliance and Business Excellence
Strive to bring excellence within our performances and scope of work while observing all applicable laws Never trespass or deviate from our approved operational and financial systems Concentrate fully on maximizing shareholders’ returns through good governance and through proper application of all management functions
Core Values
Sharing & Team Work

Annual Report 2019 5
CSR is a relationship with all of our stakeholders.
Our Employment Practices ensure competitive salaries and wages along with benefits including healthcare. All of our employees are entitled to OPD and hospital beds at Kulsum International Hospital (run by Saif Group) at nominal rates.
Along with General Electric, USA who are our O&M Contractors, the company provides highest standards of occupational health and safety all around our plant premises.
We are committed to the community around us and, therefore, we comply with all applicable regulations in this area. Every year, young boys with relevant qualifications from our neighbourhood community get internships which serve as a platform for them considering the fact they are able to work along GE experienced personnel and, under the guidance of our own senior management.
Besides the above, the owner/directors provide substantial services in their own local areas as follows:
Saifullah Foundation for Sustainable Development (SFSD) was established as an independent non-political, non-profit NGO registered under Khyber Pakhtunkhwa Social Welfare Agencies (Registration and Control Ordinance, 1961). Begum Kulsum Saifullah Khan (Hilal-e-Imtiaz), the founding Chairperson, was the inspiration behind its establishment. SFSD manages;
Saifullah Khan TrustAkbar Kare Institute
SAIFULLAH KHAN TRUST (SKT)SKT focuses on promotion of skill based education and, financial help to bright students in the shape of stipends. Around 300 students receive stipends each year. FM – 88 radio station was set up in 2004 in Lakki District for awareness oriented program and for entertainment. Both of these objectives are being achieved and FM 88 has gained huge popularity. Clean water facility has been provided to the village of Lawang Khel with a population of 2000 people. Earlier these villagers did not have access to clean drinking water despite an existing water supply scheme which had not functioned for 10 years.
AKBAR KARE INSTITUTE (AKI)AKI is a therapy centre for all children of Khyber Pakhtunkhwa (K.P.K), Pakistan who have Motor Developmental Delay primarily due to Cerebral Palsy. Cerebral palsy is a disorder of movement, muscle tone or posture that is caused by injury or abnormal development in the immature brain, most often before birth.
As often happens with innovative new projects in the developing world, AKI was inspired by the personal experiences of one woman and her family. Costs and expenses have been met by the founding family through their organization, the Saifullah Foundation for Sustainable Development (SFSD). All services, aids, and referrals are free and no expense is passed onto the client families.
Corporate Social Responsibility (CSR)

SPL 6
Operations AnalysisComparison of Plant Operation For Year 2019 & 2018
Parameters Units 2019 2018
Plant Operating Hours on Gas Fuel Hrs 4,392 5,942
Plant Operating Hours on HSD Fuel Hrs - 15
Utilization Factor % 43.7 61.92
Load Factor % 40.19 62.86
Complex Reliability Factor % 97.05 99.49
Complex Start Up Reliability Factor % 97.50 93.67
Generation on HSD Fuel MWh - 2,769
Generation on Gas Fuel MWh 716,203 1,101,916
Net Generation MWh 716,203 1,104,685
Period Hours Hrs 8,760 8,760
Service Hours Hrs 4,863 6,378
Standby Hours Hrs 3,193 1,900
Available Hours Hrs 8,057 8,278
Planned Outage Hours Hrs 458 437
Unplanned Outage Hours Hrs 245 44
Toral Outage Hours Hrs 703 482
Availability Factor % 92.88 94.50

Annual Report 2019 7
Dear Shareholders
I am pleased to present the Annual Report of your Company for the financial year ended December 31, 2019.
Your Board of Directors is cognizant of your Company’s obligation to be compliant with listed Companies (Code of Corporate Governance) Regulation 2019 and the Companies Act, 2017. The Board has ensured that adequate policies and procedures are in place to make and enhance the corporate values. Company’s performance has been better than last year. Details of financial and operational performance indicators have been described in more detail in Report of the Board of Directors to shareholders along with the Audited Financial Statements.
On behalf of the Board, I would like to acknowledge with thanks the contributions made by the management staff, employees, lender banks, suppliers, contractors, regulatory authorities, various government functionaries, at the same time would also like to acknowledge the trust shown by our shareholders in the Company.
March 27, 2020 Javed Saifullah KhanIslamabad
Chairperson’s Review

SPL 8
9

Annual Report 2019 9
The Board of Directors is pleased to present the Annual Report of Saif Power Limited (the Company) along with its audited Financial Statements for the year ended December 31, 2019.
About the Company
The Company is an Independent Power Producer (IPP) and its power plant is located at Qadirabad, Sahiwal. The Complex – Combined Cycle Thermal Power Plant is a dual fuel power generating station where the primary fuel is natural gas and the backup fuel is High Speed Diesel (HSD). Gross Capacity of the power plant is 225MWs with two Gas Turbines from GE France and a Steam Turbine from Siemens Sweden. The 6 FA.03 Gas Turbines are perhaps the most fuel efficient in the world in their rated capacity and, our combined cycle efficiency is the highest in Pakistan within such Gross capacity.
PRINCIPAL ACTIVITY
The principal activity of the Company is to own, operate & maintain a combined cycle power plant and undertake the business of power generation & sell electricity to National Transmission and Despatch Company (Power Purchaser). The Company is listed on Pakistan Stock Exchange Limited.
OPERATIONS
The Company continues to follow best practices to ensure best Reliability, Availability and Operational Performance. During the year, reliability factor was 97.05% as compared to 99.49% in 2018 and availability factor was 92.88% as compared to 94.50% in 2018. Load factor was 40.19% as compared to 61.92% in 2018 as per dispatch requirement from Power Purchaser. Since 2018, the plant has mostly run on RLNG fuel.
FINANCIAL PERFORMANCE
Unconsolidated:
The Company continues to perform well in current circumstances under challenges. The Company earned a net profit of Rs. 3,650 million, resulting in earning per share (EPS) of Rs. 9.44 as compared to Rs. 3,033 million and EPS Rs. 7.85 in 2018.
REPORT OF THE BOARD OF DIRECTORS TO SHAREHOLDERS

SPL 10
Key Financial and Operating Data of last six years is as follows:
FOR THE YEAR ENDING DECEMBER 2019 2018 2017 2016 2015 2014
------------------------------Rupees in million-------------------------------
Turnover 14,910 16,690 12,257 11,946 14,981 18,520
Gross Profit 5,018 4,065 3,478 3,188 3,290 3,746
Net Profit 3,650 3,033 2,592 2,312 2,063 1,988
Property, Plant and Equipment 12,800 13,294 13,688 14,213 14,802 15,353
Long term equity investment 738 631 - - - -
Net worth 14,808 12,047 10,396 9,216 7,872 6,969
Long term financing 788 2,975 4,761 6,499 7,823 9,529
Short term borrowing 5,260 5,449 1,928 1,267 866 1,508
Earnings per share – (in rupees) 9.44 7.85 6.71 5.98 5.34 5.14
Dispatch level- (percentages) 40.19% 61.92% 32.30% 58.79% 50.85% 41.99%
Capacity Made Available-GWHs 1,782 1,784 1,786 1,675 1,652 1,746
Consolidated:
Consolidated net profit during the year under review is Rs. 3,646 million resulting in earning per share (EPS) of Rs. 9.44 (2018: Rs. 3,032 million and EPS Rs. 7.85).
Appropriations and movement in reserve have been disclosed in the consolidated statement of changes in equity.
PENDING ISSUES
In the case against M/s Sui Northern Gas Pipelines Limited (SNGPL), after the arbitration award in Company’s favour for an amount of Rs. 270.66 million (dispute amount of Rs. 239.68 million & related costs of Rs. 30.98 million), the Company filed a petition in the Civil Court Lahore to obtain the enforcement Decree in lieu of the Arbitration award. SNGPL had challenged the award both in civil court and in Lahore High Court (LHC). The LHC dismissed the petition of SNGPL. Supreme Court of Pakistan has also disposed-off the appeal. The Company has already adjusted the awarded amount as above against payables to SNGPL.
During the year, SNGPL has filed suit for recovery before District Judge (Invested with Powers of the Gas Utility Court), Lahore against this adjustment including a claim for a markup amount of Rs. 136.14 million from the date of such adjustment. SNGPL has also filed a request for Arbitration before the London Court of International Arbitration (LCIA). In its submission to LCIA, subsequent to year end, SNGPL has claimed markup amount of Rs. 236.47 million from the date of such adjustment. The Company’s position is that no amount is payable to SNGPL and in any case, LCIA Arbitration is the only competent forum to decide on this case.

Annual Report 2019 11
In the case against Power Purchaser, the Arbitrator has awarded Rs. 477.56 million in Company’s favour along with related costs. The Company has filed a petition in Lahore High Court for its enforcement. Power Purchaser has also challenged the partial final award and final award in Civil Court, Lahore, which is pending adjudication.
LOOKING FORWARD
(a) Circular Debt
The circular debt position of power sector has not shown any positive curves since last year. The Company’s receivables have increased by Rs. 950 million. However, the company has arranged adequate working capital lines to fully sustain the operations in future years.
(b) Further to above, GOP is making huge efforts to reduce the circular debt amount. GOP is also in the process of issuing a Sukuk instrument for Rs. 200 billion for payment to the power sector.
(c) Last principal instalments of long term loans of the Company will be paid to the lenders at the end of March 2020 quarter. The fact that Power Purchaser will not be required to pay the amounts of long term loan instalment and markup anymore, the pressure on them to that extent will ease. Hopefully, the Company will not add to its receivables during the current year and, in fact, may receive money to partially adjust the already existing receivables.
CREDIT RATING
PACRA’s rating for the Company is A+ in the long term and A1 in the short term while the ‘Outlook’ has been determined as ‘Stable’, which denote a low expectation of credit risk and indicate adequate capacity for timely payment of financial obligations.
CORPORATE SOCIAL RESPONSIBILITY, SAFETY, HEALTH AND QUALITY
Your company works with all stakeholders to ensure that it complies with all applicable regulations; contributes to community development; provides highest standards of safety, health and environment; offers competitive wages and benefits to its employees. The parent company provides necessary support in this regard with a centralized process.
IMPACT OF COMPANY’S BUSINESS ON ENVIRONMENT
Your Company maintains a tight control on all type of emissions from the Plant and ensures that under no circumstances any value of the emission exceeds beyond the limits provided in the Environmental Protection Agency (EPA) guidelines.
PRINCIPAL RISKS & UNCERTAINTIES
The Company has ensured that appropriate controls exist to cater to any unforeseen risks & uncertainties. Most of the financial risks are covered through tariff. However, liquidity risk remains as one of the uncertainties for reliable operations of the company. This risk, as highlighted above, has been mitigated by arranging adequate credit lines from thirteen different banks. Financial risk management is also disclosed in notes to the financial statements. Operational risks have been mitigated to a great extent through outsourcing of plant operations to M/s General Electric (who are both the original supplier and the O&M contractor) and through a comprehensive and effective insurance policy.

SPL 12
INTERNAL AUDIT AND CONTROL
The independent internal audit function headed by a qualified person reporting to the Audit Committee is in operation. The scope of internal auditing within the Company is clearly defined which broadly involves review and evaluation of internal control system, safeguarding of assets, accuracy and completeness of accounting records.
ADEQUACY OF INTERNAL FINANCIAL CONTROLS
Your Company complies with the highest standards of Corporate Governance and, internal controls are sound in design and have been effectively implemented and monitored.
DIVIDEND
The Board has recommended a final dividend of 20% (Rs. 2 per share) for the year ended 2019 to the shareholders for their approval in Annual General Meeting, in addition to interim dividend of 10% (Rs. 1.00 per share), making it total dividend of 30% (Rs. 3 per share) as compared to 29.5% (Rs. 2.95 per share) for previous year. Unless there is any contingency, the Board of Directors of your company would continue with the policy of paying out all surplus cash available within the Company.
INVESTMENT IN SUBSIDIARY
This represents equity investment in Saif Cement Limit (“SCL”) formerly Saif Cement (Private) Limited which was converted into a Public Limited Company on March 29, 2019. SCL is setting up a cement manufacturing plant in Saidulwali Village, Paharpur, Dera Ismail Khan, Khyber Pakhtunkhawa (KPK). The Company during the year, acquired additional 10,390,419, fully paid ordinary shares of Rs. 10 each and paid Rs. 3.5 million as share deposit money against right entitlement for which the shares were issued subsequent to year end. The Company holds 96.28% of issued share capital of SCL as at December 31, 2019.
The Company intends to invest equivalent US $ 20 million in SCL, (which would be adjustable to the foreign exchange rates during the tenure of the project) at par value of Rs. 10 per share, in line with the approval from NEPRA and from the Company's shareholders at the extraordinary general meeting held on February 28, 2018. Accordingly, the Company's intended investment will eventually result in approximately 21% of equity of SCL instead of currently held 96.28%.
Subsequent to year end, additional investment of Rs. 13,701,880 has been made against which the shares have also been issued.
CORPORATE AND FINANCIAL REPORTING FRAMEWORK
Board of Directors
The activities of the Board are based on the requirements and duties laid down under relevant laws and Memorandum and Articles of Association of the Company. This compliance assists the Board in safeguarding the interests of all the stakeholders. The Board of Directors provides oversight in the governance, management and control of the Company and help in setting the goals, objectives and strategies of the Company and to formulating the policies and guidelines towards achieving such goals and objectives.

Annual Report 2019 13
The total number of directors are seven as per the following:
A Male: 5
B Female: 2
The composition of board is as follows:
A Independent Director 1
B Other Non-executive Director 6
The Chairperson of the Board is a non-executive director. The positions of Chairperson and CEO are held by separate individuals with clearly defined roles and responsibilities. As required by Companies Act, 2017 and listed companies code of corporate governance, all directors are provided with sufficient information of their duties and responsibilities under respective laws and the Company’s Memorandum and Articles of Association.
In compliance with the Corporate and Financial Reporting Framework of the Code of Corporate
Governance, the Directors confirm the following:
• The financial statements of the Company, prepared by the management of the Company, present its state of affairs fairly, including the result of its operations, cash flows and changes in equity.
• Proper books of account of the Company have been maintained.
• Appropriate accounting policies have been consistently applied in preparation of financial statements and accounting estimates are based on reasonable and prudent judgment.
• International Financial Reporting Standards (IFRS), as applicable in Pakistan, and subject to waivers from the competent authority, have been followed in preparation of financial statements and, any departures therefrom (if any) have been adequately disclosed and explained.
• The system of internal control is sound in design and has been effectively implemented and monitored.
• There are no significant doubts upon Company’s ability to continue as a going concern.
• All the directors on the Board are fully conversant with their duties and responsibilities as directors of corporate bodies. The directors were apprised of their duties and responsibilities through orientation courses.
• There has been no trading of shares by CEO, Directors, CFO, Company Secretary and their spouses.
• Information about outstanding taxes and levies is given in the notes to the financial statements.

SPL 14
During the year, four Board of Directors’ Meetings were held, attendance position was as under:-
Name of Directors Status Meetings attended
Mrs. Hoor Yousafzai-Chairperson Elected 01/04
Mr. Javed Saifullah Khan Appointed 04/04
Mr. Osman Saifullah Khan Elected 04/04
Mr. Jehangir Saifullah Khan Elected 02/04
Mr. Assad Saifullah Khan Elected 04/04
Ms. Jehannaz Saifullah Khan Elected 04/04
Mr. Naved Abid Khan Appointed 02/04
Mr. Rana Muhammad Shafi Resigned 00/00
Leave of absence was granted to Director(s) who could not attend any meeting. The current term of the directors shall stand completed in October 2020 when fresh elections will be held for appointment of directors through general meeting of the shareholders.
During the year, four Audit Committee Meetings were held, attendance position was as under:-
Name of Directors Status Meetings attended
Mr. Naved Abid Khan Chairman 03/04
Mr. Osman Saifullah Khan Member 04/04
Mr. Jehangir Saifullah Khan Member 03/04
During the year, one HR and Remuneration Committee was held, attendance position was as under:-
Name of Directors Status Meetings attended
Mr. Naved Abid Khan Chairman 01/01
Mr. Jehangir Saifullah Khan Member 01/01
Mr. Assad Saifullah Khan Member 01/01
DIRECTORS’ TRAINING
Directors are well versed with and have the requisite knowledge of Code of Corporate Governance and all applicable laws.
During the year one director joined the Board, who is exempt from the directors’ training program in accordance with clause 19(2) of Chapter VI of the Listed Companies (Code of Corporate Governance) Regulations, 2019 as having minimum 14 years of education and over 15 years of experience on the Board of a listed Company. The total number of directors who have completed/ are exempt from

Annual Report 2019 15
training is six out of seven directors.
DIRECTORS’ REMUNERATION
Non-Executive directors and Independent director are entitled for only fee for attending the meetings, as determined by the Board from time to time.
RELATED PARTY TRANSACTIONS
Transaction undertaken with related parties are carried out on arm’s length basis during the year and have been ratified by audit committee and approved by the Board.
PATTERN OF SHAREHOLDING
The statement of pattern of shareholding as on December 31, 2019 is attached with the report.
AUDITORS
The present auditors M/s KPMG Taseer Hadi & Co, Chartered Accountants, Islamabad retire and being eligible, offer themselves for re-appointment for the year 2020.
INFORMATION OF SUBSIDIARY REQUIRED TO BE DISCLOSED U/S 226(3) OF THE COMPANIES ACT, 2017
SAIF CEMENT LIMITED
PRINCIPAL ACTIVITY
The principal activity of Saif Cement Limited (SCL) after Commercial Operation Date will be production and sale of Cement. Currently, SCL is engaged in developing a Greenfield Cement Production Plant with a clinker production capacity of 6,500 Tons Per Day at Paharpur, Dera Ismail Khan, KP province.
FINANCIAL PERFORMANCE AND FUTURE OUTLOOK
As SCL is in developmental phase; therefore, no profit is reported for the year. Loss for the year amounting to Rupees 3,516,621 (2018: Rupees. 772,334), represents administrative expenses only. Loss per share reported during the year was Rs.0.046 (2018: Loss per Share Rs. 0.012). SCL has never defaulted on any payment.
SCL has achieved majority of its milestones and will be moving towards financial close with the lenders.
BOARD OF DIRECTORS
During the year on March 29, 2019 SCL was converted into a Public Limited Company and the number of Directors were increased to twelve (12). Accordingly, ten (10) more directors were appointed.

SPL 16
However, subsequently Four (4) directors resigned during the year. The detail is as follows:
S. No NAME STATUS
1 Mr. Jehangir Saifullah Khan Elected (31/10/2017)
2 Mrs. Hoor Yousafzai Elected (31/10/2017)
3 Mr. Anwar Saifullah Khan Appointed on conversion
4 Mr. Javed Saifullah Khan Appointed on conversion
5 Mr. Osman Saifullah Khan Appointed on conversion
6 Mr. Assad Saifullah Khan Appointed on conversion
7 Mr. Faisal Saifullah Khan Appointed on conversion
8 Mr. Abbas Saifullah Khan Appointed on conversion
9 Mr. Humayun Saifullah Khan Appointed & Resigned
10 Mr. Iqbal Saifullah Khan Appointed & Resigned
11 Mr. Salim Saifullah Khan Appointed & Resigned
12 Mr. Muhammad Aly Saifullah Khan Appointed & Resigned
PRINCIPAL RISKS AND UNCERTAINITIES
Currently, the cement industry is in an oversupply position. Hopefully, with all the dams being now awarded and initial constructions happening, the demand in North will push up tremendously by the time SCL comes into operations in around 2.5 years’ time.
ACKNOWLEDGEMENT
The Directors of your Company would like to show their appreciation to its customers, suppliers, financial institutions, regulators and to all other stakeholders for their cooperation and support during the year.
The Directors of your Company would also like to express their deep appreciation for the services, loyalty and efforts being continuously rendered by the employees of the Company and hope that they will continue to do so in the future.
The Board would like to record its appreciation for the invaluable contributions rendered by the outgoing director and welcomes the new director.
For and on behalf of the Board
_________________ __________________Sohail H. Hydari Javed Saifullah Khan Chief Executive Officer Director
Islamabad: March 27, 2020

Annual Report 2019 17

SPL 18

Annual Report 2019 19

SPL 20

Annual Report 2019 21

SPL 22

Annual Report 2019 23

SPL 24

Annual Report 2019 25

SPL 26
Statement of Compliance with Listed Companies (Code of Corporate Governance) Regulations, 2019 The Company has complied with the requirements of the Regulations in the following manner:
1. The total number of directors are seven as per the following:
a Male: 5
b Female: 2
2. The composition of board is as follows:
a Independent Director* 1
b Other Non-executive Director(including female directors)
6
c Executive Directors 0
d Female Directors 2 * This requirement of Regulations 2019 will be complied with during upcoming election of directors, as
permitted by Regulations 2019.
3. The directors have confirmed that none of them is serving as a director on more than seven listed companies, including this company;
4. The Company has prepared a “Code of Conduct” and has ensured that appropriate steps have been taken to disseminate it throughout the Company along with its supporting policies and procedures;
5. The Board has developed a vision/mission statement, overall corporate strategy and significant policies of the Company. The Board has ensured that complete record of particulars of the significant policies along with their date of approval or updating is maintained by the Company;
6. All the powers of the Board have been duly exercised and decisions on relevant matters have been taken by the Board/ shareholders as empowered by the relevant provisions of the Act and these Regulations;
7. The meetings of the Board were presided over by the Chairperson and, in her absence, by a director elected by the Board for this purpose. The Board has complied with the requirements of Act and the Regulations with respect to frequency, recording and circulating minutes of meeting of the Board;
8. The Board have a formal policy and transparent procedures for remuneration of directors in accordance with the Act and these Regulations;
9. The Board members have either completed or are exempt from Directors’ training program except for only one female director who will complete the Directors’ training program in due course of time;
10. The Board has approved appointment of Chief Financial Officer, Company Secretary and Head of Internal Audit, including their remuneration and terms and conditions of employment and complied with relevant requirements of the Regulations;
Annual Report 2019 27
11. Chief Financial Officer and Chief Executive Officer duly endorsed the financial statements before approval of the Board;
12. The Board has formed committees comprising of members given below:
a) Audit Committee (Name of members and Chairman)
Mr. Naved Abid Khan Chairman Mr. Osman Saifullah Khan Member Mr. Jehangir Saifullah Khan Member
b) b) HR and Remuneration Committee (Name of members and Chairman)
Mr. Naved Abid Khan Chairman Mr. Jehangir Saifullah Khan Member Mr. Assad Saifullah Khan Member
13. The terms of reference of the aforesaid committees have been formed, documented and advised to the committee for compliance;
14. The frequency of meetings (quarterly/half yearly/ yearly) of the committee were as per following:
a) Audit Committee -Quarterlyb) HR and Remuneration Committee -On required basis
15. The Board has set up an effective internal audit function who are considered suitably qualified and experienced for the purpose and are conversant with the policies and procedures of the Company;
16. The statutory auditors of the company have confirmed that they have been given a satisfactory rating under the Quality Control Review program of the Institute of Chartered Accountants of Pakistan and registered with Audit Oversight Board of Pakistan, that they and all their partners are in compliance with International Federation of Accountants (IFAC) guidelines on code of ethics as adopted by the Institute of Chartered Accountants of Pakistan and that they and the partners of the firm involved in the audit are not a close relative (spouse, parent, dependent and non-dependent children) of the chief executive officer, chief financial officer, head of internal audit, company secretary or director of the Company;
17. The statutory auditors or the persons associated with them have not been appointed to provide other services except in accordance with the Act, these Regulations or any other regulatory requirement and the auditors have confirmed that they have observed IFAC guidelines in this regard;
18. We confirm that all other requirements of the regulations 3,6,7,8,27,32,33 and 36 of the Regulations have been complied with.
Sohail H. Hydari Javed Saifullah KhanChief Executive Officer Director
IslamabadMarch 27, 2020

SPL 28
Review Report on the Statement of Compliance contained in Listed Companies (Code of Corporate Governance) Regulations, 2019We have reviewed the enclosed Statement of Compliance with the Listed Companies (Code of Corporate Governance) Regulations, 2019 (the Regulations) prepared by the Board of Directors of Saif Power Limited for the year ended December 31, 2019 in accordance with the requirements of regulation 36 of the Regulations.
The responsibility for compliance with the Regulations is that of the Board of Directors of the Company. Our responsibility is to review whether the Statement of Compliance reflects the status of the Company's compliance with the provisions of the Regulations and report if it does not and to highlight any non-compliance with the requirements of the Regulations. A review is limited primarily to inquiries of the Company's personnel and review of various documents prepared by the Company to comply with the Regulations.
As a part of our audit of the financial statements we are required to obtain an understanding of the accounting and internal control systems sufficient to plan the audit and develop an effective audit approach. We are not required to consider whether the Board of Directors' statement on internal control covers all risks and controls or to form an opinion on the effectiveness of such internal controls, the Company's corporate governance procedures and risks.
The Regulations require the Company to place before the Audit Committee, and upon recommendation of the Audit Committee, place before the Board of Directors for their review and approval, its related party transactions and also ensure compliance with the requirements of section 208 of the Companies Act, 2017. We are only required and have ensured compliance of this requirement to the extent of the approval of the related party transactions by the Board of Directors upon recommendation of the Audit Committee. We have not carried out procedures to assess and determine the Company's process for identification of related parties and that whether the related party transactions were undertaken at arm's length price or not.
Based on our review, nothing has come to our attention which causes us to believe that the Statement of Compliance does not appropriately reflect the Company's compliance, in all material respects, with the requirements contained in the Regulations as applicable to the Company for the year ended December 31, 2019.
KPMG Taseer Hadi & Co.Chartered Accountants
IslamabadApril 01, 2020
INDEPENDENT AUDITORS’ REVIEW REPORTTo the members of Saif Power Limited

Annual Report 2019 29
Opinion
We have audited the annexed financial statements of Saif Power Limited, which comprise the statement of financial position as at December 31, 2019, and the statement of profit or loss, the statement of comprehensive income, the statement of changes in equity, the statement of cash flows for the year then ended, and notes to the financial statements, including a summary of significant accounting policies and other explanatory information, and we state that we have obtained all the information and explanations which, to the best of our knowledge and belief, were necessary for the purposes of the audit.
In our opinion and to the best of our information and according to the explanations given to us, the statement of financial position, statement of profit or loss and other comprehensive income, the statement of changes in equity and the statement of cash flows together with the notes forming part thereof conform with the accounting and reporting standards as applicable in Pakistan and give the information required by the Companies Act, 2017 (XIX of 2017), in the manner so required and respectively give a true and fair view of the state of the Company’s affairs as at December 31, 2019 and of the profit or loss and other comprehensive income or loss, the changes in equity and its cash flows for the year then ended.
Basis for Opinion
We conducted our audit in accordance with International Standards on Auditing (ISAs) as applicable in Pakistan. Our responsibilities under those standards are further described in the Auditors’ Responsibilities for the Audit of the Financial Statements section of our report. We are independent of the Company in accordance with the International Ethics Standards Board for Accountants’ Code of Ethics for Professional Accountants as adopted by the Institute of Chartered Accountants of Pakistan (the Code) and we have fulfilled our other ethical responsibilities in accordance with the Code. We believe that the audit evidence we have obtained is sufficient and appropriate to provide a basis for our opinion.
Key Audit Matters
Key audit matters are those matters that, in our professional judgment, were of most significance in our audit of the financial statements of the current period. These matters were addressed in the context of our audit of the financial statements as a whole, and in forming our opinion thereon, and we do not provide a separate opinion on these matters.
INDEPENDENT AUDITORS’ REPORTTo the Members of Saif Power LimitedReport on the audit of the Financial Statements

SPL 30
Following are the Key audit matters.
Sr No. Key audit matters How the matter was addressed in our audit
1.Trade debts(Refer note 16.1, 16.2 and 16.3 to the financial statements)
Trade debts include an overdue amount of Rs 7.67 billion, receivable from National Trans-mission and Dispatch Company (NTDC). The Company considers this amount to be fully recoverable as this is secured by guarantee is-sued by the Government of Pakistan (GoP) un-der the Implementation Agreement (IA).
Further, we draw attention to note 16.2 and 16.3 to the financial statements, which de-scribe the matters regarding the recoverability and adjustment of certain trade debts.
We considered the matter as key audit matter due to the quantum, age of overdue amounts and management’s judgment relating to dis-puted amounts.
Our audit procedures in relation to the mat-ter included:• Circularized request for direct
confirmation of balance due from NTDC, reviewed confirmation directly received from NTDC and tested the reconciliation;
• Checked, on sample basis, trade debts ageing report classification within the appropriate ageing bracket with underlying documentation;
• Checked, on sample basis, cash receipts from NTDC subsequent to financial year end relating to year end balance with underlying documentation;
• Held discussions at appropriate level of management and Audit Committee to assess their views on the timing of settlement and recoverability of trade debts;
• With respect to disputed trade debts, (a) Obtained confirmation from the Company’s external legal advisor and reviewed the related arbitration orders; (b) Evaluated technical ability of the external legal advisors used by the Company; (c) Assessed the matter under applicable accounting frame work; and
• Reviewed related disclosures made in the financial statements regarding the matter.

Annual Report 2019 31
2. Recognition of Revenue
(Refer to note 3 and 21 to the financial statements)
The Company is engaged in sale of electricity to National Transmission and Dispatch Company (NTDC).
The Company recognized gross revenue during the year from Capacity Purchase Price (CPP) and Energy Purchase Price (EPP) amounting to Rs. 10.205 billion and Rs. 6.188 billion respectively.
We considered this as key audit matter due to the significance of the amounts requiring significant time and resource due to magnitude and revenue being a key economic indicator of the Company.
Our audit procedures in relation to the mat-ter included:• Tested the design, implementation and
operating effectiveness of the relevant key internal controls which govern revenue recognition from the sale of electricity;
• Assessed whether appropriate revenue recognition policies are applied in accordance with applicable accounting and reporting framework;
• Analyzed Power Purchase Agreement (PPA) to evaluate whether revenue was recognized in accordance with the terms of PPA;
• Performed substantive test of details on sale transactions by inspecting the underlying documentation;
• Performed recalculation of EPP revenue based on electricity produced and CPP revenue based on capacity available; and
• Reviewed related disclosures made in the financial statements regarding the matter.
Information Other than the Financial Statements and Auditors’ Report Thereon
Management is responsible for the other information. Other information comprises the information included in the annual report for the year ended December 31, 2019, but does not include the financial statements and our auditors’ report thereon.
Our opinion on the financial statements does not cover the other information and we do not express any form of assurance conclusion thereon.
In connection with our audit of the financial statements, our responsibility is to read the other information and, in doing so, consider whether the other information is materially inconsistent with the financial statements or our knowledge obtained in the audit or otherwise appears to be materially misstated. If, based on the work we have performed, we conclude that there is a material misstatement of this other information, we are required to report that fact. We have nothing to report in this regard.
Responsibilities of Management and Board of Directors for the Financial Statements
Management is responsible for the preparation and fair presentation of the financial statements in accordance with the accounting and reporting standards as applicable in Pakistan and the requirements of Companies Act, 2017 (XIX of 2017) and for such internal control as management determines is necessary to enable the preparation of financial statements that are free from material misstatement, whether due to fraud or error.
In preparing the financial statements, management is responsible for assessing the Company’s ability to continue as a going concern, disclosing, as applicable, matters related to going concern and using the going concern basis of accounting unless management either intends to liquidate the Company or to cease operations, or has no realistic alternative but to do so.
Board of directors are responsible for overseeing the Company’s financial reporting process.

SPL 32
Auditors’ Responsibilities for the Audit of the Financial Statements
Our objectives are to obtain reasonable assurance about whether the financial statements as a whole are free from material misstatement, whether due to fraud or error, and to issue an auditors’ report that includes our opinion. Reasonable assurance is a high level of assurance, but is not a guarantee that an audit conducted in accordance with ISAs as applicable in Pakistan will always detect a material misstatement when it exists. Misstatements can arise from fraud or error and are considered material if, individually or in the aggregate, they could reasonably be expected to influence the economic decisions of users taken on the basis of these financial statements.
As part of an audit in accordance with ISAs as applicable in Pakistan, we exercise professional judgment and maintain professional skepticism throughout the audit. We also:
• Identify and assess the risks of material misstatement of the financial statements, whether due to fraud or error, design and perform audit procedures responsive to those risks, and obtain audit evidence that is sufficient and appropriate to provide a basis for our opinion. The risk of not detecting a material misstatement resulting from fraud is higher than for one resulting from error, as fraud may involve collusion, forgery, intentional omissions, misrepresentations, or the override of internal control.
• Obtain an understanding of internal control relevant to the audit in order to design audit procedures that are appropriate in the circumstances, but not for the purpose of expressing an opinion on the effectiveness of the Company’s internal control.
• Evaluate the appropriateness of accounting policies used and the reasonableness of accounting estimates and related disclosures made by management.
• Conclude on the appropriateness of management’s use of the going concern basis of accounting and, based on the audit evidence obtained, whether a material uncertainty exists related to events or conditions that may cast significant doubt on the Company’s ability to continue as a going concern. If we conclude that a material uncertainty exists, we are required to draw attention in our auditors’ report to the related disclosures in the financial statements or, if such disclosures are inadequate, to modify our opinion. Our conclusions are based on the audit evidence obtained up to the date of our auditors’ report. However, future events or conditions may cause the Company to cease to continue as a going concern.
• Evaluate the overall presentation, structure and content of the financial statements, including the disclosures, and whether the financial statements represent the underlying transactions and events in a manner that achieves fair presentation.
We communicate with the board of directors regarding, among other matters, the planned scope and timing of the audit and significant audit findings, including any significant deficiencies in internal control that we identify during our audit.
We also provide the board of directors with a statement that we have complied with relevant ethical requirements regarding independence, and to communicate with them all relationships and other matters that may reasonably be thought to bear on our independence, and where applicable, related safeguards.
From the matters communicated with the board of directors, we determine those matters that were of most significance in the audit of the financial statements of the current period and are therefore the key audit matters. We describe these matters in our auditors’ report unless law or regulation precludes public disclosure about the matter or when, in extremely rare circumstances, we determine that a matter should not be communicated in our report because the adverse consequences of doing so would reasonably be expected to outweigh the public interest benefits of such communication.

Annual Report 2019 33
Report on Other Legal and Regulatory Requirements
Based on our audit, we further report that in our opinion:
a) proper books of account have been kept by the Company as required by the Companies Act, 2017 (XIX of 2017);
b) the statement of financial position, the statement of profit or loss, the statement of comprehensive income, the statement of changes in equity and the statement of cash flows together with the notes thereon have been drawn up in conformity with the Companies Act, 2017 (XIX of 2017) and are in agreement with the books of account and returns;
c) investments made, expenditure incurred and guarantees extended during the year were for the purpose of the Company’s business; and
d) zakat deductible at source under the Zakat and Ushr Ordinance, 1980 (XVIII of 1980), was deducted by the Company and deposited in the Central Zakat Fund established under section 7 of that Ordinance.
The engagement partner on the audit resulting in this independent auditors’ report is Inam Ullah Kakra.
KPMG Taseer Hadi & Co.Chartered AccountantsIslamabadApril 01, 2020

SPL 34
2019 2018 Note RupeesSHARE CAPITAL AND RESERVES Share capital 4 3,864,717,790 3,864,717,790 Unappropriated profit - revenue reserve 10,943,280,351 8,182,507,613 Total equity 14,807,998,141 12,047,225,403 Liabilities Long term financing 5 - 652,714,443 Sub-ordinated loan 6 714,425,109 799,618,050 Lease liabilities 7 44,006,839 8,808,920 Non-current liabilities 758,431,948 1,461,141,413 Trade and other payables 8 2,026,701,229 1,039,856,731 Short term borrowings 9 5,260,383,317 5,448,553,994 Current portion of non-current liabilities 10 1,155,704,363 2,486,085,146 Markup accrued 11 695,660,585 550,426,755 Unclaimed dividend 15,465,337 10,190,825 Current liabilities 9,153,914,831 9,535,113,451 Total liabilities 9,912,346,779 10,996,254,864 Total equity and liabilities 24,720,344,920 23,043,480,267 Contingencies and commitments 12
ASSETS Property, plant and equipment 13 12,799,939,113 13,294,424,176 Right of use assets 14 52,997,400 - Investment in subsidiary 15 738,404,190 631,000,000 Long term deposits 4,372,660 3,331,810 Non-current assets 13,595,713,363 13,928,755,986 Advance income tax 14,602,800 13,980,237 Stock in trade - HSD 133,035,854 134,110,136 Trade debts 16 9,650,652,780 8,415,730,184 Other receivables 17 1,164,439,454 498,002,758 Advances 18 98,224,239 919,117 Trade deposits and short term prepayments 19 63,005,356 51,686,607 Bank balances 20 671,074 295,242 Current assets 11,124,631,557 9,114,724,281 Total assets 24,720,344,920 23,043,480,267 The annexed notes 1 to 34 form an integral part of these financial statements.
STATEMENT OF FINANCIAL POSITIONAs at December 31, 2019
Chief Financial Officer Chief Executive Officer Director

Annual Report 2019 35
2019 2018 Note Rupees
Turnover - net 21 14,910,380,876 16,690,327,029
Cost of sales 22 (9,892,199,117) (12,625,322,730)
Gross profit 5,018,181,759 4,065,004,299
Other income 23 2,120,857 2,134,826
Administrative expenses 24 (161,469,016) (139,565,844)
Finance cost 25 (1,208,886,692) (894,492,401)
Profit for the year 3,649,946,908 3,033,080,880
Earnings per share - basic and diluted 26 9.44 7.85
The annexed notes 1 to 34 form an integral part of these financial statements.
STATEMENT OF PROFIT OR LOSS For the year ended December 31, 2019
Chief Financial Officer Chief Executive Officer Director

SPL 36
2019 2018 Note Rupees
Profit for the year 3,649,946,908 3,033,080,880
Other comprehensive income for the year
Items that will not be reclassified to profit or loss
Remeasurement of defined benefit liability 8.2.1 & 8.2.2 (289,078) (9,978,718)
Total comprehensive income for the year 3,649,657,830 3,023,102,162
The annexed notes 1 to 34 form an integral part of these financial statements.
STATEMENT OF COMPREHENSIVE INCOME For the year ended December 31, 2019
Chief Financial Officer Chief Executive Officer Director

Annual Report 2019 37
2019 2018 Note Rupees
CASH FLOW FROM OPERATING ACTIVITIES
Profit for the year 3,649,946,908 3,033,080,880 Adjustments for: Provision for staff retirement benefits - gratuity 8.2.2 8,986,020 6,336,213 Depreciation and impairment loss - Property, plant and equipment 13.1 1,432,017,045 594,432,179 Depreciation - Right of use assets 14 10,267,521 - Finance cost 25 1,208,886,692 894,492,401 Gain on disposal of property, plant and equipment 23 (426,062) (243,500) Insurance claim (820,647,372) (34,012) Profit on deposit accounts 23 (1,076,273) (15,717) Return on investments 23 (337,739) (1,480,932) 5,487,616,740 4,526,567,512 Changes in: Stock in trade 1,074,282 (6,114,300) Trade debts (1,234,922,596) (3,032,182,247) Other receivable 119,316,676 (90,552,912) Advances (97,305,122) 563,641 Trade deposits and prepayments (12,777,524) (4,849,281) Trade and other payables 157,720,958 (392,050,482) Cash generated from operating activities 4,420,723,414 1,001,381,931 Income taxes paid (622,563) (1,607,384) Finance cost paid (1,063,652,862) (723,938,842) Staff retirement benefits paid (16,314,930) (8,979,288)Net cash generated from operating activities 3,340,133,059 266,856,417 Cash flows from investing activities Acquisition of property, plant and equipment 13 (609,330) (4,034,117) Acquisition of right of use assets (540,809) - (Increase)/ decrease in long term deposits (1,040,850) 502,900 Proceeds from sale of property, plant and equipment 1,067,747 315,000 Investment in subsidiary 15 (107,404,190) (631,000,000) Insurance claim received 34,894,000 39,600 Profit on deposit accounts 23 1,076,273 15,717 Return on investments - receipt 23 337,739 1,480,932 Net cash used in investing activities (72,219,420) (632,679,968) Cash flows from financing activities Repayment of long term financing (2,186,800,525) (1,786,097,130) Dividends paid (883,610,580) (1,368,438,059) Short term borrowings - net (188,170,677) 3,521,040,247 Lease liabilities paid (8,956,025) (4,810,769)Net cash generated from /(used in) financing activities (3,267,537,807) 361,694,289 Net decrease in cash and cash equivalents 375,832 (4,129,262)Cash and cash equivalents at January 01 295,242 4,424,504 Cash and cash equivalents at December 31 20 671,074 295,242 The annexed notes 1 to 34 form an integral part of these financial statements.
STATEMENT OF CASH FLOWS For the year ended December 31, 2019
Chief Financial Officer Chief Executive Officer Director

SPL 38
Share Unappropriated Total capital profit - revenue equity reserve
Rupees
Balance as at January 1, 2018 3,864,717,790 6,531,380,266 10,396,098,056
Profit for the year - 3,033,080,880 3,033,080,880
Other comprehensive income for the year - (9,978,718) (9,978,718)
Total comprehensive income for the year - 3,023,102,162 3,023,102,162
Transaction with owners of the Company
Distributions
Final dividend - 2017@ Rs. 1.90 per share - (734,296,380) (734,296,380)
First interim dividend - 2018 @ Rs. 1.65 per share - (637,678,435) (637,678,435)
Total transactions with owners of the Company - (1,371,974,815) (1,371,974,815)
Balance as at December 31, 2018 3,864,717,790 8,182,507,613 12,047,225,403
Balance as at January 1, 2019 3,864,717,790 8,182,507,613 12,047,225,403
Profit for the year - 3,649,946,908 3,649,946,908
Other comprehensive income for the year - (289,078) (289,078)
Total comprehensive income for the year - 3,649,657,830 3,649,657,830
Transaction with owners of the Company
Distributions
Final dividend - 2018@ Rs. 1.30 per share - (502,413,313) (502,413,313)
First interim dividend - 2019 @ Rs. 1 per share - (386,471,779) (386,471,779)
Total transactions with owners of the Company - (888,885,092) (888,885,092)
Balance as at December 31, 2019 3,864,717,790 10,943,280,351 14,807,998,141
The annexed notes 1 to 34 form an integral part of these financial statements.
STATEMENT OF CHANGES IN EQUITYFor the year ended December 31, 2019
Chief Financial Officer Chief Executive Officer Director

Annual Report 2019 39
1 Reporting entity Saif Power Limited ("the Company") was incorporated in Pakistan on November 11, 2004 as a public
limited company under the repealed Companies Ordinance, 1984 (which has now been replaced by the Companies Act, 2017) and commenced operations from April 30, 2010. The shares of the Company are quoted on Pakistan Stock Exchange Limited. The principal activities of the Company are to own, operate and maintain a combined cycle power plant having nameplate capacity of 225 MW (ISO) and sell the electricity to National Transmission and Despatch Company (NTDC). The Company is a subsidiary of Saif Holdings Limited (''the Holding Company'') with shareholding of 51.04% (2018: 51.04%) ordinary shares.
Geographical locations of the Company's business units are as follows: - The registered office of the Company is situated at 1st Floor, Kashmir Commercial Complex Fazal-ul-Haq
Road, Block E, Blue Area, Islamabad; and - Plant of the Company is situated at Chak 56/5L, Qadarabad Multan Road, District Sahiwal, Punjab,
Pakistan. 2 BASIS OF PREPARATION 2.1 Statement of compliance These financial statements have been prepared in accordance with the accounting and reporting standards
as applicable in Pakistan. The accounting and reporting standards applicable in Pakistan comprise of: - International Financial Reporting Standards (IFRS Standards) issued by the International Accounting
Standards Board (IASB) as notified under the Companies Act, 2017; and - Provisions of and directives issued under the Companies Act, 2017. Where provisions of and directives issued under the Companies Act, 2017 differ from the IFRS Standards,
the provisions of and directives issued under the Companies Act, 2017 have been followed. 2.2 Basis of measurement and preparation These financial statements have been prepared under the historical cost convention except for staff
retirement benefits, which have been measured at values determined through actuarial valuation. 2.3 Functional and presentation currency These financial statements are presented in Pakistan Rupee (Rupees), which is the Company's functional
currency. All financial information presented in Rupees has been rounded off to the nearest of Rupees, unless otherwise indicated.
2.4 Use of judgments and estimates The preparation of financial statements in conformity with the accounting and reporting standards as
applicable in Pakistan requires management to make judgments, estimates and assumptions that affect the application of policies and reported amounts of assets and liabilities, income and expenses. The estimates and associated assumptions are based on historical experience and various other factors that are believed to be reasonable under the circumstances and the results of which form the basis of making the judgments about the carrying values of assets and liabilities that are not readily apparent from other sources. Actual results may differ from these estimates.
NOTES TO THE FINANCIAL STATEMENTS For the year ended December 31, 2019

SPL 40
The estimates and underlying assumptions are reviewed on an ongoing basis. Revisions to accounting estimates are recognised in the period in which the estimates are revised if the revision affects only that period, or in the period of revision and future periods. Judgments and estimates made by management in the application of accounting and reporting standards as applicable in Pakistan that may have significant effect on the financial statements and estimates with a significant risk of material adjustments in the next years are discussed in the ensuing paragraphs:
(a) Property, plant and equipment The Company reviews the useful lives of property, plant and equipment on a regular basis. Any change in
estimate in future years might affect the carrying amounts of the respective items of property, plant and equipment with corresponding effect on depreciation charge and impairment.
(b) Impairment of financial assets In making an estimate of the recoverable amount of the Company’s financial assets, the management
considers estimated cash flows and their terminal value for impairment testing. (c) Impairment of non-financial assets The carrying amounts of the Company's assets are reviewed at each reporting date to determine whether
there is any indication of impairment loss. If any such indication exists, recoverable amount is estimated using the criteria given in respective accounting standards to determine the extent of impairment loss, if any.
(d) Taxation The Company takes into account the current income tax law and decisions taken by the tax authorities.
Instances where the Company's views differ from the views taken by the income tax department at the assessment stage and where the Company considers that its view on items of material nature is in accordance with law, the amounts are shown as contingent liabilities.
(e) Employee benefits Gratuity is provided for permanent employees of the Company for which liability is recognised in the
Company’s financial statements. The calculation of defined benefit liability requires assumptions to be made of future outcomes, the principal ones being in respect of expected salary growth, expected mortality of active members and the discount rate used to convert future cash flows to current values. Calculations are sensitive to the changes in assumptions used.
(f) Provision for inventory obsolescence and doubtful receivables The Company reviews the carrying amount of stores and spares and stock in trade on regular basis and
provision is made for obsolescence, if there is any change in usage pattern and physical form of related stores and spares and stock in trade. Further the carrying amounts of trade and other receivables are assessed on regular basis and if there is any doubt about the realisability of these receivables, appropriate amount is provided for.
NOTES TO THE FINANCIAL STATEMENTS For the year ended December 31, 2019

Annual Report 2019 41
(g) Provisions and contingencies A provision is recognised if, as a result of a past event, the Company has a present legal or constructive
obligation that can be estimated reliably, and it is probable that an outflow of economic benefits will be required to settle the obligation. Provisions are determined by discounting the expected future cash flows at a pre-tax rate that reflects current market assessments of the time value of money and the risks specific to the liability. The unwinding of the discount is recognised as finance cost, if any.
Where it is not probable that an outflow of resources embodying economic benefits will be required to
settle the obligation or the amount of the obligation cannot be measured with sufficient reliability, it is disclosed as contingent liability.
(h) Lease term The Company has applied judgement to determine the lease term for some lease contracts in which it is
a lessee that includes renewal options. The assessment of whether the Company is reasonably certain to exercise such options impacts the lease term, which significantly affects the amount of lease liabilities and right-of-use assets recognized.
(i) Other Pursuant to decisions of Supreme Court of Pakistan related to discretionary beneficial ownership in an
overseas trusts on a prudent basis and in good faith, transactions with "Orastar" have been disclosed in note 29 irrespective of the absence of significant influence and the fact that the companies are not associated under Companies Act, 2017.
3 SIGNIFICANT ACCOUNTING POLICIES The accounting policies set out below have been applied consistently to all periods presented in these
financial statements except for the change as indicated below: The Company has adopted following standards which became effective during the year: (a) IFRS-9 ‘Financial instruments’ (b) IFRS-15 ‘Revenue from contracts with customers’ (c) IFRS-16 ‘Leases’ (a) IFRS-9 Financial Instruments In July 2014, the IASB issued the final version of IFRS -9 Financial Instruments ("IFRS-9") that replaces
IAS-39 Financial Instruments: recognition and measurement ("IAS-39") and all previous versions of IFRS 9. IFRS-9 brings together all three aspects of the accounting for financial instruments: classification & measurement, impairment and hedge accounting. IFRS-9 introduces a single approach to determining whether a financial asset is measured at amortized cost or fair value and replaces the multiple rules in IAS-39. The three principal classification categories under the new standard for financial instruments are: measured at amortized cost, fair value through other comprehensive income (“FVTOCI”) and fair value through profit and loss (“FVTPL”). The classification of financial instruments under IFRS-9 is generally based on the business model in which a financial instrument is managed and its contractual cash flow characteristics. The previous categories under IAS-39 of held to maturity, loans and receivables and available for sale have been removed. For financial liabilities, IFRS-9 retains most of the requirements of IAS-39; however, where the fair value option is applied to financial liabilities, any change in fair value resulting from an entity’s own credit risk is recorded in other comprehensive income.
NOTES TO THE FINANCIAL STATEMENTS For the year ended December 31, 2019

SPL 42
The following table explains the original measurement categories under IAS-39 and new measurement categories under IFRS-9 for each class of the Company's financial assets and financial liabilities as at January 01, 2019.
Original classification New classification under IAS-39 under IFRS-9 Financial assets Long term deposits Loans and receivable Amortized cost Trade debts Loans and receivable Amortized cost Other receivables Loans and receivable Amortized cost Advances to employees Loans and receivable Amortized cost Security deposits Loans and receivable Amortized cost Bank balances Loans and receivable Amortized cost Financial Liabilities Long term financing Amortized cost Amortized cost Sub-ordinated loan Amortized cost Amortized cost Lease liabilities Amortized cost Amortized cost Trade and other payables Amortized cost Amortized cost Short term borrowings Amortized cost Amortized cost Markup accrued Amortized cost Amortized cost Unclaimed dividend Amortized cost Amortized cost There is no change in the carrying amounts of financial assets and financial liabilities at the initial application
date of IFRS-9, except for a change in accounting classification under IFRS-9 from category under IAS-39 as disclosed in the above table.
The Company did not formerly apply hedge accounting to its financial instruments and has not elected to
apply hedge accounting to any of its financial instruments upon adoption of IFRS-9. Impact of new impairment model IFRS-9 replaces the “incurred loss” model in IAS-39 with an “expected loss” model. The new impairment
model applies to financial instruments measured at amortized cost, and contract assets and debt investments measured at FVTOCI. Under IFRS-9, credit losses will be recognized earlier than under IAS-39. The standard also provides a simplified approach to measuring expected credit losses using a lifetime expected loss allowance. The credit loss model groups receivables based on similar credit risk characteristics and days past due in order to estimate loss allowance. Through S.R.O 985(I)/2019 dated September 2, 2019, the Securities and Exchange Commission of Pakistan (SECP) has exempted applicability of IFRS-9 in respect of debts due from Government of Pakistan to power supply chain companies for a limited period of three years i.e. till June 30, 2021. Accordingly, the management believes that requirements of IFRS-9 relating to expected credit loss on its trade debts are not applicable to the Company.
(b) IFRS-15 Revenue from contracts with customers Applicable for accounting periods beginning on or after July 1, 2018 this standard establishes a single
comprehensive model for determining whether, how much and when revenue is recognized. It replaced IAS-18 Revenue, IAS-11 Construction contracts, IFRIC-13 customer loyalty programs, IFRIC-15 agreements for the construction of real estate, IFRIC-18 transfers of assets from customers and SIC-31 Revenue-barter transaction involving advertising services.
NOTES TO THE FINANCIAL STATEMENTS For the year ended December 31, 2019

Annual Report 2019 43
The Company has entered into PPA with NTDC for a period of 30 years starting from its Commercial Operation Date i.e. April 30, 2010. Under the PPA, the Company is obligated to sell and deliver all output of the Complex in accordance with provisions of PPA. The Company's arrangement with NTDC falls under the definition of lease under IFRS-16 for which exemption is available to the Company. Accordingly, revenue in respect of Capacity Purchase Price (CPP) is recognized when due at rates specified under the PPA and revised reference tariff determined by National Electric Power Regulatory Authority (NEPRA) and after incorporation of relevant applicable quarterly indexation.
PPA also contains other performance obligations i.e. sale of electricity, insurance and operation &
maintenance. Revenue from sale of electricity is recognized when or as the Company satisfies performance obligation by
transferring the promised good or service to a customer. A good or service is transferred when the customer obtains control of that good or service. The Company principally satisfies its performance obligation in respect of supply of electricity upon transmission of electricity and related fuel cost component of the tariff determined by National Electric Power Regulatory Authority (NEPRA) is invoiced to the customer as part of Energy Purchase Price (EPP).
Revenue associated with the operating phase of the PPA i.e. insurance and operations & maintenance
of the plant is measured based on the consideration specified in contract with customer. Revenue from contract with customer is recognized when or as the Company satisfies a performance obligation by transferring a promised good or service to a customer. A good or service is transferred when the customer obtains control of that good or service. The Company principally satisfies its performance obligations of insurance, operations and maintenance over time and the amount of revenue is recognized based on the consideration specified in the PPA. Consideration for operating phase of the PPA i.e. Insurance and fixed O&M component of tariff is billed to customer as part of CPP whereas variable O&M component is billed to customer as part of EPP. The amount of revenue recognised in respect of operating phase excludes the estimates of variable consideration as it is not highly probable that a significant reversal in the amount of cumulative revenue recognised will occur in future when the uncertainty associated with the variable consideration is subsequently resolved.
(c) IFRS-16 Leases IFRS-16 introduced a single, on-balance sheet accounting model for lessees. As a result, the Company,
as a lessee, has recognised right-of-use assets representing its rights to use the underlying assets and lease liabilities representing its obligation to make lease payments. Lessor accounting remains similar to previous accounting policies. Control of the Company's plant due to purchase of total output by NTDC and other arrangement under the Power Purchase Agreement (PPA) was classified as a lease under IFRIC-4 “Determining whether an Arrangement Contains a Lease” which due to exemption available to the Company were not accounted for as a lease in prior years. After applicability of IFRS-16, the Company's arrangement with NTDC falls under the definition of a lease as defined in IFRS-16, however, the SECP through S.R.O 986(I)/2019 dated September 2, 2019 has extended the earlier exemption from IFRIC-4 to all companies, which have entered into power purchase arrangements before January 01, 2019. The Company signed its Power Purchase Agreement with NTDC on April 30, 2007, accordingly, requirement of lease accounting relating to the Company’s arrangement with NTDC are not applicable to the Company. Had IFRS-16 been applied on transactions with Power Purchaser, impact on financial statements would have been as follows:
2019 2018 Rupees Rupees Decrease in unappropriated profit at January 01 (2,537,257,125) (2,679,582,780) Decrease in profit for the year (540,933,333) 142,325,655 Decrease in unappropriated profit at December 31 (3,078,190,458) (2,537,257,125)
NOTES TO THE FINANCIAL STATEMENTS For the year ended December 31, 2019

SPL 44
The Company has applied IFRS-16 using the modified retrospective approach for arrangements not covered in exemptions from SECP, under which the cumulative effect of initial application is recognised in retained earnings at January 01, 2019. Accordingly, the comparative information presented for 2018 are not required to be restated – i.e. it is presented, as previously reported, under IAS-17 and related interpretations. The details of the changes in accounting policies are disclosed below.
(i) Definition of Lease Previously, the Company determined at contract inception whether an arrangement was or contained a
lease under IFRIC-4 'Determining Whether an Arrangement contains a Lease'. The Company now assesses whether a contract is or contains a lease based on the new definition of a lease. Under IFRS-16, a contract is, or contains, a lease if the contract conveys a right to control the use of an identified asset for a period of time in exchange for consideration.
On transition to IFRS-16, the Company elected to apply the practical expedient to grandfather the
assessment of which transactions are leases. It applied IFRS-16 only to contracts that were previously identified as leases. Contracts that were not identified as leases under IAS-17 and IFRIC-4 were not reassessed. Therefore, the definition of a lease under IFRS-16 has been applied only to contracts entered into or changed on or after January 01, 2019.
At inception or on reassessment of a contract that contains a lease component, the Company allocates
the consideration in the contract to each lease and non-lease component on the basis of their relative stand-alone prices. However, for leases of properties in which it is a lessee, the Company has elected not to separate non-lease components and will instead account for the lease and non-lease components as a single lease component.
The Company leased assets primarily comprising office buildings and motor vehicles. As a lessee, the
Company previously classified leases as operating or finance leases based on its assessment of whether the lease transferred substantially all of the risks and rewards of ownership. Under IFRS-16, the Company recognizes right-of-use assets and lease liabilities for most leases – i.e. these leases are on-balance sheet.
Upon transition to IFRS-16 in respect of existing finance leases of vehicles, there was no impact as of
January 01, 2019 except for nomenclature of leased assets to right-of-use assets. The Company presents right-of-use assets and related lease liabilities on face of the statement of financial position. Amounts becoming due within next twelve months are presented within “current portion of non-current liabilities" in these financial statements.
(ii) Accounting policies The Company recognises a right-of-use asset and a lease liability at the lease commencement date. The
right-of-use asset is initially measured at cost, and subsequently at cost less any accumulated depreciation and impairment losses, and adjusted for certain re-measurements of the lease liability. The lease liability is initially measured at the present value of the lease payments that are not paid at the commencement date, discounted using the interest rate implicit in the lease or, if that rate cannot be readily determined, the Company’s incremental borrowing rate.
The lease liability is subsequently increased by the interest cost on the lease liability and decreased by lease
payment made. It is re-measured when there is a change in future lease payments arising from a change in an index or rate, a change in the estimate of the amount expected to be payable under a residual value
NOTES TO THE FINANCIAL STATEMENTS For the year ended December 31, 2019

Annual Report 2019 45
guarantee, or as appropriate, changes in the assessment of whether a purchase or extension option is reasonably certain to be exercised or a termination option is reasonably certain not to be exercised.
(iii) Transition Previously, the Company classified property leases as operating leases under IAS-17. These include rental
premises of head office and guest houses. The leases typically run for a period of around 5 to 10 years. Some leases include an option to renew the lease by mutual consent of the Company and the lessors.
At transition, for leases classified as operating leases under IAS-17, lease liabilities were measured at the
present value of the remaining lease payments, discounted at the Company’s incremental borrowing rate. Right-of-use assets are measured at either:
- their carrying amount as if IFRS-16 had been applied since the commencement date, discounted using
the lessee’s incremental borrowing rate at the date of initial application – the Company has not applied this approach; or
- an amount equal to the lease liability, adjusted by the amount of any prepaid or accrued lease payments – the Company applied this approach to all leases.
The Company leases a number of vehicles. These leases were classified as finance leases under IAS-17. For
these finance leases, the carrying amount of the right-of-use asset and the lease liability at January 01, 2019 were determined at the carrying amount of the lease asset and lease liability under IAS-17 immediately before that date.
Impacts on Financial statements Impacts on transition On transition to IFRS 16, the Company recognized additional right of use assets and additional lease liabilities,
recognizing the difference in retained earnings. The impact on transition is summarized below. At January 01, 2019
(Rupees) Right-of-use assets 40,837,169 Lease liabilities 39,378,394 Prepaid Rent as at January 01, 2019 1,458,775 When measuring lease liabilities for leases that were classified as operating leases, the Company discounted
lease payments using its incremental borrowing rate at January 01, 2019. The weighted-average rate applied is 11.24%.
At January 01, 2019
(Rupees) Finance lease liabilities as at January 01, 2019 12,504,766 Operating leases recognised as lease liabilities 39,378,394 Lease liabilities recognised at January 01, 2019 51,883,160 Impacts for the period As a result of initially applying IFRS 16, in relation to the leases that were previously classified as operating
leases, the Company recognized Rs.33,376,949 of right-of-use assets and Rs. 34,937,682 of lease liability as at December 31, 2019.
NOTES TO THE FINANCIAL STATEMENTS For the year ended December 31, 2019

SPL 46
Also in relation to those leases under IFRS 16, the Company has recognized depreciation and interest costs, instead of operating lease expense. During the year, the Company recognized Rs. 7,460,220 of depreciation charged and Rs. 4,057,412 of interest costs from these leases.
3.1 Property, plant and equipment Owned These are stated at cost less accumulated depreciation and impairment loss, if any, except for freehold
land, stores held for capitalisation and capital work in progress which are stated at cost less impairment loss, if any. Cost comprises purchase price, including import duties, non-recourse purchase taxes and other related costs of bringing the asset to its present working condition and location for intended use. Exchange gains or losses on long term foreign currency loans utilised for acquisition of assets are added to / deducted from cost of respective asset in accordance with note 3.7.
Depreciation is charged to profit or loss on straight line method at the rates given in note 13, after taking
into account their respective residual values if any, so as to write off the depreciable amount over their estimated useful lives whereby depreciable amount adjusted for above exchange rate movements of an asset is written off over its remaining estimated useful life. Depreciation is charged from the month asset is available for use whereas no depreciation is charged in the month in which the asset is disposed off.
Normal repairs and maintenance are charged to profit or loss as and when incurred whereas major
improvements and modifications are capitalised. Gains and losses on disposal of an item of property, plant and equipment are determined by comparing the proceeds from disposal with the carrying amount of property, plant and equipment disposed off, and are recognised net within “other income” in profit or loss.
Ijarah Rentals payable under Ijarah arrangement are charged to profit or loss on a straight line basis over the
term of the Ijarah lease arrangement. 3.2 Staff retirement benefits - Defined benefit plan The Company operates a funded gratuity scheme covering all permanent employees completing the
minimum qualifying period of service, for which liability is recognised in the Company’s financial statements. The assets of the fund plan are held independently in a separate fund. Provision for gratuity is made to cover obligations under the scheme in accordance with actuarial recommendations. The latest actuarial valuation was carried out by the Company as at December 31, 2019. The details of actuarial valuation are given in note 8.2 to these financial statements. The actuarial gains and losses are recognised in other comprehensive income in the year in which they arise.
3.3 Taxation (a) Current The profits and gains of the Company derived from electric power generation are exempt from tax subject
to the conditions and limitations provided for in terms of clause (132) of Part I of the Second Schedule to the Income Tax Ordinance, 2001. Further, the Company is also exempt from minimum tax on turnover under clause (11 A) of Part IV of the Second Schedule to the Income Tax Ordinance, 2001.
NOTES TO THE FINANCIAL STATEMENTS For the year ended December 31, 2019

Annual Report 2019 47
(b) Deferred Deferred tax has not been provided in these financial statements as the profits and gains of the Company
derived from electric power generation are exempt from tax subject to the conditions and limitations provided for in terms of clause (132) of Part I of the Second Schedule to the Income Tax Ordinance, 2001.
3.4 Borrowing costs Borrowing costs on loans which are directly attributable to the acquisition, construction or production
of a qualifying asset are capitalised as part of the cost of that asset. Borrowing cost includes exchange differences arising from foreign currency borrowings to the extent that these are regarded as adjustment to borrowing cost. All other borrowing costs are charged to profit or loss.
3.5 Provisions Provisions are recognised when the Company has a present legal or constructive obligation as a result
of past event, and it is probable that an outflow of economic resources will be required to settle such obligations and a reliable estimate can be made of the amount of the obligation. Provisions are reviewed at the end of each reporting period and are adjusted to reflect the current best estimate.
3.6 Stock in trade These are valued at lower of cost and net realisable value. Cost is determined using weighted average cost
method. Cost of inventory comprises of the purchase price and other direct costs incurred in bringing the inventory items to their present location and condition. Net realisable value signifies the estimated selling price in the ordinary course of business less costs necessarily to be incurred in order to make a sale.
3.7 Foreign currency transactions and translations Foreign currency transactions are recorded in PKR at the rate of exchange prevailing at the date of
transaction. Monetary assets and liabilities denominated in foreign currencies are translated at the exchange rate prevalent on the reporting date. Non monetary assets that are measured in terms of historical cost in a foreign currency are translated using the exchange rate at the date of the transactions. Exchange differences are accounted for as follows:
(i) Exchange differences related to foreign currency loans obtained for financing of the plant and machinery
are capitalised and depreciated over the remaining useful life of the related assets in accordance with SRO 24(1)/2012 of SECP.
(ii) All other exchange differences are charged to profit or loss on net basis. 3.8 Financial Instruments - Initial recognition and subsequent measurement Initial Recognition All financial assets and liabilities are initially measured at cost which is the fair value of the consideration
given or received. These are subsequently measured at fair value, amortised cost or cost as the case may be.
NOTES TO THE FINANCIAL STATEMENTS For the year ended December 31, 2019

SPL 48
Classification of financial assets - policy applicable from January 01, 2019
The Company classifies its financial instruments in the following categories:- at fair value through profit or loss (“FVTPL”),- at fair value through other comprehensive income (“FVTOCI”), or- at amortised cost.
The Company determines the classification of financial assets at initial recognition. The classification of
instruments (other than equity instruments) is driven by the Company’s business model for managing the financial assets and their contractual cash flow characteristics.
Financial assets that meet the following conditions are subsequently measured at amortised cost:
- the financial asset is held within a business model whose objective is to hold financial assets in order to collect contractual cash flows; and
- the contractual terms of the financial asset give rise on specified dates to cash flows that are solely payments of principal and interest on the principal amount outstanding.
Financial assets that meet the following conditions are subsequently measured at FVTOCI:
- the financial asset is held within a business model whose objective is achieved by both collecting contractual cash flows and selling the financial assets; and
- the contractual terms of the financial asset give rise on specified dates to cash flows that are solely payments of principal and interest on the principal amount outstanding.
By default, all other financial assets are subsequently measured at FVTPL. Classification of financial liabilities - policy applicable from January 01, 2019 The Company classifies its financial liabilities in the following categories:
- at fair value through profit or loss (“FVTPL”), or - at amortised cost. Financial liabilities are measured at amortised cost, unless they are required to be measured at FVTPL (such
as instruments held for trading or derivatives) or the Company has opted to measure them at FVTPL. Subsequent measurement - policy applicable from January 01, 2019 i) Financial assets at FVTOCI Elected investments in equity instruments at FVTOCI are initially recognized at fair value plus transaction
costs. Subsequently, they are measured at fair value, with gains or losses arising from changes in fair value recognised in other comprehensive income / (loss).
ii) Financial assets and liabilities at amortised cost Financial assets and liabilities at amortised cost are initially recognised at fair value, and subsequently
carried at amortised cost, and in the case of financial assets, less any impairment.
NOTES TO THE FINANCIAL STATEMENTS For the year ended December 31, 2019

Annual Report 2019 49
iii) Financial assets and liabilities at FVTPL Financial assets and liabilities carried at FVTPL are initially recorded at fair value and transaction costs are
expensed in the statement of profit or loss and other comprehensive income. Realised and unrealised gains and losses arising from changes in the fair value of the financial assets and liabilities held at FVTPL are included in the statement of profit or loss and other comprehensive income in the period in which they arise.
Where management has opted to recognise a financial liability at FVTPL, any changes associated with the Company’s own credit risk will be recognized in other comprehensive income / (loss). Currently, there are no financial liabilities designated at FVTPL.
Derecognition - policy applicable from January 01, 2019 i) Financial assets The Company derecognises financial assets only when the contractual rights to cash flows from the financial
assets expire or when it transfers the financial assets and substantially all the associated risks and rewards of ownership to another entity. On derecognition of a financial asset measured at amortised cost, the difference between the asset’s carrying value and the sum of the consideration received and receivable is recognised in profit or loss. In addition, on derecognition of an investment in a debt instrument classified as at FVTOCI, the cumulative gain or loss previously accumulated in the investments revaluation reserve is reclassified to profit or loss. In contrast, on derecognition of an investment in equity instrument which the Company has elected on initial recognition to measure at FVTOCI, the cumulative gain or loss previously accumulated in the investments revaluation reserve is not reclassified to profit or loss, but is transferred to statement of changes in equity.
ii) Financial liabilities The Company derecognises financial liabilities only when its obligations under the financial liabilities are
discharged, cancelled or expired. The difference between the carrying amount of the financial liability derecognised and the consideration paid and payable, including any non cash assets transferred or liabilities assumed, is recognised in the statement of profit or loss and other comprehensive income.
Offsetting of financial assets and financial liabilities - Policy applicable from January 01, 2019 Financial assets and liabilities are offset and the net amount presented in the statement of financial
position when, and only when, the Company has a legal right to offset the amounts and intends either to settle them on a net basis or to realise the asset and settle the liability simultaneously.
Financial Instruments - Policy applicable before January 01, 2019 Non-derivative financial assets These are initially recognised on the date that they are originated i.e. on the trade date, which is the
date that the Company becomes a party to the contractual provisions of the instrument. Investments are recognised on settlement date.
NOTES TO THE FINANCIAL STATEMENTS For the year ended December 31, 2019

SPL 50
A financial asset is derecognised when the contractual rights to the cash flows from the asset expire, or when the Company transfers the rights to receive the contractual cash flows in a transaction in which substantially all the risks and rewards of ownership of the financial asset are transferred. Any interest in such transferred financial assets that is created or retained by the Company is recognised as a separate asset or liability.
The Company's non-derivative financial assets are classified as loans and receivables. Loans and receivables comprise trade debts, deposits, other receivables, advances to employees, cash and
cash equivalents. Trade debts, deposits and other receivables Deposits and trade and other receivable are stated initially at the fair value. Subsequent to initial
recognition these are stated at their amortised cost as reduced by appropriate provision for impairment. Known impaired receivables are written off, while receivables considered doubtful of recovery are fully provided for.
The allowance for doubtful accounts is based on the Company’s assessment of the collectability of
counterparty accounts. The Company regularly reviews its debts and receivables that remain outstanding past their applicable payment terms and establishes allowance and potential write-offs by considering factors such as historical experience, credit quality, age of the accounts receivable balances, and current economic conditions that may affect a counterparty’s ability to pay.
Cash and cash equivalents Cash and cash equivalents comprise cash and bank balances and short term investments that are readily
convertible to known amounts of cash and which are subject to an insignificant risk of changes in their fair value.
Non-derivative financial liabilities The Company initially recognises non derivative financial liabilities on the date that they are originated
or the date that the Company becomes a party to the contractual provisions of the instrument. The Company derecognises a financial liability when its contractual obligations are discharged, cancelled or expired.
These financial liabilities are recognised initially at fair value less any directly attributable transaction
costs. Subsequent to initial recognition, these financial liabilities are measured at amortised cost using the effective interest method. Non derivative financial liabilities comprise of mark-up bearing borrowings including long term financing, obligations under finance lease, subordinated loan, short term borrowings, markup accrued and trade and other payables.
Trade and other payables Liabilities for trade and other payable are carried at amortised cost, which approximates the fair value
of consideration to be paid in future for goods and services received, whether or not billed to the Company.
NOTES TO THE FINANCIAL STATEMENTS For the year ended December 31, 2019

Annual Report 2019 51
Borrowings Mark-up bearing borrowings are recognised initially at cost, less attributable transaction costs. Subsequent
to initial recognition, mark-up bearing borrowings are stated at originally recognised amount less subsequent repayments, while the difference between the original recognised amounts (as reduced by periodic payments) and redemption value is recognised in profit or loss over the period of borrowings on an effective rate basis except to the extent capitalised as borrowing cost.
Finance costs are accounted for on an accrual basis and are reported under mark-up accrued on borrowings
to the extent of the amount remains unpaid. Offsetting of financial assets and financial liabilities Financial assets and liabilities are offset and the net amount presented in the statement of financial
position when, and only when, the Company has a legal right to offset the amounts and intends either to settle them on a net basis or to realise the asset and settle the liability simultaneously.
3.9 Impairment of financial asset - Policy applicable from January 01, 2019 The Company recognises loss allowance for Expected Credit Loss (ECL) on financial assets measured at
amortised cost and FVTOCI at an amount equal to lifetime ECLs except for the financial assets in which there is no significant increase in credit risk since initial recognition or financial assets which are determined to have low credit risk at the reporting date, in which case 12 months’ ECL is recorded.
For trade debts the Company applies IFRS 9 simplified approach to measure the expected credit losses (loss allowance) which uses a life time expected allowance. The Company uses General 3-stage approach for deposits, other receivables, advances and bank balances i.e. to measure ECL through loss allowance at an amount equal to 12-month ECL if credit risk on a financial instruments has not increased significantly since initial recognition.
The following were either determined to have low or there was no increase in credit risk since initial recognition as at the reporting date:
- Long term deposits; - Other receivables; - Advances to employees; - Security Deposits; and - Bank balances.
Life time ECLs are the ECLs that results from all possible default events over the expected life of a financial instrument. 12 months ECLs are portion of ECL that result from default events that are possible within 12 months after the reporting date.
ECLs are a probability weighted estimate of credit losses. Credit losses are measured at the present value of all cash shortfalls (i.e. the difference between cash flows due to the entity in accordance with the contract and cash flows that the Company expects to receive).
The gross carrying amount of a financial asset is written off when the Company has no reasonable expectation of recovering a financial asset in its entirety or a portion thereof.
NOTES TO THE FINANCIAL STATEMENTS For the year ended December 31, 2019

SPL 52
The Company uses simplified approach for expected credit loss of trade debts. Impairment of financial asset - Policy applicable before January 01, 2019 Financial assets are assessed at each reporting date to determine whether there is objective evidence
that they are impaired. A financial asset is impaired if objective evidence indicates that a loss event has occurred after the initial recognition of the asset, and that the loss event had a negative effect on the estimated future cash flows of that asset that can be estimated reliably. Objective evidence that financial assets are impaired may include default or delinquency by a debtor or indications that a debtor or issuer will enter bankruptcy.
All individually significant assets are assessed for specific impairment. All individually significant assets
found not to be specifically impaired are then collectively assessed for any impairment that has been incurred but not yet identified. Assets that are not individually significant are collectively assessed for impairment by grouping together assets with similar risk characteristics.
An impairment loss in respect of a financial asset measured at amortised cost is calculated as the difference
between its carrying amount and the present value of the estimated future cash flows discounted at the asset’s original effective interest rate. Losses are recognised in profit or loss and are reflected in an allowance account. Interest on the impaired asset continues to be recognised through the unwinding of the discount. When a subsequent event causes the amount of impairment loss to decrease, the decrease in impairment loss is reversed through profit or loss.
3.10 Finance income and finance cost Finance income comprises profit on deposit accounts and profit on short term investment. Profit on
deposit accounts is accrued on a time proportion basis by reference to the principal outstanding and the applicable rate of return. Income on term deposit receipts is recognised on time proportion basis taking into account the effective yield of such securities.
Finance cost comprises interest expense on borrowings, interest on finance lease liabilities, bank charges,
exchange loss - net and other charges on borrowings. Mark-up and other charges on borrowings other than expense incurred on qualifying assets are charged to profit or loss in the period in which they are incurred.
3.11 Impairment of non-financial assets The carrying amounts of non-financial assets other than inventories, are reviewed at each reporting date
to determine whether there is any indication of impairment. If any such indication exists, then the asset’s recoverable amount is estimated. The recoverable amount of an asset or cash-generating unit is the greater of its value in use and its fair value less costs to sell. In assessing value in use, the estimated future cash flows are discounted to their present value using a pre-tax discount rate that reflects current market assessment of the time value of money and the risks specific to the asset. For the purpose of impairment testing, assets that cannot be tested individually are grouped together into the smallest group of assets that generates cash inflows from continuing use that are largely independent of the cash inflows of other assets or groups of assets (the “cash-generating unit, or CGU”).
The Company’s corporate assets do not generate separate cash inflows. If there is an indication that a
corporate asset may be impaired, then the recoverable amount is determined for the CGU to which the
NOTES TO THE FINANCIAL STATEMENTS For the year ended December 31, 2019

Annual Report 2019 53
corporate asset belongs. An impairment loss is recognised if the carrying amount of an asset or its CGU exceeds its estimated recoverable amount. Impairment losses are recognised in profit or loss.
Impairment losses recognized in prior periods are assessed at each reporting date for any indications that
the loss has decreased or no longer exists. An impairment loss is reversed if there has been a change in the estimates used to determine the recoverable amount. An impairment loss is reversed only to the extent that the asset’s carrying amount does not exceed the carrying amount that would have been determined, net of depreciation or amortisation, if no impairment loss had been recognised.
3.12 Provision for Workers' Profit Participation Fund The Company does not account for Provision for Workers Profit Participation Fund (WPPF) in its profit or
loss as they are pass through items to NTDC under the PPA. In case the liability arises, it is recovered from NTDC.
3.13 Dividend Dividend distribution to the shareholders is recognised as liability in the period in which it is
declared. 3.14 Forthcoming changes in approved accounting standards that are not yet effective The following International Financial Reporting Standards (IFRS Standards) as notified under the Companies
Act, 2017 and the amendments and interpretations thereto will be effective for accounting periods beginning on or after January 01, 2020:
- Amendment to IFRS 3 ‘Business Combinations’ – Definition of a Business (effective for business
combinations for which the acquisition date is on or after the beginning of annual period beginning on or after January 01, 2020). The IASB has issued amendments aiming to resolve the difficulties that arise when an entity determines whether it has acquired a business or a group of assets. The amendments clarify that to be considered a business, an acquired set of activities and assets must include, at a minimum, an input and a substantive process that together significantly contribute to the ability to create outputs. The amendments include an election to use a concentration test. The standard is effective for transactions in the future and therefore would not have an impact on past financial statements.
- Amendments to IAS 1 Presentation of Financial Statements and IAS 8 Accounting Policies, Changes in
Accounting Estimates and Errors (effective for annual periods beginning on or after January 01, 2020). The amendments are intended to make the definition of material in IAS 1 easier to understand and are not intended to alter the underlying concept of materiality in IFRS Standards. In addition, the IASB has also issued guidance on how to make materiality judgments when preparing their general purpose financial statements in accordance with IFRS Standards.
- On March 29, 2018 the International Accounting Standards Board (the IASB) has issued a revised Conceptual
Framework for Financial Reporting which is applicable immediately and contain changes that will set a new direction for IFRS in the future.. The Conceptual Framework primarily serves as a tool for the IASB to develop standards and to assist the IFRS Interpretations Committee in interpreting them. It does not override the requirements of individual IFRSs and any inconsistencies with the revised Framework
NOTES TO THE FINANCIAL STATEMENTS For the year ended December 31, 2019

SPL 54
will be subject to the usual due process – this means that the overall impact on standard setting may take some time to crystallise. The companies may use the Framework as a reference for selecting their accounting policies in the absence of specific IFRS requirements. In these cases, companies should review those policies and apply the new guidance retrospectively as of January 01, 2020, unless the new guidance contains specific scope outs.
- Interest Rate Benchmark Reform which amended IFRS 9, IAS 39 and IFRS 7 is applicable for annual financial
periods beginning on or after January 01, 2020. The G20 asked the Financial Stability Board (FSB) to undertake a fundamental review of major interest rate benchmarks. Following the review, the FSB published a report setting out its recommended reforms of some major interest rate benchmarks such as IBORs. Public authorities in many jurisdictions have since taken steps to implement those recommendations. This has in turn led to uncertainty about the long-term viability of some interest rate benchmarks. In these amendments, the term 'interest rate benchmark reform' refers to the market-wide reform of an interest rate benchmark including its replacement with an alternative benchmark rate, such as that resulting from the FSB's recommendations set out in its July 2014 report 'Reforming Major Interest Rate Benchmarks' (the reform). The amendments made provide relief from the potential effects of the uncertainty caused by the reform. A company shall apply the exceptions to all hedging relationships directly affected by interest rate benchmark reform. The amendments are not likely to affect the financial statements of the Company.
- IFRS 14 Regulatory Deferral Accounts - (effective for annual periods beginning on or after July 01, 2019)
provides interim guidance on accounting for regulatory deferral accounts balances while IASB considers more comprehensive guidance on accounting for the effects of rate regulation. In order to apply the interim standard, an entity has to be rate regulated – i.e. the establishment of prices that can be charged to its customers for goods or services is subject to oversight and/or approved by an authorized body. The term ‘regulatory deferral account balance’ has been chosen as a neutral descriptor for expense (income) or variance account that is included or is expected to be included by the rate regulator in establishing the rate(s) that can be charged to customers and would not otherwise be recognized as an asset or liability under other IFRSs. The standard is not likely to have any effect on the Company’s financial statements.
The above amendments are effective from annual period beginning on or after January 01, 2020 and are
not likely to have an impact on the Company’s financial statements.
NOTES TO THE FINANCIAL STATEMENTS For the year ended December 31, 2019

Annual Report 2019 55
2019 20184 SHARE CAPITAL Rupees
4.1 Authorised share capital 405,000,000 (2018: 405,000,000) ordinary shares of Rs.10 each 4,050,000,000 4,050,000,000 4.2 Issued, subscribed and paid-up capital 386,471,779 (2018: 386,471,779) ordinary shares of Rs.10 each fully paid in cash 3,864,717,790 3,864,717,790 4.3 Saif Holdings Limited (''the Holding Company'') holds 197,272,619 i.e. 51.04% shares (2018: 197,272,619
i.e. 51.04%) ordinary shares of Rs.10 each at the reporting date. Further, 16,002 (2018: 12,502) and 100 (2018: 100) ordinary shares of Rs. 10 each are held by directors and a related party respectively. Orastar Limited held 66,022,504 (2018: 66,022,504) ordinary shares of the Company.
2019 20185 LONG TERM FINANCING Note Rupees
Loan from banking companies and financial institutionsSyndicate term finance facilities 5.1 788,379,612 2,975,180,137 Current portion of long term financing 10 (788,379,612) (2,322,465,694) - 652,714,443 5.1 Breakup of syndicate term finance facilities is as follows: Syndicate term finance facility under SFA 5.1.1 653,303,900 2,465,112,225 Syndicate term finance facility under TFFA 5.1.2 135,075,712 510,067,912 788,379,612 2,975,180,137 5.1.1 Syndicate term finance facility under Senior Facility Agreement ("SFA") National Bank of Pakistan 126,059,185 551,866,220 Habib Bank Limited 126,059,185 551,866,220 United Bank Limited 238,440,900 648,913,448 Allied Bank Limited 60,508,408 264,895,785 Faysal Bank Limited 25,211,835 110,373,243 Askari Bank Limited 25,212,635 110,374,043 Bank of Punjab 25,211,835 110,373,243 Pak Oman Investment Company Limited 15,127,101 66,223,945 Saudi Pak Industrial & Agricultural Investment Company Limited 11,472,816 50,226,078 653,303,900 2,465,112,225
This represents a syndicate senior facility of Rs. 10,727.53 million (2018: Rs. 10,727.53 million) obtained from a consortium of seven banks and two Development Finance Institutions (DFIs) led by Habib Bank Limited, the agent bank. The facility carries mark-up at the rate of 3 months KIBOR plus 3% per annum with no floor or cap and is payable in quarterly installments in a period of ten years, starting from June 30, 2010. The facility is secured against immovable property of the Company located at Sahiwal, project receivables, sponsors' shares constituting 51% of total issued share capital of the Company, lien over project accounts and all present and future assets and properties of the Company for an amount of Rs. 27,210.47 million (2018: Rs. 27,210.47 million) and assignment of the Company's rights and benefits under all project agreements.
NOTES TO THE FINANCIAL STATEMENTS For the year ended December 31, 2019

SPL 56
5.1.2 Syndicate term finance facility under Term Finance Facility Agreement ("TFFA") 2019 2018 Rupees
National Bank of Pakistan 26,046,416 114,196,490 Habib Bank Limited 26,046,416 114,196,490 United Bank Limited 49,351,750 134,224,428 Allied Bank Limited 12,502,279 54,814,314 Faysal Bank Limited 5,209,282 22,839,297 Askari Bank Limited 5,209,282 22,839,297 Saudi Pak Industrial & Agricultural Investment Company Limited 2,375,433 10,414,720 Pak Brunei Investment Company Limited 8,334,854 36,542,876 135,075,712 510,067,912 This represents a syndicate term finance facility of Rs. 2,180 million (2018: Rs. 2,180 million) obtained
from a consortium of six banks and two DFIs led by Habib Bank Limited, the agent bank. The facility carries mark-up at the rate of 3 months KIBOR plus 3% per annum with no floor or cap and payable in quarterly installments in a period of ten years, starting from June 30, 2010. The facility is secured against immovable property of the Company located at Sahiwal, project receivables, sponsors’ shares constituting 51% of total issued share capital of the Company, lien over project accounts and all present and future assets and properties of the Company for an amount of Rs. 2,906.66 million (2018: Rs. 2,906.66 million) and assignment of the Company's rights and benefits under all project agreements.
5.2 Subject to certain materiality test, significant covenants of above facilities are as follows: (i) Restriction of creation of further charge on the assets; (ii) Certain restriction on distribution of dividend; and (iii) Maintenance of debt service coverage ratio, debt equity ratio and leverage ratio. Further covenants under these loans relate to the operation of the Company, project accounts, PPA
and material agreements.
2019 20186 SUB-ORDINATED LOAN - UNSECURED Note Rupees
Balance at January 01 959,541,656 762,252,708 Exchange loss capitalised 6.1 112,095,994 197,288,948 1,071,637,650 959,541,656 Current portion of subordinated loan (357,212,541) (159,923,606)Balance at December 31 6.2 714,425,109 799,618,050 6.1 Exchange loss on sub-ordinated loan has been capitalised in accordance with note 3.7(i).
6.2 This represents remaining balance of US $ 6,898,215 (2018: US $ 6,898,215) from the original foreign
currency loan of US $ 8,946,353 obtained from Orastar Limited, incorporated under the laws of British Virgin Island (BVI). The loan is duly registered with State Bank of Pakistan (SBP). The loan carries a markup at the rate of 3 months USD LIBOR plus 3% per annum and payable in quarterly installments in a period of six years starting from January 1, 2019 subject to availability of surplus funds for distribution. As per agreement, the Company can also issue shares to Orastar Limited in lieu of repayment on mutually agreed basis.
NOTES TO THE FINANCIAL STATEMENTS For the year ended December 31, 2019

Annual Report 2019 57
2019 20187 LEASE LIABILITIES Rupees Lease liabilities (2018: Finance lease liabilities) 54,119,049 12,504,766 Less: Current portion (10,112,210) (3,695,846) Long term portion 44,006,839 8,808,920 Movement of lease liabilities under IFRS 16 is as follows: Balance at January 01 51,883,160 - New lease liabilities 11,191,914 - Interest 5,857,956 - Payments during the year (14,813,981) - Balance at December 31 54,119,049 - Current portion of lease liabilities (10,112,210) - Non-Current Portion of Lease Liabilities 44,006,839 - Maturity analysis of undiscounted lease payments that will be paid after the reporting date is as follow:
2019 2018 Rupees Less than one year 15,486,470 - One to two years 18,377,242 - Two to three years 13,844,328 - Three to four years 14,296,757 - Four to five years 3,085,813 - More than five years 3,099,162 - 68,189,772 - 8 TRADE AND OTHER PAYABLES Creditors 1,574,857,652 587,359,435 Accrued liabilities 31,871,623 27,237,829 Withholding tax payable 2,285,020 2,856,577 Sales tax payable - 28,169,431 WPPF payable 8.1 182,497,345 151,654,044 Payable to staff gratuity fund 8.2 9,275,098 16,314,930 Support services fee payable to the Holding Company 221,525,725 221,525,725 Other payables 4,388,766 4,738,760 2,026,701,229 1,039,856,731
8.1 Workers' Profit Participation Fund Balance at January 01 151,654,044 129,606,247 Provision for the year 182,497,345 151,654,044 Payment during the year (151,654,044) (129,606,247) Balance at December 31 8.1.1 182,497,345 151,654,044 8.1.1 This represent Workers' Profit Participation Fund (WPPF) payable at the rate of 5% of the net profit for
the year and is a pass through item under the provisions of Power Purchase Agreement (PPA).
NOTES TO THE FINANCIAL STATEMENTS For the year ended December 31, 2019

SPL 58
2019 20188.2 Payable to staff gratuity fund Note Rupees The amount recognised in the statement of financial position is as follows: Present value of defined benefit obligation 8.2.1 80,798,915 64,878,789 Less: Fair value of plan assets 8.2.2 (71,523,817) (48,563,859) Net defined benefit liability 9,275,098 16,314,930 8.2.1 The movement in present value of defined benefit obligation is as follows: Balance at January 01 64,878,789 45,809,648 Included in profit or loss Current service cost 7,905,156 5,965,817 Interest cost 8,549,441 3,779,296 16,454,597 9,745,113 Included in other comprehensive income Remeasurement loss: - Actuarial loss 174,937 9,324,028 Others Benefits paid (709,408) - Balance at December 31 80,798,915 64,878,789 8.2.2 The movement in fair value of plan assets is as follows: Balance at January 01 48,563,859 36,830,361 Included in profit or loss Interest income 7,468,577 3,408,900 Included in other comprehensive income Return on plan assets excluding interest income (114,141) (654,690) Others Contribution to gratuity fund 16,314,930 8,979,288 Benefits paid (709,408) - Balance at December 31 71,523,817 48,563,859 Breakup of plan assets is as follows: Cash at bank 22,574 124,570 Cash balance 1,046 - Treasury bills 56,456,644 48,439,289 Term finance certificates 15,043,553 - 71,523,817 48,563,859 Allocation of gratuity expense is as follows:
Cost of sales 22.1 5,158,242 3,639,344 Administrative expenses 24.1 3,827,778 2,696,869 8,986,020 6,336,213
NOTES TO THE FINANCIAL STATEMENTS For the year ended December 31, 2019

Annual Report 2019 59
Gratuity plan entitles a retired employee to receive gratuity equivalent to last drawn salary into eligible number of years of service. The gratuity plan is administered by a gratuity fund that is legally separated from the Company and is funded by the Company based on actuarial valuation. Employees are not required to contribute to this plan. The latest actuarial valuation was carried out on December 31, 2019 using projected unit credit method. Expected gratuity expense for the next financial year is Rs. 8,983,007. This defined benefit plan exposes the Company to the following actuarial risks:
(a) Final salary risk The risk that the final salary at the time of cessation of service is greater than what we assumed. Since
the benefit is calculated on the final salary (which will closely reflect inflation and other macroeconomic factors), the benefit amount increases as salary increases.
(b) Demographic risks -Mortality risk The risk that the actual mortality experience is different than the assumed mortality. This effect is more
pronounced in schemes where the age and service distribution is on the higher side. -Withdrawal risk The risk of actual withdrawals experience is different from assumed withdrawal probability. The
significance of the withdrawal risk varies with the age, service and the entitled benefits of the beneficiary.
(c ) Investment risk The risk of the investment under performing and being not sufficient to meet the liabilities.
Key actuarial assumptions 2019 2018 Discount rate used for interest cost 13.25% 8.25% Discount rate used for year end obligation 11.25% 13.25% Future salary growth 10.25% 12.25% Expected mortality for active members As per SLIC 2001-2005 As per SLIC 2001-2005 setback 1 Year setback 1 Year Average expected remaining working life time of employees 5 years 5 years Sensitivity analysis
Reasonably possible changes at the reporting date at one of the relevant actuarial assumptions, holding other assumption constant, would have affected the defined benefit obligations by the amount shown below;
NOTES TO THE FINANCIAL STATEMENTS For the year ended December 31, 2019
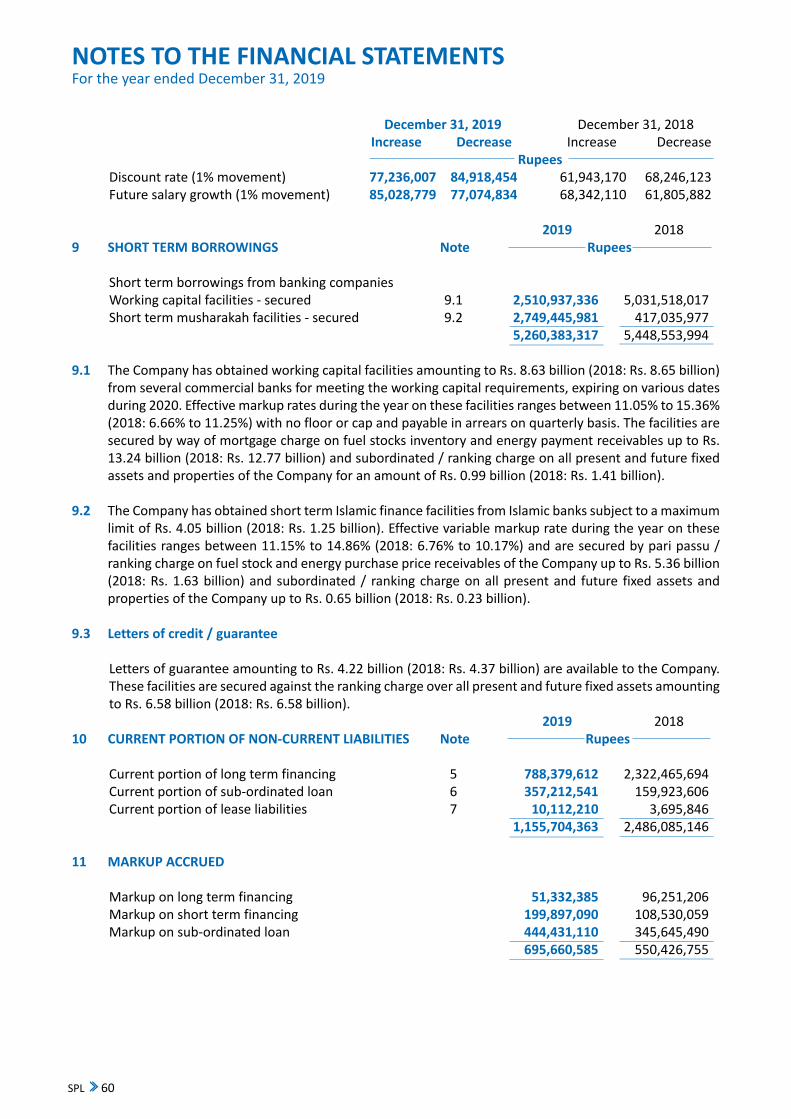
SPL 60
December 31, 2019 December 31, 2018 Increase Decrease Increase Decrease Rupees
Discount rate (1% movement) 77,236,007 84,918,454 61,943,170 68,246,123 Future salary growth (1% movement) 85,028,779 77,074,834 68,342,110 61,805,882
2019 20189 SHORT TERM BORROWINGS Note Rupees
Short term borrowings from banking companies Working capital facilities - secured 9.1 2,510,937,336 5,031,518,017 Short term musharakah facilities - secured 9.2 2,749,445,981 417,035,977 5,260,383,317 5,448,553,994 9.1 The Company has obtained working capital facilities amounting to Rs. 8.63 billion (2018: Rs. 8.65 billion)
from several commercial banks for meeting the working capital requirements, expiring on various dates during 2020. Effective markup rates during the year on these facilities ranges between 11.05% to 15.36% (2018: 6.66% to 11.25%) with no floor or cap and payable in arrears on quarterly basis. The facilities are secured by way of mortgage charge on fuel stocks inventory and energy payment receivables up to Rs. 13.24 billion (2018: Rs. 12.77 billion) and subordinated / ranking charge on all present and future fixed assets and properties of the Company for an amount of Rs. 0.99 billion (2018: Rs. 1.41 billion).
9.2 The Company has obtained short term Islamic finance facilities from Islamic banks subject to a maximum
limit of Rs. 4.05 billion (2018: Rs. 1.25 billion). Effective variable markup rate during the year on these facilities ranges between 11.15% to 14.86% (2018: 6.76% to 10.17%) and are secured by pari passu / ranking charge on fuel stock and energy purchase price receivables of the Company up to Rs. 5.36 billion (2018: Rs. 1.63 billion) and subordinated / ranking charge on all present and future fixed assets and properties of the Company up to Rs. 0.65 billion (2018: Rs. 0.23 billion).
9.3 Letters of credit / guarantee Letters of guarantee amounting to Rs. 4.22 billion (2018: Rs. 4.37 billion) are available to the Company.
These facilities are secured against the ranking charge over all present and future fixed assets amounting to Rs. 6.58 billion (2018: Rs. 6.58 billion).
2019 201810 CURRENT PORTION OF NON-CURRENT LIABILITIES Note Rupees Current portion of long term financing 5 788,379,612 2,322,465,694 Current portion of sub-ordinated loan 6 357,212,541 159,923,606 Current portion of lease liabilities 7 10,112,210 3,695,846 1,155,704,363 2,486,085,146 11 MARKUP ACCRUED Markup on long term financing 51,332,385 96,251,206 Markup on short term financing 199,897,090 108,530,059 Markup on sub-ordinated loan 444,431,110 345,645,490 695,660,585 550,426,755
NOTES TO THE FINANCIAL STATEMENTS For the year ended December 31, 2019

Annual Report 2019 61
12 CONTINGENCIES AND COMMITMENTS 12.1 Contingencies: 12.1.1 In 2014, the tax authorities raised sales tax demand of Rs. 1,498.51 million by partially disallowing
input sales tax for the tax periods 2010 to 2013 by apportioning the total claim to energy purchase price and capacity purchase price, the latter being not subject to sales tax. On appeal filed by the Company, the Appellate Tribunal Inland Revenue (ATIR) directed the taxation officer to decide the matter in line with expected judgment of the Honorable High Court in parallel cases. Consequently, at present, the aforesaid tax demand is no more payable. Tax Authorities, against the decision of ATIR, filed reference application under section 47 of the Sales Tax Act, 1990 before the Honorable Islamabad High Court on October 16, 2015. However, in case the matter is eventually resolved against the Company, the tax payment will be claimable under the Power Purchase Agreement. Based on the advice of the Company's tax consultants and decision of the Lahore High Court in a parallel case, the Company’s management believes that the contention of tax department even after filing of reference application does not commensurate with the related statutory provisions and the issue is likely to be decided in favor of the Company.
12.1.2 For the tax period July 2015 to June 2016, the assessing officer raised sales tax demand of Rs. 10.43
million in the matter of inadmissibility of input tax in relation to financial banking services, security services and business support services procured by the Company. The Company filed an appeal with Commissioner (Appeals), who decided the matter in favor of the Company on account of business support services and remanded the matter to assessing officer on account of security services and financial banking services. The Company filed appeal to the Appellant Tribunal Inland Revenue (ATIR) against the order of Commissioner (Appeals) which is pending adjudication. Maximum amount of contingency as per the Company's records is Rs. 4.92 million.
12.1.3 In respect of Tax Years 2014 and 2015, the assessing officer amended the Company’s assessments and
raised tax demand amounting to Rs. 25.15 million and Rs. 9.45 million respectively by subjecting bank profit, return on investments and foreign exchange gain to tax. The Company filed an appeal before Commissioner (Appeals), who confirmed the tax imposed in the earlier order and further ordered to charge tax on interest on delayed payment revenue. On May 29, 2018 the Company filed an appeal before ATIR against the order of Commissioner (Appeals). Subsequent to year end, ATIR decided the case in favour of the Company.
12.1.4 For Tax Year 2015, the assessing officer raised demand of Rs. 55.6 million in March 2017 for alleged non-withholding of tax on salaries, payment for goods and service, rent and dividend. The Company filed appeal before Commissioner (Appeals) who remanded the case to the assessing officer who in turn created a demand of Rs. 13.4 million in September 2018. The Company again filed appeal before Commissioner (Appeals) against the appeal effect order on October 16, 2018. Commissioner (Appeals) remanded the case to assessing officer where it is pending for final assessment.
12.1.5 For Tax Year 2013, the assessing officer in June 29, 2019 raised a demand of Rs. 29.09 million on
account of non-payment to Workers' Welfare Fund. The Company filed appeal before Commissioner (Appeals) on July 26, 2019. Subsequent to year end, Commissioner (Appeals) decided the matter in favour of the Company.
12.1.6 Sui Northern Gas Pipelines Limited (SNGPL) has claimed an amount of Rs.95.99 million (2018: Rs
89.28 million) on account of late payment by the Company against SNGPL's invoices of Regasified Liquefied Natural Gas (RLNG). SNGPL submitted these RLNG invoices to the Company without getting determination of RLNG tariff from Oil and Gas Regulatory Authority (OGRA). The Company has considered such SNGPL invoices to be invalid without OGRA determination. Therefore, no provision for the above mentioned amount has been made in these financial statements.
12.2 Commitments: The Company is committed to pay monthly fee and milestone payments to its O&M contractors as per
terms agreed in the Operations & Maintenance (O&M) agreement.
NOTES TO THE FINANCIAL STATEMENTS For the year ended December 31, 2019

SPL 62
NO
TES
TO T
HE F
INAN
CIAL
STA
TEM
ENTS
Fo
r the
yea
r end
ed D
ecem
ber 3
1, 2
019
13
PRO
PERT
Y, P
LAN
T AN
D EQ
UIP
MEN
T
O
wne
d as
sets
Le
ased
ass
ets
Fr
eeho
ld
Build
ings
on
Plan
t and
O
ffice
Co
mpu
ter
Furn
iture
M
otor
cycl
e Ve
hicl
es
Oth
er
Stor
es h
eld
for
Vehi
cles
To
tal
la
nd
free
hold
land
m
achi
nery
eq
uipm
ent
and
acce
ssor
ies
and
fixtu
res
and
bicy
cle
as
sets
ca
pita
lizat
ion
Cost
Ru
pees
Bala
nce
at Ja
nuar
y 1,
201
8 4
3,89
0,60
0 2
,352
,888
,758
15,
143,
868,
768
1
0,37
7,03
0
5,2
80,8
25
3,8
07,1
68
395
,645
8
,245
,194
6
26,2
30
511
,038
,581
2
5,02
9,56
0 1
8,10
5,44
8,35
9 Ad
ditio
ns
-
-
-
625
,142
3
45,9
45
3,0
63,0
30
-
-
-
-
-
4,0
34,1
17
Tran
sfer
s -
-
-
-
-
-
-
7
,905
,238
-
-
(7
,905
,238
) -
Disp
osal
s -
-
-
(1
8,28
9)
(74,
240)
-
-
(3
57,5
00)
-
-
-
(450
,029
)Ef
fect
of e
xcha
nge
loss
(Ref
er n
ote
6.1)
-
-
1
97,2
88,9
48
-
-
-
-
-
-
-
-
197
,288
,948
Ba
lanc
e at
Dec
embe
r 31,
201
8 4
3,89
0,60
0 2
,352
,888
,758
15,
341,
157,
716
1
0,98
3,88
3
5,5
52,5
30
6,8
70,1
98
395
,645
1
5,79
2,93
2
626
,230
5
11,0
38,5
81
17,
124,
322
18,
306,
321,
395
Bala
nce
at Ja
nuar
y 1,
201
9 4
3,89
0,60
0 2
,352
,888
,758
15,
341,
157,
716
1
0,98
3,88
3
5,5
52,5
30
6,8
70,1
98
395
,645
1
5,79
2,93
2
626
,230
5
11,0
38,5
81
17,
124,
322
18,
306,
321,
395
Reco
gniti
on o
f rig
ht-o
f-use
ass
et o
n in
itial
app
licat
ion
of IF
RS 1
6 -
-
-
-
-
-
-
-
-
-
(1
7,12
4,32
2)
(17,
124,
322)
Adju
sted
bal
ance
at J
anua
ry 1
, 201
9 4
3,89
0,60
0 2
,352
,888
,758
15,
341,
157,
716
1
0,98
3,88
3
5,5
52,5
30
6,8
70,1
98
395
,645
1
5,79
2,93
2
626
,230
5
11,0
38,5
81
-
18,
289,
197,
073
Addi
tions
-
-
1
,069
,563
,372
2
57,6
30
338
,700
1
3,00
0
-
-
-
-
-
1,0
70,1
72,7
02
Disp
osal
-
-
-
(4
7,21
0)
(90,
090)
-
-
(3
,152
,912
) -
-
-
(3
,290
,212
)De
reco
gniti
on
-
-
(1,5
73,8
00,4
69)
-
-
-
-
-
-
-
-
(1,5
73,8
00,4
69)
Effe
ct o
f exc
hang
e lo
ss (R
efer
not
e 6.
1)
-
-
112
,095
,994
-
-
-
-
-
-
-
-
1
12,0
95,9
94
Bala
nce
at D
ecem
ber 3
1, 2
019
43,
890,
600
2,3
52,8
88,7
58 1
4,94
9,01
6,61
3
11,
194,
303
5
,801
,140
6
,883
,198
3
95,6
45
12,
640,
020
6
26,2
30
511
,038
,581
-
1
7,89
4,37
5,08
8 DE
PREC
IATI
ON
Ba
lanc
e at
Janu
ary
1, 2
018
-
610,
793,
692
3
,778
,111
,078
7
,977
,451
4
,541
,034
3
,006
,387
2
94,2
21
5,6
95,5
56
626
,230
-
6
,792
,332
4
,417
,837
,981
Ch
arge
for t
he y
ear
-
78,
351,
192
5
09,5
78,6
59
516
,717
1
99,6
45
435
,988
2
6,01
5
1,8
46,2
47
-
-
3,4
77,7
16
594
,432
,179
O
n tr
ansf
ers
-
-
-
-
-
-
-
3,8
40,7
55
-
-
(3,8
40,7
55)
- O
n di
spos
als
-
-
-
(12,
701)
(7
4,24
0)
-
-
(286
,000
) -
-
-
(3
72,9
41)
Bala
nce
at D
ecem
ber 3
1, 2
018
- 6
89,1
44,8
84
4,2
87,6
89,7
37
8,4
81,4
67
4,6
66,4
39
3,4
42,3
75
320
,236
1
1,09
6,55
8
626
,230
-
6
,429
,293
5
,011
,897
,219
Ba
lanc
e at
Janu
ary
1, 2
019
- 6
89,1
44,8
84
4,2
87,6
89,7
37
8,4
81,4
67
4,6
66,4
39
3,4
42,3
75
320
,236
1
1,09
6,55
8
626
,230
-
6
,429
,293
5
,011
,897
,219
Re
cogn
ition
of r
ight
-of-u
se a
sset
on
initi
al a
pplic
atio
n of
IFRS
16
-
-
-
-
-
-
-
-
-
-
(6,4
29,2
93)
(6,4
29,2
93)
Adju
sted
bal
ance
at J
anua
ry 1
, 201
9 -
689
,144
,884
4
,287
,689
,737
8
,481
,467
4
,666
,439
3
,442
,375
3
20,2
36
11,
096,
558
6
26,2
30
-
-
5,0
05,4
67,9
26
Char
ge fo
r the
yea
r -
7
8,35
1,19
2
516
,598
,772
6
22,6
51
307
,486
4
48,4
76
13,
896
1
,880
,474
-
-
-
5
98,2
22,9
47
On
disp
osal
s -
-
-
(3
6,10
8)
(90,
090)
-
-
(2
,522
,329
) -
-
-
(2
,648
,527
)O
n de
reco
gniti
on
-
-
(506
,606
,371
) -
-
-
-
-
-
-
-
(5
06,6
06,3
71)
Bala
nce
at D
ecem
ber 3
1, 2
019
- 7
67,4
96,0
76
4,2
97,6
82,1
38
9,0
68,0
10
4,8
83,8
35
3,8
90,8
51
334
,132
1
0,45
4,70
3
626
,230
-
-
5
,094
,435
,975
IM
PAIR
MEN
T Ba
lanc
e at
Janu
ary
1, 2
018
-
-
-
-
-
-
-
-
-
-
-
- Ch
arge
for t
he y
ear
-
-
-
-
-
-
-
-
-
-
-
- Ba
lanc
e at
Dec
embe
r 31,
201
8 -
-
-
-
-
-
-
-
-
-
-
-
Bala
nce
at Ja
nuar
y 1,
201
9 -
-
-
-
-
-
-
-
-
-
-
-
Char
ge fo
r the
yea
r -
-
8
33,7
94,0
98
-
-
-
-
-
-
-
-
833
,794
,098
O
n de
reco
gniti
on
-
-
(833
,794
,098
) -
-
-
-
-
-
-
-
(8
33,7
94,0
98)
Bala
nce
at D
ecem
ber 3
1, 2
019
-
-
-
-
-
-
-
-
-
-
-
- Ca
rryi
ng a
mou
nts
At Ja
nuar
y 1,
201
8 4
3,89
0,60
0 1
,742
,095
,066
11,
365,
757,
690
2
,399
,579
7
39,7
91
800
,781
1
01,4
24
2,5
49,6
38
-
511
,038
,581
1
8,23
7,22
8 1
3,68
7,61
0,37
8 At
Dec
embe
r 31,
201
8 4
3,89
0,60
0 1
,663
,743
,874
11,
053,
467,
979
2
,502
,416
8
86,0
91
3,4
27,8
23
75,
409
4
,696
,374
-
5
11,0
38,5
81
10,
695,
029
13,
294,
424,
176
At D
ecem
ber 3
1, 2
019
43,
890,
600
1,5
85,3
92,6
82 1
0,65
1,33
4,47
5
2,1
26,2
93
917
,305
2
,992
,347
6
1,51
3
2,1
85,3
17
-
511
,038
,581
-
1
2,79
9,93
9,11
3
Rate
of d
epre
ciat
ion
per a
nnum
(%)
- 3.
33%
3.
33%
to 4
.92%
10
% to
33.
33%
33
.33%
10
%
20%
20
%
10%
-
20%
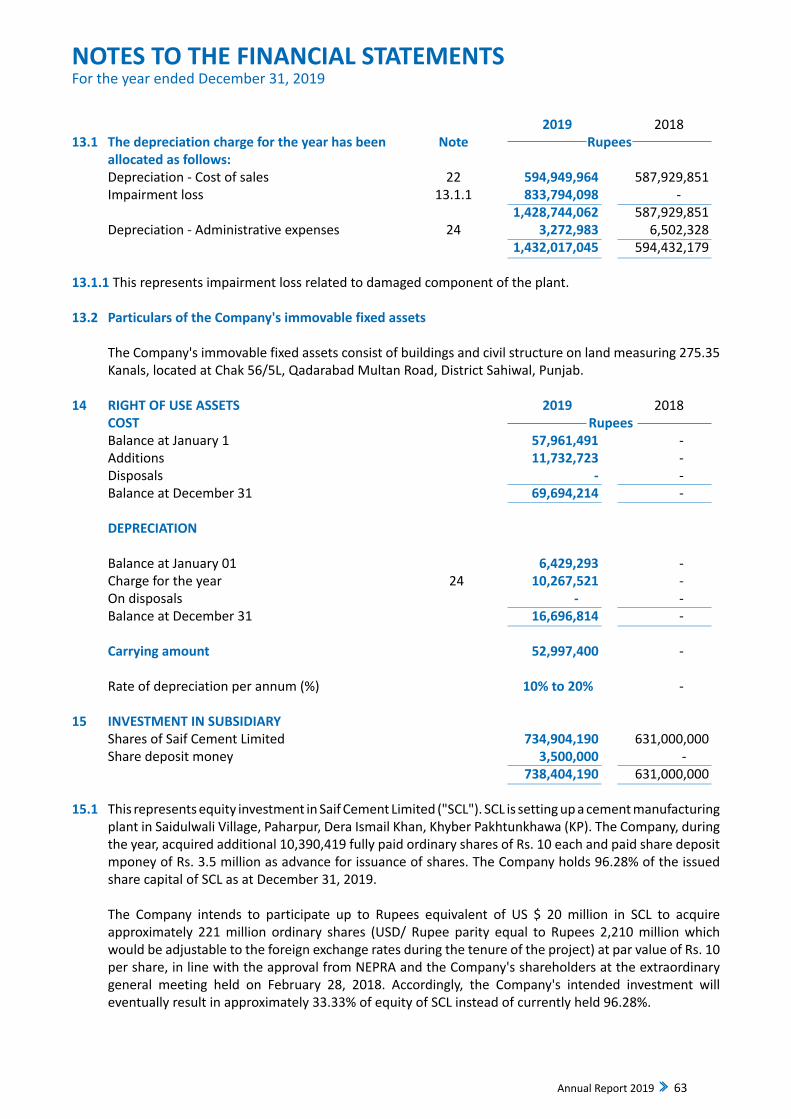
Annual Report 2019 63
2019 201813.1 The depreciation charge for the year has been Note Rupees allocated as follows: Depreciation - Cost of sales 22 594,949,964 587,929,851 Impairment loss 13.1.1 833,794,098 - 1,428,744,062 587,929,851 Depreciation - Administrative expenses 24 3,272,983 6,502,328 1,432,017,045 594,432,179 13.1.1 This represents impairment loss related to damaged component of the plant. 13.2 Particulars of the Company's immovable fixed assets The Company's immovable fixed assets consist of buildings and civil structure on land measuring 275.35
Kanals, located at Chak 56/5L, Qadarabad Multan Road, District Sahiwal, Punjab. 14 RIGHT OF USE ASSETS 2019 2018 COST Rupees Balance at January 1 57,961,491 - Additions 11,732,723 - Disposals - - Balance at December 31 69,694,214 - DEPRECIATION Balance at January 01 6,429,293 - Charge for the year 24 10,267,521 - On disposals - - Balance at December 31 16,696,814 - Carrying amount 52,997,400 - Rate of depreciation per annum (%) 10% to 20% - 15 INVESTMENT IN SUBSIDIARY Shares of Saif Cement Limited 734,904,190 631,000,000 Share deposit money 3,500,000 - 738,404,190 631,000,000 15.1 This represents equity investment in Saif Cement Limited ("SCL"). SCL is setting up a cement manufacturing
plant in Saidulwali Village, Paharpur, Dera Ismail Khan, Khyber Pakhtunkhawa (KP). The Company, during the year, acquired additional 10,390,419 fully paid ordinary shares of Rs. 10 each and paid share deposit mponey of Rs. 3.5 million as advance for issuance of shares. The Company holds 96.28% of the issued share capital of SCL as at December 31, 2019.
The Company intends to participate up to Rupees equivalent of US $ 20 million in SCL to acquire approximately 221 million ordinary shares (USD/ Rupee parity equal to Rupees 2,210 million which would be adjustable to the foreign exchange rates during the tenure of the project) at par value of Rs. 10 per share, in line with the approval from NEPRA and the Company's shareholders at the extraordinary general meeting held on February 28, 2018. Accordingly, the Company's intended investment will eventually result in approximately 33.33% of equity of SCL instead of currently held 96.28%.
NOTES TO THE FINANCIAL STATEMENTS For the year ended December 31, 2019

SPL 64
2019 201816 TRADE DEBTS Note Rupees National Transmission and Dispatch Company (NTDC) 16.1 9,650,652,780 8,415,730,184 16.1 Trade debts include an overdue amount of Rs 7.67 billion (2018: Rs. 6.72 billion) on account of circular debt.
The Company considers this amount to be fully recoverable because this is secured by way of guarantee issued by the Government of Pakistan (GoP) under the Implementation Agreement (IA). Additionally, trade debts are subject to markup on delayed payments under PPA at the rate of KIBOR+4.5% per annum except RLNG fuel invoices which are subject to markup of KIBOR+2% for first 30 days and after 30 days markup will be KIBOR+4.5%. GoP is committed, hence continuously pursuing for satisfactory settlement of debt issue.
16.2 Included in trade debts is an amount of Rs. 477.56 million (2018: Rs. 477.56 million) relating to capacity
purchase price not acknowledged by NTDC as the plant was not fully available for power generation. However, the sole reason of this under-utilisation of plant capacity was non-availability of fuel owing to non-payment by NTDC.
The Company along with other Independent Power Producers (IPPs) agreed with NTDC to resolve the
dispute through dispute resolution mechanism (appointment of expert) under the PPA. In his decision the expert in August 2015 determined that the amount mentioned above is payable to the Company and accordingly the Company has claimed the said amount from NTDC. Since NTDC did not conform to requirements of PPA relating to Expert decision within 30 days, the IPPs went to London Court of International Arbitration (LCIA).
Sole arbitrator appointed by LCIA issued a partial final award on June 08, 2017 wherein it was inter alia
held that the expert determination is final and binding. Thereafter, a final award was issued by the sole arbitrator on October 29, 2017 pursuant to which NTDC was ordered to pay Rs. 477.56 million (2018: Rs. 477.56 million) along with cost of proceedings, interest from the date of expert determination till payment by NTDC, after Arbitrator decision, to the Company. The Company filed petitions before Lahore High Court for enforcement of partial final award and final award on June 17, 2017 and November 30, 2017 respectively, which proceedings are pending till date. NTDC has also challenged the partial final award and final award in Civil Court, Lahore.
16.3 During year ended December 31, 2016 an amount of Rs. 239.68 million relating to capacity purchase
price not acknowledged by NTDC was adjusted by the Company against payable to SNGPL pursuant to award in favour of the Company for the whole amount by the London Court of International Arbitration (LCIA). SNGPL disputed the adjustment/set off amount of Award in the Lahore High Court, however, the court dismissed such petition of SNGPL. Thereafter, SNGPL filed appeal before the Supreme Court of Pakistan, which disposed off the appeal by stating that the judgement of the Lahore High Court, to the extent it decides on merits, the question of the Company’s right to set off is set aside (without prejudice to the rights of the parties). SNGPL also challenged the award in Civil Court, Lahore, on April 21, 2016 which is pending adjudication. On June 07, 2016 the Company filed a petition in the Civil Court Lahore to obtain a Decree in lieu of the arbitration award and also adjusted an amount of Rs. 270.66 million (inclusive of the aforementioned amount of Rs. 239.68 million) from payable to SNGPL as such amount was allowed by the LCIA in its award. During the year, SNGPL has filed suit for recovery before District Judge, Lahore (Invested with Powers of the Gas Utility Court) on March 01, 2019 against this adjustment including a claim for markup from the date of such adjustment and also has filed a request for Arbitration before LCIA on March 22, 2019. In its submission to LCIA on March 06, 2020, SNGPL has claimed adjusted amount of Rs. 270.66 million and markup amount of Rs. 236.47 million from the date of such adjustment. The Company’s position is that no amount is payable to SNGPL and in any case, LCIA Arbitration is the only competent forum to decide on this case.
16.4 For aging of receivable from NTDC at the reporting date, refer to note 27.4.
NOTES TO THE FINANCIAL STATEMENTS For the year ended December 31, 2019

Annual Report 2019 65
2019 201817 OTHER RECEIVABLES Note Rupees
Workers' Profit Participation Fund (WPPF) receivable 334,044,648 496,240,240 Insurance claim receivable 785,753,372 - Sales tax receivable - net 27,741,941 - Other receivables 16,899,493 1,762,518 1,164,439,454 498,002,758 18 ADVANCES - considered good Advances to supplier 18.1 97,456,918 374,545 Advances to employees 767,321 544,572 98,224,239 919,117 18.1 These include advance payment to SNGPL amounitng to Rs. 96,332,896. 19 TRADE DEPOSITS AND SHORT TERM PREPAYMENTS Prepayments 61,172,356 49,101,107 Security deposit 1,833,000 1,833,000 Current portion of long term deposits - 752,500 63,005,356 51,686,607 20 BANK BALANCES Cash at bank: Current accounts Local currency 366,950 22,428 Deposit accounts Local currency - 974 Foreign currency 20.1 304,124 271,840 20.2 304,124 272,814 671,074 295,242 20.1 This represents an amount of USD 1,964 (2018: USD 1,954) in US Dollar deposit and current accounts.
20.2 These carry markup ranging from 7.75% to 11.96% (2018: 4% to 4.62%) per annum for Rupee denominated
balances while 0.15% (2018: 0.15%) per annum for US Dollar denominated balances.
2019 201821 TURNOVER - NET Rupees
Gross Energy Purchase Price 10,205,164,015 13,685,991,456 Less: Sales tax (1,482,801,609) (1,990,837,969) 8,722,362,406 11,695,153,487 Capacity Purchase Price 6,188,018,470 4,995,173,542 14,910,380,876 16,690,327,029
NOTES TO THE FINANCIAL STATEMENTS For the year ended December 31, 2019

SPL 66
2019 201822 COST OF SALES Note Rupees Raw material consumed 8,118,148,860 11,000,232,532 Operation and maintenance 888,634,449 815,409,235 Salaries and other benefits 22.1 66,550,886 58,102,812 Electricity charges 37,946,391 21,568,216 Insurance expense/ (recovery) 22.2 (652,965,263) 138,225,809 Depreciation and impairment loss 13.1 1,428,744,062 587,929,851 Office expenses 2,440,992 1,564,615 Travelling, conveyance and entertainment 1,708,330 1,093,134 Repair and maintenance 905,299 1,098,461 Communication 85,111 98,065 9,892,199,117 12,625,322,730 22.1 These include Rs. 5,158,242 (2018: Rs. 3,639,344) charged in respect of staff retirement benefits -
gratuity. 22.2 This includes Rs. 820,628,372 related to recovery on account of damaged component of the plant.
2019 201823 OTHER INCOME Note Rupees Income from financial assets Profit on deposit accounts 1,076,273 15,717 Return on investments 337,739 1,480,932 Income from non financial assets Insurance claim 19,000 34,012 Gain on disposal of property, plant and equipment 426,062 243,500 Scrap sales 261,783 360,665 2,120,857 2,134,826 24 ADMINISTRATIVE EXPENSES Salaries and other benefits 24.1 56,697,254 46,297,938 Traveling and conveyance 2,085,418 1,300,740 Rent, rates and taxes 444,703 10,165,604 Security services 12,732,924 11,941,276 Office expenses 6,193,658 6,395,772 Fees and subscriptions 14,999,962 11,447,724 Legal and professional 10,573,269 6,305,262 Consultancy 23,357,590 22,736,520 Repair and maintenance 6,054,129 5,673,520 Utilities 1,972,699 1,575,165 Insurance 2,659,388 2,393,835 Depreciation - Property, plant and equipment 13.1 3,272,983 6,502,328 Depreciation - Right of use assets 14 10,267,521 - Auditors' remuneration 24.2 2,721,803 1,962,500 Donations 24.3 7,300,000 4,600,000 Advertisements 135,715 267,660 161,469,016 139,565,844 24.1 These include Rs. 3,827,778 (2018: Rs. 2,696,869) charged in respect of staff retirement benefits -
gratuity.
NOTES TO THE FINANCIAL STATEMENTS For the year ended December 31, 2019

Annual Report 2019 67
2019 2018 Rupees24.2 Auditors' remuneration Annual audit fee 866,000 770,000 Half yearly review fee 478,000 424,000 Consolidation 281,000 250,000 Certifications 399,403 208,500 Out of pocket expenses 71,000 70,000 Other services 626,400 240,000 2,721,803 1,962,500 24.3 This includes donation amounting to Rs. 6 million (2018: Rs. 4.5 million) to Akbar Kare Institute, Kulsum
Plaza, Jinnah Avenue, Blue Area, Islamabad, a company registered under Section 42 of the repealed Companies Ordinance, 1984 in which following directors of the Company are common directors:
Name of Director Nature of interest in donee Mrs. Hoor Yousafzai Director Mr. Jehangir Saifullah Khan Director
2019 201825 FINANCE COST Rupees Markup on short term borrowings 741,042,628 303,758,174 Markup on long term financing 302,026,632 401,469,713 Markup on sub-ordinated loan 56,797,500 43,961,603 Guarantee commission and arrangement fee 16,499,996 16,500,598 Markup on lease liabilities 5,857,956 918,537 Bank charges 474,718 597,487 Exchange loss - net 86,187,262 127,286,289 1,208,886,692 894,492,401 26 EARNINGS PER SHARE
Profit for the year (Rupees) 3,649,946,908 3,033,080,880 Weighted average number of shares (Numbers) 386,471,779 386,471,779 Earnings per share - basic (Rupees) 9.44 7.85 There is no dilution effect on the basic earnings per share of the Company.
NOTES TO THE FINANCIAL STATEMENTS For the year ended December 31, 2019

SPL 68
27 FINANCIAL INSTRUMENTS - FAIR VALUES AND RISK MANAGEMENT Fair value measurement
Fair value is the amount that would be received on sale of an asset or paid on transfer of a liability in an orderly transaction between market participants at the measurement date. Consequently, differences can arise between carrying values and fair value estimates. Underlying the definition of fair value is the presumption that the Company is a going concern without any intention or requirement to curtail materially the scale of its operations or to undertake a transaction on adverse terms.
The fair value of financial assets and liabilities traded in active markets i.e. listed equity shares are based on the quoted market prices at the close of trading on the period end date. The quoted market prices used for financial assets held by the Company is current bid price. A financial instrument is regarded as quoted in an active market if quoted prices are readily and regularly available from an exchange, dealer, broker, industry group, pricing service, or regulatory agency, and those prices represent actual and regularly occurring market transactions on an arm’s length basis.
IFRS 13, 'Fair Value Measurements' requires the Company to classify fair value measurements using a fair
value hierarchy that reflects the significance of the inputs used in making the measurements. The fair value hierarchy has the following levels:
- Quoted prices (unadjusted) in active markets for identical assets or liabilities (level 1). - Inputs other than quoted prices included within level 1 that are observable for the asset or liability,
either directly (that is, as prices) or indirectly (that is, derived from prices) (level 2). - Inputs for the asset or liability that are not based on observable market data (that is, unobservable
inputs) (level 3).
NOTES TO THE FINANCIAL STATEMENTS For the year ended December 31, 2019

Annual Report 2019 69
A. Accounting classifications and fair values
27.1 The following table shows the carrying amounts and fair values of financial assets and financial liabilities, including their levels in the fair value hierarchy.
December 31, 2019 Rupees Financial assets measured at fair value - - - - - - -
Financial assets not measured at fair value 27.2 Long term deposits 4,372,660 - 4,372,660 - - - -Trade debts 9,650,652,780 - 9,650,652,780 - - - - Other receivables 1,136,697,513 - 1,136,697,513 - - - - Advances to employees 767,321 - 767,321 - - - - Security deposits 1,833,000 - 1,833,000 - - - - Bank balances 671,074 - 671,074 - - - - Total 10,794,994,348 - 10,794,994,348 - - - - Financial liabilities not measured at fair value 27.2 Long term financing - 788,379,612 788,379,612 - - - - Sub-ordinated loan - 1,071,637,650 1,071,637,650 - - - - Lease liabilities - 54,119,049 54,119,049 - - - - Trade and other payables 27.3 - 2,024,416,209 2,024,416,209 - - - - Short term borrowings - 5,260,383,317 5,260,383,317 - - - - Markup accrued - 695,660,585 695,660,585 - - - - Unclaimed dividend - 15,465,337 15,465,337 - - - - Total - 9,910,061,759 9,910,061,759 - - - -
December 31, 2018 Rupees Financial assets measured at fair value - - - - - - - Financial assets not measured at fair value 27.2 Long term deposits 4,084,310 - 4,084,310 - - - - Trade debts 8,415,730,184 - 8,415,730,184 - - - - Other receivables 498,002,758 - 498,002,758 - - - - Advances to employees 544,572 - 544,572 - - - - Security deposits 1,833,000 - 1,833,000 - - - - Bank balances 295,242 - 295,242 - - - - Total 8,920,490,066 - 8,920,490,066 - - - - Financial liabilities not measured at fair value 27.2 Long term financing - 2,975,180,137 2,975,180,137 - - - - Sub-ordinated loan - 959,541,656 959,541,656 - - - - Lease liabilities - 12,504,766 12,504,766 - - - - Trade and other payables 27.3 - 1,008,830,723 1,008,830,723 - - - - Short term borrowings - 5,448,553,994 5,448,553,994 - - - - Markup accrued - 550,426,755 550,426,755 - - - - Unclaimed dividend - 10,190,825 10,190,825 - - - - Total - 10,965,228,856 10,965,228,856 - - - -
27.2 The Company has not disclosed the fair values for these financial assets and financial liabilities, as these are either short term in nature or repriced periodically. Therefore, their carrying amounts are reasonable approximation of fair value.
27.3 This excludes withholding tax payable and sales tax payable.
Note
Note
Amortised cost
Amortised cost
Loan andreceivable
Other financial liabilities
Fair value
Fair value
Carrying Amount
Carrying Amount
Total
Total
Level 1
Level 1
Level 3
Level 3
Level 2
Level 2
Total
Total

SPL 70
B. Financial risk management The Company has exposure to the credit risk, market risk and liquidity risk from its use of financial
instruments. The Board of Directors has overall responsibility for the establishment and oversight of the Company's
risk management framework. The Board is responsible for developing and monitoring the Company's risk management policies.
The Company's risk management policies are established to identify and analyse the risks faced by the
Company, to set appropriate risk limits and controls, and to monitor risks and adherence to limits. Risk management policies and systems are reviewed regularly to reflect changes in market conditions and the Company's activities. The Company, through its training and management standards and procedures, aims to develop a disciplined and constructive control environment in which all employees understand their roles and obligations.
The Audit Committee oversees how management monitors compliance with the Company's risk
management policies and procedures and reviews the adequacy of the risk management framework in relation to the risks faced by the Company. The Audit Committee is assisted in its oversight role by Internal Audit. Internal Audit undertakes both regular and ad-hoc reviews of risk management controls and procedures, the result of which are reported to the Audit Committee.
27.4 Credit risk Credit risk is the risk of financial loss to the Company if a customer or counterparty to a financial
instrument fails to meet its contractual obligations. Concentrations of credit risk indicate the relative sensitivity of the Company's performance to developments affecting a particular industry. The primary activity of the Company is power generation and sale of total output to NTDC. The Company is exposed to credit risk from its operations.
Exposure to credit risk The carrying amount of financial assets represents the maximum credit exposure. The maximum
exposure to credit risk at the reporting date was:
2019 2018 Note Rupees Long term deposits 4,372,660 4,084,310 Trade debts 16 9,650,652,780 8,415,730,184 Other receivables 17 1,136,697,513 498,002,758 Advances to employees 18 767,321 544,572 Security deposits 19 1,833,000 1,833,000 Bank balances 20 671,074 295,242 10,794,994,348 8,920,490,066
NOTES TO THE FINANCIAL STATEMENTS For the year ended December 31, 2019

Annual Report 2019 71
Credit risk is minimum as the bank accounts are maintained with reputable banks having good credit ratings. Further, as disclosed in note 16.1 that the trade debts are secured by way of guarantee issued by the Government of Pakistan (GoP) under the Implementation Agreement (IA). Credit quality of financial assets
The credit quality of Company's financial assets have been assessed as follows by reference to external
credit rating of counterparties determined by the Pakistan Credit Rating Agency Limited (PACRA) and JCR - VIS Credit Rating Company Limited (JCR - VIS). The counterparties for which external credit ratings were not available have been assessed by reference to internal credit ratings determined based on their historical information for any default in meeting obligations.
2019 2018 Trade debts Rupees
Counterparties without external credit ratings 9,650,652,780 8,415,730,184 Impairment losses
The aging of trade debts at the reporting date was:
2019 2018 Gross Impairment Gross Impairment Rupees
Not past due 1,984,620,058 - 1,698,500,047 - Past due 0 - 60 days 415,111,850 - 525,770,527 - Past due 61 - 120 days 2,324,160,738 - 3,805,573,181 - Past due 121 - 180 days 504,803,329 - 814,388,033 - 181 days and above 4,421,956,805 - 1,571,498,396 - 9,650,652,780 - 8,415,730,184 - As trade debts are ultimately receivable from GoP, therefore, these are exempt from impairment
provisioning requirements. Impact of ECL on financial assets not covered under exemption was not material and accordingly has not been included in these financial statements.
2019 2018 Security deposits Rupees Counterparties without external credit ratings 1,833,000 1,833,000 Other receivables Counterparties without external credit ratings 1,136,697,513 498,002,758 Long term deposits Counterparties with external credit ratings - AA+ (2018: A1+) 1,290,450 1,002,100
Counterparties with external credit ratings - BBB- (2018: A-) 3,082,210 3,082,210 Advances to employees Counterparties without external credit ratings 767,321 544,572 Cash and cash equivalents The Company held cash at bank amounting to Rs. 671,074 as at December 31, 2019 (2018: Rs.295,242).
Cash at bank is held with banks and financial institution counter parties, which are rated A1+ based on JCR-VIS rating.
NOTES TO THE FINANCIAL STATEMENTS For the year ended December 31, 2019

SPL 72
27.5 Liquidity risk Liquidity risk is the risk that the Company will not be able to meet its financial obligations as they fall due.
Prudent liquidity risk management implies maintaining sufficient cash and marketable securities, the availability of funding to an adequate amount of committed credit facilities and the ability to close out market positions due to dynamic nature of the business. The Company's approach to managing liquidity is to ensure, as far as possible, that it will always have sufficient liquidity to meet its liabilities when due, under both normal and stressed conditions, without incurring unacceptable losses or risking damage to the Company's reputation.
There were no defaults on loans payable during the year. The maturity profile of the Company’s financial liabilities based on the contractual amounts is as
follows: Carrying Contractual cash Maturity in less Maturity after Maturity after amount flows than 1 year one year and up five years to five years Rupees 2019 Long term financing 788,379,612 814,536,069 814,536,069 - - Sub-ordinated loan 1,071,637,650 1,186,509,727 397,691,282 788,818,445 - Lease liabilities 54,119,049 68,189,772 15,486,470 49,604,140 3,099,162 Trade and other payables 2,024,416,209 2,024,416,209 2,024,416,209 - - Short term borrowing 5,260,383,317 5,260,383,317 5,260,383,317 - - Markup accrued 695,660,585 695,660,585 695,660,585 - - Unclaimed dividend 15,465,337 15,465,337 15,465,337 - - 9,910,061,759 10,065,161,016 9,223,639,269 838,422,585 3,099,162
Carrying Contractual cash Maturity in less Maturity after Maturity after amount flows than 1 year one year and up five years to five years Rupees 2018 Long term financing 2,975,180,137 3,514,802,741 2,822,450,712 692,352,029 - Sub-ordinated loan 959,541,656 1,133,275,103 212,042,429 755,517,697 165,714,977 Lease liabilities 12,504,766 14,420,582 4,913,222 9,507,360 - Trade and other payables 1,008,830,723 1,008,830,723 1,008,830,723 - - Short term borrowing 5,448,553,994 5,448,553,994 5,448,553,994 - - Markup accrued 550,426,755 550,426,755 550,426,755 - - Unclaimed dividend 10,190,825 10,190,825 10,190,825 - - 10,965,228,856 11,680,500,723 10,057,408,660 1,457,377,086 165,714,977 It is not expected that the cash flows included in the maturity analysis could occur significantly earlier or at significantly different
amount. The contractual cash flows relating to long term borrowings and lease liabilities have been determined on the basis of expected
markup rates. The markup rates have been disclosed in notes 5, 6 and 7 to these financial statements.
NOTES TO THE FINANCIAL STATEMENTS For the year ended December 31, 2019

Annual Report 2019 73
27.6 Market risk Market risk is the risk that the value of the financial instrument may fluctuate as a result of changes in
market interest rates or the market price due to change in credit rating of the issuer or the instrument, change in market sentiments, speculative activities, supply and demand of securities and liquidity in the market. The Company is exposed to currency risk and interest rates only.
Currency risk Rupee is the functional currency of the Company and as a result currency exposures arise from
transactions and balances in currencies other than Rupee. The Company's potential foreign currency exposure comprise:
Transactional exposure in respect of non functional currency monetary items Transactional exposure in respect of non functional currency expenditure and revenues Transactional exposure in respect of non functional currency monetary items
Monetary items, including financial assets and liabilities, denominated in currencies other than the
functional currency of the Company are periodically restated to Rupee equivalent, and the associated gain or loss is taken to the profit or loss. The foreign currency risk related to monetary items is managed as part of the risk management strategy. Transactional exposure in respect of non functional currency expenditure and revenues
Certain operating and capital expenditure is incurred by the Company in currencies other than the functional currency. These currency risks are managed as part of overall risk management strategy. The Company does not enter into forward exchange contracts.
The Company's exposure to foreign currency risk was as follows based on notional amounts:
2019 2018 2019 2018 Rupees USD Subordinated loan 1,071,637,650 959,541,656 6,898,215 6,898,215 Accrued markup on subordinated loan 444,431,110 345,645,490 2,860,838 2,484,871 Trade and other payables 1,538,438,818 345,407,974 9,903,050 2,483,163 Other receivables (768,004,106) - (4,943,702) - Bank balances (304,124) (271,840) (1,964) (1,954) 2,286,199,348 1,650,323,280 14,716,437 11,864,295 The following significant exchange rates have been applied: Average Rate Reporting Date Rate 2019 2018 2019 2018 US Dollars 151.30 122.30 155.35 139.10
NOTES TO THE FINANCIAL STATEMENTS For the year ended December 31, 2019
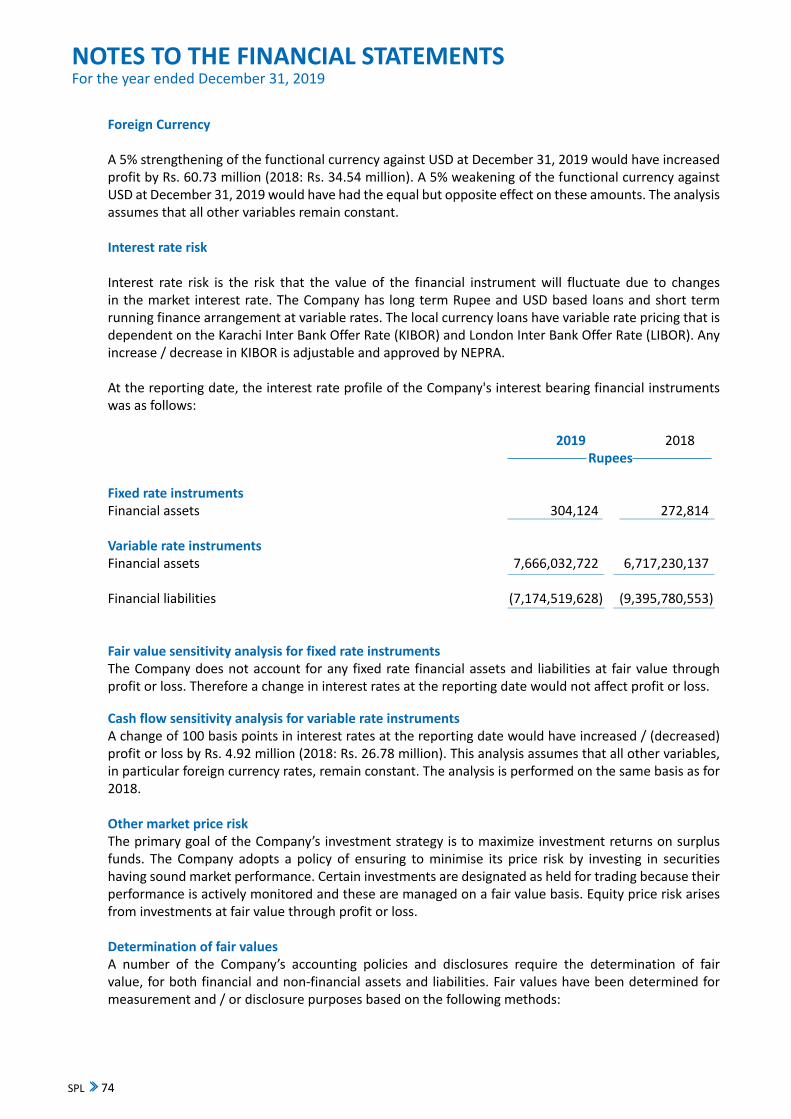
SPL 74
Foreign Currency A 5% strengthening of the functional currency against USD at December 31, 2019 would have increased
profit by Rs. 60.73 million (2018: Rs. 34.54 million). A 5% weakening of the functional currency against USD at December 31, 2019 would have had the equal but opposite effect on these amounts. The analysis assumes that all other variables remain constant.
Interest rate risk Interest rate risk is the risk that the value of the financial instrument will fluctuate due to changes
in the market interest rate. The Company has long term Rupee and USD based loans and short term running finance arrangement at variable rates. The local currency loans have variable rate pricing that is dependent on the Karachi Inter Bank Offer Rate (KIBOR) and London Inter Bank Offer Rate (LIBOR). Any increase / decrease in KIBOR is adjustable and approved by NEPRA.
At the reporting date, the interest rate profile of the Company's interest bearing financial instruments
was as follows:
2019 2018 Rupees Fixed rate instruments Financial assets 304,124 272,814 Variable rate instruments Financial assets 7,666,032,722 6,717,230,137 Financial liabilities (7,174,519,628) (9,395,780,553) Fair value sensitivity analysis for fixed rate instruments The Company does not account for any fixed rate financial assets and liabilities at fair value through
profit or loss. Therefore a change in interest rates at the reporting date would not affect profit or loss.
Cash flow sensitivity analysis for variable rate instruments A change of 100 basis points in interest rates at the reporting date would have increased / (decreased)
profit or loss by Rs. 4.92 million (2018: Rs. 26.78 million). This analysis assumes that all other variables, in particular foreign currency rates, remain constant. The analysis is performed on the same basis as for 2018.
Other market price risk The primary goal of the Company’s investment strategy is to maximize investment returns on surplus
funds. The Company adopts a policy of ensuring to minimise its price risk by investing in securities having sound market performance. Certain investments are designated as held for trading because their performance is actively monitored and these are managed on a fair value basis. Equity price risk arises from investments at fair value through profit or loss.
Determination of fair values A number of the Company’s accounting policies and disclosures require the determination of fair
value, for both financial and non-financial assets and liabilities. Fair values have been determined for measurement and / or disclosure purposes based on the following methods:
NOTES TO THE FINANCIAL STATEMENTS For the year ended December 31, 2019

Annual Report 2019 75
Non - derivative financial assets The fair value of non - derivative financial assets is estimated as the present value of future cash flows,
discounted at the market rate of interest at the reporting date. This fair value is determined for disclosure purposes.
Non - derivative financial liabilities Fair value, which is determined for disclosure purposes, is calculated based on the present value of
future principal and interest cash flows, discounted at the market rate of interest at the reporting date. 27.7 Capital Risk Management The Company's objective when managing capital is to safeguard the Company's ability to continue
as a going concern so that it can continue to provide returns for shareholders and benefits for other stakeholders and to maintain a strong capital base to support the sustained development of its business. The Company manages its capital structure which comprises of capital and reserves by monitoring the return on net assets and makes adjustments, if required, in the light of changes in economic conditions. In order to maintain or adjust the capital structure, the Company may adjust the amount of dividend to shareholders, appropriation of amounts to capital reserves or / and issue new shares. There was no change in the Company's approach to capital management during the year and the Company is not subject to externally imposed capital requirement.
28 REMUNERATION OF CHIEF EXECUTIVE, DIRECTORS AND EXECUTIVES The aggregate amounts charged in these financial statements for remuneration including benefits
applicable to the chief executive officer, directors and executives of the Company are given below: 2019 2018 Rupees Chief executive officer Managerial remuneration - Gross 26,400,000 17,200,000 Staff retirement benefits 3,403,046 1,901,408 Bonus 4,400,000 3,900,000 34,203,046 23,001,408 Number of persons 1 1 Executives Managerial remuneration - Gross 47,528,668 47,131,120 Staff retirement benefits 4,008,302 3,348,990 Bonus 8,019,268 6,874,636 59,556,238 57,354,746 Number of persons including those who worked part of the year 8 9
28.1 Executive means any employee whose basic salary exceeds Rs. 1,200,000 (2018: Rs. 1,200,000) per year.
28.2 In addition to the above, chief executive officer and executives are provided with the Company maintained
vehicles and health insurance coverage as per the Company's policy. 28.3 No remuneration has been paid to the directors of the Company, except for meeting fee amounting to
Rs. 290,000 which was paid to 7 directors (2018: Rs. 100,000 paid to 6 directors).
NOTES TO THE FINANCIAL STATEMENTS For the year ended December 31, 2019

SPL 76
29 RELATED PARTY TRANSACTIONS The Company is subsidiary of Saif Holdings Limited ("the Holding Company"), therefore the Holding
Company and all associated undertakings of the Holding Company are related parties of the Company. Other related parties comprise of directors, key management personnel, entities over which directors are able to exercise significant influence and major shareholders. Balances and other arrangements with Orastar Limited have been disclosed in note 4.3, 6, 10 and 11 to the financial statements. Balance with a related party is disclosed in note 8 to the financial statements. Transactions with related parties other than those disclosed in note 24.3 to these financial statements are as follows:
2019 2018 Note Rupees Saif Holdings Limited - the Holding Company (51.04% shareholding-common directorship) Rent - 675,000 Dividend 453,727,024 700,317,797 Expenses incurred on behalf of the Company - 354,561 Saif Health Care Limited - Associated Company (Common directorship) Expenses incurred on behalf of the Company - 222,720 Saif Textile Limited - Associated Company (Common directorship) Dividend 230 355 Key Management Personnel Note Dividend to Directors 36,804 44,379 Remuneration including benefits and perquisites 29.1 65,133,013 55,585,059 to key management personnel Other Related Parties Contribution to Saif Power Limited - Staff Gratuity Fund 8.2.2 16,314,930 8,979,288 29.1 Key management personnel comprise of Chief Executive Officer (Mr. Sohail H. Hydari), Chief Financial
Officer (Mr. Hammad Mahmood) and General Manager Plant (Mr. Ghias Ul Hassan). The key management personnel are also provided with the Company maintained vehicles and health insurance coverage as per the Company's policy.
NOTES TO THE FINANCIAL STATEMENTS For the year ended December 31, 2019

Annual Report 2019 77
30 R
ECO
NCI
LIAT
ION
OF
MO
VEM
ENT
OF
LIAB
ILIT
IES
TO C
ASH
FLO
WS
ARIS
ING
FRO
M F
INAN
CIN
G A
CTIV
ITIE
S
Li
abili
ties
Equi
ty
Long
Ter
m
Sub-
ordi
nate
d
Shor
t ter
m
Un
appr
opria
ted
To
tal
Fina
ncin
g lo
an
borr
owin
gs
Leas
e lia
bilit
ies
Shar
e Ca
pita
l pr
ofit
- rev
enue
re
serv
e
Ru
pees
Ba
lanc
e at
Janu
ary
01, 2
019
2,9
75,1
80,1
37
959
,541
,656
5
,448
,553
,994
1
2,50
4,76
6
3,8
64,7
17,7
90
8,1
82,5
07,6
13
21,
443,
005,
956
Appl
icat
ion
of IF
RS 1
6 -
-
-
3
9,37
8,39
4
-
-
39,
378,
394
Adju
sted
bal
ance
at J
anua
ry 0
1, 2
019
2,9
75,1
80,1
37
959
,541
,656
5
,448
,553
,994
5
1,88
3,16
0
3,8
64,7
17,7
90
8,1
82,5
07,6
13
21,
482,
384,
350
Chan
ges f
rom
fina
ncin
g ca
sh fl
ows
Proc
eeds
from
shor
t-ter
m b
orro
win
gs -
net
-
-
(188
,170
,677
) -
-
-
(1
88,1
70,6
77)
Repa
ymen
ts o
f lon
g te
rm fi
nanc
ing
(2,1
86,8
00,5
25)
-
-
-
-
-
(2,1
86,8
00,5
25)
Leas
e lia
bilit
ies a
ssum
ed /
(pai
d)
-
-
-
(8,9
56,0
25)
-
-
(8,9
56,0
25)
Divi
dend
pai
d -
-
-
-
-
(8
83,6
10,5
80)
(883
,610
,580
)To
tal c
hang
es fr
om fi
nanc
ing
cash
flow
s (2
,186
,800
,525
) -
(1
88,1
70,6
77)
(8,9
56,0
25)
-
(883
,610
,580
) (3
,267
,537
,807
) Ef
fect
of c
hang
es in
fore
ign
exch
ange
rate
s -
1
12,0
95,9
94
-
-
-
-
112
,095
,994
O
ther
cha
nges
Li
abili
ty re
late
d Le
ase
of n
ew v
ehic
les
-
-
-
11,
191,
914
-
-
1
1,19
1,91
4 M
ovem
ent i
n un
clai
med
div
iden
d -
-
-
-
-
(5
,274
,512
) (5
,274
,512
)To
tal l
iabi
lity
rela
ted
othe
r cha
nges
-
-
-
1
1,19
1,91
4
-
(5,2
74,5
12)
5,9
17,4
02
Equi
ty re
late
d To
tal c
ompr
ehen
sive
inco
me
for t
he y
ear
-
-
-
-
-
3,6
49,6
57,8
30
3,6
49,6
57,8
30
Tota
l equ
ity re
late
d ot
her c
hang
es
-
-
-
-
-
3,6
49,6
57,8
30
3,6
49,6
57,8
30
Bala
nce
at D
ecem
ber 3
1, 2
019
788
,379
,612
1
,071
,637
,650
5
,260
,383
,317
5
4,11
9,04
9
3,8
64,7
17,7
90
10,
943,
280,
351
2
1,98
2,51
7,76
9 Ba
lanc
e at
Janu
ary
01, 2
018
4,7
61,2
77,2
67
762
,252
,708
1
,927
,513
,747
1
7,31
5,53
5
3,8
64,7
17,7
90
6,5
31,3
80,2
66
17,
864,
457,
313
Chan
ges f
rom
fina
ncin
g ca
sh fl
ows
Proc
eeds
from
shor
t-ter
m b
orro
win
gs -
net
-
-
3,5
21,0
40,2
47
-
-
-
3,5
21,0
40,2
47
Repa
ymen
ts o
f lon
g te
rm fi
nanc
ing
(1,7
86,0
97,1
30)
-
-
-
-
-
(1,7
86,0
97,1
30)
Paym
ent o
f fin
ance
leas
e lia
bilit
ies
-
-
-
(4,8
10,7
69)
-
-
(4,8
10,7
69)
Divi
dend
pai
d -
-
-
-
-
(1
,368
,438
,059
) (1
,368
,438
,059
)To
tal c
hang
es fr
om fi
nanc
ing
cash
flow
s (1
,786
,097
,130
) -
3
,521
,040
,247
(4
,810
,769
) -
(1
,368
,438
,059
) 3
61,6
94,2
89
The
effe
ct o
f cha
nges
in fo
reig
n ex
chan
ge ra
tes
-
197
,288
,948
-
-
-
-
1
97,2
88,9
48
Oth
er c
hang
es
Liab
ility
rela
ted
Mov
emen
t in
uncl
aim
ed d
ivid
end
-
-
-
-
-
(3,5
36,7
56)
(3,5
36,7
56)
Tota
l lia
bilit
y re
late
d ot
her c
hang
es
-
-
-
-
-
(3,5
36,7
56)
(3,5
36,7
56)
Equi
ty re
late
d To
tal c
ompr
ehen
sive
inco
me
for t
he y
ear
-
-
-
-
-
3,0
23,1
02,1
62
3,0
23,1
02,1
62
Tota
l equ
ity re
late
d ot
her c
hang
es
-
-
-
-
-
3,0
23,1
02,1
62
3,0
23,1
02,1
62
Bala
nce
at D
ecem
ber 3
1, 2
018
2,9
75,1
80,1
37
959
,541
,656
5
,448
,553
,994
1
2,50
4,76
6
3,8
64,7
17,7
90
8,1
82,5
07,6
13
21,
443,
005,
956
NO
TES
TO T
HE F
INAN
CIAL
STA
TEM
ENTS
Fo
r the
yea
r end
ed D
ecem
ber 3
1, 2
019

SPL 78
31 NUMBER OF EMPLOYEES 2019 2018
At year end 42 43 Average during the year 43 41 32 CAPACITY AND PRODUCTION Installed capacity based on hours 8,760 (2018: 8,760) – Megawatt hours 1,781,975 1,784,253 Actual energy delivered – Megawatt hours 716,203 1,104,685 - Output produced by the plant is dependent on the load demanded by NTDC. 33 NON ADJUSTING EVENTS AFTER REPORTING DATE The Board of Directors proposed final dividend for the year ended December 31, 2019 at the rate of Rs.
2 (2018: Rs. 1.30) per share in their meeting held on March 27, 2020. 34 DATE OF APPROVAL OF FINANCIAL STATEMENTS These financial statements were approved by the Board of Directors in their meeting held on March 27,
2020.
NOTES TO THE FINANCIAL STATEMENTS For the year ended December 31, 2019
Chief Financial Officer Chief Executive Officer Director

Annual Report 2019 79
CONSOLIDATED FINANCIAL STATEMENTSFor the year ended December 31, 2019

SPL 80
Opinion
We have audited the annexed consolidated financial statements of Saif Power Limited (“the Company”) and its subsidiary (the Group), which comprise the consolidated statement of financial position as at December 31, 2019 and the consolidated statement of profit or loss, the consolidated statement of comprehensive income, the consolidated statement of changes in equity and the consolidated statement of cash flows for the year then ended, and notes to the consolidated financial statements, including a summary of significant accounting policies and other explanatory information.
In our opinion, consolidated financial statements give a true and fair view of the consolidated financial position of the Group as at December 31, 2019 and its consolidated financial performance and its consolidated cash flows for the year then ended in accordance with the accounting and reporting standards as applicable in Pakistan.
Basis for Opinion
We conducted our audit in accordance with International Standards on Auditing (ISAs) as applicable in Pakistan. Our responsibilities under those standards are further described in the Auditors’ Responsibilities for the Audit of the Consolidated Financial Statements section of our report. We are independent of the Group in accordance with the International Ethics Standards Board for Accountants’ Code of Ethics for Professional Accountants as adopted by the Institute of the Chartered Accountants of Pakistan (the Code), and we have fulfilled our other ethical responsibilities in accordance with the Code. We believe that the audit evidence we have obtained is sufficient and appropriate to provide a basis for our opinion.
Key Audit Matters
Key audit matters are those matters that, in our professional judgment, were of most significance in our audit of the consolidated financial statements of the current period. These matters were addressed in the context of our audit of the consolidated financial statements as a whole, and in forming our opinion thereon, and we do not provide a separate opinion on these matters.
INDEPENDENT AUDITORS’ REPORTTo the Members of Saif Power LimitedReport on the audit of Consolidated Financial Statements

Annual Report 2019 81
Following are the Key audit matters:
Sr.no. Key audit matters How the matter was addressed in our audit1. Trade debts
(Refer note 18.1, 18.2 and 18.3 to the consolidated financial statements)
Trade debts include an overdue amount of Rs 7.67 billion, receivable from National Transmission and Dispatch Company (NTDC). The Company considers this amount to be fully recoverable as this is secured by guarantee issued by the Government of Pakistan (GoP) under the Implementation Agreement (IA).
Further, we draw attention to note 18.2 and 18.3 to the consolidated financial statements, which describe the matters regarding the recoverability and adjustment of certain trade debts.We considered the matter as key audit matter due to the quantum, age of overdue amounts and management’s judgment relating to disputed amounts.
Our audit procedures in relation to the matter included:• Circularised request for direct
confirmation of balance due from NTDC, reviewed confirmation directly received from NTDC and tested the reconciliation;
• Checked, on sample basis, trade debts ageing report classification within the appropriate ageing bracket with underlying documentation;
• Checked, on sample basis, cash receipts from NTDC subsequent to financial year end relating to year end balance with underlying documentation;
• Held discussions at appropriate level of management and Audit Committee to assess their views on the timing of settlement and recoverability of trade debts;
• With respect to disputed trade debts, (a) Obtained confirmation from the Company’s external legal advisor and reviewed the related arbitration orders; (b) Evaluated technical ability of the external legal advisors used by the Company; (c) Assessed the matter under applicable accounting frame work; and
• Reviewed related disclosures made in the consolidated financial statements regarding the matter.

SPL 82
2. Recognition of Revenue
(Refer to note 3 and 21 to the consolidated financial statements)
The Company is engaged in sale of electricity to National Transmission and Dispatch Company (NTDC).
The Company recognised gross revenue during the year from Capacity Purchase Price (CPP) and Energy Purchase Price (EPP) amounting to Rs. 10.205 billion and Rs. 6.188 billion respectively.
We considered this as key audit matter due to the significance of the amounts requiring significant time and resource due to magnitude and revenue being a key economic indicator of the Company.
Our audit procedures in relation to the mat-ter included:• Tested the design, implementation and
operating effectiveness of the relevant key internal controls which govern revenue recognition from the sale of electricity;
• Assessed whether appropriate revenue recognition policies are applied in accordance with applicable accounting and reporting framework;
• Analyzed Power Purchase Agreement (PPA) to evaluate whether revenue was recognized in accordance with the terms of PPA;
• Performed substantive test of details on sale transactions by inspecting the underlying documentation;
• Performed recalculation of EPP revenue based on electricity produced and CPP revenue based on capacity available; and
• Reviewed related disclosures made in the financial statements regarding the matter.
Information Other than the Financial Statements and Auditors’ Report Thereon
Management is responsible for the other information. Other information comprises the information included in the annual report for the year ended December 31, 2019 but does not include the consolidated financial statements and our auditors’ report thereon.
Our opinion on the consolidated financial statements does not cover the other information and we do not express any form of assurance conclusion thereon.
In connection with our audit of the consolidated financial statements, our responsibility is to read the other information and, in doing so, consider whether the other information is materially inconsistent with the consolidated financial statements or our knowledge obtained in the audit or otherwise appears to be materially misstated. If, based on the work we have performed, we conclude that there is a material misstatement of this other information, we are required to report that fact. We have nothing to report in this regard.
Responsibilities of Management and the Board of Directors for the Consolidated Financial Statements
Management is responsible for the preparation and fair presentation of the consolidated financial statements in accordance with accounting and reporting standards as applicable in Pakistan and Companies Act, 2017 and for such internal control as management determines is necessary to enable the preparation of consolidated financial statements that are free from material misstatement, whether due to fraud or error.
In preparing the consolidated financial statements, management is responsible for assessing the Group’s ability to continue as a going concern, disclosing, as applicable, matters related to going concern and using the going concern basis of accounting unless management either intends to liquidate the Group or to cease operations, or has no realistic alternative but to do so.
The Board of Directors is responsible for overseeing the Group’s financial reporting process.
Auditors’ Responsibilities for the Audit of the Consolidated Financial Statements
Our objectives are to obtain reasonable assurance about whether the consolidated financial statements as a whole are free from material misstatement, whether due to fraud or error, and to issue an auditors’ report that includes our opinion. Reasonable assurance is a high level of assurance, but is not a guarantee that an audit conducted in accordance with ISAs as applicable in Pakistan will always detect a material misstatement

Annual Report 2019 83
when it exists. Misstatements can arise from fraud or error and are considered material if, individually or in the aggregate, they could reasonably be expected to influence the economic decisions of users taken on the basis of these consolidated financial statements.
As part of an audit in accordance with ISAs as applicable in Pakistan, we exercise professional judgment and maintain professional skepticism throughout the audit. We also:
• Identify and assess the risks of material misstatement of the consolidated financial statements, whether due to fraud or error, design and perform audit procedures responsive to those risks, and obtain audit evidence that is sufficient and appropriate to provide a basis for our opinion. The risk of not detecting a material misstatement resulting from fraud is higher than for one resulting from error, as fraud may involve collusion, forgery, intentional omissions, misrepresentations, or the override of internal control.
• Obtain an understanding of internal control relevant to the audit in order to design audit procedures that are appropriate in the circumstances, but not for the purpose of expressing an opinion on the effectiveness of the Group’s internal control.
• Evaluate the appropriateness of accounting policies used and the reasonableness of accounting estimates and related disclosures made by management.
• Conclude on the appropriateness of management’s use of the going concern basis of accounting and, based on the audit evidence obtained, whether a material uncertainty exists related to events or conditions that may cast significant doubt on the Group’s ability to continue as a going concern. If we conclude that a material uncertainty exists, we are required to draw attention in our auditors’ report to the related disclosures in the consolidated financial statements or, if such disclosures are inadequate, to modify our opinion. Our conclusions are based on the audit evidence obtained up to the date of our auditors’ report. However, future events or conditions may cause the Group to cease to continue as a going concern.
• Evaluate the overall presentation, structure and content of the consolidated financial statements, including the disclosures, and whether the consolidated financial statements represent the underlying transactions and events in a manner that achieves fair presentation.
• Obtain sufficient appropriate audit evidence regarding the financial information of the entities or business activities within the Group to express an opinion on the consolidated financial statements. We are responsible for the direction, supervision and performance of the group audit. We remain solely responsible for our audit opinion.
We communicate with the Board of Directors regarding, among other matters, the planned scope and timing of the audit and significant audit findings, including any significant deficiencies in internal control that we identify during our audit.
We also provide the Board of Directors with a statement that we have complied with relevant ethical requirements regarding independence, and to communicate with them all relationships and other matters that may reasonably be thought to bear on our independence, and where applicable, related safeguards.
From the matters communicated with the Board of Directors, we determine those matters that were of most significance in the audit of the consolidated financial statements of the current period and are therefore the key audit matters. We describe these matters in our auditors’ report unless law or regulation precludes public disclosure about the matter or when, in extremely rare circumstances, we determine that a matter should not be communicated in our report because the adverse consequences of doing so would reasonably be expected to outweigh the public interest benefits of such communication.
The engagement partner on the audit resulting in this independent auditors’ report is Inam Ullah Kakra.
KPMG Taseer Hadi & Co.Chartered Accountants IslamabadApril 01, 2020

SPL 84
2019 2018 Note RupeesShare capital and reserves Share capital 4 3,864,717,790 3,864,717,790 Unappropriated profit - revenue reserve 10,939,558,934 8,181,713,965 Equity attributable to the owners of the Company 14,804,276,724 12,046,431,755 Non controlling interests 27,802,426 19,609 Total equity 14,832,079,150 12,046,451,364 Liabilities Long term financing 5 - 652,714,443 Sub-ordinated loan 6 714,425,109 799,618,050 Lease liabilities 7 50,547,079 8,808,920 Deferred liability - gratuity 8 2,962,420 - Non-current liabilities 767,934,608 1,461,141,413 Trade and other payables 9 2,098,782,870 1,114,195,632 Short term borrowings 10 5,260,383,317 5,473,050,970 Current portion of non-current liabilities 11 1,157,226,851 2,486,085,146 Markup accrued 12 695,660,585 550,426,755 Unclaimed dividend 15,465,337 10,190,825 Current liabilities 9,227,518,960 9,633,949,328 Total liabilities 9,995,453,568 11,095,090,741 Total equity and liabilities 24,827,532,718 23,141,542,105 Contingencies and commitments 13
Assets Property, plant and equipment 14 13,544,119,637 13,945,393,792 Right of use assets 15 61,518,397 - Project transaction costs 16 58,237,690 43,515,591 Goodwill 17 11,530,918 11,530,918 Long term deposits 4,372,660 3,331,810 Non-current assets 13,679,779,302 14,003,772,111 Advance income tax 24,118,484 22,846,495 Stock in trade - HSD 133,035,854 134,110,136 Trade debts 18 9,650,652,780 8,415,730,184 Other receivables 19 1,164,439,454 498,002,758 Advances 20 98,349,239 921,217 Trade deposits and short term prepayments 21 63,005,356 51,686,607 Bank balances 22 14,152,249 14,472,597 Current assets 11,147,753,416 9,137,769,994 Total assets 24,827,532,718 23,141,542,105
The annexed notes 1 to 35 form an integral part of these consolidated financial statements.
CONSOLIDATED STATEMENT OF FINANCIAL POSITIONAs at December 31, 2019
Chief Financial Officer Chief Executive Officer Director

Annual Report 2019 85
2019 2018 Note Rupees
Turnover - net 23 14,910,380,876 16,690,327,029
Cost of sales 24 (9,892,199,117) (12,625,322,730)
Gross profit 5,018,181,759 4,065,004,299
Other income 25 3,276,881 2,428,315
Administrative expenses 26 (165,140,898) (140,566,840)
Finance cost 27 (1,209,887,456) (894,557,228)
Profit for the year 3,646,430,286 3,032,308,546
Profit/ (loss) attributable to:
- Owners of the Company 3,646,529,852 3,032,309,620
- Non-controlling interests (99,566) (1,074)
3,646,430,286 3,032,308,546
The annexed notes 1 to 35 form an integral part of these consolidated financial statements.
CONSOLIDATED STATEMENT OF PROFIT OR LOSS For the year ended December 31, 2019
Chief Financial Officer Chief Executive Officer Director

SPL 86
2019 2018 Note Rupees
Profit for the year 3,646,430,286 3,032,308,546
Other comprehensive income for the year
Items that will not be reclassified to profit or loss
Remeasurement of defined benefit liability 9.2.1 & 9.2.2 (289,078) (9,978,718)
Total comprehensive income for the year 3,646,141,208 3,022,329,828
Total comprehensive income attributable to:
- Owners of the Company 3,646,240,774 3,022,330,902
- Non-controlling interests (99,566) (1,074)
3,646,141,208 3,022,329,828
The annexed notes 1 to 35 form an integral part of these consolidated financial statements.
CONSOLIDATED STATEMENT OF COMPREHENSIVE INCOME For the year ended December 31, 2019
Chief Financial Officer Chief Executive Officer Director

Annual Report 2019 87
2019 2018 Note RupeesCash flows from operating activities Profit for the year 3,646,430,286 3,032,308,546 Adjustments for: Provision for staff retirement benefits - gratuity 9.2.2 8,986,020 6,336,213 Depreciation and impairment loss - Property, plant and equipment 14.2 1,432,333,228 594,521,390 Depreciation - Right of use assets 15 11,971,720 - Finance cost 27 1,209,887,456 894,557,228 Gain on disposal of property, plant and equipment 25 (426,062) (243,500) Insurance claim (820,647,372) (34,012) Profit on deposit accounts 25 (1,076,273) (15,717) Return on investments 25 (1,493,763) (1,774,421) 5,485,965,240 4,525,655,727 Changes in: Stock in trade 1,074,282 (6,114,300) Trade debts (1,234,922,596) (3,032,182,247) Other receivable 119,316,676 (90,552,912) Advances (97,428,022) 566,479 Trade deposits and prepayments (12,777,524) (4,849,281) Trade and other payables 155,463,698 (379,816,886) Cash generated from operating activities 4,416,691,754 1,012,706,580 Income taxes paid (1,271,989) (9,781,109) Finance cost paid (1,064,653,626) (724,003,669) Deferred liability - gratuity 2,962,420 - Staff retirement benefits paid (16,314,930) (8,979,288)Net cash generated from operating activities 3,337,413,629 269,942,514 Cash flows from investing activities Acquisition of property, plant and equipment 14 (94,136,421) (511,659,447) Acquisition of right of use assets (540,809) - (Increase)/ decrease in long term deposits (1,040,850) 502,900 Proceeds from sale of property, plant and equipment 1,067,747 315,000 Acquisition of subsidiary, net of cash acquired - 21,190,461 Movement in Project Transaction cost (14,722,099) - Insurance claim received 34,894,000 39,600 Profit on deposit accounts 25 1,076,273 15,717 Return on investments - receipt 25 1,493,763 1,774,421 Net cash used in investing activities (71,908,396) (487,821,348) Cash flows from financing activities Repayment of long term financing (2,186,800,525) (1,786,097,130) Dividends paid (883,610,580) (1,368,438,059) Receipt against issuance of shares of the Subsidiary Company 28,371,670 - Short term borrowings - net (212,667,653) 3,387,272,885 Lease liabilities paid (11,118,493) (4,810,769)Net cash (used in)/generated from financing activities (3,265,825,581) 227,926,927 Net decrease in cash and cash equivalents (320,348) 10,048,093 Cash and cash equivalents at January 01 14,472,597 4,424,504 Cash and cash equivalents at December 31 22 14,152,249 14,472,597 The annexed notes 1 to 35 form an integral part of these consolidated financial statements.
CONSOLIDATED STATEMENT OF CASH FLOWS For the year ended December 31, 2019
Chief Financial Officer Chief Executive Officer Director

SPL 88
Share Unappropriated Non-Controlling Total equity capital profit - revenue interest reserve
RupeesBalance at 01 January 2018 3,864,717,790 6,531,380,266 - 10,396,098,056 Profit for the year - 3,032,309,620 (1,074) 3,032,308,546 Other comprehensive income for the year - (9,978,718) - (9,978,718)Total comprehensive income for the year - 3,022,330,902 (1,074) 3,022,329,828 Transaction with owners of the Company Distributions Final dividend - 2017@ Rs. 1.90 per share - (734,296,380) - (734,296,380)First interim dividend - 2018 @ Rs. 1.65 per share - (637,678,435) - (637,678,435)Total distributions - (1,371,974,815) - (1,371,974,815) Changes in ownership interests Acquisition of subsidiary with NCI - - (1,705) (1,705)Acquisition of NCI without a change in control - (22,388) 22,388 - Total changes in ownership interests - (22,388) 20,683 (1,705) Total transactions with owners of the Company - (1,371,997,203) 20,683 (1,371,976,520) Balance as at December 31, 2018 3,864,717,790 8,181,713,965 19,609 12,046,451,364 Balance as at January 1, 2019 3,864,717,790 8,181,713,965 19,609 12,046,451,364 Profit for the year - 3,646,529,852 (99,566) 3,646,430,286 Other comprehensive income for the year - (289,078) - (289,078)Total comprehensive income for the year - 3,646,240,774 (99,566) 3,646,141,208 Transaction with owners of the Company Distributions Final dividend - 2018@ Rs. 1.30 per share - (502,413,313) - (502,413,313)First interim dividend - 2019 @ Rs. 1 per share - (386,471,779) - (386,471,779)Total distributions - (888,885,092) - (888,885,092) Changes in ownership interests Consideration paid by NCI for acquisition of shares - - 28,371,670 28,371,670 Disposal of share to NCI without change in control - 489,287 (489,287) - Total changes in ownership interests - 489,287 27,882,383 28,371,670 Total transactions with owners of the Company - (888,395,805) 27,882,383 (860,513,422) Balance as at December 31, 2019 3,864,717,790 10,939,558,934 27,802,426 14,832,079,150
The annexed notes 1 to 35 form an integral part of these consolidated financial statements.
CONSOLIDATED STATEMENT OF CHANGES IN EQUITY For the year ended December 31, 2019
Chief Financial Officer Chief Executive Officer Director

Annual Report 2019 89
1 Reporting entity Saif Power Limited ("the Company") was incorporated in Pakistan on November 11, 2004 as a public
limited company under the repealed Companies Ordinance, 1984 (which has now been replaced by the Companies Act, 2017) and commenced operations from April 30, 2010. The shares of the Company are quoted on Pakistan Stock Exchange Limited. The Company is a subsidiary of Saif Holdings Limited (''the Controlling Party'') with shareholding of 51.04% (2018: 51.04%) ordinary shares.
The Group consists of Saif Power Limited (the Company) and Saif Cement Limited. The principal activities of the Company are to own, operate and maintain a combined cycle power plant
having nameplate capacity of 225 MW (ISO) and sell the electricity to National Transmission and Dispatch Company (NTDC).
Subsidiary:
Saif Cement Limited (the Subsidiary Company) is a public limited company incorporated in Pakistan on January 13, 2017 under the repealed Companies Ordinance, 1984 (which has now been replaced by the Companies Act, 2017).
The Subsidiary Company is engaged in the construction of Greenfield Cement Production Plant of 6,500 tons
per day clinker production line on an EPC Turnkey Contracting Basis near D.I. Khan, Khyber Pakhtunkhwa province. Thereafter, the principal business of the Subsidiary Company will be production and sale of cement.
Geographical locations of the Group's business units are as follows: - The registered office of the Company is situated at 1st Floor, Kashmir Commercial Complex Fazal-ul-Haq
Road, Block E, Blue Area, Islamabad; - Plant of the Company is situated at Chak 56/5L, Qadarabad Multan Road, District Sahiwal, Punjab,
Pakistan; - The registered office of the Subsidiary Company, is located at APTMA House, Tehkal Payan, Jamrud Road,
Peshawar; and - Construction site of cement plant of the Subsidiary Company, is located at Saiduwali Village Tehsil Paharpur,
District Dera Ismail Khan, Khyber Pakhtoonkhawa, Pakistan. 2 BASIS OF PREPARATION These consolidated financial statements include the financial statements of the Company and its Subsidiary
(collectively "the Group"). The financial statements of the Subsidiary are prepared for the same reporting period as the Holding Company, using consistent accounting policies.
2.1 Statement of compliance These consolidated financial statements have been prepared in accordance with the accounting and
reporting standards as applicable in Pakistan. The accounting and reporting standards applicable in Pakistan comprise of:
NOTES TO THE CONSOLIDATED FINANCIAL STATEMENTS For the year ended December 31, 2019

SPL 90
- International Financial Reporting Standards (IFRS Standards) issued by the International Accounting Standards Board (IASB) as notified under the Companies Act, 2017; and
- Provisions of and directives issued under the Companies Act, 2017. Where provisions of and directives issued under the Companies Act, 2017 differ from the IFRS Standards,
the provisions of and directives issued under the Companies Act, 2017 have been followed. 2.2 Basis of measurement and preparation These consolidated financial statements have been prepared under the historical cost convention
except for staff retirement benefits, which have been measured at values determined through actuarial valuation.
2.3 Functional and presentation currency These consolidated financial statements are presented in Pakistan Rupee (Rupees), which is the Group's
functional currency. All financial information presented in Rupees has been rounded off to the nearest of Rupees, unless otherwise indicated.
2.4 Use of judgments and estimates The preparation of financial statements in conformity with the accounting and reporting standards as
applicable in Pakistan requires management to make judgments, estimates and assumptions that affect the application of policies and reported amounts of assets and liabilities, income and expenses. The estimates and associated assumptions are based on historical experience and various other factors that are believed to be reasonable under the circumstances and the results of which form the basis of making the judgments about the carrying values of assets and liabilities that are not readily apparent from other sources. Actual results may differ from these estimates.
The estimates and underlying assumptions are reviewed on an ongoing basis. Revisions to accounting
estimates are recognised in the period in which the estimates are revised if the revision affects only that period, or in the period of revision and future periods. Judgments and estimates made by management in the application of accounting and reporting standards as applicable in Pakistan that may have significant effect on the financial statements and estimates with a significant risk of material adjustments in the next years are discussed in the ensuing paragraphs:
(a) Property, plant and equipment The Group reviews the useful lives of property, plant and equipment on a regular basis. Any change in
estimate in future years might affect the carrying amounts of the respective items of property, plant and equipment with corresponding effect on depreciation charge and impairment.
(b) Impairment of financial assets In making an estimate of the recoverable amount of the Group’s financial assets, the management
considers estimated cash flows and their terminal value for impairment testing.
NOTES TO THE CONSOLIDATED FINANCIAL STATEMENTS For the year ended December 31, 2019

Annual Report 2019 91
(c) Impairment of non-financial assets The carrying amounts of the Group's assets are reviewed at each reporting date to determine whether
there is any indication of impairment loss. If any such indication exists, recoverable amount is estimated using the criteria given in respective accounting standards to determine the extent of impairment loss, if any.
(d) Taxation The Group takes into account the current income tax law and decisions taken by the tax authorities.
Instances where the Group's views differ from the views taken by the income tax department at the assessment stage and where the Group considers that its view on items of material nature is in accordance with law, the amounts are shown as contingent liabilities.
A deferred tax asset is recognized to the extent that it is probable that future taxable profits will be available
against which the temporary difference, unused tax losses and tax credits can be utilized. Deferred tax assets are reviewed at each reporting date and are reduced to the extent that it is no longer probable that the related tax benefit will be realized.
(e) Employee benefits Gratuity is provided for permanent employees of the Company for which liability is recognised in the
Group’s financial statements. The calculation of defined benefit liability requires assumptions to be made of future outcomes, the principal ones being in respect of expected salary growth, expected mortality of active members and the discount rate used to convert future cash flows to current values. Calculations are sensitive to the changes in assumptions used.
Unfunded defined benefits plan is provided for permanent employees of the Subsidiary Company for which
deferred liability is recognized in the consolidated financial statements. Where payment or settlement is deferred and the effect would be material, these amounts are stated at their present values.
(f) Provision for inventory obsolescence and doubtful receivables The Group reviews the carrying amount of stores and spares and stock in trade on regular basis and
provision is made for obsolescence, if there is any change in usage pattern and physical form of related stores and spares and stock in trade. Further the carrying amounts of trade and other receivables are assessed on regular basis and if there is any doubt about the realisability of these receivables, appropriate amount is provided for.
(g) Provisions and contingencies A provision is recognised if, as a result of a past event, the Group has a present legal or constructive
obligation that can be estimated reliably, and it is probable that an outflow of economic benefits will be required to settle the obligation. Provisions are determined by discounting the expected future cash flows at a pre-tax rate that reflects current market assessments of the time value of money and the risks specific to the liability. The unwinding of the discount is recognised as finance cost, if any.
Where it is not probable that an outflow of resources embodying economic benefits will be required to
settle the obligation or the amount of the obligation cannot be measured with sufficient reliability, it is disclosed as contingent liability.
NOTES TO THE CONSOLIDATED FINANCIAL STATEMENTS For the year ended December 31, 2019

SPL 92
(h) Lease term The Group has applied judgement to determine the lease term for some lease contracts in which it is
a lessee that includes renewal options. The assessment of whether the Group is reasonably certain to exercise such options impacts the lease term, which significantly affects the amount of lease liabilities and right-of-use assets recognized.
(i) Other Pursuant to decisions of Supreme Court of Pakistan related to discretionary beneficial ownership in an
overseas trusts on a prudent basis and in good faith, transactions with "Orastar" have been disclosed in note 30 irrespective of the absence of significant influence and the fact that the companies are not associated under Companies Act, 2017.
3 SIGNIFICANT ACCOUNTING POLICIES The accounting policies set out below have been applied consistently to all periods presented in these
financial statements except for the change as indicated below: The Group has adopted following standards which became effective during the year: (a) IFRS-9 ‘Financial instruments’ (b) IFRS-15 ‘Revenue from contracts with customers’ (c) IFRS-16 ‘Leases’ (a) IFRS-9 Financial Instruments In July 2014, the IASB issued the final version of IFRS -9 Financial Instruments ("IFRS-9") that replaces
IAS-39 Financial Instruments: recognition and measurement ("IAS-39") and all previous versions of IFRS 9. IFRS-9 brings together all three aspects of the accounting for financial instruments: classification & measurement, impairment and hedge accounting. IFRS-9 introduces a single approach to determining whether a financial asset is measured at amortized cost or fair value and replaces the multiple rules in IAS-39. The three principal classification categories under the new standard for financial instruments are: measured at amortized cost, fair value through other comprehensive income (“FVTOCI”) and fair value through profit and loss (“FVTPL”). The classification of financial instruments under IFRS-9 is generally based on the business model in which a financial instrument is managed and its contractual cash flow characteristics. The previous categories under IAS-39 of held to maturity, loans and receivables and available for sale have been removed. For financial liabilities, IFRS-9 retains most of the requirements of IAS-39; however, where the fair value option is applied to financial liabilities, any change in fair value resulting from an entity’s own credit risk is recorded in other comprehensive income.
The following table explains the original measurement categories under IAS-39 and new measurement
categories under IFRS-9 for each class of the Group's financial assets and financial liabilities as at January 01, 2019.
NOTES TO THE CONSOLIDATED FINANCIAL STATEMENTS For the year ended December 31, 2019

Annual Report 2019 93
Original classification New classification under IAS-39 under IFRS-9 Financial assets Long term deposits Loans and receivable Amortized cost Trade debts Loans and receivable Amortized cost Other receivables Loans and receivable Amortized cost Advances to employees Loans and receivable Amortized cost Security deposits Loans and receivable Amortized cost Bank balances Loans and receivable Amortized cost Financial Liabilities Long term financing Amortized cost Amortized cost Sub-ordinated loan Amortized cost Amortized cost Lease liabilities Amortized cost Amortized cost Deferred liability - gratuity Amortized cost Amortized cost Trade and other payables Amortized cost Amortized cost Short term borrowings Amortized cost Amortized cost Markup accrued Amortized cost Amortized cost Unclaimed dividend Amortized cost Amortized cost There is no change in the carrying amounts of financial assets and financial liabilities at the initial application
date of IFRS-9, except for a change in accounting classification under IFRS-9 from category under IAS-39 as disclosed in the above table.
The Group did not formerly apply hedge accounting to its financial instruments and has not elected to
apply hedge accounting to any of its financial instruments upon adoption of IFRS-9. Impact of new impairment model IFRS-9 replaces the “incurred loss” model in IAS-39 with an “expected loss” model. The new impairment
model applies to financial instruments measured at amortized cost, and contract assets and debt investments measured at FVTOCI. Under IFRS-9, credit losses will be recognized earlier than under IAS-39. The standard also provides a simplified approach to measuring expected credit losses using a lifetime expected loss allowance. The credit loss model groups receivables based on similar credit risk characteristics and days past due in order to estimate loss allowance. Through S.R.O 985(I)/2019 dated September 2, 2019, the Securities and Exchange Commission of Pakistan (SECP) has exempted applicability of IFRS-9 in respect of debts due from Government of Pakistan to power supply chain companies for a limited period of three years i.e. till June 30, 2021. Accordingly, the management believes that requirements of IFRS-9 relating to expected credit loss on its trade debts are not applicable to the Company.
(b) IFRS-15 Revenue from contracts with customers Applicable for accounting periods beginning on or after July 1, 2018 this standard establishes a single
comprehensive model for determining whether, how much and when revenue is recognized. It replaced IAS-18 Revenue, IAS-11 Construction contracts, IFRIC-13 customer loyalty programs, IFRIC-15 agreements for the construction of real estate, IFRIC-18 transfers of assets from customers and SIC-31 Revenue-barter transaction involving advertising services.
The Company has entered into PPA with NTDC for a period of 30 years starting from its Commercial
Operation Date i.e. April 30, 2010. Under the PPA, the Company is obligated to sell and deliver all output of the Complex in accordance with provisions of PPA. The Company's arrangement with NTDC falls under the
NOTES TO THE CONSOLIDATED FINANCIAL STATEMENTS For the year ended December 31, 2019

SPL 94
definition of lease under IFRS-16 for which exemption is available to the Company. Accordingly, revenue in respect of Capacity Purchase Price (CPP) is recognized when due at rates specified under the PPA and revised reference tariff determined by National Electric Power Regulatory Authority (NEPRA) and after incorporation of relevant applicable quarterly indexation.
PPA also contains other performance obligations i.e. sale of electricity, insurance and operation &
maintenance. Revenue from sale of electricity is recognized when or as the Company satisfies performance obligation by
transferring the promised good or service to a customer. A good or service is transferred when the customer obtains control of that good or service. The Company principally satisfies its performance obligation in respect of supply of electricity upon transmission of electricity and related fuel cost component of the tariff determined by National Electric Power Regulatory Authority (NEPRA) is invoiced to the customer as part of Energy Purchase Price (EPP).
Revenue associated with the operating phase of the PPA i.e. insurance and operations & maintenance
of the plant is measured based on the consideration specified in contract with customer. Revenue from contract with customer is recognized when or as the Company satisfies a performance obligation by transferring a promised good or service to a customer. A good or service is transferred when the customer obtains control of that good or service. The Company principally satisfies its performance obligations of insurance, operations and maintenance over time and the amount of revenue is recognized based on the consideration specified in the PPA. Consideration for operating phase of the PPA i.e. Insurance and fixed O&M component of tariff is billed to customer as part of CPP whereas variable O&M component is billed to customer as part of EPP. The amount of revenue recognised in respect of operating phase excludes the estimates of variable consideration as it is not highly probable that a significant reversal in the amount of cumulative revenue recognised will occur in future when the uncertainty associated with the variable consideration is subsequently resolved.
(c) IFRS-16 Leases IFRS-16 introduced a single, on-balance sheet accounting model for lessees. As a result, the Company,
as a lessee, has recognised right-of-use assets representing its rights to use the underlying assets and lease liabilities representing its obligation to make lease payments. Lessor accounting remains similar to previous accounting policies. Control of the Company's plant due to purchase of total output by NTDC and other arrangement under the Power Purchase Agreement (PPA) was classified as a lease under IFRIC-4 “Determining whether an Arrangement Contains a Lease” which due to exemption available to the Company were not accounted for as a lease in prior years. After applicability of IFRS-16, the Company's arrangement with NTDC falls under the definition of a lease as defined in IFRS-16, however, the SECP through S.R.O 986(I)/2019 dated September 2, 2019 has extended the earlier exemption from IFRIC-4 to all companies, which have entered into power purchase arrangements before January 01, 2019. The Company signed its Power Purchase Agreement with NTDC on April 30, 2007, accordingly, requirement of lease accounting relating to the Company’s arrangement with NTDC are not applicable to the Company. Had IFRS-16 been applied on transactions with Power Purchaser, impact on financial statements would have been as follows:
2019 2018 Rupees Decrease in unappropriated profit at January 01 (2,537,257,125) (2,679,582,780) Decrease in profit for the year (540,933,333) 142,325,655 Decrease in unappropriated profit at December 31 (3,078,190,458) (2,537,257,125) The Group has applied IFRS-16 using the modified retrospective approach for arrangements not covered
in exemptions from SECP, under which the cumulative effect of initial application is recognised in retained
NOTES TO THE CONSOLIDATED FINANCIAL STATEMENTS For the year ended December 31, 2019

Annual Report 2019 95
earnings at January 01, 2019. Accordingly, the comparative information presented for 2018 are not required to be restated – i.e. it is presented, as previously reported, under IAS-17 and related interpretations. The details of the changes in accounting policies are disclosed below.
(i) Definition of Lease Previously, the Group determined at contract inception whether an arrangement was or contained a lease
under IFRIC-4 'Determining Whether an Arrangement contains a Lease'. The Group now assesses whether a contract is or contains a lease based on the new definition of a lease. Under IFRS-16, a contract is, or contains, a lease if the contract conveys a right to control the use of an identified asset for a period of time in exchange for consideration.
On transition to IFRS-16, the Group elected to apply the practical expedient to grandfather the assessment of
which transactions are leases. It applied IFRS-16 only to contracts that were previously identified as leases. Contracts that were not identified as leases under IAS-17 and IFRIC-4 were not reassessed. Therefore, the definition of a lease under IFRS-16 has been applied only to contracts entered into or changed on or after January 01, 2019.
At inception or on reassessment of a contract that contains a lease component, the Group allocates the
consideration in the contract to each lease and non-lease component on the basis of their relative stand-alone prices. However, for leases of properties in which it is a lessee, the Group has elected not to separate non-lease components and will instead account for the lease and non-lease components as a single lease component.
The Group leased assets primarily comprising office buildings and motor vehicles. As a lessee, the Group
previously classified leases as operating or finance leases based on its assessment of whether the lease transferred substantially all of the risks and rewards of ownership. Under IFRS-16, the Group recognizes right-of-use assets and lease liabilities for most leases – i.e. these leases are on-balance sheet.
Upon transition to IFRS-16 in respect of existing finance leases of vehicles, there was no impact as of
January 01, 2019 except for nomenclature of leased assets to right-of-use assets. The Group presents right-of-use assets and related lease liabilities on face of the statement of financial position. Amounts becoming due within next twelve months are presented within “current portion of non-current liabilities" in these financial statements.
(ii) Accounting policies The Group recognises a right-of-use asset and a lease liability at the lease commencement date. The right-
of-use asset is initially measured at cost, and subsequently at cost less any accumulated depreciation and impairment losses, and adjusted for certain re-measurements of the lease liability. The lease liability is initially measured at the present value of the lease payments that are not paid at the commencement date, discounted using the interest rate implicit in the lease or, if that rate cannot be readily determined, the Group’s incremental borrowing rate.
The lease liability is subsequently increased by the interest cost on the lease liability and decreased by lease
payment made. It is re-measured when there is a change in future lease payments arising from a change in an index or rate, a change in the estimate of the amount expected to be payable under a residual value guarantee, or as appropriate, changes in the assessment of whether a purchase or extension option is reasonably certain to be exercised or a termination option is reasonably certain not to be exercised.
(iii) Transition Previously, the Group classified property leases as operating leases under IAS-17. These include rental
NOTES TO THE CONSOLIDATED FINANCIAL STATEMENTS For the year ended December 31, 2019

SPL 96
premises of head office and guest houses. The leases typically run for a period of around 5 to 10 years. Some leases include an option to renew the lease by mutual consent of the Group and the lessors.
At transition, for leases classified as operating leases under IAS-17, lease liabilities were measured at the
present value of the remaining lease payments, discounted at the Group’s incremental borrowing rate. Right-of-use assets are measured at either:
- their carrying amount as if IFRS-16 had been applied since the commencement date, discounted using
the lessee’s incremental borrowing rate at the date of initial application – the Group has not applied this approach; or
- an amount equal to the lease liability, adjusted by the amount of any prepaid or accrued lease payments – the Company applied this approach to all leases.
The Group leases a number of vehicles. These leases were classified as finance leases under IAS-17. For
these finance leases, the carrying amount of the right-of-use asset and the lease liability at January 01, 2019 were determined at the carrying amount of the lease asset and lease liability under IAS-17 immediately before that date.
Impacts on Financial statements Impacts on transition On transition to IFRS 16, the Group recognized additional right of use assets and additional lease liabilities,
recognizing the difference in retained earnings. The impact on transition is summarized below. At January 01, 2019
(Rupees) Right-of-use assets 40,837,169 Lease liabilities 39,378,394 Prepaid Rent as at January 01, 2019 1,458,775 When measuring lease liabilities for leases that were classified as operating leases, the Group discounted
lease payments using its incremental borrowing rate at January 01, 2019. The weighted-average rate applied is 11.24%.
At January 01, 2019
(Rupees) Finance lease liabilities as at January 01, 2019 12,504,766 Operating leases recognised as lease liabilities 39,378,394 Lease liabilities recognised at January 01, 2019 51,883,160 Impacts for the period As a result of initially applying IFRS 16, in relation to the leases that were previously classified as operating
leases, the Company recognized Rs.33,376,949 of right-of-use assets and Rs. 34,937,682 of lease liability as at December 31, 2019.
Also in relation to those leases under IFRS 16, the Company has recognized depreciation and interest costs,
instead of operating lease expense. During the year, the Company recognized Rs. 7,460,220 of depreciation charged and Rs. 4,057,412 of interest costs from these leases.
NOTES TO THE CONSOLIDATED FINANCIAL STATEMENTS For the year ended December 31, 2019

Annual Report 2019 97
3.1 Property, plant and equipment Owned These are stated at cost less accumulated depreciation and impairment loss, if any, except for freehold
land, stores held for capitalisation and capital work in progress which are stated at cost less impairment loss, if any. Cost comprises purchase price, including import duties, non-recourse purchase taxes and other related costs of bringing the asset to its present working condition and location for intended use. Exchange gains or losses on long term foreign currency loans utilised for acquisition of assets are added to / deducted from cost of respective asset in accordance with note 3.7.
Depreciation is charged to profit or loss on straight line method at the rates given in note 14, after taking
into account their respective residual values if any, so as to write off the depreciable amount over their estimated useful lives whereby depreciable amount adjusted for above exchange rate movements of an asset is written off over its remaining estimated useful life. Depreciation is charged from the month asset is available for use whereas no depreciation is charged in the month in which the asset is disposed off.
Normal repairs and maintenance are charged to profit or loss as and when incurred whereas major
improvements and modifications are capitalised. Gains and losses on disposal of an item of property, plant and equipment are determined by comparing the proceeds from disposal with the carrying amount of property, plant and equipment disposed off, and are recognised net within “other income” in profit or loss.
Ijarah Rentals payable under Ijarah arrangement are charged to profit or loss on a straight line basis over the
term of the Ijarah lease arrangement. 3.2 Staff retirement benefits - Defined benefit plan The Company operates a funded gratuity scheme covering all permanent employees completing
the minimum qualifying period of service, for which liability is recognised in the financial statements. The assets of the fund plan are held independently in a separate fund. Provision for gratuity is made to cover obligations under the scheme in accordance with actuarial recommendations. The latest actuarial valuation was carried out by the Company as at December 31, 2019. The details of actuarial valuation are given in note 9.2 to these consolidated financial statements. The actuarial gains and losses are recognised in other comprehensive income in the year in which they arise. The Subsidiary Company operates an unfunded defined benefits plan for its permanent employees, for which deferred liability is recognized in these financial statements. Where payment or settlement is deferred and the effect would be material, these amounts are stated at their present values.
Unfunded defined benefit plan is provided for permanent employees of the Subsidiary Company for which
deferred liability is recognized in the financial statements. Where payment or settlement is deferred and the effect would be material, these amounts are stated at their present values.
NOTES TO THE CONSOLIDATED FINANCIAL STATEMENTS For the year ended December 31, 2019

SPL 98
3.3 Taxation (a) Current The profits and gains of the Company derived from electric power generation are exempt from tax subject
to the conditions and limitations provided for in terms of clause (132) of Part I of the Second Schedule to the Income Tax Ordinance, 2001. Further, the Company is also exempt from minimum tax on turnover under clause (11 A) of Part IV of the Second Schedule to the Income Tax Ordinance, 2001.
The Subsidiary Company accounts for current taxation on the basis of taxable income at the current rates
of taxation after taking into account tax credits and rebates, if any, and any adjustment to tax payable in respect of previous year in accordance with the provisions of the Income Tax Ordinance, 2001.
(b) Deferred Deferred tax has not been provided in these financial statements as the profits and gains of the Company
derived from electric power generation are exempt from tax subject to the conditions and limitations provided for in terms of clause (132) of Part I of the Second Schedule to the Income Tax Ordinance, 2001.
The Subsidiary Company recognises deferred tax to the extent that it is probable that future taxable profits
will be available against which the temporary differences, unused tax losses and tax credits can be utilised. Deferred tax assets are reviewed at each reporting date and are reduced to the extent that it is no longer probable that the related tax benefit will be realised.
3.4 Borrowing costs Borrowing costs on loans which are directly attributable to the acquisition, construction or production
of a qualifying asset are capitalised as part of the cost of that asset. Borrowing cost includes exchange differences arising from foreign currency borrowings to the extent that these are regarded as adjustment to borrowing cost. All other borrowing costs are charged to profit or loss.
3.5 Provisions Provisions are recognised when the Group has a present legal or constructive obligation as a result of past
event, and it is probable that an outflow of economic resources will be required to settle such obligations and a reliable estimate can be made of the amount of the obligation. Provisions are reviewed at the end of each reporting period and are adjusted to reflect the current best estimate.
3.6 Stock in trade These are valued at lower of cost and net realisable value. Cost is determined using weighted average cost
method. Cost of inventory comprises of the purchase price and other direct costs incurred in bringing the inventory items to their present location and condition. Net realisable value signifies the estimated selling price in the ordinary course of business less costs necessarily to be incurred in order to make a sale.
NOTES TO THE CONSOLIDATED FINANCIAL STATEMENTS For the year ended December 31, 2019

Annual Report 2019 99
3.7 Foreign currency transactions and translations Foreign currency transactions are recorded in PKR at the rate of exchange prevailing at the date of
transaction. Monetary assets and liabilities denominated in foreign currencies are translated at the exchange rate prevalent on the reporting date. Non monetary assets that are measured in terms of historical cost in a foreign currency are translated using the exchange rate at the date of the transactions. Exchange differences are accounted for as follows:
(i) Exchange differences related to foreign currency loans obtained for financing of the plant and machinery are capitalised and depreciated over the remaining useful life of the related assets in accordance with SRO 24(1)/2012 of SECP.
(ii) All other exchange differences are charged to profit or loss on net basis. 3.8 Financial Instruments - Initial recognition and subsequent measurement Initial Recognition All financial assets and liabilities are initially measured at cost which is the fair value of the consideration
given or received. These are subsequently measured at fair value, amortised cost or cost as the case may be.
Classification of financial assets - policy applicable from January 01, 2019 The Group classifies its financial instruments in the following categories:- at fair value through profit or loss (“FVTPL”),- at fair value through other comprehensive income (“FVTOCI”), or- at amortised cost. The Group determines the classification of financial assets at initial recognition. The classification of
instruments (other than equity instruments) is driven by the Group’s business model for managing the financial assets and their contractual cash flow characteristics.
Financial assets that meet the following conditions are subsequently measured at amortised cost:
- the financial asset is held within a business model whose objective is to hold financial assets in order to collect contractual cash flows; and
- the contractual terms of the financial asset give rise on specified dates to cash flows that are solely payments of principal and interest on the principal amount outstanding.
Financial assets that meet the following conditions are subsequently measured at FVTOCI: - the financial asset is held within a business model whose objective is achieved by both collecting contractual
cash flows and selling the financial assets; and
- the contractual terms of the financial asset give rise on specified dates to cash flows that are solely payments of principal and interest on the principal amount outstanding.
NOTES TO THE CONSOLIDATED FINANCIAL STATEMENTS For the year ended December 31, 2019

SPL 100
By default, all other financial assets are subsequently measured at FVTPL. Classification of financial liabilities - policy applicable from January 01, 2019 The Group classifies its financial liabilities in the following categories:- at fair value through profit or loss (“FVTPL”), or- at amortised cost.
Financial liabilities are measured at amortised cost, unless they are required to be measured at FVTPL (such as instruments held for trading or derivatives) or the Group has opted to measure them at FVTPL.
Subsequent measurement - policy applicable from January 01, 2019 i) Financial assets at FVTOCI Elected investments in equity instruments at FVTOCI are initially recognized at fair value plus transaction
costs. Subsequently, they are measured at fair value, with gains or losses arising from changes in fair value recognised in other comprehensive income / (loss).
ii) Financial assets and liabilities at amortised cost Financial assets and liabilities at amortised cost are initially recognised at fair value, and subsequently
carried at amortised cost, and in the case of financial assets, less any impairment. iii) Financial assets and liabilities at FVTPL Financial assets and liabilities carried at FVTPL are initially recorded at fair value and transaction costs are
expensed in the statement of profit or loss and other comprehensive income. Realised and unrealised gains and losses arising from changes in the fair value of the financial assets and liabilities held at FVTPL are included in the statement of profit or loss and other comprehensive income in the period in which they arise.
Where management has opted to recognise a financial liability at FVTPL, any changes associated with the
Group’s own credit risk will be recognized in other comprehensive income / (loss). Currently, there are no financial liabilities designated at FVTPL.
Derecognition - policy applicable from January 01, 2019 i) Financial assets The Group derecognises financial assets only when the contractual rights to cash flows from the financial
assets expire or when it transfers the financial assets and substantially all the associated risks and rewards of ownership to another entity. On derecognition of a financial asset measured at amortised cost, the difference between the asset’s carrying value and the sum of the consideration received and receivable is recognised in profit or loss. In addition, on derecognition of an investment in a debt instrument classified as at FVTOCI, the cumulative gain or loss previously accumulated in the investments revaluation reserve is reclassified to profit or loss. In contrast, on derecognition of an investment in equity instrument which the Group has elected on initial recognition to measure at FVTOCI, the cumulative gain or loss previously accumulated in the investments revaluation reserve is not reclassified to profit or loss, but is transferred to statement of changes in equity.
NOTES TO THE CONSOLIDATED FINANCIAL STATEMENTS For the year ended December 31, 2019

Annual Report 2019 101
ii) Financial liabilities The Group derecognises financial liabilities only when its obligations under the financial liabilities are
discharged, cancelled or expired. The difference between the carrying amount of the financial liability derecognised and the consideration paid and payable, including any non cash assets transferred or liabilities assumed, is recognised in the statement of profit or loss and other comprehensive income.
Offsetting of financial assets and financial liabilities - Policy applicable from January 01, 2019 Financial assets and liabilities are offset and the net amount presented in the statement of financial
position when, and only when, the Group has a legal right to offset the amounts and intends either to settle them on a net basis or to realise the asset and settle the liability simultaneously.
Financial Instruments - Policy applicable before January 01, 2019 Non-derivative financial assets These are initially recognised on the date that they are originated i.e. on the trade date, which is the
date that the Group becomes a party to the contractual provisions of the instrument. Investments are recognised on settlement date.
A financial asset is derecognised when the contractual rights to the cash flows from the asset expire,
or when the Group transfers the rights to receive the contractual cash flows in a transaction in which substantially all the risks and rewards of ownership of the financial asset are transferred. Any interest in such transferred financial assets that is created or retained by the Group is recognised as a separate asset or liability.
The Group's non-derivative financial assets are classified as loans and receivables. Loans and receivables comprise trade debts, deposits, other receivables, advances to employees, cash and
cash equivalents. Trade debts, deposits and other receivables Deposits and trade and other receivable are stated initially at the fair value. Subsequent to initial
recognition these are stated at their amortised cost as reduced by appropriate provision for impairment. Known impaired receivables are written off, while receivables considered doubtful of recovery are fully provided for.
The allowance for doubtful accounts is based on the Group’s assessment of the collectability of
counterparty accounts. The Group regularly reviews its debts and receivables that remain outstanding past their applicable payment terms and establishes allowance and potential write-offs by considering factors such as historical experience, credit quality, age of the accounts receivable balances, and current economic conditions that may affect a counterparty’s ability to pay.
Cash and cash equivalents Cash and cash equivalents comprise cash and bank balances and short term investments that are readily
convertible to known amounts of cash and which are subject to an insignificant risk of changes in their fair value.
NOTES TO THE CONSOLIDATED FINANCIAL STATEMENTS For the year ended December 31, 2019

SPL 102
Non-derivative financial liabilities The Group initially recognises non derivative financial liabilities on the date that they are originated
or the date that the Company becomes a party to the contractual provisions of the instrument. The Group derecognises a financial liability when its contractual obligations are discharged, cancelled or expired.
These financial liabilities are recognised initially at fair value less any directly attributable transaction
costs. Subsequent to initial recognition, these financial liabilities are measured at amortised cost using the effective interest method. Non derivative financial liabilities comprise of mark-up bearing borrowings including long term financing, obligations under finance lease, subordinated loan, short term borrowings, markup accrued and trade and other payables.
Trade and other payables Liabilities for trade and other payable are carried at amortised cost, which approximates the fair value
of consideration to be paid in future for goods and services received, whether or not billed to the Group.
Borrowings Mark-up bearing borrowings are recognised initially at cost, less attributable transaction costs. Subsequent
to initial recognition, mark-up bearing borrowings are stated at originally recognised amount less subsequent repayments, while the difference between the original recognised amounts (as reduced by periodic payments) and redemption value is recognised in profit or loss over the period of borrowings on an effective rate basis except to the extent capitalised as borrowing cost.
Finance costs are accounted for on an accrual basis and are reported under mark-up accrued on borrowings
to the extent of the amount remains unpaid. Offsetting of financial assets and financial liabilities Financial assets and liabilities are offset and the net amount presented in the statement of financial
position when, and only when, the Group has a legal right to offset the amounts and intends either to settle them on a net basis or to realise the asset and settle the liability simultaneously.
3.9 Impairment of financial asset - Policy applicable from January 01, 2019 The Group recognises loss allowance for Expected Credit Loss (ECL) on financial assets measured at
amortised cost and FVTOCI at an amount equal to lifetime ECLs except for the financial assets in which there is no significant increase in credit risk since initial recognition or financial assets which are determined to have low credit risk at the reporting date, in which case 12 months’ ECL is recorded.
For trade debts the Group applies IFRS 9 simplified approach to measure the expected credit losses (loss
allowance) which uses a life time expected allowance. The Group uses General 3-stage approach for deposits, other receivables, advances and bank balances i.e. to measure ECL through loss allowance at an amount equal to 12-month ECL if credit risk on a financial instruments has not increased significantly since initial recognition.
NOTES TO THE CONSOLIDATED FINANCIAL STATEMENTS For the year ended December 31, 2019

Annual Report 2019 103
The following were either determined to have low or there was no increase in credit risk since initial recognition as at the reporting date:
- Long term deposits; - Other receivables; - Advances to employees; - Security Deposits; and - Bank balances. Life time ECLs are the ECLs that results from all possible default events over the expected life of a financial
instrument. 12 months ECLs are portion of ECL that result from default events that are possible within 12 months after the reporting date.
ECLs are a probability weighted estimate of credit losses. Credit losses are measured at the present value
of all cash shortfalls (i.e. the difference between cash flows due to the entity in accordance with the contract and cash flows that the Group expects to receive).
The gross carrying amount of a financial asset is written off when the Group has no reasonable expectation
of recovering a financial asset in its entirety or a portion thereof. The Group uses simplified approach for expected credit loss of trade debts. Impairment of financial asset - Policy applicable before January 01, 2019 Financial assets are assessed at each reporting date to determine whether there is objective evidence
that they are impaired. A financial asset is impaired if objective evidence indicates that a loss event has occurred after the initial recognition of the asset, and that the loss event had a negative effect on the estimated future cash flows of that asset that can be estimated reliably. Objective evidence that financial assets are impaired may include default or delinquency by a debtor or indications that a debtor or issuer will enter bankruptcy.
All individually significant assets are assessed for specific impairment. All individually significant assets
found not to be specifically impaired are then collectively assessed for any impairment that has been incurred but not yet identified. Assets that are not individually significant are collectively assessed for impairment by grouping together assets with similar risk characteristics.
An impairment loss in respect of a financial asset measured at amortised cost is calculated as the difference
between its carrying amount and the present value of the estimated future cash flows discounted at the asset’s original effective interest rate. Losses are recognised in profit or loss and are reflected in an allowance account. Interest on the impaired asset continues to be recognised through the unwinding of the discount. When a subsequent event causes the amount of impairment loss to decrease, the decrease in impairment loss is reversed through profit or loss.
3.10 Finance income and finance cost Finance income comprises profit on deposit accounts and profit on short term investment. Profit on
deposit accounts is accrued on a time proportion basis by reference to the principal outstanding and the applicable rate of return. Income on term deposit receipts is recognised on time proportion basis taking into account the effective yield of such securities.
NOTES TO THE CONSOLIDATED FINANCIAL STATEMENTS For the year ended December 31, 2019

SPL 104
Finance cost comprises interest expense on borrowings, interest on finance lease liabilities, bank charges, exchange loss - net and other charges on borrowings. Mark-up and other charges on borrowings other than expense incurred on qualifying assets are charged to profit or loss in the period in which they are incurred.
3.11 Impairment of non-financial assets The carrying amounts of non-financial assets other than inventories, are reviewed at each reporting date
to determine whether there is any indication of impairment. If any such indication exists, then the asset’s recoverable amount is estimated. The recoverable amount of an asset or cash-generating unit is the greater of its value in use and its fair value less costs to sell. In assessing value in use, the estimated future cash flows are discounted to their present value using a pre-tax discount rate that reflects current market assessment of the time value of money and the risks specific to the asset. For the purpose of impairment testing, assets that cannot be tested individually are grouped together into the smallest group of assets that generates cash inflows from continuing use that are largely independent of the cash inflows of other assets or groups of assets (the “cash-generating unit, or CGU”).
The Group's corporate assets do not generate separate cash inflows. If there is an indication that a corporate
asset may be impaired, then the recoverable amount is determined for the CGU to which the corporate asset belongs. An impairment loss is recognised if the carrying amount of an asset or its CGU exceeds its estimated recoverable amount. Impairment losses are recognised in profit or loss.
Impairment losses recognized in prior periods are assessed at each reporting date for any indications that
the loss has decreased or no longer exists. An impairment loss is reversed if there has been a change in the estimates used to determine the recoverable amount. An impairment loss is reversed only to the extent that the asset’s carrying amount does not exceed the carrying amount that would have been determined, net of depreciation or amortisation, if no impairment loss had been recognised.
3.12 Provision for Workers' Profit Participation Fund The Company does not account for Provision for Workers Profit Participation Fund (WPPF) in its profit or
loss as they are pass through items to NTDC under the PPA. In case the liability arises, it is recovered from NTDC.
3.13 Dividend Dividend distribution to the shareholders is recognised as liability in the period in which it is
declared. 3.14 Forthcoming changes in approved accounting standards that are not yet effective The following International Financial Reporting Standards (IFRS Standards) as notified under the Companies
Act, 2017 and the amendments and interpretations thereto will be effective for accounting periods beginning on or after January 01, 2020:
- Amendment to IFRS 3 ‘Business Combinations’ – Definition of a Business (effective for business
combinations for which the acquisition date is on or after the beginning of annual period beginning on or
NOTES TO THE CONSOLIDATED FINANCIAL STATEMENTS For the year ended December 31, 2019

Annual Report 2019 105
after January 01, 2020). The IASB has issued amendments aiming to resolve the difficulties that arise when an entity determines whether it has acquired a business or a group of assets. The amendments clarify that to be considered a business, an acquired set of activities and assets must include, at a minimum, an input and a substantive process that together significantly contribute to the ability to create outputs. The amendments include an election to use a concentration test. The standard is effective for transactions in the future and therefore would not have an impact on past financial statements.
- Amendments to IAS 1 Presentation of Financial Statements and IAS 8 Accounting Policies, Changes in
Accounting Estimates and Errors (effective for annual periods beginning on or after January 01, 2020). The amendments are intended to make the definition of material in IAS 1 easier to understand and are not intended to alter the underlying concept of materiality in IFRS Standards. In addition, the IASB has also issued guidance on how to make materiality judgments when preparing their general purpose financial statements in accordance with IFRS Standards.
- On March 29, 2018 the International Accounting Standards Board (the IASB) has issued a revised
Conceptual Framework for Financial Reporting which is applicable immediately and contain changes that will set a new direction for IFRS in the future.. The Conceptual Framework primarily serves as a tool for the IASB to develop standards and to assist the IFRS Interpretations Committee in interpreting them. It does not override the requirements of individual IFRSs and any inconsistencies with the revised Framework will be subject to the usual due process – this means that the overall impact on standard setting may take some time to crystallise. The companies may use the Framework as a reference for selecting their accounting policies in the absence of specific IFRS requirements. In these cases, companies should review those policies and apply the new guidance retrospectively as of January 01, 2020, unless the new guidance contains specific scope outs.
- Interest Rate Benchmark Reform which amended IFRS 9, IAS 39 and IFRS 7 is applicable for annual financial
periods beginning on or after January 01, 2020. The G20 asked the Financial Stability Board (FSB) to undertake a fundamental review of major interest rate benchmarks. Following the review, the FSB published a report setting out its recommended reforms of some major interest rate benchmarks such as IBORs. Public authorities in many jurisdictions have since taken steps to implement those recommendations. This has in turn led to uncertainty about the long-term viability of some interest rate benchmarks. In these amendments, the term 'interest rate benchmark reform' refers to the market-wide reform of an interest rate benchmark including its replacement with an alternative benchmark rate, such as that resulting from the FSB's recommendations set out in its July 2014 report 'Reforming Major Interest Rate Benchmarks' (the reform). The amendments made provide relief from the potential effects of the uncertainty caused by the reform. A company shall apply the exceptions to all hedging relationships directly affected by interest rate benchmark reform. The amendments are not likely to affect the financial statements of the Group.
- IFRS 14 Regulatory Deferral Accounts - (effective for annual periods beginning on or after July 01, 2019)
provides interim guidance on accounting for regulatory deferral accounts balances while IASB considers more comprehensive guidance on accounting for the effects of rate regulation. In order to apply the interim standard, an entity has to be rate regulated – i.e. the establishment of prices that can be charged to its customers for goods or services is subject to oversight and/or approved by an authorized body. The term ‘regulatory deferral account balance’ has been chosen as a neutral descriptor for expense (income) or variance account that is included or is expected to be included by the rate regulator in establishing the rate(s) that can be charged to customers and would not otherwise be recognized as an asset or liability under other IFRSs. The standard is not likely to have any effect on the Group’s financial statements.
The above amendments are effective from annual period beginning on or after January 01, 2020 and are not likely to have an impact on the Group’s financial statements.
NOTES TO THE CONSOLIDATED FINANCIAL STATEMENTS For the year ended December 31, 2019

SPL 106
2019 20184 SHARE CAPITAL Rupees 4.1 Authorised share capital 405,000,000 (2018: 405,000,000) ordinary shares of Rs.10 each 4,050,000,000 4,050,000,000 4.2 Issued, subscribed and paid-up capital 386,471,779 (2018: 386,471,779) ordinary shares of Rs.10 each fully paid in cash. 3,864,717,790 3,864,717,790 4.3 Saif Holdings Limited (''the Controlling Party'') holds 197,272,619 i.e. 51.04% shares (2018: 197,272,619
i.e. 51.04%) ordinary shares of Rs.10/- each at the reporting date. Further, 16,002 (2018: 12,502) and 100 (2018: 100) ordinary shares of Rs.10 each are held by directors and a related party respectively. Orastar Limited held 66,022,504 (2018: 66,022,504) ordinary shares of the Company.
2019 20185 LONG TERM FINANCING Note Rupees Loan from banking companies and financial institutions Syndicate term finance facilities 5.1 788,379,612 2,975,180,137 Current portion of long term financing 11 (788,379,612) (2,322,465,694) - 652,714,443 5.1 Breakup of syndicate term finance facilities is as follows: Syndicate term finance facility under SFA 5.1.1 653,303,900 2,465,112,225 Syndicate term finance facility under TFFA 5.1.2 135,075,712 510,067,912 788,379,612 2,975,180,137 5.1.1 Syndicate term finance facility under Senior Facility Agreement ("SFA") National Bank of Pakistan 126,059,185 551,866,220 Habib Bank Limited 126,059,185 551,866,220 United Bank Limited 238,440,900 648,913,448 Allied Bank Limited 60,508,408 264,895,785 Faysal Bank Limited 25,211,835 110,373,243 Askari Bank Limited 25,212,635 110,374,043 Bank of Punjab 25,211,835 110,373,243 Pak Oman Investment Company Limited 15,127,101 66,223,945 Saudi Pak Industrial & Agricultural Investment Company Limited 11,472,816 50,226,078 653,303,900 2,465,112,225
This represents a syndicate senior facility of Rs. 10,727.53 million (2018: Rs. 10,727.53 million) obtained from a consortium of seven banks and two Development Finance Institutions (DFIs) led by Habib Bank Limited, the agent bank. The facility carries mark-up at the rate of 3 months KIBOR plus 3% per annum with no floor or cap and is payable in quarterly installments in a period of ten years, starting from June 30, 2010. The facility is secured against immovable property of the Company located at Sahiwal, project receivables, sponsors' shares constituting 51% of total issued share capital of the Company, lien over project accounts and all present and future assets and properties of the Company for an amount of Rs. 27,210.47 million (2018: Rs. 27,210.47 million) and assignment of the Company's rights and benefits under all project agreements.
NOTES TO THE CONSOLIDATED FINANCIAL STATEMENTS For the year ended December 31, 2019

Annual Report 2019 107
NOTES TO THE CONSOLIDATED FINANCIAL STATEMENTS For the year ended December 31, 2019
2019 2018 Rupees 5.1.2 Syndicate term finance facility under Term Finance Facility Agreement ("TFFA") National Bank of Pakistan 26,046,416 114,196,490 Habib Bank Limited 26,046,416 114,196,490 United Bank Limited 49,351,750 134,224,428 Allied Bank Limited 12,502,279 54,814,314 Faysal Bank Limited 5,209,282 22,839,297 Askari Bank Limited 5,209,282 22,839,297 Saudi Pak Industrial & Agricultural Investment Company Limited 2,375,433 10,414,720 Pak Brunei Investment Company Limited 8,334,854 36,542,876 135,075,712 510,067,912 This represents a syndicate term finance facility of Rs. 2,180 million (2018: Rs. 2,180 million) obtained
from a consortium of six banks and two DFIs led by Habib Bank Limited, the agent bank. The facility carries mark-up at the rate of 3 months KIBOR plus 3% per annum with no floor or cap and payable in quarterly installments in a period of ten years, starting from June 30, 2010. The facility is secured against immovable property of the Company located at Sahiwal, project receivables, sponsors’ shares constituting 51% of total issued share capital of the Company, lien over project accounts and all present and future assets and properties of the Company for an amount of Rs. 2,906.66 million (2018: Rs. 2,906.66 million) and assignment of the Company's rights and benefits under all project agreements.
5.2 Subject to certain materiality test, significant covenants of above facilities are as follows:
(i) Restriction of creation of further charge on the assets; (ii) Certain restriction on distribution of dividend; and (iii) Maintenance of debt service coverage ratio, debt equity ratio and leverage ratio.
Further covenants under these loans relate to the operation of the Company, project accounts, PPA and
material agreements. 2019 20186 SUB-ORDINATED LOAN - UNSECURED Note Rupees Balance at January 01 959,541,656 762,252,708 Exchange loss capitalised 6.1 112,095,994 197,288,948 1,071,637,650 959,541,656 Current portion of subordinated loan (357,212,541) (159,923,606) Balance at December 31 6.2 714,425,109 799,618,050 6.1 Exchange loss on sub-ordinated loan has been capitalised in accordance with note 3.7(i).
6.2 This represents remaining balance of US $ 6,898,215 (2018: US $ 6,898,215) from the original foreign
currency loan of US $ 8,946,353 obtained from Orastar Limited, incorporated under the laws of British Virgin Island (BVI). The loan is duly registered with State Bank of Pakistan (SBP). The loan carries a markup at the rate of 3 months USD LIBOR plus 3% per annum and payable in quarterly installments in a period of six years starting from January 1, 2019 subject to availability of surplus funds for distribution. As per agreement, the Company can also issue shares to Orastar Limited in lieu of repayment on mutually agreed basis.

SPL 108
NOTES TO THE CONSOLIDATED FINANCIAL STATEMENTS For the year ended December 31, 2019
2019 20187 LEASE LIABILITIES Rupees Lease liabilities (2018: Finance lease liabilities) 62,181,777 12,504,766 Less: Current portion (11,634,698) (3,695,846) Long term portion 50,547,079 8,808,920 Movement of lease liabilities under IFRS 16 is as follows: Balance at January 01 51,883,160 - New lease liabilities 21,417,110 - Interest 6,844,743 - Payments during the year (17,963,236) - Balance at December 31 62,181,777 - Current portion of lease liabilities (11,634,698) - Non-Current Portion of Lease Liabilities 50,547,079 - Maturity analysis of undiscounted lease payments that will be paid after the reporting date is as
follow:
2019 2018 Note Rupees Less than one year 18,088,190 - One to two years 20,978,962 - Two to three years 16,456,048 - Three to four years 16,898,477 - Four to five years 3,496,254 - More than five years 3,099,162 - 79,017,093 -
8 Deferred liability - gratuity Balance at January 01 - - Provision for gratuity expense for the year 8.2 2,962,420 - Benefit paid during the year - - Balance at December 31 8.1 2,962,420 - 8.1 During the year, unfunded defined benefit plan has been provided for permanent employees of the
Subsidiary Company, in service for more than one year, for which deferred liability has been recognised in these financial statements. The actuarial valuation in respect of provision for gratuity has not been carried out since the management believes that impact is not material.
8.2 Gratuity expense amounting to Rs. 2,890,288 was capitalized as capital work in progress as disclosed in
note 14.1.2 in accordance with the Subsidiary Company's approved policy for capitalization of expenses, while expense amounting to Rs. 72,132 was as administrative expense as disclosed in note 26.1.

Annual Report 2019 109
NOTES TO THE CONSOLIDATED FINANCIAL STATEMENTS For the year ended December 31, 2019
2019 20189 TRADE AND OTHER PAYABLES Note Rupees Creditors 1,587,031,977 588,197,211 Accrued liabilities 90,110,760 100,187,093 Withholding tax payable 2,565,581 2,906,022 Sales tax payable - 28,169,431 WPPF payable 9.1 182,497,345 151,654,044 Payable to staff gratuity fund 9.2 9,275,098 16,314,930 Support services fee payable to the Holding Company 221,525,725 221,525,725 Other payables 5,776,384 5,241,176 2,098,782,870 1,114,195,632 9.1 Workers' Profit Participation Fund Balance at January 01 151,654,044 129,606,247 Provision for the year 182,497,345 151,654,044 Payment during the year (151,654,044) (129,606,247) Balance at December 31 9.1.1 182,497,345 151,654,044 9.1.1 This represent Workers' Profit Participation Fund (WPPF) payable at the rate of 5% of the net profit for
the year and is a pass through item under the provisions of Power Purchase Agreement (PPA).
2019 20189.2 Payable to staff gratuity fund Note Rupees
The amount recognised in the statement of financial position is as follows: Present value of defined benefit obligation 9.2.1 80,798,915 64,878,789 Less: Fair value of plan assets 9.2.2 (71,523,817) (48,563,859) Net defined benefit liability 9,275,098 16,314,930 9.2.1 The movement in present value of defined benefit obligation is as follows: Balance at January 01 64,878,789 45,809,648 Included in profit or loss Current service cost 7,905,156 5,965,817 Interest cost 8,549,441 3,779,296 16,454,597 9,745,113
Included in other comprehensive income Remeasurement loss: - Actuarial loss 174,937 9,324,028
Others
Benefits paid (709,408) - Balance at December 31 80,798,915 64,878,789

SPL 110
NOTES TO THE CONSOLIDATED FINANCIAL STATEMENTS For the year ended December 31, 2019
2019 2018 Note Rupees 9.2.2 The movement in fair value of plan assets is as follows: Balance at January 01 48,563,859 36,830,361 Included in profit or loss Interest income 7,468,577 3,408,900 Included in other comprehensive income Return on plan assets excluding interest income (114,141) (654,690) Others Contribution to gratuity fund 16,314,930 8,979,288 Benefits paid (709,408) - Balance at December 31 71,523,817 48,563,859 Breakup of plan assets is as follows: Cash at bank 22,574 124,570 Cash balance 1,046 - Treasury bills 56,456,644 48,439,289 Term finance certificates 15,043,553 - 71,523,817 48,563,859 Allocation of gratuity expense is as follows: Cost of sales 24.1 5,158,242 3,639,344 Administrative expenses 26.1 3,827,778 2,696,869 8,986,020 6,336,213 Gratuity plan entitles a retired employee to receive gratuity equivalent to last drawn salary into eligible
number of years of service. The gratuity plan is administered by a gratuity fund that is legally separated from the Company and is funded by the Company based on actuarial valuation. Employees are not required to contribute to this plan. The latest actuarial valuation was carried out on December 31, 2019 using projected unit credit method. Expected gratuity expense for the next financial year is Rs. 8,983,007. This defined benefit plan exposes the Company to the following actuarial risks:
(a) Final salary risk The risk that the final salary at the time of cessation of service is greater than what we assumed. Since
the benefit is calculated on the final salary (which will closely reflect inflation and other macroeconomic factors), the benefit amount increases as salary increases.
(b) Demographic risks -Mortality risk The risk that the actual mortality experience is different than the assumed mortality. This effect is more
pronounced in schemes where the age and service distribution is on the higher side.
-Withdrawal risk The risk of actual withdrawals experience is different from assumed withdrawal probability. The
significance of the withdrawal risk varies with the age, service and the entitled benefits of the beneficiary.

Annual Report 2019 111
(c) Investment risk The risk of the investment underperforming and being not sufficient to meet the liabilities.
Key actuarial assumptions 2019 2018 Discount rate used for interest cost 13.25% 8.25% Discount rate used for year end obligation 11.25% 13.25% Future salary growth 10.25% 12.25% Expected mortality for active members As per SLIC As per SLIC 2001-2005 2001-2005 setback 1 Year setback 1 Year Average expected remaining working life time of employees 5 years 5 years Sensitivity analysis Reasonably possible changes at the reporting date at one of the relevant actuarial assumptions, holding
other assumption constant, would have affected the defined benefit obligations by the amount shown below;
December 31, 2019 December 31, 2018 Increase Decrease Increase Decrease Rupees
Discount rate (1% movement) 77,236,007 84,918,454 61,943,170 68,246,123 Future salary growth (1% movement) 85,028,779 77,074,834 68,342,110 61,805,882 2019 201810 SHORT TERM BORROWINGS Note Rupees Short term borrowings from banking companies Working capital facilities - secured 10.1 2,510,937,336 5,031,518,017 Short term musharakah facilities - secured 10.2 2,749,445,981 417,035,977 Loan from related party 10.3 - 24,496,976 5,260,383,317 5,473,050,970 10.1 The Company has obtained working capital facilities amounting to Rs. 8.63 billion (2018: Rs. 8.65 billion)
from several commercial banks for meeting the working capital requirements, expiring on various dates during 2020. Effective markup rates during the year on these facilities ranges between 11.05% to 15.36% (2018: 6.66% to 11.25%) with no floor or cap and payable in arrears on quarterly basis. The facilities are secured by way of mortgage charge on fuel stocks inventory and energy payment receivables up to Rs. 13.24 billion (2018: Rs. 12.77 billion) and subordinated / ranking charge on all present and future fixed assets and properties of the Company for an amount of Rs. 0.99 billion (2018: Rs. 1.41 billion).
10.2 The Company has obtained short term Islamic finance facilities from Islamic banks subject to a maximum limit of Rs. 4.05 billion (2018: Rs. 1.25 billion). Effective variable markup rate during the year on these facilities ranges between 11.15% to 14.86% (2018: 6.76% to 10.17%) and are secured by pari passu / ranking charge on fuel stock and energy purchase price receivables of the Company up to Rs. 5.36 billion (2018: Rs. 1.63 billion) and subordinated / ranking charge on all present and future fixed assets and properties of the Company up to Rs. 0.65 billion (2018: Rs. 0.23 billion).
NOTES TO THE CONSOLIDATED FINANCIAL STATEMENTS For the year ended December 31, 2019

SPL 112
10.3 This represented principal and interest accrued in respect of loan obtained by the Subsidiary Company from the Controlling party.
10.4 Letters of credit / guarantee Letters of guarantee amounting to Rs. 4.22 billion (2018: Rs. 4.37 billion) are available to the Company.
These facilities are secured against the ranking charge over all present and future fixed assets amounting to Rs. 6.58 billion (2018: Rs. 6.58 billion).
2019 201811 CURRENT PORTION OF NON-CURRENT LIABILITIES Note Rupees Current portion of long term financing 5 788,379,612 2,322,465,694 Current portion of sub-ordinated loan 6 357,212,541 159,923,606 Current portion of lease liabilities 7 11,634,698 3,695,846 1,157,226,851 2,486,085,146 12 MARKUP ACCRUED Markup on long term financing 51,332,385 96,251,206 Markup on short term financing 199,897,090 108,530,059 Markup on sub-ordinated loan 444,431,110 345,645,490 695,660,585 550,426,755 13 CONTINGENCIES AND COMMITMENTS 13.1 Contingencies: 13.1.1 In 2014, the tax authorities raised sales tax demand of Rs. 1,498.51 million by partially disallowing
input sales tax for the tax periods 2010 to 2013 by apportioning the total claim to energy purchase price and capacity purchase price, the latter being not subject to sales tax. On appeal filed by the Company, the Appellate Tribunal Inland Revenue (ATIR) directed the taxation officer to decide the matter in line with expected judgment of the Honorable High Court in parallel cases. Consequently, at present, the aforesaid tax demand is no more payable. Tax Authorities, against the decision of ATIR, filed reference application under section 47 of the Sales Tax Act, 1990 before the Honorable Islamabad High Court on October 16, 2015. However, in case the matter is eventually resolved against the Company, the tax payment will be claimable under the Power Purchase Agreement. Based on the advice of the Company's tax consultants and decision of the Lahore High Court in a parallel case, the Company’s management believes that the contention of tax department even after filing of reference application does not commensurate with the related statutory provisions and the issue is likely to be decided in favor of the Company.
13.1.2 For the tax period July 2015 to June 2016, the assessing officer raised sales tax demand of Rs. 10.43
million in the matter of inadmissibility of input tax in relation to financial banking services, security services and business support services procured by the Company. The Company filed an appeal with
NOTES TO THE CONSOLIDATED FINANCIAL STATEMENTS For the year ended December 31, 2019

Annual Report 2019 113
NOTES TO THE CONSOLIDATED FINANCIAL STATEMENTS For the year ended December 31, 2019
Commissioner (Appeals), who decided the matter in favor of the Company on account of business support services and remanded the matter to assessing officer on account of security services and financial banking services. The Company filed appeal to the Appellant Tribunal Inland Revenue (ATIR) against the order of Commissioner (Appeals) which is pending adjudication. Maximum amount of contingency as per the Company's records is Rs. 4.92 million.
13.1.3 In respect of Tax Years 2014 and 2015, the assessing officer amended the Company’s assessments and
raised tax demand amounting to Rs. 25.15 million and Rs. 9.45 million respectively by subjecting bank profit, return on investments and foreign exchange gain to tax. The Company filed an appeal before Commissioner (Appeals), who confirmed the tax imposed in the earlier order and further ordered to charge tax on interest on delayed payment revenue. On May 29, 2018 the Company filed an appeal before ATIR against the order of Commissioner (Appeals). Subsequent to year end, ATIR decided the case in favour of the Company.
13.1.4 For Tax Year 2015, the assessing officer raised demand of Rs. 55.6 million in March 2017 for alleged
non-withholding of tax on salaries, payment for goods and service, rent and dividend. The Company filed appeal before Commissioner (Appeals) who remanded the case to the assessing officer who in turn created a demand of Rs. 13.4 million in September 2018. The Company again filed appeal before Commissioner (Appeals) against the appeal effect order on October 16, 2018. Commissioner (Appeals) remanded the case to assessing officer where it is pending for final assessment.
13.1.5 For Tax Year 2013, the assessing officer in June 29, 2019 raised a demand of Rs. 29.09 million on
account of non-payment to Workers' Welfare Fund. The Company filed appeal before Commissioner (Appeals) on July 26, 2019. Subsequent to year end, Commissioner (Appeals) decided the matter in favour of the Company.
13.1.6 Sui Northern Gas Pipelines Limited (SNGPL) has claimed an amount of Rs.95.99 million (2018: Rs
89.28 million) on account of late payment by the Company against SNGPL's invoices of Regasified Liquefied Natural Gas (RLNG). SNGPL submitted these RLNG invoices to the Company without getting determination of RLNG tariff from Oil and Gas Regulatory Authority (OGRA). The Company has considered such SNGPL invoices to be invalid without OGRA determination. Therefore, no provision for the above mentioned amount has been made in these financial statements.
13.2 Commitments: 13.2.1 The Company is committed to pay monthly fee and milestone payments to its O&M contractors as per
terms agreed in the Operations & Maintenance (O&M) agreement.
13.2.2 Performance guarantees amounting to Rs. 10.3 million in favor of Directorate General Mines and Minerals have been issued by banks on behalf of the Subsidiary Company. Also refer note 22.1 and 22.4.

SPL 114
NO
TES
TO T
HE C
ON
SOLI
DATE
D FI
NAN
CIAL
STA
TEM
ENTS
Fo
r the
yea
r end
ed D
ecem
ber 3
1, 2
019
14
PRO
PERT
Y, P
LAN
T AN
D EQ
UIP
MEN
T
O
wne
d as
sets
Leas
ed a
sset
s
Fr
eeho
ld
Build
ings
on
Plan
t and
O
ffice
Co
mpu
ter
Furn
iture
M
otor
cycl
e Ve
hicl
es
Oth
er
Stor
es h
eld
for
Capi
tal w
ork
in
Vehi
cles
To
tal
la
nd
free
hold
land
m
achi
nery
eq
uipm
ent
and
acce
ssor
ies
and
fixtu
res
and
bicy
cle
as
sets
ca
pita
l exp
endi
ture
pro
gres
s (no
te 1
4.1)
Cost
Ru
pees
Bala
nce
at Ja
nuar
y 1,
201
8 4
3,89
0,60
0 2
,352
,888
,758
15,
143,
868,
768
1
0,37
7,03
0
5,2
80,8
25
3,8
07,1
68
395
,645
8
,245
,194
6
26,2
30
511
,038
,581
-
2
5,02
9,56
0
18,
105,
448,
359
Acqu
isitio
n th
roug
h bu
sines
s com
bina
tion
500
,000
-
-
2
64,5
32
238
,293
-
-
1
43,7
24
-
-
167
,533
,284
-
1
68,6
79,8
33
Addi
tions
4
15,3
67,6
00
-
-
661
,412
3
68,1
95
3,0
63,0
30
-
-
-
-
66,
952,
874
-
4
86,4
13,1
11
Tran
sfer
s -
-
-
-
-
-
-
7
,905
,238
-
-
-
(7
,905
,238
) -
Disp
osal
s -
-
-
(1
8,28
9)
(74,
240)
-
-
(3
57,5
00)
-
-
-
-
(450
,029
)Ef
fect
of e
xcha
nge
loss
(Ref
er n
ote
6.1)
-
-
1
97,2
88,9
48
-
-
-
-
-
-
-
-
-
197
,288
,948
Ba
lanc
e at
Dec
embe
r 31,
201
8 4
59,7
58,2
00
2,35
2,88
8,75
8 1
5,34
1,15
7,71
6
11,
284,
685
5
,813
,073
6
,870
,198
3
95,6
45
15,
936,
656
6
26,2
30
511
,038
,581
2
34,4
86,1
58
17,
124,
322
1
8,95
7,38
0,22
2 Ba
lanc
e at
Janu
ary
1, 2
019
459
,758
,200
2,
352,
888,
758
15,
341,
157,
716
1
1,28
4,68
5
5,8
13,0
73
6,8
70,1
98
395
,645
1
5,93
6,65
6
626
,230
5
11,0
38,5
81
234
,486
,158
1
7,12
4,32
2
18,9
57,3
80,2
22
Reco
gniti
on o
f rig
ht-o
f-use
ass
et o
n in
itial
app
licat
ion
of IF
RS 1
6 -
-
-
-
-
-
-
-
-
-
-
(1
7,12
4,32
2)
(17,
124,
322)
Adju
sted
bal
ance
at J
anua
ry 1
, 201
9 4
59,7
58,2
00
2,35
2,88
8,75
8 1
5,34
1,15
7,71
6
11,
284,
685
5
,813
,073
6
,870
,198
3
95,6
45
15,
936,
656
6
26,2
30
511
,038
,581
2
34,4
86,1
58
-
18,
940,
255,
900
Addi
tions
1
,698
,085
-
1
,069
,563
,372
2
36,0
74
809
,106
1
3,00
0
-
-
-
-
91,
380,
156
-
1
,163
,699
,793
Di
spos
al
-
-
-
(47,
210)
(9
0,09
0)
-
-
(3,1
52,9
12)
-
-
-
-
(3,2
90,2
12)
Dere
cogn
ition
-
-
(1
,573
,800
,469
) -
-
-
-
-
-
-
-
-
(1
,573
,800
,469
)Ef
fect
of e
xcha
nge
loss
(Ref
er n
ote
6.1)
-
-
1
12,0
95,9
94
-
-
-
-
-
-
-
-
-
112
,095
,994
Ba
lanc
e at
Dec
embe
r 31,
201
9 4
61,4
56,2
85
2,35
2,88
8,75
8 1
4,94
9,01
6,61
3
11,
473,
549
6
,532
,089
6
,883
,198
3
95,6
45
12,
783,
744
6
26,2
30
511
,038
,581
3
25,8
66,3
14
-
18,
638,
961,
006
DEPR
ECIA
TIO
N
Bala
nce
at Ja
nuar
y 1,
201
8 -
6
10,7
93,6
92
3,7
78,1
11,0
78
7,9
77,4
51
4,5
41,0
34
3,0
06,3
87
294
,221
5
,695
,556
6
26,2
30
-
-
6,7
92,3
32
4,4
17,8
37,9
81
Char
ge fo
r the
yea
r -
7
8,35
1,19
2
509
,578
,659
5
65,4
49
225
,540
4
35,9
88
26,
015
1
,860
,831
-
-
-
3
,477
,716
5
94,5
21,3
90
On
tran
sfer
s -
-
-
-
-
-
-
3
,840
,755
-
-
-
(3
,840
,755
) -
On
disp
osal
s -
-
-
(1
2,70
1)
(74,
240)
-
-
(2
86,0
00)
-
-
-
-
(372
,941
)Ba
lanc
e at
Dec
embe
r 31,
201
8 -
6
89,1
44,8
84
4,2
87,6
89,7
37
8,5
30,1
99
4,6
92,3
34
3,4
42,3
75
320
,236
1
1,11
1,14
2
626
,230
-
-
6
,429
,293
5
,011
,986
,430
Ba
lanc
e at
Janu
ary
1, 2
019
-
689
,144
,884
4
,287
,689
,737
8
,530
,199
4
,692
,334
3
,442
,375
3
20,2
36
11,
111,
142
6
26,2
30
-
-
6,4
29,2
93
5,0
11,9
86,4
30
Reco
gniti
on o
f rig
ht-o
f-use
ass
et o
n in
itial
app
licat
ion
of IF
RS 1
6 -
-
-
-
-
-
-
-
-
-
-
(6
,429
,293
) (6
,429
,293
)Ad
just
ed b
alan
ce a
t Jan
uary
1, 2
019
-
689
,144
,884
4
,287
,689
,737
8
,530
,199
4
,692
,334
3
,442
,375
3
20,2
36
11,
111,
142
6
26,2
30
-
-
-
5,0
05,5
57,1
37
Char
ge fo
r the
yea
r -
7
8,35
1,19
2
516
,598
,772
6
82,3
74
528
,944
4
48,4
76
13,
896
1
,915
,476
-
-
-
-
5
98,5
39,1
30
On
disp
osal
s -
-
-
(3
6,10
8)
(90,
090)
-
-
(2
,522
,329
) -
-
-
-
(2
,648
,527
)O
n de
reco
gniti
on
-
-
(506
,606
,371
) -
-
-
-
-
-
-
-
-
(5
06,6
06,3
71)
Bala
nce
at D
ecem
ber 3
1, 2
019
-
767
,496
,076
4
,297
,682
,138
9
,176
,465
5
,131
,188
3
,890
,851
3
34,1
32
10,
504,
289
6
26,2
30
-
-
-
5,0
94,8
41,3
69
IMPA
IRM
ENT
Bala
nce
at Ja
nuar
y 1,
201
8 -
-
-
-
-
-
-
-
-
-
-
-
-
Char
ge fo
r the
yea
r -
-
-
-
-
-
-
-
-
-
-
-
-
Bala
nce
at D
ecem
ber 3
1, 2
018
-
-
-
-
-
-
-
-
-
-
-
-
- Ba
lanc
e at
Janu
ary
1, 2
019
-
-
-
-
-
-
-
-
-
-
-
-
- Ch
arge
for t
he y
ear
-
-
833
,794
,098
-
-
-
-
-
-
-
-
-
8
33,7
94,0
98
On
dere
cogn
ition
-
-
(8
33,7
94,0
98)
-
-
-
-
-
-
-
-
-
(833
,794
,098
)Ba
lanc
e at
Dec
embe
r 31,
201
9 -
-
-
-
-
-
-
-
-
-
-
-
-
Carr
ying
am
ount
s At
Janu
ary
1, 2
018
43,
890,
600
1,7
42,0
95,0
66 1
1,36
5,75
7,69
0
2,3
99,5
79
739
,791
8
00,7
81
101
,424
2
,549
,638
-
5
11,0
38,5
81
-
18,
237,
228
13
,687
,610
,378
At
Dec
embe
r 31,
201
8 4
59,7
58,2
00
1,66
3,74
3,87
4 1
1,05
3,46
7,97
9
2,7
54,4
86
1,1
20,7
39
3,4
27,8
23
75,
409
4
,825
,514
-
5
11,0
38,5
81
234
,486
,158
1
0,69
5,02
9
13,9
45,3
93,7
92
At D
ecem
ber 3
1, 2
019
461
,456
,285
1,
585,
392,
682
10,
651,
334,
475
2
,297
,084
1
,400
,901
2
,992
,347
6
1,51
3
2,2
79,4
55
-
511
,038
,581
3
25,8
66,3
14
-
13,
544,
119,
637
Ra
te o
f dep
reci
atio
n pe
r ann
um (%
) -
3.33
%
3.33
% to
4.9
2%
10 %
to 3
3.33
%
33.3
3%
10%
20
%
20%
10
%
- -
20%

Annual Report 2019 115
NOTES TO THE CONSOLIDATED FINANCIAL STATEMENTS For the year ended December 31, 2019
2019 201814.1 Capital work in progress Note Rupees Advisory and consultancy charges 14.1.1 215,172,303 175,855,868 Salaries, wages and other benefits 14.1.2 54,612,666 18,942,027 Security charges 13,149,013 10,720,193 Borrowing 14.1.3 9,463,167 8,733,221 Travelling expenses 2,545,297 2,137,975 License fee 820,840 725,040 Equipment rentals 903,468 1,082,500 Fuel expenses 4,279,369 1,750,809 Vehicle rentals 2,891,001 1,383,770 Miscellaneous expenses 14.1.4 22,029,190 13,154,755 325,866,314 234,486,158 14.1.1 This includes cost of technical advisory services amounting to Rs. 74,548,877 (2018: Rs. 73,131,932)
from PEG S.A. and cost of geological exploration consultancy amounting to Rs. 83,070,914 (2018: Rs. 82,201,535) procured by Subsidiary Company, from Sinoma Handan Engineering Company (Private) Limited and cost of consulting services amounting to Rs. 22.16 million (2018: Nil) from Hybrid Technics (Private) Limited in respect of seeking approval for establishing Special Economic Zone in Paharpur, Dera Ismail Khan.
14.1.2 These include Rs. 2,890,288 (2018: Nil) charged in respect of staff retirement benefits - gratuity of
permanent employees of Subsidiary Company. 14.1.3 An amount of Rs. 729,946 (2018: Rs. 3,494,767) representing borrowing cost for the year has been
capitalized by Subsidiary Company using capitalization rate of 7.05% - 12.47% per annum (2018: 7.05% - 9.86% per annum).
14.1.4 This includes an amount of Rs. 488,000 (2018: Rs. 165,000) representing auditor's remuneration paid
in relation to statuary auditor's certification in respect of further issues of ordinary shares.
2019 201814.2 The depreciation charge for the year has been Note Rupees allocated as follows: Depreciation - Cost of sales 24 594,949,964 587,929,851 Impairment loss 14.2.1 833,794,098 - 1,428,744,062 587,929,851 Depreciation - Administrative expenses 26 3,589,166 6,591,539 1,432,333,228 594,521,390 14.2.1 This represents impairment loss related to damaged component of the plant. 14.3 Particulars of the immovable fixed assets The Company's immovable fixed assets consist of buildings and civil structure on land measuring
275.35 Kanals, located at Chak 56/5L, Qadarabad Multan Road, District Sahiwal, Punjab.
The Subsidiary Company's immovable fixed assets consist of land measuring 4,410 kanals and 4 marlas, located at Saiduwali Village Tehsil Paharpur, District Dera Ismail Khan, Khyber Pakhtoonkhawa, Pakistan.

SPL 116
2019 201815 RIGHT OF USE ASSETS Note Rupees COST
Balance at January 1 57,961,491 - Additions 21,957,919 - Disposals - - Balance at December 31 79,919,410 - DEPRECIATION
Balance at January 01 6,429,293 - Charge for the year 26 11,971,720 - On disposals - - Balance at December 31 18,401,013 - Carrying amount 61,518,397 - Rate of depreciation per annum (%) 10% to 20% - 16 PORJECT TRANSACTION COST
These represent expenses incurred against advisory services in relation to the project financing of the Subsidiary Company.
2019 201817 GOODWILL Rupees
Balance at January 01 11,530,918 - Acquisition through business combinations - 11,530,918 Balance at December 31 11,530,918 11,530,918 Acquisition of subsidiary The Company acquired 1,062,500 ordinary shares of Rs. 10 each of the Subsidiary Company, on August
01, 2018 ("the acquisition date") through issuance of shares by the Subsidiary Company. Further right issue of 72,427,919 ordinary shares of Rs. 10 each was made by the Subsidiary Company to the Company till December 31, 2019 as a result the Company holds 96.28% of the issued share capital of the Subsidiary Company. Control of the Subsidiary Company was transferred to the Company on acquisition date.
2019 201818 TRADE DEBTS Note Rupees National Transmission and Dispatch Company (NTDC) 18.1 9,650,652,780 8,415,730,184 18.1 Trade debts include an overdue amount of Rs 7.67 billion (2018: Rs. 6.72 billion) on account of circular debt.
The Company considers this amount to be fully recoverable because this is secured by way of guarantee issued by the Government of Pakistan (GoP) under the Implementation Agreement (IA). Additionally, trade debts are subject to markup on delayed payments under PPA at the rate of KIBOR+4.5% per annum except RLNG fuel invoices which are subject to markup of KIBOR+2% for first 30 days and after 30 days markup will be KIBOR+4.5%. GoP is committed, hence continuously pursuing for satisfactory settlement of debt issue.
NOTES TO THE CONSOLIDATED FINANCIAL STATEMENTS For the year ended December 31, 2019

Annual Report 2019 117
18.2 Included in trade debts is an amount of Rs. 477.56 million (2018: Rs. 477.56 million) relating to capacity purchase price not acknowledged by NTDC as the plant was not fully available for power generation. However, the sole reason of this under-utilisation of plant capacity was non-availability of fuel owing to non-payment by NTDC.
The Company along with other Independent Power Producers (IPPs) agreed with NTDC to resolve the
dispute through dispute resolution mechanism (appointment of expert) under the PPA. In his decision the expert in August 2015 determined that the amount mentioned above is payable to the Company and accordingly the Company has claimed the said amount from NTDC. Since NTDC did not conform to requirements of PPA relating to Expert decision within 30 days, the IPPs went to London Court of International Arbitration (LCIA).
Sole arbitrator appointed by LCIA issued a partial final award on June 08, 2017 wherein it was inter alia
held that the expert determination is final and binding. Thereafter, a final award was issued by the sole arbitrator on October 29, 2017 pursuant to which NTDC was ordered to pay Rs. 477.56 million (2018: Rs. 477.56 million) along with cost of proceedings, interest from the date of expert determination till payment by NTDC, after Arbitrator decision, to the Company. The Company filed petitions before Lahore High Court for enforcement of partial final award and final award on June 17, 2017 and November 30, 2017 respectively, which proceedings are pending till date. NTDC has also challenged the partial final award and final award in Civil Court, Lahore.
18.3 During year ended December 31, 2016 an amount of Rs. 239.68 million relating to capacity purchase
price not acknowledged by NTDC was adjusted by the Company against payable to SNGPL pursuant to award in favour of the Company for the whole amount by the London Court of International Arbitration (Arbitrator). SNGPL disputed the adjustment/set off amount of Award in the Lahore High Court, however, the court dismissed such petition of SNGPL. Thereafter, SNGPL filed appeal before the Supreme Court of Pakistan, which disposed off the appeal by stating that the judgement of the Lahore High Court, to the extent it decides on merits, the question of the Company’s right to set off is set aside (without prejudice to the rights of the parties). SNGPL also challenged the award in Civil Court, Lahore, on April 21, 2016 which is pending adjudication. On June 07, 2016 the Company filed a petition in the Civil Court Lahore to obtain a Decree in lieu of the arbitration award and also adjusted an amount of Rs. 270.66 million (inclusive of the aforementioned amount of Rs. 239.68 million) from payable to SNGPL as such amount was allowed by the LCIA in its award. During the year, SNGPL has filed suit for recovery before District Judge, Lahore (Invested with Powers of the Gas Utility Court) on March 01, 2019 against this adjustment including a claim for markup from the date of such adjustment and also has filed a request for Arbitration before LCIA on March 22, 2019. In its submission to LCIA on March 06, 2020, SNGPL has claimed adjusted amount of Rs. 270.66 million and markup amount of Rs. 236.47 million from the date of such adjustment. The Company’s position is that no amount is payable to SNGPL and in any case, LCIA Arbitration is the only competent forum to decide on this case.
18.4 For aging of receivable from NTDC at the reporting date, refer to note 28.4. 2019 2018 19 OTHER RECEIVABLES Rupees Workers' Profit Participation Fund (WPPF) receivable 334,044,648 496,240,240 Insurance claim receivable 785,753,372 - Sales tax receivable - net 27,741,941 - Other receivables 16,899,493 1,762,518 1,164,439,454 498,002,758
NOTES TO THE CONSOLIDATED FINANCIAL STATEMENTS For the year ended December 31, 2019

SPL 118
2019 201820 ADVANCES - considered good Note Rupees Advances to supplier 20.1 97,456,918 374,545 Advances to employees 892,321 546,672 98,349,239 921,217
20.1 These include advance payment to SNGPL amounting to Rs. 96,332,896. 21 TRADE DEPOSITS AND SHORT TERM PREPAYMENTS Prepayments 61,172,356 49,101,107 Security deposit 1,833,000 1,833,000 Current portion of long term deposits - 752,500 63,005,356 51,686,607 22 CASH AND BANK BALANCES Cash in hand 140,230 146,698 Cash at bank: Current accounts Local currency 22.1 2,876,939 3,407,673 Deposit accounts Local currency - 974 Foreign currency 22.2 304,124 271,840 22.3 304,124 272,814 Short term investment 22.4 10,830,956 10,645,412 14,152,249 14,472,597 22.1 This includes an amount of Rs. 0.3 million under lien to secure bank guarantee issued on behalf of the
Subsidiary Company. Also refer note 13.2.2. 22.2 This represents an amount of USD 1,964 (2018: USD 1,954) in US Dollar deposit and current
accounts. 22.3 These carry markup ranging from 7.75% to 11.96% (2018: 4% to 4.62%) per annum for Rupee
denominated balances while 0.15% (2018: 0.15%) per annum for US Dollar denominated balances.
22.4 This represents investment in local currency Term Deposit Receipt carrying interest rate of 8.05% to 12.1% (2018: 8.05%) per annum having maturity of three months. The deposit is under lien to secure bank guarantee issued on behalf of the Subsidiary Company. Also refer note 13.2.2.
NOTES TO THE CONSOLIDATED FINANCIAL STATEMENTS For the year ended December 31, 2019

Annual Report 2019 119
2019 201823 TURNOVER - NET Note Rupees Gross Energy Purchase Price 10,205,164,015 13,685,991,456 Less: Sales tax (1,482,801,609) (1,990,837,969) 8,722,362,406 11,695,153,487 Capacity Purchase Price 6,188,018,470 4,995,173,542 14,910,380,876 16,690,327,029 24 COST OF SALES
Raw material consumed 8,118,148,860 11,000,232,532 Operation and maintenance 888,634,449 815,409,235 Salaries and other benefits 24.1 66,550,886 58,102,812 Electricity charges 37,946,391 21,568,216 Insurance expense/ (recovery) 24.2 (652,965,263) 138,225,809 Depreciation and impairment loss 14.2 1,428,744,062 587,929,851 Office expenses 2,440,992 1,564,615 Travelling, conveyance and entertainment 1,708,330 1,093,134 Repair and maintenance 905,299 1,098,461 Communication 85,111 98,065 9,892,199,117 12,625,322,730 24.1 These include Rs. 5,158,242 (2018: Rs. 3,639,344) charged in respect of staff retirement benefits -
gratuity.
24.2 This includes Rs. 820,628,372 related to recovery on account of damaged component of the plant.
2019 201825 OTHER INCOME Note Rupees Income from financial assets Profit on deposit accounts 1,076,273 15,717 Return on investments 1,493,763 1,774,421 Income from non financial assets Insurance claim 19,000 34,012 Gain on disposal of property, plant and equipment 426,062 243,500 Scrap sales 261,783 360,665 3,276,881 2,428,315
NOTES TO THE CONSOLIDATED FINANCIAL STATEMENTS For the year ended December 31, 2019

SPL 120
2019 201826 ADMINISTRATIVE EXPENSES Note Rupees Salaries and other benefits 26.1 57,431,593 46,513,472 Traveling and conveyance 2,097,040 1,300,740 Rent, rates and taxes 444,703 10,165,604 Security services 12,732,924 11,941,276 Office expenses 6,193,658 6,395,772 Fees and subscriptions 14,999,962 11,447,724 Legal and professional 10,811,554 6,555,262 Consultancy 23,357,590 22,736,520 Repair and maintenance 6,064,034 5,677,380 Utilities 1,977,924 1,575,165 Insurance 2,659,388 2,393,835 Depreciation - Property, plant and equipment 14.2 3,589,166 6,591,539 Depreciation - Right of use assets 15 11,971,720 - Auditors' remuneration 26.2 3,271,803 2,122,500 Donations 26.3 7,300,000 4,600,000 Advertisements 135,715 267,660 Others 102,124 282,391 165,140,898 140,566,840 26.1 These include Rs. 3,827,778 and Rs. 72,132 (2018: Rs. 2,696,869 and Nil) charged
in respect of staff retirement benefits - gratuity for permanent employees of the Company and the Subsidiary Company respectively.
2019 201826.2 Auditors' remuneration Rupees Annual audit fee 1,141,000 870,000 Half yearly review fee 478,000 424,000 Consolidation 281,000 250,000 Certifications 399,403 263,500 Out of pocket expenses 71,000 75,000 Other services 901,400 240,000 3,271,803 2,122,500 26.3 This includes donation amounting to Rs. 6 million (2018: Rs. 4.5 million) to Akbar Kare Institute, Kulsum
Plaza, Jinnah Avenue, Blue Area, Islamabad, a company registered under Section 42 of the repealed Companies Ordinance, 1984 in which following directors of the Company are common directors:
Name of Director Nature of interest in donee Mrs. Hoor Yousafzai Director Mr. Jehangir Saifullah Khan Director
NOTES TO THE CONSOLIDATED FINANCIAL STATEMENTS For the year ended December 31, 2019

Annual Report 2019 121
NOTES TO THE CONSOLIDATED FINANCIAL STATEMENTS For the year ended December 31, 2019
2019 201827 FINANCE COST Rupees Markup on short term borrowings 741,042,628 303,758,174 Markup on long term financing 302,026,632 401,469,713 Markup on sub-ordinated loan 56,797,500 43,961,603 Guarantee commission and arrangement fee 16,499,996 16,500,598 Markup on lease liabilities 6,844,743 918,537 Bank charges 488,695 662,314 Exchange loss - net 86,187,262 127,286,289 1,209,887,456 894,557,228
28 FINANCIAL INSTRUMENTS - FAIR VALUES AND RISK MANAGEMENT Fair value measurement Fair value is the amount that would be received on sale of an asset or paid on transfer of a liability in an
orderly transaction between market participants at the measurement date. Consequently, differences can arise between carrying values and fair value estimates. Underlying the definition of fair value is the presumption that the Group is a going concern without any intention or requirement to curtail materially the scale of its operations or to undertake a transaction on adverse terms.
The fair value of financial assets and liabilities traded in active markets i.e. listed equity shares are based
on the quoted market prices at the close of trading on the period end date. The quoted market prices used for financial assets held by the Group is current bid price. A financial instrument is regarded as quoted in an active market if quoted prices are readily and regularly available from an exchange, dealer, broker, industry group, pricing service, or regulatory agency, and those prices represent actual and regularly occurring market transactions on an arm’s length basis.
IFRS 13, 'Fair Value Measurements' requires the Group to classify fair value measurements using a fair
value hierarchy that reflects the significance of the inputs used in making the measurements. The fair value hierarchy has the following levels:
- Quoted prices (unadjusted) in active markets for identical assets or liabilities (level 1). - Inputs other than quoted prices included within level 1 that are observable for the asset or liability,
either directly (that is, as prices) or indirectly (that is, derived from prices) (level 2). - Inputs for the asset or liability that are not based on observable market data (that is, unobservable
inputs) (level 3).

SPL 122
NOTES TO THE CONSOLIDATED FINANCIAL STATEMENTS For the year ended December 31, 2019
A. Accounting classifications and fair values
28.1 The following table shows the carrying amounts and fair values of financial assets and financial liabilities, including their levels in the fair value hierarchy.
December 31, 2019 Rupees Financial assets measured at fair value - - - - - - - Financial assets not measured at fair value 28.2 Long term deposits 4,372,660 - 4,372,660 - - - - Trade debts 9,650,652,780 - 9,650,652,780 - - - - Other receivables 1,136,697,513 - 1,136,697,513 - - - - Advances to employees 892,321 - 892,321 - - - - Security deposits 1,833,000 - 1,833,000 - - - - Bank balances 14,152,249 - 14,152,249 - - - - Total 10,808,600,523 - 10,808,600,523 - - - - Financial liabilities not measured at fair value 28.2 Long term financing - 788,379,612 788,379,612 - - - - Sub-ordinated loan - 1,071,637,650 1,071,637,650 - - - - Lease liabilities - 62,181,777 62,181,777 - - - - Deferred liability - gratuity - 2,962,420 2,962,420 - - - - Trade and other payables 28.3 - 2,096,217,289 2,096,217,289 - - - - Short term borrowings - 5,260,383,317 5,260,383,317 - - - - Markup accrued - 695,660,585 695,660,585 - - - - Unclaimed dividend - 15,465,337 15,465,337 - - - - Total - 9,992,887,987 9,992,887,987 - - - -
December 31, 2018 Rupees Financial assets measured at fair value - - - - - - - Financial assets not measured at fair value 28.2 Long term deposits 4,084,310 - 4,084,310 - - - - Trade debts 8,415,730,184 - 8,415,730,184 - - - - Other receivables 498,002,758 - 498,002,758 - - - - Advances to employees 546,672 - 546,672 - - - - Security deposits 1,833,000 - 1,833,000 - - - - Bank balances 14,472,597 - 14,472,597 - - - - Total 8,934,669,521 - 8,934,669,521 - - - - Financial liabilities not measured at fair value 28.2 Long term financing - 2,975,180,137 2,975,180,137 - - - - Sub-ordinated loan - 959,541,656 959,541,656 - - - - Lease liabilities - 12,504,766 12,504,766 - - - - Trade and other payables 28.3 - 1,083,120,179 1,083,120,179 - - - - Short term borrowings - 5,473,050,970 5,473,050,970 - - - - Markup accrued - 550,426,755 550,426,755 - - - - Unclaimed dividend - 10,190,825 10,190,825 - - - - Total - 11,064,015,288 11,064,015,288 - - - - 28.2 The Group has not disclosed the fair values for these financial assets and financial liabilities, as these are either short term in nature or repriced periodically. Therefore,
their carrying amounts are reasonable approximation of fair value.
28.3 This excludes withholding tax payable and sales tax payable.
Note
Note
Amortised cost
Amortised cost
Loan andreceivable
Other financial liabilities
Fair value
Fair value
Carrying Amount
Carrying Amount
Total
Total
Level 1
Level 1
Level 3
Level 3
Level 2
Level 2
Total
Total

Annual Report 2019 123
B. Financial risk management The Group has exposure to the credit risk, market risk and liquidity risk from its use of financial
instruments. The Board of Directors has overall responsibility for the establishment and oversight of the Group's
risk management framework. The Board is responsible for developing and monitoring the Group's risk management policies.
The Group's risk management policies are established to identify and analyse the risks faced by the
Group, to set appropriate risk limits and controls, and to monitor risks and adherence to limits. Risk management policies and systems are reviewed regularly to reflect changes in market conditions and the Group's activities. The Group, through its training and management standards and procedures, aims to develop a disciplined and constructive control environment in which all employees understand their roles and obligations.
The Audit Committee oversees how management monitors compliance with the Group's risk management
policies and procedures and reviews the adequacy of the risk management framework in relation to the risks faced by the Group. The Audit Committee is assisted in its oversight role by Internal Audit. Internal Audit undertakes both regular and ad-hoc reviews of risk management controls and procedures, the result of which are reported to the Audit Committee.
28.4 Credit risk Credit risk is the risk of financial loss to the Group if a customer or counterparty to a financial instrument
fails to meet its contractual obligations. Concentrations of credit risk indicate the relative sensitivity of the Group's performance to developments affecting a particular industry. The primary activity of the Group is power generation and sale of total output to NTDC. The Group is exposed to credit risk from its operations.
Exposure to credit risk The carrying amount of financial assets represents the maximum credit exposure. The maximum
exposure to credit risk at the reporting date was: 2019 2018 Note Rupees Long term deposits 4,372,660 4,084,310 Trade debts 18 9,650,652,780 8,415,730,184 Other receivables 19 1,136,697,513 498,002,758 Advances to employees 20 892,321 546,672 Security deposits 21 1,833,000 1,833,000 Bank balances 22 14,152,249 14,472,597 10,808,600,523 8,934,669,521 Credit risk is minimum as the bank accounts are maintained with reputable banks having good credit
ratings. Further, as disclosed in note 18.1 that the trade debts are secured by way of guarantee issued by the Government of Pakistan (GoP) under the Implementation Agreement (IA).
NOTES TO THE CONSOLIDATED FINANCIAL STATEMENTS For the year ended December 31, 2019

SPL 124
Credit quality of financial assets The credit quality of Group's financial assets have been assessed as follows by reference to external
credit rating of counterparties determined by the Pakistan Credit Rating Agency Limited (PACRA) and JCR - VIS Credit Rating Group Limited (JCR - VIS). The counterparties for which external credit ratings were not available have been assessed by reference to internal credit ratings determined based on their historical information for any default in meeting obligations.
.
2019 2018 Trade debts Rupees
Counterparties without external credit ratings 9,650,652,780 8,415,730,184 Impairment losses
The aging of trade debts at the reporting date was:
2019 2018 Gross Impairment Gross Impairment Rupees
Not past due 1,984,620,058 - 1,698,500,047 - Past due 0 - 60 days 415,111,850 - 525,770,527 - Past due 61 - 120 days 2,324,160,738 - 3,805,573,181 - Past due 121 - 180 days 504,803,329 - 814,388,033 - 181 days and above 4,421,956,805 - 1,571,498,396 - 9,650,652,780 - 8,415,730,184 -
As trade debts are ultimately receivable from GoP, therefore, these are exempt from impairment provisioning requirements. Impact of ECL on financial assets not covered under exemption was not material and accordingly has not been included in these financial statements.
2019 2018 Security deposits Rupees Counterparties without external credit ratings 1,833,000 1,833,000 Other receivables Counterparties without external credit ratings 1,136,697,513 498,002,758 Long term deposits Counterparties with external credit ratings - AA+ (2018: A1+) 1,290,450 1,002,100 Counterparties with external credit ratings - BBB- (2018: A-) 3,082,210 3,082,210 Advances to employees Counterparties without external credit ratings 892,321 546,672
NOTES TO THE CONSOLIDATED FINANCIAL STATEMENTS For the year ended December 31, 2019

Annual Report 2019 125
Cash and cash equivalents The Group held cash at bank amounting to Rs. 14,012,019 as at December 31, 2019 (2018: Rs.14,325,899).
Cash at bank is held with banks and financial institution counter parties, which are rated A1+ based on JCR-VIS rating.
28.5 Liquidity risk Liquidity risk is the risk that the Group will not be able to meet its financial obligations as they fall due.
Prudent liquidity risk management implies maintaining sufficient cash and marketable securities, the availability of funding to an adequate amount of committed credit facilities and the ability to close out market positions due to dynamic nature of the business. The Group's approach to managing liquidity is to ensure, as far as possible, that it will always have sufficient liquidity to meet its liabilities when due, under both normal and stressed conditions, without incurring unacceptable losses or risking damage to the Group's reputation.
There were no defaults on loans payable during the year.
The maturity profile of the Group’s financial liabilities based on the contractual amounts is as follows:
Carrying Contractual cash Maturity in less Maturity after Maturity after amount flows than 1 year one year and up five years to five years Rupees 2019 Long term financing 788,379,612 814,536,069 814,536,069 - - Sub-ordinated loan 1,071,637,650 1,186,509,727 397,691,282 788,818,445 - Lease liabilities 62,181,777 79,017,093 18,088,190 57,829,741 3,099,162 Deferred liability - gratuity 2,962,420 2,962,420 2,962,420 - - Trade and other payables 2,096,217,289 2,096,217,289 2,096,217,289 - - Short term borrowing 5,260,383,317 5,260,383,317 5,260,383,317 - - Markup accrued 695,660,585 695,660,585 695,660,585 - - Unclaimed dividend 15,465,337 15,465,337 15,465,337 - - 9,992,887,987 10,150,751,837 9,301,004,489 846,648,186 3,099,162
Carrying Contractual cash Maturity in less Maturity after Maturity after amount flows than 1 year one year and up five years to five years Rupees 2018 Long term financing 2,975,180,137 3,514,802,741 2,822,450,712 692,352,029 - Sub-ordinated loan 959,541,656 1,133,275,103 212,042,429 755,517,697 165,714,977 Lease liabilities 12,504,766 14,420,582 4,913,222 9,507,360 - Trade and other payables 1,083,120,179 1,083,120,179 1,083,120,179 - - Short term borrowing 5,473,050,970 5,473,050,970 5,473,050,970 - - Markup accrued 550,426,755 550,426,755 550,426,755 - - Unclaimed dividend 10,190,825 10,190,825 10,190,825 - - 11,064,015,288 11,779,287,155 10,156,195,092 1,457,377,086 165,714,977 It is not expected that the cash flows included in the maturity analysis could occur significantly earlier or at
significantly different amount. The contractual cash flows relating to long term borrowings and lease liabilities have been determined
on the basis of expected markup rates. The markup rates have been disclosed in notes 5, 6 and 7 to these financial statements.
NOTES TO THE CONSOLIDATED FINANCIAL STATEMENTS For the year ended December 31, 2019

SPL 126
28.6 Market risk Market risk is the risk that the value of the financial instrument may fluctuate as a result of changes in
market interest rates or the market price due to change in credit rating of the issuer or the instrument, change in market sentiments, speculative activities, supply and demand of securities and liquidity in the market. The Group is exposed to currency risk and interest rates only.
Currency risk Rupee is the functional currency of the Group and as a result currency exposures arise from transactions
and balances in currencies other than Rupee. The Group's potential foreign currency exposure comprise:
Transactional exposure in respect of non functional currency monetary items Transactional exposure in respect of non functional currency expenditure and revenues Transactional exposure in respect of non functional currency monetary items Monetary items, including financial assets and liabilities, denominated in currencies other than the
functional currency of the Group are periodically restated to Rupee equivalent, and the associated gain or loss is taken to the profit or loss. The foreign currency risk related to monetary items is managed as part of the risk management strategy.
Transactional exposure in respect of non functional currency expenditure and revenues Certain operating and capital expenditure is incurred by the Group in currencies other than the functional
currency. These currency risks are managed as part of overall risk management strategy. The Group does not enter into forward exchange contracts.
The Group's exposure to foreign currency risk was as follows based on notional amounts:
2019 2018 2019 2018 Rupees USD Subordinated loan 1,071,637,650 959,541,656 6,898,215 6,898,215 Accrued markup on subordinated loan 444,431,110 345,645,490 2,860,838 2,484,871 Trade and other payables 1,584,453,954 411,044,532 10,199,253 2,955,029 Other receivables (768,004,106) - (4,943,702) - Bank balances (304,124) (271,840) (1,964) (1,954) 2,332,214,484 1,715,959,838 15,012,640 12,336,161 The following significant exchange rates have been applied: Average Rate Reporting Date Rate 2019 2018 2019 2018 US Dollars 151.30 122.30 155.35 139.10
NOTES TO THE CONSOLIDATED FINANCIAL STATEMENTS For the year ended December 31, 2019

Annual Report 2019 127
Foreign Currency Sensitivity Analysis A 5% strengthening of the functional currency against USD at December 31, 2019 would have increased
profit by Rs. 63.03 million (2018: Rs. 37.82 million). A 5% weakening of the functional currency against USD at December 31, 2019 would have had the equal but opposite effect on these amounts. The analysis assumes that all other variables remain constant.
Interest rate risk Interest rate risk is the risk that the value of the financial instrument will fluctuate due to changes in the
market interest rate. The Group has long term Rupee and USD based loans and short term running finance arrangement at variable rates. The local currency loans have variable rate pricing that is dependent on the Karachi Inter Bank Offer Rate (KIBOR) and London Inter Bank Offer Rate (LIBOR). Any increase / decrease in KIBOR is adjustable and approved by NEPRA.
At the reporting date, the interest rate profile of the Group's interest bearing financial instruments was
as follows:
2019 2018 Rupees Fixed rate instruments Financial assets 11,135,080 10,918,226 Variable rate instruments Financial assets 7,666,032,722 6,717,230,137
Financial liabilities (7,188,507,196) (9,420,277,529) Fair value sensitivity analysis for fixed rate instruments The Group does not account for any fixed rate financial assets and liabilities at fair value through profit
or loss. Therefore a change in interest rates at the reporting date would not affect profit or loss.
Cash flow sensitivity analysis for variable rate instruments A change of 100 basis points in interest rates at the reporting date would have increased / (decreased)
profit or loss by Rs. 4.78 million (2018: Rs. 27.03 million). This analysis assumes that all other variables, in particular foreign currency rates, remain constant. The analysis is performed on the same basis as for 2018.
Other market price risk The primary goal of the Group’s investment strategy is to maximize investment returns on surplus funds.
The Group adopts a policy of ensuring to minimize its price risk by investing in securities having sound market performance. Certain investments are designated as held for trading because their performance is actively monitored and these are managed on a fair value basis. Equity price risk arises from investments at fair value through profit or loss.
Determination of fair values A number of the Group’s accounting policies and disclosures require the determination of fair value, for
both financial and non-financial assets and liabilities. Fair values have been determined for measurement and / or disclosure purposes based on the following methods:
NOTES TO THE CONSOLIDATED FINANCIAL STATEMENTS For the year ended December 31, 2019

SPL 128
Non - derivative financial assets The fair value of non - derivative financial assets is estimated as the present value of future cash flows,
discounted at the market rate of interest at the reporting date. This fair value is determined for disclosure purposes.
Non - derivative financial liabilities Fair value, which is determined for disclosure purposes, is calculated based on the present value of future
principal and interest cash flows, discounted at the market rate of interest at the reporting date. 28.7 Capital Risk Management The Group's objective when managing capital is to safeguard the Group's ability to continue as a going
concern so that it can continue to provide returns for shareholders and benefits for other stakeholders and to maintain a strong capital base to support the sustained development of its business. The Group manages its capital structure which comprises of capital and reserves by monitoring the return on net assets and makes adjustments, if required, in the light of changes in economic conditions. In order to maintain or adjust the capital structure, the Group may adjust the amount of dividend to shareholders, appropriation of amounts to capital reserves or / and issue new shares. There was no change in the Group's approach to capital management during the year and the Group is not subject to externally imposed capital requirement.
29 REMUNERATION OF CHIEF EXECUTIVE, DIRECTORS AND EXECUTIVES The aggregate amounts charged in these financial statements for remuneration including benefits
applicable to the chief executive officer, directors and executives of the Company are given below: 2019 2018 Rupees Chief executive officer Managerial remuneration - Gross 26,400,000 17,200,000 Staff retirement benefits 3,403,046 1,901,408 Bonus 4,400,000 3,900,000 34,203,046 23,001,408 Number of persons 1 1 Executives Managerial remuneration - Gross 75,633,713 52,556,120 Staff retirement benefits 6,660,302 3,348,990 Bonus 8,019,268 6,874,636 90,313,283 62,779,746 Number of persons including those who worked part of the year 12 9 29.1 Executive means any employee whose basic salary exceeds Rs. 1,200,000 (2018: Rs. 1,200,000) per
year. 29.2 In addition to the above, chief executive officer and executives are provided with the Company maintained
vehicles and health insurance coverage as per the Company's policy. 29.3 No remuneration has been paid to the directors of the Company, except for meeting fee amounting to
Rs. 290,000 which was paid to 7 directors (2018: Rs. 100,000 paid to 6 directors).
NOTES TO THE CONSOLIDATED FINANCIAL STATEMENTS For the year ended December 31, 2019

Annual Report 2019 129
30 RELATED PARTY TRANSACTIONS The Company is subsidiary of Saif Holdings Limited ("the Controlling Party"), therefore the Controlling
Party the Subsidiary Company and all associated undertakings of the Controlling Party are related parties of the Group. Other related parties comprise of directors, key management personnel, entities over which directors are able to exercise significant influence and major shareholders. Balances and other arrangements with Orastar Limited have been disclosed in note 4.3, 6, 11 and 12 to the financial statements.
Transactions with related parties Transactions with related parties other than those disclosed in note 26.3 to these financial statements
are as follows: 2019 2018 Note Rupees Saif Holdings Limited - the Holding Company (51.04% shareholding-common directorship) Issuance of share capital against cash by Saif Cement Limited 26,762,910 - Rent - 675,000 Dividend 453,727,024 700,317,797 Expenses incurred on behalf of the Company - 354,561 Saif Health Care Limited - Associated Company (Common directorship) Expenses incurred on behalf of the Company - 222,720 Saif Textile Limited - Associated Company (Common directorship) Dividend 230 355 Saif Energy Limited - Associated Company (Common directorship) Expenses incurred on behalf of Saif Cement Limited - 52,720 JSK Feeds Limited - Associated Company (Common directorship) Expenses incurred on behalf of Saif Cement Limited 854,919 326,063 JHI Holdings (Private) Limited - Associated Company (Common directorship) Repayment of principal and markup on loan obtained by Saif Cement Limited - 138,047,865 Transaction with Shareholders Purchase of land by Saif Cement Limited from Director (Jehangir Saifullah Khan) - 396,399,019
NOTES TO THE CONSOLIDATED FINANCIAL STATEMENTS For the year ended December 31, 2019
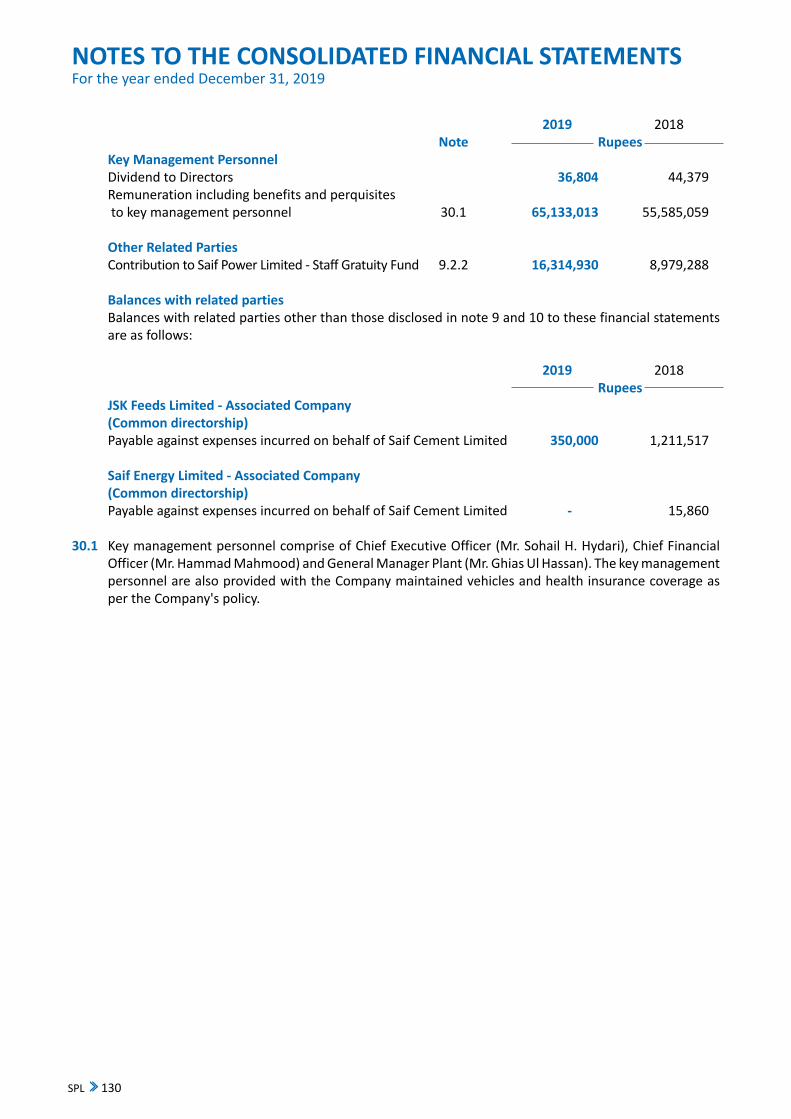
SPL 130
2019 2018 Note Rupees Key Management Personnel Dividend to Directors 36,804 44,379 Remuneration including benefits and perquisites to key management personnel 30.1 65,133,013 55,585,059 Other Related Parties Contribution to Saif Power Limited - Staff Gratuity Fund 9.2.2 16,314,930 8,979,288 Balances with related parties Balances with related parties other than those disclosed in note 9 and 10 to these financial statements
are as follows: 2019 2018 Rupees JSK Feeds Limited - Associated Company (Common directorship) Payable against expenses incurred on behalf of Saif Cement Limited 350,000 1,211,517 Saif Energy Limited - Associated Company (Common directorship) Payable against expenses incurred on behalf of Saif Cement Limited - 15,860 30.1 Key management personnel comprise of Chief Executive Officer (Mr. Sohail H. Hydari), Chief Financial
Officer (Mr. Hammad Mahmood) and General Manager Plant (Mr. Ghias Ul Hassan). The key management personnel are also provided with the Company maintained vehicles and health insurance coverage as per the Company's policy.
NOTES TO THE CONSOLIDATED FINANCIAL STATEMENTS For the year ended December 31, 2019

Annual Report 2019 131
NO
TES
TO T
HE C
ON
SOLI
DATE
D FI
NAN
CIAL
STA
TEM
ENTS
Fo
r the
yea
r end
ed D
ecem
ber 3
1, 2
019
31 R
ECO
NCI
LIAT
ION
OF
MO
VEM
ENT
OF
LIAB
ILIT
IES
TO C
ASH
FLO
WS
ARIS
ING
FRO
M F
INAN
CIN
G A
CTIV
ITIE
S
Li
abili
ties
E
quity
Lo
ng T
erm
Su
b-or
dina
ted
Sh
ort t
erm
Shar
e Ca
pita
l U
n ap
prop
riate
d
NCI
T
otal
Fina
ncin
g lo
an
borr
owin
gs
Leas
e lia
bilit
ies
pr
ofit
- rev
enue
re
serv
e
Ru
pees
Ba
lanc
e at
Janu
ary
01, 2
019
2,9
75,1
80,1
37
959
,541
,656
5
,473
,050
,970
1
2,50
4,76
6
3,8
64,7
17,7
90
8,1
81,7
13,9
65
19,
609
21
,466
,728
,893
Ap
plic
atio
n of
IFRS
16
-
-
-
39,
378,
394
-
-
-
3
9,37
8,39
4 Ad
just
ed b
alan
ce a
t Jan
uary
01,
201
9 2
,975
,180
,137
9
59,5
41,6
56
5,4
73,0
50,9
70
51,
883,
160
3
,864
,717
,790
8
,181
,713
,965
1
9,60
9
21,5
06,1
07,2
87
Chan
ges f
rom
fina
ncin
g ca
sh fl
ows
Proc
eeds
from
shor
t-ter
m b
orro
win
gs -
net
-
-
(212
,667
,653
) -
-
-
-
(2
12,6
67,6
53)
Repa
ymen
ts o
f lon
g te
rm fi
nanc
ing
(2,1
86,8
00,5
25)
-
-
-
-
-
-
(2,1
86,8
00,5
25)
Leas
e lia
bilit
ies a
ssum
ed /
(pai
d)
-
-
-
(11,
118,
493)
-
-
-
(1
1,11
8,49
3)Co
nsid
erat
ion
paid
by
NCI
for a
cqui
sitio
n of
shar
es
-
-
-
-
-
-
28,
371,
670
2
8,37
1,67
0 Di
vide
nd p
aid
-
-
-
-
-
(883
,610
,580
) -
(8
83,6
10,5
80)
Tota
l cha
nges
from
fina
ncin
g ca
sh fl
ows
(2,1
86,8
00,5
25)
-
(212
,667
,653
) (1
1,11
8,49
3)
-
(883
,610
,580
) 2
8,37
1,67
0
(3,2
65,8
25,5
81)
Disp
osal
of s
hare
to N
CI w
ithou
t cha
nge
in c
ontr
ol
-
-
-
-
-
489
,287
(4
89,2
87)
- Ef
fect
of c
hang
es in
fore
ign
exch
ange
rate
s -
1
12,0
95,9
94
-
-
-
-
-
112
,095
,994
-
112
,095
,994
-
-
-
4
89,2
87
(489
,287
) 1
12,0
95,9
94
Oth
er c
hang
es
Liab
ility
rela
ted
Leas
e of
new
veh
icle
s -
-
-
2
1,41
7,11
0
-
-
-
21,
417,
110
Mov
emen
t in
uncl
aim
ed d
ivid
end
-
-
-
-
-
(5,2
74,5
12)
-
(5,2
74,5
12)
Tota
l lia
bilit
y re
late
d ot
her c
hang
es
-
-
-
21,
417,
110
-
(5
,274
,512
) -
1
6,14
2,59
8 Eq
uity
rela
ted
Tota
l com
preh
ensiv
e in
com
e fo
r the
yea
r -
-
-
-
-
3
,646
,240
,774
(9
9,56
6)
3,6
46,1
41,2
08
Tota
l equ
ity re
late
d ot
her c
hang
es
-
-
-
-
-
3,6
46,2
40,7
74
(99,
566)
3
,646
,141
,208
Ba
lanc
e at
Dec
embe
r 31,
201
9 7
88,3
79,6
12
1,0
71,6
37,6
50
5,2
60,3
83,3
17
62,
181,
777
3
,864
,717
,790
1
0,93
9,55
8,93
4
27,
802,
426
22
,014
,661
,506
Ba
lanc
e at
Janu
ary
01, 2
018
4,7
61,2
77,2
67
762
,252
,708
1
,927
,513
,747
1
7,31
5,53
5
3,8
64,7
17,7
90
6,5
31,3
80,2
66
-
17,
864,
457,
313
Chan
ges f
rom
fina
ncin
g ca
sh fl
ows
Proc
eeds
from
shor
t-ter
m b
orro
win
gs -
net
-
-
3,3
87,2
72,8
85
-
-
-
-
3,3
87,2
72,8
85
Repa
ymen
ts o
f lon
g te
rm fi
nanc
ing
(1,7
86,0
97,1
30)
-
-
-
-
-
-
(1,7
86,0
97,1
30)
Paym
ent o
f fin
ance
leas
e lia
bilit
ies
-
-
-
(4,8
10,7
69)
-
-
-
(4,8
10,7
69)
Divi
dend
pai
d -
-
-
-
-
(1
,368
,438
,059
) -
(1
,368
,438
,059
)To
tal c
hang
es fr
om fi
nanc
ing
cash
flow
s (1
,786
,097
,130
) -
3
,387
,272
,885
(4
,810
,769
) -
(1
,368
,438
,059
) -
2
27,9
26,9
27
Chan
ges a
risin
g fr
om o
btai
ning
or l
osin
g co
ntro
l of t
he su
bsid
iary
-
-
1
58,2
64,3
38
-
-
-
(1,7
05)
158
,262
,633
Ac
quisi
tion
of N
CI w
ithou
t cha
nge
in c
ontr
ol
-
-
-
-
-
(22,
388)
2
2,38
8
- Th
e ef
fect
of c
hang
es in
fore
ign
exch
ange
rate
s -
1
97,2
88,9
48
-
-
-
-
-
197
,288
,948
-
197
,288
,948
1
58,2
64,3
38
-
-
(22,
388)
2
0,68
3
355
,551
,581
O
ther
cha
nges
Li
abili
ty re
late
d M
ovem
ent i
n un
clai
med
div
iden
d -
-
-
-
-
(3
,536
,756
) -
(3
,536
,756
)To
tal l
iabi
lity
rela
ted
othe
r cha
nges
-
-
-
-
-
(3
,536
,756
) -
(3
,536
,756
) Eq
uity
rela
ted
Tota
l com
preh
ensiv
e in
com
e fo
r the
yea
r -
-
-
-
-
3
,022
,330
,902
(1
,074
) 3
,022
,329
,828
To
tal e
quity
rela
ted
othe
r cha
nges
-
-
-
-
-
3
,022
,330
,902
(1
,074
) 3
,022
,329
,828
Ba
lanc
e at
Dec
embe
r 31,
201
8 2
,975
,180
,137
9
59,5
41,6
56
5,4
73,0
50,9
70
12,
504,
766
3
,864
,717
,790
8
,181
,713
,965
1
9,60
9
21,4
66,7
28,8
93

SPL 132
32 NUMBER OF EMPLOYEES 2019 2018 At year end 72 71 Average during the year 72 63 33 CAPACITY AND PRODUCTION Installed capacity based on hours 8,760 (2018: 8,760) – Megawatt hours 1,781,975 1,784,253 Actual energy delivered – Megawatt hours 716,203 1,104,685 - Output produced by the plant is dependent on the load demanded by NTDC. 34 NON ADJUSTING EVENTS AFTER REPORTING DATE The Board of Directors proposed final dividend for the year ended December 31, 2019 at the rate of Rs.
2 (2018: Rs. 1.30) per share in their meeting held on March 27, 2020. 35 DATE OF APPROVAL OF FINANCIAL STATEMENTS These consolidated financial statements were approved by the Board of Directors in their meeting held
on March 27, 2020.
NOTES TO THE CONSOLIDATED FINANCIAL STATEMENTS For the year ended December 31, 2019
Chief Financial Officer Chief Executive Officer Director

Annual Report 2019 133
NO. OF SHAREHOLDERS From To SHARES HELD PERCENTAGE 94 1 100 2,863 0.0007 2521 101 500 1,254,540 0.3246 817 501 1000 813,148 0.2104 585 1001 5000 1,518,110 0.3928 151 5001 10000 1,190,626 0.3081 56 10001 15000 712,133 0.1843 40 15001 20000 750,500 0.1942 24 20001 25000 568,000 0.147 23 25001 30000 651,500 0.1686 8 30001 35000 263,000 0.0681 10 35001 40000 384,500 0.0995 5 40001 45000 216,000 0.0559 15 45001 50000 737,500 0.1908 3 50001 55000 162,500 0.042 4 55001 60000 238,000 0.0616 1 65001 70000 69,000 0.0179 6 70001 75000 434,684 0.1125 5 75001 80000 394,000 0.1019 3 80001 85000 246,000 0.0637 2 85001 90000 172,500 0.0446 4 90001 95000 377,500 0.0977 11 95001 100000 1,095,500 0.2835 2 100001 105000 207,000 0.0536 4 105001 110000 428,000 0.1107 1 110001 115000 114,500 0.0296 3 120001 125000 373,500 0.0966 2 125001 130000 260,000 0.0673 4 145001 150000 595,500 0.1541 1 155001 160000 156,500 0.0405 1 160001 165000 163,000 0.0422 2 170001 175000 346,500 0.0897 1 175001 180000 179,500 0.0464 1 180001 185000 184,000 0.0476 1 190001 195000 191,500 0.0496 1 195001 200000 197,363 0.0511 2 220001 225000 447,000 0.1157 1 230001 235000 232,500 0.0602 1 250001 255000 250,500 0.0648 1 255001 260000 257,500 0.0666 1 265001 270000 268,000 0.0693 2 270001 275000 549,500 0.1422 1 280001 285000 282,500 0.0731 1 295001 300000 300,000 0.0776 1 305001 310000 309,500 0.0801 1 315001 320000 320,000 0.0828 2 345001 350000 700,000 0.1811 1 380001 385000 381,500 0.0987 1 395001 400000 400,000 0.1035 1 410001 415000 412,500 0.1067 2 440001 445000 883,500 0.2286 1 465001 470000 470,000 0.1216 1 475001 480000 476,000 0.1232 1 495001 500000 500,000 0.1294 1 500001 505000 503,500 0.1303
Pattern of ShareholdingSaif Power LimitedAs at December 31, 2019

SPL 134
Pattern of ShareholdingSaif Power LimitedAs at December 31, 2019
NO. OF SHAREHOLDERS From To SHARES HELD PERCENTAGE 2 565001 570000 1,140,000 0.295 1 650001 655000 654,000 0.1692 1 665001 670000 666,500 0.1725 1 705001 710000 706,500 0.1828 1 810001 815000 810,195 0.2096 1 995001 1000000 1,000,000 0.2588 1 1085001 1090000 1,088,498 0.2816 1 1095001 1100000 1,100,000 0.2846 1 1175001 1180000 1,177,637 0.3047 1 1335001 1340000 1,339,000 0.3465 1 1495001 1500000 1,500,000 0.3881 1 1710001 1715000 1,713,000 0.4432 1 2415001 2420000 2,418,500 0.6258 1 2670001 2675000 2,673,219 0.6917 1 3245001 3250000 3,248,000 0.8404 1 3420001 3425000 3,421,904 0.8854 1 4445001 4450000 4,449,500 1.1513 1 4935001 4940000 4,935,882 1.2772 1 8555001 8560000 8,555,684 2.2138 1 10235001 10240000 10,237,000 2.6488 1 10470001 10475000 10,475,000 2.7104 1 13885001 13890000 13,889,000 3.5938 1 15345001 15350000 15,350,000 3.9718 1 15590001 15595000 15,590,354 4.034 1 66020001 66025000 66,022,504 17.0834 1 188715001 188720000 188,716,935 48.8307 4462 386,471,779 100
CATEGORY OF SHAREHOLDER NO OF FOLIO SHARES PERCENTAGE
DIRECTORS, CHIEF EXECUTIVE OFFICER, AND THEIR SPOUSE AND MINOR CHILDREN 7 16,002 0.0041ASSOCIATED COMPANIES, UNDERTAKINGS AND RELATED PARTIES 3 197,272,719 51.0445BANKS, DFI AND NBFI 7 60,123,854 15.5571INSURANCE COMPANIES 4 5,477,382 1.4173MODARABAS AND MUTUTAL FUNDS 14 11,669,000 3.0194GENERAL PUBLIC (LOCAL) 4,287 22,609,909 5.8503GENERAL PUBLIC (FOREIGN) 96 3,541,906 0.9165OTHERS 44 85,761,007 22.1907Total 4,462 386,471,779 100

Annual Report 2019 135
DIRECTORS, CHIEF EXECUTIVE OFFICER, AND THEIR SPOUSE SHARES PERCENTAGEAND MINOR CHILDREN HOOR YOUSAFZAI 1 -JAVED SAIFULLAH KHAN 5,000 0.0013OSMAN SAIFULLAH KHAN 5,000 0.0013JEHANGIR SAIFULLAH KHAN 4,000 0.001ASSAD SAIFULLAH KHAN 1,000 0.0003JEHANNAZ SAIFULLAH KHAN 1,000 0.0003NAVED ABID KHAN 1 - ASSOCIATED COMPANIES, UNDERTAKINGS AND RELATED PARTIES SAIF HOLDINGS LIMITED 197,272,619 51.0445SAIF TEXTILE MILLS LIMITED 100 - BANKS, FI AND NBFI SAMBA BANK LIMITED 1,500,000 0.3881ALLIED BANK LIMITED 13,889,000 3.5938HABIB BANK LIMITED-TREASURY DIVISION 15,590,354 4.034BANK AL HABIB LIMITED 3,248,000 0.8404UNITED BANK LIMITED - TRADING PORTFOLIO 10,237,000 2.6488MCB BANK LIMITED – TREASURY 15,350,000 3.9718PAIR INVESTMENT COMPANY LIMITED 309,500 0.0801
INSURANCE COMPANIES UBL INSURERS LIMITED 503,500 0.1303IGI LIFE INSURANCE LIMITED 13,000 0.0034ADAMJEE LIFE ASSURANCE COMPANY LIMITED 25,000 0.0065ADAMJEE INSURANCE COMPANY LIMITED 4,935,882 1.2772 MODARABAS AND MUTUAL FUNDS CDC-TRUSTEE AKD INDEX TRACKER FUND 46,000 0.0119CDC-TRUSTEE UBL STOCK ADVANTAGE FUND 2,673,219 0.6917CDC-TRUSTEE UBL ASSET ALLOCATION FUND 1,088,498 0.2817CDC-TRUSTEE UBL RETIREMENT SAVING FUND-EQUITY SUB FUND 706,500 0.1828CDC-TRUSTEE UBL DEDICATED EQUITY FUND 71,184 0.0184CDC - TRUSTEE NBP STOCK FUND 570,000 0.1475CDC - TRUSTEE NBP BALANCED FUND 130,000 0.0336CDC-TRUSTEE NBP SARMAYA IZAFA FUND 93,000 0.0241CDC-TRUSTEE NBP ISLAMIC REGULAR INCOME FUND 29,500 0.0076CDC-TRUSTEE AL-AMEEN ISLAMIC ASSETS ALLOCATION FUND 810,195 0.2096CDC-TRUSTEE AL-AMEEN ISLAMIC RET. FUND-EQUITY SUB FUND 654,000 0.1692CDC-TRUSTEE AL AMEEN ISLAMIC DEDICATED EQUITY FUND 1,177,637 0.3047CDC-TRUSTEE AL AMEEN ISLAMIC ENERGY FUND 197,363 0.0511CDC-TRUSTEE AL-AMEEN SHARIAH STOCK FUND 3,421,904 0.8854 GENERAL PUBLIC (LOCAL) GENERAL PUBLIC (LOCAL) 22,609,909 5.8503GENERAL PUBLIC (FOREIGN) 3,541,906 0.9165 OTHERS (Joint Stock Companies, Charitable Trust, Non-resident Companies, various funds etc.) 85,761,007 22.1907
HOLDING MORE THAN TEN PERCENTAGE SAIF HOLDINGS LIMITED 197,272,619 51.0445ORASTAR LIMITED 66,022,504 17.0834
Pattern of ShareholdingSaif Power LimitedAs at December 31, 2019

SPL 136
46,000
2,673,219
1,088,498
706,500
71,184
570,000
130,000
93,000
29,500
810,195
654,000
1,177,637
197,363
3,421,904
0.0119
0.6917
0.2817
0.1828
0.0184
0.1475
0.0336
0.0241
0.0076
0.2096
0.1692
0.3047
0.0511
0.8854
22,609,909
3,541,906
5.8503
0.9165
85,761,00722.1907
197,272,619 51.0445
66,022,504 17.0834

Annual Report 2019 137
1
5,000
5,000
4,000
1,000
1,000
1
-
0.0013
0.0013
0.001
0.0003
0.0003
-
197,272,619
100
51.0445
-
1,500,000
13,889,000
15,590,354
3,248,000
10,237,000
15,350,000
309,500
0.3881
3.5938
4.034
0.8404
2.6488
3.9718
0.0801
503,500
13,000
25,000
4,935,882
0.1303
0.0034
0.0065
1.2772

SPL 138
1335001
1495001
1710001
2415001
2670001
3245001
3420001
4445001
4935001
8555001
10235001
10470001
13885001
15345001
15590001
66020001
188715001
1340000
1500000
1715000
2420000
2675000
3250000
3425000
4450000
4940000
8560000
10240000
10475000
13890000
15350000
15595000
66025000
188720000
1
1
1
1
1
1
1
1
1
1
1
1
1
1
1
1
1
4462
1,339,000
1,500,000
1,713,000
2,418,500
2,673,219
3,248,000
3,421,904
4,449,500
4,935,882
8,555,684
10,237,000
10,475,000
13,889,000
15,350,000
15,590,354
66,022,504
188,716,935
386,471,779
0.3465
0.3881
0.4432
0.6258
0.6917
0.8404
0.8854
1.1513
1.2772
2.2138
2.6488
2.7104
3.5938
3.9718
4.034
17.0834
48.8307
100
7
3
7
4
14
4,287
96
44
16,002
197,272,719
60,123,854
5,477,382
11,669,000
22,609,909
3,541,906
85,761,007
4,462 386,471,779
0.0041
51.0445
15.5571
1.4173
3.0194
5.8503
0.9165
22.1907
100

Annual Report 2019 139
1
1
1
2
1
1
1
1
2
1
1
1
1
2
1
1
1
2
1
1
1
1
2
1
1
1
1
1
1
1
1
180001
190001
195001
220001
230001
250001
255001
265001
270001
280001
295001
305001
315001
345001
380001
395001
410001
440001
465001
475001
495001
500001
565001
650001
665001
705001
810001
995001
1085001
1095001
1175001
185000
195000
200000
225000
235000
255000
260000
270000
275000
285000
300000
310000
320000
350000
385000
400000
415000
445000
470000
480000
500000
505000
570000
655000
670000
710000
815000
1000000
1090000
1100000
1180000
184,000
191,500
197,363
447,000
232,500
250,500
257,500
268,000
549,500
282,500
300,000
309,500
320,000
700,000
381,500
400,000
412,500
883,500
470,000
476,000
500,000
503,500
1,140,000
654,000
666,500
706,500
810,195
1,000,000
1,088,498
1,100,000
1,177,637
0.0476
0.0496
0.0511
0.1157
0.0602
0.0648
0.0666
0.0693
0.1422
0.0731
0.0776
0.0801
0.0828
0.1811
0.0987
0.1035
0.1067
0.2286
0.1216
0.1232
0.1294
0.1303
0.295
0.1692
0.1725
0.1828
0.2096
0.2588
0.2816
0.2846
0.3047

SPL 140
94
2521
817
585
151
56
40
24
23
8
10
5
15
3
4
1
6
5
3
2
4
11
2
4
1
3
2
4
1
1
2
1
1
101
501
1001
5001
10001
15001
20001
25001
30001
35001
40001
45001
50001
55001
65001
70001
75001
80001
85001
90001
95001
100001
105001
110001
120001
125001
145001
155001
160001
170001
175001
100
500
1000
5000
10000
15000
20000
25000
30000
35000
40000
45000
50000
55000
60000
70000
75000
80000
85000
90000
95000
100000
105000
110000
115000
125000
130000
150000
160000
165000
175000
180000
2,863
1,254,540
813,148
1,518,110
1,190,626
712,133
750,500
568,000
651,500
263,000
384,500
216,000
737,500
162,500
238,000
69,000
434,684
394,000
246,000
172,500
377,500
1,095,500
207,000
428,000
114,500
373,500
260,000
595,500
156,500
163,000
346,500
179,500
0.0007
0.3246
0.2104
0.3928
0.3081
0.1843
0.1942
0.147
0.1686
0.0681
0.0995
0.0559
0.1908
0.042
0.0616
0.0179
0.1125
0.1019
0.0637
0.0446
0.0977
0.2835
0.0536
0.1107
0.0296
0.0966
0.0673
0.1541
0.0405
0.0422
0.0897
0.0464

Annual Report 2019 141
NO. OF SHAREHOLDERS From To SHARES HELD PERCENTAGE 11 101 500 1,265 0.00 1 1,000 1,500 1,034 0.00 1 160,500 161,000 153,387 0.21 1 2,676,500 2,676,291 2,676,291 3.51 1 73,490,000 73,490,500 73,490,419 96.28 15 76,329,586 100.00
CATEGORY OF SHAREHOLDERS OF SUBSIDIARY COMPANY
Categories of shareholders Shareholders Share Held Percentage
DIRECTORS, CHIEF EXECUTIVE AND THEIR SPOUSE AND MINOR CHILDREN 8 1,839 0.002ASSOCIATED COMPANIES, UNDERTAKING AND RELATED PARTIES(Companies): Saif Power Limited 1 73,490,419 96.278Saif Holdings Limited 1 2,676,291 3.51OTHERS SHAREHOLDERS 5 161,037 0.21
Pattern of ShareholdingSaif Cement LimitedAs at December 31, 2019

SPL 142
101
1,000
160,500
2,676,500
73,490,000
500
1,500
161,000
2,676,291
73,490,500
11
1
1
1
1
15
1,265
1,034
153,387
2,676,291
73,490,419
76,329,586
0.00
0.00
0.21
3.51
96.28
100.00
81,839 0.002
1 73,490,419 96.2781 2,676,291 3.515 161,037 0.21

Annual Report 2019 143
Notice of 16th Annual General MeetingNotice is hereby given that the 16th Annual General Meeting (AGM) of Shareholders of Saif Power Limited (“the Company”) will be held on April 29, 2020, Wednesday at 11:00 a.m from Company’s registered office, 1st Floor, Kashmir Commercial Complex, Fazal-ul-Haq Road, Block E, Blue Area, Islamabad via video-link. Due to recent outbreak of COVID-19 pandemic, and the precautions taken by the Government of Pakistan against the spread of the evolving COVID-19 pandemic, it is instructed to avoid public gathering at one place.
Further, in accordance with the directives given by the Securities and Exchange Commission of Pakistan (SECP) vide its Circular No. EMD/MISC/82/2012 dated March 17, 2020 to companies to modify their usual planning for annual general meetings for the well-being of the shareholders and to avoid large gatherings by provision of video-link facilities. Therefore, to ensure the health and safety of our shareholders we will be holding AGM via video-link. Shareholders are encouraged to attend the AGM through login via video-link or by consolidating their attendance through proxies to transact the following business:
ORDINARY BUSINESS
1. To confirm the minutes of Last Annual General Meeting held on April 30, 2019.
2. To receive, consider and adopt the Audited Financial Statements of the Company (standalone and consolidated) for the year ended December 31, 2019 together with Directors’ and Auditors’ reports thereon.
3. To consider and approve the final dividend of Rs.2.00 per share i.e. 20% in addition to interim dividend of Rs. 1.00 per share i.e. 10 %, making total dividend of Rs. 3.00 per share i.e. 30%, Rs. 1.00 per share already paid, as recommended by Directors.
4. To appoint statutory auditors of the Company for the year ending December 31, 2020 and fix their remuneration. The Board of Directors have recommended the appointment of retiring auditors, M/s KPMG Taseer Hadi & Co. Chartered Accountants, Islamabad, being eligible, have offered themselves for reappointment.
5. To transact any other business with permission of the Chair.
Important note: In the event that there are any further instructions or notifications from the SECP and/or the Pakistan Stock Exchange or any change for the ANNUAL GENERAL MEETING, the Company will announce the same at the Pakistan Stock Exchange through PUCARS system.
By Order Of The Board
Islamabad Waseemullah
April 08, 2020 Company Secretary
Notes:
i. Shareholders who are willing to attend and participate in AGM can do so through video-link that will be provided to shareholders after completion of identification and verification formalities. Shareholders are requested to provide their Name, Computerized National Identity Card (CNIC), Folio Number, Cellular Number and e-mail address by 05:00 p.m. on April 24, 2020 at the e-mail address [email protected]. The video-link of the meeting will be sent to shareholder on their e-mail addresses.
ii. Shareholders can also provide their comments / suggestions along with attendance for the agenda items of the AGM on whatsApp Number +923018441725 and e-mail [email protected].
iii. The Company will ensure that comments / suggestions of shareholders be read out at the meeting by the Company Secretary and the responses be made part of the minutes of the meeting. Any and all suggestions and comments received from shareholders shall be duly discussed in the meeting and be recorded appropriately in the minutes. The minutes of the meeting will be recorded and kept as per requirements.

SPL 144
iv. Share Transfer Book of the Company will remain closed from April 23, 2020 to April 29, 2020 (Both days inclusive). Transfer received in order at the share Registrar’s office by the close of business on April 22, 2020 will be treated in time for the purpose of payment of final dividend.
v. A shareholder entitled to attend and vote at the Meeting may appoint another shareholder as his /her proxy to attend and vote on his /her behalf. The instrument appointing the proxy duly completed must be received at the Company’s Registered Office not later than 48 hours before the time of holding of the meeting.
vi. CDC individual Account holders or Sub-account holders are required to bring with them their original CNIC / Original Passport along with participant’s ID number and their Account number in order to facilitate identification.
vii. In case of Corporate entity, resolution of the Board of Directors/Power of attorney with specimen signature of nominees shall be required to be produced (unless provided earlier) at the time of meeting.
viii. Shareholders are requested to immediately notify their change in address, if any.
SPECIAL NOTES TO SHAREHOLDERS:
ix. Transmission of Annual Financial Statements through e-mail (optional):
Shareholders who wish to receive the Annual Report through e-mail are requested to provide a duly completed annexed consent form to Company’s Share Registrar, M/s THK Associates (Pvt) Ltd. 1st Floor, 40-C, Block-6, P.E.C.H.S Karachi. Form is also available at Company’s website www.saifpower.com.
x Consent for video conference facility:
Shareholders can also avail video conference facility under the provision of Section 134 of the Companies Act, 2017 to participate in AGM. Shareholders must hold in aggregate 10% or more shareholding residing in that city and consent of shareholders must reach at the registered address of the Company at least 10 days prior to the Annual General Meeting in order to participate in the meeting through video conference facility.
xi Payment of Cash dividend electronically into the bank account:
Under proviso to Section 242 of the Companies Act-2017, listed companies are required to pay cash dividends only through electronic mode directly into the bank accounts of shareholders. Shareholders are requested to submit their information, to their investor account services or their brokers where shares are placed electronically. Physical holding, shareholders are requested to submit their information to the Company’s Shares Registrar as appended below:
THK ASSOCIATES (PVT) LIMITED
1st Floor, 40-C, Block-6, P.E.C.H.S, KARACHI-75400
UAN: +92-21-111-000-322 Direct: +92-21-34168270 Fax: +92-21-34168271 Email: [email protected]
Information for cash dividend electronically into bank account
I Mr./Ms./Mrs._______________________ S/o, D/o, w/o, ___________________________ hereby authorizes Saif Power Limited to directly credit cash dividends into following bank account:
Title of Bank Account, International Bank Account Number (IBNR), Bank’s name, Branch name and address.
It is stated that the above particulars given by me are correct to the best of my knowledge and I shall keep the Company/ Share Registrar informed in case of any changes in the said particulars in future.
_________________________
Signature of the shareholder

Annual Report 2019 145
xii Unclaimed Dividend
Shareholders who could not collect their dividend are advised to contact our Share Registrar to collect their unclaimed dividend, if any.
Contact information
For any query/problem/information, the investors may contact the company/or share registrar at the following:
Company Secretary Share Registrar [email protected] THK Associates (Pvt) Ltd [email protected] UAN: +92-21-111-000-322 051-2271381-83 Email: [email protected]
xiii Withholding tax on dividend
(a) Pursuant to the provisions of the Finance Act 2019 effective July 1, 2019 the rates of deduction of income tax from dividend payments under the Income Tax Ordinance, 2001 have been revised as follows:
1. Rate of tax deduction for active tax payers is 7.5%.
2. Rate of tax deduction for non-active tax payers is 15%.
Shareholders who are filers, are advised to make sure that their names are entered into latest Active Tax Payers List (ATL) provided on the website of FBR before the date of approval of cash dividend that is April 29, 2020, otherwise they shall be treated as non-filers and tax on their cash dividend will be deducted at the rate of 15% instead of 7.5%.
(b) As per FBR Circulars C. No.1 (29) WHT/2006 dated June 30, 2010 and C. No.1 (43) DG (WHT)/2008-Vol. 1166417-R dated May 12, 2015 the valid exemption certificate is mandatory to claim exemption of withholding tax U/S 150 of the Income Tax Ordinance, 2001 (tax on dividend amount) where the statutory exemption under clause 47B of Part-IV of Second Schedule is available. Shareholders who fall in the category mentioned in above clause and want to avail exemption U/S 150 of the Ordinance, must provide valid Tax Exemption Certificate to our Share Registrar THK Associates (Private) Limited before the date of approval of cash dividend that is April 29, 2020 otherwise tax will be deducted on dividend as per applicable rates.
(c) Further, according to clarification received from Federal Board of Revenue (FBR), with-holding tax will be determined separately on 'Filer/Non-Filer' status of Principal shareholder as well as Joint-Holder(s) based on their shareholding proportions, in case of joint accounts. Joint shareholders are requested to provide shareholding proportions of Principal shareholder and Joint-Holder(s) in respect of shares held by them (only if not already provided) to our Share Registrar, in writing as follows:
Principal Shareholders Joint ShareholdersCompany Name
Folio/CDS Account #
Total Shares Name and CNIC #
Shareholding Proportion (No. of Shares)
Name and CNIC #
Shareholding Proportion (No. Of Shares)
The required information must reach our Share Registrar by April 22, 2020; otherwise it will be assumed that the shares are equally held by Principal shareholder and Joint Holder(s).
Share Registrar: THK ASSOCIATES (PVT) LIMITED 1st Floor, 40-C, Block-6, P.E.C.H.S, KARACHI-75400 UAN: +92-21-111-000-322 Direct: +92-21-34168270 Fax: +92-21-34168271 Email: [email protected]

SPL 146
xiv E-Voting
Shareholders can exercise their right to demand a poll subject to meeting requirements of Sections 143 -145 of Companies Act, 2017 and applicable clauses of Companies (Postal Ballot) Regulations 2018.
CORONAVIRUS CONTINGENCY PLANNING FOR 16th ANNUAL GENERAL MEETING OF SAIF POWER LIMITED
In view of the recent outbreak of COVID-19 pandemic, the steps taken by the Government to avoid large public gathering at one place and vide circular No. EMD/MISC/82/2012 notified by SECP dated March 17, 2020, require companies to modify their usual planning for annual general meetings for the well-being of shareholders and to avoid large gatherings by provision of video-link facilities.
Accordingly the Company intends to convene this AGM, with ensuring compliance with the quorum requirements, requests shareholders to consolidate their attendance and voting at the AGM through proxies.
Furthermore, shareholders who are willing to registering to connect through video-link facility are required to mention their Name, Folio Number, CNIC and cellular number in the e-mail with subject ‘Registration for Saif Power Ltd AGM’. Video-link and login credentials will be shared with the participants whose e-mail containing all the required particulars is received at [[email protected]] and/or WhatsApp +92 3018441725 before 05:00 p.m. by April 24, 2020.
The Company will follow the best practices and comply with the instructions of Government and SECP to ensure protective measures for wellbeing of its shareholders. Therefore, shareholders are encouraged to attend the AGM through video-link or by consolidating their attendance through proxies.
On account of the current lockdown in effect following the outbreak of COVID-19 pandemic, our logistics partners are running very limited operations at this time, and we are therefore unable to deliver copies of the Annual Report to each of our shareholders. Therefore, in compliance with Sections 55 and 223(6) of the Companies Act, 2017, we have made the Annual Report available for download on the Company’s website www.saifpower.com. Further, shareholders desirous of receiving Annual Report and notice of AGM via email can send request mentioning their Name, Folio Number, CNIC and cellular number on email address [[email protected]] and/or WhatsApp number +923018441725.

Annual Report 2019 147
I/We
of being a member of SAIF POWER LIMITED
and holder of(Number of Shares)
Ordinary shares as per share Register Folio No. and/or CDC
Participant I.D.No. and Sub Account No. , hereby appoint
of or failing him
of
Signed this day of 2020.
Witnesses
1) Signature :
Name :
Address :
CNIC/Passport No. :
2) Signature :
Name :
Address :
Signature onRs. 50/-Revenue
Stamp
(Signature must agree with the specimensignature registered with the company)
CNIC/Passport No. :
NOTES:
Form of Proxy
as my proxy to vote for me and on my behalf at the Annual General Meeting of the Company to be held the April 29, 2020 Wednesday at 11:00 am at any adjournment thereof.
1. No Proxy shall be valid unless duly signed along with revenue stamp and in case of a company should be executed under its common seal under signed by its authorized person.
2. This instrument appointing a proxy, duly completed, must be received at the registered Office of the Company at first Floor, Kashmir Commercial Complex, Block E, Fazal-ul-Haq Road, Blue Area, not later than 48 hours before the time of holding the Annual General Meeting.
3. Attested copies of the CNIC or the passport of beneficial owners shall be furnished with the proxy form.
4. The proxy shall produce his original CNIC or original passport at the time of the Meeting.
5. In case of corporate entity, the Board's resolution / power of attorney with specimen signature of the nominee shall be furnished along with proxy form to the Company.
Form of Proxy
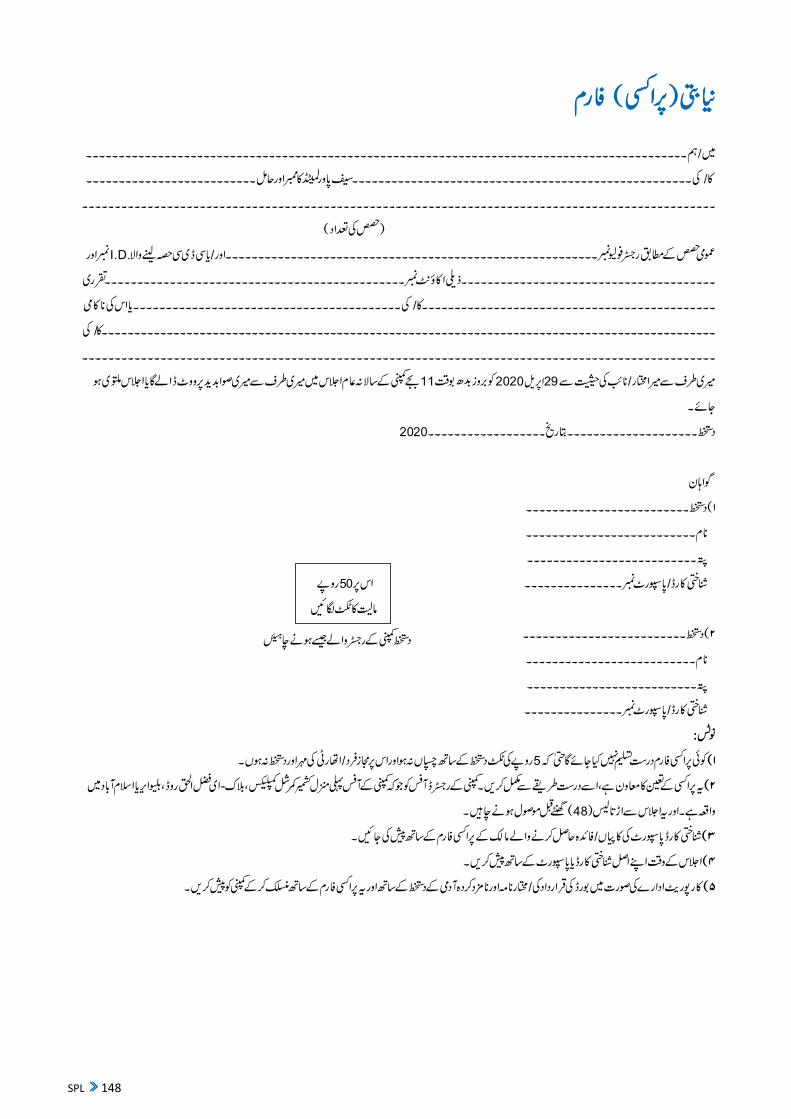
SPL 148

Annual Report 2019 149
Electronic Transmission Consent Form
Date:
General Manager
THK Associates (Private) Ltd. 1st Floor, 40-C, Block-6, P.E.C.H.S, Karachi 75400, P.O Box. No: 8533
Pursuant to the directions given by Securities and Exchange Commission of Pakistan through its SRO 787 (I)/2014 dated September 8, 2014, I/we Mr./Ms/M/s
hereby give consent to receive the Audited Financial Statements along with notice
of Annual General Meeting of M/s Saif Power Limited through email on my/our
email address provided as under:
It is stated that above mentioned praticulars are true and correct. I/we shall notify
you and the the Company in writing in case of any change in my/our email address
or withdrawal of my/our above mentioned consent.
S/o, D/o, W/o
Name of Member / shareholder:
Folio/CDC Account Number:
Email Address:
Signature of the Member/ShareholderCNIC Number:


SAIF POWER LIMITED 1st Floor, Kashmir Commercial Complex (KCC), Fazal-ul-Haq Road, Block E, Blue Area, Islamabad.Tel: +92-51-2271378-83, Fax: +92-51-2277670www.saifpower.com
Saif Group