annual report - eyrir
TRANSCRIPT

07ANNUAL REPORT
eyrir invest

KEY FIGURES PRESENTED IN ISK
Total assets - ISK millions Net earnings - ISK millions
2003 2004 2005 2006 20072003 2004 2005 2006 2007
Equity - ISK millions
2003 2004 2005 2006 2007
• Eyrir Invest posted net earnings of ISK 797 million in 2007, return on equity was 5,7%
• Average annual increase in book value per share from Eyrir Invest's foundation, in mide-year 2000, is 54%
• Eyrir Invest's equity ratio at year end 2007 was 38%, at the end of January 2008 the ratio is 43%. No off balance-sheet equity forward contracts at year end.
• Eyrir Invest finances its assets equally with equity and long term debt, average maturity of debts are 4 years.
• Eyrir Invest's total assets amounted to ISK 48,204 million at year end 2007, compared to ISK 26,265 million at year end 2006. In mid January 2008 after the conclusion of the Stork transaction, total assets amounted to ISK 44,300 million.
Risk diversificationHoldings

KEY FIGURES PRESENTED IN EUROS
Total assets - EUR thousands Net earnings - EUR thousandsEquity - EUR thousands
2003 2004 2005 2006 2007 2003 2004 2005 2006 20072003 2004 2005 2006 2007
•Eyrir Invest posted net earnings of EUR 9,095 thousand in 2007, return on equity was 5,7%.
• Average annual increase in book value per share from Eyrir Invest's foundation, in mid-year 2000, is close to 50%.
•Eyrir Invest's equity ratio at year end 2007 was 38% at the end of January this year the ratio is 43%. No off balance-sheet equity forward contracts at year end.
•Eyrir Invest finances its assets equally with equity and long term debt, average maturity of debts are 4 years.
•Eyrir Invest's total assets amounted to 528,549 thousand at year end 2007, compared to EUR 277,616 thousand at year end 2006. In mid January 2008 after the conclusion of the Stork transaction, total assets amounted to EUR 459,020 thousand.
Risk diversificationHoldings

07A N N U A L R E P O R T Tableofcontents
MissionandStrategy 3
Lettertoshareholdersandcreditors 6
Turbulenttimesbutstrongfundamentals 8
Financialstrengths 10
EyrirInvest’sportfolio 11
MarelFoodSystemshf. 12
MarelAcquiresStorkFoodSystem 14
Marel’sGrowthFollowingaChangeinOwnership 16
Ossurhf. 18
Socialresponsibility 20
Shareholders 21
History 22
OurPeople 24
FinancialStatementspresentedinISK 28
FinancialStatementspresentedinEuros 64

2 | Eyrir Invest 2007 Annual Report

Eyrir Invest 2007 Annual Report | 3
EyrirInvestisaninternationalinvestmentcompanywherethemainemphasisisoninvestmentsinlistedEuropeancom-panies,especiallyintheNordicandBalticcountries.
MissionandStrategy
Eyrir Invest’s mission is to increase shareholders’ value by active ownership and trading of equities and other securities. Eyrir Invest places great empha-sis on participating in operations and strategic planning of its core holdings. Eyrir Invest’s buy and build strategy has increased share holders value above market returns since the company’s foundation
•Eyrir Invest invests in industrial companies with the potential tobecome true global leaders and financial institutions with regional leadership. Through leadership, the companies create economies of scale to the benefit of customers, employees and shareholders.
•EyrirInvestaimsatbeingaleadinginvestorinthecompaniesitinvestsin, as well as building strong relationships with other investors in each of these companies.
•EyrirInvestinvestsinfewcompaniesatanygiventime.
•EyrirInvest’slong-terminvestmentstrategydoesnotfollowapreconceived time frame.
FinancialobjectivesEyrir Invest aims to achieve a healthy return on equity, while maintaining a strong balance sheet.
•Thereturnonequitytargetis16%annuallycalculatedinEurosfortheperiod2008-2010,comparedto50%actualaverageannualreturninEuros for the period 2000-2007.
•Thecompany’sequityratio,basedonmarketvalueofitsassets,willbemaintainedat40-50%,dependingonitsportfolio’sliquidityandrisk profile.

4 | Eyrir Invest 2007 Annual Report

Eyrir Invest 2007 Annual Report | 5
6 | Eyrir Invest 2007 Annual Report
Lettertoshareholdersandcreditors
-20.0% -10.0% 0.0% 10.0% 20.0% 30.0% 40.0% 50.0% 60.0%
ReykjavikICEX15
OsloOSEAX
CopenhagenKFX
HelsinkiHEX25
StockholmOMX
UKFTSE100
USS&P500In EurosIn Reporting currency
USNasdaq
EyrirInvest***
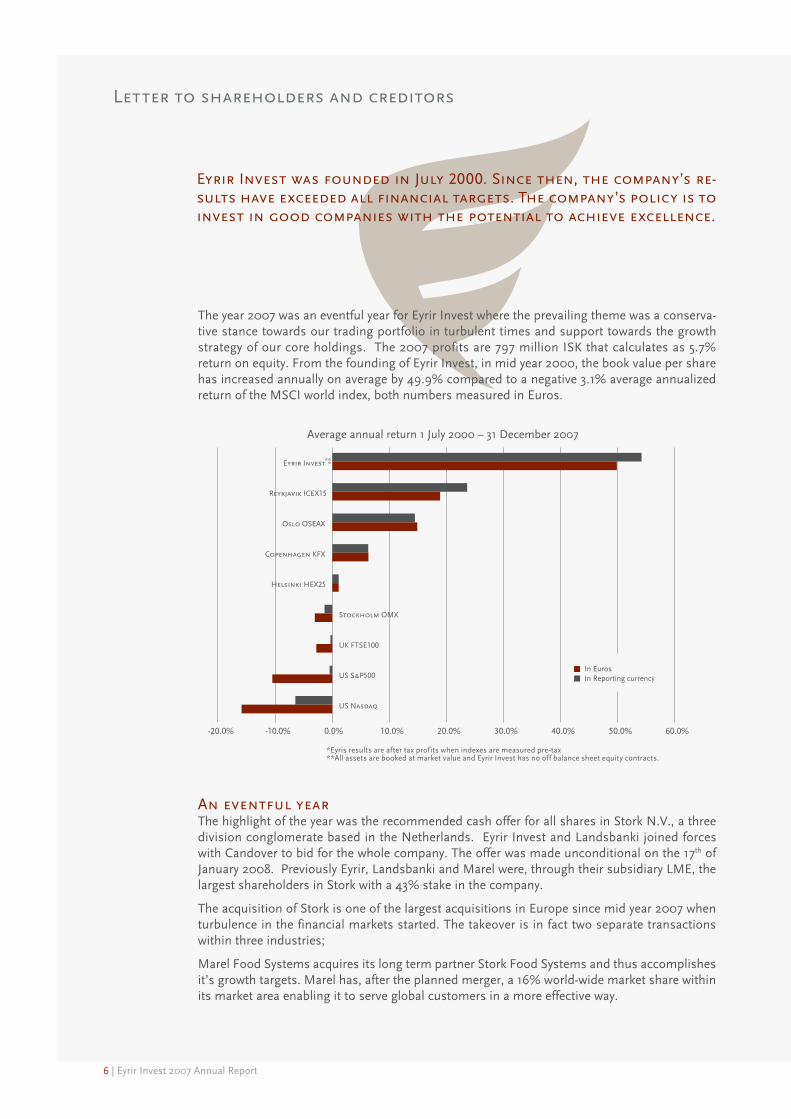
Average annual return 1 July 2000 – 31 December 2007
The year 2007 was an eventful year for Eyrir Invest where the prevailing theme was a conserva-tive stance towards our trading portfolio in turbulent times and support towards the growth strategyofourcoreholdings.The2007profitsare797millionISKthatcalculatesas5.7%return on equity. From the founding of Eyrir Invest, in mid year 2000, the book value per share hasincreasedannuallyonaverageby49.9%comparedtoanegative3.1%averageannualizedreturn of the MSCI world index, both numbers measured in Euros.
AneventfulyearThe highlight of the year was the recommended cash offer for all shares in Stork N.V., a three division conglomerate based in the Netherlands. Eyrir Invest and Landsbanki joined forces with Candover to bid for the whole company. The offer was made unconditional on the 17th of January 2008. Previously Eyrir, Landsbanki and Marel were, through their subsidiary LME, the largestshareholdersinStorkwitha43%stakeinthecompany.
The acquisition of Stork is one of the largest acquisitions in Europe since mid year 2007 when turbulence in the financial markets started. The takeover is in fact two separate transactions within three industries;
Marel Food Systems acquires its long term partner Stork Food Systems and thus accomplishes it’sgrowthtargets.Marelhas,aftertheplannedmerger,a16%world-widemarketsharewithinits market area enabling it to serve global customers in a more effective way.
EyrirInvestwasfoundedinJuly2000.Sincethen,thecompany’sre-sultshaveexceededallfinancialtargets.Thecompany’spolicyistoinvestingoodcompanieswiththepotentialtoachieveexcellence.
*Eyris results are after tax profits when indexes are measured pre-tax **All assets are booked at market value and Eyrir Invest has no off balance sheet equity contracts.

Eyrir Invest 2007 Annual Report | 7
London Acquisition, a takeover vehicle owned and con-trolled by Eyrir Invest, Landsbanki and Candover buys the two remaining divisions of Stork N.V; Stork Aero-space and Stork Technical Services.
Eyrir Invest´s portfolio is well diversified among various industries that are expected to enjoy growth in coming years. Our great companies are well positioned within those industries. Eyrir Invest places high emphasis on participating in operations and strategic planning of it’s core holdings and our “buy and build” strategy has a proven track record of long term value creation.
EyrirInvestisFinanciallyStrongDuring this year Eyrir Invest further broadened its strong shareholder base. Our shareholders are successful entrepreneurs with background in various industries namely shipping, banking, insurance, fishing, pharmaceuticals and retailing. The support that Eyrir Invest has received from its shareholders and financial markets is highly appreciated.
Equity at year end is ISK 18,133 million (EUR 199 m) compared to ISK 11,995 m (EUR 127 m) at the beginning of the year. Thordur Magnusson (Chairman) and Arni Oddur Thordarson (CEO) remainprincipalshareholderswith51%oftotaloutstandingshares.
Eyrir Invest accounting methods reflect true value and the management emphasize transparency of theaccounts. All assets are booked at market value and the company holds no off-balance sheet equity contracts. All long term holdings are long term financed with average maturity of debts around 4 years. Financing takes place through international and domestic banks as well as listed bonds on the OMX Stock Exchange. By listing the bonds Eyrir Invest is required to publish its financial results twice a year.
EyrisInvestequityratioatyearendis38%anddeferredtaxes4%.EyrirInvestdecreasedlever-age significantly and increased further cash position with the sale of the Stork shares on January 17th 2008 when the recommended cash offer was declared unconditional for the com-pany. The sale proceeds were partly reinvested in London Acquisitions, the takeover vehicle of Stork. Eyrir Invest holds cash on hand to participate fully in the planned Marel Food System’s equity offering.
Turbulences in financial markets and less demanding equity prices can create opportunities to financiallysoundinvestorswithalongtermview.Ourtargetedannualreturnonequityis16%measured in Euros for the period 2008-2010 while we are committed to maintain strongly long term financed.
Food Systems28%
Financial Services20%
Health Care18%
TechnicalServices
/ Oil & Gas11%
Aerospace11%
Other2%
Cash10%
Risk diversification
Equity - ISK millions
2003 2004 2006
New equity
200720050
5,000
10,000
15,000
20,000

8 | Eyrir Invest 2007 Annual Report
Turbulenttimesbutstrongfundamentals
AfteraperiodofrapidgrowththeIcelandiceconomyisonapathtowardseasingofimbalances.TheeconomicfundamentalsintheNordiccountriesandBalticsremainstrongandEyrirInvestseesgoodpotentialforvaluecreationlookingahead.
Iceland–atimelycorrection
The past few years have been a time of breathtaking growth for the Icelandic economy and domestic share prices have subsequently soared. In the last couple of years however imbal-ances, such as the trade deficit and increasing inflation, have been growing in the economy. In addition concerns over growth prospects in the developed part of the world were rising in the second half of 2007. As in most markets share prices slumped in the Icelandic stock market in the second half of 2007.
The development of economic indicators in Iceland show that the imbalances in the economy have been levelling. The trade deficit is decreasing from its extreme highs in 2006 and even though inflation is still on a high level, lower inflation in 2008 is widely expected. So far the adjustment has taken place without serious problems and even though risks can still be identi-fied the consensus is that a “soft” landing can be achieved.
Iceland’slongtermeconomicstrengthremainsstrong.Privatizationandgeneralopeningupof the economy, combined with successful growth of Icelandic companies into European markets has changed the fundaments of the economy. Another important characteristic is the flexibility of Icelandic companies and the economy as a whole, which allows for a quick adap-tion to changes in foreign markets.
One of the most important long term issue for the Icelandic economy became evident in 2007 and will get even more attention in the coming years; namely the growing importance of the Euro in the Icelandic economy, at the cost of the Icelandic krona (ISK). For some time the largest Icelandic companies have funded a substantial part of their operations in foreign cur-rency. The trend towards funding in foreign currencies seems to be accelerating as private parties and smaller companies seek to lower their funding costs. The share of Iceland’s foreign tradetowardstheEurozonehassteadilyincreasedandsubsequentlytheEurohasemergedasIceland’s most important trading currency. Many of Iceland’s largest companies now create more revenue in Euros than in ISK. More importantly Icelandic banks now hold a significant part of their assets outside of Iceland denominating them in Euros, Sterling and other foreign currencies. This has resulted in the rising of Icelands total foreign debt as a portion of GDP but such a comparison is somewhat misleading, as a large part of those debts are in fact a financ-ing of foreign and not domestic assets.
Convergence towards Europe and eventually the Euro therefore seems to be an inevitable issue for the Icelandic economy in 2008 and the coming years. Eyrir Invest has prepared itself for this development and a decision has been made to change Eyrir Invests base currency to Euros when the equity of strategic holdings changes from ISK to foreign currencies. That will not change the actual results but make all reporting more transparent.

Eyrir Invest 2007 Annual Report | 9
-10% -5% 0% 5% 10% 15% 20%
Iceland
Norway
Denmark
Finland
Sweden
Japan
S&P 500
Nasdaq 100
Changes in equity prices in various markets in 2007 – in local currencies –
-2%
0%
2%
4%
6%
8%
10%
12%
2007 E
2006
2008 E
Esto
nia
Latv
ia
Lith
uani
a
Den
mar
k
Finl
and
Icel
and
Nor
way
Swed
en
Economic growth
NordicandBaltic–strongfundamentals
The turmoil in financial markets has had a profound effect on stock markets in Scandinavia and the Baltic region. That was to be expected as one of the main characteristics of the region is its openness and relatively high participation in foreign trade andglobalization.ManyofthemostprominentcompaniesinScandinavia are truly global players. In the long run this is cer-tainly a sign of the strength in the Nordic economies. These companies do also have low debt ratio and have been holding back from competing with private equity firms in industrial takeovers.
One effect of the financial turmoil manifested itself in increased concerns about economic stability in the Baltic region. The Baltic countries have come a long way in a relatively short time and their alignment with Europe and their Scandinavian neigh-bours is progressing fast. This has among other things lead to rapidly rising wages, low unemployment and on the negative side high inflation and substantial trade deficits.
NordicbankshaverealizedthepotentialintheBalticregionand have played an important part in rebuilding the Baltic economies. The Swedish banks Swedbank and SEB are the two largest banks in the Baltic’s and their combined market share iswellinexcessof50%.In2007growingconcernsabouttheeconomic stability in the region was one of the major factors explaining the sharp fall of share prices in Swedbank and SEB.
Economic fundamentals in the Baltic’s remain strong. Trade is flourishing and all three countries are on their way to become fullmembersoftheEurozone.Forinvestorslookingfurtherahead the Baltic’s remain a high potential area with its strong economic growth and a natural extension of the economically successful Nordic region.
Eyrir Invest´s decision to place a large portion of its trading portfolio on these markets is for risk diversification to counter-balance large holdings in the industrial companies Ossur and Marel Food Systems.
OutlookTheIcelandiceconomyisdealingwithimbalancesbuttheeconomyisgraduallystabilizingandthegloballongterm outlook is positive. This includes the outlook for the Nordic and Baltic. The economic fundamentals remain strong regardless of recent turbulence in financial markets. Some slowdown in growth rates is to be expected however in light of the strong growth in preceding years, such a slowdown is only natural and a part of an orderly re-balancing of an economy. Looking ahead there remains great potential for value creation in this economic area that is both fast growing and vibrant.

10 | Eyrir Invest 2007 Annual Report
Eyrir Invests financing is solid and capitlaisation at year end 2007 is divided between equity and other long-term financing as follows:
Equityratioatyear-end 38%Deferredtaxliability 4%Netinterestbearingdebts52%
Financialstrength
Eyrir Invest has increased the company’s equity by issuing andsellingnewshares inrecentyears. The increaseamountedto38million Euros in 2005, 12million Euros in 2006 and a further 61million Euro increase in 2007. The Company’s equity at year end2007isrecordedat199millionEurosandtotalassetsamountto529millionEuros.
Assets and liabilities denominated in foreign currencyShares in Ossur incl. in USD figures, but shares
in Marel incl. in EUR figures– by currency area –
Assets and liabilites denominated in foreign currency
– by currency area –
0
10,000
20,000
30,000
40,000
0
5,000
10,000
15,000
20,000
25,000
Liabilities
Assets
Europe N-America Japan
ISK
mill
ions
Europe N-America Japan
ISK
mill
ions
Liabilities
Assets
During 2007 the Company further strengthened its capitalisation. New equity was issued and sold for a total amount of 61 million Euro. The average maturity of interest bearing debt is four years at the end of 2007. This was achieved by new borrowings of 172 million Euros through both domestic and international banks. In 2007 two listed bond issues were furthermore completed. The OMX Nordic Exchange listing requires Eyrir Invest to publish its financial results twice a year.
AssetsandliabilitiesdenominatedinforeigncurrenciesOver99%ofrevenuesofcompaniesintheEyrirInvest´sportfolioaregeneratedoutsideIceland.
Assets in foreign currencies at the end of 2007 were ISK 3 billion greater than liabilities in for-eign currencies. If, however, shares in Ossur (USD) and Marel Food Systems (EUR) are classi-fied as foreign assets, assets in foreign currencies are ISK 24 billion higher than liabilites in foreign currencies.
Theaveragematurityof interest bearingdebt is four years attheendof2007.

Eyrir Invest 2007 Annual Report | 11
Eyrir Invest’stotalequityportfolioiswortheur444millionatyearend2007.Attheendofjanuary(poststorktransaction)EyrirInvest’stotalportfolioiswortheur417million.
EyrirInvest’sportfolio
Food Systems28%
Financial Services20%
Health Care18%
TechnicalServices
/ Oil & Gas11%
Aerospace11%
Other2%
Cash10%
Risk diversification
Cash10%
London Acq./ Stork NV
22%
Trading Portfolio22%
Marel hf.28%
Ossur hf.18%
Holdings
Eyrir Invest investments can be classified in two categories; investment in strategic holdings (80%oftotalasset)andtradingportfolio(20%oftotalasset).Thethemeoftheyearwasaconservative stance towards our trading portfolio in turbulent times and support towards the growth strategy of our core holdings. Eyrir Invests core holdings are expected to enjoy good growth in the coming years despite worsening global economic outlook.
Strategic holdings are Ossur, Marel Food Systems and investment in London Acquisition, the takeover vehicle of Stork N.V. The vast majority of the trading portfolio is in highly liquid “blue-chip” shares in banks and insurances.
• Ossur, a world-wide leading prosthetic solution company and is as well top-tier player within the bracing and support field of orthopedics. Health care remains one of the fastest growing industries in the western part of the world, and will continue to be so as the Baby-boomers generation enters now the retirement age. Eyrir Invest is the 2nd largest investor in the company holding close to 20% of total shares. Thordur Magnusson, Chairman ofEyrir Invest, is the Vice Chairman of Ossur hf.
• Marel Food Systems. Parallel to the planned acquisition of Stork Food Systems, Marel becomes well positioned to capture the growth prospects anticipated for food-processing systems. The industry is a fast growing busi-ness driven by changes in consumer habits and geographical expansion. EyrirInvestistheleadinginvestorinMarelwith32%oftotalsharesinthecompany. Arni Thordarson, the CEO of Eyrir Invest Chairs the Board of Marel and Margret Jonsdottir, CFO of Eyrir Invest, is Board Member in Marel.
• London Acquisitions B.V., owner of the Netherlands based industrial con-glomerate Stork N.V. Operations in Stork consist of two divisions, Stork Aerospace and Stork Technical Services. Both divisions are expected to show strong growth in the coming years. The aerospace industry is coming out of a cyclical downturn and entering a period of upturns in both civil and defense sectors. Stork Technical Services is extremely strong in services to the oil- and gas sectors, where there is high demand for new investments for many years to come.
• Nordic Financial Institutions. The vast majority of the trading portfolio is in highly liquid “blue-chip” shares in financial institutions that have domestic markets in the Nordic countries and with high growth potential in The Baltic Countries, Central and Eastern Europe. During recent turmoil on the finan-cial markets valuations of Nordic financial institutions have fallen to histori-cal lows, thus making these companies attractive investments for investors withalonginvestmenthorizon.
Majority of the portfolio are listed companies in Europe, with main bulk in companies listed on the OMX Nordic Stock Exchange. Stork is listed on the Euronext Exchange but will be delisted following the takeover by London Acquisition.
Theyear2007wascharacterizedbyextremevolatilityinallfinancialmarketsduetorisinguncertainty, faltering confidence among market participants and growing worries about eco-nomic outlook. Despite these conditions Eyrir Invest achieved positive results.

12 | Eyrir Invest 2007 Annual Report
MarelFoodSystemshf.
Marel Food Systems is a strongly financed and fast growing company serving the food process-ing industry. The company’s expansion is based on profitable internal growth and on acquisi-tions of powerful companies in similar fields. Marel is listed on the Nordic OMX Stock Exchange and has a market capital of close to EUR 450 million at year end 2007.
The industry in which Marel Food Systems operates is an attractive one as it is fast growing and highly fragmented. The growth in the industry is based on changes in consumer habits and geographical expansion of markets. In the next 5-10 years the market is expected to grow at an annualrateof5-6%andwithevenhighergrowthratefortheemergingmarketsorcloseto7%.
GrowthStrategyandExecution
Marel Food Systems Board, at its Annual General Meeting in 2006, set an ambitious growth target of tripling annual turnover within 3-5 years. This was to be accomplished by strategic acquisitions in order to expand the company’s technological base and improve its access to markets. In the months following the AGM, Marel doubled its business by acquiring two of the company’s main competitors: AEW Delford in the UK and Scanvaegt in Denmark.
In November 2007 Marel Food Systems announced the acquisition of its long term industrial partner Stork Food Systems. The companies businesses are complementary where the Stork Food Systems strengths are within the poultry segments and Marel roots are within the fish processing industry. The acquisition is subject to the approval of the antitrust authorities which is anticipated in 1H 2007. The industry is highly competitive and ongoing consolidation is taking place among multinational customers. There is increased need for economies of scale to be able to serve these global customers. Combined world-wide market share of Stork and Marelwithinthemeat,poultryandfishprocessingindustrywillbearound16%.
MarelFoodSystem’svisionistobeaninternationalleader in developing and marketing high-techprocessing equipment for the food processingindustryinordertoincreasetheproductivityofit’scustomers.
1983
1984
1985
1986
1987
1988
1989
1990
1991
1992
1993
1994
1995
1996
1997
1998
1999
200
0
200
1
200
2
200
3
200
4
200
5
200
6
200
7E
* Pro forma turnover, Marel Food Systems estimate by Landsbanki Research
Inco
me
in E
UR
‘00
0
0
100,000
200,000
300,000
400,000
500,000
600,000
700,000
Stork Food Systems
AEW Delford and Scanwaegt
Marel Food Systems
Marel – turnover

Eyrir Invest 2007 Annual Report | 13
FinancialStrengths
The financing of the Stork Food System acquisition is fully secured, with long term debt (5-9 years) and new equity equally. The purchase price is favorable for a profitable and fast growing company.
In 2006, Marel Food Systems final-izedapublicofferingthatsignifi-cantly broadened its shareholder base. The shareholder base was further strengthened in second half of 2007 by equity issue primary targeted toward pension funds. The total market cap of Marel at year end 2007 is 450 million Euros. Pre-emptive share offering for EUR 120 millions will take place as soon as the approval by competition authorities is granted. The offering is fully secured by Landsbanki with support from Eyrir Invest and Grundvig Invest (the former owner of Scanvaegt).
Outlook
After three substantial acquisitions in last two years, Marel Food Systems now has the scale and scope to serve its global customers. Marel Food Systems will not enter into large scale acquisitions for the time being. The full focus is now on operations and on capturing the synergies within the group and to increase profitability. A stronger and larger company will have greater ability to promote internal growth in new markets in Eastern Europe, Asia and South America.
Pro forma revenues of core businesses for 2008 are expected to amount to EUR 650 million compared to 130 million Euros in 2005. Moreover the EBIT is expected to be close to 60 mil-lion Euros compared to close to 10 million in 2005. New strategy growth plan will be introduced at the AGM 2009.
Marel Food Systems thrives on imagination and ingenuity. It uses these elements to innovate solutions for all food processors, directly and positively affecting the quality and value of fish, meat, poultry, cheese and prepared-food products around the world.
Strong internal growthStrong external growth3-5 years Strategy
0
200
400
600
800
1000
1200
2005 2006 2007 2008/2010 2015
Stork Food Systems
Scanvaegt
AEW Delford
Marel (incl. Carnitech)
Strategic goals set in 2006

14 | Eyrir Invest 2007 Annual Report
VictoryAfterTwo-YearStruggle
MarelAcquiresStorkFoodSystems
If the merger of Marel Food Systems and Stork Food Systems goes through, the resulting company will be the larg-est in the world in the development and marketing of high-tech equipment for the food processing industry. At the same time, Marel has substantially ex-ceeded its goals set forth in early 2006 for growth in the next three to five years. Those plans were, in fact, considered quite bold at the tim. Hörður Arnarson, CEO, announced, during a presentation of the annual report in early February 2006, that the goal was to triple Marel’s sizeoverthenextfewyearsandgainafifteen to twenty percent market share. Marel’s turnover in 2005 was EUR 129 million. Next year the company’s turno-ver is estimated at EUR 650 million.
“Those who are first to act can choose
the most promising partners. The rules are the same as on the dance floor,” he jested at a meeting last week with investors and shareholders presenting the purchase of Stork Food Systems.
Marel doubles in size in 2006.
The first big step in the expansion process was taken at the beginning of april 2006 with the acquisition of aeW Thurne and delford sorta-weigh for eur 40 million. Among the products manufactured by those com-panies are high-speed slicing machin-ery, check weighing and weigh price la-belling equipment, and portion loading robots. The primary marketing areas of the newly added companies were in Britain, the United States, Holland and France.
“From now on, these former com-petitors of Marel will go by the name AEW Delford Systems,” said Arnar-son in the wake of the acquisition and further stated that Marel had now strengthened its product line in meat processing, which is where the British company excelled.
The next big step in Marel’s expan-sion process was taken at the be-ginning of august 2006 with the acquisition of the danish company scanvægt for eur 109.2 million.
With the acquisition, Lars Grundtvig, Chairman of Scanvægt, and his family acquired an eighteen percent share in Marel, thus becoming its third largest shareholder. A subsequent statement issued by Marel revealed that coupled with the acquisition of AEW Delford the company’s turnover had grown by one-hundred percent in 2006.
The baTTle over sTork
The first informal discussions concern-ing a merger between Marel and Stork Food Systems took place in November 2005, according to sources. However, the potential merger of the companies did not become the subject of public discussion until October of last year
following a struggle within Stork’s shareholder group. Two of the largest shareholders at the time, the American investment funds Centaurus and Paul-son with about a third of the shares, pressed for the divestment of the com-pany and the sale of ancillary opera-tions so that it could focus on its core operations in the aerospace industry.
That same day this newspaper and the Dutch business newspaper Het Finan-cieele Dagblad reported that the merger of Marel and the food-processing equip-ment unit of Stork could create a major player in the industry and that Marel was highly interested in such a merger. At the time Marel was among the four largest in the sector, each of them with a market share of approximately eight percent. The two companies had coop-erated closely over the last eight years and were an obvious choice for a merg-er since there was no overlap between their fields of operation.
A few days earlier, the foreign media had reported on the attitude of the in-vestment funds, but the Board of Stork was opposed to a sale. However, a shareholders’ meeting in mid-October voted in favor of selling Stork’s ancillary operations. In Holland, the struggle was portrayed as a clash be-tween the imper-sonal
bottom-line at-titude of the American
investment funds and older values embodied by Stork’s CEO, Sjoerd Vol-lebregt, who was opposed to the sale of the division and said he was more interested in its growth, e.g. through a takeover of Marel.
The Dutch Companies Act stipulates that it is at the discretion of a com-pany’s board whether it complies with the will of its shareholders, something which Stork’s Board chose not to do
Markaðurinn December 5, 2007
At the end of last month, Marel Food Systems negotiated a takeover of the foodprocessingequipmentunitoftheDutchindustrialconglomerate,Stork,N.V.Withthetakeover,Marelhasreacheditsgoalofbecomingagloballeaderinitsfield,onahighlyfragmentedmarketonthevergeofagreatconsolidation.Infact,thecompanywillbethelargestintheworld.ÓliKristjánÁrmannssontracesthecompany’sjourneytoreachthis goal from the time the course was set around two years ago. Additionally, thesimultaneousconflictwithinandsurroundingHolland’slargest industrialcompanywillcometoanend.
2006 EUR 210 million
2005 EUR 130 million
Marel
Food Systems’
Turnover
ArniOddurThordarson,ChairmanofMarel Food Systems, said thatthere was an inherent advantageto be among the earliestparticipants intheconsolidationprocess predicted for thefragmented market of companiesoperating in the field of foodprocessingequipment.

Eyrir Invest 2007 Annual Report | 15
lMe holding Company
LME, the holding company for Marel, Landsbanki Íslands and Eyrir Invest, which at that point controlled an ap-proximately eight percent share in Stork, did not participate in the dispute. “We don’t side with the hedge funds any more than the Board. The manag-ers of Marel and Stork agree that each company is a leader in its field and that they are a perfect fit. The funds want to sharpen the focus and that Stork should concentrate on its core element, aerospace services. We agree with both parties, but we have not been collabo-rating with the funds,” said Þórðarson and added that the main reason for investing in Stork to begin with was to ensure a continuation of the successful collaboration of the two companies and at the same time to secure Marel’s in-fluence in case of an ownership change or division of Stork.
A vicious altercation ensued between the investment funds and Stork. The funds brought charges against the Board and a shareholders’ meeting was convened where a vote of no confi-dence was to be brought up. The Board responded by issuing cumulative pref-erence shares in mid-December 2006 as a protection against a takeover, a maneuver which is authorised under Dutch law. The case ended before the Enterprise Chamber of the Amsterdam Court of Appeals.
The Enterprise Chamber issued a ruling on January 18, 2007 which went against Stork and ordered the company to withdraw the preference shares. The ruling also prohibited the no- confi-dence vote at the shareholders’ meet-ing, appointed Supervisory Board members and mandated an investiga-tion into the affairs of the company. These developments greatly slowed down all progress as the results of the investigation are still not expected for a few months. LME and Stork continued their talks, but only informally due to the altercation with the American funds and there was little forward movement until the summer, when things heated up.
Candover makes a bid for stork n.v. On June 19, the British investment fund Candover made a takeover offer of EUR 47 per share. In the interim, LME had been slowly increasing its share in the company, and a few days before the of-fer held eleven percent. LME then rap-idly increased its share and managed to defend against the takeover. Other shareholders were not thrilled about the offer, considering it rather too low.
In early July, LME had close to a twenty percent share in Stork and it became clear that the company might even resist the takeover bid by Cando-ver on its own, as it required the sup-port of eighty percent of shareholders. lMe, however, continued to gradu-ally increase its share; the price of the shares in stork was slightly higher than the takeover offer so there was no pressure on share-holders to accept. Around the middle of August, LME had a third of the shares in Stork and had become the larg-est shareholder. The pos-sibility was raised that the company might ini- tiate its own takeover of Stork in collaboration with other investors.
Cando- ver extended its offer by two weeks in early
September around the same time as
LME’s share in Stork had reached forty-three percent.
Thordarson, CEO of Eyrir, said that the investment demonstrated a long-term commitment to the Stork Group. “An increase in share ownership is also intended to protect the investment al-ready made in the company,” he said. Trilateral discussions commenced be-tween Candover, Stork and LME on a possible solution. In mid-September Candover withdrew its offer while dis-cussions continued between the com-panies. The goal of having results by mid October was not met. A statement was issued saying that discussions con-tinued aiming at a solution acceptable to all parties. It was clear that LME was not only ensuring a merger between Marel and Stork Food Systems, but that the company considered Stork a promising investment opportunity with great growth potential.
Merger in The nexT Year
The results of the negotiations saw the light of day on no-vember 28 of last year, when Marel’s acquisition of stork Food systems for eur 415 million.
The acquisition doubled Marel’s turnover and sizeand the foundation for con-tinued internal growth and profitabil- ity is said to have been reinforced. Fi-nancing is reportedly fully guaran- teed through the sale of shares in LME
Holding Company, a share issue underwritten
by Landsbanki, and through long-term debt financing. Ne-
gotiations were concluded at the same time concerning the par-
ticipation of Eyrir Invest and Lands-banki in the takeover of the remainder of Stork with Candover.
As soon as antitrust authorities agree to the acquisition, the integration proc-ess between the companies will begin, Arnarson thinks this might happen in early February of next year. “That inte-gration will be much simpler than in earlier takeovers,” says Arnarson, since the companies’ product lines comple-ment each other and people are famil-iar with each other as a result of the extensive collaboration that has already taken place.
after the merger the market share of Marel and stork Food systems will be around sixteen per-cent. The largest competitor has an approximately ten percent share.
2008
EUR
650
mill
ion
*
2007 EUR 290 million*
*Estimate
The article was originaly publiched in Markaðurinn on December 5, 2007 a weekly business addition of Fréttablaðið. It has been translated from Icelandic, slightly shortened and headings have been added.
Hörður Arnarson, CEO ofMarelFoodSystems,wasunsurprisinglyvery satisfied with the outcome.“Wearereachingthegoalwesetourselvesatthebeginningoflastyeartobecomeoneoftheleadingcompanies on the market. Whatwe intended to achieve in threetofiveyearswearedoingintwoyears,”saidArnarsoninaninter-viewwithFréttablaðið.

16 | Eyrir Invest 2007 Annual Report
11 October 2005
Following a change in ownership at Marel, Arni Oddur Thordarson, CEO of Eyrir, becomes Chairman. “Eyrir is focused on the long term and intends to support the company’s continued growth,” said Thordarson.
November 2005
Informal discussions take place concern-ing the potential merger of Marel and Stork Food Systems.
December 2005
Marel puts forth a conditional offer to buy all shares in Stork Food Systems, which is turned down.
7 February 2006
As part of the 2006 annual report presen-tation, Marel announces a new future strategy to become one of the three big-gest companies in the industry within three to five years and gain a fifteen to twenty percent market share.
6 April 2006
Marel issues bonds for a nominal value of ISK 6 billion. The stated purpose is “to finance the company’s future growth in accordance with the growth objectives presented at the company’s Annual General Meeting in February.”
10 April 2006
The acquisition of AEW Thurne (“AEW”) and Delford Sortaweigh (“Delford”) from AEW Delford Group Limited for GBP 13.55 million is announced. The acquisition is presented as the first step in the imple-mentation of Marel’s new growth policy.
8 May 2006
LME Holding Company, owned by Marel, Eyrir Invest, and Landsbanki Íslands, increases its share in the Dutch company Stork N.V. from 4.79 percent to 5.1 per-cent.
8 August 2006
Marel acquires all shares in the Danish company Scanvægt International AS for DKK 815 million. The owners of Scanvægt simultaneously acquire an eighteen per-cent share in Marel.
18 August 2006
A shareholders’ meeting agrees to a share capital increase due to the acquisition of Scanvægt and a motion to authorizeMarel’s Board to increase the company’s share capital by a nominal value of up to 60 million.
24 August 2006
The Board of Marel decides to increase share capital by 127,016,732 shares. 52,016,732 shares go to the sellers of Scanvægt International. Investors are offered to buy the remainder for ISK 74 per share.
15 September 2006
A three-part share offering is concluded. The number of Marel’s shareholders grow from 1100 to 3700, 25 pension funds become shareholders and foreign owner-ship reaches fifteen percent.
9 October 2006
In the wake of media coverage concerning a potential merger between Marel and Stork Food Systems, the company dis-closes that informal discussions have taken place concerning the possibility of closer collaboration. The announcement states that “there are no formal discus-sions taking place concerning a merger of Marel and Stork Food Systems,” and reit-erates that LME’s investment in the Stork Group was made to “ensure the continua-tion of the successful collaboration between Marel and Stork Food Systems,” that the companies have been engaged in for the last eight years.
28 February 2007
Marel presents its 2006 Annual Report. Hörður Arnarson, CEO, says that the year was very eventful and that the acquisitions made in 2006 have made Marel a leader in its field.
8 March 2007
Marel’s Annual General Meeting agrees to authorizethecompany’sBoardtoissueshares denominated in Euros instead of Icelandic krona.
Marel’sGrowthFollowingaChangeinOwnershipintheFallof2005

Eyrir Invest 2007 Annual Report | 17
9 March 2007
The Marel Group launches a new corpo-rate identity, Marel Food Systems, intended to contribute to “the Group’s continuing journey towards becoming a world leader in the food processing industry. Marel Food Systems is the unified sales and serv-ice front for the four primary brands: AEW Delford, Carnitech, Marel, and Scanvægt”.
5 June 2007
A new organisational chart is presented where Marel’s operations in Iceland are separated from the parent company, Marel hf., and a new subsidiary formed to man-age those operations, Marel ehf. The operations in Iceland will form an inde-pendent part of the group alongside AEW Delford, Carnitech, a production company in Slovakia and Scanvægt. The parent com-pany will be called Marel Food Systems hf. following the approval of a shareholders’ meeting.
19 June 2007
A subsidiary of Marel hf. purchases the distribution and service divisions of Maritech in Norway from AKVA Group ASA. Following the acquisition, Marel Food Systems will manage its own distri-bution in Norway.
5 July 2007
A shareholders’ meeting approves the namechangeandauthorizesMarelFoodSystems to increase its share capital by up to ISK 100 million nominal value.
6 July 2007
A statement by Arni Oddur Thordarson, Chairman of Marel, reveals that LME, the holding company of Eyrir Invest, Marel and Landsbanki Íslands, has accumulated a 19.5 percent share in the Stork industrial group in Holland and will not accept the proposed takeover offer for the shares.
17 July 2007
A new name, Marel Food Systems, become active in OMX Nordic Exchange Iceland’s trading system.
10 August 2007
In the second quarter results, Hörður Arnarson says that the integration of the operations of Marel, Carnitech, Scanvægt, and AEW/Delford under the banner of Marel Food Systems is proceeding accord-ing to plan. He points out that turbulence in financial markets may lead to opportuni-ties for external growth in well financed, listed companies.
4 September 2007
Candover’s holding company, London Acquisition, extends its takeover offer for all shares in Stork until September 18. LME, which holds a forty-three percent share in Stork, is engaged in discussions with both London Acquisition and Stork concerning the offer and possible solu-tions. There is increasing pressure to merge Marel and Stork Food Systems and it becomes clear that LME will not accept Candover’s takeover offer.
17 September 2007
Candover withdraws its takeover offer for Stork since it has become clear that the majority of shareholders will not accept it. Formal discussions nevertheless continue between the companies and results are expected around the middle of October.
15 October 2007
An announcement is made that formal discussions between LME Holding Company, Stork N.V. and Candover con-
tinue but no deadline is set for results. “An announcement regarding the results of the discussions will be made at the appropri-ate time,” reads a statement to OMX Nordic Exchange Iceland.
28 November 2007
Marel Food Systems announces that the company has reached an agreement with Stork N.V. regarding the purchase of Stork Food Systems. The acquisition price is EUR 415 million. “The acquisition doubles Marel’sturnoverandsizeinadditiontoreinforcing the foundation for continued internal growth and profitability,” a state-ment reads. It is expected that the acquisi-
tionwillbefinalizedandconditionsmetsometime early next year.
29 November 2007
At a presentation of the acquisition of Stork Food Systems, representatives of Marel are jubilant that the goals set for the next three to five years have been reached and exceeded in less than two years. The company’s focus will now be on integra-tion and internal growth. Marel announces a share issue worth in total EUR 147 mil-lion to finance the acquisition of Stork Food Systems.
3 December 2007
Marel completes a private placement of shares for IKR 2.7 billion. “Through the private share placement that was com-pleted on Friday, Marel raised EUR 30 mil-lion and enlarged and broadened the shareholders’ group. An offering of new shares to pre-emptive rights holders total-ling EUR 117 million is planned for next year,” reads a statement to OMX Nordic Exchange Iceland.

18 | Eyrir Invest 2007 Annual Report
Ossurhf.Ossur is a financially strong and fast growing company, listed on the OMX Nordic Exchange. The Company has a broad international shareholder base, as the shares are widely owned by the public, pension funds and other strong investors.
The market value of Ossur at year end was USD 672 million. Eyrir Invest is the 2nd largest investorinOssur,holdingcloseto20%ofthesharecapital.WilliamDemantinDenmarkisthelargestshareholderholdingcloseto34%ofthesharecapital.
Eyrir Invest has diligently supported the company’s ambitious growth strategy. Over the last two years Ossur has transformed from being a prosthetic company into one of the largest players in prosthetic and the new segments of bracing and support.
2007Overview
Theyear2007wascharacterizedbystronggrowthinprosthetics,restructuringintheAmericasandinternalfocus.ThetotalsalesamountedtoUSD336millionreflectinga33%overallrevenuegrowthin2006and7%internalgrowth.
Followingnumerousacquisitionsin2005and2006Ossurfocusedonoptimizingthebrac-ing and supports sales efforts, strengthening the infrastructure and brand awareness within the areas of orthopaedics where the Company is active. In 2007 further restructuring efforts
Ossurhf.
Ossurisaworld-wideleadingprostheticsolutioncompanyandafastgrowingtop-tierplayerinthefieldsofbracingandsupport.
Bracing & Support
Prosthetics
2002 2003 2004 2005 200620010
20,000
40,000
60,000
80,000
100,000
120,000
140,000
160,000
180,000
20072002 2003 2004 2005 2006
8194
124
160
252
336
0
50,000
100,000
150,000
200,000
250,000
300,000
350,000
2007
16%
32%
29%
57%
33%
CAGR2002
-200
733%
Sales Products

Eyrir Invest 2007 Annual Report | 19
were made on order to be prepared for the changes envisioned and to fully leverage the synergies from past acquisitions. Based on past experience in consolidating the prosthetics sales channels, the Company’s management is confident that Ossur will see good harvest in coming years.
Ossur operates within niche segments of the $25 billion orthopaedic industry, focusing on three segments within the non-invasive orthopaedic market: prosthetics, bracing and sup-ports and compression therapy products. Strong underlying market growth drivers in these markets include demographic aspects such as an aging population, increases in lifestyle diseases and more active and wealthy seniors. The Company aims to leverage its high-tech platformandotherproductknow-howintoorthopedics,byutilizingtheCompany’sexistingresources and expertise on a larger scale.
The health care sector has historically had limited sensitivity to economic fluctuations and the recent negative developments in the global financial markets are not expected to have significant impact on the Company‘s underlying businesses.
During 2007 Ossur increased the share capital through a private placement of new shares, representinganincreaseof9.9%ofthetotalsharecapital.Theofferingwastostrengthenthe Company’s capital structure and expand the shareholder base. In particular it was pleas-ing to see one of Denmarks largest and most prominent pension funds, ATP-Pension Fund, participateintheofferingandtakea3,5%stakeinOssur.
Ossurtransformation
Following the acquisitions completed since late 2005, Ossur has transformed from being a prosthetics company into a global player in both prosthetics and bracing and support. In 2007bracingandsupportsalesaccountedfor53%ofthetotalsalesandprostheticsaccountedfor46%.From2002-2007theannualcompoundedsalesgrowthhasbeen33%,thereof approximately one third organic growth, confirming ability to grow through acquisi-tions and maintain healthy organic growth and profitability at the same time.
100%
2002 2003 2004 2005 200620010
80%
40%
20%
60%
EuropeNorth America International
2007
0
10
20
30
40
50
60
70
80
90
100
Markets

20 | Eyrir Invest 2007 Annual Report
Socialresponsibility
EyrirInvestiscommittedtohighstandardsofcorporategovernance,socialresponsibility,businessintegrityandprofessionalisminallitsactivities.EyrirInvestbelievesinopenandhonestcommunicationswithstakeholders.EyrirInvestiscommittedtosupportthecommunitythroughgrantsanddonations.EyrirInvestalsoencouragesthemanagementinallofitsprincipalholdingsto honor all stakeholders and apply the highest standards of corporategovernanceandsocialconduct.
As a shareholder Eyrir Invest supports and encourages the aggressive strategy of its princi-palholdingstowardsinvestmentandexpensesinR&D,whichamountto5-7%ofsalesinMarel and Ossur. Both Marel and Ossur are subsequently the largest investors in Iceland in terms of R&D spending on higher levels.
EyrirInvest’spolicytodonate0.5%ofnetprofitstocharityandvariousresearchandeduca-tionalprojectsisstillinforce.In2006thispolicywasformalizedbytheestablishmentofEyrir Invest’s Charity and Culture Fund.
Various donations have been made to charity such as the “Mothers in Need Charity” that assist “low-income” families in troubled times. The Dyslexia Association in Iceland also received a donation this year. Furthermore Eyrir Invest has donated smaller grants to numerous charities.
In past years Eyrir Invest has sponsored various projects at all levels of education. The company has supported projects whose purpose is to encourage interest in mathematics and promote mathematics proficiency among elementary students as well as research projects at university level.
Eyrir Invest has through the years supported start-up companies i.e. businesses with a limited operating history. Starting a new business is not an easy task and Eyrir Invest’s support in this regards is both financial and professional.

Eyrir Invest 2007 Annual Report | 21
The Board Members of Eyrir Invest are Thordur Magnusson, Jon Helgi Gudmundsson, Sigurjon Jonsson. Steinunn Jonsdottir is a substitute Board Member.
Co-founders and principal shareholders of Eyrir Invest are Thordur Magnusson, Chairman, and Arni Oddur Thordarson, CEO. Information on their background is in “Our people” section of this report.
T h e h o l d i n g c o m p a n y Straumborg hf. is owned by Jon Helgi Gudmundsson and his family. In addition to Straumborg Mr Gudmunds-son and family run Norvik and Smaragardur (real estate). Straumborg is a majority owner of Norvik Bank in Lativa, Norvik Bank in Moscow and NorvikCreditOrganizationinYerevan,Armenia.
Norvik’s roots go back to 1962 with the founding of the hardware store Byko. Today, Byko is Iceland’s largest home improvement retailer and
supplier to the professional sector of the building industry. Norvik also operates various other retail stores, including Kaupas, Elko and Intersport. Parts of Norvik are also Byko-Lat, Ced Sia and Vika Wood in Lativa and Norwood of Russia. These companies specialise in the processing and export of timber and other wood products from Lativa and Russia. Norvik also operates a timber wholesale and shipping operation in the UK under the name of Continental Wood and the newest addition is a sawing mill company in Sweden, Jarl Timber.
Sigurjon Jonsson is the principal owner and Chairman of Skipavik, ship-yard and a building contractor in Stykkisholmur, Iceland. Jonsson previ-ously owned and operated Raekjunes, a fishing and scallops processing company.
Arkur is owned by Steinunn Jonsdottir. Jonsdottir holds a seat on the board of Norvik and has held board seats on various other companies in Iceland. Jonsdottir holds an MBA degree from Reykjavik University and is an active investor in Iceland.
In 2007 the shareholders group was extended and nine financially sound investors joined the group. Their participation substantially strengthens the company and its capacity to pursue further growth. The ownership is through Landsbanki Lux Custody Account where the ownership varies from0,4%to4,1%.
Shareholders
ShareholdersinEyrirInvest,atyear-endwerefifteencomparedtosevenatthe beginningof the year. These investors are successful entrepreneurswithabackgroundinvariousindustriessuchasbanking,pharmaceuticals,construction,retailandfisheries.TheshareholdersownershiptogetherwiththeownershipoftheMembersoftheBoardisasfollows:
ThordurMagnusson 28.0%ArniOddurThordarson 23.9%LandsbankiLuxCustodyAccount 21.2%Straumborgehf. 11.9%SigurjonJonsson 11.4%Arkurehf. 3.6%
Thordur Magnusson, Chairman Arni Oddur Thordarson, CEO
Sigurjon Jonsson
Jon Helgi Gudmundsson
Steinunn Jonsdottir

22 | Eyrir Invest 2007 Annual Report
History
2000-2002Thordur Magnusson, chairman, and Arni Oddur Thordarson, CEO, founded Eyrir Invest in mid year 2000 and have been the company’s principal own-ers from the very beginning.
Eyrir invested in the investment company Gilding, as a principal owner. Gilding was Eyrir Invest’s only investment during the first two years of operation. In 2002 Eyrir Invest acquired shares in Bunadarbanki Islands in exchange for its shares in Gilding. This marked the beginning of Eyrir Invest’s actual opera-tion.
2003-2004
Eyrir Invest participated in many restructuring projects in Iceland, including playing an instrumen-tal role in the merger of Bunadarbanki and Kaupthing. After receiving shares in Bunadarbanki in exchange of Gilding shares, Eyrir Invest in part-nership with other former Gilding investors acquired further shares in free market and together the group builtupa25%positionintheformerstateownedbank. In the beginning of the year 2003 the 50/50 merger between Bunadarbanki and Kaupthing was announced.
Eyrir Invest moved into its own offices at Skola-vordustigur 13, Reykjavik. Increased emphasis was placed on ownership in shares listed on foreign stock exchanges, mainly on the Scandinavian mar-ket. Margret Jónsdóttir becomes the CFO of Eyrir Invest.
In 2004, Eyrir Invest purchased a considerable share in Marel and Össur and defines them as long term active holding with emphasis on participating in operation, strategic planning and capital allocation of those companies.
EyrirInvestwasfoundedinmidyear2000.Sincethen,thecompany´sresultshave exceeded all financial targets. In fact, from foundation to date thebookvaluepersharehasgrownannuallyontheaverageby49.9%measuredinEuros.

Eyrir Invest 2007 Annual Report | 23
2005-2006
In 2005 and 2006, new financially sound investors join Eyrir Invest. Their participation substantially strengthens the company and its capacity to pursue further growth. Our shareholders consist of entre-preneurs from various industries such as banking, shipping, fishing, retail, pharmaceuticals, construc-tion and real estate. Eyrir Invest strengthens its operation by hiring new professionals with main focus on equity and industry analysis.
Eyrir becomes the leading investor in Marel with closeto30%shareandthe2ndlargestshareholderinOssurwithcloseto20%oftotaloutstandingshares. Arni Thordarson chairs the Board of Marel and Thordur Magnusson becomes vice chairman of the Board of Ossur.
In 2005/2006 Ossur makes four substantial acqui-sitions into the bracing- and support business by acquiring the US companies Royce Medical, and Innovative Sports, the UK company Innovative Medical Products and Gibaud Group in France. Those acquisitions more than double Ossur reve-nues and confirm the company as a top-tier player within the orthopedic business.
Marel announces a new strategy focusing on ambi-tious growth to be achieved both by acquisitions and organic growth at it’s AGM in the year begin-ning of 2006. In the months following, Marel dou-bles its business by acquiring two of the company’s main competitors: AEW Delford in the UK and Scanvaegt in Denmark. Marel launched a success-ful and vastly oversubscribed share offering in September 2006 which strengthened its capital and shareholder base significantly.
2007-
The year 2007 was an eventful one for Eyrir Invest where the prevailing theme was a conservative stance towards the trading portfolio in turbulent times and support to the growth strategy of Eyrir Invest´s core holdings. Financing was further strengthened by a substantial equity increase ena-bling the company to pursue further growth. The executiveteamincreasedinsize.Coreholdingdivi-sion and trading desk were separated as two income divisions with support from finance and equity analysis departments.
The highlight of the year was the conclusion of a two years battle over Stork, a three division conglomer-ate based in the Netherlands. Eventually Eyrir Invest and Landsbanki joined forces with Candover to bid for the whole company for a total value of 1.7 billion Euros. The offer was made unconditional on the 17th of January 2008. The transaction was a highly complex one as participants needed to debate over the value of three companies within three indus-tries.
Previously, LME a holding company owned by Eyrir, LandsbankiandMarelhadbuiltupa43%stakeinStork by acquiring its shares gradually throughout the year. LME, the largest shareholder in Stork then sold its shares to the takeover vehicle London AcquisitionownedbyEyrirInvest(15%),Landsbanki(10%)andCandover(75%)inco-operationwiththemanagement.
Simultaneously to the Stork deal, Marel acquires its long term partner Stork Food Systems and thus accomplishing its growth targets of five folding its revenues in two years time. After the acquisition Marel/Stork Food Systems is a leader within its field witha16%world-widemarketshareandsubsequentlybetter positioned to serve its global customers.
In the past few years Ossur and Marel have success-fully pursued a strategy of high external growth. Looking ahead the focus has been turned to internal growth and increased profitability.
The vast majority of the trading portfolio is shares in highly liquid “blue-chip financial institutions in the Nordic countries. The core holdings have favour-able growth prospects, irrespective of short- and midterm economic outlook.
Eyrir Invest´s introduces a new investment profile withlessriskexposureandanannualizedreturnonequityistargetedat16%measuredinEuros.

24 | Eyrir Invest 2007 Annual Report
OurPeople
EyrirInvesthasnineemployees.Theyarealldedicatedprofessionalswithgoodeducation andwide-ranging experience on the financialmarkets and othervarioussectorsoftheeconomy.Eyrir Investencouragesitsemployeestoin-creasetheirknowledgeconsistently,particularlybycontinuouseducation.
Board of Directors
CEO
EquityTrading
CoreHoldings
Equity Analysis
Finance and treasury
Thordur Magnusson, Chairman.
Before founding Eyrir Invest, Magnusson was CFO at Eimskip for over 20 years and held a seat on the board of a number of Icelandic companies and organizations onbehalf of Eimskip.
Currently, Magnusson holds a seat on the boards of many Icelandic companies, including Ossur hf., Byko hf., Kaupas hf. retail chains and the parent company Norvik. Magnusson chairs the Board of Marorka ehf.,an energy efficiency systems enterprise, Calidris ehf and Handtölvur Gagnatækni ehf.
Magnusson graduated with business degree from the University of Iceland in 1974 and holds an MBA degree from the University of Minnesota.
Arni Oddur Thordarson, CEO.
In mid-ear 2000, Thordarson co-founded Eyrir Invest and has been its CEO since foundation. Thordarson has an extensive international business experience, serving as board member in various businesses through the years. Prior to co-founding Eyrir Invest, Thordarson was Head of Corporate Finance & Capital Markets at Búnaðarbanki Íslands, which later on merged with Kaupþing.
Since autumn 2005 Thordarson has been the Chairman of Marel Food Systems and a board member in Egils Brewery. Thordarson holds a seat on the Advisory Board of Arctic Venture, a Stockholm based venture fund.
ThordarsonholdsaMBAdegreefromIMDinSwitzerlandand Cand.Oecon/Business Administration from the University of Iceland.

Eyrir Invest 2007 Annual Report | 25
Aldis Arna Tryggvadottir, Equity analyst.
Tryggvadottir worked in the auditing sector with Price-WaterhouseCoopers in Iceland before joining Eyrir Invest. Tryggvadottir has a B.Sc. Degree in Business Administration from Reykjavik University and a Certificate in Securities Brokerage.
Orn Validmarsson, Equity analyst.
Before joining Eyrir Invest, Valdimarsson worked for several years at Vidskiptabladid (Business Weekly) as a journalist, CEO and editor. Valdimarsson has held seat on the board of various firms and been a member of the Ethics Committee of the Icelandic Federation of Journalists. Valdimarsson has a B.Sc. Degree in Economics from the University of Iceland and holds an Executive Certificate from Copenhagen Business School.
Gudni Rafn Eiríksson, Head of Proprietary Trading.
Eiriksson has over eight years of experience on the financial market and before joining Eyrir Invest he worked as an eq-uity broker at Kaupthing Bank in Iceland.
Eiriksson holds a B.Sc. degree in Business Administration from the University of Iceland and a Certificate in Securities Brokerage.
Gudbjorg Heida Gudmundsdottir, Equity analyst.
Gudmundsdottir holds a M.Sc. Degree in engineering from the University of Iceland, and is currently studying for a Certificate in Securities Brokerage. Before joining Eyrir Invest Gudmundsdottir worked at Sigurjonsson & Thor pat-ent bureau.
Inga Hafdis Sigurjonsdottir, Accounting.
Before joining Eyrir Invest Sigurjonsdottir worked in account-ing at Navision A/S in Denmark and later at Microsoft Business Solutions. Sigurjonsdottir hold a B.Sc. Degree in Business Administration from Bifrost University.
Olof Bjork Thorleifsdottir, Middle Office.
Before joining Eyrir Invest, Thorleifsdottir worked in finance and accounting at the Fisheries Investment Fund, in Back Office at FBA Investment Bank and as an operational manager at the Culturalcenter at Gerduberg.
Margret Jonsdottir, CFO.
Jonsdottir worked as Director of Finance at the Industrial Loan Fund which merged into FBA Investment Bank which later on merged with Glitnir. At FBA, she headed the Accounting and Budgeting department. Before joining Eyrir Invest, she worked as Director of Accounting and Budgeting at MasterCard, Iceland. Jonsdottir is a boardmember of Marel hf. Jonsdottir holds a Master of Accounting and Auditing degree and Cand. Oecon/Business Administration from the University of Iceland.

26 | Eyrir Invest 2007 Annual Report

Eyrir Invest 2007 Annual Report | 27

28 | Eyrir Invest 2007 Annual Report

Eyrir Invest 2007 Annual Report | 29
EyrirInvestehf.
Separate
Financial Statements
31 December 2007
Presented in ISK

30 | Eyrir Invest 2007 Annual Report
Contents
EndorsementbytheBoardofDirectorsandtheCEO 31
IndependentAuditor’sReport 33
IncomeStatement 34
BalanceSheet 35
StatementofChangesinEquity 36
StatementofCashFlows 37
Notes 38

Eyrir Invest 2007 Annual Report | 31Amounts are in ISK thousands
EndorsementandStatementbytheBoardofDirectorsandtheCEO
Eyrir Invest ehf.’s aim is to own, buy and sell shares, other securities and all other financial assets. The Company
started its operation in the year 2000.
Eyrir Invest ehf.’s financial statements are for the first time prepared according to International Financial Reporting
Standards (IFRSs) as adopted by the EU. The Company’s financial statements for the previous years have been
prepared in accordance with the Icelandic Financial Statements Act and accounting principles in Iceland. The total
effect of IFRS adoption on the Company’s financial statements is that equity at the beginning of the year 2006
increases by ISK 1 million, from ISK 9,617 million to ISK 9,618 million. The effect of IFRS adoption is further explained
in the notes to the financial statements.
According to the Income Statement, profit for the year amounted to ISK 797 million. According to the Balance Sheet,
equity at the end of the year amounted to ISK 18,133 million.
During the year the nominal value of share capital of the Company was increased by ISK 200.3 million. In January and
February shares with nominal value of ISK 20 million were sold to new shareholders for ISK 487 million, net of selling
cost. In April options for shares with nominal value of ISK 36.3 million at the rate of 19.0 were exercised. The increase
in equity according to the exercise was ISK 690 million. In September shares with nominal value of ISK 144 million
were sold for ISK 4,205 million, net of selling cost.
Shareholders at the end of the year were 15, but were 7 at the beginning of the year. Four shareholders held more than
10%ofoutstandingshareseachattheendoftheyear2007.Theyare:
ÞordurMagnusson 28.0%
ArniOddurÞordarson 23.9%
Straumborgehf. 11.9%
SigurjonJonsson 11.4%
TheBoardofDirectorsproposesadividendpaymentamountingtoISK199million,whichis25%ofprofitfortheyear.
StatementbytheBoardofDirectorsandtheCEOThe Annual Financial Statements have been prepared in accordance with International Financial Reporting Standards
(IFRSs) as adopted by the EU and additional Icelandic disclosure requirements for financial statements of listed
companies.
According to our best knowledge it is our opinion that the Annual Financial Statements give a true and fair view of
the financial performance of the Company for the financial year 2007, its assets, liabilities and financial position as at
31 December 2007 and its cash flows for the financial year 2007.

32 | Eyrir Invest 2007 Annual Report
EndorsementandStatementbytheBoardofDirectorsandtheCEO,contd.
Further, in our opinion the Financial Statements and Endorsement of the Board of Directors and the CEO give a fair
view of the development and performance of the Company’s operations and its position and describes the principal
risks and uncertainties faced by the Company.
The Board of Directors and the CEO have today discussed the Annual Financial Statements of Eyrir Invest ehf. for the
year 2007 and confirm them by means of their signatures. The Board of Directors and the CEO recommend that the
Financial Statements will be approved at the Annual General Meeting of Eyrir Invest ehf.
Reykjavik, 7 February 2008.
The Board of Directors:
Thordur Magnusson, Chairman
Sigurjon Jonsson
Jon Helgi Gudmundsson
CEO:
Arni Oddur Thordarson

Eyrir Invest 2007 Annual Report | 33Amounts are in ISK thousands
IndependentAuditor’sReport
TotheBoardofDirectorsandShareholdersofEyrirInvestehf.
Report on the Financial Statements
We have audited the accompanying financial statements of Eyrir Invest ehf. (the “Company”), which comprise the
balance sheet as at December 31, 2007, and the income statement, statement of changes in equity and statement of
cash flows for the year then ended, and a summary of significant accounting policies and other explanatory notes.
Management’s Responsibility for the Financial Statements
Management is responsible for the preparation and fair presentation of these financial statements in accordance with
International Financial Reporting Standards as adopted by the EU. This responsibility includes: designing, implementing
and maintaining internal control relevant to the preparation and fair presentation of financial statements that are free
from material misstatements, whether due to fraud or error; selecting and applying appropriate accounting policies;
and making accounting estimates that are reasonable in the circumstances.
Auditor’s Responsibility
Our responsibility is to express an opinion on these financial statements based on our audit. We conducted our audit
in accordance with International Standards on Auditing. Those standards require that we comply with relevant ethical
requirements and plan and perform the audit to obtain reasonable assurance whether the financial statements are
free of material misstatement.
An audit involves performing procedures to obtain audit evidence about the amounts and disclosures in the financial
statements. The procedures selected depend on the auditor’s judgement, including the assessment of the risks of
material misstatement of the financial statements, whether due to fraud or error. In making those risk assessments, the
auditor considers internal control relevant to the entity’s preparation and fair presentation of the financial statements
in order to design audit procedures that are appropriate in the circumstances, but not for the purpose of expressing
an opinion on the effectiveness of the entity’s internal control. An audit also includes evaluating the appropriateness
of accounting principles used and the reasonableness of accounting estimates made by management, as well as
evaluating the overall presentation of the financial statements.
We believe that the audit evidence we have obtained is sufficient and appropriate to provide a basis for our audit
opinion.
Opinion
In our opinion, the financial statements give a true and fair view of the financial position of Eyrir Invest ehf. as at
December 31, 2007, and of its financial performance and its cash flows for the year then ended in accordance with
International Financial Reporting Standards as adopted by the EU.
Reykjavik, 7 February 2008.
KPMG hf.
Saemundur Valdimarsson

34 | Eyrir Invest 2007 Annual Report
IncomeStatementfortheyear2007
Notes 2007 2006 Investment income:
Net income from securities and derivatives 6 1,761,577 3,061,683 Interest income 279,305 78,742
Interest expenses ( 1,653,272 ) ( 922,927 )
Net foreign exchange gain (loss) 7 821,259 ( 126,242 )
Net operating revenue 1,208,869 2,091,256
Operating expenses:
Salaries and salary related expenses 8 236,102 168,655 Other operating expenses 9 64,943 48,417
Operating expenses 301,045 217,072
Profit before income tax 907,824 1,874,184
Income tax 10,22 ( 111,143 ) ( 307,874 )
Profit for the year 796,681 1,566,310
Earnings per share:Basic earnings per share (ISK) 11 1.28 3.20 Diluted earnings per share (ISK) 11 1.27 3.20
The notes on pages 38 to 63 are an integral part of these financial statements.

Eyrir Invest 2007 Annual Report | 35Amounts are in ISK thousands
BalanceSheetasat31December2007
Notes 2007 2006Assets:
Cash and cash equivalents 12 6,958,889 261,052 Investment securities 13 40,508,576 25,483,638 Derivatives 15 484,873 338,205 Trade and other receivables 16 33,210 31,323 Operating assets 17 218,073 151,074
Total assets 48,203,621 26,265,292
Equity:Share capital 18 730,305 530,005 Share premium 9,280,785 3,892,423 Reserves 21,526 102,248 Retained earnings 8,100,561 7,470,306
Total equity 18,133,177 11,994,982
Liabilities:Derivatives 15 298,498 285,921 Trade and other payables 19 2,358,992 183,842 Borrowings 20,21 25,668,482 12,139,943 Deferred tax liability 22 1,744,472 1,660,604
Total liabilities 30,070,444 14,270,310
Total equity and liabilities 48,203,621 26,265,292
The notes on pages 38 to 63 are an integral part of these financial statements.

36 | Eyrir Invest 2007 Annual Report
StatementofChangesinEquity,fortheyear2007
Reserves
Notes Sharecapital
Sharepremium
Share optionreserve
Retained earnings
Totalequity
2006
Equity 1.1.2006 (IS-GAAP) 482,005 2,812,423 0 6,322,331 9,616,759
Effect of transition to IFRS 26 0 0 8,837 ( 7,662 ) 1,175
Equity 1.1.2006 (IFRS) 482,005 2,812,423 8,837 6,314,669 9,617,934
Profit for the year 1,566,310 1,566,310
Dividends (ISK 0.85 per share) ( 410,673 ) ( 410,673 )
Issued share capital 48,000 1,080,000 1,128,000
Share based payments 93,411 93,411
Equity 31.12.2006 18 530,005 3,892,423 102,248 7,470,306 11,994,982
2007
Equity 1.1.2007 (IS-GAAP) 530,005 3,892,423 0 7,559,004 11,981,432
Effect of transition to IFRS 26 0 0 102,248 ( 88,698 ) 13,550
Equity 1.1.2007 (IFRS) 530,005 3,892,423 102,248 7,470,306 11,994,982
Profit for the year 796,681 796,681
Dividends (ISK 0.31 per share) ( 166,426 ) ( 166,426 )
Issued share capital 164,000 4,555,764 4,719,764
Exercise of share options 36,300 653,400 689,700
Share based payments 98,476 98,476
Transfer of share option reserve 179,198 ( 179,198 ) 0
Equity 31.12.2007 18 730,305 9,280,785 21,526 8,100,561 18,133,177
The notes on pages 38 to 63 are an integral part of these financial statements.

Eyrir Invest 2007 Annual Report | 37Amounts are in ISK thousands
StatementofCashFlowsfortheyear2007
Notes 2007 2006
Cash flows from operating activities:
Profit for the year 796,681 1,566,310 Adjustments for:
Net loss (gain) on the sale of shares in other companies 54,663 ( 2,786,320 )
Unrealised gain on securities ( 1,415,920 ) ( 607,461 )
Share options expensed 98,476 93,411 Depreciation 9,494 7,151 Income tax 111,143 307,874
Working capital used in operations ( 345,463 ) ( 1,419,035 )
Change in operating assets and liabilities ( 7,425 ) 51,909
Net cash used in operating activities ( 352,888 ) ( 1,367,126 )
Cash flows from investing activities:
Investments in shares ( 49,898,287 ) ( 29,891,524 )
Proceeds from the sale of shares 38,579,903 23,449,839 Derivatives, change ( 134,091 ) ( 348,263 )
Investments in bonds ( 164,610 ) 0 Acquisition of operating assets 17 ( 76,493 ) ( 1,034 )
Net cash used in investing activities ( 11,693,578 ) ( 6,790,982 )
Cash flows from financing activities:
Proceeds from the issue of share capital 5,382,190 1,128,000 Dividends paid ( 166,426 ) ( 410,673 )
Proceeds from borrowings 15,110,162 6,360,734 Repayment of borrowings ( 1,581,623 ) ( 461,534 )
Net cash provided by financing activities 18,744,303 6,616,527
Increase (decrease) in cash and cash equivalents 6,697,837 ( 1,541,581 )
Cash and cash equivalents at 1 January 261,052 1,802,633
Cash and cash equivalents at 31 December 12 6,958,889 261,052
Other information:
Interest income received Interest expense paid Dividends received
277,839 1,284,941
251,613
78,742 762,950 162,335
The notes on pages 38 to 63 are an integral part of these financial statements.

38 | Eyrir Invest 2007 Annual Report
Notes
1.ReportingEntityEyrir Invest ehf. (the “Company”) is a company incorporated and domiciled in Iceland. The registered office of the Company is at Skólavörðustígur 13 in Reykjavík, Iceland. The financial statements of Eyrir Invest ehf. as at and for the year ended 31 December 2007 comprise the Company.Eyrir Invest ehf. is an investment company, aiming to own, buy and sell shares, bonds and other financial instruments. The Company has listed bonds on the Iceland Stock Exchange.
2.BasisofpreparationAssets and liabilities in the Balance Sheet are presented in liquidity order which is considered more appropriate for the Company than the current/non-current presentation. For each asset and liability item that combines amounts expected to be recovered or settled after more than 12 months, a payment schedule is disclosed.
The Financial Statements of Eyrir Invest ehf. are labelled as separate financial statements because the Company does not have any investments in subsidiaries and it accounts for all its investments in associates as financial assets designated at fair value through profit or loss. Accordingly, Eyrir Invest ehf. does not prepare either consolidated financial statements or individual financial statements for the year 2007.
a. Statement of complianceThe financial statements have been prepared in accordance with International Financial Reporting Standards (IFRSs) as adopted by the EU. These are the Company´s first IFRS annual financial statements and IFRS 1, First-time Adoption of International Financial reporting Standards, has been applied.
An explanation of how the transition to IFRSs has affected the reported financial position, financial performance and cash flows of the Company is provided in note 26. This note includes reconciliations of equity and performance for comparative period reported under Icelandic GAAP (IS-GAAP) to those reported for the period under IFRSs.
The Financial Statements were approved by the Board of Directors of Eyrir Invest ehf. on 7 February 2008.
b. Basis of measurementThe Financial Statements have been prepared on the historical cost basis except for the following:
•derivativefinancialinstrumentsaremeasuredatfairvalue;•financialinstrumentsatfairvaluethroughprofitorlossaremeasuredatfairvalue,includingallinvestmentsinassociates. The methods used to measure fair values are discussed further in note 3b.
c. Functional and presentation currencyThe Financial Statements are prepared in Icelandic Krona (ISK), which is the Company’s functional currency. All financial information presented in ISK has been rounded to the nearest thousand.
d. Use of estimates and judgementsThe preparation of financial statements in conformity with IFRSs requires management to make judgements, estimates and assumptions that affect the application of accounting policies and the reported amounts of assets, liabilities, income and expenses. Actual results may differ from these estimates. Estimates and underlying assumptions are reviewed on an ongoing basis. Revisions to accounting estimates are recognised in the period in which the estimate is revised and in any future periods affected. In particular, information about significant areas of estimation uncertainty and critical judgements in applying accounting policies that have the most significant effect on the amount recognised in the financial statements is described in note 4h.

Eyrir Invest 2007 Annual Report | 39Amounts are in ISK thousands
3.AccountingpoliciesrelatedtofinancialinstrumentsThe accounting policies set out below have been applied consistently to all periods presented in these Financial Statements.
a. Financial instruments(i) Non-derivative financial instrumentsNon-derivative financial instruments comprise investments in equity and debt securities, loans, trade and other receivables, cash and cash equivalents, borrowings, trade and other payables.
Non-derivative financial instruments are recognised initially at fair value plus, for instruments not at fair value through profit or loss, any directly attributable transaction costs. Subsequent to initial recognition non-derivative financial instruments are measured as described below.
Cash and cash equivalents comprise cash balances, call deposits and mutual-fund certificates that are readily convertible to known amounts of cash and are subject to an insignificant risk of changes in value.
Accounting for finance income and expenses is discussed in note 3c.
Financial assets at fair value through profit or lossAn instrument is classified at fair value through profit or loss if it is held for trading or is designated as such upon initial recognition. Financial instruments are designated at fair value through profit or loss if the Company manages such investments and makes purchase and sale decisions based on their fair value. Upon initial recognition attributable transaction costs are recognised in profit or loss when incurred. Financial instruments at fair value through profit or loss are measured at fair value, and changes therein are recognised in profit or loss.
OtherOther non-derivative financial instruments are measured at amortised cost using the effective interest method, less any impairment losses for financial assets.
(ii)Derivative financial instrumentsThe Company holds derivative financial instruments for investment purposes and also to hedge its interest rate risk exposures. Embedded derivatives are separated from the host contract and accounted for separately if the economic characteristics and risks of the host contract and the embedded derivative are not closely related, a separate instrument with the same terms as the embedded derivative would meet the definition of a derivative, and the combined instrument is not measured at fair value through profit or loss.
Derivatives are recognised initially at fair value; attributable transaction costs are recognised in profit or loss when incurred. Subsequent to initial recognition, derivatives are measured at fair value, and changes therein are accounted for through profit or loss. Derivatives with positive fair value at the reporting date are recognised as assets in the
Balance Sheet while derivatives with negative fair value are recognised as liabilities.
Hedge accounting is not applied.
(iii) Share capital
Ordinary sharesOrdinary shares are classified as equity. Incremental costs directly attributable to issue of shares and share options are recognised as a deduction from equity.

40 | Eyrir Invest 2007 Annual Report
3.Contd.
Repurchase of share capitalWhen share capital recognised as equity is repurchased, the amount of the consideration paid, which includes directly attributable costs, is recognised as a deduction from equity. Repurchased shares are classified as treasury shares and are presented as a deduction from total equity. When treasury shares are sold subsequently, the amount received is recognised as an increase in equity, and the resulting surplus or deficit on the transaction is transferred to/from share premium.
Dividends Dividends are recognised as a decrease in equity in the period in which they are declared.
b. Fair value measurement principles for financial instrumentsA number of the Company’s accounting policies and disclosures require the determination of fair value, for both financial and non-financial assets and liabilities. Fair values have been determined for measurement and / or disclosure purposes based on the following methods. When applicable, further information about the assumptions made in determining fair values is disclosed in the notes specific to that asset or liability.
(i) SecuritiesSecurities in the Balance Sheet consist of investments in equity and debt securities. The fair value of securities is determined by reference to their quoted market bid price at the reporting date without any deduction for estimated future selling costs. When a quoted market price is not available on a stock exchange or from a broker / dealer for non-exchange-traded financial instruments, the fair value of the investment is estimated using valuation techniques, including use of recent arm’s length market transactions, reference to the current fair value of another instrument that is substantially the same, discounted cash flow techniques, option pricing models or any other valuation technique that provides a reliable estimate of prices obtained in actual market transactions.
Where discounted cash flow techniques are used, estimated future cash flows are based on management’s best estimates and the discount rate used is a market rate at the reporting date applicable for an instrument with similar terms and conditions. Where other pricing models are used, inputs are based on market data at the reporting date. Fair values for unquoted equity investments are estimated, if possible, using applicable price / earnings ratios for similar listed companies adjusted to reflect the specific circumstances of the issuer.
Associates are those entities in which the Company has significant influence, but not control, over the financial and operating policies. Investments in associates are designated at fair value through profit or loss on initial recognition and are included in the item securities in the Balance Sheet. The Company defines its operations partly as venture capital organisation and that part of the business is clearly and objectively distinct from other operations.
(ii) DerivativesThe fair value of forward exchange contracts are based on their listed market price, if available. If a listed market price is not available, then fair value is estimated by discounting the difference between the contractual forward price and the current forward price for the residual maturity of the contract using a risk-free interest rate based on government bonds.
The fair value of interest rate swaps is based on broker quotes. Those quotes are tested for reasonableness by discounting estimated future cash flows based on the terms and maturity of each contract and using market interest rates for a similar instrument at the measurement date.
(iii) Trade and other receivablesThe fair value of trade and other receivables, which is determined for disclosure purposes, is estimated as the present value of future cash flows, discounted at the market rate of interest at the reporting date.

Eyrir Invest 2007 Annual Report | 41Amounts are in ISK thousands
(iv) Non-derivative financial liabilitiesFair value, which is determined for disclosure purposes, is calculated based on the present value of future principal and interest cash flows, discounted at the market rate of interest at the reporting date.
(v) Share-based payment transactionsThe fair value of employee stock options is measured using a Black-Scholes model. Measurement inputs include share price on measurement date, exercise price of the instrument, expected volatility based on weighted average historic volatility adjusted for changes expected due to publicly available information, weighted average expected life of the instruments based on historical experience and general option holder behaviour, expected dividends, and the risk-free interest rate based on government bonds. Service and non-market performance conditions attached to the transactions are not taken into account in determining fair value.
c. Investment income(i) Net income from securities and derivativesNet income from investments in securities and derivatives comprise net gain or loss on the sale of shares, changes in the fair value of the investments and derivatives, other than foreign exchange economic hedges, transaction costs and dividend income. Dividend income is recognised in the Income Statement on the date the entity’s right to receive payments is established.
(ii) Interest incomeInterest income comprises interest income on funds invested. Interest income is recognised as it accrues, using the effective interest method.
(iii) Interest expensesInterest expenses comprise interest expense on borrowings. All borrowing costs are recognised in the Income Statement, using the effective interest method.
(iv) Net foreign exchange gain (loss)Net foreign exchange gain (loss) comprises foreign exchange changes arising from assets and liabilities de-nominated in foreign currencies and gains and losses arising from derivatives hedging economically the foreign currency risk. Net currency gains and losses are reported on a net basis.
4.Otheraccountingpolicies
a. Foreign currency(i) Foreign currency transactionsTransactions in foreign currencies are translated to the functional currency of the Company at exchange rates at the dates of the transactions. Monetary assets and liabilities denominated in foreign currencies at the reporting date are translated to the functional currency at the exchange rate ruling at that date. Foreign currency gain or loss arising on translation are recognised in the Income Statement.
b. Operating assets(i) Buildings and other operating assetsBuildings and other operating assets are measured at cost less accumulated depreciation and accumulated impairment losses. Cost includes expenditure that is directly attributable to the acquisition of the asset.
(ii) Subsequent costsThe cost of replacing part of an item of operating asset is recognised in the carrying amount of the item if it is probable that the future economic benefits embodied within the part will flow to the Company and the cost of the item can be measured reliably. The carrying amount of the replaced part is derecognised. All other costs are recognised in the Income Statement as an expense as incurred.

42 | Eyrir Invest 2007 Annual Report
(iii) DepreciationDepreciation is recognised in the Income Statement on a straight-line basis over the estimated useful live of each part of operating assets. The estimated useful lives are as follows:
Buildings 50 years
Other operating assets 3-5 years
Depreciation methods, useful lives and residual values are reviewed at each reporting date.
c. Impairment(i) Financial assetsA financial asset is assessed at each reporting date to determine whether there is any objective evidence that it is impaired. A financial asset is considered to be impaired if objective evidence indicates that one or more events have had a negative effect on the estimated future cash flows of that asset.
An impairment loss in respect of a financial asset measured at amortised cost is calculated as the difference between its carrying amount, and the present value of the estimated future cash flows discounted at the original effective interest rate. All impairment losses are recognised in the Income Statement.
An impairment loss is reversed if the reversal can be related objectively to an event occurring after the impairment loss was recognised. For financial assets measured at amortised cost, the reversal is recognised in the Income Statement.
(ii) Non-financial assetsThe carrying amounts of the Company’s non-financial assets are reviewed at each reporting date to determine whether there is any indication of impairment. If any such indication exists, then the asset’s recoverable amount is estimated.
An impairment loss is recognised if the carrying amount of an asset or its cash-generating unit exceeds its estimated recoverable amount. A cash-generating unit is the smallest identifiable asset group that generates cash flows that largely are independent from other assets and groups. Impairment losses are recognised in the Income Statement.
An impairment loss is recognised if the carrying amount of an asset or its cash-generating unit exceeds its estimated recoverable amount. Impairment losses are recognised in the Income Statement. The recoverable amount of an asset or cash-generating unit is the greater of its value in use and its fair value less costs to sell. In assessing value in use, the estimated future cash flows are discounted to their present value using a pre-tax discount rate that reflects current market assessments of the time value of money and the risks specific to the asset.
Impairment losses recognised in prior periods are assessed at each reporting date for any indications that the loss has decreased or no longer exists. An impairment loss is reversed if there has been a change in the estimates used to determine the recoverable amount. An impairment loss is reversed only to the extent that the asset’s carrying amount does not exceed the carrying amount that would have been determined, net of depreciation or amortisation, if no impairment loss had been recognised.
d. Employee benefits(i) Defined contribution plansA defined contribution plan is a post-employment benefit plan under which an entity pays fixed contributions into a separate entity and will have no legal or constructive obligation to pay further amounts. Obligations for contributions to defined contribution pension plans are recognised as an employee benefit expense in the Income Statement when they are due.
(ii) Share-based payment transactionsThe grant date fair value of options granted to employees is recognised as an employee expense, with a corresponding
4.Contd.

Eyrir Invest 2007 Annual Report | 43Amounts are in ISK thousands
increase in equity, over the period in which the employees become unconditionally entitled to the options. The amount recognised as an expense is adjusted to reflect the actual number of share options that vest.
e. Income tax expenseIncome tax expense comprises current tax and deferred tax. Income tax expense is recognised in profit or loss except to the extent that it relates to items recognised directly in equity, in which case it is recognised in equity.
Current tax is the expected tax payable on the taxable income for the year, using tax rates enacted or substantially enacted at the reporting date, and any adjustment to tax payable in respect of previous years.Deferred tax is recognised using the balance sheet method, providing for temporary differences between the carrying amounts of assets and liabilities for financial reporting purposes and the amounts used for taxation purposes. Deferred tax is measured at the tax rates that are expected to be applied to the temporary differences when they reverse, based on the laws that have been enacted or substantively enacted by the reporting date. Deferred tax assets and liabilities are offset if there is a legally enforceable right to offset current tax liabilities and assets.
A deferred tax asset is recognised to the extent that it is probable that future taxable profits will be available against which the temporary difference can be utilised. Deferred tax assets are reviewed at each reporting date and are reduced to the extent that it is no longer probable that the related tax benefit will be realised.
f. Earnings per shareThe Company presents basic and diluted earnings per share (EPS) data for its ordinary shares. Basic EPS is calculated by dividing the profit attributable to ordinary shareholders of the Company by the weighted average number of ordinary shares outstanding during the year. Diluted EPS is determined by adjusting the profit or loss attributable to ordinary shareholders and the weighted average number of ordinary shares outstanding for the effects of all dilutive potential ordinary shares.
g. New standards and interpretations not yet adoptedA number of new standards, amendments to standards and interpretations are either not yet effective for the year ended 31 December 2007, and have not been applied in preparing these Financial Statements:
IFRS 8 Operating Segments sets out requirements for disclosure of information about an entity’s operating segments and also about the entity’s products and services, the geographical areas in which it operates, and its major customers. If adopted by the EU, IFRS 8, which becomes mandatory for the Company´s 2009 financial statements, is not expected to have any impact on the financial statements.
Revised IAS 23 Borrowing Costs removes the option to expense borrowing costs and requires that an entity capitalise borrowing costs directly attributable to the acquisition, construction or production of a qualifying asset as part of the cost of that asset. The revised IAS 23 will become mandatory for the Company’s 2009 financial statements and will constitute a change in accounting policy for the Company. In accordance with the transitional provisions the Company will apply the revised IAS 23 to qualifying assets for which capitalisation of borrowing costs commences on or after the effective date.
IFRIC 11 IFRS 2 – Group and Treasury Share Transactions requires a share-based payment arrangement in which an entity receives goods or services as consideration for its own equity instruments to be accounted for as an equity-settled share-based payment transaction, regardless of how the equity instruments are obtained. IFRIC 11 will become mandatory for the Company’s 2008 financial statements, with retrospective application required. It is not expected to have any impact on the financial statements.
IFRIC 12 Service Concession Arrangements provides guidance on certain recognition and measurement issues that arise in accounting for public-to-private service concession arrangements. IFRIC 12, which becomes mandatory for the Company’s 2008 financial statements, is not expected to have any effect on the financial statements.
IFRIC 13 Customer Loyalty Programmes addresses the accounting by entities that operate, or otherwise participate
4.Contd.

44 | Eyrir Invest 2007 Annual Report
in, customer loyalty programmes for their customers. It relates to customer loyalty programmes under which the customer can redeem credits for awards such as free or discounted goods or services. IFRIC 13, which becomes mandatory for the Company’s 2009 financial statements, is not expected to have any impact on the financial statements.
IFRIC 14 IAS 19 – The Limit on a Defined Benefit Asset, Minimum Funding Requirements and their Interaction clarifies when refunds or reductions in future contributions in relation to defined benefit assets should be regarded as available and provides guidance on the impact of minimum funding requirements (MFR) on such assets. It also addresses when a MFR might give rise to a liability. IFRIC 14 will become mandatory for the Company’s 2008 financial statements, and will not have any impact on the financial statements.
h. Accounting estimates and judgements
Key sources of estimation uncertainty
Determination of fair values of f inancial instruments As indicated in note 3b the Company’s securities, derivatives and investments in associates are measured at fair value on the Balance Sheet. For the majority of these financial instruments, quoted market prices are readily available. However, certain financial instruments, for example, over-the-counter derivatives or unquoted securities are fair valued using valuation techniques, including reference to the current fair values of other instruments that are substantially the same, subject to the appropriate adjustments.
Fair value estimates are made at a specific point in time, based on market conditions and information about the financial instrument. These estimates are subjective in nature and involve uncertainties and matters of significant judgement, e.g. interest rates, volatility, estimated cash flows etc., and therefore, cannot be determined with precision.
Determination of impairment of f inancial assetsAssets accounted for at amortised cost are evaluated for impairment on the basis described in accounting policy 4c(i). The assessment for impairment is based upon management’s best estimate of the present value of the cash flows that are expected to be received. In estimating these cash flows, management makes judgements about a counterparty’s financial situation and the net realisable value of any underlying collateral.
Determination of impairment of non-financial assetsNon-financial assets are regularly valuated for impairment. The assessment for impairment is based upon management’s estimates of future cash flows and discount rate.
Determination of fair value of share-based payment transactionsThe fair value of options at grant date is determined as disclosed in accounting policy 4d(ii). For share options granted to employees, in many cases market prices are not available, because the options granted are subject to terms and conditions that do not apply to traded options. If traded options with similar terms and conditions do not exist, the fair value of the options granted are estimated by applying an option pricing model. In estimating the fair value of options at grant date, the management considers factors that knowledgeable, willing market participants would consider in selecting the option pricing model to be used for this purpose.
Critical accounting judgements in applying the Company’s accounting policies
Classification of securitiesThe Company’s accounting policies provide scope for securities to be designated at fair value through profit or loss. By making this designation, the management has determined that it has met the necessary criteria as set out in accounting policy 3a(i).
4.Contd.

Eyrir Invest 2007 Annual Report | 45Amounts are in ISK thousands
5.Financialriskmanagement
OverviewThe Company maintains positions in both derivative and non-derivative financial instruments in accordance with its investment strategy. The Company´s investment portfolio comprises quoted and non-quoted equity and debt investments.
The Company’s investing activities expose it to various types of risk that are associated with the financial instruments and markets in which it invests. The most important types of financial risk to which the Company is exposed from its use of financial instruments are:
•creditrisk•liquidityrisk•marketrisk
This note presents information about the Company’s exposure to each of the above risks, the Company’s objectives, policies and processes for measuring and managing risk, and the Company’s management of capital. Further quantitative disclosures are included throughout these Financial Statements.
The Board of Directors of the Company has overall responsibility for the establishment and oversight of the Company’s risk management. The Board has commended the CEO day to day developing and monitoring of the Company’s risk management policies.
The Company’s risk management policies are established to identify and analyse the risks faced by the Company, to set appropriate risk limits and controls, and to monitor risks and adherence to limits. Risk management policies and systems are reviewed regularly to reflect changes in market conditions and the Company’s activities. The Company, through its training and management standards and procedures, aims to develop a disciplined and constructive control environment in which all employees understand their roles and obligations.
Credit riskCredit risk is the risk of financial loss to the Company if a counterparty to a financial instrument fails to meet its contractualobligations.TheCompanyaimstominimizethisriskfactorbyonlyenteringagreementswithsolidandwell known financial institutions in addition to closely monitoring the credit risk on an ongoing basis.
Transactions involving derivative financial instruments are usually with counterparties with whom the Company has signed master netting agreements. Master netting agreements provide for the net settlement of contracts with the same counterparty in the event of default. The impact of the master netting agreements is to reduce credit risk.
There were no significant concentrations of credit risk to counterparties at 31 December 2007.
Liquidity riskLiquidity risk is the risk that the Company will not be able to meet its financial obligations as they fall due. The Company’s approach to managing liquidity is to ensure that it will always have sufficient liquidity to meet its liabilities when due and not risking damage to the Company’s reputation.
The Company´s financial instruments can include investments in unlisted equity investments and derivative contracts traded over-the-counter, which are not traded in an organised public market and which generally may be illiquid. As a result, the Company may not be able to liquidate quickly some of its investments in these instruments at an amount close to its fair value in order to meet its liquidity requirements, or to respond to specific events such asadeteriorationinthecredit-worthinessofanyparticularissuer.Unlistedfinancialinstrumentswere0.8%oftotalassetsatyear-end2007(2006:0.3%).

46 | Eyrir Invest 2007 Annual Report
To mitigate this risk the Company has a policy of minimum available cash at any given time and in addition to that, the Company´s listed financial investments are in large and mid cap companies in different markets, which represent large part of the total assets, that are considered to be readily realisable as they are listed on stock exchanges.
The Company maintains lines of credit with financial institutions. The credit lines amount for up to ISK 3,280 million.
Market riskMarket risk is the risk that changes in market prices, such as foreign exchange rates, interest rates and equity prices will affect the Company’s income or the value of its holdings of financial instruments. The objective of market risk management is to manage and control market risk exposures within acceptable parameters, while optimising the return. The Company’s market risk is managed on a daily basis by the employees in accordance with policies and procedures in place.
Details of the Company’s investment portfolio at the reporting date are disclosed in the schedule of investments included in note
Currency riskThe Company is exposed to currency risk on sales and purchases of equity and debt securities, and borrowings that are denominated in a currency other than the functional currency of the Company.
The Company uses forward exchange contracts to hedge its currency risk. When necessary, forward exchange contracts are rolled over at maturity.
The Company’s borrowings denominated in foreign currencies, especially in euro and SEK, proposes currency risk which is economically hedged with assets in the same currency.
The Company’s total net currency balance is monitored on daily basis and traded as any other calculated financial position.
Interest rate riskThe majority of the Company’s financial assets are non-interest-bearing. Interest-bearing financial assets are subject to limited exposure to fair value interest rate risk due to fluctuations in the prevailing levels of market interest rates. The Company is exposed to interest risk from interest bearing liabilities and that risk is mitigated by active risk management. Any excess cash and cash equivalents of the Company are invested in short-term money market loans to banks.
The Company adopts a policy of ensuring that some of its exposure to changes in interest rates on borrowings is on a fixed rate basis. This is achieved by entering into interest rate swaps.
Other market price riskEquity price risk arises from financial assets at fair value through profit or loss, primarily equity securities.
Price risk is the risk that value of the instrument will fluctuate as a result of changes in market prices, whether caused by factors specific to an individual investment, its issuer or all factors affecting all instruments traded in the market.
As the majority of the Company´s financial assets are carried at fair value with fair value changes recognised in the Income Statement, all changes in market conditions will directly affect investment income.
Price risk is mitigated by the Company´s Management by constructing a diversified portfolio of investments and
5.Contd.

Eyrir Invest 2007 Annual Report | 47Amounts are in ISK thousands
instruments traded on various markets. In addition market fluctuations are monitored on intraday basis which enables the Company to react quickly to any changes in the market.
The Company´s financial investments is diversified by industries as follows:
2007 2006
Food systems; Marel and Stork Food Systems 37.8% 33.6%
Financial 22.5% 31.3%
Health services; Ossur 20.8% 26.4%
Technical services - Oil & gas; Stork 11.4% 3.3%
Aerospace services; Stork 7.5% 5.4%
Capital managementThe Board´s policy is to maintain a strong capital base so as sustain future development of the business. The Board ofDirectorshaveproposedtoAnnualGeneralMeetingsinrecentyearsthat10%-25%ofeachyearprofitispaidas dividend to shareholders.
The Board´s target is to connect the interests of the shareholders and employees of the Company. For that purpose the Board has entered into share option agreements with the employees. At year-end 2007 options for 12 million shares have been granted and will vest in the next four years.
The Board seeks to maintain a balance between the higher returns that might be possible with higher levels of borrowings and the advantages and security afforded by a sound capital position. The Comany’s return on capital was5.7%(2006:17.6%).
There were no changes in the Company’s approach to capital management during the year.
The Company is not subject to externally imposed capital requirements.
5.Contd.

48 | Eyrir Invest 2007 Annual Report
Investmentincome
6.Netincomefromsecuritiesandderivativesisspecifiedasfollows:
2007 2006
(Loss) gain on the sale of shares ( 54,663 ) 2,786,320
Dividends earned 251,613 162,335
Change in fair value of securities 1,415,920 340,387
Change in fair value of derivatives 148,707 ( 227,359 )
Net income from securities and derivatives 1,761,577 3,061,683
7.Netforeignexchangegain(loss)arespecifiedasfollows:
Translation exchange gain (loss) 464,809 ( 602,014 )
Net gain on currency and interest rate derivatives 356,450 475,772
Net foreign exchange gain (loss) total 821,259 ( 126,242 )
Salariesandsalaryrelatedexpenses
8.Salariesandsalaryrelatedexpensesarespecifiedasfollows:
Salaries and performance-based payments 104,846 60,017
Equity-settled shared-based payment transactions 98,476 93,411
Contributions to defined contribution plans 10,281 5,377
Other salary-related expenses 22,499 9,850
Total salaries and salary-related expenses 236,102 168,655
Full time equivalent positions at the end of the year 10 5
Salaries to the Chairman of the Board and the CEO are specified as follows:
Salaries Bonus Other benefits
Total salaries & benefits
Thordur Magnusson, Chairman 12,600 0 1,920 14,520
Arni Oddur Thordarson, CEO 27,600 0 1,285 28,885
The Chairman of the Board and the CEO exercised in 2007 stock options that were granted in 2005. The difference in exercise price and market price were ISK 79.2 million and ISK 138.6 million, respectively. The Chairman and the CEO do not have any outstanding share options at year-end 2007.
Contribution to defined contribution plans paid in 2007 amounted to ISK 1.26 million for the Chairman and ISK 2.76 million for the CEO.

Eyrir Invest 2007 Annual Report | 49Amounts are in ISK thousands
Otheroperatingexpenses
9.Otheroperatingexpensesspecifyasfollows:
2007 2006
Depreciation 9,494 7,151
Contribution and grants 3,900 17,900
Other operating expenses 51,549 23,366
Total other operating expenses 64,943 48,417
Incometaxexpense
10.IncometaxrecognisedintheIncomeStatementisspecifiedasfollows:
Change in deferred tax due to origination and reversal of temporary differences 111,143 307,874
Total income tax expense in Income Statement 111,143 307,874
Reconciliation of effective tax rate:
2007 2006
Profit before income tax 907,824 1,874,184
Income tax using the Company’s tax rate 18.0% 163,408 18.0% 337,353
Tax exempt revenue ( 5.0% ) ( 45,290 ) ( 1.6% ) ( 29,220 )
Share options exercised ( 2.7% ) ( 24,667 ) 0
Other changes 1.9% 17,692 0.0% ( 259 )
Effective tax rate 12.2% 111,143 16.4% 307,874
Earningspershare
11.ProfitattributabletoordinaryequityholdersoftheCompany:
2007 2006
Profit for the year 796,681 1,566,310
Weighted average number of ordinary sharesin thousand shares
Issued ordinary shares at 1 January 530,005 482,005
Effect of the increase of share capital in September 2006 0 4,077
Effect of the increase of share capital in November 2006 0 3,068
Effect of the increase of share capital in January 2007 11,178 0
Effect of the increase of share capital in February 2007 7,036 0
Effect of the increase of share capital in September 2007 47,035 0
Effect of stock options exercised in April 2007 26,454 0
Weighted average number of ordinary shares at 31 December 621,708 489,150

50 | Eyrir Invest 2007 Annual Report
Weighted average number of ordinary shares (diluted)in thousand shares
2007 2006
Weighted average number of ordinary shares (basic) 621,708 489,150
Effect of share options 3,631 0
Weighted average number of ordinary shares (diluted) at 31 December 625,339 489,150
Earnings per share:
Basic earnings per share (ISK) 1.28 3.20
Diluted earnings per share (ISK) 1.27 3.20
Cashandcashequivalents
12.Cashandcashequivalentsarespecifiedasfollows:
Bank deposits 6,388,176 261,052
Mutual-fund certificates 570,713 0
Total cash and cash equivalents 6,958,889 261,052
Investmentsecurities
13.Investmentsecuritiesarespecifiedasfollows:
Listed securities: OwnershipFair value
12/31/07Ownership
Fair value12/31/06
Listed on the Iceland Stock Exchange:
Marel Food Systems hf. 31.2% 12,869,385 29.6% 8,368,040
Ossur hf. 19.9% 8,277,961 15.4% 6,797,133 Other companies 2,905,553 1,281,433
Total listed on the Iceland Stock Exchange 24,052,899 16,446,606
Listed on foreign stock exchanges:Listed on stock exchange in Stockholm 4,758,873 5,801,316 Listed on stock exchange in Helsinki 0 1,137,062 Listed on stock exchange in Oslo 507,541 751,341 Listed on stock exchange in Frankfurt 1,184,512 0 Total listed on foreign stock exchanges 6,450,926 7,689,719
Total listed securities 30,503,825 24,136,325
Unlisted securities:LME ehf.* 40.0% 9,635,471 40.0% 1,271,451 Unlisted foreign shares 204,670 75,862 Unlisted bonds 164,610 0
Total unlisted securities 10,004,751 1,347,313
Fair value of investment securities at year-end 40,508,576 25,483,638
11.Contd.
*All assets of LME ehf. are in listed shares.

Eyrir Invest 2007 Annual Report | 51Amounts are in ISK thousands
Associates
14.Aspresentedinnote13, investmentsinassociatesareaccountedforatfairvaluethroughprofitorlossandpresentedwithininvestmentsecuritiesintheBalanceSheet.Atendofyear2007,basedonbothdirectandindirectownership,thefollowinginvestmentsaredefinedasassociates:
Ownership
Marel Food Systems hf., Iceland 31.2%LME ehf., Iceland 40.0%
All assets of LME ehf. are in listed shares.
Derivatives
15.Netassetsandliabilitiesinderivativesarespecifiedasfollows:
2007 2006
Net position of bond derivatives 366,459 0 Net position of interest rate derivatives 95,884 149,695 Net position of currency derivatives ( 275,968 ) ( 97,411 )
Net position of derivatives 186,375 52,284
Derivatives - assets in the Balance Sheet 484,873 338,205 Derivatives - liabilities in the Balance Sheet ( 298,498 ) ( 285,921 )
Net position of derivatives 186,375 52,284
Tradeandotherreceivables
16.Tradeandotherreceivablesarespecifiedasfollows:
Prepaid expenses 31,744 31,323 Other receivables 1,466 0 Total trade and other receivables 33,210 31,323
At 31 December 2007 and 31 December 2006 no allowance was conseded for doubtful receivables. No impairment loss was recognised during the years.

52 | Eyrir Invest 2007 Annual Report
Operatingassets
17.Operatingassetsarespecifiedasfollows:
Grosscarryingamount Buildings Other
operating assets
Total
Balance at 1.1.2006 138,000 23,508 161,508
Additions during the year 345 969 1,314
Sales and disposals during the year 0 ( 640 ) ( 640 )
Balance at 31.12.2006 138,345 23,837 162,182
Additions during the year 62,645 13,848 76,493
Balance 31.12.2007 200,990 37,685 238,675
Depreciationandimpairmentlosses Buildings Other
operating assets
Total
Balance at 1.1.2006 1,640 2,677 4,317
Depreciation 2,760 4,391 7,151
Sales and disposals during the year 0 ( 360 ) ( 360 )
Balance 31.12.2006 4,400 6,708 11,108
Depreciation 2,760 6,734 9,494
Balance 31.12.2007 7,160 13,442 20,602
Carrying amounts
1.1.2006 136,360 20,831 157,191
31.12.2006 133,945 17,129 151,074
31.12.2007 193,830 24,243 218,073
Depreciation ratios 2% 20-30%
Equity
18.Issuedcapital
A shareholders meeting in January 2007 approved an increase in nominal value of share capital of ISK 20 million which was sold for ISK 487 million, net of cost of ISK 13 million. In April 2007 share options for shares with nominal value of ISK 36.3 million were exercised. The selling price amounting to ISK 690 million was paid in August 2007. A shareholders meeting in August 2007 approved an increase in nominal value of share capital of up to ISK 150 million. In September an increase in nominal value of share capital of ISK 144 million was sold for ISK 4,205 million, net of cost of ISK 114.5 million. Share capital was increased during the year 2006 by a nominal value of ISK 48 million, from ISK 482 million to ISK 530 million.

Eyrir Invest 2007 Annual Report | 53Amounts are in ISK thousands
The Company’s share capital, according to its Articles of Association amounts to ISK 730 million and is all fully paid. The holders of ordinary shares are entitled to dividends as declared from time to time and are entitled to one vote per share at meetings of the Company. Share capital according to the Balance Sheet amounted to ISK 730 million at the end of year 2007, share capital is specified as follows:
Amounts Ratio
Total issued shares at the end of the year 730,305 100.0%
Own shares 0 0.0%
Share capital according to the Articles of Association 730,305 100.0%
Share premiumShare premium represents excess of payment above nominal value (ISK 1 per share) that shareholders have paid for sharessoldbytheCompany.AccordingtoIcelandicCompaniesAct,25%ofthenominalvalueofsharecapitalmustbe held in reserve which can not be paid out as dividend to shareholders.
Share option reserveThe reserve includes the accrued part of the fair value of share options. This reserve is transferred to share premium when share options are exercised. The reserve is transferred to retained earnings when the share options are not exercised
Tradeandotherpayables
19.Tradeandotherpayablesarespecifiedasfollows:
2007 2006
Trade payables 2,295,030 114,342
Other payables 63,962 69,500
Total trade and other payables 2,358,992 183,842
18.Contd.

54 | Eyrir Invest 2007 Annual Report
Borrowings
20.Borrowingsarespecifiedasfollows:
2007 2006Carrying amount
Carrying amount
EUR 9,727,661 3,865,910
ISK 8,710,092 2,911,823
SEK 4,304,685 1,563,164
USD 1,319,641 2,052,692
GBP 968,403 1,077,487
CHF 244,712 260,078
NOK 212,588 212,058
JPY 180,700 196,731
Borrowings total 25,668,482 12,139,943
Borrowings are secured as follows:
Secured bank loans 17,003,188 9,237,824
Unsecured bond issues 8,665,294 2,902,119
Borrowings total 25,668,482 12,139,943
Company’s investment securities amounting to ISK 24,630 millions are mortgaged to secure borrowings with the remaining balance of ISK 17,003 million at the year-end 2007.
21.Repaymentofborrowingsarespecifiedasfollows:
Repayments in 2007 - 2,445,806
Repayments in 2008 692,344 265,037
Repayments in 2009 10,364,271 5,177,596
Repayments in 2010 1,417,909 1,349,384
Repayments in 2011 2,014,090 0
Repayments in 2012 11,179,868 2,902,120
Borrowings total 25,668,482 12,139,943
22.Thedeferredincometaxliabilityisspecifiedasfollows:
2007 2006
Deferred income tax liability 1.1. 1,680,074 1,354,411
Changes due to IFRS ( 19,470 ) ( 1,681 )
Deferred income tax liability 1.1. (IFRS) 1,660,604 1,352,730
Income tax expense recognised in Income Statement 111,143 307,874
Income tax recognised directly in equity ( 27,275 ) 0
Deferred income tax liability 31.12. 1,744,472 1,660,604

Eyrir Invest 2007 Annual Report | 55Amounts are in ISK thousands
The deferred income tax liability is attributable to the following items:
2007 2006
Securities 2,170,948 1,896,614
Accrued share options expense ( 4,940 ) 0 Operating assets 473 693
2,166,481 1,897,307
Tax losses carried forward ( 422,009 ) ( 236,703 )
Deferred income tax liability at end of period 1,744,472 1,660,604
When the Company pays dividends to its shareholders, it is required to pay a portion of the dividends to taxation authorities on behalf of shareholders, i.e. withholding tax. The amount paid to taxation authorities is charged to equity as a part of the dividends.
Share-basedpayments
23.Thetermsandconditionsofgrantsareasfollows:
Grant date / employees entitledNumber of
instruments in thousands
Vesting conditions
Contractual life of option
Options granted 2006 4,750 32/44 months service 3 years
Options granted 2007 7,250 23/35/47/59 months service 5 years
Total 12,000
All options are to be settled by physical delivery of shares. Options vesting in 12 months can be excercised three times during the contractual life, at the end of each 12 month period. Accordingly 24 month options can be exercised two times and the 36 month options only once at the end of the 36 month period.
The number and weighted average excercise price of share options is as follows in thousands:
Weighted average
exercise price
Number of options
Weighted average
exercise price
Number of options
2007 2007 2006 2006
Outstanding at 1 January 19.0 41,050 19.0 36,300 Exercised during the year 19.0 ( 36,300 ) 0
Granted during the year 24.0 7,250 19.0 4,750
Outstanding at 31 December 22.0 12,000 19.0 41,050
Excercisable at 31 December 0 36,300
Options excercised during the year belong to key management, i.e. the CEO and the Chairman of the Board.
The options outstanding at 31 December 2007 have a weighted average contractual life of 2.3 years. The share price at the date of exercise for share options exercised in 2007 was 25.
22.Contd.

56 | Eyrir Invest 2007 Annual Report
The fair value of services received in return for share options granted based on the fair value of share options granted, measuring using a Black-Scholes model, with the following inputs:
Granted
2006Granted
2007
Fair value at grant date, average 12, 24, and 36 months options 6.96 9.81 Share price 25.0 25.0 Exercise price * 19.0 24.0 Expected volatility (weighted average volatility) 22.2% 23.2%Option life (expected weighted average life) 3.5 4.8Expected dividends * 0.0% 0.0%Risk-free interest rate (based on government bonds) 12.4% 11.6%
* Excercise price is depended on dividends paid during the life of the option.
Total recognised expenses for the year arising from share-based payment transactions amounted to ISK 98 million (2006: ISK 99 million) including accrued social security expenses related to share-based payments.
Financialinstruments
24.Creditrisk
Exposure to credit risk The carrying amount of financial assets represents the maximum credit exposure. The maximum exposure to credit risk at the reporting date was:
Carrying amount
2007 2006
Financial assets at fair value through profit or loss 484,873 338,205
Loans and receivables 197,820 31,323 Cash and cash equivalents 6,958,889 261,052
7,641,582 630,580
Liquidity risk The following are the contractual maturities of financial liabilities, including estimated future interest payments:
31 December 2007
Financial liabilities:
Carryingamount
Contractualcash flows
Less than1 year
1 - 2years
2 - 5years
More than5 years
Secured bank loans 17,003,188 20,935,266 1,527,341 5,819,628 13,588,297 0
Unsecured bond issues 8,665,294 10,832,757 742,268 6,563,331 3,527,158 0
Trade and other payables 2,358,992 2,358,992 2,358,992 0 0 0
28,027,474 34,127,015 4,628,601 12,382,959 17,115,455 0
23.Contd.

Eyrir Invest 2007 Annual Report | 57Amounts are in ISK thousands
31 December 2006
Financial liabilities:
Carryingamount
Contractualcash flows
Less than 1 year
1- 2 years 2-5 years More than 5 years
Secured bank loans 9,237,824 11,192,917 3,214,221 918,557 7,060,139 0
Unsecured bond issues 2,902,119 3,803,800 157,300 157,300 471,900 3,017,300
Trade and other payables 183,842 183,842 183,842 0 0 0
12,323,785 15,180,559 3,555,363 1,075,857 7,532,039 3,017,300
Currency risk
Exposure to currency risk
The Company´s exposure to foreign currency risk was as follows based on notional amounts:
31 December 2007 EUR SEK USD GBP NOK Other
Financial instruments at fair value through profit or loss 10,725,674 4,758,872 65,484 0 646,727 ( 6,238 )
Loans and receivables 166,076 0 0 0 0 0
Cash and equvalents 3,452,578 2,432,478 158 0 319 1,458
Secured bank loans ( 9,746,712 ) ( 4,293,344 ) ( 1,316,164 ) ( 965,851 ) ( 212,027 ) ( 424,292 )
Trade payables 0 ( 572,465 ) 0 0 0 0
Net balance sheet exposure 4,597,616 2,325,541 ( 1,250,522 ) ( 965,85 ) 435,019 ( 429,072 )
24.Contd.
31 December 2006 EUR SEK USD GBP NOK Other
Financial instruments at fair value through profit or loss 2,416,150 5,745,306 182,375 0 751,340 ( 6,585 )
Cash and equvalents 3,715 161,965 7,002 0 0 121
Secured bank loans ( 3,864,911 ) ( 1,563,165 ) ( 2,052,692 ) ( 1,077,488 ) ( 212,057 ) ( 456,807 )
Net balance sheet exposure ( 1,445,046 ) 4,344,106 ( 1,863,315 ) ( 1,077,488 ) 539,283 ( 463,271 )
The following significant exchange rates applied during the year:
Average rate Reporting date spot rate
2007 2006 2007 2006
EUR 87.846 87.965 91.450 94.870
SEK 9.498 9.511 9.713 10.477
USD 64.168 69.943 62.150 72.000

58 | Eyrir Invest 2007 Annual Report
Sensitivity analysisA10%strengtheningoftheIcelandickrónaagainstthefollowingcurrenciesat31Decemberwouldhaveincreased(decreased) post-tax profit or loss by the amounts shown below. This analysis assumes that all other variables, in particular interest rates, remain constant. This analysis is performed on the same basis for 2006.
Profit or loss2007 2006
EUR 377,005 ( 118,798 )
SEK 190,694 342,936 Other ( 181,255 ) ( 235,519 )
A10%weakeningoftheIcelandickrónaagainsttheabovecurrencieswouldhavehadtheequalbutoppositeeffecton the above currencies to the amounts shown above, on the basis that all other variables remain constant.
Interest rate risk At the reporting date the interest rate profile of the Company´s interest bearing financial instruments was:
Carrying amount
Fixed rate instruments 2007 2006
Financial assets 164,610 0
Financial liabilities ( 8,665,294 ) ( 2,902,119 )
( 8,500,684 ) ( 2,902,119 )
Variable rate instruments
Financial liabilities ( 17,003,189 ) ( 9,237,824 )
Fair value sensitivity analysis for fixed rate instrumentsThe Company does not account for any fixed rate financial assets and liabilities at fair value through profit or loss, and the Company does not designate derivatives (interest rate swaps) as hedging instruments under a fair value hedge accounting model. Therefore a change in interest rates at the reporting date would not affect profit or loss.
Cash flow sensitivity analysis for variable rate instruments A change of 100 basis points in interest rates at the reporting date would have increased (decreased) post-tax profit or loss by the amounts shown below. This analysis assumes that all other variables, in particular foreign currency rates, remain constant. The analysis is performed on the same basis for 2006.
2007 2006
Profit or loss Profit or loss
100 bp 100 bp 100 bp 100 bpincrease decrease increase decrease
Variable rate instruments ( 137,404 ) 137,404 ( 74,849 ) 74,849
Cash flow sensitivity (net) ( 137,404 ) 137,404 ( 74,849) ) 74,849
24.Contd.

Eyrir Invest 2007 Annual Report | 59Amounts are in ISK thousands
Fair values
Fair values versus carrying amounts The fair values of financial assets and liabilities, together with the carrying amounts shown in the balance sheet, are as follows:
31 December 2007 31 December 2006Carrying Fair value Carrying Fair valueamount amount
Financial instruments designated at fair value through profit or loss 40,530,341 40,530,341 25,535,922 25,535,922
Loans and receivables 197,820 197,820 31,323 31,323
Cash and cash equivalents 6,958,889 6,958,889 261,052 261,052
Secured bank loans ( 17,003,188 ) ( 16,355,055 ) ( 9,237,824 ) ( 8,678,995 )
Unsecured bond issues ( 8,665,294 ) ( 8,378,539 ) ( 2,902,119 ) ( 2,999,870 )
Trade and other payables ( 2,358,992 ) ( 2,358,992 ) ( 183,842 ) ( 183,842 )
19,659,576 20,594,464 13,504,512 13,965,590
The basis for determining fair values is disclosed in note 4.
Interest rates used for determining fair values
The interest rate used to discount estimated cash flows, where applicable, are based on the government yield curve at the reporting date plus an adequate credit spread, and were as follows:
2007 2006
Secured bank loans 6.8%-8.0% 5.2%-7.6%
Unsecured bond issues, indexed / non-indexed 6.7%/18.5% 6.2%/-
Relatedparties
Identity of related parties
25.TheCompanyhasarelatedpartyrelationshipwithitsassociates,andwithitsdirectorsandexecutiveofficers.
Transactions with related parties During the year the Company paid salaries to the Chairman of the Board of Directors and the CEO. Both the Chairman and the CEO exercised their share options during the year. Further information is in note 8. The members of the Board of Directors and the CEO purchased part of share increases during the year at the same rate as other shareholders. These transactions were priced on an arm’s length basis.
24.Contd.
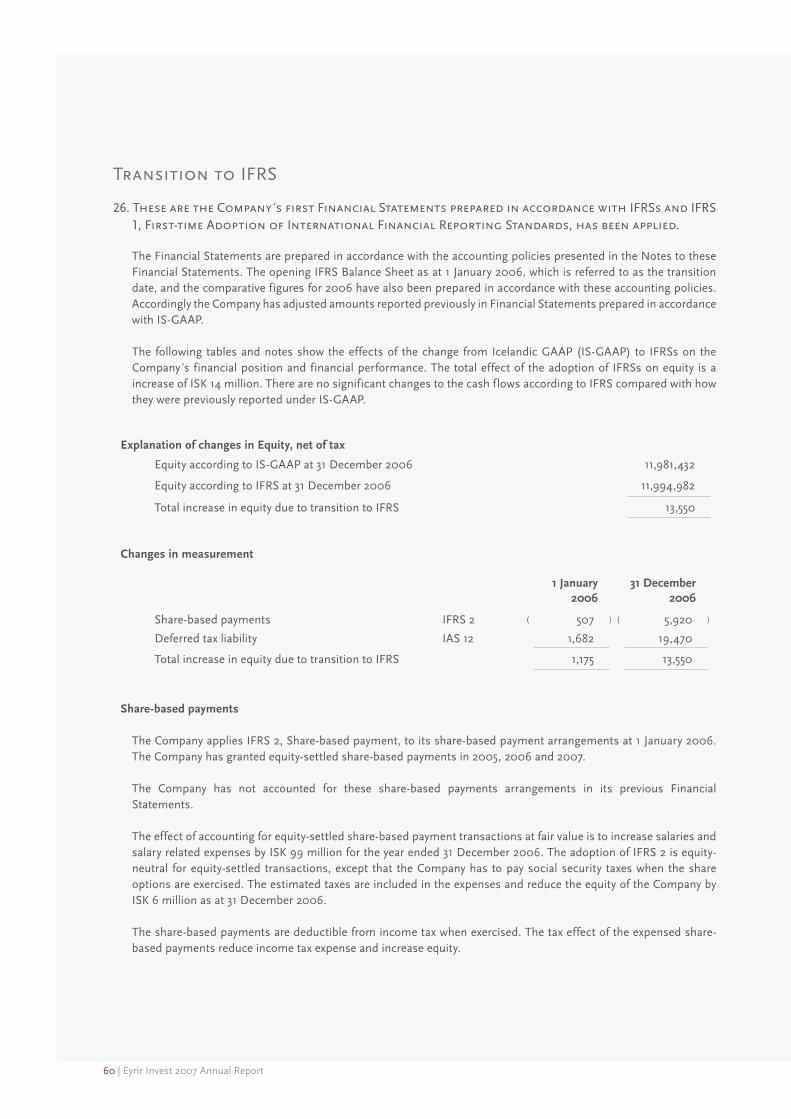
60 | Eyrir Invest 2007 Annual Report
TransitiontoIFRS
26.ThesearetheCompany´sfirstFinancialStatementspreparedinaccordancewithIFRSsandIFRS1,First-timeAdoptionofInternationalFinancialReportingStandards,hasbeenapplied. The Financial Statements are prepared in accordance with the accounting policies presented in the Notes to these Financial Statements. The opening IFRS Balance Sheet as at 1 January 2006, which is referred to as the transition date, and the comparative figures for 2006 have also been prepared in accordance with these accounting policies. Accordingly the Company has adjusted amounts reported previously in Financial Statements prepared in accordance with IS-GAAP. The following tables and notes show the effects of the change from Icelandic GAAP (IS-GAAP) to IFRSs on the Company´s financial position and financial performance. The total effect of the adoption of IFRSs on equity is a increase of ISK 14 million. There are no significant changes to the cash flows according to IFRS compared with how they were previously reported under IS-GAAP.
Explanation of changes in Equity, net of tax
Equity according to IS-GAAP at 31 December 2006 11,981,432
Equity according to IFRS at 31 December 2006 11,994,982
Total increase in equity due to transition to IFRS 13,550
Changes in measurement
1 January 31 December2006 2006
Share-based payments IFRS 2 ( 507 ) ( 5,920 )
Deferred tax liability IAS 12 1,682 19,470
Total increase in equity due to transition to IFRS 1,175 13,550
Share-based payments
The Company applies IFRS 2, Share-based payment, to its share-based payment arrangements at 1 January 2006. The Company has granted equity-settled share-based payments in 2005, 2006 and 2007. The Company has not accounted for these share-based payments arrangements in its previous Financial Statements. The effect of accounting for equity-settled share-based payment transactions at fair value is to increase salaries and salary related expenses by ISK 99 million for the year ended 31 December 2006. The adoption of IFRS 2 is equity-neutral for equity-settled transactions, except that the Company has to pay social security taxes when the share options are exercised. The estimated taxes are included in the expenses and reduce the equity of the Company by ISK 6 million as at 31 December 2006. The share-based payments are deductible from income tax when exercised. The tax effect of the expensed share-based payments reduce income tax expense and increase equity.

Eyrir Invest 2007 Annual Report | 61Amounts are in ISK thousands
Changes in presentation
Change in the presentation of dividends earnedDividends earned which has been presented as a separate line item in the Income Statement is now included in Net income from securities and derivatives.
Change in the presentation of Contributions and grantsContributions and grants which has been presented as a separate line item in the Income Statement is now included in Other operating expenses.
Change in the presentation of Investment securitiesSecurities have been divided into four line items in previous Financial Statements. Shares in other companies and bonds are now included in the line item Securities. The bonds are either listed or unlisted loans to companies that Eyrir Invest ehf. has share in. Mutual fund certificates that are readily convertible to known amounts of cash and are subject to an insignificant risk of change in value are now included in cash and cash equivalents.
Change in the presentation of Derivatives liabilitiesDerivative financial instruments with negative net value were previously included in Interest-bearing borrowings, but are now included as a separate line item in Derivatives among liabilities in the Balance Sheet. Derivative assets are as before shown as a separate line item among assets in the Balance Sheet.
Explanation of changes in the profit for the year 2006
According to IS-GAAPIS-GAAP Changes in Changes in IFRS
According to IFRSs2006 valuation presentation 2006
Net gains on investments in share and shares derivatives 2,920,296 ( 20,948 ) 162,335 3,061,683 Net income from securities
and derivatives
Dividends earned 162,335 ( 162,335 ) 0
Interest earned 78,742 78,742 Interest income
Changes in foreign exchange currency and interest rate derivatives
( 126,242 ) ( 126,242 )Net foreign exchange gain (loss)
Financial expenses ( 922,927 ) ( 922,927 ) Interest expenses
Net operating revenue 2,112,204 2,091,256 Net operating revenue
Salaries and salary related expenses 69,830 98,825 168,655 Salaries and salary related expenses
Other operating expenses 30,517 17,900 48,417 Other operating expenses
Contributions and grants 17,900 ( 17,900 ) 0
Operating expenses 118,247 217,072 Operating expenses
Profit before income tax 1,993,957 1,874,184 Profit before income tax
Income tax ( 329,692 ) 21,818 ( 307,874 ) Income tax
Profit for the year 1,664,265 ( 97,955 ) 0 1,566,310 Profit for the year
26.Contd.

62 | Eyrir Invest 2007 Annual Report
Explanation of changes in the profit of the year 2006
Profit for the year according to IS-GAAP 1,664,265
Net changes in fair value of associated company ( 20,948 )
Share-based payment expenses ( 93,411 )
Social security taxes ( 5,414 )
Income tax effect 21,818
Profit for the year according to IFRS 1,566,310
Explanation of changes in Balance Sheet as at 31 December 2005
According to IS-GAAPIS-GAAP Changes in Changes in IFRS
According to IFRSs12/31/05 valuation presentation 12/31/05
Shares in other companies 15,486,620 26,262 15,512,882 Investment securities
Derivatives 10,890 10,890 Derivatives
Mutual funds 121,343 ( 121,343 ) 0 -
Bonds 26,262 ( 26,262 ) 0 -
Sundry receivables 85,742 85,742 Trade and other receivables
Fixed assets 157,191 157,191 Operating assets
Cash and cash equivalents 1,681,290 121,343 1,802,633 Cash and cash equivalents
Total assets 17,569,338 0 0 17,569,338 Total assets
Capital stock 482,005 482,005 Share capital
Contributed capital in excess of par 2,812,423 2,812,423 Share premium
8,837 8,837 Reserves
Retained earnings 6,322,331 ( 7,662 ) 6,314,669 Retained earnings
Stockholders equity 9,616,759 1,175 0 9,617,934 Total equity
Deferred income tax liability 1,354,411 ( 1,682 ) 1,352,729 Deferred tax liability
149,521 149,521 Derivatives
Interest-bearing borrowings 6,526,664 ( 149,521 ) 6,377,143 Borrowings
Taxes for the year 7,333 7,333 Current tax liability
Other liabilities 64,171 507 64,678 Trade and other payables
Total liabilities 7,952,579 ( 1,175 ) 0 7,951,404 Total liabilities
Total stockholders equity and liabilities 17,569,338 0 0 17,569,338 Total equity and liabilities
26.Contd.

Eyrir Invest 2007 Annual Report | 63Amounts are in ISK thousands
Explanation of changes in Balance Sheet as at 31 December 2006
According to IS-GAAPIS-GAAP Changes in Changes in IFRS
According to IFRSs12/31/06 valuation presentation 12/31/06
Shares in other companies 24,212,187 1,271,451 25,483,638 Investment securities
Derivatives 338,205 338,205 Derivatives
Mutual funds 0 0 -
Bonds 1,271,451 ( 1,271,451 ) 0 -
Sundry receivables 31,323 31,323 Trade and other receivables
Fixed assets 151,074 151,074 Operating assets
Cash and cash equivalents 261,052 261,052 Cash and cash equivalents
Total assets 26,265,292 0 0 26,265,292 Total assets
Capital stock 530,005 530,005 Share capital
Contributed capital in excess of par 3,892,423 3,892,423 Share premium
102,248 102,248 Reserves
Retained earnings 7,559,004 ( 88,698 ) 7,470,306 Retained earnings
Stockholders equity 11,981,432 13,550 0 11,994,982 Total equity
Deferred income tax liability 1,680,074 ( 19,470 ) 1,660,604 Deferred tax liability
285,921 285,921 Derivatives
Interest-bearing borrowings 12,425,864 ( 285,921 ) 12,139,943 Borrowings
Taxes for the year 0 0 Current tax liability
Other liabilities 177,922 5,920 183,842 Trade and other payables
Total liabilities 14,283,860 ( 13,550 ) 0 14,270,310 Total liabilities
Total stockholders equity and liabilities 26,265,292 0 0 26,265,292 Total equity and liabilities
26.Contd.

64 | Eyrir Invest 2007 Annual Report

Eyrir Invest 2007 Annual Report | 65
EyrirInvestehf.
Seperate
Financial Statements
31 December 2007
Presented in EUR

66 | Eyrir Invest 2007 Annual Report
Contents
EndorsementbytheBoardofDirectorsandtheCEO 67
IndependentAuditor’sReport 69
IncomeStatement 70
BalanceSheet 71
StatementofChangesinEquity 72
StatementofCashFlows 73
Notes 74

Eyrir Invest 2007 Annual Report | 67Amounts are in Euros thousands
EndorsementandStatementbytheBoardofDirectorsandtheCEO
Eyrir Invest ehf.’s aim is to own, buy and sell shares, other securities and all other financial assets. The Company
started its operation in the year 2000.
Eyrir Invest ehf.’s financial statements are for the first time prepared according to International Financial Reporting
Standards (IFRSs) as adopted by the EU. The Company’s financial statements for the previous years have been
prepared in accordance with the Icelandic Financial Statements Act and accounting principles in Iceland. The total
effect of IFRS adoption on the Company’s financial statements is that equity at the beginning of the year 2006
increases by e 16 thousand, from e 129,101 thousand to e 129,117 thousand. The effect of IFRS adoption is further
explained in the notes to the financial statements.
According to the Income Statement, profit for the year amounted to e 9,095 thousand. According to the Balance
Sheet, equity at the end of the year amounted to e 198,829 thousand.
During the year the nominal value of share capital of the Company was increased by e 2,286 thousand. In January
and February shares with nominal value of e 228 thousand were sold to new shareholders for e 5,559 thousand, net of
selling cost. In April options for shares with nominal value of e 414 thousand at the rate of 19.0 were exercised. The
increase in equity according to the exercise was e 7,873 thousand. In September shares with nominal value of e 1,644
thousand were sold for e 48,002 thousand, net of selling cost.
Shareholders at the end of the year were 15, but were 7 at the beginning of the year. Four shareholders held more than
10%ofoutstandingshareseachattheendoftheyear2007.Theyare:
ÞordurMagnusson 28.0%
ArniOddurÞordarson 23.9%
Straumborgehf. 11.9%
SigurjonJonsson 11.4%
The Board of Directors proposes a dividend payment amounting to e2,182thousand,whichis25%ofprofitfortheyear
2007.
StatementbytheBoardofDirectorsandtheCEOThe Annual Financial Statements have been prepared in accordance with International Financial Reporting Standards
(IFRSs) as adopted by the EU and additional Icelandic disclosure requirements for financial statements of listed
companies.
According to our best knowledge it is our opinion that the Annual Financial Statements give a true and fair view of the financial performance of the Company for the financial year 2007, its assets, liabilities and financial position as at 31 December 2007 and its cash flows for the financial year 2007.

68 | Eyrir Invest 2007 Annual Report
EndorsementandStatementbytheBoardofDirectorsandtheCEO,contd.
Further, in our opinion the Financial Statements and Endorsement of the Board of Directors and the CEO give a fair
view of the development and performance of the Company’s operations and its position and describes the principal
risks and uncertainties faced by the Company.
The Board of Directors and the CEO have today discussed the Annual Financial Statements of Eyrir Invest ehf. for the
year 2007 and confirm them by means of their signatures. The Board of Directors and the CEO recommend that the
Financial Statements will be approved at the Annual General Meeting of Eyrir Invest ehf.
Reykjavik, 7 February 2008.
The Board of Directors:
Thordur Magnusson, Chairman
Sigurjon Jonsson
Jon Helgi Gudmundsson
CEO:
Arni Oddur Thordarson

Eyrir Invest 2007 Annual Report | 69Amounts are in Euros thousands
IndependentAuditor’sReport
TotheBoardofDirectorsandShareholdersofEyrirInvestehf.
Report on the Financial Statements
We have audited the accompanying financial statements of Eyrir Invest ehf. (the “Company”), which comprise the
balance sheet as at December 31, 2007, and the income statement, statement of changes in equity and statement of
cash flows for the year then ended, and a summary of significant accounting policies and other explanatory notes.
Management’s Responsibility for the Financial Statements
Management is responsible for the preparation and fair presentation of these financial statements in accordance with
International Financial Reporting Standards as adopted by the EU. This responsibility includes: designing, implementing
and maintaining internal control relevant to the preparation and fair presentation of financial statements that are free
from material misstatements, whether due to fraud or error; selecting and applying appropriate accounting policies;
and making accounting estimates that are reasonable in the circumstances.
Auditor’s Responsibility
Our responsibility is to express an opinion on these financial statements based on our audit. We conducted our audit
in accordance with International Standards on Auditing. Those standards require that we comply with relevant ethical
requirements and plan and perform the audit to obtain reasonable assurance whether the financial statements are
free of material misstatement.
An audit involves performing procedures to obtain audit evidence about the amounts and disclosures in the financial
statements. The procedures selected depend on the auditor’s judgement, including the assessment of the risks of
material misstatement of the financial statements, whether due to fraud or error. In making those risk assessments, the
auditor considers internal control relevant to the entity’s preparation and fair presentation of the financial statements
in order to design audit procedures that are appropriate in the circumstances, but not for the purpose of expressing
an opinion on the effectiveness of the entity’s internal control. An audit also includes evaluating the appropriateness
of accounting principles used and the reasonableness of accounting estimates made by management, as well as
evaluating the overall presentation of the financial statements.
We believe that the audit evidence we have obtained is sufficient and appropriate to provide a basis for our audit
opinion.
Opinion
In our opinion, the financial statements give a true and fair view of the financial position of Eyrir Invest ehf. as at
December 31, 2007, and of its financial performance and its cash flows for the year then ended in accordance with
International Financial Reporting Standards as adopted by the EU.
Reykjavik, 7 February 2008.
KPMG hf.
Saemundur Valdimarsson

70 | Eyrir Invest 2007 Annual Report
IncomeStatementfortheyear2007
Notes 2007 2006 Investment income:
Net income from securities and derivatives 6 20,109 34,903 Interest income 3,189 898
Interest expenses ( 18,873 ) ( 10,521 )
Net foreign exchange gain (loss) 7 9,375 ( 1,439 )
Net operating revenue 13,800 23,841
Operating expenses:
Salaries and salary related expenses 8 2,695 1,923 Other operating expenses 9 741 552
Operating expenses 3,436 2,475
Profit before income tax 10,364 21,366
Income tax 10,22 ( 1,269 ) ( 3,510 )
Profit for the year 9,095 17,856
Earnings per share:Basic earnings per share (each share is 1 Icelandic króna) 11 0.0146 0.0365Diluted earnings per share (each share is 1 Icelandic króna) 11 0.0145 0.0365
The notes on pages 74 to 99 are an integral part of these financial statements.

Eyrir Invest 2007 Annual Report | 71Amounts are in Euros thousands
BalanceSheetasat31December2007
Notes 2007 2006Assets:
Cash and cash equivalents 12 76,304 2,759 Investment securities 13 444,173 269,355 Derivatives 15 5,317 3,575 Trade and other receivables 16 364 331 Operating assets 17 2,391 1,597
Total assets 528,549 277,617
Equity:Share capital 18 9,012 6,726 Share premium 109,665 48,154 Reserves ( 18,225 ) ( 19,277 )
Retained earnings 98,377 91,180
Total equity 198,829 126,783
Liabilities:Derivatives 15 3,273 3,022 Trade and other payables 19 25,866 1,943 Borrowings 20,21 281,453 128,316 Deferred tax liability 22 19,128 17,552
329,720 150,833
Total equity and liabilities 528,549 277,616
The notes on pages 74 to 99 are an integral part of these financial statements.

72 | Eyrir Invest 2007 Annual Report
StatementofChangesinEquityfortheyear2007
Reserves
NotesShare
capitalShare
premiumShare option
reserveTranslation
reserveRetained earnings
Totalequity
2006
Equity 1.1.2006 (IS-GAAP) 6,178 35,842 0 8,972 78,109 129,101
Effect of transition to IFRS 26 0 0 119 0 ( 103 ) 16
Equity 1.1.2006 (IFRS) 6,178 35,842 119 8,972 78,006 129,117
Profit for the year 17,856 17,856
Dividends (ISK 0.85 per share) ( 4,682 ) ( 4,682 )
Issued share capital 548 12,312 12,860
Share based payments 1,064 1,064
Translation difference ( 29,432 ) ( 29,432 )
Equity 31.12.2006 18 6,726 48,154 1,183 ( 20,460 ) 91,180 126,783
2007
Equity 1.1.2007 (IS-GAAP) 6,726 48,154 0 ( 20,639 ) 92,399 126,640
Effect of transition to IFRS 26 0 0 1,183 179 ( (1,219) ) 143
Equity 1.1.2007 (IFRS) 6,726 48,154 1,183 ( 20,460 ) 91,180 126,783
Profit for the year 9,095 9,095
Dividends (ISK 0.31 per share) ( 1,898 ) ( 1,898 )
Issued share capital 1,872 52,006 53,878
Exercise of share options 414 7,459 7,873
Share based payments 1,124 1,124
Transfer of share option reserve 2,046 ( 2,046 ) 0
Translation difference 1,974 1,974
Equity 31.12.2007 18 9,012 109,665 261 ( 18,486 ) 98,377 198,829
The notes on pages 74 to 99 are an integral part of these financial statements.

Eyrir Invest 2007 Annual Report | 73Amounts are in Euros thousands
StatementofCashFlowsfortheyear2007
Notes 2007 2006
Cash flows from operating activities:
Profit for the year 9,095 17,856 Adjustments for:
Net loss (gain) on the sale of shares in other companies 624 ( 31,764 )
Unrealised gain on securities ( 16,163 ) ( 6,925 )
Share options expensed 1,124 ) 1,065 Depreciation 108 82 Income tax 1,269 3,510
Working capital used in operations ( 3,943 ) ( 16,176 )
Change in operating assets and liabilities ( 85 ) 592
Net cash used in operating activities ( 4,028 ) ( 15,584 )
Cash flows from investing activities:
Investments in shares ( 569,615 ) ( 340,761 )
Proceeds from the sale of shares 440,410 267,326 Derivatives, change ( 1,531 ) ( 3,970 )
Investments in bonds ( 1,879 ) Acquisition of operating assets 17 ( 873 ) ( 12 )
Net cash used in investing activities ( 133,488 ) ( 77,417 )
Cash flows from financing activities:
Proceeds from the issue of share capital 61,441 12,860 Dividends paid ( 1,898 ) ( 4,682 )
Proceeds from borrowings 172,490 72,512 Repayment of borrowings ( 18,055 ) ( 5,261 )
Net cash provided by financing activities 213,978 75,429
Increase (decrease) in cash and cash equivalents 76,462 ( 17,572 )
Cash and cash equivalents at 1 January 2,759 24,200
Foreign Exchange Translation Adjustments ( 2,917 ) ( 3,869 )
Cash and cash equivalents at 31 December 12 76,304 2,759
Other information:
Interest income received Interest expense paid Dividends received
3,17214,668
2,872
8988,6981,851
The notes on pages 74 to 99 are an integral part of these financial statements.

74 | Eyrir Invest 2007 Annual Report
NotestotheFinancialStatements
1.ReportingEntityEyrir Invest ehf. (the “Company”) is a company incorporated and domiciled in Iceland. The registered office of the Company is at Skólavörðustígur 13 in Reykjavík, Iceland. The financial statements of Eyrir Invest ehf. as at and for the year ended 31 December 2007 comprise the Company.
Eyrir Invest ehf. is an investment company, aiming to own, buy and sell shares, bonds and other financial instruments. The Company has listed bonds on the Iceland Stock Exchange.
2.BasisofpreparationAssets and liabilities in the Balance Sheet are presented in liquidity order which is considered more appropriate for the Company than the current/non-current presentation. For each asset and liability item that combines amounts expected to be recovered or settled after more than 12 months, a payment schedule is disclosed.
The Financial Statements of Eyrir Invest ehf. are labelled as separate financial statements because the Company does not have any investments in subsidiaries and it accounts for all its investments in associates as financial assets designated at fair value through profit or loss. Accordingly, Eyrir Invest ehf. does not prepare either consolidated financial statements or individual financial statements for the year 2007.
a. Statement of complianceThe financial statements have been prepared in accordance with International Financial Reporting Standards (IFRSs) as adopted by the EU. These are the Company´s first IFRS annual financial statements and IFRS 1, First-time Adoption of International Financial reoporting Standards, has been applied.
An explanation of how the transition to IFRSs has affected the reported financial position, financial performance and cash flows of the Company is provided in note 26. This note includes reconciliations of equity and performance for comparative period reported under Icelandic GAAP (IS-GAAP) to those reported for the period under IFRSs.
The Financial Statements were approved by the Board of Directors of Eyrir Invest ehf. on 7 February 2008.
b. Basis of measurementThe Financial Statements have been prepared on the historical cost basis except for the following: •derivativefinancialinstrumentsaremeasuredatfairvalue;•financialinstrumentsatfairvaluethroughprofitorlossaremeasuredatfairvalue,includingallinvestmentsin
associates.The methods used to measure fair values are discussed further in note 3b.
c. Functional and presentation currency
The Company’s functional currency is the Icelandic króna. The Financial Statements are presented in euros (e), for
the convenience of the reader. For this purpose the rate of ISK 87.60 = 1 e was used for the translation of the Income
Statement, which is the average exchange rate for the year 2007, and the rate of ISK 91.20 = 1 e for the translation of the Balance Sheet, which is the exchange rate at year-end 2007. The average exchange rate for the year 2006 was
ISK 87.72 = 1 e and the exchange rate at year-end 2006 was ISK 94.61 = 1 e.
d. Use of estimates and judgementsThe preparation of financial statements in conformity with IFRSs requires management to make judgements, estimates and assumptions that affect the application of accounting policies and the reported amounts of assets, liabilities, income and expenses. Actual results may differ from these estimates. Estimates and underlying assumptions are reviewed on an ongoing basis. Revisions to accounting estimates are recognised in the period in which the estimate is revised and in any future periods affected. In particular, information about significant areas of estimation uncertainty and critical judgements in applying accounting policies that have the most significant effect on the amount recognised in the financial statements is described in note 4h.

Eyrir Invest 2007 Annual Report | 75Amounts are in Euros thousands
3.AccountingpoliciesrelatedtofinancialinstrumentsThe accounting policies set out below have been applied consistently to all periods presented in these Financial Statements.
a. Financial instruments
(i)Non-derivative financial instrumentsNon-derivative financial instruments comprise investments in equity and debt securities, loans, trade and other receivables, cash and cash equivalents, borrowings, trade and other payables.
Non-derivative financial instruments are recognised initially at fair value plus, for instruments not at fair value through profit or loss, any directly attributable transaction costs. Subsequent to initial recognition non-derivative financial instruments are measured as described below.
Cash and cash equivalents comprise cash balances, call deposits and mutual-fund certificates that are readily convertible to known amounts of cash and are subject to an insignificant risk of changes in value.
Accounting for finance income and expenses is discussed in note 3c.
Financial assets at fair value through profit or lossAn instrument is classified at fair value through profit or loss if it is held for trading or is designated as such upon initial recognition. Financial instruments are designated at fair value through profit or loss if the Company manages such investments and makes purchase and sale decisions based on their fair value. Upon initial recognition attributable transaction costs are recognised in profit or loss when incurred. Financial instruments at fair value through profit or loss are measured at fair value, and changes therein are recognised in profit or loss.
OtherOther non-derivative financial instruments are measured at amortised cost using the effective interest method, less any impairment losses for financial assets.
(ii)Derivative financial instrumentsThe Company holds derivative financial instruments for investment purposes and also to hedge its interest rate risk exposures. Embedded derivatives are separated from the host contract and accounted for separately if the economic characteristics and risks of the host contract and the embedded derivative are not closely related, a separate instrument with the same terms as the embedded derivative would meet the definition of a derivative, and the combined instrument is not measured at fair value through profit or loss.
Derivatives are recognised initially at fair value; attributable transaction costs are recognised in profit or loss when incurred. Subsequent to initial recognition, derivatives are measured at fair value, and changes therein are accounted for through profit or loss. Derivatives with positive fair value at the reporting date are recognised as assets in the
Balance Sheet while derivatives with negative fair value are recognised as liabilities.
Hedge accounting is not applied.
(iii)Share capital
Ordinary sharesOrdinary shares are classified as equity. Incremental costs directly attributable to issue of shares and share options are recognised as a deduction from equity.

76 | Eyrir Invest 2007 Annual Report
Repurchase of share capitalWhen share capital recognised as equity is repurchased, the amount of the consideration paid, which includes directly attributable costs, is recognised as a deduction from equity. Repurchased shares are classified as treasury shares and are presented as a deduction from total equity. When treasury shares are sold subsequently, the amount received is recognised as an increase in equity, and the resulting surplus or deficit on the transaction is transferred to/from share premium.
Dividends Dividends are recognised as a decrease in equity in the period in which they are declared.
b. Fair value measurement principles for financial instrumentsA number of the Company’s accounting policies and disclosures require the determination of fair value, for both financial and non-financial assets and liabilities. Fair values have been determined for measurement and / or disclosure purposes based on the following methods. When applicable, further information about the assumptions made in determining fair values is disclosed in the notes specific to that asset or liability.
(i)SecuritiesSecurities in the Balance Sheet consist of investments in equity and debt securities. The fair value of securities is determined by reference to their quoted market bid price at the reporting date without any deduction for estimated future selling costs. When a quoted market price is not available on a stock exchange or from a broker / dealer for non-exchange-traded financial instruments, the fair value of the investment is estimated using valuation techniques, including use of recent arm’s length market transactions, reference to the current fair value of another instrument that is substantially the same, discounted cash flow techniques, option pricing models or any other valuation technique that provides a reliable estimate of prices obtained in actual market transactions.
Where discounted cash flow techniques are used, estimated future cash flows are based on management’s best estimates and the discount rate used is a market rate at the reporting date applicable for an instrument with similar terms and conditions. Where other pricing models are used, inputs are based on market data at the reporting date. Fair values for unquoted equity investments are estimated, if possible, using applicable price / earnings ratios for similar listed companies adjusted to reflect the specific circumstances of the issuer.
Associates are those entities in which the Company has significant influence, but not control, over the financial and operating policies. Investments in associates are designated at fair value through profit or loss on initial recognition and are included in the item securities in the Balance Sheet. The Company defines its operations partly as venture capital organisation and that part of the business is clearly and objectively distinct from other operations.
(ii)DerivativesThe fair value of forward exchange contracts are based on their listed market price, if available. If a listed market price is not available, then fair value is estimated by discounting the difference between the contractual forward price and the current forward price for the residual maturity of the contract using a risk-free interest rate based on government bonds.
The fair value of interest rate swaps is based on broker quotes. Those quotes are tested for reasonableness by discounting estimated future cash flows based on the terms and maturity of each contract and using market interest rates for a similar instrument at the measurement date.
(iii)Trade and other receivablesThe fair value of trade and other receivables, which is determined for disclosure purposes, is estimated as the present value of future cash flows, discounted at the market rate of interest at the reporting date.
3.Contd.

Eyrir Invest 2007 Annual Report | 77Amounts are in Euros thousands
(iv)Non-derivative financial liabilitiesFair value, which is determined for disclosure purposes, is calculated based on the present value of future principal and interest cash flows, discounted at the market rate of interest at the reporting date.
(v)Share-based payment transactionsThe fair value of employee stock options is measured using a Black-Scholes model. Measurement inputs include share price on measurement date, exercise price of the instrument, expected volatility based on weighted average historic volatility adjusted for changes expected due to publicly available information, weighted average expected life of the instruments based on historical experience and general option holder behaviour, expected dividends, and the risk-free interest rate based on government bonds. Service and non-market performance conditions attached to the transactions are not taken into account in determining fair value.
c. Investment income(i)Net income from securities and derivativesNet income from investments in securities and derivatives comprise net gain or loss on the sale of shares, changes in the fair value of the investments and derivatives, other than foreign exchange economic hedges, transaction costs and dividend income. Dividend income is recognised in the Income Statement on the date the entity’s right to receive payments is established.
(ii)Interest incomeInterest income comprises interest income on funds invested. Interest income is recognised as it accrues, using the effective interest method.
(iii)Interest expensesInterest expenses comprise interest expense on borrowings. All borrowing costs are recognised in the Income Statement, using the effective interest method.
(iv)Net foreign exchange gain (loss)Net foreign exchange gain (loss) comprises foreign exchange changes arising from assets and liabilities de-nominated in foreign currencies and gains and losses arising from derivatives hedging economically the foreign currency risk. Net currency gains and losses are reported on a net basis.
4.Otheraccountingpolicies
a. Foreign currency(i)Foreign currency transactionsTransactions in foreign currencies are translated to the functional currency of the Company at exchange rates at the dates of the transactions. Monetary assets and liabilities denominated in foreign currencies at the reporting date are translated to the functional currency at the exchange rate ruling at that date. Foreign currency gain or loss arising on translation are recognised in the Income Statement.
b. Operating assets(i)Buildings and other operating assetsBuildings and other operating assets are measured at cost less accumulated depreciation and accumulated impairment losses. Cost includes expenditure that is directly attributable to the acquisition of the asset.
(ii)Subsequent costsThe cost of replacing part of an item of operating asset is recognised in the carrying amount of the item if it is probable that the future economic benefits embodied within the part will flow to the Company and the cost of the item can be measured reliably. The carrying amount of the replaced part is derecognised. All other costs are recognised in the Income Statement as an expense as incurred.
3.Contd.

78 | Eyrir Invest 2007 Annual Report
(iii)DepreciationDepreciation is recognised in the Income Statement on a straight-line basis over the estimated useful live of each part of operating assets. The estimated useful lives are as follows:
Buildings 50 years
Other operating assets 3-5 years
Depreciation methods, useful lives and residual values are reviewed at each reporting date.
c. Impairment(i)Financial assetsA financial asset is assessed at each reporting date to determine whether there is any objective evidence that it is impaired. A financial asset is considered to be impaired if objective evidence indicates that one or more events have had a negative effect on the estimated future cash flows of that asset.
An impairment loss in respect of a financial asset measured at amortised cost is calculated as the difference between its carrying amount, and the present value of the estimated future cash flows discounted at the original effective interest rate. All impairment losses are recognised in the Income Statement.
An impairment loss is reversed if the reversal can be related objectively to an event occurring after the impairment loss was recognised. For financial assets measured at amortised cost, the reversal is recognised in the Income Statement.
(ii)Non-financial assetsThe carrying amounts of the Company’s non-financial assets are reviewed at each reporting date to determine whether there is any indication of impairment. If any such indication exists, then the asset’s recoverable amount is estimated.
An impairment loss is recognised if the carrying amount of an asset or its cash-generating unit exceeds its estimated recoverable amount. A cash-generating unit is the smallest identifiable asset group that generates cash flows that largely are independent from other assets and groups. Impairment losses are recognised in the Income Statement.
An impairment loss is recognised if the carrying amount of an asset or its cash-generating unit exceeds its estimated recoverable amount. Impairment losses are recognised in the Income Statement. The recoverable amount of an asset or cash-generating unit is the greater of its value in use and its fair value less costs to sell. In assessing value in use, the estimated future cash flows are discounted to their present value using a pre-tax discount rate that reflects current market assessments of the time value of money and the risks specific to the asset.
Impairment losses recognised in prior periods are assessed at each reporting date for any indications that the loss has decreased or no longer exists. An impairment loss is reversed if there has been a change in the estimates used to determine the recoverable amount. An impairment loss is reversed only to the extent that the asset’s carrying amount does not exceed the carrying amount that would have been determined, net of depreciation or amortisation, if no impairment loss had been recognised.
d. Employee benefits(i)Defined contribution plansA defined contribution plan is a post-employment benefit plan under which an entity pays fixed contributions into a separate entity and will have no legal or constructive obligation to pay further amounts. Obligations for contributions to defined contribution pension plans are recognised as an employee benefit expense in the Income Statement when they are due.
(ii)Share-based payment transactionsThe grant date fair value of options granted to employees is recognised as an employee expense, with a corresponding
4.Contd.

Eyrir Invest 2007 Annual Report | 79Amounts are in Euros thousands
increase in equity, over the period in which the employees become unconditionally entitled to the options. The amount recognised as an expense is adjusted to reflect the actual number of share options that vest.
e. Income tax expenseIncome tax expense comprises current tax and deferred tax. Income tax expense is recognised in profit or loss except to the extent that it relates to items recognised directly in equity, in which case it is recognised in equity.
Current tax is the expected tax payable on the taxable income for the year, using tax rates enacted or substantially enacted at the reporting date, and any adjustment to tax payable in respect of previous years.Deferred tax is recognised using the balance sheet method, providing for temporary differences between the carrying amounts of assets and liabilities for financial reporting purposes and the amounts used for taxation purposes. Deferred tax is measured at the tax rates that are expected to be applied to the temporary differences when they reverse, based on the laws that have been enacted or substantively enacted by the reporting date. Deferred tax assets and liabilities are offset if there is a legally enforceable right to offset current tax liabilities and assets.
A deferred tax asset is recognised to the extent that it is probable that future taxable profits will be available against which the temporary difference can be utilised. Deferred tax assets are reviewed at each reporting date and are reduced to the extent that it is no longer probable that the related tax benefit will be realised.
f. Earnings per shareThe Company presents basic and diluted earnings per share (EPS) data for its ordinary shares. Basic EPS is calculated by dividing the profit attributable to ordinary shareholders of the Company by the weighted average number of ordinary shares outstanding during the year. Diluted EPS is determined by adjusting the profit or loss attributable to ordinary shareholders and the weighted average number of ordinary shares outstanding for the effects of all dilutive potential ordinary shares.
g. New standards and interpretations not yet adoptedA number of new standards, amendments to standards and interpretations are either not yet effective for the year ended 31 December 2007, and have not been applied in preparing these Financial Statements:
IFRS 8 Operating Segments sets out requirements for disclosure of information about an entity’s operating segments and also about the entity’s products and services, the geographical areas in which it operates, and its major customers. If adopted by the EU, IFRS 8, which becomes mandatory for the Company´s 2009 financial statements, is not expected to have any impact on the financial statements.
Revised IAS 23 Borrowing Costs removes the option to expense borrowing costs and requires that an entity capitalise borrowing costs directly attributable to the acquisition, construction or production of a qualifying asset as part of the cost of that asset. The revised IAS 23 will become mandatory for the Company’s 2009 financial statements and will constitute a change in accounting policy for the Company. In accordance with the transitional provisions the Company will apply the revised IAS 23 to qualifying assets for which capitalisation of borrowing costs commences on or after the effective date.
IFRIC 11 IFRS 2 – Group and Treasury Share Transactions requires a share-based payment arrangement in which an entity receives goods or services as consideration for its own equity instruments to be accounted for as an equity-settled share-based payment transaction, regardless of how the equity instruments are obtained. IFRIC 11 will become mandatory for the Company’s 2008 financial statements, with retrospective application required. It is not expected to have any impact on the financial statements.
IFRIC 12 Service Concession Arrangements provides guidance on certain recognition and measurement issues that arise in accounting for public-to-private service concession arrangements. IFRIC 12, which becomes mandatory for the Company’s 2008 financial statements, is not expected to have any effect on the financial statements.
IFRIC 13 Customer Loyalty Programmes addresses the accounting by entities that operate, or otherwise participate
4.Contd.

80 | Eyrir Invest 2007 Annual Report
in, customer loyalty programmes for their customers. It relates to customer loyalty programmes under which the customer can redeem credits for awards such as free or discounted goods or services. IFRIC 13, which becomes mandatory for the Company’s 2009 financial statements, is not expected to have any impact on the financial statements.
IFRIC 14 IAS 19 – The Limit on a Defined Benefit Asset, Minimum Funding Requirements and their Interaction clarifies when refunds or reductions in future contributions in relation to defined benefit assets should be regarded as available and provides guidance on the impact of minimum funding requirements (MFR) on such assets. It also addresses when a MFR might give rise to a liability. IFRIC 14 will become mandatory for the Company’s 2008 financial statements, and will not have any impact on the financial statements.
h. Accounting estimates and judgements
Key sources of estimation uncertainty
Determination of fair values of f inancial instruments As indicated in note 3b the Company’s securities, derivatives and investments in associates are measured at fair value on the Balance Sheet. For the majority of these financial instruments, quoted market prices are readily available. However, certain financial instruments, for example, over-the-counter derivatives or unquoted securities are fair valued using valuation techniques, including reference to the current fair values of other instruments that are substantially the same, subject to the appropriate adjustments.
Fair value estimates are made at a specific point in time, based on market conditions and information about the financial instrument. These estimates are subjective in nature and involve uncertainties and matters of significant judgement, e.g. interest rates, volatility, estimated cash flows etc., and therefore, cannot be determined with precision.
Determination of impairment of f inancial assetsAssets accounted for at amortised cost are evaluated for impairment on the basis described in accounting policy 4c(i). The assessment for impairment is based upon management’s best estimate of the present value of the cash flows that are expected to be received. In estimating these cash flows, management makes judgements about a counterparty’s financial situation and the net realisable value of any underlying collateral.
Determination of impairment of non-financial assetsNon-financial assets are regularily valuated for impairment. The assessment for impairment is based upon management’s estimates of future cash flows and discount rate.
Determination of fair value of share-based payment transactionsThe fair value of options at grant date is determined as disclosed in accounting policy 4d(ii). For share options granted to employees, in many cases market prices are not available, because the options granted are subject to terms and conditions that do not apply to traded options. If traded options with similar terms and conditions do not exist, the fair value of the options granted are estimated by applying an option pricing model. In estimating the fair value of options at grant date, the management considers factors that knowledgeable, willing market participants would consider in selecting the option pricing model to be used for this purpose.
Critical accounting judgements in applying the Company’s accounting policies
Classification of securitiesThe Company’s accounting policies provide scope for securities to be designated at fair value through profit or loss. By making this designation, the management has determined that it has met the necessary criteria as set out in accounting policy 3a(i).
4.Contd.

Eyrir Invest 2007 Annual Report | 81Amounts are in Euros thousands
5.Financialriskmanagement
OverviewThe Company maintains positions in both derivative and non-derivative financial instruments in accordance with its investment strategy. The Company´s investment portfolio comprises quoted and non-quoted equity and debt investments.
The Company’s investing activities expose it to various types of risk that are associated with the financial instruments and markets in which it invests. The most important types of financial risk to which the Company is exposed from its use of financial instruments are:
•creditrisk•liquidityrisk•marketrisk
This note presents information about the Company’s exposure to each of the above risks, the Company’s objectives, policies and processes for measuring and managing risk, and the Company’s management of capital. Further quantitative disclosures are included throughout these Financial Statements.
The Board of Directors of the Company has overall responsibility for the establishment and oversight of the Company’s risk management. The Board has commended the CEO day to day developing and monitoring of the Company’s risk management policies.
The Company’s risk management policies are established to identify and analyse the risks faced by the Company, to set appropriate risk limits and controls, and to monitor risks and adherence to limits. Risk management policies and systems are reviewed regularly to reflect changes in market conditions and the Company’s activities. The Company, through its training and management standards and procedures, aims to develop a disciplined and constructive control environment in which all employees understand their roles and obligations.
Credit riskCredit risk is the risk of financial loss to the Company if a counterparty to a financial instrument fails to meet its contractualobligations.TheCompanyaimstominimizethisriskfactorbyonlyenteringagreementswithsolidandwell known financial institutions in addition to closely monitoring the credit risk on an ongoing basis.
Transactions involving derivative financial instruments are usually with counterparties with whom the Company has signed master netting agreements. Master netting agreements provide for the net settlement of contracts with the same counterparty in the event of default. The impact of the master netting agreements is to reduce credit risk.
There were no significant concentrations of credit risk to counterparties at 31 December 2007.
Liquidity riskLiquidity risk is the risk that the Company will not be able to meet its financial obligations as they fall due. The Company’s approach to managing liquidity is to ensure that it will always have sufficient liquidity to meet its liabilities when due and not risking damage to the Company’s reputation.
The Company´s financial instruments can include investments in unlisted equity investments and derivative contracts traded over-the-counter, which are not traded in an organised public market and which generally may be illiquid. As a result, the Company may not be able to liquidate quickly some of its investments in these instruments at an amount close to its fair value in order to meet its liquidity requirements, or to respond to specific events such asadeteriorationinthecredit-worthinessofanyparticularissuer.Unlistedfinancialinstrumentswere0.8%oftotalassetsatyear-end2007(2006:0.3%).

82 | Eyrir Invest 2007 Annual Report
To mitigate this risk the Company has a policy of minimum available cash at any given time and in addition to that, the Company´s listed financial investments are in large and mid cap companies in different markets, which represent large part of the total assets, that are considered to be readily realisable as they are listed on stock exchanges.
The Company maintains lines of credit with financial institutions. The credit lines amount for up to e 35,965 thousand.
Market riskMarket risk is the risk that changes in market prices, such as foreign exchange rates, interest rates and equity prices will affect the Company’s income or the value of its holdings of financial instruments. The objective of market risk management is to manage and control market risk exposures within acceptable parameters, while optimising the return. The Company’s market risk is managed on a daily basis by the employees in accordance with policies and procedures in place.
Details of the Company’s investment portfolio at the reporting date are disclosed in the schedule of investments included in note
Currency riskThe Company is exposed to currency risk on sales and purchases of equity and debt securities, and borrowings that are denominated in a currency other than the functional currency of the Company.
The Company uses forward exchange contracts to hedge its currency risk. When necessary, forward exchange contracts are rolled over at maturity.
The Company’s borrowings denominated in foreign currencies, especially in euro and SEK, proposes currency risk which is economically hedged with assets in the same currency.
The Company’s total net currency balance is monitored on daily basis and traded as any other calculated financial position.
Interest rate riskThe majority of the Company’s financial assets are non-interest-bearing. Interest-bearing financial assets are subject to limited exposure to fair value interest rate risk due to fluctuations in the prevailing levels of market interest rates. The Company is exposed to interest risk from interest bearing liabilities and that risk is mitigated by active risk management. Any excess cash and cash equivalents of the Company are invested in short-term money market loans to banks.
The Company adopts a policy of ensuring that some of its exposure to changes in interest rates on borrowings is on a fixed rate basis. This is achieved by entering into interest rate swaps.
Other market price riskEquity price risk arises from financial assets at fair value through profit or loss, primarily equity securities.
Price risk is the risk that value of the instrument will fluctuate as a result of changes in market prices, whether caused by factors specific to an individual investment, its issuer or all factors affecting all instruments traded in the market.
As the majority of the Company´s financial assets are carried at fair value with fair value changes recognised in the Income Statement, all changes in market conditions will directly affect investment income.
5.Contd.

Eyrir Invest 2007 Annual Report | 83Amounts are in Euros thousands
Price risk is mitigated by the Company´s Management by constructing a diversified portfolio of investments and instruments traded on various markets. In addition market fluctuations are monitored on intraday basis which enables the Company to react quickly to any changes in the market.
The Company´s financial investments is diversified by industries as follows:
2007 2006
Food systems; Marel and Stork Food Systems 37.8% 33.6%
Financial 22.5% 31.3%
Health services; Ossur 20.8% 26.4%
Technical services - Oil & gas; Stork 11.4% 3.3%
Aerospace services; Stork 7.5% 5.4%
Capital managementThe Board´s policy is to maintain a strong capital base so as sustain future development of the business. The Board ofDirectorshaveproposedtoAnnualGeneralMeetingsinrecentyearsthat10%-25%ofeachyearprofitispaidas dividend to shareholders.
The Board´s target is to connect the interests of the shareholders and employees of the Company. For that purpose the Board has entered into share option agreements with the employees. At year-end 2007 options for 12 million shares have been granted and will vest in the next four years.
The Board seeks to maintain a balance between the higher returns that might be possible with higher levels of borrowings and the advantages and security afforded by a sound capital position. The Comany’s return on capital was5.7%(2006:17.6%).
There were no changes in the Company’s approach to capital management during the year.
The Company is not subject to externally imposed capital requirements.
5.Contd.

84 | Eyrir Invest 2007 Annual Report
Investmentincome
6.Netincomefromsecuritiesandderivativesisspecifiedasfollows:
2007 2006
(Loss) gain on the sale of shares ( 624 ) 31,764
Dividends earned 2,872 1,851
Change in fair value of securities 16,163 3,880
Change in fair value of derivatives 1,698 ( 2,592 )
Net income from securities and derivatives 20,109 34,903
7.Netforeignexchangegain(loss)arespecifiedasfollows:
Translation exchange gain (loss) 5,306 ( 6,863 )
Net gain on currency and interest rate derivatives 4,069 5,424
Net foreign exchange gain (loss) total 9,375 ( 1,439 )
Salariesandsalaryrelatedexpenses
8.Salariesandsalaryrelatedexpensesarespecifiedasfollows:
Salaries and performance-based payments 1,197 684
Equity-settled shared-based payment transactions 1,124 1,066
Contributions to defined contribution plans 117 61
Other salary-related expenses 257 112
Total salaries and salary-related expenses 2,695 1,923
Full time equivalent positions at the end of the year 10 5
Salaries to the Chairman of the Board and the CEO are specified as follows:
Salaries Bonus Other benefits
Total saleries & benefits
Thordur Magnusson, Chairman 144 0 22 166
Arni Oddur Thordarson, CEO 315 0 15 330
The Chairman of the Board and the CEO exercised in 2007 stock options that were granted in 2005. The difference
in exercise price and market price were e 904 thousand and e 1,582 thousand, respectively. The Chairman and the CEO do not have any outstanding share options at year-end 2007.
Contribution to defined contribution plans paid in 2007 amounted to e 14 thousand for the Chairman and e 32 thousand for the CEO.

Eyrir Invest 2007 Annual Report | 85Amounts are in Euros thousands
Otheroperatingexpenses
9.Otheroperatingexpensesspecifyasfollows:
2007 2006
Depreciation 108 82
Contribution and grants 45 204
Other operating expenses 588 266
Total other operating expenses 741 552
Incometaxexpense
10.IncometaxrecognisedintheIncomeStatementisspecifiedasfollows:
Change in deferred tax due to origination and reversal of temporary differences 1,269 3,510
Total income tax expense in Income Statement 1,269 3,510
Reconciliation of effective tax rate:
2007 2006
Profit before income tax 10,364 21,366
Income tax using the Company’s tax rate 18.0% 1,866 18.0% 3,846
Tax exempt revenue ( 5.0% ) ( 517 ) ( 1.6% ) ( 333 )
Share options exercised ( 2.7% ) ( 282 ) 0
Other changes 1.9% 202 0.0% ( 3 )
Effective tax rate 12.2% 1,269 16.4% 3,510
Earningspershare
11.ProfitattributabletoordinaryequityholdersoftheCompany:
2007 2006
Profit for the year 9,095 17,856
Weighted average number of ordinary sharesin thousand shares
Issued ordinary shares at 1 January 530,005 482,005
Effect of the increase of share capital in September 2006 0 4,077
Effect of the increase of share capital in November 2006 0 3,068
Effect of the increase of share capital in January 2007 11,178 0
Effect of the increase of share capital in February 2007 7,036 0
Effect of the increase of share capital in September 2007 47,035 0
Effect of stock options exercised in April 2007 26,454 0
Weighted average number of ordinary shares at 31 December 621,708 489,150

86 | Eyrir Invest 2007 Annual Report
Weighted average number of ordinary shares (diluted)in thousand shares
2007 2006
Weighted average number of ordinary shares (basic) 621,708 489,150
Effect of share options 3,631 0
Weighted average number of ordinary shares (diluted) at 31 December 625,339 489,150
Earnings per share:
Basic earnings per share (each share is 1 Icelandic krona) 0.0146 0.0365
Diluted earnings per share (each share is 1 Icelandic krona) 0.0145 0.0365
Cashandcashequivalents
12.Cashandcashequivalentsarespecifiedasfollows:
Bank deposits 70,046 2,759
Mutual-fund certificates 6,258 0
Total cash and cash equivalents 76,304 2,759
Investmentsecurities
13.Investmentsecuritiesarespecifiedasfollows:
Listed securities: OwnershipFair value
12/31/07Ownership
Fair value12/31/06
Listed on the Iceland Stock Exchange:Marel Food Systems hf. 31.2% 141,112 29.6% 88,448 Ossur hf. 19.9% 90,767 15.4% 71,844 Other companies 31,859 13,544
Total listed on the Iceland Stock Exchange 263,738 173,836
Listed on foreign stock exchanges:Listed on stock exchange in Stockholm 52,181 61,318 Listed on stock exchange in Helsinki 0 12,018 Listed on stock exchange in Oslo 5,565 7,941 Listed on stock exchange in Frankfurt 12,988 0 Total listed on foreign stock exchanges 70,734 81,277
Total listed securities 334,472 255,113
Unlisted securities:LME ehf.* 40.0% 105,652 40.0% 13,438 Unlisted foreign shares 2,244 803 Unlisted bonds 1,805 0
Total unlisted securities 109,701 14,241
Fair value of investment securities at year-end 444,173 269,354
11.Contd.
*All assets of LME ehf. are in listed shares.

Eyrir Invest 2007 Annual Report | 87Amounts are in Euros thousands
Associates
14.Aspresentedinnote13, investmentsinassociatesareaccountedforatfairvaluethroughprofitorlossandpresentedwithininvestmentsecuritiesintheBalanceSheet.Atendofyear2007,basedonbothdirectandindirectownership,thefollowinginvestmentsaredefinedasassociates:
Ownership
Marel Food Systems hf., Iceland 31.2%LME ehf., Iceland 40.0%
All assets of LME ehf. are in listed shares.
Derivatives
15.Netassetsandliabilitiesinderivativesarespecifiedasfollows:
2007 2006
Net position of bond derivatives 4,019 0 Net position of interest rate derivatives 1,051 1,583 Net position of currency derivatives ( 3,026 ) ( 1,030 )
Net position of derivatives 2,044 553
Derivatives - assets in the Balance Sheet 5,317 3,575 Derivatives - liabilities in the Balance Sheet ( 3,273 ) ( 3,022 )
Net position of derivatives 2,044 553
Tradeandotherreceivables
16.Tradeandotherreceivablesarespecifiedasfollows:
Prepaid expenses 348 331 Other receivables 16 0 Total trade and other receivables 364 331
At 31 December 2007 and 31 December 2006 no allowance was conseded for doubtful receivables. No impairment loss was recognised during the years.

88 | Eyrir Invest 2007 Annual Report
Operatingassets
17.Operatingassetsarespecifiedasfollows:
Gross carrying amount Buildings Other
operating assets
Total
Balance at 1.1.2006 1,853 316 2,169
Additions during the year 0 15 15
Sales and disposals during the year 0 ( 11 ) ( 11 )
Translation difference ( 394 ( 64 ) ( 458 )
Balance at 31.12.2006 1,459 256 1,715
Additions during the year 715 158 873
Translation difference 30 ( 1 ) 29
Balance 31.12.2007 2,204 413 2,617
Depreciation and impairment losses Buildings Other
operating assets
Total
Balance at 1.1.2006 22 37 59
Depreciation 32 50 82
Sales and disposals during the year 0 ( 8 ) ( 8 )
Translation difference ( 8 ) ( 7 ) ( 15 )
Balance 31.12.2006 46 72 118
Depreciation 32 76 108
Translation difference 1 ( 1 ) 0
Balance 31.12.2007 79 147 226
Carrying amounts
1.1.2006 1,831 279 2,110
31.12.2006 1,413 184 1,597
31.12.2007 2,125 266 2,391
Depreciation ratios 2% 20-30%

Eyrir Invest 2007 Annual Report | 89Amounts are in Euros thousands
Equity
18.Issuedcapital
A shareholders meeting in January 2007 approved an increase in nominal value of share capital of e 228 thousand which was sold for e 5,559 thousand, net of cost of e 148 thousand. In April 2007 share options for shares with nominal value of e 414 thousand were exercised. The selling price amounting to e 7,873 thousand was paid in August 2007. A shareholders meeting in August 2007 approved an increase in nominal value of share captial of up to e 1,712 thousand. In September an increase in nominal value of share capital of e 1,644 thousand was sold for e 48,002 thousand, net of cost of e 1,307 thousand. Share capital was increased during the year 2006 by a nominal value of e 548 thousand, from e 6,178 thousand to e 6,726 thousand.
The Company’s share capital, according to its Articles of Association amounts to e 9,012 thousand and is all fully paid. The holders of ordinary shares are entitled to dividends as declared from time to time and are entitled to one vote per share at meetings of the Company. Share capital according to the Balance Sheet amounted to e 9,012 thousand at the end of year 2007, share capital is specified as follows:
Amounts Ratio
Total issued shares at the end of the year 9,012 100.0%
Own shares 0 0.0%
Share capital according to the Articles of Association 9,012 100.0%
Share premiumShare premium represents excess of payment above nominal value (ISK 1 per share) that shareholders have paid for sharessoldbytheCompany.AccordingtoIcelandicCompaniesAct,25%ofthenominalvalueofsharecapitalmustbe held in reserve which can not be paid out as dividend to shareholders.
Share option reserveThe reserve includes the accrued part of the fair value of share options. This reserve is transferred to share premium when share options are exercised. The reserve is transferred to retained earnings when the share options are not exercised.
Tradeandotherpayables
19.Tradeandotherpayablesarespecifiedasfollows:
2007 2006
Trade payables 25,165 1,209
Other payables 701 734
Total trade and other payables 25,866 1,943

90 | Eyrir Invest 2007 Annual Report
Borrowings
20.Borrowingsarespecifiedasfollows:
2007 2006Carrying amount
Carrying amount
EUR 106,664 40,863
ISK 95,506 30,777
SEK 47,200 16,522
USD 14,470 21,696
GBP 10,618 11,389
CHF 2,683 2,749
NOK 2,331 2,241
JPY 1,981 2,079
Borrowings total 281,453 128,316
Borrowings are secured as follows:
Secured bank loans 186,439 97,641
Unsecured bond issues 95,014 30,675
Borrowings total 281,453 128,316
Company’s investment securities amounting to e 270,066 thousand are mortgaged to secure borrowings with the
remaining balance of e 186,439 thousand at the year-end 2007.
21.Repaymentofborrowingsarespecifiedasfollows:
Repayments in 2007 - 25,851
Repayments in 2008 7,591 2,801
Repayments in 2009 113,643 54,726
Repayments in 2010 15,547 14,263
Repayments in 2011 22,084 0
Repayments in 2012 122,588 30,675
Borrowings totals 281,453 128,316
22.Thedeferredincometaxliabilityisspecifiedasfollows:
2007 2006
Deferred income tax liability 1.1. 17,758 18,182
Changes due to IFRS ( 206 ) ( 23 )
Deferred income tax liability 1.1. (IFRS) 17,552 18,159
Income tax expense recognised in Income Statement 1,269 3,510
Income tax recognised directly in equity ( 311 ) 0
Income tax on translation difference, posted in equity 618 ( 4,117 )
Deferred income tax liability 31.12. 19,128 17,552

Eyrir Invest 2007 Annual Report | 91Amounts are in Euros thousands
The deferred income tax liability is attributable to the following items:
2007 2006
Securities 23,804 20,047
Accrued share options expense ( 54 ) 0 Operating assets 5 7
23,755 20,054
Tax losses carried forward ( 4,627 ) ( 2,502 )
Deferred income tax liability at end of period 19,128 17,552
When the Company pays dividends to its shareholders, it is required to pay a portion of the dividends to taxation authorities on behalf of shareholders, i.e. withholding tax. The amount paid to taxation authorities is charged to equity as a part of the dividends.
Share-basedpayments
23.Thetermsandconditionsofgrantsareasfollows:
Grant date / employees entitledNumber of
instruments in thousands
Vesting conditions
Contractual life of option
Options granted 2006 4,750 32/44 months service 3 years
Options granted 2007 7,250 23/35/47/59 months service 5 years
Total 12,000
All options are to be settled by physical delivery of shares. Options vesting in 12 months can be excercised three times during the contractual life, at the end of each 12 month period. Accordingly 24 month options can be exercised two times and the 36 month options only once at the end of the 36 month period.
The number and weighted average excercise price of share options is as follows in thousands:
Weighted average
exercise price
Number of options
Weighted average
exercise price
Number of options
2007 2007 2006 2006
Outstanding at 1 January 19.0 41,050 19.0 36,300 Exercised during the year 19.0 ( 36,300 ) 0
Granted during the year 24.0 7,250 19.0 4,750
Outstanding at 31 December 22.0 12,000 19.0 41,050
Excercisable at 31 December 0 36,300
Options excercised during the year belong to key management, i.e. the CEO and the Chairman of the Board.
The options outstanding at 31 December 2007 have a weighted average contractual life of 2.3 years. The share price at the date of exercise for share options exercised in 2007 was ISK 25 per share (e 0.274).
22.Contd.

92 | Eyrir Invest 2007 Annual Report
The fair value of services received in return for share options granted based on the fair value of share options granted, mesuring using a Black-Scholes model, with the following inputs:
Granted
2006Granted
2007
Fair value at grant date, average 12, 24, and 36 months options 6.96 9.81 Share price 25.0 25.0 Exercise price * 19.0 24.0 Expected volatility (weighted average volatility) 22.2% 23.2%Option life (expected weighted average life) 3.5 4.8Expected dividends * 0.0% 0.0%Risk-free interest rate (based on government bonds) 12.4% 11.6%
* Excercise price is depended on dividends paid during the life of the option.
Total recognised expenses for the year arising from share-based payment transactions amounted to e 1,124 thousand
(2006: e 1,129 thousand) including accrued social security expenses related to share-based payments.
Financialinstruments
24.Creditrisk
Exposure to credit risk The carrying amount of financial assets represents the maximum credit exposure. The maximum exposure to credit risk at the reporting date was:
Carrying amount
2007 2006
Financial assets at fair value through profit or loss 5,317 3,575
Loans and receivables 2,169 331 Cash and cash equivalents 76,304 2,759
83,790 6,665
Liquidity risk The following are the contractual maturities of financial liabilities, including estimated future interest payments:
31 December 2007
Financial liabilities: Carryingamount
Contractualcash flows
Less than1 year
1 - 2years
2 - 5years
More than5 years
Secured bank loans 186,439 229,553 16,747 63,812 148,994 0
Unsecured bond issues 95,014 118,780 8,139 71,966 38,675 0
Trade and other payables 25,866 25,866 25,866 0 0 0
307,319 374,199 50,752 135,778 187,669 0
23.Contd.

Eyrir Invest 2007 Annual Report | 93Amounts are in ISK thousands
31 December 2006
Financial liabilities: Carryingamount
Contractualcash flows
Less than1 year
1 - 2years
2 - 5years
More than5 years
Secured bank loans 97,641 118,306 33,973 9,709 74,624 0
Unsecured bond issues 30,675 40,205 1,663 1,663 4,987 31,892
Trade and other payables 1,943 1,943 1,943 0 0 0
130,259 160,454 37,579 11,372 79,611 31,892
Currency risk
Exposure to currency risk
The Company´s exposure to foreign currency risk was as follows based on notional amounts:
31 December 2007 EUR SEK USD GBP NOK Other
Financial instruments at fair value through profit or loss 117,606 52,181 718 0 7,091 ( 68 )
Loans and receivables 1,821 0 0 0 0 0
Cash and equvalents 37,857 26,672 2 0 3 16
Secured bank loans ( 106,872 ) ( 47,076 ) ( 14,432 ) ( 10,590 ) ( 2,325 ) ( 4,652 )
Trade payables 0 ( 6,277 ) 0 0 0 0
Net balance sheet exposure 50,412 25,500 ( 13,712 ) ( 10,590 ) 4,769 ( 4,704 )
24.Contd.
31 December 2006 EUR SEK USD GBP NOK Other
Financial instruments at fair value through profit or loss 25,538 60,726 1,928 0 7,941 ( 70 )
Cash and equvalents 39 1,712 74 0 0 1
Secured bank loans ( 40,851 ) ( 16,522 ) ( 21,696 ) ( 11,389 ) ( 2,241 ) ( 4,828 )
Net balance sheet exposure ( 15,274 ) 45,916 ( 19,694 ) ( 11,389 ) 5,700 ( 4,897 )
The following significant exchange rates applied to the Icelandic krona during the year:
Average rate Reporting date spot rate
2007 2006 2007 2006
EUR 87.846 87.965 91.450 94.870
SEK 9.498 9.511 9.713 10.477
USD 64.168 69.943 62.150 72.000

94 | Eyrir Invest 2007 Annual Report
Sensitivity analysisA10%strengtheningoftheIcelandickrónaagainstthefollowingcurrenciesat31Decemberwouldhaveincreased(decreased) post-tax profit or loss by the amounts shown below. This analysis assumes that all other variables, in particular interest rates, remain constant. This analysis is performed on the same basis for 2006.
Profit or loss2007 2006
EUR 4,304 ( 1,354 )
SEK 2,177 3,909 Other ( 2,069 ) ( 2,685 )
A10%weakeningoftheIcelandickrónaagainsttheabovecurrencieswouldhavehadtheequalbutoppositeeffecton the above currencies to the amounts shown above, on the basis that all other variables remain constant.
Interest rate risk At the reporting date the interest rate profile of the Company´s interest bearing financial instruments was:
Carrying amount2007 2006
Fixed rate instruments 1,805 0
Financial assets ( 95,014 ) ( 30,675 )
Financial liabilities ( 93,209 ) ( 30,675 )
Variable rate instruments
Financial liabilities ( 186,439 ) ( 97,641 )
Fair value sensitivity analysis for fixed rate instrumentsThe Company does not account for any fixed rate financial assets and liabilities at fair value through profit or loss, and the Company does not designate derivatives (interest rate swaps) as hedging instruments under a fair value hedge accounting model. Therefore a change in interest rates at the reporting date would not affect profit or loss.
Cash flow sensitivity analysis for variable rate instruments A change of 100 basis points in interest rates at the reporting date would have increased (decreased) post-tax profit or loss by the amounts shown below. This analysis assumes that all other variables, in particular foreign currency rates, remain constant. The analysis is performed on the same basis for 2006.
2007 2006
Profit or loss Profit or loss
100 bp 100 bp 100 bp 100 bpincrease decrease increase decrease
Variable rate instruments ( 1,569 ) 1,569 ( 853 ) 853
Cash flow sensitivity (net) ( 1,569 ) 1,569 ( 853 ) 853
24.Contd.

Eyrir Invest 2007 Annual Report | 95Amounts are in Euros thousands
Fair values
Fair values versus carrying amounts The fair values of financial assets and liabilities, together with the carrying amounts shown in the balance sheet, are as follows:
31 December 2007 31 December 2006Carrying Fair value Carrying Fair valueamount amount
Financial instruments designated at fair value through profit or loss 444,412 444,412 269,907 269,907
Loans and receivables 2,169 2,169 331 331
Cash and cash equivalents 76,303 76,303 2,759 2,759
Secured bank loans ( 186,439 ) ( 179,332 ) ( 97,641 ) ( 91,734 )
Unsecured bond issues ( 95,014 ) ( 91,870 ) ( 30,675 ) ( 31,708 )
Trade and other payables ( 25,866 ) ( 25,866 ) ( 1,943 ) ( 1,943 )
215,566 225,817 142,738 147,612
The basis for determining fair values is disclosed in note 4.
Interest rates used for determining fair values
The interest rate used to discount estimated cash flows, where applicable, are based on the government yield curve at the reporting date plus an adequate credit spread, and were as follows:
2007 2006
Secured bank loans 6.8%-8.0% 5.2%-7.6%
Unsecured bond issues, indexed / non-indexed 6.7%/18.5% 6.2%/-
Relatedparties
Identity of related parties
25.TheCompanyhasarelatedpartyrelationshipwithitsassociates,andwithitsdirectorsandexecutiveofficers.
Transactions with related parties During the year the Company paid salaries to the Chairman of the Board of Directors and the CEO. Both the Chairman and the CEO exercised their share options during the year. Further information is in note 8. The members of the Board of Directors and the CEO purchased part of share increases during the year at the same rate as other shareholders. These transactions were priced on an arm’s length basis.
24.Contd.

96 | Eyrir Invest 2007 Annual Report
TransitiontoIFRS
26.ThesearetheCompany´sfirstFinancialStatementspreparedinaccordancewithIFRSsandIFRS1,First-timeAdoptionofInternationalFinancialReportingStandards,hasbeenapplied. The Financial Statements are prepared in accordance with the accounting policies presented in the Notes to these Financial Statements. The opening IFRS Balance Sheet as at 1 January 2006, which is referred to as the transition date, and the comparative figures for 2006 have also been prepared in accordance with these accounting policies. Accordingly the Company has adjusted amounts reported previously in Financial Statements prepared in accordance with IS-GAAP. The following tables and notes show the effects of the change from Icelandic GAAP (IS-GAAP) to IFRSs on the Company´s financial position and financial performance. The total effect of the adoption of IFRSs on equity is a increase of ISK 14 million. There are no significant changes to the cash flows according to IFRS compared with how they were previously reported under IS-GAAP.
Explanation of changes in Equity, net of tax
Equity according to IS-GAAP at 31 December 2006 126,640
Equity according to IFRS at 31 December 2006 126,782
Total increase in equity due to transition to IFRS 142
Changes in measurement
1 January 31 December2006 2006
Share-based payments IFRS 2 ( 7 ) ( 64 )
Deferred tax liability IAS 12 23 206
Total increase in equity due to transition to IFRS 16 142
Share-based payments
The Company applies IFRS 2, Share-based payment, to its share-based payment arrangements at 1 January 2006. The Company has granted equity-settled share-based payments in 2005, 2006 and 2007. The Company has not accounted for these share-based payments arrangements in its previous Financial Statements.
The effect of accounting for equity-settled share-based payment transactions at fair value is to increase salaries and
salary related expenses by e 1,127 thousand for the year ended 31 December 2006. The adoption of IFRS 2 is equity-neutral for equity-settled transactions, except that the Company has to pay social security taxes when the share options are exercised. The estimated taxes are included in the expenses and reduce the equity of the Company by
e 64 thousand as at 31 December 2006. The share-based payments are deductible from income tax when exercised. The tax effect of the expensed share-based payments reduce income tax expense and increase equity.

Eyrir Invest 2007 Annual Report | 97Amounts are in Euros thousands
Changes in presentation
Change in the presentation of dividends earnedDividends earned which has been presented as a separate line item in the Income Statement is now included in Net income from securites and derivatives.
Change in the presentation of Contributions and grantsContributions and grants which has been presented as a separate line item in the Income Statement is now included in Other operating expenses.
Change in the presentation of Investment securitiesSecurities have been divided into four line items in previous Financial Statements. Shares in other companies and bonds are now included in the line item Securities. The bonds are either listed or unlisted loans to companies that Eyrir Invest ehf. has share in. Mutual fund certificates that are readily convertible to known amounts of cash and are subject to an insignificant risk of change in value are now included in cash and cash equivalents.
Change in the presentation of Derivatives liabilitiesDerivative financial instruments with negative net value were previously included in Interest-bearing borrowings, but are now included as a separate line item in Derivatives among liabilities in the Balance Sheet. Derivative assets are as before shown as a separate line item among assets in the Balance Sheet.
Explanation of changes in the profit for the year 2006
According to IS-GAAPIS-GAAP Changes in Changes in IFRS
According to IFRSs2006 valuation presentation 2006
Net gains on investments in share and shares derivatives 33,291 ( 238 ) 1,850 34,903 Net income from securities
and derivatives
Dividends earned 1,850 ( 1,850 ) 0
Interest earned 898 898 Interest income
Changes in foreign exchange currency and interest rate derivatives
( 1,439 ) ( 1,439 )Net foreign exchange gain (loss)
Financial expenses ( 10,521 ) ( 10,521 ) Interest expenses
Net operating revenue 24,079 23,841 Net operating revenue
Salaries and salary related expenses 796 1,127 1,923 Salaries and salary related expenses
Other operating expenses 348 204 552 Other operating expenses
Contributions and grants 204 ( 204 ) 0
Operating expenses 1,348 2,475 Operating expenses
Profit before income tax 22,731 21,366 Profit before income tax
Income tax ( 3,759 ) 249 ( 3,510 ) Income tax
Profit for the year 18,972 ( 1,116 ) 0 17,856 Profit for the year
26.Contd.

98 | Eyrir Invest 2007 Annual Report
Explanation of changes in the profit of the year 2006
Profit for the year according to IS-GAAP 18,972
Net changes in fair value of associated company ( 238 )
Share-based payment expenses ( 1,065 )
Social security taxes ( 62 )
Income tax effect 249
Profit for the year according to IFRS 17,856
Explanation of changes in Balance Sheet as at 31 December 2005
According to IS-GAAPIS-GAAP Changes in Changes in IFRS
According to IFRSs12/31/05 valuation presentation 12/31/05
Shares in other companies 207,902 353 208,255 Investment securities
Derivatives 146 146 Derivatives
Mutual funds 1,629 ( 1,629 ) 0 -
Bonds 353 ( 353 ) 0 -
Sundry receivables 1,151 1,151 Trade and other recievables
Fixed assets 2,110 2,110 Operating assets
Cash and cash equivalents 22,571 1,629 24,200 Cash and cash equivalents
Total assets 235,862 0 0 235,862 Total assets
Capital stock 6,178 6,178 Share capital
Contributed capital in excess of par 35,842 35,842 Share premium
119 119 Reserves
Retained earnings 78,109 ( 103 ) 78,006 Retained earnings
Unrealizedcurrencyfluctuations 8,972 8,972 Translation reserve
Stockholders equity 129,101 16 0 129,117 Total equity
Deferred income tax liability 18,182 ( 23 ) 18,159 Deferred tax liability
2,007 2,007 Derivatives
Interest-bearing borrowings 87,618 ( 2,007 ) 85,611 Borrowings
Taxes for the year 98 98 Current tax liability
Other liabilities 863 7 870 Trade and other payables
Total liabilities 106,761 ( 16 ) 0 106,745 Total liabilities
Total stockholders equity and liabilities 235,862 0 0 235,862 Total equity and liabilities
26.Contd.

102 | Eyrir Invest 2007 Annual Report

For further information please contact Eyrir Invest ehf., Skolavordustigur 13, 101 Reykjavik, tel.: +354 525 0200,
fax + 354 525 0209 or visit our website, www.eyrir.is

Eyrir Invest ehf. | Skolavordustigur 13 | 101 Reykjavik | Iceland | tel.: +354 525 0200 | www.eyrir.is