annual report - liteon.com · 3.1.3 audit committee ... with the advantages of an elite, ......
TRANSCRIPT

TSE:2301
www.liteon.com
Lite-On Technology Corporation
ANNUAL REPORT
Lite-On Group 40th Anniversary

Spokesperson:
Brownson Chu
General Manager, Finance Department
Tel: 886-2-8798-2888
e-mail: [email protected]
Acting Spokesperson:
Julia Wang
Senior Director, Investor Relations/Public Relations
Tel: 886-2-8798-2888
e-mail: [email protected]
Global Headquarter:
No. 392, Ruey Kuang Road, Neihu,
Taipei 114, Taiwan, R.O.C.
Tel: 886-2-8798-2888
Major Factory:
No. 90, Chien-I Road, Chung Ho City,
Taipei 235, Taiwan, R.O.C.
Tel: 886-2-2222-6181
Stock Affairs Department:
1F, No. 392, Ruey Kuang Road, Neihu,
Taipei 114, Taiwan, R.O.C.
Tel: 886-2-8798-2301
www.liteon.com
CPAs:
Jr-Shian Ke and Ching-Fu Chang
Deloitte & Touche
12F, No. 156, Sec. 3, Min-Sheng E. Road,
Taipei 105, Taiwan, R.O.C.
Tel: 886-2-2545-9988
www.deloitte.com.tw
GDR and related information:
Citibank, N.A.
www.londonstockexchange.com & www.citi.com/dr
Lite-On Technology Corporation website:
www.liteon.com
CONTACT INFORMATION
3. Corporate Governance3.1 Introduction
3.1.1 Major Resolutions of the General Meeting
3.1.2 Board of Directors
3.1.3 Audit Committee
3.1.4 The Compensation Committee
3.1.5 The Growth Strategic Committee
3.2 Anti-Corruption
3.3 Corporate Risk Management
3.4 Information Regarding Board Members and
Management Team
3.5 Statement of Internal Control System
4. Capital and Shares4.1 The Top-10 Shareholders and Information of
Related Parties
4.2 The Structure of Shareholders
4.3 Change in the Proportion of Shareholding among
the Directors, Managers, and Major Shareholders
5. Financial Information5.1 Consolidated Financial Statements of 2015
5.2 Parent Company Only Financial Statements of 2015
Contact Information
Members of Top Management
Business Philosophy
1. Letter to Shareholders
2. Corporate Overview2.1 Company Profile
2.2 Lite-On Corporate Values
2.3 Organization Chart
Table of Contents
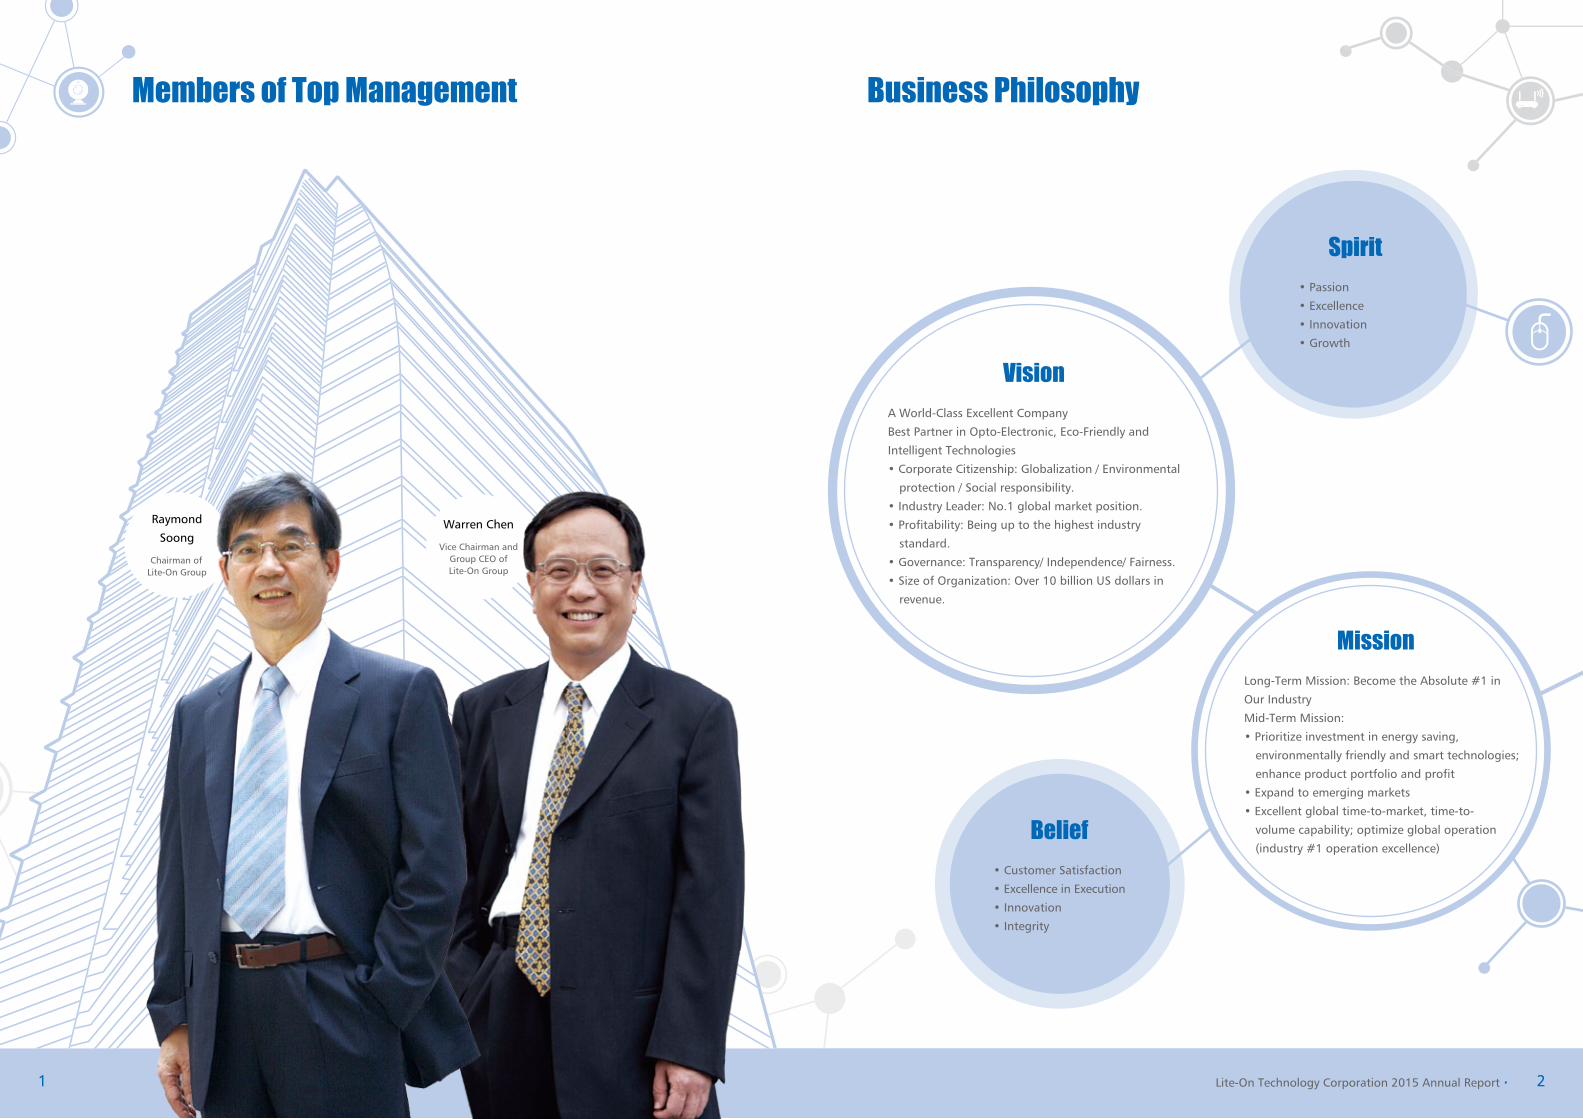
Raymond
Soong
Chairman of Lite-On Group
Warren Chen
Vice Chairman and Group CEO of Lite-On Group
Members of Top Management Business Philosophy
VisionA World-Class Excellent Company
Best Partner in Opto-Electronic, Eco-Friendly and
Intelligent Technologies
• Corporate Citizenship: Globalization / Environmental
protection / Social responsibility.
• Industry Leader: No.1 global market position.
• Profitability: Being up to the highest industry
standard.
• Governance: Transparency/ Independence/ Fairness.
• Size of Organization: Over 10 billion US dollars in
revenue.
Belief• Customer Satisfaction
• Excellence in Execution
• Innovation
• Integrity
Spirit• Passion
• Excellence
• Innovation
• Growth
MissionLong-Term Mission: Become the Absolute #1 in
Our Industry
Mid-Term Mission:
• Prioritize investment in energy saving,
environmentally friendly and smart technologies;
enhance product portfolio and profit
• Expand to emerging markets
• Excellent global time-to-market, time-to-
volume capability; optimize global operation
(industry #1 operation excellence)
1 2Lite-On Technology Corporation 2015 Annual Report‧

3 4‧Lite-On Technology Corporation 2015 Annual Report Lite-On Technology Corporation 2015 Annual Report‧
Letter to Shareholders
Dear Shareholders,
Despite the lower demand for products and services in the global information and communication industries in
2015, the Lite-On Group has been focusing on profits, steadying operations and increasing shareholders’ return
on equity as our operational strategies. We have shown an increase in profits through our ability to execute and
compete. Cloud computing, LED lighting, automotive electronics, biomedical technology, and industrial automation
were the five Internet of Things (IoT) applications that we concentrated on as we transformed ourselves. In each and
every application area, we have consolidated business across areas and invested aggressively in resources, research
and team to expand business. We have used One LiteOn’s advantage as our new re-starting point. In 2015, LiteOn’s
global consolidated revenue amounted to NT$216.929 billion. As part of the overall revenue, non-PC-related products
exceeded 60%. Our net profit after taxes was NT$7.223 billion for the year and our annual earnings per share (EPS)
reached NT$3.11. This represented a yearly growth of 11%.
Operating Performance
All core products of LiteOn have continued to grow steadily in 2015. In recent years, we have been aggressively
growing our non-PC areas. We are gradually seeing results in the cloud computing, high-end cameras and LED lighting
areas. In 2015, they have not only grown steadily but will continue to be the growth areas and profit centers in 2016.
The optoelectronic department benefited from the increase in market demand for LED lighting, consumer electronics
and portable devices. It also benefited from increased production in camera modules and an increase market share in
high-end smart phones. With the increase in demand for cloud application server power management systems and
portable devices, our revenue in this area rose to a record high. In our core business groups, we saw an expansion in
market share for high-end server casings and input devices (peripherals such as keyboards and mice), an increase in
delivery of tablet PC peripheral applications and smooth delivery of the new laser models of multifunction machines.
All the above contributed to continued growth in revenue for the information product division. Market demand for
storage devices increased and gaming-related products rose nearly 10% in revenues.
The five IoT application areas of cloud computing, LED lighting, automobile electronics, medical biotechnology,
and industrial automation were LiteOn’s main focal points as it transformed itself. Development in new business
areas has taken off and research and innovation have led into operations, scaling up and a new wave of growth
momentum. In 2015, LiteOn successfully introduced data center power management systems by providing innovative
and flexible cloud applications for critical infrastructure power management, remote backup, and remote monitoring
as comprehensive solutions. Our electric car chargers have received technical and specification certifications from
Europeran and American countries and our customers and product installations have increased substantially. In the
area of LED lighting, LiteOn not only provided LED lighting products to car manufacturers around the world but is
also zealously developing integrated optical censors in new application areas for monitoring heart rates, directions,
environmental colors and gesture controls. With the development self-driving vehicles in full swing, LiteOn has
built smart sensing modules to be used in various driving situations. In the area of intelligent manufacturing, after
successfully developing 3D printing and scanning technology, we have led the industry in becoming the world’s first
company to build mobile phone antennas through 3D printing. Such antennas have been used with smartphones
manufactured by international brand companies. Because they are produced completely without the process of
plating and use green recyclable materials, the impact on the environment is greatly reduced and the customers
have offered high praises. LiteOn’s own biomedical technology brand, Skyla®, has successfully entered the global
biotechnology healthcare market, developing automated biochemical analyzers and glycated hemoglobin analyzers. In
March of 2016, we announced the establishment of the first overseas biotechnology research and development center
in Singapore geared towards the emergency and remote care markets. This integrates our dual advantages of product
design and product manufacturing and allows us to zealously develop highly competitive point-of-care products.
Corporate Social Responsibility
Nationally, LiteOn has received CommonWealth Magazine’s Benchmark Enterprise Award nine consecutive years,
the Taiwan Corporate Sustainability Award four times, and Global Views Monthly’s Excellence in Corporate Social
Responsibility Award eight times. Internationally, LiteOn has held a place on the Dow Jones Sustainability Index (DJSI)
for five years in a row and a place on the Morgan Stanley Sustainability Report for two years in a row. We have also
been featured on the A List in the Climate Disclosure Leadership Index (CDLI). Our highly transparent information
disclosure measures earned us the highest ranking of A++ on the TWSE (Taiwan Stock Exchange) two consecutive
years.
Future Outlook
As the technology industry of traditional hardware manufacturing rapidly crosses over to big data, smart LED lighting,
automobile electronics, medical biotechnology, smart home systems, intelligent manufacturing, and IoT applications,
there is need for careful integration with existing industries or a replacement of them. The global economic
environment is facing a variety of uncertainties. As we cross our 40th anniversary threshold, what is most important to
LiteOn is to face this new wave on a new starting point.
Looking ahead, LiteOn will continue to strengthen its production advantage and operational structure. We will eagerly
participate in the development of new applications and use a multi-directional approach to create sustainable growth
and achieve our developmental goals of transformation and advancement. With the advantages of an elite, world-class
company, LiteOn is committed to becoming the best choice for a business partner for any global customer seeking
innovative design, hardware manufacturing and applications in the areas of light, electricity, energy conservation
and smart technology. We have efficiently integrated the eight business units of Mobile Mechanics, PID, Power
Systems, Storage, MEC, CDSS, OPS and the New Business unit. This was a display of our institutional spirit of passion,
excellence, innovation and growth as well as an exercise in flexibility and creativity for the One LiteOn team. We will
eagerly seek out the next wave of growth and market opportunities to demonstrate One LiteOn’s holistic productivity
and competitiveness.
In the past 40 years, LiteOn has consistently faced a variety of challenges. In overcoming each challenge, it has grown
and attained great results. We hope that this spirit can be sustained generation after generation, making LiteOn an
asset for society and an ever-lasting and ever-growing Taiwanese enterprise. This will require the persistence and effort
of each member of our team as well as the support and affirmation of every customer, supplier, business partner,
shareholder and society at large. Together, we will build a centenarian corporation out of LiteOn.
Raymond Soong
Chairman of Lite-On Group
Warren Chen
Vice Chairman and Group CEO
of Lite-On Group

5 6‧Lite-On Technology Corporation 2015 Annual Report Lite-On Technology Corporation 2015 Annual Report‧
2.1 COMPANY PROFILE
Established: 1975/6/2
Date of Listing: 1983/1/26
Company Code: 2301
Paid-in-Capital: NT$ 23.3 B (as of December 2015)
About Lite-On Technology
Established in 1975, the Lite-On Group, a leading global organization and major player in optoelectronic components
industry, envisions being “the Best Partner in Opto-electronic, Eco-friendly and Intelligent Technologies.” The
company serves customers from communication, computer, consumer electronics, LED lighting, cloud computing and
automotive electronics.
For more than 40 years Lite-On has concentrated on establishing its unique competitive advantages in mass
production. Through resource integration and management, the company maximizes the returns from a diverse
product portfolio to realize excellent growth both in revenue and profits. Every product line at Lite-On is aimed to
be the largest in Taiwan and global top 3 in terms of market size. As technology advances with time, Lite-On image
business becomes the largest in Taiwan. It is also one of the top 2 suppliers of optical drives, the top 1 supplier of
notebook power supplies and one of the top 2 keyboard suppliers in global markets. Lite-On is also the world’s second
largest supplier of power supplies, one of the top 3 camera module suppliers, the No. 1 supplier of LED street lights
by market share in North America and also the top 1 supplier by volume in Taiwan. In 2014, Lite-On successfully
completed the consolidation of nine subsidiaries under the “One Lite-On” program. The core business strategy remains
focused on advancing resource utilization, using automation to optimize production and efficiency, and promoting
lean production to transform the overall production process and productivity. In the long-term, the focus is on
profitability, operation excellence and enhancing shareholder returns to lay down the foundation for a sustainable
enterprise.
In recent years, Lite-On has actively moved beyond the information and communication technology industry into fields
such as LED lighting, automotive electronics, medical and biotech, and cloud computing, which have generated a new
wave of revenue growth. These include energy-saving products such as indoor/outdoor LED lighting and automotive
LEDs; power management systems and solid state drive used in data centers; and automotive electronics; as well as
energy storage products such as electric vehicle charging equipment, wireless charging and quick charging battery
modules.
The global technology industry is now set to welcome a new wave of changes. Lite-On hopes to leverage our existing
advantage as a world-class enterprise in this age of changes and challenges to become the best partner of global
customers stimulating innovations and developing applications for opto-electronic, eco-friendly and intelligent
technologies.
2.2 Lite-On Corporate Values
Customer Satisfaction, Excellence in Execution, Innovation, and Integrity are the guiding principles, commitments,
and beliefs of Lite-On Technology. These values are applied throughout the company’s daily business operations and
management.
Customer Satisfaction
As the best partners for our customers, we attentively listen to their needs, mastering market trends and using our
strong expertise to fulfill their goals.
Excellence in Execution
With outstanding execution, we dedicate ourselves to fulfilling our commitments to customers, while creating
innovative competitive advantages.
Innovation
With open minds and innovative technology, we are at the forefront of the mass production of next-gen technology.
Integrity
We emphasize integrity, transparency, and doing the right thing to earn the respect of our employees and trust of our
customers and stakeholders to ensure solid and sustainable business operations.
Corporate Overview

7 8‧Lite-On Technology Corporation 2015 Annual Report Lite-On Technology Corporation 2015 Annual Report‧
CSER Office IR/PR
2.3 Organization Chart
Regions
US
EU
SGP
China Operations
Mobile Mechanics
PID
Power System
Storage
NMEC
CDSS
OPS
New Business
Business Units
Strategy & Investment
FIN
Operational Controlling
HR
Legal / IP
MOE
ICC
Manufacturing Technology
OSHM
Function Units
Audit Committee
Compensation Committee
CorporateInternal Audit
Growth StrategicCommittee Stock Affairs
Shareholder’s Meeting
Board of Directors Group Chairman
Vice Chairman & Group CEO
3.1 Introduction
Lite-On emphasizes transparent and effective corporate governance and has drafted a corporate governance
framework and implemented practices in accordance with the Company Act, Securities and Exchange Act, and other
relevant laws and regulations. The company continues to improve its management performance, while safeguarding
the rights and interests of investors and other stakeholders.
Lite-On’s corporate governance milestones:
1. In 2007, the company introduced the role of independent director to replace supervisors, and established its first
Audit Committee. In 2008 and 2010, a Compensation Committee and a Growth Strategic Committee were estab-
lished respectively under the board of directors.
2. Lite-On places high emphasis on the complete, timely, fair and transparent disclosure of information. In addition to
publishing financial data, statements, annual reports and material information onto the Market Observation Post
System (MOPS), Lite-On also makes this information accessible from its website for the convenience of local and
foreign investors. (www.liteon.com)
3. The company will continue to pursue sound corporate governance and the transparency, timeliness, and fairness
of financial information disclosure. In 2015, Lite-On was rated A++ by the Securities and Futures Institute during
its Information Disclosure Evaluation. In 2016, Lite-On was rated top 5% in Corporate Governance Evaluation ar-
ranged by Taiwan Stock Exchange (TWSE).
4. In 2015, Lite-On’s IMG site at Guangzhou and AE site at Kaohsiung both obtained Product Liability Insurance AAA
Certification from ACE Group, the world’s most creditworthy certifier. So far, twelve of the company’s plant sites
have obtained Product Liability Insurance AAA Certification, and Lite-On has set a goal for all plant sites to obtain
AAA certification.
Lite-On’s Board of Directors, Audit Committee, Compensation Committee and Growth Strategic Committee perform
their duties in accordance with the “Board of Directors Meeting Rules,” “Audit Committee Organizational Rules,”
“Compensation Committee Organizational Rules,” and “Growth Strategic Committee Organizational Rules.
3.1.1 Major Resolutions of the General Meeting
The Company held a regular session of the General Meeting of 2014 on June 24th 2015 at the International
Conference Center of Lite-On Technology Building located at No. 392, Rai Guang Road, 1/F, Neihu, Taipei. Major
resolutions and the status of execution are shown below:
i. Adoption of 2014 Financial Statements
ii. Adoption of the Proposal for Appropriation of 2014 Earnings
iii. Proposal for dividends and employee bonuses payable in newly-issued shares of common stock for 2014
iv. Amendment to “Regulations Governing Loaning of Funds and Making of Endorsements/guarantees”
v. Amendment to “Rules and Procedures of Shareholders’ Meeting”
vi. Amendment to “Regulations Governing Election of Directors”
All above resolutions have exceeded legal requirement of the voting numbers and been approved in the AGM.
Corporate Governance

9 10‧Lite-On Technology Corporation 2015 Annual Report Lite-On Technology Corporation 2015 Annual Report‧
• Announcement of the Board of Directors’ resolution on capital reduction through cancellation of treasury
stocks and the record date.
• Lite-On Technology Corp. announced the results of it’s operations for the first three quarters of Y2015.
(8) BOD resolutions on 2015/11/19
• Change in internal audit officer.
(9) BOD resolutions on 2016/03/25
• Board of Directors’ resolution on the schedule and agenda of year 2016 shareholders’ meeting.
• Board of directors resolution for remuneration of employees and directors of 2015
• Board of directors resolution for issuance of new share for capital increase.
• Board of Directors Resolution for dividend distribution.
• Announcement of Donation to Lite-On Culture Foundation.
• Lite-On Technology Corp. announced the results of it’s operations for Y2015.
(10) BOD resolutions on 2016/04/27
• Board of Directors’ resolution the candidates’ qualification for Directors and Independent directors of year
2016 shareholders’ meeting.
2. The Board and the Functional Committees
The
Board
Chairman Raymond Soong
Vice Chairman Lite-On Capital Inc. Representative: Warren Chen
Directors
David Lin
Dorcas Investment Co., Ltd. Representative: Joseph Lin
Ta-Sung Investment Co., Ltd. Representative: Keh-Shew Lu
Ta-Sung Investment Co., Ltd. Representative: Rick Wu
Yuan Pao Development & Investment Co., Ltd. Representative: CH Chen
Yuan Pao Development & Investment Co., Ltd. Representative: David Lee
Independent Directors Kuo-Feng Wu, Harvey Chang, Edward Yang
3.1.2 Board of Directors
The company’s directors are elected according to its “Director Election Policy,” where candidates are nominated based
on the system stipulated in Article 192-1 of the Company Act. The company is required by law to announce before the
book closure date of its annual general meeting the period of directors’ (including independent directors) nomination
(no less than 10 days) and the number of directors (including independent directors) to be elected. The list of director
candidates (including independent directors) needs to be reviewed by the board to make sure that all candidates are
qualified (including independent directors) before the election commences during the annual general meeting.
The board consists of 11 members; all of whom are elected by shareholders. Board members currently include one
Chairman; six institutional investor representatives from Lite-On Capital, Dorcas Investment Co. Ltd., Ta-Sung Inv Co.
Ltd. and Yuan Pao Development & Inv. Co., Ltd.; one natural-person director; and three independent directors. These
members come from a broad variety of backgrounds and experience, and are capable of fulfilling their duties. They
have been given the duty to exercise proper governance of the board of directors, to supervise/appoint/instruct the
management, and to oversee the company’s financial, social, and environmental performance in ways that maximize
stakeholders’ interests.
Board members’ backgrounds, education, concurrent roles at other companies etc and functioning of the board of
directors as well as various functional committees have already been disclosed in the company’s annual report. The an-
nual report is accessible on the Market Observation Post System and from the company’s website (www.liteon.com).
According to Lite-On’s “Board of Directors Meeting Rules,” board meetings are held at least once ev-
ery quarter. A total of ten board meetings were held in 2015 (from January 1st, 2015 to April 30th, 2016) .
1. Major Resolutions of the Board Meetings
Following are the important resolutions from the board during 2015/01/01-2016/04/30.
(1) BOD resolutions on 2015/02/13
• BOD approved the investment in China.
• Interim Meeting of Board Approves the Acquisition of Equipment by Subsidiary Zhuhai Lite-On Mobile Tech-
nology Co., Ltd.
(2) BOD resolutions on 2015/03/25
• Board of Directors Resolution for dividend distribution.
• Board of directors resolution for issuance of new share for capital increase.
• Announcement of Donation to Lite-On Culture Foundation.
• Lite-On Technology Corp. announced the results of it’s operations for Y2014.
• Board of Directors’ resolution on the schedule and agenda of year 2015 shareholders’ meeting.
(3) BOD resolutions on 2015/05/13
• Lite-On Technology Corp. announced the results of it’s operations for Y2015 Q1.
• Announcement of Lite-On Technology Corporation’s Board of Directors Resolution for the disposition of as-
sets to Lite-On Electronics(Guangzhou)Co., Ltd.
(4) BOD resolutions on 2015/07/20
• Announcement of the record date for 2014 dividend.
• Lite-on Technology Corp.’s Board of Directors meeting approves plan to repurchase shares.
(5) BOD resolutions on 2015/08/11
• Lite-On Technology Corp. announced the results of it’s operations for Y2015 H1.
(6) BOD resolutions on 2015/09/18
• BOD approved its subsidiary Lite-On Green Energy B.V.to dispose 100% shares of Romeo Tetti PV1 S.R.L.
• Lite-on Technology Corp.’s Board of Directors approved to acquire real estate via auction process.
(7) BOD resolutions on 2015/11/12
• According to Regulations Governing Loaning of Funds and Making of Endorsements/Guarantees by Public
Companies Article 22 Paragraph 1 Section 3.
Audit CommitteeSince: 2007/06/21
Chair Person: Kuo-Feng WuMembers: Harvey Chang, Edward Yang
Compensation CommitteeSince: 2008/08/27
Chair Person: Harvey ChangMembers: Kuo-Feng Wu, Edward Yang
Growth Strategic CommitteeSince: 2010/09/01
Chair Person: Edward YangMembers: Raymond Soong, Warren Chen, Keh-Shew Lu, David Lin

11 12‧Lite-On Technology Corporation 2015 Annual Report Lite-On Technology Corporation 2015 Annual Report‧
3. Board Meetings Attendance
The Board held 10 meetings (A) in the recent period of time (from January 1st, 2015 to April 30th, 2016) with the
attendance of the directors specified as below:
Title Name Attend (sit in) in
person (B)Attend by proxy
Attendance rate (%) 【B/A】
Chairman Raymond Soong 10 0 100
Vice
Chairman
Lite-On Capital Inc. Representative:Warren Chen
10 0 100%
Director David Lin 8 2 80%
DirectorDorcas Investment Co., Ltd. Representative:Joseph Lin
8 2 80%
DirectorTa-Sung Investment Co., Ltd. Representative:Keh-Shew Lu
3 7 30
DirectorTa-Sung Investment Co., Ltd. Representative: Rick Wu
10 0 100%
DirectorYuan Pao Development & Investment Co., Ltd. Representative: CH Chen
9 1 90
DirectorYuan Pao Development & Investment Co., Ltd. Representative: David Lee
10 0 100%
Independent Director
Kuo-Feng Wu 9 1 90%
Independent Director
Harvey Chang 9 1 90%
Independent Director
Edward Yang 9 1 90%
Important Notice:
(1) Minutes of Board meetings where Article 14-3 of the Securities and Exchange Act is applicable and contained
information on the objection or qualified opinions of the independent directors on record or in writing: none.
(2) The avoidance of the conflict of interest by the directors on relevant motions:
A. Three occasions, In the 9th session of the 23th Board Meeting, Director Mr. Raymond Soong, Mr. David Lin,
Mr. Warren Chen and Mr. CH Chen avoided the discussion and did not vote the motion of donation to
Lite-On Cultural Foundation.
B. In the 9th session of the 30th Board Meeting, Director Mr. Raymond Soong, Mr. David Lin, Mr. Warren Chen
and Mr. CH Chen avoided the discussion and did not vote the motion of donation to Lite-On Cultural
Foundation.
C. In the 9th session of the 31th Board Meeting, Director Mr. Raymond Soong, Mr. Warren Chen, Mr. Keh-Shew
Lu, Mr. CH Chen, Mr. David Lee, Mr. Joseph Lin, Mr. Kuo-Feng Wu, Mr. Harvey Chang and Mr. Edward
Yang avoided his own qualification discussion and did not vote the motion of the candidates’ qualification
for Directors and Independent directors of year 2016 shareholders’ meeting.
(3) For strengthening and accelerating the growth strategy of the Company and the whole business group, the
Company has established the Growth Strategic Committee in 2010. The Committee is authorized by Board of
Directors to direct and review the Company and the Group’s overall growth strategies, and to preview the im-
portant investment projects, and periodically reports the resolutions to the Board of Directors.
(4) The company will continue to pursue sound corporate governance and the transparency, timeliness, and fair-
ness of financial information disclosure. In 2015, Lite-On was rated A++ by the Securities and Futures Insti-
tute during its Information Disclosure Evaluation. Meanwhile, Lite-On was rated top 5% in Corporate Gover-
nance Evaluation arranged by Taiwan Stock Exchange (TWSE).
3.1.3 Audit Committee
Chairperson: Independent Director Kuo-Feng Wu
Members: Independent Director Harvey Chang, Independent Director Edward Yao-Wu Yang
The Audit Committee consists entirely of independent directors. The duties of its three members are to assist the board
of directors in reviewing the company’s financial statements, internal control systems, audit practices, accounting poli-
cies, major asset transactions, and appointment/dismissal of external auditors, finance officers, accounting officers,
and internal auditors so as to ensure compliance with government regulations.
Effective internal control systems and audit operations are the foundation of sound corporate governance. In order to
maintain an effective internal control system, particularly in the area of risk management, financial and operational
control, the Audit Committee regularly reviews reports submitted by internal auditors and assesses the independence
of the company’s financial statement auditors, thereby ensuring the utmost integrity in financial reporting.
According to Lite-On’s “Audit Committee Organizational Rules,” the Audit Committee meets at least once every quar-
ter. A total of nine Audit Committee meetings were held (from January 1st, 2015 to April 30th, 2016).
(1) The operation of the Audit Committee
The Audit Committee held 9 meetings (A) in the recent period of time (from January 1st 2015 to April 30th 2016)
with the attendance of the independence directors specified below:
Title NameAttend (sit in) in
person (B)Attend by
proxyAttendance rate (%)
【B/A】(note)
Independent Director Kuo-Feng Wu 8 1 89%
Independent Director Harvey Chang 8 1 89%
Independent Director Edward Yang 8 1 89%
Important Notice:
1. Issues stated in Article 14-5 of the Securities and Exchange Act of the ROC and other issues not passed by the
Audit Committee but resolved by more than two-thirds of the directors: none.
2. The act of the avoidance of the conflict of interest by the independent director: none.
3. The communications between the independent director and the Chief Audit Officer and the certified public ac-
countants:
(1). The Chief Audit Officer reported to the Audit Committee on the establishment of and amendment to the
internal control system.
(2). The Chief Audit Officer reported to the Audit Committee on the conduct of internal audits and the find-
ings.
(3). The Chief Audit Officer reported to the Audit Committee on the annual audit plan and the implementa-
tion of the plan.
(4). The Chief Audit Officer reported to the Audit Committee on the findings of each audit and the tracking of
corrective actions and preventive actions.
(5). The Chief Audit Officer provided information on the addition or amendment of laws governing securities
and exchange to the Audit Committee.
(6). The Chief Audit Officer presented to the Audit Committee the report on the conduct of special audits pre-
scribed by the committee and the findings.
(7). Before year start, the certified public accountants reported to the Audit Committee the valuation of inde-
pendent , annual service contents and compensation.
(8). The certified public accountants reported to the Audit Committee on the planning, implementation, and
result of each period of the year.
(9). The certified public accountants reported to the Audit Committee on the quarterly and the annual exter-
nal audits
(10). The certified public accountants reported to the Audit Committee on newly established statement of fi-
nancial accounting standards and related laws on securities and exchange any time as needed.

13 14‧Lite-On Technology Corporation 2015 Annual Report Lite-On Technology Corporation 2015 Annual Report‧
(11). The certified public accountants reported to the Audit Committee in time when special issue occurs (no
special issue occurred in 2014).
Note:
* If a specific independent director resigned before the end of the fiscal year, specify the date of resignation in
the relevant field. The attendance (sit in) rate of such director or supervisor in Board meetings shall be based
on the actual attendance to meetings during his term of office.
* If there is a newly elected independent director who filled in the vacancy of the relieved independent direc-
tor, specify the names of and differentiate the old and new independent director, the date of office of the
new independent director or the date of renewal. The attendance (sit in) rate of such independent director in
Board meetings shall be based on the actual attendance to meetings during his term of office.
(2) The participation of the supervisors in the Board
The Company has established the Audit Committee on June 21 2007 to perform the functions of the supervisors as
required by law.
3.1.4 The Compensation Committee
Chairperson: Independent Director Harvey Chang
Members: Independent Director Kuo-Feng Wu, Independent Director Edward Yang
The Compensation Committee was established in 2009 to strengthen corporate governance and align the company
with international practices. The Compensation Committee has been authorized by the board of directors to supervise,
review and decide the company’s compensation policies.
Duties of the Compensation Committee extend beyond employees’ incentives and bonuses, to cover performance ap-
praisals and remuneration of directors and executive managers as well. Lite-On’s Compensation Committee consists of
three members; all of whom are chosen from independent directors to ensure objectivity, professionalism and fairness
of the committee, while avoiding any conflicts of interest those members may have with the company.
The Compensation Committee reviews the company’s remuneration policies and plans on a regular basis to ensure
that they sufficient to attract, motivate and retain talent. The committee reviews the performance and remuneration
of directors, the CEO and executives, and evaluates employee bonuses on a yearly basis.
3.1.5 The Growth Strategic Committee
Chairperson: Independent Director Edward Yao-Wu Yang
Members: Director Raymond Soong, Director David Lin, Director Warren Chen, Director Keh-Shew Lu
The Growth Strategic Committee was established in 2010 in an attempt to strengthen and accelerate the growth of
the Lite-On Group. The committee is authorized by the board of directors to review growth strategies for the Company
and the Group as a whole. It is also responsible for the preliminary assessment of all major investments of the Com-
pany and the Group. It reports its resolutions regularly to the board of directors.
The scope of responsibility of Lite-On’s Growth Strategic Committee covers Lite-On Technology Corporation as well as
its subsidiaries and certain business departments.
Committee members comprise five directors, all of whom are appointed by the board of directors.
A total of two Growth Strategic Committee meetings were held in 2015.

15 16‧Lite-On Technology Corporation 2015 Annual Report Lite-On Technology Corporation 2015 Annual Report‧
3.2 Anti-corruption
Lite-On upholds its reputation by obeying the laws and ethics of the countries in which it performs its business activi-
ties. We do not tolerate any violation of laws or ethics during our pursuit for sales, profits and performance targets.
The company has proper measures in place to govern activities that are prone to risks of bribery, and regularly pro-
motes employees’ awareness on this issue as a means to prevent corruptive behaviors.
“Integrity” is one of our four core values. The company has implemented an Ethical Code of Conduct for Employees
to help employees understand how to handle situations and issues encountered in daily work activities. This Code of
Conduct has been included as part of orientation programs to give new recruits an understanding of the company’s
standards with regard to reputation, laws and ethics. The Ethical Code of Conduct for Employees contains the follow-
ing ethical guidelines:
1. Gifts and hospitality:
1.1 Company employees may not give or accept any gifts intended to improperly influence normal business or de-
cisions. Company employees must immediately notify their supervisor or return any substantial gifts that they
have received. If, however, a gift constitutes a small gift such as often exchanged in business contact, it shall
not be subject to this restriction.
1.2 Customers and company employees may engage in reasonable social activities within the course of the busi-
ness contact in so far as such activities are clearly for business purposes and are respectable in tone. However,
any excessively generous treatment shall require the prior consent of the employee’s supervisor and a subse-
quent report to the supervisor. While dining is a necessary accompaniment of meetings between company
employees and suppliers or customers, the principle of reciprocity should be emphasized.
1.3 Company employees should avoid any improper actions, and absolutely may not give or accept any kickbacks
in any form under any circumstances. While engaged in private shopping, company employees and their fam-
ily members may not accept discounts from suppliers due to their relationship with this company, unless such
discounts are given to all employees of this company.
2. Principles governing business-related payments:
Any employee who discovers an irregularity affecting company assets or monies that may disrupt payments must
immediately notify their supervisor. If the irregularity involves a supplier, the employee must notify the head of
purchasing. No bribes of any kind may be given to any person; there are no exceptions to this rule. So-called bribes
refer to payments given to certain persons to induce them to violate the rules of their employers or the laws of
their country.
2.1 Payments to suppliers: payments can only be made for goods or services provided by suppliers that an autho-
rized procuring unit has verified to have complied with the company’s standards.
2.2 Payments to government officials: the company can not provide government officials of any country with pay-
ments that are prohibited in that country. Legitimate payments given to government officials must comply
with all procedures specifically required by the company.
2.3 Payments to consultants, wholesalers or distributors: payments to consultants, wholesalers and distributors
must be equivalent to the value of the services they provide.
2.4 Payments to customers: payments may not be directly or indirectly given to employees of any existing or po-
tential customer with the intent of inducing them to take improper actions.
2.5 Payments to others: payments may be made to persons who are not civil servants or customers in accordance
with the procedures prescribed by the company, provided that such payments are not for ordinary commercial
purposes as defined by the laws of the country where the payments take place.
2.6 Payments outside the payee’s place of domicile: paying expenses or salaries to an account in a country where
the payee does not reside or do business (this may sometimes be termed “distributed expenses”) is acceptable
as long as this does not violate laws, and provided that the entire transaction does not compromise the com-
pany’s ethical standards.
2.7 Forgery of records: payments cannot be approved, executed, or accepted if part of the payment is
intended or known to be used for purposes other than those stated on the records. When there is no
disbursement explanation in the company’s account books, all “kickback funds” or similar funds or ac-
count transfers are strictly prohibited.
In addition to establishing uniform standards that apply consistently to all employees, Lite-On has also emphasized
on explaining the values of these ethical standards so that employees can understand how they are relevant to their
daily activities and avoid conducts that may constitute violations against laws or the company’s anti-corruption policy.
Through uses of proprietary materials and structured courses, the company has been able to convey its governance
guidelines and operating procedures to the comprehension of all employees. Course contents are presented in ways
that are relevant to employees’ work activities and real-life scenarios, with quizzes at the end of each module to help
them learn. Furthermore, the company also has consultative services in place to clarify employees’ queries regarding
work ethics, anti-corruption guidelines, insider information, anti-trust, and EICC policies and practices, thereby secur-
ing the company’s interests while protect employees from any illegal involvement.
1. Based on the Ethical Code of Conduct for Employees, Lite-On has created online courses that inform employees of
the various policies and practices the company has on anti-corruption. For new recruits, the company has arranged
a series of online orientation that encompasses courses on “Employee Ethics and Anti-Corruption,” “Material In-
sider Information,” and “Anti-trust and Compliance;” all of which are related to corporate ethics and proper busi-
ness conduct. In addition to establishing uniform standards that apply consistently to all employees, Lite-On also
emphasizes through action the values of these ethical standards so that employees can appreciate how they are
relevant to their daily activities and avoid conduct that may otherwise constitute violations against laws or compa-
ny policy. Courses on “Material Insider Information” and “Anti-trust and Compliance” have been made compulsory
for every employee to ensure consistent understanding to the company’s ethics policies and principles. Lite-On has
been active in providing anti-corruption training to indirect production workers.
2. In addition to organizing EICC (Electronic Industry Code of Conduct) workshops at locations where the company
operates, the company has also created an online learning platform that trains employees on EICC values including:
business integrity, avoidance of illegitimate gains, open information, respect for intellectual property, responsible
advertising, fair trading, confidentiality, responsible minerals procurement, respect for privacy, and prohibition
against retaliation.
3. Consultative services and channels: the company has a Legal Department that supports employees with legal coun-
sel over the course of their business dealings with customers. In the occurrence of a major legal incident, the Legal
Department will position itself at the frontline to resolve the matter with the employees involved, while making
sure that the company complies with regulations and that the company’s and employee’s interests are protected.
4. Grievance and reporting channels: internally, the company has hotlines, e-mail and opinion letter boxes available
for employees to raise complaints; externally, the company makes public disclosures on its CSR web page regard-
ing any unethical or illegal conduct found over the course of its business. Grievance hotlines, e-mail, and mailboxes
have been made available for outsiders to raise complaints or report their concerns. In 2015, Lite-On received one
complaint concerning violation of business integrity in illegal activity, and the concerned incidence did not occur
after the thorough investigation.

17 18‧Lite-On Technology Corporation 2015 Annual Report Lite-On Technology Corporation 2015 Annual Report‧
3.3 Corporate Risk Management
Lite-On has devoted itself to ensuring the economic, environmental and social sustainability for stakeholders including
customers, shareholders, employees and the community et cetera. While taking steps to realize this goal, Lite-On
adopts a robust risk management framework that identifies and controls the various risks of concern, so that said risk
can then be transferred, mitigated, minimized or even eliminated entirely. This risk management framework is also one
of the main reasons behind Lite-On’s sustainable growth and outstanding performance.
The Risk Management Framework
Lite-On’s risk management framework and internal control system allow it to take the initiative and respond to the
risks associated with its operations in the most cost-effective manner. The Group CEO serves as the highest ranking
officer in the company’s risk management framework.
Risk Management Life Cycle
Based on experience accumulated throughout its long history, the company has been able to develop a comprehensive
risk management framework with job functions and areas of responsibility clearly segregated for risk identification
purposes. Risks identified within the organization are classified into “External Risks,” “Operational Risks,” and
“Information Disclosure Risks.” Each risk is further assessed and assigned a severity level of high, medium, or low,
and mapped onto a risk map for ease of identification. This enables the organization to take further steps to transfer,
Board of Directors (Audit Committee)
Group CEO
Corporate Internal
Audit
Business Groups
Mobile Mechanics Portable Image Devices Power System Storage
New BusinessNew Mechanical
CompetenceConnected Devices and
System SolutionsOptoelectronic Product
Solution
Function Units
Human Resources
LegalOperational Controlling
Manufacturing Operation Excellence Occupational
Safety and Health
Management
Regional Operations
• United States• Europe• Singapore• China
Strategy & Investment
InnocellCreativityCenter
FinanceManufacturing
Technology
InvestorRelations &
Public Relations
Corporate Social and
EnvironmentResponsibility
Office
accept, mitigate, and avoid the identified risks. By executing the PDCA cycle (plan, do, check, and act) the company
is able to improve its control over various risk factors and reduce the chances of risks occurring and the impact they
might have.
“External Risks” refer to external factors such as slow sales, competition, loss of market demand, change in consumer
preferences, changes in technologies, new competing products, international incidents, economic recession,
mergers and acquisitions, change in foreign currency control, election outcomes, extortion, noise, pollution, natural
disasters, etc. “Operational Risks” refer to problems that are associated with the company itself, such as inability to
deliver goods on time, defective goods, unresolved technical issues, high procurement costs, excess inventory, poor
production design, plant malfunction, employee discipline, safety incidents, fire hazard, employment of child labor,
forced labor, loss of data, information errors, financial reporting mistakes, etc.. “Information Disclosure Risks.” refer to
risks associated with the disclosure of public information as part of the company’s operations, such as pricing failure,
leakage of commercial confidentialities, unreliable financial forecasts, frequent adjustment of financial forecasts,
failure to prepare quarterly/annual financial statements on time, failure to disclose required information, correction of
errors etc. By setting key performance indicators (KPI) within the organization, Lite-On is able to assess whether key
risks have emerged, and take necessary actions to transfer, accept, mitigate or avoid such risks. In order to minimize
the possibility and degree of loss, the company adopts a risk management system that is even more proactive than
insurance. Meanwhile, Lite-On is progressively implementing an “AAA Product Liability Control Project” as enhanced
management over manufacturing and sales risk.
Occurrence Risk Map
High
• Operations (neglect of safety rules/loss of personal property)
• Health and safety (lighting)
• Environment (chemicals) • Human resources (orders/child
labor/work hour) • Finance (Electricity bills)• Business strategy (shareholder
relations)
• Market risk (customers' needs and satisfaction)
Medium
• Operations (use of water/mistakes) • Human resources (hazardous jobs) • Environment (noise) • Finance (carbon tax)
• Safety and health (furnace temperature)
• Human resources (work hours/grievance channels)
• Business (budget spending) • Operations (products and
services)
• Politics (political development) • Health and safety (chemical
corrosion) • Business (business performance) • Finance (liquidity) • Compliance (legal and
reputation risks) • Strategies (business model/
organization)
Low
• Compliance (local environmental protection laws)
• Human resources (protection of whistle-blowers)
• Business (pension) • Human resources (bribery) • Safety and health (substance
exposure/fatigue/burns)
• Safety and health (safety of gas tanks)
• Environmental safety (poisonous gas and fire)
• Human resources (limitation of freedom)
• Finance (derivatives)
Impact Low Medium High

19 20‧Lite-On Technology Corporation 2015 Annual Report Lite-On Technology Corporation 2015 Annual Report‧
Continued improvement in risk management through PDCA cycle (see chart)
‧ Risk Management Projects
In order to address external and operational risks of higher occurrence or impact, Lite-On has implemented a
risk management plan throughout all plant sites that focuses on “Raising Safety Awareness,” “Protecting Critical
Assets,” and “Establishing Safety Systems and Rules.” Apart from raising risk awareness within Lite-On, the
company has also executed a number of risk management projects that not only help identify dangers within
various production centers, but also provides suggestions for future improvements. Through one project at a
time, Lite-On is able to accomplish the overall goal of its risk management, and build a foundation for sustainable
operations.
‧ Raising Safety Awareness
The Risk Management Department arranges regular training and seminars featuring the use of case studies to help
employees learn from past mistakes, and hence raise their awareness towards safety and risk management.
‧ Protecting Critical Assets
Each year, the company conducts infrared tests on electrical appliances used in plant sites, and performs random
checks on their risk management practices to identify areas of weakness and ways of minimizing foreseeable risks.
Meanwhile, logistics operations are also inspected regularly to reduce logistics risks. All products that Lite-On offers
to its customers undergo stringent internal quality control and are certified by third-party engineers who scrutinize
everything the company does from product design, manufacturing to after-sale liabilities.
‧ Establishing Safety Systems and Rules
Lite-On has been establishing a risk control and checking system since 2009 that aims to grade each property by
level of associated risk, and thereby facilitate future assessments and management. Through regular inspections
and improvements, Lite-On is able to optimize the risk profiles of its production sites, reducing the possibility of
accidents and hence minimizing loss of workers, plant, equipment, raw materials, and operations.
The risk rating and audit system also helps reflect the risk status of various production sites. It reminds workers of the
potential dangers present in the workplace, and allows quantifiable targets to be set and improved upon. In the short
term, the system helps eliminate risks as soon as they are discovered; in the long run, it enables management to better
plan its risk controls and implementation.
Lite-On will be introducing new business continuity management to make sure that the company can resume
operations rapidly and remain competitive when facing any disaster. At the current stage, the company is focused on
developing a Business Continuity Plan (BCP) that achieves the following benefits:
‧ Ensure business recoverability and sustainability; reduce overall operational risks and maintain competitiveness.
‧ Provide assurances to customers and secure or even expand market share.
‧ Protect the company’s reputation and shareholders’ interests.
‧ Reduce costs of supply chain management and create industry service value.
Com
mun
icat
e
M
onitor Identify Evaluate
Assess
Continuous improvements
Internal Audit
‧ Performs independent audits on
risk management activities.
‧ Reports to Audit Committee on
audit progress.
Board of Directors (Audit Committee)
‧ Ensures implementation of
appropriate risk management
framework and culture.
‧ Risk management decisioning and
resource allocation
Functional units and business groups
‧ Perform self assessment, control
and management of risks.
‧ Improve management practices.
Executive management (Group CEO)
‧ Executes the board's risk
management decisions.
‧Manages function units and
business groups.

21 22‧Lite-On Technology Corporation 2015 Annual Report Lite-On Technology Corporation 2015 Annual Report‧
3.4 Information Regarding Board Members and Management Team
3.4.1 The profiles of the directors and the independent directors
2016/04/26
Title NameDate of appointment (office)
Tenure (year)
Date of initial appointment
Proportion of shareholding at the time of appointment
Proportion of shareholding at present
Proportion of shareholding by spouse and underage children
Proportion of shareholding under the title of a third party Important experience (education)
Other positions of the company or other companies
Quantity % Quantity % Quantity % Quantity %
Chairman Raymond Soong 102.6.19 three 81.05.20 77,738,111 3.37% 78,908,736 3.38% 14,891,742 0.64% 0 0%
Honorary PhD in Management, National Chiao Tung UniversityChairman & Founder of Lite-On Group/Lite-On Cultural Foundation Member of Board of Councilors, the Doctorate College of Technology, South California (USC)Chief Engineer, Texas Instruments Taiwan Ltd.
Note 1
Vice Chairman
Lite-On Capital Inc.
102.6.19 three
90.04.19 14,817,672 0.64% 15,040,803 0.64% 0 0% 0 0% Chemical Engineering, Chinese Culture University GCEO of Lite-On Group and CEO of Lite-On Technology Corp.President, Lite-On Electronic Co.Manufacturing Super-Intendant, Texas Instrument
Note 2
Representative:Warren Chen 87.05.19 0 0% 8,627,361 0.37% 2,671,893 0.11% 0 0%
Director David Lin 102.6.19 three 87.05.19 8,783,494 0.38% 11,399,322 0.49% 519,331 0.02%1,500,000
(trust)0.06%
EMBA, Tulane University, USA Bachelor of Electrophysics, National Chiao Tung University GM of Texas Instruments Taiwan Ltd.President of Silitech CorporationCEO of Lite-On Group GCEO Lite-On Group and Lite-On technology Corp.Vice Chairman, Lite-On Group and Lite-On technology Corp.
Note 3
DirectorDorcas Investment Co., Ltd.
102.6.19 three90.04.19 5,930,283 0.26% 6,019,584 0.26% 0 0% 0 0% MBA, University of South California
Bachelor, Dept of Mechanical Engineering, UCLACEO, Dorcas Investment Co., Ltd.
Note 4Representative: Joseph Lin 96.06.21 0 0% 295,167 0.01% 0 0% 0 0%
Director
Ta-Sung Investment Co., Ltd.
102.6.19 three
87.05.19 46,159,459 2.00% 46,854,554 2.01% 0 0% 0 0%Bachelor, EE, National Cheng Kung University Master, EE, Texas Institute of Technology PhD, EE, Texas Institute of Technology Asian Regional President, Senior VP, Texas Instruments Director, VArmour Corp. Ltd.
Note 5
Representative: Keh-Shew Lu 91.09.01 0 0% 0 0% 0 0% 0 0%
Director
Ta-Sung Investment Co., Ltd.
102.6.19 three
87.05.19 46,159,459 2.00% 46,854,554 2.01% 0 0% 0 0%Bachelor, Dept. of Commerce, Tamkang University;VP, Office of Group President, Lite-On Technology CorporationDirector, Silitech Technology CorporationSupervisor, Leotek CorpSupervisor, Co-tech Copper Foil Corporation Supervisor, Lite-On IT Corporation.
Note 6
Representative : Rick Wu 90.04.19 0 0% 993,068 0.04% 51,097 0% 0 0%
Director
Yuan Pao Development & Investment Co. Ltd.
102.6.19 three
93.06.15 36,527,518 1.58% 39,277,570 1.68% 0 0% 0 0%Bachelor, Dept of Mechanical Engineering, National Taiwan UniversityVice CEO, Texas Instruments Taiwan Ltd.Chairman, Co-tech Copper Foil CorporationChairman, On-Bright Electronics Incorporated Co., Ltd.
Note 7
Representative : CH Chen 93.06.15 0 0% 0 0% 0 0% 0 0%
Director
Yuan Pao Development & Investment Co. Ltd.
102.6.19 three
93.06.15 36,527,518 1.58% 39,277,570 1.68% 0 0% 0 0% Graduate Institute of Accounting, National Cheng Chi University;Director, representative of Dynacard Co.,Ltd.Director, representative of ADDtek CorporationCFO, Lite-On Semiconductor Corp.
Note 8
Representative : David Lee 92.06.17 0 0% 6,484 0% 0 0% 0 0%
Independent Director
Kuo-Feng Wu 102.6.19 three 96.6.21 0 0% 0 0% 0 0% 0 0%
Bachelor, Dept of Economics, National Chung Hsing University,Chairman, KPMG;Senior CPA, KPMGDirector, Taipei CPA AssociationExecutive Director, ROC CPA Independent Supervisor, Wistron Corporation,Supervisor, Darfon CorporationVice Chairman, Financial Accounting Standards Committee, Accounting Research and Development Foundation,Convener, Accounting Practice Committee, Taiwan Accounting Association.Supervisor, Tynsolar Corporation.Chairman, International affairs committee of ROCCPA
Note 9

23 24‧Lite-On Technology Corporation 2015 Annual Report Lite-On Technology Corporation 2015 Annual Report‧
Title NameDate of appointment (office)
Tenure (year)
Date of initial appointment
Proportion of shareholding at the time of appointment
Proportion of shareholding at present
Proportion of shareholding by spouse and underage children
Proportion of shareholding under the title of a third party Important experience (education)
Other positions of the company or other companies
Quantity % Quantity % Quantity % Quantity %
Independent Director
Harvey Chang 102.6.19 three 96.6.21 0 0% 0 0% 0 0% 0 0%
MBA, The Wharton School, Pennsylvania State University;Bachelor, Dept of Geology, National Taiwan University; President and CEO, Taiwan Mobile;Senior VP and CFO, TSMC;Chairman, China Securities Investment Trust Corp.President, China Development Trust Co. Ltd. ;President, Grand Cathay Securities; Manager, Trust Dept, International Dept, Chiao Tung Bank;Manger, Banking Dept, Morgan Bank Taipei Branch;Associate Manger, Multinational Corporation Dept, Citibank Taipei.
Note 10
Independent Director
Edward Yang 102.06.19 three 96.6.21 0 0% 0 0% 0 0% 0 0%
Stanford Executive Program (SEP), Stanford University, USA;Master of EE, Oregon State University, USA;Bachelor of EE, National Cheng Kung University;Independent Director, Focal Tech.Independent Director, Silicon Storage TechnologyIndependent Director, Pericom SemiconductorCommissioner, Advanced Research Advisory Committee, ITRICommissioner, Research & Development Advisory committee, Institute for Information IndustryCommissioner, Advisory Committee of Engineer Department, San Jose State University.VP and CTO, Personal System Product Division, HP Corporation; VP and CTO, Corporate System Product Division, HP Corporation;President, Singapore Network and Telecommunications Business Unit, HP Corporation;Managing Director, Monte Jade Science and Technology Association Managing Director, China Institute of Engineering;Managing Director, Information Service Association of R.O.C.Director, U-System Inc.
Note 11
Below notes of other positions of the company or other companies are only display public offering companies and
important subsidiaries.
Note 1: Chairman, Lite-On Technology Corp., Lite-On Semiconductor Corp., DIODES,INC. and G-Pro Electronics (SH) Co., Ltd.Chairman, representative of Silitech Technology Corp. and Co-tech Copper Foil Corporation.Director, Lite-On Singapore Pte. Ltd., Lite-On Mobile Pte. Ltd., Actron Technology Corporation, DYNA International Holding Co.,Ltd., DYNA International Co., Ltd. and Lite-On Semiconductor(HK)LTD. Director, representative of Lite-On China Holding Co. Ltd.(BVI), Silitech (BVI) Holding Ltd., Silitech (Bermuda) Holding Ltd., Silitech Technology Corp. Ltd., Silitech Technology Corp. Sdn. Bhd., Silitech (Hong Kong) Holding Ltd., Silitech Technologuy(Su Zhou) Ltd. and Xurong Electroinc (Shenzhen) Co., Ltd.
Note 2: Vice Chairman, representative of Lite-On Technology Corp.Director, Lite-On Singapore Pte. Ltd. and Lite-On Mobile Pte. Ltd.Director, representative of Lite-On Semiconductor Corp., Lite-On China Holding Co., Ltd. (BVI), Silitech Technology Corp., Silitech (BVI) Holding Ltd., Silitech (Bermuda) Holding Ltd., Silitech Technology Corp. Ltd., Silitech Technology Corp. Sdn. Bhd., Silitech (Hong Kong) Holding Ltd., Silitech Technologuy(Su Zhou) Ltd. and Xurong Electroinc (Shenzhen) Co., Ltd.
Note 3: Director, Lite-On Technology Corp.Independent director, Sino-America Silicon Products Inc. and Rafael Micro Technology Corp.
Note 4: Director, representative of Lite-On Technology Corp.
Note 5: Director, representative of Lite-On Technology Corp. and Nuvoton Technology Corp.President and CEO of Diodes Incorporated Co., Ltd.
Note 6: Director, representative of Lite-On Technology Corp.Supervisor, representative of Lite-On Semiconductor Corp.
Note 7: Vice Chairman, DIODES, INC. and Lite-On Semiconductor Corp.Director, G-Pro Electronics (SH) Corp., Ltd., DYNA International Holding Co., Ltd., DYNA International Co., Ltd., Lite-On semiconductor (HK) Ltd, On-Bright Electronics (Hong Kong) Co., Ltd, and CO-TECH DEVELOPMENT CORP.Director, representative of Lite-On Technology Corp. and Kwong Lung Enterprise Co, Ltd.
Note 8: Chairman, representative of Taiwan On-Bright Electronics., Ltd. and SyncMOS Technologies International, Inc.Chairman, On-Bright Electronics (SH) and On-Bright Electronics (Guangzhou)Director, DYNA International Holding Co., Ltd., DYNA International Co. Ltd., Lite-On Semiconductor (HK) Ltd., On-Bright Electronics (Hong Kong), On-Brilliant Electronics (Hong Kong) Co., Ltd., Lite-On semi (Wuxi) Ltd. and G-Pro Electronics (SH) Corp., Ltd.Director, representative of Lite-On Technology Corp. and Actron Technology Corporation.CEO, Lite-On Semiconductor Corp.
Note 9: Independent Director, Lite-On Technology Corp. and Wistron Corp. Independent supervisor, Advantech Corp.
Note 10: Independent Director, Lite-On Technology Corp.
Note 11: Chairman, GVT fundIndependent director, Lite-On Technology Corp.Partner, iD Ventures America, LLCDirector, Sifotonics Technologies, Applied BioCode and Bandwidth 10.
25 26‧Lite-On Technology Corporation 2015 Annual Report Lite-On Technology Corporation 2015 Annual Report‧
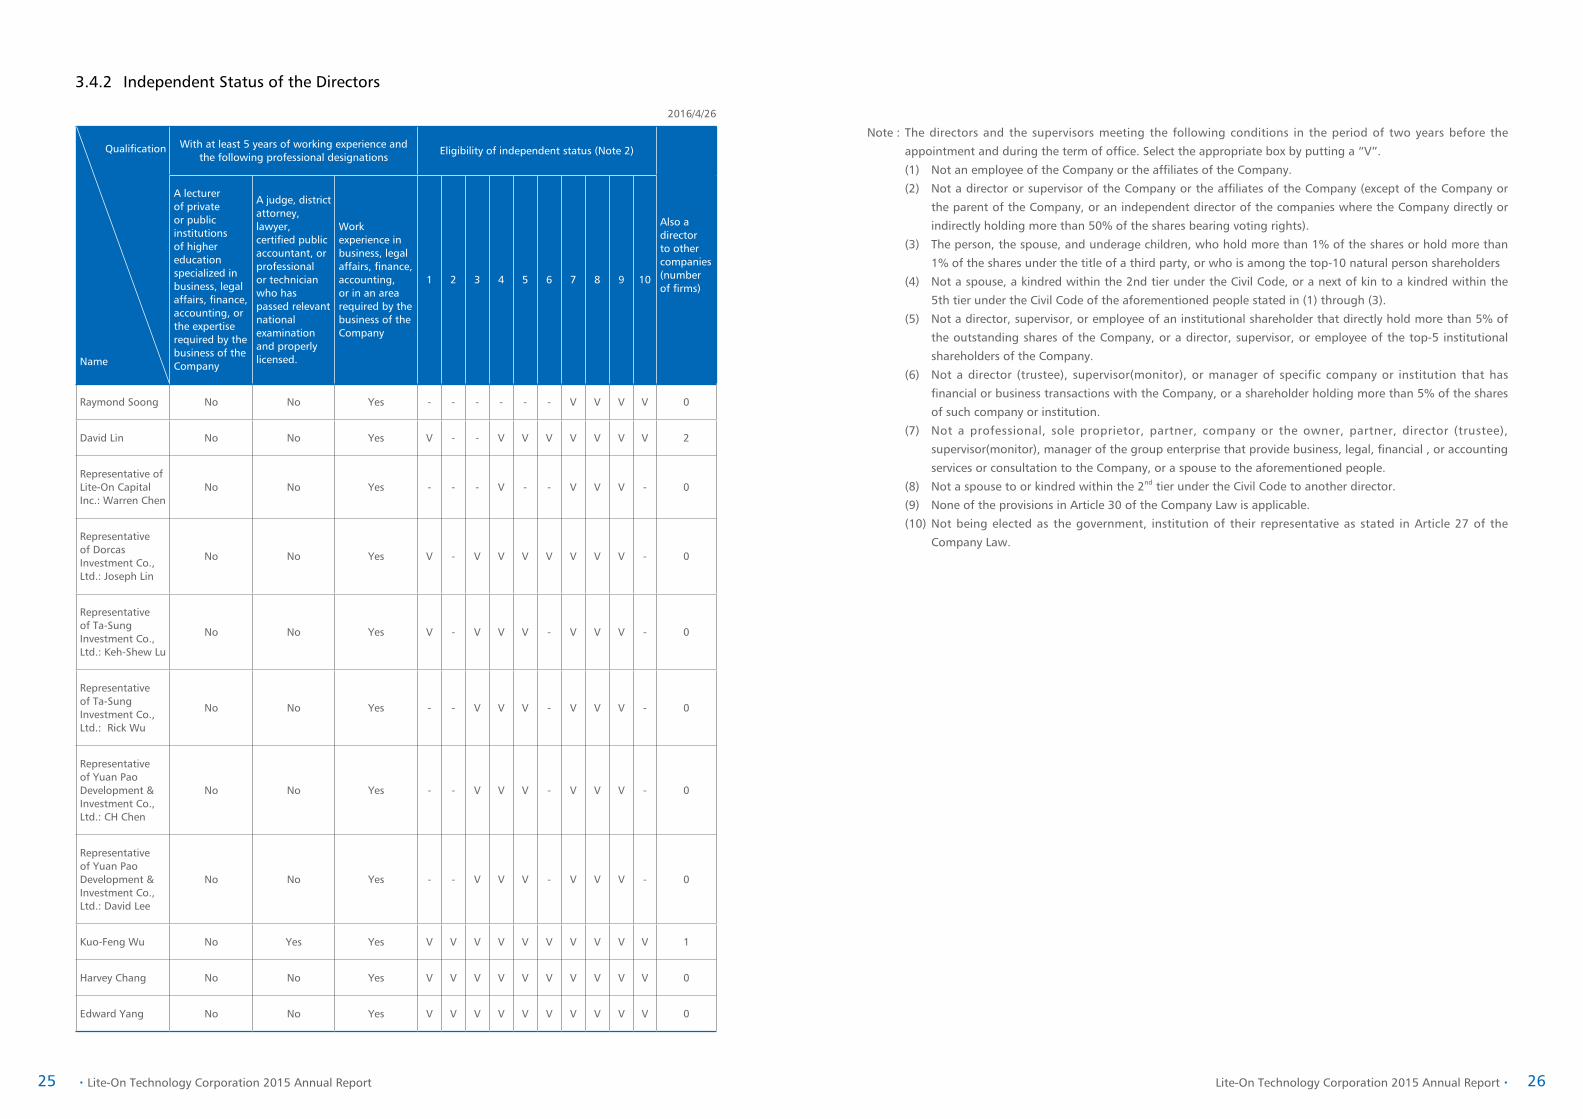
3.4.2 Independent Status of the Directors
2016/4/26
Qualification
Name
With at least 5 years of working experience and the following professional designations
Eligibility of independent status (Note 2)
Also a director to other companies (number of firms)
A lecturer of private or public institutions of higher education specialized in business, legal affairs, finance, accounting, or the expertise required by the business of the Company
A judge, district attorney, lawyer, certified public accountant, or professional or technician who has passed relevant national examination and properly licensed.
Work experience in business, legal affairs, finance, accounting, or in an area required by the business of the Company
1 2 3 4 5 6 7 8 9 10
Raymond Soong No No Yes - - - - - - V V V V 0
David Lin No No Yes V - - V V V V V V V 2
Representative of Lite-On Capital Inc.: Warren Chen
No No Yes - - - V - - V V V - 0
Representative of Dorcas Investment Co., Ltd.: Joseph Lin
No No Yes V - V V V V V V V - 0
Representative of Ta-Sung Investment Co., Ltd.: Keh-Shew Lu
No No Yes V - V V V - V V V - 0
Representative of Ta-Sung Investment Co., Ltd.: Rick Wu
No No Yes - - V V V - V V V - 0
Representative of Yuan Pao Development & Investment Co., Ltd.: CH Chen
No No Yes - - V V V - V V V - 0
Representative of Yuan Pao Development & Investment Co., Ltd.: David Lee
No No Yes - - V V V - V V V - 0
Kuo-Feng Wu No Yes Yes V V V V V V V V V V 1
Harvey Chang No No Yes V V V V V V V V V V 0
Edward Yang No No Yes V V V V V V V V V V 0
Note : The directors and the supervisors meeting the following conditions in the period of two years before the
appointment and during the term of office. Select the appropriate box by putting a “V”.
(1) Not an employee of the Company or the affiliates of the Company.
(2) Not a director or supervisor of the Company or the affiliates of the Company (except of the Company or
the parent of the Company, or an independent director of the companies where the Company directly or
indirectly holding more than 50% of the shares bearing voting rights).
(3) The person, the spouse, and underage children, who hold more than 1% of the shares or hold more than
1% of the shares under the title of a third party, or who is among the top-10 natural person shareholders
(4) Not a spouse, a kindred within the 2nd tier under the Civil Code, or a next of kin to a kindred within the
5th tier under the Civil Code of the aforementioned people stated in (1) through (3).
(5) Not a director, supervisor, or employee of an institutional shareholder that directly hold more than 5% of
the outstanding shares of the Company, or a director, supervisor, or employee of the top-5 institutional
shareholders of the Company.
(6) Not a director (trustee), supervisor(monitor), or manager of specific company or institution that has
financial or business transactions with the Company, or a shareholder holding more than 5% of the shares
of such company or institution.
(7) Not a professional, sole proprietor, partner, company or the owner, partner, director (trustee),
supervisor(monitor), manager of the group enterprise that provide business, legal, financial , or accounting
services or consultation to the Company, or a spouse to the aforementioned people.
(8) Not a spouse to or kindred within the 2nd tier under the Civil Code to another director.
(9) None of the provisions in Article 30 of the Company Law is applicable.
(10) Not being elected as the government, institution of their representative as stated in Article 27 of the
Company Law.

27 28‧Lite-On Technology Corporation 2015 Annual Report Lite-On Technology Corporation 2015 Annual Report‧
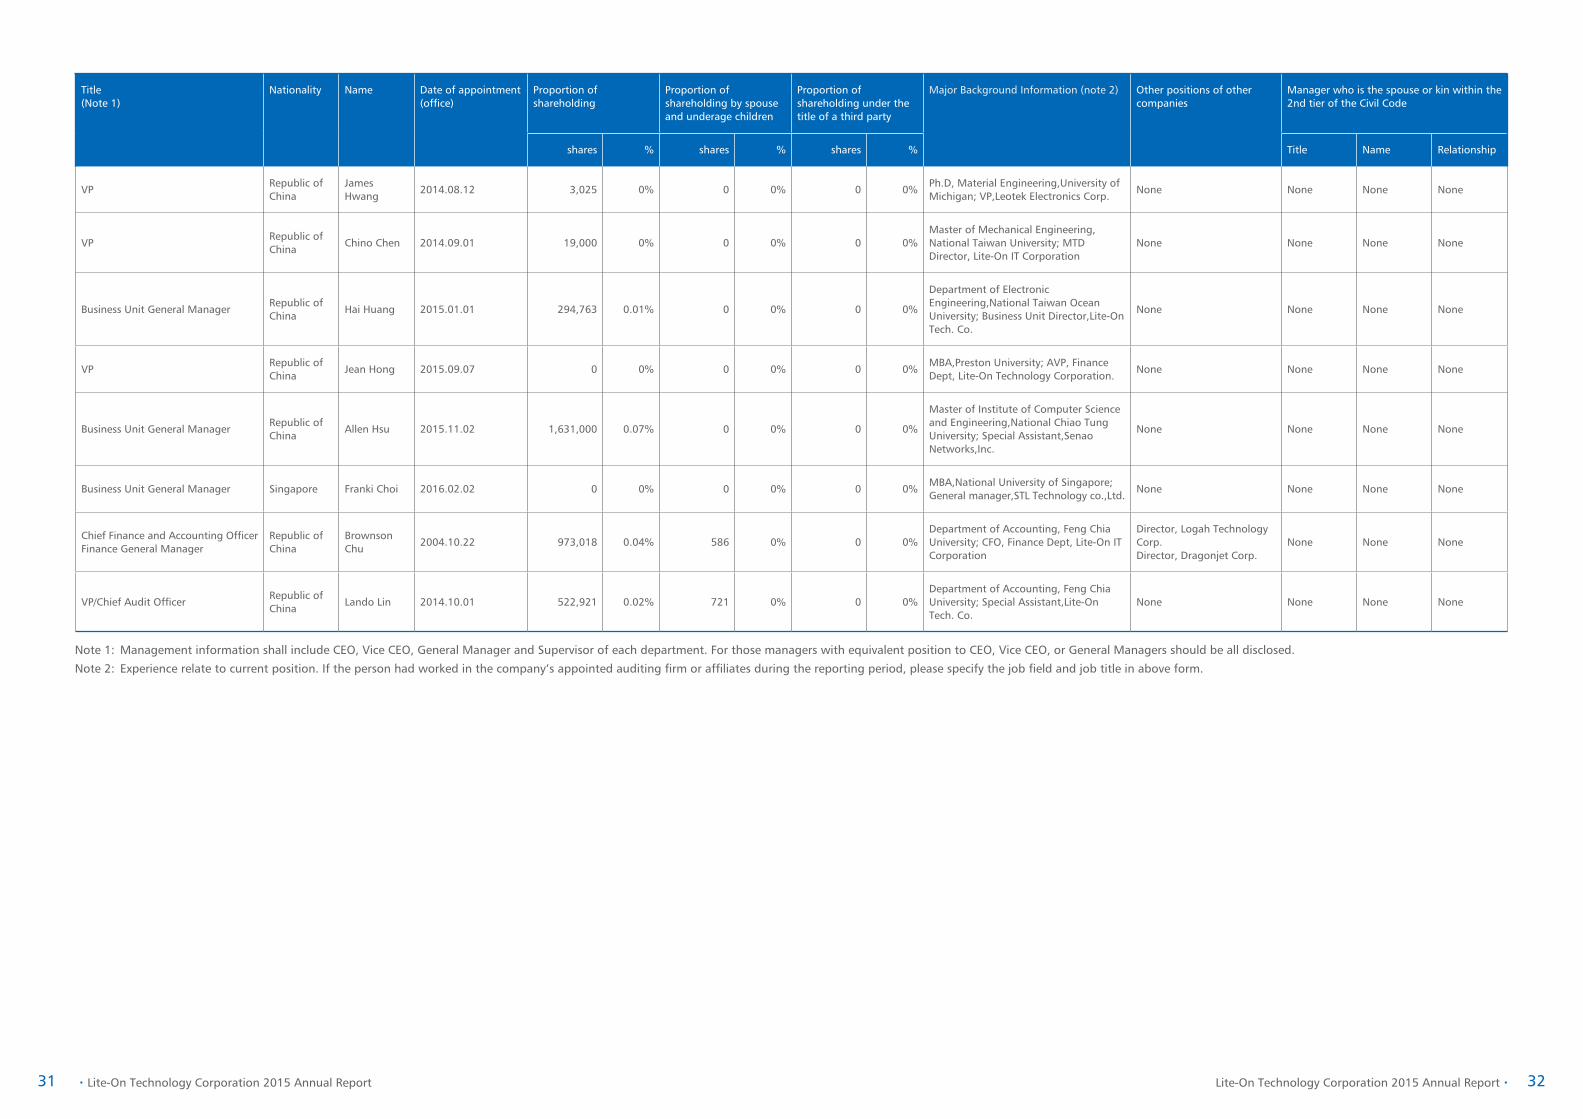
3.4.3 Profile of the Management Team
Date: 2016/04/26
Title(Note 1)
Nationality Name Date of appointment (office)
Proportion of shareholding
Proportion of shareholding by spouse and underage children
Proportion of shareholding under the title of a third party
Major Background Information (note 2) Other positions of other companies
Manager who is the spouse or kin within the 2nd tier of the Civil Code
shares % shares % shares % Title Name Relationship
Vice Chairman/GCEO
Republic of China
Warren Chen 2002.11.04 8,627,361 0.37% 2,671,893 0.11% 0 0%
Chemical Engineering, Chinese Culture University GCEO of Lite-On Group; CEO of Lite-On Technology Corp.; President, Lite-On Electronic Co.
Refer to profile of director for detail
None None None
Business Group CEORepublic of China
Danny Liao 2013.06.19 2,492,467 0.11% 0 0% 0 0%MBA, Lake Superior State University; CEO, Lite-On IT Corporation
Director, Silitech Technology Corp.
None None None
Business Group PresidentRepublic of China
Alexander Huang
2010.06.01 35,204 0% 494 0% 0 0%
Department of Information Engineering (previously Computer Dept); Microsoft Greater China Regional President, President of Microsoft Taiwan.
None None None None
Business Unit General ManagerRepublic of China
Shilung Chiang
2002.11.04 606,198 0.03% 402,000 0.02% 0 0%MBA, University of Pittsburgh; President, Computer Business Division, Digital Corporation.
Director, Lite-On Singapore Pte. Ltd.
None None None
Business Group CEORepublic of China
Peter Chiu 2002.11.04 1,416,103 0.06% 0 0% 0 0%
Master of Finance, National Taiwan University; Master of Production System Engineering and Management Study, Taipei Technology University; Vice President, First International Computers.
Director, Silitech Technology Corp.,Director, Dragonjet Corp.
None None None
Operation Controlling General Manager
Republic of China
DI Wang 2002.11.04 1,522,997 0.07% 17,051 0% 0 0%Ph.D, Northeastern University/Mathematics; VP in Sales Engineering, Potrans Electrical Corp.
None None None None
HR General ManagerRepublic of China
Albert Chang 2002.11.04 776,882 0.03% 292,522 0.01% 0 0%Master of Industrial Management, National Cheng Kung University; ABIT U.S. Branch President
Director, representative of Lite-On China Holding Co., Ltd. and Lite-On Semiconductor Corp.
None None None
Business Group President Republic of China
Rex Chuang 2002.11.04 1,122,747 0.05% 650,034 0.03% 0 0%Electronic Engineering, Hsin Pu Industrial Vocational School; VP of production, Lite-On Electronics Corp.,
None None None None
VPRepublic of China
Sonny Chao 2002.11.04 1,073,419 0.05% 2,573 0% 0 0%
School of Industrial Engineering, Polytechnic Institute of N.Y.; Philips Taiwan Global Marketing & Sales Sr. Program Manager
None None None None
Senior VPRepublic of China
TC Huang 2002.11.04 1,443,554 0.06% 2,919 0% 0 0%University of Leicester/Business Administration; Manager , Yu long Corporation
None None None None
Business Group CEORepublic of China
Johnson Sun 2002.11.04 1,702,580 0.07% 224,545 0.01% 0 0%Department of Electrical Engineering, Feng Chia University; Safety Engineer, Sony Corporation.
None None None None
Business Unit General ManagerRepublic of China
Henry Chen 2003.11.01 98,371 0% 0 0% 0 0%Graduate Institute of Electrical Engineering, Tatung University; Project Manager, Mustek Systems.
None None None None

29 30‧Lite-On Technology Corporation 2015 Annual Report Lite-On Technology Corporation 2015 Annual Report‧
Title(Note 1)
Nationality Name Date of appointment (office)
Proportion of shareholding
Proportion of shareholding by spouse and underage children
Proportion of shareholding under the title of a third party
Major Background Information (note 2) Other positions of other companies
Manager who is the spouse or kin within the 2nd tier of the Civil Code
shares % shares % shares % Title Name Relationship
VP US Wing Eng 2002.11.04 2,426,490 0.10% 0 0% 0 0%Master of Electrical Engineering, Stanford University; Director of Design Dept, AT&T Bell Lab.
None None None None
VPRepublic of China
HY Lee 2002.11.04 639,542 0.03% 25,885 0% 0 0%Master of Industrial Engineering, National Ching Hua University; Asst VP, Universal Microelectronics
None None None None
VPRepublic of China
Victor Hsu 2012.11.27 118,350 0.01% 0 0% 0 0%University of Illinois at Urbana-Champaign/MBA; Group CFO of Samson Holding Ltd.
Director, Logah Technology Corp.
None None None
VPRepublic of China
Joseph SK Chen
2013.01.02 101,713 0% 23,837 0% 0 0%Department of Electronics, Taipei Tech College; VP of CPBU, Sysgration Corporation Ltd.
None None None None
VPRepublic of China
Johnson Wang
2013.06.03 95,576 0% 0 0% 0 0%Master of Chemistry, National Ching Hua University; SCM VP, EATON PHOENIXTEC MMPL CO., LTD.
None None None None
VPRepublic of China
Anson Chiu 2013.08.19 189,655 0.01% 0 0% 0 0%
Department of Industrial Management, Lunghwa University of Science and Technology; Procurement Specialist, Crownpo Technology Inc.
Director, Dragonjet Corp. None None None
Business Unit General ManagerRepublic of China
BC Liao 2013.08.19 311,879 0.01% 10,074 0% 0 0%Industrial Management, Chung Yuan Christian University; Procurement Manager, Philips;
None None None None
Business Unit General ManagerRepublic of China
Jerry Hsu 2013.08.19 885,322 0.04% 1,552 0% 0 0%
Department of Electronics, Lunghwa University of Science and Technology; Engineer of power support design, ALITECH CO., LTD
None None None None
VPRepublic of China
CY Chung 2013.10.02 85,050 0% 11,055 0% 0 0%Industrial Management, National Cheng Kung University; Acting SBG Head, Hon Hai Precision Industrial Corp.
None None None None
VPRepublic of China
Joe Wu 2014.03.20 45,436 0% 0 0% 0 0%Biomedical Engineering , Chung Yuan Christian University; AVP, First International Computer, Inc.
None None None None
Business Unit General ManagerRepublic of China
Michael Wang
2014.06.13 70,594 0% 0 0% 0 0%Master of Information Engineering, Tamkang University; General Manager,Lite-On Automotive Corp.
None None None None
VPRepublic of China
TsungCheng Wang
2014.06.13 41,777 0% 5,170 0% 0 0%Ph.D, Mechanical Eng,Wayne State University; General Manager,Lite-On Automotive Corp.
None None None None
Business Group CEORepublic of China
Charlie Tseng 2014.08.12 0 0% 0 0% 0 0%EMBA,National Chiao Tung University; CEO, Lite-On IT Corporation
None None None None
Business Unit General ManagerRepublic of China
David Yeh 2014.08.12 40,000 0% 0 0% 0 0%Master of Administration,Tulane University; General Manager,Leotek Electronics Corp.
None None None None
31 32‧Lite-On Technology Corporation 2015 Annual Report Lite-On Technology Corporation 2015 Annual Report‧
Title(Note 1)
Nationality Name Date of appointment (office)
Proportion of shareholding
Proportion of shareholding by spouse and underage children
Proportion of shareholding under the title of a third party
Major Background Information (note 2) Other positions of other companies
Manager who is the spouse or kin within the 2nd tier of the Civil Code
shares % shares % shares % Title Name Relationship
VPRepublic of China
James Hwang
2014.08.12 3,025 0% 0 0% 0 0%Ph.D, Material Engineering,University of Michigan; VP,Leotek Electronics Corp.
None None None None
VPRepublic of China
Chino Chen 2014.09.01 19,000 0% 0 0% 0 0%Master of Mechanical Engineering, National Taiwan University; MTD Director, Lite-On IT Corporation
None None None None
Business Unit General ManagerRepublic of China
Hai Huang 2015.01.01 294,763 0.01% 0 0% 0 0%
Department of Electronic Engineering,National Taiwan Ocean University; Business Unit Director,Lite-On Tech. Co.
None None None None
VPRepublic of China
Jean Hong 2015.09.07 0 0% 0 0% 0 0%MBA,Preston University; AVP, Finance Dept, Lite-On Technology Corporation.
None None None None
Business Unit General ManagerRepublic of China
Allen Hsu 2015.11.02 1,631,000 0.07% 0 0% 0 0%
Master of Institute of Computer Science and Engineering,National Chiao Tung University; Special Assistant,Senao Networks,Inc.
None None None None
Business Unit General Manager Singapore Franki Choi 2016.02.02 0 0% 0 0% 0 0%MBA,National University of Singapore; General manager,STL Technology co.,Ltd.
None None None None
Chief Finance and Accounting Officer Finance General Manager
Republic of China
Brownson Chu
2004.10.22 973,018 0.04% 586 0% 0 0%Department of Accounting, Feng Chia University; CFO, Finance Dept, Lite-On IT Corporation
Director, Logah Technology Corp.Director, Dragonjet Corp.
None None None
VP/Chief Audit OfficerRepublic of China
Lando Lin 2014.10.01 522,921 0.02% 721 0% 0 0%Department of Accounting, Feng Chia University; Special Assistant,Lite-On Tech. Co.
None None None None
Note 1: Management information shall include CEO, Vice CEO, General Manager and Supervisor of each department. For those managers with equivalent position to CEO, Vice CEO, or General Managers should be all disclosed.
Note 2: Experience relate to current position. If the person had worked in the company’s appointed auditing firm or affiliates during the reporting period, please specify the job field and job title in above form.

33 34‧Lite-On Technology Corporation 2015 Annual Report Lite-On Technology Corporation 2015 Annual Report‧
3.5 Statement of Internal Control System
Lite-On Technology Corporation
Statement of Internal Control System
Date: March 25, 2016
Based on the findings of a self-assessment, Lite-On Technology Corporation (LOT) states the following with regard to
its internal control system during the year 2015:
1. LOT is fully aware that establishing, operating, and maintaining an internal control system are the responsibilities
of its Board of Directors and management. LOT has established such a system to provide reasonable assurance
in achieving objectives related to the effectiveness and efficiency of operations (including profits, performance,
and safeguarding of assets), reliability, timeliness, transparency, and regulatory compliance of reporting and
compliance with applicable laws, regulations, and bylaws.
2. An internal control system has inherent limitations. An effective internal control system, no matter how perfectly
designed, can provide only a reasonable assurance in the accomplishment of the three objectives mentioned above.
Furthermore, the effectiveness of an internal control system may change along with changes in environment or
circumstances. The internal control system of LOT contains self-monitoring mechanisms, and LOT takes corrective
actions as soon as a deficiency is identified.
3. LOT evaluates the design and operating effectiveness of its internal control system based on the criteria provided in
the “Regulations Governing the Establishment of Internal Control Systems by Public Companies ” (herein referred to
as “Regulations”). The internal control system evaluation criteria stated in the Regulations classify internal control
into five key elements based on the process of management control: 1. control environment, 2. risk assessment, 3.
control activities, 4. information and communications, and 5.monitoring. Each component further contains several
items. Please refer to the Regulations for details.
4. LOT has evaluated the design and operating effectiveness of its internal control system according to the aforesaid
criteria.
5. Based on the findings of the evaluation mentioned in the preceding paragraph, LOT believes that as at
December 31, 2015, its internal control system (including its supervision and management of subsidiaries),
which encompasses internal controls for the knowledge of the degree of achieving operational effectiveness and
efficiency objectives, reliability, timeliness, transparency, and regulatory compliance of reporting and compliance
with applicable laws, regulations, and bylaws, was effectively designed and operated and reasonably assured the
achievement of the above-stated objectives.
6. This Statement will form an integral part of LOT’s Annual Report and Prospectus and will be made public. Any
falsehood, concealment, or other illegality in the content made public will entail legal liability under Articles 20, 32,
171 and 174 of the Securities and Exchange Act.
7. This Statement has been passed by the LOT Board of Directors’ Meeting on March 25, 2016, where all of the eleven
attending directors did not express any dissenting opinion and affirmed the content of this Statement.
Lite-On Technology Corporation
Raymond Soong Warren Chen
Chairman CEO
4.1 The Top-10 Shareholders and Information of Related Parties
2016/4/26
Name
Shareholding by selfShareholding by spouse and underage children
Shareholding under the title of a third party
Specify the names and relations of the top-10 shareholders who are related-parties as stated in SFAS No. 6, or spouse or kindred within the 2nd tier under the Civil Code
Quantity of shares
Proportion of shareholding
Quantity of shares
Proportion of shareholding
Quantity of shares
Proportion of shareholding
Title (or name)
Relation
Ta-Rong Investment Co., Ltd.
82,490,995 3.53% 0 0% 0 0% Raymond Soong Director
Ta-Rong Investment Co., Ltd. Representative: Shu-Yan Tsai
44,068 0% 0 0% 0 0%Ming-Hsing /Yuan Pao Development/Ta-Sung ( Investment Co., Ltd. )
Representative/Director
Raymond Soong 78,908,736 3.38% 14,891,742 0.64% 0 0%
Ta-Rong /Yuan Pao Development/Ta-Sung/Ming-Hsing ( Investment Co., Ltd. )
Director
FUBON LIFE INSURANCE CO.,LTD
67,808,623 2.90% 0 0% 0 0% None None
FUBON LIFE INSURANCE CO.,LTD Representative: Pen-Yuan Cheng
0 0% 0 0% 0 0% None None
NAN SHAN LIFE INSURANCE CO.,LTD
67,199,519 2.88% 0 0% 0 0% None None
NAN SHAN LIFE INSURANCE CO.,LTD Representative:Ying-Tsung Tu
0 0% 0 0% 0 0% None None
CAPITAL SECURITIES NOMINEE LIMITED
64,862,783 2.78% 0 0% 0 0% None None
Ta-Sung Investment Co., Ltd.
46,854,554 2.01% 0 0% 0 0%Raymond Soong: Shu-Yan Tsai
Director
Ta-Sung Investment Co., Ltd.Representative: Keh-Shew Lu
0 0% 0 0% 0 0% None None
Ta-Sung Investment Co., Ltd. Representative: Rick Wu
993,068 0.04% 51,097 0% 0 0% None None
Ming-Hsing Investment Co., Ltd.
45,179,843 1.93% 0 0% 0 0% Raymond Soong Director
Ming-Hsing Investment Co., Ltd. Representative: Shu-Yan Tsai
44,068 0% 0 0% 0 0%Ta-Rong /Yuan Pao Development/Ta-Sung ( Investment Co., Ltd. )
Representative/Director
Government of Singapore
39,804,898 1.70% 0 0% 0 0% None None
Yuan Pao Development & Investment Co. Ltd.
39,277,570 1.68% 0 0% 0 0%Raymond Soong: Shu-Yan Tsai
Director
Yuan Pao Development & Investment Co. Ltd. Representative : CH Chen
0 0% 0 0% 0 0% None None
Yuan Pao Development & Investment Co. Ltd. Representative : David Lee
6,484 0% 0 0% 0 0% None None
GMO Emerging Markets Fund
36,281,836 1.55% 0 0% 0 0% None None
Capital and Shares

35 36‧Lite-On Technology Corporation 2015 Annual Report Lite-On Technology Corporation 2015 Annual Report‧
4.2 The Structure of Shareholders
2016/4/26
Governmental Organizations
Financial Institutions
Other Institutional Investors
Individuals Foreign Institutional Shareholders and Individuals
The People's Republic of China Individuals
Total
Numbers of Shareholders
6 18 311 143,296 826 0 144,457
Holding Shares
133 231,736,471 467,127,389 524,586,987 1,111,477,357 0 2,334,928,337
Holding Stake 0% 9.92% 20.01% 22.47% 47.60% 0% 100%
4.3 Change in the Proportion of Shareholding among the Directors, Managers, and Major Shareholders
Title (note 1) Name 2015 Current period to April 26
Change in number of shareholdings
Change in number of shares pledged under lien
Change in number of shareholdings
Change in number of shares pledged under lien
Chairman Raymond Soong 392,580 0 0 0
Vice Chairman
Lite-ON Capital Inc. 74,829 0 0 0
Representative: Warren Chen
(400,859) 0 0 0
Director David Lin 56,713 0 0 0
DirectorDorcas Investment Co., Ltd 29,948 0 0 0
Representative:Joseph Lin 1,468 0 0 0
DirectorTa Sung Investment Co., Ltd. 233,107 0 0 0
Representative: Keh Shew Lu 0 0 0 0
DirectorTa Sung Investment Co., Ltd. 233,107 0 0 0
Representative: Rick Wu 4,940 0 0 0
Director
Yuan Pao Development & Investment Co., Ltd.:
184,465 0 2,200,000 0
Representative: CH Chen 0 0 0 0
Director
Yuan Pao Development & Investment Co., Ltd.:
184,465 0 2,200,000 0
Representative: David Lee 32 0 0 0
Independent Director
Kuo-Feng Wu 0 0 0 0
Independent Director
Harvey Chang 0 0 0 0
Independent Director
Edward Yang 0 0 0 0
Vice Chairman/GCEO
Warren Chen (400,859) 0 0 0
Business Group CEO
Danny Liao 252,450 0 (250,000) 0
Title (note 1) Name 2015 Current period to April 26
Change in number of shareholdings
Change in number of shares pledged under lien
Change in number of shareholdings
Change in number of shares pledged under lien
Business Group President
Alexander Huang (51,975) 0 (155,000) 0
Business Unit General Manager
Shilung Chiang (302,457) 0 0 0
Business Group CEO
Peter Chiu 196,100 0 0 0
Operation Controlling General Manager
DI Wang 2,054 0 0 0
HR General Manager
Albert Chang 108,633 0 0 0
Business Group President
Rex Chuang (86,191) 0 (210,000) 0
VP Sonny Chao 50,116 0 0 0
Senior VP TC Huang 68,923 0 (10,000) 0
Business Group CEO
Johnson Sun 278,019 0 (179,300) 0
Business Unit General Manager
Henry Chen 39,414 0 (35,000) 0
VP Wing Eng 91,674 0 0 0
VP HY Lee 48,952 0 0 0
VP Victor Hsu 58,300 0 0 0
VP Joseph SK Chen 50,257 0 0 0
VP Johnson Wang (9,749) 0 (5,000) 0
VP Anson Chiu 85,520 0 0 0
Business Unit General Manager
BC Liao 66,228 0 0 0
Business Unit General Manager
Jerry Hsu 98,931 0 0 0
VP CY Chung 75,050 0 0 0
VP Joe Wu 35,051 0 0 0
Business Unit General Manager
Michael Wang 70,002 0 0 0
VP TsungCheng Wang 45,033 0 (10,000) 0
Business Group CEO
Charlie Tseng 47,000 0 (47,000) 0
Business Unit General Manager
David Yeh 40,000 0 0 0
VP James Hwang 2,005 0 0 0
VP Chino Chen 100,000 0 (81,000) 0

37 38‧Lite-On Technology Corporation 2015 Annual Report Lite-On Technology Corporation 2015 Annual Report‧
Title (note 1) Name 2015 Current period to April 26
Change in number of shareholdings
Change in number of shares pledged under lien
Change in number of shareholdings
Change in number of shares pledged under lien
Business Unit General Manager
Hai Huang 81,068 0 0 0
VP Jean Hong 0 0 0 0
Business Unit General Manager
Allen Hsu 0 0 0 0
Business Unit General Manager
Franki Choi 0 0 0 0
Chief Finance and Accounting Officer Finance General Manager
Brownson Chu 109,318 0 0 0
VP/Chief Audit Officer
Lando Lin 62,303 0 0 0
Lite-On Technology Corporation and Subsidiaries Consolidated Financial Statements for the Years Ended December 31, 2015 and 2014 and Independent Auditors’ Report
5.1 Consolidated Financial Statements of 2015
Financial Information

39 40‧Lite-On Technology Corporation 2015 Annual Report Lite-On Technology Corporation 2015 Annual Report‧
- 1 -
DECLARATION OF CONSOLIDATION OF FINANCIAL STATEMENTS OF AFFILIATES The companies required to be included in the consolidated financial statements of affiliates in accordance
with the “Criteria Governing Preparation of Affiliation Reports, Consolidated Business Reports and
Consolidated Financial Statements of Affiliated Enterprises” for the year ended December 31, 2015 are
all the same as the companies required to be included in the consolidated financial statements of parent
and subsidiary companies as provided in International Financial Reporting Standards No. 10
“Consolidated Financial Statements”. Relevant information that should be disclosed in the consolidated
financial statements of affiliates has all been disclosed in the consolidated financial statements of parent
and subsidiary companies. Hence, we do not prepare a separate set of consolidated financial statements
of affiliates.
Very truly yours, LITE-ON TECHNOLOGY CORPORATION By RAYMOND SOONG Chairman March 25, 2016

41 42‧Lite-On Technology Corporation 2015 Annual Report Lite-On Technology Corporation 2015 Annual Report‧
- 3 -
LITE-ON TECHNOLOGY CORPORATION AND SUBSIDIARIES CONSOLIDATED BALANCE SHEETS (In Thousands of New Taiwan Dollars)
December 31, 2015 December 31, 2014
(Restated) January 1, 2014
(Restated) ASSETS Amount % Amount % Amount % CURRENT ASSETS
Cash and cash equivalents (Note 6) $ 65,501,807 31 $ 66,483,356 31 $ 66,056,220 31 Financial assets at fair value through profit or loss - current (Note 7) 53,211 - 13,111 - 14,867 - Available-for-sale financial assets - current (Note 8) - - - - 13 - Debt instruments with no active market - current (Note 10) 694,435 - 78,170 - 22,390 - Notes receivable 300,825 - 311,666 - 175,756 - Trade receivables, net (Note 11) 50,079,869 24 51,134,012 23 49,500,169 23 Trade receivables from related parties (Note 34) 66,338 - 73,069 - 81,554 - Other receivables 1,289,849 1 1,420,019 1 2,319,810 1 Other receivables from related parties (Note 34) 10,481 - 3,053 - 18,951 - Inventories, net (Note 12) 28,826,436 14 29,513,791 14 27,203,533 13 Non-current assets classified as held for sale (Note 13) - - 129,505 - - - Other current assets (Note 19) 3,744,824 2 4,561,144 2 5,037,428 3
Total current assets 150,568,075 72 153,720,896 71 150,430,691 71
NONCURRENT ASSETS
Available-for-sale financial assets - non-current (Note 8) 670,328 - 1,326,255 1 2,143,990 1 Debt instruments with no active market - non-current (Note 10) 834 - 518 - 14,100 - Investments accounted for using equity method (Note 15) 4,095,167 2 4,055,902 2 3,531,425 2 Property, plant and equipment, net (Note 16) 33,389,439 16 36,107,216 17 37,001,382 17 Investment properties, net (Note 17) 499,950 - 537,030 - - - Intangible assets, net (Note 18) 15,938,232 8 16,298,963 8 15,716,262 7 Deferred tax assets 3,164,798 2 3,105,466 1 2,204,470 1 Refundable deposits 579,758 - 492,255 - 390,443 - Other noncurrent assets (Note 19) 747,282 - 889,328 - 925,989 1
Total noncurrent assets 59,085,788 28 62,812,933 29 61,928,061 29
TOTAL $ 209,653,863 100 $ 216,533,829 100 $ 212,358,752 100 LIABILITIES AND EQUITY CURRENT LIABILITIES
Short-term borrowings (Note 20) $ 17,670,878 8 $ 22,911,114 11 $ 15,576,780 7 Financial liabilities at fair value through profit or loss - current (Note 7) 55,945 - 38,408 - 27,836 - Derivative financial instruments for hedging- current (Note 9) - - 11,989 - - - Notes payable 178,594 - 122,947 - 191,488 - Trade payables 58,224,636 28 61,920,859 29 60,307,826 29 Trade payables to related parties (Note 34) 856,945 - 953,666 - 568,624 - Other payables 21,118,958 10 19,693,248 9 21,352,914 10 Other payables to related parties (Note 34) 12,941 - 6,741 - 11,699 - Current tax liabilities 2,475,535 1 2,272,036 1 2,102,971 1 Provisions - current (Note 22) 1,068,810 1 1,080,628 - 874,502 1 Advance receipts 3,275,828 2 2,832,769 1 1,401,939 1 Current portion of long-term borrowings (Note 20) 4,796,118 2 8,358,989 4 8,867,669 4 Finance lease payables - current (Note 21) 95,501 - 85,232 - 72,735 -
Total current liabilities 109,830,689 52 120,288,626 55 111,356,983 53
NONCURRENT LIABILITIES
Derivative financial instruments for hedging - noncurrent (Note 9) - - - - 46,969 - Long-term borrowings, net of current portion (Note 20) 16,355,753 8 13,564,160 6 18,508,496 9 Deferred tax liabilities 3,531,564 2 3,229,792 2 2,721,656 1 Finance lease payables, net of current portion (Note 21) 5,398 - 101,721 - 172,948 - Net defined benefit liabilities - noncurrent (Note 23) 155,854 - 96,021 - 219,709 - Guarantee deposits 91,012 - 80,871 - 81,608 -
Total noncurrent liabilities 20,139,581 10 17,072,565 8 21,751,386 10
Total liabilities 129,970,270 62 137,361,191 63 133,108,369 63
EQUITY ATTRIBUTABLE TO OWNERS OF THE COMPANY
Share capital Ordinary shares 23,349,283 11 23,416,737 11 23,246,552 11 Advance receipts for common stock - - - - 29,705 -
Total share capital 23,349,283 11 23,416,737 11 23,276,257 11 Capital surplus
Additional paid-in capital from share issuance in excess of par value 9,251,603 4 9,238,931 4 9,096,489 4 Bond conversion 7,462,138 4 7,534,962 4 7,540,388 4 Treasury stock transactions 275,516 - 445,694 - 430,851 - Difference between consideration and carrying amounts adjusted arising from changes in percentage of
ownership in subsidiaries 43,236 - 30,960 - - - Arising from share of changes in capital surplus of associates 278,747 - 231,446 - 15,487 - Merger 10,015,194 5 10,112,934 5 10,120,217 5 Employee stock options - - - - 8,587 -
Total capital surplus 27,326,434 13 27,594,927 13 27,212,019 13 Retain earnings
Legal reserve 10,123,042 5 9,476,876 5 8,601,391 4 Special reserve 232,213 - 49,669 - 689,913 - Unappropriated earnings 13,011,073 6 11,432,541 5 12,176,414 6
Total retained earnings 23,366,328 11 20,959,086 10 21,467,718 10 Other equity
Exchange differences on translating foreign operations 3,347,902 2 4,125,097 2 2,383,040 1 Unrealized gain (loss) on available-for-sale financial assets (152,714 ) - 139,072 - 83,231 - Unrealized loss on cash flow hedging - - (11,989 ) - (46,969 ) -
Total other equity 3,195,188 2 4,252,180 2 2,419,302 1 Treasury shares (1,248,722 ) (1 ) (1,248,722 ) (1 ) (1,334,660 ) (1 )
Total equity attributable to owners of the Company 75,988,511 36 74,974,208 35 73,040,636 34
NONCONTROLLING INTERESTS 3,695,082 2 4,198,430 2 6,209,747 3
Total equity 79,683,593 38 79,172,638 37 79,250,383 37 TOTAL $ 209,653,863 100 $ 216,533,829 100 $ 212,358,752 100 The accompanying notes are an integral part of the consolidated financial statements.
- 4 -
LITE-ON TECHNOLOGY CORPORATION AND SUBSIDIARIES CONSOLIDATED STATEMENTS OF COMPREHENSIVE INCOME (In Thousands of New Taiwan Dollars, Except Earnings Per Share) For the Years Ended December 31 2015 2014 (Restated) Amount % Amount % OPERATING REVENUE
Sales (Notes 25 and 34) $ 222,826,970 103 $ 237,313,030 103 Less: Sales allowance 4,258,037 2 3,733,656 2 Sales returns 1,640,199 1 2,947,400 1
Total operating revenue 216,928,734 100 230,631,974 100
COST OF GOODS SOLD (Notes 12, 28 and 34) 188,787,517 87 202,383,860 88 GROSS PROFIT 28,141,217 13 28,248,114 12 OPERATING EXPENSES (Notes 28 and 34)
Selling and marketing expenses 7,450,517 3 8,794,035 4 General and administrative expenses 6,051,269 3 5,955,613 2 Research and development expenses 5,986,608 3 6,372,383 3
Total operating expenses 19,488,394 9 21,122,031 9
OPERATING INCOME 8,652,823 4 7,126,083 3 NONOPERATING INCOME AND EXPENSES
Share of profit of associates (Note 15) 124,439 - 41,056 - Interest income 1,170,008 - 1,357,118 1 Dividend income 66,500 - 39,824 - Other income (Notes 30 and 34) 1,573,429 1 1,305,569 - Gain (loss) on disposal of investments (71,351) - 468,873 - Net gain on foreign currency exchange 123,658 - 58,022 - Gain on financial assets at fair value through profit
or loss (Note 7) 360,034 - 249,729 - Finance costs (578,715) - (673,634) - Other expenses (1,087,531) (1) (703,177) - Net loss on disposal of property, plant and equipment (15,465) - (77,334) - Impairment loss (Notes 8 and 16) (311,188) - (1,444,257) (1)
Total nonoperating income and expenses 1,353,818 - 621,789 -
PROFIT BEFORE INCOME TAX 10,006,641 4 7,747,872 3 INCOME TAX EXPENSE (Note 26) 2,693,809 1 2,070,880 1 NET PROFIT FOR THE YEAR 7,312,832 3 5,676,992 2
(Continued)

43 44‧Lite-On Technology Corporation 2015 Annual Report Lite-On Technology Corporation 2015 Annual Report‧
- 5 -
LITE-ON TECHNOLOGY CORPORATION AND SUBSIDIARIES CONSOLIDATED STATEMENTS OF COMPREHENSIVE INCOME (In Thousands of New Taiwan Dollars, Except Earnings Per Share) For the Years Ended December 31 2015 2014 (Restated) Amount % Amount % OTHER COMPREHENSIVE INCOME (Notes 23, 24
and 26) Items that will not be reclassified subsequently to
profit or loss Remeasurement of defined benefit plans $ (75,240) - $ 27,065 - Share of the other comprehensive loss of
associates accounted for using the equity method (25,529) - (12,836) -
Income tax relating to items that will not be reclassified subsequently to profit or loss 15,604 - (8,647) - (85,165) - 5,582 -
Items that may be reclassified subsequently to profit or loss Exchange differences on translating foreign
operations (932,034) - 2,115,652 1 Unrealized gain (loss) on available-for-sale
financial assets (292,354) - 53,856 - Unrealized gain on hedging instruments
determined to be the effective portion of cash flow hedging 11,989 - 34,980 -
Share of the other comprehensive income (loss) of associates accounted for using the equity method (27,849) - 167,523 -
Income tax relating to items that may be reclassified subsequently to profit or loss 130,178 - (424,675) - (1,110,070) - 1,947,336 1
Other comprehensive income (loss) for the year,
net of income tax (1,195,235) - 1,952,918 1 TOTAL COMPREHENSIVE INCOME FOR THE
YEAR $ 6,117,597 3 $ 7,629,910 3 NET PROFIT ATTRIBUTABLE TO:
Owners of the Company $ 7,222,899 3 $ 6,460,808 3 Non-controlling interests 89,933 - (783,816) (1)
$ 7,312,832 3 $ 5,676,992 2
(Continued)
- 6 -
LITE-ON TECHNOLOGY CORPORATION AND SUBSIDIARIES CONSOLIDATED STATEMENTS OF COMPREHENSIVE INCOME (In Thousands of New Taiwan Dollars, Except Earnings Per Share) For the Years Ended December 31 2015 2014 (Restated) Amount % Amount % TOTAL COMPREHENSIVE INCOME
ATTRIBUTABLE TO: Owners of the Company $ 6,080,431 3 $ 8,306,764 3 Non-controlling interests 37,166 - (676,854) -
$ 6,117,597 3 $ 7,629,910 3 EARNINGS PER SHARE (NEW TAIWAN
DOLLARS; Note 27)
Basic $3.11 $2.78 Diluted $3.07 $2.75
The accompanying notes are an integral part of the consolidated financial statements. (Concluded)

45 46‧Lite-On Technology Corporation 2015 Annual Report Lite-On Technology Corporation 2015 Annual Report‧
- 7 -
LITE-ON TECHNOLOGY CORPORATION AND SUBSIDIARIES CONSOLIDATED STATEMENTS OF CHANGES IN EQUITY (In Thousands of New Taiwan Dollars) Equity Attributable to Owners of the Company Capital Surplus (Note 24)
Difference Between
Consideration
Additional
and Carry Amounts Adjusted Other Equity (Notes 24 and 30)
Paid-in Arising from Arising from Exchange Unrealized Issue of Share Capital (Note 24) Capital from Changes in Share of Differences on Gain on Noncontrolling Advance Share Issuance Percentage of Changes in Retained Earnings (Notes 24 and 31) Translating Available-for- Treasury Interests
Share
(In Thousands) Amount Receipts for
Common Stock Total in Excess of Par Value
Bond Conversion
Treasury Stock Transactions
Ownership in Subsidiaries
Capital Surplus of Associates Merger
Employee Stock Options Total Legal Reserve Special Reserve
Unappropriated Earnings Total
Foreign Operations
sale Financial Assets
Cash Flow Hedges Total
Shares (Note 24)
(Notes 24, 29, 30 and 31) Total Equity
BALANCE AT JANUARY 1, 2014 2,324,655 $ 23,246,552 $ 29,705 $ 23,276,257 $ 9,096,489 $ 7,540,388 $ 430,851 $ - $ 15,487 $ 10,120,217 $ 8,587 $ 27,212,019 $ 8,601,391 $ 689,913 $ 12,172,082 $ 21,463,386 $ 2,383,040 $ 83,231 $ (46,969 ) $ 2,419,302 $ (1,334,660 ) $ 6,200,851 $ 79,237,155 Effect of retrospective application of IFRSs and
restatement of financial statements (Note 3) - - - - - - - - - - - - - - 4,332 4,332 - - - - - 8,896 13,228
2,324,655 23,246,552 29,705 23,276,257 9,096,489 7,540,388 430,851 - 15,487 10,120,217 8,587 27,212,019 8,601,391 689,913 12,176,414 21,467,718 2,383,040 83,231 (46,969 ) 2,419,302 (1,334,660 ) 6,209,747 79,250,383 Appropriation of the 2013 earnings
Legal reserve - - - - - - - - - - - - 875,485 - (875,485 ) - - - - - - - - Special reserve - - - - - - - - - - - - - (640,244 ) 640,244 - - - - - - - - Cash dividends - 27.1% - - - - - - - - - - - - - - (6,307,866 ) (6,307,866 ) - - - - - - (6,307,866 ) Stock dividends - 0.5% 11,638 116,381 - 116,381 - - - - - - - - - - (116,381 ) (116,381 ) - - - - - - -
Changes in noncontrolling interests - - - - - - - - - - - - - - - - - - - - - (127,371 ) (127,371 ) Other changes in capital surplus
Additional acquisition of partially owned subsidiaries - - - - - - - - - - - - - - (543,482 ) (543,482 ) - - - - - (469,686 ) (1,013,168 ) Arising from changes in percentage of ownership
interest in subsidiaries - - - - - - (206 ) 30,960 - - (694 ) 30,060 - - - - - - - - - - 30,060 Change in capital surplus from investments in
associates and joint ventures accounted for by the equity method - - - - - - (556 ) - 215,959 - (7,893 ) 207,510 - - - - - - - - - - 207,510
Stock dividends of employee transferred to capital 4,085 40,849 - 40,849 149,096 - - - - - - 149,096 - - - - - - - - - - 189,945 Issue of common shares under employee share
options 2,971 29,705 (29,705 ) - - - - - - - - - - - - - - - - - - - - Change in capital from cash dividends of the Parent
Company paid to subsidiaries - - - - - - 65,430 - - - - 65,430 - - - - - - - - - - 65,430 Disposal of investments accounted for using equity
method - - - - - - - - - - - - - - - - (1,240 ) - - (1,240 ) - - (1,240 ) Effect of acquisition and deconsolidation of subsidiaries - - - - - - - - - - - - - - - - (13,549 ) - - (13,549 ) - (737,406 ) (750,955 ) Net profit for the year ended December 31, 2014 - - - - - - - - - - - - - - 6,460,808 6,460,808 - - - - - (783,816 ) 5,676,992 Other comprehensive income for the year ended
December 31, 2014, net of income tax - - - - - - - - - - - - - - (1,711 ) (1,711 ) 1,756,846 55,841 34,980 1,847,667 - 106,962 1,952,918 Total comprehensive income for the year ended
December 31, 2014 - - - - - - - - - - - - - - 6,459,097 6,459,097 1,756,846 55,841 34,980 1,847,667 - (676,854 ) 7,629,910 Cancellation of treasury shares (1,675 ) (16,750 ) - (16,750 ) (6,654 ) (5,426 ) (49,825 ) - - (7,283 ) - (69,188 ) - - - - - - - - 85,938 - - BALANCE AT DECEMBER 31, 2014 2,341,674 23,416,737 - 23,416,737 9,238,931 7,534,962 445,694 30,960 231,446 10,112,934 - 27,594,927 9,476,876 49,669 11,432,541 20,959,086 4,125,097 139,072 (11,989 ) 4,252,180 (1,248,722 ) 4,198,430 79,172,638 Appropriation of the 2014 earnings
Legal reserve - - - - - - - - - - - - 646,166 - (646,166 ) - - - - - - - - Special reserve - - - - - - - - - - - - - 182,544 (182,544 ) - - - - - - - - Cash dividends - 19.7% - - - - - - - - - - - - - - (4,613,097 ) (4,613,097 ) - - - - - - (4,613,097 ) Stock dividends - 0.5% 11,708 117,084 - 117,084 - - - - - - - - - - (117,084 ) (117,084 ) - - - - - - -
Changes in noncontrolling interests - - - - - - - - - - - - - - - - - - - - - (540,514 ) (540,514 ) Other changes in capital surplus
Arising from changes in percentage of ownership interest in subsidiaries - - - - - - - 12,276 - - - 12,276 - - - - - - - - - - 12,276
Change in capital surplus from investments in associates and joint ventures accounted for by the equity method - - - - - - - - 47,301 - - 47,301 - - - - - - - - - - 47,301
Stock dividends of employee transferred to capital 4,333 43,332 - 43,332 102,960 - - - - - - 102,960 - - - - - - - - - - 146,292 Change in capital from cash dividends of the Parent
Company paid to subsidiaries - - - - - - 47,779 - - - - 47,779 - - - - - - - - - - 47,779 Net profit for the year ended December 31, 2015 - - - - - - - - - - - - - - 7,222,899 7,222,899 - - - - - 89,933 7,312,832 Other comprehensive income (loss) for the year ended
December 31, 2015, net of income tax - - - - - - - - - - - - - - (85,476 ) (85,476 ) (777,195 ) (291,786 ) 11,989 (1,056,992 ) - (52,767 ) (1,195,235 ) Total comprehensive income for the year ended
December 31, 2015 - - - - - - - - - - - - - - 7,137,423 7,137,423 (777,195 ) (291,786 ) 11,989 (1,056,992 ) - 37,166 6,117,597 Cancellation of treasury shares (22,787 ) (227,870 ) - (227,870 ) (90,288 ) (72,824 ) (217,957 ) - - (97,740 ) - (478,809 ) - - - - - - - - - - (706,679 ) BALANCE AT DECEMBER 31, 2015 2,334,928 $ 23,349,283 $ - $ 23,349,283 $ 9,251,603 $ 7,462,138 $ 275,516 $ 43,236 $ 278,747 $ 10,015,194 $ - $ 27,326,434 $ 10,123,042 $ 232,213 $ 13,011,073 $ 23,366,328 $ 3,347,902 $ (152,714 ) $ - $ 3,195,188 $ (1,248,722 ) $ 3,695,082 $ 79,683,593 The accompanying notes are an integral part of the consolidated financial statements.
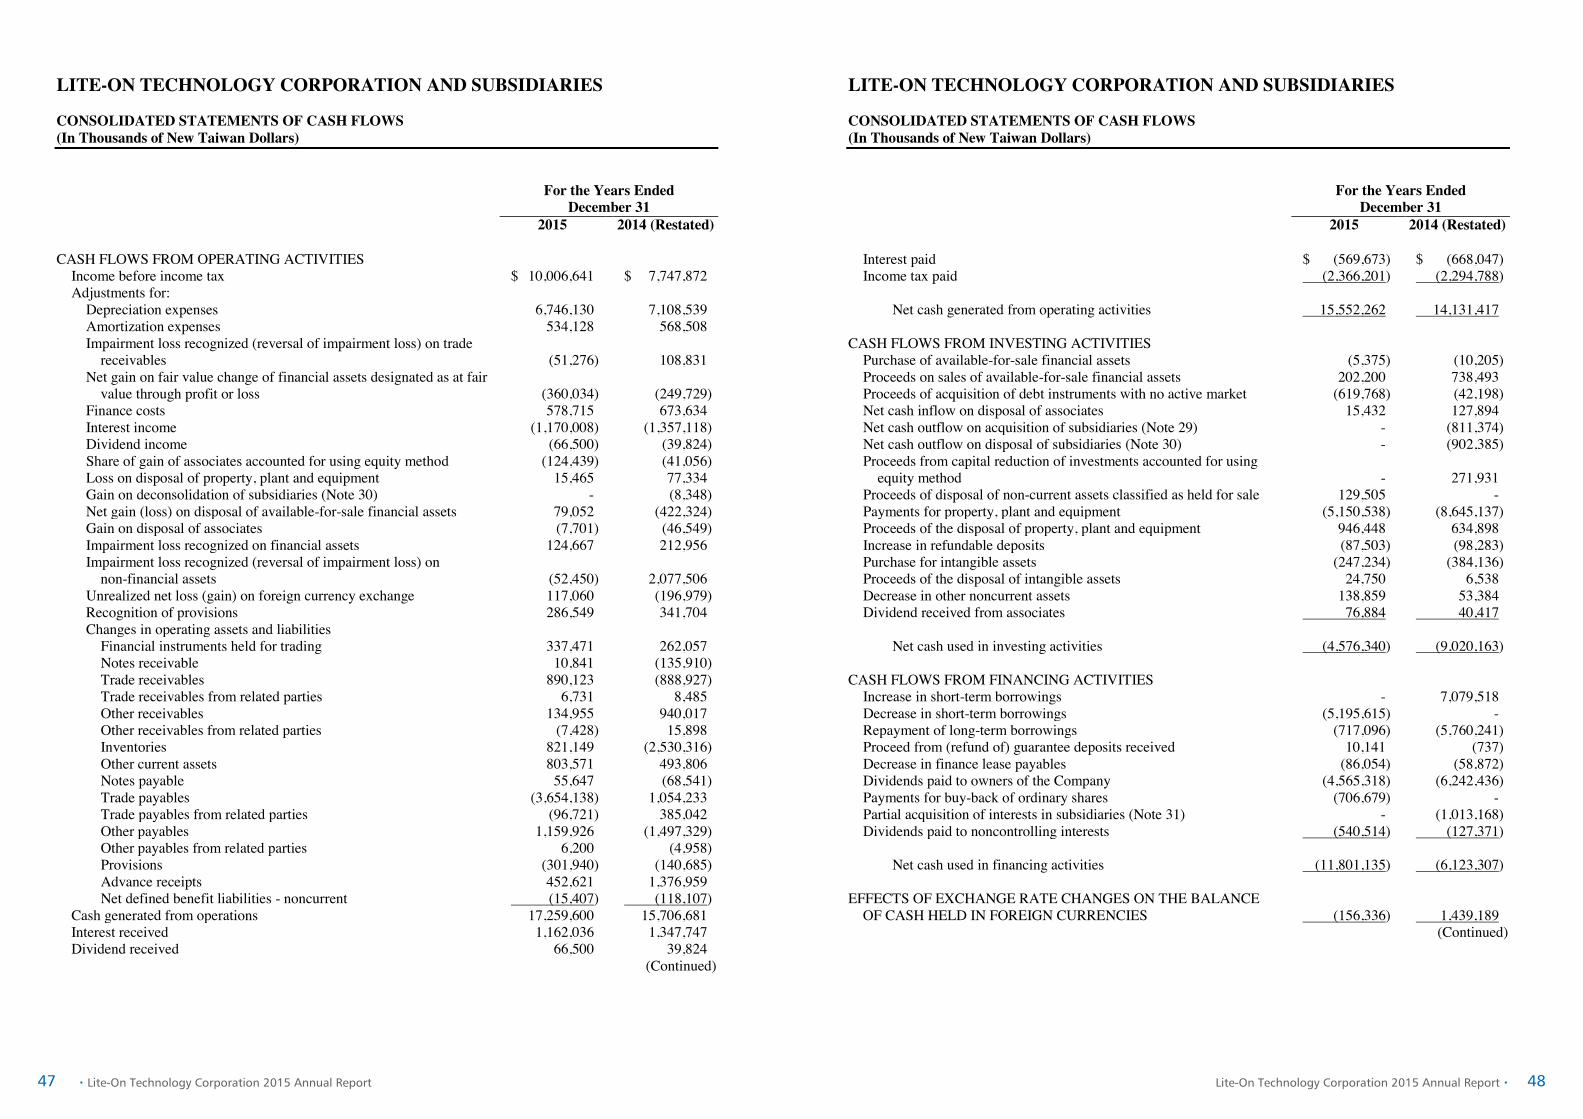
47 48‧Lite-On Technology Corporation 2015 Annual Report Lite-On Technology Corporation 2015 Annual Report‧
- 8 -
LITE-ON TECHNOLOGY CORPORATION AND SUBSIDIARIES CONSOLIDATED STATEMENTS OF CASH FLOWS (In Thousands of New Taiwan Dollars)
For the Years Ended
December 31 2015 2014 (Restated) CASH FLOWS FROM OPERATING ACTIVITIES
Income before income tax $ 10,006,641 $ 7,747,872 Adjustments for:
Depreciation expenses 6,746,130 7,108,539 Amortization expenses 534,128 568,508 Impairment loss recognized (reversal of impairment loss) on trade
receivables (51,276) 108,831 Net gain on fair value change of financial assets designated as at fair
value through profit or loss (360,034) (249,729) Finance costs 578,715 673,634 Interest income (1,170,008) (1,357,118) Dividend income (66,500) (39,824) Share of gain of associates accounted for using equity method (124,439) (41,056) Loss on disposal of property, plant and equipment 15,465 77,334 Gain on deconsolidation of subsidiaries (Note 30) - (8,348) Net gain (loss) on disposal of available-for-sale financial assets 79,052 (422,324) Gain on disposal of associates (7,701) (46,549) Impairment loss recognized on financial assets 124,667 212,956 Impairment loss recognized (reversal of impairment loss) on
non-financial assets (52,450) 2,077,506 Unrealized net loss (gain) on foreign currency exchange 117,060 (196,979) Recognition of provisions 286,549 341,704 Changes in operating assets and liabilities
Financial instruments held for trading 337,471 262,057 Notes receivable 10,841 (135,910) Trade receivables 890,123 (888,927) Trade receivables from related parties 6,731 8,485 Other receivables 134,955 940,017 Other receivables from related parties (7,428) 15,898 Inventories 821,149 (2,530,316) Other current assets 803,571 493,806 Notes payable 55,647 (68,541) Trade payables (3,654,138) 1,054,233 Trade payables from related parties (96,721) 385,042 Other payables 1,159,926 (1,497,329) Other payables from related parties 6,200 (4,958) Provisions (301,940) (140,685) Advance receipts 452,621 1,376,959 Net defined benefit liabilities - noncurrent (15,407) (118,107)
Cash generated from operations 17,259,600 15,706,681 Interest received 1,162,036 1,347,747 Dividend received 66,500 39,824
(Continued)
- 9 -
LITE-ON TECHNOLOGY CORPORATION AND SUBSIDIARIES CONSOLIDATED STATEMENTS OF CASH FLOWS (In Thousands of New Taiwan Dollars)
For the Years Ended
December 31 2015 2014 (Restated)
Interest paid $ (569,673) $ (668,047) Income tax paid (2,366,201) (2,294,788)
Net cash generated from operating activities 15,552,262 14,131,417
CASH FLOWS FROM INVESTING ACTIVITIES
Purchase of available-for-sale financial assets (5,375) (10,205) Proceeds on sales of available-for-sale financial assets 202,200 738,493 Proceeds of acquisition of debt instruments with no active market (619,768) (42,198) Net cash inflow on disposal of associates 15,432 127,894 Net cash outflow on acquisition of subsidiaries (Note 29) - (811,374) Net cash outflow on disposal of subsidiaries (Note 30) - (902,385) Proceeds from capital reduction of investments accounted for using
equity method - 271,931 Proceeds of disposal of non-current assets classified as held for sale 129,505 - Payments for property, plant and equipment (5,150,538) (8,645,137) Proceeds of the disposal of property, plant and equipment 946,448 634,898 Increase in refundable deposits (87,503) (98,283) Purchase for intangible assets (247,234) (384,136) Proceeds of the disposal of intangible assets 24,750 6,538 Decrease in other noncurrent assets 138,859 53,384 Dividend received from associates 76,884 40,417
Net cash used in investing activities (4,576,340) (9,020,163)
CASH FLOWS FROM FINANCING ACTIVITIES
Increase in short-term borrowings - 7,079,518 Decrease in short-term borrowings (5,195,615) - Repayment of long-term borrowings (717,096) (5,760,241) Proceed from (refund of) guarantee deposits received 10,141 (737) Decrease in finance lease payables (86,054) (58,872) Dividends paid to owners of the Company (4,565,318) (6,242,436) Payments for buy-back of ordinary shares (706,679) - Partial acquisition of interests in subsidiaries (Note 31) - (1,013,168) Dividends paid to noncontrolling interests (540,514) (127,371)
Net cash used in financing activities (11,801,135) (6,123,307)
EFFECTS OF EXCHANGE RATE CHANGES ON THE BALANCE
OF CASH HELD IN FOREIGN CURRENCIES (156,336) 1,439,189 (Continued)

49 50‧Lite-On Technology Corporation 2015 Annual Report Lite-On Technology Corporation 2015 Annual Report‧
- 10 -
LITE-ON TECHNOLOGY CORPORATION AND SUBSIDIARIES CONSOLIDATED STATEMENTS OF CASH FLOWS (In Thousands of New Taiwan Dollars)
For the Years Ended
December 31 2015 2014 (Restated) NET INCREASE (DECREASE) IN CASH AND CASH
EQUIVALENTS $ (981,549) $ 427,136 CASH AND CASH EQUIVALENTS AT THE BEGINNING OF THE
YEAR 66,483,356 66,056,220 CASH AND CASH EQUIVALENTS AT THE END OF THE YEAR $ 65,501,807 $ 66,483,356 The accompanying notes are an integral part of the consolidated financial statements. (Concluded)
- 11 -
LITE-ON TECHNOLOGY CORPORATION AND SUBSIDIARIES NOTES TO CONSOLIDATED FINANCIAL STATEMENTS FOR THE YEARS ENDED DECEMBER 31, 2015 AND 2014 (In Thousands of New Taiwan Dollars, Unless Stated Otherwise) 1. GENERAL INFORMATION
Lite-On Technology Corporation (the “Parent Company”) was established in March 1989. The Parent Company’s shares have been listed on the Taiwan Stock Exchange. The Parent Company manufactures and markets (1) computer software, hardware, peripherals and components, (2) monitors, multifunction and all-in-one printers, cameras and Internet systems and image-processing equipment; (3) information storage and process equipment, electronic components and office equipment; (4) electronic coils, transformers, power suppliers and electronic hardware parts; (5) light-emitting diode (LED) products; (6) electronic car products; and (7) optical lens modules and optoelectronic components. The Parent Company merged with Lite-On Electronics, Inc., Silitek Corp. and GVC Corp., with the Parent Company as the survivor entity. The merger took effect on November 4, 2002, and the Parent Company thus assumed all rights and obligations of the three merged companies on that date. The Parent Company merged with its subsidiary, Lite-On Enclosure Inc., with the Parent Company as the survivor entity. The merger took effect on April 1, 2004, and the Parent Company thus assumed all rights and obligations of its former subsidiary on that date. The Parent Company separately merged with Li Shin International Enterprise Corp., Lite-On Clean Energy Technology Corp., Lite-On Automotive Corp., Leotek Electronics Corp., Lite-On IT Corporation and LarView Technologies Corp., with the Parent Company as the survivor entity. The merger separately took effect on March 22, 2014, April 15, 2014, June 1, 2014, June 29, 2014, June 30, 2014 and September 1, 2014, and the Parent Company thus assumed all rights and obligations of the six merged companies on those date. The consolidated financial statements are presented in the Parent Company’s functional currency, the New Taiwan dollars.
2. APPROVAL OF FINANCIAL STATEMENTS The consolidated financial statements were approved by the Parent Company board of directors on March 25, 2016.
3. APPLICATION OF NEW, AMENDED AND REVISED STANDARDS AND INTERPRETATIONS
a. Initial application of the amendments to the Regulations Governing the Preparation of Financial Reports by Securities Issuers and the 2013 version of the International Financial Reporting Standards (IFRS), International Accounting Standards (IAS), Interpretations of IFRS (IFRIC), and Interpretations of IAS (SIC) endorsed by the FSC Rule No. 1030029342 and Rule No. 1030010325 issued by the FSC on April 3, 2014, stipulated that the Parent Company and its subsidiaries (collectively, the “Group”) should apply the 2013 version of IFRS, IAS, IFRIC and SIC (collectively, the “IFRSs”) endorsed by the FSC and the related amendments to the Regulations Governing the Preparation of Financial Reports by Securities Issuers starting January 1, 2015.

51 52‧Lite-On Technology Corporation 2015 Annual Report Lite-On Technology Corporation 2015 Annual Report‧
- 12 -
Except for the following, the initial application of the amendments to the Regulations Governing the Preparation of Financial Reports by Securities Issuers and the 2013 IFRSs version did not have any material impact on the Group’s accounting policies:
1) IFRS 10 “Consolidated Financial Statements”
IFRS 10 replaces IAS 27 “Consolidated and Separate Financial Statements” and SIC 12 “Consolidation - Special Purpose Entities”. The Group considers whether it has control over other entities for consolidation. The Group has control over an investee if and only if it has i) power over the investee; ii) exposure, or rights, to variable returns from its involvement with the investee and iii) the ability to use its power over the investee to affect the amount of its returns. Additional guidance has been included in IFRS 10 to explain when an investor has control over an investee.
2) IFRS 12 “Disclosure of Interests in Other Entities”
IFRS 12 is a new disclosure standard and is applicable to entities that have interests in subsidiaries, joint arrangements, associates and unconsolidated structured entities. In general, the disclosure requirements in IFRS 12 are more extensive than in previous standards. Please refer to Note 14 and Note 15 for related disclosures.
3) IFRS 13 “Fair Value Measurement”
IFRS 13 establishes a single source of guidance for fair value measurements. It defines fair value, establishes a framework for measuring fair value, and requires disclosures about fair value measurements. The disclosure requirements in IFRS 13 are more extensive than in previous standards; for example, quantitative and qualitative disclosures based on the three-level fair value hierarchy previously required only for financial instruments have been extended by IFRS 13 to cover all assets and liabilities within its scope. The fair value measurements under IFRS 13 are applied prospectively from January 1, 2015. Refer to Note 33 for related disclosures.
4) Amendment to IAS 1 “Presentation of Items of Other Comprehensive Income” The amendment to IAS 1 requires items of other comprehensive income to be grouped into those items that (1) will not be reclassified subsequently to profit or loss; and (2) may be reclassified subsequently to profit or loss. Income taxes on related items of other comprehensive income are grouped on the same basis. Under previous IAS 1, there were no such requirements. The Group retrospectively applied the above amendments starting from 2015. Items not expected to be reclassified to profit or loss are remeasurements of the defined benefit plans. Items expected to be reclassified to profit or loss are the exchange differences on translating foreign operations, unrealized gains (loss) on available-for-sale financial assets, cash flow hedges, and share of the other comprehensive income (except the share of the remeasurements of the defined benefit plans) of subsidiaries and associates accounted for using the equity method. The application of the above amendments did not result in any impact on the net profit for the year, other comprehensive income for the year (net of income tax), and total comprehensive income for the year.
- 13 -
5) Revision to IAS 19 “Employee Benefits” Revised IAS 19 requires the recognition of changes in defined benefit obligations and in the fair value of plan assets when they occur, and hence eliminates the “corridor approach” permitted under previous IAS 19 and accelerates the recognition of past service costs. The revision requires all remeasurements of the defined benefit plans to be recognized immediately through other comprehensive income in order for the net pension asset or liability to reflect the full value of the plan deficit or surplus. Remeasurement of the defined benefit plans is presented separately as other equity. Furthermore, the interest cost and expected return on plan assets used in previous IAS 19 are replaced with a “net interest” amount, which is calculated by applying the discount rate to the net defined benefit liability or asset. In addition, the revised IAS 19 introduces certain changes in the presentation of the defined benefit cost, and also includes more extensive disclosures. On initial application of the revised IAS 19, the changes in cumulative employee benefit costs as of December 31, 2013 that resulted from the retrospective application in the past are adjusted to net defined benefit liabilities, deferred tax assets and other equity and retained earnings; the carrying amounts of inventories are not adjusted. The impact of the new standards on the current period is set out below:
Impact on Assets, Liabilities and Equity December 31,
2015 Decrease in deferred tax assets $ (1,940) Decrease in net defined benefit liabilities $ (11,254) Increase in retained earnings $ 3,214 Non-controlling interests 6,100 Total effect on equity $ 9,314
Impact on Total Comprehensive Income
For the Year Ended
December 31, 2015
Increase in operating cost $ (395) Increase in operating expense (1,201) Decrease in income tax expense 263 Decrease in net profit for the year $ (1,333) Decrease in net profit attributable to:
Owners of the Parent Company $ (460) Non-controlling interests (873)
$ (1,333) Decrease in total comprehensive income attributable to:
Owners of the Parent Company $ (460) Non-controlling interests (873)
$ (1,333)

53 54‧Lite-On Technology Corporation 2015 Annual Report Lite-On Technology Corporation 2015 Annual Report‧
- 14 -
The impact on the prior reporting period is set out below:
Impact on Assets, Liabilities and Equity
As Originally Stated
Adjustments Arising from
Initial Application Restated
December 31, 2014 Deferred tax assets $ 3,107,672 $ (2,206) $ 3,105,466 Accrued pension liabilities $ 108,874 $ (108,874) $ - Net defined benefit liabilities $ - $ 96,021 $ 96,021 Retained earnings $ 20,955,605 $ 3,481 $ 20,959,086 Non-controlling interests $ 4,191,264 $ 7,166 $ 4,198,430 January 1, 2014 Deferred tax assets $ 2,207,204 $ (2,734) $ 2,204,470 Accrued pension liabilities $ 235,671 $ (235,671) $ - Net defined benefit liabilities $ - $ 219,709 $ 219,709 Retained earnings $ 21,463,386 $ 4,332 $ 21,467,718 Non-controlling interests $ 6,200,851 $ 8,896 $ 6,209,747
Impact on Total Comprehensive Income
As Originally Stated
Adjustments Arising from
Initial Application Restated
Operating cost $ 202,383,002 $ 858 $ 202,383,860 Operating expense 21,119,771 2,260 21,122,031 Income tax expense 2,071,417 (537) 2,080,880 Total effect on net profit for the year 5,679,573 (2,581) 5,676,992 Total effect on total comprehensive
income for the year 7,632,491 (2,581) 7,629,910 Impact on net profit attributable to:
Owners of the Parent Company $ 6,461,659 $ (851) $ 6,460,808 Non-controlling interests (782,086) (1,730) (783,816) $ 5,679,573 $ (2,581) $ 5,676,992
Impact on total comprehensive income
attributable to: Owners of the Parent Company $ 8,307,615 $ (851) $ 8,306,764 Non-controlling interests (675,124) (1,730) (676,854) $ 7,632,491 $ (2,581) $ 7,629,910
(Continued)
- 15 -
Impact on Total Comprehensive Income
As Originally Stated
Adjustments Arising from
Initial Application Restated
Impact on earnings per share:
Basic $ 2.78 $ - $ 2.78 Diluted $ 2.75 $ - $ 2.75
(Concluded) 6) Amendments to IFRS 7 “Disclosure - Offsetting Financial Assets and Financial Liabilities”
The amendments to IFRS 7 require disclosure of information about rights of offset and related arrangements (such as collateral posting requirements) for financial instruments under enforceable master netting arrangements and similar arrangements. Refer to Note 33 for related disclosure.
b. New IFRSs in issue but not yet endorsed by the FSC
On March 10, 2016, the FSC announced the scope of the 2016 version of IFRSs to be endorsed and will take effect from January 1, 2017. The scope includes all IFRSs that were issued by the IASB before January 1, 2016 and have effective dates on or before January 1, 2017, which means the scope excludes those that are not yet effective as of January 1, 2017 such as IFRS 9 “Financial Instruments” and IFRS 15 “Revenue from Contracts with Customers” and those with undetermined effective date. In addition, the FSC announced that the Company should apply IFRS 15 starting January 1, 2018. As of the date the financial statements were authorized for issue, the FSC has not announced the effective dates of other new, amended and revised standards and interpretations. The Group has not applied the following New IFRSs issued by the IASB but not yet endorsed by the FSC.
New IFRSs Effective Date
Announced by IASB (Note 1) Annual Improvements to IFRSs 2010-2012 Cycle July 1, 2014 (Note 2) Annual Improvements to IFRSs 2011-2013 Cycle July 1, 2014 Annual Improvements to IFRSs 2012-2014 Cycle January 1, 2016 (Note 4) IFRS 9 “Financial Instruments” January 1, 2018 Amendments to IFRS 9 and IFRS 7 “Mandatory Effective Date of
IFRS 9 and Transition Disclosures” January 1, 2018
Amendments to IFRS 10 and IAS 28 “Sales or Contribution of Assets between an Investor and its Associate or Joint Venture”
January 1, 2016 (Note 3)
Amendments to IFRS 10, IFRS 12 and IAS 28 “Investment Entities: Applying the Consolidation Exception”
January 1, 2016
Amendment to IFRS 11 “Accounting for Acquisitions of Interests in Joint Operations”
January 1, 2016
IFRS 14 “Regulatory Deferral Accounts” January 1, 2016 IFRS 15 “Revenue from Contracts with Customers” January 1, 2018 IFRS 16 “Leases” January 1, 2019 Amendment to IAS 1 “Disclosure Initiative” January 1, 2016 Amendment to IAS 7 “Disclosure Initiative” January 1, 2017 Amendments to IAS 12 “Recognition of Deferred Tax Assets for
Unrealized Losses” January 1, 2017
(Continued)
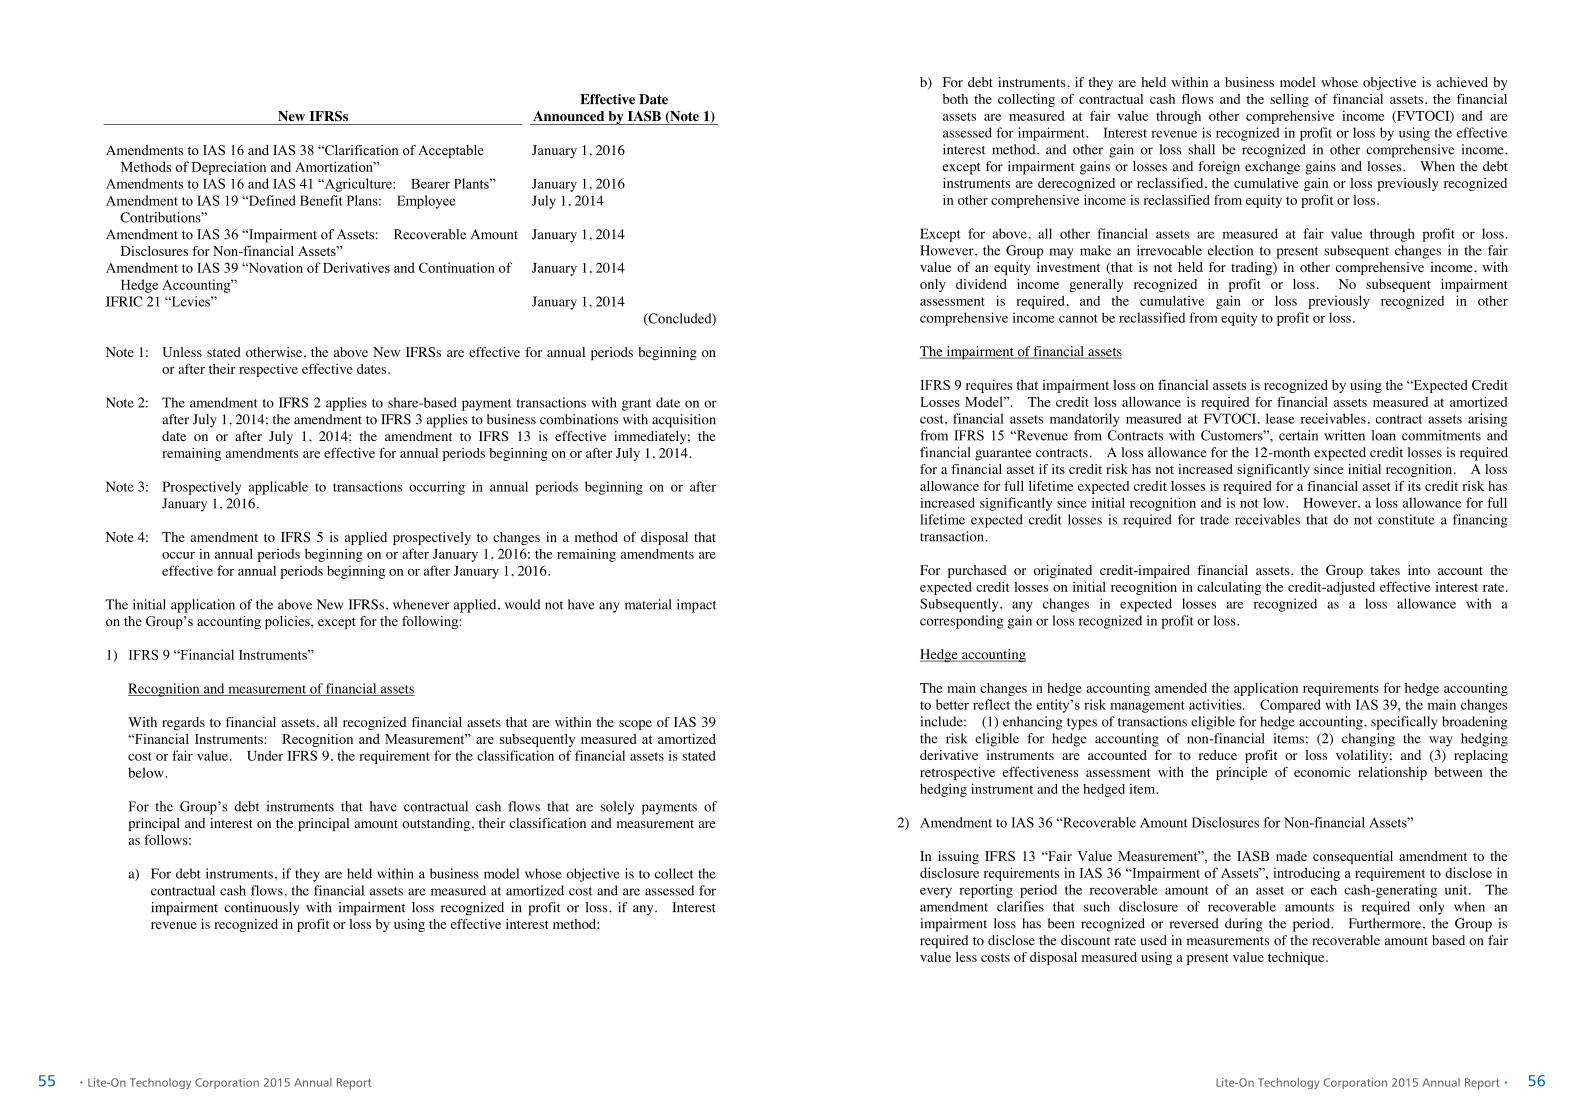
55 56‧Lite-On Technology Corporation 2015 Annual Report Lite-On Technology Corporation 2015 Annual Report‧
- 16 -
New IFRSs Effective Date
Announced by IASB (Note 1) Amendments to IAS 16 and IAS 38 “Clarification of Acceptable
Methods of Depreciation and Amortization” January 1, 2016
Amendments to IAS 16 and IAS 41 “Agriculture: Bearer Plants” January 1, 2016 Amendment to IAS 19 “Defined Benefit Plans: Employee
Contributions” July 1, 2014
Amendment to IAS 36 “Impairment of Assets: Recoverable Amount Disclosures for Non-financial Assets”
January 1, 2014
Amendment to IAS 39 “Novation of Derivatives and Continuation of Hedge Accounting”
January 1, 2014
IFRIC 21 “Levies” January 1, 2014 (Concluded)
Note 1: Unless stated otherwise, the above New IFRSs are effective for annual periods beginning on
or after their respective effective dates. Note 2: The amendment to IFRS 2 applies to share-based payment transactions with grant date on or
after July 1, 2014; the amendment to IFRS 3 applies to business combinations with acquisition date on or after July 1, 2014; the amendment to IFRS 13 is effective immediately; the remaining amendments are effective for annual periods beginning on or after July 1, 2014.
Note 3: Prospectively applicable to transactions occurring in annual periods beginning on or after
January 1, 2016. Note 4: The amendment to IFRS 5 is applied prospectively to changes in a method of disposal that
occur in annual periods beginning on or after January 1, 2016; the remaining amendments are effective for annual periods beginning on or after January 1, 2016.
The initial application of the above New IFRSs, whenever applied, would not have any material impact on the Group’s accounting policies, except for the following: 1) IFRS 9 “Financial Instruments”
Recognition and measurement of financial assets With regards to financial assets, all recognized financial assets that are within the scope of IAS 39 “Financial Instruments: Recognition and Measurement” are subsequently measured at amortized cost or fair value. Under IFRS 9, the requirement for the classification of financial assets is stated below. For the Group’s debt instruments that have contractual cash flows that are solely payments of principal and interest on the principal amount outstanding, their classification and measurement are as follows: a) For debt instruments, if they are held within a business model whose objective is to collect the
contractual cash flows, the financial assets are measured at amortized cost and are assessed for impairment continuously with impairment loss recognized in profit or loss, if any. Interest revenue is recognized in profit or loss by using the effective interest method;
- 17 -
b) For debt instruments, if they are held within a business model whose objective is achieved by both the collecting of contractual cash flows and the selling of financial assets, the financial assets are measured at fair value through other comprehensive income (FVTOCI) and are assessed for impairment. Interest revenue is recognized in profit or loss by using the effective interest method, and other gain or loss shall be recognized in other comprehensive income, except for impairment gains or losses and foreign exchange gains and losses. When the debt instruments are derecognized or reclassified, the cumulative gain or loss previously recognized in other comprehensive income is reclassified from equity to profit or loss.
Except for above, all other financial assets are measured at fair value through profit or loss. However, the Group may make an irrevocable election to present subsequent changes in the fair value of an equity investment (that is not held for trading) in other comprehensive income, with only dividend income generally recognized in profit or loss. No subsequent impairment assessment is required, and the cumulative gain or loss previously recognized in other comprehensive income cannot be reclassified from equity to profit or loss. The impairment of financial assets IFRS 9 requires that impairment loss on financial assets is recognized by using the “Expected Credit Losses Model”. The credit loss allowance is required for financial assets measured at amortized cost, financial assets mandatorily measured at FVTOCI, lease receivables, contract assets arising from IFRS 15 “Revenue from Contracts with Customers”, certain written loan commitments and financial guarantee contracts. A loss allowance for the 12-month expected credit losses is required for a financial asset if its credit risk has not increased significantly since initial recognition. A loss allowance for full lifetime expected credit losses is required for a financial asset if its credit risk has increased significantly since initial recognition and is not low. However, a loss allowance for full lifetime expected credit losses is required for trade receivables that do not constitute a financing transaction. For purchased or originated credit-impaired financial assets, the Group takes into account the expected credit losses on initial recognition in calculating the credit-adjusted effective interest rate. Subsequently, any changes in expected losses are recognized as a loss allowance with a corresponding gain or loss recognized in profit or loss. Hedge accounting The main changes in hedge accounting amended the application requirements for hedge accounting to better reflect the entity’s risk management activities. Compared with IAS 39, the main changes include: (1) enhancing types of transactions eligible for hedge accounting, specifically broadening the risk eligible for hedge accounting of non-financial items; (2) changing the way hedging derivative instruments are accounted for to reduce profit or loss volatility; and (3) replacing retrospective effectiveness assessment with the principle of economic relationship between the hedging instrument and the hedged item.
2) Amendment to IAS 36 “Recoverable Amount Disclosures for Non-financial Assets”
In issuing IFRS 13 “Fair Value Measurement”, the IASB made consequential amendment to the disclosure requirements in IAS 36 “Impairment of Assets”, introducing a requirement to disclose in every reporting period the recoverable amount of an asset or each cash-generating unit. The amendment clarifies that such disclosure of recoverable amounts is required only when an impairment loss has been recognized or reversed during the period. Furthermore, the Group is required to disclose the discount rate used in measurements of the recoverable amount based on fair value less costs of disposal measured using a present value technique.

57 58‧Lite-On Technology Corporation 2015 Annual Report Lite-On Technology Corporation 2015 Annual Report‧
- 18 -
3) IFRS 15 “Revenue from Contracts with Customers”
IFRS 15 establishes principles for recognizing revenue that apply to all contracts with customers, and will supersedes IAS 18 “Revenue”, IAS 11 “Construction Contracts” and a number of revenue-related interpretations. When applying IFRS 15, an entity shall recognize revenue by applying the following steps: Identify the contract with the customer; Identify the performance obligations in the contract; Determine the transaction price; Allocate the transaction price to the performance obligations in the contracts; and Recognize revenue when the entity satisfies a performance obligation. When IFRS 15 is effective, an entity may elect to apply this Standard either retrospectively to each prior reporting period presented or retrospectively with the cumulative effect of initially applying this Standard recognized at the date of initial application.
4) Amendments to IFRS 10 and IAS 28 “Sale or Contribution of Assets between an Investor and its Associate or Joint Venture” The amendments stipulate that, when an entity sells or contributes to an associate assets that constitute a business as defined in IFRS 3 “Business Combination”, or when an entity loses control of a subsidiary that contains a business but retains significant influence or joint control, the gain or loss resulting from the transaction is recognized in full. Also, when an entity loses control of a subsidiary that does not contain a business as defined in IFRS 3 but retains significant influence or joint control in an associate or a joint venture, the gain or loss resulting from the asset sale or contribution is recognized only to the extent of the unrelated investors’ interest in the associate or joint venture, and the entity’s share of the gain or loss is eliminated.
5) IFRS 16 “Leases” IFRS 16 sets out the accounting standards for leases that will supersede IAS 17 and a number of related interpretations. Under IFRS 16, if the Group is a lessee, it shall recognize right-of-use assets and lease liabilities for all leases on the consolidated balance sheets except for low-value and short-term leases. The Group may elect to apply the accounting method similar to the accounting for operating lease under IAS 17 to the low-value and short-term leases. On the consolidated statements of comprehensive income, the Group should present the depreciation expense charged on the right-of-use asset separately from interest expense accrued on the lease liability; interest is computed by using effective interest method. On the consolidated statements of cash flows, cash payments for the principal portion of the lease liability are classified within financing activities; cash payments for interest portion are classified within operating activities. When IFRS 16 becomes effective, the Group may elect to apply this Standard either retrospectively to each prior reporting period presented or retrospectively with the cumulative effect of the initial application of this Standard recognized at the date of initial application.
Except for the above impact, as of the date the consolidated financial statements were authorized for issue, the Group is continuously assessing the possible impact that the application of other standards and interpretations will have on the Group’s financial position and financial performance, and will disclose the relevant impact when the assessment is completed.
- 19 -
4. SUMMARY OF SIGNIFICANT ACCOUNTING POLICIES a. Statement of compliance
The consolidated financial statements have been prepared in accordance with the Regulations Governing the Preparation of Financial Reports by Securities Issuers and IFRSs as endorsed by the FSC.
b. Basis of preparation The consolidated financial statements have been prepared on the historical cost basis except for financial instruments which are measured at fair value. The fair value measurements are grouped into Levels 1 to 3 based on the degree to which the fair value measurement inputs are observable and the significance of the inputs to the fair value measurement in its entirety, which are described as follows: 1) Level 1 inputs are quoted prices (unadjusted) in active markets for identical assets or liabilities; 2) Level 2 inputs are inputs other than quoted prices included within Level 1 that are observable for
the asset or liability, either directly (i.e. as prices) or indirectly (i.e. derived from prices); and 3) Level 3 inputs are unobservable inputs for the asset or liability.
c. Basis of consolidation
The consolidated financial statements incorporate the financial statements of the Company and the entities controlled by the Company. Income and expenses of subsidiaries acquired or disposed of during the period are included in the consolidated statement of profit or loss and other comprehensive income from the effective date of acquisition up to the effective date of disposal, as appropriate. When necessary, adjustments are made to the financial statements of subsidiaries to bring their accounting policies into line with those used by the Company. All intra-group transactions, balances, income and expenses are eliminated in full upon consolidation. Total comprehensive income of subsidiaries is attributed to the owners of the Company and to the non-controlling interests even if this results in the non-controlling interests having a deficit balance. Changes in the Group’s ownership interests in subsidiaries that do not result in the Group losing control over the subsidiaries are accounted for as equity transactions. The carrying amounts of the Group’s interests and the non-controlling interests are adjusted to reflect the changes in their relative interests in the subsidiaries. Any difference between the amount by which the non-controlling interests are adjusted and the fair value of the consideration paid or received is recognized directly in equity and attributed to the owners of the Company. When the Group loses control of a subsidiary, a gain or loss is recognized in profit or loss and is calculated as the difference between (i) the aggregate of the fair value of the consideration received and any investment retained in the former subsidiary at its fair value at the date when control is lost and (ii) the assets (including any goodwill) and liabilities and any non-controlling interests of the former subsidiary at their carrying amounts at the date when control is lost. The Group accounts for all amounts recognized in other comprehensive income in relation to that subsidiary on the same basis as would be required if the Group had directly disposed of the related assets or liabilities. The fair value of any investment retained in the former subsidiary at the date when control is lost is regarded as the fair value on initial recognition. See Note 14 and Table 7 for the detailed information of subsidiaries (including the percentage of ownership and main business).

59 60‧Lite-On Technology Corporation 2015 Annual Report Lite-On Technology Corporation 2015 Annual Report‧
- 20 -
d. Classification of current and non-current assets and liabilities
Current assets include: 1) Assets held primarily for the purpose of trading; 2) Assets expected to be realized within twelve months after the reporting period; and 3) Cash and cash equivalents unless the asset is restricted from being exchanged or used to settle a
liability for at least twelve months after the reporting period. Current liabilities include: 1) Liabilities held primarily for the purpose of trading; 2) Liabilities due to be settled within twelve months after the reporting period, even if an agreement to
refinance, or to reschedule payments, on a long-term basis is completed after the reporting period and before the consolidated financial statements are authorized for issue; and
3) Liabilities for which the Group does not have an unconditional right to defer settlement for at least
twelve months after the reporting period. Terms of a liability that could, at the option of the counterparty, result in its settlement by the issue of equity instruments do not affect its classification.
Assets and liabilities that are not classified as current are classified as non-current.
e. Business combinations
Acquisitions of businesses are accounted for using the acquisition method. Acquisition-related costs are generally recognized in profit or loss as incurred. Goodwill is measured as the excess of the sum of the consideration transferred, the amount of any non-controlling interests in the acquiree, and the fair value of the acquirer’s previously held equity interest in the acquiree over the net of the acquisition-date amounts of the identifiable assets acquired and the liabilities assumed.
f. Foreign currencies
In preparing the financial statements of each individual group entity, transactions in currencies other than the entity’s functional currency (foreign currencies) are recognized at the rates of exchange prevailing at the dates of the transactions. At the end of each reporting period, monetary items denominated in foreign currencies are retranslated at the rates prevailing at that date. Exchange differences on monetary items arising from settlement or translation are recognized in profit or loss in the period. Non-monetary items measured at fair value that are denominated in foreign currencies are retranslated at the rates prevailing at the date when the fair value was determined. Exchange differences arising on the retranslation of non-monetary items are included in profit or loss for the period except for exchange differences arising from the retranslation of non-monetary items in respect of which gains and losses are recognized directly in other comprehensive income, in which case, the exchange differences are also recognized directly in other comprehensive income. Non-monetary items that are measured at historical cost in a foreign currency are not retranslated.
- 21 -
For the purposes of presenting consolidated financial statements, the assets and liabilities of the Group’s foreign operations are translated into New Taiwan dollars using exchange rates prevailing at the end of each reporting period. Income and expense items are translated at the average exchange rates for the period. Exchange differences arising are recognized in other comprehensive income. On the disposal of a disposal of the Company’s entire interest in a foreign operation, or a disposal involving loss of control over a subsidiary that includes a foreign operation, or a disposal of an interest in a joint arrangement or an associate that includes a foreign operation of which the retained interest becomes a financial asset, all of the exchange differences accumulated in equity in respect of that operation attributable to the owners of the Company are reclassified to profit or loss. In relation to a partial disposal of a subsidiary that does not result in the Company losing control over the subsidiary, the proportionate share of accumulated exchange differences is re-attributed to non-controlling interests of the subsidiary and is not recognized in profit or loss. For all other partial disposals, the proportionate share of the accumulated exchange differences recognized in other comprehensive income is reclassified to profit or loss. Goodwill and fair value adjustments on identifiable assets and liabilities acquired arising on the acquisition of a foreign operation are treated as assets and liabilities of the foreign operation and translated at the rate of exchange prevailing at the end of each reporting period. Exchange differences arising are recognized in other comprehensive income.
g. Inventories
Inventories consist of raw materials, work-in-process, finished goods, merchandise, and inventory in transit. Inventories are stated at the lower of cost or net realizable value. Inventory write-downs are made by item, except where it may be appropriate to group similar or related items. Net realizable value is the estimated selling price of inventories less all estimated costs of completion and costs necessary to make the sale. Inventories are recorded at weighted-average cost on the balance sheet date.
h. Investment accounted for using equity method Investment in associates is accounted for using equity method. An associate is an entity over which the Group has significant influence and that is not a subsidiary. Significant influence is the power to participate in financial and operating policy decisions of an investee, but is not control or joint control over the policies. Under the equity method, investments in an associate are initially recognized at cost and adjusted thereafter to recognize the Group’s share of the profit or loss and other comprehensive income of the associate. The Group also recognizes the changes in the Group’s share of equity of associates attributable to the Group. Any excess of the cost of acquisition over the Group’s share of the net fair value of the identifiable assets and liabilities of an associate at the date of acquisition is recognized as goodwill, which is included within the carrying amount of the investment and is not amortized. Any excess of the Group’s share of the net fair value of the identifiable assets and liabilities over the cost of acquisition, after reassessment, is recognized immediately in profit or loss.

61 62‧Lite-On Technology Corporation 2015 Annual Report Lite-On Technology Corporation 2015 Annual Report‧
- 22 -
When the Group subscribes for additional new shares of the associate at a percentage different from its existing ownership percentage, the resulting carrying amount of the investment differs from the amount of the Group’s proportionate interest in the associate. The Group records such a difference as an adjustment to investments with the corresponding amount charged or credited to capital surplus - changes in the Group’s share of equity of associates. If the Group’s ownership interest is reduced due to the additional subscription of the new shares of associate, the proportionate amount of the gains or losses previously recognized in other comprehensive income in relation to that associate is reclassified to profit or loss on the same basis as would be required if the investee had directly disposed of the related assets or liabilities. When the adjustment should be debited to capital surplus, but the capital surplus recognized from investments accounted for by the equity method is insufficient, the shortage is debited to retained earnings. The entire carrying amount of the investment (including goodwill) is tested for impairment as a single asset by comparing its recoverable amount with its carrying amount. Any impairment loss recognized is deducted from investment and the carrying amount is net of impairment loss. Any reversal of that impairment loss is recognized to the extent that the recoverable amount of the investment subsequently increases.
When a group entity transacts with its associate, profits and losses resulting from the transactions with the associate are recognized in the Group’s consolidated financial statements only to the extent of interests in the associate that are not related to the Group.
i. Property, plant and equipment
Property, plant and equipment are stated at cost, less recognized accumulated depreciation and accumulated impairment loss. Property, plant and equipment in the course of construction are carried at cost, less any recognized impairment loss. Cost includes professional fees and borrowing costs eligible for capitalization. Such assets are depreciated and classified to the appropriate categories of property, plant and equipment when completed and ready for intended use. Depreciation on property, plant and equipment (including assets held under finance leases) is recognized using the straight-line method. Each significant part is depreciated separately. If the lease term is shorter than the useful lives, assets are depreciated over the lease term. The estimated useful lives, residual values and depreciation method are reviewed at the end of each reporting period, with the effect of any changes in estimate accounted for on a prospective basis.
j. Investment properties Investment properties are properties held to earn rentals or for capital appreciation. Investment properties also include land held for a currently undetermined future use. Investment properties are measured initially at cost, including transaction costs. Subsequent to initial recognition, investment properties are measured at cost less accumulated depreciation and accumulated impairment loss. Depreciation is recognized using the straight-line method. On derecognition of an investment property, the difference between the net disposal proceeds and the carrying amount of the asset is included in profit or loss.
k. Goodwill
Goodwill arising from the acquisition of a business is carried at cost as established at the date of acquisition of the business less accumulated impairment loss.
- 23 -
For the purposes of impairment testing, goodwill is allocated to each of the Group’s cash-generating units or groups of cash-generating units (referred to as cash-generating units) that is expected to benefit from the synergies of the combination. A cash-generating unit to which goodwill has been allocated is tested for impairment annually, or more frequently when there is an indication that the unit may be impaired, by comparing its carrying amount, including the attributed goodwill, with its recoverable amount. However, if the goodwill allocated to a cash-generating unit was acquired in a business combination during the current annual period, that unit shall be tested for impairment before the end of the current annual period. If the recoverable amount of the cash-generating unit is less than its carrying amount, the impairment loss is allocated first to reduce the carrying amount of any goodwill allocated to the unit and then to the other assets of the unit pro rata based on the carrying amount of each asset in the unit. Any impairment loss is recognized directly in profit or loss. An impairment loss recognized for goodwill is not reversed in subsequent periods. For an investment accounted for using equity method, the cash-generating unit of the whole entity is tested for impairment. If impairment is identified but the recoverable amount of the asset later increases, the previously recognized impairment loss is reversed through profit or loss to the extent that the carrying amount of the investment at the date the impairment is reversed does not exceed what the amortized cost would have been had the impairment not been recognized.
l. Intangible assets
1) Intangible assets acquired separately Intangible assets with finite useful lives that are acquired separately are initially measured at cost and subsequently measured at cost less accumulated amortization and accumulated impairment loss. Amortization is recognized on a straight-line basis. The estimated useful life, residual value, and amortization method are reviewed at the end of each reporting period, with the effect of any changes in estimate accounted for on a prospective basis. Intangible assets with indefinite useful lives that are acquired separately are measured at cost less accumulated impairment loss.
2) Intangible assets acquired in a business combination Intangible assets acquired in a business combination and recognized separately from goodwill are initially recognized at their fair value at the acquisition date (which is regarded as their cost). Subsequent to initial recognition, they are measured on the same basis as intangible assets that are acquired separately.
3) Derecognition of intangible assets On derecognition of an intangible asset, the difference between the net disposal proceeds and the carrying amount of the asset are recognized in profit or loss.
m. Impairment of tangible and intangible assets other than goodwill At the end of each reporting period, the Group reviews the carrying amounts of its tangible and intangible assets, excluding goodwill, to determine whether there is any indication that those assets have suffered an impairment loss. If any such indication exists, the recoverable amount of the asset is estimated in order to determine the extent of the impairment loss. When it is not possible to estimate the recoverable amount of an individual asset, the Company estimates the recoverable amount of the cash-generating unit to which the asset belongs. Corporate assets are allocated to the individual cash-generating units on a reasonable and consistent basis of allocation. Intangible assets with indefinite useful lives and intangible assets not yet available for use are tested for impairment at least annually, and whenever there is an indication that the asset may be impaired.

63 64‧Lite-On Technology Corporation 2015 Annual Report Lite-On Technology Corporation 2015 Annual Report‧
- 24 -
Recoverable amount is the higher of fair value less costs to sell and value in use. If the recoverable amount of an asset or cash-generating unit is estimated to be less than its carrying amount, the carrying amount of the asset or cash-generating unit is reduced to its recoverable amount, with the resulting impairment loss recognized in profit or loss. When an impairment loss is subsequently reversed, the carrying amount of the asset or cash-generating unit is increased to the revised estimate of its recoverable amount, but only to the extent of the carrying amount that would have been determined had no impairment loss been recognized for the asset or cash-generating unit in prior years. A reversal of an impairment loss is recognized in profit or loss.
n. Non-current assets held for sale Non-current assets are classified as held for sale if their carrying amount will be recovered principally through a sale transaction rather than through continuing use. This condition is regarded as met only when the sale is highly probable and the non-current asset is available for immediate sale in its present condition. To meet the criteria for the sale being highly probable, the appropriate level of management must be committed to the sale, which should be expected to qualify for recognition as a completed sale within one year from the date of classification. When the Group is committed to a sale plan involving loss of control of a subsidiary, all of the assets and liabilities of that subsidiary are classified as held for sale when the criteria described above are met, regardless of whether the Group will retain a non-controlling interest in its former subsidiary after the sale. Non-current assets classified as held for sale are measured at the lower of their previous carrying amount and fair value less costs to sell. Recognition of depreciation of those assets would cease.
o. Financial instruments Financial assets and financial liabilities are recognized when a group entity becomes a party to the contractual provisions of the instruments. Financial assets and financial liabilities are initially measured at fair value. Transaction costs that are directly attributable to the acquisition or issue of financial assets and financial liabilities (other than financial assets and financial liabilities at fair value through profit or loss) are added to or deducted from the fair value of the financial assets or financial liabilities, as appropriate, on initial recognition. Transaction costs directly attributable to the acquisition of financial assets or financial liabilities at fair value through profit or loss are recognized immediately in profit or loss. 1) Financial assets
All regular way purchases or sales of financial assets are recognized and derecognized on a trade date basis. a) Measurement category
Financial assets are classified into the following categories: Financial assets at fair value through profit or loss, available-for-sale financial assets, and loans and receivables. i. Financial assets at fair value through profit or loss
Financial assets are classified as at fair value through profit or loss when the financial asset doesn’t meet the criteria of hedge accounting. Financial assets at fair value through profit or loss are stated at fair value, with any gains or losses arising on remeasurement recognized in profit or loss.
- 25 -
ii. Available-for-sale financial assets
Available-for-sale financial assets are non-derivatives that are either designated as available-for-sale or are not classified as loans and receivables, held-to-maturity investments or financial assets at fair value through profit or loss. Available-for-sale financial assets are measured at fair value. Changes in the carrying amount of available-for-sale monetary financial assets relating to changes in foreign currency exchange rates, interest income calculated using the effective interest method and dividends on available-for-sale equity investments are recognized in profit or loss. Other changes in the carrying amount of available-for-sale financial assets are recognized in other comprehensive income and will be reclassified to profit or loss when the investment is disposed of or is determined to be impaired. Dividends on available-for-sale equity instruments are recognized in profit or loss when the Group’s right to receive the dividends is established.
iii. Loans and receivables
Loans and receivables including cash and cash equivalent, note receivable, debt investments with no active market, trade receivables, and other receivables are measured at amortized cost using the effective interest method, less any impairment, except for short-term receivables when the effect of discounting is immaterial. Cash equivalent includes time deposits and investments that meet short-term cash commitments, within highly liquid, readily convertible to a known amount of cash and be subject to an insignificant risk of changes in value.
b) Impairment of financial assets Financial assets, other than those at fair value through profit or loss, are assessed for indicators of impairment at the end of each reporting period. Financial assets are considered to be impaired when there is objective evidence that, as a result of one or more events that occurred after the initial recognition of the financial asset, the estimated future cash flows of the investment have been affected. For financial assets carried at amortized cost, such as trade receivables, assets that are assessed not to be impaired individually are, in addition, assessed for impairment on a collective basis. The Company assesses the collectability of receivables by performing the account aging analysis and examining current trends in the credit quality of its customers. For financial assets carried at amortized cost, the amount of the impairment loss recognized is the difference between the asset’s carrying amount and the present value of estimated future cash flows, discounted at the financial asset’s original effective interest rate. For financial assets measured at amortized cost, if, in a subsequent period, the amount of the impairment loss decreases and the decrease can be related objectively to an event occurring after the impairment was recognized, the previously recognized impairment loss is reversed through profit or loss to the extent that the carrying amount of the investment at the date the impairment is reversed does not exceed what the amortized cost would have been had the impairment not been recognized. For available-for-sale equity investments, a significant or prolonged decline in the fair value of the security below its cost is considered to be objective evidence of impairment.

65 66‧Lite-On Technology Corporation 2015 Annual Report Lite-On Technology Corporation 2015 Annual Report‧
- 26 -
When an available-for-sale financial asset is considered to be impaired, cumulative gains or losses previously recognized in other comprehensive income are reclassified to profit or loss in the period. In respect of available-for-sale equity securities, impairment loss previously recognized in profit or loss are not reversed through profit or loss. Any increase in fair value subsequent to an impairment loss is recognized in other comprehensive income. The carrying amount of the financial asset is reduced by the impairment loss directly for all financial assets with the exception of trade receivables where the carrying amount is reduced through the use of an allowance account. When a trade receivable is considered uncollectible, it is written off against the allowance account. Subsequent recoveries of amounts previously written off are credited against the allowance account. Changes in the carrying amount of the allowance account are recognized in profit or loss except for uncollectible trade receivables that are written off against the allowance account.
c) Derecognition of financial assets
The Group derecognizes a financial asset only when the contractual rights to the cash flows from the asset expire, or when it transfers the financial asset and substantially all the risks and rewards of ownership of the asset to another party. On derecognition of a financial asset in its entirety, the difference between the asset’s carrying amount and the sum of the consideration received and receivable and the cumulative gain or loss that had been recognized in other comprehensive income is recognized in profit or loss.
2) Financial liabilities and equity instruments
Debt and equity instruments issued by an entity of the Group are classified as either financial liabilities or as equity in accordance with the substance of the contractual arrangements and the definitions of a financial liability and an equity instrument. a) Financial liabilities subsequent measurement
Financial liabilities are measured at amortized cost using the effective interest method.
b) Derecognition of financial liabilities The difference between the carrying amount of the financial liability derecognized and the consideration paid is recognized in profit or loss.
c) Equity instruments
Equity instruments issued by a group entity are classified as either financial liabilities or as equity in accordance with the substance of the contractual arrangements and the definitions of a financial liability and an equity instrument. Equity instruments issued by an entity of the Group are recognized at the proceeds received, net of direct issue costs. Repurchase of the Company’s own equity instruments is recognized in and deducted directly from equity. No gain or loss is recognized in profit or loss on the purchase, sale, issue or cancellation of the Company’s own equity instruments.
- 27 -
3) Derivative financial instruments The Group enters into a variety of derivative financial instruments to manage its exposure to interest rate and foreign exchange rate risks, including foreign exchange forward contracts, interest rate swaps and option contracts. Derivatives are initially recognized at fair value at the date the derivative contracts are entered into and are subsequently remeasured to their fair value at the end of each reporting period. The resulting gain or loss is recognized in profit or loss immediately unless the derivative is designated and effective as a hedging instrument, in which event the timing of the recognition in profit or loss depends on the nature of the hedge relationship. When the fair value of derivative financial instruments is positive, the derivative is recognized as a financial asset; when the fair value of derivative financial instruments is negative, the derivative is recognized as a financial liability.
p. Hedge accounting The Group designates derivative hedging instruments to conduct cash flow hedges. The effective portion of changes in the fair value of derivatives is recognized in other comprehensive income. The gain or loss relating to the ineffective portion is recognized immediately in profit or loss. The associated gains or losses that were recognized in other comprehensive income are reclassified from equity to profit or loss as a reclassification adjustment in the line item relating to the hedged item in the same period when the hedged item affects profit or loss. Hedge accounting is discontinued prospectively when the Group revokes the designated hedging relationship, or when the hedging instrument expires or is sold, terminated, or exercised, or when it no longer meets the criteria for hedge accounting. The cumulative gain or loss on the hedging instrument that has been previously recognized in other comprehensive income from the period when the hedge was effective remains separately in equity until the forecast transaction occurs. When a forecast transaction is no longer expected to occur, the gain or loss accumulated in equity is recognized immediately in profit or loss.
q. Provisions Provisions are measured at the best estimate of the discounted cash flows of the consideration required to settle the present obligation at the end of the reporting period, taking into account the risks and uncertainties surrounding the obligation. When a provision is measured using the cash flows estimated to settle the present obligation, its carrying amount is the present value of those cash flows. Provisions for the expected cost of warranty obligations are recognized at the date of sale of the relevant products, at the best estimate of the expenditure required to settle the Group’s obligation by the management of the Group.
r. Revenue recognition
Revenue is measured at the fair value of the consideration received or receivable. Revenue is reduced for estimated customer returns, rebates and other similar allowances. Allowance for sales returns and liability for returns are recognized at the time of sale based on the seller’s reliable estimate of future returns and based on past experience and other relevant factors. 1) Sale of goods
Revenue from the sale of goods is recognized when all the following conditions are satisfied: a) The Group has transferred to the buyer the significant risks and rewards of ownership of the
goods;

67 68‧Lite-On Technology Corporation 2015 Annual Report Lite-On Technology Corporation 2015 Annual Report‧
- 28 -
b) The Group retains neither continuing managerial involvement to the degree usually associated
with ownership nor effective control over the goods sold; c) The amount of revenue can be measured reliably; d) It is probable that the economic benefits associated with the transaction will flow to the Group;
and e) The costs incurred or to be incurred in respect of the transaction can be measured reliably. The Group does not recognize sales revenue on materials delivered to subcontractors because this delivery does not involve a transfer of risks and rewards of materials ownership. Revenue from selling of properties in the course of ordinary activities is recognized when the construction is completed and the properties are transferred to buyers. Until such revenue is recognized, deposits received from sales of properties and installment payments are carried in the consolidated balance sheets under current liabilities.
2) Rental revenue
The operation of leasing business was in accordance with IAS 17- Leases, that is, the possible situation related to leasing (ex. the condition of leasing, and the burden of future cost) would treat as operating lease.
3) Electricity generation revenue
Revenue is recognized when the power is transmitted to the substation of a power company. Electricity generation revenue is based on the fair value of subsidiary’s settled value with power company. However, when receivables are expected to be realized within one year, the difference between fair value and maturity value of receivables is insignificant and the trading of power is very frequent, the fair value of settled value will not have to be discounted to the present value.
4) Dividend and interest income Dividend income from investments is recognized when the shareholder’s right to receive payment has been established provided that it is probable that the economic benefits will flow to the Group and the amount of income can be measured reliably. Interest income from a financial asset is recognized when it is probable that the economic benefits will flow to the Group and the amount of income can be measured reliably. Interest income is accrued on a time basis, by reference to the principal outstanding and at the effective interest rate applicable.
s. Leasing Leases are classified as finance leases whenever the terms of the lease transfer substantially all the risks and rewards of ownership to the lessee. All other leases are classified as operating leases. 1) The Group as lessor
Rental income from operating leases is recognized on a straight-line basis over the term of the relevant lease.
- 29 -
2) The Group as lessee Operating lease payments are recognized as an expense on a straight-line basis over the lease term.
t. Employee benefits 1) Short-term employee benefits
Liabilities recognized in respect of short-term employee benefits are measured at the undiscounted amount of the benefits expected to be paid in exchange for the related service.
2) Retirement benefits
Payments to defined contribution retirement benefit plans are recognized as an expense when employees have rendered service entitling them to the contributions. Defined benefit costs (including service cost, net interest and remeasurement) under the defined benefit retirement benefit plans are determined using the projected unit credit method. Service cost (including current service cost) and net interest on the net defined benefit liability (asset) are recognized as employee benefits expense in the period they occur. Remeasurement, comprising actuarial gains and losses, the effect of the changes to the asset ceiling and the return on plan assets (excluding interest), is recognized in other comprehensive income in the period in which they occur. Remeasurement recognized in other comprehensive income is reflected immediately in retained earnings and will not be reclassified to profit or loss. Net defined benefit liability (asset) represents the actual deficit (surplus) in the Group’s defined benefit plan. Any surplus resulting from this calculation is limited to the present value of any refunds from the plans or reductions in future contributions to the plans.
3) Termination benefits
A liability for a termination benefit is recognized at the earlier of when the Group can no longer withdraw the offer of the termination benefit and when the Group recognizes any related restructuring costs.
u. Taxation Income tax expense represents the sum of the tax currently payable and deferred tax. 1) Current tax
According to the Income Tax Law, an additional tax at 10% of unappropriated earnings is provided for as income tax in the year the shareholders approve to retain the earnings. Adjustments of prior years’ tax liabilities are added to or deducted from the current year’s tax provision.
2) Deferred tax Deferred tax is recognized on temporary differences between the carrying amounts of assets and liabilities and the corresponding tax bases used in the computation of taxable profit. Deferred tax liabilities are generally recognized for all taxable temporary differences. Deferred tax assets are generally recognized for all deductible temporary differences, research and development expenditures, and personnel training expenditures to the extent that it is probable that taxable profits will be available against which those deductible temporary differences can be utilized.

69 70‧Lite-On Technology Corporation 2015 Annual Report Lite-On Technology Corporation 2015 Annual Report‧
- 30 -
Deferred tax liabilities are recognized for taxable temporary differences associated with investments in subsidiaries and associates, except where the Group is able to control the reversal of the temporary difference and it is probable that the temporary difference will not reverse in the foreseeable future. Deferred tax assets arising from deductible temporary differences associated with such investments are only recognized to the extent that it is probable that there will be sufficient taxable profits against which to utilize the benefits of the temporary differences and they are expected to reverse in the foreseeable future. The carrying amount of deferred tax assets is reviewed at the end of each reporting period and reduced to the extent that it is no longer probable that sufficient taxable profits will be available to allow all or part of the asset to be recovered. A previously unrecognized deferred tax asset is also reviewed at the end of each reporting period and recognized to the to the extent that it has become probable that future taxable profit will allow the deferred tax asset to be recovered. Deferred tax liabilities and assets are measured at the tax rates that are expected to apply in the period in which the liability is settled or the asset realized, based on tax rates (and tax laws) that have been enacted or substantively enacted by the end of the reporting period. The measurement of deferred tax liabilities and assets reflects the tax consequences that would follow from the manner in which the Group expects, at the end of the reporting period, to recover or settle the carrying amount of its assets and liabilities.
3) Current and deferred tax for the year Current and deferred tax are recognized in profit or loss, except when they relate to items that are recognized in other comprehensive income or directly in equity, in which case, the current and deferred tax are also recognized in other comprehensive income or directly in equity respectively. Where current tax or deferred tax arises from the initial accounting for a business combination, the tax effect is included in the accounting for the business combination.
5. CRITICAL ACCOUNTING JUDGMENTS AND KEY SOURCES OF ESTIMATION
UNCERTAINTY In the application of the Group's accounting policies (Note 4), management is required to make judgments, estimates and assumptions about the carrying amounts of assets and liabilities that are not readily apparent from other sources. The estimates and associated assumptions are based on historical experience and other factors that are considered relevant. Actual results may differ from these estimates. The estimates and underlying assumptions are reviewed on an ongoing basis. Revisions to accounting estimates are recognized in the period in which the estimate is revised if the revision affects only that period or in the period of the revision and future periods if the revision affects both current and future periods. a. Impairment of goodwill
Determining whether goodwill is impaired requires an estimation of the value in use of the cash-generating units to which goodwill has been allocated. The value in use calculation requires management to estimate the future cash flows expected to arise from the cash-generating unit and a suitable discount rate in order to calculate present value. Where the actual future cash flows are less than expected, a material impairment loss may arise.
- 31 -
b. Estimated impairment of trade receivables
When there is objective evidence of impairment loss, the Group takes into consideration the estimation of future cash flows. The amount of the impairment loss is measured as the difference between the asset’s carrying amount and the present value of estimated future cash flows discounted at the financial asset’s original effective interest rate. Where the actual future cash flows are less than expected, a material impairment loss may arise.
c. Income taxes
Deferred tax assets are recognized to the extent that it is probable that future taxable profits will be available against which those deferred tax assets can be utilized. Assessment of the realization of the deferred tax assets requires the Group’s subjective judgment and estimation, including the future revenue growth and profitability, tax holidays, the amount of tax credits that can be utilized and feasible tax planning strategies. Any changes in the global economic environment, industry trends and relevant laws and regulations could result in significant adjustments to the deferred tax assets.
d. Fair value measurements and valuation processes
If some of the Group's assets and liabilities measured at fair value have no quoted prices in active markets, the Group’s management determines whether to engage third party qualified valuers to determine the appropriate valuation techniques for fair value measurements. Where Level 1 inputs are not available, the Group or engaged valuers would determine appropriate inputs by referring to prices of same equity instruments not quoted in active markets, market prices or rates and specific features of derivatives. If the actual changes of inputs in the future differ from expectation, fair value might vary accordingly. The Group updates inputs every quarter to confirm the appropriateness of fair value measurement. Information about the valuation techniques and inputs used in determining the fair value of various assets and liabilities is disclosed in Note 33.
e. Impairment of property, plant and equipment
The impairment of equipment in relation to the production of handsets was based on the recoverable amount of those assets, which is the higher of fair value less costs to sell or value-in-use of those assets. Any changes in the market price or future cash flows will affect the recoverable amount of those assets and may lead to recognition of additional or reversal of impairment losses.
f. Write-down of inventory Net realizable value of inventory is the estimated selling price in the ordinary course of business less the estimated costs of completion and the estimated costs necessary to make the sale. The estimation of net realizable value was based on current market conditions and the historical experience of selling products of a similar nature. Changes in market conditions may have a material impact on the estimation of net realizable value.
g. Impairment of investment in associates
The Group immediately recognizes impairment loss on its net investment in the associate when there is any indication that the investment may be impaired and the carrying amount may not be recoverable. The Group also takes into consideration the market conditions and industry development to evaluate the appropriateness of assumptions.

71 72‧Lite-On Technology Corporation 2015 Annual Report Lite-On Technology Corporation 2015 Annual Report‧
- 32 -
h. Recognition and measurement of defined benefit plans Net defined benefit liabilities (assets) and the resulting defined benefit costs under defined benefit pension plans are calculated using the projected unit credit method. Actuarial assumptions comprise the discount rate, rate of employee turnover, and future salary increase, etc. Changes in economic circumstances and market conditions will affect these assumptions and may have a material impact on the amount of the expense and the liability.
6. CASH AND CASH EQUIVALENTS
December 31 2015 2014 Cash on hand $ 22,503 $ 124,912 Checking accounts 1,214,794 1,923,505 Demand deposits 36,787,305 35,292,046 Time deposits 27,477,205 29,142,893 $ 65,501,807 $ 66,483,356
7. FINANCIAL INSTRUMENTS AT FAIR VALUE THROUGH PROFIT OR LOSS
December 31 2015 2014 Financial assets held for trading Derivative financial assets (not under hedge accounting)
Currency swap contracts $ 45,845 $ 889 Foreign exchange forward contracts 7,366 12,222
$ 53,211 $ 13,111 Current $ 53,211 $ 13,111 Non-current - - $ 53,211 $ 13,111 Financial liabilities held for trading Derivative financial liabilities (not under hedge accounting)
Foreign exchange forward contracts $ 55,945 $ 38,206 Currency swap contracts - 202
$ 55,945 $ 38,408 Current $ 55,945 $ 38,408 Non-current - - $ 55,945 $ 38,408
- 33 -
a. At the end of the reporting period, outstanding forward exchange contracts and cross-currency swap contracts not under hedge accounting were as follows:
Currency Maturity
Date Notional Amount (In Thousands)
December 31, 2015 The Parent Company
Currency swap contracts USD/NTD 2016.11.09 USD100,000/NTD3,212,900 Lite-On Overseas Trading Co., Ltd.
Forward exchange contracts CNY/USD 2016.02.23 CNY110,012/USD17,000 Lite-On Singapore Pte. Ltd.
Forward exchange contracts USD/EUR 2016.01.06 USD10,606/EUR10,000 Forward exchange contracts USD/BRL 2016.01.25 USD2,000/BRL8,052 Forward exchange contracts NTD/USD 2016.02.04 NTD825,000/USD25,000
Lite-On Electronics (Thailand) Co., Ltd. Forward exchange contracts THB/USD 2016.04.08 THB82,945/USD2,300
Philip & Lite-On Digital Solutions Corp. Forward exchange contracts USD/EUR 2016.01.08 USD6,571/EUR6,000
Lite-On Mobile Pte. Ltd. Forward exchange contracts CNY/USD 2016.01.20 CNY256,100/USD40,000 Forward exchange contracts EUR/USD 2016.01.21 EUR5,500/USD5,981
Silitech Technology Corp. Forward exchange contracts USD/MYR 2016.01.08-
2016.03.08 USD1,180/MYR5,099
Forward exchange contracts EUR/MYR 2016.02.25 EUR50/MYR240 December 31, 2014 Lite-On Overseas Trading Co., Ltd.
Forward exchange contracts CNY/USD 2015.01.12 CNY277,020/USD45,000 Currency swap contracts CNY/USD 2015.01.22 CNY93,435/USD15,000
Lite-On Singapore Pte. Ltd. Forward exchange contracts CNY/USD 2015.01.12 CNY402,870/USD65,000 Forward exchange contracts USD/EUR 2015.01.30 USD8,047/EUR6,600
Lite-On Electronics (Thailand) Co., Ltd. Forward exchange contracts THB/USD 2015.04.07 THB66,086/USD2,000
DongGuan G-Pro Computer Co., Ltd. Currency swap contracts CNY/USD 2015.01.05 CNY38,058/USD6,104
LET (HK) Ltd. Forward exchange contracts USD/EUR 2015.01.29 USD10,972/EUR9,000
Guangzhou Lite-On Mobile Electronic Components Co., Ltd.
Forward exchange contracts CNY/USD 2015.01.05 CNY43,173/USD7,000 Forward exchange contracts CNY/EUR 2015.01.05 CNY2,307/EUR300
Zhuhai Lite-On Mobile Telecommunication Co., Ltd.
Forward exchange contracts CNY/USD 2015.01.05 CNY18,503/USD3,000 (Continued)

73 74‧Lite-On Technology Corporation 2015 Annual Report Lite-On Technology Corporation 2015 Annual Report‧
- 34 -
Currency Maturity
Date Notional Amount (In Thousands)
Lite-On Mobile Pte. Ltd.
Forward exchange contracts CNY/USD 2015.01.12 CNY204,072/USD33,000 Forward exchange contracts USD/EUR 2015.01.12 USD1,230/EUR1,000 Forward exchange contracts USD/BRL 2015.01.15 USD2,500/BRL6,626 Forward exchange contracts INR/USD 2015.01.15 INR93,759/USD1,500 Forward exchange contracts JPY/USD 2015.01.26 JPY144,114/USD1,200
Silitech Technology Corp. Forward exchange contracts USD/MYR 2015.01.06-
2015.03.06 USD1,670/MYR5,737
(Concluded) The Group entered into derivative contracts in 2015 and 2014 to manage exposures due to fluctuations of foreign exchange rates. The derivative contracts entered into by the subsidiaries did not meet the criteria for hedge accounting. Thus, the derivative contracts classified as financial assets or financial liabilities at fair value through profit or loss. The financial risk management objectives of the subsidiaries were to minimize risks due to changes in fair value or cash flows.
8. AVAILABLE-FOR-SALE FINANCIAL ASSETS
December 31 2015 2014 Non-current Domestic investments
Quoted shares $ 316,426 $ 626,191 Emerging market shares 178,716 178,716 Unquoted shares 83,923 144,617
579,065 949,524 Foreign investments
Mutual funds 53,178 143,434 Unquoted shares 26,539 221,811 Quoted shares 11,546 11,486
91,263 376,731 $ 670,328 $ 1,326,255 Refer to Note 33 for information relating to the fair values of on available-for-sale financial assets determined. There was objective evidence that the fair values of some financial assets were below their carrying costs and will permanently decline. As a result, the Group recognized impairment losses of $124,667 thousand and $212,956 thousand in the consolidated statements of comprehensive income for the years ended December 31, 2015 and 2014, respectively.
- 35 -
9. DERIVATIVE FINANCIAL INSTRUMENTS FOR HEDGING
December 31 2015 2014 Derivative financial liabilities under hedge accounting - current Cash flow hedges - interest rate swaps $ - $ 11,989 The Parent Company’s liabilities with floating interest rate might be affected by changes in the market rate. Thus, future cash flows on those liabilities might fluctuate, exposing the Parent Company to cash flow risk. To hedge against this risk, the Parent Company entered into an interest rate swap contract with a bank to change the floating rate of its liabilities to fixed rate. The cash flow hedge transactions are deemed sufficient. The outstanding interest rate swap contracts of the Parent Company at the end of the reporting period were as follows:
Notional Amount (In Thousands)
Maturity Date
Range of Interest Rates
Paid
Range of Interest Rates
Received December 31, 2015: None. December 31, 2014 NT$2,400,000 2015.09.23 1.895% 0.888%
10. DEBT INVESTMENTS WITH NO ACTIVE MARKET
December 31 2015 2014 Financial product $ 424,399 $ - Pledged deposits 270,870 78,688 695,269 78,688 Current $ 694,435 $ 78,170 Noncurrent 834 518 $ 695,269 $ 78,688
Financial product mainly refers to the subsidiary - Silitech Technology (SuZhou) Co., Ltd. to guarantee income-bearing bank deposit products to amortized cost measurement, and it shall not be paid or redeemed with the contract period.
Refer to Note 35 for information on bond investments with no active market pledged as security.

75 76‧Lite-On Technology Corporation 2015 Annual Report Lite-On Technology Corporation 2015 Annual Report‧
- 36 -
11. TRADE RECEIVABLES, NET
December 31 2015 2014 Trade receivables $ 50,390,680 $ 51,509,351 Allowance for impairment loss (239,849) (298,871) Unrealized interest revenues (70,962) (76,468) $ 50,079,869 $ 51,134,012 The average credit period on sales of goods was 90 days. In determining the recoverability of a trade receivable, the Group considered any change in the credit quality of the trade receivable since the date credit was initially granted to the end of the reporting period. The Group recognized an allowance for impairment loss of 100% against all receivables over 240 days because historical experience had been that receivables that are past due beyond 240 days were not recoverable. Allowance for impairment loss were recognized against trade receivables between 1 days and 240 days based on estimated irrecoverable amounts determined by reference to past default experience of the counterparties and an analysis of their current financial position. The aging of receivables was as follows:
December 31 2015 2014 Not overdue $ 49,137,082 $ 50,205,142 Overdue
1-60 days 999,794 1,069,101 61-210 days 114,839 109,378 211-240 days 4,119 4,743 Over 241 days 134,846 120,987
1,253,598 1,304,209 $ 50,390,680 $ 51,509,351 The above aging schedule was based on the past due date. As of December 31, 2015 and 2014, the Group did not have the age of the trade receivables that were past due but not impaired. At the end of the reporting period, trade receivables from sales on installments by the Group were as follows:
December 31 2015 2014 Trade receivables $ 1,169,694 $ 941,026 Unrealized interests revenue (70,962) (76,468) $ 1,098,732 $ 864,558
- 37 -
Movements in the allowance for impairment loss recognized on notes receivable and trade receivables were as follows: For the Year Ended December 31 2015 2014 Balance at January 1 $ 298,871 $ 215,850 Allowance for impairment loss (reversal of impairment loss) (51,276) 108,831 Uncollectible amounts written off during the period as uncollectible (4,742) (762) Foreign exchange translation (1,647) (2,988) Reclassification (1,357) - Effect of business combination - (22,060) Balance at December 31 $ 239,849 $ 298,871
12. INVENTORIES, NET
December 31 2015 2014 Finished goods $ 18,725,787 $ 15,623,878 Raw materials 7,069,710 7,413,962 Work in progress 2,546,266 3,834,591 Inventory in transit 218,599 2,336,889 Merchandise 266,074 304,471 $ 28,826,436 $ 29,513,791 The costs of inventories recognized as cost of goods sold for the years ended December 31, 2015 and 2014 were $188,787,517 thousand and $202,383,860 thousand, respectively. The cost of inventories recognized as cost of goods sold for the years ended December 31, 2015 included inventory reversal amounting to $238,971 thousand of inventory write-downs due to inventory write-off. Previous write-downs were reversed as a result of the Group closed out part of the inventory that already recognized write-downs. The cost of inventories recognized as cost of goods sold for the years ended December 31, 2014 included inventory write-downs of $846,205 thousand, which resulted from write-downs of inventory to net realizable value.
13. NON-CURRENT ASSETS CLASSIFIED AS HELD FOR SALE
Silitech Technology (SuZhou) Co., Ltd., a subsidiary of the Parent Company, entered into an agreement to sell idle equipment in the fourth quarter of 2014. This sale was mainly based on centralized management and production strategy considerations. The sales proceeds substantially exceeded the carrying amount of the related net assets; thus, no impairment losses were recognized on the assets reclassified to held for sale and the sale was completed in January 2015.
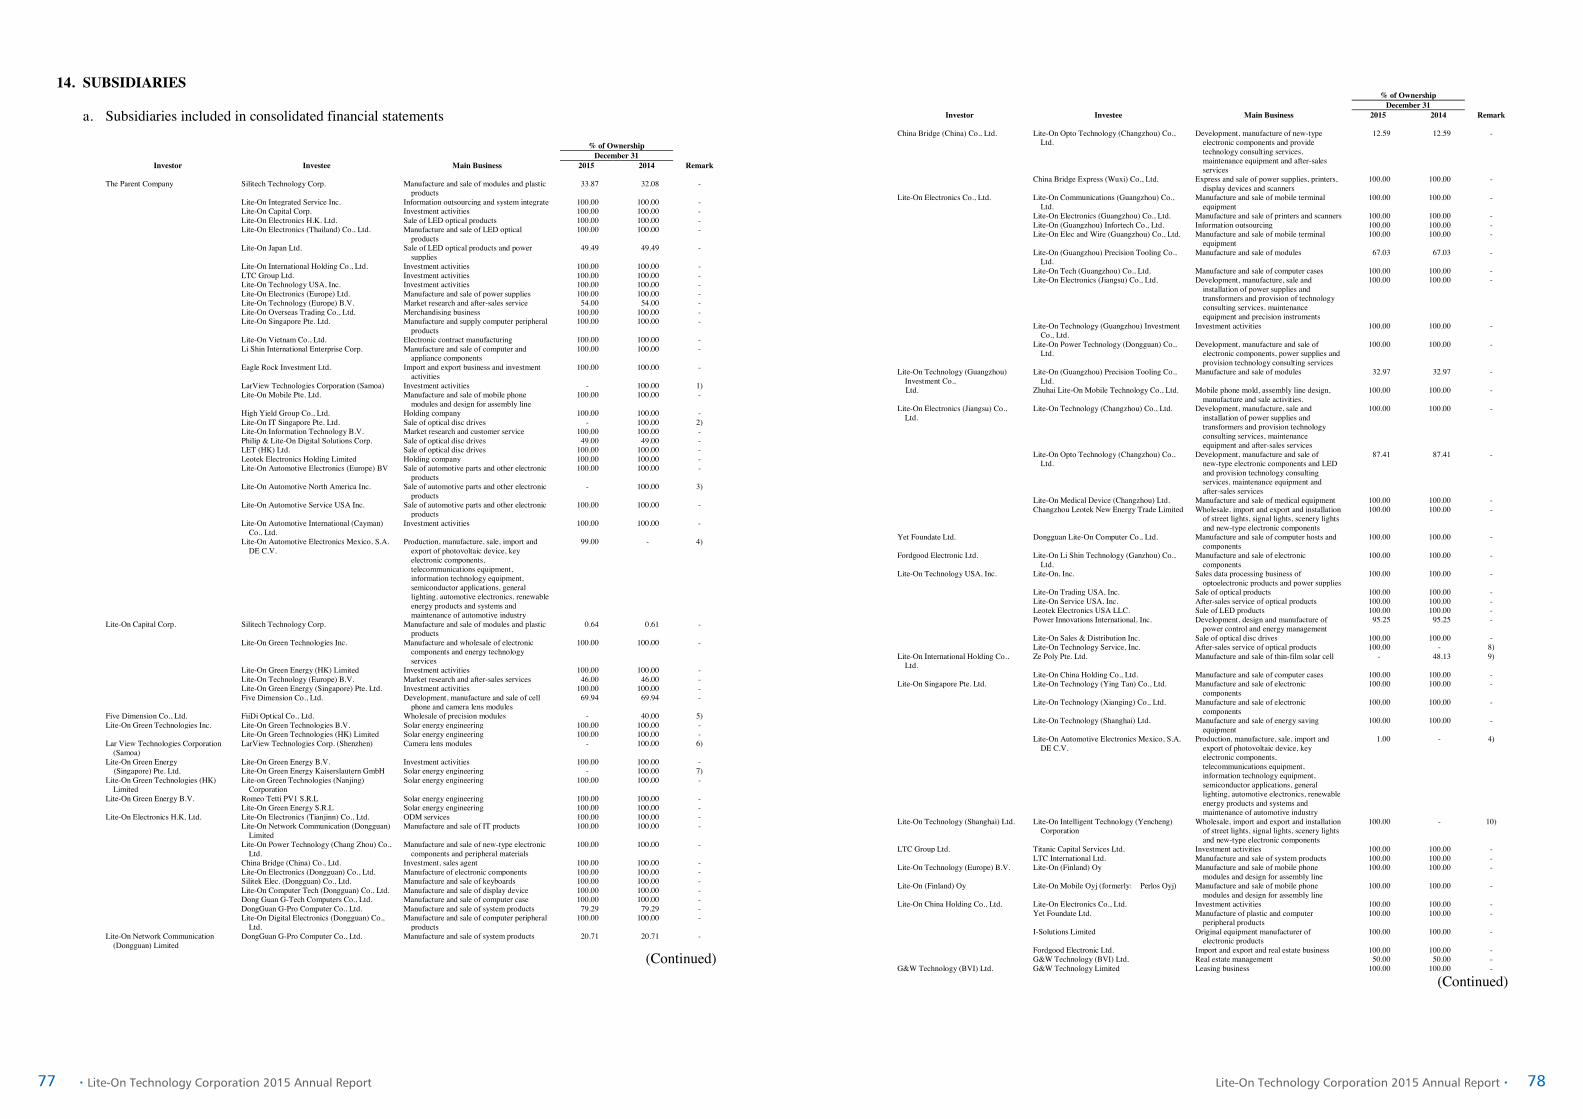
77 78‧Lite-On Technology Corporation 2015 Annual Report Lite-On Technology Corporation 2015 Annual Report‧
- 38 -
14. SUBSIDIARIES a. Subsidiaries included in consolidated financial statements
% of Ownership December 31
Investor Investee Main Business 2015 2014 Remark The Parent Company Silitech Technology Corp. Manufacture and sale of modules and plastic
products 33.87 32.08 -
Lite-On Integrated Service Inc. Information outsourcing and system integrate 100.00 100.00 - Lite-On Capital Corp. Investment activities 100.00 100.00 - Lite-On Electronics H.K. Ltd. Sale of LED optical products 100.00 100.00 - Lite-On Electronics (Thailand) Co., Ltd. Manufacture and sale of LED optical
products 100.00 100.00 -
Lite-On Japan Ltd. Sale of LED optical products and power supplies
49.49 49.49 -
Lite-On International Holding Co., Ltd. Investment activities 100.00 100.00 - LTC Group Ltd. Investment activities 100.00 100.00 - Lite-On Technology USA, Inc. Investment activities 100.00 100.00 - Lite-On Electronics (Europe) Ltd. Manufacture and sale of power supplies 100.00 100.00 - Lite-On Technology (Europe) B.V. Market research and after-sales service 54.00 54.00 - Lite-On Overseas Trading Co., Ltd. Merchandising business 100.00 100.00 - Lite-On Singapore Pte. Ltd. Manufacture and supply computer peripheral
products 100.00 100.00 -
Lite-On Vietnam Co., Ltd. Electronic contract manufacturing 100.00 100.00 - Li Shin International Enterprise Corp. Manufacture and sale of computer and
appliance components 100.00 100.00 -
Eagle Rock Investment Ltd. Import and export business and investment activities
100.00 100.00 -
LarView Technologies Corporation (Samoa) Investment activities - 100.00 1) Lite-On Mobile Pte. Ltd. Manufacture and sale of mobile phone
modules and design for assembly line 100.00 100.00 -
High Yield Group Co., Ltd. Holding company 100.00 100.00 - Lite-On IT Singapore Pte. Ltd. Sale of optical disc drives - 100.00 2) Lite-On Information Technology B.V. Market research and customer service 100.00 100.00 - Philip & Lite-On Digital Solutions Corp. Sale of optical disc drives 49.00 49.00 - LET (HK) Ltd. Sale of optical disc drives 100.00 100.00 - Leotek Electronics Holding Limited Holding company 100.00 100.00 - Lite-On Automotive Electronics (Europe) BV Sale of automotive parts and other electronic
products 100.00 100.00 -
Lite-On Automotive North America Inc. Sale of automotive parts and other electronic products
- 100.00 3)
Lite-On Automotive Service USA Inc. Sale of automotive parts and other electronic products
100.00 100.00 -
Lite-On Automotive International (Cayman) Co., Ltd.
Investment activities 100.00 100.00 -
Lite-On Automotive Electronics Mexico, S.A. DE C.V.
Production, manufacture, sale, import and export of photovoltaic device, key electronic components, telecommunications equipment, information technology equipment, semiconductor applications, general lighting, automotive electronics, renewable energy products and systems and maintenance of automotive industry
99.00 - 4)
Lite-On Capital Corp. Silitech Technology Corp. Manufacture and sale of modules and plastic products
0.64 0.61 -
Lite-On Green Technologies Inc. Manufacture and wholesale of electronic components and energy technology services
100.00 100.00 -
Lite-On Green Energy (HK) Limited Investment activities 100.00 100.00 - Lite-On Technology (Europe) B.V. Market research and after-sales services 46.00 46.00 - Lite-On Green Energy (Singapore) Pte. Ltd. Investment activities 100.00 100.00 - Five Dimension Co., Ltd. Development, manufacture and sale of cell
phone and camera lens modules 69.94 69.94 -
Five Dimension Co., Ltd. FiiDi Optical Co., Ltd. Wholesale of precision modules - 40.00 5) Lite-On Green Technologies Inc. Lite-On Green Technologies B.V. Solar energy engineering 100.00 100.00 - Lite-On Green Technologies (HK) Limited Solar energy engineering 100.00 100.00 - Lar View Technologies Corporation
(Samoa) LarView Technologies Corp. (Shenzhen) Camera lens modules - 100.00 6)
Lite-On Green Energy Lite-On Green Energy B.V. Investment activities 100.00 100.00 - (Singapore) Pte. Ltd. Lite-On Green Energy Kaiserslautern GmbH Solar energy engineering - 100.00 7) Lite-On Green Technologies (HK)
Limited Lite-on Green Technologies (Nanjing)
Corporation Solar energy engineering 100.00 100.00 -
Lite-On Green Energy B.V. Romeo Tetti PV1 S.R.L Solar energy engineering 100.00 100.00 - Lite-On Green Energy S.R.L Solar energy engineering 100.00 100.00 - Lite-On Electronics H.K. Ltd. Lite-On Electronics (Tianjinn) Co., Ltd. ODM services 100.00 100.00 - Lite-On Network Communication (Dongguan)
Limited Manufacture and sale of IT products 100.00 100.00 -
Lite-On Power Technology (Chang Zhou) Co., Ltd.
Manufacture and sale of new-type electronic components and peripheral materials
100.00 100.00 -
China Bridge (China) Co., Ltd. Investment, sales agent 100.00 100.00 - Lite-On Electronics (Dongguan) Co., Ltd. Manufacture of electronic components 100.00 100.00 - Silitek Elec. (Dongguan) Co., Ltd. Manufacture and sale of keyboards 100.00 100.00 - Lite-On Computer Tech (Dongguan) Co., Ltd. Manufacture and sale of display device 100.00 100.00 - Dong Guan G-Tech Computers Co., Ltd. Manufacture and sale of computer case 100.00 100.00 - DongGuan G-Pro Computer Co., Ltd. Manufacture and sale of system products 79.29 79.29 - Lite-On Digital Electronics (Dongguan) Co.,
Ltd. Manufacture and sale of computer peripheral
products 100.00 100.00 -
Lite-On Network Communication (Dongguan) Limited
DongGuan G-Pro Computer Co., Ltd. Manufacture and sale of system products 20.71 20.71 -
(Continued)
- 39 -
% of Ownership December 31
Investor Investee Main Business 2015 2014 Remark China Bridge (China) Co., Ltd. Lite-On Opto Technology (Changzhou) Co.,
Ltd. Development, manufacture of new-type
electronic components and provide technology consulting services, maintenance equipment and after-sales services
12.59 12.59 -
China Bridge Express (Wuxi) Co., Ltd. Express and sale of power supplies, printers, display devices and scanners
100.00 100.00 -
Lite-On Electronics Co., Ltd. Lite-On Communications (Guangzhou) Co., Ltd.
Manufacture and sale of mobile terminal equipment
100.00 100.00 -
Lite-On Electronics (Guangzhou) Co., Ltd. Manufacture and sale of printers and scanners 100.00 100.00 - Lite-On (Guangzhou) Infortech Co., Ltd. Information outsourcing 100.00 100.00 - Lite-On Elec and Wire (Guangzhou) Co., Ltd. Manufacture and sale of mobile terminal
equipment 100.00 100.00 -
Lite-On (Guangzhou) Precision Tooling Co., Ltd.
Manufacture and sale of modules 67.03 67.03 -
Lite-On Tech (Guangzhou) Co., Ltd. Manufacture and sale of computer cases 100.00 100.00 - Lite-On Electronics (Jiangsu) Co., Ltd. Development, manufacture, sale and
installation of power supplies and transformers and provision of technology consulting services, maintenance equipment and precision instruments
100.00 100.00 -
Lite-On Technology (Guangzhou) Investment Co., Ltd.
Investment activities 100.00 100.00 -
Lite-On Power Technology (Dongguan) Co., Ltd.
Development, manufacture and sale of electronic components, power supplies and provision technology consulting services
100.00 100.00 -
Lite-On Technology (Guangzhou) Investment Co.,
Lite-On (Guangzhou) Precision Tooling Co., Ltd.
Manufacture and sale of modules 32.97 32.97 -
Ltd. Zhuhai Lite-On Mobile Technology Co., Ltd. Mobile phone mold, assembly line design, manufacture and sale activities.
100.00 100.00 -
Lite-On Electronics (Jiangsu) Co., Ltd.
Lite-On Technology (Changzhou) Co., Ltd. Development, manufacture, sale and installation of power supplies and transformers and provision technology consulting services, maintenance equipment and after-sales services
100.00 100.00 -
Lite-On Opto Technology (Changzhou) Co., Ltd.
Development, manufacture and sale of new-type electronic components and LED and provision technology consulting services, maintenance equipment and after-sales services
87.41 87.41 -
Lite-On Medical Device (Changzhou) Ltd. Manufacture and sale of medical equipment 100.00 100.00 - Changzhou Leotek New Energy Trade Limited Wholesale, import and export and installation
of street lights, signal lights, scenery lights and new-type electronic components
100.00 100.00 -
Yet Foundate Ltd. Dongguan Lite-On Computer Co., Ltd. Manufacture and sale of computer hosts and components
100.00 100.00 -
Fordgood Electronic Ltd. Lite-On Li Shin Technology (Ganzhou) Co., Ltd.
Manufacture and sale of electronic components
100.00 100.00 -
Lite-On Technology USA, Inc. Lite-On, Inc. Sales data processing business of optoelectronic products and power supplies
100.00 100.00 -
Lite-On Trading USA, Inc. Sale of optical products 100.00 100.00 - Lite-On Service USA, Inc. After-sales service of optical products 100.00 100.00 - Leotek Electronics USA LLC. Sale of LED products 100.00 100.00 - Power Innovations International, Inc. Development, design and manufacture of
power control and energy management 95.25 95.25 -
Lite-On Sales & Distribution Inc. Sale of optical disc drives 100.00 100.00 - Lite-On Technology Service, Inc. After-sales service of optical products 100.00 - 8) Lite-On International Holding Co.,
Ltd. Ze Poly Pte. Ltd. Manufacture and sale of thin-film solar cell - 48.13 9)
Lite-On China Holding Co., Ltd. Manufacture and sale of computer cases 100.00 100.00 - Lite-On Singapore Pte. Ltd. Lite-On Technology (Ying Tan) Co., Ltd. Manufacture and sale of electronic
components 100.00 100.00 -
Lite-On Technology (Xianging) Co., Ltd. Manufacture and sale of electronic components
100.00 100.00 -
Lite-On Technology (Shanghai) Ltd. Manufacture and sale of energy saving equipment
100.00 100.00 -
Lite-On Automotive Electronics Mexico, S.A. DE C.V.
Production, manufacture, sale, import and export of photovoltaic device, key electronic components, telecommunications equipment, information technology equipment, semiconductor applications, general lighting, automotive electronics, renewable energy products and systems and maintenance of automotive industry
1.00 - 4)
Lite-On Technology (Shanghai) Ltd. Lite-On Intelligent Technology (Yencheng) Corporation
Wholesale, import and export and installation of street lights, signal lights, scenery lights and new-type electronic components
100.00 - 10)
LTC Group Ltd. Titanic Capital Services Ltd. Investment activities 100.00 100.00 - LTC International Ltd. Manufacture and sale of system products 100.00 100.00 - Lite-On Technology (Europe) B.V. Lite-On (Finland) Oy Manufacture and sale of mobile phone
modules and design for assembly line 100.00 100.00 -
Lite-On (Finland) Oy Lite-On Mobile Oyj (formerly: Perlos Oyj) Manufacture and sale of mobile phone modules and design for assembly line
100.00 100.00 -
Lite-On China Holding Co., Ltd. Lite-On Electronics Co., Ltd. Investment activities 100.00 100.00 - Yet Foundate Ltd. Manufacture of plastic and computer
peripheral products 100.00 100.00 -
I-Solutions Limited Original equipment manufacturer of electronic products
100.00 100.00 -
Fordgood Electronic Ltd. Import and export and real estate business 100.00 100.00 - G&W Technology (BVI) Ltd. Real estate management 50.00 50.00 - G&W Technology (BVI) Ltd. G&W Technology Limited Leasing business 100.00 100.00 -
(Continued)

79 80‧Lite-On Technology Corporation 2015 Annual Report Lite-On Technology Corporation 2015 Annual Report‧
- 40 -
% of Ownership December 31
Investor Investee Main Business 2015 2014 Remark Eagle Rock Investment Ltd. Huizhou Li Shin Electronic Co., Ltd. Manufacture of computer peripheral products 100.00 100.00 - Huizhou Fu Tai Electronic Co., Ltd. Manufacture of computer peripheral products 100.00 100.00 - Li Shin Technology (Huizhou) Ltd. Manufacture and sale of new-type electronic
components and peripheral materials 100.00 100.00 -
High Yield Group Co., Ltd. Lite-On IT International (HK) Ltd. Sale of optical disc drives 100.00 100.00 - Lite-On IT International (HK) Ltd. Lite-On Opto Technology (Guangzhou) Co.,
Ltd. Manufacture and sale of optical disc drives 100.00 100.00 -
Lite-On Auto Electric Technology (Guangzhou) Ltd.
Manufacture and sale of optical disc drives 100.00 100.00 -
Lite-On IT Opto Tech (BH) Co., Ltd. Manufacture and sale of optical disc drives 100.00 100.00 - Lite-On Information Technology B.V. Lite-On Information Technology GmbH Sale of optical disc drives 100.00 100.00 - Philip & Lite-On Digital Solutions
Corp. Philips & Lite-On Digital Solutions Germany
GmbH Development and sale of modules of
automotive recorders 100.00 100.00 -
Philips & Lite-On Digital Solutions USA Inc. Sale of optical disc drives 100.00 100.00 - Philips & Lite-On Digital Solutions Korea Ltd. Sale of optical disc drives 100.00 100.00 - Philips & Lite-On Digital Solutions
Netherlands B.V. Sale and design of optical disc drives 100.00 100.00 -
Philip & Lite-On Digital Solutions (Shanghai) Co., Ltd.
Sale of optical disc drives 100.00 100.00 -
Silitech Technology Corp. Silitech (BVI) Holding Ltd. Investment activities 100.00 100.00 - Lite-On Japan Ltd. Sale of LED optical products and power
supplies 7.87 7.87 -
Silitech (BVI) Holding Ltd. Silitech (Bermuda) Holding Ltd. Investment activities 100.00 100.00 - Silitech (Bermuda) Holding Ltd. Silitech Technology Corp. Ltd. Manufacture of plastic and computer
peripheral products 100.00 100.00 -
Silitech Technology Corp. Sdn. Bhd. Manufacture of computer peripheral products 100.00 100.00 - Silitech (Hong Kong) Holding Ltd. Investment activities 100.00 100.00 - Silitech International (India) Private Limited Development, manufacture and sale of
automotive parts 100.00 100.00 -
Silitech (Hong Kong) Holding Ltd. Silitech Technology (SuZhou) Co., Ltd. Manufacture and sale of automotive parts 100.00 100.00 - Silitech Technology Corp. Ltd. Xurong Electronic (Shenzhen) Co., Ltd. Manufacture of automotive parts, touch
panels and plastic and rubber assembly 100.00 100.00 -
SuZhou Xulong Mold Producing Co., Ltd. Development, manufacture and sale of precision modules and new-type electronic components (chip components, testing elements, hybrid integrated circuits)
60.00 60.00 -
Lite-On Automotive International (Cayman) Co., Ltd.
Lite-On Automotive Holdings (Hong Kong) Co., Ltd.
Investment activities 100.00 100.00 -
Lite-On Automotive Holdings (Hong Kong) Co., Ltd.
Lite-On Automotive (Wuxi) Co., Ltd. Manufacture, sale and processing of electronic products
100.00 100.00 -
Lite-On Automotive Electronics (Guangzhou) Co., Ltd.
Manufacture, sale and processing of electronic products
100.00 100.00 -
Lite-On Japan Ltd. Lite-On Japan (S) Pte. Ltd. Import and export business of electronic components
100.00 100.00 -
L&K Industries Philippines, Inc. Import and export business of electronic components
100.00 100.00 -
Lite-On Japan (H.K.) Limited Import and export business of electronic components
100.00 100.00 -
Lite-On Japan (Korea) Co., Ltd. Import and export business of electronic components
100.00 100.00 -
Lite-On Japan (Thailand) Co., Ltd. Import and export business of electronic components
100.00 100.00 -
Lite-On Japan (H.K.) Limited NL (Shanghai) Co., Ltd. Import and export business of electronic components
100.00 100.00 -
Lite-On Mobile Oyj (formerly: Perlos Oyj)
Lite-On Mobile Sweden AB Manufacture and sale of mobile phone modules and design for assembly line
100.00 100.00 -
Lite-On Mobile Indústria e Comércio de Plásticos Ltda.
Manufacture and sale of mobile phone modules and design for assembly line
3.14 3.53 -
Lite-On Mobile Pte. Ltd. Guangzhou Lite-On Mobile Electronic Components Co., Ltd.
Manufacture and sale of mobile phone modules and design for assembly line
100.00 100.00 -
Guangzhou Lite-On Mobile Engineering Plastics Co., Ltd.
Manufacture and sale of mobile phone modules and design for assembly line
100.00 100.00 -
Beijing Lite-On Mobile Electronic and Telecommunication Components Co., Ltd.
Manufacture and sale of mobile phone modules and design for assembly line
100.00 100.00 -
Shenzhen Lite-On Mobile Precision Molds Co., Ltd.
Manufacture and sale of mobile phone modules and design for assembly line
100.00 100.00 -
Lite-On Mobile Indústria e Comércio de Plásticos Ltda.
Manufacture and sale of mobile phone modules and design for assembly line
96.86 96.47 -
Perlos Precision Plastics Moulding Limited Liability Company
Manufacture and sale of mobile phone modules and design for assembly line
100.00 100.00 -
Lite-On Mobile India Private Limited. Manufacture and sale of mobile phone modules and design for assembly line
100.00 100.00 -
Lite-On Young Fast Pte. Ltd. Investment activities 100.00 100.00 - Guangzhou Lite-On Mobile Electronic
Components Co., Ltd. Yantai Lite-On Mobile Electronic Components
Co., Ltd. Manufacture and sale of mobile phone
modules and design for assembly line 100.00 100.00 -
Lite-On Young Fast Pte. Ltd. Lite-On Young Fast (Huizhou) Co., Ltd. Modules of touch panels 100.00 100.00 -
(Concluded)
Remark: 1) LarView Technologies Corporation (Samoa) was dissolved after liquidation in November 2015.
2) Lite-On IT Singapore Pte. Ltd. was dissolved after merging with Lite-On Singapore Pte. Ltd. in
January 2015. 3) Lite-On Automotive North America Inc. was dissolved after liquidation in May 2015.
- 41 -
4) Established in January 2015. 5) In November 2014, the Group acquired power to cast the majority of the equity; thus, this investee
was included in the consolidated financial statement effective that month. The Company was dissolved after liquidation in April 2015.
6) Accomplished the liquidation in July 2015. 7) Accomplished the liquidation in September 2015.
8) Established in August 2015.
9) Accomplished the liquidation in September 2015. 10) Established in December 2015.
b. Subsidiaries excluded from consolidated financial statements: None. c. Details of subsidiaries that have material non-controlling interests
Proportion of Ownership and Voting Rights Held by
Non-controlling Interests December 31
Name of Subsidiary 2015 2014 Silitech Technology Corp. 65.49% 67.31%
See Table 7 and Table 8 for the information on place of incorporation and principal place of business.
Profit (Loss) Allocated to Non-controlling Interests Accumulated Non-controlling
For the Year Ended Interests December 31 December 31
Name of Subsidiary 2015 2014 2015 2014 Silitech Technology Corp. $ 52,347 $ (949,973) $ 2,885,289 $ 3,251,040 Others 37,586 166,157 809,793 947,390 $ 89,933 $ (783,816) $ 3,695,082 $ 4,198,430
Summarized financial information in respect of each of the Group’s subsidiaries that has material non-controlling interests is set out below. The summarized financial information below represents amounts before intragroup eliminations.

81 82‧Lite-On Technology Corporation 2015 Annual Report Lite-On Technology Corporation 2015 Annual Report‧
- 42 -
Silitech Technology Corp. and Silitech Technology Corp.’s subsidiaries: December 31 2015 2014 Current assets $ 5,467,860 $ 5,982,635 Non-current assets 1,941,195 2,129,489 Current liabilities (1,399,290) (1,642,438) Non-current liabilities (1,608,984) (1,666,121) Equity $ 4,400,781 $ 4,803,565 Equity attributable to:
Parent Company $ 1,515,492 $ 1,552,525 Non-controlling interests of Silitech Technology Corp. 2,875,966 3,196,711 Non-controlling interests of Silitech Technology Corp.’s
subsidiaries 9,323 54,329 $ 4,400,781 $ 4,803,565 For the Year Ended December 31 2015 2014 Revenue $ 3,530,193 $ 4,502,520 Profit (loss) for the year $ 101,383 $ (1,402,037) Other comprehensive income (loss) for the year (42,252) 108,677 Total comprehensive income (loss) for the year $ 59,131 $ (1,293,360) Profit (loss) attributable to:
Parent Company $ 49,036 $ (452,064) Non-controlling interests of Silitech Technology Corp. 96,941 (933,156) Non-controlling interests of Silitech Technology Corp.’s
subsidiaries (44,594) (16,817) $ 101,383 $ (1,402,037) Total comprehensive income attributable to:
Parent Company $ 34,981 $ (417,244) Non-controlling interests of Silitech Technology Corp. 69,155 (861,279) Non-controlling interests of Silitech Technology Corp.’s
subsidiaries (45,005) (14,837) $ 59,131 $ (1,293,360) Net cash inflow (outflow) from:
Operating activities $ 424,898 $ 131,756 Investing activities (412,759) (311,856) Financing activities (461,902) (308,671) Foreign exchange translation (6,274) 71,955
Net cash outflow $ (456,037) $ (416,816) Dividends paid to non-controlling interest
Silitech Technology Corp. $ 148,827 $ 127,371
- 43 -
15. INVESTMENTS ACCOUNTED FOR USING EQUITY METHOD
Investments in Associates
December 31 2015 2014 Material associates
Lite-On Semiconductor Corp. $ 1,748,154 $ 1,698,507 Dragonjet Corporation 1,047,765 1,060,414 Logah Technology Corp. 277,156 352,473
3,073,075 3,111,394 Associates that are not individually material 1,022,092 944,508 $ 4,095,167 $ 4,055,902 a. Material associates:
December 31 Name of Associate 2015 2014 Lite-On Semiconductor Corp. 20.62% 20.23% Dragonjet Corporation 29.62% 29.62% Logah Technology Corp. 31.77% 32.53% Refer to Table 7 “names, locations, and related information of investees over which the Company exercises significant influence” for the nature of activities, principal place of business and country of incorporation of the associates. The equity-method investees’ financial statements, which had been used to determine the carrying amount of the Group’s investments share of profit and other comprehensive income of associates, had been audited. Starting from March 28, 2014, the Group has no power to govern the financial and operating policies of Logah Technology Corp. The Group used the fair value measurement for its investments after it lost control of Logah Technology Corp. (please refer to Note 30). The Group still has significant influence on Logah Technology Corp.; thus, the Group accounted for this investment by the equity method. Fair value (Level 1) of investments in associates with available published price quotation are summarized as follows:
December 31
Name of Associate 2015 2014 Lite-On Semiconductor Corp. $ 1,366,148 $ 1,429,838 Logah Technology Corp. $ 324,211 $ 599,741 The Group’s investments of the above mentioned associates are measured by equity method.
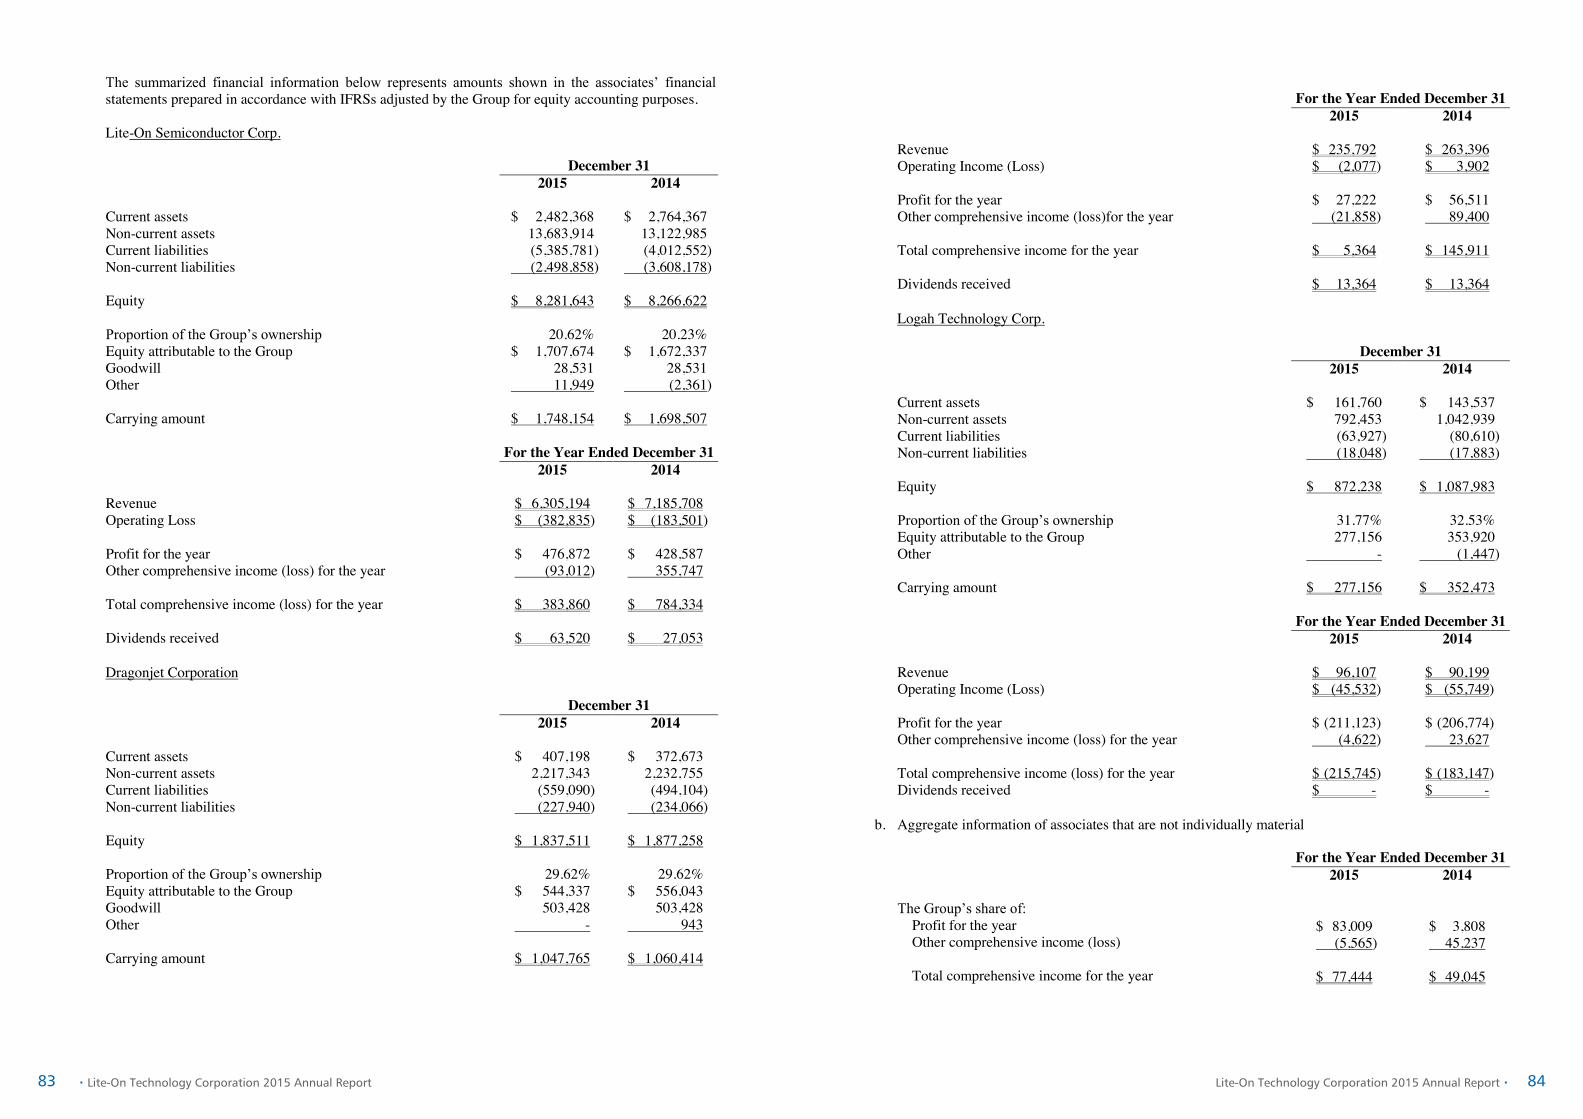
83 84‧Lite-On Technology Corporation 2015 Annual Report Lite-On Technology Corporation 2015 Annual Report‧
- 44 -
The summarized financial information below represents amounts shown in the associates’ financial statements prepared in accordance with IFRSs adjusted by the Group for equity accounting purposes. Lite-On Semiconductor Corp.
December 31 2015 2014 Current assets $ 2,482,368 $ 2,764,367 Non-current assets 13,683,914 13,122,985 Current liabilities (5,385,781) (4,012,552) Non-current liabilities (2,498,858) (3,608,178) Equity $ 8,281,643 $ 8,266,622 Proportion of the Group’s ownership 20.62% 20.23% Equity attributable to the Group $ 1,707,674 $ 1,672,337 Goodwill 28,531 28,531 Other 11,949 (2,361) Carrying amount $ 1,748,154 $ 1,698,507
For the Year Ended December 31 2015 2014 Revenue $ 6,305,194 $ 7,185,708 Operating Loss $ (382,835) $ (183,501) Profit for the year $ 476,872 $ 428,587 Other comprehensive income (loss) for the year (93,012) 355,747 Total comprehensive income (loss) for the year $ 383,860 $ 784,334 Dividends received $ 63,520 $ 27,053
Dragonjet Corporation December 31 2015 2014 Current assets $ 407,198 $ 372,673 Non-current assets 2,217,343 2,232,755 Current liabilities (559,090) (494,104) Non-current liabilities (227,940) (234,066) Equity $ 1,837,511 $ 1,877,258 Proportion of the Group’s ownership 29.62% 29.62% Equity attributable to the Group $ 544,337 $ 556,043 Goodwill 503,428 503,428 Other - 943 Carrying amount $ 1,047,765 $ 1,060,414
- 45 -
For the Year Ended December 31 2015 2014 Revenue $ 235,792 $ 263,396 Operating Income (Loss) $ (2,077) $ 3,902 Profit for the year $ 27,222 $ 56,511 Other comprehensive income (loss)for the year (21,858) 89,400 Total comprehensive income for the year $ 5,364 $ 145,911 Dividends received $ 13,364 $ 13,364
Logah Technology Corp.
December 31 2015 2014 Current assets $ 161,760 $ 143,537 Non-current assets 792,453 1,042,939 Current liabilities (63,927) (80,610) Non-current liabilities (18,048) (17,883) Equity $ 872,238 $ 1,087,983 Proportion of the Group’s ownership 31.77% 32.53% Equity attributable to the Group 277,156 353,920 Other - (1,447) Carrying amount $ 277,156 $ 352,473
For the Year Ended December 31 2015 2014 Revenue $ 96,107 $ 90,199 Operating Income (Loss) $ (45,532) $ (55,749) Profit for the year $ (211,123) $ (206,774) Other comprehensive income (loss) for the year (4,622) 23,627 Total comprehensive income (loss) for the year $ (215,745) $ (183,147) Dividends received $ - $ -
b. Aggregate information of associates that are not individually material
For the Year Ended December 31 2015 2014 The Group’s share of:
Profit for the year $ 83,009 $ 3,808 Other comprehensive income (loss) (5,565) 45,237 Total comprehensive income for the year $ 77,444 $ 49,045

85 86‧Lite-On Technology Corporation 2015 Annual Report Lite-On Technology Corporation 2015 Annual Report‧
- 46 -
Investments in associates that are not individually material are accounted for by the equity method and the share of profit or loss and other comprehensive income of those investments were calculated based on the financial statements that were not audited. Management believes there is no material impact on the equity method accounting or the calculation of the share of profit or loss and other comprehensive income from the financial statements of associates that are not individually material that have not been audited.
16. PROPERTY, PLANT AND EQUIPMENT, NET
December 31 2015 2014 Freehold land $ 2,339,337 $ 2,335,867 Buildings 11,678,185 12,424,092 Machinery equipment 14,961,795 16,012,090 Tooling equipment 227,999 140,111 Transportation equipment 15,936 21,681 Office equipment 425,556 465,815 Equipment held under finance lease 257,851 267,468 Other equipment 3,482,780 4,440,092 $ 33,389,439 $ 36,107,216
For the Year Ended December 31, 2015
January 1, 2015 Additions Disposals
Effect of Business
Combination Reclassification
Effect of Foreign
Currency Exchange
Differences December 31,
2015 Cost Freehold land $ 2,335,867 $ - $ 53 $ - $ 10,275 $ (6,752 ) $ 2,339,337 Buildings 20,591,355 149,911 90,266 - 296,816 (204,233 ) 20,743,583 Machinery equipment 42,733,143 4,364,717 3,675,925 - 589,501 (598,207 ) 43,413,229 Tooling equipment 3,884,972 159,092 688,688 - 234,079 (41,861 ) 3,547,594 Transportation equipment 83,156 5,050 5,171 - (9,336 ) (1,149 ) 72,550 Office equipment 2,730,452 221,682 231,804 - (245,268 ) (11,749 ) 2,463,313 Equipment held under
finance lease 1,411,445 97,851 679 - (11,741 ) (26,317 ) 1,470,559 Other equipment 9,077,902 802,393 435,101 - (1,647,974 ) (72,521 ) 7,724,699 82,848,292 $ 5,800,696 $ 5,127,687 $ - $ (783,648 ) $ (962,789 ) 81,774,864 Accumulated depreciation Buildings 7,821,429 $ 814,098 $ 57,152 $ - $ 186,352 $ (79,546 ) 8,685,181 Machinery equipment 25,607,321 4,831,830 2,278,086 - (194,641 ) (361,859 ) 27,604,565 Tooling equipment 3,704,341 194,072 667,103 - 107,787 (40,502 ) 3,298,595 Transportation equipment 60,551 8,307 4,978 - (7,076 ) (937 ) 55,867 Office equipment 2,254,755 239,883 211,497 - (243,435 ) (10,788 ) 2,028,918 Equipment held under
finance lease 1,101,485 108,323 281 - (18,002 ) (20,973 ) 1,170,552 Other equipment 4,534,639 516,782 423,837 - (505,686 ) (38,541 ) 4,083,357 45,084,521 $ 6,713,295 $ 3,642,934 $ - $ (674,701 ) $ (553,146 ) 46,927,035 Accumulated impairment Freehold land - $ - $ - $ - $ - $ - - Buildings 345,834 16 - - 2,287 32,080 380,217 Machinery equipment 1,113,732 130,276 494,361 - 84,402 12,820 846,869 Tooling equipment 40,520 - 24,163 - 908 3,735 21,000 Transportation equipment 924 - 170 - - (7 ) 747 Office equipment 9,882 - 968 - - (75 ) 8,839 Equipment held under
finance lease 42,492 - - - - (336 ) 42,156 Other equipment 103,171 56,229 3,178 - 5,529 (3,189 ) 158,562 1,656,555 $ 186,521 $ 522,840 $ - $ 93,126 $ 45,028 1,458,390 $ 36,107,216 $ 33,389,439
- 47 -
For the Year Ended December 31, 2014
January 1, 2014 Additions Disposals
Effect of Business
Combination Reclassification
Effect of Foreign
Currency Exchange
Differences December 31,
2014 Cost Freehold land $ 2,398,990 $ - $ - $ (56,368 ) $ - $ (6,755 ) $ 2,335,867 Buildings 20,283,203 101,821 65,610 (135,706 ) (31,002 ) 438,649 20,591,355 Machinery equipment 40,610,971 5,026,374 3,129,618 (141,208 ) (701,125 ) 1,067,749 42,733,143 Tooling equipment 4,114,144 122,835 304,519 - 9,974 (57,462 ) 3,884,972 Transportation equipment 89,042 6,182 11,220 (1,600 ) (72 ) 824 83,156 Office equipment 2,757,887 182,053 153,056 803 (85,220 ) 27,985 2,730,452 Equipment held under
finance lease 1,420,378 73,977 13,380 (68,222 ) (21,608 ) 20,300 1,411,445 Other equipment 6,784,900 2,926,602 193,794 (31,642 ) (498,728 ) 90,564 9,077,902 78,459,515 $ 8,439,844 $ 3,871,197 $ (433,943 ) $ (1,327,781 ) $ 1,581,854 82,848,292 Accumulated depreciation Buildings 6,947,394 $ 811,998 $ 30,105 $ (11,582 ) $ (159,084 ) $ 262,808 7,821,429 Machinery equipment 22,822,096 4,857,725 1,949,067 (185,703 ) (545,589 ) 607,859 25,607,321 Tooling equipment 3,611,874 406,792 409,189 - 2,572 92,292 3,704,341 Transportation equipment 64,939 8,299 10,202 (1,301 ) (2,269 ) 1,085 60,551 Office equipment 2,016,021 281,832 90,590 (20,156 ) 26,560 41,088 2,254,755 Equipment held under
finance lease 1,026,069 53,531 12,442 (24,858 ) (9,004 ) 68,189 1,101,485 Other equipment 3,725,652 688,362 185,661 (22,620 ) 307,456 21,450 4,534,639 40,214,045 $ 7,108,539 $ 2,687,256 $ (266,220 ) $ (379,358 ) $ 1,094,771 45,084,521 Accumulated impairment Freehold land - $ - $ - $ - $ - $ - - Buildings 168,211 193,933 5,851 - - (10,459 ) 345,834 Machinery equipment 998,389 886,485 463,493 (79,978 ) (178,024 ) (49,647 ) 1,113,732 Tooling equipment 22,877 19,520 1,908 - - 31 40,520 Transportation equipment 301 890 - (299 ) - 32 924 Office equipment 4,431 7,713 439 (2,133 ) - 310 9,882 Equipment held under
finance lease 14,338 40,943 - (14,241 ) - 1,452 42,492 Other equipment 35,541 81,817 18 (3,902 ) - (10,267 ) 103,171 1,244,088 $ 1,231,301 $ 471,709 $ (100,553 ) $ (178,024 ) $ (68,548 ) 1,656,555 $ 37,001,382 $ 36,107,216
For the years ended December 31, 2015 and 2014, as the result of the declining sale of some of the products in the market, the estimated future cash flows expected to arise from the related equipment was decreased and recognized impairment loss $186,521 thousand and $1,231,301 thousand, respectively. The Group carried out a review of the recoverable amount of that related equipment and determined that the carrying amount exceeded the recoverable amount. The impairment loss had been recognized in the consolidated statements of comprehensive income. The above items of property, plant and equipment are depreciated on a straight-line basis at the following rates per annum: Buildings 5-60 years Machinery equipment 2-10 years Tooling equipment 2-10 years Transportation equipment 3-10 years Office equipment 2-10 years Equipment held under finance lease 3-40 years Other equipment 2-10 years

87 88‧Lite-On Technology Corporation 2015 Annual Report Lite-On Technology Corporation 2015 Annual Report‧
- 48 -
17. INVESTMENT PROPERTIES, NET
Completed Investment Property
Cost Balance at January 1, 2014 $ - Transferred from property, plant and equipment 706,741 Net exchange differences 26,737 Balance at December 31, 2014 $ 733,478 Accumulated depreciation Balance at January 1, 2014 $ - Transferred from property, plant and equipment 189,287 Net exchange differences 7,161 Balance at December 31, 2014 $ 196,448 Balance at December 31, 2014, net $ 537,030 Cost Balance at January 1, 2015 $ 733,478 Net exchange differences (5,814) Balance at December 31, 2015 $ 727,664 Accumulated depreciation Balance at January 1, 2015 $ 196,448 Depreciation Expense 32,835 Net exchange differences (1,569) Balance at December 31, 2015 $ 227,714 Balance at December 31, 2015, net $ 499,950 The investment properties held by the Group are depreciated using the straight-line method over their estimated useful lives of 20 years. The fair value of the investment properties as of December 31, 2014 was $613,771 thousand. The Group’s management estimated no significant differences between this fair value and that for the years ended 2015. For the investment properties valued by an independent appraiser, the Group’s management determined their fair value by reference to the appraiser’s market evidence of the transaction price of real estate.
- 49 -
18. OTHER INTANGIBLE ASSETS, NET
December 31 2015 2014 Goodwill $ 14,994,136 $ 14,953,187 Patents 6,920 12,188 Patents use rights 561,640 786,297 Software 253,143 286,304 Other intangible assets 122,393 260,987 $ 15,938,232 $ 16,298,963 For the Year Ended December 31, 2015
January 1, 2015 Additions Disposals
Effect of Business
Combination Reclassification
Effect of Foreign
Currency Exchange
Differences December 31,
2015 Cost Goodwill $ 15,483,954 $ 92,264 $ - $ - $ - $ (51,315 ) $ 15,524,903 Patents 39,481 - - - (1,566 ) (142 ) 37,773 Patents use rights 2,695,878 - - - - 2,695,878 Client relationships 163,819 - - - - - 163,819 Software 563,576 139,208 37,243 - 3,981 (469 ) 669,053 Other intangible assets 3,859,575 15,762 1,009,378 - (854,677 ) (19,833 ) 1,991,449 22,806,283 $ 247,234 $ 1,046,621 $ - $ (852,262 ) $ (71,759 ) 21,082,875 Accumulated amortization Goodwill 77,234 $ - $ - $ - $ - $ - 77,234 Patents 27,293 4,850 - - (1,178 ) (112 ) 30,853 Patents use rights 1,909,581 224,657 - - - - 2,134,238 Client relationships 163,819 - - - - - 163,819 Software 277,272 159,610 26,243 - 5,191 80 415,910 Other intangible assets 3,598,588 145,011 995,602 - (865,406 ) (13,535 ) 1,869,056 6,053,787 $ 534,128 $ 1,021,845 $ - $ (861,393 ) $ (13,567 ) 4,691,110 Accumulated impairment Goodwill 453,533 $ - $ - $ - $ - $ - 453,533 Patents - - - - - - - Patents use rights - - - - - - - Software - - - - - - - Other intangible assets - - - - - - - 453,533 $ - $ - $ - $ - $ - 453,533 $ 16,298,963 $ 15,938,232
For the Year Ended December 31, 2014
January 1, 2014 Additions Disposals
Effect of Business
Combination Reclassification
Effect of Foreign
Currency Exchange
Differences December 31,
2014 Cost Goodwill $ 14,792,433 $ 697,770 $ - $ (5,043 ) $ - $ (1,206 ) $ 15,483,954 Patents 37,328 1,092 6,143 130 7,187 (113 ) 39,481 Patents use rights 2,695,878 - - - - - 2,695,878 Client relationships 163,819 - - - - - 163,819 Software 265,373 279,302 12,047 51,550 (19,224 ) (1,378 ) 563,576 Other intangible assets 3,427,496 56,165 38,730 1,836 413,730 (922 ) 3,859,575 21,382,327 $ 1,034,329 $ 56,920 $ 48,473 $ 401,693 $ (3,619 ) 22,806,283 Accumulated amortization Goodwill 77,234 $ - $ - $ - $ - $ - 77,234 Patents 25,927 8,772 4,093 - (3,251 ) (62 ) 27,293 Patents use rights 1,684,924 224,657 - 1,909,581 Client relationships 163,819 - - - - - 163,819 Software 203,832 108,482 10,543 3,799 (26,655 ) (1,643 ) 277,272 Other intangible assets 3,056,796 226,597 35,746 879 342,389 7,673 3,598,588 5,212,532 $ 568,508 $ 50,382 $ 4,678 $ 312,483 $ 5,968 6,053,787
(Continued)

89 90‧Lite-On Technology Corporation 2015 Annual Report Lite-On Technology Corporation 2015 Annual Report‧
- 50 -
For the Year Ended December 31, 2014
January 1, 2014 Additions Disposals
Effect of Business
Combination Reclassification
Effect of Foreign
Currency Exchange
Differences December 31,
2014 Accumulated impairment Goodwill $ 453,533 $ - $ - $ - $ - $ - $ 453,533 Patents - - - - - - - Patents use rights - - - - - - - Software - - - - - - - Other intangible assets - - - - - - - 453,533 $ - $ - $ - $ - $ - 453,533 $ 15,716,262 $ 16,298,963
(Concluded) a. The Parent Company acquired an asset group from SEEnergy Corp. in September 2015. IFRS 3
“Business Combinations” and IAS 38 “Intangible Assets” define recognized goodwill as the sum of the acquisition cost plus other direct transaction costs minus the fair value of the identifiable net assets acquired. Thus, goodwill was calculated as follows:
Acquisition price $ 30,093 Fair value of acquired identifiable net assets:
Inventories $ 2,420 Property, plant and equipment 340 Software 71 2,831
Goodwill $ 27,262 To integrate its overall resources and enhance the efficiency of operations, the Parent Company had short-form mergers - in accordance with Article 19 of the Business Mergers and Acquisitions Act - with Li Shin International Enterprise Corp., Lite-On Automotive Corp., Leotek Electronics Corp., Lite-On IT Corp. and LarView Technologies Corp. on March 22, 2014, June 1, 2014, June 29, 2014, June 30, 2014 and September 1, 2014, respectively, under the board of directors’ approval. The Parent Company was the survivor entity in all of these mergers. The investment premium due to merger from Li Shin International Enterprise Corp., Lite-On Automotive Corp., Leotek Electronics Corp., were $1,708,258 thousand, $165,424 thousand, and $220,170 thousand, respectively. The investment premium from acquisition of LarView Technologies Corp. was $368,462 thousand. The goodwill from Lite-On IT Corporation, and Lite-On Automotive Corp. acquiring other companies was $2,806,508 thousand and $112,416 thousand, respectively. The total amount of $5,381,238 thousand was transferred to the Parent Company and recorded as intangible assets - goodwill.
The Parent Company completed the purchase of some assets of the IrDA Department of Avago Technologies Limited. Statement of IFRS 3 - “Business Combinations” and IAS 38 - “Intangible Assets” define recognized goodwill as the sum of the acquisition cost plus other direct transaction costs minus the fair value of the identifiable net assets acquired. Thus, the goodwill generated was calculated at $411,932 thousand as of December 31, 2009. The goodwill arising from the Parent Company’s acquisition of Lite-On Enclosure Inc. in 2004 was $210,220 thousand was amortized for about five years. However, under the Guidelines Governing the Preparation of Financial Reports, effective January 1, 2006, goodwill need no longer be amortized. As of December 31, 2015 and 2014, the carrying value of goodwill was $132,986 thousand.
b. As of the goodwill resulting from the acquisition of LarView Technologies, Power Innovations International Inc. and Five Dimension Co., Ltd. in 2014, refer to Note 29.
- 51 -
c. Goodwill is allocated to the Group’s recoverable amount of cash-generating units. The recoverable amount of all cash-generating units has been determined based on value-in-use calculations. These calculations use pre-tax cash flow projections based on financial budgets approved by the management covering the future five-year period. As of December 31, 2015 and 2014, the recoverable amount of all cash-generating units calculated using the value-in-use exceeded their carrying amount, so goodwill was not impaired. The key assumptions used for value-in-use calculations are gross margin, growth rate and discount rate.
Management determined gross margin based on past performance and future profits. The growth rate used is consistent with the forecasts included in industry reports. The discount rates used are pre-tax and reflect specific risks relating to the relevant cash-generating units.
19. OTHER ASSETS
December 31 2015 2014 Prepayments $ 2,408,898 $ 2,689,934 Offset against business tax payable 1,220,409 1,530,386 Prepayments for lease 654,742 775,063 Prepayment for equipment 63,956 93,450 Others 144,101 361,639 $ 4,492,106 $ 5,450,472 Current $ 3,744,824 $ 4,561,144 Non-current 747,282 889,328 $ 4,492,106 $ 5,450,472 Prepayments for lease with carrying amounts of $618,648 thousand and $630,003 thousand as of December 31, 2015 and 2014, respectively, referred to land use rights located in mainland China.
20. BORROWINGS
a. Short-term borrowings
December 31, 2015 2014 Unsecured borrowings Line of credit borrowings $ 17,670,878 $ 22,911,114 Market interest rates for short-term borrowings were as follows:
December 31, 2015 2014 Short-term borrowings 0.7%-4% 0.82%-4.1%

91 92‧Lite-On Technology Corporation 2015 Annual Report Lite-On Technology Corporation 2015 Annual Report‧
- 52 -
b. Long-term borrowings
December 31, 2015 2014 Unsecured borrowings The Parent Company $ 12,500,000 $ 12,925,000 Lite-On Mobile Pte. Ltd. 6,555,000 6,319,993 Silitech Technology Corp. 1,440,000 1,440,000 Guangzhou Lite-On Mobile Electronic Components Co., Ltd. 524,396 1,011,199 Lite-On Japan Ltd. 102,082 193,630 Five Dimension Co., Ltd 26,890 28,977 21,148,368 21,918,799 Current portion (4,795,064) (8,358,016) 16,353,304 13,560,783 Secured borrowings Power Innovations International Inc. 3,503 4,350 Current portion (1,054) (973) 2,449 3,377 $ 16,355,753 $ 13,564,160 1) As of December 31, 2015 and 2014, the Parent Company had 2 and 4 long-term bank loans
respectively with contract terms between October 19, 2011 and September 23, 2018. The floating interest rates are (1.5789% to 1.59067% and 1.520% to 1.703% and as of December 31, 2015 and 2014, respectively) payable monthly or quarterly. These loans should be repaid in 5 or 8 installments or at lump sum on loan maturity.
On September 23, 2008, the Parent Company signed a contract for a five-year syndicated loan with Citibank and 14 other financial institutions, and on May 16, 2011 changed the contract period to seven years from 2008. The repayment period is between September 23, 2008 and September 22, 2015. The credit line is NT$15 billion, consisting of (a) $12 billion and (b) $3 billion of the credit line of the above syndicated loan. The Parent Company had repaid the syndicated loan in September 2015. On September 12, 2013, the Parent Company signed another contract for a five-year syndicated loan with Citibank and 16 other financial institutions. The credit line was $15 billion, which was for Parent Company to repay the former syndicated loan with Citibank signed on September 23, 2008, consisting of (a) $12 billion and (b) $3 billion of the credit line of the above syndicated loan. It should be used as a medium-term loan but may not be used on a revolving basis. The principal of this syndication loan should be repaid three years after September 23, 2013 in five semiannual installments with the first payment paid on September 23, 2016, and the interest rate is the 90-day Taipei Interbank Offered Rate plus 61 points. Under the syndicated loan agreement, the Parent Company should maintain the agreed financial ratios based on the most recent semiannual or annual financial statements. As of December 31, 2015 and 2014, the Company used $12 billion of the credit line of the above syndicated loan. As of December 31, 2015 and 2014, the Parent Company did not violate the financial ratio agreement stated above.
- 53 -
2) Lite-On Mobile Pte. Ltd., a subsidiary of the Parent Company, had a long-term, syndicated-bank loan. As of December 31, 2015 and 2014, the floating interest rates were 0.92075% to 1.4239% and 0.925% to 1.395%, respectively. The principal is repayable from April 29, 2014 in five semiannual installments. On April 29, 2011, Lite-On Mobile Pte. Ltd. signed a loan contract with Citibank and 13 other financial institutions (the endorsements and guarantees were provided by the Parent Company). This contract is on a five-year syndicated loan of US$200 million. As of December 31, 2015 and 2014, Lite-On Mobile Pte. Ltd. had used US$40 million and US$120 million, respectively, of the syndicated loan. The principal of this syndication loan should be repaid three years after April 29, 2011 in five semiannual installments with the first payment paid on April 29, 2014. On March 31, 2014, Lite-On Mobile Pte. Ltd. signed with Citibank and 12 other financial institutions (the endorsements and guarantees were provided by the Parent Company). This contract is on a five-year syndicated loan of US$200 million. This syndicated loan was for Lite-On Mobile Pte. Ltd. to prepay the syndicated loan with Citibank under a contract signed on April 29, 2011. As of December 31, 2015 and 2014, Lite-On Mobile Pte. Ltd. had used US$160 million and US$80 million of the syndicated loan. The principal of this syndication loan should be repaid three years after March 31, 2014 in five semiannual installments with the first payment paid on March 31, 2017.
3) Silitech Technology Co., Ltd., a subsidiary of the Parent Company, entered into a $2.4 billion syndicated loan contract, with the Land Bank of Taiwan as lead bank and a contract term from February 18, 2013 to February 18, 2018. This loan was obtained for the purposes of supporting working capital and capital expenditure. As of December 31, 2015 and 2014, Silitech had both used $1.44 billion of the syndicated loan, with an interest rate of 1.5958% to 1.5962% and 1.6786%, respectively. The first repayment of $480 million should be made on August 18, 2017. The remaining principal of $960 million is repayable by February 18, 2018.
4) Guangzhou Lite-On Mobile Electronic Components Co., Ltd., a subsidiary of the Parent Company, had a syndicated loan with Citibank. As of December 31, 2015 and 2014, the floating interest rates were 1.2031% and 0.880%. The principal is repayable from December 28, 2014 in five semiannual installments. This contract is a five-year syndicated loan of US$50 million and was signed with Citibank and 10 other financial institutions (the endorsements and guarantees were provided by the Parent Company). As of December 31, 2015 and 2014, Guangzhou Lite-On Mobile Electronic Components Co., Ltd. had used US$16 million and US$32 million of the credit line of the syndicated loan.
5) As of December 31, 2015, Lite-On Japan Ltd., a subsidiary of the Parent Company, had 6 long-term bank loans, with contract terms from March 2011 to October 2018, with interest rate of 0.975% to 1.35% and principal repayable in trimestral installments. As of December 31, 2014, Lite-On Japan Ltd., a subsidiary of the Parent Company, had 11 long-term bank loans, with contract terms from March 2011 to October 2018, with interest rate of 0.935% to 1.35% and principal repayable in trimestral installments.
6) As of December 31, 2015 and 2014, Five Dimension Co., Ltd, a subsidiary of the Parent Company, had both 3 long-term bank loans, with contract terms from March 28, 2012 to March 20, 2027, with interest rate of 0.4% to 2.375%. and principal repayable monthly installments or at lump sum on loan maturity.

93 94‧Lite-On Technology Corporation 2015 Annual Report Lite-On Technology Corporation 2015 Annual Report‧
- 54 -
7) As of December 31, 2015 and 2014, Power Innovations International Inc., a subsidiary of the Parent Company, had both a long-term secured borrowing of machinery, with contract terms from March 28, 2013 to February 28, 2019, with interest rate of 4.4%.
21. FINANCE LEASE PAYABLES
December 31 2015 2014 Minimum lease payments Not later than one year $ 98,508 $ 93,485 Later than one year and not later than five years 5,790 104,988 104,298 198,473 Future finance charges (3,399) (11,520) Present value of minimum lease payments $ 100,899 $ 186,953 Present value of minimum lease payments Not later than one year $ 95,501 $ 85,232 Later than one year and not later than five years 5,398 101,721 $ 100,899 $ 186,953 Current $ 95,501 $ 85,232 Non-current 5,398 101,721 $ 100,899 $ 186,953 Guangzhou Lite-On Mobile Electronic Components Co., Ltd. $ 93,390 $ 177,962 Power Innovations International Inc. 7,010 8,244 Lite-On Mobile Sweden AB 499 700 Lite-On Mobile Oyj (formerly Perlos Oyj) - 47 100,899 186,953 Current portion of long-term capital lease liabilities (95,501) (85,232) $ 5,398 $ 101,721 a. Guangzhou Lite-On Mobile Electronic Components Co., Ltd. leased buildings, machinery and
equipment under capital leases valid from January 1, 2007 to December 31, 2016. The terms of these leases were 10 years, with 7.11% interest rate.
b. Power Innovations International Inc. leased machinery and equipment under capital leases valid from
March 28, 2013 to March 31, 2020. The terms of these leases were between five and seven years, with 3.49% to 4.75% interest rate. The machinery and equipment can be bought at bargain purchase prices at the end of the lease terms.
c. Lite-On Mobile Sweden AB leased machinery and equipment under capital leases valid from January 9,
2013 to January 31, 2016. The terms of these leases were three years, with 2.36% interest rate. d. Lite-On Mobile Oyj (formerly Perlos Oyj) leased machinery and equipment under capital leases valid
from October 1, 2010 to September 30, 2015. The terms of these leases were four years, with 5.00% interest rate.
- 55 -
22. PROVISIONS
December 31 2015 2014 Current Warranties $ 1,068,810 $ 1,080,628
For the Year Ended December 31 2015 2014 Balance at January 1 $ 1,080,628 $ 874,502 Recognition of provisions 286,549 341,704 Usage (301,940) (149,273) Effect of foreign currency exchange differences 3,573 13,695 Balance at December 31 $ 1,068,810 $ 1,080,628
Based on the local legislation for the sale of goods, provision for warranty claims is the present value of management’s best estimate of the future outflow of economic benefits that will be required under the Company’s obligations for warranties. The estimate had been made on the basis of historical warranty trends and may vary as a result of the entry of new materials, altered manufacturing processes or other events affecting product quality.
23. RETIREMENT BENEFIT PLANS
a. Defined contribution plans
The Parent Company and subsidiaries - Philips & Lite-On Digital Solutions Corp., Silitech Technology Corp., Lite-On Integrated Services Inc. and Lite-On Green Technologies Inc. of the Group adopted a pension plan under the Labor Pension Act (the “LPA”), which is a state-managed defined contribution plan. Under the LPA, an entity makes monthly contributions to employees’ individual pension accounts at 6% of monthly salaries and wages. Some consolidated entities, which are mainly in investments, have either very few or even no staff. These companies have no pension plans and thus do not contribute to pension funds and do not recognize pension costs. Except for these companies, the remaining companies all contribute to pension funds and recognize pension costs based on local government regulations.
b. Defined benefit plans
The Parent Company and subsidiaries - Philips & Lite-On Digital Solutions Corp. and Silitech Technology Corp. of the Group adopted the defined benefit plan under the Labor Standards Law, under which pension benefits are calculated on the basis of the length of service and average monthly salaries of the six months before retirement. The Parent Company and subsidiaries - Philips & Lite-On Digital Solutions Corp. and Silitech Technology Corp. of the Group contribute amounts equal to 2% to 2.5% of total monthly salaries and wages to a pension fund administered by the pension fund monitoring committee. Pension contributions are deposited in the Bank of Taiwan in the committee’s name. Before the end of each year, the Company assesses the balance in the pension fund. If the amount of the balance in the pension fund is inadequate to pay retirement benefits for employees who conform to retirement requirements in the next year, the Company is required to fund the difference in one

95 96‧Lite-On Technology Corporation 2015 Annual Report Lite-On Technology Corporation 2015 Annual Report‧
- 56 -
appropriation that should be made before the end of March of the next year. The pension fund is managed by the Bureau of Labor Funds, Ministry of Labor (“the Bureau”); the Company has no right to influence the investment policy and strategy. The amounts included in the balance sheets in respect of the Company’s defined benefit plans were as follows: December 31 2015 2014 Present value of defined benefit obligation $ 1,257,757 $ 1,178,095 Fair value of plan assets (1,101,903) (1,082,074) Net defined benefit liability $ 155,854 $ 96,021 Movements in net defined benefit liability (asset) were as follows:
Present Value of the Defined
Benefit Obligation
Fair Value of the Plan Assets
Net Defined Benefit
Liability (Asset) Balance at January 1, 2014 $ 1,263,529 $ (1,043,820) $ 219,709 Service cost
Current service cost 17,031 - 17,031 Past service cost and gain on settlements (6,960) - (6,960)
Net interest expense (income) 19,925 (20,125) (200) Recognized in profit or loss 29,996 (20,125) 9,871 Remeasurement
Return on plan assets (excluding amounts included in net interest) - (9,253) (9,253)
Actuarial loss - changes in demographic assumptions 2,557 - 2,557
Actuarial loss - changes in financial assumptions 2,118 - 2,118
Actuarial gain - experience adjustments (22,487) - (22,487) Recognized in other comprehensive income
(loss) (17,812) (9,253) (27,065) Contributions from the employer - (27,243) (27,243) Benefits paid (22,354) 16,763 (5,591) Assets (liability) eliminated on the
deconsolidation of subsidiaries (75,112) 1,604 (73,508) Exchange differences on foreign plans (152) - (152) Balance at December 31, 2014 $ 1,178,095 $ (1,082,074) $ (96,021) Balance at January 1, 2015 $ 1,178,095 $ (1,082,074) $ 96,021 Service cost 12,544 - 12,544 Net interest expense (income) 20,308 (18,137) 1,991 Recognized in profit or loss 32,852 (18,137) 14,535 Remeasurement
Return on plan assets (excluding amounts included in net interest) - (10,604) (10,604)
Actuarial loss - changes in demographic assumptions 4,795 - 4,795
(Continued)
- 57 -
Present Value of the Defined
Benefit Obligation
Fair Value of the Plan Assets
Net Defined Benefit
Liability (Asset)
Actuarial loss - changes in financial assumptions $ 71,548 $ - $ 71,548
Actuarial loss - experience adjustments 9,501 - 9,501 Recognized in other comprehensive income
(loss) 85,844 (10,604) 75,240 Contributions from the employer - (21,910) (21,910) Benefits paid (36,202) 31,002 (5,200) Exchange differences on foreign plans (2,832) - (2,832) Balance at December 31, 2015 $ 1,257,757 $ (1,101,903) $ 155,854
(Concluded) Through the defined benefit plans under the Labor Standards Law, the Company is exposed to the following risks: 1) Investment risk: The plan assets are invested in domestic and foreign equity and debt securities,
bank deposits, etc. The investment is conducted at the discretion of the Bureau or under the mandated management. However, in accordance with relevant regulations, the return generated by plan assets should not be below the interest rate for a 2-year time deposit with local banks.
2) Interest risk: A decrease in the government bond interest rate will increase the present value of the
defined benefit obligation; however, this will be partially offset by an increase in the return on the plan’s debt investments.
3) Salary risk: The present value of the defined benefit obligation is calculated by reference to the
future salaries of plan participants. As such, an increase in the salary of the plan participants will increase the present value of the defined benefit obligation.
The actuarial valuations of the present value of the defined benefit obligation were carried out by qualified actuaries. The significant assumptions used for the purposes of the actuarial valuations were as follows: December 31 2015 2014 Discount rate(s) 1.10%-4.375% 1.70%-4.125% Expected rate(s) of salary increase 3.00%-4.75% 3.00%-4.75% Mortality rate 0.253%-1.0943% 0.0253%-1.0943% Turnover rate 0.5%-45% 1%-48% Expected return on plan assets 1.10%-4.375% 1.70%-2.25%

97 98‧Lite-On Technology Corporation 2015 Annual Report Lite-On Technology Corporation 2015 Annual Report‧
- 58 -
If possible reasonable change in each of the significant actuarial assumptions will occur and all other assumptions will remain constant, the present value of the defined benefit obligation would increase (decrease) as follows: December 31 2015 2014 Discount rate(s)
0.25% increase $ (32,514) $ (29,014) 0.25% decrease $ 33,759 $ 30,170
Expected rate(s) of salary increase 0.25% increase $ 32,481 $ 29,304 0.25% decrease $ (31,469) $ (28,341)
The sensitivity analysis presented above may not be representative of the actual change in the present value of the defined benefit obligation as it is unlikely that the change in assumptions would occur in isolation of one another as some of the assumptions may be correlated. December 31 2015 2014 The expected contributions to the plan for the next year $ 21,613 $ 23,576 The average duration of the defined benefit obligation 10.32-18.53 years 11.32-19.53 years
24. EQUITY
a. Share capital
1) Common shares
December 31 2015 2014 Number of shares authorized (in thousands) 3,500,000 3,500,000 Amount of shares authorized $ 35,000,000 $ 35,000,000 Number of shares issued and fully paid (in thousands) 2,334,928 2,341,674 Amount of shares issued $ 23,349,283 $ 23,416,737 Fully paid common shares, which have a par value of $10, carry one vote per share and carry a right to dividends. Of the Parent Company’s authorized shares, 100,000 thousand shares had been reserved for the issuance of employee share options.
2) Issued global depositary receipts On September 25, 1996, the Parent Company issued 4,900 thousand units of global depositary receipts (GDRs) on the London Stock Exchange. These GDRs represented 49,000 thousand common shares of the Parent Company.
- 59 -
On April 3, 1995, GVC Corp. issued 5,000 thousand units of GDRs on the London Stock Exchange. These GDRs represented 25,000 thousand common shares of GVC Corp., which later issued more shares. As of November 4, 2002, the outstanding GDRs were 7,627 thousand units, or 38,136 thousand common shares of GVC Corp. For merger purposes, these GDRs were exchanged for the Parent Company’s 1,478 thousand marketable equity securities, which represented the Parent Company’s 14,781 thousand common shares. As of December 31, 2015 and 2014, the outstanding marketable equity securities were 5,217 thousand units and 5,213 thousand units, representing 52,168 thousand common share and 52,127 thousand common share of the Parent Company, respectively. The rights and obligation of security holders are the same as those of common shareholders, except for voting rights. As of December 31, 2015 and 2014, the unredeemed GDRs amounted to 816 thousand units and 994 thousand units.
b. Capital surplus The premium from shares issued in excess of par (including share premium from issuance of common shares, conversion of bonds, and merger) and donations may be used to offset a deficit; in addition, when the Company has no deficit, such capital surplus may be distributed as cash dividends or transferred to capital limited to a certain percentage of the Parent Company’s capital surplus and once a year. The capital surplus arising from share of changes in equities of subsidiaries, changes in equities of associates and joint ventures accounted for by the equity method and treasury share transactions from dividends according to the Parent Company’s shares holding by subsidiaries may only be used to offset a deficit.
c. Retained earnings and dividend policy To ensure the availability of cash for the Parent Company’s present and future expansion plans and to meet shareholders’ cash flow requirements, the Parent Company prefers to distribute more stock dividends. In principle, cash dividends are limited to 10% of total dividends distributed. The Parent Company’s Articles of Incorporation provide that the annual net income, less any deficit, and 10% legal reserve as well as special reserve equal to the debit balances of the shareholders’ equity accounts, together with the distributable unappropriated earnings of prior years, can be retained partially on the basis of operating requirements. The remainder should be distributed as follows: 1) Bonus to employees: At least 1%. 2) Bonus to directors: 1.5% or less. 3) Others, as dividends. If the bonus to employees is in the form of shares, it may be distributed to the employees’ subsidiaries. The requirements and the method of distribution of these share bonuses are based on resolutions passed by the board of directors. In accordance with the amendments to the Company Act in May 2015, the recipients of dividends and bonuses are limited to shareholders and do not include employees. The consequential amendments to the Company’s Articles of Incorporation had been proposed by the Parent Company’s board of directors on March 25, 2016 and are subject to the resolution of the shareholders in their meeting to be held on June 24, 2016. For information about the accrual basis of the employees’ compensation and remuneration to directors and supervisors and the actual appropriations, please refer to Note 28 (b). Under Rule No. 1010012865, Rule No. 1010047490, and Rule No. 1030006415 issued by the FSC and the directive titled “Questions and Answers for Special Reserves Appropriated Following Adoption of IFRSs”, the Parent Company should appropriate or reverse a special reserve.

99 100‧Lite-On Technology Corporation 2015 Annual Report Lite-On Technology Corporation 2015 Annual Report‧
- 60 -
Appropriation of earnings to legal reserve shall be made until the legal reserve equals the Parent Company’s paid-in capital. Legal reserve may be used to offset deficit. If the Parent Company has no deficit and the legal reserve has exceeded 25% of the Parent Company’s paid-in capital, the excess may be transferred to capital or distributed in cash. Except for non-ROC resident shareholders, all shareholders receiving the dividends are allowed a tax credit equal to their proportionate share of the income tax paid by the Parent Company. The appropriations of earnings for 2014 and 2013 had been approved in the shareholders’ meetings on June 24, 2015 and June 19, 2014, respectively. The appropriations and dividends per share were as follows:
Appropriation of Earnings Dividends Per Share
(NT$) 2014 2013 2014 2013 Legal reserve $ 646,166 $ 875,485 Legal special reserve 182,544 - Reversal of special reserve - 640,244 Share dividends 117,084 116,381 $ 0.05 $ 0.05 Cash dividends 4,613,097 6,307,866 1.97 2.71 The appropriations of earnings for 2015 had been proposed by the Parent Company’s board of directors on March 25, 2016. The appropriations and dividends per share were as follows:
Appropriation
of Earnings Dividends Per Share (NT$)
Legal reserve $ 722,290 Special reserve 166,389 Share dividends 116,746 $0.05 Cash dividends 5,113,493 2.19 The appropriations of earnings for 2015 are subject to the resolution of the shareholders’ meeting to be held on June 24, 2016.
d. Other equity items Movements in other equity items were as follows: For the Year Ended December 31, 2015
Foreign Currency
Translation Reserve
Unrealized Gain (Loss)
from Available-for- sale Financial
Assets
Cash Flow Hedges Reserve Total
Balance at January 1 $ 4,125,097 $ 139,072 $ (11,989) $ 4,252,180 Exchange differences arising on
translating the financial statements of foreign operations (881,221) - - (881,221)
(Continued)
- 61 -
For the Year Ended December 31, 2015
Foreign Currency
Translation Reserve
Unrealized Gain (Loss)
from Available-for- sale Financial
Assets
Cash Flow Hedges Reserve Total
Gain arising on changes in the
fair value of available-for- sale financial assets $ - $ (371,318) $ - $ (371,318)
Reclassification to loss from disposal of available-for-sale financial assets - 79,052 - 79,052
Gain arising on changes in the fair value of hedging instruments - - 11,989 11,989
Share of other comprehensive income of associates (28,329) 480 - (27,849)
Income tax effect 132,355 - - 132,355 Balance at December 31 $ 3,347,902 $ (152,714) $ - $ 3,195,188
(Concluded) For the Year Ended December 31, 2014
Foreign Currency
Translation Reserve
Unrealized Gain (Loss)
from Available-for- sale Financial
Assets
Cash Flow Hedges Reserve Total
Balance at January 1 $ 2,383,040 $ 83,231 $ (46,969) $ 2,419,302 Exchange differences arising on
translating the financial statements of foreign operations 1,995,848 - - 1,995,848
Gain arising on changes in the fair value of available-for- sale financial assets - 475,947 - 475,947
Reclassification to income from disposal of available-for-sale financial assets - (422,324) - (422,324)
Gain arising on changes in the fair value of hedging instruments - - 34,980 34,980
Share of other comprehensive income of associates 165,305 2,218 - 167,523
(Continued)

101 102‧Lite-On Technology Corporation 2015 Annual Report Lite-On Technology Corporation 2015 Annual Report‧
- 62 -
For the Year Ended December 31, 2014
Foreign Currency
Translation Reserve
Unrealized Gain (Loss)
from Available-for- sale Financial
Assets
Cash Flow Hedges Reserve Total
The proportionate share of
other comprehensive income reclassified to profit or loss upon partial disposal of associates $ (1,240) $ - $ - $ (1,240)
Effect of deconsolidation of subsidiary (Note 30) (13,549) - - (13,549)
Income tax effect (404,307) - - (404,307) Balance at December 31 $ 4,125,097 $ 139,072 $ (11,989) $ 4,252,180
(Concluded) The exchange differences arising on translation of foreign operation’s net assets from its functional currency to the Parent Company’s presentation currency are recognized directly in other comprehensive income and also accumulated in the foreign currency translation reserve. Unrealized gain/loss on available-for-sale financial assets represents the cumulative gains or losses arising from the fair value measurement on available-for-sale financial assets that are recognized in other comprehensive income. When those available-for-sale financial assets have been disposed of or are determined to be impaired subsequently, the related cumulative gains or losses in other comprehensive income are reclassified to profit or loss. The cash flow hedges reserve represents the cumulative effective portion of gains or losses arising on changes in fair value of the hedging instruments entered into as cash flow hedges. The cumulative gain or loss arising on changes in fair value of the hedging instruments that are recognized and accumulated in cash flow hedges reserve will be reclassified to profit or loss only when the hedge transaction affects profit or loss.
e. Non-controlling interests
For the Year Ended December 31 2015 2014 Balance at January 1 $ 4,198,430 $ 6,209,747 Attributable to non-controlling interests:
Share of profit (loss) for the year 89,933 (783,816) Exchange difference arising on translation of foreign entities (50,813) 119,804 Unrealized gain (loss) on available-for-sale financial assets (88) 233 Remeasurement on define benefit plans 323 8,785 Related income tax (2,189) (21,860)
Decrease in non-controlling interests (540,514) (1,334,463) Balance at December 31 $ 3,695,082 $ 4,198,430
- 63 -
The Group recognized a decrease in non-controlling interests for the years ended December 31, 2015 and 2014 because of the attribution of cash dividends to non-controlling interests, the effect of the acquisition and deconsolidation of subsidiary and acquisition of non-controlling interests in subsidiaries.
f. Treasury shares
Unit: In Thousands of Shares
Purpose of Buyback
Number of Shares at January 1
Increase During the
Period
Decrease During the
Period
Number of Shares at
December 31 For the year ended December 31, 2015 Shares held by subsidiaries 26,575 133 - 26,708 Shares buyback for cancellation - 22,787 22,787 - 26,575 22,920 22,787 26,708 For the year ended December 31, 2014 Shares held by subsidiaries 28,118 132 1,675 26,575 The Parent Company’s shares held by its subsidiaries at the end of the reporting periods were as follows:
Name of Subsidiary
Number of Shares Held
(In Thousands) Carrying Amount Market Price
December 31, 2015 Lite-On Capital Inc. 15,041 $ 718,857 $ 479,049 LTC International Ltd. 6,969 297,469 221,759 Yet Foundate Ltd. 2,260 126,881 71,820 Lite-On Electronics Co., Ltd. 2,438 105,515 77,491 $ 1,248,722 $ 850,119 December 31, 2014 Lite-On Capital Inc. 14,966 $ 718,857 $ 544,761 LTC International Ltd. 6,935 297,469 272,328 Yet Foundate Ltd. 2,248 126,881 95,922 Lite-On Electronics Co., Ltd. 2,426 105,515 103,497 $ 1,248,722 $ 1,016,508 On July 20, 2015, the Parent Company’s Board of Directors approved the repurchase of up to 100,000 thousand shares listed on the Taiwan Stock Exchange between July 21, 2015 and September 20, 2015, with the buyback price ranging from $25.34 to $53.97. By the end of the repurchase period, the Parent Company had bought back 22,787 thousand shares for $706,679 thousand. The Parent Company has already registered with the Ministry of Economic Affairs to cancel those buy-back shares.
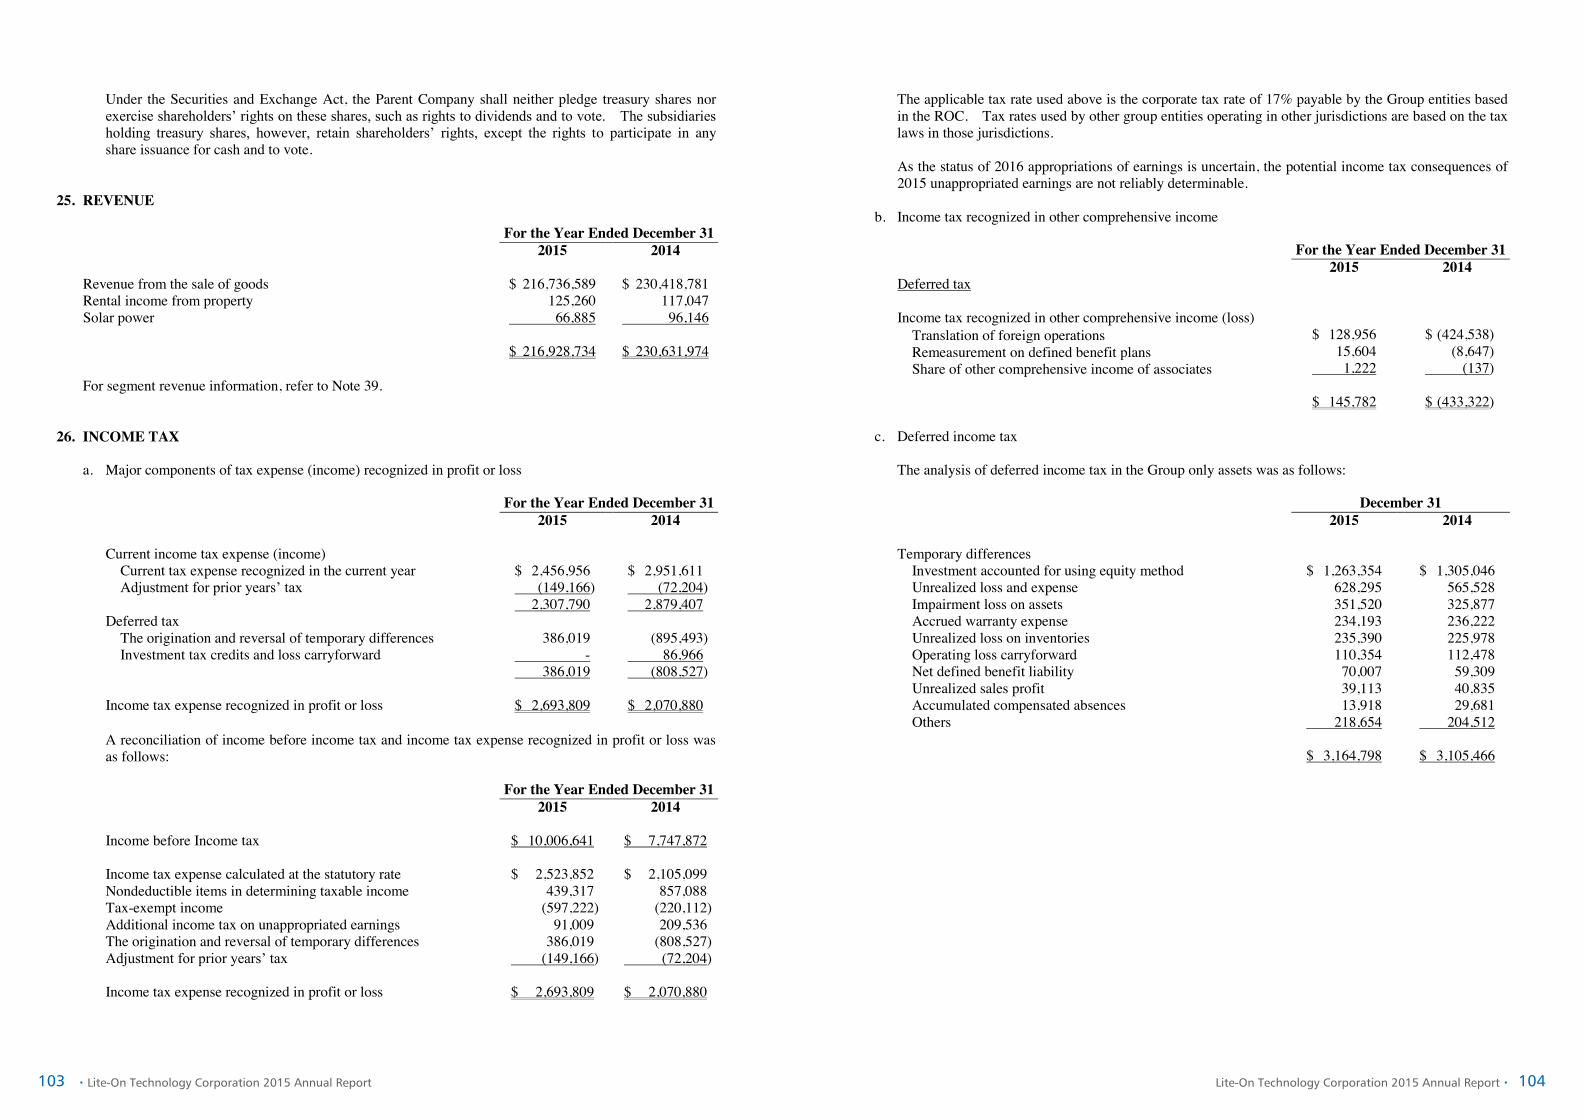
103 104‧Lite-On Technology Corporation 2015 Annual Report Lite-On Technology Corporation 2015 Annual Report‧
- 64 -
Under the Securities and Exchange Act, the Parent Company shall neither pledge treasury shares nor exercise shareholders’ rights on these shares, such as rights to dividends and to vote. The subsidiaries holding treasury shares, however, retain shareholders’ rights, except the rights to participate in any share issuance for cash and to vote.
25. REVENUE
For the Year Ended December 31 2015 2014 Revenue from the sale of goods $ 216,736,589 $ 230,418,781 Rental income from property 125,260 117,047 Solar power 66,885 96,146 $ 216,928,734 $ 230,631,974 For segment revenue information, refer to Note 39.
26. INCOME TAX
a. Major components of tax expense (income) recognized in profit or loss
For the Year Ended December 31 2015 2014 Current income tax expense (income)
Current tax expense recognized in the current year $ 2,456,956 $ 2,951,611 Adjustment for prior years’ tax (149,166) (72,204)
2,307,790 2,879,407 Deferred tax
The origination and reversal of temporary differences 386,019 (895,493) Investment tax credits and loss carryforward - 86,966 386,019 (808,527)
Income tax expense recognized in profit or loss $ 2,693,809 $ 2,070,880 A reconciliation of income before income tax and income tax expense recognized in profit or loss was as follows:
For the Year Ended December 31 2015 2014 Income before Income tax $ 10,006,641 $ 7,747,872 Income tax expense calculated at the statutory rate $ 2,523,852 $ 2,105,099 Nondeductible items in determining taxable income 439,317 857,088 Tax-exempt income (597,222) (220,112) Additional income tax on unappropriated earnings 91,009 209,536 The origination and reversal of temporary differences 386,019 (808,527) Adjustment for prior years’ tax (149,166) (72,204) Income tax expense recognized in profit or loss $ 2,693,809 $ 2,070,880
- 65 -
The applicable tax rate used above is the corporate tax rate of 17% payable by the Group entities based in the ROC. Tax rates used by other group entities operating in other jurisdictions are based on the tax laws in those jurisdictions. As the status of 2016 appropriations of earnings is uncertain, the potential income tax consequences of 2015 unappropriated earnings are not reliably determinable.
b. Income tax recognized in other comprehensive income
For the Year Ended December 31 2015 2014 Deferred tax Income tax recognized in other comprehensive income (loss)
Translation of foreign operations $ 128,956 $ (424,538) Remeasurement on defined benefit plans 15,604 (8,647) Share of other comprehensive income of associates 1,222 (137) $ 145,782 $ (433,322)
c. Deferred income tax
The analysis of deferred income tax in the Group only assets was as follows:
December 31 2015 2014 Temporary differences
Investment accounted for using equity method $ 1,263,354 $ 1,305,046 Unrealized loss and expense 628,295 565,528 Impairment loss on assets 351,520 325,877 Accrued warranty expense 234,193 236,222 Unrealized loss on inventories 235,390 225,978 Operating loss carryforward 110,354 112,478 Net defined benefit liability 70,007 59,309 Unrealized sales profit 39,113 40,835 Accumulated compensated absences 13,918 29,681 Others 218,654 204,512
$ 3,164,798 $ 3,105,466

105 106‧Lite-On Technology Corporation 2015 Annual Report Lite-On Technology Corporation 2015 Annual Report‧
- 66 -
Opening Balance
Recognized in Profit (Loss)
Recognized in Other
Comprehensive Income (Loss)
Exchange Differences
Closing Balance
2015 Temporary differences
Investment accounted for using equity method $ 1,305,046 $ (53,741 ) $ - $ 12,049 $ 1,263,354
Unrealized loss and expense 565,528 80,908 - (18,141 ) 628,295 Impairment loss on assets 325,877 33,054 - (7,411 ) 351,520 Accrued warranty expense 236,222 (2,616 ) - 587 234,193 Unrealized loss on inventories 225,978 12,132 - (2,720 ) 235,390 Operating loss carryforward 112,478 (2,738 ) - 614 110,354 Net defined benefit liability 59,309 (5,575 ) 16,826 (553 ) 70,007 Unrealized sales profit 40,835 (2,220 ) - 498 39,113 Accumulated compensated absences 29,681 (20,319 ) - 4,556 13,918 Others 204,512 15,386 - (1,244 ) 218,654
$ 3,105,466 $ 54,271 $ 16,826 $ (11,765 ) $ 3,164,798 2014 Investment tax credits $ 48,324 $ (48,324 ) $ - $ - $ - Temporary differences
Investment accounted for using equity method 522,830 716,142 59,819 6,255 1,305,046
Unrealized loss and expense 475,000 89,804 - 724 565,528 Impairment loss on assets 298,231 27,425 - 221 325,877 Accrued warranty expense 262,069 (25,639 ) - (208 ) 236,222 Unrealized loss on inventories 151,972 73,414 - 592 225,978 Operating loss carryforward 149,223 (38,642 ) - 1,897 112,478 Net defined benefit liability 39,556 28,388 (8,647 ) 12 59,309 Unrealized sales profit 51,236 (10,318 ) - (83 ) 40,835 Accumulated compensated absences 8,204 21,477 - - 29,681 Available-for-sale financial assets 4,771 (4,771 ) - - - Others 193,054 11,366 - 92 204,512
$ 2,204,470 $ 840,322 $ 51,172 $ 9,502 $ 3,105,466 The analysis of deferred income tax in the Group only liabilities was as follows:
December 31 2015 2014 Temporary differences
Investment accounted for using equity method $ 2,905,065 $ 2,614,664 Unrealized amortization of goodwill 353,808 353,808 Land value increment tax 239,693 239,693 Others 32,998 21,627
$ 3,531,564 $ 3,229,792
Opening Balance
Recognized in Profit (Loss)
Recognized in Other
Comprehensive Income (Loss)
Exchange Differences
Closing Balance
2015 Temporary differences
Investment accounted for using equity method $ 2,614,664 $ 428,842 $ (128,956 ) $ (9,485 ) $ 2,905,065
Unrealized amortization of goodwill 353,808 - - - 353,808 Land value increment tax 239,693 - - - 239,693 Others 21,627 11,448 - (77 ) 32,998
$ 3,229,792 $ 440,290 $ (128,956 ) $ (9,562 ) $ 3,531,564
(Continued)
- 67 -
Opening Balance
Recognized in Profit (Loss)
Recognized in Other
Comprehensive Income (Loss)
Exchange Differences
Closing Balance
2014 Temporary differences
Investment accounted for using equity method $ 2,080,163 $ 56,452 $ 484,494 $ (6,445 ) $ 2,614,664
Unrealized amortization of goodwill 334,048 19,760 - - 353,808 Land value increment tax 239,693 - - - 239,693 Others 67,752 (44,417 ) - (1,708 ) 21,627
$ 2,721,656 $ 31,795 $ 484,494 $ (8,153 ) $ 3,229,792
(Concluded)
d. As of December 31, 2015 and 2014, the aggregate deductible temporary differences for which no deferred income tax assets have been recognized amounted to $1,103,742 thousand and $530,132 thousand, respectively.
e. Integrated income tax
December 31 2015 2014 Unappropriated earnings
Unappropriated earnings generated before January 1, 1998 $ 2,215 $ 2,215 Unappropriated earnings generated on and after January 1,
1998 13,008,858 11,430,326 $ 13,011,073 $ 11,432,541 Imputation credits accounts $ 1,485,076 $ 1,308,623 The estimated and actual creditable ratio for distribution of earnings of 2015 and 2014 were 11.41% and 11.18%, respectively. According to the amendments to the Income Tax Law Article 66-6, effective on January 1, 2015, the creditable ratio for ROC resident shareholders has been halved. In addition, according to legal interpretation No. 10204562810 announced by the Taxation Administration of the Ministry of Finance, when calculating imputation credits in the year of first-time adoption of IFRSs, the cumulative retained earnings include the net increase or net decrease in retained earnings arising from first-time adoption of IFRSs. Under the Income Tax Law, for distribution of earnings generated after January 1, 1998, the imputation credits allocated to ROC resident shareholders of the Parent Company was calculated based on the creditable ratio as of the date of dividend distribution. The actual imputation credits allocated to shareholders of the Parent Company was based on the balance of the Imputation Credit Accounts (ICA) as of the date of dividend distribution. Therefore, the expected creditable ratio for the 2015 earnings may differ from the actual creditable ratio to be used in allocating imputation credits to the shareholders.
f. Income tax assessments The tax returns of Parent Company through all years, except 2012 to 2014, have been assessed by the tax authorities. The Parent Company disagreed with the tax authorities’ assessment of 2013 tax return and applied for a reexamination. Nevertheless, to be conservative, the Parent Company provided for the possible income tax.

107 108‧Lite-On Technology Corporation 2015 Annual Report Lite-On Technology Corporation 2015 Annual Report‧
- 68 -
27. EARNINGS PER SHARE
Unit: NT$ Per Share For the Year Ended December 31 2015 2014 Basic earnings per share $ 3.11 $ 2.78 Diluted earnings per share $ 3.07 $ 2.75 The earnings and weighted average number of common shares outstanding in the computation of earnings per share from continuing operations were as follows:
Amounts
(Numerator)
Shares (Denominator) (Thousands)
Earnings Per Share
(NT$) 2015 Basic EPS
The net income of common shareholders $ 7,222,899 2,320,208 $ 3.11 Effect of dilutive potential common stock
Bonus issue to employees or employee remuneration 34,377
Diluted EPS
The net income of common shareholders plus the effect of potential dilutive common stock $ 7,222,899 2,354,585 $ 3.07
2014 Basic EPS
The net income of common shareholders $ 6,460,808 2,323,511 $ 2.78 Effect of dilutive potential common stock
Bonus issue to employees or employee remuneration - 27,413
Diluted EPS
The net income of common shareholders plus the effect of potential dilutive common stock $ 6,460,808 2,350,924 $ 2.75
The weighted average number of shares outstanding used for the earnings per share computation was adjusted retroactively for the issuance of bonus shares on August 16, 2015. This adjustment caused the basic and diluted after-tax earnings per share for the year ended December 31, 2014 to decrease from $2.80 to $2.76 and from $2.78 to $2.75, respectively. Since the Parent Company is allowed to settle the bonuses or remuneration paid to employees in cash or shares, the Parent Company presumed that the entire amount of the bonus or remuneration would be settled in shares and the resulting potential shares were included in the weighted average number of shares outstanding used in the computation of diluted earnings per share, as the effect is dilutive. The dilutive effect of the potential shares is included in the computation of diluted earnings per share until the number of shares to be distributed to employees is resolved in the following year.
- 69 -
28. ADDITIONAL INFORMATION ON EXPENSES For the Year Ended December 31 2015 2014 a. Depreciation and amortization
Property, plant and equipment $ 6,713,295 $ 7,108,539 Investment property 32,835 - Intangible assets 534,128 568,508
$ 7,280,258 $ 7,677,047
An analysis of deprecation by function Recognized in cost of revenue $ 5,873,561 $ 6,078,049 Recognized in operating expenses 872,569 1,030,490
$ 6,746,130 $ 7,108,539
An analysis of amortization by function Recognized in cost of revenue $ 52,404 $ 69,585 Recognized in operating expenses 481,724 498,923
$ 534,128 $ 568,508
d. Employee benefit expenses
Post-employment benefits
Defined contribution plans $ 722,054 $ 591,495 Defined benefit plans (Note 23) 14,535 9,871 736,589 601,366
Termination benefits 212,304 30,357 Other employee benefits 26,043,612 25,216,163 $ 26,992,505 $ 25,847,886
Employee benefit expenses summarized by function Recognized in cost of revenue $ 17,263,079 $ 15,912,346 Recognized in operating expenses 9,729,426 9,935,540 $ 26,992,505 $ 25,847,886

109 110‧Lite-On Technology Corporation 2015 Annual Report Lite-On Technology Corporation 2015 Annual Report‧
- 70 -
To be in compliance with the Company Act as amended in May 2015, the proposed amended Articles of Incorporation of the Company stipulate to distribute employees’ compensation and remuneration to directors at a certain percentage of net profit before income tax, employees’ compensation, and remuneration to directors. The employees’ compensation and remuneration to directors for the year ended December 31, 2015 have been approved by the Parent Company’s board of directors on March 25, 2016 and are subject to the resolution and adoption of the amendments to the Company’s Articles of Incorporation by the shareholders in their meeting to be held on June 24, 2016, and in addition thereto a report of such distribution shall be submitted to the shareholders' meeting. The details were as follows:
For the Year Ended December 31, 2015
Cash Share Employees’ compensation $ 858,514 $ 163,526 Remuneration to directors 61,395 - The 4,264 thousand shares for 2015 were determined by dividing the amount of share compensation resolved in 2016 by $38.35, the closing price of the shares on the day immediately preceding the Parent Company’s board of directors’ meeting. Material differences between these estimates and the amounts proposed by the board of directors on or before the financial statements are authorized for issue are adjusted in the year the bonus and remuneration are recognized. If there is a change in the proposed amounts after the financial statements are authorized for issue, the differences are recorded as a change in accounting estimate. The appropriations of bonuses to employees and remuneration to directors for 2014 and 2013, which were been approved in the shareholders’ meetings on June 24, 2015 and June 19, 2014, respectively, were as follows: For the Year Ended December 31 2014 2013
Cash
Dividends Share
Dividends Cash
Dividends Share
Dividends Bonus to employees $ 768,033 $ 146,292 $ 997,212 $ 189,945 Remuneration of directors 54,924 - 70,039 - The 4,333 thousand shares for 2014 was determined by dividing the amount of share bonus approved in 2015 by the closing price of $33.76 (after considering the effect of cash and stock dividends) on the day immediately preceding the shareholders’ meeting. The 4,085 thousand shares for 2013 was determined by dividing the amount of share bonus resolved in 2014 by the closing price of $46.50 (after considering the effect of cash and stock dividends) on the day immediately preceding the shareholders’ meeting. There was no difference between the amounts of the bonus to employees and the remuneration to directors approved in the shareholders’ meeting on June 24, 2015 and June 19, 2014 and the amounts recognized in the Parent Company’s separate financial statements for the years ended December 31, 2014 and 2013, respectively. Information on the bonus to employees and directors proposed by the Company’s board of directors is available on the Market Observation Post System website of the Taiwan Stock Exchange.
- 71 -
29. ACQUISITION OF SUBSIDIARIES a. Subsidiaries acquired
Principal Activity Date of
Acquisition
Proportion of Voting Equity
Interests Acquired (%)
Consideration Transferred
(Note) LarView
Technologies Corp.
Manufacture of optical instruments, general Instruments, computers and peripherals.
April 2014 83.33 $ 600,000
Power Innovations International Inc.
Development, design and manufacture of power control equipment and energy management.
June 2014 95.25 424,174
Five Dimension Co., Ltd
Development, manufacture and sale of cell phone and camera lens modules
November 2014 69.94 61,798
$ 1,085,972
Note: Including fair value of the originally held equity of LarView Technologies Corp. at the
acquisition date and fair value of non-controlling interests. The Parent Company acquired 83.33% equity of LarView Technologies Corp. not only to upgrade its capability in the automated processing of camera modules but also to expand the market for this product. Since the Parent Company’s subsidiary, Lite-On Capital Corp., already had a 16.67% equity in LarView, the Group’s equity in LarView became 100% after the acquisition. To integrate its overall resources and enhance the efficiency of operations, the Parent Company had a short-form merger - in accordance with Article 19 of the Business Mergers and Acquisitions Act - with LarView Technologies Corp. on September 1, 2014. The Parent Company was the survivor entity in all of these mergers. Lite-On Technology USA, Inc., a subsidiary of the Parent Company, acquired 95.25% equity in Power Innovations International Inc. to enhance power system projects and development of uninterruptible power system. Lite-On Capital Corp., a subsidiary of the Parent Company, acquired 69.94% equity in Five Dimension Co., Ltd to enhance research and development capabilities in professional camera and maintain its market competiveness.

111 112‧Lite-On Technology Corporation 2015 Annual Report Lite-On Technology Corporation 2015 Annual Report‧
- 72 -
b. Considerations transferred
LarView Technologies
Corp.
Power Innovations
International Inc.
Five Dimension
Co., Ltd Total Cash $ 500,000 $ 417,237 $ 58,604 $ 975,841 Fair value of the originally held
equity of LarView Technologies Corp. at the acquisition date (recorded as available-for-sale financial assets - noncurrent) 100,000 - - 100,000
Fair value of non-controlling interests - 6,937 3,194 10,131
$ 600,000 $ 424,174 $ 61,798 $ 1,085,972
c. Assets acquired and liabilities assumed at the date of acquisition
LarView Technologies
Corp.
Power Innovations
International Inc.
Five Dimension
Co., Ltd Total Current assets
Cash and cash equivalents $ 41,259 $ 87,390 $ 35,818 $ 164,467 Trade and other receivables 145,720 38,680 142 184,542 Inventories, net 152,159 49,644 - 201,803 Other 5,138 2,542 1,846 9,526
Non-current assets Property, plant and
equipment 265,250 30,280 330 295,860 Investments accounted for
using equity method 4,439 - 158 4,597 Intangible assets 47,205 1,093 540 48,838 Refundable deposits 1,000 1,020 1,509 3,529 Other 13,798 - 564 14,362
Current liabilities Short-term borrowings (125,708) (955) - (126,663) Trade and other payables (246,654) (35,836) (1,250) (283,740) Advances received (14,068) (13,990) - (28,058) Current portion of long-term
borrowings - (2,147) (2,878) (5,025) Finance lease payables - (142) - (142)
Non-current liabilities Long-term borrowings (58,000) (11,542) (26,152) (95,694)
$ 231,538 $ 146,037 $ 10,627 $ 388,202
- 73 -
d. Goodwill arising on acquisition
LarView Technologies
Corp.
Power Innovations
International Inc.
Five Dimension
Co., Ltd Total Consideration transferred $ 600,000 $ 424,174 $ 61,798 $ 1,085,972 Less: Fair value of
identifiable net assets acquired (Note) (231,538) (146,037) (10,627) (388,202)
Goodwill arising on acquisition $ 368,462 $ 278,137 $ 51,171 $ 697,770
Note: The fair value of identifiable net assets is a provisional amount measured at the acquisition date
of Power Innovations International Inc. However, the Group reduced by 65,002 thousand of the fair value of identifiable net assets and increased the amount of goodwill recognized on the acquisition in June 2014 because of the acquisition of relevant information in the second quarter of 2015.
e. Net cash outflow on acquisition of subsidiaries
For the Year Ended
December 31, 2014
Consideration paid in cash $ 975,841 Cash and cash equivalents acquired (164,467) $ 811,374
f. Impact of acquisitions on the results of the Group
The acquirees’ operating results up to the acquisition date included in the consolidated statements of comprehensive income were as follows:
For the Year Ended
December 31, 2014
Revenue
LarView Technologies Corp. $ 556,013 Power Innovations International Inc. 211,591 Five Dimension Co., Ltd 23
$ 767,627 Profit (loss)
LarView Technologies Corp. $ (265,299) Power Innovations International Inc. 37,433 Five Dimension Co., Ltd (2,951)
$ (230,817)
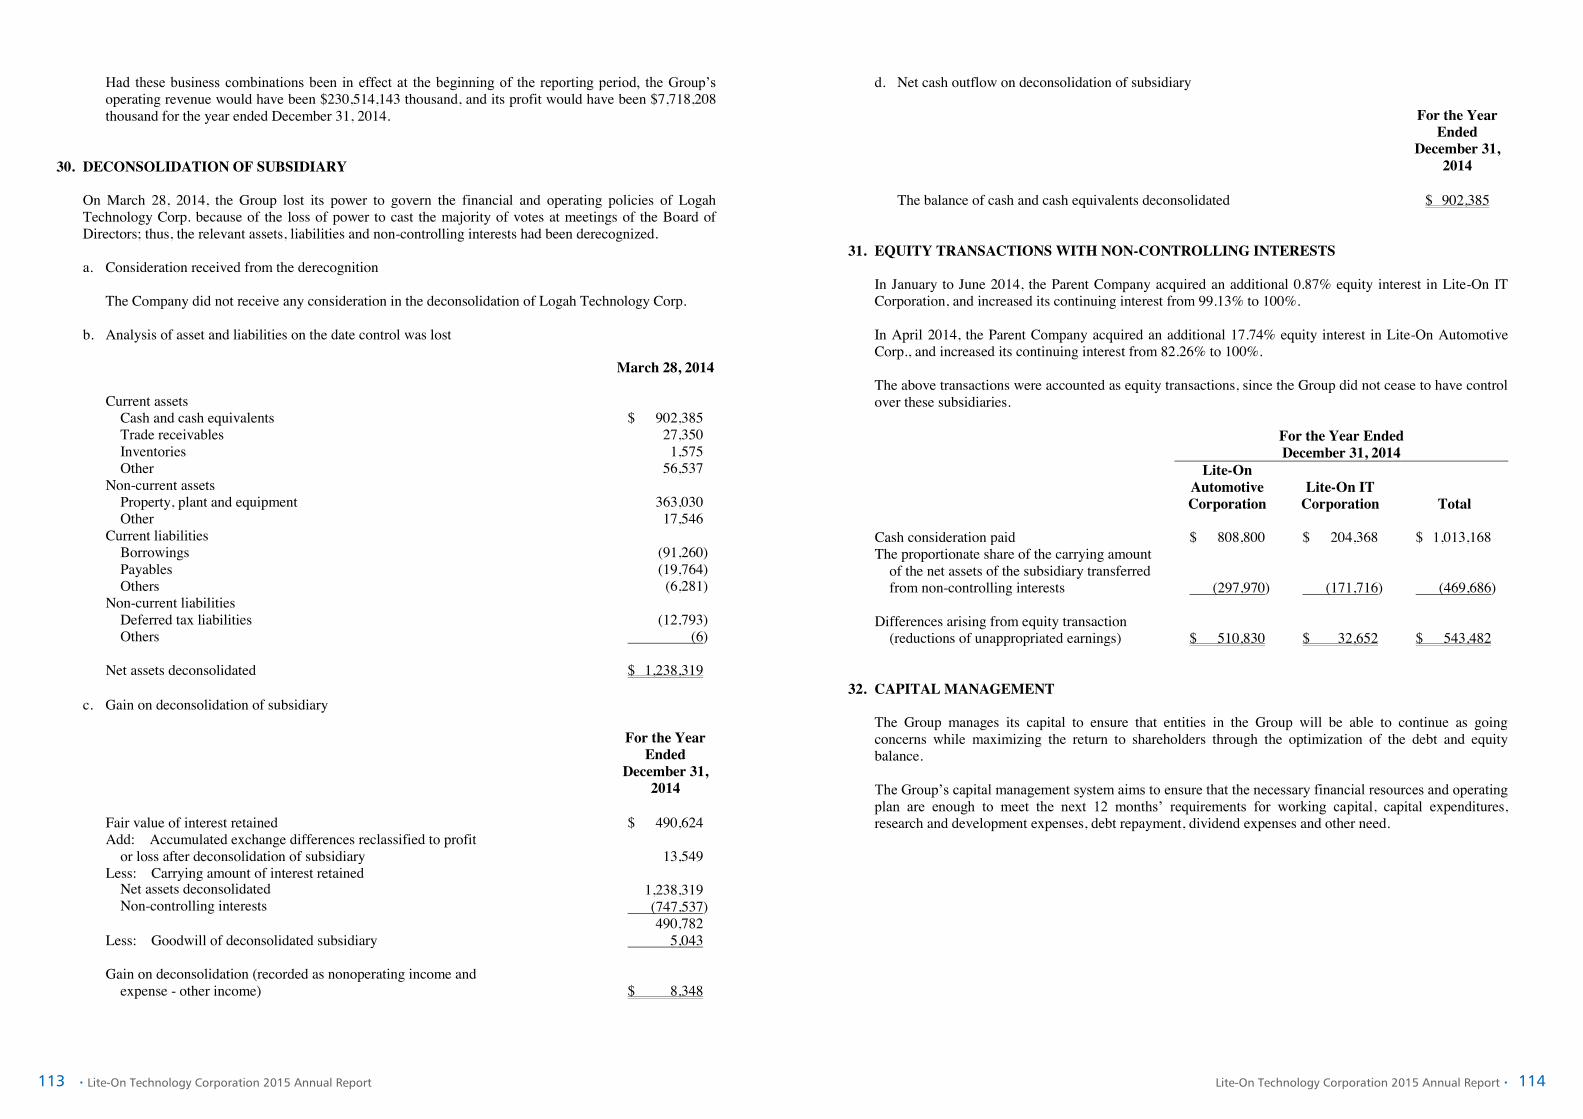
113 114‧Lite-On Technology Corporation 2015 Annual Report Lite-On Technology Corporation 2015 Annual Report‧
- 74 -
Had these business combinations been in effect at the beginning of the reporting period, the Group’s operating revenue would have been $230,514,143 thousand, and its profit would have been $7,718,208 thousand for the year ended December 31, 2014.
30. DECONSOLIDATION OF SUBSIDIARY
On March 28, 2014, the Group lost its power to govern the financial and operating policies of Logah Technology Corp. because of the loss of power to cast the majority of votes at meetings of the Board of Directors; thus, the relevant assets, liabilities and non-controlling interests had been derecognized. a. Consideration received from the derecognition
The Company did not receive any consideration in the deconsolidation of Logah Technology Corp.
b. Analysis of asset and liabilities on the date control was lost
March 28, 2014 Current assets
Cash and cash equivalents $ 902,385 Trade receivables 27,350 Inventories 1,575 Other 56,537
Non-current assets Property, plant and equipment 363,030 Other 17,546
Current liabilities Borrowings (91,260) Payables (19,764) Others (6,281)
Non-current liabilities Deferred tax liabilities (12,793) Others (6)
Net assets deconsolidated $ 1,238,319 c. Gain on deconsolidation of subsidiary
For the Year Ended
December 31, 2014
Fair value of interest retained $ 490,624 Add: Accumulated exchange differences reclassified to profit
or loss after deconsolidation of subsidiary 13,549 Less: Carrying amount of interest retained
Net assets deconsolidated 1,238,319 Non-controlling interests (747,537) 490,782
Less: Goodwill of deconsolidated subsidiary 5,043
Gain on deconsolidation (recorded as nonoperating income and expense - other income) $ 8,348
- 75 -
d. Net cash outflow on deconsolidation of subsidiary
For the Year Ended
December 31, 2014
The balance of cash and cash equivalents deconsolidated $ 902,385
31. EQUITY TRANSACTIONS WITH NON-CONTROLLING INTERESTS
In January to June 2014, the Parent Company acquired an additional 0.87% equity interest in Lite-On IT Corporation, and increased its continuing interest from 99.13% to 100%. In April 2014, the Parent Company acquired an additional 17.74% equity interest in Lite-On Automotive Corp., and increased its continuing interest from 82.26% to 100%. The above transactions were accounted as equity transactions, since the Group did not cease to have control over these subsidiaries.
For the Year Ended December 31, 2014
Lite-On Automotive Corporation
Lite-On IT Corporation
Total Cash consideration paid $ 808,800 $ 204,368 $ 1,013,168 The proportionate share of the carrying amount
of the net assets of the subsidiary transferred from non-controlling interests (297,970) (171,716)
(469,686) Differences arising from equity transaction
(reductions of unappropriated earnings) $ 510,830 $ 32,652
$ 543,482 32. CAPITAL MANAGEMENT
The Group manages its capital to ensure that entities in the Group will be able to continue as going concerns while maximizing the return to shareholders through the optimization of the debt and equity balance. The Group’s capital management system aims to ensure that the necessary financial resources and operating plan are enough to meet the next 12 months’ requirements for working capital, capital expenditures, research and development expenses, debt repayment, dividend expenses and other need.

115 116‧Lite-On Technology Corporation 2015 Annual Report Lite-On Technology Corporation 2015 Annual Report‧
- 76 -
33. FINANCIAL INSTRUMENTS a. Fair value of financial instruments that are not measured at fair value
For certain financial instruments-including notes receivable, trade receivables, trade receivables - related parties, other receivables, other receivables - related parties, debt investments with no active market, short-term borrowings, notes payable, trade payables, trade payables - related parties, other payables, other payables - related parties, and finance lease payables-the Group’s management considers the carrying amounts of these financial instruments recognized in the financial statements as approximating their fair values. For long-term loans (including their current portion) with floating rates, the carrying amounts of long-term loans are used as basis to estimate their fair value.
b. Fair value of financial instruments that are measured at fair value on a recurring basis
The following table provides an analysis of financial instruments that are measured subsequent to initial recognition at fair value, grouped into Levels 1 to 3 based on the degree to which the fair value is observable: Level 1 fair value measurements are those derived from quoted prices in active markets for identical
assets or liabilities; Level 2 fair value measurements are those derived from inputs other than quoted prices included
within Level 1 that are observable for the asset or liability, either directly (i.e. as prices) or indirectly (i.e. derived from prices); and
Level 3 fair value measurements are those derived from valuation techniques that include inputs for
the asset or liability that are not based on observable market data (unobservable inputs). 1) Fair value hierarchy
December 31, 2015 Level 1 Level 2 Level 3 Total Financial assets at FVTPL
Derivative financial assets $ - $ 53,211 $ - $ 53,211 Financial liabilities at FVTPL
Derivative financial liabilities $ - $ 55,945 $ - $ 55,945 Available-for-sale financial assets
Securities listed in ROC - equity securities $ 316,426 $ - $ - $ 316,426
Securities listed in other countries - equity securities 11,546 - - 11,546
Unlisted securities - ROC - equity securities - - 83,923 83,923
Unlisted securities - other countries - equity securities - - 26,539 26,539
Mutual funds - 53,178 - 53,178
Emerging market stocks - 178,716 - 178,716 $ 327,972 $ 231,894 $ 110,462 $ 670,328
- 77 -
December 31, 2014 Level 1 Level 2 Level 3 Total Financial assets at FVTPL
Derivative financial assets $ - $ 13,111 $ - $ 13,111 Financial liabilities at FVTPL
Derivative financial liabilities $ - $ 38,408 $ - $ 38,408 Available-for-sale financial assets
Securities listed in ROC - equity securities $ 626,191 $ - $ - $ 626,191
Securities listed in other countries - equity securities 11,486 - - 11,486
Unlisted securities - ROC - equity securities - - 144,617 144,617
Unlisted securities - other countries - equity securities - - 221,811 221,811
Mutual funds - 143,434 - 143,434
Emerging market stocks - 178,716 - 178,716 $ 637,677 $ 322,150 $ 366,428 $ 1,326,255
There were no transfers between Levels 1 and 2 in the current and prior periods.
2) Reconciliation of Level 3 fair value measurements of financial assets
Investments on Equity
Instruments Unlisted Quotes December 31, 2015 Balance at January 1, 2015 $ 366,428 Total gains or losses
In profit or loss (124,667) In other comprehensive income 1,598
Additions 33,627 Disposals (166,524) Balance at December 31, 2015 $ 110,462 December 31, 2014 Balance at January 1, 2014 $ 613,534 Total gains or losses
In profit or loss (176,965) In other comprehensive income 4,209
Additions 26,150 Disposals (500) Transfers out of Level 3 (100,000) Balance at December 31, 2014 $ 366,428
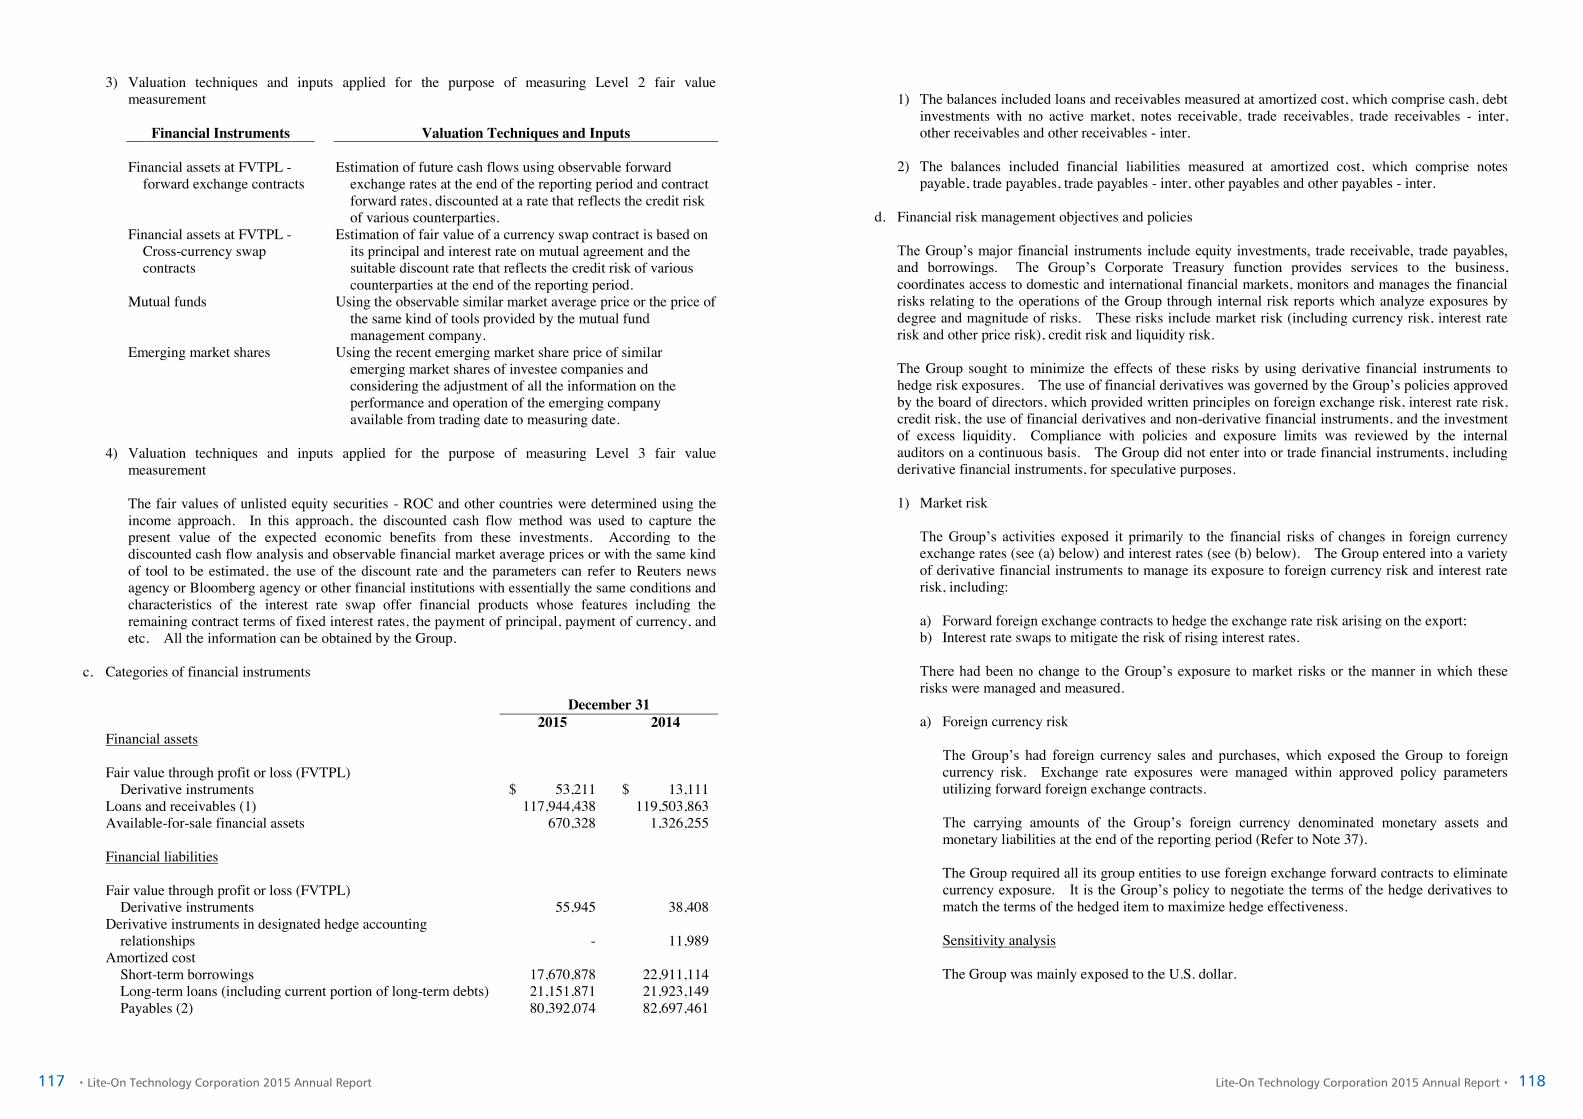
117 118‧Lite-On Technology Corporation 2015 Annual Report Lite-On Technology Corporation 2015 Annual Report‧
- 78 -
3) Valuation techniques and inputs applied for the purpose of measuring Level 2 fair value measurement
Financial Instruments Valuation Techniques and Inputs Financial assets at FVTPL -
forward exchange contracts Estimation of future cash flows using observable forward
exchange rates at the end of the reporting period and contract forward rates, discounted at a rate that reflects the credit risk of various counterparties.
Financial assets at FVTPL - Cross-currency swap contracts
Estimation of fair value of a currency swap contract is based on its principal and interest rate on mutual agreement and the suitable discount rate that reflects the credit risk of various counterparties at the end of the reporting period.
Mutual funds Using the observable similar market average price or the price of the same kind of tools provided by the mutual fund management company.
Emerging market shares Using the recent emerging market share price of similar emerging market shares of investee companies and considering the adjustment of all the information on the performance and operation of the emerging company available from trading date to measuring date.
4) Valuation techniques and inputs applied for the purpose of measuring Level 3 fair value
measurement The fair values of unlisted equity securities - ROC and other countries were determined using the income approach. In this approach, the discounted cash flow method was used to capture the present value of the expected economic benefits from these investments. According to the discounted cash flow analysis and observable financial market average prices or with the same kind of tool to be estimated, the use of the discount rate and the parameters can refer to Reuters news agency or Bloomberg agency or other financial institutions with essentially the same conditions and characteristics of the interest rate swap offer financial products whose features including the remaining contract terms of fixed interest rates, the payment of principal, payment of currency, and etc. All the information can be obtained by the Group.
c. Categories of financial instruments
December 31 2015 2014 Financial assets Fair value through profit or loss (FVTPL)
Derivative instruments $ 53,211 $ 13,111 Loans and receivables (1) 117,944,438 119,503,863 Available-for-sale financial assets 670,328 1,326,255 Financial liabilities Fair value through profit or loss (FVTPL)
Derivative instruments 55,945 38,408 Derivative instruments in designated hedge accounting
relationships - 11,989 Amortized cost
Short-term borrowings 17,670,878 22,911,114 Long-term loans (including current portion of long-term debts) 21,151,871 21,923,149 Payables (2) 80,392,074 82,697,461
- 79 -
1) The balances included loans and receivables measured at amortized cost, which comprise cash, debt
investments with no active market, notes receivable, trade receivables, trade receivables - inter, other receivables and other receivables - inter.
2) The balances included financial liabilities measured at amortized cost, which comprise notes
payable, trade payables, trade payables - inter, other payables and other payables - inter.
d. Financial risk management objectives and policies The Group’s major financial instruments include equity investments, trade receivable, trade payables, and borrowings. The Group’s Corporate Treasury function provides services to the business, coordinates access to domestic and international financial markets, monitors and manages the financial risks relating to the operations of the Group through internal risk reports which analyze exposures by degree and magnitude of risks. These risks include market risk (including currency risk, interest rate risk and other price risk), credit risk and liquidity risk. The Group sought to minimize the effects of these risks by using derivative financial instruments to hedge risk exposures. The use of financial derivatives was governed by the Group’s policies approved by the board of directors, which provided written principles on foreign exchange risk, interest rate risk, credit risk, the use of financial derivatives and non-derivative financial instruments, and the investment of excess liquidity. Compliance with policies and exposure limits was reviewed by the internal auditors on a continuous basis. The Group did not enter into or trade financial instruments, including derivative financial instruments, for speculative purposes. 1) Market risk
The Group’s activities exposed it primarily to the financial risks of changes in foreign currency exchange rates (see (a) below) and interest rates (see (b) below). The Group entered into a variety of derivative financial instruments to manage its exposure to foreign currency risk and interest rate risk, including: a) Forward foreign exchange contracts to hedge the exchange rate risk arising on the export; b) Interest rate swaps to mitigate the risk of rising interest rates. There had been no change to the Group’s exposure to market risks or the manner in which these risks were managed and measured. a) Foreign currency risk
The Group’s had foreign currency sales and purchases, which exposed the Group to foreign currency risk. Exchange rate exposures were managed within approved policy parameters utilizing forward foreign exchange contracts. The carrying amounts of the Group’s foreign currency denominated monetary assets and monetary liabilities at the end of the reporting period (Refer to Note 37). The Group required all its group entities to use foreign exchange forward contracts to eliminate currency exposure. It is the Group’s policy to negotiate the terms of the hedge derivatives to match the terms of the hedged item to maximize hedge effectiveness. Sensitivity analysis The Group was mainly exposed to the U.S. dollar.

119 120‧Lite-On Technology Corporation 2015 Annual Report Lite-On Technology Corporation 2015 Annual Report‧
- 80 -
The following table details the Group’s sensitivity to a 5% increase and decrease in New Taiwan dollars (the functional currency) against the relevant foreign currencies. The sensitivity analysis included only outstanding foreign currency denominated monetary items. A positive number below indicates an increase in pre-tax profit and other equity associated with New Taiwan dollars strengthen 5% against the relevant currency. For a 5% weakening of New Taiwan dollars against the relevant currency, there would be an equal and opposite impact on pre-tax profit and other equity and the balances below would be negative. Currency USD Impact For the Year Ended December 31 2015 2014 Profit or loss $ 9,064 $ 5,267
b) Interest rate risk The Group was exposed to interest rate risk because entities in the Group borrowed funds at both fixed and floating interest rates. The risk is managed by the Group by maintaining an appropriate mix of fixed and floating rate borrowings, and using interest rate swap contracts and forward interest rate contracts. Hedging activities are evaluated regularly to align with interest rate views and defined risk appetite, ensuring the most cost - effective hedging strategies are applied. The carrying amount of the Group’s financial assets and financial liabilities with exposure to interest rates at the end of the reporting period were as follows: December 31
2015 2014
Fair value interest rate risk
Financial assets (i) $ 28,172,474 $ 29,221,581 Financial liabilities (ii) 15,645,260 21,140,609
Cash flow interest rate risk Financial assets (iii) 36,787,305 35,292,046 Financial liabilities (iv) 23,278,388 23,880,607
i. The balances included time deposit and debt investments with no active market. ii. The balances included financial liabilities exposed to fair value risk from interest rate
fluctuation. iii. The balances included demand deposits. iv. The balances included financial liabilities exposed to cash flow risk from interest rate
fluctuation. The Parent Company aims to keep borrowings at variable rates. In order to achieve this result, the Parent Company entered into interest rate swaps to hedge its exposures to changes in fair values of the borrowings. The critical terms of these interest rate swaps are similar to those of hedged borrowings. These interest rate swaps were designated as effective hedging instruments and hedge accounting is used.
- 81 -
The Parent Company was also exposed to cash flow interest rate risk in relation to variable-rate bank borrowings and pay-fixed/receive-floating interest rate swaps. The Parent Company’s cash flow interest rate risk was mainly concentrated in the fluctuation of the average rate for 90-day notes in Taiwan’s secondary market arising from the Group’s New Taiwan dollars denominated borrowings. Sensitivity analysis The sensitivity analyses below were determined based on the Group’s exposure to interest rates for both derivatives and non-derivative instruments at the end of the reporting period. For floating rate liabilities, the analysis was prepared assuming the amount of the liability outstanding at the end of the reporting period was outstanding for the whole year. If interest rates had been 25 basis points higher and all other variables were held constant, the Group’s pre-tax profit for the years ended December 31, 2015 and 2014 would increase by $33,772 thousand and decrease $28,529 thousand.
c) Other price risk The Group was exposed to equity price risk through its investments in listed equity securities. Equity investments are held for strategic rather than trading purposes. The Group does not actively trade these investments. Sensitivity analysis The sensitivity analyses below were determined based on the exposure to equity price risks at the end of the reporting period. If equity prices had been 10% higher, the pre-tax other comprehensive income for the years ended December 31, 2015 and 2014 would increase by $32,797 thousand and $63,768 thousand as a result of the changes in fair value of available-for-sale financial assets.
2) Credit risk Credit risk refers to the risk that counterparty will default on its contractual obligations resulting in financial loss to the Group. The Group is exposed to credit risk from trade receivables, deposits, and other financial instruments. Credit risk on business-related exposures is managed separately from that on financial-related exposures. a) Business related credit risk
To maintain the quality of receivables, the Group has established operating procedures to manage credit risk. For individual customers, risk factors considered include the customer’s financial position, credit rating agency rating, the Group’s internal credit rating, and transaction history as well as current economic conditions that may affect the customer’s ability to pay. The Group also has the right to use some credit protection enhancement tools, such as requiring advance payments, to reduce the credit risks involving certain customers.
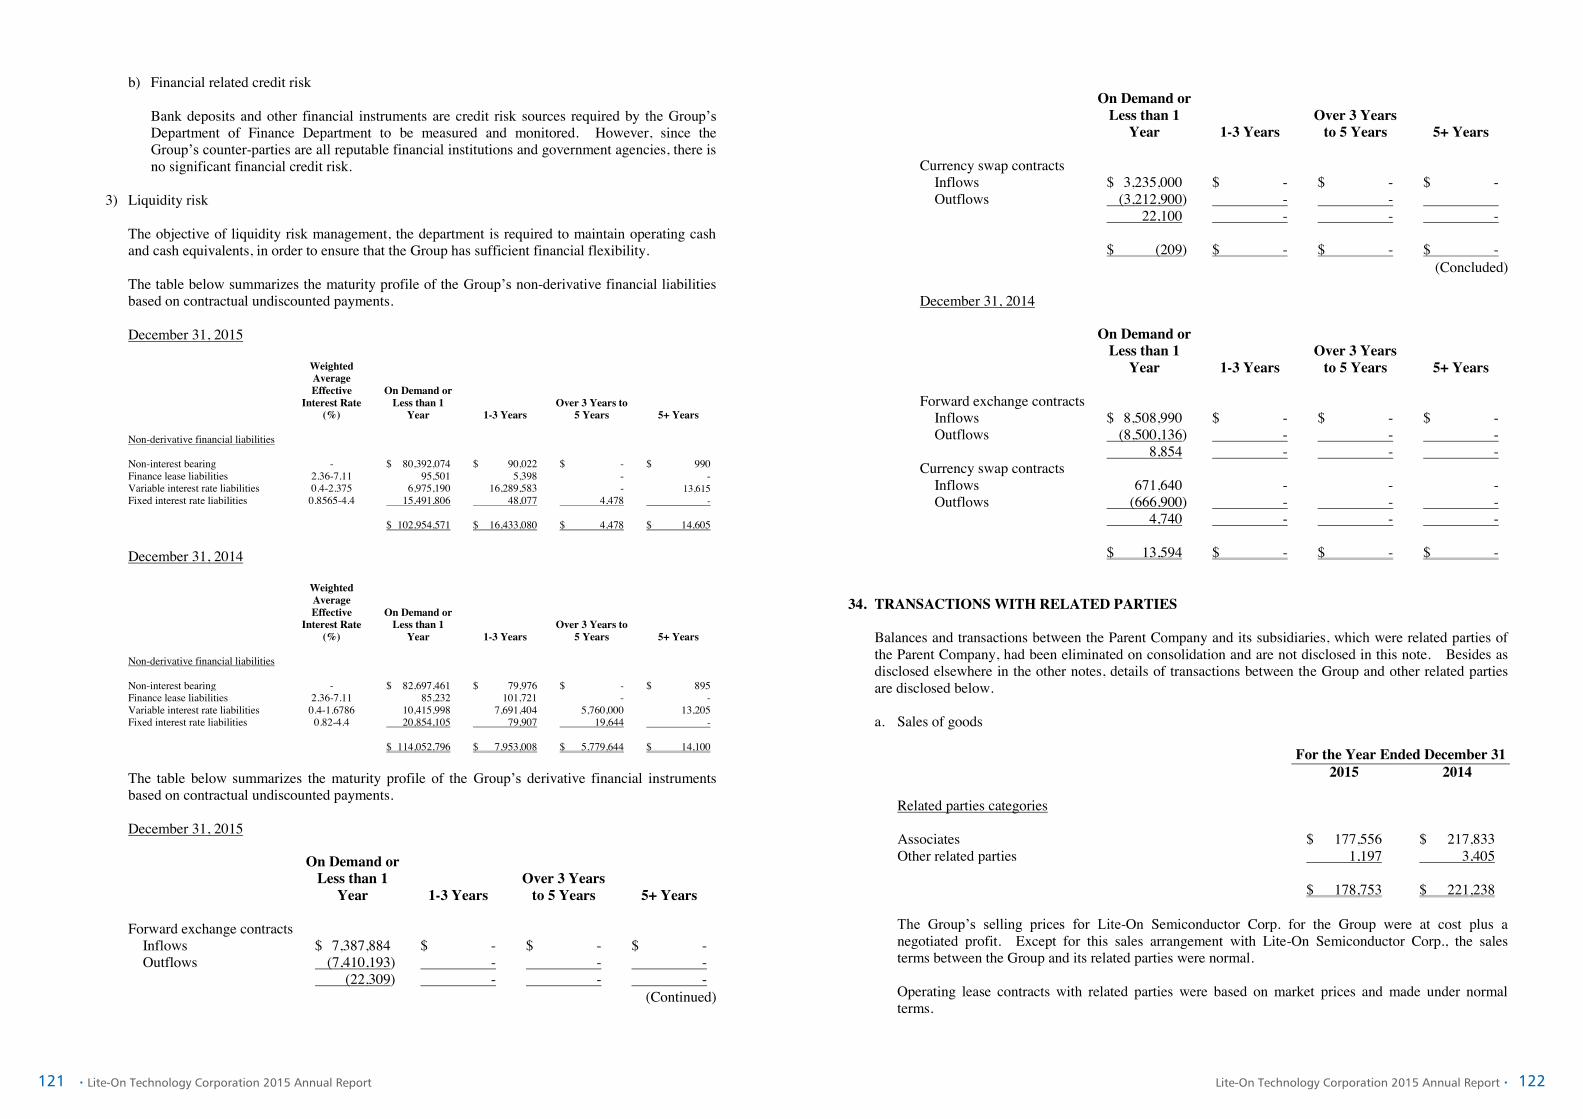
121 122‧Lite-On Technology Corporation 2015 Annual Report Lite-On Technology Corporation 2015 Annual Report‧
- 82 -
b) Financial related credit risk Bank deposits and other financial instruments are credit risk sources required by the Group’s Department of Finance Department to be measured and monitored. However, since the Group’s counter-parties are all reputable financial institutions and government agencies, there is no significant financial credit risk.
3) Liquidity risk The objective of liquidity risk management, the department is required to maintain operating cash and cash equivalents, in order to ensure that the Group has sufficient financial flexibility. The table below summarizes the maturity profile of the Group’s non-derivative financial liabilities based on contractual undiscounted payments. December 31, 2015
Weighted Average Effective
Interest Rate (%)
On Demand or Less than 1
Year 1-3 Years Over 3 Years to
5 Years 5+ Years Non-derivative financial liabilities Non-interest bearing - $ 80,392,074 $ 90,022 $ - $ 990 Finance lease liabilities 2.36-7.11 95,501 5,398 - - Variable interest rate liabilities 0.4-2.375 6,975,190 16,289,583 - 13,615 Fixed interest rate liabilities 0.8565-4.4 15,491,806 48,077 4,478 - $ 102,954,571 $ 16,433,080 $ 4,478 $ 14,605 December 31, 2014
Weighted Average Effective
Interest Rate (%)
On Demand or Less than 1
Year 1-3 Years Over 3 Years to
5 Years 5+ Years Non-derivative financial liabilities Non-interest bearing - $ 82,697,461 $ 79,976 $ - $ 895 Finance lease liabilities 2.36-7.11 85,232 101,721 - - Variable interest rate liabilities 0.4-1.6786 10,415,998 7,691,404 5,760,000 13,205 Fixed interest rate liabilities 0.82-4.4 20,854,105 79,907 19,644 - $ 114,052,796 $ 7,953,008 $ 5,779,644 $ 14,100 The table below summarizes the maturity profile of the Group’s derivative financial instruments based on contractual undiscounted payments. December 31, 2015
On Demand or Less than 1
Year 1-3 Years Over 3 Years
to 5 Years 5+ Years Forward exchange contracts
Inflows $ 7,387,884 $ - $ - $ - Outflows (7,410,193) - - -
(22,309) - - - (Continued)
- 83 -
On Demand or Less than 1
Year 1-3 Years Over 3 Years
to 5 Years 5+ Years Currency swap contracts
Inflows $ 3,235,000 $ - $ - $ - Outflows (3,212,900) - -
22,100 - - - $ (209) $ - $ - $ -
(Concluded) December 31, 2014
On Demand or Less than 1
Year 1-3 Years Over 3 Years
to 5 Years 5+ Years Forward exchange contracts
Inflows $ 8,508,990 $ - $ - $ - Outflows (8,500,136) - - -
8,854 - - - Currency swap contracts
Inflows 671,640 - - - Outflows (666,900) - - -
4,740 - - - $ 13,594 $ - $ - $ -
34. TRANSACTIONS WITH RELATED PARTIES Balances and transactions between the Parent Company and its subsidiaries, which were related parties of the Parent Company, had been eliminated on consolidation and are not disclosed in this note. Besides as disclosed elsewhere in the other notes, details of transactions between the Group and other related parties are disclosed below. a. Sales of goods
For the Year Ended December 31 2015 2014 Related parties categories Associates $ 177,556 $ 217,833 Other related parties 1,197 3,405 $ 178,753 $ 221,238 The Group’s selling prices for Lite-On Semiconductor Corp. for the Group were at cost plus a negotiated profit. Except for this sales arrangement with Lite-On Semiconductor Corp., the sales terms between the Group and its related parties were normal. Operating lease contracts with related parties were based on market prices and made under normal terms.

123 124‧Lite-On Technology Corporation 2015 Annual Report Lite-On Technology Corporation 2015 Annual Report‧
- 84 -
b. Purchases of goods
For the Year Ended December 31 2015 2014 Related parties categories Associates $ 4,796,010 $ 4,696,060 Other related parties 707,559 632,680 $ 5,503,569 $ 5,328,740 The cost of the Group’s purchases from Lite-On Semiconductor Corp. for the years ended December 31, 2015 and 2014 was based on cost plus specific profit. Except for these purchases, the purchase terms between the Group and its related parties were normal.
c. Receivables from related parties
December 31 2015 2014 Related parties categories Trade receivable
Associates $ 66,243 $ 72,417 Other related parties 95 652
$ 66,338 $ 73,069 Other receivable
Associates $ 10,462 $ 2,850 Other related parties 19 203
$ 10,481 $ 3,053 The outstanding trade receivables from related parties are unsecured. For the years ended December 31, 2015 and 2014, no impairment loss was recognized for trade receivables from related parties.
d. Payables to related parties
December 31 2015 2014 Related parties categories Trade payable
Associates $ 575,365 $ 677,197 Other related parties 281,580 276,469
$ 856,945 $ 953,666 Other payable
Associates $ 4 $ 738 Other related parties 12,937 6,003
$ 12,941 $ 6,741
- 85 -
The outstanding trade payables from related parties are unsecured.
e. Operating expense
For the Year Ended December 31 2015 2014 Related parties categories Other related parties $ 69,011 $ 61,690
f. Other revenues
For the Year Ended December 31 2015 2014 Related parties categories Associates $ 5,664 $ 4,053 Other related parties 1,867 1,542 $ 7,531 $ 5,595
g. Compensation of key management personnel
For the Year Ended December 31 2015 2014 Short-term employee benefits $ 577,154 $ 629,048 Post-employment benefits 24,453 19,054 Termination benefits - 14,088 $ 601,607 $ 662,190 The remuneration of directors and key executives was determined by the remuneration committee having regard to the performance of individuals and market trends.
35. ASSETS PLEDGED AS COLLATERAL OR FOR SECURITY
December 31 2015 2014 Pledge-time deposits $ 270,870 $ 78,688 Above assets included the guarantee deposits that had been provided for (a) a government projects (b) the customs agency for shipment clearance in advance of duty payments (c) the tax refund guarantee.

125 126‧Lite-On Technology Corporation 2015 Annual Report Lite-On Technology Corporation 2015 Annual Report‧
- 86 -
36. SIGNIFICANT CONTINGENT LIABILITIES AND UNRECOGNIZED COMMITMENTS
a. CMP Consulting Service, Inc., KI, Inc., Aaron Wagner, The Stereo Shop, David Carney, Jr., Tina Corse, Cynthia R. Rall, Richard R. Rall, Aaron Deshaw and Don Cheung filed an antitrust group lawsuit against the Company and its subsidiaries - Philips & Lite-On Digital Solutions Corporation, Philips & Lite-On Digital Solutions USA, Inc. and other companies with related businesses - with a court in California, from October 2009 to September 2010. The Parent Company has assigned lawyers in the United States as its representative in these lawsuits. In September 2015, the Parent Company has reached a settlement with the direct plaintiff group. The lawsuit with indirect plaintiff group is still in progress. The Parent Company already accrued a reasonable amount in case of a loss on this lawsuit and will continue to recognize the losses quarterly on the basis of a reasonable estimation of the lawsuit until the settlement of this lawsuit.
b. In the second quarter of 2013, the Attorney General of the State of Florida filed antitrust lawsuits
against the Parent Company and its subsidiaries - Philips & Lite-On Digital Solutions Corporation and Philips & Lite-On Digital Solutions USA, Inc. - as well as other companies with related businesses with the U.S. District Court for the Northern District of California (USDC-NDC). The Parent Company assigned lawyers as its representative in these lawsuits. In the second quarter of 2014, the USDC-NDC allowed the plaintiff to proceed with the lawsuits but dismissed certain parts of these lawsuits. Although the outcome of the proceedings had not been determined, the Parent Company accrued a reasonable amount in case of a loss on this lawsuit and will continue to recognize the losses quarterly at this reasonably estimated amount until the settlement of this lawsuit.
c. In the second quarter of 2013, Dell Inc. and Dell Products L.P. filed a complaint with the United States
District Court for Western District of Texas. In the fourth quarter of 2013, Acer Inc., Acer America Corporation, Gateway Inc. and Gateway U.S. Retail, Inc. filed a complaint with the United States District Court for the Northern District of California. In the fourth quarter of 2013, Ingram Micro Inc., and Synnex Corporation filed a complaint with the United States District Court for the Central District of California. In the third quarter of 2015, Alfred H. Siegel, the bankruptcy trustee of Circuit City Stores, Inc. filed a complaint with the United States District Court for the Northern District of California. In the fourth quarter of 2015, Peter Kravitz, the bankruptcy trustee of RadioShack Corporation, filed a complaint with the United States District Court for the Northern District of California. All these complaints constituted an antitrust group lawsuit against the Parent Company and other companies with related businesses. The Parent Company assigned lawyers as its representative in these lawsuits. Although the outcome of the proceedings had not been determined, the Parent Company already accrued a reasonable amount in case of a loss on this lawsuit and will continue to recognize losses quarterly at this reasonably estimated amount until the settlement of this lawsuit.
d. From the second quarter of 2010 to the second quarter of 2014, petitioner Carlos Fogelman filed a
motion for authorization to institute class action antitrust proceedings with the Superior Court of Quebec in the district of Montreal. The Fanshawe College of Applied Arts and Technology filed a statement of claim in Ontario court. Neil Godfrey filed a statement of claim with the Superior Court of British Columbia. Donald Woligroski filed a statement of claim in Manitoba court. Cindy Retallick filed a statement of claim in Saskatchewan court. All plaintiffs filed the antitrust group lawsuit against the Company and its subsidiaries - Philips & Lite-On Digital Solutions Corporation, Philips & Lite-On Digital Solutions USA, Inc. and other companies with related businesses. The Parent Company assigned lawyers as its representative in these lawsuits. Although the outcome of the proceedings had not been determined, the Parent Company accrued a reasonable amount in case of a loss on this lawsuit and will continue to recognize the losses quarterly on the basis of a reasonable estimation of the lawsuit until the settlement of this lawsuit.
- 87 -
37. SIGNIFICANT ASSETS AND LIABILITIES DENOMINATED IN FOREIGN CURRENCIES The following information was aggregated by the foreign currencies other than functional currencies of the group entities and the exchange rates between foreign currencies and respective functional currencies were disclosed. The significant assets and liabilities denominated in foreign currencies were as follows: December 31, 2015
Foreign
Currencies Exchange Rate Carrying Amount
Financial assets Monetary items
USD $ 1,084,165 32.775 (USD:NTD) $ 35,533,506 USD 557,386 6.4766 (USD:CNY) 18,268,326 EUR 10,569 0.9154 (EUR:USD) 378,415 HKD 43,873 7.7503 (HKD:USD) 185,535 JPY 221,634 120.36 (JPY:USD) 60,351 HKD 7,184 4.2289 (HKD:NTD) 30,382
$ 54,456,515 Non-monetary items
Investments accounted for using equity method USD 1,396 32.775 (USD:NTD) $ 45,749
Financial liabilities Monetary items
USD 1,078,634 32.775 (USD:NTD) $ 35,352,229 USD 1,013,643 6.4766 (USD:CNY) 33,222,149 EUR 1,790 7.0751 (EUR:CNY) 64,088 JPY 69,550 0.2723 (JPY:NTD) 18,938 EUR 485 35.8034 (EUR:NTD) 17,365 JPY 45,731 120.36 (JPY:USD) 12,453
$ 68,687,222 December 31, 2014
Foreign
Currencies Exchange Rate Carrying Amount
Financial assets Monetary items
USD $ 993,000 31.6 (USD:NTD) $ 31,378,797 USD 628,566 6.1866 (USD:CNY) 19,862,689 EUR 3,477 0.8229 (EUR:USD) 133,519 HKD 24,497 7.755 (HKD:USD) 99,822
(Continued)

127 128‧Lite-On Technology Corporation 2015 Annual Report Lite-On Technology Corporation 2015 Annual Report‧
- 88 -
Foreign
Currencies Exchange Rate Carrying Amount
JPY $ 154,927 119.66 (JPY:USD) $ 40,916 HKD 2,787 4.0748 (HKD:NTD) 11,357
$ 51,527,100 Non-monetary items
Investments accounted for using equity method USD 316 31.6 (USD:NTD) $ 9,988
Financial liabilities Monetary items
USD 1,209,762 6.1866 (USD:CNY) $ 38,228,484 USD 989,667 31.6 (USD:NTD) 31,273,464 EUR 3,961 38.4003 (EUR:NTD) 152,112 EUR 2,807 7.518 (EUR:CNY) 107,801 JPY 114,668 119.66 (JPY:USD) 30,284 JPY 29,990 0.2641 (JPY:NTD) 7,920
$ 69,800,065
(Concluded) For the years ended December 31, 2015 and 2014 net foreign exchange gains was $123,658 thousand and $58,022 thousand. It is impractical to disclose net foreign exchange gains or losses by each significant foreign currency due to the variety of the foreign currency transactions of the group entities.
38. SEPARATELY DISCLOSED ITEMS
a. Information on significant transactions and information on investees:
1) Financing provided: Please see Table 1 attached 2) Endorsement/guarantee provided: Please see Table 2 attached 3) Marketable securities held (excluding investment in subsidiaries, associates and jointly controlled
entities): Please see Table 3 attached 4) Marketable securities acquired and disposed of at costs or prices of at least NT$300 million or 20%
of the paid-in capital: Please see Table 4 attached 5) Acquisition of individual real estate properties at costs of at least NT $300 million or 20% of the
paid-in capital: None 6) Disposal of individual real estate properties at prices of at least NT$300 million or 20% of the
paid-in capital: None 7) Total purchases from or sales to related parties of at amounting to at least NT$100 million or 20%
of the paid-in capital: Please see Table 5 attached
- 89 -
8) Receivables from related parties amounting to at least NT$100 million or 20% of the paid-in capital: Please see Table 6 attached
9) Trading in derivative instruments: Notes 7, 9 and 33 to the financial statements 10) Names, locations, and related information of investees over which the Company exercises
significant influence: Please see Table 7 attached
b. Information on investments in mainland China:
1) Information on any investee company in mainland China, showing the name, principal business activities, paid-in capital, method of investment, inward and outward remittance of funds, ownership percentage, net income of investees, investment income or loss, carrying amount of the investment at the end of the period, repatriations of investment income, and limit on the amount of investment in the mainland China area. Please see Table 8 attached
2) Any of the following significant transactions with investee companies in mainland China, either
directly or indirectly through a third party, and their prices, payment terms, and unrealized gains or losses: Please see Table 9 attached
c. Intercompany relationships and significant intercompany transactions: Please see Table 9 attached
39. SEGMENT INFORMATION
a. General information
The Group identified the reportable segments based on the managerial reporting information, and the segments by the types of products which included Optoelectronics, Information Technologies, Storage, and Mobile Mechanics and Others. The types of products are described as follows: 1) Optoelectronics: LED Components and Lighting Products, Camera Modules and Automotive
Electronics. 2) Information technologies: Products used in Server, Networking Devices, NB, Tablets, DT and
Multifunction Peripheral. 3) Storage: Optical Disk Drives and Solid State Drives. 4) The Group also had Mobile Mechanics and Others operating segments that did not exceed the
quantitative threshold. These segments mainly engage in manufacturing and selling of Mechanical Products for Mobile Devices and others.
b. Measurement of segment information
The Group uses the income before income tax from operations as the measurement for segment profit and the basis of performance assessment. There was no material differences between the accounting policies of the operating segment and the accounting policies described in Note 4.

129 130‧Lite-On Technology Corporation 2015 Annual Report Lite-On Technology Corporation 2015 Annual Report‧
- 90 -
c. Segment information The segment information provided to the chief operating decision-maker for the reportable segments is as follows:
Optoelectronics Information Technologies Storage
Mobile Mechanics and
Others Elimination Total 2015 Sales from external customers $ 53,160,628 $ 105,899,693 $ 34,201,009 $ 23,667,404 $ - $ 216,928,734 Sales among segments 1,514,501 1,724,299 14,068 609,444 (3,862,312 ) - Operating profit (loss) 1,915,800 6,886,653 2,219,191 (1,300,981 ) - 9,720,663 2014 Sales from external customers 60,958,757 103,532,918 38,760,007 $ 27,380,292 - $ 230,631,974 Sales among segments 1,460,397 2,198,233 - 807,138 (4,465,768 ) - Operating profit (loss) 1,612,663 7,173,364 2,631,152 (3,137,528 ) - 8,279,651
d. Geographic information
Revenue from External
Customers Non-current Assets For the Year Ended December 31 December 31 2015 2014 2015 2014 Asia $ 151,570,732 $ 167,023,169 $ 52,643,046 $ 56,486,000 America 41,682,293 39,738,424 1,109,369 530,407 Europe 23,241,976 23,035,368 567,044 413,851 Others 433,733 835,013 - - $ 216,928,734 $ 230,631,974 $ 54,319,459 $ 57,430,258 The geographic information is presented by billing regions. Noncurrent assets include intangible assets, properties, plant and equipment.
e. Information about major customers
Single customers contributed 10% or more to the Group’s revenue were as follows:
For the Year Ended December 31 2015 2014 Amount % Amount % Customer A $ - - $ 24,108,155 10.45 There is no customer representing at least 10% of gross sales for the year ended December 31, 2015.
f. Reconciliation information for segment profit (loss)
1) The revenue from external parties reported to the chief operating decision-maker is used the same accounting policies in consistent with in the statement of comprehensive income.
- 91 -
2) A reconciliation of reportable segments profit (loss) and income before income tax is provided as follows:
For the Year Ended December 31 2015 2014 Reportable segments’ profit $ 9,720,663 $ 8,279,651 Unclassified loss (1,067,840) (1,153,568) Non-operating income and expenses 1,353,818 621,789 Profit before income tax $ 10,006,641 $ 7,747,872
3) Segment profit represented the profit before tax earned by each segment without unclassified of
headquarter administration costs, share of profits of associates, gain or loss on disposal of investments, dividend income, interest income, gain or loss on disposal of property, plant and equipment, exchange gain or loss, valuation gain or loss on financial instruments, finance costs, impairment loss, other expense and income tax expense. This was the measure reported to the chief operating decision maker for the purpose of resource allocation and assessment of segment performance.

131 132‧Lite-On Technology Corporation 2015 Annual Report Lite-On Technology Corporation 2015 Annual Report‧
- 92 -
TABLE 1 LITE-ON TECHNOLOGY CORPORATION AND SUBSIDIARIES FINANCING PROVIDED FOR THE YEAR ENDED DECEMBER 31, 2015 (Amounts in Thousands of New Taiwan Dollars)
No. Financing Company Counter-party Financial Statement Account Related Party
Maximum Balance for the
Period Ending Balance Amount
Actually Drawn Interest Rate Nature for Financing (Note 1)
Transaction Amount
Reasons for Financing
Allowance for Bad Debt
Collateral Financing Limits for Each
Borrowing Company (Note 2)
Financing Company’s
Total Financing Amount Limits
(Note 2)
Note Item Value
1 China Bridge (China) Co.,
Ltd. Lite-On Opto Technology
(Changzhou) Co., Ltd. Receivables from related
parties Yes $ 262,560
$ - $ - 1.0465% b $ - Operating capital $ - None $ - $ 1,336,475 $ 1,336,475
2 Lite-On Opto Technology
(Changzhou) Co., Ltd. Lite-on Green
Technologies (Nanjing) Corporation
Receivables from related parties
Yes 45,868
- - 4.2% b - Operating capital - None - 2,904,295 2,904,295
Changzhou Leotek New Energy Trade Limited
Receivables from related parties
Yes 207,048
177,118 177,118 3.045%-4.2% b - Operating capital - None - 2,904,295 2,904,295
3 Lite-On Technology
(Changzhou) Co., Ltd. Lite-On Technology
(Shanghai) Ltd. Receivables from related
parties Yes 606,168 - - 4.2% b - Equipment purchase - None - 4,181,385 4,181,385
Zhuhai Lite-On Mobile Technology Co., Ltd.
Receivables from related parties
Yes 2,548,200 1,265,125 1,265,125 3.57% b - Operating capital - None - 4,181,385 4,181,385
4 Lite-On Electronics (Tianjinn)
Co., Ltd. Lite-On Medical Device
(Changzhou) Ltd. Receivables from related
parties Yes 45,463
22,772 22,772 3.22%-4.2% b - Operating capital - None - 2,920,513 2,920,513
Lite-On Technology (Shanghai) Ltd.
Receivables from related parties
Yes 555,654
- - 4.2% b - Equipment purchase - None - 2,920,513 2,920,513
Lite-On Opto Technology (Guangzhou) Ltd.
Receivables from related parties
Yes 258,810
253,025 253,025 3.57% b - Operating capital - None - 2,920,513 2,920,513
5 Lite-On Power Technology
(Chang Zhou) Co., Ltd. Lite-On Technology
(Shanghai) Ltd. Receivables from related
parties Yes 706,258
- - 4.2% b - Equipment purchase - None - 770,086 770,086
6 Lite-On Network
Communication (Dongguan) Limited
Silitek Elec. (Dongguan) Co., Ltd.
Receivables from related parties
Yes 201,788
- - 4.2% b - Operating capital - None - 1,199,489 1,199,489
7 Dongguan Lite-On Computer
Co., Ltd. Yantai Lite-On Mobile
Electronic Components Co., Ltd.
Receivables from related parties
Yes 51,762 50,605 50,605 3.395%-4.2% b - Operating capital - None - 109,967 109,967
8 DongGuan G-Pro Computer
Co., Ltd. Silitek Elec. (Dongguan)
Co., Ltd. Receivables from related
parties Yes 258,810 - - 3.92% b - Operating capital - None - 859,298 859,298
9 Dong Guan G-Tech
Computers Co., Ltd. Lite-On Electronics
(Dongguan) Co., Ltd. Receivables from related
parties Yes 103,524 - - 3.92% b - Operating capital - None - 830,594 830,594
10 Huizhou Li Shin Electronic
Co., Ltd. Lite-On Technology
(Xianging) Co., Ltd. Receivables from related
parties Yes 51,762 - - 4.2% b - Operating capital - None - 583,904 583,904
11 Guangzhou Lite-On Mobile
Engineering Plastics Co., Ltd.
Zhuhai Lite-On Mobile Technology Co., Ltd.
Receivables from related parties
Yes 1,294,050 1,265,125 1,265,125 4.2% b - Operating capital - None - 4,786,834 4,786,834
12 Guangzhou Lite-On Mobile
Electronic Components Lite-On Young Fast
(Huizhou) Co., Ltd. Receivables from related
parties Yes 126,118 - - 5.6% b - Operating capital - None - 10,968,633 10,968,633
Co., Ltd. Beijing Lite-On Mobile Electronic and Telecommunication Components Co., Ltd.
Receivables from related parties
Yes 879,954 - - 4.2% b - Operating capital - None - 10,968,633 10,968,633
13 Lite-On Auto Electric
Technology (Guangzhou) Ltd.
Yantai Lite-On Mobile Electronic Components Co., Ltd.
Receivables from related parties
Yes 51,762 50,605 50,605 3.395%-4.2% b - Operating capital - None - 129,736 129,736
(Continued)

133 134‧Lite-On Technology Corporation 2015 Annual Report Lite-On Technology Corporation 2015 Annual Report‧
- 93 -
No. Financing Company Counter-party Financial Statement Account Related Party
Maximum Balance for the
Period Ending Balance Amount
Actually Drawn Interest Rate Nature for Financing (Note 1)
Transaction Amount
Reasons for Financing
Allowance for Bad Debt
Collateral Financing Limits for Each
Borrowing Company (Note 2)
Financing Company’s
Total Financing Amount Limits
(Note 2)
Note Item Value
14 Lite-On Opto Technology
(Guangzhou) Co., Ltd. Shenzhen Lite-On Mobile
Precision Molds Co., Ltd.
Receivables from related parties
Yes $ 126,285 $ - $ - 4.2% b $ - Operating capital $ - None $ - $ 2,502,557 $ 2,502,557
15 Lite-On Mobile Oyj
(formerly: Perlos Oyj) Lite-On Mobile India
Private Limited Receivables from related
parties Yes 160,818 160,598 160,598 2.357%-2.446% b - Operating capital - None - 1,135,093 1,135,093
16 Lite-On Mobile Pte. Ltd. Lite-On Mobile India
Private Limited Receivables from related
parties Yes 942,951 941,659 941,659 2.107%-2.196% b - Operating capital - None - 569,947 569,947
17 Lite-On China Holding Co.,
Ltd. Lite-On Mobile Pte. Ltd. Receivables from related
parties Yes 656,400 - - 0.86% b - Operating capital - None - 27,133,899 27,133,899
18 Eagle Rock Investment Ltd. Lite-On Mobile Pte. Ltd. Receivables from related
parties Yes 656,400 - - 0.86% b - Operating capital - None - 1,497,057 1,497,057
19 Lite-On Green Energy B.V. Romeo Tetti PV1 S.R.L. Receivables from related
parties Yes 123,838 38,557 38,557 2.235% b - Operating capital - None - 340,531 340,531
20 Lite-On Technology (Europe)
B.V. Lite-On Green Energy
B.V. Receivables from related
parties Yes 62,634 14,321 14,321 1.00% b - Operating capital - None - 2,857,813 2,857,813
21 Lite-On Capital Corporation Lite-On Green
Technologies Inc. Receivables from related
parties Yes 115,000 - - 1.00% b - Operating capital - None - 859,305 859,305
22 Lite-On Singapore Pte. Ltd. Lite-On China Holding
Co., Ltd. Receivables from related
parties Yes 295,380
- - 0.86% b - Operating capital - None - 15,559,263 15,559,263
Lite-On Mobile Pte. Ltd. Receivables from related parties
Yes 1,311,000 1,311,000 1,311,000 0.86% b - Operating capital - None - 15,559,263 15,559,263
23 Lite-On Electronics
(Guangzhou) Co., Ltd. Silitek Elec. (Dongguan)
Co., Ltd. Receivables from related
parties Yes 248,925
-
-
3.745% b - Operating capital - None - 13,745,648 13,745,648
Zhuhai Lite-On Mobile Technology Co., Ltd.
Receivables from related parties
Yes 1,529,100 1,518,150 - 3.22% b - Operating capital - None - 13,745,648 13,745,648
24 LTC International Ltd. Lite-On Automotive
Electronics Mexico, S.A. DE C.V.
Receivables from related parties
Yes 98,460
98,325
98,325
4.08% b - Operating capital - None - 355,113 355,113
25 Lite-On Automotive (Wuxi)
Co., Ltd. Lite-On Green
Technologies (Nanjing) Corporation
Receivables from related parties
Yes 56,938
55,666
55,666
3.395% b - Operating capital - None - 586,300 586,300
26 Li Shin Technology (Huizhou)
Ltd. Lite-On Technology
(Xianging) Co., Ltd. Receivables from related
parties Yes 75,908
75,908
75,908
3.045% b - Operating capital - None - 415,799 415,799
27 China Bridge Express (Wuxi)
Co., Ltd. Changzhou Leotek New
Energy Trade Limited Receivables from related
parties Yes 151,815
-
-
3.045% b - Operating capital - None - 493,823 493,823
Note 1: Reasons for financing are as follows:
a. Business relationship. b. The need for short-term financing.
Note 2: Financing limit for each borrower and aggregate financing limits are calculated based on the Company’s policy. Note 3: The net worth value is based on the most current reviewed financial statements. Note 4: All intercompany financing loans have been eliminated from consolidation.
(Concluded)

135 136‧Lite-On Technology Corporation 2015 Annual Report Lite-On Technology Corporation 2015 Annual Report‧
- 94 -
TABLE 2 LITE-ON TECHNOLOGY CORPORATION AND SUBSIDIARIES ENDORSEMENT/GUARANTEE PROVIDED FOR THE YEAR ENDED DECEMBER 31, 2015 (Amounts in Thousands of New Taiwan Dollars)
No. Endorsement/ Guarantee Provider
Guaranteed Party Limits on
Endorsement/ Guarantee Amount Provided to Each Guaranteed Party
(Note 2)
Maximum Balance
for the Period Ending Balance Amount Actually
Drawn
Amount of Endorsement/
Guarantee Collateralized by Properties
Ratio of Accumulated Endorsement/
Guarantee to Net Equity Per Latest
Financial Statements
(%)
Maximum Endorsement/
Guarantee Amount Allowable (Note 2)
Guarantee Provided by
Parent Company
Guarantee Provided by A Subsidiary
Guarantee Provided to Subsidiaries In Mainland
China
Note Name Nature of
Relationship (Note 1)
0 Lite-On Technology Lite-On Technology (Europe) B.V. b $ 7,598,851 $ 140,006 $ 68,026 $ 68,026 $ - 0.09 $ 30,395,404 Yes No No Corporation (the “Parent Lite-On Mobile Pte. Ltd. (Note 3) b 7,598,851 10,064,000 7,866,000 6,555,000 - 10.35 30,395,404 Yes No No Company”) Silitek Elec. (Dongguan) Co., Ltd. c 7,598,851 2,490,900 2,490,900 1,311,000 - 3.28 30,395,404 Yes No Yes Guangzhou Lite-On Mobile
Electronic Components Co., Ltd. c 7,598,851 1,320,900 852,150 524,400 - 1.12 30,395,404 Yes No Yes
1 Lite-On Mobile Oyj Lite-On Mobile Sweden AB b 181,615 15,708 - - - - 454,037 No No No (formerly: Perlos Oyj) Guangzhou Lite-On Mobile
Electronic Components Co., Ltd. c 181,615 823,091 804,693 87,718 - 1.06 454,037 No No Yes
2 Lite-On Capital Corporation Lite-On Green Technologies B.V. c 2,148,264 864,280 839,876 839,876 - 1.11 2,148,264 No No No
Note 1: Relationship between endorser/guarantor and endorsee/guarantee are as follows:
a. Business relationship. b. A subsidiary in which the Company holds directly over 50% of equity interest. c. An investee in which the Company and its subsidiaries hold over 50% of equity interest.
Note 2: a. The aggregate amount of guarantees/endorsements by Lite-On Technology Corporation should not exceed 40% of its net worth, and the amount of guarantees/endorsements for any single entity should not exceed 10% of its net worth.
b. The endorsement/guarantee limit for each entity and the total endorsement/guarantee limit are calculated on the basis of Lite-On Mobile Oyj’s and Lite-On Capital Corporation’s endorsement/guarantee procedures. c. Limits on endorsement/guarantee amount provided to each guaranteed party and maximum endorsement/guarantee amount allowable were calculated on the basis of the net worth of the endorsement/guarantee provider, as shown in its most recent reviewed financial statements.
Note 3: The guarantee provided by the Parent Company to Lite-On Mobile Pte. Ltd. is for the repayment of the latter’s syndicated loan obtained in December 2013.

137 138‧Lite-On Technology Corporation 2015 Annual Report Lite-On Technology Corporation 2015 Annual Report‧
- 95 -
TABLE 3 LITE-ON TECHNOLOGY CORPORATION AND SUBSIDIARIES MARKETABLE SECURITIES HELD DECEMBER 31, 2015 (In Thousands of New Taiwan Dollars, Unless Stated Otherwise)
Held Company Name Marketable Securities Type and Name Relationship with the Company Financial Statement Account
December 31, 2015
Note Shares/Units (In Thousands)
Carrying Value (Foreign
Currencies in Thousands)
Percentage of
Ownership (%)
Fair Value (Foreign
Currencies in Thousands)
Lite-On Technology Corporation Common stock EPISTAR Corporation Member of the board of directors Available-for-sale financial assets -
non-current 5,908 $ 150,653 0.54 $ 150,653
Wistron Corporation - 〃 4,981 92,648 0.19 92,648 CO-TECH Development Corp. Chairman of the board is the same person 〃 1,530 14,535 0.73 14,535 Com2B Corp. - 〃 5,000 19,009 11.11 19,009 Avamax Corp. - 〃 559 - 6.99 - Note Aetas Technology, Inc. Member of the board of directors 〃 4,026 - 8.07 - Note AuriaSolar Co., Ltd. - 〃 41,400 - 19.71 - Note Z-Com, Inc. - 〃 3,245 28,490 4.10 28,490 - Fong Han Electronics Co., Ltd. - 〃 1,167 - 6.67 - Note Xepex Electronics Co., Ltd. - 〃 - - - - Note AOPEN, Inc. - 〃 100 903 0.08 903 Oplink Communications, Inc. - 〃 12 9,262 0.07 9,262 North America Micro-Electronic & Software,
Incorporated - 〃 5 1,154 2.67 1,154
Action Media Technologies, Inc. - 〃 38 - - - Note Taiwan Changxing Technology Co., Ltd. - 〃 462 4,620 15.40 4,620 Preferred stock Arkologic Holdings Limited - 〃 11,111 - 7.66 - Note PI-CORAL - 〃 1,139 - 10.65 - Note Convertible bond Xepex Electronics Co., Ltd. - Debt investments with no active market -
non-current 150 - - - Note
Lite-On Capital Corporation Common stock Lite-On Technology Corporation The Parent Company Available-for-sale financial assets -
non-current 15,041 479,049 0.64 479,049
Lead Data, Inc. - 〃 865 6,095 0.59 6,095 Compund Solar Technology Co., Ltd. - 〃 2,000 - 2.86 - Note Z-Com, Inc. - 〃 2,631 23,102 3.33 23,102 Auden Techno Corp. Member of the board of directors 〃 8,124 178,716 19.90 178,716
(Continued)

139 140‧Lite-On Technology Corporation 2015 Annual Report Lite-On Technology Corporation 2015 Annual Report‧
- 96 -
Held Company Name Marketable Securities Type and Name Relationship with the Company Financial Statement Account
December 31, 2015
Note Shares/Units (In Thousands)
Carrying Value (Foreign
Currencies in Thousands)
Percentage of
Ownership (%)
Fair Value (Foreign
Currencies in Thousands)
Lite-On Green Energy (HK) Limited Common stock Changzhou Binhu Thin Film Solar Greenhouse
Co., Ltd. - Available-for-sale financial assets -
non-current - US$ 140 19.90 US$ 140
Lite-On Electronics Co., Ltd. Share certificates Lite-On Technology Corporation GDR The Parent Company 〃 244 $ 77,491 0.10 $ 77,491 Yet Foundate Ltd. Share certificates Lite-On Technology Corporation GDR 〃 〃 226 71,820 0.10 71,820 Common stock Northen Lights Semiconductor - 〃 3,000 - 5.91 - Note LTC Group Ltd. (BVI) Common stock VIZIO, Inc. - 〃 437 - 2.90 - Note LTC International Ltd. Common stock Lite-On Technology Corporation The Parent Company 〃 3,774 120,210 0.16 120,210 Share certificates Lite-On Technology Corporation GDR 〃 〃 320 101,549 0.14 101,549 Lite-On China Holding Co., Ltd. Common stock COMMIT Incorporated - 〃 4,962 - 1.87 - Note LET (HK) Ltd. Fund Innovation Works Development Fund, L.P. - 〃 - HK$ 6,152 - HK$ 6,152 Silitech Technology Corp. Common stock Chi Mei Mold Co., Ltd. Member of the board of directors 〃 1,300 $ 11,165 13.00 $ 11,165 RTR-TECH Technology Co., Ltd. 〃 〃 6,820 68,138 9.46 68,138 Silitech (Bermuda) Holding Ltd. Common stock Innovation Works Development Fund, L.P. - 〃 - US$ 828 - US$ 828 Lite-On Japan Ltd. Common stock Tamura Corporation - 〃 19,250 JPY 6,969 0.03 JPY 6,969 The Dai-ichi Life Insurance Company, Limited - 〃 7 JPY 1,425 - JPY 1,425 With Corporation - 〃 9,000 JPY 5,400 14.20 JPY 5,400
(Continued)
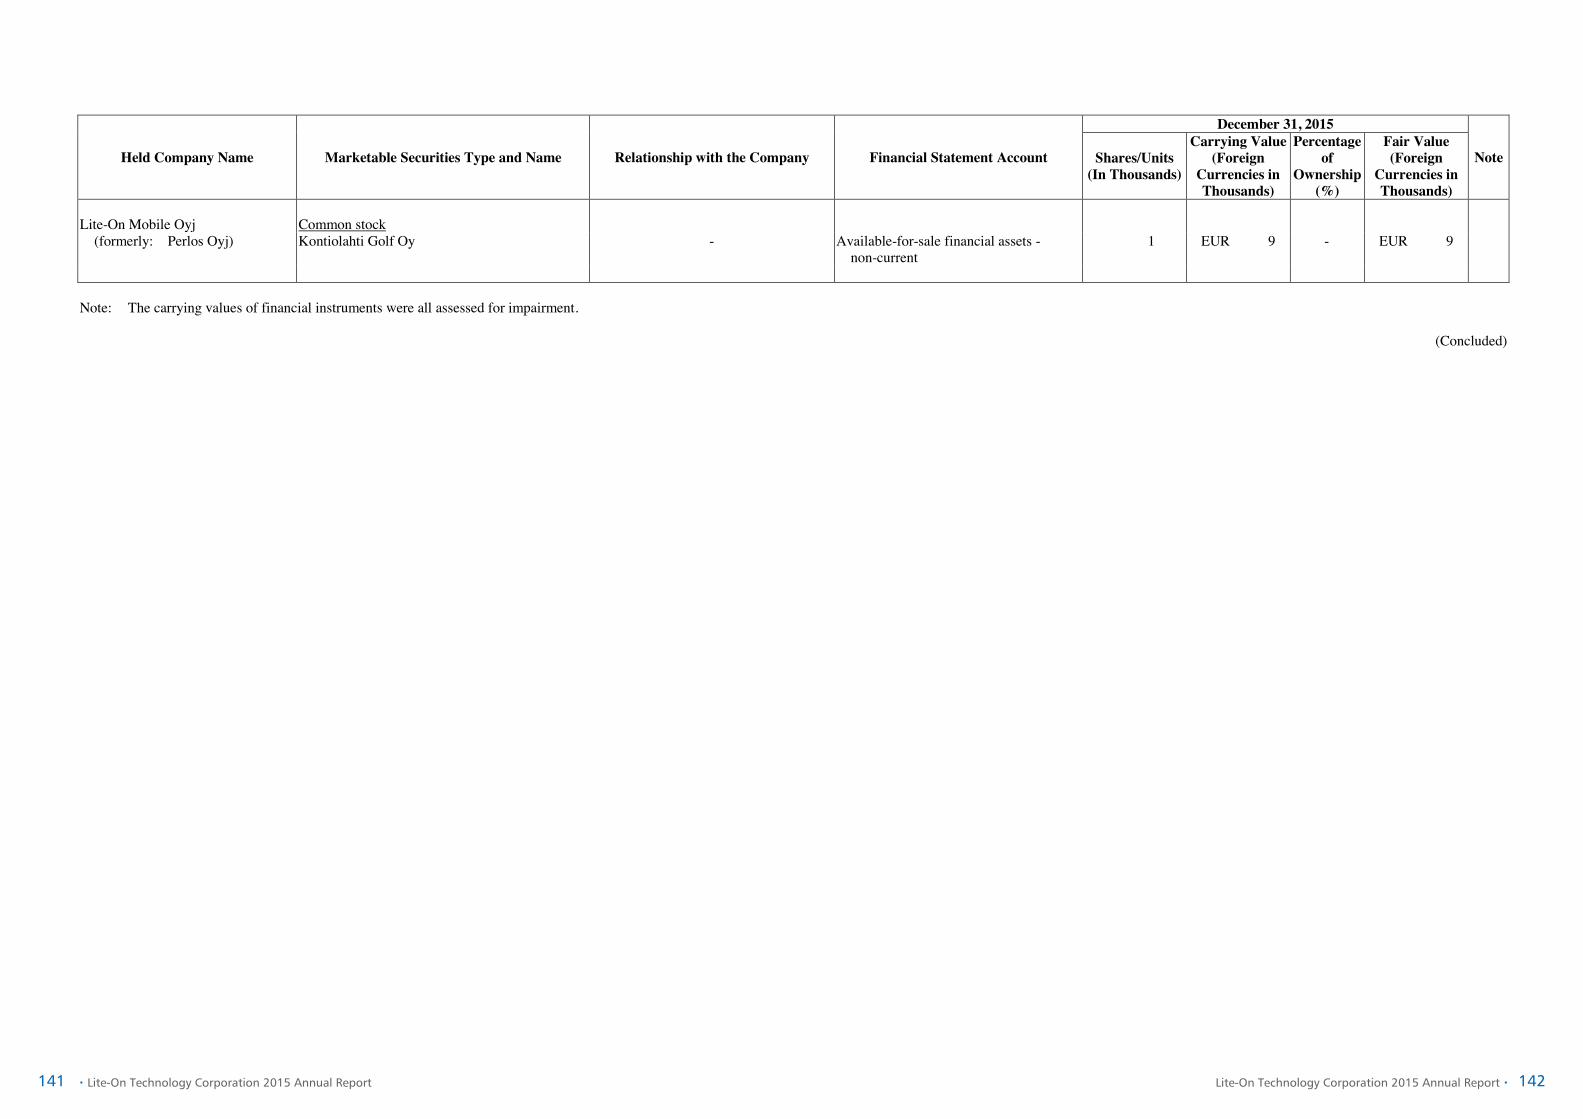
141 142‧Lite-On Technology Corporation 2015 Annual Report Lite-On Technology Corporation 2015 Annual Report‧
- 97 -
Held Company Name Marketable Securities Type and Name Relationship with the Company Financial Statement Account
December 31, 2015
Note Shares/Units (In Thousands)
Carrying Value (Foreign
Currencies in Thousands)
Percentage of
Ownership (%)
Fair Value (Foreign
Currencies in Thousands)
Lite-On Mobile Oyj Common stock (formerly: Perlos Oyj) Kontiolahti Golf Oy - Available-for-sale financial assets -
non-current 1 EUR 9 - EUR 9
Note: The carrying values of financial instruments were all assessed for impairment.
(Concluded)

143 144‧Lite-On Technology Corporation 2015 Annual Report Lite-On Technology Corporation 2015 Annual Report‧
- 98 -
TABLE 4 LITE-ON TECHNOLOGY CORPORATION AND SUBSIDIARIES MARKETABLE SECURITIES ACQUIRED AND DISPOSED OF AT COSTS OR PRICES OF AT LEAST NT$300 MILLION OR 20% OF THE PAID-IN CAPITAL FOR THE YEAR ENDED DECEMBER 31, 2015 (Amounts in Thousands of New Taiwan Dollars or in Thousands of Foreign Currencies)
Company Name Marketable Securities Type and Name Financial Statement Account Counterparty Nature of Relationship
Beginning Balance Acquisition Disposal Ending Balance Shares/Units
(In Thousands) Amount Shares/Units (In Thousands) Amount Shares/Units
(In Thousands) Amount Carrying Amount
Gain (Loss) on Disposal
Shares/Units (In Thousands) Amount
Lite-On Singapore Pte. Ltd. Lite-On Technology (Shanghai) Ltd. Investment accounted for using equity
method - - - $ - - US$ 70,412
(Note 1) - $ - $ - $ - - US$ 70,412
Lite-On Technology Corporation Lite-On International Holding Co., Ltd. 〃 - - 285,825 23,434,167 50,000 $ 2,239,074
(Note 2) - - 566,837
(Note 2) - 335,825 $ 25,106,404
Lite-On International Holding Co., Ltd. Lite-On China Holding Co., Ltd. 〃 - - 349,442 US$ 781,049
50,000 US$ 69,239
(Note 3) - - US$ 22,404
(Note 3) - 399,442 US$ 827,884
Lite-On China Holding Co., Ltd. Lite-On Electronics Co., Ltd. 〃 - - 2,578,633 US$ 734,782
387,600 US$ 70,869
(Note 4) - - US$ 21,835
(Note 4) - 2,966,233 US$ 783,816
Lite-On Electronics Co., Ltd. Lite-On Technology (GZ) Investment Company
Ltd. 〃 - - - HK$ 373,543
- HK$ 381,110
(Note 5) - - HK$ 148,838
(Note 5) - - HK$ 605,815
Lite-On Technology (GZ) Investment
Company Ltd. Zhuhai Lite-On Mobile Technology Co., Ltd. 〃 - - - $ - - CNY 461,665
(Note 6) - - CNY121,154
(Note 6) - - US$ 340,511
Silitech Technology Corp. Allianz Global Investors Taiwan Money Market
Fund Financial instruments at fair value
through profit or loss - current - - - - 61,617 $ 760,000 61,617 760,667 $ 760,000 667 - $ -
Yuanta De-Li Money Market Fund 〃 - - - - 29,261 470,000 29,261 470,384 470,000 384 - - Silitech Technology (SuZhou) Co., Ltd. Fixed Income Instruments Debt investments with no active
market - current - - - - - 424,399
(CNY 83,810 ) - - - - - 424,399
(CNY 83,810 ) Note 1: The acquisition amount of US$65,000 thousand was the capital injected in the investee during the period. Note 2: The acquisition amount of $1,555,000 thousand was the capital injected in the investee during the period; the $684,074 thousand is from the gain accounted for using equity method; the $248,776 thousand in the disposal is from the other comprehensive income for using equity method and the $318,061 thousand in the disposal
is from the changes in equities for using equity method. Note 3: The acquisition amount of US$50,000 thousand was the capital injected in the investee during the period; the US$19,239 thousand is from the gain accounted for using equity method; the US$12,250 thousand in the disposal is from the other comprehensive income for using equity method and the US$10,154 thousand in the
disposal is from the changes in equities for using equity method. Note 4: The acquisition amount of US$50,000 thousand was the capital injected in the investee during the period; the US$20,869 thousand is from the gain accounted for using equity method; the US$11,681 thousand in the disposal is from the other comprehensive income for using equity method and the US$10,154 thousand in the
disposal is from the changes in equities for using equity method. Note 5: The acquisition amount of HK$381,110 thousand was the capital injected in the investee during the period; the HK$23,390 thousand in the disposal is from the loss accounted for using equity method, the HK$44,446 thousand in the disposal is from the other comprehensive income for using equity method and the HK$81,002
thousand in the disposal is from the changes in equities for using equity method. Note 6: The acquisition amount of CNY461,665 thousand was the capital injected in the investee during the period; the CNY26,093 thousand in the disposal is from the loss accounted for using equity method and the CNY95,061 thousand in the disposal is from the changes in equities for using equity method.

145 146‧Lite-On Technology Corporation 2015 Annual Report Lite-On Technology Corporation 2015 Annual Report‧- 99 -
TABLE 5 LITE-ON TECHNOLOGY CORPORATION AND SUBSIDIARIES TOTAL PURCHASES FROM OR SALES TO RELATED PARTIES OF AT AMOUNTING TO AT LEAST NT$100 MILLION OR 20% OF THE PAID-IN CAPITAL FOR THE YEAR ENDED DECEMBER 31, 2015 (Amounts in Thousands of New Taiwan Dollars or in Thousands of Foreign Currencies)
Company Name Related Party Nature of Relationship
Transaction Details Abnormal Transaction Notes/Accounts (Payable) or Receivable Note Purchase/
Sale Amount % to Total Payment Terms Unit Price Payment Terms Ending Balance % to
Total Lite-On Technology Corporation Lite-On Trading USA, Inc. Note 2 Sale $ (3,295,462) (3) About 90 days Cost-plus pricing No significant difference $ 1,082,305 3 Lite-On Japan Ltd. Note 1 Sale (861,796) (1) About 90 days Cost-plus pricing No significant difference 164,723 1 Philip & Lite-On Digital Solutions Corp. Note 1 Sale (12,810,242) (10) About 90 days Cost-plus pricing No significant difference 4,214,601 13 Lite-On Singapore Pte. Ltd. Note 1 Sale (4,697,862) (4) About 90 days Cost-plus pricing No significant difference 899,640 3 China Bridge Express (Wuxi) Co., Ltd. Note 2 Sale (826,743) (1) About 90 days Cost-plus pricing No significant difference 304,660 1 Lite-On Sales & Distribution Inc. Note 2 Sale (128,049) - About 90 days Cost-plus pricing No significant difference 129,288 - Lite-On China Holding Co., Ltd. Note 2 Sale (141,230) - About 90 days Cost-plus pricing No significant difference 142,250 - Lite-On Technology (Changzhou) Co., Ltd. Note 2 Sale (1,163,932) (1) About 90 days Cost-plus pricing No significant difference 479,631 1 Lite-On Technology (Changzhou) Co., Ltd. Note 2 Purchase 1,519,674 1 About 90 days Cost-plus pricing No significant difference (521,929) (2) LET (HK) Ltd. Note 1 Purchase 10,040,910 9 About 90 days Cost-plus pricing No significant difference (853,098) (3) Lite-On Singapore Pte. Ltd. Note 1 Purchase 24,766,587 22 About 90 days Cost-plus pricing No significant difference (8,193,189) (30) Li Shin International Enterprise Corp. Note 1 Purchase 3,531,460 3 About 90 days Cost-plus pricing No significant difference (829,029) (3) Lite-On Overseas Trading Co., Ltd. Note 1 Purchase 57,023,431 51 About 90 days Cost-plus pricing No significant difference (8,115,555) (30) Lite-On Automotive Electronics (Guangzhou) Co., Ltd. Note 2 Purchase 735,033 1 About 90 days Cost-plus pricing No significant difference (264,241) (1) Lite-On Network Communication (Dongguan) Limited Lite-On Overseas Trading Co., Ltd. Note 3 Sale (7,422,514) (96) About 90 days Cost-plus pricing No significant difference 1,009,696 90 China Bridge Express (Wuxi) Co., Ltd. Note 4 Sale (244,867) (3) About 90 days Cost-plus pricing No significant difference 101,682 9 Lite-On Electronics (Dongguan) Co., Ltd. Lite-On Overseas Trading Co., Ltd. Note 3 Sale (12,605,138) (100) About 90 days Cost-plus pricing No significant difference 1,107,114 100 Silitek Elec. (Dongguan) Co., Ltd. Lite-On Overseas Trading Co., Ltd. Note 3 Sale (8,704,470) (95) About 90 days Cost-plus pricing No significant difference 1,199,503 90 Lite-On Electronics (Guangzhou) Co., Ltd. Lite-On Overseas Trading Co., Ltd. Note 3 Sale (39,788,218) (70) About 90 days Cost-plus pricing No significant difference 6,627,863 49 Dong Guan G-Tech Computers Co., Ltd. Note 4 Sale (140,509) - About 90 days Cost-plus pricing No significant difference - - Dong Guan G-Tech Computers Co., Ltd. Lite-On Overseas Trading Co., Ltd. Note 3 Sale (3,054,784) (90) About 90 days Cost-plus pricing No significant difference 311,575 82 Lite-On Electronics (Guangzhou) Co., Ltd. Note 4 Sale (265,491) (8) About 90 days Cost-plus pricing No significant difference 68,476 18 Lite-On Electronics (Thailand) Co., Ltd. Lite-On Singapore Pte. Ltd. Note 3 Sale (3,148,388) (97) About 90 days Cost-plus pricing No significant difference 736,127 95 Lite-On Power Technology (Dongguan) Co., Ltd. Lite-On Electronic Co., Ltd. Note 4 Sale (1,483,284) (100) About 90 days Cost-plus pricing No significant difference - - Lite-On Singapore Pte. Ltd. Lite-On Electronics H.K. Ltd. Note 3 Sale (2,059,526) (2) About 90 days Cost-plus pricing No significant difference 391,471 2 Lite-On Japan Ltd. Note 3 Sale (1,559,866) (2) About 90 days Cost-plus pricing No significant difference 536,939 2 Lite-On, Inc. Note 4 Sale (621,231) (1) About 90 days Cost-plus pricing No significant difference 136,069 1 Lite-On Trading USA, Inc. Note 4 Sale (4,725,589) (6) About 90 days Cost-plus pricing No significant difference 1,605,131 7 China Bridge Express (Wuxi) Co., Ltd. Note 4 Sale (1,146,671) (1) About 90 days Cost-plus pricing No significant difference 500,853 2 Leotek Electronics USA LLC Note 4 Sale (1,405,437) (2) About 90 days Cost-plus pricing No significant difference 532,180 2 Lite-On Overseas Trading Co., Ltd. Note 3 Sale (382,058) - About 90 days Cost-plus pricing No significant difference 643,670 3 Philips & Lite-On Digital Solutions USA Inc. Note 4 Sale (9,918,059) (12) About 90 days Cost-plus pricing No significant difference 1,449,385 6 Philips & Lite-On Digital Solutions Germany GmbH. Note 4 Sale (1,836,539) (2) About 90 days Cost-plus pricing No significant difference 291,208 1 Lite-On Sales & Distribution Inc. Note 4 Sale (570,405) (1) About 90 days Cost-plus pricing No significant difference 206,718 1 Lite-On Technology (Changzhou) Co., Ltd. Note 4 Sale (206,086) - About 90 days Cost-plus pricing No significant difference 69,014 - Lite-On Overseas Trading Co., Ltd. Lite-On Network Communication (Dongguan) Limited Note 4 Sale (6,369,124) (4) About 90 days Cost-plus pricing No significant difference 1,770,962 5 Lite-On Technology (Changzhou) Co., Ltd. Note 4 Sale (15,216,534) (9) About 90 days Cost-plus pricing No significant difference 5,355,946 14 Lite-On Electronics (Dongguan) Co., Ltd. Note 4 Sale (11,171,663) (6) About 90 days Cost-plus pricing No significant difference 1,211,482 3 Silitek Elec. (Dongguan) Co., Ltd. Note 4 Sale (6,835,674) (4) About 90 days Cost-plus pricing No significant difference 656,886 2 Dong Guan G-Tech Computers Co., Ltd. Note 4 Sale (1,968,661) (1) About 90 days Cost-plus pricing No significant difference 645,524 2 DongGuan G-Pro Computer Co., Ltd. Note 4 Sale (5,144,551) (3) About 90 days Cost-plus pricing No significant difference 1,298,409 4
(Continued)

147 148‧Lite-On Technology Corporation 2015 Annual Report Lite-On Technology Corporation 2015 Annual Report‧
- 100 -
Company Name Related Party Nature of Relationship
Transaction Details Abnormal Transaction Notes/Accounts (Payable) or Receivable Note Purchase/
Sale Amount % to Total Payment Terms Unit Price Payment Terms Ending Balance % to
Total Lite-On Overseas Trading Co., Ltd. Lite-On Singapore Pte. Ltd. Note 3 Sale $ (29,420,468) (17) About 90 days Cost-plus pricing No significant difference $ 8,597,033 23 Lite-On Electronics (Guangzhou) Co., Ltd. Note 4 Sale (41,278,205) (24) About 90 days Cost-plus pricing No significant difference 9,277,765 25 I-Solutions Limited Note 4 Sale (437,145) - About 90 days Cost-plus pricing No significant difference 154,260 - Huizhou Li Shin Electronic Co., Ltd. Note 4 Sale (178,268) - About 90 days Cost-plus pricing No significant difference 181,261 - Lite-On Semiconductor Corp. Note 5 Purchase 536,171 - About 90 days Cost-plus pricing No significant difference (195,694) - Diodes Taiwan Inc. Note 6 Purchase 415,916 - About 90 days Cost-plus pricing No significant difference (118,820) - Lite-On Electronics Co., Ltd. Lite-On Singapore Pte. Ltd. Note 3 Sale (1,483,284) (100) About 90 days Cost-plus pricing No significant difference - - LET (HK) Ltd. Lite-On Singapore Pte. Ltd. Note 3 Sale (9,698,066) (28) About 90 days Cost-plus pricing No significant difference 11,280 - Lite-On Opto Technology (Guangzhou) Co., Ltd. Note 4 Sale (1,494,368) (4) About 90 days Cost-plus pricing No significant difference 691,681 10 Lite-On IT Opto Tech (BH) Co., Ltd. Note 4 Sale (12,234,874) (35) About 90 days Cost-plus pricing No significant difference 5,044,250 76 Auto Electric Technology (Guangzhou) Ltd. Note 4 Sale (232,412) (1) About 90 days Cost-plus pricing No significant difference 62,428 1 Lite-Space Technology Company Limited Note 5 Purchase 3,761,826 10 About 90 days Cost-plus pricing No significant difference (257,850) (4) DongGuan G-Pro Computer Co., Ltd. Lite-On Overseas Trading Co., Ltd. Note 3 Sale (6,514,823) (100) About 90 days Cost-plus pricing No significant difference - - Lite-On Electronics (Tianjinn) Co., Ltd. Lite-On Overseas Trading Co., Ltd. Note 3 Sale (1,669,705) (100) About 90 days Cost-plus pricing No significant difference 301,145 100 Lite-On Auto Electric Technology (Guangzhou) Ltd. Philip & Lite-On Digital Solutions (Shanghai) Co., Ltd. Note 4 Sale (280,499) (36) About 90 days Cost-plus pricing No significant difference - - Lite-On Technology (Shanghai) Ltd. Note 4 Sale (477,351) (60) About 90 days Cost-plus pricing No significant difference 36,929 84 Lite-On IT Opto Tech (BH) Co., Ltd. LET (HK) Ltd. Note 3 Sale (17,591,910) (100) About 90 days Cost-plus pricing No significant difference 1,516,402 100 Lite-On Opto Technology (Guangzhou) Co., Ltd. LET (HK) Ltd. Note 3 Sale (2,992,426) (96) About 90 days Cost-plus pricing No significant difference 646,403 94 Lite-On Auto Electric Technology (Guangzhou) Ltd. Note 4 Sale (101,562) (3) About 90 days Cost-plus pricing No significant difference 42,103 6 Huizhou Li Shin Electronic Co., Ltd. Li Shin International Enterprise Corp. Note 3 Sale (1,567,066) (76) About 90 days Cost-plus pricing No significant difference 434,320 81 Lite-On Li Shin Technology (Ganzhou) Co., Ltd. Li Shin International Enterprise Corp. Note 3 Sale (578,563) (100) About 90 days Cost-plus pricing No significant difference 224,556 100 Lite-On Technology (Ying Tan) Co., Ltd. Li Shin International Enterprise Corp. Note 3 Sale (752,158) (100) About 90 days Cost-plus pricing No significant difference 231,985 100 Lite-On Technology (Xianging) Co., Ltd. Li Shin International Enterprise Corp. Note 3 Sale (577,179) (100) About 90 days Cost-plus pricing No significant difference 103,926 100 Lite-On Opto Technology (Changzhou) Co., Ltd. Lite-On Singapore Pte. Ltd. Note 3 Sale (3,189,894) (100) About 90 days Cost-plus pricing No significant difference 173,523 95 Lite-On Technology (Changzhou) Co., Ltd. Lite-On Overseas Trading Co., Ltd. Note 3 Sale (8,782,083) (36) About 90 days Cost-plus pricing No significant difference 661,207 29 Lite-On Singapore Pte. Ltd. Note 3 Sale (13,803,594) (57) About 90 days Cost-plus pricing No significant difference 1,122,616 49 Lite-On Automotive (Wuxi) Co., Ltd. Lite-On Technology (Shanghai) Ltd Note 4 Sale (132,867) (18) About 90 days Cost-plus pricing No significant difference 170,302 49 Lite-On Automotive Electronics (Guangzhou) Co., Ltd. Lite-On Singapore Pte. Ltd. Note 3 Sale (1,102,906) (34) About 90 days Cost-plus pricing No significant difference 359,621 29 Lite-On Technology (Shanghai) Ltd Note 4 Sale (174,067) (5) About 90 days Cost-plus pricing No significant difference 176,933 14 Lite-On Technology (Shanghai) Ltd. Philip & Lite-On Digital Solutions (Shanghai) Co., Ltd. Note 4 Sale (635,528) (60) About 90 days Cost-plus pricing No significant difference 44,675 12 Lite-On Japan Ltd. Lite-On Semiconductor Corp. Note 5 Sale JPY (662,058) (4) About 90 days Cost-plus pricing No significant difference JPY 240,826 8 Lite-On Semiconductor Corp. Note 5 Purchase JPY 1,530,248 9 About 90 days Cost-plus pricing No significant difference JPY (283,014) (8) Shenzhen Lite-On Mobile Precision Molds Co., Ltd. Guangzhou Lite-On Mobile Electronic Components Co., Ltd. Note 4 Sale $ (605,618) (85) About 90 days Cost-plus pricing No significant difference $ 106,272 94 Lite-On Mobile Pte. Ltd. Guangzhou Lite-On Mobile Electronic Components Co., Ltd. Note 4 Sale (329,664) (20) About 90 days Cost-plus pricing No significant difference 4,984 1 Beijing Lite-On Mobile Electronic and
Telecommunication Components Co., Ltd. Lite-On Mobile Oyj (formerly: Perlos Oyj) Note 4 Sale (727,809) (39) About 90 days Cost-plus pricing No significant difference 14,278 24
Guangzhou Lite-On Mobile Electronic Components Co.,
Ltd. Lite-On Mobile Pte. Ltd. Note 3 Sale (456,762) (9) About 90 days Cost-plus pricing No significant difference 253,851 19
Lite-On Mobile Oyj (formerly: Perlos Oyj) Note 4 Sale (102,823) (2) About 90 days Cost-plus pricing No significant difference 28,162 2 (Continued)
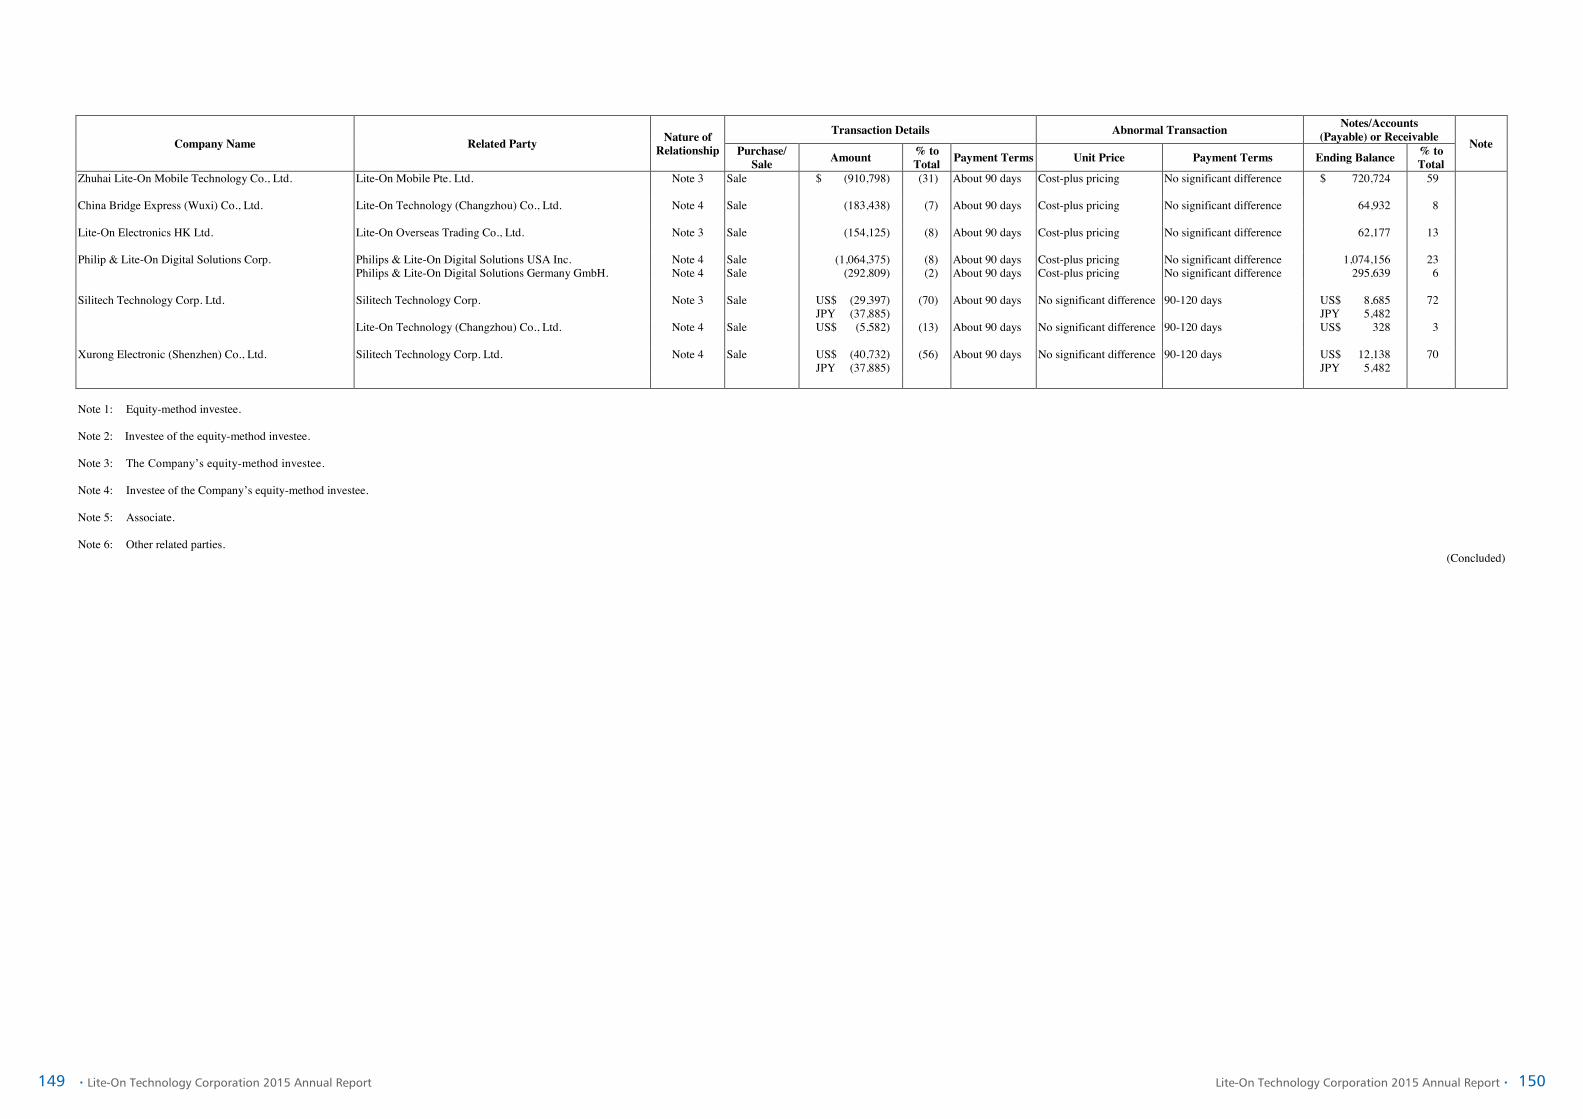
149 150‧Lite-On Technology Corporation 2015 Annual Report Lite-On Technology Corporation 2015 Annual Report‧
- 101 -
Company Name Related Party Nature of Relationship
Transaction Details Abnormal Transaction Notes/Accounts (Payable) or Receivable Note Purchase/
Sale Amount % to Total Payment Terms Unit Price Payment Terms Ending Balance % to
Total Zhuhai Lite-On Mobile Technology Co., Ltd. Lite-On Mobile Pte. Ltd. Note 3 Sale $ (910,798) (31) About 90 days Cost-plus pricing No significant difference $ 720,724 59 China Bridge Express (Wuxi) Co., Ltd. Lite-On Technology (Changzhou) Co., Ltd. Note 4 Sale (183,438) (7) About 90 days Cost-plus pricing No significant difference 64,932 8 Lite-On Electronics HK Ltd. Lite-On Overseas Trading Co., Ltd. Note 3 Sale (154,125) (8) About 90 days Cost-plus pricing No significant difference 62,177 13 Philip & Lite-On Digital Solutions Corp. Philips & Lite-On Digital Solutions USA Inc. Note 4 Sale (1,064,375) (8) About 90 days Cost-plus pricing No significant difference 1,074,156 23 Philips & Lite-On Digital Solutions Germany GmbH. Note 4 Sale (292,809) (2) About 90 days Cost-plus pricing No significant difference 295,639 6 Silitech Technology Corp. Ltd. Silitech Technology Corp. Note 3 Sale US$ (29,397)
JPY (37,885) (70) About 90 days No significant difference 90-120 days US$ 8,685
JPY 5,482 72
Lite-On Technology (Changzhou) Co., Ltd. Note 4 Sale US$ (5,582) (13) About 90 days No significant difference 90-120 days US$ 328 3 Xurong Electronic (Shenzhen) Co., Ltd. Silitech Technology Corp. Ltd. Note 4 Sale US$ (40,732)
JPY (37,885) (56) About 90 days No significant difference 90-120 days US$ 12,138
JPY 5,482 70
Note 1: Equity-method investee. Note 2: Investee of the equity-method investee. Note 3: The Company’s equity-method investee. Note 4: Investee of the Company’s equity-method investee. Note 5: Associate. Note 6: Other related parties.
(Concluded)

151 152‧Lite-On Technology Corporation 2015 Annual Report Lite-On Technology Corporation 2015 Annual Report‧
- 102 -
TABLE 6 LITE-ON TECHNOLOGY CORPORATION AND SUBSIDIARIES RECEIVABLES FROM RELATED PARTIES AMOUNTING TO AT LEAST NT$100 MILLION OR 20% OF THE PAID-IN CAPITAL DECEMBER 31, 2015 (Amounts in Thousands of New Taiwan Dollars or in Thousands of Foreign Currencies)
Company Name Related Party Nature of Relationship
Ending Balance of Notes
Receivable-inter
Ending Balance of Trade
Receivables-inter
Ending Balance of Other
Receivables-inter
Turnover Rate
Overdue Amounts Received in Subsequent
Period
Allowance for Bad Debts Amount Action Taken
Lite-On Technology Corporation Philip & Lite-On Digital Solutions Corp. Note 1 $ - $ 4,214,601 $ 229,265 3.68 $ - - $ 1,887,965 $ - Lite-On Technology (Changzhou) Co., Ltd. Note 2 - 479,631 - 2.51 - - 953 - China Bridge Express (Wuxi) Co., Ltd. Note 2 - 304,660 - 2.19 - - 136,707 - Titanic Capital Services Ltd. Note 2 - - 132,038 - - - - - Lite-On Singapore Pte. Ltd. Note 1 - 899,640 166,969 4.34 34 - 127,044 - Lite-On Japan Ltd. Note 1 - 164,723 7,847 2.79 549 - 12,238 - Lite-On Trading USA, Inc. Note 2 - 1,082,305 - 3.34 - - 486,743 - Lite-On Sales & Distribution Inc Note 2 - 129,288 3,707 1.98 - - - - Philips & Lite-On Digital Solutions USA Inc. Note 2 - - 100,098 2.15 - - - - Lite-On Overseas Trading Co., Ltd. Note 1 - 3,575,995 2,077 0.01 - - 1,458,232 - Lite-On China Holding Co., Ltd. Note 2 - 142,250 - 0.94 - - 142,250 - Lite-On Network Communication (Dongguan) Limited Lite-On Overseas Trading Co., Ltd. Note 3 - 1,009,696 - 7.68 - - 1,009,696 - China Bridge Express (Wuxi) Co., Ltd. Note 4 - 101,682 - 4.20 - - 52,364 - Dong Guan G-Tech Computers Co., Ltd. Lite-On Overseas Trading Co., Ltd. Note 3 - 311,575 - 9.57 - - 311,575 - Lite-On Electronics (Tianjinn) Co., Ltd. Lite-On Overseas Trading Co., Ltd. Note 3 - 301,145 - 6.21 - - 301,145 - Lite-On Opto Technology (Guangzhou) Ltd. Note 4 - - 257,316 - - - - - Lite-On Electronics (Dongguan) Co., Ltd. Lite-On Overseas Trading Co., Ltd. Note 3 - 1,107,114 - 11.97 - - 1,107,114 - G&W Technology (BVI) Limited G&W Technology Limited Note 4 - - 178,546 - - - - - Silitek Elec. (Dongguan) Co., Ltd. Lite-On Overseas Trading Co., Ltd. Note 3 - 1,199,503 15,736 5.10 - - 1,199,503 - Lite-On Electronics (Thailand) Co., Ltd. Lite-On Singapore Pte. Ltd. Note 3 - 736,127 9,947 4.05 - - 503,031 - Lite-On Singapore Pte. Ltd. Lite-On Electronics H.K. Ltd. Note 3 - 391,471 - 5.28 - - 17,597 - Lite-On Japan Ltd. Note 3 - 536,939 1,230 3.53 - - 88,435 - Lite-On Trading USA, Inc. Note 4 - 1,605,131 122 2.93 - - 1,088,630 - Lite-On Mobile Pte. Ltd. Note 3 - - 1,311,501 - - - - - China Bridge Express (Wuxi) Co., Ltd. Note 4 - 500,853 - 2.61 - - 215,467 - Lite-On Overseas Trading Co., Ltd. Note 3 - 643,670 5 0.66 - - 430,809 - Lite-On, Inc. Note 4 - 136,069 1,793 4.45 29,155 - 114,142 - Leotek Electronics USA LLC Note 4 - 532,180 - 2.77 - - - - Philips & Lite-On Digital Solutions USA Inc. Note 4 - 1,449,385 - 13.69 - - 1,385,983 - Philips & Lite-On Digital Solutions Germany
GmbH. Note 4 - 291,208 3,827- 12.61 - - 291,208 -
Lite-On Sales & Distribution Inc. Note 4 - 206,718 - 5.52 - - 143,025 -
(Continued)

153 154‧Lite-On Technology Corporation 2015 Annual Report Lite-On Technology Corporation 2015 Annual Report‧
- 103 -
Company Name Related Party Nature of Relationship
Ending Balance of Notes
Receivable-inter
Ending Balance of Trade
Receivables-inter
Ending Balance of Other
Receivables-inter
Turnover Rate
Overdue Amounts Received in Subsequent
Period
Allowance for Bad Debts Amount Action Taken
Lite-On Technology (Changzhou) Co., Ltd. Lite-On Overseas Trading Co., Ltd. Note 3 $ - $ 661,207 $ - 18.47 $ - - $ 661,021 $ - Lite-On Singapore Pte. Ltd. Note 3 - 1,122,616 - 14.50 - - 1,110,882 - Zhuhai Lite-On Mobile Technology Co., Ltd. Note 4 - - 1,280,305 - - - - - Lite-On Opto Technology (Changzhou) Co., Ltd. Lite-On Singapore Pte. Ltd. Note 3 - 173,523 - 17.64 - - 173,523 - Changzhou Leotek New Energy Trade Limited Note 4 - - 177,252 - - - - - Lite-On Electronics (Guangzhou) Co., Ltd. Lite-On Overseas Trading Co., Ltd. Note 3 - 6,627,863 - 5.08 - - 5,356,048 - Huizhou Li Shin Electronic Co., Ltd. Li-Shin International Enterprise Corp. Note 3 - 434,320 - 4.41 - - 434,320 - Lite-On Technology (Ying Tan) Co., Ltd. Li-Shin International Enterprise Corp. Note 3 - 231,985 - 2.91 - - 171,390 - Lite-On Technology (Xianning) Co Ltd. Li-Shin International Enterprise Corp. Note 3 - 103,926 - 4.17 - - 103,926 - Lite-On Li Shin Technology (Ganzhou) Co., Ltd. Li-Shin International Enterprise Corp. Note 3 - 224,556 - 3.06 - - 210,272 - LET (HK) Ltd. Lite-On Opto Technology (Guangzhou) Co., Ltd. Note 4 - 691,681 1,725 1.16 - - 373,715 - Lite-On IT Opto Tech (BH) Co., Ltd. Note 4 - 5,044,250 19,128 1.91 - - 2,851,955 - Lite-On Overseas Trading Co., Ltd. Lite-On Network Communication (Dongguan)
Limited Note 4 - 1,770,962 - 3.72 - - 1,446,812 -
Lite-On Technology (Changzhou) Co., Ltd. Note 4 - 5,355,946 - 2.54 - - 26,712 - Silitek Elec. (Dongguan) Co., Ltd. Note 4 - 656,886 1,747 6.98 - - 656,886 - Lite-On Electronics (Dongguan) Co., Ltd. Note 4 - 1,211,482 - 9.22 - - 1,044,356 - Dong Guan G-Tech Computers Co., Ltd. Note 4 - 645,524 - 2.83 114,047 - 201,508 - I-Solutions Limited Note 4 - 154,260 - 2.39 - - 51,418 - DongGuan G-Pro Computer Co., Ltd. Note 4 - 1,298,409 3,303 4.13 - - 1,298,409 - Lite-On Electronics (Guangzhou) Co., Ltd. Note 4 - 9,277,765 - 4.25 - - 6,279,178 - Lite-On Singapore Pte. Ltd. Note 3 - 8,597,033 - 2.95 - - 8,041,598 - Huizhou Li Shin Electronic Co., Ltd. Note 4 - 181,261 - 1.97 - - 74,719 - Li-Shin International Enterprise Corp. Huizhou Li Shin Electronic Ltd. Note 4 - 183,563 282 - - - 183,563 - Philip & Lite-On Digital Solutions Corp. Philips & Lite-On Digital Solutions USA Inc. Note 4 - 1,074,156 4,070 1.98 - - - - Philips & Lite-On Digital Solutions Germany
GmbH Note 4 - 295,639 - 1.98 - - - -
Lite-On Automotive (Wuxi) Co., Ltd. Lite-On Technology (Shanghai) Ltd. Note 4 - 170,302 1,684 1.56 4,751 - 52,772 - Lite-On Automotive Electronics (Guangzhou) Co., Ltd. Lite-On Singapore Pte. Ltd. Note 3 - 359,621 193 3.61 - - 150,768 - Lite-On Technology (Shanghai) Ltd. Note 4 - 176,933 321 1.97 595 - 64,336 - Lite-On Opto Technology (Guangzhou) Co., Ltd. LET (HK) Ltd. Note 3 - 646,403 - 6.52 - - 435,794 - Lite-On IT Opto Tech (BH) Co., Ltd. LET (HK) Ltd. Note 3 - 1,516,402 - 5.11 - - 951,500 - Silitech Technology Corp. Ltd. Silitech (BVI) Holding Ltd. Note 3 - - 370,404 - - - - - Silitech (BVI) Holding Ltd. Silitech (Bermuda) Holding Ltd. Note 4 - - US$ 10,987 - - - - -
(Continued)
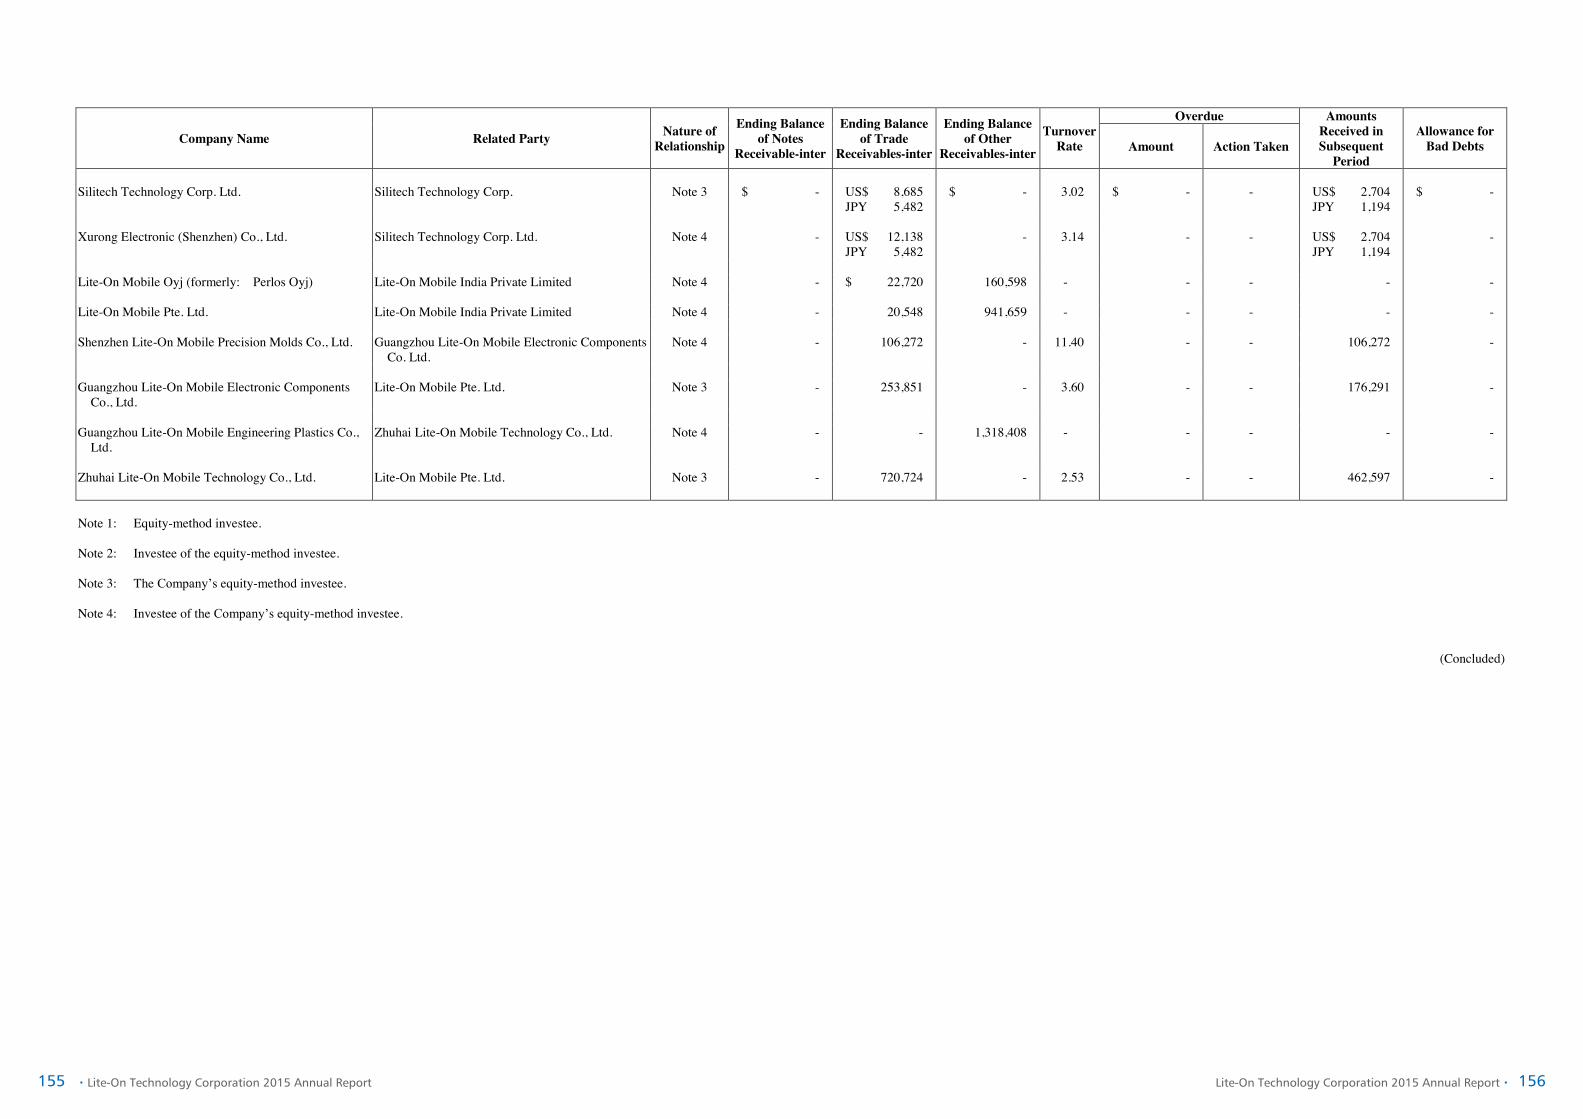
155 156‧Lite-On Technology Corporation 2015 Annual Report Lite-On Technology Corporation 2015 Annual Report‧
- 104 -
Company Name Related Party Nature of Relationship
Ending Balance of Notes
Receivable-inter
Ending Balance of Trade
Receivables-inter
Ending Balance of Other
Receivables-inter
Turnover Rate
Overdue Amounts Received in Subsequent
Period
Allowance for Bad Debts Amount Action Taken
Silitech Technology Corp. Ltd. Silitech Technology Corp. Note 3 $ - US$ 8,685
JPY 5,482 $ - 3.02 $ - - US$ 2,704
JPY 1,194 $ -
Xurong Electronic (Shenzhen) Co., Ltd. Silitech Technology Corp. Ltd. Note 4 - US$ 12,138
JPY 5,482 - 3.14 - - US$ 2,704
JPY 1,194 -
Lite-On Mobile Oyj (formerly: Perlos Oyj) Lite-On Mobile India Private Limited Note 4 - $ 22,720 160,598 - - - - - Lite-On Mobile Pte. Ltd. Lite-On Mobile India Private Limited Note 4 - 20,548 941,659 - - - - - Shenzhen Lite-On Mobile Precision Molds Co., Ltd. Guangzhou Lite-On Mobile Electronic Components
Co. Ltd. Note 4 - 106,272 - 11.40 - - 106,272 -
Guangzhou Lite-On Mobile Electronic Components
Co., Ltd. Lite-On Mobile Pte. Ltd. Note 3 - 253,851 - 3.60 - - 176,291 -
Guangzhou Lite-On Mobile Engineering Plastics Co.,
Ltd. Zhuhai Lite-On Mobile Technology Co., Ltd. Note 4 - - 1,318,408 - - - - -
Zhuhai Lite-On Mobile Technology Co., Ltd. Lite-On Mobile Pte. Ltd. Note 3 - 720,724 - 2.53 - - 462,597 - Note 1: Equity-method investee. Note 2: Investee of the equity-method investee. Note 3: The Company’s equity-method investee. Note 4: Investee of the Company’s equity-method investee.
(Concluded)

157 158‧Lite-On Technology Corporation 2015 Annual Report Lite-On Technology Corporation 2015 Annual Report‧
- 105 -
TABLE 7 LITE-ON TECHNOLOGY CORPORATION AND SUBSIDIARIES NAMES, LOCATIONS, AND RELATED INFORMATION OF INVESTEES OVER WHICH THE COMPANY EXERCISES SIGNIFICANT INFLUENCE FOR THE YEAR ENDED DECEMBER 31, 2015 (Amounts in Thousands of New Taiwan Dollars or Thousands of Foreign Currencies)
Investor Company Investee Company Location Main Businesses and Products
Original Investment Amount Balance as of December 31, 2015 Net Income
(Losses) of the Investee
Share of Profits/Losses of
Investee Note December 31,
2015 December 31,
2014 Shares
(In Thousands)
Percentage of
Ownership (%)
Carrying Value
Lite-On Technology Corporation Silitech Technology Corp. New Taipei City, Taiwan Manufacture and sale of modules and plastic products $ 324,685 $ 324,685 60,757 33.87 $ 1,487,387 $ 145,977 $ 48,123 Subsidiary Lite-On Integrated Service Inc. Taipei City, Taiwan Information outsourcing and system integrate 25,886 25,886 3,400 100.00 46,323 6,156 6,156 Subsidiary Dragonjet Corporation New Taipei City, Taiwan Manufacture and sale of computer peripherals,
printers, digital cameras, modules and plastic products
1,069,080 1,069,080 26,727 29.62 1,047,765 27,222 7,190 Associate
Logah Technology Corp. Kaohsiung, Taiwan Development, manufacture and sale of LCD TV inverters
402,787 402,787 31,683 28.10 245,119 (211,123) (58,772) Associate
Lite-On Capital Corporation Taipei City, Taiwan Investment activities 4,096,367 4,096,367 209,545 100.00 1,598,494 119,625 90,142 Subsidiary Lite-On Electronics H.K. Ltd. Hong Kong Sale of LED optical products 7,339,481 7,339,481 17,865 100.00 11,231,033 HK$ 263,289 1,083,435 Subsidiary Lite-On Electronics (Thailand) Co., Ltd. Thailand Manufacture and sale of LED optical products 529,106 529,106 5,030 100.00 1,304,188 THB 127,107 117,040 Subsidiary Lite-On Japan Ltd. Japan Sale of LED optical products and power supplies 248,305 253,111 6,162 49.49 358,234 JPY 136,647 17,732 Subsidiary Lite-On International Holding Co., Ltd. British Virgin Islands Investment activities US$ 335,825 US$ 285,825 335,825 100.00 25,106,404 US$ 19,424 684,074 Subsidiary LTC Group Ltd. British Virgin Islands Investment activities $ 1,380,308 $ 1,380,308 41,916 100.00 592,312 US$ 7,000 204,426 Subsidiary Lite-On Technology USA, Inc. USA Investment activities US$ 55,172 US$ 50,407 436 100.00 2,359,141 US$ 3,972 47,345 Subsidiary Lite-On Electronics (Europe) Ltd. United Kingdom Manufacture and sale of power supplies $ 44,559 $ 44,559 300 100.00 53,011 GBP 118 5,670 Subsidiary Lite-On Technology (Europe) B.V. Netherlands Market research and after-sales service 2,543,184 2,543,184 331 54.00 311,079 EUR 3,796 71,041 Subsidiary Lite-On Overseas Trading Co., Ltd. British Virgin Islands Merchandising business 168,947 168,947 5,143 100.00 242,239 US$ (1,509) (51,924) Subsidiary Lite-On Singapore Pte. Ltd. Singapore Manufacture and supply computer peripheral products US$ 63,788 US$ 63,788 51,777 100.00 15,338,196 US$ 108,286 3,652,054 Subsidiary Lite-On Vietnam Co., Ltd. Vietnam Electronic contract manufacturing US$ 3,000 US$ 3,000 - 100.00 70,420 US$ (246) (7,975) Subsidiary Lite-On Mobile Pte. Ltd. Singapore Manufacture and sale of mobile phone modules and
design for assembly line EUR 250,329 EUR 250,329 178,178 100.00 8,790,237 US$ (36,450) (1,118,948) Subsidiary
Li Shin International Enterprise Corp. British Virgin Islands Manufacture and sale of computer and appliance components
$ 56,929 $ 56,929 1,748 100.00 (67,845) US$ 7 232 Subsidiary
Eagle Rock Investment Ltd. British Virgin Islands Import and export business and investment activities 341 341 10 100.00 1,410,738 US$ (11,442) (373,069) Subsidiary Lite-On Semiconductor Corp. New Taipei City, Taiwan Manufacture of image sensor and rectifier 773,618 773,618 57,204 18.52 1,544,501 $ 476,872 90,538 Associate Canfield Ltd. Apia, Samoa Import and export business and investment activities 7,142 7,142 200 33.33 4,713 US$ 5 26 Associate High Yield Group Co., Ltd. British Virgin Islands Holding company 2,271,806 2,271,806 68,138 100.00 5,305,483 US$ 16,622 113,434 Subsidiary Lite-On Information Technology B.V. Netherlands Market research and customer service 1,597,319 1,597,319 11,018 100.00 18,056 EUR (15) (812) Subsidiary Philip & Lite-On Digital Solutions Corp. Taiwan Sale of optical disc drives 267,113 267,113 17,150 49.00 337,073 $ 51,483 25,227 Subsidiary Lite-On IT Singapore Pte. Ltd. Singapore Sale of optical disc drives - 2,872 - - - - - Subsidiary
(Note 1) Lite-Space Technology Company Limited Hong Kong Sale of computer components 149,968 149,968 5,100 39.23 41,036 US$ 3,483 42,924 Associate LET (HK) Ltd. Hong Kong Sale of optical disc drives 42 42 10 100.00 (285,689) HK$ 3,769 131,347 Subsidiary Leotek Electronics Holding Limited Hong Kong Holding company US$ 1,010 US$ 1,010 25,000 100.00 9,668 HK$ (2,471) (9,913) Subsidiary Lite-On Automotive Electronics (Europe)
B.V. Netherlands Sale of automotive parts and other electronic products EUR 1,090 EUR 1,090 24 100.00 43,143 EUR (2) (86) Subsidiary
Lite-On Automotive North America Inc. USA Sale of automotive parts and other electronic products US$ - US$ 600 - - - US$ (6) (195) Subsidiary (Note 2)
Lite-On Automotive Service USA Inc. USA Sale of automotive parts and other electronic products US$ 60 US$ 60 1 100.00 12,908 US$ (16) (533) Subsidiary Lite-On Automotive International (Cayman)
Co., Ltd. Cayman Investment activities US$ 100,626 US$ 100,626 11,967 100.00 1,897,276 US$ 8,222 274,316 Subsidiary
Lar View Technologies Corp. (Samoa) Samoa Investment activities US$ - US$ 200 - - - US$ (1) (46) Subsidiary (Note 3)
Lite-On Automotive Electronics Mexico, S.A. DE C.V.
Mexico Production, manufacture, sale, import and export of photovoltaic device, key electronic components, telecommunications equipment, information technology equipment, semiconductor applications, general lighting, automotive electronics, renewable energy products and systems and maintenance of automotive industry
US$ 4,950 US$ - - 99.00 (59,097) MXN (22,049) (42,481) Subsidiary

159 160‧Lite-On Technology Corporation 2015 Annual Report Lite-On Technology Corporation 2015 Annual Report‧
- 106 -
(Continued)
Investor Company Investee Company Location Main Businesses and Products
Original Investment Amount Balance as of December 31, 2015 Net Income
(Losses) of the Investee
Share of Profits/Losses of
Investee Note December 31,
2015 December 31,
2014 Shares
(In Thousands)
Percentage of
Ownership (%)
Carrying Value
Lite-On Capital Corporation Silitech Technology Corp. New Taipei City, Taiwan Manufacture and sale of modules and plastic products $ 115,572 $ 115,572 1,153 0.64 $ 109,680 $ 145,977 $ - Subsidiary Lite-On Green Technologies Inc. Taipei City, Taiwan Manufacture and wholesale of electronic components
and energy technology services 1,040,000 1,040,000 84,000 100.00 258,199 74,352 - Subsidiary
Lite-On Green Energy (HK) Limited Hong Kong Investment activities US$ 3,000 US$ 3,000 3,000 100.00 3,834 US$ (1,510) - Subsidiary Lite-On Technology (Europe) B.V. Netherlands Market research and after-sales service $ 2,126,479 $ 2,126,479 282 46.00 263,143 EUR 3,796 - Subsidiary Lite-On Semiconductor Corp. New Taipei City, Taiwan Manufacture of image sensor and rectifier - - 6,486 2.10 203,653 $ 476,872 - Associate Lite-On Green Energy (Singapore) Pte. Ltd. Singapore Investment activities 440,974 440,974 11,150 100.00 318,730 EUR 26 - Subsidiary Logah Technology Corp. Kaohsiung, Taiwan Development, manufacture and sale of LCD TV
inverters 74,538 89,694 4,141 3.67 32,037 $ (211,123) - Associate
Five Dimension Co., Ltd. Japan Development, manufacture and sale of cell phone and camera lens modules
JPY 23,340 JPY 23,340 11 69.94 38,187 JPY (107,189) - Subsidiary
Lite-On Green Technologies Inc. Lite-On Green Technologies B.V. Netherlands Solar energy engineering EUR 16,020 EUR 16,020 30 100.00 215,236 EUR (356) - Subsidiary Lite-On Green Technologies (HK) Limited Hong Kong Solar energy engineering US$ 760 US$ 760 4,000 100.00 (59,373) US$ (599) - Subsidiary Lite-On Green Energy Lite-On Green Energy B.V. Netherlands Investment activities EUR 11,000 EUR 11,000 100 100.00 EUR 8,938 EUR (174) - Subsidiary (Singapore) Pte. Ltd. Lite-On Green Energy Kaiserslautern GmbH Oldenburg, Germany Solar energy engineering EUR - EUR 25 - - EUR - EUR - - Subsidiary
(Note 4) Lite-On Green Technologies B.V. Kompaktsolar GmbH Berlin, Germany Solar energy engineering EUR 401 EUR 401 51 51.00 EUR - EUR - - Associate Lite-On Green Energy B.V. Romeo Tetti PV1 S.R.L Italy Solar energy engineering EUR 9,847 EUR 9,847 - 100.00 EUR 8,317 EUR (13) - Subsidiary Lite-On Green Energy S.R.L Italy Solar energy engineering EUR 60 EUR 60 10 100.00 EUR 2 EUR (17) - Subsidiary China Bridge (China) Co., Ltd. Lite-On Opto Technology (Changzhou) Co.,
Ltd. Changzhou, China Development, manufacture of new-type electronic
components and provide technology consulting services, maintenance equipment and after-sales services
CNY 85,015 CNY 85,015 - 12.59 CNY 72,256 CNY 4,308 - Subsidiary
China Bridge Express (Wuxi) Co., Ltd. Wuxi, China Express and sale of power supplies, printers, display devices and scanners
CNY 36,244 CNY 36,244 - 100.00 CNY 97,584 CNY 413 - Subsidiary
Lite-On Electronics (Jiangsu) Co.,
Ltd. Lite-On Technology (Changzhou) Co., Ltd. Changzhou, China Development, manufacture, sale and installation of
power supplies and transformers and provision technology consulting services, maintenance equipment and after-sales services
CNY 332,038 CNY 467,038 - 100.00 CNY 826,279 CNY 61,895 - Subsidiary
Lite-On Opto Technology (Changzhou) Co., Ltd.
Changzhou, China Development, manufacture and sale of new-type electronic components and LED and provision technology consulting services, maintenance equipment and after-sales services
CNY 503,977 CNY 503,977 - 87.41 CNY 501,659 CNY 4,308 - Subsidiary
Lite-On Medical Device (Changzhou) Ltd. Changzhou, China Manufacture and sale of medical equipment CNY 30,640 CNY - - 100.00 CNY 28,444 CNY (2,095) - Subsidiary Lite-On Automotive International
(Cayman) Co., Ltd. Lite-On Automotive Holdings (Hong Kong)
Co., Ltd. Hong Kong Investment activities HK$ 41,384 HK$ 41,384 100,626 100.00 US$ 62,003 HK$ 63,844 - Subsidiary
Lite-On Technology USA, Inc. Lite-On, Inc. USA Sales data processing business of optoelectronic
products and power supplies US$ 3,000 US$ 3,000 3,000 100.00 US$ 4,721 US$ 530 - Subsidiary
Lite-On Trading USA, Inc. California USA Sale of optical products US$ 31,500 US$ 31,500 315 100.00 US$ 32,454 US$ 840 - Subsidiary Lite-On Service USA, Inc. California USA After-sales service of optical products US$ 1,000 US$ 1,000 10 100.00 US$ 1,087 US$ 9 - Subsidiary Leotek Electronics USA LLC. USA Sale of LED products US$ 5,792 US$ 5,792 - 100.00 US$ 8,270 US$ 1,257 - Subsidiary Power Innovations International, Inc. USA Development, design and manufacture of power
control and energy management US$ 15,756 US$ 13,716 12,916 95.25 US$ 17,731 US$ 1,110 - Subsidiary
Lite-On Sales & Distribution Inc. USA Sale of optical disc drives US$ 4,765 US$ - 1 100.00 US$ 5,084 US$ 319 - Subsidiary (Note 5)
Lite-On Technology Service, Inc. USA After-sales service of optical products US$ 1,500 US$ - 1 100.00 US$ 1,536 US$ 36 - Subsidiary Lite-On International Holding
Co., Ltd. Ze Poly Pte. Ltd. Singapore Manufacture and sale of thin-film solar cell - US$ 7,700 - - - - - Subsidiary
(Note 6) Lite-On China Holding Co., Ltd. British Virgin Islands Manufacture and sale of computer cases US$ 399,441 US$ 349,441 399,442 100.00 US$ 827,884 US$ 19,239 - Subsidiary
(Continued)
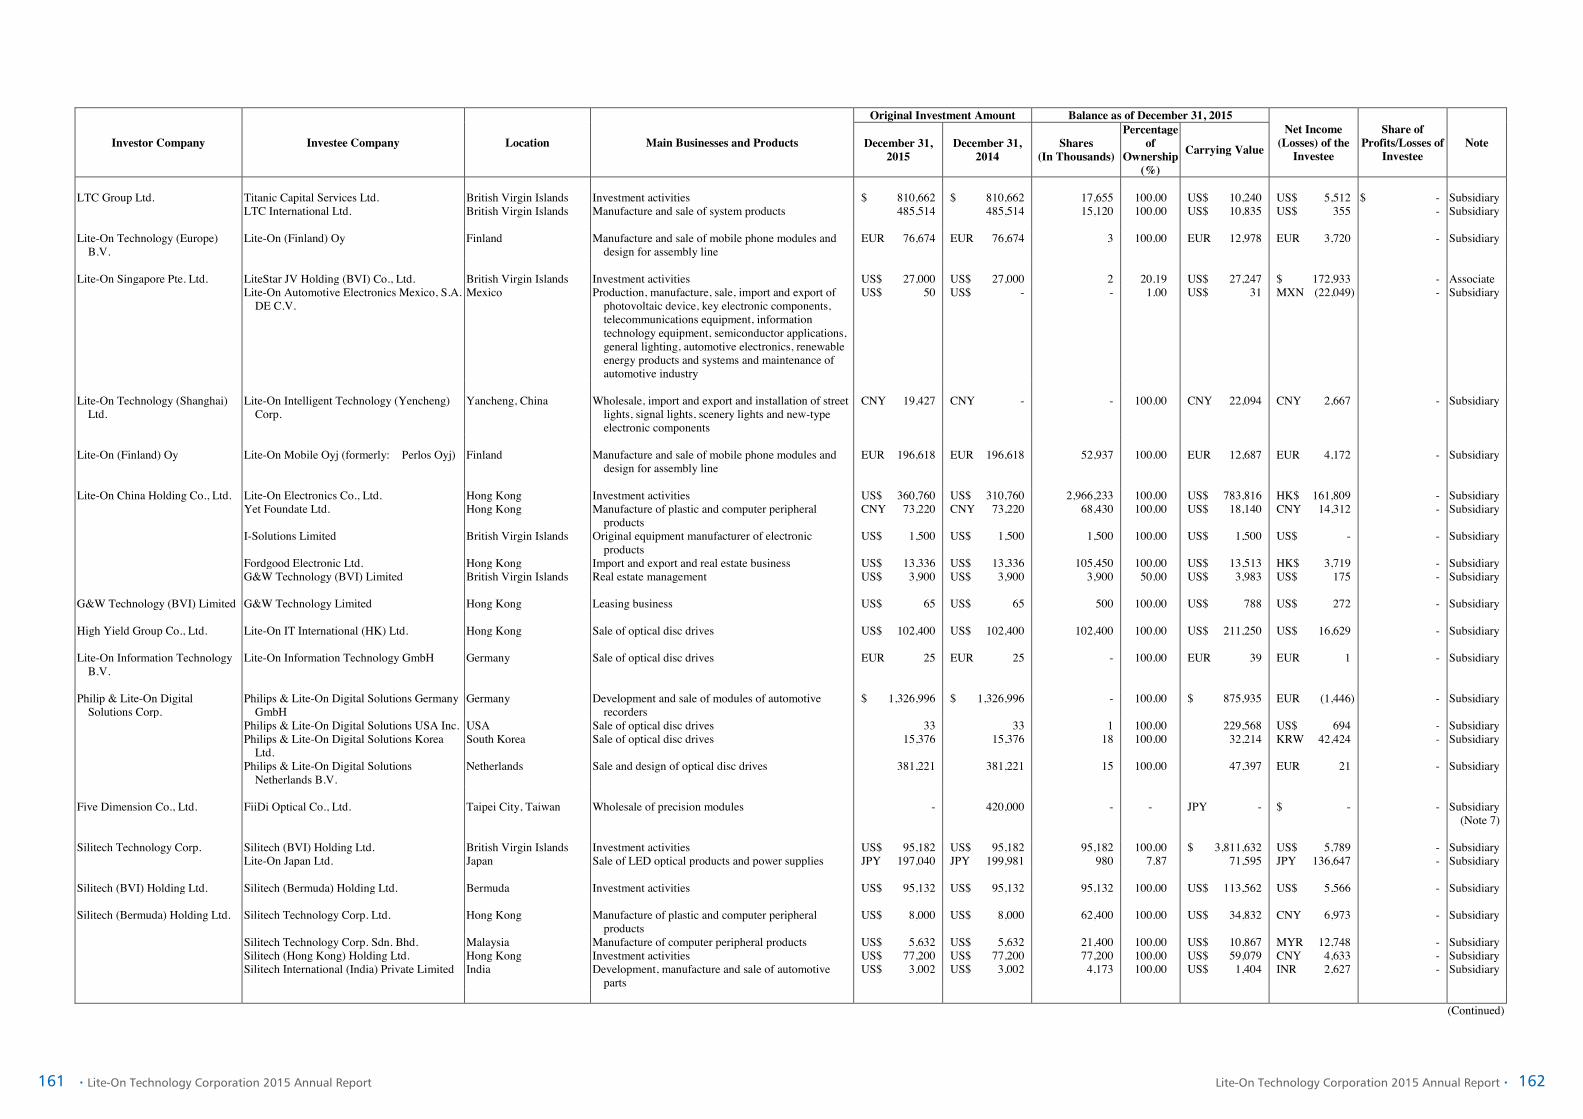
161 162‧Lite-On Technology Corporation 2015 Annual Report Lite-On Technology Corporation 2015 Annual Report‧
- 107 -
Investor Company Investee Company Location Main Businesses and Products
Original Investment Amount Balance as of December 31, 2015 Net Income
(Losses) of the Investee
Share of Profits/Losses of
Investee Note December 31,
2015 December 31,
2014 Shares
(In Thousands)
Percentage of
Ownership (%)
Carrying Value
LTC Group Ltd. Titanic Capital Services Ltd. British Virgin Islands Investment activities $ 810,662 $ 810,662 17,655 100.00 US$ 10,240 US$ 5,512 $ - Subsidiary LTC International Ltd. British Virgin Islands Manufacture and sale of system products 485,514 485,514 15,120 100.00 US$ 10,835 US$ 355 - Subsidiary Lite-On Technology (Europe)
B.V. Lite-On (Finland) Oy Finland Manufacture and sale of mobile phone modules and
design for assembly line EUR 76,674 EUR 76,674 3 100.00 EUR 12,978 EUR 3,720 - Subsidiary
Lite-On Singapore Pte. Ltd. LiteStar JV Holding (BVI) Co., Ltd. British Virgin Islands Investment activities US$ 27,000 US$ 27,000 2 20.19 US$ 27,247 $ 172,933 - Associate Lite-On Automotive Electronics Mexico, S.A.
DE C.V. Mexico Production, manufacture, sale, import and export of
photovoltaic device, key electronic components, telecommunications equipment, information technology equipment, semiconductor applications, general lighting, automotive electronics, renewable energy products and systems and maintenance of automotive industry
US$ 50 US$ - - 1.00 US$ 31 MXN (22,049) - Subsidiary
Lite-On Technology (Shanghai)
Ltd. Lite-On Intelligent Technology (Yencheng)
Corp. Yancheng, China Wholesale, import and export and installation of street
lights, signal lights, scenery lights and new-type electronic components
CNY 19,427 CNY - - 100.00 CNY 22,094 CNY 2,667 - Subsidiary
Lite-On (Finland) Oy Lite-On Mobile Oyj (formerly: Perlos Oyj) Finland Manufacture and sale of mobile phone modules and
design for assembly line EUR 196,618 EUR 196,618 52,937 100.00 EUR 12,687 EUR 4,172 - Subsidiary
Lite-On China Holding Co., Ltd. Lite-On Electronics Co., Ltd. Hong Kong Investment activities US$ 360,760 US$ 310,760 2,966,233 100.00 US$ 783,816 HK$ 161,809 - Subsidiary Yet Foundate Ltd. Hong Kong Manufacture of plastic and computer peripheral
products CNY 73,220 CNY 73,220 68,430 100.00 US$ 18,140 CNY 14,312 - Subsidiary
I-Solutions Limited British Virgin Islands Original equipment manufacturer of electronic products
US$ 1,500 US$ 1,500 1,500 100.00 US$ 1,500 US$ - - Subsidiary
Fordgood Electronic Ltd. Hong Kong Import and export and real estate business US$ 13,336 US$ 13,336 105,450 100.00 US$ 13,513 HK$ 3,719 - Subsidiary G&W Technology (BVI) Limited British Virgin Islands Real estate management US$ 3,900 US$ 3,900 3,900 50.00 US$ 3,983 US$ 175 - Subsidiary G&W Technology (BVI) Limited G&W Technology Limited Hong Kong Leasing business US$ 65 US$ 65 500 100.00 US$ 788 US$ 272 - Subsidiary High Yield Group Co., Ltd. Lite-On IT International (HK) Ltd. Hong Kong Sale of optical disc drives US$ 102,400 US$ 102,400 102,400 100.00 US$ 211,250 US$ 16,629 - Subsidiary Lite-On Information Technology
B.V. Lite-On Information Technology GmbH Germany Sale of optical disc drives EUR 25 EUR 25 - 100.00 EUR 39 EUR 1 - Subsidiary
Philip & Lite-On Digital
Solutions Corp. Philips & Lite-On Digital Solutions Germany
GmbH Germany Development and sale of modules of automotive
recorders $ 1,326,996 $ 1,326,996 - 100.00 $ 875,935 EUR (1,446) - Subsidiary
Philips & Lite-On Digital Solutions USA Inc. USA Sale of optical disc drives 33 33 1 100.00 229,568 US$ 694 - Subsidiary Philips & Lite-On Digital Solutions Korea
Ltd. South Korea Sale of optical disc drives 15,376 15,376 18 100.00 32,214 KRW 42,424 - Subsidiary
Philips & Lite-On Digital Solutions Netherlands B.V.
Netherlands Sale and design of optical disc drives 381,221 381,221 15 100.00 47,397 EUR 21 - Subsidiary
Five Dimension Co., Ltd. FiiDi Optical Co., Ltd. Taipei City, Taiwan Wholesale of precision modules - 420,000 - - JPY - $ - - Subsidiary
(Note 7) Silitech Technology Corp. Silitech (BVI) Holding Ltd. British Virgin Islands Investment activities US$ 95,182 US$ 95,182 95,182 100.00 $ 3,811,632 US$ 5,789 - Subsidiary Lite-On Japan Ltd. Japan Sale of LED optical products and power supplies JPY 197,040 JPY 199,981 980 7.87 71,595 JPY 136,647 - Subsidiary Silitech (BVI) Holding Ltd. Silitech (Bermuda) Holding Ltd. Bermuda Investment activities US$ 95,132 US$ 95,132 95,132 100.00 US$ 113,562 US$ 5,566 - Subsidiary Silitech (Bermuda) Holding Ltd. Silitech Technology Corp. Ltd. Hong Kong Manufacture of plastic and computer peripheral
products US$ 8,000 US$ 8,000 62,400 100.00 US$ 34,832 CNY 6,973 - Subsidiary
Silitech Technology Corp. Sdn. Bhd. Malaysia Manufacture of computer peripheral products US$ 5,632 US$ 5,632 21,400 100.00 US$ 10,867 MYR 12,748 - Subsidiary Silitech (Hong Kong) Holding Ltd. Hong Kong Investment activities US$ 77,200 US$ 77,200 77,200 100.00 US$ 59,079 CNY 4,633 - Subsidiary Silitech International (India) Private Limited India Development, manufacture and sale of automotive
parts US$ 3,002 US$ 3,002 4,173 100.00 US$ 1,404 INR 2,627 - Subsidiary
(Continued)

163 164‧Lite-On Technology Corporation 2015 Annual Report Lite-On Technology Corporation 2015 Annual Report‧
- 108 -
Investor Company Investee Company Location Main Businesses and Products
Original Investment Amount Balance as of December 31, 2015 Net Income
(Losses) of the Investee
Share of Profits/Losses of
Investee Note December 31,
2015 December 31,
2014 Shares
(In Thousands)
Percentage of
Ownership (%)
Carrying Value
Lite-On Japan Ltd. Lite-On Japan (S) Pte. Ltd. Singapore Import and export business of electronic components JPY 68,811 JPY 68,811 988 100.00 JPY 68,811 JPY (7,407) $ - Subsidiary
(Note 8) L&K Industries Philippines, Inc. Philippines Import and export business of electronic components JPY 261,944 JPY 261,944 1,000 100.00 JPY 261,944 JPY 118,901 - Subsidiary
(Note 8) Lite-On Japan (H.K.) Limited Hong Kong Import and export business of electronic components JPY 70,000 JPY 70,000 50 100.00 JPY 70,000 JPY 51,534 - Subsidiary
(Note 8) Lite-On Japan (Korea) Co., Ltd. South Korea Import and export business of electronic components JPY 22,593 JPY 22,593 20 100.00 JPY 22,593 JPY - - Subsidiary
(Note 8) Lite-On Japan (Thailand) Co., Ltd. Thailand Import and export business of electronic components JPY 65,939 JPY 65,939 200 100.00 JPY 65,939 JPY 70,576 - Subsidiary
(Notes 8 and 9)
Lite-On Japan (H.K.) Limited NL (Shanghai) Co., Ltd. China Import and export business of electronic components JPY 35,655 JPY 35,655 30 100.00 JPY 35,655 JPY 29,215 - Subsidiary
(Note 8) Lite-On Mobile Oyj (formerly:
Perlos Oyj) Lite-On Mobile Sweden AB Sweden Manufacture and sale of mobile phone modules and
design for assembly line EUR 20,551 EUR 20,551 20 100.00 EUR 291 SEK 585 - Subsidiary
Lite-On Mobile Indústria e Comércio de Plásticos Ltda.
Brazil Manufacture and sale of mobile phone modules and design for assembly line
EUR 2,509 EUR 2,509 6,507 3.14 EUR 234 BRL (25,231) - Subsidiary
Lite-On Mobile Pte. Ltd. Lite-On Mobile Indústria e Comércio de
Plásticos Ltda. Brazil Manufacture and sale of mobile phone modules and
design for assembly line US$ 104,702 US$ 97,802 200,490 96.86 US$ 8,150 BRL (25,231) - Subsidiary
Perlos Precision Plastics Moulding Limited Liability Company
Hungary Manufacture and sale of mobile phone modules and design for assembly line
US$ 733 US$ 733 - 100.00 US$ 3,796 EUR 83 - Subsidiary
Lite-On Mobile India Private Limited. India Manufacture and sale of mobile phone modules and design for assembly line
US$ 18,508 US$ 18,508 59,095 100.00 US$ (9,652) INR (1,399,984) - Subsidiary
Lite-On Young Fast Pte. Ltd. Singapore Investment activities US$ 7,864 US$ 7,864 10 100.00 US$ 3,507 US$ 1,002 - Subsidiary Yamada-Lom Fabricacao De Artefatos De
Material Plastico Ltda. Brazil Manufacture and sale of mobile phone modules and
design for assembly line US$ 540 US$ 540 - 25.00 US$ (44) BRL (815) - Associate
Guangzhou Lite-On Mobile
Electronic Components Co., Ltd.
Yantai Lite-On Mobile Electronic Components Co., Ltd.
Yantai, China Manufacture and sale of mobile phone modules and design for assembly line
CNY 20,000 CNY 20,000 - 100.00 CNY 27,045 CNY 7,178 - Subsidiary
Note 1: Lite-On IT Singapore Pte. Ltd. was dissolved after merging with Lite-On Singapore Pte. in January 2015. Note 2: Lite-On Automotive North America Inc. was dissolved after liquidation in May 2015. Note 3: Lar View Technologies Corp. (Samoa) was dissolved after liquidation in November 2015. Note 4: Lite-On Green Energy Kaiserslautern GmbH was dissolved after liquidation in September 2015. Note 5: The Group reorganized its structure and Lite-On Sales & Distribution Inc. became directly held by Lite-On Technology USA, Inc. Note 6: Ze Poly Pte. Ltd. was dissolved after liquidation in September 2015. Note 7: FiiDi Optical Co., Ltd. was dissolved after liquidation in April 2015. Note 8: Investment income/losses and adjustment for changes in equities for using equity method recognized by Lite-On Japan Ltd. Note 9: The Group reorganized its structure and Lite-On Japan (Thailand) Co., Ltd. became directly held by Lite-On Japan Ltd. Note 10: Please refer to Table 8 for information on investment in Mainland China.
(Concluded)

165 166‧Lite-On Technology Corporation 2015 Annual Report Lite-On Technology Corporation 2015 Annual Report‧
- 109 -
TABLE 8 LITE-ON TECHNOLOGY CORPORATION AND SUBSIDIARIES INFORMATION ON INVESTMENT IN MAINLAND CHINA FOR THE YEAR ENDED DECEMBER 31, 2015 (Amounts in Thousands of New Taiwan Dollars or Thousands of Foreign Currencies)
Investor Company Investee Company Main Businesses and Products Total Amount of Paid-in Capital
Method of Investment
Accumulated Outflow of
Investment from Taiwan as of
January 1, 2015
Investment of Flows Accumulated Outflow of
Investment from Taiwan as of
December 31, 2015
Net Income (Losses) of the
Investee Company (Note 2)
Percentage of
Ownership
Share of Profits/Losses
(Note 2)
Carrying Amount as of
December 31, 2015
Accumulated Inward
Remittance of Earnings as of
December 31, 2015
Note Outflow Inflow
Lite-On Technology
Corporation Lite-On Computer Tech (Dongguan) Co.,
Ltd. Manufacture and sale of display device $ 537,510
(US$ 16,400 ) Note 1 $ 933,071
(US$ 28,469 ) $ - $ - $ 933,071
(US$ 28,469 ) $ (14,656 ) (CNY -2,898 )
100.00 $ (14,656 ) (CNY -2,898 )
$ 495,741 (HK$ 117,227 )
$ -
DongGuan G-Pro Computer Co., Ltd. Manufacture and sale of system products 747,303 (US$ 22,801 )
Note 1 747,303 (US$ 22,801 )
- - 747,303 (US$ 22,801 )
200,336 (CNY 39,614 )
100.00 200,336 (CNY 39,614 )
892,903 (HK$ 211,143 )
-
Lite-On Electronics (Tianjinn) Co., Ltd. ODM services 2,179,538 (US$ 66,500 )
Note 1 2,179,472 (US$ 66,498 )
- - 2,179,472 (US$ 66,498 )
213,459 (CNY 42,209 )
100.00 213,459 (CNY 42,209 )
2,981,831 (HK$ 705,108 )
-
Lite-On Electronics (Dongguan) Co., Ltd. Manufacture of electronic components 1,160,235 (US$ 35,400 )
Note 1 1,160,235 (US$ 35,400 )
- - 1,160,235 (US$ 35,400 )
80,212 (CNY 15,861 )
100.00 80,212 (CNY 15,861 )
1,236,129 (HK$ 292,305 )
-
Silitek Elec. (Dongguan) Co., Ltd. Manufacture and sale of keyboards 157,320 (US$ 4,800 )
Note 1 157,320 (US$ 4,800 )
- - 157,320 (US$ 4,800 )
186,080 (CNY 36,795 )
100.00 186,080 (CNY 36,795 )
1,482,132 (HK$ 350,477 )
-
Lite-On Electronics (Guangzhou) Co., Ltd. Manufacture and sale of printers and scanners
1,199,565 (US$ 36,600 )
Note 1 1,199,565 (US$ 36,600 )
- - 1,199,565 (US$ 36,600 )
629,353 (CNY 124,447 )
100.00 629,353 (CNY 124,447 )
14,396,711 (HK$ 3,404,363 )
-
Note 3
China Bridge (China) Co., Ltd. Investment, sales agent 974,892 (US$ 29,745 )
Note 1 974,892 (US$ 29,745 )
- - 974,892 (US$ 29,745 )
(80,617 ) (CNY -15,941 )
100.00 (80,617 ) (CNY -15,941 )
1,375,725 (HK$ 325,315 )
-
Lite-On Network Communication (Dongguan) Limited
Manufacture and sale of IT products 464,422 (US$ 14,170 )
Note 1 464,422 (US$ 14,170 )
- - 464,422 (US$ 14,170 )
240,333 (CNY 47,523 )
100.00 240,333 (CNY 47,523 )
1,208,209 (HK$ 285,703 )
-
Lite-On Communications (Guangzhou) Co., Ltd.
Manufacture and sale of mobile terminal equipment
804,954 (US$ 24,560 )
Note 1 804,954 (US$ 24,560 )
- - 804,954 (US$ 24,560 )
- 100.00 - - -
Note 3
Dong Guan G-Tech Computers Co., Ltd. Manufacture and sale of computer case 376,913 (US$ 11,500 )
Note 1 376,913 (US$ 11,500 )
- - 376,913 (US$ 11,500 )
86,402 (CNY 17,085 )
100.00 86,402 (CNY 17,085 )
744,379 (HK$ 176,022 )
-
Lite-On Tech (Guangzhou) Co., Ltd. Manufacture and sale of computer case 1,088,130 (US$ 33,200 )
Note 1 1,088,130 (US$ 33,200 )
- - 1,088,130 (US$ 33,200 )
- 100.00 - - - Note 3
COMMIT Incorporated Manufacture and sale of application software and multimedia product design
1,051,619 (US$ 32,086 )
Note 1 19,665 (US$ 600 )
- - 19,665 (US$ 600 )
- 1.87 - - -
Lite-On Elec and Wire (Guangzhou) Co., Ltd.
Manufacture and sale of mobile terminal equipment
518,173 (US$ 15,810 )
Note 1 518,173 (US$ 15,810 )
- - 518,173 (US$ 15,810 )
- 100.00 - - - Note 3
Lite-On (Guangzhou) Infortech Co., Ltd. Information outsourcing 41,624 (US$ 1,270 )
Note 1 76,825 (US$ 2,344 )
- - 76,825 (US$ 2,344 )
7,131 (CNY 1,410 )
100.00 7,131 (CNY 1,410 )
178,967 (HK$ 42,320 )
-
Lite-On (Guangzhou) Precision Tooling Co., Ltd.
Manufacture and sale of modules 596,505 (US$ 18,200 )
Note 1 399,855 (US$ 12,200 )
- - 399,855 (US$ 12,200 )
- 100.00 - - - Note 3
Lite-On Digital Electronics (Dongguan) Co., Ltd.
Manufacture and sale of computer peripheral products
98,325 (US$ 3,000 )
Note 1 98,325 (US$ 3,000 )
- - 98,325 (US$ 3,000 )
4,516 (CNY 893 )
100.00 4,516 (CNY 893 )
95,704 (HK$ 22,631 )
-
Lite-On Power Technology (Chang Zhou) Co., Ltd.
Manufacture and sale of new-type electronic components and peripheral materials
551,276 (US$ 16,820 )
Note 1 589,426 (US$ 17,984 )
- - 589,426 (US$ 17,984 )
24,391 (CNY 4,823 )
100.00 24,391 (CNY 4,823 )
- -
Lite-On Li Shin Technology (Ganzhou) Co., Ltd.
Manufacture and sale of electronic components
393,300 (US$ 12,000 )
Note 1 437,087 (US$ 13,336 )
- - 437,087 (US$ 13,336 )
15,455 (CNY 3,056 )
100.00 15,455 (CNY 3,056 )
367,445 (HK$ 86,889 )
-
Lite-On Technology (Xianging) Co., Ltd. Manufacture and sale of electronic components
213,038 (US$ 6,500 )
Note 1 213,038 (US$ 6,500 )
- - 213,038 (US$ 6,500 )
(41,201 ) (CNY -8,147 )
100.00 (41,201 ) (CNY -8,147 )
140,998 (US$ 4,302 )
-
Lite-On Electronics (Jiangsu) Co., Ltd. Development, manufacture, sale and installation of power supplies and transformers and provision of technology consulting services, maintenance equipment and precision instruments
4,949,025 (US$ 151,000 )
Note 1 4,785,150 (US$ 146,000 )
163,875 (US$ 5,000 )
- 4,949,025 (US$ 151,000 )
317,754 (CNY 62,832 )
100.00 317,754 (CNY 62,832 )
8,020,151 (HK$ 1,896,510 )
-
Lite-On Technology (Guangzhou) Investment Co., Ltd.
Investment activities 983,250 (US$ 30,000 )
Note 1 983,250 (US$ 30,000 )
1,638,750 (US$ 50,000 )
- 2,622,000 (US$ 80,000 )
(92,122 ) (CNY -18,216 )
100.00 (92,122 ) (CNY -18,216 )
2,561,931 (HK$ 605,815 )
-
Lite-On Technology (Ying Tan) Co., Ltd. Manufacture and sale of electronic components
360,525 (US$ 11,000 )
Note 1 360,525 (US$ 11,000 )
- - 360,525 (US$ 11,000 )
22,231 (CNY 4,396 )
100.00 22,231 (CNY 4,396 )
444,265 (US$ 13,555 )
-
Lite-On Power Technology (Dongguan) Co., Ltd.
Development, manufacture and sale of electronic components, power supplies and provision technology consulting services
523,482 (US$ 15,972 )
Note 1 523,482 (US$ 15,972 )
- - 523,482 (US$ 15,972 )
(165,552 ) (CNY -32,736 )
100.00 (165,552 ) (CNY -32,736 )
836,163 (HK$ 197,726 )
-
(Continued)

167 168‧Lite-On Technology Corporation 2015 Annual Report Lite-On Technology Corporation 2015 Annual Report‧
- 110 -
Investor Company Investee Company Main Businesses and Products Total Amount of Paid-in Capital
Method of Investment
Accumulated Outflow of
Investment from Taiwan as of
January 1, 2015
Investment of Flows Accumulated Outflow of
Investment from Taiwan as of
December 31, 2015
Net Income (Losses) of the
Investee Company (Note 2)
Percentage of
Ownership
Share of Profits/Losses
(Note 2)
Carrying Amount as of
December 31, 2015
Accumulated Inward
Remittance of Earnings as of
December 31, 2015
Note Outflow Inflow
Lite-On Technology
Corporation Beijing Lite-On Mobile Electronic and
Telecommunication Components Co., Ltd.
Manufacture and sale of mobile phone modules and design for assembly line
$ 524,400 (US$ 16,000 )
Note 1 $ 1,716,230 (US$ 52,364 )
$ - $ - $ 1,716,230 (US$ 52,364 )
$ (508,233 ) (CNY -100,497 )
100.00 $ (508,233 ) (CNY -100,497 )
$ 1,182,522 (US$ 36,080 )
$ -
Guangzhou Lite-On Mobile Engineering Plastics Co., Ltd.
Manufacture and sale of mobile phone modules and design for assembly line
641,407 (US$ 19,570 )
Note 1 2,970,300 (US$ 90,627 )
- - 2,970,300 (US$ 90,627 )
74,270 (CNY 14,686 )
100.00 74,270 (CNY 14,686 )
1,911,897 (US$ 58,334 )
-
Guangzhou Lite-On Mobile Electronic Components Co., Ltd.
Manufacture and sale of mobile phone modules and design for assembly line
1,314,278 (US$ 40,100 )
Note 1 3,780,662 (US$ 115,352 )
- - 3,780,662 (US$ 115,352 )
78,179 (CNY 15,459 )
100.00 78,179 (CNY 15,459 )
4,387,009 (US$ 133,852 )
-
Shenzhen Lite-On Mobile Precision Molds Co., Ltd.
Manufacture and sale of mobile phone modules and design for assembly line
270,650 (HK$ 64,000 )
Note 1 427,746 (US$ 13,051 )
- - 427,746 (US$ 13,051 )
(5,770 ) (CNY -1,141 )
100.00 (5,770 ) (CNY -1,141 )
489,331 (US$ 14,930 )
-
Zhuhai Lite-On Mobile Technology Company Ltd.
Manufacture and sale of mobile phone modules and design for assembly line
609,681 (US$ 18,602 )
Note 1 508,963 (US$ 15,529 )
- - 508,963 (US$ 15,529 )
(144,955 ) (CNY -28,663 )
100.00 (144,955 ) (CNY -28,663 )
1,723,156 (CNY 340,511 )
- Note 4
Lite-On Young Fast (Huizhou) Co., Ltd. Modules of touch panels 327,750 (US$ 10,000 )
Note 1 213,038 (US$ 6,500 )
- - 213,038 (US$ 6,500 )
30,262 (CNY 5,984 )
100.00 30,262 (CNY 5,984 )
(18,911 ) (US$ -577 )
-
Lite-on Green Technologies (Nanjing) Corporation
Solar energy engineering 24,581 (US$ 750 )
Note 1 24,581 (US$ 750 )
- - 24,581 (US$ 750 )
(18,843 ) (CNY -3,726 )
100.00 (18,843 ) (CNY -3,726 )
(65,124 ) (US$ -1,987 )
-
Changzhou Binhu Thin Film Solar Greenhouse Co., Ltd.
Manufacture and sale of solar energy engineering
303,377 (CNY 59,950 )
Note 1 98,227 (US$ 2,997 )
- - 98,227 (US$ 2,997 )
- 19.90 - 4,589 (US$ 140 )
-
Epricrystal (Changzhou) Co., Ltd. Manufacture, design and sale of light-emitting diode products
4,588,500 (US$ 140,000 )
Note 1 884,925 (US$ 27,000 )
- - 884,925 (US$ 27,000 )
184,042 (CNY 36,392 )
22.40 41,231 (CNY 8,153 )
957,158 (CNY 189,143 )
-
Dongguan Lite-On Computer Co., Ltd. Manufacture and sale of computer hosts and components
65,550 (US$ 2,000 )
Note 1 65,550 (US$ 2,000 )
- - 65,550 (US$ 2,000 )
57,738 (CNY 11,417 )
100.00 57,738 (CNY 11,417 )
106,589 (CNY 21,063 )
-
Huizhou Li Shin Electronic Co., Ltd. Manufacture of computer peripheral products
206,728 (US$ 6,308 )
Note 1 133,361 (US$ 4,069 )
- - 133,361 (US$ 4,069 )
36,194 (CNY 7,157 )
100.00 36,194 (CNY 7,157 )
629,411 (US$ 19,204 )
-
Huizhou Fu Tai Electronic Co., Ltd. Manufacture of computer peripheral products
31,748 (US$ 969 )
Note 1 2,130 (US$ 65 )
- - 2,130 (US$ 65 )
3,677 (CNY 727 )
100.00 3,677 (CNY 727 )
67,320 (US$ 2,054 )
-
Li Shin Technology (Huizhou) Ltd. Manufacture and sale of new-type electronic components and peripheral materials
196,650 (US$ 6,000 )
Note 1 - - - - 5,871 (CNY 1,161 )
100.00 5,871 (CNY 1,161 )
451,934 (US$ 13,789 )
-
Lite-On Opto Technology (Guangzhou) Co., Ltd.
Manufacture and sale of optical disc drives
1,409,325 (US$ 43,000 )
Note 1 1,409,325 (US$ 43,000 )
- - 1,409,325 (US$ 43,000 )
(118,723 ) (CNY -23,476 )
100.00 (118,723 ) (CNY -23,476 )
2,722,980 (US$ 83,081 )
-
Lite-On Auto Electric Technology (Guangzhou) Ltd.
Manufacture and sale of optical disc drives
65,550 (US$ 2,000 )
Note 1 65,550 (US$ 2,000 )
- - 65,550 (US$ 2,000 )
4,410 (CNY 872 )
100.00 4,410 (CNY 872 )
141,719 (US$ 4,324 )
-
Lite-On IT Opto Tech (BH) Co., Ltd. Manufacture and sale of optical disc drives
1,802,625 (US$ 55,000 )
Note 1 1,802,625 (US$ 55,000 )
- - 1,802,625 (US$ 55,000 )
636,241 (CNY 125,809 )
100.00 636,241 (CNY 125,809 )
4,003,565 (US$ 122,153 )
-
Lite-On Automotive (Wuxi) Co., Ltd. Manufacture, sale and processing of electronic products
163,875 (US$ 5,000 )
Note 1 163,875 (US$ 5,000 )
- - 163,875 (US$ 5,000 )
110,070 (CNY 21,765 )
100.00 110,070 (CNY 21,765 )
635,959 (HK$ 150,384 )
-
Lite-On Automotive Electronics (Guangzhou) Co., Ltd.
Manufacture, sale and processing of electronic products
203,205 (US$ 6,200 )
Note 1 192,389 (US$ 5,870 )
- - 192,389 (US$ 5,870 )
149,648 (CNY 29,591 )
100.00 149,648 (CNY 29,591 )
1,395,359 (HK$ 329,958 )
-
Changzhou Leotek New Energy Trade Limited
Wholesale, import and export and installation of street lights, signal lights, scenery lights and new-type electronic components
32,775 (US$ 1,000 )
Note 1 32,775 (US$ 1,000 )
- - 32,775 (US$ 1,000 )
(15,055 ) (CNY -2,977 )
100.00 (15,055 ) (CNY -2,977 )
14,458 (CNY 2,857 )
-
LarView Technologies Corp. (Shenzhen) Camera modules 6,555 (US$ 200 )
Note 1 6,555 (US$ 200 )
- 3,147 (US$ 96 )
3,408 (US$ 104 )
-
100.00 -
-
- Note 5
Lite-On Technology (Shanghai) Ltd. Manufacture and sale of energy saving equipment
2,130,375 (US$ 65,000 )
Note 1 - 2,130,375 (US$ 65,000 )
- 2,130,375 (US$ 65,000 )
177,852 (CNY 35,168 )
100.00 177,852 (CNY 35,168 )
2,307,753 (US$ 70,412 )
-
Philip & Lite-On Digital
Solutions Corp. Philip & Lite-On Digital Solutions
(Shanghai) Co., Ltd. Sale of optical disc drives 32,775
(US$ 1,000 ) Note 1 32,775
(US$ 1,000 ) - - 32,775
(US$ 1,000 ) 21,700 (CNY 4,291 )
100.00 21,700 (CNY 4,291 )
513,408 -
Silitech Technology
Corp. Xurong Electronic (Shenzhen) Co., Ltd. Manufacture of automotive parts, touch
panels and plastic & rubber assembly 91,890 (US$ 2,800 )
Note 1 203,354 - - 203,354 100,752 (CNY 19,889 )
100.00 100,752 (CNY 19,889 )
1,070,118 (CNY 211,327 )
114,895 (CNY 22,681 )
Silitech Technology (SuZhou) Co., Ltd. Manufacture and sale of automotive parts 2,559,804 (US$ 78,000 )
Note 1 2,559,804 (US$ 78,000 )
- - 2,559,804 (US$ 78,000 )
16,332 (CNY 3,224 )
100.00 16,332 (CNY 3,224 )
1,835,222 (CNY 362,420 )
-
SuZhou Xulong Mold Producing Co., Ltd. Development, manufacture and sale of precision modules and new-type electronic components (chip components, testing elements, hybrid integrated circuits)
147,681 (US$ 4,500 )
Note 1 - - - - (111,481 ) (CNY -22,007 )
60.00 (66,888 ) (CNY -13,204 )
13,986 (CNY 2,762 )
-
Accumulated Investment in Mainland China as of December 31, 2015
Investment Amounts Authorized by Investment Commission, MOEA Upper Limit on Investment
$37,519,738 (US$1,144,767) $38,410,661 (US$1,171,950) Note 6
(Continued)

169 170‧Lite-On Technology Corporation 2015 Annual Report Lite-On Technology Corporation 2015 Annual Report‧
- 111 -
Note 1: Indirect investment in Mainland China through holding companies. Note 2: Amount was recognized based on the audited financial statements. Note 3: Lite-On Electronics (Guangzhou) Co., Ltd. merged with Lite-On Tech (Guangzhou) Co., Ltd., Lite-On (Guangzhou) Precision Tooling Co., Ltd., Lite-On Communications (Guangzhou) Co., Ltd. and Lite-On Elec and Wire (Guangzhou) Co., Ltd., with the Lite-On Electronics (Guangzhou) Co., Ltd. as the survivor entity.
Because the merging process was still under way as of December 31, 2015, the change in the amount of investment in Mainland China has not yet been registered with the Ministry of Economic Affairs. Note 4: Zhuhai Lite-On Mobile Technology Company Ltd. reorganized its structure on March 5, 2015; thus Lite-On Technology (Guangzhou) Investment Co., Ltd. wholly acquired Zhuhai Lite-On Mobile Technology Company Ltd. and injected its own funds CNY 461,665 thousand in the same year in July. Note 5: LarView Technologies Corp. (Shenzhen) completed its liquidation in July 2015. Note 6: Under Order No. 09704604680 and Order No. 10420404350 issued by the Ministry of Economic Affairs, R.O.C. on August 29, 2008 and February 16, 2015, respectively, the Parent Company acquired a certification-approved by the Industrial Development Bureau and valid from February 9, 2015 to February 8, 2018 - of its
status as operation headquarters in the ROC. Thus, the Parent Company has no limitation on the amount of investing in Mainland China.
(Concluded)

171 172‧Lite-On Technology Corporation 2015 Annual Report Lite-On Technology Corporation 2015 Annual Report‧
- 112 -
ABLE 9 LITE-ON TECHNOLOGY CORPORATION AND SUBSIDIARIES INTERCOMPANY RELATIONSHIPS AND SIGNIFICANT INTERCOMPANY TRANSACTIONS FOR THE YEAR ENDED DECEMBER 31, 2015 (Amounts in Thousands of New Taiwan Dollars)
No. (Note 1) Company Name Counter Party
Nature of Relationship
(Note 2)
Intercompany Transaction
Financial Statements Item Amount Terms
% of Consolidated
Net Revenue or Total Assets
(Note 3) 0 Lite-On Technology Corporation Philip & Lite-On Digital Solutions Corp. a. Sales $ 12,810,242 Cost-plus pricing 6 Philip & Lite-On Digital Solutions Corp. a. Accounts receivable 4,214,601 Cost-plus pricing 2 Philip & Lite-On Digital Solutions Corp. a. Other receivables 229,265 No significant difference - Lite-On Technology (Changzhou) Co., Ltd. a. Sales 1,163,932 Cost-plus pricing 1 Lite-On Technology (Changzhou) Co., Ltd. a. Accounts receivable 479,631 Cost-plus pricing - Lite-On Technology (Changzhou) Co., Ltd. a. Purchases 1,519,674 Cost-plus pricing 1 Lite-On Technology (Changzhou) Co., Ltd. a. Accounts payable 521,929 Cost-plus pricing - LET (HK) Ltd. a. Purchases 10,040,910 Cost-plus pricing 5 LET (HK) Ltd. a. Accounts payable 853,098 Cost-plus pricing - China Bridge Express (Wuxi) Co., Ltd. a. Sales 826,743 Cost-plus pricing - China Bridge Express (Wuxi) Co., Ltd. a. Accounts receivable 304,660 Cost-plus pricing - Titanic Capital Services Ltd. a. Other receivables 132,038 No significant difference - Titanic Capital Services Ltd. a. Other payables 435,879 No significant difference - Lite-On Electronics (Guangzhou) Co., Ltd. a. Disposal of property,
plant and equipment 357,116 No significant difference -
Lite-On Singapore Pte. Ltd. a. Sales 4,697,862 Cost-plus pricing 2 Lite-On Singapore Pte. Ltd. a. Accounts receivable 899,640 Cost-plus pricing - Lite-On Singapore Pte. Ltd. a. Other receivables 166,969 No significant difference - Lite-On Singapore Pte. Ltd. a. Purchases 24,766,587 Cost-plus pricing 11 Lite-On Singapore Pte. Ltd. a. Accounts payable 8,193,189 Cost-plus pricing 4 Lite-On Japan Ltd. a. Sales 861,796 Cost-plus pricing - Lite-On Japan Ltd. a. Accounts receivable 164,723 Cost-plus pricing - Lite-On Trading USA, Inc. a. Sales 3,295,462 Cost-plus pricing 2 Lite-On Trading USA, Inc. a. Accounts receivable 1,082,305 Cost-plus pricing 1 Lite-On Sales & Distribution Inc. a. Sales 128,049 Cost-plus pricing - Lite-On Sales & Distribution Inc. a. Accounts receivable 129,288 Cost-plus pricing - Philips & Lite-On Digital Solutions USA Inc. a. Other receivables 100,098 No significant difference - Lite-On Overseas Trading Co., Ltd. a. Accounts receivable 3,575,995 Cost-plus pricing 2 Lite-On Overseas Trading Co., Ltd. a. Purchases 57,023,431 Cost-plus pricing 26 Lite-On Overseas Trading Co., Ltd. a. Accounts payable 8,115,555 Cost-plus pricing 4 Lite-On China Holding Co., Ltd. a. Sales 141,230 Cost-plus pricing - Lite-On China Holding Co., Ltd. a. Accounts receivable 142,250 Cost-plus pricing - Li Shin International Enterprise Corp. a. Purchases 3,531,460 Cost-plus pricing 2 Li Shin International Enterprise Corp. a. Accounts payable 829,029 Cost-plus pricing - Lite-On Automotive Electronics (Guangzhou) Co., Ltd. a. Purchases 735,033 Cost-plus pricing - Lite-On Automotive Electronics (Guangzhou) Co., Ltd. a. Accounts payable 264,241 Cost-plus pricing -
(Continued)

173 174‧Lite-On Technology Corporation 2015 Annual Report Lite-On Technology Corporation 2015 Annual Report‧
- 113 -
No. (Note 1) Company Name Counter Party
Nature of Relationship
(Note 2)
Intercompany Transaction
Financial Statements Item Amount Terms
% of Consolidated
Net Revenue or Total Assets
(Note 3) 1 Lite-On Electronics (Tianjinn) Co., Ltd. Lite-On Overseas Trading Co., Ltd. c. Sales $ 1,669,705 Cost-plus pricing 1 Lite-On Overseas Trading Co., Ltd. c. Accounts receivable 301,145 Cost-plus pricing - Lite-On Opto Technology (Guangzhou) Co., Ltd. c. Other receivables 257,316 No significant difference - 2 Lite-On Network Communication (Dongguan) Limited Lite-On Overseas Trading Co., Ltd. c. Sales 7,422,514 Cost-plus pricing 3 Lite-On Overseas Trading Co., Ltd. c. Accounts receivable 1,009,696 No significant difference - China Bridge Express (Wuxi) Co., Ltd. c. Sales 244,867 Cost-plus pricing - China Bridge Express (Wuxi) Co., Ltd. c. Accounts receivable 101,682 No significant difference - 3 Lite-On Opto Technology (Changzhou) Co., Ltd. Changzhou Leotek New Energy Trade Limited c. Other receivables 177,252 No significant difference - Lite-On Singapore Pte. Ltd. c. Sales 3,189,894 Cost-plus pricing 1 Lite-On Singapore Pte. Ltd. c. Accounts receivable 173,523 No significant difference - 4 Lite-On Li Shin Technology (Ganzhou) Co., Ltd. Li Shin International Enterprise Corp. c. Sales 578,563 Cost-plus pricing - Li Shin International Enterprise Corp. c. Accounts receivable 224,556 Cost-plus pricing - 5 Lite-On Technology (Changzhou) Co., Ltd. Lite-On Singapore Pte. Ltd. c. Sales 13,803,594 Cost-plus pricing 6 Lite-On Singapore Pte. Ltd. c. Accounts receivable 1,122,616 Cost-plus pricing 1 Lite-On Overseas Trading Co., Ltd. c. Sales 8,782,083 Cost-plus pricing 4 Lite-On Overseas Trading Co., Ltd. c. Accounts receivable 661,207 Cost-plus pricing - Zhuhai Lite-On Mobile Technology Co., Ltd. c. Other receivables 1,280,305 No significant difference 1 6 Lite-On Technology (Ying Tan) Co., Ltd. Li Shin International Enterprise Corp. c. Sales 752,158 Cost-plus pricing - Li Shin International Enterprise Corp. c. Accounts receivable 231,985 Cost-plus pricing - 7 Lite-On Technology (Xianging) Co., Ltd. Li Shin International Enterprise Corp. c. Sales 577,179 Cost-plus pricing - Li Shin International Enterprise Corp. c. Accounts receivable 103,926 Cost-plus pricing - 8 Lite-On Technology (Shanghai) Ltd. Philip & Lite-On Digital Solutions (Shanghai) Co., Ltd. c. Sales 635,528 Cost-plus pricing - 9 China Bridge Express (Wuxi) Co., Ltd. Lite-On Technology (Changzhou) Co., Ltd. c. Sales 183,438 Cost-plus pricing -
10 Lite-On Electronics (Dongguan) Co., Ltd. Lite-On Overseas Trading Co., Ltd. c. Sales 12,605,138 Cost-plus pricing 6 Lite-On Overseas Trading Co., Ltd. c. Accounts receivable 1,107,114 Cost-plus pricing 1
11 Silitek Elec. (Dongguan) Co., Ltd. Lite-On Overseas Trading Co., Ltd. c. Sales 8,704,470 Cost-plus pricing 4 Lite-On Overseas Trading Co., Ltd. c. Accounts receivable 1,199,503 Cost-plus pricing 1
12 Lite-On Power Technology (Dongguan) Co., Ltd. Lite-On Electronics Co., Ltd. c. Sales 1,483,284 Cost-plus pricing 1
(Continued)

175 176‧Lite-On Technology Corporation 2015 Annual Report Lite-On Technology Corporation 2015 Annual Report‧
- 114 -
No. (Note 1) Company Name Counter Party
Nature of Relationship
(Note 2)
Intercompany Transaction
Financial Statements Item Amount Terms
% of Consolidated
Net Revenue or Total Assets
(Note 3)
13 Lite-On Electronics H.K. Ltd. Lite-On Overseas Trading Co., Ltd. c. Sales $ 154,125 Cost-plus pricing -
14 Lite-On Electronics Co., Ltd. Lite-On Singapore Pte. Ltd. c. Sales 1,483,284 Cost-plus pricing 1
15 Dong Guan G-Tech Computers Co., Ltd. Lite-On Electronics (Guangzhou) Co., Ltd. c. Sales 265,491 Cost-plus pricing - Lite-On Overseas Trading Co., Ltd. c. Sales 3,054,784 Cost-plus pricing 1 Lite-On Overseas Trading Co., Ltd. c. Accounts receivable 311,575 Cost-plus pricing -
16 Huizhou Li Shin Electronic Co., Ltd. Li Shin International Enterprise Corp. c. Sales 1,567,066 Cost-plus pricing 1 Li Shin International Enterprise Corp. c. Accounts receivable 434,320 Cost-plus pricing -
17 DongGuan G-Pro Computer Co., Ltd. Lite-On Overseas Trading Co., Ltd. c. Sales 6,514,823 Cost-plus pricing 3
18 Lite-On Electronics (Guangzhou) Co., Ltd. Dong Guan G-Tech Computers Co., Ltd. c. Sales 140,509 Cost-plus pricing - Lite-On Overseas Trading Co., Ltd. c. Sales 39,788,218 Cost-plus pricing 18 Lite-On Overseas Trading Co., Ltd. c. Accounts receivable 6,627,863 No significant difference 3
19 Lite-On Opto Technology (Guangzhou) Co., Ltd. Lite-On Auto Electric Technology (Guangzhou) Ltd. c. Sales 101,562 Cost-plus pricing - LET (HK) Ltd. c. Sales 2,992,426 Cost-plus pricing 1 LET (HK) Ltd. c. Accounts receivable 646,403 Cost-plus pricing -
20 Lite-On Auto Electric Technology (Guangzhou) Ltd. Lite-On Technology (Shanghai) Ltd. c. Sales 477,351 Cost-plus pricing - Philip & Lite-On Digital Solutions (Shanghai) Co., Ltd. c. Sales 280,499 Cost-plus pricing -
21 Lite-On IT Opto Tech (BH) Co., Ltd. LET (HK) Ltd. c. Sales 17,591,910 Cost-plus pricing 8 LET (HK) Ltd. c. Accounts receivable 1,516,402 Cost-plus pricing 1
22 LET (HK) Ltd. Lite-On Opto Technology (Guangzhou) Co., Ltd. c. Sales 1,494,368 Cost-plus pricing 1 Lite-On Opto Technology (Guangzhou) Co., Ltd. c. Accounts receivable 691,681 Cost-plus pricing - Lite-On Auto Electric Technology (Guangzhou) Ltd. c. Sales 232,412 Cost-plus pricing - Lite-On IT Opto Tech (BH) Co., Ltd. c. Sales 12,234,874 Cost-plus pricing 6 Lite-On IT Opto Tech (BH) Co., Ltd. c. Accounts receivable 5,044,250 Cost-plus pricing 2 Lite-On Singapore Pte. Ltd. c. Sales 9,698,066 Cost-plus pricing 4 Lite-Space Technology Company Limited c. Purchases 3,761,826 Cost-plus pricing 1 Lite-Space Technology Company Limited c. Accounts payable 257,850 Cost-plus pricing -
23 Lite-On Electronics (Thailand) Co., Ltd. Lite-On Singapore Pte. Ltd. c. Sales 3,148,388 Cost-plus pricing 1 Lite-On Singapore Pte. Ltd. c. Accounts receivable 736,127 Cost-plus pricing -
(Continued)

177 178‧Lite-On Technology Corporation 2015 Annual Report Lite-On Technology Corporation 2015 Annual Report‧
- 115 -
No. (Note 1) Company Name Counter Party
Nature of Relationship
(Note 2)
Intercompany Transaction
Financial Statements Item Amount Terms
% of Consolidated
Net Revenue or Total Assets
(Note 3)
24 Lite-On Singapore Pte. Ltd. Lite-On Technology (Changzhou) Co., Ltd. c. Sales $ 206,086 Cost-plus pricing - China Bridge Express (Wuxi) Co., Ltd. c. Sales 1,146,671 Cost-plus pricing 1 China Bridge Express (Wuxi) Co., Ltd. c. Accounts receivable 500,853 Cost-plus pricing - Lite-On Electronics H.K. Ltd. c. Sales 2,059,526 Cost-plus pricing 1 Lite-On Electronics H.K. Ltd. c. Accounts receivable 391,471 Cost-plus pricing - Lite-On Japan Ltd. c. Sales 1,559,866 Cost-plus pricing 1 Lite-On Japan Ltd. c. Accounts receivable 536,939 Cost-plus pricing - Lite-On, Inc. c. Sales 621,231 Cost-plus pricing - Lite-On, Inc. c. Accounts receivable 136,069 Cost-plus pricing - Lite-On Trading USA, Inc. c. Sales 4,725,589 Cost-plus pricing 2 Lite-On Trading USA, Inc. c. Accounts receivable 1,605,131 Cost-plus pricing 1 Leotek Electronics USA LLC c. Sales 1,405,437 Cost-plus pricing 1 Leotek Electronics USA LLC c. Accounts receivable 532,180 Cost-plus pricing - Lite-On Sales & Distribution Inc. c. Sales 570,405 Cost-plus pricing - Lite-On Sales & Distribution Inc. c. Accounts receivable 206,718 Cost-plus pricing - Philips & Lite-On Digital Solutions USA Inc. c. Sales 9,918,059 Cost-plus pricing 5 Philips & Lite-On Digital Solutions USA Inc. c. Accounts receivable 1,449,385 Cost-plus pricing 1 Philips & Lite-On Digital Solutions Germany GmbH c. Sales 1,836,539 Cost-plus pricing 1 Philips & Lite-On Digital Solutions Germany GmbH c. Accounts receivable 291,208 Cost-plus pricing - Lite-On Overseas Trading Co., Ltd. c. Sales 382,058 Cost-plus pricing - Lite-On Overseas Trading Co., Ltd. c. Accounts receivable 643,670 Cost-plus pricing - Lite-On Mobile Pte. Ltd. c. Other receivables 1,311,501 No significant difference 1
25 G&W Technology (BVI) Limited G&W Technology Limited c. Other receivables 178,546 No significant difference -
26 Lite-On Overseas Trading Co., Ltd. Lite-On Network Communication (Dongguan) Limited c. Sales 6,369,124 Cost-plus pricing 3 Lite-On Network Communication (Dongguan) Limited c. Accounts receivable 1,770,962 Cost-plus pricing 1 Lite-On Technology (Changzhou) Co., Ltd. c. Sales 15,216,534 Cost-plus pricing 7 Lite-On Technology (Changzhou) Co., Ltd. c. Accounts receivable 5,335,946 Cost-plus pricing 3 Lite-On Electronics (Dongguan) Co., Ltd. c. Sales 11,171,663 Cost-plus pricing 5 Lite-On Electronics (Dongguan) Co., Ltd. c. Accounts receivable 1,211,482 Cost-plus pricing 1 Silitek Elec. (Dongguan) Co., Ltd. c. Sales 6,835,674 Cost-plus pricing 3 Silitek Elec. (Dongguan) Co., Ltd. c. Accounts receivable 656,886 Cost-plus pricing - Dong Guan G-Tech Computers Co., Ltd. c. Sales 1,968,661 Cost-plus pricing 1 Dong Guan G-Tech Computers Co., Ltd. c. Accounts receivable 645,524 Cost-plus pricing -
(Continued)

179 180‧Lite-On Technology Corporation 2015 Annual Report Lite-On Technology Corporation 2015 Annual Report‧
- 116 -
No. (Note 1) Company Name Counter Party
Nature of Relationship
(Note 2)
Intercompany Transaction
Financial Statements Item Amount Terms
% of Consolidated
Net Revenue or Total Assets
(Note 3)
26 Lite-On Overseas Trading Co., Ltd. I-Solutions Limited c. Sales $ 437,145 Cost-plus pricing - I-Solutions Limited c. Accounts receivable 154,260 Cost-plus pricing - Huizhou Li Shin Electronic Co., Ltd. c. Sales 178,268 Cost-plus pricing - Huizhou Li Shin Electronic Co., Ltd. c. Accounts receivable 181,261 Cost-plus pricing - DongGuan G-Pro Computer Co., Ltd. c. Sales 5,144,551 Cost-plus pricing 2 DongGuan G-Pro Computer Co., Ltd. c. Accounts receivable 1,298,409 Cost-plus pricing 1 Lite-On Electronics (Guangzhou) Co., Ltd. c. Sales 41,278,205 Cost-plus pricing 19 Lite-On Electronics (Guangzhou) Co., Ltd. c. Accounts receivable 9,277,765 Cost-plus pricing 4 Lite-On Singapore Pte. Ltd. c. Sales 29,420,468 Cost-plus pricing 14 Lite-On Singapore Pte. Ltd. c. Accounts receivable 8,597,033 Cost-plus pricing 4
27 Li Shin International Enterprise Corp. Huizhou Li Shin Electronic Co., Ltd. c. Accounts receivable 183,563 Cost-plus pricing -
28 Lite-On Mobile Oyj (formerly: Perlos Oyj) Lite-On Mobile India Private Limited c. Other receivables 160,598 No significant difference -
29 Lite-On Automotive Electronics (Guangzhou) Co., Ltd. Lite-On Technology (Shanghai) Ltd. c. Sales 174,067 Cost-plus pricing - Lite-On Technology (Shanghai) Ltd. c. Accounts receivable 176,933 Cost-plus pricing - Lite-On Singapore Pte. Ltd. c. Sales 1,102,906 Cost-plus pricing 1 Lite-On Singapore Pte. Ltd. c. Accounts receivable 359,621 Cost-plus pricing -
30 Guangzhou Lite-On Mobile Engineering Plastics Co., Ltd. Zhuhai Lite-On Mobile Technology Co., Ltd. c. Other receivables 1,318,408 No significant difference 1
31 Beijing Lite-On Mobile Electronic and Telecommunications Lite-On Mobile Oyj (formerly: Perlos Oyj) c. Sales 727,809 Cost-plus pricing - Components Co., Ltd.
32 Shenzhen Lite-On Mobile Precision Molds Co., Ltd. Guangzhou Lite-On Mobile Electronic Components Co., Ltd. c. Sales 605,618 Cost-plus pricing - Guangzhou Lite-On Mobile Electronic Components Co., Ltd. c. Accounts receivable 106,272 Cost-plus pricing -
33 Guangzhou Lite-On Mobile Electronic Components Co., Ltd. Lite-On Mobile Oyj (formerly: Perlos Oyj) c. Sales 102,823 Cost-plus pricing - Lite-On Mobile Pte. Ltd. c. Sales 456,762 Cost-plus pricing - Lite-On Mobile Pte. Ltd. c. Accounts receivable 253,851 Cost-plus pricing -
34 Lite-On Mobile Pte. Ltd. Lite-On Mobile India Private Limited c. Other receivables 941,659 No significant difference - Guangzhou Lite-On Mobile Electronic Components Co., Ltd. c. Sales 329,664 Cost-plus pricing -
35 Zhuhai Lite-On Mobile Technology Co., Ltd. Lite-On Mobile Pte. Ltd. c. Sales 910,798 Cost-plus pricing - Lite-On Mobile Pte. Ltd. c. Accounts receivable 720,724 Cost-plus pricing -
36 Silitech Technology Corp. Silitech (BVI) Holding Ltd. c. Other receivables 370,404 Cost-plus pricing - Silitech Technology Corporation Ltd. c. Purchases 941,634 Cost-plus pricing - Silitech Technology Corporation Ltd. c. Accounts payable 286,523 Cost-plus pricing -
(Continued)
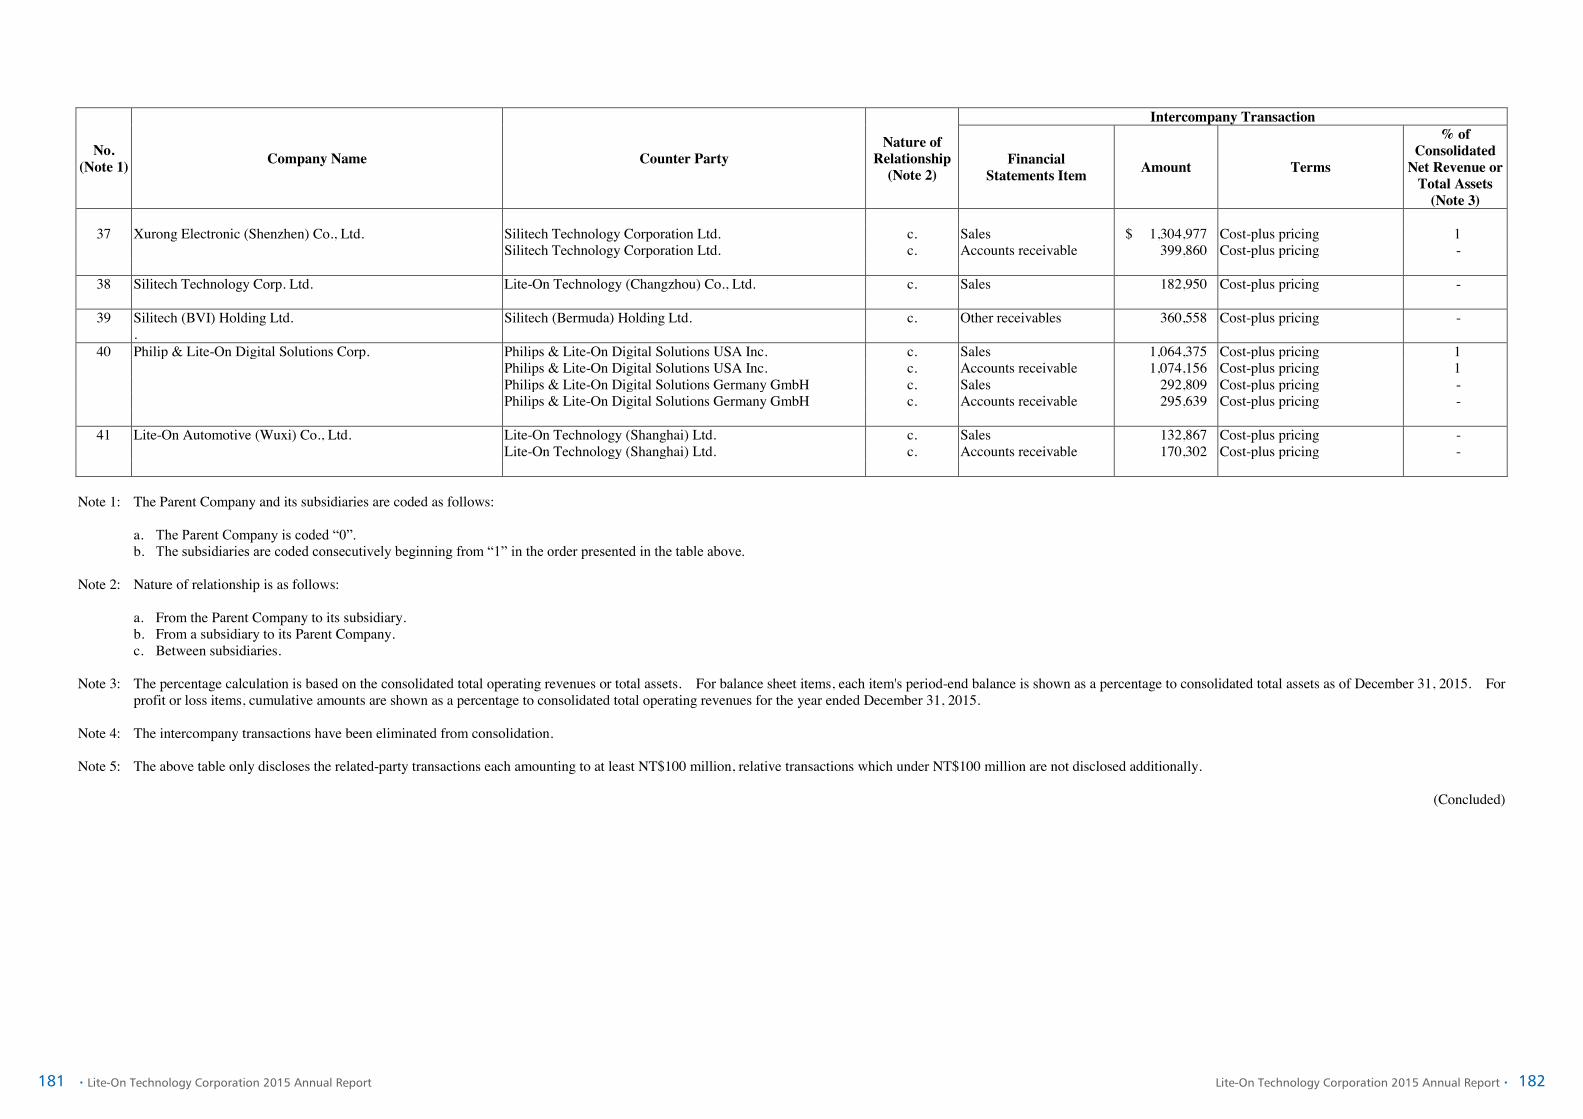
181 182‧Lite-On Technology Corporation 2015 Annual Report Lite-On Technology Corporation 2015 Annual Report‧
- 117 -
No. (Note 1) Company Name Counter Party
Nature of Relationship
(Note 2)
Intercompany Transaction
Financial Statements Item Amount Terms
% of Consolidated
Net Revenue or Total Assets
(Note 3)
37 Xurong Electronic (Shenzhen) Co., Ltd. Silitech Technology Corporation Ltd. c. Sales $ 1,304,977 Cost-plus pricing 1 Silitech Technology Corporation Ltd. c. Accounts receivable 399,860 Cost-plus pricing -
38 Silitech Technology Corp. Ltd. Lite-On Technology (Changzhou) Co., Ltd. c. Sales 182,950 Cost-plus pricing -
39 Silitech (BVI) Holding Ltd. Silitech (Bermuda) Holding Ltd. c. Other receivables 360,558 Cost-plus pricing - .
40 Philip & Lite-On Digital Solutions Corp. Philips & Lite-On Digital Solutions USA Inc. c. Sales 1,064,375 Cost-plus pricing 1 Philips & Lite-On Digital Solutions USA Inc. c. Accounts receivable 1,074,156 Cost-plus pricing 1 Philips & Lite-On Digital Solutions Germany GmbH c. Sales 292,809 Cost-plus pricing - Philips & Lite-On Digital Solutions Germany GmbH c. Accounts receivable 295,639 Cost-plus pricing -
41 Lite-On Automotive (Wuxi) Co., Ltd. Lite-On Technology (Shanghai) Ltd. c. Sales 132,867 Cost-plus pricing - Lite-On Technology (Shanghai) Ltd. c. Accounts receivable 170,302 Cost-plus pricing -
Note 1: The Parent Company and its subsidiaries are coded as follows:
a. The Parent Company is coded “0”. b. The subsidiaries are coded consecutively beginning from “1” in the order presented in the table above.
Note 2: Nature of relationship is as follows:
a. From the Parent Company to its subsidiary. b. From a subsidiary to its Parent Company. c. Between subsidiaries.
Note 3: The percentage calculation is based on the consolidated total operating revenues or total assets. For balance sheet items, each item's period-end balance is shown as a percentage to consolidated total assets as of December 31, 2015. For
profit or loss items, cumulative amounts are shown as a percentage to consolidated total operating revenues for the year ended December 31, 2015. Note 4: The intercompany transactions have been eliminated from consolidation. Note 5: The above table only discloses the related-party transactions each amounting to at least NT$100 million, relative transactions which under NT$100 million are not disclosed additionally.
(Concluded)

183 184‧Lite-On Technology Corporation 2015 Annual Report Lite-On Technology Corporation 2015 Annual Report‧
Lite-On Technology Corporation Financial Statements for the Years Ended December 31, 2015 and 2014 and Independent Auditors’ Report
5.2 Parent Company Only Financial Statements of 2015
- 1 -
INDEPENDENT AUDITORS’ REPORT The Board of Directors and Stockholders Lite-On Technology Corporation We have audited the accompanying balance sheets of Lite-On Technology Corporation as of December 31, 2015, December 31, 2014 and January 1, 2014, and the related statements of comprehensive income, changes in equity and cash flows for the years then ended. These financial statements are the responsibility of Lite-On Technology Corporation’s management. Our responsibility is to express an opinion on these financial statements based on our audits. We conducted our audits in accordance with the Regulations Governing Auditing and Attestation of Financial Statements by Certified Public Accountants and auditing standards generally accepted in the Republic of China. Those rules and standards require that we plan and perform the audit to obtain reasonable assurance about whether the financial statements are free of material misstatement. An audit includes examining, on a test basis, evidence supporting the amounts and disclosures in the financial statements. An audit also includes assessing the accounting principles used and significant estimates made by management, as well as evaluating the overall financial statement presentation. We believe that our audits provide a reasonable basis for our opinion. In our opinion, the financial statements referred to above present fairly, in all material respects, the financial position of Lite-On Technology Corporation as of December 31, 2015, December 31, 2014 and January 1, 2014, and its financial performance and its cash flows for the years then ended, in conformity with the Regulations Governing the Preparation of Financial Reports by Securities Issuers. The accompanying schedules of major accounting items of Lite-On Technology Corporation as of and for the year ended December 31, 2015 are presented for the purpose of additional analysis. Such schedules have been subjected to the auditing procedures described in the second paragraph. In our opinion, such schedules are consistent, in all material respects, with the financial statements required to in the first paragraph. March 25, 2016
Notice to Readers The accompanying financial statements are intended only to present the financial position, financial performance and cash flows in accordance with accounting principles and practices generally accepted in the Republic of China and not those of any other jurisdictions. The standards, procedures and practices to audit such financial statements are those generally applied in the Republic of China. For the convenience of readers, the independent auditors’ report and the accompanying financial statements have been translated into English from the original Chinese version prepared and used in the Republic of China. If there is any conflict between the English version and the original Chinese version or any difference in the interpretation of the two versions, the Chinese-language independent auditors’ report and financial statements shall prevail.
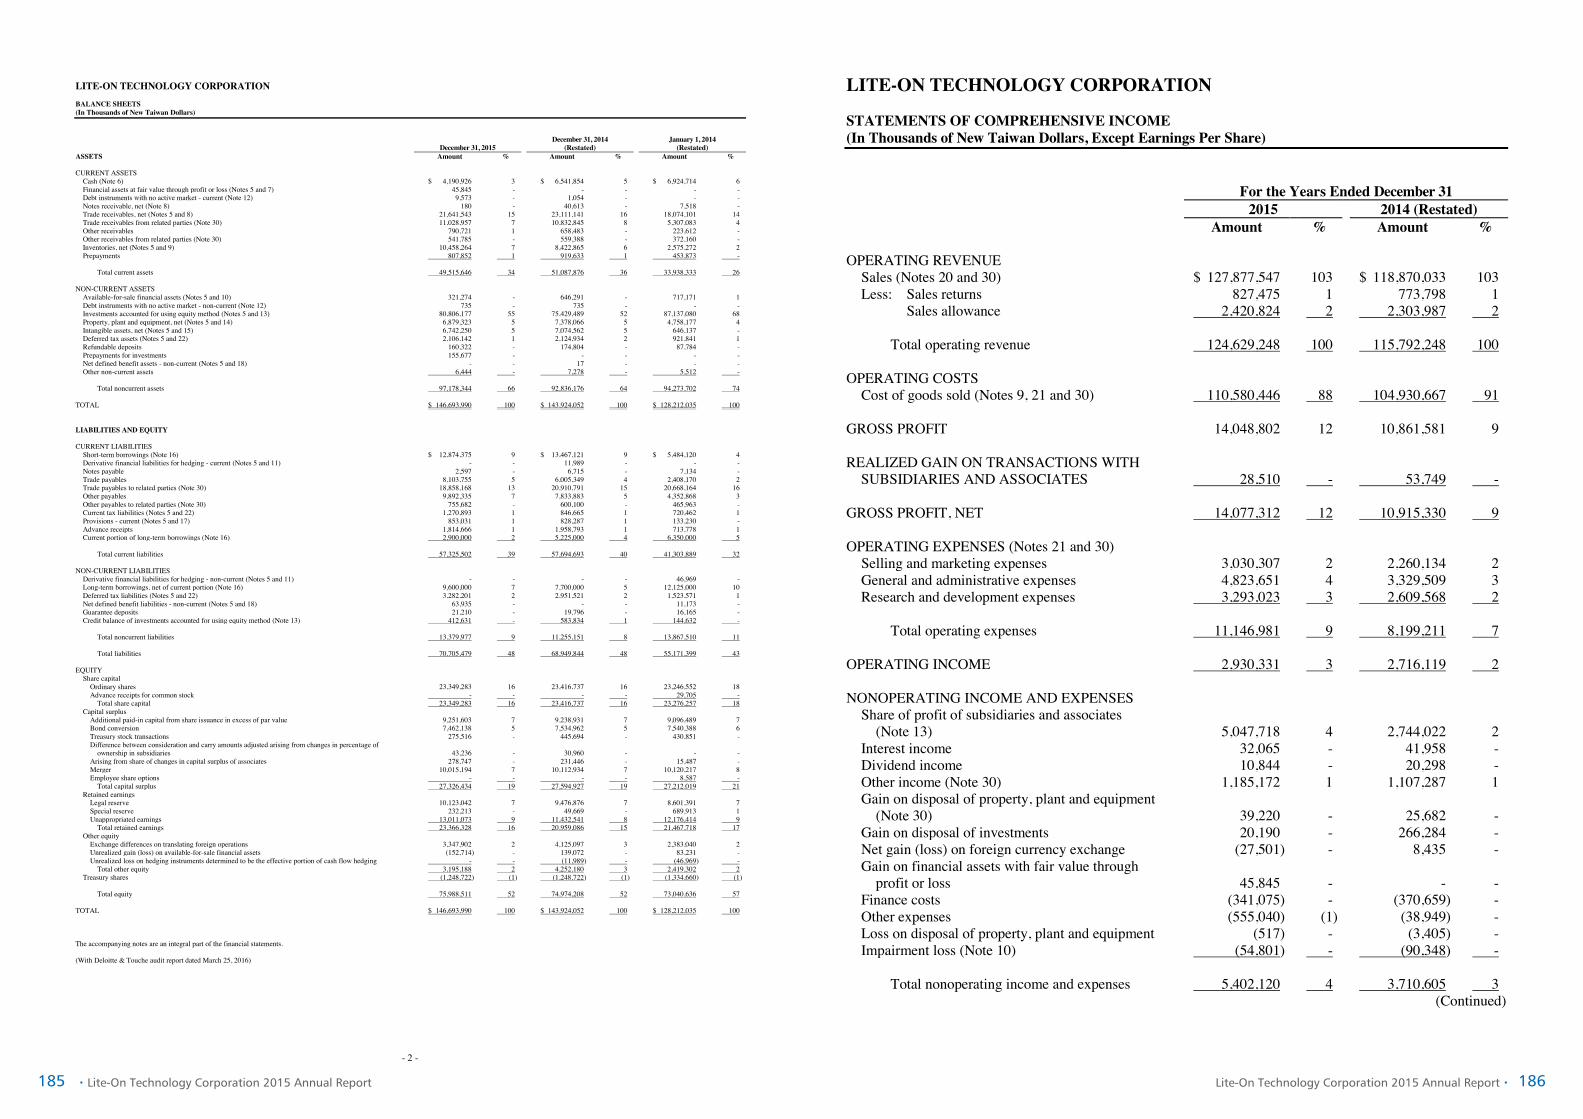
185 186‧Lite-On Technology Corporation 2015 Annual Report Lite-On Technology Corporation 2015 Annual Report‧
- 2 -
LITE-ON TECHNOLOGY CORPORATION BALANCE SHEETS (In Thousands of New Taiwan Dollars)
December 31, 2015 December 31, 2014
(Restated) January 1, 2014
(Restated) ASSETS Amount % Amount % Amount % CURRENT ASSETS
Cash (Note 6) $ 4,190,926 3 $ 6,541,854 5 $ 6,924,714 6 Financial assets at fair value through profit or loss (Notes 5 and 7) 45,845 - - - - - Debt instruments with no active market - current (Note 12) 9,573 - 1,054 - - - Notes receivable, net (Note 8) 180 - 40,613 - 7,518 - Trade receivables, net (Notes 5 and 8) 21,641,543 15 23,111,141 16 18,074,101 14 Trade receivables from related parties (Note 30) 11,028,957 7 10,832,845 8 5,307,083 4 Other receivables 790,721 1 658,483 - 223,612 - Other receivables from related parties (Note 30) 541,785 - 559,388 - 372,160 - Inventories, net (Notes 5 and 9) 10,458,264 7 8,422,865 6 2,575,272 2 Prepayments 807,852 1 919,633 1 453,873 -
Total current assets 49,515,646 34 51,087,876 36 33,938,333 26
NON-CURRENT ASSETS
Available-for-sale financial assets (Notes 5 and 10) 321,274 - 646,291 - 717,171 1 Debt instruments with no active market - non-current (Note 12) 735 - 735 - - - Investments accounted for using equity method (Notes 5 and 13) 80,806,177 55 75,429,489 52 87,137,080 68 Property, plant and equipment, net (Notes 5 and 14) 6,879,323 5 7,378,066 5 4,758,177 4 Intangible assets, net (Notes 5 and 15) 6,742,250 5 7,074,562 5 646,137 - Deferred tax assets (Notes 5 and 22) 2,106,142 1 2,124,934 2 921,841 1 Refundable deposits 160,322 - 174,804 - 87,784 - Prepayments for investments 155,677 - - - - - Net defined benefit assets - non-current (Notes 5 and 18) - - 17 - - - Other non-current assets 6,444 - 7,278 - 5,512 -
Total noncurrent assets 97,178,344 66 92,836,176 64 94,273,702 74
TOTAL $ 146,693,990 100 $ 143,924,052 100 $ 128,212,035 100 LIABILITIES AND EQUITY CURRENT LIABILITIES
Short-term borrowings (Note 16) $ 12,874,375 9 $ 13,467,121 9 $ 5,484,120 4 Derivative financial liabilities for hedging - current (Notes 5 and 11) - - 11,989 - - - Notes payable 2,597 - 6,715 - 7,134 - Trade payables 8,103,755 5 6,005,349 4 2,408,170 2 Trade payables to related parties (Note 30) 18,858,168 13 20,910,791 15 20,668,164 16 Other payables 9,892,335 7 7,833,883 5 4,352,868 3 Other payables to related parties (Note 30) 755,682 - 600,100 - 465,963 - Current tax liabilities (Notes 5 and 22) 1,270,893 1 846,665 1 720,462 1 Provisions - current (Notes 5 and 17) 853,031 1 828,287 1 133,230 - Advance receipts 1,814,666 1 1,958,793 1 713,778 1 Current portion of long-term borrowings (Note 16) 2,900,000 2 5,225,000 4 6,350,000 5
Total current liabilities 57,325,502 39 57,694,693 40 41,303,889 32
NON-CURRENT LIABILITIES
Derivative financial liabilities for hedging - non-current (Notes 5 and 11) - - - - 46,969 - Long-term borrowings, net of current portion (Note 16) 9,600,000 7 7,700,000 5 12,125,000 10 Deferred tax liabilities (Notes 5 and 22) 3,282,201 2 2,951,521 2 1,523,571 1 Net defined benefit liabilities - non-current (Notes 5 and 18) 63,935 - - - 11,173 - Guarantee deposits 21,210 - 19,796 - 16,165 - Credit balance of investments accounted for using equity method (Note 13) 412,631 - 583,834 1 144,632 -
Total noncurrent liabilities 13,379,977 9 11,255,151 8 13,867,510 11
Total liabilities 70,705,479 48 68,949,844 48 55,171,399 43
EQUITY
Share capital Ordinary shares 23,349,283 16 23,416,737 16 23,246,552 18 Advance receipts for common stock - - - - 29,705 -
Total share capital 23,349,283 16 23,416,737 16 23,276,257 18 Capital surplus
Additional paid-in capital from share issuance in excess of par value 9,251,603 7 9,238,931 7 9,096,489 7 Bond conversion 7,462,138 5 7,534,962 5 7,540,388 6 Treasury stock transactions 275,516 - 445,694 - 430,851 - Difference between consideration and carry amounts adjusted arising from changes in percentage of
ownership in subsidiaries 43,236 - 30,960 - - - Arising from share of changes in capital surplus of associates 278,747 - 231,446 - 15,487 - Merger 10,015,194 7 10,112,934 7 10,120,217 8 Employee share options - - - - 8,587 -
Total capital surplus 27,326,434 19 27,594,927 19 27,212,019 21 Retained earnings
Legal reserve 10,123,042 7 9,476,876 7 8,601,391 7 Special reserve 232,213 - 49,669 - 689,913 1 Unappropriated earnings 13,011,073 9 11,432,541 8 12,176,414 9
Total retained earnings 23,366,328 16 20,959,086 15 21,467,718 17 Other equity
Exchange differences on translating foreign operations 3,347,902 2 4,125,097 3 2,383,040 2 Unrealized gain (loss) on available-for-sale financial assets (152,714 ) - 139,072 - 83,231 - Unrealized loss on hedging instruments determined to be the effective portion of cash flow hedging - - (11,989 ) - (46,969 ) -
Total other equity 3,195,188 2 4,252,180 3 2,419,302 2 Treasury shares (1,248,722 ) (1 ) (1,248,722 ) (1 ) (1,334,660 ) (1 )
Total equity 75,988,511 52 74,974,208 52 73,040,636 57
TOTAL $ 146,693,990 100 $ 143,924,052 100 $ 128,212,035 100 The accompanying notes are an integral part of the financial statements. (With Deloitte & Touche audit report dated March 25, 2016)
- 3 -
LITE-ON TECHNOLOGY CORPORATION STATEMENTS OF COMPREHENSIVE INCOME (In Thousands of New Taiwan Dollars, Except Earnings Per Share) For the Years Ended December 31 2015 2014 (Restated) Amount % Amount % OPERATING REVENUE
Sales (Notes 20 and 30) $ 127,877,547 103 $ 118,870,033 103 Less: Sales returns 827,475 1 773,798 1 Sales allowance 2,420,824 2 2,303,987 2
Total operating revenue 124,629,248 100 115,792,248 100
OPERATING COSTS
Cost of goods sold (Notes 9, 21 and 30) 110,580,446 88 104,930,667 91 GROSS PROFIT 14,048,802 12 10,861,581 9 REALIZED GAIN ON TRANSACTIONS WITH
SUBSIDIARIES AND ASSOCIATES 28,510 - 53,749 - GROSS PROFIT, NET 14,077,312 12 10,915,330 9 OPERATING EXPENSES (Notes 21 and 30)
Selling and marketing expenses 3,030,307 2 2,260,134 2 General and administrative expenses 4,823,651 4 3,329,509 3 Research and development expenses 3,293,023 3 2,609,568 2
Total operating expenses 11,146,981 9 8,199,211 7
OPERATING INCOME 2,930,331 3 2,716,119 2 NONOPERATING INCOME AND EXPENSES
Share of profit of subsidiaries and associates (Note 13) 5,047,718 4 2,744,022 2
Interest income 32,065 - 41,958 - Dividend income 10,844 - 20,298 - Other income (Note 30) 1,185,172 1 1,107,287 1 Gain on disposal of property, plant and equipment
(Note 30) 39,220 - 25,682 - Gain on disposal of investments 20,190 - 266,284 - Net gain (loss) on foreign currency exchange (27,501) - 8,435 - Gain on financial assets with fair value through
profit or loss 45,845 - - - Finance costs (341,075) - (370,659) - Other expenses (555,040) (1) (38,949) - Loss on disposal of property, plant and equipment (517) - (3,405) - Impairment loss (Note 10) (54,801) - (90,348) -
Total nonoperating income and expenses 5,402,120 4 3,710,605 3
(Continued)

187 188‧Lite-On Technology Corporation 2015 Annual Report Lite-On Technology Corporation 2015 Annual Report‧
- 4 -
LITE-ON TECHNOLOGY CORPORATION STATEMENTS OF COMPREHENSIVE INCOME (In Thousands of New Taiwan Dollars, Except Earnings Per Share) For the Years Ended December 31 2015 2014 (Restated) Amount % Amount % PROFIT BEFORE INCOME TAX $ 8,332,451 7 $ 6,426,724 5 INCOME TAX BENEFIT (EXPENSE) (Notes 5
and 22) (1,109,552) (1) 34,084 - NET PROFIT FOR THE YEAR 7,222,899 6 6,460,808 5 OTHER COMPREHENSIVE INCOME (Notes 18, 19
and 22) Items that will not be reclassified subsequently to
profit or loss: Remeasurement of defined benefit plans (76,626) - 9,908 - Share of other comprehensive loss of subsidiaries
and associates accounted for using the equity method (21,876) - (9,935) -
Income tax relating to items that will not be reclassified subsequently to profit or loss 13,026 - (1,684) - (85,476) - (1,711) -
Items that may be reclassified subsequently to profit or loss: Exchange differences on translating foreign
operations (818,537) (1) 2,394,153 2 Unrealized gain (loss) on available-for-sale
financial assets (300,819) - 39,301 - Unrealized Gain on hedging instruments
determined to be the effective portion of cash flow hedging 11,989 - 34,980 -
Share of other comprehensive loss of subsidiaries and associates accounted for using the equity method (81,980) - (216,460) -
Income tax relating to items that may be reclassified subsequently to profit or loss 132,355 - (404,307) - (1,056,992) (1) 1,847,667 2
Other comprehensive income (loss) for the year,
net of income tax (1,142,468) (1) 1,845,956 2 TOTAL COMPREHENSIVE INCOME FOR THE
YEAR $ 6,080,431 5 $ 8,306,764 7 (Continued)
- 5 -
LITE-ON TECHNOLOGY CORPORATION STATEMENTS OF COMPREHENSIVE INCOME (In Thousands of New Taiwan Dollars, Except Earnings Per Share) For the Years Ended December 31 2015 2014 (Restated) Amount % Amount % EARNINGS PER SHARE (NEW TAIWAN
DOLLARS; Note 23)
Basic $3.11 $2.78 Diluted $3.07 $2.75
The accompanying notes are an integral part of the financial statements. (With Deloitte & Touche audit report dated March 25, 2016) (Concluded)

189 190‧Lite-On Technology Corporation 2015 Annual Report Lite-On Technology Corporation 2015 Annual Report‧
- 6 -
LITE-ON TECHNOLOGY CORPORATION STATEMENTS OF CHANGES IN EQUITY (In Thousands of New Taiwan Dollars) Capital Surplus (Note 19)
Difference Between
Consideration and Carry Amounts
Arising from Share of Other Equity (Note 19)
Issue of Share Capital (Note 19) Additional
Paid-in Capital Adjusted Arising from Change in
Changes in Capital Surplus
Exchange Differences on
Unrealized Gain (Loss) on
Advance from Share Percentage of of Associates Retained Earnings (Notes 19 and 26) Translating Available-for- Treasury
Shares
(In Thousands) Amount Receipts for
Common Stock Total Excess of Par
Value Bond
Conversion Treasury Stock Transactions
Ownership in Subsidiaries
and Joint Ventures Merger
Employee Stock Options Total Legal Reserve Special Reserve
Unappropriated Earnings Total
Foreign Operations
sale Financial Assets
Cash Flow Hedges Total
Shares (Note 19) Total Equity
BALANCE AT JANUARY 1, 2014 2,324,655 $ 23,246,552 $ 29,705 $ 23,276,257 $ 9,096,489 $ 7,540,388 $ 430,851 $ - $ 15,487 $ 10,120,217 $ 8,587 $ 27,212,019 $ 8,601,391 $ 689,913 $ 12,172,082 $ 21,463,386 $ 2,383,040 $ 83,231 $ (46,969 ) $ 2,419,302 $ (1,334,660 ) $ 73,036,304 Effect of retrospective application of IFRSs
and restatement of financial statements (Note 3) - - - - - - - - - - - - - - 4,332 4,332 - - - - - 4,332
BALANCE AT JANUARY 1, 2014 AS
RESTATED 2,324,655 23,246,552 29,705 23,276,257 9,096,489 7,540,388 430,851 - 15,487 10,120,217 8,587 27,212,019 8,601,391 689,913 12,176,414 21,467,718 2,383,040 83,231 (46,969 ) 2,419,302 (1,334,660 ) 73,040,636 Appropriation of the 2013 earnings
Legal reserve - - - - - - - - - - - - 875,485 - (875,485 ) - - - - - - - Special reserve - - - - - - - - - - - - - (640,244 ) 640,244 - - - - - - - Cash dividends - 27.1% - - - - - - - - - - - - - - (6,307,866 ) (6,307,866 ) - - - - - (6,307,866 ) Stock dividends - 0.5% 11,638 116,381 - 116,381 - - - - - - - - - - (116,381 ) (116,381 ) - - - - - -
Other changes in capital surplus
Additional acquisition of partially owned subsidiaries - - - - - - - - - - - - - - (543,482 ) (543,482 ) - - - - - (543,482 )
Changes in percentage of ownership interest in subsidiaries - - - - - - (206 ) 30,960 - - (694 ) 30,060 - - - - - - - - - 30,060
Change in capital surplus from investments in associates and joint ventures accounted for using equity method - - - - - - (556 ) - 215,959 - (7,893 ) 207,510 - - - - - - - - - 207,510
Stock dividends of employee transfer to capital 4,085 40,849 - 40,849 149,096 - - - - - - 149,096 - - - - - - - - - 189,945
Issue of common shares under employee share options 2,971 29,705 (29,705 ) - - - - - - - - - - - - - - - - - - -
Change in capital surplus from cash dividends of the Company paid to subsidiaries - - - - - - 65,430 - - - - 65,430 - - - - - - - - - 65,430
Disposal of investments accounted for using
equity method - - - - - - - - - - - - - - - - (1,240 ) - - (1,240 ) - (1,240 ) Effect of acquisition and deconsolidation of
subsidiaries - - - - - - - - - - - - - - - - (13,549 ) - - (13,549 ) - (13,549 ) Net profit for the year ended December 31,
2014 - - - - - - - - - - - - - - 6,460,808 6,460,808 - - - - - 6,460,808 Other comprehensive income for the year
ended December 31, 2014, net of income tax - - - - - - - - - - - - - - (1,711 ) (1,711 ) 1,756,846 55,841 34,980 1,847,667 - 1,845,956
Total comprehensive income for the year
ended December 31, 2014 - - - - - - - - - - - - - - 6,459,097 6,459,097 1,756,846 55,841 34,980 1,847,667 - 8,306,764 Cancellation of treasury shares (1,675 ) (16,750 ) - (16,750 ) (6,654 ) (5,426 ) (49,825 ) - - (7,283 ) - (69,188 ) - - - - - - - - 85,938 - BALANCE AT DECEMBER 31, 2014 AS
RESTATED 2,341,674 23,416,737 - 23,416,737 9,238,931 7,534,962 445,694 30,960 231,446 10,112,934 - 27,594,927 9,476,876 49,669 11,432,541 20,959,086 4,125,097 139,072 (11,989 ) 4,252,180 (1,248,722 ) 74,974,208 Appropriation of the 2014 earnings
Legal reserve - - - - - - - - - - - - 646,166 - (646,166 ) - - - - - - - Special reserve - - - - - - - - - - - - - 182,544 (182,544 ) - - - - - - - Cash dividends - 19.7% - - - - - - - - - - - - - - (4,613,097 ) (4,613,097 ) - - - - - (4,613,097 ) Stock dividends - 0.5% 11,708 117,084 - 117,084 - - - - - - - - - - (117,084 ) (117,084 ) - - - - - -
Other changes in capital surplus
Changes in percentage of ownership interest in subsidiaries - - - - - - - 12,276 - - - 12,276 - - - - - - - - - 12,276
Change in capital surplus from investments in associates and joint ventures accounted for using equity method - - - - - - - - 47,301 - - 47,301 - - - - - - - - - 47,301
Stock dividends of employee transfer to capital 4,333 43,332 - 43,332 102,960 - - - - - - 102,960 - - - - - - - - - 146,292
Change in capital surplus from cash dividends of the Company paid to subsidiaries - - - - - 47,779 - - - - 47,779 - - - - - - - - - 47,779
Net profit for the year ended December 31,
2015 - - - - - - - - - - - - - - 7,222,899 7,222,899 - - - - - 7,222,899 Other comprehensive income (loss) for the
year ended December 31, 2015, net of income tax - - - - - - - - - - - - - - (85,476 ) (85,476 ) (777,195 ) (291,786 ) 11,989 (1,056,992 ) - (1,142,468 )
Total comprehensive income for the year
ended December 31, 2015 - - - - - - - - - - - - - - 7,137,423 7,137,423 (777,195 ) (291,786 ) 11,989 (1,056,992 ) - 6,080,431 Cancellation of treasury shares (22,787 ) (227,870 ) - (227,870 ) (90,288 ) (72,824 ) (217,957 ) - - (97,740 ) - (478,809 ) - - - - - - - - - (706,679 ) BALANCE AT DECEMBER 31, 2015 2,334,928 $ 23,349,283 $ - $ 23,349,283 $ 9,251,603 $ 7,462,138 $ 275,516 $ 43,236 $ 278,747 $ 10,015,194 $ - $ 27,326,434 $ 10,123,042 $ 232,213 $ 13,011,073 $ 23,366,328 $ 3,347,902 $ (152,714 ) $ - $ 3,195,188 $ (1,248,722 ) $ 75,988,511 The accompanying notes are an integral part of the financial statements. (With Deloitte & Touche audit report dated March 25, 2016)
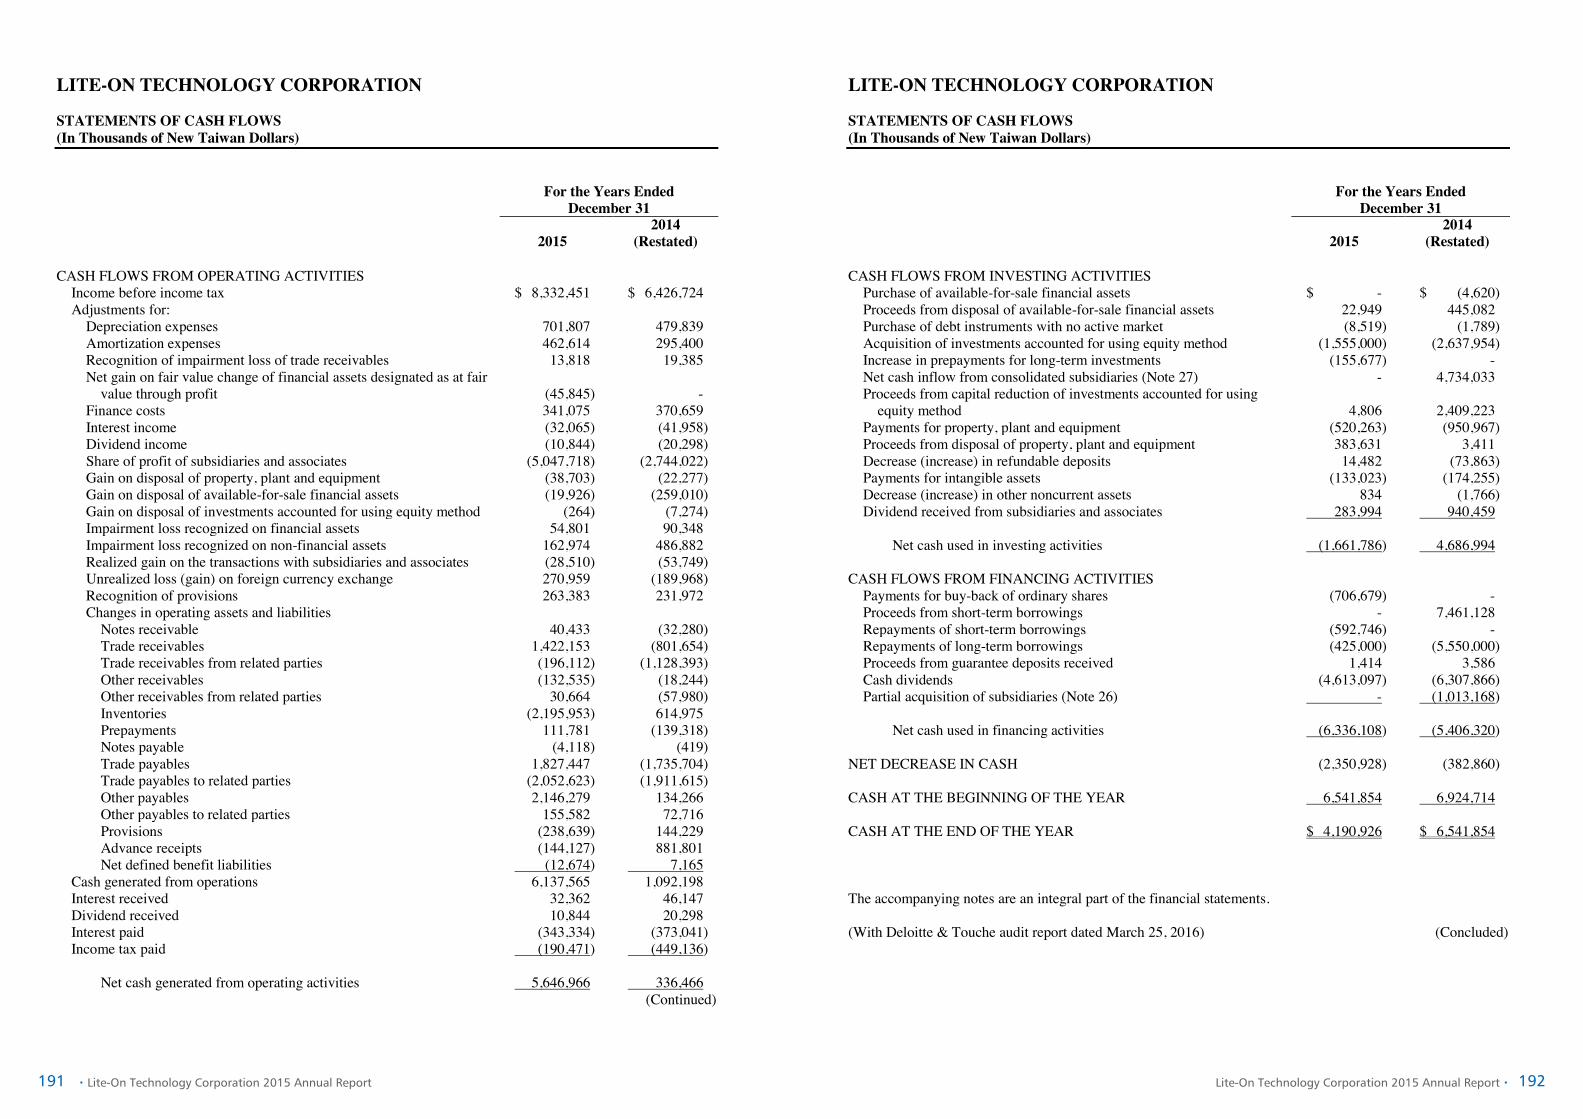
191 192‧Lite-On Technology Corporation 2015 Annual Report Lite-On Technology Corporation 2015 Annual Report‧
- 7 -
LITE-ON TECHNOLOGY CORPORATION STATEMENTS OF CASH FLOWS (In Thousands of New Taiwan Dollars)
For the Years Ended
December 31
2015 2014
(Restated) CASH FLOWS FROM OPERATING ACTIVITIES
Income before income tax $ 8,332,451 $ 6,426,724 Adjustments for:
Depreciation expenses 701,807 479,839 Amortization expenses 462,614 295,400 Recognition of impairment loss of trade receivables 13,818 19,385 Net gain on fair value change of financial assets designated as at fair
value through profit (45,845) - Finance costs 341,075 370,659 Interest income (32,065) (41,958) Dividend income (10,844) (20,298) Share of profit of subsidiaries and associates (5,047,718) (2,744,022) Gain on disposal of property, plant and equipment (38,703) (22,277) Gain on disposal of available-for-sale financial assets (19,926) (259,010) Gain on disposal of investments accounted for using equity method (264) (7,274) Impairment loss recognized on financial assets 54,801 90,348 Impairment loss recognized on non-financial assets 162,974 486,882 Realized gain on the transactions with subsidiaries and associates (28,510) (53,749) Unrealized loss (gain) on foreign currency exchange 270,959 (189,968) Recognition of provisions 263,383 231,972 Changes in operating assets and liabilities
Notes receivable 40,433 (32,280) Trade receivables 1,422,153 (801,654) Trade receivables from related parties (196,112) (1,128,393) Other receivables (132,535) (18,244) Other receivables from related parties 30,664 (57,980) Inventories (2,195,953) 614,975 Prepayments 111,781 (139,318) Notes payable (4,118) (419) Trade payables 1,827,447 (1,735,704) Trade payables to related parties (2,052,623) (1,911,615) Other payables 2,146,279 134,266 Other payables to related parties 155,582 72,716 Provisions (238,639) 144,229 Advance receipts (144,127) 881,801 Net defined benefit liabilities (12,674) 7,165
Cash generated from operations 6,137,565 1,092,198 Interest received 32,362 46,147 Dividend received 10,844 20,298 Interest paid (343,334) (373,041) Income tax paid (190,471) (449,136)
Net cash generated from operating activities 5,646,966 336,466
(Continued)
- 8 -
LITE-ON TECHNOLOGY CORPORATION STATEMENTS OF CASH FLOWS (In Thousands of New Taiwan Dollars)
For the Years Ended
December 31
2015 2014
(Restated) CASH FLOWS FROM INVESTING ACTIVITIES
Purchase of available-for-sale financial assets $ - $ (4,620) Proceeds from disposal of available-for-sale financial assets 22,949 445,082 Purchase of debt instruments with no active market (8,519) (1,789) Acquisition of investments accounted for using equity method (1,555,000) (2,637,954) Increase in prepayments for long-term investments (155,677) - Net cash inflow from consolidated subsidiaries (Note 27) - 4,734,033 Proceeds from capital reduction of investments accounted for using
equity method 4,806 2,409,223 Payments for property, plant and equipment (520,263) (950,967) Proceeds from disposal of property, plant and equipment 383,631 3,411 Decrease (increase) in refundable deposits 14,482 (73,863) Payments for intangible assets (133,023) (174,255) Decrease (increase) in other noncurrent assets 834 (1,766) Dividend received from subsidiaries and associates 283,994 940,459
Net cash used in investing activities (1,661,786) 4,686,994
CASH FLOWS FROM FINANCING ACTIVITIES
Payments for buy-back of ordinary shares (706,679) - Proceeds from short-term borrowings - 7,461,128 Repayments of short-term borrowings (592,746) - Repayments of long-term borrowings (425,000) (5,550,000) Proceeds from guarantee deposits received 1,414 3,586 Cash dividends (4,613,097) (6,307,866) Partial acquisition of subsidiaries (Note 26) - (1,013,168)
Net cash used in financing activities (6,336,108) (5,406,320)
NET DECREASE IN CASH (2,350,928) (382,860) CASH AT THE BEGINNING OF THE YEAR 6,541,854 6,924,714 CASH AT THE END OF THE YEAR $ 4,190,926 $ 6,541,854 The accompanying notes are an integral part of the financial statements. (With Deloitte & Touche audit report dated March 25, 2016) (Concluded)

193 194‧Lite-On Technology Corporation 2015 Annual Report Lite-On Technology Corporation 2015 Annual Report‧
- 9 -
LITE-ON TECHNOLOGY CORPORATION NOTES TO FINANCIAL STATEMENTS FOR THE YEARS ENDED DECEMBER 31, 2015 AND 2014 (In Thousands of New Taiwan Dollars, Unless Stated Otherwise) 1. GENERAL INFORMATION
Lite-On Technology Corporation (the “Company”) was established in March 1989. The Company’s shares have been listed on the Taiwan Stock Exchange. The Company manufactures and markets (1) computer software, hardware, peripherals and components; (2) monitors, multifunction and all-in-one printers, cameras and Internet systems and image-processing equipment; (3) information storage and process equipment, electronic components and office equipment; (4) electronic coils, transformers, power suppliers and electronic hardware parts; (5) light-emitting diode (LED) products; (6) electronic car products; and (7) optical lens modules and optoelectronic components. The Company merged with Lite-On Electronics, Inc., Silitek Corp. and GVC Corp., with the Company as the survivor entity. The merger took effect on November 4, 2002, and the Company thus assumed all rights and obligations of the three merged companies on that date. The Company merged with its subsidiary, Lite-On Enclosure Inc., with the Company as the survivor entity. The merger took effect on April 1, 2004, and the Company thus assumed all rights and obligations of its former subsidiary on that date. The Company separately merged with Li Shin International Enterprise Corp., Lite-On Clean Energy Technology Corp., Lite-On Automotive Corp., Leotek Electronics Corp., Lite-On IT Corporation and LarView Technologies Corp., with the Company as the survivor entity. The merger separately took effect on March 22, 2014, April 15, 2014, June 1, 2014, June 29, 2014, June 30, 2014 and September 1, 2014, and the Company thus assumed all rights and obligations of the six merged companies on those date. The financial statements are presented in the Company’s functional currency, the New Taiwan dollar.
2. APPROVAL OF FINANCIAL STATEMENTS The financial statements were approved by the board of directors and authorized for issue on March 25, 2016.
3. APPLICATION OF NEW, AMENDED AND REVISED STANDARDS AND INTERPRETATIONS
a. Initial application of the amendments to the Regulations Governing the Preparation of Financial Reports
by Securities Issuers and the 2013 version of the International Financial Reporting Standards (IFRS), International Accounting Standards (IAS), Interpretations of IFRS (IFRIC), and Interpretations of IAS (SIC) endorsed by the FSC Rule No. 1030029342 and Rule No. 1030010325 issued by the FSC on April 3, 2014, stipulated that the Company should apply the 2013 version of IFRS, IAS, IFRIC and SIC (collectively, the “IFRSs”) endorsed by the FSC and the related amendments to the Regulations Governing the Preparation of Financial Reports by Securities Issuers starting January 1, 2015.
- 10 -
Except for the following, the initial application of the amendments to the Regulations Governing the Preparation of Financial Reports by Securities Issuers and the 2013 IFRSs version did not have any material impact on the Company’s accounting policies: 1) IFRS 12 “Disclosure of Interests in Other Entities”
IFRS 12 is a new disclosure standard and is applicable to entities that have interests in subsidiaries and associates. In general, the disclosure requirements in IFRS 12 are more extensive than in previous standards. Please refer to Note 13 for related disclosures.
2) IFRS 13 “Fair Value Measurement”
IFRS 13 establishes a single source of guidance for fair value measurements. It defines fair value, establishes a framework for measuring fair value, and requires disclosures about fair value measurements. The disclosure requirements in IFRS 13 are more extensive than in previous standards; for example, quantitative and qualitative disclosures based on the three-level fair value hierarchy previously required only for financial instruments have been extended by IFRS 13 to cover all assets and liabilities within its scope. The fair value measurements under IFRS 13 are applied prospectively from January 1, 2015. Refer to Note 29 for related disclosure.
3) Amendment to IAS 1 “Presentation of Items of Other Comprehensive Income”
The amendment to IAS 1 requires items of other comprehensive income to be grouped into those items that (1) will not be reclassified subsequently to profit or loss; and (2) may be reclassified subsequently to profit or loss. Income taxes on related items of other comprehensive income are grouped on the same basis. Under previous IAS 1, there were no such requirements. The Company retrospectively applied the above amendments starting from 2015. Items not expected to be reclassified to profit or loss are remeasurements of the defined benefit plans. Items expected to be reclassified to profit or loss are the exchange differences on translating foreign operations, unrealized gains (loss) on available-for-sale financial assets, cash flow hedges, and share of the other comprehensive income (except the share of the remeasurements of the defined benefit plans) of subsidiaries and associates accounted for using the equity method. The application of the above amendments did not result in any impact on the net profit for the year, other comprehensive income for the year (net of income tax), and total comprehensive income for the year.
4) Revision to IAS 19 “Employee Benefits” Revised IAS 19 requires the recognition of changes in defined benefit obligations and in the fair value of plan assets when they occur, and hence eliminates the “corridor approach” permitted under previous IAS 19 and accelerates the recognition of past service costs. The revision requires all remeasurements of the defined benefit plans to be recognized immediately through other comprehensive income in order for the net pension asset or liability to reflect the full value of the plan deficit or surplus. Furthermore, the interest cost and expected return on plan assets used in previous IAS 19 are replaced with a “net interest” amount, which is calculated by applying the discount rate to the net defined benefit liability or asset. In addition, the revised IAS 19 introduces certain changes in the presentation of the defined benefit cost, and also includes more extensive disclosures. On initial application of the revised IAS 19 in 2015, the changes in cumulative employee benefit costs as of December 31, 2013 that resulted from the retrospective application in the past are adjusted to investments accounted for using equity method and retained earnings; the carrying amounts of inventories are not adjusted.

195 196‧Lite-On Technology Corporation 2015 Annual Report Lite-On Technology Corporation 2015 Annual Report‧
- 11 -
The impact of the new standards on the current period is set out below:
Impact on Assets, Liabilities and Equity December 31,
2015 Increase in investments accounted for using equity method $ 3,170 Increase in retained earnings $ 3,170
Impact on Total Comprehensive Income (Loss)
For the Year Ended
December 31, 2015
Decrease in share of the profit of subsidiaries and associates $ (443) Decrease in net profit for the year $ (443) Decrease in other comprehensive income for the year $ (443) The impact on the prior reporting period is set out below:
Impact on Assets, Liabilities and Equity
As Originally Stated
Adjustments Arising from
Initial Application Restated
December 31, 2014 Investments accounted for using equity
method $ 75,426,008 $ 3,481 $ 75,429,489 Retained earnings $ 11,429,060 $ 3,481 $ 11,432,541 January 1, 2014 Investments accounted for using equity
method $ 87,132,748 $ 4,332 $ 87,137,080 Retained earnings $ 12,172,082 $ 4,332 $ 12,176,414
Impact on Total Comprehensive Income
As Originally Stated
Adjustments Arising from
Initial Application Restated
Share of the profit of subsidiaries and
associates $ 2,744,873 $ (851) $ 2,744,022 Total effect on net profit for the year $ 6,461,659 $ (851) $ 6,460,808 Total effect on total comprehensive
income for the year $ 8,307,615 $ (851) $ 8,306,764 Impact on earnings per share: Basic $ 2.78 $ - $ 2.78 Diluted $ 2.75 $ - $ 2.75
- 12 -
5) Amendment to IFRS 7 “Disclosure - Offsetting Financial Assets and Financial Liabilities”
The amendments to IFRS 7 require disclosure of information about rights of offset and related arrangements (such as collateral posting requirements) for financial instruments under enforceable master netting arrangements and similar arrangements. Refer to Note 29 for related disclosure.
b. New IFRSs in issue but not yet endorsed by FSC
On March 10, 2016, the FSC announced the scope of the 2016 version of IFRSs to be endorsed and will take effect from January 1, 2017. The scope includes all IFRSs that were issued by the IASB before January 1, 2016 and have effective dates on or before January 1, 2017, which means the scope excludes those that are not yet effective as of January 1, 2017 such as IFRS 9 “Financial Instruments” and IFRS 15 “Revenue from Contracts with Customers” and those with undetermined effective date. In addition, the FSC announced that the Company should apply IFRS 15 starting January 1, 2018. As of the date the financial statements were authorized for issue, the FSC has not announced the effective dates of other new, amended and revised standards and interpretations. The Company has not applied the following New IFRSs issued by the IASB but not yet endorsed by the FSC.
The New IFRSs Not Included in the 2013 IFRSs Version Effective Date
Announced by IASB (Note 1) Annual Improvements to IFRSs 2010-2012 Cycle July 1, 2014 (Note 2) Annual Improvements to IFRSs 2011-2013 Cycle July 1, 2014 Annual Improvements to IFRSs 2012-2014 Cycle January 1, 2016 (Note 3) IFRS 9 “Financial Instruments” January 1, 2018 Amendments to IFRS 9 and IFRS 7 “Mandatory Effective Date of
IFRS 9 and Transition Disclosures” January 1, 2018
Amendments to IFRS 10 and IAS 28 “Sales or Contribution of Assets between an Investor and its Associate or Joint Venture”
January 1, 2016 (Note 3)
Amendments to IFRS 10, IAS 12 and IAS 28 “Investment Entities: Applying the Consolidation Exception”
To be determined by IASB
Amendment to IFRS 11 “Accounting for Acquisitions of Interests in Joint Operations”
January 1, 2016
IFRS 14 “Regulatory Deferral Accounts” January 1, 2016 IFRS 15 “Revenue from Contracts with Customers” January 1, 2018 IFRS 16 “Leases” January 1, 2019 Amendment to IAS 1 “Disclosure Initiative” January 1, 2016 Amendment to IAS 7 “Disclosure Initiative” January 1, 2017 Amendment to IAS 12 “Recognition of Deferred Tax Assets for
Unrealized Losses” January 1, 2017
Amendments to IAS 16 and IAS 38 “Clarification of Acceptable Methods of Depreciation and Amortization”
January 1, 2016
Amendments to IAS 16 and IAS 41 “Agriculture: Bearer Plants” January 1, 2016 Amendment to IAS 19 “Defined Benefit Plans: Employee
Contributions” July 1, 2014
Amendment to IAS 27 “Equity Method in Separate Financial Statements”
January 1, 2016
Amendment to IAS 36 “Impairment of Assets: Recoverable Amount Disclosures for Non-financial Assets”
January 1, 2014
Amendment to IAS 39 “Novation of Derivatives and Continuation of Hedge Accounting”
January 1, 2014
IFRIC 21 “Levies” January 1, 2014

197 198‧Lite-On Technology Corporation 2015 Annual Report Lite-On Technology Corporation 2015 Annual Report‧
- 13 -
Note 1: Unless stated otherwise, the above New IFRSs are effective for annual periods beginning on or after their respective effective dates.
Note 2: The amendment to IFRS 2 applies to share-based payment transactions with grant date on or
after July 1, 2014; the amendment to IFRS 3 applies to business combinations with acquisition date on or after July 1, 2014; the amendment to IFRS 13 is effective immediately; the remaining amendments are effective for annual periods beginning on or after July 1, 2014.
Note 3: The amendment to IFRS 5 is applied prospectively to changes in a method of disposal that
occur in annual periods beginning on or after January 1, 2016; the remaining amendments are effective for annual periods beginning on or after January 1, 2016.
The initial application of the above New IFRSs, whenever applied, would not have any material impact on the Company’s accounting policies, except for the following: 1) IFRS 9 “Financial Instruments”
Recognition and measurement of financial assets With regards to financial assets, all recognized financial assets that are within the scope of IAS 39 “Financial Instruments: Recognition and Measurement” are subsequently measured at amortized cost or fair value. Under IFRS 9, the requirement for the classification of financial assets is stated below. For the Company’s debt instruments that have contractual cash flows that are solely payments of principal and interest on the principal amount outstanding, their classification and measurement are as follows: a) For debt instruments, if they are held within a business model whose objective is to collect the
contractual cash flows, the financial assets are measured at amortized cost and are assessed for impairment continuously with impairment loss recognized in profit or loss, if any. Interest revenue is recognized in profit or loss by using the effective interest method;
b) For debt instruments, if they are held within a business model whose objective is achieved by
both the collecting of contractual cash flows and the selling of financial assets, the financial assets are measured at fair value through other comprehensive income (FVTOCI) and are assessed for impairment. Interest revenue is recognized in profit or loss by using the effective interest method, and other gain or loss shall be recognized in other comprehensive income, except for impairment gains or losses and foreign exchange gains and losses. When the debt instrument is derecognized or reclassified the cumulative gain or loss previously recognized in other comprehensive income is reclassified from equity to profit or loss.
Except for above, all other financial assets are measured at fair value through profit or loss. However, the Company may make an irrevocable election to present subsequent changes in the fair value of an equity investment (that is not held for trading) in other comprehensive income, with only dividend income generally recognized in profit or loss. No subsequent impairment assessment is required, and the cumulative gain or loss previously recognized in other comprehensive income cannot be reclassified from equity to profit or loss.
- 14 -
The impairment of financial assets IFRS 9 requires that impairment loss on financial assets is recognized by using the “Expected Credit Losses Model”. The credit loss allowance is required for financial assets measured at amortized cost, financial assets mandatorily measured at FVTOCI, lease receivables, contract assets arising from IFRS 15 “Revenue from Contracts with Customers”, certain written loan commitments and financial guarantee contracts. A loss allowance for the 12-month expected credit losses is required for a financial asset if its credit risk has not increased significantly since initial recognition. A loss allowance for full lifetime expected credit losses is required for a financial asset if its credit risk has increased significantly since initial recognition and is not low. However, a loss allowance for full lifetime expected credit losses is required for trade receivables that do not constitute a financing transaction. For purchased or originated credit-impaired financial assets, the Company takes into account the expected credit losses on initial recognition in calculating the credit-adjusted effective interest rate. Subsequently, any changes in expected losses are recognized as a loss allowance with a corresponding gain or loss recognized in profit or loss. Hedge accounting The main changes in hedge accounting amended the application requirements for hedge accounting to better reflect the entity’s risk management activities. Compared with IAS 39, the main changes include: (1) enhancing types of transactions eligible for hedge accounting, specifically broadening the risk eligible for hedge accounting of non-financial items; (2) changing the way hedging derivative instruments are accounted for to reduce profit or loss volatility; and (3) replacing retrospective effectiveness assessment with the principle of economic relationship between the hedging instrument and the hedged item.
2) Amendment to IAS 36 “Recoverable Amount Disclosures for Non-financial Assets”
In issuing IFRS 13 “Fair Value Measurement”, the IASB made consequential amendment to the disclosure requirements in IAS 36 “Impairment of Assets”, introducing a requirement to disclose in every reporting period the recoverable amount of an asset or each cash-generating unit. The amendment clarifies that such disclosure of recoverable amounts is required only when an impairment loss has been recognized or reversed during the period. Furthermore, the Company is required to disclose the discount rate used in measurements of the recoverable amount based on fair value less costs of disposal measured using a present value technique.
3) IFRS 15 “Revenue from Contracts with Customers”
IFRS 15 establishes principles for recognizing revenue that apply to all contracts with customers, and will supersedes IAS 18 “Revenue”, IAS 11 “Construction Contracts” and a number of revenue-related interpretations from January 1, 2017. When applying IFRS 15, an entity shall recognize revenue by applying the following steps: Identify the contract with the customer; Identify the performance obligations in the contract; Determine the transaction price; Allocate the transaction price to the performance obligations in the contracts; and Recognize revenue when the entity satisfies a performance obligation. When IFRS 15 is effective, an entity may elect to apply this Standard either retrospectively to each prior reporting period presented or retrospectively with the cumulative effect of initially applying this Standard recognized at the date of initial application.

199 200‧Lite-On Technology Corporation 2015 Annual Report Lite-On Technology Corporation 2015 Annual Report‧
- 15 -
4) Amendments to IFRS 10 and IAS 28 “Sale or Contribution of Assets between an Investor and its Associate or Joint Venture” The amendments stipulated that, when an entity sells or contributes to an associate assets that constitute a business as defined in IFRS 3 “Business Combinations” or when an entity loses control of a subsidiary that contains a business but retains significant influence or joint control, the gain or loss resulting from the transaction is recognized in full. Also, when an entity loses control of a subsidiary that does not contain a business as defined in IFRS 3 but retains significant influence or joint control in an associate or a joint venture, the gain or loss resulting from the asset sale or contribution is recognized only to the extent of the unrelated investors’ interest in the associate or joint venture and the entity’s share of the gain or loss is eliminated.
5) IFRS 16 “Leases”
IFRS 16 sets out the accounting standards for leases that will supersede IAS 17 and a number of related interpretations. Under IFRS 16, if the Company is a lessee, it shall recognize right-of-use assets and lease liabilities for all leases on the balance sheets except for low-value and short-term leases. The Company may elect to apply the accounting method similar to the accounting for operating lease under IAS 17 to the low-value and short-term leases. On the statements of comprehensive income, the Company should present the depreciation expense charged on the right-of-use asset separately from interest expense accrued on the lease liability; interest is computed by using effective interest method. On the of cash flows, cash payments for the principal portion of the lease liability and interest portion are both classified within operating activities. When IFRS 16 becomes effective, the Company may elect to apply this Standard either retrospectively to each prior reporting period presented or retrospectively with the cumulative effect of the initial application of this Standard recognized at the date of initial application.
Except for the above impact, as of the date the financial statements were authorized for issue, the Company is continuingly assessing the possible impact that the application of other standards and interpretations will have on the Company’s financial position and financial performance, and will disclose the relevant impact when the assessment is complete.
4. SUMMARY OF SIGNIFICANT ACCOUNTING POLICIES
a. Statement of compliance
The financial statements have been prepared in accordance with the Regulations Governing the Preparation of Financial Reports by Securities Issuers, and IFRS as endorsed by the FSC.
b. Basis of preparation The financial statements have been prepared on the historical cost basis except for financial instruments that are measured at fair values. The fair value measurements are grouped into Levels 1 to 3 based on the degree to which the fair value measurement inputs are observable and the significance of the inputs to the fair value measurement in its entirety, which are described as follows: 1) Level 1 inputs are quoted prices (unadjusted) in active markets for identical assets or liabilities;
- 16 -
2) Level 2 inputs are inputs other than quoted prices included within Level 1 that are observable for the asset or liability, either directly (i.e. as prices) or indirectly (i.e. derived from prices); and
3) Level 3 inputs are unobservable inputs for the asset or liability. When preparing the company’s financial statements, the Company used equity method to account for its investment in subsidiaries, associates and joint ventures. In order for the amounts of the net profit for the year, other comprehensive income for the year and total equity in the company’s financial statements to be the same with the amounts attributable to the owner of the Company in its consolidated financial statements, adjustments arising from the differences in accounting treatment between company only basis and consolidated basis were made to investments accounted for by equity method, share of profit or loss of subsidiaries, associates and joint ventures, share of other comprehensive income of subsidiaries, associates and related equity items, as appropriate, in the parent company only financial statements.
c. Classification of current and non-current assets and liabilities Current assets include: 1) Assets held primarily for the purpose of trading; 2) Assets expected to be realized within 12 months after the reporting period; and 3) Cash and cash equivalents unless the asset is restricted from being exchanged or used to settle a
liability for at least 12 months after the reporting period. Current liabilities include: 1) Liabilities held primarily for the purpose of trading; 2) Liabilities due to be settled within 12 months after the reporting period, and 3) Liabilities for which the Company does not have an unconditional right to defer settlement for at
least 12 months after the reporting period. Terms of a liability that could, at the option of the counterparty, result in its settlement by the issue of equity instruments do not affect its classification.
Assets and liabilities that are not classified as current are classified as non-current.
d. Business combinations Acquisitions of businesses are accounted for using the acquisition method. Acquisition-related costs are generally recognized in profit or loss as incurred. Goodwill is measured as the excess of the sum of the consideration transferred, the amount of any non-controlling interests in the acquiree, and the fair value of the acquirer’s previously held equity interest in the acquiree over the net of the acquisition-date amounts of the identifiable assets acquired and the liabilities assumed.
e. Foreign currencies
In preparing the Company’s financial statements, transactions in currencies other than the Company’s functional currency (foreign currencies) are recognized at the rates of exchange prevailing at the dates of the transactions.

201 202‧Lite-On Technology Corporation 2015 Annual Report Lite-On Technology Corporation 2015 Annual Report‧
- 17 -
At the end of each reporting period, monetary items denominated in foreign currencies are retranslated at the rates prevailing at that date. Exchange differences on monetary items arising from settlement or translation are recognized in profit or loss in the period. Non-monetary items measured at fair value that are denominated in foreign currencies are retranslated at the rates prevailing at the date when the fair value was determined. Exchange differences arising on the retranslation of non-monetary items are included in profit or loss for the period except for exchange differences arising from the retranslation of non-monetary items in respect of which gains and losses are recognized directly in other comprehensive income, in which case, the exchange differences are also recognized directly in other comprehensive income. Non-monetary items that are measured at historical cost in a foreign currency are not retranslated. For the purposes of presenting financial statements, the assets and liabilities of the Company’s foreign operations (including of the subsidiaries and associates, in other countries or currencies used different with the Company) are translated into New Taiwan dollars using exchange rates prevailing at the end of each reporting period. Income and expense items are translated at the average exchange rates for the period. Exchange differences arising are recognized in other comprehensive income. On the disposal of a foreign operation (i.e. a disposal of the Company’s entire interest in a foreign operation, or a disposal involving loss of control over a subsidiary that includes a foreign operation, or a partial disposal of an interest in an associate that includes a foreign operation of which the retained interest becomes a financial asset), all of the exchange differences accumulated in equity in respect of that operation are reclassified to profit or loss. In relation to a partial disposal of a subsidiary that does not result in the Company losing control over the subsidiary, the proportionate share of accumulated exchange differences is included in the calculation of equity transactions but is not recognized in profit or loss. For all other partial disposals, the proportionate share of the accumulated exchange differences recognized in other comprehensive income is reclassified to profit or loss. Goodwill and fair value adjustments on identifiable assets and liabilities acquired arising on the acquisition of a foreign operation are treated as assets and liabilities of the foreign operation and translated at the rate of exchange prevailing at the end of each reporting period. Exchange differences arising are recognized in other comprehensive income.
f. Inventories
Inventories consist of raw materials, work-in-process, finished goods, merchandise, and inventory in transit. Inventories are stated at the lower of cost or net realizable value. Inventory write-downs are made by item, except where it may be appropriate to group similar or related items. Net realizable value is the estimated selling price of inventories less all estimated costs of completion and costs necessary to make the sale. Inventories are recorded at weighted-average cost on the balance sheet date.
g. Investments accounted for using equity method
Investments in subsidiaries and associates are accounted for using equity method. 1) Investments in subsidiaries
Subsidiaries are the entities controlled by the Company. Under the equity method, the investment is initially recognized at cost and the carrying amount is increased or decreased to recognize the Company's share of the profit or loss and other comprehensive income of the subsidiary after the date of acquisition. Besides, the Company also recognizes the Company’s share of the change in other equity of the subsidiary.
- 18 -
Changes in the Company’s ownership interests in subsidiaries that do not result in the Company’s loss of control over the subsidiaries are accounted for as equity transactions. Any difference between the carrying amounts of the investment and the fair value of the consideration paid or received is recognized directly in equity. When the Company’s share of losses of a subsidiary equals or exceeds its interest in that subsidiary, the Company continues recognizing its share of further losses. The acquisition cost in excess of the acquisition-date fair value of the identifiable net assets acquired is recognized as goodwill. Goodwill is not amortized. The acquisition-date fair value of the net identifiable assets acquired in excess of the acquisition cost is recognized immediately in profit or loss. The Company assesses its investment for any impairment by comparing the carrying amount with the estimated recoverable amount as assessed based on the entire financial statements of the invested company. Impairment loss is recognized when the carrying amount exceeds the recoverable amount. If the recoverable amount of the investment subsequently increases, the Company recognizes reversal of the impairment loss; the adjusted post-reversal carrying amount should not exceed the carrying amount that would have been recognized (net of amortization or depreciation) had no impairment loss been recognized in prior years. An impairment loss recognized on goodwill cannot be reversed in a subsequent period. When the Company loses control of a subsidiary, it recognizes the investment retained in the former subsidiary at its fair value at the date when control is lost. The difference between the fair value of the retained investment plus any consideration received and the carrying amount of previous investment at the date when control is lost is recognized as a gain or loss in profit or loss. Besides, the Company accounts for all amounts previously recognized in other comprehensive income in relation to that subsidiary on the same basis as would be required if the Company had directly disposed of the related assets or liabilities. Profits and losses from downstream transactions are eliminated in full. Profits and losses from upstream and sidestream transactions are recognized in the Company’s financial statements only to the extent of interests in the subsidiary that are not related to the Company.
2) Investments in associates
An associate is an entity over which the Company has significant influence and that is neither a subsidiary nor a joint venture. Significant influence is the power to participate in the financial and operating policy decisions of the investee but is not control or joint control over those policies. Under the equity method, an investment in an associate is initially recognized at cost and adjusted thereafter to recognize the Company’s share of the profit or loss and other comprehensive income of the associate. Besides, the Company also recognizes the Company’s share of the change in equity of the associate. Any excess of the cost of acquisition over the Company’s share of the net fair value of the identifiable assets and liabilities of an associate recognized at the date of acquisition is recognized as goodwill, which is included within the carrying amount of the investment and is not amortized. Any excess of the Company’s share of the net fair value of the identifiable assets and liabilities over the cost of acquisition, after reassessment, is recognized immediately in profit or loss. When the Company subscribes for additional new shares of the associate at a percentage different from its existing ownership percentage, the resulting carrying amount of the investment differs from the amount of the Company’s proportionate interest in the associate. The Company records such a difference as an adjustment to investments with the corresponding amount charged or credited to capital surplus - changes in the Company’s share of equity of associates. If the Company’s
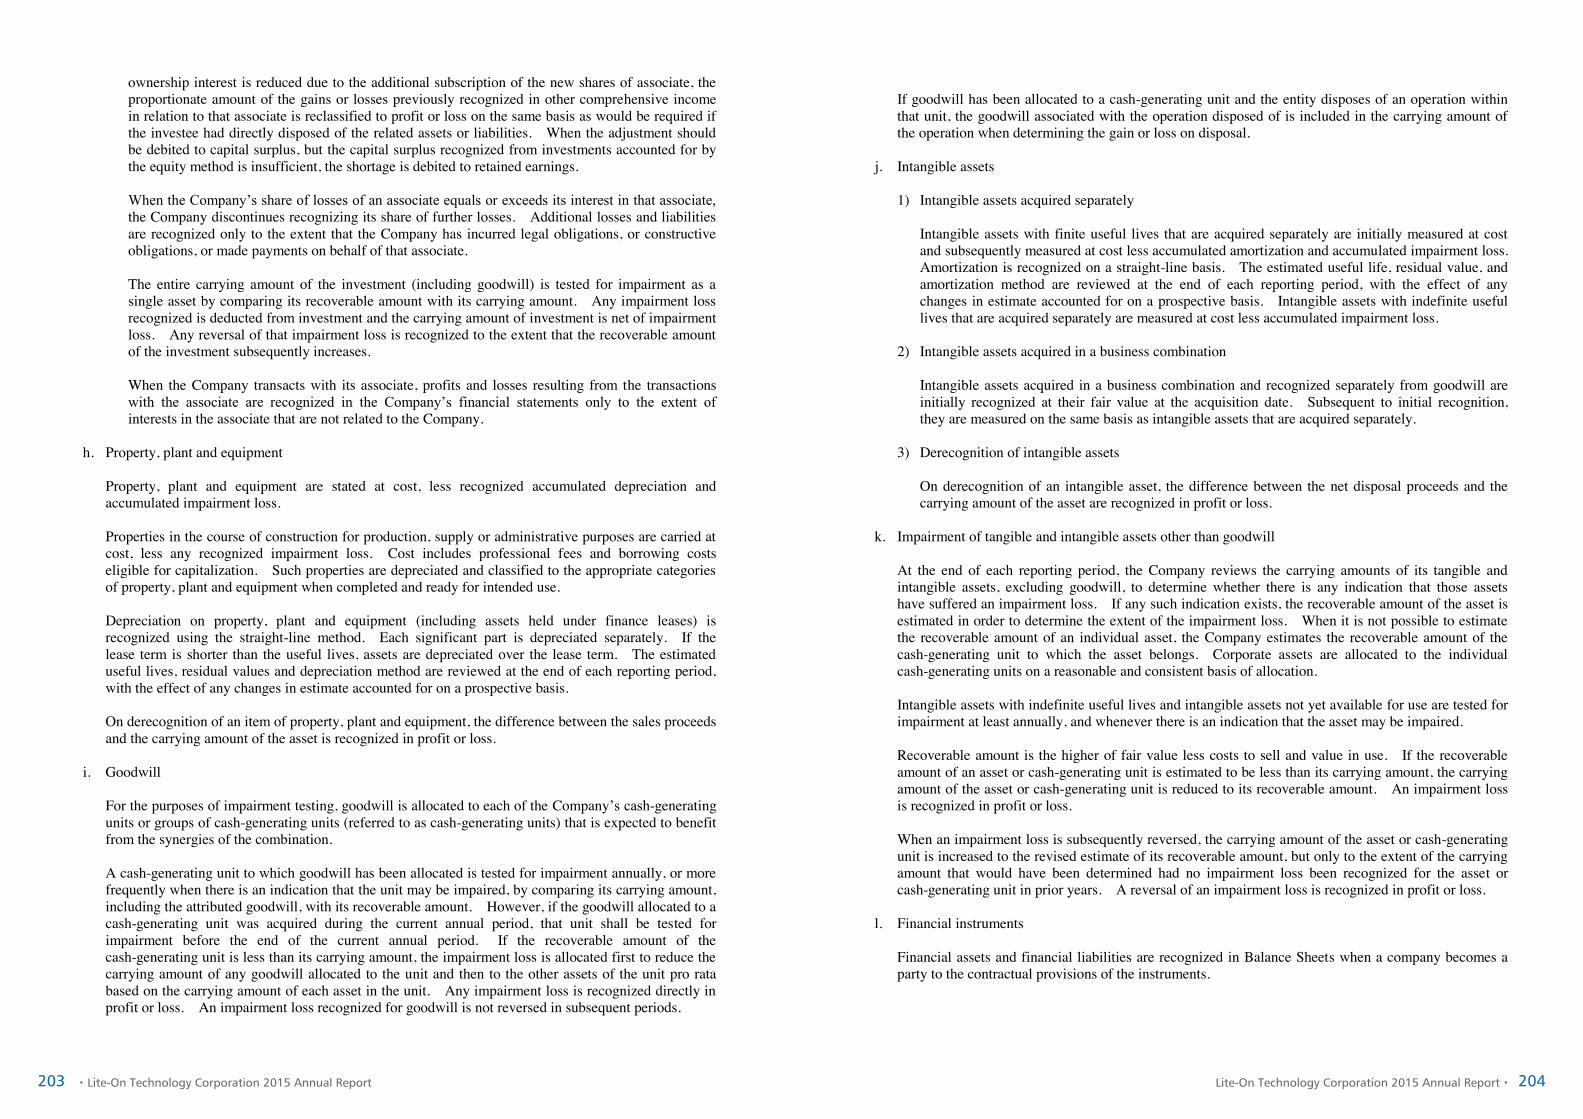
203 204‧Lite-On Technology Corporation 2015 Annual Report Lite-On Technology Corporation 2015 Annual Report‧
- 19 -
ownership interest is reduced due to the additional subscription of the new shares of associate, the proportionate amount of the gains or losses previously recognized in other comprehensive income in relation to that associate is reclassified to profit or loss on the same basis as would be required if the investee had directly disposed of the related assets or liabilities. When the adjustment should be debited to capital surplus, but the capital surplus recognized from investments accounted for by the equity method is insufficient, the shortage is debited to retained earnings. When the Company’s share of losses of an associate equals or exceeds its interest in that associate, the Company discontinues recognizing its share of further losses. Additional losses and liabilities are recognized only to the extent that the Company has incurred legal obligations, or constructive obligations, or made payments on behalf of that associate. The entire carrying amount of the investment (including goodwill) is tested for impairment as a single asset by comparing its recoverable amount with its carrying amount. Any impairment loss recognized is deducted from investment and the carrying amount of investment is net of impairment loss. Any reversal of that impairment loss is recognized to the extent that the recoverable amount of the investment subsequently increases. When the Company transacts with its associate, profits and losses resulting from the transactions with the associate are recognized in the Company’s financial statements only to the extent of interests in the associate that are not related to the Company.
h. Property, plant and equipment Property, plant and equipment are stated at cost, less recognized accumulated depreciation and accumulated impairment loss. Properties in the course of construction for production, supply or administrative purposes are carried at cost, less any recognized impairment loss. Cost includes professional fees and borrowing costs eligible for capitalization. Such properties are depreciated and classified to the appropriate categories of property, plant and equipment when completed and ready for intended use. Depreciation on property, plant and equipment (including assets held under finance leases) is recognized using the straight-line method. Each significant part is depreciated separately. If the lease term is shorter than the useful lives, assets are depreciated over the lease term. The estimated useful lives, residual values and depreciation method are reviewed at the end of each reporting period, with the effect of any changes in estimate accounted for on a prospective basis. On derecognition of an item of property, plant and equipment, the difference between the sales proceeds and the carrying amount of the asset is recognized in profit or loss.
i. Goodwill For the purposes of impairment testing, goodwill is allocated to each of the Company’s cash-generating units or groups of cash-generating units (referred to as cash-generating units) that is expected to benefit from the synergies of the combination. A cash-generating unit to which goodwill has been allocated is tested for impairment annually, or more frequently when there is an indication that the unit may be impaired, by comparing its carrying amount, including the attributed goodwill, with its recoverable amount. However, if the goodwill allocated to a cash-generating unit was acquired during the current annual period, that unit shall be tested for impairment before the end of the current annual period. If the recoverable amount of the cash-generating unit is less than its carrying amount, the impairment loss is allocated first to reduce the carrying amount of any goodwill allocated to the unit and then to the other assets of the unit pro rata based on the carrying amount of each asset in the unit. Any impairment loss is recognized directly in profit or loss. An impairment loss recognized for goodwill is not reversed in subsequent periods.
- 20 -
If goodwill has been allocated to a cash-generating unit and the entity disposes of an operation within that unit, the goodwill associated with the operation disposed of is included in the carrying amount of the operation when determining the gain or loss on disposal.
j. Intangible assets
1) Intangible assets acquired separately Intangible assets with finite useful lives that are acquired separately are initially measured at cost and subsequently measured at cost less accumulated amortization and accumulated impairment loss. Amortization is recognized on a straight-line basis. The estimated useful life, residual value, and amortization method are reviewed at the end of each reporting period, with the effect of any changes in estimate accounted for on a prospective basis. Intangible assets with indefinite useful lives that are acquired separately are measured at cost less accumulated impairment loss.
2) Intangible assets acquired in a business combination Intangible assets acquired in a business combination and recognized separately from goodwill are initially recognized at their fair value at the acquisition date. Subsequent to initial recognition, they are measured on the same basis as intangible assets that are acquired separately.
3) Derecognition of intangible assets
On derecognition of an intangible asset, the difference between the net disposal proceeds and the carrying amount of the asset are recognized in profit or loss.
k. Impairment of tangible and intangible assets other than goodwill
At the end of each reporting period, the Company reviews the carrying amounts of its tangible and intangible assets, excluding goodwill, to determine whether there is any indication that those assets have suffered an impairment loss. If any such indication exists, the recoverable amount of the asset is estimated in order to determine the extent of the impairment loss. When it is not possible to estimate the recoverable amount of an individual asset, the Company estimates the recoverable amount of the cash-generating unit to which the asset belongs. Corporate assets are allocated to the individual cash-generating units on a reasonable and consistent basis of allocation. Intangible assets with indefinite useful lives and intangible assets not yet available for use are tested for impairment at least annually, and whenever there is an indication that the asset may be impaired. Recoverable amount is the higher of fair value less costs to sell and value in use. If the recoverable amount of an asset or cash-generating unit is estimated to be less than its carrying amount, the carrying amount of the asset or cash-generating unit is reduced to its recoverable amount. An impairment loss is recognized in profit or loss. When an impairment loss is subsequently reversed, the carrying amount of the asset or cash-generating unit is increased to the revised estimate of its recoverable amount, but only to the extent of the carrying amount that would have been determined had no impairment loss been recognized for the asset or cash-generating unit in prior years. A reversal of an impairment loss is recognized in profit or loss.
l. Financial instruments
Financial assets and financial liabilities are recognized in Balance Sheets when a company becomes a party to the contractual provisions of the instruments.

205 206‧Lite-On Technology Corporation 2015 Annual Report Lite-On Technology Corporation 2015 Annual Report‧
- 21 -
Financial assets and financial liabilities are initially measured at fair value. Transaction costs that are directly attributable to the acquisition or issue of financial assets and financial liabilities (other than financial assets and financial liabilities at fair value through profit or loss) are added to or deducted from the fair value of the financial assets or financial liabilities, as appropriate, on initial recognition. Transaction costs directly attributable to the acquisition of financial assets or financial liabilities at fair value through profit or loss are recognized immediately in profit or loss. 1) Financial assets
All regular way purchases or sales of financial assets are recognized and derecognized on a trade date basis. a) Measurement category
Financial assets are classified into the following categories: Financial assets at fair value through profit or loss, available-for-sale financial assets, and loans and receivables. i. Financial assets at fair value through profit or loss
Financial assets at fair value through profit or loss are derivatives that do not meet the criteria for hedge accounting and are measured at fair value with any gains or losses arising from remeasurement recognized in profit or loss.
ii. Available-for-sale financial assets
Available-for-sale financial assets are non-derivatives that are either designated as available-for-sale or are not classified as loans and receivables, held-to-maturity investments or financial assets at fair value through profit or loss. Available-for-sale financial assets are measured at fair value. Changes in the carrying amount of available-for-sale monetary financial assets relating to changes in foreign currency exchange rates, interest income calculated using the effective interest method and dividends on available-for-sale equity investments are recognized in profit or loss. Other changes in the carrying amount of available-for-sale financial assets are recognized in other comprehensive income and will be reclassified to profit or loss when the investment is disposed of or is determined to be impaired. Dividends on available-for-sale equity instruments are recognized in profit or loss when the Company’s right to receive the dividends is established.
iii. Loans and receivables Except for financial assets at fair value through profit or loss, loans and receivables (primarily including cash, note receivables, debt instruments with no active market, trade receivables, and other receivables) are measured at amortized cost using the effective interest method, less any impairment, except for short-term receivables when the effect of discounting is immaterial.
b) Impairment of financial assets Financial assets are assessed for indicators of impairment at the end of each reporting period. Financial assets are considered to be impaired when there is objective evidence that, as a result of one or more events that occurred after the initial recognition of the financial asset, the estimated future cash flows of the investment have been affected.
- 22 -
For financial assets carried at amortized cost, such as trade receivables, assets that are assessed not to be impaired individually are, in addition, assessed for impairment on a collective basis. The Company assesses the collectability of receivables by performing the account aging analysis and examining current trends in the credit quality of its customers. For financial assets carried at amortized cost, the amount of the impairment loss recognized is the difference between the asset’s carrying amount and the present value of estimated future cash flows, discounted at the financial asset’s original effective interest rate. For financial assets measured at amortized cost, if, in a subsequent period, the amount of the impairment loss decreases and the decrease can be related objectively to an event occurring after the impairment was recognized, the previously recognized impairment loss is reversed through profit or loss to the extent that the carrying amount of the investment at the date the impairment is reversed does not exceed what the amortized cost would have been had the impairment not been recognized. For available-for-sale equity investments, a significant or prolonged decline in the fair value of the security below its cost is considered to be objective evidence of impairment. When an available-for-sale financial asset is considered to be impaired, cumulative gains or losses previously recognized in other comprehensive income are reclassified to profit or loss in the period. In respect of available-for-sale equity securities, impairment loss previously recognized in profit or loss are not reversed through profit or loss. Any increase in fair value subsequent to an impairment loss is recognized in other comprehensive income. The carrying amount of the financial asset is reduced by the impairment loss directly for all financial assets with the exception of trade receivables, where the carrying amount is reduced through the use of an allowance account. When a trade receivable is considered uncollectible, it is written off against the allowance account. Subsequent recoveries of amounts previously written off are credited against the allowance account. Changes in the carrying amount of the allowance account are recognized in profit or loss except for uncollectible trade receivables that are written off against the allowance account.
c) Derecognition of financial assets The Company derecognizes a financial asset only when the contractual rights to the cash flows from the asset expire, or when it transfers the financial asset and substantially all the risks and rewards of ownership of the asset to another party. On derecognition of a financial asset in its entirety, the difference between the asset’s carrying amount and the sum of the consideration received and receivable and the cumulative gain or loss that had been recognized in other comprehensive income is recognized in profit or loss.
2) Financial liabilities and equity instruments
Debt and equity instruments issued by a company entity are classified as either financial liabilities or as equity in accordance with the substance of the contractual arrangements and the definitions of a financial liability and an equity instrument. a) Financial liabilities subsequent measurement
Financial liabilities are measured at amortized cost using the effective interest method.

207 208‧Lite-On Technology Corporation 2015 Annual Report Lite-On Technology Corporation 2015 Annual Report‧
- 23 -
b) Derecognition of financial liabilities The difference between the carrying amount of the financial liability derecognized and the consideration paid, including any non-cash assets transferred or liabilities assumed, is recognized in profit or loss.
c) Equity instruments An equity instrument is any contract that evidences a residual interest in the assets of an entity after deducting all of its liabilities. Equity instruments issued by the Company are recognized at the proceeds received, net of direct issue costs. Repurchase of the Company’s own equity instruments is recognized in and deducted directly from equity. No gain or loss is recognized in profit or loss on the purchase, sale, issue or cancellation of the Company’s own equity instruments.
m. Hedge accounting The Company designates derivative hedging instruments to conduct cash flow hedges. The effective portion of changes in the fair value of derivatives is recognized in other comprehensive income. The gain or loss relating to the ineffective portion is recognized immediately in profit or loss. The associated gains or losses that were recognized in other comprehensive income are reclassified from equity to profit or loss as a reclassification adjustment in the line item relating to the hedged item in the same period when the hedged item affects profit or loss. Hedge accounting is discontinued prospectively when the Company revokes the designated hedging relationship, or when the hedging instrument expires or is sold, terminated, or exercised, or when it no longer meets the criteria for hedge accounting. The cumulative gain or loss on the hedging instrument that has been previously recognized in other comprehensive income from the period when the hedge was effective remains separately in equity until the forecast transaction occurs. When a forecast transaction is no longer expected to occur, the gain or loss accumulated in equity is recognized immediately in profit or loss.
n. Provisions Provisions are measured at the best estimate of the discounted cash flows of the consideration required to settle the present obligation at the end of the reporting period, taking into account the risks and uncertainties surrounding the obligation. When a provision is measured using the cash flows estimated to settle the present obligation, its carrying amount is the present value of those cash flows. Provisions for the expected cost of warranty obligations are recognized at the date of sale of the relevant products, at the best estimate of the expenditure required to settle the Company’s obligation by the management of the Company
o. Revenue recognition Revenue is measured at the fair value of the consideration received or receivable. Revenue is reduced for estimated customer returns, rebates and other similar allowances. Sales returns are recognized at the time of sale provided the seller can reliably estimate future returns and recognizes a liability for returns based on previous experience and other relevant factors. 1) Sale of goods
Revenue from the sale of goods is recognized when the goods are delivered and titles have passed, at which time all the following conditions are satisfied:
- 24 -
a) The Company has transferred to the buyer the significant risks and rewards of ownership of the goods;
b) The Company retains neither continuing managerial involvement to the degree usually
associated with ownership nor effective control over the goods sold; c) The amount of revenue can be measured reliably; d) It is probable that the economic benefits associated with the transaction will flow to the
Company; and e) The costs incurred or to be incurred in respect of the transaction can be measured reliably. The Company does not recognize sales revenue on materials delivered to subcontractors because this delivery does not involve a transfer of risks and rewards of materials ownership. Revenue from selling of properties in the course of ordinary activities is recognized when the construction is completed and the properties are transferred to buyers. Until such revenue is recognized, deposits received from sales of properties and installment payments are carried in the balance sheets under current liabilities.
2) Rendering of services
Service income is recognized when services are provided. 3) Royalties
Royalty revenue is recognized on an accrual basis in accordance with the substance of the relevant agreement provided that it is probable that the economic benefits will flow to the Company and the amount of revenue can be measured reliably. Royalties determined on a time basis are recognized on a straight-line basis over the period of the agreement. Royalty arrangements that are based on production, sales and other measures are recognized by reference to the underlying arrangement.
4) Rental revenue
The operation of leasing business was in accordance with IAS 17- Leases, that is, the possible situation related to leasing (ex. the condition of leasing, and the burden of future cost) would treat as operating lease.
5) Dividend and interest income
Dividend income from investments is recognized when the shareholder’s right to receive payment has been established provided that it is probable that the economic benefits will flow to the Company and the amount of income can be measured reliably. Interest income from a financial asset is recognized when it is probable that the economic benefits will flow to the Company and the amount of income can be measured reliably. Interest income is accrued on a time basis, by reference to the principal outstanding and at the effective interest rate applicable.
p. Leasing Leases are classified as finance leases whenever the terms of the lease transfer substantially all the risks and rewards of ownership to the lessee. All other leases are classified as operating leases.

209 210‧Lite-On Technology Corporation 2015 Annual Report Lite-On Technology Corporation 2015 Annual Report‧
- 25 -
1) The Company as lessor Rental income from operating leases is recognized on a straight-line basis over the term of the relevant lease.
2) The Company as lessee Operating lease payments are recognized as an expense on a straight-line basis over the lease term.
q. Employee benefits
1) Short-term employee benefits
Liabilities recognized in respect of short-term employee benefits are measured at the undiscounted amount of the benefits expected to be paid in exchange for the related service.
2) Retirement benefits
Payments to defined contribution retirement benefit plans are recognized as an expense when employees have rendered service entitling them to the contributions. Defined benefit costs (including service cost, net interest and remeasurement) under the defined benefit retirement benefit plans are determined using the projected unit credit method. Service cost (including current service cost) and net interest on the net defined benefit liability (asset) are recognized as employee benefits expense in the period they occur. Remeasurement, comprising actuarial gains and losses and the return on plan assets (excluding interest), is recognized in other comprehensive income in the period in which they occur. Remeasurement recognized in other comprehensive income is reflected immediately in retained earnings and will not be reclassified to profit or loss. Net defined benefit liability (asset) represents the actual deficit (surplus) in the Company’s defined benefit plan. Any surplus resulting from this calculation is limited to the present value of any refunds from the plans or reductions in future contributions to the plans.
3) Termination benefits
A liability for a termination benefit is recognized at the earlier of when the Company can no longer withdraw the offer of the termination benefit and when the Company recognizes any related restructuring costs.
r. Taxation
Income tax expense represents the sum of the tax currently payable and deferred tax. 1) Current tax
According to the Income Tax Law, an additional tax at 10% of unappropriated earnings is provided for as income tax in the year the shareholders approve to retain the earnings. Adjustments of prior years’ tax liabilities are added to or deducted from the current year’s tax provision.
- 26 -
2) Deferred tax Deferred tax is recognized on temporary differences between the carrying amounts of assets and liabilities in the financial statements and the corresponding tax bases used in the computation of taxable profit. Deferred tax liabilities are generally recognized for all taxable temporary differences. Deferred tax assets are generally recognized for all deductible temporary differences, research and development expenditures, and personnel training expenditures to the extent that it is probable that taxable profits will be available against which those deductible temporary differences can be utilized. Deferred tax liabilities are recognized for taxable temporary differences associated with investments in subsidiaries and associates, except where the Company is able to control the reversal of the temporary difference and it is probable that the temporary difference will not reverse in the foreseeable future. Deferred tax assets arising from deductible temporary differences associated with such investments are only recognized to the extent that it is probable that there will be sufficient taxable profits against which to utilize the benefits of the temporary differences and they are expected to reverse in the foreseeable future. The carrying amount of deferred tax assets is reviewed at the end of each reporting period and reduced to the extent that it is no longer probable that sufficient taxable profits will be available to allow all or part of the asset to be recovered. A previously unrecognized deferred tax asset is also reviewed at the end of each reporting period and recognized to the extent that it has become probable that future taxable profit will allow the deferred tax asset to be recovered. Deferred tax liabilities and assets are measured at the tax rates that are expected to apply in the period in which the liability is settled or the asset realized, based on tax rates and tax laws that have been enacted or substantively enacted by the end of the reporting period. The measurement of deferred tax liabilities and assets reflects the tax consequences that would follow from the manner in which the Company expects, at the end of the reporting period, to recover or settle the carrying amount of its assets and liabilities.
3) Current and deferred tax for the year
Current and deferred tax are recognized in profit or loss, except when they relate to items that are recognized in other comprehensive income or directly in equity, in which case, the current and deferred tax are also recognized in other comprehensive income or directly in equity respectively. Where current tax or deferred tax arises from the initial accounting for a business combination, the tax effect is included in the accounting for the business combination.
5. CRITICAL ACCOUNTING JUDGMENTS AND KEY SOURCES OF ESTIMATION UNCERTAINTY In the application of the Company's accounting policies (Note 4), management is required to make judgments, estimates and assumptions about the carrying amounts of assets and liabilities that are not readily apparent from other sources. The estimates and associated assumptions are based on historical experience and other factors that are considered relevant. Actual results may differ from these estimates. The estimates and underlying assumptions are reviewed on an ongoing basis. Revisions to accounting estimates are recognized in the period in which the estimate is revised if the revision affects only that period or in the period of the revision and future periods if the revision affects both current and future periods.

211 212‧Lite-On Technology Corporation 2015 Annual Report Lite-On Technology Corporation 2015 Annual Report‧
- 27 -
a. Impairment of goodwill
Determining whether goodwill is impaired requires an estimation of the value in use of the cash-generating units to which goodwill has been allocated. The value in use calculation requires management to estimate the future cash flows expected to arise from the cash-generating unit and a suitable discount rate in order to calculate present value. Where the actual future cash flows are less than expected, a material impairment loss may arise.
b. Estimated impairment of trade receivables
When there is objective evidence of impairment loss, the Company takes into consideration the estimation of future cash flows. The amount of the impairment loss is measured as the difference between the asset’s carrying amount and the present value of estimated future cash flows discounted at the financial asset’s original effective interest rate. Where the actual future cash flows are less than expected, a material impairment loss may arise.
c. Income taxes
Deferred tax assets are recognized to the extent that it is probable that future taxable profits will be available against which those deferred tax assets can be utilized. Assessment of the realization of the deferred tax assets requires the Company’s subjective judgment and estimation, including the future revenue growth and profitability, tax holidays, the amount of tax credits that can be utilized and feasible tax planning strategies. Any changes in the global economic environment, industry trends and relevant laws and regulations could result in significant adjustments to the deferred tax assets.
d. Fair value measurements and valuation processes
If some of the Company's assets and liabilities measured at fair value have no quoted prices in active markets, the Company’s management uses its judgment in selecting an appropriate valuation technique for financial instruments or to determine whether to engage third party qualified valuers and to determine the appropriate valuation techniques for fair value measurements. Where Level 1 inputs are not available, the Company or engaged valuers would determine appropriate inputs by referring to prices of same equity instruments not quoted in active markets and market prices or rates and specific features of derivatives. If the actual changes of inputs in the future differ from expectation, fair value might vary accordingly. The Company updates inputs every quarter to confirm the appropriateness of fair value measurement. Information about the valuation techniques and inputs used in determining the fair value of various assets and liabilities is disclosed in Note 29.
e. Impairment of property, plant and equipment The impairment of equipment in relation to the production of handsets was based on the recoverable amount of those assets, which is the higher of fair value less costs to sell or value-in-use of those assets. Any changes in the market price or future cash flows will affect the recoverable amount of those assets and may lead to recognition of additional or reversal of impairment losses.
f. Write-down of inventory
Net realizable value of inventory is the estimated selling price in the ordinary course of business less the estimated costs of completion and the estimated costs necessary to make the sale. The estimation of net realizable value was based on current market conditions and the historical experience of selling products of a similar nature. Changes in market conditions may have a material impact on the estimation of net realizable value.
- 28 -
g. Impairment of investment in the associate The Company immediately recognizes impairment loss on its net investment in the associate when there is any indication that the investment may be impaired and the carrying amount may not be recoverable. The Company also takes into consideration the market conditions and industry development to evaluate the appropriateness of assumptions.
h. Recognition and measurement of defined benefit plans Net defined benefit liabilities (assets) and the resulting defined benefit costs under defined benefit pension plans are calculated using the projected unit credit method. Actuarial assumptions comprise the discount rate, rate of employee turnover, and future salary increase, etc. Changes in economic circumstances and market conditions will affect these assumptions and may have a material impact on the amount of the expense and the liability.
6. CASH
December 31 2015 2014 Cash on hand $ 1,352 $ 1,340 Demand deposits 4,189,574 6,540,514
$ 4,190,926 $ 6,541,854
7. FINANCIAL ASSETS AT FAIR VALUE THROUGH PROFIT OR LOSS
December 31 2015 2014 Financial assets held for trading Derivative financial assets (not under hedge accounting)
Cross-currency swap contracts $ 45,845 $ - At the end of the reporting period, cross-currency swap contracts not under hedge accounting were as follows:
Currency Maturity Date Notional Amount (In Thousands)
December 31, 2015 Cross-currency swap contracts USD/NTD 2016.11.09 USD100,000/NTD3,212,900 December 31, 2014: None. The Company entered into cross-currency swap contracts during the year ended December 31, 2015 to manage exposures due to fluctuations of foreign exchange rates. The derivative contracts entered into by the Company did not meet the criteria for hedge accounting. Thus, the derivative contracts classified as financial assets or financial liabilities at fair value through profit or loss. The financial risk management objectives of the Company were to minimize risks due to changes in fair value or cash flows.

213 214‧Lite-On Technology Corporation 2015 Annual Report Lite-On Technology Corporation 2015 Annual Report‧
- 29 -
On financial instruments with fair value through profit or loss (FVTPL), the Company had (a) net gains of $45,845 thousand for the year ended December 31, 2015.
8. TRADE RECEIVABLES, NET
December 31 2015 2014 Notes receivable Notes receivable - operating $ 180 $ 40,613 Allowance for impairment loss - - $ 180 $ 40,613 Trade receivables Trade receivables $ 21,751,209 $ 23,212,545 Allowance for impairment loss (68,241) (54,423) Unrealized interests revenue (41,425) (46,981) $ 21,641,543 $ 23,111,141 The aging of receivables was as follows:
December 31 2015 2014 Not overdue $ 21,312,911 $ 22,678,151 Overdue
1-60 days 304,692 382,757 61-210 days 73,030 63,945 211-240 days 1,026 - Over 241 days 59,550 87,692
438,298 534,394 $ 21,751,209 $ 23,212,545 The above aging schedule was based on the past due date. As of December 31, 2015 and 2014, the Company did not have the age of the trade receivables that were past due but not impaired. Movements in the allowance for impairment loss recognized on trade receivables were as follows: For the Year Ended December 31 2015 2014 Balance at January 1 $ 54,423 $ 21,109 Allowance for impairment loss 13,818 19,385 Acquired from business combination - 13,929 Balance at December 31 $ 68,241 $ 54,423
- 30 -
At the end of the reporting period, trade receivables from sales on installments by the Company were as follows: December 31 2015 2014 Gross amounts trade receivables $ 966,328 $ 789,720 Unrealized interests revenue (41,425) (46,981) $ 924,903 $ 742,739 The amounts of the above trade receivables expected to be recovered were $161,055 thousand per year from 2016 to 2021.
9. INVENTORIES, NET
December 31 2015 2014 Merchandise $ 6,265,512 $ 4,770,066 Raw materials 2,388,627 1,906,659 Finished good 985,689 884,640 Work in progress 818,436 445,210 Inventory in transit - 416,290 $ 10,458,264 $ 8,422,865 Movements in the allowance for inventory write-down were as follows: For the Year Ended December 31 2015 2014 Balance at January 1 $ 1,159,243 $ 218,025 Allowance for inventory write-downs 162,974 486,882 Acquired from business combination - 454,336 Balance at December 31 $ 1,322,217 $ 1,159,243 The cost of inventories recognized as cost of goods sold for the years ended December 31, 2015 and 2014 was $110,580,446 thousand and $104,930,667 thousand, respectively.
10. AVAILABLE-FOR-SALE FINANCIAL ASSETS
December 31 2015 2014 Non-current Domestic investments
Listed shares $ 287,229 $ 591,405 Unlisted shares 4,620 4,620
291,849 596,025 (Continued)

215 216‧Lite-On Technology Corporation 2015 Annual Report Lite-On Technology Corporation 2015 Annual Report‧
- 31 -
December 31 2015 2014 Foreign investments
Unlisted shares $ 20,163 $ 41,337 Listed shares 9,262 8,929
29,425 50,266 $ 321,274 $ 646,291
(Concluded) Refer to Note 29 for information relating to the fair values of on available-for-sale financial assets determined. There was objective evidence that the fair values of some financial assets were below their carrying costs and will permanently decline. As a result, the Company recognized impairment losses of $54,801 thousand and $90,348 thousand respectively in the statements of comprehensive income for the years ended December 31, 2015 and 2014.
11. DERIVATIVE FINANCIAL INSTRUMENTS FOR HEDGING
December 31 2015 2014 Derivative financial assets under hedge accounting - current Cash flow hedges - interest rate swaps $ - $ 11,989 The Company’s liabilities with floating interest rate might be affected by changes in the market rate. Thus, future cash flows on those liabilities might fluctuate, exposing the Company to cash flow risk. To hedge against this risk, the Company entered into an interest rate swap contract with a bank to change the floating rate of its liabilities to fixed rate. The cash flow hedge transactions are deemed sufficient. The outstanding interest rate swap contracts of the Company at the end of the reporting period were as follows: December 31, 2015: None. December 31, 2014 Notional Amounts (In Thousands) Maturity Date
Range of Interest Rates Paid
Range of Interest Rates Received
NT$2,400,000 2008.9.23-2015.9.23 1.895% 0.888%
- 32 -
12. DEBT INSTRUMENTS WITH NO ACTIVE MARKET
December 31 2015 2014 Pledged deposits $ 10,308 $ 1,789 Current $ 9,573 $ 1,054 Non-current 735 735 $ 10,308 $ 1,789 Refer to Note 31 for information on debt instruments with no active market pledged as security.
13. INVESTMENTS ACCOUNTED FOR BY THE EQUITY METHOD
December 31 2015 2014 Investments in subsidiaries $ 77,923,043 $ 72,554,730 Investments in associates 2,883,134 2,874,759 $ 80,806,177 $ 75,429,489 a. Investments in subsidiaries
December 31 2015 2014 Lite-On International Holding Co., Ltd. $ 25,106,404 $ 23,434,167 Lite-On Singapore Pte. Ltd. 15,338,196 11,059,029 Lite-On Electronics H.K. Ltd. 11,231,033 10,381,190 Lite-On Mobile Pte. Ltd. 8,790,237 10,248,622 High Yield Group Co., Ltd. 5,305,483 5,436,169 Lite-On Technology USA, Inc. 2,359,141 1,930,753 Lite-On Automotive International (Cayman) Co., Ltd. 1,897,276 1,637,335 Lite-On Capital Corp. 1,598,494 1,499,284 Silitech Technology Corp. 1,487,387 1,523,632 Eagle Rock Investment Ltd. 1,410,738 1,768,331 Lite-On Electronics (Thailand) Co., Ltd. 1,304,188 1,252,123 LTC Group Ltd. (BVI) 592,312 349,883 Lite-On Japan Ltd. 358,234 337,901 Philip & Lite-On Digital Solutions Corp. 337,073 467,959 Lite-On Technology (Europe) B.V. 311,079 216,138 Lite-On Overseas Trading Co., Ltd. 242,239 281,227 Lite-On Vietnam Co., Ltd. 70,420 71,623 Lite-On Electronics (Europe) Ltd. 53,011 47,877 Lite-On Integrated Service Inc. 46,323 45,290 Lite-On Automotive Electronics (Europe) B.V. 43,143 45,626 Lite-On Information Technology B.V. 18,056 11,355 Lite-On Automotive Service USA Inc. 12,908 12,955 Leotek Electronics Holding Limited 9,668 15,526 Lite-On IT Singapore Pte. Ltd. - 397,240
(Continued)

217 218‧Lite-On Technology Corporation 2015 Annual Report Lite-On Technology Corporation 2015 Annual Report‧
- 33 -
December 31 2015 2014 Lite-On Sales & Distribution Inc. $ - $ 69,816 Lite-On Automotive North America Inc. - 10,291 LarView Technologies Corporation (Samoa) - 3,388 Lite-On Automotive Electronics Mexico, S.A. DE C.V. (59,097) - Li Shin International Enterprise Corp. (67,845) (65,643) LET (HK) Ltd. (285,689) (518,191) 77,510,412 71,970,896 Add: Credit balance on the carrying value of investments
accounted for using equity method 412,631 583,834 $ 77,923,043 $ 72,554,730
(Concluded)
Proportion of Ownership and
Voting Rights December 31 2015 2014 Lite-On International Holding Co., Ltd. 100.00% 100.00% Lite-On Electronics H.K. Ltd. 100.00% 100.00% Lite-On Capital Corp. 100.00% 100.00% Lite-On Singapore Pte. Ltd. 100.00% 100.00% Lite-On Technology USA, Inc. 100.00% 100.00% Lite-On Electronics (Thailand) Co., Ltd. 100.00% 100.00% LTC Group Ltd. (BVI) 100.00% 100.00% Lite-On Overseas Trading Co., Ltd. 100.00% 100.00% Lite-On Electronics (Europe) Ltd. 100.00% 100.00% Lite-On Integrated Service Inc. 100.00% 100.00% Lite-On Mobile Pte. Ltd. 100.00% 100.00% Lite-On Vietnam Co., Ltd. 100.00% 100.00% Li Shin International Enterprise Corp. 100.00% 100.00% Eagle Rock Investment Ltd. 100.00% 100.00% LET (HK) Ltd. 100.00% 100.00% High Yield Group Co., Ltd. 100.00% 100.00% Lite-On Information Technology B.V. 100.00% 100.00% Leotek Electronics Holding Limited 100.00% 100.00% Lite-On Automotive Electronics (Europe) B.V. 100.00% 100.00% Lite-On Automotive Service USA Inc. 100.00% 100.00% Lite-On Automotive International (Cayman) Co., Ltd. 100.00% 100.00% Lite-On Automotive Electronics Mexico, S.A. DE C.V. 99.00% - Lite-On Technology (Europe) B.V. 54.00% 54.00% Lite-On Japan Ltd. 49.49% 49.49% Philip & Lite-On Digital Solutions Corp. 49.00% 49.00% Silitech Technology Corp. 33.87% 32.08% LarView Technologies Corporation (Samoa) - 100.00% Lite-On Automotive North America Inc. - 100.00% Lite-On Sales & Distribution Inc. - 100.00% Lite-On IT Singapore Pte. Ltd. - 100.00%
The Company and the subsidiary - Lite-On Singapore Pte. Ltd. set up a subsidiary - Lite-On Automotive Electronics Mexico, S.A. DE C.V. and acquired all equity interest on January 2015.
- 34 -
Due to the reorganization within the group, Lite-On Technology USA, Inc. acquired all equity of Lite-On Sales & Distribution Inc. in January 2015. In addition, Lite-On Singapore Pte. Ltd. merged with Lite-On IT Singapore Pte. Ltd., with Lite-On Singapore Pte. Ltd. as the survivor entity. The merger took effect in January 2015, and Lite-On Singapore Pte. Ltd. thus assumed all rights and obligations of Lite-On IT Singapore Pte. Ltd. on that date. Lite-On Automotive North America Inc. and LarView Technologies Corporation (Samoa) were liquidated in May and November 2015, respectively. The Company holds less than 50% equity interest in Lite-On Japan Ltd. and Silitech Technology Corp. Base on the contractual arrangements between the Company and other investors, the Company has the power to direct the relevant activities of Lite-On Japan Ltd. and Silitech Technology Corp. Therefore, the directors of the Company concluded that the Company has the practical ability to direct the relevant activities of Lite-On Japan Ltd. and Silitech Technology Corp. unilaterally and hence the Company has control over Lite-On Japan Ltd. and Silitech Technology Corp. The investments accounted for by the equity method including the share of profit or loss and other comprehensive income of those investments for the years ended December 31, 2015 and 2014 were based on the subsidiaries’ financial statements audited by auditors for the same years.
b. Investments in associates
December 31 2015 2014 Material associates
Lite-On Semiconductor Corp. $ 1,544,501 $ 1,499,910 Dragonjet Corporation 1,047,765 1,060,414 Logah Technology Corp. 245,119 304,447
2,837,385 2,864,771 Associates that are not individually material 45,749 9,988 $ 2,883,134 $ 2,874,759 Material associates:
December 31 Name of Associate 2015 2014 Lite-On Semiconductor Corp. 18.52% 18.17% Dragonjet Corporation 29.62% 29.62% Logah Technology Corp. 28.10% 28.10% Refer to Table 6 “Names, locations, and related information of investees over which the company exercises significant influence” for the nature of activities, principal place of business and country of incorporation of the associates. The combined equities of the Company and its subsidiaries were more than 20% of the outstanding common stocks of Lite-On Semiconductor Corp. as of December 31, 2015 and 2014. Thus, the investee was accounted for by the equity method. The financial statements used as basis for calculating the equity-method investments, the Company’s share of profit or loss, and the other comprehensive income attributable the Company had all been audited.
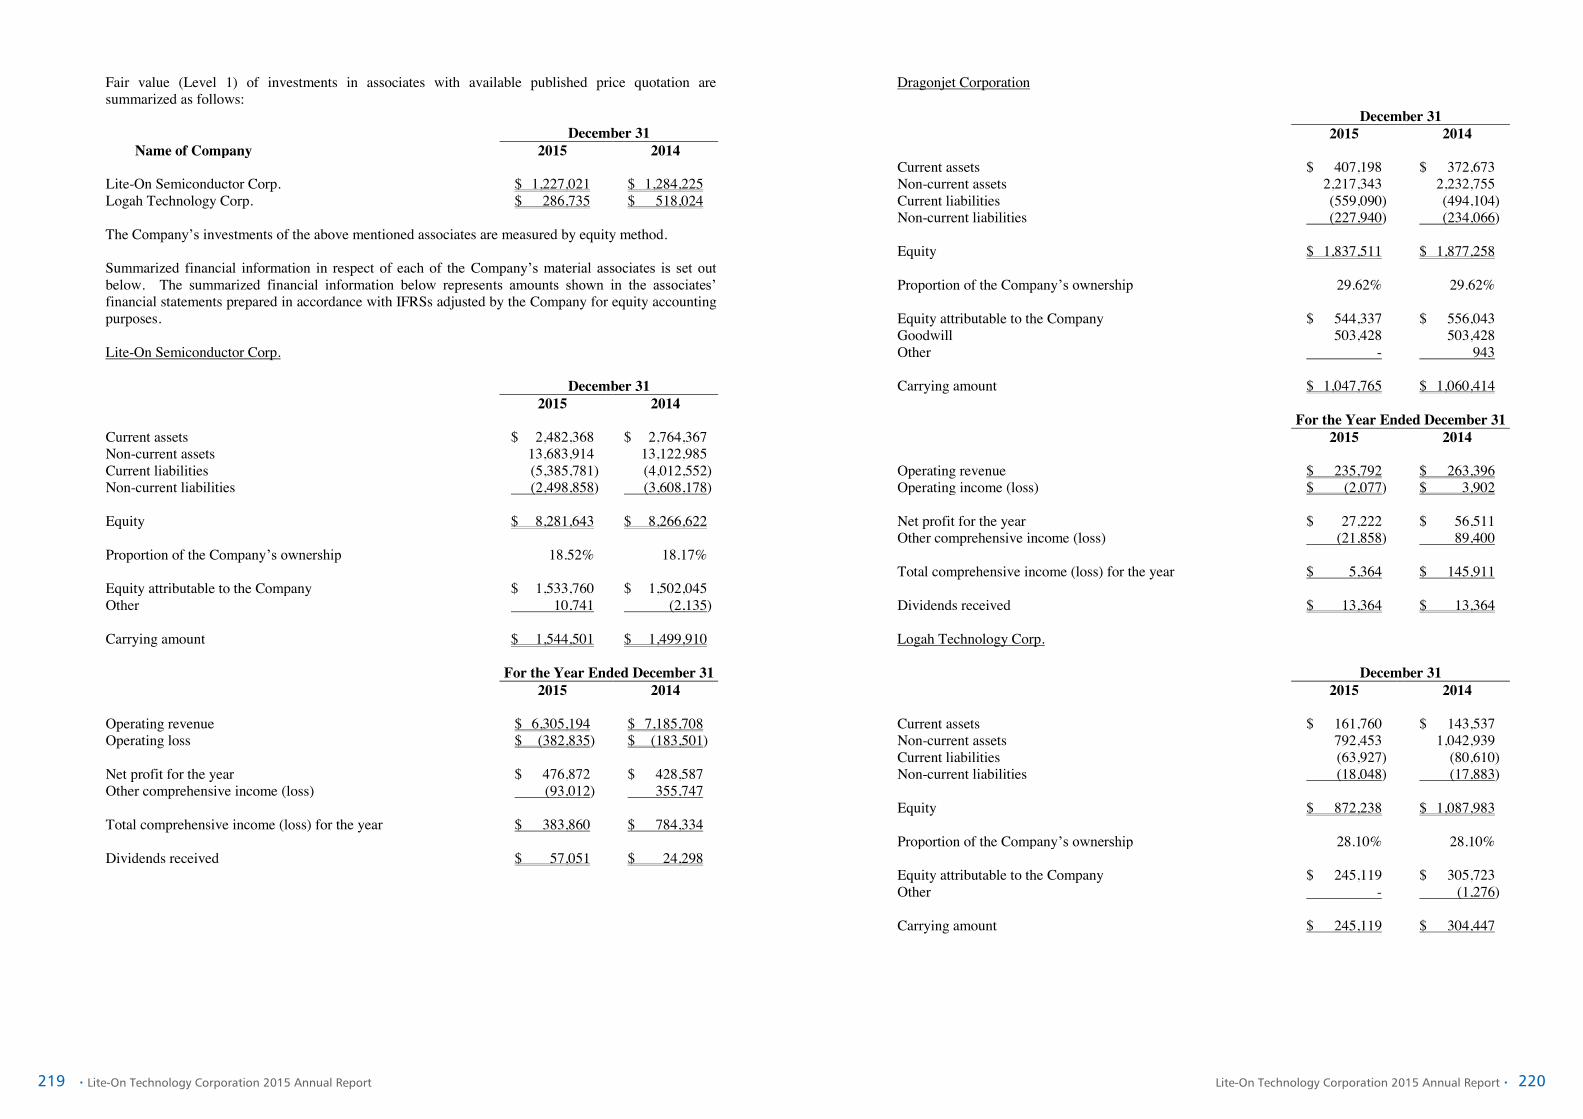
219 220‧Lite-On Technology Corporation 2015 Annual Report Lite-On Technology Corporation 2015 Annual Report‧
- 35 -
Fair value (Level 1) of investments in associates with available published price quotation are summarized as follows: December 31 Name of Company 2015 2014 Lite-On Semiconductor Corp. $ 1,227,021 $ 1,284,225 Logah Technology Corp. $ 286,735 $ 518,024 The Company’s investments of the above mentioned associates are measured by equity method. Summarized financial information in respect of each of the Company’s material associates is set out below. The summarized financial information below represents amounts shown in the associates’ financial statements prepared in accordance with IFRSs adjusted by the Company for equity accounting purposes. Lite-On Semiconductor Corp. December 31 2015 2014 Current assets $ 2,482,368 $ 2,764,367 Non-current assets 13,683,914 13,122,985 Current liabilities (5,385,781) (4,012,552) Non-current liabilities (2,498,858) (3,608,178) Equity $ 8,281,643 $ 8,266,622 Proportion of the Company’s ownership 18.52% 18.17% Equity attributable to the Company $ 1,533,760 $ 1,502,045 Other 10,741 (2,135) Carrying amount $ 1,544,501 $ 1,499,910 For the Year Ended December 31 2015 2014 Operating revenue $ 6,305,194 $ 7,185,708 Operating loss $ (382,835) $ (183,501) Net profit for the year $ 476,872 $ 428,587 Other comprehensive income (loss) (93,012) 355,747 Total comprehensive income (loss) for the year $ 383,860 $ 784,334 Dividends received $ 57,051 $ 24,298
- 36 -
Dragonjet Corporation December 31 2015 2014 Current assets $ 407,198 $ 372,673 Non-current assets 2,217,343 2,232,755 Current liabilities (559,090) (494,104) Non-current liabilities (227,940) (234,066) Equity $ 1,837,511 $ 1,877,258 Proportion of the Company’s ownership 29.62% 29.62% Equity attributable to the Company $ 544,337 $ 556,043 Goodwill 503,428 503,428 Other - 943 Carrying amount $ 1,047,765 $ 1,060,414
For the Year Ended December 31 2015 2014 Operating revenue $ 235,792 $ 263,396 Operating income (loss) $ (2,077) $ 3,902 Net profit for the year $ 27,222 $ 56,511 Other comprehensive income (loss) (21,858) 89,400 Total comprehensive income (loss) for the year $ 5,364 $ 145,911 Dividends received $ 13,364 $ 13,364 Logah Technology Corp. December 31 2015 2014 Current assets $ 161,760 $ 143,537 Non-current assets 792,453 1,042,939 Current liabilities (63,927) (80,610) Non-current liabilities (18,048) (17,883) Equity $ 872,238 $ 1,087,983 Proportion of the Company’s ownership 28.10% 28.10% Equity attributable to the Company $ 245,119 $ 305,723 Other - (1,276) Carrying amount $ 245,119 $ 304,447

221 222‧Lite-On Technology Corporation 2015 Annual Report Lite-On Technology Corporation 2015 Annual Report‧
- 37 -
For the Year Ended December 31 2015 2014 Operating revenue $ 96,107 $ 90,199 Operating loss $ (45,532) $ (55,749) Net loss for the year $ (211,123) $ (206,774) Other comprehensive income (loss) (4,622) 23,627 Total comprehensive income (loss) for the year $ (215,745) $ (185,147) Dividends received $ - $ - Aggregate information of associates that are not individually material: For the Year Ended December 31 2015 2014 The Company’s share of:
Net profit for the year $ 42,950 $ 23,966 Other comprehensive income (loss) (7,189) 1,842 Total comprehensive income (loss) for the year $ 35,761 $ 25,808
Investments accounted for by the equity method and the share of profit or loss and other comprehensive income from those investments in associates that are not individually material are calculated based on the financial statements that have not been audited. Management believes there is no material impact on the equity method accounting or the calculation of the share of profit or loss and other comprehensive income from the financial statements of associates that are not individually material that have not been audited.
14. PROPERTY, PLANT AND EQUIPMENT, NET
December 31 2015 2014 Carrying amounts of each class Freehold land $ 2,226,499 $ 2,226,499 Buildings 3,118,967 2,935,988 Machinery equipment 1,080,507 1,413,967 Tooling equipment 106,959 80,239 Transportation equipment 353 519 Office equipment 177,409 168,000 Equipment held under finance lease 20,253 47,405 Other equipment 148,376 505,449 $ 6,879,323 $ 7,378,066
- 38 -
For the Year Ended December 31, 2015
January 1,
2015 Additions Disposals
Acquired from Business
Combination Reclassification December 31,
2015 Cost Freehold land $ 2,226,499 $ - $ - $ - $ - $ 2,226,499 Buildings 4,491,518 300,983 22,421 - 116,998 4,887,078 Machinery equipment 3,903,005 247,928 583,721 - 259,327 3,826,539 Tooling equipment 575,356 96,690 14,898 - (2 ) 657,146 Transportation equipment 4,605 - - - (709 ) 3,896 Office equipment 800,410 103,957 68,921 - (32,769 ) 802,677 Equipment held under finance
lease 87,081 - 16,624 - 865 71,322 Other equipment 1,073,239 76,863 22,765 - (607,811 ) 519,526 13,161,713 $ 826,421 $ 729,350 $ - $ (264,101 ) 12,994,683 Accumulated depreciation Buildings 1,550,320 $ 136,617 $ 22,375 $ - $ 98,339 1,762,901 Machinery equipment 2,489,038 329,991 218,574 - - 145,577 2,746,032 Tooling equipment 495,117 51,026 14,091 - - 18,135 550,187 Transportation equipment 4,086 166 - - (709 ) 3,543 Office equipment 632,410 97,654 68,635 - (36,161 ) 625,268 Equipment held under finance
lease 39,676 23,108 4,818 - (6,897 ) 51,069 Other equipment 567,790 63,245 22,633 - (237,252 ) 371,150 5,778,437 $ 701,807 $ 351,126 $ - $ (18,968 ) 6,110,150 Accumulated impairment Freehold land - $ - $ - $ - $ - - Buildings 5,210 - - - - 5,210 Machinery equipment - - - - - - Tooling equipment - - - - - - Transportation equipment - - - - - - Office equipment - - - - - - Equipment held under finance
lease - - - - - - Other equipment - - - - - - 5,210 $ - $ - $ - $ - 5,210 $ 7,378,066 $ 6,879,323
For the Year Ended December 31, 2014
January 1,
2014 Additions Disposals
Acquired from Business
Combination Reclassification December 31,
2014 Cost Freehold land $ 2,033,482 $ - $ - $ 193,017 $ - $ 2,226,499 Buildings 3,240,213 - - 1,251,305 - 4,491,518 Machinery equipment 2,270,617 652,863 86,196 1,202,399 (136,678 ) 3,903,005 Tooling equipment 266,286 27,895 32,795 316,321 (2,351 ) 575,356 Transportation equipment 827 93 993 4,678 - 4,605 Office equipment 518,017 70,072 11,030 224,501 (1,150 ) 800,410 Equipment held under finance
lease 5,515 - - 81,566 - 87,081 Other equipment 460,298 232,233 22,142 402,850 - 1,073,239 8,795,255 $ 983,156 $ 153,156 $ 3,676,637 $ (140,179 ) 13,161,713 Accumulated depreciation Buildings 1,016,138 105,367 - 428,815 - 1,550,320 Machinery equipment 2,053,972 197,205 82,770 370,500 (49,869 ) 2,489,038 Tooling equipment 260,679 36,404 32,754 233,139 (2,351 ) 495,117 Transportation equipment 770 149 993 4,160 - 4,086 Office equipment 402,842 67,835 10,844 174,520 (1,943 ) 632,410 Equipment held under finance
lease 5,250 5,462 - 28,964 - 39,676 Other equipment 290,480 67,417 19,328 229,221 - 567,790 4,030,131 $ 479,839 $ 146,689 $ 1,469,319 $ (54,163 ) 5,778,437
(Continued)

223 224‧Lite-On Technology Corporation 2015 Annual Report Lite-On Technology Corporation 2015 Annual Report‧
- 39 -
For the Year Ended December 31, 2014
January 1,
2014 Additions Disposals
Acquired from Business
Combination Reclassification December 31,
2014 Accumulated impairment Freehold land $ - $ - $ - $ - $ - $ - Buildings - - - 5,210 - 5,210 Machinery equipment 6,947 - - - (6,947 ) - Tooling equipment - - - - - - Transportation equipment - - - - - - Office equipment - - - - - - Equipment held under finance
lease - - - - - - Other equipment - - - - - - 6,947 $ - $ - $ 5,210 $ (6,947 ) 5,210 $ 4,758,177 $ 7,378,066
(Concluded) No impairment assessment was performed for the years ended 2015 and 2014 as there was no indication of impairment. The above items of property, plant and equipment were depreciated on a straight-line basis over the estimated useful life of the asset: Buildings 2-60 years Machinery equipment 2-10 years Tooling equipment 2-10 years Transportation equipment 3-10 years Office equipment 2-10 years Equipment held under finance lease 3-5 years Other equipment 2-10 years
15. INTANGIBLE ASSETS, NET
December 31 2015 2014 Carrying amounts of each class Goodwill $ 5,953,418 $ 5,926,156 Patents 568,420 860,597 Software 220,412 287,809 Client relationships - - $ 6,742,250 $ 7,074,562
- 40 -
For the Year Ended December 31, 2015
January 1,
2015 Additions Disposals
Acquired from Business
Combination Reclassification December 31,
2015 Cost Goodwill $ 6,003,390 $ 27,262 $ - $ - $ - $ 6,030,652 Patents 4,332,221 - 946,176 - 22,032 3,408,077 Software 1,045,410 103,001 36,121 - 8,231 1,120,521 Client relationships 163,819 - - - - 163,819 11,544,840 $ 130,263 $ 982,297 $ - $ 30,263 10,723,069 Accumulated amortization Goodwill 77,234 $ - $ - $ - $ - 77,234 Patents 3,471,624 292,219 946,176 - 21,990 2,839,657 Software 757,601 170,395 36,121 - 8,234 900,109 Client relationships 163,819 - - - - 163,819 4,470,278 $ 462,614 $ 982,297 $ - $ 30,224 3,980,819 Accumulated impairment Goodwill - $ - $ - $ - $ - - Patents - - - - - - Software - - - - - - Client relationships - - - - - - - $ - $ - $ - $ - - $ 7,074,562 $ 6,742,250
(Concluded)
For the Year Ended December 31, 2014
January 1,
2014 Additions Disposals
Acquired from Business
Combination Reclassification December 31,
2014 Cost Goodwill $ 622,152 $ - $ - $ 5,381,238 $ - $ 6,003,390 Patents 27,134 543 - 4,304,544 - 4,332,221 Software 638,731 252,781 15,324 177,155 (7,933 ) 1,045,410 Client relationships 163,819 - - - - 163,819 1,451,836 $ 253,324 $ 15,324 $ 9,862,937 $ (7,933 ) 11,544,840 Accumulated amortization Goodwill 77,234 $ - $ - $ - $ - 77,234 Patents 21,481 165,897 - 3,284,246 - 3,471,624 Software 543,165 129,503 15,324 108,190 (7,933 ) 757,601 Client relationships 163,819 - - - - 163,819 805,699 $ 295,400 $ 15,324 $ 3,392,436 $ (7,933 ) 4,470,278 Accumulated impairment Goodwill - $ - $ - $ - $ - - Patents - - - - - - Software - - - - - - Client relationships - - - - - - - $ - $ - $ - $ - - $ 646,137 $ 7,074,562 The above items of other intangible assets were amortized on a straight-line basis over the estimated useful life of the asset: Patents 6 years Software 1-14 years Client relationships 4 years
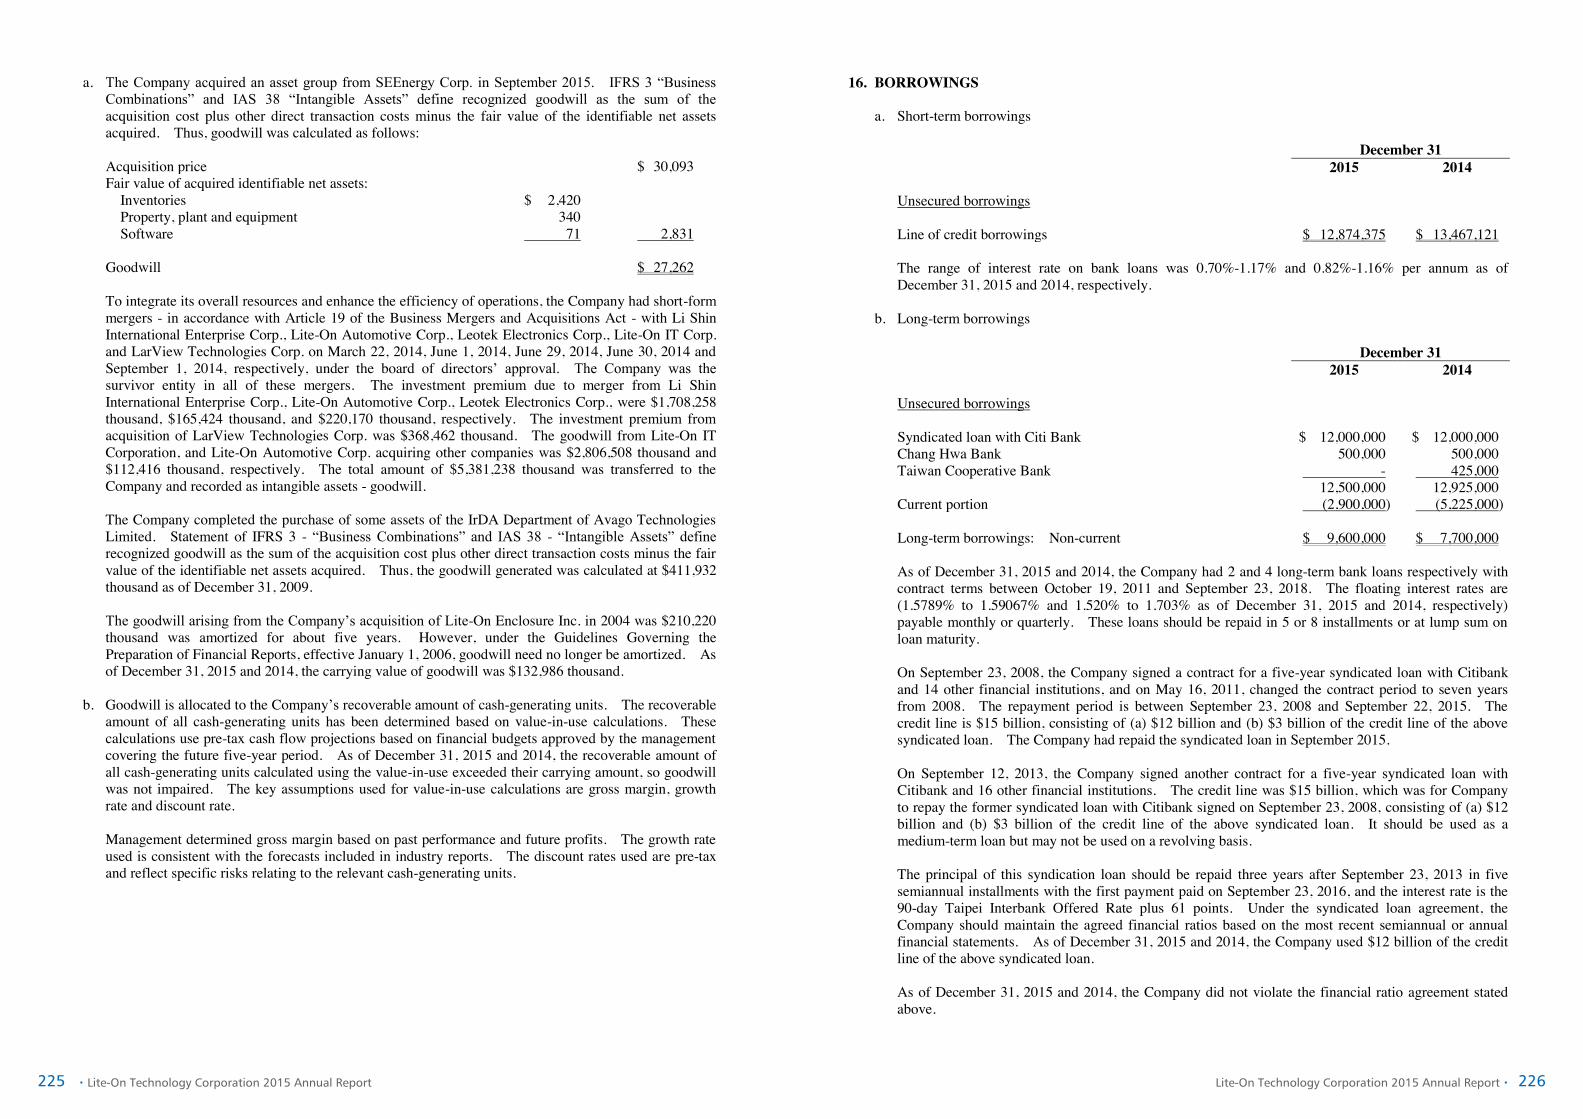
225 226‧Lite-On Technology Corporation 2015 Annual Report Lite-On Technology Corporation 2015 Annual Report‧
- 41 -
a. The Company acquired an asset group from SEEnergy Corp. in September 2015. IFRS 3 “Business Combinations” and IAS 38 “Intangible Assets” define recognized goodwill as the sum of the acquisition cost plus other direct transaction costs minus the fair value of the identifiable net assets acquired. Thus, goodwill was calculated as follows:
Acquisition price $ 30,093 Fair value of acquired identifiable net assets:
Inventories $ 2,420 Property, plant and equipment 340 Software 71 2,831
Goodwill $ 27,262 To integrate its overall resources and enhance the efficiency of operations, the Company had short-form mergers - in accordance with Article 19 of the Business Mergers and Acquisitions Act - with Li Shin International Enterprise Corp., Lite-On Automotive Corp., Leotek Electronics Corp., Lite-On IT Corp. and LarView Technologies Corp. on March 22, 2014, June 1, 2014, June 29, 2014, June 30, 2014 and September 1, 2014, respectively, under the board of directors’ approval. The Company was the survivor entity in all of these mergers. The investment premium due to merger from Li Shin International Enterprise Corp., Lite-On Automotive Corp., Leotek Electronics Corp., were $1,708,258 thousand, $165,424 thousand, and $220,170 thousand, respectively. The investment premium from acquisition of LarView Technologies Corp. was $368,462 thousand. The goodwill from Lite-On IT Corporation, and Lite-On Automotive Corp. acquiring other companies was $2,806,508 thousand and $112,416 thousand, respectively. The total amount of $5,381,238 thousand was transferred to the Company and recorded as intangible assets - goodwill. The Company completed the purchase of some assets of the IrDA Department of Avago Technologies Limited. Statement of IFRS 3 - “Business Combinations” and IAS 38 - “Intangible Assets” define recognized goodwill as the sum of the acquisition cost plus other direct transaction costs minus the fair value of the identifiable net assets acquired. Thus, the goodwill generated was calculated at $411,932 thousand as of December 31, 2009. The goodwill arising from the Company’s acquisition of Lite-On Enclosure Inc. in 2004 was $210,220 thousand was amortized for about five years. However, under the Guidelines Governing the Preparation of Financial Reports, effective January 1, 2006, goodwill need no longer be amortized. As of December 31, 2015 and 2014, the carrying value of goodwill was $132,986 thousand.
b. Goodwill is allocated to the Company’s recoverable amount of cash-generating units. The recoverable
amount of all cash-generating units has been determined based on value-in-use calculations. These calculations use pre-tax cash flow projections based on financial budgets approved by the management covering the future five-year period. As of December 31, 2015 and 2014, the recoverable amount of all cash-generating units calculated using the value-in-use exceeded their carrying amount, so goodwill was not impaired. The key assumptions used for value-in-use calculations are gross margin, growth rate and discount rate. Management determined gross margin based on past performance and future profits. The growth rate used is consistent with the forecasts included in industry reports. The discount rates used are pre-tax and reflect specific risks relating to the relevant cash-generating units.
- 42 -
16. BORROWINGS a. Short-term borrowings
December 31 2015 2014 Unsecured borrowings Line of credit borrowings $ 12,874,375 $ 13,467,121 The range of interest rate on bank loans was 0.70%-1.17% and 0.82%-1.16% per annum as of December 31, 2015 and 2014, respectively.
b. Long-term borrowings
December 31 2015 2014 Unsecured borrowings Syndicated loan with Citi Bank $ 12,000,000 $ 12,000,000 Chang Hwa Bank 500,000 500,000 Taiwan Cooperative Bank - 425,000 12,500,000 12,925,000 Current portion (2,900,000) (5,225,000) Long-term borrowings: Non-current $ 9,600,000 $ 7,700,000 As of December 31, 2015 and 2014, the Company had 2 and 4 long-term bank loans respectively with contract terms between October 19, 2011 and September 23, 2018. The floating interest rates are (1.5789% to 1.59067% and 1.520% to 1.703% as of December 31, 2015 and 2014, respectively) payable monthly or quarterly. These loans should be repaid in 5 or 8 installments or at lump sum on loan maturity. On September 23, 2008, the Company signed a contract for a five-year syndicated loan with Citibank and 14 other financial institutions, and on May 16, 2011, changed the contract period to seven years from 2008. The repayment period is between September 23, 2008 and September 22, 2015. The credit line is $15 billion, consisting of (a) $12 billion and (b) $3 billion of the credit line of the above syndicated loan. The Company had repaid the syndicated loan in September 2015. On September 12, 2013, the Company signed another contract for a five-year syndicated loan with Citibank and 16 other financial institutions. The credit line was $15 billion, which was for Company to repay the former syndicated loan with Citibank signed on September 23, 2008, consisting of (a) $12 billion and (b) $3 billion of the credit line of the above syndicated loan. It should be used as a medium-term loan but may not be used on a revolving basis. The principal of this syndication loan should be repaid three years after September 23, 2013 in five semiannual installments with the first payment paid on September 23, 2016, and the interest rate is the 90-day Taipei Interbank Offered Rate plus 61 points. Under the syndicated loan agreement, the Company should maintain the agreed financial ratios based on the most recent semiannual or annual financial statements. As of December 31, 2015 and 2014, the Company used $12 billion of the credit line of the above syndicated loan. As of December 31, 2015 and 2014, the Company did not violate the financial ratio agreement stated above.

227 228‧Lite-On Technology Corporation 2015 Annual Report Lite-On Technology Corporation 2015 Annual Report‧
- 43 -
17. PROVISIONS
December 31 2015 2014 Current Warranties $ 853,031 $ 828,287 Movements in the provisions were as follows: For the Year Ended December 31 2015 2014 Balance at January 1 $ 828,287 $ 133,230 Recognition of provisions 263,383 231,972 Usage (238,639) (109,217) Acquired from business combination - 572,302 Balance at December 31 $ 853,031 $ 828,287 The provision for warranty claims represents the present value of management’s best estimate of the future outflow of economic benefits that will be required under the Company’s obligations for warranties under local sale of goods legislation. The estimate had been made on the basis of historical warranty trends and may vary as a result of the entry of new materials, altered manufacturing processes or other events affecting product quality.
18. RETIREMENT BENEFIT PLANS a. Defined contribution plans
The Company adopted a pension plan under the Labor Pension Act (the “LPA”), which is a state-managed defined contribution plan. Under the LPA, an entity makes monthly contributions to employees’ individual pension accounts at 6% of monthly salaries and wages.
b. Defined benefit plans The defined benefit plan adopted by the Company in accordance with the Labor Standards Law is operated by the government. Pension benefits are calculated on the basis of the length of service and average monthly salaries of the six months before retirement. The Company contributes amounts equal to 2% of total monthly salaries and wages to a pension fund administered by the pension fund monitoring committee. Pension contributions are deposited in the Bank of Taiwan in the committee’s name. Before the end of each year, the Company assesses the balance in the pension fund. If the amount of the balance in the pension fund is inadequate to pay retirement benefits for employees who conform to retirement requirements in the next year, the Company is required to fund the difference in one appropriation that should be made before the end of March of the next year. The pension fund is managed by the Bureau of Labor Funds, Ministry of Labor (“the Bureau”); the Company has no right to influence the investment policy and strategy.
- 44 -
The amounts included in the balance sheets in respect of the Company’s defined benefit plans were as follows: December 31 2015 2014 Present value of defined benefit obligation $ 1,154,819 $ 1,072,976 Fair value of plan assets (1,090,884) (1,072,993) Net defined benefit liability (asset) $ 63,935 $ (17) Movements in net defined benefit liability (asset) were as follows:
Present Value of the Defined
Benefit Obligation
Fair Value of the Plan Assets
Net Defined Benefit
Liability (Asset) Balance at January 1, 2014 $ 870,102 $ (858,929) $ 11,173 Current service cost 7,661 - 7,661 Net interest expense (income) 17,292 (17,439) (147) Recognized in profit or loss 24,953 (17,439) 7,514 Remeasurement
Return on plan assets (excluding amounts included in net interest) - (4,794) (4,794)
Actuarial loss - changes in financial assumptions 4,572 - 4,572
Actuarial gain - experience adjustments (9,686) - (9,686) Recognized in other comprehensive income
(loss) (5,114) (4,794) (9,908) Contributions from the employer - (17,243) (17,243) Benefits paid (16,619) 16,619 - Business combinations 199,654 (191,207) 8,447 Balance at December 31, 2014 $ 1,072,976 $ (1,072,993) $ (17) Balance at January 1, 2015 $ 1,072,976 $ (1,072,993) $ (17) Current service cost 7,717 - 7,717 Net interest expense (income) 17,964 (18,137) (173) Recognized in profit or loss 25,681 (18,137) 7,544 Remeasurement
Return on plan assets (excluding amounts included in net interest) - (10,538) (10,538)
Actuarial loss - changes in financial assumptions 68,088 - 68,088
Actuarial loss - experience adjustments 19,076 - 19,076 Recognized in other comprehensive income
(loss) 87,164 (10,538) 76,626 Contributions from the employer - (20,218) (20,218) Benefits paid (31,002) 31,002 - Balance at December 31, 2015 $ 1,154,819 $ (1,090,884) $ 63,935

229 230‧Lite-On Technology Corporation 2015 Annual Report Lite-On Technology Corporation 2015 Annual Report‧
- 45 -
Through the defined benefit plans under the Labor Standards Law, the Company is exposed to the following risks: 1) Investment risk: The plan assets are invested in domestic and foreign equity and debt securities,
bank deposits, etc. The investment is conducted at the discretion of the Bureau or under the mandated management. However, in accordance with relevant regulations, the return generated by plan assets should not be below the interest rate for a 2-year time deposit with local banks.
2) Interest risk: A decrease in the government bond interest rate will increase the present value of the
defined benefit obligation; however, this will be partially offset by an increase in the return on the plan’s debt investments.
3) Salary risk: The present value of the defined benefit obligation is calculated by reference to the
future salaries of plan participants. As such, an increase in the salary of the plan participants will increase the present value of the defined benefit obligation.
The actuarial valuations of the present value of the defined benefit obligation were carried out by qualified actuaries. The significant assumptions used for the purposes of the actuarial valuations were as follows: December 31 2015 2014 Discount rate 1.10% 1.70% Expected rate of salary increase 3.00% 3.00% If possible reasonable change in each of the significant actuarial assumptions will occur and all other assumptions will remain constant, the present value of the defined benefit obligation would increase (decrease) as follows: December 31 2015 2014 Discount rate
0.25% increase $ (29,099) $ (29,014) 0.25% decrease $ 30,194 $ 30,170
Expected rate of salary increase 0.25% increase $ 28,997 $ 29,304 0.25% decrease $ (28,114) $ (28,341)
The sensitivity analysis presented above may not be representative of the actual change in the present value of the defined benefit obligation as it is unlikely that the change in assumptions would occur in isolation of one another as some of the assumptions may be correlated. December 31 2015 2014 The expected contributions to the plan for the next year $ 19,920 $ 20,400 The average duration of the defined benefit obligation 10.32 years 11.32 years
- 46 -
19. EQUITY
a. Share capital
1) Ordinary shares
December 31 2015 2014 Numbers of shares authorized (in thousands) 3,500,000 3,500,000 Shares authorized $ 35,000,000 $ 35,000,000 Number of shares issued and fully paid (in thousands) 2,334,928 2,341,674 Shares issued $ 23,349,283 $ 23,416,737 Fully paid ordinary shares, which have a par value of $10, carry one vote per share and carry a right to dividends. Of the Company’s authorized shares, 100,000 thousand shares had been reserved for the issuance of employee share options.
2) Issued global depositary receipts On September 25, 1996, the Company issued 4,900 thousand units of global depositary receipts (GDRs) on the London Stock Exchange. These GDRs represented 49,000 thousand common shares of the Company. On April 3, 1995, GVC Corp. issued 5,000 units of GDRs on the London Stock Exchange. These GDRs represented 25,000 thousand common shares of GVC Corp., which later issued more shares. As of November 4, 2002, the outstanding GDRs were 7,627 thousand units, or 38,136 thousand common shares of GVC Corp. For merger purposes, these GDRs were exchanged for the Company’s 1,478 thousand marketable equity securities, which represented the Company’s 14,781 thousand common shares. As of December 31, 2015 and 2014, the outstanding marketable equity securities were 5,217 thousand units and 5,213 thousand units, representing 52,168 thousand common share and 52,127 thousand common shares of the Company, respectively. The rights and obligation of security holders are the same as those of common shareholders, except for voting rights. As of December 31, 2015 and 2014, the unredeemed GDRs amounted to 816 thousand units and 994 thousand units.
b. Capital surplus
The premium from shares issued in excess of par (including share premium from issuance of common shares, conversion of bonds, and merger) and donations may be used to offset a deficit; in addition, when the Company has no deficit, such capital surplus may be distributed as cash dividends or transferred to capital limited to a certain percentage of the Company’s capital surplus and once a year. The capital surplus arising from share of changes in equities of subsidiaries, changes in equities of associates and joint ventures accounted for by the equity method and treasury share transactions from dividends according to the Company’s shares holding by subsidiaries may only be used to offset a deficit.
c. Retained earnings and dividend policy
To ensure the availability of cash for the Company’s present and future expansion plans and to meet shareholders’ cash flow requirements, the Company prefers to distribute more stock dividends. In principle, cash dividends are limited to 10% of total dividends distributed.

231 232‧Lite-On Technology Corporation 2015 Annual Report Lite-On Technology Corporation 2015 Annual Report‧
- 47 -
The Company’s Articles of Incorporation provide that the annual net income, less any deficit, and 10% legal reserve as well as special reserve equal to the debit balances of the shareholders’ equity accounts, together with the distributable unappropriated earnings of prior years, can be retained partially on the basis of operating requirements. The remainder should be distributed as follows: 1) Bonus to employees: At least 1%. 2) Bonus to directors: 1.5% or less. 3) Others, as dividends. If the bonus to employees is in the form of shares, it may be distributed to the employees’ subsidiaries. The requirements and the method of distribution of these share bonuses are based on resolutions passed by the board of directors. In accordance with the amendments to the Company Act in May 2015, the recipients of dividends and bonuses are limited to shareholders and do not include employees. The consequential amendments to the Company’s Articles of Incorporation had been proposed by the Company’s board of directors on March 25, 2016 and are subject to the resolution of the shareholders in their meeting to be held on June 24, 2016. For information about the accrual basis of the employees’ compensation and remuneration to directors and supervisors and the actual appropriations, please refer to Note 21 (b). Under Rule No. 1010012865, Rule No. 1010047490 and Rule No. 1030006415 issued by the FSC and the directive titled “Questions and Answers for Special Reserves Appropriated Following Adoption of IFRSs”, the Company should appropriate or reverse a special reserve. Appropriation of earnings to legal reserve shall be made until the legal reserve equals the Company’s paid-in capital. Legal reserve may be used to offset deficit. If the Company has no deficit and the legal reserve has exceeded 25% of the Company’s paid-in capital, the excess may be transferred to capital or distributed in cash. Except for non-ROC resident shareholders, all shareholders receiving the dividends are allowed a tax credit equal to their proportionate share of the income tax paid by the Company. The appropriations of earnings for 2014 and 2013 had been approved in the shareholders’ meetings on June 24, 2015 and June 19, 2014, respectively. The appropriations and dividends per share were as follows:
Appropriation of Earnings Dividends Per Share
(NT$) 2014 2013 2014 2013 Legal reserve $ 646,166 $ 875,485 Special reserve 182,544 - Reversal of special reserve - 640,244 Share dividends 117,084 116,381 $ 0.05 $ 0.05 Cash dividends 4,613,097 6,307,866 1.97 2.71 The appropriations of earnings for 2015 had been proposed by the Company’s board of directors on March 25, 2016. The appropriations and dividends per share were as follows:
Appropriation
of Earnings Dividends Per Share (NT$)
Legal reserve $ 722,290 Special reserve 166,389 Share dividends 116,746 $ 0.05 Cash dividends 5,113,493 2.19
- 48 -
The appropriations of earnings for 2015 are subject to the resolution of the shareholders’ meeting to be held on June 24, 2016.
d. Others equity items Movements in others equity items were as follows: 2015
Foreign Currency
Translation Reserve
Unrealized Gain (Loss)
from Available-for- sale Financial
Assets
Cash Flow Hedges Reserve Total
Balance at January 1 $ 4,125,097 $ 139,072 $ (11,989) $ 4,252,180 Exchange differences arising on
translating the financial statements of foreign operations (818,537) - - (818,537)
Loss arising on changes in the fair value of available-for- sale financial assets - (280,893) - (280,893)
Reclassification to income from disposal of available-for-sale financial assets - (19,926) - (19,926)
Gain arising on changes in the fair value of hedging instruments - - 11,989 11,989
Share of other comprehensive income of subsidiaries and associates (91,013) 9,033 - (81,980)
Income tax effect 132,355 - - 132,355 Balance at December 31 $ 3,347,902 $ (152,714) $ - $ 3,195,188
2014
Foreign Currency
Translation Reserve
Unrealized Gain from
Available-for- sale Financial
Assets
Cash Flow Hedges Reserve Total
Balance at January 1 $ 2,383,040 $ 83,231 $ (46,969) $ 2,419,302 Exchange differences arising on
translating the financial statements of foreign operations 2,394,153 - - 2,394,153
Gain arising on changes in the fair value of available-for- sale financial assets - 298,311 - 298,311
Reclassification to income from disposal of available-for-sale financial assets - (259,010) - (259,010)
(Continued)

233 234‧Lite-On Technology Corporation 2015 Annual Report Lite-On Technology Corporation 2015 Annual Report‧
- 49 -
2014
Foreign Currency
Translation Reserve
Unrealized Gain from
Available-for- sale Financial
Assets
Cash Flow Hedges Reserve Total
Gain arising on changes in the
fair value of hedging instruments $ - $ - $ 34,980 $ 34,980
Share of other comprehensive income of subsidiaries and associates (233,000) 16,540 - (216,460)
The proportionate share of other comprehensive income reclassified to profit or loss upon partial disposal of associates (1,240) - - (1,240)
Effect of deconsolidation of subsidiary (Note 25) (13,549) - - (13,549)
Income tax effect (404,307) - - (404,307) Balance at December 31 $ 4,125,097 $ 139,072 $ (11,989) $ 4,252,180
(Concluded) The exchange differences arising on translation of foreign operation’s net assets from its functional currency to the Company’s presentation currency are recognized directly in other comprehensive income and also accumulated in the foreign currency translation reserve. Unrealized gain/loss on available-for-sale financial assets represents the cumulative gains or losses arising from the fair value measurement on available-for-sale financial assets that are recognized in other comprehensive income. When those available-for-sale financial assets have been disposed of or are determined to be impaired subsequently, the related cumulative gains or losses in other comprehensive income are reclassified to profit or loss. The cash flow hedges reserve represents the cumulative effective portion of gains or losses arising on changes in fair value of the hedging instruments entered into as cash flow hedges. The cumulative gain or loss arising on changes in fair value of the hedging instruments that are recognized and accumulated in cash flow hedges reserve will be reclassified to profit or loss only when the hedge transaction affects profit or loss.
e. Treasury shares
Unit: In Thousands of Shares
Purpose of Buyback
Number of Shares at January 1
Increase During the
Period
Decrease During the
Period
Number of Shares at
December 31 For the year ended December 31, 2015 Shares held by its subsidiaries 26,575 133 - 26,708 Shares buyback for cancellation - 22,787 22,787 - 26,575 22,920 22,787 26,708
(Continued)
- 50 -
Purpose of Buyback
Number of Shares at January 1
Increase During the
Period
Decrease During the
Period
Number of Shares at
December 31 For the year ended December 31, 2014 Shares held by its subsidiaries 28,118 132 1,675 26,575
(Concluded) The Company’s shares held by its subsidiaries at the end of the reporting periods were as follows:
Name of Subsidiary
Number of Shares Held
(In Thousands) Carrying Amount Market Price
December 31, 2015 Lite-On Capital Corp. 15,041 $ 718,857 $ 479,049 LTC International Ltd. 6,969 297,469 221,759 Yet Foundate Ltd. 2,260 126,881 71,820 Lite-On Electronics Co., Ltd. 2,438 105,515 77,491 $ 1,248,722 $ 850,119 December 31, 2014 Lite-On Capital Corp. 14,966 $ 718,857 $ 544,761 LTC International Ltd. 6,935 297,469 272,328 Yet Foundate Ltd. 2,248 126,881 95,922 Lite-On Electronics Co., Ltd. 2,426 105,515 103,497 $ 1,248,722 $ 1,016,508 On July 20, 2015, the Company’s Board of Directors approved the repurchase of up to 100,000 thousand shares listed on the Taiwan Stock Exchange between July 21, 2015 and September 20, 2015, with the buyback price ranging from $25.34 to $53.97. By the end of the repurchase period, the Company had bought back 22,787 thousand shares for $706,679 thousand. The Company has already registered with the Ministry of Economic Affairs to cancel those buy-back shares. Under the Securities and Exchange Act, the Company shall neither pledge treasury shares nor exercise shareholders’ rights on these shares, such as rights to dividends and to vote. The subsidiaries holding treasury shares, however, retain shareholders’ rights, except the rights to participate in any share issuance for cash and to vote.
20. REVENUE
For the Year Ended December 31 2015 2014 Revenue from the sale of goods $ 122,362,953 $ 113,855,987 Royalty income 1,332,439 1,054,983 Revenue from management services 830,524 766,148 Rental income from property 103,332 115,130 $ 124,629,248 $ 115,792,248

235 236‧Lite-On Technology Corporation 2015 Annual Report Lite-On Technology Corporation 2015 Annual Report‧
- 51 -
21. ADDITIONAL INFORMATION ON EXPENSES Net income included the following items: For the Year Ended December 31 2015 2014 a. Depreciation and amortization
Property, plant and equipment $ 701,807 $ 479,839 Intangible assets 462,614 295,400 $ 1,164,421 $ 775,239 Depreciation expenses summarized by function
Recognized in cost of revenue $ 212,606 $ 107,948 Recognized in operating expenses 489,201 371,891
$ 701,807 $ 479,839 Amortization expenses summarized by function
Recognized in cost of revenue $ 3,084 $ 11,772 Recognized in operating expenses 459,530 283,628
$ 462,614 $ 295,400
b. Employee benefit expenses
Post-employment benefits (Note 18)
Defined contribution plans $ 213,948 $ 171,589 Defined benefit plans 7,544 7,514 221,492 179,103
Termination benefits 32,500 17,770 Other employee benefits 6,001,944 4,943,380 $ 6,255,936 $ 5,140,253 Employee benefit expenses summarized by function
Recognized in cost of revenue $ 807,678 $ 462,255 Recognized in operating expenses 5,448,258 4,677,998 $ 6,255,936 $ 5,140,253
To be in compliance with the Company Act as amended in May 2015, the proposed amended Articles of Incorporation of the Company stipulate to distribute employees’ compensation and remuneration to directors at a certain percentage of net profit before income tax, employees’ compensation, and remuneration to directors. The employees’ compensation and remuneration to directors for the year ended December 31, 2015 have been approved by the Company’s board of directors on March 25, 2016 and are subject to the resolution and adoption of the amendments to the Company’s Articles of Incorporation by the shareholders in their meeting to be held on June 24, 2016, and in addition thereto a report of such distribution shall be submitted to the shareholders' meeting. The details were as follows:
For the Year Ended December 31, 2015
Cash Share Employees’ compensation $ 858,514 $ 163,526 Remuneration to directors 61,395 -
- 52 -
The 4,264 thousand shares for 2015 were determined by dividing the amount of share compensation resolved in 2016 by $38.35, the closing price of the shares on the day immediately preceding the Company’s board of directors’ meeting. Material differences between such estimated amounts and the amounts proposed by the board of directors on or before the date the financial statements are authorized for issue are adjusted in the year the bonus and remuneration were recognized. If there is a change in the proposed amounts after the financial statements were authorized for issue, the differences are recorded as a change in accounting estimate and adjusted in the following year. The appropriations of bonuses to employees and remuneration to directors for 2014 and 2013, which have been approved in the shareholders’ meetings on June 24, 2015 and June 19, 2014, respectively, were as follows: For the Year Ended December 31 2014 2013
Cash
Dividends Share
Dividends Cash
Dividends Share
Dividends Bonus to employees $ 768,033 $ 146,292 $ 997,212 $ 189,945 Remuneration of directors 54,924 - 70,039 - The 4,333 thousand shares for 2014 was determined by dividing the amount of share bonus approved in 2015 by the closing price of $33.76 (after considering the effect of cash and stock dividends) on the day immediately preceding the shareholders’ meeting. The 4,085 thousand shares for 2013 was determined by dividing the amount of share bonus resolved in 2014 by the closing price of $46.50 (after considering the effect of cash and stock dividends) on the day immediately preceding the shareholders’ meeting. There was no difference between the amounts of the bonus to employees and the remuneration to directors approved in the shareholders’ meeting on June 24, 2015 and June 19, 2014 and the amounts recognized in the Company’s financial statements for the years ended December 31, 2014 and 2013, respectively. Information on the employees’ compensation and remuneration to directors resolved by the Company’s board of directors in 2016 and bonus to employees and directors resolved by the shareholders' meeting in 2015 and 2014 are available on the Market Observation Post System website of the Taiwan Stock Exchange.
22. INCOME TAX
a. Income tax recognized in profit or loss The major components of tax expense (benefit) were as follows: For the Year Ended December 31 2015 2014 Current income tax expense (benefit)
Current tax expense recognized in the current year $ 768,721 $ 833,181 Adjustment for prior years’ tax (154,022) (76,196)
614,699 756,985 Deferred tax
The origination and reversal of temporary differences 494,853 (791,069) Income tax expense recognized in profit or loss $ 1,109,552 $ (34,084)

237 238‧Lite-On Technology Corporation 2015 Annual Report Lite-On Technology Corporation 2015 Annual Report‧
- 53 -
A reconciliation of income before income tax and income tax expense (benefit) recognized in profit or loss was as follows: For the Year Ended December 31 2015 2014 Income before tax $ 8,332,451 $ 6,426,724 Income tax expense at the statutory rate $ 1,416,517 $ 1,092,543 Tax effect of adjusting items:
Deductible items in determining taxable income (738,895) (468,898) Additional income tax on unappropriated earnings 91,099 209,536 The origination and reversal of temporary differences 494,853 (791,069) Adjustment for prior years’ tax (154,022) (76,196) Income tax expense (benefit) recognized in profit or loss $ 1,109,552 $ (34,084) The applicable tax rate used above is the corporate tax rate of 17% payable by the Company. As the status of 2016 appropriations of earnings is uncertain, the potential income tax consequences of 2015 unappropriated earnings are not reliably determinable.
b. Income tax expense recognized in other comprehensive income
For the Year Ended December 31 2015 2014 Deferred income tax expense (benefit)
Translation of foreign operations $ (132,355) $ 404,307 Related to actuarial gain/loss from defined benefit plans (13,026) 1,684
$ (145,381) $ 405,991
c. Deferred income tax balance
The analysis of deferred income tax assets was as follows: December 31 2015 2014 Temporary differences
Investment accounted for using equity method $ 1,109,952 $ 1,266,944 Impairment loss on assets 328,940 325,877 Unrealized loss on inventories 224,777 197,071 Unrealized loss and expense 190,948 117,257 Accrued warranty expense 145,015 113,095 Net defined benefit liability 47,346 36,465 Unrealized sales profit 38,615 40,835 Unrealized exchange loss net 12,699 - Accumulated compensated absences 7,850 27,390 $ 2,106,142 $ 2,124,934
- 54 -
Opening Balance
Recognized in Profit (Loss)
Recognized in Other
Comprehensive Income (Loss)
Acquired from Business
Combination Closing Balance 2015 Temporary differences
Investment accounted for using equity method $ 1,266,944 $ (156,992) $ - $ - $ 1,109,952
Impairment loss on assets 325,877 3,063 - - 328,940 Unrealized loss on
inventories 197,071 27,706 - - 224,777 Unrealized loss and
expense 117,257 73,691 - - 190,948 Accrued warranty expense 113,095 31,920 - - 145,015 Net defined benefit
liability 36,465 (2,145) 13,026 - 47,346 Unrealized sales profit 40,835 (2,220) - - 38,615 Unrealized exchange loss
net - 12,699 - - 12,699 Accumulated
compensated absences 27,390 (19,540) - - 7,850 $ 2,124,934 $ (31,818) $ 13,026 $ - $ 2,106,142
2014 Temporary differences
Investment accounted for using equity method $ 374,803 $ 477,908 $ - $ 414,233 $ 1,266,944
Impairment loss on assets 298,231 15,359 - 12,287 325,877 Unrealized loss on
inventories 37,064 88,805 - 71,202 197,071 Unrealized loss and
expense 107,152 5,164 - 4,941 117,257 Accrued warranty expense 22,649 (32,423) - 122,869 113,095 Unrealized sales profit 51,236 (42,152) - 31,751 40,835 Net defined benefit
liability 24,590 1,654 (1,684) 11,905 36,465 Accumulated
compensated absences 1,596 25,794 - - 27,390 Available-for-sale
financial assets 4,520 (4,771) - 251 - $ 921,841 $ 535,338 $ (1,684) $ 669,439 $ 2,124,934
The analysis of deferred income tax liabilities was as follows: December 31 2015 2014 Temporary differences
Investment accounted for using equity method $ 2,698,177 $ 2,355,715 Unrealized amortization of goodwill 353,808 353,808 Land value increment tax 230,216 230,216 Unrealized exchange gains net - 11,782 $ 3,282,201 $ 2,951,521

239 240‧Lite-On Technology Corporation 2015 Annual Report Lite-On Technology Corporation 2015 Annual Report‧
- 55 -
Opening Balance
Recognized in (Profit) Loss
Recognized in Other
Comprehensive (Income) Loss
Acquired from Business
Combination Closing Balance 2015 Temporary differences
Investment accounted for using equity method $ 2,355,715 $ 474,817 $ (132,355) $ - $ 2,698,177
Unrealized amortization of goodwill 353,808 - - - 353,808
Land value increment tax 230,216 - - - 230,216 Unrealized exchange
gains net 11,782 (11,782) - - - $ 2,951,521 $ 463,035 $ (132,355) $ - $ 3,282,201 2014 Temporary differences
Investment accounted for using equity method $ 1,212,198 $ (238,275) $ 404,307 $ 977,485 $ 2,355,715
Unrealized amortization of goodwill 35,737 - - 318,071 $ - 353,808
Land value increment tax 230,216 - - - 230,216 Unrealized exchange
gains net 45,420 (17,456) - (16,182) 11,782 $ 1,523,571 $ (255,731) $ 404,307 $ 1,279,374 $ 2,951,521
d. The aggregate amount of temporary difference associated with investments for which deferred tax
liabilities have not been recognized
As of December 31, 2015 and 2014, the aggregate deductible temporary differences for which no deferred income tax assets have been recognized amounted to $663,496 thousand and $223,496 thousand, respectively.
e. Integrated income tax
December 31 2015 2014 Unappropriated earnings
Unappropriated earnings generated before January 1, 1998 $ 2,215 $ 2,215 Unappropriated earnings generated on and after January 1,
1998 13,008,858 11,430,326 $ 13,011,073 $ 11,432,541 Imputation credits accounts $ 1,485,076 $ 1,308,623 The estimated and actual creditable ratio for distribution of earnings of 2015 and 2014 were 11.41% and 11.18%, respectively. According to the amendments to the Income Tax Law Article 66-6, effective on January 1, 2015, the creditable ratio for ROC resident shareholders has been halved. In addition, according to legal interpretation No. 10204562810 announced by the Taxation Administration of the Ministry of Finance, when calculating imputation credits in the year of first-time adoption of IFRSs, the cumulative retained earnings include the net increase or net decrease in retained earnings arising from first-time adoption of IFRSs.
- 56 -
Under the Income Tax Law, for distribution of earnings generated after January 1, 1998, the imputation credits allocated to ROC resident shareholders of the Company was calculated based on the creditable ratio as of the date of dividend distribution. The actual imputation credits allocated to shareholders of the Company was based on the balance of the Imputation Credit Accounts (ICA) as of the date of dividend distribution. Therefore, the expected creditable ratio for the 2015 earnings may differ from the actual creditable ratio to be used in allocating imputation credits to the shareholders.
f. Income tax assessments
The tax returns through all years, except 2012 to 2014, have been assessed by the tax authorities. The Company disagreed with the tax authorities’ assessment of 2013 tax return and applied for a reexamination. Nevertheless, to be conservative, the Company provided for the possible income tax.
23. EARNINGS PER SHARE
Unit: NT$ Per Share For the Year Ended December 31 2015 2014 Basic earnings per share $ 3.11 $ 2.78 Diluted earnings per share $ 3.07 $ 2.75
The earnings and weighted average number of ordinary shares outstanding in the computation of earnings per share from continuing operations were as follows:
Amounts
(Numerator)
Shares (Denominator) (Thousands)
Earnings Per Share
(NT$) 2015 Basic EPS
The net income of common shareholders $ 7,222,899 2,320,208 $ 3.11 Effect of dilutive potential common stock:
Employees’ compensation - 34,377 Diluted EPS
The net income of common shareholders plus the effect of potential dilutive common stock $ 7,222,899 2,354,585 $ 3.07
2014 Basic EPS
The net income of common shareholders $ 6,460,808 2,323,511 $ 2.78 Effect of dilutive potential common stock:
Bonus issue to employees - 27,413 Diluted EPS
The net income of common shareholders plus the effect of potential dilutive common stock $ 6,460,808 2,350,924 $ 2.75

241 242‧Lite-On Technology Corporation 2015 Annual Report Lite-On Technology Corporation 2015 Annual Report‧
- 57 -
The weighted average number of shares outstanding used for the earnings per share computation was adjusted retroactively for the issuance of bonus shares on August 16, 2015. This adjustment caused the basic and diluted after-tax earnings per share for the year ended December 31, 2014 to decrease from $2.80 to $2.78 and from $2.76 to $2.75, respectively. Since the Company is allowed to settle the bonuses or remuneration paid to employees in cash or shares, the Company presumed that the entire amount of the bonus or remuneration would be settled in shares and the resulting potential shares were included in the weighted average number of shares outstanding used in the computation of diluted earnings per share, as the effect is dilutive. The dilutive effect of the potential shares is included in the computation of diluted earnings per share until the number of shares to be distributed to employees is resolved in the following year.
24. ACQUISITION OF SUBSIDIARIES - WITH OBTAINED CONTROL
Principal Activity Date of
Acquisition
Proportion of Voting Equity
Interests Acquired (%)
Consideration Transferred
LarView
Technologies Corp.
Manufacture of optical instruments, general Instruments, computers and peripherals.
April 2014 83.33 $ 500,000
LarView Technologies Corp. was acquired not only to upgrade its capability in the automated processing of camera modules but also to expand the market for this product. For details about the acquisition of LarView Technologies Corp., please refer to Note 29 to the consolidated financial statements for the year ended December 31, 2015.
25. DISPOSAL OF SUBSIDIARIES - WITH LOSS OF CONTROL On March 28, 2014, the Company lost its power to govern the financial and operating policies of Logah Technology Corp. because of the loss of power to cast the majority of votes at meetings of the Board of Directors. For details about the disposal of Logah Technology Corp., please refer to Note 30 to the consolidated financial statements for the year ended December 31, 2015.
26. EQUITY TRANSACTIONS WITH NON-CONTROLLING INTERESTS In January to June 2014, the Company acquired an additional 0.87% equity interest in Lite-On IT Corporation, and increased the equity interest from 99.13 % to 100%. In April 2014, the Company acquired an additional 17.74% equity interest in Lite-On Automotive Corp., and increased the equity interest from 82.26 % to 100%.
- 58 -
The above transactions were accounted for as equity transactions, since the Company did not cease to have control over these subsidiaries. For the Year Ended December 31, 2014
Lite-On Automotive Corporation
Lite-On IT Corporation Total
Cash consideration paid $ 808,800 $ 204,368 $ 1,013,168 The proportionate share of the carrying amount of
the net assets of the subsidiary transferred from non-controlling interests (297,970) (171,716) (469,686)
Differences arising from equity transaction (reductions of unappropriated earnings) $ 510,830 $ 32,652 $ 543,482
27. ACQUISITION OF SUBSIDIARIES
a. Subsidiaries acquired
Principal Activity Date of
Acquisition
Ownership with
Direct/Indirect Voting Rights
Consideration Transfer
Li Shin International
Enterprise Corp. Manufacture of business
machinery equipment and electronic components
March 22, 2014 100% $ -
Lite-On Clean Energy Technology Corp.
Manufacture of business machinery equipment, power supplies, batteries and modules
April 15, 2014 100% -
Lite-On Automotive Corporation
Manufacture and sale of automotive electronic components
June 1, 2014 100% -
Leotek Electronics Corp.
Development, manufacture and sale of LED products, including display panel, light bulb, streetlight, emergency flasher, traffic light, warning light and etc.
June 29, 2014 100% 1,264,985
Lite-On IT Corporation
Manufacture and sale of data storage and processing equipment, electronic components and business machinery equipment
June 30, 2014 100% -
LarView Technologies Corp.
Manufacture of optical instruments, general instruments, electronic components, computers and peripherals.
September 1, 2014
100% 85,075
$ 1,350,060 To integrate its overall resources and enhance the efficiency of operations, the Company had short-form mergers - in accordance with Article 19 of the Business Mergers and Acquisitions Act - with Li Shin International Enterprise Corp., Lite-On Clean Energy Technology Corp., Lite-On Automotive Corp., Leotek Electronics Corp., Lite-On IT Corp. and LarView Technologies Corp. on March 22, 2014, April 15, 2014, June 1, 2014, June 29, 2014, June 30, 2014 and September 1, 2014, respectively, under the board of directors’ approval. The Company was the survivor entity in all of these mergers.

243 244‧Lite-On Technology Corporation 2015 Annual Report Lite-On Technology Corporation 2015 Annual Report‧
- 59 -
b. Assets acquired and liabilities assumed at the date of acquisition
Li Shin International
Enterprise Corp.
Lite-On Clean Energy
Technology Corp.
Lite-On Automotive
Corp.
Leotek Electronics
Corp. Lite-On IT
Corporation
LarView Technologies
Corp. Total
Current assets Cash $ 726,692 $ 5,939 $ 174,865 $ 709,079 $ 4,404,246 $ 63,272 $ 6,084,093 Trade and other receivables 945,002 26,886 553,011 584,255 6,505,987 507,553 9,122,694 Inventories, net 69,153 33,776 254,702 136,576 5,830,823 309,495 6,634,525 Other 15,079 2,846 37,361 41,605 258,325 52,524 407,740
Non-current assets Available-for-sale financial asset -
noncurrent 13 - 202,324 36,644 256,026 - 495,007 Investments accounted for by the equity
method 1,711,495 - 1,517,774 40,040 5,771,412 3,204 9,043,925 Property, plant and equipment, net 130,978 24,550 72,344 227,384 1,457,601 289,251 2,202,108 Intangible assets, net 2,758 2,515 112,416 - 3,890,498 - 4,008,187 Deferred tax assets 9,775 110 25,607 39,349 594,598 - 669,439 Prepayments for pension fund 8,360 - - 87 - - 8,447
Current liabilities
Short-term borrowings - (207,948 ) (15,000 ) - - (298,925 ) (521,873 ) Trade and other payables (922,972 ) (57,522 ) (811,729 ) (505,974 ) (7,087,200 ) (780,416 ) (10,165,813 ) Current tax liabilities (25,877 ) - (44,725 ) (35,717 ) (95,245 ) - (201,564 ) Provisions - (3,893 ) (121,119 ) (52,194 ) (395,096 ) - (572,302 ) Other (219 ) (1,766 ) (58,986 ) (38,952 ) (429,170 ) (3,540 ) (532,633 )
Non-current liabilities Deferred tax liabilities (20,497 ) (110 ) (159,779 ) (5,300 ) (1,093,688 ) - (1,279,374 ) Other - - - (45 ) - - (45 )
Net identifiable assets $ 2,649,740 $ (174,617 ) $ 1,739,066 $ 1,176,837 $ 19,869,117 $ 142,418 $ 25,402,561
c. Net cash inflow from consolidated subsidiaries
For the Year Ended
December 31, 2014
Obtaining cash $ 6,084,093 Transfer consideration of cash payments (1,350,060) $ 4,734,033
28. CAPITAL MANAGEMENT
The Company manages its capital to ensure that entities in the Company will be able to continue as going concerns while maximizing the return to shareholders through the optimization of the debt and equity balance. The Company’s capital management system aims to ensure that the necessary financial resources and operating plan are enough to meet the next 12 months’ requirements for working capital, capital expenditures, research and development expenses, debt repayment, dividend expenses and other need.
29. FINANCIAL INSTRUMENTS a. Fair value of financial instruments that are not measured at fair value
For certain financial instruments-including notes receivable, trade receivables including related parties, other receivables including related parties, debt investments with no active market, short-term borrowings, notes payable, trade payables including related parties, other receivables including related parties, and other payables including related parties - the Company’s management considers the carrying amounts of these financial instruments recognized in the financial statements as approximating their fair values. For long-term loans (including their current portion) with floating rates, the carrying amounts of long-term loans are used as basis to estimate their fair value.
- 60 -
b. Fair value of financial instruments that are measured at fair value on a recurring basis
The following table provides an analysis of financial instruments that are measured subsequent to initial recognition at fair value, grouped into Levels 1 to 3 based on the degree to which the fair value is observable: Level 1 fair value measurements are those derived from quoted prices in active markets for identical
assets or liabilities; Level 2 fair value measurements are those derived from inputs other than quoted prices included
within Level 1 that are observable for the asset or liability, either directly (i.e. as prices) or indirectly (i.e. derived from prices); and
Level 3 fair value measurements are those derived from valuation techniques that include inputs for
the asset or liability that are not based on observable market data (unobservable inputs). 1) Fair value hierarchy
December 31, 2015 Level 1 Level 2 Level 3 Total Financial assets at FVTPL
Cross-currency swap contracts $ - $ 45,845 $ - $ 45,845
Available-for-sale financial assets Securities listed in ROC - equity securities $ 287,229 $ - $ - $ 287,229 Securities listed in other countries - equity
securities 9,262 - - 9,262 Unlisted securities - ROC - equity securities - - 4,620 4,620 Unlisted securities - other countries - equity
securities - - 20,163 20,163 $ 296,491 $ - $ 24,783 $ 321,274 December 31, 2014 Level 1 Level 2 Level 3 Total Available-for-sale financial assets
Securities listed in ROC - equity securities $ 591,405 $ - $ - $ 591,405 Securities listed in other countries - equity
securities 8,929 - - 8,929 Unlisted securities - ROC - equity securities - - 4,620 4,620 Unlisted securities - other countries - equity
securities - - 41,337 41,337 $ 600,334 $ - $ 45,957 $ 646,291 Derivative financial liabilities for hedging -
noncurrent Cash flow hedges - interest rate swaps $ - $ 11,989 $ - $ 11,989
There were no transfers between Levels 1 and 2 in the current and prior periods.

245 246‧Lite-On Technology Corporation 2015 Annual Report Lite-On Technology Corporation 2015 Annual Report‧
- 61 -
2) Reconciliation of Level 3 fair value measurements of financial instruments
Investments on Equity
Instruments Unlisted Quotes December 31, 2015 Financial assets Balance at January 1, 2015 $ 45,957 Total gains or losses
In profit or loss (54,801) Additions 33,627 Balance at December 31, 2015 $ 24,783 December 31, 2014 Financial assets Balance at January 1, 2014 $ 19,009 Total gains or losses
In profit or loss (90,348) Additions 4,620 Acquired from business combination 112,676 Balance at December 31, 2014 $ 45,957
3) Valuation techniques and inputs applied for the purpose of measuring Level 2 fair value
measurement
Financial Instruments Valuation Techniques and Inputs Financial assets at FVTPL -
Cross-currency swap contracts
Estimation of fair value of a currency swap contract is based on its principal and interest rate on mutual agreement and the suitable discount rate that reflects the credit risk of various counterparties at the end of the reporting period.
4) Valuation techniques and inputs applied for the purpose of measuring Level 3 fair value
measurement The fair values of unlisted equity securities - ROC and other countries were determined using the income approach. In this approach, the discounted cash flow method was used to capture the present value of the expected economic benefits from these investments. According to the discounted cash flow analysis and observable financial market average prices or with the same kind of tool to be estimated, the use of the discount rate and the parameters can refer to Reuters news agency or Bloomberg agency or other financial institutions with essentially the same conditions and characteristics of the interest rate swap offer financial products whose features including the remaining contract terms of fixed interest rates, the payment of principal, payment of currency, and etc. All the information can be obtained by the Company.
- 62 -
c. Categories of financial instruments
December 31 2015 2014 Financial assets Designated as at FVTPL $ 45,845 $ - Loans and receivables (1) 38,204,420 41,746,113 Available-for-sale financial assets 321,274 646,291 Financial liabilities Derivative instruments in designated hedge accounting
relationships - 11,989 Measured at amortized cost
Short-term borrowings 12,874,375 13,467,121 Long-term loans (included current portion of long-term debts) 12,500,000 12,925,000 Payables (2) 37,612,537 35,356,838
1) The balances included loans and receivables measured at amortized cost, which comprise cash, debt
instruments with no active market, notes receivable, trade receivables, trade receivables - inter, other receivables and other receivables - inter.
2) The balances included financial liabilities measured at amortized cost, which comprise notes
payable, trade payables, trade payables - inter, other payables and other payables - inter.
d. Financial risk management objectives and policies The Company’s major financial instruments included equity investments, trade receivable, trade payables and borrowings. The Company’s Corporate Treasury function provides services to the business, coordinates access to domestic and international financial markets, monitors and manages the financial risks relating to the operations of the Company through internal risk reports which analyze exposures by degree and magnitude of risks. These risks include market risk (including currency risk, interest rate risk and other price risk), credit risk and liquidity risk. The Company sought to minimize the effects of these risks by using derivative financial instruments to hedge risk exposures. The use of financial derivatives was governed by the Company’s policies approved by the board of directors, which provided written principles on foreign exchange risk, interest rate risk, credit risk, the use of financial derivatives and non-derivative financial instruments, and the investment of excess liquidity. Compliance with policies and exposure limits was reviewed by the internal auditors on a continuous basis. The Company did not enter into or trade financial instruments, including derivative financial instruments, for speculative purposes. 1) Market risk
The Company’s activities exposed it primarily to the financial risks of changes in foreign currency exchange rates (see a) below) and interest rates (see b) below). The Company entered into a variety of derivative financial instruments to manage its exposure to foreign currency risk and interest rate risk, including: Forward foreign exchange contracts to hedge the exchange rate risk arising on the export; Interest rate swaps to mitigate the risk of rising interest rates. There had been no change to the Company’s exposure to market risks or the manner in which these risks were managed and measured.

247 248‧Lite-On Technology Corporation 2015 Annual Report Lite-On Technology Corporation 2015 Annual Report‧
- 63 -
a) Foreign currency risk
The Company had foreign currency sales and purchases, which exposed the Company to foreign currency risk. The Company is an international electronics manufacturing entity with stable foreign currency income that covers foreign currency expense; exchange rate exposures were managed through foreign currency loans. The carrying amounts of the Company’s foreign currency denominated monetary assets and monetary liabilities and of the derivatives exposing to foreign currency risk at the end of the reporting period are set out in Note 33. Sensitivity analysis The Company was mainly exposed to the currency USD. The following table details the Company’s sensitivity to a 5% increase and decrease in New Taiwan dollars (the functional currency) against the U.S. dollars. The sensitivity analysis included only outstanding foreign currency denominated monetary items. A positive number below indicates an increase in pre-tax profit and other equity associated with New Taiwan dollars strengthen 5% against the U.S. dollars. For a 5% weakening of New Taiwan dollars against the U.S. dollars, there would be an equal and opposite impact on pre-tax profit and other equity and the balances below would be negative. Currency USD Impact For the Year Ended December 31 2015 2014 Profit or loss $ (33,750) $ (25,245)
b) Interest rate risk
The Company was exposed to interest rate risk because entities in the Company borrowed funds at both fixed and floating interest rates. The risk is managed by the Company by maintaining an appropriate mix of fixed and floating rate borrowings, and using interest rate swap contracts. Hedging activities are evaluated regularly to align with interest rate views and defined risk appetite, ensuring the most cost-effective hedging strategies are applied. The carrying amount of the Company’s financial assets and financial liabilities with exposure to interest rates at the end of the reporting period were as follows: December 31 2015 2014 Fair value interest rate risk
Financial assets (i) $ 10,308 $ 1,789 Financial liabilities (ii) 11,074,375 10,481,921
Cash flow interest rate risk Financial assets (iii) 4,189,574 6,540,514 Financial liabilities (iv) 14,300,000 15,910,200
i. The balances included debt instruments with no active market. ii. The balances included financial liabilities exposed to fair value risk from interest rate
fluctuation.
- 64 -
iii. The balances included demand deposits. iv. The balances included financial liabilities exposed to cash flow risk from interest rate
fluctuation. The Company was also exposed to cash flow interest rate risk in relation to variable-rate bank borrowings and pay-fixed/receive-floating interest rate swaps. The Company’s cash flow interest rate risk was mainly concentrated in the fluctuation of the average rate for 90-day notes in Taiwan’s secondary market arising from the Company’s New Taiwan dollars denominated borrowings. Sensitivity analysis The sensitivity analyses below were determined based on the Company’s exposure to interest rates for both derivatives and non-derivative instruments at the end of the reporting period. For floating rate liabilities, the analysis was prepared assuming the amount of the liability outstanding at the end of the reporting period was outstanding for the whole year. If interest rates had been 25 basis points higher and all other variables were held constant, the Company’s pre-tax profit years ended December 31, 2015 and 2014 would decrease by $25,276 thousand and $23,424 thousand.
c) Other price risk The Company was exposed to equity price risk through its investments in listed equity securities. Equity investments are held for strategic rather than trading purposes. The Company does not actively trade these investments. Sensitivity analysis The sensitivity analyses below were determined based on the exposure to equity price risks at the end of the reporting period. If equity prices had been 10% higher, the pre-tax other comprehensive income years ended December 31, 2015 and 2014 would increase by $29,649 thousand and $60,033 thousand as a result of the changes in fair value of available-for-sale shares.
2) Credit risk Credit risk refers to the risk that counterparty will default on its contractual obligations resulting in financial loss to the Company. The Company is exposed to credit risk from trade receivables, deposits and other financial instruments. Credit risks on business-related exposures are managed separately from that on financial-related exposures. a) Business related credit risk
To maintain the quality of receivables, the Company has established operating procedures to manage credit risk. For individual customers, risk factors considered include the customer’s financial position, credit rating agency rating, the Company’s internal credit rating, and transaction history as well as current economic conditions that may affect the customer’s ability to pay. The Company also has the right to use some credit protection enhancement tools, such as requiring advance payments, to reduce the credit risks involving certain customers.

249 250‧Lite-On Technology Corporation 2015 Annual Report Lite-On Technology Corporation 2015 Annual Report‧
- 65 -
b) Financial related credit risk Bank deposits and other financial instruments are credit risk sources required by the Company’s department of finance department to be measured and monitored. However, since the Company’s counter-parties are all reputable financial institutions and government agencies, there is no significant financial credit risk.
3) Liquidity risk The Company manages liquidity risk by monitoring and maintaining a level of cash and cash equivalents deemed adequate to finance the Company’s operations. The table below summarizes the maturity profile of the Company’s non-derivative financial liabilities based on contractual undiscounted payments. December 31, 2015
Weighted Average Effective
Interest Rate (%)
On Demand or Less than
1 Year 1-3 Years 3 Years to
5 Years 5+ Years Non-derivative financial liabilities Non-interest bearing - $ 37,612,537 $ 21,210 $ - $ - Fixed interest rate liabilities 0.7-1.17 11,074,375 - - - Variable interest rate liabilities 0.89-1.5907 4,700,000 9,600,000 - - $ 53,386,912 $ 9,621,210 $ - $ - December 31, 2014
Weighted Average Effective
Interest Rate (%)
On Demand or Less than
1 Year 1-3 Years 3 Years to
5 Years 5+ Years Non-derivative financial liabilities Non-interest bearing - $ 35,356,838 $ 19,796 $ - $ - Fixed interest rate liabilities 0.83-1.16 10,481,921 - - - Variable interest rate liabilities 0.82-1.703 8,210,200 7,700,000 - - $ 54,048,959 $ 7,719,796 $ - $ - The table below summarizes the maturity profile of the Company’s derivative financial instruments based on contractual undiscounted payments. December 31, 2015
On Demand or Less than
1 Year 1-3 Years 3 Years to
5 Years 5+ Years Currency swap contracts
Inflows $ 3,235,000 $ - $ - $ - Outflows (3,212,900) - - -
$ 22,100 $ - $ - $ - December 31, 2014: None.
- 66 -
30. TRANSACTIONS WITH RELATED PARTIES
Significant transactions with related parties are summarized below. a. Sales of goods
For the Year Ended December 31 Related Parties Categories 2015 2014 Subsidiaries $ 23,938,054 $ 24,745,344 Other related parties 462 479 $ 23,938,516 $ 24,745,823
b. Purchases of goods
For the Year Ended December 31 Related Parties Categories 2015 2014 Subsidiaries $ 97,618,457 $ 102,990,258 Other related parties 19 343 $ 97,618,476 $ 102,990,601
The sales prices and payment terms to related parties were not significantly different from those of sales to third parties. For other related party transactions, price and terms were determined in accordance with mutual agreements.
c. Receivables from related parties
December 31 Related Parties Categories 2015 2014 Trade receivables Subsidiaries $ 11,028,955 $ 10,832,845 Other related parties 2 - $ 11,028,957 $ 10,832,845 Other receivables Subsidiaries $ 540,848 $ 559,185 Associates 918 - Other related parties 19 203 $ 541,785 $ 559,388
The outstanding trade receivables from related parties are unsecured. For the years ended December 31, 2015 and 2014, no impairment loss was recognized for trade receivables from related parties.

251 252‧Lite-On Technology Corporation 2015 Annual Report Lite-On Technology Corporation 2015 Annual Report‧
- 67 -
d. Payables to related parties
December 31 Related Parties Categories 2015 2014 Accounts payable Subsidiaries $ 18,782,250 $ 20,882,049 Other related parties 75,918 27,220 Associates - 1,522 $ 18,858,168 $ 20,910,791 Other payable Subsidiaries $ 748,387 $ 595,372 Other related parties 7,295 4,317 Associates - 411 $ 755,682 $ 600,100 The outstanding trade payables from related parties are unsecured.
e. Acquisition of property, plant and equipment
Purchase Price For the Year Ended December 31 Related Parties Categories 2015 2014 Subsidiaries $ 30,632 $ 807
f. Disposal of property, plant and equipment
For the Year Ended December 31 2015 2014 Related Parties Categories Proceeds Gains Proceeds Gains Subsidiaries $ 359,680 $ 36 $ 269 $ -
g. Operating expense
For the Year Ended December 31 Related Parties Categories 2015 2014 Subsidiaries $ 915,022 $ 266,300 Other related parties 61,107 57,008 $ 976,129 $ 323,308
- 68 -
h. Other revenues
For the Year Ended December 31 Related Parties Categories 2015 2014 Subsidiaries $ 160,635 $ 120,342 Associates 3,748 4,053 Other related parties 648 617 $ 165,031 $ 125,012
i. Compensation of management personnel
For the Year Ended December 31 Related Parties Categories 2015 2014 Short-term employee benefits $ 511,862 $ 522,938 Post-employment benefits 22,062 18,421 $ 533,924 $ 541,359 The remuneration of directors and key executives was determined by the remuneration committee having regard to the performance of individuals and market trends.
31. ASSETS PLEDGED AS COLLATERAL OR FOR SECURITY
December 31 2015 2014 Pledge-time deposits $ 10,308 $ 1,789 Pledged assets - noncurrent included the refundable deposits that had been provided for a government projects.
32. SIGNIFICANT CONTINGENT LIABILITIES AND UNRECOGNIZED COMMITMENTS
a. CMP Consulting Service, Inc., KI, Inc., Aaron Wagner, The Stereo Shop, David Carney, Jr., Tina
Corse, Cynthia R. Rall, Richard R. Rall, Aaron Deshaw and Don Cheung filed an antitrust group lawsuit against the Company and its subsidiaries - Philips & Lite-On Digital Solutions Corporation, Philips & Lite-On Digital Solutions USA, Inc. and other companies with related businesses - with a court in California, from October 2009 to September 2010. The Company has assigned lawyers in the United States as its representative in these lawsuits. In September 2015, the Company has reached a settlement with the direct plaintiff group. The lawsuit with indirect plaintiff group is still in progress. The Company already accrued a reasonable amount in case of a loss on this lawsuit and will continue to recognize the losses quarterly on the basis of a reasonable estimation of the lawsuit until the settlement of this lawsuit.
b. In the second quarter of 2013, the Attorney General of the State of Florida filed antitrust lawsuits
against the Company and its subsidiaries - Philips & Lite-On Digital Solutions Corporation and Philips & Lite-On Digital Solutions USA, Inc. - as well as other companies with related businesses with the U.S. District Court for the Northern District of California (USDC-NDC). The Company assigned lawyers in the United States as its representative in these lawsuits. In the second quarter of 2014, the USDC-NDC allowed the plaintiff to proceed with the lawsuits but dismissed certain parts of these lawsuits. Although the outcome of the proceedings had not been determined, the Company already

253 254‧Lite-On Technology Corporation 2015 Annual Report Lite-On Technology Corporation 2015 Annual Report‧
- 69 -
accrued a reasonable amount in case of a loss on this lawsuit and will continue to recognize the losses quarterly at this reasonably estimated amount until the settlement of this lawsuit.
c. In the second quarter of 2013, Dell Inc. and Dell Products L.P. filed a complaint with the United States
District Court for Western District of Texas. In the fourth quarter of 2013, Acer Inc., Acer America Corporation, Gateway Inc. and Gateway U.S. Retail, Inc. filed a complaint with the United States District Court for the Northern District of California. In the fourth quarter of 2013, Ingram Micro Inc., and Synnex Corporation filed a complaint with the United States District Court for the Central District of California. In the third quarter of 2015, Alfred H. Siegel, the bankruptcy trustee of Circuit City Stores, Inc., filed a complaint with the United States District Court for the Northern District of California. In the fourth quarter of 2015, Peter Kravitz, the bankruptcy trustee of RadioShack Corporation, filed a complaint with the United States District Court for the Northern District of California. All these complaints constituted an antitrust group lawsuit against the Company and other companies with related businesses. The Company assigned lawyers as its representative in these lawsuits. Although the outcome of the proceedings had not been determined, the Company already accrued a reasonable amount in case of a loss on this lawsuit and will continue to recognize losses quarterly at this reasonably estimated amount until the settlement of this lawsuit.
d. From the second quarter of 2010 to the second quarter of 2014, petitioner Carlos Fogelman filed a
motion for authorization to institute class action antitrust proceedings with the Superior Court of Quebec in the district of Montreal. The Fanshawe College of Applied Arts and Technology filed a statement of claim in Ontario court. Neil Godfrey filed a statement of claim with the Superior Court of British Columbia. Donald Woligroski filed a statement of claim in Manitoba court. Cindy Retallick filed a statement of claim in Saskatchewan court. All plaintiffs filed the antitrust group lawsuit against the Company and its subsidiaries - Philips & Lite-On Digital Solutions Corporation, Philips & Lite-On Digital Solutions USA, Inc. and other companies with related businesses. The Company assigned lawyers as its representative in these lawsuits. Although the outcome of the proceedings had not been determined, the Company accrued a reasonable amount in case of a loss on this lawsuit and will continue to recognize the losses quarterly on the basis of a reasonable estimation of the lawsuit until the settlement of this lawsuit.
33. SIGNIFICANT ASSETS AND LIABILITIES DENOMINATED IN FOREIGN CURRENCIES The following information was aggregated by the foreign currencies other than functional currencies and the exchange rates between foreign currencies and respective functional currencies were disclosed. The significant assets and liabilities denominated in foreign currencies were as follows: December 31, 2015
Foreign
Currencies Exchange Rate Carrying Amount
Financial assets Monetary items
USD $ 1,049,145 32.775 (USD:NTD) $ 34,385,727 EUR 2,162 35.8034 (EUR:NTD) 77,406 HKD 7,184 4.2289 (HKD:NTD) 30,382 CZK 5,805 1.3261 (CZK:NTD) 7,698 JPY 5,513 0.2723 (JPY:NTD) 1,501
$ 34,502,714
(Continued)
- 70 -
Foreign
Currencies Exchange Rate Carrying Amount
Non-monetary items
Investments accounted for using equity method USD $ 1,866,396 32.775 (USD:NTD) $ 61,171,129 HKD 2,658,071 4.2289 (HKD:NTD) 11,240,716 EUR 10,398 35.8034 (EUR:NTD) 372,284 JPY 1,315,588 0.2723 (JPY:NTD) 358,235
$ 73,142,364 Financial liabilities Monetary items
USD 1,069,740 32.775 (USD:NTD) $ 35,060,726 CZK 13,733 1.3261 (CZK:NTD) 18,211 JPY 64,068 0.2723 (JPY:NTD) 17,446 EUR 484 35.8034 (EUR:NTD) 17,338 HKD 3,764 4.2289 (HKD:NTD) 15,917
$ 35,129,638 Non-monetary items
Investments accounted for using equity method HKD 67,556 4.2289 (HKD:NTD) $ 285,688 USD 2,070 32.775 (USD:NTD) 67,844
$ 353,532
(Concluded) December 31, 2014
Foreign
Currencies Exchange Rate Carrying Amount
Financial assets Monetary items
USD $ 962,334 31.6 (USD:NTD) $ 30,409,765 EUR 4,580 38.4003 (EUR:NTD) 175,873 CZK 14,214 1.3862 (CZK:NTD) 19,703 HKD 2,787 4.0748 (HKD:NTD) 11,357 JPY 30,231 0.2641 (JPY:NTD) 7,984
$ 30,624,682
(Continued)

255 256‧Lite-On Technology Corporation 2015 Annual Report Lite-On Technology Corporation 2015 Annual Report‧
- 71 -
Foreign
Currencies Exchange Rate Carrying Amount
Non-monetary items
Investments accounted for using equity method USD $ 1,794,963 31.6 (USD:NTD) $ 56,720,841 HKD 2,551,466 4.0748 (HKD:NTD) 10,396,714 THB 1,305,246 0.9593 (THB:NTD) 1,252,122 EUR 7,113 38.4003 (EUR:NTD) 273,141 JPY 1,279,443 0.2641 (JPY:NTD) 337,901
$ 68,980,719 Financial liabilities Monetary items
USD 978,312 31.6 (USD:NTD) $ 30,914,646 EUR 2,318 38.4003 (EUR:NTD) 89,012 HKD 3,792 4.0748 (HKD:NTD) 15,452 CZK 10,562 1.3862 (CZK:NTD) 14,641 JPY 29,990 0.2641 (JPY:NTD) 7,920
$ 31,041,671 Non-monetary items
Investments accounted for using equity method
HKD 127,170 4.0748 (HKD:NTD) $ 518,191 USD 2,070 31.6 (USD:NTD) 65,643
$ 583,834
(Concluded) For the years ended December 31, 2015 and 2014 net foreign exchange gains (loss) were $(27,501) thousand and $8,435 thousand. It is impractical to disclose net foreign exchange gains or losses by each significant foreign currency due to the variety of the foreign currency transactions of the group entities.
34. SEPARATELY DISCLOSED ITEMS
a. Information on significant transactions and information on investees:
1) Financing provided to others: None. 2) Endorsements/guarantees provided: Please see Table 1 attached. 3) Marketable securities held (excluding investment in subsidiaries, associates and joint ventures):
Please see Table 2 attached. 4) Marketable securities acquired and disposed at costs or prices at least NT$300 million or 20% of the
paid-in capital: Please see Table 3 attached. 5) Acquisition of individual real estate at costs of at least NT $300 million or 20% of the paid-in
capital: None.
- 72 -
6) Disposal of individual real estate at prices of at least NT$300 million or 20% of the paid-in capital:
None. 7) Total purchases from or sales to related parties amounting to at least NT$100 million or 20% of the
paid-in capital: Please see Table 4 attached. 8) Receivables from related parties amounting to at least NT$100 million or 20% of the paid-in
capital: Please see Table 5 attached. 9) Trading in derivative instruments: Note 7, Note 11 and Note 29 to the financial statements. 10) Information on investees: Please see Table 6 attached.
b. Information on investments in mainland China: 1) Information on any investee company in mainland China, showing the name, principal business
activities, paid-in capital, method of investment, inward and outward remittance of funds, ownership percentage, net income of investees, investment income or loss, carrying amount of the investment at the end of the period, repatriations of investment income, and limit on the amount of investment in the mainland China area. Please see Table 7 attached.
2) Significant direct or indirect transactions with the investee, prices, payment terms and unrealized
gain or loss: Note 30 to the financial statements.

257 258‧Lite-On Technology Corporation 2015 Annual Report Lite-On Technology Corporation 2015 Annual Report‧
- 73 -
TABLE 1 LITE-ON TECHNOLOGY CORPORATION ENDORSEMENT/GUARANTEE PROVIDED FOR THE YEAR ENDED DECEMBER 31, 2015 (Amounts in Thousands of New Taiwan Dollars)
No. Endorsement/ Guarantee Provider
Guaranteed Party Limits on
Endorsement/ Guarantee Amount Provided to Each Guaranteed Party
(Note 2)
Maximum Balance
for the Period Ending Balance Amount Actually
Drawn
Amount of Endorsement/
Guarantee Collateralized by Properties
Ratio of Accumulated Endorsement/
Guarantee to Net Equity Per Latest
Financial Statements
(%)
Maximum Endorsement/
Guarantee Amount Allowable (Note 2)
Guarantee Provided by
Parent Company
Guarantee Provided by A Subsidiary
Guarantee Provided to Subsidiaries In Mainland
China
Note Name Nature of
Relationship (Note 1)
0 Lite-On Technology Lite-On Technology (Europe) B.V. b $ 7,598,851 $ 140,006 $ 68,026 $ 68,026 $ - 0.09 $ 30,395,404 Yes No No Corporation Lite-On Mobile Pte. Ltd. (Note 3) b 7,598,851 10,064,000 7,866,000 6,555,000 - 10.35 30,395,404 Yes No No Silitek Elec. (Dongguan) Co., Ltd. c 7,598,851 2,490,900 2,490,900 1,311,000 - 3.28 30,395,404 Yes No Yes Guangzhou Lite-On Mobile
Electronic Components Co., Ltd. c 7,598,851 1,320,900 852,150 524,400 - 1.12 30,395,404 Yes No Yes
Note 1: Relationship between the Company and endorsee/guarantee are as follows:
a. Business relationship. b. A subsidiary in which the Company holds directly over 50% of equity interest. c. An investee in which the Company and its subsidiaries hold over 50% of equity interest.
Note 2: a. The aggregate amount of guarantees/endorsements by Lite-On Technology Corporation should not exceed 40% of its net worth, and the amount of guarantees/endorsements for any single entity should not exceed 10% of its net worth.
b. Limits on endorsement/guarantee amount provided to each guaranteed party and maximum endorsement/guarantee amount allowable were calculated on the basis of the net worth of the endorsement/guarantee provider, as shown in its most recent audited financial statements.
Note 3: The guarantee provided by the Company to Lite-On Mobile Pte. Ltd. is for the repayment of the latter’s syndicated loan obtained in December 2013.

259 260‧Lite-On Technology Corporation 2015 Annual Report Lite-On Technology Corporation 2015 Annual Report‧
- 74 -
TABLE 2 LITE-ON TECHNOLOGY CORPORATION MARKETABLE SECURITIES HELD DECEMBER 31, 2015 (In Thousands of New Taiwan Dollars)
Held Company Name Marketable Securities Type and Name Relationship with the Company Financial Statement Account
December 31, 2015
Note Units (In Thousands) Carrying Value
Percentage of
Ownership (%)
Fair Value
Lite-On Technology Corporation Common stock EPISTAR Corporation Member of the board of directors Available-for-sale financial assets -
non-current 5,908 $ 150,653 0.54 $ 150,653
Wistron Corporation - 〃 4,981 92,648 0.19 92,648 CO-TECH Development Corp. Chairman of the board is the same person 〃 1,530 14,535 0.73 14,535 Com2B Corp. - 〃 5,000 19,009 11.11 19,009 Avamax Corp. - 〃 559 - 6.99 - Note Aetas Technology, Inc. Member of the board of directors 〃 4,026 - 8.07 - Note AuriaSolar Co., Ltd. - 〃 41,400 - 19.71 - Note Z-Com, Inc. - 〃 3,245 28,490 4.10 28,490 Fong Han Electronics Co., Ltd. - 〃 1,167 - 6.67 - Note Xepex Electronics Co., Ltd. - 〃 - - - - Note AOPEN, Inc. - 〃 100 903 0.08 903 Oplink Communications, Inc. - 〃 12 9,262 0.07 9,262 North America Micro-Electronic & Software,
Incorporated - 〃 5 1,154 2.67 1,154
Action Media Technologies, Inc. - 〃 38 - - - Note Taiwan Changxing Technology Co., Ltd. - 〃 462 4,620 15.40 4,620 Preferred stock Arkologic Holdings Limited - 〃 11,111 - 7.66 - Note PI-CORAL - 〃 1,139 - 10.65 - Note Convertible bond Xepex Electronics Co., Ltd. - Debt investments with no active market -
non-current 150 - - - Note
Note: The carrying value of financial instruments were all assessed for impairment.

261 262‧Lite-On Technology Corporation 2015 Annual Report Lite-On Technology Corporation 2015 Annual Report‧
- 75 -
TABLE 3 LITE-ON TECHNOLOGY CORPORATION MARKETABLE SECURITIES ACQUIRED AND DISPOSED OF AT COSTS OR PRICES OF AT LEAST NT$300 MILLION OR 20% OF THE PAID-IN CAPITAL FOR THE YEAR ENDED DECEMBER 31, 2015 (Amounts in Thousands of New Taiwan Dollars)
Company Name Marketable Securities Type and Name Financial Statement Account Counterparty Nature of Relationship
Beginning Balance Acquisition Disposal Ending Balance Shares/Units
(In Thousands)
Amount Shares/Units
(In Thousands)
Amount Shares/Units
(In Thousands)
Amount Carrying Amount
Gain (Loss) on Disposal
Shares/Units (In
Thousands) Amount
Lite-On Technology
Corporation Lite-On International Holding Co., Ltd. Investment accounted for using
equity method - Subsidiary 285,825 $ 23,434,167 50,000 $ 2,239,074
(Note) - $ - $ 566,837
(Note) $ - $ 335,825 $ 25,106,404
Note: The acquisition amount of $1,555,000 thousand was the capital injected in the investee during the period; the $684,074 thousand is from the gain accounted for using equity method; the $248,776 thousand is from the other comprehensive loss for using equity method and the $318,061 thousand
in the disposal is from the changes in equities for using equity method.

263 264‧Lite-On Technology Corporation 2015 Annual Report Lite-On Technology Corporation 2015 Annual Report‧
- 76 -
TABLE 4 LITE-ON TECHNOLOGY CORPORATION TOTAL PURCHASES FROM OR SALES TO RELATED PARTIES OF AT AMOUNTING TO AT LEAST NT$100 MILLION OR 20% OF THE PAID-IN CAPITAL FOR THE YEAR ENDED DECEMBER 31, 2015 (Amounts in Thousands of New Taiwan Dollars)
Company Name Related Party Nature of Relationship
Transaction Details Abnormal Transaction Notes/Accounts (Payable) or Receivable Note Purchase/
Sale Amount % to Total Payment Terms Unit Price Payment Terms Ending Balance % to
Total Lite-On Technology Corporation Lite-On Trading USA, Inc. Note 2 Sale $ (3,295,462) (3) About 90 days Cost-plus pricing No significant difference $ 1,082,305 3 Lite-On Japan Ltd. Note 1 Sale (861,796) (1) About 90 days Cost-plus pricing No significant difference 164,723 1 Philip & Lite-On Digital Solutions Corp. Note 1 Sale (12,810,242) (10) About 90 days Cost-plus pricing No significant difference 4,214,601 13 Lite-On Singapore Pte. Ltd. Note 1 Sale (4,697,862) (4) About 90 days Cost-plus pricing No significant difference 899,640 3 China Bridge Express (Wuxi) Co., Ltd. Note 2 Sale (826,743) (1) About 90 days Cost-plus pricing No significant difference 304,660 1 Lite-On Technology (Changzhou) Co., Ltd. Note 2 Sale (1,163,932) (1) About 90 days Cost-plus pricing No significant difference 479,631 1 Lite-On Sales & Distribution Inc. Note 2 Sale (128,049) - About 90 days Cost-plus pricing No significant difference 129,288 - Lite-On China Holding Co., Ltd. Note 2 Sale (141,230) - About 90 days Cost-plus pricing No significant difference 142,250 - Lite-On Technology (Changzhou) Co., Ltd. Note 2 Purchase 1,519,674 1 About 90 days Cost-plus pricing No significant difference (521,929) (2) LET (HK) Ltd. Note 1 Purchase 10,040,910 9 About 90 days Cost-plus pricing No significant difference (853,098) (3) Lite-On Singapore Pte. Ltd. Note 1 Purchase 24,766,587 22 About 90 days Cost-plus pricing No significant difference (8,193,189) (30) Li Shin International Enterprise Corp. Note 1 Purchase 3,531,460 3 About 90 days Cost-plus pricing No significant difference (829,029) (3) Lite-On Overseas Trading Co., Ltd. Note 1 Purchase 57,023,431 51 About 90 days Cost-plus pricing No significant difference (8,115,555) (30) Lite-On Automotive Electronics (Guangzhou) Co., Ltd. Note 2 Purchase 735,033 1 About 90 days Cost-plus pricing No significant difference (264,241) (1) Note 1: Equity-method investee. Note 2: Investee of the equity-method investee.

265 266‧Lite-On Technology Corporation 2015 Annual Report Lite-On Technology Corporation 2015 Annual Report‧
- 77 -
TABLE 5 LITE-ON TECHNOLOGY CORPORATION RECEIVABLES FROM RELATED PARTIES AMOUNTING TO AT LEAST NT$100 MILLION OR 20% OF THE PAID-IN CAPITAL DECEMBER 31, 2015 (Amounts in Thousands of New Taiwan Dollars)
Company Name Related Party Nature of Relationship
Ending Balance of Notes
Receivable-inter
Ending Balance of Trade
Receivables-inter
Ending Balance of Other
Receivables-inter
Turnover Rate
Overdue Amounts Received in Subsequent
Period
Allowance for Bad Debts Amount Action Taken
Lite-On Technology Corporation Philip & Lite-On Digital Solutions Corp. Note 1 $ - $ 4,214,601 $ 229,265 3.68 $ - - $ 1,887,965 $ - Lite-On Technology (Changzhou) Co., Ltd. Note 2 - 479,631 - 2.51 - - 953 - China Bridge Express (Wuxi) Co., Ltd. Note 2 - 304,660 - 2.19 - - 136,707 - Titanic Capital Services Ltd. Note 2 - - 132,038 - - - - - Lite-On Singapore Pte. Ltd. Note 1 - 899,640 166,969 4.34 34 - 127,044 - Lite-On Japan Ltd. Note 1 - 164,723 7,847 2.79 549 - 12,238 - Lite-On Trading USA, Inc. Note 2 - 1,082,305 - 3.34 - - 486,743 - Lite-On Sales & Distribution Inc. Note 2 - 129,288 3,707 1.98 - - - - Philips & Lite-On Digital Solutions USA Inc. Note 2 - - 100,098 2.15 - - - - Lite-On Overseas Trading Co., Ltd. Note 1 - 3,575,995 2,077 0.01 - - 1,458,232 - Lite-On China Holding Co., Ltd. Note 2 - 142,250 - 0.94 - - 142,250 - Note 1: Equity-method investee. Note 2: Investee of the equity-method investee.

267 268‧Lite-On Technology Corporation 2015 Annual Report Lite-On Technology Corporation 2015 Annual Report‧
- 78 -
TABLE 6 LITE-ON TECHNOLOGY CORPORATION NAMES, LOCATIONS, AND RELATED INFORMATION OF INVESTEES OVER WHICH THE COMPANY EXERCISES SIGNIFICANT INFLUENCE FOR THE YEAR ENDED DECEMBER 31, 2015 (Amounts in Thousands of New Taiwan Dollars or Thousands of Foreign Currencies)
Investor Company Investee Company Location Main Businesses and Products
Original Investment Amount Balance as of December 31, 2015 Net Income (Loss) of the
Investee
Share of Profits/Loss of
Investee Note December 31,
2015 December 31,
2014 Shares
(In Thousands)
Percentage of
Ownership (%)
Carrying Value
Lite-On Technology Corporation Silitech Technology Corp. New Taipei City, Taiwan Manufacture and sale of modules and plastic products $ 324,685 $ 324,685 60,757 33.87 $ 1,487,387 $ 145,977 $ 48,123 Subsidiary Lite-On Integrated Service Inc. Taipei City, Taiwan Information outsourcing and system integrate 25,886 25,886 3,400 100.00 46,323 6,156 6,156 Subsidiary Dragonjet Corporation New Taipei City, Taiwan Manufacture and sale of computer peripherals,
printers, digital cameras, modules and plastic products
1,069,080 1,069,080 26,727 29.62 1,047,765 27,222 7,190 Associate
Logah Technology Corp. Kaohsiung City, Taiwan Development, manufacture and sale of LCD TV inverters
402,787 402,787 31,683 28.10 245,119 (211,123) (58,772) Associate
Lite-On Capital Corp. Taipei City, Taiwan Investment activities 4,096,367 4,096,367 209,545 100.00 1,598,494 119,625 90,142 Subsidiary Lite-On Electronics H.K. Ltd. Hong Kong Sale of LED optical products 7,339,481 7,339,481 17,865 100.00 11,231,033 HK$ 263,289 1,083,435 Subsidiary Lite-On Electronics (Thailand) Co., Ltd. Thailand Manufacture and sale of LED optical products 529,106 529,106 5,030 100.00 1,304,188 THB 127,107 117,040 Subsidiary Lite-On Japan Ltd. Japan Sale of LED optical products and power supplies 248,305 253,111 6,162 49.49 358,234 JPY 136,647 17,732 Subsidiary Lite-On International Holding Co., Ltd. British Virgin Islands Investment activities US$ 335,825 US$ 285,825 335,825 100.00 25,106,404 US$ 19,424 684,074 Subsidiary LTC Group Ltd. British Virgin Islands Investment activities $ 1,380,308 $ 1,380,308 41,916 100.00 592,312 US$ 7,000 204,426 Subsidiary Lite-On Technology USA, Inc. USA Investment activities US$ 55,172 US$ 50,407 436 100.00 2,359,141 US$ 3,972 47,345 Subsidiary Lite-On Electronics (Europe) Ltd. United Kingdom Manufacture and sale of power supplies $ 44,559 $ 44,559 300 100.00 53,011 GBP 118 5,670 Subsidiary Lite-On Technology (Europe) B.V. Netherlands Market research and after-sales service 2,543,184 2,543,184 331 54.00 311,079 EUR 3,796 71,041 Subsidiary Lite-On Overseas Trading Co., Ltd. British Virgin Islands Merchandising business 168,947 168,947 5,143 100.00 242,239 US$ (1,509) (51,924) Subsidiary Lite-On Singapore Pte. Ltd. Singapore Manufacture and supply computer peripheral products US$ 63,788 US$ 63,788 51,777 100.00 15,338,196 US$ 108,286 3,652,054 Subsidiary Lite-On Vietnam Co., Ltd. Vietnam Electronic contract manufacturing US$ 3,000 US$ 3,000 - 100.00 70,420 US$ (246) (7,975) Subsidiary Lite-On Mobile Pte. Ltd. Singapore Manufacture and sale of mobile phone modules and
design for assembly line EUR 250,329 EUR 250,329 178,178 100.00 8,790,237 US$ (36,450) (1,118,948) Subsidiary
Li Shin International Enterprise Corp. British Virgin Islands Manufacture and sale of computer and appliance components
$ 56,929 $ 56,929 1,748 100.00 (67,845) US$ 7 232 Subsidiary (Note 4)
Eagle Rock Investment Ltd. British Virgin Islands Import and export business and investment activities 341 341 10 100.00 1,410,738 US$ (11,442) (373,069) Subsidiary Lite-On Semiconductor Corp. New Taipei City, Taiwan Manufacture of image sensor and rectifier 773,618 773,618 57,204 18.52 1,544,501 $ 476,872 90,538 Associate Canfield Ltd. Apia, Samoa Import and export business and investment activities 7,142 7,142 200 33.33 4,713 US$ 5 26 Associate High Yield Group Co., Ltd. British Virgin Islands Holding company 2,271,806 2,271,806 68,138 100.00 5,305,483 US$ 16,622 113,434 Subsidiary Lite-On Information Technology B.V. Netherlands Market research and customer service 1,597,319 1,597,319 11,018 100.00 18,056 EUR (15) (812) Subsidiary Philip & Lite-On Digital Solutions Corp. Taipei City, Taiwan Sale of optical disc drives 267,113 267,113 17,150 49.00 337,073 $ 51,483 25,227 Subsidiary Lite-On IT Singapore Pte. Ltd. Singapore Sale of optical disc drives - 2,872 - - - - - Subsidiary
(Note 1) Lite-Space Technology Company Limited Hong Kong Sale of computer components 149,968 149,968 5,100 39.23 41,036 US$ 3,483 42,924 Associate LET (HK) Ltd. Hong Kong Sale of optical disc drives 42 42 10 100.00 (285,689) HK$ 3,769 131,347 Subsidiary
(Note 4) Leotek Electronics Holding Limited Hong Kong Holding company US$ 1,010 US$ 1,010 25,000 100.00 9,668 HK$ (2,471) (9,913) Subsidiary Lite-On Automotive Electronics (Europe)
B.V. Netherlands Sale of automotive parts and other electronic products EUR 1,090 EUR 1,090 24 100.00 43,143 EUR (2) (86) Subsidiary
Lite-On Automotive North America Inc. USA Sale of automotive parts and other electronic products US$ - US$ 600 - - - US$ (6) (195) Subsidiary (Note 2)
Lite-On Automotive Service USA Inc. USA Sale of automotive parts and other electronic products US$ 60 US$ 60 1 100.00 12,908 US$ (16) (533) Subsidiary Lite-On Automotive International (Cayman)
Co., Ltd. Cayman Investment activities US$ 100,626 US$ 100,626 11,967 100.00 1,897,276 US$ 8,222 274,316 Subsidiary
Lar View Technologies Corp. (Samoa) Samoa Investment activities US$ - US$ 200 - - - US$ (1) (46) Subsidiary (Note 3)
Lite-On Automotive Electronics Mexico, S.A. DE C.V.
Mexico Production, manufacture, sale, import and export of photovoltaic device, key electronic components, telecommunications equipment, information technology equipment, semiconductor applications, general lighting, automotive electronics, renewable energy products and services and maintenance of automotive system
US$ 4,950 US$ - - 99.00 (59,097) MXN (22,049) (42,481) Subsidiary (Note 4)
(Continued)

269 270‧Lite-On Technology Corporation 2015 Annual Report Lite-On Technology Corporation 2015 Annual Report‧
- 79 -
Note 1: Lite-On IT Singapore Pte. Ltd. was dissolved after merging with Lite-On Singapore Pte. in January 2015. Note 2: Lite-On Automotive North America Inc. was dissolved after liquidation in May 2015. Note 3: Lar View Technologies Corp. (Samoa) was dissolved after liquidation in November 2015. Note 4: Credit balance of Long-Term Equity Investment under the equity method has been transferred to the credit balance of Other Liabilities – Investment Using the Equity Method for Li Shin International Enterprise Corp., LET (HK) Ltd. and Lite-On Automotive Electronics Mexico, S.A. DE
C.V. Note 5: Please refer to Table 7 for information on investment in Mainland China.
(Concluded)

271 272‧Lite-On Technology Corporation 2015 Annual Report Lite-On Technology Corporation 2015 Annual Report‧
- 80 -
TABLE 7 LITE-ON TECHNOLOGY CORPORATION INFORMATION ON INVESTMENT IN MAINLAND CHINA FOR THE YEAR ENDED DECEMBER 31, 2015 (Amounts in Thousands of New Taiwan Dollars or Thousands of Foreign Currencies)
Investor Company Investee Company Main Businesses and Products Total Amount of Paid-in Capital
(Note 2)
Method of Investment
Accumulated Outflow of
Investment from Taiwan as of
January 1, 2015
Investment of Flows Accumulated Outflow of
Investment from Taiwan as of
December 31, 2015
Net Income (Loss) of the Investee
Company (Note 2)
Percentage of
Ownership
Share of Profits/Loss
(Note 2)
Carrying Amount as of
December 31, 2015 (Note 2)
Accumulated Inward
Remittance of Earnings as of
December 31, 2015
Note Outflow Inflow
Lite-On Technology
Corporation Lite-On Computer Tech (Dongguan) Co.,
Ltd. Manufacture and sale of display device $ 537,510
(US$ 16,400 ) Note 1 $ 933,071
(US$ 28,469 ) $ - $ - $ 933,071
(US$ 28,469 ) $ (14,656 ) (CNY -2,898 )
100.00 $ (14,656 ) (CNY -2,898 )
$ 495,741 (HK$ 117,227 )
$ -
DongGuan G-Pro Computer Co., Ltd. Manufacture and sale of system products 747,303 (US$ 22,801 )
Note 1 747,303 (US$ 22,801 )
- - 747,303 (US$ 22,801 )
200,336 (CNY 39,614 )
100.00 200,336 (CNY 39,614 )
892,903 (HK$ 211,143 )
-
Lite-On Electronics (Tianjinn) Co., Ltd. ODM services 2,179,538 (US$ 66,500 )
Note 1 2,179,472 (US$ 66,498 )
- - 2,179,472 (US$ 66,498 )
213,459 (CNY 42,209 )
100.00 213,459 (CNY 42,209 )
2,981,831 (HK$ 705,108 )
-
Lite-On Electronics (Dongguan) Co., Ltd. Manufacture of electronic components 1,160,235 (US$ 35,400 )
Note 1 1,160,235 (US$ 35,400 )
- - 1,160,235 (US$ 35,400 )
80,212 (CNY 15,861 )
100.00 80,212 (CNY 15,861 )
1,236,129 (HK$ 292,305 )
-
Silitek Elec. (Dongguan) Co., Ltd. Manufacture and sale of keyboards 157,320 (US$ 4,800 )
Note 1 157,320 (US$ 4,800 )
- - 157,320 (US$ 4,800 )
186,080 (CNY 36,795 )
100.00 186,080 (CNY 36,795 )
1,482,132 (HK$ 350,477 )
-
Lite-On Electronics (Guangzhou) Co., Ltd. Manufacture and sale of printers and scanners
1,199,565 (US$ 36,600 )
Note 1 1,199,565 (US$ 36,600 )
- - 1,199,565 (US$ 36,600 )
629,353 (CNY 124,447 )
100.00 629,353 (CNY 124,447 )
14,396,711 (HK$ 3,404,363 )
-
Note 3
China Bridge (China) Co., Ltd. Investment, sales agent 974,892 (US$ 29,745 )
Note 1 974,892 (US$ 29,745 )
- - 974,892 (US$ 29,745 )
(80,617 ) (CNY -15,941 )
100.00 (80,617 ) (CNY -15,941 )
1,375,725 (HK$ 325,315 )
-
Lite-On Network Communication (Dongguan) Limited
Manufacture and sale of IT products 464,422 (US$ 14,170 )
Note 1 464,422 (US$ 14,170 )
- - 464,422 (US$ 14,170 )
240,333 (CNY 47,523 )
100.00 240,333 (CNY 47,523 )
1,208,209 (HK$ 285,703 )
-
Lite-On Communications (Guangzhou) Co., Ltd.
Manufacture and sale of mobile terminal equipment
804,954 (US$ 24,560 )
Note 1 804,954 (US$ 24,560 )
- - 804,954 (US$ 24,560 )
- 100.00 - - -
Note 3
Dong Guan G-Tech Computers Co., Ltd. Manufacture and sale of computer case 376,913 (US$ 11,500 )
Note 1 376,913 (US$ 11,500 )
- - 376,913 (US$ 11,500 )
86,402 (CNY 17,085 )
100.00 86,402 (CNY 17,085 )
744,379 (HK$ 176,022 )
-
Lite-On Tech (Guangzhou) Co., Ltd. Manufacture and sale of computer case 1,088,130 (US$ 33,200 )
Note 1 1,088,130 (US$ 33,200 )
- - 1,088,130 (US$ 33,200 )
- 100.00 - - - Note 3
COMMIT Incorporated Manufacture and sale of application software and multimedia product design
1,051,619 (US$ 32,086 )
Note 1 19,665 (US$ 600 )
- - 19,665 (US$ 600 )
- 1.87 - - -
Lite-On Elec and Wire (Guangzhou) Co., Ltd.
Manufacture and sale of mobile terminal equipment
518,173 (US$ 15,810 )
Note 1 518,173 (US$ 15,810 )
- - 518,173 (US$ 15,810 )
- 100.00 - - - Note 3
Lite-On (Guangzhou) Infortech Co., Ltd. Information outsourcing 41,624 (US$ 1,270 )
Note 1 76,825 (US$ 2,344 )
- - 76,825 (US$ 2,344 )
7,131 (CNY 1,410 )
100.00 7,131 (CNY 1,410 )
178,967 (HK$ 42,320 )
-
Lite-On (Guangzhou) Precision Tooling Co., Ltd.
Manufacture and sale of modules 596,505 (US$ 18,200 )
Note 1 399,855 (US$ 12,200 )
- - 399,855 (US$ 12,200 )
- 100.00 - - - Note 3
Lite-On Digital Electronics (Dongguan) Co., Ltd.
Manufacture and sale of computer peripheral products
98,325 (US$ 3,000 )
Note 1 98,325 (US$ 3,000 )
- - 98,325 (US$ 3,000 )
4,516 (CNY 893 )
100.00 4,516 (CNY 893 )
95,704 (HK$ 22,631 )
-
Lite-On Power Technology (Chang Zhou) Co., Ltd.
Manufacture and sale of electronic components and peripheral materials
551,276 (US$ 16,820 )
Note 1 589,426 (US$ 17,984 )
- - 589,426 (US$ 17,984 )
24,391 (CNY 4,823 )
100.00 24,391 (CNY 4,823 )
- -
Lite-On Li Shin Technology (Ganzhou) Co., Ltd.
Manufacture and sale of electronic components
393,300 (US$ 12,000 )
Note 1 437,087 (US$ 13,336 )
- - 437,087 (US$ 13,336 )
15,455 (CNY 3,056 )
100.00 15,455 (CNY 3,056 )
367,445 (HK$ 86,889 )
-
Lite-On Technology (Xianging) Co., Ltd. Manufacture and sale of electronic components
213,038 (US$ 6,500 )
Note 1 213,038 (US$ 6,500 )
- - 213,038 (US$ 6,500 )
(41,201 ) (CNY -8,147 )
100.00 (41,201 ) (CNY -8,147 )
140,998 (US$ 4,302 )
-
Lite-On Technology (Jiangsu) Co., Ltd. Development, manufacture, sale and installation of power supplies and transformers and provision of technology consulting services, maintenance equipment and precision instruments
4,949,025 (US$ 151,000 )
Note 1 4,785,150 (US$ 146,000 )
163,875 (US$ 5,000 )
- 4,949,025 (US$ 151,000 )
317,754 (CNY 62,832 )
100.00 317,754 (CNY 62,832 )
8,020,151 (HK$ 1,896,510 )
-
Lite-On Technology (Guangzhou) Investment Co., Ltd.
Investment activities 983,250 (US$ 30,000 )
Note 1 983,250 (US$ 30,000 )
1,638,750 (US$ 50,000 )
- 2,622,000 (US$ 80,000 )
(92,122 ) (CNY -18,216 )
100.00 (92,122 ) (CNY -18,216 )
2,561,931 (HK$ 605,815 )
-
Lite-On Technology (Ying Tan) Co., Ltd. Manufacture and sale of new-type electronic components
360,525 (US$ 11,000 )
Note 1 360,525 (US$ 11,000 )
- - 360,525 (US$ 11,000 )
22,231 (CNY 4,396 )
100.00 22,231 (CNY 4,396 )
444,265 (US$ 13,555 )
-
Lite-On Power Technology (Dongguan) Co., Ltd.
Development, manufacture and sale of electronic components, power supplies and provision technology consulting services
523,482 (US$ 15,972 )
Note 1 523,482 (US$ 15,972 )
- - 523,482 (US$ 15,972 )
(165,552 ) (CNY -32,736 )
100.00 (165,552 ) (CNY -32,736 )
836,163 (HK$ 197,726 )
-
(Continued)

273 274‧Lite-On Technology Corporation 2015 Annual Report Lite-On Technology Corporation 2015 Annual Report‧
- 81 -
Investor Company Investee Company Main Businesses and Products Total Amount of Paid-in Capital
(Note 2)
Method of Investment
Accumulated Outflow of
Investment from Taiwan as of
January 1, 2015
Investment of Flows Accumulated Outflow of
Investment from Taiwan as of
December 31, 2015
Net Income (Loss) of the Investee
Company (Note 2)
Percentage of
Ownership
Share of Profits/Loss
(Note 2)
Carrying Amount as of
December 31, 2015
Accumulated Inward
Remittance of Earnings as of
December 31, 2015
Note Outflow Inflow
Lite-On Technology
Corporation Beijing Lite-On Mobile Electronic and
Telecommunication Components Co., Ltd.
Manufacture and sale of mobile phone modules and design for assembly line
$ 524,400 (US$ 16,000 )
Note 1 $ 1,716,230 (US$ 52,364 )
$ - $ - $ 1,716,230 (US$ 52,364 )
$ (508,233 ) (CNY -100,497 )
100.00 $ (508,233 ) (CNY -100,497 )
$ 1,182,522 (US$ 36,080 )
$ -
Guangzhou Lite-On Mobile Engineering Plastics Co., Ltd.
Manufacture and sale of mobile phone modules and design for assembly line
641,407 (US$ 19,570 )
Note 1 2,970,300 (US$ 90,627 )
- - 2,970,300 (US$ 90,627 )
74,270 (CNY 14,686 )
100.00 74,270 (CNY 14,686 )
1,911,897 (US$ 58,334 )
-
Guangzhou Lite-On Mobile Electronic Components Co., Ltd.
Manufacture and sale of mobile phone modules and design for assembly line
1,314,278 (US$ 40,100 )
Note 1 3,780,662 (US$ 115,352 )
- - 3,780,662 (US$ 115,352 )
78,179 (CNY 15,459 )
100.00 78,179 (CNY 15,459 )
4,387,009 (US$ 133,852 )
-
Shenzhen Lite-On Mobile Precision Molds Co., Ltd.
Manufacture and sale of mobile phone modules and design for assembly line
270,650 (HK$ 64,000 )
Note 1 427,746 (US$ 13,051 )
- - 427,746 (US$ 13,051 )
(5,770 ) (CNY -1,141 )
100.00 (5,770 ) (CNY -1,141 )
489,331 (US$ 14,930 )
-
Zhuhai Lite-On Mobile Technology Company Ltd.
Manufacture and sale of mobile phone modules and design for assembly line
609,681 (US$ 18,602 )
Note 1 508,963 (US$ 15,529 )
- - 508,963 (US$ 15,529 )
(144,955 ) (CNY -28,663 )
100.00 (144,955 ) (CNY -28,663 )
1,723,156 (CNY 340,551 )
- Note 4
Lite-On Young Fast (Huizhou) Co., Ltd. Modules of touch panels 327,750 (US$ 10,000 )
Note 1 213,038 (US$ 6,500 )
- - 213,038 (US$ 6,500 )
30,262 (CNY 5,984 )
100.00 30,262 (CNY 5,984 )
(18,911 ) (US$ -577 )
-
Lite-on Green Technologies (Nanjing) Corporation
Solar energy engineering 24,581 (US$ 750 )
Note 1 24,581 (US$ 750 )
- - 24,581 (US$ 750 )
(18,843 ) (CNY -3,726 )
100.00 (18,843 ) (CNY -3,726 )
(65,124 ) (US$ -1,987 )
-
Changzhou Binhu Thin Film Solar Greenhouse Co., Ltd.
Manufacture and sale of solar energy equipment
303,377 (CNY 59,950 )
Note 1 98,227 (US$ 2,997 )
- - 98,227 (US$ 2,997 )
- 19.90 - 4,589 (US$ 140 )
-
Epricrystal (Changzhou) Co., Ltd. Manufacture, design and sale of light-emitting diode products
4,588,500 (US$ 140,000 )
Note 1 884,925 (US$ 27,000 )
- - 884,925 (US$ 27,000 )
184,042 (CNY 36,392 )
22.40 41,231 (CNY 8,153 )
957,158 (CNY 189,143 )
-
Dongguan Lite-On Computer Co., Ltd. Manufacture and sale of computer hosts and components
65,550 (US$ 2,000 )
Note 1 65,550 (US$ 2,000 )
- - 65,550 (US$ 2,000 )
57,738 (CNY 11,417 )
100.00 57,738 (CNY 11,417 )
106,589 (CNY 21,063 )
-
Huizhou Li Shin Electronic Co., Ltd. Manufacture of computer peripheral products
206,728 (US$ 6,308 )
Note 1 133,361 (US$ 4,069 )
- - 133,361 (US$ 4,069 )
36,194 (CNY 7,157 )
100.00 36,194 (CNY 7,157 )
629,411 (US$ 19,204 )
-
Huizhou Fu Tai Electronic Co., Ltd. Manufacture of computer peripheral products
31,748 (US$ 969 )
Note 1 2,130 (US$ 65 )
- - 2,130 (US$ 65 )
3,677 (CNY 727 )
100.00 3,677 (CNY 727 )
67,320 (US$ 2,054 )
-
Li Shin Technology (Huizhou) Ltd. Manufacture and sale of electronic components and peripheral materials
196,650 (US$ 6,000 )
Note 1 - - - - 5,871 (CNY 1,161 )
100.00 5,871 (CNY 1,161 )
451,934 (US$ 13,789 )
-
Lite-On Opto Technology (Guangzhou) Co., Ltd.
Manufacture and sale of optical disc drives
1,409,325 (US$ 43,000 )
Note 1 1,409,325 (US$ 43,000 )
- - 1,409,325 (US$ 43,000 )
(118,723 ) (CNY -23,476 )
100.00 (118,723 ) (CNY -23,476 )
2,722,980 (US$ 83,081 )
-
Lite-On Auto Electric Technology (Guangzhou) Ltd.
Manufacture and sale of optical disc drives
65,550 (US$ 2,000 )
Note 1 65,550 (US$ 2,000 )
- - 65,550 (US$ 2,000 )
4,410 (CNY 872 )
100.00 4,410 (CNY 872 )
141,719 (US$ 4,324 )
-
Lite-On IT Opto Tech (BH) Co., Ltd. Manufacture and sale of optical disc drives
1,802,625 (US$ 55,000 )
Note 1 1,802,625 (US$ 55,000 )
- - 1,802,625 (US$ 55,000 )
636,241 (CNY 125,809 )
100.00 636,241 (CNY 125,809 )
4,003,565 (US$ 122,153 )
-
Lite-On Automotive (Wuxi) Co., Ltd. Manufacture, sale and processing of electronic products
163,875 (US$ 5,000 )
Note 1 163,875 (US$ 5,000 )
- - 163,875 (US$ 5,000 )
110,070 (CNY 21,765 )
100.00 110,070 (CNY 21,765 )
635,959 (HK$ 150,384 )
-
Lite-On Automotive Electronics (Guangzhou) Co., Ltd.
Manufacture, sale and processing of electronic products
203,205 (US$ 6,200 )
Note 1 192,389 (US$ 5,870 )
- - 192,389 (US$ 5,870 )
149,648 (CNY 29,591 )
100.00 149,648 (CNY 29,591 )
1,395,359 (HK$ 329,958 )
-
Changzhou Leotek New Energy Trade Limited
Wholesale, import and export and installation of street lights, signal lights, scenery lights and new-type electronic components
32,775 (US$ 1,000 )
Note 1 32,775 (US$ 1,000 )
- - 32,775 (US$ 1,000 )
(15,055 ) (CNY -2,977 )
100.00 (15,055 ) (CNY -2,977 )
14,458 (CNY 2,857 )
-
LarView Technologies Corp. (Shenzhen) Camera lens modules 6,555 (US$ 200 )
Note 1 6,555 (US$ 200 )
- 3,147 (US$ 96 )
3,408 (US$ 104 )
- 100.00 - - - Note 5
Lite-On Technology (Shanghai) Ltd. Manufacture and sale of energy saving equipment
2,130,375 (US$ 65,000 )
Note 1 - 2,130,375 (US$ 65,000 )
- 2,130,375 (US$ 65,000 )
177,852 (CNY 35,168 )
100.00 177,852 (CNY 35,168 )
2,307,753 (US$ 70,412 )
-
Accumulated Investment in Mainland China as of December 31, 2015 (Note 2)
Investment Amounts Authorized by Investment Commission, MOEA (Note 2) Upper Limit on Investment
$37,519,738 (US$1,144,767) $38,410,661 (US$1,171,950) Note 6
Note 1: Indirect investment in Mainland China through holding companies. Note 2: Amount was recognized based on the audited financial statements. Note 3: Lite-On Electronics (Guangzhou) Co., Ltd. merged with Lite-On Tech (Guangzhou) Co., Ltd., Lite-On (Guangzhou) Precision Tooling Co., Ltd., Lite-On Communications (Guangzhou) Co., Ltd. and Lite-On Elec and Wire (Guangzhou) Co., Ltd., with the Lite-On Electronics (Guangzhou) Co., Ltd. as the survivor entity.
Because the merging process was still under way as of December 31, 2015, the change in the amount of investment in Mainland China has not yet been registered with the Ministry of Economic Affairs. Note 4: Zhuhai Lite-On Mobile Technology Company Ltd. reorganized its structure on March 5, 2015; thus Lite-On Technology (Guangzhou) Investment Co., Ltd. wholly acquired Zhuhai Lite-On Mobile Technology Company Ltd. and injected its own funds CNY461,665 thousand in the same year in July. Note 5: LarView Technologies Corp. (Shenzhen) completed its liquidation in July 2015. Note 6: Under Order No. 09704604680 and Order No. 10420404350 issued by the Ministry of Economic Affairs, R.O.C. on August 29, 2008 and February 16, 2015, respectively, the Company acquired a certification-approved by the Industrial Development Bureau and valid from February 9, 2015 to February 8, 2018 - of its status as
operation headquarters in the ROC. Thus, the Company has no limitation on the amount of investing in Mainland China.
(Concluded)

Lite-On Technology Corporation
Chairman: Raymond Soong

www.liteon.com