annual report and - unga groupungagroup.com/wp-content/uploads/2014/10/uglannualreport2010.pdf ·...
TRANSCRIPT


1
ANNUAL REPORT ANDFINANCIAL STATEMENTS 2010
CONTENTS PAgES
Contents 1
Notice of Meeting 3
Directors’ Profile 4
Chairman’s Statement 6
Managing Director’s Report 8
Corporate Governance 10
Corporate Social Responsibility 12
Five Year Financial Review 14
Corporate Information 15
Report of the Directors 16
Statement of Directors’ Responsibilities 17
Independent Auditors’ Report 18
Consolidated Statement of Comprehensive Income 19
Consolidated Statement of Financial Position 20
Company Statement of Financial Position 21
Consolidated Statement of Changes in Equity 22
Company Statement of Changes in Equity 23
Consolidated Statement of Cash Flows 24
Notes to the Financial Statements 25
Form of Proxy 59

2

3
Notice of Meeting
NOTICE IS HEREBY GIVEN that the Eighty Third Annual General Meeting of the Company will be held at Laico Regency, Crystal Ballroom, Nairobi on Wednesday, 1 December 2010 at 10.30 a.m. for the following purposes:-
AgENDA
1. To read the notice convening the meeting.
2. To confirm the minutes of the Eighty Second Annual General Meeting held on 4 December 2009.
3. To receive the Chairman’s report.
4. To receive and adopt the Audited Financial Statements for the financial year ended 30 June 2010 together
with the reports of the Directors and the Auditors thereon.
5. To approve a first and final dividend of Kshs 0.50 per share for the year ended 30 June 2010 payable on or about Monday, 17 January 2011 to the shareholders on the Register of Members at the close of business
on Wednesday, 1 December 2010.
6. Election of Directors:-
i) Mr A McKittrick retires in accordance with Articles 88 and 89 of the Company’s Articles of Association
and, being eligible, offers himself for re-election.
ii) Mr V O Ojode retires in accordance with Articles 88 and 89 of the Company’s Articles of Association
and, being eligible, offers himself for re-election.
iii) Mr J K Kibet retires in accordance with Articles 88 and 89 of the Company’s Articles of Association
and, being eligible, offers himself for re-election.
7. To approve the Directors’ remuneration as shown in the Financial Statements for the year ended 30 June
2010.
8. To note that Messrs Deloitte & Touche continue in office as Auditors under the provisions of Section 159(2) of the Companies Act and to authorise the Directors to fix their remuneration for the ensuing financial year.
BY ORDER OF THE BOARD
J L g MAONgASECRETARY
18 October 2010
Notes: A member entitled to attend and vote is entitled to appoint a proxy to attend and vote in his stead and a 1. proxy need not be a member of the Company.In the case of a member being a limited Company, this form must be completed under its common seal 2. or under the hand of an officer or attorney duly authorised in writing.To be valid, a form of proxy, which is provided with this report, must be duly completed by the member 3. and must be lodged at the Company’s Offices, Ngano House, Commercial Street, Industrial Area, P O Box 30096, 00100-Nairobi, or posted in time to reach not later than 10.00 a.m. on 29 November 2010.Subject to the shareholders’ approval, the Register of Members will be closed from the close of business 4. on Wednesday, 1 December 2010 at 4.30 p.m for one day for the purpose of processing the dividend.

4
Directors’ Profiles
Richard Kemoli, MBE, FIoD - Chairman (75)
Appointed to the Board in January 1984. He holds a BSc (Econ) from University of Makerere, Kampala and is a fellow of the Institute of Directors (FIoD), UK. He had a long and successful
career with Commonwealth Development Corporation and has held directorships in several private and public sector institutions. He is a past Chairman of Housing Finance Company of Kenya Limited and Kenya Open Golf Limited. He is currently the Chairman of Lafarge Bamburi Cement Limited, a director in East Africa Breweries Limited, CMC Holdings Limited, Kakuzi Limited and several private companies.
Jeremiah G Kiereini EGH, EBS, SS – Non Exec (81)
Appointed to the Board in January 1984. He worked in the Kenya Civil Service for 30 years where he held various senior positions culminating in his appointment as Chief Secretary, Head of Civil
Service and Secretary to the Cabinet. He is the current Chairman of East African Breweries Limited and has directorships in many other companies including CMC Holdings Limited group of companies, CFC Stanbic Bank Limited, Heritage Insurance Company Limited and CFC Life Assurance Company Limited.
Andrew S Ndegwa - Non Exec (42)
Appointed to the Board in September 2001. He graduated from University of Oxford with a Bachelor of Arts (Hons) degree in Philosophy, Politics and Economics. He started his
career in the banking industry, firstly with Citibank Limited and then with Mercantile Banking Company Limited before moving to First Chartered Securities Limited where he is the Executive Director. He holds many other directorships among which are East African Breweries Limited and NIC Bank Limited.
Nicholas C Hutchinson - Exec (54)
Appointed to the Board in May 2003, having become the Group Managing Director of Unga Holdings Limited in September 2000. He holds a BSc (Hons) degree in Horticulture from the
University of London and has many years of business management experience working for Monsanto Company in East Africa, Europe, North America and South Asia.
Alan McKittrick - Non Exec (55)
Appointed to the Board in September 1998. An engineer by profession and Group Managing Director of NAS Holdings Limited for the past 15 years. He has other directorships and considerable
experience in Eastern and Southern Africa in the manufacturing and production sectors including the livestock industry. He was the Group’s Managing Director between September 1998 and May 2003.
Vitalis O Ojode - Non Exec (65)
Appointed to the Board in May 2003. He is a BCom (Hons) graduate from University of Nairobi; a Fellow of the Association of Chartered Certified Accountants (FCCA) and is a member of ICPAK.
He worked for UDV Kenya Limited for many years

5
Directors’ Profiles (continued)
where he held several directorships in the group both in Kenya and Tanzania. He was the Group’s Finance Director between November 2001 and May 2006. He is currently a consultant in Financial Management and is a Council Member of Strathmore University.
Jinaro K Kibet - Non Exec (47)
Appointed to the Board in February 2005. He holds an LLB degree from University of Nairobi; is an Advocate of the High Court of Kenya and a partner in the Law firm of Ochieng,
Onyango, Kibet and Ohaga- Advocates. He holds other directorships including Elmarak Holdings Limited and Sicham Aviation Limited.
Mrs Isabella Ochola-Wilson - Non Exec (61).
Appointed to the Board in June 2006. She has a BA degree in Business Administration from University of Dar-es-Salaam and an MBA (Marketing) from University of British Columbia, Canada. She
has many years of management experience working for Johnson and Johnson (K) Limited. She has a directorship in NIC Bank Limited among others. She is currently a Business Consultant, having retired from as a project Manager with DFID’s Business Partnership Programme in 2005.
John L g Maonga - Company Secretary (49)
Appointed Company Secretary in 2002. He holds a BA degree from University of Nairobi and is a Certified Public Secretary. He is a member of ICPSK and has over 23 years in Company Secretarial and Registration Services.

6
Chairman’s Statement
Unga Group Limited (UGL) marked its centenary among other events with pre-tax profits of Shs 335 million – 29% up on the previous year. This compares with Shs 260 million for the previous year.
This performance has been maintained in often difficult conditions and it indicates the robustness of the Group’s core business and company structure, the soundness of our policy and management, and the strength of our prospects and foresight.
The challenges in the past year included the global downturn which left no economy unscathed, and in particular factors such as an initial maize shortage, high wheat prices, and duty penalties imposed by local fiscal policy.
UGL was well prepared to handle these pressures, proving the wisdom of our planning and ongoing policy:
• Focusing on our traditional core business of milling and distribution of flour and animal nutrition products, while remaining open to expansion of product range and new markets.
• Ensuring our reputation for the highest quality of our products by maintaining standards, service performance and business integrity.
• Investing in the growth of the ability and productivity of our people, both individually and as a team.
• Constantly seeking ways to improve the efficiency and reach of the business, by modernising plant, increasing capacity, product and packaging innovation, widening our geographic spread, improving distribution leverage, and harnessing synergistic partnerships.
These clear and solid foundations, pursued with energy, vigour and skill by management and staff, are assuring added shareholder values and so that in 2010 we will pay dividends of Shs 0.50 per share, subject to shareholders’ approval at the annual general meeting on 1 December 2010. This is a landmark event as we last paid a dividend in 1998.
In addition to the direct business bottom line, the Board believes that shareholders, management, staff, customers and stakeholders also expect UGL to depict broader societal values – in the way it conducts its core business and beyond. To understand the Group’s position on this, I ask you to read our report on “Corporate Social Responsibility” elsewhere in this document. CSR is not a peripheral issue; it must be, and now is, a formal plank of policy.
We aim to grow this aspect of our performance, based on a creative formula directly linked to our people and our business. Teams of employees can use a large part of any income gains/cost savings they achieve to fund CSR projects of their choice. The Group’s CSR themes are youth literacy and the fight against the scourge of HIV/AIDS.
We believe this, together with our core business principles and plans, will serve well in the coming years. There will certainly be operational challenges and continued growth in market competition. But the market itself is growing rapidly and regionally, our core business lines are in areas of universal demand, and the economic environment is essentially vigorous.

7
Chairman’s Statement (continued)
The conversion of positive indicators into positive results does require consistent and supportive government policy. This year, our results were damaged by the sudden re-imposition of import duty on maize imports. Business needs to know exactly where the policy goalposts are, if it is to score for its shareholders, its staff and the national economy.
I take this opportunity to applaud the people of UGL for their efforts and performance in 2010, and believe they have the skills, the structure and the determination to take the Group to even greater heights in the years ahead.
We have completed 100 years. We now have 101 reasons to move forward with confidence.
Finally I take this opportunity to thank my colleagues on the Board for their unstinting support at Board meetings and their wise counsel that has enabled management to execute the policies we have laid down that have resulted in a satisfactory performance during the ended financial year.
Richard Kemoli MBE FIoDChairman

8
Managing Director’s Report
Industry and Performance
Unga Group Limited’s (UGL) 100th operating year was not spectacular in any single respect, but important progress was made in building the company’s strength and flexibility, to take maximum advantage of future opportunities.
The Group achieved growth in volumes across its portfolio, but a number of factors inhibited margins and, on balance, turnover remained flat. Pre tax profits were up from Shs 260 million in the previous year to Shs 335 million. The balance sheet strengthened and net current assets increased by 19% over prior year.
Route-to-market restructuring in the animal nutrition business was significantly advanced, by assigning many direct customers to a stronger network of regional distributors. There were start-up burdens in this process – terms of trade incentives
and deposits to cover credit risk – but the reduction in immediate gains will be more than off-set by long term benefits to margins and marketing weight.
Better penetration of our human nutrition portfolio in low income areas was immediately achieved by appointing small scale ‘hub’ dealers in relevant areas of Nairobi.
UGL’s quest for synergistic partnerships is by nature a gradual, incremental process. No specific agreements were entered during the year, but progress made in identifying potential partners is expected to realize benefits in 2011/2012.
There were some problems, ironically arising from especially positive conditions. The wheat milling division in Uganda, and the self-opening bags packaging operation achieved such good demand that their production systems were unable to keep up.
And in the maize sector, astute planning was undermined by an about-face in tax policy. Correctly anticipating a shortage of local maize, UGL procured substantial imported stocks, duty free, owing to drought conditions, and was thus able to assure supply, hold prices steady and still achieve good margins. However, a second major consignment to maintain this position was compromised by sudden, unheralded re-imposition of duty, which severely eroded margins in competition with an unexpectedly good local harvest.
Sector Performance
Human Foods
The wheat division achieved volume growth in both the Kenya and Uganda markets and, despite high grain prices, improved margins.
Good margins on the Familia® range of porridges cushioned the maize division from the effects of lower maize meal margins. Maize sales were boosted by a joint promotion (a Centenary project) with East African Breweries, who rewarded loyal Senator Keg consumers with packets of Jogoo®.
UGL took a stronger position in Nairobi’s low-income market by appointing hub distributors and ensuring compliance with recommended retail prices.
Animal Nutrition and health
Volume gains were achieved, but prevailing trade terms gave distributors the better margins. The transition to new route-to-market systems will help redress the balance, and in the longer term UGL should achieve greater benefit of both volume and margin growth.

9
Managing Director’s Report (continued)
Packaging
This section achieved modest volume growth, with strong demand for wheat flour products (indeed, some demand was unmet owing to capacity shortfalls) and UGL’s diverse customer base compensating for depressed volumes on maize-based products.
Human capital and people development
Training and development of UGL’s people remains central in all operations.
Employees are being given the opportunity for the second consecutive year to attend the annual Association of Manufacturing Excellence meeting in USA; 360-degree appraisal training has been extended to middle management (among many benefits this will encourage staff to take ownership of their careers); crucial quarterly audits have ensured that performance against our safety indices continues to improve.
The Group’s more proactive and in-built approach to Corporate Social Responsibility directly involves and builds UGL’s people as individuals and as teams.
Outlook
Prices of wheat and some raw materials in the feeds sector are likely to remain high. Continued favourable rains are likely to ensure ready availability of local maize grain at reasonable cost.
Capacity expansion is warranted in the increasingly successful human foods business in Uganda, and in the packaging division’s bleached bag production.Animal feed production facilities in Nairobi need to be modernized, in combination with the recent route-to-market restructuring, to meet growing competition.
Improved distribution leverage and an expanded product range are high priorities in the coming year. The Group is evaluating entry to the market for nutritionally enhanced porridges for low-income segments.
With stable and validated overall policies now in place, the Group is in a position to marshal year-on-year targets into longer-term projections. Accordingly, management has been tasked to co-ordinate and consolidate projects and performance benchmarks into a five-year Strategic Plan for 2011-2015.
Conclusion
Positive performance and progress was recorded in the past year. Planning measures have proved accurate and timely and, far from running out of breath, we are gaining momentum.
My personal thanks to the Board, management team and staff for their guidance and effort towards the current results, and their commitment to UGL’s blend of traditional values and innovative practices which provide strong foundations for UGL’s market leadership and future optimism.
Nick HutchinsonGroup Managing Director

10
The Unga Group complies fully and strictly with all requirements of a publicly listed company, including clarity of financial reporting and accountability to shareholders, and aims to set best practice standards in product and service quality and fair conduct towards its staff, suppliers and customers.
The Group recognises its responsibilities of good citizenship in the national and international communities, especially with regard to social welfare, environmental care, economic value and principles of integrity. Role of the Board
The Board holds the Group’s long-term vision, sets broad goals, plans and organisational policies to uphold it, and it offers guidance on strategic decisions and actions of management.
Composition of the Board
The Board consists of the Chairman, who has non-executive responsibilities, one executive and six non-executive directors. One third of the directors retire by rotation each year but are eligible for re-election. The directors’ profiles appear on pages 3 and 4 of this Annual Report.
Other Board Information
The roles of the Chairman and Chief Executive are clearly separated, to ensure true accountability of management to shareholders through the Board, in parallel with equally sure autonomy and authority of management in the day-to-day operation of the Group. Directors are kept fully informed of all company activities through both regular and special event reports.
Board Meetings
The Board has four scheduled meetings per year and stands ready for additional meetings on any specific or urgent matters. In the period under review, the Board met four times.
Board Committees
Under its mandate to establish appropriate committees for technical or other specialised issues, the Board currently operates an Audit Committee of Mr J Kiereini (Chairman), Mr J Kibet and Mr A Ndegwa, which met four times in the year under review. It has since been expanded to cover risk and will be renamed “Board Audit and Risk Committee”. In addition there is a Nominating and Remuneration Committee of Mr J Kibet (Chairman), Mr R Kemoli, Mr J Kiereini and Mr A Ndegwa, which did not meet during the year.
Communication
The Board receives management reports in advance of all scheduled meetings and as necessary at other times. The Board issues an Annual Report and Financial Statements to all shareholders and other interested parties, and keeps the public advised through half-yearly and annual press notices of results and any significant developments. Shareholders have direct access to the company in line with conventional business practices.
Directors benefits and loans In the year under review, Directors have received no benefits other than fees and no loans to directors have been advanced.
Corporate governance

11
Corporate Governance (continued)
Directors’ InterestThe interest of the Directors in the shares of the company as at 30 June 2010, were as follows:
Name No. of shares
Alan McKittrick 13,472
Distribution of shareholders
(a) By number of shares range
Shareholding(No of shares) No. of shareholders
Less than 1,000 4,7391,001-5,000 2,3565,001-10,000 60310,001-100,000 510100,001-1,000,000 411,000,001 and above 4
Total 8,253 (b) By category of shareholders
Category No. of shareholders No. of shares % shareholding
Local individuals 7,363 29,174,151 38.54Local institutions 498 44,348,656 58.58East African individuals 79 222,236 0.29East African institutions 21 76,820 0.10Foreign investors 292 1,885,123 2.49
Total 8,253 75,706,986 100.00
Major shareholders
The top ten shareholders as at 30 June 2010 were as follows:
Name No.of shares % shareholding
1.Victus Limited 38,557,190 50.932. Moses Thara 3,808,117 5.033. Alimohamed Adam 1,047,342 1.384. Kingsway Nominees Limited 1,043,254 1.385. Savitaben Velji Raichand Shah 745,677 0.986. Lawrence Gatitu Mbugua 603,475 0.807. Shah D Premchand & Premchand D F Shah 497,356 0.668. Mohamed A Alimohamed Adam 392,877 0.529. Paul Wanderi Ndungu 341,280 0.4510. Stanbic Nominees Kenya Ltd. A/c R 48701 325,704 0.43
R Kemoli N HutchinsonDirector Director
29 September 2010 29 September 2010

12
Corporate Social Responsibility
LAND MAWE ESTATE: clean up around 500 houses and planting trees. 3,000 residents benefit. A UGL team supported Land Mawe Frontline 2000 self-help youth group with equipment, led initial clean up of 15 tonnes of garbage, and established a regular clean-up service which is now a source of ongoing funding for the self-help initiative.
Unga Group Limited (UGL) has always been “a good corporate citizen”. Throughout its hundred years it has honoured its responsibilities to staff welfare, to customer care, to good environmental practices and in values to the national economy. It has maintained ethical business and product standards and, in addition, has given in cash and kind to charitable causes.
But the more recent concept of Corporate Social Responsibility (CSR) demands more than that. True CSR means more than running a decent company and using the corporate chequebook to finance “look good” and “feel good” donations to charitable projects.
CSR must be built-in to the way a company always thinks, not just bolted-on to what it occasionally does.
A company must, through its policy and management and staff (not just its bank) be an active part of its society and neighbouring communities. It must help ensure projects are sustainable, with their own business viability independent of donors.
UGL, more than ever before, is taking those principles on board. It is recognizing the cardinals of any sustainable development project:
• It must be chosen by its beneficiaries, according to their priorities.• It must be owned by them.• It must be run by them.• It must have its own self-sustaining business viability• And, ideally, it must be capable of going to scale.
The Group has identified two principal CSR themes: Youth Literacy (especially the girl child) and HIV/AIDS. And it has set a formula that both selects the projects and drives the level of support.
Staff themselves choose the projects they wish to help (which makes the portfolio diverse and assures personal commitment and involvement) and they also determine the level of support funding available – based on the income gains and/or cost savings they are able to secure from initiatives identified and implemented by employees at each site.
This is a long-term journey, now embedded as permanent company policy. All the people of UGL will engage with social issues and their neighbourhoods – directly, personally and corporately.
The staff response has been emphatic. Here are some examples of some of the initial projects in this programme

13
Corporate Social Responsibility (continued)
UASIN gISHU HIgH SCHOOL:offer scholarships to bright but needy children, and establish a revenue project to assure funding. The UGL team provided immediate support for two children, and are helping the school establish a poultry business, as a learning aid and to sustain and hopefully expand the scholarship programme.
NILE ROAD SCHOOL: donations of books and food to the school; establishment of a broiler house for income/education. A UGL team funded construction and start up of the broiler business, and gives ongoing technical support. Children, staff and parents are involved and the project is already expanding on business merit. The school is non-residential and is for the mentally challenged and has student population aged from 7-40 years.
NAKURU HIV/AIDS gROUPS: empowering people living with HIV/AIDS through small animal agriculture; developing income-generating projects for Chemi ya Neema in Subukia and Huruma na Kuangamiza Ukimwi in Lare. The UGL team has helped build, stock and supervise rabbit and poultry growing facilities, and fostered community partnerships via youth football tournaments.
NAGURU CHILDREN’S HOME (Uganda): giving help and hope, to a centre giving haven to more than 100 abandoned/brutalized children aged between 2 and 13. The UGL team, in partnership with other donors, gave clothing, bedding, food and other essentials, and has established a long-term scholarship fund. This fund is intended to support the education (from Primary 5) of a young girl through university.

14
Five Year Financial Review (Summary)
2006 2007 2008 2009 2010 Shs’000 Shs’000 Shs’000 Shs’000 Shs’000CONSOLIDATED INCOME STATEMENT
Turnover 7,305,958 7,675,347 9,450,824 11,643,639 11,524,454Profit Before Taxation 142,427 156,665 564,016 260,439 335,101Taxation Charge (77,826) (23,055) (190,355) (75,247) (98,928)Profit For the Year 64,601 133,610 373,661 185,192 236,173Earnings Per Share Shs 0.58 Shs 1.31 Shs 3.06 Shs 1.55 1.81
CONSOLIDATED STATEMENT OFFINANCIAL POSITIONASSETS Non-current Assets Property, plant & equipment 1,489,051 1,367,942 1,657,068 1,579,744 1,505,873Other 261,425 239,167 166,178 152,940 138,710 1,750,476 1,607,109 1,823,246 1,732,684 1,644,583Current Assets Inventories 834,754 982,522 1,197,245 2,270,794 1,958,201Trade & other receivables 608,712 622,507 1,014,441 971,625 796,847Other 49,297 49,401 37,844 66,238 35,748Term deposits, cash & bank balances 346,930 455,830 688,752 524,200 629,041
1,839,693 2,110,260 2,938,282 3,832,857 3,419,837 Total Assets 3,590,169 3,717,369 4,761,528 5,565,541 5,064,420EQUITY AND LIABILITIES Capital and reserves Share Capital 315,454 315,454 315,454 378,535 378,535Share premium 73,148 73,148 73,148 73,148 73,148Reserves 1,059,596 1,141,147 1,656,459 1,715,291 1,848,086Equity attributable to equity holders of the parent 1,448,198 1,529,749 2,045,061 2,166,974 2,299,769
Non controlling interest 748,412 789,240 918,985 979,413 1,064,934
Total Equity 2,196,610 2,318,989 2,964,046 3,146,387 3,364,703Non current liabilities Deferred taxation - - 202,205 270,012 283,308Borrowings 37,344 - - - -Other 51,754 50,571 61,790 64,130 72,046 89,098 50,571 263,995 334,142 355,354
Current liabilitiesTrade and other payables 509,713 419,532 772,934 766,545 535,513Borrowings 327,549 333,452 4,557 5,577 5,608Due to related companies 438,574 567,648 700,266 1,282,751 728,845Other 28,625 27,177 55,730 30,139 74,397
1,304,461 1,347,809 1,533,487 2,085,012 1,344,363
Total equity and liabilities 3,590,169 3,717,369 4,761,528 5,565,541 5,064,420

15
Corporate Information
DIRECTORS R Kemoli - Chairman N C Hutchinson* - Group Managing Director A McKittrick J G Kiereini A S M Ndegwa - (Alternate - J P M Ndegwa) V O Ojode J K Kibet I Ochola-Wilson (Mrs)
*British
SECRETARY J L G Maonga Certified Public Secretary (Kenya) Livingstone Associates Deloitte Place, Waiyaki Way, Muthangari P O Box 30029, 00100 Nairobi
REGISTERED OFFICE Plot No.209/6841 Ngano House, Commercial Street Industrial Area P O Box 30096, 00100 Nairobi
REGISTRARS Custody & Registrars Services Limited 6th Floor, Bruce House Standard Street P O Box 8484 – 00100 Nairobi
AUDITORS Deloitte & Touche Certified Public Accountants (Kenya) Deloitte Place, Waiyaki Way, Muthangari P O Box 40092, 00100 Nairobi
BANKERS Barclays Bank of Kenya Limited Barclays Plaza Branch P O Box 46661, 00200 Nairobi
ADVOCATES Kaplan & Stratton Williamson House 4th Ngong Avenue P O Box 40111, 00100 Nairobi

16
Report of the Directors
The directors present their report together with the audited financial statements of the group for the year ended 30 June 2010.
Activities
The company operates as a holding company. The principal activities of the group continue to be the milling of wheat and maize, the manufacture of packaging materials and animal nutrition products, and the distribution of animal health products. 2010 2009 Shs’000 Shs’000Group Results
Profit before taxation 335,101 260,439Taxation charge (98,928) (75,247) ________ _______Profit for the year 236,173 185,192 ======= =======
Attributable to:Equity holders of the parent 137,236 117,318Non Controlling interest 98,937 67,874 ________ _______ 236,173 185,192 ======= =======Dividend
The directors recommend the payment of a first and final dividend of Shs 0.50 per share amounting to Shs 37,853,493 (2009: Nil) in respect of the financial year. The dividend is subject to approval by the shareholders at the next Annual General Meeting.
Directors
The present board of directors is shown on page 15.
Mr A McKittrick, Mr V O Ojode and Mr J K Kibet retire in accordance with Articles 88 and 89 of the Company’s Articles of Association and, being eligible, offer themselves for re-election.
Auditors
Deloitte & Touche, having confirmed their willingness, continue in office in accordance with section 159 (2) of the Companies Act.
By Order of the Board
J L g MaongaSecretary
29 September 2010
Nairobi
17
Statement of Directors’ Responsibilities
The Kenyan Companies Act requires the directors to prepare financial statements for each financial year which give a true and fair view of the state of affairs of the group and of the company as at the end of the financial year and of its operating results of the group for that year. It also requires the directors to ensure that the company keeps proper accounting records which disclose with reasonable accuracy at any time the financial position of the group. They are also responsible for safeguarding the assets of the group.
The directors are responsible for the preparation and fair presentation of these financial statements in accordance with International Financial Reporting Standards and in the manner required by the Kenyan Companies Act. This responsibility includes: designing, implementing and maintaining internal controls relevant to the preparation and fair presentation of financial statements that are free from material misstatement whether due to fraud or error; selecting and applying appropriate accounting policies; and making accounting estimates that are reasonable in the circumstances.
The directors accept responsibility for the annual financial statements, which have been prepared using appropriate accounting policies supported by reasonable and prudent judgements and estimates, in conformity with International Financial Reporting Standards and in the manner required by the Kenyan Companies Act. The directors are of the opinion that the financial statements give a true and fair view of the state of the financial affairs of the group and of the company and of the group’s operating results. The directors further accept responsibility for the maintenance of accounting records which may be relied upon in the preparation of financial statements, as well as adequate systems of internal financial control.
Nothing has come to the attention of the directors to indicate that the parent company and its subsidiaries will not remain a going concern for at least the next twelve months from the date of this statement.
R Kemoli N HutchinsonDirector Director
29 September 2010

18
Independent Auditors’ Report to the Members of Unga Group Limited Report on the Financial StatementsWe have audited the accompanying financial statements of Unga Group Limited and its subsidiaries, set out on pages19 to 56 which comprise the consolidated and company statements of financial position as at 30 June 2010, and the consolidated statement of comprehensive income, consolidated and company statements of changes in equity and consolidated statement of cash flows for the year then ended, and a summary of significant accounting policies and other explanatory notes.
Directors’ Responsibility for the Financial StatementsThe directors are responsible for the preparation and fair presentation of these financial statements in accordance with International Financial Reporting Standards and the requirements of the Kenyan Companies Act. This responsibility includes: designing, implementing and maintaining internal controls relevant to the preparation and fair presentation of financial statements that are free from material misstatement, whether due to fraud or error; selecting and applying appropriate accounting policies; and making accounting estimates that are reasonable in the circumstances.
Auditors’ ResponsibilityOur responsibility is to express an opinion on these financial statements based on our audit. We conducted our audit in accordance with International Standards on Auditing. Those standards require that we comply with ethical requirements and plan and perform the audit to obtain reasonable assurance whether the financial statements are free from material misstatement.
An audit involves performing procedures to obtain audit evidence about the amounts and disclosures in the financial statements. The procedures selected depend on our judgement, including the assessment of the risks of material misstatement of the financial statements, whether due to fraud or error. In making those risk assessments, we considered the internal controls relevant to the entity’s preparation and fair presentation of the financial statements in order to design audit procedures that were appropriate in the circumstances, but not for the purpose of expressing an opinion on the entity’s internal controls. An audit also includes evaluating the appropriateness of accounting policies used and the reasonableness of accounting estimates made by the directors, as well as evaluating the overall presentation of the financial statements.
We believe that the audit evidence we have obtained is sufficient and appropriate to provide a basis for our audit opinion.
OpinionIn our opinion, the accompanying financial statements give a true and fair view of the state of financial affairs of the group and of the company as at 30 June 2010, and of the group’s profit and cash flows for the year then ended in accordance with International Financial Reporting Standards and the requirements of the Kenyan Companies Act.
Report on Other Legal RequirementsAs required by the Kenyan Companies Act we report to you, based on our audit, that:i) we have obtained all the information and explanations which to the best of our knowledge and belief were necessary
for the purposes of our audit;ii) in our opinion, proper books of account have been kept by the company, so far as appears from our examination of
those books; andiii) the company’s statement of financial position (balance sheet) is in agreement with the books of account.
Certified Public Accountants (Kenya)29 September 2010
19
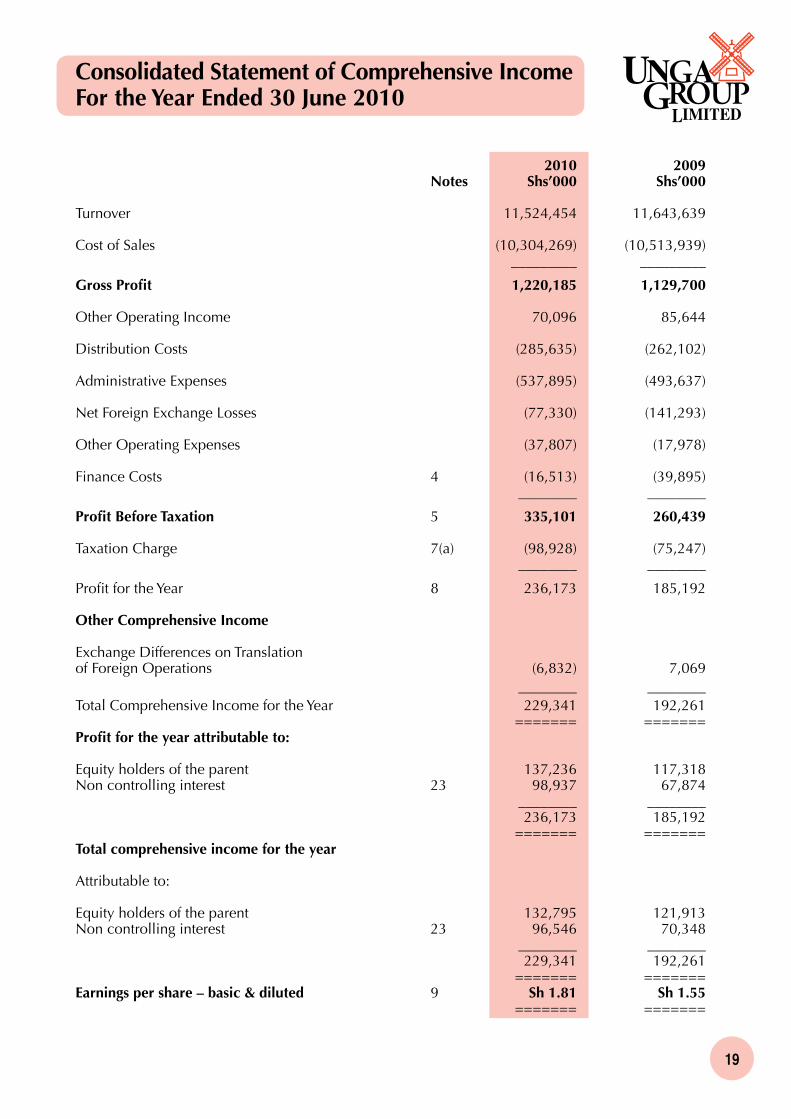
Consolidated Statement of Comprehensive IncomeFor the Year Ended 30 June 2010
2010 2009 Notes Shs’000 Shs’000
Turnover 11,524,454 11,643,639
Cost of Sales (10,304,269) (10,513,939) _________ _________
Gross Profit 1,220,185 1,129,700
Other Operating Income 70,096 85,644
Distribution Costs (285,635) (262,102)
Administrative Expenses (537,895) (493,637)
Net Foreign Exchange Losses (77,330) (141,293)
Other Operating Expenses (37,807) (17,978)
Finance Costs 4 (16,513) (39,895) ________ ________
Profit Before Taxation 5 335,101 260,439
Taxation Charge 7(a) (98,928) (75,247) ________ ________
Profit for the Year 8 236,173 185,192
Other Comprehensive Income
Exchange Differences on Translationof Foreign Operations (6,832) 7,069 ________ ________Total Comprehensive Income for the Year 229,341 192,261 ======= =======Profit for the year attributable to:
Equity holders of the parent 137,236 117,318Non controlling interest 23 98,937 67,874 ________ ________ 236,173 185,192 ======= =======Total comprehensive income for the year
Attributable to:
Equity holders of the parent 132,795 121,913Non controlling interest 23 96,546 70,348 ________ ________ 229,341 192,261 ======= =======Earnings per share – basic & diluted 9 Sh 1.81 Sh 1.55 ======= =======

20
Consolidated Statement of Financial Position30 June 2010
2010 2009 Notes Shs’000 Shs’000ASSETSNon current assetsProperty, plant and equipment 11 1,505,873 1,579,744Prepaid operating lease rentals 12 42,153 44,422Intangible assets 13 760 1,655Retirement benefits asset 15 82,600 97,806Deferred taxation 16 13,197 9,057 1,644,583 1,732,684Current assetsInventories 17 1,958,201 2,270,794Trade and other receivables 18 796,847 971,625Taxation recoverable 7(c) 31,820 62,310Term deposits 20 202,902 49,359Cash and bank balances 28(b) 426,139 474,841
3,415,909 3,828,929Properties held for sale 21 3,928 3,928 3,419,837 3,832,857
Total assets 5,064,420 5,565,541EQUITY AND LIABILITIESCapital and reservesShare capital 22 378,535 378,535Share premium 73,148 73,148Revaluation reserve 715,018 738,456Translation reserve 7,215 11,656Revenue reserve 1,125,853 965,179
Equity attributable to equity holders of the parent 2,299,769 2,166,974Non controlling interest 23 1,064,934 979,413Total equity 3,364,703 3,146,387
Non current liabilitiesDeferred taxation 16 283,308 270,012 Service gratuity 24 66,438 58,553Due to related companies 27 5,608 5,577
355,354 334,142Current liabilitiesLoans payable 25 5,608 5,577Trade and other payables 26 535,513 766,545Unclaimed dividends 21,482 21,482Due to related companies 27 728,845 1,282,751Taxation payable 7(c) 52,915 8,657 1,344,363 2,085,012
Total equity and liabilities 5,064,420 5,565,541
The financial statements on pages 19 to 56 were approved by the board of directors on 29 September 2010, and were signed on its behalf by:
R Kemoli N HutchinsonDirector Director

21
2010 2009 Notes Shs’000 Shs’000ASSETS Non current assetsInvestment in subsidiary company 14 1,297,335 1,297,335 _________ _________
Current assetsOther receivables 18 728 441Due from subsidiary companies 19(a) 106,731 112,336Taxation recoverable 7(d) 385 4,134Term deposits 20 69,500 30,000Bank balance 4,868 32,731 _________ _________
182,212 179,642 _________ _________
Total assets 1,479,547 1,476,977 ======== ========EQUITY AND LIABILITIESCapital and reservesShare capital 22 378,535 378,535Share premium 73,148 73,148Revenue reserve 998,346 996,845 _________ _________
1,450,029 1,448,528 _________ _________
Current liabilitiesDue to subsidiary company 19(b) 23,013 23,013 Other payables 26 6,505 5,436 _________ _________
29,518 28,449 _________ _________
Total equity and liabilities 1,479,547 1,476,977 ======== ========
The financial statements on pages 19 to 56 were approved by the board of directors on 29 September 2010, and were signed on its behalf by:
R Kemoli N HutchinsonDirector Director
Company Statement of Financial Position30 June 2010

22
Consolidated Statement of Changes in EquityFor the Year Ended 30 June 2010
SharecapitalSh’000
Share premium
Sh’000
Revaluation reserveSh’000
Translation reserveSh’000
Revenue reserveSh’000
Equity attributable
to equity holdersSh’000
Non-controlling
interestSh’000
TotalSh’000
At 1 July 2008 315,454 73,148 763,610 7,061 885,788 2,045,061 918,985 2,964,046
_______ _______ ________ ________ _________ _________ ________ ________
Profit for the year - - - - 117,318 117,318 67,874 185,192
Other comprehensive income for the year
- - - 4,595 - 4,595 2,474 7,069
_______ _______ _______ _______ _______ _______ _______ _______
Total comprehensive income for the year - - - 4,595 117,318 121,913 70,348 192,261
Issue of bonus shares 63,081 - - - (63,081)
Transfer of excess depreciation - - (35,934) - 35,934
Deferred taxation on excess depreciation
- - 10,780 - (10,780)
Dividend paid to non controlling interest
- - - - - (9,920) (9,920)
_______ _______ ________ ________ _________ _________ ________ ________
At 30 June 2009 378,535 73,148 738,456 11,656 965,179 2,166,974 979,413 3,146,387
====== ====== ======= ====== ======= ======== ====== =======
At 1 July 2009 378,535 73,148 738,456 11,656 965,179 2,166,974 979,413 3,146,387
_______ _______ ________ ________ _________ _________ ________ ________
Profit for the year - - - - 137,236 137,236 98,937 236,173
Other comprehensive loss for the year
- - - (4,441) - (4,441) (2,391) (6,832)
_______ _______ ________ ________ _________ _________ ________ ________
Total comprehensive income for the year - - - (4,441) 137,236 132,795 96,546 229,341
_______ _______ ________ ________ _________ _________ ________ ________
Transfer of excess depreciation - - (33,460) - (33,460) - - -
Deferred taxation on excess depreciation
- - 10,022 - 10,022 - - -
Dividend paid to non controlling interest
- - - - - - (11,025) (11,025)
_______ _______ ________ ________ _________ _________ _________ _________
At 30 June 2010 378,535 73,148 715,018 7,215 1,125,853 2,299,769 1,064,934 3,364,703
====== ====== ====== ====== ======= ======= ======= =======
The revaluation reserve is not distributable and represents the surplus arising from the revaluation of property, plant and equipment.
Revenue reserve represents profit from the normal operations of the group.

23
Company Statement of Changes in EquityFor the Year Ended 30 June 2010
Share Share Revenue capital premium reserve Total Shs’000 Shs’000 Shs’000 Shs’000
At 1 July 2008 315,454 73,148 1,053,932 1,442,534
Issue of bonus shares 63,081 - (63,081) -
Total comprehensive income for the year - - 5,994 5,994 ________ _________ _________ ________
At 30 June 2009 378,535 73,148 996,845 1,448,528 ======= ======== ======== ========
At 1 July 2009 378,535 73,148 996,845 1,448,528
Total comprehensive income for the year - - 1,501 1,501 ________ _________ _________ ________
At 30 June 2010 378,535 73,148 998,346 1,450,029 ======= ======== ======== ========

24
Consolidated Statement of Cash FlowsFor the Year Ended 30 June 2010
2010 2009 Notes Shs’000 Shs’000
CASH FLOWS FROM OPERATINg ACTIVITIES
Cash generated from/(used in) operations 28(a) 175,583 (48,103)Taxation paid 7(c) (13,191) (73,993) _________ _________
Net cash generated from/(used in) operating activities 162,392 (122,096) _________ _________
CASH FLOWS FROM INVESTINg ACTIVITIES
Purchase of property, plant and equipment 11 (46,145) (37,822)Purchase of intangible assets 13 (173) (1,030) Proceeds of disposal of property, plant and equipment 1,328 2,476Proceeds of disposal of properties held for sale - 5,062 Investment in term deposit 20 (39,500) - _________ _________
Net cash used in investing activities (84,490) (31,314) _________ _________
CASH FLOWS FROM FINANCINg ACTIVITIES
Dividends paid to non controlling interest 23 (11,025) (9,920) _________ _________
INCREASE/(DECREASE) IN CASH AND CASH EQUIVALENTS 66,877 (163,330)
CASH AND CASH EQUIVALENTS AT BEgINNINg OF YEAR 494,200 658,752
Exchange adjustment (1,536) (1,222) _________ _________CASH AND CASH EQUIVALENTS AT END OF YEAR 28(b) 559,541 494,200 ======= ========

25
1 ACCOUNTINg POLICIES
Statement of compliance
The financial statements have been prepared in accordance with International Financial Reporting Standards.
For the Kenyan Companies Act reporting purposes, in these financial statements the balance sheet is represented by/is equivalent to the statement of financial position and the profit and loss account is presented in the statement of comprehensive income.
Adoption of new and revised International Financial Reporting Standards (IFRSs) and Interpretations (IFRIC)
(i) Standards and Interpretations affecting amounts reported in the current period (and/or prior periods)
• IAS 1 (revised) ‘Presentation of financial statements’ – effective 1 January 2009.
A revised version of IAS 1 was issued in September 2007. It prohibits the presentation of items of income and expenses (that is, ‘non-owner changes in equity’) in the statement of changes in equity, requiring ‘non-owner changes in equity’ to be presented separately from owner changes in equity in a statement of comprehensive income.
According to the amendment of IAS 1 in January 2008, each component of equity, including each item of other comprehensive income, should be reconciled between carrying amount at the beginning and at end of the period. Since the change only impacts presentation aspects, there is no impact on retained earnings.
The group also elected to use the titles per revised IAS 1 of ‘statement of financial position’ and ‘statement of cash flows’ to describe the ‘balance sheet’ and ‘cash flow statement’ respectively.
• IFRS 8, Operating segments
IFRS 8, “Operating Segments”, which replaces IAS 14, “Segment reporting”, was issued in November 2006 and is effective for annual periods beginning on or after 1 January 2009. The new standard is based on the management approach and the company’s internal reporting of segment information to the entity’s Chief Operating Decision Maker. The new standard will enable investors to assess the company’s business performance from the same perspective used by the management in making decisions about operating matters.
Management has chosen to organise the entity around differences in market segments served by their products into two main segments namely consumer and animal health and nutrition.
Adoption of these interpretations and standards has not led to any changes in the group’s accounting policies.
Notes to the Financial StatementsFor the Year Ended 30 June 2010
26
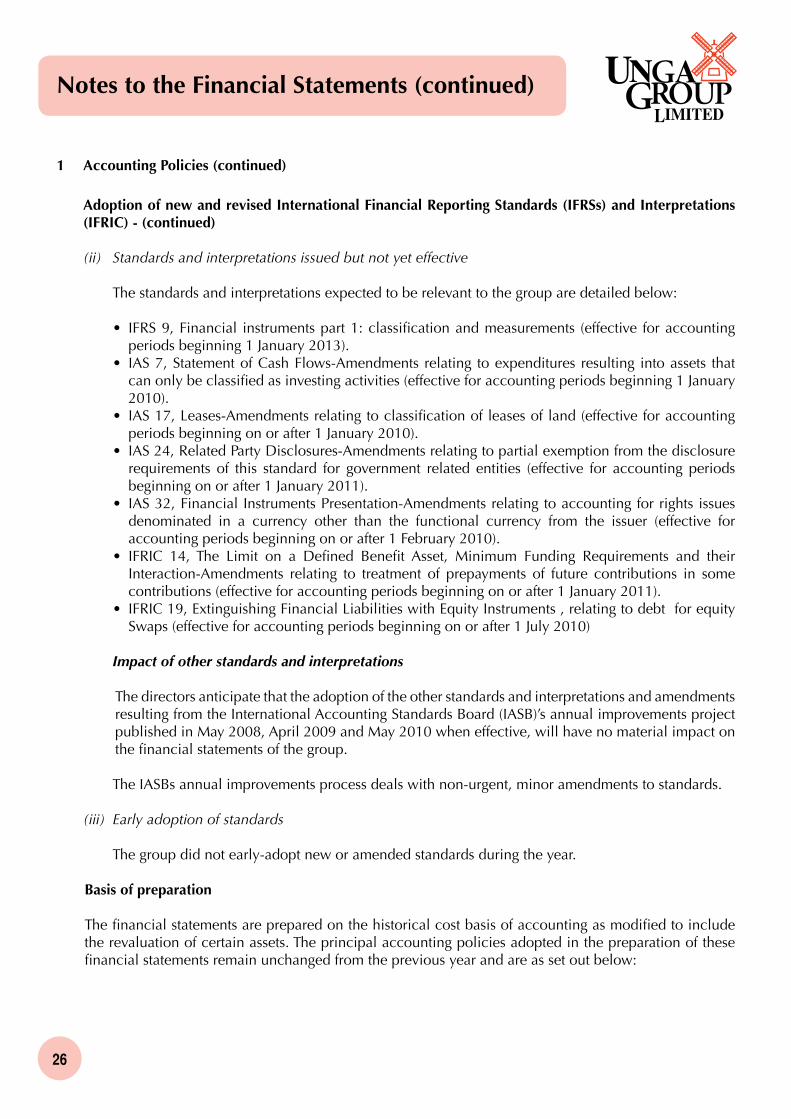
Adoption of new and revised International Financial Reporting Standards (IFRSs) and Interpretations (IFRIC) - (continued)
(ii) Standards and interpretations issued but not yet effective
The standards and interpretations expected to be relevant to the group are detailed below:
• IFRS 9, Financial instruments part 1: classification and measurements (effective for accounting periods beginning 1 January 2013).
• IAS 7, Statement of Cash Flows-Amendments relating to expenditures resulting into assets that can only be classified as investing activities (effective for accounting periods beginning 1 January 2010).
• IAS 17, Leases-Amendments relating to classification of leases of land (effective for accounting periods beginning on or after 1 January 2010).
• IAS 24, Related Party Disclosures-Amendments relating to partial exemption from the disclosure requirements of this standard for government related entities (effective for accounting periods beginning on or after 1 January 2011).
• IAS 32, Financial Instruments Presentation-Amendments relating to accounting for rights issues denominated in a currency other than the functional currency from the issuer (effective for accounting periods beginning on or after 1 February 2010).
• IFRIC 14, The Limit on a Defined Benefit Asset, Minimum Funding Requirements and their Interaction-Amendments relating to treatment of prepayments of future contributions in some contributions (effective for accounting periods beginning on or after 1 January 2011).
• IFRIC 19, Extinguishing Financial Liabilities with Equity Instruments , relating to debt for equity Swaps (effective for accounting periods beginning on or after 1 July 2010)
Impact of other standards and interpretations
The directors anticipate that the adoption of the other standards and interpretations and amendments resulting from the International Accounting Standards Board (IASB)’s annual improvements project published in May 2008, April 2009 and May 2010 when effective, will have no material impact on the financial statements of the group.
The IASBs annual improvements process deals with non-urgent, minor amendments to standards.
(iii) Early adoption of standards
The group did not early-adopt new or amended standards during the year.
Basis of preparation
The financial statements are prepared on the historical cost basis of accounting as modified to include the revaluation of certain assets. The principal accounting policies adopted in the preparation of these financial statements remain unchanged from the previous year and are as set out below:
1 Accounting Policies (continued)
Notes to the Financial Statements (continued)

27
Notes to the Financial Statements (continued)
Consolidation
The consolidated financial statements incorporate the financial statements of Unga Group Limited and its subsidiary companies, all of which are made up to 30 June each year.
Subsidiary undertakings are those companies in which the group either directly or indirectly has an interest of more than 50% of the voting rights or otherwise has power to exercise control over the operations. All subsidiaries have been consolidated. Subsidiaries are consolidated from the date on which effective control is transferred to the group and are no longer consolidated as from the date of disposal. All inter-company transactions and balances and unrealised surpluses and deficits on transactions with the subsidiary companies have been eliminated. Subsidiary undertakings are disclosed on note 13.
Non controlling interests in the net assets of consolidated subsidiaries are identified separately from the group’s equity therein. Non controlling interests consist of the amount of those interests at the date of the original business combination and the non controlling interest’s share of changes in equity since the date of the combination. Losses applicable to the non controlling interests in excess of the non controlling’s interest in the subsidiary’s equity are allocated against the interests of the Group except to the extent that the non controlling interest has a binding obligation and is able to make an additional investment to cover the losses.
Investments in subsidiary companies
Investments in subsidiary companies are stated at cost less provision for impairment where applicable.
Revenue recognition
Turnover, which represents net sales to external customers during the year, is recognised when goods are delivered and title has passed.
Interest income is accrued on a time basis, by reference to the principal outstanding and at the effective interest rate applicable.
Taxation
Income tax represents the sum of tax currently payable and deferred tax.
Current taxation is provided on the basis of the results for the year as shown in the financial statements, adjusted in accordance with tax legislation.
Deferred taxation is provided, under the liability method, for all temporary differences arising between the tax bases of assets and liabilities and their carrying values for financial reporting purposes. Currently enacted tax rates are used to determine deferred income tax.
A deferred tax asset is recognised to the extent that it is probable that future taxable profits will be available against which the unused tax losses and unused tax credits can be utilised, while deferred tax liabilities are recognised for all taxable temporary differences.
1 Accounting Policies (continued)

28
Foreign currencies
i) Transactions and balances
Transactions in foreign currencies during the year are translated into Kenya Shillings at rates ruling at the transaction dates. Assets and liabilities which are expressed in foreign currencies are translated into Kenya Shillings at rates ruling at the end of the reporting period. The resulting differences from conversion and translation are dealt with in the profit or loss for the year in which they arise.
ii) Translation of foreign operations
The results and financial position of all the group entities (none of which has the currency of a hyperinflationery economy) that have a functional currency different from the presentation currency are translated into the presentation currency as follows:
• assets and liabilities for each statement of financial position presented are translated into Kenya Shillings using exchange rates prevailing at the end of the reporting period;
• income and expenses for each statement of comprehensive income are translated at average exchange rates (unless this average is not a reasonable approximation of the cumulative effect of the rates prevailing on the transaction dates, in which case income and expenses are translated at the dates of the transactions); and
• All resulting exchange differences are recognised under other comprehensive income and accumulated in a separate heading, translation reserve, in the consolidated statement of changes in equity
Employee benefits costs
The group operates a defined benefit retirement scheme for its employees. The assets of this scheme are held in a separate trustee administered fund. The scheme is funded by contributions from both the employees and the employer. Benefits are paid to retiring staff in accordance with scheme rules. The cost of providing retirement benefits is assessed using the attained age method by qualified actuaries. The scheme is valued once every three years: the last valuation was as at 31 December 2009.
The amount recognised at the end of each reporting period represents the difference between the actuarial value of past service pension benefits and the fair value of scheme assets.
The retirement benefit asset is amortised on the straight line basis over a period recommended by the scheme’s Actuaries.
The group also contributes to a statutory defined contribution pension scheme, the National Social Security Fund (NSSF). The group’s obligations under the scheme are limited to specific contributions legislated from time to time and are currently limited to a maximum of Shs 200 per month per employee. The group’s contributions are charged to profit or loss in the year to which they relate.
1 Accounting Policies (continued)
Notes to the Financial Statements (continued)
29
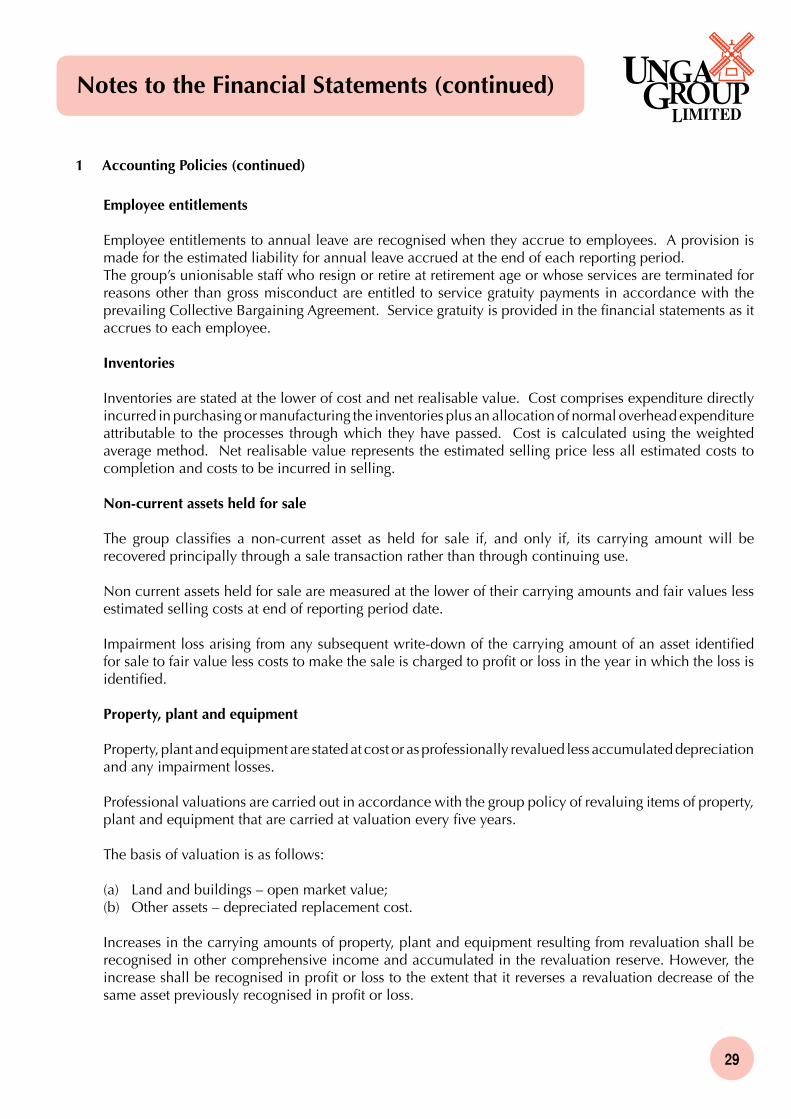
Employee entitlements
Employee entitlements to annual leave are recognised when they accrue to employees. A provision is made for the estimated liability for annual leave accrued at the end of each reporting period.The group’s unionisable staff who resign or retire at retirement age or whose services are terminated for reasons other than gross misconduct are entitled to service gratuity payments in accordance with the prevailing Collective Bargaining Agreement. Service gratuity is provided in the financial statements as it accrues to each employee.
Inventories
Inventories are stated at the lower of cost and net realisable value. Cost comprises expenditure directly incurred in purchasing or manufacturing the inventories plus an allocation of normal overhead expenditure attributable to the processes through which they have passed. Cost is calculated using the weighted average method. Net realisable value represents the estimated selling price less all estimated costs to completion and costs to be incurred in selling.
Non-current assets held for sale
The group classifies a non-current asset as held for sale if, and only if, its carrying amount will be recovered principally through a sale transaction rather than through continuing use.
Non current assets held for sale are measured at the lower of their carrying amounts and fair values less estimated selling costs at end of reporting period date.
Impairment loss arising from any subsequent write-down of the carrying amount of an asset identified for sale to fair value less costs to make the sale is charged to profit or loss in the year in which the loss is identified.
Property, plant and equipment
Property, plant and equipment are stated at cost or as professionally revalued less accumulated depreciation and any impairment losses.
Professional valuations are carried out in accordance with the group policy of revaluing items of property, plant and equipment that are carried at valuation every five years.
The basis of valuation is as follows:
(a) Land and buildings – open market value;(b) Other assets – depreciated replacement cost.
Increases in the carrying amounts of property, plant and equipment resulting from revaluation shall be recognised in other comprehensive income and accumulated in the revaluation reserve. However, the increase shall be recognised in profit or loss to the extent that it reverses a revaluation decrease of the same asset previously recognised in profit or loss.
1 Accounting Policies (continued)
Notes to the Financial Statements (continued)

30
Property, plant and equipment (continued)
Decreases that offset previous increases of the same asset are recognised in other comprehensive income and charged against the revaluation surplus; all other decreases are charged to profit or loss. Each year the difference between depreciation based on the revalued carrying amount of an asset (the depreciation charged to profit or loss) and depreciation based on the asset’s original cost is transferred from the revaluation surplus to revenue reserves.
Depreciation
Depreciation is calculated to write off the cost or valuation of property, plant and equipment in equal annual instalments over their estimated useful lives. The annual rates used are:
Long leasehold buildings 2.5%Short leasehold buildings Over period of leaseComputer equipment 33.3%Plant and machinery 5 - 7.5%Furniture and fittings 12.5%Motor vehicles 25%Silos Shorter of 50 years or the unexpired period of the lease in respect of the land on which they are built
Excess depreciation
Excess depreciation, representing the additional depreciation attributable to revaluations of property, plant and equipment over depreciation based on historical cost, is transferred annually from the revaluation reserve to revenue reserve.
Leasehold land
Payments to acquire interests in leasehold land are treated as prepaid operating lease rentals and amortised over the term of the related lease.
Intangible assets
Intangible assets represent computer software.
Intangible assets acquired separately are measured on initial recognition at cost. Following initial recognition, intangible assets are carried at cost less any accumulated amortisation and any accumulated impairment losses.
Intangible assets are amortised over the useful economic life of three years and assessed for impairment whenever there is an indication that the intangible asset may be impaired. The amortisation period and the amortisation method is reviewed at each financial year end.
Changes in the expected useful life or the expected pattern of consumption of future economic benefits embodied in the asset is accounted for by changing the amortisation period or method, as appropriate, and are treated as changes in accounting estimates. The amortisation expense is recognised in profit or loss.
1 Accounting Policies (continued)
Notes to the Financial Statements (continued)

31
1 Accounting Policies (continued)
Gains or losses arising from de-recognition of an intangible asset are measured as the difference between the net disposal proceeds and the carrying amount of the asset and are recognised in profit or loss when the asset is derecognized.
Impairment
At the end of each reporting period, the group reviews the carrying amounts of its tangible and intangible assets to determine whether there is any indication that those assets have suffered an impairment loss. If any such indication exists, the recoverable amount of the asset is estimated in order to determine the extent of the impairment loss. Where it is not possible to estimate the recoverable amount of an individual asset, the group estimates the recoverable amount of the cash generating unit to which the asset belongs. Any impairment losses are recognised as an expense immediately. Where an impairment loss subsequently reverses, the carrying amount of the asset is increased to the revised estimate of its recoverable amount. A reversal of an impairment loss is recognised as income immediately.
Leases
Leases are classified as finance leases whenever the terms of the lease transfer substantially all risks and rewards of ownership to a company within the group as a lessee. All other leases are classified as operating leases.
The company as a lessorRental income from operating leases is recognised on the straight line basis over the terms of the relevant leases.
The company as a lesseeRentals payable under operating leases are charged to profit or loss on the straight line basis over the term of the relevant lease.
Dividends payable
Dividends payable on ordinary shares are charged to retained earnings in the period in which they are declared. Proposed dividends are not accrued for until ratified in an Annual General Meeting.
Financial instruments
Financial assets and liabilities are recognised in the group’s statement of financial position when the group has become a party to the contractual provisions of the instrument.
Trade receivablesTrade receivables are stated at their nominal value as reduced by appropriate allowances for estimated irrecoverable amounts. Objective evidence of impairment of the receivables is when there is significant financial difficulty of the counter party or when there is a default or delinquency in payment according to agreed terms. When a trade receivable is considered uncollectible it is written off against the allowance account. Subsequent recoveries of amounts previously written off are credited against the allowance account. Changes in the carrying amount of the allowance account are recognised in profit or loss.
Notes to the Financial Statements (continued)

32
1 Accounting Policies (continued)
Financial instruments (continued)
Term depositsTerm deposits are classified as held to maturity and are measured at amortised cost.
Bank borrowingsInterest bearing bank loans and overdrafts are recorded at the proceeds received, net of direct issue costs. Finance charges including premiums payable on settlement or redemption, are accounted for on
the accruals basis and are added to the carrying amount of the instrument to the extent that they are not settled in the period they arise.
Trade payablesTrade payables are stated at their nominal value.
Segmental reporting
Operating segments are reported in a manner consistent with the internal reporting provided to the Chief Operating Decision Maker (the Group Managing Director). The management then allocates resources to and assesses the performance of the operating segments of the Group.
Segment result is segment revenue less segment expenses.
Segment revenue is the revenue that is directly attributable to a segment plus the relevant portion of the group’s revenue that can be allocated to the segment on a reasonable basis.
Segment expenses are expenses resulting from the operating activities of a segment plus the relevant portion of an expense that can be allocated to the segment on a reasonable basis.
Segment assets and liabilities comprise those operating assets and liabilities that are directly attributable to the segment or can be allocated to the segment on a reasonable basis.
Capital expenditure represents the total cost incurred during the year to acquire segment assets (property, plant and equipment) that are expected to be used during more than one year.
Comparatives
Where necessary, comparative figures have been adjusted to conform with changes in presentation in the current year.
2 CRITICAL JUDgEMENTS IN APPLYINg THE gROUP’S ACCOUNTINg POLICIES
In the process of applying the group’s accounting policies, management has made estimates and assumptions that affect the reported amounts of assets and liabilities within the next financial year. Estimates and judgements are continually evaluated and are based on historical experience and other factors, including expectations of future events that are believed to be reasonable under the circumstances. The key areas of judgement in applying the group’s accounting policies are dealt with below:
Notes to the Financial Statements (continued)

33
2 Critical judgements in applying the group’s Accounting Policies (continued)
Notes to the Financial Statements (continued)
Impairment losses
At the end of each reporting period , the group reviews the carrying amounts of its tangible and intangible assets to determine whether there is any indication that those assets have suffered an impairment loss. If any such indication exists, the recoverable amount of the asset is estimated in order to determine the extent of the impairment loss. Where it is not possible to estimate the recoverable amount of an individual asset, the group estimates the recoverable amount of the cash generating unit to which the asset belongs.
Property, plant and equipment
Critical estimates are made by directors in determining the useful lives and residual values to property, plant and equipment based on the intended use of the assets and the economic lives of those assets. Subsequent changes in circumstances such as technological advances or prospective utilisation of the assets concerned could result in the actual useful lives or residual values differing from initial estimates.
3 OPERATING SEGMENTS
The principal activity of the group continues to be the milling of wheat and maize, the manufacture of packaging materials and animal nutrition products, and the distribution of animal health products.
Management has chosen to organise the entity around differences in market segments served by their products into two main segments namely consumer and animal health and nutrition. Management considered the fact that reports regularly reviewed by the chief operating decision maker in order to allocate resources and to assess performance are based on these two operating segments. Description of the types of products and services from which each reportable segment derives its revenues
Unga Group Limited has two reportable segments: consumer and animal nutrition and health. The consumer segment produces products for human consumption. The animal nutrition and health segment produces animal feed and mineral supplement products and distributes products for animal health.
Measurement of operating segment profit or loss, assets and liabilities
The accounting policies of the operating segments are the same as those described in the summary of significant accounting policies.
Unga Group Limited accounts for intersegment sales and transfers as if the sales or transfers were to third parties, i.e. at current market prices.
Factors that management uses to identify the entity’s reportable segments Unga Group Limited segments are strategic business units that serve different market segments. They are managed separately because each business requires different technology and marketing strategies.
Information about major customers
One customer under the animal health and nutrition segment accounts for more than 10% of the revenue arising from direct sales while other operating segments have none.
34
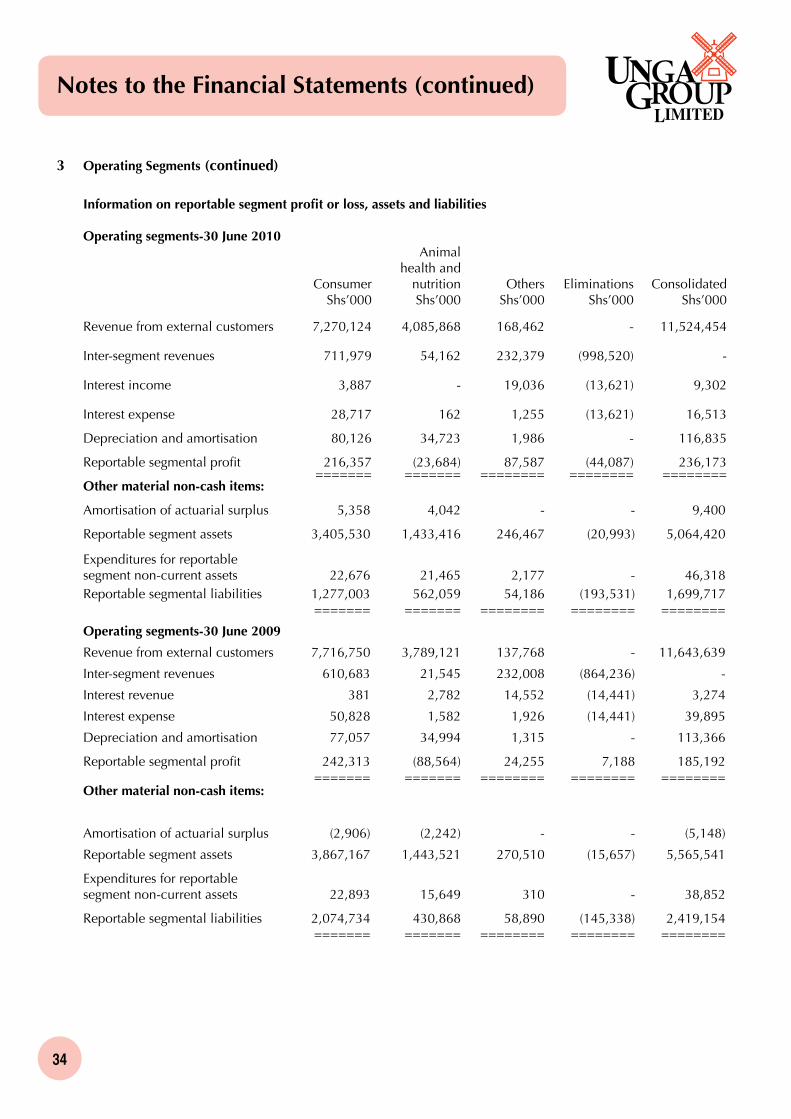
3 Operating Segments (continued)
Information on reportable segment profit or loss, assets and liabilities Operating segments-30 June 2010 Animal health and Consumer nutrition Others Eliminations Consolidated Shs’000 Shs’000 Shs’000 Shs’000 Shs’000
Revenue from external customers 7,270,124 4,085,868 168,462 - 11,524,454
Inter-segment revenues 711,979 54,162 232,379 (998,520) -
Interest income 3,887 - 19,036 (13,621) 9,302
Interest expense 28,717 162 1,255 (13,621) 16,513
Depreciation and amortisation 80,126 34,723 1,986 - 116,835
Reportable segmental profit 216,357 (23,684) 87,587 (44,087) 236,173 ======= ======= ======== ======== ========Other material non-cash items:
Amortisation of actuarial surplus 5,358 4,042 - - 9,400
Reportable segment assets 3,405,530 1,433,416 246,467 (20,993) 5,064,420
Expenditures for reportablesegment non-current assets 22,676 21,465 2,177 - 46,318Reportable segmental liabilities 1,277,003 562,059 54,186 (193,531) 1,699,717 ======= ======= ======== ======== ========
Operating segments-30 June 2009
Revenue from external customers 7,716,750 3,789,121 137,768 - 11,643,639
Inter-segment revenues 610,683 21,545 232,008 (864,236) -
Interest revenue 381 2,782 14,552 (14,441) 3,274
Interest expense 50,828 1,582 1,926 (14,441) 39,895
Depreciation and amortisation 77,057 34,994 1,315 - 113,366
Reportable segmental profit 242,313 (88,564) 24,255 7,188 185,192 ======= ======= ======== ======== ========Other material non-cash items:
Amortisation of actuarial surplus (2,906) (2,242) - - (5,148)
Reportable segment assets 3,867,167 1,443,521 270,510 (15,657) 5,565,541
Expenditures for reportablesegment non-current assets 22,893 15,649 310 - 38,852
Reportable segmental liabilities 2,074,734 430,868 58,890 (145,338) 2,419,154 ======= ======= ======== ======== ========
Notes to the Financial Statements (continued)

35
3 Operating Segments (continued)
Geographical information
At 30 June 2010
Country Non-current Revenues assets Shs’000 Shs’000
Kenya 10,591,827 1,533,960Uganda 932,627 110,623
Total 11,524,454 1,644,583 ======== =========At 30 June 2009Kenya 10,789,390 1,608,659Uganda 854,249 124,025
Total 11,643,639 1,732,684 ======== =========
4 FINANCE COSTS 2010 2009 Shs’000 Shs’000Interest payable:
Loans 2,339 3,338 Bank overdrafts 1,484 2,095 Other 12,690 34,462 ________ ________
16,513 39,895 ======= ========
5 PROFIT BEFORE TAXATION 2010 2009 Shs’000 Shs’000
The profit before taxation is arrived at after charging:
Staff costs (note 6) 461,775 393,208Depreciation (note 11) 114,489 111,169 Amortisation of prepaid operating lease rentals (note 12) 1,589 1,613Amortisation of intangible assets (note 13) 757 584Directors emoluments - fees 2,640 2,640 - other 12,554 11,799Auditors’ remuneration 7,870 7,656Loss on write off of assets 299 732 Rent payable 35,992 27,218Amortisation of defined benefit scheme asset (note 15) 9,400 5,148 Reduction in actuarial surplus on retirement benefit asset (note 15) 5,806 11,476
and after crediting:
Profit on disposal of properties held for sale - (2,264) Profit on disposal of property, plant and equipment (1,328) (2,476)Rent receivable (72) (320) Bad debt recoveries - (15,092) ======= =======
Notes to the Financial Statements (continued)
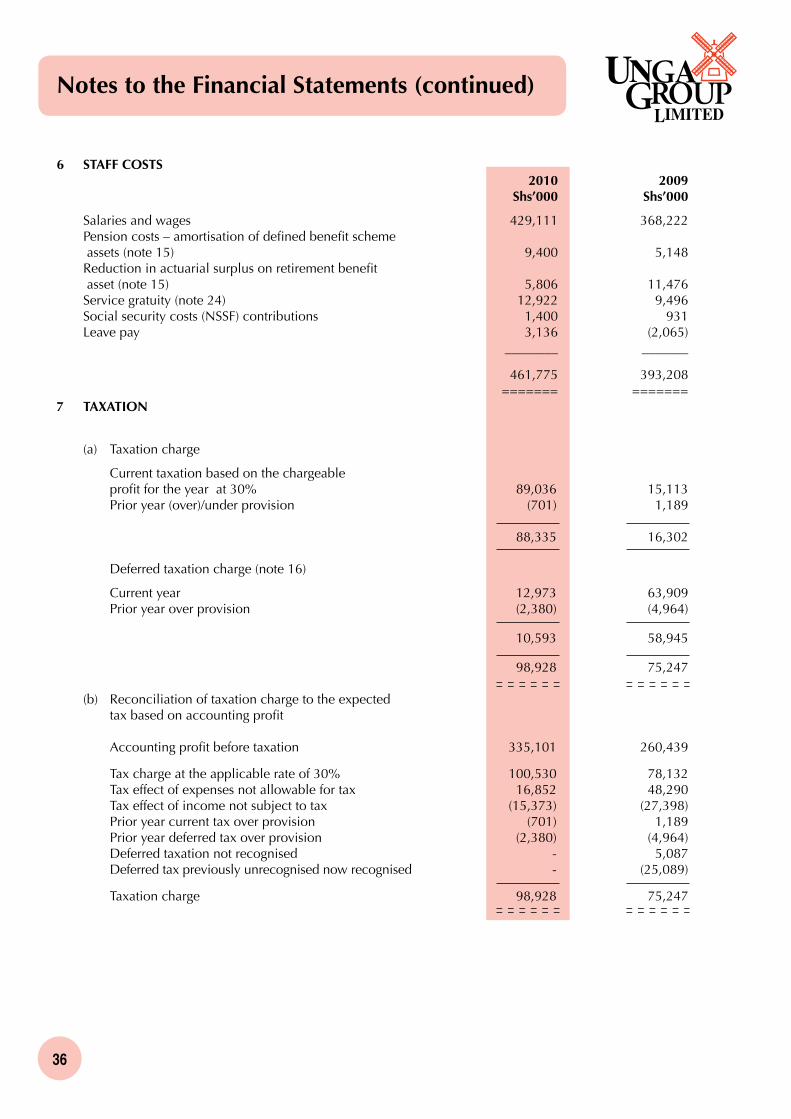
36
6 STAFF COSTS 2010 2009 Shs’000 Shs’000
Salaries and wages 429,111 368,222Pension costs – amortisation of defined benefit scheme assets (note 15) 9,400 5,148 Reduction in actuarial surplus on retirement benefit asset (note 15) 5,806 11,476 Service gratuity (note 24) 12,922 9,496 Social security costs (NSSF) contributions 1,400 931 Leave pay 3,136 (2,065) ________ _______
461,775 393,208 ======= =======
7 TAXATION
(a) Taxation charge
Current taxation based on the chargeable profit for the year at 30% 89,036 15,113 Prior year (over)/under provision (701) 1,189
88,335 16,302
Deferred taxation charge (note 16)
Current year 12,973 63,909 Prior year over provision (2,380) (4,964) 10,593 58,945 98,928 75,247
(b) Reconciliation of taxation charge to the expected tax based on accounting profit
Accounting profit before taxation 335,101 260,439
Tax charge at the applicable rate of 30% 100,530 78,132 Tax effect of expenses not allowable for tax 16,852 48,290 Tax effect of income not subject to tax (15,373) (27,398) Prior year current tax over provision (701) 1,189 Prior year deferred tax over provision (2,380) (4,964) Deferred taxation not recognised - 5,087 Deferred tax previously unrecognised now recognised - (25,089)
Taxation charge 98,928 75,247
Notes to the Financial Statements (continued)

37
2010 2009 Shs’000 Shs’000(c) Taxation payable/(recoverable)
At beginning of year: Payable 8,657 34,248 Recoverable (62,310) (30,210)
(53,653) 4,038
Charge for the year 88,335 16,302 Exchange adjustment (396) - Payments during the year (13,191) (73,993)
At end of year 21,095 (53,653)
Comprising: Payable 52,915 8,657 Recoverable (31,820) (62,310)
21,095 (53,653)
(d) Taxation payable/ (recoverable) - COMpANy
At beginning of year (4,134) (2,503) Charge for the year 5,141 1,531 Payments during the year (1,392) (3,162) ________ _______
At end of year (385) (4,134) ======= =======
8 PROFIT FOR THE YEAR
A profit of Shs 1,501,000 (2009 – Shs 5,994,000) has been dealt with in the books of the company, Unga Group Limited.
9 EARNINGS PER SHARE
Basic earnings per share has been calculated by dividing the net profit attributable to shareholders by the weighted average number of ordinary shares in issue during the year.
2010 2009
Profit for the year attributable to shareholders (Shs ‘000) 137,236 117,318 ======== ========
Weighted average number of ordinary shares 75,706,986 75,706,986 ======== ========
Basic earnings per share Sh 1.81 Shs 1.55 ======== ========
Diluted earnings per share is the same as basic earnings per share.
Notes to the Financial Statements (continued)
7 Taxation (continued)

38
10 DIVIDEND 2010 2009
Dividend – proposed (Shs) 37,853,493 - ======== ======== Number of ordinary shares 75,706,986 75,706,986 ======== ========
Dividend per share Shs 0.50 - ======== ========
In respect of the current financial year, the directors propose a first and final dividend of Shs 0.50 per ordinary share totalling Shs 37,853,493 (2009 – Nil). The proposed dividend is subject to approval by shareholders at the Annual General Meeting and has not been included as a liability in these financial statements.
Payment of dividends is subject to withholding tax at a rate of 10% for non-resident shareholders and 5% for resident shareholders. For resident shareholders, withholding tax is only deductible where the shareholding is below 12.5%.
11 PROPERTY, PLANT AND EQUIPMENT
Group Plant, Capital Leasehold machinery, Motor work in buildings and equipment vehicles progress Total Shs’000 Shs’000 Shs’000 Shs’000 Shs’000
Cost or Valuation
At 1 July 2009 856,491 1,064,627 144,694 15,032 2,080,844Exchange adjustments (2,964) (5,155) (236) - (8,355)Additions 5,165 12,046 20,301 310 37,822Disposals - - (9,126) - (9,126)Asset write off - (416) - (316) (732) Transfer from work in progress - 15,026 - (15,026) - Transfer from properties held for sale (note 21) 4,524 - - - 4,524 ________ _________ _______ ________ ________
At 30 June 2009 863,216 1,086,128 155,633 - 2,104,977 ________ _________ _______ ________ ________Comprising:Valuation in 2008 856,491 919,148 - - 1,775,639Cost 6,725 166,980 155,633 - 329,338 ________ _________ _______ ________ ________
863,216 1,086,128 155,633 - 2,104,977 ________ _________ _______ ________ ________
At 1 July 2010 863,216 1,086,128 155,633 - 2,104,977Exchange adjustments (2,256) (3,957) (182) - (6,395)Additions - 32,397 8,811 4,937 46,145Disposals - (44) (14,391) - (14,435) ________ _________ _______ _______ _______
Notes to the Financial Statements (continued)

39
Group (continued) Plant, Capital Leasehold machinery, Motor work in buildings and equipment vehicles progress Total Shs’000 Shs’000 Shs’000 Shs’000 Shs’000
At 30 June 2010 860,960 1,114,524 149,871 4,937 2,130,292 ________ _________ _______ ________ ________
Comprising:Valuation in 2008 856,491 919,148 - - 1,775,639Cost 4,469 195,376 149,871 4,937 354,653 ________ _________ _______ ________ ________
860,960 1,114,524 149,871 4,937 2,130,292 ________ _________ _______ ________ ________
Depreciation
At 1 July 2008 2,009 298,037 123,730 - 423,776Exchange adjustments (124) (462) - (586)Charge for the year 26,254 70,454 14,461 - 111,169Eliminated on disposal - - (9,126) - (9,126) ________ _________ _______ ________ ________
At 30 June 2009 28,139 368,029 129,065 - 525,233 ________ _________ _______ ________ ________At 1 July 2009 28,139 368,029 129,065 - 525,233Exchange adjustments (208) (582) (122) - (912) Charge for the year 26,500 73,977 14,012 - 114,489Eliminated on disposal - - (14,391) - (14,391) ________ _________ _______ ________ ________
At 30 June 2010 54,431 441,424 128,564 - 624,419 ________ _________ _______ ________ ________Net Book Value
At 30 June 2010 806,529 673,100 21,307 4,937 1,505,873 ======== ======== ======= ======= ========
At 30 June 2009 835,077 718,099 26,568 - 1,579,744 ======== ======== ======= ======= ========Net Book Value (Cost basis)
At 30 June 2010 694,630 466,625 21,307 4,937 1,187,499 ======== ======== ======= ======= ========
At 30 June 2009 738,634 485,689 26,568 - 1,250,891 ======== ======== ======= ======= ========
Buildings and certain items of property, plant and equipment were revalued as at 30 June 2008 by Tysons Limited, Registered Valuers and Estate Agents on an open market value basis.
The group has pledged assets with net book value of Shs 688,403,000 (2009 - Shs 723,403,000) to secure its borrowings facilities.
Notes to the Financial Statements (continued)
11 Property, Plant and Equipment (continued)

40
Notes to the Financial Statements (continued)
12 PREPAID OPERATINg LEASE RENTALS
Group 2010 2009 Shs’000 Shs’000COST
At beginning of year 60,466 61,122Exchange adjustment (735) (968)Transfer from assets held for sale (note 21) - 312 _______ ______ At end of year 59,731 60,466 _______ ______AMORTISATION
At beginning of year 16,044 14,511 Exchange adjustment (55) (80)Amortisation for the year 1,589 1,613 _______ ______
At end of year 17,578 16,044 _______ ______
NET BOOK VALUE
At end of year 42,153 44,422 ====== ======
The group has pledged leasehold land with a net book value of Shs 14,704,000 (2009 - Shs 15,500,000)to secure borrowings granted to it.
13 INTANGIBLE ASSETS - COMPUTER SOFTWARE
Group 2010 2009 Shs’000 Shs’000COSTAt beginning of year 40,944 39,914 Additions 173 1,030 Exchange difference (12) - Write off (299) - _______ ______At end of year 40,806 40,944 _______ ______AMORTISATION At beginning of year 39,289 38,705 Amortisation for the year 757 584 _______ ______ At end of year 40,046 39,289 _______ ______
NET BOOK VALUEAt end of year 760 1,655 ====== ======

41
14 INVESTMENT IN SUBSIDIARY COMPANY
Group 2010 2009 Shs’000 Shs’000Unquoted investment at cost in wholly owned subsidiary: Unga Investments Limited 1,297,335 1,297,335 ======= ======== Details of the company’s subsidiaries are as follows:
Unga Investments Limited has a 65% holding in its subsidiary, Unga Holdings Limited, which has the following subsidiaries:
Unga Farm Care (East Africa) Limited has a 74% holding in Unga Farm Care (Tanzania) Limited, a company incorporated in Tanzania. This subsidiary is dormant and is currently undergoing liquidation. The carrying amount of this investment has been fully impaired.
NameShare capital
Shs ‘000Country of incorporation
Principal activity Percentage
Unga Investments Limited 22,200 KenyaOperates as a holding and an investment company.
100
CompanyShare capital
Shs ‘000Country of Incorporation
Principal activity Percentage
Unga Limited 220,000 KenyaMilling and sale of wheat and maize.
100%
Unga Farm Care (East Africa) Limited
22,520 Kenya
Manufacture and distribution of animal health and crop protection products, animal feeds and mineral supplements.
100%
Unga Feeds Limited 42,300 Kenya Dormant company. 100%
Unga Foods Limited 15,400 Kenya Dormant company. 100%
Bullpak Limited 4,760 KenyaManufacture and sale of packaging material for wheat and maize flour products.
51%
Unga Millers (U) Limited Ush 231,881 UgandaMilling and sale of wheat and maize, and distribution of animal nutrition products.
60%
Notes to the Financial Statements (continued)

42
15 RETIREMENT BENEFITS ASSET
Group
The retirement benefits scheme asset represents a surplus of the fair value of scheme assets over the value of past service pension benefits based on an actuarial valuation carried out as at 31 December 2009. In accordance with a recommendation by the actuaries, the group is taking a contribution holiday for 5 years with effect from 1 January 2010.
The length of the contribution holiday is subject to review at every valuation date based on the advice of the Actuaries. The next actuarial valuation is due as at 31 December 2012.
The principal actuarial assumptions applied in the last valuation were:
Rate of interest 9% Rate of salary escalation 7% Rate of pension increases 0% ======
Amounts recognised in profit or loss in respect of the defined benefit plan are as follows:
2010 2009 Shs’000 Shs’000Reduction in actuarial surplus arising from valuation in the year (note 6) 5,806 11,476Amortisation of surplus 9,400 5,148 _______ _______
15,206 16,624 ====== =======
The amount included in the statement of financial position arising from the group’s obligation in respect of this defined benefit plan is as follows: 2010 2009 Shs’000 Shs’000
Fair value of plan assets 268,300 246,181Present value of funded defined benefit obligation (176,300) (143,227) _______ _______ Excess of plan assets over accrued liabilities 92,000 102,954Charge recognised in profit or loss (9,400) (5,148) _______ _______
Net asset arising from defined benefit obligation 82,600 97,806 ====== ========Movement:
Share of excess of plan assets over accrued liabilities b/f 102,954 129,013Reduction in actuarial surplus arising from valuation in the year (note 6) (5,806) (11,476) _______ ________
Share of excess of plan assets over accrued liabilities c/f 97,148 117,537 _______ ________
Notes to the Financial Statements (continued)

43
2010 2009 Shs’000 Shs’000
Amortisation at beginning of year (5,148) (14,583) Charge recognised in profit or loss (9,400) (5,148) _______ ________
Amortisation at end of year (14,548) (19,731) _______ ________
Net asset arising from defined benefit obligation 82,600 97,806 ====== ========
16 DEFERRED TAXATION
Deferred taxation is provided on all temporary differences under the liability method using the currently enacted rate of 30%. 2010 2009 Shs’000 Shs’000 The net deferred taxation liability is made up as follows:
Deferred tax liabilities: Accelerated capital allowances 87,561 92,452 Unrealised exchange differences - 19,165 Revaluation surpluses in subsidiary companies 276,128 284,431 ________ ________
363,689 396,048 ________ ________ Deferred tax assets: Tax losses available for offset against future profits (258) (66,728) Provision for leave pay (2,915) (1,425) General provisions (58,950) (51,721) Provision for service gratuity (19,931) (17,566) Unrealised exchange differences (11,524) - _______ _______
(93,578) (137,440) _______ _______
Net deferred tax liability 270,111 258,608 Deferred tax asset not recognised - 2,347 ________ ________
Net deferred tax liability recognised 270,111 260,955 ======= ======== Movement on the deferred tax account is as follows:
At beginning of year 260,955 202,205 Exchange adjustments (1,437) (195) Charge recognised in profit or loss(note 7) 10,593 58,945 ________ _______
At end of year 270,111 260,955 ======= =======
15 RETIREMENT BENEFITS ASSET (continued)
Notes to the Financial Statements (continued)
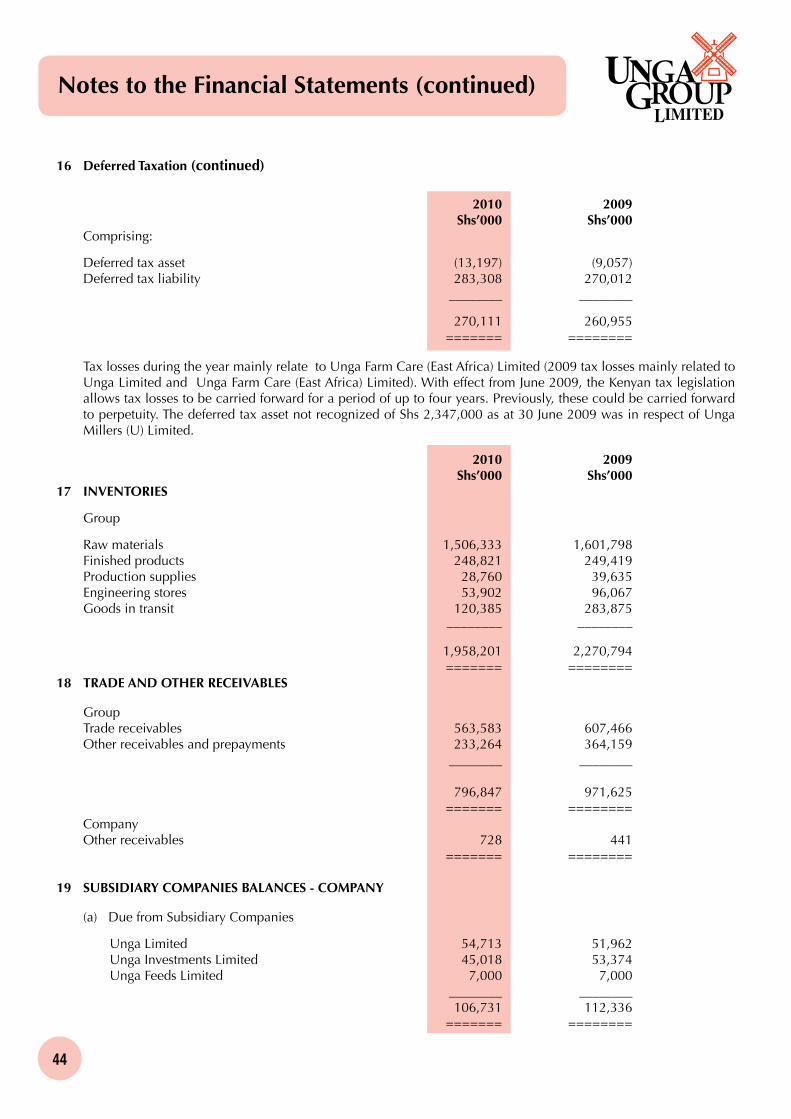
44
16 Deferred Taxation (continued)
2010 2009 Shs’000 Shs’000 Comprising:
Deferred tax asset (13,197) (9,057) Deferred tax liability 283,308 270,012 ________ ________
270,111 260,955 ======= ========
Tax losses during the year mainly relate to Unga Farm Care (East Africa) Limited (2009 tax losses mainly related to Unga Limited and Unga Farm Care (East Africa) Limited). With effect from June 2009, the Kenyan tax legislation allows tax losses to be carried forward for a period of up to four years. Previously, these could be carried forward to perpetuity. The deferred tax asset not recognized of Shs 2,347,000 as at 30 June 2009 was in respect of Unga Millers (U) Limited.
2010 2009 Shs’000 Shs’00017 INVENTORIES
Group
Raw materials 1,506,333 1,601,798 Finished products 248,821 249,419 Production supplies 28,760 39,635 Engineering stores 53,902 96,067 Goods in transit 120,385 283,875 ________ ________ 1,958,201 2,270,794 ======= ========18 TRADE AND OTHER RECEIVABLES
Group Trade receivables 563,583 607,466 Other receivables and prepayments 233,264 364,159 ________ ________ 796,847 971,625 ======= ======== Company Other receivables 728 441 ======= ========
19 SUBSIDIARY COMPANIES BALANCES - COMPANY (a) Due from Subsidiary Companies
Unga Limited 54,713 51,962 Unga Investments Limited 45,018 53,374 Unga Feeds Limited 7,000 7,000 ________ ________ 106,731 112,336 ======= ========
Notes to the Financial Statements (continued)

45
19 Subsidiary Companies Balances - Company (continued)
2010 2009 Shs’000 Shs’000 (b) Due to Subsidiary Companies Unga Holdings Limited 23,013 23,013 ======= ========20 TERM DEPOSITS
Group
Maturing within 90 days: 133,402 19,359 Maturing within 180 days: 69,500 30,000 ________ ________
Term deposits with banks 202,902 49,359 ======= ======== Company
Term deposits with banks: Maturing within 180 days: 69,500 30,000 ======= ========
The effective interest rate on term deposits as at 30 June 2010 was 4% (2009 – 6%).
21 PROPERTIES HELD FOR SALE
2010 2009 Shs’000 Shs’000
Group At beginning of year 3,928 7,634 Disposals - (2,798) Reclassified from prepaid operating lease rentals (note 12) - 3,928 Reclassified to prepaid operating lease rentals (note 12) - (312) Reclassified to property, plant and equipment rentals (note 11) - (4,524) ________ __________
At end of year 3,928 3,928 ======= ========
A deposit of Sh 7 million representing 10% of the agreed sales price for this property was received by Unga Investments Limited from the buyer during the year. 22 SHARE CAPITAL 2010 2009 Shs’000 Shs’000 Authorised: 82,760,000 ordinary shares of Shs 5 each 413,800 413,800 ======= =======
Issued and fully paid: 75,706,986 ordinary shares of Shs 5 each 378,535 378,535 ======= =======
Notes to the Financial Statements (continued)

46
23 NON-CONTROLLING INTEREST
2010 2009 Shs’000 Shs’000 Group At beginning of year 979,413 918,985 Dividend paid (11,025) (9,920) _________ __________
968,388 909,065 _________ __________
Share of profit for the year 98,937 67,874 Exchange adjustment (2,391) 2,474 _________ __________
Total comprehensive income for the year 96,546 70,348 _________ __________
At end of year 1,064,934 979,413 ======= ======== The non-controlling interest consists of:
Unga Holdings Limited: Equity interest held by Seaboard Corporation 35% 988,144 922,790
Bullpak Limited: Equity interest held by Nampak Holdings Limited 49% 64,248 56,623
Unga Millers (U) Limited: Equity interest held by individual minority shareholders 40% 12,542 - _________ __________
1,064,934 979,413 ======= ========
24 SERVICE GRATUITY 2010 2009 Shs’000 Shs’000 Group At beginning of year 58,553 57,233 Charge recognised in profit or loss 12,922 9,496 Paid during the year (5,037) (8,176) ________ _______
At end of year 66,438 58,553 ======= =======
The service gratuity represents the present value of future obligations in respect of unionisable staff in accordance with the Collective Bargaining Agreement.
Notes to the Financial Statements (continued)

47
25 LOANS PAYABLE
2010 2009 Shs’000 Shs’000 Group At beginning of year 5,577 4,557 Exchange adjustment (278) 1,020 Loans received 309 - ________ _______
At end of year 5,608 5,577 ======= =======
These are short term loans advanced by the minority shareholders to a subsidiary company. The loans attract interest at 12% per annum (2009: 12%) and are repayable by September 2010.
26 TRADE AND OTHER PAYABLES
2010 2009 Shs’000 Shs’000 Group Trade payables 342,345 560,349 Other payables and accruals 193,168 206,196 ________ _______
535,513 766,545 ======= ======= Company Other payables and accruals 6,505 5,436 ======= =======
27 DUE TO RELATED COMPANIES
Group Seaboard Overseas Corporation 706,768 1,202,819 Nampak Kenya Limited 1,083 57,938 Nampak International Limited 26,602 27,571 ________ ________
734,453 1,288,328 ======= ======== The amounts are repayable as follows:
On demand or within one year 728,845 1,282,751 In the second to the fifth years 5,608 5,577 ________ ________
734,453 1,288,328 ======= ========
Notes to the Financial Statements (continued)

48
28 NOTES TO THE STATEMENT OF CASH FLOWS 2010 2009 Shs’000 Shs’000 (a) Reconciliation of profit before taxation to cash generated from operations
Profit before taxation 335,101 260,439
Adjustments for: Depreciation (note 11) 114,489 111,169 Amortisation of prepaid operating lease rentals (note 12) 1,589 1,613 Amortisation of intangible assets (note 13) 757 584 Profit on disposal of properties held for sale - (2,264) Profit on disposal of property, plant and equipment (1,328) (2,476) Loss on write off of asset (note 11) - 732 Loss on write off of intangible asset (note 13) 299 - Amortization of retirement benefits asset (note 15) 9,400 5,148 Reduction in actuarial surplus arising from valuation of retirement benefit asset in the year (note 15) 5,806 11,476
Working capital changes;
Decrease/(increase) in inventories 311,737 (1,060,365) Decrease in trade and other receivables 174,526 44,578 Decrease in trade and other payables (230,803) 215,485 Movement in related company balance (553,875) 364,458 Increase in service gratuity 7,885 1,320 ________ ________
Cash generated from/(used in) operations 175,583 (48,103) ======= ========
(b) Analysis of the balances of cash and cash equivalents as shown in the statement of financial position
Bank balances 425,780 474,643 Cash balances 359 198 ________ ________ 426,139 474,841 Term deposits (note 20) 133,402 19,359 ________ ________
At end of year 559,541 494,200 ======= ========
Notes to the Financial Statements (continued)

49
2010 2009 Shs’000 Shs’000
(c) Exchange adjustments on working capital
Inventories (856) 13,184 Trade and other receivables (252) 1,762 Trade and other payables (229) 2,827 ________ _______
(1,337) 17,773 ======= =======
For the purpose of the cash flow statement, cash equivalents include short term liquid investments which are readily convertible into known amounts of cash and which were within three months of maturity when acquired, less advances from the bank repayable within three months from the date of advance.
28 Notes to the Statement of Cash Flows (continued)
29 RELATED PARTY TRANSACTIONS
By an agreement entered into on 17 March 2000 and later amended on 27 April 2002, Unga Holdings Limited is managed by Seaboard Overseas Management Company. Under this agreement Seaboard Overseas Management Company provides technical and operational support including a resident management team. The agreement was for an initial term of five years and could be extended for a further five-year term at the option of the management company. This has been extended for a further five year term.
A profit-based management fee is currently payable, subject to a minimum of Shs 12 million per year. Seaboard Overseas Management Company is a related party by virtue of common shareholding.
2010 2009 Shs’000 Shs’000 Group
During the year the following transactions were entered into with related parties
Purchase of goods/services:
Raw material purchases 3,220,339 4,848,153 Management fee - Seaboard Overseas Management Company 19,233 18,944 Other expenses - Seaboard Overseas Management Company 67,251 55,426 - Nampak Kenya Limited 5,104 5,104 Spares purchases - Seaboard Overseas Limited 26,783 37,085 Interest charged 2,317 24,189 ======== ======= Company
Management fee 12,000 12,000 ======= =======
Amounts not settled as at the end of the reporting period are disclosed in note 27.
Notes to the Financial Statements (continued)

50
29 Related Party Transactions (continued)
Key management compensation
The remuneration of directors and other members of key management during the year were as follows:
2010 2009 Shs’000 Shs’000
Salaries and other short-term employment benefits 43,183 48,871 ======= ====== Directors’ remuneration
Fees for services as a director 2,640 2,640 Other emoluments (included in key management compensation above) 12,554 11,799 ________ _______
15,194 14,369 ======= =======
30 CAPITAL RISK MANAGEMENT
The group manages its capital to ensure that it will be able to continue as a going concern while maximising the return to stakeholders through the optimisation of the debt and equity balance.
The capital structure of the group consists of debt, cash and cash equivalents and equity attributable to equity holders, comprising issued capital and reserves.
Consistent with others in the industry, the group monitors capital on the basis of the gearing ratio. This ratio is calculated as net debt divided by total capital. Net debt is calculated as total borrowings less cash and cash equivalents. The constitution of capital managed by the group is as follows:
2010 2009 Shs’000 Shs’000
Share capital 378,535 378,535 Share premium 73,148 73,148 Revaluation reserve 715,018 738,456 Translation reserve 7,215 11,656 Revenue reserve 1,125,853 965,179 ________ ________
Equity 2,299,769 2,166,974 ======= ========
Borrowings 5,608 5,577 Less: bank and cash balances (629,041) (524,200) ________ _________
Net bank and cash balances (623,433) (518,623) ======= ========
Notes to the Financial Statements (continued)

51
31 FINANCIAL RISK MANAGEMENT
The group’s activities expose it to a variety of financial risks, including credit risk and the effects of changes in debt prices, foreign currency exchange rates and interest rates. The group’s overall risk management programme focuses on the unpredictability of financial markets and seeks to minimise potential adverse effects on its financial performance.
Risk management is carried out by management under policies based on guidance received from the board of directors. Management identifies and evaluates financial risks. The board provides guidance for overall risk management, as well as providing direction on specific areas such as foreign exchange risk and liquidity risk.
The group has policies in place to ensure that sales are made to customers with an appropriate credit history.
Credit risk
Credit risk is managed on a group-wide basis. Credit risk arises from cash and cash equivalents, deposits with banks, as well as trade and other receivables. The credit risk on liquid funds is limited because the counterparties are banks with high credit-ratings assigned by the banking regulatory authority The group management assesses the credit quality of each customer, taking into account their financial position, past experience and other factors. Individual risk limits are set based on internal or external ratings in accordance with limits set by the management. The utilisation of credit limits is regularly monitored.
The amount that best represents the group’s and company’s maximum exposure to credit risk as at the end of each reporting period is made up as follows:
Group
30 June 2010 Fully performing Past due Impaired Total Shs’000 Shs’000 Shs’000 Shs’000 Trade receivables 504,272 59,311 228,811 792,394Bank balances 425,780 - - 425,780Term deposits 202,902 - - 202,902 ________ ________ ________ ________ 1,132,954 59,311 228,811 1,421,076 ======== ======= ======== ========
30 June 2009 Trade receivables 487,983 119,483 206,069 813,535Bank balances 474,643 - - 474,643Term deposits 49,359 - - 49,359 ________ ________ ________ ________ 1,011,985 119,483 206,069 1,337,537 ======== ======= ======== ========
Notes to the Financial Statements (continued)

52
Company
30 June 2010 Fully performing Past due Impaired Total Shs’000 Shs’000 Shs’000 Shs’000 Due from subsidiary companies 106,731 - - 106,731Bank balances 4,868 - - 4,868Term deposits 69,500 - - 69,500 ________ ________ ________ ________ 181,099 - - 181,099 ======== ======= ======== ========30 June 2009
Due from subsidiary companies 112,336 - - 112,336Bank balances 32,731 - - 32,731Term deposits 30,000 - - 30,000 ________ ________ ________ ________ 175,067 - - 175,067 ======== ======= ======== ========Credit risk (Continued) The customers under the fully performing category are paying their debts as they continue trading.
The receivables that are past due relate to trade receivables overdue between 30 to 120 days. These receivables are not impaired and continue to be paid. The credit control department is actively following these receivables. Cash deposits of Shs 15,750,000 (2009: Shs 15,400,000) and bank guarantees amounting to Shs 239,000,000 (2009: Shs 139,575,000) are held as collateral for trade receivables.
The impaired amounts are fully provided for and the amount of the loss incurred dealt with in profit or loss during the year of impairment.
In determining the recoverability of a trade receivable, the company considers any change in the credit quality of the trade receivable from the date credit was initially granted up to the end of the reporting period. The concentration of credit risk is limited due to the customer base being large and unrelated. Liquidity risk
Ultimate responsibility for liquidity risk management rests with the board of directors, which together with management, closely monitors the group’s short, medium and long term funding and liquidity management requirements. The group manages liquidity risk by maintaining adequate reserves, banking facilities and reserve borrowing facilities, by continuously monitoring forecast and actual cash flows and matching the maturity profiles of financial assets and liabilities.
The following table analyses the group’s financial liabilities that will be settled on a net basis into relevant maturity groupings based on the remaining period at end of reporting period to the contractual maturity date. The amounts disclosed in the table below are the contractual undiscounted cash flows. Balances due within 12 months equal their carrying balances, as the impact of discounting is not significant.
31 Financial Risk Management (continued)
Notes to the Financial Statements (continued)
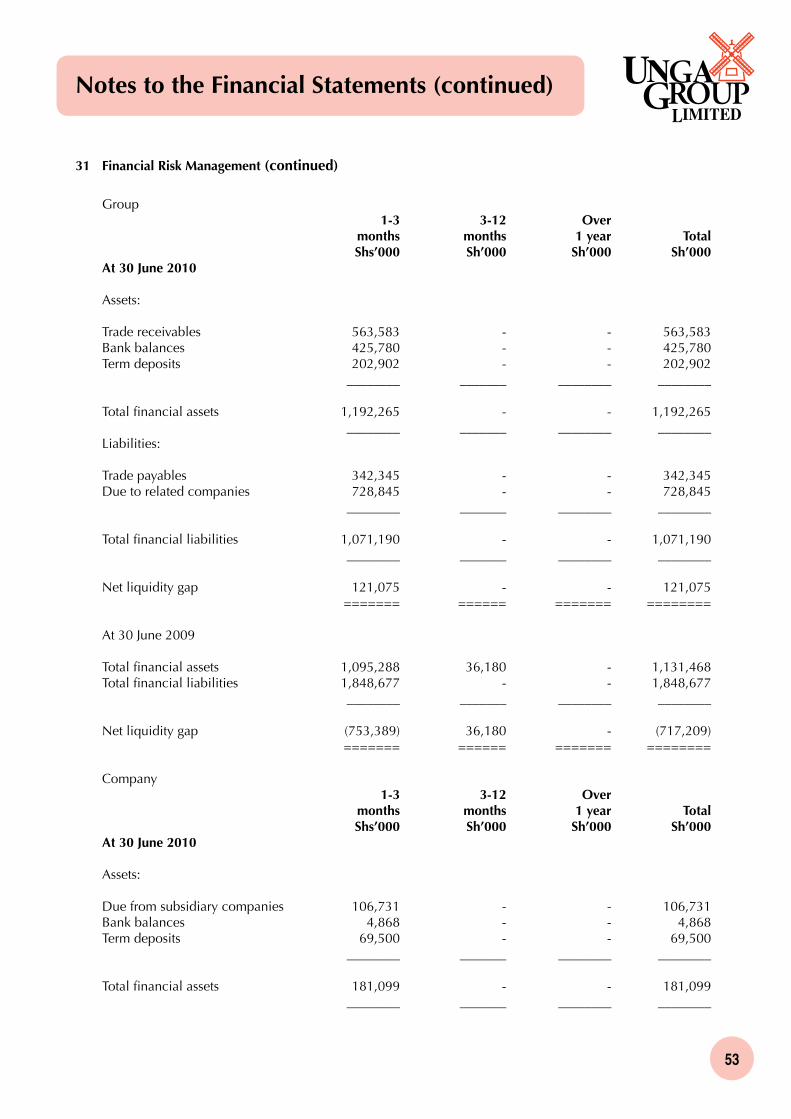
53
31 Financial Risk Management (continued)
Group 1-3 3-12 Over months months 1 year Total Shs’000 Sh’000 Sh’000 Sh’000At 30 June 2010
Assets:
Trade receivables 563,583 - - 563,583Bank balances 425,780 - - 425,780Term deposits 202,902 - - 202,902 ________ _______ ________ ________
Total financial assets 1,192,265 - - 1,192,265 ________ _______ ________ ________Liabilities: Trade payables 342,345 - - 342,345Due to related companies 728,845 - - 728,845 ________ _______ ________ ________
Total financial liabilities 1,071,190 - - 1,071,190 ________ _______ ________ ________ Net liquidity gap 121,075 - - 121,075 ======= ====== ======= ========
At 30 June 2009
Total financial assets 1,095,288 36,180 - 1,131,468Total financial liabilities 1,848,677 - - 1,848,677 ________ _______ ________ ________
Net liquidity gap (753,389) 36,180 - (717,209) ======= ====== ======= ========
Company 1-3 3-12 Over months months 1 year Total Shs’000 Sh’000 Sh’000 Sh’000At 30 June 2010
Assets:
Due from subsidiary companies 106,731 - - 106,731Bank balances 4,868 - - 4,868Term deposits 69,500 - - 69,500 ________ _______ ________ ________
Total financial assets 181,099 - - 181,099 ________ _______ ________ ________
Notes to the Financial Statements (continued)

54
31 Financial Risk Management (continued)
1-3 3-12 Over months months 1 year Total Shs’000 Sh’000 Sh’000 Sh’000Liabilities: Due to related company 23,013 - - 23,013 ________ _______ ________ ________
Net liquidity gap 158,086 - - 158,086 ======= ====== ======= ========
At 30 June 2009
Total financial assets 175,067 - - 175,067Total financial liabilities 23,013 - - 23,013 ________ _______ ________ ________
Net liquidity gap 152,054 - - 152,054 ======= ====== ======= ========
The group has undrawn committed borrowing facilities amounting to Sh 400,000,000 (2009 – Sh 125,000,000). The borrowing facilities consist of loans and bank overdrafts. Security for these borrowings includes an all assets debenture for Shs 1.5 billion issued by a subsidiary company, corporate guarantees by group companies and legal charges over certain properties owned by subsidiary companies, and a property registered in the name of a group company (See notes 11 and 12).Market risk
(i) Foreign exchange risk
The group undertakes certain transactions denominated in foreign currencies. Exchange rate exposures are managed within approved parameters.
The carrying amounts of the group’s foreign currency denominated monetary assets and liabilities at end of reporting period date are as follows:
Group USD gBP EURO Shs’000 Shs’000 Shs’000 30 June 2010 Assets
Bank and cash balances 54,764 - 5,279 ======= ====== =====
Liabilities
Trade payables 25,149 1,188 - Due to related companies 269,187 - 20,663 ________ _______ ______
294,336 1,188 20,663 ======= ====== ======
Notes to the Financial Statements (continued)

55
31 Financial Risk Management (continued)
USD gBP EURO Shs’000 Shs’000 Shs’000 30 June 2009
Total assets 71,540 - 143 ======= ====== ======
Total liabilities 912,528 8,437 16,855 ======= ====== ======
At 30 June 2010, if the Shilling had weakened/strengthened by 5% against the foreign currencies with all other variables held constant, the impact on pre tax profit for the year and total capital would have been Shs 12,807,000 (2009: Shs 43,307,000) lower/higher, mainly as a result of export sales, foreign denominated loans and bank balances.
Company
The company has no foreign denominated financial instruments and thus not exposed to foreign exchange risks.
(ii) Interest rate risk
Interest rate risks arise from fluctuations in the bank borrowing rates. The interest rates vary from time to time depending on the prevailing economic circumstances. The group closely monitors the interest rate trends to minimize the potential adverse impact of interest rate changes.
As at 30 June 2010, the group had short term and fixed deposits with a carrying amount of Shs 202,902,000 (2009: Shs 49,359,000). An increase or decrease of 10 percent in the interest rate would result in an increase/decrease in pre-tax profit and total capital of Shs 405,804 (2009: Shs 296,154). The company had no other interest bearing financial assets and liabilities.
(iii) Price risk Price risk arises from fluctuations in the prices of equity investments. At 30 June 2010 and 30 June 2009, the group did not hold investments that would be subject to price risk; hence this risk is not relevant.
2010 2009 Shs’000 Shs’000
32 CAPITAL COMMITMENTS
Commitments at the year end for which no provisionhas been made in these financial statements:
Group
Authorised but not contracted for 699,974 623,162 ======= =======
33 CONTINGENT LIABILITIES
Guarantees 56,610 20,601 ======= ========
Notes to the Financial Statements (continued)
56
33 Contingent Liabilities (continued)
Several legal claims have been made against the group by former employees, mainly for wrongful dismissal or industrial accident claims. The cases are ongoing and their likely outcomes are not known.
The directors, based on advice received from the group’s legal advisors, believe no material liability will arise from these cases.
34 INCORPORATION
The company is domiciled and incorporated in Kenya under the Companies Act.
35 CURRENCY
The financial statements are presented in Kenya Shillings thousands (Shs’000).
Notes to the Financial Statements (continued)

57

58

59
I/We
of being a member/members
of Unga Group Limited, hereby appoint
and failing him/her
whom failing, the duly appointed Chairman of the Meeting, as my/our proxy, to vote for me/us and
on my/our behalf at the Eighty Third Annual General meeting of the Company to be held on Wednes-
day, 1 December 2010 at 10.30 a.m. and at any adjournment thereof.
As witness my/our hand this day of 2010
Signed Signed
Notes
1 If you are unable to attend this meeting personally, this form should be completed and returned to the Secretary, Unga Group Limited, P O Box 30096, 00100 Nairobi, to reach him no later than 48 hours before the time appointed for the meeting.
2. A person appointed to act as a proxy need not also be a member of the Company.3. If the appointer is a corporation, this form must be under its common seal or under the hand of an
officer or an attorney duly authorised in writing.
NoYes Item No.
2 4 5
6 (i) 6 (ii)
6 (iii)
7
8
I authorise my proxy to vote as follows on the resolutions for the meeting:
Form of Proxy

60
The Secretary
UNgA gROUP LIMITEDP.O. Box 3009600100 GpONAIROBI
FOLD 3
FOLD 2
FOLD
1
