annual report and accounts for the year to 31 july 2017 · revaluation reserve comprehensive income...
TRANSCRIPT

Annual Report and Accounts for the Year to 31 July 2017www.ed.ac.uk

*Sources: QS World University Rankings 2016/17 and Times Higher Education World University Rankings 2016/17
The University of Edinburgh at a glance
Our strategic objectives
University world league table position*
QS 19thTHE 27th
Leadership in learning
We equip students with the knowledge, skills and experiences to flourish in a complex world and become successful graduates who contribute to society.
Leadership in researchAs a major, comprehensive university, we conduct research of the highest standard across a broad spectrum of disciplines.
Total research income (£m)*
2017 2652016 254 2015 2312014 216
10%The number of research applications in 2016/17 grew by ten per cent.
*Source: HESA Destination of Leavers of Higher Education survey, published July 2016.
*Figures exclude exceptional items.
Our statements
The Consolidated Comprehensive Statement of Income (COSI)We have reported our financial statements 2016/17 in line with Financial Reporting Standard 102 (FRS 102) which came in to effect for the University on 1st August 2015.
FRS102 has changed the Financial Statements fundamentally: both in format and also the and interpretation of key figures and accounting concepts. As the standard is still relatively new and the notes overleaf guide the user on key changes and on how to interpret this statement
Notes
a Income
Tuition fees and education contracts
b Funding body grants
Research income
Other income
Investment income
c Donations and endowments
Total income
d Expenditure
Staff costs
Other operating expenses
Depreciation
Interest and other finance costs
Total expenditure
Surplus/(deficit) before other gains and losses
Gain on disposal of fixed assets
e Gain on investments
Surplus/(deficit) before tax
Taxation
f Surplus/(deficit) for the year
gUnrealised surplus on revaluation of heritage assets
Actuarial loss in respect of pension schemes
Total comprehensive income for the year
h Represented by:
i Unrestricted comprehensive income for the year
Restricted comprehensive income for the year
Endowment comprehensive income for the year
Revaluation reserve comprehensive income for the year
a) The income format and content has changedTuition fees now appear first on the statement and are reported before funding body grants.
b) Income from funding body grants now includes capital grants recognised in full on receiptPreviously, the majority of SFC capital grants were deferred on the balance sheet and ‘drip fed’ into income over a number of years as the capital items were depreciated. Now, only capital grants with performance related conditions are deferred, and then released to the COSI once the conditions are met.
c) New donations/endowments are now recognised as income in the year of receiptPreviously, income from donations and endowments was deferred and then recognised when we spent it. Now, this income will be included in the year it is received or pledged, but, as with capital grants, we still defer this income if the donation has performance related conditions that have not been met at the balance sheet date.
Also, when a donor endows money (where initial sum is invested and we spend the interest) this appears here too, even though this initial sum is invested to generate a return.
d) Expenditure format is unchanged — but changes behind the scenesThere is no change to format, although accounting treatment of some of the numbers. For example, staff costs now include a new provision relating to the University’s share of the USS deficit recovery plan and a provision for holiday pay earned but not taken at the balance sheet date. Other operating expenses are lower as more Estates project spend is capitalised.
e) Unrealised gains/losses on investments (not yet converted to cash) now feature hereThese used to appear within the Statement of Total Recognised Gains and Losses.
f) Surplus for the year has changedThis no longer represents funds available for reinvestment. The term ‘surplus’ now includes capital grants, restricted resources (for example endowments) and unrealised sums valued at a point in time.
g) Unrealised gains/losses on revaluation and pension schemes now includedThese amounts, not yet converted to cash, are calculated as at a point in time, using market indices.
h) Comprehensive income lines are newThese represent the net movement during the year between income and expenditure, as well as any unrealised gains, for each reserve.
Restricted funds were previously reported as deferred income on the balance sheet but will now flow to the restricted income and expenditure reserve, this ‘ring-fences’ restricted income for its intended purpose.
i) Unrestricted comprehensive income for the yearWe now believe this to be the most appropriate measure of our performance and sustainability.
93%Our percentage of UK/EU graduates in employment or further study six months after graduating is 92.8 per cent.*

Overview01 Highlights of 2017 02 Our approach to reporting 03 Material issues 04 Vice-Convener of Court’s introduction 06 Principal’s foreword
Strategy and value model 08 Our strategy10 Our value model 12 Understanding our risks
Operational review 16 Operational review
Financial review24 Finance Director’s foreword 26 Financial review
Our vision We deliver impact for society.
As a truly global university, rooted in Scotland’s capital city, we make a significant, sustainable and socially responsible contribution to the world.
Governance 36 Corporate governance statement 44 Independent auditor’s report to the Court of
the University of Edinburgh
Financial statements 46 Consolidated and University statement of comprehensive income and expenditure47 Consolidated and University statement of
changes in reserves48 Consolidated and University balance sheet49 Consolidated statement of cash flow 50 Notes to the financial statements85 Five-year summary (unaudited)
Table of contents

To view our Annual Report and Accounts online, please visit: www.ed.ac.uk/finance/accounts
*figures exclude exceptional items **applicants accepted from the Scottish index of multiple deprivation 20 per cent most deprived postcodes shown by year of entry
£9.7m We awarded £9.7 million through our three main UK undergraduate bursary schemes.
0 20 40 60 80 100
2016
162
2015
2017
131
121
1302014
SIMD 20 student entrants**
10%Income from research grants and contract grew by 10 per cent year-on-year.
0 20 40 60 80 100
2016
929
2015
2017
2014
889
825
781
Total revenue (£m)*
10.5 Our undergraduate applicant-to-enrolments ratio was 10.5 for the 2016/17 academic year.
0 20 40 60 80 100
2016
39,575
2015
2017
2014
37,510
35,255
33,110
Student numbers 16%The University’s annual return on endowment funds was 16.3 per cent in 2016/17.
0 20 40 60 80 100
2016
392
2015
2017
2014
343
315
295
Endowment fund value (£m)
43% The percentage of students from outside the UK.
0 20 40 60 80 100
2016
188
2015
2017
136
96
Capital expenditure (£m)
Highlights of 2017
1Annual Report and Accounts 2016/17
Overview
Strategy and value model
Operational review
Financial review
Governance
Financial statements

In line with good reporting practice, we aim to think beyond just our financial value and incorporate non-financial performance into our assessment too, as a way of presenting a more balanced report of how we create value in the short, medium and long term. The report considers all resources that contribute to value creation, as well as identifying the risks, opportunities and outcomes that could affect our ability to create value over time. We recognise that our stakeholders have a significant influence on the ability of the University to create value and are essential to our success.
Our value model on page 10 explains how we are shaped by our external environment as well as our vision and strategy, risks and opportunities and the interdependencies among key resources. Various forms of capital determine the value of the University:
• Reputation• Social and relationship• People• Knowledge• Financial• Physical• Natural With more than 14,000 staff and more than 39,000 students, we understand the significance of our impact on these varying capitals and their role in value creation and longevity of our institution.
In the next academic year, the Leadership Foundation will be supported by the Funding Councils to work with the IIRC and the British Universities Finance Directors Group (BUFDG), to investigate how integrated thinking and reporting can be applied more widely across higher education in the same way that it has been incorporated into many other sectors of the economy and across the world. In recent years, BUFDG have encouraged universities to adopt integrated reporting and have supported and guided us through our journey.
The IR framework was developed by the International Integrated Reporting Council (IIRC) and we have followed the guiding principles in Section 3 of the IR Framework. We incorporated IR into our 2015/16 Annual Report and Accounts to communicate a clear, integrated narrative that demonstrates our overall performance and value.
We have continued this journey in our Annual Report and Accounts for 2016/17, which describes our integrated thinking and explains how the information in the report is interrelated.
Last year was the beginning of our Integrated Reporting (IR) journey.
Our approach to reporting
Integrated reporting communicates how economic, environmental and social sustainability is incorporated and implemented into an organisation’s strategy. It recognises ‘value’ as more than simply financial value and allows reporting to adapt to a constantly changing, demanding environment.
Professor Mervyn King Chair, IIRC
2 Annual Report and Accounts 2016/17

The student experienceThe experience of our students while they study here is of vital importance to the University, and our rating in the National Student Survey (NSS) of 83 per cent is an area of focus for improvement. Students are already benefiting from our increased investment in teaching, but there is more for us to do.
This is covered in the Vice-Convener of Court’s introduction on page four, included in the Strategic Plan performance framework on page nine, the Risk Register on pages 14 and 15 and page 19 of the Operational Review.
Details of the University’s work to enhance the student experience can be found at www.ed.ac.uk/staff/enhancing-student-experience.
Political uncertaintyLast summer’s vote to leave the European Union, followed by an unclear outcome from the 2017 General Election has caused inevitable uncertainty. Nobody yet knows the long-term effect of leaving the EU, but it is clear that our role as one of the leading teaching and research-intensive universities in the world is more important than ever, and it is our job to seize the opportunities ahead whilst preparing for all eventualities.
This is covered in our Risk Register on pages 14 and 15 of this document as well as in the Finance Director’s Foreword on pages 24 and 25. Regular updates on the effect of changes in the UK’s relationship with the EU can be found at www.ed.ac.uk/news/eu.
Service excellenceIn support of the University’s vision, we have committed to a review of key professional service functions and core systems to ensure that we get the best from the sum of our efforts by building effective and efficient services. The initiative, which is known as the Service Excellence Programme, is being run by colleagues in Colleges, Schools and Support Groups working together in a joint approach.
This is primarily covered in the Finance Director’s Foreword on pages 24 and 25. Details of the programme and regular updates can be found at www.ed.ac.uk/university-secretary-group/service-excellence-programme.
City Region DealThe University of Edinburgh will be a key partner in a major initiative that seeks to make Edinburgh and its surrounding region the European leader for applying data science to products and services. The move to transform the region into a digital powerhouse is a key strand of the recently announced Edinburgh and South-East Scotland City Deal. Under the agreement, significant investment from the UK and Scottish Governments will be provided for major infrastructure projects in Edinburgh, the Lothians, Fife and the Borders.
This is covered on page 19 of the Operational Review as well as in the Vice-Convener of Court’s introduction on page four and the Finance Director’s Foreword on pages 24 and 25. Details of the City Region Deal can be found at www.acceleratinggrowth.org.uk.
Estates strategyWe are extremely proud of our ambition to create a world-class estate for a world-class university and will deliver this through our £1.1 billion programme of new buildings and refurbishment of the existing physical estate. The physical estate is one of our key capitals which we use to provide a stimulating environment in which to create value for and with our students and staff.
This is covered in the Finance Director’s Foreword on pages 24 and 25, and in our Risk Register on pages 14 and 15.
Regular updates on our estates programme can be found at www.ed.ac.uk/estatesprojects.
PensionsThe valuation of the University Superannuation Scheme (USS) as at 31 March 2017 is underway and the development of proposals is scheduled for completion by the statutory deadline of 30 June 2018. It is expected that this will become a high-profile issue and consultation with employees is likely early in 2018.
This is covered in note 31 of the Financial Statements on pages 76 to 83 and the Financial Review on page 32.
Material issues have been identified as follows: those which we believe could affect our ability to create meaningful value in the short, medium or long term; issues that are important to key stakeholders; issues that form the basis of strategic discussions and decision making; and finally, issues that could intensify or lead to lost opportunity if left unchecked.
Insight into how these six material issues are managed and how they impact the University are signposted here:
In assessing what should be included in our Integrated Report, we applied the principle of materiality.
Material issues
3Annual Report and Accounts 2016/17
Overview
Strategy and value model
Operational review
Financial review
Governance
Financial statements

The breadth and quality of content within this year’s Annual Report and Accounts is a wonderful testament to the University of Edinburgh and to what makes it great: its people, its alumni, its life-changing teaching and world-changing research. We have been more ambitious than ever in our local and global contribution to education, innovation, research and society as a whole, and 2017 marks another year of growth for the University.
This is in spite of a shifting political and economic landscape in the UK. Last summer’s vote to leave the European Union, followed by an unclear outcome from the 2017 General Election, has caused inevitable uncertainty. Nobody yet knows the long-term effect of leaving the EU, but it is clear that our role as one of the leading teaching and research-intensive universities in the world is more important than ever, and it is our job to seize the opportunities ahead whilst preparing for all eventualities.
We are now in the first year of our Strategic Plan 2016, which builds on the strong foundations laid down over the last five years. While we are incredibly proud to be a global institution, the University of Edinburgh is grounded in the Scottish community and it is from this base that we will continue to look to the widest international horizons. Our commitment to ‘contributing locally’ is one of four development themes within the Strategic Plan, which you can read more about on page 19.
It therefore gave us great pleasure in 2017 to announce our role as a key partner in the Edinburgh and South East Scotland City Region Deal, an ambitious initiative that seeks to make the city and its surrounds the European leader in data science expertise. The long term investment by the partners is a huge vote of confidence in the economic and intellectual strength of Edinburgh and South-East Scotland and promises major development to the area. Its success is key to the aspirations laid down in our Strategic Plan 2016, as we work with partners to grow the region’s digital economy and open up new opportunities for our businesses and communities to flourish. You can find more detailed information about the City Region Deal at edin.ac/2vFp5EC.
The experience of our students while they study here is of vital importance to the University, and our rating in the National Student Survey (NSS) of 83 per cent is an area of focus for improvement. Students are already benefiting from our increased investment in teaching, but there is more for us to do. Working with our academic staff, we have re-emphasised the importance of excellence in teaching at all stages of a career through a more rounded, lifecycle approach, and will also incorporate a teaching requirement in recruitment of all academic staff. In response to student requests, we are also introducing a mandatory mid-semester feedback exercise that will be rolled out at every level of undergraduate teaching.
We also have ambitious plans to improve many aspects of the student experience outside of the classroom, and in recent years we have invested heavily in staff, buildings, facilities, technology and infrastructure for our students The approval of a new £82 million investment in a state-of the-art expansion of the University Union will create a new Student Centre for Student Services and Edinburgh University Students’ Association, will increase the number of student study spaces within the Main Library and will enhance the social, pastoral and developmental student experience. This ‘one stop shop’ will give students a more integrated and seamless access to all the many services they need to draw on throughout their University experience.
Edinburgh is an institution with extraordinary campuses, international influence and a global reputation, which welcomes students and staff with great ability and potential from all over the world. The University now has students from over 160 countries, and we welcome 43 per cent of our students from beyond the UK. The University’s position and potential as one of the leading teaching research-intensive Universities in the world remains strong.
After more than 15 years in office, Principal and Vice Chancellor Professor Sir Timothy O’Shea, will leave the University in January 2018. In 2002, he established clear plans to develop the University’s reputation as a world-class university, and has guided the institution through decisions that have had invaluable impact on its future. He has set us up to compete both internationally and locally, helping Edinburgh establish a truly international influence and a global reputation. He has been committed to strong governance throughout his tenure, leaving the University a stronger institution, and it is thanks to Sir Timothy that Edinburgh is now well prepared for the further changes ahead. I know that I speak on behalf of all staff and students that have been at the University under Sir Timothy’s leadership when I say how truly grateful we are for his guidance and commitment over the last 15 years.
Sir Timothy joins an illustrious list of former Principals in the marvellous legacy he has bestowed on the University. Our new Principal and Vice-Chancellor, Professor Peter Mathieson, will take office in February 2018. To meet the challenges and opportunities ahead, the University of Edinburgh must be bold, ambitious and innovative. As we look to the future, I am more convinced than ever of the University’s position and potential as one of the leading teaching and research-intensive Universities in the world, and I have enormous pleasure in welcoming Peter to this great institution.
Ms Anne RichardsVice-Convener of Court
4 Annual Report and Accounts 2016/17
Vice-Convener of Court’s introduction

Contributing locallySocial impact pledge
Edinburgh was one of the first higher education institutions in Scotland to commit to the Social Impact Pledge, which asks public sector organisations across Scotland to commit to increasing their social impact by making a public commitment to changing three aspects of their current operations or policies. The University delivered three specific projects as part of the Pledge, all of which enabled more students and academics to engage with the community.
Students worked with families of primary school children across Edinburgh to encourage them to include reading, writing and counting in their everyday lives. This initiative to boost literacy and numeracy was developed by the University’s Moray House School of Education in partnership with the Scottish Book Trust. The University has also supported efforts, in collaboration with the Students’ Association, to increase the number of student start-ups that offer goods and services for the benefit of the local community and to ensure their long-term sustainability.
Further information is available online at www.ed.ac.uk/local.
5Annual Report and Accounts 2016/17
Overview
Strategy and value model
Operational review
Financial review
Governance
Financial statements
5Annual Report and Accounts 2016/17

I have enjoyed my time as the Principal and Vice-Chancellor at Edinburgh immensely and, as I prepare to demit office, it is with a degree of pride that I note another successful year for the University.
Brexit presents a challenge, but we remain positive as we strive to maintain the mobility of European staff and to sustain European-funded research partnerships. To that end, staff numbers coming to Edinburgh from EU countries remain buoyant, far outweighing the number of EU staff moving on.
The University continues to attract outstanding students from across Europe, and so we were very pleased to represent the UK at celebrations in Strasbourg to mark 30 years of the EU’s student exchange scheme, Erasmus+. As a mark of our commitment, we will guarantee international mobility support for all 2018/19 undergraduate entrants whose programmes include a year abroad.
It was also our great pleasure to host the annual conference of the Coimbra Group – an association of European universities committed to creating academic and cultural ties. This event marked the start of my presidency of the Group.
Our focus included academic exchange, innovation and employability. There was much for me to share with delegates, including news that, in the past year, eight early-career academics at Edinburgh have secured a record €12 million from the European Research Council’s Starting Grants programme.
These researchers are a vital part of a bigger picture. The University has enjoyed an outstanding year with £364.5 million in new research awards – a 36 per cent increase on the previous year and a record total. We have achieved, on average, an eight per cent increase in new awards in each year from 2010 to 2016/17, and our application success rate remains high at 36 per cent.
This growth of high-quality research – together with teaching and the student experience – have been my priorities as my tenure draws to a close. Students have been at the heart of major improvements across campus, including better teaching facilities and enhanced services to support their wellbeing; part of a £200 million long-term investment programme.
Our lecture recording system, Media Hopper Replay, is now live in more than 100 teaching spaces, giving students access to recordings for study and revision purposes. Students will also benefit from focused mid-course feedback activities across all levels for the first time. These will complement our existing end-of-year course enhancement questionnaires.
A £3.65 million programme to upgrade and refurbish nearly 100 teaching spaces has been completed and the Main Library is now open round the clock, with more than 350 new study spaces.
We are not resting on our laurels. Our Future Teacher programme has been exploring how teaching is changing and how staff and students should respond. Interactive sessions have sparked debate about the digital approaches that teachers and learners will need in the classrooms of tomorrow.
Whatever that digital future looks like, Edinburgh can help to shape it and, in summer 2017, we signed up to what could prove to be one of the most significant events in our illustrious history.
The Edinburgh and South East Scotland City Region Deal has pledged £1.1 billion to fund major infrastructure projects in Edinburgh, the Lothians, Fife and the Borders, and to make Edinburgh and its surrounding area the Data Capital of Europe. Building on our strengths in data innovation, we will partner local authorities, schools and employers to help create the workforce of the future. In so doing, we can renew the civic tradition on which the University was founded; and, as a world-leading centre of excellence that is at the forefront of technology trends, we can add vision and value to this vital boost to the region’s prosperity.
Professor Sir Timothy O’SheaPrincipal and Vice-Chancellor
6 Annual Report and Accounts 2016/17
Principal’s foreword

Partnership with industryOptical imaging project ‘Proteus’
Edinburgh Research and Innovation (ERI, Edinburgh Innovation from 7 August 2017) is the innovation management service for the University of Edinburgh, providing access to the academic expertise, intellectual property and state-of-the-art research facilities available at the University. ERI develop partnerships between business and academia to manage and facilitate the exchange of knowledge, research and ideas.
Proteus is an EPSRC Interdisciplinary Research Collaboration led by the University of Edinburgh as part of a consortium with the University of Bath and Heriot-Watt University. In collaboration with the Edinburgh Critical Care Group and with the support of ERI, Proteus has recently been awarded £2.9 million of funding from Wellcome Trust and CARB-X. In addition to the £11.3 million awarded to the group from EPSRC, multiple translational and centre funding awards have been secured exceeding £16 million. ERI’s work with the Proteus team also underpinned the creation of the University spin-out “Edinburgh Molecular Imaging”.
7Annual Report and Accounts 2016/17
Overview
Strategy and value model
Operational review
Financial review
Governance
Financial statements
7Annual Report and Accounts 2016/17

The city
E of dinburgh,
r gr
foow
a
th
n od u rr ole in it
Ou
r
asc
el and amb t oi i ns
r O
upe
ople
Dig
itaan
l tr
srfomation
P artnerships an
ddata
with
d in
ustry
Leadersh n lip i earning
Leadership re in search
gb
lo
allyo
Delivering impact
for society
lca
lly
cin g Con
bu
tri
tin
g
nue
Infl
Vision
As a truly global university, rooted in Scotland’s capital city, we make a significant, sustainable and socially responsible contribution to the world.
Mission
As a centre of academic excellence we aim to:
• provide the highest-quality research-led teaching and learning;
• challenge the boundaries of knowledge, research and disciplines;
• enable our graduates and staff to be exceptional individuals equipped to address global challenges;
• promote good health, economic growth, cultural understanding and social wellbeing.
We deliver impact for society.
We discover, develop and share knowledge.
Our structure The University is organised into three Colleges, three Support Groups and a Corporate Group which includes 14 subsidiary companies.
Strategic objectivesLeadership in learning
We prize learning. All of our students have the opportunity to experience different ways of learning by drawing on one of the widest subject mixes available in any leading university.
Leadership in research
As a major, comprehensive university we conduct research of the highest standard across a broad spectrum of disciplines. In the Research Excellence Framework assessment in 2014, we were fourth in the UK by research power and in the top five in most individual subjects.
Development themesOur development themes give an overview of key areas for development over the period of our Strategic Plan. The development themes do not include everything we will focus on; rather they are the key areas for change.They demonstrate how we will succeed in achieving our goals.
The development themes are:
• Influencing globally• Contributing locally• Partnerships with industry• Digital transformation and data
2016/17 Staff numbers
Student numbers
Expenditure £m
College of Arts, Humanities & Social Sciences
3,692 23,647 156
College of Medicine & Veterinary Medicine
3,105 6,322 226
College of Science & Engineering 3,187 9,607 190
Corporate Services Group 2,416 - 135
Information Services Group 718 - 45
University Secretary’s Group 1,026 - 54
Corporate Group 142 - 67
14,286 39,576 873
8 Annual Report and Accounts 2016/17
Our strategy

Strategic plan A new performance framework for the University’s Strategic Plan 2016 has been developed; reflecting both key medium-term outcome measures and leading indicators of performance in the areas of key focus for the years ahead. The following table sets out our assessment of progress in the first year of the plan.
- - achieved/on track - - strong or improving position but needs attention - - progress neededA RG
* Scottish index of multiple deprivation 20/40 per cent most deprived postcodes
Strategic objectives
Leadership in learning Student satisfaction: via NSS, PTES and PRES surveys
A NSS satisfaction improving – so is benchmark
Proportions in graduate level employment or further study
G Trend positive awaiting 2016/17 HESA data
Leadership in research Research income per member of academic staff
G Positive trend maintained
Research publication quality – based on citations
G Positive trend maintained
Doctoral degrees awarded per member of academic staff
A Stable – below Russell Group upper quartile
REF2021 performance G Results available 2021
Scale and ambitions for growth
Financial sustainability Interest cover G Both measures appear within tolerance over forecast period
Operating surplus as a percentage of income
G
Annual carbon emissions Absolute levels to return to 2007/08 baseline G Absolute growth reflecting recent expansion but reduction measures due to kick in alongside changes in grid composition
Relative emission levels (tco2/£million) G
Our people
Staff population characteristics
Age profile A Static levels of staff in under 25 age band and in under 40 academic staff
Gender profile (G10) A Improvements in gender balance but not yet sufficient to reassure fully on track
SIMD20/40* entrants A On track but challenging
School gender balance G On track
School intake diversity R Good diversity overall, but keen to ensure reflected at individual School level
Influencing globally
The University’s non-UK population
Academic staff from UK/EU and outside EU G Balance maintained with a slight increase in EU staff
Student entrants from outside UK G On track
Research reputation Measured through QS survey A Ranked 28th – exceptional performance – but continuing to pay attention as represents slight drop from 24th
Partnerships with industry
Innovation activity measured through
Patents, licences, start-ups and the value of consultancy and translational awards
G On track
Digital transformation and data
Online distance learning expansion in post graduate students R Moving in the right direction but continues to be a stretch target
9Annual Report and Accounts 2016/17
Overview
Strateg
y and value mo
del
Operational review
Financial reviewG
overnanceFinancial statem
ents

Value created
Capitals we draw from Short-term Medium-term Long-term University outputs Outcomes
People
• staff• students• alumni• global partner group
• promote diversity and equality
• widen access to those from under represented groups
• support personal and professional development
• culture of high performance
• supportive and inclusive culture
• promote Edinburgh values
High performing staff
Talented students
• increase recruitment reputation• increase funding opportunities
Finance
• funding • grants• fees• donations
• value for money• effective budgeting,
forecasting and planning
• surplus for reinvestment
• create and maintain financial sustainability
• economic growth
• secure funds for investment
• control environment• investment appraisal
Government and stakeholder assurance
Surpluses for reinvestment
Economic impact
• money when we need it• resources to continue value creation• autonomy of thought and action• resilient growth for us and society
University reputation
• local• global
• recruit staff and students
• industry engagement• civic engagement
• multidisciplinary collaboration
• solve global challenges
• international partnerships
• graduate students• publish successful
research findings
Influencing globally and locally
Innovative teaching
Breakthrough research
• brand is enhanced in the eyes of stakeholders
Physical assets
• places of learning• our campuses
• learning environments• research space• information systems
• capital plan
• dynamic review • maintain• replace • renew
World class estate
• city and university quality spaces and sense of place
• space for community engagement, events and city visitors
• reputation of university is enhanced• attracts future staff and students
Natural resources
• energy• Edinburgh city• the enviroment
• increase efficiency of energy consumption
• living lab for learning and research
• design and build low energy buildings
• responsible investment
• net zero by 2040• embrace the circular
economy
• reduced emission of greenhouse gases• improved knowledge of environmental
impact through research• trained graduates influence corporates and
governments
Lower carbon emissions
Lower energy consumption
Switch from polluting energy sources
University reputation
Social and relationship
People
Knowledge
Finance
Physical assets
Natural resources
Knowledge
• research• teaching• intellectual property• know-how• educational technology
• learning experiences• feedback and
engagement
• teaching policy • knowledge exchange
Graduates
Cultural understanding
Economic growth
Research output
• new stock of graduates and researchers
• better trained workers• evidenced research findings• policy influence on governments• impact for society
• research projects• support environment
• research and teaching policy • research discoveries
Res
earc
hLe
arni
ng
Social and relationship
• academic networks• UK and Scottish government • city region• networks
• outreach work• community
engagement• exchange ideas
• align investment strategy to environmental, social and governance factors
• sustain licences to operate
• build industry partnerships
• intellectual property• civic pride• alumni influence
• increase reputation• attract staff, students and funding• better quality jobs both directly and
indirectly• good corporate citizen and stronger public
engagement
Outcome agreements
Global industry engagement
Contributing locally
1110 Annual Report and Accounts 2016/17Annual Report and Accounts 2016/17
Overview
Strateg
y and value mo
del
Operational review
Financial reviewG
overnanceFinancial statem
ents
Our value model

Our appetite for risk
Unacceptable to take risks Higher willingness to take risks
Reputation
Compliance
Finance
Research
Education and student experience
Knowledge exchange
International development
Major change activities
Environment and social responsibility
People and culture
The risk of adverse consequences is inherent in all activity. Dynamic enterprise will inevitably create new risks but can also be associated with potential rewards. Effective risk management is about ensuring that all significant relevant risks are understood and prioritised as part of normal management practices to increase the probability of successful outcomes while protecting the reputation and sustainability of the University.
Risk managementThe University has a holistic approach that builds risk management into its structures and processes through a framework comprising governance, a defined risk appetite and an underlying policy and control environment.
Process The University operates processes for the identification, evaluation and management of significant risks that threaten the achievement of its strategic objectives and its value creation model. It records them in the University Risk Register. The Risk Management Committee monitors and reviews emerging and changing risks throughout the year and informs the University’s Central Management Group and reports the committee’s findings to the University Court’s Audit and Risk Committee.
Risk owners assess gross and net risk regularly, and each of the risks in the Register is formally assessed at least once each year and reviewed by the Risk Management Committee. The Risk Management Committee ensures that the risks are being actively managed, with the appropriate strategies in place to work effectively.
College, Support Group and subsidiary company risk registers ensure key operational risks are identified and managed by the appropriate organisation within the University. Internal Audit supports this process and undertakes reviews of key areas throughout the year according to a rolling audit plan.
All major projects have individual risk registers and risk assessment is incorporated into planning and decision-making processes.
The University’s approach is to minimise its exposure to reputational, compliance and financial risk, while accepting and encouraging an increased degree of risk in pursuit of its mission and objectives. It recognises that its appetite for risk varies according to the activity undertaken but that controlled risk taking enables us to take advantage of opportunities to generate further value.
In 2016/17, the University commissioned an external review of the effectiveness of its risk management processes, which found that effective risk management systems were in place and put the University in the upper quartile of its peer group in terms of risk management system maturity. The University is continuing to build on this to further strengthen and embed effective risk and opportunity management across all levels of the organisation.
12 Annual Report and Accounts 2016/17
Understanding our risks

Delivering impact for societySustainable campus fund
To support the delivery of the University’s Climate Strategy 2016, the Sustainable Campus Fund was set up as an internal investment vehicle that provides financing to parties within the University for implementing energy efficiency, renewable energy, and other sustainability projects that generate cost savings. In May 2016, £2.75 million was allocated for three years commencing in 2016/17.
Staff and students from around the University have put forward ideas via an online platform. A network of over 100 Energy Coordinators has helped to disseminate information about the fund. The fund has helped to generate broader interest and awareness in energy efficiency.
Further information is available online at www.ed.ac.uk/about/sustainability/news/propose-your-sustainable-project-ideas.
13Annual Report and Accounts 2016/17
Overview
Strateg
y and value mo
del
Operational review
Financial reviewG
overnanceFinancial statem
entsAnnual Report and Accounts 2016/17 13

Risk area Risk description Risk management
Student experience Failure to provide a high-quality student experience impacts on the University’s reputation, student recruitment and retention.
• The Learning and Teaching Policy Group provides a platform for University-wide leadership and coordination leading on the priority themes of: raising the status of teaching; fostering a staff-student community; and investing in student facing facilities, both physical and digital.
Research excellence Failure to grow and diversify the spread and magnitude of research awards leads to reduced research income and impacts on our research standing.
• These risks are actively managed by the University’s Research Policy Group, which promotes and engages with activities relating to embedding and sustaining research excellence, including development of a research strategy in alignment with the University strategy.
Government policy and legislation
Developments in government policy or legislation related directly or indirectly to higher education impact the University’s activities.
• Constructive engagement directly and via Universities Scotland and Universities UK with the Scottish and UK governments to ensure that the implications for the University of potential regulatory changes are understood by policy makers.
Changes in UK relationship with the EU
Implementation of changes in the UK relationship with the EU creates uncertainty and impacts partner, student and funder relationships and competitiveness relative to international peers.
• This risk is managed by proactive communications to maintain the confidence of current staff, students and applicants; acceleration of strategic partnerships with EU universities; increased recruitment activity for EU and international students and expanded distance learning provision.
Financial sustainability Failure to maintain effective business and financial controls results in an adverse effect on the University’s financial sustainability.
• Financial control is exercised by the University Court, acting through Policy & Resources Committee, the Audit and Risk Committee and the Central Management Group. These formal channels are augmented informally by meetings of the Principal’s Strategy Group and the Strategic Finance Group.
• The Finance Strategy includes financial planning, budgetary processes and a ten-year forecast informed by an integrated financial model of the University.
Digital transformation and data
Insufficient investment, constraints or weak coordination in IT and Library so that the critical services required by the University fail to be maintained and fail to scale with the University’s key objectives.
• An Information Services wide change programme is focusing on the need to adapt the workforce and organisation through a Digital Transformation programme.
• A core system review will underpin delivery of our Service Excellence Programme.
Strategic developments – change management and projects
Inadequate implementation of major change projects individually or as a combined programme of activity leads to a failure to implement change effectively.
• Comprehensive forward-planning, and provision of human and financial resource, established programme and project management processes, including gateway reviews.
• Linkage between resource allocation and financial management to identify resources for, and returns from, major projects.
Risk registerThe University Risk Register is formally reviewed and updated annually by the Audit and Risk Committee and approved by the University Court. The most recent update was approved at the Court meeting on 19 June 2017 and aligns with the University’s Strategic Plan 2016. Set out on the following pages are those risks we consider most material selected from our risk register. The list is not exhaustive and in no particular order, as there are many events that could trigger additional actions to manage them in an organisation as large and complex as ours. The decision to leave the EU and the continuing uncertain external environment leads to risk across many areas of the University including uncertainty in research funding, staff recruitment and retention, student recruitment, investment, exchange rates and industry engagement. There are also opportunities, including the University’s involvement in the Edinburgh and South-East Scotland City Region Deal, as a key partner in a major initiative that seeks to make the city and its surrounds the European leader in data science expertise.
14 Annual Report and Accounts 2016/17
Understanding our risks (continued)

Our stakeholdersThe University has a complex group of stakeholders who are critical to its sustained progress. Considerable resources are invested each year to ensure that we engage with every stakeholder group listed here to listen to and meet their needs, manage their expectations and deliver our commitments to them.
Maintenance, enhancement and investment in the estate
Rate of investment in and enhancement of the estate is inadequate to meet the growth aspirations of the University.
• Establishment of an Estates Vision 2017-2027 to underpin development of the Estates Strategy. A refreshed Estate Strategy and capital development and refurbishment programme has been agreed and programme boards established to coordinate campus-wide strategy.
• A fully updated condition and compliance survey assists with determining the annual maintenance and compliance programme.
Retain or attract sufficient key staff
Inability to retain, attract, and develop key staff leads to lack of capability to support and grow the University.
• Promote the attractiveness of the University as a globally significant institution.• Support new staff to enable them to become effective.• Flexible strategies to respond to the recruitment and retention needs of
different areas.• Regular monitoring of the proportion of UK, EU and non-EU staff to allow early
identification of issues.• Evidence-based pay analysis, retention framework and contribution pay.
UK immigration policies and practice
Changes to UK immigration policies and practice and their inadequate implementation by the University leads to financial and legal penalties, reputational damage and loss of international staff and students.
• The University’s Home Office Assurance Group regularly reviews policies and procedures connected with the University’s licence and ensures compliance.
Loss of sensitive data Compromise of University systems due to missing, ineffective or inappropriate controls results in severe reputational damage and financial impact due to loss or exposure of sensitive data.
• The Chief Information Security Office within Information Services leads the University’s information security strategy to address cyber threats.
• Access to core, sensitive systems is carefully controlled and users of these systems are required to attend training.
• The European General Data Protection Regulation (EU) 2016/679 (GDPR) replaces the Data Protection Act (DPA) in May 2018. The University’s statutory Data Protection Officer (DPO) ensures compliance with GDPR.
Risk area Risk description Risk management
15Annual Report and Accounts 2016/17
Overview
Strateg
y and value mo
del
Operational review
Financial reviewG
overnanceFinancial statem
ents

Entry to academic year 2016/17 2015/16 2014/15
Undergraduate enrolments:
Total applications 62,276 59,583 57,383
Total offers 23,617 22,762 21,693
Total enrolments 5,916 5,655 5,457
Applicants-to-enrolments ratio 10.5 10.5 10.5
Matriculation rate (enrolments/offers) 25.0% 24.8% 25.2%
Postgraduate home and EU:
Total applications 5,908 8,736 8,338
Total enrolments 3,146 2,967 2,907
Applicants-to-enrolments ratio 1.9 2.9 2.9
Postgraduate overseas:
Total applications 33,269 30,235 26,776
Total enrolments 3,024 2,762 2,523
Applicants-to-enrolments ratio 11.0 10.9 10.6
Student demand profile
Leadership in researchAs a major, comprehensive university we conduct research of the highest standard across a broad spectrum of disciplines.
Our rich interdisciplinary research environment brings together world-class researchers providing world-leading research outputs and insight. Researchers at Edinburgh are developing low-cost, low-energy technology to decontaminate sewage water in villages using state-of-the-art solar energy and water filtration technologies to develop the simple solar-powered purification systems that can provide remote parts of India with clean drinking water for the first time. The initiative will not only provide safer drinking water, but could also help reduce the spread of disease. Around 77 million people in India do not have access to safe drinking water – more than any other country in the world. The project is being carried out in partnership with the Indian Institute of Science Education & Research, Pune.
Two advanced medical scanners have been installed as part of a £14 million makeover of research imaging facilities at the University. The device combines MRI with another type of imaging technology – positron emission tomography (PET) – in a single machine.
supports Schools’ analysis of student experience. The undergraduate dashboard reflects admissions processes, course results and programme results, along with National Student Survey (NSS) and Course Enhancement survey outcomes. This dashboard has been very positively received; it is now embedded in annual Quality Assurance monitoring processes across all three Colleges, and is also used in various curriculum development activities. Efforts are now focused on developing a postgraduate taught dashboard.
Edinburgh University Students’ Association was the first in the UK to offer student-led Teaching Awards. The awards encourage staff and students to celebrate the best of the teaching on offer at the University. Students can nominate academic and support staff who have had the biggest impact on their time at University. Courses, teachers, research and dissertation supervisors, students who tutor, personal tutors, and support staff are all eligible for recognition. From the analysis of nearly 3,000 Teaching Awards nomination comments from students, the report provides practical examples of best practices in teaching and offers recommendations to improve teaching quality.
Leadership in learning We equip students with the knowledge, skills and experiences to flourish in a complex world and become successful graduates who contribute to society.
This has been another successful admissions year for the University. We have received more applications, made more offers and more students will enrol at the University in 2017 than ever before. Over 12,000 students are joining us at Edinburgh this year. We are particularly pleased to note an increase in the recruitment of UK and EU taught postgraduate students, achieved in the context of a very challenging recruitment environment. Whilst numbers are healthy, we are continually assessing our approach and working on new ways to ensure we respond effectively to challenges and capitalise on all opportunities over the coming years.
The Destination of Leavers from Higher Education (DLHE) survey asks graduates what they are doing on a specific date six months after graduation. Looking at full-time first degree UK domiciled students who graduated in 2016 from Edinburgh we found that 92.8 per cent were in a positive destination, i.e. in employment or further study, with 75 per cent in Highly Skilled Employment and Further Study (HSEFS).
Effective teaching is fundamental to the student experience, and we have taken a number of steps to further improve standards through a number of investments and initiatives. From 2017, the focus of our academic staff incentives has shifted to encourage excellence in teaching as a result of a review into our core staffing processes. To accomplish a more holistic teaching method, that includes teaching at all stages of a career, a new initiative has been established to incorporate a teaching requirement into all recruitment of academic staff. In all that we do, our students come first.
To help us enhance student experience, the University has introduced a dashboard to provide student data that is more accessible and easier to interpret. This
We deliver impact for society. As a truly global university, rooted in Scotland’s capital city, we make a significant, sustainable and socially responsible contribution to the world. Our mission to discover, develop and share knowledge is at the heart of what we do.
16 Annual Report and Accounts 2016/17
Operational review

Digital transformation and dataUniversity hosts first Wikimedian in Residence
In 2016 the University of Edinburgh partnered with Wikimedia UK to host our first Wikimedian in Residence. Our Wikimedian works closely with students and staff on projects to improve the coverage and content of key research topics. Learning to edit Wikipedia and understanding how digital knowledge is created, shared and contested online is an emerging digital skill for the future.
One focus of this partnership has been to encourage women to contribute, particularly in areas where content coverage is currently skewed. We have organised a range of ‘editathon’ events in partnership with Colleges and Schools. Editathons provide an opportunity to learn new skills and to target specific content areas. The result is always new or improved quality coverage of articles, topics and citations. As a result of our Wikimedian residency, 500 staff, students and members of the public have been trained and over 1,000 articles created and improved. Of this year’s editathon attendees, 65 per cent were women.
17Annual Report and Accounts 2016/17
Overview
Strategy and value model
Op
erational review
Financial review
Governance
Financial statements
17Annual Report and Accounts 2016/17

be characterised by an accelerating pace of change, new geo-political dynamics, complex global challenges and rising expectations in an increasingly connected and digital environment. This creates challenges and opportunities and will require a new, shared way of working. We will share knowledge and best practice, and work collaboratively to realise our ambitions together. We must work collectively across our global offices, our colleges, schools, institutes, academies and services across the University.
The first group of postgraduate and undergraduate students to take part in the MasterCard Foundation Scholars Program joined us for the launch of the scheme at the beginning of October 2016. Since the launch over 10,000 applications have been received for 25 places for 2017/18. The scheme supports the brightest and best African scholars, 200 over seven years, who have great potential but few educational opportunities. They will undertake their studies at Edinburgh on a full scholarship and they will benefit from extracurricular summer schools and internships to build their abilities and make a difference to their home countries and communities on their return.
Edinburgh is representing the UK at an event marking 30 years of success of the EU’s student exchange programme. Edinburgh has participated in the Erasmus initiative since 1987 and has received approximately €18 million of funding from the programme.
Influencing globallyWe have a long history of generating knowledge for the public good and nurturing some of the world’s best students to make a difference to the world.
Edinburgh has always been an international university, drawing academics and students from all over the world, working with institutions internationally, and leading research that has had a global impact. This year, we published our three-year Edinburgh Global Engagement Plan, which celebrates our global community in all its forms. We will develop greater engagement with these communities in and beyond Edinburgh, building on our tradition of attracting and working with the world’s best talent. We must attract the best students, regardless of where they are from, by removing barriers to access, and delivering outstanding teaching and learning on campus, digitally and around the world. We will create an environment to support and nurture our staff to deliver world-class and world-changing research. We will continue to work collaboratively with partners around the world. Who we will partner with is changing; we will continue to work with key strategic university partners, but we will also forge transformative partnerships with governments, the private sector, civil society, countries and communities.
We recognise that how we must work and who we must work with is different in different places around the world. Our global engagement will be shaped by local priorities, partnerships and opportunities and we will articulate our strategy and support our activity regionally. The next five years will
Thirty years of Erasmus funding has enabled more than 7,000 Edinburgh students and staff to study, train, volunteer or teach abroad. We now have more than 500 Erasmus exchange links with more than 300 partners in Europe. Our priority is to develop these vital research and exchange links, and so help to maintain Edinburgh’s standing as a truly global university. Prof Sir Timothy O’Shea Principal and Vice-Chancellor
Edinburgh Imaging now houses six scanners dedicated to research, making it one of the largest networks in Europe with ties to clinical care. Research carried out with the new scanner will examine the brain at all stages of life – from birth to old age. Studies involving babies and young children aim to shed new light on the factors that affect healthy brain growth in early life.
Speak:Unique is an innovative project led by pioneering researchers at the University. The project aims to develop intelligible and personalised voices for use in communication aids for people whose voices have become impaired through diseases such as Motor Neurone Disease or Parkinson’s disease. The technology underpinning the project was designed by researchers in the Centre for Speech Technology Research. The technology uses a statistical model to generate the waveforms for synthetic speech (Hidden Markov Model or HMM-based synthesis), and the project is a collaboration between the Centre for Speech Technology Research (based in Linguistics and English Language), the Anne Rowling Regenerative Neurology Clinic, and the Euan MacDonald Centre for Motor Neurone Disease.
During a year of considerable change, it was pleasing to note that Edinburgh Innovations (the innovation management service of the University) was involved in 45 student start-ups – an increase of 12 per cent on the previous year.
In honour of the Principal’s support of enterprise, a ‘Through the Years’ exhibition was held to throw the spotlight on 15 of the University’s most interesting spin-outs and start-ups from the last 15 years. Those participating in the event included: Fanduel, a billion dollar tech start up; Pufferfish, a unique technology company with customers such as Coldplay; pureLiFi which is seeking to replace current Wi-Fi technology and Krotos, an innovative audio tool which has been featured in the live-action remake of the Jungle Book and the Avengers: Age of Ultron.
Leadership in research (continued)
The University has strengthened links with South East Asia by establishing a new base
18 Annual Report and Accounts 2016/17
Operational review (continued)

recommended that with the right funding, the Edinburgh city region could become the global destination of choice for organisations that power services through the application of data science. The audit highlighted the area’s world-class strengths in digital industries and its ability to grow high-value digital companies, such as Skyscanner and FanDuel, as a strong basis for growth.
In October 2016 we engaged in a “live case study challenge” with the Oxford Group, as part of a development programme for a group of senior staff from the Wellcome Trust. This is a collaborative learning experience with participants from Wellcome working in partnership with the University to deliver insights, ideas and proposals for how we might tackle one of our own real, key strategic challenges, that of how the University should develop industrial research linkages, recognising that it is geographically distant from significant concentrations of industry.
Digital transformation and dataThe University is home to leading expertise in data science.
The University of Edinburgh is the first Scottish university to become a Government-approved Centre of Excellence for Cyber Security Research in the UK. As announced in the Government’s National Cyber Security Strategy, Academic Centres of Excellence will specialise in developing the latest cyber security techniques and contribute to the UK’s increased knowledge and capability in this field. Edinburgh is now recognised by the National Cyber Security Centre as meeting the tough minimum standards
The University was again the single largest landlord on the Fringe this year, with over 1.3 million ticket sales for performances in University buildings over the Summer Festival period. We were responsible for 58 separate performance spaces. In this, our second major digital arts collaboration with Edinburgh International Festival and 59 productions, our academics lent their expertise to tell the story of the geology and history of Edinburgh and James Hutton’s work.
Partnerships with industryWe will be a global leader in industry engagement, with strong industrial and commercial funding, complementing public sector and third sector support.
Core to finding solutions to the world’s problems is close collaboration between research teams and colleagues in other institutions and industry. Edinburgh and the wider city region drives significant economic growth for Scotland and the UK and in the Edinburgh city region companies have adopted data-driven innovation to great effect. A recent Science and Innovation Audit commissioned by the UK Government
Borders. The University will partner with local authorities, schools and employers across the region to create the workforce of the future by supporting a massive increase in the provision of data skills. The agreement is between the Scottish Government, the six local authorities, the UK Government and regional partners. Both governments are committed to jointly investing £600 million over the next 15 years and regional partners have committed to adding up to £500 million, overall representing a deal worth £1.1 billion.
in Singapore in May 2017. The South East Asia Office will help the University work with partners in education, business and government across the region. The University has a history of interaction with South East Asia in a number of disciplines, including social sciences, medicine and engineering. The office joins Edinburgh’s overseas network, which includes bases in North America, Latin America, South Asia and East Asia.
The International Diabetes Centre (IDC) at Shenzhen People’s Hospital in southern China will be based on Scotland’s renowned healthcare model for managing patients with chronic conditions. This is a significant international partnership to help China improve its healthcare services. It will be supported by the University and aims to deliver world-leading medical education, research and patient care. The IDC, which will occupy three floors of the 2,400-bed hospital, has been formally launched and is scheduled to be operational by November 2017.
Improving the effectiveness and sustainability of agri-food systems is vital to tackling the challenges of global population growth, rapid urbanisation, food and environmental security, and diet and health. The University is investing around £35 million in the new Global Academy of Agriculture and Food Security. The funds will enhance our provision of targeted education, training, research, innovation and consulting, to contribute to global food and environmental security, sustainable rural development, and animal and human wellbeing.
Contributing locallyFor more than four centuries we have been Edinburgh’s civic university.
The University of Edinburgh will be a key partner in a major initiative that seeks to make Edinburgh and its surrounding region the European leader for applying data science to products and services. The move to transform the region into a digital powerhouse is a key strand of the recently announced City Region Deal. Under the agreement, significant investment from the UK and Scottish Governments will be provided for major infrastructure projects in Edinburgh, the Lothians, Fife and the
The City Deal is a major vote of confidence in the economic strengths and further potential of Edinburgh and South East Scotland. We are delighted to be working with our partners to grow the region’s digital economy and to open up new opportunities for our businesses and communities to flourish. Professor Charlie JefferySenior Vice-Principal
19Annual Report and Accounts 2016/17
Overview
Strategy and value model
Op
erational review
Financial review
Governance
Financial statements

0
20,000
40,000
60,000
80,000
100,000
Fuels, water, waste and University vehicles
Business travelGasElectricity
2017201620152014201320122011201020092008
As low carbon programmes, such as the Sustainable Campus Fund are implemented, the University expects to see a reduction in its emissions in the coming years. The increase in overall carbon emissions can be attributed to downtime with the University's Combined Heat and Power Energy Centres, resulting in the need for more electricity from the national grid. The quality of business travel data is improving, resulting in more sources of carbon emissions being reported.
Absolute carbon emissions
Cyber security and privacy is now an essential aspect of modern life which impacts the technology we see and use, as well as the behind-the-scenes technology we rely on that supports the physical and virtual infrastructures. Our recognition as a centre of excellence will bring fresh impetus to our research to help make the digital world safer for everyone. Professor David AspinallSchool of Informatics
required, meaning it has met rigorous criteria which assess the quantity and quality of their researchers, their research output and the impact of their research. All of the successful universities have invested considerable capital including financial, intellectual, managerial and leadership over many years to grow their capacity and capability to the point where they meet the standards for recognition. The development will support research by experts at the University to protect the security and privacy of individuals, businesses and other organisations online.
What makes us Edinburgh?Our scale and ambitions for growth, our people, and the city of Edinburgh provide a unique context for the University.
Our scale and ambitions for growth The international reputation of the University paired with the historical richness of the city makes Edinburgh an exciting and unique place to study and live. A multi-million pound investment in buildings and facilities across the University is underway. Over the next few years, a series of projects will transform existing spaces, provide new ones and offer staff and students a greatly enhanced environment in which to work and study.
The CityThe University is embedded in the city of Edinburgh, and the city is as important to us as we are to it.
The University has been praised in a new survey that ranks Edinburgh as one of Europe’s most dynamic cities. The poll by property firm Savills says the University has been a key contributor to Edinburgh’s ninth place ranking. It highlights the University’s expertise in the fields of medicine, Scots law, literature, science and engineering. Edinburgh is ranked third in the UK, behind London, which came top of the Europe-wide list. Savills reports that Europe’s top-performing cities have strong infrastructure investments, high-quality universities, and innovative businesses capable of attracting a global workforce. The report also highlights how successful cities create partnerships across business, education and the public sector.
Social responsibility and sustainabilityTo meet the challenge of the Paris Agreement, signed by the UK Government in 2016, and to support Scotland’s and the world’s transition to a low carbon economy, the University will reduce its carbon emissions per million pound turnover by 50 per cent from a 2007/08 baseline, and will become a net zero carbon university by 2040.
To meet these new obligations we will take action on research, learning and teaching, operations, responsible investment, and will investigate renewables opportunities. It will use the University’s five campuses as living laboratories for learning and to test innovative
Digital transformation and data (continued)
ideas that can be replicated elsewhere. The Renewable Energy and Low Carbon Options Review Group will review what further investments in renewable technologies could be made that build on investments of more than £30 million in low carbon and renewable technology on campus.
The Sustainable Campus Fund has allocated £2.75 million for three years commencing 2016/17 to staff and students for implementing energy efficiency, renewable energy and other sustainability projects that generate cost savings. A new online course on sustainability and social responsibility was launched this year and was made available
20 Annual Report and Accounts 2016/17
Operational review (continued)

2013 2014 2015 2016 2017
Income (tonnes CO2e / £m) 135 128 116 100 100
Staff (tonnes CO2e / staff FTE) 12.1 11.5 10.6 9.7 9.3
Students (tonnes CO2e / student headcount) 3.0 3.3 2.8 2.4 2.3
Key performance indicators
Waste arising: 5,392 tonnes
Residential waste mass used to create energy (ERWMENE)
Residential waste mass anaerobic digestion (ERWMADI)
Incinerated waste
Composted waste
Recycled waste
Landfill waste
5%
1%
19%
17%
34%
21%
Hazardous waste3%
University waste breakdown 2016/17
In 2016/17, 1,853 tonnes of the University’s waste was recycled and reused. This included electrical and electronic waste, paper and cardboard, glass and books.
Reuse of materials, and routes for reuse, continues to grow. This has been helped by forging good relationships with external organisations, improving various channels of communication and increasing the number of staff using WARPit, the internal reuse portal.
Our peopleOur students and staff are the heart of the University. We are proud of our diverse and international community and are intent on ensuring we provide the best support to all our staff, students and their families.
As the UK prepares to exit the European Union, we understand that this is an uncertain and anxious time for many people. As a result, we have put together a programme of additional support to provide staff with up-to-date information and legal advice on how to secure permanent residency in the UK or British citizenship, along with financial support to help with those procedures. We are committed to providing staff who are nationals of the European Economic Area and Switzerland - and any other member of staff with an EEA or Swiss partner, and their dependents, with the necessary support.
Staff numbers coming to the University from other EU countries remain buoyant in the wake of the referendum vote. Edinburgh’s global reputation continues to be underpinned by its ever-strengthening links with universities across Europe and beyond. The University continues to attract the brightest and the best staff and students and to create new collaborations across
borders. The number of EU staff moving on is far outweighed by the 235 new colleagues we have welcomed from other EU nations in recent months. This net gain is part of a continuing trend. Over the past three years, EU staff numbers - both academic and support - have increased each year.
The University’s international reach grows stronger. This year, students will join us from more than 160 countries. Our international staff and student population approaches 20,000 and over 43 per cent of our students and 29 per cent of our staff are from outside the UK. There are over 170,000 alumni across the world. The University’s overseas operations in Latin America, South East Asia, South Asia, North America and China are strategically important hubs for our exchange with fast emerging nations across the world.
The Inspire Launch Grow (ILG) event showcases and celebrates the exceptional entrepreneurial talent from students and academic staff at the University. This prestigious event took place in June 2017 and a special thank you presentation was given to the Principal, Professor Sir Timothy O’Shea, who has been a great supporter of enterprise during his 15-year tenure. The 2017 winner was Post-Doctoral Research Fellow Lissa Herron with Eggcellent Proteins who has found a way to use transgenic chickens that produce valuable proteins useful for research and therapeutic use, with applications in cancer, chronic disease, and cell therapy.
Grant Wheeler, Head of Enterprise Development at Edinburgh Research and Innovation (Edinburgh Innovation from 7 August 2017), commented: “The entrepreneurial talent here at The University of Edinburgh is amongst the best in the UK and this is reflected in the quality of this year’s entries to the ILG awards. The presence of so many successful companies that started here at the University, during the Principals term of office, highlights the first class support that we provide to the student and staff network.”
We have received almost £1.2 million from the estate of a former staff member on what would have been his 100th birthday. Robert Ormiston Curle served as the University’s
to all students. The University has delivered projects on literacy and numeracy, digital literacy and social enterprise, all of which have benefitted the public and contributed towards our commitment to the Social Impact Pledge.
Utilising the Benchmark Standards for University Social Responsibility across the European Higher Education Area, a cohort of 60 European students will be trained in a European Students Sustainability Auditing project culminating in four audits of European higher education institutions.
The University has made a significant commitment to move towards a Circular Economy. The circular economy is about transitioning from a ‘take-make-dispose’ linear approach to resource use, to systems that encourage reuse and extraction of maximum value before returning resources to the biosphere. To improve and further implement circular public procurement at the University, in 2017 the University commissioned a piece of research that will set the scene for the University’s future procurement strategies and activities to transition towards a Circular Economy.
21Annual Report and Accounts 2016/17
Overview
Strategy and value model
Op
erational review
Financial review
Governance
Financial statements

PT system across the University; sharing good practice: ensuring that the many examples of good practice are shared across the University; and PhD Supervision: ensuring staff carry out effective supervision of postgraduate research students.
We are continually driving growth and investing in our students, our staff and our physical estate to produce student-centred, research intensive, industry-engaged campuses. We have ambitious plans to transform Edinburgh’s physical landscape. The Estates Capital Plan includes the refurbishment as well as the creation of new spaces to house new initiatives such as the Data Technology Institute. We are proud to have invested in the refurbishment of McEwan Hall for conferences, exhibitions, events and education. The main hall has been restored, making it a spectacular multi-functional space in a unique and splendid Victorian setting. A new entrance hall provides greatly improved visitor facilities. Disabled access has been addressed with the main public access to the hall now through a new entrance way situated in Bristo Square.
Equality and diversityThe Estates Department at the University has been working in partnership with DisabledGo to produce online accessibility information for University buildings. DisabledGo is an award-winning disability organisation that produces online access guides to allow staff, students and visitors to make informed decisions based on their own access requirements. The guides include information regarding the accessibility of teaching rooms, lecture theatres, meeting rooms, cafes and toilets. In addition to this, a free app, AccessAble - Edinburgh University was launched and offers an instant detailed access guide with information about ramps, lifts and accessible toilets. It also has an in-built emergency locator that can send a GPS location to a chosen emergency contact by email or SMS.
As of 31 July 2017, 3.5 per cent (2016: 3.1 per cent) of our staff have declared that they have a disability. We are committed to a policy of equal opportunities for disabled staff and students and aim to create an environment enabling staff to participate fully in University life. The Disability Review
report and recommendations was published this year, following the review panel’s engagement with disabled students and staff, and input from the Student Disability Service, academic staff, Coordinators of Adjustments and others. The review focused on two main areas; the implementation of adjustments for disabled students and accessibility of the estate.
Places on the widening access clearing scheme in Scotland for 2017/18 were advertised in August 2017 and offered to applicants from the least affluent 20 per cent of postcodes in Scotland (Scottish Index of Multiple Deprivation (SIMD20)). The Scottish Government has funded the additional places to increase the proportion of university students from the most disadvantaged 20 per cent of households in Scotland to 20 per cent by 2030. In 2017 we saw a 20 per cent overall increase in acceptances from SIMD20 students who had been made an offer at the University of Edinburgh.
The University is committed to delivering equality of opportunity to all its employees regardless of their gender or other protected characteristics. Despite this commitment, we have, like many organisations, a gender pay gap in favour of male employees, largely due to a greater proportion of men being employed in the higher grades and a greater proportion of women in the lower grades (vertical segregation). Our overall median and mean pay gaps are 16.6 per cent and 13.7 per cent. The mean and median salaries for men and women in grades 1 to 9 are relatively similar, however, a gender pay gap exists within the highest pay band (grade 10) and this has a major influence on the University’s overall pay gap. A variety of approaches have been employed to address this. Revised appointment and promotion policies (including strategies to increase understanding of the promotion process) have increased the proportion of women at grade 10 from 22.8 per cent in 2013/14 to 25.0 per cent in 2015/16. The actions to reduce the gender pay gap at grade 10 (as reported in the last annual review) have resulted in a decrease in the pay gap at grade 10 from 2015 figures of 11.3 per cent and 9.26 per cent (mean and median) to 7.1 per cent and 6.3 per cent respectively.
Accountant under six principals from 1946 until his retirement in 1980. Funds from the Robert O Curle Charitable Trust will support medical and veterinary research, including the creation of a £1 million high-tech research suite for studies into eye diseases at Edinburgh BioQuarter. The donation will also help purchase equipment for the University’s Hospital for Small Animals, as well as laboratory tools to support conservation research at the Royal (Dick) School of Veterinary Studies. In recognition of his significant contributions in life and in death, the Robert O Curle Charitable Trust has now been awarded the distinction of University Benefactor.
Student experienceFailure to provide a high quality student experience is classed as the most significant internal risk facing the University. In 2017, Court endorsed a number of actions to enhance learning, teaching and the wider student experience. These focused on nurturing excellent teaching (and eliminating instances of teaching underperformance) and on taking measures to bridge the gap between NSS outcomes and other forms of student feedback on their experience which show significantly greater satisfaction with teaching. Schools took steps to ensure early semester induction events had as wide a reach across the student body as possible. All Schools were asked to deliver a mid-semester feedback exercise for all courses taken by honours-level students. Schools were encouraged to review content and approach to communications with students, focusing on: communicating positive changes to their students (such as investment in facilities); celebrating success (of both students and staff); and, underlining the message that student feedback is important to us and leads to positive changes.
Areas for further development highlighted in the Enhancement-led Institutional Review are space management: the need for the views of staff and students to be taken into account in planning space for teaching and learning; feedback to students to ensure consistency in the quality and quantity of feedback across the University; the Personal Tutor (PT) system: ensuring the effective implementation of the
Our people (continued)
22 Annual Report and Accounts 2016/17
Operational review (continued)

Leadership in researchNew Royal Society fellows
Four Edinburgh academics have been elected to a prestigious fellowship in recognition of their outstanding contributions to science. They are among 50 distinguished scientists announced as new Fellows of the Royal Society. The Fellowship is made up of the most eminent scientists, engineers and technologists from or living and working in the UK and the Commonwealth. More than a quarter of this year’s intake of Fellows are women.
The Edinburgh academics elected to the Fellowship of the Royal Society are: Professor Wendy Bickmore, Director of the MRC Human Genetics Unit; Professor Christopher Bishop (not pictured), Professor of Computer Science; Professor Gabriele Hegerl, Professor of Climate System Science; and Professor Josephine Pemberton, Professor of Molecular Ecology.
23Annual Report and Accounts 2016/17
Overview
Strategy and value model
Op
erational review
Financial review
Governance
Financial statements
Annual Report and Accounts 2016/17 23

It has been another year in which the University has operated in challenging circumstances, facing headwinds in UK public sector funding, more political uncertainty and higher education funding pressures. The UK economy has yet to feel the consequences of Brexit, and we do not yet know what it will mean for research funding or freedom of movement for our students and staff – our most important assets. In response we have been prudent in our cost management which has allowed us to generate an unrestricted surplus this year of 7.4 per cent of income. The £56 million surplus before other gains and loses generated is small relative to our £1.1 billion capital investment programme but we believe we can sustain this by building on our distinctive, local and global reputation. The University of Edinburgh is well positioned for the future, and we will continue to innovate to maintain our position and reputation as an influential and world-class institution.
Integrated reportingThis is the second year that we have aligned our Annual Report and Accounts to the International Integrated Reporting Framework, championed by the British Universities Finance Directors Group (BUFDG). Integrated reporting has provided a very useful framework within which we can demonstrate the huge value created by the University to our wide and distinctive group of stakeholders. I am keen to see its use as a catalyst to develop and promote more transparent integrated thinking within the University, which will better enable us to demonstrate the effectiveness and efficiency of our world leading University. As chair of BUFDG, I am promoting awareness and adoption of the integrated reporting framework with my colleagues across the UK higher education sector.
Integrated reporting is a topic of both academic and practical interest to us at the University of Edinburgh and we are working with a wide variety of partners to develop it for internal and external consumption. We have been working to develop a set of financial statements that reflect the integrated reporting framework, and in doing so we are able to highlight significant factors affecting the external environment including aspects of the political, economic, social, environmental and commercial landscape that affect the University’s ability to create value in the short, medium and long term as well as openly discuss the challenges and uncertainties that the University is likely to encounter in pursuing its strategy.
Service excellenceAs a world-leading centre of academic excellence, it is essential that the University of Edinburgh continually revolutionises and transforms the way it works, to maintain flexible and efficient professional services that can respond effectively to changing priorities and expectations. The University is investing significantly in a Service Excellence Programme (SEP), a University-wide initiative designed to review and transform the professional services that we provide to our students and colleagues.
Service Excellence is a five-year Programme focusing specifically on the areas of student administration and support, human
resources and finance. In parallel we are upgrading the Core Systems technology that underpins these services by working closely with colleagues in the Digital Transformation Programme. The SEP will prioritise key journeys that our customers take with us and redesign them end to end to significantly improve their experience. Our transformation work will ensure our customers can interact with us anytime, anywhere and through the channels they choose.
Service Excellence is now moving into its next phase of work, to implement best practice in how we provide and deliver professional services to support our core mission of research and learning and teaching. It will deliver improved service quality levels to students, academics and professional services staff, unlock greater efficiency and effectiveness by removing duplication of effort and complexity and, wherever possible, freeing up capacity. We are excited by the potential of new core IT systems for HR, finance, payroll and procurement to enhance the use of data, student systems and the online experience. By simplifying the way we do things and by focusing on the user experience of our systems, we are laying solid foundations for growth. We will invest significant resource and effort to support and develop our staff during the transition phase.
City Region DealWe are hugely proud to be a key partner in the City Region Deal, where significant sums will be invested by the UK and Scottish Governments. We will work diligently and responsibly to make sure this money is invested wisely, as we work with stakeholders from government, society and the University to make a positive and long lasting difference to the city.
This initiative coincides with our ambitious plans to transform the University’s physical landscape in the city and enhance its sense of place for its citizens through the Estates Capital Plan. We share with our partners the ambitious plan to strengthen Edinburgh’s reputation as a leader in data driven education, research and knowledge exchange as well as a highly desirable place to live, work and study.
24 Annual Report and Accounts 2016/17
Finance Director’s foreword

0
220
440
660
880
1,100Proposed
Approved
202720262025202420232022202120202019201850%50%50%51%51%61%71%83%90% 54%
50%50%50%39%29%
17%
10%
46% 49% 49%
Estate programme - indicative forecast project spend (cumulative)Estates Capital Plan We are extremely proud of our ambition to create a world-class estate for a world-class university, and will deliver this through our £1.1 billion programme of new buildings and refurbishment of the existing physical estate. The physical estate is one of our key capitals which we use to provide a stimulating environment in which to create value for our students and staff. Planned projects include a new home for the School of Biological Sciences, the creation of the Bayes Centre and a refurbishment of the historic School of Law at Old College. Capital investment in our physical estate was £188 million in 2016/17 and spend on approved projects is forecast to average over £111 million per annum for the next ten years. The scale and speed of our investment plans will not only result in a transformational change for the University but will also make a positive economic contribution locally and nationally with the support of hundreds of associated jobs as we deliver our ambition.
Endowment and Investment Fund performanceThe Endowment and Investment Fund continues to grow despite market volatility. The overall return on investment in 2016/17 was 16.4 per cent. Our unit price grew by 14 per cent this year following an increase of seven per cent in 2015/16. The valuation of the fund at 31 July 2017 (including cash invested) grew to £527 million.
Pension liabilitiesEvery three years, pension schemes have a formal revaluation to establish the gap between scheme assets (investments to pay pensions) and project liabilities (what is expected to pay out to pensioners). The latest triennial valuation of the University Superannuation Scheme (USS) as at 31 March 2017 is underway and the development of proposals is scheduled for completion by the statutory deadline of 30 June 2018.
Social responsibility and sustainabilityThe University has made a significant and positive contribution to society through the efforts of its staff, students and alumni in 2016/17. Our commitment to become zero-carbon by 2040 has reinforced our commitment to being a socially responsible and sustainable University. The University’s Climate Strategy 2016 lays out a comprehensive whole institution approach to climate change mitigation and adaptation to achieve the ambitious targets. This year, commitments to protect and respect human rights and have a zero tolerance approach to slavery and human trafficking in all its forms was set out in the University’s Modern Slavery Statement.
Community engagementThe University’s Community Engagement Strategy seeks to strengthen the relationships between the University and the local communities where we are based and where most of our staff and students live. We want the local communities to access our research and learning opportunities and enhance students’ experiential learning by offering opportunities to work in and with communities. We also wish to build awareness and understanding of the University’s role in the community and to develop a more ‘open door’ approach to groups and individuals wishing to interact with us.
I’d like to take this opportunity to thank my colleagues for all of the hard work this year. It has sometimes been challenging to realise and address the changes that are needed to improve the way we work, and I am continually grateful for everything they do. We are an ambitious team who have made significant progress and still have energy and ambition to achieve more. We will keep putting our students and staff at the heart of the organisation, and we will continue to work openly and transparently with our supplier partners, our colleagues and every stakeholder in our institution.
Mr Phil McNaullDirector of Finance
25Annual Report and Accounts 2016/17
Overview
Strategy and value model
Operational review
Financial review
Governance
Financial statements

* Research and Development Expenditure Credit (RDEC)
2017 total £m
2016
Ex.RDEC £m
RDEC * £m
Total £m
Income 929 889 19 908
Expenditure 873 844 - 844
Operating surplus/(deficit) 56 45 19 64
Gain on disposal of assets 8 1 - 1
Gain on investments 66 29 - 29
Tax - - (4) (4)
Surplus for the year 130 75 15 90
Revaluations surplus - 7 - 7
Actuarial loss (5) (41) - (41)
Total comprehensive income 125 41 15 56
Represented by:
Unrestricted comprehensive income 69 - 15 15
Endowment comprehensive income 49 28 - 28
Restricted comprehensive income 7 6 - 6
Revaluation comprehensive income - 7 - 7
125 41 15 56
Fixed assets 1,617 1,493
Heritage assets 212 212
Investments 531 471
Net current assets 266 255
Total assets less current liabilities 2,626 2,431
Creditors over one year (319) (257)
Pension provisions (261) (254)
Net assets 2,046 1,920
Summary financial informationAnnual accounts 2016/17The Annual Report and Accounts comprise the financial results of the University, consolidated with the results of its subsidiaries. The subsidiaries’ operations include letting accommodation for conference facilities and the Edinburgh Festival, publishing, provision of utilities services to the University and high-performance computing services. For commercial reasons these activities are channelled through limited companies. The subsidiaries transfer their taxable profits to the University each year by Gift Aid.
FRS 102The accounts are prepared in accordance with Statement of Recommended Practice Accounting for Further and Higher Education Institutions 2015 (SORP 2015) and with Financial Reporting Standard (FRS 102). Following this reporting framework, the University Group’s comprehensive income for the year is £125 million.
Comprehensive income for the year has moved favourably on the prior year by £69 million (2015/16 favourable £4 million), exemplifying the potential for figures to fluctuate year-on-year due to changes in market value and changes in actuarial assumptions. Of the £69 million movement, there was £36 million favourable movement from actuarial gains on pension schemes, an £8 million gain on sale of land, plus an additional £37 million unrealised gain on investments.
Two favourable movements occurring in 2015/16 create reverse unfavourable movements of £22 million in 2016/17; the Research and Development Expenditure Credit (RDEC) claim of £15 million (net of tax) and the revaluation gain on heritage assets of £7 million. Once these major items are accounted for, the underlying trend is a favourable movement of £10 million from improved income generation and cost control.
Comprehensive income includes unspent restricted funds and unrealised gains and losses, so does not represent funds available for reinvestment. To help the reader understand the Group financial performance, the ‘comprehensive income’ for the year (previously known as surplus) is broken down into its constituent parts:
• Unrestricted – available to re-invest in the business.• Restricted – which are committed funds, not surplus cash. The total unrestricted comprehensive income for 2016/17 was £69 million, (2015/16 £15 million) which was 55 per cent of total comprehensive income (2015/16 – 27 per cent), representing funds available for reinvestment. Of this unrestricted figure, 25 per cent or £17 million is an unrealised gain on investment (2015/16, 40 per cent, or £6 million), which is yet to be converted to cash, and has resulted from the change in market value of unrestricted invested funds in the year. Once this is removed, the residual, realised element, £52 million of unrestricted comprehensive income is now the most appropriate measure of performance (2015/16 £9 million), which represents six per cent of turnover (2015/16 one per cent).
26 Annual Report and Accounts 2016/17
Financial review
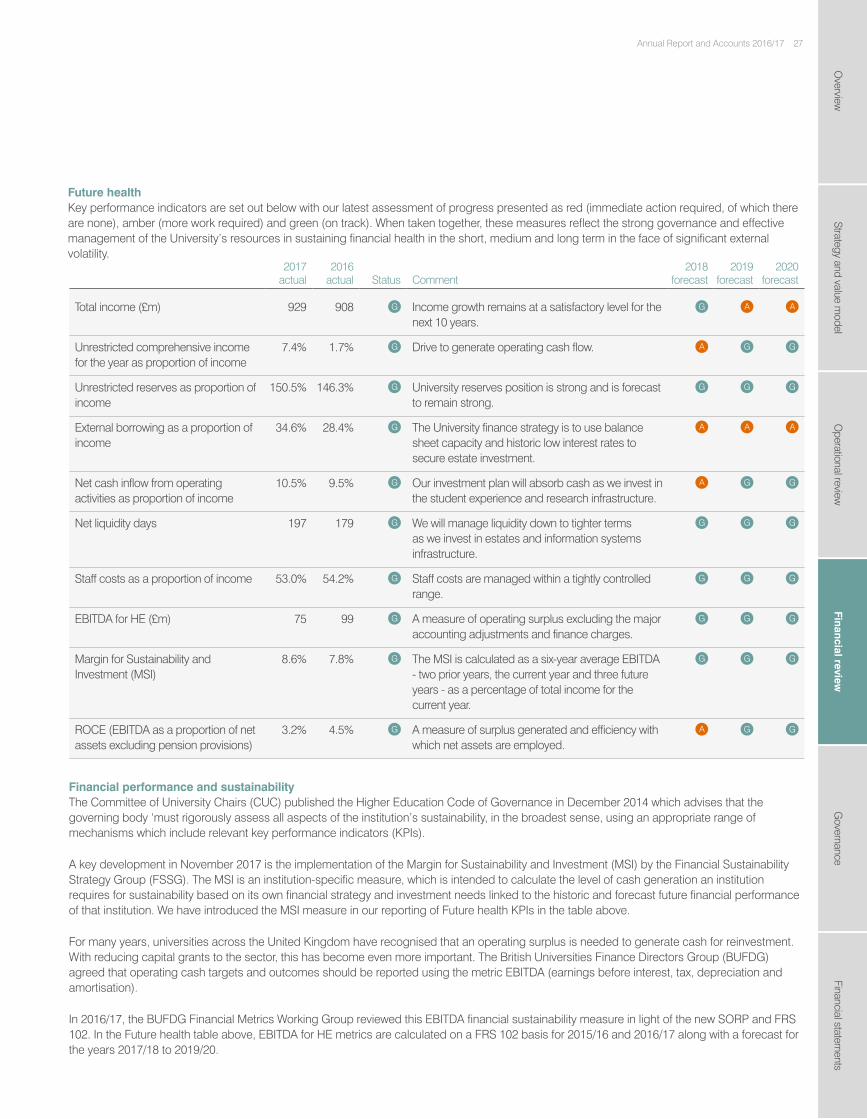
2017 actual
2016 actual Status Comment
2018 forecast
2019 forecast
2020 forecast
Total income (£m) 929 908 G Income growth remains at a satisfactory level for the next 10 years.
G A A
Unrestricted comprehensive income for the year as proportion of income
7.4% 1.7% G Drive to generate operating cash flow. A G G
Unrestricted reserves as proportion of income
150.5% 146.3% G University reserves position is strong and is forecast to remain strong.
G G G
External borrowing as a proportion of income
34.6% 28.4% G The University finance strategy is to use balance sheet capacity and historic low interest rates to secure estate investment.
A A A
Net cash inflow from operating activities as proportion of income
10.5% 9.5% G Our investment plan will absorb cash as we invest in the student experience and research infrastructure.
A G G
Net liquidity days 197 179 G We will manage liquidity down to tighter terms as we invest in estates and information systems infrastructure.
G G G
Staff costs as a proportion of income 53.0% 54.2% G Staff costs are managed within a tightly controlled range.
G G G
EBITDA for HE (£m) 75 99 G A measure of operating surplus excluding the major accounting adjustments and finance charges.
G G G
Margin for Sustainability and Investment (MSI)
8.6% 7.8% G The MSI is calculated as a six-year average EBITDA - two prior years, the current year and three future years - as a percentage of total income for the current year.
G G G
ROCE (EBITDA as a proportion of net assets excluding pension provisions)
3.2% 4.5% G A measure of surplus generated and efficiency with which net assets are employed.
A G G
Financial performance and sustainabilityThe Committee of University Chairs (CUC) published the Higher Education Code of Governance in December 2014 which advises that the governing body ‘must rigorously assess all aspects of the institution’s sustainability, in the broadest sense, using an appropriate range of mechanisms which include relevant key performance indicators (KPIs).
A key development in November 2017 is the implementation of the Margin for Sustainability and Investment (MSI) by the Financial Sustainability Strategy Group (FSSG). The MSI is an institution-specific measure, which is intended to calculate the level of cash generation an institution requires for sustainability based on its own financial strategy and investment needs linked to the historic and forecast future financial performance of that institution. We have introduced the MSI measure in our reporting of Future health KPIs in the table above.
For many years, universities across the United Kingdom have recognised that an operating surplus is needed to generate cash for reinvestment. With reducing capital grants to the sector, this has become even more important. The British Universities Finance Directors Group (BUFDG) agreed that operating cash targets and outcomes should be reported using the metric EBITDA (earnings before interest, tax, depreciation and amortisation).
In 2016/17, the BUFDG Financial Metrics Working Group reviewed this EBITDA financial sustainability measure in light of the new SORP and FRS 102. In the Future health table above, EBITDA for HE metrics are calculated on a FRS 102 basis for 2015/16 and 2016/17 along with a forecast for the years 2017/18 to 2019/20.
Future healthKey performance indicators are set out below with our latest assessment of progress presented as red (immediate action required, of which there are none), amber (more work required) and green (on track). When taken together, these measures reflect the strong governance and effective management of the University’s resources in sustaining financial health in the short, medium and long term in the face of significant external volatility.
27Annual Report and Accounts 2016/17
Overview
Strategy and value model
Operational review
Financial review
Governance
Financial statements
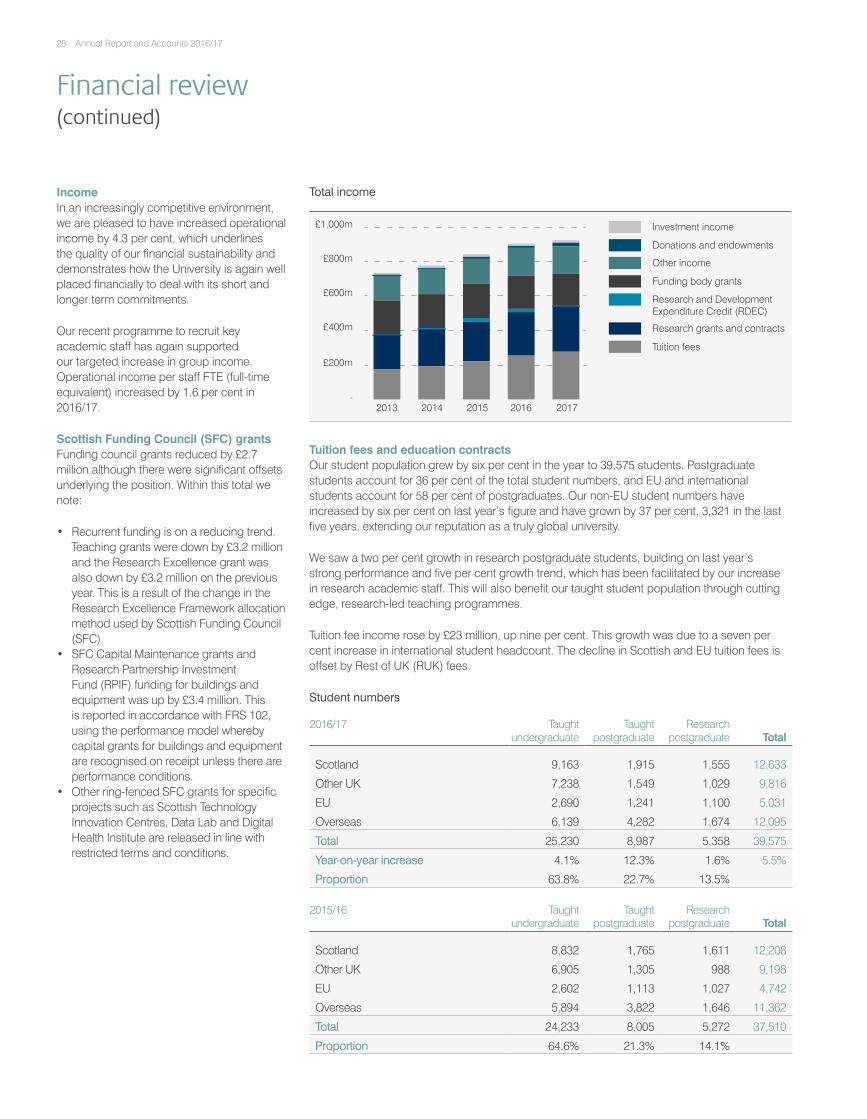
-
£200m
£400m
£600m
£800m
£1,000m Investment income
Donations and endowments
Other income
Funding body grants
Research and Development Expenditure Credit (RDEC)
Research grants and contracts
Tuition fees
20172016201520142013
Total income
Student numbers
2016/17 Taught undergraduate
Taught postgraduate
Research postgraduate Total
Scotland 9,163 1,915 1,555 12,633
Other UK 7,238 1,549 1,029 9,816
EU 2,690 1,241 1,100 5,031
Overseas 6,139 4,282 1,674 12,095
Total 25,230 8,987 5,358 39,575
Year-on-year increase 4.1% 12.3% 1.6% 5.5%
Proportion 63.8% 22.7% 13.5%
2015/16 Taught undergraduate
Taught postgraduate
Research postgraduate Total
Scotland 8,832 1,765 1,611 12,208
Other UK 6,905 1,305 988 9,198
EU 2,602 1,113 1,027 4,742
Overseas 5,894 3,822 1,646 11,362
Total 24,233 8,005 5,272 37,510
Proportion 64.6% 21.3% 14.1%
IncomeIn an increasingly competitive environment, we are pleased to have increased operational income by 4.3 per cent, which underlines the quality of our financial sustainability and demonstrates how the University is again well placed financially to deal with its short and longer term commitments.
Our recent programme to recruit key academic staff has again supported our targeted increase in group income. Operational income per staff FTE (full-time equivalent) increased by 1.6 per cent in 2016/17.
Scottish Funding Council (SFC) grantsFunding council grants reduced by £2.7 million although there were significant offsets underlying the position. Within this total we note:
• Recurrent funding is on a reducing trend. Teaching grants were down by £3.2 million and the Research Excellence grant was also down by £3.2 million on the previous year. This is a result of the change in the Research Excellence Framework allocation method used by Scottish Funding Council (SFC).
• SFC Capital Maintenance grants and Research Partnership Investment Fund (RPIF) funding for buildings and equipment was up by £3.4 million. This is reported in accordance with FRS 102, using the performance model whereby capital grants for buildings and equipment are recognised on receipt unless there are performance conditions.
• Other ring-fenced SFC grants for specific projects such as Scottish Technology Innovation Centres, Data Lab and Digital Health Institute are released in line with restricted terms and conditions.
Tuition fees and education contractsOur student population grew by six per cent in the year to 39,575 students. Postgraduate students account for 36 per cent of the total student numbers, and EU and international students account for 58 per cent of postgraduates. Our non-EU student numbers have increased by six per cent on last year’s figure and have grown by 37 per cent, 3,321 in the last five years, extending our reputation as a truly global university.
We saw a two per cent growth in research postgraduate students, building on last year’s strong performance and five per cent growth trend, which has been facilitated by our increase in research academic staff. This will also benefit our taught student population through cutting edge, research-led teaching programmes.
Tuition fee income rose by £23 million, up nine per cent. This growth was due to a seven per cent increase in international student headcount. The decline in Scottish and EU tuition fees is offset by Rest of UK (RUK) fees.
28 Annual Report and Accounts 2016/17
Financial review(continued)

-
£50m
£100m
£150m
£200m
£250m
£300m UK industry, commerce and public operations
UK central, government bodies, local and health authorities
UK-based charities
EU and other
Research Councils
20172016201520142013
Research income
we unwind the opening provision made on 1 August 2014 based on the 2012 triennial valuation. In 2014/15 this was based on the 2015 triennial valuation.
Staff costs, as a proportion of total operating income, were 53 per cent, compared to nearly 54 per cent in the prior year (excluding RDEC). 54 per cent (£15 million) of the increase was in academic and related support staff, with a further 30 per cent (£8 million) invested in research grants and contracts staff as research income continued to grow. Staff were awarded a 1.1% pay increase on 1 August 2016. Increased staff FTE accounts for three per cent of the total salary cost increase and an additional one per cent is due to incremental drift, which occurs as staff progress up the pay scale. Salaries make up 74 per cent of total staff costs, with pensions, National Insurance and other employer costs comprising 26 per cent.
University staff are eligible to join one of two defined benefits pension schemes – the University Superannuation Scheme (USS) and the Staff Benefits Scheme (EUSBS) or, since March 2013, a defined contribution scheme, National Employee Savings Trust (NEST). Pensions are a significant staff benefit (26 per cent of direct salary costs) and the cost of providing these increased by 13 per cent (£10 million) on 2015/16.
Research grants and contractsResearch income from grants and contracts grew by four per cent (£11.4 million) on the previous year to £265 million. Research Councils UK grant income dropped three per cent (£3.5 million), and Industry funding dropped eight per cent (£0.6 million). Central and Local Government research income grew by 15 per cent (£3.5 million), research income from UK charities increased by 17 per cent (£8.4 million) and EU Government bodies research funding grew by seven per cent (£2.2 million). Research income from other sources increased by six per cent (£1.4 million), due to funding from other overseas sources.
The University achieved great success in winning research grants and contracts of £364 million, up by 36 per cent on last year’s total of £268 million and 19 per cent up on the previous record of £305 million reported in 2014/15. The number of research applications increased by two per cent and the value was up by 10 per cent to £968 million. Our success rate in converting research applications continues to increase, now at 53 per cent in volume terms. In value terms, our conversion factor was 36 per cent.
Other incomeNearly a fifth of the University’s income, £157 million, is earned from other sources, three per cent lower (£4 million) than last year’s performance. Residences, Catering and Conferences income grew by eight per cent (£5 million) due to new accommodation at sites in Holyrood and Riego Street. Restricted income dropped by £2 million due to reduced funding from Jisc (Joint Information Systems Committee). Unrestricted income from academic and related activities dropped by £4 million; however, in the prior year we reported a one-off receipt of £5 million, so the underlying trend is a £1 million increase.
Investment incomeIncome from our endowment investments was £8.4 million, down seven per cent on last year, but the overall market value of investments (income plus capital appreciation) grew by 14 per cent. Other investment income grew by £1.6 million on last year and bank interest grew by £0.3m to £3.4 million, an increase of 10 per cent.
Donations and endowmentsUnder FRS 102, revenue recognition rules mean that we include income from new donations and endowments accepted in the year. 2016/17 saw donations increase by £13 million to £20 million and we received £1.7 million from new endowments (down by £2.7 million on last year). Following FRS 102, where income is donated with restrictions that have performance conditions, we can defer the income and release it in line with the restricted expenditure as it is incurred. Where there are no performance conditions, income is recognised in the year, but is then held in a specific reserve, so it is only spent on the restricted purpose specified by the donor.
ExpenditureGroup expenditure increased year-on-year by three per cent (£29 million), reflecting controlled investment for growth.
Staff costsA university’s most valuable resource is its staff, and our costs to sustain this resource in 2016/17 were £493 million, up by three per cent (£15 million). If we remove the impact of the USS pension scheme recovery plan, the underlying movement is five per cent (£25 million). FRS 102 means that we provide for our share of the USS pension recovery plan in the staff costs and pension schemes disclosure (note 31). In 2016/17, we have a net credit adjustment of £4.9 million as
29Annual Report and Accounts 2016/17
Overview
Strategy and value model
Operational review
Financial review
Governance
Financial statements

2017 %
2017 £m
2016 %
2016 £m
University spend with small and medium-sized enterprises 46% 116 53% 100
University spend in Scotland 53% 133 51% 96
University spend in Edinburgh and Lothians 26% 65 25% 47
Procurement spendOther operating costsOther costs, which include expenditure on subsidiary company activities, student accommodation, bursaries, premises costs and library services, have increased by £6 million (two per cent) from last year.
There were significant investments in academic endeavour with a £5 million increase in academic departments and scholarships spend. Direct research spend kept pace with prior year at £97 million and £3 million from increased activity in residences and catering. Library, computer and academic services costs increased by £4 million. Estates refurbishment costs were reduced by five per cent (£2 million). Other income generating activities costs reduced by £4 million, due in part to restructuring of services and cessation of operations in two subsidiary companies, FloWave Ltd and Sunergos Ltd in 2016/17.
Expenditure on prizes, scholarships, studentships and bursaries remains a priority, increasing by five per cent to £32 million. The 2016/17 academic session saw 89 first-year undergraduate students awarded an access bursary with over 420 continuing students having their access bursary renewed, totalling over £527,000. 1,393 accommodation bursaries were awarded, totalling over £2 million, and 1,609 University of Edinburgh RUK bursaries were awarded, totalling approximately £7.2 million. Over 3,400 undergraduate students currently hold an Edinburgh Bursary rising from 3,100 in 2015/16.
DepreciationDepreciation accounted for five per cent of total spend (£47 million in 2016/17), up by 15 per cent (£6 million) on last year. This planned increase is due to the increased capital spend, reflecting the University’s ambitious capital programme and commitment to investing in quality infrastructure and equipment.
Interest costsInterest and other finance costs are £15 million; two thirds of the charge, £9 million, is interest payable on borrowing and finance leases and £6 million is the net charge on pension scheme liabilities.
Sustainable procurementOur sustainable procurement goal is to procure goods and services in ways that maximise efficiency and effectiveness while minimising social, environmental and other risks. As part of this commitment we encourage the use of supported businesses for the provision of some goods and services.
In 2016, the UK Modern Slavery Act (2015) came into force, requiring organisations with a turnover of over £36 million to publish a statement detailing what actions they are taking to combat any risks of modern slavery in their own operations and in their supply chains.
The University recognises there are risks of modern slavery, in particular in the supply chains of the goods and services we buy. In 2016, the University published a Modern Slavery Statement, detailing what steps we already take to combat modern slavery, our relevant policies and procedures, and an action plan to ensure sustained focus on this issue. The statement sets out our commitment to protect and respect human rights and have a zero tolerance approach to slavery and human trafficking in all its forms.
The University continues to look for savings and value for money opportunities to make most effective use of resources. Specific Procurement-led initiatives resulted in Value for Money savings of approximately £13.7 million during 2016/17. The savings resulted mainly from higher value competitive tenders. Other savings were achieved through access to 177 collaborative contracts with APUC (Advanced Procurement for Universities and Colleges), other institutions and sectors.
At the year end, the amount due to trade creditors was equivalent to 17 days of purchases from suppliers. Nothing was paid under the Late Payments of Commercial Debts (Interest) Act 1998. The University’s policy is to pay agreed invoices in accordance with the agreed terms of payment, which are available at www.ed.ac.uk/schools-departments/procurement/supplying/terms-and-conditions-of-purchase.
30 Annual Report and Accounts 2016/17
Financial review(continued)

Fund manager Asset type
Aviva Multi-asset
Baillie Gifford Equities
Blackrock Equities
Hermes Property
Kames Capital High yield bonds
M&G Illiquid credit opportunities
Northern Trust Emerging market equities
Northern Trust World custom equities
Pentech Venture Capital
Savills Property
2017 £m
2017 %
2016 £m
2015 £m
2014 £m
2013 £m
Fixed assets 1,617 55% 1,493 1,399 1,246 1,228
Heritage assets 212 7% 212 205 175 171
Current assets 571 19% 531 495 477 450
Investments 531 18% 471 327 298 284
Total assets
Estate programme - major projects at design stage
CampusProjected value £m
Major projects at design stage included:
Edinburgh Futures Institute - Quartermile A 119
Student Centre A 82
Murchison House Refurbishment B 14
KB Infrastructure Project [Phase 1] B 13
Major projects under construction included:
Institute for Regeneration and Repair C 54
BAYES A 40
McEwan Hall redevelopment A 34
Old College School of Law refurbishment A 31
Easter Bush Centre Building D 30
Endowment assetsThe Investment Committee regularly reviews the fund managers and asset types in the unitised fund to diversify risk. Current fund managers and associated asset types are presented in the table below.
Often the strengths of the collections relate to the University’s own specialist areas of excellence, but their breadth means they appeal to a wide range of users from publishers to genealogists from a rare book to a potted specimen in the natural history collection. Many of these items are deemed of national importance while others, such as the historic musical instrument collection and some of the Islamic manuscripts, are regarded as world-class research and heritage resources. For these reasons, the heritage assets held in University Collections at Edinburgh make a telling contribution to scholarly endeavour, teaching and learning, the promotion of innovation and the dissemination of knowledge for the public benefit.
Our heritage assets totalled £212 million at 31 July 2017. The collections that have been valued are estimated at £208 million and, following gains of £7 million in 2015/16, there were no revaluations in year.
Balance sheetWe are pleased to report continued strength in the University Group balance sheet. This strength was a key factor in securing long-term funding to invest in the transformational Estates Strategy and provides a strong covenant to the trustees of our pension funds. All balance sheet financial metrics are resilient.
Capital programme and estates maintenanceThe University continues to deliver a significant programme of estates developments and equipment procurement. The development pipeline of estates projects is £1.1 billion over the next 10 years to support infrastructure developments that will deliver high-quality educational and research facilities. Hard-won and carefully stewarded University cash reserves provide the leverage to raise the additional external grants and donation funding required. The physical estate, encompassing buildings from several centuries ago, is a key component of the University of Edinburgh brand. It requires a substantial level of investment to sustain the high-quality.
Our funding strategy for investment in our estate is to utilise cash reserves and leverage external grants, donations and long term loans including the £300 million loan facilities reported in 2015/16.
Heritage assetsSince its foundation in 1583, the University of Edinburgh has acquired extensive collections of heritage assets to support its teaching, research and public engagement. These assets comprise printed, manuscript and photographic material, as well as objects such as paintings, sculptures and natural history, geology and anatomy specimens. This is a highly valued element of the physical capital from which we create value.
31Annual Report and Accounts 2016/17
Overview
Strategy and value model
Operational review
Financial review
Governance
Financial statements

£35
£36
£37
£38
£39
£40
Jul2017
Jun2017
May2017
Apr2017
Mar2017
Feb2017
Jan2017
Dec2016
Nov2016
Oct2016
Sep2016
Aug2016
Investment unit price movement 2016/17
During the year Black Rock and other University investments were sold to buy Northern Trust World Custom ESG Equity and M&G Illiquid assets. The University has also invested in the UoE Deaconess subsidiary company.
Investment performance continues to deliver satisfactory results despite market volatility. In the year to 31 July 2017, the Endowment and Investment fund unit price rose to £39.34, an increase of 14 per cent on the price at 31 July 2016 (£34.51). In 2016/17, the University invested an additional £27 million in its unitised fund and £1.2 million of new endowment funds from bequests. The number of units rose from 12.6 million to 13.4 million bringing the valuation at the year end to £527 million.
Responsible Investment (RI)The University continues to review its approach to responsible investment including engagement strategies with companies it invests in. We are working to strengthen with our fund managers how we engage with companies. Similarly to 2016, we were assessed highly by the UNPRI (United Nations Principles of Responsible Investment) for Strategy and Governance (A+) and also for general integration of ESG in listed Equity (A) and Property (B). Our Responsible Investment Policy can be found at www.ed.ac.uk/about/sustainability/themes/responsible-investment.
Endowment assets (continued) All of our fund managers are signatories to UNPRI.
To support the University’s strategic commitment to deliver impact for society, the University has committed to a range of social finance initiatives. This builds on the leadership shown by the University in the area of social investment and community engagement, as well as its commitment to responsible areas of investment. The University has agreed to invest £1 million in a new scheme with Big Issue Invest, the social investment arm of The Big Issue Group, one of the world’s most recognised social enterprises. The scheme offers loans and investments to non-profit organisations and charities that are trying to find new solutions to some of the toughest social challenges, and demonstrates the University’s commitment to generating positive social value as well as financial return.
Net current assetsNet current assets have increased by £11 million on last year, due to a bigger increase in current assets, of £40 million, than in current liabilities, which increased by £29 million. Current assets grew by seven per cent, due to a £51 million combined increase in cash and cash equivalents and investments, offset by a £12 million decrease in trade receivables (due to prior year accrual of RDEC income). Our value creation strategy is to make our cash balances work hard before they are required to fund the long-term capital plan and we
have placed an additional £27 million of our treasury balance as an investment with our current fund managers in the year. After capital appreciation, our total general reserve investment is now valued at £139 million.
Current liabilities increased by £29 million due to increased accruals and deferred income.
Pension liabilitiesThe University’s defined benefit pension schemes (USS and EUSBS) continue to record deficits relative to their forecast liabilities (full details are provided in Note 31 on pages 76 to 83). The University’s share of the deficit on the Lothian Pension Fund (LPF) decreased by £1.2 million, while the deficit on the Strathclyde Pension Fund (SPF) has decreased by £2.5 million.
The triennial valuation of the EUSBS scheme took place as at 31 March 2015. This showed a shortfall between the assets and liabilities of £101.7 million. The University has proposed changes to the benefit structure to ensure the scheme can continue to provide an alternative level of benefits at a sustainable cost. The proposed changes were subject to consultation with affected employees, which took place during August and September 2016. The Trustees and the University have now agreed upon a recovery plan, which provided for a substantial one-off lump sum payment of £19 million in July 2016, plus a further £1 million paid annually while the scheme is in deficit. On an FRS 102 basis the fund deficit at 31 July 2017 included in these financial statements was £145.6 million (2016: £131.3 million).
The USS sector deficit at its last triennial valuation at March 2014 was approximately £5.3 billion. An alternative way of expressing the position is that the scheme’s assets were sufficient to cover 89 per cent of its liabilities. USS is currently consulting with employers and staff representatives on reform that will make the scheme sustainable. At the previous valuation at 31 March 2011 the shortfall was £2.9 billion, equivalent to a funding level of 92 per cent. The valuation as at 31 March 2017 is underway and is scheduled for completion by the statutory deadline of 30 June 2018. In the years between valuations, the financial position is updated by keeping all the assumptions to determine accrued pension constant except
32 Annual Report and Accounts 2016/17
Financial review(continued)

Pension schemeAssets
£mLiabilities
£mDeficit
£mActive
membersActive
members %
Service cost accounted for under FRS102:
EUSBS 403 (549) (146) 1,887 17.1%
LGPS (SPF and LPF) 56 (60) (4) 47 0.4%
459 (609) (150) 1,934 17.5%
Defined contribution treatment:
USS 7,475 67.7%
NEST 1,424 12.9%
Other schemes 212 1.9%
9,111 82.5%
Total 11,045 100.0%
Pension liabilities and active members 2016/17
the discount rate. Using this methodology the deficit was £12.6 billion at 31 March 2017 (2016: £10 billion).
Following a review of scheme funding, the trustee confirmed that substantially increased contributions would be required to continue to provide the existing arrangements.
Since 1 April 2016, all members became part of the USS Retirement Income Builder. From that date all members will accrue a pension of 1/75th of salary and a cash lump sum of 3/75th of salary for each year of service, based on pensionable salary each year. From 1 October 2016, a Career-Revalued Benefits (CRB) scheme is available on pensionable salary up to the threshold – initially £55,000 a year.
From 1 October 2016, the new defined contribution (DC) section was introduced, the USS Investment Builder. Members of the USS pension scheme earning above £55,000 per year will be automatically contributing to the new DC section on their earnings above that level. In addition, all members, irrespective of their salary, will have the opportunity to take up a one percent matching contribution from their employer.
Prior to 2015/16, the University’s share of the USS deficit was not accounted for on the University’s balance sheet as the scheme assets and liabilities are not broken down by individual institution; however this has
changed from 2015/16 under FRS 102. Under FRS 102 the present value of deficit recovery plans for multi-employer pension schemes needs to be recognised on the balance sheet as a provision for that liability. Under the new rules the initial liability in respect of the University’s share of the USS deficit was recorded as a provision on the balance sheet, and will be unwound over time as the liability is discharged.
TaxationThe University is an exempt charity within the meaning of the Trustee Investment and Charities (Scotland) Act 2005 and recognised as a charity by HM Revenue & Customs. Commercial trading activities undertaken by the University are operated through its subsidiary companies and attract VAT where applicable. Indirect tax (VAT) and payroll taxes (PAYE and National Insurance contributions) collected and paid amounted to £4.4 million and £119 million respectively.
33Annual Report and Accounts 2016/17
Overview
Strategy and value model
Operational review
Financial review
Governance
Financial statements

£253m £52m
£86m
£95m
2016
£148m
£216m
£176m
Closingcash
Capitalexpenditure
Investingactivities
Financingactivities
Cash inflowfrom operating
activities
Openingcash
£176m
£97m
£122m
2017
£54m
£45m
£250m
2
1
3
4
The net impact of the cash inflows and outflows in 2016/17 was a £74 million cash inflow, as inflows on operating activities and financing, exceeded the outflow from capital expenditure and investing activities.
The University's operations generate cash flows in and out of the business: inflows from fees, grants and services; outflows from payments to staff, students and suppliers. In 2016/17 this resulted in a net inflow of £97 million (2015/16 £86 million).
The University invests in its estate, acquiring new land, buildings and equipment and refurbishing existing property. In 2016/17 this resulted in a cash outflow of £122 million (2015/16 £95 million). Capital expenditure on land and buildings was £166 million and on fixtures, fittings and equipment it was £20 million. Offset against these outflows, we received in £42 million in capital grant and £23 million from selling fixed assets.
The University borrows from external sources to fund capital expenditure. In 2016/17 the University drew down £67 million of European Investment Bank (EIB) loan funding, the second of three tranches of a £200 million long-term loan facility. When interest and loan repayments are deducted, the net cash inflow from financing activities totals £54 million, (2015/16 £148 million).
The University generates cash flow from investing cash: placing funds on short term deposit and in longer term investments. In 2016/17 this generated £45 million inflow (2015/16 £216 million outflow).
4
3
2
1
Cash movementThe University has cash commitments of £283 million. £139 million is contractually committed via leases, capital contracts and borrowings and £144 million relates to restricted funds not spent but provided by external funders, mainly research sponsors and donors.
Changes in cash movement for 2016/17 are summarised in the graphs below as follows:
34 Annual Report and Accounts 2016/17
Financial Review(continued)

Institutional sustainabilityThe University of Edinburgh’s governing body, the University Court, has comprehensive arrangements in place to monitor, assess and ensure the institution’s sustainability. The University’s Strategic Plan 2016 performance measures provide a benchmark for the University Court and its committees to annually consider and review progress against. These measures cover the University’s activities including teaching, learning and the student experience, research outputs, financial performance and sustainability, financial health and other key areas. This annual reporting is supplemented by in-year reporting of areas where further work is required.
The annual self-evaluation progress report on the University’s Outcome Agreement with the Scottish Funding Council is reviewed and considered by the Principal. This progress report covers activity in support of broad outcomes, and for 2016/17 these included: industry/university collaboration, exploitation and competitiveness and research, widening access to university, learner journey and retention, equality and diversity as well as the coherence of education provision. The progress report on the Outcome Agreement sits alongside the annual report on institution-led internal review, which is part of the University’s quality assurance and enhancement arrangements.
FutureThe University of Edinburgh has made good progress over the last year, and we are confident that the institution is well placed financially to deal with its short and longer term commitments. While the consequences of leaving the EU are still somewhat ambiguous, our new framework which focuses on online education and international partnerships will ensure continued stability. We are also able to manage significant change as it arises and work is underway to ensure compliance with the provisions of the Higher Education Governance (Scotland) Act 2016.
The University will continue to introduce changes to its Annual Report and Accounts to improve the quality of financial and non-financial performance reporting to its broad audience of stakeholders. These will increasingly reflect the integrated thinking, forecasting and reporting we apply internally.
Ms Anne Richards Vice-Convener of Court
35Annual Report and Accounts 2016/17
Overview
Strategy and value model
Operational review
Financial review
Governance
Financial statements

Throughout 2016/17, the University has applied the main principles of the Scottish Code of Good Higher Education Governance. This code has been revised under the auspices of the Committee of Scottish Chairs and the University contributed constructively throughout the consultation process, recognising the importance of supporting high level principles of good governance across a diverse sector.
The Higher Education Governance (Scotland) Act 2016 received Royal Assent in April 2016. Compliance with the requirements of the Act will require amendment of University Ordinances, which are subject to the approval of the Privy Council. Throughout 2016/17, Nominations Committee, which includes representatives from the main stakeholder groups on the University Court including student, Senate, General Council and co-opted members, has given careful consideration to appropriate amendments to ensure compliance with the new Act within the four year transitional period and this work will continue in 2017/18.
University governance The University of Edinburgh is constituted by the Universities (Scotland) Acts 1858 to 1966. The Universities (Scotland) Acts make specific provision for three major bodies in the Governance of the University: Court, Senate and General Council.
University CourtThe University Court has 22 members. The Rector, who is elected by staff and students of the University, presides over meetings of Court. The role of the Vice-Convener of Court is similar to that of chair of institution in many other universities in that the Vice-Convener is responsible for the leadership of the University Court. The Vice-Convener was appointed by an open, transparent recruitment process, managed by the Nominations Committee which included involvement by staff and students. Court has a majority of lay members, including assessors appointed by the Chancellor and the City of Edinburgh Council and elected by General Council. There are also assessors elected by members of Senate and by non-teaching/academic staff from amongst their number and two fully matriculated student members nominated by the Students’
Representative Council (known as Edinburgh University Students’ Association). The Principal is an ex-officio member and acts as the Chief Executive Officer of the University and its Accountable Officer. Co-opted members of Court and external members of the Court Committees are appointed through a robust, transparent, open advertisement and interview process managed by the Nominations Committee (which includes staff and student members) taking into consideration skills, experience and diversity. A Skills Register is maintained for all Court members at www.docs.sasg.ed.ac.uk/GaSP/Governance/CourtSkillsRegister.pdf.
In addition to the members of Court and the University Secretary, a number of senior officers of the University regularly attended meetings during 2016/17: Rector’s Assessor, Senior Vice-Principal, Vice-Principal (Planning, Resources and Research Policy), Heads of Colleges and Support Groups, Deputy Secretary Strategic Planning, Deputy Secretary Student Experience and Directors of Finance, Communications and Marketing, Estates, Legal Services and Human Resources. The Head of Court Services who acts as Clerk to Court is also in attendance at all meetings.
The terms of office of the two student representatives ceased at the end of the academic year 2016/17 and they were succeeded by new members. The term of office of the Non-Teaching Staff Assessor ceased at the end of 2016/17, with a replacement elected from a field of five nominations. Rt Hon Frank Ross was appointed Lord Provost of the City of Edinburgh in May 2017 and replaced Rt Hon Donald Wilson as the City of Edinburgh Council Court Assessor. Training and development opportunities are made available as appropriate for all Court members throughout the year and a mentoring scheme for new Court members is also in operation.
Court is committed to the Nolan Principles regarding standards to be adopted in public life. It maintains a Register of Interests of its members and senior University officers which is publicly available for inspection. On joining Court, members are required to sign a statement confirming that they will comply
with the University’s Code of Conduct which makes reference to the Nolan Principles and to the Register of Interests. The current interests of members of the Court are published at www.ed.ac.uk/governance-strategic-planning/governance/university-court.
The University is committed to protecting and respecting human rights and has a zero tolerance approach to slavery and human trafficking in all its forms. Court has approved a statement in relation to slavery and human trafficking, in compliance with the Modern Slavery Act 2015, published on the University’s website at www.ed.ac.uk/about/sustainability/about/programmes/fairness-trade-sustainable-procurement/modern-slavery/statement.
Court met on five occasions during 2016/17 and between meetings considered any urgent matters which required Court approval via the Exception Committee, which has delegated authority to enable decisions to be taken between Court meetings. Members were also kept informed by electronic means of any significant issues affecting the University. A Court seminar was held in September 2016 on the implications of Brexit and in December 2016 on the student experience. In April 2017, Court held its annual ‘Meet the Court’ event, at which the Principal, Vice-Convener of Court, Rector and University Secretary delivered presentations to staff and students on the activities of Court and led a question and answer session.
Court has overall responsibility for the University’s strategic development. It is actively engaged in the University’s strategic planning processes and in monitoring progress against the Strategic Plan, supported by the work of its committees. The Strategic Plan 2016 was approved by Court at its meeting on 20 June 2016, following a wide consultation process and at its meeting on 6 February 2017 Court approved a performance measurement framework to assess the University’s performance against the Strategic Plan.
36 Annual Report and Accounts 2016/17
Corporate governance statementThe University of Edinburgh is committed to sector-leading standards of corporate governance.

Audit and Risk CommitteeConvener: Mr Alan Johnston, Lay Member of Court The Audit and Risk Committee’s purpose is to review the effectiveness of the University’s corporate governance arrangements, financial systems, internal control environment and risk management arrangements and provide appropriate assurances to Court on these areas.
Committee on University BenefactorsConvener: Professor Sir Timothy O’Shea, Principal and Vice-Chancellor The Committee on University Benefactors’ purpose is to advise Court on the recipients of the Distinction of University Benefactor.
Exception CommitteeConvener: Ms Anne Richards, Vice-Convener of Court The Exception Committee’s purpose is, under delegated authority, to make decisions which would otherwise require Court approval between meetings of Court subject to defined principles and on the understanding that any matter so referred can be referred to the full Court should this be the wish of the Exception Committee.
Nominations CommitteeConvener: Ms Anne Richards, Vice-Convener of Court The Nominations Committee’s purpose is to make recommendations to Court on the appointment of co-opted members of Court, the Court’s nominations of Curators of Patronage and the filling of vacancies as these arise in the Standing Committees of Court.
Policy and Resources CommitteeConvener: Ms Anne Richards, Vice-Convener of Court The Policy and Resources Committee’s purpose is to provide strategic oversight of the University’s financial, investment, estates and people affairs and to advise Court on any other business of particular importance or complexity.
Remuneration CommitteeConvener: Lady Susan Rice, Lay Member of Court The Remuneration Committee advises Court and oversees the preparation of policies and procedures in respect of salaries, emoluments and conditions of service including severance arrangements for the University’s senior management including the Principal and those at professorial or equivalent level and to keep these under review.
University of Edinburghcommittee structure
University CourtUniversity Court, the University’s governing body, is a body corporate, with perpetual succession and a common seal. The present powers of the Court are defined in the Universities (Scotland) Act (1966) and include the amendment of the composition, powers and functions of bodies in the University and the creation of new bodies, the administration and management of the whole revenue and property of the University, internal arrangements of the University, staff appointments and, on the recommendation of Senate, the regulation of degrees, admission and discipline of students. It is responsible for ensuring that the Senate has in place effective arrangements for academic quality assurance and enhancement.
Standing committees
During 2016/17, as well as the more routine items, Court considered the following:
• Appointment of Professor Peter Mathieson as the next Principal of the University of Edinburgh on the unanimous nomination of the Curators of Patronage and the unanimous recommendation of the Selection Committee, which included staff and student Court members and an external assessor.
• Consideration and endorsement of the University’s involvement in the Edinburgh and South-East Scotland City Region Deal, as a key partner in a major initiative that seeks to make the city and its surrounds the European leader in data science expertise.
• Investment in a University-wide lecture capture system, to begin operation from the 2017/18 academic year.
• Approval for the development of a number of major estates projects, including:
• The Edinburgh Futures Institute at the Old Edinburgh Royal Infirmary Quartermile site to support interdisciplinary teaching, research and co-production and close working with partners beyond the University;
• The ‘Building a New Biology’ project, which will integrate existing and new buildings into a cohesive mini-campus with 30,000m² of research space housing more than 800 scientists, improved teaching and social space and a Technology Hub; and
• An ambitious new Student Centre between Bristo Square and George Square co-locating University and Students’ Association student services in one integrated site.
37Annual Report and Accounts 2016/17
Overview
Strategy and value model
Operational review
Financial review
G
overnanceFinancial statem
ents

Knowledge Strategy Committee Convener: Ms Doreen Davidson, Lay Member of Court The Knowledge Strategy Committee’s purpose is to oversee the University’s knowledge management activities in the areas of library, information echnology, technology enhanced learning, management information and e-Administration on behalf of Court; and to give initial consideration to and advise on any other Court business in respect of the University’s knowledge management activities.
Joint committee of Senate and Court
University Court
Curriculum and Student Progression CommitteeConvener: Professor Alan Murray, Assistant Principal The Curriculum and Student Progression Committee is responsible, on behalf of the Senatus, for the academic regulatory framework, apart from those aspects which are primarily parts of the Quality Assurance Framework.
Learning and Teaching CommitteeConvener: Professor Charlie Jeffery, Senior Vice-Principal The Learning and Teaching Committee is responsible, on behalf of the Senate, for undergraduate, taught postgraduate and other forms of academic provision, apart from postgraduate research and higher degrees.
Quality Assurance CommitteeConvener: Professor Tina Harrison, Assistant Principal The Quality Assurance Committee is responsible for the University’s academic quality assurance framework.
Researcher Experience CommitteeConvener: Professor Jeremy Bradshaw, Assistant Principal The Researcher Experience Committee is responsible for postgraduate research degree training, higher degrees and training provision of other, early career researchers. It aims to promote an outstanding student experience and vibrant research community across the University, through a proactive agenda supporting an environment that fosters and enables change.
The Senate The Senatus Academicus (Senate) is the University’s supreme academic body. Its core function is to regulate and superintend the teaching and discipline of the University and to promote research. Further information on the Senatus Academicus can be found at: www.ed.ac.uk/academic-services/committees/senate.
University of Edinburgh committee structure Standing committees
Court News is published after each Court meeting on the University webpages highlighting key items considered by Court. Court also continued to receive reports from the Edinburgh University Students’ Association President outlining activities and matters arising from the student body.
Performance evaluationDuring 2016/17, Court undertook an annual review of its effectiveness, which included mapping out assurances and providing evidence on compliance with Court’s Statement of Primary Responsibilities and with the Scottish Code of Good Higher Education Governance as well as an anonymised survey of Court members’ views.
Each of these Committees is formally constituted with terms of reference and conducts its business both through regular
meetings and by electronic communication when appropriate.
General CouncilGeneral Council consists mainly of alumni of the University of Edinburgh, includes eligible academic staff and a more limited number from other related categories. It has a statutory right to comment on matters which affect the well-being and prosperity of the University and to be consulted on ordinances and resolutions. The aim is to ensure that graduates of this University have a continuing voice in the management of its affairs. It is also responsible for election of the Chancellor and three Court Assessors. Further information on the General Council can be found at www.general-council.ed.ac.uk.
Central Management GroupThe University also has a Central Management Group whose membership includes major budget holders in the University, Vice-Principals who advise the Principal on senior management decisions, particularly on the allocation of budgets to Colleges and Support Services and representation from Heads of Schools. The Central Management Group is chaired by the Principal and acts as a forum for debate and decision-making on initiatives and issues for the University. Its members are responsible and accountable for all components of the University’s budget, both income and expenditure. As such it plays an important part in the internal governance and academic operations of the University, and brings together the academic, financial, human resources and accommodation aspects of planning. It is responsible for managing the
38 Annual Report and Accounts 2016/17
Corporate governance statement (continued)

Estates CommitteeConvener: Professor Jonathan Seckl, Vice-Principal Planning, Resources and Research Policy The Estates Committee’s purpose is to oversee the University’s estate in order that it can support world-class academic, teaching and research activity.
Investment Committee Convener: Mr Richard Davidson, External Member The role of the Investment Committee is to consider the corporate governance and other related implications of the University’s investments.
People Committee Convener: Professor Jane Norman, Vice-Principal People and Culture The People Committee provides advice and guidance on the University’s strategic human resources policies and objectives and provides assurance that the University was monitoring its performance and managing its HR issues effectively.
Risk Management CommitteeConvener: Mr Hugh Edmiston, Director of Corporate Services The role of the Risk Management Committee is to support and advise Audit and Risk Committee and through it the Court, on the implementation and monitoring of the risk management policy.
Policy and Resources Committee
Audit and Risk Committee
Thematic committeesStanding committees
University’s performance and for assisting the Principal in delivery of the University’s strategy. The Central Management Group also provides advice and views on proposals and reports and ensures a consistent approach to activity across the University.
The University’s system of internal control The University Court is responsible for the University’s system of internal control and for reviewing its effectiveness. Such a system is designed to manage, rather than eliminate, the risk of failure to achieve business objectives and can only provide reasonable and not absolute assurance against material misstatement or loss.
The internal control environment includes delegated authorities, policies, procedural and system controls, planning and budgetary processes, professional capability in specialist areas, governance structures and management reporting. A Delegated Authority Schedule lists those Committees or individuals to whom authority has been delegated by the University Court to commit the University to a contractual or quasi-contractual arrangements within approved budget limits. The most recent iteration was approved by Court on 5 December 2016 and is subject to annual review.
The senior management team receives regular reports on the University’s performance, including appropriate performance indicators, and considers any control issues brought to its attention by early warning mechanisms which are embedded within the operational units and reinforced by risk awareness training. The senior management team and the Audit and Risk Committee also receive regular reports from Internal Audit which include recommendations for improvement.
The University operates processes for the identification, evaluation and management of significant risks. The risk management framework established in the University includes a Risk Management Committee which reports to the Audit and Risk Committee. The Audit and Risk Committee is a Standing Committee reporting directly to Court and has oversight of risk management arrangements based on advice and information from the Risk Management Committee. The University’s Risk Register focuses primarily on risks related to the attainment of the University’s strategic objectives and identifies responsibility for the overall management of each risk. This aligns to the University Strategic Plan. During 2016/17 the Register and Risk Appetite Statement was reviewed by the
Risk Management Committee and revised to reflect the Strategic Plan 2016. Following consideration by the Central Management Group, the Audit and Risk Committee, and the Policy and Resources Committee the University Risk Register and Risk Appetite Statement 2017/18 were approved by Court on 19 June 2017.
College, Support Group and subsidiary company risk registers ensure key operational risks are identified and managed by the relevant sub-organisation within the University. All major projects have risk registers, and risk assessment is incorporated into planning and decision-making processes: risk assessment training and awareness are promoted through the management structure. The University’s major risks are regularly reviewed and there are year-end processes to obtain further assurances on the adequacy of the management of key risks and to document the sources of assurances for each major risk.
Internal Audit undertake an independent review of the overall risk management process, having regard to best practice as recommended by professional institutes and other relevant organisations. The Audit and Risk Committee considered the Internal Audit
39Annual Report and Accounts 2016/17
Overview
Strategy and value model
Operational review
Financial review
G
overnanceFinancial statem
ents

The University’s system of internal control (continued)opinion on risk management at its meeting on 19 September 2017 and expressed itself satisfied with the outcome.
By its 4 December 2017 meeting, Court had received the Audit and Risk Committee Report for the year ended 31 July 2017 and information from the Risk Management Committee; it also had taken account of relevant events since 31 July 2017. During 2016/17, the Audit and Risk Committee was responsible for advising Court on the effectiveness of policies and procedures for risk assessment and risk management arrangements. Court considers, on the recommendation of the Audit and Risk Committee that a risk management process wholly compliant with the guidance provided by the UK Corporate Governance Code, in so far as its provisions apply to the higher education sector, has been in place throughout the year ended 31 July 2017.
In reaching this view, Court’s confirmation of the effectiveness of the system of internal control has also been informed by the following:
• The Internal Audit Service’s annual report for 2016/17 presented to the Audit and Risk Committee on the adequacy and effectiveness of systems of internal control including governance and risk management, together with recommendations for improvement, along with the Principal’s expression of satisfaction with the performance of the Internal Audit service in his capacity as Accountable Officer;
• The Risk Management Committee’s Annual Report 2016/17 presented to the Audit and Risk Committee regarding its operation;
• Comments made by the External Auditors in their Report to the Audit and Risk Committee and other reports; and
• The work of managers within the institution, who have responsibility for the development and maintenance of the internal control framework, and by any relevant comments made by other external agencies (e.g. the Quality Assurance Agency for Higher Education, Scottish Funding Council).
Charitable status The University had charitable status (no. SC005336) under the legislative framework operative throughout the 2016/17 financial year. The University Court considers that the University meets the ‘Charity Test’ set out in Section 7 of the Charities and Trustee Investment (Scotland) Act 2005 and it will take such actions as are necessary to ensure continued full compliance with the legislation, and retention of charitable status.
The University’s endowments are administered as the University of Edinburgh Endowment and Investment Fund, overseen by the Investment Committee. Professional fund managers are employed by that Committee on behalf of the University Court. Investment income is applied for the specific purposes of the relevant endowments, or in the case of other investment funds, for the University’s general purposes. All of those purposes are charitable for the purposes of the legislation.
Income derived from philanthropic donations and benefactions arising from the University’s Development activities are disbursed by a Trust with separate charitable status, The University of Edinburgh Development Trust. The Board of Trustees includes individuals external to the University. All disbursements are applied for the specific purposes of the relevant donations and benefactions, or in the case of general donations and benefactions, for the University’s general purposes. All of those purposes are charitable for the purposes of the legislation. The operations of the Development Trust were reviewed in 2016/17, with the University Court accepting the recommendations of the review, that: new philanthropic donations will be made directly to the University from a future date (to be agreed); that the Development Trust is retained, primarily to receive legacy pledges, and is streamlined; and that the University Court accepts an oversight function in relation to the University’s philanthropic and alumni relations activity.
Going concern The University’s activities and the factors likely to affect its future development, performance and position are set out in the Financial Review. Its financial performance for the year to 31 July 2017, income and expenditure, assets, liquidity and cash flows are set out in more detail in the Notes to the Financial Statements.
The University has adequate financial resources and its current forecasts and projections show it to be well placed to manage its activities successfully having taken account of risks and uncertainties highlighted in the Annual Report and Accounts.
Court considers that the University has adequate resources to continue in operation for the foreseeable future and for this reason the going concern basis continues to be adopted when preparing the Accounts.
40 Annual Report and Accounts 2016/17
Corporate governance statement (continued)

Responsibilities of Court On 12 May 2014 Court adopted a Statement of Primary Responsibilities published on the University website www.ed.ac.uk/governance-strategic-planning/governance/university-governance/other-useful-information. This was in operation throughout 2016/17.
Statement of responsibilities relating to the reports and financial statementsThe detailed requirements relating to financial matters are governed by law, agreements and regulations as decreed by various bodies and are stated as follows:
Court is responsible for keeping proper accounting records, which disclose, with reasonable accuracy, the financial position of the University at any time and enable it to ensure that the financial statements are prepared in accordance with the Universities (Scotland) Acts 1858-1966, the Statement of Recommended Practice: Accounting for Further and Higher Education and other relevant accounting standards. In addition, within the terms and conditions of a Financial Memorandum agreed between the Scottish Funding Council and the Court of the University of Edinburgh, the University Court, through its designated office holder, is required to prepare financial statements for each financial year which give a true and fair view of the state of affairs of the University and of the surplus or deficit and cash flows for that year.
In causing the financial statements to be prepared, Court has to ensure that:
• suitable accounting policies are selected and applied consistently;• judgements and estimates are made that are reasonable and prudent;• applicable accounting standards have been followed; and• financial statements are prepared on the going concern basis. Court has taken reasonable steps to:
• ensure that funds from the Scottish Funding Council are used only for the purposes for which they have been given and in accordance with the Financial Memorandum with the Funding Council and any other conditions which the Funding Council may from time to time prescribe;
• ensure that there are appropriate financial and management controls in place to safeguard public funds and funds from other sources;
• safeguard the assets of the University and hence take reasonable steps to prevent and detect fraud; and
• secure the economical, efficient and effective management of the University’s resources and expenditure.
Ms Anne RichardsVice-Convener of Court 4 December 2017
41Annual Report and Accounts 2016/17
Overview
Strategy and value model
Operational review
Financial review
G
overnanceFinancial statem
ents

Court meetings attended
Committee memberships 2016/17
Committee memberships 2017/18
Rector
Presides at meetings of Court Mr Steve Morrison 5/5
Principal and Vice-Chancellor Professor Sir Timothy O’Shea 5/5 CB PRC EXC NC CB PRC EXC NC
Chancellor’s Assessor
Nominated by Chancellor Sheriff Principal Edward F Bowen 3/5 CB CB
General Council Assessors
Three Assessors elected by General Council for terms of office of four years
Dr Alan Brown 5/5 ARC ARC CB
Mr Ritchie Walker 4/5 KSC KSC
Ms Doreen Davidson 5/5 CB PRC EXC NC NC EXC KSC
CB PRC EXC NC EXC KSC RC
Senatus Academicus Assessors
Four Assessors elected by the Senate for terms of office of four years
Professor Sandy Tudhope 5/5 NC NC
Professor Elizabeth Bomberg 4/5
Professor Sarah Cooper 5/5 PRC EXC PRC EXC
Dr Claire Phillips 4/5 KSC CB
City of Edinburgh Council Assessor
One Assessor nominated by City of Edinburgh Council
The Rt Hon Donald Wilson (to 29 June 2017) 0/4 CB
The Rt Hon Frank Ross (from 29 June 2017) 1/1 CB
Co-Opted Members
Eight appointed by Court for a term of office of three years including the Vice-Convener (equivalent to Chair of institution)
Ms Anne Richards 5/5 PRC EXC NC RC PRC EXC NC RC
(Vice-Convener of Court)
Mr David Bentley 4/5 PRC CB EXC PRC CB EXC
Dr Robert Black 5/5 ARC NC ARC NC
Mr Peter Budd 2/5 ARC CB KSC ARC CB
Ms Alison Grant 3/5 PRC KSC PRC KSC
Dr Chris Masters 5/5 PRC RC EXC PRC RC EXC
Lady Susan Rice 5/5 PRC EXC NC RC PRC EXC NC RC
Mr Alan Johnston 5/5 ARC EXC RC ARC EXC RC
Non-Teaching Staff Assessor
Elected by non-teaching staff for a period of four years
Ms Angi Lamb 5/5 KSC KSC
Student Members
Annually nominated by the Edinburgh University Students’ Association (EUSA) from among sabbatical officers
Mr Alec Edgecliffe-Johnson (to 8 June 2017) 4/4 EXC PRC NC
Ms Jenna Kelly (to 8 June 2017) 4/4
Mr Patrick Kilduff (from 9 June 2017) 1/1 EXC PRC NC
Ms Esther Dominy (from 9 June 2017) 1/1
Audit and Risk Committee ARC Knowledge Strategy Committee KSC
Committee on University Benefactors CB Nominations Committee NC
Estates Committee EC People Committee PC
Exception Committee EXC Policy and Resources Committee PRC
Investment Committee IC Remuneration Committee RC
Membership of the University Court
Further information and biographies of members of the University Court can be found at www.ed.ac.uk/governance-strategic-planning/governance/university-court/membership-of-court.
42 Annual Report and Accounts 2016/17
Corporate governance statement (continued)

Remuneration CommitteeMeetings attended
Ex-officio Member
Vice-Convener of Court Ms Anne Richards 2/2
Lay Members of Court Lady Susan Rice (Convener)
2/2
Mr Alan Johnston 1/2
Dr Chris Masters 2/2Policy and Resources CommitteeMeetings attended
Ex-officio Members
The Principal Professor Sir Timothy O’Shea 4/5
Vice-Convener of Court Ms Anne Richards (Convener) 5/5
University Secretary Ms Sarah Smith 5/5
Senate Assessor Professor Sarah Cooper 5/5
Vice Principal Planning & Resources Professor Jonathan Seckl 4/5
Lay Members of Court Ms Doreen Davidson 5/5
Mr David Bentley 4/5
Lady Susan Rice 4/5
Dr Chris Masters 5/5
Ms Alison Grant 4/5
Student Member of Court Mr Alec Edgecliffe-Johnson (to 8 June 2017)
3/4
Mr Patrick Kilduff (from 9 June 2016)
1/1
Nominations CommitteeMeetings attended
Ex-officio Members
The Principal Professor Sir Timothy O’Shea 3/3
Vice-Convener of Court Ms Anne Richards (Convener)
3/3
University Secretary Ms Sarah Smith 3/3
Senate Assessor Professor Sandy Tudhope 2/3
General Council Assessor Ms Doreen Davidson 3/3
Lay Members of Court Dr Robert Black 2/3
Lady Susan Rice 1/3
Student Member of Court Mr Alec Edgecliffe-Johnson 2/3
Exception Committee
Ex-officio Members
The Principal Professor Sir Timothy O’Shea
Vice-Convener of Court Ms Anne Richards (Convener)
University Secretary Ms Sarah Smith
Convener of Audit & Risk Committee
Mr Alan Johnston
Convener of Knowledge Strategy Committee
Ms Doreen Davidson
Convener of Remuneration Committee
Lady Susan Rice
Senate/Non-Teaching Staff Assessor Professor Sarah Cooper
Student Member of Court Mr Patrick Kilduff
Knowledge Strategy Committee
Meetings attended
Ex-officio Member
Chief Information Officer Mr Gavin McLachlan 4/4
EUSA Representative Mr Patrick Garratt 1/4
Members of Court Ms Doreen Davidson (Convener)
4/4
Mr Ritchie Walker 4/4
Ms Angi Lamb 4/4
Ms Alison Grant 3/4
Dr Claire Phillips 4/4
Members of Senate Professor Charlie Jeffery 4/4
Professor Tina Harrison 3/4
Professor Alan Murrray 1/4
Professor Jeremy Bradshaw 3/4
Professor Siân Bayne/Ms Melissa Highton
3/4
Audit and Risk Committee
Meetings attended
Lay Members of Court Mr Alan Johnston (Convener) 4/4
Mr Peter Budd 1/4
Dr Robert Black 3/4
Dr Alan Brown 4/4
External Members
Appointed through an open advertisement and interview process
Mr Bindesh Savjani 3/4
Mr Jim Bishop 3/4
Membership of Standing Committees
Full details of terms of reference and committee membership are published on the University’s website at www.ed.ac.uk/schools-departments/governance-strategic-planning/governance/university-committees.
43Annual Report and Accounts 2016/17
Overview
Strategy and value model
Operational review
Financial review
G
overnanceFinancial statem
ents

OpinionIn our opinion, the University of Edinburgh’s group financial statements and parent institution financial statements (the “financial statements”):
• give a true and fair view of the state of the group’s and of the parent institution’s affairs as at 31 July 2017 and of the group’s and university’s income and expenditure and cash flows for the year then ended;
• have been properly prepared in accordance with United Kingdom Generally Accepted Accounting Practice (United Kingdom Accounting Standards, comprising FRS 102 “The Financial Reporting Standard applicable in the UK and Republic of Ireland”, and applicable law);
• have been properly prepared in accordance with the requirements of the Statement of Recommended Practice – Accounting for Further and Higher Education; and
• have been prepared in accordance with the requirements of the Charities and Trustee Investment (Scotland) Act 2005 and regulation 14 of the Charities Accounts (Scotland) Regulations 2006 as amended).
We have audited the financial statements, included within the Annual Report and Accounts (the “Annual Report”), which comprise the Consolidated and University Balance Sheet as at 31 July 2017; the consolidated Statement of Comprehensive Income and Expenditure for the year then ended; the consolidated and university’s Statement of Changes in Reserves for the year then ended; the consolidated Statement of Cash Flow for the year then ended; and the notes to the financial statements, which include a summary of significant accounting policies and other explanatory information.
Basis for opinionWe conducted our audit in accordance with International Standards on Auditing (UK) (“ISAs (UK)”) and applicable law. Our responsibilities under ISAs (UK) are further described in the Auditors’ responsibilities for the audit of the financial statements section of our report. We believe that the audit evidence we have obtained is sufficient and appropriate to provide a basis for our opinion.
IndependenceWe remained independent of the group in accordance with the ethical requirements that are relevant to our audit of the financial statements in the UK, which includes the FRC’s Ethical Standard, and we have fulfilled our other ethical responsibilities in accordance with these requirements.
Report on the audit of the financial statements
Conclusions relating to going concernWe have nothing to report in respect of the following matters in relation to which ISAs (UK) require us to report to you when:
• the Court’s use of the going concern basis of accounting in the preparation of the financial statements is not appropriate; or
• the Court has not disclosed in the financial statements any identified material uncertainties that may cast significant doubt about the group’s and parent institution’s ability to continue to adopt the going concern basis of accounting for a period of at least twelve months from the date when the financial statements are authorised for issue.
However, because not all future events or conditions can be predicted, this statement is not a guarantee as to the group’s and parent institution’s ability to continue as a going concern.
Reporting on other information The other information comprises all of the information in the Annual Report other than the financial statements and our auditors’ report thereon. The Court is responsible for the other information. Our opinion on the financial statements does not cover the other information and, accordingly, we do not express an audit opinion or, except to the extent otherwise explicitly stated in this report, any form of assurance thereon.
In connection with our audit of the financial statements, our responsibility is to read the other information and, in doing so, consider whether the other information is materially inconsistent with the financial statements or our knowledge obtained in the audit, or otherwise appears to be materially misstated. If we identify an apparent material inconsistency or material misstatement, we are required to perform procedures to conclude whether there is a material misstatement of the financial statements or a material misstatement of the other information. If, based on the work we have performed, we conclude that there is a material misstatement of this other information, we are required to report that fact. We have nothing to report based on these responsibilities.
Based on the responsibilities described above and our work undertaken in the course of the audit, ISAs (UK) require us also to report certain opinions and matters as described below.
Trustees’ ReportUnder the Charities Accounts (Scotland) Regulations 2006 (as amended) we are required to report to you if, in our opinion, the information given in the Trustees’ Annual Report is inconsistent in any material respect with the financial statements. We have no exceptions to report arising from this responsibility.
44 Annual Report and Accounts 2016/17
Independent auditor’s report to the Court of the University of Edinburgh

Responsibilities for the financial statements and the audit
Responsibilities of the Court for the financial statementsAs explained more fully in the statement of Responsibilities of the Court set out on page 41, the Court is responsible for the preparation of the financial statements in accordance with the applicable framework and for being satisfied that they give a true and fair view. The Court is also responsible for such internal control as they determine is necessary to enable the preparation of financial statements that are free from material misstatement, whether due to fraud or error.
In preparing the financial statements, the Court is responsible for assessing the group’s and parent institution’s ability to continue as a going concern, disclosing as applicable, matters related to going concern and using the going concern basis of accounting unless the Court either intends to liquidate the group and parent institution or to cease operations, or has no realistic alternative but to do so.
Auditors’ responsibilities for the audit of the financial statementsWe have been appointed as auditors under section 44(1)(c) of the Charities and Trustee Investment (Scotland) Act 2005 and report in accordance with regulations made under that Act.
Our objectives are to obtain reasonable assurance about whether the financial statements as a whole are free from material misstatement, whether due to fraud or error, and to issue an auditors’ report that includes our opinion. Reasonable assurance is a high level of assurance, but is not a guarantee that an audit conducted in accordance with ISAs (UK) will always detect a material misstatement when it exists. Misstatements can arise from fraud or error and are considered material if, individually or in the aggregate, they could reasonably be expected to influence the economic decisions of users taken on the basis of these financial statements.
A further description of our responsibilities for the audit of the financial statements is located on the Financial Reporting Council’s website at: www.frc.org.uk/auditorsresponsibilities. This description forms part of our auditors’ report.
Use of this reportThis report, including the opinions, has been prepared for and only for the Court in accordance with section 44(1)(c) of the Charities and Trustee Investment (Scotland) Act 2005 and regulation 10 of the Charities Accounts (Scotland) Regulations 2006 (as amended) and for no other purpose. We do not, in giving these opinions, accept or assume responsibility for any other purpose or to any other person to whom this report is shown or into whose hands it may come save where expressly agreed by our prior consent in writing.
Opinions on other matters prescribed in the requirements attached to the Scottish Funding Council's Financial Memorandum In our opinion, in all material respects:
• the requirements of the Scottish Funding Council’s accounts direction have been met;
• funds from whatever source administered by the parent institution for specific purposes have been properly applied to those purposes and, if relevant, managed in accordance with relevant legislation and any other terms and conditions attached to them; and
• funds provided by the Funding Council have been applied in accordance with the Financial Memorandum and the mandatory requirements attached to the Financial Memorandum.
Sufficiency of accounting records and information and explanations receivedUnder the Charities Accounts (Scotland) Regulations 2006 (as amended) we are required to report to you if, in our opinion:
• sufficient accounting records have not been kept by the parent institution; or
• the parent institution financial statements are not in agreement with the accounting records and returns; or
• we have not received all the information and explanations we require for our audit.
We have no exceptions to report arising from this responsibility.
PricewaterhouseCoopers LLPChartered Accountants and Statutory Auditors Glasgow 4 December 2017
Other required reporting
45Annual Report and Accounts 2016/17
Overview
Strategy and value model
Operational review
Financial review
G
overnanceFinancial statem
ents

2017 2016
NoteConsolidated
£’000 University
£’000 Consolidated
£’000 University
£’000
Income
Tuition fees and education contracts 3 278,493 278,493 255,046 255,046
Funding body grants 4 191,844 191,844 194,514 194,514
Research income 5 265,252 265,252 253,885 253,885
Exceptional item: Research Development Expenditure Credit 5 - - 19,010 19,010
Other income 6 156,814 133,379 161,252 132,394
Investment income 7 14,548 14,904 13,284 13,634
Donations and endowments 8 21,896 21,962 11,474 11,474
Total income 928,847 905,834 908,465 879,957
Expenditure
Staff costs 9 492,564 477,767 477,889 463,114
Other operating expenses 10 318,891 310,041 313,061 307,907
Depreciation 13 46,700 45,157 40,286 38,650
Interest and other finance costs 11 14,490 14,491 12,757 12,757
Total expenditure 872,645 847,456 843,993 822,428
Surplus before other gains and losses 56,202 58,378 64,472 57,529
Gain on disposal of fixed assets 8,048 8,048 518 518
Gain on investments 15 66,209 66,209 28,935 28,935
Surplus before tax 130,459 132,635 93,925 86,982
Taxation 12 (18) - 2 -
Exceptional item: tax on Research Development Expenditure Credit 12 - - (3,932) (3,932)
Surplus for the year 130,441 132,635 89,995 83,050
Unrealised surplus on revaluation of heritage assets 13 - - 7,240 7,240
Actuarial loss in respect of pension schemes 20 (5,129) (5,129) (41,053) (41,053)
Total comprehensive income for the year 125,312 127,506 56,182 49,237
Represented by:
Unrestricted comprehensive income/(expense) for the year before exceptional items
68,782 70,736 54 (2,319)
Exceptional items: Research Development Expenditure Credit and tax 5 &12 - - 15,078 15,078
Unrestricted comprehensive income for the year 68,782 70,736 15,132 12,759
Endowment comprehensive income for the year 21 49,325 49,325 28,197 28,197
Restricted comprehensive income for the year 22 7,205 7,445 5,613 1,041
Revaluation reserve comprehensive income for the year 23 - - 7,240 7,240
125,312 127,506 56,182 49,237
Surplus for the year attributable to:
University continuing activities 130,441 132,635 74,917 67,972
Exceptional items: Research Development Expenditure Credit and tax 5 &12 - - 15,078 15,078
130,441 132,635 89,995 83,050
46 Annual Report and Accounts 2016/17
Consolidated and University statement of comprehensive income and expenditureFor the year ended 31 July 2017
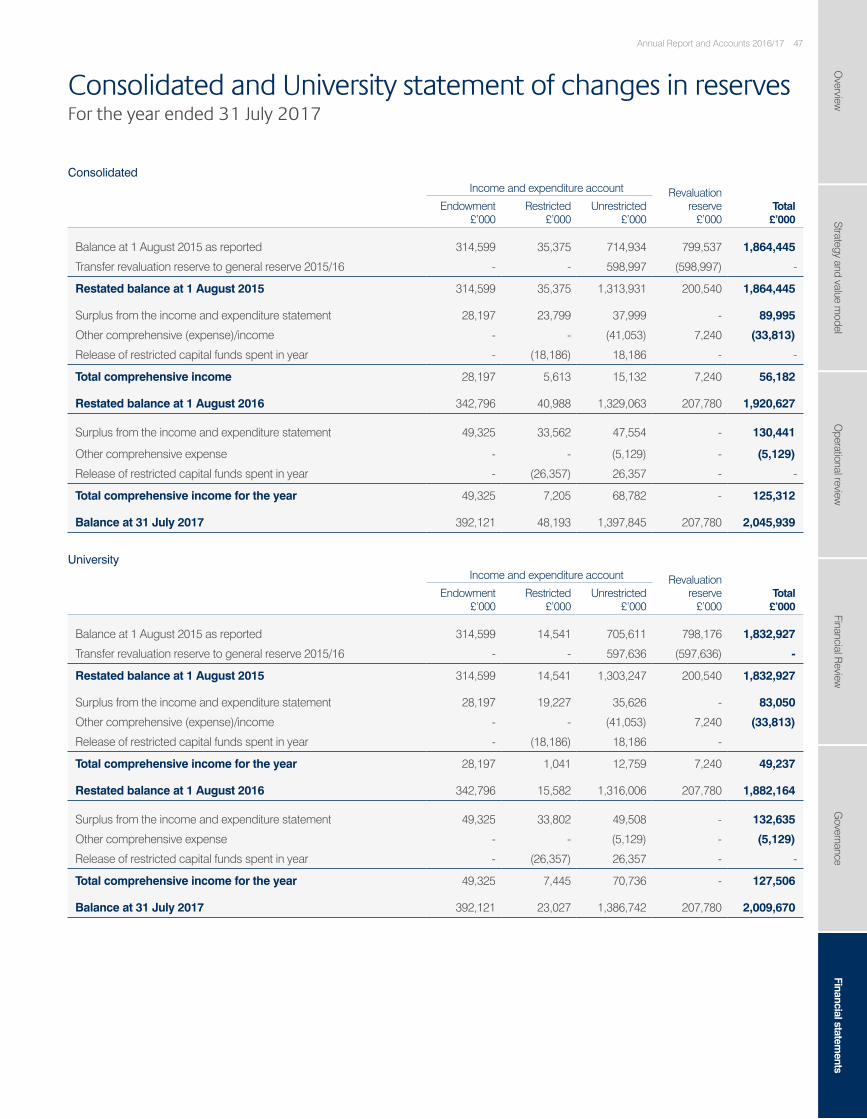
University Income and expenditure account Revaluation
reserve £’000
Total £’000
Endowment £’000
Restricted £’000
Unrestricted £’000
Balance at 1 August 2015 as reported 314,599 14,541 705,611 798,176 1,832,927
Transfer revaluation reserve to general reserve 2015/16 - - 597,636 (597,636) -
Restated balance at 1 August 2015 314,599 14,541 1,303,247 200,540 1,832,927
Surplus from the income and expenditure statement 28,197 19,227 35,626 - 83,050
Other comprehensive (expense)/income - - (41,053) 7,240 (33,813)
Release of restricted capital funds spent in year - (18,186) 18,186 -
Total comprehensive income for the year 28,197 1,041 12,759 7,240 49,237
Restated balance at 1 August 2016 342,796 15,582 1,316,006 207,780 1,882,164
Surplus from the income and expenditure statement 49,325 33,802 49,508 - 132,635
Other comprehensive expense - - (5,129) - (5,129)
Release of restricted capital funds spent in year - (26,357) 26,357 - -
Total comprehensive income for the year 49,325 7,445 70,736 - 127,506
Balance at 31 July 2017 392,121 23,027 1,386,742 207,780 2,009,670
Consolidated Income and expenditure account Revaluation
reserve £’000
Total £’000
Endowment £’000
Restricted £’000
Unrestricted £’000
Balance at 1 August 2015 as reported 314,599 35,375 714,934 799,537 1,864,445
Transfer revaluation reserve to general reserve 2015/16 - - 598,997 (598,997) -
Restated balance at 1 August 2015 314,599 35,375 1,313,931 200,540 1,864,445
Surplus from the income and expenditure statement 28,197 23,799 37,999 - 89,995
Other comprehensive (expense)/income - - (41,053) 7,240 (33,813)
Release of restricted capital funds spent in year - (18,186) 18,186 - -
Total comprehensive income 28,197 5,613 15,132 7,240 56,182
Restated balance at 1 August 2016 342,796 40,988 1,329,063 207,780 1,920,627
Surplus from the income and expenditure statement 49,325 33,562 47,554 - 130,441
Other comprehensive expense - - (5,129) - (5,129)
Release of restricted capital funds spent in year - (26,357) 26,357 - -
Total comprehensive income for the year 49,325 7,205 68,782 - 125,312
Balance at 31 July 2017 392,121 48,193 1,397,845 207,780 2,045,939
Overview
Strategy and value model
Operational review
Financial R
eviewG
overnanceFinancial statem
ents47Annual Report and Accounts 2016/17
Consolidated and University statement of changes in reservesFor the year ended 31 July 2017

Mr Phil McNaullDirector of Finance
Ms Anne RichardsVice-Convener of Court
Professor Sir Timothy O’SheaPrincipal and Vice-Chancellor
The financial statements on pages 46 to 84 were adopted by Court on 4 December 2017 and were signed on its behalf by:
2017 2016
NotesConsolidated
£’000 University
£’000 Consolidated
£’000 University
£’000
Restricted reserves
Income and expenditure reserve - endowment reserves 21 392,121 392,121 342,796 342,796
Income and expenditure reserve - restricted reserves 22 48,193 23,027 40,988 15,582
Unrestricted reserves
Income and expenditure reserve - unrestricted reserves 1,397,845 1,386,742 1,329,063 1,316,005
Revaluation reserve 23 207,780 207,780 207,780 207,780
Total reserves 2,045,939 2,009,670 1,920,627 1,882,163
2017 2016
NoteConsolidated
£’000 University
£’000 Consolidated
£’000 University
£’000
Non-current assets
Fixed assets 13 1,617,062 1,607,640 1,493,042 1,466,024
Heritage assets 13 & 14 212,208 212,208 212,143 212,143
Investments 15 530,584 535,476 470,762 490,271
2,359,854 2,355,324 2,175,947 2,168,438
Current assets
Stock 3,664 2,912 3,371 2,561
Trade and other receivables 16 121,950 111,782 134,076 122,416
Investments 17 195,000 195,000 218,062 215,000
Cash and cash equivalents 24 250,207 221,265 175,783 149,766
570,821 530,959 531,292 489,743
Creditors: amounts falling due within one year 18 (304,527) (296,404) (276,232) (266,238)
Net current assets 266,294 234,555 255,060 223,505
Total assets less current liabilities 2,626,148 2,589,879 2,431,007 2,391,943
Creditors: amounts falling due after more than one year 19 (319,415) (319,415) (256,692) (256,092)
Pension provisions 20 (260,794) (260,794) (253,688) (253,688)
Total net assets 2,045,939 2,009,670 1,920,627 1,882,163
48 Annual Report and Accounts 2016/17
Consolidated and University balance sheetFor the year ended 31 July 2017

Note2017 £’000
2016 £’000
Cash flow from operating activities
Surplus for the year 130,441 89,995
Adjustments for non-cash items
Depreciation 13 46,700 40,286
Donated assets 14 - (76)
Impairment 15 - 223
Gain on investments 15 (66,209) (28,935)
(Decrease)/increase in pension provision 20 (2,324) 11,280
Adjustments for working capital items
Increase in stock (293) (636)
Decrease/(increase) in debtors 16 12,126 (13,749)
Increase in creditors and accruals 18 & 19 29,645 26,762
Adjustments for investing or financing activities
Investment income 7 (14,548) (13,284)
Interest payable 11 14,276 12,412
New endowments received 21 (1,714) (4,427)
Profit on the sale of fixed assets (8,048) (518)
Capital grant income (42,253) (33,337)
Net cash inflow from operating activities 97,799 85,996
Cash flows from fixed asset investing activities
Proceeds from sales of fixed assets 23,723 1,325
Capital grant receipts 42,253 33,337
Payments made to acquire fixed assets (188,070) (129,688)
Cash flows from other investing activities
Investment income 7 14,548 12,474
Disposal of non-current asset investments 15 105,707 54,349
Payments made to acquire non-current asset investments 15 (99,320) (169,273)
Decrease/(increase) in cash on deposit 17 23,062 (98,062)
Lump sum pension contribution to EUSBS 20 (1,010) (20,000)
New endowment cash received 21 1,714 4,427
Net cash outflow from investing activities (77,393) (311,111)
Cash flows from financing activities
Interest paid 11 (8,998) (5,237)
Interest element of finance lease payments 11 (121) (145)
New unsecured loans 19 67,000 167,000
Repayments of amounts borrowed 19 (3,662) (13,299)
Capital element of finance lease payments (201) (156)
Net cash inflow from financing activities 54,018 148,163
Increase/(decrease) in cash and cash equivalents in the year 74,424 (76,952)
Cash and cash equivalents at beginning of the year 24 175,783 252,735
Cash and cash equivalents at end of the year 24 250,207 175,783
Overview
Strategy and value model
Operational review
Financial R
eviewG
overnanceFinancial statem
ents49Annual Report and Accounts 2016/17
Consolidated statement of cash flowFor the year ended 31 July 2017

Income recognition Income from the sale of goods or services is credited to the consolidated statement of comprehensive income and expenditure when the goods or services are supplied to the external customers or the terms of the contract have been satisfied.
Fee income is stated gross of any expenditure which is not a discount and credited to the consolidated statement of comprehensive income and expenditure over the period in which students are studying. Where the amount of the tuition fee is reduced by a discount for prompt payment, income receivable is shown net of the discount.
Bursaries and scholarships are accounted for gross as expenditure and not deducted from income.
Funds the University receives and disburses as paying agent on behalf of a funding body are excluded from the consolidated statement of comprehensive income and expenditure of the University where the University is exposed to minimal risk or enjoys minimal economic benefit related to the transaction.
Government grants, including funding council block grant and research grants from government sources, and other grants and donations, from non-government sources including research grants from non-government sources, are recognised within the consolidated statement of comprehensive income and expenditure when the University is entitled to the income and performance-related conditions have been met. Income received in advance of performance-related conditions is deferred on the balance sheet and released to the consolidated statement of comprehensive income and expenditure in line with such conditions being met.
Other grants and donations from non-government sources, including research grants from non-government sources, are recognised within the consolidated statement of comprehensive income and expenditure when the University is entitled to the income and performance-related conditions have been met. Income received in advance of performance-related conditions being met is deferred on the balance sheet and released to the consolidated statement of
1. STATEMENT OF PRINCIPAL ACCOUNTING POLICIES Basis of preparation These financial statements have been prepared in accordance with the Statement of Recommended Practice (SORP): Accounting for Further and Higher Education (2015) and in accordance with applicable accounting standards. The University is a public benefit entity and therefore has applied the relevant public benefit requirement of the applicable accounting standards. The financial statements are prepared in accordance with the historical cost convention (modified by the revaluation of heritage assets and investments).
The financial statements have been prepared on a going concern basis. Court considers this is appropriate as the University has considerable financial resources together with a significant value of contracted income over the medium term. Therefore, Court believes it is well placed to manage its business risks.
Judgements made by management in the application of these accounting policies that have a significant effect on the financial statements and estimates with a significant risk of material adjustment in the next year are discussed in note 2.
Basis of consolidation The consolidated financial statements include the University and all its subsidiaries for the financial year to 31 July 2017. The results of subsidiaries acquired or disposed of during the period are included in the consolidated statement of income and expenditure from the date of acquisition, or up to the date of disposal. Intragroup transactions are eliminated on consolidation. The University has taken advantage of the exemption within FRS 102 Section 33.1A and has not disclosed transactions with other group entities where it holds 100 per cent of the voting rights.
The consolidated statements do not include the income and expenditure of the Edinburgh University Students’ Association as it is a separate charity over which the University does not exert control or dominant influence over policy decisions.
Associated companies and jointly controlled entities are accounted for using the equity method.
50 Annual Report and Accounts 2016/17
Notes to the financial statements

Where capital funding is received or receivable the income recognition is dependent on whether the University entitlement to the funds is subject to any performance-related conditions being met. Funding is recognised within the consolidated statement of comprehensive income and expenditure when any performance-related conditions have been met. Funding received in advance of performance-related conditions is deferred on the balance sheet and released to the consolidated statement of comprehensive income and expenditure in line with such conditions being met. In the absence of performance-related conditions, capital funding is recognised as income in line with other donations with donor-imposed restrictions and recognised within the consolidated statement of comprehensive income and expenditure when the University is entitled to the funding. The income is retained within the restricted reserve until such time that it is utilised in line with such restrictions, at which point it is released to general reserves through a reserve transfer.
Accounting for retirement benefitsThe University participates in three active pension schemes, the Universities Superannuation Scheme (USS), the University of Edinburgh Staff Benefits Scheme (EUSBS) and the National Employee Savings Trust (NEST). We also participate in other legacy schemes on behalf of retired and active members, the Medical Research Council (MRCPS), the Lothian Pension Fund (LPF), the Strathclyde Pension Fund (SPF) and the Scottish Teacher Superannuation Scheme (STSS).
USS, STSS, MRCPS and NEST are multi-employer schemes and, given the mutual nature of the schemes, it is not possible to identify the University’s shares of the assets and liabilities for these schemes. Consequently, the University cannot apply defined benefit accounting and, according to section 28 FRS 102, the schemes are accounted as defined contribution schemes. The EUSBS, SPF and LPF schemes are defined benefit schemes. Each fund is valued every three years by professionally qualified independent actuaries.
With effect from 1 October 2016, USS changed from a defined benefit only pension scheme to a hybrid pension scheme,
comprehensive income and expenditure when such conditions are met.
Donations and endowments are non-exchange transactions without performance-related conditions. Donations and endowments with donor-imposed restrictions are recognised within the consolidated statement of comprehensive income and expenditure when the University is entitled to the income. Income is retained within the restricted reserve until such time that it is utilised in line with such restrictions at which point the income is released to general reserves through a reserve transfer.
Investment income and appreciation of endowments is recorded in income in the year in which it arises and as either restricted or unrestricted income according to the terms of the restriction applied to the individual endowment fund. Investment income is credited to the consolidated statement of comprehensive income and expenditure when received.
Donations with no restrictions are recorded within the consolidated statement of comprehensive income and expenditure when the University is entitled to the income.
Donations and endowments with restrictions are classified as restricted reserves with additional disclosure provided within the notes to the accounts.
There are four main types of donations and endowments with restrictions:
1. Restricted donations - the donor has specified that the donation must be used for a particular objective.
2. Unrestricted permanent endowments - the donor has specified that the fund is to be permanently invested to generate an income stream for the general benefit of the University.
3. Restricted expendable endowments - the donor has specified a particular objective other than the purchase or construction of tangible fixed assets, and the University can convert the donated sum into income.
4. Restricted permanent endowments - the donor has specified that the fund is to be permanently invested to generate an income stream to be applied to a particular objective.
Overview
Strategy and value model
Operational review
Financial R
eviewG
overnanceFinancial statem
ents51Annual Report and Accounts 2016/17

1. STATEMENT OF PRINCIPAL ACCOUNTING POLICIES (continued)
separately for each plan by estimating the amount of future benefit that employees have earned in return for their service in the current and prior periods; that benefit is discounted to determine its present value, and the fair value of any plan assets (at bid price) and any unrecognised past service costs are deducted. The liability discount rate is the yield at the balance sheet date on AA credit rated bonds denominated in the currency of, and having maturity dates approximating to the terms of the Group’s obligations. The calculation is performed by a qualified actuary using the projected unit credit method. When the calculation results in a benefit to the Group, the recognised asset is limited to the total of any unrecognised past service costs and the present value of benefits available in the form of any future refunds from the plan, reductions in future contributions to the plan or on settlement of the plan and takes into account the adverse effect of any minimum funding requirements.
Employment benefits Short-term employment benefits such as salaries and compensated absences are recognised as an expense in the year in which the employees render service to the University. Any unused benefits, such as holiday entitlements earned but not taken at the balance sheet date, are accrued and measured as the additional amount the University expects to pay as a result of the unused entitlements.
Finance leasesLeases in which the University assumes substantially all the risks and rewards of ownership of the leased asset are classified as finance leases. Leased assets acquired by way of finance lease are stated at an amount equal to the lower of their fair value and the present value of the minimum lease payments at inception of the lease, less accumulated depreciation and less accumulated impairment losses. Lease payments are accounted for as described below.
Minimum lease payments are apportioned between the finance charge and the reduction of the outstanding liability. The finance charge is allocated to each period during the lease term so as to produce a constant periodic rate of interest on the remaining balance of the liability.
providing defined benefits for all members, as well as defined contribution benefits. The assets of the scheme are held in a separate trustee-administered fund. Because of the mutual nature of the scheme, the assets are not attributed to individual institutions and a scheme-wide contribution rate is set. The institution is therefore exposed to actuarial risks associated with other institutions’ employees and is unable to identify its share of the underlying assets and liabilities of the scheme on a consistent and reasonable basis. As required by section 28 of FRS 102, “Employee benefits”, the University therefore accounts for the scheme as if it were a wholly defined contribution scheme. As a result, the amount charged to the consolidated statement of comprehensive income and expenditure represents the contributions payable to the scheme. Since the institution has entered into an agreement (the Recovery Plan) that determines how each employer within the scheme will fund the overall deficit, the University recognises a liability for the contributions payable that arise from the agreement (to the extent that they relate to the deficit) and therefore an expense is recognised.
A small number of subsidiary company employees are members of other defined contribution schemes. Contributions are charged in the consolidated statement of comprehensive income and expenditure in the year in which they become payable.
Defined contribution planA defined contribution plan is a post-employment benefit plan under which the organisation pays fixed contributions into a separate entity and will have no legal or constructive obligation to pay further amounts. Obligations for contributions to defined contribution pension plans are recognised as an expense in the consolidated statement of comprehensive income and expenditure in the periods during which services are rendered by employees and as they become payable in accordance with the rules of the scheme.
Defined benefit planA defined benefit plan is a post-employment benefit plan other than a defined contribution plan. The Group’s net obligation in respect of defined benefit pension plans and other post-employment benefits are calculated
52 Annual Report and Accounts 2016/17
Notes to the financial statements(continued)

the building and is also shown at cost less accumulated depreciation.
Freehold land is not depreciated as it is considered to have an indefinite useful life. Freehold buildings are depreciated on a straight line basis over their expected useful lives as follows:
Major plant and infrastructure 10 to 15 years System built properties 15 to 25 years General buildings 50 to 80 years Historic and legacy properties 100 years
Leasehold land and buildings are depreciated over the life of the lease up to a maximum of 50 years.
No depreciation is charged on assets in the course of construction.
Major repairs and refurbishments are capitalised and depreciated over 10 to 15 years where they substantially add to the total area of the building, prolong its useful life or enhance the economic benefits of the building.
All land and buildings, including those constructed or acquired with the aid of specific grants, are included in the balance sheet with the exception of the New College Divinity complex on the Mound, which is regarded as inalienable, and two farms, which form part of agricultural tenancies. In addition, the University occupies various premises owned by the NHS and the main locations are subject to formal rentals and service charges which are reflected in the consolidated statement of comprehensive income and expenditure. Some NHS premises are, however, occupied under arrangements such as historic ‘knock for knock’ agreements. It is not possible to attribute value to these arrangements and hence these assets are not included in the financial statements.
EquipmentEquipment, including computers and software, costing less than £50,000 per individual item or group of related items, is written off in the year of acquisition. All other equipment, the purchase or external development costs of major new application software and the initial complement of furniture acquired as part of the initial fit out of a newly constructed building or major refurbishment, is capitalised.
Operating leasesCosts in respect of operating leases are charged on a straight-line basis over the lease term. Any lease premiums or incentives are spread over the minimum lease term.
Research and development Research and development costs incurred by the University on its own behalf are written off in the year incurred with the exception of any equipment or software that is capitalised in line with the University’s accounting policy.
Foreign currencyTransactions in foreign currencies are translated to the respective functional currencies of Group entities at the foreign exchange rate ruling at the date of the transaction. Monetary assets and liabilities denominated in foreign currencies at the balance sheet date are retranslated to the functional currency at the foreign exchange rate ruling at that date. Foreign exchange differences arising on translation are recognised in the consolidated statement of comprehensive income and expenditure. Non-monetary assets and liabilities that are measured in terms of historical cost in a foreign currency are translated using the exchange rate at the date of the transaction. Non-monetary assets and liabilities denominated in foreign currencies that are stated at fair value are retranslated to the functional currency at foreign exchange rates ruling at the dates the fair value was determined.
Land and buildingsLand and buildings are stated at deemed cost less accumulated depreciation and accumulated impairment losses. Land and buildings owned by the University were independently valued by Gerald Eve LLP, an independent firm of chartered surveyors on 1 August 2014. The land and building assets that had been revalued to fair value prior to the date of transition to SORP, are measured on the basis of deemed cost, being the revalued amount at the date of that revaluation.
Property additions since 1 August 2014 including extensions to buildings and building under construction are shown at cost less any accumulated depreciation. The cost of renovating, upgrading or converting buildings is capitalised where the subsequent expenditure prolongs the useful life or enhances the economic benefits of
Overview
Strategy and value model
Operational review
Financial R
eviewG
overnanceFinancial statem
ents53Annual Report and Accounts 2016/17

1. STATEMENT OF PRINCIPAL ACCOUNTING POLICIES (continued)
Non-current investments are held on the balance sheet at fair value. Investments in subsidiary companies are shown at the lower of cost or net realisable value.
Investment in associates, if material, is shown in the consolidated balance sheet at the share of net assets.
Current asset investments include temporary and money market deposits and are included at the lower of cost and net realisable value.
Stock Stocks for resale and other stocks are included at the lower of cost and net realisable value. Where necessary, provision is made for obsolete, slow-moving and defective stocks.
Cash and cash equivalentsCash includes cash in hand, deposits repayable on demand and overdrafts. Deposits are repayable on demand if they are in practice available within 24 hours without penalty.
Cash equivalents are short-term, highly liquid investments that are readily convertible to known amounts of cash with insignificant risk of change in value.
Investment propertiesInvestment properties are initially included in the balance sheet at the balance sheet date at their fair value on the basis of an annual independent valuation. Mixed-use investment properties are separated between investment properties and property, plant and equipment. Changes in the fair value of investment properties are recognised immediately within the consolidated statement of comprehensive income and expenditure.
Borrowing costsBorrowing costs are recognised as expenditure in the period in which they are incurred.
Capitalised equipment is stated at cost and depreciated over a four-year period from the year in which the equipment, software or building is commissioned.
Donated equipment is capitalised at depreciated replacement cost at the date of receipt and is depreciated over a four-year period.
It has been recognised that building plant acquired by the University’s subsidiary, UoE Utilities Supply Company Limited, has a long operating life and is depreciated over 10 to 15 years. Certain other subsidiaries provide different rates of depreciation to that of the parent. These have an immaterial effect on the results of the Group.
Heritage assetsThe University holds, preserves and makes available a number of collections, exhibits, artefacts and other assets of historical, artistic or scientific importance. Heritage assets acquired before 1 August 1999 without reliable estimates of cost or value on a cost-benefit basis have not been capitalised. Acquisitions since 1 August 1999 have been capitalised at cost, or, in the case of donated assets, at expert valuation on receipt. Heritage assets are not depreciated since their long economic life and high residual value mean that any depreciation would not be material.
The University receives a large number of donated assets in addition to heritage assets bought by the University’s Centre for Research Collections. Donated assets are not valued unless they are of special interest as the cost of doing so is not commensurate with the benefits to readers of the Annual Report and Accounts. Donated assets that are capitalised are reported in the consolidate statement of comprehensive income and expenditure at valuation.
Investments Assets held in the University of Edinburgh Investment and Endowment Fund, which holds endowment and general fund investments, continue to be administered by external fund managers.
54 Annual Report and Accounts 2016/17
Notes to the financial statements(continued)

Provisions, contingent liabilities and contingent assetsProvisions are recognised in the financial statements when:
• the University has a present obligation (legal or constructive) as a result of a past event;
• it is probable that an outflow of economic benefits will be required to settle the obligation; and
• a reliable estimate can be made of the amount of the obligation.
The amount recognised as a provision is determined by discounting the expected future cash flows at a discount rate that reflects risks specific to the liability.
A contingent liability arises from a past event that gives the University a possible obligation whose existence will only be confirmed by the occurrence or otherwise of uncertain future events not wholly within the control of the University. Contingent liabilities also arise in circumstances where a provision would otherwise be made but either it is not probable that an outflow of resources will be required or the amount of the obligation cannot be measured reliably.
A contingent asset arises where an event has taken place that gives the University a possible asset whose existence will only be confirmed by the occurrence or otherwise of uncertain future events not wholly within the control of the University.
Contingent assets and liabilities are not recognised in the balance sheet but are disclosed in the notes.
Financial instrumentsFinancial assets and financial liabilities are recognised when the Group becomes a party to the contractual provisions of the instrument. Financial liabilities are classified according to the substance of the contractual arrangements entered into. The University’s financial assets and liabilities all meet the criteria for basic financial instruments prescribed within FRS 102 Section 11.8. FRS 102 para. 11.13 requires financial instruments, i.e. the unsecured bank loans, to be recognised at the present value of the future payments discounted at a market rate of interest.
Taxation status The University is an exempt charity within the meaning of the Trustee Investment and Charities (Scotland) Act 2005 and, as such, is a charity within the meaning of Section 506 (1) of the Income and Corporation Taxes Act 1988. The University is recognised as a charity by HM Revenue & Customs and is recorded on the index of charities maintained by the Office of Scottish Charity Regulator. It is therefore a charity within the meaning of Para 1 of schedule 6 to the Finance Act 2010 and accordingly, the University is potentially exempt from UK Corporation Tax in respect of income or capital gains received within categories covered by section 478-488 of the Corporation Tax Act 2010 (CTA 2010) or section 256 of the Taxation of Chargeable Gains Act 1992, to the extent that such income or gains are applied to exclusively charitable purposes. The University receives no similar exemption in respect of Value Added Tax.
The University’s subsidiary companies, except those with charitable status, are not exempt from taxation. The charge for taxation is based on the profit or loss for the year after charging the cost of any Gift Aid payment payable to the University. The charge for taxation also takes into account taxation deferred because of timing differences between the treatment of certain items for taxation and accounting purposes. Charitable subsidiaries are exempt from taxation under the same legislation as the University.
Overview
Strategy and value model
Operational review
Financial R
eviewG
overnanceFinancial statem
ents55Annual Report and Accounts 2016/17
and appropriate assets to cover their technical provisions.
Holiday earned but not taken and other employee benefits provisionThe employee leave accrual is calculated from a sample of departments’ holidays earned, but not taken, at the balance sheet date of 31 July 2017. This sample is attributed across the whole population of employees.
Heritage assetsHeritage assets are valued based on assumptions made by external valuers and the University’s Centre for Research Collections. Asset valuations are determined by the valuer’s opinion on the physical condition of items and their judgement of market conditions.
Property, plant and equipmentGroup depreciation charge is calculated based on assumptions on asset useful economic lives and expected residual value. The remaining depreciable lives of assets are periodically reviewed based on actual experience and expected future utilisation. A change in depreciable life is treated as a change in accounting estimate and the accelerated depreciation is accounted for in the period of change and future periods.
Key sources of estimation uncertaintyFRS 102 requires that assumptions used in the calculation of liabilities are disclosed as they may represent a source of material uncertainty. In the preparation of the consolidated financial statements, management has made judgements, estimates and assumptions that affect the amounts reported for assets and liabilities as at the balance sheet date and the amounts reported for revenues and expenses during the year. Any estimates, assumptions and judgements that have a significant risk of causing a material adjustment to the carrying amount of assets and liabilities within the financial statements within the next financial year are addressed below. Actual results may differ from these estimates. Estimates and underlying assumptions are regularly reviewed.
2. ESTIMATES AND JUDGEMENTSCritical accounting judgementsFRS 102 requires that accounting judgements that are considered to be critical by those charged with governance are explained in more detail as to why the judgement has been applied.
Multi-employer pension schemesFRS 102 makes the distinction between a group plan and a multi-employer scheme. A group plan consists of a collection of entities under common control typically with a sponsoring employer. A multi-employer scheme is a scheme for entities not under common control and represents (typically) an industry-wide scheme such as USS. The accounting for a multi-employer scheme where the employer has entered into an agreement with the scheme that determines how the employer will fund a deficit results in the recognition of a liability for the contributions payable that arise from the agreement (to the extent that they relate to the deficit) and the resulting expense in the consolidated statement of comprehensive income and expenditure in accordance with FRS 102 section 28.
The University has judged that the schemes provided by Universities Superannuation Scheme (USS), Medical Research Council (MRCPS) and the Scottish Teacher Superannuation Scheme (STSS) meet the definition of a multi-employer scheme. The University has recognised the discounted fair value of the contractual contributions under the funding plan in existence at the date of approving the financial statements.
Pension provisions – key actuarial assumptionsThe key actuarial assumptions used in the valuation of the USS, EUSBS, SPF and LPF pension schemes including discount rates, salary and pension increases, and mortality rates are reported in note 31 Pension schemes.
The cost of the USS deficit recovery plan has been estimated based on a model devised by USS and the British Universities Finance Directors Group (BUFDG) based on the USS March 2014 deficit valuation. The 2014 valuation was the third valuation for USS under the scheme-specific funding regime introduced by the Pensions Act 2004, which requires schemes to adopt a statutory funding objective, which is to have sufficient
56 Annual Report and Accounts 2016/17
Notes to the financial statements(continued)

Funding body grants
Tuition fees and education contracts
Consolidated and University
2017 £’000
2016 £’000
SFC recurrent grants
Teaching 64,566 67,669
Research and knowledge exchange 89,218 92,389
SFC specific grants
Strategic funding: UK Research Partnership Investment Fund (RPIF)
3,114 1,723
Capital maintenance grants 18,047 16,082
Ring-fenced grants funded by Scottish Government 6,500 2,650
Other grants 10,399 14,001
191,844 194,514
2017 2016 Total
£’000Capital
£’000Revenue
£’000Total
£’000
Research grants and contracts
Research Councils 6,639 110,916 117,555 121,062
UK based charities 2,593 55,505 58,098 49,736
UK central government bodies, local and health authorities
4,580 21,753 26,333 22,845
UK industry, commerce and public corporations
- 7,771 7,771 8,405
EU government bodies 58 31,777 31,835 29,641
EU other 385 2,990 3,375 2,896
Other overseas - 11,102 11,102 7,972
Other sources - 9,183 9,183 11,328
Total research grants and contracts 14,255 250,997 265,252 253,885
Research exceptional income
Research and Development Expenditure Credit (RDEC)
- - - 19,010
14,255 250,997 265,252 272,895
Consolidated and University
2017 £’000
2016 £’000
Scotland & EU fees 53,745 52,267
Rest of UK (RUK) 55,356 50,446
Non-EU fees 150,307 131,461
Research training support grants 15,474 16,243
Short course and other fees and support grants (non-credit bearing)
3,611 4,629
278,493 255,046
Research incomeThe figures for research income include the University’s share of the research activity of the Scottish Universities Environmental Research Centre (SUERC) of £2 million. SUERC is a jointly controlled entity with the University of Glasgow.
Research exceptional incomeThe exceptional item in the prior year relates to a claim in respect of Research and Development Expenditure Credits (RDEC) for the year 1 August 2014 to 31 July 2015 and an additional claim for the period 1 August 2013 to 31 July 2014. The RDEC income in the prior year is stated gross of Corporation Tax of £3.9 million (see note 12).
5. RESEARCH INCOME
Further reductions to Teaching and Research Excellence Grants (£6.3 million in total) are offset by increased capital funding for Infrastructure of £3.4 million. Other grants (including research pooling) decreased by £3.6 million and these are recognised in line with restricted conditions.
4. FUNDING BODY GRANTS
Undergraduate (UG) numbers (full time equivalents) increased by four per cent (1,012). UG fee income rose £10 million, driving up the average fee for UG students by 4.5 per cent. Postgraduate (PGT) fees rose by 22 per cent, £14.5 million; numbers rose by 12 per cent and the average price rose by nine per cent.
3. TUITION FEES AND EDUCATION CONTRACTS
Overview
Strategy and value model
Operational review
Financial R
eviewG
overnanceFinancial statem
ents57Annual Report and Accounts 2016/17

Donations and endowments
Investment income
Other income
2017 2016
NoteConsolidated
£’000 University
£’000 Consolidated
£’000 University
£’000
New endowments 21 1,714 1,714 4,428 4,428
Donations with restrictions 22 16,230 16,296 5,523 5,523
Unrestricted donations 3,952 3,952 1,523 1,523
21,896 21,962 11,474 11,474
2017 2016
Consolidated £’000
University £’000
Consolidated £’000
University £’000
Residences, catering and conferences 67,927 51,761 62,821 47,601
Restricted grants and income:
Academic and related activities 24,080 24,080 23,642 23,642
Academic services and support activities
5,154 2,158 5,241 2,331
Information systems grants 1,564 1,564 3,600 3,600
Unrestricted income:
Academic and related activities 35,356 35,356 39,394 39,394
Income generating, academic services and support activities
22,733 18,460 26,554 15,826
156,814 133,379 161,252 132,394
2017 2016
NoteConsolidated
£’000 University
£’000 Consolidated
£’000 University
£’000
Income from expendable endowments
21 5,728 5,728 6,170 6,170
Income from permanent endowments
21 2,762 2,762 2,988 2,988
Other investment income 2,648 2,648 1,021 1,021
Other interest receivable 3,410 3,766 3,105 3,455
14,548 14,904 13,284 13,634
Donations increased by £13 million to £20 million, and 80 per cent of these donations came with restrictions on how we spend the money. We received £1.7 million from new endowments, where we invest capital and spend the investment income earned; down by £2.7 million on last year.
8. DONATIONS AND ENDOWMENTS
Income from our endowment investments was £8.4 million, down seven per cent on last year, but the overall market return on investments (income plus capital appreciation) was 16 per cent.
7. INVESTMENT INCOME
Unrestricted academic and related activity has dropped from £39.4 million to £35.4 million. Once we exclude a one-off provision release of £5 million in the prior year, the position is an increase of £1 million. Accommodation Services income increased by £5.1 million (eight per cent); remaining restricted funds fell by £1.7 million partly due to reduced Jisc funding.
6. OTHER INCOME
58 Annual Report and Accounts 2016/17
Notes to the financial statements(continued)

Staff costs
2017 2016
Consolidated University Consolidated University
Academic / teaching departments 4,944 4,944 4,776 4,776
Academic / teaching services 603 603 610 610
Research grants and contracts 2,135 2,135 2,084 2,084
Administration and central services 895 895 821 821
Premises 690 690 680 680
Other including income-generating operations
136 - 158 -
Catering and residences 584 584 586 586
9,987 9,851 9,715 9,557
Staff on open-ended contracts 7,136 7,026 6,862 6,737
Staff on fixed-term contracts 2,499 2,473 2,507 2,474
Staff on guaranteed hours contracts 352 352 346 346
9,987 9,851 9,715 9,557
2017 2016
Consolidated £’000
University £’000
Consolidated £’000
University £’000
Salaries 366,970 354,761 354,587 341,098
Social security costs 37,110 36,111 30,133 29,528
Pension costs (note 31) 91,278 89,839 81,044 80,363
Movement on USS pension provision (4,854) (4,854) 9,975 9,975
Other unfunded pension costs 55 55 60 60
Severance costs 2,005 1,855 2,090 2,090
492,564 477,767 477,889 463,114
Analysis of the above costs by activity:
Academic/ teaching departments 267,033 267,033 252,260 252,260
Research grants and contracts 113,642 113,642 105,774 105,774
Library, computer and other academic support services
30,597 30,597 30,524 30,524
Administration and central services 40,252 40,252 34,315 34,315
Premises 18,615 18,615 19,266 19,266
Other including income-generating operations
7,783 - 7,984 -
Residences and catering operations 14,396 7,532 13,936 7,145
Unfunded pensions 55 55 60 60
Severance costs 2,005 1,855 2,090 2,090
Pension service costs and USS provision in excess of scheme contributions payable (note 31)
(1,814) (1,814) 11,680 11,680
492,564 477,767 477,889 463,114
Staff numbers (expressed as average full time equivalents during the year) were as follows:
The University of Edinburgh is committed to a policy of equal opportunities for staff and students with disabilities, and aims to create an environment enabling staff to participate fully in University life. Wherever practical the University policy in relation to staff with disabilities is to:
• Develop a positive culture where disabled employees are able to develop to their full potential. It values a diverse workforce which includes the representation of disabled staff, and will continue to enhance and embed its approach to supporting disabled staff, through policy and good practice and in accordance with current legislation;
• Ensure that we provide a working environment free from discrimination, harassment, bullying and victimisation, in line with the University’s Equality and Diversity Outcomes and Action Plan and Dignity & Respect Policy; and
• Commit to creating an accessible and welcoming working environment, including using both internal and external services and support for potential and current staff.
3.5 per cent (2016: 3.1 per cent) of our staff have declared that they have a disability.
Staff costs grew by six per cent, three per cent due to volume increases, and three per cent increase in price. The pay award was 1.1 per cent and the remaining 1.9 per cent reflects incremental drift and change in the mix of staff.
9. STAFF COSTS
Overview
Strategy and value model
Operational review
Financial R
eviewG
overnanceFinancial statem
ents59Annual Report and Accounts 2016/17

Key management personnel
Emoluments of the Principal
Staff numbers (expressed as an average employee count) were as follows:9. STAFF COSTS (continued)
2017 number
2016 number
Number of posts (expressed as full time equivalents during the year) included in key management personnel
8.4 8.4
2017 £’000
2016 £’000
Key management personnel compensation 2,023 1,906
2017 £’000
2016 £’000
Remuneration 257 251
Lump sum award 20 15
Benefit in kind 8 2
Sub-total excluding pension contributions & life cover 285 268
Employer’s life cover 5 2
Payment in lieu of employer’s pension contribution 31 31
321 301
2017 2016
Consolidated University Consolidated University
Staff on open-ended contracts 8,198 8,084 7,816 7,661
Staff on fixed-term contracts 2,895 2,867 2,902 2,867
Staff on guaranteed hours contracts 3,193 3,193 2,886 2,886
14,286 14,144 13,604 13,414
Percentage of staff on fixed-term contracts 20.26% 20.27% 21.33% 21.37%
Emoluments of the PrincipalThe Principal occupies a house that is provided to him by the University on a representative basis, that is, as part of his role as University Principal and this is reported as a benefit in kind. As well as being used as a family home, a number of rooms within the Principal’s residence are regularly used to host University events involving staff, students, alumni, and supporters.
The Principal was awarded and accepted a one per cent increase in basic salary in 2016; and a three per cent increase in basic salary in 2017 (the average (mean) pay increase for all staff for the same period, incorporating the pay award and incremental progression, was 3.1 per cent) The Principal also accepted a capped contractual lump sum award of £20,000 in recognition of strong performance against a number of key strategic objectives.
The median basic salary for Heads of Russell Group institutions in the most recent UCEA Senior staff remuneration survey is £278,875 per annum.
The Principal opted out of the pension scheme in 2015. Additional payments equivalent to the pension contributions foregone are included within emoluments.
Key management personnelKey management personnel are those persons having authority and responsibility for planning, directing and controlling the activities of the Institution. This includes compensation paid to key management personnel.
Key management personnel compensation includes remuneration and all employee benefits including employer pension contributions.
60 Annual Report and Accounts 2016/17
Notes to the financial statements(continued)

Compensation for loss of office
Senior post holders
2017 £’000
2016 £’000
Compensation payable to senior post holders - 82
Other compensation paid in excess of £100,000 209 270
209 352
2017
Clinical number
Non-clinical number
Total
2016 number
£100,000–£109,999 19 25 44 44
£110,000–£119,999 16 20 36 33
£120,000–£129,999 7 10 17 19
£130,000–£139,999 10 15 25 27
£140,000–£149,999 10 8 18 15
£150,000–£159,999 5 7 12 11
£160,000–£169,999 7 6 13 8
£170,000–£179,999 7 1 8 9
£180,000–£189,999 5 1 6 12
£190,000–£199,999 7 - 7 4
£200,000–£209,999 8 3 11 6
£210,000–£219,999 - - - 2
£220,000–£229,999 1 - 1 2
£230,000–£239,999 5 - 5 3
£240,000–£249,999 1 1 2 4
£250,000–£259,999 1 - 1 1
£260,000–£269,999 1 - 1 1
£280,000–£289,999 1 - 1 -
£290,000–£299,999 - - - 2
£300,000–£309,999 - 1 1 -
111 98 209 203
Senior post holdersRemuneration of higher paid staff includes NHS merit awards, but exclude employer’s pension contributions and termination payments.
Staff are included in the range that reflects their annual remuneration for that year.
53 per cent (2016: 54 per cent) of senior post holders are clinical academics.
Compensation for loss of officeCompensation includes the cost of enhancing pension benefits on early retirement.
There was no compensation payable to key management personnel for the year (2016: nil).
There was no compensation payable to senior post holders during the year (2016: three).
Severance arrangements for senior post holders are overseen by the University’s remuneration committee and all compensation is paid in line with the severance guidance approved by the University Court.
Overview
Strategy and value model
Operational review
Financial R
eviewG
overnanceFinancial statem
ents61Annual Report and Accounts 2016/17

9. STAFF COSTS (continued)
2017 2016
Consolidated £’000
University £’000
Consolidated £’000
University £’000
Academic and related expenditure 66,468 66,468 63,618 63,606
Scholarships & stipends 31,622 31,622 29,940 29,940
Research grants and contracts 96,590 96,590 96,469 96,469
Library, computer and other academic support services
15,740 15,740 11,835 11,727
Administration and central services 21,477 21,588 20,392 20,392
Refurbishment and maintenance 16,223 15,925 16,896 16,568
Utilities costs 16,896 19,768 17,150 19,993
Other premises costs 9,715 9,715 11,288 11,288
Other including income generating operations
9,875 4,460 13,796 12,511
Residences and catering operations 34,285 28,165 31,677 25,413
318,891 310,041 313,061 307,907
Other operating expenses include:
Agency staff costs 7,341 7,130 4,376 4,095
Operating lease rentals:
Land and buildings 20,007 21,420 17,350 18,737
Other 1,051 969 1,107 1,028
Fees charged by external auditors:
In respect of audit services 217 164 218 160
In respect of non-audit services 300 300 115 115
Related party transactions
Income £’000
Expenditure £’000
2017 total
£’000
Balance due at 31 July 2017
£’000
Arup Scotland/Ove Arup Foundation Ltd 69 77 8 -
British Library - 40 40 -
Edinburgh College 1 36 35 -
Edinburgh Festival Fringe Society 2 7 5 -
Edinburgh University Students’ Association - 3,038 3,038 -
Fios Genomics Ltd 5 48 43 -
ICAS - 2 2 -
LBS Group - 4 4 -
Marie Curie Cancer Care/Hospice 57 1 (56) -
Newbattle Abbey College - 4 4 -
Pleasance Theatre Festival Ltd 233 - (233) -
Royal Zoological Society of Scotland - 23 23 -
Sainsburys Bank/ Supermarkets Ltd 18 4 (14) -
Scottish Association of Marine Science (SAMS) - 87 87 -
Scottish Water/Scottish Water Business Stream Ltd 23 413 390 -
Universitas 21, LBG 9 - (9) -
417 3,784 3,367 -
10. OTHER OPERATING EXPENSES
Court MembersThe Court members are the trustees for charitable law purposes. Due to the nature of the University’s operations and the compositions of Court, being drawn from local public and private sector organisations, it is inevitable that transactions will take place with organisations in which a member of Court may have an interest. All transactions involving organisations in which a member of Court may have an interest are conducted at arm’s length and in accordance with the University’s Financial Regulations and usual procurement procedures.
The University has taken advantage of the exemption allowed by FRS 102 not to disclose transactions between wholly owned group companies. Related party transactions with University spinout companies have not been disclosed as they are not material.
No Court member has received any remuneration nor waived payments from the group during the year (2016: nil).
The total expenses paid to or on behalf of three Court members was £2,000.88 (2016: £1,222.34). This represents travel and subsistence expenses incurred in attending Court and other Committee meetings in their official capacity.
62 Annual Report and Accounts 2016/17
Notes to the financial statements(continued)

Consolidated fixed assets
Taxation
2017 2016
Consolidated £’000
University £’000
Consolidated £’000
University £’000
Recognised in the statement of comprehensive income
Current tax:
UK Corporation tax charge on subsidiaries’ profits
18 - (2) -
Exceptional item: tax on RDEC income - - 3,932 3,932
18 - 3,930 3,932
2017 2016
NotesConsolidated
£’000University
£’000Consolidated
£’000University
£’000
Loan interest 8,844 8,845 6,604 6,604
Finance lease interest 121 121 145 145
Net charge on pension scheme
20 5,525 5,525 6,008 6,008
14,490 14,491 12,757 12,757
Land and
buildings £’000
Fixtures, fittings and equipment
‘£’000Total
£’000
Heritage assets £’000
Total including heritage
assets £’000
Cost or valuation
As at 1 August 2016 1,499,155 168,693 1,667,848 212,143 1,879,991
Additions 168,000 20,388 188,388 65 188,453
Transfer to Endowment & Investment Fund
(12,034) - (12,034) - (12,034)
Disposals (2,488) (5,860) (8,348) - (8,348)
As at 31 July 2017 1,652,633 183,221 1,835,854 212,208 2,048,062
Accumulated depreciation
As at 1 August 2016 43,896 130,910 174,806 - 174,806
Charge for the year 30,029 16,671 46,700 - 46,700
Transfer to Endowment & Investment Fund
(414) - (414) - (414)
Disposals (384) (1,916) (2,300) - (2,300)
As at 31 July 2017 73,127 145,665 218,792 - 218,792
Net book value
As at 31 July 2017 1,579,506 37,556 1,617,062 212,208 1,829,270
As at 31 July 2016 1,455,259 37,783 1,493,042 212,143 1,705,185
At 31 July 2017, land and buildings included £120.6 million (2016: £32.2 million) in respect of buildings under construction.
All land and buildings are held on a freehold basis with the exception of the new medical school at the Royal Infirmary of Edinburgh at Little France. This is constructed on land held under a long leasehold of 130 years.
Gains on disposal of land and building fixed assets amounted to £8.1 million (2016: £0.5 million).
Certain land and buildings have been partly financed from Exchequer Funds. Funding body grants of £27.4 million recognised as income in the year relates to additional exchequer funding of land and buildings. Should any of these assets be sold the University may be liable, under the terms of the Financial Memorandum with the Scottish Funding Council, to surrender part of the proceeds.
On 31 July 2017, the Endowment and Investment Fund bought the University’s share of Deaconess Ltd. Deaconess House is now 100 per cent owned by the Endowment and Investment Fund (previously, 42 per cent owned by the University).
13. FIXED ASSETSConsolidated
Current tax, including UK corporation tax and foreign tax, is provided at amounts expected to be paid (or recovered) using the tax rates and laws that have been enacted or substantively enacted by the balance sheet date.
The exceptional item in the prior year relates to tax payable on the Research and Development Expenditure Credit (RDEC) of £19 million included in University research income receivable (Note 5) as at 31 July 2016 and included in the tax surplus of the University for the years ending 31 July 2014 and 2015. The net exceptional item of £15.1 million research income was received from HMRC in respect of RDEC in the year to 31 July 2016.
UK Corporation tax at 20 per cent (2016: 20 per cent)
12. TAXATION
11. INTEREST AND OTHER FINANCE COSTS
Overview
Strategy and value model
Operational review
Financial R
eviewG
overnanceFinancial statem
ents63Annual Report and Accounts 2016/17

University fixed assets
Consolidated fixed assets (continued)13. FIXED ASSETS (continued)
Land and
buildings £’000
Fixtures, fittings and equipment
‘£’000Total
£’000
Heritage assets £’000
Total including heritage
assets £’000
Cost or valuation
As at 1 August 2016 1,477,224 149,342 1,626,566 212,143 1,838,709
Additions 167,969 20,136 188,105 65 188,170
Surplus on revaluation - - - - -
Disposals (1,367) (378) (1,745) - (1,745)
As at 31 July 2017 1,643,826 169,100 1,812,926 212,208 2,025,134
Accumulated depreciation
As at 1 August 2016 42,217 118,325 160,542 - 160,542
Charge for the year 29,406 15,751 45,157 - 45,157
Disposals (69) (344) (413) - (413)
As at 31 July 2017 71,554 133,732 205,286 - 205,286
Net book value
As at 31 July 2017 1,572,272 35,368 1,607,640 212,208 1,819,848
As at 31 July 2016 1,435,007 31,017 1,466,024 212,143 1,678,167
At 31 July 2017, freehold land and buildings included £88.1 million (2016: £87.8 million) in respect of freehold land and is not depreciated.
At 31 July 2017, land and buildings included £120.6 million (2016: £30.4 million) in respect of buildings under construction.
The increase of £90.2 million in the value of buildings under construction included further investment is in the Meadow Lane student accommodation, Edinburgh Data Technology Centre, New Biological Sciences facilities at the King’s Buildings, Easter Bush Innovation Centre and Energy Centre and the redevelopment of the Surgical Wing of the Old Royal Infirmary at Quartermile projects.
In addition to the increase in buildings under construction, the Lauriston Fire Station at the Edinburgh College of Art campus, and a further building in Chambers Street were acquired during the year. Other significant additions to existing buildings included costs of refurbishing the McEwan Hall, Old College School of Law, Edinburgh College of Art Main building, St Cecilia’s Hall and fitting out leased property at Argyle House.
There is a standard security over various properties belonging to the University which has been granted as part of a loan arrangement, and further standard securities have been granted over certain properties in favour of the University of Edinburgh Staff Benefits Scheme as part of a pension funding guarantee arrangement.
The net book value of tangible fixed assets includes an amount of £2.3 million (2016: £2.4 million) of buildings, fixtures and fittings held under finance leases. The depreciation charge on these assets for the year was £31,021 (2016: £31,021).
Deaconess House, as part of the Endowment and Investment Fund, is classified as an investment property. Previously the University owned portion had been accounted for as an operating asset and depreciated.
University
64 Annual Report and Accounts 2016/17
Notes to the financial statements(continued)

Additions and disposals
Collections Method valuation
Valuationundertaken by
Information on qualifications of collection valuers can be found at
Rare Books, Archives and Manuscripts
External Bernard Quaritch Ltd www.quaritch.com
McNaughtan’s mcnaughtans.co.uk
Musical Instrument Museums Edinburgh
External Sothebys www.sothebys.com
Art Collection External Sothebys and Paolozzi Foundation
www.sothebys.com and www.paolozzifoundation.org
Museum Heritage Collection
Internal Dr John Scally www.ed.ac.uk/schools-departments/information-services/services/library-museum-gallery/museums-and-galleries
Cockburn Museum of Geology
Internal Dr John Scally www.ed.ac.uk/schools-departments/information-services/services/library-museum-gallery/museums-and-galleries
Natural History Collections
Internal Prof Mark Blaxter & Prof Graham Stone
Anatomical Collections Internal Malcom McCallum
School of Chemistry Internal Dr John Scally
Classics Teaching Collection
Internal Prof Ben Harte & Dr Sue Rigby
Polish School of Medicine Historical Collections
Internal Dr Maria Dlugolecka-Graham
2013 £’000
2014 £’000
2015 £’000
2016 £’000
2017 £’000
Acquisitions purchased with specific donations - - - 67 15
Acquisitions purchased with University funds - 1,300 - 159 50
Total cost of acquisitions purchased - 1,300 - 226 65
Value of acquisitions by donation - - - 76 -
Total acquisitions capitalised - 1,300 - 302 65
Acquisitions for the current and previous four years were as follows:
Main collections The University holds and conserves collections of heritage assets which are capitalised. Details of the collections held can be found at www.ed.ac.uk/information-services/library-museum-gallery/crc/collections.
University policy on acquisitions, preservation, management and disposalThe University of Edinburgh Collections Management Policy is available at: www.ed.ac.uk/information-services/library-museum-gallery/crc/about/collections-policies.
Heritage assets capitalisedHeritage assets acquired before 1 August 1999 without reliable estimates of cost or value on a cost-benefit basis have not been capitalised. Acquisitions since 1 August 1999 have been capitalised at cost, or, in the case of donated assets, at expert valuation on receipt.
The University’s two major collections (the Library Special Collection of Rare Books, Manuscripts and Archives and the Fine Art Collections) were externally valued in 2015. A valuation of Special Collection items held in remote storage was undertaken in 2016. In light of the recent external valuations an uplift was not applied to the collections in the current year.
The remaining collections are assessed internally by the University’s Centre for Research Collections. Any movement in value is applied if commensurate with market activity, or material benefit to the readers of the Annual Report and Accounts.
Additions and disposalsThe University receives a large number of donated assets in addition to heritage assets bought by the University’s Centre for Research Collections. Donated assets are not valued unless they are of special interest as the cost of doing so is not commensurate with the benefits to readers of the Annual Report and Accounts. Donated assets that are capitalised are reported in the consolidated statement of comprehensive income and expenditure at valuation.
14. HERITAGE ASSETS
The University also loans out and receives loans of heritage assets.
Overview
Strategy and value model
Operational review
Financial R
eviewG
overnanceFinancial statem
ents65Annual Report and Accounts 2016/17

University
Subsidiary companies
£’000
Endowment and Investment
fund £’000
Other fixed asset
investments £’000
Total £’000
As at 1 August 2016 19,995 435,656 34,627 490,278
Additions - 99,320 - 99,320
Disposals (13,250) (71,449) (34,963) (119,662)
Loans advanced 2,348 - - 2,348
Loans repaid (5,808) - (66) (5,874)
Appreciation 1,863 63,381 965 66,209
Impairment 2,857 - - 2,857
As at 31 July 2017 8,005 526,908 563 535,476
Consolidated Endowment and Investment
Fund £’000
Other fixed asset
investments £’000
Total £’000
As at 1 August 2016 435,656 35,106 470,762
Additions 99,320 - 99,320
Disposals (71,449) (34,192) (105,641)
Loans repaid - (66) (66)
Appreciation 63,381 2,828 66,209
As at 31 July 2017 526,908 3,676 530,584
Non-current investments consist of:
The University of Edinburgh Endowment and Investment fund
526,908 563 527,471
Edinburgh University Press Ltd (intellectual property)
- 118 118
Unlisted investments - 2,995 2,995
526,908 3,676 530,584
15. NON-CURRENT INVESTMENTS
66 Annual Report and Accounts 2016/17
Notes to the financial statements(continued)

Current investments
University
Subsidiary companies
£’000
Endowment and Investment
fund £’000
Other fixed assets
investments £’000
Total £’000
2017 2016
Consolidated £’000
University £’000
Consolidated £’000
University £’000
Short-term deposits 195,000 195,000 218,062 215,000
2017 2016
Consolidated £’000
University £’000
Consolidated £’000
University £’000
Amounts falling due within one year:
Research grants receivables 71,720 71,720 68,441 68,441
Other trade receivables 35,166 21,269 54,041 42,116
Prepayments and accrued income 15,064 14,046 11,594 10,554
Amounts due from subsidiary companies - 4,747 - 1,305
121,950 111,782 134,076 122,416
Non-current investments consist of:
The University of Edinburgh Endowment and Investment fund portfolio
Equities - 301,357 - 301,357
Fixed interest stocks - 68,376 - 68,376
Property - 107,814 - 107,814
Multi asset type - 40,449 - 40,449
Venture capital - 3,513 - 3,513
Bank deposits held at fund managers - 1,577 - 1,577
Bank deposits held by the University - 3,822 - 3,822
Other investments
Other - - 563 563
Investment in subsidiary companies
Edinburgh University Press Ltd 358 - - 358
Loans to subsidiary companies
UoE Utilities Supply Company Ltd 5,900 - - 5,900
Old College Capital LLP 1,318 - - 1,318
Old College Capital Strategic Investments
206 - - 206
FloWave TT Ltd 195 - - 195
Sunergos Innovations Ltd 28 - - 28
8,005 526,908 563 535,476
Non-current investments
The University’s Treasury Management policy grants the Director of Finance delegated authority to deposit or invest funds with approved organisations to approved limits.
17. CURRENT INVESTMENTS
16. TRADE AND OTHER RECEIVABLES
The loans to subsidiary companies are interest-bearing with the exception of the loans to provide venture capital funding to Old College Capital LLP and Old College Capital Strategic Investments.
Overview
Strategy and value model
Operational review
Financial R
eviewG
overnanceFinancial statem
ents67Annual Report and Accounts 2016/17

Accruals and deferred income
2017 2016
Consolidated £’000
University £’000
Consolidated £’000
University £’000
Obligations under finance lease 809 809 1,031 1,031
Unsecured loans 317,892 317,892 254,549 254,549
Other creditors 714 714 1,112 512
319,415 319,415 256,692 256,092
2017 2016
Consolidated £’000
University £’000
Consolidated £’000
University £’000
Accruals 53,787 53,787 45,823 45,823
Donations and other restricted income deferred
23,137 23,137 27,953 27,953
Research grants received on account 116,664 116,664 113,102 113,102
Estates capital grants deferred 19,472 19,472 8,412 8,412
Other income deferred 34,810 29,461 26,816 21,688
247,870 242,521 222,106 216,978
2017 2016
Consolidated £’000
University £’000
Consolidated £’000
University £’000
Unsecured loans 3,174 3,174 3,264 3,264
Obligations under finance leases 222 222 201 201
Trade payables 38,684 35,736 41,030 35,082
Social security and other taxation payable
14,577 13,866 9,631 9,404
Accruals and deferred income (see below)
247,870 242,521 222,106 216,978
Amounts due to subsidiary companies - 885 - 1,309
304,527 296,404 276,232 266,238
19. CREDITORS: AMOUNTS FALLING DUE AFTER MORE THAN ONE YEAR
Accruals and deferred incomeIn addition to accruals of expenditure, research and other restricted income has been deferred until specific performance-related conditions have been met.
18. CREDITORS: AMOUNTS FALLING DUE WITHIN ONE YEAR
68 Annual Report and Accounts 2016/17
Notes to the financial statements(continued)

Unsecured loansInterest rate % Repayable Borrower
Amount £’000
Prudential plc 6.98 2026-2030 University 30,000
European Investment Bank 4.105 2017-2036 University 44,382
Lloyds Bank plc 5.89 2017-2036 University 6,527
Private Placements repayable in 20 years*
3.20 2036 University 40,000
The Royal Bank of Scotland plc 0.2% above base 2017-2037 University 6,640
Private Placements repayable in 25 years*
3.38 2041 University 40,000
Private Placements repayable in 30 years*
3.46 2046 University 20,000
European Investment Bank** 2.105 2021-2046 University 134,000
FRS102 amortisation adjustment (483)
321,066
2017 2016
Consolidated £’000
University £’000
Consolidated £’000
University £’000
Unsecured bank loans are repayable as follows:
Due within one year 18 3,174 3,174 3,264 3,264
Due between two and five years
10,335 10,335 14,506 14,506
Due in five years or more 307,557 307,557 240,043 240,043
321,066 321,066 257,813 257,813
2017 2016
NoteConsolidated
£’000 University
£’000 Consolidated
£’000 University
£’000
Obligations under finance leases are due as follows:
Due within one year 18 222 222 201 201
Due between two and five years
809 809 1,031 1,031
Due in five years or more - - - -
1,031 1,031 1,232 1,232
**The University has a further £200 million loan facility from the European Investment Bank, with £134 million drawn down to date.
*In 2015/16 the University raised £100 million through the issue of senior notes purchased by US financial institutions, Northwestern Mutual Life Insurance Company and Babson Capital Management.
The total of new unsecured loans in 2017 was £67 million (2016: £167 million).
Unsecured loans outstanding at 31 July 2017 were as follows:
Borrowings, including creditors falling due within one year, at 31 July were as follows:
Overview
Strategy and value model
Operational review
Financial R
eviewG
overnanceFinancial statem
ents69Annual Report and Accounts 2016/17

Provisions for liabilitiesObligation to fund deficit
on USS pension
£’000
Pension enhancement on termination
£’000
Unfunded pension
provision £’000
Funded pension scheme
provision £’000
Total £’000
As at 1 August 2016 105,459 7,390 1,510 139,329 253,688
Utilised in year (6,346) (584) (139) (11,270) (18,339)
Additions in year 1,491 - - 14,310 15,801
Additional contributions paid by the University
- - - (1,010) (1,010)
Interest in year 1,931 178 36 3,380 5,525
Actuarial (gain)/loss in respect of pension schemes
- 207 (331) 5,253 5,129
As at 31 July 2017 102,535 7,191 1,076 149,992 260,794
In compliance with FRS 102, Section 21: Provisions and contingencies, the provisions relate only to contractual and legal obligations of the University. All provisions relate to retirement benefits and details including assumptions used are included in Note 31: Pension Schemes.
USS deficitThe obligation to fund the past deficit on the Universities Superannuation Scheme (USS) arises from the contractual obligation with the pension scheme for future payments relating to benefits arising from past performance. Management have assessed future active USS scheme staff and their projected salary payments over the 17-year period of the contracted obligation in assessing the value of this provision.
Pension enhancement and unfunded pensionsThe University has a liability for the enhancement of pensions payable to some former members of staff who have taken early retirement and for the supplementation of Federated Superannuation Scheme for Universities (FSSU) and state pensions granted to certain former members of the University staff. These liabilities are unfunded but are assessed on the same basis as the liabilities within each defined benefit pension scheme.
Funded pension schemesThe provision represents the net liability in respect of the deficits on the Staff Benefit Scheme, Strathclyde Pension Fund and Lothian Pension fund assessed under FRS 102.
20. PROVISIONS FOR LIABILITIES
70 Annual Report and Accounts 2016/17
Notes to the financial statements(continued)

Endowment reserves Permanent unrestricted
endowments £’000
Permanent restricted
endowments £’000
Expendable restricted
endowments £’000
2017 total
£’000
2016 total
£’000
Capital 5,215 103,718 184,009 292,942 270,335
Accumulated income - 10,897 38,957 49,854 44,264
As at 1 August 5,215 114,615 222,966 342,796 314,599
New endowments - 1,047 667 1,714 4,427
Investment income 129 2,633 5,727 8,489 9,159
Expenditure (130) (2,876) (5,890) (8,896) (7,039)
Increase in market value of investments
731 16,302 30,985 48,018 21,650
730 17,106 31,489 49,325 28,197
Transfers - 210 (210) - -
As at 31 July 5,945 131,931 254,245 392,121 342,796
Represented by:
Capital 5,945 120,012 209,351 335,308 292,942
Accumulated income - 11,919 44,894 56,813 49,854
5,945 131,931 254,245 392,121 342,796
Analysis by type of purpose:
Chairs and lectureships 887 19,680 37,923 58,490 113,902
Prizes and scholarships 3,186 70,707 136,261 210,154 92,605
Other 1,872 41,544 80,061 123,477 136,289
5,945 131,931 254,245 392,121 342,796
Non-current asset investments:
Equities 3,374 74,892 144,326 222,592 199,516
Multi asset 453 10,053 19,372 29,878 -
Fixed interest stocks 766 16,993 32,747 50,506 65,234
Property 1,207 26,794 51,635 79,636 69,445
Venture capital 39 873 1,683 2,595 2,297
Bank deposits held at fund managers
18 392 755 1,165 5,487
Bank deposits held by the University
43 950 1,830 2,823 (215)
Non-current asset investments 5,900 130,947 252,348 389,195 341,764
Cash balances held by the University
22 484 934 1,440 (1,226)
Current asset - working capital 23 500 963 1,486 2,258
Total endowment assets 5,945 131,931 254,245 392,121 342,796
The University’s Endowment Fund is part of the Endowment and Investment Fund of £527 million (see note 15) which is invested with a number of fund managers and in different asset types, to diversify risk.
21. ENDOWMENT RESERVES Consolidated and University
Overview
Strategy and value model
Operational review
Financial R
eviewG
overnanceFinancial statem
ents71Annual Report and Accounts 2016/17

Revaluation reservesConsolidated and University Heritage assets £’000
2017 total
£’000
2016 total
£’000
Balances at 1 August 207,780 207,780 200,540
Revaluation in year - - 7,240
Revaluation depreciation in year - - -
Revaluation realised on disposal - - -
Total restricted comprehensive income for the year - - 7,240
Balances at 31 July 207,780 207,780 207,780
University
Capital grants £’000
Donations and revenue
grants £’000
2017 total
£’000
2016 total
£’000
Balances at 1 August - 15,582 15,582 14,541
New donations and grants receivable 32,579 10,130 42,709 24,796
Capital grants utilised (26,357) - (26,357) (18,186)
Expenditure - (8,907) (8,907) (5,569)
Total restricted comprehensive income for the year
6,222 1,223 7,445 1,041
Balances at 31 July 6,222 16,805 23,027 15,582
Consolidated
Capital grants £’000
Donations and revenue
grants £’000
2017 total
£’000
2016 total
£’000
Balances at 1 August 4,489 36,499 40,988 35,375
New donations and grants receivable 28,807 13,662 42,469 29,368
Capital grants utilised (26,357) - (26,357) (18,186)
Expenditure - (8,907) (8,907) (5,569)
Total restricted comprehensive income for the year
2,450 4,755 7,205 5,613
Balances at 31 July 6,939 41,254 48,193 40,988
Closing reserves comprise the following funds:
Donations 15,096 13,368
Capital grants 6,939 -
Other grants 992 2,214
Funds held at University of Edinburgh Development Trust
25,166 25,406
48,193 40,988
The University’s revaluation reserves have been restated at 1 August 2015. This has meant that prior-year revaluation gains on our land and buildings, which we have accounted for on a historic cost basis from 1 August 2015 onwards, are now included in the balance of general reserves. This has been restated following the advice of the British Universities Finance Directors Group’s Financial Reporting Council and has been done in order to improve consistency of accounts presentation across the higher education sector.
23. REVALUATION RESERVE
22. RESTRICTED RESERVESReserves with restrictions are as follows:
72 Annual Report and Accounts 2016/17
Notes to the financial statements(continued)

2017
Land and buildings
£’000
Other leases £’000
Total £’000
2016 total
£’000
Payable during the year 18,407 1,061 19,468 16,079
Future minimum lease payments due:
Not later than one year 11,313 981 12,294 11,038
Later than one year and not later than five years 18,348 1,707 20,055 21,791
Later than five years 43,485 - 43,485 47,575
Total lease payments due 73,146 2,688 75,834 80,404
2017 2016
Consolidated £’000
University £’000
Consolidated £’000
University £’000
Commitments contracted for at 31 July 139,620 139,620 141,577 141,560
University As at 1 August 2016
£’000Cash flows
£’000
As at 31 July 2017
£’000
Cash and cash equivalents 149,766 71,499 221,265
Consolidated As at 1 August 2016
£’000Cash flows
£’000
As at 31 July 2017
£’000
Cash and cash equivalents 175,783 74,424 250,207
28. EVENTS AFTER THE REPORTING YEARIn the interval between the end of the financial year and the date of this report, there were no items, transactions or events of a material and unusual nature likely, in the opinion of the Court, to affect significantly the operations of the Group, the results of those operations, or the state of affairs of the Group in subsequent financial years.
26. CONTINGENT LIABILITIESThe University has given written undertakings to support its subsidiary companies for twelve months from the date of approval of these financial statements.
27. LEASE OBLIGATIONSTotal rentals payable under operating leases:
25. CAPITAL AND OTHER COMMITMENTS
24. CASH AND EQUIVALENTS
Overview
Strategy and value model
Operational review
Financial R
eviewG
overnanceFinancial statem
ents73Annual Report and Accounts 2016/17

Old College Capital LLP, SI and GPThe University is the sole limited partner of Old College Capital LLP and partner of Old College Capital SI and GP. The main purpose of Old College Capital LLP includes making early and mid-stage investments into selected companies that emerge from the University. Old College SI invests in Epidarex, a venture-capital fund. Old College Capital GP is a limited liability partner of Old College Capital LLP and Old College Capital SI.
Research into Results Limited The University owns 100 percent of the issued share capital of Research into Results Limited. The principal activity is the delivery of research and project management services in the area of international development.
Edinburgh University Press LimitedEdinburgh University Press Limited is a charity registered in Scotland, registered charity number SC035813, incorporated as a limited company, of which the University owns 100 per cent of the issued share capital of 357,482 ordinary shares of £1 each. The principal activity of Edinburgh University Press Limited is the publication of educational books and journals.
The University of Edinburgh Development TrustThe University of Edinburgh Development Trust is a charity registered in Scotland, registered charity number SC004307. The trust is classed as a “quasi-subsidiary” of the University under the guidelines of FRS 102: Section 2 Concepts and Pervasive Principles. The primary purpose of the Trust is to act as a fund raiser of funds for the benefit of the University.
The Andrew Grant Bequest The Andrew Grant Bequest is a charity registered in Scotland, Registered Charity No SC001097. The trust is classed as a “quasi-subsidiary” of the University under the guidelines of FRS 102: Section 2 Concepts and Pervasive Principles. The primary purpose of the charity is to manage the monies in the Andrew Grant bequest in accordance with the terms of the original benefactions from Andrew Grant.
29. SUBSIDIARY UNDERTAKINGSSubsidiary undertakings comprise companies registered in Scotland as follows:
Edinburgh Research and Innovation LimitedThe University owns 100 per cent of the issued share capital of Edinburgh Research and Innovation Limited, consisting of two ordinary shares of £1 each. The company’s main activities are concerned with the commercialisation of the world-class research and academic expertise at the University of Edinburgh to potential funders, collaborators, licensees or investors. From August 2017, the company name has been changed to Edinburgh Innovations Limited.
Edinburgh Technology Fund Limited The University owns 100 per cent of the issued share capital of Edinburgh Technology Fund Limited, consisting of 6,000 “A” ordinary shares of £1 each. The principal activity of the company is the management of investment funds providing seed corn venture capital for early stage high-technology developments and the management of its portfolio of investments made using its funds.
Edinburgh Technology Transfer Centre LimitedThe University is the only member of the Company which is limited by guarantee. In the event of the Company being wound up, the members’ liability is limited to £1 each. The company was dormant in the year to 31 July 2017.
UoE Accommodation Limited The University owns 100 per cent of the issued share capital of UoE Accommodation Limited, consisting of two ordinary shares of £1 each. The company’s main activities are concerned with non-student lettings and the provision of nursery childcare services for the University of Edinburgh.
UoE HPCX Limited The University owns 100 per cent of the share capital of UoE HPCX Limited consisting of one ordinary share of £1. The company’s principal activity is the provision of high-performance computing services.
UoE Utilities Supply Company LimitedThe University owns 100 per cent of the issued share capital of UoE Utilities Supply Company Limited, consisting of two ordinary shares of £1. This company was set up to provide utility services to the University.
74 Annual Report and Accounts 2016/17
Notes to the financial statements(continued)

Associated undertakings include the following:
Roslin Cells LimitedFollowing the acquisition of the Roslin Institute, the University now nominates one member of Roslin Cells, a company limited by guarantees of £1 from each of two members. No share of the accounts of that body is consolidated on the ground of materiality.
In addition to the above associated undertakings, the Group and University nominate members of other companies limited by guarantee, and have also acquired in excess of 20 per cent of the issued capital of several start-up companies limited by shares, under seed corn funding and spin-off arrangements. No consolidation is made in these accounts and no investment value is reflected on the basis of materiality.
Other subsidiary undertakings are as follows:
University of Edinburgh Deaconess Limited (UoEDL) The University owns 100 per cent of the share capital, consisting of 22,821,322 ordinary shares of £1 in UoEDL, a company registered in England. The main activities are that of investing in and operating student accommodation property, and in particular, Deaconess House.
Overseas OfficesThe University operates overseas offices of which several are incorporated including the North American Office - University of Edinburgh incorporated, registered in the United States which supports the University’s activity in North America and the Hong Kong Centre for Carbon Innovation Limited.
Dormant subsidiary undertakings in the process of winding up are as follows:
FloWave TT LimitedThe University owns 100 per cent of the issued share capital of FloWave TT Limited, consisting of one ordinary share of £1. The company is registered in Scotland. The company is now dormant and in the process of being wound up following the transfer of the wavetank facilities and operations to the University.
Sunergos Innovations LimitedThe University owns 100 per cent of the share capital, consisting of 100 ordinary shares of £1. The company is registered in Scotland. The main activities include the commercial exploitation of intellectual property arising from research. The company is now dormant and in the process of being wound up following the transfer to the University of the intellectual property commercial exploitation activities.
Overview
Strategy and value model
Operational review
Financial R
eviewG
overnanceFinancial statem
ents75Annual Report and Accounts 2016/17

Connected charitable institutions
Not consolidatedOpening balance
£’000Income
£’000Expenditure
£’000
Change in market value
£’000
Closing balance
£’000
Edinburgh University Students’ Association* (Scottish Charity No. SC015800)
214 11,953 (11,934) - 233
Edinburgh University Sports Union (Scottish Charity No. SC009248)
133 789 (780) - 142
347 12,742 (12,714) - 375
Consolidated Opening balance
£’000Income
£’000Expenditure
£’000
Change in market value
£’000
Closing balance
£’000
University of Edinburgh Development Trust (Scottish Charity No. SC004307)
26,164 19,792 (19,833) - 26,123
Edinburgh University Press Limited (Scottish Charity No. SC035813)
1,716 3,236 (3,139) - 1,813
The Andrew Grant Bequest (Scottish Charity No. SC001097)
4,260 112 (113) 616 4,875
32,140 23,140 (23,085) 616 32,811
USS, STSS and MRCPS are multi-employer schemes and, given the mutual nature of the schemes, it is not possible to identify the University’s shares of the assets and liabilities for these schemes. Consequently, the University cannot apply defined benefit accounting and, according to section 28 FRS 102, the schemes are accounted as defined contribution schemes. Costs charged to the consolidated statement of comprehensive income and expenditure (the Consolidated Statement) shown below reflect the contributions in year. No share of any deficit or surplus in the STSS and MRCPS schemes is included in these accounts. A liability for the future contributions payable to USS that relate to a deficit recovery plan agreement is recognised and the resulting expense is included the Consolidated Statement.
The EUSBS, SPF and LPF schemes are accounted for under FRS 102, section 28 and the funded pension costs charged to the Consolidated Statement shown below reflect the service cost calculated under FRS 102. The FRS 102 disclosures of the University pension assets, liabilities and costs are included at the end of this note.
University pension schemesThe University participates in three active pension schemes; the Universities Superannuation Scheme (USS), the University of Edinburgh Staff Benefits Scheme (EUSBS) and the National Employee Savings Trust (NEST), and operates salary sacrifice for active staff members of these schemes. The University also participates in other legacy pension schemes on behalf of both retired and active members. These legacy schemes are closed to new University employees but some former employees of Moray House Institute of Education, Edinburgh College of Art and the Medical Research Council Human Genetics Unit remain members of the Scottish Teachers Superannuation Scheme (STSS), the Strathclyde Pension Fund (SPF), the Lothian Pension Fund (LPF) and the Medical Research Council Pension Scheme (MRCPS). The Federated Superannuation Scheme for Universities (FSSU) covers a small number of academic staff that did not transfer to USS when it was introduced in 1975.
31. PENSION SCHEMES
A number of charitable institutions are administered by or on behalf of the University and have been established for its general or special purposes. Three of the connected institutions are included as a subsidiary undertaking in these consolidated financial statements; the others are not included in the consolidation since the University does not have control over their activities.
The University Court is also the sole Corporate Trustee of Andrew Grant Bequest which is included in the Group accounts of the University.
*Note the Edinburgh University Students’ Association figures are at 31 March 2017, which is in line with their reporting year end.
30. CONNECTED CHARITABLE INSTITUTIONS
76 Annual Report and Accounts 2016/17
Notes to the financial statements(continued)
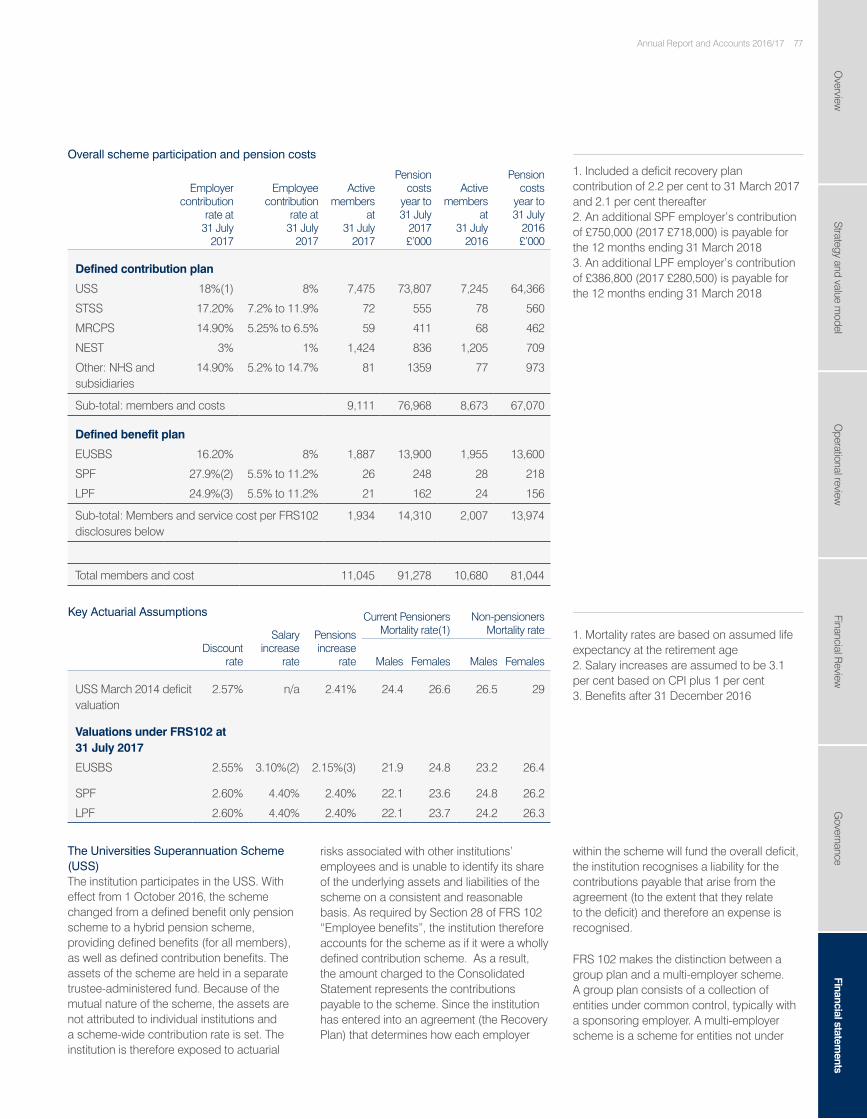
Key Actuarial Assumptions
Salary increase
rate
Pensions increase
rate
Current Pensioners Mortality rate(1)
Non-pensioners Mortality rate
Discount rate
Males Females Males Females
USS March 2014 deficit valuation
2.57% n/a 2.41% 24.4 26.6 26.5 29
Valuations under FRS102 at 31 July 2017
EUSBS 2.55% 3.10%(2) 2.15%(3) 21.9 24.8 23.2 26.4
SPF 2.60% 4.40% 2.40% 22.1 23.6 24.8 26.2
LPF 2.60% 4.40% 2.40% 22.1 23.7 24.2 26.3
Employer contribution
rate at 31 July
2017
Employee contribution
rate at 31 July
2017
Active members
at 31 July
2017
Pension costs
year to 31 July
2017 £’000
Active members
at 31 July
2016
Pension costs
year to 31 July
2016 £’000
Defined contribution plan
USS 18%(1) 8% 7,475 73,807 7,245 64,366
STSS 17.20% 7.2% to 11.9% 72 555 78 560
MRCPS 14.90% 5.25% to 6.5% 59 411 68 462
NEST 3% 1% 1,424 836 1,205 709
Other: NHS and subsidiaries
14.90% 5.2% to 14.7% 81 1359 77 973
Sub-total: members and costs 9,111 76,968 8,673 67,070
Defined benefit plan
EUSBS 16.20% 8% 1,887 13,900 1,955 13,600
SPF 27.9%(2) 5.5% to 11.2% 26 248 28 218
LPF 24.9%(3) 5.5% to 11.2% 21 162 24 156
Sub-total: Members and service cost per FRS102 disclosures below
1,934 14,310 2,007 13,974
Total members and cost 11,045 91,278 10,680 81,044
within the scheme will fund the overall deficit, the institution recognises a liability for the contributions payable that arise from the agreement (to the extent that they relate to the deficit) and therefore an expense is recognised.
FRS 102 makes the distinction between a group plan and a multi-employer scheme. A group plan consists of a collection of entities under common control, typically with a sponsoring employer. A multi-employer scheme is a scheme for entities not under
risks associated with other institutions’ employees and is unable to identify its share of the underlying assets and liabilities of the scheme on a consistent and reasonable basis. As required by Section 28 of FRS 102 “Employee benefits”, the institution therefore accounts for the scheme as if it were a wholly defined contribution scheme. As a result, the amount charged to the Consolidated Statement represents the contributions payable to the scheme. Since the institution has entered into an agreement (the Recovery Plan) that determines how each employer
The Universities Superannuation Scheme (USS)The institution participates in the USS. With effect from 1 October 2016, the scheme changed from a defined benefit only pension scheme to a hybrid pension scheme, providing defined benefits (for all members), as well as defined contribution benefits. The assets of the scheme are held in a separate trustee-administered fund. Because of the mutual nature of the scheme, the assets are not attributed to individual institutions and a scheme-wide contribution rate is set. The institution is therefore exposed to actuarial
1. Mortality rates are based on assumed life expectancy at the retirement age 2. Salary increases are assumed to be 3.1 per cent based on CPI plus 1 per cent 3. Benefits after 31 December 2016
1. Included a deficit recovery plan contribution of 2.2 per cent to 31 March 2017 and 2.1 per cent thereafter 2. An additional SPF employer’s contribution of £750,000 (2017 £718,000) is payable for the 12 months ending 31 March 2018 3. An additional LPF employer’s contribution of £386,800 (2017 £280,500) is payable for the 12 months ending 31 March 2018
Overall scheme participation and pension costs
Overview
Strategy and value model
Operational review
Financial R
eviewG
overnanceFinancial statem
ents77Annual Report and Accounts 2016/17
USS scheme assets31. PENSION SCHEMES (continued)
2017 £bn
2016 £bn
Scheme assets 60.0 49.8
Total scheme liabilities 77.5 58.3
FRS 102 total scheme deficit 17.5 8.5
FRS 102 total funding level 77% 85%
valuation as at 31 March 2017 is underway and is scheduled for completion by the statutory deadline of 30 June 2018.
Since the institution cannot identify its share of scheme assets and liabilities, the following disclosures reflect those relevant for the scheme as a whole.
The main demographic assumption used relates to the mortality assumptions. Mortality in retirement is assumed to be in line with the Continuous Mortality Investigation’s (CMI) S1NA tables as follows:
• Male members’ mortality 98 per cent of S1NA (“light”) YoB tables – no age rating
• Female members’ mortality 99 per cent of S1NA (“light”) YoB tables – rated down one year
Use of these mortality tables reasonably reflects the actual USS experience. To allow for further improvements in mortality rates the CMI 2014 projections with a 1.5 per cent p.a. long-term rate were also adopted.
Scottish Teachers Superannuation Scheme (STSS)The STSS provides final salary benefits to former members of the Moray House School of Education and is a multi-employer defined benefits scheme. The University is unable to identify its share of the underlying assets and liabilities of the scheme. Accordingly, the University has taken advantage of the exemption in FRS 102 and has accounted for a defined contribution scheme. The last actuarial valuation was carried out as at 31 March 2005 and the results of this valuation were rolled forward to calculate an updated liability of £20.9 billion at 31 March 2012. The next valuation will be based on the scheme data as at 31 March 2016 and will begin in 2016-17. Any changes arising from that valuation will apply from 1 April 2019.
As the scheme is unfunded, no surplus or shortfall can be identified. The present STSS employers’ contribution rate is 17.2 per cent. Future pension contribution rates will be set by the schemes actuary at a level to meet the cost of pensions as they accrue.
Medical Research Council Pension Scheme (MRCPS) As a result of the merger with the Human Genetics Unit, the University obtained membership of the Medical Research
common control and represents (typically) an industry-wide scheme such as the USS. The accounting for a multi-employer scheme where the employer has entered into an agreement with the scheme that determines how the employer will fund a deficit results in the recognition of a liability for the contributions payable that arise from the agreement (to the extent that they relate to the deficit). The resulting expense is recorded in the Consolidated Statement in accordance with section 28 of FRS 102. Court are satisfied that the scheme provided by the USS meets the definition of a multi-employer scheme and has therefore recognised the discounted fair value of the contractual contributions under the funding plan in existence at the date of approving the financial statements.
The total cost charged to the Consolidated Statement is £73.807 million (2016: £64.366 million) as shown in the overall scheme participation and pension costs table.
The latest available full actuarial valuation of the scheme was at 31 March 2014 (the valuation date), which was carried out using the projected unit method. The 2014 valuation was the third valuation for USS under the scheme-specific funding regime introduced by the Pensions Act 2004. It requires schemes to adopt a statutory funding objective, which is to have sufficient and appropriate assets to cover their technical provisions. At the valuation date, the value of the assets of the scheme was £41.6 billion and the value of the scheme’s technical provisions was £46.9 billion indicating a shortfall of £5.3 billion. The assets therefore were sufficient to cover 89 per cent of the benefits which had accrued to members after allowing for expected future increases in earnings. Since the institution has entered into an agreement (the Recovery Plan that determines how each employer within the scheme will fund the overall deficit), the University recognises a liability of £102.5 million (2016: £105.5 million) for the discounted fair value of the future contractual contributions payable that arise from the agreement to the extent that they relate to the deficit and the resulting expense in the income and expenditure account. The overall employer contribution of 18 per cent includes an element of 2.1 per cent (2.2 per cent to March 2017) paid in respect of this liability under the agreed deficit recovery plan. The
78 Annual Report and Accounts 2016/17
Notes to the financial statements(continued)

NEST is a defined contribution scheme. Pension contribution rates will be set by the scheme’s actuary at a level to meet the cost of pensions as they accrue.
National Health Service Superannuation Scheme (NHSSS)As a result of the merger with the Human Genetics Unit, the University gained a number of staff in the NHSSS pension scheme. Under the definitions set out in FRS 102, the NHSSS is a multi-employer scheme. The University is unable to identify its share of the underlying assets and liabilities of the scheme. Accordingly, the University has taken advantage of the exemption in FRS 102 and has accounted as if it were a defined contribution scheme. An actuarial assessment was carried out at 31 March 2012.
The Federated Superannuation Scheme for Universities (FSSU)FSSU was a defined benefit scheme and covered a very small number of academic staff who did not transfer to USS when it was introduced in 1975. Pension provision was by means of assurance policies, selected by the member from a panel and held in trust by the Trustees. Persons who retired under the scheme are entitled to additional benefits that may arise under the FSSU Supplementation scheme. These additional benefits are unfunded and are paid direct to retired members by Court. Full provision has been made in the year for the actuarial valuation of the liabilities of this scheme.
There are no active members but the University has three retired members in receipt of FSSU supplementation retirement benefits.
Unfunded pensions The University has a number of unfunded pensions which relate to the mergers with the Edinburgh College of Art and the Moray House School of Education and ex-gratia payments from the University. The value of these liabilities is £8.3 million (2016: £8.9 million): This comprises:
• Moray House School of Education and Edinburgh College of Art: £7.2 million (2016: £7.4 million)
• University of Edinburgh: £1.1 million (2016: £1.5 million)
Council Pension Scheme (MRCPS) with effect from 1 October 2011. The MRC is a final salary, defined benefit pension scheme. Under the terms of the merger the MRCPS is responsible for past service liabilities prior to the merger and the University is responsible for the future service from the merger date.
The University is unable to identify its share of the underlying assets and liabilities of the scheme. Under the definitions set out in FRS 102, the MRCPS is a multi-employer scheme. Accordingly, the University has taken advantage of the exemption in FRS 102 and has accounted for its contributions as if it were a defined contribution scheme.
The required MRCPS contribution rate is assessed every three years in accordance with advice of the Government Actuary. Triennial valuations are conducted under the Pensions Act 2004 on a scheme specific funding basis using the project unit method. The latest actuarial assessment of the MRCPS was at 31 December 2013. At the valuation date, the value of the assets of the MRCPS was £1.05 billion (2010: £884 million) and the value of the scheme’s technical provisions was £0.9 billion indicating a surplus of £160 million. The assets were therefore sufficient to cover 118 per cent of the benefits that accrued to members after allowing for expected future increases in earnings. As a result of the 2013 valuation, the trustees determined that the employer contribution rate from 1 April 2015 will remain at 14.9 per cent. The results of the next triennial valuation due as at 31 December 2016 are expected to be published towards the end of 2017.
National Employee Savings Trust (NEST)The University joined the NEST scheme in March 2013 to provide a low-cost alternative pension to EUSBS scheme membership. NEST is administered by a Trustee and was established as a result of the 2008 Pensions Act, which introduced the requirement to automatically enrol workers into a workplace pension scheme if they:
• are aged between 22 and State Pension Age
• earn more than £10,000 a year• work in the UK.
Overview
Strategy and value model
Operational review
Financial R
eviewG
overnanceFinancial statem
ents79Annual Report and Accounts 2016/17

Lothian Pension Fund (LPF)
Edinburgh University Staff Benefits Scheme (EUSBS)
31. PENSION SCHEMES (continued)
The University’s share of assets in the LPF scheme were: Value at 31 July
2017 £m
Value at 31 July
2016 £m
Value at 31 July
2015 £m
Market value of assets:
Equities 18.3 14.4 11.7
Bonds 2.8 4.5 3.2
Property 1.4 1.7 1.6
Cash 0.9 0.6 1.2
Total market value of assets 23.4 21.2 17.7
Present value of scheme liabilities
Funded (26.9) (26.0) (22.1)
Unfunded (0.2) (0.2) (0.2)
Deficit in the scheme - net pension liability (3.7) (5.0) (4.6)
The assets in the EUSBS scheme were: Value at 31 July
2017 £m
Value at 31 July
2016 £m
Value at 31 July
2015 £m
Market value of assets:
Equities 149.9 145.4 126.3
Debt 21.5 82.6 73.1
Property 36.2 34.7 32.6
Liability driven investments 23.5 - -
Private equity and diversified growth funds 163.9 88.2 84.7
Cash 7.8 20.4 2.1
Total market value of assets 402.8 371.3 318.8
Present value of scheme liabilities (548.4) (502.6) (423.7)
Deficit in the scheme - net pension liability (145.6) (131.3) (104.9)
The EUSBS is an externally-funded defined benefit scheme. The assets of EUSBS are held in a separate trustee-administered fund. The latest formal triennial actuarial valuation of the scheme was carried out as at 31 March 2015 and has been rolled forward as the basis for the following valuation under FRS 102. As at 31 July 2017, the value of the assets in the scheme was £402.8 million (2016: £371.3 million) and the present value of the funded and unfunded benefits accrued was £548.4 million (2016: £502.6 million), leaving a shortfall of £145.6 million (2016: £131.3 million) included in the University pension liability.
Further information is available at: www.ed.ac.uk/schools-departments/finance/pensions/scheme-details/sbs.
Lothian Pension Fund (LPF)Former members of the Edinburgh College of Art are members of the LPF scheme, which is an externally funded, multi-employer, defined benefits scheme from which pensions and other related benefits are paid. LPF is a pool into which employees’ and employers’ contributions and income from investments are paid, and from which previous and other related benefits are paid out, in accordance with the provisions of the Local Government Pension Scheme. The last full valuation was carried out at 31 March 2014 and the results have been rolled forward as the basis for the following valuation under FRS 102. As at 31 July 2017, the value of the University’s assets in the LPF scheme was £23.4 million (2016: £21.2 million) and the present value of the funded and unfunded benefits accrued was £27.1 million (2016: £26.2 million), leaving a shortfall of £3.7 million (2016: £5.0 million) included in the University pension liability. There will be a formal actuarial valuation of the Local Government Pension Scheme (LGPS) in Scotland as at 31 March 2017 that will impact the Consolidated Statement and Consolidated and University balance sheets for the year ended 31 July 2018.
Further information on the scheme is available at: www.lpf.org.uk.
Edinburgh University Staff Benefits Scheme (EUSBS)
80 Annual Report and Accounts 2016/17
Notes to the financial statements(continued)

Strathclyde Pension Fund (SPF)
The University’s share of assets in the SPF scheme were: Value at 31 July
2017 £m
Value at 31 July
2016 £m
Value at 31 July
2015 £m
Market value of assets:
Equities 23.2 21.2 19.4
Bonds 4.6 4.6 3.1
Property 3.6 3.2 3.1
Cash 1.3 - 0.3
Total market value of assets 32.7 29.0 25.9
Present value of scheme liabilities:
Funded (32.7) (31.5) (28.2)
Unfunded (0.5) (0.6) (0.6)
Deficit in the scheme - net pension liability (0.5) (3.1) (2.9)
Strathclyde Pension Fund (SPF)Former members of the Moray House School of Education are members of the SPF pension scheme, which is an externally-funded, multi-employer, defined benefits scheme from which pensions and other related benefits are paid. SPF was, under the State Pension rules up to 5 April 2016, contracted out of the State Second Pension (S2P) scheme. From 6 April 2016, employees are no longer able to contract out of the S2P. SPF is a pool into which employees’ and employers’ contributions and income from investments are paid, and from which previous and other related benefits are paid out, in accordance with the provisions of the Local Government Pension Scheme. The last full valuation was carried out at 31 March 2011 and the results have been rolled forward as the basis for the following valuation under FRS 102.
As at 31 July 2017, the value of the University’s assets in the SPF scheme was £32.7 million (2016: £29.0 million) and the value of the funded and unfunded benefits accrued was £33.2 million (2016: £32.1 million), leaving a deficit of £0.5 million (2016: £3.1 million) included in the University pension liability. There will be a formal actuarial valuation of the Local Government Pension Scheme (LGPS) in Scotland as at 31 March 2017 that will impact the Consolidated Statement and Consolidated and University balance sheets for the year ended 31 July 2018.
Further information on the scheme is available at: www.spfo.org.uk.
Overview
Strategy and value model
Operational review
Financial R
eviewG
overnanceFinancial statem
ents81Annual Report and Accounts 2016/17

*An additional £1.01 million (2016: £20 million) recurrent contribution was made to the EUSBS in the year as part of a deficit recovery plan while the scheme is in deficit.
31. PENSION SCHEMES (continued)
Analysis of movement in deficit 2017 £’000
2016 £’000
Deficit at beginning of year 139,329 112,356
Contributions or benefits paid by the University (11,270) (12,269)
Additional contributions paid by University* (1,010) (20,000)
Current service cost 14,310 13,972
Past service cost - 2
Other finance charge 3,380 3,946
Loss recognised in other comprehensive income 5,253 41,322
Deficit at end of year 149,992 139,329
2017 £’000
2016 £’000
Analysis of the amount shown in the balance sheet for EUSBS, LPF and SPF pensions:
Scheme assets 458,766 421,540
Scheme liabilities 608,758 560,869
Deficit in the schemes – net pension liability recorded within pension provisions (Note 20)
149,992 139,329
Unfunded ex gratia pension liability 8,267 8,900
Total provision for net liability 158,259 148,229
Current service cost 14,310 13,972
Past service costs - 2
Total operating charge 14,310 13,974
Analysis of the amount charged to interest payable
Interest cost 13,776 17,354
Expected return on assets (10,396) (13,408)
Net charge to other interest and other finance costs 3,380 3,946
Analysis of other comprehensive income:
Gain on assets (30,260) (29,729)
Experience gain on liabilities (49) (706)
Past service credit arising on change of pension increase assumption in the financial year
35,562 71,757
Total charge to other comprehensive income before deduction for tax
5,253 41,322
FRS 102 disclosuresThe following amounts were measured in accordance with the requirements of FRS 102 in respect of EUSBS, SPF and LPF and have been recognised in these financial statements.
82 Annual Report and Accounts 2016/17
Notes to the financial statements(continued)

History of experience gains and losses 2017 2016 2015 2014 2013
Difference between actual and expected return on scheme assets:
Amount (£’000) 30,260 29,729 21,470 (6,063) 33,286
% of assets at end of year 6.6% 7.1% 5.9% -1.8% 10.5%
Experience (losses)/gains on scheme liabilities:
Amount (£’000) (35,513) (71,051) (24,669) (35,672) (3,603)
% of liabilities at end of year -5.8% -12.8% -4.4% -8.2% -0.9%
Actual return on scheme assets 2017 £’000
2016 £’000
Expected return on scheme assets 10,396 13,408
Asset gain 30,260 29,729
40,656 43,137
Analysis of movement in the fair value of scheme assets 2017 £’000
2016 £’000
Fair value of assets at the start of the year 421,540 362,389
Expected return on assets 10,396 13,408
Actuarial gain on assets 30,260 29,729
Actual scheme contributions paid by University* 11,270 12,269
Additional contributions paid by University** 1,010 20,000
Actual member contributions 469 402
Actual benefit payments (16,179) (16,657)
Fair value of scheme assets at the end of the year 458,766 421,540
Analysis of movement in the present value of liabilities 2017 £’000
2016 £’000
Present value of liabilities at the start of the year 560,869 474,745
Current service cost 14,310 13,972
Interest cost 13,776 17,354
Past service cost recorded within other comprehensive Income - 2
Actual member contributions 469 402
Actuarial loss 35,513 71,051
Actual benefit payments (16,179) (16,657)
Present value of liabilities at the end of the year 608,758 560,869
*Actual contributions in the financial year 2016/17 are £11.3 million (2016: £12.3 million) based on the same member take up in the Salary Sacrifice arrangement.
**An additional £1.01 million (2016: £20 million) recurrent contribution was made to the EUSBS in the year as part of a deficit recovery plan while the scheme is in deficit.
Overview
Strategy and value model
Operational review
Financial R
eviewG
overnanceFinancial statem
ents83Annual Report and Accounts 2016/17

Financial instruments
HE
childcare £’000
HE discretionary
undergraduate £’000
HE discretionary
postgraduate £’000
HE Other £’000
2017 Total
£’000
2016 Total
£’000
Balance at 1 August - - - - - -
Allocation received in year 302 798 216 10 1,326 1,305
Expenditure (314) (850) (154) (5) (1,323) (1,308)
Repaid as clawback - - - (5) (5) -
Interest received - 2 - - 2 3
Virements 12 50 (62) - - -
Balance at 31 July - - - - - -
2017 2016
NoteConsolidated
£’000 University
£’000 Consolidated
£’000 University
£’000
Financial assets
Measured at fair value through profit and loss
Non-current investments 15 530,584 535,476 470,762 490,278
Measured at amortised cost
Trade and other receivables 16 106,886 92,989 122,482 110,557
Investments in short term deposits 17 195,000 195,000 218,062 215,000
Amounts due from subsidiary companies
16 - 4,747 - 1,305
832,470 828,212 811,306 817,140
Financial liabilities
Measured at amortised cost
Unsecured loans 18 & 19 321,066 321,066 257,813 257,813
Trade payables 18 38,684 35,736 41,030 35,082
Accruals and deferred income 18 247,870 242,521 222,106 216,978
Other long-term creditors 19 714 714 1,112 512
Finance lease liabilities 19 1,031 1,031 1,232 1,232
Amounts due to subsidiary companies
18 - 885 - 1,309
609,365 601,953 523,293 512,926
33. STUDENT SUPPORT PAYMENTS
The financial statements have been prepared on the historical cost convention (modified by the revaluation of heritage asset and investments), except for certain financial assets and liabilities which are carried at fair value or amortised cost as appropriate.
Fair value measurements are, to the extent possible, based on are quoted prices in active markets for identical assets or liabilities that the entity can access. Where quoted prices are not available the University then, also to the extent possible, uses observable market data for the asset or liability, either directly or indirectly. All other fair value measurements and based on unobservable inputs for the asset or liability. Further details are provided in the accounting policies.
32. FINANCIAL INSTRUMENTS
84 Annual Report and Accounts 2016/17
Notes to the financial statements(continued)

GROUP INCOME AND EXPENDITURE ACCOUNT FOR THE YEAR TO 31 JULY 2014
£’0002013 £’000
Income
Tuition fees
Home and EU higher education students 74,722 64,144
Non-EU fees 100,906 93,435
Education grants 18,439 16,500
Total tuition fees 194,067 174,079
Funding body grants
Recurrent teaching grant 76,316 80,621
Recurrent research grant 100,446 93,439
Specific grants 23,094 26,096
Deferred capital grants released in year 4,260 4,126
Total funding body grants 204,116 204,282
Research grants and contracts
Research councils 109,101 97,054
UK-based charities 43,178 43,335
UK central, government bodies, local and health authorities
17,903 17,346
UK industry, commerce and public corporations 5,413 8,733
EU government bodies 24,325 23,383
EU other 2,071 1,614
Other overseas 6,714 5,011
Other sources 7,229 3,647
Total research grants and contracts 215,934 200,123
Other operating income
Residences, catering and conferences 50,170 48,195
Specific grants, donations and other designated income
35,199 28,869
General income 57,597 60,258
Released from deferred capital grants 2,345 3,059
Benefit on acquisition 2,078 1,351
Total other operating income 147,389 141,732
Endowment income and interest receivable
Income from expendable endowments 6,689 5,292
Income from permanent endowments 3,727 2,991
Other investment income 270 485
Other interest receivable 8,438 8,802
Total endowment income and interest receivable 19,124 17,570
Total income 780,630 737,786
CONSOLIDATED STATEMENT OF COMPREHENSIVE INCOME AND EXPENDITURE FOR THE YEAR TO 31 JULY
2017 £’000
2016 £’000
2015 £’000
Income
Tuition fees and education contracts
Home and EU higher education students 109,101 102,713 87,961
Non-EU fees 150,307 131,461 115,060
Education grants 19,085 20,872 18,727
Total tuition fees 278,493 255,046 221,748
Funding body grants
Recurrent teaching grant 64,566 67,669 72,489
Recurrent research grant 89,218 92,389 100,896
Specific grants 38,060 34,456 25,473
Total funding body grants 191,844 194,514 198,858
Research grants and contracts
Research councils 117,555 121,062 114,819
UK based charities 58,098 49,736 46,095
UK central government bodies, local and health authorities
26,333 22,845 17,423
UK industry, commerce and public corporations 7,771 8,405 7,499
EU government bodies 31,835 29,641 26,381
EU other 3,375 2,896 2,883
Other overseas 11,102 7,972 7,249
Other sources 9,183 11,328 8,809
Total research grants and contracts (excluding RDEC)
265,252 253,885 231,158
Other income
Residences, catering and conferences 67,927 62,821 54,574
Specific grants, donations and other designated income
30,798 32,483 33,873
General income 58,089 65,948 57,270
Total other income 156,814 161,252 145,717
Investment income
Income from expendable endowments 5,728 6,170 6,733
Income from permanent endowments 2,762 2,988 3,756
Other investment income 2,648 1,021 490
Other interest receivable 3,410 3,105 3,620
Net return on pension scheme assets - - -
Total investment income 14,548 13,284 14,599
Total income before endowments and donations 906,951 877,981 812,080
Donations and endowments
New endowments 1,714 4,428 2,008
Donations with restrictions 16,230 5,523 10,396
Unrestricted donations 3,952 1,523 -
Total donations and endowments 21,896 11,474 12,404
Total income 928,847 889,455 824,484
Overview
Strategy and value model
Operational review
Financial R
eviewG
overnanceFinancial statem
ents85Annual Report and Accounts 2016/17
Five-year summary (unaudited) FRS 102 2007 SORP

GROUP INCOME AND EXPENDITURE ACCOUNT FOR THE YEAR TO 31 JULY 2014
£’0002013 £’000
Expenditure
Staff costs
Salaries and wages 312,836 291,214
Social security costs 25,528 21,716
Other pension costs 68,886 63,180
Unfunded pensions 916 (595)
Severance costs 1,828 1,750
Total staff costs 409,994 377,265
Other operating expenses
Academic and related expenditure 58,695 52,199
Scholarships & stipends 23,045 20,010
Research grants and contracts 83,907 75,774
Library, computer and other academic support services
13,156 14,803
Administration and central services 18,395 18,513
Refurbishment and maintenance 32,535 28,703
Utilities costs 17,608 19,614
Premises 9,757 12,768
Other including income generating operations 13,121 14,186
Residences and catering operations 29,148 28,194
Total other operating expenses 299,367 284,765
Depreciation 32,292 32,699
Interest payable 5,538 5,604
Total expenditure 747,191 700,333
Surplus on continuing operations 33,439 37,453
Exceptional items - -
Tax and minority interest (36) (14)
Gain on disposal of assets - 547
Transfers from/(to) endowment reserves (3,003) 265
- -
Surplus retained within general reserves 30,400 38,251
Transfers (from)/to endowment reserves 3,003 (265)
Surplus after depreciation of assets at valuation, taxation and minority interest
33,403 37,986
Net appreciation on tangible fixed asset – land and buildings values
- (7,542)
Unrealised surplus on revaluation of tangible fixed assets – heritage assets
2,700 1,636
New endowments and appreciation on endowment and investments
11,687 42,215
Actuarial gain/(loss) in respect of pension schemes (43,335) 32,683
Total gain recognised during the current year 4,455 106,978
CONSOLIDATED STATEMENT OF COMPREHENSIVE INCOME AND EXPENDITURE FOR THE YEAR TO 31 JULY
2017 £’000
2016 £’000
2015 £’000
Expenditure
Staff costs
Salaries and wages 366,970 354,587 342,659
Social security costs 37,110 30,133 27,381
Pension costs 91,278 81,044 75,430
Movement on USS provision (4,854) 9,975 46,527
Other unfunded pension costs 55 60 837
Severance costs 2,005 2,090 1,521
Total staff costs 492,564 477,889 494,355
Other operating expenses
Academic and related expenditure 66,468 63,618 61,948
Scholarships & stipends 31,622 29,940 25,835
Research grants and contracts 96,590 96,469 79,735
Library, computer and other academic support services
15,740 11,835 9,888
Administration and central services 21,477 20,392 17,869
Refurbishment and maintenance 16,223 16,896 21,298
Utilities costs 16,896 17,150 21,428
Other premises costs 9,715 11,288 8,164
Other including income generating operations 9,875 13,796 13,855
Residences and catering operations 34,285 31,677 30,960
Total other operating expenses 318,891 313,061 290,981
Depreciation 46,700 40,286 34,154
Interest and other finance costs 14,490 12,757 11,131
Total expenditure 872,645 843,993 830,621
Surplus/(deficit) before other gains and losses 56,202 45,462 (6,137)
Exceptional items (RDEC) - 19,010 21,868
Tax and minority interest (18) (3,930) (4,956)
Gain on disposal of fixed assets 8,048 518 39
Gain on investments 66,209 28,935 15,880
Surplus for the year 130,441 89,995 26,694
Unrealised surplus on revaluation of land and buildings - - -
Unrealised surplus on revaluation of heritage assets - 7,240 29,443
Actuarial loss in respect of pension schemes (5,129) (41,053) (3,199)
Total comprehensive income for the year 125,312 56,182 52,938
86 Annual Report and Accounts 2016/17
Five-year summary (unaudited)FRS 102 2007 SORP

GROUP BALANCE SHEET AS AT 31 JULY
2014 £m
2013 £m
Fixed assets
Heritage assets
1,421 1,399
Endowment assets 298 284
Current assets 477 450
Total assets 2,196 2,133
Less current liabilities (260) (250)
Total assets less current liabilities 1,936 1,883
Non-current liabilities (106) (118)
Pension liability and provisions (113) (64)
TOTAL NET ASSETS 1,717 1,701
Represented by:
Deferred capital grants 378 366
Endowments 298 284
Reserves 1,041 1,050
TOTAL FUNDS 1,717 1,700
CONSOLIDATED BALANCE SHEET AT 31 JULY 2017 £m
2016 £m
2015 £m
Fixed assets 1,617 1,493 1,399
Heritage assets 212 212 205
1,829 1,705 1,604
Investments 531 471 327
Current assets 571 531 495
Total assets 2,931 2,707 2,426
Less current liabilities (305) (276) (253)
Total assets less current liabilities 2,626 2,431 2,173
Non-current liabilities (319) (257) (93)
Pension provisions (261) (254) (216)
TOTAL NET ASSETS 2,046 1,920 1,864
Restricted reserves 440 383 350
Unrestricted reserves 1,606 1,537 1,514
TOTAL FUNDS 2,046 1,920 1,864
Overview
Strategy and value model
Operational review
Financial R
eviewG
overnanceFinancial statem
ents87Annual Report and Accounts 2016/17
FRS 102 2007 SORP

2017 2016 2015 2014 2013
Liquidity measures
Liquidity ratio ([current assets - stock] / current liabilities) x 1.9 1.9 2.0 1.8 1.8
Extent to which current liabilities can be met from cash and liquid investments
Days ratio of cash to total expenditure (investments + cash at bank - overdraft) / (total expenditure - depreciation)*365
Days 197 179 167 194 191
The number of days expenditure that could be sustained from available funds
Solvency measures
Interest cover (earnings before interest and tax / interest payable) x 3.9 5.1 1.4 6.0 6.8
Measures the ability to pay interest on outstanding debt
Interest cover (operating cash flow/ interest payable) x 6.7 6.7 5.7 9.5 8.6
Measures how easily the University can pay outstanding debt in cash terms
Gearing (creditors>1 year / endowment + general reserves including pension reserve) % 18% 24% 11% 8.0% 8.1%
Measures the extent to which the University is funded by long-term debt
Operating performance
Surplus before other gains and losses % 6.1% 6.8% -0.7% 4.3% 5.1%
Measures the ability to deliver surpluses
ROCE (EBITDA/[total net assets - pension provisions]) 3.2% 4.5% 2.1% 3.0% 3.3%
Measures the return that is being earned on capital invested
EBITDA for HE (FRS102 surplus/(deficit) before other gains/losses + interest payable + depreciation + change to pension provisions within staff costs - capital grants received - new permanent endowments)
£m 75 99 43 n/a n/a
EBITDA (historic cost surplus for year + depreciation + amortisation + interest payable + tax charges - release of deferred capital grants - exceptional items + FRS staff charges)
£m n/a n/a n/a 55 59
Measures operating performance before local decisions on accounting and finance policies are taken into account
88 Annual Report and Accounts 2016/17
Five-year summary (unaudited)

GROUP INCOME AND EXPENDITURE ACCOUNT FOR THE YEAR TO 31 JULY 2014
% total 2013
% total
Income
Tuition fees
Home and EU higher education students 9.6% 8.7%
Non-EU fees 12.9% 12.7%
Education grants 2.4% 2.2%
Tuition fees as % of total income 24.9% 23.6%
Funding body grants
Recurrent teaching grant 9.8% 10.9%
Recurrent research grant 12.9% 12.7%
Specific grants 3.0% 3.5%
Deferred capital grants released in year 0.5% 0.6%
Funding body grants as % of total income 26.2% 27.7%
Research grants and contracts
Research councils 14.0% 13.2%
UK-based charities 5.5% 5.9%
UK central, government bodies, local and health authorities
2.3% 2.4%
UK industry, commerce and public corporations 0.7% 1.2%
EU government bodies 3.1% 3.2%
EU other 0.3% 0.2%
Other overseas 0.9% 0.7%
Other sources 0.9% 0.5%
Research grants and contracts as % of total income
27.8% 27.3%
Other operating income
Residences, catering and conferences 6.4% 6.5%
Specific grants, donations and other designated income
4.5% 3.9%
General income 7.4% 8.2%
Released from deferred capital grants 0.3% 0.4%
Benefit on acquisition 0.3% 0.2%
Other operating income as % of total income 18.9% 19.2%
Endowment income and interest receivable
Income from expendable endowments 0.9% 0.7%
Income from permanent endowments 0.5% 0.4%
Other investment income 0.0% 0.1%
Other interest receivable 1.1% 1.2%
Endowment income and interest receivable as % of total income
2.5% 2.4%
Total income £’000 780,630 737,786
CONSOLIDATED STATEMENT OF COMPREHENSIVE INCOME AND EXPENDITURE FOR THE YEAR TO 31 JULY
2017 % total
2016 % total
2015 % total
Income
Tuition fees and education contracts
Home and EU higher education students 11.7% 11.5% 10.7%
Non-EU fees 16.2% 14.8% 14.0%
Education grants 2.1% 2.3% 2.3%
Tuition fees as % of total income 30.0% 28.6% 27.9%
Funding body grants
Recurrent teaching grant 7.0% 7.6% 8.8%
Recurrent research grant 9.6% 10.4% 12.2%
Specific grants 4.1% 3.9% 3.1%
Funding body grants as % of total income 20.7% 21.9% 24.1%
Research grants and contracts
Research councils 12.7% 13.6% 13.9%
UK based charities 6.3% 5.6% 5.6%
UK central government bodies, local and health authorities
2.8% 2.6% 2.1%
UK industry, commerce and public corporations 0.8% 0.9% 0.9%
EU government bodies 3.4% 3.3% 3.2%
EU other 0.4% 0.3% 0.3%
Other overseas 1.2% 0.9% 0.9%
Other sources 1.0% 1.3% 1.1%
Research grants and contracts as % of total income
28.6% 28.5% 28.0%
Other income
Residences, catering and conferences 7.3% 7.1% 6.6%
Specific grants, donations and other designated income
3.3% 3.7% 4.1%
General income 6.3% 7.4% 7.9%
Other income as % of total income 16.9% 18.2% 17.6%
Investment income
Income from expendable endowments 0.6% 0.7% 0.8%
Income from permanent endowments 0.3% 0.3% 0.5%
Other investment income 0.3% 0.1% 0.1%
Other interest receivable 0.4% 0.3% 0.4%
Net return on pension scheme assets
Total investment income as % of total income 1.6% 1.5% 1.8%
Total income before endowments and donations as % of total income
97.8% 98.7% 98.5%
Donations and endowments
New endowments 0.2% 0.5% 0.2%
Donations with restrictions 1.7% 0.6% 1.3%
Unrestricted donations 0.4% 0.2% 0.0%
Total donations and endowments as % of total income
2.3% 1.3% 1.5%
Total income £’000 928,847 889,455 824,484
Overview
Strategy and value model
Operational review
Financial R
eviewG
overnanceFinancial statem
ents89Annual Report and Accounts 2016/17
FRS 102 2007 SORP

GROUP INCOME AND EXPENDITURE ACCOUNT FOR THE YEAR TO 31 JULY 2014
% total 2013
% total
Expenditure
Staff costs
Salaries and wages 41.9% 41.6%
Social security costs 3.4% 3.1%
Other pension costs 9.2% 9.0%
Severance costs 0.2% 0.2%
Unfunded pensions 0.1% -0.1%
Staff costs as % of total expenditure 54.9% 53.9%
Other operating expenses
Academic and related expenditure 10.1% 9.7%
Research grants and contracts 11.2% 10.8%
Library, computer and other academic support services
1.8% 2.1%
Administration and central services 3.3% 3.2%
Premises 8.0% 8.7%
Other including income generating operations 1.8% 2.0%
Residences and catering operations 3.9% 4.0%
Other operating expenses as % of total expenditure
40.1% 40.7%
Depreciation as % of total expenditure 4.3% 4.7%
Interest payable as % of total expenditure 0.7% 0.8%
Total expenditure £’000 747,191 700,333
Expenditure as % of total income 95.7% 94.9%
CONSOLIDATED STATEMENT OF COMPREHENSIVE INCOME AND EXPENDITURE FOR THE YEAR TO 31 JULY
2017 % total
2016 % total
2015 % total
Expenditure
Staff costs
Salaries and wages 42.1% 42.0% 41.3%
Social security costs 4.3% 3.6% 3.3%
Pension costs 10.5% 9.6% 9.1%
Movement on USS provision -0.6% 1.2% 5.6%
Other unfunded pension costs 0.0% 0.0% 0.1%
Severance costs 0.2% 0.2% 0.2%
Staff costs as % of total expenditure 56.4% 56.6% 59.5%
Other operating expenses
Academic and related expenditure 7.6% 7.5% 7.5%
Scholarships & stipends 3.6% 3.5%
Research grants and contracts 11.1% 11.4% 9.6%
Library, computer and other academic support services
1.8% 1.4% 1.2%
Administration and central services 2.5% 2.4% 2.2%
Refurbishment and maintenance 1.9% 2.0%
Utilities costs 1.9% 2.0%
Other premises costs 1.1% 1.3% 1.0%
Other including income generating operations 1.1% 1.6% 1.7%
Residences and catering operations 3.9% 3.8% 3.7%
Other operating expenses as % of total expenditure
36.5% 37.0% 35.0%
Depreciation as % of total expenditure 5.4% 4.8% 4.1%
Interest payable as % of total expenditure 1.7% 1.5% 1.3%
Total expenditure £’000 872,645 843,993 830,621
Expenditure as % of total income 93.9% 94.9% 100.7%
90 Annual Report and Accounts 2016/17
Five-year summary (unaudited) FRS 102 2007 SORP

What makes us EdinburghOur scale and ambitions for growth, our people, and the city of Edinburgh provide a unique context for the University.

*Sources: QS World University Rankings 2016/17 and Times Higher Education World University Rankings 2016/17
The University of Edinburgh at a glance
Our strategic objectives
University world league table position*
QS 19thTHE 27th
Leadership in learning
We equip students with the knowledge, skills and experiences to flourish in a complex world and become successful graduates who contribute to society.
Leadership in researchAs a major, comprehensive university, we conduct research of the highest standard across a broad spectrum of disciplines.
Total research income (£m)*
2017 2652016 254 2015 2312014 216
10%The number of research applications in 2016/17 grew by ten per cent.
*Source: HESA Destination of Leavers of Higher Education survey, published July 2016.
*Figures exclude exceptional items.
Our statements
The Consolidated Comprehensive Statement of Income (COSI)We have reported our financial statements 2016/17 in line with Financial Reporting Standard 102 (FRS 102) which came in to effect for the University on 1st August 2015.
FRS102 has changed the Financial Statements fundamentally: both in format and also the and interpretation of key figures and accounting concepts. As the standard is still relatively new and the notes overleaf guide the user on key changes and on how to interpret this statement
Notes
a Income
Tuition fees and education contracts
b Funding body grants
Research income
Other income
Investment income
c Donations and endowments
Total income
d Expenditure
Staff costs
Other operating expenses
Depreciation
Interest and other finance costs
Total expenditure
Surplus/(deficit) before other gains and losses
Gain on disposal of fixed assets
e Gain on investments
Surplus/(deficit) before tax
Taxation
f Surplus/(deficit) for the year
gUnrealised surplus on revaluation of heritage assets
Actuarial loss in respect of pension schemes
Total comprehensive income for the year
h Represented by:
i Unrestricted comprehensive income for the year
Restricted comprehensive income for the year
Endowment comprehensive income for the year
Revaluation reserve comprehensive income for the year
a) The income format and content has changedTuition fees now appear first on the statement and are reported before funding body grants.
b) Income from funding body grants now includes capital grants recognised in full on receiptPreviously, the majority of SFC capital grants were deferred on the balance sheet and ‘drip fed’ into income over a number of years as the capital items were depreciated. Now, only capital grants with performance related conditions are deferred, and then released to the COSI once the conditions are met.
c) New donations/endowments are now recognised as income in the year of receiptPreviously, income from donations and endowments was deferred and then recognised when we spent it. Now, this income will be included in the year it is received or pledged, but, as with capital grants, we still defer this income if the donation has performance related conditions that have not been met at the balance sheet date.
Also, when a donor endows money (where initial sum is invested and we spend the interest) this appears here too, even though this initial sum is invested to generate a return.
d) Expenditure format is unchanged — but changes behind the scenesThere is no change to format, although accounting treatment of some of the numbers. For example, staff costs now include a new provision relating to the University’s share of the USS deficit recovery plan and a provision for holiday pay earned but not taken at the balance sheet date. Other operating expenses are lower as more Estates project spend is capitalised.
e) Unrealised gains/losses on investments (not yet converted to cash) now feature hereThese used to appear within the Statement of Total Recognised Gains and Losses.
f) Surplus for the year has changedThis no longer represents funds available for reinvestment. The term ‘surplus’ now includes capital grants, restricted resources (for example endowments) and unrealised sums valued at a point in time.
g) Unrealised gains/losses on revaluation and pension schemes now includedThese amounts, not yet converted to cash, are calculated as at a point in time, using market indices.
h) Comprehensive income lines are newThese represent the net movement during the year between income and expenditure, as well as any unrealised gains, for each reserve.
Restricted funds were previously reported as deferred income on the balance sheet but will now flow to the restricted income and expenditure reserve, this ‘ring-fences’ restricted income for its intended purpose.
i) Unrestricted comprehensive income for the yearWe now believe this to be the most appropriate measure of our performance and sustainability.
93%Our percentage of UK/EU graduates in employment or further study six months after graduating is 92.8 per cent.*

This publication is available online at www.ed.ac.uk/finance/accounts It can also be made available in alternative formats on request.
The University of EdinburghCommunications and Marketing C Floor, Forrest Hill Building, 5 Forrest Hill, Edinburgh EH1 2QL T: +44 (0)131 650 2252 F: +44 (0)131 650 2253 E: [email protected]
www.ed.ac.uk
Published by: The University of Edinburgh
Designed by:Emperor, www.emperordesign.co.uk
Printed by: J Thomson Colour Printers
Cover photography by Neil Hannah
Photography also by:Robert BradyPaul DoddsAngus ForbesDave MorrisJohn NeedThe University of Edinburgh, Digital Imaging UnitPeter TuffyDouglas Vernimmen
All photos and images used in this publication are protected by copyright and may not be reproduced without permission. No part of this publication may be reproduced without the written permission of the University of Edinburgh.
© The University of Edinburgh 2017
Thank you to all staff and students who helped in the production of this publication.
The University of Edinburgh is a charitable body registered in Scotland, with registration number SC005336.