annual report and accounts 2016/17 - nhsbsa annual... · £100 million £200 million £300 million...
TRANSCRIPT

Annual Report and Accounts 2016/17
HC 255

Presented to Parliament pursuant to Schedule 15, Section 6 of the National Health Service Act 2006
Ordered by the House of Commons to be printed on 10 July 2017
HC 255
Annual Report and Accounts 2016/17

© NHS Business Services Authority copyright 2017
The text of this document (this excludes, where present, the Royal Arms and all departmental or agency logos) may be reproduced free of charge in any format or medium provided that it is reproduced accurately and not in a misleading context.
The material must be acknowledged as NHS Business Services Authority copyright and the document title specified. Where third party material has been identified, permission from the respective copyright holder must be sought.
Any enquiries related to this publication should be sent to us at Corporate Secretary, Stella House, Goldcrest Way, Newburn Riverside, Newcastle upon Tyne, NE15 8NY.
This publication is available at https://www.gov.uk/government/publications.
Print ISBN 9781474147439Web ISBN 9781474147446
ID 28061708 07/17
Printed on paper containing 75% recycled fibre content minimum.
Printed in the UK by the Williams Lea Group on behalf of the Controller of Her Majesty’s Stationery Office.

4
1. Performance report 5
1.1 Overview 6
1.1.1 Statement from our Chief Executive 6
1.1.2 About us 7
1.1.3 Our key risks and issues 9
1.1.4 Performance summary 10
1.2 Performance analysis 18
1.2.1 How we measure performance 18
1.2.2 Financial review 18
1.2.3 Good business – Corporate responsibility 22
2. Accountability report 28
2.1 Corporate governance report 29
2.1.1 Directors’ report 29
2.1.2 Statement of accounting officer’s responsibilities 30
2.1.3 Annual governance statement 31
2.2 Remuneration and staff report 52
2.2.1 Remuneration report 52
2.2.2 Staff report 59
2.3 Parliamentary, accountability and audit report 65
2.3.1 Regularity of expenditure 65
2.3.2 Fees and charges 65
2.3.3 Long term expenditure trends 65
2.3.4 Accounting Officer’s disclosure to the auditors 65
2.3.5 External auditors 65
Appendix 1 – Our key performance indicators (KPIs) 66
Appendix 2 – Sustainability report 75
Certificate and report of the Comptroller and Auditor General 81
Financial statements and notes to the accounts 84
Contents

5
1. Performance report
1.Performance report
Our performance report gives you an overview of our purpose and activities. It summarises our performance over the year.

6
1.1. Overview
1.1.1 Statement from our Chief Executive
2016/17 was an important year for the NHS Business Services Authority (NHSBSA), which has seen us re-evaluate our overall approach to our business. As a result, we‘ve strengthened our position and renewed our dedication to delivering our strategic goals.
We have refreshed our purpose statement to bring it closer into line with what we have always believed; that we are here to support a better NHS. Through our varied services and work, we deliver crucial benefits to our many different stakeholders and are the guardians of over £34 billion of NHS spending. This represents a huge proportion of the overall NHS budget and we are proud that our success drives benefits for stakeholders and patients across the health service.
Over the last twelve months we have, for the first time, made a real push to begin growing our business and taking on more work on behalf of our NHS partners. This is a significant shift in our strategic thinking but one that will improve the services we can deliver while ensuring our success in the future. This ambition has led to our new vision statement; that we want to be the business partner of choice for the NHS. We’ll do this by delivering an expanded range of supporting services both in areas in which we already have expertise, such as HR and payroll services, and also in areas where we’re quickly growing our capability, such as data analytics and insight.
This report also details other important areas where we’ve been successful this year, all of which are impressive and will make a real difference to the NHS. For example, we’re saving NHS money through driving value from the Supply Chain contract, by protecting revenue received from patient charges, and from the many projects being driven by our Pacific programme. We’re reducing the cost of running our operations too, by absorbing growth
and inflation costs and making efficiency savings through delivering more for less. We’re also working to enhance customer experience across the board, by improving the services we deliver and digitising our customer interactions, making their experience with us simpler, clearer and faster.
We’re excited about our future and our ability to grow, while striving to fulfil our purpose and deliver our strategic goals. These directly relate to the trends and material issues we have identified.
I encourage you to also read our updated strategy and business plan for 2017/18 and beyond - found at www.nhsbsa.nhs.uk/what-we-do/strategy-business-plan-and-annual-report. These documents set out our goals and plans for the coming years and take account of the challenging context we work in.
I must also mention the hard work and dedication of Nick Scholte – our previous Chief Executive who was in post since the NHSBSA was created in 2006. Nick retired in May 2017, leaving a modern, forward-thinking organisation with a clear purpose, vision and set of goals.
Finally I’d like to thank our NHSBSA colleagues across the organisation for their commitment to our strategic goals over the last 12 months. After the impressive year that we’ve just had, I’m confident we can continue to improve our services and provide further value across the health and care system.
Alistair McDonaldChief Executive

7
1.1.2 About us
The NHSBSA is a Special Health Authority and an Arm’s Length Body (ALB) of the Department of Health (DH). We provide a range of critical central services to NHS organisations, NHS contractors, patients and the public. The NHSBSA was created in 2006 by bringing together a number of previously separate NHS organisations. We still deliver the core range of services we started with and have taken on additional services as our stakeholders’ needs have evolved (see Figure 2). Appendix 1 summarises our services and their key performance indicators (KPIs). Figure 1 shows the money we handle and how it is accounted for.
Figure 1: The money flowing through the NHSBSA

8
Figure 2: Our journey

9
Our strategy, shown at Figure 3 below, is made up of our purpose, vision and strategic goals and has
been developed to ensure we can continue to address threats and opportunities identified in the longer term.
Figure 3: Our strategy
1.1.3 Our key risks and issues
A summary of our key risks and issues is given in our Annual Governance Statement in section 2.1.3.

10
1.1.4 Performance summary
1,096,934,672 prescription items processed in 2016/17
EHICs provided to UK residents in 2016/17
UK patients received help with their NHS health costs
FP17 dental claim forms processed in 2016/17
Total Reward Statements and
available for current and former NHS employees to view
proportion of colleagues who completed the staff survey this year
revenue collected for the NHS from the sale of prescription prepayment
7.4 million
74%
45,119,982
5.8million
2,307,974
on our ‘Ask Us’onlineknowledge base
Over
162,000 monthly hits
£117.5 million
the number of claims for free prescriptions and dental procedures checked by our loss recovery teams
5.7 million
the number of cases processed in NHS Pensions in 2016/17
449,918
the amount of money we handle on behalf of our stakeholders every year
£34 billion
4,095,121 our contact centre handled
total amount of recurring savings the NHSBSA has delivered so far for the NHS and its patients
and 622,037 emails
£581m i l l i o n
81%the engagement level of our staff was
in 2016/17
followers on social media sites
76k
Our HR Shared Service managed
the recruitment of
posts on behalf of our NHS clients
in 2016/17
responses to our surveys from our customers and stakeholders in 2016/1758,581
of recurring savings so far through the NHS Supply Chain contract
£216 million
We ranked 124thout of 439 participating organisations in Stonewall's Workplace Equality Index
Our new scanning service scanned
4,207,705documents in 2016/17.
calls in 2016/17
reduction in greenhouse gas emissions since 2009/10
63%
Over
5,406
11
Our certifications

12
Working towards our strategic goals
Our strategic goals are very important to us, and measuring our success against achieving them provides a yardstick for our overall success. We’ve made significant progress against all of our strategic goals over the past few years.
We will improve service and deliver great results
for customers
We will collaborate to create £1 billion for
patients
We will reduce our unit costs by 50%
The worldwide consumer sector average Net Promoter Score (NPS) is +45. We want to reach that goal by 2020 and by the end of 2016/17
had achieved +23.
We’re over halfway towards our goal of creating £1 billion of recurring savings to return
to patient care by 2018.
By making efficiency savings and by absorbing growth and inflation costs, we’ve reduced our unit costs by 25.8% so far against our 2013/14 baseline
year.
-45
-40
-30
-20
-10
0
+10
+20
+30
+40
+45
£0
£100 million
£200 million
£300 million
£400 million
£500 million
£600 million
£700 million
£800 million
£900 million
£1 billion
0%
5%
10%
15%
20%
25%
30%
35%
40%
45%
50%
+23 £581m 25.8%

13
Our programmes of work
The current contract with DHL for the supply and distribution of hospital capital, clinical and consumables products will end in September 2018. Our Supplier Management team has been working with the DH to support the implementation of a new service model. We’ve also been working closely with NHS Improvement to drive down the cost of everyday hospital consumables. The work has involved the retendering of frameworks to concentrate demand through fewer suppliers to achieve lower prices.
Supply Chain transformation
The NHSBSA has now delivered nearly £600 million of recurring savings to the wider NHS. The Pacific programme’s work on European Economic Area (EEA) healthcare charging process redesign, prescription exemption checking and dental performance management has developed throughout this year and is delivering these savings alongside further gains from NHS Supply Chain. We continue to work closely with partner organisations such as DH, NHS England and NHS Right Care to identify new ways of saving money. Our work is currently concentrating on themes such as prescribing spend variation, medicines optimisation and review of the national drug tariff. We’ve also increased awareness of Pacific and what we are able to offer, with particular focus on increasing engagement with Clinical Commissioning Groups and Sustainability and Transformation Plans.
Our Pacific programme

14
Following the success of our Prescription Exemption Checking Service, our loss recovery work was expanded this year to include claims for free dental treatment. The Dental Eligibility Checking Service (DECS) determines whether patients who have claimed exemption from paying dental charges were eligible for free treatment. The service went live in June 2016 and since then over 190,000 penalty charge notices have been issued to patients who should have paid for their treatment. As a result, over £8 million in unpaid dental charges has been recovered which can now be returned to NHS services.
Loss recovery services
Our Pensions reprocurement programme is continuing work towards reshaping and modernising the service operating model so that we can continue to pay NHS pensioners when the current contractual arrangements come to an end. We’re also in the process of digitising the service with a new online portal that will enable NHS Pension Scheme members and employers to manage personal information and records online, transforming the service and giving increased ownership and understanding of the NHS Pension to our customers. The initial alpha stage of development, which passed Government Digital Service (GDS) assessment this year, concentrates on giving customers the ability to view and check their employment record and change their personal details.
NHS Pensions reprocurement
15
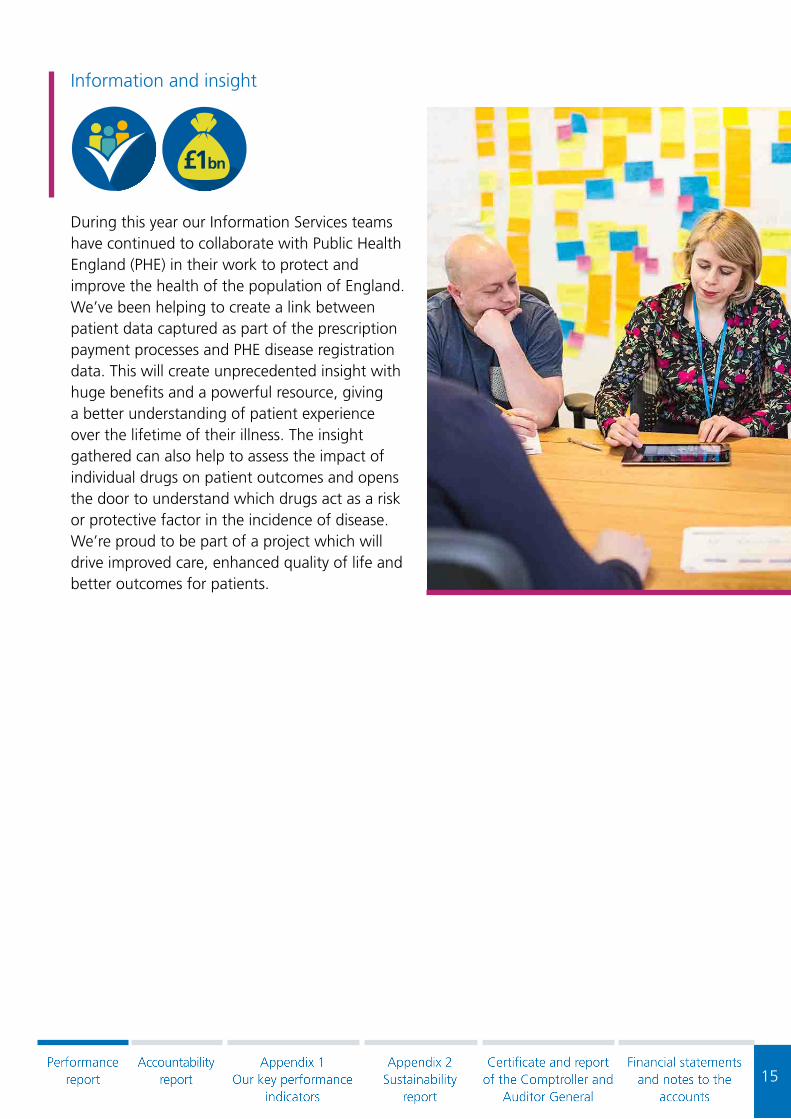
During this year our Information Services teams have continued to collaborate with Public Health England (PHE) in their work to protect and improve the health of the population of England. We’ve been helping to create a link between patient data captured as part of the prescription payment processes and PHE disease registration data. This will create unprecedented insight with huge benefits and a powerful resource, giving a better understanding of patient experience over the lifetime of their illness. The insight gathered can also help to assess the impact of individual drugs on patient outcomes and opens the door to understand which drugs act as a risk or protective factor in the incidence of disease. We’re proud to be part of a project which will drive improved care, enhanced quality of life and better outcomes for patients.
Information and insight

16
We’ve made further progress this year in digitising our services. Maternity exemption has reached the private beta stage this year, where a limited number of expectant mothers are now using the service, along with their midwives, to ensure they can receive the help with their health costs that they’re entitled to. Other projects are similarly progressing quickly, such as Pensions digitisation and Pharmacy digital submissions. The work we’re doing will make a tangible difference to our customers as these services will be designed around their needs. The new solutions will also help us to deliver even more accurate data while making each of the processes simpler, clearer and faster.
Digitising our services
By doing work for other NHS organisations and bringing in funds, it helps us to reduce our unit costs – one of our strategic goals. This year we started to focus more than ever on our growth agenda and we’re becoming more proactive at growing our business in areas we’re good at and have a proven track record in. HR services and payroll, scanning, exemption checking services and provider management services are all areas where growth is possible and we’ve been actively taking our services out to potential customers, showing them how we can help them to save their own money and deliver ‘best in class’ services, making us the delivery partner of choice for the NHS.
Growing our business

17
This year we introduced an e-recruitment system for our HR Shared Services clients and launched an e-learning service to include a branded learning management system for NHS Improvement. We handled recruitment campaigns for our clients throughout the year, recruiting to over 5,400 posts across the NHS. We were also delighted to welcome Monitor and King’s IFM as new HR Shared Services clients this year.
HR Shared Services
Document scanning is a relatively new service for the NHSBSA, starting with a pilot project to scan North East Ambulance Service personnel records in October 2015. The fleet of scanning machines has since grown from two machines to nine, with another twelve scanners due to be installed in June 2017. This year the service was also accepted onto the NHS London Procurement Partnership (LPP) framework, which is an excellent achievement and reward for the many months of hard work the team put in. This year we scanned over 4 million documents on behalf of our clients and hope to grow this even further next year.
Scanning services

18
1.2.1 How we measure performance
We agree our performance measures with our sponsors and clients. Our operational KPIs and performance during 2016/17 are shown in Appendix 1.
Our Leadership Team and Board monitor and review our performance at Board meetings through an integrated balanced scorecard approach. This summarises:
• performance against the identified KPIs and strategic goals
• the current financial position
• people related issues
• customer satisfaction and complaints
• client engagement
• progress against key change projects.
The following sections give more details on our performance in key areas in 2016/17.
1.2.2 Financial review
Background
The financial statements contained within this report have been prepared in accordance with the Direction given by the Secretary of State for Health under the NHS Act 2006 and in a format instructed by the DH with the approval of HM Treasury.
Our accounts for 2016/17 have been prepared in accordance with DH Group Accounting Manual 2016/17 (GAM), and comply with HM Treasury’s Government Financial Reporting Manual 2016/17 (FReM). The accounting policies contained in the GAM follow International Financial Reporting Standards to the extent that they are meaningful and appropriate to the NHS, as determined by HM Treasury, which is advised by the Financial Reporting Advisory Board. They comprise a Statement of Financial Position, Statement of Comprehensive Net Expenditure, Statement of Cash Flows and Statement of Changes in Taxpayers Equity, all with related notes.
The accounts are based on three distinct segments. The first of these relates to bursary payments we make on behalf of the DH for social work students, the second to our operating expenditure (which represents our running costs) and the third segment relates to NHS Supply Chain trading.
Financial performance 2016/17
As a Special Health Authority we receive funding from the DH to deliver a range of essential services outlined in our Direction Order.
In 2016/17 the NHSBSA was set a range of financial and operational service delivery targets. In financial terms we are able to report that we successfully achieved all funding targets as outlined in Table 1.
1.2 Performance analysis

19
Table 1: Financial target performance 2016/17
Funding stream Limit £m Actual £m Achieved
Revenue DEL (revenue departmental spending limit, including external developments)
104.6 103.4
Capital charges (ring-fenced revenue departmental expenditure limit)
17.2 16.0
Capital expenditure limit 18.1 14.1
We are required to report our performance against the Better Payments Practice Code, which requires non NHS trade creditors to be paid within 30 days or agreed terms. Our performance against this target for 2016/17 is detailed in Table 2 below.
NHS Supply Chain* is entitled to agree extended payment terms with suppliers as defined in the
Master Services Agreement. Supply Chain paid 80.3% of invoices by number and 74.9% by value within these payment terms. The Table shows NHS Supply Chain’s performance with reference to the 30 day target in the Better Payments Practice Code for comparison purposes only, as this target does not apply to them.
Table 2: Better Payments Practice Code performance 2016/17
NHSBSA (excluding NHS Supply Chain)
NHS Supply Chain only
NumberValue
£mNumber
Value £m
Total non-NHS trade invoices paid 11,009 96.1 2,129,078 1,586.26
Total non-NHS trade invoices paid within target 10,349 90.3 1,273,500 954.51
Percentage of non-NHS trade invoices paid within target 94.0% 94.6% 59.8%* 60.2%*
Percentage of non-NHS trade invoices paid within Master Services Agreement
80.3% 74.9%
Reducing our costs
In cash terms, our gross annual operating (running) costs are around £20 million lower in 2016/17 than they were in 2005/06.
In real terms, adjusting for inflation and volume transaction growth, our gross operating costs have reduced by £94 million compared to 2005/06, which is a reduction of 45%.
These savings have been delivered by transforming the management, infrastructure and business processes within the organisation, and rationalising our estate to make it the most cost effective in the ALB sector.

20
Future financial targets – the challenge
In response to the HM Treasury Spending Review (SR) 2015 the NHSBSA submitted a financial plan to the DH that identified funding reduction opportunities totalling £48 million over the period 2016/17 to 2019/20. The DH endorsed our plans and agreed provisional revenue funding allocations up to 2019/20.
We have successfully delivered the targets for year 1 of our financial plan (2016/17).
Our savings plans for 2017/18 to 2019/20 are underpinned by some key assumptions:
• the costs associated with the administration of NHS Pensions will be funded by way of a levy on the NHS Pension Scheme from 2017/18 (circa £25 million p.a.)
• a recognition that our digitisation and sourcing plans will be the key driver in reducing our real terms unit costs by 50%, and that savings from this programme of activity will come on stream in years 3 and 4 of the SR period (2018/19 and 2019/20)
• that use of the Electronic Prescription Service (EPS) will increase in line with projections made by NHS Digital, which will enable us to reduce the operating cost of NHS Prescription Services.
Our provisional revenue funding allocations for 2017/18 to 2019/20 are summarised in Table 3 below:
2016/17£m (actual)
Table 3: NHSBSA Recurring Revenue Funding Requirements to 2019/20
2017/18£m
2018/19£m
2019/20£m
100.2Revenue DEL (after savings and excluding external developments)
79.42 78.52 67.46
The Revenue Departmental Expenditure Limit (DEL) for 2017/18 represents a reduction of 21% in our revenue funding. In addition to funding the administration costs of NHS Pensions from a levy on the NHS Pension Scheme (circa £25 million), we are planning to deliver efficiency savings of circa £6.5 million in 2017/18.
To facilitate the delivery of this level of savings, we used a £3.2 million transition fund to support a range of restructuring exercises to reduce headcount and secure a lower cost base for 2017/18 and beyond.
The figures in Table 3 include NHS Protect. The functions of this service will transfer to a new DH ALB during 2017/18 and the top-slice to our provisional revenue funding allocation has been agreed with the DH.

21
Pension costs for current staff
The treatment of pension liabilities and relevant pension scheme details are set out in the accounting policies note 3.5 to the financial statements and in the Remuneration Report.
Hosted services
We provide a range of hosted financial, payroll and HR services to other NHS organisations and DH teams. The costs that we incur in providing these services (primarily staff costs) have been included within our operating expenditure, as has the total income contributions received from these organisations to cover costs. For 2016/17 the income received from hosted and managed services was £2.2 million.
The income and expenditure of the organisations to which we provide hosted services, although disbursed by us, is not included in our income and expenditure accounts and is charged to the relevant organisation’s accounts.
Auditor
The Comptroller and Auditor General is appointed by statute to audit the NHSBSA. The audit fee for the year ended 31 March 2017 of £0.130 million is for the audit of these accounts. An additional notional fee of £0.095 million relates to the audit of the NHS Pension Scheme accounts.
Updates following the reporting period
The events to report after the reporting period include the planned transfer of NHS Protect functions to a new DH ALB during 2017/18. It is proposed that this will be known as the NHS Counter Fraud Authority (NHSCFA). Planning work is underway pending due Parliamentary process through a statutory instrument.
There have been two major incidents relating to our ICT services post 31 March 2017:
Cyber-attack: A cyber-attack in mid-May 2017 affected a significant number of NHS organisations. The NHSBSA had deployed the security patch as recommended by NHS Digital to both of its key networks and as a precautionary measure took down its external facing systems over the affected weekend. No systems or services were impacted by the attack.
Power outage at data centre: The NHSBSA’s third party ICT supplier informed us of a major power outage at their main data centre in late May 2017. This caused the majority of our main systems and one of our networks to be unavailable for a two-day period, with disruption to systems not being fully resolved for a further week. This had a significant impact on service availability for our customers but did not result in any payments being delayed. A full root cause analysis is being undertaken to ensure business continuity risk in the event of a similar issue can be improved.

22
1.2.3 Good Business – Corporate Responsibility
Background
Corporate responsibility (CR) is about ensuring that we make a positive impact on society by delivering our services. It’s about people, communities and our environment. It’s not an afterthought – it’s embedded in our business strategy. Put simply, it’s just about doing good business.
Our strategic goals (page 9) have been developed to ensure we can continue to meet our purpose and address the threats and opportunities identified longer term. We also recognise that
some areas require specific focus (Figure 4). These areas are identified through our annual materiality assessment and stakeholder engagement approach. Our Committee and Staff Network structure has matured during 2016/17, and now ensures a cross-business strategic approach to the agenda. Full details are available in our Good Business – Corporate Responsibility Strategy, which is available on our website at: www.nhsbsa.nhs.uk/what-we-do/corporate-responsibility. Our approach ensures we address issues specifically related to our business, but also addresses how we can add value to wider society.
Figure 4: Specific corporate responsibility strategies ‘Good Business’
– our Corporate Responsibility
strategy
Health and safety strategy
and action plan
Environment and resource
efficiency strategy and action plan
Wellbeing strategy and action plan
Community investment
strategy and action plan
Diversity and inclusion strategy and action plan
Each area has its own detailed annual report available on our website – at www.nhsbsa.nhs.uk/what-we-do/corporate-responsibility. The following gives a high level overview of our performance during 2016/17.

23
Health and safety – During 2016/17 the NHSBSA had three RIDDOR reportable accidents / dangerous occurrences. This number of reportable events is very low for a business of our type and size, when compared to published Health and Safety Executive figures. We believe that this is a result of our proactive approach to health and safety, ensuring all of our people are involved, supported and understand their role in ensuring we look after ourselves and those around us.
We have delivered all of the actions set out in our 2016/17 Action Plan. This has included ongoing review and update of our policies and processes. Our Safety, Health and Environment team has
worked closely with our Property and Facilities Management team to review and update their operational management system. The teams also worked together on the procurement and transition into our new hard and soft facilities management contracts with new suppliers.
We have created user friendly areas of our intranet site for our people to access key documents and guidance such as risk assessments and COSHH assessments for each of our sites. We’ve also continued to review and refresh our approach to training and awareness, creating bespoke e-learning modules in areas such as Display Screen Equipment (DSE) and Manager’s Responsibilities.
Our intranet health and safety pages have been made more user friendly.

24
Environment (including HM Treasury Sustainability Report) – Each year the NHSBSA sets its own environmental targets and an action plan aligned to its key impacts and the Greening Government Commitments (GGC). A full data set can be seen in Appendix 2 – Sustainability Report. A summary of our progress against our targets is shown in Table 4 below.
Table 4: Environment and resource efficiency targets (Note: Targets - By the end of 2019/20, on 2009/10 baseline)
Target2016/17
performanceCommentary*
70% reduction in greenhouse gas emissions
63%
We’ve reduced electricity use through improvements to our building management systems and further reduced our business travel.
35% reduction in water consumption
30%Close monitoring of water use in our buildings has enabled us to quickly identify issues and address them appropriately.
65% reduction in waste generated
28%A change of scope in waste data reporting has impacted on our original waste reduction target.
Less than 10% of waste to landfill
6%
Including prescription waste in our waste data, as well as the improved waste service contract at our Fleetwood office, has reduced the proportion of waste being sent to landfill.
50% reduction in office paper use
40%
A one-off exercise requiring a bulk purchase of paper impacted this target during 2016/17. The overall trend in paper use since 2009/10 has continued to decrease.
*Further details can be found in Appendix 2 - Sustainability report
During 2016/17 we have continued to maintain our externally accredited ISO 14001 Environmental Management System and Carbon Trust Standard.
25
Sustainable procurement
At the start of 2016/17 we reassessed the NHSBSA’s approach to sustainable procurement using the government’s Flexible Framework benchmarking tool. The results of this informed our 2016/17 sustainable procurement action plan – this is integrated as part of the NHSBSA Environment and Resource Efficiency Strategy and Action Plan.
During the year we have launched our updated Sustainable Procurement Policy, bringing together for the first time our approach to procurement in relation to the whole CR agenda. The launch was supported by training sessions across the business, focusing on our strategic sourcing and portfolio management teams, and designated sustainable procurement leads.
Our approach has ensured all strategic sourcing and procurement activity is fully assessed, and requirements are embedded into contracts. As a minimum, Government Buying Standards (GBS) are embedded in relevant contracts, with further requirements being assessed around broader environmental, social and economic value. Examples of positive outcomes are included in the Corporate Responsibility Annual Report, with the most significant area being the re-procurement of the NHSBSA’s facilities management services. This included sustainability requirements around food and catering services as well as property and maintenance requirements.
We have continued our work with NHS Supply Chain. Details of annual performance in this area can be viewed within the NHS Supply Chain Annual Sustainability Report at www.supplychain.nhs.uk/about-us/sustainability/
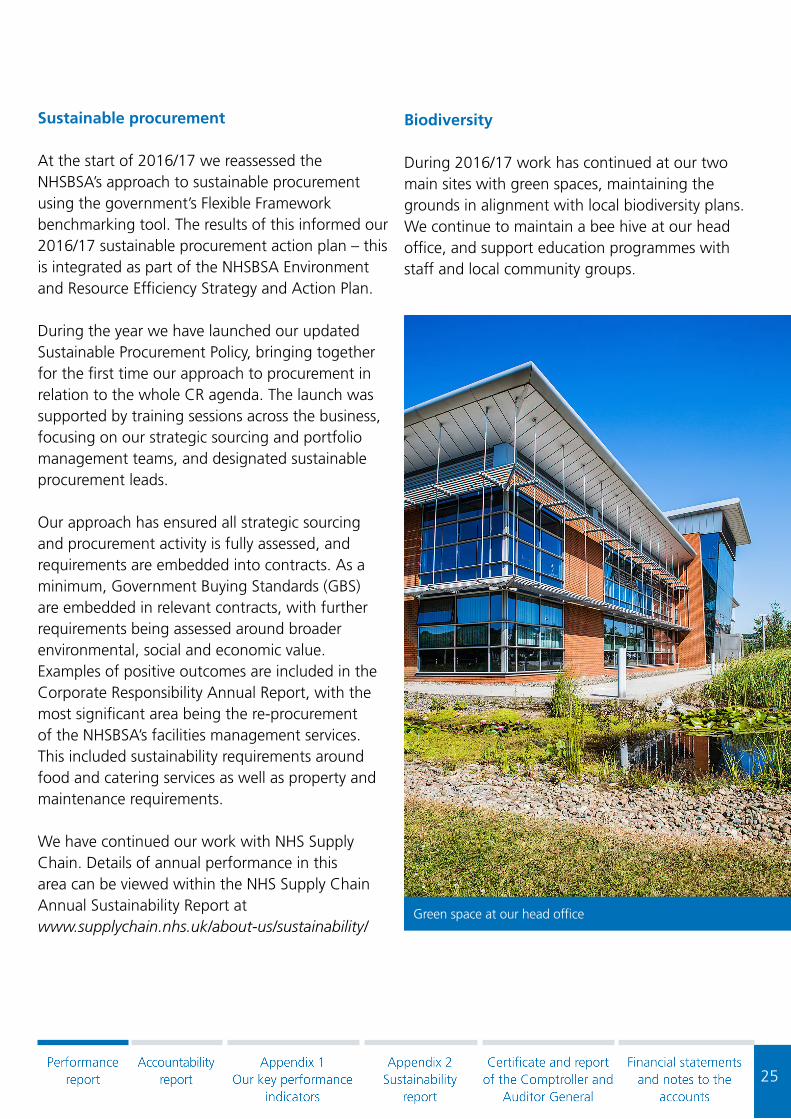
Biodiversity
During 2016/17 work has continued at our two main sites with green spaces, maintaining the grounds in alignment with local biodiversity plans. We continue to maintain a bee hive at our head office, and support education programmes with staff and local community groups.
Green space at our head office

26
Community investment
The NHSBSA offers all staff two days of paid volunteering leave per year. This year we have continued to help and encourage teams and individuals to engage in volunteering activity and make the link to personal development needs and opportunities. We’ve also launched our apprenticeship scheme, with our first apprentices in our finance department and customer contact centre. Plans are in place to extend this scheme during 2017/18
into areas including HR, Property and Facilities Management and Project Management. We’ve continued to encourage joint working between our Community, Environment and Wellbeing (CEW) Network and our Diversity and Inclusion Network, collaborating on events and initiatives, and we’ve also continued to maintain our payroll giving schemes.
Launch of the NHSBSA Apprenticeship Scheme
Wellbeing
We have continued to follow the criteria set out by the Better Health at Work Awards, and achieved the Continuing Excellence Level Award in recognition of the support, campaigns and guidance provided to staff nationally. Our Wakefield office was also the first of our offices to achieve their local award - Wakefield Workplace Health and Wellbeing Charter Mark.
We have continued to champion mental health, maintaining support services and information for our people and their families. We have maintained our domestic abuse champion network, and continued to ensure health and fitness opportunities are made available
across our sites, such as fitness classes, health checks, yoga sessions and a timetable of health awareness campaigns.
Wakefield team accepting their Health and Wellbeing Charter Mark

27
Diversity and inclusion
We successfully completed our previous four year strategy, so we’ve now launched our 2016-19 Diversity and Inclusion Strategy. Our governance structure remains in place to ensure its delivery, made up of our Diversity and Inclusion Committee, supported by the Staff Network.
During 2016/17, the network delivered a programme of awareness raising campaigns and events. Key focus areas this year included; LGBT (Lesbian, Gay, Bisexual and Trans) History Month, Chinese New Year, Learning Disabilities Week, Dyslexia Awareness Week, Equal Pay Day, Anti-Bullying Week, International Women’s Day and World Autism Awareness Day. Many religious celebrations were also covered, including Ramadan, Eid, Diwali and various winter festivals. The network also worked in partnership with the CEW Network to deliver various campaigns including Dementia Awareness Week, Men’s Health Week, World Mental Health Day, World Sight Day, 16 Days of Action Against Domestic Violence, and World AIDS Day.
We have again moved up Stonewall’s Workplace Equality Index by 28 places, to 124th out of the 439 participating organisations, continuing our significant progress (2017 – 124th, 2016 – 152nd, 2015 – 194th, 2014 – 310th).
Other areas of activity have included participation in Newcastle Pride and Blackpool Pride; hosting work placements as part of Project Choice, an internship programme which equips young people with learning disabilities, difficulties, autism and/or physical disabilities with the social and work-based skills needed to enable them to obtain
employment; working with the Autism Alliance on the Connect to Autism project – aiming to ensure our services are fully accessible to customers with autism, and our staff are aware of how best to support and communicate with people with autism; continuing our work with the Dementia Action Alliance on their Dementia Friends programme; supporting Newcastle College’s Learning Development Retail Scheme, which provides young people with learning disabilities, difficulties, autism and/or physical disabilities with retail experience and customer service skills, and becoming accredited at Level 2 – Disability Confident Employer, as part of the Disability Confident scheme.
Alistair McDonaldChief ExecutiveNHS Business Services Authority26 June 2017
Newcastle Pride 2016

28
2.Accountability report
The accountability report summarises our corporate governance arrangements and contributes to our accountability to Parliament.

29
2.1 Corporate governance report
2.1.1 Directors’ report
Composition of Board, directorships and significant interests - A list of executive and non-executive directors and a declaration of their interests is shown in Section 2.1.3 Annual Governance Statement Table 5. No company directorships or significant interests were held by the Board members which may conflict with their management responsibilities.
Personal data related incidents - A full summary of personal data related incidents is included in Section 2.1.3 Annual Governance Statement Table 8.
Consulting and providing information - We communicate with our people regularly, providing them with information and news through our weekly internal newsletter, The Loop. Our corporate intranet, The Hub, continues to develop and improve and is a central information portal for all of our colleagues. It features employee profiles and has search facilities and discussion areas, as well as the news stories featured in The Loop. Our internal news includes information and updates from all of our service areas, functions and locations, updates from Board meetings, latest business news and articles about what our colleagues are doing both inside and outside work. We’ve developed other channels of internal communication, such as welcome screen messages that are displayed to all of our colleagues when they start their PC.
Our organisation’s strategy is rolled out through organisation-wide communications and discussed team-by-team. Our strategic goals and organisational values are reflected in our individual colleagues’ key objectives as part of their ORO (Ongoing Review and Objectives) performance appraisal process. This process includes regular formal review meetings and more informal one-to-one meetings taking place throughout the year.
Consultation is undertaken using a variety of methods including team meetings, subject specific workshops, online forums, etc. Formal consultation with trade unions is undertaken at the National Joint Committee when broad matters of common interest are negotiated and discussed. Other committees and groups also meet to discuss specific issues, such as health and safety, diversity and inclusion, and community, environment and wellbeing.
We measure the engagement, motivation and satisfaction levels of our people through our annual staff survey. The 2016/17 survey shows that the overall engagement score has remained steady at 81%. This is very encouraging, particularly as the organisation is going through extensive change and continues to operate in a financially challenging environment.

30
The Principal Accounting Officer for the DH has appointed the Chief Executive of the NHSBSA as the Accounting Officer. As Chief Executive and Accounting Officer, I have responsibility for maintaining a sound system of internal control that supports the achievement of the organisation’s policies, aims and objectives. I also have responsibility for safeguarding the public funds and the organisation’s assets for which I am personally responsible, in accordance with the responsibilities set out in HM Treasury’s Managing Public Money and as assigned to me in the Accounting Officer Memorandum.
Under the National Health Service Act 2006 and directions made there under by the Secretary of State with the approval of Treasury, we are required to prepare a statement of accounts for each financial year in the form, and on the basis, determined by the Secretary of State, with the approval of Treasury. The accounts are prepared on an accruals basis and must give a true and fair view of the state of affairs of the NHSBSA and of its net operating costs, changes in taxpayers’ equity and cash flows for the financial year. As Accounting Officer, I have responsibility for ensuring the preparation of our accounts and transmission to the Comptroller and Auditor General.
In preparing the accounts, I am required to comply with the requirements of the Government Financial Reporting Manual and in particular to:
• observe the accounts direction issued by the Secretary of State, including the relevant accounting and disclosure requirements, and applied suitable accounting policies on a consistent basis
• make judgements and estimates on a reasonable basis
• state whether applicable accounting standards, as set out in the Government Financial Reporting Manual, have been followed and disclosed and explained any material departures in the financial statements
• prepare the financial statements on a going concern basis, unless inappropriate to presume that the NHSBSA will continue in operation.
My relevant responsibilities as Accounting Officer, including responsibility for the propriety and regularity of the public funds and assets vested in the NHSBSA, and for the keeping of proper records, are set out in Managing Public Money issued by the Treasury.
As Accounting Officer I can confirm that:
• as far as I am aware, there is no relevant audit information of which the NHSBSA’s auditors are unaware
• I have taken all the steps I ought to have taken to make myself aware of any relevant audit information and to establish that the NHSBSA’s auditors are aware of that information
• the annual report and accounts as a whole is fair, balanced and understandable
• I take personal responsibility for the annual report and accounts and the judgements required for determining that it is fair, balanced and understandable.
2.1.2 Statement of Accounting Officer’s responsibilities

31
Introduction
The Accounting Officer for the NHSBSA is required to provide assurances about the stewardship of the organisation. These assurances are provided in this Governance Statement, in line with HM Treasury guidance.
The Accounting Officer for the NHSBSA is Alistair McDonald, Chief Executive.
Scope of responsibilities
The NHSBSA’s Board is accountable for internal control, ensuring that its business is conducted in accordance with the law and proper standards. It also ensures that public money is safeguarded, properly accounted for, and used economically, efficiently and effectively in accordance with HM Treasury’s Managing Public Money. In discharging this responsibility the Board is also responsible for putting in place proper arrangements for the governance of its affairs and facilitating the exercise of its functions. This includes ensuring a sound system of internal control is maintained throughout the year which supports the achievement of the NHSBSA’s policies, aims and objectives and arrangements are in place for the management of risk.
As Accounting Officer for the NHSBSA, the Chief Executive has overall responsibility for ensuring that contracted administrators for any outsourced activity manage risks effectively, and for reviewing the effectiveness of the administrator’s systems of internal control.
The purpose of the Governance Framework
The NHSBSA operates an integrated governance framework. This framework comprises the systems and processes by which the NHSBSA leads, directs and controls its functions and accounts to, and engages with, the DH and the wider NHS community. The NHSBSA takes its responsibilities seriously, striving to be a good corporate citizen. In aiming to embed this, the corporate governance framework is underpinned by the culture, values and behaviours adopted across the NHSBSA.
A significant element of the framework is the system of internal control, which is designed to manage risk to a reasonable level. It cannot eliminate all risks of failure to achieve policies, aims and objectives and can therefore only provide reasonable and not absolute assurance of effectiveness. The system of internal control is based on an ongoing process designed to:
• identify and prioritise the risks to achieving our policies, aims and objectives
• evaluate the likelihood of those risks being realised, the impact should they be realised, and to manage them efficiently, effectively and economically.
The governance framework and system of internal control have been in place for the year ended 31 March 2017 and up to the date of approval of the annual report and accounts.
2.1.3 Annual Governance Statement

32
NHSBSA Governance Framework
The overarching Corporate Governance Framework has been approved and adopted by the Board and is subject to annual review. The framework incorporates the following elements:
• Statutory Instruments and Directions which describe and govern the NHSBSA’s core operations, processes and structure.
• Code of Conduct and Accountability for NHS Boards, instilling a culture of accountability, probity and openness underpinning the work of the NHS.
• Matters determined by the Board which ensure that the NHSBSA has appropriate decision making processes in place, including:
- Standing Orders - Standing Financial Instructions - Scheme of Delegation.
• Other management information which supports effective governance and operation, i.e. corporate policies and procedures.
The Corporate Secretary is responsible for ensuring that all decisions made are legal and comply with the NHSBSA Corporate Governance Framework. The NHSBSA complies with the HM Treasury Corporate Governance Code where it applies to us.
NHSBSA Board
The Board is responsible for the strategic direction and integrated governance of the NHSBSA, including the stewardship of its finances. In fulfilling these responsibilities the Board reserves certain decision making powers, including decisions on strategy and budgets, but other key duties have been delegated to the NHSBSA’s two standing committees:
• Audit and Risk Management Committee.
• Remuneration and Nominations Committee.
The roles and responsibilities of these standing committees are described more fully below. All powers of the NHSBSA that have not been retained as reserved for the Board or otherwise delegated to a standing committee are exercised on behalf of the Board by the Chief Executive, unless otherwise specified in the NHSBSA’s Standing Financial Instructions or Scheme of Delegation. The Chair is primarily responsible for leading the Board and ensuring its effectiveness with the Chief Executive responsible for day-to-day management. The documents which describe how the NHSBSA operates are included in the Corporate Governance Framework. This framework includes the Standing Financial Instructions and Scheme of Delegation which details which decisions the Board has reserved for itself and those which it has delegated and to whom.

33
Board membership and responsibilities
Membership of the Board is currently made up of a non-executive Chair, four non-executive directors, Chief Executive and three executive directors, one of which is a finance director. The key roles and responsibilities of the Board are:
• to set and oversee the strategic direction of the NHSBSA
• continued appraisal of the financial and operational performance of the NHSBSA
• to discharge their duties of regulation and control
• to receive reports and updates from the Standing Committees
• to adopt the Annual Report and Accounts.
The Board has met nine times up to the end of March 2017 and is responsible for approving the business plan and budget in advance of the financial year. Subsequent reporting is based on an exception principle ensuring that the Board focuses on key issues and utilises its time effectively.
The Board receives regular updates from its standing committees on the business covered, risks identified and actions taken. These updates are delivered by the non-executive Chair of the respective Committee.
At each meeting, the Board receives an integrated balanced scorecard which summarises:
• performance against the identified key performance indicators and strategic goals
• the current financial position
• people related issues
• customer satisfaction and complaints
• client engagement
• progress against key change projects
• corporate risks and issues.
The data presented to the Board is produced and quality assured by the NHSBSA Information Services Team adopting the six dimensions of data quality approach.
The NHSBSA’s Senior DH Sponsor is also invited to Board meetings to ensure members of the Board, in particular non-executive directors, are able to get an understanding of the key stakeholders’ views.
Board members must declare their interests to the Chair and Corporate Secretary in any matter relating to the NHSBSA’s business at the time that they become aware of a potential conflict. Members will normally be excluded from the discussion after declaring an interest related to that issue. The minutes of the meeting will record the member’s declaration.
Table 5 shows the number of meetings attended by Board members during the financial year and also highlights their declared business interests.

34
Table 5: Board members
Board memberMeetings attended
Register of interests
Non-executive Chair:Silla Maizey
9 of 9
Non-executive director, Network Rail
Director and Company Secretary, Saffron Solutions Ltd
Non-executive director, John Menzies plc.
Non-executive director, Crown Commercial Service
Non-executive, Chair of Remuneration and Nominations Committee, Senior Independent Director:Mark Ellerby
9 of 9
Independent industry advisor, Advent International
Non-executive director, Leeds Teaching Hospitals NHS Trust
Non-executive director Trustee, Dementia Forward
Non-executive Chair of Audit and Risk Management Committee:Andrew Flanagan
8 of 9
Commissioner, Civil Service Commission
Member of Advisory Board, NHS NELCSU
Non-executive director, Criminal Injuries Compensation Authority
Chair, Scottish Police Authority
Non-executive director, CIPFA Business Services Ltd
Non-executive:Malcolm Green
6 of 9 Non-executive director, Thrive Homes
Non-executive:Debra Bailey
6 of 9Chief Information Officer, Nationwide Building Society

35
Chief Executive (retired 7 May 2017):Nick Scholte
9 of 9 Nothing declared
Chief Executive (from 8 May 2017), Director of Service Delivery (until 7 May 2017):Alistair McDonald
9 of 9 Nothing declared
Director of Finance and Corporate Services:Patrick McGahon
8 of 9 Nothing declared
Director of Change and Commercial Delivery:Steven Pink
9 of 9 Nothing declared

36
NHSBSA Board review of effectiveness
The NHSBSA Board is required to consider its own effectiveness on a regular basis. In 2015/16, the Board engaged an independent and experienced assessor to undertake the review. The process involved a series of discussions and one-to-one interviews. This in-depth review is scheduled to take place every three years, with an online review being completed in other years. This year’s online review was completed during January 2017. Areas highlighted for consideration by the Board included training for members, particularly members of the Audit and Risk Management Committee. Also, improving communications between the executives and non-executives between meetings, and considering the frequency of meetings. The recommendations were accepted by the Board and actions are being taken forward.
During 2016/17, the Board continued to operate within its governance framework and codes of conduct. Furthermore, the NHSBSA has:
• achieved its financial targets
• consistently delivered against its agreed key performance indicators
• continued to operate its assurance process through the assurance map process
• maintained its robust performance reporting mechanism using a dashboard style approach
• maintained its risk management procedures using dashboard reporting giving an overview of the risk profile of the whole organisation yet focusing attention on relevant areas
• maintained an effective, risk-based internal audit programme, ensuring internal audit recommendations are addressed appropriately.
The Board’s two standing committees are described on pages 37-40.

37
Table 6: Audit and Risk Management Committee Meetings attended
Non-executive directors:
Andrew Flanagan (Chair of Committee) 7 of 7
Malcolm Green 7 of 7
Debra Bailey 3 of 6
Executive directors:
Patrick McGahon (Director of Finance and Corporate Services) 7 of 7
Non-executive directors (specific items/ meetings)
Silla Maizey (Chair of Board) 1 of 7
Executive directors (specific items/ meetings):
Nick Scholte (Chief Executive) 3 of 7
Alistair McDonald (Director of Service Delivery) 3 of 7
Steven Pink (Director of Change and Commercial Delivery) 2 of 7
Audit and Risk Management Committee
The Committee is chaired by a non-executive director and has met seven times during 2016/17. Membership of this Committee is made up of three non-executive directors including the Chair, one of whom is required to have recent and relevant financial experience. Andrew Flanagan provides this experience and also chairs the Committee.
One non-executive director post was vacant between April-June 2016, however the Committee remained quorate with at least two members present. Debra Bailey was appointed to this post on 1 June 2016.
There is also a requirement for regular attendance from the Director of Finance and Corporate Services and representatives from both internal and external audit. The Chief Executive and Accounting Officer is invited to attend at least one meeting during the year to discuss the assurance processes which support the production of the Annual Report and Accounts. Other staff are invited to attend meetings as appropriate (Table 6).

38
Our DH Senior Programme Manager, Nigel Zaman, has also attended all seven Committee meetings during 2016/17.
The Committee is responsible for providing the Board with an independent and objective view of the adequacy and effectiveness of the NHSBSA’s governance and assurance arrangements, including the governance framework, risk management, controls and related assurances. Updates are provided to the Board following each meeting and subsequent Board meetings receive copies of the confirmed minutes. An annual report is submitted to the Board following the completion of the Annual Accounts process which summarises the work undertaken by the Committee during the previous year. In addition, the Committee receives an annual review of the NHSBSA Risk Management Framework. This was most recently undertaken in June 2016 and concluded that the framework was effective and fit-for-purpose.
The Audit and Risk Management Committee’s key responsibilities are:
• monitoring financial governance and reviewing the draft financial statements
• reviewing the effectiveness of internal controls
• monitoring the effectiveness of risk management controls
• monitoring the effectiveness of fraud and security management
• seeking assurance regarding the control environment
• reviewing the effectiveness of internal audit arrangements.
These standing items are complimented by a series of risk-based presentations on ‘Areas of Focus’ providing an opportunity for members to seek more detailed assurance from senior leaders (see Assurance Arrangements).
Audit and Risk Management Committee review of effectiveness
The Committee reviewed its effectiveness during January 2017 using an online survey. The questions were the same as those used in 2016 for comparison purposes. Overall, the results were positive with areas highlighted for consideration around members’ training and skills required for the future.

39
Remuneration and Nominations Committee
The Remuneration and Nominations Committee (formerly the Remuneration and Terms of Service Committee) is a standing committee of the Board and comprises three non-executive directors, one of whom chairs the Committee. The Chief Executive and/or other executive directors attend these meetings on an ‘as required’ basis (Table 7).
Table 7: Remuneration and Nominations Committee Meetings attended
Non-executive directors:
Mark Ellerby (Chair of Committee) 5 of 5
Silla Maizey (Chair of Board) 5 of 5
Malcolm Green 5 of 5
Executive directors (specific meetings/ items):
Nick Scholte (Chief Executive) 5 of 5
The key responsibilities of the Remuneration and Nominations Committee are to:
• determine the terms of service, remuneration and other benefits of the executive team and any other relevant employees, in accordance with the NHS Executive and Senior Managers Pay Framework and other relevant guidance issued by DH
• monitor systems to evaluate the performance of relevant employees
• oversee contractual arrangements for relevant employees
• nominate candidates for appointment as officer members of the Board
• monitor succession planning arrangements
• support the process operated by the DH for the appointment (or proposed re-appointment) of the Chair or non-executive members of the Board.
The Chair of the Committee provides updates to the Board following each meeting and confirmed minutes are shared at subsequent Board meetings. The Committee also reviews and approves the Remuneration Report of the Annual Report to ensure its accuracy.

40
Remuneration and Nominations Committee review of effectiveness
The Committee reviewed its effectiveness during January 2017 using an online survey. The results demonstrated the effectiveness of the Committee in delivering its functions.
The full terms of reference for both of these Committees can be found in the NHSBSA’s Corporate Governance Framework which is published on the NHSBSA website.
NHSBSA sponsorship arrangements
The NHSBSA manages a complex range of business activities on behalf of the DH. Accountability arrangements with the Department comprise an overall Senior Departmental Sponsor, with individual sponsors providing policy direction for each core service stream.
A clear ongoing accountability framework is in operation, which includes formal reviews with Senior Sponsors. This is consolidated through a formal framework agreement between the NHSBSA and DH. Strategic, policy and operational issues are reviewed alongside the corporate risk register, assurance arrangements and the latest financial position. Additionally, regular scheduled meetings are held with the individual service sponsors.

41
Nick ScholteChief Executive1
Figure 5: NHSBSA Leadership Team (1retired 7 May 2017, 2not a member of the Board, 3Chief Executive from 8 May 2017)
• Internal Governance• Risk and Assurance• Business Planning
and Strategy Development• Learning and Organisation Development
• Finance• Property• Human Resources
incl. HR Services (External)
• Information Technology
• Contract Management
• Communications• NHS Protect
• NHS Pensions• NHS Help with
Health Costs• European Health
Insurance Card• Contact Centre
Services• NHS Dental
Services• Student Services• NHS Prescription
Services• Customer Insight• Information
Services
• Pacific• Change• Supplier
Management• Strategic
Sourcing
Mark DibbleCorporate Secretary2
Patrick McGahonDirector of Finance and
Corporate Services
Alistair McDonaldDirector of Service
Delivery3
Steven PinkDirector of Change and
Commercial Delivery
NHSBSA management
Other than those matters reserved for the Board, responsibility for the day-to-day management ofthe NHSBSA is delegated to the Chief Executive, who is the Accounting Officer. The Chief Executive is supported by a Leadership Team of executive directors responsible for the areas shown below (Figure 5).

42
Key governance systems
The NHSBSA has identified the following areas which support the overarching governance arrangements:
• Risk management
• Assurance
• Managing information.
The Audit and Risk Management Committee regularly reviews these areas to ensure that they remain robust and effective. This enables the committee to provide assurances to the Board that appropriate risk identification and management processes are taking place across the organisation.
Risk management
Risk appetite – Risk appetite can be defined as an organisation’s unique attitude towards risk taking, which in turn dictates the amount of risk that it considers acceptable. The NHSBSA’s aim is to ensure that its overall level of risk is balanced, sustainable and appropriate. The NHSBSA’s risk appetite dictates that all risks classified as extreme, within our control, are mitigated until the residual risk rating falls to high, moderate or low. All risks are mitigated to an acceptable level.
Process – The NHSBSA Risk Management Framework comprises:
• Risk management policy
• Risk management methodology
• Risk and issue register.
These are applied consistently across the NHSBSA, with risks and issues being escalated up the hierarchy as dictated by our policy. These tiers consist of:
• Services / Corporate Teams – Risks and issues are managed on an ongoing basis as part of business-as-usual, with registers owned and managed by the Head of Service.
• Project / Programme – Risks are reviewed and managed by Project Managers as part of the project governance process. Significant risks and issues are escalated to the Programme Manager and Portfolio Board and these are also reported to the Leadership Team on a monthly basis.
• Corporate – Each quarter the Leadership Team review the top-level Corporate Risk Register. This review is informed by collated versions of team and project risk registers, and a paper produced by the NHSBSA Risk Group. The Leadership Team is also free to identify further risks and issues at this meeting.
• Audit and Risk Management Committee – The Committee receives updates on the work undertaken in the area of risk and issue management. The Committee also receives a copy of the Corporate Risk Register, and ‘Areas of Focus’ presentations on specific risk / issue areas. This process enables the Committee to provide assurances to the Board that appropriate risk management processes are in place and risk mitigation is taking place.

43
Significant risks and issues
In a dynamic and complex business environment significant risks can always be encountered.
Significant risks and issues managed and closed in year
Guaranteed minimum pension – changes in HMRC reporting of GMP data and a transfer of responsibility for calculation work post-2016 created a resource risk for the NHSBSA.
Mitigation details: Operational preparation was completed. One inclusive funding risk was created on the corporate risk register.
Funding for major programmes – a lack of clarity around funding had led to delays for our major programmes.
Mitigation details: By working closely with our sponsors we agreed funding arrangements to enable us to progress our key strategic programmes.
Current risks / issues
FundingThe requirement from central government for ongoing cost reductions creates a risk that the NHSBSA is unable to maintain services and deliver required change projects. The ongoing delivery of our strategy, including service digitisation and growth, is a key mitigation, along with ongoing engagement with our sponsors.
Information securityAlthough the organisation has not suffered any major issues in this area, the volumes and sensitivity of data we hold means the Leadership Team and Board have purposefully continued to closely monitor the organisation’s approach to information and cyber security. Ongoing benchmarking against best practice standards and ongoing scrutiny by our Audit and Risk Management Committee ensures the risk is managed as threats continue to evolve on a day-by-day basis. Improvements are also being made through our IT and digitisation programmes.
Attraction and retention of specialist capabilityOur challenging strategic goals and the changing environment in which we are operating has created a risk around our ability to attract and also retain people with specific and in-demand skills. This could result in an inability to deliver our business objectives. Our HR and Learning and Organisation Development teams are taking forward a number of actions to address this risk, including implementation of a recruitment strategy, a talent-management framework, succession planning and the transfer of knowledge from short-term contractors to our teams.
Delivery of £1 billion savings target within timescale Although the NHSBSA’s Pacific programme remains on track to deliver improvements in patient experience and £1 billion overall, the timescale for this is at risk due to a number of political and economic changes. The team continues to engage with key stakeholders across the system to identify and deliver savings.

44
Payment to NHS PensionersWith current contractual arrangements to run the NHS Pensions service coming to an end, there is a risk of service disruption if the re-procurement and insourcing project is not delivered to its timetable. Currently, the project is on target, with an agreed approach with the DH.
NHS Supply Chain savings targetRevised contractual arrangements for NHS Supply Chain created a new £300 million savings target for the service. We are therefore ensuring that we monitor the risk that this is not delivered, particularly with ongoing discussions over the future of NHS Supply Chain.
Use of Electronic Prescription Service (EPS)If usage rates of EPS do not continue to increase, the NHSBSA will not be able to make the desired levels of financial savings in NHS Prescription Services. Also, as this is a third party system, a system failure or reduction in use would cause a major pressure on NHS Prescription Services. Although we cannot directly address this risk, we continue to support the broader health and care system with the roll-out and support of EPS.
IT infrastructure and systemsAs existing NHSBSA software and hardware is becoming unsupported and contracts and licences are expiring, a risk has arisen around applications becoming unusable or difficult to fix in the event of a failure. This may result in service delivery failures. This risk has remained throughout the year and continues to be addressed by our risk-based IT plan for end-of-life systems and our project to replace our current managed IT infrastructure contract.
Delivery of NHS Supply Chain ServicesWe are continuing to support the DH’s procurement transformation programme as the current contractual arrangements for the delivery of NHS Supply Chain are approaching an end. This includes development of a service continuity plan to ensure there is no disruption to service delivery for customers.

45
Assurance arrangements
The NHSBSA uses an assurance map approach, using the best practice three lines of defence model, to identify the sources of assurance in place over each of the key functions and services we deliver. The three lines of defence represent:
• first line: management control and reporting
• second line: functional oversight and governance systems
• third line: independent review and regulatory oversight.
This model provides the basis upon which the NHSBSA leadership can determine the focus of assurance effort, assess the outcome of existing assurance activity and determine its assurance appetite. The assurance map is fully integrated with the risk management process with areas of concern being reflected in the relevant business area risk register and escalated to the Corporate Risk Register, where required.
A schedule of two reviews of the overarching assurance map each year, by the Leadership Team and Audit and Risk Management Committee, has been implemented to ensure that the NHSBSA is accurately represented and that areas of concern are being addressed. This provides challenge to the business and oversight of the process in terms of the assurances highlighted.
The Audit and Risk Management Committee has continued a programme of ‘Areas of Focus’ exercises to assure itself on behalf of the Board regarding the robustness of controls. During 2016/17 exercises were carried out in the following areas:
• Organisational capability
• Contract management
• Property and facilities management
• IT infrastructure and sourcing
• NHS Pensions
• Information Security
The Committee has gained an increased awareness over the assurances in place for each of the areas reviewed.

46
Third party assurance
The NHSBSA provides services to the wider NHS including making dental, prescription and student bursary payments on behalf of Clinical Commissioning Groups, Area Teams and Welsh Audit Commission. To provide third party assurance over the controls in place for these payments the NHSBSA engage PricewaterhouseCoopers to undertake an audit exercise in each area. This results in the production of ISAE3402 reports on the control, design and tests of operating effectiveness of the controls in place during the financial year, all of which have an unqualified opinion for 2016/17
Managing information
During 2016/17 the NHSBSA has continued to improve its approach to handling information efficiently and securely. Each year, the NHSBSA undertakes a detailed self-assessment using the NHS-wide Information Governance Toolkit. Using this toolkit, the NHSBSA’s rating for 2016/17 was an overall ‘satisfactory’ rating.
The NHSBSA has not had any security incidents classified as level 2 serious untoward incidents by the DH. However, using the DH categorisation framework, there were fourteen incidents classed as minor to report for the year. These were not Level 2 or above, and so they are not required to be formally reported to the DH (Table 8).
Table 8: Information incidents
Category Nature of incident Total
ILoss of inadequately protected electronic equipment, devices or pa-per documents from secured NHS premises
0
IILoss of inadequately protected electronic equipment, devices or pa-per documents from outside secured NHS premises
0
IIIInsecure disposal of inadequately protected electronic equipment, devices or paper documents
0
IV Unauthorised disclosure 14
V Other 0
Total number of incidents 14
47
In the course of the NHSBSA’s business, information is held and used about members of the public and NHS colleagues. Some of this information is of a personal and sensitive nature and as a consequence stringent controls are in place to ensure the security of this information.
Issues relating to information governance within the NHSBSA are coordinated by the Information Governance and Security Group which is chaired by the Director of Service Delivery who holds the position of both Caldicott Guardian and Senior Information Risk Owner (SIRO). The remit of the Caldicott Guardian is to ensure that any person identifiable information is held and used properly. The remit of the SIRO is to take ownership of the NHSBSA’s information risk policy, act as advocate for information risk to the Board and provide written advice to the Accounting Officer on the content of the Annual Governance Statement with regard to information risk.
Data protection and freedom of information
As a Special Health Authority, the NHSBSA is subject to the requirements of the Data Protection Act (DPA) 1998 and the appropriate notifications have been filed with the Information Commissioner’s Office. This means that all subject access requests are responded to within the provisions of the Act, typically within 40 calendar days.
During 2016/17, we dealt with 291 DPA requests. All bar 21 were responded to within the required timeframe.
The NHSBSA is also subject to the requirements of the Freedom of Information Act (FOI) 2000. This means that all requests for information are responded to within the provisions of the Act, typically within 20 working days.
During 2016/17, we dealt with 505 FOI requests. All bar 11 were responded to within the required timeframe.
As a public sector information holder, the NHSBSA complies with the cost allocation and charging requirements set out in HM Treasury and Office of Public Sector Information guidance. The NHSBSA can confirm that for 2016/17 no charges were made for access to information under the Freedom of Information Act 2000, but that a £10 fee per request was charged for Subject Access Requests made under the provisions of the Data Protection Act 1998.
Whistleblowing
The NHSBSA has appropriate, effective whistleblowing arrangements in place (i.e. policy and procedure) which have been updated to take account of the recommendations from the recent Sir Robert Francis report. The overall effectiveness of these arrangements is reviewed by the Audit and Risk Management Committee on an annual basis. This includes having an identified non-executive director with specific accountability for these arrangements.
Health inequalities
The Health and Social Care Act 2012 created a legal responsibility for the Secretary of State for Health to have regard for the need to reduce health inequalities. As a Special Health Authority, the NHSBSA supports the Secretary of State in delivering these functions so far as our functions allow. We believe that our most significant contribution to reducing health inequalities can be delivered through our ability to provide accurate information and insight to our NHS commissioning colleagues.
48
Handling complaints
At the NHSBSA we pride ourselves on the level of service that we provide to our customers and other service users. We aim to resolve all complaints fairly and promptly in accordance with our defined policy.
During 2016/17 we have maintained our approach to handling complaints, learning lessons about our services, putting things right when things have gone wrong and apologising when we have let anyone down.
The total number of formal complaints resolved during 2016/17 was 607 of which 73 (12%) were found to be justified. This compares to a total of 337 in 2015/16 of which 60 (18%) were found to be justified.
We significantly increased the volume of exemption checks in-year for both dental treatment and prescriptions and handled a marginal increase in complaints from patients. The introduction of the new NHS Pension Scheme and migration onto the new Pensions administration platform in 2015 also caused some small processing delays which have continued on into this year. These have continued to affect the overall volume of complaints and we have continued to deal with each complaint appropriately and improve our services wherever possible. As processing times have improved, the volume of complaints has seen a corresponding decrease.
Sources of assurance
Audit and Risk Management Committee
One of the key sources of assurance provision for the NHSBSA’s Board is from the Audit and Risk Management Committee, whose key responsibilities are described in the Audit and Risk Management Committee section. The Committee meets these responsibilities by receiving regular reports on a range of audit and assurance topics. The following is a list of the key reports:
• Risk Management updates – setting out and assessing the major risks and issues that we face, aligned with key areas of focus set out in the Business Plan and Strategy. These reports detail the movements in risks and issues between reporting periods and identify emerging risks and issues, the actions which have been taken or are planned to mitigate them, estimated post-mitigation risk and the target date.
• Annual Risk Management report – outlining how our risk management arrangements have continued to operate effectively during the year and how they have been reviewed and strengthened.
• Assurance Map review – two reviews of the overarching NHSBSA Assurance Map each year.
• Areas of Focus presentations – focusing on high-risk areas, or other topics highlighted, for example, through internal audits, assurance maps, etc.
• Internal Audit progress report – regular progress reports on the work undertaken by Internal Audit against the agreed plan.

49
• External Audit reports – regular progress reports on the work undertaken by External Audit.
• Internal / External Audit recommendations tracker – updates on progress made across the NHSBSA implementing audit recommendations.
• Fraud / Local Security Management annual reports – reports detailing the work undertaken during the year mapped against the agreed work plans.
• Whistleblowing update report – updates on whistleblowing activity across the business each year.
• Third Party Assurance reports – the outcome of the third party assurance engagements undertaken by PricewaterhouseCoopers to review the control environment covering prescription, dental and student bursary payments. The outcome of these engagements is shared with clients, as appropriate, to provide third party assurance for the payments we make on their behalf.
Other sources of assurance
Supporting the role of the Board and the Audit and Risk Management Committee, the NHSBSA’s governance and control environment also includes the following elements:
• Risk Management Process – see Risk Management section.
• Enhanced Performance Management Framework – reviewed by the Leadership Team on a monthly basis and by the Board at each meeting. The framework provides a
balanced scorecard approach covering the key areas of performance.
• Information Governance and Security Group (IGSG) – all information risks are reviewed by the IGSG on a regular basis. The group is also responsible for ensuring that the NHSBSA complies with information governance and security best practice and performs a self-assessment against a nationally developed toolkit.
• Diversity and Inclusion Committee – controls are in place to ensure that all of our obligations under equality, diversity and human rights legislation are adhered to. The Diversity and Inclusion Committee, which is chaired by the executive director diversity and inclusion champion, monitors performance against our Diversity and Inclusion Strategy and achievement of our equality objectives.
• Statutory Function Discharge Review – a full review is undertaken at least annually to ensure correct arrangements are in place, and legally compliant. The process would identify any irregularities, and is in line with the recommendations of the Harris Review.
• NHS Pension Scheme – as an employer with staff entitled to membership of the NHS Pension Scheme, control measures are in place to ensure all employer obligations contained within the Scheme are in accordance with the Scheme rules, and that member Pension Scheme records are accurately updated in accordance with the timescales detailed in the Regulations.
• National Joint Health and Safety Committee – controls are in place to ensure that we comply with relevant health and safety law and good

50
practice. The National Joint Health and Safety Committee, which is chaired by the executive director safety, health and environment champion, monitors performance against our Health and Safety Strategy and Action Plan.
• Community, Environment and Wellbeing (CEW) Committee – our strategies and action plans in relation to community, environment and wellbeing are monitored by the CEW Committee, which is chaired by the executive director safety, health and environment champion. The NHSBSA must also deliver against the Greening Government Commitments, requiring regular performance updates provided to the DH, and subsequently central government.
Accounting Officer’s review of effectiveness
I was designated as Accounting Officer with effect from 8 May 2017. Nick Scholte was the Accounting Officer during 2016/17. I am satisfied that there was an appropriate handover between Accounting Officers, and, on the basis of evidence received from the executive directors, the non-executive chair of the Board and the non-executive director chairs of the sub-committees, particularly the Audit and Risk Management Committee, that I have the necessary level of assurance for the whole period covered by this Annual Governance Statement.
As Accounting Officer, I have responsibility for reviewing the effectiveness of the system of internal control. My review is informed in a number of ways. The Head of Internal Audit provides me with my annual opinion of the overall adequacy and effectiveness of the organisation’s risk management, control and governance processes.
The Head of Internal Audit’s opinion was that, based on the work completed to date, there is moderate assurance given to the Accounting Officer that the NHSBSA has had adequate and effective systems of control, governance and risk management in place for the reporting year 2016/17.
The Assurance Framework itself provides me with evidence that the effectiveness of controls that manage the risks to the NHSBSA achieving its principal objectives have been reviewed. My review is informed by:
• The work of the Audit and Risk Management Committee which informs the Board about the outcome of its activities through submission of its minutes and its annual report to the Board.
• The findings of both the NAO and the internal audit reviews. The Audit and Risk Management Committee oversees progress towards the implementation of all such recommendations.
• The work of the Fraud Specialists to prevent, deter, investigate and report fraud activity. The Audit and Risk Management Committee receives the annual work plan and annual report of the Fraud Specialists and provides updates to the Board as appropriate.
A plan to ensure continuous improvement of the assurance system is in place and theAudit and Risk Management Committee continues to monitor improvements in the overall corporate assurance framework.

51
Significant governance issues
There were no significant issues raised during 2016/17.
Conclusion
My review confirms that the NHSBSA has a system of governance that supports the achievement of its policies, aims and objectives and that continuous improvement is ongoing.

52
2.2.1 Remuneration report
Following a review of the Board effectiveness in 2015/16 it was agreed that the Board should more proactively consider the functions of a nominations committee. It was therefore decided to incorporate those functions in to the existing Remuneration Committee and amend its Terms of Reference accordingly. The Remuneration Committee was therefore renamed the Remuneration and Nominations Committee.
The remuneration of the NHSBSA executive directors is set by the Remuneration and Nominations Committee on behalf of the NHSBSA Board, subject to approval by the DH. The Committee is chaired by a non-executive director. The NHSBSA Chair also attends.
This report for the year ended 31 March 2017 is produced by the Board. The Remuneration and Nominations Committee met on five occasions during the period 1 April 2016 to 31 March 2017. Additional meetings were held during the course of the year to agree the process to recruit a new Chief Executive in advance of the existing Chief Executive retiring in May 2017.
The Remuneration and Nominations Committee operates within a framework laid down by the DH, and taking into account the recommendations of the Senior Salaries Review Body. Its remit is to determine, on behalf of the NHSBSA, the Terms of Service, remuneration and other benefits of the Chief Executive, executive directors and such other posts that are specifically designated by the Board to be within their purview, with the intention that
relevant employees are fairly rewarded for their individual contributions to the organisation. This includes setting the terms for the recruitment of any new executive directors within the DH framework.
The Committee has an objective to satisfy itself that appropriate and effective succession planning arrangements are in place for relevant employees. During the last year, the Committee has made progress in ensuring that adequate arrangements are in place for our executive directors.
The Committee also ensures that an effective system is in place and being properly administered to monitor and evaluate the performance of relevant employees, including such assessments as may be required to determine their level of remuneration.
The remuneration of executive directors is reviewed at least annually by the Remuneration and Nominations Committee, taking account of NHS national awards, central DH directions or guidance and other relevant factors. The remuneration for the tenure of non-executive directors is determined by the Secretary of State for Health.
With the approval of the DH Remuneration Committee, we operate the NHS Executive and Senior Managers (ESM) pay framework.
2.2 Remuneration and staff report
53
Appointments
Non-executive directors are appointed to the NHSBSA Board by the Secretary of State for a fixed period of time. Executive directors have NHSBSA contracts of employment, in which there are no contractual clauses or other agreements for compensation in the event of early termination of office other than those provided by statutory requirements and normal pay provisions.
Emoluments of Board members
The remuneration relating to all directors in post during 2016/17 is detailed in the tables below which identify the salary, other payments and allowances and pension benefits applicable to both executives and non-executives.

Non-executive directorsThe following table sets out details of payments made and appointment term details for the Chair and non-executive members. Subject to audit
Table 9: Non-executive director remuneration
Name and title
2016/17 2015/16
Date of appointment/
re-appointment
Appointment ends
Salary (bands
of (£5,000)
Expense payments (taxable) total to nearest
£100
Performance pay and bonuses
(bands of £5000)
Long term performance
pay and bonuses
(bands of £5000)
All pension-related benefits (bands
of £2,500)
TOTAL (bands
of £5,000)
Salary (bands
of (£5,000)
Expense payments (taxable) total to nearest
£100
Performance pay and bonuses
(bands of £5000)
Long term performance
pay and bonuses
(bands of £5000)
All pension-related benefits
(bands of £2,500)
TOTAL4 (bands of £5,000)
£000 £000 £000 £000 £000 £000 £000 £000 £000 £000 £000 £000
S MaizeyChair 60-65 4.4 0 0 0 65-70 60-65 1.7 0 0 0 65-70 9 Sep 2013 8 Sep 2017
M EllerbyNon-executive director, Senior Independent Director and Chair of Remuneration and Nominations Committee
5-10 1.8 0 0 0 5-10 5-10 1.3 0 0 0 5-10 1 Apr 201431 Mar 2018
A FlanaganNon-executive director and Chair of Audit and Risk Management Committee
10-15 4.1 0 0 0 15-20 5-101 2.9 0 0 0 10-15 1 Apr 201431 Mar 2020
M GreenNon-executive director
5-10 4.7 0 0 0 10-15 5-10 2.9 0 0 0 10-15 1 Apr 201431 Mar 2017
D BaileyNon-executive director
02 1.3 0 0 0 0-5 - - - - - - 1 June 201631 May 2019
D Hulf3
Non-executive director (until 30 Nov 2015)
0 1.9 0 0 0 0-5 5-101 2.1 0 0 0 5-101 Dec 2005reappointed1 Dec 2009
30 Nov 2015
¹ part year (full year equivalent: £10-15k) / 2 does not draw a salary / 3 payment in relation to 2015/16 tax and National Insurance / 4 bands corrected from Annual Report 2015/16.

Senior manager remunerationThe following table sets out details of payments made and appointment term details for the Chief Executive and senior managers Subject to audit
Table 10: Senior manager remuneration
Name and title
2016/17 2015/16
Date of appointment/
re-appointment
Appointment ends
Salary (bands
of (£5,000)
Expense payments (taxable) total to nearest
£100
Performance pay and bonuses
(bands of £5000)
Long term performance
pay and bonuses
(bands of £5000)
All pension-related benefits (bands
of £2,500)
TOTAL (bands
of £5,000)
Salary (bands
of (£5,000)
Expense payments (taxable) total to nearest
£100
Performance pay and bonuses
(bands of £5000)
Long term performance
pay and bonuses
(bands of £5000)
All pension-related benefits
(bands of £2,500)
TOTAL (bands of £5,000)
£000 £0001 £000 £000 £000 £000 £000 £000 £000 £000 £000 £000
N ScholteChief Executive
155-160
9.6 0 032.5-
35195-200
150-155
8.7 0 035-37.5
195-200
1 Feb 2006 7 May 2017
A McDonaldDirector of Service Delivery
115-120
5.0 0 0 02 120-125
105-110
5.0 0 010-
12.52
120-125
1 May 2006
Permanent contract
(6 months’ notice)
P McGahonDirector of Finance and Corporate Services
115-120
5.0 0 035-37.5
160-165
115-120
5.0 0 032.5-
35155-160
5 Aug 2013
Permanent contract
(6 months’ notice)
S Pink Director of Change and Commercial Delivery
130-135
5.3 0 035-37.5
170-175
130-135
5.1 0 047.5-
50185-190
30 Apr 2012
Permanent contract
(6 months’ notice)
¹ all taxable expense payments relate to the provision of a lease car or transport allowance2 left pension scheme 31 January 2016
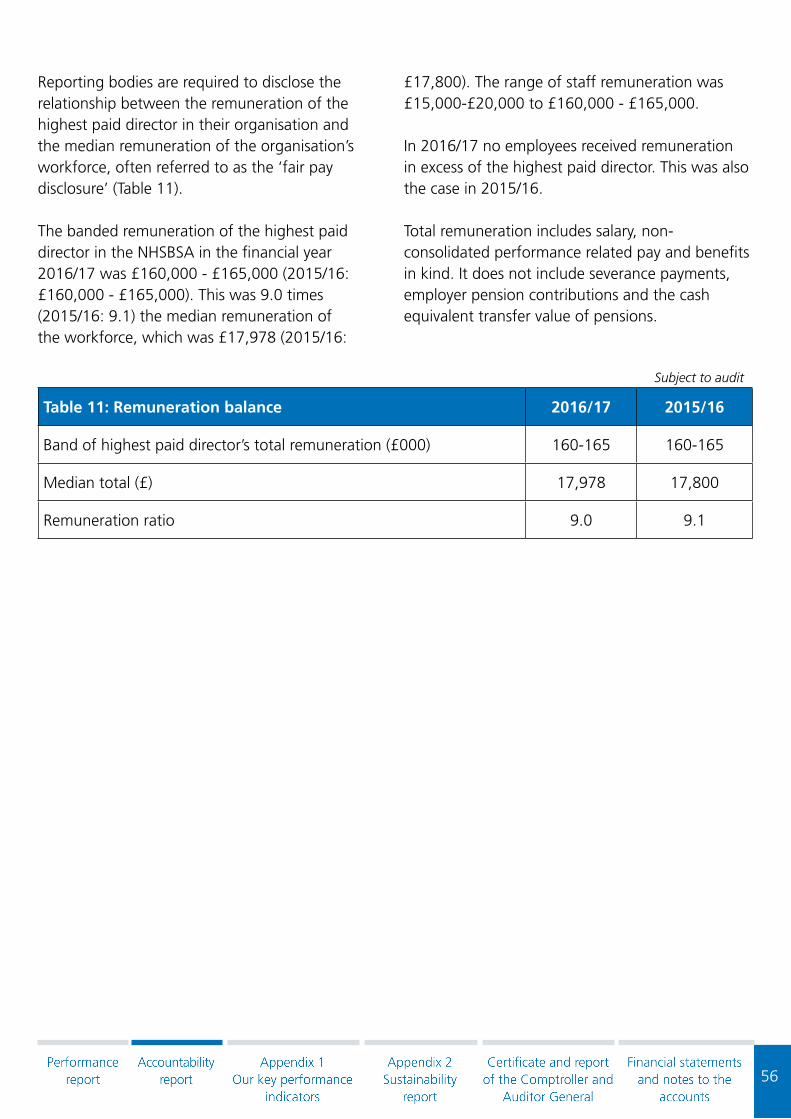
56
Reporting bodies are required to disclose the relationship between the remuneration of the highest paid director in their organisation and the median remuneration of the organisation’s workforce, often referred to as the ‘fair pay disclosure’ (Table 11).
The banded remuneration of the highest paid director in the NHSBSA in the financial year 2016/17 was £160,000 - £165,000 (2015/16: £160,000 - £165,000). This was 9.0 times (2015/16: 9.1) the median remuneration of the workforce, which was £17,978 (2015/16:
£17,800). The range of staff remuneration was £15,000-£20,000 to £160,000 - £165,000.
In 2016/17 no employees received remuneration in excess of the highest paid director. This was also the case in 2015/16.
Total remuneration includes salary, non-consolidated performance related pay and benefits in kind. It does not include severance payments, employer pension contributions and the cash equivalent transfer value of pensions.
Subject to audit
Table 11: Remuneration balance 2016/17 2015/16
Band of highest paid director’s total remuneration (£000) 160-165 160-165
Median total (£) 17,978 17,800
Remuneration ratio 9.0 9.1

57
Pension benefits
The table below sets out the pension benefits of the Chief Executive and senior managers of the NHSBSA:
Table 12: Pension benefits of senior managers
Name and title
Real increase
in pension at age 60 (bands of £2,500)
Real increase
in pension lump sum at age 60 (bands of £2,500)
Total accrued
pension at age 60 at 31 March
2017 (bands of £5,000)
Lump sum at age 60 related
to accrued pension at 31 March 2017(bands of £5,000)
Cash Equivalent
Transfer Value at 31 March 2017
Cash Equivalent
Transfer Value at 31 March 2016
Real increase in Cash
Equivalent Transfer
Value
£000 £000 £000 £000 £000 £000 £000
N ScholteChief Executive 0-2.5 5-7.5 65-70 200-205 1,479 1,356 69
A McDonaldDirector of Service Delivery1
- - - - - - -
P McGahonDirector of Finance and Corporate Services
2.5-5 0-2.5 40-45 115-120 771 718 36
S Pink Director of Change and Commercial Delivery
2.5-5 -2
20-25 -2
254 218 17
1 left pension scheme 31 January 20162 no lump sum is disclosed for S Pink as he is a member of the 2008 Section of the NHS Pension Scheme where there is no set minimum lump sum
There are no entries in respect of pensions for non executive directors as they don’t receive pensionable remuneration.
Subject to audit

58
Cash Equivalent Transfer Value
A Cash Equivalent Transfer Value (CETV) is the actuarially assessed capital value of the pension scheme benefits accrued by a member at a particular point in time. The benefits valued are the members’ accrued benefits and any contingent spouse’s pension payable from the scheme.
A CETV is a payment made by a pension scheme or arrangement to secure pension benefits in another pension scheme or arrangement when the member leaves a scheme and chooses to transfer the benefit accrued in the former scheme. The pension figures shown relate to the benefits that the individual has accrued as a consequence of their total membership of the pension scheme, not just their service in a senior capacity to which disclosure applies.
The CETV figure and the other pension details include the value of any pension benefits in another scheme or arrangement which the individual has transferred to the NHS Pension Scheme. They also include any additional pension benefit accrued to the member as a result of their purchasing additional years of pension service in the scheme at their own cost. CETV are calculated within the guidelines and framework prescribed by the Institute and Faculty of Actuaries.
Real increase in CETV
This reflects the increase in CETV effectively funded by the employer. It takes account of the increase in accrued pension due to inflation, contributions paid by the employee (including the value of any benefits transferred from another scheme or arrangement) and uses common market valuation factors for the start and end of period.
On 16 March 2016, there was a reduction in the discount rate used to calculate the CETV figures, from 3% to 2.8%. Due to the lead time in re-performing the calculations for all staff affected, the 2015/16 reported figures reflected the old rate. The 2016/17 CETV figures reflect the new rates.

59
2.2.2 Staff report
Staff numbers and costs
Table 11 gives details of staff numbers and costs.
Table 11: Staff numbers and related costs - Executive members and staff costs:
Total 2016/17 £000
Permanently employed
£000Other £000
Total 2015/16 £000
Salaries and wages 67,086 61,443 5,643 65,870
Social security costs 5,459 5,459 0 4,244
Employer contributions to NHS Pensions
7,099 7,099 0 6,996
Other pensions costs 498 498 0 619
Termination costs 3,395 3,395 0 5,073
Total 83,537 77,894 5,643 82,802
Capitalised staff costs (1,230) - - (1,865)
82,307 - - 80,937
The average number of persons employed during the year was:Subject to audit
Table 12
Total Permanently employed Other 2015/16
2,587 2,479 108 2,591
The whole time equivalent number of staff whose cost was capitalised was 20 (2015/16: 30)
Gender balance
Table 13 below provides details of the number of staff and gender at director, senior manager and other staff level.
Table 13: Employee data (based on head count, not full-time equivalent)
Female MaleTotal (31
March 2017)
Directors 2 7 9
Senior managers (band 8c and above) 22 54 76
Total employees 1,634 1,175 2,809
Subject to audit

60
Employee sickness
We have an absence management policy covering the whole organisation which provides a consistent framework approach. The policy is underpinned by an externally provided occupational health service and employee assistance programme.
All figures calculated by Full Time Equivalent (FTE)
Table 14: NHS sickness absence figures
Figures converted by DH to best estimates of required data items
Statistics published by NHS Digital from ESR data warehouse
Average FTE 2016Adjusted FTE days
lost to Cabinet Office definitions
Average sick days per FTE
FTE days availableFTE days recorded sickness absence
2,743 19,526 7.0 1,001,085 31,675
Source: NHS Digital - Sickness Absence and Publication - based on data from the ESR Data Warehouse. Period covered: January to December 2016
NHS sickness absence figures notes:
Data items: ESR does not hold details of normal number of days worked by each employee. Data on days available and days recorded sick are based on a 365 day year.
The number of FTE days available has been taken directly from ESR. This has been converted to FTE years in the first column by dividing by 365 (with a further adjustment where the figures are based on less than 12 months’ data).
The number of FTE days lost to sickness absence has been taken directly from ESR. The adjusted FTE days lost has been calculated by multiplying by 225/365 to give the Cabinet Office measure (with a further adjustment where the figures are based on less than 12 months’ data).
Average annual sick days per FTE has been estimated by dividing the estimated number of FTE days sick by the average FTE, and multiplying by 225 (the typical number of working days per year).

61
Supporting disabled people
Work has continued to support our aim to employ a workforce which is representative of the diverse population we serve. In 2016 we became accredited as a Level 2 - Disability Confident Employer organisation under the government’s new Disability Confident Scheme, which replaced the Disability Equality ‘Two Ticks’ Scheme we were previously accredited under.
Our commitment to job applicants and staff with a disability includes providing a Guaranteed Interview Scheme for job applicants with a disability and our continued support of Project Choice, offering work experience placements for young people with learning disabilities and difficulties. We have support measures in place through relevant policies and our Occupational Health Service and Employee Assistance Programme to ensure we can continue to employ staff who become disabled. Through our appraisal procedure and by monitoring our promotion statistics, we ensure that there are no barriers to the training, career development and promotion of employees with disabilities.
Expenditure on consultancy and temporary staff
The total consultancy expenditure incurred on the provision of operating services was £0 (2015/16 –£0). The total contingent labour expenditure incurred on the provision of operating services was £3.6 million (2015/16 – £2.2 million).
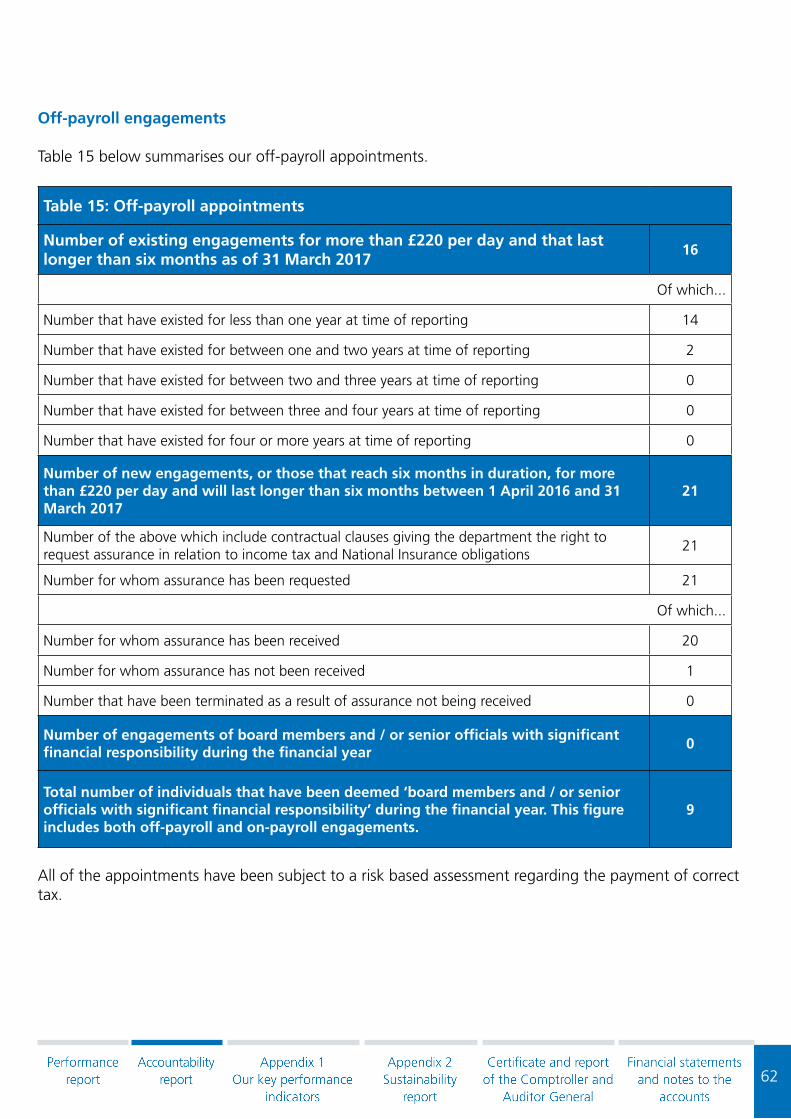
62
Off-payroll engagements
Table 15 below summarises our off-payroll appointments.
Table 15: Off-payroll appointments
Number of existing engagements for more than £220 per day and that last longer than six months as of 31 March 2017
16
Of which...
Number that have existed for less than one year at time of reporting 14
Number that have existed for between one and two years at time of reporting 2
Number that have existed for between two and three years at time of reporting 0
Number that have existed for between three and four years at time of reporting 0
Number that have existed for four or more years at time of reporting 0
Number of new engagements, or those that reach six months in duration, for more than £220 per day and will last longer than six months between 1 April 2016 and 31 March 2017
21
Number of the above which include contractual clauses giving the department the right to request assurance in relation to income tax and National Insurance obligations
21
Number for whom assurance has been requested 21
Of which...
Number for whom assurance has been received 20
Number for whom assurance has not been received 1
Number that have been terminated as a result of assurance not being received 0
Number of engagements of board members and / or senior officials with significant financial responsibility during the financial year
0
Total number of individuals that have been deemed ‘board members and / or senior officials with significant financial responsibility’ during the financial year. This figure includes both off-payroll and on-payroll engagements.
9
All of the appointments have been subject to a risk based assessment regarding the payment of correct tax.

63
Exit packages
Details of exit packages are included in Table 16.
Table 16: Staff numbers and related costs – Exit costs
2016/17Number of compulsory
redundancies
Number of other depar-tures agreed
Total number of exit pack-
ages
Cost of compulsory
redundancies £000
Cost of other departures
agreed £000
Total cost of exit packages
£000
<£10,000 22 0 22 79 0 79
£10,000-£25,000
9 1 10 164 13 177
£25,000-£50,000
20 2 22 798 84 882
£50,000-£100,000
20 2 22 1,381 126 1,507
£100,000-£150,000
6 0 6 726 0 726
£150,000-£200,000
3 0 3 507 0 507
>£200,000 0 0 0 0 0 0
Total number of exit packages by type
80 5 85 3,655 224 3,879
There were no special payments made during the year.
Number of agreements Total value of agreements
£000
Voluntary redundancies incl. early retirement 5 224
Mutually agreed resignations 0 0
Early retirements in the efficiency of services 0 0
Contractual payments in lieu of notice 0 0
Exit payments 0 0
Non-contractual payments 0 0
Total 5 224
Subject to audit
Subject to audit

64
Table 17: Staff numbers and related costs – Exit costs
2015/16Number of compulsory
redundancies
Number of other depar-tures agreed
Total number of exit pack-
ages
Cost of compulsory
redundancies £000
Cost of other departures
agreed £000
Total cost of exit packages
£000
<£10,000 15 3 18 49 13 62
£10,000-£25,000
41 8 49 711 130 841
£25,000-£50,000
9 17 26 352 645 997
£50,000-£100,000
15 24 39 1,015 1,699 2,714
£100,000-£150,000
4 1 5 476 105 581
£150,000-£200,000
0 0 0 - - -
>£200,000 0 0 0 - - -Total number of exit packages by type
84 53 137 2,603 2,592 5,195
There were no special payments made during the year.
Number of agreements Total value of agreements
£000
Voluntary redundancies incl. early retirement 53 2,478
Mutually agreed resignations 0 -
Early retirements in the efficiency of services 0 -
Contractual payments in lieu of notice 29 114
Exit payments 0 -
Non-contractual payments 0 -
Total 82 2,592
Subject to audit
Subject to audit
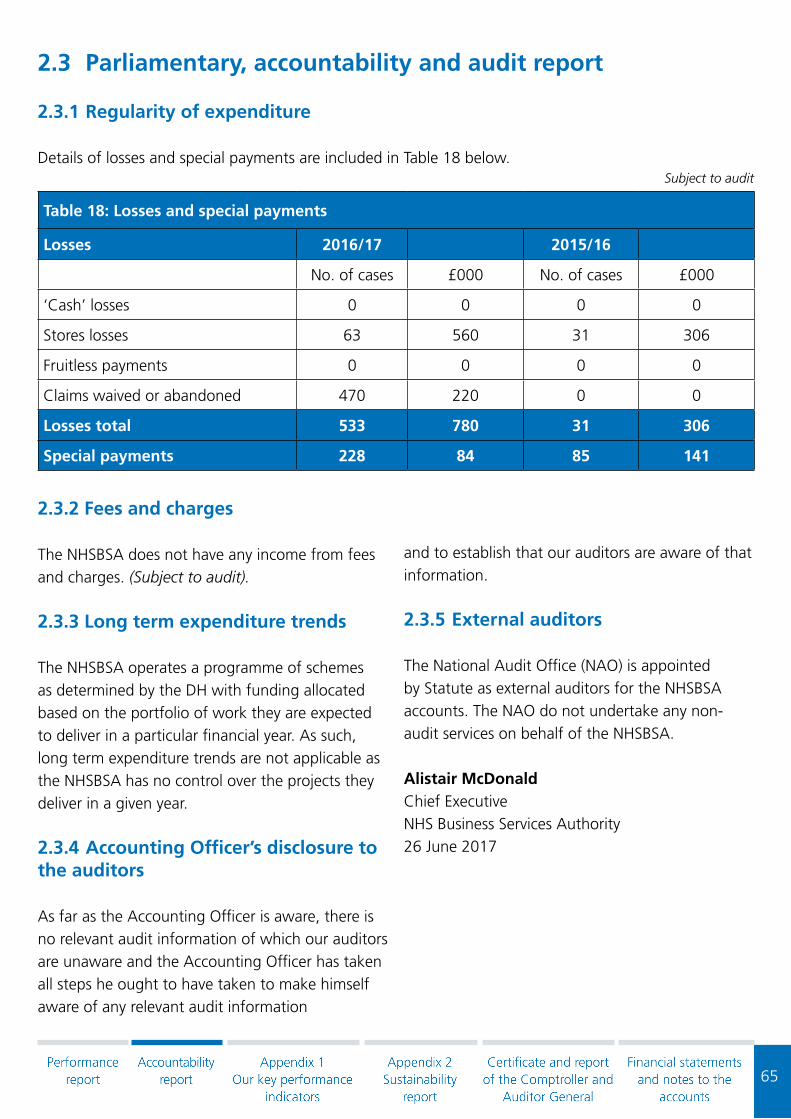
65
2.3 Parliamentary, accountability and audit report
2.3.1 Regularity of expenditure
Details of losses and special payments are included in Table 18 below.
Table 18: Losses and special payments
Losses 2016/17 2015/16
No. of cases £000 No. of cases £000
‘Cash’ losses 0 0 0 0
Stores losses 63 560 31 306
Fruitless payments 0 0 0 0
Claims waived or abandoned 470 220 0 0
Losses total 533 780 31 306
Special payments 228 84 85 141
2.3.2 Fees and charges
The NHSBSA does not have any income from fees and charges. (Subject to audit).
2.3.3 Long term expenditure trends
The NHSBSA operates a programme of schemes as determined by the DH with funding allocated based on the portfolio of work they are expected to deliver in a particular financial year. As such, long term expenditure trends are not applicable as the NHSBSA has no control over the projects they deliver in a given year.
2.3.4 Accounting Officer’s disclosure to the auditors
As far as the Accounting Officer is aware, there is no relevant audit information of which our auditors are unaware and the Accounting Officer has taken all steps he ought to have taken to make himself aware of any relevant audit information
and to establish that our auditors are aware of that information.
2.3.5 External auditors
The National Audit Office (NAO) is appointed by Statute as external auditors for the NHSBSA accounts. The NAO do not undertake any non-audit services on behalf of the NHSBSA.
Alistair McDonaldChief ExecutiveNHS Business Services Authority26 June 2017
Subject to audit

66
Appendix 1Our Key Performance Indicators (KPIs)

67
Appendix 1 - Our Key Performance Indicators (KPIs)
Contact Centre
KPI domain KPI name Target 2016-17
Servicedelivery
Average speed of answer - overall 120 sec 63 sec
NHS Dental Services
KPI domain KPI name Target 2016-17
Customercare
Average speed of answer 120 sec 72 sec
Clear emails within 2 working days of receipt 98.00% 99.45%
Issue final response to customer complaints within 10 working days 100.00% 99.67%
Issue initial response to customer complaints within 3 working days 100.00% 100.00%
Quality ofservice
Accuracy of data capture 99.90% 99.96%
Accuracy of payment - sample based on Pensions Online (POL) data 99.90% 100.00%
Accuracy of published dental reports 100.00% 100.00%
Servicedelivery
% activity reports on first available schedule 99.90% 99.86%
% Clinical Advisor cases completed within 2 months 50.00% 94.73%
% Clinical Advisor cases completed within 3 months 90.00% 98.38%
% of Area Teams on target to have a minimum of 2,000 questionnaires sent to patients in England by the end of 2016/17
100.00% 100.00%
% of Health Boards on target to have a minimum of 2,000 questionnaires sent to patients in Wales by the end of 2016/17
100.00% 100.00%
Carry out no fewer than 20 routine orthodontic performance assessments by end March 2017
100.00% 100.00%
Carry out no fewer than 330 routine assessments by end March 2017
100.00% 100.00%
Carry out no fewer than 83 CA reports by end March 2017 100.00% 116.87%
Non-confirmed eligibility checks (England) 130,000 180,000
Non-confirmed eligibility checks (Wales) 12,000 12,000
Payment transfers in accordance with prescribed dates (all) 100.00% 100.00%
Reporting in accordance with publication timetable 100.00% 99.42%
Issue final response to customer complaints within 10 working days One complaint response was issued outside the 10 working days target
% activity reports on first available schedule A delay in making reports available was recorded, which was due to providing support to customers whose FP17 forms had been rejected. The way this KPI is recorded in future will change to more accurately reflect the actual performance.
Reporting in accordance with publication timetable We experienced a short delay in the publication of some reports while implementing a new operating system.

68
NHS Dental Exemption Checking Services
KPI domain KPI name Target 2016-17
Servicedelivery
PCN letters sent against plan 100.00% 101.24%
% surcharge letters sent against system generated surcharge 100.00% 100.00%
% making payments 7.50% 19.53%
Customer care
Average speed of answer 120 sec 58 sec
% emails answered within 2 days 98.00% 99.62%
% letters cleared within 5 days 100.00% 100.00%
European Health Insurance Card (EHIC)
KPI domain KPI name Target 2016-17
Servicedelivery
% EHIC applications processed and distributed within target 99.00% 99.95%
Quality ofservice
% accuracy of processed applications 98.00% 98.71%
Customercare
Average speed of answer 120 sec 51 sec
Clear emails within 2 working days of receipt 98.00% 99.96%
Information Services
KPI domain KPI name Target 2016-17
Quality ofservice
% accuracy of drug tariff team workload 99.90% 99.98%
% accuracy of published dental reports 100.00% 100.00%
Prescription processing information accuracy 99.00% 99.55%
Servicedelivery
% Drug Tariff electronic and paper published within agreed target / schedule
100.00% 99.76%
Customer information reports and systems published within target 100.00% 100.00%
Information systems (ePACT) available to external stakeholders 99.50% 99.08%
Information systems (ISP) available to external stakeholders 99.50% 99.72%
MI reports published within target deadlines 100.00% 100.00%
MPD Freedom of Information requests (FOIs) provided within 20 working days of receipt
100.00% 98.44%
MPD Subject Access Requests (SARs) provided within 40 calendar days of receipt
100.00% 93.94%
Parliamentary Questions (PQs) answered within deadline 100.00% 100.00%
Prescription FOIs provided within 20 working days of receipt 100.00% 99.64%
Reporting in accordance with publication timetable 100.00% 99.42%
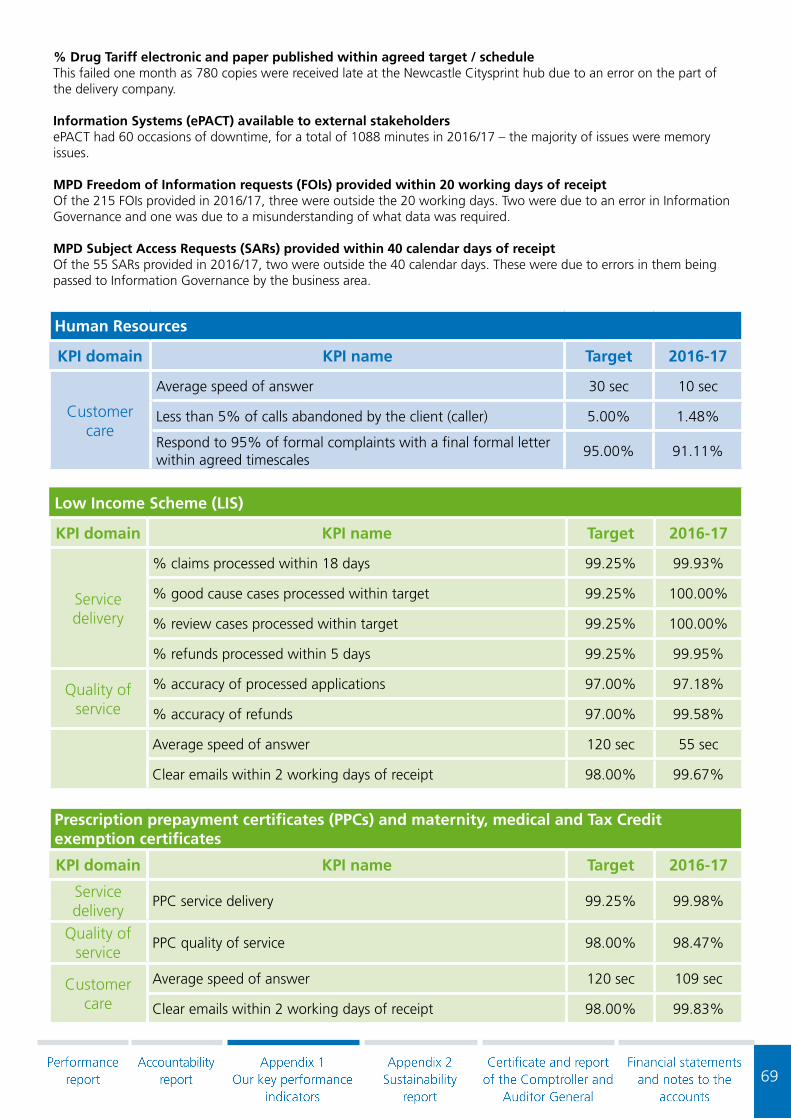
69
% Drug Tariff electronic and paper published within agreed target / scheduleThis failed one month as 780 copies were received late at the Newcastle Citysprint hub due to an error on the part of the delivery company.
Information Systems (ePACT) available to external stakeholders ePACT had 60 occasions of downtime, for a total of 1088 minutes in 2016/17 – the majority of issues were memory issues.
MPD Freedom of Information requests (FOIs) provided within 20 working days of receipt Of the 215 FOIs provided in 2016/17, three were outside the 20 working days. Two were due to an error in Information Governance and one was due to a misunderstanding of what data was required.
MPD Subject Access Requests (SARs) provided within 40 calendar days of receipt Of the 55 SARs provided in 2016/17, two were outside the 40 calendar days. These were due to errors in them being passed to Information Governance by the business area.
Human Resources
KPI domain KPI name Target 2016-17
Customercare
Average speed of answer 30 sec 10 sec
Less than 5% of calls abandoned by the client (caller) 5.00% 1.48%
Respond to 95% of formal complaints with a final formal letter within agreed timescales
95.00% 91.11%
Low Income Scheme (LIS)
KPI domain KPI name Target 2016-17
Servicedelivery
% claims processed within 18 days 99.25% 99.93%
% good cause cases processed within target 99.25% 100.00%
% review cases processed within target 99.25% 100.00%
% refunds processed within 5 days 99.25% 99.95%
Quality ofservice
% accuracy of processed applications 97.00% 97.18%
% accuracy of refunds 97.00% 99.58%
Average speed of answer 120 sec 55 sec
Clear emails within 2 working days of receipt 98.00% 99.67%
Prescription prepayment certificates (PPCs) and maternity, medical and Tax Credit exemption certificates
KPI domain KPI name Target 2016-17
Servicedelivery
PPC service delivery 99.25% 99.98%
Quality ofservice
PPC quality of service 98.00% 98.47%
Customer care
Average speed of answer 120 sec 109 sec
Clear emails within 2 working days of receipt 98.00% 99.83%

70
Prescription Exemption Checking Service (PECS)
KPI domain KPI name Target 2016-17
Service delivery
PCN letters sent against plan 100.00% 100.09%
% surcharge letters sent against system generated surcharge 100.00% 100.00%
% making payments 7.50% 21.25%
Quality of service
% accuracy of PECS patient data capture 97.50% 98.92%
Customercare
Average speed of answer 120 sec 55 sec
% emails answered within 2 days 98.00% 99.67%
% letters cleared within 5 days 100.00% 100.00%

71
NHS Pensions
KPI do-main
KPI name Target 2016-17
Quality of service
Pensions accuracy (case administration and payments) - pre-release errors 98.50% 99.17%
Performance of EP - all pensions calculations - accuracy 99.90% 100.00%
Servicedelivery
5-year rejoiner – Cash Equivalent Transfer Value (CETV) - within 3 calendar months
99.00% 97.47%
Awards - 99.5% by one calendar month following due date 99.50% 95.43%
Child allowance - 98.5% by one calendar month following due date 98.50% 100.00%
Death gratuity - 99% by one calendar month following due date 99.00% 100.00%
GP practice employers and Direction Bodies (Direction Body, independent provider and New Fair Deal) (reported one month in arrears)
95.00% 96.69%
Main employers, Clinical Commissioning Groups (CCGs) and Clinical Support Groups (CSGs), GP and Dental Staff (reported one month in arrears)
98.00% 98.8%
Officer estimate - 95% within 40 working days 95.00% 82.97%
Payments to pensioners (Paymaster contract) 100.00% 100.00%
Pensions contributions - CCGs and CSGs - by 19th (reported one month in arrears)
98.00% 99.79%
Pensions contributions - Directions - by 19th (reported one month in arrears) 95.00% 97.47%
Pensions contributions - GP and dental staff - by 19th (reported one month in arrears)
95.00% 99.00%
Pensions contributions - GP practices - by 19th (reported one month in arrears)
95.00% 95.82%
Pensions contributions - Independent providers - by 19th 95.00% 97.53%
Pensions contributions - Main employers - by 19th (reported one month in arrears)
98.00% 98.70%
Pensions contributions - New Fair Deal - by 19th 95.00% 98.80%
Pensions on divorce CETV - 95% within 3 calendar months 95.00% 89.67%
Performance of EP - BACS automatic notifications paid within 7 working days 100.00% 100.00%
Performance of EP - payment issued for printing in voucher cases in 3 working days
100.00% 100.00%
Practitioner estimate - 97.5% within 40 working days 97.50% 67.64%
Refunds - 99.95% by one calendar month following date of receiving application
99.95% 99.65%
Sub Awards - 98% by one calendar month following due date 98.00% 72.87%
Transfer Value In - estimate 98% within 2 calendar months 98.00% 89.68%
Transfer Value Out - estimate 95% within 3 calendar months 95.00% 83.43%
Transfer Value Out - payment 99.7% within 6 calendar months 99.70% 90.26%
Widowers pension - 97% by one calendar month following due date 97.00% 100.00%

72
NHS Pensions entered 2016/17 with pressure and failed KPIs in areas of Awards, Estimates, Transfers In and Sub Awards. The business focused on a recovery strategy that would achieve long term sustainability and as such facilitated cross-training of staff to increase knowledge and skills across the business and remove single points of failure for a greater customer experience. The volume of work reached a peak in June 2016 and triggered contingency until January 2017. During this time resources were redeployed into priority areas and various processes reviewed to seek efficiency.
By March 2017 the business had recovered in all areas with the exception of Sub Awards and Practitioner Estimates. We continued to reduce the existing backlog of cases whilst dealing with various change factors and an increase in the volume of complex cases, which administering three different schemes brings. The area of transfers out payments recovered in December 2016 but marginally missed in February / March 2017 due to fulfilling the requirements for Greenbury.
NHS Student Bursaries
KPI domain KPI name Target 2016-17
FinancialTo ensure overpayment financial values, as a result of withdrawals, does not exceed 1% of the bursary expenditure
1.00% 0.76%
Servicedelivery
% initial payments to new students within target 100.00% 100.00%
% authorised extensions paid within target 100.00% 100.00%
Provide quarterly updates to bursary forecasts 100.00% 100.00%
Provide monthly database and principal reports 100.00% 100.00%
Provide reports at intervals during the year in accordance with frameworks and agreed timescales
100.00% 100.00%
% subsequent payments to continuing students within target 100.00% 100.00%
To ensure delivery against the monthly capacity clearance plan is no greater than a 5% deficit
-5.00% -0.74%
% disabled student allowance applications processed within target
100.00% 100.00%
% practice placement expenses paid within target 100.00% 100.00%
% tuition invoices paid within target 100.00% 91.11%
% bursary amendments following withdrawal/suspension processed within target
100.00% 100.00%
% payments to resumers within target 100.00% 100.00%
% accounts updated within target following change of circumstance
100.00% 100.00%
Quality ofservice
% absolute cash variance (post-payment financial accuracy) 99.00% 99.12%
Customercare
% informal complaints resolved within 10 working days 100.00% 98.58%
% formal complaints (stage 1) resolved within 25 working days 100.00% 100.00%
% formal complaints (stage 2) resolved within 15 working days 100.00% 100.00%
Average speed of answer 120 sec 55 sec
% tuition invoices paid within target High volume of invoices received during Christmas weeks meant 198 tuition fees weren’t paid within 20 working days. Those invoices that failed were paid as quickly as possible and there was no negative correspondence received. Measures have been put in place to mitigate the risk of this re-occurring in the future.

73
Social Work Bursaries
KPI domain KPI name Target 2016-17
Budget% money owed due to change of circumstances 1.00% -0.12%
Provide scheduled reports within target 100.00% 100.00%
Servicedelivery
% bursary amendments following withdrawal/suspension processed within target
100.00% 100.00%
% disabled student allowance applications processed within target 100.00% 100.00%
% invoices processed within 20 working days 100.00% 100.00%
% payments made to HEIs within target 100.00% 100.00%
% subsequent payments made to students within target 100.00% N/A
To deliver within a 5% tolerance of the monthly capacity and capability plans
-5.00% -4.47%
Quality ofservice
% accuracy of processed applications 97.50% 97.15%
% net cash variance of processed applications99.0%-101.0%
100.63%
Customercare
% enquiries responded to within 10 working days 100.00% 100.00%
% informal complaints resolved within 10 working days 100.00% 100.00%
% formal complaints (stage 1) resolved within 25 working days 100.00% N/A
% formal complaints (stage 2) resolved within 15 working days 100.00% 100.00%
% Higher Education Institute (HEI) correspondence responded to within 5 working days
100.00% N/A
Average speed of answer 120 sec 53 sec
Education Support Grant
KPI domain KPI name Target 2016-17
Servicedelivery
% payments made to new students within target 100.00% 100.00%
Quality ofservice
% net cash variance payment to Higher Education Institutes (HEIs)99.0%-101.0%
100.00%
Customer care
% informal complaints resolved within 10 working days 100.00% N/A
% formal complaints (stage 1) resolved within 25 working days 100.00% N/A
% formal complaints (stage 2) resolved within 15 working days 100.00% N/A

74
NHS Prescription Services
KPI domain KPI name Target 2016-17
Servicedelivery
Batch retrieval requests within agreed target 85.00% 96.14%
Health benefit requests completed to target 99.00% 99.64%
Prescription search requests completed within agreed target 90.00% 100.00%
Successful payments and file transfers 100.00% 100.00%
Quality of service
Absolute cash variance 99.30% 99.77%
Accuracy of payments 99.10% 99.64%
Net cash variance99.8%-100.2%
99.98%

75
Appendix 2Sustainability report

76
Table 1: Greenhouse gas emissions
2009/10 2010/11 2011/12 2012/13 2013/14 2014/15 2015/16 2016/17
Non-financial Indicators (t CO2e)*
Gross emissions Scope 1** (direct)
1.7k 1.3k 1.0k 1.1k 0.5k 0.7k 0.4k 0.4k
Gross emissions Scope 2*** (indirect)
5.4k 5.1k 4.7k 3.9k 2.7k 3.2k 2.8k 2.5k
Gross emissions Scope 3**** (indirect – business travel)
0.8k 0.8k 0.8k 0.7k 0.6k 0.4k 0.4k 0.3k
TOTAL 7.9k 7.2k 6.5k 5.7k 3.8k 4.3k 3.6k 3.2k
Building CO2e per FTE 2.91 2.69 2.65 1.55 1.37 1.44 1.24 1.13
Business travel CO2e per FTE 0.18 0.21 0.27 0.20 0.19 0.15 0.14 0.15
Related energy consumption (kWh)
Gas 8.4m 6.0m 4.6m 5.6m 2.5m 2.4m 2.1m 2.1m
Electricity: Grid 11.0m 10.1m 9.4m 8.4m 6.1m 5.9m 5.6m 5.6m
Gas Oil N/A N/A N/A 0.2m N/A N/A N/A N/A
Self-generated energy (kWh)
PV N/A N/A N/A 65k 65k 35k 31k 48k
Financial indicators*****
Expenditure on energy £1.2m £1.1m £1.1m £1.0m £0.8m £0.7m £0.7m £0.7m
Expenditure on carbon reduction commitment
N/A <£2k <£2k £66k £63k £46k £3k £44k
Expenditure on official business travel
£1.1m £1.1m £1.0m £1.1m £1.3m £1.0m £0.9m £0.9m
TOTAL £2.3m £2.2m £2.1m £2.2m £2.2m £1.7m £1.6m £1.6m
Notes: * emissions accounting includes all Scope 1 and 2 emissions along with separately identified Scope 3 emissions related to official business travel. Details of carbon accounting within the NHSBSA, in support of HM Treasury Guidance, are available on request. Greening Government carbon conversion factors have been used.
Scope 1**: gas used in buildings (Approx. 1% has been estimated where we are a minor tenant in large office blocks, and there is no direct metering), gas oil, fugitive emissions from air conditioning units in buildings we own and/or control, transport emissions from vehicles we own or on finance lease.

77
Scope 2***: electricity used in buildings (approx. 1% has been estimated where we are a minor tenant in large office blocks, and there is no direct metering).
Scope 3****: transport emissions from hire cars, grey fleet, taxis (some figures are approximated using spend data), buses (figures are approximated using spend data), air (data prior to June 2010 is estimated using data from 2010-11), rail (data prior to June 2010 is estimated using data from 2010-11).
***** minor estimates have been included for areas without direct billing, for example, where the energy bills are part of the service charge for a building.
Performance commentary including measures
Scope 1 emissions have broadly stayed the same as 2015/16.
We have seen a reduction in electricity usage (scope 2 emissions) in relation to improvements to our building management systems.
Scope 3 emissions relating to business travel have reduced compared to 2015/16 as we continue to improve our technology infrastructure e.g. video conferencing and collaborative IT systems.
Controllable impacts commentary
Our main impacts are from the operation of our offices (electricity and gas), and to a lesser extent our business travel, having offices, customers, clients and sponsors spread around the UK.
Overview of influenced impacts
Our key influential impacts are related to our supply chain.

78
Table 2: Waste
2009/10 2010/11 2011/12 2012/13 2013/14 2014/15 2015/16 2016/17
Non-financial Indicators (tonnes)*
Landfilled 504 466 261 161 189 193 188 93
Recycled / reused / composted (non-prescription / dental form waste)**
634 471 322 516 309 201 196 218
ICT waste recycled externally 2 0 16 36 2 3 0 15
Recycled / reused / composted (prescription / dental form waste)***
200 586 114 350 302 137 125 1009
Recycled / reused / composted (prescriptions stored offsite by third party)***
575 575 575 575 200 599 596 0
Incinerated / energy from waste
26 23 50 17 94 87 75 88
TOTAL 1941 2121 1338 1655 1096 1220 1180 1423
Office waste per FTE 0.46 0.39 0.29 0.28 0.24 0.19 0.18 0.16
Financial Indicators ****
Landfilled - - - £26.7k £5.0k £3.1k £3.1k £4.7k
Recycled / reused / composted(non-prescription / dental form waste)
- - - £31.0k £18.5k £18.7k £16.2k £24.1k
Recycled / reused / composted(prescription / dental form waste)
- - - - £31.6k £29.0k £22.5k £8.3k
ICT waste recycled externally - - - - 0 0 0 0
Incinerated / energy from waste
- - - £2.6k £14.3k £15.1k £14.0k £14.9k
TOTAL £36k £36k £39k £60k £69k £66k £56k £52k
* waste (tonnes): approx. 1% has been estimated where we are a minor tenant in large office blocks, and waste is managed through the service agreement.
** Recycled / reused / composted (non-prescription / dental form waste): approx. 1% has been estimated due to a short period of contract transition for confidential waste recycling during 2016/17.
79
*** Recycled prescriptions: this data has been updated to include prescription waste previously recycled as part of a third party management contract. This was not previously reported as the NHSBSA did not directly contract the waste recycling service. This waste stream is no longer managed by a third party and all prescriptions are now collected directly from the NHSBSA. Data has been updated for previous years to allow a consistent comparison. We have used estimates between 2009/10 and 2013/14 as data was not available. Costs for this third party service were for storage and records management and a specific value for recycling was not made available.
**** minor estimates included aligned to non-financial estimates listed here, and due to some data reporting issues for 2009/10. All waste costs are included together up to 2012/13 due to level of reporting possible, with 2012/13 data split. ICT waste costs are included within managed service contract costs so have not been included here.
Financial figures for 13/14 and 15/16 for waste disposal have been updated to account for double reporting within landfill costs.
Performance commentary including measures
Due to a change in policy, the NHSBSA was required to recycle a significant amount of stored prescriptions during 2016/17. This has caused an increase in our total waste figure and reduced the proportion of waste sent to landfill. During 2016/17 a new waste service was introduced at our Fleetwood office which has diverted further waste from landfill.
Controllable impacts commentary
Our key controllable impact is the production of office waste. Our strategy to digitise our services and move away from paper-based processes supports ongoing reduction in office waste produced.
Overview of influenced impacts
Our key influential impact is related to the use of prescriptions. The roll out of the Electronic Prescription Service (EPS) is reducing large numbers of paper prescriptions being printed and transported to our premises to be scanned, stored and then recycled. We are continuing to promote the further take-up of EPS. We are also working with our suppliers to reduce waste in our supply chain.

80
Table 3: Finite resource consumption
2009/10 2010/11 2011/12 2012/13 2013/14 2014/15 2015/16 2016/17
Non-financial Indicators (m³)*
Water from office estate 25.9k 24.2k 24.5k 24.9k 17.4k 18.7k 19.7k 20.0k
Water from non-office estate 0.2k 0.3k 0.3k 0.2k 0.3k 0.5k 0.2k 0.2k
TOTAL 26.2k 24.5k 24.8k 25.1k 17.7k 19.2k 19.9k 20.2k
Water - m³ per FTE (office estate)
10.34 9.99 10.99 9.58 7.09 7.46 7.70 7.96
Paper - reams of A4** 48k 48k 34k 29k 26k 35k 27k 29k
Paper - reams per FTE 16 16 12 11 10 14 10 11
Financial Indicators ***
Mains water supply and treatment
£93.3k £96.7k £83.7k £90.2k £74.0k £86.2k £75.1k £88.7k
* water (m3): approx. 1% has been estimated where we are a minor tenant in large office blocks, and there is no direct metering.
** paper (reams): reams of A4 reported here refer to office paper purchased by the NHSBSA directly. It does not include paper purchased on our behalf e.g. leaflets, scheme documents etc. linked to our outsourced services.
*** minor estimates have been included for areas without direct billing, for example, where the water bills are part of the service charge for a building.
Performance commentary including measuresWe have seen an increase in water consumption at two of our offices during 2016/17. At Stella House we have identified
that this is because of the maintenance of our onsite pond habitat. During dry periods this has required refilling. At our
Middlebrook office, flushing of urinals has been reset to address identified high water use.
Due to a specific piece of work requested during 2016/17 we saw a temporary increase in paper use. This has now been
completed.
Controllable impacts commentaryOur key controllable impact is water use in our buildings. We continue to monitor office paper and our strategy to digitise
our services should deliver further reductions.
Overview of influenced impactsOur key influential impacts are related to our supply chain. We are also working with our suppliers to reduce resource
consumption in our supply chain.

81
Certificate and report of the Comptroller and Auditor General

82
The certificate and report of the Comptroller and Auditor General to the House of Commons
I certify that I have audited the financial statements of NHS Business Services Authority for the year ended 31 March 2017 under the National Health Service Act 2006. The financial statements comprise: the Statements of Comprehensive Net Expenditure, Financial Position, Cash Flows, Changes in Taxpayers’ Equity; and the related notes. These financial statements have been prepared under the accounting policies set out within them. I have also audited the information in the remuneration and staff report and the Parliamentary Accountability Disclosures that is described in that report as having been audited.
Respective responsibilities of the Accounting Officer and auditor
As explained more fully in the Statement of Accounting Officer’s Responsibilities, the Chief Executive as Accounting Officer is responsible for the preparation of the financial statements and for being satisfied that they give a true and fair view. My responsibility is to audit, certify and report on the financial statements in accordance with the National Health Service Act 2006. I conducted my audit in accordance with International Standards on Auditing (UK and Ireland). Those standards require me and my staff to comply with the Auditing Practices Board’s Ethical Standards for Auditors.
Scope of the audit of the financial statements
An audit involves obtaining evidence about the amounts and disclosures in the financial statements sufficient to give reasonable assurance that the financial statements are free from material misstatement, whether caused by fraud or error. This includes an assessment of: whether the accounting policies are appropriate to the NHS Business Services Authority’s circumstances and have been consistently applied and adequately disclosed; the reasonableness of significant accounting estimates made by the NHS Business Services Authority; and the overall presentation of the financial statements. In addition I read all the financial and non-financial information in the Annual Report to identify material inconsistencies with the audited financial statements and to identify any information that is apparently materially incorrect based on, or materially inconsistent with, the knowledge acquired by me in the course of performing the audit. If I become aware of any apparent material misstatements or inconsistencies I consider the implications for my certificate.
I am required to obtain evidence sufficient to give reasonable assurance that the expenditure and income recorded in the financial statements have been applied to the purposes intended by Parliament and the financial transactions recorded in the financial statements conform to the authorities which govern them.
Opinion on regularity
In my opinion, in all material respects the expenditure and income recorded in the financial statements have been applied to the purposes intended by Parliament and the financial transactions recorded in the financial statements conform to the authorities which govern them.

83
Opinion on financial statements
In my opinion:
• the financial statements give a true and fair view of the state of NHS Business Services Authority’s affairs as at 31 March 2017 and of the net expenditure for the year then ended; and
• the financial statements have been properly prepared in accordance with the National Health Service Act 2006 and Secretary of State directions issued thereunder.
Opinion on other matters
In my opinion:
• the parts of the Remuneration and Staff report and the the Parliamentary Accountability disclosures to be audited have been properly prepared in accordance with Secretary of State directions made under the National Health Service Act 2006; and
• the information given in the Performance report and Accountability report for the financial year for which the financial statements are prepared is consistent with the financial statements.
Matters on which I report by exception
I have nothing to report in respect of the following matters which I report to you if, in my opinion:
• adequate accounting records have not been kept or returns adequate for my audit have not been received from branches not visited by my staff; or
• the financial statements and parts of the Remuneration and Staff Report and the Parliamentary Accountability disclosures to be audited are not in agreement with the accounting records and returns; or
• I have not received all of the information and explanations I require for my audit; or
• the governance statement does not reflect compliance with HM Treasury’s guidance.
Report
I have no observations to make on these financial statements.
Sir Amyas C E Morse Date: 29 June 2017 Comptroller and Auditor General
National Audit Office157-197 Buckingham Palace RoadVictoriaLondonSW1W 9SP

84
Financial statements and notes to the accounts

85
Account of NHS Business Services Authority 2016-17
Statement of Comprehensive Net Expenditurefor the year ended 31 March 2017
Notes 2016-17 2015-16£000 £000
Income from sale of goods and services 2.2 1,623,937 805,340
Other operating income 3.1 107,963 101,655
Total operating income 1,731,900 906,995
Staff Costs 3.4 82,307 80,937
Purchase of goods and services 2.2 1,444,230 712,113
Other operating expenditure 3.2 324,671 232,666
Total operating expenditure 1,851,208 1,025,716
Net operating expenditure 119,308 118,721
Total Net Expenditure 119,308 118,721
Other Comprehensive Net Expenditure
Net (gain) on revaluation of property, plant & equipment 0 0Adjustment for notional costs (95) (90)
Total comprehensive net expenditure for the year 119,213 118,631
The notes on pages 89 to 110 form part of these accounts.

86
Account of NHS Business Services Authority 2016-17
Statement of Financial Position at 31 March 2017
Notes 31 March 2017 31 March 2016£000 £000
Non Current AssetsProperty, Plant & Equipment 4.2 34,041 35,419Intangible Assets 4.1 38,472 40,952Other Financial Assets 4.3 91,949 89,970Total non-current assets 164,462 166,341
Current AssetsInventories 4.4 79,156 76,790Trade and other receivables 4.5 178,682 164,483Cash and cash equivalents 4.6 54,992 31,860Total current assets 312,830 273,133
Total Assets 477,292 439,474
Current LiabilitiesTrade and other payables 4.7 173,481 133,310Provisions for liabilities and charges 4.8 2,801 2,232Total current liabilities 176,282 135,542
Net current assets/liabilities 136,548 137,591
Total assets less current liabilities 301,010 303,932
Non-current liabilitiesProvisions for liabilities and charges 4.8 604 605Total non-current liabilities 604 605
Total Assets Less Liabilities: 300,406 303,327
Taxpayers' Equity
General Fund 295,550 298,471Revaluation Reserve 4,856 4,856
Total Taxpayers' Equity: 300,406 303,327
The notes on pages 89 to 110 form part of these accounts.
Alistair McDonaldChief Executivexx June 201726 June 2017

87
Account of NHS Business Services Authority 2016-17
Statement of Changes in Taxpayers’ EquityFor the year ended 31 March 2017
General Fund
Revaluation Reserve
Total Reserves
£000 £000 £000Balance at 31 March 2016 298,471 4,856 303,327
Changes in taxpayers’ equity for 2016-17Total net expenditure for the year (119,308) 0 (119,308)Non-cash charges – notional costs 95 0 95Total recognised income and expense for 2016-17 (119,213) 0 (119,213)
Net Parliamentary Funding 116,292 0 116,292
Balance at 31 March 2017 295,550 4,856 300,406
General Fund
Revaluation Reserve
Total Reserves
£000 £000 £000Balance at 31 March 2015 249,177 4,856 254,033
Changes in taxpayers’ equity for 2015-16Total net expenditure for the year (118,721) 0 (118,721)Non-cash charges – notional costs 90 0 90Total recognised income and expense for 2015-16 (118,631) 0 (118,631)
Net Parliamentary Funding 167,925 0 167,925
Balance at 31 March 2016 298,471 4,856 303,327
The notes on pages 89 to 110 form part of these accounts.

88
Account of NHS Business Services Authority 2016-17
Statement of Cash Flows for the year ended 31 March 2017
Notes 2016-17 2015-16£000 £000
Cash flows from operating activitiesNet operating expenditure (119,308) (118,721)Other cash flow adjustments 5.3 17,783 17,822Movement in working capital 5.1 23,606 (61,167)Provisions utilised 4.8 (1,122) (13)Net cash (outflow) from operating activities (79,041) (162,079)
Cash flows from investing activitiesInterest received 3.1 0 2,486Purchase of property, plant and equipment 4.2 (4,648) (7,904)Purchase of intangible assets 4.1 (9,471) (6,286)Payments for financial assets 4.3 0 (40,000)Proceeds from disposal of financial assets 4.3 0 50,890Net cash inflow/(outflow) from investing activities (14,119) (814)
Cash flows from financing activitiesNet Parliamentary Funding 116,292 167,925Net financing 116,292 167,925
Net increase/(decrease) in cash and cash equivalents 23,132 5,032
Cash and cash equivalents at 31 March 2016 5.2 31,860 26,828
Cash and cash equivalents at 31 March 2017 5.2 54,992 31,860
The notes on pages 89 to 110 form part of these accounts.

89
Account of NHS Business Services Authority 2016-17
Notes to the Accounts1. Accounting PoliciesAs directed by the Secretary of State for Health, the following financial statements have been prepared in accordance with the DH Group Accounting Manual 2016-17 (GAM) issued by the Department of Health, and comply with HM Treasury's Government Financial Reporting Manual 2016-17 (FReM). The accounting policies contained in the GAM follow International Financial Reporting Standards to the extent that they are meaningful and appropriate to the NHS, as determined by HM Treasury, which is advised by the Financial Reporting Advisory Board. Where the GAM permits a choice of accounting policy, the accounting policy which is judged to be most appropriate to the particular circumstances of the Authority for the purpose of giving a true and fair view has been selected. The particular policies adopted by the Authority are described below. They have been applied consistently in dealing with items considered material in relation to the accounts.
1.1 Accounting ConventionsThese accounts have been prepared under the historical cost convention modified to account for the revaluation of property, plant and equipment, intangible assets, inventories and certain financial assets and financial liabilities.
Critical accounting judgements and key sources of estimation uncertainty
In the application of the Authority’s accounting policies, management is required to make judgements, estimates and assumptions about the carrying amounts of assets and liabilities that are not readily apparent from other sources. The estimates and associated assumptions are based on historical experience and other factors, that are considered to be relevant. Actual results may differ from those estimates. The estimates and underlying assumptions are continually reviewed. Revisions to accounting estimates are recognised in the period in which the estimate is revised if the revision affects only that period, or in the period of the revision and future periods if the revision affects both current and future periods.

90
Account of NHS Business Services Authority 2016-17
1. Accounting Policies (continued)
1.2 IncomeIncome is accounted for applying the accruals convention. Income is recognised to the extent that it is probable that the economic benefits will flow to the Authority and the income can be reliably measured.
The main source of funding of the Authority is Parliamentary Funding from the Department of Health within an approved cash limit, which is credited to the general fund. Parliamentary funding is recognised in the financial period in which it is received.
Operating income is income which relates directly to the operating activities of the Authority. It principally comprises fees and charges for services provided on a full-cost basis to external customers, as well as public repayment work. Where income is received for a specific activity which is to be delivered in the following financial year, that income is deferred.
The main source of funding for the Supply Chain trading division of the Authority is income from sales to NHS customers. Additional income comes from similar sales to non-NHS customers.
The funding of Social Work Bursary payments and Education Support Grant comes from the DH Policy Team. This income is treated as operating income.
1.3 TaxationThe Authority is not liable to pay corporation tax. Expenditure is shown net of recoverable VAT. Irrecoverable VAT is charged to the most appropriate expenditure heading or capitalised if it relates to an asset.
1.4 Property, Plant & Equipment
(a) CapitalisationAll assets falling into the following categories are capitalised:Property, Plant & Equipment which is capable of being used for more than one year and they:● individually have a cost equal to or greater than £5,000; or● collectively have a cost of at least £5,000 and an individual cost of more than £250, where the assets are functionally interdependent, they have broadly simultaneous purchase dates, are anticipated to have simultaneous disposal dates and are under single managerial control; or● form part of the initial setting-up cost of a new building, irrespective of their individual or collective cost.
(b) ValuationLand and buildings used for the Authority’s services or for administrative purposes are stated in the Statement of Financial Position at their revalued amounts, being the fair value at the date of revaluation less any subsequent accumulated depreciation and impairment losses. Revaluations are performed with sufficient regularity to ensure that carrying amounts are not materially different from those that would be determined at the Statement of Financial Position date. The latest revaluation was carried out by an independent RICS qualified valuer from the DVS Valuation Office Agency as at 31 March 2015. Fair values are determined as follows:
Land and non-specialised buildings – market value for existing useSpecialised buildings – depreciated replacement cost
Properties in the course of construction for service or administration purposes are carried at cost, less any impairment loss. Cost includes professional fees but not borrowing costs, which are recognised as expenses immediately, as allowed by IAS 23 for assets held at fair value. Assets are revalued and depreciation commences when they are brought into use.
Fixtures and equipment are carried at depreciated historic cost as this is not considered to be materially different from fair value.
An increase arising on revaluation is taken to the revaluation reserve except when it reverses an impairment for the same asset previously recognised in expenditure, in which case it is credited to expenditure to the extent of the decrease previously charged there. A revaluation decrease that does not result from a loss of economic value or service potential is recognised as an impairment charged to the revaluation reserve to the extent that there is a balance on the reserve for the asset and, thereafter, to expenditure. Impairment losses that arise from a clear consumption of economic benefit are taken to expenditure. Gains and losses recognised in the revaluation reserve are reported as other comprehensive net expenditure in the Statement of Comprehensive Net Expenditure

91
Account of NHS Business Services Authority 2016-17
1. Accounting Policies (continued)
1.5 Intangible AssetsExpenditure on research activities is recognised as an expense in the period in which it is incurred.
Intangible assets are capitalised when they have a cost of at least £5,000. Intangible assets acquired separately are initially recognised at fair value. Internally-generated assets are recognised if, and only if, all of the following have been demonstrated:
● the technical feasibility of completing the intangible asset so that it will be available for use● the intention to complete the intangible asset and use it● the ability to use the intangible asset● how the intangible asset will generate probable future economic benefits● the availability of adequate technical, financial and other resources to complete the intangible asset and use it● the ability to measure reliably the expenditure attributable to the intangible asset during its development
The amount initially recognised for internally-generated intangible assets is the sum of the expenditure incurred from the date when the criteria above are initially met. Where no internally-generated intangible asset can be recognised, the expenditure is charged to the Statement of Comprehensive Net Expenditure (SoCNE) in the period in which it is incurred.
Following initial recognition, intangible assets are carried at fair value by reference to an active market, or, where no active market exists, at amortised replacement cost (modern equivalent assets basis), indexed for relevant price increases, as a proxy for fair value. Internally-developed software is held at amortised historic cost to reflect the opposite effects of development costs and technological advances.
1.6 Depreciation, amortisation and impairmentsLand and properties under construction are not depreciated.Otherwise, depreciation and amortisation are charged on a straight line basis to write off the costs or valuation of tangible and intangible non-current assets, less any residual value, over their estimated useful lives. The estimated useful lives and residual values are reviewed each year end, with the effect of any changes recognised on a prospective basis. Assets held under finance leases are depreciated over their estimated useful lives or, where shorter, the lease term.At each Statement of Financial Position date, the Authority checks whether there is any indication that any of its tangible or intangible non-current assets have suffered an impairment loss. If there is indication of an impairment loss, the recoverable amount of the asset is estimated to determine whether there has been a loss and, if so, its amount. Intangible assets not yet available for use are tested for impairment annually.
If there has been an impairment loss, the asset is written down to its recoverable amount, with the loss charged to the revaluation reserve to the extent that there is a balance on the reserve for the asset and, thereafter, to the SoCNE. Where an impairment loss subsequently reverses, the carrying amount of the asset is increased to the revised estimate of the recoverable amount but capped at the amount that would have been determined had there been no initial impairment loss. The reversal of the impairment loss is credited to the SoCNE to the extent of the decrease previously charged there and thereafter to the revaluation reserve.
1.7 InventoriesInventories are valued at the lower of cost and estimated net realisable value using a weighted average cost formula.
1.8 Cash and cash equivalentsCash is cash in hand and deposits with any financial institution repayable without penalty on notice of not more than 24 hours. Cash equivalents are investments that mature in 3 months or less from the date of acquisition and that are readily convertible to known amounts of cash with insignificant risk of change in value.

92
Account of NHS Business Services Authority 2016-17
1. Accounting Policies (continued)
1.9 Losses and Special PaymentsLosses and special payments are items that Parliament would not have contemplated when it agreed funds for the health service or passed legislation. By their nature they are items that ideally should not arise. They are therefore subject to special control procedures compared with the generality of payments. They are divided into different categories, which govern the way each individual case is handled.
Losses and special payments are charged to the relevant functional headings including losses which would have been made good through insurance cover had the Authority not been bearing its own risks (with insurance premiums then being included as normal revenue expenditure).
1.10 Employee benefitsShort-term employee benefitsSalaries, wages and employment-related payments are recognised in the period in which the service is received from employees. The cost of leave earned but not taken by employees at the end of the period is recognised in the financial statements to the extent that employees are permitted to carry forward leave into the following period.
Retirement benefit costsMost past and present employees are covered by the provisions of the NHS Pensions Scheme. The scheme is an unfunded, defined benefit scheme that covers NHS employers, General Practices and other bodies, allowed under the direction of the Secretary of State, in England and Wales. The scheme is not designed to be run in a way that would enable NHS bodies to identify their share of the underlying scheme assets and liabilities. Therefore, the scheme is accounted for as if it were a defined contribution scheme: the cost to the NHS body of participating in the scheme is taken as equal to the contributions payable to the scheme for the accounting period.
For early retirements, other than those due to ill health, the additional pension liabilities are not funded by the scheme. The full amount of the liability for the additional costs is charged to expenditure at the time the Authority commits itself to the retirement, regardless of the method of payment.
1.11 Research and DevelopmentResearch and development expenditure is charged against income in the year in which it is incurred, except insofar as development expenditure relates to a clearly defined project and the benefits of it can reasonably be regarded as assured. Expenditure so deferred is limited to the value of future benefits expected and is amortised through the SoCNE on a systematic basis over the period expected to benefit from the project. It is revalued on the basis of current cost. The amortisation is calculated on the same basis as depreciation, on a quarterly basis.

93
Account of NHS Business Services Authority 2016-17
1. Accounting Policies (continued)
1.12 LeasesLeases are classified as finance leases when substantially all the risks and rewards of ownership are transferred to the lessee. All other leases are classified as operating leases.
The Authority as lesseeProperty, plant and equipment held under finance leases are initially recognised, at the inception of the lease, at fair value or, if lower, at the present value of the minimum lease payments, with a matching liability for the lease obligation to the lessor. Lease payments are apportioned between finance charges and reduction of the lease obligation so as to achieve a constant rate on interest on the remaining balance of the liability. Finance charges are recognised in calculating the Authority’s net operating cost.Operating lease payments are recognised as an expense on a straight-line basis over the lease term. Lease incentives are recognised initially as a liability and subsequently as a reduction of rentals on a straight-line basis over the lease term.Contingent rentals are recognised as an expense in the period in which they are incurred.Where a lease is for land and buildings, the land and building components are separated. Leased land is treated as an operating lease. Leased buildings are assessed as to whether they are operating or finance leases.
The Authority as lessorAmounts due from lessees under finance leases are recorded as receivables at the amount of the Authority’s net investment in the leases. Finance lease income is allocated to accounting periods so as to reflect a constant periodic rate of return on the Authority’s net investment outstanding in respect of the leases.Rental income from operating leases is recognised on a straight-line basis over the term of the lease. Initial direct costs incurred in negotiating and arranging an operating lease are added to the carrying amount of the leased asset and recognised on a straight-line basis over the lease term.
1.13 ProvisionsThe Authority provides for legal or constructive obligations that are of uncertain timing or amount at the Statement of Financial Position date on the basis of the best estimate of the expenditure required to settle the obligation. Where the effect of the time value of money is significant, the estimated risk-adjusted cash flows are discounted using the Treasury's discount rates of -2.70%, -1.95% and -0.80% for cash flows due in 0-5 years, 5-10 years and over 10 years respectively (2015/16: -1.55%, -1.00% and -0.80%) in real terms. In the case of early retirement costs the rate is 0.24% (2015/16: 1.37%).
1.14 Financial Instruments
Financial assetsFinancial assets are recognised on the Statement of Financial Position when the Authority becomes party to the financial instrument contract or, in the case of trade receivables, when the goods or services have been delivered. Financial assets are derecognised when the contractual rights have expired or the asset has been transferred.
Financial assets are initially recognised at fair value.
Financial assets are classified into the following categories: financial assets ‘at fair value through profit and loss’; ‘held to maturity investments’; ‘available for sale’ financial assets, and ‘loans and receivables’. The classification depends on the nature and purpose of the financial assets and is determined at the time of initial recognition.
Financial assets at fair value through profit and lossEmbedded derivatives that have different risks and characteristics to their host contracts, and contracts with embedded derivatives whose separate value cannot be ascertained, are treated as financial assets at fair value through profit and loss. They are held at fair value, with any resultant gain or loss recognised in the SoCNE. The net gain or loss incorporates any interest earned on the financial asset.
Held to maturity investmentsHeld to maturity investments are non-derivative financial assets with fixed or determinable payments and fixed maturity, and there is a positive intention and ability to hold to maturity. After initial recognition, they are held at amortised cost using the effective interest method, less any impairment. Interest is recognised using the effective interest method.
Available for sale financial assetsAvailable for sale financial assets are non-derivative financial assets that are designated as available for sale or that do not fall within any of the other three financial asset classifications. They are measured at fair value with changes in value taken to the revaluation reserve, with the exception of impairment losses. Accumulated gains or losses are recycled to the SoCNE on de-recognition.

94
Account of NHS Business Services Authority 2016-17
1. Accounting Policies (continued)
Loans and receivablesLoans and receivables are non-derivative financial assets with fixed or determinable payments which are not quoted in an active market. After initial recognition, they are measured at amortised cost using the effective interest method, less any impairment. Interest is recognised using the effective interest method.
Fair value is determined by reference to quoted market prices where possible, otherwise by valuation techniques.
The effective interest rate is the rate that exactly discounts estimated future cash receipts through the expected life of the financial asset, to the net carrying amount of the financial asset.
At the Statement of Financial Position date, the Authority assesses whether any financial assets, other than those held at ‘fair value through profit and loss’ are impaired. Financial assets are impaired and impairment losses recognised if there is objective evidence of impairment as a result of one or more events which occurred after the initial recognition of the asset and which has an impact on the estimated future cash flows of the asset.
For financial assets carried at amortised cost, the amount of the impairment loss is measured as the difference between the asset’s carrying amount and the present value of the revised future cash flows discounted at the asset’s original effective interest rate. The loss is recognised in the Statement of Comprehensive Net Expenditure and the carrying amount of the asset is reduced directly, or through a provision for impairment of receivables.
If, in a subsequent period, the amount of the impairment loss decreases and the decrease can be related objectively to an event occurring after the impairment was recognised, the previously recognised impairment loss is reversed through the Statement of Comprehensive Net Expenditure to the extent that the carrying amount of the receivable at the date of the impairment is reversed does not exceed what the amortised cost would have been had the impairment not been recognised.
Financial liabilitiesFinancial liabilities are recognised on the Statement of Financial Position when the Authority becomes party to the contractual provisions of the financial instrument or, in the case of trade payables, when the goods or services have been received. Financial liabilities are derecognised when the liability has been discharged, that is, the liability has been paid or has expired.
Financial liabilities are initially recognised at fair value.
Financial liabilities are classified as either financial liabilities ‘at fair value through profit and loss’ or other financial liabilities.
Financial liabilities at fair value through profit and lossEmbedded derivatives that have different risks and characteristics to their host contracts, and contracts with embedded derivatives whose separate value cannot be ascertained, are treated as financial liabilities at fair value through profit and loss. They are held at fair value, with any resultant gain or loss recognised in the Statement of Comprehensive Net Expenditure. The net gain or loss incorporates any interest earned on the financial asset.
Other financial liabilitiesAfter initial recognition, all other financial liabilities are measured at amortised cost using the effective interest method. The effective interest rate is the rate that exactly discounts estimated future cash payments through the life of the asset, to the net carrying amount of the financial liability. Interest is recognised using the effective interest method.
1.15 Accounting standards that have been issued but have not yet been adoptedThe HM Treasury FReM does not require the following Standards and Interpretations to be applied in 2016-17. These standards are still subject to HM Treasury FReM interpretation, with IFRS 9 and IFRS 15 being for implementation in 2018-19, and IFRS 16 in 2019-20.
● IFRS 9 Financial Instruments – Application required for accounting periods beginning on or after 1 January 2018, but not yet adopted by the FReM: early adoption is not therefore permitted● IFRS 15 Revenue for Contracts with Customers - Application required for accounting periods beginning on or after 1 January 2018, but not yet adopted by the FReM: early adoption is not therefore permitted● IFRS 16 Leases – Application required for accounting periods beginning on or after 1 January 2019, but not yet adopted by the FReM: early adoption is not therefore permitted.
Application of these standards is not expected to have a material impact on future financial statements.

95
Acc
ount
of N
HS
Bus
ines
s Se
rvic
es A
utho
rity
2016
-17
2.1
Ope
ratin
g se
gmen
ts
Tota
l
2016
/17
2015
/16
2016
/17
2015
/16
2016
/17
2015
/16
2016
/17
2015
/16
2016
/17
2015
/16
£000
£000
£000
£000
£000
£000
£000
£000
£000
£000
Not
es
Inco
me
from
sal
e of
goo
ds a
nd s
ervi
ces
2.2
(1,6
23,9
37)
(805
,340
)0
00
00
0(1
,623
,937
)(8
05,3
40)
Oth
er o
pera
ting
inco
me
3.1
00
(76,
355)
(73,
903)
(37,
444)
(30,
048)
5,83
62,
296
(107
,963
)(1
01,6
55)
Tota
l ope
ratin
g in
com
e(1
,623
,937
)(8
05,3
40)
(76,
355)
(73,
903)
(37,
444)
(30,
048)
5,83
62,
296
(1,7
31,9
00)
(906
,995
)
Staf
f cos
ts3.
40
00
082
,307
80,9
370
082
,307
80,9
37Pu
rcha
se o
f goo
ds a
nd s
ervi
ces
2.2
1,44
4,23
071
2,11
30
00
00
01,
444,
230
712,
113
Oth
er o
pera
ting
expe
nditu
re3.
217
9,64
390
,484
76,3
5573
,903
74,5
0970
,575
(5,8
36)
(2,2
96)
324,
671
232,
666
Tota
l ope
ratin
g ex
pend
iture
1,62
3,87
380
2,59
776
,355
73,9
0315
6,81
615
1,51
2(5
,836
)(2
,296
)1,
851,
208
1,02
5,71
6
Net
Ope
ratin
g Ex
pend
iture
/(Inc
ome)
(64)
(2,7
43)
00
119,
372
121,
464
00
119,
308
118,
721
Stat
emen
t of F
inan
cial
Pos
ition
Asse
ts27
1,14
223
4,29
68,
005
7,35
819
8,14
519
7,82
00
047
7,29
243
9,47
4
Liab
ilitie
s(1
47,7
03)
(110
,921
)(5
,219
)(4
,572
)(2
3,96
4)(2
0,65
4)0
0(1
76,8
86)
(136
,147
)
Asse
ts le
ss L
iabi
litie
s12
3,43
912
3,37
52,
786
2,78
617
4,18
117
7,16
60
030
0,40
630
3,32
7
2.2
Supp
ly C
hain
2016
/17
2015
/16
£000
£000
Inco
me
from
sal
e of
goo
ds a
nd s
ervi
ces
1,62
3,93
780
5,34
0
Purc
hase
of g
oods
and
ser
vice
s1,
444,
230
712,
113
Gro
ss o
pera
ting
inco
me
179,
707
93,2
27
Ope
ratin
g co
sts
179,
643
90,4
84
Net
ope
ratin
g in
com
e/(e
xpen
ditu
re)
642,
743
The
abov
e tra
ding
figu
res
ther
efor
e re
flect
a fu
ll ye
ar fo
r 201
6-17
and
6 m
onth
s fo
r 201
5-16
.
The
Mas
ter S
ervi
ces
Agre
emen
t cov
erin
g Su
pply
Cha
in s
ervi
ces
was
rene
gotia
ted
durin
g 20
15-1
6. U
nder
the
revi
sed
agre
emen
t, fro
m 1
st O
ctob
er 2
015,
con
trol o
ver t
he c
onsu
mab
les
tradi
ng e
lem
ent o
f the
ser
vice
pas
sed
from
the
Serv
ice
Prov
ider
bac
k to
N
HSB
SA. A
ll re
late
d w
orki
ng c
apita
l bal
ance
s w
ere
incl
uded
in th
e N
HSB
SA's
Sta
tem
ent o
f Fin
anci
al P
ositi
on fr
om th
is d
ate,
and
all
rela
ted
tradi
ng fr
om th
is d
ate
is in
clud
ed in
the
NH
SBSA
's S
tate
men
t of C
ompr
ehen
sive
Net
Exp
endi
ture
.
The
Auth
ority
's a
ctiv
ities
are
con
side
red
to fa
ll w
ithin
thre
e se
gmen
ts: S
uppl
y C
hain
con
sum
able
s tra
ding
, the
pay
men
t of S
ocia
l Wor
k Bu
rsar
ies
and
Educ
atio
n Su
ppor
t Gra
nt (E
SG) ,
and
the
Auth
ority
's o
pera
ting
expe
nditu
re re
latin
g to
the
prov
isio
n of
ser
vice
s to
th
e w
ider
NH
S.
Det
ails
of t
he in
com
e an
d ex
pend
iture
and
ass
ets
and
liabi
litie
s of
the
segm
ents
are
sho
wn
belo
w. T
he s
egm
ents
' sha
res
of a
sset
s an
d lia
bilit
ies
are
disc
lose
d in
mor
e de
tail
with
in th
e re
leva
nt n
otes
to th
e ac
coun
ts.
Bur
sarie
sSe
rvic
e Pr
ovis
ion
Supp
ly C
hain
Intr
a-se
gmen
t A
djus
tmen
ts
Stat
emen
t of C
ompr
ehen
sive
Net
Exp
endi
ture

96
Account of NHS Business Services Authority 2016-17
3.1 Other operating income 2016-17 2015-16
£000 £000
Department of Health (DH) invoiced funding 6,338 5,788Services to other DH Group Bodies 13,952 9,163Services provided to UK Devolved Administrations and Crown Dependencies 2,685 2,672Supply Chain interest charges 0 2,486Social Work Bursary and ESG funding from the Department of Health 76,355 73,903Other income 8,633 7,643Total Operating income 107,963 101,655
3.2 Other operating expenditure (Non-Staff) 2016-17 2015-16
£000 £000Non-executive members' remuneration 109 108Rentals under operating leases 1,889 2,015Establishment expenses 10,221 10,521Transport 509 671Premises 11,247 7,609External contractors 202,772 115,755Non-cash: Depreciation 6,026 5,409 Amortisation 11,951 10,765 Change in carrying value of Financial Assets (1,979) 1,979
15,998 18,153Auditors' remuneration - audit fees 130 140Legal & Professional fees 5,348 3,717Other costs 93 74Social Work Bursaries and ESG 76,355 73,903Total non-staff costs 324,671 232,666
Legal & Professional fees includes the notional fee for the audit of the NHS Pension Scheme accounts of £95k (2015-16 £90k)
External contractors includes £173,807k relating to Supply Chain (2015-16 £88,188k)

97
Account of NHS Business Services Authority 2016-17
3.3 Operating leases
Authority as lessee
2016-17 2015-16£000 £000
Payments recognised as an expenseMinimum lease payments 1,889 2,015
1,889 2,015Total future minimum lease paymentsPayable:Within one year 1,451 1,193Later than one year and not later than five years 4,514 2,560Later than five years 4,800 5,387Total 10,765 9,140
3.4 Staff costs
Executive members and staff costs: 2016-17 2015-16
£000 £000
Salaries and wages 67,086 65,870Social security costs 5,459 4,244Employer contributions to NHS Pensions 7,099 6,996Other pension costs 498 619Termination costs 3,395 5,073
Total 83,537 82,802
Capitalised staff costs (1,230) (1,865)
82,307 80,937
Note on expenditure of staff benefitsThe amount spent on staff benefits during the year totalled £Nil (2015-16 £Nil).
The whole time equivalent number of staff whose cost was capitalised was 20 (2015-16: 30)

98
Account of NHS Business Services Authority 2016-17
3.5 Pension costsMost past and present employees are covered by the provisions of the two NHS Pension Schemes. Details of the benefits payable and rules of the Schemes can be found on the NHS Pensions website at www.nhsbsa.nhs.uk/pensions. Both are unfunded defined benefit schemes that cover NHS employers, GP practices and other bodies, allowed under the direction of the Secretary of State in England and Wales. They are not designed to be run in a way that would enable NHS bodies to identify their share of the underlying scheme assets and liabilities. Therefore, each scheme is accounted for as if it were a defined contribution scheme: the cost to the NHS body of participating in each scheme is taken as equal to the contributions payable to that scheme for the accounting period.
In order that the defined benefit obligations recognised in the financial statements do not differ materially from those that would be determined at the reporting date by a formal actuarial valuation, the FReM requires that “the period between formal valuations shall be four years, with approximate assessments in intervening years”. An outline of these follows:
a) Full actuarial (funding) valuationThe purpose of this valuation is to assess the level of liability in respect of the benefits due under the schemes (taking into account their recent demographic experience), and to recommend contribution rates payable by employees and employers. The last published actuarial valuation undertaken for the NHS Pension Scheme was completed for the year ending 31 March 2012. The Scheme Regulations allow for the level of contribution rates to be changed by the Secretary of State for Health, with the consent of HM Treasury, and consideration of the advice of the Scheme Actuary and appropriate employee and employer representatives as deemed appropriate.
The next actuarial valuation is to be carried out as at 31 March 2016. This will set the employer contribution rate payable from April 2019 and will consider the cost of the Scheme relative to the employer cost cap. There are provisions in the Public Service Pension Act 2013 to adjust member benefits or contribution rates if the cost of the Scheme changes by more than 2% of pay. Subject to this ‘employer cost cap’ assessment, any required revisions to member benefits or contribution rates will be determined by the Secretary of State for Health after consultation with the relevant stakeholders.
b) Accounting valuationA valuation of scheme liability is carried out annually by the scheme actuary (currently the Government Actuary’s Department) as at the end of the reporting period. This utilises an actuarial assessment for the previous accounting period in conjunction with updated membership and financial data for the current reporting period, and are accepted as providing suitably robust figures for financial reporting purposes. The valuation of scheme liability as at 31 March 2017, is based on valuation data as 31 March 2016, updated to 31 March 2017 with summary global member and accounting data. In undertaking this actuarial assessment, the methodology prescribed in IAS 19, relevant FReM interpretations, and the discount rate prescribed by HM Treasury have also been used.
The latest assessment of the liabilities of the scheme is contained in the scheme actuary report, which forms part of the annual NHS Pension Scheme (England and Wales) Pension Accounts. These accounts can be viewed on the NHS Pensions website and are published annually. Copies can also be obtained from The Stationery Office.
Civil Service Pension SchemeSome past and present employees are covered by the provisions of the Civil Service Pension Scheme (CSPS). The defined benefit elements of the scheme are unfunded and non-contributory except in respect of dependents' benefits. The Authority recognises the expected costs of these elements on a systematic and rational basis over the period during which it benefits from employees' services by payment to the CSPS of amounts calculated on an accruing basis. Liability for payment of future benefits is a charge on the CSPS. In respect of the defined contribution elements of the scheme, the Authority recognises the contributions payable for the year.

99
Account of NHS Business Services Authority 2016-17
4.1 Intangible assets
4.1.1 Intangible assets 2016-17Software licences
Information Technology
Development Expenditure Total
£000 £000 £000 £000
Gross cost at 1 April 2016 3,901 80,357 2,683 86,941Additions - purchased 3,878 1,090 4,503 9,471Reclassifications 0 2,617 (2,617) 0Disposals (427) (3,510) 0 (3,937)Gross cost at 31 March 2017 7,352 80,554 4,569 92,475AmortisationAccumulated amortisation at 1 April 2016 1,032 44,957 0 45,989Charged during the year 1,498 10,453 0 11,951Disposals (427) (3,510) 0 (3,937)Accumulated amortisation at 31 March 2017 2,103 51,900 0 54,003
Net book value at 31 March 2016 2,869 35,400 2,683 40,952
Net book value at 31 March 2017 5,249 28,654 4,569 38,472
4.1.2 Intangible assets 2015-16
Software licences
Information Technology
Development Expenditure Total
£000 £000 £000 £000
Gross cost at 1 April 2015 3,846 85,486 18,942 108,274Additions - purchased 532 571 5,183 6,286Reclassifications 196 21,235 (21,442) (11)Disposals (673) (26,935) 0 (27,608)Gross cost at 31 March 2016 3,901 80,357 2,683 86,941
Amortisation:Accumulated amortisation at 1 April 2015 715 62,117 0 62,832Charged during the year 990 9,775 0 10,765Disposals (673) (26,935) 0 (27,608)Accumulated amortisation at 31 March 2016 1,032 44,957 0 45,989
Net book value at 31 March 2015 3,131 23,369 18,942 45,442
Net book value at 31 March 2016 2,869 35,400 2,683 40,952
Supply Chain and Bursaries had no Intangible assets during the accounting period (2016-17 - £Nil)

100
Account of NHS Business Services Authority 2016-17
4.2 Property, Plant and Equipment
4.2.1 Property, Plant and Equipment 2016/17Land Buildings Plant & Transport Information Furniture Total
excluding machinery equipment technology & fittingsdwellings
£000 £000 £000 £000 £000 £000 £000
Cost or Valuation at 1 April 2016 4,934 24,553 422 11 35,474 8,250 73,644Additions - purchased 0 473 0 0 4,175 0 4,648Reclassifications 0 0 0 0 0 0 0Disposals 0 (463) (101) 0 (17,831) (1,363) (19,758)Revaluation 0 0 0 0 0 0 0Gross cost at 31 March 2017 4,934 24,563 321 11 21,818 6,887 58,534
DepreciationAccumulated depreciation at 1 April 2016 0 6,547 255 11 27,510 3,902 38,225Reclassifications 0 0 0 0 0 0 0Disposals 0 (463) (101) 0 (17,831) (1,363) (19,758)Impairments 0 0 0 0 0 0 0Charged during the year 0 1,413 70 0 3,118 1,425 6,026Accumulated depreciation at 31 March 2017 0 7,497 224 11 12,797 3,964 24,493
Net book value at 31 March 2016 4,934 18,006 167 0 7,964 4,348 35,419
Net book value at 31 March 2017 4,934 17,066 97 0 9,021 2,923 34,041
4.2.2 Property, Plant and Equipment 2015/16Land Buildings Plant & Transport Information Furniture Total
excluding machinery equipment technology & fittingsdwellings
£000 £000 £000 £000 £000 £000 £000
Cost or Valuation at 1 April 2015 4,934 23,111 2,517 35 34,603 7,154 72,354Additions - purchased 0 2,117 0 0 4,137 1,650 7,904Reclassifications 0 0 0 0 11 0 11Disposals 0 (675) (2,095) (24) (3,277) (554) (6,625)Revaluation 0 0 0 0 0 0 0Gross cost at 31 March 2016 4,934 24,553 422 11 35,474 8,250 73,644
DepreciationAccumulated depreciation at 1 April 2015 0 5,724 2,252 35 28,318 3,112 39,441Reclassifications 0 0 0 0 0 0 0Disposals 0 (675) (2,095) (24) (3,277) (554) (6,625)Impairments 0 0 0 0 0 0 0Charged during the year 0 1,498 98 0 2,469 1,344 5,409Accumulated depreciation at 31 March 2016 0 6,547 255 11 27,510 3,902 38,225
Net book value at 31 March 2015 4,934 17,387 265 0 6,285 4,042 32,913
Net book value at 31 March 2016 4,934 18,006 167 0 7,964 4,348 35,419
Supply Chain and Bursaries had no Property, Plant and Equipment during the accounting period (2015-16 - £Nil)

101
Account of NHS Business Services Authority 2016-17
4.2 Property, Plant and Equipment (continued)
4.2.3 Economic Lives of Non-current Assets
Min Life Max LifeIntangible assets Years YearsSoftware licences 1 5Information technology 5 5
Property, Plant and EquipmentBuildings excl. dwellings 3 65Plant & machinery 5 10Transport equipment 5 7Information technology 5 8Furniture & fittings 5 10
4.2.4 Impairments
a) Impairments charged in the year to the Statement of Comprehensive Net Expenditure
Property, plant and
equipmentIntangible
assetsProperty, plant and equipment
Intangible assets
£000 £000 £000 £000Impairments arose from:
0 0 0 0Total 0 0 0 0
b) Impairments charged in the year to the revaluation reserve
Property, plant and
equipmentIntangible
assetsProperty, plant &
equipmentIntangible
assets£000 £000 £000 £000
0 0 0 0
2015-16
Charged to the revaluation reserve:
2016-17 2015-16
Enhancement expenditure written off on revaluation
2016-17

102
Account of NHS Business Services Authority 2016-17
4.3 Financial Assets
Supply Chain
Working Capital
Supply Chain
Working Capital
2016-17 2015-16£000 £000
Value at 1 April 89,970 172,581Additions 0 40,000Disposals 0 (120,632)Changes in carrying value 1,979 (1,979)Value at 31 March 91,949 89,970
The asset is classified as 'loans and receivables' (Note 9) and carried at amortised cost, calculated using the effective interest method. Changes in carrying value during the year are taken to operating expenditure (Note 3.2).
The working capital is due to be repaid to NHSBSA on or before the end of the outsourced arrangement on 30 September 2018. The total amount now due is £95,000k (2016 - £95,000k) and the carrying value has been calculated on the assumption that the whole amount will be repaid on 30 September 2018. Any change in assumption around the repayment date would result in an increase in the carrying value up to a maximum of £95,000k.
Up until 30 September 2015, the working capital was split into two elements; consumables and capital, which were interest bearing and non-interest bearing respectively. Following a renegotiation of the contract, the consumables element of £100,632k was returned to NHSBSA control from 1st October 2015, leaving only the capital element of £115,000k outstanding. A repayment of £20,000k was received in March 2016 leaving the amount due at £95,000k.
The above asset represents the working capital loaned to the outsourced provider to run the NHS Supply Chain capital service.

103
Account of NHS Business Services Authority 2016-17
4.4 Inventories
31 March 2017 31 March 2016£000 £000
Opening balance 76,790 0Additions 1,446,596 788,903Cost of sales (1,444,230) (712,113)Closing balance 79,156 76,790
All inventories relate to Supply Chain goods held for resale
4.5 Receivables31 March 2017 31 March 2016
£000 £000Trade receivables 117,202 108,114Provision for impairment of receivables (1,595) (1,600)Prepayments and accrued income 22,891 35,864Other receivables 40,184 22,105Trade and other receivables 178,682 164,483
Segmental splitSupply Chain 157,089 151,026Service Provision 16,505 9,436Bursaries 5,088 4,021
178,682 164,483
There are no non-current receivables (2016 - Nil)
Current

104
Account of NHS Business Services Authority 2016-17
4.6 Cash and Cash equivalents
2016-17 2015-16£000 £000
Balance at 1 April 31,860 26,835Net change in the year 23,132 5,025Balance at 31 March 54,992 31,860
Comprising:31 March 2017 31 March 2016
£000 £000Held with the Government Banking Service 54,991 31,859Commercial banks and cash in hand 1 1Cash and Cash equivalents as in Statement of financial position 54,992 31,860Bank overdraft 0 0Cash and Cash equivalents 54,992 31,860
Segmental splitSupply Chain 34,897 6,480Service Provision 17,178 22,043Bursaries 2,917 3,337
54,992 31,860
4.7 Trade and other payables
31 March 2017 31 March 2016£000 £000
Trade payables 85,721 59,863Tax and social security 46 1Accruals and deferred income 20,125 20,719Other payables 67,589 52,727Trade and other payables 173,481 133,310
Segmental splitSupply Chain 147,703 110,921Service Provision 23,270 19,905Bursaries 2,508 2,484
173,481 133,310
There are no non-current trade and other payables (2016 - Nil)
Current

105
Account of NHS Business Services Authority 2016-17
4.8 Provisions for liabilities and charges
31 March 2017 31 March 2016£000 £000
Pensions relating to other staff 1 4Legal claims 89 61Other 2,711 2,167Total 2,801 2,232
31 March 2017 31 March 2016£000 £000
Pensions relating to other staff 0 0Legal claims 31 32Other 573 573Total 604 605
Segmental splitSupply Chain 0 0Service Provision 694 749Bursaries 2,711 2,088
3,405 2,837
Pensions Legal Other Totalrelating to claims
otherstaff£000 £000 £000 £000
At 1 April 2015 15 118 652 785Arising during the year 0 10 2,088 2,098Utilised during the year (11) (2) 0 (13)Reversed unused 0 (33) 0 (33)At 1 April 2016 4 93 2,740 2,837Arising during the year 6 78 2,193 2,277Utilised during the year (9) (9) (1,104) (1,122)Reversed unused 0 (42) (545) (587)At 31 March 2017 1 120 3,284 3,405
Expected timing of cash-flows:Within one year 1 89 2,711 2,801Later than one year and not later than five years 0 6 573 579Later than five years 0 25 0 25
Contingencies at 31 March 2017
At 31 March 2017, there were no known contingent assets or liabilities (March 2016: £nil).
Other provisions at 31 March 2017 relate to Leasehold Property Decommissioning, based on professional valuations (£573k), and Social Work Bursary tuition fee entitlement (£2,711k).
Current
Non-current

106
Account of NHS Business Services Authority 2016-17
4.9 Events after the reporting period
4.10 Capital commitments
The Authority had contracted capital commitments as at 31 Marchfor which no provision has been made:
31 March 2017 31 March 2016£000 £000
Property, plant and equipment 0 3,474Intangible assets 544 2,942Total 544 6,416
The Accounts were authorised for issue on xx June 2017 by the NHSBSA Chief Executive and Accounting Officer.
The only event to report after the reporting period is the planned transfer of NHS Protect functions to a new DH ALB during 2017/18. It is proposed that this will be known as the NHS Counter Fraud Authority (NHSCFA). Planning work is underway pending due Parliamentary process through a statutory instrument.
The Accounts were authorised for issue by the Accounting Officer on the date of the Audit Certificate of the Comptroller and Auditor General.

107
Account of NHS Business Services Authority 2016-17
5.1 Movements in working capital 2016-17 2015-16
£000 £000
(Increase)/decrease in receivables within 1 year (14,199) 9,453(Increase)/decrease in inventories (2,366) 278Increase/(decrease) in payables within 1 year 40,171 (70,898)Total 23,606 (61,167)
5.2 Analysis of changes in net debtAs at 1 Cash As at 1 Cash As at 31
April 2015 flows April 2016 flows March 2017£000 £000 £000 £000 £000
GBS cash at bank 26,834 5,025 31,859 23,132 54,991Commercial cash at bank and in hand 1 0 1 0 1Bank overdraft (7) 7 0 0 0Total 26,828 5,032 31,860 23,132 54,992
5.3 Other cash flow adjustments 2016-17 2015-16£000 £000
Depreciation 6,026 5,409Amortisation 11,951 10,765Change in carrying value of Financial Assets (1,979) 1,979Notional Costs 95 90Interest Received 0 (2,486)Provisions - Arising in Year 2,277 2,098Provisions - Reversed unused (587) (33)Total 17,783 17,822
The above comparative movements for 2015-16 are net of balances received on taking control of the Supply Chain consumables business on 1st October 2015 - see note 4.3

108
Account of NHS Business Services Authority 2016-17
6. Losses and special paymentsLosses and special payments are now disclosed in the main body of the Annual Report on page 65.
7. Related Party Transactions
8. Other commitments
The Authority has entered into a non-cancellable contract for the provision of contracted out Dental and IT infrastructure services totalling £20,049k (2016: £8,908k) over the remaining 21 months as at 31 March 2017. £11,341k (2016: £8,908k) of this commitment is payable within one year.
The Authority is a body corporate established by order of the Secretary of State for Health.
The Department of Health is regarded as a related party. During the year the Authority had a significant number of material transactions with the Department and with other entities for which the Department is regarded as the parent Department including NHS England, Public Health England, Health Education England and NHS Trusts and Foundation Trusts.
During the year none of the Department of Health Ministers, Authority board members or members of the key management staff, or parties related to any of them, has undertaken any material transactions with NHSBSA. Compensation paid to directors has been disclosed in the Remuneration Report.
The Authority has entered into non-cancellable contracts (which are not operating leases) for the provision of contracted out Pensions and IT services totalling £10,092k over the remaining 16 months as at 31 March 2017. (2016: £15,244k). £7,837k (2016: £11,328k) of this commitment is payable within one year.

109
Account of NHS Business Services Authority 2016-17
9. Financial Instruments
Financial risk management
Currency risk
Interest rate risk
Credit Risk
Liquidity Risk
9.1 Financial AssetsAt ‘fair value
through profit and loss’
Loans and receivables
Available for sale
Total
£000 £000 £000 £000
Trade receivables 0 107,566 0 107,566Other receivables 0 21,053 0 21,053Cash at bank and in hand 0 31,860 0 31,860Other financial assets 0 120,487 0 120,487Total at 31 March 2016 0 280,966 0 280,966
Trade receivables 0 117,202 0 117,202Other receivables 0 38,589 0 38,589Cash at bank and in hand 0 54,992 0 54,992Other financial assets 0 108,670 0 108,670Total at 31 March 2017 0 319,453 0 319,453
9.2 Financial Liabilities
At ‘fair value through profit
and loss’
Other Total
£000 £000 £000Trade Payables 0 59,863 59,863Other payables 0 52,728 52,728Borrowings 0 0 0Other financial liabilities 0 23,216 23,216Total at 31 March 2016 0 135,807 135,807
Trade Payables 0 85,721 85,721Other payables 0 67,635 67,635Borrowings 0 0 0Other financial liabilities 0 19,847 19,847Total at 31 March 2017 0 173,203 173,203
Financial reporting standard IFRS 7 requires disclosure of the role that financial instruments have had during the period in creating or changing the risks a body faces in undertaking its activities. As the cash requirements of the Authority are met primarily through Parliamentary Funding, financial instruments play a more limited role in creating risk that would apply to a non-public sector body of a similar size. The majority of financial instruments relate to contracts for non-financial items in line with the Authority’s expected purchase and usage requirements and the Authority is therefore exposed to little credit, liquidity or market risk.
The Authority is principally a domestic organisation with the great majority of transactions, assets and liabilities being in the UK and Sterling based. The Authority has no overseas operations. The Authority therefore has low exposure to currency rate fluctuations.
All of the Authority's financial assets and financial liabilities carry nil or fixed rates of interest. The Authority is not, therefore, exposed to significant interest-rate risk.
Because the majority of the Authority’s income comes from funds voted by Parliament and from other NHS bodies the Authority has low exposure to credit risk. The credit risk associated with Supply Chain working capital is assessed as low due to the controls and governance in place to manage the risk.
The Authority's net operating costs are financed from resources voted annually by Parliament. The Authority largely finances its capital expenditure from funds made available from Government under an agreed capital resource limit. The Authority is not, therefore, exposed to significant liquidity risks.

110
Account of NHS Business Services Authority 2016-17
9 Financial Instruments (continued)
9.3 Maturity of financial liabilities
31 March 2017 31 March 2016£000 £000
In one year or less 172,630 135,234In more than one year but not more than five years 573 573In more than five years 0 0Total 173,203 135,807
9.4 Fair valuesFair values of financial assets and liabilities do not differ from the carrying amounts.
