annual report and accounts 2012 - unilever … to the annual report and accounts this pdf version of...
TRANSCRIPT
DISCLAIMER
Notes to the Annual Report and Accounts This PDF version of the Unilever Annual Report and Accounts 2012 is an exact copy of the document provided to Unilever’s shareholders.
Certain sections of the Unilever Annual Report and Accounts 2012 have been audited. These are on pages 86 to 131, 133 to 136, 139 to 141, and those parts noted as audited within the Directors’ Remuneration Report on pages 77 to 81.
The maintenance and integrity of the Unilever website is the responsibility of the Directors; the work carried out by the auditors does not involve consideration of these matters. Accordingly, the auditors accept no responsibility for any changes that may have occurred to the financial statements since they were initially placed on the website.
Legislation in the United Kingdom and the Netherlands governing the preparation and dissemination of financial statements may differ from legislation in other jurisdictions.
Disclaimer Except where you are a shareholder, this material is provided for information purposes only and is not, in particular, intended to confer any legal rights on you.
This Annual Report and Accounts does not constitute an invitation to invest in Unilever shares. Any decisions you make in reliance on this information are solely your responsibility.
The information is given as of the dates specified, is not updated, and any forward-looking statements are made subject to the reservations specified on the final page of the Report.
Unilever accepts no responsibility for any information on other websites that may be accessed from this site by hyperlinks.
UNILEVERAN
NUAL REPORT AN
D ACCOUNTS 2012
Making sustainable living com
monplace
ANNUAL REPORT AND ACCOUNTS 2012
MAKING SUSTAINABLE LIVING COMMONPLACE
UNILEVER N.V.Weena 455, PO Box 7603000 DK RotterdamThe NetherlandsT +31 (0)10 217 4000F +31 (0)10 217 4798
Commercial Register RotterdamNumber: 24051830
UNILEVER PLCUnilever House100 Victoria EmbankmentLondon EC4Y 0DYUnited KingdomT +44 (0)20 7822 5252F +44 (0)20 7822 5951
UNILEVER PLC REGISTERED OFFICEUnilever PLCPort SunlightWirralMerseyside CH62 4ZDUnited Kingdom
Registered in England and WalesCompany Number: 41424
For further information on our social, economic and environmental performance, please visit our website
WWW.UNILEVER.COM

BEN & JERRY’SMakes great ice cream while supporting suppliers around the world through its commitment to achieving Fairtrade certification for every flavour by the end of 2013.
DOVEHelps women to realise their personal potential for beauty and encourages men to take better care of themselves by engaging them with products that deliver superior care.
OUR PURPOSETO MAKE SUSTAINABLE LIVING COMMONPLACEWe work to create a better future every day, with brands and services that help people feel good, look good and get more out of life.
Our first priority is to our consumers – then customers, employees, suppliers and communities. When we fulfil our responsibilities to them, we believe that our shareholders will be rewarded.
PUREITImproves lives by providing people with safe, affordable drinking water where supplies are of poor quality, without the need for gas, electricity or a pressurised water supply.
OUR BRANDS IN ACTION UNILEVER OWNS SOME OF THE WORLD’S BEST KNOWN AND BEST LOVED BRANDS. TO FIND OUT MORE GO TO WWW.UNILEVER.COM/BRANDS-IN-ACTION.
KNORRProvides great tasting, nutritious meals for families every day while funding sustainability projects for suppliers and smallholder farmers through its €1 million Sustainability Partnership Fund.
OMO/PERSILIs concentrating liquid detergents, to deliver tough stain-removing performance, while using less water and energy in manufacture and transportation.
ABOUT UNILEVER
EXAMPLES OF OUR PURPOSE DRIVEN BRANDS
Cautionary statementThis document may contain forward-looking statements, including ‘forward-looking statements’ within the meaning of the United States Private Securities Litigation Reform Act of 1995. Words such as ‘will’, ‘aim’, ‘expects’, ‘anticipates’, ‘intends’, ‘looks’, ‘believes’, ‘vision’, or the negative of these terms and other similar expressions of future performance or results, and their negatives, are intended to identify such forward-looking statements. These forward-looking statements are based upon current expectations and assumptions regarding anticipated developments and other factors affecting the Group. They are not historical facts, nor are they guarantees of future performance.
Because these forward-looking statements involve risks and uncertainties, there are important factors that could cause actual results to differ materially from those expressed or implied by these forward-looking statements. Among other risks and uncertainties, the material or principal factors which cause actual results to differ materially are: Unilever’s global brands not meeting consumer preferences; increasing competitive pressures; Unilever’s investment choices in its portfolio management; inability to find sustainable solutions to support long-term growth; customer relationships; the recruitment and retention of talented employees; disruptions in our supply chain; the cost of raw materials and commodities; secure and reliable IT infrastructure; successful execution of acquisitions, divestitures and business transformation projects; economic and political risks and natural disasters; the debt crisis in Europe; financial risks; failure to meet high product safety and ethical standards; and managing regulatory, tax and legal matters. Further details of potential risks and uncertainties affecting the Group are described in the Group’s filings with the London Stock Exchange, Euronext Amsterdam and the US Securities and Exchange Commission, including the Group’s Annual Report on Form 20-F for the year ended 31 December 2012 and the Annual Report and Accounts 2012. These forward-looking statements speak only as of the date of this announcement. Except as required by any applicable law or regulation, the Group expressly disclaims any obligation or undertaking to release publicly any updates or revisions to any forward-looking statements contained herein to reflect any change in the Group’s expectations with regard thereto or any change in events, conditions or circumstances on which any such statement is based.
This document is not prepared in accordance with US GAAP and should not therefore be relied upon by readers as such. The Group’s Annual Report on Form 20-F for 2012 is separately filed with the US Securities and Exchange Commission and is available on our corporate website www.unilever.com. Any information on or linked from our or third-party websites is not incorporated by reference into this document or the Annual Report on Form 20-F. In addition, a printed copy of the Annual Report on Form 20-F is available, free of charge, upon request to Unilever PLC, Investor Relations Department, Unilever House, 100 Victoria Embankment, London EC4Y 0DY, United Kingdom.
Designed and produced by Unilever Communications in conjunction with Addison at www.addison.co.uk.Photography by Oliver Edwards, Igor Emmerich, Philip Gatward, Michael Heffernan, Chris Moyse, Rian Ardi Wakito, Martin Wanyoike, The Pack Shot Company and from the Unilever image library.
Printed at Pureprint Group, ISO 14001. FSC® certified and CarbonNeutral®.
This document forms part of the Unilever Annual Report and Accounts 2012 suite of documents and is printed on Amadeus 100% Recycled Silk. This has been exclusively supplied by Denmaur Independent Papers which has offset the carbon produced by the production and delivery of this paper to the printer.
The paper contains 100% recycled content, of which 100% is de-inked post-consumer waste. All of the pulp is bleached using an elemental chlorine free process (ECF). Printed in the UK by Pureprint using its alcofree® and pureprint® environmental printing technology, and vegetable inks were used throughout. Pureprint is a CarbonNeutral® company. Both manufacturing mill and the printer are registered to the Environmental Management System ISO 14001 and are Forest Stewardship Council® (FSC) chain-of-custody certified. If you have finished with this document and no longer wish to retain it, please pass it on to other interested readers or dispose of it in your recycled paper waste. Thank you.

Our Annual Report and Accounts 2012 is
complemented by: 1) The Unilever Sustainable
Living Plan: Progress Report 2012, a printed report outlining
performance against our USLP targets for the period
1 January-31 December 2012, to be published in April 2013; and
2) The online Unilever Sustainable Living Report for 2012, which covers
our USLP targets, the scope of our assurance programme and a wealth of
information on our approach to running a responsible business.
See www.unilever.com/sustainable-living
Other information The brand names shown in this report are trademarks owned by or
licensed to companies within the Unilever Group. This document contains certain statements that are neither reported financial results
nor other historical information. These statements are forward-looking statements, including within the meaning of the United States Private
Securities Litigation Reform Act of 1995. Actual results may differ materially from those disclosed in our forward-looking statements. For a description of
factors that could affect future results, reference should be made to the full ‘Cautionary statement’ on the inside back cover and to the section entitled ‘Risks’
on pages 36 to 41. For information about our non-GAAP measures, see pages 34 and 35. In our report we make reference to Unilever’s and other third-party
websites, and to social media sites. Information on websites and/or social media sites is not incorporated herein and does not form part of this document. This Annual Report
comprises regulated information within the meaning of sections 1:1 and 5:25c of the Act on Financial Supervision (“Wet op het financieel toezicht (Wft)”) in the Netherlands.
1Report of the Directors About Unilever
ABOUT UNILEVER GOVERNANCE FINANCIAL STATEMENTS SHAREHOLDER INFORMATION
2 Chairman’s statement4 Chief Executive Officer’s review6 Operational highlights8 Our Compass strategy9 Our business model10 Unilever Sustainable Living Plan12 Winning with brands and innovation16 Winning in the market place20 Winning through continuous improvement24 Winning with people28 Financial review 201236 Risks
42 Biographies44 Corporate governance56 Report of the Audit Committee58 Report of the Corporate
Responsibility Committee60 Report of the Nominating and
Corporate Governance Committee62 Directors’ Remuneration Report
83 Statement of Directors’ responsibilities84 Auditors’ reports86 Consolidated income statement87 Consolidated statement of
comprehensive income87 Consolidated statement of changes
in equity88 Consolidated balance sheet89 Consolidated cash flow statement90 Notes to the consolidated
financial statements132 Company accounts
144 Financial calendar144 Contact details145 Website145 Share registration145 Publications148 Index
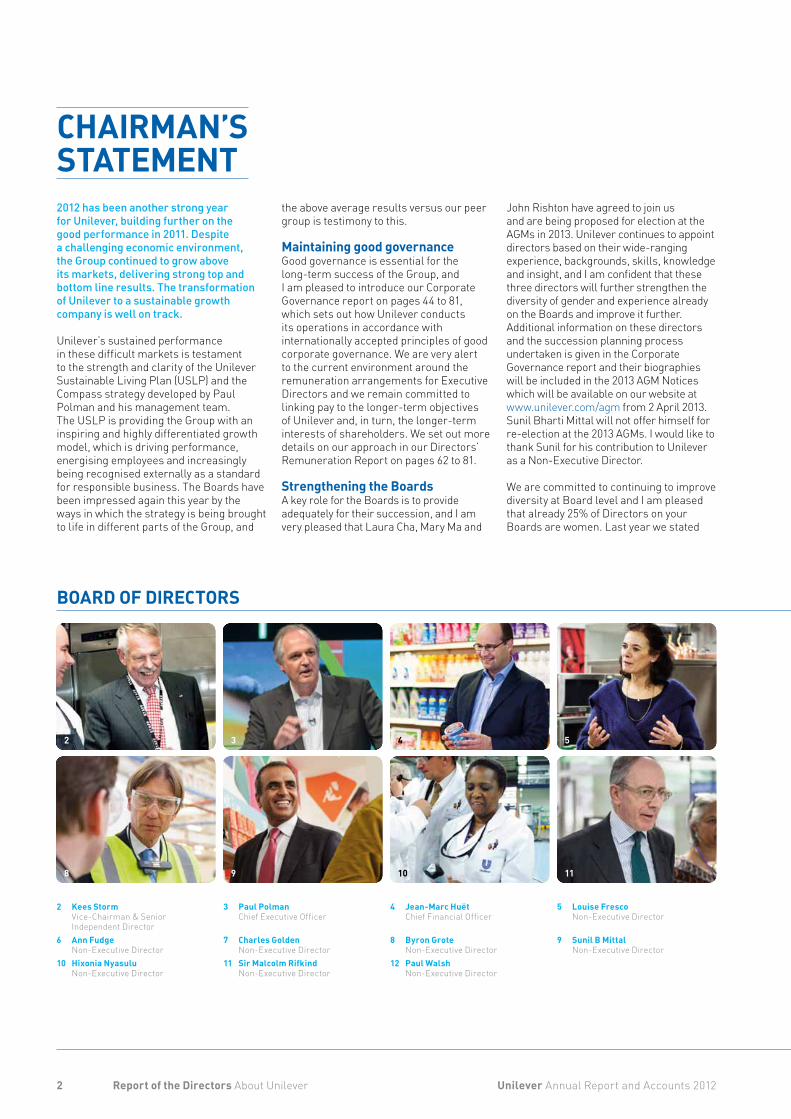
2012 has been another strong year for Unilever, building further on the good performance in 2011. Despite a challenging economic environment, the Group continued to grow above its markets, delivering strong top and bottom line results. The transformation of Unilever to a sustainable growth company is well on track. Unilever’s sustained performance in these difficult markets is testament to the strength and clarity of the Unilever Sustainable Living Plan (USLP) and the Compass strategy developed by Paul Polman and his management team. The USLP is providing the Group with an inspiring and highly differentiated growth model, which is driving performance, energising employees and increasingly being recognised externally as a standard for responsible business. The Boards have been impressed again this year by the ways in which the strategy is being brought to life in different parts of the Group, and
the above average results versus our peer group is testimony to this.
Maintaining good governanceGood governance is essential for the long-term success of the Group, and I am pleased to introduce our Corporate Governance report on pages 44 to 81, which sets out how Unilever conducts its operations in accordance with internationally accepted principles of good corporate governance. We are very alert to the current environment around the remuneration arrangements for Executive Directors and we remain committed to linking pay to the longer-term objectives of Unilever and, in turn, the longer-term interests of shareholders. We set out more details on our approach in our Directors’ Remuneration Report on pages 62 to 81.
Strengthening the BoardsA key role for the Boards is to provide adequately for their succession, and I am very pleased that Laura Cha, Mary Ma and
John Rishton have agreed to join us and are being proposed for election at the AGMs in 2013. Unilever continues to appoint directors based on their wide-ranging experience, backgrounds, skills, knowledge and insight, and I am confident that these three directors will further strengthen the diversity of gender and experience already on the Boards and improve it further. Additional information on these directors and the succession planning process undertaken is given in the Corporate Governance report and their biographies will be included in the 2013 AGM Notices which will be available on our website at www.unilever.com/agm from 2 April 2013. Sunil Bharti Mittal will not offer himself for re-election at the 2013 AGMs. I would like to thank Sunil for his contribution to Unilever as a Non-Executive Director.
We are committed to continuing to improve diversity at Board level and I am pleased that already 25% of Directors on your Boards are women. Last year we stated
2 Kees Storm Vice-Chairman & Senior Independent Director
6 Ann Fudge Non-Executive Director
10 Hixonia Nyasulu Non-Executive Director
4 Jean-Marc Huët Chief Financial Officer
8 Byron Grote Non-Executive Director
12 Paul Walsh Non-Executive Director
3 Paul Polman Chief Executive Officer
7 Charles Golden Non-Executive Director
11 Sir Malcolm Rifkind Non-Executive Director
5 Louise Fresco Non-Executive Director
9 Sunil B Mittal Non-Executive Director
2 Unilever Annual Report and Accounts 2012Report of the Directors About Unilever
CHAIRMAN’S STATEMENT
BOARD OF DIRECTORS
2 3 4 5
8 9 10 11
our aim to increase that percentage, and the introduction of these Non-Executive Directors, should they be elected, will achieve this.
Board evaluationFollowing the external evaluation in 2011, our internal process this year suggested minor recommendations to the operation of the Boards and confirmed that no major modifications were required. The process concluded that overall the Boards continued to operate in an effective manner. More information on previous evaluations and this year’s agreed actions is found within the Corporate Governance report.
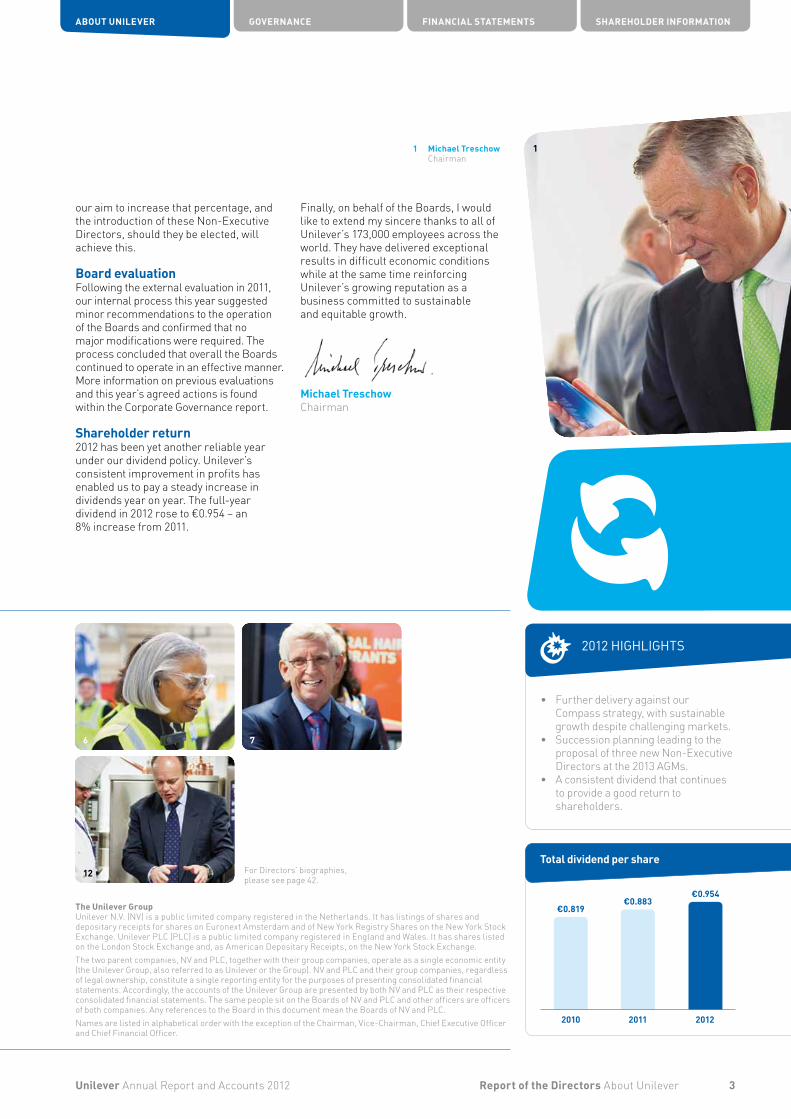
Shareholder return2012 has been yet another reliable year under our dividend policy. Unilever’s consistent improvement in profits has enabled us to pay a steady increase in dividends year on year. The full-year dividend in 2012 rose to €0.954 – an 8% increase from 2011.
Finally, on behalf of the Boards, I would like to extend my sincere thanks to all of Unilever’s 173,000 employees across the world. They have delivered exceptional results in difficult economic conditions while at the same time reinforcing Unilever’s growing reputation as a business committed to sustainable and equitable growth.
Michael Treschow Chairman
The Unilever Group Unilever N.V. (NV) is a public limited company registered in the Netherlands. It has listings of shares and depositary receipts for shares on Euronext Amsterdam and of New York Registry Shares on the New York Stock Exchange. Unilever PLC (PLC) is a public limited company registered in England and Wales. It has shares listed on the London Stock Exchange and, as American Depositary Receipts, on the New York Stock Exchange.The two parent companies, NV and PLC, together with their group companies, operate as a single economic entity (the Unilever Group, also referred to as Unilever or the Group). NV and PLC and their group companies, regardless of legal ownership, constitute a single reporting entity for the purposes of presenting consolidated financial statements. Accordingly, the accounts of the Unilever Group are presented by both NV and PLC as their respective consolidated financial statements. The same people sit on the Boards of NV and PLC and other officers are officers of both companies. Any references to the Board in this document mean the Boards of NV and PLC.Names are listed in alphabetical order with the exception of the Chairman, Vice-Chairman, Chief Executive Officer and Chief Financial Officer.
For Directors’ biographies, please see page 42.
1 Michael Treschow Chairman
• Further delivery against our Compass strategy, with sustainable growth despite challenging markets.
• Succession planning leading to the proposal of three new Non-Executive Directors at the 2013 AGMs.
• A consistent dividend that continues to provide a good return to shareholders.
3Unilever Annual Report and Accounts 2012 Report of the Directors About Unilever
ABOUT UNILEVER GOVERNANCE FINANCIAL STATEMENTS SHAREHOLDER INFORMATION
BOARD OF DIRECTORS
2012 HIGHLIGHTS
6 7
1
12
1 Paul Polman∆ Chief Executive Officer
Unilever transformation on track
Our prediction that 2012 would be another challenging year for the global economy turned out to be accurate. We saw continued volatility in the world’s markets resulting in commodity cost rises significantly in excess of expectations. The threat of the world’s largest economy going over a ‘fiscal cliff’ and the euro crisis added uncertainty and undermined fragile consumer confidence.
Overall it is a ‘bi-polar’ economic world – one of sluggish growth in most developed markets contrasted by still relatively healthy consumption and growth in emerging markets.
Simultaneously we are facing challenges to the world’s social and environmental equilibrium. Growing issues of inequality and rising levels of unemployment – especially among young people – place added strains on social cohesion. But the biggest challenge is the continuing threat to ‘planetary boundaries’, resulting in extreme weather patterns and growing resource constraints. These have an increasing impact on our business.
Volatility and uncertainty – the new normalWe remain convinced that businesses that both address the direct concerns of citizens and the needs of the environment will prosper over the long term. Companies need to show leadership to rebuild citizens’ trust – currently at an all time low. This thinking lies at the heart of the Unilever Sustainable Living Plan (USLP) and our Compass vision of doubling the business while reducing our environmental footprint and increasing our positive social impact. As it becomes embedded, there is growing evidence that it is also accelerating our growth. It certainly contributed to another strong year for Unilever in 2012.
Strong business performance in 2012Turnover increased by 10.5%, taking Unilever through the €50 billion barrier, a significant milestone to becoming an €80 billion company. We have grown by nearly 30% in just four years. Growth was broad based – across all our markets and categories – and high quality, with a good balance of price and volume. Emerging markets continued to be the prime engine, growing for the second consecutive year by more than 11% and now accounting for 55% of total business.
Growth was ahead of our markets, with approximately 60% of the business gaining share. Personal Care and Home Care showed double digit growth, in line with our strategic priorities.
Despite commodity cost increases of over €1.5 billion, and the heavy investments made in supporting our brands, growth was profitable, with 0.3% improvement in core operating margin to 13.8%.
High impact innovations, rolled out globally at speed, continue to be key growth drivers. With the addition of Magnum and Sunsilk last year, we now have 14 brands with sales of more than €1 billion a year, and these brands accounted for almost 50% of Unilever’s growth in 2012. We delivered on our white space market strategy too. The launch of TRESemmé in Brazil last year was one of Unilever’s most successful ever, adding almost €150 million in turnover.
We continue to strengthen our portfolio, thanks to strategic acquisitions since 2011 in Personal Care – including Sara Lee, Alberto Culver and Kalina in Russia – and disposal of several slower-growing businesses, notably in Foods. This combination added over 1% to turnover growth in 2012.
The delivery of the Compass strategy and the embedding of the USLP are not only benefiting citizens and communities but also shareholders who have seen a Total Shareholder Return (TSR) of close to 100% over the past four years.
The year aheadWe expect 2013 and beyond to be as difficult and challenging. We believe this further validates our Compass strategy with the USLP at its heart. Re-establishing trust with citizens and meeting the needs of society will be the keys to ongoing success. Our brands should be a force for good in addressing global challenges – be it access to water, hygiene and sanitation or sustainable and nutritious food.
For example, the Lifebuoy handwashing campaigns target one of the biggest killers of children under five – diarrhoea. Domestos is helping improve sanitation in some of the most impoverished parts of the world through a combination of educational programmes and simply the building of toilets. Pureit is bringing safe drinking water to an increasing number of people. Dove is addressing one of the biggest issues facing adolescent girls around the world, self-esteem. Through our sustainable sourcing programmes, Rainforest Alliance certification of Lipton tea and Knorr’s Sustainability Partnership Fund, we are helping to improve the livelihoods of farmers and helping to guarantee future supplies. As our ambitions are high, working in partnership with others is key to delivery.
Unilever Annual Report and Accounts 20124
CHIEF EXECUTIVE OFFICER’S REVIEW
1
•
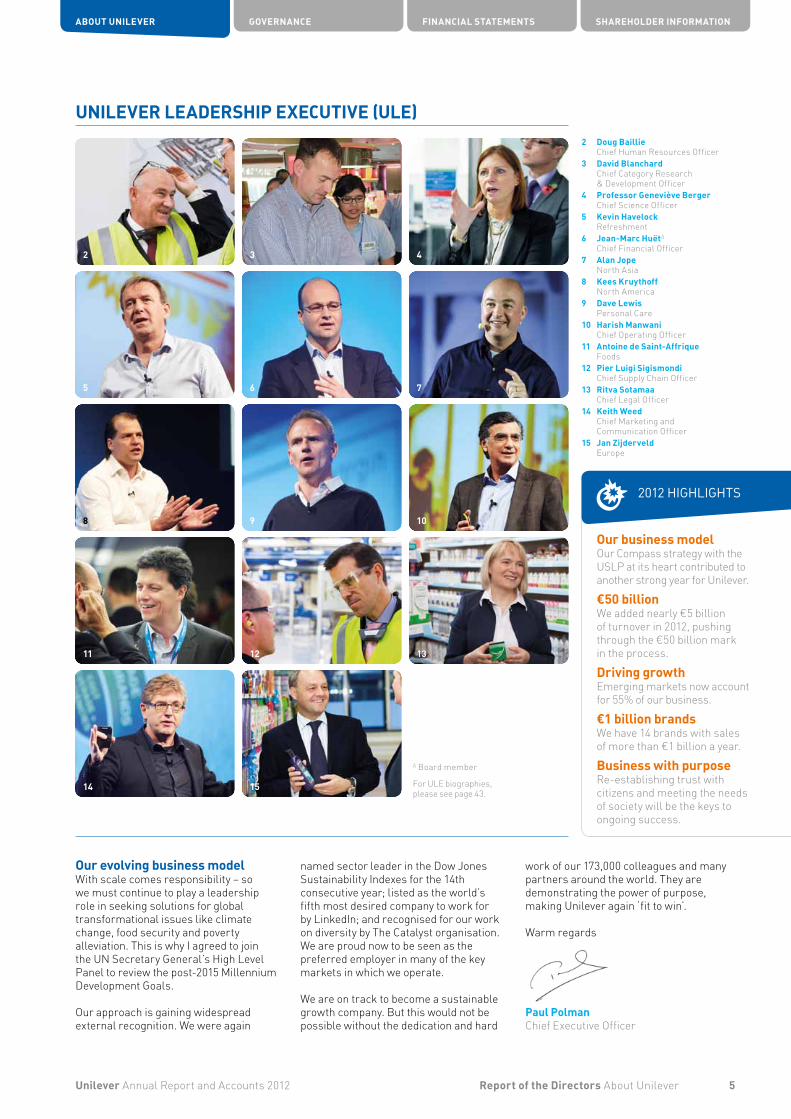
2 Doug Baillie Chief Human Resources Officer
3 David Blanchard Chief Category Research & Development Officer
4 Professor Geneviève Berger Chief Science Officer
5 Kevin Havelock Refreshment
6 Jean-Marc Huët∆ Chief Financial Officer
7 Alan Jope North Asia
8 Kees Kruythoff North America
9 Dave Lewis Personal Care
10 Harish Manwani Chief Operating Officer
11 Antoine de Saint-Affrique Foods
12 Pier Luigi Sigismondi Chief Supply Chain Officer
13 Ritva Sotamaa Chief Legal Officer
14 Keith Weed Chief Marketing and Communication Officer
15 Jan Zijderveld Europe
∆ Board member
For ULE biographies, please see page 43.
Our evolving business modelWith scale comes responsibility – so we must continue to play a leadership role in seeking solutions for global transformational issues like climate change, food security and poverty alleviation. This is why I agreed to join the UN Secretary General’s High Level Panel to review the post-2015 Millennium Development Goals. Our approach is gaining widespread external recognition. We were again
named sector leader in the Dow Jones Sustainability Indexes for the 14th consecutive year; listed as the world’s fifth most desired company to work for by LinkedIn; and recognised for our work on diversity by The Catalyst organisation. We are proud now to be seen as the preferred employer in many of the key markets in which we operate.
We are on track to become a sustainable growth company. But this would not be possible without the dedication and hard
work of our 173,000 colleagues and many partners around the world. They are demonstrating the power of purpose, making Unilever again ‘fit to win’.
Warm regards
Paul PolmanChief Executive Officer
Our business modelOur Compass strategy with the USLP at its heart contributed to another strong year for Unilever.
€50 billionWe added nearly €5 billion of turnover in 2012, pushing through the €50 billion mark in the process.
Driving growthEmerging markets now account for 55% of our business.
€1 billion brandsWe have 14 brands with sales of more than €1 billion a year.
Business with purposeRe-establishing trust with citizens and meeting the needs of society will be the keys to ongoing success.
5Unilever Annual Report and Accounts 2012 Report of the Directors About Unilever
ABOUT UNILEVER GOVERNANCE FINANCIAL STATEMENTS SHAREHOLDER INFORMATION
UNILEVER LEADERSHIP EXECUTIVE (ULE)
2012 HIGHLIGHTS
2
5
8
11
14
3
6
9
12
15
4
7
10
13
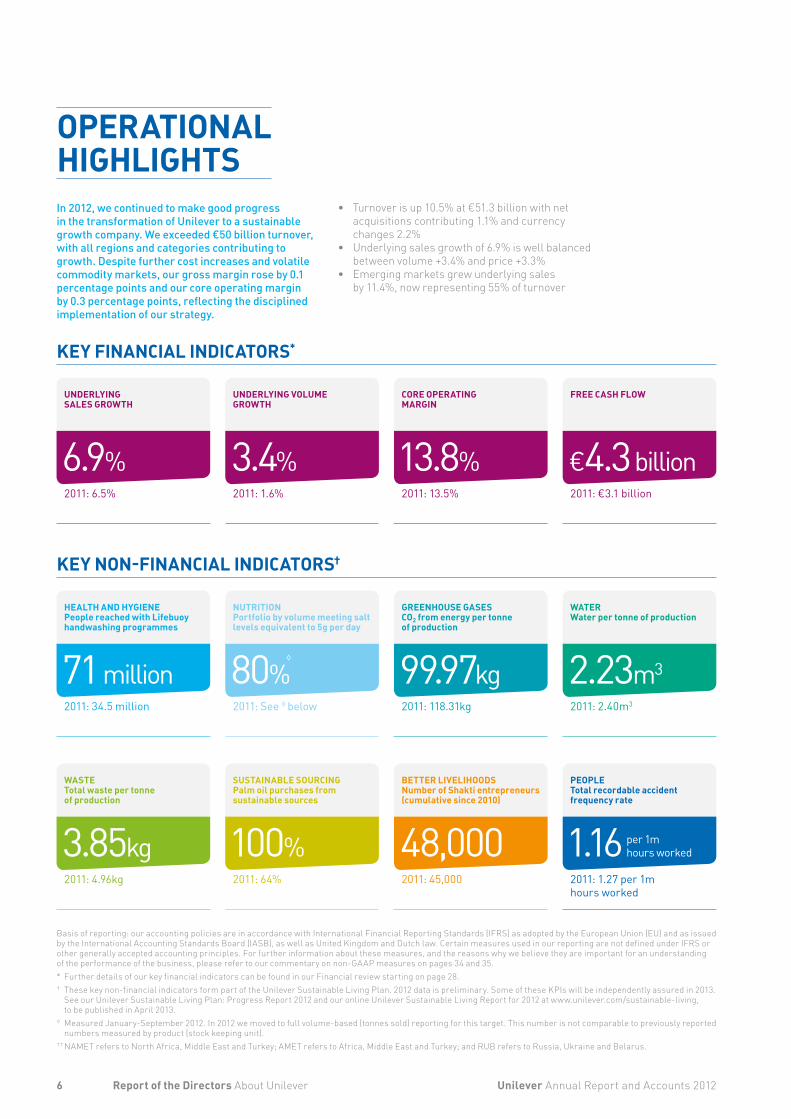
In 2012, we continued to make good progress in the transformation of Unilever to a sustainable growth company. We exceeded €50 billion turnover, with all regions and categories contributing to growth. Despite further cost increases and volatile commodity markets, our gross margin rose by 0.1 percentage points and our core operating margin by 0.3 percentage points, reflecting the disciplined implementation of our strategy.
• Turnoverisup10.5%at€51.3billionwithnetacquisitionscontributing1.1%andcurrencychanges2.2%
• Underlyingsalesgrowthof6.9%iswellbalancedbetweenvolume+3.4%andprice+3.3%
• Emergingmarketsgrewunderlyingsalesby11.4%,nowrepresenting55%ofturnover
Basisofreporting:ouraccountingpoliciesareinaccordancewithInternationalFinancialReportingStandards(IFRS)asadoptedbytheEuropeanUnion(EU)andasissuedbytheInternationalAccountingStandardsBoard(IASB),aswellasUnitedKingdomandDutchlaw.CertainmeasuresusedinourreportingarenotdefinedunderIFRSorothergenerallyacceptedaccountingprinciples.Forfurtherinformationaboutthesemeasures,andthereasonswhywebelievetheyareimportantforanunderstandingoftheperformanceofthebusiness,pleaserefertoourcommentaryonnon-GAAPmeasuresonpages34and35.* FurtherdetailsofourkeyfinancialindicatorscanbefoundinourFinancialreviewstartingonpage28.† Thesekeynon-financialindicatorsformpartoftheUnileverSustainableLivingPlan.2012dataispreliminary.SomeoftheseKPIswillbeindependentlyassuredin2013.SeeourUnileverSustainableLivingPlan:ProgressReport2012andouronlineUnileverSustainableLivingReportfor2012atwww.unilever.com/sustainable-living,tobepublishedinApril2013.
◊ MeasuredJanuary-September2012.In2012wemovedtofullvolume-based(tonnessold)reportingforthistarget.Thisnumberisnotcomparabletopreviouslyreportednumbersmeasuredbyproduct(stockkeepingunit).
††NAMETreferstoNorthAfrica,MiddleEastandTurkey;AMETreferstoAfrica,MiddleEastandTurkey;andRUBreferstoRussia,UkraineandBelarus.
6.9%2011: 6.5%
71 million2011: 34.5 million
3.85kg2011: 4.96kg
3.4%2011: 1.6%
80%◊
2011: See ◊ below
100%2011: 64%
13.8%2011: 13.5%
99.97kg2011: 118.31kg
48,0002011: 45,000
€4.3 billion2011: €3.1 billion
2.23m3
2011: 2.40m3
1.162011: 1.27 per 1m hours worked
per 1m hours worked
UNDERLYING SALES GROWTH
HEALTH AND HYGIENE People reached with Lifebuoy handwashing programmes
WASTE Total waste per tonne of production
UNDERLYING VOLUME GROWTH
NUTRITION Portfolio by volume meeting salt levels equivalent to 5g per day
SUSTAINABLE SOURCING Palm oil purchases from sustainable sources
CORE OPERATING MARGIN
GREENHOUSE GASES CO2 from energy per tonne of production
BETTER LIVELIHOODS Number of Shakti entrepreneurs (cumulative since 2010)
FREE CASH FLOW
WATER Water per tonne of production
PEOPLE Total recordable accidentfrequency rate
6 Unilever Annual Report and Accounts 2012Report of the Directors About Unilever
OPERATIONAL HIGHLIGHTS
KEY FINANCIAL INDICATORS*
KEY NON-FINANCIAL INDICATORS†
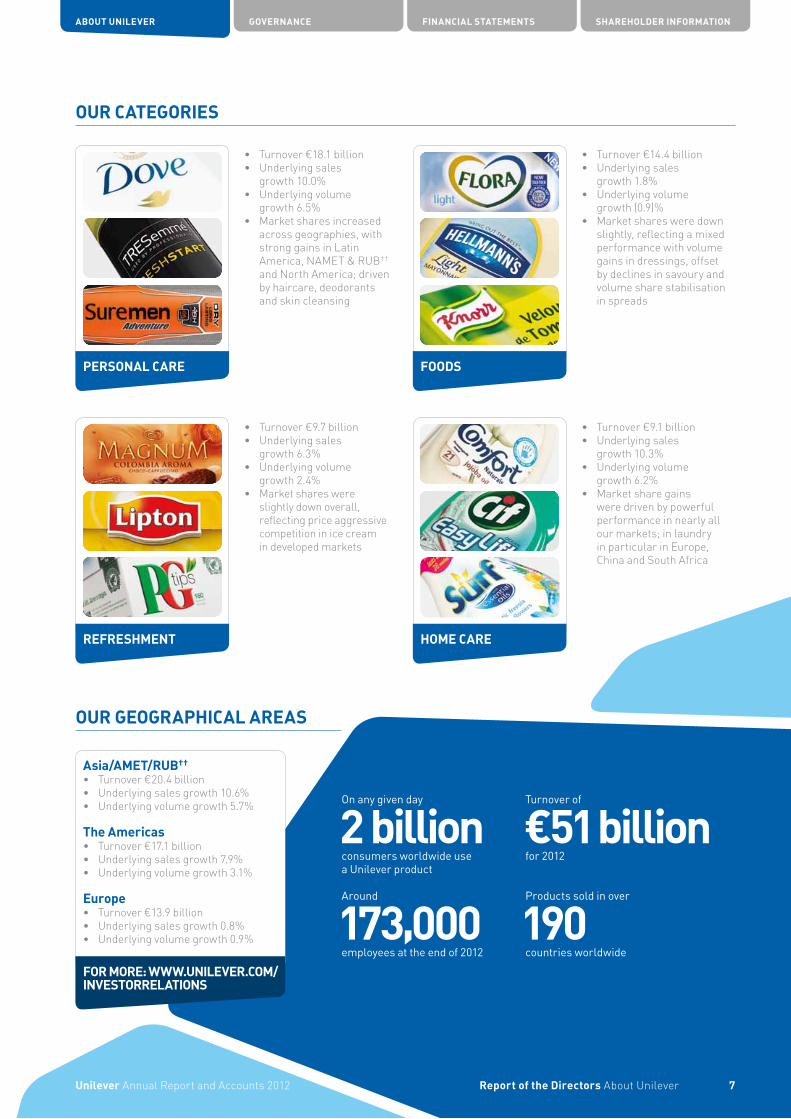
• Turnover€18.1billion• Underlyingsales
growth10.0%• Underlyingvolume
growth6.5%• Marketsharesincreased
acrossgeographies,withstronggainsinLatinAmerica,NAMET&RUB††andNorthAmerica;drivenbyhaircare,deodorantsandskincleansing
• Turnover€9.1billion• Underlyingsales
growth10.3%• Underlyingvolume
growth6.2%• Marketsharegains
weredrivenbypowerfulperformanceinnearlyallourmarkets;inlaundryinparticularinEurope,ChinaandSouthAfrica
Asia/AMET/RUB††
• Turnover€20.4billion• Underlyingsalesgrowth10.6%• Underlyingvolumegrowth5.7%
The Americas• Turnover€17.1billion• Underlyingsalesgrowth7.9%• Underlyingvolumegrowth3.1%
Europe• Turnover€13.9billion• Underlyingsalesgrowth0.8%• Underlyingvolumegrowth0.9%
• Turnover€14.4billion• Underlyingsales
growth1.8%• Underlyingvolume
growth(0.9)%• Marketsharesweredown
slightly,reflectingamixedperformancewithvolumegainsindressings,offsetbydeclinesinsavouryandvolumesharestabilisationinspreads
• Turnover€9.7billion• Underlyingsales
growth6.3%• Underlyingvolume
growth2.4%• Marketshareswere
slightlydownoverall,reflectingpriceaggressivecompetitioninicecreamindevelopedmarkets
On any given day
2 billionconsumers worldwide use a Unilever product
Around
173,000employees at the end of 2012
Turnover of
€51 billionfor 2012
Products sold in over
190countries worldwide
ABOUT UNILEVER GOVERNANCE FINANCIAL STATEMENTS SHAREHOLDER INFORMATION
7Report of the DirectorsAboutUnileverUnileverAnnualReportandAccounts2012
OUR CATEGORIES
OUR GEOGRAPHICAL AREAS
PERSONAL CARE
HOME CARE
FOR MORE: WWW.UNILEVER.COM/INVESTORRELATIONS
FOODS
REFRESHMENT
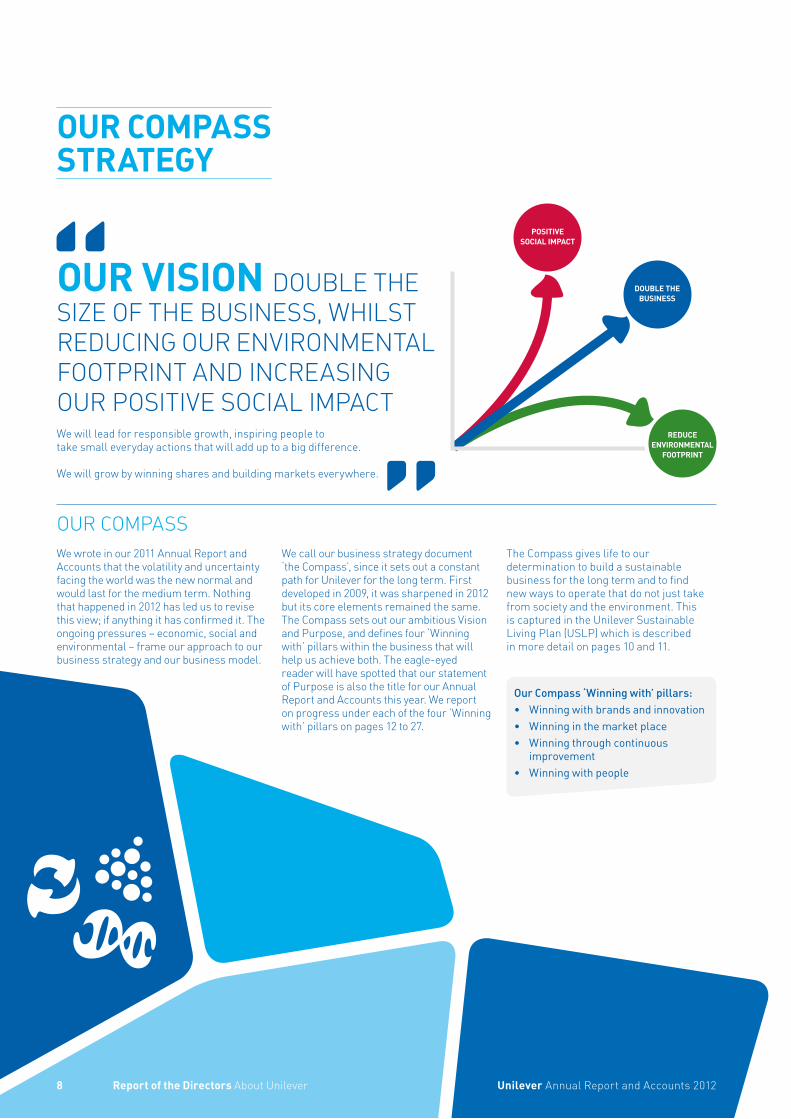
OUR VISION DOUBLE THE SIZE OF THE BUSINESS, WHILST REDUCING OUR ENVIRONMENTAL FOOTPRINT AND INCREASING OUR POSITIVE SOCIAL IMPACTWe will lead for responsible growth, inspiring people to take small everyday actions that will add up to a big difference.
We will grow by winning shares and building markets everywhere.
We wrote in our 2011 Annual Report and Accounts that the volatility and uncertainty facing the world was the new normal and would last for the medium term. Nothing that happened in 2012 has led us to revise this view; if anything it has confirmed it. The ongoing pressures – economic, social and environmental – frame our approach to our business strategy and our business model.
Our Compass ‘Winning with’ pillars:• Winningwithbrandsandinnovation• Winninginthemarketplace• Winningthroughcontinuous
improvement• Winningwithpeople
We call our business strategy document ‘the Compass’, since it sets out a constant path for Unilever for the long term. First developed in 2009, it was sharpened in 2012 but its core elements remained the same. The Compass sets out our ambitious Vision and Purpose, and defines four ‘Winning with’ pillars within the business that will help us achieve both. The eagle-eyed reader will have spotted that our statement of Purpose is also the title for our Annual Report and Accounts this year. We report on progress under each of the four ‘Winning with’ pillars on pages 12 to 27.
The Compass gives life to our determination to build a sustainable business for the long term and to find new ways to operate that do not just take from society and the environment. This is captured in the Unilever Sustainable Living Plan (USLP) which is described in more detail on pages 10 and 11.
Unilever Annual Report and Accounts 20128 Report of the Directors About Unilever
OUR COMPASS STRATEGY
OUR COMPASS
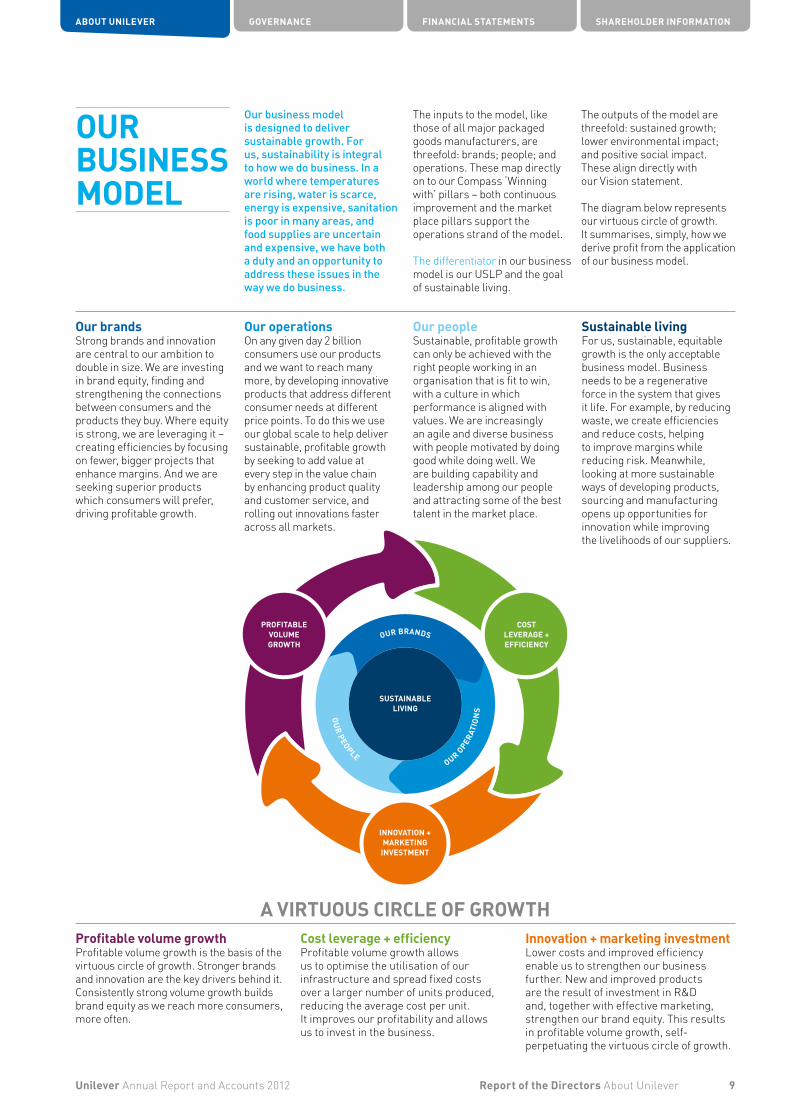
Our brandsStrong brands and innovation are central to our ambition to double in size. We are investing in brand equity, finding and strengthening the connections between consumers and the products they buy. Where equity is strong, we are leveraging it – creating efficiencies by focusing on fewer, bigger projects that enhance margins. And we are seeking superior products which consumers will prefer, driving profitable growth.
Profitable volume growthProfitable volume growth is the basis of the virtuous circle of growth. Stronger brands and innovation are the key drivers behind it. Consistently strong volume growth builds brand equity as we reach more consumers, more often.
Cost leverage + efficiencyProfitable volume growth allows us to optimise the utilisation of our infrastructure and spread fixed costs over a larger number of units produced, reducing the average cost per unit. It improves our profitability and allows us to invest in the business.
Innovation + marketing investmentLower costs and improved efficiency enable us to strengthen our business further. New and improved products are the result of investment in R&D and, together with effective marketing, strengthen our brand equity. This results in profitable volume growth, self-perpetuating the virtuous circle of growth.
Our operationsOn any given day 2 billion consumers use our products and we want to reach many more, by developing innovative products that address different consumer needs at different price points. To do this we use our global scale to help deliver sustainable, profitable growth by seeking to add value at every step in the value chain by enhancing product quality and customer service, and rolling out innovations faster across all markets.
Our peopleSustainable, profitable growth can only be achieved with the right people working in an organisation that is fit to win, with a culture in which performance is aligned with values. We are increasingly an agile and diverse business with people motivated by doing good while doing well. We are building capability and leadership among our people and attracting some of the best talent in the market place.
Sustainable livingFor us, sustainable, equitable growth is the only acceptable business model. Business needs to be a regenerative force in the system that gives it life. For example, by reducing waste, we create efficiencies and reduce costs, helping to improve margins while reducing risk. Meanwhile, looking at more sustainable ways of developing products, sourcing and manufacturing opens up opportunities for innovation while improving the livelihoods of our suppliers.
Our business model is designed to deliver sustainable growth. For us, sustainability is integral to how we do business. In a world where temperatures are rising, water is scarce, energy is expensive, sanitation is poor in many areas, and food supplies are uncertain and expensive, we have both a duty and an opportunity to address these issues in the way we do business.
The inputs to the model, like those of all major packaged goods manufacturers, are threefold: brands; people; and operations. These map directly on to our Compass ‘Winning with’ pillars – both continuous improvement and the market place pillars support the operations strand of the model.
The differentiator in our business model is our USLP and the goal of sustainable living.
The outputs of the model are threefold: sustained growth; lower environmental impact; and positive social impact. These align directly with our Vision statement.
The diagram below represents our virtuous circle of growth. It summarises, simply, how we derive profit from the application of our business model.
9Unilever Annual Report and Accounts 2012 Report of the Directors About Unilever
ABOUT UNILEVER GOVERNANCE FINANCIAL STATEMENTS SHAREHOLDER INFORMATION
OUR BUSINESS MODEL
A VIRTUOUS CIRCLE OF GROWTH

OUR UNILEVER SUSTAINABLE LIVING PLAN IN ACTION PROGRESS AGAINST OUR PLAN IS DETAILED IN THE SUSTAINABLE LIVING SECTION OF WWW.UNILEVER.COM/SUSTAINABLE-LIVING AND IN OUR UNILEVER SUSTAINABLE LIVING PLAN: PROGRESS REPORT 2012, TO BE PUBLISHED IN APRIL 2013.
We will continually work to improve the taste and nutritional quality of all our products. By 2020 we will double the proportion of our portfolio that meets the highest nutritional standards, based on globally recognised dietary guidelines. This will help hundreds of millions of people to achieve a healthier diet.
18% OF OUR PORTFOLIO BY VOLUME MET THE CRITERIA IN 2012†◊
Our commitment is to halve the greenhouse gas impact of our products across the lifecycle by 2020.̂
OUR GREENHOUSE GAS IMPACT HAS REDUCED BY AROUND 6% SINCE 2010†‡
Our commitment is to halve the water associated with the consumer use of our products by 2020.̂ +
OUR WATER IMPACT HAS REMAINED BROADLY UNCHANGED SINCE 2010†‡
By 2020 we will help more than a billion people to improve their hygiene habits and we will bring safe drinking water to 500 million people. This will help reduce the incidence of life-threatening diseases like diarrhoea.
AROUND 220 MILLION PEOPLE REACHED BY END 2012 THROUGH OUR PROGRAMMES ON HANDWASHING, SAFE DRINKING WATER, ORAL HEALTH AND SELF-ESTEEM†
By 2020 we will help more than a billion people take action to improve their health and well-being.
By 2020 our goal is to halve the environmental footprint of the making and use of our products as we grow our business.̂
10 Unilever Annual Report and Accounts 2012Report of the Directors About Unilever
UNILEVER SUSTAINABLE LIVING PLAN
1 HEALTH AND HYGIENE
2 NUTRITION 3 GREENHOUSE GASES
4 WATER
IMPROVING HEALTH AND WELL-BEING
REDUCING ENVIRONMENTAL IMPACT

With 7 billion people on our planet, the earth’s resources can be strained. This means sustainable, equitable growth is the only acceptable model of growth for our business. We believe growth and sustainability are not in conflict. In fact, in our experience, sustainability drives growth. By focusing on sustainable living needs, we can build brands with a significant purpose. By reducing waste, we create efficiencies and reduce costs, which helps to improve our margins. And we have found that once we start looking at product development, sourcing and manufacturing through a sustainability lens, it opens up great opportunities for innovation.
Our Unilever Sustainable Living Plan (USLP) sets out to decouple our growth from our environmental impact, while at the same time increasing our positive social impact. Our USLP has three big goals that by 2020 will enable us to:
• Help more than a billion people to improve their health and well-being.
• Halve the environmental footprint of our products.
• Source 100% of our agricultural raw materials sustainably and enhance the livelihoods of people across our value chain.
Underpinning these goals are seven commitments supported by around 50 targets spanning our social, environmental and economic performance across the value chain – from the sourcing of raw materials all the way through to the use of our products in the home.
In the second year of our USLP, we made steady progress across our commitments. Our USLP is ambitious and we have much more to do. We continue to strive to deliver our stretching goals.
Our commitment is to halve the waste associated with the disposal of our products by 2020.̂
OUR WASTE IMPACT HAS REDUCED BY AROUND 7% SINCE 2010†‡
By 2020 we will source 100% of our agricultural raw materials sustainably.
AROUND ONE THIRD SUSTAINABLY SOURCED BY END 2012†
By 2020 we will engage with at least 500,000 smallholder farmers and 75,000 small-scale distributors in our supply network.
48,000 SHAKTI SMALL-SCALE DISTRIBUTORS BY END 2012†
^ Our environmental targets are expressed on a ‘per consumer use’ basis, using a lifecycle approach. This means a single use, portion or serving of a product.
† 2012 figures are preliminary. They will be finalised in the Unilever Sustainable Living Plan: Progress Report 2012, to be published in April 2013.
◊ Measured January-September 2012. In 2012 we moved to full volume-based (tonnes sold) reporting for this commitment. This number is not comparable to previously reported numbers measured by product (stock keeping unit).
‡ Measured July 2011-June 2012, compared to January-December 2010.+ In seven water-scarce countries representing around half the world’s population.
By 2020 we will enhance the livelihoods of hundreds of thousands of people as we grow our business.
Unilever Annual Report and Accounts 2012
ABOUT UNILEVER GOVERNANCE FINANCIAL STATEMENTS SHAREHOLDER INFORMATION
11Report of the Directors About Unilever
5 WASTE 6 SUSTAINABLE SOURCING
7 BETTER LIVELIHOODS
ENHANCING LIVELIHOODS
SEE OUR UNILEVER SUSTAINABLE LIVING PLAN: PROGRESS REPORT 2012, TO BE PUBLISHED IN APRIL 2013, FOR FURTHER DETAIL.

Unilever Annual Report and Accounts 201212 Report of the Directors About Unilever
WINNING WITH BRANDS AND INNOVATION
Strong brands and innovation will play central roles in our ambition to double the size of our business. We are investing heavily in the equity of our brands, seeking to find the connections between consumers and the products they buy, and so to strengthen them. Where we have strong brand equity, we are leveraging it – creating efficiencies by focusing on fewer, bigger projects that enhance margins. And we are improving our brands, developing superior products which consumers will prefer, driving profitable growth.
Building brand equities
The strength of our business lies in brands that consumers love to buy and use. As we invest greater and greater effort in understanding consumers’ relationships with our products, we increasingly find they are looking for brands that make a difference in their lives and to their world. So to make our brands stronger, we want to draw out the ways in which our products resonate with consumers – and create brands with purpose.
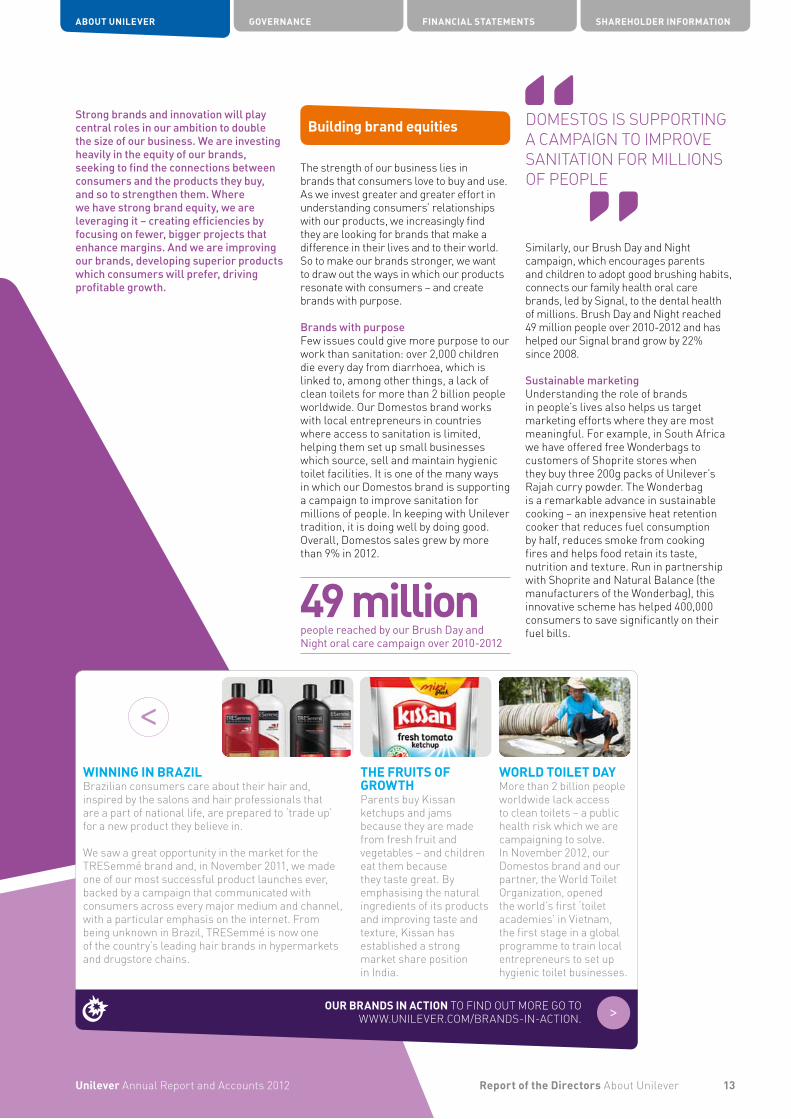
Brands with purposeFew issues could give more purpose to our work than sanitation: over 2,000 children die every day from diarrhoea, which is linked to, among other things, a lack of clean toilets for more than 2 billion people worldwide. Our Domestos brand works with local entrepreneurs in countries where access to sanitation is limited, helping them set up small businesses which source, sell and maintain hygienic toilet facilities. It is one of the many ways in which our Domestos brand is supporting a campaign to improve sanitation for millions of people. In keeping with Unilever tradition, it is doing well by doing good. Overall, Domestos sales grew by more than 9% in 2012.
Similarly, our Brush Day and Night campaign, which encourages parents and children to adopt good brushing habits, connects our family health oral care brands, led by Signal, to the dental health of millions. Brush Day and Night reached 49 million people over 2010-2012 and has helped our Signal brand grow by 22% since 2008.
Sustainable marketingUnderstanding the role of brands in people’s lives also helps us target marketing efforts where they are most meaningful. For example, in South Africa we have offered free Wonderbags to customers of Shoprite stores when they buy three 200g packs of Unilever’s Rajah curry powder. The Wonderbag is a remarkable advance in sustainable cooking – an inexpensive heat retention cooker that reduces fuel consumption by half, reduces smoke from cooking fires and helps food retain its taste, nutrition and texture. Run in partnership with Shoprite and Natural Balance (the manufacturers of the Wonderbag), this innovative scheme has helped 400,000 consumers to save significantly on their fuel bills.
49 millionpeople reached by our Brush Day and Night oral care campaign over 2010-2012
WINNING IN BRAZIL Brazilian consumers care about their hair and, inspired by the salons and hair professionals that are a part of national life, are prepared to ‘trade up’ for a new product they believe in.
We saw a great opportunity in the market for the TRESemmé brand and, in November 2011, we made one of our most successful product launches ever, backed by a campaign that communicated with consumers across every major medium and channel, with a particular emphasis on the internet. From being unknown in Brazil, TRESemmé is now one of the country’s leading hair brands in hypermarkets and drugstore chains.
THE FRUITS OF GROWTH Parents buy Kissan ketchups and jams because they are made from fresh fruit and vegetables – and children eat them because they taste great. By emphasising the natural ingredients of its products and improving taste and texture, Kissan has established a strong market share position in India.
WORLD TOILET DAY More than 2 billion people worldwide lack access to clean toilets – a public health risk which we are campaigning to solve. In November 2012, our Domestos brand and our partner, the World Toilet Organization, opened the world’s first ‘toilet academies’ in Vietnam, the first stage in a global programme to train local entrepreneurs to set up hygienic toilet businesses.
OUR BRANDS IN ACTION TO FIND OUT MORE GO TO WWW.UNILEVER.COM/BRANDS-IN-ACTION.
DOMESTOS IS SUPPORTING A CAMPAIGN TO IMPROVE SANITATION FOR MILLIONS OF PEOPLE
13Report of the Directors About Unilever
ABOUT UNILEVER GOVERNANCE FINANCIAL STATEMENTS SHAREHOLDER INFORMATION
Unilever Annual Report and Accounts 2012
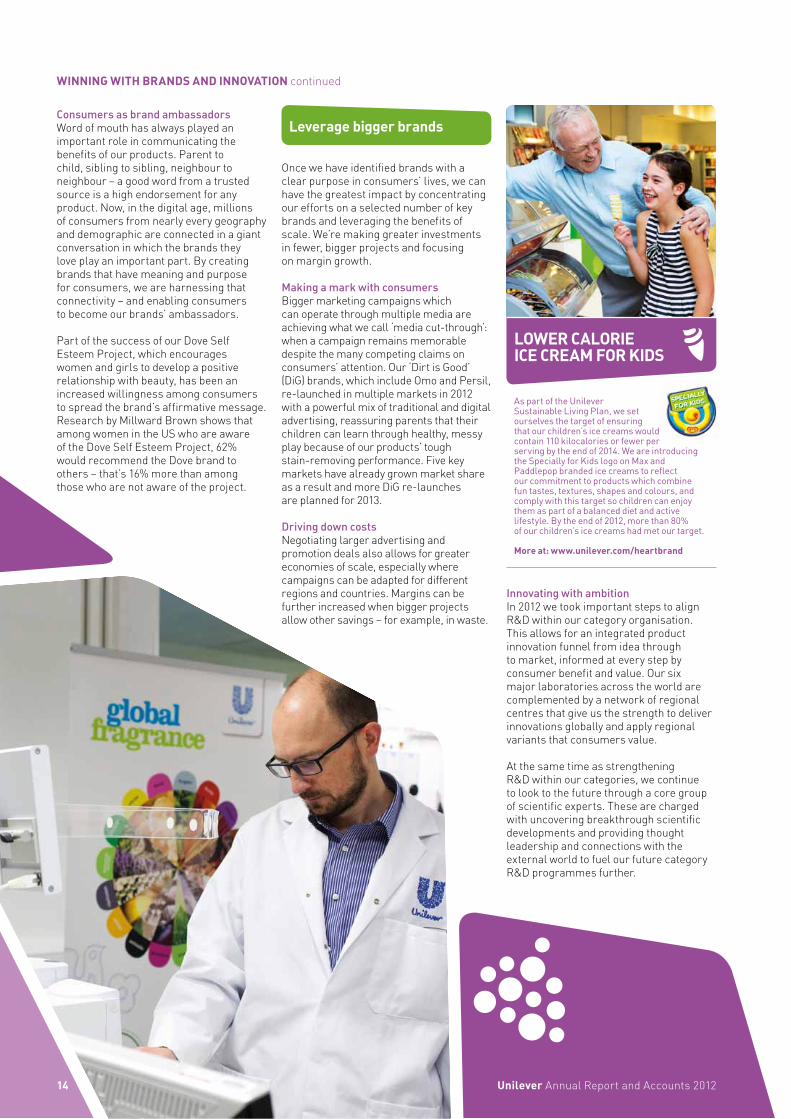
Consumers as brand ambassadorsWord of mouth has always played an important role in communicating the benefits of our products. Parent to child, sibling to sibling, neighbour to neighbour – a good word from a trusted source is a high endorsement for any product. Now, in the digital age, millions of consumers from nearly every geography and demographic are connected in a giant conversation in which the brands they love play an important part. By creating brands that have meaning and purpose for consumers, we are harnessing that connectivity – and enabling consumers to become our brands’ ambassadors.
Part of the success of our Dove Self Esteem Project, which encourages women and girls to develop a positive relationship with beauty, has been an increased willingness among consumers to spread the brand’s affirmative message. Research by Millward Brown shows that among women in the US who are aware of the Dove Self Esteem Project, 62% would recommend the Dove brand to others – that’s 16% more than among those who are not aware of the project.
Leverage bigger brands
Once we have identified brands with a clear purpose in consumers’ lives, we can have the greatest impact by concentrating our efforts on a selected number of key brands and leveraging the benefits of scale. We’re making greater investments in fewer, bigger projects and focusing on margin growth.
Making a mark with consumersBigger marketing campaigns which can operate through multiple media are achieving what we call ‘media cut-through’: when a campaign remains memorable despite the many competing claims on consumers’ attention. Our ‘Dirt is Good’ (DiG) brands, which include Omo and Persil, re-launched in multiple markets in 2012 with a powerful mix of traditional and digital advertising, reassuring parents that their children can learn through healthy, messy play because of our products’ tough stain-removing performance. Five key markets have already grown market share as a result and more DiG re-launches are planned for 2013. Driving down costsNegotiating larger advertising and promotion deals also allows for greater economies of scale, especially where campaigns can be adapted for different regions and countries. Margins can be further increased when bigger projects allow other savings – for example, in waste.
Innovating with ambitionIn 2012 we took important steps to align R&D within our category organisation. This allows for an integrated product innovation funnel from idea through to market, informed at every step by consumer benefit and value. Our six major laboratories across the world are complemented by a network of regional centres that give us the strength to deliver innovations globally and apply regional variants that consumers value.
At the same time as strengthening R&D within our categories, we continue to look to the future through a core group of scientific experts. These are charged with uncovering breakthrough scientific developments and providing thought leadership and connections with the external world to fuel our future category R&D programmes further.
As part of the Unilever Sustainable Living Plan, we set ourselves the target of ensuring that our children’s ice creams would contain 110 kilocalories or fewer per serving by the end of 2014. We are introducing the Specially for Kids logo on Max and Paddlepop branded ice creams to reflect our commitment to products which combine fun tastes, textures, shapes and colours, and comply with this target so children can enjoy them as part of a balanced diet and active lifestyle. By the end of 2012, more than 80% of our children’s ice creams had met our target.
More at: www.unilever.com/heartbrand
14 Unilever Annual Report and Accounts 2012
WINNING WITH BRANDS AND INNOVATION continued
LOWER CALORIE ICE CREAM FOR KIDS
includes a range of salon-quality dry shampoos designed to rejuvenate hair without a single drop of water – good for the environment as well as helping grow our business. Alongside TRESemmé’s rapid launch, we introduced more than 80 new or renewed products in Brazil, including two new Dove variants and re-launches of the Seda and Clear ranges, resulting in substantial gains in a vital market.
Win consumer preference
By making superior products with benefits people appreciate, we increasingly win consumer preference for premium brands where added value is greatest. Premiumisation, innovation and differentiation will be essential if we are to grow faster than our markets.
Superiority you can feelThe team behind every product in every category of our business is set a clear target for improvement: we want all our brands to be superior to the competition. At present, our global ‘Product Benchmarking Programme’ shows that 96% of our products in scope are considered equal to, or better than, our key competitors’. And where we have
made advances in product performance, we are increasingly able to tell consumers how they will benefit.
When we improved the Sunlight hand dishwash brand, for instance, we had thought carefully about the billions of hours spent every day across the world washing dishes, and the benefits that could come from a dishwash that degreases dishes faster and more easily. We made sure our marketing communicated these improvements, with the result that we converted millions of households to Sunlight, doubling turnover for the dishwash brand in six years.
Quality worth paying for As well as driving volume growth, superior products can command premium prices, ensuring that growth is profitable. All around the world, we are offering products for which consumers are willing to trade up, with a corresponding rise in added value. In Russia, for example, we launched the Carte d’Or ice cream range in December 2011. The Carte d’Or products were made to premium recipes and marketed accordingly – creating additional value per serving. In just over six months, Carte d’Or sales grew profitably to represent some 25% of the premium segment.
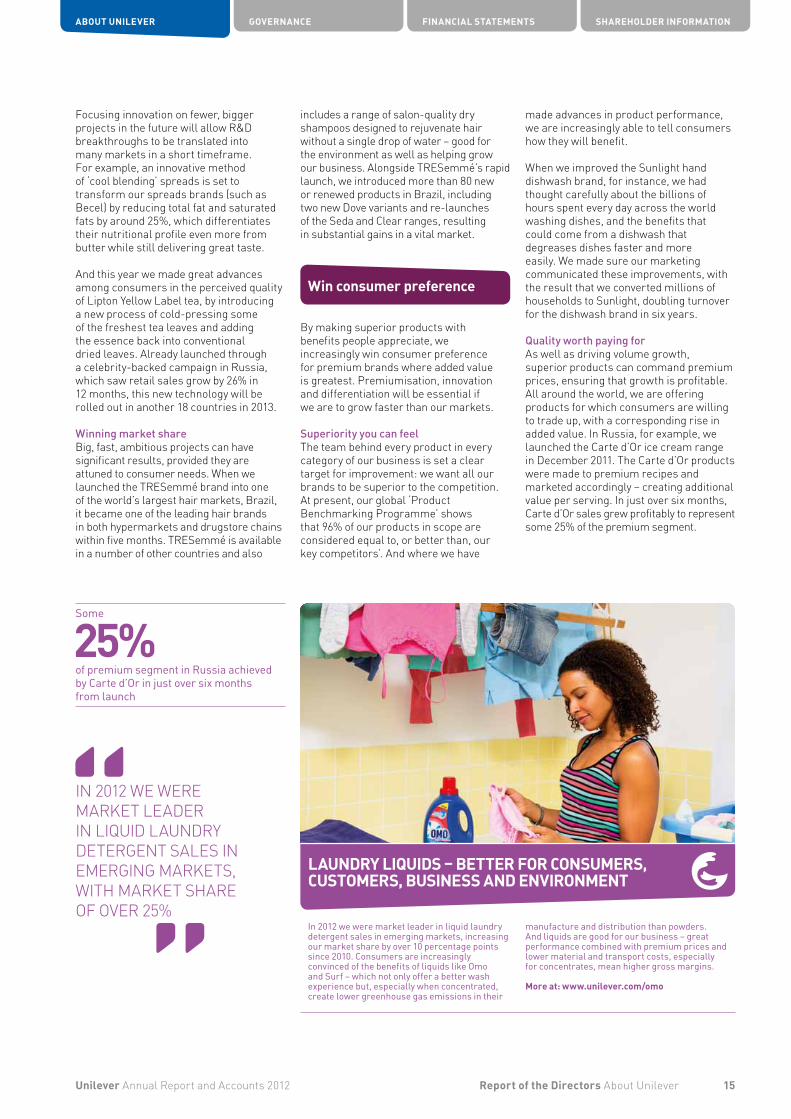
Some
25%of premium segment in Russia achieved by Carte d’Or in just over six months from launch
In 2012 we were market leader in liquid laundry detergent sales in emerging markets, increasing our market share by over 10 percentage points since 2010. Consumers are increasingly convinced of the benefits of liquids like Omo and Surf – which not only offer a better wash experience but, especially when concentrated, create lower greenhouse gas emissions in their
manufacture and distribution than powders.And liquids are good for our business – great performance combined with premium prices and lower material and transport costs, especially for concentrates, mean higher gross margins.
More at: www.unilever.com/omo
IN 2012 WE WERE MARKET LEADER IN LIQUID LAUNDRY DETERGENT SALES IN EMERGING MARKETS, WITH MARKET SHARE OF OVER 25%
Focusing innovation on fewer, bigger projects in the future will allow R&D breakthroughs to be translated into many markets in a short timeframe. For example, an innovative method of ‘cool blending’ spreads is set to transform our spreads brands (such as Becel) by reducing total fat and saturated fats by around 25%, which differentiates their nutritional profile even more from butter while still delivering great taste.
And this year we made great advances among consumers in the perceived quality of Lipton Yellow Label tea, by introducing a new process of cold-pressing some of the freshest tea leaves and adding the essence back into conventional dried leaves. Already launched through a celebrity-backed campaign in Russia, which saw retail sales grow by 26% in 12 months, this new technology will be rolled out in another 18 countries in 2013.
Winning market shareBig, fast, ambitious projects can have significant results, provided they are attuned to consumer needs. When we launched the TRESemmé brand into one of the world’s largest hair markets, Brazil, it became one of the leading hair brands in both hypermarkets and drugstore chains within five months. TRESemmé is available in a number of other countries and also
15Unilever Annual Report and Accounts 2012 Report of the Directors About Unilever
ABOUT UNILEVER GOVERNANCE FINANCIAL STATEMENTS SHAREHOLDER INFORMATION
LAUNDRY LIQUIDS – BETTER FOR CONSUMERS, CUSTOMERS, BUSINESS AND ENVIRONMENT

16 Unilever Annual Report and Accounts 2012
WINNING IN THE MARKET PLACE
There are 2 billion consumers who use our products on any given day and we want to reach many more. We do this by addressing different consumer needs with relevant innovations at different price points, rolling them out fast across all markets, and increasing the availability and visibility of our products through our growing ‘Perfect Stores’ programme. At the heart of our ‘winning in the market place’ strategy is a desire to achieve growth in the most cost-effective and sustainable way.
Reaching more consumers
Market development is a key driver of our growth and built around the following approach: • reaching up (encouraging more
affluent consumers to use our premium brands);
• reaching down (offering value products for consumers on lower incomes in emerging and developed markets); and
• reaching wide (being first and fast to take our brands into what we call ‘white spaces’, namely new geographies like Central Africa and Myanmar, emerging consumer segments like male grooming, and new channels like e-commerce).
PremiumisationBy 2020, 1.8 billion more consumers, mainly from emerging markets, will move up the ladder and become more affluent. Reaching up is therefore a critical growth opportunity for us.
During 2012, we continued to focus on building our premium portfolio across categories to deliver growth and better margins. For example, in January 2012, we launched the Dove hair range in the Philippines, and it became the market’s number three brand in just six months. Similarly, in May we launched the Clear brand into the US, the largest haircare market in the world, proof that we can grow through premium brands in developed markets too.
It’s not just in Personal Care that we are driving premiumisation. Magnum, our premium ice cream brand, is growing faster than the category average and became a €1 billion brand in 2012. You can now buy Magnum in more than 40 countries, including the Philippines, Pakistan and Thailand, following the 2012 roll-out of the brand in these countries.
Offering affordable brandsThere remain many less affluent consumers in emerging markets who can benefit from our affordable brands. However, reaching down is not simply about expanding into these markets; it is also about offering affordable products to shoppers struggling in tough economic conditions across Europe and the US. This year, for example, 46 million people in the US used food stamps.
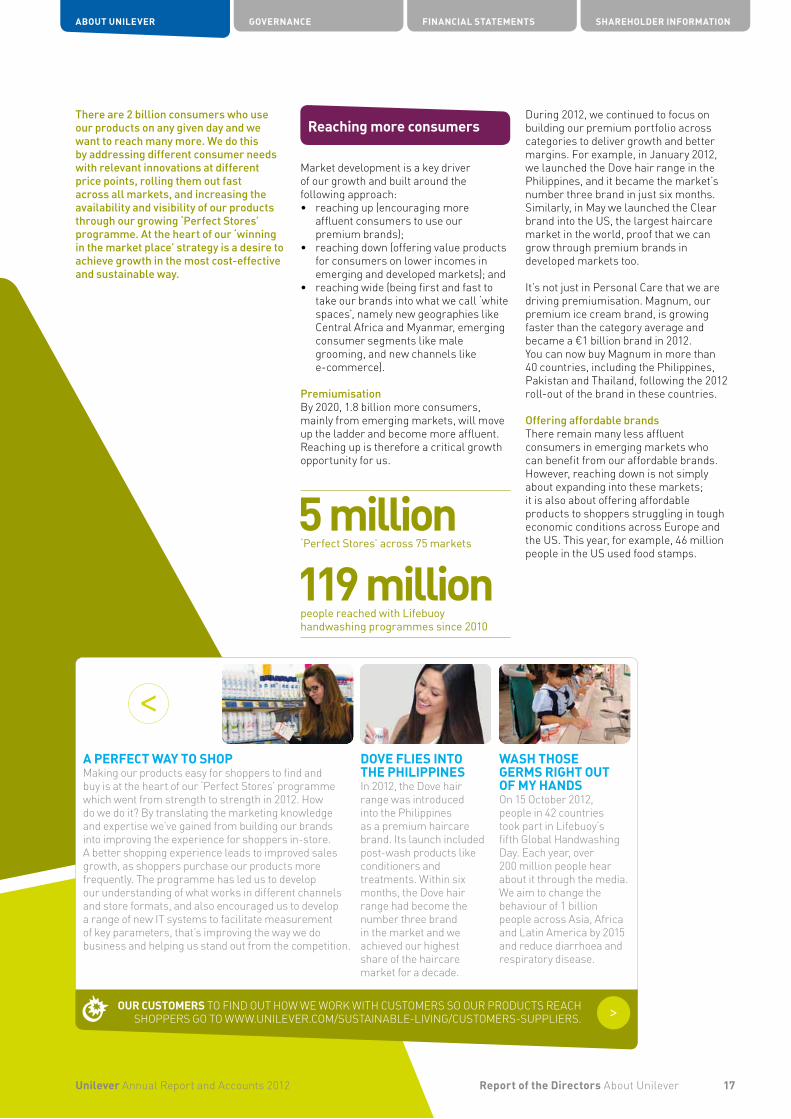
5 million‘Perfect Stores’ across 75 markets
119 million people reached with Lifebuoy handwashing programmes since 2010
A PERFECT WAY TO SHOPMaking our products easy for shoppers to find and buy is at the heart of our ‘Perfect Stores’ programme which went from strength to strength in 2012. How do we do it? By translating the marketing knowledge and expertise we’ve gained from building our brands into improving the experience for shoppers in-store. A better shopping experience leads to improved sales growth, as shoppers purchase our products more frequently. The programme has led us to develop our understanding of what works in different channels and store formats, and also encouraged us to develop a range of new IT systems to facilitate measurement of key parameters, that’s improving the way we do business and helping us stand out from the competition.
DOVE FLIES INTO THE PHILIPPINES In 2012, the Dove hair range was introduced into the Philippines as a premium haircare brand. Its launch included post-wash products like conditioners and treatments. Within six months, the Dove hair range had become the number three brand in the market and we achieved our highest share of the haircare market for a decade.
WASH THOSE GERMS RIGHT OUT OF MY HANDSOn 15 October 2012, people in 42 countries took part in Lifebuoy’s fifth Global Handwashing Day. Each year, over 200 million people hear about it through the media. We aim to change the behaviour of 1 billion people across Asia, Africa and Latin America by 2015 and reduce diarrhoea and respiratory disease.
OUR CUSTOMERS TO FIND OUT HOW WE WORK WITH CUSTOMERS SO OUR PRODUCTS REACH SHOPPERS GO TO WWW.UNILEVER.COM/SUSTAINABLE-LIVING/CUSTOMERS-SUPPLIERS.
17Report of the Directors About Unilever
ABOUT UNILEVER GOVERNANCE FINANCIAL STATEMENTS SHAREHOLDER INFORMATION
Unilever Annual Report and Accounts 2012

‘Local jewels’ are offering good value to consumers and our business. Responding swiftly to the economic crisis in Greece, in less than six months from development we launched Elais, a new value-for-money food brand, which offers consumers a high quality product range positioned for lower incomes.
And it’s not just new or local brands. In 1894, William Lever launched an affordable soap called Lifebuoy. Today, building on its legacy, the global soap brand is helping to raise hygiene standards in emerging markets through the Unilever Sustainable Living Plan (USLP). Lifebuoy has reached 119 million people with handwashing programmes since 2010, while helping the brand experience double digit growth in the last three years.
Growing in white spacesWe are continuing to fill white spaces, taking our brands into new markets and expanding into emerging consumer segments, to create new growth opportunities. Today, people can buy Dove and Axe products in more than 70 countries; Cif in more than 60, following its expansion into China and Mexico in 2012; Knorr Jelly Bouillon in almost 40; and Clear in more than 40, after its successful 2012 launch in the US, Australia and Canada.
In 2012, we successfully integrated two acquisitions, Kalina, the Russian personal care company, and Alberto Culver, the global hair and skincare company, and both are now experiencing double digit growth.
In November 2011, the TRESemmé brand was launched into Brazil just six months after the Alberto Culver acquisition was completed. We have since launched the brand in Indonesia, India, Thailand and the Philippines, proving our organisational capability to roll out a brand with speed and agility. Moreover, it demonstrates our ability to transform an acquisition into a growth opportunity by swiftly launching its brands into new territories.
We are also looking to reach wide by accelerating our presence through three important channels which have all demonstrated high growth for us in 2012: drug stores; e-commerce; and ‘out of home’ (selling for consumers’ consumption away from home). In drug stores, for example, we recorded our highest underlying sales growth of 11% in 2012 in this channel.
Leveraging entire value chain
Reaching more consumers is also about partnering with our retailers to encourage shoppers to buy our brands so that we can grow sustainably together across the value chain. We estimate that 68% of our greenhouse gas impact comes from consumers using our products, so we help customers engage with shoppers and consumers to adopt more sustainable lifestyles.
The economic crisis in Greece has led consumers to switch to cheaper, local brands. Using our trusted brand, Elais (named after the goddess of olive oil), we created a range of value-for-money food products to tap into consumer needs. Our supply chain, customer, finance, sales and marketing teams collaborated swiftly to develop and launch – within six months – eight new economy products from olive oil to mayonnaise. At launch, the range was stocked in promotional displays to boost awareness and encourage people to buy. The new Elais range is one of the fastest growing recent launches in Greece.
More at: www.unilever.gr/elais
Report of the Directors About Unilever Unilever Annual Report and Accounts 201218
WINNING IN THE MARKET PLACE continued
THE NEW ECONOMY
For the last three years, we have worked on ‘A Better Future Begins at Home’, a joint shopper programme with retailer Tesco, to encourage sustainable behaviour. It combines advice with promotions around our brands, all carrying a strong sustainability message. By rewarding shoppers for making more sustainable choices, it is educating them in how small actions can make a big difference both to the environment and to their wallet. So far the programme has been implemented in nine markets from the UK to China. As well as growing our sales, it has delivered benefits ranging from consumers recycling more to people planting trees in the local community.
Taking care of our customersWe believe that customer satisfaction is the single most important measure of success for us in this area. And customers are more satisfied with us than ever. In 2012, Unilever was named supplier of the year in the drug store channel, in Boots and Superdrug (UK), Rite Aid (US), Shoppers DrugMart (Canada) and Farmacias Benavides (Mexico). Meanwhile, in emerging markets in Asia, Africa and the Middle East, we were rated the number one supplier in seven markets. In Brazil and Argentina, our most important markets in Latin America, we are frequently evaluated in the top three, while in the UK Unilever was named supplier of the year by almost all our customers.
Fast, flawless execution
As well as working with our customers on joint initiatives, we are also working with them to help drive sales of our products through our ‘Perfect Stores’ programme. This is a repeatable model which ensures the right products are available in stores and are marketed clearly to shoppers. Pilot studies in India and Argentina show that outlets enrolled for the ‘Perfect Stores’ programme grow on average 4% more than other outlets.
In 2012, we supported the development of another 2 million ‘Perfect Stores’ and extended our programme to more than 30 new markets. This means that at the end of 2012 we had 5 million ‘Perfect Stores’ in 75 markets – and we aim to have 20 million. Next, we will roll out
the next generation of the programme, ‘Perfect Store 2.0’, aimed at improving the way we market our brands to shoppers, improving shelf stand-out and ensuring we give shoppers more reasons to choose our brands in-store.
Improving the retail experienceMeanwhile, we’re helping our customers improve the retail experience in ‘Perfect Stores’ using hand-held technology and the power of analytics, suggesting salesmen for store-specific orders and promotions, plus tips on displays. We also empowered thousands of our Shakti entrepreneurs with mobile phones to book sales orders. We will continue to innovate and grow sustainably with our customers, whether they’re a small-scale distributor in rural India or a global retailer.
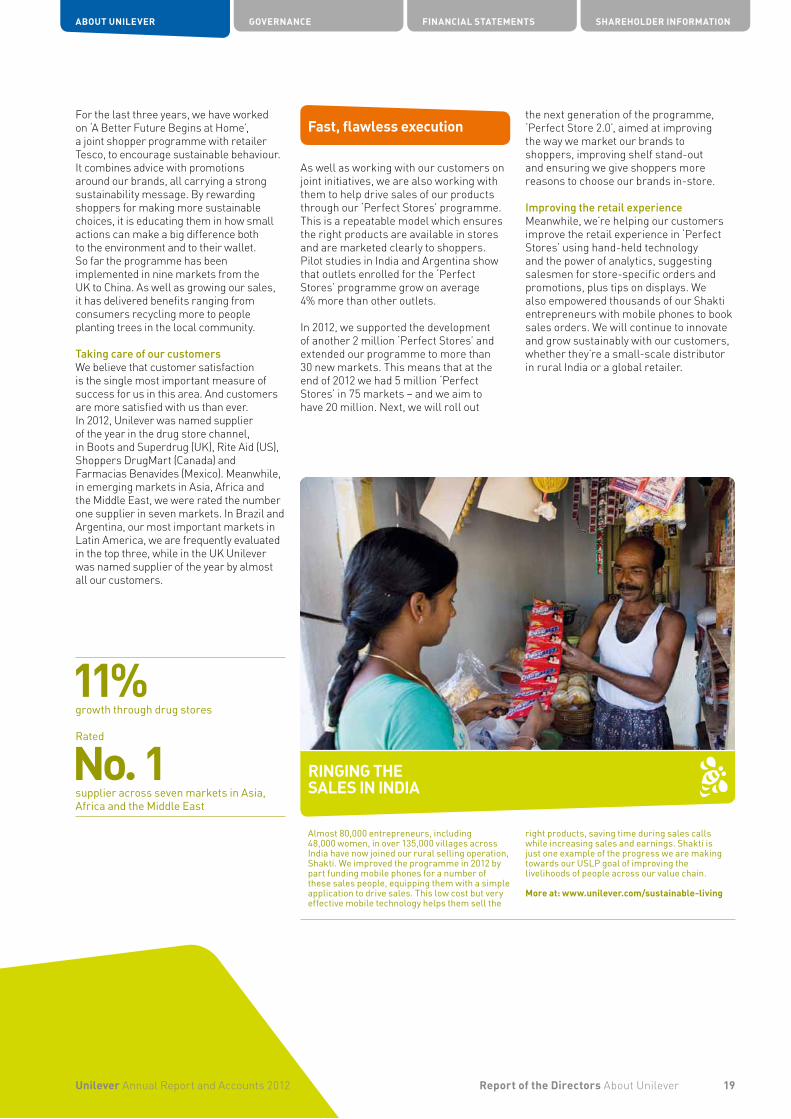
11%growth through drug stores
Rated
No. 1supplier across seven markets in Asia, Africa and the Middle East
Almost 80,000 entrepreneurs, including 48,000 women, in over 135,000 villages across India have now joined our rural selling operation, Shakti. We improved the programme in 2012 by part funding mobile phones for a number of these sales people, equipping them with a simple application to drive sales. This low cost but very effective mobile technology helps them sell the
right products, saving time during sales calls while increasing sales and earnings. Shakti is just one example of the progress we are making towards our USLP goal of improving the livelihoods of people across our value chain.
More at: www.unilever.com/sustainable-living
19Report of the Directors About Unilever
ABOUT UNILEVER GOVERNANCE FINANCIAL STATEMENTS SHAREHOLDER INFORMATION
Unilever Annual Report and Accounts 2012
RINGING THE SALES IN INDIA

20 Report of the Directors About Unilever Unilever Annual Report and Accounts 2012
WINNING THROUGH CONTINUOUS IMPROVEMENT

Our continuous improvement programme aims to deliver sustainable, profitable growth by seeking to add value at every step in the value chain by enhancing product quality and customer service, and rolling out innovations faster. This approach, combined with our global scale, generates significant savings that we invest back into our brands and factories to fuel growth and fulfil our ambition to reach more consumers. It’s also helping us create new ways to source, manufacture and deliver our products more sustainably.
Leveraging entire value chain
By working across the entire value chain – from sourcing, manufacturing and logistics through to innovation, advertising and promotions, and pricing – we can use our global scale to add value, reach new markets and meet our sustainability targets. Working with global scale and local agilityOur procurement organisation now buys the majority of all materials and services centrally – some €35 billion in 2012. This scale improves our buying efficiency and has made a considerable contribution towards our €1.4 billion supply chain savings, double what we saved in 2007.
When it comes to production, our philosophy of ‘design once, deploy everywhere’, enables us to maximise our global scale. This ensures our world-class manufacturing network of over 250 factories delivers higher quality products and faster global innovation roll-outs. In 2012, we also increased cross-border sourcing by investing in large regional or global manufacturing bases, making better use of our capital.
Our global logistics network transports our finished goods over 1.5 billion kilometres each year. This scale enables us to have global and regional distribution hubs, improving operational efficiency
significantly and reducing vehicle kilometres by 175 million over the next three years in Europe alone – cutting costs and emissions while improving service.
Driving return on marketing and capital investmentCompleting the value chain picture, we focused on getting the best return on marketing investment for every brand in every category, spending €6.8 billion on advertising and promotion in 2012. We reviewed our approach to marketing through our ‘Crafting Brands for Life’ programme, placing an emphasis on learning through continuous improvement. By focusing on creating fewer but better advertisements, and using them in more places, we drove down advertising production and fees globally, reducing our overall spend by over €41 million. Our return on marketing investment delivered over €175 million in savings in 2012, vital to fund our marketing programmes.
€1.4 billion in supply chain savings in 2012
39% of all tea sourced comes from farms certified by the Rainforest Alliance
TAKING PALM OIL IN HAND In 2012, three years ahead of schedule, we succeeded in sourcing 100% of our palm oil sustainably. We’re one of the largest buyers in the world, purchasing some 3% of the total volume produced.
Importantly, this is just the beginning. We also want to know exactly where it comes from, so we’re now aiming to purchase entirely from traceable certified sources by 2020, which means we’ll be able to track every tonne back to the certified plantation where it was grown. We’ll be helped in this by our €69 million investment in a new palm kernel oil processing plant in Indonesia, which will bring us closer to the source. We are also actively considering similar joint venture investments in processing crude palm oil derivatives in South East Asia, India and West Africa.
TIME FOR TEA As part of our plan to source tea sustainably, for the last six years we’ve worked with the Kenya Tea Development Agency to educate its smallholder farmers about sustainable cultivation and Rainforest Alliance certification. And it’s working – many certified tea farmers are now achieving higher yields. Globally our programmes have contributed to training 450,000 smallholder farmers.
SUPPLIER OF THE YEAR In the UK, our supply chain dramatically improved customer service through closer customer collaboration, a new planning process and a more responsive sourcing network. We were named the top multi-category supplier in the Advantage Group Survey and supplier of the year by the major retailers including Asda, Sainsbury’s and Boots.
OUR SUPPLIERS TO FIND OUT HOW WE PARTNER WITH SUPPLIERS TO MEET CONSUMERS’ AND CUSTOMERS’ NEEDS GO TO WWW.UNILEVER.COM/ABOUTUS/SUPPLIER.
21Report of the Directors About Unilever
ABOUT UNILEVER GOVERNANCE FINANCIAL STATEMENTS SHAREHOLDER INFORMATION
Unilever Annual Report and Accounts 2012

Local relevance with low-cost business modelsOne of Unilever’s particular strengths is our ability to combine global scale with locally tailored solutions. We have identified several levers to improve our gross margin over the long term, one of which is the application of ‘low-cost business models’ to parts of the business such as laundry. We expect a significant profitability uplift once these measures are implemented, enabling us to invest back into the business, maintaining and accelerating the momentum of the virtuous circle of growth.
Working in partnership with our suppliersOur scale also helps us to meet our ambitious targets for sustainable sourcing. In 2012, we sourced around one third of all agricultural raw materials sustainably, including 100% of our palm oil, our largest agricultural raw material, three years ahead of schedule. Elsewhere, 39% of all the tea we source comes from farms certified by the Rainforest Alliance. Sourcing sustainably means that farmers can improve their living conditions and earn an income they can live on. It also helps maintain and improve soil fertility, enhance water quality and availability, and protect biodiversity.
However, we cannot achieve our sustainable growth agenda alone. We work in partnership with our suppliers to support the growth and innovation we need. Through our ‘Partner to Win’ programme, we work with more than 150 strategic suppliers by sharing strategies and growth plans. This enables us to build capacity and create new technologies. Our suppliers are also key to generating new ideas and are partnering with us on over 65% of the deliverables in our medium and long-term innovation projects.
Improving eco-efficiencyWe are also focusing on improving sustainability in our manufacturing network. Thanks to programmes to reduce, reuse, recycle and recover, over half our manufacturing sites now send zero non-hazardous waste to landfill. We sourced 26% of our energy used in manufacturing from renewables, and reduced our CO2 emissions from energy by 838,000 tonnes in the period 2008 to 2012. These efforts have contributed towards the recognition by the Dow Jones Sustainability Indexes, which named Unilever a global super-sector leader in 2012.
Reaching more consumers
To meet our growth ambition we need to reach more consumers. We continue to work hard to ensure our products are always available wherever the consumer is shopping.
To reach different kinds of consumers we have developed segmented supply chains across categories, portfolios, geographies and channels to deliver the right service at the right cost. For example, in Indonesia, Pond’s is a premium brand that’s often sold by small specialist retailers with little space to showcase the entire range and as a result they have a tendency to run out of stock. Following a successful trial, we now offer a daily delivery service, extending the roll-out to Greater Jakarta – experiencing sales growth of more than 80%.
We have been increasing on-shelf availability (OSA), getting more products more quickly on to shelves. In 2012, stores in our OSA programme reduced empty shelves by 13%.
In 2012, our customers rated us higher than ever before. According to the global Advantage Group Survey, we improved in 70% of our key markets and are in the top third in ten out of 14 of our key markets.
We are also working hard to increase product quality – reducing both complaints
and incidents. Consumer complaints were down by 29% in 2012 versus 2009, while product incidents were down by 75%. In addition, we are making and designing better products. In 2012, 57% of our products scored higher than our competitors’ in blind tests, compared to just 21% in 2009.
Fast, flawless execution
Our ability to deliver quality products, innovate, and make better decisions quickly is critical to our sustainable growth agenda. For example, we have almost halved the time it takes to launch key innovations into the market place. New capabilities and centralised processes are making it possible to almost halve the time it takes to build new factories. Unilever’s Global Engineering Services uses ‘cookie cutter’ templates for factories, design and suppliers, helping us to deliver consistent high quality products wherever in the world they are made, as well as improving our speed to market.
We are also investing for growth and are building world-class factories, enabling us to cater to the substantial volume growth so far. As well as increasing capacity and flexibility, our new plants create competitiveness through manufacturing excellence and by using sustainable technologies.
Over half of our 252 manufacturing sites across the world, from Costa Rica to Japan, send no non-hazardous waste to landfill, up from 74 at the start of the year. 100% of our sites send zero waste to landfill in 18 countries, the equivalent of removing over 1 million household bins of waste every year. This has been achieved by eliminating
waste in the factories. We also reduced, reused, recycled and recovered waste. For example, in Russia, Unilever recycles tea bags to make animal bedding or wallpaper.
More at: www.unilever.com/sustainable-living
22 Unilever Annual Report and Accounts 2012Report of the Directors About Unilever
WINNING THROUGH CONTINUOUS IMPROVEMENT continued
ZERO WASTE TO LANDFILL

Operational excellenceEnterprise Support, Unilever’s global shared services, is transforming our internal operations. By simplifying our internal processes, it is helping us both reduce costs and, by enabling us to act faster and with greater agility, improve our service to customers.
In Finance Services, for example, we have simplified our reporting processes, systems and tools, reducing our reporting time from 25 working days in 2010 to 19 today. We aim to reduce this still further.
In IT we are leveraging technology across Unilever which is helping us manage our growing business more efficiently. We have simplified 200 local IT transaction systems by replacing them with four global systems, managed as one for speed and resilience. This is delivering many benefits, for example helping us integrate acquisitions swiftly – both Alberto Culver and the Sara Lee personal care brands were integrated in just over six months.
We are also using technology to improve our service to customers. More than 50,000 of our representatives in areas
Product incidents down
75%in 2012 versus 2009
Reduced CO2 emissions from energy from factory operations between 2008 and 2012 by
838,000 tonnes
As part of our low-cost business model strategy, we analysed every link in the value chain for Wheel, our value washing powder in India. As a result of technology and productivity improvements in manufacturing as well as distributing the product from our factory direct to the customer, we delivered savings right across the value chain, ensuring our products are affordable to people on low incomes and reducing our carbon footprint.
More at: www.hul.co.in/wheel
such as sales, merchandising and store auditing are connected to Unilever’s information systems. They use mobile devices to help them carry out sales transactions and record and upload up-to-date market data. This lets us monitor how our products are being presented to shoppers in over 4 million stores in our ‘Perfect Stores’ programme (see page 17).
It’s not just customers who are benefiting – we are talking directly to consumers too through our digital hub which is connecting them securely with our brands across multiple digital channels. For example, we launched our Dove digital presence in 30 countries in just 30 days – just one of 650 brand activations across 50 countries.
Bringing it all together, in May 2012 we opened a global operations centre in Bangalore, tapping into the talent and mindset of emerging markets. This is the heart of our global shared services operations, and will support our end-to-end IT, Finance and Information Management across the whole of Unilever.
ABOUT UNILEVER GOVERNANCE FINANCIAL STATEMENTS SHAREHOLDER INFORMATION
Unilever Annual Report and Accounts 2012 23Report of the Directors About Unilever
MAKING WHEEL SPIN

I AM EXCITED TO SEE THE TEA PICKERS USING MY DESIGN IN THE FIELD
Samwel Nyagucha, tea picker, Kenya
Unilever Annual Report and Accounts 2012Report of the Directors About Unilever24
WINNING WITH PEOPLE

Sustainable, profitable growth can only be achieved if the right people are working in an organisation that is fit to win, underpinned by a culture in which performance is always aligned with values. We are increasingly an agile, flexible and diverse business with people who are motivated by doing good while doing well. We are building capability and leadership among our people – and we are attracting some of the best talent in the market place.
Capability and leadership
To double the size of our business, we need to support the talented people we already employ so they can be the best they can be. We also need to attract the best people in the market place.
Employer of choiceThis year, we were voted the number one FMCG (fast-moving consumer goods) employer of choice among graduates in 20 countries. Potential employees in markets as diverse as Russia and Vietnam, Brazil and Bangladesh, or Indonesia and the UK think that we are the most attractive employer in our sector.
We achieved this top ranking in several countries for the very first time, including Mexico, Germany and Spain – while in India we were employer of choice, not just in our sector, but across the entire employment market.
We are leveraging our partnership with One Young World, an annual global summit where young ambassadors collaborate on projects to change the world for the better. This year it allowed us to introduce Unilever and its commitment to making sustainability commonplace to 1,200 delegates from 183 countries.
Employer brandWe have focused on ensuring that our standing as an employer – what we call our ‘employer brand’ – has our commitment to sustainability at the core. We have built an employer brand development tool which leverages best practice, and adapted our recruitment models to reach the best people wherever they are in the world.
Our digital presence is a vital factor in this. Sustained investment and innovation in our social media interactions have seen us become the highest ranked FMCG company on LinkedIn’s global InDemand index. Our Facebook global careers page has attracted more than 110,000 ‘likes’, with the highest numbers in India, Brazil, Egypt and Indonesia of any global careers page. It is the second largest Facebook page dedicated to careers.
No. 1FMCG employer of choice among graduates in
20 countries
BASKETS OF INGENUITYEach year, we recognise a number of employees as ‘Unilever heroes’ for work that brings our values to life (see page 26). Samwel Nyagucha was picking tea on our Kaptien estate in Kenya when he saw a way to make pickers’ work more efficient. Inspired by baskets he’d seen on other estates, he designed a new picking basket which keeps the tea fresh and is light and easy to carry, allowing the picker to work more efficiently.
In 2012, 6,500 baskets made to Samwel’s design were distributed across our tea plantations in Kenya and they were introduced in Unilever Tea Tanzania.
REACHING TOMORROW’S LEADERS – DIGITALLY We went from 40,000 followers on LinkedIn to 235,000 in ten months – and we are still exploring the potential of social networks as a way to engage with future employees. Recruits can now reach us through Twitter and Facebook as well as LinkedIn – and we have seen an increase in career page visits.
DIVERSITY RECOGNISEDWe are proud winners of the prestigious 2013 Catalyst Award, honouring exceptional business initiatives for women in the workplace. We were recognised for accelerating the advancement of high-potential women, and leveraging cultural diversity and multinational expertise to promote a culture of inclusion.
OUR PEOPLE IN ACTION TO FIND OUT MORE ABOUT WHAT WE DO AND MEET SOME OF THE PEOPLE WHO BRING OUR PRODUCTS TO LIFE GO TO WWW.UNILEVER.COM/CAREERS.
25Report of the Directors About Unilever
ABOUT UNILEVER GOVERNANCE FINANCIAL STATEMENTS SHAREHOLDER INFORMATION
Unilever Annual Report and Accounts 2012

Leadership for the futureWe are committed to the growth of our people throughout their careers, and to ensuring that leadership skills in particular are developed at every level of management. Our new Four Acres Learning and Leadership Centre in Singapore, scheduled to open in mid-2013, is physical proof of this commitment. Like our long-standing Four Acres Centre in Kingston, UK, the facility will run a global curriculum to drive excellence and commitment to leadership development and sustainability.
We now have programmes for existing and future leaders at all levels. These are designed in a blended approach of leaders teaching leaders, senior executive sponsorship, academic rigour and application through job experience, mentors and coaches.
A diverse business for a diverse worldTwo billion people use our products every day and, if we are to meet their needs, we need to reflect their diversity in our own workplaces. Through better recruitment,
family-friendly working conditions, a culture of accountability, and initiatives like employee networks and mentoring, our business is becoming increasingly gender-balanced. By the end of 2012, 41% of our management headcount were women, compared to 39% at the end of 2011. After a decade of steady improvement, achieving an increase of more than 1% in a single year shows progress – but we recognise there is still a long way to go.
We are working hard to improve further and it is encouraging that we have received external recognition for our efforts. For example, we were: awarded the prestigious 2013 Catalyst Award; awarded Company of the Year in the Vodafone European Diversity Awards 2012; named Top Employer by workingmums.co.uk; winners of Japanese magazine Toyo Keizai’s Female Management Appointment Award for 2012; named among the 2012 Working Mother 100 Best Companies in the US; and our US business was given a 100% rating in the Human Rights Campaign’s Corporate Equality Index.
Values and performance culture
Ours has always been a business based on values. We aim to ensure that integrity, responsibility, respect and pioneering spirit underpin our activities. In the last two years we have found new ways to express those values through the Unilever Sustainable Living Plan (USLP).
Engaged employeesWe have been encouraged by what our people are telling us about our culture. Our Global People Survey (GPS) measures the level of engagement of all employees. Over 114,000 eligible employees participated in the 2012 survey, representing an 87% response rate. Our engagement score of 75%, up from 73% in the 2010 GPS, is now in line with the scores of high-performing employers in our class.
Other key aspects of the survey also showed good progress: scores rose by 5% for people management, and by 4% for performance culture, bias for action and diversity. We believe that the USLP and our values are significant factors in keeping employees fully engaged in our business – and therefore driving performance.
Everyday heroesOur values are exemplified every day by thousands of employees, without whom our business could not meet its ambitions for sustainable growth. But even amidst all this good work, some actions stand out. This year we honoured six employees nominated by their colleagues as ‘Unilever heroes’ – one of the ways in which we recognise significant contributions to society and our business.
In 2011, we began work on the Unilever Four Acres Learning and Leadership Centre in Singapore. The facility is on course to open in mid-2013, and will provide learning and capability development from our new global curriculum, designed to ensure that our people have the skills to meet our growth ambitions.
Four Acres Singapore has accommodation for 55 students and includes two flexible training rooms, a teaching amphitheatre and a multi-purpose hall for up to 200 people.
More at: www.unilever.com/ developing-and-engaging-our-people
26 Report of the Directors About Unilever Unilever Annual Report and Accounts 2012
WINNING WITH PEOPLE continued
FOUR ACRES SINGAPORE
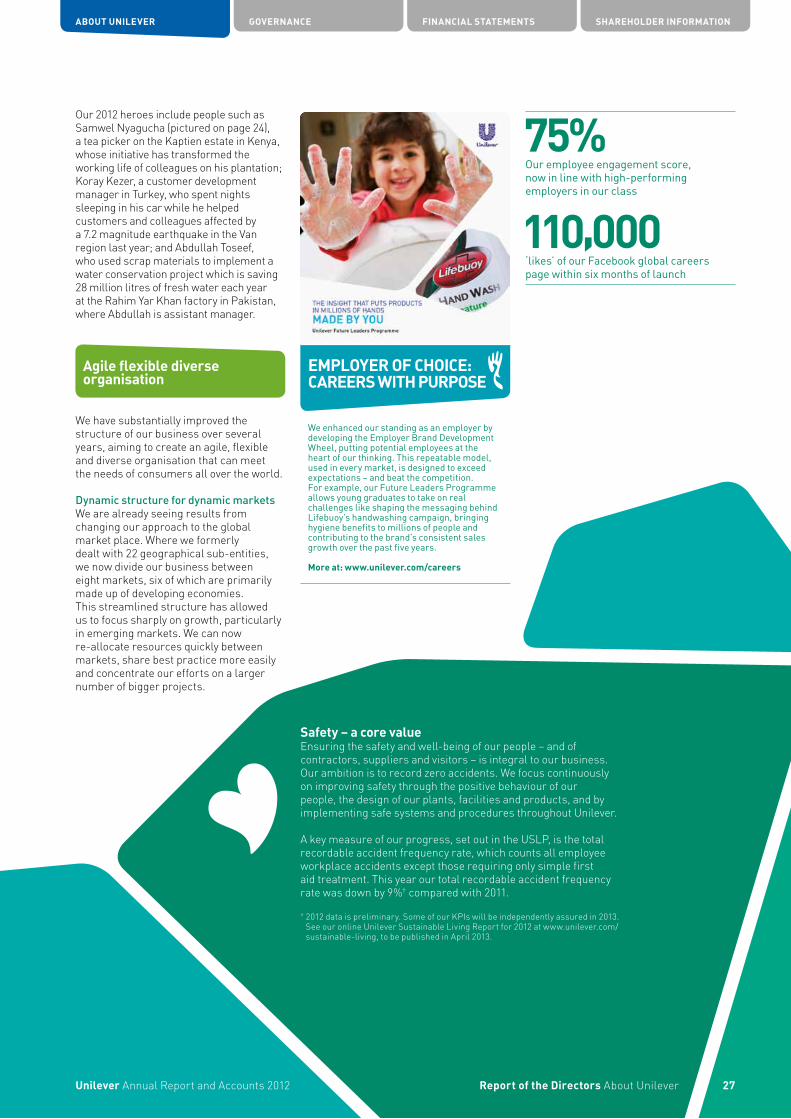
Our 2012 heroes include people such as Samwel Nyagucha (pictured on page 24), a tea picker on the Kaptien estate in Kenya, whose initiative has transformed the working life of colleagues on his plantation; Koray Kezer, a customer development manager in Turkey, who spent nights sleeping in his car while he helped customers and colleagues affected by a 7.2 magnitude earthquake in the Van region last year; and Abdullah Toseef, who used scrap materials to implement a water conservation project which is saving 28 million litres of fresh water each year at the Rahim Yar Khan factory in Pakistan, where Abdullah is assistant manager.
Agile flexible diverse organisation
We have substantially improved the structure of our business over several years, aiming to create an agile, flexible and diverse organisation that can meet the needs of consumers all over the world.
Dynamic structure for dynamic marketsWe are already seeing results from changing our approach to the global market place. Where we formerly dealt with 22 geographical sub-entities, we now divide our business between eight markets, six of which are primarily made up of developing economies. This streamlined structure has allowed us to focus sharply on growth, particularly in emerging markets. We can now re-allocate resources quickly between markets, share best practice more easily and concentrate our efforts on a larger number of bigger projects.
Safety – a core valueEnsuring the safety and well-being of our people – and of contractors, suppliers and visitors – is integral to our business. Our ambition is to record zero accidents. We focus continuously on improving safety through the positive behaviour of our people, the design of our plants, facilities and products, and by implementing safe systems and procedures throughout Unilever.
A key measure of our progress, set out in the USLP, is the total recordable accident frequency rate, which counts all employee workplace accidents except those requiring only simple first aid treatment. This year our total recordable accident frequency rate was down by 9%† compared with 2011.
† 2012 data is preliminary. Some of our KPIs will be independently assured in 2013. See our online Unilever Sustainable Living Report for 2012 at www.unilever.com/sustainable-living, to be published in April 2013.
We enhanced our standing as an employer by developing the Employer Brand Development Wheel, putting potential employees at the heart of our thinking. This repeatable model, used in every market, is designed to exceed expectations – and beat the competition. For example, our Future Leaders Programme allows young graduates to take on real challenges like shaping the messaging behind Lifebuoy’s handwashing campaign, bringing hygiene benefits to millions of people and contributing to the brand’s consistent sales growth over the past five years.
More at: www.unilever.com/careers
75%Our employee engagement score, now in line with high-performing employers in our class
110,000‘likes’ of our Facebook global careers page within six months of launch
ABOUT UNILEVER GOVERNANCE FINANCIAL STATEMENTS SHAREHOLDER INFORMATION
27Report of the Directors About UnileverUnilever Annual Report and Accounts 2012
EMPLOYER OF CHOICE:CAREERS WITH PURPOSE
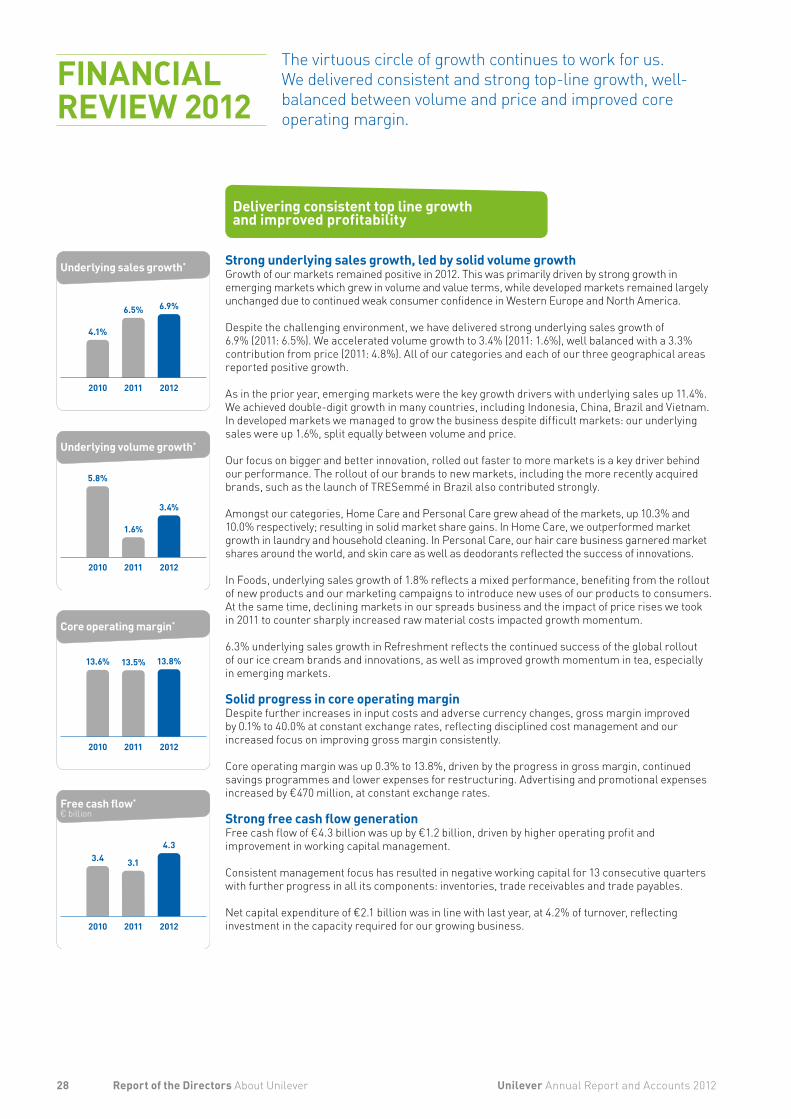
The virtuous circle of growth continues to work for us. We delivered consistent and strong top-line growth, well-balanced between volume and price and improved core operating margin.
Delivering consistent top line growth and improved profitability
Strong underlying sales growth, led by solid volume growthGrowth of our markets remained positive in 2012. This was primarily driven by strong growth in emerging markets which grew in volume and value terms, while developed markets remained largely unchanged due to continued weak consumer confidence in Western Europe and North America.
Despite the challenging environment, we have delivered strong underlying sales growth of 6.9% (2011: 6.5%). We accelerated volume growth to 3.4% (2011: 1.6%), well balanced with a 3.3% contribution from price (2011: 4.8%). All of our categories and each of our three geographical areas reported positive growth.
As in the prior year, emerging markets were the key growth drivers with underlying sales up 11.4%. We achieved double-digit growth in many countries, including Indonesia, China, Brazil and Vietnam. In developed markets we managed to grow the business despite difficult markets: our underlying sales were up 1.6%, split equally between volume and price.
Our focus on bigger and better innovation, rolled out faster to more markets is a key driver behind our performance. The rollout of our brands to new markets, including the more recently acquired brands, such as the launch of TRESemmé in Brazil also contributed strongly.
Amongst our categories, Home Care and Personal Care grew ahead of the markets, up 10.3% and 10.0% respectively; resulting in solid market share gains. In Home Care, we outperformed market growth in laundry and household cleaning. In Personal Care, our hair care business garnered market shares around the world, and skin care as well as deodorants reflected the success of innovations.
In Foods, underlying sales growth of 1.8% reflects a mixed performance, benefiting from the rollout of new products and our marketing campaigns to introduce new uses of our products to consumers. At the same time, declining markets in our spreads business and the impact of price rises we took in 2011 to counter sharply increased raw material costs impacted growth momentum.
6.3% underlying sales growth in Refreshment reflects the continued success of the global rollout of our ice cream brands and innovations, as well as improved growth momentum in tea, especially in emerging markets.
Solid progress in core operating marginDespite further increases in input costs and adverse currency changes, gross margin improved by 0.1% to 40.0% at constant exchange rates, reflecting disciplined cost management and our increased focus on improving gross margin consistently.
Core operating margin was up 0.3% to 13.8%, driven by the progress in gross margin, continued savings programmes and lower expenses for restructuring. Advertising and promotional expenses increased by €470 million, at constant exchange rates.
Strong free cash flow generation Free cash flow of €4.3 billion was up by €1.2 billion, driven by higher operating profit and improvement in working capital management.
Consistent management focus has resulted in negative working capital for 13 consecutive quarters with further progress in all its components: inventories, trade receivables and trade payables.
Net capital expenditure of €2.1 billion was in line with last year, at 4.2% of turnover, reflecting investment in the capacity required for our growing business.
28 Unilever Annual Report and Accounts 2012Report of the Directors About Unilever
FINANCIAL REVIEW 2012
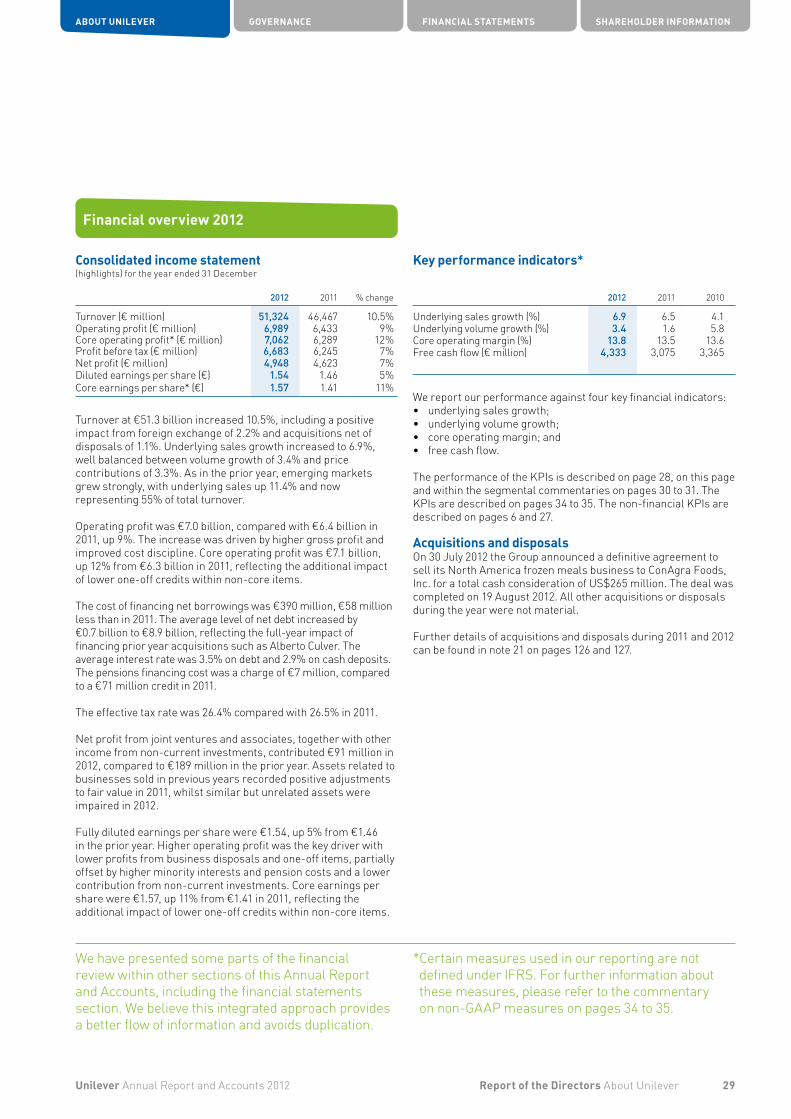
Financial overview 2012
Consolidated income statement(highlights) for the year ended 31 December
2012 2011 % change
Turnover (€ million) 51,324 46,467 10.5%Operating profit (€ million) 6,989 6,433 9%Core operating profit* (€ million) 7,062 6,289 12%Profit before tax (€ million) 6,683 6,245 7%Net profit (€ million) 4,948 4,623 7%Diluted earnings per share (€) 1.54 1.46 5%Core earnings per share* (€) 1.57 1.41 11%
Turnover at €51.3 billion increased 10.5%, including a positive impact from foreign exchange of 2.2% and acquisitions net of disposals of 1.1%. Underlying sales growth increased to 6.9%, well balanced between volume growth of 3.4% and price contributions of 3.3%. As in the prior year, emerging markets grew strongly, with underlying sales up 11.4% and now representing 55% of total turnover.
Operating profit was €7.0 billion, compared with €6.4 billion in 2011, up 9%. The increase was driven by higher gross profit and improved cost discipline. Core operating profit was €7.1 billion, up 12% from €6.3 billion in 2011, reflecting the additional impact of lower one-off credits within non-core items.
The cost of financing net borrowings was €390 million, €58 million less than in 2011. The average level of net debt increased by €0.7 billion to €8.9 billion, reflecting the full-year impact of financing prior year acquisitions such as Alberto Culver. The average interest rate was 3.5% on debt and 2.9% on cash deposits. The pensions financing cost was a charge of €7 million, compared to a €71 million credit in 2011.
The effective tax rate was 26.4% compared with 26.5% in 2011.
Net profit from joint ventures and associates, together with other income from non-current investments, contributed €91 million in 2012, compared to €189 million in the prior year. Assets related to businesses sold in previous years recorded positive adjustments to fair value in 2011, whilst similar but unrelated assets were impaired in 2012.
Fully diluted earnings per share were €1.54, up 5% from €1.46 in the prior year. Higher operating profit was the key driver with lower profits from business disposals and one-off items, partially offset by higher minority interests and pension costs and a lower contribution from non-current investments. Core earnings per share were €1.57, up 11% from €1.41 in 2011, reflecting the additional impact of lower one-off credits within non-core items.
We have presented some parts of the financial review within other sections of this Annual Report and Accounts, including the financial statements section. We believe this integrated approach provides a better flow of information and avoids duplication.
Key performance indicators*
2012 2011 2010
Underlying sales growth (%) 6.9 6.5 4.1Underlying volume growth (%) 3.4 1.6 5.8Core operating margin (%) 13.8 13.5 13.6Free cash flow (€ million) 4,333 3,075 3,365
We report our performance against four key financial indicators:• underlying sales growth;• underlying volume growth;• core operating margin; and• free cash flow.
The performance of the KPIs is described on page 28, on this page and within the segmental commentaries on pages 30 to 31. The KPIs are described on pages 34 to 35. The non-financial KPIs are described on pages 6 and 27.
Acquisitions and disposalsOn 30 July 2012 the Group announced a definitive agreement to sell its North America frozen meals business to ConAgra Foods, Inc. for a total cash consideration of US$265 million. The deal was completed on 19 August 2012. All other acquisitions or disposals during the year were not material.
Further details of acquisitions and disposals during 2011 and 2012 can be found in note 21 on pages 126 and 127.
* Certain measures used in our reporting are not defined under IFRS. For further information about these measures, please refer to the commentary on non-GAAP measures on pages 34 to 35.
29Unilever Annual Report and Accounts 2012 Report of the Directors About Unilever
ABOUT UNILEVER GOVERNANCE FINANCIAL STATEMENTS SHAREHOLDER INFORMATION

Personal Care
2012 2011%
Change
Turnover (€ million) 18,097 15,471 17.0Operating profit (€ million) 2,928 2,536 15.5
Core operating margin (%) 17.1 17.6 (0.5)
Underlying sales growth (%) 10.0 8.2Underlying volume growth (%) 6.5 4.2Effect of price changes (%) 3.3 3.8
Key developments• Personal Care grew strongly again in 2012, with market
outperforming growth spurred by innovation and the rollout of our brands in new markets, complemented by a strong contribution of the recently acquired brands.
• Underlying sales growth of 10.0% was driven by both higher volumes and a positive price contribution. Market shares increased, benefiting from gains in all geographies and strong performance in the haircare, deodorants and skin cleansing categories.
• Core operating margin was down 0.5%, reflecting continued investments in building beauty capabilities and infrastructure.
Refreshment
2012 2011%
Change
Turnover (€ million) 9,726 8,804 10.5Operating profit (€ million) 911 723 26.0
Core operating margin (%) 9.4 7.7 1.7
Underlying sales growth (%) 6.3 4.9Underlying volume growth (%) 2.4 1.4Effect of price changes (%) 3.9 3.4
Key developments• Performance in Refreshment improved in growth momentum
as well as profitability. Underlying sales growth of 6.3% reflects good contribution from volume growth and from price changes. Core operating margin improved by 1.7%. This was driven by higher gross margin, strong savings programmes and cost discipline.
• In ice cream, growth momentum was driven by powerful performance in Latin America, Asia, North America and Europe and benefited from innovation behind our global brands such as Magnum, which is now a brand with sales in excess of €1 billion.
• In tea, innovation improved growth momentum in particular in emerging markets, such as Russia, Arabia and India.
Foods
2012 2011%
Change
Turnover (€ million) 14,444 13,986 3.3Operating profit (€ million) 2,605 2,693 (3.3)
Core operating margin (%) 17.5 17.5 –
Underlying sales growth (%) 1.8 4.9Underlying volume growth (%) (0.9) (1.2)Effect of price changes (%) 2.7 6.2
Key developments• Underlying sales growth in Foods was 1.8%. Volume growth
was slightly negative, continuing to reflect the impact of a contracting spreads market and the price rises we took in 2011 to counter significant increases in input prices.
• Growth was supported by the rollout of innovations such as Knorr Jelly Bouillon and Knorr Baking Bags, as well as solid results delivered by our Food Solutions business.
• Core operating margin was flat with lower gross margin, reflecting the impact of higher commodity costs, offset by improved cost discipline and savings delivery.
Home Care
2012 2011%
Change
Turnover (€ million) 9,057 8,206 10.4Operating profit (€ million) 545 481 13.3
Core operating margin (%) 5.9 5.4 0.5
Underlying sales growth (%) 10.3 8.1Underlying volume growth (%) 6.2 2.2Effect of price changes (%) 3.9 5.8
Key developments• Home Care delivered a strong performance with underlying
sales growth of 10.3%, ahead of market growth and balanced between volume growth of 6.2% and price changes contributing 3.9%.
• We improved value market shares in our laundry business across geographies and in particular in a number of highly competitive markets such as UK, France, China and South Africa on the back of continued innovation and the rollout of our brands.
• Household care growth was equally supported by the rollout of new and improved products, driving strong growth momentum for our global brands Domestos, Cif and Sunlight.
• Core operating margin was up by 0.5%, benefiting from successful new business models.
30 Unilever Annual Report and Accounts 2012Report of the Directors About Unilever
FINANCIAL REVIEW 2012 continued

Asia/AMET/RUB 2012 2011
%Change
Turnover (€ million) 20,357 17,723 14.9Operating profit (€ million) 2,637 2,109 25.0
Core operating margin (%) 13.1 12.0 1.1
Underlying sales growth (%) 10.6 11.2Underlying volume growth (%) 5.7 5.0Effect of price changes (%) 4.6 5.9
Key developments• Strong underlying sales growth of 10.6% continued at a similar
level as the prior year with an even stronger volume component of 5.7%, despite a higher base and some softness in economic growth in the region. Innovation and the rollout of our brands into new markets supported the growth momentum, which resulted in double-digit growth in a number of countries, including Indonesia, China, Thailand and India.
• Gains in value market share were primarily driven by the Personal Care and Home Care categories, on the back of strong sustained momentum in haircare, deodorants and household care. Foods value shares were slightly down.
• Core operating margin was up 1.1%, benefiting from improved gross margin and cost discipline.
The Americas 2012 2011
%Change
Turnover (€ million) 17,088 15,251 12.0Operating profit (€ million) 2,433 2,250 8.1
Core operating margin (%) 14.2 13.9 0.3
Underlying sales growth (%) 7.9 6.3Underlying volume growth (%) 3.1 0.4Effect of price changes (%) 4.8 5.9
Key developments• Underlying sales growth of 7.9% was well balanced between
volume growth of 3.1% and price contributions of 4.8% and benefited from continued strong growth in Latin America.
Unilever Group
Turnover€ million
2012
USG%
2012
UVG%
2012
Turnover€ million
2011
USG%
2011
UVG%
2011
Turnover€ million
2010
USG%
2010
UVG%
2010
Unilever Total 51,324 6.9 3.4 46,467 6.5 1.6 44,262 4.1 5.8
Developed markets 22,993 1.6 0.8 21,470 0.8 (1.6) 20,990 0.4 2.0Emerging markets 28,331 11.4 5.7 24,997 11.5 4.4 23,272 7.9 9.7
Double-digit growth in markets such as Brazil and Argentina was driven by continued excellent performance in Personal Care and Home Care. Value market shares in these categories are up, as are shares in parts of Foods.
• Underlying sales growth in North America improved on the prior year, with positive contributions from volume and price, despite flat market volume growth. Market share gains were driven by strong performance in Personal Care and they also improved in Foods.
• Core operating margin increased by 0.3% to 14.2%, benefiting from improved gross margin and better cost control, partly offset by increased advertising and promotions expenditure.
• Other key developments include the disposal of our remaining frozen foods business in North America.
Europe 2012 2011
%Change
Turnover (€ million) 13,879 13,493 2.9Operating profit (€ million) 1,919 2,074 (7.5)
Core operating margin (%) 14.2 15.1 (0.9)
Underlying sales growth (%) 0.8 0.7Underlying volume growth (%) 0.9 (1.4)Effect of price changes (%) (0.1) 2.1
Key developments• Market conditions in Europe remained challenging,
particularly in Southern Europe. Economic conditions continued to have a negative impact on consumer demand, resulting in negative volume growth and intense competition.
• Underlying sales growth of 0.8% was entirely volume driven and benefited from ongoing strong performance in France and the UK while Southern European markets such as Greece and Spain continued to suffer.
• In this context, we managed to increase market shares to some extent driven by gains in Personal Care and Home Care.
• Core operating margin declined by 0.9%. This reflects negative gross margin development on the impact of higher commodity costs and a strong prior year comparator.
31Unilever Annual Report and Accounts 2012 Report of the Directors About Unilever
ABOUT UNILEVER GOVERNANCE FINANCIAL STATEMENTS SHAREHOLDER INFORMATION
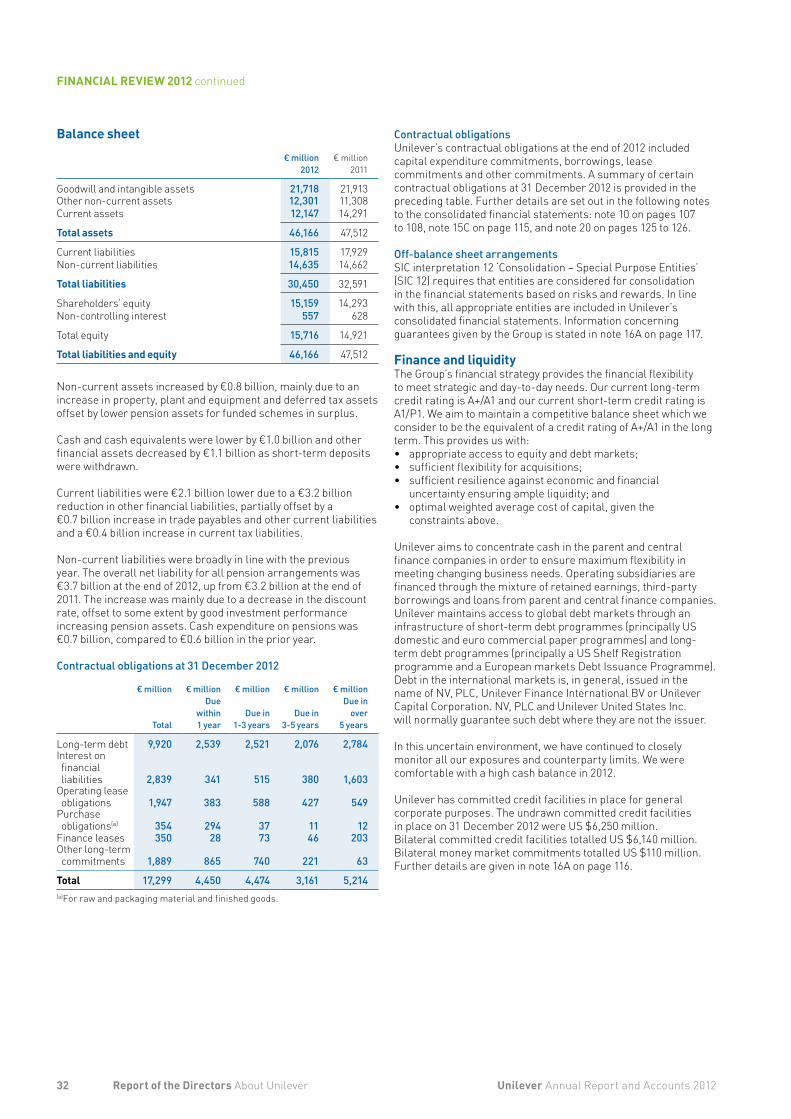
Contractual obligationsUnilever’s contractual obligations at the end of 2012 included capital expenditure commitments, borrowings, lease commitments and other commitments. A summary of certain contractual obligations at 31 December 2012 is provided in the preceding table. Further details are set out in the following notes to the consolidated financial statements: note 10 on pages 107 to 108, note 15C on page 115, and note 20 on pages 125 to 126.
Off-balance sheet arrangementsSIC interpretation 12 ‘Consolidation – Special Purpose Entities’ (SIC 12) requires that entities are considered for consolidation in the financial statements based on risks and rewards. In line with this, all appropriate entities are included in Unilever’s consolidated financial statements. Information concerning guarantees given by the Group is stated in note 16A on page 117.
Finance and liquidityThe Group’s financial strategy provides the financial flexibility to meet strategic and day-to-day needs. Our current long-term credit rating is A+/A1 and our current short-term credit rating is A1/P1. We aim to maintain a competitive balance sheet which we consider to be the equivalent of a credit rating of A+/A1 in the long term. This provides us with:• appropriate access to equity and debt markets;• sufficient flexibility for acquisitions;• sufficient resilience against economic and financial
uncertainty ensuring ample liquidity; and• optimal weighted average cost of capital, given the
constraints above.
Unilever aims to concentrate cash in the parent and central finance companies in order to ensure maximum flexibility in meeting changing business needs. Operating subsidiaries are financed through the mixture of retained earnings, third-party borrowings and loans from parent and central finance companies. Unilever maintains access to global debt markets through an infrastructure of short-term debt programmes (principally US domestic and euro commercial paper programmes) and long-term debt programmes (principally a US Shelf Registration programme and a European markets Debt Issuance Programme). Debt in the international markets is, in general, issued in the name of NV, PLC, Unilever Finance International BV or Unilever Capital Corporation. NV, PLC and Unilever United States Inc. will normally guarantee such debt where they are not the issuer.
In this uncertain environment, we have continued to closely monitor all our exposures and counterparty limits. We were comfortable with a high cash balance in 2012.
Unilever has committed credit facilities in place for general corporate purposes. The undrawn committed credit facilities in place on 31 December 2012 were US $6,250 million. Bilateral committed credit facilities totalled US $6,140 million. Bilateral money market commitments totalled US $110 million. Further details are given in note 16A on page 116.
Balance sheet
€ million
2012€ million
2011
Goodwill and intangible assets 21,718 21,913Other non-current assets 12,301 11,308Current assets 12,147 14,291
Total assets 46,166 47,512
Current liabilities 15,815 17,929Non-current liabilities 14,635 14,662
Total liabilities 30,450 32,591
Shareholders’ equity 15,159 14,293Non-controlling interest 557 628
Total equity 15,716 14,921
Total liabilities and equity 46,166 47,512
Non-current assets increased by €0.8 billion, mainly due to an increase in property, plant and equipment and deferred tax assets offset by lower pension assets for funded schemes in surplus.
Cash and cash equivalents were lower by €1.0 billion and other financial assets decreased by €1.1 billion as short-term deposits were withdrawn.
Current liabilities were €2.1 billion lower due to a €3.2 billion reduction in other financial liabilities, partially offset by a €0.7 billion increase in trade payables and other current liabilities and a €0.4 billion increase in current tax liabilities.
Non-current liabilities were broadly in line with the previous year. The overall net liability for all pension arrangements was €3.7 billion at the end of 2012, up from €3.2 billion at the end of 2011. The increase was mainly due to a decrease in the discount rate, offset to some extent by good investment performance increasing pension assets. Cash expenditure on pensions was €0.7 billion, compared to €0.6 billion in the prior year.
Contractual obligations at 31 December 2012
€ million
Total
€ millionDue
within1 year
€ million
Due in1-3 years
€ million
Due in3-5 years
€ millionDue in
over 5 years
Long-term debt 9,920 2,539 2,521 2,076 2,784Interest on financial liabilities 2,839 341 515 380 1,603
Operating lease obligations 1,947 383 588 427 549
Purchase obligations(a) 354 294 37 11 12
Finance leases 350 28 73 46 203Other long-term commitments 1,889 865 740 221 63
Total 17,299 4,450 4,474 3,161 5,214(a)For raw and packaging material and finished goods.
32 Unilever Annual Report and Accounts 2012Report of the Directors About Unilever
FINANCIAL REVIEW 2012 continued
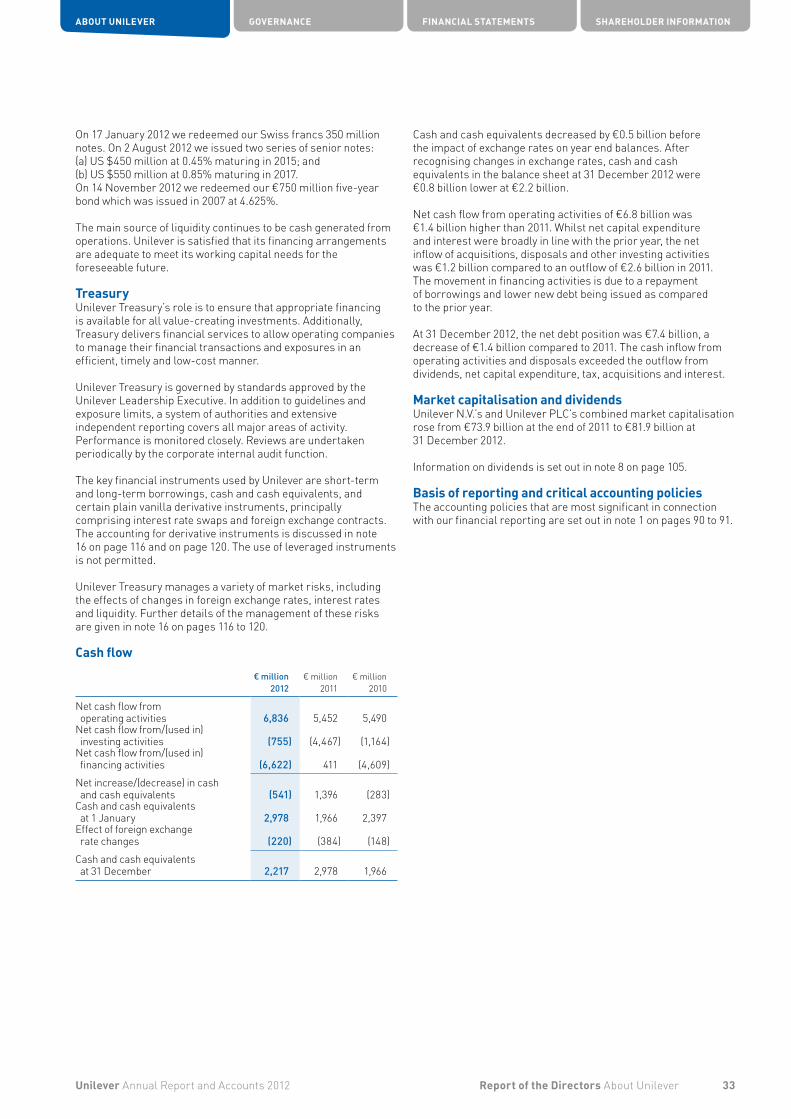
Cash and cash equivalents decreased by €0.5 billion before the impact of exchange rates on year end balances. After recognising changes in exchange rates, cash and cash equivalents in the balance sheet at 31 December 2012 were €0.8 billion lower at €2.2 billion.
Net cash flow from operating activities of €6.8 billion was €1.4 billion higher than 2011. Whilst net capital expenditure and interest were broadly in line with the prior year, the net inflow of acquisitions, disposals and other investing activities was €1.2 billion compared to an outflow of €2.6 billion in 2011. The movement in financing activities is due to a repayment of borrowings and lower new debt being issued as compared to the prior year.
At 31 December 2012, the net debt position was €7.4 billion, a decrease of €1.4 billion compared to 2011. The cash inflow from operating activities and disposals exceeded the outflow from dividends, net capital expenditure, tax, acquisitions and interest.
Market capitalisation and dividendsUnilever N.V.’s and Unilever PLC’s combined market capitalisation rose from €73.9 billion at the end of 2011 to €81.9 billion at 31 December 2012.
Information on dividends is set out in note 8 on page 105.
Basis of reporting and critical accounting policiesThe accounting policies that are most significant in connection with our financial reporting are set out in note 1 on pages 90 to 91.
On 17 January 2012 we redeemed our Swiss francs 350 million notes. On 2 August 2012 we issued two series of senior notes:(a) US $450 million at 0.45% maturing in 2015; and(b) US $550 million at 0.85% maturing in 2017.On 14 November 2012 we redeemed our €750 million five-year bond which was issued in 2007 at 4.625%.
The main source of liquidity continues to be cash generated from operations. Unilever is satisfied that its financing arrangements are adequate to meet its working capital needs for the foreseeable future.
TreasuryUnilever Treasury’s role is to ensure that appropriate financing is available for all value-creating investments. Additionally, Treasury delivers financial services to allow operating companies to manage their financial transactions and exposures in an efficient, timely and low-cost manner.
Unilever Treasury is governed by standards approved by the Unilever Leadership Executive. In addition to guidelines and exposure limits, a system of authorities and extensive independent reporting covers all major areas of activity. Performance is monitored closely. Reviews are undertaken periodically by the corporate internal audit function.
The key financial instruments used by Unilever are short-term and long-term borrowings, cash and cash equivalents, and certain plain vanilla derivative instruments, principally comprising interest rate swaps and foreign exchange contracts. The accounting for derivative instruments is discussed in note 16 on page 116 and on page 120. The use of leveraged instruments is not permitted.
Unilever Treasury manages a variety of market risks, including the effects of changes in foreign exchange rates, interest rates and liquidity. Further details of the management of these risks are given in note 16 on pages 116 to 120.
Cash flow
€ million
2012€ million
2011€ million
2010
Net cash flow from operating activities 6,836 5,452 5,490
Net cash flow from/(used in) investing activities (755) (4,467) (1,164)
Net cash flow from/(used in) financing activities (6,622) 411 (4,609)
Net increase/(decrease) in cash and cash equivalents (541) 1,396 (283)
Cash and cash equivalents at 1 January 2,978 1,966 2,397
Effect of foreign exchange rate changes (220) (384) (148)
Cash and cash equivalents at 31 December 2,217 2,978 1,966
Unilever Annual Report and Accounts 2012 Report of the Directors About Unilever
ABOUT UNILEVER GOVERNANCE FINANCIAL STATEMENTS SHAREHOLDER INFORMATION
33

Foods
2012vs 2011
2011vs 2010
Underlying sales growth (%) 1.8 4.9Effect of acquisitions (%) – 0.2Effect of disposals (%) (1.5) (4.3)Effect of exchange rates (%) 3.0 (1.9)Turnover growth (%) 3.3 (1.3)
Refreshment
2012vs 2011
2011vs 2010
Underlying sales growth (%) 6.3 4.9Effect of acquisitions (%) 0.8 0.3Effect of disposals (%) 0.7 (0.3)Effect of exchange rates (%) 2.4 (2.5)Turnover growth (%) 10.5 2.3
Home Care
2012vs 2011
2011vs 2010
Underlying sales growth (%) 10.3 8.1Effect of acquisitions (%) 0.6 1.3Effect of disposals (%) (1.1) 0.1Effect of exchange rates (%) 0.6 (3.1)Turnover growth (%) 10.4 6.2
Underlying volume growth (UVG)Underlying volume growth is underlying sales growth after eliminating the impact of price changes. The relationship between the two measures is set out below:
2012vs 2011
2011vs 2010
Underlying volume growth (%) 3.4 1.6Effect of price changes (%) 3.3 4.8Underlying sales growth (%) 6.9 6.5
The UVG and price effect for category and geographical area are shown in the tables on pages 30 to 31.
Free cash flow (FCF)Free cash flow represents the cash generated from the operation and financing of the business. The movement in FCF measures our progress against the commitment to deliver strong cash flows. FCF is not used as a liquidity measure within Unilever. FCF includes the cash flow from group operating activities, less income tax paid, net capital expenditure, net interest and preference dividends paid.
Non-GAAP measures
Certain discussions and analyses set out in this Annual Report and Accounts include measures which are not defined by generally accepted accounting principles (GAAP) such as IFRS. We believe this information, along with comparable GAAP measurements, is useful to investors because it provides a basis for measuring our operating performance, ability to retire debt and invest in new business opportunities. Our management uses these financial measures, along with the most directly comparable GAAP financial measures, in evaluating our operating performance and value creation. Non-GAAP financial measures should not be considered in isolation from, or as a substitute for, financial information presented in compliance with GAAP. Non-GAAP financial measures as reported by us may not be comparable with similarly titled amounts reported by other companies.
In the following sections we set out our definitions of the following non-GAAP measures and provide reconciliations to relevant GAAP measures:• underlying sales growth;• underlying volume growth;• core operating profit and core operating margin (including
acquisition and disposal related costs, gain/(loss) on disposal of group companies, impairments and other one-off items (non-core items));
• core earnings per share (core EPS);• free cash flow; and• net debt.
Underlying sales growth (USG)USG reflects the change in revenue from continuing operations at constant rates of exchange, excluding the effects of acquisitions and disposals. It is a measure that provides valuable additional information on the underlying performance of the business. In particular, it presents the organic growth of our business year on year and is used internally as a core measure of sales performance.
The reconciliation of USG to changes in the GAAP measure turnover is as follows:
Total Group
2012vs 2011
2011vs 2010
Underlying sales growth (%) 6.9 6.5Effect of acquisitions (%) 1.8 2.7Effect of disposals (%) (0.7) (1.5)Effect of exchange rates (%) 2.2 (2.5)Turnover growth (%) 10.5 5.0
Personal Care
2012vs 2011
2011vs 2010
Underlying sales growth (%) 10.0 8.2Effect of acquisitions (%) 4.4 7.3Effect of disposals (%) (0.5) (0.2)Effect of exchange rates (%) 2.3 (2.9)Turnover growth (%) 17.0 12.4
34 Unilever Annual Report and Accounts 2012Report of the Directors About Unilever
FINANCIAL REVIEW 2012 continued
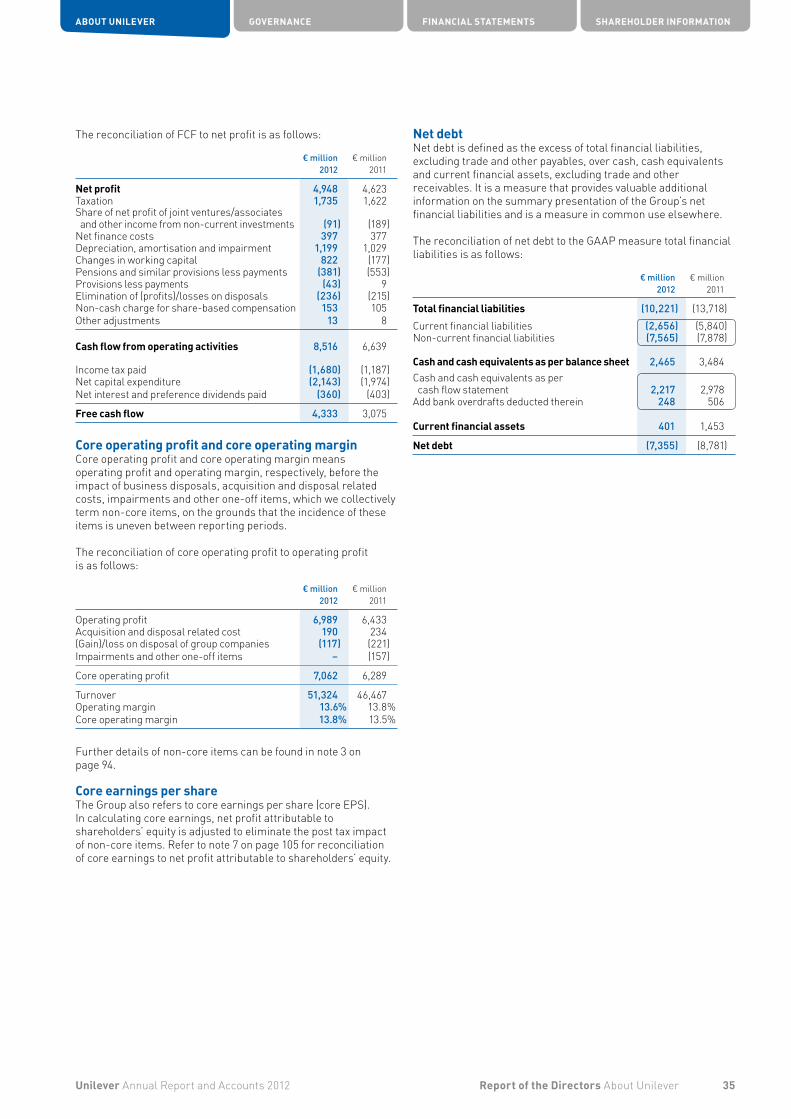
The reconciliation of FCF to net profit is as follows:
€ million
2012€ million
2011
Net profit 4,948 4,623Taxation 1,735 1,622Share of net profit of joint ventures/associates and other income from non-current investments (91) (189)
Net finance costs 397 377Depreciation, amortisation and impairment 1,199 1,029Changes in working capital 822 (177)Pensions and similar provisions less payments (381) (553)Provisions less payments (43) 9Elimination of (profits)/losses on disposals (236) (215)Non-cash charge for share-based compensation 153 105Other adjustments 13 8
Cash flow from operating activities 8,516 6,639
Income tax paid (1,680) (1,187)Net capital expenditure (2,143) (1,974)Net interest and preference dividends paid (360) (403)
Free cash flow 4,333 3,075
Core operating profit and core operating marginCore operating profit and core operating margin means operating profit and operating margin, respectively, before the impact of business disposals, acquisition and disposal related costs, impairments and other one-off items, which we collectively term non-core items, on the grounds that the incidence of these items is uneven between reporting periods.
The reconciliation of core operating profit to operating profit is as follows:
€ million2012
€ million2011
Operating profit 6,989 6,433Acquisition and disposal related cost 190 234(Gain)/loss on disposal of group companies (117) (221)Impairments and other one-off items – (157)
Core operating profit 7,062 6,289
Turnover 51,324 46,467Operating margin 13.6% 13.8%Core operating margin 13.8% 13.5%
Further details of non-core items can be found in note 3 on page 94.
Core earnings per shareThe Group also refers to core earnings per share (core EPS). In calculating core earnings, net profit attributable to shareholders’ equity is adjusted to eliminate the post tax impact of non-core items. Refer to note 7 on page 105 for reconciliation of core earnings to net profit attributable to shareholders’ equity.
Net debtNet debt is defined as the excess of total financial liabilities, excluding trade and other payables, over cash, cash equivalents and current financial assets, excluding trade and other receivables. It is a measure that provides valuable additional information on the summary presentation of the Group’s net financial liabilities and is a measure in common use elsewhere.
The reconciliation of net debt to the GAAP measure total financial liabilities is as follows:
€ million2012
€ million2011
Total financial liabilities (10,221) (13,718)Current financial liabilities (2,656) (5,840)Non-current financial liabilities (7,565) (7,878)
Cash and cash equivalents as per balance sheet 2,465 3,484Cash and cash equivalents as per cash flow statement 2,217 2,978
Add bank overdrafts deducted therein 248 506
Current financial assets 401 1,453
Net debt (7,355) (8,781)
35Unilever Annual Report and Accounts 2012 Report of the Directors About Unilever
ABOUT UNILEVER GOVERNANCE FINANCIAL STATEMENTS SHAREHOLDER INFORMATION

Outlook and risks 2013
The following discussion of the risk outlook and our principal risk management activities includes ‘forward-looking’ statements that reflect Unilever’s view of the operating risk environment. The actual results could differ materially from those projected. See the ‘Cautionary statement’ on the inside back cover.
OutlookMarket conditions for our business were challenging in 2012 and we do not anticipate this changing significantly in 2013.
Economic pressures are expected to continue. We expect consumer markets to remain flat to slightly down in developed markets. In emerging markets consumer demand remains robust but there is nonetheless the risk of modest slowdown in key markets such as China, India and Brazil. Currency markets remain volatile and uncertain. Although we have seen rather more stable conditions in key commodity markets in 2012 we remain watchful for further periods of volatility in 2013. A worsening economic scenario could be triggered by a major Eurozone crisis prompted by countries leaving the euro or by a break-up of the euro leading to significant contraction in financial markets, followed by a severe recession in Europe and knock-on effects globally. Terrorist activity and political unrest may also result in business interruptions and a decreased demand for our products.
The competitive environment for our business is likely to remain intense in 2013. Our competitors, both global and local, will continue to shift resources into emerging markets. We expect continued high levels of competitive challenge to our many category leadership positions. Some of this may be price based, but we also expect strong innovation based competition. With the improvements we have been making to our business we are well prepared for these challenges.
In a period of significant uncertainty and downside risk, we believe Unilever’s operational and financial flexibility, and speed of response to a fast changing environment are vital assets. We will continue to focus on our long term strategic priority of driving volume growth ahead of our markets whilst providing a steady improvement in core operating margin and strong cash flow. We are well placed in emerging markets and we expect these markets to continue to drive growth. Our portfolio strategy defines the role of our categories and our 2013 outlook fully reflects the choices made. This gives us confidence that Unilever is fit to win, whatever the circumstances.
Principal risk factorsOur business is subject to risks and uncertainties. The risks that we regard as the most relevant to our business are identified below. We have also commented on certain mitigating actions that we believe help us to manage these risks. However, we may not be successful in deploying some or all of these mitigating actions. If the circumstances in these risks occur or are not successfully mitigated, our cashflow, operating results, financial position, business and reputation could be materially adversely affected. In addition risks and uncertainties could cause actual results to vary from those described below, which may include forward-looking statements, or could impact on our ability to meet our targets or be detrimental to our profitability or reputation.
Consumer PreferenceAs a branded goods business, Unilever’s success depends on the value and relevance of our brands and products to consumers across the world and on our ability to innovate.
Consumer tastes, preferences and behaviours are constantly changing and Unilever’s ability to respond to these changes and to continue to differentiate our brands and products is vital to our business.
We are dependent on creating innovative products that continue to meet the needs of our consumers. If we are unable to innovate effectively, Unilever’s sales or margins could be materially adversely affected.
We continuously monitor external market trends and collate consumer, customer and shopper insight in order to develop category and brand strategies.
Our Research and Development function actively searches for ways in which to translate the trends in consumer preference and taste into new technologies for incorporation into future products.
Our innovation management process deploys the necessary tools, technologies and resources to convert category strategies into projects and category plans, develop products and relevant brand communication and successfully roll out new products to our consumers.
36 Unilever Annual Report and Accounts 2012Report of the Directors About Unilever
RISKS
Description of risk What we are doing to manage the risk
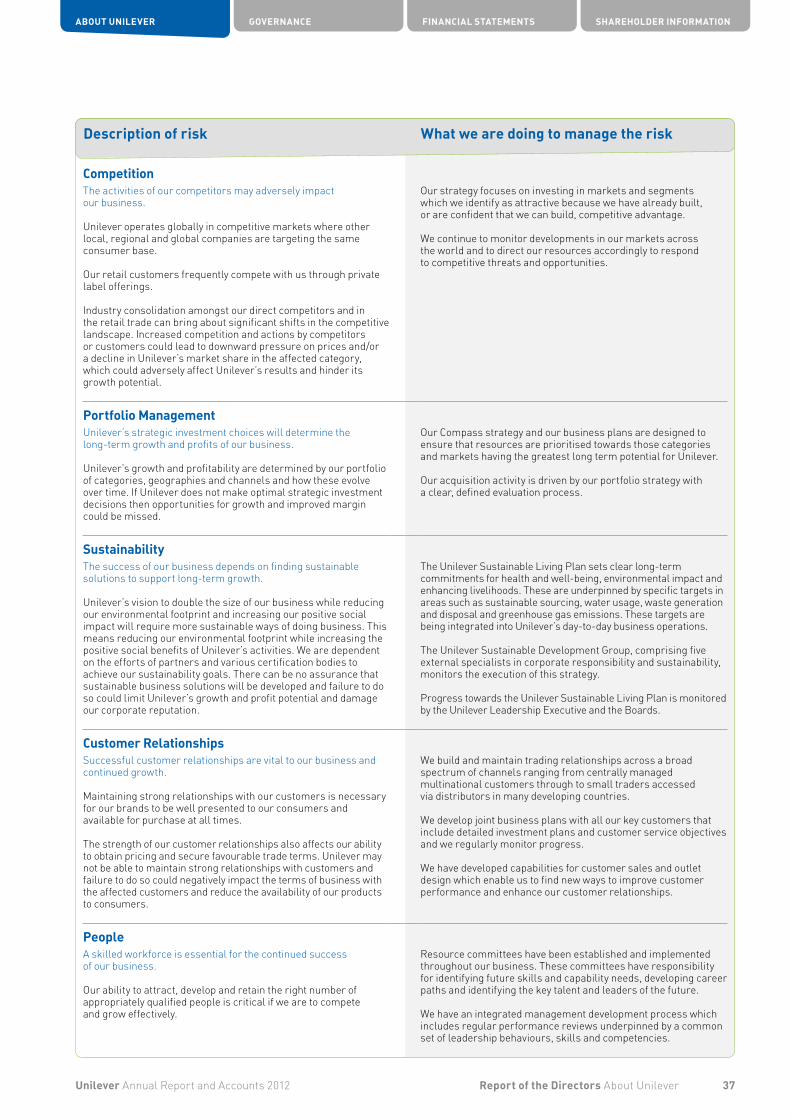
CompetitionThe activities of our competitors may adversely impact our business.
Unilever operates globally in competitive markets where other local, regional and global companies are targeting the same consumer base.
Our retail customers frequently compete with us through private label offerings.
Industry consolidation amongst our direct competitors and in the retail trade can bring about significant shifts in the competitive landscape. Increased competition and actions by competitors or customers could lead to downward pressure on prices and/or a decline in Unilever’s market share in the affected category, which could adversely affect Unilever’s results and hinder its growth potential.
Our strategy focuses on investing in markets and segments which we identify as attractive because we have already built, or are confident that we can build, competitive advantage.
We continue to monitor developments in our markets across the world and to direct our resources accordingly to respond to competitive threats and opportunities.
Portfolio Management Unilever’s strategic investment choices will determine the long-term growth and profits of our business.
Unilever’s growth and profitability are determined by our portfolio of categories, geographies and channels and how these evolve over time. If Unilever does not make optimal strategic investment decisions then opportunities for growth and improved margin could be missed.
Our Compass strategy and our business plans are designed to ensure that resources are prioritised towards those categories and markets having the greatest long term potential for Unilever.
Our acquisition activity is driven by our portfolio strategy with a clear, defined evaluation process.
SustainabilityThe success of our business depends on finding sustainable solutions to support long-term growth.
Unilever’s vision to double the size of our business while reducing our environmental footprint and increasing our positive social impact will require more sustainable ways of doing business. This means reducing our environmental footprint while increasing the positive social benefits of Unilever’s activities. We are dependent on the efforts of partners and various certification bodies to achieve our sustainability goals. There can be no assurance that sustainable business solutions will be developed and failure to do so could limit Unilever’s growth and profit potential and damage our corporate reputation.
The Unilever Sustainable Living Plan sets clear long-term commitments for health and well-being, environmental impact and enhancing livelihoods. These are underpinned by specific targets in areas such as sustainable sourcing, water usage, waste generation and disposal and greenhouse gas emissions. These targets are being integrated into Unilever’s day-to-day business operations.
The Unilever Sustainable Development Group, comprising five external specialists in corporate responsibility and sustainability, monitors the execution of this strategy.
Progress towards the Unilever Sustainable Living Plan is monitored by the Unilever Leadership Executive and the Boards.
Customer RelationshipsSuccessful customer relationships are vital to our business and continued growth.
Maintaining strong relationships with our customers is necessary for our brands to be well presented to our consumers and available for purchase at all times.
The strength of our customer relationships also affects our ability to obtain pricing and secure favourable trade terms. Unilever may not be able to maintain strong relationships with customers and failure to do so could negatively impact the terms of business with the affected customers and reduce the availability of our products to consumers.
We build and maintain trading relationships across a broad spectrum of channels ranging from centrally managed multinational customers through to small traders accessed via distributors in many developing countries.
We develop joint business plans with all our key customers that include detailed investment plans and customer service objectives and we regularly monitor progress.
We have developed capabilities for customer sales and outlet design which enable us to find new ways to improve customer performance and enhance our customer relationships.
PeopleA skilled workforce is essential for the continued success of our business.
Our ability to attract, develop and retain the right number of appropriately qualified people is critical if we are to compete and grow effectively.
Resource committees have been established and implemented throughout our business. These committees have responsibility for identifying future skills and capability needs, developing career paths and identifying the key talent and leaders of the future.
We have an integrated management development process which includes regular performance reviews underpinned by a common set of leadership behaviours, skills and competencies.
37Unilever Annual Report and Accounts 2012 Report of the Directors About Unilever
ABOUT UNILEVER GOVERNANCE FINANCIAL STATEMENTS SHAREHOLDER INFORMATION
Description of risk What we are doing to manage the risk
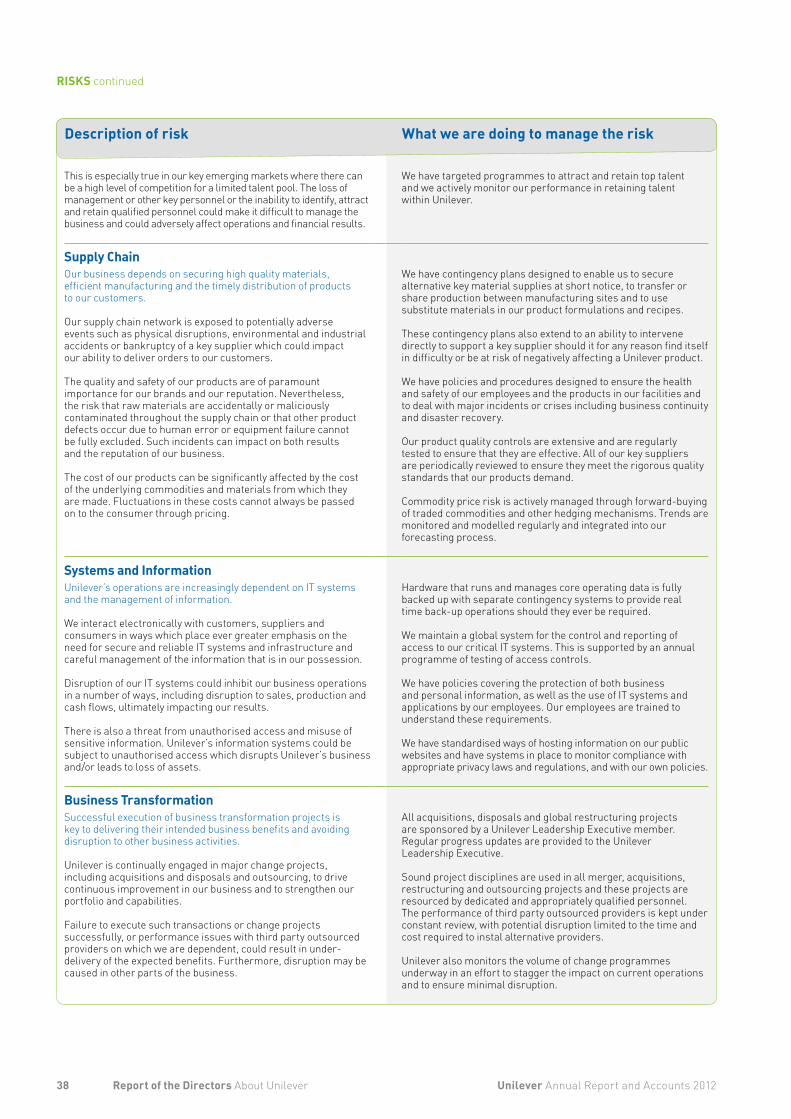
This is especially true in our key emerging markets where there can be a high level of competition for a limited talent pool. The loss of management or other key personnel or the inability to identify, attract and retain qualified personnel could make it difficult to manage the business and could adversely affect operations and financial results.
We have targeted programmes to attract and retain top talent and we actively monitor our performance in retaining talent within Unilever.
Supply Chain Our business depends on securing high quality materials, efficient manufacturing and the timely distribution of products to our customers.
Our supply chain network is exposed to potentially adverse events such as physical disruptions, environmental and industrial accidents or bankruptcy of a key supplier which could impact our ability to deliver orders to our customers.
The quality and safety of our products are of paramount importance for our brands and our reputation. Nevertheless, the risk that raw materials are accidentally or maliciously contaminated throughout the supply chain or that other product defects occur due to human error or equipment failure cannot be fully excluded. Such incidents can impact on both results and the reputation of our business.
The cost of our products can be significantly affected by the cost of the underlying commodities and materials from which they are made. Fluctuations in these costs cannot always be passed on to the consumer through pricing.
We have contingency plans designed to enable us to secure alternative key material supplies at short notice, to transfer or share production between manufacturing sites and to use substitute materials in our product formulations and recipes.
These contingency plans also extend to an ability to intervene directly to support a key supplier should it for any reason find itself in difficulty or be at risk of negatively affecting a Unilever product.
We have policies and procedures designed to ensure the health and safety of our employees and the products in our facilities and to deal with major incidents or crises including business continuity and disaster recovery.
Our product quality controls are extensive and are regularly tested to ensure that they are effective. All of our key suppliers are periodically reviewed to ensure they meet the rigorous quality standards that our products demand.
Commodity price risk is actively managed through forward-buying of traded commodities and other hedging mechanisms. Trends are monitored and modelled regularly and integrated into our forecasting process.
Systems and InformationUnilever’s operations are increasingly dependent on IT systems and the management of information.
We interact electronically with customers, suppliers and consumers in ways which place ever greater emphasis on the need for secure and reliable IT systems and infrastructure and careful management of the information that is in our possession.
Disruption of our IT systems could inhibit our business operations in a number of ways, including disruption to sales, production and cash flows, ultimately impacting our results. There is also a threat from unauthorised access and misuse of sensitive information. Unilever’s information systems could be subject to unauthorised access which disrupts Unilever’s business and/or leads to loss of assets.
Hardware that runs and manages core operating data is fully backed up with separate contingency systems to provide real time back-up operations should they ever be required.
We maintain a global system for the control and reporting of access to our critical IT systems. This is supported by an annual programme of testing of access controls.
We have policies covering the protection of both business and personal information, as well as the use of IT systems and applications by our employees. Our employees are trained to understand these requirements.
We have standardised ways of hosting information on our public websites and have systems in place to monitor compliance with appropriate privacy laws and regulations, and with our own policies.
Business TransformationSuccessful execution of business transformation projects is key to delivering their intended business benefits and avoiding disruption to other business activities.
Unilever is continually engaged in major change projects, including acquisitions and disposals and outsourcing, to drive continuous improvement in our business and to strengthen our portfolio and capabilities.
Failure to execute such transactions or change projects successfully, or performance issues with third party outsourced providers on which we are dependent, could result in under-delivery of the expected benefits. Furthermore, disruption may be caused in other parts of the business.
All acquisitions, disposals and global restructuring projects are sponsored by a Unilever Leadership Executive member. Regular progress updates are provided to the Unilever Leadership Executive.
Sound project disciplines are used in all merger, acquisitions, restructuring and outsourcing projects and these projects are resourced by dedicated and appropriately qualified personnel. The performance of third party outsourced providers is kept under constant review, with potential disruption limited to the time and cost required to instal alternative providers.
Unilever also monitors the volume of change programmes underway in an effort to stagger the impact on current operations and to ensure minimal disruption.
38 Unilever Annual Report and Accounts 2012Report of the Directors About Unilever
RISKS continued
Description of risk What we are doing to manage the risk
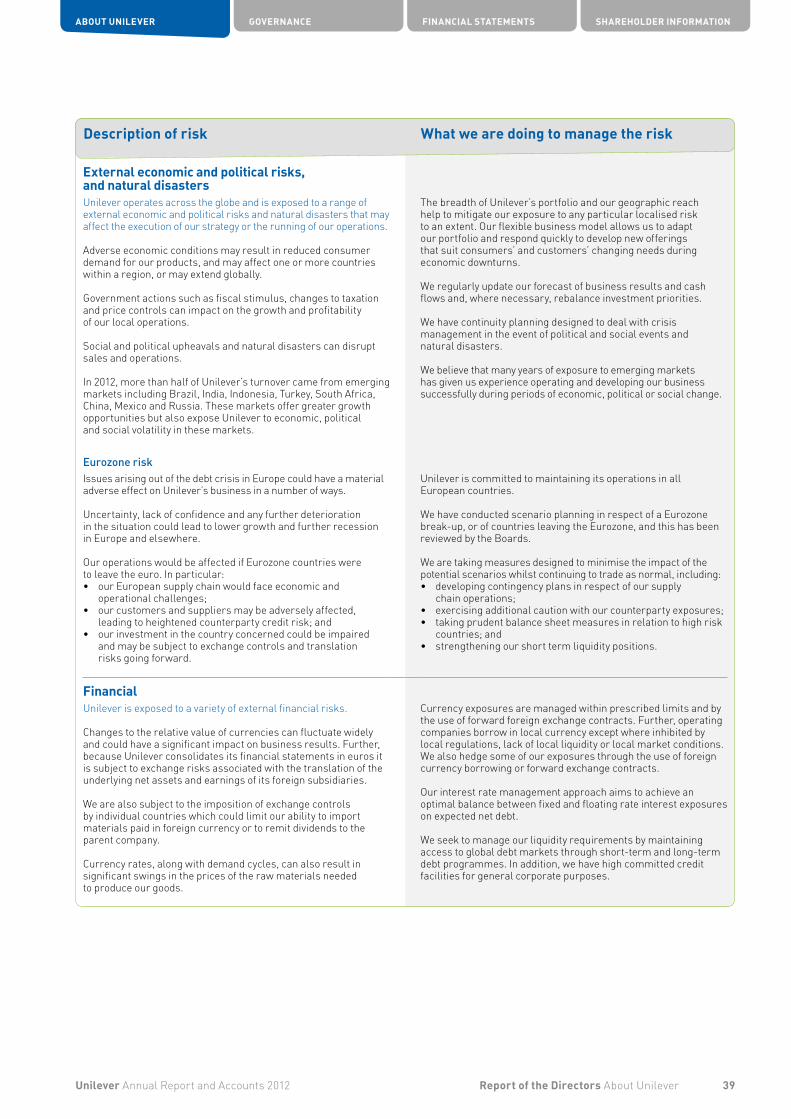
External economic and political risks, and natural disastersUnilever operates across the globe and is exposed to a range of external economic and political risks and natural disasters that may affect the execution of our strategy or the running of our operations.
Adverse economic conditions may result in reduced consumer demand for our products, and may affect one or more countries within a region, or may extend globally.
Government actions such as fiscal stimulus, changes to taxation and price controls can impact on the growth and profitability of our local operations.
Social and political upheavals and natural disasters can disrupt sales and operations.
In 2012, more than half of Unilever’s turnover came from emerging markets including Brazil, India, Indonesia, Turkey, South Africa, China, Mexico and Russia. These markets offer greater growth opportunities but also expose Unilever to economic, political and social volatility in these markets.
The breadth of Unilever’s portfolio and our geographic reach help to mitigate our exposure to any particular localised risk to an extent. Our flexible business model allows us to adapt our portfolio and respond quickly to develop new offerings that suit consumers’ and customers’ changing needs during economic downturns.
We regularly update our forecast of business results and cash flows and, where necessary, rebalance investment priorities.
We have continuity planning designed to deal with crisis management in the event of political and social events and natural disasters.
We believe that many years of exposure to emerging markets has given us experience operating and developing our business successfully during periods of economic, political or social change.
Eurozone riskIssues arising out of the debt crisis in Europe could have a material adverse effect on Unilever’s business in a number of ways.
Uncertainty, lack of confidence and any further deterioration in the situation could lead to lower growth and further recession in Europe and elsewhere.
Our operations would be affected if Eurozone countries were to leave the euro. In particular: • our European supply chain would face economic and
operational challenges;• our customers and suppliers may be adversely affected,
leading to heightened counterparty credit risk; and• our investment in the country concerned could be impaired
and may be subject to exchange controls and translation risks going forward.
Unilever is committed to maintaining its operations in all European countries.
We have conducted scenario planning in respect of a Eurozone break-up, or of countries leaving the Eurozone, and this has been reviewed by the Boards.
We are taking measures designed to minimise the impact of the potential scenarios whilst continuing to trade as normal, including:• developing contingency plans in respect of our supply
chain operations;• exercising additional caution with our counterparty exposures;• taking prudent balance sheet measures in relation to high risk
countries; and• strengthening our short term liquidity positions.
FinancialUnilever is exposed to a variety of external financial risks.
Changes to the relative value of currencies can fluctuate widely and could have a significant impact on business results. Further, because Unilever consolidates its financial statements in euros it is subject to exchange risks associated with the translation of the underlying net assets and earnings of its foreign subsidiaries.
We are also subject to the imposition of exchange controls by individual countries which could limit our ability to import materials paid in foreign currency or to remit dividends to the parent company.
Currency rates, along with demand cycles, can also result in significant swings in the prices of the raw materials needed to produce our goods.
Currency exposures are managed within prescribed limits and by the use of forward foreign exchange contracts. Further, operating companies borrow in local currency except where inhibited by local regulations, lack of local liquidity or local market conditions. We also hedge some of our exposures through the use of foreign currency borrowing or forward exchange contracts.
Our interest rate management approach aims to achieve an optimal balance between fixed and floating rate interest exposures on expected net debt.
We seek to manage our liquidity requirements by maintaining access to global debt markets through short-term and long-term debt programmes. In addition, we have high committed credit facilities for general corporate purposes.
39Unilever Annual Report and Accounts 2012 Report of the Directors About Unilever
ABOUT UNILEVER GOVERNANCE FINANCIAL STATEMENTS SHAREHOLDER INFORMATION
Description of risk What we are doing to manage the risk
Unilever may face liquidity risk, i.e. difficulty in meeting its obligations, associated with its financial liabilities. A material and sustained shortfall in our cash flow could undermine Unilever’s credit rating, impair investor confidence and also restrict Unilever’s ability to raise funds.
We are exposed to market interest rate fluctuations on our floating rate debt. Increases in benchmark interest rates could increase the interest cost of our floating rate debt and increase the cost of future borrowings.
In times of financial market volatility, we are also potentially exposed to counterparty risks with banks, suppliers and customers.
Certain businesses have defined benefit pension plans, most now closed to new employees, which are exposed to movements in interest rates, fluctuating values of underlying investments and increased life expectancy. Changes in any or all of these inputs could potentially increase the cost to Unilever of funding the schemes and therefore have an adverse impact on profitability and cash flow.
Group Treasury regularly monitors exposure to our banks, tightening counter party limits where appropriate. Unilever actively manages its banking exposures on a daily basis.
We regularly assess and monitor counterparty risk in our customers and take appropriate action to manage our exposures.
Our pension investment standards require us to invest across a range of equities, bonds, property, alternative assets and cash such that the failure of any single investment will not have a material impact on the overall value of assets.
The majority of our assets, including those held in our ‘pooled’ investment vehicle, Univest, are managed by external fund managers and are regularly monitored by pension trustees and central pensions and investment teams.
Further information on financial instruments and capital and treasury risk management is included in note 16 on pages 116 to 120.
EthicalActing in an ethical manner, consistent with the expectations of customers, consumers and other stakeholders is essential for the protection of the reputation of Unilever and its brands.
Unilever’s brands and reputation are valuable assets and the way in which we operate, contribute to society and engage with the world around us is always under scrutiny both internally and externally. Despite the commitment of Unilever to ethical business and the steps we take to adhere to this commitment, there remains a risk that activities or events cause us to fall short of our desired standard, resulting in damage to Unilever’s corporate reputation and business results.
Our Code of Business Principles (the ‘Code’) and our Code Policies govern the behaviour of our employees, suppliers, distributors and other third parties who work with us.
Our processes for identifying and resolving cases of unethical practice are clearly defined and regularly communicated throughout Unilever. Data relating to instances of unethical practice is reviewed by the Unilever Leadership Executive and by relevant Board committees and helps to determine the allocation of resources for future policy development, training and awareness initiatives.
Legal, Regulatory and OtherCompliance with laws and regulations is an essential part of Unilever’s business operations.
Unilever is subject to local, regional and global laws and regulations in such diverse areas as product safety, product claims, trademarks, copyright, patents, competition, employee health and safety, the environment, corporate governance, listing and disclosure, employment and taxes.
Failure to comply with laws and regulations could expose Unilever to civil and/or criminal actions leading to damages, fines and criminal sanctions against us and/or our employees with possible consequences for our corporate reputation.
Changes to laws and regulations could have a material impact on the cost of doing business.
Unilever is also exposed to varying degrees of risk and uncertainty related to other factors including environmental, political, social and fiscal risks. All these risks could materially affect Unilever’s business. There may be other risks which are unknown to Unilever or which are currently believed to be immaterial.
The Code of Business Principles sets out our commitment to complying with the laws and regulations of the countries in which we operate. In specialist areas the relevant teams at global, regional or local level are responsible for setting detailed standards and ensuring that all employees are aware of and comply with regulations and laws specific and relevant to their roles.
Our legal specialists are heavily involved in monitoring and reviewing our practices to provide reasonable assurance that we remain aware of and in line with all relevant laws and legal obligations.
Various mitigating processes exist within Unilever operating systems that are designed to help mitigate other areas of risk including terrorism, fiscal and other forms of regulatory change or economic instability.
40 Unilever Annual Report and Accounts 2012Report of the Directors About Unilever
RISKS continued
Description of risk What we are doing to manage the risk

Our Risk Appetite and Approach to Risk Management Risk management is integral to Unilever’s strategy and to the achievement of Unilever’s long-term goals. Our success as an organisation depends on our ability to identify and exploit the opportunities generated by our business and the markets we are in. In doing this we take an embedded approach to risk management which puts risk and opportunity assessment at the core of the leadership team agenda, which is where we believe it should be.
Unilever adopts a risk profile that is aligned to our vision to double the size of our business while reducing our environmental footprint and increasing our positive social impact. Our available capital and other resources are applied to underpin our priorities. We aim to maintain a strong single A credit rating on a long term basis, reflecting the strength of our balance sheet and cash flows.
Our approach to risk management is designed to provide reasonable, but not absolute, assurance that our assets are safeguarded, the risks facing the business are being assessed and mitigated and all information that may be required to be disclosed is reported to Unilever’s senior management including, where appropriate, the Chief Executive Officer and Chief Financial Officer.
OrganisationThe Unilever Boards assume overall accountability for the management of risk and for reviewing the effectiveness of Unilever’s risk management and internal control systems.
The Boards have established a clear organisational structure with well defined accountabilities for the principal risks that Unilever faces in the short, medium and longer term. This organisational structure and distribution of accountabilities and responsibilities ensures that every country in which we operate has specific resources and processes for risk review and risk mitigation. This is supported by the Unilever Leadership Executive, which takes an active responsibility for focusing on the principal areas of risk to Unilever. The Boards regularly review these risk areas, including consideration of environmental, social and governance matters, and retain responsibility for determining the nature and extent of the significant risks that Unilever is prepared to take to achieve its strategic objectives.
Foundation and PrinciplesUnilever’s approach to doing business is framed by our Corporate Purpose. Our Code of Business Principles sets out the standards of behaviour that we expect all employees to adhere to. Day-to-day responsibility for ensuring these principles are applied throughout Unilever rests with senior management across categories, geographies and functions. A network of Code Officers and Committees supports the activities necessary to communicate the Code, deliver training, maintain processes and procedures (including ‘hotlines’) to report and respond to alleged breaches, and to capture and communicate learnings.
We have a framework of Code Policies that underpin the Code and set out the non-negotiable standards of behaviour expected from all our employees.
Unilever’s functional standards define mandatory requirements across a range of specialist areas such as health and safety, accounting and reporting and financial risk management.
Processes Unilever operates a wide range of processes and activities across all its operations covering strategy, planning, execution and performance management. Risk management is integrated into every stage of this business cycle. These procedures are formalised and documented and are increasingly being centralised and automated into transactional and other information technology systems.
Assurance and Re-AssuranceAssurance on compliance with the Code of Business Principles and all of our Code Policies is obtained annually from Unilever management via a formal Code declaration. In addition, there are specialist compliance programmes which run during the year and vary depending on the business priorities. These specialist compliance programmes supplement the Code declaration. Our Corporate Audit function plays a vital role in providing to both management and the Boards an objective and independent review of the effectiveness of risk management and internal control systems throughout Unilever.
Boards’ assessment of compliance with the Risk Management frameworksThe Boards, advised by the Committees where appropriate, regularly review the significant risks and decisions that could have a material impact on Unilever. These reviews consider the boundaries to the risks that Unilever is prepared to take in pursuit of the business strategy and the effectiveness of the management controls in place to mitigate the risk exposure.
The Boards, through the Audit Committee, have reviewed the assessment of risks, internal controls and disclosure controls and procedures in operation within Unilever. They have also considered the effectiveness of any remedial actions taken for the year covered by this document and up to the date of its approval by the Boards.
Details of the activities of the Audit Committee in relation to this can be found in the Report of the Audit Committee on pages 56 and 57.
Further statements on compliance with the specific risk management and control requirements in the Dutch Corporate Governance Code, the UK Corporate Governance Code, the US Securities Exchange Act (1934) and the Sarbanes-Oxley (2002) Act can be found on pages 52 to 54.
41Unilever Annual Report and Accounts 2012 Report of the Directors About Unilever
ABOUT UNILEVER GOVERNANCE FINANCIAL STATEMENTS SHAREHOLDER INFORMATION
Michael TreschowChairman
Kees StormVice-Chairman and Senior Independent Director
Paul PolmanChief Executive OfficerExecutive Director
Jean-Marc HuëtChief Financial OfficerExecutive Director
Nationality Swedish Age 69Appointed Chairman May 2007Committee membership: Nominating & Corporate Governance, Compensation & Management ResourcesKey areas of prior experience: Consumer, science & technologyCurrent external appointments: Non-executive director, ABB Group. Chairman, Dometic Group. Board member, Knut and Alice Wallenberg Foundation. Member of the European Advisory, Eli Lilly and CompanyPrevious relevant experience: Chairman, Telefonaktiebolaget L M Ericsson 2002-2011. Chairman, AB Electrolux 2004-2007, Confederation of Swedish Enterprise 2004-2007. CEO, AB Electrolux 1997-2002, Atlas Copco 1991-1997
Nationality Dutch Age 70Appointed May 2006Committee membership:Audit, Nominating & Corporate Governance, Compensation & Management ResourcesKey areas of prior experience: FinanceCurrent external appointments: Chairman, supervisory board, and audit committee member, KLM Royal Dutch Airlines N.V. Member, supervisory board, AEGON N.V. Chairman and audit committee member, Anheuser-Busch InBev S.A. Board member and audit committee member, Baxter International, Inc. Vice-chairman, supervisory board, Pon Holdings B.V.Previous relevant experience:Chairman, executive board, AEGON N.V. 1993-2002
Nationality Dutch Age 56Appointed CEO January 2009Appointed Director October 2008Key areas of prior experience: Finance, consumer, sales/marketingCurrent external appointments: Non-executive director, The Dow Chemical Company. President, Kilimanjaro Blind Trust. Vice-chairman, executive committee, World Business Council for Sustainable DevelopmentPrevious relevant experience: Procter & Gamble Co. 1979-2001, group president Europe and officer, Procter & Gamble Co. 2001-2006. Chief financial officer, Nestlé S.A. 2006-2008. Director, Alcon Inc 2006-2008. Executive vice president and zone director for the Americas 2008
Nationality Dutch Age 43Appointed CFO February 2010Appointed Director May 2010Key areas of prior experience: Finance, consumerCurrent external appointments: Non-executive director, Delta Topco LimitedPrevious relevant experience: Executive vice president and chief financial officer, Bristol-Myers Squibb Company 2008-2009. Non-executive director, Mead Johnson Nutrition 2009. Chief financial officer, Royal Numico NV 2003-2007. Investment Banking, Goldman Sachs International 1993-2003. Clement Trading 1991-1993
Louise FrescoNon-Executive Director
Ann FudgeNon-Executive Director
Charles E GoldenNon-Executive Director
Byron E GroteNon-Executive Director
Nationality Dutch Age 61Appointed May 2009Committee membership: Corporate ResponsibilityKey areas of prior experience: Science/technology, academiaCurrent external appointments: Professor of international development and sustainability at the University of Amsterdam. Supervisory director, RABO Bank. Member, Social and Economic Council of the Netherlands (SER)Previous relevant experience: Director of research (1997-1999) and assistant director-general for agriculture (2000-2006), the Agriculture Department of the UN’s Food and Agriculture Organisation (FAO), president of the Advisory Council, Research on Nature and Environment, vice-chair, Council of the United Nations University
Nationality American Age 61Appointed May 2009Committee membership: Nominating & Corporate Governance, Compensation & Management ResourcesKey areas of prior experience: Consumer, sales/marketingCurrent external appointments: Non-executive director, Infosys, Novartis AG, General Electric Co. Chairman, US Programs Advisory Panel of Gates Foundation. Honorary director of Catalyst. Member, Foreign Affairs Policy Board, U.S. State Department. Member, finance committee of Harvard University Previous relevant experience: Non-executive director, Buzzient Inc. 2010-2013. Chairman & CEO, Young & Rubicam 2003-2006. Various positions at General Mills 1977-1986, Kraft General Foods 1986-2001
Nationality American Age 66Appointed May 2006Committee membership: AuditKey areas of prior experience: FinanceCurrent external appointments: Non-executive director Indiana University Health, Hill-Rom Holdings, Eaton Corporation and the Lilly Endowment. Member of finance committee, Indianapolis Museum of ArtPrevious relevant experience: Executive vice-president, chief financial officer and director, Eli Lilly and Company 1996-2006
Nationality American/British Age 64Appointed May 2006Committee membership: Audit (Chairman)Key areas of prior experience: FinanceCurrent external appointments: Executive vice president, Corporate Business Activities, BP p.l.c.Previous relevant experience: Chief financial officer, BP p.l.c. 2002-2011. Member, UK Business – Government Forum on Tax and Globalisation 2008-2010. Vice-chairman, UK Government’s Public Services Productivity Panel 1998-2000
Sunil Bharti MittalNon-Executive Director
Hixonia NyasuluNon-Executive Director
Sir Malcolm RifkindNon-Executive Director
Paul WalshNon-Executive Director
Nationality Indian Age 55Appointed May 2011Committee membership: NoneKey areas of prior experience: Science/technology, sales/marketingCurrent external appointments: Founder, chairman and group CEO, Bharti Enterprises. Prime Minister’s Council on Trade & Industry (India). Member, Board of SoftBank, Carnegie Endowment, International Telecommunication Union, Harvard University’s Global Advisory Council, Harvard Business School’s Dean’s Advisory Board. Commissioner of Broadband Commission at ITU.Previous relevant experience: Non-executive director, Standard Chartered Bank PLC; president, Confederation of Indian Industry
Nationality South African Age 58Appointed May 2007Committee membership: Corporate ResponsibilityKey areas of prior experience: Sales/marketingCurrent external appointments: Director, Barloworld Ltd. Member, advisory board of JP Morgan S.A. Beneficiary, Sequel Property InvestmentsPrevious relevant experience: Chairman, Sasol Ltd, Ithala Development Finance Corporation. Deputy chairman, Nedbank Limited. Non-executive director, AVI Ltd
Nationality British Age 66Appointed May 2010Committee membership: Corporate Responsibility (Chairman)Key areas of prior experience: Government, legal and regulatory affairsCurrent external appointments: Non-executive director, Adam Smith International and Continental Farmers Group plcPrevious relevant experience: A Queen’s Counsel. Served in Cabinets of Margaret Thatcher and John Major, last position being that of Foreign Secretary
Nationality British Age 57Appointed May 2009Committee membership: Nominating & Corporate Governance (Chairman), Compensation & Management Resources (Chairman)Key areas of prior experience: Finance, consumer, sales/marketingCurrent external appointments: Chief executive officer and director, Diageo PLC. Non-executive director, FedEx Corporation Inc. and Avanti Communications Group PLC. Ambassador, Business Ambassador Network, adviser to the Department of Energy and Climate Change. Member, International Business Leaders Forum.Previous relevant experience: Chief operating officer, Diageo plc 2000. CEO, The Pilsbury Company. Non-executive director, Centrica plc
42 Unilever Annual Report and Accounts 2012Report of the Directors Governance
BIOGRAPHIESBoard of Directors
Doug BaillieChief HR Officer
Professor Geneviève BergerChief Science Officer
David BlanchardChief Category R&D Officer
Kevin HavelockRefreshment
Nationality British Age 57Appointed Chief HR Officer in February 2011 Appointed to ULE as President of Western Europe in May 2008. Joined Unilever 1978 Previous Unilever posts include: CEO Hindustan Unilever Limited; Group-Vice President South Asia 2006; Group Vice-President – Africa, Middle East & Turkey 2005; President Africa Regional Group 2004; National Manager Unilever South Africa 2000 Current external appointments: Board member, Synergos
Nationality French Age 58Appointed to ULE July 2008 Previous posts include: Non-executive director, Smith & Nephew plc 2010-2012. Chairman of the Health Advisory Board for the European Commission; Professor at the University of Paris and La Pitié-Salpêtrière Teaching Hospital; and director general of the French Centre National de la Recherche Scientifique Current external appointments: Non-executive director, AstraZeneca PLC
Nationality British Age 48Appointed to ULE February 2013. Joined Unilever 1986 Previous Unilever posts include: Senior Vice President for Unilever Research & Development. Chairman of Unilever Canada Inc. SVP Marketing Operations Foods America. VP R&D for Global Dressings. Director of Product Development for Margarine and Spreads
Nationality British Age 55Appointed to ULE November 2011. Joined Unilever 1985 Previous Unilever posts include: Chairman, Unilever Arabia and President Unilever USA
Alan JopeNorth Asia
Kees KruythoffNorth America
Dave LewisPersonal Care
Harish ManwaniChief Operating Officer
Nationality British Age 48Appointed to ULE November 2011. Joined Unilever 1985 Previous Unilever posts include: Chairman of Unilever Greater China; Global Category Leader for SCC and Dressings; Chief operating officer and subsequently president of Unilever’s combined Home and Personal Care business in North America; and vice president, Personal Care ThailandCurrent external appointments: Member of the advisory board for China, Enactus
Nationality Dutch Age 44 Appointed to ULE November 2011. Joined Unilever 1993 Previous Unilever posts include: Executive vice president Brazil 2008; Chairman of Unilever Foods South Africa 2004; and a member of the board of Unilever Bestfoods Asia 2002Current external appointments: Member of the Worldwide board of directors, Enactus; Board member, USA Grocery Manufacturing Association.
Nationality British Age 47 Appointed to ULE May 2010. Joined Unilever 1987 Previous Unilever posts include: President, Americas; Chairman, Unilever UK and Ireland; Managing Director, UK home and personal care business; Senior Vice President for Home and Personal Care, Central and Eastern Europe; Managing Director and innovation leader, Indonesia/South East Asia; Marketing Director and innovation leader, Homecare South AmericaCurrent external appointments: Non-executive director, British Sky Broadcasting Group PLC
Nationality Indian Age 59Appointed Chief Operating Officer in September 2011Appointed to ULE April 2005 as President Asia Africa. Joined Unilever 1976. Non-Executive Chairman, Hindustan Unilever Previous Unilever posts include: President Asia, Africa, Central & Eastern Europe 2008; and Group President, Home and Personal Care, North America 2004Current external appointments: Member of executive board, Indian School of Business; non-executive director, Whirlpool Corporation; board member, Singapore Economic Development Board; board member, The Human Capital Leadership Institute
Antoine de Saint-AffriqueFoods
Pier Luigi SigismondiChief Supply Chain Officer
Ritva SotamaaChief Legal Officer
Keith WeedChief Marketing and Communication Officer
Nationality French Age 48Appointed to ULE November 2011. First joined Unilever 1989 until 1997; re-joined Unilever 2000 Previous Unilever posts include: Executive Vice President Skin category; Executive Vice President Unilever Central & Eastern Europe. Vice President Marketing for Liebig Maille Amora, Danone Group/PAI 1997-2000 Current external appointments: French State Foreign Trade Adviser, Comité National des Conseillers du Commerce Extérieur de la France; non-executive director, Essilor International
Nationality Italian Age 47Appointed to ULE September 2009 Previous posts include: Nestlé S.A. in 2002. Moved to Nestlé Mexico in 2005 as Vice-President of Operations and R&D. Prior to Nestlé S.A. he was Vice President of Operations for A T Kearney Current external appointments: Board member, GS1
Nationality Finnish Age 49Appointed to ULE February 2013Previous posts include: General Counsel for Siemens AG – Siemens Healthcare; various posts at General Electric – GE Healthcare (the most recent being General Counsel, GE Healthcare Systems); General Counsel, Instrumentarium Corporation
Nationality British Age 51 Appointed to ULE April 2010. Joined Unilever 1983 Previous Unilever posts include: Executive Vice President for Global Home Care & Hygiene; Chairman of Lever Fabergé; SVP Hair and Oral Care Current external appointments: Non-executive director, Sun Products Corporation; board member, Business in the Community International Board, World Economic Forum Consumer Industry Board
Jan ZijderveldEurope
Nationality Dutch Age 48 Appointed to ULE February 2011. Joined Unilever 1988 Previous Unilever posts include: Executive Vice President South East Asia and Australasia; Chairman of Unilever Middle East North Africa; Chairman of Nordic ice cream business; Marketing Director Italy; European Olive Oil Category Director; and General Manager – Sauces and Dressings Europe Current external appointments: Board member, AIM, FoodDrinkEurope, Pepsi/Unilever Lipton JV; board member and co-chair, ECR Europe (Efficient Consumer Response); member, Groupe d’Ouchy; member, Dutch Advisory Council, INSEAD
ABOUT UNILEVER GOVERNANCE FINANCIAL STATEMENTS SHAREHOLDER INFORMATION
43Unilever Annual Report and Accounts 2012 Report of the Directors Governance
For Paul Polman and Jean-Marc Huët see page 42
Unilever Leadership Executive (ULE)
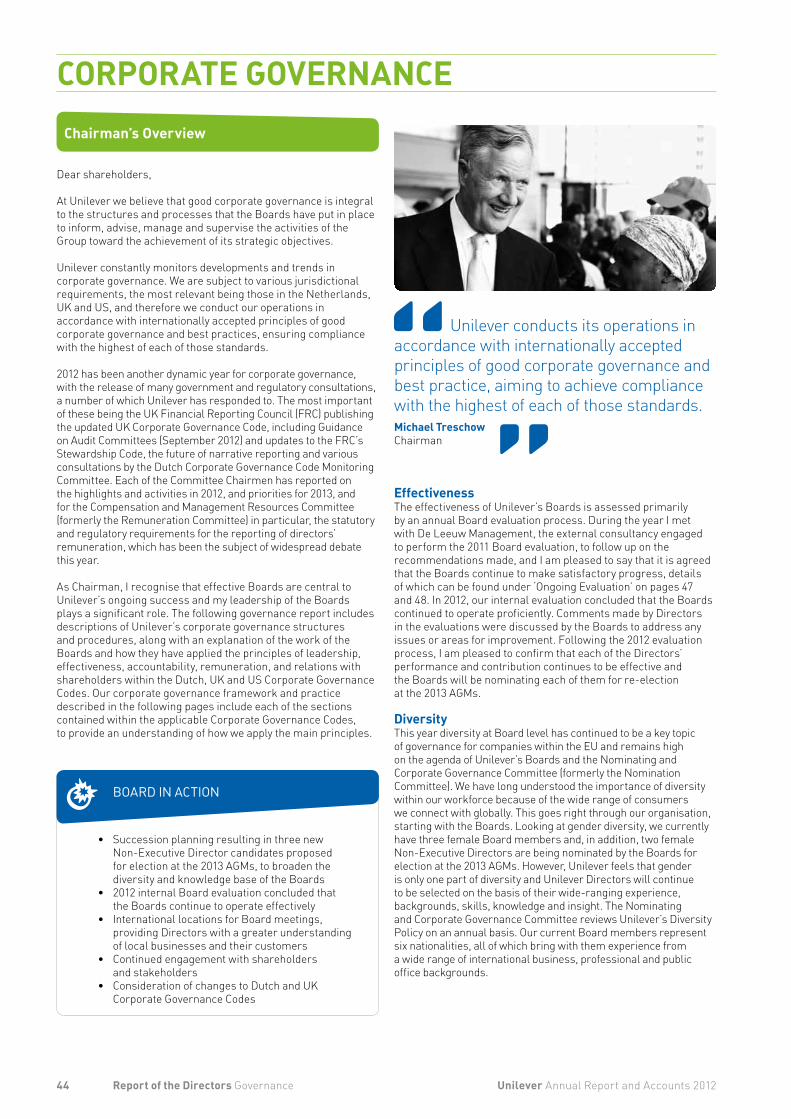
Chairman’s Overview
Dear shareholders,
At Unilever we believe that good corporate governance is integral to the structures and processes that the Boards have put in place to inform, advise, manage and supervise the activities of the Group toward the achievement of its strategic objectives.
Unilever constantly monitors developments and trends in corporate governance. We are subject to various jurisdictional requirements, the most relevant being those in the Netherlands, UK and US, and therefore we conduct our operations in accordance with internationally accepted principles of good corporate governance and best practices, ensuring compliance with the highest of each of those standards.
2012 has been another dynamic year for corporate governance, with the release of many government and regulatory consultations, a number of which Unilever has responded to. The most important of these being the UK Financial Reporting Council (FRC) publishing the updated UK Corporate Governance Code, including Guidance on Audit Committees (September 2012) and updates to the FRC’s Stewardship Code, the future of narrative reporting and various consultations by the Dutch Corporate Governance Code Monitoring Committee. Each of the Committee Chairmen has reported on the highlights and activities in 2012, and priorities for 2013, and for the Compensation and Management Resources Committee (formerly the Remuneration Committee) in particular, the statutory and regulatory requirements for the reporting of directors’ remuneration, which has been the subject of widespread debate this year.
As Chairman, I recognise that effective Boards are central to Unilever’s ongoing success and my leadership of the Boards plays a significant role. The following governance report includes descriptions of Unilever’s corporate governance structures and procedures, along with an explanation of the work of the Boards and how they have applied the principles of leadership, effectiveness, accountability, remuneration, and relations with shareholders within the Dutch, UK and US Corporate Governance Codes. Our corporate governance framework and practice described in the following pages include each of the sections contained within the applicable Corporate Governance Codes, to provide an understanding of how we apply the main principles.
EffectivenessThe effectiveness of Unilever’s Boards is assessed primarily by an annual Board evaluation process. During the year I met with De Leeuw Management, the external consultancy engaged to perform the 2011 Board evaluation, to follow up on the recommendations made, and I am pleased to say that it is agreed that the Boards continue to make satisfactory progress, details of which can be found under ‘Ongoing Evaluation’ on pages 47 and 48. In 2012, our internal evaluation concluded that the Boards continued to operate proficiently. Comments made by Directors in the evaluations were discussed by the Boards to address any issues or areas for improvement. Following the 2012 evaluation process, I am pleased to confirm that each of the Directors’ performance and contribution continues to be effective and the Boards will be nominating each of them for re-election at the 2013 AGMs.
DiversityThis year diversity at Board level has continued to be a key topic of governance for companies within the EU and remains high on the agenda of Unilever’s Boards and the Nominating and Corporate Governance Committee (formerly the Nomination Committee). We have long understood the importance of diversity within our workforce because of the wide range of consumers we connect with globally. This goes right through our organisation, starting with the Boards. Looking at gender diversity, we currently have three female Board members and, in addition, two female Non-Executive Directors are being nominated by the Boards for election at the 2013 AGMs. However, Unilever feels that gender is only one part of diversity and Unilever Directors will continue to be selected on the basis of their wide-ranging experience, backgrounds, skills, knowledge and insight. The Nominating and Corporate Governance Committee reviews Unilever’s Diversity Policy on an annual basis. Our current Board members represent six nationalities, all of which bring with them experience from a wide range of international business, professional and public office backgrounds.
Unilever conducts its operations in accordance with internationally accepted principles of good corporate governance and best practice, aiming to achieve compliance with the highest of each of those standards.Michael TreschowChairman
• Succession planning resulting in three new Non-Executive Director candidates proposed for election at the 2013 AGMs, to broaden the diversity and knowledge base of the Boards
• 2012 internal Board evaluation concluded that the Boards continue to operate effectively
• International locations for Board meetings, providing Directors with a greater understanding of local businesses and their customers
• Continued engagement with shareholders and stakeholders
• Consideration of changes to Dutch and UK Corporate Governance Codes
44 Unilever Annual Report and Accounts 2012Report of the Directors Governance
CORPORATE GOVERNANCE
BOARD IN ACTION

Changes to the BoardsThe current Directors, with their biographies, are shown on page 42. Sunil Bharti Mittal will not offer himself for re-election at the 2013 AGMs. During 2012 the Nominating and Corporate Governance Committee engaged the services of an executive search agency to assist with Non-Executive Director succession planning. Russell Reynolds Associates, who also assist in the recruitment of senior executives as appropriate, employed a rigorous search process, by firstly gaining a thorough understanding of the strategic goals of Unilever, the specific leadership roles and competencies needed to meet those goals, and the culture of our organisation, in which to identify potential candidates. As a result of this, it is the Boards’ intention to nominate Laura Cha, Mary Ma and John Rishton for election to the Boards as Non-Executive Directors at the 2013 AGMs. They are all distinguished in their respective fields and will bring additional expertise to the Boards. In particular, they will all bring knowledge and an understanding of emerging markets, a prime driver of Unilever’s growth, and further strengthen the financial expertise of the Boards. With three Non-Executive Directors due to reach Unilever’s usual nine-year maximum tenure in 2015, we felt it prudent to appoint Non-Executive Directors at this time to enable them to become familiar with the operations and governance of the business in the meantime. The Boards believe that the increase in the size of the Boards for this reason will improve its effectiveness. I am sure together the three Non-Executive Director candidates, if appointed at the 2013 AGMs, will add considerably to the business. The 2013 AGM Notices will be available on our website at www.unilever.com/agm from 2 April 2013. The three Non-Executive Director candidates will participate in a tailored induction programme and join the ongoing training programme in which all Directors participate.
Board CommitteesIn 2012 the Boards reviewed the names of the Board Committees in light of governance requirements and general practice in the Netherlands, UK and US, and with effect from 1 January 2013 the Committees are: the Audit Committee (no change), Compensation and Management Resources Committee, the Corporate Responsibility Committee and the Nominating and Corporate Governance Committee.
Annual General MeetingsThis year we held the AGMs of NV and PLC on the same day. The Chief Executive Officer and I attended both meetings in person, with half the Board members present attending in person in Rotterdam and the other half in person in London and a satellite link between the two venues to facilitate Directors’ attendance at both meetings. Following the introduction of this successful format in 2012 we have decided to follow the same format for the 2013 AGMs, further details of which are contained in the 2013 Chairman’s Letter and Notices of Annual General Meetings. At the 2012 AGMs all resolutions were passed with votes ranging between 98.74% and 99.98% for NV and votes ranging between 89.01% and 99.94% for PLC.
Shareholder and Stakeholder EngagementUnilever values open, constructive and effective communication with our shareholders. During 2012 I met with a number of investors and industry representatives to answer their questions and to gain a better understanding of their policies on governance and voting. We expect and welcome further engagement with our institutional investors. My dialogue with investors this year has taken the form of corporate governance issues engagements, attending investor events, together with engagement with major investors on a number of occasions, and a meeting with the Foundation Unilever NV Trust Office. The AGMs are also a great opportunity for myself and the rest of the Board to engage with shareholders. We provide a great deal of information on our website that aims to answer any queries about the Group and shareholders are also invited to write to me at any time should they have a matter they wish to discuss.
Michael TreschowChairman
ABOUT UNILEVER GOVERNANCE FINANCIAL STATEMENTS SHAREHOLDER INFORMATION
45Unilever Annual Report and Accounts 2012 Report of the Directors Governance
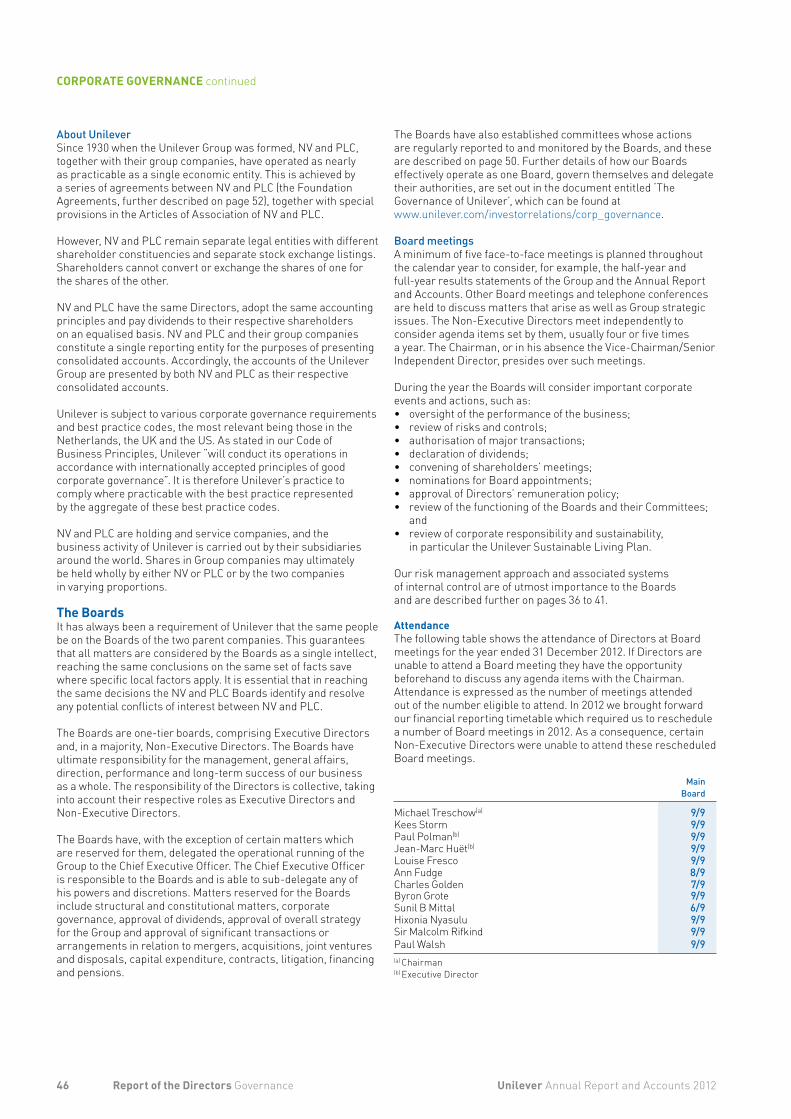
About UnileverSince 1930 when the Unilever Group was formed, NV and PLC, together with their group companies, have operated as nearly as practicable as a single economic entity. This is achieved by a series of agreements between NV and PLC (the Foundation Agreements, further described on page 52), together with special provisions in the Articles of Association of NV and PLC.
However, NV and PLC remain separate legal entities with different shareholder constituencies and separate stock exchange listings. Shareholders cannot convert or exchange the shares of one for the shares of the other.
NV and PLC have the same Directors, adopt the same accounting principles and pay dividends to their respective shareholders on an equalised basis. NV and PLC and their group companies constitute a single reporting entity for the purposes of presenting consolidated accounts. Accordingly, the accounts of the Unilever Group are presented by both NV and PLC as their respective consolidated accounts.
Unilever is subject to various corporate governance requirements and best practice codes, the most relevant being those in the Netherlands, the UK and the US. As stated in our Code of Business Principles, Unilever “will conduct its operations in accordance with internationally accepted principles of good corporate governance”. It is therefore Unilever’s practice to comply where practicable with the best practice represented by the aggregate of these best practice codes.
NV and PLC are holding and service companies, and the business activity of Unilever is carried out by their subsidiaries around the world. Shares in Group companies may ultimately be held wholly by either NV or PLC or by the two companies in varying proportions.
The BoardsIt has always been a requirement of Unilever that the same people be on the Boards of the two parent companies. This guarantees that all matters are considered by the Boards as a single intellect, reaching the same conclusions on the same set of facts save where specific local factors apply. It is essential that in reaching the same decisions the NV and PLC Boards identify and resolve any potential conflicts of interest between NV and PLC.
The Boards are one-tier boards, comprising Executive Directors and, in a majority, Non-Executive Directors. The Boards have ultimate responsibility for the management, general affairs, direction, performance and long-term success of our business as a whole. The responsibility of the Directors is collective, taking into account their respective roles as Executive Directors and Non-Executive Directors.
The Boards have, with the exception of certain matters which are reserved for them, delegated the operational running of the Group to the Chief Executive Officer. The Chief Executive Officer is responsible to the Boards and is able to sub-delegate any of his powers and discretions. Matters reserved for the Boards include structural and constitutional matters, corporate governance, approval of dividends, approval of overall strategy for the Group and approval of significant transactions or arrangements in relation to mergers, acquisitions, joint ventures and disposals, capital expenditure, contracts, litigation, financing and pensions.
The Boards have also established committees whose actions are regularly reported to and monitored by the Boards, and these are described on page 50. Further details of how our Boards effectively operate as one Board, govern themselves and delegate their authorities, are set out in the document entitled ‘The Governance of Unilever’, which can be found at www.unilever.com/investorrelations/corp_governance.
Board meetingsA minimum of five face-to-face meetings is planned throughout the calendar year to consider, for example, the half-year and full-year results statements of the Group and the Annual Report and Accounts. Other Board meetings and telephone conferences are held to discuss matters that arise as well as Group strategic issues. The Non-Executive Directors meet independently to consider agenda items set by them, usually four or five times a year. The Chairman, or in his absence the Vice-Chairman/Senior Independent Director, presides over such meetings.
During the year the Boards will consider important corporate events and actions, such as:• oversight of the performance of the business;• review of risks and controls;• authorisation of major transactions;• declaration of dividends;• convening of shareholders’ meetings;• nominations for Board appointments;• approval of Directors’ remuneration policy;• review of the functioning of the Boards and their Committees;
and• review of corporate responsibility and sustainability,
in particular the Unilever Sustainable Living Plan.
Our risk management approach and associated systems of internal control are of utmost importance to the Boards and are described further on pages 36 to 41.
Attendance The following table shows the attendance of Directors at Board meetings for the year ended 31 December 2012. If Directors are unable to attend a Board meeting they have the opportunity beforehand to discuss any agenda items with the Chairman.Attendance is expressed as the number of meetings attended out of the number eligible to attend. In 2012 we brought forward our financial reporting timetable which required us to reschedule a number of Board meetings in 2012. As a consequence, certain Non-Executive Directors were unable to attend these rescheduled Board meetings.
Main Board
Michael Treschow(a) 9/9Kees Storm 9/9Paul Polman(b) 9/9Jean-Marc Huët(b) 9/9Louise Fresco 9/9Ann Fudge 8/9Charles Golden 7/9Byron Grote 9/9Sunil B Mittal 6/9Hixonia Nyasulu 9/9Sir Malcolm Rifkind 9/9Paul Walsh 9/9(a) Chairman (b) Executive Director
46 Unilever Annual Report and Accounts 2012Report of the Directors Governance
CORPORATE GOVERNANCE continued
A procedure is in place to enable Directors, if they so wish, to seek independent advice at Unilever’s expense.
Board evaluationUnilever’s Chairman, in conjunction with the Vice-Chairman/Senior Independent Director, leads the process whereby the Boards formally assess their own performance, with the aim of helping to improve the effectiveness of the Boards and their Committees. The evaluation process consists of an internal exercise performed annually with an independent third-party evaluation carried out at least once every three years.
This year we took a more rigorous approach to our internal evaluation process by engaging an independent governance specialist. This external source challenged and provided insight into the questions in our Board, CEO and Chairman’s evaluation questionnaires and resulted in the creation of three full and confidential questionnaires for all Directors to complete, hosted for the first time using online facilities. The detailed questionnaire invited comments on a number of key areas including board responsibility, operations, effectiveness, training and knowledge. In addition, each year the Chairman conducts a process of evaluating the performance and contribution of each Director that includes a one-to-one performance and feedback discussion with each Director. The evaluation of the performance of the Chairman is led by the Vice-Chairman/Senior Independent Director and the Chairman leads the evaluation of the Chief Executive Officer, both using the bespoke questionnaires. Committees of the Boards evaluate themselves annually under supervision of their respective chairmen taking into account the views of respective Committee members and the Boards.
Ongoing evaluationIn the table on the following page we report progress on the key actions agreed by the Boards on a year-on-year basis, in order to provide a meaningful assessment of the challenges the Boards face as they evolve and an insight into how well they respond to those challenges.
Meetings of the Boards may be held either in London or Rotterdam or such other locations as the Boards think fit, with one or two off-site Board meetings a year. In 2012, Board meetings were held in Port Sunlight, UK; Istanbul, Turkey; and Paris, France. In these locations the Boards learnt more about the business in the UK, the politico-economic view of Turkey and the trading environment in France. Visits such as these allow the Non-Executive Directors to meet senior managers around Unilever’s global business and in turn allow them to gain a deeper understanding of the business.
Appointment of DirectorsUpon consideration and recommendation from the Nominating and Corporate Governance Committee for a candidate to be nominated by the Boards as an independent Director, Directors are appointed by shareholders at the AGMs. All existing Directors, unless they are retiring, submit themselves for re-election every year, and shareholders vote to re-appoint them by a simple majority vote. A list of our current Directors and the periods during which they have served as such is set out on page 42.
In order to seek to ensure that NV and PLC have the same Directors, the Articles of Association of NV and PLC contain provisions which are designed to ensure that both NV and PLC shareholders are presented with the same candidates for election as Directors. This is achieved through a nomination procedure operated by the Boards of NV and PLC through Unilever’s Nominating and Corporate Governance Committee.
Based on the evaluation of the Boards, its Committees and its individual Directors, the Nominating and Corporate Governance Committee recommends to each Board a list of candidates for nomination/re-election at the AGMs of both NV and PLC. In addition, shareholders are able to nominate Directors. To do so they must put a resolution to both AGMs in line with local requirements. However, in order to ensure that the Boards remain identical, anyone being elected as a Director of NV must also be elected as a Director of PLC and vice versa. Therefore, if an individual fails to be elected to both companies then he or she will be unable to take their place on either Board.
The provisions in the Articles of Association for appointing Directors cannot be changed without the permission, in the case of NV, of the holders of the special ordinary shares numbered 1 to 2,400 inclusive and, in the case of PLC, of the holders of PLC’s deferred stock. The NV special ordinary shares may only be transferred to one or more other holders of such shares. The joint holders of both the NV special ordinary shares and the PLC deferred stock are N.V. Elma and United Holdings Limited, which are joint subsidiaries of NV and PLC. The Boards of N.V. Elma and United Holdings Limited comprise the members of the Nominating and Corporate Governance Committee, which comprise Non-Executive Directors of Unilever only.
Board induction, training and supportUpon election, Directors receive a comprehensive Directors’ Information Pack and are briefed thoroughly on their responsibilities and the business with a tailored induction programme. The Chairman ensures that ongoing training is provided for Directors by way of site visits, presentations and circulated updates at Board and Board Committee meetings on, among other things, Unilever’s business, environmental, social and corporate governance, regulatory developments and investor relations matters. In 2012 the Board knowledge sessions were on digital strategy, Unilever’s Foods strategy and the supply chain.
ABOUT UNILEVER GOVERNANCE FINANCIAL STATEMENTS SHAREHOLDER INFORMATION
47Unilever Annual Report and Accounts 2012 Report of the Directors Governance
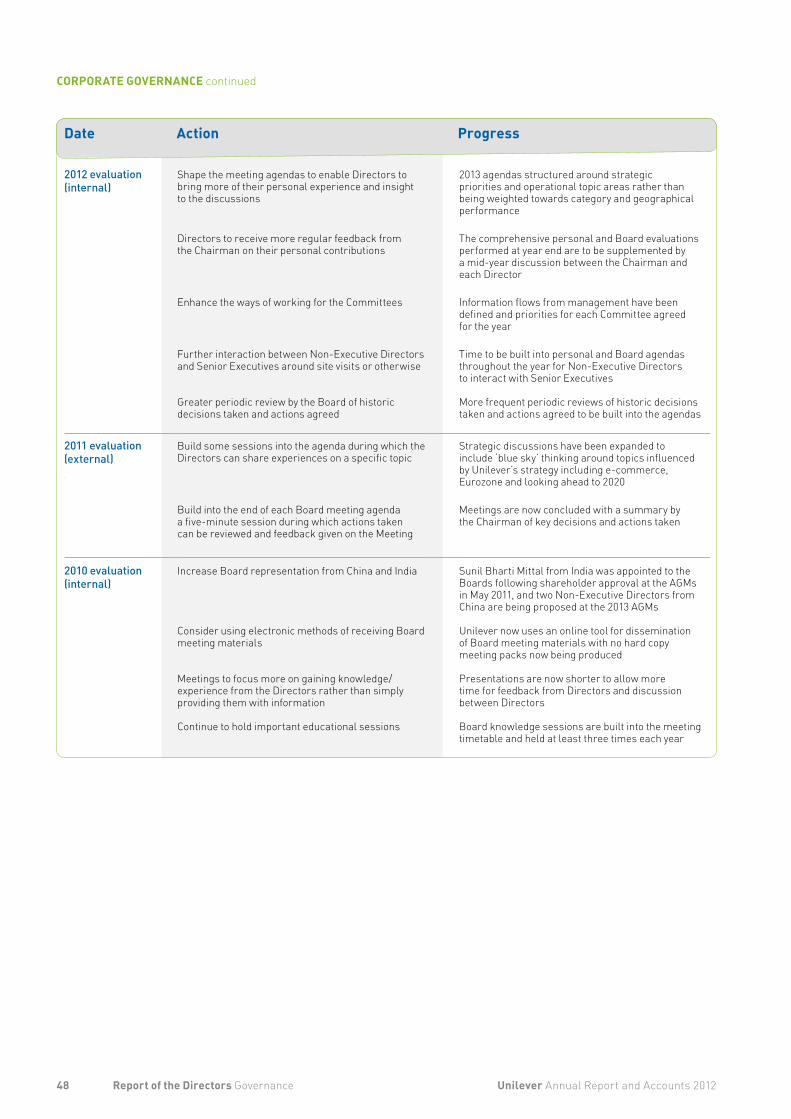
2012 evaluation (internal)
Shape the meeting agendas to enable Directors to bring more of their personal experience and insight to the discussions
2013 agendas structured around strategic priorities and operational topic areas rather than being weighted towards category and geographical performance
Directors to receive more regular feedback from the Chairman on their personal contributions
The comprehensive personal and Board evaluations performed at year end are to be supplemented by a mid-year discussion between the Chairman and each Director
Enhance the ways of working for the Committees Information flows from management have been defined and priorities for each Committee agreed for the year
Further interaction between Non-Executive Directors and Senior Executives around site visits or otherwise
Greater periodic review by the Board of historic decisions taken and actions agreed
Time to be built into personal and Board agendas throughout the year for Non-Executive Directors to interact with Senior Executives
More frequent periodic reviews of historic decisions taken and actions agreed to be built into the agendas
2011 evaluation (external)
Build some sessions into the agenda during which the Directors can share experiences on a specific topic
Strategic discussions have been expanded to include ‘blue sky’ thinking around topics influenced by Unilever’s strategy including e-commerce, Eurozone and looking ahead to 2020
Build into the end of each Board meeting agenda a five-minute session during which actions taken can be reviewed and feedback given on the Meeting
Meetings are now concluded with a summary by the Chairman of key decisions and actions taken
2010 evaluation (internal)
Increase Board representation from China and India
Consider using electronic methods of receiving Board meeting materials
Meetings to focus more on gaining knowledge/experience from the Directors rather than simply providing them with information
Continue to hold important educational sessions
Sunil Bharti Mittal from India was appointed to the Boards following shareholder approval at the AGMs in May 2011, and two Non-Executive Directors from China are being proposed at the 2013 AGMs
Unilever now uses an online tool for dissemination of Board meeting materials with no hard copy meeting packs now being produced
Presentations are now shorter to allow more time for feedback from Directors and discussion between Directors
Board knowledge sessions are built into the meeting timetable and held at least three times each year
48 Unilever Annual Report and Accounts 2012Report of the Directors Governance
Date Action Progress
CORPORATE GOVERNANCE continued

Our Directors
Non-Executive Directors
ChairmanUnilever has an independent Non-Executive Chairman and a Chief Executive Officer. There is a clear division of responsibilities between their roles.
The Chairman is primarily responsible for leadership of the Boards and ensuring their effectiveness. The Chairman sets the Boards’ agenda, ensures the Directors receive accurate, timely and clear information, promotes effective relationships and open communication between the Executive and Non-Executive Directors and maintains effective communication with major shareholders. With the Group Secretary, the Chairman will take the lead in providing a properly constructed induction programme for new Directors that is comprehensive, formal and tailored.
Vice-Chairman/Senior Independent DirectorKees Storm is Vice-Chairman/Senior Independent Director. He acts as the Boards’ spokesman, and serves as an intermediary for the other Directors when necessary. He is also a point of contact for shareholders if they have concerns which cannot be resolved through the Chairman or Chief Executive Officer.
Non-Executive DirectorsThe Non-Executive Directors share responsibility, together with the Executive Directors, for the execution of the Boards’ duties. The role of Non-Executive Directors is essentially supervisory. As they make up the Committees of the Boards, it is important that they can be considered to be independent.
Role and ResponsibilitiesThe key elements of the role and responsibilities of the Non-Executive Directors are:• supervision of, and advice to, the Chief Executive Officer;• developing strategy with the Chief Executive Officer;• scrutiny of performance of the business and the Chief
Executive Officer;• oversight of risks and controls;• reporting of performance;• remuneration of and succession planning for Executive
Directors; and• governance and compliance.
The Non-Executive Directors are chosen individually for their broad and relevant experience and international outlook, as well as for their independence and details of their various appointments can be found in their biographies on page 42. In consultation with the Nominating and Corporate Governance Committee, the Boards review both the adequacy of succession planning processes and succession planning itself at both Board and Unilever Leadership Executive (ULE) level. The profile set by the Boards for the Non-Executive Directors provides guiding principles for the composition of the Boards in line with the recommendations of applicable governance regulations and best practice, and takes into account the balance of skills, diversity, knowledge and experience on the Boards. The profile set by the Boards for the Non-Executive Directors and the schedule used for orderly succession planning can be found in ‘The Governance of Unilever’ document and on our website at www.unilever.com/investorrelations/corp_governance.
MeetingsThe Non-Executive Directors meet as a group, without the Executive Directors present, under the leadership of the Chairman to consider specific agenda items and wide-ranging business matters of relevance to the Group. In 2012 they met five times.
IndependenceFollowing the conclusion of a thorough review of all relevant relationships of the Non-Executive Directors, and their related or connected persons, our Boards consider all of our Non-Executive Directors to be independent of Unilever by reference to the criteria set out in ‘The Governance of Unilever’ and derived from the relevant best practice guidelines in the Netherlands, UK and US.
None of our Non-Executive Directors are elected or appointed under any arrangement or understanding with any major shareholder, customer, supplier or otherwise.
RemunerationThe remuneration of the Non-Executive Directors is determined by the Boards, within the overall limit set by the shareholders at the AGMs in 2007, and is reported on page 80. We do not grant our Non-Executive Directors any personal loans or guarantees nor are they entitled to any severance payments.
TenureSubject to individual review, the Boards propose the Non-Executive Directors for re-election each year at the AGMs. Although the Dutch Corporate Governance Code sets the suggested length of tenure at a maximum of 12 years for Non-Executive Directors, they normally serve for a maximum of nine years. Their nomination for re-election is subject to continued good performance which is evaluated by the Boards, based on the recommendations of the Nominating and Corporate Governance Committee.
Executive Directors
Chief Executive OfficerThe Chief Executive Officer has the authority to determine which duties regarding the operational management of the companies and their business enterprises will be carried out under his responsibility, by one or more Executive Directors or by one or more other persons. This provides a basis for the ULE that is chaired by and reports to the Chief Executive Officer. For ULE members’ biographies see page 43.
Executive DirectorsDuring 2012, Unilever continued to have two Executive Directors, the Chief Executive Officer and Chief Financial Officer, who were also members of the ULE and are full-time employees of Unilever.
The Executive Directors submit themselves for re-election at the AGMs each year, and the Nominating and Corporate Governance Committee carefully considers each nomination for re-appointment. Executive Directors stop holding executive office on ceasing to be Directors.
We do not grant our Executive Directors any personal loans or guarantees.
There are no family relationships between any of our Executive Directors, members of the ULE or Non-Executive Directors, and none of our Executive Directors or other key management personnel are elected or appointed under any arrangement or understanding with any major shareholder, customer, supplier or otherwise.
ABOUT UNILEVER GOVERNANCE FINANCIAL STATEMENTS SHAREHOLDER INFORMATION
49Unilever Annual Report and Accounts 2012 Report of the Directors Governance

Our Committees
Board CommitteesThe Boards have established four Board Committees, the Audit Committee, the Compensation and Management Resources Committee, the Corporate Responsibility Committee and the Nominating and Corporate Governance Committee, all formally set up by Board resolutions with defined remits. They are all made up solely of Non-Executive Directors and report regularly to the Boards.
All Committees are provided with sufficient resources to undertake their duties, and the terms of reference for each Committee are contained within ‘The Governance of Unilever’ which is available at www.unilever.com/investorrelations/corp_governance.
The reports of each Committee can be found on pages 56 to 81.
AttendanceAttendance tables can be found within each Committee Report. If Directors are unable to attend a Committee meeting, they have the opportunity beforehand to discuss any agenda items with the chairman of the meeting.
Management Committee
Disclosure CommitteeThe Boards have set up, through the Chief Executive Officer, a Disclosure Committee which is responsible for helping the Boards ensure that financial and other information required to be disclosed publicly is disclosed in a timely manner and that the information that is disclosed is complete and accurate in all material aspects.
The Committee comprises the Controller (Chairman), the Group Secretary and Chief Legal Officer, the Treasurer and the NV and PLC Deputy Secretaries.
Outside appointmentsUnilever recognises the benefit to the individual and to the Group of involvement by Unilever senior executives acting as directors of other companies outside the Unilever Group, broadening their experience and knowledge. For our Executive Directors, the number of outside directorships of listed companies is generally limited to one per individual, and in the case of publicly listed companies approval is required from the Chairman. Outside directorships must not involve an excessive commitment or conflict of interest. Fees paid in connection with an outside directorship may be retained by the individual, reflecting that any outside directorship is the responsibility of the individual and that Unilever takes no responsibility in this regard.
Director matters
Conflicts of interestWe attach special importance to avoiding conflicts of interest between NV and PLC and their Directors. The Boards are responsible for ensuring that there are rules in place to avoid conflicts of interest by Board members. Conflicts of interest are understood not to include transactions and other activities between companies in the Unilever Group.
Authorisation of situational conflicts is given by the Boards to the relevant Director. The authorisation includes conditions relating to keeping Unilever information confidential and to their exclusion from receiving and discussing relevant information at Board meetings. Situational conflicts are reviewed annually by the Boards as part of the determination of Director independence. In between those reviews Directors have a duty to inform the Boards of any relevant changes to the situation. A Director may not vote on, or be counted in a quorum in relation to, any resolution of the Boards in respect of any contract in which he or she has a material interest. The procedures that Unilever has put in place to deal with conflicts of interest have operated effectively.
Borrowing powersThe borrowing powers of NV Directors on behalf of NV are not limited by the Articles of Association of NV. PLC Directors have the power to borrow on behalf of PLC up to three times the PLC proportion of the adjusted capital and reserves of the Unilever Group, as defined in PLC’s Articles of Association, without the approval of shareholders (by way of an ordinary resolution).
IndemnificationThe terms of Directors’ indemnification are provided for in NV’s Articles of Association. The power to indemnify Directors is provided for in PLC’s Articles of Association and deeds of indemnity have been issued to all PLC Directors. Appropriate qualifying third-party Directors’ and Officers’ liability insurance was in place for all Unilever Directors throughout 2012 and is currently in force.
In addition, PLC provides indemnities (including, where applicable, a qualifying pension scheme indemnity provision) to the Directors from time to time of two subsidiaries that act as trustee respectively of two of Unilever’s UK pension schemes. Appropriate trustee liability insurance is also in place.
Group SecretaryThe Group Secretary is available to advise all Directors on matters relating to the governance of the Group and ensures that Board procedures are complied with. The Group Secretary is Tonia Lovell.
Tonia LovellGroup Secretary
50 Unilever Annual Report and Accounts 2012Report of the Directors Governance
CORPORATE GOVERNANCE continued
Our Shareholders
Shareholder matters
Shareholder and Stakeholder EngagementThe Chief Financial Officer has lead responsibility for investor relations, with the active involvement of the Chief Executive Officer. They are supported by our Investor Relations department which organises presentations for analysts and investors, and such presentations are generally made available on our website. Briefings on quarterly results are given via teleconference and are accessible by telephone or via our website. For further information visit our website at www.unilever.com/investorrelations.
The Boards are briefed on reactions to quarterly results announcements. They, or the relevant Board Committee, are briefed on any issues raised by shareholders that are relevant to their responsibilities. Our shareholders can raise issues directly with the Chairman and, if appropriate, the Vice-Chairman/Senior Independent Director.
Both NV and PLC communicate with their respective shareholders at the AGMs as well as responding to their questions and enquiries during the course of the year. We take the views of our shareholders into account and, in accordance with all applicable legislation and regulations, may consult them in an appropriate way before putting proposals to our AGMs.
General Meetings of shareholdersAt the AGMs, a review is given of the progress of the business over the last year and there is a discussion of current issues. Shareholders are encouraged to attend the meetings and ask questions, and the question and answer sessions form an important part of the meetings. The business generally conducted includes approval/adoption of the Annual Report and Accounts, appointment of directors, appointment of external auditors, and authorisation for the Boards to allot and repurchase shares.
General Meetings of shareholders of NV and PLC are held at times and places decided by our Boards. NV meetings are normally held in Rotterdam and PLC meetings are normally held in London.
The external auditors are welcomed to the AGMs and they are entitled to address the meetings.
Voting rightsNV shareholders can cast one vote for each €0.16 nominal capital that they hold. This means that they can cast one vote for each NV ordinary share or NV New York Registry Share. Shareholders can vote in person or by proxy. Similar arrangements apply to holders of depositary receipts issued for NV shares and the holders of NV preference shares. PLC shareholders can cast one vote for each 31⁄9p nominal capital that they hold. This means shareholders can cast one vote for each PLC ordinary share or PLC American Depositary Receipt of shares.
The Trustees of the PLC employee share trusts may vote or abstain in any way they think fit and in doing so may take into account both financial and non-financial interests of the beneficiaries of the employee share trusts or their dependants. Historically the Trustees tend not to exercise this right.
More information on the exercise of voting rights can be found in NV’s and PLC’s Articles of Association and in the respective Notices of Meetings which can be found on our website at www.unilever.com/agm.
Shareholder proposed resolutionsShareholders of NV may propose resolutions if they individually or together hold 1% of NV’s issued capital in the form of shares or depositary receipts for shares, or if they individually or together hold shares or depositary receipts worth €50 million. Shareholders who together represent at least 10% of the issued capital of NV can also requisition Extraordinary General Meetings to deal with specific resolutions.
Shareholders of PLC who together hold shares representing at least 5% of the total voting rights of PLC, or 100 shareholders who hold on average £100 each in nominal value of PLC share capital, can require PLC to propose a resolution at a General Meeting. PLC shareholders holding in aggregate 5% of the issued PLC ordinary shares are able to convene a General Meeting of PLC.
Required majoritiesResolutions are usually adopted at NV and PLC shareholder meetings by an absolute majority of votes cast, unless there are other requirements under the applicable laws or NV’s or PLC’s Articles of Association. For example, there are special requirements for resolutions relating to the alteration of the Articles of Association, the liquidation of NV or PLC and the alteration of the Equalisation Agreement.
A proposal to alter the Articles of Association of NV can only be made by the Board of NV. A proposal to alter the Articles of Association of PLC can be made either by the Board of PLC or by approval of shareholders by special resolution in accordance with the UK Companies Act 2006. Unless expressly specified to the contrary in the Articles of Association of PLC, PLC’s Articles of Association may be amended by a special resolution. Proposals to alter the provisions in the Articles of Association of NV and PLC respectively relating to the unity of management require the prior approval of meetings of the holders of the NV special ordinary shares and the PLC deferred stock. The Articles of Association of both NV and PLC can be found on our website at www.unilever.com/investorrelations/corp_governance.
Right to hold sharesUnilever’s constitutional documents place no limitations on the right to hold NV and PLC shares. There are no limitations on the right to hold or exercise voting rights on the ordinary shares of NV and PLC imposed by Dutch or English law.
Electronic communicationShareholders of NV and PLC can electronically appoint a proxy to vote on their behalf at the respective AGM. Shareholders of PLC can also choose to receive electronic notification that the Annual Report and Accounts and Notice of AGMs have been published on our website, instead of receiving printed copies.
Share capital matters
Margarine Union (1930) Limited: Conversion RightsThe first Viscount Leverhulme was the founder of the company which became PLC. When he died in 1925, he left in his will a large number of PLC shares in various trusts.
When the will trusts were varied in 1983, the interests of the beneficiaries of his will were also preserved. Four classes of special shares were created in Margarine Union (1930) Limited, a subsidiary of PLC. One of these classes can be converted at the end of the year 2038 into 70,875,000 PLC ordinary shares of 31⁄9p each. As at 4 March 2013 this represents 5.4% of PLC’s issued ordinary capital. These convertible shares replicate the rights which the descendants of the first Viscount would have had under his will. This class of the special shares only has a right to dividends in specified circumstances, and no dividends have yet been paid.
ABOUT UNILEVER GOVERNANCE FINANCIAL STATEMENTS SHAREHOLDER INFORMATION
51Unilever Annual Report and Accounts 2012 Report of the Directors Governance
Foundation Unilever NV Trust OfficeThe Foundation Unilever NV Trust Office (Stichting Administratiekantoor Unilever N.V.) is a trust office with a board independent of Unilever. As part of its corporate objects, the Foundation issues depositary receipts in exchange for the NV ordinary shares and NV 7% preference shares it holds in NV. These depositary receipts are listed on Euronext Amsterdam, as are the NV ordinary and 7% preference shares themselves.
Holders of depositary receipts can under all circumstances exchange their depositary receipts for the underlying shares (and vice versa) and are entitled to dividends and all economic benefits on the underlying shares held by the Foundation. They can attend all General Meetings of NV, either personally or by proxy, and also have the right to speak. They can under all circumstances and without limitation exercise their voting rights. The Foundation only votes shares that are not represented at a General Meeting. The Foundation votes in such a way as it deems to be in the interests of the holders of the depositary receipts. This voting policy is laid down in the Conditions of Administration that apply to the depositary receipts.
The Foundation’s shareholding fluctuates daily. Its holdings on 4 March 2013 were 1,321,784,807 NV ordinary shares (77.08%) and 9,776 NV 7% cumulative preference shares (33.71%).
The members of the board at the Foundation are Mr J H Schraven (chairman), Mr P P de Koning, Prof Emeritus Dr L Koopmans and Mr A A Olijslager. The Foundation reports periodically on its activities. Further information on the Foundation, including its Articles of Association and Conditions of Administration, can be found on its website at www.administratiekantoor-unilever.nl.
Unilever considers the arrangements of the Foundation appropriate and in the interest of NV and its shareholders given the size of the voting rights attached to the financing preference shares and the relatively low attendance of holders of ordinary shares at the General Meetings of NV.
Further information on the share capital of NV and PLC is given on pages 54 and 55.
Our Foundation Agreements
Foundation AgreementsThe Unilever Group is created and maintained by a series of agreements between the parent companies, NV and PLC, together with special provisions in their respective Articles of Association, which are together known as the Foundation Agreements. These agreements enable Unilever to achieve unity of management, operations, shareholders’ rights, purpose and mission. Further information on these agreements is provided below and in the document entitled ‘The Governance of Unilever’ which is available on our website at www.unilever.com/investorrelations/corp_governance.
NV’s Articles of Association contain, among other things, the objects clause, which sets out the scope of activities that NV is authorised to undertake. They are drafted to give a wide scope and provide that the primary objectives are: to carry on business as a holding company; to manage any companies in which it has an interest; and to operate and carry into effect the Equalisation Agreement. At the 2010 PLC AGM, the shareholders agreed that the objects clause be removed from PLC’s Articles of Association so that there are no restrictions on its objects.
NV’s and PLC’s Articles of Association, together with the additional three Foundation Agreements detailed below, can be found on our website at www.unilever.com/investorrelations/corp_governance.
Equalisation AgreementThe Equalisation Agreement makes the economic position of the shareholders of NV and PLC, as far as possible, the same as if they held shares in a single company. The Equalisation Agreement regulates the mutual rights of the shareholders of NV and PLC. Under the Equalisation Agreement, NV and PLC must adopt the same financial periods and accounting policies.
Each NV ordinary share represents the same underlying economic interest in the Unilever Group as each PLC ordinary share.
The Deed of Mutual CovenantsThe Deed of Mutual Covenants provides that NV and PLC and their respective subsidiary companies shall co-operate in every way for the purpose of maintaining a common operating policy. They shall exchange all relevant information about their respective businesses – the intention being to create and maintain a common operating platform for the Unilever Group throughout the world. The Deed also contains provisions for the allocation of assets between NV and PLC.
The Agreement for Mutual Guarantees of BorrowingUnder the Agreement for Mutual Guarantees of Borrowing between NV and PLC, each company will, if asked by the other, guarantee the borrowings of the other. The two companies also jointly guarantee the borrowings of their subsidiaries. These arrangements are used, as a matter of financial policy, for certain significant public borrowings. They enable lenders to rely on our combined financial strength.
Our requirements and compliance
Requirements and compliance – generalUnilever is subject to corporate governance requirements in the Netherlands, the UK and the US. In this section we report on our compliance with the corporate governance regulations and best practice codes applicable in the Netherlands and the UK and we also describe compliance with corporate governance standards in the US.
Under the European Takeover Directive as implemented in the Netherlands and the UK, the UK Companies Act 2006 and rules of the US Securities and Exchange Commission, Unilever is required to provide information on contracts and other arrangements essential or material to the business of the Group. Other than the Foundation Agreements discussed above, we believe we do not have any such contracts or arrangements.
Our governance arrangements are designed and structured to promote and further the interests of our companies and their shareholders. The Boards however reserve the right, in cases where they decide such to be in the interests of the companies or our shareholders, to depart from that which is set out in the present and previous sections in relation to our corporate governance. Any such changes will be reported in future Annual Reports and Accounts and, when necessary, through changes to the relevant documents published on our website. As appropriate, proposals for change will be put to our shareholders for approval.
52 Unilever Annual Report and Accounts 2012Report of the Directors Governance
CORPORATE GOVERNANCE continued

Our principal risks and our approach to risk management and systems of internal control are described on pages 36 to 41.
Requirements – The NetherlandsNV complies with almost all of the principles and best practice provisions of the Dutch Corporate Governance Code (Dutch Code), a copy of which is available at www.commissiecorporategovernance.nl.
Unilever places a great deal of importance on corporate responsibility and sustainability as is evidenced by our vision to double the size of the company while reducing our environmental impact. Unilever is keen to ensure focus on key financial performance measures which we believe to be the drivers of shareholder value creation and relative total shareholder return. Unilever therefore believes that the interests of the business and shareholders are best served by linking the long-term share plans to the measures as described in the Directors’ Remuneration Report and has not included a non-financial performance indicator (Principle II.2 and bpp II.2.3).
Risk management and controlAs a result of the review of the Audit Committee (as described in its report on pages 56 and 57) the Boards believe that as regards financial reporting risks, the risk management and control systems provide reasonable assurance that the financial statements do not contain any errors of material importance and the risk management and control systems have worked properly in 2012 (bpp II.1.5).
The aforesaid statements are not statements in accordance with the requirements of Section 404 of the US Sarbanes-Oxley Act of 2002.
Retention period of sharesThe Dutch Code recommends that shares granted to Executive Directors must be retained for a period of at least five years (bpp II.2.5). Our shareholder-approved remuneration policy requires Executive Directors to build and retain a personal shareholding in Unilever. The Boards believe that this is in line with the spirit of the Dutch Code.
Severance payIt is our policy to set the level of severance payments for Directors at no more than one year’s salary, unless the Boards, at the proposal of the Compensation and Management Resources Committee, find this manifestly unreasonable given circumstances or unless otherwise dictated by applicable law (bpp II.2.8).
Compensation and Management Resources CommitteeThe Compensation and Management Resources Committee (formerly the Remuneration Committee) may not be chaired by a Board member who is a member of the management board of another listed company (bpp III.5.11). Paul Walsh is Chairman of the Compensation and Management Resources Committee and has been CEO of Diageo Plc since 2000. Paul has profound knowledge and understanding of remuneration matters at companies operating globally and understands how remuneration policies support the growth objective. His experience and insight of remuneration matters is very valuable to Unilever. The Boards believe that Mr Walsh is ideally placed for the position of Chairman of the Compensation and Management Resources Committee.
Financing preference sharesNV issued 6% and 7% cumulative preference shares between 1927 and 1964. Their voting rights are based on their nominal value, as prescribed by Dutch law. The Dutch Code recommends that the voting rights on such shares should, in any event when they are newly issued, be based on their economic value rather
than on their nominal value (bpp IV.1.2). NV agrees with this principle but cannot unilaterally reduce voting rights of its outstanding preference shares.
Anti-takeover constructions and control over the company NV confirms that it has no anti-takeover constructions, in the sense of constructions that are intended solely, or primarily, to block future hostile public offers for its shares (bpp IV.3.11). Nor does NV have any constructions whose specific purpose is to prevent a bidder, after acquiring 75% of the capital, from appointing or dismissing members of the Board and subsequently altering the Articles of Association. The acquisition through a public offer of a majority of the shares in a company does not under Dutch law preclude in all circumstances the continued right of the board of the company to exercise its powers.
Meetings of analysts and presentations to investorsWe have extensive procedures for handling relations with and communicating with shareholders, investors, analysts and the media (see also page 51). The important presentations and meetings are conducted as far as practicable in accordance with the Dutch Code (bpp IV.3.1). Due to their large number and overlap in information, however, some of the less important ones are not announced in advance, made accessible to everyone or put on our website.
Corporate Governance StatementNV is required to make a statement concerning corporate governance as referred to in article 2a of the decree on additional requirements for annual reports (Vaststellingsbesluit nadere voorschriften inhoud jaarverslag) with effect from 1 January 2010 (the ‘Decree’). The information required to be included in this corporate governance statement as described in articles 3, 3a and 3b of the Decree can be found in the following sections of this Annual Report and Accounts:• the information concerning compliance with the Dutch Code,
as required by article 3 of the Decree, can be found under ‘Corporate Governance’ within the section ‘Requirements – the Netherlands’;
• the information concerning Unilever’s risk management and control frameworks relating to the financial reporting process, as required by article 3a(a) of the Decree, can be found under ‘Outlook and risks’ on pages 36 to 41 and within the relevant sections under ‘Corporate Governance’;
• the information regarding the functioning of NV’s General Meeting of shareholders, and the authority and rights of NV’s shareholders, as required by article 3a(b) of the Decree, can be found within the relevant sections under ‘Corporate Governance’;
• the information regarding the composition and functioning of NV’s Board and its Committees, as required by article 3a(c) of the Decree, can be found within the relevant sections under ‘Corporate Governance’; and
• the information concerning the inclusion of the information required by the decree Article 10 European Takeover Directive, as required by article 3b of the Decree, can be found within the relevant sections under ‘Corporate Governance’.
Requirements – The United KingdomPLC is required, as a company that is incorporated in the UK and listed on the London Stock Exchange, to state how it has applied the main principles and how far it has complied with the provisions set out in the 2010 UK Corporate Governance Code, a copy of which is available at www.frc.org.uk.
In the preceding pages we have described how we have applied the main principles and the provisions of the UK Code. In 2012, PLC complied with all UK Code provisions.
ABOUT UNILEVER GOVERNANCE FINANCIAL STATEMENTS SHAREHOLDER INFORMATION
53Unilever Annual Report and Accounts 2012 Report of the Directors Governance

Risk management and controlOur approach to risk management and systems of internal control is in line with the recommendations in the report on ‘Internal Control – Revised Guidance for Directors on the UK Combined Code’ (‘The Turnbull guidance’). It is Unilever’s practice to bring acquired companies within the Group’s governance procedures as soon as is practicable and in any event by the end of the first full year of operation.
Requirements – The United StatesBoth NV and PLC are listed on the New York Stock Exchange. As such, both companies must comply with the requirements of US legislation, such as the Sarbanes-Oxley Act of 2002, regulations enacted under US securities laws and the Listing Standards of the New York Stock Exchange (NYSE), that are applicable to foreign private issuers, copies of which are available at www.sec.gov and www.nyse.com.
We are compliant with the Listing Standards of the NYSE applicable to foreign private issuers.
We are also required to disclose any significant ways in which our corporate governance practices differ from those typically followed by US companies listed on the NYSE. Our corporate governance practices do not significantly differ from those required of US companies listed on the NYSE. Attention is drawn to the Report of the Audit Committee on pages 56 and 57. In addition, further details about our corporate governance are provided in the document entitled ‘The Governance of Unilever’, which can be found on our website at www.unilever.com/investorrelations/corp_governance.
All senior executives and senior financial officers have declared their understanding of and compliance with Unilever’s Code of Business Principles and the related Code Policies. No waiver from any provision of the Code of Business Principles or Code Policies was granted in 2012 to any of the persons falling within the scope of the SEC requirements. The Code Policies include mandatory requirements covering, but not limited to, the following areas: accurate records, reporting and accounting; anti-bribery; avoiding conflicts of interest; gifts and entertainment; preventing insider trading; political activities and political donations; contact with government, regulators and non-governmental organisations; respect, dignity and fair treatment; and external communications (the media, investors and analysts). Our Code of Business Principles can be found on our website at www.unilever.com/investorrelations/corp_governance.
Risk management and controlBased on an evaluation by the Boards, the Chief Executive Officer and the Chief Financial Officer concluded that the design and operation of the Group’s disclosure controls and procedures, including those defined in United States Securities Exchange Act of 1934 – Rule 13a – 15(e), as at 31 December 2012 were effective, and that subsequently until the date of the approval of the Annual Report and Accounts by the Boards, there have been no significant changes in the Group’s internal controls, or in other factors that could significantly affect those controls.
Unilever is required by Section 404 of the US Sarbanes-Oxley Act of 2002 to report on the effectiveness of its internal control over financial reporting. This requirement will be reported on separately and will form part of Unilever’s Annual Report on Form 20-F.
Share capital
NV’s issued share capital on 31 December 2012 was made up of:• €274,356,432 split into 1,714,727,700 ordinary shares
of €0.16 each; • €1,028,568 split into 2,400 ordinary shares numbered
1 to 2,400 known as special shares; and • €81,454,014 split into two classes (6% and 7%) of
cumulative preference shares (‘financing preference shares’).
The voting rights attached to NV’s outstanding shares are split as follows:
Total number of votes % of issued capital
1,714,727,700 ordinary shares 1,714,727,700(a) 76.892,400 special shares 6,428,550 0.29161,060 6% cumulative preference shares 431,409,276(b) 19.34
29,000 7% cumulative preference shares 77,678,313(c) 3.48
(a) Of which 141,560,629 shares were held in treasury and 16,789,821 shares were held to satisfy obligations under share-based incentive schemes as at 31 December 2012. These shares are not voted on.
(b) Of which 37,679 6% cumulative preference shares were held in treasury as at 31 December 2012. These shares are not voted on.
(c) Of which 7,562 7% cumulative preference shares were held in treasury as at 31 December 2012. These shares are not voted on.
NV may issue shares not yet issued and grant rights to subscribe for shares only pursuant to a resolution of the General Meeting of Shareholders or of another corporate body designated for such purpose by a resolution of the General Meeting. At the NV AGM held on 9 May 2012 the Board was designated, in accordance with Articles 96 and 96a of Book 2 of the Netherlands Civil Code, as the corporate body authorised until 9 November 2013 to resolve on the issue of – or on the granting of rights to subscribe for – shares not yet issued and to restrict or exclude the statutory pre-emption rights that accrue to shareholders upon issue of shares, on the understanding that this authority is limited to 10% of the issued share capital of NV, plus an additional 10% of the issued share capital of NV in connection with or on the occasion of mergers and acquisitions.
At the 2012 NV AGM the Board of NV was authorised, in accordance with Article 98 of Book 2 of the Netherlands Civil Code, until 9 November 2013 to cause NV to buy back its own shares and depositary receipts thereof, with a maximum of 10% of issued share capital, either through purchase on a stock exchange or otherwise, at a price, excluding expenses, not lower than the nominal value of the shares and not higher than 10% above the average of the closing price of the shares on Eurolist by Euronext Amsterdam for the five business days before the day on which the purchase is made.
The above mentioned authorities are renewed annually.
54 Unilever Annual Report and Accounts 2012Report of the Directors Governance
CORPORATE GOVERNANCE continued
PLC’s issued share capital on 31 December 2012 was made up of:• £40,760,420 split into 1,310,156,361 ordinary shares
of 31/9p each; and • £100,000 of deferred stock.
The total number of voting rights attached to PLC’s outstanding shares is as follows:
Total number of votes % of issued capital
1,310,156,361 ordinary shares 1,310,156,361(a) 99.76£100,000 deferred stock 3,214,285 0.24(a) Of which 26,696,994 shares were held by PLC in treasury and 8,046,353
shares were held by NV group companies or by share trusts as at 31 December 2012. These shares are not voted on.
The Board of PLC may, under sections 551, 570 and 571 of the UK Companies Act 2006 and subject to the passing of the appropriate resolutions at a meeting of shareholders, issue shares within the limits prescribed within the resolutions. At the 2012 PLC AGM the Directors were authorised to issue new shares pursuant to section 551 of the UK Companies Act 2006, limited to a maximum of £13,300,000 nominal value, which at the time represented approximately 33% of PLC’s issued ordinary share capital and pursuant to section 570 of the UK Companies Act, to disapply pre-emption rights up to approximately 5% of PLC’s issued ordinary share capital. These authorities are renewed annually.
At the 2012 PLC AGM the Board of PLC was authorised in accordance with its Articles of Association to make market purchases of its ordinary shares representing just under 10% of PLC’s issued capital and within the limits prescribed within the resolution until the earlier of the six-month anniversary after the 2012 year end or the conclusion of the 2013 PLC AGM. A similar authority will be sought at the 2013 AGM of PLC pursuant to the UK Companies Act 2006.
Analysis of shareholding
Significant shareholders of NVAs far as Unilever is aware, the only holders of more than 5% (as referred to in the Act on Financial Supervision in the Netherlands) in the NV share capital (apart from the Foundation Unilever NV Trust Office, see page 52, and shares held in treasury by NV, see page 54), are ING Groep N.V. (‘ING’) and ASR Nederland N.V. (‘ASR’).
The voting rights of such shareholders are the same as for other holders of the class of share indicated. The two shareholders have each notified the Netherlands Authority for the Financial Markets (AFM) of their holdings. Detailed below are the interests in NV shares provided to NV by ING and ASR in the second half of 2012. All interests are mainly held in cumulative preference shares.
Class of sharesTotal number
of shares% of issued
capitalNominal value
of shares
ING Ordinary shares 3,920,989 0.23 €627,3587% Cumulative preference shares 20,665 71.26 €8,856,399
6% Cumulative preference shares 74,088 46.0 €31,751,894
ASR Ordinary shares 2,913,322 0.17 €466,1326% Cumulative preference shares 46,000 28.56 €19,714,220
Between 1 January 2010 and 31 December 2012, ING and ASR have held more than 5% in the share capital of NV.
Significant shareholders of PLCThe following table gives notified details of shareholders who held more than 3% of, or 3% of voting rights attributable to, PLC’s shares or deferred stock (excluding treasury shares) on 4 March 2013. The voting rights of such shareholders are the same as for other holders of the class of share indicated.
Title of class Name of holder
Number ofshares held
Approximate% held
Deferred Stock Naamlooze Vennootschap Elma 50,000 50
United Holdings Limited 50,000 50
Ordinary shares BlackRock, Inc. 74,570,243 5
Trustees of the Leverhulme Trust and the Leverhulme Trade Charities Trust 70,566,764 5
Between 1 January 2010 and 31 December 2012, Legal & General Group plc and BlackRock, Inc. have held more than 3% of, or 3% of voting rights attributable to, PLC’s ordinary shares. During this period, and as notified, these holdings reduced to below the 3% reporting threshold. The table above sets out the notifiable interest of shares or voting rights attributable to PLC as at 4 March 2013.
Controlling security holdersTo our knowledge, the Unilever Group is not owned or controlled, directly or indirectly, by another corporation, any foreign government or by any other legal or natural person. We are not aware of any arrangements the operation of which may at a subsequent date result in a change of control of Unilever.
Purchases of shares during 2012During 2012 Unilever Group companies purchased 37,894 NV ordinary shares, each with a nominal value of €0.16 for €1 million. This represents 0.002% of the called-up share capital of NV.
During 2012 Unilever Group companies purchased 10 NV 6% cumulative preference shares and 16 NV 7% cumulative preference shares each with a nominal value of €428.57 for €23,100. The repurchase was undertaken under the public cash offer for all outstanding 6% and 7% cumulative preference shares as announced on 19 October 2011.
No PLC ordinary shares were purchased by Unilever Group companies during 2012.
ABOUT UNILEVER GOVERNANCE FINANCIAL STATEMENTS SHAREHOLDER INFORMATION
55Unilever Annual Report and Accounts 2012 Report of the Directors Governance

Membership of the CommitteeThe Audit Committee is comprised only of independent Non-Executive Directors with a minimum requirement of three such members. During 2012 the Committee comprised Byron Grote (Chairman), Charles Golden and Kees Storm. Byron Grote took over the Chairmanship of the Committee on 29 February 2012 from Kees Storm and, from this date, he also became the Audit Committee’s financial expert for the purposes of the US Sarbanes-Oxley Act of 2002 in place of Kees Storm. The Committee met seven times in 2012, and all Committee members attended all the meetings. The Boards have satisfied themselves that the current members of the Audit Committee are competent in financial matters and have recent and relevant experience. Other attendees at Committee meetings (or part thereof) were the Chief Financial Officer, Chief Auditor, Group Controller, Chief Legal Officer & Group Secretary and the external auditor. Throughout the year the Committee members periodically met without others present and also held separate private sessions with the Chief Financial Officer, Chief Auditor and the external auditor, allowing the Committee to discuss any issues of emerging concern in more detail directly.
Role of the CommitteeThe role and responsibilities of the Audit Committee are set out in written terms of reference which are reviewed annually by the Committee taking into account relevant legislation and recommended good practice. The terms of reference are contained within ‘The Governance of Unilever’ which is available on our website at www.unilever.com/investorrelations/corp_governance. The Committee’s responsibilities include, but are not limited to, the following matters with a view to bringing any relevant issues to the attention of the Boards: • the integrity of Unilever’s financial statements; • risk management and internal control arrangements;• compliance with legal and regulatory requirements; • the external auditors’ performance, qualifications and
independence, the approval process of non-audit services, together with their nomination for shareholder approval; and
• the performance of the internal audit function.
How the Committee has discharged its responsibilitiesDuring the year, the Committee’s principal activities were as follows:
Financial statements The Committee considered reports from the Chief Financial Officer on the quarterly and annual financial statements, including other financial statements and disclosures prior to their publication and issues reviewed by the Disclosure Committee. They also reviewed the 2011 Annual Report and Accounts and Annual Report on Form 20-F, the quarterly performance and accompanying press releases prior to publication. These reviews incorporated the accounting policies and key judgements and estimates underpinning the financial statements as disclosed within Note 1 on pages 90 and 91, including:• goodwill and intangibles, including impairment analysis;• core operating profit definition;• business combinations;• pension obligations;• provisions and contingencies;• tax charges and taxation; and• going concern assessment.
The Committee was satisfied with the accounting treatments adopted.
Risk management and internal control arrangementsThe Committee reviewed Unilever’s overall approach to risk management and control, and its processes, outcomes and disclosure. It reviewed:
Byron Grote 7 / 7Chairman of the Audit Committee
Charles Golden 7 / 7Kees Storm 7 / 7
This table shows the attendance of Directors at Committee meetings for the year ended 31 December 2012. If Directors are unable to attend a meeting, they have the opportunity beforehand to discuss any agenda items with the Committee Chairman. Attendance is expressed as the number of meetings attended out of the number eligible to attend.
• Review of the effectiveness of internal controls over financial reporting including internal audit findings
• Review of the 2011 Annual Report & Accounts • Review of the Group’s dividend policy• Assessment of the debt crisis and Unilever’s
response• Review of pension costs• Review of IT systems, developments and controls• Review of commodity risk management• Review of legal proceedings, competition,
anti-bribery and regulatory matters• Review of corporate risks for which the Audit
Committee had oversight in 2012
• Review of management’s improvements to reporting and internal financial control arrangements
• Ongoing assessment of new regulatory requirements for Audit Committees with respect to reporting and governance
• Continual assessment of the corporate risks for which the Audit Committee has oversight and related mitigation/response plans
• External benchmarking of the Internal Audit function
56 Unilever Annual Report and Accounts 2012Report of the Directors Governance
REPORT OF THE AUDIT COMMITTEE
ATTENDANCE
COMMITTEE MEMBERS AND ATTENDANCE
HIGHLIGHTS OF 2012
PRIORITIES FOR 2013
• the Controller’s Quarterly Risk and Control Status Report, including Code of Business Principles cases relating to frauds and financial crimes and significant complaints received through the global Ethics Hotline;
• regular reviews of the 2012 corporate risks for which the Audit Committee had oversight and the proposed 2013 corporate risks identified by the Unilever Leadership Executive;
• progress on management’s improvements to reporting and internal financial control arrangements;
• the application of information and communication technology; • tax planning, insurance arrangements and related risk
management;• treasury policies, including debt issuance and hedging; • commodity risk management, governance and derivatives
hedging; and• litigation and regulatory investigations.
The Committee reviewed the application of the requirements under Section 404 of the US Sarbanes-Oxley Act of 2002 with respect to internal controls over financial reporting.
In addition, the Committee reviewed the annual financial plan and Unilever’s dividend policy and dividend proposals.
In fulfilling its oversight responsibilities in relation to risk management, internal control and the financial statements, the Committee met regularly with senior members of management and are fully satisfied with the key judgements taken.
Internal audit functionThe Committee reviewed Corporate Audit’s audit plan for the year and agreed its budget and resource requirements. It reviewed interim and year-end summary reports and management’s response. The Committee carried out an evaluation of the performance of the internal audit function and was satisfied with the effectiveness of the function. The Committee met independently with the Chief Auditor during the year and discussed the results of the audits performed during the year.
Audit of the Annual AccountsPricewaterhouseCoopers, Unilever’s external auditors and independent registered public accounting firm, reported in depth to the Committee on the scope and outcome of the annual audit, including their audit of internal controls over financial reporting as required by Section 404 of the US Sarbanes-Oxley Act of 2002. Their reports included accounting matters, governance and control, and accounting developments.
The Committee held independent meetings with the external auditors during the year and reviewed, agreed, discussed and challenged their audit plan, including their assessment of the financial reporting risk profile of the Group. The Committee discussed the views and conclusions of PricewaterhouseCoopers regarding management’s treatment of significant transactions and areas of judgement during the year and PricewaterhouseCoopers confirmed they were satisfied that these had been treated appropriately in the financial statements.
External auditors The Committee is responsible for monitoring the performance, objectivity and independence of the external auditor and recommends the appointment of the external auditor to the Boards. PricewaterhouseCoopers (and prior to the merger of Price Waterhouse and Coopers & Lybrand, Coopers & Lybrand) has been Unilever’s sole auditor since 1987. The last external audit tender was conducted in 2002 and the lead audit partners are rotated every five years. The Dutch lead audit partner will rotate this year. The current UK lead audit partner joined the audit team for the 2011 year end and is due to rotate following the 2015 year end.
Each year, the Committee assesses the effectiveness of the external audit process which includes gaining feedback from key stakeholders at all levels across Unilever. The Committee has considered the tenure, quality and fees of the auditors and determined that a tender for the audit work is not necessary at this time. As a result, the Committee has approved the extension of the current external audit contract by one year, and recommended to the Boards the re-appointment of the external auditors. On the recommendation of the Audit Committee, the Directors will be proposing the re-appointment of PricewaterhouseCoopers at the AGMs in May 2013 (see pages 137 and 143).
Both Unilever and the auditors have for many years had safeguards in place to avoid the possibility that the auditors’ objectivity and independence could be compromised, such as audit partner rotation and the restriction on non-audit services that the external auditors can perform as described below. The Committee reviewed the report from PricewaterhouseCoopers on the actions they take to comply with the professional and regulatory requirements and best practice designed to ensure their independence from Unilever.
The Committee also reviewed the statutory audit, audit related and non-audit related services provided by PricewaterhouseCoopers and compliance with Unilever’s documented approach, which prescribes in detail the types of engagements, listed below, for which the external auditors can be used:• statutory audit services, including audit of subsidiaries;• audit related engagements – services that involve attestation,
assurance or certification of factual information that may be required by external parties;
• non-audit related services – work that our auditors are best placed to undertake, which may include: – tax services – all significant tax work is put to tender; – acquisition and disposal services, including related due
diligence, audits and accountants’ reports; and – internal control reviews.
Several types of engagements are prohibited, including:• bookkeeping or similar services;• systems design and implementation related to financial
information or risk management;• valuation services;• actuarial services;• internal audit; and• staff secondments to a management function.
All audit related engagements over €250,000 and non-audit related engagements over €100,000 required specific advance approval of the Audit Committee Chairman. The Committee further approved all engagements below these levels which have been authorised by the Group Controller. These authorities are reviewed regularly and, where necessary, updated in the light of internal developments, external developments and best practice. Following legislation introduced in the Netherlands with effect from 1 January 2013, we have further reduced the types of engagements for which the external auditors can be used in the Netherlands.
Evaluation of the Audit CommitteeThe Boards evaluated the performance of the Committee and the Committee carried out a self-assessment of its performance, and each have concluded the Committee is performing effectively.
Byron Grote Chairman of the Audit CommitteeCharles GoldenKees Storm
ABOUT UNILEVER GOVERNANCE FINANCIAL STATEMENTS SHAREHOLDER INFORMATION
57Unilever Annual Report and Accounts 2012 Report of the Directors Governance

Terms of referenceThe Corporate Responsibility Committee (previously the Corporate Responsibility and Reputation Committee) oversees Unilever’s conduct as a responsible multinational business. The Committee is also charged with ensuring that Unilever’s reputation is protected and enhanced. A key element of the role is the need to identify any external developments which are likely to have an influence upon Unilever’s standing in society and to bring these to the attention of the Boards.
The Committee comprises three independent Non-Executive Directors: Sir Malcolm Rifkind, Hixonia Nyasulu and Louise Fresco. Sir Malcolm Rifkind chairs the Committee. The Chief Marketing & Communication Officer attends the Committee’s meetings.
The Committee’s discussions are informed by the perspectives of the Group’s two sustainability leadership groups, both of which are chaired by the Chief Marketing & Communication Officer. The first is the Unilever Sustainable Development Group (USDG) – a group of experts from outside the Group who advise Unilever’s senior leadership on its sustainability strategy. The second is the Unilever Sustainable Living Plan Steering Team – the group of Unilever’s senior executives who are accountable for driving sustainable growth. The insights from these groups help to keep the Boards informed of current and emerging trends and any potential risks arising from sustainability issues.
During 2012 the Boards reviewed the names and terms of reference of the Committees. It was agreed that the name of the Corporate Responsibility and Reputation Committee should be shortened to the Corporate Responsibility Committee from 2013. Minor changes were incorporated into its terms of reference. The Committee’s terms of reference and details of the Unilever Sustainable Development Group are available on our website at www.unilever.com/investorrelations/corp_governance and www.unilever.com/sustainable-living/ourapproach/Governance respectively.
MeetingsMeetings are held quarterly and ad hoc as required. The Committee Chairman reports the conclusions to the Boards. Four meetings were held in 2012.
The Committee’s agenda comprises a number of standing items. These include the Code of Business Principles (the Code), litigation and the Unilever Sustainable Living Plan (USLP), as well as occupational safety and product safety and quality. In addition, the Committee reviews further items, such as the corporate risks which fall within its remit and a range of strategic issues. These issues are grouped into a number of themes and reviewed on a regular basis to ensure the Committee stays abreast of current trends.
Code of Business PrinciplesThe Committee is responsible for the oversight of the Code and associated Code Policies which set out the standards of conduct we expect of our employees.
The Committee ensures that the Code and Code Policies remain fit for purpose and are appropriately applied. In this regard it complements the role of the Audit Committee which considers the Code as part of its remit to review risk management.
Sir Malcolm Rifkind 4 / 4Chairman of the Corporate Responsibility Committee
Louise Fresco 4 / 4Hixonia Nyasulu 4 / 4
This table shows the attendance of Directors at Committee meetings for the year ended 31 December 2012. If Directors are unable to attend a meeting, they have the opportunity beforehand to discuss any agenda items with the Committee Chairman. Attendance is expressed as the number of meetings attended out of the number eligible to attend.
• Scrutiny of Unilever’s Code of Business Principles• Monitoring of Unilever’s anti-bribery framework• Review of the Unilever Sustainable Living Plan:
Progress Report 2011• Analysis of Unilever’s safe travel standard
• Compliance with Code of Business Principles by third parties
• Progress on the Unilever Sustainable Living Plan• Product quality
58 Unilever Annual Report and Accounts 2012Report of the Directors Governance
REPORT OF THE CORPORATE RESPONSIBILITY COMMITTEE
ATTENDANCE
COMMITTEE MEMBERS AND ATTENDANCE
HIGHLIGHTS OF 2012
PRIORITIES FOR 2013
The Committee maintains close scrutiny of the mechanisms for compliance with the Code and Code Policies as ongoing compliance is essential to promote and protect Unilever’s values and standards, and hence the good reputation of the Group. At each meeting the Committee reviews detailed statistics on the completion of investigations into non-compliance with the Code and Code Policies. Reporting of these statistics has been improved over the year.
Training is also an ongoing topic of review. Members of the Committee keep abreast of the training provided to employees relating to the Code and the Code Policies. In 2012 online courses on Protecting Information, Respect, Dignity and Fair Treatment and Living the Code were rolled out.
Litigation reviewThe Chief Legal Officer reports to the Committee on litigation and regulatory matters which may have a reputational impact including environmental issues, bribery and corruption compliance and competition law compliance. These matters are then also considered by the full Boards. For further information on ‘legal proceedings’ please see note 20 on page 126.
Unilever Sustainable Living PlanThe Committee monitors progress on Unilever’s Sustainable Living Plan and reviews any potential risks that could affect Unilever’s reputation. Each of its meetings addresses a different element of the USLP.
The USLP is at the heart of Unilever’s vision to double the size of its business while reducing its environmental footprint and increasing its positive social impact.
In the autumn, members of the Committee were pleased to note that Unilever had incorporated sustainability into its Virtuous Circle of Growth model as a succinct way of communicating how sustainability can deliver benefits for the business in terms of growth opportunities, cost savings and risk reduction (see page 9).
Unilever’s first report on the USLP was published in April 2012 (Unilever Sustainable Living Plan: Progress Report 2011). The Committee reviewed the report and plans for its communication.
The Committee also studied a report of Unilever’s activities at Rio+20, the United Nations Conference on Sustainable Development, in June 2012. The purpose of Unilever’s participation in the summit was to raise the profile of the Unilever Sustainable Living Plan, to influence the global sustainability debate and to encourage other businesses and partners to take action on sustainability.
The Committee reviewed research by Unilever on what influences opinion formers’ views of Unilever. This revealed that sustainability is an important driver of reputation for companies in the consumer goods sector and that Unilever is well regarded for its sustainability efforts.
SafetyAn analysis of occupational safety and product safety and quality is included at each meeting. The Committee views these as extremely important topics and continues to advocate that they are allocated high priority by Unilever management. During 2012, Unilever placed particular effort on safe travel, working with Cranfield University and other partners to develop an approach that tackles internal risks as well as collaborating with others to address external risk factors such as road safety blackspots.
Further itemsThe Committee reviewed the processes for managing and identifying reputational risk, particularly the risks arising from the increasing use of social media which means information can be communicated rapidly to a worldwide audience.
Towards the end of the year, the Committee put in place an annual review of issues that are strategically important to Unilever. This allows Committee members to see how the Group is managing the issues and how issues may change in prominence or risk over time. The first review was held early in 2013.
In 2012 a particularly important discussion centred on market regulation that affects the Group’s ability to operate effectively. Compliance with differing regulatory regimes adds complexity and cost to the business. Unilever advocates consistent principles for regulations globally to ensure consumers can enjoy our products safely, sustainably and effectively, whilst allowing Unilever to operate efficiently on a global scale.
Evaluation of the Corporate Responsibility CommitteeThe Boards evaluated the performance of the Committee and the Committee carried out a self-assessment of its performance, and each have concluded the Committee is performing effectively.
Sir Malcolm RifkindChairman of the Corporate Responsibility CommitteeLouise FrescoHixonia Nyasulu
ABOUT UNILEVER GOVERNANCE FINANCIAL STATEMENTS SHAREHOLDER INFORMATION
59Unilever Annual Report and Accounts 2012 Report of the Directors Governance
Role of the CommitteeThe Nominating and Corporate Governance Committee (formerly the Nomination Committee) comprises three Independent Non-Executive Directors and the Chairman. It is chaired by Paul Walsh. The other members are Ann Fudge, Kees Storm and Michael Treschow. The Group Secretary acts as secretary to the Committee.
The Committee is responsible for evaluating the balance of skills, experience, independence and knowledge on the Board and drawing up selection criteria, ongoing succession planning and appointment procedures. Executive and Non-Executive Directors offer themselves for election each year at the Annual General Meetings. The Nominating and Corporate Governance Committee is responsible for recommending candidates for nomination as Executive Directors (including the Chief Executive Officer) and Non-Executive Directors each year based on the process of evaluations referred to below. After Directors have been appointed by shareholders the Committee recommends to the Boards candidates for election as Chairman and Vice-Chairman/Senior Independent Director. During the year the Committee also consulted with the Chief Executive Officer on the selection criteria and appointment procedures for senior management. It also keeps oversight of all matters relating to corporate governance, bringing any issues to the attention of the Boards. The Committee’s Terms of Reference are contained in ‘The Governance of Unilever’ and are also available on our website at www.unilever.com/investorrelations/corp_governance.
Process for the appointment of DirectorsUnilever has formal procedures for the evaluation of the Boards, the Board Committees and the individual Directors. The Chairman, in conjunction with the Vice-Chairman/Senior Independent Director, leads the process whereby the Boards assess their own performance as well as interviews between the Chairman and each of the Directors to discuss individual performance. The results of the evaluations are provided to the Committee when it discusses the nominations for re-election of Directors.
Where a vacancy arises on the Boards, the Committee may seek the services of specialist recruitment firms and other external experts to assist in finding individuals with the appropriate skills and expertise. The Committee reviews candidates presented by the recruitment firm, or recommended by Directors and members of the Unilever Leadership Executive, and all members of the Committee are involved in the interview process before making their recommendations to the full Boards for approval.
In nominating Directors, the Committee follows the agreed Board profile of potential Non-Executive Directors, which takes into account the roles of Non-Executive Directors set out in the Dutch and UK Corporate Governance Codes. The Board profile, contained in ‘The Governance of Unilever’ which can be found on our website at www.unilever.com/investorrelations/corp_governance, includes that the Boards should comprise a majority of Non-Executive Directors who should be independent of Unilever and free from any conflicts of interest. With respect to composition and qualities of the Boards, they should be in keeping with the size of Unilever, its portfolio, culture and geographical spread and its status as a listed company, with the objective pursued by the Boards having a variety of age, gender, expertise, social background and nationality and, wherever possible, the Boards should reflect Unilever’s consumer base and take into account the footprint and strategy of the Group. The Board profile is set out opposite. The Committee also this year set out a profile for Non-Executive Directors appointed as future members of the Audit Committee. This includes experience with financial administration, accounting policies, internal control and risk management of multinationals with share
Paul Walsh 6 / 6Chairman of the Nominating and Corporate Governance Committee
Ann Fudge 6 / 6Kees Storm 6 / 6Michael Treschow 6 / 6
This table shows the attendance of Directors at Committee meetings for the year ended 31 December 2012. If Directors are unable to attend a meeting, they have the opportunity beforehand to discuss any agenda items with the Committee Chairman. Attendance is expressed as the number of meetings attended out of the number eligible to attend.
• Recommendation to the Boards of three potential new Non-Executive Directors
• Focused on Board and Committee succession• Board and Committee performance
evaluation process• Renaming of Board Committees and review
of terms of reference• Reviewed relevant legislative and corporate
governance changes • Reviewed relevant recommendations
on diversity• Response to UK Executive Remuneration
Consultations• Revised standard terms of appointment
for Non-Executive Directors
• Continued focus on Board and Committee succession
• Review induction arrangements for new Non-Executive Directors
60 Unilever Annual Report and Accounts 2012Report of the Directors Governance
REPORT OF THE NOMINATING AND CORPORATE GOVERNANCE COMMITTEE
ATTENDANCE
COMMITTEE MEMBERS AND ATTENDANCE
HIGHLIGHTS OF 2012
PRIORITIES FOR 2013

The Committee revised the standard terms of appointment for Non-Executive Directors. It now contains provisions to promote the success of the company in accordance with the latest requirements of UK and Dutch company law and best practice guidelines and updated language on tenure of appointment, termination and fees. As at the date of the 2013 AGMs, all (re-)appointed Non-Executive Directors will sign up to the revised terms of appointment.
For our internal board evaluation this year, Unilever used Thinking Board, the web-based governance self-assessment service from Independent Audit. This provided an added external perspective when considering our approach and Independent Audit challenged us on the questions used and helped us to analyse the results. Further information on this evaluation can be found on pages 47 and 48, the results of which were discussed at the December 2012 Board Meetings. During 2012 the Chairman followed-up with the external consultant who carried out our 2011 Board evaluation, on the recommendations from the evaluation, and the conclusions were that the actions identified had been progressed efficiently.
The Boards evaluated the performance of the Committee and the Committee carried out a self-assessment of its performance, and each has concluded the Committee is performing effectively.
Paul Walsh Chairman of the Nominating and Corporate Governance CommitteeAnn FudgeKees StormMichael Treschow
Profile of Unilever’s Boards of Directors
Desired expertise and experienceIn view of Unilever’s objectives and activities, it is important that the Boards have sufficient financial literacy, have at least one financial expert and are composed in such a way that the following expertise and experience are present in one or more of its members:• Executive management experience and knowledge of
corporate governance issues at main board level with a company comparable in size and international spread of activities with multiple stock exchange listings;
• Understanding of human resources and remuneration in large international companies;
• Experience with financial administration, accounting policies and internal control;
• Risk management of multinationals with share listings;• Understanding of the markets where Unilever is active;• Experience in and understanding of the fast moving
consumer goods (FMCG) market;• Knowledge of marketing and commercial expertise;• Awareness of corporate social responsibility issues; and• Experience with R&D in those fields where Unilever
is active.
ProfileThis profile guides the Nominating and Corporate Governance Committee and the Boards on the occasion of the nomination of Directors. It is reviewed and updated by the Boards periodically.
listings and up-to-date knowledge of financial regulations, perhaps through having been a CFO.
It is recognised that Executive Directors may be invited to become a Non-Executive Director of another company and that such an appointment, subject to the approval of the Chairman and where relevant the Chief Executive Officer, may broaden the knowledge and experience to the benefit of the Group (see page 42 for details in the biographies). In May 2012 Jean-Marc Huët was appointed as a non-executive director of Delta Topco Limited, a directorship which the Chairman approved because it would further benefit the Boards’ knowledge and experience.
Activities of the Committee during the yearThe Committee met six times in 2012. All Committee members attended the meetings they were eligible to attend. Other attendees at Committee meetings (or part thereof) were the Chief Executive Officer, the Chief HR Officer and the Group Secretary.
The Committee proposed the nomination of all Directors offering themselves for re-election at the 2012 AGMs in May 2012.
Following recommendations from the Committee, it was announced in December 2012 that the Boards will propose to shareholders the nominations of Laura Cha, Mary Ma and John Rishton as Non-Executive Directors at the 2013 AGMs. These three candidates were chosen because they are all distinguished in their fields. They will bring knowledge and understanding of emerging markets, a prime driver of Unilever’s growth, and further strengthen the financial expertise of the Boards, which will add considerably to the business. In making these appointments the Nominating and Corporate Governance Committee was supported by an independent executive search firm, Russell Reynolds Associates, chosen by the Committee and which had been engaged to identify suitable candidates for the roles required. The Committee has approved an extensive induction programme for the three candidates which involves meeting with all members of the ULE and other relevant senior managers to obtain a thorough understanding of the business.
The Committee undertook a review of the terms of reference of the Board Committees with a view to changing the names and scope of the current Committees, with reference to Dutch, UK and US best practice, whilst ensuring compliance with respective guidelines. The changes were approved by the Board and as a result the Committee will now be called the ‘Nominating and Corporate Governance Committee’.
The Board recognises the benefits of diversity throughout the Group, including gender balance. The Committee reviewed and considered relevant recommendations on diversity and is pleased that we already have 25% female representation on the Boards and that two female Non-Executive Directors are nominated for election at the 2013 AGMs. However, Unilever feels that gender is only one part of diversity, and Unilever Directors will continue to be selected on the basis of their wide-ranging experience, backgrounds, skills, knowledge and insight.
The Committee reviewed and discussed the proposals for executive directors sitting on remuneration committees. The Committee ensured that this was included in the ongoing debate through the CBI employers’ association and through the General Counsel 100 network. The Committee also discussed and approved a response submitted by the Chairman to the UK Department of Business, Innovation and Skills (BIS) consultation on shareholder voting rights.
ABOUT UNILEVER GOVERNANCE FINANCIAL STATEMENTS SHAREHOLDER INFORMATION
61Unilever Annual Report and Accounts 2012 Report of the Directors Governance

Dear shareholders,
Our new look Directors’ Remuneration ReportI am pleased to present our Directors’ Remuneration Report (Report) for the 2012 financial year. At Unilever one of our aims is to be a market leader in the field of corporate governance. We have therefore reviewed the format and layout of our 2012 Directors’ Remuneration Report with the aim of making it clearer and easier to understand for shareholders while still providing a high standard of information. We have also taken steps to take account, as far as practicable, of the draft revised remuneration reporting regulations provided by the Department of Business, Innovation and Skills (BIS) in the UK.
In order to ensure that we were meeting our aims of simplicity and transparency we consulted our largest shareholders in the UK and the Netherlands and their feedback has been instrumental in shaping this Report.
No changes to our remuneration policyWe have made no changes to our remuneration policy in 2012. The Committee has continued to monitor the structure and operation of our executive pay arrangements, including having regular dialogue with our largest shareholders, to ensure that they remain appropriate and continue to incentivise executives to deliver the business strategy. In last year’s Report, we noted that we would be reviewing the performance metrics for our long-term incentive plans to ensure that they support the delivery of a long-term sustainable business. The Committee has decided to make no changes to performance metrics at this stage but plans to continue to review long-term performance metrics during 2013.
2012 reward outcomesUnilever has made strong progress this year towards its vision of doubling in size while reducing its environmental footprint and increasing its positive social impact. The business has delivered outstanding underlying sales and volume growth, particularly in emerging markets, while continuing to improve its core operating margin. Diluted earnings per share increased by 5% in 2012 to €1.54 with core earnings per share increasing by 11% to €1.57. During the year we also made strong progress against our Unilever Sustainable Living Plan (USLP) goals, further embedding the purpose of sustainable living across the business.
In view of this financial success, the quality of performance and their personal contribution, the Committee decided that it was appropriate to award a maximum bonus of 200% of base salary to the CEO (100% of maximum) and a bonus of 147% of base salary to the CFO (98% of maximum). The Committee also assessed three-year performance against 2010 Global Share Incentive Plan (GSIP) targets and determined that awards should vest at 109% of target opportunity (54.5% of maximum).
The CEO’s salary will be increased by 3.6% with effect from 1 January 2013 which is below the average increase in the Unilever Group and the CFO’s salary remains unchanged for 2013.
Paul Walsh Chairman of the Compensation and Management Resources Committee
Paul Walsh 7 / 7Chairman of the Compensation and Management Resources Committee
Ann Fudge 6 / 7Kees Storm 6 / 7Michael Treschow 7 / 7
This table shows the attendance of Directors at Committee meetings for the year ended 31 December 2012. If Directors are unable to attend a meeting, they have the opportunity beforehand to discuss any agenda items with the Committee Chairman. Attendance is expressed as the number of meetings attended out of the number eligible to attend.
• No changes have been made to the remuneration policy during the year
• We have reviewed and amended the structure of our Directors’ Remuneration Report to make it clearer and more transparent for shareholders
• Review of the remuneration policy, and in particular the performance metrics for the long-term incentive arrangements, to ensure that it remains aligned with Unilever’s short- and long-term strategy
• Consider the introduction of an all-employee share scheme
62 Unilever Annual Report and Accounts 2012Report of the Directors Governance
DIRECTORS’ REMUNERATION REPORT
COMMITTEE MEMBERS AND ATTENDANCE
HIGHLIGHTS OF 2012
PRIORITIES FOR 2013
ATTENDANCE
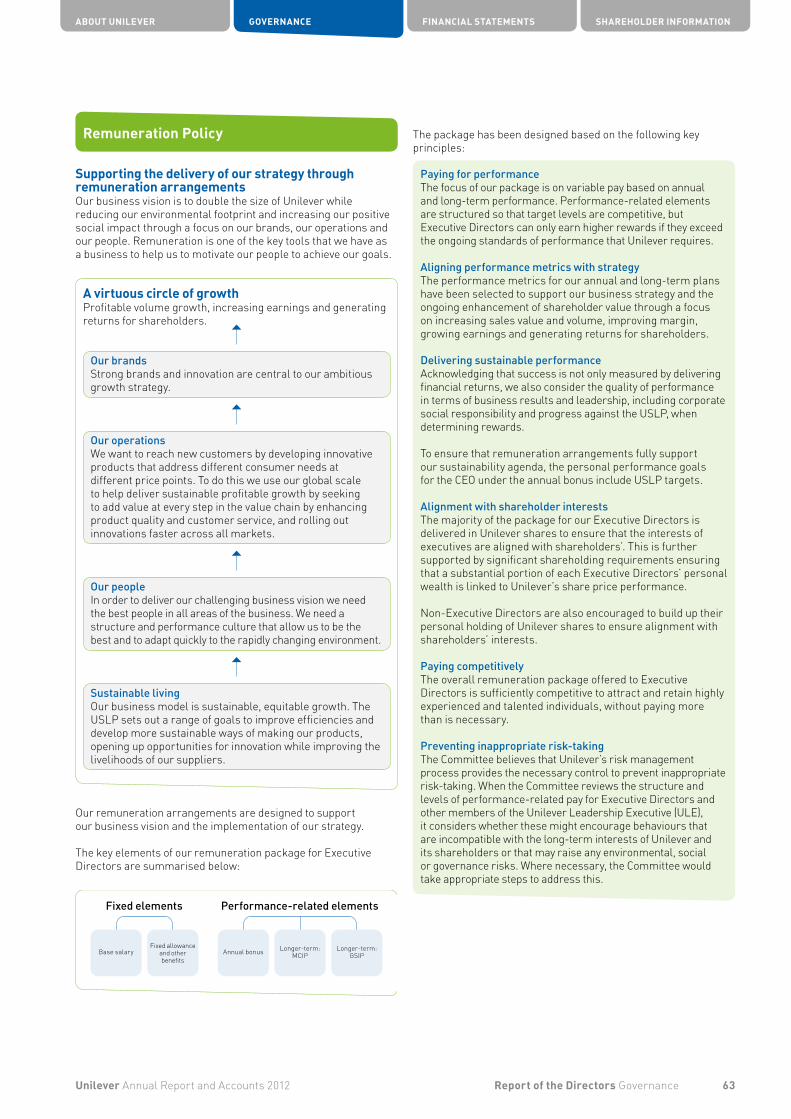
Remuneration Policy
Supporting the delivery of our strategy through remuneration arrangementsOur business vision is to double the size of Unilever while reducing our environmental footprint and increasing our positive social impact through a focus on our brands, our operations and our people. Remuneration is one of the key tools that we have as a business to help us to motivate our people to achieve our goals.
A virtuous circle of growthProfitable volume growth, increasing earnings and generating returns for shareholders.
Our brandsStrong brands and innovation are central to our ambitious growth strategy.
Our operationsWe want to reach new customers by developing innovative products that address different consumer needs at different price points. To do this we use our global scale to help deliver sustainable profitable growth by seeking to add value at every step in the value chain by enhancing product quality and customer service, and rolling out innovations faster across all markets.
Our peopleIn order to deliver our challenging business vision we need the best people in all areas of the business. We need a structure and performance culture that allow us to be the best and to adapt quickly to the rapidly changing environment.
Sustainable livingOur business model is sustainable, equitable growth. The USLP sets out a range of goals to improve efficiencies and develop more sustainable ways of making our products, opening up opportunities for innovation while improving the livelihoods of our suppliers.
Our remuneration arrangements are designed to support our business vision and the implementation of our strategy.
The key elements of our remuneration package for Executive Directors are summarised below:
The package has been designed based on the following key principles:
Paying for performanceThe focus of our package is on variable pay based on annual and long-term performance. Performance-related elements are structured so that target levels are competitive, but Executive Directors can only earn higher rewards if they exceed the ongoing standards of performance that Unilever requires.
Aligning performance metrics with strategyThe performance metrics for our annual and long-term plans have been selected to support our business strategy and the ongoing enhancement of shareholder value through a focus on increasing sales value and volume, improving margin, growing earnings and generating returns for shareholders.
Delivering sustainable performanceAcknowledging that success is not only measured by delivering financial returns, we also consider the quality of performance in terms of business results and leadership, including corporate social responsibility and progress against the USLP, when determining rewards.
To ensure that remuneration arrangements fully support our sustainability agenda, the personal performance goals for the CEO under the annual bonus include USLP targets.
Alignment with shareholder interestsThe majority of the package for our Executive Directors is delivered in Unilever shares to ensure that the interests of executives are aligned with shareholders’. This is further supported by significant shareholding requirements ensuring that a substantial portion of each Executive Directors’ personal wealth is linked to Unilever’s share price performance.
Non-Executive Directors are also encouraged to build up their personal holding of Unilever shares to ensure alignment with shareholders’ interests.
Paying competitivelyThe overall remuneration package offered to Executive Directors is sufficiently competitive to attract and retain highly experienced and talented individuals, without paying more than is necessary.
Preventing inappropriate risk-takingThe Committee believes that Unilever’s risk management process provides the necessary control to prevent inappropriate risk-taking. When the Committee reviews the structure and levels of performance-related pay for Executive Directors and other members of the Unilever Leadership Executive (ULE), it considers whether these might encourage behaviours that are incompatible with the long-term interests of Unilever and its shareholders or that may raise any environmental, social or governance risks. Where necessary, the Committee would take appropriate steps to address this.
ABOUT UNILEVER GOVERNANCE FINANCIAL STATEMENTS SHAREHOLDER INFORMATION
63Unilever Annual Report and Accounts 2012 Report of the Directors Governance
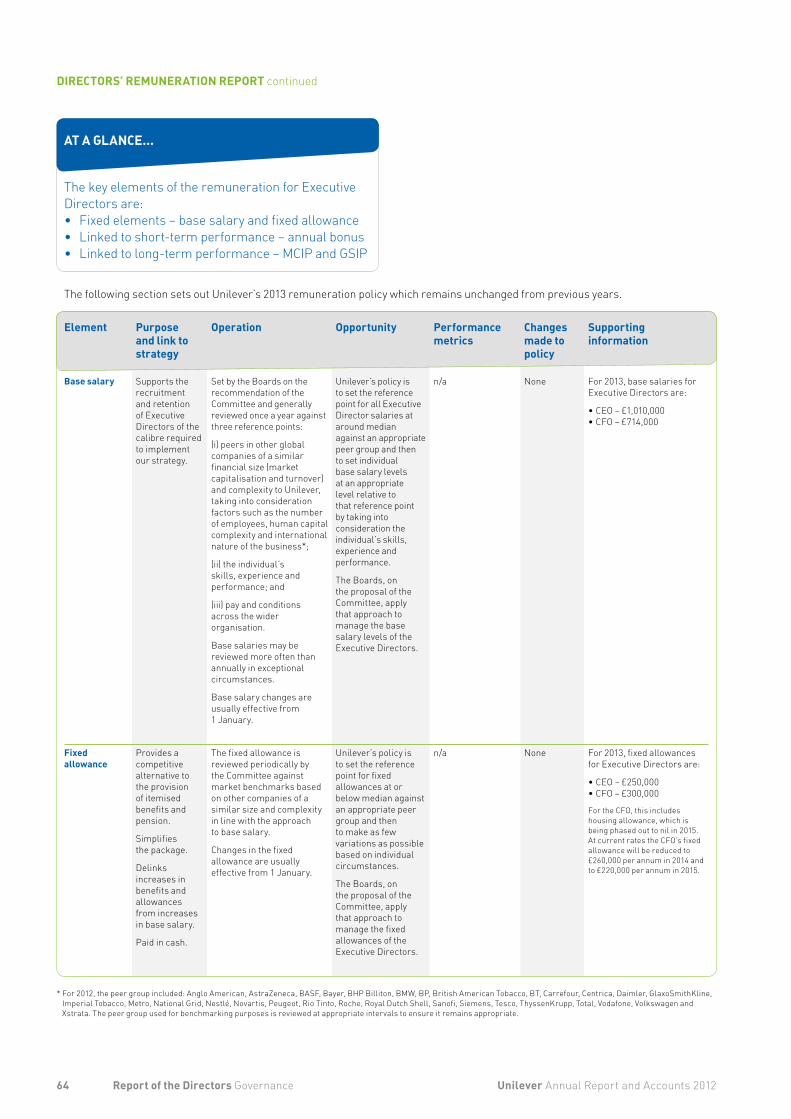
The key elements of the remuneration for Executive Directors are:• Fixed elements – base salary and fixed allowance• Linked to short-term performance – annual bonus• Linked to long-term performance – MCIP and GSIP
The following section sets out Unilever’s 2013 remuneration policy which remains unchanged from previous years.
Base salary Supports the recruitment and retention of Executive Directors of the calibre required to implement our strategy.
Set by the Boards on the recommendation of the Committee and generally reviewed once a year against three reference points:
(i) peers in other global companies of a similar financial size (market capitalisation and turnover) and complexity to Unilever, taking into consideration factors such as the number of employees, human capital complexity and international nature of the business*;
(ii) the individual’s skills, experience and performance; and
(iii) pay and conditions across the wider organisation.
Base salaries may be reviewed more often than annually in exceptional circumstances.
Base salary changes are usually effective from 1 January.
Unilever’s policy is to set the reference point for all Executive Director salaries at around median against an appropriate peer group and then to set individual base salary levels at an appropriate level relative to that reference point by taking into consideration the individual’s skills, experience and performance.
The Boards, on the proposal of the Committee, apply that approach to manage the base salary levels of the Executive Directors.
n/a None For 2013, base salaries for Executive Directors are:
•CEO – £1,010,000•CFO – £714,000
Fixed allowance
Provides a competitive alternative to the provision of itemised benefits and pension.
Simplifies the package.
Delinks increases in benefits and allowances from increases in base salary.
Paid in cash.
The fixed allowance is reviewed periodically by the Committee against market benchmarks based on other companies of a similar size and complexity in line with the approach to base salary.
Changes in the fixed allowance are usually effective from 1 January.
Unilever’s policy is to set the reference point for fixed allowances at or below median against an appropriate peer group and then to make as few variations as possible based on individual circumstances.
The Boards, on the proposal of the Committee, apply that approach to manage the fixed allowances of the Executive Directors.
n/a None For 2013, fixed allowances for Executive Directors are:
•CEO – £250,000•CFO – £300,000
For the CFO, this includes housing allowance, which is being phased out to nil in 2015. At current rates the CFO’s fixed allowance will be reduced to £260,000 per annum in 2014 and to £220,000 per annum in 2015.
* For 2012, the peer group included: Anglo American, AstraZeneca, BASF, Bayer, BHP Billiton, BMW, BP, British American Tobacco, BT, Carrefour, Centrica, Daimler, GlaxoSmithKline, Imperial Tobacco, Metro, National Grid, Nestlé, Novartis, Peugeot, Rio Tinto, Roche, Royal Dutch Shell, Sanofi, Siemens, Tesco, ThyssenKrupp, Total, Vodafone, Volkswagen and Xstrata. The peer group used for benchmarking purposes is reviewed at appropriate intervals to ensure it remains appropriate.
64 Unilever Annual Report and Accounts 2012Report of the Directors Governance
DIRECTORS’ REMUNERATION REPORT continued
AT A GLANCE...
Element Purpose and link to strategy
Operation Opportunity Performance metrics
Changes made to policy
Supporting information
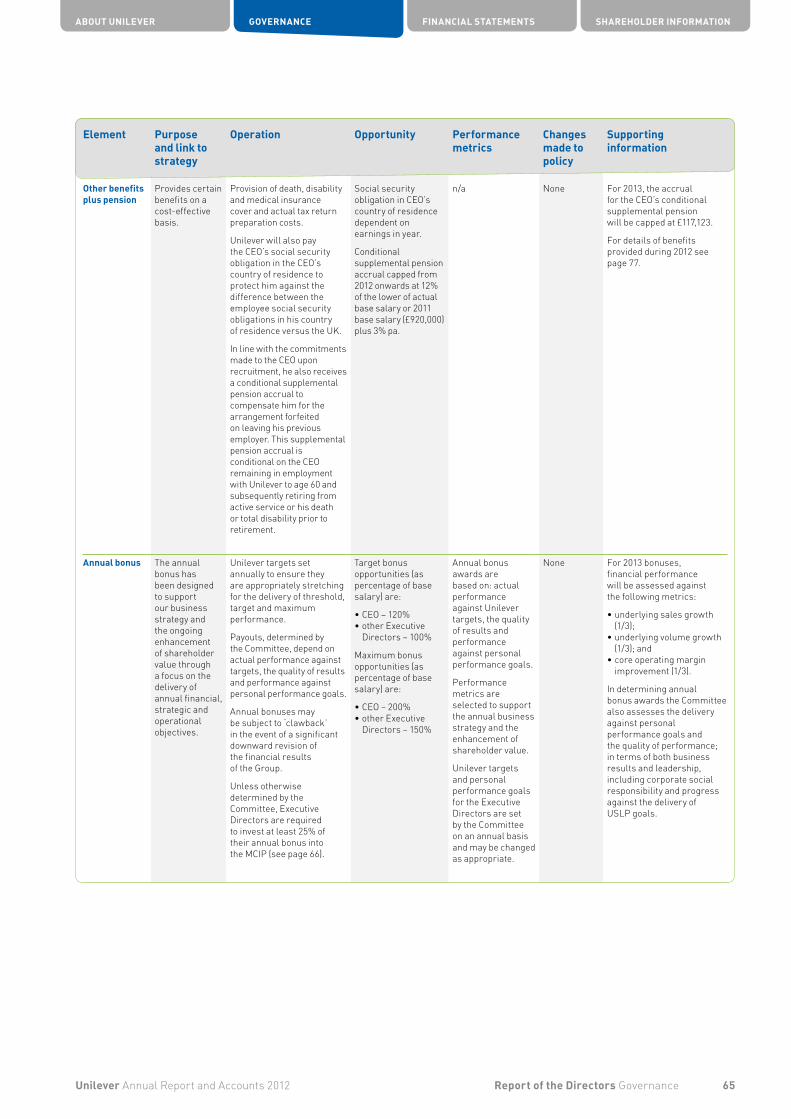
Other benefits plus pension
Provides certain benefits on a cost-effective basis.
Provision of death, disability and medical insurance cover and actual tax return preparation costs.
Unilever will also pay the CEO’s social security obligation in the CEO’s country of residence to protect him against the difference between the employee social security obligations in his country of residence versus the UK.
In line with the commitments made to the CEO upon recruitment, he also receives a conditional supplemental pension accrual to compensate him for the arrangement forfeited on leaving his previous employer. This supplemental pension accrual is conditional on the CEO remaining in employment with Unilever to age 60 and subsequently retiring from active service or his death or total disability prior to retirement.
Social security obligation in CEO’s country of residence dependent on earnings in year.
Conditional supplemental pension accrual capped from 2012 onwards at 12% of the lower of actual base salary or 2011 base salary (£920,000) plus 3% pa.
n/a None For 2013, the accrual for the CEO’s conditional supplemental pension will be capped at £117,123.
For details of benefits provided during 2012 see page 77.
Annual bonus The annual bonus has been designed to support our business strategy and the ongoing enhancement of shareholder value through a focus on the delivery of annual financial, strategic and operational objectives.
Unilever targets set annually to ensure they are appropriately stretching for the delivery of threshold, target and maximum performance.
Payouts, determined by the Committee, depend on actual performance against targets, the quality of results and performance against personal performance goals.
Annual bonuses may be subject to ‘clawback’ in the event of a significant downward revision of the financial results of the Group.
Unless otherwise determined by the Committee, Executive Directors are required to invest at least 25% of their annual bonus into the MCIP (see page 66).
Target bonus opportunities (as percentage of base salary) are:
•CEO – 120%•other Executive
Directors – 100%
Maximum bonus opportunities (as percentage of base salary) are:
•CEO – 200%•other Executive
Directors – 150%
Annual bonus awards are based on: actual performance against Unilever targets, the quality of results and performance against personal performance goals.
Performance metrics are selected to support the annual business strategy and the enhancement of shareholder value.
Unilever targets and personal performance goals for the Executive Directors are set by the Committee on an annual basis and may be changed as appropriate.
None For 2013 bonuses, financial performance will be assessed against the following metrics:
•underlying sales growth (1/3);
•underlying volume growth (1/3); and
•core operating margin improvement (1/3).
In determining annual bonus awards the Committee also assesses the delivery against personal performance goals and the quality of performance; in terms of both business results and leadership, including corporate social responsibility and progress against the delivery of USLP goals.
ABOUT UNILEVER GOVERNANCE FINANCIAL STATEMENTS SHAREHOLDER INFORMATION
65Unilever Annual Report and Accounts 2012 Report of the Directors Governance
Element Purpose and link to strategy
Operation Opportunity Performance metrics
Changes made to policy
Supporting information
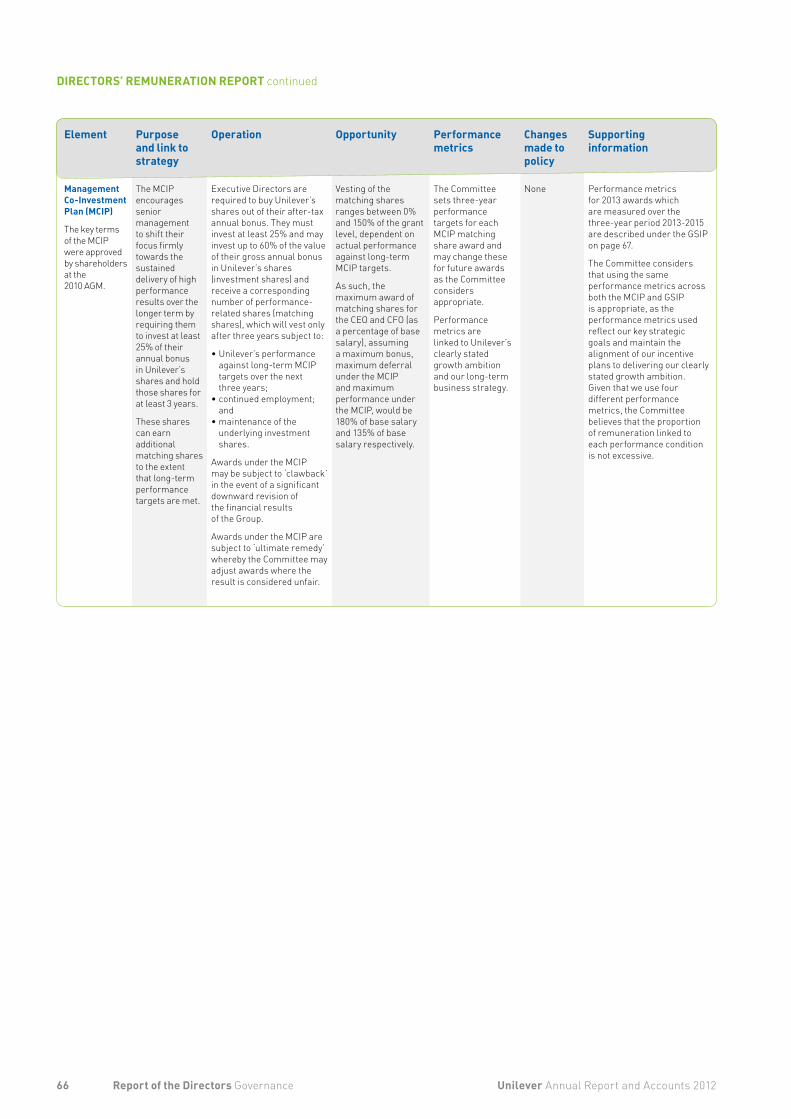
Management Co-Investment Plan (MCIP)
The key terms of the MCIP were approved by shareholders at the 2010 AGM.
The MCIP encourages senior management to shift their focus firmly towards the sustained delivery of high performance results over the longer term by requiring them to invest at least 25% of their annual bonus in Unilever’s shares and hold those shares for at least 3 years.
These shares can earn additional matching shares to the extent that long-term performance targets are met.
Executive Directors are required to buy Unilever’s shares out of their after-tax annual bonus. They must invest at least 25% and may invest up to 60% of the value of their gross annual bonus in Unilever’s shares (investment shares) and receive a corresponding number of performance-related shares (matching shares), which will vest only after three years subject to:
•Unilever’s performance against long-term MCIP targets over the next three years;
•continued employment; and
•maintenance of the underlying investment shares.
Awards under the MCIP may be subject to ‘clawback’ in the event of a significant downward revision of the financial results of the Group.
Awards under the MCIP are subject to ‘ultimate remedy’ whereby the Committee may adjust awards where the result is considered unfair.
Vesting of the matching shares ranges between 0% and 150% of the grant level, dependent on actual performance against long-term MCIP targets.
As such, the maximum award of matching shares for the CEO and CFO (as a percentage of base salary), assuming a maximum bonus, maximum deferral under the MCIP and maximum performance under the MCIP, would be 180% of base salary and 135% of base salary respectively.
The Committee sets three-year performance targets for each MCIP matching share award and may change these for future awards as the Committee considers appropriate.
Performance metrics are linked to Unilever’s clearly stated growth ambition and our long-term business strategy.
None Performance metrics for 2013 awards which are measured over the three-year period 2013-2015 are described under the GSIP on page 67.
The Committee considers that using the same performance metrics across both the MCIP and GSIP is appropriate, as the performance metrics used reflect our key strategic goals and maintain the alignment of our incentive plans to delivering our clearly stated growth ambition. Given that we use four different performance metrics, the Committee believes that the proportion of remuneration linked to each performance condition is not excessive.
66 Unilever Annual Report and Accounts 2012Report of the Directors Governance
DIRECTORS’ REMUNERATION REPORT continued
Element Purpose and link to strategy
Operation Opportunity Performance metrics
Changes made to policy
Supporting information
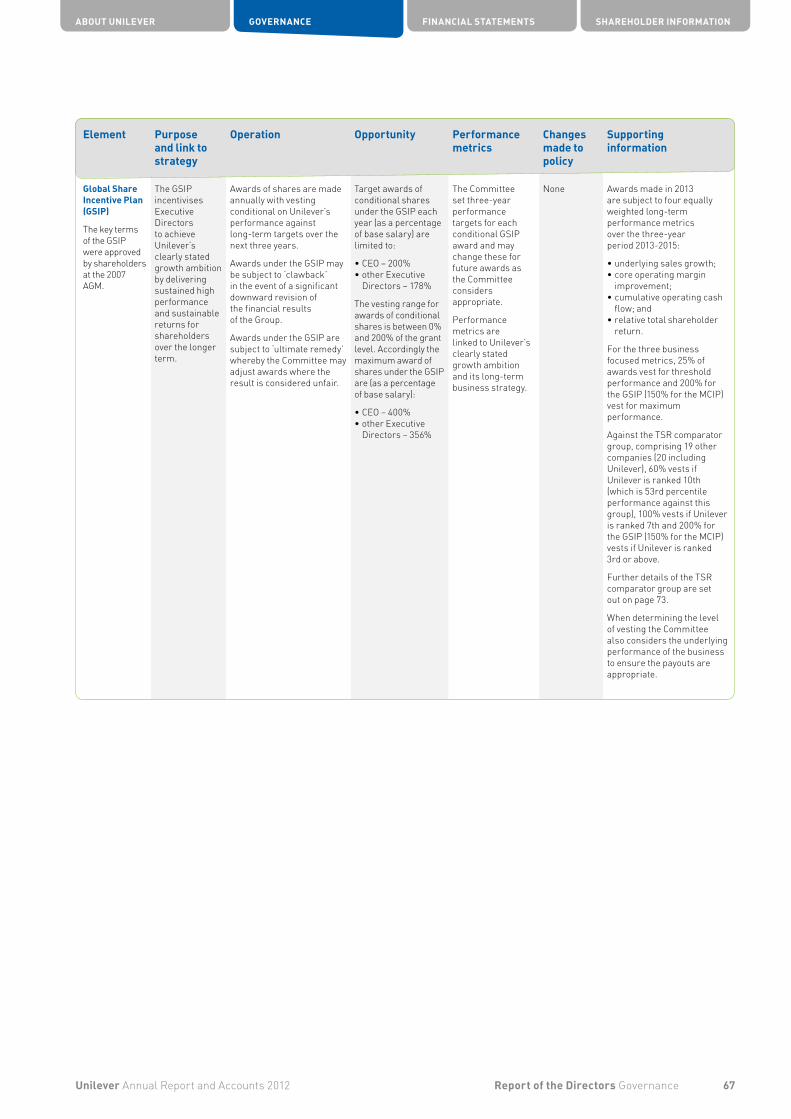
Global Share Incentive Plan (GSIP)
The key terms of the GSIP were approved by shareholders at the 2007 AGM.
The GSIP incentivises Executive Directors to achieve Unilever’s clearly stated growth ambition by delivering sustained high performance and sustainable returns for shareholders over the longer term.
Awards of shares are made annually with vesting conditional on Unilever’s performance against long-term targets over the next three years.
Awards under the GSIP may be subject to ‘clawback’ in the event of a significant downward revision of the financial results of the Group.
Awards under the GSIP are subject to ‘ultimate remedy’ whereby the Committee may adjust awards where the result is considered unfair.
Target awards of conditional shares under the GSIP each year (as a percentage of base salary) are limited to:
•CEO – 200%•other Executive
Directors – 178%
The vesting range for awards of conditional shares is between 0% and 200% of the grant level. Accordingly the maximum award of shares under the GSIP are (as a percentage of base salary):
•CEO – 400%•other Executive
Directors – 356%
The Committee set three-year performance targets for each conditional GSIP award and may change these for future awards as the Committee considers appropriate.
Performance metrics are linked to Unilever’s clearly stated growth ambition and its long-term business strategy.
None Awards made in 2013 are subject to four equally weighted long-term performance metrics over the three-year period 2013-2015:
•underlying sales growth;•core operating margin
improvement;•cumulative operating cash
flow; and•relative total shareholder
return.
For the three business focused metrics, 25% of awards vest for threshold performance and 200% for the GSIP (150% for the MCIP) vest for maximum performance.
Against the TSR comparator group, comprising 19 other companies (20 including Unilever), 60% vests if Unilever is ranked 10th (which is 53rd percentile performance against this group), 100% vests if Unilever is ranked 7th and 200% for the GSIP (150% for the MCIP) vests if Unilever is ranked 3rd or above.
Further details of the TSR comparator group are set out on page 73.
When determining the level of vesting the Committee also considers the underlying performance of the business to ensure the payouts are appropriate.
ABOUT UNILEVER GOVERNANCE FINANCIAL STATEMENTS SHAREHOLDER INFORMATION
67Unilever Annual Report and Accounts 2012 Report of the Directors Governance
Element Purpose and link to strategy
Operation Opportunity Performance metrics
Changes made to policy
Supporting information
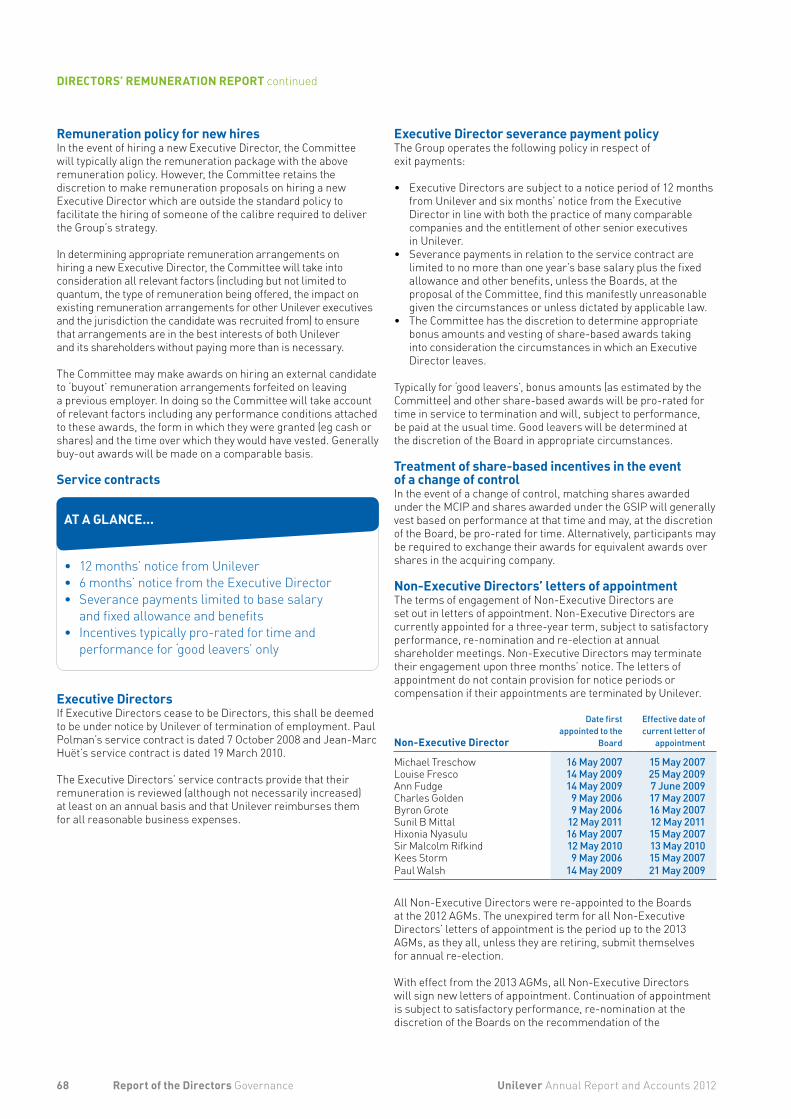
Remuneration policy for new hiresIn the event of hiring a new Executive Director, the Committee will typically align the remuneration package with the above remuneration policy. However, the Committee retains the discretion to make remuneration proposals on hiring a new Executive Director which are outside the standard policy to facilitate the hiring of someone of the calibre required to deliver the Group’s strategy.
In determining appropriate remuneration arrangements on hiring a new Executive Director, the Committee will take into consideration all relevant factors (including but not limited to quantum, the type of remuneration being offered, the impact on existing remuneration arrangements for other Unilever executives and the jurisdiction the candidate was recruited from) to ensure that arrangements are in the best interests of both Unilever and its shareholders without paying more than is necessary.
The Committee may make awards on hiring an external candidate to ‘buyout’ remuneration arrangements forfeited on leaving a previous employer. In doing so the Committee will take account of relevant factors including any performance conditions attached to these awards, the form in which they were granted (eg cash or shares) and the time over which they would have vested. Generally buy-out awards will be made on a comparable basis.
Service contracts
• 12 months’ notice from Unilever• 6 months’ notice from the Executive Director• Severance payments limited to base salary
and fixed allowance and benefits• Incentives typically pro-rated for time and
performance for ‘good leavers’ only
Executive Director severance payment policy The Group operates the following policy in respect of exit payments:
• Executive Directors are subject to a notice period of 12 months from Unilever and six months’ notice from the Executive Director in line with both the practice of many comparable companies and the entitlement of other senior executives in Unilever.
• Severance payments in relation to the service contract are limited to no more than one year’s base salary plus the fixed allowance and other benefits, unless the Boards, at the proposal of the Committee, find this manifestly unreasonable given the circumstances or unless dictated by applicable law.
• The Committee has the discretion to determine appropriate bonus amounts and vesting of share-based awards taking into consideration the circumstances in which an Executive Director leaves.
Typically for ‘good leavers’, bonus amounts (as estimated by the Committee) and other share-based awards will be pro-rated for time in service to termination and will, subject to performance, be paid at the usual time. Good leavers will be determined at the discretion of the Board in appropriate circumstances.
Treatment of share-based incentives in the event of a change of controlIn the event of a change of control, matching shares awarded under the MCIP and shares awarded under the GSIP will generally vest based on performance at that time and may, at the discretion of the Board, be pro-rated for time. Alternatively, participants may be required to exchange their awards for equivalent awards over shares in the acquiring company.
Non-Executive Directors’ letters of appointmentThe terms of engagement of Non-Executive Directors are set out in letters of appointment. Non-Executive Directors are currently appointed for a three-year term, subject to satisfactory performance, re-nomination and re-election at annual shareholder meetings. Non-Executive Directors may terminate their engagement upon three months’ notice. The letters of appointment do not contain provision for notice periods or compensation if their appointments are terminated by Unilever.
Non-Executive Director
Date first appointed to the
Board
Effective date of current letter of
appointment
Michael Treschow 16 May 2007 15 May 2007Louise Fresco 14 May 2009 25 May 2009Ann Fudge 14 May 2009 7 June 2009Charles Golden 9 May 2006 17 May 2007Byron Grote 9 May 2006 16 May 2007Sunil B Mittal 12 May 2011 12 May 2011Hixonia Nyasulu 16 May 2007 15 May 2007Sir Malcolm Rifkind 12 May 2010 13 May 2010Kees Storm 9 May 2006 15 May 2007Paul Walsh 14 May 2009 21 May 2009
All Non-Executive Directors were re-appointed to the Boards at the 2012 AGMs. The unexpired term for all Non-Executive Directors’ letters of appointment is the period up to the 2013 AGMs, as they all, unless they are retiring, submit themselves for annual re-election.
With effect from the 2013 AGMs, all Non-Executive Directors will sign new letters of appointment. Continuation of appointment is subject to satisfactory performance, re-nomination at the discretion of the Boards on the recommendation of the
Executive DirectorsIf Executive Directors cease to be Directors, this shall be deemed to be under notice by Unilever of termination of employment. Paul Polman’s service contract is dated 7 October 2008 and Jean-Marc Huët’s service contract is dated 19 March 2010.
The Executive Directors’ service contracts provide that their remuneration is reviewed (although not necessarily increased) at least on an annual basis and that Unilever reimburses them for all reasonable business expenses.
68 Unilever Annual Report and Accounts 2012Report of the Directors Governance
DIRECTORS’ REMUNERATION REPORT continued
AT A GLANCE...
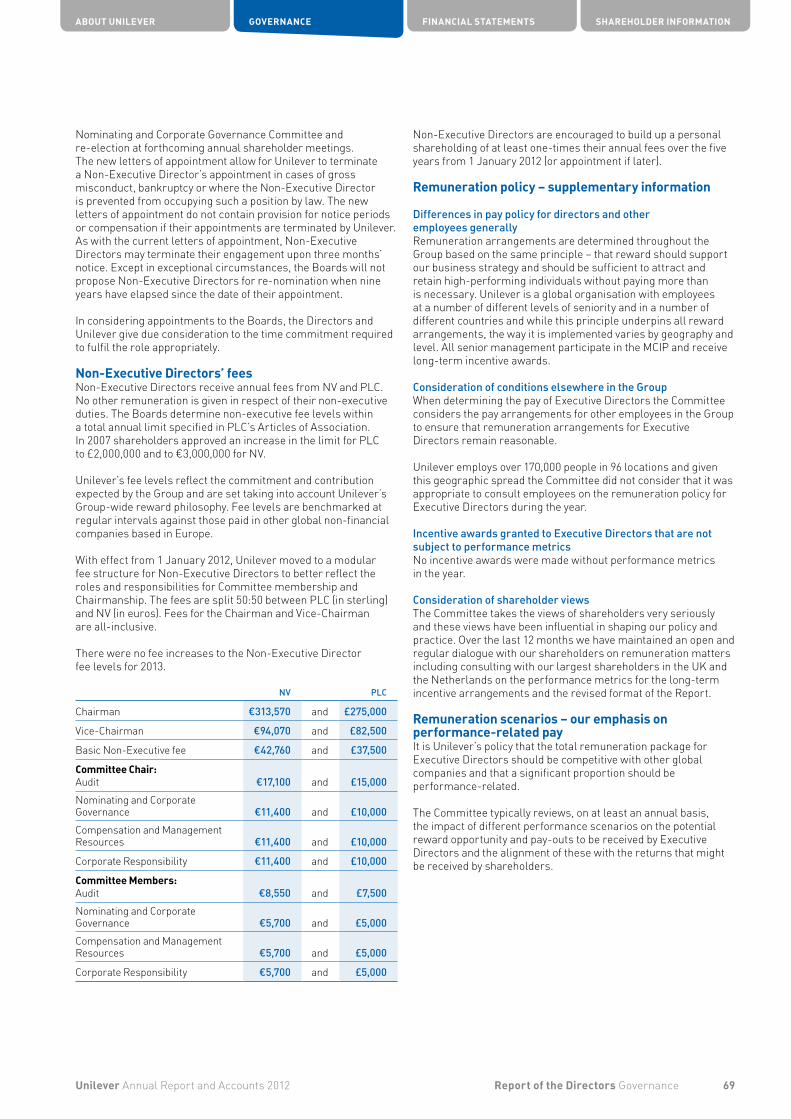
Nominating and Corporate Governance Committee and re-election at forthcoming annual shareholder meetings. The new letters of appointment allow for Unilever to terminate a Non-Executive Director’s appointment in cases of gross misconduct, bankruptcy or where the Non-Executive Director is prevented from occupying such a position by law. The new letters of appointment do not contain provision for notice periods or compensation if their appointments are terminated by Unilever. As with the current letters of appointment, Non-Executive Directors may terminate their engagement upon three months’ notice. Except in exceptional circumstances, the Boards will not propose Non-Executive Directors for re-nomination when nine years have elapsed since the date of their appointment.
In considering appointments to the Boards, the Directors and Unilever give due consideration to the time commitment required to fulfil the role appropriately.
Non-Executive Directors’ feesNon-Executive Directors receive annual fees from NV and PLC. No other remuneration is given in respect of their non-executive duties. The Boards determine non-executive fee levels within a total annual limit specified in PLC’s Articles of Association. In 2007 shareholders approved an increase in the limit for PLC to £2,000,000 and to €3,000,000 for NV.
Unilever’s fee levels reflect the commitment and contribution expected by the Group and are set taking into account Unilever’s Group-wide reward philosophy. Fee levels are benchmarked at regular intervals against those paid in other global non-financial companies based in Europe.
With effect from 1 January 2012, Unilever moved to a modular fee structure for Non-Executive Directors to better reflect the roles and responsibilities for Committee membership and Chairmanship. The fees are split 50:50 between PLC (in sterling) and NV (in euros). Fees for the Chairman and Vice-Chairman are all-inclusive.
There were no fee increases to the Non-Executive Director fee levels for 2013.
NV PLC
Chairman €313,570 and £275,000
Vice-Chairman €94,070 and £82,500
Basic Non-Executive fee €42,760 and £37,500
Committee Chair:Audit €17,100 and £15,000Nominating and CorporateGovernance €11,400 and £10,000Compensation and ManagementResources €11,400 and £10,000
Corporate Responsibility €11,400 and £10,000
Committee Members:Audit €8,550 and £7,500Nominating and CorporateGovernance €5,700 and £5,000Compensation and ManagementResources €5,700 and £5,000
Corporate Responsibility €5,700 and £5,000
Non-Executive Directors are encouraged to build up a personal shareholding of at least one-times their annual fees over the five years from 1 January 2012 (or appointment if later).
Remuneration policy – supplementary information
Differences in pay policy for directors and other employees generallyRemuneration arrangements are determined throughout the Group based on the same principle – that reward should support our business strategy and should be sufficient to attract and retain high-performing individuals without paying more than is necessary. Unilever is a global organisation with employees at a number of different levels of seniority and in a number of different countries and while this principle underpins all reward arrangements, the way it is implemented varies by geography and level. All senior management participate in the MCIP and receive long-term incentive awards.
Consideration of conditions elsewhere in the GroupWhen determining the pay of Executive Directors the Committee considers the pay arrangements for other employees in the Group to ensure that remuneration arrangements for Executive Directors remain reasonable.
Unilever employs over 170,000 people in 96 locations and given this geographic spread the Committee did not consider that it was appropriate to consult employees on the remuneration policy for Executive Directors during the year.
Incentive awards granted to Executive Directors that are not subject to performance metrics No incentive awards were made without performance metrics in the year.
Consideration of shareholder viewsThe Committee takes the views of shareholders very seriously and these views have been influential in shaping our policy and practice. Over the last 12 months we have maintained an open and regular dialogue with our shareholders on remuneration matters including consulting with our largest shareholders in the UK and the Netherlands on the performance metrics for the long-term incentive arrangements and the revised format of the Report.
Remuneration scenarios – our emphasis on performance-related payIt is Unilever’s policy that the total remuneration package for Executive Directors should be competitive with other global companies and that a significant proportion should be performance-related.
The Committee typically reviews, on at least an annual basis, the impact of different performance scenarios on the potential reward opportunity and pay-outs to be received by Executive Directors and the alignment of these with the returns that might be received by shareholders.
ABOUT UNILEVER GOVERNANCE FINANCIAL STATEMENTS SHAREHOLDER INFORMATION
69Unilever Annual Report and Accounts 2012 Report of the Directors Governance
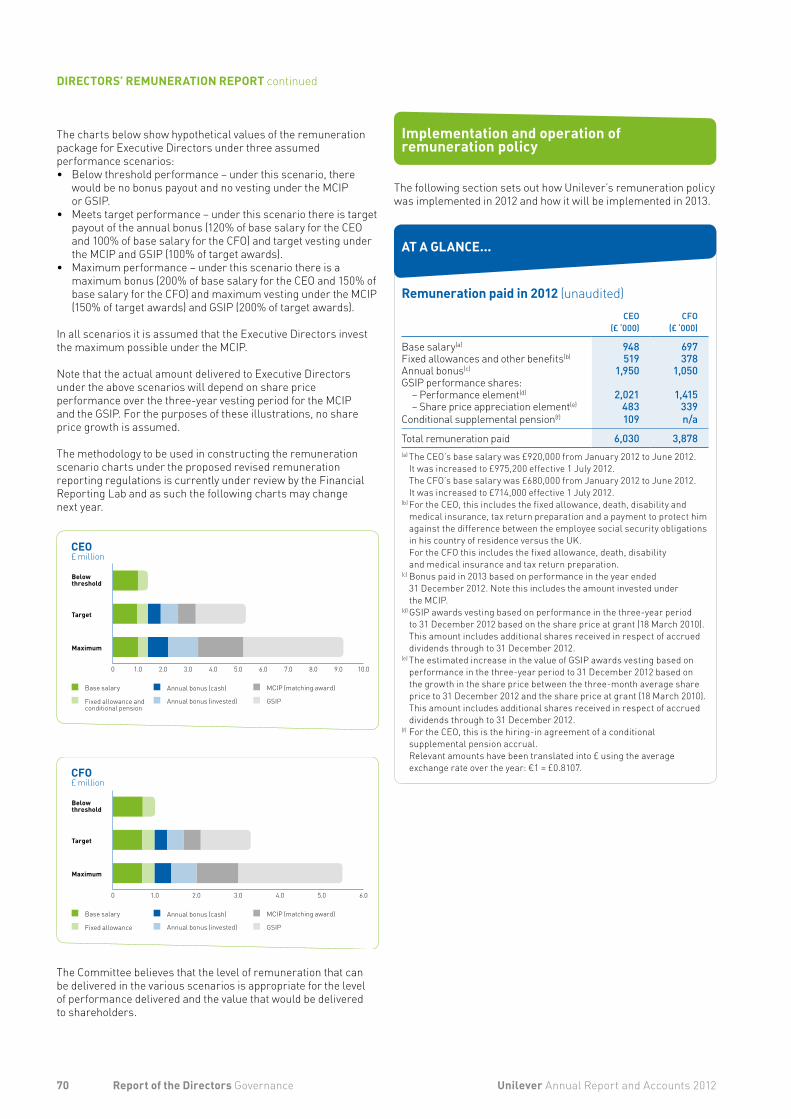
The charts below show hypothetical values of the remuneration package for Executive Directors under three assumed performance scenarios:• Below threshold performance – under this scenario, there
would be no bonus payout and no vesting under the MCIP or GSIP.
• Meets target performance – under this scenario there is target payout of the annual bonus (120% of base salary for the CEO and 100% of base salary for the CFO) and target vesting under the MCIP and GSIP (100% of target awards).
• Maximum performance – under this scenario there is a maximum bonus (200% of base salary for the CEO and 150% of base salary for the CFO) and maximum vesting under the MCIP (150% of target awards) and GSIP (200% of target awards).
In all scenarios it is assumed that the Executive Directors invest the maximum possible under the MCIP.
Note that the actual amount delivered to Executive Directors under the above scenarios will depend on share price performance over the three-year vesting period for the MCIP and the GSIP. For the purposes of these illustrations, no share price growth is assumed.
The methodology to be used in constructing the remuneration scenario charts under the proposed revised remuneration reporting regulations is currently under review by the Financial Reporting Lab and as such the following charts may change next year.
The Committee believes that the level of remuneration that can be delivered in the various scenarios is appropriate for the level of performance delivered and the value that would be delivered to shareholders.
Implementation and operation of remuneration policy
The following section sets out how Unilever’s remuneration policy was implemented in 2012 and how it will be implemented in 2013.
Remuneration paid in 2012 (unaudited)CEO
(£ ‘000)CFO
(£ ‘000)
Base salary(a) 948 697Fixed allowances and other benefits(b) 519 378Annual bonus(c) 1,950 1,050GSIP performance shares:
– Performance element(d) 2,021 1,415– Share price appreciation element(e) 483 339
Conditional supplemental pension(f) 109 n/a
Total remuneration paid 6,030 3,878(a) The CEO’s base salary was £920,000 from January 2012 to June 2012.
It was increased to £975,200 effective 1 July 2012. The CFO’s base salary was £680,000 from January 2012 to June 2012. It was increased to £714,000 effective 1 July 2012.
(b) For the CEO, this includes the fixed allowance, death, disability and medical insurance, tax return preparation and a payment to protect him against the difference between the employee social security obligations in his country of residence versus the UK. For the CFO this includes the fixed allowance, death, disability and medical insurance and tax return preparation.
(c) Bonus paid in 2013 based on performance in the year ended 31 December 2012. Note this includes the amount invested under the MCIP.
(d) GSIP awards vesting based on performance in the three-year period to 31 December 2012 based on the share price at grant (18 March 2010). This amount includes additional shares received in respect of accrued dividends through to 31 December 2012.
(e) The estimated increase in the value of GSIP awards vesting based on performance in the three-year period to 31 December 2012 based on the growth in the share price between the three-month average share price to 31 December 2012 and the share price at grant (18 March 2010). This amount includes additional shares received in respect of accrued dividends through to 31 December 2012.
(f) For the CEO, this is the hiring-in agreement of a conditional supplemental pension accrual. Relevant amounts have been translated into £ using the average exchange rate over the year: €1 = £0.8107.
70 Unilever Annual Report and Accounts 2012Report of the Directors Governance
DIRECTORS’ REMUNERATION REPORT continued
AT A GLANCE...
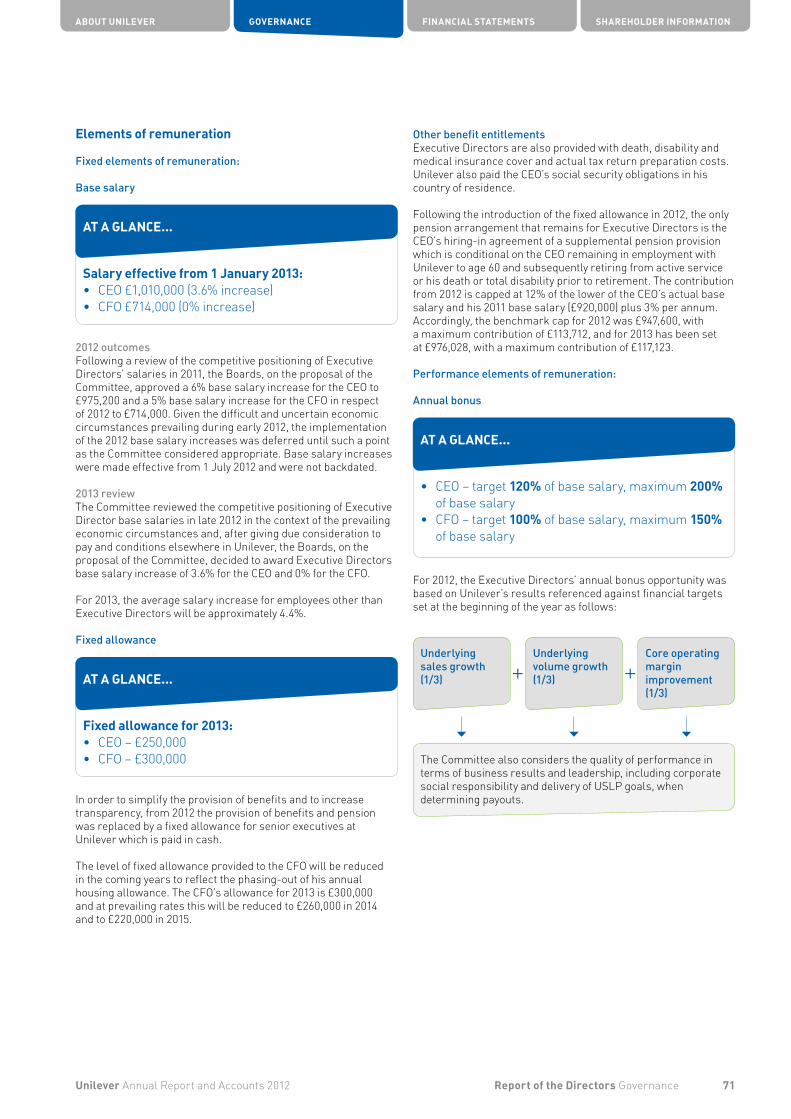
Salary effective from 1 January 2013:• CEO £1,010,000 (3.6% increase)• CFO £714,000 (0% increase)
Fixed allowance for 2013:• CEO – £250,000 • CFO – £300,000
• CEO – target 120% of base salary, maximum 200% of base salary
• CFO – target 100% of base salary, maximum 150% of base salary
2012 outcomesFollowing a review of the competitive positioning of Executive Directors’ salaries in 2011, the Boards, on the proposal of the Committee, approved a 6% base salary increase for the CEO to £975,200 and a 5% base salary increase for the CFO in respect of 2012 to £714,000. Given the difficult and uncertain economic circumstances prevailing during early 2012, the implementation of the 2012 base salary increases was deferred until such a point as the Committee considered appropriate. Base salary increases were made effective from 1 July 2012 and were not backdated.
2013 reviewThe Committee reviewed the competitive positioning of Executive Director base salaries in late 2012 in the context of the prevailing economic circumstances and, after giving due consideration to pay and conditions elsewhere in Unilever, the Boards, on the proposal of the Committee, decided to award Executive Directors base salary increase of 3.6% for the CEO and 0% for the CFO.
For 2013, the average salary increase for employees other than Executive Directors will be approximately 4.4%.
In order to simplify the provision of benefits and to increase transparency, from 2012 the provision of benefits and pension was replaced by a fixed allowance for senior executives at Unilever which is paid in cash.
The level of fixed allowance provided to the CFO will be reduced in the coming years to reflect the phasing-out of his annual housing allowance. The CFO’s allowance for 2013 is £300,000 and at prevailing rates this will be reduced to £260,000 in 2014 and to £220,000 in 2015.
For 2012, the Executive Directors’ annual bonus opportunity was based on Unilever’s results referenced against financial targets set at the beginning of the year as follows:
Other benefit entitlementsExecutive Directors are also provided with death, disability and medical insurance cover and actual tax return preparation costs. Unilever also paid the CEO’s social security obligations in his country of residence.
Following the introduction of the fixed allowance in 2012, the only pension arrangement that remains for Executive Directors is the CEO’s hiring-in agreement of a supplemental pension provision which is conditional on the CEO remaining in employment with Unilever to age 60 and subsequently retiring from active service or his death or total disability prior to retirement. The contribution from 2012 is capped at 12% of the lower of the CEO’s actual base salary and his 2011 base salary (£920,000) plus 3% per annum. Accordingly, the benchmark cap for 2012 was £947,600, with a maximum contribution of £113,712, and for 2013 has been set at £976,028, with a maximum contribution of £117,123.
Performance elements of remuneration:
Annual bonus
Underlying sales growth (1/3)
The Committee also considers the quality of performance in terms of business results and leadership, including corporate social responsibility and delivery of USLP goals, when determining payouts.
Underlying volume growth (1/3)
Core operating margin improvement (1/3)
Elements of remuneration
Fixed elements of remuneration:
Base salary
ABOUT UNILEVER GOVERNANCE FINANCIAL STATEMENTS SHAREHOLDER INFORMATION
71Unilever Annual Report and Accounts 2012 Report of the Directors Governance
AT A GLANCE...
AT A GLANCE...
AT A GLANCE...
Fixed allowance

• CEO – £1,950,400 (100% of maximum, 200% of base salary)
• CFO – £1,049,580 (98% of maximum, 147% of base salary)
When determining bonus payments the Committee considers performance against targets, the quality of business performance and the individual performance rating (in accordance with our Group-wide performance management system).
Performance against targets:
Performance against targets was strong with maximum underlying sales growth and underlying volume growth targets being exceeded, meaning we grew above our markets and outperformed much of the competition. Core operating margin improvement was close to maximum. This included a mix of higher-quality margin drivers and a reduction in restructuring charges.
The Committee considered that the CEO had an exceptional year leading the business to deliver outstanding financial performance, strong returns to shareholders and excellent progress towards achieving a number of the goals set under the USLP. Similarly the Committee considered that the CFO had a strong year, supporting the CEO in delivering this business success.
Taking into account performance against targets, the quality of results and individual contribution, the Committee determined that the CEO should be awarded a bonus of 200% of base salary in respect of 2012 with the CFO being awarded a bonus of 147% of base salary.
2013 bonus policyThere will be no change to the Executive Directors’ annual bonus opportunities for 2013 as set out in the Remuneration Policy table on page 65 and the annual bonus performance metrics will remain the same as for 2012.
• Out of their after-tax annual bonus awards, Executive Directors are required to invest 25% of their gross bonus and may invest up to 60% of their gross bonus in the MCIP
• They are awarded an equal number of MCIP matching shares
• Maximum vesting of 1.5x initial award • Maximum award 200% of base salary for the CEO and 175%* of base salary for CFO
• Maximum vesting of 2x initial award• Maximum vesting of 400% of base salary for
the CEO and 350%* of base salary for the CFO * This is the current operational maximum. The maximum pursuant
to the remuneration policy is 178% with maximum vesting of 356% of base salary as set out on page 67.
The MCIP investment is made personally by Executive Directors from their net after-tax annual bonus. In the event that their net after-tax annual bonus is insufficient to cover full participation in the MCIP at 60%, Executive Directors write Unilever a cheque for the balance of the shares they purchase. In return, they receive a corresponding award of performance-related matching shares.
On 18 February 2013, the CEO invested 60% and the CFO invested 25% of their 2012 bonus into MCIP investment shares and received corresponding awards of performance-related MCIP matching shares. MCIP matching awards are subject to the same performance metrics as GSIP awards (see below). Further information on matching awards is set out on page 78.
GSIP
72 Unilever Annual Report and Accounts 2012Report of the Directors Governance
DIRECTORS’ REMUNERATION REPORT continued
AT A GLANCE...
2012 outcomes
AT A GLANCE...
AT A GLANCE...
MCIP
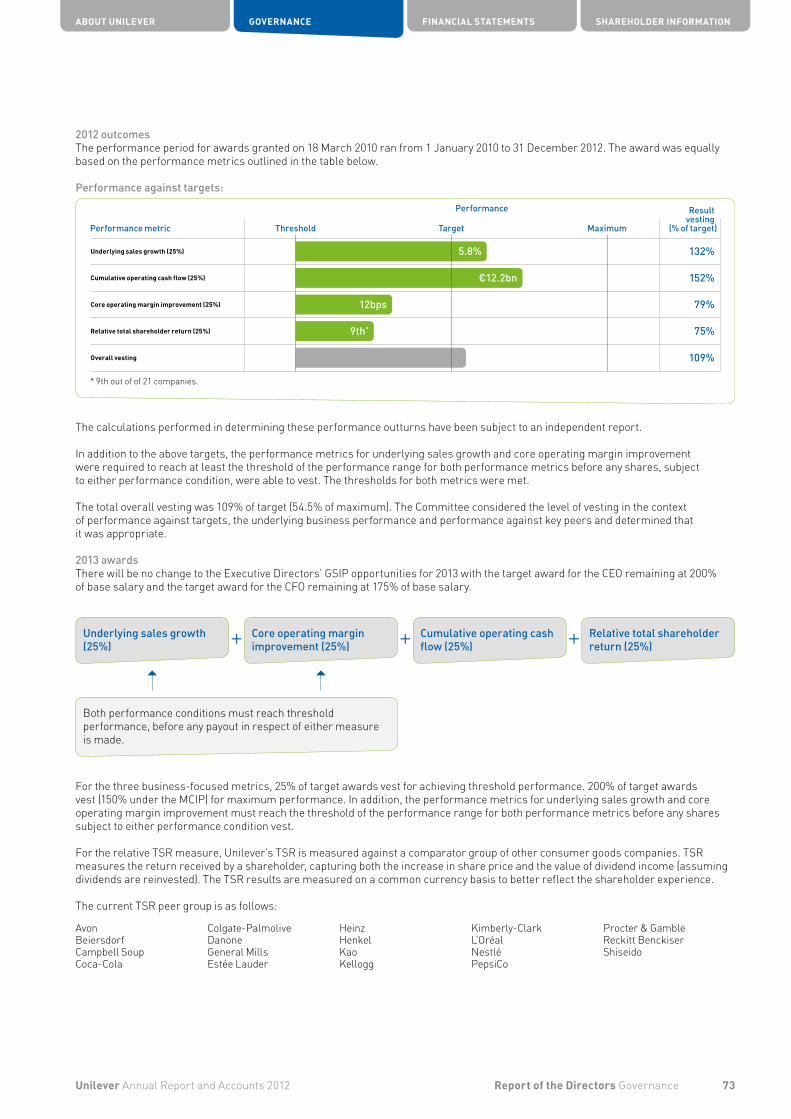
2012 outcomesThe performance period for awards granted on 18 March 2010 ran from 1 January 2010 to 31 December 2012. The award was equally based on the performance metrics outlined in the table below.
Performance against targets:
The calculations performed in determining these performance outturns have been subject to an independent report.
In addition to the above targets, the performance metrics for underlying sales growth and core operating margin improvement were required to reach at least the threshold of the performance range for both performance metrics before any shares, subject to either performance condition, were able to vest. The thresholds for both metrics were met.
The total overall vesting was 109% of target (54.5% of maximum). The Committee considered the level of vesting in the context of performance against targets, the underlying business performance and performance against key peers and determined that it was appropriate.
2013 awardsThere will be no change to the Executive Directors’ GSIP opportunities for 2013 with the target award for the CEO remaining at 200% of base salary and the target award for the CFO remaining at 175% of base salary.
For the three business-focused metrics, 25% of target awards vest for achieving threshold performance. 200% of target awards vest (150% under the MCIP) for maximum performance. In addition, the performance metrics for underlying sales growth and core operating margin improvement must reach the threshold of the performance range for both performance metrics before any shares subject to either performance condition vest.
For the relative TSR measure, Unilever’s TSR is measured against a comparator group of other consumer goods companies. TSR measures the return received by a shareholder, capturing both the increase in share price and the value of dividend income (assuming dividends are reinvested). The TSR results are measured on a common currency basis to better reflect the shareholder experience.
The current TSR peer group is as follows:
Avon Colgate-Palmolive Heinz Kimberly-Clark Procter & GambleBeiersdorf Danone Henkel L’Oréal Reckitt BenckiserCampbell Soup General Mills Kao Nestlé Shiseido Coca-Cola Estée Lauder Kellogg PepsiCo
Underlying sales growth (25%)
Core operating margin improvement (25%)
Cumulative operating cash flow (25%)
Relative total shareholder return (25%)
Both performance conditions must reach threshold performance, before any payout in respect of either measure is made.
ABOUT UNILEVER GOVERNANCE FINANCIAL STATEMENTS SHAREHOLDER INFORMATION
73Unilever Annual Report and Accounts 2012 Report of the Directors Governance

Following the demerger announced by Sara Lee in January 2011, the TSR comparator group for all outstanding awards was adjusted with effect from 1 October 2012 to discontinue their participation and to include Estée Lauder as a replacement.
Following the demerger announced by Kraft in August 2011, as no suitable comparator could be established, the Committee considered it appropriate to exclude, and not replace, Kraft from the TSR comparator group for outstanding awards granted in 2011 and 2012 and for awards granted from 1 January 2013. The TSR comparator group will therefore consist of 19 companies with effect from 1 January 2013. Kraft is included in the comparator group for 2010 awards which vest based on performance to 31 December 2012.
Unilever TSR performance is therefore compared to the performance of 19 other companies (20 including Unilever). No shares in the portion of the award subject to TSR vest if Unilever is ranked below position 10 in the peer group at the end of the three-year period, 60% vest if Unilever is ranked 10th (which is 53rd percentile performance against the peer group), 100% vests if Unilever is ranked 7th and 200% (150% under the MCIP) vests if Unilever is ranked 3rd or above. Straight-line vesting occurs between these points. Dividend re-investment Both GSIP and MCIP provide that dividends will be re-invested in respect of the conditional shares under award but will only be paid out to the extent that the underlying shares vest.
Ultimate remedyGrants under the GSIP and MCIP are subject to ultimate remedy. Upon vesting of an award, the Committee shall have the discretionary power to adjust the value of the award if the award, in the Committee’s opinion taking all circumstances into account, produces an unfair result. In exercising this discretion the Committee may take into account Unilever’s performance against non-financial measures. The Committee will only adjust the value of a vesting award upwards after obtaining shareholder consent.
Following a thorough evaluation of performance in respect of awards vesting based on performance to 31 December 2012 the Committee considered it appropriate not to exercise its discretion to adjust awards either upwards or downwards.
Clawback The Committee is authorised to reclaim or ‘claw back’ performance-related payments to Executive Directors in the event of a significant downward revision of the financial results of the Group. This includes the annual bonus together with any awards that have been made and/or vested shares under the Share Matching Plan, the GSIP and the MCIP.
Share Matching PlanPrior to their participation in the MCIP, Executive Directors were required to invest 25% of their bonus into shares and hold them for a minimum period of three years under the Share Matching Plan. The Executive Directors would then receive a corresponding matching award in the form of NV and PLC shares. The matching shares would normally vest after three years provided the underlying shares have been retained during this period and the Executive Director has not resigned or been dismissed. The last award made under the Share Matching Plan was made in 2011, relating to the annual bonus earned for 2010, and will vest in March 2014 (see page 78 for details).
Payments to former DirectorsThere have been no payments to former Directors during the year.
Minimum shareholding requirement The Articles of Association of NV and PLC do not require Directors of NV or Directors of PLC to hold shares in NV or PLC. However, the remuneration arrangements applicable to our Executive Directors require them to build and retain a personal shareholding in Unilever (by the later of 2015 or five years from the date of appointment) to firmly align their interests with those of Unilever’s long-term shareholders as outlined below.
On 31 December 2012, the Executive Directors’ share ownership against guidelines were:
Share ownership
guideline as % of
base salary
Have guidelines been met?
Actual share
ownership (as a % of
base salary)1
Paul Polman 400% Yes 1,041%
Jean-Marc Huët 300% Yes 353%1 Includes bonuses invested in shares under the Share Matching Plan
and the MCIP, including accrued dividends. Unvested GSIP awards and matching shares under the Share Matching Plan and the MCIP that are subject to performance metrics do not count. Based on 30 day average share prices to 31 December 2012.
The other members of the ULE are required to build a shareholding of 300% of base salary. This requirement is 150% of base salary for the ‘top 100’ management layer below.
Serving as a non-executive on the board of another companyExecutive Directors serving as non-executive directors on the board of other companies are permitted to retain all remuneration and fees earned from outside directorships subject to a maximum of one outside listed directorship (see outside appointments on page 50 for further details).
Paul Polman is a non-executive director of The Dow Chemical Company and received an annual fee of €89,627 (US $115,000 based on the average exchange rate over the year €1 – US $1.2831). In addition he received a restricted award of 3,150 ordinary shares with a nominal value of US $2.50 per share in the capital of The Dow Chemical Company. The shares include the rights to vote and to receive dividends thereon. The shares cannot be sold or transferred until Paul Polman leaves the board of directors of The Dow Chemical Company, and in any case not earlier than 5 March 2014. Jean-Marc Huët was appointed as a non-executive director of Delta Topco Limited on 25 May 2012 and will receive a fee of €109,111 (US $140,000) in respect of his directorship for 2012.
74 Unilever Annual Report and Accounts 2012Report of the Directors Governance
DIRECTORS’ REMUNERATION REPORT continued

Five-year historical Total Shareholder Return (‘TSR’) performanceThe table below includes:• growth in the value of a hypothetical £100 holding over five
years FTSE 100 comparison based on 30-trading-day average values; and
• growth in the value of a hypothetical €100 investment over five years AEX comparison based on 30-trading-day average values.
The Committee has decided to show Unilever’s performance against the FTSE 100 Index, London and also the Euronext 100 index (AEX), Amsterdam as these are the most relevant indices in the UK and the Netherlands where we have our principal listings. Unilever is a constituent of both of these indices.
Comparing pay with performanceThe following chart shows a comparison of total pay for the role of CEO and TSR performance of Unilever since Paul Polman was appointed CEO in 1 January 2009.
The first award to the CEO under the GSIP following his appointment was granted in 2008 and vested based on performance to 31 December 2010.
Non-Executive DirectorsThe policy for Non-Executive Directors’ fees is set out on page 69. There were no fee increases to Non-Executive Director fee levels for 2013.
The Compensation and Management Resources CommitteeDuring 2012 the Committee comprised four Non-Executive Directors: Paul Walsh (Committee Chairman), Michael Treschow, Ann Fudge and Kees Storm.
The Committee reviewed its Terms of Reference during the year. To recognise its change in scope to include performance evaluation of the ULE and leadership development of the ULE and Senior Corporate Executives it resolved to change its name from the Remuneration Committee to the Compensation and Management Resources Committee with effect from 1 January 2013.
The Committee is concerned with:• the remuneration policy for the ULE and senior corporate
executives;• the remuneration and benefits of the Directors and other
members of the ULE;• the design and terms of all long-term incentive plans;• leadership development, especially of the ULE and senior
corporate executives; and• performance evaluation of the members of the ULE.
The Committee’s revised Terms of Reference are contained within ‘The Governance of Unilever’, and are also set out on our website www.unilever.com/investorrelations/corp_governance.
During the year, the Committee reviewed its own effectiveness and concluded that it was broadly operating effectively. Where appropriate, the Committee agreed steps to enhance its effectiveness.
ABOUT UNILEVER GOVERNANCE FINANCIAL STATEMENTS SHAREHOLDER INFORMATION
75Unilever Annual Report and Accounts 2012 Report of the Directors Governance
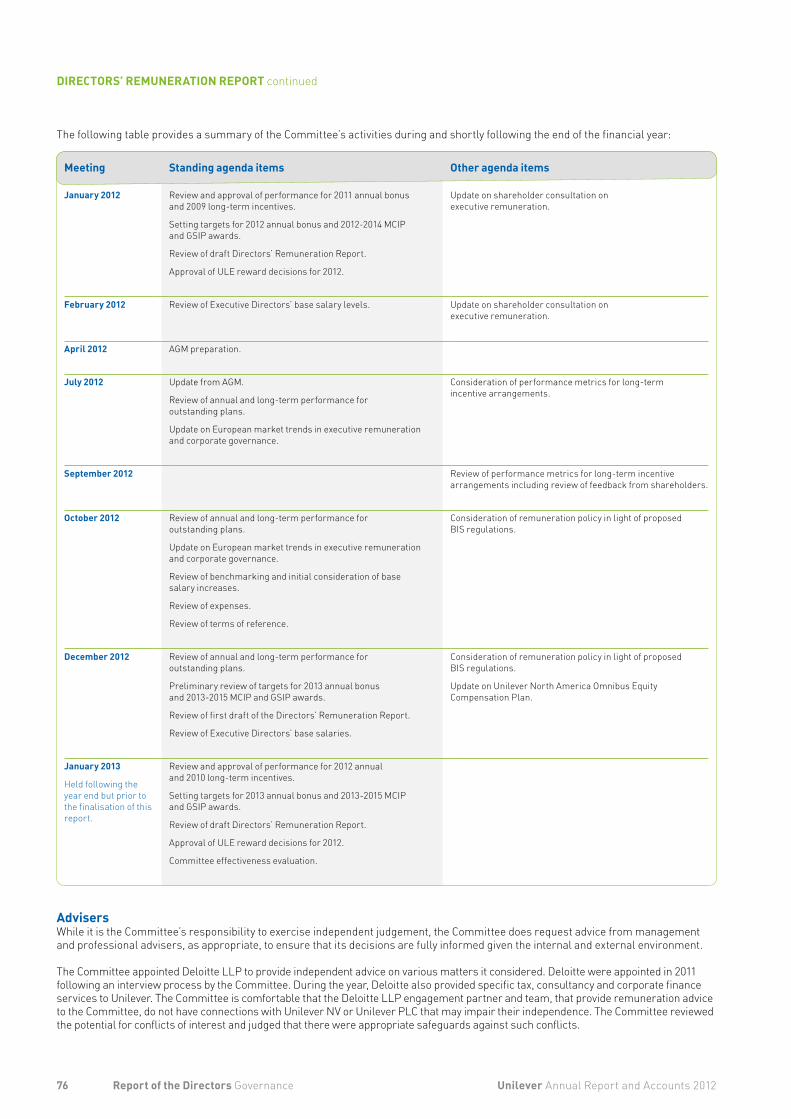
The following table provides a summary of the Committee’s activities during and shortly following the end of the financial year:
AdvisersWhile it is the Committee’s responsibility to exercise independent judgement, the Committee does request advice from management and professional advisers, as appropriate, to ensure that its decisions are fully informed given the internal and external environment.
The Committee appointed Deloitte LLP to provide independent advice on various matters it considered. Deloitte were appointed in 2011 following an interview process by the Committee. During the year, Deloitte also provided specific tax, consultancy and corporate finance services to Unilever. The Committee is comfortable that the Deloitte LLP engagement partner and team, that provide remuneration advice to the Committee, do not have connections with Unilever NV or Unilever PLC that may impair their independence. The Committee reviewed the potential for conflicts of interest and judged that there were appropriate safeguards against such conflicts.
January 2012 Review and approval of performance for 2011 annual bonus and 2009 long-term incentives.
Setting targets for 2012 annual bonus and 2012-2014 MCIP and GSIP awards.
Review of draft Directors’ Remuneration Report.
Approval of ULE reward decisions for 2012.
Update on shareholder consultation on executive remuneration.
February 2012 Review of Executive Directors’ base salary levels. Update on shareholder consultation on executive remuneration.
April 2012 AGM preparation.
July 2012 Update from AGM.
Review of annual and long-term performance for outstanding plans.
Update on European market trends in executive remuneration and corporate governance.
Consideration of performance metrics for long-term incentive arrangements.
September 2012 Review of performance metrics for long-term incentive arrangements including review of feedback from shareholders.
October 2012 Review of annual and long-term performance for outstanding plans.
Update on European market trends in executive remuneration and corporate governance.
Review of benchmarking and initial consideration of base salary increases.
Review of expenses.
Review of terms of reference.
Consideration of remuneration policy in light of proposed BIS regulations.
December 2012 Review of annual and long-term performance for outstanding plans.
Preliminary review of targets for 2013 annual bonus and 2013-2015 MCIP and GSIP awards.
Review of first draft of the Directors’ Remuneration Report.
Review of Executive Directors’ base salaries.
Consideration of remuneration policy in light of proposed BIS regulations.
Update on Unilever North America Omnibus Equity Compensation Plan.
January 2013
Held following the year end but prior to the finalisation of this report.
Review and approval of performance for 2012 annual and 2010 long-term incentives.
Setting targets for 2013 annual bonus and 2013-2015 MCIP and GSIP awards.
Review of draft Directors’ Remuneration Report.
Approval of ULE reward decisions for 2012.
Committee effectiveness evaluation.
76 Unilever Annual Report and Accounts 2012Report of the Directors Governance
DIRECTORS’ REMUNERATION REPORT continued
Meeting Standing agenda items Other agenda items

Deloitte is a member of the Remuneration Consultants Group and, as such, voluntarily operates under the code of conduct in relation to executive remuneration consulting in the UK. Further details can be found at www.remunerationconsultantsgroup.com.
During the year the Committee also sought input from the Chief Executive Officer (Paul Polman), the Chief Human Resources Officer (Doug Baillie) and the SVP Global Head of Reward (Peter Newhouse) on various subjects including the remuneration of senior management. No individual was present when their own remuneration was being discussed to ensure a conflict of interest did not arise. The Committee also received legal and governance advice from the Group Secretary (Tonia Lovell).
Shareholder votingUnilever remains committed to ongoing shareholder dialogue and takes an active interest in voting outcomes. In the event of a substantial vote against a resolution in relation to Directors’ remuneration, Unilever would seek to understand the reasons for any such vote and would set out in the following Annual Report and Accounts any actions in response to it.
The following table sets out actual voting in respect of our previous Report:
Voting outcome (% of votes) For Against
2011 Director’s Remuneration Report (2012 AGM) PLC 93.9% 6.1%
31,530,263 votes were withheld (c. 2.5% of share capital).
The Directors’ Remuneration Report is not subject to a shareholder vote in the Netherlands.
Audited information
Executive Directors’ remuneration in 2012
Remuneration for individual Executive Directors (audited)
Annual emoluments 2012
Name and base country
Basesalary€ ‘000
Fixed allowance
€ ‘000
Value ofbenefits
€ ‘000Bonus€ ‘000
Sub total€ ‘000
Pension€ ‘000
Share awards
€ ‘000Total
€ ‘000
Paul Polman (UK) 1,169(a) 308(b) 332(c) 2,406(d) 4,215 134(e) 3,290(i) 7,639(j)
Jean-Marc Huët (UK) 860(f) 419(g) 46(h) 1,295(d) 2,620 0 2,699(i) 5,319
Total 2012 2,029 727 378 3,701 6,835 134 5,989 12,958
Total 2011 1,840 0 489(k) 2,133 4,462 506(l) 5,640 10,608(m)
(a) The CEO’s base salary was set in sterling at £920,000 per annum from January 2012 to June 2012. It was increased to £975,200 effective 1 July 2012.(b) Fixed allowance set in sterling at £250,000 which replaced certain benefits and pension. The CEO elected to invest part of his fixed allowance into the
Unilever international pension plan fund in 2012.(c) Benefits for medical insurance, tax return preparation and costs of provision for death-in-service benefits and administration. Also includes payment to
protect against the difference between the employee social security obligations in his country of residence versus the UK. He also received a further payment of €152,505 in 2012 in relation to his social security obligations for 2010 and 2011 following a reconciliation for those years. This data was previously captured in the Allowances and Other Payments section.
(d) Bonus for the full year 2012. Includes the value of both the cash element and the portion invested in NV and PLC shares under the MCIP. It does not include matching shares awarded on a conditional basis under the MCIP.
(e) Conditional supplemental pension provision agreed with the CEO on hiring. This payment is conditional on the CEO remaining in employment with Unilever to age 60 and subsequently retiring from active service or his death or total disability prior to retirement.
(f) The CFO’s base salary was set in sterling at £680,000 from January 2012 to June 2012. It was increased to £714,000 effective 1 July 2012.(g) Fixed allowance set in sterling at £340,000 for 2012 which replaced certain benefits and pension.(h) Includes benefits for medical insurance, tax return preparation and costs of provision for death-in-service benefits and administration.(i) Costs are non-cash and relate to the expenses following IFRS 2. This is based on share prices on grant dates, 98% adjustment factor for GSIP and MCIP
shares awarded in 2012 and GSIP shares awarded in 2011 and 2010, and 89% adjustment factor for GSIP shares awarded in 2009 to take account of the external performance condition TSR.
(j) This does not include the one-time Dutch crisis tax charge to which Dutch-based employers like Unilever N.V. are subject of 16% on the portion of employees’ 2012 salaries exceeding €150,000 from current employment that is taxable in the Netherlands. This tax charge for Unilever N.V. with respect to the CEO is €112,394.
(k) Value of benefits in 2011 also included an allowance in lieu of company car, private use of chauffeur-driven car, entertaining allowance and, for the CFO, an annual housing and educational allowance, but excluded death-in-service benefits.
(l) Pension in 2011 also included company contributions towards defined contribution pension plans and death-in-service benefits.(m) Total 2011 split Paul Polman €6,661m and Jean-Marc Huët €3,947m.
Amounts have been translated into euros using the average exchange rate over the year: €1 = £0.8107 (2011: €1 = £0.8692).
We do not grant our Executive Directors any personal loans or guarantees.
ABOUT UNILEVER GOVERNANCE FINANCIAL STATEMENTS SHAREHOLDER INFORMATION
77Unilever Annual Report and Accounts 2012 Report of the Directors Governance
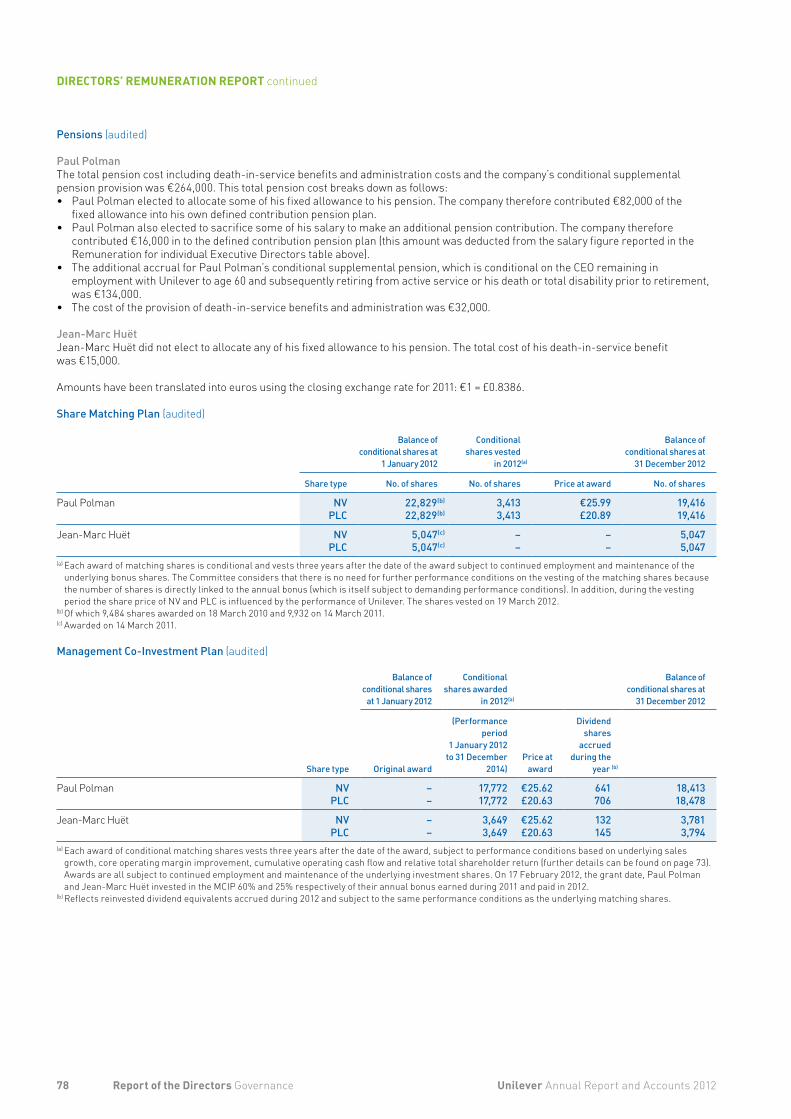
Pensions (audited)
Paul Polman The total pension cost including death-in-service benefits and administration costs and the company’s conditional supplemental pension provision was €264,000. This total pension cost breaks down as follows:• Paul Polman elected to allocate some of his fixed allowance to his pension. The company therefore contributed €82,000 of the
fixed allowance into his own defined contribution pension plan.• Paul Polman also elected to sacrifice some of his salary to make an additional pension contribution. The company therefore
contributed €16,000 in to the defined contribution pension plan (this amount was deducted from the salary figure reported in the Remuneration for individual Executive Directors table above).
• The additional accrual for Paul Polman’s conditional supplemental pension, which is conditional on the CEO remaining in employment with Unilever to age 60 and subsequently retiring from active service or his death or total disability prior to retirement, was €134,000.
• The cost of the provision of death-in-service benefits and administration was €32,000.
Jean-Marc HuëtJean-Marc Huët did not elect to allocate any of his fixed allowance to his pension. The total cost of his death-in-service benefit was €15,000.
Amounts have been translated into euros using the closing exchange rate for 2011: €1 = £0.8386.
Share Matching Plan (audited)
Balance of conditional shares at
1 January 2012
Conditional shares vested
in 2012(a)
Balance of conditional shares at
31 December 2012
Share type No. of shares No. of shares Price at award No. of shares
Paul Polman NV 22,829(b) 3,413 €25.99 19,416PLC 22,829(b) 3,413 £20.89 19,416
Jean-Marc Huët NV 5,047(c) – – 5,047PLC 5,047(c) – – 5,047
(a) Each award of matching shares is conditional and vests three years after the date of the award subject to continued employment and maintenance of the underlying bonus shares. The Committee considers that there is no need for further performance conditions on the vesting of the matching shares because the number of shares is directly linked to the annual bonus (which is itself subject to demanding performance conditions). In addition, during the vesting period the share price of NV and PLC is influenced by the performance of Unilever. The shares vested on 19 March 2012.
(b) Of which 9,484 shares awarded on 18 March 2010 and 9,932 on 14 March 2011.(c) Awarded on 14 March 2011.
Management Co-Investment Plan (audited)
Balance of conditional shares
at 1 January 2012
Conditional shares awarded
in 2012(a)
Balance of conditional shares at
31 December 2012
Share type Original award
(Performance period
1 January 2012 to 31 December
2014)Price at
award
Dividend shares
accrued during the
year (b)
Paul Polman NV – 17,772 €25.62 641 18,413PLC – 17,772 £20.63 706 18,478
Jean-Marc Huët NV – 3,649 €25.62 132 3,781 PLC – 3,649 £20.63 145 3,794(a) Each award of conditional matching shares vests three years after the date of the award, subject to performance conditions based on underlying sales
growth, core operating margin improvement, cumulative operating cash flow and relative total shareholder return (further details can be found on page 73). Awards are all subject to continued employment and maintenance of the underlying investment shares. On 17 February 2012, the grant date, Paul Polman and Jean-Marc Huët invested in the MCIP 60% and 25% respectively of their annual bonus earned during 2011 and paid in 2012.
(b) Reflects reinvested dividend equivalents accrued during 2012 and subject to the same performance conditions as the underlying matching shares.
78 Unilever Annual Report and Accounts 2012Report of the Directors Governance
DIRECTORS’ REMUNERATION REPORT continued
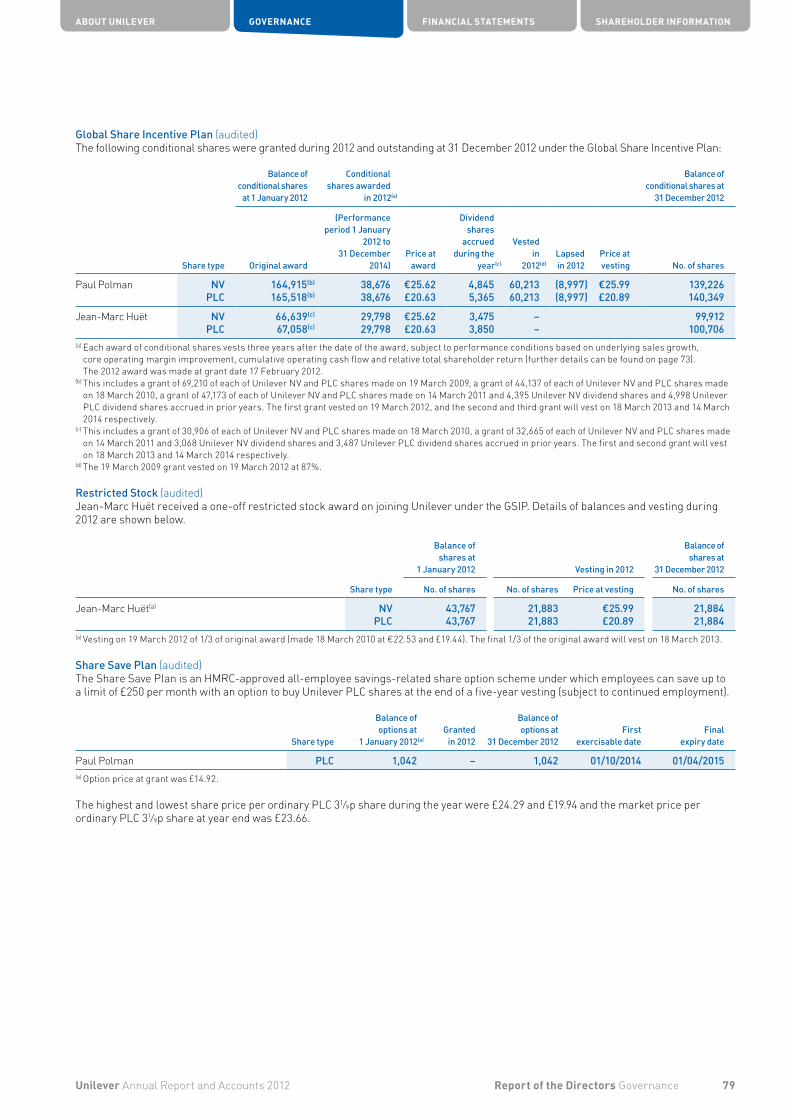
Global Share Incentive Plan (audited)The following conditional shares were granted during 2012 and outstanding at 31 December 2012 under the Global Share Incentive Plan:
Balance of conditional shares
at 1 January 2012
Conditional shares awarded
in 2012(a)
Balance of conditional shares at
31 December 2012
Share type Original award
(Performance period 1 January
2012 to 31 December
2014)Price at
award
Dividend shares
accrued during the
year(c)
Vested in
2012(d)Lapsed in 2012
Price at vesting No. of shares
Paul Polman NV 164,915(b) 38,676 €25.62 4,845 60,213 (8,997) €25.99 139,226PLC 165,518(b) 38,676 £20.63 5,365 60,213 (8,997) £20.89 140,349
Jean-Marc Huët NV 66,639(c) 29,798 €25.62 3,475 – 99,912 PLC 67,058(c) 29,798 £20.63 3,850 – 100,706(a) Each award of conditional shares vests three years after the date of the award, subject to performance conditions based on underlying sales growth,
core operating margin improvement, cumulative operating cash flow and relative total shareholder return (further details can be found on page 73). The 2012 award was made at grant date 17 February 2012.
(b) This includes a grant of 69,210 of each of Unilever NV and PLC shares made on 19 March 2009, a grant of 44,137 of each of Unilever NV and PLC shares made on 18 March 2010, a grant of 47,173 of each of Unilever NV and PLC shares made on 14 March 2011 and 4,395 Unilever NV dividend shares and 4,998 Unilever PLC dividend shares accrued in prior years. The first grant vested on 19 March 2012, and the second and third grant will vest on 18 March 2013 and 14 March 2014 respectively.
(c) This includes a grant of 30,906 of each of Unilever NV and PLC shares made on 18 March 2010, a grant of 32,665 of each of Unilever NV and PLC shares made on 14 March 2011 and 3,068 Unilever NV dividend shares and 3,487 Unilever PLC dividend shares accrued in prior years. The first and second grant will vest on 18 March 2013 and 14 March 2014 respectively.
(d) The 19 March 2009 grant vested on 19 March 2012 at 87%.
Restricted Stock (audited)Jean-Marc Huët received a one-off restricted stock award on joining Unilever under the GSIP. Details of balances and vesting during 2012 are shown below.
Balance ofshares at
1 January 2012 Vesting in 2012
Balance of shares at
31 December 2012
Share type No. of shares No. of shares Price at vesting No. of shares
Jean-Marc Huët(a) NV 43,767 21,883 €25.99 21,884 PLC 43,767 21,883 £20.89 21,884(a) Vesting on 19 March 2012 of 1/3 of original award (made 18 March 2010 at €22.53 and £19.44). The final 1/3 of the original award will vest on 18 March 2013.
Share Save Plan (audited)The Share Save Plan is an HMRC-approved all-employee savings-related share option scheme under which employees can save up to a limit of £250 per month with an option to buy Unilever PLC shares at the end of a five-year vesting (subject to continued employment).
Share type
Balance ofoptions at
1 January 2012(a)Granted in 2012
Balance of options at
31 December 2012First
exercisable dateFinal
expiry date
Paul Polman PLC 1,042 – 1,042 01/10/2014 01/04/2015(a) Option price at grant was £14.92.
The highest and lowest share price per ordinary PLC 31⁄9p share during the year were £24.29 and £19.94 and the market price per ordinary PLC 31⁄9p share at year end was £23.66.
ABOUT UNILEVER GOVERNANCE FINANCIAL STATEMENTS SHAREHOLDER INFORMATION
79Unilever Annual Report and Accounts 2012 Report of the Directors Governance

Executive Directors’ interests in shares (audited)
Share type(a) Shares held at 1 January 2012(b) Shares held at 31 December 2012(b)
Paul Polman NV 173,401 234,291PLC 131,481 192,371
Jean-Marc Huët NV 38,769 52,921PLC 38,769 52,921
(a) NV shares are ordinary €0.16 shares and PLC shares are ordinary 31⁄9p shares.(b) Numbers exclude awards and options over shares which are disclosed above.
The table shows the interest in NV and PLC ordinary shares of Executive Directors and their connected persons as at 31 December 2012. On 18 February 2013 Paul Polman and Jean-Marc Huët invested 60% and 25% respectively of their annual bonus earned in 2012 and paid in 2013 in the MCIP. This resulted in 22,999 NV and 22,999 PLC investment shares for Paul Polman and 5,157 NV and 5,157 PLC investment shares for Jean-Marc Huët. They each received a corresponding award of performance-related NV and PLC shares under the terms of the MCIP.
The voting rights of the Directors who hold interests in the share capital of NV and PLC are the same as for other holders of the class of shares indicated. None of the Directors’ (Executive and Non-Executive) or other executive officers’ shareholdings amounts to more than 1% of the issued shares in that class of share. Except as stated above, all shareholdings are beneficial.
Non-Executive Directors’ remuneration in 2012 (audited)
Non-Executive Directors
Total fees paid in
2012(a)
€ ’000
Total fees paid in
2011€ ’000
Michael Treschow(b) 659(c) 635
Louise Fresco 108 87
Ann Fudge 139 113
Charles Golden 133 113
Byron Grote(d) 128 87
Sunil Bharti Mittal 96 59
Hixonia Nyasulu 127 113
Kees Storm(e) 203 160
Sir Malcolm Rifkind(f) 119 97
Paul Walsh(g) 143 94
Former DirectorJeroen van der Veer(h) – 75
Total 1,855 1,633(a) Covers fees received from both NV in euros and PLC in sterling. Includes basic Non-Executive fee and committee chairmanship and/or membership.
In moving to the new modular fee structure on 1 January 2012, the intercontinental travel allowance was discontinued. Ann Fudge, Charles Golden and Hixonia Nyasulu received a one-time payment of £10,000 each to compensate for the removal of this allowance.
(b) Chairman.(c) This does not include the one-time Dutch crisis tax charge to which Dutch-based companies like Unilever N.V. are subject to of 16% on the portion
of directors’ 2012 fees exceeding €150,000 from current appointment that is taxable in the Netherlands. The tax charge for Unilever N.V. with respect to the Chairman is €26,751.
(d) Chairman of Audit Committee.(e) Vice Chairman.(f) Chairman of Corporate Responsibility Committee.(g) Chairman of Compensation and Management Resources Committee & Nominating and Corporate Governance Committee.(h) Retired at AGMs in 2011.
We do not grant our Non-Executive Directors any personal loans or guarantees.
80 Unilever Annual Report and Accounts 2012Report of the Directors Governance
DIRECTORS’ REMUNERATION REPORT continued
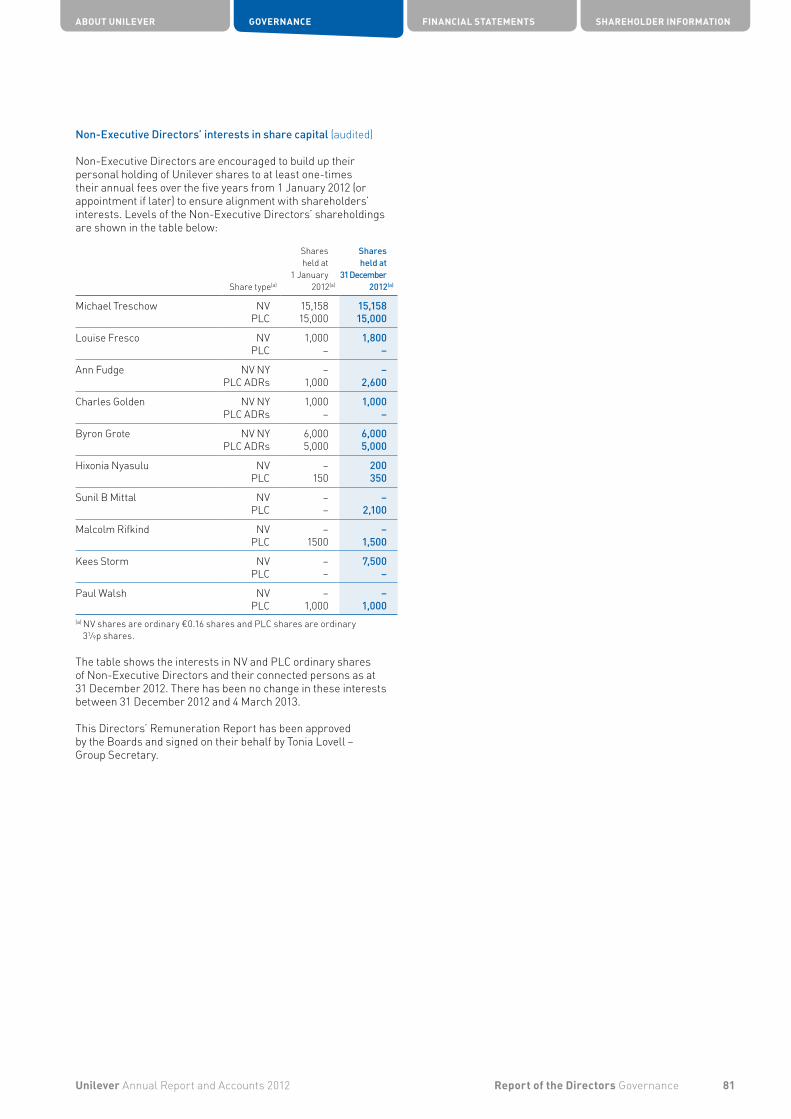
Non-Executive Directors’ interests in share capital (audited)
Non-Executive Directors are encouraged to build up their personal holding of Unilever shares to at least one-times their annual fees over the five years from 1 January 2012 (or appointment if later) to ensure alignment with shareholders’ interests. Levels of the Non-Executive Directors’ shareholdings are shown in the table below:
Share type(a)
Shares held at
1 January 2012(a)
Shares held at
31 December 2012(a)
Michael Treschow NV 15,158 15,158PLC 15,000 15,000
Louise Fresco NV 1,000 1,800 PLC – –
Ann Fudge NV NY – –PLC ADRs 1,000 2,600
Charles Golden NV NY 1,000 1,000PLC ADRs – –
Byron Grote NV NY 6,000 6,000PLC ADRs 5,000 5,000
Hixonia Nyasulu NV – 200 PLC 150 350
Sunil B Mittal NV – –PLC – 2,100
Malcolm Rifkind NV – –PLC 1500 1,500
Kees Storm NV – 7,500PLC – –
Paul Walsh NV – – PLC 1,000 1,000(a) NV shares are ordinary €0.16 shares and PLC shares are ordinary
31⁄9p shares.
The table shows the interests in NV and PLC ordinary shares of Non-Executive Directors and their connected persons as at 31 December 2012. There has been no change in these interests between 31 December 2012 and 4 March 2013.
This Directors’ Remuneration Report has been approved by the Boards and signed on their behalf by Tonia Lovell – Group Secretary.
ABOUT UNILEVER GOVERNANCE FINANCIAL STATEMENTS SHAREHOLDER INFORMATION
81Unilever Annual Report and Accounts 2012 Report of the Directors Governance
Notes to the consolidated financial statements (continued)
15 Capital and funding 112 15A Share capital 113 15B Equity 114 15C Financial liabilities 115
16 Treasury risk management 116 16A Management of liquidity risk 116 16B Management of market risk 118 16C Derivatives and hedging 120
17 Investment and return 121 17A Financial assets 122 17B Credit risk 122
18 Financial instruments fair value risk 123
19 Provisions 124
20 Commitments and contingent liabilities 125
21 Acquisitions and disposals 126
22 Assets and liabilities held for sale 128
23 Related party transactions 128
24 Remuneration of auditors 129
25 Events after the balance sheet date 129
26 Principal group companies and non-current investments 130
Independent auditor’s report – Unilever N.V. 132
Company accounts – Unilever N.V. 133
Notes to the Company accounts – Unilever N.V. 134
Further statutory and other information – Unilever N.V. 137
Independent auditor’s report – Unilever PLC 138
Company accounts – Unilever PLC 139
Notes to the Company accounts – Unilever PLC 140
Further statutory and other information – Unilever PLC 142
Shareholder information 144
Statement of Directors’ responsibilities 83
Independent auditors’ reports 84
Consolidated income statement 86
Consolidated statement of comprehensive income 87
Consolidated statement of changes in equity 87
Consolidated balance sheet 88
Consolidated cash flow statement 89
Notes to the consolidated financial statements 90
1 Accounting information and policies 90
2 Segment information 92
3 Gross profit and operating costs 94
4 Employees 95 4A Staff and management costs 95 4B Pensions and similar obligations 95 4C Share-based compensation plans 101
5 Net finance costs 102
6 Taxation 102 6A Income tax 102 6B Deferred tax 103 6C Tax on other comprehensive income 104
7 Combined earnings per share 105
8 Dividends on ordinary capital 105
9 Goodwill and intangible assets 106
10 Property, plant and equipment 107
11 Other non-current assets 109
12 Inventories 110
13 Trade and other current receivables 110
14 Trade payables and other liabilities 111
82 Unilever Annual Report and Accounts 2012Financial statements
FINANCIAL STATEMENTSContents
Directors’ responsibility statementEach of the Directors confirms that, to the best of his or her knowledge:• The financial statements which have been prepared in
accordance with International Financial Reporting Standards as adopted by the EU and as issued by the International Accounting Standards Board (in the case of the consolidated financial statements) and UK accounting standards (in the case of the PLC parent company accounts) and UK accounting standards and Part 9 of Book 2 of the Dutch Civil Code (in the case of the NV parent company accounts), give a true and fair view of the assets, liabilities, financial position and profit or loss of the Group and the NV and PLC entities taken as a whole; and
• The Report of the Directors includes a fair review of the development and performance of the business and the position of the Group and the NV and PLC entities taken as a whole, together with a description of the principal risks and uncertainties they face.
The Directors and their roles are listed on pages 42 and 49.
Going concernThe activities of the Group, together with the factors likely to affect its future development, performance, the financial position of the Group, its cash flows, liquidity position and borrowing facilities are described in About Unilever and the Financial review 2012 on pages 2 to 35. In addition, we describe in notes 15 to 18 on pages 112 to 124 the Group’s objectives, policies and processes for managing its capital; its financial risk management objectives; details of its financial instruments and hedging activities and its exposures to credit and liquidity risk.
The Group has considerable financial resources together with established business relationships with many customers and suppliers in countries throughout the world. As a consequence, the Directors believe that the Group is well placed to manage its business risks successfully despite the current uncertain outlook.
After making enquiries, the Directors have a reasonable expectation that the Group has adequate resources to continue in operational existence for the foreseeable future. Accordingly, they continue to adopt the going concern basis in preparing this Annual Report and Accounts.
Internal and disclosure controls and proceduresPlease refer to pages 36 to 40 for a discussion of Unilever’s principal risk factors and to page 41 for commentary on the Group’s approach to risk management and control.
Annual accountsThe Directors are required by Part 9 of Book 2 of the Civil Code in the Netherlands and the UK Companies Act 2006 to prepare accounts for each financial year which give a true and fair view of the state of affairs of the Unilever Group, and the NV and PLC entities, as at the end of the financial year and of the profit or loss and cash flows for that year.
The Directors consider that, in preparing the accounts, the Group and the NV and PLC entities have used the most appropriate accounting policies, consistently applied and supported by reasonable and prudent judgements and estimates, and that all International Financial Reporting Standards as adopted by the EU and as issued by the International Accounting Standards Board (in the case of the consolidated financial statements), UK accounting standards (in the case of the parent company accounts) and Dutch law (in the case of the NV parent company accounts) which they consider to be applicable have been followed.
The Directors have responsibility for ensuring that NV and PLC keep accounting records which disclose with reasonable accuracy their financial position and which enable the Directors to ensure that the accounts comply with the relevant legislation. They also have a general responsibility for taking such steps as are reasonably open to them to safeguard the assets of the Group, and to prevent and detect fraud and other irregularities.
This statement, which should be read in conjunction with the Auditors’ reports, is made with a view to distinguishing for shareholders the respective responsibilities of the Directors and of the auditors in relation to the accounts.
A copy of the financial statements of the Unilever Group is placed on our website at www.unilever.com/investorrelations. The maintenance and integrity of the website are the responsibility of the Directors, and the work carried out by the auditors does not involve consideration of these matters. Accordingly, the auditors accept no responsibility for any changes that may have occurred to the financial statements since they were initially placed on the website. Legislation in the UK and the Netherlands governing the preparation and dissemination of financial statements may differ from legislation in other jurisdictions.
UK law sets out additional responsibilities for the Directors of PLC regarding disclosure of information to auditors. Disclosure in respect of these responsibilities is made on page 143.
ABOUT UNILEVER GOVERNANCE FINANCIAL STATEMENTS SHAREHOLDER INFORMATION
83Unilever Annual Report and Accounts 2012 Financial statements
STATEMENT OF DIRECTORS’ RESPONSIBILITIES
We believe that the audit evidence we have obtained is sufficient and appropriate to provide a basis for our audit opinion.
Opinion with respect to the consolidated financial statementsIn our opinion, the consolidated financial statements give a true and fair view of the financial position of Unilever Group as at 31 December 2012, and of its result and its cash flows for the year then ended in accordance with International Financial Reporting Standards as adopted by the European Union and as issued by the International Accounting Standards Board and with Part 9 of Book 2 of the Dutch Civil Code.
Separate report on company accountsWe have reported separately on the company accounts of Unilever N.V. for the year ended 31 December 2012.
Report on other legal and regulatory requirementsPursuant to the legal requirement under Section 2: 393 sub 5 at e and f of the Dutch Civil Code, we have no deficiencies to report as a result of our examination whether the Report of the Directors, to the extent we can assess, has been prepared in accordance with Part 9 of Book 2 of this Code, and whether the information as required under Section 2: 392 sub 1 at b-h has been annexed. Further we report that the Report of the Directors, to the extent we can assess, is consistent with the consolidated financial statements as required by Section 2: 391 sub 4 of the Dutch Civil Code.
Amsterdam, 5 March 2013PricewaterhouseCoopers Accountants N.V.
R A J Swaak RA
Independent auditor’s report
To: the General Meeting of Shareholders of Unilever N.V.
Report on the consolidated financial statementsWe have audited the accompanying consolidated financial statements 2012 as set out on pages 86 to 131 which are part of the Annual Report and Accounts 2012 of the Unilever Group for the year ended 31 December 2012, which comprise the consolidated income statement, consolidated statement of comprehensive income, consolidated statement of changes in equity, consolidated balance sheet, consolidated cash flow statement and the notes to the consolidated financial statements, comprising a summary of significant accounting policies and other explanatory information.
Directors’ responsibilityThe Directors are responsible for the preparation and fair presentation of these consolidated financial statements in accordance with International Financial Reporting Standards as adopted by the European Union and as issued by the International Accounting Standards Board and with Part 9 of Book 2 of the Dutch Civil Code, and for the preparation of the Report of the Directors in accordance with Part 9 of Book 2 of the Dutch Civil Code. Furthermore, the Directors are responsible for such internal control as they determine is necessary to enable the preparation of the consolidated financial statements that are free from material misstatement, whether due to fraud or error.
Auditor’s responsibilityOur responsibility is to express an opinion on these consolidated financial statements based on our audit. We conducted our audit in accordance with Dutch law, including the Dutch Standards on Auditing. This requires that we comply with ethical requirements and plan and perform the audit to obtain reasonable assurance about whether the consolidated financial statements are free from material misstatement.
An audit involves performing procedures to obtain audit evidence about the amounts and disclosures in the consolidated financial statements. The procedures selected depend on the auditor’s judgement, including the assessment of the risks of material misstatement of the consolidated financial statements, whether due to fraud or error. In making those risk assessments, the auditor considers internal control relevant to the company’s preparation and fair presentation of the consolidated financial statements in order to design audit procedures that are appropriate in the circumstances, but not for the purpose of expressing an opinion on the effectiveness of the company’s internal control. An audit also includes evaluating the appropriateness of accounting policies used and the reasonableness of accounting estimates made by the Directors, as well as evaluating the overall presentation of the consolidated financial statements.
84 Unilever Annual Report and Accounts 2012Financial statements
AUDITOR’S REPORT NETHERLANDS

Opinion on financial statements In our opinion the group financial statements: • give a true and fair view of the state of the Group’s affairs
as at 31 December 2012 and of its profit and cash flows for the year then ended;
• have been properly prepared in accordance with IFRSs as adopted by the European Union; and
• have been prepared in accordance with the requirements of the Companies Act 2006 and Article 4 of the IAS Regulation.
Separate opinion in relation to IFRSs as issued by the IASB As explained in note 1 to the group financial statements, the Group in addition to complying with its legal obligation to apply IFRSs as adopted by the European Union, has also applied IFRSs as issued by the International Accounting Standards Board (IASB).
In our opinion the group financial statements comply with IFRSs as issued by the IASB.
Opinion on other matters prescribed by the Companies Act 2006 In our opinion, the information given in the Directors’ Report set out on pages 142 and 143 for the financial year for which the group financial statements are prepared is consistent with the group financial statements.
Matters on which we are required to report by exception We have nothing to report in respect of the following: Under the Companies Act 2006 we are required to report to you if, in our opinion: • certain disclosures of Directors’ remuneration specified
by law are not made; or • we have not received all the information and explanations
we require for our audit.
Under the Listing Rules we are required to review: • the Directors’ statement, set out on page 83, in relation to
going concern; • the part of the Corporate Governance statement relating to the
parent company’s compliance with the nine provisions of the UK Corporate Governance Code specified for our review; and
• certain elements of the report to shareholders by the Board on Directors’ remuneration.
Other matters We have reported separately on the parent company financial statements of Unilever PLC for the year ended 31 December 2012 and on the information in the Directors’ Remuneration Report that is described as having been audited.
John Baker (Senior Statutory Auditor)for and on behalf of PricewaterhouseCoopers LLPChartered Accountants and Statutory AuditorsLondon5 March 2013
Independent auditor’s report to the members of Unilever PLC
We have audited the group financial statements of Unilever Group for the year ended 31 December 2012 which comprise the consolidated income statement, consolidated statement of comprehensive income, consolidated statement of changes in equity, consolidated balance sheet, consolidated cash flow statement, and the related notes on pages 86 to 131. The financial reporting framework that has been applied in their preparation is applicable law and International Financial Reporting Standards (IFRSs) as adopted by the European Union.
Respective responsibilities of Directors and auditors As explained more fully in the Statement of Directors’ responsibilities set out on page 83, the Directors are responsible for the preparation of the group financial statements and for being satisfied that they give a true and fair view. Our responsibility is to audit and express an opinion on the group financial statements in accordance with applicable law and International Standards on Auditing (UK and Ireland). Those standards require us to comply with the Auditing Practices Board’s Ethical Standards for Auditors.
This report, including the opinions, has been prepared for and only for the parent company’s members as a body in accordance with Chapter 3 of Part 16 of the Companies Act 2006 and for no other purpose. We do not, in giving these opinions, accept or assume responsibility for any other purpose or to any other person to whom this report is shown or into whose hands it may come save where expressly agreed by our prior consent in writing.
Scope of the audit of the financial statementsAn audit involves obtaining evidence about the amounts and disclosures in the group financial statements sufficient to give reasonable assurance that the financial statements are free from material misstatement, whether caused by fraud or error. This includes an assessment of: whether the accounting policies are appropriate to the group’s circumstances and have been consistently applied and adequately disclosed; the reasonableness of significant accounting estimates made by the Directors; and the overall presentation of the group financial statements. In addition, we read all the financial and non-financial information in the Annual Report and Accounts 2012 to identify material inconsistencies with the audited financial statements. If we become aware of any apparent material misstatements or inconsistencies we consider the implications for our report.
ABOUT UNILEVER GOVERNANCE FINANCIAL STATEMENTS SHAREHOLDER INFORMATION
85Unilever Annual Report and Accounts 2012 Financial statements
AUDITOR’S REPORT UNITED KINGDOM
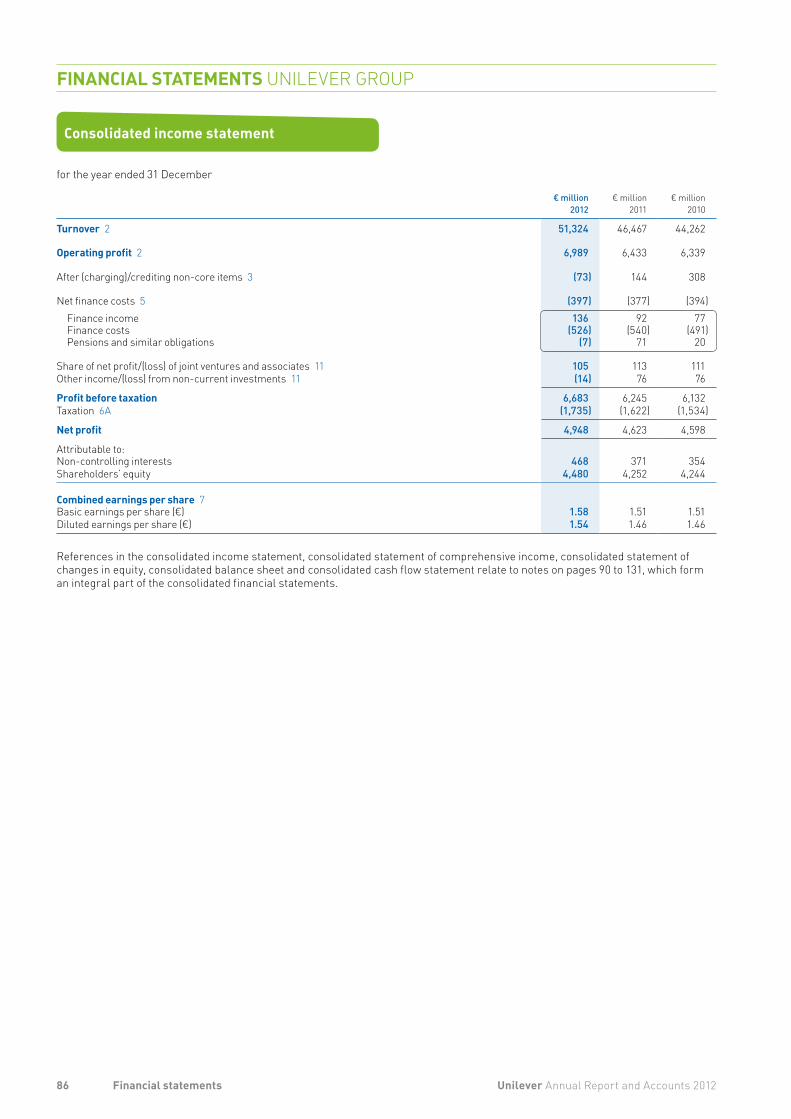
Consolidated income statement
for the year ended 31 December
€ million2012
€ million2011
€ million2010
Turnover 2 51,324 46,467 44,262
Operating profit 2 6,989 6,433 6,339
After (charging)/crediting non-core items 3 (73) 144 308
Net finance costs 5 (397) (377) (394)Finance income 136 92 77Finance costs (526) (540) (491)Pensions and similar obligations (7) 71 20
Share of net profit/(loss) of joint ventures and associates 11 105 113 111Other income/(loss) from non-current investments 11 (14) 76 76
Profit before taxation 6,683 6,245 6,132Taxation 6A (1,735) (1,622) (1,534)
Net profit 4,948 4,623 4,598
Attributable to:Non-controlling interests 468 371 354Shareholders’ equity 4,480 4,252 4,244
Combined earnings per share 7Basic earnings per share (€) 1.58 1.51 1.51Diluted earnings per share (€) 1.54 1.46 1.46
References in the consolidated income statement, consolidated statement of comprehensive income, consolidated statement of changes in equity, consolidated balance sheet and consolidated cash flow statement relate to notes on pages 90 to 131, which form an integral part of the consolidated financial statements.
86 Unilever Annual Report and Accounts 2012Financial statements
FINANCIAL STATEMENTS UNILEVER GROUP

Consolidated statement of comprehensive income
for the year ended 31 December
€ million2012
€ million2011
€ million2010
Fair value gains/(losses) on financial instruments net of tax:On cash flow hedges (141) (148) 41On available-for-sale financial assets 16 (20) 2
Actuarial gains/(losses) on pension schemes net of tax (644) (1,243) 105Currency retranslation gains/(losses) net of tax(a) (316) (703) 460
Other comprehensive income 6C (1,085) (2,114) 608Net profit 4,948 4,623 4,598
Total comprehensive income 15 3,863 2,509 5,206
Attributable to:Non-controlling interests 444 314 412Shareholders’ equity 3,419 2,195 4,794
(a) Includes fair value gains/(losses) on net investment hedges of €(160) million (2011: €45 million; 2010: €107 million).
Consolidated statement of changes in equity
for the year ended 31 December
€ million
2012€ million
2011€ million
2010
Equity at 1 January 14,921 15,078 12,536Total comprehensive income for the year 3,863 2,509 5,206Dividends on ordinary capital (2,696) (2,487) (2,309)Movement in treasury stock 52 48 (126)Share-based payment credit 153 105 144Dividends paid to minority shareholders (464) (288) (289)Currency retranslation gains/(losses) net of tax (2) (1) 2Other movements in equity (111) (43) (86)
Equity at 31 December 15B 15,716 14,921 15,078
For further information on movements in equity please refer to note 15B on page 114.
ABOUT UNILEVER GOVERNANCE FINANCIAL STATEMENTS SHAREHOLDER INFORMATION
87Unilever Annual Report and Accounts 2012 Financial statements

Consolidated balance sheet
as at 31 December
€ million2012
€ million2011
AssetsNon-current assetsGoodwill 9 14,619 14,896 Intangible assets 9 7,099 7,017 Property, plant and equipment 10 9,445 8,774 Pension asset for funded schemes in surplus 4B 672 1,003 Deferred tax assets 6B 1,113 421 Financial assets 17A 535 478 Other non-current assets 11 536 632
34,019 33,221
Current assetsInventories 12 4,436 4,601 Trade and other current receivables 13 4,436 4,513 Current tax assets 217 219 Cash and cash equivalents 17A 2,465 3,484 Other financial assets 17A 401 1,453 Non-current assets held for sale 22 192 21
12,147 14,291
Total assets 46,166 47,512
Liabilities Current liabilitiesFinancial liabilities 15C 2,656 5,840 Trade payables and other current liabilities 14 11,668 10,971 Current tax liabilities 1,129 725 Provisions 19 361 393 Liabilities associated with assets held for sale 22 1 –
15,815 17,929
Non-current liabilitiesFinancial liabilities 15C 7,565 7,878 Non-current tax liabilities 100 258 Pensions and post-retirement healthcare liabilities:
Funded schemes in deficit 4B 2,291 2,295 Unfunded schemes 4B 2,040 1,911
Provisions 19 846 908 Deferred tax liabilities 6B 1,393 1,125 Other non-current liabilities 14 400 287
14,635 14,662
Total liabilities 30,450 32,591
EquityShareholders’ equityCalled up share capital 15A 484 484 Share premium 15B 140 137 Other reserves 15B (6,196) (6,004)Retained profit 15B 20,731 19,676
Shareholders’ equity 15,159 14,293 Non-controlling interests 15B 557 628
Total equity 15,716 14,921
Total liabilities and equity 46,166 47,512
These financial statements have been approved by the Directors.
The Board of Directors5 March 2013
88 Unilever Annual Report and Accounts 2012Financial statements
FINANCIAL STATEMENTS UNILEVER GROUP continued

Consolidated cash flow statement
for the year ended 31 December
€ million2012
€ million2011
€ million2010
Net profit 4,948 4,623 4,598Taxation 1,735 1,622 1,534Share of net profit of joint ventures/associates and other income/(loss) from non-current investments (91) (189) (187)Net finance costs 5 397 377 394Operating profit 6,989 6,433 6,339Depreciation, amortisation and impairment 1,199 1,029 993Changes in working capital: 822 (177) 169
Inventories (9) (219) (573)Trade and other receivables 1 (399) (343)Trade payables and other liabilities 830 441 1,085
Pensions and similar obligations less payments (381) (553) (472)Provisions less payments (43) 9 72Elimination of (profits)/losses on disposals (236) (215) (476)Non-cash charge for share-based compensation 153 105 144Other adjustments 13 8 49
Cash flow from operating activities 8,516 6,639 6,818Income tax paid (1,680) (1,187) (1,328)
Net cash flow from operating activities 6,836 5,452 5,490
Interest received 146 93 70Purchase of intangible assets (405) (264) (177)Purchase of property, plant and equipment (1,975) (1,835) (1,638)Disposal of property, plant and equipment 237 125 114Acquisition of group companies, joint ventures and associates (133) (3,098) (1,252)Disposal of group companies, joint ventures and associates 246 1,378 891Acquisition of other non-current investments (91) (88) (85)Disposal of other non-current investments 88 178 151Dividends from joint ventures, associates and other non-current investments 128 116 184(Purchase)/sale of financial assets 1,004 (1,072) 578
Net cash flow (used in)/from investing activities (755) (4,467) (1,164)
Dividends paid on ordinary share capital (2,699) (2,485) (2,323)Interest and preference dividends paid (506) (496) (494)Net change in short-term borrowings (870) 1,261 (46)Additional financial liabilities 1,441 3,419 86Repayment of financial liabilities (3,565) (907) (1,391)Capital element of finance lease rental payments (15) (16) (22)Other movements on treasury stock 48 30 (124)Other financing activities (456) (395) (295)
Net cash flow (used in)/from financing activities (6,622) 411 (4,609)
Net increase/(decrease) in cash and cash equivalents (541) 1,396 (283)Cash and cash equivalents at the beginning of the year 2,978 1,966 2,397Effect of foreign exchange rate changes (220) (384) (148)
Cash and cash equivalents at the end of the year 17A 2,217 2,978 1,966
The cash flows of pension funds (other than contributions and other direct payments made by the Group in respect of pensions and similar obligations) are not included in the group cash flow statement.
ABOUT UNILEVER GOVERNANCE FINANCIAL STATEMENTS SHAREHOLDER INFORMATION
89Unilever Annual Report and Accounts 2012 Financial statements

Accounting policiesAccounting policies are included in the relevant notes to the consolidated financial statements and have been highlighted with light green shading on pages 92 to 129. The accounting policies below are applied throughout the financial statements.
Foreign currenciesThe consolidated financial statements are presented in euros. The functional currencies of NV and PLC are euros and sterling respectively. Items included in the financial statements of individual group companies are recorded in their respective functional currency which is the currency of the primary economic environment in which each entity operates.
Foreign currency transactions in individual group companies are translated into functional currency using exchange rates at the date of the transaction. Foreign exchange gains and losses from settlement of these transactions, and from translation of monetary assets and liabilities at year-end exchange rates, are recognised in the income statement except when deferred in equity as qualifying hedges.
In preparing the consolidated financial statements, the balances in individual group companies are translated from their functional currency into euros. The income statement, the cash flow statement and all other movements in assets and liabilities are translated at average rates of exchange as a proxy for the transaction rate, or at the transaction rate itself if more appropriate. Assets and liabilities are translated at year-end exchange rates.
The ordinary share capital of NV and PLC is translated in accordance with the Equalisation Agreement. The difference between the value for PLC and the value by applying the year-end rate of exchange is taken to other reserves (see note 15B on page 114).
The effect of exchange rate changes during the year on net assets of foreign operations is recorded in equity. For this purpose net assets include loans between group companies and any related foreign exchange contracts where settlement is neither planned nor likely to occur in the foreseeable future. The Group applies hedge accounting to exchange differences arising between the functional currency of a foreign operation and the euro, regardless of whether the net investment is held directly or through an intermediate parent. Differences arising on retranslation of a financial liability designated as a foreign currency net investment hedge are recorded in equity to the extent that the hedge is effective. These differences are reported within profit or loss to the extent that the hedge is ineffective.
Cumulative exchange differences arising since the date of transition to IFRS of 1 January 2004 are reported as a separate component of other reserves. In the event of disposal or part disposal of an interest in a group company either through sale or as a result of a repayment of capital, the cumulative exchange difference is recognised in the income statement as part of the profit or loss on disposal of group companies.
1. Accounting information and policies
The accounting policies adopted are the same as those which were applied for the previous financial year, except as set out below under the heading ‘Recent accounting developments’.
UnileverThe two parent companies, NV and PLC, together with their group companies, operate as a single economic entity (the Unilever Group, also referred to as Unilever or the Group). NV and PLC have the same Directors and are linked by a series of agreements, including an Equalisation Agreement, which are designed so that the positions of the shareholders of both companies are as closely as possible the same as if they held shares in a single company.
The Equalisation Agreement provides that both companies adopt the same accounting principles. It also requires that dividends and other rights and benefits attaching to each ordinary share of NV, be equal in value to those rights and benefits attaching to each ordinary share of PLC, as if each such unit of capital formed part of the ordinary share capital of one and the same company.
Basis of consolidationDue to the operational and contractual arrangements referred to above, NV and PLC form a single reporting entity for the purposes of presenting consolidated financial statements. Accordingly, the financial statements of Unilever are presented by both NV and PLC as their respective consolidated financial statements. Group companies included in the consolidation are those companies controlled by NV or PLC. Control exists when the Group has the power to govern the financial and operating policies of an entity so as to obtain benefits from its activities.
The net assets and results of acquired businesses are included in the consolidated financial statements from their respective dates of acquisition, being the date on which the Group obtains control. The results of disposed businesses are included in the consolidated financial statements up to their date of disposal, being the date control ceases.
Intra-group transactions and balances are eliminated.
The company income statement for NV is included in the consolidated financial statements. An abbreviated income statement has been disclosed in the NV company accounts on page 133 in accordance with Section 402, Book 2, of the Netherlands Civil Code.
Companies legislation and accounting standardsThe consolidated financial statements have been prepared in accordance with International Financial Reporting Standards (IFRS) as adopted by the European Union (EU), IFRIC Interpretations and in accordance with Part 9 of Book 2 of the Civil Code in the Netherlands and the UK Companies Act 2006 applicable to companies reporting under IFRS. They are also in compliance with IFRS as issued by the International Accounting Standards Board (IASB).
These financial statements are prepared under the historical cost convention unless otherwise indicated.
90 Unilever Annual Report and Accounts 2012Financial statements
NOTES TO THE CONSOLIDATED FINANCIAL STATEMENTS UNILEVER GROUP
• IFRS 13 ‘Fair value measurement’ explains how to measure fair value and enhances fair value disclosures. The standard does not significantly change the measurement of fair value but codifies it in one place. This standard has been endorsed by the EU.
• IFRS 9 ‘Financial instruments’, replaces the current classification and measurement models for financial assets with two classification categories: amortised cost and fair value. Classification is driven by the business model for managing the assets and the contractual cash flow characteristics. Financial liabilities are not affected by the changes. Effective from 1 January 2015.
• Amendments to IAS 1 ‘Presentation of items of other comprehensive income’ will result in items of other comprehensive income that may be reclassified to profit or loss being presented separately from items that would never be reclassified. Endorsed by the EU and effective from 1 July 2012.
• Amendments to IAS 32 ‘Financial instruments: Presentation’ (effective from 1 January 2014) and IFRS 7 ‘Financial instruments: Disclosures’ provide additional guidance on when financial assets and liabilities may be offset. These standards have been endorsed by the EU.
• Amendments to IFRS 10 ‘Consolidated financial statements’, IFRS 11 ‘Joint arrangements’ and IFRS 12 ‘Disclosure of interests in other entities’ on transition guidance.
• Amendments to IAS 1 ‘Presentation of Financial Statements’ clarifies comparative information requirements.
• Amendments to IAS 16 ‘Property, plant and equipment’ explains that servicing equipment is not classified as inventory when used for more than one period.
• Amendments to IAS 32 ‘Financial Instruments: Presentation’ clarifies that the treatment of tax on distributions and equity transaction costs must follow IAS 12 ‘Income taxes’.
• Amendments to IAS 34 ‘Interim Financial Reporting’ aligns the disclosure required for segment assets and liabilities in interim financial statements with IFRS 8 ‘Operating segments’.
The EU has endorsed the following standards, which will be mandatory from 1 January 2014 with early application permitted. This is a year later than the adoption dates in the standards themselves, which require that entities complying with IFRS as issued by the IASB apply them from 1 January 2013. The Group will adopt these standards from 1 January 2013, which is a year early from an EU perspective. The impact of the standards on the consolidated results or financial position of the Group will not be material.• IFRS 10 ‘Consolidated financial statements’ replaces current
guidance on control and consolidation. The core principle that a consolidated entity presents a parent and its subsidiaries as if they were a single entity remains unchanged, as do the mechanics of consolidation.
• IFRS 11 ‘Joint arrangements’ requires joint arrangements to be accounted for as a joint operation or as a joint venture depending on the rights and obligations of each party to the arrangement. Equity accounting for joint ventures, already used by Unilever, will become mandatory.
• IFRS 12 ‘Disclosure of interests in other entities’ requires enhanced disclosures of the nature, risks and financial effects associated with the Group’s interests in subsidiaries, associates, joint arrangements and unconsolidated structured entities.
• IAS 27 ‘Separate financial statements (Revised)’. The standard is revised to reflect the issue of IFRS 10.
• IAS 28 ‘Investments in associates and joint ventures (Revised)’. The standard is revised to reflect the issue of IFRS 11.
1. Accounting information and policies continued
Critical accounting estimates and judgementsThe preparation of financial statements requires management to make judgements, estimates and assumptions in the application of accounting policies that affect the reported amounts of assets, liabilities, income and expenses. Actual results may differ from these estimates. Estimates and judgements are continuously evaluated and are based on historical experience and other factors, including expectations of future events that are believed to be reasonable. Revisions to accounting estimates are recognised in the period in which the estimate is revised and in any future period affected.
Information about critical judgements in applying accounting policies, as well as estimates and assumptions that have the most significant risk of causing a material adjustment to the carrying amounts of assets and liabilities within the next financial year, are included in the following notes:• separate presentation of items in the income statement
– note 3;• measurement of defined benefit obligations – note 4B;• key assumptions used in discounted cash flow projections
– note 9;• utilisation of tax losses and recognition of other deferred tax
assets – note 6B;• likelihood of occurrence of provisions and contingencies,
including tax investigations and audits – notes 19 and 20; and• measurement of consideration and assets and liabilities
acquired as part of business combinations – note 21.
Recent accounting developments
Adopted by the GroupThe following amended standards are relevant to the Group and have been adopted for the first time in these financial statements, with no material impact:• IFRS 7 ‘Financial Instruments: Disclosures (Amendment)’.• IAS 12 ‘Income Taxes (Amendment) – Deferred Taxes: Recovery
of Underlying Assets’.
Not adopted by the GroupThe Group is currently assessing the impact of the following new standards and amendments that are not yet effective.
The Group does not currently believe adoption of these standards would have a material impact on the consolidated results or financial position of the Group. All of the following new standards and amendments are effective from 1 January 2013 unless otherwise stated. Standards have not yet been endorsed by the EU unless otherwise stated.• IAS 19 ‘Employee benefits (Revised)’ changes a number of
disclosure requirements for post-employment arrangements and restricts the accounting options available for defined benefit pension plans. The return on pension plan assets and finance charge will be replaced by a net interest expense or income, calculated by applying the liability discount rate to the net defined benefit asset or liability. The Group expects this change will result in an increase in finance costs of €150 million in 2012 (€179 million in 2011) with a corresponding increase in actuarial gains or losses on pension schemes before tax when restated under the new standard. The revised standard has been endorsed by the EU.
ABOUT UNILEVER GOVERNANCE FINANCIAL STATEMENTS SHAREHOLDER INFORMATION
91Unilever Annual Report and Accounts 2012 Financial statements

2. Segment information
Segmental reportingThe Group has revised its operating segments to align with the new structure under which the business is managed. From 2012, operating segment information is provided based on four product areas rather than geographical regions. The four product areas are:Personal Care – including sales of skincare and haircare products, deodorants and oral care products.Foods – including sales of soups, bouillons, sauces, snacks, mayonnaise, salad dressings, margarines and spreads.Refreshment – including sales of ice cream, tea-based beverages, weight-management products and nutritionally enhanced
staples sold in developing markets.Home Care – including sales of home care products, such as laundry tablets, powders and liquids, soap bars and a wide
range of cleaning products.
Revenue recognition Turnover comprises sales of goods after the deduction of discounts, sales taxes and estimated returns. It does not include sales between group companies. Discounts given by Unilever include rebates, price reductions and incentives given to customers, promotional couponing and trade communication costs.
Turnover is recognised when the risks and rewards of the underlying products have been substantially transferred to the customer. Depending on individual customer terms, this can be at the time of dispatch, delivery or upon formal customer acceptance.
Core operating profit From 2012 the Group refers to core operating profit which means operating profit before the impact of non-core items (refer to note 3 for explanation of non-core items).
€ millionPersonal
Care
€ million
Foods
€ million
Refresh ment
€ million
Home Care
€ million
Total
2012Turnover 18,097 14,444 9,726 9,057 51,324
Operating profit 2,928 2,605 911 545 6,989Non-core items 3 160 (73) – (14) 73
Core operating profit 3,088 2,532 911 531 7,062
Share of net profit/(loss) of joint ventures and associates 1 5 99 – 105
Depreciation and amortisation 336 311 340 212 1,199Impairment and other non-cash charges(a) 189 141 106 128 564
2011Turnover 15,471 13,986 8,804 8,206 46,467
Operating profit 2,536 2,693 723 481 6,433 Non-core items 3 187 (244) (47) (40) (144)
Core operating profit 2,723 2,449 676 441 6,289
Share of net profit/(loss) of joint ventures and associates 5 7 98 3 113
Depreciation and amortisation 272 286 281 190 1,029Impairment and other non-cash charges(a) 138 183 154 136 611
2010Turnover 13,767 14,164 8,605 7,726 44,262
Operating profit 2,296 2,846 724 473 6,339 Non-core items 3 50 (464) (2) 108 (308)
Core operating profit 2,346 2,382 722 581 6,031
Share of net profit/(loss) of joint ventures and associates 7 18 92 (6) 111
Depreciation and amortisation 255 282 273 183 993Impairment and other non-cash charges(a) 123 132 81 190 526(a) Other non-cash charges include charges to the income statement during the year in respect of the share-based compensation and provisions.
92 Unilever Annual Report and Accounts 2012Financial statements
NOTES TO THE CONSOLIDATED FINANCIAL STATEMENTS UNILEVER GROUP continued
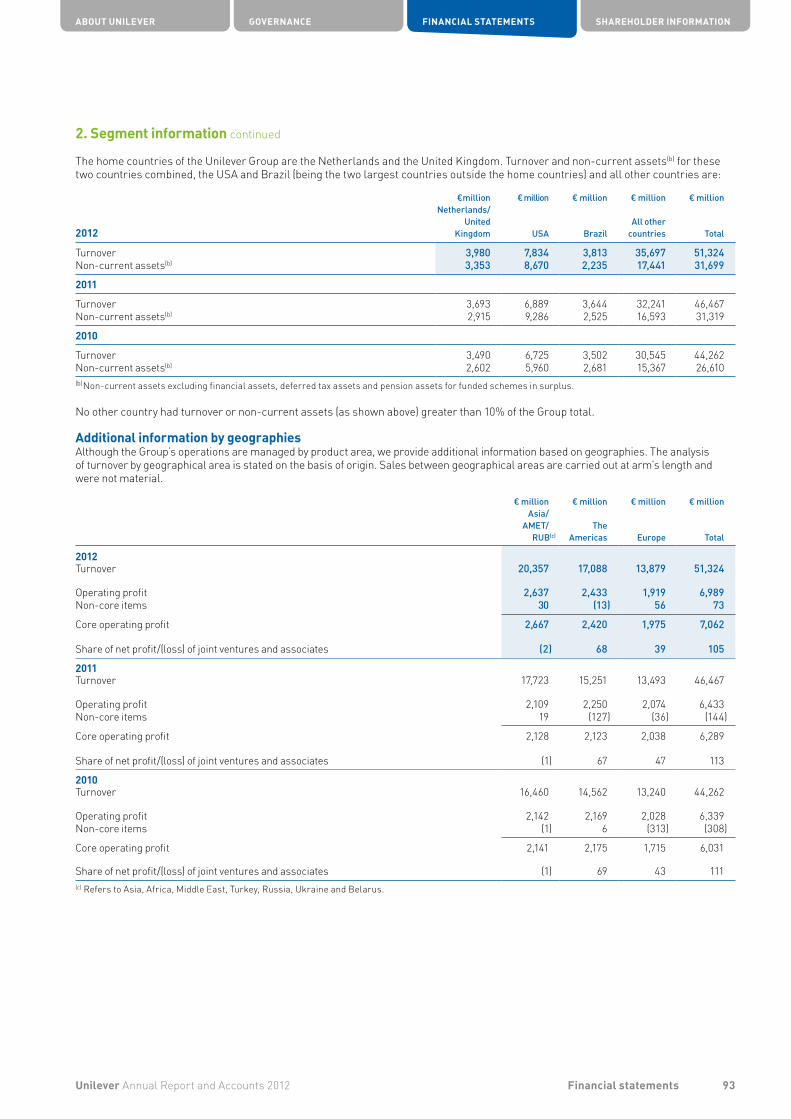
2. Segment information continued
The home countries of the Unilever Group are the Netherlands and the United Kingdom. Turnover and non-current assets(b) for these two countries combined, the USA and Brazil (being the two largest countries outside the home countries) and all other countries are:
2012
€millionNetherlands/
UnitedKingdom
€ million
USA
€ million
Brazil
€ million
All othercountries
€ million
Total
Turnover 3,980 7,834 3,813 35,697 51,324Non-current assets(b) 3,353 8,670 2,235 17,441 31,699
2011
Turnover 3,693 6,889 3,644 32,241 46,467 Non-current assets(b) 2,915 9,286 2,525 16,593 31,319
2010
Turnover 3,490 6,725 3,502 30,545 44,262Non-current assets(b) 2,602 5,960 2,681 15,367 26,610(b) Non-current assets excluding financial assets, deferred tax assets and pension assets for funded schemes in surplus.
No other country had turnover or non-current assets (as shown above) greater than 10% of the Group total.
Additional information by geographiesAlthough the Group’s operations are managed by product area, we provide additional information based on geographies. The analysis of turnover by geographical area is stated on the basis of origin. Sales between geographical areas are carried out at arm’s length and were not material.
€ millionAsia/
AMET/RUB(c)
€ million
The Americas
€ million
Europe
€ million
Total
2012Turnover 20,357 17,088 13,879 51,324
Operating profit 2,637 2,433 1,919 6,989Non-core items 30 (13) 56 73
Core operating profit 2,667 2,420 1,975 7,062
Share of net profit/(loss) of joint ventures and associates (2) 68 39 105
2011Turnover 17,723 15,251 13,493 46,467
Operating profit 2,109 2,250 2,074 6,433 Non-core items 19 (127) (36) (144)
Core operating profit 2,128 2,123 2,038 6,289
Share of net profit/(loss) of joint ventures and associates (1) 67 47 113
2010Turnover 16,460 14,562 13,240 44,262
Operating profit 2,142 2,169 2,028 6,339 Non-core items (1) 6 (313) (308)
Core operating profit 2,141 2,175 1,715 6,031
Share of net profit/(loss) of joint ventures and associates (1) 69 43 111 (c) Refers to Asia, Africa, Middle East, Turkey, Russia, Ukraine and Belarus.
ABOUT UNILEVER GOVERNANCE FINANCIAL STATEMENTS SHAREHOLDER INFORMATION
93Unilever Annual Report and Accounts 2012 Financial statements
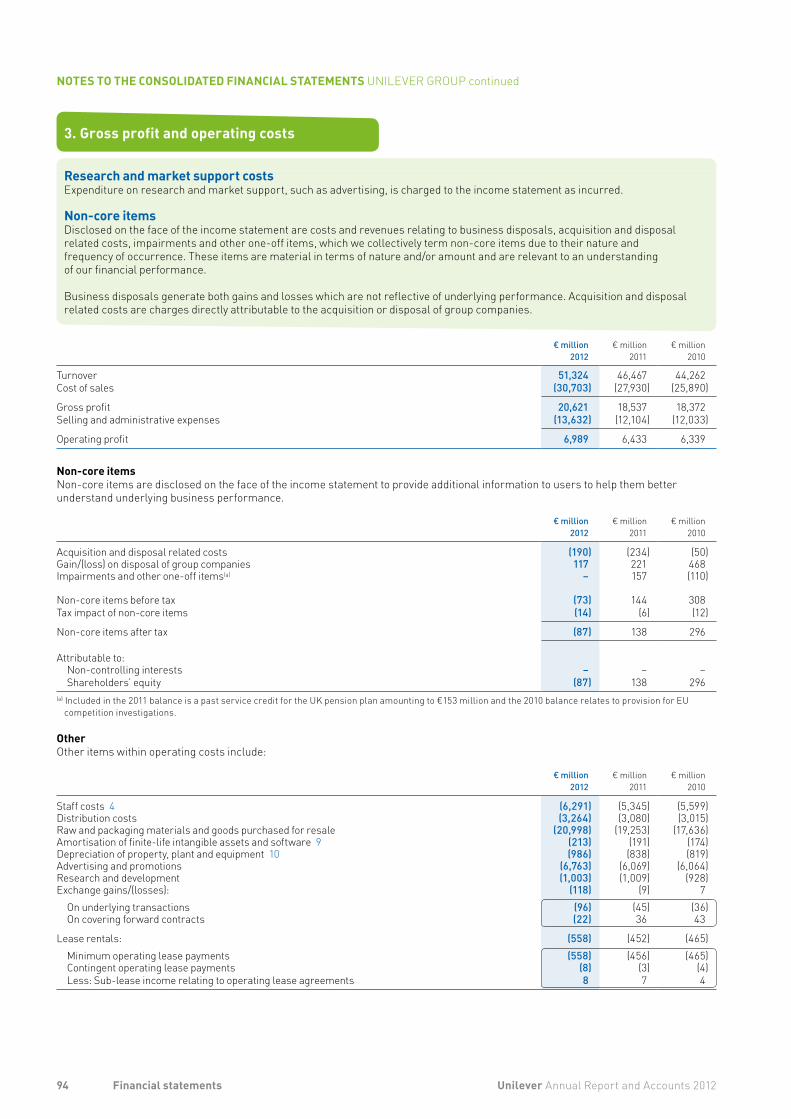
3. Gross profit and operating costs
Research and market support costsExpenditure on research and market support, such as advertising, is charged to the income statement as incurred.
Non-core itemsDisclosed on the face of the income statement are costs and revenues relating to business disposals, acquisition and disposal related costs, impairments and other one-off items, which we collectively term non-core items due to their nature and frequency of occurrence. These items are material in terms of nature and/or amount and are relevant to an understanding of our financial performance.
Business disposals generate both gains and losses which are not reflective of underlying performance. Acquisition and disposal related costs are charges directly attributable to the acquisition or disposal of group companies.
€ million2012
€ million2011
€ million2010
Turnover 51,324 46,467 44,262Cost of sales (30,703) (27,930) (25,890)
Gross profit 20,621 18,537 18,372 Selling and administrative expenses (13,632) (12,104) (12,033)
Operating profit 6,989 6,433 6,339
Non-core itemsNon-core items are disclosed on the face of the income statement to provide additional information to users to help them better understand underlying business performance.
€ million2012
€ million2011
€ million2010
Acquisition and disposal related costs (190) (234) (50)Gain/(loss) on disposal of group companies 117 221 468Impairments and other one-off items(a) – 157 (110)
Non-core items before tax (73) 144 308Tax impact of non-core items (14) (6) (12)
Non-core items after tax (87) 138 296
Attributable to:Non-controlling interests – – –Shareholders’ equity (87) 138 296
(a) Included in the 2011 balance is a past service credit for the UK pension plan amounting to €153 million and the 2010 balance relates to provision for EU competition investigations.
OtherOther items within operating costs include:
€ million2012
€ million2011
€ million2010
Staff costs 4 (6,291) (5,345) (5,599)Distribution costs (3,264) (3,080) (3,015)Raw and packaging materials and goods purchased for resale (20,998) (19,253) (17,636)Amortisation of finite-life intangible assets and software 9 (213) (191) (174)Depreciation of property, plant and equipment 10 (986) (838) (819)Advertising and promotions (6,763) (6,069) (6,064)Research and development (1,003) (1,009) (928)Exchange gains/(losses): (118) (9) 7
On underlying transactions (96) (45) (36)On covering forward contracts (22) 36 43
Lease rentals: (558) (452) (465)Minimum operating lease payments (558) (456) (465)Contingent operating lease payments (8) (3) (4)Less: Sub-lease income relating to operating lease agreements 8 7 4
94 Unilever Annual Report and Accounts 2012Financial statements
NOTES TO THE CONSOLIDATED FINANCIAL STATEMENTS UNILEVER GROUP continued

4. Employees
4A. Staff and management costs
Staff costs€ million
2012€ million
2011€ million
2010
Remuneration of employees (5,133) (4,596) (4,572)Pensions and other post-employment benefits (346) (17) (276)Social security costs (659) (627) (607)Share-based compensation costs (153) (105) (144)
(6,291) (5,345) (5,599)
Average number of employees during the year’0002012
’0002011
’0002010
Asia/AMET/RUB 94 92 90The Americas 43 42 40Europe 35 35 35
172 169 165
Key management compensation€ million
2012€ million
2011€ million
2010
Salaries and short-term employee benefits (28) (15) (17)Non-Executive Directors’ fees (2) (2) (2)Post-employment benefits (2) (2) (2)Share-based benefits (10) (11) (10)
(42) (30) (31)
Of which:Executive Directors (12) (10) (7)Non-Executive Directors (2) (2) (2)Other (28) (18) (22)
(42) (30) (31)
Key management personnel are defined as the members of the Unilever Leadership Executive (ULE) and the Non-Executive Directors.
Details of the remuneration of Directors are given in the parts noted as audited in the Directors’ Remuneration Report on pages 62 to 81.
4B. Pensions and similar obligations
For defined benefit plans, operating and finance costs are recognised separately in the income statement. The amount charged to operating cost in the income statement is the cost of accruing pension benefits promised to employees over the year, plus the costs of individual events such as past service benefit enhancements, settlements and curtailments (such events are recognised immediately in the income statement). The amount charged or credited to finance costs includes a credit equivalent to the Group’s expected return on the pension plans’ assets over the year, offset by a charge equal to the expected increase in the plans’ liabilities over the year due to the passage of time. Any differences between the expected return on assets and the return actually achieved, and any changes in the liabilities over the year due to changes in assumptions or experience within the plans, are recognised immediately in the statement of comprehensive income.
The defined benefit plan surplus or deficit on the balance sheet comprises the total for each plan of the fair value of plan assets less the present value of the defined benefit obligation (using a discount rate based on high quality corporate bonds).
All defined benefit plans are subject to regular actuarial review using the projected unit method, either by external consultants or by actuaries employed by Unilever. The Group policy is that the most important plans, representing approximately 80% of the defined benefit liabilities, are formally valued every year. Other principal plans, accounting for approximately a further 15% of liabilities, have their liabilities updated each year. Group policy for the remaining plans requires a full actuarial valuation at least every three years. Asset values for all plans are updated every year.
For defined contribution plans, the charges to the income statement are the company contributions payable, as the company’s obligation is limited to contributions paid into the plans. The assets and liabilities of such plans are not included in the balance sheet of the Group.
ABOUT UNILEVER GOVERNANCE FINANCIAL STATEMENTS SHAREHOLDER INFORMATION
95Unilever Annual Report and Accounts 2012 Financial statements
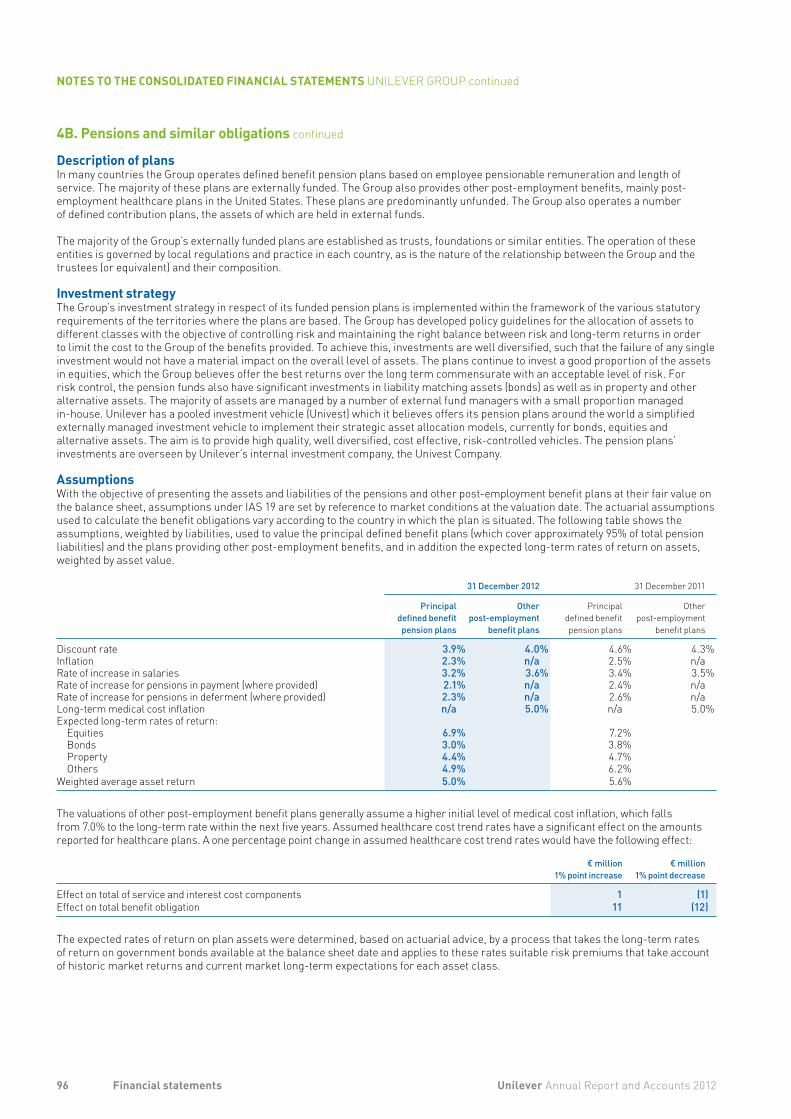
4B. Pensions and similar obligations continued
Description of plansIn many countries the Group operates defined benefit pension plans based on employee pensionable remuneration and length of service. The majority of these plans are externally funded. The Group also provides other post-employment benefits, mainly post-employment healthcare plans in the United States. These plans are predominantly unfunded. The Group also operates a number of defined contribution plans, the assets of which are held in external funds.
The majority of the Group’s externally funded plans are established as trusts, foundations or similar entities. The operation of these entities is governed by local regulations and practice in each country, as is the nature of the relationship between the Group and the trustees (or equivalent) and their composition.
Investment strategyThe Group’s investment strategy in respect of its funded pension plans is implemented within the framework of the various statutoryrequirements of the territories where the plans are based. The Group has developed policy guidelines for the allocation of assets todifferent classes with the objective of controlling risk and maintaining the right balance between risk and long-term returns in order to limit the cost to the Group of the benefits provided. To achieve this, investments are well diversified, such that the failure of any singleinvestment would not have a material impact on the overall level of assets. The plans continue to invest a good proportion of the assets in equities, which the Group believes offer the best returns over the long term commensurate with an acceptable level of risk. For risk control, the pension funds also have significant investments in liability matching assets (bonds) as well as in property and other alternative assets. The majority of assets are managed by a number of external fund managers with a small proportion managed in-house. Unilever has a pooled investment vehicle (Univest) which it believes offers its pension plans around the world a simplified externally managed investment vehicle to implement their strategic asset allocation models, currently for bonds, equities and alternative assets. The aim is to provide high quality, well diversified, cost effective, risk-controlled vehicles. The pension plans’ investments are overseen by Unilever’s internal investment company, the Univest Company.
AssumptionsWith the objective of presenting the assets and liabilities of the pensions and other post-employment benefit plans at their fair value on the balance sheet, assumptions under IAS 19 are set by reference to market conditions at the valuation date. The actuarial assumptions used to calculate the benefit obligations vary according to the country in which the plan is situated. The following table shows the assumptions, weighted by liabilities, used to value the principal defined benefit plans (which cover approximately 95% of total pension liabilities) and the plans providing other post-employment benefits, and in addition the expected long-term rates of return on assets, weighted by asset value.
31 December 2012 31 December 2011
Principal defined benefit pension plans
Otherpost-employment
benefit plans
Principal defined benefit pension plans
Other post-employment
benefit plans
Discount rate 3.9% 4.0% 4.6% 4.3%Inflation 2.3% n/a 2.5% n/aRate of increase in salaries 3.2% 3.6% 3.4% 3.5%Rate of increase for pensions in payment (where provided) 2.1% n/a 2.4% n/aRate of increase for pensions in deferment (where provided) 2.3% n/a 2.6% n/aLong-term medical cost inflation n/a 5.0% n/a 5.0%Expected long-term rates of return:
Equities 6.9% 7.2%Bonds 3.0% 3.8%Property 4.4% 4.7%Others 4.9% 6.2%
Weighted average asset return 5.0% 5.6%
The valuations of other post-employment benefit plans generally assume a higher initial level of medical cost inflation, which falls from 7.0% to the long-term rate within the next five years. Assumed healthcare cost trend rates have a significant effect on the amounts reported for healthcare plans. A one percentage point change in assumed healthcare cost trend rates would have the following effect:
€ million1% point increase
€ million1% point decrease
Effect on total of service and interest cost components 1 (1)Effect on total benefit obligation 11 (12)
The expected rates of return on plan assets were determined, based on actuarial advice, by a process that takes the long-term rates of return on government bonds available at the balance sheet date and applies to these rates suitable risk premiums that take account of historic market returns and current market long-term expectations for each asset class.
96 Unilever Annual Report and Accounts 2012Financial statements
NOTES TO THE CONSOLIDATED FINANCIAL STATEMENTS UNILEVER GROUP continued
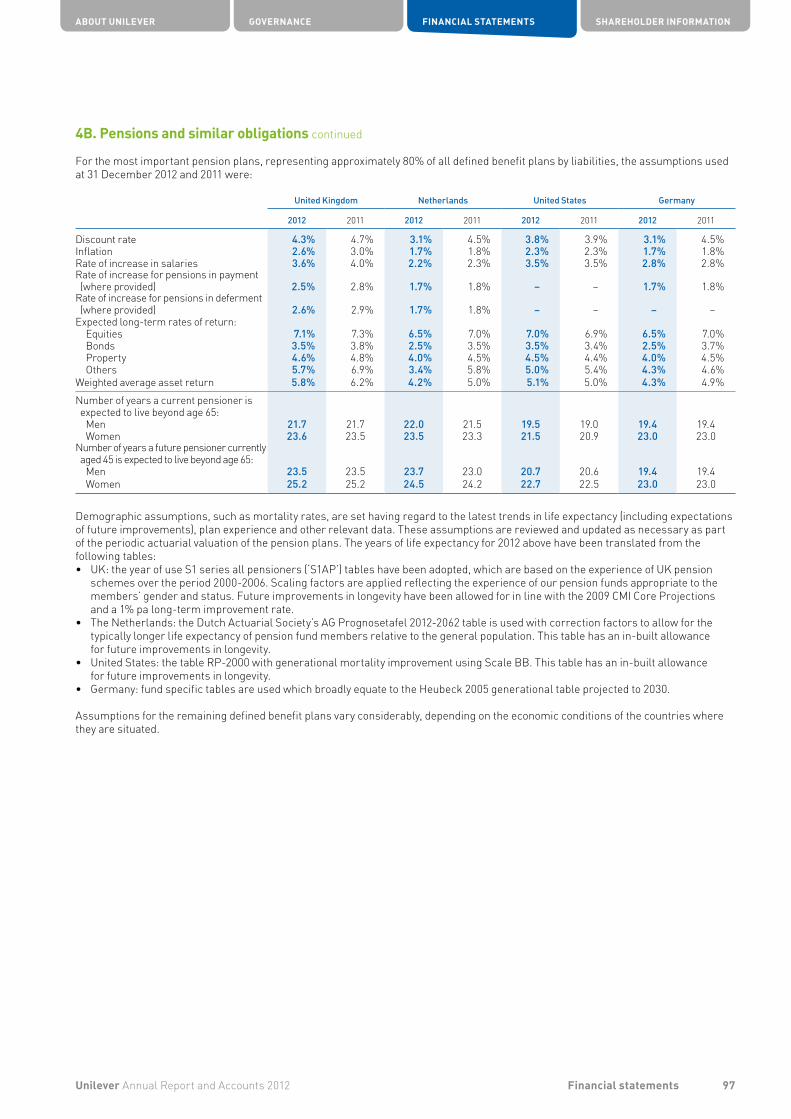
4B. Pensions and similar obligations continued
For the most important pension plans, representing approximately 80% of all defined benefit plans by liabilities, the assumptions used at 31 December 2012 and 2011 were:
United Kingdom Netherlands United States Germany
2012 2011 2012 2011 2012 2011 2012 2011
Discount rate 4.3% 4.7% 3.1% 4.5% 3.8% 3.9% 3.1% 4.5%Inflation 2.6% 3.0% 1.7% 1.8% 2.3% 2.3% 1.7% 1.8%Rate of increase in salaries 3.6% 4.0% 2.2% 2.3% 3.5% 3.5% 2.8% 2.8%Rate of increase for pensions in payment (where provided) 2.5% 2.8% 1.7% 1.8% – – 1.7% 1.8%
Rate of increase for pensions in deferment (where provided) 2.6% 2.9% 1.7% 1.8% – – – –
Expected long-term rates of return:Equities 7.1% 7.3% 6.5% 7.0% 7.0% 6.9% 6.5% 7.0%Bonds 3.5% 3.8% 2.5% 3.5% 3.5% 3.4% 2.5% 3.7%Property 4.6% 4.8% 4.0% 4.5% 4.5% 4.4% 4.0% 4.5%Others 5.7% 6.9% 3.4% 5.8% 5.0% 5.4% 4.3% 4.6%
Weighted average asset return 5.8% 6.2% 4.2% 5.0% 5.1% 5.0% 4.3% 4.9%Number of years a current pensioner is expected to live beyond age 65:
Men 21.7 21.7 22.0 21.5 19.5 19.0 19.4 19.4Women 23.6 23.5 23.5 23.3 21.5 20.9 23.0 23.0
Number of years a future pensioner currently aged 45 is expected to live beyond age 65:
Men 23.5 23.5 23.7 23.0 20.7 20.6 19.4 19.4Women 25.2 25.2 24.5 24.2 22.7 22.5 23.0 23.0
Demographic assumptions, such as mortality rates, are set having regard to the latest trends in life expectancy (including expectations of future improvements), plan experience and other relevant data. These assumptions are reviewed and updated as necessary as part of the periodic actuarial valuation of the pension plans. The years of life expectancy for 2012 above have been translated from the following tables:• UK: the year of use S1 series all pensioners (‘S1AP’) tables have been adopted, which are based on the experience of UK pension
schemes over the period 2000-2006. Scaling factors are applied reflecting the experience of our pension funds appropriate to the members’ gender and status. Future improvements in longevity have been allowed for in line with the 2009 CMI Core Projections and a 1% pa long-term improvement rate.
• The Netherlands: the Dutch Actuarial Society’s AG Prognosetafel 2012-2062 table is used with correction factors to allow for the typically longer life expectancy of pension fund members relative to the general population. This table has an in-built allowance for future improvements in longevity.
• United States: the table RP-2000 with generational mortality improvement using Scale BB. This table has an in-built allowance for future improvements in longevity.
• Germany: fund specific tables are used which broadly equate to the Heubeck 2005 generational table projected to 2030.
Assumptions for the remaining defined benefit plans vary considerably, depending on the economic conditions of the countries where they are situated.
ABOUT UNILEVER GOVERNANCE FINANCIAL STATEMENTS SHAREHOLDER INFORMATION
97Unilever Annual Report and Accounts 2012 Financial statements
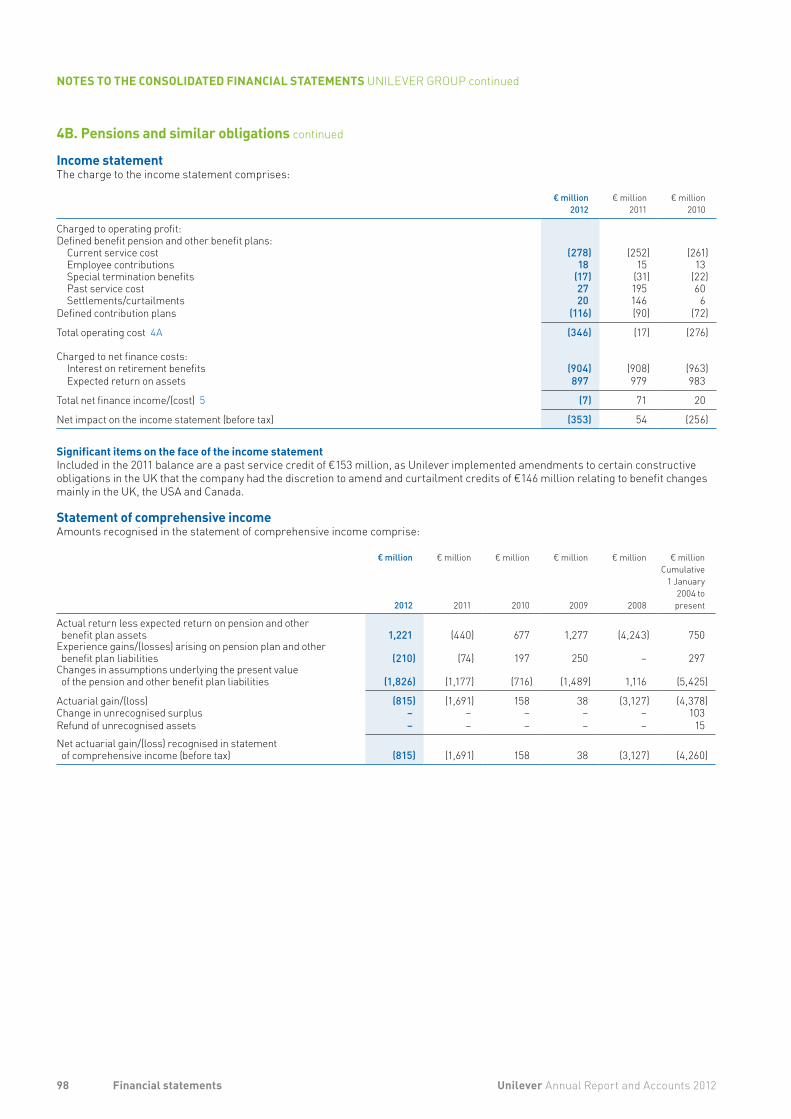
4B. Pensions and similar obligations continued
Income statementThe charge to the income statement comprises:
€ million2012
€ million2011
€ million2010
Charged to operating profit:Defined benefit pension and other benefit plans:
Current service cost (278) (252) (261)Employee contributions 18 15 13Special termination benefits (17) (31) (22)Past service cost 27 195 60Settlements/curtailments 20 146 6
Defined contribution plans (116) (90) (72)
Total operating cost 4A (346) (17) (276)
Charged to net finance costs:Interest on retirement benefits (904) (908) (963)Expected return on assets 897 979 983
Total net finance income/(cost) 5 (7) 71 20
Net impact on the income statement (before tax) (353) 54 (256)
Significant items on the face of the income statementIncluded in the 2011 balance are a past service credit of €153 million, as Unilever implemented amendments to certain constructive obligations in the UK that the company had the discretion to amend and curtailment credits of €146 million relating to benefit changes mainly in the UK, the USA and Canada.
Statement of comprehensive incomeAmounts recognised in the statement of comprehensive income comprise:
€ million
2012
€ million
2011
€ million
2010
€ million
2009
€ million
2008
€ millionCumulative
1 January2004 topresent
Actual return less expected return on pension and other benefit plan assets 1,221 (440) 677 1,277 (4,243) 750
Experience gains/(losses) arising on pension plan and other benefit plan liabilities (210) (74) 197 250 – 297
Changes in assumptions underlying the present value of the pension and other benefit plan liabilities (1,826) (1,177) (716) (1,489) 1,116 (5,425)
Actuarial gain/(loss) (815) (1,691) 158 38 (3,127) (4,378)Change in unrecognised surplus – – – – – 103Refund of unrecognised assets – – – – – 15Net actuarial gain/(loss) recognised in statement of comprehensive income (before tax) (815) (1,691) 158 38 (3,127) (4,260)
98 Unilever Annual Report and Accounts 2012Financial statements
NOTES TO THE CONSOLIDATED FINANCIAL STATEMENTS UNILEVER GROUP continued
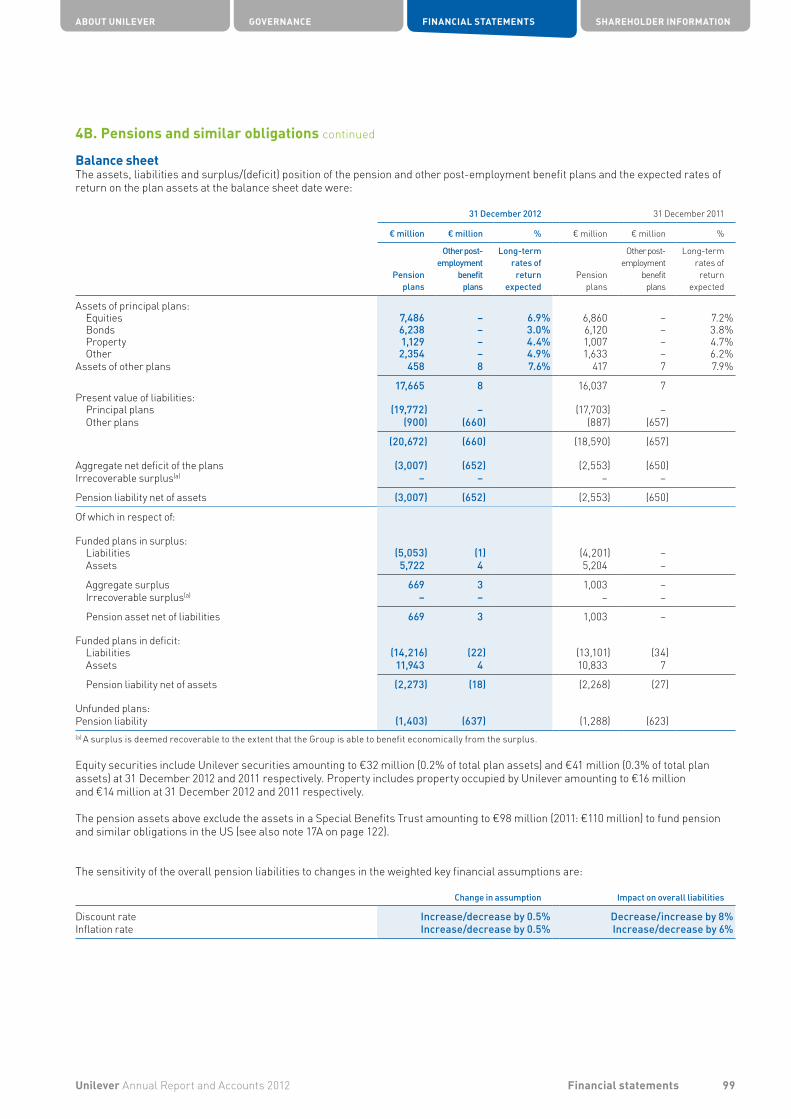
4B. Pensions and similar obligations continued
Balance sheetThe assets, liabilities and surplus/(deficit) position of the pension and other post-employment benefit plans and the expected rates of return on the plan assets at the balance sheet date were:
31 December 2012 31 December 2011
€ million € million % € million € million %
Pensionplans
Other post-employment
benefitplans
Long-termrates of
returnexpected
Pensionplans
Other post-employment
benefitplans
Long-termrates ofreturn
expected
Assets of principal plans:Equities 7,486 – 6.9% 6,860 – 7.2%Bonds 6,238 – 3.0% 6,120 – 3.8%Property 1,129 – 4.4% 1,007 – 4.7%Other 2,354 – 4.9% 1,633 – 6.2%
Assets of other plans 458 8 7.6% 417 7 7.9%
17,665 8 16,037 7Present value of liabilities:
Principal plans (19,772) – (17,703) –Other plans (900) (660) (887) (657)
(20,672) (660) (18,590) (657)
Aggregate net deficit of the plans (3,007) (652) (2,553) (650)Irrecoverable surplus(a) – – – –
Pension liability net of assets (3,007) (652) (2,553) (650)
Of which in respect of:
Funded plans in surplus:Liabilities (5,053) (1) (4,201) –Assets 5,722 4 5,204 –
Aggregate surplus 669 3 1,003 –Irrecoverable surplus(a) – – – –
Pension asset net of liabilities 669 3 1,003 –
Funded plans in deficit:Liabilities (14,216) (22) (13,101) (34)Assets 11,943 4 10,833 7
Pension liability net of assets (2,273) (18) (2,268) (27)
Unfunded plans:Pension liability (1,403) (637) (1,288) (623)(a) A surplus is deemed recoverable to the extent that the Group is able to benefit economically from the surplus.
Equity securities include Unilever securities amounting to €32 million (0.2% of total plan assets) and €41 million (0.3% of total plan assets) at 31 December 2012 and 2011 respectively. Property includes property occupied by Unilever amounting to €16 million and €14 million at 31 December 2012 and 2011 respectively.
The pension assets above exclude the assets in a Special Benefits Trust amounting to €98 million (2011: €110 million) to fund pension and similar obligations in the US (see also note 17A on page 122).
The sensitivity of the overall pension liabilities to changes in the weighted key financial assumptions are:
Change in assumption Impact on overall liabilities
Discount rate Increase/decrease by 0.5% Decrease/increase by 8%Inflation rate Increase/decrease by 0.5% Increase/decrease by 6%
ABOUT UNILEVER GOVERNANCE FINANCIAL STATEMENTS SHAREHOLDER INFORMATION
99Unilever Annual Report and Accounts 2012 Financial statements
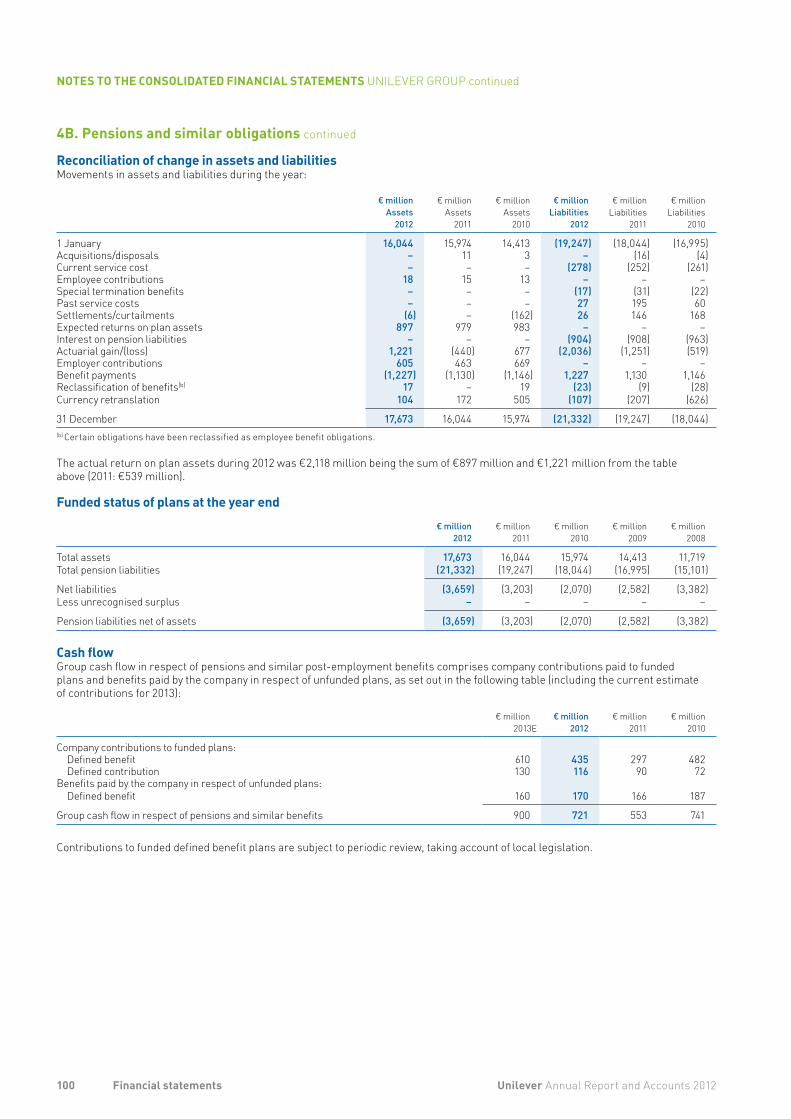
4B. Pensions and similar obligations continued
Reconciliation of change in assets and liabilitiesMovements in assets and liabilities during the year:
€ millionAssets
2012
€ millionAssets
2011
€ millionAssets
2010
€ millionLiabilities
2012
€ millionLiabilities
2011
€ millionLiabilities
2010
1 January 16,044 15,974 14,413 (19,247) (18,044) (16,995)Acquisitions/disposals – 11 3 – (16) (4)Current service cost – – – (278) (252) (261)Employee contributions 18 15 13 – – –Special termination benefits – – – (17) (31) (22)Past service costs – – – 27 195 60Settlements/curtailments (6) – (162) 26 146 168Expected returns on plan assets 897 979 983 – – –Interest on pension liabilities – – – (904) (908) (963)Actuarial gain/(loss) 1,221 (440) 677 (2,036) (1,251) (519)Employer contributions 605 463 669 – – –Benefit payments (1,227) (1,130) (1,146) 1,227 1,130 1,146Reclassification of benefits(b) 17 – 19 (23) (9) (28)Currency retranslation 104 172 505 (107) (207) (626)
31 December 17,673 16,044 15,974 (21,332) (19,247) (18,044)(b) Certain obligations have been reclassified as employee benefit obligations.
The actual return on plan assets during 2012 was €2,118 million being the sum of €897 million and €1,221 million from the table above (2011: €539 million).
Funded status of plans at the year end
€ million2012
€ million2011
€ million2010
€ million2009
€ million2008
Total assets 17,673 16,044 15,974 14,413 11,719Total pension liabilities (21,332) (19,247) (18,044) (16,995) (15,101)
Net liabilities (3,659) (3,203) (2,070) (2,582) (3,382)Less unrecognised surplus – – – – –
Pension liabilities net of assets (3,659) (3,203) (2,070) (2,582) (3,382)
Cash flowGroup cash flow in respect of pensions and similar post-employment benefits comprises company contributions paid to funded plans and benefits paid by the company in respect of unfunded plans, as set out in the following table (including the current estimate of contributions for 2013):
€ million
2013E€ million
2012€ million
2011€ million
2010
Company contributions to funded plans:Defined benefit 610 435 297 482Defined contribution 130 116 90 72
Benefits paid by the company in respect of unfunded plans:Defined benefit 160 170 166 187
Group cash flow in respect of pensions and similar benefits 900 721 553 741
Contributions to funded defined benefit plans are subject to periodic review, taking account of local legislation.
100 Unilever Annual Report and Accounts 2012Financial statements
NOTES TO THE CONSOLIDATED FINANCIAL STATEMENTS UNILEVER GROUP continued

4C. Share-based compensation plans
The fair value of the awards at the grant date is calculated using pricing models and recognised over the vesting period of the grant as a remuneration cost with a corresponding increase in equity. The value of the charge is adjusted to reflect expected and actual levels of awards vesting, except where the failure to vest is as a result of not meeting a market condition. Cancellations of equity instruments are treated as an acceleration of the vesting period and any outstanding charge is recognised in the income statement immediately.
As at 31 December 2012, the Group had share-based compensation plans in the form of performance shares, share options and other share awards.
The numbers in this note include those for Executive Directors shown in the Directors’ Remuneration Report on pages 62 to 81 and those for key management personnel shown in note 4A on page 95. Non-Executive Directors do not participate in any of the share-based compensation plans.
The charge in each of the last three years is shown below, and relates to equity settled plans:
Income statement charge
€ million2012
€ million2011
€ million2010
Performance share plans (147) (93) (120)Other plans (6) (12) (24)
(153) (105) (144)
Performance Share PlansPerformance share awards are made under the Management Co-Investment Plan (MCIP) and the Global Share Incentive Plan (GSIP). The MCIP allows Unilever’s managers to invest up to 60% of their annual bonus in shares in Unilever and to receive a corresponding award of performance-related shares. Under GSIP Unilever’s managers receive annual awards of NV and PLC shares. The awards of both plans will vest after three years between 0% and 200% of grant level, depending on the satisfaction of performance metrics.
The performance metrics of both MCIP and GSIP are underlying sales growth, operating cash flow and core operating margin improvement. There is an additional target based on relative total shareholder return (TSR) for senior executives.
A summary of the status of the Performance Share Plans as at 31 December 2012, 2011 and 2010 and changes during the years ended on these dates is presented below:
2012Number of
shares
2011Number of
shares
2010Number of
shares
Outstanding at 1 January 18,642,656 17,240,376 17,536,148Awarded 7,036,147 9,587,934 9,292,689Vested (6,277,057) (6,688,229) (8,626,746)Forfeited (1,370,645) (1,497,425) (961,715)
Outstanding at 31 December 18,031,101 18,642,656 17,240,376
2012 2011 2010
Share award value informationFair value per share award during the year €25.02 €22.91 €21.49
Additional informationAt 31 December 2012, there were options outstanding to purchase 16,823,830 (2011: 24,196,358) ordinary shares in NV or PLC in respect of share-based compensation plans of NV and its subsidiaries and the North American plans, and 9,418,749 (2011: 10,396,180) ordinary shares in NV or PLC in respect of share-based compensation plans of PLC and its subsidiaries.
ABOUT UNILEVER GOVERNANCE FINANCIAL STATEMENTS SHAREHOLDER INFORMATION
101Unilever Annual Report and Accounts 2012 Financial statements
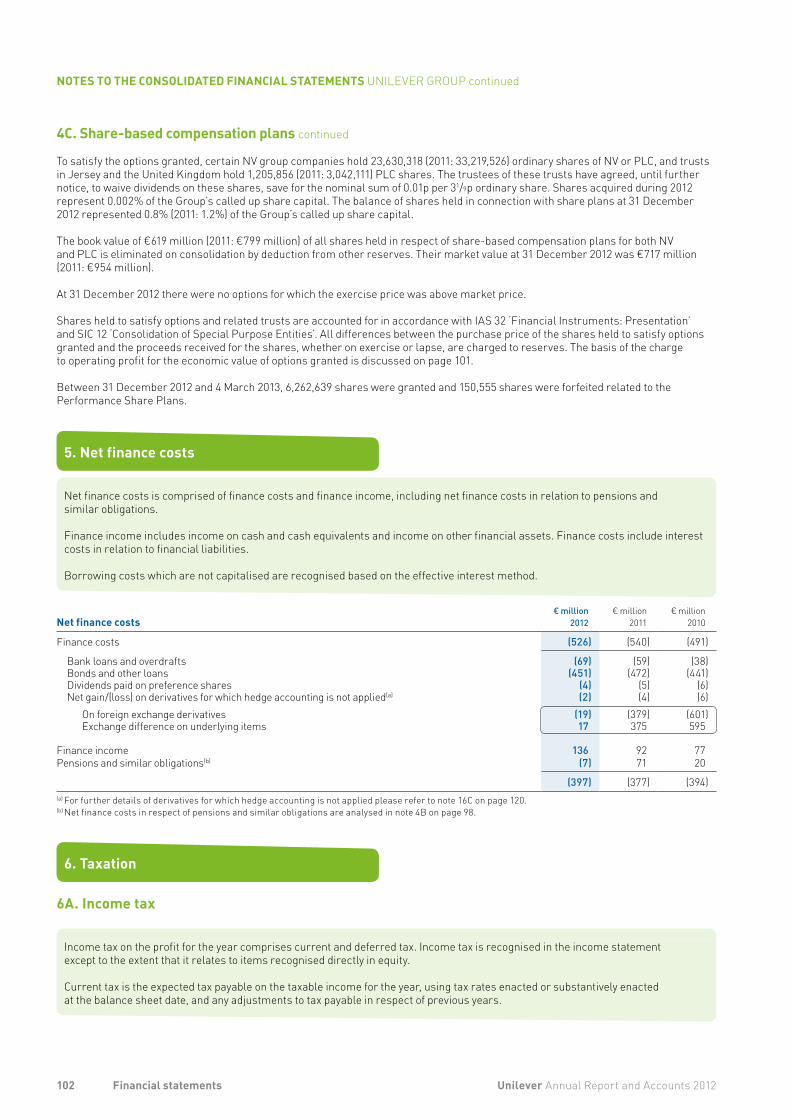
4C. Share-based compensation plans continued
To satisfy the options granted, certain NV group companies hold 23,630,318 (2011: 33,219,526) ordinary shares of NV or PLC, and trusts in Jersey and the United Kingdom hold 1,205,856 (2011: 3,042,111) PLC shares. The trustees of these trusts have agreed, until further notice, to waive dividends on these shares, save for the nominal sum of 0.01p per 31/9p ordinary share. Shares acquired during 2012 represent 0.002% of the Group’s called up share capital. The balance of shares held in connection with share plans at 31 December 2012 represented 0.8% (2011: 1.2%) of the Group’s called up share capital.
The book value of €619 million (2011: €799 million) of all shares held in respect of share-based compensation plans for both NV and PLC is eliminated on consolidation by deduction from other reserves. Their market value at 31 December 2012 was €717 million (2011: €954 million).
At 31 December 2012 there were no options for which the exercise price was above market price.
Shares held to satisfy options and related trusts are accounted for in accordance with IAS 32 ‘Financial Instruments: Presentation’ and SIC 12 ‘Consolidation of Special Purpose Entities’. All differences between the purchase price of the shares held to satisfy options granted and the proceeds received for the shares, whether on exercise or lapse, are charged to reserves. The basis of the charge to operating profit for the economic value of options granted is discussed on page 101.
Between 31 December 2012 and 4 March 2013, 6,262,639 shares were granted and 150,555 shares were forfeited related to the Performance Share Plans.
5. Net finance costs
Net finance costs is comprised of finance costs and finance income, including net finance costs in relation to pensions and similar obligations.
Finance income includes income on cash and cash equivalents and income on other financial assets. Finance costs include interest costs in relation to financial liabilities.
Borrowing costs which are not capitalised are recognised based on the effective interest method.
Net finance costs€ million
2012€ million
2011€ million
2010
Finance costs (526) (540) (491)
Bank loans and overdrafts (69) (59) (38)Bonds and other loans (451) (472) (441)Dividends paid on preference shares (4) (5) (6)Net gain/(loss) on derivatives for which hedge accounting is not applied(a) (2) (4) (6)
On foreign exchange derivatives (19) (379) (601)Exchange difference on underlying items 17 375 595
Finance income 136 92 77Pensions and similar obligations(b) (7) 71 20
(397) (377) (394)(a) For further details of derivatives for which hedge accounting is not applied please refer to note 16C on page 120.(b) Net finance costs in respect of pensions and similar obligations are analysed in note 4B on page 98.
6. Taxation
6A. Income tax
Income tax on the profit for the year comprises current and deferred tax. Income tax is recognised in the income statement except to the extent that it relates to items recognised directly in equity.
Current tax is the expected tax payable on the taxable income for the year, using tax rates enacted or substantively enacted at the balance sheet date, and any adjustments to tax payable in respect of previous years.
102 Unilever Annual Report and Accounts 2012Financial statements
NOTES TO THE CONSOLIDATED FINANCIAL STATEMENTS UNILEVER GROUP continued

6A. Income tax continued
Tax charge in income statement€ million
2012€ million
2011€ million
2010
Current taxCurrent year (1,897) (1,571) (1,479)Over/(under) provided in prior years (135) 93 88
(2,032) (1,478) (1,391)
Deferred taxOrigination and reversal of temporary differences 164 (179) (237)Changes in tax rates 81 1 (2)Recognition of previously unrecognised losses brought forward 52 34 96
297 (144) (143)
(1,735) (1,622) (1,534)
The reconciliation between the computed weighted average rate of income tax expense, which is generally applicable to Unilever companies, and the actual rate of taxation charged is as follows:
Reconciliation of effective tax rate%
2012%
2011%
2010
Computed rate of tax(a) 26 27 28Differences due to:
Incentive tax credits (5) (5) (5)Withholding tax on dividends 2 2 2Adjustments to previous years – (1) (3)Expenses not deductible for tax purposes 2 1 1Other 1 2 3
Effective tax rate 26 26 26(a) The computed tax rate used is the average of the standard rate of tax applicable in the countries in which Unilever operates, weighted by the amount of profit
before taxation generated in each of those countries. For this reason the rate may vary from year to year according to the mix of profit and related tax rates.
6B. Deferred tax
Deferred tax is recognised using the liability method on taxable temporary differences between the tax base and the accounting base of items included in the balance sheet of the Group. Certain temporary differences are not provided for as follows: • goodwill not deductible for tax purposes; • the initial recognition of assets or liabilities that affect neither accounting nor taxable profit; and • differences relating to investments in subsidiaries to the extent that they will probably not reverse in the foreseeable future. The amount of deferred tax provided is based on the expected manner of realisation or settlement of the carrying amount of assets and liabilities, using tax rates enacted, or substantively enacted, at the year end.
A deferred tax asset is recognised only to the extent that it is probable that future taxable profits will be available against which the asset can be utilised. Deferred tax assets are reduced to the extent that it is no longer probable that the related tax benefit will be realised.
Movements in 2012 and 2011
€ millionAs at
1 January2012
€ million
Incomestatement
€ million
Other
€ millionAs at
31 December2012
€ millionAs at
1 January2011
€ million
Incomestatement
€ million
Other
€ millionAs at
31 December2011
Pensions and similar obligations 748 (39) 125 834 440 (113) 421 748Provisions 661 105 (147) 619 701 (45) 5 661Goodwill and intangible assets (1,721) 92 193 (1,436) (1,122) 78 (677) (1,721)Accelerated tax depreciation (668) (45) 90 (623) (540) (60) (68) (668)Tax losses 100 43 (9) 134 117 (21) 4 100Fair value gains (20) 6 (7) (21) (25) (12) 17 (20)Fair value losses 31 5 (24) 12 13 2 16 31Share-based payments 118 64 (10) 172 120 (19) 17 118Other 47 66 (84) 29 23 46 (22) 47
(704) 297 127 (280) (273) (144) (287) (704)
ABOUT UNILEVER GOVERNANCE FINANCIAL STATEMENTS SHAREHOLDER INFORMATION
103Unilever Annual Report and Accounts 2012 Financial statements

6B. Deferred tax continued
At the balance sheet date, the Group has unused tax losses of €1,582 million (2011: €1,568 million) and tax credits amounting to €120 million (2011: €39 million) available for offset against future taxable profits. Deferred tax assets have not been recognised in respect of unused tax losses of €1,234 million (2011: €1,191 million) and tax credits of €120 million (2011: €38 million), as it is not probable that there will be future taxable profits within the entities against which the losses can be utilised. The majority of these tax losses and credits arise in tax jurisdictions where they do not expire with the exception of €516 million (2011: €512 million) of state and federal tax losses in the US which expire between now and 2031.
Other deductible temporary differences of €39 million (2011: €58 million) have not been recognised as a deferred tax asset. There is no expiry date for these differences.
At the balance sheet date, the aggregate amount of temporary differences associated with undistributed earnings of subsidiaries for which deferred tax liabilities have not been recognised was €1,449 million (2011: €1,443 million). No liability has been recognised in respect of these differences because the Group is in a position to control the timing of the reversal of the temporary differences, and it is probable that such differences will not reverse in the foreseeable future.
Deferred income tax assets and liabilities are offset when there is a legally enforceable right to set off current tax assets against current tax liabilities and when the deferred income taxes relate to the same fiscal authority. The following amounts, determined after appropriate offsetting, are shown in the consolidated balance sheet:
Deferred tax assets and liabilities
€ millionAssets
2012
€ millionAssets
2011
€ millionLiabilities
2012
€ millionLiabilities
2011
€ millionTotal2012
€ millionTotal2011
Pensions and similar obligations 614 555 220 193 834 748 Provisions 561 419 58 242 619 661 Goodwill and intangible assets (111) (612) (1,325) (1,109) (1,436) (1,721)Accelerated tax depreciation (175) (129) (448) (539) (623) (668)Tax losses 133 69 1 31 134 100 Fair value gains 7 (1) (28) (19) (21) (20)Fair value losses 1 27 11 4 12 31 Share-based payments 51 63 121 55 172 118 Other 32 30 (3) 17 29 47
1,113 421 (1,393) (1,125) (280) (704)Of which deferred tax to be recovered/(settled) after more than 12 months 725 163 (1,378) (1,131) (653) (968)
6C. Tax on other comprehensive income
Income tax is recognised in other comprehensive income for items recognised directly in equity.
Tax effects of the components of other comprehensive income were as follows:
€ million
Beforetax
2012
€ millionTax
charge/credit
2012
€ million
Aftertax
2012
€ million
Beforetax
2011
€ millionTax
charge/credit
2011
€ million
Aftertax
2011
Fair value gains/(losses) on financial instruments (130) 5 (125) (194) 26 (168)Actuarial gains/(losses) on pension schemes (815) 171 (644) (1,691) 448 (1,243)Currency retranslation gains/(losses) (307) (9) (316) (713) 10 (703)
(1,252) 167 (1,085) (2,598) 484 (2,114)
104 Unilever Annual Report and Accounts 2012Financial statements
NOTES TO THE CONSOLIDATED FINANCIAL STATEMENTS UNILEVER GROUP continued
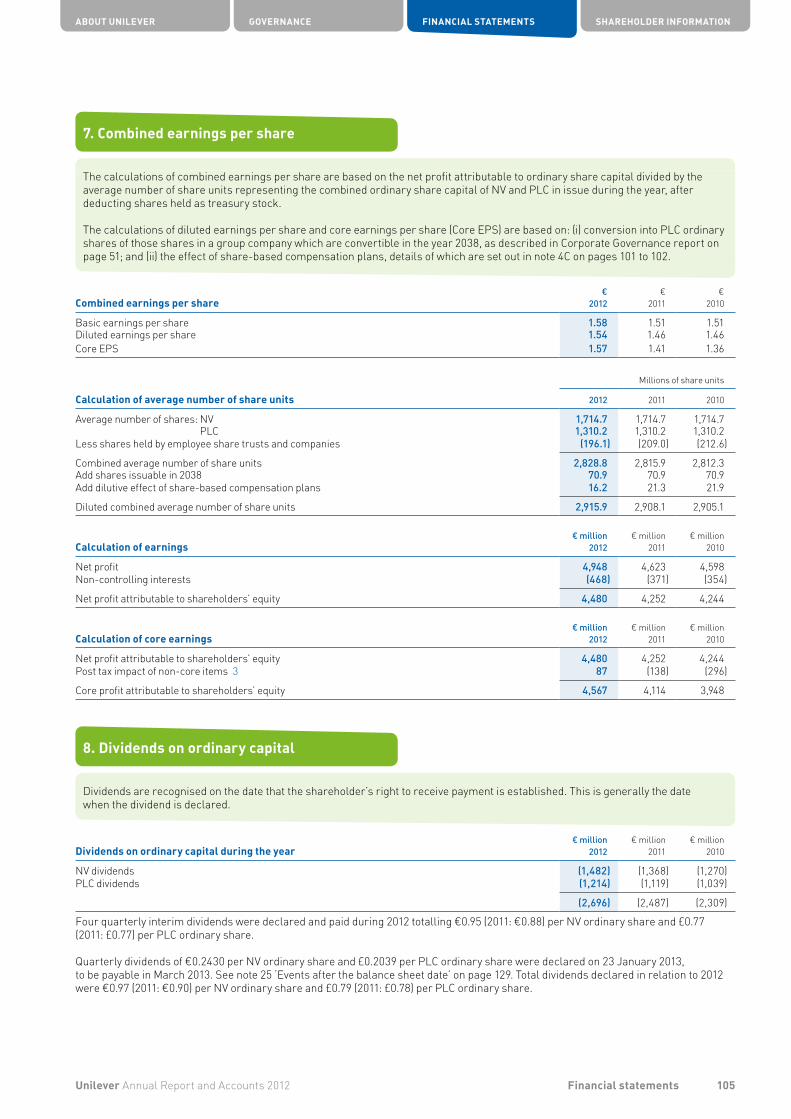
7. Combined earnings per share
The calculations of combined earnings per share are based on the net profit attributable to ordinary share capital divided by the average number of share units representing the combined ordinary share capital of NV and PLC in issue during the year, after deducting shares held as treasury stock.
The calculations of diluted earnings per share and core earnings per share (Core EPS) are based on: (i) conversion into PLC ordinary shares of those shares in a group company which are convertible in the year 2038, as described in Corporate Governance report on page 51; and (ii) the effect of share-based compensation plans, details of which are set out in note 4C on pages 101 to 102.
Combined earnings per share€
2012€
2011€
2010
Basic earnings per share 1.58 1.51 1.51Diluted earnings per share 1.54 1.46 1.46Core EPS 1.57 1.41 1.36
Millions of share units
Calculation of average number of share units 2012 2011 2010
Average number of shares: NV 1,714.7 1,714.7 1,714.7PLC 1,310.2 1,310.2 1,310.2
Less shares held by employee share trusts and companies (196.1) (209.0) (212.6)
Combined average number of share units 2,828.8 2,815.9 2,812.3Add shares issuable in 2038 70.9 70.9 70.9Add dilutive effect of share-based compensation plans 16.2 21.3 21.9
Diluted combined average number of share units 2,915.9 2,908.1 2,905.1
Calculation of earnings€ million
2012€ million
2011€ million
2010
Net profit 4,948 4,623 4,598Non-controlling interests (468) (371) (354)
Net profit attributable to shareholders’ equity 4,480 4,252 4,244
Calculation of core earnings€ million
2012€ million
2011€ million
2010
Net profit attributable to shareholders’ equity 4,480 4,252 4,244 Post tax impact of non-core items 3 87 (138) (296)
Core profit attributable to shareholders’ equity 4,567 4,114 3,948
8. Dividends on ordinary capital
Dividends are recognised on the date that the shareholder’s right to receive payment is established. This is generally the date when the dividend is declared.
Dividends on ordinary capital during the year€ million
2012€ million
2011€ million
2010
NV dividends (1,482) (1,368) (1,270)PLC dividends (1,214) (1,119) (1,039)
(2,696) (2,487) (2,309)
Four quarterly interim dividends were declared and paid during 2012 totalling €0.95 (2011: €0.88) per NV ordinary share and £0.77 (2011: £0.77) per PLC ordinary share.
Quarterly dividends of €0.2430 per NV ordinary share and £0.2039 per PLC ordinary share were declared on 23 January 2013, to be payable in March 2013. See note 25 ‘Events after the balance sheet date’ on page 129. Total dividends declared in relation to 2012 were €0.97 (2011: €0.90) per NV ordinary share and £0.79 (2011: £0.78) per PLC ordinary share.
ABOUT UNILEVER GOVERNANCE FINANCIAL STATEMENTS SHAREHOLDER INFORMATION
105Unilever Annual Report and Accounts 2012 Financial statements
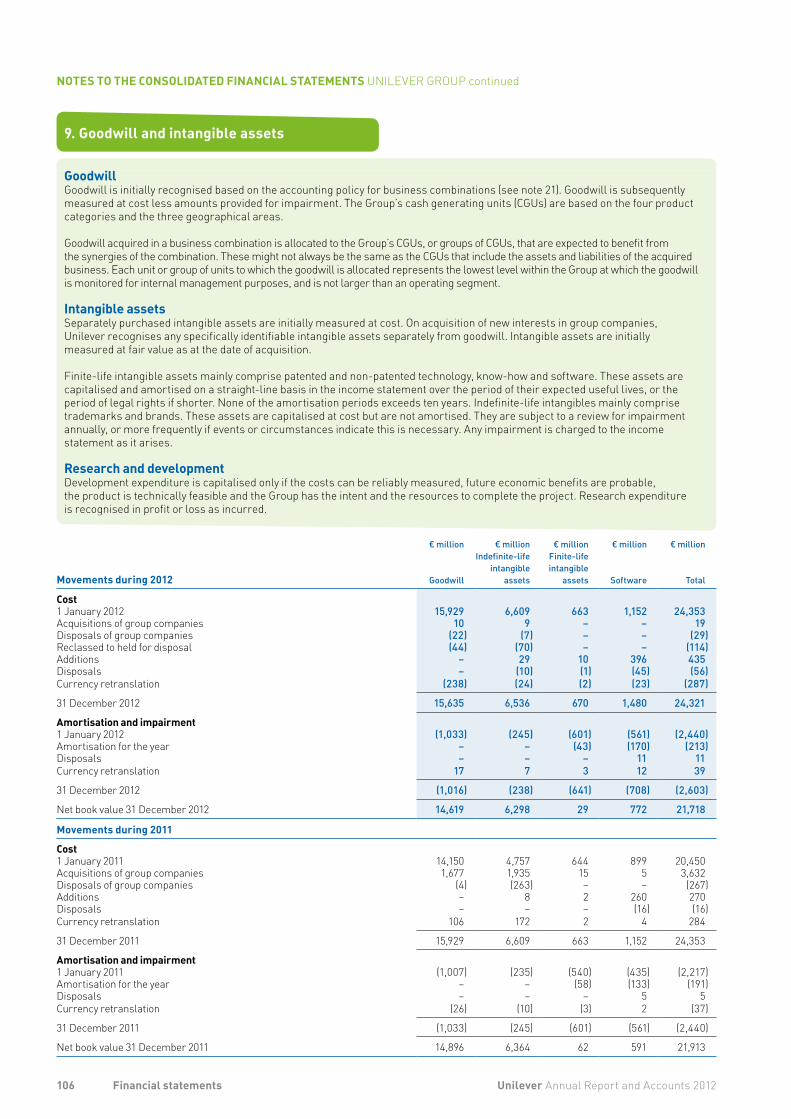
9. Goodwill and intangible assets
GoodwillGoodwill is initially recognised based on the accounting policy for business combinations (see note 21). Goodwill is subsequently measured at cost less amounts provided for impairment. The Group’s cash generating units (CGUs) are based on the four product categories and the three geographical areas.
Goodwill acquired in a business combination is allocated to the Group’s CGUs, or groups of CGUs, that are expected to benefit from the synergies of the combination. These might not always be the same as the CGUs that include the assets and liabilities of the acquired business. Each unit or group of units to which the goodwill is allocated represents the lowest level within the Group at which the goodwill is monitored for internal management purposes, and is not larger than an operating segment.
Intangible assetsSeparately purchased intangible assets are initially measured at cost. On acquisition of new interests in group companies, Unilever recognises any specifically identifiable intangible assets separately from goodwill. Intangible assets are initially measured at fair value as at the date of acquisition.
Finite-life intangible assets mainly comprise patented and non-patented technology, know-how and software. These assets are capitalised and amortised on a straight-line basis in the income statement over the period of their expected useful lives, or the period of legal rights if shorter. None of the amortisation periods exceeds ten years. Indefinite-life intangibles mainly comprise trademarks and brands. These assets are capitalised at cost but are not amortised. They are subject to a review for impairment annually, or more frequently if events or circumstances indicate this is necessary. Any impairment is charged to the income statement as it arises.
Research and developmentDevelopment expenditure is capitalised only if the costs can be reliably measured, future economic benefits are probable, the product is technically feasible and the Group has the intent and the resources to complete the project. Research expenditure is recognised in profit or loss as incurred.
Movements during 2012
€ million
Goodwill
€ millionIndefinite-life
intangibleassets
€ millionFinite-lifeintangible
assets
€ million
Software
€ million
Total
Cost1 January 2012 15,929 6,609 663 1,152 24,353Acquisitions of group companies 10 9 – – 19Disposals of group companies (22) (7) – – (29)Reclassed to held for disposal (44) (70) – – (114)Additions – 29 10 396 435Disposals – (10) (1) (45) (56)Currency retranslation (238) (24) (2) (23) (287)
31 December 2012 15,635 6,536 670 1,480 24,321
Amortisation and impairment1 January 2012 (1,033) (245) (601) (561) (2,440)Amortisation for the year – – (43) (170) (213)Disposals – – – 11 11Currency retranslation 17 7 3 12 39
31 December 2012 (1,016) (238) (641) (708) (2,603)
Net book value 31 December 2012 14,619 6,298 29 772 21,718
Movements during 2011
Cost1 January 2011 14,150 4,757 644 899 20,450Acquisitions of group companies 1,677 1,935 15 5 3,632Disposals of group companies (4) (263) – – (267)Additions – 8 2 260 270Disposals – – – (16) (16)Currency retranslation 106 172 2 4 284
31 December 2011 15,929 6,609 663 1,152 24,353
Amortisation and impairment1 January 2011 (1,007) (235) (540) (435) (2,217)Amortisation for the year – – (58) (133) (191)Disposals – – – 5 5Currency retranslation (26) (10) (3) 2 (37)
31 December 2011 (1,033) (245) (601) (561) (2,440)
Net book value 31 December 2011 14,896 6,364 62 591 21,913
106 Unilever Annual Report and Accounts 2012Financial statements
NOTES TO THE CONSOLIDATED FINANCIAL STATEMENTS UNILEVER GROUP continued
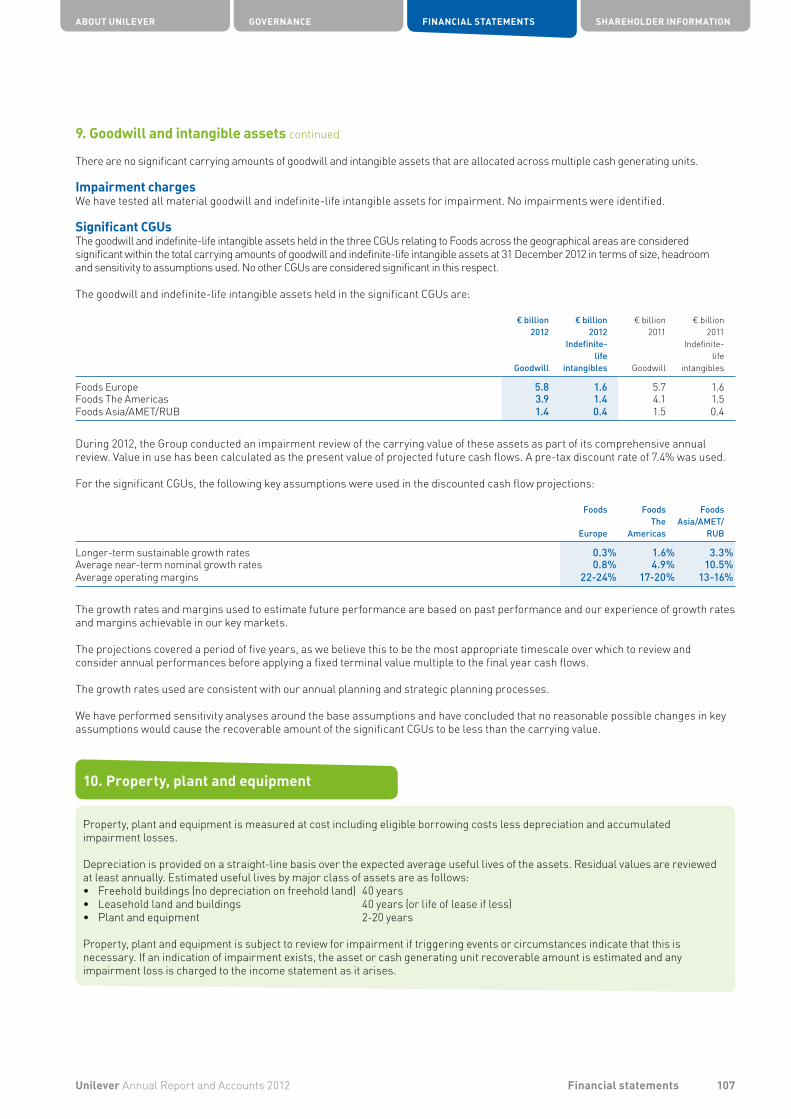
9. Goodwill and intangible assets continued
There are no significant carrying amounts of goodwill and intangible assets that are allocated across multiple cash generating units.
Impairment chargesWe have tested all material goodwill and indefinite-life intangible assets for impairment. No impairments were identified.
Significant CGUsThe goodwill and indefinite-life intangible assets held in the three CGUs relating to Foods across the geographical areas are considered significant within the total carrying amounts of goodwill and indefinite-life intangible assets at 31 December 2012 in terms of size, headroom and sensitivity to assumptions used. No other CGUs are considered significant in this respect.
The goodwill and indefinite-life intangible assets held in the significant CGUs are:
€ billion2012
Goodwill
€ billion2012
Indefinite- life
intangibles
€ billion2011
Goodwill
€ billion2011
Indefinite-life
intangibles
Foods Europe 5.8 1.6 5.7 1.6Foods The Americas 3.9 1.4 4.1 1.5Foods Asia/AMET/RUB 1.4 0.4 1.5 0.4
During 2012, the Group conducted an impairment review of the carrying value of these assets as part of its comprehensive annual review. Value in use has been calculated as the present value of projected future cash flows. A pre-tax discount rate of 7.4% was used.
For the significant CGUs, the following key assumptions were used in the discounted cash flow projections:
Foods
Europe
FoodsThe
Americas
FoodsAsia/AMET/
RUB
Longer-term sustainable growth rates 0.3% 1.6% 3.3%Average near-term nominal growth rates 0.8% 4.9% 10.5%Average operating margins 22-24% 17-20% 13-16%
The growth rates and margins used to estimate future performance are based on past performance and our experience of growth rates and margins achievable in our key markets.
The projections covered a period of five years, as we believe this to be the most appropriate timescale over which to review and consider annual performances before applying a fixed terminal value multiple to the final year cash flows.
The growth rates used are consistent with our annual planning and strategic planning processes.
We have performed sensitivity analyses around the base assumptions and have concluded that no reasonable possible changes in key assumptions would cause the recoverable amount of the significant CGUs to be less than the carrying value.
10. Property, plant and equipment
Property, plant and equipment is measured at cost including eligible borrowing costs less depreciation and accumulated impairment losses.
Depreciation is provided on a straight-line basis over the expected average useful lives of the assets. Residual values are reviewed at least annually. Estimated useful lives by major class of assets are as follows:• Freehold buildings (no depreciation on freehold land) 40 years• Leasehold land and buildings 40 years (or life of lease if less)• Plant and equipment 2-20 years
Property, plant and equipment is subject to review for impairment if triggering events or circumstances indicate that this is necessary. If an indication of impairment exists, the asset or cash generating unit recoverable amount is estimated and any impairment loss is charged to the income statement as it arises.
ABOUT UNILEVER GOVERNANCE FINANCIAL STATEMENTS SHAREHOLDER INFORMATION
107Unilever Annual Report and Accounts 2012 Financial statements
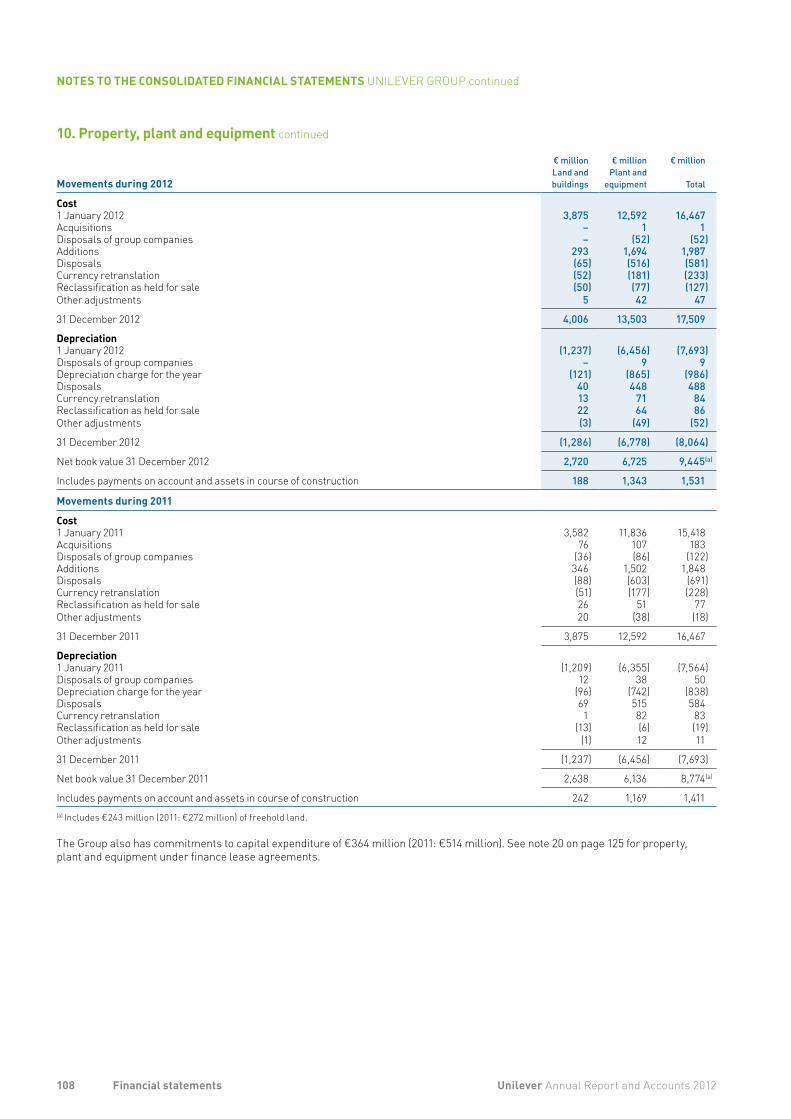
10. Property, plant and equipment continued
Movements during 2012
€ millionLand andbuildings
€ millionPlant and
equipment
€ million
Total
Cost1 January 2012 3,875 12,592 16,467Acquisitions – 1 1Disposals of group companies – (52) (52)Additions 293 1,694 1,987Disposals (65) (516) (581)Currency retranslation (52) (181) (233)Reclassification as held for sale (50) (77) (127)Other adjustments 5 42 47
31 December 2012 4,006 13,503 17,509
Depreciation1 January 2012 (1,237) (6,456) (7,693)Disposals of group companies – 9 9Depreciation charge for the year (121) (865) (986)Disposals 40 448 488Currency retranslation 13 71 84Reclassification as held for sale 22 64 86Other adjustments (3) (49) (52)
31 December 2012 (1,286) (6,778) (8,064)
Net book value 31 December 2012 2,720 6,725 9,445(a)
Includes payments on account and assets in course of construction 188 1,343 1,531
Movements during 2011
Cost1 January 2011 3,582 11,836 15,418Acquisitions 76 107 183Disposals of group companies (36) (86) (122)Additions 346 1,502 1,848Disposals (88) (603) (691)Currency retranslation (51) (177) (228)Reclassification as held for sale 26 51 77Other adjustments 20 (38) (18)
31 December 2011 3,875 12,592 16,467
Depreciation1 January 2011 (1,209) (6,355) (7,564)Disposals of group companies 12 38 50Depreciation charge for the year (96) (742) (838)Disposals 69 515 584Currency retranslation 1 82 83Reclassification as held for sale (13) (6) (19)Other adjustments (1) 12 11
31 December 2011 (1,237) (6,456) (7,693)
Net book value 31 December 2011 2,638 6,136 8,774(a)
Includes payments on account and assets in course of construction 242 1,169 1,411(a) Includes €243 million (2011: €272 million) of freehold land.
The Group also has commitments to capital expenditure of €364 million (2011: €514 million). See note 20 on page 125 for property, plant and equipment under finance lease agreements.
108 Unilever Annual Report and Accounts 2012Financial statements
NOTES TO THE CONSOLIDATED FINANCIAL STATEMENTS UNILEVER GROUP continued
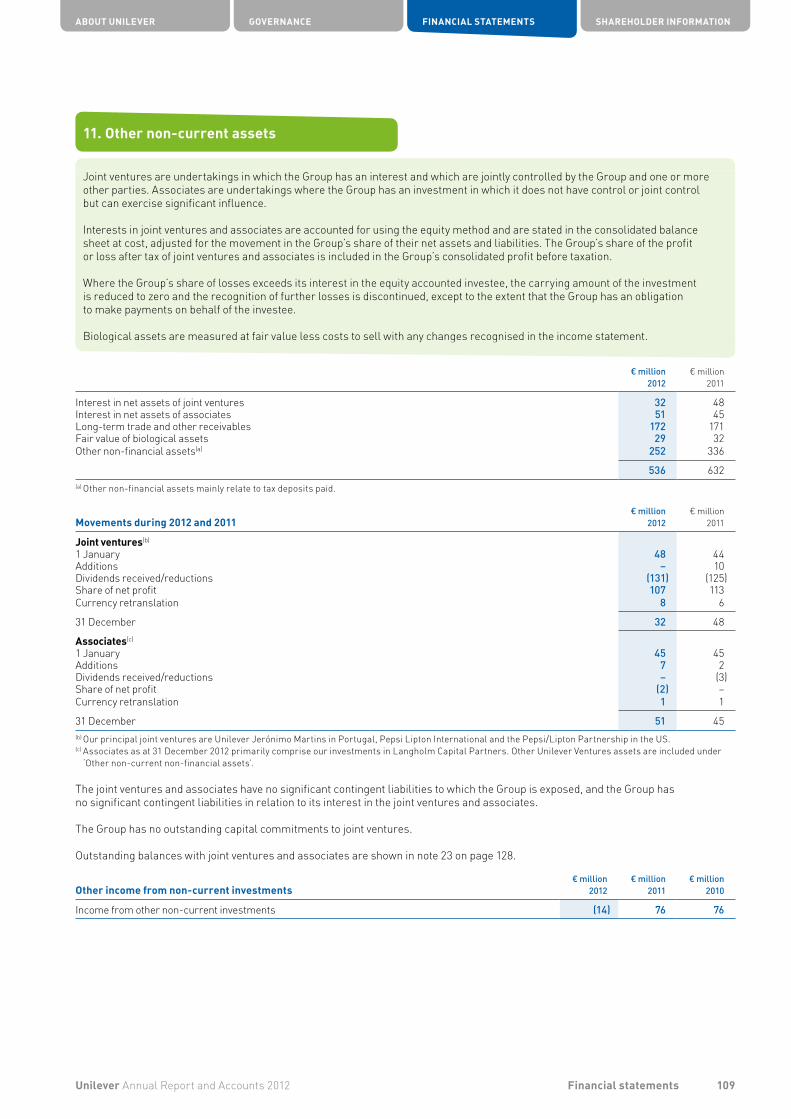
11. Other non-current assets
Joint ventures are undertakings in which the Group has an interest and which are jointly controlled by the Group and one or more other parties. Associates are undertakings where the Group has an investment in which it does not have control or joint control but can exercise significant influence.
Interests in joint ventures and associates are accounted for using the equity method and are stated in the consolidated balance sheet at cost, adjusted for the movement in the Group’s share of their net assets and liabilities. The Group’s share of the profit or loss after tax of joint ventures and associates is included in the Group’s consolidated profit before taxation.
Where the Group’s share of losses exceeds its interest in the equity accounted investee, the carrying amount of the investment is reduced to zero and the recognition of further losses is discontinued, except to the extent that the Group has an obligation to make payments on behalf of the investee.
Biological assets are measured at fair value less costs to sell with any changes recognised in the income statement.
€ million2012
€ million2011
Interest in net assets of joint ventures 32 48 Interest in net assets of associates 51 45 Long-term trade and other receivables 172 171 Fair value of biological assets 29 32 Other non-financial assets(a) 252 336
536 632 (a) Other non-financial assets mainly relate to tax deposits paid.
Movements during 2012 and 2011€ million
2012€ million
2011
Joint ventures(b)
1 January 48 44 Additions – 10 Dividends received/reductions (131) (125)Share of net profit 107 113 Currency retranslation 8 6
31 December 32 48
Associates(c)
1 January 45 45 Additions 7 2 Dividends received/reductions – (3)Share of net profit (2) – Currency retranslation 1 1
31 December 51 45 (b) Our principal joint ventures are Unilever Jerónimo Martins in Portugal, Pepsi Lipton International and the Pepsi/Lipton Partnership in the US.(c) Associates as at 31 December 2012 primarily comprise our investments in Langholm Capital Partners. Other Unilever Ventures assets are included under
‘Other non-current non-financial assets’.
The joint ventures and associates have no significant contingent liabilities to which the Group is exposed, and the Group has no significant contingent liabilities in relation to its interest in the joint ventures and associates.
The Group has no outstanding capital commitments to joint ventures.
Outstanding balances with joint ventures and associates are shown in note 23 on page 128.
Other income from non-current investments€ million
2012€ million
2011€ million
2010
Income from other non-current investments (14) 76 76
ABOUT UNILEVER GOVERNANCE FINANCIAL STATEMENTS SHAREHOLDER INFORMATION
109Unilever Annual Report and Accounts 2012 Financial statements

12. Inventories
Inventories are valued at the lower of weighted average cost and net realisable value. Cost comprises direct costs and, where appropriate, a proportion of attributable production overheads. Net realisable value is the estimated selling price less the estimated costs necessary to make the sale.
Inventories€ million
2012€ million
2011
Raw materials and consumables 1,517 1,584Finished goods and goods for resale 2,919 3,017
4,436 4,601
Inventories with a value of €143 million (2011: €158 million) are carried at net realisable value, this being lower than cost. During 2012, €131 million (2011: €99 million) was charged to the income statement for damaged, obsolete and lost inventories. In 2012, €71 million (2011: €43 million) was utilised or released to the income statement from inventory provisions taken in earlier years.
13. Trade and other current receivables
Trade and other receivables are initially recognised at fair value plus any directly attributable transaction costs. Subsequently these assets are held at amortised cost, using the effective interest method and net of any impairment losses.
We do not consider the fair values of trade and other receivables to be significantly different from their carrying values. Credit terms for customers are determined in individual territories. Concentrations of credit risk with respect to trade receivables are limited, due to the Group’s customer base being large and diverse. Our historical experience of collecting receivables, supported by the level of default, is that credit risk is low across territories and so trade receivables are considered to be a single class of financial assets. Balances are considered for impairment on an individual basis rather than by reference to the extent that they become overdue.
Trade and other current receivables€ million
2012€ million
2011
Due within one yearTrade receivables 2,793 2,897Prepayments and accrued income 549 591Other receivables 1,094 1,025
4,436 4,513
Other receivables comprise financial assets of €502 million (2011: €327 million), including supplier and customer deposits, employee advances and certain derivatives, and non-financial assets of €592 million (2011: €698 million), including tax deposits and reclaimable sales tax.
110 Unilever Annual Report and Accounts 2012Financial statements
NOTES TO THE CONSOLIDATED FINANCIAL STATEMENTS UNILEVER GROUP continued
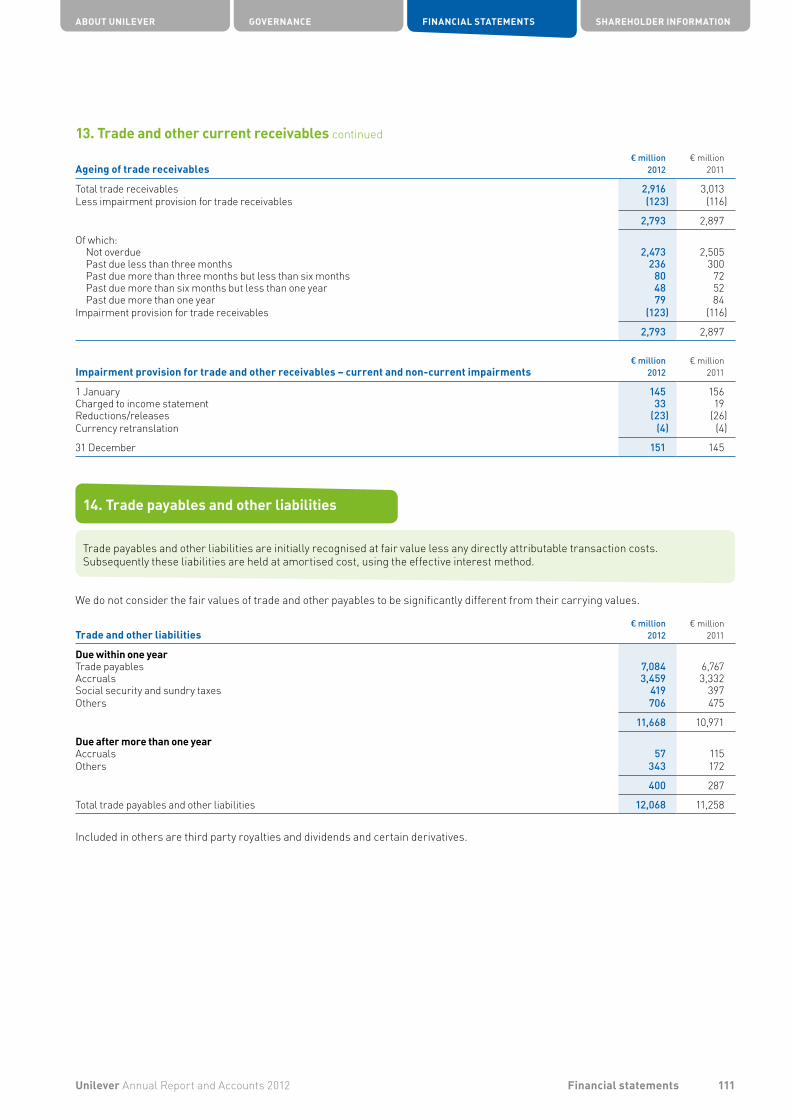
13. Trade and other current receivables continued
Ageing of trade receivables € million
2012€ million
2011
Total trade receivables 2,916 3,013Less impairment provision for trade receivables (123) (116)
2,793 2,897
Of which:Not overdue 2,473 2,505Past due less than three months 236 300Past due more than three months but less than six months 80 72Past due more than six months but less than one year 48 52Past due more than one year 79 84
Impairment provision for trade receivables (123) (116)
2,793 2,897
Impairment provision for trade and other receivables – current and non-current impairments€ million
2012€ million
2011
1 January 145 156Charged to income statement 33 19Reductions/releases (23) (26)Currency retranslation (4) (4)
31 December 151 145
14. Trade payables and other liabilities
Trade payables and other liabilities are initially recognised at fair value less any directly attributable transaction costs. Subsequently these liabilities are held at amortised cost, using the effective interest method.
We do not consider the fair values of trade and other payables to be significantly different from their carrying values.
Trade and other liabilities€ million
2012€ million
2011
Due within one yearTrade payables 7,084 6,767Accruals 3,459 3,332Social security and sundry taxes 419 397Others 706 475
11,668 10,971
Due after more than one yearAccruals 57 115Others 343 172
400 287
Total trade payables and other liabilities 12,068 11,258
Included in others are third party royalties and dividends and certain derivatives.
ABOUT UNILEVER GOVERNANCE FINANCIAL STATEMENTS SHAREHOLDER INFORMATION
111Unilever Annual Report and Accounts 2012 Financial statements
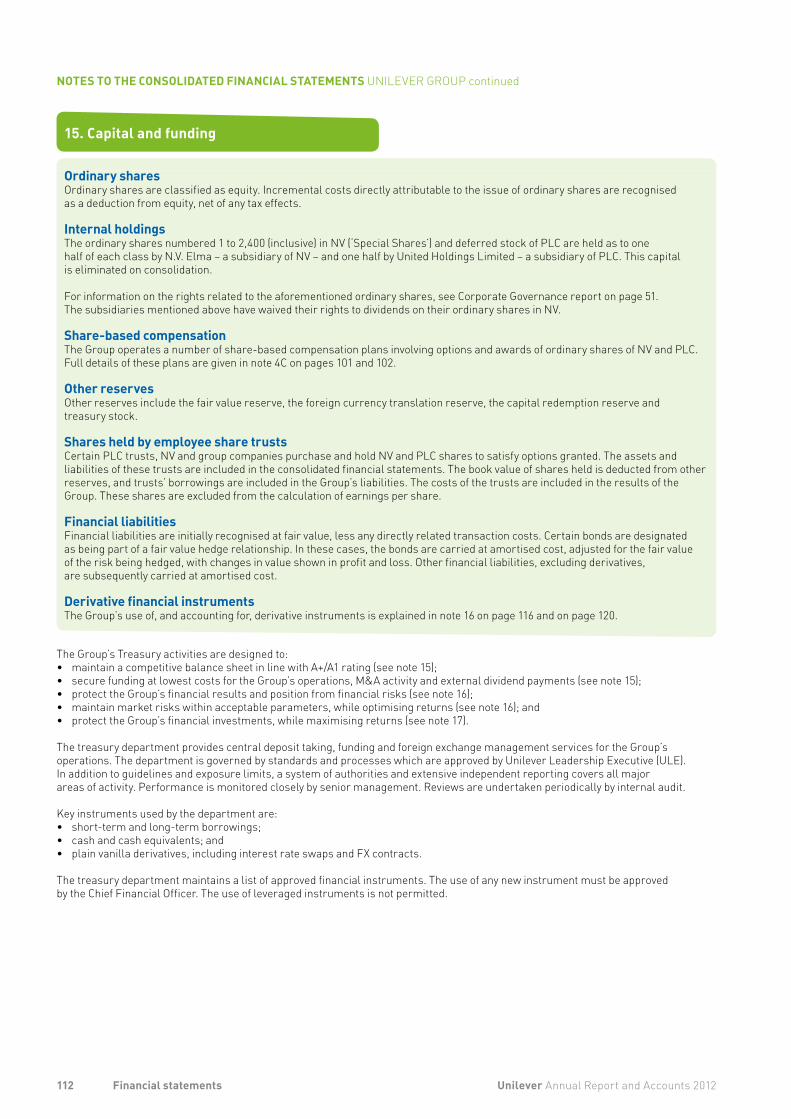
15. Capital and funding
Ordinary sharesOrdinary shares are classified as equity. Incremental costs directly attributable to the issue of ordinary shares are recognised as a deduction from equity, net of any tax effects.
Internal holdingsThe ordinary shares numbered 1 to 2,400 (inclusive) in NV (‘Special Shares’) and deferred stock of PLC are held as to one half of each class by N.V. Elma – a subsidiary of NV – and one half by United Holdings Limited – a subsidiary of PLC. This capital is eliminated on consolidation.
For information on the rights related to the aforementioned ordinary shares, see Corporate Governance report on page 51. The subsidiaries mentioned above have waived their rights to dividends on their ordinary shares in NV.
Share-based compensationThe Group operates a number of share-based compensation plans involving options and awards of ordinary shares of NV and PLC. Full details of these plans are given in note 4C on pages 101 and 102.
Other reservesOther reserves include the fair value reserve, the foreign currency translation reserve, the capital redemption reserve and treasury stock.
Shares held by employee share trustsCertain PLC trusts, NV and group companies purchase and hold NV and PLC shares to satisfy options granted. The assets and liabilities of these trusts are included in the consolidated financial statements. The book value of shares held is deducted from other reserves, and trusts’ borrowings are included in the Group’s liabilities. The costs of the trusts are included in the results of the Group. These shares are excluded from the calculation of earnings per share.
Financial liabilitiesFinancial liabilities are initially recognised at fair value, less any directly related transaction costs. Certain bonds are designated as being part of a fair value hedge relationship. In these cases, the bonds are carried at amortised cost, adjusted for the fair value of the risk being hedged, with changes in value shown in profit and loss. Other financial liabilities, excluding derivatives, are subsequently carried at amortised cost.
Derivative financial instrumentsThe Group’s use of, and accounting for, derivative instruments is explained in note 16 on page 116 and on page 120.
The Group’s Treasury activities are designed to: • maintain a competitive balance sheet in line with A+/A1 rating (see note 15);• secure funding at lowest costs for the Group’s operations, M&A activity and external dividend payments (see note 15);• protect the Group’s financial results and position from financial risks (see note 16);• maintain market risks within acceptable parameters, while optimising returns (see note 16); and• protect the Group’s financial investments, while maximising returns (see note 17).
The treasury department provides central deposit taking, funding and foreign exchange management services for the Group’s operations. The department is governed by standards and processes which are approved by Unilever Leadership Executive (ULE). In addition to guidelines and exposure limits, a system of authorities and extensive independent reporting covers all major areas of activity. Performance is monitored closely by senior management. Reviews are undertaken periodically by internal audit.
Key instruments used by the department are: • short-term and long-term borrowings;• cash and cash equivalents; and• plain vanilla derivatives, including interest rate swaps and FX contracts.
The treasury department maintains a list of approved financial instruments. The use of any new instrument must be approved by the Chief Financial Officer. The use of leveraged instruments is not permitted.
112 Unilever Annual Report and Accounts 2012Financial statements
NOTES TO THE CONSOLIDATED FINANCIAL STATEMENTS UNILEVER GROUP continued
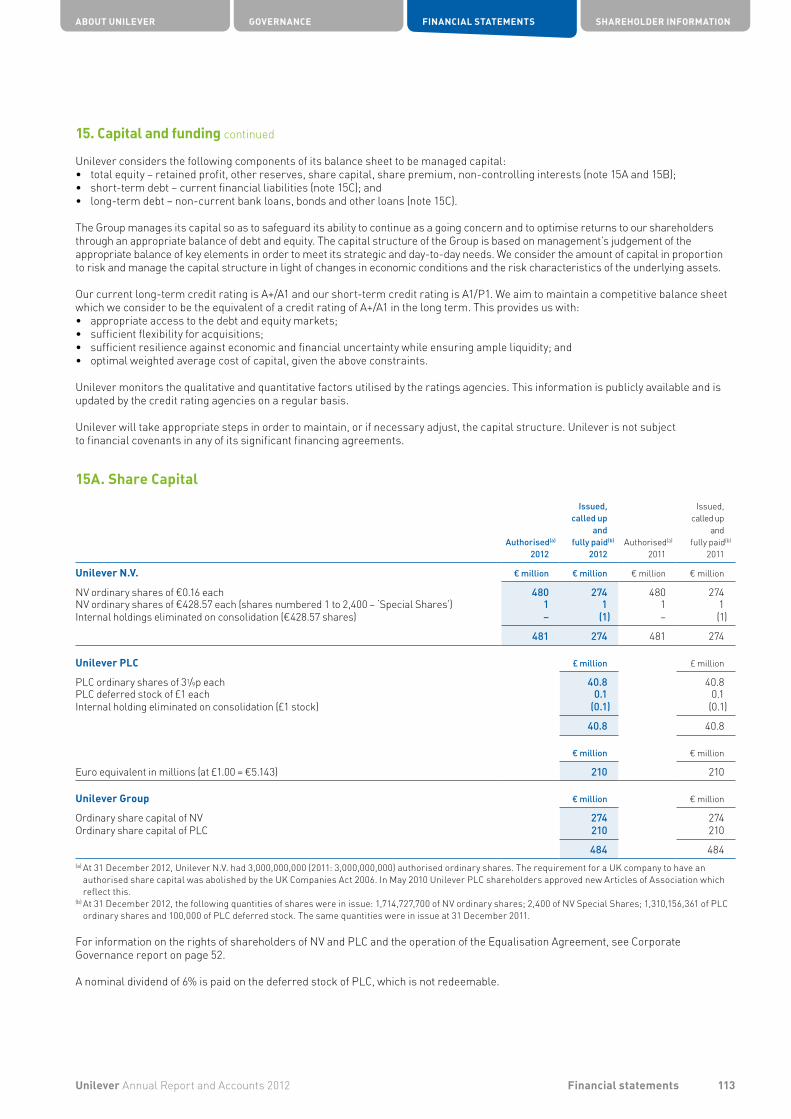
15. Capital and funding continued
Unilever considers the following components of its balance sheet to be managed capital: • total equity – retained profit, other reserves, share capital, share premium, non-controlling interests (note 15A and 15B);• short-term debt – current financial liabilities (note 15C); and• long-term debt – non-current bank loans, bonds and other loans (note 15C).
The Group manages its capital so as to safeguard its ability to continue as a going concern and to optimise returns to our shareholders through an appropriate balance of debt and equity. The capital structure of the Group is based on management’s judgement of the appropriate balance of key elements in order to meet its strategic and day-to-day needs. We consider the amount of capital in proportion to risk and manage the capital structure in light of changes in economic conditions and the risk characteristics of the underlying assets.
Our current long-term credit rating is A+/A1 and our short-term credit rating is A1/P1. We aim to maintain a competitive balance sheet which we consider to be the equivalent of a credit rating of A+/A1 in the long term. This provides us with: • appropriate access to the debt and equity markets;• sufficient flexibility for acquisitions;• sufficient resilience against economic and financial uncertainty while ensuring ample liquidity; and• optimal weighted average cost of capital, given the above constraints.
Unilever monitors the qualitative and quantitative factors utilised by the ratings agencies. This information is publicly available and is updated by the credit rating agencies on a regular basis.
Unilever will take appropriate steps in order to maintain, or if necessary adjust, the capital structure. Unilever is not subject to financial covenants in any of its significant financing agreements.
15A. Share Capital
Authorised(a)
2012
Issued,called up
andfully paid(b)
2012
Authorised(a)
2011
Issued, called up
and fully paid(b)
2011
Unilever N.V. € million € million € million € million
NV ordinary shares of €0.16 each 480 274 480 274NV ordinary shares of €428.57 each (shares numbered 1 to 2,400 – ‘Special Shares’) 1 1 1 1Internal holdings eliminated on consolidation (€428.57 shares) – (1) – (1)
481 274 481 274
Unilever PLC £ million £ million
PLC ordinary shares of 31/9p each 40.8 40.8PLC deferred stock of £1 each 0.1 0.1Internal holding eliminated on consolidation (£1 stock) (0.1) (0.1)
40.8 40.8
€ million € million
Euro equivalent in millions (at £1.00 = €5.143) 210 210
Unilever Group € million € million
Ordinary share capital of NV 274 274 Ordinary share capital of PLC 210 210
484 484 (a) At 31 December 2012, Unilever N.V. had 3,000,000,000 (2011: 3,000,000,000) authorised ordinary shares. The requirement for a UK company to have an
authorised share capital was abolished by the UK Companies Act 2006. In May 2010 Unilever PLC shareholders approved new Articles of Association which reflect this.
(b) At 31 December 2012, the following quantities of shares were in issue: 1,714,727,700 of NV ordinary shares; 2,400 of NV Special Shares; 1,310,156,361 of PLC ordinary shares and 100,000 of PLC deferred stock. The same quantities were in issue at 31 December 2011.
For information on the rights of shareholders of NV and PLC and the operation of the Equalisation Agreement, see Corporate Governance report on page 52.
A nominal dividend of 6% is paid on the deferred stock of PLC, which is not redeemable.
ABOUT UNILEVER GOVERNANCE FINANCIAL STATEMENTS SHAREHOLDER INFORMATION
113Unilever Annual Report and Accounts 2012 Financial statements
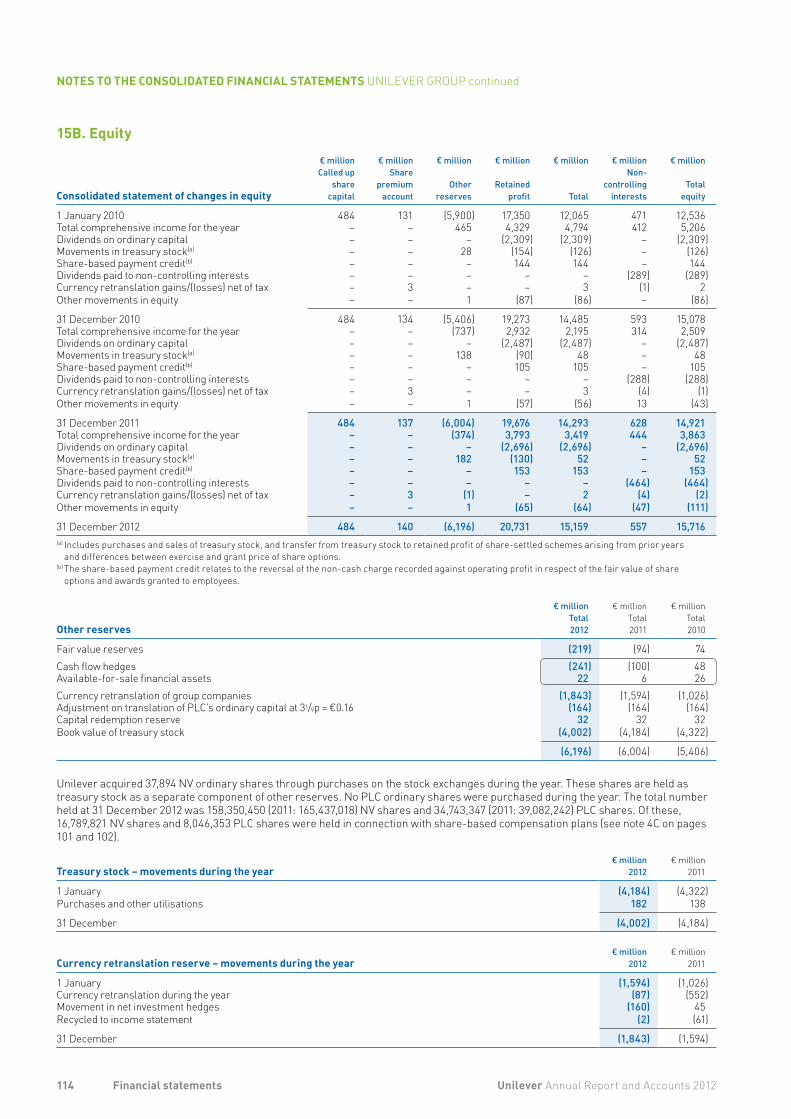
15B. Equity
Consolidated statement of changes in equity
€ millionCalled up
sharecapital
€ millionShare
premiumaccount
€ million
Otherreserves
€ million
Retainedprofit
€ million
Total
€ millionNon-
controllinginterests
€ million
Totalequity
1 January 2010 484 131 (5,900) 17,350 12,065 471 12,536Total comprehensive income for the year – – 465 4,329 4,794 412 5,206Dividends on ordinary capital – – – (2,309) (2,309) – (2,309)Movements in treasury stock(a) – – 28 (154) (126) – (126)Share-based payment credit(b) – – – 144 144 – 144Dividends paid to non-controlling interests – – – – – (289) (289)Currency retranslation gains/(losses) net of tax – 3 – – 3 (1) 2Other movements in equity – – 1 (87) (86) – (86)
31 December 2010 484 134 (5,406) 19,273 14,485 593 15,078Total comprehensive income for the year – – (737) 2,932 2,195 314 2,509 Dividends on ordinary capital – – – (2,487) (2,487) – (2,487)Movements in treasury stock(a) – – 138 (90) 48 – 48 Share-based payment credit(b) – – – 105 105 – 105 Dividends paid to non-controlling interests – – – – – (288) (288)Currency retranslation gains/(losses) net of tax – 3 – – 3 (4) (1)Other movements in equity – – 1 (57) (56) 13 (43)
31 December 2011 484 137 (6,004) 19,676 14,293 628 14,921Total comprehensive income for the year – – (374) 3,793 3,419 444 3,863Dividends on ordinary capital – – – (2,696) (2,696) – (2,696)Movements in treasury stock(a) – – 182 (130) 52 – 52Share-based payment credit(b) – – – 153 153 – 153Dividends paid to non-controlling interests – – – – – (464) (464)Currency retranslation gains/(losses) net of tax – 3 (1) – 2 (4) (2)Other movements in equity – – 1 (65) (64) (47) (111)
31 December 2012 484 140 (6,196) 20,731 15,159 557 15,716(a) Includes purchases and sales of treasury stock, and transfer from treasury stock to retained profit of share-settled schemes arising from prior years
and differences between exercise and grant price of share options.(b) The share-based payment credit relates to the reversal of the non-cash charge recorded against operating profit in respect of the fair value of share
options and awards granted to employees.
Other reserves
€ millionTotal2012
€ millionTotal2011
€ millionTotal2010
Fair value reserves (219) (94) 74Cash flow hedges (241) (100) 48Available-for-sale financial assets 22 6 26Currency retranslation of group companies (1,843) (1,594) (1,026)Adjustment on translation of PLC’s ordinary capital at 31/9p = €0.16 (164) (164) (164)Capital redemption reserve 32 32 32Book value of treasury stock (4,002) (4,184) (4,322)
(6,196) (6,004) (5,406)
Unilever acquired 37,894 NV ordinary shares through purchases on the stock exchanges during the year. These shares are held as treasury stock as a separate component of other reserves. No PLC ordinary shares were purchased during the year. The total number held at 31 December 2012 was 158,350,450 (2011: 165,437,018) NV shares and 34,743,347 (2011: 39,082,242) PLC shares. Of these, 16,789,821 NV shares and 8,046,353 PLC shares were held in connection with share-based compensation plans (see note 4C on pages 101 and 102).
Treasury stock – movements during the year€ million
2012€ million
2011
1 January (4,184) (4,322)Purchases and other utilisations 182 138
31 December (4,002) (4,184)
Currency retranslation reserve – movements during the year€ million
2012€ million
2011
1 January (1,594) (1,026)Currency retranslation during the year (87) (552)Movement in net investment hedges (160) 45Recycled to income statement (2) (61)
31 December (1,843) (1,594)
114 Unilever Annual Report and Accounts 2012Financial statements
NOTES TO THE CONSOLIDATED FINANCIAL STATEMENTS UNILEVER GROUP continued
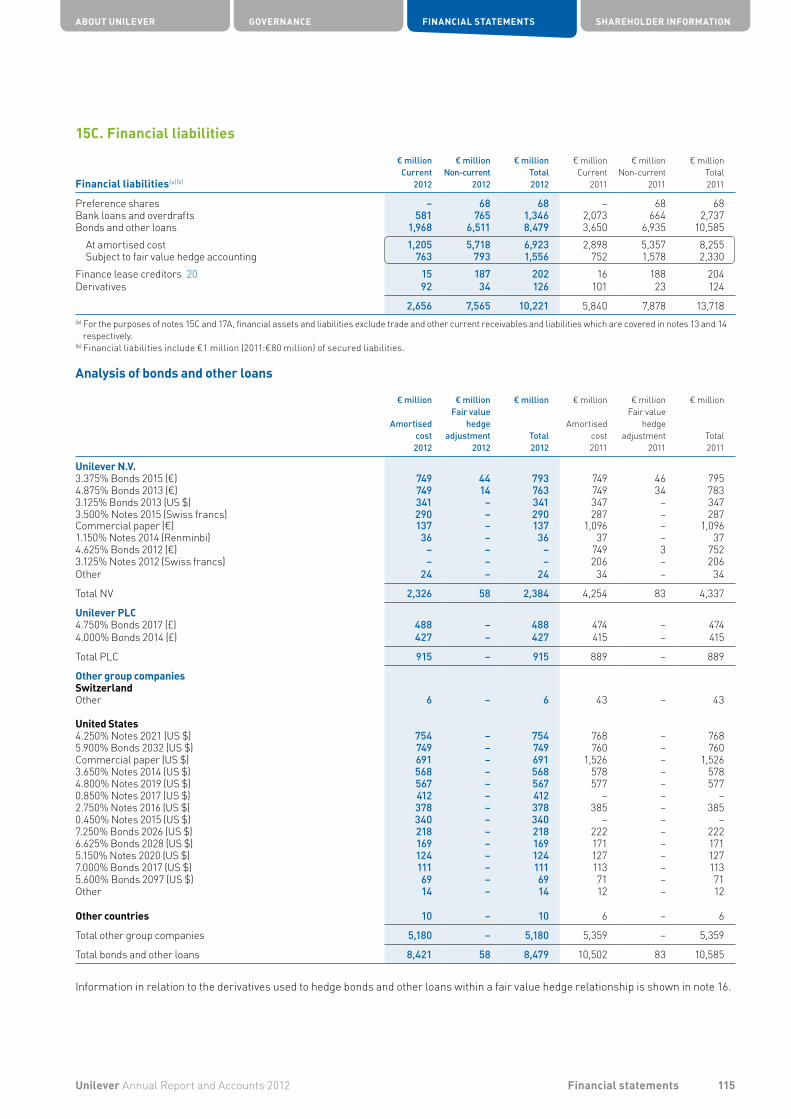
15C. Financial liabilities
Financial liabilities(a)(b)
€ million Current
2012
€ million Non-current
2012
€ million Total 2012
€ million Current
2011
€ million Non-current
2011
€ million Total 2011
Preference shares – 68 68 – 68 68Bank loans and overdrafts 581 765 1,346 2,073 664 2,737Bonds and other loans 1,968 6,511 8,479 3,650 6,935 10,585
At amortised cost 1,205 5,718 6,923 2,898 5,357 8,255Subject to fair value hedge accounting 763 793 1,556 752 1,578 2,330
Finance lease creditors 20 15 187 202 16 188 204Derivatives 92 34 126 101 23 124
2,656 7,565 10,221 5,840 7,878 13,718(a) For the purposes of notes 15C and 17A, financial assets and liabilities exclude trade and other current receivables and liabilities which are covered in notes 13 and 14
respectively.(b) Financial liabilities include €1 million (2011:€80 million) of secured liabilities.
Analysis of bonds and other loans
€ million
Amortisedcost2012
€ millionFair value
hedge adjustment
2012
€ million
Total2012
€ million
Amortisedcost2011
€ millionFair value
hedge adjustment
2011
€ million
Total2011
Unilever N.V.3.375% Bonds 2015 (€) 749 44 793 749 46 7954.875% Bonds 2013 (€) 749 14 763 749 34 7833.125% Bonds 2013 (US $) 341 – 341 347 – 3473.500% Notes 2015 (Swiss francs) 290 – 290 287 – 287Commercial paper (€) 137 – 137 1,096 – 1,0961.150% Notes 2014 (Renminbi) 36 – 36 37 – 374.625% Bonds 2012 (€) – – – 749 3 7523.125% Notes 2012 (Swiss francs) – – – 206 – 206Other 24 – 24 34 – 34
Total NV 2,326 58 2,384 4,254 83 4,337
Unilever PLC4.750% Bonds 2017 (£) 488 – 488 474 – 4744.000% Bonds 2014 (£) 427 – 427 415 – 415
Total PLC 915 – 915 889 – 889
Other group companiesSwitzerlandOther 6 – 6 43 – 43
United States4.250% Notes 2021 (US $) 754 – 754 768 – 7685.900% Bonds 2032 (US $) 749 – 749 760 – 760Commercial paper (US $) 691 – 691 1,526 – 1,5263.650% Notes 2014 (US $) 568 – 568 578 – 5784.800% Notes 2019 (US $) 567 – 567 577 – 5770.850% Notes 2017 (US $) 412 – 412 – – –2.750% Notes 2016 (US $) 378 – 378 385 – 3850.450% Notes 2015 (US $) 340 – 340 – – –7.250% Bonds 2026 (US $) 218 – 218 222 – 2226.625% Bonds 2028 (US $) 169 – 169 171 – 1715.150% Notes 2020 (US $) 124 – 124 127 – 1277.000% Bonds 2017 (US $) 111 – 111 113 – 1135.600% Bonds 2097 (US $) 69 – 69 71 – 71Other 14 – 14 12 – 12
Other countries 10 – 10 6 – 6
Total other group companies 5,180 – 5,180 5,359 – 5,359
Total bonds and other loans 8,421 58 8,479 10,502 83 10,585
Information in relation to the derivatives used to hedge bonds and other loans within a fair value hedge relationship is shown in note 16.
ABOUT UNILEVER GOVERNANCE FINANCIAL STATEMENTS SHAREHOLDER INFORMATION
115Unilever Annual Report and Accounts 2012 Financial statements

16. Treasury risk management
Derivatives and hedge accountingDerivatives are measured at fair value with any related transaction costs expensed as incurred. The treatment of changes in the value of derivatives depends on their use as explained below.
(i) Fair value hedgesCertain derivatives are held to hedge the risk of changes in value of a specific bond or other loan. In these situations, the Group designates the liability and related derivative to be part of a fair value hedge relationship. The carrying value of the bond is adjusted by the fair value of the risk being hedged, with changes going to the income statement. Gains and losses on the corresponding derivative are also recognised in the income statement. The amounts recognised are offset in the income statement to the extent that the hedge is effective. When the relationship no longer meets the criteria for hedge accounting, the fair value hedge adjustment made to the bond is amortised to the income statement using the effective interest method.
(ii) Cash flow hedgesDerivatives are also held to hedge the uncertainty in timing or amount of future forecast cash flows. Such derivatives are classified as being part of cash flow hedge relationships. For an effective hedge, gains and losses from changes in the fair value of derivatives are recognised in equity. Any ineffective elements of the hedge are recognised in the income statement. If the hedged cash flow relates to a non-financial asset, the amount accumulated in equity is subsequently included within the carrying value of that asset. For other cash flow hedges, amounts deferred in equity are taken to the income statement at the same time as the related cash flow.
When a derivative no longer qualifies for hedge accounting, any cumulative gain or loss remains in equity until the related cash flow occurs. When the cash flow takes place, the cumulative gain or loss is taken to the income statement. If the hedged cash flow is no longer expected to occur, the cumulative gain or loss is taken to the income statement immediately.
(iii) Net investment hedgesCertain derivatives are designated as hedges of the currency risk on the Group’s investment in foreign subsidiaries. The accounting policy for these arrangements is set out in note 1.
(iv) Derivatives for which hedge accounting is not appliedDerivatives not classified as hedges are held in order to hedge certain balance sheet items and commodity exposures. No hedge accounting is applied to these derivatives, which are carried at fair value with changes being recognised in the income statement.
The Group is exposed to the following risks that arise from its use of financial instruments, the management of which is described in the following sections:• liquidity risk (see note 16A);• market risk (see note 16B); and• credit risk (see note 17B).
16A. Management of liquidity risk
Liquidity risk is the risk that the Group will face difficulty in meeting its obligations associated with its financial liabilities. The Group’s approach to managing liquidity is to ensure that it will have sufficient funds to meet its liabilities when due without incurring unacceptable losses. In doing this, management considers both normal and stressed conditions. A material and sustained shortfall in our cash flow could undermine the Group’s credit rating, impair investor confidence and also restrict the Group’s ability to raise funds.
Given continuing volatility in the financial markets, the Group has maintained a cautious funding strategy, running a positive cash balance throughout 2012. This has been the result of a strong cash delivery from the business, coupled with the proceeds from bond issuances in 2012. This cash has been invested conservatively with low risk counter-parties at maturities of less than six months.
Cash flow from operating activities provides the funds to service the financing of financial liabilities on a day-to-day basis. The Group seeks to manage its liquidity requirements by maintaining access to global debt markets through short-term and long-term debt programmes. In addition, Unilever has committed credit facilities for general corporate use.
Unilever had US $6,250 million of undrawn committed facilities on 31 December 2012 as follows:• revolving 364-day bilateral credit facilities of in aggregate US $6,140 million (2011: US $5,950 million) with a 364-day term-out; and• 364-day bilateral money market commitments of in aggregate US $110 million (2011: US $200 million), under which the underwriting
banks agree, subject to certain conditions, to subscribe for notes with maturities of up to three years.
As part of the regular annual process these facilities will again be renewed in 2013.
116 Unilever Annual Report and Accounts 2012Financial statements
NOTES TO THE CONSOLIDATED FINANCIAL STATEMENTS UNILEVER GROUP continued
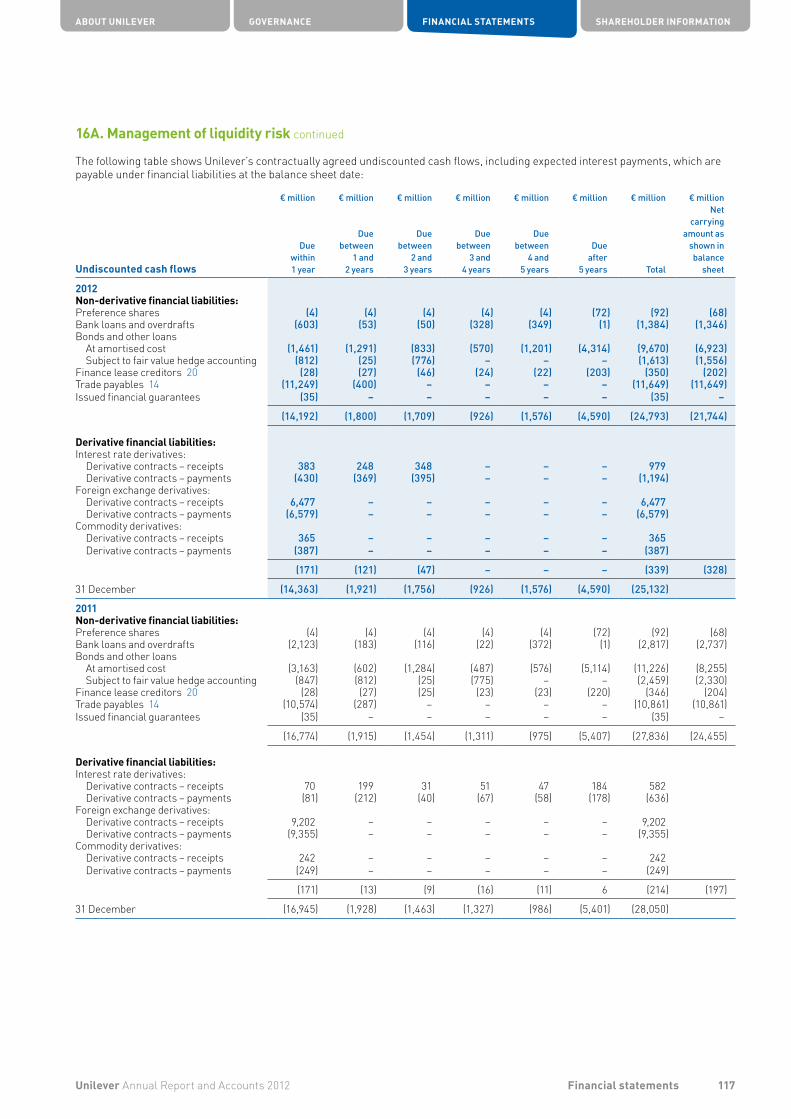
16A. Management of liquidity risk continued
The following table shows Unilever’s contractually agreed undiscounted cash flows, including expected interest payments, which are payable under financial liabilities at the balance sheet date:
Undiscounted cash flows
€ million
Duewithin1 year
€ million
Duebetween
1 and2 years
€ million
Duebetween
2 and3 years
€ million
Duebetween
3 and4 years
€ million
Duebetween
4 and5 years
€ million
Dueafter
5 years
€ million
Total
€ millionNet
carryingamount as
shown inbalance
sheet
2012Non-derivative financial liabilities:Preference shares (4) (4) (4) (4) (4) (72) (92) (68)Bank loans and overdrafts (603) (53) (50) (328) (349) (1) (1,384) (1,346)Bonds and other loans
At amortised cost (1,461) (1,291) (833) (570) (1,201) (4,314) (9,670) (6,923)Subject to fair value hedge accounting (812) (25) (776) – – – (1,613) (1,556)
Finance lease creditors 20 (28) (27) (46) (24) (22) (203) (350) (202)Trade payables 14 (11,249) (400) – – – – (11,649) (11,649)Issued financial guarantees (35) – – – – – (35) –
(14,192) (1,800) (1,709) (926) (1,576) (4,590) (24,793) (21,744)
Derivative financial liabilities:Interest rate derivatives:
Derivative contracts – receipts 383 248 348 – – – 979Derivative contracts – payments (430) (369) (395) – – – (1,194)
Foreign exchange derivatives:Derivative contracts – receipts 6,477 – – – – – 6,477Derivative contracts – payments (6,579) – – – – – (6,579)
Commodity derivatives:Derivative contracts – receipts 365 – – – – – 365Derivative contracts – payments (387) – – – – – (387)
(171) (121) (47) – – – (339) (328)
31 December (14,363) (1,921) (1,756) (926) (1,576) (4,590) (25,132)
2011Non-derivative financial liabilities:Preference shares (4) (4) (4) (4) (4) (72) (92) (68)Bank loans and overdrafts (2,123) (183) (116) (22) (372) (1) (2,817) (2,737)Bonds and other loans
At amortised cost (3,163) (602) (1,284) (487) (576) (5,114) (11,226) (8,255)Subject to fair value hedge accounting (847) (812) (25) (775) – – (2,459) (2,330)
Finance lease creditors 20 (28) (27) (25) (23) (23) (220) (346) (204)Trade payables 14 (10,574) (287) – – – – (10,861) (10,861)Issued financial guarantees (35) – – – – – (35) –
(16,774) (1,915) (1,454) (1,311) (975) (5,407) (27,836) (24,455)
Derivative financial liabilities:Interest rate derivatives:
Derivative contracts – receipts 70 199 31 51 47 184 582Derivative contracts – payments (81) (212) (40) (67) (58) (178) (636)
Foreign exchange derivatives:Derivative contracts – receipts 9,202 – – – – – 9,202Derivative contracts – payments (9,355) – – – – – (9,355)
Commodity derivatives:Derivative contracts – receipts 242 – – – – – 242Derivative contracts – payments (249) – – – – – (249)
(171) (13) (9) (16) (11) 6 (214) (197)
31 December (16,945) (1,928) (1,463) (1,327) (986) (5,401) (28,050)
ABOUT UNILEVER GOVERNANCE FINANCIAL STATEMENTS SHAREHOLDER INFORMATION
117Unilever Annual Report and Accounts 2012 Financial statements

16A. Management of liquidity risk continued
The following table shows cash flows for which cash flow hedge accounting is applied. The derivatives in the cash flow hedge relationships are expected to have an impact on profit and loss in the same periods as the cash flows occur.
€ million
Duewithin1 year
€ million
Duebetween
1 and 2 years
€ million
Duebetween
2 and 3 years
€ million
Duebetween
3 and 4 years
€ million
Duebetween
4 and 5 years
€ million
Dueafter
5 years
€ million
Total
€ millionNet
carryingamount of
related derivatives[a]
2012Foreign exchange cash inflows 877 – – – – – 877Foreign exchange cash outflows (473) – – – – – (473) (4)Interest rate cash flows – (173) (109) – – – (282) (146)Commodity contracts cash flows (498) – – – – – (498) (19)
2011Foreign exchange cash inflows 779 – – – – – 779Foreign exchange cash outflows (519) – – – – – (519) 3Interest rate cash flows – – (17) (41) (57) (170) (285) (27)Commodity contracts cash flows (356) – – – – – (356) (2)[a] See note 16C on page 120.
16B. Management of market risk
Unilever’s size and operations result in it being exposed to the following market risks that arise from its use of financial instruments:• commodity price risk;• currency risk; and• interest rate risk.
The above risks may affect the Group’s income and expenses, or the value of its financial instruments. The objective of the Group’s management of market risk is to maintain this risk within acceptable parameters, while optimising returns. Generally, the Group applies hedge accounting to manage the volatility in profit and loss arising from market risk.
The Group’s exposure to, and management of, these risks is explained below. It often includes derivative financial instruments, the uses of which are described in note 16C.
i) Commodity price riskThe Group is exposed to the risk of changes in commodity prices in relation to its purchase of certain raw materials.
At 31 December 2012, the Group has hedged its exposure to future commodity purchases for €504 million (2011: €368 million) with commodity derivatives.
The Group uses commodity forward contracts to hedge against this risk. All commodity forward contracts hedge future purchases of raw materials and the contracts are settled either in cash or by physical delivery.
Commodity derivatives are generally designated as hedging instruments in cash flow hedge accounting relations.
A 10% increase in commodity prices as at 31 December 2012 would have led to a €49 million gain on the commodity derivatives in the cash flow hedge reserve (2011: €38 million gain in the cash flow hedge reserve). A decrease of 10% in commodity prices on a full-year basis would have the equal but opposite effect.
ii) Currency riskCurrency risk on sales, purchases and borrowings
Because of Unilever’s global reach, it is subject to the risk that changes in foreign currency values impact the Group’s sales, purchases and borrowings.
The Group manages currency exposures within prescribed limits, mainly through the use of forward foreign currency exchange contracts.
Operating companies manage foreign exchange exposures within prescribed limits. Local compliance is monitored centrally.
As an estimation of the approximate impact of the residual risk, with respect to financial instruments, the Group has calculated the impact of a 10% change in exchange rates.
118 Unilever Annual Report and Accounts 2012Financial statements
NOTES TO THE CONSOLIDATED FINANCIAL STATEMENTS UNILEVER GROUP continued
Potential impact of risk Management policy and hedging strategy
Sensitivity to the risk
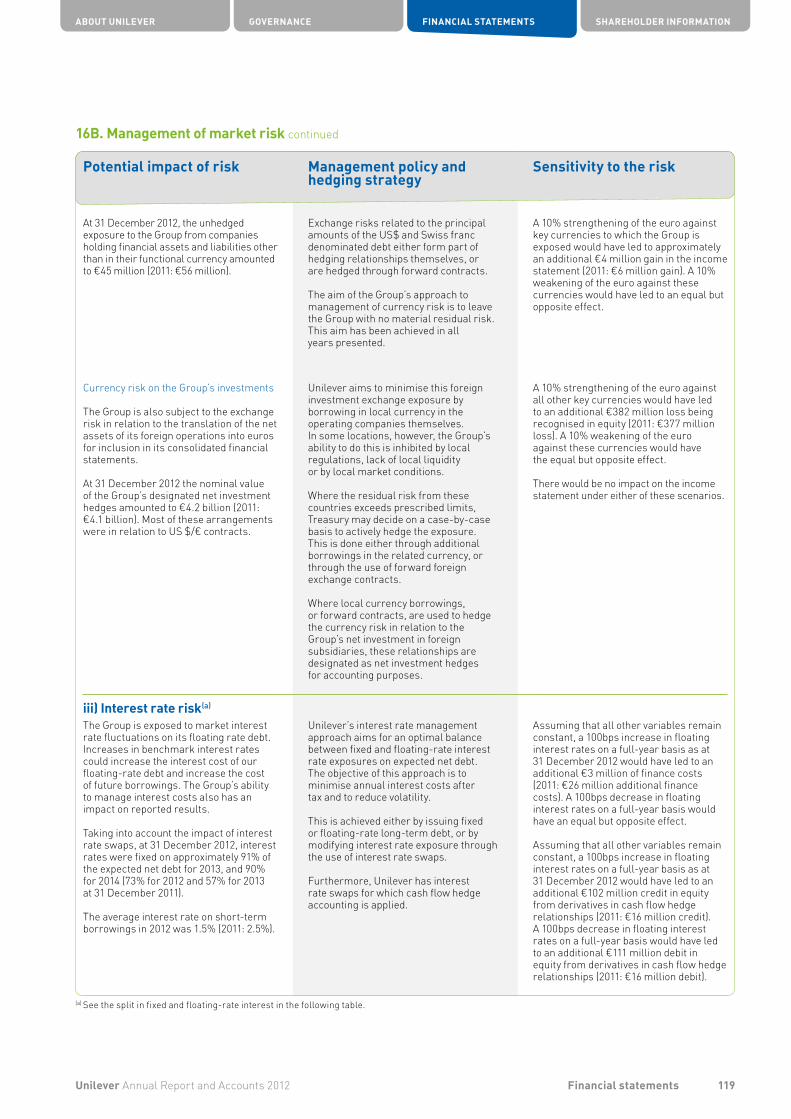
At 31 December 2012, the unhedged exposure to the Group from companies holding financial assets and liabilities other than in their functional currency amounted to €45 million (2011: €56 million).
Exchange risks related to the principal amounts of the US$ and Swiss franc denominated debt either form part of hedging relationships themselves, or are hedged through forward contracts.
The aim of the Group’s approach to management of currency risk is to leave the Group with no material residual risk. This aim has been achieved in all years presented.
A 10% strengthening of the euro against key currencies to which the Group is exposed would have led to approximately an additional €4 million gain in the income statement (2011: €6 million gain). A 10% weakening of the euro against these currencies would have led to an equal but opposite effect.
Currency risk on the Group’s investments
The Group is also subject to the exchange risk in relation to the translation of the net assets of its foreign operations into euros for inclusion in its consolidated financial statements.
At 31 December 2012 the nominal value of the Group’s designated net investment hedges amounted to €4.2 billion (2011: €4.1 billion). Most of these arrangements were in relation to US $/€ contracts.
Unilever aims to minimise this foreign investment exchange exposure by borrowing in local currency in the operating companies themselves. In some locations, however, the Group’s ability to do this is inhibited by local regulations, lack of local liquidity or by local market conditions.
Where the residual risk from these countries exceeds prescribed limits, Treasury may decide on a case-by-case basis to actively hedge the exposure. This is done either through additional borrowings in the related currency, or through the use of forward foreign exchange contracts.
Where local currency borrowings, or forward contracts, are used to hedge the currency risk in relation to the Group’s net investment in foreign subsidiaries, these relationships are designated as net investment hedges for accounting purposes.
A 10% strengthening of the euro against all other key currencies would have led to an additional €382 million loss being recognised in equity (2011: €377 million loss). A 10% weakening of the euro against these currencies would have the equal but opposite effect.
There would be no impact on the income statement under either of these scenarios.
iii) Interest rate risk(a)
The Group is exposed to market interest rate fluctuations on its floating rate debt. Increases in benchmark interest rates could increase the interest cost of our floating-rate debt and increase the cost of future borrowings. The Group’s ability to manage interest costs also has an impact on reported results.
Taking into account the impact of interest rate swaps, at 31 December 2012, interest rates were fixed on approximately 91% of the expected net debt for 2013, and 90% for 2014 (73% for 2012 and 57% for 2013 at 31 December 2011).
The average interest rate on short-term borrowings in 2012 was 1.5% (2011: 2.5%).
Unilever’s interest rate management approach aims for an optimal balance between fixed and floating-rate interest rate exposures on expected net debt. The objective of this approach is to minimise annual interest costs after tax and to reduce volatility.
This is achieved either by issuing fixed or floating-rate long-term debt, or by modifying interest rate exposure through the use of interest rate swaps.
Furthermore, Unilever has interest rate swaps for which cash flow hedge accounting is applied.
Assuming that all other variables remain constant, a 100bps increase in floating interest rates on a full-year basis as at 31 December 2012 would have led to an additional €3 million of finance costs (2011: €26 million additional finance costs). A 100bps decrease in floating interest rates on a full-year basis would have an equal but opposite effect.
Assuming that all other variables remain constant, a 100bps increase in floating interest rates on a full-year basis as at 31 December 2012 would have led to an additional €102 million credit in equity from derivatives in cash flow hedge relationships (2011: €16 million credit). A 100bps decrease in floating interest rates on a full-year basis would have led to an additional €111 million debit in equity from derivatives in cash flow hedge relationships (2011: €16 million debit).
(a) See the split in fixed and floating-rate interest in the following table.
ABOUT UNILEVER GOVERNANCE FINANCIAL STATEMENTS SHAREHOLDER INFORMATION
119Unilever Annual Report and Accounts 2012 Financial statements
16B. Management of market risk continued
Potential impact of risk Management policy and hedging strategy
Sensitivity to the risk

16B. Management of market risk continued
The following table shows the split in fixed and floating rate interest exposures, taking into account the impact of interest rate swaps and cross currency swaps:
€ million 2012
€ million 2011
Cash and cash equivalents 2,465 3,484 Current other financial assets 401 1,453 Current financial liabilities (2,656) (5,840)Non-current financial liabilities (7,565) (7,878)
Net debt (7,355) (8,781)Of which:Fixed rate (weighted average amount of fixing for the following year) (7,053) (6,179)Floating rate (302) (2,602)
(7,355) (8,781)
16C. Derivatives and hedging
The Group does not use derivative financial instruments for speculative purposes. The uses of derivatives and the related values of derivatives are summarised in the following table:
€ million
Trade and other
receivables
€ millionOther
current financial
assets
€ millionTrade
payables and other liabilities
€ million
Current financial
liabilities
€ millionNon-
current financial
liabilities
€ million
Total
31 December 2012Foreign exchange derivatives
Fair value hedges 1 – (5) – – (4)Cash flow hedges 9 – (13) – – (4)Hedges of net investments in foreign operations – (126)(a) – (5) – (131)Hedge accounting not applied 10 222 (16) (57) – 159
Cross currency swapsHedge accounting not applied – 38 – (30) (34) (26)
Interest rate swapsFair value hedges – 36 – – – 36Cash flow hedges – – (146) – – (146)Hedge accounting not applied – – – – – –
Commodity contractsCash flow hedges 3 – (22) – – (19)Hedge accounting not applied – – – – – –
23 170 (202) (92) (34) (135)
Total assets 193 Total liabilities (328) (135)
31 December 2011Foreign exchange derivatives
Fair value hedges 9 – (4) – – 5Cash flow hedges 22 – (19) – – 3Hedges of net investments in foreign operations – 18 – (7) – 11Hedge accounting not applied 22 50 (17) (92) – (37)
Cross currency swapsHedge accounting not applied – 31 – (2) (23) 6
Interest rate swapsFair value hedges – 109 – – – 109Cash flow hedges – – (27) – – (27)Hedge accounting not applied – – – – – –
Commodity contractsCash flow hedges 4 – (6) – – (2)Hedge accounting not applied 1 – – – – 1
58 208 (73) (101) (23)
Total assets 266 Total liabilities (197) 69(a) The offsetting swaps that are used to hedge concern loans are included in other current financial assets under Hedge accounting not applied.
120 Unilever Annual Report and Accounts 2012Financial statements
NOTES TO THE CONSOLIDATED FINANCIAL STATEMENTS UNILEVER GROUP continued
17. Investment and return
Cash and cash equivalentsCash and cash equivalents in the balance sheet include deposits, investments in money market funds and highly liquid investments. To be classified as cash and cash equivalents, an asset must:• be readily convertible into cash; • have an insignificant risk of changes in value; and• have a maturity period of three months or less at acquisition.Cash and cash equivalents in the cash flow statement also include bank overdrafts and are recorded at amortised cost.
Other financial assetsOther financial assets are first recognised on the trade date. At that point they are classified as: (i) held-to-maturity investments;(ii) loans and receivables;(iii) available-for-sale financial assets; or(iv) financial assets at fair value through profit or loss.
(i) Held-to-maturity investmentsThese are assets with set cash flows and fixed maturities which Unilever intends to hold to maturity. They are held at cost plus interest using the effective interest method, less any impairment.
(ii) Loans and receivablesThese are assets with an established payment profile and which are not listed on a recognised stock exchange. They are initially recognised at fair value, which is usually the original invoice amount plus any directly related transaction costs. Afterwards loans and receivables are carried at amortised cost, less any impairment.
(iii) Available-for-sale financial assetsAny financial assets not classified as either loans and receivables or financial assets at fair value through profit or loss are designated as available-for-sale. They are initially recognised at fair value, usually the original invoice amount plus any directly related transaction costs. Afterwards they are measured at fair value with changes being recognised in equity. When the investment is sold or impaired, the accumulated gains and losses are moved from equity to the income statement. Interest and dividends from these assets are recognised in the income statement.
(iv) Financial assets at fair value through profit or lossThese are derivatives and assets that are held for trading. Related transaction costs are expensed as incurred. Unless they form part of a hedging relationship, these assets are held at fair value, with changes being recognised in the income statement.
Impairment of financial assetsEach year the Group assesses whether there is evidence that financial assets are impaired. A significant or prolonged fall in value below the cost of an asset generally indicates that an asset may be impaired. If impaired, financial assets are written down to their estimated recoverable amount. Impairment losses on assets classified as loans and receivables are recognised in profit and loss. When a later event causes the impairment losses to decrease, the reduction in impairment loss is also recognised in profit and loss. Impairment losses on assets classified as available-for-sale are recognised by moving the loss accumulated in equity to the income statement. Any subsequent recovery in value of an available-for-sale debt security is recognised within profit and loss. However, any subsequent recovery in value of an equity security is recognised within equity, and is recorded at amortised cost.
ABOUT UNILEVER GOVERNANCE FINANCIAL STATEMENTS SHAREHOLDER INFORMATION
121Unilever Annual Report and Accounts 2012 Financial statements

17A. Financial assets
The Group’s treasury function aims to protect the Group’s financial investments, while maximising returns. The Group’s cash resources and other financial assets are shown below.
Financial assets(a)
€ million
Current2012
€ million Non-
current2012
€ million
Total 2012
€ million
Current 2011
€ million Non-
current 2011
€ million
Total 2011
Cash and cash equivalentsCash at bank and in hand 831 – 831 1,139 – 1,139Short-term deposits with maturity of less than 3 months 1,495 – 1,495 2,243 – 2,243Other cash equivalents(b) 139 – 139 102 – 102
2,465 – 2,465 3,484 – 3,484
Other financial assetsHeld-to-maturity investments 26 3 29 – – –Loans and receivables(c) 2 1 3 930 2 932Available-for-sale financial assets(d) 183 504 687 307 413 720Financial assets at fair value through profit or loss:
Derivatives 170 – 170 208 – 208Other 20 27 47 8 63 71
401 535 936 1,453 478 1,931
Total 2,866 535 3,401 4,937 478 5,415(a) For the purposes of notes 15C and 17A, financial assets and liabilities exclude trade and other current receivables and liabilities which are covered in notes
13 and 14 respectively.(b) Other cash equivalents include investments in money market funds of €20 million (2011: €20 million) and investments in treasury bills of €67 million
(2011: €nil) for which the risk of changes in value is insignificant.(c) Current loans and receivables include short-term deposits with banks with maturities of longer than three months.(d) Current available-for-sale financial assets include government securities and A-minus or higher rated money and capital market instruments.
Also included are investments in money market funds of €104 million (2011: €116 million) for which the risk of changes in value is insignificant. Non-current available-for-sale financial assets predominantly consist of investments in a number of companies and financial institutions in Europe and the US, including €98 million (2011: €110 million) of assets in a trust to fund benefit obligations in the US (see also note 4B on page 99).
Cash and cash equivalents reconciliation to the cash flow statement€ million
2012€ million
2011
Cash and cash equivalents per balance sheet 2,465 3,484Less: bank overdrafts (248) (506)
Cash and cash equivalents per cash flow statement 2,217 2,978
17B. Credit risk
Credit risk is the risk of financial loss to the Group if a customer or counter-party fails to meet its contractual obligations. Additional information in relation to credit risk on trade receivables is given in note 13. These risks are generally managed by local controllers. Credit risk related to the use of treasury instruments is managed on a Group basis. This risk arises from transactions with financial institutions involving cash and cash equivalents, deposits and derivative financial instruments. To reduce this risk, Unilever has concentrated its main activities with a limited number of counter-parties which have secure credit ratings. Individual risk limits are set for each counter-party based on financial position, credit rating and past experience. Credit limits and concentration of exposures are actively monitored by the Group’s treasury department. Netting agreements are also put in place with Unilever’s principal counter-parties. In the case of a default, these arrangements would allow Unilever to net assets and liabilities across transactions with that counter-party. To further reduce the Group’s credit exposures on derivative financial instruments, Unilever has collateral agreements with Unilever’s principal counter-parties in relation to derivative financial instruments. Under these arrangements, counter-parties are required to deposit securities and/or cash as a collateral for their obligations in respect of derivative financial instruments. At 31 December 2012 the collateral held by Unilever under such arrangements amounted to €6 million (2011: €88 million), of which €6 million (2011: €43 million) was in cash, and €nil (2011: €45 million) was in the form of bond securities. The non-cash collateral has not been recognised as an asset in the Group’s balance sheet.
Further details in relation to the Group’s exposure to credit risk are shown in note 13 and note 16A.
122 Unilever Annual Report and Accounts 2012Financial statements
NOTES TO THE CONSOLIDATED FINANCIAL STATEMENTS UNILEVER GROUP continued
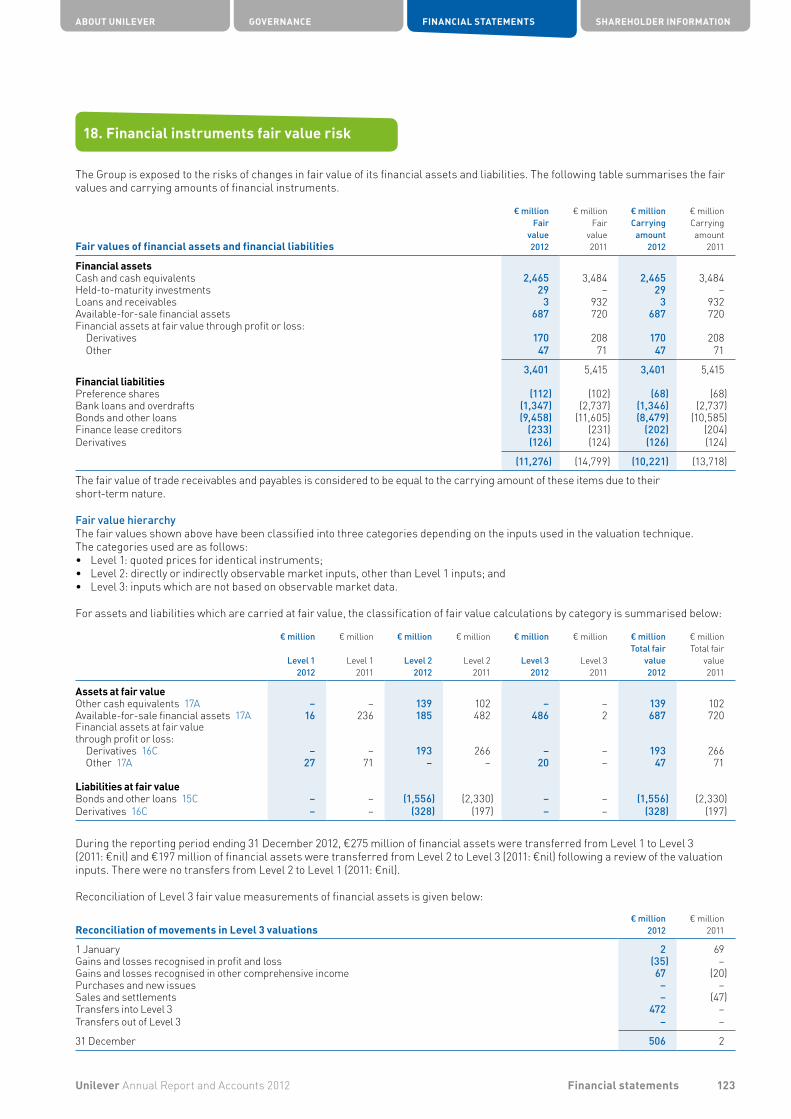
18. Financial instruments fair value risk
The Group is exposed to the risks of changes in fair value of its financial assets and liabilities. The following table summarises the fair values and carrying amounts of financial instruments.
Fair values of financial assets and financial liabilities
€ millionFair
value2012
€ millionFair
value2011
€ millionCarrying
amount2012
€ millionCarryingamount
2011
Financial assetsCash and cash equivalents 2,465 3,484 2,465 3,484Held-to-maturity investments 29 – 29 –Loans and receivables 3 932 3 932Available-for-sale financial assets 687 720 687 720Financial assets at fair value through profit or loss:
Derivatives 170 208 170 208Other 47 71 47 71
3,401 5,415 3,401 5,415Financial liabilitiesPreference shares (112) (102) (68) (68)Bank loans and overdrafts (1,347) (2,737) (1,346) (2,737)Bonds and other loans (9,458) (11,605) (8,479) (10,585)Finance lease creditors (233) (231) (202) (204)Derivatives (126) (124) (126) (124)
(11,276) (14,799) (10,221) (13,718)
The fair value of trade receivables and payables is considered to be equal to the carrying amount of these items due to their short-term nature.
Fair value hierarchyThe fair values shown above have been classified into three categories depending on the inputs used in the valuation technique. The categories used are as follows:• Level 1: quoted prices for identical instruments;• Level 2: directly or indirectly observable market inputs, other than Level 1 inputs; and• Level 3: inputs which are not based on observable market data.
For assets and liabilities which are carried at fair value, the classification of fair value calculations by category is summarised below:
€ million
Level 1 2012
€ million
Level 1 2011
€ million
Level 2 2012
€ million
Level 2 2011
€ million
Level 3 2012
€ million
Level 32011
€ millionTotal fair
value 2012
€ millionTotal fair
value2011
Assets at fair valueOther cash equivalents 17A – – 139 102 – – 139 102Available-for-sale financial assets 17A 16 236 185 482 486 2 687 720Financial assets at fair value through profit or loss:
Derivatives 16C – – 193 266 – – 193 266Other 17A 27 71 – – 20 – 47 71
Liabilities at fair valueBonds and other loans 15C – – (1,556) (2,330) – – (1,556) (2,330)Derivatives 16C – – (328) (197) – – (328) (197)
During the reporting period ending 31 December 2012, €275 million of financial assets were transferred from Level 1 to Level 3(2011: €nil) and €197 million of financial assets were transferred from Level 2 to Level 3 (2011: €nil) following a review of the valuation inputs. There were no transfers from Level 2 to Level 1 (2011: €nil).
Reconciliation of Level 3 fair value measurements of financial assets is given below:
Reconciliation of movements in Level 3 valuations€ million
2012€ million
2011
1 January 2 69Gains and losses recognised in profit and loss (35) –Gains and losses recognised in other comprehensive income 67 (20)Purchases and new issues – –Sales and settlements – (47)Transfers into Level 3 472 –Transfers out of Level 3 – –
31 December 506 2
ABOUT UNILEVER GOVERNANCE FINANCIAL STATEMENTS SHAREHOLDER INFORMATION
123Unilever Annual Report and Accounts 2012 Financial statements

18. Financial instruments fair value risk continued
Significant unobservable inputs used in Level 3 fair valuesThe only individually material asset valued using Level 3 techniques is a particular unlisted investment with a carrying value at year end of €197 million. A change in one or more of the inputs to reasonably possible alternative assumptions would not change fair value significantly.
Calculation of fair valuesThe fair values of the financial assets and liabilities are defined as being the amounts at which the instruments could be exchanged or liability settled in an arm’s length transaction between knowledgeable, willing parties. The following methods and assumptions have been used to estimate the fair values:
Assets and liabilities carried at fair value• The fair values of quoted investments falling into Level 1 are based on current bid prices. • The fair values of unquoted available-for-sale financial assets are based on recent trades in liquid markets, observable market
rates, discounted cash flow analysis and statistical modelling techniques such as Monte Carlo simulation. If all significant inputs required to fair value an instrument are observable, the instrument is included in Level 2. If one or more of the significant inputs is not based on observable market data, the instrument is included in Level 3.
• Derivatives are valued using valuation techniques with market observable inputs. The models incorporate various inputs including the credit quality of counter-parties, foreign exchange spot and forward rates, interest rate curves and forward rate curves of the underlying commodities.
• For listed securities where the market is not liquid, and for unlisted securities, valuation techniques are used. These include the use of recent arm’s length transactions, reference to other instruments that are substantially the same and discounted cash flow calculations.
Other financial assets and liabilities (fair values for disclosure purposes only)• Cash and cash equivalents, trade and other current receivables, bank loans and overdrafts, trade payables and other current
liabilities have fair values that approximate to their carrying amounts due to their short-term nature.• The fair values of preference shares and listed bonds are based on their market value.• Non-listed bonds, other loans, bank loans and non-current receivables and payables are based on the net present value of the
anticipated future cash flows associated with these instruments using rates currently available for debt on similar terms, credit risk and remaining maturities.
• Fair values for finance lease creditors have been assessed by reference to current market rates for comparable leasing arrangements.
19. Provisions
Provisions are recognised where a legal or constructive obligation exists at the balance sheet date, as a result of a past event, where the amount of the obligation can be reliably estimated and where the outflow of economic benefit is probable.
Provisions€ million
2012€ million
2011
Due within one year 361 393Due after one year 846 908
Total provisions 1,207 1,301
Movements during 2012
€ million
Restructuring
€ million
Legal
€ millionDisputed
indirect taxes
€ million
Other
€ million
Total
1 January 2012 348 81 654 218 1,301Income statement:
Charges 255 24 359 48 686Releases (70) (6) (190) (9) (275)
Utilisation (240) (36) (80) (46) (402)Currency translation (3) (2) (95) (3) (103)
31 December 2012 290 61 648 208 1,207
The provision for disputed indirect taxes is comprised of a number of small disputed items. The largest elements relate to disputes with Brazilian authorities. Due to the nature of the disputes, the timing of provision utilisation and any cash outflows is uncertain. The majority of disputed items attract an interest charge.
No individual items within the remaining provisions are significant. Unilever expects that the issues relating to these restructuring, legal and other provisions will be substantively resolved within five years.
124 Unilever Annual Report and Accounts 2012Financial statements
NOTES TO THE CONSOLIDATED FINANCIAL STATEMENTS UNILEVER GROUP continued
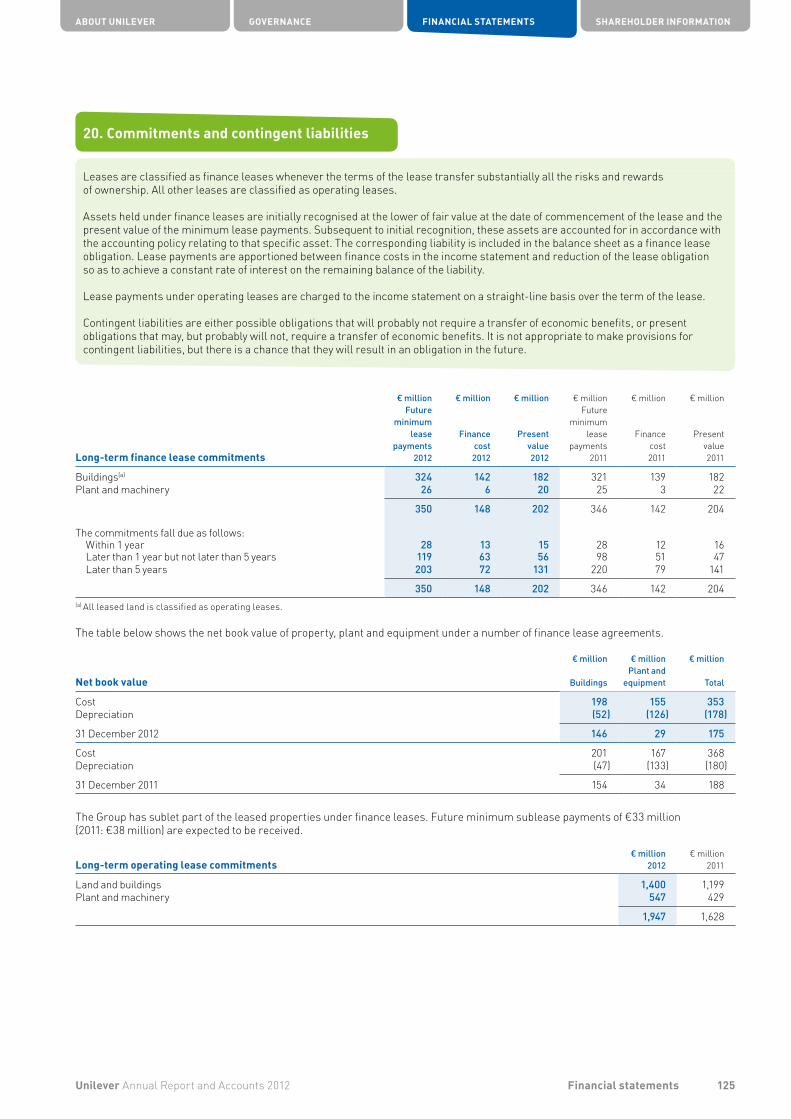
20. Commitments and contingent liabilities
Leases are classified as finance leases whenever the terms of the lease transfer substantially all the risks and rewards of ownership. All other leases are classified as operating leases.
Assets held under finance leases are initially recognised at the lower of fair value at the date of commencement of the lease and the present value of the minimum lease payments. Subsequent to initial recognition, these assets are accounted for in accordance with the accounting policy relating to that specific asset. The corresponding liability is included in the balance sheet as a finance lease obligation. Lease payments are apportioned between finance costs in the income statement and reduction of the lease obligation so as to achieve a constant rate of interest on the remaining balance of the liability.
Lease payments under operating leases are charged to the income statement on a straight-line basis over the term of the lease.
Contingent liabilities are either possible obligations that will probably not require a transfer of economic benefits, or present obligations that may, but probably will not, require a transfer of economic benefits. It is not appropriate to make provisions for contingent liabilities, but there is a chance that they will result in an obligation in the future.
Long-term finance lease commitments
€ millionFuture
minimumlease
payments2012
€ million
Financecost2012
€ million
Presentvalue2012
€ millionFuture
minimumlease
payments2011
€ million
Financecost2011
€ million
Presentvalue2011
Buildings(a) 324 142 182 321 139 182Plant and machinery 26 6 20 25 3 22
350 148 202 346 142 204
The commitments fall due as follows:Within 1 year 28 13 15 28 12 16Later than 1 year but not later than 5 years 119 63 56 98 51 47Later than 5 years 203 72 131 220 79 141
350 148 202 346 142 204(a) All leased land is classified as operating leases.
The table below shows the net book value of property, plant and equipment under a number of finance lease agreements.
Net book value
€ million
Buildings
€ millionPlant and
equipment
€ million
Total
Cost 198 155 353Depreciation (52) (126) (178)
31 December 2012 146 29 175
Cost 201 167 368Depreciation (47) (133) (180)
31 December 2011 154 34 188
The Group has sublet part of the leased properties under finance leases. Future minimum sublease payments of €33 million (2011: €38 million) are expected to be received.
Long-term operating lease commitments
€ million2012
€ million2011
Land and buildings 1,400 1,199Plant and machinery 547 429
1,947 1,628
ABOUT UNILEVER GOVERNANCE FINANCIAL STATEMENTS SHAREHOLDER INFORMATION
125Unilever Annual Report and Accounts 2012 Financial statements

20. Commitments and contingent liabilities continued
Operating lease and other commitments fall due as follows:
€ million
Operatingleases
2012
€ million
Operatingleases
2011
€ millionOther
commit-ments
2012
€ millionOther
commit-ments
2011
Within 1 year 383 381 1,159 1,087Later than 1 year but not later than 5 years 1,015 836 1,009 1,078Later than 5 years 549 411 75 99
1,947 1,628 2,243 2,264
The Group has sublet part of the leased properties under operating leases. Future minimum sublease payments of €50 million (2011: €58 million) are expected to be received.
Other commitments principally comprise commitments under contracts to purchase materials and services. They do not include commitments for capital expenditure, which are reported in note 10 on page 108.
Contingent liabilities arise in respect of litigation against group companies, investigations by competition, regulatory and fiscal authorities and obligations arising under environmental legislation. The estimated total of such contingent liabilities at 31 December 2012 was €236 million (2011: €246 million). The Group does not believe that any of these contingent liabilities will result in a material loss.
Legal proceedingsThe Group is involved from time to time in legal and arbitration proceedings arising in the ordinary course of business.
Ongoing compliance with competition laws is of key importance to Unilever. As the approach to enforcement of competition authorities globally continues to evolve, it is possible that our industry may on occasions be the focus of investigations. It is Unilever’s policy to co-operate fully with competition authorities whenever questions or issues arise. In addition the Group continues to reinforce and enhance our internal competition law compliance programme on an ongoing basis. Where specific issues arise provisions are made and contingent liabilities disclosed to the extent appropriate.
Details of the significant outstanding legal proceedings and ongoing regulatory investigations are as follows:
Tax case in BrazilDuring 2004 in Brazil, and in common with many other businesses operating in that country, one of our Brazilian subsidiaries received a notice of infringement from the Federal Revenue Service. The notice alleges that a 2001 reorganisation of our local corporate structure was undertaken without valid business purpose. The dispute is in court and, if upheld, will result in a tax payment relating to years from 2001 to the present day. The 2001 reorganisation was comparable with restructurings done by many companies in Brazil. The Group believes that the likelihood of a successful challenge by the tax authorities is remote, however, there can be no guarantee of success in court.
21. Acquisitions and disposals
Business combinations are accounted for using the acquisition accounting method as at the acquisition date, which is the date at which control is transferred to the Group.
Goodwill is measured at the acquisition date as the fair value of consideration transferred, plus non-controlling interests and the fair value of any previously held equity interests less the net recognised amount (which is generally fair value) of the identifiable assets and liabilities assumed. Consideration transferred does not include amounts related to settlement of pre-existing relationships. Such amounts are generally recognised in net profit.
Transaction costs are expensed as incurred, other than those incurred in relation to the issue of debt or equity securities. Any contingent consideration payable is measured at fair value at the acquisition date. Subsequent changes in the fair value of contingent consideration are recognised in net profit.
Changes in ownership that do not result in a change of control are accounted for as equity transactions and therefore do not have any impact on goodwill. The difference between consideration and the non-controlling share of net assets acquired is recognised within equity.
126 Unilever Annual Report and Accounts 2012Financial statements
NOTES TO THE CONSOLIDATED FINANCIAL STATEMENTS UNILEVER GROUP continued
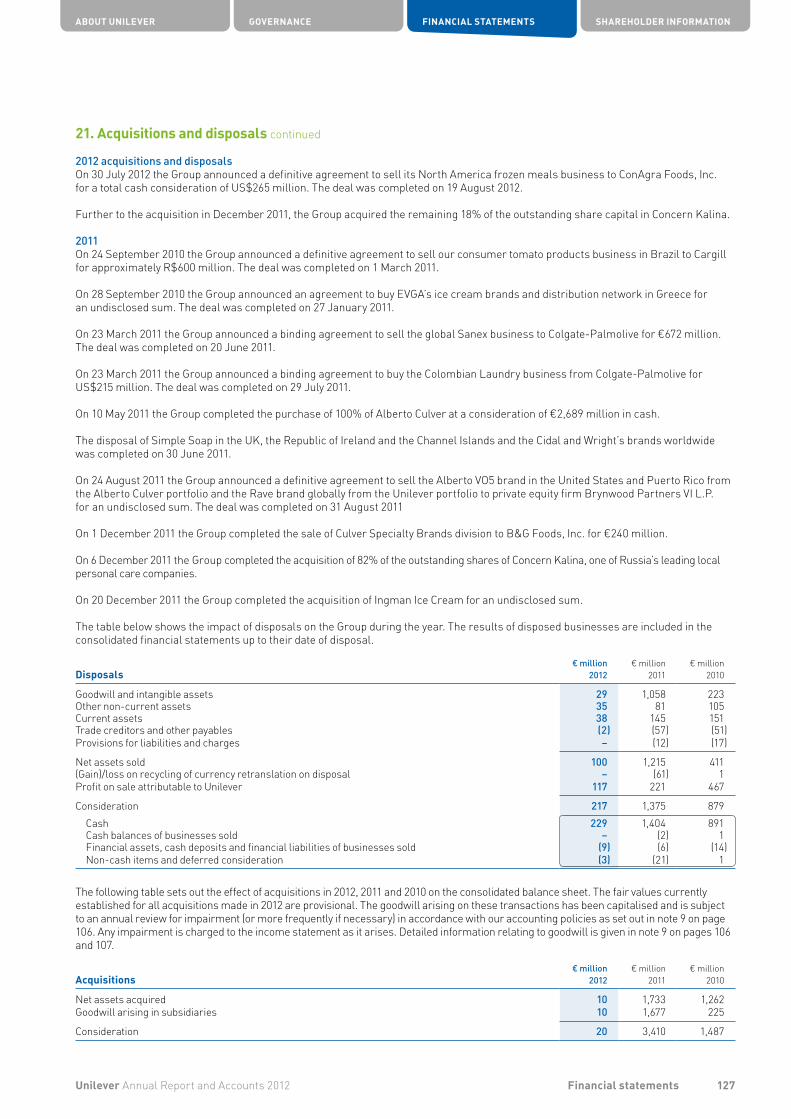
21. Acquisitions and disposals continued
2012 acquisitions and disposals On 30 July 2012 the Group announced a definitive agreement to sell its North America frozen meals business to ConAgra Foods, Inc. for a total cash consideration of US$265 million. The deal was completed on 19 August 2012.
Further to the acquisition in December 2011, the Group acquired the remaining 18% of the outstanding share capital in Concern Kalina.
2011On 24 September 2010 the Group announced a definitive agreement to sell our consumer tomato products business in Brazil to Cargill for approximately R$600 million. The deal was completed on 1 March 2011.
On 28 September 2010 the Group announced an agreement to buy EVGA’s ice cream brands and distribution network in Greece for an undisclosed sum. The deal was completed on 27 January 2011.
On 23 March 2011 the Group announced a binding agreement to sell the global Sanex business to Colgate-Palmolive for €672 million. The deal was completed on 20 June 2011.
On 23 March 2011 the Group announced a binding agreement to buy the Colombian Laundry business from Colgate-Palmolive for US$215 million. The deal was completed on 29 July 2011.
On 10 May 2011 the Group completed the purchase of 100% of Alberto Culver at a consideration of €2,689 million in cash.
The disposal of Simple Soap in the UK, the Republic of Ireland and the Channel Islands and the Cidal and Wright’s brands worldwide was completed on 30 June 2011.
On 24 August 2011 the Group announced a definitive agreement to sell the Alberto VO5 brand in the United States and Puerto Rico from the Alberto Culver portfolio and the Rave brand globally from the Unilever portfolio to private equity firm Brynwood Partners VI L.P. for an undisclosed sum. The deal was completed on 31 August 2011
On 1 December 2011 the Group completed the sale of Culver Specialty Brands division to B&G Foods, Inc. for €240 million.
On 6 December 2011 the Group completed the acquisition of 82% of the outstanding shares of Concern Kalina, one of Russia’s leading local personal care companies.
On 20 December 2011 the Group completed the acquisition of Ingman Ice Cream for an undisclosed sum.
The table below shows the impact of disposals on the Group during the year. The results of disposed businesses are included in the consolidated financial statements up to their date of disposal.
Disposals€ million
2012€ million
2011€ million
2010
Goodwill and intangible assets 29 1,058 223Other non-current assets 35 81 105Current assets 38 145 151Trade creditors and other payables (2) (57) (51)Provisions for liabilities and charges – (12) (17)
Net assets sold 100 1,215 411(Gain)/loss on recycling of currency retranslation on disposal – (61) 1Profit on sale attributable to Unilever 117 221 467
Consideration 217 1,375 879Cash 229 1,404 891Cash balances of businesses sold – (2) 1Financial assets, cash deposits and financial liabilities of businesses sold (9) (6) (14)Non-cash items and deferred consideration (3) (21) 1
The following table sets out the effect of acquisitions in 2012, 2011 and 2010 on the consolidated balance sheet. The fair values currently established for all acquisitions made in 2012 are provisional. The goodwill arising on these transactions has been capitalised and is subject to an annual review for impairment (or more frequently if necessary) in accordance with our accounting policies as set out in note 9 on page 106. Any impairment is charged to the income statement as it arises. Detailed information relating to goodwill is given in note 9 on pages 106 and 107.
Acquisitions
€ million2012
€ million2011
€ million2010
Net assets acquired 10 1,733 1,262Goodwill arising in subsidiaries 10 1,677 225
Consideration 20 3,410 1,487
ABOUT UNILEVER GOVERNANCE FINANCIAL STATEMENTS SHAREHOLDER INFORMATION
127Unilever Annual Report and Accounts 2012 Financial statements
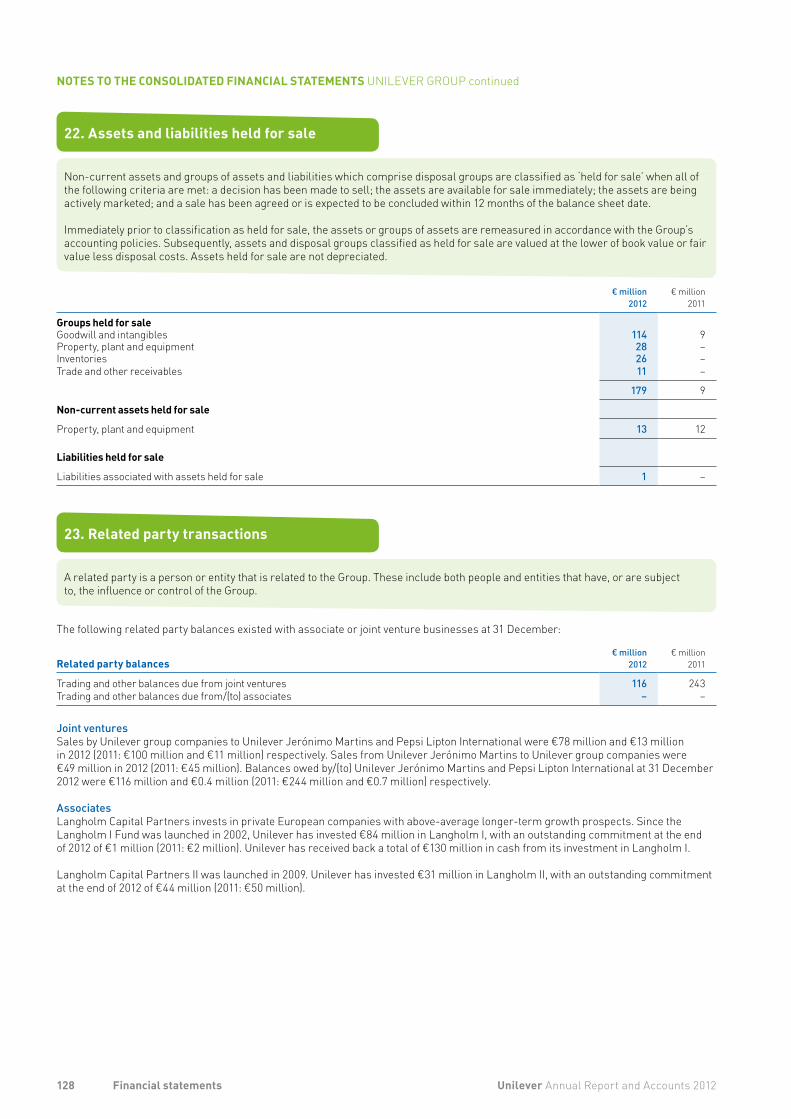
22. Assets and liabilities held for sale
Non-current assets and groups of assets and liabilities which comprise disposal groups are classified as ‘held for sale’ when all of the following criteria are met: a decision has been made to sell; the assets are available for sale immediately; the assets are being actively marketed; and a sale has been agreed or is expected to be concluded within 12 months of the balance sheet date.
Immediately prior to classification as held for sale, the assets or groups of assets are remeasured in accordance with the Group’s accounting policies. Subsequently, assets and disposal groups classified as held for sale are valued at the lower of book value or fair value less disposal costs. Assets held for sale are not depreciated.
€ million2012
€ million2011
Groups held for saleGoodwill and intangibles 114 9Property, plant and equipment 28 –Inventories 26 –Trade and other receivables 11 –
179 9
Non-current assets held for sale
Property, plant and equipment 13 12
Liabilities held for sale
Liabilities associated with assets held for sale 1 –
23. Related party transactions
A related party is a person or entity that is related to the Group. These include both people and entities that have, or are subject to, the influence or control of the Group.
The following related party balances existed with associate or joint venture businesses at 31 December:
Related party balances
€ million2012
€ million2011
Trading and other balances due from joint ventures 116 243Trading and other balances due from/(to) associates – –
Joint venturesSales by Unilever group companies to Unilever Jerónimo Martins and Pepsi Lipton International were €78 million and €13 million in 2012 (2011: €100 million and €11 million) respectively. Sales from Unilever Jerónimo Martins to Unilever group companies were€49 million in 2012 (2011: €45 million). Balances owed by/(to) Unilever Jerónimo Martins and Pepsi Lipton International at 31 December 2012 were €116 million and €0.4 million (2011: €244 million and €0.7 million) respectively.
AssociatesLangholm Capital Partners invests in private European companies with above-average longer-term growth prospects. Since the Langholm I Fund was launched in 2002, Unilever has invested €84 million in Langholm I, with an outstanding commitment at the end of 2012 of €1 million (2011: €2 million). Unilever has received back a total of €130 million in cash from its investment in Langholm I.
Langholm Capital Partners II was launched in 2009. Unilever has invested €31 million in Langholm II, with an outstanding commitment at the end of 2012 of €44 million (2011: €50 million).
128 Unilever Annual Report and Accounts 2012Financial statements
NOTES TO THE CONSOLIDATED FINANCIAL STATEMENTS UNILEVER GROUP continued
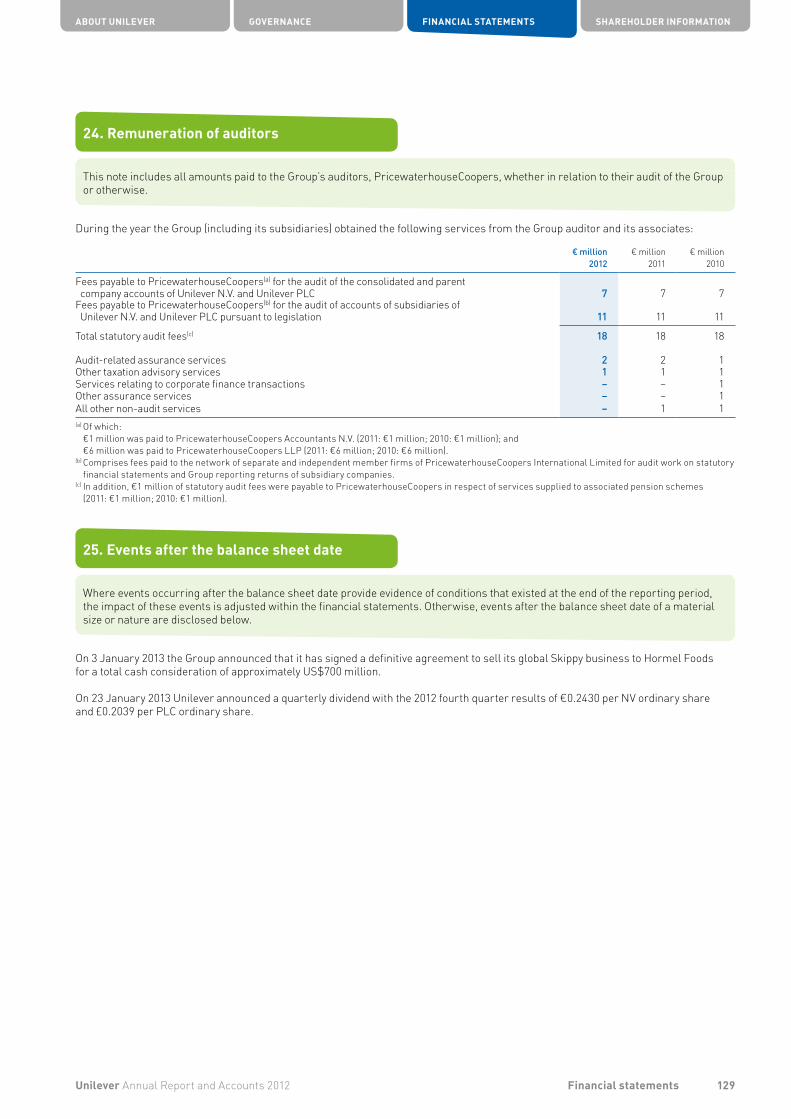
24. Remuneration of auditors
This note includes all amounts paid to the Group’s auditors, PricewaterhouseCoopers, whether in relation to their audit of the Group or otherwise.
During the year the Group (including its subsidiaries) obtained the following services from the Group auditor and its associates:
€ million2012
€ million2011
€ million2010
Fees payable to PricewaterhouseCoopers(a) for the audit of the consolidated and parent company accounts of Unilever N.V. and Unilever PLC 7 7 7
Fees payable to PricewaterhouseCoopers(b) for the audit of accounts of subsidiaries of Unilever N.V. and Unilever PLC pursuant to legislation 11 11 11
Total statutory audit fees(c) 18 18 18
Audit-related assurance services 2 2 1Other taxation advisory services 1 1 1Services relating to corporate finance transactions – – 1Other assurance services – – 1All other non-audit services – 1 1(a) Of which:
€1 million was paid to PricewaterhouseCoopers Accountants N.V. (2011: €1 million; 2010: €1 million); and €6 million was paid to PricewaterhouseCoopers LLP (2011: €6 million; 2010: €6 million).
(b) Comprises fees paid to the network of separate and independent member firms of PricewaterhouseCoopers International Limited for audit work on statutory financial statements and Group reporting returns of subsidiary companies.
(c) In addition, €1 million of statutory audit fees were payable to PricewaterhouseCoopers in respect of services supplied to associated pension schemes (2011: €1 million; 2010: €1 million).
25. Events after the balance sheet date
Where events occurring after the balance sheet date provide evidence of conditions that existed at the end of the reporting period, the impact of these events is adjusted within the financial statements. Otherwise, events after the balance sheet date of a material size or nature are disclosed below.
On 3 January 2013 the Group announced that it has signed a definitive agreement to sell its global Skippy business to Hormel Foods for a total cash consideration of approximately US$700 million.
On 23 January 2013 Unilever announced a quarterly dividend with the 2012 fourth quarter results of €0.2430 per NV ordinary share and £0.2039 per PLC ordinary share.
ABOUT UNILEVER GOVERNANCE FINANCIAL STATEMENTS SHAREHOLDER INFORMATION
129Unilever Annual Report and Accounts 2012 Financial statements

26. Principal group companies and non-current investments
as at 31 December 2012
The companies listed below and on page 131 are those which, in the opinion of the Directors, principally affect the amount of profit and assets shown in the Unilever Group financial statements. The Directors consider that those companies not listed are not significant in relation to Unilever as a whole.
Full information as required by Articles 379 and 414 of Book 2 of the Civil Code in the Netherlands has been filed by Unilever N.V. with the Commercial Registry in Rotterdam.
Particulars of PLC group companies and other significant holdings as required by the UK Companies Act 2006 will be annexed to the next Annual Return of Unilever PLC.
Unless otherwise indicated, the companies are incorporated and principally operate in the countries under which they are shown.
The aggregate percentage of equity capital directly or indirectly held by NV or PLC is shown in the margin, except where it is 100%. All these percentages are rounded to the nearest whole number.
The percentage of Unilever’s shareholdings held either directly or indirectly by NV and PLC are identified in the tables according to the following code:
NV 100% aPLC 100% bNV 55%; PLC 45% cNV 65%; PLC 35% dNV 3%; PLC 97% eNV 15%; PLC 85% fNV 18%; PLC 82% gNV 64%; PLC 36% hNV 66%; PLC 34% iNV 9%; PLC 91% j
Due to the inclusion of certain partnerships in the consolidated group financial statements of Unilever, para 264(b) of the German trade law grants an exemption from the duty to prepare individual statutory financial statements and management reports in accordance with the requirements for limited liability companies and to have these audited and published.
Group companies
% Ownership
ArgentinaUnilever de Argentina S.A. dAustraliaUnilever Australia Ltd. bBelgiumUnilever Belgium NV/SA aBrazilUnilever Brasil Ltda. dCanadaUnilever Canada Inc. dChileUnilever Chile SA d
% Ownership
ChinaUnilever Services (He Fei) Co Limited a
99FranceUnilever France dGermanyMaizena Grundstücksverwaltung
GmbH & Co. OHG hPfanni GmbH & Co. OHG Stavenhagen dUnilever Deutschland GmbH dUnilever Deutschland Holding GmbH dUnilever Deutschland Immobilien Leasing
GmbH & Co. OHG iUnilever Deutschland Produktions GmbH & Co. OHG dGreeceElais Unilever Hellas SA a
52IndiaHindustan Unilever Ltd. b
85IndonesiaP.T. Unilever Indonesia Tbk dItalyUnilever Italy Holdings Srl dJapanUnilever Japan KK aMexicoUnilever de México S. de R.L. de C.V. dThe NetherlandsMixhold B.V. dUnilever Finance International B.V. aUnilever N.V.(a) Unilever Nederland B.V. aUNUS Holding B.V. cPolandUnilever Polska S.A. bRussiaOOO Unilever Rus gSingapore Unilever Asia Private Limited a
74South AfricaUnilever South Africa (Pty) Limited fSpain Unilever España S.A. aSwedenUnilever Sverige AB aSwitzerland Unilever Americas Supply Chain Company AG aUnilever Finance International AG aUnilever Supply Chain Company AG aUnilever Schweiz GmbH aThailandUnilever Thai Trading Ltd. d
(a) See ‘Basis of consolidation’ in note 1 on page 90.
130 Unilever Annual Report and Accounts 2012Financial statements
NOTES TO THE CONSOLIDATED FINANCIAL STATEMENTS UNILEVER GROUP continued

26. Principal group companies and non-current investments continued
% Ownership
Turkey Unilever Sanayi ve Ticaret Türk A.S,. dUnited Kingdom Unilever UK Ltd. jUnilever PLC(a) Unilever UK Holdings Ltd. bUnilever UK & CN Holdings Ltd. eUnited States of America Alberto – Culver USA, Inc. cConopco, Inc. cUnilever Capital Corporation cUnilever United States, Inc. c
(a) See ‘Basis of consolidation’ in note 1 on page 90.
Joint ventures
% Ownership
55PortugalUnilever Jerónimo Martins, Lda b
50United States of America Pepsi/Lipton Partnership c
Associates
% Ownership
40United Kingdom Langholm Capital Partners L.P. b
In addition, we have revenues either from our own operations or otherwise in the following locations: Albania, Algeria, Andorra, Angola, Antigua, Armenia, Austria, Azerbaijan, Bahamas, Bahrain, Bangladesh, Barbados, Belarus, Belize, Benin, Bhutan, Bolivia, Bosnia and Herzegovina, Botswana, Brunei, Bulgaria, Burkina Faso, Burundi, Cambodia, Cameroon, Cape Verde, Central African Republic, Chad, Colombia, Comoros, Congo, Costa Rica, Côte d’Ivoire, Croatia, Cuba, Cyprus, Czech Republic, Democratic Republic of Congo, Denmark, Djibouti, Dominica, Dominican Republic, Ecuador, Egypt, El Salvador, Equatorial Guinea, Eritrea, Estonia, Ethiopia, Fiji, Finland, French Guiana, Gabon, Gambia, Georgia, Ghana, Grenada, Guadeloupe, Guatemala, Guinea, Guinea-Bissau, Guyana, Haiti, Honduras, Hong Kong, Hungary, Iceland, Iran, Iraq, Ireland, Israel, Jamaica, Jordan, Kazakhstan, Kenya, Kiribati, Kuwait, Kyrgyzstan, Lao People’s Democratic Republic, Latvia, Lebanon, Lesotho, Liberia, Libya, Liechtenstein, Lithuania, Luxembourg, Macao, Macedonia, Madagascar, Malawi, Malaysia, Mali, Malta, Marshall Islands, Martinique, Mauritania, Mauritius, Micronesia (federated States Of), Moldova (Republic of), Monaco, Mongolia, Montenegro, Morocco, Mozambique, Myanmar, Namibia, Nauru, Nepal, New Zealand, Nicaragua, Niger, Nigeria, Norway, Oman, Pakistan, Palau, Palestine, Panama, Papua New Guinea, Paraguay, Peru, Philippines, Portugal, Qatar, Romania, Rwanda, Saint Kitts and Nevis, Saint Lucia, Saint Vincent and the Grenadines, Samoa, San Marino, Saudi Arabia, Senegal, Serbia, Seychelles, Sierra Leone, Slovakia, Slovenia, Solomon Islands, Somalia, South Korea, South Sudan, Sri Lanka, Sudan, Suriname, Swaziland, Syria, Taiwan, Tajikistan, Tanzania, Timor-Leste, Togo, Tonga, Trinidad & Tobago, Tunisia, Turkmenistan, Tuvalu, Uganda, Ukraine, United Arab Emirates, Uruguay, Uzbekistan, Vanuatu, Venezuela, Vietnam, Yemen, Zambia and Zimbabwe.
ABOUT UNILEVER GOVERNANCE FINANCIAL STATEMENTS SHAREHOLDER INFORMATION
131Unilever Annual Report and Accounts 2012 Financial statements
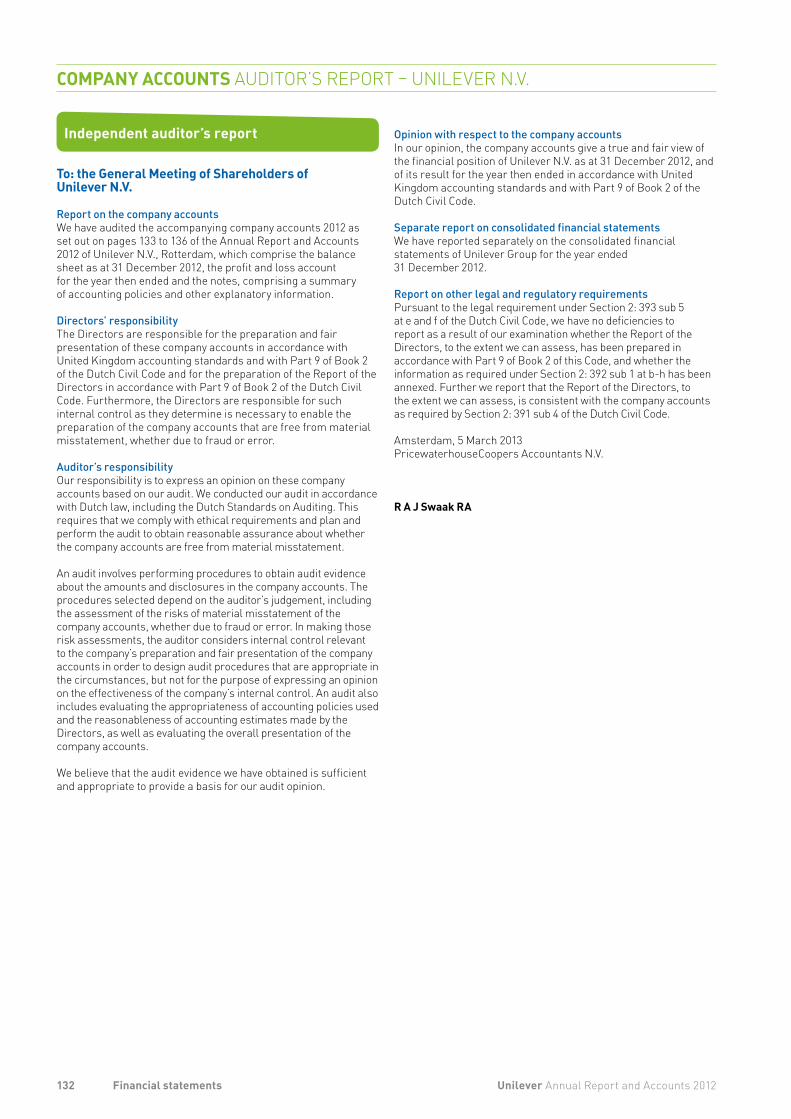
Opinion with respect to the company accountsIn our opinion, the company accounts give a true and fair view of the financial position of Unilever N.V. as at 31 December 2012, and of its result for the year then ended in accordance with United Kingdom accounting standards and with Part 9 of Book 2 of the Dutch Civil Code.
Separate report on consolidated financial statementsWe have reported separately on the consolidated financial statements of Unilever Group for the year ended 31 December 2012.
Report on other legal and regulatory requirementsPursuant to the legal requirement under Section 2: 393 sub 5 at e and f of the Dutch Civil Code, we have no deficiencies to report as a result of our examination whether the Report of the Directors, to the extent we can assess, has been prepared in accordance with Part 9 of Book 2 of this Code, and whether the information as required under Section 2: 392 sub 1 at b-h has been annexed. Further we report that the Report of the Directors, to the extent we can assess, is consistent with the company accounts as required by Section 2: 391 sub 4 of the Dutch Civil Code.
Amsterdam, 5 March 2013PricewaterhouseCoopers Accountants N.V.
R A J Swaak RA
Independent auditor’s report
To: the General Meeting of Shareholders of Unilever N.V.
Report on the company accountsWe have audited the accompanying company accounts 2012 as set out on pages 133 to 136 of the Annual Report and Accounts 2012 of Unilever N.V., Rotterdam, which comprise the balance sheet as at 31 December 2012, the profit and loss account for the year then ended and the notes, comprising a summary of accounting policies and other explanatory information.
Directors’ responsibilityThe Directors are responsible for the preparation and fair presentation of these company accounts in accordance with United Kingdom accounting standards and with Part 9 of Book 2 of the Dutch Civil Code and for the preparation of the Report of the Directors in accordance with Part 9 of Book 2 of the Dutch Civil Code. Furthermore, the Directors are responsible for such internal control as they determine is necessary to enable the preparation of the company accounts that are free from material misstatement, whether due to fraud or error.
Auditor’s responsibilityOur responsibility is to express an opinion on these company accounts based on our audit. We conducted our audit in accordance with Dutch law, including the Dutch Standards on Auditing. This requires that we comply with ethical requirements and plan and perform the audit to obtain reasonable assurance about whether the company accounts are free from material misstatement.
An audit involves performing procedures to obtain audit evidence about the amounts and disclosures in the company accounts. The procedures selected depend on the auditor’s judgement, including the assessment of the risks of material misstatement of the company accounts, whether due to fraud or error. In making those risk assessments, the auditor considers internal control relevant to the company’s preparation and fair presentation of the company accounts in order to design audit procedures that are appropriate in the circumstances, but not for the purpose of expressing an opinion on the effectiveness of the company’s internal control. An audit also includes evaluating the appropriateness of accounting policies used and the reasonableness of accounting estimates made by the Directors, as well as evaluating the overall presentation of the company accounts.
We believe that the audit evidence we have obtained is sufficient and appropriate to provide a basis for our audit opinion.
132 Unilever Annual Report and Accounts 2012Financial statements
COMPANY ACCOUNTS AUDITOR’S REPORT – UNILEVER N.V.
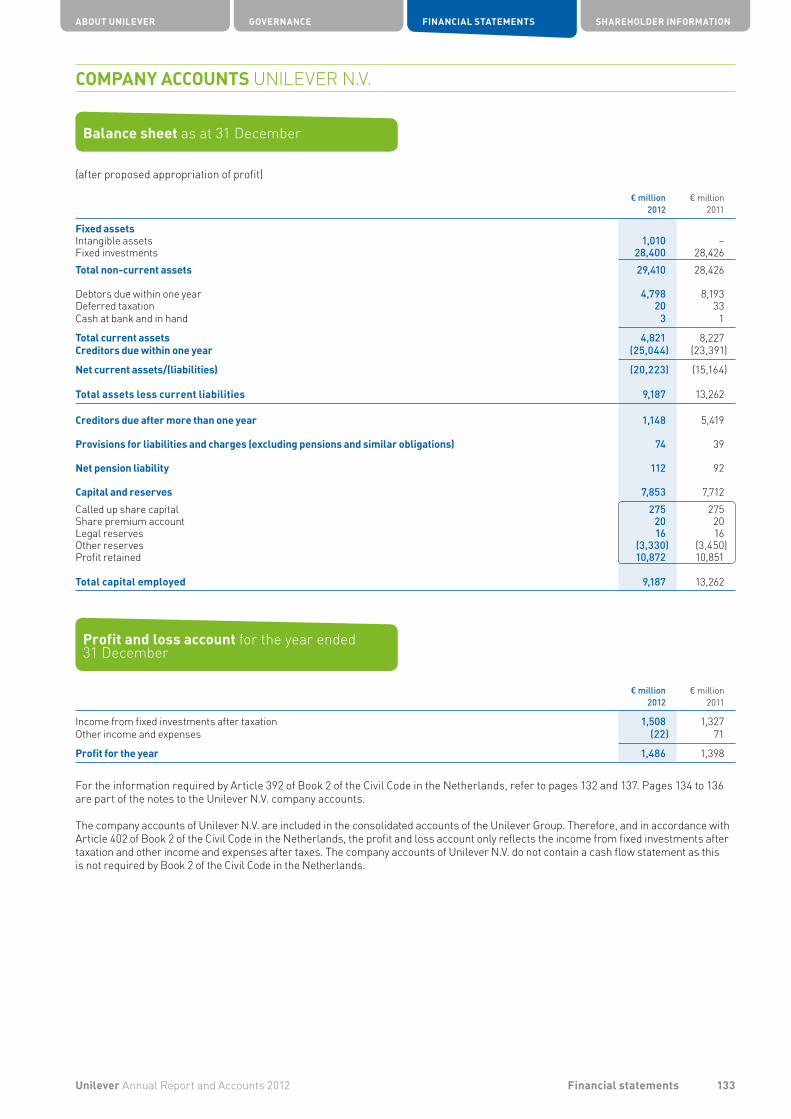
Balance sheet as at 31 December
(after proposed appropriation of profit)
€ million2012
€ million2011
Fixed assetsIntangible assets 1,010 –Fixed investments 28,400 28,426Total non-current assets 29,410 28,426
Debtors due within one year 4,798 8,193Deferred taxation 20 33Cash at bank and in hand 3 1
Total current assets 4,821 8,227Creditors due within one year (25,044) (23,391)
Net current assets/(liabilities) (20,223) (15,164)
Total assets less current liabilities 9,187 13,262
Creditors due after more than one year 1,148 5,419
Provisions for liabilities and charges (excluding pensions and similar obligations) 74 39
Net pension liability 112 92
Capital and reserves 7,853 7,712Called up share capital 275 275Share premium account 20 20Legal reserves 16 16Other reserves (3,330) (3,450)Profit retained 10,872 10,851
Total capital employed 9,187 13,262
Profit and loss account for the year ended 31 December
€ million2012
€ million2011
Income from fixed investments after taxation 1,508 1,327Other income and expenses (22) 71
Profit for the year 1,486 1,398
For the information required by Article 392 of Book 2 of the Civil Code in the Netherlands, refer to pages 132 and 137. Pages 134 to 136 are part of the notes to the Unilever N.V. company accounts.
The company accounts of Unilever N.V. are included in the consolidated accounts of the Unilever Group. Therefore, and in accordance with Article 402 of Book 2 of the Civil Code in the Netherlands, the profit and loss account only reflects the income from fixed investments after taxation and other income and expenses after taxes. The company accounts of Unilever N.V. do not contain a cash flow statement as this is not required by Book 2 of the Civil Code in the Netherlands.
ABOUT UNILEVER GOVERNANCE FINANCIAL STATEMENTS SHAREHOLDER INFORMATION
133Unilever Annual Report and Accounts 2012 Financial statements
COMPANY ACCOUNTS UNILEVER N.V.
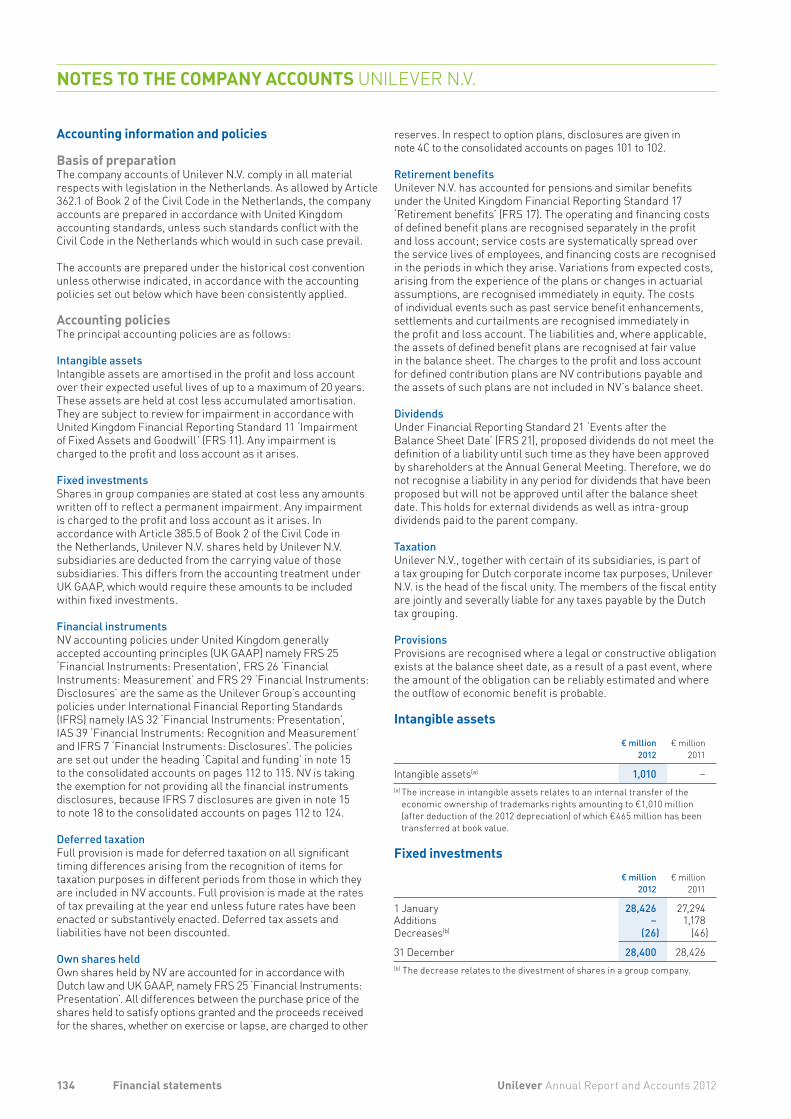
reserves. In respect to option plans, disclosures are given in note 4C to the consolidated accounts on pages 101 to 102.
Retirement benefitsUnilever N.V. has accounted for pensions and similar benefits under the United Kingdom Financial Reporting Standard 17 ‘Retirement benefits’ (FRS 17). The operating and financing costs of defined benefit plans are recognised separately in the profit and loss account; service costs are systematically spread over the service lives of employees, and financing costs are recognised in the periods in which they arise. Variations from expected costs, arising from the experience of the plans or changes in actuarial assumptions, are recognised immediately in equity. The costs of individual events such as past service benefit enhancements, settlements and curtailments are recognised immediately in the profit and loss account. The liabilities and, where applicable, the assets of defined benefit plans are recognised at fair value in the balance sheet. The charges to the profit and loss account for defined contribution plans are NV contributions payable and the assets of such plans are not included in NV’s balance sheet.
DividendsUnder Financial Reporting Standard 21 ‘Events after the Balance Sheet Date’ (FRS 21), proposed dividends do not meet the definition of a liability until such time as they have been approved by shareholders at the Annual General Meeting. Therefore, we do not recognise a liability in any period for dividends that have been proposed but will not be approved until after the balance sheet date. This holds for external dividends as well as intra-group dividends paid to the parent company.
TaxationUnilever N.V., together with certain of its subsidiaries, is part of a tax grouping for Dutch corporate income tax purposes, Unilever N.V. is the head of the fiscal unity. The members of the fiscal entity are jointly and severally liable for any taxes payable by the Dutch tax grouping.
ProvisionsProvisions are recognised where a legal or constructive obligation exists at the balance sheet date, as a result of a past event, where the amount of the obligation can be reliably estimated and where the outflow of economic benefit is probable.
Intangible assets€ million
2012€ million
2011
Intangible assets(a) 1,010 –(a) The increase in intangible assets relates to an internal transfer of the
economic ownership of trademarks rights amounting to €1,010 million (after deduction of the 2012 depreciation) of which €465 million has been transferred at book value.
Fixed investments
€ million
2012€ million
2011
1 January 28,426 27,294Additions – 1,178Decreases(b) (26) (46)
31 December 28,400 28,426(b) The decrease relates to the divestment of shares in a group company.
Accounting information and policies
Basis of preparationThe company accounts of Unilever N.V. comply in all material respects with legislation in the Netherlands. As allowed by Article 362.1 of Book 2 of the Civil Code in the Netherlands, the company accounts are prepared in accordance with United Kingdom accounting standards, unless such standards conflict with the Civil Code in the Netherlands which would in such case prevail.
The accounts are prepared under the historical cost convention unless otherwise indicated, in accordance with the accounting policies set out below which have been consistently applied.
Accounting policiesThe principal accounting policies are as follows:
Intangible assetsIntangible assets are amortised in the profit and loss account over their expected useful lives of up to a maximum of 20 years. These assets are held at cost less accumulated amortisation. They are subject to review for impairment in accordance with United Kingdom Financial Reporting Standard 11 ‘Impairment of Fixed Assets and Goodwill’ (FRS 11). Any impairment is charged to the profit and loss account as it arises.
Fixed investmentsShares in group companies are stated at cost less any amounts written off to reflect a permanent impairment. Any impairment is charged to the profit and loss account as it arises. In accordance with Article 385.5 of Book 2 of the Civil Code in the Netherlands, Unilever N.V. shares held by Unilever N.V. subsidiaries are deducted from the carrying value of those subsidiaries. This differs from the accounting treatment under UK GAAP, which would require these amounts to be included within fixed investments.
Financial instrumentsNV accounting policies under United Kingdom generally accepted accounting principles (UK GAAP) namely FRS 25 ‘Financial Instruments: Presentation’, FRS 26 ‘Financial Instruments: Measurement’ and FRS 29 ‘Financial Instruments: Disclosures’ are the same as the Unilever Group’s accounting policies under International Financial Reporting Standards (IFRS) namely IAS 32 ‘Financial Instruments: Presentation’, IAS 39 ‘Financial Instruments: Recognition and Measurement’ and IFRS 7 ‘Financial Instruments: Disclosures’. The policies are set out under the heading ‘Capital and funding’ in note 15 to the consolidated accounts on pages 112 to 115. NV is taking the exemption for not providing all the financial instruments disclosures, because IFRS 7 disclosures are given in note 15 to note 18 to the consolidated accounts on pages 112 to 124.
Deferred taxationFull provision is made for deferred taxation on all significant timing differences arising from the recognition of items for taxation purposes in different periods from those in which they are included in NV accounts. Full provision is made at the rates of tax prevailing at the year end unless future rates have been enacted or substantively enacted. Deferred tax assets and liabilities have not been discounted.
Own shares held Own shares held by NV are accounted for in accordance with Dutch law and UK GAAP, namely FRS 25 ‘Financial Instruments: Presentation’. All differences between the purchase price of the shares held to satisfy options granted and the proceeds received for the shares, whether on exercise or lapse, are charged to other
134 Unilever Annual Report and Accounts 2012Financial statements
NOTES TO THE COMPANY ACCOUNTS UNILEVER N.V.
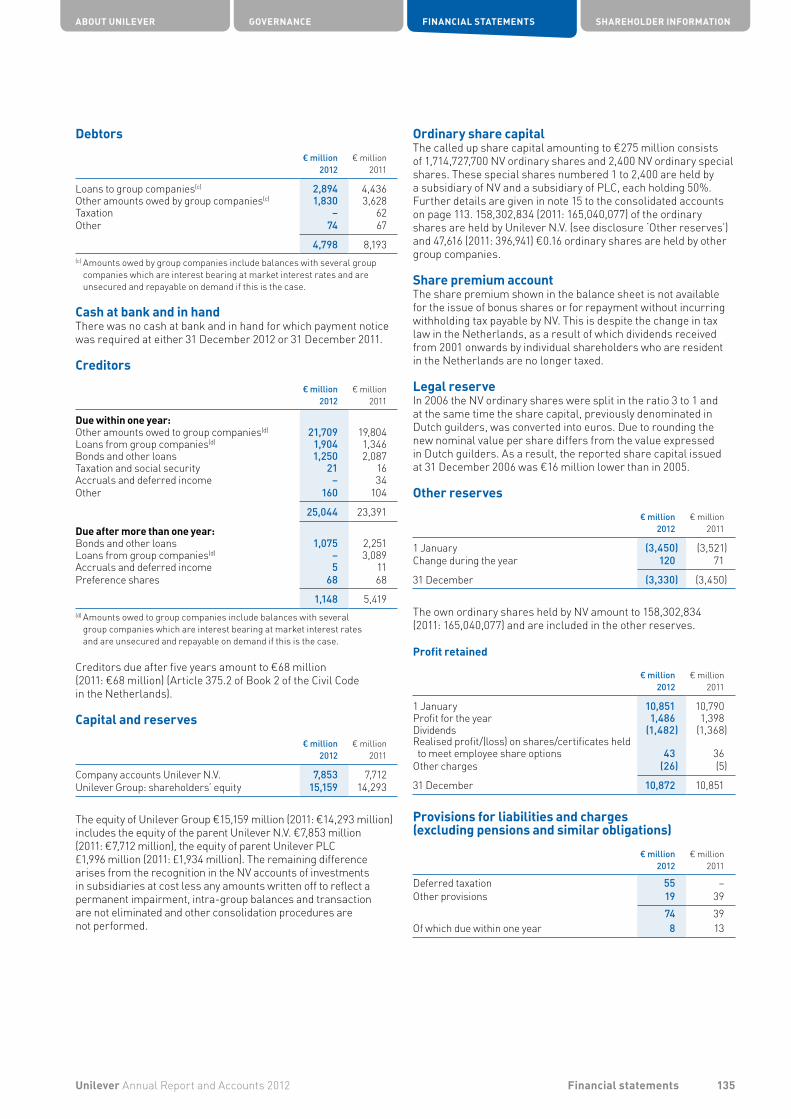
Ordinary share capitalThe called up share capital amounting to €275 million consists of 1,714,727,700 NV ordinary shares and 2,400 NV ordinary special shares. These special shares numbered 1 to 2,400 are held by a subsidiary of NV and a subsidiary of PLC, each holding 50%. Further details are given in note 15 to the consolidated accounts on page 113. 158,302,834 (2011: 165,040,077) of the ordinary shares are held by Unilever N.V. (see disclosure ‘Other reserves’) and 47,616 (2011: 396,941) €0.16 ordinary shares are held by other group companies.
Share premium accountThe share premium shown in the balance sheet is not available for the issue of bonus shares or for repayment without incurring withholding tax payable by NV. This is despite the change in tax law in the Netherlands, as a result of which dividends received from 2001 onwards by individual shareholders who are resident in the Netherlands are no longer taxed.
Legal reserveIn 2006 the NV ordinary shares were split in the ratio 3 to 1 and at the same time the share capital, previously denominated in Dutch guilders, was converted into euros. Due to rounding the new nominal value per share differs from the value expressed in Dutch guilders. As a result, the reported share capital issued at 31 December 2006 was €16 million lower than in 2005.
Other reserves
€ million
2012€ million
2011
1 January (3,450) (3,521)Change during the year 120 71
31 December (3,330) (3,450)
The own ordinary shares held by NV amount to 158,302,834 (2011: 165,040,077) and are included in the other reserves.
Profit retained
€ million
2012€ million
2011
1 January 10,851 10,790Profit for the year 1,486 1,398Dividends (1,482) (1,368)Realised profit/(loss) on shares/certificates held to meet employee share options 43 36
Other charges (26) (5)
31 December 10,872 10,851
Provisions for liabilities and charges (excluding pensions and similar obligations)
€ million2012
€ million2011
Deferred taxation 55 –Other provisions 19 39
74 39Of which due within one year 8 13
Debtors
€ million
2012€ million
2011
Loans to group companies(c) 2,894 4,436Other amounts owed by group companies(c) 1,830 3,628Taxation – 62Other 74 67
4,798 8,193(c) Amounts owed by group companies include balances with several group
companies which are interest bearing at market interest rates and are unsecured and repayable on demand if this is the case.
Cash at bank and in handThere was no cash at bank and in hand for which payment notice was required at either 31 December 2012 or 31 December 2011.
Creditors
€ million
2012€ million
2011
Due within one year:Other amounts owed to group companies(d) 21,709 19,804Loans from group companies(d) 1,904 1,346Bonds and other loans 1,250 2,087Taxation and social security 21 16Accruals and deferred income – 34Other 160 104
25,044 23,391
Due after more than one year:Bonds and other loans 1,075 2,251Loans from group companies(d) – 3,089Accruals and deferred income 5 11Preference shares 68 68
1,148 5,419(d) Amounts owed to group companies include balances with several
group companies which are interest bearing at market interest rates and are unsecured and repayable on demand if this is the case.
Creditors due after five years amount to €68 million (2011: €68 million) (Article 375.2 of Book 2 of the Civil Code in the Netherlands).
Capital and reserves
€ million
2012€ million
2011
Company accounts Unilever N.V. 7,853 7,712Unilever Group: shareholders’ equity 15,159 14,293
The equity of Unilever Group €15,159 million (2011: €14,293 million) includes the equity of the parent Unilever N.V. €7,853 million (2011: €7,712 million), the equity of parent Unilever PLC £1,996 million (2011: £1,934 million). The remaining difference arises from the recognition in the NV accounts of investments in subsidiaries at cost less any amounts written off to reflect a permanent impairment, intra-group balances and transaction are not eliminated and other consolidation procedures are not performed.
ABOUT UNILEVER GOVERNANCE FINANCIAL STATEMENTS SHAREHOLDER INFORMATION
135Unilever Annual Report and Accounts 2012 Financial statements
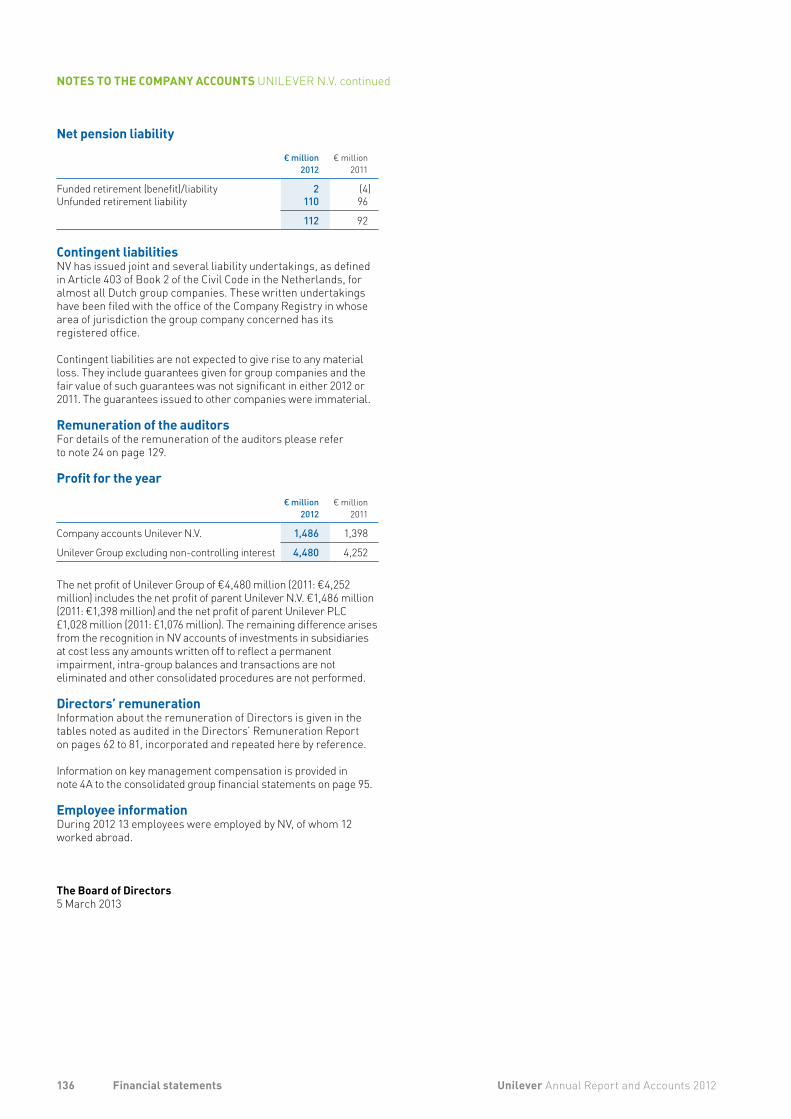
Net pension liability
€ million2012
€ million2011
Funded retirement (benefit)/liability 2 (4)Unfunded retirement liability 110 96
112 92
Contingent liabilitiesNV has issued joint and several liability undertakings, as defined in Article 403 of Book 2 of the Civil Code in the Netherlands, for almost all Dutch group companies. These written undertakings have been filed with the office of the Company Registry in whose area of jurisdiction the group company concerned has its registered office.
Contingent liabilities are not expected to give rise to any material loss. They include guarantees given for group companies and the fair value of such guarantees was not significant in either 2012 or 2011. The guarantees issued to other companies were immaterial.
Remuneration of the auditorsFor details of the remuneration of the auditors please refer to note 24 on page 129.
Profit for the year
€ million2012
€ million2011
Company accounts Unilever N.V. 1,486 1,398
Unilever Group excluding non-controlling interest 4,480 4,252
The net profit of Unilever Group of €4,480 million (2011: €4,252 million) includes the net profit of parent Unilever N.V. €1,486 million (2011: €1,398 million) and the net profit of parent Unilever PLC £1,028 million (2011: £1,076 million). The remaining difference arises from the recognition in NV accounts of investments in subsidiaries at cost less any amounts written off to reflect a permanent impairment, intra-group balances and transactions are not eliminated and other consolidated procedures are not performed.
Directors’ remunerationInformation about the remuneration of Directors is given in the tables noted as audited in the Directors’ Remuneration Report on pages 62 to 81, incorporated and repeated here by reference.
Information on key management compensation is provided in note 4A to the consolidated group financial statements on page 95.
Employee informationDuring 2012 13 employees were employed by NV, of whom 12 worked abroad.
The Board of Directors5 March 2013
136 Unilever Annual Report and Accounts 2012Financial statements
NOTES TO THE COMPANY ACCOUNTS UNILEVER N.V. continued

Post balance sheet eventOn 23 January 2013 the Directors announced a dividend of €0.243 per Unilever N.V. ordinary share. The dividend is payable from 13 March 2013 to shareholders registered at close of business on 8 February 2013.
Special controlling rights under the Articles of AssociationSee note 15 to the consolidated accounts on pages 112 to 115.
AuditorsA resolution will be proposed at the Annual General Meeting on 15 May 2013 for the re-appointment of PricewaterhouseCoopers Accountants N.V. as auditors of Unilever N.V. The present appointment will end at the conclusion of the Annual General Meeting.
The rules for profit appropriation in the Articles of Association (summary of Article 38)The profit for the year is applied firstly to the reserves required by law or by the Equalisation Agreement, secondly to cover losses of previous years, if any, and thirdly to the reserves deemed necessary by the Board of Directors. Dividends due to the holders of the Cumulative Preference Shares, including any arrears in such dividends, are then paid; if the profit is insufficient for this purpose, the amount available is distributed to them in proportion to the dividend percentages of their shares. Any profit remaining thereafter shall be distributed to the holders of ordinary shares in proportion to the nominal value of their respective holdings of ordinary shares. The General Meeting can only decide to make distributions from reserves on the basis of a proposal by the Board and in compliance with the law and the Equalisation Agreement.
Proposed profit appropriation€ million
2012€ million
2011
Profit for the year (available for distribution) 1,486 1,398Dividend (1,134) (1,047)
To profit retained 352 351
Corporate CentreUnilever N.V.Weena 455PO Box 7603000 DK RotterdamThe Netherlands
ABOUT UNILEVER GOVERNANCE FINANCIAL STATEMENTS SHAREHOLDER INFORMATION
137Unilever Annual Report and Accounts 2012 Financial statements
FURTHER STATUTORY AND OTHER INFORMATION UNILEVER N.V.
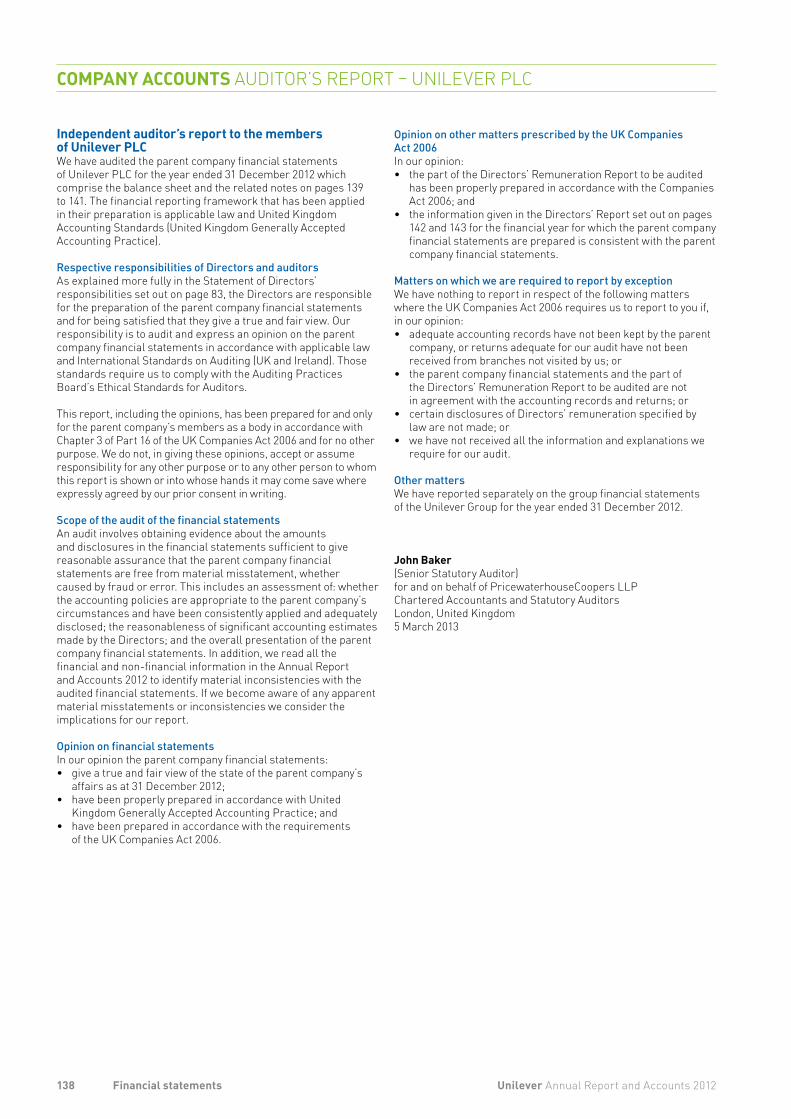
Opinion on other matters prescribed by the UK Companies Act 2006 In our opinion: • the part of the Directors’ Remuneration Report to be audited
has been properly prepared in accordance with the Companies Act 2006; and
• the information given in the Directors’ Report set out on pages 142 and 143 for the financial year for which the parent company financial statements are prepared is consistent with the parent company financial statements.
Matters on which we are required to report by exception We have nothing to report in respect of the following matters where the UK Companies Act 2006 requires us to report to you if, in our opinion: • adequate accounting records have not been kept by the parent
company, or returns adequate for our audit have not been received from branches not visited by us; or
• the parent company financial statements and the part of the Directors’ Remuneration Report to be audited are not in agreement with the accounting records and returns; or
• certain disclosures of Directors’ remuneration specified by law are not made; or
• we have not received all the information and explanations we require for our audit.
Other matters We have reported separately on the group financial statements of the Unilever Group for the year ended 31 December 2012.
John Baker(Senior Statutory Auditor)for and on behalf of PricewaterhouseCoopers LLPChartered Accountants and Statutory AuditorsLondon, United Kingdom5 March 2013
Independent auditor’s report to the members of Unilever PLCWe have audited the parent company financial statements of Unilever PLC for the year ended 31 December 2012 which comprise the balance sheet and the related notes on pages 139 to 141. The financial reporting framework that has been applied in their preparation is applicable law and United Kingdom Accounting Standards (United Kingdom Generally Accepted Accounting Practice).
Respective responsibilities of Directors and auditors As explained more fully in the Statement of Directors’ responsibilities set out on page 83, the Directors are responsible for the preparation of the parent company financial statements and for being satisfied that they give a true and fair view. Our responsibility is to audit and express an opinion on the parent company financial statements in accordance with applicable law and International Standards on Auditing (UK and Ireland). Those standards require us to comply with the Auditing Practices Board’s Ethical Standards for Auditors.
This report, including the opinions, has been prepared for and only for the parent company’s members as a body in accordance with Chapter 3 of Part 16 of the UK Companies Act 2006 and for no other purpose. We do not, in giving these opinions, accept or assume responsibility for any other purpose or to any other person to whom this report is shown or into whose hands it may come save where expressly agreed by our prior consent in writing.
Scope of the audit of the financial statementsAn audit involves obtaining evidence about the amounts and disclosures in the financial statements sufficient to give reasonable assurance that the parent company financial statements are free from material misstatement, whether caused by fraud or error. This includes an assessment of: whether the accounting policies are appropriate to the parent company’s circumstances and have been consistently applied and adequately disclosed; the reasonableness of significant accounting estimates made by the Directors; and the overall presentation of the parent company financial statements. In addition, we read all the financial and non-financial information in the Annual Report and Accounts 2012 to identify material inconsistencies with the audited financial statements. If we become aware of any apparent material misstatements or inconsistencies we consider the implications for our report.
Opinion on financial statements In our opinion the parent company financial statements: • give a true and fair view of the state of the parent company’s
affairs as at 31 December 2012;• have been properly prepared in accordance with United
Kingdom Generally Accepted Accounting Practice; and • have been prepared in accordance with the requirements
of the UK Companies Act 2006.
138 Unilever Annual Report and Accounts 2012Financial statements
COMPANY ACCOUNTS AUDITOR’S REPORT – UNILEVER PLC

Balance sheet as at 31 December
£ million2012
£ million2011
Fixed assetsIntangible assets 166 59Fixed investments 5,979 5,979
6,145 6,038
Current assetsDebtors due within one year 256 428Creditors due within one year (3,651) (3,778)
Net current assets/(liabilities) (3,395) (3,350)
Total assets less current liabilities 2,750 2,688
Creditors due after more than one year 746 745
Provision for liabilities and charges (excluding pensions and similar obligations) 8 9
Capital and reserves 1,996 1,934Called up share capital 41 41Share premium account 94 94Capital redemption reserve 11 11Other reserves (381) (405)Profit retained 2,231 2,193
Total capital employed 2,750 2,688
The financial statements on pages 139 to 141 were approved by the Board of Directors on 5 March 2013 and signed on its behalf by M Treschow and P Polman.
As permitted by Section 408 of the United Kingdom Companies Act 2006, an entity profit and loss account is not included as part of the published company accounts for PLC. Under the terms of Financial Reporting Standard 1 (revised 1996) ‘Cash Flow Statements’ (FRS 1) a cash flow statement is not included, as the cash flows are included in the consolidated cash flow statement of the Unilever Group.
On behalf of the Board of Directors
M Treschow ChairmanP Polman Chief Executive Officer5 March 2013
ABOUT UNILEVER GOVERNANCE FINANCIAL STATEMENTS SHAREHOLDER INFORMATION
139Unilever Annual Report and Accounts 2012 Financial statements
COMPANY ACCOUNTS UNILEVER PLC
Deferred taxationFull provision is made for deferred taxation on all significant timing differences arising from the recognition of items for taxation purposes in different periods from those in which they are included in the company’s accounts. Full provision is made at the rates of tax prevailing at the year end unless future rates have been enacted or substantively enacted. Deferred tax assets and liabilities have not been discounted.
Shares held by employee share trustsShares held to satisfy options are accounted for in accordance with UK GAAP, namely FRS 25 ‘Financial Instruments: Presentation’, FRS 20 ‘Share Based Payments’ and Urgent Issues Task Force abstract 38 ‘Accounting for ESOP Trusts’ (UITF 38). All differences between the purchase price of the shares held to satisfy options granted and the proceeds received for the shares, whether on exercise or lapse, are charged to other reserves.
DividendsUnder FRS 21 ‘Events after the Balance Sheet Date’, proposed dividends do not meet the definition of a liability until such time as they have been approved by shareholders at the Annual General Meeting. Therefore, we do not recognise a liability in any period for dividends that have been proposed but will not be approved until after the balance sheet date. This holds for external dividends as well as intra-group dividends paid to the parent company.
ProvisionsProvisions are recognised where a legal or constructive obligation exists at the balance sheet date, as a result of a past event, where the amount of the obligation can be reliably estimated and where the outflow of economic benefit is probable.
Accounting information and policies
Basis of preparationThe accounts have been prepared on the going concern basis and in accordance with applicable United Kingdom accounting standards and the UK Companies Act 2006.
The accounts are prepared under the historical cost convention except for the revaluation of financial assets classified as ‘available-for-sale investments’ or ‘fair value through profit or loss’, and ‘derivative financial instruments’ in accordance with the accounting policies set out below which have been consistently applied.
Accounting policiesThe principal accounting policies are as follows:
Intangible assetsIntangible assets comprise trademarks purchased after 1 January 1998 and are amortised in the profit and loss account over their expected useful lives of up to a maximum of 20 years. These assets are held at cost less accumulated amortisation. They are subject to review for impairment in accordance with United Kingdom Financial Reporting Standard 11 ‘Impairment of Fixed Assets and Goodwill’ (FRS 11). Any impairment is charged to the profit and loss account as it arises.
Fixed investmentsShares in group companies are stated at cost less any amounts written off to reflect a permanent impairment. Any impairment is charged to the profit and loss account as it arises.
Financial instruments The company’s accounting policies under United Kingdom generally accepted accounting principles (UK GAAP), namely FRS 25 ‘Financial Instruments: Presentation’, FRS 26 ‘Financial Instruments: Measurement’ and FRS 29 ‘Financial Instruments: Disclosures’, are the same as the Unilever Group’s accounting policies under International Financial Reporting Standards (IFRS) namely IAS 32 ‘Financial Instruments: Presentation’, IAS 39 ‘Financial Instruments: Recognition and Measurement’ and IFRS 7 ‘Financial Instruments: Disclosures’. The policies are set out under the heading ‘Capital and funding’ in note 15 to the consolidated accounts on pages 112 and 115. PLC is taking the exemption for financial instruments disclosures, because IFRS 7 disclosures are given in notes 15 to 18 to the consolidated accounts on pages 112 to 124.
140 Unilever Annual Report and Accounts 2012Financial statements
NOTES TO THE COMPANY ACCOUNTS UNILEVER PLC

Ordinary share capitalThe called up share capital amounting to £41 million (2011: £41 million) consists of 1,310,156,361 (2011: 1,310,156,361) PLC ordinary shares and 100,000 (2011: 100,000) PLC deferred stock. The deferred stock of PLC are held as to one half of each class by N.V. Elma – a subsidiary of NV – and one half by United Holdings Ltd – a subsidiary of PLC. Further details are given in note 15 to the consolidated accounts on pages 112 to 115.
Other reservesThe own ordinary shares held by PLC amount to 27,902,850 (2011: 29,739,105) and are included in Other reserves.
£ million
2012£ million
2011
1 January (405) (428)Movements in shares 24 23
31 December (381) (405)
Profit retained
£ million
2012£ million
2011
1 January 2,193 2,090Profit for the year 1,028 1,076Other movements – 6Dividends(f) (990) (979)
31 December 2,231 2,193(f) Further details are given in note 8 to the consolidated accounts on
page 105.
Contingent liabilitiesContingent liabilities are not expected to give rise to any material loss. They include guarantees given for group companies and the fair value of such guarantees was not significant in either 2012 or 2011. The guarantees issued to other companies were immaterial.
Remuneration of auditorsThe parent company accounts of Unilever PLC are required to comply with The Companies (Disclosure of Auditor Remuneration) Regulations 2005. Auditor’s remuneration in respect of Unilever PLC is included within the disclosures in note 24 on page 129.
Profit appropriation
£ million
2012£ million
2011
Profit for the year (available for distribution) 1,028 1,076Dividends(g) (749) (752)
To profit retained 279 324(g) The dividend to be paid in March 2013 (see post balance sheet event) is not
included in the 2012 dividend amount.
Post balance sheet eventOn 23 January 2013 the Directors announced a dividend of £0.2039 per Unilever PLC ordinary share. The dividend is payable from 13 March 2013 to shareholders registered at close of business on 8 February 2013.
Intangible assets£ million
2012£ million
2011
Intangible assets(a) 166 59(a) The increase in the intangible assets mainly relates to an internal transfer
of the economic ownership of trademark rights amounting to £105 million (after deduction of the 2012 depreciation).
Fixed investments£ million
2012£ million
2011
Shares in group companies(b) 5,979 5,979(b) Fixed asset investments comprise equity shares of the associated company
Hindustan Unilever Limited, with a cost of £60 million (2011: £60 million). These are listed on the Bombay Stock Exchange and had a market value of £4,721 million (2011: £3,880 million) at 31 December 2012. The carrying value of the investments is supported by their underlying net assets.
Debtors£ million
2012£ million
2011
Due within one year:Amounts owed by group companies(c) 240 418Taxation and social security 15 7Other 1 3
256 428(c) Amounts owed by group companies include balances with several
group companies which are interest bearing at market interest rates and are unsecured and repayable on demand if this is the case.
Creditors
£ million
2012£ million
2011
Due within one year:Amounts owed to group companies(d) 3,638 3,764Accruals and deferred income 11 11Other 2 3
3,651 3,778
Due after more than one year:Bonds and other loans(e) 746 745(d) Amounts owed to group companies include balances with several
group companies which are interest bearing at market interest rates and are unsecured and repayable on demand if this is the case.
(e) In 2009 Unilever PLC issued the following senior notes: •on19March£350millionat4.0%maturingDecember2014
(year-end value at amortised cost £348 million); and •on17June£400millionat4.75%maturingJune2017
(year-end value amortised cost £398 million).
Provisions for liabilities and charges (excluding pensions and similar obligations)
£ million2012
£ million2011
Deferred taxation 7 8Other provisions 1 1
8 9
Of which due within one year 1 1
ABOUT UNILEVER GOVERNANCE FINANCIAL STATEMENTS SHAREHOLDER INFORMATION
141Unilever Annual Report and Accounts 2012 Financial statements
Employee involvement and communicationUnilever’s UK companies maintain formal processes to inform, consult and involve employees and their representatives. We recognise collective bargaining on a number of sites and engage with employees via the Sourcing Unit Forum including officer representation from the three recognised trade unions. Our sites use tools such as Total Productive Maintenance which rely heavily on employee involvement, contribution and commitment.
A National Consultative Council covering employees and management representatives exists to provide a forum for discussing issues relating to the United Kingdom. A European Works Council, embracing employee and management representatives from countries within Europe, has been in existence for several years and provides a forum for discussing issues that extend across national boundaries.
The company carries out regular and wide-ranging monitoring surveys providing valuable insight into employee views, attitudes and levels of engagement.
The Directors’ Reports of the United Kingdom operating companies contain more details about how they have communicated with their employees during 2012.
Equal opportunities and diversityUnder the umbrella of our Code of Business Principles, Unilever aims to ensure that applications for employment from people with disabilities, and other under-represented groups, are given full and fair consideration and that such people are given the same training, development and prospects as other employees. Every effort is also made to retrain and support employees who become disabled while working within the Group.
Unilever continues to review ways in which greater diversity can be achieved in recruitment and selection. We have put in place policies which promote the achievement of diversity in our business and we review these regularly. For example, Unilever UK provides policies on home working, flexible working, maternity and paternity leave, child care provision and career breaks, which help us to meet the objective of greater employee diversity.
Charitable and other contributionsUnilever collates the cost of its community involvement activities using the London Benchmarking Group model. The model recommends the separation of charitable donations, community investment, commercial initiatives in the community and management costs relating to the programme of activity.
During 2012 Unilever PLC made a total contribution of £0.6 million towards community investment.
No donation or contribution was made or expenditure incurred for political purposes.
Directors’ Report of PLC
For the purposes of the UK Companies Act 2006, the Directors’ Report of Unilever PLC for the year ended 31 December 2012 comprises this and the following page and the information contained in the Report of the Directors on pages 2 to 81 which includes the company’s position on environment and corporate responsibility matters, Dividends on page 105, Principal group companies and non-current investments on pages 130 and 131, and Treasury risk management on pages 116 to 120. The information required to be given pursuant to Section 992 of the UK Companies Act 2006 is covered elsewhere in this Annual Report.
The Directors’ Report has been drawn up and presented in accordance with and in reliance upon English company law and liabilities of the Directors in connection with that report shall be subject to the limitations and restrictions provided by such law.
Under the UK Companies Act 2006, a safe harbour limits the liability of Directors in respect of statements in and omissions from the Directors’ Report. Under English Law the Directors would be liable to Unilever (but not to any third party) if the Directors’ Report contained errors as a result of recklessness or knowing misstatement or dishonest concealment of a material fact, but would not otherwise be liable.
Business reviewThe UK Companies Act 2006 requires Unilever PLC to set out in this report a fair review of the business of the Group during the financial year ended 31 December 2012 including a description of the principal risks and uncertainties facing the Group and an analysis of the position of the Group’s business at the end of the financial year, known as a ‘Business review’.
The information that fulfils the current Business review requirements can be found on the following pages of this Annual Report which are incorporated into this report by reference:• a description of the outlook of the Group and the principal
risks and uncertainties facing the Group – see pages 36 to 41;• the development and performance of the Group’s business
during the year – see pages 28 to 35;• the position of the Group’s business at the end of the
year – see pages 32 and 88;• key performance indicators – see pages 6, 29 to 31, 34 and 35;• other key indicators – see page 6;• main trends and factors likely to affect the future development,
performance and position of the Group – see page 36;• environmental matters and policy, including the impact of the
Group’s business on the environment – see pages 6 and 8 to 27;• employee matters and policy – see pages 24 to 27 and
also below; • social and community matters and policy – see pages
6 and 8 to 27;• a statement that the Directors do not believe that there are
any contracts or other arrangements which are essential to the business of the Group is given on page 52; and
• an explanation of the business model and the Group’s Strategy for delivering its objectives – see pages 8 and 9.
142 Unilever Annual Report and Accounts 2012Financial statements
FURTHER STATUTORY AND OTHER INFORMATION UNILEVER PLC
Other information
UK Capital Gains TaxThe market value of PLC 31/9p ordinary shares at 31 March 1982 would have been 76.84p per share. Since 1982, PLC ordinary shares have been sub-divided on two occasions and consolidated on two occasions. First, with effect on 26 June 1987, the 25p shares were split into five shares of 5p each. Secondly, with effect on 13 October 1997, the 5p shares were split into four shares of 1.25p each. Thirdly, with effect on 10 May 1999, the shares were consolidated by replacing every 112 shares of 1.25p each with 100 shares of 1.4p each. Lastly, with effect on 22 May 2006, the shares were consolidated by replacing every 20 shares of 1.4p each with nine shares of 31/9p each.
Corporate Centre Unilever PLC Registered OfficeUnilever PLC Port SunlightUnilever House Wirral100 Victoria Embankment Merseyside CH62 4ZDLondon EC4Y 0DY Registered number: 41424
Unilever PLC RegistrarsComputershare Investor Services PLCThe PavilionsBridgwater RoadBristol BS99 6ZY
Supplier payment policiesIndividual operating companies are responsible for agreeing the terms and conditions under which business transactions with their suppliers are conducted. The Directors’ Reports of the United Kingdom operating companies give information about their supplier payment policies as required by the UK Companies Act 2006. PLC, as a holding company, does not itself make any relevant payments in this respect.
Auditors and disclosure of information to auditorsA resolution will be proposed at the AGM on 15 May 2013 for the re-appointment of PricewaterhouseCoopers LLP as auditors of PLC. The present appointment will end at the conclusion of the AGM.
To the best of each of the Directors’ knowledge and belief, and having made appropriate enquiries of other officers of the Unilever Group, all information relevant to enabling the auditors to provide their opinions on PLC’s consolidated and parent company accounts has been provided. Each of the Directors has taken all reasonable steps to ensure their awareness of any relevant audit information and to establish that Unilever PLC’s auditors are aware of any such information.
Authority to purchase own sharesAt the AGM of PLC held on 9 May 2012, authority was given to make market purchases of PLC ordinary shares of 31⁄9p each, to a maximum of 128 million shares. This authority will expire at the AGM on 15 May 2013, and a resolution will be proposed to renew the authority.
Details of shares purchased by an employee share trust and Unilever Group companies to satisfy options granted under PLC’s employee share schemes are given on page 55 and in note 4 to the consolidated accounts on pages 101 and 102.
This Directors’ Report of Unilever PLC has been approved by the Board and signed on their behalf by Tonia Lovell – Group Secretary.
ABOUT UNILEVER GOVERNANCE FINANCIAL STATEMENTS SHAREHOLDER INFORMATION
143Unilever Annual Report and Accounts 2012 Financial statements
Financial calendar
Annual General Meetings
DateVoting Record
dateVoting &
Registration date
NV 9.30am 15 May 2013 17 April 2013 5.30pm 8 May 2013
PLC 3.00pm 15 May 2013 10 May 2013 3.00pm 13 May 2013
Announcements of results
First Quarter 25 April 2013 Third Quarter 24 October 2013Second Quarter 25 July 2013 Fourth Quarter 23 January 2014
Quarterly DividendsDates listed below are applicable to all four Unilever listings (NV ordinary shares, PLC ordinary shares, NV New York shares, and PLC ADRs).
Announced Ex-dividend date Record date Payment date
Quarterly Dividend announced with the Q4 2012 results 23 January 2013 6 February 2013 8 February 2013 13 March 2013Quarterly Dividend announced with the Q1 2013 results 25 April 2013 8 May 2013 10 May 2013 2 June 2013Quarterly Dividend announced with the Q2 2013 results 25 July 2013 7 August 2013 9 August 2013 11 September 2013Quarterly Dividend announced with the Q3 2013 results 24 October 2013 6 November 2013 8 November 2013 11 December 2013
Preferential Dividends – NV
Announced Ex-dividend date Record date Payment date
6% and 7% 6 September 2013 9 September 2013 11 September 2013 1 October 2013
Contact details
Rotterdam LondonUnilever N.V. Unilever PLCInvestor Relations Department Investor Relations DepartmentWeena 455, PO Box 760 Unilever House3000 DK Rotterdam 100 Victoria EmbankmentThe Netherlands London EC4Y 0DY United Kingdom
Telephone +44 (0)20 7822 6830 Telephone +44 (0)20 7822 6830Telefax +44 (0)20 7822 5754 Telefax +44 (0)20 7822 5754
Any queries can also be sent to us electronically via www.unilever.com/resource/contactus.aspx.
144 Unilever Annual Report and Accounts 2012Shareholder information
SHAREHOLDER INFORMATION
Publications
Copies of the following publications can be accessed directly or ordered through www.unilever.com/investorrelations or www.unilever.nl/onsbedrijf/beleggers.
Unilever Annual Report and Accounts 2012Available in English with figures in euros. It forms the basis for the Form 20-F that is filed with the United States Securities and Exchange Commission, which is also available free of charge at www.sec.gov.
Quarterly Results AnnouncementsAvailable in English with figures in euros.
Website
Shareholders are encouraged to visit our website www.unilever.com which has a wealth of information about Unilever. Any information on or linked from the website is not incorporated by reference into this Annual Report and Accounts.
There is a section designed specifically for investors at www.unilever.com/investorrelations. It includes detailed coverage of the Unilever share price, our quarterly and annual results, performance charts, financial news and investor relations speeches and presentations. It also includes conference and investor/analyst presentations.
You can also view this year’s Annual Report and Accounts, and prior years’ Annual Review and Annual Report and Accounts documents at www.unilever.com/investorrelations.
PLC shareholders can elect to receive their shareholder communications such as the Annual Report and Accounts and other shareholder documents electronically by registering at www.unilever.com/shareholderservices.
Shareholders are also able to view documents on our website.
Share registration
The NetherlandsANT Trust & Corporate Services N.V.Claude Debussylaan 241082 MD Amsterdam
Telephone +31 (0)20 522 2555 Telefax +31 (0)20 522 2500Website www.ant-trust.comEmail [email protected]
UKComputershare Investor Services PLCThe PavilionsBridgwater RoadBristol BS99 6ZY
Telephone +44 (0)870 600 3977Telefax +44 (0)870 703 6119Website www.investorcentre.co.uk/contactusEmail [email protected]
USACitibank Shareholder ServicesPO Box 43077Providence, RI 02940-3077
Toll free phone (inside US) 888 502 6356Toll phone (outside US) +1 781 575 4555Website www.citi.com/drEmail [email protected]
ABOUT UNILEVER GOVERNANCE FINANCIAL STATEMENTS SHAREHOLDER INFORMATION
145Unilever Annual Report and Accounts 2012 Shareholder information

146 Unilever Annual Report and Accounts 2012
NOTES

147Unilever Annual Report and Accounts 2012
NOTES
Accounting policies 6, 90-91, 134, 140Acquisitions 29, 126-127Advertising and promotion 21, 94Americas, The 7, 31, 93, 95, 107Annual General Meetings 45, 144Asia/AMET/RUB 7, 31, 93, 95, 107Associates 86, 89, 92-93, 109, 128, 131Audit Committee 50, 56-57Auditors 57, 84-85, 129, 132, 137, 138, 141, 143Balance sheet 32, 88, 133, 139Biographies 42-43Board committees 50Board remuneration 62-81Boards 2, 44-47Brands 9, 12-15Capital expenditure 107-108Cash 121-122Cash flow 33, 89Categories 30, 92Cautionary statement Inside back coverChairman 2-3, 42, 44, 49Chief Executive Officer 4-5, 42, 49 Commitments 32, 125-126Company accounts, statutory and other information 132-143Compensation and Management Resources Committee 53, 62-81 Comprehensive income 87, 104Contingent liabilities 125-126, 136, 141Core earnings per share 29, 35, 105Core operating margin 6, 28-31, 35Core operating profit 29, 35, 92-93Corporate governance 44-55Corporate responsibility 58-59Corporate Responsibility Committee 50, 58-59Deferred tax 103-104, 134, 140Depreciation 94, 107-108Directors’ responsibilities 83Disposals 126-127Diversity 25, 44, 142 Dividends 105, 134, 140, 144Earnings per share 29, 86, 105Employees 7, 24-27, 95, 142Equalisation Agreement 52Equity 114Europe 7, 31, 93, 95, 107Exchange rates 90Executive Directors 42, 45, 49-50, 64-68, 77-80Finance and liquidity 32, 116-118Finance costs and income 102Financial assets 121-122Financial calendar 144Financial instruments 116-124Financial liabilities 112, 115Financial review 28-35Foods 7, 30, 92Free cash flow 6, 28-29, 34-35 Geographies 7, 31, 93, 95, 107Goodwill 106-107
Gross profit 94Group structure 3, 90Home Care 7, 30, 92Impairment 92, 94, 106-107Income statement 29, 86Innovation 9, 12-15Intangible assets 106-107, 134, 140-141International Financial Reporting Standards 6, 90Inventories 110Joint ventures 92-93, 109, 128, 131Key management 95Key performance indicators 6, 28-31, 34-35Leases 32, 125-126Legal proceedings 126Market capitalisation 33Net debt 35Nominating and Corporate Governance Committee 50, 60-61Non-core items 92-93, 94Non-Executive Directors 42, 45, 49, 68-69, 75, 80-81Non-GAAP measures 34-35Off-balance sheet arrangements 32Operating costs 94Operating profit 29, 92-94Outlook 36Payables 111Pensions and similar obligations 95-100Personal Care 7, 30, 92Post balance sheet events 129, 137, 141Preference shares and dividends 102, 144Principal group companies 130-131Property, plant and equipment 107-108Provisions 124Receivables 110-111Refreshment 7, 30, 92Related-party transactions 128 Research and development 12-15, 94, 106Reserves 114, 135, 141Restructuring 124Revenue recognition 92Risk management and control 41, 53-54, 56-57Risks – principal risks 36-40Segment information 30-31, 92-93Share-based payments 101-102Share capital 51-52, 54-55, 113, 135, 141Shareholders 51-52, 54-55Share registration 145Staff costs 95Strategy 8Taxation 102-104, 134, 140Total shareholder return 75Treasury 33, 112-124Turnover 92-93Underlying volume growth 6-7, 28-31, 34-35Underlying sales growth 6-7, 28, 31, 34-35Unilever Leadership Executive 5, 43Voting 51Website 145
148 Unilever Annual Report and Accounts 2012
INDEX

BEN & JERRY’SMakes great ice cream while supporting suppliers around the world through its commitment to achieving Fairtrade certification for every flavour by the end of 2013.
DOVEHelps women to realise their personal potential for beauty and encourages men to take better care of themselves by engaging them with products that deliver superior care.
OUR PURPOSETO MAKE SUSTAINABLE LIVING COMMONPLACEWe work to create a better future every day, with brands and services that help people feel good, look good and get more out of life.
Our first priority is to our consumers – then customers, employees, suppliers and communities. When we fulfil our responsibilities to them, we believe that our shareholders will be rewarded.
PUREITImproves lives by providing people with safe, affordable drinking water where supplies are of poor quality, without the need for gas, electricity or a pressurised water supply.
OUR BRANDS IN ACTION UNILEVER OWNS SOME OF THE WORLD’S BEST KNOWN AND BEST LOVED BRANDS. TO FIND OUT MORE GO TO WWW.UNILEVER.COM/BRANDS-IN-ACTION.
KNORRProvides great tasting, nutritious meals for families every day while funding sustainability projects for suppliers and smallholder farmers through its €1 million Sustainability Partnership Fund.
OMO/PERSILIs concentrating liquid detergents, to deliver tough stain-removing performance, while using less water and energy in manufacture and transportation.
ABOUT UNILEVER
EXAMPLES OF OUR PURPOSE DRIVEN BRANDS
Cautionary statementThis document may contain forward-looking statements, including ‘forward-looking statements’ within the meaning of the United States Private Securities Litigation Reform Act of 1995. Words such as ‘will’, ‘aim’, ‘expects’, ‘anticipates’, ‘intends’, ‘looks’, ‘believes’, ‘vision’, or the negative of these terms and other similar expressions of future performance or results, and their negatives, are intended to identify such forward-looking statements. These forward-looking statements are based upon current expectations and assumptions regarding anticipated developments and other factors affecting the Group. They are not historical facts, nor are they guarantees of future performance.
Because these forward-looking statements involve risks and uncertainties, there are important factors that could cause actual results to differ materially from those expressed or implied by these forward-looking statements. Among other risks and uncertainties, the material or principal factors which cause actual results to differ materially are: Unilever’s global brands not meeting consumer preferences; increasing competitive pressures; Unilever’s investment choices in its portfolio management; inability to find sustainable solutions to support long-term growth; customer relationships; the recruitment and retention of talented employees; disruptions in our supply chain; the cost of raw materials and commodities; secure and reliable IT infrastructure; successful execution of acquisitions, divestitures and business transformation projects; economic and political risks and natural disasters; the debt crisis in Europe; financial risks; failure to meet high product safety and ethical standards; and managing regulatory, tax and legal matters. Further details of potential risks and uncertainties affecting the Group are described in the Group’s filings with the London Stock Exchange, Euronext Amsterdam and the US Securities and Exchange Commission, including the Group’s Annual Report on Form 20-F for the year ended 31 December 2012 and the Annual Report and Accounts 2012. These forward-looking statements speak only as of the date of this announcement. Except as required by any applicable law or regulation, the Group expressly disclaims any obligation or undertaking to release publicly any updates or revisions to any forward-looking statements contained herein to reflect any change in the Group’s expectations with regard thereto or any change in events, conditions or circumstances on which any such statement is based.
This document is not prepared in accordance with US GAAP and should not therefore be relied upon by readers as such. The Group’s Annual Report on Form 20-F for 2012 is separately filed with the US Securities and Exchange Commission and is available on our corporate website www.unilever.com. Any information on or linked from our or third-party websites is not incorporated by reference into this document or the Annual Report on Form 20-F. In addition, a printed copy of the Annual Report on Form 20-F is available, free of charge, upon request to Unilever PLC, Investor Relations Department, Unilever House, 100 Victoria Embankment, London EC4Y 0DY, United Kingdom.
Designed and produced by Unilever Communications in conjunction with Addison at www.addison.co.uk.Photography by Oliver Edwards, Igor Emmerich, Philip Gatward, Michael Heffernan, Chris Moyse, Rian Ardi Wakito, Martin Wanyoike, The Pack Shot Company and from the Unilever image library.
Printed at Pureprint Group, ISO 14001. FSC® certified and CarbonNeutral®.
This document forms part of the Unilever Annual Report and Accounts 2012 suite of documents and is printed on Amadeus 100% Recycled Silk. This has been exclusively supplied by Denmaur Independent Papers which has offset the carbon produced by the production and delivery of this paper to the printer.
The paper contains 100% recycled content, of which 100% is de-inked post-consumer waste. All of the pulp is bleached using an elemental chlorine free process (ECF). Printed in the UK by Pureprint using its alcofree® and pureprint® environmental printing technology, and vegetable inks were used throughout. Pureprint is a CarbonNeutral® company. Both manufacturing mill and the printer are registered to the Environmental Management System ISO 14001 and are Forest Stewardship Council® (FSC) chain-of-custody certified. If you have finished with this document and no longer wish to retain it, please pass it on to other interested readers or dispose of it in your recycled paper waste. Thank you.

UNILEVERAN
NUAL REPORT AN
D ACCOUNTS 2012
Making sustainable living com
monplace
ANNUAL REPORT AND ACCOUNTS 2012
MAKING SUSTAINABLE LIVING COMMONPLACE
UNILEVER N.V.Weena 455, PO Box 7603000 DK RotterdamThe NetherlandsT +31 (0)10 217 4000F +31 (0)10 217 4798
Commercial Register RotterdamNumber: 24051830
UNILEVER PLCUnilever House100 Victoria EmbankmentLondon EC4Y 0DYUnited KingdomT +44 (0)20 7822 5252F +44 (0)20 7822 5951
UNILEVER PLC REGISTERED OFFICEUnilever PLCPort SunlightWirralMerseyside CH62 4ZDUnited Kingdom
Registered in England and WalesCompany Number: 41424
For further information on our social, economic and environmental performance, please visit our website
WWW.UNILEVER.COM