annual report & accounts 2009 - carrs group
TRANSCRIPT

Carr’s Milling Industries PLCAnnual Report & Accounts 2009
Carr’s Milling Industries PLC A
nnual Report & A
ccounts 2009
Carr’s Milling Industries PLCOld Croft, Stanwix Carlisle CA3 9BA
www.carrs-milling.com

01 Financial and Commercial Highlights
02 Chairman’s Statement
05 Chief Executive’s Review
12 Financial Review
15 Board of Directors
16 Registered Offi ce and Advisers
17 Report of the Directors
20 Corporate Governance
23 Directors’ Remuneration Report
27 Independent Auditors’ Report
28 Consolidated Income Statement
29 Consolidated and Company Statement of Recognised Income and Expense
30 Consolidated and Company Balance Sheet
31 Consolidated and Company Cash Flow Statement
32 Principal Accounting Policies
37 Notes to the Financial Statements
81 Five Year Statement
83 Notice of Annual General Meeting
84 Directory of Operations
Carr’s Milling Industries PLCCarr’s Milling Industries PLC is focussed on the principal activities of agriculture, food and engineering. The Company’s agriculture business comprises fertiliser blending, retailing of farm machinery/supplies and animal feed manufacture in the UK, US and Germany. Carr’s principal food businesses are all fl our millers based in three UK locations. Engineering comprises Bendalls, R Hind, Carrs MSM and Wälischmiller based in Southern Germany which was acquired in 2009.
Designed and produced by corporateprm, Edinburgh and London. www.corporateprm.co.uk
Financial HighlightsRevenue
£350.0m(2008: £372.3m)
Dividend per share
23.0p(2008: 23.0p)
Earnings per share
50.4p(2008: 92.7p)
Profit before tax
£7.0m(2008: £12.9m)
Commercial Highlights> Successful launch of two new Crystalyx products, Optimum and Smallholder Block
> Acquisition of Wälischmiller Engineering based in Southern Germany complements Carr’s MSM business and opens up new overseas markets
> All three of the Group’s flour mills made volume gains through innovation
> Exclusive UK rights secured in July 2009 for unique phosphate enhancing fertiliser - AVAIL
Annual Report & Accounts 2009Carr’s Milling Industries PLC 1Annual Report & Accounts 2009Carr’s Milling Industries PLC

In the 52 weeks to 29 August 2009, the massive increase in commodity prices and the 40% uplift in the farm-gate milk price which had helped make the prior year a tremendously successful one for Carr’s were absent; indeed, both trends reversed. This particularly impacted the Group’s fertiliser business, the star performer in 2008, which swung into loss in 2009. Accordingly, Group pre-tax profit was substantially lower than in 2008, but it did remain comfortably ahead of that for 2007.
Chairman’s Statement
Richard Inglewood Chairman
Financial Review In the year under review, revenue decreased by 6% to £350.0m (2008: £372.3m), pre-tax profit reduced by 45% to £7.0m (2008: £12.9m), and fully diluted earnings per share were 45% lower at 50.3p (2008: 91.2p). The great majority of the reduction in Group revenue and all the reduction in Group profit was attributable to fertiliser, which in 2008 had contributed £4.1m of pre-tax profit estimated to be of an exceptional trading nature due to the massive increases in raw material prices.
Assisted by a placing of ordinary shares to raise £2.6m (net) in September 2008, total shareholders’ equity increased by 20% to £29.9m (2008: £25.0m), or 340p (2008: 298p) per share.
Although net debt increased to £19.3m (2008: £17.4m), following payment of the £4.3m consideration for the acquisition of the Wälischmiller Engineering business, gearing reduced to 65% (2008: 70%). Net interest expense of £1.3m (2008: £1.6m) was covered 5.6 times (2008: 8.0 times) by Group operating profit of £7.3m (2008: £12.9m).
The result is stated after a retirement benefit charge of £1.6m (2008: £1.1m). Equity shareholders’ funds are stated after a retirement
benefit obligation of £14.7m (2008: £16.6m), gross of tax, and £10.6m (2008: £11.9m), net of tax benefit. The reduction in retirement benefit obligation, computed in accordance with IAS 19, is due to contributions towards the past service deficit by the Company, better investment returns and lower inflation.
DividendsThe Board is proposing an unchanged final dividend per share of 17.0p. If approved by shareholders at the Annual General Meeting on 5 January 2010, the dividend will be paid on 15 January 2010 to shareholders on the register at the close of business on 18 December 2009, with the shares going ex-dividend on 16 December 2009.
Together with the unchanged interim dividend per share of 6.0p, paid on 8 May 2009, the proposed dividends per share for the year total an unchanged 23.0p, covered 2.2 times (2008: 4.0 times) by basic earnings per share.
Annual Report & Accounts 2009Carr’s Milling Industries PLC2

Annual Report & Accounts 2009Carr’s Milling Industries PLC 3Annual Report & Accounts 2009Carr’s Milling Industries PLC
OutlookThe Agriculture Division will have to contend with the long-term declining trend in the number of UK milk producers, but it is anticipated that farm-gate milk prices, which have fallen in the past year, will stabilise and therefore stimulate demand for agricultural products and in particular the Group’s branded feed products, Crystalyx and Aminomax. With fertiliser raw material prices stabilising and now much reduced from the peak in April 2008 and with the lower sales in 2009, it is also anticipated that demand for fertiliser will improve, with a more favourable outlook on margins.
The Food Division is expected to continue to suffer from market turbulence in the face of overcapacity and the impact of the recession on consumers of bread and biscuits, in particular.
In the Engineering Division, the shortage of funding available to customers has delayed the placing of orders and, while the businesses have satisfactory order books, there will be gaps in the production programme in the first half of the year. The enquiry level remains buoyant across the nuclear, oil and gas sectors, which bodes well for the future.
In the current year, in the context of extremely difficult markets, the Board expects trading in the Group’s principal activities to be broadly flat, other than for fertiliser, where a partial recovery is envisaged. Further out, the Board believes that Carr’s is well placed, having regard in particular to the long-term demand for agricultural products, the diversity of the Group’s activities and the Group’s well-invested facilities.
Richard Inglewood Chairman17 November 2009

4

Annual Report & Accounts 2009Carr’s Milling Industries PLC
Annual Report & Accounts 2009Carr’s Milling Industries PLC 5
Chief Executive’s Review
Chris Holmes Chief Executive Officer
AgricultureOperating profit
£6.0m
FoodOperating profit
£2.3m
EngineeringOperating profit
£1.4m
There is little doubt that the 52 week period to August 2009 was extremely challenging given the well publicised volatile and economic conditions that prevailed.
In these circumstances, the strength of Carr’s diversity of its activities, not only between its three Divisions but also within those Divisions, was demonstrated. From its well invested facilities and continuing product innovations most of the individual activities increased their profit, enabling the Group to achieve a pre-tax profit well above 2007, despite the market conditions for Fertiliser as adverse as 2008 had been favourable.
During the year the Group’s smallest Division, Engineering, was substantially expanded with the acquisition of the Wälischmiller Engineering business in Germany. The expertise of Wälischmiller with our existing high tech engineering business in the UK, Carrs MSM, should enable further opportunities of growth, both in the UK and internationally.

Carr’s Milling Industries PLC6
The fuel oil business, trading as Johnstone Wallace Fuels in south west Scotland and Wallace Oils in Cumbria, benefited from the cold winter and increased both its market share and its profit. This business, formed primarily by acquisitions in 2005 and 2007, is now making a useful contribution to the Group result.
Overseas In the USA, Animal Feed Supplement suffered a near 30% volume decline in sales of its Smartlic and Feed in a Drum feed blocks, as a result of the impact of low beef prices caused by the recession, record high ingredient prices and, as a consequence, lower livestock numbers. Year on year, the profit was higher due to cost reductions and the translation of US$ profit at £1:$1.50 (2008: £1:$1.99).
In Germany, Crystalyx Products, the joint venture with Agravis to manufacture feed blocks, also suffered volume declines as a result of the very low German farm-gate milk price and the strong Euro, which acted as a hindrance to exports.
Chief Executive’s Review continued
AgricultureIn the year, the market place experienced significant volatility in raw material prices and declines in both the farm-gate milk price (from 26.3p to 23.3p per litre) and milk output. The massive price increases for fertiliser raw materials in the prior year reversed and selling prices were frequently adjusted downwards. Divisional revenue was 8% lower at £255.0m (2008: £275.8m) and operating profit (before retirement benefit charge but after non-recurring items and amortisation) decreased by 48% to £6.0m (2008: £11.7m). Additionally, the Group’s share of post-tax profit in associate and joint ventures was down 34% at £1.1m (2008: £1.6m).
Operating profit*
£6.0m(2008: £11.7m)
Revenue
£255.0m(2008: £275.8m)
United KingdomCompound and blended animal feed volumes and profit were appreciably lower. This resulted from increased alternative usage of cheaper home-grown cereals sourced from the prolific 2008 harvest, especially in the important January-April period, from the continuing reduction in cattle numbers and from the continuing compound animal feed production overcapacity in the north west of England and indeed the UK.
Caltech, the low moisture feed block business increased its profits, despite the higher price of the principal raw material, molasses. Two new products were introduced during the year - Optimum, for dairy cattle, in September 2008 and, through market demand - Smallholder Block in August 2009, both with pleasing results.
The fertiliser result was significantly affected by the very substantial decline in both selling price (which had peaked in April 2008 and declined significantly from January 2009) and volumes (down 30% on the prior year). Fertiliser sales suffered from farmers deferring orders in anticipation of lower selling prices. A considerable part of the deterioration from profit to loss was due to sales of inventories at below historic cost following a significant decrease in raw material prices from January this year. Despite the adverse market conditions, sales volumes of environmentally friendly speciality fertilisers substantially increased and the unique phosphate fertiliser enhancer, AVAIL, to which Carr’s has secured exclusive UK rights, was successfully launched in July 2009. It is thought to have considerable potential.
The retailing of rural supplies from a network of 15 stores in the north of England and in Scotland and of agricultural machinery and ground care equipment from six of these stores increased both revenue and profit. Whilst rural supplies is the higher margin activity, agricultural machinery and ground care equipment had a particularly good year.
Annual Report & Accounts 2009
*before retirement benefit charge but after non-recurring items and amortisation

7
Despite the adverse market conditions, sales volumes of
environmentally friendly speciality fertilisers substantially increased.
> Crystalyx launched in New Zealand
> Successful launch of two new Crystalyx products, Optimum
and Smallholder Block
> Exclusive UK rights secured in July 2009 for unique phosphate enhancing fertiliser - AVAIL
> Aminomax bypass protein being launched from new plant in the USA

Chief Executive’s Review continued
The decline in revenue reflected the lower price of the principal raw material, milling wheat, which was passed on to the customer. The operating margin, though improved, remained modest, at 3.0% (2008: 2.3%). In the year, all three of the Group’s flour mills - at Kirkcaldy (Fife), Silloth (Cumbria) and Maldon (Essex) – made volume gains through product innovation and increased their profit through cost reduction. Each of the three mills has maintained its own regional identity and has a strong local management team. This has enabled the
FoodOperating profit (before retirement benefit charge but after non-recurring items and amortisation) of £2.3m (2008: £2.0m), up 19%, was achieved on revenue 8% lower at £79.0m (2008: £85.6m).
8
Operating profit*
£2.3m(2008: £2.0m)
Revenue
£79.0m(2008: £85.6m)
development of close working relationships with customers. As a result, our people develop a deep understanding of specific customer needs which allows us to provide the highest levels of product and service quality. With its own extensive research and development facilities, the business has an excellent record of providing innovative solutions to customers’ technical challenges and has recently gained new sales in the breakfast cereals sector through this approach.
Annual Report & Accounts 2009Carr’s Milling Industries PLC
*before retirement benefit charge but after non-recurring items and amortisation

Annual Report & Accounts 2009Carr’s Milling Industries PLC 9
Growingour markets
The three flour mills aim to provide the highest levels of
product and service quality.
> All three of the Group’s flour mills made volume gains through innovation
> New sales in the breakfast cereals sector through innovative solutions to customers’ technical challenges

Annual Report & Accounts 2009Carr’s Milling Industries PLC10
Chief Executive’s Review continued
EngineeringOperating profit (before retirement benefit charge but after non-recurring items and amortisation) increased by 31% to £1.4m (2008: £1.1m) on revenue up 48% at £15.9m (2008: £10.7m). On a like-for-like basis, excluding Wälischmiller Engineering, the revenue increase would have been 1%, to £10.8m.
Carrs MSM and Wälischmiller Engineering have complementary
businesses in various European countries, as well as Russia, Japan and China.
Operating profit*
£1.4m(2008: £1.1m)
Revenue
£15.9m(2008: £10.7m)
Bendalls, the Group’s specialist steel fabrication business, benefited from completion of substantial contracts for pressure vessels for delivery both in the UK and overseas, but continued to suffer delays by contractors, due to funding issues and design changes, on certain other contracts.
Carrs MSM, the manufacturer of master slave manipulators for research centres and nuclear plants, traded well, albeit recording a slightly reduced profit after a slow start to the year. Wälischmiller Engineering, the remote handling technology, robotics and radiation equipment business based in southern Germany, which was acquired in March 2009, contributed substantially to divisional revenue and profit, despite being in the Group for only the second half of the year. Carrs MSM and Wälischmiller Engineering have complementary businesses, supplying well designed and engineered manipulators to research and nuclear facilities in various European countries, as well as Russia, Japan and China.
StaffThis year posed a different challenge to 2008 with commodity price falls, particularly fertiliser, lower agriculture feed volume in the UK and USA plus the global recession. The Company performed well in these circumstances and my thanks go to all my colleagues in the UK, Europe and the USA for their contribution during the year.
Chris Holmes Chief Executive Officer17 November 2009
*before retirement benefit charge but after non-recurring items and amortisation

“Lorem ipsum dolor sit amet, consectetuer adipiscing elit, sed diam nonummy nibh euismod tincidunt ut laoreet dolore magna aliquam erat volutpat.”
potential> Bendalls skills and quality of work
meet the most demanding of engineering environments
> Acquisition of Wälischmiller Engineering based in Southern Germany complements Carr’s MSM business and opens up new overseas markets
11Annual Report & Accounts 2009Carr’s Milling Industries PLC

Annual Report & Accounts 2009Carr’s Milling Industries PLC12
Financial Review
The Group’s operations are organised into three business divisions, agriculture, food and engineering, and the performance of these three divisions in the year is discussed in the Chief Executive’s Review on pages 5 to 11. The agriculture business operates predominately in the North of England, Wales and Scotland, in addition there are two animal feed plants in the US and a plant in Germany. The flour business operates entirely within the UK and the engineering business operates in the UK and Germany.
Ronald Wood Finance Director
The markets in which all three businesses operate are competitive both in terms of pricing from other suppliers and the retail environment in general which has a direct impact on many of our customers. Despite this, Carr’s businesses have a long record of increasing sales and profits through a combination of investing in modern efficient factories, developing a range of quality products and making sound acquisitions. The businesses are under the control of stable, experienced and talented operational management teams supported by a skilled workforce.
Business objectivesThere are five key elements to the Group’s strategy for meeting its objectives of continuing growth and profitability:
• Deliverquality, innovativeandcost-effectiveproductsandservicestoour customers
• Organicgrowth• Seekacquisitionstocomplementourexistingbusinesses• Maximiseoperationalefficiency• Securingemployeehealthandsafety
We monitor our performance against the strategy by means of key performance indicators (‘KPIs’).
• Organicsalesgrowth–yearonyearincreaseinsalesrevenueexcludingthe impact of acquisitions and disposals
• Grossreturnonrevenue–grossprofitasapercentageofrevenue• Netreturnonrevenue–operatingprofitbeforenon-recurringitems
as a percentage of revenue• Adjustedearningspershare–profitattributedtoequityshareholders
less non-recurring items and amortisation divided by the weighted average number of shares in issue during the period
• Return on net assets – profit before tax and before non-recurringitems and amortisation as a percentage of net assets
• Freecashflow–cashgeneratedfromoperationslesstaxandinterestpaid
Performance against KPIs 2009 2008
Organic sales growth -7.3% 44.9% Gross return on revenue 11.7% 12.0% Net return on revenue 2.1% 3.4% Adjusted earnings per share 50.4p 108.6p Return on net assets 21.1% 46.4% Free cash flow £5.6m £3.0m

13Annual Report & Accounts 2009Carr’s Milling Industries PLC
Business strategiesThe Group’s market strategy is to focus on growing the quality end of the markets in which we operate, to establish meaningful and long lasting relationships with our customers, by a combination of product development and high service levels, and to invest in quality facilities. Each business within the Group is given the responsibility for developing its own plans to deliver the objectives of the Group with particular emphasis on growing sales through the supply of quality products, service and product innovation, improving operational efficiency and securing employee health and safety. The role of the Board in achieving Group objectives has been to support operational management and to identify suitable acquisitions that will create new customers to the Group or will secure existing market positions.
FInAnCIAL REvIEW
OverviewGroup revenue from activities during the period was £350.0 million (2008: £372.3 million).
Profit before taxation and before non-recurring items and amortisation of intangible assets decreased, after an exceptional result in 2008, to £7.0 million (2008: £12.8 million). Non-recurring items and amortisation are disclosed in note 6 to the financial statements.
Net finance costs were £1.3 million (2008: £1.6 million) and were covered 5.6 times (2008: 8.0 times) by Group operating profit.
TaxationThe Group’s effective tax charge on profit from activities after net finance costs was 30.6% (2008: 40.9%). A reconciliation of the actual total tax charge to the standard rate of corporation tax in the UK of 28% is set out in note 9 to the financial statements.
Earnings per shareThe profit attributable to the equity holders of the Company amounted to £4.4 million (2008: £7.7 million), and basic earnings per share was 50.4p (2008: 92.7p). Adjusted earnings per share of 50.4p (2008: 108.6p) is calculated by dividing the profit attributed to equity shareholders for the period, before non-recurring items and amortisation of intangible assets, by the weighted average number of shares in issue during the period.
Balance sheet reviewWe have continued to invest in the business with total capital expenditure in the year of £4.7 million (2008: £3.1 million), making our total capital expenditure in the last three years £10.5 million. In the current year we have continued to invest in production facilities with over £2.0 million spent on our fertiliser plants, oil distribution depots and flour mills.
The value of inventories has fallen in the current year by £7.2 million (23.1%) reflecting the substantial decrease in the price and quantity of raw materials, particularly within the fertiliser business.
Trade and other receivables have decreased £7.7 million, principally due to the decrease in trade receivables of £8.1 million arising from the decreased selling prices with debtor days remaining similar to last year across all businesses.
Trade and other payables have decreased by £17.0 million, reflecting a significant decrease in trade payables of £13.6 million which is primarily due to the decreased cost of raw materials. The retirement benefit obligation favourable movement of £1.9 million in the year is discussed in the section headed Pensions.
Overall net assets increased by £5.7 million to £33.3million (2008: decrease £1.3 million).
Cash flow and net debtThe Group’s operational cash generation increased in the year with cash flows generated from operations in the current year of £9.8 million (2008: £5.2 million).
Net debt at the period end was £19.3 million (2008: £17.4 million) with gearing at 64.7% (2008: 69.8%). Net debt is expected to decrease over the next couple of years excluding any acquisition funding.
PensionsThe Group operates its current pension arrangements on a defined benefit and defined contribution basis. The defined benefit section is closed to new members and has 90 active members, 95 deferred members and 184 current pensioners, and the scheme receives additional contributions from the Group in accordance with the latest actuarial valuation as agreed between the Company and the Trustees.
The valuation under the IAS19 accounting basis showed a deficit before the related deferred tax asset in the scheme at 29 August 2009 of £14.7 million (30 August 2008: £16.6 million). Actuarial gains of £1.0 million (2008: loss £11.1 million) have been reported in the Statement of Recognised Income and Expense.
A Group subsidiary undertaking is a participating employer in a defined benefit pension scheme. This scheme is closed to future service accrual. The IAS19 accounting basis showed a deficit, for that scheme, before the related deferred tax asset in the scheme at 29 August 2009 of £5.0 million (2008: £2.6 million). The details of both pension schemes are given in note 28 to the financial statements.
Treasury PoliciesThe Group’s policy is structured to ensure adequate financial resources are available for the development of its business while managing its currency and interest rate risks. The Group’s strategy, policy and controls are developed centrally and approved by the Board. The Group does not engage in speculative transactions.

Annual Report & Accounts 2009Carr’s Milling Industries PLC14
Financial Review continued
The main elements of treasury activity are outlined below.
Foreign currency riskThe major foreign currency risk facing the Group is in the purchasing of raw materials in the fertiliser and flour milling operations. The major currency involved is the US dollar. The policy of the Group is to hedge using forward foreign exchange contracts with UK banks as soon as commitment has been given to the underlying transaction. The result of the Group’s foreign subsidiaries is translated into sterling at the average rates of exchange for the period concerned. The Group’s policy is to hedge its international assets and has designated foreign currency borrowings as a hedge against net investment in foreign operations.
The balance sheets of the foreign subsidiaries are translated into sterling at the closing US dollar and Euro exchange rates. Any gains or losses on the translation of the balance sheet into sterling are recorded in reserves.
Interest rate riskHistorically the policy of the Group has been to hedge around 40% to 60% of the core borrowings. Due to the cessation of the interest rate swap in October 2009 we do not have interest rate hedging instruments in place to protect the Group against significant increases in interest rates. We will continue to review the appropriateness of our interest rate policy and our hedging policy during the financial year.
Credit riskPractically all sales are made on credit terms to an extensive range of customers, which include UK food producers, agricultural merchants, farmers and the nuclear industry. Overdue accounts are reviewed monthly at divisional management meetings. Historically, the incidence of bad debts is low. The current financial climate requires the Group’s credit control function to be exceptionally vigilant.
FundingThe Group has historically been cash generative. The bank position for each operation is monitored on a daily basis and capital expenditure above a certain level is approved at the monthly Group board meeting. Each operation has access to the Group’s overdraft facility or has facilities specific to that operation and all term debt is arranged centrally. New bank facilities for approximately half the Group’s funding requirements, for the three years to August 2012, was agreed in the period. The balance of the Group’s funding is negotiated annually.
Resources, risks and uncertaintiesThe Group aims to safeguard the assets that give it competitive advantage, being its product quality, product innovation and service levels, its operational management, skilled workforce and its modern well-equipped factories.
ReputationIt is the responsibility of local operational management assisted by the Group Health and Safety Manager to maintain and where possible enhance the Group’s reputation for product quality, product innovation, service levels and a culture of safe working.
Manufacturing facilitiesThe Group has continued to invest in its production facilities in all three businesses and it intends to continue investing to ensure that it maintains a competitive edge.
EmployeesWhile the Group continues to invest in facilities and equipment we also continue to invest in our people. The Group offers training programmes where additional skills are required to undertake their responsibilities. The businesses have strategies for retaining staff, including the provision of competitive terms and conditions, and a contributory occupational pension scheme.
Principal risks and uncertainties Each year the Group carries out a formal exercise to identify and assess the impact of risks on its business and this year the exercise was carried out in August 2009.
The Board has identified six vulnerabilities specific to the Group’s activities, whose converse gives rise to potential upside:
• Adecline in thesizeandprosperityof thedairy farming industry innorth west England and south west Scotland, in particular through a reduction in the farm-gate milk price.
• A decline in the size and prosperity of other parts of the farmingindustry, in particular the beef and sheep farming industry, in northern England and Scotland.
• AdeclineinthesizeandprosperityofthebeeffarmingindustryintheUSA.
• For fertiliser, a sharp decline in the Sterling price of raw materials,leading to inventory devaluation and sale deferment, and unsettled markets.
• Forflour,marketturbulence,inthefaceofovercapacityandtheimpactof the recession on consumers of bread, biscuits and confectionery, and a sharp increase in the milling wheat price.
• For Engineering, funding problems for large capital projects and arecession driven-increase in contract deferral and variation.
On behalf of the BoardRonald C WoodFinance Director17 November 2009

Board of Directors
Lord InglewoodNon-Executive Chairman
Robert HeygateNon-Executive Director
Chris HolmesChief Executive Offi cer
Alistair WannopNon-Executive Director
Ron WoodFinance Director
15
Registered Office and Advisers
Registered OfficeCarr’s Milling Industries PLCOld Croft, StanwixCarlisle CA3 9BARegistered No. 98221
Independent AuditorsPricewaterhouseCoopers LLP 89 Sandyford RoadNewcastle upon Tyne NE1 8HW
BankersClydesdale Bank PLC82 English StreetCarlisle CA3 8HP
The Royal Bank of Scotland plc37 Lowther StreetCarlisle CA3 8EL
Financial Adviser and BrokerInvestec Bank (UK) Limited 2 Gresham StreetLondon EC2V 7QP
SolicitorsHalliwellsThe Plaza100 Old Hall StreetLiverpool L3 9TD
DLA Piper UKIndia BuildingsWater StreetLiverpool L2 0NH
Atkinson Ritson15 Fisher StreetCarlisle CA3 8RW
RegistrarsCapita Registrars Northern HouseWoodsome ParkFenay BridgeHuddersfield HD8 0LA
Annual Report & Accounts 2009Carr’s Milling Industries PLC16

Annual Report & Accounts 2009Carr’s Milling Industries PLC 17
Report of the Directors
The Directors submit their report and the audited consolidated accounts of the Group and Company for the period ended 29 August 2009.
The company is a public limited company incorporated and domiciled in England and Wales whose shares are listed and traded on the London Stock Exchange. The address of its registered office is Old Croft, Stanwix, Carlisle, CA3 9BA.
PRinciPAl Activities, business Review And futuRe develoPmentsThe Group’s activities are Agriculture, Food and Engineering. A review of the business and future development of the Group and a discussion of the principal risks and uncertainties faced by the Group is presented in the Chief Executive’s Review on pages 5 to 11 and in the Group Financial Review on pages 12 to 14.
Results And dividendsThe profit on ordinary activities before taxation, was £7.0 million (2008 : £12.9 million). After taxation charge of £1.8 million (2008 : £4.6 million), the profit for the year is £5.2 million (2008 : £8.3 million). An interim dividend of 6.0p (2008 : 6.0p) per ordinary share was paid on 8 May 2009. The Directors recommend the payment of a final dividend for the period, which is not reflected in these accounts, of 17.0p (2008 : 17.0p) per ordinary share which, together with the interim dividend, represents 23.0p per ordinary share, totalling £2.0 million (2008 : 23.0p per ordinary share, totalling £2.0 million).
Subject to approval at the Annual General Meeting, the final dividend will be paid on 15 January 2010 to members on the register at the close of business on 18 December 2009. Shares will be ex-dividend on 16 December 2009.
Key performance indicators are presented in the Group Financial Review on page 12.
finAnciAl instRumentsThe Group’s risk management objectives and policy are discussed in the Treasury Policy section of the Financial Review on page 14.
PensionsEstimates of the amount and timing of future funding obligations for the Group’s pension plans are based on various assumptions including, among other things, the actual and projected market performance of the pension plan assets, future long-term corporate bond yields, increased longevity of members and statutory requirements. In the last period, the relative improvement in equity markets, cash funding from the Company, together with lower inflation has decreased the deficit. The Group continually reviews this risk and takes action to mitigate where possible. In addition, while the Group is consulted by the trustees on the investment strategies of its pension plans, the Group has no direct control over these matters as the trustees are directly responsible for the strategy.
Details of the Group’s pension plans are in note 28 in the Notes to the Financial Statements.
diRectoRs And theiR inteRestsThe Directors of the Company who served during the period and up to the date of signing the financial statements are stated on page 15. Each of the current Directors served for the whole of the period under review. Lord Inglewood and A G M Wannop retire in accordance with the Articles of Association and, being eligible, each offers himself for re-election.
Biographical details of the directors are shown below:
non-executive directorsLord Inglewood (58) was a Conservative member of the European Parliament for ten years until his retirement in 2004, was a Government Minister from 1995 to 1997 and has been a member of the House of Lords since 1989. He brings to the Board wide experience, in particular of EU and Westminster politics, allied with a knowledge of farming in Carr’s north-west England heartland. He is also Chairman of CN Group Limited, the Carlisle based regional media company.
Mr A R Heygate (64) is an executive director of Heygate & Sons Limited, the UK’s largest independent flour miller, and is also engaged in animal feed compounding and other agricultural activities.
Mr A G M Wannop (47) is a director of English Food and Farming Partnership and of Cumbria Vision. He has actively farmed in Cumbria for many years.
Lord Inglewood, Mr A R Heygate and Mr A G Wannop have two year fixed term contracts which expire on 31 August 2011.
executive directorsMr C N C Holmes (58) was appointed to the Board in January 1992, and as CEO in September 1994. Previously he held senior management positions in the agricultural division of J Bibby & Sons.
Mr R C Wood (62) was appointed to the Board as Finance Director in January 1988 and is a member of the Chartered Institute of Management Accountants. Mr R C Wood is also Company Secretary. He is also non-executive director of Cumbria Partnership NHS Trust. All fees receivable are paid to the Company.
The two executive directors have service contracts which provide for a rolling one year notice period.
The Company has maintained a directors’ and officers’ liability insurance policy throughout the period and up to signing the financial statements, which is a qualifying third party indemnity provision for the purpose of the Companies Act 2006. Neither the Company’s indemnity nor insurance provides cover in the event that a director is proved to have acted fraudulently or dishonestly. No claims have been made either under the indemnity or the insurance policy.

18 Annual Report & Accounts 2009Carr’s Milling Industries PLC
Report of the Directors continued
emPloyment PoliciesThe Company’s policy on employee involvement is to adopt an open management style, thereby encouraging informal consultation at all levels about aspects of the Company’s operations.
Employment policies are designed to provide equal opportunities irrespective of colour, ethnic or natural origin, nationality, sex, religion, marital or disabled status. Full consideration is given to applications for employment by and the continuing employment, training and career development of disabled people.
PoliticAl And chARitAble donAtionsDuring the period ended 29 August 2009 the Group contributed £10,111 (2008 : £11,569) in the UK for charitable purposes. There were no political donations during the year (2008 : Nil).
PAyment of suPPlieRsPayment terms are agreed with each supplier and every endeavour is made to adhere to the agreed terms. The average credit terms for the Group as a whole, based on the year-end trade payables figure and a 365 day year, is 45 days (2008 : 45 days). The Company has no outstanding trade payables at the end of the financial period.
shARe cAPitAlThe Company has a single class of share capital which is divided into Ordinary Shares of £0.25 each.
The movement in the share capital during the year is detailed in note 29 to the financial statements.
The interests of the Directors, as defined by the Companies Act 2006, in the ordinary shares of the Company, other than in respect of options to acquire ordinary shares (which are detailed in the analysis of options included in the Directors’ Remuneration Report on pages 23 to 26), are as follows:
on 29 August 2009 on 30 August 2008 ordinary shares Ordinary Shares
C N C Holmes 106,415 106,415R C Wood 92,077 92,077A R Heygate 37,225 37,225W R Inglewood 4,410 4,410A G M Wannop 2,261 2,261
All the above interests are beneficial. There have been no other changes to the above interests in the period from 29 August 2009 to 6 November 2009.
Rights And obligAtions AttAching to shAResIn a general meeting of the Company, subject to the provisions of the articles of association and to any special rights or restrictions as to voting attached to any class of shares in the Company (of which they are none), the holders of the Ordinary Shares are entitled to one vote in a poll for every Ordinary Share held. No member shall be entitled to vote at any general meeting or class meeting in respect of any shares held if any call or other sum then payable in respect of that share remains unpaid. Currently all issued shares are fully paid.
Full details of the deadlines for exercising voting rights in respect of the resolutions to be considered at the Annual General Meeting to be held on 5 January 2010 are set out in the Notice of Annual General Meeting.
Subject to the provisions of the Companies Act 2006, the Company may, by ordinary resolution, declare a dividend to be paid to the members, but no dividend shall exceed the amount recommended by the Board. The Board may pay interim dividends. and also any fixed rate dividend, whenever the financial position of the Company, in the opinion of the Board, justifies its payment. All dividends shall be apportioned and paid pro rata according to the amounts paid up on the shares.
mAjoR shAReholdeRsThe Company has been informed of the following interests at 6 November 2009 in the 8,784,286 ordinary shares of the Company, as required by the Companies Act 2006:
Percentage of Number of shares Issued share capital
Heygate & Sons Limited* 1,265,287 14.4%T W G Charlton 575,000 6.5%Rathbone Nominees Limited 516,800 5.9%Goldman Sachs Securities (Nominees) Limited 363,060 4.1%HSBC Global Custody Nominee (UK) Limited 350,000 4.0%BNY GIL Client Account (Nominees) 295,000 3.4%Barclayshare Nominees Limited 285,220 3.2%
* A R Heygate is a director of Heygate & Sons Limited. diRectoRs’ stAtement As to disclosuRe of infoRmAtion to AuditoRsThe Directors who were members of the Board at the time of approving the Directors’ Report are listed on page 15. Having made enquiries of fellow Directors each of these Directors, at the date of this report, confirms that:
• tothebestofeachDirector’sknowledgeandbelief,thereisnorelevantauditinformationofwhichtheCompany’sauditorsareunaware;and
• eachDirectorhastakenallthestepsadirectormightreasonablybeexpectedtohavetakentobeawareofrelevantauditinformationandtoestablishthat the Company’s auditors are aware of that information.
This confirmation is given and should be interpreted in accordance with the provisions of s418 of the Companies Act 2006.

Annual Report & Accounts 2009Carr’s Milling Industries PLC 19
AnnuAl geneRAl meeting And sPeciAl business to be tRAnsActed At the AnnuAl geneRAl meeting
The Notice convening the Annual General Meeting appears on page 83 and includes the following items of Special Business:
(i) Resolution 7 : directors power to allot securities Under section 551 of the Act, relevant shares may only be issued
with the consent of the shareholders, unless the shareholders pass a resolution generally authorising the directors to issue shares without further reference to the shareholders. This resolution authorises the issue of shares up to an aggregate nominal value of £724,704, which is equal to 33% of the nominal value of the current issued ordinary share capital of the Company, for the period commencing with the passing of the resolution until the conclusion of the next annual general meeting of the Company or 6 months from the next accounting reference date of the Company (whichever is the earlier).
(ii) Resolution 8 : disapplication of pre-emption rights on equity issues for cash
Sections 570 - 573 of the Act requires that a company issuing shares for cash must first offer them to existing shareholders following a statutory procedure which, in the case of a rights issue, may prove to be both costly and cumbersome. This resolution excludes that statutory procedure as far as rights issues are concerned. It also enables the directors to allot shares up to an aggregate nominal value of £219,607, which is equal to 10% of the nominal value of the current issued ordinary share capital of the Company, subject to resolution 7 being passed. The directors believe that the limited powers provided by this resolution will maintain a desirable degree of flexibility. Unless previously revoked or varied, the disapplication will expire on the conclusion of the next annual general meeting of the Company or 6 months from the next accounting reference date of the Company (whichever is the earlier).
(iii) Resolution 9 : Authority for the market purchase by the company of its own shares
Section 693 of the Act requires the Company to obtain the shareholders’ consent prior to making any market purchase of the Company’s own shares. Resolution 9 sets out the conditions of the authority as required by section 166 of the Act and the resolution is proposed as a special resolution as required by the Listing Rules of the UK Listing Authority. The directors have no current intentions relating to this authority but believe that the limited nature of the resolution will provide a desirable degree of flexibility. The directors intend that any shares so purchased will be cancelled. The total number of share options in issue at the date of this document is 246,125 which, if exercised, would represent 2.8% of the issued share capital of the Company as at the date hereof and would, if the authority under this resolution were to be exercised in full, represent 3.1% of the issued share capital of the Company following completion of the purchase of the Company’s own shares.
diRectoRs’ ResPonsibilitiesThe Directors are responsible for preparing the Annual Report, the Directors’ Remuneration Report and the financial statements in accordance with applicable law and regulations.
Company law requires the Directors to prepare financial statements for each financial period. Under that law the directors have elected to prepare the Group and parent company financial statements in accordance with International Financial Reporting Standards (IFRSs) as adopted by the European Union. Under company law the directors must not approve the financial statements unless they are satisfied that they give a true and fair view of the state of affairs of the Group and the Company and of the profit or loss of the Group for that period. In preparing those financial statements, the Directors are required to:
• selectsuitableaccountingpoliciesandthenapplythemconsistently;• makejudgementsandaccountingestimatesthatarereasonableand
prudent;• statewhetherapplicableIFRSsasadoptedbytheEuropeanUnion
have been followed, subject to any material departures disclosed and explainedinthefinancialstatements;
• preparethefinancialstatementsonthegoingconcernbasis,unlessit is inappropriate to presume that the Company will continue in business.
The Directors confirm that they have complied with the above requirements in preparing the financial statements.
The Directors are responsible for keeping adequate accounting records that are sufficient to show and explain the Company’s transactions and disclose with reasonable accuracy at any time the financial position of the Company and of the Group and enable them to ensure that the financial statements and Directors’ Remuneration Report comply with the Companies Act 2006 and, as regards the group financial statements, Article 4 of the IAS Regulation. They are also responsible for safeguarding the assets of the Company and the Group and hence for taking reasonable steps for the prevention and detection of fraud and other irregularities.
The Directors are responsible for the maintenance and integrity of the Carr’s Milling Industries PLC website. Legislation in the United Kingdom governing the preparation and dissemination of financial statements may differ from legislation in other jurisdictions.
Each of the directors, whose names and functions are listed on page 15 confirm that, to the best of their knowledge:
• theGroupfinancialstatements,whichhavebeenpreparedinaccordance with IFRSs as adopted by the EU, give a true and fair view oftheassets,liabilities,financialpositionandprofitoftheGroup;and
• theChiefExecutive’sReviewincludesafairreviewofthedevelopment and performance of the business and the position of the Group, together with a description of the principal risks and uncertainties that it faces.
By Order of the BoardRonald C WoodCompany Secretary17 November 2009

Corporate Governance
stAtement by the diRectoRs on comPliAnce with the PRovisions of the combined code
PRinciPles of good goveRnAnceThe Board is committed to high standards of corporate governance. The adoption and maintenance of good governance is the responsibility of the Board as a whole. This report, together with the Directors’ Remuneration Report on pages 23 to 26, describes how the Board applies the principles of good governance and best practice as set out in Section 1 of the Combined Code on Corporate Governance 2008 (the “Combined Code 2008”). A statement of compliance can be found at the end of this report.
the boARdThe Board consists of a non-executive Chairman, two executive Directors and two other non-executives. Lord Inglewood is considered independent and his independence was assessed when he was appointed as non-executive Chairman. A R Heygate is a non-executive Director and the Board considers him to be independent although the Combined Code 2008 would not deem him independent due to his long association with the Company and he represents a significant shareholder. The Board believes that he acts in the best interests of the Company and that his holding of shares in the Company aligns his interests with that of the shareholders. A G M Wannop is the senior independent non-executive Director. The Combined Code 2008 recommends that the Board of Directors of a UK public company should include a balance of executive and non-executive Directors (including independent non-executives) such that no individual or small group of individuals can dominate the Board’s decision-making. The Board is confident that it meets the requirements of the Combined Code 2008 with the exception of A R Heygate as outlined above.
The Board meets eleven times throughout the year to determine the strategic direction of the Group and to review operating, financial and risk performance. To enable them to carry out these responsibilities all Directors have full and timely access to all relevant information. There is a formal schedule of matters reserved to the Board, which includes:
• approvaloftheGroup’sannualBusinessPlan;• theGroup’sstrategy;• acquisitions,disposalsandcapitalexpenditureprojectsabovecertain
thresholds;• allguarantees;• treasurypolicies;• thefinancialstatements;• theCompany’sdividendpolicy;• transactionsinvolvingtheissueorpurchaseofCompanyshares;• borrowingpowers;• appointmentstotheBoard;• alterationstotheMemorandumandArticlesofAssociation;• legalactionsbroughtbyoragainsttheGroupabovecertain
thresholds;and• thescopeofdelegationstoBoardcommittees,subsidiaryboardsand
executive management of the Group.
The Company’s Articles of Association provide that one third of the Directors retire by rotation each year at the Annual General Meeting which is in compliance with the Combined Code 2008. All new Directors are subject to election by shareholders at the first opportunity following their appointment.
Directors’ biographies are shown on page 17. The formal terms of reference for the main Board Committees together with the terms and conditions of appointment of non-executive Directors are reviewed annually and are available for inspection at the Company’s Registered Office and at the Annual General Meeting.
boARd meeting AgendAIn advance of all Board meetings the Directors are supplied with detailed and comprehensive papers covering the Group’s operating functions. Members of the executive management team attend and make presentations as appropriate at meetings of the Board. The Company Secretary is responsible to the Board for the timeliness and quality of information.
Directors can obtain independent professional advice at the Company’s expense in performance of their duties as Directors. None of the Directors obtained independent professional advice in the period under review. All Directors have access to the advice and the services of the Company Secretary. In addition to these formal roles, the Non-executive Directors have access to senior management of the business either by telephone or via involvement at informal meetings.
boARd committeesAudit committeeThe Audit Committee currently comprises the three non-executives, W R Inglewood, A R Heygate and A G M Wannop. The Committee is chaired by A R Heygate. The Board considers that the Company meets the main requirements of the Combined Code 2008 for a Company of Carr’s size.
The Board are responsible for assessing the Group’s internal financial controls and meeting with the external auditors as appropriate. The external auditors have the opportunity for direct access to the Committee without the executive Directors being present.
The Committee reviews the Group’s accounting policies and internal reports on accounting and internal financial control matters together with reports from the external auditors. The Audit Committee has overall responsibility for monitoring the integrity of financial statements and related announcements and for all aspects of internal control. The Committee meets at least twice a year and such meetings involve a review of the Group’s interim and full year statements. The Audit Committee is also responsible for recommendations for the appointment, reappointment or removal of the external auditors and for reviewing their effectiveness. The audit committee carries out each year a full evaluation of the external auditor as to its complete independence from the Group and that is adequately resourced and technically capable to deliver an objective audit to shareholders. Based on this review the audit committee recommends to the board each year the continuation, or removal and replacement, of the external auditor. It also approves the terms of engagement and remuneration and monitors their independence including the nature and levels of non-audit services. Recommendations by the auditors on internal control procedures are considered by the Audit Committee and implemented where appropriate.
The Chairman of the Audit Committee will be available at the Annual General Meeting to respond to any shareholder questions that might be raised on the Committee’s activities.
20 Annual Report & Accounts 2009Carr’s Milling Industries PLC
Audit Remuneration board committee committee
no. of meetings 11 2 2 W R Inglewood 11 2 2C N C Holmes 11 R C Wood 11 A R Heygate 10 1 2A G M Wannop 11 2 2
meetings AttendAnceDetails of the number of meetings of, and members’ attendance at, the Board, Audit and Remuneration Committees during the period are set out in the table below.
Remuneration committeeThe Remuneration Committee currently comprises A G M Wannop (Chairman), W R Inglewood and A R Heygate. It is a requirement of the Combined Code 2008 that the Remuneration Committee should, in the case of smaller companies, consist of at least two members who are considered by the Combined Code 2008 to be independent. The Company has complied with this. The Board is confident that the Company complies with the requirements of the Combined Code 2008 in terms of the required number of independent Directors for a Company of Carr’s size. C N C Holmes, Chief Executive, attends meetings of the Committee by invitation and in an advisory capacity. No Director attends any part of a meeting at which his own remuneration is discussed. The Chairman and the executive Directors determine the remuneration of the other non-executive Directors. The remuneration of the Chairman is determined by the Board.
The Committee recommends to the Board the policy for executive remuneration and determines, on behalf of the Board, the other terms and conditions of service for each executive Director. It determines appropriate performance conditions for the annual cash bonus and deferred bonus scheme and approves awards and the issue of options in accordance with the terms of those schemes. The executive directors’ contract periods are one year. The Remuneration Committee also monitors the level and structure of remuneration of senior management below that of main board Director. The Committee has access to advice from the Company Secretary and to detailed analysis of executive remuneration in comparable companies. Details of the Committee’s current remuneration policies are given in the Directors’ Remuneration Report on pages 23 to 26.
The Chairman of the Remuneration Committee attends the Annual General Meeting to respond to any shareholder questions that might be raised on the Committee’s activities.
RelAtions with shAReholdeRsThe Board recognises the importance of good communications with all shareholders. The Group maintains dialogue with institutional shareholders and analysts, and general presentations are made when financial results are announced. Shareholders have access to the Company’s website at www.carrs-milling.com.
The Annual General Meeting is the principal forum for all the directors to engage in dialogue with private investors. All shareholders are given the opportunity to raise questions at the meeting. The Group aims to send notices of Annual General Meetings to shareholders at least 20 working days before the meeting, as required by the Combined Code 2008, and it is the Company’s practice to indicate the proxy voting results on all resolutions at the meetings.
going conceRnThe Directors have prepared the accounts on a going concern basis, having satisfied themselves from a review of internal budgets and forecasts and current bank facilities that the Group has adequate resources to continue in operational existence for the foreseeable future.
inteRnAl contRolThe Board of Directors has overall responsibility for the Group’s systems of internal control, including financial, operational and compliance controls and risk management, which safeguards the shareholders’ investment and the Group’s assets, and for reviewing its effectiveness. Such a system can only provide reasonable and not absolute assurance against material misstatement or loss, as it is designed to manage rather than eliminate the risk of failure to achieve business objectives.
The Board of Directors is not aware of any significant losses caused by breaches of internal control in the period.
Annual Report & Accounts 2009Carr’s Milling Industries PLC 21

Corporate Governance continued
The Group operates within a clearly defined organisational structure with established responsibilities, authorities and reporting lines to the Board. The organisational structure has been designed in order to plan, execute, monitor and control the Group’s objectives effectively and to ensure that internal control becomes embedded in the operations. The Board confirms that the key on-going processes and features of the Group’s internal risk based control system, which accord with the Turnbull guidance, have been fully operative and up to the date of the Annual Report being approved. These include: a process to identify and evaluatebusinessrisk;astrongcontrolenvironment;aninformationandcommunicationprocess;amonitoringsystemandaregularBoardreviewfor effectiveness. The Finance Director and Group Financial Accountant are responsible for overseeing the Group’s internal controls.
The Group does not have an internal audit function as the Board consider that the Group has not yet reached a size where a separate internal audit function would be an appropriate or cost effective method of ensuring compliance with Group policies, and therefore does not currently propose to introduce a Group internal audit function. This area will be kept under review as part of the Board’s assessment of the Group’s systems of internal control.
The management of the Group’s businesses identified the key business risks within their operations, considered the financial implications and assessed the effectiveness of the control processes in place to mitigate these risks. The Board reviewed a summary of the findings and this, along with direct involvement in the strategies of the businesses, investment appraisal and budgeting process, enabled the Board to report on the effectiveness of internal control.
AuditoRs indePendenceThe Board is satisfied that PricewaterhouseCoopers LLP has adequate policies and safeguards in place to ensure that auditor objectivity and independence is maintained. The Group meets its obligations for maintaining the appropriate relationship with the external auditors through the Audit Committee whose terms of reference include an obligation to consider and keep under review the degree of work undertaken by the external auditors, other than the statutory audit, to ensure such objectivity and independence is safeguarded.
comPliAnce with the Revised combined codeThe Directors consider that the Company has, during the period ended 29 August 2009, complied with the requirements of the Combined Code 2008 other than as set out below.
• thenon-executivedirector,ARHeygate,isnotdeemedtobeindependent under the requirements of the Combined Code 2008 although the Board considers him to be independent (Sch.3.1)
• themembersoftheAuditCommitteearedeemednottohaverecent and relevant financial experience in accordance with the Combined Code 2008 (Sch.3.1). However, the Board believes their business knowledge and experience is sufficient to satisfy the Committee’s obligations
• therearenospecificprovisionsforcompensationonearlytermination of the executive directors (B.1.5)
• theBoarddidnothaveinplaceduringtheperiodaformalandrigorous process of evaluation of its own performance and that of its committees (A.6.1). Rigorous but informal evaluation has historically been carried out by the Chairman and Chief Executive, an evaluation of the performance of the individual directors has also been carried out by the Remuneration Committee
• thereisnoseparateNominationsCommittee(A.4.1)toassessandrecommend new directors. Instead the Board as a whole considers these areas following initial scrutiny and recommendations by the Chief Executive and Chairman
• oneAuditCommitteemeetingwaschairedbyWRInglewoodin the absence of A R Heygate.
By order of the Board
Ronald C WoodCompany SecretaryCarlisleCA3 9BA17 November 2009
22 Annual Report & Accounts 2009Carr’s Milling Industries PLC

Directors’ Remuneration Report
infoRmAtion not subject to Audit.
RemuneRAtion committeeAll matters relating to executive remuneration are determined by the Remuneration Committee, a sub-committee of the Board of Directors. The Remuneration Committee comprises A G M Wannop (Chairman), A R Heygate and Lord Inglewood. As appropriate, the Committee may invite the Chief Executive Officer to participate in some of its discussions. The Committee is responsible for determining the terms and conditions of employment of executive directors. It is also responsible for considering management recommendations for remuneration and employment terms of the Company’s senior staff, including incentive arrangements for bonus payments and grant of share options.
The remuneration of the non-executive directors is determined by the Chairman and the Chief Executive Officer and reflects the time, commitment and responsibility of their roles.
The Remuneration Committee’s decisions are made on the basis of rewarding individuals for the nature of jobs they undertake and their performance therein. Proper regard is given to the need to attract and retain high quality, well-motivated staff at all levels and to the remuneration being paid by similar companies.
detAils of RemuneRAtionThe remuneration of directors is set out in detail on page 24. The Company’s Remuneration Committee decides the remuneration policy that applies to executive directors and the Group’s other senior management.
Each of the executive directors has a one-year rolling contract. The most recent executed contracts for the executive directors were dated 10 June 2002 and as amended on 17 November 2006 and 19 June 2008. In the event of termination C N C Holmes would be entitled to loss of salary, benefits and pensionable service for the notice period. R C Wood receives a pension from the Carr’s Milling Industries Pension Scheme 1993 and he would be entitled to loss of salary and benefits in the event of termination of employment. Contracts do not provide additional compensation for severance as a result of a change of control. The contracts of non-executive directors of the Company are fixed for two years and the most recent executed contracts for W R Inglewood, A R Heygate and A G M Wannop were 1 September 2009.
The Company’s policy is that a proportion of the remuneration of the executive directors should be performance related. As described below, executive directors may earn annual incentive payments together with the benefits of participation in Share Option Schemes.
constituent elements of RemuneRAtion PAckAgeIn applying the above principles to the determination of executive director remuneration, the Remuneration Committee gives consideration to several componentswhichtogethercomprisethetotalremunerationpackage;these consist of the following:
basic salary is determined by the Committee at the beginning of each year. In deciding appropriate levels, the Committee considers the position in the Group, personal and Company performance and relies on information on a comparable group of companies. Basic salaries were last reviewed in August 2009, with increases taking effect from 1 September 2009. The next review will take place in August 2010. Executive directors’ contracts of service, which include details of remuneration, will be available for inspection at the Annual General Meeting.
Annual bonus is paid up to a maximum of 60% of Basic Salary on achievement of profit targets. Annual bonus payments are not pensionable and conform to best practice as set out in the Combined Code 2008.
benefits in kind comprise private healthcare which is not pensionable, critical illness and death in service cover.
Pension contribution. The Company’s defined benefit pension scheme aims at producing a pension of two-thirds final pensionable salary at normal retirement age of 60. C N C Holmes is a member of the pension scheme and his final pension is based on the notional earnings cap and can retire early without actuarial reduction to his pension.
C N C Holmes’ pension information is given in the section subject to audit.
R C Wood receives a pension from the pension scheme.
The normal retirement age is 60 with a two-thirds surviving spouse’s pension. On death in service a lump sum equal to four times basic salary is payable together with a surviving spouse’s pension of two-thirds of the director’s prospective pension. For death after retirement a spouse’s pension of two-thirds of the member’s pension is payable plus the balance of a five year guarantee if applicable.
Non-executive directors do not participate in the pension scheme.
Pensions in payment are guaranteed to be increased annually by 5% or the increase in the Retail Price Index (RPI) if less.
share options. Salary and a bonus scheme are intended as the most significantpartofDirectors’remuneration;inaddition,executiveshareoptions can be proposed by the Remuneration Committee and are granted periodically to promote the involvement of senior management in the longer term success of the Company. Options can only be exercised if certain performance criteria are achieved by the Company. These criteria are based on the growth in the Company’s adjusted earnings per share in excess of the growth in the retail price index over the performance period by an average 2% per annum for each of the three years in the performance period.
defeRRed bonus schemeIn February 2006, the Group established an HMRC Approved Deferred Bonus Scheme. In the year ended 29 August 2009, the Remuneration Committee declined to offer the two executive directors deferred bonus shares (2008: Nil).
non-executive RemuneRAtionThe remuneration of the non-executive directors is agreed by the Group Board taking into account a number of factors pertinent to their position and role as non-executive directors. The non-executive directors do not participate in share option awards, bonus plans or pension arrangements.
Annual Report & Accounts 2009Carr’s Milling Industries PLC 23

Directors’ Remuneration Report continued
PeRfoRmAnce gRAPhThe following graph illustrates the Company’s total shareholder return performance since 31 August 2004 relative to the FTSE All-share index. The Company considers that the FTSE All-share index to be the most appropriate comparator group as it is a broad index and reflects the Company’s broad range of activities.
Carr’s Milling Industries
FTSE All-Share Price Index
Source: Thomson Datastream
2005 2006 2007 2008 2009
250
200
150
100
50
infoRmAtion subject to AuditdiRectoRs’ RemuneRAtion 2009 2008 gain on Gain on Fees & total Total 2009 2008 exercise Exercise Basic Annual emoluments Emoluments Pension Pension of share of Share Salary Bonus Benefits 2009 2008 contributions Contributions options Options £’000 £’000 £’000 £’000 £’000 £’000 £’000 £’000 £’000
executive directorsC N C Holmes 406 — 1 407 469 20 24 — 168R C Wood 186 — 1 187 287 — 6 — 203
non-executive directorsW R Inglewood 50 — — 50 45 — — — —A R Heygate 25 — — 25 25 — — — —A G M Wannop 25 — — 25 25 — — — —
692 — 2 694 851 20 30 — 371
The basic salary of C N C Holmes includes an additional sum representing 93% of his gross basic salary to normal retirement age at 5 September 2011, or earlier retirement from the Company. This additional sum represents compensation for the reduction in pension entitlement.
24 Annual Report & Accounts 2009Carr’s Milling Industries PLC

executive diRectoRs’ Pension infoRmAtion c n c holmesAge at 29 August 2009 57 £’000
Directors’ contributions during the period 9
Increase in accrued pension entitlement for the period At 29 August 2009 excluding inflation 1 including inflation 4
Total accrued pension entitlement At 29 August 2009 75 At 30 August 2008 79
Transfer value of pension At 29 August 2009 1,627 At 30 August 2008 1,325 Increase/(decrease) in transfer value less contributions made by directors At 29 August 2009 293 At 30 August 2008 (1,176)
Transfer value of the increase in accrued benefits less contributions made by directors At 29 August 2009 16 The accrued pension entitlement and transfer value of pension at 29 August 2009 for C N C Holmes have been determined using the maximum of the earnings cap applicable for 2008/09.
The accrued pension entitlement is the amount that the director would receive if he retired at the end of the period.
The decrease in the accrued entitlement is the difference between the accrued benefit at the period end and that at the previous period end.
The transfer values have been calculated on the basis of actuarial advice in accordance with Actuarial Guidance Note GN11. The transfer values of the accrued entitlement represent the value of assets that the pension scheme would need to transfer to another pension provider on transferring the scheme’s liability in respect of the director’s pension benefits. They do not represent sums payable to the director and, therefore cannot be added meaningfully to annual remuneration. diRectoRs’ shARe oPtionsThe Company operates an HMRC approved and an unapproved share option scheme to reward employees’ performance and to incentivise at senior levels. Exercise is subject to performance conditions. For all options granted the exercise criterion has been that earnings should achieve growth which exceeds the percentage growth in the Retail Price Index by 2% or more. The rules of the schemes conform to institutional investor guidelines.
The performance criterion, which applies to the executive directors to whom options have been granted under the Schemes, was chosen as it requires significant improvement in financial performance. No options have been granted at a discount to the market price at the date of their grant.
Options to acquire shares in the Company, granted to directors under the Scheme but not exercised, as at 29 August 2009 are:
At 31 Exercised Granted At Earliest date August during during 29 August Exercise Date of from which Expiry 2008 period period 2009 price grant exercisable date
C N C Holmes 6,000 — — 6,000 502.3p 20 Feb 2006 Feb 2009 Feb 2016
R C Wood 6,000 — — 6,000 502.3p 20 Feb 2006 Feb 2009 Feb 2016
The two executive directors did not exercise executive share options during the year:
The middle market closing price of the shares at 28 August 2009 was 445.0p (29 August 2008: 662.5p) and the range throughout the year was 680.0p to 405.0p.
Annual Report & Accounts 2009Carr’s Milling Industries PLC 25

Directors’ Remuneration Report continued
defeRRed bonus schemeThe Group operates an approved HMRC deferred bonus scheme to reward employees’ performance and to incentivise at senior levels. In the year ended 1 September 2007 the two executive directors elected to defer 50% of the bonus paid in November 2007 in the form of a Bonus Share Award. The Remuneration Committee granted a Matching Share Award and on meeting in full the performance conditions, the two directors will receive matching shares. The matching shares equal the gross amount of deferred bonus divided by the average price per share at date of deferral.
To qualify for the Maximum Award Multiple of 1 the growth in the Company’s adjusted earnings per share over the 3 years ending 31 August 2010 must equal or exceed the growth in the Retail Price Index (“RPI”) over the 3 years by an average of 4% per annum. The Award Multiple will be reduced to 0.5 should the growth in adjusted earnings per share over the 3 years equal the growth in RPI by an average of 2% per annum. Should the Company’s adjusted earnings per share fall between the two threshold levels, referred to above, the Award Multiple will be measured on a straight line basis between 0.5 and 1.
Maximum Maximum no. of No. of Bonus Base no. of award matching Exercise award shares shares multiple shares date
C N C Holmes 2,131 3,612 1 3,612 30 November 2010
R C Wood 1,860 3,153 1 3,153 30 November 2010
On behalf of the Board
A G M Wannop
Chairman of the Remuneration Committee
17 November 2009
26 Annual Report & Accounts 2009Carr’s Milling Industries PLC

Independent Auditors’ Report to the Members of Carr’s Milling Industries PLC
We have audited the financial statements of Carr’s Milling Industries PLC for the period ended 29 August 2009 which comprise the consolidated income statement, the consolidated and company statements of recognised income and expense, the consolidated and company balance sheets, the consolidated and company cash flow statements, principal accounting policies and the related notes. The financial reporting framework that has been applied in their preparation is applicable law and International Financial Reporting Standards (IFRSs) as adopted by the European Union and, as regards the parent company financial statements, as applied in accordance with the provisions of the Companies Act 2006.
ResPective ResPonsibilities of diRectoRs And AuditoRs As explained more fully in the directors’ responsibilities statement set out on page 19, the directors are responsible for the preparation of the financial statements and for being satisfied that they give a true and fair view. Our responsibility is to audit the financial statements in accordance with applicable law and International Standards on Auditing (UK and Ireland). Those standards require us to comply with the Auditing Practices Board’s Ethical Standards for Auditors.
This report, including the opinions, has been prepared for and only for the company’s members as a body in accordance with Sections 495 to 497 of the Companies Act 2006 and for no other purpose. We do not, in giving these opinions, accept or assume responsibility for any other purpose or to any other person to whom this report is shown or into whose hands it may come save where expressly agreed by our prior consent in writing.
scoPe of the Audit of the finAnciAl stAtements An audit involves obtaining evidence about the amounts and disclosures in the financial statements sufficient to give reasonable assurance that the financial statements are free from material misstatement, whether caused by fraud or error. This includes an assessment of: whether the accounting policies are appropriate to the group’s and the parent company’s circumstancesandhavebeenconsistentlyappliedandadequatelydisclosed;thereasonablenessofsignificantaccountingestimatesmadebythedirectors;and the overall presentation of the financial statements. oPinion on finAnciAl stAtements In our opinion:
• thefinancialstatementsgiveatrueandfairviewofthestateofthegroup’s and of the parent company’s affairs as at 29 August 2009 and of the group’s profit and group’s and parent company’s cash flows for theperiodthenended;
• thegroupfinancialstatementshavebeenproperlypreparedinaccordancewithIFRSsasadoptedbytheEuropeanUnion;
• theparentcompanyfinancialstatementshavebeenproperlypreparedin accordance with IFRSs as adopted by the European Union and as appliedinaccordancewiththeprovisionsoftheCompaniesAct2006;and
• thefinancialstatementshavebeenpreparedinaccordancewiththerequirements of the Companies Act 2006 and, as regards the group financial statements, Article 4 of the lAS Regulation.
oPinion on otheR mAtteRs PRescRibed by the comPAnies Act 2006 In our opinion:
• thepartofthedirectors’remunerationreporttobeauditedhasbeenproperlypreparedinaccordancewiththeCompaniesAct2006;
• theinformationgiveninthestatementoncorporategovernancewithrespect to rules 7.2.5 and 7.2.6 of the Disclosure and Transparency Rules issued by the Financial Services Authority is consistent with the financialstatements;and
• theinformationgiveninthedirectors’reportforthefinancialperiodfor which the financial statements are prepared is consistent with the financial statements.
mAtteRs on which we ARe RequiRed to RePoRt by excePtion We have nothing to report in respect of the following:
Under the Companies Act 2006 we are required to report to you if, in our opinion:
• adequateaccountingrecordshavenotbeenkeptbytheparentcompany, or returns adequate for our audit have not been received frombranchesnotvisitedbyus;or
• theparentcompanyfinancialstatementsandthepartofthedirectors’remuneration report to be audited are not in agreement with the accountingrecordsandreturns;or
• certaindisclosuresofdirectors’remunerationspecifiedbylawarenotmade;or
• wehavenotreceivedalltheinformationandexplanationswerequireforouraudit;or
• acorporategovernancestatementhasnotbeenpreparedbytheparent company.
Under the Listing Rules we are required to review:
• thedirectors’statement,setoutonpage21,inrelationtogoingconcern;and
• thepartsoftheCorporateGovernanceStatementrelatingtothecompany’s compliance with the nine provisions of the June 2008 Combined Code specified for our review.
Richard Bunter (Senior Statutory Auditor)for and on behalf of PricewaterhouseCoopers LLPChartered Accountants and Statutory AuditorsNewcastle upon Tyne17 November 2009
Annual Report & Accounts 2009Carr’s Milling Industries PLC 27

Consolidated Income Statementfor the period ended 29 August 2009
52 week 52 week period period 2009 2008 Notes £’000 £’000
Revenue 2,3 350,023 372,307Cost of sales 3 (309,016) (327,757)
gross profit 3 41,007 44,550Net operating expenses 3 (33,712) (31,675)
Group operating profit 3,4 7,295 12,875
Analysed as: operating profit before non-recurring items and amortisation 7,295 12,814Non-recurring items and amortisation 6 — 61
group operating profit 7,295 12,875
Interest income 8 211 454Interest expense 8 (1,522) (2,061)Share of post-tax profit in associate and joint ventures 5 1,051 1,590
Profit before taxation 2 7,035 12,858Taxation 2,9 (1,829) (4,605)
Profit for the period 5,206 8,253
Profit attributable to minority interest 785 552
Profit attributable to equity shareholders 4,421 7,701
5,206 8,253
earnings per share (pence) Basic 11 50.4 92.7Diluted 11 50.3 91.2
All of the above are derived from continuing operations.
28 Annual Report & Accounts 2009Carr’s Milling Industries PLC

Consolidated and Company Statement of Recognised Income and Expensefor the period ended 29 August 2009
group company 52 week 52 week 52 week 52 week period period period period 2009 2008 2009 2008 Notes £’000 £’000 £’000 £’000
Foreign exchange translation differences arising on translation of overseas subsidiaries 30 276 583 — —
Actuarial gains/(losses) on retirement benefit obligation:- Group 28 951 (11,065) 951 (11,065)- Share of associate 28 (1,386) (1,193) — —
Taxation (charge)/credit on actuarial movement on retirement benefit obligation:- Group 19 (266) 3,116 (266) 3,116- Share of associate 388 334 — —
net (expense)/income recognised directly in equity (37) (8,225) 685 (7,949)Profit for the period 5,206 8,253 7,954 3,216
total recognised income and expense for the period 30 5,169 28 8,639 (4,733)
Attributable to minority interest 30 782 545 — —
Attributable to equity shareholders 30 4,387 (517) 8,639 (4,733)
5,169 28 8,639 (4,733)
Annual Report & Accounts 2009Carr’s Milling Industries PLC 29

Consolidated and Company Balance SheetAs at 29 August 2009
group company 52 week 52 week 52 week 52 week period period period period 2009 2008 2009 2008 Notes £’000 £’000 £’000 £’000
Assetsnon-current assets Goodwill 12 1,654 1,381 — —Other intangible assets 12 764 294 — —Property, plant and equipment 13 31,764 28,596 — —Investment property 14 718 737 — —Investment in subsidiary undertakings 15,18 — — 13,002 13,001Investment in associate 15,16 2,735 2,870 1,470 1,470Interest in joint ventures 15,17 1,840 1,609 320 303Other investments 15 51 51 — —Financial assets- Non-current receivables 21 53 50 2,275 —Deferred tax assets 19 5,015 5,318 4,111 4,640
44,594 40,906 21,178 19,414
current assetsInventories 20 23,860 31,014 — —Trade and other receivables 21 43,059 50,754 13,213 17,221Current tax assets 22 119 65 959 1,602Financial assets- Derivative financial instruments 27 16 927 — 31- Cash at bank and in hand 23 10,304 3,896 16,038 —
77,358 86,656 30,210 18,854
total assets 121,952 127,562 51,388 38,268
liabilitiescurrent liabilitiesFinancial liabilities- Borrowings 26 (10,226) (15,004) (3,748) (5,489)- Derivative financial instruments 27 (43) (22) (43) —Trade and other payables 24 (35,928) (52,977) (833) (2,328)Current tax liabilities 25 (708) (2,054) — —
(46,905) (70,057) (4,624) (7,817)
non-current liabilitiesFinancial liabilities- Borrowings 26 (19,403) (6,325) (14,410) (5,371)- Derivative financial instruments 27 — (14) — (14)Retirement benefit obligation 28 (14,673) (16,558) (14,673) (16,558)Deferred tax liabilities 19 (4,840) (4,775) — —Other non-current liabilities 24 (2,834) (2,237) — —
(41,750) (29,909) (29,083) (21,943)
total liabilities (88,655) (99,966) (33,707) (29,760)
net assets 33,297 27,596 17,681 8,508
shareholders’ equityOrdinary shares 29 2,196 2,094 2,196 2,094Share premium 30 7,738 5,252 7,738 5,252Treasury share reserve 30 (101) (101) — —Equity compensation reserve 30,31 164 206 199 233Foreign exchange reserve 30 386 107 — —Other reserve 30 1,508 1,539 — —Retained earnings 30 17,999 15,880 7,548 929
total shareholders’ equity 30 29,890 24,977 17,681 8,508Minority interests in equity 30 3,407 2,619 — —
total equity 30 33,297 27,596 17,681 8,508
The financial statements set out on pages 28 to 80 were approved by the Board on 17 November 2009 and signed on its behalf by:
christopher n c holmes Ronald c wood
30 Annual Report & Accounts 2009Carr’s Milling Industries PLC

Consolidated and Company Cash Flow StatementFor the period ended 29 August 2009
group company 52 week 52 week 52 week 52 week period period period period 2009 2008 2009 2008 Notes £’000 £’000 £’000 £’000
cash flows from operating activitiesCash generated from/(used in) operations 33 9,817 5,233 (2,840) (2,755)Interest received 204 447 342 580Interest paid (1,456) (2,016) (588) (739)Tax (paid)/recovered (2,985) (647) 924 373
Net cash generated from/(used in) operating activities 5,580 3,017 (2,162) (2,541)
cash flows from investing activitiesAcquisition of subsidiaries (net of cash acquired) 32 (4,258) (588) — —Investment in joint ventures — (294) — —Dividends received from subsidiaries — — 6,100 3,340Net receipt/(payment) of loans to subsidiaries — — 1,806 (2,606)Purchase of intangible assets (25) (4) — —Proceeds from sale of property, plant and equipment 282 177 — —Purchase of property, plant and equipment (2,612) (2,141) — —Receipt of non-current receivables — 50 — —
Net cash (used in)/generated from investing activities (6,613) (2,800) 7,906 734 cash flows from financing activitiesNet proceeds from issue of ordinary share capital 30 2,588 209 2,588 209Net proceeds from loans from subsidiaries — — 1,517 1,021Net proceeds from issue of new bank loans 18,029 1,495 14,878 1,495Finance lease principal repayments (1,025) (912) — —Repayment of borrowings (6,450) (1,010) (6,375) (750)(Decrease)/increase in other borrowings (1,195) 1,872 — —Disposal of interest rate swap — 111 — 111Dividends paid to shareholders 10 (2,020) (1,618) (2,020) (1,618)
Net cash generated from financing activities 9,927 147 10,588 468
Effects of exchange rate changes 161 300 (174) 78
net increase/(decrease) in cash and cash equivalents 9,055 664 16,158 (1,261)Cash and cash equivalents at beginning of the period 23 66 (598) (120) 1,141
Cash and cash equivalents at end of the period 23 9,121 66 16,038 (120)
Annual Report & Accounts 2009Carr’s Milling Industries PLC 31

Principal Accounting Policies
bAsis of AccountingThe consolidated financial statements are prepared in accordance with International Financial Reporting Standards (IFRSs) and IFRIC interpretations endorsed by the European Union (EU) and with those parts of the Companies Act 2006 applicable to companies reporting under IFRS.
The company is a public limited company incorporated and domiciled in England and Wales whose shares are listed and traded on the London Stock Exchange. The address of its registered office is Old Croft, Stanwix, Carlisle, CA3 9BA.
The preparation of financial statements in conformity with generally accepted accounting principles requires the use of estimates and assumptions that affect the reported amounts of assets and liabilities at the date of the financial statements and the reported amounts of revenues and expenses during the reporting period. Although these estimates are based on management’s best knowledge of the amount, event or actions, actual results ultimately may differ materially from those estimates.
The consolidated financial statements are prepared under the historic cost convention as modified by the revaluation of financial assets and liabilities at fair value through profit or loss.
bAsis of consolidAtionThe consolidated financial statements comprise Carr’s Milling Industries PLC and all its subsidiaries, together with the Group’s share of the results of its associate and joint ventures. The financial statements of the subsidiaries, associate and joint ventures are prepared as of the same reporting date and consolidated using consistent accounting policies. Group inter-company balances and transactions, including any unrealised profits arising from Group inter-company transactions, are eliminated in full. Profits and losses on transactions with the associate and joint ventures are recognised in the consolidated income statement.
Results of subsidiary undertakings acquired during the current financial period were included in the financial statements from the effective date of control. The separable net assets, both tangible and intangible, of the acquired subsidiary undertakings were incorporated into the financial statements on the basis of the fair value as at the effective date of the Group acquiring control.
Subsidiaries are entities where the Group has the power to govern the financial and operating policies, generally accompanied by a share of more than 50% of the voting rights. Subsidiaries are consolidated from the date on which control is transferred to the Group and are included until the date on which the Group ceases to control them. Associates are entities over which the Group has significant influence but not control, generally accompanied by a share of between 20% and 50% of the voting rights. Joint ventures are entities over which the Group has joint control, established by contractual agreement. Investments in associates and joint ventures are accounted for using the equity method. The Group’s share of its associate and joint ventures’ post-tax profits or losses are recognised in the income statement, and its share of movement in reserves is recognised in reserves. The cumulative movements are adjusted against the carrying amount of the investment. The Group’s investment in associate and joint ventures includes any goodwill arising on acquisition. If the Group’s share of losses in an associate or joint venture equals or exceeds its investment in the associate or joint venture, the Group does not recognise further losses, unless it has incurred obligations or made payments on behalf of the associate or joint venture.
All subsidiaries are accounted for by applying the purchase method. The cost of a business combination is measured as the aggregate of the fair values, at the acquisition date, of the assets given, liabilities incurred or assumed, and equity instruments issued by the Group, together with any costs directly attributable to the combination. The identifiable assets, liabilities and contingent liabilities of the acquiree are measured initially at fair value at the acquisition date, irrespective of the extent of any minority interest. The excess of the cost of the business combination over the Group’s interest in the net fair value of the identifiable assets, liabilities and contingent liabilities is recognised as goodwill.
The Group applies a policy of treating transactions with minority interests as transactions with parties external to the Group.
emPloyee shARe tRustStanding Interpretations Committee (SIC) 12 requires that the Group consolidate a special purpose entity where the substance of the relationship between the parties indicates that the Group controls the entity. The employee share trust sponsored by the Group falls within this category of special purpose entity and has been accounted for as if it were, in substance, a subsidiary.
Shares acquired by the trust have been recognised in the treasury share reserve and have been excluded from the calculation of earnings per share in the current period, as the shares have not been allocated to a share scheme. When such an allocation occurs the shares will be included in the diluted earnings per share calculation.
cuRRency tRAnslAtionThe financial statements for the Group’s subsidiaries, associate and joint ventures are prepared using their functional currency. The functional currency is the currency of the primary economic environment in which an entity operates. The presentation currency of the Group and functional currency of the Group is Sterling.
Foreign currency transactions are translated into the functional currency using exchange rates prevailing at the dates of the transactions. Exchange differences resulting from the settlement of such transactions and from the translation, at exchange rates ruling at the balance sheet date, of monetary assets and liabilities denominated in currencies other than the functional currency are recognised in the consolidated income statement.
The balance sheets of foreign operations are translated into sterling using the exchange rate at the balance sheet date and the income statements are translated into sterling using the average exchange rate for the period. Where this average is not a reasonable approximation of the cumulative effect of the rates prevailing on the transaction dates, the exchange rate on the transaction date is used. Exchange differences arising are recognised as a separate component of shareholders’ equity. On disposal of a foreign operation any cumulative exchange differences held in shareholders’ equity are transferred to the consolidated income statement.
Revenue RecognitionRevenue from the sale of goods or services is measured at the fair value of the consideration, net of rebates and excluding value added tax. Revenue from the sale of goods or services is recognised when the Group has transferred the significant risks and rewards of ownership of the goods to the buyer, when the amount of revenue can be measured reliably and when it is probable that the economic benefits associated with the transaction will flow to the Group. Inter segmental revenue is on an arm’s length basis.
In respect of construction contracts, revenue is calculated on the basis of the stage of completion and the total sales value of each contract.
32 Annual Report & Accounts 2009Carr’s Milling Industries PLC

RetiRement benefit obligAtionsThe Group participates in two defined benefit pension schemes, Carr’s Milling Industries Pension Scheme 1993 and Carrs Billington Agriculture Pension Scheme. The Group also offers various defined contribution schemes to its employees.
The assets of the above named schemes are held separately from those of the Group and are invested with independent investment managers.
Contributions to defined contribution schemes are charged to the consolidated income statement in the period to which they relate.The liability recognised in the consolidated balance sheet at the period end in respect of defined benefit pension schemes is the present value of the defined benefit obligation at the balance sheet date less the fair value of scheme assets. Independent actuaries calculate the defined benefit obligation annually using the projected unit credit method. The present value of the defined benefit obligation is determined by discounting the estimated future cash outflows using interest rates of high-quality corporate bonds that are denominated in the currency in which the benefits will be paid, and that have terms to maturity approximating to the terms of the related pension liability.
The current service costs, past service costs and gains and losses on settlements and curtailments are included in operating profit in the consolidated income statement.
A charge is made within operating costs which represents the expected increase in the liabilities of the pension schemes during the period. This arises from the liabilities of the schemes being one year closer to payment.
A credit representing the expected return on the assets of the pension schemes during the period is netted against the above charge within operating costs. This is based on the market value of the assets of the schemes at the start of the financial period. Actuarial gains and losses arising from experience adjustments and changes in actuarial assumptions are recognised in the consolidated statement of recognised income and expense. The pension schemes’ deficits or surpluses, to the extent that they are considered recoverable, are recognised in full on the consolidated balance sheet.
The Group’s share of the deficit in the Carrs Billington Agriculture Pension Scheme is recognised through its investment in associate.
shARe bAsed PAymentsThe Group issues equity-settled share-based payments to certain employees. Equity-settled share-based payments are measured at fair value at the date of the grant. The fair value determined at the grant date of the equity-settled share-based payments is expensed on a straight-line basis over the vesting period, based on the Group’s estimate of shares that will eventually vest.
Fair value is measured by use of a valuation model. The expected life used in the model has been adjusted, based on management’s best estimate, for the effects of non-transferability, exercise restrictions and behavioural considerations.
At each balance sheet date the Group revises its estimate of the number of options that are expected to vest. Changes to the fair value recognised as a result of this are charged or credited to the consolidated income statement with a corresponding adjustment to the equity compensation reserve.
inteRestInterest is recognised in the consolidated income statement on an accruals basis using the effective interest method.
segmentAl RePoRtingThe Group’s primary reporting format is business segments and its secondary format is geographical segments. A business segment is a component of the Group that is engaged in providing a group of related products and is subject to risks and returns that are different from those of other business segments. A geographical segment is a component of the Group that operates within a particular economic environment and this is subject to risks and returns that are materially different from those of components operating in other economic environments.
Revenue, costs, assets and liabilities have been allocated between segments firstlyonthoseitemsspecifictothesegments;anyremainingitemshavebeen allocated using a reasonable basis such as management time incurred.
non-RecuRRing items And AmoRtisAtionNon-recurring items and amortisation that are material by size and/or by nature are presented within their relevant income statement category. Items that management consider fall into this category are disclosed within a note to the financial statements. The separate disclosure of non-recurring items and amortisation helps provide a better indication of the Group’s underlying business performance. Events which may give rise to non-recurring items include, but are not limited to, gains or losses on the disposal of businesses, the restructuring of businesses, the integration of new businesses, asset impairments and net gains on transfers of deferred pensioners from the group pension scheme.
goodwillGoodwill arising on consolidation represents the excess of the cost of acquisition over the fair value of the identifiable assets, liabilities and contingent liabilities of the acquired entity at the date of the acquisition.
At the date of acquisition, goodwill is allocated to cash generating units for the purpose of impairment testing.
Goodwill is recognised as an asset, which is carried at cost less impairment, and assessed for impairment annually. Any impairment is recognised immediately in the income statement. Once recognised, an impairment of goodwill is not reversed under any circumstance.
Where a business combination results in an excess of the acquirer’s interest in the net fair value of the acquiree’s indentifiable assets, liabilities and contingent liabilities over cost, the excess is credited to the consolidated income statement in the period of acquisition.
Goodwill written off to reserves under UK GAAP prior to 31 August 1998 has not been reinstated and would not form part of the gain or loss on the disposal of a business.
otheR intAngible AssetsOther intangible assets are carried at cost less accumulated amortisation. Amortisation commences when assets are available for use. The expected useful lives, over which the assets are amortised, are generally as follows:
Customer relationships 1 - 5 yearsBrands 15 - 20 yearsKnow-how 5 yearsPatents and trademarks contractual lifeSoftware 3 - 10 years
Customer relationships and brands are amortised in line with the profit and income streams they are respectively expected to generate over their expected useful life.
Know-how, patents, trademarks and software are amortised on a straight-line basis.
Annual Report & Accounts 2009Carr’s Milling Industries PLC 33

Principal Accounting Policies continued
The cost of intangible assets acquired in a business combination is the fair value at the acquisition date. The cost of separately acquired intangible assets comprises the purchase price and any directly attributable costs of preparing the assets for use.
All research costs are recognised in the consolidated income statement as incurred. Development costs are recognised as an asset only to the extent that specific recognition criteria, as set out in IAS38 ‘Intangible assets’, relevant to the proposed application are met and the amount recognised is recoverable through future economic benefits.
PRoPeRty, PlAnt And equiPmentProperty, plant and equipment is carried at cost less accumulated depreciation and accumulated impairment losses. Cost comprises purchase price and directly attributable costs.
Freehold land and assets under construction are not depreciated. For all other property, plant and equipment, depreciation is calculated on a straight-line basis to allocate cost less residual values of the assets over their estimated useful lives as follows:
Freehold buildings up to 50 yearsLeasehold buildings shorter of 50 years or lease termPlant and equipment 3 to 20 years
Residual values and useful lives are reviewed at each financial period-end.
Assets not fully constructed at the balance sheet date are classified as assets in the course of construction. When construction is complete these assets are reclassified to the appropriate heading within property, plant and equipment. Depreciation commences when the asset is ready for use.
The cost of maintenance, repairs and minor equipment is charged to theincomestatementasincurred;thecostofmajorrenovationsandimprovements is capitalised.
Gains and losses on disposals are determined by comparing the proceeds with the carrying amount and are recognised within the income statement.
investment PRoPeRtyInvestment properties are properties held for long-term rental yields. Investment properties are carried in the balance sheet at cost less accumulated depreciation. Freehold land is not depreciated. For all other investment property, depreciation is calculated on a straight-line basis to allocate cost less residual values of the assets over their estimated useful lives as follows:
Freehold buildings up to 50 years
The cost of maintenance, repairs and minor equipment is charged to theincomestatementasincurred;thecostofmajorrenovationsandimprovements is capitalised.
Gains and losses on disposals are determined by comparing the proceeds with the carrying amount and are recognised within the income statement.
imPAiRment of AssetsAt each reporting date, the Group assesses whether there is any indication that an asset may be impaired. Where an indicator of impairment exists, the Group makes an estimate of recoverable amount. Where the carrying amount of an asset exceeds its recoverable amount the asset is written down to its recoverable amount. Recoverable amount is the higher of fair value less costs to sell and value in use and is deemed for an individual asset. If the asset does not generate cash flows that are largely independent
of those from other assets or groups of assets, the recoverable amount of the cash generating unit to which the asset belongs is determined. Discount rates reflecting the asset specific risks and the time value of money are used for the value in use calculation.
inventoRiesInventories are stated at the lower of cost and net realisable value. Cost comprises direct materials and, where applicable, direct labour costs and those overheads that have been incurred in bringing the inventories to their present location and condition. Where appropriate, cost is calculated on a specific identification basis. Otherwise inventories are valued using the first-in first-out method.
Contract work in progress is measured at the selling price of the work performed at the balance sheet date. The selling price is measured by reference to the stage of completion at the balance sheet date and total expected income from the contract work.
The stage of completion is determined as the proportion that contract costs incurred for work performed to date bear to the total estimated total contract costs. Amounts invoiced for work completed are deducted from the selling price, while amounts invoiced in excess of work completed are recognised as current liabilities.
Where it is probable that contract costs will exceed total contract revenue the expected loss is recognised immediately as an expense in the income statement.
Net realisable value represents the estimated selling price less all estimated costs to completion and costs to be incurred in marketing, selling and distribution.
cAsh And cAsh equivAlentsCash and cash equivalents for the purposes of the consolidated cash flow statement comprise cash at bank and in hand, money market deposits and other short term highly liquid investments with original maturities of three months or less and bank overdrafts. Bank overdrafts are presented in borrowings within current liabilities in the consolidated balance sheet.
gRAntsGrants received on capital expenditure are recorded as deferred income and taken to the consolidated income statement in equal annual instalments over the expected useful lives of the assets concerned.
Revenue grants and contributions are taken to the consolidated income statement in the period to which they apply.
leAsesLeases are classified as finance leases at inception where substantially all of the risks and rewards of ownership are transferred to the Group. Assets classified as finance leases are capitalised on the consolidated balance sheet and are depreciated over the shorter of the useful life of the asset and the term of the lease. The interest element of the rental obligations is charged to the consolidated income statement over the period of the lease using the actuarial method.
Rentals paid under operating leases are charged to the consolidated income statement on a straight-line basis over the term of the lease. Leasehold land is normally classified as an operating lease. Payments made to acquire leasehold land are included in prepayments at cost and are amortised over the life of the lease. Any incentives to enter into operating leases are recognised as a reduction of rental expense over the lease term on a straight-line basis.
34 Annual Report & Accounts 2009Carr’s Milling Industries PLC

tAxThe tax charge comprises current tax and deferred tax.
The current tax charge represents an estimate of the amounts payable to tax authorities in respect of the Group’s taxable profits.
Deferred tax is provided in full, using the liability method, on temporary differences arising between the tax base of assets and liabilities and their carrying amounts in the consolidated financial statements. Deferred tax arising from initial recognition of an asset or liability in a transaction, other than a business combination, that at the time of the transaction affects neither accounting nor taxable profit or loss, is not recognised. Deferred tax is measured using tax rates that have been enacted or substantively enacted by the balance sheet date and are expected to apply when the asset is realised or the liability is settled.
Deferred tax assets are recognised to the extent that it is probable that future taxable profit will be available against which the temporary differences can be utilised.
Deferred tax is provided on temporary differences arising on investments in subsidiaries, associates and joint ventures, except where the Group is able to control the timing of the reversal of the temporary difference and it is probable that the temporary difference will not reverse in the foreseeable future.
Tax is recognised in the consolidated income statement, unless the tax relates to items recognised directly in shareholders’ equity, in which case the tax is recognised directly in shareholders’ equity through the consolidated statement of recognised income and expense.
dividendsFinal equity dividends to the shareholders of the Company are recognised in the period that they are approved by the shareholders. Interim equity dividends are recognised in the period that they are paid.
Dividends receivable are recognised in the period in which they are received.
finAnciAl instRumentsFinancial assets and liabilities are recognised on the Group’s consolidated balance sheet when the Group becomes a party to the contractual provisions of the instrument.
Trade receivables Trade receivables are recognised initially at fair value and subsequently measured at amortised cost using the effective interest method, less provision for impairment. A provision for impairment of trade receivables is established when there is objective evidence that the group will not be able to collect all amounts due according to the original terms of the receivables. Significant financial difficulties of the debtor, probability that the debtor will enter bankruptcy or financial reorganisation, and default or delinquency in payments are considered indicators that the trade receivable is impaired. The amount of the provision is the difference between the asset’s carrying amount and the present value of estimated future cash flows, discounted at the original effective interest rate. The carrying amount of the asset is reduced through the use of an allowance account, and the amount of the loss is recognised in the income statement. When a trade receivable is uncollectible, it is written off against the allowance account for trade receivables.
InvestmentsInvestments are initially measured at cost, including transaction costs. They are classified as either ‘available-for-sale’, ‘fair value through profit or loss’ or ‘held to maturity’. Where securities are designated as ‘at fair value through
profit or loss’, gains and losses arising from changes in fair value are included in net profit or loss for the period. For ‘available-for-sale’ investments, gains or losses arising from changes in fair value are recognised directly in equity, until the security is disposed of or is determined to be impaired, at which time the cumulative gain or loss previously recognised in equity is included in the net profit or loss for the period.
Available for sale financial assets are non-derivatives that are either designated in this category or not classified in any of the other categories. They are included in non-current assets unless management intends to dispose of the investment within 12 months of the balance sheet date.
Equity investments that do not have a quoted market price in an active market and whose fair value cannot be reliably measured by other means are held at cost. ‘Held-to-maturity’ investments are measured at amortised cost using the effective interest method.
Financial liability and equityFinancial liabilities and equity instruments are classified according to the substance of the contractual arrangements entered into.
An equity instrument is any contract that evidences a residual interest in the assets of the Group after deducting all of its liabilities.
Bank borrowingsInterest-bearing loans and overdrafts are recognised initially at fair value net of direct issue costs and are subsequently stated at amortised cost. Finance charges, including premiums payable on settlement or redemption and direct issue costs, are accounted for on an effective interest method and are added to the carrying amount of the instrument to the extent that they are not settled in the period in which they arise.
Trade payablesTrade payables are recognised initially at fair value and subsequently measured at amortised cost using the effective interest method.
Equity instrumentsEquity instruments issued by the Company are recorded at the proceeds received, net of direct issue costs.
Derivative financial instruments and hedging activitiesThe Group primarily uses interest rate swaps, caps and collars and forward foreign currency contracts to manage its exposures to fluctuating interest and foreign exchange rates. These instruments are initially recognised at fair value and are subsequently re-measured at their fair value at each balance sheet date.
The Group’s policy is to hedge its international assets and it has designated foreign currency borrowings as a hedge against net investment in foreign operations. The portion of the gain or loss on an instrument used to hedge a net investment in a foreign operation that is determined as an effective hedge is recognised directly in equity. The gain or loss on any ineffective portion of the hedge is recognised immediately in the income statement.
Fair valuationFair values are based on market values, where available. Where market values are not readily available, the Group establishes fair valuation techniques;theseincludetheuseofrecentarm’slengthtransactions,reference to other similar instruments and discounted cash flow analysis.
Annual Report & Accounts 2009Carr’s Milling Industries PLC 35

Principal Accounting Policies continued
new stAndARds And inteRPRetAtionsThe following new standards and interpretations, which are in issue at the balance sheet date but not yet effective, have not been applied in these financial statements: Effective for periods commencing on or after
IAS 1 Revised - Presentation of financial statements 1 January 2009IFRS 8 Operating Segments 1 January 2009IFRIC 12 Service Concession Arrangements 30 March 2009IFRIC 13 Customer Loyalty Programmes 1 January 2009IFRIC 14 ‘IAS 19 - The limit on a defined benefit asset, minimum funding requirements and their interaction’ 1 January 2009IFRIC 15 Agreements for construction of real estates 1 January 2009IFRIC 16 Hedges of a net investment in a foreign operation 1 October 2008IFRIC 17 Distributions of non-cash assets to owners 1 July 2009IFRIC 18 Transfer of assets from customers 1 July 2009IAS 23 Revised - Borrowing costs 1 January 2009Amendment to IAS 32 Financial instruments: Presentation and IAS 1 Presentation of financial statements, puttable financial instruments and obligations arising on liquidation 1 January 2009IAS 27 (Revised) Consolidated and separate financial statements 1 July 2009Amendment to IAS 39 - Eligible hedged items 1 July 2009Amendment to IFRS 1 ‘First time adoption of IFRS’ and IAS 27 ‘Consolidated and separate financial statements’ 1 July 2009IFRS 2, Share-based payment Amendment Vesting conditions and cancellations 1 January 2009IFRS 3 (Revised) Business combinations 1 July 2009
It is considered that the above standards and interpretations will not have a significant effect on the results or net assets of the Group. IAS 1 Revised and IFRS 8 will have no impact on the results or net assets of the Group but will increase the level of disclosure to be made in the financial statements. In the current economic climate it is considered that IFRIC 14 will have no effect on the results or net assets of the Group.
From 31 August 2008, the following standards, amendments and interpretations became effective and were adopted by the Group:
• AmendmenttoIAS39andIFRS7-Reclassificationoffinancialassets
The adoption of this amendment has not had a significant impact on the Group’s profit for the year or equity.
significAnt judgements, key AssumPtions And estimAtesApplication of certain Group accounting policies requires management to make judgements, assumptions and estimates concerning the future as detailed below.
Valuation of pension obligationsThe valuation of the Group’s defined benefit pension scheme is determined each period following advice from the Group’s actuary and can fluctuate based on a number of external factors. Such factors include the major assumptions as shown in the table in note 28 and actual returns on scheme assets compared to those predicted in the previous scheme valuation.
Valuation of share-based paymentsThe fair value of share-based payments is determined using valuation models and is charged to the income statement over the vesting period.
The valuation models require certain assumptions to be made as shown in the tables in note 31. Estimations of vesting and satisfaction of performance criteria are required to determine fair value.
Impairment of goodwillThe carrying value of goodwill must be assessed for impairment annually. This requires an estimation of the value in use of the cash generating units to which goodwill is allocated. Value in use is dependent on estimations of future cash flows from the cash generating unit and the use of an appropriate discount rate to discount those cash flows to their present value.
No impairment has been identified in the period (note 12).
Provision for impairment of trade receivablesThe financial statements include a provision for impairment of trade receivables (note 21) that is based on management’s estimation of recoverability. There is a risk that the provision will not match the trade receivables that ultimately prove to be irrecoverable.
Valuation of derivative financial instrumentsThe fair value of derivative financial instruments (note 27) is determined using market factors at the period end over which management have no control. Such factors include the estimation of future currency exchange rates and interest rates. In addition the fair value of such instruments is affected by the global economic environment and financial institution pricing structures.
36 Annual Report & Accounts 2009Carr’s Milling Industries PLC

Notes to the Financial Statements
1 The Company has taken advantage of the exemption, under section 408 of the Companies Act 2006, from presenting its own income statement. The profit after tax for the period dealt with in the accounts of the Company was £7,954,000 (2008: £3,216,000).
2 segmentAl RePoRtingPrimary reporting format - business segmentsThe segment results for the period ended 29 August 2009 are as follows:
Agriculture food engineering other group £’000 £’000 £’000 £’000 £’000
Total gross segment revenue 255,117 78,956 15,992 156 350,221Inter-segment revenue (124) (3) (71) — (198)
Revenue 254,993 78,953 15,921 156 350,023
operating profit/(loss) before retirement benefit charge* 6,039 2,335 1,421 (895) 8,900Analysed as:Before non-recurring items and amortisation 6,039 2,335 1,421 (895) 8,900Non-recurring items and amortisation — — — — —
6,039 2,335 1,421 (895) 8,900
Retirement benefit charge* (1,605) Interest income 211 Interest expense (1,522)Share of post-tax profit of associate (Agriculture) 863Share of post-tax profit of joint ventures (Agriculture) 188
Profit before taxation 7,035Taxation (1,829)
Profit for the period 5,206
Segment assets 50,893 27,572 14,796 17,748 111,009
Unallocated assets - Investment in associate (Agriculture) 2,735- Investment in joint ventures (Agriculture) 1,840- Other investments 51- Income tax assets 5,134
total assets 120,769
Total assets in the above analysis represents total assets as disclosed in the balance sheet of £121,952,000 less bank overdrafts of £1,183,000.
Segment liabilities 26,819 6,604 4,528 854 38,805 Unallocated liabilities - Group borrowings 28,446- Retirement benefit obligation* 14,673- Income tax liabilities 5,548
total liabilities 87,472
Total liabilities in the above analysis represents total liabilities as disclosed in the balance sheet of £88,655,000 less bank overdrafts of £1,183,000.
other segment items
Capital expenditure (excluding acquisitions) - Property, plant and equipment 3,212 1,152 224 88 4,676- Other intangible assets 6 — 19 — 25
Depreciation of property, plant and equipment 1,538 1,375 329 169 3,411Depreciation of investment property — 15 — 4 19Loss/(profit) on the disposal of property, plant and equipment 6 — (6) — —
Amortisation of intangible assets 11 26 40 — 77
* It is not possible to allocate the costs, assets and liabilities of the defined benefit pension scheme across the segments. Therefore, this is shown as a reconciling item.
Annual Report & Accounts 2009Carr’s Milling Industries PLC 37

Notes to the Financial Statements continued
2 segmentAl RePoRting continuedPrimary reporting format - business segmentsThe segment results for the period ended 30 August 2008 are as follows:
Agriculture food engineering other group £’000 £’000 £’000 £’000 £’000
Total gross segment revenue 276,158 85,563 10,885 198 372,804Inter-segment revenue (331) (3) (163) — (497)
Revenue 275,827 85,560 10,722 198 372,307
operating profit/(loss) before retirement benefit charge* 11,711 1,956 1,085 (817) 13,935Analysed as:Before non-recurring items and amortisation 11,752 2,012 1,060 (950) 13,874Non-recurring items and amortisation (41) (56) 25 133 61
11,711 1,956 1,085 (817) 13,935
Retirement benefit charge* (1,060) Interest income 454 Interest expense (2,061)Share of post-tax profit of associate (Agriculture) 1,273Share of post-tax profit of joint ventures (Agriculture) 317
Profit before taxation 12,858Taxation (4,605)
Profit for the period 8,253
Segment assets 75,899 28,294 8,955 671 113,819
Unallocated assets - Investment in associate (Agriculture) 2,870- Investment in joint ventures (Agriculture) 1,609- Other investments 51- Income tax assets 5,383
total assets 123,732
Total assets in the above analysis represents total assets as disclosed in the balance sheet of £127,562,000 less bank overdrafts of £3,830,000.
Segment liabilities 42,962 7,074 2,746 2,468 55,250 Unallocated liabilities - Group borrowings 17,499- Retirement benefit obligation* 16,558- Income tax liabilities 6,829
total liabilities 96,136
Total liabilities in the above analysis represents total liabilities as disclosed in the balance sheet of £99,966,000 less bank overdrafts of £3,830,000.
other segment items
Capital expenditure (excluding acquisitions)- Property, plant and equipment 1,722 1,029 119 190 3,060 - Other intangible assets 4 — — — 4
Depreciation of property, plant and equipment 1,549 1,351 291 127 3,318 Depreciation of investment property — 15 — 4 19(Profit)/loss on the disposal of property, plant and equipment (41) (4) — 2 (43)
Amortisation of intangible assets 50 77 32 — 159Impairment of trade investment — — — 200 200
* It is not possible to allocate the costs, assets and liabilities of the defined benefit pension scheme across the segments. Therefore, this is shown as a reconciling item.
38 Annual Report & Accounts 2009Carr’s Milling Industries PLC

2 segmentAl RePoRting continued
secondary reporting format - geographical segments
Revenue segment assets capital expenditure 2009 2008 2009 2008 2009 2008 £’000 £’000 £’000 £’000 £’000 £’000
UK 330,512 359,700 102,597 110,919 4,556 2,989Other 19,511 12,607 8,412 2,900 145 75
350,023 372,307 111,009 113,819 4,701 3,064
The geographical analysis of revenue is presented by revenue destination. Included within capital expenditure is intangible asset additions of £25,000 (2008: £4,000) which were incurred in other countries.
3 Revenue, cost of sAles And net oPeRAting exPenses
2009 2008 £’000 £’000 £’000 £’000
Revenue - from sale of goods 334,102 361,585- from contracts 15,921 10,722 350,023 372,307Cost of sales (309,016) (327,757)
Gross profit 41,007 44,550Net operating expenses: Distribution costs (18,985) (18,105) Administrative expenses - normal (14,727) (13,631)- non-recurring items and amortisation (see note 6) — 61 (14,727) (13,570) (33,712) (31,675)
group operating profit 7,295 12,875
4 gRouP oPeRAting PRofit
2009 2008 £’000 £’000
Group operating profit is stated after (crediting)/charging:Amortisation of grants (10) (20)Profit on disposal of property, plant and equipment — (43)Depreciation of property, plant and equipment held under finance lease 857 901Depreciation of owned property, plant and equipment 2,554 2,417Depreciation of owned investment property 19 19Amortisation of intangible assets 77 159Foreign exchange (gains)/losses (703) 378Derivative financial instruments losses/(gains) 889 (915)Operating lease charges:Plant and machinery 608 606Other 11 3Auditors’ remuneration:Auditservices(Company£11,000;2008£10,000) 65 63The auditing of accounts of associates of the company pursuant to legislation(including that of countries and territories outside Great Britain) 134 124Services relating to taxation 81 69Other services 24 48
Included within group operating profit is the following in respect of investment property leased to, and occupied by, external parties:Rental income (43) (43)Operating expenses 53 59
10 16
Annual Report & Accounts 2009Carr’s Milling Industries PLC 39

Notes to the Financial Statements continued
5 shARe of Post-tAx PRofit in AssociAte And joint ventuRes
2009 2008 £’000 £’000
Share of post-tax profit in associate - normal 863 1,273
863 1,273
Share of post-tax profit in joint ventures - normal 188 321 - non-recurring items and amortisation (see note 6) — (4)
188 317
Total share of post-tax profit in associate and joint ventures 1,051 1,590
6 non-RecuRRing items And AmoRtisAtion
2009 2008 tax credit/ Tax credit/ Amount (charge) Amount (charge) £’000 £’000 £’000 £’000
Group operating profit:Amortisation of intangible assets — — (118) 33 Net gain on transfer of deferred pensioners from Group scheme — — 379 (95)Impairment of trade investment — — (200) —
— — 61 (62) Share of post-tax profit in associate and joint ventures: Amortisation of intangible assets and impairment of goodwill recognised in joint ventures, net of tax — — (4) —
Non-recurring items and amortisation before taxation — — 57 (62) Withdrawal of Industrial Buildings Allowances — — — (1,317)
Total non-recurring items and amortisation — — 57 (1,379)
Profit before taxation 7,035 12,858Non-recurring items and amortisation — 57
Adjusted profit before taxation 7,035 12,801
Group operating profit 7,295 12,875Non-recurring items and amortisation — 61
Adjusted Group operating profit 7,295 12,814
40 Annual Report & Accounts 2009Carr’s Milling Industries PLC

7 stAff costs
2009 2008group £’000 £’000
Wages and salaries 21,086 18,827Social security costs 2,239 2,154Other pension costs 2,549 1,887Share based payment (income)/expense (36) 123
25,838 22,991
Included within other pension costs is £1,605,000 (2008: £1,060,000) in respect of the defined benefit pension scheme.
The above disclosure excludes the £nil (2008: £379,000) net gain arising from the transfer of deferred pensioners from the Group pension scheme (note 28).
The average monthly number of employees, including directors, during the period was made up as follows:
2009 2008 number Number
Sales, office and management 469 439Manufacture and distribution 317 299
786 738
Key management are considered to be the directors of the Group.
Full details of the directors’ emoluments, pension benefits and share options are given in the Directors’ Remuneration Report on pages 23 to 26.
8 inteRest income And inteRest exPense
2009 2008 £’000 £’000
interest income
Bank interest 195 372Other interest 16 82
Total interest income 211 454
interest expense
Interest payable on bank overdrafts (419) (639)Interest payable on bank loans and other borrowings (757) (1,131)Interest payable on finance leases (141) (114)Other interest (176) (142)Movement in fair value of interest related derivative instruments (note 27) (29) (35)
Total interest expense (1,522) (2,061)
Annual Report & Accounts 2009Carr’s Milling Industries PLC 41

Notes to the Financial Statements continued
9 tAxAtion
2009 2008 £’000 £’000
(a) Analysis of the charge in the periodcurrent tax:UK corporation tax Current period 980 2,653 Prior period (38) (381) Foreign tax Current period 729 479 Consortium relief Prior period — 261
Group current tax 1,671 3,012
deferred tax: Origination and reversal of timing differences 158 1,593
Group deferred tax (note 19) 158 1,593
Tax on profit on ordinary activities 1,829 4,605
(b) factors affecting tax charge for the periodThe tax assessed for the period is lower (2008: higher) than the rate of corporation tax in the UK of 28% (2008: 29.17%). The differences are explained below:
2009 2008 £’000 £’000
Profit before taxation 7,035 12,858
Tax at 28% (2008: 29.17%) 1,970 3,751 Effects of:Tax effect of share of profit in associate and joint ventures (294) (464) Tax effect of expenses that are not allowable in determining taxable profit 170 185 Effects of withdrawal of Industrial Buildings Allowances — 1,317Effects of different tax rates of foreign subsidiaries 76 68 Effects of changes in tax rates — (90)Over provision in prior years (57) (120)Utilisation of unrecognised tax losses (45) (50)Other 9 8
Total tax charge for the period 1,829 4,605
10 dividends
2009 2008equity £’000 £’000
Final dividend for the period ended 30 August 2008 of 17.0p per 25.0p share (2007: 13.5p) 1,493 1,115Interim paid of 6.0p per 25.0p share (2008: 6.0p) 527 503
2,020 1,618
The proposed dividend to be considered by shareholders at the Annual General Meeting is £1,493,329, being 17.0p per share, making a total for the period of 23.0p. The financial statements do not reflect this dividend payable.
42 Annual Report & Accounts 2009Carr’s Milling Industries PLC

11 eARnings PeR oRdinARy shAReEarnings per share are calculated by reference to a weighted average of 8,773,022 shares (2008: 8,304,877) in issue during the period.
Non-recurring costs and amortisation that are charged or credited to profit do not relate to the profitability of the Group on an ongoing basis. Therefore an adjusted earnings per share is presented as follows:
2009 2008 earnings Earnings earnings per share Earnings per share £’000 pence £’000 pence
Earnings per share - basic 4,421 50.4 7,701 92.7
Non-recurring items and intangible asset amortisation:Amortisation of intangible assets — — 118 1.4 Net gain on transfer of deferred pensioners from Group scheme — — (379) (4.6)Impairment of trade investment — — 200 2.4Amortisation of intangible asset and impairment of goodwill recognised in joint ventures, net of tax — — 4 0.1 Taxation arising on the above non-recurring items and amortisation — — 62 0.7Withdrawal of Industrial Buildings Allowances — — 1,317 15.9
Earnings per share - adjusted 4,421 50.4 9,023 108.6
For diluted earnings per share, the weighted average number of ordinary shares in issue is adjusted to assume conversion of all dilutive potential ordinary shares. The potentially dilutive ordinary shares, where the exercise price is less than the average market price of the Company’s ordinary shares during the period, are disclosed in note 31.
2009 2008 weighted Weighted average earnings average Earnings earnings number per share Earnings number per share £’000 of shares pence £’000 of shares pence
Earnings per share 4,421 8,773,022 50.4 7,701 8,304,877 92.7
Effect of dilutive securities:Options — — — — 92,776 (1.0) Save as you earn (SAYE) — — — — 13,855 (0.1) Deferred bonus scheme — 8,038 (0.1) — 31,357 (0.4)
Diluted earnings per share 4,421 8,781,060 50.3 7,701 8,442,865 91.2
Annual Report & Accounts 2009Carr’s Milling Industries PLC 43

Notes to the Financial Statements continued
12 goodwill And otheR intAngible Assets
Customer Patents and Goodwill relationships Brands Know-how trademarks Software Totalgroup £’000 £’000 £’000 £’000 £’000 £’000 £’000
cost At 2 September 2007 1,076 2,346 357 160 79 — 4,018Exchange differences — — — — 9 — 9 Additions 365 — — — 4 — 369
At 30 August 2008 1,441 2,346 357 160 92 — 4,396Exchange differences — — — — 11 — 11Subsidiaries acquired 313 — 263 — — 254 830Additions — — — — 6 19 25Contingent consideration (40) — — — — — (40)
At 29 August 2009 1,714 2,346 620 160 109 273 5,222
AmortisationAt 2 September 2007 60 2,258 95 112 33 — 2,558Exchange differences — — — — 4 — 4Charge for the period — 88 30 32 9 — 159
At 30 August 2008 60 2,346 125 144 46 — 2,721Exchange differences — — — — 6 — 6Charge for the period — — 35 16 11 15 77
At 29 August 2009 60 2,346 160 160 63 15 2,804
net book valueAt 1 September 2007 1,016 88 262 48 46 — 1,460
At 30 August 2008 1,381 — 232 16 46 — 1,675
At 29 August 2009 1,654 — 460 — 46 258 2,418
During the period goodwill of £313,000 arose on the acquisition of part of the trade and certain assets and liabilities of Hans Wälischmiller GmbH (note 32). Goodwill represents the value of the employees which under IFRS should not be recognised as an asset on the balance sheet. It also represents opportunities to be gained from Wälischmiller Engineering GmbH’s presence in the European and Far Eastern marketplace.
The adjustment of £40,000 in respect of contingent consideration represents the net amount originally recognised as purchase consideration for J M Raine Limited that is no longer payable to the vendor under the terms of the earn out provision of the contract.
In 2008 goodwill of £365,000 arose on the acquisition of J M Raine Limited. Goodwill represents the expansion of the existing agricultural and ground care machinery business.
For the purpose of impairment testing, goodwill acquired in a business combination is allocated to cash generating units that are expected to benefit from the synergies of the acquisition.
The carrying value of goodwill has been allocated to the following cash generating units:
29 August 30 August 2009 2008 £’000 £’000
Carrs Agriculture Limited - Fertiliser Montrose profit centre 40 40 Carrs Billington Agriculture (Sales) Limited 195 195 Carrs Billington Agriculture (Sales) Limited - Johnstone Wallace Oils profit centre 781 781 Carrs Billington Agriculture (Sales) Limited - Spennymoor profit centre 325 365 Wälischmiller Engineering GmbH 313 —
1,654 1,381
Goodwill is tested annually for impairment, or more frequently if there are indications that goodwill might be impaired. Goodwill is tested for impairment by estimating future cash flows from the cash generating units to which goodwill has been allocated and discounting these cash flows to their present value. The key assumptions in this calculation are in respect of discount rates used and change in cash flows. Management estimates discount rates using pre-tax rates that reflect current market assessments of the time value of money and the risks specific to the cash generating units.
Cash flows are estimated using the most recent budget information for the year to August 2010, which has been approved by the Board. The pre-tax discount rate used in the calculations is 8.5%.
44 Annual Report & Accounts 2009Carr’s Milling Industries PLC
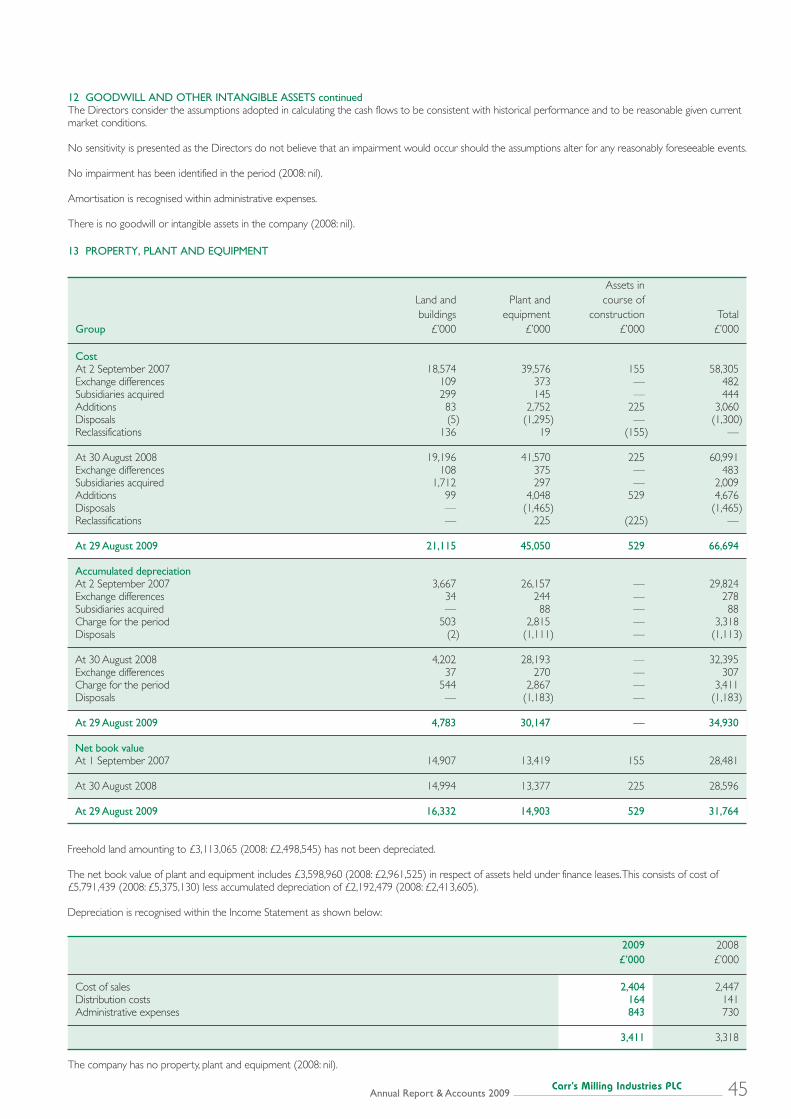
Assets in Land and Plant and course of buildings equipment construction Totalgroup £’000 £’000 £’000 £’000
costAt 2 September 2007 18,574 39,576 155 58,305 Exchange differences 109 373 — 482Subsidiaries acquired 299 145 — 444Additions 83 2,752 225 3,060Disposals (5) (1,295) — (1,300)Reclassifications 136 19 (155) —
At 30 August 2008 19,196 41,570 225 60,991 Exchange differences 108 375 — 483Subsidiaries acquired 1,712 297 — 2,009Additions 99 4,048 529 4,676Disposals — (1,465) (1,465)Reclassifications — 225 (225) —
At 29 August 2009 21,115 45,050 529 66,694
Accumulated depreciationAt 2 September 2007 3,667 26,157 — 29,824Exchange differences 34 244 — 278Subsidiaries acquired — 88 — 88Charge for the period 503 2,815 — 3,318 Disposals (2) (1,111) — (1,113)
At 30 August 2008 4,202 28,193 — 32,395Exchange differences 37 270 — 307Charge for the period 544 2,867 — 3,411Disposals — (1,183) — (1,183)
At 29 August 2009 4,783 30,147 — 34,930
net book valueAt 1 September 2007 14,907 13,419 155 28,481
At 30 August 2008 14,994 13,377 225 28,596
At 29 August 2009 16,332 14,903 529 31,764
Freehold land amounting to £3,113,065 (2008: £2,498,545) has not been depreciated.
The net book value of plant and equipment includes £3,598,960 (2008: £2,961,525) in respect of assets held under finance leases. This consists of cost of £5,791,439 (2008: £5,375,130) less accumulated depreciation of £2,192,479 (2008: £2,413,605).
Depreciation is recognised within the Income Statement as shown below:
2009 2008 £’000 £’000
Cost of sales 2,404 2,447 Distribution costs 164 141Administrative expenses 843 730
3,411 3,318
The company has no property, plant and equipment (2008: nil).
Annual Report & Accounts 2009Carr’s Milling Industries PLC 45
12 goodwill And otheR intAngible Assets continuedThe Directors consider the assumptions adopted in calculating the cash flows to be consistent with historical performance and to be reasonable given current market conditions.
No sensitivity is presented as the Directors do not believe that an impairment would occur should the assumptions alter for any reasonably foreseeable events.
No impairment has been identified in the period (2008: nil).
Amortisation is recognised within administrative expenses.
There is no goodwill or intangible assets in the company (2008: nil).
13 PRoPeRty, PlAnt And equiPment

Notes to the Financial Statements continued
14 investment PRoPeRty
15 investments
Land and buildingsgroup £’000
costAt 2 september 2007, 30 August 2008 and 29 August 2009 871
Accumulated depreciationAt 2 September 2007 115 Charge for the period 19
At 30 August 2008 134 Charge for the period 19
At 29 August 2009 153
net book valueAt 1 September 2007 756
At 30 August 2008 737
At 29 August 2009 718
Included within investment property are properties occupied by life tenants. The net book value of these properties at 29 August 2009 is £224,000 (2008: £230,000).
The directors do not consider that the fair value of investment properties differs materially from carrying value. Investment properties have not been valued as at 29 August 2009 by an independent professionally qualified valuer.
There is no investment property in the company (2008: nil).
Joint Other ventures Associate investments Totalgroup £’000 £’000 £’000 £’000
costAt 2 September 2007 935 2,456 260 3,651Exchange difference 63 — — 63 Additions 294 — — 294 Share of post-tax profit 317 1,273 — 1,590Share of losses recognised directly in equity — (859) — (859)
At 30 August 2008 1,609 2,870 260 4,739Exchange difference 43 — — 43Share of post-tax profit 188 863 — 1,051Share of losses recognised directly in equity — (998) — (998)
At 29 August 2009 1,840 2,735 260 4,835
Provision for impairmentAt 2 September 2007 — — 9 9Provision in the period — — 200 200
At 30 August 2008 and 29 August 2009 — — 209 209
net book valueAt 1 September 2007 935 2,456 251 3,642
At 30 August 2008 1,609 2,870 51 4,530
At 29 August 2009 1,840 2,735 51 4,626
46 Annual Report & Accounts 2009Carr’s Milling Industries PLC

15 investments continuedOther investments comprise shares in several private limited companies. These investments have been classified as unquoted investments for which fair value cannot be reliably measured and are held at cost.
In 2008 Carrs Billington Agriculture (Sales) Limited increased its holding of preference shares in its joint venture, Bibby Agriculture Limited, at a cost of £290,000.
On 1 July 2007 Carrs Agriculture Limited exercised an option to purchase 50% of the issued share capital of Silloth Storage Company Limited. The cash consideration, including costs, was £4,050, which was paid and recognised during the period ended 30 August 2008. The principal activity of the joint venture is the storage of cane derived livestock feed supplements. Of the remaining 50%, 48% is held by Peter Cremer GmbH and 2% is held by Prime Molasses Limited.
In 2008 an investment with a carrying cost of £200,000 was fully provided against. This investment is loss making and therefore the directors considered it appropriate to recognise the provision.
Joint Shares in Other ventures Associate subsidiaries investments Totalcompany £’000 £’000 £’000 £’000 £’000
costAt 2 September 2007 269 1,470 18,011 200 19,950 Exchange difference 34 — — — 34Share based payment expense in respect of employees of subsidiary undertakings — — 76 — 76
At 30 August 2008 303 1,470 18,087 200 20,060 Exchange difference 17 — — — 17Share based payment expense in respect of employees of subsidiary undertakings — — 1 — 1
At 29 August 2009 320 1,470 18,088 200 20,078
Provision for impairmentAt 2 September 2007 — — 5,086 — 5,086Provision in the period — — — 200 200
At 30 August 2008 and 29 August 2009 — — 5,086 200 5,286
net book valueAt 1 September 2007 269 1,470 12,925 200 14,864
At 30 August 2008 303 1,470 13,001 — 14,774
At 29 August 2009 320 1,470 13,002 — 14,792
Other investments comprise shares in several private limited companies. These investments have been classified as unquoted investments for which fair value cannot be reliably measured and are held at cost.
In 2008 an investment with a carrying cost of £200,000 was fully provided against. This investment is loss making and therefore the directors considered it appropriate to recognise the provision.
Annual Report & Accounts 2009Carr’s Milling Industries PLC 47

Notes to the Financial Statements continued
16 investment in AssociAteThe associated undertaking at 29 August 2009 is:
group and company
Proportion of shares held Ordinary Country of Country of name % incorporation operation Activity
Carrs Billington Agriculture (Operations) Limited 49 England UK Manufacture of animal feed
Associates are accounted for using the equity method.
The aggregate amounts relating to the associate, of which the group recognises 49%, are:
2009 2008 £’000 £’000
Total assets 21,140 24,572 Total liabilities (18,059) (21,215) Revenues 91,153 92,324Profit after tax 1,761 2,598
Included within the investment in associate is a loan for £1,225,000 (2008: £1,225,000) which is considered to form part of the net investment in associate.
17 inteRest in joint ventuResThe joint ventures at 29 August 2009 are:
group
Proportion of shares held Ordinary Preference Country of Country of name % % incorporation operation Activity
Crystalyx Products GmbH 50 — Germany Germany Manufacture of animal feed blocksBibby Agriculture Limited 26 26 England UK Sale of agricultural products
Afgritech Limited 50 — England UK Producers of ingredients of animal feedSilloth Storage Company Limited 50 — England UK Storage of cane derived livestock feed supplement
Crystalyx Products GmbH has a 31 December accounting period end.
Silloth Storage Company Limited has a 30 June accounting period end.
Interests in the joint ventures listed above are held directly by the holding company with the following exceptions: Carrs Billington Agriculture (Sales) Limited holds 50% of the ordinary share capital and 50% of the preference share capital in Bibby Agriculture Limited. Carrs Agriculture Limited holds 50% of the ordinarysharecapitalinSillothStorageCompanyLimited.ThepreferencesharesinBibbyAgricultureLimitedareredeemablewiththreemonthsnotice;carry no dividend entitlement except at the director’s discretion, and no voting rights.
Joint ventures are accounted for using the equity method.
The aggregate amounts included in the financial statements relating to the Group’s share of joint ventures are:
2009 2008 £’000 £’000
Non-current assets 1,639 1,636 Current assets 2,079 2,240 Current liabilities (2,285) (2,498) Non-current liabilities (480) (656) Income 12,102 12,420Expenses (11,824) (11,961)Net finance costs (18) (12)
Goodwill of £17,000 arose on the investment in Silloth Storage Company Limited. This is included in the carrying amount of the Group’s interest in joint ventures and is not shown as a separate asset. Included within interest in joint ventures is an amount of £870,000 (2008: £870,000) which relates to the Group’s interest in the preference share capital of Bibby Agriculture Limited.
48 Annual Report & Accounts 2009Carr’s Milling Industries PLC

18 investment in subsidiARy undeRtAkings
Proportion of shares held Ordinary Country of Country of name % incorporation operation Activity
Carrs Agriculture Limited 100 England UK Manufacture of animal feed blocks and fertiliser Carrs Billington Agriculture (Sales) Limited 51 England UK Agricultural retailers Animal Feed Supplement Inc. 100 USA USA Manufacture of animal feed blocks Carr’s Flour Mills Limited 100 England UK Flour milling Carrs Engineering Limited 100 England UK Engineering Wälischmiller Engineering GmbH 100 Germany Germany EngineeringBowie and Aram Limited 100 Scotland UK Travel agents B.R.B. Trust Limited 100 England UK Financial services Carrs Properties Limited 100 England UK Property holding
Investments in the subsidiaries listed above are held directly by the holding company with the following exception: Carrs Engineering Limited holds 100% of the ordinary share capital in Wälischmiller Engineering GmbH.
Dormant subsidiaries are not shown above because disclosure would be excessively lengthy. A full list of subsidiary undertakings will be annexed to the Company’s next annual return.
During the period Carrs Engineering Limited acquired the entire issued share capital of Wälischmiller Engineering GmbH (note 32).
On 29 August 2009 Bowie and Aram Limited ceased to trade. This business is immaterial to the Group as a whole and therefore it has not been disclosed as a discontinued operation.
19 defeRRed tAx Assets And liAbilitiesDeferred tax assets and liabilities are attributable to the following:
Assets liabilities net 2009 2008 2009 2008 2009 2008group £’000 £’000 £’000 £’000 £’000 £’000
Accelerated tax depreciation — — (3,972) (3,907) (3,972) (3,907)Employee benefits 4,108 4,636 — — 4,108 4,636Other 907 682 (868) (868) 39 (186)
Tax assets/(liabilities) 5,015 5,318 (4,840) (4,775) 175 543
movement in deferred tax during the period
At At 31 August Exchange In respect of Recognised Recognised 29 August 2008 differences acquisitions in income in equity 2009 £’000 £’000 £’000 £’000 £’000 £’000
Accelerated tax depreciation (3,907) — — (65) — (3,972)Employee benefits 4,636 — — (262) (266) 4,108Other (186) 56 — 169 — 39
543 56 — (158) (266) 175
movement in deferred tax during the prior period
At At 2 September Exchange In respect of Recognised Recognised 30 August 2007 differences acquisitions in income in equity 2008 £’000 £’000 £’000 £’000 £’000 £’000
Accelerated tax depreciation (2,550) — (3) (1,354) — (3,907)Employee benefits 2,746 — — (371) 2,261 4,636Other (386) 68 — 132 — (186)
(190) 68 (3) (1,593) 2,261 543
Annual Report & Accounts 2009Carr’s Milling Industries PLC 49

Notes to the Financial Statements continued
Assets 2009 2008company £’000 £’000
Accelerated tax depreciation 3 —Employee benefits 4,108 4,636 Other — 4
Tax assets 4,111 4,640
movement in deferred tax during the period
19 defeRRed tAx Assets And liAbilities continued
At At 31 August Recognised Recognised 29 August 2008 in income in equity 2009 £’000 £’000 £’000 £’000
Accelerated tax depreciation — 3 — 3Employee benefits 4,636 (262) (266) 4,108 Other 4 (4) — —
4,640 (263) (266) 4,111
movement in deferred tax during the prior period
At At 2 September Recognised Recognised 30 August 2007 in income in equity 2008 £’000 £’000 £’000 £’000
Employee benefits 2,746 (371) 2,261 4,636Other 4 — — 4
2,750 (371) 2,261 4,640
Tax of £285,000 (2008: £310,000) in respect of tax losses has not been recognised as a deferred tax asset in the Group balance sheet.
Tax of £66,000 (2008: £66,000) in respect of tax losses have not been recognised as a deferred tax asset in the Company balance sheet.
Included in the prior year Group and Company Statement of Recognised Income and Expense is £3,116,000. This consists of the £2,261,000 deferred tax credit as shown in the tables above, £447,000 corporation tax credit arising on the £1,531,700 salary compensation for pension payment made to a director in the prior period and corporation tax credit of £408,000 on pension contributions in excess of the retirement benefit charge in the prior period.
50 Annual Report & Accounts 2009Carr’s Milling Industries PLC

20 inventoRies
2009 2008group £’000 £’000
Raw materials and consumables 9,337 15,458 Work in progress 1,526 1,442 Finished goods and goods for resale 12,997 14,114
23,860 31,014
Inventories are stated after a provision for impairment of £799,000 (2008: £619,000).
Cost of sales consists of the following:
Material cost 291,428 311,929 Processing cost 6,276 4,420 Other 11,312 11,408
309,016 327,757
The company has no inventories (2008: nil).
21 tRAde And otheR ReceivAbles
group company 2009 2008 2009 2008 £’000 £’000 £’000 £’000
current:Trade receivables 41,671 49,817 — — Less: provision for impairment of trade receivables (2,903) (2,900) — —
Trade receivables - net 38,768 46,917 — —Amounts recoverable on contracts 1,642 394 — — Amounts owed by Group undertakings (note 38) — — 12,560 16,384Amounts owed by other related parties (note 38) 607 625 411 374Other receivables 821 1,585 118 284Prepayments and accrued income 1,221 1,233 124 179
43,059 50,754 13,213 17,221
non-current:Amounts owed by Group undertakings (note 38) — — 2,275 —Amounts owed by other related parties (note 38) 50 50 — — Other receivables 3 — — —
53 50 2,275 —
The movement in the provision for impaired trade receivables consists of increases for additional provisions offset by receivables written off and unused provision released back to the income statement. Amounts charged to the allowance account are generally written off when there is no expectation of recovering additional cash.
During the period a charge of £317,000 (2008: £1,019,000) has been recognised within administrative expenses in the income statement in respect of the provision for impairment of trade receivables.
No impairment of other receivables has been recognised in the current or preceding period.
Interest bearing, non-trading amounts owed by group undertakings carry interest at base rate +1.75%. Such amounts are unsecured and repayable on demand.
Annual Report & Accounts 2009Carr’s Milling Industries PLC 51

Notes to the Financial Statements continued
21 tRAde And otheR ReceivAbles continued
2009 2008 gross impairment Gross Impairment £’000 £’000 £’000 £’000
the ageing of trade receivables is as follows: Not past due 29,117 (215) 34,148 (208)Past due 0 - 30 days 6,100 (225) 8,538 (159)Past due 31 - 60 days 2,199 (262) 2,048 (130)Past due 61 - 90 days 1,267 (276) 2,029 (481)Past due 91 - 120 days 848 (284) 1,070 (284)Past 121 days 2,140 (1,641) 1,984 (1,638)
41,671 (2,903) 49,817 (2,900)
The Company has no trade receivables (2008: nil).
No major renegotiation of terms has taken place during the current period or preceding period. The credit quality of customers is assessed at subsidiary and Group level, taking into account their financial positions, past experiences and other relevant factors. Individual customer credit limits are imposed based on these factors. It is Group policy that overdue accounts are reviewed monthly at divisional management meetings to mitigate exposure to credit risk and are provided for where appropriate. The maximum exposure to credit risk at the period end is the carrying value, net of provision for impairment, of each receivable. The Group and Company do not hold any significant collateral as security (2008: £nil).
group company 2009 2008 2009 2008 £’000 £’000 £’000 £’000
The carrying value of trade receivables are denominated in the following currencies:
Sterling 37,869 46,283 — —US Dollar 66 347 — —Euro 833 287 — —
38,768 46,917 — —
22 cuRRent tAx Assets
group company 2009 2008 2009 2008 £’000 £’000 £’000 £’000
Corporation tax recoverable 119 65 342 193Group taxation relief — — 617 1,409
119 65 959 1,602
52 Annual Report & Accounts 2009Carr’s Milling Industries PLC

23 cAsh And cAsh equivAlents And bAnk oveRdRAfts
group company 2009 2008 2009 2008 £’000 £’000 £’000 £’000
Cash at bank and in hand per the balance sheet 10,304 3,896 16,038 —Bank overdrafts (note 26) (1,183) (3,830) — (120)
Cash and cash equivalents per the cash flow statement 9,121 66 16,038 (120)
24 tRAde And otheR PAyAbles
group company 2009 2008 2009 2008 £’000 £’000 £’000 £’000
current:Trade payables 20,245 33,882 — —Payments on account 1,956 2,549 — — Amounts owed to Group undertakings (note 38) — — 129 48Amounts owed to other related parties (note 38) 7,597 9,336 — —Other taxes and social security payable 1,292 1,680 207 1,148Other payables 1,714 1,733 166 360Accruals and deferred income 3,124 3,797 331 772
35,928 52,977 833 2,328
non-current:Other payables 2,718 2,111 — —Accruals and deferred income 116 126 — —
2,834 2,237 — —
Amounts owed to group undertakings are interest free, unsecured and repayable on demand.
Included within non-current accruals and deferred income is the following in respect of government grants:
group company 2009 2008 2009 2008 £’000 £’000 £’000 £’000
At the beginning of the period 126 146 — —Amortisation in the period (10) (20) — —
At the end of the period 116 126 — —
25 cuRRent tAx liAbilities
group company 2009 2008 2009 2008 £’000 £’000 £’000 £’000
Current tax 708 1,715 — —Consortium tax relief (note 38) — 339 — —
708 2,054 — —
Annual Report & Accounts 2009Carr’s Milling Industries PLC 53

Notes to the Financial Statements continued
26 boRRowings
group company 2009 2008 2009 2008 £’000 £’000 £’000 £’000
the net borrowings are:Borrowings as above 29,629 21,329 18,158 10,860Cash and cash equivalents (10,304) (3,896) (16,038) —
Net borrowings 19,325 17,433 2,120 10,860
Bank loans and other borrowings includes an amount of £7,010,000 (2008: £8,205,000) which is secured on trade receivables. The Company, together with certain subsidiaries, act as guarantors on the bank loans. In addition, Royal Bank of Scotland PLC have a legal charge over certain properties. Finance lease obligations are secured on the assets to which they relate.
Interest bearing loans from group undertakings carry interest at base rate or base rate + 1.25%. Such amounts are unsecured and repayable on demand.
Other loans are non-interest bearing and have no fixed date for repayment. The bank loans are repayable by instalments and the overdraft is repayable on demand.
Non-current bank loans includes a revolving credit facility of £10 million which is repayable in August 2012.
group company 2009 2008 2009 2008 £’000 £’000 £’000 £’000
current:Bank overdrafts 1,183 3,830 — 120Bank loans and other borrowings 8,096 9,196 454 991Loans from group undertakings (note 38) — — 3,294 4,378Other loans (note 38) — 1,225 — —Finance leases 947 753 — —
10,226 15,004 3,748 5,489
non-current:Bank loans 16,776 5,371 14,410 5,371Other loans (note 38) 1,265 37 — —Finance leases 1,362 917 — —
19,403 6,325 14,410 5,371
borrowings are repayable as follows:On demand or within one year 10,226 15,004 3,748 5,489In the second year 1,828 5,710 454 5,122In the third to fifth years inclusive 17,575 615 13,956 249
29,629 21,329 18,158 10,860
Group and company borrowings are shown in the balance sheet net of arrangement fees of £135,450 of which £45,786 is deducted from current liabilities (2008: £12,208 of which £8,667 is deducted from current liabilities).
54 Annual Report & Accounts 2009Carr’s Milling Industries PLC

27 deRivAtives And otheR finAnciAl instRuments
The Group’s activities expose it to a variety of financial risks. The Board reviews and agrees policies for managing its risk and they are summarised below. These policies have remained unchanged throughout the period.
credit riskThe Group has no significant concentrations of credit risk. Credit risk arises from cash and cash equivalents, derivative financial instruments, deposits with banks and financial institutions, as well as credit exposures to customers. The credit quality of trade and other receivables is detailed in note 21.
The majority of Group revenues are made on credit terms. It is Group policy that overdue accounts are reviewed monthly at divisional management meetings to mitigate exposure to credit risk and are provided for where appropriate. The current financial climate requires the Group’s credit control function to be exceptionally vigilant.
Price riskThe Group is not exposed to equity securities price risk. Due to the nature of its business the Group is exposed to commodity price risk such as the fluctuation in wheat prices and fertiliser commodity prices. This risk is, however, managed primarily through the use of contracts to secure supply at agreed prices.
market riskMarket risk is the risk that changes in foreign exchange rates (currency risk) and interest rates (interest rate risk) will affect income or the value of financial assets and liabilities.
currency riskThe Group publishes its financial statements in Sterling but conducts business in some foreign currencies. As a result it is subject to foreign currency exchange risk due to the effects that exchange rate movements have on the translation of results and the underlying net assets of its foreign subsidiaries.
The Group’s subsidiary, Animal Feed Supplement Inc., operates in the US and its revenues and expenses are denominated exclusively in US dollars.
The Group’s subsidiary, Wälischmiller Engineering GmbH, operates in Germany and its revenues and expenses are denominated exclusively in Euros.
Crystalyx Products GmbH, a joint venture of the Group, operates in Germany and its revenues and expenses are denominated exclusively in Euros. The Group is also exposed to foreign currency risk on its purchases of raw materials for the fertiliser and flour milling operations. The major currency involved is the US dollar. The policy of the Group is to hedge using forward foreign exchange contracts with UK banks as soon as commitment has been given to the underlying transaction.
The Group is hedging its international assets and has designated foreign currency borrowings as a hedge against its net investment in foreign operations.
Annual Report & Accounts 2009Carr’s Milling Industries PLC 55

Notes to the Financial Statements continued
27 deRivAtives And otheR finAnciAl instRuments continuedfinancial instruments by currency
2009 2008 us US sterling dollar euro total Sterling Dollar Euro Total
group £’000 £’000 £’000 £’000 £’000 £’000 £’000 £’000
Assets Other investments 51 — — 51 51 — — 51Non-current receivables 53 — — 53 50 — — 50Current trade and other receivables 41,696 333 1,030 43,059 49,916 548 290 50,754Current derivatives — — 16 16 — 896 31 927Cash and cash equivalents 8,102 1,989 213 10,304 3,853 39 4 3,896
49,902 2,322 1,259 53,483 53,870 1,483 325 55,678
liabilities Current borrowings 9,499 288 439 10,226 13,138 (71) 1,937 15,004Current derivatives 43 — — 43 — — 22 22Current trade and other payables 32,940 697 2,291 35,928 45,986 6,834 157 52,977Non-current borrowings 16,997 — 2,406 19,403 6,289 — 36 6,325Non-current derivatives — — — — 14 — — 14Other non-current liabilities 116 2,718 — 2,834 125 2,112 — 2,237
59,595 3,703 5,136 68,434 65,552 8,875 2,152 76,579
2009 2008 us US sterling dollar euro total Sterling Dollar Euro Total
company £’000 £’000 £’000 £’000 £’000 £’000 £’000 £’000
Assets Non-current receivables 2,275 — — 2,275 — — — —Current trade and other receivables 13,213 — — 13,213 17,221 — — 17,221Current derivatives — — — — — — 31 31Cash and cash equivalents 14,128 1,887 23 16,038 — — — —
29,616 1,887 23 31,526 17,221 — 31 17,252
liabilities Current borrowings 568 3,180 — 3,748 (1,015) 4,204 2,300 5,489Current derivatives 43 — — 43 — — — —Current trade and other payables 833 — — 833 2,328 — — 2,328Non-current borrowings 14,410 — — 14,410 5,371 — — 5,371Non-current derivatives — — — — 14 — — 14
15,854 3,180 — 19,034 6,698 4,204 2,300 13,202
The Group and Company has right of offset on certain bank accounts.
sensitivity analysis The impact of a weakening or strengthening in Sterling against other currencies at the balance sheet date would be as follows:
2009 2008 5% weakening 5% strengthening 5% weakening 5% strengthening £’000 £’000 £’000 £’000
Impact on profit after taxation 211 (191) (414) 375Impact on total equity 199 309 (162) 148
This sensitivity analysis is not an indication of actual results, which may materially differ. For the purposes of this sensitivity analysis all other variables have been held constant.
56 Annual Report & Accounts 2009Carr’s Milling Industries PLC

27 deRivAtives And otheR finAnciAl instRuments continuedinterest rate risk The Group finances its operations through a mixture of retained earnings and bank borrowings. The Group borrows in the desired currencies at fixed and floating rates of interest and then uses interest rate caps and swaps to manage the Group’s exposure to interest rate fluctuations. At the period end £7.6 million (2008: £7.4 million) of the group’s borrowings were at a fixed rate of interest.
weighted Weighted average average effective effective interest rate 2009 interest rate 2008group % £’000 % £’000
Bank overdrafts 3.00 1,183 6.00 3,830Bank loans and other borrowings 2.94 24,872 6.52 14,567Other loans — 1,265 — 1,262Finance lease liabilities 2.50 2,309 7.00 1,670
29,629 21,329
Fixed rate 7,559 7,420Floating rate 20,805 12,647Non-interest bearing 1,265 1,262
29,629 21,329
The effect of the Group’s interest rate swaps is to classify £5.25 million (2008: £5.75 million) of floating rate borrowings as fixed rate in the above table.
The Group’s floating rate financial liabilities bear interest determined as follows: Bankoverdrafts Baserate+2.5%margin;Baserate+2%;Currencylendingrate+2.25%;USprimerate+2.5%marginBankloansandotherborrowings Libor+2.5%;Baserate+1.75%margin;Euribor+2.5%
weighted Weighted average average effective effective interest rate 2009 interest rate 2008company % £’000 % £’000
Bank overdrafts 3.00 — 6.00 120Bank loans and other borrowings 3.19 14,864 6.86 6,362Loans from group undertakings 1.51 3,294 5.02 4,378
18,158 10,860
Fixed rate 5,250 5,750Floating rate 12,908 5,110
18,158 10,860
The effect of the Company’s interest rate swaps is to classify £5.25 million (2008: £5.75 million) of floating rate borrowings as fixed rate in the above table.
The Company’s floating rate financial liabilities bear interest determined as follows: Bank overdrafts Base rate + 2.5% margin Bank loans and other borrowings Libor + 2.5%
Annual Report & Accounts 2009Carr’s Milling Industries PLC 57

Notes to the Financial Statements continued
27 deRivAtives And otheR finAnciAl instRuments continuedsensitivity analysis The impact of a decrease or increase in interest rates during the period would be as follows:
2009 2008 1% decrease 1% increase 1% decrease 1% increase £’000 £’000 £’000 £’000
Impact on profit after taxation 347 (347) 160 (160)Impact on total equity 347 (347) 160 (160)
This sensitivity analysis is not an indication of actual results, which may materially differ. For the purposes of this sensitivity analysis all other variables have been held constant. liquidity risk The Group’s policy throughout the period has been to maintain a mix of short and medium term borrowings. Short-term flexibility is achieved by overdraft facilities. In addition it is the Group’s policy to maintain committed undrawn facilities in order to provide flexibility in the management of the Group’s liquidity. The table below analyses the Group’s financial liabilities which will be settled on a net basis into relevant maturity groupings based on the remaining period at the balance sheet date to the contractual maturity date. The amounts disclosed in the table are the contractual undiscounted cash flows which have been calculated using spot rates at the relevant balance sheet date.
2009 2008 within one to two to Within One to Two to one two five one two five total year years years Total year years years
group £’000 £’000 £’000 £’000 £’000 £’000 £’000 £’000
Bank overdrafts 1,183 1,183 — — 3,830 3,830 — —Bank loans and other borrowings 26,589 8,704 1,665 16,220 15,097 9,610 5,235 252Other loans 1,265 — 40 1,225 1,262 1,225 37 —Finance lease liabilities 2,577 1,071 783 723 1,872 855 592 425Derivatives 43 43 — — 36 22 14 —Trade and other payables 35,928 35,928 — — 52,977 52,977 — —Other non-current liabilities 2,834 — — 2,834 2,237 — — 2,237
70,419 46,929 2,488 21,002 77,311 68,519 5,878 2,914
2009 2008 within one to two to Within One to Two to one two five one two five total year years years Total year years years
company £’000 £’000 £’000 £’000 £’000 £’000 £’000 £’000
Bank overdrafts — — — — 120 120 — —Bank loans and other borrowings 16,388 978 963 14,447 6,892 1,405 5,235 252Loans from group undertakings 3,294 3,294 — — 4,378 4,378 — —Derivatives 43 43 — — 14 — 14 —Trade and other payables 833 833 — — 2,328 2,328 — —
20,558 5,148 963 14,447 13,732 8,231 5,249 252
future minimum lease payments of finance leases
58 Annual Report & Accounts 2009Carr’s Milling Industries PLC
Repayment profile 2009 2008 2009 2008group £’000 £’000 £’000 £’000
Amount payable: Within one year 1,071 855 947 753In the second year 783 592 702 551In the third to fifth years inclusive 723 425 660 366
2,577 1,872 2,309 1,670Less: future finance charges (268) (202)
Present value of lease obligations 2,309 1,670
The Company has no finance lease obligations (2008: nil).

2009 2008 floating rate Floating rate £’000 £’000
Expiring in one year or less 18,427 15,699
The Company’s overdraft is within a group facility and it is therefore not possible to determine the Company’s undrawn committed facilities at the balance sheet date.
capital risk management The Group’s objectives when managing capital are to safeguard the Group’s ability to continue as a going concern in order to provide returns for shareholders and benefits for other stakeholders and to maintain an efficient capital structure to optimise the cost of capital. In order to maintain or adjust the capital structure, the Group may adjust the amount of dividends paid to shareholders, return capital to shareholders, issue new shares or sell assets to reduce debt.
The group monitors capital on the basis of the gearing ratio. This ratio is calculated as net debt divided by shareholders’ equity. Net debt is calculated as total borrowings (including current and non-current borrowings) as shown in the consolidated balance sheet less cash and cash equivalents. Shareholders’ equity is as shown in the consolidated balance sheet.
The gearing ratio at 29 August 2009 was 64.7% (2008: 69.8%).
fair values of financial assets and liabilities
27 deRivAtives And otheR finAnciAl instRuments continuedborrowing facilities The Group has various undrawn committed facilities. The undrawn facilities available at 29 August 2009, in respect of which all conditions precedent had been met, were as follows:
group company 2009 2008 2009 2008 book fair Book Fair book fair Book Fair value value value value value value value value
group £’000 £’000 £’000 £’000 £’000 £’000 £’000 £’000
AssetsOther investments 51 51 51 51 — — — — Non-current receivables 53 53 50 50 2,275 2,275 — — Current trade and other receivables 43,059 43,059 50,754 50,754 13,213 13,213 17,221 17,221 Current derivatives 16 16 927 927 — — 31 31 Cash and cash equivalents 10,304 10,304 3,896 3,896 16,038 16,038 — —
53,483 53,483 55,678 55,678 31,526 31,526 17,252 17,252
liabilities Current borrowings 10,226 10,226 15,004 15,004 3,748 3,748 5,489 5,489 Current derivatives 43 43 22 22 43 43 — — Current trade and other payables 35,928 35,928 52,977 52,977 833 833 2,328 2,328 Non-current borrowings 19,403 19,371 6,325 6,370 14,410 14,532 5,371 5,472 Non-current derivatives — — 14 14 — — 14 14 Other non-current liabilities 2,834 2,834 2,237 2,237 — — — —
68,434 68,402 76,579 76,624 19,034 19,156 13,202 13,303
Where market values are not available, fair values have been calculated by discounting expected cash flows at prevailing interest rates and by applying year end exchange rates. Other investments consist of investments in unquoted companies, which are held at cost as fair value cannot be reliably measured.
Derivative instruments are recognised in the balance sheet at fair value. The fair value of current assets and current liabilities are assumed to approximate to book value due to the short term maturity of the instrument.
Annual Report & Accounts 2009Carr’s Milling Industries PLC 59

Notes to the Financial Statements continued
27 deRivAtives And otheR finAnciAl instRuments continuedderivative financial instruments hedge of net investment in foreign subsidiariesThe Company has US dollar denominated borrowings totalling $5,200,000 which the Group has partially hedged against its investment in its US subsidiary. The fair value of the US dollar borrowings at 29 August 2009 was £3,180,000 and a foreign exchange pre-tax loss of £316,000 was recognised in equity during the year on translation of this loan to sterling.
A subsidiary of the Group has Euro denominated net loans receivable totalling X104,000 which the Group has partially hedged against its investment in its European subsidiary. The fair value of the Euro net loans receivable at 29 August 2009 was £91,000 and a foreign exchange pre-tax gain of £6,000 was recognised in equity during the year on translation of this net loan to sterling.
currency derivatives The Group and Company use forward foreign currency contracts to manage its exchange risk exposure. At the balance sheet date, the fair value of outstanding forward foreign currency contracts are as below:
2009 2008 contractual Contractual fair or notional Fair or notional value amount value amountgroup £’000 £’000 £’000 £’000
At beginning of period 905 12,999 (10) 932(Losses)/gains during the period (889) (12,180) 915 12,067
At end of period 16 819 905 12,999
Included within: Current assets 16 819 927 13,813Current liabilities — — (22) (814)
16 819 905 12,999
2009 2008 contractual Contractual fair or notional Fair or notional value amount value amountcompany £’000 £’000 £’000 £’000
At beginning of period 31 1,920 — —(Losses)/gains during the period (31) (1,920) 31 1,920
At end of period — — 31 1,920
Included within: Current assets — — 31 1,920
— — 31 1,920
Fair value has been determined by reference to the value of equivalent forward foreign currency contracts at the balance sheet date.
All forward foreign currency contracts have a maturity of less than one year after the balance sheet date. Gains and losses on currency related derivatives are included within adminstrative expenses.
60 Annual Report & Accounts 2009Carr’s Milling Industries PLC

27 deRivAtives And otheR finAnciAl instRuments continuedinterest rate derivatives The Group and Company use interest rate caps and swaps to manage their interest rate risk exposure. At the balance sheet date, the fair value of these instruments are as below:
interest rate cap interest rate swap group company group company 2009 2008 2009 2008 2009 2008 2009 2008
£’000 £’000 £’000 £’000 £’000 £’000 £’000 £’000
At beginning of period — 21 — — (14) 111 (14) 111 Disposal of derivative — — — — — (111) — (111)Losses during the period — (21) — — (29) (14) (29) (14)
At end of period — — — — (43) (14) (43) (14)
Included within: Current liabilities — — — — (43) — (43) —Non-current liabilities — — — — — (14) — (14)
— — — — (43) (14) (43) (14)
Fair value has been determined by reference to the value of equivalent instruments at the balance sheet date. All interest related derivatives have a maturity date of less than one year after the balance sheet date. Gains and losses on interest related derivatives are included within interest income/expense in the income statement. The interest rate cap had a notional value of £3,500,000 and a strike rate of 5.5%. The date of maturity was 30 September 2008. Interest rate swaps held at 29 August 2009 have outstanding notional values of £4,500,000 and £750,000 (original notional value of £1,500,000) and a fixed interest rate of 5.68% and 5.70% respectively. Interest payments under both swap agreements are being made at quarterly intervals. The date of maturity was 26 October 2009 and is 3 December 2009 respectively.
28 RetiRement benefit obligAtionThe Group participates in two defined benefit pension schemes, Carr’s Milling Industries Pension Scheme 1993 and Carrs Billington Agriculture Pension Scheme.
carr’s milling industriesThe Company sponsors the Carr’s Milling Industries Pension Scheme 1993 and offers a defined contribution and a defined benefit section. The assets of the scheme are held separately from those of the Group and are invested with independent investment managers.
The pension expense for the defined contribution section of the scheme for the period was £233,000 (2008: £174,000). Contributions totalling £19,000 (2008: £8,700) were payable to the fund at the period end and are included in other creditors.
The defined benefit section of the scheme is funded to cover future pension liabilities (including expected future earnings and pension increases). It is subject to an independent valuation on a triennial basis by a qualified actuary who determines the rate of the employer’s contribution. The most recent valuation of the scheme was at 1 January 2009 and adopted the Projected Unit Method. It was assumed that the investment returns would be 6.5% per annum and that the salary increases would average 4.15% per annum. It was also assumed that present and future pensions would increase once in payment at the lesser of 5.0% per annum and price inflation subject to a minimum of 0% per annum.
The actuarial valuation as at 1 January 2009 shows a funding shortfall (technical provisions minus value of assets) of £16,084,000.
The pension contribution made by the Group over the period to the defined benefit section was £2,539,000 (2008: £2,517,000).
In addition, the Group offers a Group Personal Pension plan to certain employees of Carr’s Flour Mills Limited. The pension expense for this scheme for the period was £270,000 (2008: £255,000).
The following disclosures relate to the defined benefit section of the Carr’s Milling Industries Pension Scheme 1993. The last full actuarial valuation of this scheme was carried out by a qualified independent actuary as at 1 January 2009 and updated on an approximate basis to 29 August 2009.
Annual Report & Accounts 2009Carr’s Milling Industries PLC 61

Notes to the Financial Statements continued
28 RetiRement benefit obligAtion continued
major assumptions:
2009 2008 % %
Inflation 3.1 3.9 Salary increases 4.1 4.9 Rate of discount 5.6 6.2 Pension in payment increases: Pre 1 September 2001 3.4 4.2 Post 1 September 2001 3.1 3.9 Revaluation rate for deferred pensioners for pensions revaluing at 5.0% per annum or RPI if less 3.1 3.9
The mortality tables used in the valuation have been updated to (130% of qx) PN*A00 (Year of Birth) and the Long Cohort improvement factors with a 1% underpin. The mortality assumptions adopted imply the following life expectancies at age 65:
At At 29 August 30 August 2009 2008
Males currently age 45 (2008: 40) 23.5 years 23.2 yearsFemales currently age 45 (2008: 40) 26.0 years 26.0 yearsMales currently age 65 (2008: 65) 21.5 years 22.0 yearsFemales currently age 65 (2008: 65) 24.1 years 24.8 years
Amounts recognised in the income statement in respect of defined benefit schemes:
2009 2008 £’000 £’000
Current service cost 568 678 Interest on pension scheme liabilities 2,937 2,490 Expected return on pension scheme assets (1,900) (2,108)
1,605 1,060
In addition a net gain of £nil (2008: £379,000) arising from the transfer of deferred pensioners from the Group scheme is included within administrative expenses.
The expense is recognised within the Income Statement as shown below:
2009 2008 £’000 £’000
Cost of sales 299 213 Distribution costs 19 7Administrative expenses 1,287 840
1,605 1,060
Actuarial gains of £951,000 (2008: Losses of £11,065,000) have been reported in the Statement of Recognised Income and Expense.
The cumulative amounts of acturial losses recognised in the Statement of Recognised Income and Expense since adoption of IAS19 is £8,594,000.
62 Annual Report & Accounts 2009Carr’s Milling Industries PLC

28 RetiRement benefit obligAtion continued
Amounts included in the balance sheet:
2009 2008 £’000 £’000
Present value of defined benefit obligations (46,763) (48,016) Fair value of scheme assets 32,090 31,458
Deficit in scheme (14,673) (16,558) Past service cost not yet recognised in the balance sheet — —
Total liability recognised in the balance sheet (14,673) (16,558)Amount included in current liabilities — —
Amount included in non-current liabilities (14,673) (16,558)
movements in the present value of defined benefit obligations:
2009 2008 £’000 £’000
At the beginning of the period 48,016 43,721 Current service cost 568 678 Interest cost 2,937 2,490 Changes in assumptions underlying the defined benefit obligation (3,041) 7,230 Benefits paid (1,717) (3,339)Reduction in obligation following payment in lieu of pension to a director — (1,439)Effect of settlements — (1,325)
At the end of the period 46,763 48,016
The prior year reduction in obligation following payment in lieu of pension to a director of £1,439,000 is recognised in the Statement of Recognised Income and Expense net of the payment made of £1,531,700.
movements in the fair value of scheme assets:
2009 2008 £’000 £’000
At the beginning of the period 31,458 33,914 Expected return on scheme assets 1,900 2,108 Actual return less expected return on scheme assets (2,090) (3,742) Contributions by employer 2,539 2,517 Benefits paid (1,717) (3,339)
At the end of the period 32,090 31,458
Analysis of the scheme assets, expected rate of return and actual return:
expected return fair value of assets 2009 2008 2009 2008 % % £’000 £’000
Equity instruments 7.2 7.3 16,311 15,715 Debt instruments 4.6 5.3 12,629 13,575 Property 7.0 6.8 2,676 1,678 Other assets 4.6 5.75 474 490
6.1 6.4 32,090 31,458
Actual return on scheme assets (190) (1,634)
The expected long term return on other assets is determined by reference to bank base rates at the balance sheet date. The expected return on bonds is determined by reference to UK long dated gilt and bond yields at the balance sheet date. The expected rate of return on equities and property is based on the rate of return on bonds with an allowance for out-performance.
Annual Report & Accounts 2009Carr’s Milling Industries PLC 63

Notes to the Financial Statements continued
28 RetiRement benefit obligAtion continued
history of scheme:
2009 2008 2007 2006 2005 £’000 £’000 £’000 £’000 £’000
Present value of the defined benefit obligation (46,763) (48,016) (43,721) (45,794) (39,556)Fair value of scheme assets 32,090 31,458 33,914 29,998 27,437
Deficit (14,673) (16,558) (9,807) (15,796) (12,119)
Difference between expected and actual returns on scheme assets:Amount £’000 (2,090) (3,742) 206 358 2,018 Percentage of scheme assets 6.5% 11.9% 0.6% 1.2% 7.4%
Experience gains and losses on scheme liabilities:Amount £’000 3,041 (7,323) 4,364 (4,258) (3,561) Percentage of scheme liabilities 6.5% 15.3% 10.0% 9.3% 9.0%
Included within the prior year experience gains and losses on scheme liabilities is £92,700. This is the reduction in the obligation following payment in lieu of pension to a director of £1,439,000, net of the payment made of £1,531,700.
The Group expects to contribute approximately £2,860,000 to the defined benefit scheme in the next financial period. The Company expects to contribute approximately £1,346,648 to the defined benefit scheme in the next financial period. carrs billington AgricultureCarrs Billington Agriculture (Sales) Limited, one of the Group’s subsidiary undertakings, is a participating employer of the Carrs Billington Agriculture Pension Scheme, another funded defined benefit scheme. On 30 November 2007, following consultation with the active members, the Company and Trustees agreed to close the scheme to future service accrual. This resulted in a curtailment gain in the prior year of £256,000.
The pension contribution made by Carrs Billington Agriculture (Sales) Limited over the period to the Carrs Billington Agriculture Pension Scheme was £nil (2008: £15,000).
The actuarial valuation as at 31 December 2006 shows that the market value of assets relating to the scheme was £19,921,000 and the actuarial value of those assets represented 81% of the actuarial value of benefits that had accrued to members, after allowing for expected future increase in earnings. It was assumed that the investment returns would be pre-retirement 6.2% per annum and post-retirement 4.7% per annum. At 31 December 2006, the scheme showed a deficit of £4,700,000.
Carrs Billington Agriculture (Sales) Limited offers a Group Personal Pension Plan to its employees and the pension expense for this plan in the period was £201,000 (2008: £150,000).
During the period contributions were also payable to a defined contribution pension scheme for certain employees of Carrs Billington Agriculture (Sales) Limited. The pension expense for this scheme for the period was £5,000 (2008: £9,000).
The following disclosures relate to the defined benefit scheme. The last full actuarial valuation of this scheme was carried out by a qualified independent actuary as at 31 December 2006 and updated on an approximate basis to 29 August 2009.
It is not possible to identify the underlying share of the pension scheme assets and liabilities that relate to the Group. At inception in June 2000 approximately 50% of the assets and liabilities of the pension scheme related to the Group and under IFRS approximately 50% of the assets and liabilities are included in the Group’s financial statements through the investment in associate, which is the sponsoring employer of the scheme.
64 Annual Report & Accounts 2009Carr’s Milling Industries PLC

28 RetiRement benefit obligAtion continued
major assumptions:
2009 2008 % %
Inflation 3.1 3.7 Salary increases n/A 4.2 Rate of discount 5.6 6.2 Pension in payment increases: LPI max 5% 3.1 3.6 LPI max 3% 2.6 2.9 LPI max 2.5% 2.3 2.4 Revaluation rate for deferred pensioners for pensions revaluing at 5.0% per annum or RPI if less 3.1 3.6
Mortality rates used in the valuation are based on the PMA92 and PFA92 tables, projected, medium cohort, allowing for members’ actual year of birth. The mortality assumptions adopted imply the following life expectancies at age 65:
At At 29 August 30 August 2009 2008
Males currently age 45 23.1 years 23.1 yearsFemales currently age 45 25.9 years 25.9 yearsMales currently age 65 22.0 years 22.0 yearsFemales currently age 65 24.8 years 24.8 years
Amounts recognised in the income statement of the associate in respect of defined benefit schemes:
2009 2008 £’000 £’000
Current service cost 16 27 Interest on pension scheme liabilities 1,323 1,259 Expected return on pension scheme assets (1,279) (1,400)Effects of curtailment — (256)
60 (370)
The Group’s share of the charge/(credit) is recognised within the Income Statement through the share of post-tax profit in associate.
The Group’s share of the actuarial losses of £2,828,000 (2008: £2,435,000) have been reported in the Statement of Recognised Income and Expense.
The Group’s share of the cumulative amount of actuarial losses of £6,554,000 have been recognised in the Statement of Recognised Income and Expense.
Amounts included in the balance sheet of the associate:
2009 2008 £’000 £’000
Present value of defined benefit obligations (22,858) (21,896) Fair value of scheme assets 17,903 19,254
Deficit in scheme (4,955) (2,642) Past service cost not yet recognised in the balance sheet — —
Total liability recognised in the balance sheet (4,955) (2,642)
The Group’s share of the deficit is recognised within the Balance Sheet through the investment in associate.
Annual Report & Accounts 2009Carr’s Milling Industries PLC 65

Notes to the Financial Statements continued
28 RetiRement benefit obligAtion continued
movements in the present value of defined benefit obligations:
2009 2008 £’000 £’000
At the beginning of the period 21,896 22,322 Current service cost 16 27 Interest cost 1,323 1,259Changes in assumptions underlying the defined benefit obligation 768 (570) Benefits paid (1,145) (886)Curtailments — (256)
At the end of the period 22,858 21,896
movements in the fair value of scheme assets:
expected return fair value of assets 2009 2008 2009 2008 % % £’000 £’000
Equity instruments 7.2 7.3 11,100 13,862 Debt instruments 4.5 5.3 6,624 5,199Other assets 4.5 5.3 179 193
6.2 6.7 17,903 19,254
Actual return on scheme assets (781) (1,605)
To develop the expected long-term rate of return on assets assumption, the company considered the current level of expected returns on risk free investments (primarily government bonds), the historical level of the risk premium associated with the other asset classes in which the portfolio is invested and the expectations for future returns of each asset class. The expected return for each asset class was then weighted based on the target asset allocation to develop the expected long-term rate of return on assets assumption for the portfolio. This resulted in the selection of the 6.2% assumption at 29 August 2009.
2009 2008 £’000 £’000
At the beginning of the period 19,254 20,661 Expected return on scheme assets 1,279 1,400 Actual return less expected return on scheme assets (2,060) (3,005) Contributions by employer 575 1,084 Benefits paid (1,145) (886)
At the end of the period 17,903 19,254
Analysis of the scheme assets, expected rate of return and actual return:
66 Annual Report & Accounts 2009Carr’s Milling Industries PLC

28 RetiRement benefit obligAtion continued
history of scheme:
2009 2008 2007 2006 2005 £’000 £’000 £’000 £’000 £’000
Present value of the defined benefit obligation (22,858) (21,896) (22,322) (24,698) (23,943) Fair value of scheme assets 17,903 19,254 20,661 19,008 17,466
Deficit (4,955) (2,642) (1,661) (5,690) (6,477)
Difference between expected and actual returns on scheme assets:Amount £’000 (2,060) (3,005) 192 783 1,688 Percentage of scheme assets 11.5% 15.6% 1.0% 4.1% 9.7% Experience gains and losses on scheme liabilities:Amount £’000 (768) 570 2,740 (364) (3,613) Percentage of scheme liabilities 3.4% 2.6% 12.3% 1.5% 15.1%
It is expected that contributions of approximately £575,000 will be paid to the defined benefit scheme in the next financial period.
29 cAlled-uP shARe cAPitAl
2009 2009 2008 2008group and company shares £’000 Shares £’000
Authorised:Ordinary shares of 25p each 14,000,000 3,500 10,500,000 2,625
Allotted and fully paid ordinary shares of 25p each: At start of period 8,374,286 2,094 8,256,599 2,064Exercise of share options — — 112,677 29Allotment of shares 410,000 102 5,010 1
At end of period 8,784,286 2,196 8,374,286 2,094
For details of share option, share save and deferred bonus schemes see note 31.
During the period there was a further allotment of 410,000 shares (2008: 5,010) with a nominal value of £102,000 (2008: £1,000).The object of the allotment of 410,000 shares was to fund, in part, the additional working capital requirement and to widen the institutional shareholder base.
During the period the authorised share capital was increased by 3,500,000 shares of 25p each.
Annual Report & Accounts 2009Carr’s Milling Industries PLC 67

Notes to the Financial Statements continued
30 stAtement of chAnges in shAReholdeRs’ equity And minoRity inteRest
Share Treasury Equity Foreign Total Share Premium Share Compensation Exchange Other Retained Shareholders’ Minority Capital Account Reserve Reserve Reserve Reserves Earnings Equity Interest Totalgroup £’000 £’000 £’000 £’000 £’000 £’000 £’000 £’000 £’000 £’000
Balance at 2 September 2007 2,064 5,073 (101) 95 (483) 1,570 18,574 26,792 2,062 28,854Total recognised income and expense for the period — — — — 590 — (1,107) (517) 545 28Dividends paid — — — — — — (1,618) (1,618) — (1,618) Equity settled share- based payment transactions, net of tax — — — 111 — — — 111 12 123 Share options exercised by employees 29 153 — — — — — 182 — 182Allotment of shares 1 26 — — — — — 27 — 27 Transfer — — — — — (31) 31 — — —
Balance at 30 August 2008 2,094 5,252 (101) 206 107 1,539 15,880 24,977 2,619 27,596
Balance at 31 August 2008 2,094 5,252 (101) 206 107 1,539 15,880 24,977 2,619 27,596Total recognised income and expense for the period — — — — 279 — 4,108 4,387 782 5,169Dividends paid — — — — — — (2,020) (2,020) — (2,020)Equity settled share- based payment transactions, net of tax — — — (42) — — — (42) 6 (36)Allotment of shares 102 2,486 — — — — — 2,588 — 2,588Transfer — — — — — (31) 31 — — —
balance at 29 August 2009 2,196 7,738 (101) 164 386 1,508 17,999 29,890 3,407 33,297
The treasury share reserve includes the purchase of own shares in the Company, which are held in trust. These shares were acquired by the trust in the open market place and are to be held to meet the Group’s obligations under the share based award schemes. However at the balance sheet date they have not yet been allocated to the various schemes.
The equity compensation reserve reflects the cumulative spreading, at the balance sheet date, of the fair value of the share option, share save and deferred bonus schemes over the vesting periods. The movement on the equity compensation reserve is taken through the income statement.
The amount recognised in the Statement of Recognised Income and Expense in respect of foreign exchange translation differences arising on translation of overseas subsidiaries excludes £3,000 (2008: £7,000) in respect of translation differences attributable to minority interest. The Group has opted to use previous revaluations of property made under UK GAAP as deemed cost. On adoption of IFRS the revaluation reserve was reclassified to other reserves.
68 Annual Report & Accounts 2009Carr’s Milling Industries PLC

30 stAtement of chAnges in shAReholdeRs’ equity And minoRity inteRest continued
Share Equity Share Premium Compensation Retained Total Capital Account Reserve Earnings Equitycompany £’000 £’000 £’000 £’000 £’000
Balance at 2 September 2007 2,064 5,073 112 7,280 14,529 Total recognised income and expense for the period — — — (4,733) (4,733) Dividends paid — — — (1,618) (1,618)Equity settled share-based payment transactions, net of tax — — 121 — 121 Share options exercised by employees 29 153 — — 182Allotment of shares 1 26 — — 27
Balance at30 August 2008 2,094 5,252 233 929 8,508
Balance at 31 August 2008 2,094 5,252 233 929 8,508 Total recognised income and expense for the period — — — 8,639 8,639Dividends paid — — — (2,020) (2,020)Equity settled share-based payment transactions, net of tax — — (34) — (34)Allotment of shares 102 2,486 — — 2,588
balance at29 August 2009 2,196 7,738 199 7,548 17,681
Annual Report & Accounts 2009Carr’s Milling Industries PLC 69

Notes to the Financial Statements continued
31 shARe-bAsed PAyments groupThe Group operates five share based payment schemes.
In 2008 the Group entered into a deferred bonus scheme (Deferred Bonus Scheme 2007). As part of this deferred bonus scheme the eligible individuals invest a proportion of their bonus into shares. Matching shares may be awarded after a period of three years if certain performance criteria are met. Individuals in the scheme may receive a maximum of one matching share for every share that they bought subject to the Group’s adjusted earnings per share over the period of three years ending 31 August 2010 equalling or exceeding the growth in the RPI over the same period by an average of 4% per annum. The award multiple will be reduced to 0.5 should the growth in adjusted earnings per share over the three years equal the growth in RPI by an average of 2% per annum. Should the Group’s adjusted earnings per share fall between the two threshold levels, referred to above, the award multiple will be measured on a straight-line basis between 0.5 and 1.
In 2007 the Group entered into a deferred bonus scheme (Deferred Bonus Scheme 2006). As part of this deferred bonus scheme the eligible individuals invest a proportion of their bonus into shares. Matching shares may be awarded after a period of three years if certain performance criteria are met. Individuals in the scheme may receive a maximum of one matching share for every share that they bought subject to the Group’s adjusted earnings per share over the period of three years ending 31 August 2009 equalling or exceeding the growth in the RPI over the same period by an average of 4% per annum. The award multiple will be reduced to 0.5 should the growth in adjusted earnings per share over the three years equal the growth in RPI by an average of 2% per annum. Should the Group’s adjusted earnings per share fall between the two threshold levels, referred to above, the award multiple will be measured on a straight-line basis between 0.5 and 1.
In 2006 the Group entered into three schemes, an HM Revenue and Customs approved discretionary employee share option scheme, an unapproved discretionary share option scheme and a share save scheme (comprising a 3-year and a 5-year plan).
Both the approved and unapproved share options were granted to certain senior employees and directors. Options are exercisable between three and ten years from the date of grant, subject to the movement of the Group’s adjusted earnings per share over the three years to 31 August 2008 exceeding that of the RPI by an average of 2% per annum.
All employees, subject to eligibility criteria, may participate in the share save scheme. Under this scheme employees are offered savings contracts for both 3 year and 5 year vesting period plans. The exercise period is 6 months from the vesting date.
The fair value per option granted and the assumptions used in the calculation of fair values are as follows:
Approved and Unapproved Deferred Deferred Executive Share Share Save Share Save Bonus Scheme Bonus Scheme Option Scheme 2006 Scheme 2006 2007 2006 Scheme 2006 (3-Year Plan) (5-Year Plan)
Grant date (approved) 6/12/07 7/2/07 24/2/06 1/6/06 1/6/06 Grant date (unapproved) — — 20/2/06 — — Share price at grant date (weighted average) £5.44 £6.43 £4.78 £4.64 £4.64 Exercise price (weighted average) £0.25 £0.25 £4.78 £4.79 £4.79 Number of employees 3 5 29 5 65 Shares under option (approved) 8,493 24,277 129,000 1,872 55,227 Shares under option (unapproved) — — 12,000 — — Vesting period (years) 2.83 2.67 3 3 5 Model used for valuation Black Scholes Black Scholes Binomial Black Scholes Black Scholes Expected volatility 22.00% 21.00% 22.44% 20.18% 21.37% Option life (years) 2.92 2.75 10 3.5 5.5 Expected life (years) 2.83 2.67 6.5 3.25 5.25 Risk-free rate 4.420% 5.451% 4.224% 4.683% 4.623% Expected dividends expressed as a dividend yield 3.30% 3.20% 3.36% 3.56% 3.56% Expectations of vesting 100% 100% 100% 97% 97% Expectations of meeting performance criteria 100% 0% 100% N/A N/A Fair value per option £4.74 £5.69 £0.99 £0.60 £0.78
The expected volatility is based on historical volatility calculated over the weighted average remaining life of the award being valued. The expected life is the average expected period to exercise. The risk-free rate of return is the implied yield of zero-coupon UK Government bonds with a remaining term equal to the expected term of the award being valued.
70 Annual Report & Accounts 2009Carr’s Milling Industries PLC

31 shARe-bAsed PAyments continueddeferred bonus scheme 2007The number and weighted average exercise prices are as follows:
2009 2008 weighted Weighted average average exercise number of exercise Number of price options price options £ (’000) £ (’000)
Outstanding at the beginning of the period 0.25 8 — — Granted during the period — — 0.25 8
Outstanding at the end of the period 0.25 8 0.25 8
Exercisable at the end of the period — — — —
At the period end the weighted average remaining contractual life of the options is 1.167 years (2008: 2.167) with a weighted average remaining expected life of 1.083 years (2008: 2.083).
deferred bonus scheme 2006The number and weighted average exercise prices are as follows:
2009 2008 weighted Weighted average average exercise number of exercise Number of price options price options £ (‘000) £ (’000)
Outstanding at the beginning of the period 0.25 24 0.25 24
Outstanding at the end of the period 0.25 24 0.25 24
Exercisable at the end of the period — — — —
At the period end the weighted average remaining contractual life of the options is 0.167 years (2008: 1.167 years) with a weighted average remaining expected life of 0.083 years (2008: 1.083 years).
Approved and unapproved executive share option scheme 2006 The number and weighted average exercise prices are as follows:
2009 2008 weighted Weighted average average exercise number of exercise Number of price options price options £ (’000) £ (‘000)
Outstanding at the beginning of the period 4.78 141 4.78 141
Outstanding at the end of the period 4.78 141 4.78 141
Exercisable at the end of the period 4.78 141 — —
At the period end the weighted average remaining contractual life of the options is 6.5 years (2008: 7.5 years) with a weighted average remaining expected life of 3 years (2008: 4 years).
Annual Report & Accounts 2009Carr’s Milling Industries PLC 71

Notes to the Financial Statements continued
31 shARe-bAsed PAyments continuedshare save scheme 2006 - 3 year PlanThe number and weighted average exercise prices are as follows:
2009 2008 weighted Weighted average average exercise number of exercise Number of price options price options £ (’000) £ (‘000)
Outstanding at the beginning of the period 4.79 23 4.79 24Forfeited during the period 4.79 (21) 4.79 (1)
Outstanding at the end of the period 4.79 2 4.79 23
Exercisable at the end of the period 4.79 2 — —
At the period end the weighted average remaining contractual life of the options is 0.25 years (2008: 1.25 years) with a weighted average remaining expected life of nil years (2008: 1 year).
share save scheme 2006 - 5 year PlanThe number and weighted average exercise prices are as follows:
2009 2008 weighted Weighted average average exercise number of exercise Number of price options price options £ (’000) £ (’000)
Outstanding at the beginning of the period 4.79 57 4.79 58Forfeited during the period 4.79 (2) 4.79 (1)
Outstanding at the end of the period 4.79 55 4.79 57
Exercisable at the end of the period — — — —
At the period end the weighted average remaining contractual life of the options is 2.25 years (2008: 3.25 years) with a weighted average remaining expected life of 2 years (2008: 3 years).
The total (income)/expense recognised for the period arising from share based payments are as follows:
2009 2008 £’000 £’000
Approved and Unapproved Executive Share Option Scheme 2006 23 45 Share Save Scheme 2006 - 3 Year Plan 3 5Share Save Scheme 2006 - 5 Year Plan 6 10Deferred Bonus Scheme 2006 (82) 52Deferred Bonus Scheme 2007 14 11
(36) 123
The Deferred Bonus Scheme 2006 cumulative charge has reversed in the current period as the performance criteria has not been met.
72 Annual Report & Accounts 2009Carr’s Milling Industries PLC

31 shARe-bAsed PAyments continuedcompanyIn 2008 the Company entered into a deferred bonus scheme (Deferred Bonus Scheme 2007). As part of this deferred bonus scheme the eligible individuals invest a proportion of their bonus into shares. Matching shares may be awarded after a period of three years if certain performance criteria are met. Individuals in the scheme may receive a maximum of one matching share for every share that they bought subject to the Group’s adjusted earnings per share over the period of three years ending 31 August 2010 equalling or exceeding the growth in the RPI over the same period by an average of 4% per annum. The award multiple will be reduced to 0.5 should the growth in adjusted earnings per share over the three years equal the growth in RPI by an average of 2% per annum. Should the Group’s adjusted earnings per share fall between the two threshold levels, referred to above, the award multiple will be measured on a straight-line basis between 0.5 and 1.
In 2007 the Company entered into a deferred bonus scheme (Deferred Bonus Scheme 2006). As part of this deferred bonus scheme the eligible individuals invest a proportion of their bonus into shares. Matching shares may be awarded after a period of three years if certain performance criteria are met. Individuals in the scheme may receive a maximum of one matching share for every share that they bought subject to the Group’s adjusted earnings per share over the period of three years ending 31 August 2009 equalling or exceeding the growth in the RPI over the same period by an average of 4% per annum. The award multiple will be reduced to 0.5 should the growth in adjusted earnings per share over the three years equal the growth in RPI by an average of 2% per annum. Should the Group’s adjusted earnings per share fall between the two threshold levels, referred to above, the award multiple will be measured on a straight-line basis between 0.5 and 1. In 2006 the company entered into two schemes, an HM Revenue and Customs unapproved discretionary employee share option scheme and a share save scheme (comprising a 3-year and a 5-year plan).
The unapproved share options were granted to certain senior employees and directors. Options are exercisable between three and ten years from the date of grant, subject to the movement of the Group’s adjusted earnings per share over the three years to 31 August 2008 exceeding that of the RPI by an average of 2% per annum.
All employees, subject to eligibility criteria, may participate in the share save scheme. Under this scheme employees are offered savings contracts for both 3 year and 5 year vesting period plans. The exercise period is 6 months from the vesting date.
The fair value per option granted and the assumptions used in the calculation of fair values are as follows:
Unapproved Deferred Deferred Executive Share Share Save Share Save Bonus Scheme Bonus Scheme Option Scheme 2006 Scheme 2006 2007 2006 Scheme 2006 (3-Year Plan) (5-Year Plan)
Grant date 6/12/07 7/2/07 20/2/06 1/6/06 1/6/06 Share price at grant date £5.44 £6.43 £5.02 £4.64 £4.64 Exercise price £0.25 £0.25 £5.02 £4.79 £4.79 Number of employees 2 2 2 1 1 Shares under option 6,765 14,743 12,000 780 1,344 Vesting period (years) 2.83 2.67 3 3 5 Model used for valuation Black Scholes Black Scholes Binomial Black Scholes Black Scholes Expected volatility 22.00% 21.00% 22.44% 20.18% 21.37% Option life (years) 2.92 2.75 10 3.5 5.5 Expected life (years) 2.83 2.67 6.5 3.25 5.25 Risk-free rate 4.420% 5.451% 4.224% 4.683% 4.623% Expected dividends expressed as a dividend yield 3.30% 3.20% 3.36% 3.56% 3.56% Expectations of vesting 100% 100% 100% 97% 97% Expectations of meeting performance criteria 100% 0% 100% N/A N/A Fair value per option £4.74 £5.69 £0.99 £0.60 £0.78
The expected volatility is based on historical volatility calculated over the weighted average remaining life of the award being valued. The expected life is the average expected period to exercise. The risk-free rate of return is the implied yield of zero-coupon UK Government bonds with a remaining term equal to the expected term of the award being valued.
Annual Report & Accounts 2009Carr’s Milling Industries PLC 73

Notes to the Financial Statements continued
31 shARe-bAsed PAyments continueddeferred bonus scheme 2007The number and weighted average exercise prices are as follows:
2009 2008 weighted Weighted average average exercise number of exercise Number of price options price options £ (’000) £ (’000)
Outstanding at the beginning of the period 0.25 7 — —Granted during the period — — 0.25 7
Outstanding at the end of the period 0.25 7 0.25 7
Exercisable at the end of the period — — — —
At the period end the weighted average remaining contractual life of the options is 1.167 years (2008: 2.167) with a weighted average remaining expected life of 1.083 years (2008: 2.083). deferred bonus scheme 2006The number and weighted average exercise prices are as follows:
2009 2008 weighted Weighted average average exercise number of exercise Number of price options price options £ (’000) £ (’000)
Outstanding at the beginning of the period 0.25 15 0.25 15
Outstanding at the end of the period 0.25 15 0.25 15
Exercisable at the end of the period — — — —
At the period end the weighted average remaining contractual life of the options is 0.167 years (2008: 1.167 years) with a weighted average remaining expected life of 0.083 years (2008: 1.083 years).
unapproved executive share option scheme 2006The number and weighted average exercise prices are as follows:
2009 2008 weighted Weighted average average exercise number of exercise Number of price options price options £ (’000) £ (’000)
Outstanding at the beginning of the period 5.02 12 5.02 12
Outstanding at the end of the period 5.02 12 5.02 12
Exercisable at the end of the period 5.02 12 — —
At the period end the weighted average remaining contractual life of the options is 6.5 years (2008: 7.5 years) with a weighted average remaining expected life of 3 years (2008: 4 years).
74 Annual Report & Accounts 2009Carr’s Milling Industries PLC

31 shARe-bAsed PAyments continuedshare save scheme 2006 - 3 year PlanThe number and weighted average exercise prices are as follows:
2009 2008 weighted Weighted average average exercise number of exercise Number of price options price options £ (’000) £ (’000)
Outstanding at the beginning of the period 4.79 6 4.79 6Forfeited during the period 4.79 (5) — —
Outstanding at the end of the period 4.79 1 4.79 6
Exercisable at the end of the period 4.79 1 — —
At the period end the weighted average remaining contractual life of the options is 0.25 years (2008: 1.25 years) with a weighted average remaining expected life of nil years (2008: 1 year).
share save scheme 2006 - 5 year PlanThe number and weighted average exercise prices are as follows:
2009 2008 weighted Weighted average average exercise number of exercise Number of price options price options £ (’000) £ (’000)
Outstanding at the beginning of the period 4.79 1 4.79 1
Outstanding at the end of the period 4.79 1 4.79 1
Exercisable at the end of the period — — — —
At the period end the weighted average remaining contractual life of the options is 2.25 years (2008: 3.25 years) with a weighted average remaining expected life of 2 years (2008: 3 years).
The total (income)/expense recognised for the period arising from share based payments are as follows:
2009 2008 £’000 £’000
Unapproved Executive Share Option Scheme 2006 2 4Share Save Scheme 2006 - 3 Year Plan — 2Share Save Scheme 2006 - 5 Year Plan 1 —Deferred Bonus Scheme 2006 (49) 31Deferred Bonus Scheme 2007 11 9
(35) 46
The Deferred Bonus Scheme 2006 cumulative charge has reversed in the current period as the performance criteria has not been met.
Annual Report & Accounts 2009Carr’s Milling Industries PLC 75

Notes to the Financial Statements continued
31 shARe-bAsed PAyments continuedShare based payments awarded to employees of subsidiary undertakings and recognised as an investment in subsidiary undertakings in the company are as follows:
2009 2008 £’000 £’000
Approved Executive Share Option Scheme 2006 122 102Share Save Scheme 2006 - 3 Year Plan 9 8Share Save Scheme 2006 - 5 Year Plan 27 18Deferred Bonus Scheme 2006 — 32Deferred Bonus Scheme 2007 5 2
Total carrying amount of investments 163 162
32 Acquisitionswälischmiller engineering gmbhOn 1 March 2009 Wälischmiller Engineering GmbH acquired part of the trade and certain assets and liabilities of Hans Wälischmiller GmbH for a total cash consideration, including costs, of £4,258,000. Wälischmiller Engineering GmbH was a company incorporated in Germany by the Group for this purpose and is 100% owned by Carrs Engineering Limited.
The principal activity of Wälischmiller Engineering GmbH is that of the manufacture of remote handling and robotics equipment.
This purchase has been accounted for as an acquisition.
Wälischmiller Engineering GmbH has no historical profits or losses prior to 1 March 2009.
Revenue and profit before taxation for the period from acquisition to 29 August 2009 was £5,081,000 and £561,000 respectively.
Wälischmiller Engineering GmbH has no recognised gains and losses other than the profit for the financial period shown above.
The assets and liabilities acquired are set out below:
book fair value Revaluations other value £’000 £’000 £’000 £’000
Intangible assets 254 — 263 517 Property, plant and equipment 2,082 (73) — 2,009 Inventories 3,491 — (116) 3,375 Other receivables 149 — — 149 Other payables (2,105) — — (2,105)
Net assets acquired 3,871 (73) 147 3,945 Goodwill 313
Satisfied by cash 4,258
The fair value adjustments relate to the revaluation of the land, buildings and plant acquired. Other fair value adjustments relate to the recognition of brands and inventories being brought in line with Group policy. Land and buildings were valued at open market value by independent professional valuers IMMO-HYP GmbH. Goodwill represents the value of the employees which under IFRS should not be recognised as an asset on the balance sheet. It also represents opportunities to be gained from Wälischmiller Engineering GmbH’s presence in the European and Far Eastern marketplace. Pro forma information IFRS3 requires disclosure of information as to the impact on the financial statements if the acquisition had occurred at the beginning of the accounting period. Only part of the trade of Hans Wälischmiller GmbH was acquired and as such historical information is not available for this element of the trade in isolation. It is therefore not possible to determine information as if the acquisition had occured at the beginning of the accounting period. impact on cash flows The acquisition contributed £617,000 to the Group’s net cash generated from operating activities and utilised £56,000 in respect of net cash used in investing activities.
76 Annual Report & Accounts 2009Carr’s Milling Industries PLC

group company 2009 2008 2009 2008 £’000 £’000 £’000 £’000
Profit for the period 5,206 8,253 7,954 3,216Adjustments for :Tax 1,829 4,605 (344) (183)Dividends received from subsidiaries — — (8,853) (3,340)Depreciation on property, plant and equipment 3,411 3,318 — —Profit on disposal of property, plant and equipment — (43) — —Depreciation on investment property 19 19 — —Intangible asset amortisation 77 159 — —Impairment of trade investment — 200 — 200Net fair value losses/(gains) on derivative financial instruments in operating profit 889 (915) 31 (31)Net fair value (gain)/loss on share based payments (36) 123 (35) 46Net foreign exchange differences (721) 363 480 358Finance costs: Interest income (211) (454) (350) (580) Interest expense and borrowing costs 1,536 2,069 610 781Share of profit from associate and joint ventures (1,051) (1,590) — —IAS19 income statement credit in respect of employer contributions (note 28) (2,539) (2,517) (2,539) (2,517)IAS19 income statement charge (note 28) 1,605 1,060 1,605 1,060Actuarial provisions in respect of deferred pension members — (1,325) — (1,325)Payment to director in lieu of pension — (1,532) — (1,532)Changes in working capital (excluding the effects of acquisitions):Decrease/(increase) in inventories 10,529 (15,959) — —Decrease/(increase) in receivables 7,809 (15,140) 86 (150)(Decrease)/increase in payables (18,535) 24,539 (1,485) 1,242
Cash generated from/(used in) continuing operations 9,817 5,233 (2,840) (2,755)
34 AnAlysis of net debt
33 cAsh geneRAted fRom/(used in) oPeRAtions
At Other At 31 August non-cash Exchange 29 August 2008 Cash flow changes movements 2009group £’000 £’000 £’000 £’000 £’000
Cash and cash equivalents 3,896 6,408 — — 10,304Bank overdrafts (3,830) 2,486 — 161 (1,183)
66 8,894 — 161 9,121Loans and other borrowings: - current (10,421) 1,030 1,216 79 (8,096) - non-current (5,408) (11,414) (1,215) (4) (18,041) Finance leases: - current (753) 1,025 (1,219) — (947) - non-current (917) — (445) — (1,362)
(17,433) (465) (1,663) 236 (19,325)
Other non-cash changes relate to finance leases and transfers between categories of borrowings. It also includes the release of deferred borrowing costs to the income statement.
Annual Report & Accounts 2009Carr’s Milling Industries PLC 77

Notes to the Financial Statements continued
34 AnAlysis of net debt continued
At Other At 31 August non-cash Exchange 29 August 2008 Cash flow changes movements 2009company £’000 £’000 £’000 £’000 £’000
Cash and cash equivalents — 16,212 — (174) 16,038 Bank overdrafts (120) 120 — — —
(120) 16,332 — (174) 16,038Loans and other borrowings: - current (5,369) (972) 2,909 (316) (3,748)- non-current (5,371) (9,048) 9 — (14,410)
(10,860) 6,312 2,918 (490) (2,120)
Other non-cash changes relate to the release of deferred borrowing costs to the income statement and a non-cash dividend from a subsidiary company.
35 cAPitAl commitments
2009 2008group £’000 £’000
Capital expenditure on property, plant and equipment that has been contracted for but has not been provided for in the accounts 8 474
The Company has no capital commitments (2008: nil).
36 otheR finAnciAl commitments groupAt 29 August 2009 the Group had commitments, other than land and buildings, under non-cancellable operating leases as follows:
2009 2008 £’000 £’000
Within one year 362 354Within two and five years inclusive 740 545After five years 10 16
1,112 915
company At 29 August 2009 the Company had commitments, other than land and buildings, under non-cancellable operating leases as follows:
2009 2008 £’000 £’000
Within one year 1 1Within two and five years inclusive 3 4
4 5
37 finAnciAl guARAntees The Company, together with certain subsidiary undertakings, has entered into a guarantee with Clydesdale Bank PLC in respect of the Group loans and overdraft with that bank, which at 29 August 2009 amounted to £8,474,000 (2008: £2,179,000).
The Company, together with certain subsidiary undertakings, has a s625,000 (2008: s875,000) letter of credit by Clydesdale Bank PLC in favour of Crystalyx Products GmbH, a joint venture arrangement.
The Company, together with certain subsidiary undertakings, has entered into a guarantee with Royal Bank of Scotland PLC in respect of an overdraft with that bank, which at 29 August 2009 amounted to £792,000 (2008: £978,000).
The Company has entered into a guarantee with Royal Bank of Scotland PLC in respect of an overdraft and loan facility with that bank, which at 29 August 2009 amounted to £3,100,000 (2008: £nil).
One of the Group’s bankers in the normal course of business, enters into certain specific guarantees with some of a subsidiary’s customers. All these guarantees allow the bank to have recourse to the Company if a guarantee is enforced. The total outstanding of such guarantees entered into by the bank at 29 August 2009 was £1,572,000 (2008: £2,185,000).
78 Annual Report & Accounts 2009Carr’s Milling Industries PLC

37 finAnciAl guARAntees continuedThe Company has provided specific guarantees to certain customers of a subsidiary. These are in place to guarantee the completion of the contract in any event. At 29 August 2009 the contracts under guarantee that have still to be completed have a total contract value of £2,269,000.
A subsidiary undertaking of the Company, together with an associated undertaking of the Company, has entered into a guarantee with Royal Bank of Scotland PLC in respect of a loan with that bank. The Group’s exposure to this liability at 29 August 2009 amounts to £500,000 (2008: £1,000,000).
The Company has entered into a guarantee with the Trustees of the Carrs Billington Agriculture Pension Scheme in respect of the punctual payment of obligations due to the pension scheme by the participating employers of the scheme. The Company’s total liability shall not exceed £1,500,000 (2008: £1,500,000).
The Company has provided guarantees to certain suppliers of the Group’s Fertiliser business. The maximum exposure under these guarantees is the amount owed at any one time to these suppliers. At the period end amounts owed under these guarantees was £4,695,000 (2008: £12,709,000). This is included within trade payables in the balance sheet.
The Group and Company does not expect any of the above guarantees to be called in.
38 RelAted PARties group and companyidentity of related partiesThe Group has a related party relationship with its subsidiaries, associate and joint ventures and with its directors. The balances and transactions shown below were all undertaken on an arms’ length basis.
transactions with key management personnelKey management personnel are considered to be the directors and their remuneration is disclosed within the Directors’ Remuneration Report.
group company 2009 2008 2009 2008 £’000 £’000 £’000 £’000
Balances reported in the Balance Sheet
Amounts due from key management personnel (in a trading capacity): Trade receivables 101 141 — —
101 141 — —
Transactions reported in the Income Statement
Revenue 628 577 — —Purchases (15) (11) — —
transactions with subsidiaries
group company 2009 2008 2009 2008 £’000 £’000 £’000 £’000
Balances reported in the Balance Sheet
Amounts due from subsidiary undertakings:Loans — — 14,418 16,230Other receivables — — 417 154
— — 14,835 16,384
Amounts due to subsidiary undertakings:Loans — — (3,294) (4,378)Other payables — — (129) (48)
— — (3,423) (4,426)
Transactions reported in the Income Statement
Management charges receivable — — 1,410 2,122Dividends received — — 8,853 3,340Interest receivable — — 289 453Interest payable — — (145) (256)
Annual Report & Accounts 2009Carr’s Milling Industries PLC 79

Notes to the Financial Statements continued
38 RelAted PARties continuedtransactions with associate
group company 2009 2008 2009 2008 £’000 £’000 £’000 £’000
Balances reported in the Balance Sheet
Amounts due from associate:Trade and other receivables 56 91 — —
56 91 — —
Amounts due to associate:Trade payables (7,597) (9,336) — —Current tax liabilities (consortium relief) — (262) — —
(7,597) (9,598) — —
Transactions reported in the Income Statement
Revenue 490 1,466 — —Rental income 18 18 — —Net management charges receivable 14 14 14 14Purchases (81,426) (81,611) — —
transactions with joint ventures
group company 2009 2008 2009 2008 £’000 £’000 £’000 £’000
Balances reported in the Balance Sheet
Amounts due from joint ventures:Non-current loans 50 50 — —Trade and other receivables 450 393 411 374
500 443 411 374
Included within Group and Company trade and other receivables is £370,000 (2008: £370,000) in respect of loans owed by joint ventures.
group company 2009 2008 2009 2008 £’000 £’000 £’000 £’000
Transactions reported in the Income Statement Revenue 179 272 — —Management charges receivable 56 55 — —
transactions with other related partiesOther loans of £1,225,000 (2008: £1,225,000) included within non-current borrowings (2008: current borrowings) is in respect of a loan from Edward Billington and Son Limited to Carrs Billington Agriculture (Sales) Limited. This loan is interest free, unsecured, and has no set repayment date. Included within current tax liabilities is £nil (2008: £77,000) due to Edward Billington and Son Limited in respect of consortium tax relief. Edward Billington and Son Limited has a 49% shareholding in Carrs Billington Agriculture (Sales) Limited.
Other loans, within non-current borrowings, also includes loans from the minority shareholders in Quinphos (Ireland) Limited, which is a dormant subsidiary of the Group. These loans are denominated in Euros and the sterling equivalent at 29 August 2009 was £39,587 (2008: £36,602).
80 Annual Report & Accounts 2009Carr’s Milling Industries PLC

Five Year Statement
2005 2006 2007 2008 2009Revenue and Results £’000 £’000 £’000 £’000 £’000
Revenue 192,124 242,576 252,753 372,307 350,023
group operating profit 12,264 7,116 5,785 12,875 7,295
Analysed as:operating profit before non-recurring itemsand amortisation 7,975 7,987 6,192 12,814 7,295Non-recurring items and amortisation 4,289 (871) (407) 61 —
group operating profit 12,264 7,116 5,785 12,875 7,295
Interest income 93 521 487 454 211Interest expense (1,291) (1,532) (1,484) (2,061) (1,522)Share of post-tax (loss)/profit in associate and joint ventures (697) 218 738 1,590 1,051
Profit before taxation 10,369 6,323 5,526 12,858 7,035Taxation (2,557) (1,989) (1,225) (4,605) (1,829)
Profit for the period 7,812 4,334 4,301 8,253 5,206
RatiosOperating margin (excluding non-recurring items and amortisation) 4.2% 3.3% 2.4% 3.4% 2.1%Return on net assets (excluding non-recurring items and amortisation) 27.8% 32.9% 21.0% 46.4% 21.1%Earnings per share - basic 92.1p 51.0p 50.7p 92.7p 50.4p - adjusted 50.9p 59.7p 56.0p 108.6p 50.4pDividends per ordinary share 16.0p 18.0p 19.0p 23.0p 23.0p
Annual Report & Accounts 2009Carr’s Milling Industries PLC 81
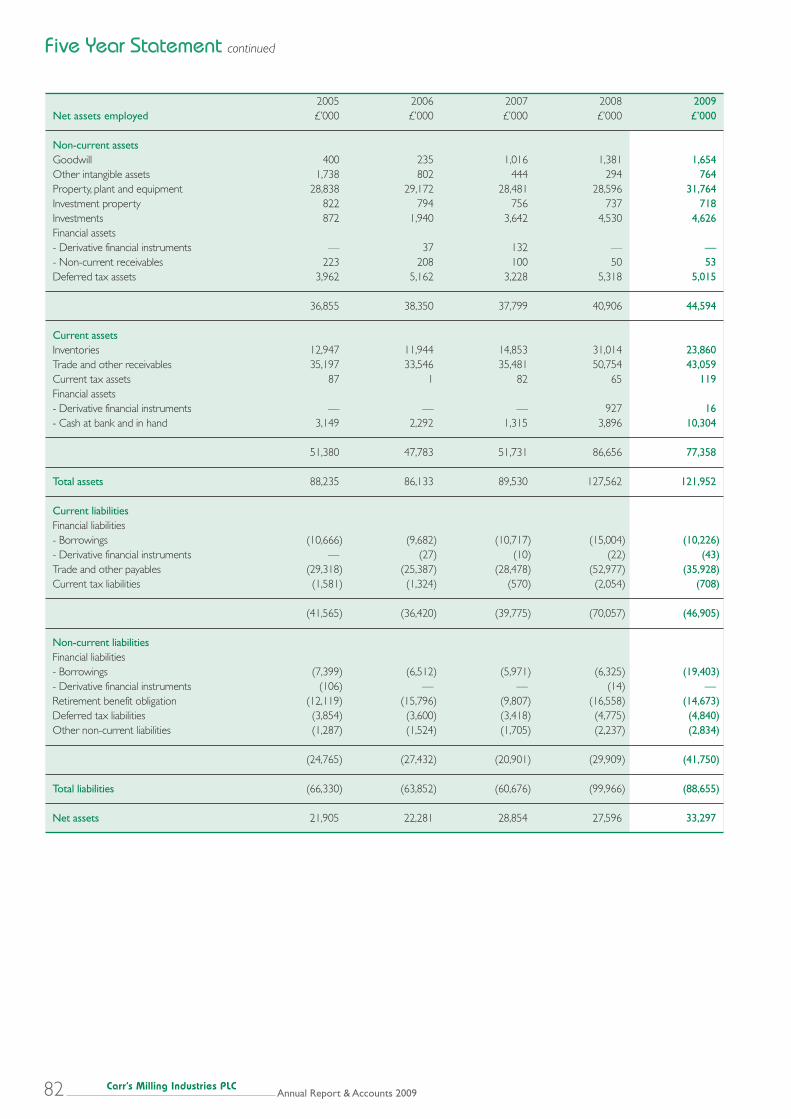
Five Year Statement continued
2005 2006 2007 2008 2009net assets employed £’000 £’000 £’000 £’000 £’000
non-current assetsGoodwill 400 235 1,016 1,381 1,654Other intangible assets 1,738 802 444 294 764Property, plant and equipment 28,838 29,172 28,481 28,596 31,764Investment property 822 794 756 737 718Investments 872 1,940 3,642 4,530 4,626Financial assets- Derivative financial instruments — 37 132 — —- Non-current receivables 223 208 100 50 53Deferred tax assets 3,962 5,162 3,228 5,318 5,015
36,855 38,350 37,799 40,906 44,594
current assetsInventories 12,947 11,944 14,853 31,014 23,860Trade and other receivables 35,197 33,546 35,481 50,754 43,059Current tax assets 87 1 82 65 119Financial assets- Derivative financial instruments — — — 927 16- Cash at bank and in hand 3,149 2,292 1,315 3,896 10,304
51,380 47,783 51,731 86,656 77,358
total assets 88,235 86,133 89,530 127,562 121,952
current liabilitiesFinancial liabilities- Borrowings (10,666) (9,682) (10,717) (15,004) (10,226)- Derivative financial instruments — (27) (10) (22) (43)Trade and other payables (29,318) (25,387) (28,478) (52,977) (35,928)Current tax liabilities (1,581) (1,324) (570) (2,054) (708)
(41,565) (36,420) (39,775) (70,057) (46,905)
non-current liabilitiesFinancial liabilities- Borrowings (7,399) (6,512) (5,971) (6,325) (19,403)- Derivative financial instruments (106) — — (14) —Retirement benefit obligation (12,119) (15,796) (9,807) (16,558) (14,673)Deferred tax liabilities (3,854) (3,600) (3,418) (4,775) (4,840)Other non-current liabilities (1,287) (1,524) (1,705) (2,237) (2,834)
(24,765) (27,432) (20,901) (29,909) (41,750)
total liabilities (66,330) (63,852) (60,676) (99,966) (88,655)
net assets 21,905 22,281 28,854 27,596 33,297
82 Annual Report & Accounts 2009Carr’s Milling Industries PLC

Company Number: 98221Carr’s Milling Industries PLC Notice of Annual General MeetingNotice is hereby given that the one hundred and first annual general meeting of the Company will be held at the Crown Hotel, Wetheral, Carlisle on Tuesday 5 January, 2010 at 11.30 a.m. for the following purposes:
oRdinARy business1. To receive the Company’s annual accounts for the financial year
ended 29 August 2009 together with the directors’ report and the auditor’s report on those accounts.
2. To declare a final dividend of 17.0p per share for the year ended 29 August 2009.
3. To re-elect Lord Inglewood who retires by rotation pursuant to the articles of association of the Company.
4. To re-elect Alistair Wannop who retires by rotation pursuant to the articles of association of the Company.
5. To re-appoint PricewaterhouseCoopers LLP as Auditors of the Company and to authorise the Audit Committee to fix their remuneration.
6. To approve the directors’ remuneration report for the financial year ended 29 August 2009.
sPeciAl business7. To consider and, if thought fit, pass the following resolution which will
be proposed as an ordinary resolution:
“thAt, in substitution for all existing and unexercised authorities and powers, the directors of the company be and they are hereby generally and unconditionally authorised for the purpose of section 551 of the Companies Act 2006 (the”Act”) to exercise all or any of the powers of the Company to allot relevant securities to such persons at such times and generally on such terms and conditions as the directors may determine (subject always to the articles of association of the Company) provided that:
(a) the maximum nominal amount of such securities which may be allottedunderthisauthorityis£724,704;and
(b) this authority shall, unless previously renewed, varied or revoked by the Company in general meeting, expire at the conclusion of the next annual general meeting or on the date which is 6 months after the next accounting reference date of the Company (if earlier) save that the directors of the Company may, before the expiry of such period, make an offer or agreement which would or might require relevant securities to be allotted after the expiry of such period and the directors of the Company may allot relevant securities in pursuance of such offer or agreement as if the authority conferred hereby had not expired.”
8. To consider and, if thought fit, pass the following resolution which will be proposed as a special resolution:
“thAt, subject to and conditional upon the passing of the resolution numbered 7 in the notice convening the meeting at which this resolution was proposed and in substitution for all existing and unexercised authorities and powers, the directors of the Company be and are hereby empowered pursuant to sections 570 - 573 of the Act to allot equity securities pursuant to the authority conferred upon them by resolution 7 as if section 561 of the Act did not apply to any such allotment provided that this authority and power shall be limited to:
(a) the allotment of equity securities in connection with a rights issue or similar offer in favour of ordinary shareholders where the equity securities respectively attributable to the interest of all other shareholders are proportionate (as nearly as may be) to the respective number of ordinary shares held by them subject only to such exclusion or other arrangements as the directors of the Company may consider appropriate to deal with fractional entitlements or legal and practical difficulties under the laws of, or the requirements of any recognised regulatorybodyinany,territory;and
(b) The allotment (otherwise than pursuant to sub-paragraph (a) above) of equity securities up to an aggregate nominal amount of £219,607 representing approximately 10% of the current issued share capital of the Company, and shall expire on the date of the next annual general meeting of the Company or (if earlier) the date which is 6 months after the next accounting reference date of the Company, save that the Company may before such expiry make an offer or agreement which would or might require equity securities to be allotted after such expiry and the directors may allot equity securities in pursuance of such offer or agreement as if the power conferred hereby had not expired.”
9. To consider and, if thought fit, pass the following resolution which will be proposed as a special resolution:
“thAt, the Company be and is hereby generally and unconditionally authorised to make market purchases (within the meaning of section 693 of the Act) or Ordinary Shares provided that:
(a) the maximum number of Ordinary Shares which may be purchased is 878,429 (representing 10% of the Company’s issuedsharecapital);
(b) the minimum price which may be paid for each Ordinary Share is25p;
(c) the maximum price which may be paid for each Ordinary Share is an amount equal to 105% of the average of the middle market quotations for an Ordinary Share as derived from the Daily Official List of London Stock Exchange plc for the 5 business days immediately preceding the day on which the OrdinaryShareinquestionispurchased;
(d) unless previously revoked or varied, the authority hereby conferred shall expire at the conclusion of the next annual general meeting of the Company to be held in 2010 or, if earlier, on the date which is 12 months after the date of the passing ofthisresolution;and
(e) the Company may make a contract or contracts to purchase Ordinary Shares under the authority hereby conferred prior to the expiry of such authority which contract or contracts will or may be executed wholly or partly after the expiry of such authority, and may make a purchase of Ordinary Shares in pursuance of any such contract or contracts.”
by oRdeR of the boARd
Ronald Wood Old CroftCompany Secretary Stanwix17 November 2009 Carlisle CA3 9BA
To be valid any Proxy form or other instrument appointing a Proxy must be received by post (during normal business hours only) or by hand at Old Croft, Stanwix, Carlisle, CA3 9BA no later than 2.00pm on Monday 4 January 2010.
The following documents are available for inspection at an agreed time (during normal business hours on any weekday) at the Company’s registered office, Old Croft, Stanwix, Carlisle, CA3 9BA. They will also be available for inspection at the Crown Hotel, Wetheral, Carlisle, CA4 8ES from 11.00am until the conclusion of the AGM:
(i) copiesoftheexecutivedirectors’servicecontracts;(ii) copiesofthenon-executivedirectors’lettersofappointment;(iii) a copy of the current Memorandum and Articles of Association
of the Company.
Annual Report & Accounts 2009Carr’s Milling Industries PLC 83
84 Annual Report & Accounts 2009Carr’s Milling Industries PLC
carr’s milling industries Plc Old Croft, Stanwix, Carlisle, Cumbria CA3 9BA Tel: 01228 554600 Fax: 01228 554601 Website: www.carrs-milling.com
Animal feed supplement, inc East Highway 212, PO Box 188, Belle Fourche, South Dakota 57717 USA Tel: 00 1 605 892 3421 Fax: 00 1 605 892 3473
Animal feed supplement, inc PO Box 105, 101 Roanoke Avenue, Poteau, Oklahoma 74953 USA Tel: 00 1 918 647 8133 Fax: 00 1 918 647 7318
caltech Solway Mills, Silloth, Wigton, Cumbria CA7 4AJ Tel: 016973 32592 Fax: 016973 32339
crystalyx Products gmbh** Am Stau 199-203, 26122, Oldenburg, Germany Tel: 00 49 441 2188 92142 Fax: 00 49 441 2188 92177
carrs billington Agriculture (operations)*Parkhill Road, Kingstown Industrial Estate, Carlisle CA3 0EX Tel: 01228 529 021 Fax: 01228 554 397
carrs billington Agriculture (operations)*Lansil Way, Lancaster LA1 3QY Tel: 01524 597 200 Fax: 01524 597 229
carrs billington Agriculture (operations)*High Mill, Langwathby, Penrith, Cumbria CA10 1NB Tel: 01768 889 800 Fax: 01768 889 807
carrs billington Agriculture (operations)*Cold Meece, Stone, Staffordshire ST15 0QW Tel: 01785 760 535 Fax: 01785 760 888
carrs billington Agriculture (operations)*Powhill, Kirkbride, Cumbria CA7 5AJTel: 01697 352 229 Fax: 01697 352 248
carrs billington Agriculture (operations)* Uredale Mill, Askrigg, Leyburn, North Yorkshire DL8 7HZ Tel: 01969 650 908 Fax: 01969 650 770
carrs fertilisers, invergordonInverbreakie Industrial Estate, Invergordon, Ross-shire IV18 0QN Tel: 01349 853 745 Fax: 01349 854 066
carrs fertilisers, montrose River Street, Montrose, Angus DD10 9RT Tel: 01674 678 400 Fax: 01674 671 318
carrs fertilisers, silloth The Wath, Silloth, Wigton, Cumbria CA7 4PH Tel: 016973 32333 Fax: 016973 32279
carrs billington Agriculture (sales), Annan25 High Street, Annan, Dumfriesshire DG12 6AE Tel: 01461 202 772 Fax: 01461 202 712
carrs billington Agriculture (sales), ApplebyCrosscroft Industrial Estate, Appleby,Cumbria CA16 6HXTel: 01768 352 999
carrs billington Agriculture (sales), barnard castleMontalbo Road, Barnard Castle, Co Durham DL12 8ED Tel: 01833 637 537 Fax: 01833 638 010
carrs billington Agriculture (sales), brockBrockholes Way, Claughton Trading Estate, Lancaster Old Road, Claughton on Brock, Preston PR3 0PZ Tel: 01995 643 200 Fax: 01995 643 220
carrs billington Agriculture (sales), carlisleMontgomery Way, Rosehill Estate, Carlisle CA1 2UY Tel: 01228 520 212 Fax: 01228 512 572
carrs billington Agriculture (sales), cockermouthUnit 5, Lakeland Agricultural Centre, Cockermouth CA13 0QQ Tel: 01900 824 105 Fax: 01900 826 860
carrs billington Agriculture (sales), gisburnPendle Mill, Mill Lane, Gisburn, Clitheroe, Lancashire BB7 4ES Tel: 01200 445 491Fax: 01200 445 305
carrs billington Agriculture (sales), hawesBurtersett Road, Hawes, North Yorkshire DL8 3NP Tel: 01969 667 334 Fax: 01969 667 335
carrs billington Agriculture (sales), hexhamTyne Mills Industrial Estate, Hexham, Northumberland NE46 1XL Tel: 01434 605 371 Fax: 01434 608 938
carrs billington Agriculture (sales), leekMacclesfield Road, Leek, Staffordshire ST13 8NR Tel: 01538 383 277Fax: 01538 385 731
carrs billington Agriculture (sales), milnathortStirling Road, Milnathort, Kinross KY13 9UZ Tel: 01577 862 381 Fax: 01577 863 057
carrs billington Agriculture (sales), morpeth20c Coopies Lane Industrial Estate, Morpeth, Northumberland NE61 6JN Tel: 01670 503 930 Fax: 01670 504 404
carrs billington Agriculture (sales), PenrithHaweswater Road, Penrith Industrial Estate, PenrithCumbria CA11 9EHTel: 01768 862 160Fax: 01768 899 345
carrs billington Agriculture (sales), PerthHighland House, St Catherine’s Road, Perth PH1 5YA Tel & Fax: 01738 643 022
carrs billington Agriculture(sales), spennymoorSouthend Works, Byers Green, Spennymoor, Co. Durham,DL16 7NLTel: 01388 662266Fax: 01388 603743
wallace oils, carlisleStephenson Industrial Estate, Willowholme, Carlisle, Cumbria CA2 5RN Tel: 01228 534 342 Fax: 01228 590 820
johnstone wallace fuels, dumfries Heathhall, Dumfries, Dumfriesshire DG1 3NX Tel: 01387 250 525 Fax: 01387 250 656
johnstone wallace fuels,Dargavel Stores,Lockerbie Road, Dumfries,Dumfriesshire DG1 3PGTel & fax: 01387 750 747
johnstone wallace fuels,Abercromby Industrial Park,Castle Douglas, DumfriesshireDG7 1BA
johnstone wallace fuels,Holmpark Industrial Estate,Newton Stewart, DumfriesshireDG8 6AWTel: 01671 404 150
johnstone wallace fuels, stranraer Droughduil, Dunragit, Stranraer DG9 8QA Tel & fax: 01581 400 356
Afgritech** Old Croft Stanwix, Carlisle Tel: 01228 554 600 Fax: 01228 554 601
bibby Agriculture** Drive House, St. David’s Park, Job’s Well Road, Carmarthen,SA31 3HB Tel: 01267 232 041 Fax: 01267 232 374
bibby Agriculture** 1A Network House Badgers Way Oxon Business Park Shrewsbury, Shropshire SY3 5AB Tel: 01743 237 890 Fax: 01743 351 552
bendalls Brunthill Road, Kingstown Industrial Estate, Carlisle CA3 0EH Tel: 01228 526 246 Fax: 01228 525 634
R hind Kingstown Broadway, Kingstown Industrial Estate, Carlisle CA3 0HA Tel: 01228 523 647 Fax: 01228 512 712
carrs msm Unit 1 Spitfire Way, Hunts Rise, South Marston Park, Swindon, Wiltshire SN3 4TX Tel: 01793 824 891 Fax: 01793 824 894
wälischmiller engineering gmbhSchießstattweg 1688677 MarkdorfGermanyTel: 0049 7544 95140Fax: 0049 7544 951499
carrs flour Solway Mills, Silloth, Wigton, Cumbria CA7 4AJ Tel: 016973 31661 Fax: 016973 32543
greens flour Station Road, Maldon, Essex CM9 4LQ Tel: 01621 852 696 Fax: 01621 854 525
hutchisons flour East Bridge, Kirkcaldy, Fife KY1 2SR Tel: 01592 267 191 Fax: 01592 641 805
john stronach Solway Mills, Silloth, Wigton, Cumbria CA7 4AJ Tel: 016973 31456 Fax: 016973 32808
silloth storage company**Station Road, Silloth,Wigton, CumbriaCA7 4JQ
* associate company** joint venture company
Directory of Operations

01 Financial and Commercial Highlights
02 Chairman’s Statement
05 Chief Executive’s Review
12 Financial Review
15 Board of Directors
16 Registered Offi ce and Advisers
17 Report of the Directors
20 Corporate Governance
23 Directors’ Remuneration Report
27 Independent Auditors’ Report
28 Consolidated Income Statement
29 Consolidated and Company Statement of Recognised Income and Expense
30 Consolidated and Company Balance Sheet
31 Consolidated and Company Cash Flow Statement
32 Principal Accounting Policies
37 Notes to the Financial Statements
81 Five Year Statement
83 Notice of Annual General Meeting
84 Directory of Operations
Carr’s Milling Industries PLCCarr’s Milling Industries PLC is focussed on the principal activities of agriculture, food and engineering. The Company’s agriculture business comprises fertiliser blending, retailing of farm machinery/supplies and animal feed manufacture in the UK, US and Germany. Carr’s principal food businesses are all fl our millers based in three UK locations. Engineering comprises Bendalls, R Hind, Carrs MSM and Wälischmiller based in Southern Germany which was acquired in 2009.
Designed and produced by corporateprm, Edinburgh and London. www.corporateprm.co.uk

Carr’s Milling Industries PLCAnnual Report & Accounts 2009
Carr’s Milling Industries PLC A
nnual Report & A
ccounts 2009
Carr’s Milling Industries PLCOld Croft, Stanwix Carlisle CA3 9BA
www.carrs-milling.com