annual report - america's health rankings executive summary overview america’s health...
TRANSCRIPT

The full report is available at www.AmericasHealthRankings.org
ANNUAL REPORT EXECUTIVE SUMMARYDECEMBER 2017

2
EXECUTIVE SUMMARYOVERVIEWAmerica’s Health Rankings® presents its 28th Annual Report, providing new insights to the longest-running assessment of the nation’s health on a state-by-state basis.
The 2017 report looks at 35 measures covering behaviors, community and environment, policy, clinical care and outcomes data. The report also serves as a benchmark for states – and the nation – to measure progress, identify emerging trends and drive action for improving public health.
This year, the report reveals that the nation is facing serious public health challenges, including rising rates of premature death and an uneven concentration of key health care providers.
United Health Foundation, through America’s Health Rankings platform, helps policy-makers, public health officials, researchers and communities improve the health, well-being and health care at the local, state and national level.
2

3
THE NATION FACES CONCERNING TRENDS IN MORTALITY
For more information please visit us at www.AmericasHealthRankings.org
Over the past five years, the change in mortality rates has varied among states, for example:
From 271.9 to 285.0 deaths per 100,000 population.
CARDIOVASCULAR DEATHS HAVE INCREASED
CANCER & CARDIOVASCULAR
DEATHS HAVE DECREASED
From 219.2 to 218.2 deaths and 318.5 to 316.2 deaths per
100,000 population, respectively.
From 13.7 to 17.7 deaths per 100,000 population.
DRUG DEATHS HAVE
INCREASED
+10%
The 2017 America's Health Rankings Annual Report finds the nation is experiencing concerning trends in mortality.
MASSACHUSETTS is ranked the healthiest state, but has experienced a large increase in the drug death rate since 2012.
Even some of the nation’s healthiest states are experiencing increases in mortality, for example:
UTAH is ranked the fourth healthiest state, but has one of the largest increases in the cardiovascular death rate since 2012.
The premature death rate has increased for the third straight year, along with increases in rates of cardiovascular and drug deaths.
+7%DRUG DEATHS
+2%CARDIOVASCULAR DEATHS
Since 2015
In the past year
Since 2015
+3%PREMATURE DEATHS
NEVADA LOUISIANA
CANCER DEATHS HAVE
DECREASED From 191.3 to 189.7 deaths
per 100,000 population.
+69%
Across the U.S., the premature death rate (the number of years of potential life lost before age 75) increased for the third straight year, reaching 7,214 years lost before age 75 per 100,000 population. This recent rise is concerning, particularly after the premature death rate declined dramatically by 20 percent from 1990 to 2015.
2017 also saw increases in the rates of cardiovascular and drug deaths nationwide. Cardiovascular deaths increased in the U.S. for the second consecutive year. The rate among blacks is significantly higher than the rate among whites, Hispanics, Asians and American Indians/Alaska Natives. Drug deaths continued on an upward trend, increasing by 7 percent to the highest level recorded by America’s Health Rankings (15.0 deaths per 100,000 population) and were particularly high among whites.
MORTALITY RATES ARE INCREASING IN MANY STATES, EVEN THOSE RANKED HIGHLY FOR OVERALL HEALTH The report finds that over the past five years, even some of the nation’s healthiest states by overall rank have experienced notable increases in key measures of mortality. Three northeastern states that regularly rank toward the top in overall health have experienced large increases in drug deaths.
• New Hampshire’s rate increased by 118 percent (additional 13.2 deaths per 100,000 population).• Massachusetts’ rate increased by 69 percent (additional 8.1 deaths per 100,000 population).• Rhode Island’s rate increased by 56 percent (additional 8.9 deaths per 100,0000 population).
This trend is also true for cardiovascular deaths. Although ranked as the fourth healthiest state this year, Utah experienced one of the largest increases in the rate of cardiovascular deaths (additional 21.9 deaths per 100,000 population) from 2012 to 2017.
While key mortality rates have increased nationally, the burden has not been felt evenly by all states. For example:
• Nevada’s rate of cancer deaths declined, but its rate of cardiovascular deaths increased since 2012 (from 191.3 to 189.7 deaths per 100,000 population and 271.9 to 285.0 deaths per 100,000 population, respectively).
• Meanwhile, Louisiana’s rate of drug deaths increased from 13.7 to 17.7 deaths per 100,000 population over the past five years, but cancer and cardiovascular deaths declined during the same period (by 1.0 deaths per 100,000 population and 2.3 deaths per 100,000 population, respectively).
3
4
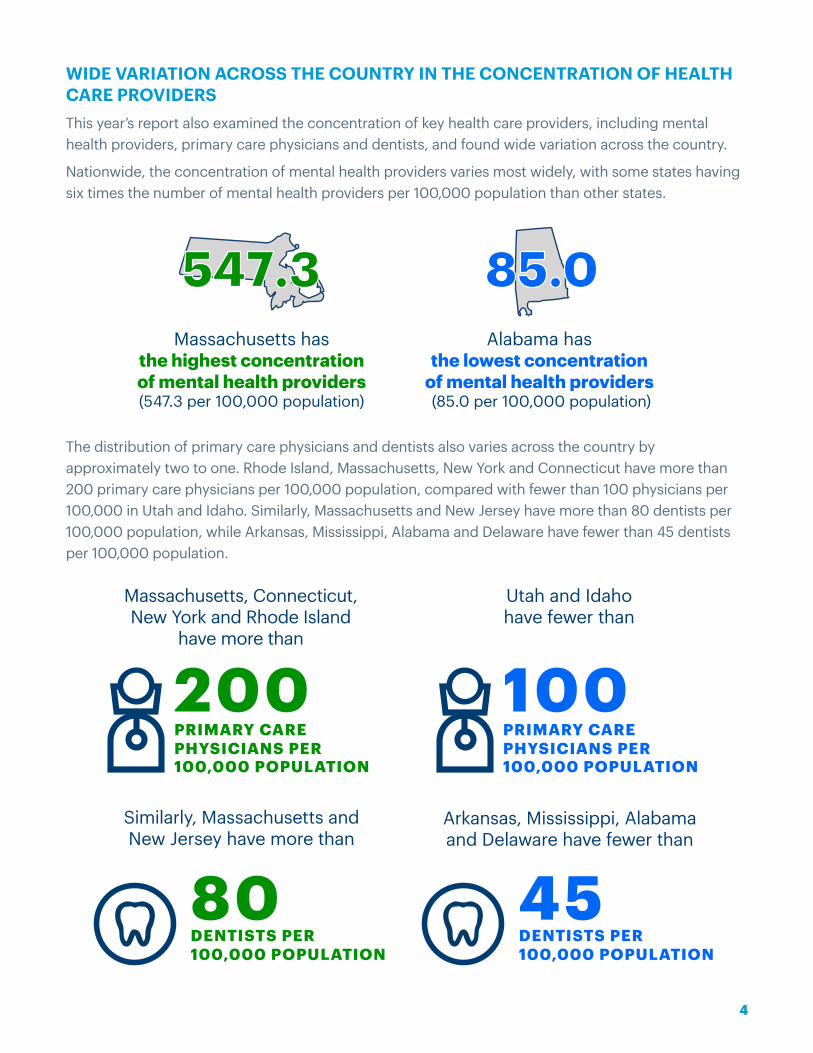
WIDE VARIATION ACROSS THE COUNTRY IN THE CONCENTRATION OF HEALTH CARE PROVIDERS This year’s report also examined the concentration of key health care providers, including mental health providers, primary care physicians and dentists, and found wide variation across the country.
Nationwide, the concentration of mental health providers varies most widely, with some states having six times the number of mental health providers per 100,000 population than other states.
For more information please visit us at www.AmericasHealthRankings.org
Nationwide, the concentration of mental health providers varies widely, with some states having six times the number of mental health
providers per 100,000 population than other states.
Alabama has the lowest concentration
of mental health providers (85.0 per 100,000 population)
Massachusetts has the highest concentration of mental health providers (547.3 per 100,000 population)
85.0
Massachusetts, Connecticut, New York and Rhode Island
have more than
Utah and Idahohave fewer than
100,000 POPULATION
100PRIMARY CARE PHYSICIANS PER
100,000 POPULATION
200PRIMARY CARE PHYSICIANS PER
Similarly, Massachusetts and New Jersey have more than
Arkansas, Mississippi, Alabama and Delaware have fewer than
45DENTISTS PER100,000 POPULATION
The distribution of primary care physicians and dentists varies across the country by approximately two to one.
The concentration of key health care providers varies widely across the country.
80DENTISTS PER100,000 POPULATION
547.3
The distribution of primary care physicians and dentists also varies across the country by approximately two to one. Rhode Island, Massachusetts, New York and Connecticut have more than 200 primary care physicians per 100,000 population, compared with fewer than 100 physicians per 100,000 in Utah and Idaho. Similarly, Massachusetts and New Jersey have more than 80 dentists per 100,000 population, while Arkansas, Mississippi, Alabama and Delaware have fewer than 45 dentists per 100,000 population.
For more information please visit us at www.AmericasHealthRankings.org
Nationwide, the concentration of mental health providers varies widely, with some states having six times the number of mental health
providers per 100,000 population than other states.
Alabama has the lowest concentration
of mental health providers (85.0 per 100,000 population)
Massachusetts has the highest concentration of mental health providers (547.3 per 100,000 population)
85.0
Massachusetts, Connecticut, New York and Rhode Island
have more than
Utah and Idahohave fewer than
100,000 POPULATION
100PRIMARY CARE PHYSICIANS PER
100,000 POPULATION
200PRIMARY CARE PHYSICIANS PER
Similarly, Massachusetts and New Jersey have more than
Arkansas, Mississippi, Alabama and Delaware have fewer than
45DENTISTS PER100,000 POPULATION
The distribution of primary care physicians and dentists varies across the country by approximately two to one.
The concentration of key health care providers varies widely across the country.
80DENTISTS PER100,000 POPULATION
547.3
4

5
2017 STATE RANKINGS
For more information please visit us at www.AmericasHealthRankings.org
The Healthiest States
CONNECTICUT
5VERMONT
3MASSACHUSETTS HAWAII
2The States With the Biggest Challenges
LOUISIANA ARKANSAS ALABAMA WEST VIRGINIAMISSISSIPPI
47484950The States That Made the
Biggest Improvement in RankThe State With the
Largest Rank Decline
NORTH DAKOTA
2017 ANNUAL REPORT RANKINGS
AK
ME
WI
VT NHWA
ID
MT NDMN
IL
MINY
OR
NV
WYSD
IAIN
PA
NJCTRI
CA UTCO
NE
MO KY
WV
VA
MDDE
AZ NM
KS
ARTN NC
SCDC
OK
LAMS AL GA
HI
TX
FL
OH
31 to 4021 to 3011 to 20 41 to 501 to 10RANK:
UTAH
4
46
UTAHFLORIDA
Not Ranked
MA
1
This year, Massachusetts ranks as the healthiest state, while Hawaii — which has held the top spot for the past five years — drops to second. Vermont (No. 3), Utah (No. 4) and Connecticut (No. 5) round out the top five states for overall health.
For the second year in a row, Mississippi (No. 50) has the greatest opportunity for improvement in overall health. Louisiana (No. 49), Arkansas (No. 48) and Alabama (No. 47) maintained their rankings from last year, while West Virginia fell three places (No. 46) to round out the five states with the most significant areas of opportunity for improvement in health and well-being.
For more information please visit us at www.AmericasHealthRankings.org
The Healthiest States
CONNECTICUT
5VERMONT
3MASSACHUSETTS HAWAII
2The States With the Biggest Challenges
LOUISIANA ARKANSAS ALABAMA WEST VIRGINIAMISSISSIPPI
47484950The States That Made the
Biggest Improvement in RankThe State With the
Largest Rank Decline
NORTH DAKOTA
2017 ANNUAL REPORT RANKINGS
AK
ME
WI
VT NHWA
ID
MT NDMN
IL
MINY
OR
NV
WYSD
IAIN
PA
NJCTRI
CA UTCO
NE
MO KY
WV
VA
MDDE
AZ NM
KS
ARTN NC
SCDC
OK
LAMS AL GA
HI
TX
FL
OH
31 to 4021 to 3011 to 20 41 to 501 to 10RANK:
UTAH
4
46
UTAHFLORIDA
Not Ranked
MA
1
5

6
ADDRESSING MOUNTING CHALLENGES TO THE HEALTH OF OUR NATION For the 28th year, America’s Health Rankings provides data and insights on a national and state-by-state level, which can be used to drive action in improving the health of our communities. While the report highlights significant challenges facing our country, United Health Foundation also recognizes cross-stakeholder collaboration has resulted in local successes, which may have potential for adaptation across geographies. Community leaders looking to improve the health of where they live are encouraged to leverage the report’s findings, along with additional data available on the America’s Health Rankings® website, to identify opportunities for improvement.
Florida and Utah experienced the largest rank improvements since last year, rising four places in the rankings to No. 32 and No. 4 in the country, respectively. Florida’s improvements include positive changes in its rankings for the percentage of children in poverty and frequent mental distress since 2016. Utah also improved its rankings for several measures in the same time period, including air pollution and immunizations among children.
For more information please visit us at www.AmericasHealthRankings.org
The Healthiest States
CONNECTICUT
5VERMONT
3MASSACHUSETTS HAWAII
2The States With the Biggest Challenges
LOUISIANA ARKANSAS ALABAMA WEST VIRGINIAMISSISSIPPI
47484950The States That Made the
Biggest Improvement in RankThe State With the
Largest Rank Decline
NORTH DAKOTA
2017 ANNUAL REPORT RANKINGS
AK
ME
WI
VT NHWA
ID
MT NDMN
IL
MINY
OR
NV
WYSD
IAIN
PA
NJCTRI
CA UTCO
NE
MO KY
WV
VA
MDDE
AZ NM
KS
ARTN NC
SCDC
OK
LAMS AL GA
HI
TX
FL
OH
31 to 4021 to 3011 to 20 41 to 501 to 10RANK:
UTAH
4
46
UTAHFLORIDA
Not Ranked
MA
1
North Dakota experienced the largest rank decline, falling seven places in the rankings to No. 18 in the country. The state’s rankings for smoking, Salmonella and immunizations among children all declined in the past year.
For more information please visit us at www.AmericasHealthRankings.org
The Healthiest States
CONNECTICUT
5VERMONT
3MASSACHUSETTS HAWAII
2The States With the Biggest Challenges
LOUISIANA ARKANSAS ALABAMA WEST VIRGINIAMISSISSIPPI
47484950The States That Made the
Biggest Improvement in RankThe State With the
Largest Rank Decline
NORTH DAKOTA
2017 ANNUAL REPORT RANKINGS
AK
ME
WI
VT NHWA
ID
MT NDMN
IL
MINY
OR
NV
WYSD
IAIN
PA
NJCTRI
CA UTCO
NE
MO KY
WV
VA
MDDE
AZ NM
KS
ARTN NC
SCDC
OK
LAMS AL GA
HI
TX
FL
OH
31 to 4021 to 3011 to 20 41 to 501 to 10RANK:
UTAH
4
46
UTAHFLORIDA
Not Ranked
MA
1
6

www.AmericasHealthRankings.org
For more information, contact:L.D. Platt
United Health Foundation(202) 654-8830