annual report accounts 2016 - themanchester.co.uk · 125 portland street manchester m1 4qd tel 0161...
TRANSCRIPT
ANNUAL REPORT& ACCOUNTS
2 0 1 6
57644 Annual Report 2016_27728_MBS_Ann_Report_2006 20/03/2017 15:17 Page 2

125 Portland StreetManchester M1 4QDTel 0161 923 8000 Fax 0161 923 8950 Web www.themanchester.co.ukAuthorised by the Prudential RegulationAuthority and regulated by the FinancialConduct Authority and Prudential RegulationAuthority
Member of the Building Societies Association
Member of the Council of Mortgage Lenders
00000 Annual Report 2016_27728_MBS_Ann_Report_2006 13/03/2017 13:17 Page 3

CONTENTS Page Chairman’s Statement 1 Strategic Report 2 Directors’ Report 9 Corporate Governance 10 Directors’ Remuneration Report 13 Statement of Directors’ Responsibilities 14 Independent Auditors’ Report 15 Statements of Comprehensive Income 17 Statements of Changes in Equity 17 Statements of Financial Position 18 Statements of Cash Flows 19 Notes to the Financial Statements 20 Annual Business Statement 59 County by Country Report 62

CHAIRMAN’S STATEMENT
MANCHESTER BUILDING SOCIETY ANNUAL REPORT & ACCOUNTS PAGE 1
In 2016 the Board continued to focus on the prudent management of the Society in line with the strategy adopted in 2013 of reducing the size of the balance sheet in order to preserve capital.
In the twelve months ended 31 December 2016 the Society and its subsidiaries (the “Group”) recorded an operating profit before impairments and provisions of £0.5m compared with £2.9m in the preceding twelve months. A modest decline in net interest income reflected the continued reduction in the size of the loan book which fell 12% from £331m to £289m largely mitigated by a 9% reduction in funding from £372m to £340m. The Society also incurred a £0.9m charge (2015: charge £1.2m) to ensure regulatory compliance of two acquired portfolios, the administration of which was brought in-house in December 2015.
Administrative expenses (including depreciation) of £8.7m were significantly higher than the £6.8m in the previous year. Professional costs were incurred on two exercises requested by the Prudential Regulation Authority (“PRA”): an evaluation of the capital required to re-enter the residential mortgage market; and the preparation of a Capital Conservation Plan. The latter was required because the Society did not meet its Common Equity Tier 1 (“CET 1”) Combined Buffer requirements as at 30 June 2016. As a result of this shortfall, the Society was prohibited by Capital Requirements Directive IV (“CRD IV”) from paying the coupons on Permanent Interest Bearing Shares (“PIBS”) in October 2016. At the request of the PRA, the Capital Conservation Plan is being revised and updated to reflect the 2016 results and to review further the potential measures for addressing the shortfall to the CET1 capital requirements.
As outlined in last year’s Annual Report, the Board has continued to explore options, in discussion with PRA, to secure the long-term future of the Society. To this end, substantial professional costs were also incurred during 2016 in respect of a proposed merger with another mutual society. In the event, the merger partner terminated discussions at a late stage. All costs relating to this exercise have been charged to administrative expenses.
The Society’s €57m Spanish Lifetime portfolio originated between 2008 and 2010 required a further provision of £1.6m in the year owing to adverse external factors, including exchange rates, property revaluations and forecast house prices in Spain. Additional loan impairment provisions were also required on the rest of the portfolio with a total impairment charge of £3.4m (2015: £0.7m).
After taking account of these charges and the compulsory Financial Services Compensation Scheme (“FSCS”) levy of £0.1m (2015: £0.3m), the Group recorded a post-tax loss of £3.4m (2015: loss £4.9m). At 31 December 2016, the Group had negative accounting reserves of £9.2m (2015: negative £5.6m).
The Society continues to have significant headroom above its Individual Capital Guidance (“ICG”) in total capital terms as set by the PRA. However, given the continuing shortfall against the CET1 Combined Buffer requirement and the loss for the year, the Society is prohibited from making the PIBS coupon payments due in April 2017. The Board considers that there continues to be uncertainty over the Society’s ability to make coupon payments thereafter.
The Society continues to hold high levels of liquidity. With effect from 30 January 2017, the Financial Services Compensation Scheme (“FSCS”) limit on the guaranteed amount of retail savings deposits was raised from £75,000 to £85,000. On 30 January 2017 99.4% of the Society’s eligible retail savings were guaranteed by the FSCS.
The Board has continued to take legal advice regarding the Society’s claim for damages against the previous external auditors, Grant Thornton UK LLP. Although the outcome of litigation is inherently uncertain, having taken account of this legal advice, the Board is firmly of the opinion that it is in the best interests of members to pursue this claim. If the matter progresses to trial, the trial will not be before 2018.
The Society is not currently engaged in merger discussions with other mutual organisations.
The Board continues to explore the possibility of entering into one or more transactions with non-mutual organisations. In the event that an offer were received from a non-mutual organisation for all or part of the Society’s operations, the Board would consider whether the transaction was in the interest of members as a whole, mindful that, while retail savers and borrowers were unlikely to be impacted greatly, there may be implications for the holders of the Society’s Profit Participating Deferred Shares (“PPDS”), PIBS and subordinated debt. In addition, taking account of the Society’s need to address its CET1 capital shortfall, the Board is evaluating whether to make an offer to buy back or convert the PIBS and other capital instruments. Any offer, if made, would reflect the current financial position of the Society and the material uncertainty regarding its long-term prospects as set out in note 1 to the accounts on page 20.
D.A. Harding Chairman 13 March 2017

STRATEGIC REPORT FOR THE YEAR ENDED 31 DECEMBER 2016
MANCHESTER BUILDING SOCIETY ANNUAL REPORT & ACCOUNTS PAGE 2
Introduction
The directors present their 94th Annual Report together with the Accounts and Annual Business Statement for the Group for the year ended 31 December 2016.
The Group consists of the Society and its two wholly owned subsidiaries: MBS (Mortgages) Limited and MBS (Property) Limited; further, under the terms of IFRS 10 Consolidated Financial Statements, this set of Financial Statements includes the consolidated position of NMB Mortgage Acquisition Company Limited (in administration) (“NMB MAC”), where the Group exerts control notwithstanding that it holds no shares in that entity.
The Group’s strategy and results for the year are covered in detail in the sections that follow, along with the principal risks and uncertainties that the Group faces.
Strategy
The Society is owned by its members. The means by which its value is preserved is by providing products that meet the financial needs of both existing and potential members.
The Group’s strategy since 2013 has been to reduce its risks and conserve its regulatory capital. This strategy was necessary because of events, fully disclosed in the Annual Report and Accounts for the year ended 31 December 2012, that led to a material write-down of the Society's reserves following a change in the accounting treatment of certain financial assets.
Risk reduction has been achieved via the disposal of almost all of the Society’s non-strategic UK lifetime mortgage assets. Further reduction has been sought by investigating the potential for disposals of other mortgage assets. The Board’s strategic aim in this regard has been to move the Society’s risk profile away from those legacy asset positions that carried higher risks and higher regulatory capital risk weightings.
During 2016 the Society initiated a project to ensure regulatory compliance of two acquired second charge loan portfolios, NMB MAC and The Consumer Loans Company Limited (CLC), the administration of which was brought in-house in December 2015. The remediation of these portfolios is ongoing and the completion of this work in 2017 is an important step towards either a disposal of those assets or a corporate transaction for the Society.
Regulatory capital conservation has continued to be a priority. The Society continues to have significant headroom above its ICG in total capital terms as set by the PRA, due to the Society’s PIBS (that is Additional Tier 1 capital being amortised into Tier 2 capital) and subordinated debt (that is Tier 2 capital). However, there is a shortfall of CET1 capital against the Combined Buffer requirement. The Society has continued to explore ways in which the CET1 regulatory capital position could be improved and a range of options was submitted in a Capital Conservation Plan to the PRA in October 2016. These options include improving the CET1 regulatory capital position by restructuring capital. At the request of the PRA, the Capital Conservation Plan is being revised and updated to reflect the 2016 results and review further the potential measures for addressing the shortfall to the CET1 capital requirements. The outcome and timing of the regulatory process is uncertain. In addition, owing to the financial position and challenges faced by the business there is a risk that the Society will not meet the regulatory requirement to hold 4.5% of CET1 capital against risk weighted assets in future. This potential risk is to be addressed in the revised and updated Capital Conservation Plan.
The Board continues to take legal advice regarding the Society’s claim for damages against the previous external auditors, Grant Thornton UK LLP.
Against this background the Board is currently reviewing the strategic direction of the Society and continues to hold discussions with the PRA; the uncertainties which exist regarding the longer term prospects of the Society are disclosed in note 1 on page 20.
Business Model
The principal activities of the Group remain the provision of competitive facilities for personal savings and for mortgage finance primarily to support owner occupation of residential property.
Emphasis in achieving these principal business objectives is placed on offering a secure home for retail depositors’ savings and on high standards of customer services to support the Group’s range of products.
Key performance indicators
Key performance indicators (“KPIs”) monitored by the Board include the following:
• Capital • Liquid assets • Retail balances • Mortgages and other loans • Administration expenses • Profit on ordinary activities before income tax
The KPIs are considered in more detail in the sections that follow below, with indications as to why each metric is considered to be of importance in assessing financial performance. Additional commentary on the Group’s performance is contained within the Chairman’s Statement.
Review of business performance
In 2016 the Group reported a loss for the financial year of £3.4m (2015: loss of £4.9m). This loss is after reflecting write-downs to the carrying value of certain assets, as detailed below, as a consequence of the Group’s projected financial performance.
In the year the Group reported operating profit before impairments and provisions and the FSCS levy of £0.5m (2015: £2.9m).

STRATEGIC REPORT FOR THE YEAR ENDED 31 DECEMBER 2016
MANCHESTER BUILDING SOCIETY ANNUAL REPORT & ACCOUNTS PAGE 3
A reconciliation of operating profit before impairments and provisions to loss on ordinary activities before income tax and the loss for the financial year is set out below:
The £2.4m reduction in operating profit before impairments and provisions from 2015 is due to:
• Net interest income in the year being £0.1m lower than in 2015. This reflects lower interest receivable as the loan book fell by £41.1m from £330.6m to £289.5m while total assets fell by £34.3m from £416.6m to £382.3m. This was mitigated by reduced interest payable on retail and wholesale funding which reduced from £371.6m to £340.1m.
• £0.1m lower fee and commission income of £0.2m (2015: £0.3m). • Exchange rate gains in the year resulted in other operating income being £0.3m higher, at £0.6m (2015: £0.3m). • 2015 included the non-recurring £0.7m profit on the sale of the Society’s minority stake in New Life Home Finance Limited. • Administrative expenses increased by £1.9m mainly due to professional fees associated with the legal claim against Grant Thornton UK LLP; a
proposed merger with another mutual society; an exercise at the request of the PRA to evaluate the capital required to re-enter the residential mortgage market; and the preparation of a Capital Conservation Plan to meet the requirements of CRD IV article 142.
There was a charge for customer redress of £1.0m (2015: £1.2m) recorded in the year in relation to potential regulatory non-compliance in two acquired portfolios, the administration of which was brought in-house in December 2015 and the BOS versus Rea decisions (note 31).
Additional net loan impairment provisions of £3.4m were incurred, as explained more fully on page 4.
In 2015 the carrying value of the head office building was written down by £2.5m to reflect the fair value.
As a result of applying the long term run-off financial projections, £0.4m (2015: £4.3m) of the deferred tax asset has been de-recognised and an income tax expense has been recognised for this amount. This results in a loss for the financial year of £3.4m (2015: loss of £4.9m) being taken to Group consolidated reserves.
After having made the above adjustments the Society has a shortfall against the CET1 Combined Buffer requirement as at 31 December 2016 and, in order to conserve capital, a distribution to PIBS holders in April 2017 is prohibited under CRD IV article 141. PROFITABILITY Result for the year: The Group reported a loss for the financial year of £3.4m (2015: loss of £4.9m) and a loss on ordinary activities before income tax for the year of £3.0m (2015: loss of £0.6m).
Net interest income: The Group’s net interest income was:
The level of interest earned on mortgages and loans was lower at £12.8m (2015: £13.9m); interest on other liquid assets was lower at £0.3m (2015: £0.5m).
Interest paid to savings members reduced from £4.2m in 2015 to £3.7m in 2016, reflecting the combined impact of lower interest rates paid on a reducing savings book (2016: £315.4m of balances owed to members compared with £324.6m at 31 December 2015).
Group Group 2016 2015£000 £000
Operating profit before impairments and provisions 547 2,917
Impairment (losses) on loans and advances to customers (3,448) (748)
Impairment of property, plant and equipment - (2,471)
Financial Services Compensation Scheme Levy (67) (277)
(Loss) on ordinary activities before income tax (2,968) (579)
Income tax (expense) (382) (4,295)
(Loss) for the financial year (3,350) (4,874)
Group Group 2016 2015£000 £000
Interest receivable and similar income 13,165 14,401 Interest payable and similar charges (4,693) (5,853)
Net interest income 8,472 8,548

STRATEGIC REPORT FOR THE YEAR ENDED 31 DECEMBER 2016
MANCHESTER BUILDING SOCIETY ANNUAL REPORT & ACCOUNTS PAGE 4
Other income and other charges: Other income and charges rose in the year, with an increase in exchange gains of £3.8m to £2.2m (2015: loss £1.6m) offset by an increase in fair value losses from economic hedging using foreign exchange derivatives of £3.4m to £1.6m (2015: gain £1.8m). The net impact of this was that other operating income was £0.3m higher, at £0.6m (2015: £0.3m).
Administrative expenses: The Group’s day to day administrative activities were broadly unchanged from those of the previous year. Overhead and depreciation expenditure increased from £6.8m to £8.7m mainly due to professional fees associated with the legal claim against Grant Thornton UK LLP; a proposed merger with another mutual society; an exercise at the request of the PRA to evaluate the capital required to re-enter the residential mortgage market; and the preparation of a Capital Conservation Plan to meet the requirements of CRD IV article 142.
Impairment losses: Impairment losses of £3.4m were recorded in 2016 (2015: losses of £0.7m) in respect of the Group’s mortgage book.
All elements of the Group’s mortgage and loan books were tested for impairment during the year and all impairment provisions were re-assessed.
The net impairment charge of £3.4m included a charge of £0.8m in respect of the NMB MAC second charge loans and CLC where the Group holds a beneficial interest and provisioning of £1.1m in respect of the core mortgage book.
There was a £1.6m increase in the ‘no negative equity guarantee’ provision for the Spanish lifetime portfolio with £0.6m arising from depreciation in Sterling during the year. The other £1.0m increase reflects the cumulative growth in gross Spanish lifetime balances from €56m to €57m combined with adverse external factors including property revaluations and forecast house prices in Spain.
FINANCIAL POSITION
Liquid Assets: The Group’s liquid assets are deposited with the Bank of England and with UK “High Street” banking counterparties in instantly accessible bank accounts. Of the Society’s total liquid funds at 31 December 2016, £67.4m was deposited with the Bank of England (2015: £55.9m). Only £0.3m of investment securities were held at 31 December 2016 (2015: £0.1m).
Within investment securities at 31 December 2016 £0.2m was held in UK Treasury Bills (2015: £nil).
Mortgages and Other Loans: Group mortgage balances, after provisions, were £289.5m (2015: £330.6m), representing a year on year decrease of 12.4 % (2015: 14.7% reduction). Further, to seek improvement in its regulatory capital position, the Society made no advances during the year (2015: £nil).
Overall, the performance of the core mortgage book continues to be in line with expectations. The Group has continued in its efforts to minimise mortgage arrears and to help borrowers in difficulties to resolve their situations, taking a consultative approach with borrowers who experience payment difficulties and applying forbearance as appropriate. At 31 December 2016, excluding the second charge portfolio, there were 19 mortgage accounts (2015: 15) where payments were 12 or more months in arrears. Outstanding balances on these accounts amounted to £7.3m (2015: £5.5m) with total arrears of £1.0m (2015: £0.8m), representing 2.3% of total gross mortgage balances (2015: 1.6%). The percentage of accounts 12 months or more in arrears has increased because of the declining level of total mortgage assets in the year and the absence of new lending. However the underlying arrears performance has been stable.
There were 12 properties in possession at the end of the year (2015: 8). These figures exclude the NMB MAC portfolio, where the Group only has a beneficial interest in the mortgage assets, and The Consumer Loans Company Limited (“CLC”) portfolio. Arrears banding information is not presented for these second charge portfolios as there is insufficient reliable data to determine this accurately.
Provisions for potential mortgage losses have been calculated by assessing impairment indicators, arrears and forbearance positions and historic loss experience. Mortgage accounts in arrears by 3 months or more are reviewed regularly, as are impairment provision requirements.
Further information is given in Note 1.
Investment property: At the year end the Society held a small number of residential properties as a result of the settlement of an impaired mortgage asset. The properties are being held, pending their eventual sale, and have a fair value of £0.8m (2015: 0.8m).
Other Assets: Included within Other Assets is a sum of £3.1m (2015: £1.0m) relating to collateral deposited in the form of cash under credit support annex agreements (“CSA”) with the Group’s counterparty providers of foreign exchange swaps.
Retail Balances: Retail balances reduced to £315.4m (2015: £324.6m) in proportion to the overall reduction in the balance sheet. The range of savings products available during the year was carefully managed in order to ensure that a suitable level of funding was held and that the rates offered were appropriately competitive.

STRATEGIC REPORT FOR THE YEAR ENDED 31 DECEMBER 2016
MANCHESTER BUILDING SOCIETY ANNUAL REPORT & ACCOUNTS PAGE 5
Capital: The purpose of the Group’s capital is to support its mortgage book and to absorb any losses that may arise, thereby offering members protection as a regulated deposit taker.
The Board manages capital within the regulatory limits set by the PRA. For regulatory capital purposes the Group is made up of the Society, MBS (Mortgages) Limited and, following approval from the PRA in 2016 for an amendment to the regulatory capital Group, MBS (Property) Limited, with the regulatory capital positions at 31 December 2016 and 31 December 2015 being:
Since the start of 2016 Total Regulatory Capital under CRD IV has decreased by £4,390k made up as follows: • the retained loss of the regulatory capital group for the year of £3,688k; • the continued grandfathering of Subordinated debt out of Tier 2 capital over a 9 year period, amounting to £500k in the year; • a reduction in the allowed collectively identified provisions of £202k. Under the CRD IV rules applicable from 1 January 2017, Total Regulatory Capital is reduced by £500k compared to the position at 31 December 2016. This is due to Tier 2 Regulatory Capital being reduced by a further £500k in respect of continuing Subordinated debt grandfathering. As at 31 December 2016 the Society had significant headroom above its ICG in total capital terms as set by the PRA due to the Society’s PIBS (that is Additional Tier 1 capital being grandfathered into Tier 2 capital) and subordinated debt (that is Tier 2 capital). However, the Society has a shortfall against the CET1 Combined Buffer requirement. The Society has continued to explore ways in which the CET1 regulatory capital position could be improved and a range of options was submitted in a Capital Conservation Plan to the PRA in October 2016. These options include improving the CET1 regulatory capital position by restructuring capital. At the request of the PRA, the Capital Conservation Plan is being revised and updated to reflect the 2016 results and review further the potential measures for addressing the shortfall to the CET1 capital requirements. The outcome and timing of the regulatory process is uncertain.
As a result of the shortfall against the CET1 Combined Buffer requirement together with the loss for the year, under CRD IV article 141, in order to conserve capital, the Society is prohibited from making the PIBS coupon payments due in April 2017. The Board considers that there continues to be uncertainty over the Society’s ability to make coupon payments thereafter.
Owing to the financial position and challenges faced by the business there is a risk that the Society will not meet the regulatory requirement to hold 4.5% of CET1 capital against risk weighted assets in future. This potential risk is to be addressed in the revised and updated Capital Conservation Plan.
The Group’s gross capital reduced to 10.9% at 31 December 2016 from 11.0% at 31 December 2015. The free capital at 31 December 2016 was 13.6% (2015: 12.6%). Definitions of gross capital and free capital may be found in the Annual Business Statement.
Financial Risk Management Objectives
The Group offers mortgage and savings products. It undertakes limited interaction with the wholesale money market for cash flow and liquidity management purposes. There are formal structures in place to monitor, report and manage the risks associated with the Group’s operations. The Board
Amendments New RegulatoryGroup due to new Regulatory Group Movement Group Movement Group
31-Dec-15 Regulatory Group 31-Dec-15 in 2016 31-Dec-16 for 2017 1-Jan-17Tier 1 Capital £000 £000 £000 £000 £000 £000 £000
Accumulated losses (3,125) (2,430) (5,555) (3,688) (9,243) - (9,243)Deductions (1) 1 - - - - - Profit Participating Deferred Shares 17,461 - 17,461 - 17,461 - 17,461
Total CET1 Capital 14,335 (2,429) 11,906 (3,688) 8,218 - 8,218
Permanent Interest Bearing SharesNominal balance 14,788 - 14,788 - 14,788 - 14,788Amortisation (4,437) - (4,437) (1,478) (5,915) (1,479) (7,394)
Net Permanent Interest Bearing Shares 10,351 - 10,351 (1,478) 8,873 (1,479) 7,394
Total Tier 1 Capital 24,686 (2,429) 22,257 (5,166) 17,091 (1,479) 15,612
Tier 2 CapitalSubordinated DebtNominal balance 14,200 - 14,200 - 14,200 - 14,200Amortisation (1,500) - (1,500) (500) (2,000) (500) (2,500)Net Subordinated Debt 12,700 - 12,700 (500) 12,200 (500) 11,700
Collective Provisions 2,155 (30) 2,125 (202) 1,923 - 1,923Permanent Interest Bearing Shares 4,437 - 4,437 1,478 5,915 1,479 7,394
Total Tier 2 Capital 19,292 (30) 19,262 776 20,038 979 21,017
Total Regulatory Capital 43,978 (2,459) 41,519 (4,390) 37,129 (500) 36,629

STRATEGIC REPORT FOR THE YEAR ENDED 31 DECEMBER 2016
MANCHESTER BUILDING SOCIETY ANNUAL REPORT & ACCOUNTS PAGE 6
Financial Risk Management Objectives (continued)
seeks to manage the risks that the Group faces through a suite of regularly reviewed and approved policies, covering: Credit, Liquidity, Financial Risk Management and Operational Risk.
Principal Risks and Uncertainties
Given the CET1 regulatory capital shortfall against the Combined Buffer, the requirement for an increase in CET1 capital in order to return to lending, and the assessed prospects for the business and its capital position without such a return, there is a material uncertainty arising from the continued run-off of the balance sheet. The Board is assessing a number of options to secure the long term future of the Group. The immediate focus is on measures to improve the capital position of the Group in discussion with the PRA. The outcome and timing of the regulatory process is uncertain.
In June 2016 the UK voted in a referendum to leave the European Union (“EU”). The medium to long term impact of this on UK government policy, the financial markets and the wider UK economy is unknown. With regard to the Group’s Spanish lifetime portfolio this introduces additional uncertainty and risk which the Board is monitoring; in particular there is added risk and uncertainty in relation to foreign exchange volatility, property values for the Spanish lifetime portfolio and the behavioral impact on Spanish lifetime mortgage borrowers.
The Society will carry out work during 2017 to prepare for the implementation of IFRS 9 – Financial instruments effective on 1 January 2018. The most significant impact on the Group is likely to be in respect of the measurement of impairment of financial assets. Under IFRS 9, impairment will be based on expected credit losses (“ECL”) rather than incurred credit losses which is the methodology the Group currently adopts under IAS 39. At initial recognition, an ECL provision is required for default events in the next 12 months, whilst following a significant increase in credit risk, a lifetime ECL is required. The review of credit risk and the calculation of ECL are required to be unbiased and probability weighted, and should include all available relevant information, with assessments of current conditions and forecasts of future economic conditions. As a result the recognition and measurement of impairment is more forward looking than is the case under IAS 39. Consequently, it is likely to lead to an increase in the Society’s total level of provision. At present, based on an initial assessment, management believes that the impact on future profitability will be modest; however it is likely to lead to an increased loan provision on adoption of IFRS 9.
Every business faces risks as part of its day-to-day operation. The Board’s risk management objectives are to seek to minimise the risks that the Group faces, by articulating that it has a low appetite for risk and by deploying a range of risk management policies and procedures within an appropriate control environment in order to achieve such an outcome.
Summarised below are the Group’s other key risks and uncertainties:
Credit Risk: The Group is exposed to the risk that it may not receive back in full any sum that has been lent (in relation to loans and advances) or any sum that it has deposited with a banking counterparty (in relation to liquid assets) when such amounts fall due. The Board monitors credit risk, underlying security values and the level of impairment provisions on a regular basis. Credit risk is more of a consideration in relation to loans and advances than in relation to the Society’s liquid assets; the former involve relationships with individuals or small businesses, whilst the latter are far fewer in number, being restricted to either the Bank of England or UK High Street banks, where credit risk is assessed as being very low.
The Society’s management of credit risk in respect of loans and advances recognises that as the portfolio runs off it is likely that a greater part of the residual assets will have a higher credit risk profile.
The assessment of credit risk and the related impairment provisioning is a critical accounting estimate, impacted by judgements relating to customer affordability and the impact of economic circumstances, including the level of interest rates. Prior to the current strategy of no new lending, credit risk was mitigated by appropriate mortgage underwriting and by limiting the Group’s exposure to particular market sectors or loans exhibiting particular attributes. Since the cessation of new lending credit risk has been mitigated through the monitoring of management information, assessment of arrears and forbearance cases, and regular loan provision reviews. The Group holds a beneficial interest in NMB MAC, a portfolio of mortgage assets, some of which are regulated by the Consumer Credit Act (“CCA”). The legal title of these loans remains with a third party business currently in administration, over which the Group exerts control. A further smaller portfolio, CLC, which had previously been beneficially owned and which is now legally owned by the Group has similarly CCA regulated mortgage assets. An assessment has been made of the estimated discounted future cash flows expected to arise from both these portfolios of loans which forms the basis for the impairment provision. Sensitivities in respect of the impairment provision required for these portfolios are given on page 37.
The administration of the NMB MAC and CLC portfolios was brought in-house in December 2015.
Insurance Risk: Impairment assessments incorporate the insurance risk attaching to the Society’s lifetime mortgage contracts, which are euro-denominated. The risk arises from a contractual term within the relevant mortgage contracts which in certain circumstances precludes the Society from pursuing the borrower or their estate for any shortfall on redemption. This risk is managed through oversight of the portfolio, including monitoring valuations, the assessment of redemptions and provisioning policy. The insurance provision is a critical accounting estimate, as its assessment is based on expected future outcomes relating to the date on which an account redeems, expected to be on the death of the borrower, their move into care or through non-health related voluntary pre-payment. It is also affected by the assumptions made in relation to house price appreciation and depreciation. This means that the insurance risk provision can move by a material amount dependent upon these assumptions and market conditions.
Liquidity Risk: The Group’s strategy is to maintain sufficient funds in unencumbered liquid form at all times to ensure that its liabilities can be met as they fall due. Regular stress testing of liquidity is undertaken by separately using 20 week and 3 month time horizons. The Group operates within closely monitored Board-approved liquidity policy limits, which are reviewed on a daily basis by the Group’s Finance and Treasury departments, reported to the executive director every week and considered by the Board each month. During 2016, the Group continued to have a significant proportion of its liquid assets deposited with the Bank of England. It should be noted that, by holding greater proportions of liquidity in Bank of England deposits, (for regulatory purposes) liquidity yields are lower.
Capital Risk: In order to conserve capital, the Society has continued to curtail new lending. The Society has also continued to explore ways in which the regulatory capital position could be improved, including by the sale of assets.

STRATEGIC REPORT FOR THE YEAR ENDED 31 DECEMBER 2016
MANCHESTER BUILDING SOCIETY ANNUAL REPORT & ACCOUNTS PAGE 7
Capital Risk (continued)
As explained on page 5 as at 31 December 2016 the Society had significant headroom above its ICG in total capital terms as set by the PRA due to the Society’s PIBS (that is Additional Tier 1 capital being amortised into Tier 2 capital) and subordinated debt (that is Tier 2 capital). However, the Society has a shortfall against the CET1 Combined Buffer requirement. The Society has continued to explore ways in which the CET1 regulatory capital position could be improved and a range of options was submitted in a Capital Conservation Plan to the PRA in October 2016. These options include improving the CET1 regulatory capital position by restructuring capital. At the request of the PRA, the Capital Conservation Plan is being revised and updated to reflect the 2016 results and review further the potential measures for addressing the shortfall to the CET1 capital requirements. The outcome and timing of the regulatory process is uncertain.
As a result of the shortfall against the CET1 Combined Buffer requirement together with the loss for the year, under CRD IV article 141, in order to conserve capital, the Society is prohibited from making the PIBS coupon payments due in April 2017. The Board considers that there continues to be uncertainty over the Society’s ability to make coupon payments thereafter.
Owing to the financial position and challenges faced by the business there is a risk that the Society will not meet the regulatory requirement to hold 4.5% of CET1 capital against risk weighted assets in future. This potential risk is to be addressed in the revised and updated Capital Conservation Plan.
Interest Rate Risk: The Group’s mortgage and savings products have different interest rate types and different maturities. This means that the Group is exposed to movements in interest rates. A movement in an external interest rate (e.g. Bank of England Base Rate or LIBOR) does not always affect every mortgage and savings product that the Society holds. The Society has more fixed rate mortgage products (notably its lifetime mortgages) than it has fixed rate savings products. Presently, there are no interest rate swaps in place. The interest rate risk position is monitored by the Risk Committee and the Board and is managed via the setting of internal policy limits and through the holding of an ascribed level of capital to mitigate the risk of interest rate movement. The Board has considered this risk by its review of financial projections under differing interest rate scenarios over the long term. The Group has a natural partial hedge provided by fixed coupons on capital and some savings.
The Board does not intend to hedge its fixed rate mortgages using interest rate swaps at this time; this position is monitored regularly. A rise in interest rates gives rise to a risk of decreasing margins as a greater portion of the mortgage portfolio than the deposit portfolio is based on fixed rates. Liquidity risk can also be managed through changes in the interest rate of the deposit book.
Currency Risk: The Group faces currency movement risks on its Euro denominated mortgage balances which represent 15% of total mortgage assets as at 31 December 2016. The exchange rate risk arising on these balances is managed and mitigated by transacting foreign exchange forwards. The exchange rate risk position is reported to the Asset and Liability Committee (ALCO) and Board each month.
Economic Risk: The Group faces the risk that its interest margin can become subjected to the pressure that is brought to bear from being an institution that is primarily funded through retail deposits. Within this market, there is great competition for attracting retail deposits at sustainable rates of interest. Market rates offered by retail institutions reduced following the launch of the Bank of England’s Funding for Lending Scheme; however, there is a risk that as repayments are required under the Funding for Lending Scheme then there may be upward pressure on rates to prevent savings outflows.
The Society is also exposed to movements in the value of residential and commercial property in both its mortgage impairment provision requirements and those property assets held at fair value; the Society’s investment property and the Group’s head office building.
Regulatory Risk: As a regulated entity, the Group is exposed to risks arising from a failure to adhere to relevant regulation. In order to minimise this risk, the Group has deployed a number of risk management policies and procedures. In January 2017 the Risk Committee and Board approved a revised Risk Management Framework (“RMF”), which is designed around the present needs of the Society. The RMF includes the responsibilities of the Board, the Risk Committee, the Conduct Committee and Management as to how the Society meets, monitors and reports on its regulatory requirements. Oversight of Regulatory Risk is the responsibility of the Compliance function and is led by the Interim Chief Risk and Compliance Officer.
The majority of the regulatory requirements that the Group faces are laid down by the PRA and the Financial Conduct Authority (“FCA”). The Group monitors developments in all relevant aspects of financial service regulation and undertakes assessments of the present and future impacts of such. Appropriate actions are taken to strengthen controls and amend the Group’s strategy to meet changing regulatory requirements.
Within the NMB MAC and CLC portfolios instances of non-compliance with the CCA have been identified. Legal advice in this regard has been incorporated within the assessment of the estimate of discounted future cash flows expected to arise from these loans, which form the basis for the impairment provision.
In addition to considering the impact of any non-compliance on the recoverability of loan balances and thus impairment provisioning, the Group considers the conduct risk which arises from having originated regulated loans and having acquired regulated loan portfolios. As is the case for all financial institutions there is a risk that aspects of current or historic business might be considered as not being conducted in accordance with all relevant regulation, or the fair and reasonable treatment of customers.
Certain activities of the Group, particularly the NMB MAC and CLC second charge loan portfolios carry greater levels of conduct risk. The administration of the NMB MAC and CLC portfolios was brought in-house in December 2015 and following that transfer the historic conduct of these portfolios was reviewed in detail by management.
Following this review, and having incorporated legal advice received, the Group has maintained its customer redress provision at £1.7m (2015: £1.7m) to provide for instances of non-compliance with the CCA within the NMB MAC and CLC portfolios. The provision includes an estimate of the potential cost of interest refunds during periods of non-compliance and other costs associated with a customer redress exercise. Full details of the customer redress provision are set out in Note 31.
Although a detailed review of these portfolios has been carried out, there is no judicial certainty in the legal position and there is a risk that further conduct issues or cases of non-compliance with regulations could be identified in the future. As a result the actual results could differ materially from our estimates.
Provision has been made where the Group is aware of a specific conduct or regulatory issue and can estimate its impact reliably, further details in respect of the Group’s consideration of other potential conduct and regulatory issues is provided in the contingent liabilities Note 32.
STRATEGIC REPORT FOR THE YEAR ENDED 31 DECEMBER 2016
MANCHESTER BUILDING SOCIETY ANNUAL REPORT & ACCOUNTS PAGE 8
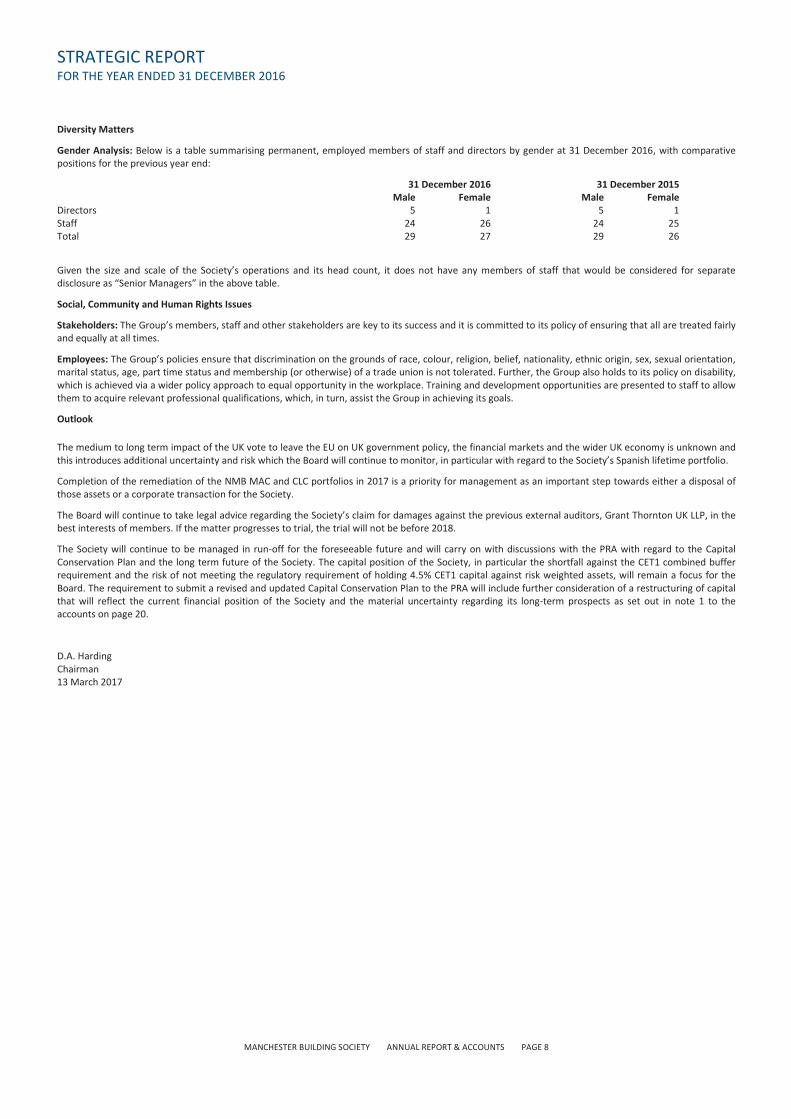
Diversity Matters
Gender Analysis: Below is a table summarising permanent, employed members of staff and directors by gender at 31 December 2016, with comparative positions for the previous year end:
31 December 2016 31 December 2015 Male Female Male Female Directors 5 1 5 1 Staff 24 26 24 25 Total 29 27 29 26
Given the size and scale of the Society’s operations and its head count, it does not have any members of staff that would be considered for separate disclosure as “Senior Managers” in the above table.
Social, Community and Human Rights Issues
Stakeholders: The Group’s members, staff and other stakeholders are key to its success and it is committed to its policy of ensuring that all are treated fairly and equally at all times.
Employees: The Group’s policies ensure that discrimination on the grounds of race, colour, religion, belief, nationality, ethnic origin, sex, sexual orientation, marital status, age, part time status and membership (or otherwise) of a trade union is not tolerated. Further, the Group also holds to its policy on disability, which is achieved via a wider policy approach to equal opportunity in the workplace. Training and development opportunities are presented to staff to allow them to acquire relevant professional qualifications, which, in turn, assist the Group in achieving its goals.
Outlook
The medium to long term impact of the UK vote to leave the EU on UK government policy, the financial markets and the wider UK economy is unknown and this introduces additional uncertainty and risk which the Board will continue to monitor, in particular with regard to the Society’s Spanish lifetime portfolio.
Completion of the remediation of the NMB MAC and CLC portfolios in 2017 is a priority for management as an important step towards either a disposal of those assets or a corporate transaction for the Society.
The Board will continue to take legal advice regarding the Society’s claim for damages against the previous external auditors, Grant Thornton UK LLP, in the best interests of members. If the matter progresses to trial, the trial will not be before 2018.
The Society will continue to be managed in run-off for the foreseeable future and will carry on with discussions with the PRA with regard to the Capital Conservation Plan and the long term future of the Society. The capital position of the Society, in particular the shortfall against the CET1 combined buffer requirement and the risk of not meeting the regulatory requirement of holding 4.5% CET1 capital against risk weighted assets, will remain a focus for the Board. The requirement to submit a revised and updated Capital Conservation Plan to the PRA will include further consideration of a restructuring of capital that will reflect the current financial position of the Society and the material uncertainty regarding its long-term prospects as set out in note 1 to the accounts on page 20.
D.A. Harding Chairman 13 March 2017

DIRECTORS’ REPORT FOR THE YEAR ENDED 31 DECEMBER 2016
MANCHESTER BUILDING SOCIETY ANNUAL REPORT & ACCOUNTS PAGE 9
Information presented in other sections of the Annual Report and Accounts
Certain information which is required to be included in the Directors’ Report has been included in the separate Strategic Report. This information is deemed to form part of the Directors’ Report:
- The Group’s profitability and financial position - The principal risks and uncertainties facing the business - Outlook for the business - Detailed financial risk management disclosures are provided in Note 1.
Directors
J.P. Allen Non-executive director H.F. Baines Vice Chairman I.A. Dewar Non-executive director D.A. Harding Chairman P.A. Lynch Interim Chief Executive F.B. Smith Non-executive director
At the Annual General Meeting Mr Harding and Mr Allen will retire by rotation and being eligible, will offer themselves for re-election.
On 10 June 2016 P.A.Lynch was appointed Interim Chief Executive.
At the year-end no director had an interest in any shares or debentures of the Society or its connected undertakings.
Other matters
Charitable & political donations
The Society made charitable donations totalling £1k (2015: £5k) during the year. No contributions were made for political purposes.
Pillar 3 Disclosure
The Society’s Pillar 3 disclosure can be located on its website.
Supplier payment policy & practice
The Society’s policy concerning the payment of its trade creditors is as follows:
a) to agree the terms of payment with a supplier; b) to ensure that suppliers are aware of the terms of payment; c) to pay invoices in conformity with the Society’s contractual and other legal obligations.
Trade creditors at 31 December 2016 amounted to 19 days of average supplies (2015: 3 days).
Going Concern
The directors consider that it is appropriate for the accounts to be prepared on a going concern basis of accounting as fully explained in Note 1 on page 20, which sets out the risks and uncertainties assessed as part of the preparation of the accounts.
Independent Auditors
In accordance with Section 77 of the Building Societies Act 1986 a resolution for the re-appointment of PricewaterhouseCoopers LLP will be proposed at the Annual General Meeting.
On behalf of the Board of Directors D.A. Harding Chairman 13 March 2017

CORPORATE GOVERNANCE
MANCHESTER BUILDING SOCIETY ANNUAL REPORT & ACCOUNTS PAGE 10
The Board is responsible for setting strategy and providing leadership within a framework of prudent and effective controls which enables risk to be assessed and managed. The Board is mindful that ownership of the Society rests with its members and that the provision of appropriate savings and mortgage products is its key aim.
In order to ensure that, as a mutual organisation, it is appropriately governed, the Society has regard to the principles of the UK Corporate Governance Code (“the Code”), which is issued by the Financial Reporting Council (“the FRC”) (located at: www.frc.org.uk/Our-Work/Codes-Standards/Corporate-governance/UK-Corporate-Governance-Code.aspx). In April 2016, the FRC published its revision of the Code which is effective for accounting periods commencing on or after 17 June 2016. The September 2014 version of the Code is applicable to companies with reporting periods beginning before 17 June 2016.
Whilst the Code is more directly relevant to listed companies, its provisions can be adopted by a mutual organisation. The Society has been mindful of the revised Code to the extent deemed reasonable and appropriate by the Board.
At 31 December 2016 the Board consisted of one executive director and five non-executive directors. Two different individuals hold the roles of Chairman and Chief Executive.
All non-executive directors are considered to be independent, except for the Chairman who, by the nature of the role that he holds, is not considered to be wholly independent. Harry Baines was nominated by the Board as the Senior Independent Director. The role of the Senior Independent Director includes being available to members, where contact through the normal channels has failed or where such contact is inappropriate.
On matters where Board approval is required, each director has a single vote; there is a majority of non-executive directors on the Board.
APPOINTMENTS TO THE BOARD
There were no new director appointments during 2016. The Remuneration and Nominations Committee’s appointment process focusses on members of the business community in order to identify suitable candidates with specific, relevant skills and experience.
On joining the Board, each director is provided with an induction which includes reading material and meetings with the executive director and certain managers. Through a programme of self-managed continuing personal development, each director ensures that they maintain a level of knowledge and skill commensurate with their role within the Group.
FINANCIAL AND BUSINESS REPORTING
The respective responsibilities of the directors and the Independent Auditors for preparing and reporting on the Annual Report and Accounts are contained within the Statement of Directors’ Responsibilities and the Independent Auditors’ Report.
REMUNERATION
Since 1 January 2011 there have been no bonus arrangements in place for any director.
No director is involved in the discussion of, or Board voting activity, that relates to their own remuneration.
The remuneration policy for directors is contained within the Remuneration Report and service contract details may be found in the Annual Business Statement. Details of directors’ remuneration are contained in Note 8 to the Accounts.
INTERACTION WITH SHAREHOLDERS
The “shareholders” of the Group are its borrowing and investing members. Unlike a PLC, each member can only have one vote and as a result there are no “major” or “significant” shareholders whose views can be canvassed for the Board. There are very few opportunities for the Group to consult with its members. The Annual General Meeting (“AGM”) provides one such opportunity and all Board members are available at this Meeting in order to discuss Society matters with any attending members.
Details of the AGM are sent out to every member; all are encouraged to vote, either in person or by proxy.
THE BOARD AND ITS COMMITTEES
In order to execute its responsibilities in an efficient manner, the Board has constituted seven Committees, of which three (Audit, Remuneration & Nominations and Risk) are oversight Committees and four (Assets and Liabilities Committee (“ALCO”), Conduct, Credit and Disclosure) are executive Committees. The Board retains responsibility for the setting of strategy and the approval of all policy matters. The three oversight Committees are responsible for a more detailed review of matters in their specialist areas, making recommendations to the Board as appropriate. The focus of the four executive Committees is on more day-to-day operational matters, operating within the Board-approved policy framework. Operational matters are delegated to the executive director and staff, within specified mandates, in order to ensure that timely decisions can be taken in support of the Board’s strategy and policy limits. In addition, the non-executive directors meet periodically to assess all aspects of governance, board responsibility and board performance.
Assets and Liabilities Committee
ALCO meets monthly to consider matters relating to liquidity and treasury management, including interest rate risk, treasury counterparty risk, exchange rate risk and interest margin management.
Membership as at 31 December 2016: P.Lynch (Chairman), D. Callaghan*, R.H. Green*, E. Lord*, S.J.Melbourne*, S.Whitehorn*.
(* not a director)

CORPORATE GOVERNANCE
MANCHESTER BUILDING SOCIETY ANNUAL REPORT & ACCOUNTS PAGE 11
Audit Committee
The Committee’s membership includes directors who are considered to be independent and its Chairman has experience in accounting and auditing matters. The Committee receives reports from the Society’s internal and external auditors and from the Compliance function; its focus is in relation to compliance with statutory and regulatory requirements and systems and controls matters, including assessing the effectiveness of risk systems delivered via a rolling Internal Audit Plan which is approved on an annual basis and covers elements of the control environment.
The Committee monitors the non-audit work undertaken by the external auditors, which related to seeking professional advice on accounting and tax matters. The Audit Committee is satisfied that this non-audit work does not impair PwC’s independence. The Committee monitors the financial reporting process, the statutory audit and reviews all financial information that is disclosed externally.
Membership as at 31 December 2016: I.A. Dewar (Chairman), J.P. Allen, F.B. Smith.
Conduct Committee
The Committee meets monthly and considers matters relating to the fair treatment of customers.
Membership as at 31 December 2016: P.A. Lynch (Chairman), E. Lord*, R. Mervill*, V. Smith*
(* not a director)
Credit Committee
The Committee meets monthly to consider all lending policy matters, loan book profile, arrears management and provisioning matters. On a return to lending it would consider lending product development.
Membership as at 31 December 2016: P.A. Lynch (Chairman), D. Callaghan*, R.H. Green*, E.Lord*, D. Spencer*, S.Whitehorn*.
(* not a director)
Disclosure Committee
The Committee meets as often as is required to monitor inside information and arrange for its release to the market. In any event, the Committee will meet at least once each year to undertake a review of the Society's systems and procedures relative to the discovery, disclosure and control of inside, regulatory and other sensitive information.
The scope of the Committee responsibilities includes the Society, its subsidiaries and associate companies, enterprises and special purpose vehicles.
Membership as at 31 December 2016: D.A. Harding (Chairman), C.W. Gee *, R.H. Green*, P.A. Lynch.
(* not a director)
Remuneration and Nominations Committee
The Committee is responsible for making recommendations to the Board in relation to the appointment of new directors, keeping under review the mix of skills and experience of the Board, and also in relation to the levels of remuneration for all Board members and certain managers, as well as policy matters affecting other employees of the Society.
Membership as at 31 December 2016: H.F. Baines (Chairman), D.A. Harding, F.B. Smith.
Risk Committee
In its oversight capacity, the Committee assesses monitors and manages significant risks faced by the Group and considers strategic issues affecting all areas of risk. Throughout the year, the Committee advised the Board on treasury, balance sheet and operational risk issues.
Membership as at 31 December 2016: I.A. Dewar (Chairman), J.P. Allen, R.H.Green*, E. Lord*, P.A. Lynch, F.B. Smith.
(* not a director)
Board and Committee attendance records for 2016
Attendance at full meetings of the Board and its Committees throughout 2016 is scheduled below. Figures displayed in brackets represent the number of meetings that any individual director was due to attend.
Board Board ALCO Audit Conduct Credit Disclosure Remuneration Risk
& Nominations
J.P. Allen 11 (11) - 4 (4) - - - - 7 (7)
H.F. Baines 11 (11) - - - - - 4 (4) -
I.A. Dewar 11 (11) - 4 (4) - - - - 7 (7)
D.A. Harding 11 (11) - - - - 3(3) 4 (4) -
P.A. Lynch 11 (11) 11 (11) - 11 (11) 11 (11) 3(3) - 7 (7)
F.B. Smith 11 (11) - 4 (4) - - - 4 (4) 6 (7)

CORPORATE GOVERNANCE
MANCHESTER BUILDING SOCIETY ANNUAL REPORT & ACCOUNTS PAGE 12
Board and Committee attendance records for 2016 (continued)
The above figures exclude instances where directors have chosen to attend a meeting where they were not a member of that Committee and at which their attendance was not strictly required. Also excluded from the above are ad hoc Board and Committee meetings called at short notice and where the agenda items considered were very restricted in nature.
Internal Control
The Board is responsible for ensuring the effectiveness of the Group’s systems of risk management and internal control, which are designed to identify, monitor and manage the Group’s risks, rather than to eliminate them completely. Through various policies, procedures and appetite statements and with the implementation of a variety of operational control processes, the Board ensures that the Group’s risks are managed proportionately.
The Society’s Risk Committee assesses monitors and manages the significant risks faced by the Group, overseeing the promotion of a risk based approach to the Group’s activities.
Directed by the Audit Committee, Internal Audit reviews the control environment throughout the year and reports its findings to the Audit Committee regularly.
Following its annual review of all control activities undertaken in the year by management , internal and external auditors and the Compliance function, the Audit Committee has satisfied itself that, commensurate with the size and risk profile of the current operations of the Society, its systems are effective.
Evaluation
The non-executive directors, led by the senior independent director, are responsible for assessing the performance of the Chairman. The Chief Executive attends the Chairman’s appraisal in order for executive views to be taken into consideration.
On an annual basis, the Board and its Committees undertake a process of assessing and formally documenting their performance during the year using a checklist that covers all areas of operation. Contributions are sought from both Board and Committee members and other relevant parties. The Board reviews and approves the written assessments undertaken by all Committees and where required, amendments are made to the Board Procedures as a result of the assessment processes.
DIRECTORS’ REMUNERATION REPORT
MANCHESTER BUILDING SOCIETY ANNUAL REPORT & ACCOUNTS PAGE 13
Introduction
The purpose of this report is to provide details of the Group’s policy on the remuneration of its executive and non-executive directors and to explain the process for setting the level of directors’ remuneration.
Remuneration and Nominations Committee
The Remuneration and Nominations Committee is responsible for the remuneration policy for all of the directors; it also reviews the remuneration of certain managers. All recommendations made by the Remuneration and Nominations Committee are considered by the full Board. The Committee has regard to best practice as set out in the UK Corporate Governance Code and with the PRA Remuneration Code to the extent that it is relevant to the Society, given that the Society is a mutual institution.
Executive director
Remuneration levels are set for the executive director so as to reward and retain the skills and commitment necessary to manage the development of the Group within a competitive and challenging business sector. In accordance with best practice, the Remuneration and Nominations Committee reviews the remuneration arrangements for the executive director on a periodic basis and compares their range of benefits to those available within similar organisations. The Committee’s objective is to promote suitable risk management arrangements, avoiding remuneration structures that promote excessive risk taking.
The executives’ remuneration arrangements include:
- salaries, reviewed by the Committee on an annual basis; - membership of the Group personal pension scheme, on the same terms as other eligible employees of the Group; - taxable benefits which include a car allowance and private health care.
Since 1 January 2011 there have been no bonus arrangements in place for any executive director.
Non-executive directors
Non-executive directors are remunerated by way of fees, which are recommended by the Remuneration and Nominations Committee to the Board on an annual basis. The level of fees is assessed on the basis of responsibility, experience, skill and time commitment and by comparison with other building societies and regional financial institutions.
Non-executive directors do not receive any other benefits; they do not have any pension arrangements through the Group.
All directors
The Group does not make mortgage loans available to any director. The above arrangements applied throughout 2016.
Other business interests
Details of directors’ other business interests are shown in the Annual Business Statement.
Directors’ emoluments
The full directors’ emoluments table may be found in Note 8 to the Accounts.
Summary
This report, in addition to Note 8 to the Accounts, is intended to provide a full explanation of the policy and application of directors’ remuneration. A resolution will be put to the Annual General Meeting inviting members to vote on the Directors’ Remuneration Report.
On behalf of the Remuneration and Nominations Committee H.F. Baines Chairman 13 March 2017

STATEMENT OF DIRECTORS’ RESPONSIBILITIES
MANCHESTER BUILDING SOCIETY ANNUAL REPORT & ACCOUNTS PAGE 14
Directors' responsibilities for preparing the Annual Report and Accounts
The following statement, which should be read in conjunction with the Statement of the Auditors’ responsibilities on page 15, is made by the directors to explain their responsibilities in relation to the preparation of the Annual Report and Accounts in accordance with applicable law and regulation.
The directors are required by the Building Societies Act 1986 (“the Act”) to prepare, for each financial year, financial statements which give a true and fair view of the income and expenditure of the Society and the Group for the financial year and of the state of affairs of the Society and the Group as at the end of the financial year.
In preparing the financial statements, the directors are required to:
- select appropriate accounting policies and apply them consistently; - make judgements and estimates that are reasonable and prudent; - state whether the financial statements have been prepared in accordance with International Financial Reporting Standards (as adopted by the
European Union); and - prepare the financial statements on the going concern basis, unless it is inappropriate to presume that the Society and Group will continue in
business.
In addition to the financial statements, the Act requires the directors to prepare, for each financial year, an Annual Business Statement and a Directors' Report, each containing prescribed information relating to the business of the Society and the Group.
Directors’ responsibilities pursuant to the Disclosure and Transparency Rules
The directors confirm that to the best of each person’s knowledge and belief:
- the financial statements, prepared in accordance with International Financial Reporting Standards (as adopted by the European Union), give a true and fair view of the assets, liabilities, financial position and profit or loss of the Group and Society; and
- the Annual Business Statement and Directors' Report includes a fair review of the development and performance of the business and the position of the Group and Society, together with a description of the principal risks and uncertainties that they face.
Directors' responsibilities for accounting records and internal control
The directors are responsible for ensuring that the Society:
- keeps accounting records in accordance with the Building Societies Act 1986; and - takes reasonable care to establish, maintain, document and review such systems and controls as are appropriate to its business in accordance
with the rules made by the Prudential Regulation Authority under the Financial Services and Markets Act 2000.
The directors have general responsibility for safeguarding the assets of the Society and the Group and for taking reasonable steps for the prevention and detection of fraud and other irregularities.
In so far as each of the directors is aware:
- There is no relevant audit information of which the Society’s auditors are unaware; and - The directors have taken all steps that they ought to have taken to make themselves aware of any relevant audit information and to establish
that the auditors are aware of that information.
The directors are responsible for the maintenance and integrity of the Society’s website. Legislation in the United Kingdom governing the preparation and dissemination of financial statements may differ from legislation in other jurisdictions.
On behalf of the Board of Directors D.A. Harding Chairman 13 March 2017

INDEPENDENT AUDITORS’ REPORT TO THE MEMBERS OF MANCHESTER BUILDING SOCIETY
MANCHESTER BUILDING SOCIETY ANNUAL REPORT & ACCOUNTS PAGE 15
Report on the financial statements
Our opinion
In our opinion, Manchester Building Society’s group financial statements and society financial statements (the “financial statements”):
• give a true and fair view of the state of the group’s and of the society’s affairs as at 31 December 2016 and of the group’s and the society’s income and expenditure and cash flows for the year then ended;
• have been properly prepared in accordance with International Financial Reporting Standards (IFRSs) as adopted by the European Union; and
• have been prepared in accordance with the requirements of the Building Societies Act 1986 and, as regards the group annual financial statements, Article 4 of the IAS Regulation.
Emphasis of matter-Group and Society: Going concern
In forming our opinion on the financial statements, which is not modified, we have considered the adequacy of the disclosures made in note 1 to the financial statements concerning the Society and Group’s ability to continue as a going concern. The directors have set out the risks and uncertainties for the business given its continued run-off and the ongoing development of plans to secure the business. These conditions, along with the other matters explained in note 1 to the financial statements, indicate the existence of a material uncertainty which may cast significant doubt about the Society and Group’s ability to continue as a going concern. The financial statements do not include the adjustments that would result if the Society and Group were unable to continue as a going concern.
What we have audited
Manchester Building Society’s financial statements comprise:
• the Group and Society Statements of Financial Position as at 31 December 2016;
• the Group and Society Statements of Comprehensive Income for the year then ended;
• the Group and Society Statements of Cash Flows for the year then ended;
• the Group and Society Statements of Changes in Equity for the year then ended; and
• the notes to the financial statements, which include a summary of significant accounting policies and other explanatory information.
The financial reporting framework that has been applied in the preparation of the financial statements is applicable law and International Financial Reporting Standards as adopted by the European Union.
In applying the financial reporting framework the directors have made a number of subjective judgements, for example in respect of significant accounting estimates. In making such estimates, they have made assumptions and considered future events.
Opinions on other matters prescribed by the Buildings Societies Act 1986
In our opinion:
• the Annual Business Statement and the Directors’ Report have been prepared in accordance with the requirements of the Building Societies Act 1986;
• the information given in the Directors’ Report for the financial year for which the financial statements are prepared is consistent with the accounting records and the financial statements; and
• the information given in the Annual Business Statement (other than the information upon which we are not required to report) gives a true representation of the matters in respect of which it is given.
Other matters on which we are required to report by exception
Propriety of accounting records and information and explanations received
Under the Building Societies Act 1986 we are required to report to you if, in our opinion:
• proper accounting records have not been kept by the society; or
• the society financial statements are not in agreement with the accounting records; or
• we have not received all the information and explanations and access to documents we require for our audit.
We have no exceptions to report arising from this responsibility.
Responsibilities for the financial statements and the audit
Our responsibilities and those of the directors
As explained more fully in the Statement of Directors’ Responsibilities set out on page 14, the directors are responsible for the preparation of the financial statements and for being satisfied that they give a true and fair view.
Our responsibility is to audit and express an opinion on the financial statements in accordance with applicable law and International Standards on Auditing (UK & Ireland) (“ISAs (UK & Ireland)”). Those standards require us to comply with the Auditing Practices Board’s Ethical Standards for Auditors.
This report, including the opinions, has been prepared for and only for the society’s members as a body in accordance with Section 78 of the Building Societies Act 1986 and for no other purpose. We do not, in giving these opinions, accept or assume responsibility for any other purpose or to any other person to whom this report is shown or into whose hands it may come save where expressly agreed by our prior consent in writing.

INDEPENDENT AUDITORS’ REPORT TO THE MEMBERS OF MANCHESTER BUILDING SOCIETY
MANCHESTER BUILDING SOCIETY ANNUAL REPORT & ACCOUNTS PAGE 16
What an audit of financial statements involves
We conducted our audit in accordance with ISAs (UK & Ireland). An audit involves obtaining evidence about the amounts and disclosures in the financial statements sufficient to give reasonable assurance that the financial statements are free from material misstatement, whether caused by fraud or error. This includes an assessment of:
• whether the accounting policies are appropriate to the group’s and society’s circumstances and have been consistently applied and adequately disclosed;
• the reasonableness of significant accounting estimates made by the directors; and
• the overall presentation of the financial statements.
We primarily focus our work in these areas by assessing the directors’ judgements against available evidence, forming our own judgements, and evaluating the disclosures in the financial statements.
We test and examine information, using sampling and other auditing techniques, to the extent we consider necessary to provide a reasonable basis for us to draw conclusions. We obtain audit evidence through testing the effectiveness of controls, substantive procedures or a combination of both.
In addition, we read all the financial and non-financial information in the Annual Report to identify material inconsistencies with the audited financial statements and to identify any information that is apparently materially incorrect based on, or materially inconsistent with, the knowledge acquired by us in the course of performing the audit. If we become aware of any apparent material misstatements or inconsistencies we consider the implications for our report.
Heather Varley (Senior Statutory Auditor)
for and on behalf of PricewaterhouseCoopers LLP
Chartered Accountants and Statutory Auditors
Manchester
13 March 2017

MANCHESTER BUILDING SOCIETY ANNUAL REPORT & ACCOUNTS PAGE 17
STATEMENTS OF COMPREHENSIVE INCOME FOR THE YEAR ENDED 31 DECEMBER 2016
The Group and the Society have no other comprehensive income. The notes on pages 20 to 58 form part of these accounts.
STATEMENTS OF CHANGES IN EQUITY
Group Group Society Society 2016 2015 2016 2015
Note £000 £000 £000 £000
Interest receivable and similar income 2 13,165 14,401 12,680 14,832 Interest payable and similar charges 3 (4,693) (5,853) (4,693) (5,853)
Net interest income 8,472 8,548 7,987 8,979
Fees and commission income 186 318 186 318 Fees and commission expense (36) (34) (36) (34)Other operating income 4 647 285 1,265 860 Other operating charges 4 (59) (58) (202) (201)Income from investments 5 - 745 - 745 Net loss on financial assets designated at fair value through profit and loss 11 - (46) - (46)
Total operating income 9,210 9,758 9,200 10,621
Administrative expenses 6 (8,449) (6,599) (7,394) (5,817)Depreciation 16 (214) (242) (145) (101)
Operating profit before impairments and provisions 547 2,917 1,661 4,703
Impairment losses 14 (3,448) (3,219) (6,209) (2,258)Financial Services Compensation Scheme Levy 31 (67) (277) (67) (277)
(Loss) / profit on ordinary activities before income tax (2,968) (579) (4,615) 2,168
Income tax expense 9 (382) (4,295) (382) (4,295)
Loss for the financial year (3,350) (4,874) (4,997) (2,127)
Accumulated Subscribed Accumulated SubscribedLosses Capital PPDS Total Losses Capital PPDS Total
£000 £000 £000 £000 £000 £000 £000 £000
Balance at 1 January 2016 (5,555) 9,788 17,461 21,694 (3,153) 9,788 17,461 24,096
Transactions with equity holders - interest on PIBS (338) - - (338) (338) - - (338)Tax credit relating to interest on PIBS - - - - - - - - Loss and total comprehensive expense for year (3,350) - - (3,350) (4,997) - - (4,997)
Balance at 31 December 2016 (9,243) 9,788 17,461 18,006 (8,488) 9,788 17,461 18,761
Accumulated Subscribed Accumulated SubscribedLosses Capital PPDS Total Losses Capital PPDS Total
£000 £000 £000 £000 £000 £000 £000 £000
Balance at 1 January 2015 (141) 9,788 17,461 27,108 (486) 9,788 17,461 26,763
Transactions with equity holders - interest on PIBS (675) - - (675) (675) - - (675)Tax credit relating to interest on PIBS 135 - - 135 135 - - 135 Loss and total comprehensive expense for year (4,874) - - (4,874) (2,127) - - (2,127)
Balance at 31 December 2015 (5,555) 9,788 17,461 21,694 (3,153) 9,788 17,461 24,096
Group 2016 Society 2016
Group 2015 Society 2015

MANCHESTER BUILDING SOCIETY ANNUAL REPORT & ACCOUNTS PAGE 18
STATEMENTS OF FINANCIAL POSITION AS AT 31 DECEMBER 2016
The accounts on pages 17 to 58 were approved by the Board of Directors on 13 March 2017. D.A. Harding P.A. Lynch I.A. Dewar Chairman Interim Chief Executive Director
Group Group Society Society 2016 2015 2016 2015
Note £000 £000 £000 £000 ASSETSLiquid assets Cash and balances with the Bank of England 67,387 55,861 67,387 55,861 Loans and advances to credit institutions 10 14,427 20,838 14,298 20,787 Investment securities 11 306 74 306 74
82,120 76,773 81,991 76,722
Derivative financial instruments 12 278 403 199 403
Loans and advances to customers Loans fully secured on residential property 13 263,815 302,441 257,704 295,265 Loans fully secured on land 13 24,419 26,802 24,419 26,802 Other loans 13 1,218 1,375 1,218 1,375
289,452 330,618 283,341 323,442
Investments Subsidiary undertakings 15 - - 10,823 13,160
- - 10,823 13,160
Property, plant and equipment 16 5,861 5,920 488 470 Investment property 17 839 781 839 781 Current tax assets - 356 - 335 Deferred tax assets 18 - 382 - 382 Other assets 19 3,754 1,343 3,640 1,322
Total assets 382,304 416,576 381,321 417,017
LIABILITIES Due to members 20 315,391 324,630 315,391 324,630 Deposits from banks 21 - 2,002 - 2,002 Other deposits 22 24,753 44,957 24,753 44,957 Derivative financial instruments 12 1,641 679 1,641 627 Other liabilities 24 1,455 1,582 1,100 1,291 Provisions for liabilities and charges 31 1,858 1,832 475 214 Subordinated liabilities 23 14,200 14,200 14,200 14,200 Subscribed capital 25 5,000 5,000 5,000 5,000
364,298 394,882 362,560 392,921 EquityAccumulated losses (9,243) (5,555) (8,488) (3,153) Subscribed capital 25 9,788 9,788 9,788 9,788 Profit participating deferred shares 27 17,461 17,461 17,461 17,461
18,006 21,694 18,761 24,096
Total equity and liabilities 382,304 416,576 381,321 417,017

MANCHESTER BUILDING SOCIETY ANNUAL REPORT & ACCOUNTS PAGE 19
STATEMENTS OF CASH FLOWS
FOR THE YEAR ENDED 31 DECEMBER 2016
The statement of cash flows in 2016 (2015 represented) has been prepared using the Indirect Method for presenting cash flows from operating activities. See note 26 for more information.
Group Group Society Society 2016 2015 2016 2015
Note £000 £000 £000 £000 Cash flows from operating activities
(Loss) / Profit before tax (2,968) (579) (4,615) 2,168 Adjusted for:Depreciation 214 242 145 101 Profit on sale of trade investments - (745) - (745)Increase in provisons 26 1,618 261 - Investment property re-classification - (781) - (781)Fair value adjustments (58) 46 (58) 46 Impairment losses - 2,471 3,518 2,762 Increase in other assets (2,055) (395) (1,983) (400)Decrease in other liablitites (127) (814) (188) (642)Income taxes paid - - - -
Cash flows from operating activities before changes in operating assets and liabilities (4,968) 1,063 (2,920) 2,509
Increase / decrease in operating assets and liabilities
Decrease in loans and advances to customers 41,166 56,754 40,101 55,365 Increase in derivative financial instruments 1,087 2,422 1,218 2,358 Increase / (decrease) in depsosits by banks (2,002) 494 (2,002) 494 Decrease in amounts owed by credit institutions 3 13 3 13 Decrease in other deposits (20,204) (21,989) (20,204) (21,989)Decrease in amount due to members (9,239) (64,845) (9,239) (64,845)
Net cash flows from / (used in)operating activities 5,843 (26,088) 6,957 (26,095)
Cash flow from investing activities
Investments in subsidiary undertakings - - (1,181) (17)Sale of trade investment - 995 - 995 Purchase of property and equipment 16 (155) (320) (163) (296)Sale of securities 8 15,941 8 15,941 Investment in securities (240) (500) (240) (500)
Net cash flows from / (used in) investing activities (387) 16,116 (1,576) 16,123
Cash flow from financing activities
Repayment of subordinated loan 23 - (1,500) - (1,500)Interest paid on subscribed capital (338) (1,075) (341) (1,075)
Net cash used in financing activities (338) (2,575) (341) (2,575)
Net movement in cash and cash equivalents 5,118 (12,547) 5,040 (12,547)Cash and cash equivalents at start of year 76,686 89,233 76,635 89,182
Cash and cash equivalents at end of year 26 81,804 76,686 81,675 76,635

NOTES TO THE FINANCIAL STATEMENTS FOR THE YEAR ENDED 31 DECEMBER 2016
MANCHESTER BUILDING SOCIETY ANNUAL REPORT & ACCOUNTS PAGE 20
1. Accounting policies and financial risk management a) Summary of significant accounting policies
The principal accounting policies applied consistently in the preparation of these financial statements are set out below.
Basis of preparation: going concern
The Group’s financial statements have been prepared on a going concern basis as explained below.
The long term continuing operation of the Society and the Group is dependent on a successful return to lending to grow the balance sheet in order to maintain profitability and rebuild regulatory capital. At present the Society has insufficient capital to return to lending and continues to manage a long term run-off of the balance sheet.
The Board continues to develop options which individually or in combination are reasonably expected to secure the future of the Society, enable it to continue to meet capital requirements and improve the quality of its regulatory capital. These options include improving its CET1 capital position including through a restructuring of capital, or securing its future through merger or alternative means.
The Board expects to further develop these plans during 2017. These plans may involve third parties and as such carry execution risk. Although these represent material uncertainties which may cast significant doubt about the Society’s and Group’s ability to continue as a going concern in the longer term, in the Board’s opinion the going concern basis is appropriate whilst there are potential options available.
In order to satisfy themselves that the Society and Group have adequate resources to continue to operate for the foreseeable future as a going concern, the directors have taken into account the following:
• The Group’s underlying financial performance for the year ended 31 December 2016; • The Group’s current level of liquidity; • The Group’s financial position as at 31 December 2016, including the headroom above the Individual Capital Guidance in total capital terms as set
by the PRA; • The Group’s financial projections for the next 2 years, in particular for income, expenditure, assets, liabilities, liquidity and regulatory capital,
including sensitivity analysis. These projections, based on a managed run-off of the balance sheet without a return to lending, indicate that the underlying operations of the Group, before costs associated with the development of its capital plans will be at a breakeven level in the short term. In the medium term it is likely that the net interest margin will be insufficient to cover operating costs and loan impairment charges, resulting in operating losses;
• An initial assessment of the potential impact of adopting IFRS 9 accounting for expected credit losses from 1 January 2018; • The ongoing legal claim against and prospects of recovery from Grant Thornton UK LLP, the previous external auditors; • The ongoing redress of customers in respect of the acquired NMB MAC and CLC portfolios; • The challenge of addressing the shortfall to the CET1 Combined Buffer requirement and of continuing to meet the regulatory requirement to hold
4.5% CET1 capital against risk weighted assets; • Ongoing discussions with the PRA and other stakeholders regarding the development of a plan to secure the future of the Society and its strategic
direction; • The operational risks faced by the Society to develop and deliver the strategic plans; • The Group’s principal risks and uncertainties as set out in the Strategic Report on pages 6 to 7.
Should there be a material stress event in the economy or to financial markets that adversely impacts the Society, or the current options available to the Society are shown to not be viable, then there is less certainty as to the going concern position of the Society.
Having due regard to these matters and after taking into consideration the material uncertainties above the Board continues to adopt the going concern basis of accounting in preparing the financial statements
Basis of preparation: accounting standards
The Group’s financial statements have been prepared in accordance with International Financial Reporting Standards (“IFRS”) and International Financial Reporting Interpretations Committee (“IFRIC”) pronouncements as issued by the International Accounting Standards Board and as adopted by the European Union and with those parts of the Building Societies (Accounts and Related Provisions) Regulations 1998 applicable to building societies reporting under IFRS. The financial statements have been prepared under the historical cost convention, as modified by the revaluation of all derivative contracts and certain other assets.
The preparation of financial statements in conformity with IFRS requires the use of certain critical accounting estimates. It also requires management to exercise its judgement in the process of applying the Group’s accounting policies. The areas involving a higher degree of judgement or complexity, or areas where assumptions and estimates are significant to the consolidated financial statements are disclosed in Note 1c.
No further IFRS accounting standards and pronouncements identified as being relevant to the Group were adopted with effect from 1 January 2016.
The Group has noted that there are a number of further new accounting standards, that are not effective at 31 December 2016, but which are likely to be adopted over the coming years. The only one of these which is likely to have a significant impact on the Group is IFRS 9 – Financial instruments, which will replace most of IAS39- Financial Instruments: Recognition and Measurement.
The final version of IFRS 9 has been issued by the International Accounting Standards Board and was endorsed by the EU on 22 November 2016. The effective date is 1 January 2018.
The standard includes changes for classification and measurement of the Group’s financial assets and liabilities, the recognition of impairment, and hedge accounting.
The most significant impact on the Group is likely to be in respect of the measurement of impairment of financial assets. Under IFRS 9, impairment will be based on expected credit losses (“ECL”) rather than incurred credit losses which is the methodology the Group currently adopts under IAS 39. At initial

NOTES TO THE FINANCIAL STATEMENTS FOR THE YEAR ENDED 31 DECEMBER 2016
MANCHESTER BUILDING SOCIETY ANNUAL REPORT & ACCOUNTS PAGE 21
1. Accounting policies and financial risk management a) Summary of significant accounting policies (continued)
Basis of preparation: accounting standards (continued)
recognition, an ECL provision is required for default events in the next 12 months, whilst following a significant increase in credit risk, a lifetime ECL is required. The review of credit risk and the calculation of ECL are required to be unbiased and probability weighted, and should include all available relevant information, with assessments of current conditions and forecasts of future economic conditions. As a result the recognition and measurement of impairment is more forward looking than is the case under IAS 39. Consequently, it is likely to lead to an increase in the total level of provision in many businesses.
At present, based on an initial assessment, management believes that the impact on the Society’s future profitability will be modest; however it is likely to lead to an increased loan provision on adoption of IFRS 9.
The classification and measurement and impairment requirements are applied retrospectively by adjusting the opening balance sheet on transition to IFRS 9, with no requirement to restate comparative periods.
The directors do not expect the other standards to have a material impact on the financial statements of the Society and Group.
Basis of consolidation
The Group’s accounts include the accounts of the Society, its subsidiary undertakings and NMB Mortgage Acquisition Company Limited (“NMB MAC”) in which the Group held no shares but over which, per IFRS 10, it exerted control. The way in which the Group met the definition of control over the entity, as set out in IFRS 10, is described more fully in Note 15.
The Society and its subsidiaries have accounting periods ending on 31 December, whilst NMB MAC has an accounting period ending on 28 February. For consolidation purposes, the accounting records of NMB MAC have been prepared at 31 December and consolidated for the 12 months ended 31 December. The accounting policies of the subsidiary undertakings are materially consistent with the Group accounting policies. The accounting policies for the other entity, where different from those of the Group, has been brought in line with those of the Group on consolidation. The Society’s Statement of Financial Position includes the investment in the subsidiary undertakings at cost, less any provision for impairment.
Interest income and expense
Interest income and expense are recognised in the Statements of Comprehensive Income for all financial instruments measured at amortised cost using the effective interest rate method. The effective interest rate method is a method of allocating the income or expense over the relevant period. The effective interest rate is the rate that exactly discounts estimated cash flows (excluding future expected credit losses) to the net carrying amount of the asset over the expected life of the instrument.
In calculating the effective interest rate all contractual terms of the financial instrument are taken into account, along with all fees paid or received, all transaction costs and any other premia or discounts.
Charges in respect of the estimated interest refund element of the customer redress provision are debited against interest income, when the provision is established.
Insurance contracts
The Society has a portfolio of lifetime mortgage loans secured on Spanish residential property. A particular clause of the mortgage contract meets the definition of an insurance contract; where a borrower dies or goes into long term care and a redemption receipt is less than the contractual sum owed the Society does not have any further ability to recover amounts from the borrower or the estate.
Under IFRS 4 the Society has continued to account for these mortgage contracts using its existing accounting policies. The mortgage contract has been classified as being not unbundled. The impact of assessing the contracts as being “not unbundled” is that the income earned on the mortgage contracts is not split between interest and insurance premium and that the mortgage asset is included within loans and advances at the present value of future cash flows.
Measurement and recognition of the income earned on the mortgage contract has been undertaken in line with the Society’s other mortgage contracts; the income earned has been included in the Income Statement within the Interest and Similar Income category. Within the Statement of Financial Position the mortgage asset and any impairment which has been calculated is disclosed in line with IAS 39.
The insurance risk liability associated with the no-negative equity guarantee is calculated by estimating potential shortfalls arising at redemption, discounted at the effective interest rate, and is represented by the impairment provision. The assessment incorporates assumptions relating to future house price values at the time of account redemption. Its assessment is also based on expected future outcomes relating to the date on which an account redeems which, given the nature of the product is expected to be on death of the borrower, but can be affected by health issues that would see borrowers move into care; it can also be affected by non-health related voluntary pre-payment. The insurance liability arising as a result of the no negative equity guarantee is presented within Note 13 to the financial statements, under the heading “Insurance risk provisions”.
Fees and commissions
Fees and commissions relating to the creating of loans and advances to members are recognised within interest income using the effective interest rate method.
Other operating income
The Group recognises foreign exchange gains and losses and rents receivable as other operating income. The Society recognises other operating income relating to the interest that it charges on the loans made to its subsidiary undertakings.

NOTES TO THE FINANCIAL STATEMENTS FOR THE YEAR ENDED 31 DECEMBER 2016
MANCHESTER BUILDING SOCIETY ANNUAL REPORT & ACCOUNTS PAGE 22
1. Accounting policies and financial risk management a) Summary of significant accounting policies (continued)
Income from investments
Income from investments is recognised when an irrevocable agreement to sell the investment is in place.
Financial assets
The Group classifies its financial assets in the following categories under IAS 39:
(i) Financial assets at fair value through profit or loss
Derivative financial instruments. These instruments economically hedge the exchange rate risk on the Group’s Euro denominated Spanish mortgages. These instruments are carried at their fair value with changes in their fair value reflected in profit or loss as part of total operating income. Hedge accounting has not been applied by the Group.
Investment securities. These instruments are carried at their market value which reflects the fair value of the asset. Changes in their fair value are recognised in profit or loss as part of total operating income. Any gain or loss on disposal is taken through profit or loss.
Financial assets at fair value through profit or loss are subsequently carried at fair value. Fair values are obtained in line with the three tier hierarchy described in IFRS 13 from quoted market prices in active markets, revaluation techniques using specialist tools and confirmations from counterparties.
Gains and losses arising from changes in the fair value of the ‘financial assets at fair value through profit or loss category are included in the profit or loss in the period in which they arise.
The fair values of financial assets carried at amortised cost as at 31 December 2016 and 31 December 2015 are detailed in the fair values of financial assets and liabilities carried at amortised cost section on page 34 and 35.
(ii) Loans and receivables
Loans and advances to credit institutions. These are sums deposited in instantly accessible bank accounts with major high street banks, used for liquidity purposes.
Loans and advances to customers. These are sums advanced to the Group’s borrowers, secured on property, land or (in a very restricted number of instances) unsecured.
Loans and receivables are carried at amortised cost using the effective interest rate method.
Purchases and sales of financial assets at fair value through profit or loss are recognised on the trade-date being the date on which the Group legally commits to purchase or sell the asset. Loans are recognised when cash is advanced to the borrowers. Financial assets are initially recognised at fair value plus transaction costs for all financial assets not carried at fair value through profit or loss. Financial assets are no longer recognised when the rights to receive cash flows from the financial assets have expired or where the Group has transferred substantially all risks and rewards of ownership.
Impairment
With regard to mortgage assets, the Group assesses at each financial position date whether there is objective evidence that a financial asset or group of financial assets is impaired. Objective evidence of impairment includes events that occurred after the initial recognition of the asset (a ‘loss event’) and that loss event (or events) has an impact on the estimated future cash flows of the financial asset or group of financial assets that can be reliably estimated.
Objective evidence that a financial asset or group of assets is impaired includes accounts going into arrears and other observable data that comes to the attention of the Group about the following loss events:
i. the Group granting to the borrower, for economic or legal reasons relating to the borrower’s financial difficulty, a concession that the lender would not otherwise consider;
ii. it becoming probable that the borrower will enter bankruptcy or other financial reorganisation; iii. observable data indicating that there is a measurable decrease in the estimated future cash flows from a group of financial assets since the initial
recognition of those assets, although the decrease cannot yet be identified with the individual financial assets in the Group, including:
– adverse changes in the payment status of borrowers in the Group; or
– national or local economic conditions that correlate with defaults on the assets in the Group. The above assessment includes those mortgage assets which are subject to forbearance arrangements.
The Group first assesses whether objective evidence of impairment exists individually for financial assets that are individually significant, and individually or collectively for financial assets that are not individually significant. If the Group determines that no objective evidence of impairment exists for an individually assessed financial asset, whether significant or not, it includes the asset in a group of financial assets with similar credit risk characteristics and collectively assesses them for impairment. Assets that are individually assessed for impairment and for which an impairment loss is or continues to be recognised are not included in a collective assessment of impairment.
If there is objective evidence that an impairment loss on loans and receivables carried at amortised cost has been incurred, the amount of the loss is measured as the difference between the assets’s carrying amount and the present value of estimated future cash flows discounted at the financial asset’s original effective interest rate. The impairment value is then reflected in a separate account from the underlying assets in the Group’s financial records and is recognised in the Statement of Comprehensive Income.

NOTES TO THE FINANCIAL STATEMENTS FOR THE YEAR ENDED 31 DECEMBER 2016
MANCHESTER BUILDING SOCIETY ANNUAL REPORT & ACCOUNTS PAGE 23
1. Accounting policies and financial risk management a) Summary of significant accounting policies (continued)
Impairment (continued)
The Group’s policy in relation to any properties that it has taken into possession is that it will seek their disposal with a view to minimising the losses that it may incur.
Investment in subsidiary undertakings
Subsidiaries are all entities over which the Group has control. The Group controls an entity when it is exposed to, or has rights to, variable returns from its involvement with the entity and has the ability to affect those returns through its power over the entity.
Investments in the Society’s subsidiary undertakings are recorded in the Statement of Financial Position at historic cost less any provision for impairment. Impairment is assessed in line with IAS 36 – Impairment of Assets comparing the carrying value of the investment against future cash flows from the subsidiary undertakings.
Property, plant and equipment
All property, plant and equipment is stated at historical cost less depreciation and any provision for impairment. Historical cost includes expenditure that is directly attributable to the acquisition of the items.
Subsequent costs are included in each asset’s carrying amount or are recognised as a separate asset, as appropriate, only when it is probable that future economic benefits associated with the item will flow to the Group and the cost of the item can be measured reliably. All other repairs and maintenance are charged to profit or loss during the financial period in which they are incurred.
Land is not depreciated. Depreciation on other assets is calculated using the straight-line method to allocate their cost less their residual values over their estimated useful lives, as follows:
- Freehold office premises: over 50 years. - Office premises structural alterations: over 20 years. - Office fixtures and fittings: over 10 years. - Computer and sundry equipment: over 5 years. - Other assets: over 4 years.
The assets’ residual values and useful lives are reviewed, and adjusted if appropriate, at each financial reporting date. The freehold head office property has been tested for impairment and written down to fair value less estimated cost of disposal.
Investment property
Investment property is residential property acquired as a result of the settlement of an impaired mortgage asset. The properties are being held, pending their eventual sale, and are carried at their fair value. Changes in their fair value are recognised in profit or loss as part of total operating income. Any gain or loss on disposal is taken through profit or loss.
Cash and cash equivalents
For the purposes of the statement of cash flows, cash and cash equivalents comprise balances with less than three months’ maturity from the date of acquisition including: cash in hand and non-restricted balances with central banks, loans and advances to banks and amounts due from other banks.
Corporation tax
Corporation tax is charged at the current rate calculated on the basis of the profit on ordinary activities as adjusted in line with HMRC requirements for taxation purposes.
Deferred income tax
Deferred income tax is provided in full, using the liability method, on temporary differences arising between the tax bases of assets and liabilities and their carrying amounts in the financial statements. Deferred income tax is determined using tax rates (and laws) that have been enacted or substantively enacted by the financial position date and are expected to apply when the deferred tax asset is realised or the liability is settled.
Deferred tax assets (“DTAs”) are recognised to the extent that it is probable that future taxable profit will be available against which deductible temporary differences can be utilised.
Pensions - Group defined contribution scheme
The Group operates a defined contribution pension scheme for its employees. All the costs incurred by the employer are included in profit or loss.
Foreign currency
Foreign currency transactions are translated into sterling, using the exchange rates prevailing at the dates of the transactions (spot exchange rate). Foreign exchange gains and losses resulting from the settlement of such transactions and from the re-measurement of monetary items at year-end exchange rates are recognised in the Statement of Comprehensive Income.
Leases
The Group has entered into operating lease agreements. Rental income and expenditure is recognised in profit or loss on a straight line basis over the term of the lease in other income and charges in the Statement of Comprehensive Income.

NOTES TO THE FINANCIAL STATEMENTS FOR THE YEAR ENDED 31 DECEMBER 2016
MANCHESTER BUILDING SOCIETY ANNUAL REPORT & ACCOUNTS PAGE 24
1. Accounting policies and financial risk management a) Summary of significant accounting policies (continued)
Financial Liabilities
All financial liabilities including shares, deposits, derivative financial instruments, debt securities and subordinated liabilities are recognised initially at fair value, being the issue proceeds, net of transaction costs incurred as appropriate. Financial liabilities, except for derivative financial instruments, are subsequently measured at amortised cost using the effective interest rate method. Following initial recognition derivative financial instruments continue to be recognised at fair value.
Offsetting
For the financial assets and liabilities subject to enforceable master netting arrangements or similar arrangements, each agreement between the Group and the counterparty allows for net settlement of the relevant financial assets and liabilities when both elect to settle on a net basis. In the absence of such an election, financial assets and liabilities will be settled on a gross basis. However, each party to the master netting agreement or similar agreement will have the option to settle all such amounts on a net basis in the event of default of the other party.
Provisions for liabilities and charges
A provision is recognised in the balance sheet if the Group has a legal or constructive obligation as a result of a past event and it is probable that an outflow of economic benefits will be required to settle the obligation and a reliable estimate can be made.
Financial Services Compensation Scheme (“FSCS”)
During 2008, claims were made on the FSCS following the failure of Bradford & Bingley plc, Heritable Bank plc, Kaupthing Singer and Friedlander Limited and London Scottish Bank plc. In order to fund the claims made under its terms of operation, the FSCS has borrowed from the Bank of England and HM Treasury. The FSCS pays interest on its borrowings; it incurs operating expenses in its own right and incurs capital losses where shortfalls arise on the realisations of assets that it is managing from the failed banks listed above. The costs of the FSCS are passed on to all UK banks and building societies.
The Society makes provision for the charge based on estimates of its share of the total levy that the FSCS will raise by comparing its level of “protected deposits” with those of all deposit taking institutions covered by the FSCS. The Society’s estimates are sensitive to the level of estimated management expenditure incurred by the FSCS and the level of capital losses that will arise in future periods as the FSCS undertakes the management of the assets of the failed banks.
In accordance with IFRIC 21 - Levies the trigger date for recognition of a provision in respect of the FSCS levy is 1 April each year and at 31 December the Society holds an accrual for one year’s interest levy.
Customer redress provision
Provision for customer redress is made when the Group is aware of a specific historic conduct or regulatory issue and it is probable that customer remediation will be required to settle the obligation. Provision is made for the estimated cost of interest refunds, which is debited against interest income, and other associated costs which are debited against other administrative expenses.
Permanent Interest Bearing Shares
The Society has two tranches of Permanent Interest Bearing Shares in issue. Both sets were issued with the intention of enhancing the Society’s regulatory capital position. The PIBS issued in 2005 confer unconditional discretion on the Society’s Board to cancel in part or in whole any interest payment due. Interest on the 1999 PIBS can only be cancelled in a restricted number of circumstances; the Board does not have an unconditional right to cancel this interest. Therefore, in accordance with IAS 32 - Financial Instruments: Presentation, within the Financial Statements the 2005 PIBS are classified as equity and the 1999 PIBS are classified as a liability. Interest paid on the 1999 PIBS issue is shown in the Statement of Comprehensive Income whereas interest paid on the 2005 PIBS issue is shown in the Statement of Changes in Equity.
As explained on page 5, as a result of the shortfall against the CET1 Combined Buffer requirement together with the loss for the year, under CRD IV article 141, in order to conserve capital, the Society is prohibited from making the PIBS coupon payments due in April 2017. The Board considers that there continues to be uncertainty over the Society’s ability to make coupon payments thereafter.
The carrying value of the PIBS in the 2016 accounts has not changed since initial recognition. In future, should there be greater certainty with regard to the expected future non-payment of PIBS coupons the fair value of the 1999 PIBS liability in the accounts will be adjusted to reflect the lower expected cash outflows (discounted back at the original effective interest rate on the instrument).
Profit Participating Deferred Shares
The Society has £18m of Profit Participating Deferred Shares, issued during 2013 (see Note 27). These instruments qualify as equity within the Statement of Financial Position. Whilst no coupon has been paid on the PPDS, any such cost would be recorded through the Statement of Changes in Equity.
b) Financial risk management
Strategy in using financial instruments
The Group accepts deposits from customers at both fixed and floating rates of interest, some of which are for fixed periods and others are open-ended; it seeks to enhance its interest margins by investing these funds in high-quality mortgages, liquidity instruments and liquid assets.
The Society has more fixed rate mortgages than fixed rate savings accounts. In order to manage the interest rate risk that arises, the Society may enter into simple-form interest rate swap arrangements with the intention of gaining some economic certainty as to its net interest margin position.
The Group uses financial instruments to invest liquid asset balances and raise funding. The Group also uses derivative financial instruments (derivatives) to manage the risks arising from its operations.

NOTES TO THE FINANCIAL STATEMENTS FOR THE YEAR ENDED 31 DECEMBER 2016
MANCHESTER BUILDING SOCIETY ANNUAL REPORT & ACCOUNTS PAGE 25
1. Accounting policies and financial risk management b) Financial risk management (continued)
Strategy in using financial instruments (continued)
The Board has authorised the use of derivatives by the Group to reduce the risk of loss arising from changes in market risks in accordance with Section 9A (4) of the Building Societies Act 1986 and derivatives are used by the Group for economic hedging purposes only. The Group does not run a trading book.
The principal derivatives used by the Group are foreign exchange contracts that are used to economically hedge Group Statement of Financial Position exposures. The Board does not intend to hedge its fixed rate mortgages using interest rate swaps at this time; this position is monitored regularly.
Credit risk - exposure
Credit risk is the risk that an individual or institutional counterparty to whom the Society has lent money will be unable to re-pay the sums in full when they fall due.
The Group manages the levels of credit risk it accepts by placing limits on the amount available in relation to individual borrowers and groups of borrowers. Such risks are monitored on a revolving basis and are subject to a regular review. Policy limits on the level of credit risk by product, industry sector and by country are approved half yearly by the Board. The exposure to any one borrower, including banking counterparties, is further restricted by sub-limits covering on and off balance sheet exposures. Actual exposures against limits are monitored daily.
The Group’s most significant concentration of credit risk is within the loans secured on residential property in the UK. The following table shows the credit exposure, which is the maximum potential exposure before provisions and including committed facilities.
Impairment provisions are provided for losses that have been incurred at the financial position date. The figure for lifetime mortgages is stated after deduction of an effective interest rate provision.
Credit risk - forbearance
The Society’s forbearance strategy is to seek to agree with borrowers in financial difficulty the provision of short to medium term assistance with their monthly mortgage payments, in order to avoid or mitigate the risk of financial loss. The range of forbearance options available in certain circumstances includes arrangements to clear the arrears over a reasonable period of time, payment concessions, and capitalisation of arrears. For mortgages that are not past due, conversion to interest only payment terms, an extension of term, or suspension of monthly payments pending sale of the property are available as options to reduce the monthly payment due and these seek to avoid a mortgage entering arrears and becoming past due, allowing time for a borrower to regularise their financial position.
As at 31 December 2016, the Society had 43 accounts (2015: 42) with balances of £5.1m (2015: £5.0m) where conversion to interest only or an extension of term had taken place. Of these, 33 accounts (2015: 35) were neither past due nor impaired, and 10 (2015: 7) were past due and/or impaired. The aggregate capital balance was £1.4m (2015: £2.0m); aggregate arrears £13k (2015: £21k); and aggregate impairment provision was £74k (2015: £nil).
The forbearance strategy seeks to avoid arrears arising or further increasing and to allow account performance to be restored by supporting the mortgage payments being brought up to date or to provide a period of time for repayment of the amount owed. The assessment of impaired loans incorporates management work-out strategies in relation to a number of credit exposures. If expectations were to change then this would affect the impairment risk. This is incorporated into the assessment of impairment provisions.
There are no specific concentrations of accounts in forbearance in relation to portfolios or geographical areas.
Credit risk – Loans and advances to customers
The analysis shown below, in relation to loans and advances to customers is based on the Group’s balances. Information is disclosed for the Society where there is significant variance between the Group and Society figures.
- Of the £311.2m of gross assets in this class £280.9m (90.3%) (2015: 90.6%) is fully secured on residential property and £29.1m (9.3%) (2015: 9.0%) is fully secured on land.
- £1.2m (0.4%) (2015: 0.4%) is unsecured personal loans. - With balances of £47.1m Lifetime mortgages represent 15.1% of this class (2015:11.4%).
Group Group Society Society 2016 2015 2016 2015£000 £000 £000 £000
Financial assetsLoans and advances to credit institutions 14,427 20,838 14,298 20,787 Investment securities 306 74 306 74 Gross loans and advances - on residential property and land 262,886 307,423 247,755 292,322 Gross loans and advances - lifetime mortgages 47,121 39,819 47,121 39,819 Gross loans and advances - other loans 1,218 1,388 1,218 1,388 Loans to subsidiary undertakings - - 10,823 13,160 Derivatives - exchange rate swaps 278 403 199 403
326,236 369,945 321,720 367,953

NOTES TO THE FINANCIAL STATEMENTS FOR THE YEAR ENDED 31 DECEMBER 2016
MANCHESTER BUILDING SOCIETY ANNUAL REPORT & ACCOUNTS PAGE 26
1. Accounting policies and financial risk management b) Financial risk management (continued)
Secured lending – fully secured on residential property
The average loan to valuation (“LTV”) of the Group’s lending that is fully secured on residential property is estimated at 37% (2015: 36%). Further analysis of the Group’s residential property lending is detailed below.
Estimates of current LTV are obtained by indexing the valuation at the last physical inspection of the property, by reference to externally published data. At 31 December 2016, 33% of the loan book had an LTV of 70% or greater (2015: 28%). In the event that valuations were to increase by 5%, at 31 December 2016 this would reduce the proportion of the loan book that had an LTV of 70% or greater to 30% (2015: 23%); in the event that House Price Indices (“HPIs”) decreased by 5% at 31 December 2016, the proportion of the loan book with an LTV of 70% or greater would increase to 37% (2015: 34%).
The Group continues to review regularly the quality of its loans that are fully secured on residential property. The proportion of these loans more than 3 months in arrears is 1.6% (2015: 3%). There are no lifetime mortgages which are past due.
The table below provides further information on the payment due status of gross loans fully secured on residential property.
* For properties in possession, £2.6m (2015: £2.7m) of collateral is held. In the analysis above, for all past due loans, £31.6m (2015: £38.9m) of collateral is
held.
** The NMB MAC and CLC mortgage books of second charge loans were initially acquired at a deep discount and are considered impaired. Arrears banding information is not presented for these portfolios as there is insufficient reliable data to determine this accurately. The net book value of these loan books after impairment provisions is £5.3m (2015: £6.6m).
In the analysis above, loans which are not impaired and are less than 3 months past due and which have collective impairment provisions total £14.9m (2015: £11.9m).
At 31 December 2016 the Group held individually identified impairment provisions of £2.2m (2015: £1.7m).
2016 2015% %
<70% 67 72 70% - 80% 12 13 80% - 90% 7 7 90% - 100% 5 3 >100% 9 5
Average loan to value of stock - UK mortgages 34 33 Average loan to value of stock - Spanish mortgages 81 78
2016 2016 2015 2015£m % £m %
Not impaired: Neither past due nor impaired 246.2 88 278.0 88 Past due up to 3 months 9.1 3 13.1 4 Past due 3 to 6 months 1.4 - 2.3 1 Past due 6 to 12 months 1.3 - 0.4 - Past due over 12 months 0.7 - 0.7 -
Impaired: Not past due and up to 3 months 2.3 1 2.1 1 Past due 3 to 6 months - - 0.1 - Past due 6 to 12 months - - - - Past due over 12 months 2.0 1 2.1 1 Possessions * 3.1 1 2.3 1
266.1 94 301.1 96
NMB MAC mortgage book - beneficial interest is held ** 13.4 5 13.5 4 CLC mortgage book ** 1.4 1 1.4 -
280.9 100 316.0 100

NOTES TO THE FINANCIAL STATEMENTS FOR THE YEAR ENDED 31 DECEMBER 2016
MANCHESTER BUILDING SOCIETY ANNUAL REPORT & ACCOUNTS PAGE 27
1. Accounting policies and financial risk management b) Financial risk management (continued)
Geographical Analysis
The table below provides information on the geographical split of the Group’s gross lending on residential property.
Secured lending – fully secured on land
The constitution of gross loans fully secured on land by industry type is as follows:
The table below provides further information on the payment due status of gross loans that are fully secured on land:
* For properties in possession £0.4m of collateral is held (2015: £1.9m). In the analysis above, for all past due loans £7.0m of collateral is held (2015: £5.1m).
In the analysis above, loans which are not impaired and are less than 3 months past due have collective impairment provisions of £50k (2015: £18k).
At 31 December 2016 the Group held individually identified impairment provisions of £4.6m (2015: £4.4m).
2016 2016 2015 2015£m % £m %
East Midlands 4.1 1 4.6 1 Greater London 15.4 6 18.8 6 London 35.9 13 43.5 14 North 6.5 2 7.5 2 North West 106.3 37 121.7 39 Other 9.9 4 10.8 3 South East 20.9 7 25.4 8 South West 7.4 3 9.8 3 Wales 6.2 2 7.9 3 West Midlands 7.3 3 9.9 3 Yorkshire 13.9 5 16.3 5
Total UK properties 233.8 83 276.2 87
Spain (lending is lifetime mortgages) 47.1 17 39.8 13
280.9 100 316.0 100
2016 2016 2015 2015£m % £m %
Offices 8.2 28 8.9 29 Shops 6.8 23 7.1 23 Industrial 4.5 16 4.8 15 Restaurants, Hotels and other 9.6 33 10.4 33
29.1 100 31.2 100
2016 2016 2015 2015£m % £m %
Not impaired: Neither past due nor impaired 20.4 70 22.5 72 Past due up to 3 months 0.9 3 1.5 5 Past due 3 to 6 months 0.1 - 0.7 2 Past due 6 to 12 months 0.3 1 0.3 1 Past due over 12 months 0.4 1 - -
Impaired: Not past due and up to 3 months 1.4 5 0.7 2 Past due 3 to 6 months - - 1.2 4 Past due 6 to 12 months - - - - Past due over 12 months 3.4 12 2.1 7 Possessions * 2.2 8 2.2 7
29.1 100 31.2 100

NOTES TO THE FINANCIAL STATEMENTS FOR THE YEAR ENDED 31 DECEMBER 2016
MANCHESTER BUILDING SOCIETY ANNUAL REPORT & ACCOUNTS PAGE 28
1. Accounting policies and financial risk management b) Financial risk management (continued)
Unsecured lending
The table below provides further information on the payment due status of gross unsecured loans:
In the analysis above, loans which are not impaired and are less than 3 months past due have collective impairment provisions of £nil (2015: £13k).
At 31 December 2016 the Group held individually identified impairment provisions of £nil (2015: £nil).
Credit risk – loans and advances to banks and investment securities
Credit risk relating to liquid assets arises from the investments held by the Group in order to meet business-as-usual liquidity requirements. This aspect of credit risk is managed by the Group’s Risk Committee, which sets and monitors compliance with policy and limits. The equivalent information has not been disclosed for the Society as there is no significant variance between the Group and Society figures.
The maximum individual counterparty exposure at the financial position date was £67m (2015: £56m) which was on deposit with the Bank of England. The number of active counterparties at the financial position date was 5 (2015: 5). All counterparties are UK domiciled banks whose registered address is within the UK and who are authorised by the PRA and regulated by the FCA and PRA as lead regulators; this is in support of the Board’s low risk appetite approach to banking counterparty risk.
For credit purposes, the liquid asset portfolio comprises the following sub-portfolios as at 31 December:
The Group’s Risk Committee monitors exposure concentrations against a variety of criteria including industry sector / asset class and country of counterparty.
Geographical exposure, assessed by reference to the registered address of the counterparty and the lead regulator of the entity, is solely within the UK.
Industry sector/asset class exposure:
Collateral held as security for liquid assets is determined by the nature of the instrument. Loans and debt securities are generally unsecured with the exception of asset backed securities which are secured by pools of financial assets.
2016 2016 2015 2015£m % £m %
Not impaired: Neither past due nor impaired 1.0 77 0.9 64 Past due up to 3 months 0.1 8 0.5 36 Past due over 12 months 0.1 15 - -
1.2 100 1.4 100
2016 2016 2015 2015£m % £m %
UK Financial institutions 81.8 100 76.7 100 Treasury Bill 0.2 - - - Mortgage backed securities 0.1 - 0.1 -
82.1 100 76.8 100
2016 2016 2015 2015£m % £m %
UK 82.1 100 76.8 100
82.1 100 76.8 100
2016 2016 2015 2015£m % £m %
UK Financial institutions 81.8 100 76.7 100 UK Government 0.2 - - - Asset backed securities 0.1 - 0.1 -
82.1 100 76.8 100

NOTES TO THE FINANCIAL STATEMENTS FOR THE YEAR ENDED 31 DECEMBER 2016
MANCHESTER BUILDING SOCIETY ANNUAL REPORT & ACCOUNTS PAGE 29
1. Accounting policies and financial risk management b) Financial risk management (continued)
Credit risk – foreign exchange derivatives and offsetting
Foreign exchange derivative financial assets are subject to offsetting, enforceable, master netting agreements. The gross amounts of these assets on the balance sheet are £278k (2015: £403k). Related amounts not set off are £1,641k (2015: £679k) financial liabilities with cash collateral received of £nil (2015: £230k).
Foreign exchange derivative financial liabilities are subject to offsetting, enforceable, master netting agreements. The gross amounts of these liabilities on the balance sheet are £1,641k (2015: £679k). Related amounts not set off are £278k (2015: £403k) financial liabilities with cash collateral received of £3,105k (2015: £955k).
Cash flow and fair value interest rate risk
Cash flow interest rate risk is the risk that the future cash flows of a financial instrument will fluctuate because of changes in market interest rates. Fair value interest rate risk is the risk that the value of a financial instrument will fluctuate because of changes in market interest rates. The Group takes on exposure to the effects of fluctuations in the prevailing levels of market interest rates on both its fair value and cash flow risks. Interest margins may increase as a result of such changes but may reduce or create losses in the event that unexpected movements arise. The Board sets limits on the level of mismatch of interest rate repricing that may be undertaken, which are monitored monthly.
The table below summarises the Group’s exposure to interest rate risks. Included in the table are the Group’s assets and liabilities at carrying amounts, categorised by the earlier of contractual repricing or maturity dates. The equivalent information has not been disclosed for the Society as there is no significant variance between the Group and Society figures.
The Group’s interest rate sensitivity exposure at 31 December 2016 and 31 December 2015 was:
Effective Non-interest 0-3 3-6 6-12 1-5 5-10 10-20 20-30 Over 30 interest
rate months months months years years years years years bearing Total% £000 £000 £000 £000 £000 £000 £000 £000 £000 £000
At 31 December 2016AssetsCash and central banks balances 0.25 67,379 - - - - - - - 8 67,387 Due from other banks 0.46 14,418 - - - - - - - 9 14,427 Investment securities 0.22 - 240 - 66 - - - - - 306 Loans to customers 3.64 228,756 190 381 2,650 2,750 9,898 2,435 119 - 247,179 Lifetime mortgages 6.76 - - 849 5,162 4,455 20,794 11,013 - - 42,273 Derivatives 18 260 - - - - - - - 278 Other assets 3,105 - - - - - - - 7,349 10,454
Total assets 313,676 690 1,230 7,878 7,205 30,692 13,448 119 7,366 382,304
LiabilitiesDue to other banks - - - - - - - - - - - Other deposits 0.76 24,631 - - - - - - - 122 24,753 Due to members 1.04 296,802 2,794 12,784 2,499 - - - - 512 315,391 Subordinated liabilities 3.96 9,200 - - - - 5,000 - - - 14,200 Derivatives 1,214 314 113 - - - - - - 1,641 Other liabilities - - - - - - - - 3,313 3,313 Subscribed capital - - - - - - - - 14,788 14,788 Profit participating deferred shares - - - - - - - - 17,461 17,461 Accumulated losses - - - - - - - - (9,243) (9,243)
Total liabilities 331,847 3,108 12,897 2,499 - 5,000 - - 26,953 382,304
(18,171) (2,418) (11,667) 5,379 7,205 25,692 13,448 119 (19,587) - Cumulative gap (18,171) (20,589) (32,256) (26,877) (19,672) 6,020 19,468 19,587 - - Interest rate sensitivity gap

NOTES TO THE FINANCIAL STATEMENTS FOR THE YEAR ENDED 31 DECEMBER 2016
MANCHESTER BUILDING SOCIETY ANNUAL REPORT & ACCOUNTS PAGE 30
1. Accounting policies and financial risk management b) Financial risk management (continued)
Cash flow and fair value interest rate risk (continued)
The Society’s financial performance is sensitive to changes in interest rates in respect of the interest it earns. Based on the assets and liabilities in the balance sheet at 31 December 2016 an increase of 1% in market interest rates across all maturities would reduce income and equity by £5.5m (2015: £4.8m reduction). These amounts are for indication only, and represent the impact of an unexpected overnight 1% parallel shift in the yield curve, without any subsequent management action, and consequently do not represent amounts that are at risk. ALCO monitor a variety of interest rate shocks from 0.5% to 2%.
Liquidity risk
The Group is exposed to daily calls on its available cash resources from customer withdrawals, maturing deposits, loan draw-downs and guarantees, and from margin and other calls on cash-settled derivatives. The Group does not maintain immediately available cash resources to meet instantly all of these needs, as experience shows that a minimum level of reinvestment of maturing funds can be predicted with a high level of certainty.
The Board sets limits on the minimum proportion of maturing funds available to meet such calls and on the nature of the funds that are available to the Society on an instantly accessible basis; with the latter, the Board strategy has been to place notable sums with the Bank of England and with other UK “High Street” banks in order to ensure that it meets its objectives of ensuring that all such funds are highly liquid.
The liquidity profile throughout 2016 has aligned with the Board’s low risk appetite in this area and day-to-day operations of the liquidity portfolio saw compliance with all policy limits throughout the period. Such policy limits are reviewed on a daily basis and it should be noted that the Group has consistently maintained cash resources in excess of the policy minimum.
The equivalent information has not been disclosed for the Society as there is no significant variance between the Group and Society figures.
The Society has continued to hold liquidity levels well in excess of the regulatory thresholds during the year. This has contributed to downward pressure on net interest income.
The table below analyses the Group’s contractual cash flows under financial liabilities.
Effective Non-interest 0-3 3-6 6-12 1-5 5-10 10-20 20-30 Over 30 interest
rate months months months years years years years years bearing Total% £000 £000 £000 £000 £000 £000 £000 £000 £000 £000
At 31 December 2015AssetsCash and central banks balances 0.50 55,844 - - - - - - - 17 55,861 Due from other banks 0.71 20,825 - - - - - - - 13 20,838 Investment securities 0.99 74 - - - - - - - - 74 Loans to customers 3.82 266,430 2,417 2,965 4,197 2,513 11,094 4,354 119 - 294,089 Lifetime mortgages 6.76 - - 353 2,979 2,903 18,031 12,263 - - 36,529 Other assets 1,346 12 - - - - - - 7,827 9,185
Total assets 344,519 2,429 3,318 7,176 5,416 29,125 16,617 119 7,857 416,576
LiabilitiesDue to other banks 0.65 1,000 1,000 - - - - - - 2 2,002 Other deposits 0.84 42,016 500 2,216 - - - - - 225 44,957 Due to members 1.21 301,703 3,958 9,243 8,910 - - - - 816 324,630 Subordinated liabilities 4.07 9,200 - - - - 5,000 - - - 14,200 Derivative financial instruments - - - - - - - - - - Other liabilities 308 283 318 - - - - - 3,184 4,093 Subscribed capital - - - - - - - - 14,788 14,788 Profit participating deferred shares - - - - - - - - 17,461 17,461 Accumulated losses - - - - - - - - (5,555) (5,555)
Total liabilities 354,227 5,741 11,777 8,910 - 5,000 - - 30,921 416,576
(9,708) (3,312) (8,459) (1,734) 5,416 24,125 16,617 119 (23,064) - Cumulative gap (9,708) (13,020) (21,479) (23,213) (17,797) 6,328 22,945 23,064 - - Interest rate sensitivity gap

NOTES TO THE FINANCIAL STATEMENTS FOR THE YEAR ENDED 31 DECEMBER 2016
MANCHESTER BUILDING SOCIETY ANNUAL REPORT & ACCOUNTS PAGE 31
1. Accounting policies and financial risk management b) Financial risk management (continued)
Liquidity risk (continued)
The table below analyses the Group’s assets and liabilities into relevant maturity groupings based on the remaining period at the financial position date to the contractual maturity date. The equivalent information has not been disclosed for the Society as there is no significant variance between the Group and Society figures.
0-3 3-12 1-5 5-10 10-15 Over 15On demand months months years years years years Total
£000 £000 £000 £000 £000 £000 £000 £000At 31 December 2016Due to members 128,350 176,188 3,982 6,871 - - - 315,391 Due to other banks and depositors 12,653 12,100 - - - - - 24,753 Derivative financial instruments - 1,215 426 - - - - 1,641 Other liabilities 1,243 91 1,858 - - - - 3,192 PIBS interest - - 200 1,600 2,000 2,000 2,000 7,800 Subordinated liabilities - 141 422 2,250 11,021 1,675 5,270 20,779
Total outflow 142,246 189,735 6,888 10,721 13,021 3,675 7,270 373,556
£000 £000 £000 £000 £000 £000 £000 £000At 31 December 2015Due to members 153,744 148,776 6,957 15,153 - - - 324,630 Due to other banks and depositors 3,947 39,308 3,749 - - - - 47,004 Derivative financial instruments - 78 601 - - - - 679 Other liabilities 1,155 268 1,991 - - - - 3,414 PIBS interest - - 400 1,600 2,000 2,000 2,000 8,000 Subordinated liabilities - 145 434 2,313 11,272 1,675 5,605 21,444
Total outflow 158,846 188,575 14,132 19,066 13,272 3,675 7,605 405,171
0-3 3-6 6-12 1-5 5-10 10-20 20-30 Over 30months months months years years years years years Total
£000 £000 £000 £000 £000 £000 £000 £000 £000At 31 December 2016AssetsCash and central banks balances 67,387 - - - - - - - 67,387 Due from other banks 14,427 240 - 66 - - - - 14,733 Derivative financial instruments 19 259 - - - - - - 278 Loans to customers 13,331 3,373 6,743 50,989 47,602 115,979 7,980 1,184 247,181 Lifetime mortgages - - 849 5,162 4,455 20,794 11,013 - 42,273 Other assets 528 185 3,128 752 - - - 5,861 10,454
Total assets 95,692 4,057 10,720 56,969 52,057 136,773 18,993 7,045 382,306
LiabilitiesDue to other banks - - - - - - - - - Other deposits 24,753 - - - - - - - 24,753 Derivative financial instruments 1,214 314 113 - - - - - 1,641 Due to members 304,537 2,794 1,188 6,872 - - - - 315,391 Subordinated liabilities - - - - 9,200 5,000 - - 14,200 Other liabilities 1,606 422 1,231 54 - - - - 3,313
Total liabilities 332,110 3,530 2,532 6,926 9,200 5,000 - - 359,298
Net liquidity gap (236,418) 527 8,188 50,043 42,857 131,773 18,993 7,045 23,008
At 31 December 2015Total assets 87,857 3,491 8,664 61,987 57,642 159,225 30,521 7,189 416,576 Total liabilities 347,263 5,743 7,524 15,152 9,200 5,000 - - 389,882
Net liquidity gap (259,406) (2,252) 1,140 46,835 48,442 154,225 30,521 7,189 26,694

NOTES TO THE FINANCIAL STATEMENTS FOR THE YEAR ENDED 31 DECEMBER 2016
MANCHESTER BUILDING SOCIETY ANNUAL REPORT & ACCOUNTS PAGE 32
1. Accounting policies and financial risk management b) Financial risk management (continued)
Liquidity risk (continued)
The matching and controlled mismatching of the maturities and interest rates of assets and liabilities is fundamental to the management of the Group. The Society does not expect to be completely matched, as transacted business is often of uncertain term and of different types. An unmatched position potentially enhances profitability but could also increase the risk of losses.
The maturities of assets and liabilities and the ability to replace, at an acceptable cost, interest-bearing liabilities as they mature are important factors in assessing the liquidity of the Group and its exposure to changes in interest rates and exchange rates.
Currency risk
At 31 December 2016 the Group had a foreign currency exposure of €57.1m (2015: €58.2m) in loans and receivables. At the balance sheet date this exposure is economically hedged with foreign exchange forward contracts. The Board sets limits on the level of exposures to foreign currency and these are monitored daily.
Foreign Exchange Sensitivity
The Group has assessed, on an indicative basis, the effect that a 10bp depreciation of the Euro would have on the Group’s income, as a result of a revaluation of the balance sheet assets and liabilities.
During 2016, the Group changed from matching Euro contracts against gross Euro assets to matching against Euro assets net of provisions. The 2015 sensitivity calculations are based on the 2016 approach.
2016 2015£000 £000
Effect on income with no Euro forward contracts (3,465) (2,703) Effect on income with Euro contracts fully matching Euro denominated assets 47 41

NOTES TO THE FINANCIAL STATEMENTS FOR THE YEAR ENDED 31 DECEMBER 2016
MANCHESTER BUILDING SOCIETY ANNUAL REPORT & ACCOUNTS PAGE 33
1. Accounting policies and financial risk management b) Financial risk management (continued)
Classification of financial assets and liabilities
The following tables show the classification of the Group’s and Society’s financial assets and liabilities
Fair value Fair valueLoans and through Loans and through
receivables profit or loss Total receivables profit or loss Total£000 £000 £000 £000 £000 £000
AssetsCash and balances with central banks 67,387 - 67,387 67,387 - 67,387 Loans and advances to credit institutions 14,427 - 14,427 14,298 - 14,298 Investment securities - 306 306 - 306 306 Derivative financial instruments - 278 278 - 199 199 Loans and advances to customers 289,452 - 289,452 283,341 - 283,341 Investments - - - 10,823 - 10,823 Other assets 3,177 - 3,177 3,128 - 3,128
374,443 584 375,027 378,977 505 379,482 Non-financial assets 7,277 1,839 Total assets 382,304 381,321
LiabilitiesDue to members 315,391 - 315,391 315,391 - 315,391 Deposits from banks - - - - - - Other deposits 24,753 - 24,753 24,753 - 24,753 Derivative financial instruments - 1,641 1,641 - 1,641 1,641 Other liabilities 1,365 - 1,365 1,008 - 1,008 Subordinated liabilities 14,200 - 14,200 14,200 - 14,200 Subscribed capital 5,000 - 5,000 5,000 - 5,000
360,709 1,641 362,350 360,352 1,641 361,993 Non-financial liabilities 19,954 19,328
382,304 381,321
Group at 31 December 2016 Society at 31 December 2016

NOTES TO THE FINANCIAL STATEMENTS FOR THE YEAR ENDED 31 DECEMBER 2016
MANCHESTER BUILDING SOCIETY ANNUAL REPORT & ACCOUNTS PAGE 34
1. Accounting policies and financial risk management b) Financial risk management (continued)
Classification of financial assets and liabilities (continued)
Fair value of financial assets and liabilities carried at amortised cost
The tables below show the book value of the Group’s and Society’s financial assets and liabilities held at amortised cost in the Statement of Financial Position.
Fair value Fair valueLoans and through Loans and through
receivables profit or loss Total receivables profit or loss Total£000 £000 £000 £000 £000 £000
AssetsCash and balances with central banks 55,861 - 55,861 55,861 - 55,861 Loans and advances to credit institutions 20,838 - 20,838 20,787 - 20,787 Investment securities - 74 74 - 74 74 Derivative financial instruments - 403 403 403 403 Loans and advances to customers 330,618 - 330,618 323,442 - 323,442 Investments - - - 13,160 - 13,160 Other assets 994 - 994 986 - 986
408,311 477 408,788 414,236 477 414,713 Non-financial assets 7,788 2,304 Total assets 416,576 417,017
LiabilitiesDue to members 324,630 - 324,630 324,630 - 324,630 Deposits from banks 2,002 - 2,002 2,002 - 2,002 Other deposits 44,957 - 44,957 44,957 - 44,957 Derivative financial instruments - 679 679 - 627 627 Other liabilities 1,314 - 1,314 1,023 - 1,023 Subordinated liabilities 14,200 - 14,200 14,200 - 14,200 Subscribed capital 5,000 - 5,000 5,000 - 5,000
392,103 679 392,782 391,812 627 392,439 Non-financial liabilities 23,794 24,578 Total liabilities 416,576 417,017
Society at 31 December 2015Group at 31 December 2015
Group 2016 2016 2015 2015Carrying Fair Carrying Fair
value value value value £000 £000 £000 £000
Financial assetsCash and balances with the Bank of England 67,387 67,387 55,861 55,861 Loans and advances to credit institutions 14,427 14,427 20,838 20,838 Loans and advances to customers 289,452 277,550 330,618 324,374 Other assets 3,177 3,177 994 994
374,443 362,541 408,311 402,067
£000 £000 £000 £000 Financial liabilitiesDue to members 315,391 315,378 324,630 324,645 Deposits from banks - - 2,002 2,002 Other deposits 24,753 24,753 44,957 44,957 Subordinated liabilities 14,200 14,200 14,200 14,200 Subscribed capital 5,000 1,425 5,000 5,975 Other liabilities 1,363 1,363 1,314 1,314
360,707 357,119 392,103 393,093

NOTES TO THE FINANCIAL STATEMENTS FOR THE YEAR ENDED 31 DECEMBER 2016
MANCHESTER BUILDING SOCIETY ANNUAL REPORT & ACCOUNTS PAGE 35
1. Accounting policies and financial risk management b) Financial risk management (continued)
Fair value of financial assets and liabilities carried at amortised cost (continued)
i. Cash and balances with the Bank of England – the fair value is the same as the carrying value as the amounts are repayable on demand. ii. Loans and advances to credit institutions – the fair value of overnight deposits is the same as the carrying value as the amounts are repayable on
demand. The estimated fair value of loans and advances to credit institutions is calculated based upon discounted expected future cash flows. iii. Loans and advances to customers – the estimated fair value of loans and advances to customers represents the discounted amount of estimated
future cash flows expected to be received after taking into account impairment and expected prepayment rates. Estimated cash flows are discounted using prevailing markets rates for items of similar maturity.
iv. Shares and borrowings – The estimated fair value of deposits with no stated maturity is the amount repayable on demand. The estimated fair value of fixed interest bearing deposits and other borrowings without quoted market prices is based on discounted cash flows using interest rates for new deposits with similar remaining maturity.
Fair value measurement
Fair value is the price that would be received to sell an asset or paid to transfer a liability in an orderly transaction between knowledgeable, willing market participants at the measurement date.
Wherever possible, fair values have been calculated using unadjusted quoted market prices in active markets for identical instruments held by the Group. Where quoted market prices are not available, or are unreliable, fair values have been determined using valuation techniques which, to the extent possible, use market observable inputs, but in some cases use non-market observable inputs.
Valuation techniques used include discounted cash flow analysis and pricing models and, where appropriate, comparison to instruments with characteristics similar to those of the instruments held by the Group.
Because a variety of estimation techniques are employed and significant estimates made, comparisons of fair values between financial institutions may not be meaningful. Readers of these financial statements are thus advised to use caution when using this data to evaluate the Group’s financial position.
The fair value measurement basis used is as follows: Level 1 Quoted prices (unadjusted) in active markets for identical assets or liabilities.
Level 2 Valuation techniques where all inputs are taken from observable market data, either directly (i.e. as prices) or indirectly (i.e. derived from prices).
Level 3 Valuation techniques where significant inputs are not based on observable market data. None of the Group’s assets or liabilities are valued using this technique.
Society 2016 2016 2015 2015Carrying Fair Carrying Fair
value value value value £000 £000 £000 £000
Financial assetsCash and balances with the Bank of England 67,387 67,387 55,861 55,861 Loans and advances to credit institutions 14,298 14,298 20,787 20,787 Loans and advances to customers 283,341 271,439 323,442 317,198 Other assets 3,128 3,128 986 986
368,154 356,252 401,076 394,832
£000 £000 £000 £000 Financial liabilitiesDue to members 315,391 315,378 324,630 324,645 Deposits from banks - - 2,002 2,002 Other deposits 24,753 24,753 44,957 44,957 Subordinated liabilities 14,200 14,200 14,200 14,200 Subscribed capital 5,000 1,425 5,000 5,975 Other liabilities 1,008 1,008 1,023 1,023
360,352 356,764 391,812 392,802

NOTES TO THE FINANCIAL STATEMENTS FOR THE YEAR ENDED 31 DECEMBER 2016
MANCHESTER BUILDING SOCIETY ANNUAL REPORT & ACCOUNTS PAGE 36
1. Accounting policies and financial risk management b) Financial risk management (continued)
Fair values of assets and liabilities held at fair value
The table below shows the fair values of the Group’s assets and liabilities held at fair value in the Statement of Financial Position analysed according to the hierarchy described above:
(i) Market prices have been used to determine the fair value of listed debt securities (ii) The fair value of derivatives and investment securities that are not listed are calculated by utilising internal valuation models using a
discounted cash flow model based on a current yield curve appropriate for the remaining term to maturity. External market data is used within these internal valuation models. Derivatives are held for trading. Investment securities are designated at fair value through profit or loss. Movements in the valuations of derivatives and investment securities are treated as fair value through profit and loss, and these financial assets and liabilities are grouped into the fair value hierarchy under level 2.
(iii) The fair value of Investment Properties is determined by using available index data and reflects the market value at the balance sheet date.
2016 2016 2016 2016Group Level 1 Level 2 Level 3 Total
£000 £000 £000 £000
Financial assetsInvestment securities 306 - - 306 Derivative financial instruments - 278 - 278
306 278 - 584
Investment properties (note 17) - 839 - 839
Financial liabilitiesDerivative financial instruments - 1,641 - - 1,641
- 1,641 - 1,641
2015 2015 2015 2015Group Level 1 Level 2 Level 3 Total
£000 £000 £000 £000
Financial assetsInvestment securities - 74 - 74 Derivative financial instruments - 403 - 403
- 477 - 477
Investment properties (note 17) - 781 - 781
Financial liabilitiesDerivative financial instruments - 679 - 679
- 679 - 679

NOTES TO THE FINANCIAL STATEMENTS FOR THE YEAR ENDED 31 DECEMBER 2016
MANCHESTER BUILDING SOCIETY ANNUAL REPORT & ACCOUNTS PAGE 37
1. Accounting policies and financial risk management c) Critical accounting estimates and judgements in applying accounting policies
The Group makes estimates and assumptions that affect the reported amounts of assets and liabilities within the financial year. The most significant areas where judgements and assumptions are made are as follows:
(i) Impairment losses on loans and advances
The Group reviews its portfolio of loans to assess potential impairment periodically. Save for lifetime mortgages (discussed further below), forbearance matters, arrears positions and indexed LTVs are reviewed on all loan accounts in order to identify potential impairment indicators. For all accounts where impairment may have occurred, the recoverability of the balance due at the financial statement date is assessed by reference to the discounted cash flows associated with the loan. The assessment of these cash flows includes periodic interest and capital repayments and a redemption amount. Within this impairment assessment, assumptions are made concerning sale disposal costs, any loss that may arise from discounts incurred at the point of sale and, in instances where the Society is not the primary charge holder, any payment that must be made to other lenders by the borrower. Values at redemption are assessed as follows:
- loans secured on residential property – assessed by reference to regional HPI data published by Nationwide Building Society and economic forecast data published by Oxford Economics.
- loans secured on land (a category which includes commercial property) – historic valuation data is supplemented with periodic updated desktop, drive-by or full inspection valuation information.
Assumptions are built in to the discounted cash flows regarding any work-out strategies on particular impaired accounts.
If the value of current house prices were 5% higher than that currently estimated, then the total impairment provision required for the Group would decrease from £21.8m to £20.6m. If current prices were 5% lower, then the provision requirement would increase by £1.1m to £22.9m.
The Group holds a beneficial interest in NMB MAC a portfolio of mortgage assets, some of which are CCA regulated. The legal title of these loans remains with this third party business to which the Group provided funding and over which it holds a debenture; under IFRS 10 this third party entity, which is currently in administration, is consolidated within the Group Financial Statements. A further smaller portfolio, CLC, which had previously been beneficially owned and which is now legally owned by the Group has similarly CCA regulated mortgage assets. The impact of non-compliance with the CCA has been assessed and included in the estimate of discounted future cash flows that forms the basis of the impairment provision. This has been assessed based on recent historic cash flow receipts, experience of redemptions and using estimates of the likely future redemption dates. The value of the mortgage assets, post impairment provision in these two portfolios, is £5.3m (2015: £6.6m) of which one third (2015: one third) relates to CCA regulated mortgages.
A 5% uplift in cash flows from the mortgage assets in these NMB MAC and CLC portfolios, associated with greater levels of recoverability than currently estimated, would result in the provision being reduced from £9.6m to £9.3m whilst a 10% reduction in cash flows would see the provision requirement increase from £9.6m to £10.1m.
The expected date of redemption is an important assumption in determining the level of impairment provision for the NMB MAC and CLC portfolios. If the average date of redemption was one year earlier than estimated this would result in the impairment provision being reduced by £0.1m to £9.5m, whilst a one year delay in the expected redemption cash flows would see the provision requirement increase from £9.6m to £9.9m.
The Board monitors its credit risk exposures, underlying security values and the level of impairment provisions on a regular basis.
(ii) Provisions for customer redress and regulatory issues
In addition to considering the impact of any non-compliance on the recoverability of loan balances and thus impairment provisioning, the Group considers the conduct risk which arises from having originated regulated loans and having acquired regulated loan portfolios. As is the case for all financial institutions there is a risk that aspects of current or historic business might be considered as not being conducted in accordance with all relevant regulation, or the fair and reasonable treatment of customers.
Certain activities of the Group, particularly the NMB MAC and CLC second charge loan portfolios carry greater levels of conduct risk. These portfolios are under regular review and assessment as part of the risk management processes within the Group. The administration of the NMB MAC and CLC portfolios was brought in-house in December 2015 and following that transfer the historic conduct of these portfolios was reviewed in detail by management.
Following this review, and having incorporated legal advice received, the Group has maintained its customer redress provision at £1.7m (2015: £1.7m) to provide for instances of non-compliance with the CCA within the NMB MAC and CLC portfolios. The provision includes an estimate of the potential cost of interest refunds during periods of non-compliance and other costs associated with a customer redress exercise. Full details of the customer redress provision are set out in Note 31.
Although a detailed review of these portfolios has been carried out, there is no judicial certainty in the legal position and there is a risk that further conduct issues or cases of non-compliance with regulations could be identified in the future. As a result the actual results could differ materially from our estimates.
Provision has been made where the Group is aware of a specific conduct or regulatory issue and can estimate its impact reliably, further details in respect of the Group’s consideration of other potential conduct and regulatory issues is provided in the contingent liability Note 32.

NOTES TO THE FINANCIAL STATEMENTS FOR THE YEAR ENDED 31 DECEMBER 2016
MANCHESTER BUILDING SOCIETY ANNUAL REPORT & ACCOUNTS PAGE 38
1. Accounting policies and financial risk management c) Critical accounting estimates and judgements in applying accounting policies (continued)
(iii) Insurance risk
The Society’s lifetime mortgages total £47.1m (2015: £39.8m). All loans are at rates of interest that are fixed for the duration of the mortgage; at inception LTVs were low and borrowers were above the age of 60. Borrowers do not make monthly repayments; instead under their contractual terms, interest is capitalised within the balance and becomes repayable on redemption of the loan.
The mortgage contracts contain a clause that behaves like an insurance policy, where in certain circumstances, if the redemption receipt is less than the contractual sum due, the Society cannot pursue the borrower or the estate for the shortfall. This exposes the Society to the risk that the redemption balance may not be recovered fully. Impairment provisions are calculated using: projection data regarding the expected remaining term of the loan and both historic and forecast Spanish HPI data. As redemption dates can be 25+ years in the future, the impairment provision is most sensitive to the value of the property at redemption, where a small change in property value assumptions in the earlier years can have a notable impact on the estimated redemption receipt.
Projection data obtained from external UK sources indicates average long term year-on-year Spanish HPI appreciation at 3.25% (2015: 3.53%) over a 25 year period. If this HPI were to decrease by 0.5% per annum, the insurance provision would increase from its current level of £4.8m to £5.6m; an increase in HPI of 0.5% per annum would see the provision reduce to £4.1m. Mortality rates are based on a third party actuarial assessment. The provision is not particularly sensitive to the date of redemption, in the event that borrowers were to live for 5 years longer than current predictions the insurance provision would decrease by £0.1m. Pre-payment rates are estimated to be 5.8% (2015: 5.5%), based on experience to date. A 0.5% decrease in the pre-payment rate would see the insurance risk provision increase from £4.8m to £5.2m whilst a 0.5% increase in pre-payment would result in a reduction in the insurance risk provision from £4.8m to £4.5m.
(iv) Deferred tax
An asset is recognised to the extent that it is considered probable that future taxable profits will be available to utilise its carrying value. The most critical element of judgement applied is that relating to the Society’s forecast profitability and the certainty of that profitability in the medium term in order to meet the requirements of IAS 12 – Income Taxes. This includes a consideration of the likely changes in economic conditions and the extent of new lending, or otherwise, in the business. The Group’s long term financial projections, based on a managed run-off of the balance sheet without a return to lending, indicate that the underlying operations of the Group will remain profitable in the short to medium term. In the medium to long term it is likely that the net interest margin will be insufficient to cover operating costs and loan impairment charges, resulting in operating losses.
As a result the recoverability of the Group’s deferred tax asset has been reassessed and £382k of deferred tax has been de-recognised in the year. Further details may be found in Note 18.
(v) Inter company loan impairment
A further impairment of £0.8m was made to the investment held in MBS (Property) Limited in the year. The investment valuation was assessed based on the discounted cash flows associated with the property, requiring an assessment of rentals, void rates and long term property values. A discount rate of 5.63% (2015: 5.63%) was applied being the rate associated with the financing arrangement in place. A 5% decrease in rental experience would increase the charge by £0.3m, while a 5% increase in rental experience would reduce the charge by £0.3m. The value of the property has been assumed to grow at 2% per annum up to a future date of disposal. If the growth rate was only 1% per annum this would lead to an increase in the impairment of £0.7m, while if the growth rate was 3% per annum the charge would be reduced to zero. Assumptions have been made in the impairment test about occupancy and void periods; if the assumed date of occupancy of vacant floors was delayed by 12 months then an additional impairment of £0.1m would be required.
The Group holds a beneficial interest in a portfolio of mortgage assets, NMB MAC, some of which are regulated by the CCA. The administration of this portfolio was brought in-house in December 2015 and following a review of the portfolio a significant charge was booked in the separate financial statements of MBS (Mortgages) Limited to provide for potential refunds and other costs associated with customer redress where cases of non-compliance with CCA regulations had been identified. Further details of this review and the charge in the year are set out in Note 1c (ii) and Note 31. Also a reassessment of the recoverability of these assets was carried out (as detailed in Note 1c (i)) and an additional impairment provision has been booked in the financial statements of MBS (Mortgages) Limited who consolidate these assets. These charges impair the ability of the subsidiary to repay the Society’s investment in it and therefore an impairment provision of £2.7m has been made in the Society’s separate financial statements, reducing the net investment in the subsidiary.
d) Segmental Analysis
The Group’s results are predominately derived from the Society’s principal activities. The Group’s other income streams are not sufficiently material to require segmental reporting. The chief operating decision maker of the Group and the Society is deemed to be the Group Board.
2. Interest receivable and similar income
Group Group Society Society 2016 2015 2016 2015£000 £000 £000 £000
On loans fully secured on residential property 11,704 12,634 11,219 13,065 On other loans 1,114 1,223 1,114 1,223 On investment securities 1 69 1 69 On other liquid assets 346 475 346 475
13,165 14,401 12,680 14,832

NOTES TO THE FINANCIAL STATEMENTS FOR THE YEAR ENDED 31 DECEMBER 2016
MANCHESTER BUILDING SOCIETY ANNUAL REPORT & ACCOUNTS PAGE 39
2. Interest receivable and similar income (continued) Interest receivable and similar income, on loans fully secured on residential property, has been reduced in the year by a charge of £0.2m (2015: £1.0m) in respect of a provision for customer redress; see Note 31 for further details.
Other than £3.2m (2015: £2.6m) generated on loans originating in Spain, all interest receivable and similar income has been generated within the United Kingdom. Interest generated on loans originating in Spain is representative of insurance income earned on insurance assets held.
3. Interest payable and similar charges
4. Other operating income and charges
Exchange gains and losses arise principally in respect of the Spanish lifetime mortgage book and are largely offset by the fair value gains and losses from the economic hedging activity with foreign exchange derivatives.
The method of presentation of fair value gains and losses on derivatives changed in 2016 to show all of the changes on one line in the notes to the accounts. Previously the gains and losses on derivatives were split between net profit or loss on derivatives and exchange gains and losses.
Rent payable by the Society under operating leases is payable to the Society’s subsidiary MBS (Property) Limited. Rent payable by the Group under operating leases is payable to 3rd parties.
5. Income from investments
Group Group Society Society 2016 2015 2016 2015£000 £000 £000 £000
On amounts due to members 3,696 4,204 3,696 4,204 On deposits and other borrowings Subordinated liabilities 573 598 573 598 Subscribed capital (Note 25) 130 400 130 400 Other 294 651 294 651
4,693 5,853 4,693 5,853
Group Group Society Society 2016 2015 2016 2015£000 £000 £000 £000
Income Rents receivable 106 47 42 22 Interest from subsidiaries - - 521 603 Other income from subsidiaries - - 120 10 Exchange gains and losses 2,180 (1,556) 2,248 (1,609) Fair value gains and losses on derivatives (1,639) 1,794 (1,666) 1,834
647 285 1,265 860 Charges Rents payable 51 51 194 194 Other 8 7 8 7
59 58 202 201
Group Group Society Society 2016 2015 2016 2015£000 £000 £000 £000
Profit on sale of shareholding in New Life Home Finance Limited - 745 - 745

NOTES TO THE FINANCIAL STATEMENTS FOR THE YEAR ENDED 31 DECEMBER 2016
MANCHESTER BUILDING SOCIETY ANNUAL REPORT & ACCOUNTS PAGE 40
6. Administrative expenses
The increase in employee costs and other administrative expenses reflects additional activity carried out during the year in relation to the legal claim against Grant Thornton UK LLP; a proposed merger with another mutual society; an exercise at the request of the PRA to evaluate the capital required to re-enter the residential mortgage market; and the preparation of a ‘Capital Conservation Plan’ to meet the requirements of CRD IV article 142.
Remuneration of the auditors
7. Employees
The average number of persons employed during the year was:
Group Group Society Society 2016 2015 2016 2015£000 £000 £000 £000
Employee costs (including Executive Directors) Wages & salaries 1,946 1,726 1,946 1,726 Social security costs 214 185 214 185 Pension costs 165 149 165 149
2,325 2,060 2,325 2,060 Other administrative expenses 6,124 4,539 5,069 3,757
8,449 6,599 7,394 5,817
Group Group Society Society 2016 2015 2016 2015£000 £000 £000 £000
Fees payable to the auditors for audit of the annual accounts Current year 317 322 317 322 Additional fees in relation to the audit of the prior year 72 48 72 48 Fees payable to the auditors for other services Audit of the accounts of subsidiaries 10 10 - - Tax compliance services 50 73 49 71 Other assurance services 62 16 62 16
511 469 500 457
Group Group Society Society 2016 2015 2016 2015
Number Number Number Number
Full-time 44 41 44 41 Part-time 7 5 7 5
51 46 51 46

NOTES TO THE FINANCIAL STATEMENTS FOR THE YEAR ENDED 31 DECEMBER 2016
MANCHESTER BUILDING SOCIETY ANNUAL REPORT & ACCOUNTS PAGE 41
8. Directors’ emoluments
Executive directors
Non-executive directors
Total directors’ emoluments
During the year a number of appointments to the executive management team were made on an interim basis. Further details regarding Key Management Personnel may be found in Note 28.
Pension Salary Contributions Benefits Total
£000 £000 £000 £000 2016
C.W. Gee (resigned 31 March 2015) - - - - P.A. Lynch 135 17 11 163
135 17 11 163 2015
C.W. Gee (resigned 31 March 2015) 29 3 3 35 P.A. Lynch 117 14 11 142
146 17 14 177
Fees Fees 2016 2015£000 £000
J.P. Allen 29 29 H.F. Baines 36 36 I.A. Dewar 29 29 D.A. Harding 72 72 F.B. Smith 29 29 J. Smith (resigned 29 April 2015) - 9
195 204
2016 2015£000 £000
Executive directors 163 177 Non-executive directors 195 204
Total directors' emoluments 358 381

NOTES TO THE FINANCIAL STATEMENTS FOR THE YEAR ENDED 31 DECEMBER 2016
MANCHESTER BUILDING SOCIETY ANNUAL REPORT & ACCOUNTS PAGE 42
9. Income tax expense/(credit)
10. Loans and advances to credit institutions
11. Investment securities
The directors of the Society consider that the primary purpose of holding investment securities is prudential. The securities are held as liquid assets with the intention of use on a continuing basis in the Group's activities.
Group Group Society Society 2016 2015 2016 2015£000 £000 £000 £000
(Loss)/profit for the year before tax (2,968) (579) (4,615) 2,168 Tax rate 20.00% 20.25% 20.00% 20.25%
Expected tax (credit) / expense (594) (117) (923) 439
Adjustment for non-deductible items 12 517 704 559 Income not taxable (7) (146) (7) (146)Deferred tax movement closing rate/average rate difference 36 (11) 36 (11)Current year losses for which no deferred tax asset recognised 752 587 390 - Fixed asset timing differences for which no deferred tax asset recognised
3 11 - -
Adjustment in respect of prior years - deferred tax (4) - (2) - Decrease in deferred tax asset recognised 184 3,454 184 3,454 Actual tax expense 382 4,295 382 4,295
ComprisingDeferred tax origination and reversal of timing difference 382 4,295 382 4,295 Deferred tax adjustment in respect of prior years - - - -
382 4,295 382 4,295
Group Group Society Society 2016 2015 2016 2015£000 £000 £000 £000
Accrued interest 10 13 10 13 Repayable on demand 14,417 20,825 14,288 20,774
14,427 20,838 14,298 20,787
Group Group Society Society 2016 2015 2016 2015£000 £000 £000 £000
Government investment securities 240 - 240 - Listed private sector investment securities 66 74 66 74
306 74 306 74
Investment securities have remaining maturities as follows: In not more than three months - - - - In more than three months but not more than one year 240 - 240 - In more than one year but not more than five years 66 74 66 74
306 74 306 74

NOTES TO THE FINANCIAL STATEMENTS FOR THE YEAR ENDED 31 DECEMBER 2016
MANCHESTER BUILDING SOCIETY ANNUAL REPORT & ACCOUNTS PAGE 43
11. Investment securities (continued)
The movement in investment securities is summarised as follows:
12. Derivative financial instruments and trading liabilities - Group
Exchange rate swaps are commitments to exchange one set of cash flows for another. Swaps result in an economic exchange of currency rates (for example, Sterling for Euros). No exchange of principal takes place. The Group’s credit risk represents the potential cost to replace the swap contracts if counterparties fail to perform their obligations. This risk is monitored by reference to the fair value of the notional amount of the contracts and the liquidity of the market. To control the level of credit risk taken, the Group assesses counterparties using techniques including credit ratings. The fair value is based on the current discounted cash flows of the swaps when compared with the current exchange rate yields.
The Group uses foreign exchange forward contracts and swaps for hedging purposes. All derivative financial instruments are held for economic purposes.
The following table describes the significant activities undertaken by the Group, the risks associated with such activities and the types of derivatives which are typically used in managing such risks.
Activity Risk Type of derivative instruments used
Mortgage lending in Euros Sensitivity to changes in exchange rates Exchange rate swaps
Group Group Society Society 2016 2015 2016 2015£000 £000 £000 £000
At 1 January 74 15,561 74 15,561 Additions 240 500 240 500 Fair value adjustment - (46) - (46)Disposals (8) (15,941) (8) (15,941)
At 31 December 306 74 306 74
Notional Fair value Fair value amount Assets Liabilities
£000 £000 £000 Derivatives held at 31 December 2016 Exchange rate swaps 44,738 278 1,641
44,738 278 1,641
Derivatives have remaining maturities as follows: Up to three months 18,648 19 1,214 Three to six months 19,033 259 314 Six to twelve months 7,057 - 113
44,738 278 1,641
Derivatives held at 31 December 2015 Exchange rate swaps 42,760 403 679
42,760 403 679

NOTES TO THE FINANCIAL STATEMENTS FOR THE YEAR ENDED 31 DECEMBER 2016
MANCHESTER BUILDING SOCIETY ANNUAL REPORT & ACCOUNTS PAGE 44
13. Loans and advances to customers
At 31 December 2016 the Group had €57.1m (2015: €58.3m) of loans denominated in Euros. These were converted into Sterling at a rate of €1.169 to the pound (2015: €1.3611).
Maturity analysis
The remaining maturity of loans and advances to customers from the date of the financial position is as follows:
The Group’s experience is that, in many cases, mortgages are redeemed before their natural or contractual redemption dates. As a consequence the maturity analysis above may not reflect actual experience.
Group Group Society Society 2016 2015 2016 2015£000 £000 £000 £000
Loans fully secured on residential property 263,815 302,441 257,704 295,265 Loans fully secured on land 24,419 26,802 24,419 26,802 Other loans 1,218 1,375 1,218 1,375
289,452 330,618 283,341 323,442
Group Group Society Society 2016 2015 2016 2015£000 £000 £000 £000
Repayable on demand 12,000 8,635 12,000 8,635 Other loans and advances secured by residual maturity repayable: In not more than three months 1,902 2,103 1,629 1,830 In more than three months but not more than one year 10,885 10,906 10,067 10,088 In more than one year but not more than five years 55,870 61,735 51,398 57,263 In more than five years 230,568 265,251 221,000 255,713
311,225 348,630 296,094 333,529
Less: impairment provisions (21,773) (18,012) (12,753) (10,087)
289,452 330,618 283,341 323,442

NOTES TO THE FINANCIAL STATEMENTS FOR THE YEAR ENDED 31 DECEMBER 2016
MANCHESTER BUILDING SOCIETY ANNUAL REPORT & ACCOUNTS PAGE 45
13. Loans and advances to customers (continued)
Loans fully Other secured on loans fully residential secured Other
property on land loans Total £000 £000 £000 £000
GroupAt 1 January 2016
Individually identified Credit risk provisions 1,706 4,370 - 6,076 Total individually identified 1,706 4,370 - 6,076
Collectively identified Credit risk provisions 8,615 18 13 8,646 Insurance risk provisions 3,290 - - 3,290 Total collectively identified 11,905 18 13 11,936
Total opening provisions 13,611 4,388 13 18,012
Amounts utilised during the year
Individually identified Credit risk provisions - - - - Total individually identified - - - -
Collectively identified Credit risk provisions 6 - - 6 Insurance risk provisions (31) - - (31) Total collectively identified (25) - - (25)
Transferred from provisions for redress (Note 31)
Collectively identified Credit risk provisions 338 - - 338 Total individually identified 338 - - 338
Statement of Comprehensive Income
Individually identified Credit risk provisions 502 268 - 770 Total individually identified 502 268 - 770
Collectively identified Credit risk provisions 1,069 32 (13) 1,088 Insurance risk provisions 1,590 - - 1,590 Total collectively identified 2,659 32 (13) 2,678
Total 3,161 300 (13) 3,448
At 31 December 2016
Individually identified Credit risk provisions 2,208 4,638 - 6,846
Total individually identified 2,208 4,638 - 6,846
Collectively identified Credit risk provisions 10,028 50 - 10,078 Insurance risk provisions 4,849 - - 4,849 Total collectively identified 14,877 50 - 14,927
Total closing provisions 17,085 4,688 - 21,773

NOTES TO THE FINANCIAL STATEMENTS FOR THE YEAR ENDED 31 DECEMBER 2016
MANCHESTER BUILDING SOCIETY ANNUAL REPORT & ACCOUNTS PAGE 46
13. Loans and advances to customers (continued)
Total impairment losses in the Statement of Comprehensive Income of the Group and Society are disclosed in Note 14.
Loans fully Other secured on loans fully residential secured Other
property on land loans Total £000 £000 £000 £000
SocietyAt 1 January 2016
Individually identified Credit risk provisions 1,706 4,370 - 6,076 Total individually identified 1,706 4,370 - 6,076
Collectively identified Credit risk provisions 690 18 13 721 Insurance risk provisions 3,290 - - 3,290 Total collectively identified 3,980 18 13 4,011
Total opening provisions 5,686 4,388 13 10,087
Amounts utilised during the year
Individually identified Credit risk provisions - - - - Total individually identified - - - -
Collectively identified Credit risk provisions 6 - - 6 Insurance risk provisions (31) - - (31) Total collectively identified (25) - - (25)
Transferred from provisions for redress (Note 31)
Individually identified Credit risk provisions - - - - Total individually identified - - - -
Statement of Comprehensive Income
Individually identified Credit risk provisions 502 268 - 770 Total individually identified 502 268 - 770
Collectively identified Credit risk provisions 313 31 (13) 331 Insurance risk provisions 1,590 - - 1,590 Total collectively identified 1,903 31 (13) 1,921
Total 2,405 299 (13) 2,691
At 31 December 2016
Individually identified Credit risk provisions 2,208 4,638 - 6,846 Total individually identified 2,208 4,638 - 6,846
Collectively identified Credit risk provisions 1,009 49 - 1,058 Insurance risk provisions 4,849 - - 4,849 Total collectively identified 5,858 49 - 5,907
Total closing provisions 8,066 4,687 - 12,753

NOTES TO THE FINANCIAL STATEMENTS FOR THE YEAR ENDED 31 DECEMBER 2016
MANCHESTER BUILDING SOCIETY ANNUAL REPORT & ACCOUNTS PAGE 47
14. Impairment losses
In 2016, following a further reassessment of the recoverability of the Society’s investment in MBS (Property) Limited, an impairment provision of £0.8m (2015: £1.6m) was reflected in the Society’s separate financial statements reducing the net investment in this subsidiary. For further details of the impairment test see Note 15.
The recoverability of the Society’s investment in MBS (Mortgages) Limited was also reassessed in 2016, and an impairment provision of £2.7m (2015: £1.2m) was reflected in the Society’s separate financial statements reducing the net investment in this subsidiary. For further details of the impairment test see Note 15.
15. Investments
The Society’s investment in its subsidiaries has been tested for impairment and appropriate reductions in the carrying balances have been made.
A further impairment of £0.8m was made to the investment held in MBS (Property) Limited in the year. The investment valuation was assessed based on the discounted cash flows associated with the property, requiring an assessment of rentals, void rates and long term property values. A discount rate of 5.63% (2015: 5.63%) was applied being the rate associated with the financing arrangement in place. A 5% decrease in rental experience would increase the charge by £0.3m, while a 5% increase in rental experience would reduce the charge by £0.3m. The value of the property has been assumed to grow at 2% per annum up to a future date of disposal. If the growth rate was only 1% per annum this would lead to an increase in the impairment of £0.7m, while if the growth rate was 3% per annum the charge would be reduced to zero. Assumptions have been made in the impairment test about occupancy and void periods; if the assumed date of occupancy of vacant floors was delayed by 12 months then an additional impairment of £0.1m would be required.
The Group holds a beneficial interest in a portfolio of mortgage assets, NMB MAC, some of which are regulated by the CCA. The administration of this portfolio was brought in-house in December 2015 and following a review of the portfolio a significant charge was booked in the separate financial statements of MBS (Mortgages) Limited to provide for potential refunds and other costs associated with customer redress where cases of non-compliance with CCA regulations had been identified. Further details of this review and the charge in the year are set out in Note 1c (ii) and Note 31. Also a reassessment of the recoverability of these assets was carried out (as detailed in Note 1c (i)) and an additional impairment provision has been booked in the financial statements of MBS (Mortgages) Limited who consolidate these assets. These charges impair the ability of the subsidiary to repay the Society’s investment in it and therefore an impairment provision of £2.7m has been made in the Society’s separate financial statements, reducing the net investment in the subsidiary.
The directors consider that the carrying value of the investment in subsidiaries is supported by their net assets.
Subsidiaries Nature of Business Country of Incorporation Proportion of and place of business Ordinary shares held
MBS (Mortgages) Limited Mortgage lending England 100% MBS (Property) Limited Property ownership England 100%
MBS (Mortgages) Limited and MBS (Property) Limited are wholly owned and wholly funded by the Society, the registered addresses are the same as that for the Society.
Group Group Society Society 2016 2015 2016 2015£000 £000 £000 £000
Impairment losses on loans and advances to customers on residential property and land 1,858 2,601 1,101 1,349 Impairment losses / (gains) on loans and advances to customers on lifetime mortgages 1,590 (1,853) 1,590 (1,853)Impairment on loan to subsidiaries: - MBS(Property) Limited - - 799 1,564 - MBS(Mortgages) Limited - - 2,719 1,198
Impairment of property, plant and equipment - 2,471 - -
3,448 3,219 6,209 2,258
Shares Loans Total Subsidiary undertakings £000 £000 £000
At 1 January 2016 2 13,158 13,160 Impairment - (3,518) (3,518)Advances - 1,181 1,181
At 31 December 2016 2 10,821 10,823

NOTES TO THE FINANCIAL STATEMENTS FOR THE YEAR ENDED 31 DECEMBER 2016
MANCHESTER BUILDING SOCIETY ANNUAL REPORT & ACCOUNTS PAGE 48
15. Investments (continued)
The Society’s ability to recover its investment in these subsidiaries is based upon the cash flows that these subsidiaries can generate.
Connected undertakings
In 2016 there was one other entity the results of which have been consolidated with the Group position under the terms of IFRS 10: NMB Mortgage Acquisition Company Limited (“NMB MAC”). The company has been funded by the Group and was in administration. The Group benefited from the cash flows arising from NMB MAC, save for those used by the administrator of the businesses to meet their day-to-day running costs, and the Group had significant influence over the company. The Group had no shareholding or voting rights in the company but was exposed to variable returns from the company. There were no material non-controlling interests. The arrangement met the definition of control under IFRS 10 and so the results of NMB MAC have been consolidated in accordance with that standard.
Connected undertakings Nature of Business Country of Incorporation Proportion of and place of business Ordinary shares held
NMB Mortgage Acquisition Company Limited* Mortgage lending England 0%
* in administration
As NMB MAC is in administration, the Group’s ability to use this entity’s assets or settle its liabilities is restricted by the cash flows that the entity is able to generate alongside the administrator’s statutory duty to manage the entity. Save for the above, there are no other significant restrictions on the Group’s ability to use assets or settle liabilities in any of the subsidiaries listed above.
The registered address for the entity is 150 Aldersgate Street, London, EC1A 4AB.
16. Property, plant and equipment
Land Alterations and fixtures and
buildings equipment Total Group £000 £000 £000
CostAt 1 January 2016 8,512 1,744 10,256 Additions (8) 163 155 Disposals - (177) (177)
At 31 December 2016 8,504 1,730 10,234
Accumulated depreciationAt 1 January 2016 3,256 1,080 4,336 Charge for the year 55 159 214 Eliminated on disposal - (177) (177)
At 31 December 2016 3,311 1,062 4,373
Carrying amountAt 31 December 2016 5,193 668 5,861 At 31 December 2015 5,256 664 5,920

NOTES TO THE FINANCIAL STATEMENTS FOR THE YEAR ENDED 31 DECEMBER 2016
MANCHESTER BUILDING SOCIETY ANNUAL REPORT & ACCOUNTS PAGE 49
16. Property, plant and equipment (continued)
The Group’s land and building, being its head office, is owned by MBS (Property) Limited.
17. Investment property - Group and Society
The movement on Investment property is as follows:
In 2015 the Society acquired a small number of residential properties as a result of the settlement of an impaired mortgage asset. The properties are being held, pending their eventual sale, as investment properties and are stated at their fair value.
Land Alterations and fixtures and
buildings equipment Total Society £000 £000 £000
CostAt 1 January 2016 - 1,135 1,135 Additions - 163 163 Disposals - (177) (177)
At 31 December 2016 - 1,121 1,121
Accumulated depreciationAt 1 January 2016 - 665 665 Charge for the year - 145 145 Eliminated on disposal - (177) (177)
At 31 December 2016 - 633 633
Carrying amountAt 31 December 2016 - 488 488 At 31 December 2015 - 470 470
Residential Residentialproperty property
£000 £000 2016 2015
Fair valueAt 1 January 781 - Transfer from loans and advances to customers - 781 Fair value gain 58 -
At 31 December 839 781

NOTES TO THE FINANCIAL STATEMENTS FOR THE YEAR ENDED 31 DECEMBER 2016
MANCHESTER BUILDING SOCIETY ANNUAL REPORT & ACCOUNTS PAGE 50
18. Deferred tax assets
Deferred income taxes are calculated on all temporary differences under the liability method using effective tax rates of 17.0% to 18.0% depending on when the timing differences are expected to reverse (2015: 20.0%). The movement on the deferred income tax account is as follows:
The movement in the deferred tax account is shown below:
Deferred tax assets are recognised for tax loss carry-forwards to the extent that the realisation of the related tax benefits through future taxable profits is probable.
The proposed reductions in the future main rates of corporation tax announced by the Chancellor of the Exchequer in the 2016 Summer budget were included in the Finance Bill 2016, which was substantively enacted on 31 October 2016. As a result, the main rate of corporation tax in the UK will fall from 20% to 19% on 1 April 2017, and by a further 2% to 17% on 1 April 2020.
The carrying value of the deferred tax asset (DTA) is £0k as no further assets have been recognised.
The Group’s long term financial projections, based on a managed run-off of the balance sheet without a return to lending, indicate that the underlying operations of the Group will remain profitable in the short to medium term. In the medium to long term it is likely that the net interest margin will be insufficient to cover operating costs and loan impairment charges, resulting in operating losses.
As a result the recoverability of the Group’s deferred tax asset of £382k has been reassessed and has been de-recognised £382k (2015: £4.3m) in the year.
If the future profits of the Group were 10% higher than those envisaged in the Group’s long term financial projections referred to above, then the amount of deferred tax asset recognised in the balance sheet would not be significant, as the Group only remains profitable in the short to medium term.
It should be noted that the de-recognised DTA is still available for tax relief purposes, as tax losses can be carried forward indefinitely under UK tax rules and can be used subject to the availability of future taxable profits.
Group Group Society Society 2016 2015 2016 2015£000 £000 £000 £000
At 1 January 382 4,542 382 4,542 Statement of comprehensive income (382) (4,295) (382) (4,295)Statement of changes in equity - 135 - 135
At 31 December - 382 - 382
Deferred tax assets are attributable to the following items:
Other provisions - 2 - 2 Accelerated tax depreciation (26) (70) (28) (65)Tax losses - 5 - - Deferred tax asset on timing differences on derivative contracts 26 445 28 445
- 382 - 382
Group Group Society Society 2016 2015 2016 2015£000 £000 £000 £000
Other provisions (2) 8 (2) 8 Tax losses (3) (479) - (466)Accelerated tax depreciation 43 (33) 37 (46)Deferred tax movement on timing differences on derivative contracts (420) (3,791) (417) (3,791)
Deferred income tax (expense)/credit in statement of comprehensive income (382) (4,295) (382) (4,295)Deferred income tax credit in statement of changes in equity - 135 - 135
(382) (4,160) (382) (4,160)

NOTES TO THE FINANCIAL STATEMENTS FOR THE YEAR ENDED 31 DECEMBER 2016
MANCHESTER BUILDING SOCIETY ANNUAL REPORT & ACCOUNTS PAGE 51
18. Deferred tax assets (continued)
In addition to the recognised deferred taxation assets and liabilities, certain deferred tax assets have not been recognised.
At 31 December 2016 for the Group, these were:
- £2,032k arising from timing differences on derivative contracts (2015: £2,207k) and - £4,727k arising from losses (2015: £4,732k)
At 31 December 2016 for the Society, these were:
- £2,032k arising from timing differences on derivative contracts (2015: £2,207k) and - £2,760k arising from losses (2015: £2,755k). 19. Other assets
The Credit support annex balances represent the sums deposited by the Society with its derivative counterparties to collateralise the derivatives issued. The balances, whilst in cash form, are not included within Liquid Assets.
20. Due to members
21. Deposits from banks
Group Group Society Society 2016 2015 2016 2015£000 £000 £000 £000
Amounts due within one year Credit support annex 3,105 955 3,105 955 Prepayments 577 349 512 336 Other assets 72 39 23 31
3,754 1,343 3,640 1,322
Group Group Society Society 2016 2015 2016 2015£000 £000 £000 £000
Held by individuals 315,391 324,630 315,391 324,630
Shares are repayable from the financial position date in the ordinary course of business as follows: Accrued interest 512 816 512 816 Repayable on demand 128,350 153,744 128,350 153,744 Other shares by residual maturity repayable: In not more than three months 175,676 147,961 175,676 147,961 In more than three months but not more than one year 3,982 6,957 3,982 6,957 In more than one year but not more than five years 6,871 15,152 6,871 15,152
315,391 324,630 315,391 324,630
Group Group Society Society 2016 2015 2016 2015£000 £000 £000 £000
Amounts owed to credit institutions are repayable from the financialposition date in the ordinary course of business as follows: Accrued interest - 2 - 2 Other amounts owed to credit institutions by residual maturity repayable: In not more than three months - 1,000 - 1,000 In more than three months but not more than one year - 1,000 - 1,000
- 2,002 - 2,002

NOTES TO THE FINANCIAL STATEMENTS FOR THE YEAR ENDED 31 DECEMBER 2016
MANCHESTER BUILDING SOCIETY ANNUAL REPORT & ACCOUNTS PAGE 52
22. Other deposits
23. Subordinated liabilities
The subordinated loans were taken to assist the financing of future development. The loans exist for a fixed period and the Society has the option to prepay the loans at par 5 years prior to the final repayment dates.
24. Other liabilities
25. Subscribed capital
The Society has two tranches of PIBS in issue. The first tranche was issued in 1999 and is remunerated at 8.00% and the other was issued in 2005 and is remunerated at 6.75%.
The two tranches are accounted for differently as they are subject to differing legal arrangements. Both tranches of PIBS are unsecured and rank pari passu with each other. In priority terms, the PIBS holders rank behind the Society’s depositing members, its wholesale counterparties and all subordinated note holders.
Group Group Society Society 2016 2015 2016 2015£000 £000 £000 £000
Amounts owed to other deposit customers are repayable from thefinancial position date in the ordinary course of business as follows: Accrued interest 122 225 122 225 Repayable on demand 12,610 3,783 12,610 3,783 Other amounts owed to other deposit customers by residual maturity repayable:
In not more than three months 12,021 38,233 12,021 38,233 In more than three months but not more than one year - 2,716 - 2,716
24,753 44,957 24,753 44,957
Group and Group and Society Society
2016 2015£000 £000
Subordinated loans Loan repayable 2022 (variable interest rate of 3 months LIBOR plus 1.75%) 5,000 5,000 Loan repayable 2023 (variable interest rate of 3 months LIBOR plus 2.45%) 4,200 4,200 Loan repayable 2032 (fixed interest rate of 6.70%) 5,000 5,000
14,200 14,200
Group Group Society Society 2016 2015 2016 2015£000 £000 £000 £000
Amounts falling due within one year: Income tax - deducted from interest payments to customers - 178 - 178 Taxation and social security 92 90 92 90 Creditors 756 569 457 402 Interest accrued on subordinated liabilites 121 124 121 124 Accruals 486 621 430 497
1,455 1,582 1,100 1,291
Group Group Society Society 2016 2015 2016 2015
Classified as a liability: £000 £000 £000 £000
8.00% Permanent Interest Bearing Shares 5,000 5,000 5,000 5,000
5,000 5,000 5,000 5,000

NOTES TO THE FINANCIAL STATEMENTS FOR THE YEAR ENDED 31 DECEMBER 2016
MANCHESTER BUILDING SOCIETY ANNUAL REPORT & ACCOUNTS PAGE 53
25. Subscribed capital (continued)
Under the terms of offer, the Board may, subject to a resolution, cancel in whole or in part any scheduled interest payment due to holders of the 8.00% PIBS in restricted circumstances, when the Society were to have in issue other shares or deposits (save for deferred shares) on which the Board could cancel interest at its discretion. As no such class of share or deposit was in issue at either of the financial statement dates, it has been assessed that the terms of the PIBS confer a contractual obligation on the Society to deliver cash in the form of interest payments and as such, the 8.00% PIBS are treated as a liability on the part of the Society and interest is booked to income and expenditure (Note 3).
The carrying value of the PIBS classified as a liability in the 2016 accounts has not changed since initial recognition. In future, should there be greater certainty with regard to the expected future non-payment of PIBS coupons the fair value of the 1999 PIBS liability in the accounts will be adjusted to reflect the lower expected cash outflows (discounted back at the original effective interest rate on the instrument).
Under the terms of offer, the Board may at its sole discretion, subject to a resolution, cancel in whole or in part any scheduled interest payment due to holders of the 6.75% PIBS. Whilst the Board does not intend to avail itself of this discretion, the facility to do so results in the assertion that the PIBS should be considered not to confer a contractual obligation on the Society to deliver cash in the form of interest payments. As such, the 6.75% PIBS are treated as forming a part of the Society’s equity and interest is booked to Statement of Changes in Equity.
As explained on page 5, as a result of the shortfall against the CET1 Combined Buffer requirement together with the loss for the year, under CRD IV article 141, in order to conserve capital, the Society is prohibited from making the PIBS coupon payments due in April 2017. The Board considers that there continues to be uncertainty over the Society’s ability to make coupon payments thereafter.
26. Cash and cash equivalents
The statement of cash flows has been prepared using the Indirect Method to determine the cash flows from operating activities; there have been no changes to the cash and cash equivalents or the net movement in cash and cash equivalents as a result of the change in presentation.
27. Profit Participating Deferred Shares
The Society issued £18m of PPDS in April 2013. The PPDS are deferred shares for the purposes of Section 119 of the Building Societies Act 1986 (as amended). They are perpetual instruments with no maturity date or right to repayment other than on a winding-up; in the event of a winding-up, the PPDS
Group Group Society Society 2016 2015 2016 2015
Classified as equity: £000 £000 £000 £000
6.75% Permanent Interest Bearing Shares 9,788 9,788 9,788 9,788
9,788 9,788 9,788 9,788
Group Group Society Society 2016 2015 2016 2015£000 £000 £000 £000
For the purposes of the cash flow statement, cash and cash equivalentscomprises the following balances with less than three months maturityfrom the date of acquisition: Cash and balances with central banks 67,387 55,861 67,387 55,861 Loans and advances to credit institutions 14,417 20,825 14,288 20,774
81,804 76,686 81,675 76,635
Group Group Society Society2016 2015 2016 2015£000 £000 £000 £000
Nominal value - proceeds received 18,000 18,000 18,000 18,000 Less: issue costs (539) (539) (539) (539)
Book value 17,461 17,461 17,461 17,461
PPDS Reserve Account at 1 January (memo) (2,130) (506)Share of (loss) for the year (1,106) (1,624)
PPDS Reserve Account at 31 December (memo) (3,236) (2,130)

NOTES TO THE FINANCIAL STATEMENTS FOR THE YEAR ENDED 31 DECEMBER 2016
MANCHESTER BUILDING SOCIETY ANNUAL REPORT & ACCOUNTS PAGE 54
27. Profit Participating Deferred Shares (continued)
would rank below claims in respect of the Society’s PIBS. The PPDS are not protected deposits for the purposes of the Financial Services Compensation Scheme. They are eligible as Common Equity Tier 1 Capital for regulatory purposes. Save as described below, the holders of the PPDS are eligible to receive a dividend, at the discretion of the Board of the Society, of up to 30% (the “Participation Percentage”) of the annual consolidated post-tax profits of the Society and its subsidiaries (calculated prior to payment of the PPDS dividend and subject to certain other adjustments).
The PPDS will also absorb the Participation Percentage of any consolidated post-tax losses recorded by the Society and its subsidiaries, any such amount being debited to a reserve account maintained by the Society for the purpose of the PPDS (the “PPDS Reserve Account”). Any net profits which are eligible to be paid to holders of PPDS as dividends but which are not so paid will be credited to the PPDS Reserve Account.
No dividends may be paid on the PPDS when the PPDS Reserve Account is in deficit as a result of previous years’ losses.
No dividend has been declared in the year.
28. Related party transactions
Key Management Personnel. The directors, the Interim Finance Director, the Interim Chief Risk and Compliance Officer and the Head of Corporate Development and Secretarial Services are considered to be the Key Management Personnel as defined by IAS 24 – Related Party Disclosures. In line with the Board’s continuing policy, there were no loans provided to any of these individuals or their close family members (2015: nil). None of the directors, or their close family members held any of the Society’s PIBS (2015: nil).
In 2016 and 2015 the Group made a number of appointments to Key Management Personnel roles on an interim basis. The Remuneration and Nominations Committee reviewed these appointments and assessed the level of fees or remuneration payable, for further details of the work of this Committee see page 13. Where the services of these Key Management Personnel are provided by entities controlled by them, then the amounts paid to the entities by the Group for their services (inclusive of VAT) and any balances outstanding at year end are disclosed below.
The total remuneration of Key Management Personnel was as follows:
Transactions with other related parties.
The following balances are outstanding at 31 December in relation to transactions with other related parties
Register. In accordance with sections 68 and 69 of the Building Societies Act 1986 a register of transactions is maintained at the Society’s head office which shows details of all transactions and arrangements with directors and connected persons.
Subsidiaries. The Group is controlled by Manchester Building Society; details of the subsidiary undertakings may be found in Note 15.
Group Group 2016 2015£000 £000
Executive directors (per note 8) 163 177 Non-executive directors (per note 8) 195 204 Key Management Personnel 645 657
1,003 1,038
The Society had the following transactions with other related parties:Group Group
2016 2015£000 £000
Purchases of interim executive services from entities controlled by Key Management 178 516 Personnel
Group Group 2016 2015£000 £000
Current payables for purchases from entities controlled by Key Management Personnel 19 10

NOTES TO THE FINANCIAL STATEMENTS FOR THE YEAR ENDED 31 DECEMBER 2016
MANCHESTER BUILDING SOCIETY ANNUAL REPORT & ACCOUNTS PAGE 55
28. Related party transactions (continued)
The Society had the following transactions with its subsidiary undertakings during the year:
29. Financial commitments
(i) Capital commitments:
(ii) Lease commitments
At the financial position date the Group had outstanding commitments as lessee under operating leases. The financial commitments are shown below.
Contingent liabilities are considered in Note 32.
Society Society 2016 2015
(i) Current loan accounts - unsecured £000 £000
As at 1 January 13,158 15,903 Loans issued during the year 2,365 1,376 Loan repayments during the year (1,184) (1,359)Impairment of subsidiary loans (3,518) (2,762)
At 31 December 10,821 13,158
(ii) Interest income charged to subsidiaries 521 603
Interest is charged at pre-agreed rates which are either fixed, track the Bank of England base rate, or track LIBOR rates.
(iii) Other income charged to subsidiary for management of NMB MAC loan book 120 10
(iv) Society recharge to subsidiaries of head office expenses 142 66
(v) Subsidiary recharge to Society on rent for head office 143 143
(vi) Cash received from borrowers by connected undertakings NMB MAC - cash received and paid through to MBS (Mortgages) Limited 556 636 CLC - cash received and paid through to Society 8 117
Group Group Society Society 2016 2015 2016 2015£000 £000 £000 £000
Capital expenditure contracted for but not provided - 10 - 10
Lessee Lessee 2016 2015
Lease commitments: £000 £000
Less than one year 41 50 One to five years - 41
41 91

NOTES TO THE FINANCIAL STATEMENTS FOR THE YEAR ENDED 31 DECEMBER 2016
MANCHESTER BUILDING SOCIETY ANNUAL REPORT & ACCOUNTS PAGE 56
30. Capital management
Regulatory capital requirements are laid down by the Society’s regulator; they are calculated, forecast and stress tested on a regular basis for the Board and period end positions are reported to the regulator. For regulatory capital purposes the Group is made up of the Society, MBS (Mortgages) Limited and, following approval from the PRA in 2016 for an amendment to the regulatory capital Group, MBS (Property) Limited, with the regulatory capital positions under CRD IV at 31 December 2016 and 31 December 2015 being:
Since the start of 2016 Total Regulatory Capital under CRD IV has decreased by £4,390k made up as follows: • the retained loss of the regulatory capital group for the year of £3,688k; • the continued grandfathering of Subordinated debt out of Tier 2 capital over a 9 year period, amounting to £500k in the year; • a reduction in the allowed collectively identified provisions of £202k. Under the CRD IV rules applicable from 1 January 2017, Total Regulatory Capital is reduced by £500k compared to the position at 31 December 2016. This is due to Tier 2 Regulatory Capital being reduced by a further £500k in respect of continuing Subordinated debt grandfathering. The decrease from December 2015 levels is due to a £7.6m reduction in Tier 1 capital (retained losses have increased by £6.1m, which includes £2.4m of MBS (Property) losses as at December 2015 which were part of the capital requirement of the 2015 solo consolidated group, plus £1.5m of PIBS grandfathering), partly offset by a reduction in risk weighted assets. As at 31 December 2016 the Society had significant headroom above its ICG in total capital terms as set by the PRA due to the Society’s PIBS (that is Additional Tier 1 capital being grandfathered into Tier 2 capital) and subordinated debt (that is Tier 2 capital). However, the Society has a shortfall against the CET1 Combined Buffer requirement. The Society has continued to explore ways in which the CET1 regulatory capital position could be improved and a range of options was submitted in a Capital Conservation Plan to the PRA in October 2016. These options include improving the CET1 regulatory capital position by restructuring the capital. At the request of the PRA, the Capital Conservation Plan is being revised and updated to reflect the 2016 results and review further the potential measures for addressing the shortfall to the CET1 capital requirements. The outcome and timing of the regulatory process is uncertain.
As a result of the shortfall against the CET1 Combined Buffer requirement together with the loss for the year, under CRD IV article 141, in order to conserve capital, the Society is prohibited from making the PIBS coupon payments due in April 2017. The Board considers that there continues to be uncertainty over the Society’s ability to make coupon payments thereafter.
Owing to the financial position and challenges faced by the business there is a risk that the Society will not meet the regulatory requirement to hold 4.5% of CET1 capital against risk weighted assets in future. This potential risk is to be addressed in the revised and updated Capital Conservation Plan.
Amendments New RegulatoryGroup due to new Regulatory Group Movement Group Movement Group
31-Dec-15 Regulatory Group 31-Dec-15 in 2016 31-Dec-16 for 2017 1-Jan-17Tier 1 Capital £000 £000 £000 £000 £000 £000 £000
Accumulated losses (3,125) (2,430) (5,555) (3,688) (9,243) - (9,243)Deductions (1) 1 - - - - - Profit Participating Deferred Shares 17,461 - 17,461 - 17,461 - 17,461
Total CET1 Capital 14,335 (2,429) 11,906 (3,688) 8,218 - 8,218
Permanent Interest Bearing SharesNominal balance 14,788 - 14,788 - 14,788 - 14,788Amortisation (4,437) - (4,437) (1,478) (5,915) (1,479) (7,394)
Net Permanent Interest Bearing Shares 10,351 - 10,351 (1,478) 8,873 (1,479) 7,394
Total Tier 1 Capital 24,686 (2,429) 22,257 (5,166) 17,091 (1,479) 15,612
Tier 2 CapitalSubordinated DebtNominal balance 14,200 - 14,200 - 14,200 - 14,200Amortisation (1,500) - (1,500) (500) (2,000) (500) (2,500)Net Subordinated Debt 12,700 - 12,700 (500) 12,200 (500) 11,700
Collective Provisions 2,155 (30) 2,125 (202) 1,923 - 1,923Permanent Interest Bearing Shares 4,437 - 4,437 1,478 5,915 1,479 7,394
Total Tier 2 Capital 19,292 (30) 19,262 776 20,038 979 21,017
Total Regulatory Capital 43,978 (2,459) 41,519 (4,390) 37,129 (500) 36,629

NOTES TO THE FINANCIAL STATEMENTS FOR THE YEAR ENDED 31 DECEMBER 2016
MANCHESTER BUILDING SOCIETY ANNUAL REPORT & ACCOUNTS PAGE 57
31. Provisions for liabilities and charges (i) Financial Services Compensation Scheme (“FSCS”) Levy
The Society’s provision for FSCS charges arises from its operation as a UK deposit taker.
The FSCS levy consists of two parts - a management expenses levy, which covers the interest cost of running the scheme, and a capital levy to cover the cost of the compensation paid, net of any recoveries.
The charge for 2016 and the provision at the end of the year include the expected management expenses levy for the FSCS scheme year 2016-17.
In 2013 the FSCS announced that there was likely to be a shortfall in their overall level of recoverability and indicated that it would levy this shortfall on deposit-taking institutions over the three years 2014-15 to 2016-17. The shortfall capital levy for the FSCS scheme year 2015-16 was received during 2016 and recognised as a charge in the Statements of Comprehensive Income for 2016. No provision is made in respect of the capital levy for scheme years beyond this period. The levy is paid during the third quarter of each year and the Society does not expect to recover any sums paid.
(ii) Customer redress provision
As is the case for all financial institutions there is a risk that aspects of current or historic business might be considered as not being conducted in accordance with all relevant regulation, or the fair and reasonable treatment of customers.
Certain activities of the Group, particularly the NMB MAC and CLC second charge loan portfolios carry greater levels of conduct risk. The administration of these portfolios was brought in-house in December 2015 and following that transfer the historic conduct of these portfolios was reviewed in detail by management.
Following this review, and having incorporated legal advice received, the Group has maintained its customer redress provision to £1.7m to provide for instances of non-compliance with the CCA within the NMB MAC and CLC portfolios. The provision includes an estimate of the potential cost of interest refunds during periods of non-compliance and other costs associated with a customer redress exercise.
Although a detailed review of these portfolios has been carried out, there is no judicial certainty in the legal position and there is a risk that further conduct issues or cases of non-compliance with regulations could be identified in the future. As a result the actual results could differ materially from our estimates.
The Directors consider the customer redress provision to be a critical accounting estimate.
Provision has been made where the Group is aware of a specific conduct or regulatory issue and can estimate its impact reliably, further details in respect of the Group’s consideration of other potential conduct and regulatory issues is provided in the contingent liabilities Note 32.
(iii) Other
In October 2016 as a result of the BOS vs Rea decision the FCA has identified that some mortgage firms have automatically included customer’s arrears balances within their monthly mortgage payments which are recalculated from time to time without considering the circumstances of the customer
Such capitalisation is permitted when the individual circumstances of the customer are considered and with the customer’s agreement.
The FCA’s work indicates that the financial impact on the majority of customers is relatively small with estimated remediation likely to be in the low hundreds of pounds.
As a result of this FCA decision a provision of £100k has been made against possible remediation of affected customers.
2016 Group Group Group Group Society Society Society SocietyFSCS Levy Customer Other Total FSCS Levy Customer Other Total
redress redress£000 £000 £000 £000 £000 £000 £000 £000
At 1 January 2016 137 1,695 - 1,832 137 77 - 214 Transferred to impairment provision (Note 13) - (338) - (338) - - - - Charge for the year 67 878 100 1,045 67 236 100 403 Provision utilised (136) (545) - (681) (136) (6) - (142)
At 31 December 2016 68 1,690 100 1,858 68 307 100 475
2015 Group Group Group Group Society Society Society SocietyFSCS Levy Customer Other Total FSCS Levy Customer Other Total
redress redress£000 £000 £000 £000 £000 £000 £000 £000
At 1 January 2015 214 - - 214 214 - - 214 Transferred from creditors - 463 - 463 - 90 - 90 Charge/(release) for the year 277 1,232 - 1,509 277 (13) - 264 Provision utilised (354) - - (354) (354) - - (354)
- At 31 December 2015 137 1,695 - 1,832 137 77 - 214

NOTES TO THE FINANCIAL STATEMENTS FOR THE YEAR ENDED 31 DECEMBER 2016
MANCHESTER BUILDING SOCIETY ANNUAL REPORT & ACCOUNTS PAGE 58
32. Contingent liabilities and assets
(i) Contingent liabilities:
Given the high level of scrutiny regarding financial institutions’ treatment of customers and business conduct from regulatory bodies and other sources there is a risk that certain aspects of the Group’s current or historic business, including, amongst other things, CCA regulated loans, may be determined by the FCA and other regulatory bodies or the courts as, in their opinion, not being conducted in accordance with applicable laws or regulations, or fair and reasonable treatment.
As detailed in Note 31 provision has been made, following a detailed analysis, for the costs of customer redress in respect of identified cases in periods of non-compliance with CCA regulations.
There is a risk that other aspects of the Group’s business might be considered as not having been conducted in accordance with all relevant regulation, or the fair and reasonable treatment of customers. It is also not possible to rule out the possibility of other instances of non-compliance with CCA or other regulations which have not been identified. No provisions against these risks are included in these accounts.
(ii) Contingent assets:
The Society continues, based on legal advice, with the claim against Grant Thornton UK LLP for breach of contract, negligence and breach of statutory duty relating to audit services and advice provided between 2006 and 2013.

ANNUAL BUSINESS STATEMENT FOR THE YEAR ENDED 31 DECEMBER 2016
MANCHESTER BUILDING SOCIETY ANNUAL REPORT & ACCOUNTS PAGE 59
1. Statutory limits
2016 Statutory
% % limit
Lending limit 11.1 25.0 Funding limit 7.28 50.0
The above percentages have been calculated in accordance with the provisions of the Building Societies Act 1986, as amended by the Building Societies Act 1997.
The Lending limit measures the proportion of business assets not in the form of loans fully secured on residential property and is calculated as (X - Y) ÷ X where:
X = business assets, being the total assets of the Group plus provisions for bad and doubtful debts less liquid assets, tangible fixed assets and intangible assets as shown in the Group accounts.
Y = the principal of, and interest accrued on, loans owed to the Group which are fully secured on residential property and mortgage loss provisions.
The Funding limit measures the proportion of shares and borrowings not in the form of shares held by individuals and is calculated as (X - Y) ÷ X where:
X = shares and borrowings, being the aggregate of:
(i) the principal value of, and interest accrued on, shares in the Society; (ii) the principal value of, and interest accrued on, sums deposited with the Society or any subsidiary undertaking of the Society; (iii) the principal value of, and interest accrued under, bills of exchange, instruments or agreements creating or acknowledging indebtedness and
accepted, made, issued or entered into by the Society or any such undertaking less any amounts qualifying as own funds.
Y = the principal value of, and interest accrued on, shares in the Society held by individuals otherwise than as bare trustees (or, in Scotland, simple trustees) for bodies corporate or for persons who include bodies corporate.
The statutory limits are laid down under the Building Societies Act 1986 as amended by the Building Societies Act 1997 and ensure that the principal purpose of a Building Society is that of making loans which are secured on residential property and are funded substantially by its members.
Other ratios
As a percentage of shares and borrowings:
2016 2015 % %
Gross capital 10.9 11.0 Free capital 13.6 12.6 Liquid assets 24.1 20.7 Leverage ratio 4.2 5.6
As a percentage of mean total assets:
(Loss) after taxation (0.84) (1.05) Group management expenses 2.17 1.48 Society management expenses 1.89 1.28
The above percentages have been prepared from the Group accounts and in particular:
'Shares and borrowings' represent the total of amounts due to customers, amounts owed to banks, amounts owed to other depositors and debt securities in issue in the Group statement of financial position.
'Gross capital' represents the aggregate of reserves, other borrowed funds, profit participating deferred shares and subscribed capital as shown in the Group statement of financial position.
'Free capital' represents the aggregate of gross capital and general loss provisions for bad and doubtful debts less property, plant and equipment in the Group statement of financial position.
'Mean total assets' represent the amount produced by halving the aggregate of total assets at the beginning and end of the financial year for the Group/Society.
'Liquid assets' represent the total of cash and balances with central banks, loans and advances to banks and debt trading securities in the Group statement of financial position.
'Leverage ratio' is the ratio of Tier 1 capital divided by total exposure, which includes the sum of on balance sheet exposures, derivative exposures and off balance sheet items.
'Management expenses' represent the aggregate of administrative expenses and depreciation taken from the Group/Society Statements of Comprehensive Income.

ANNUAL BUSINESS STATEMENT FOR THE YEAR ENDED 31 DECEMBER 2016
MANCHESTER BUILDING SOCIETY ANNUAL REPORT & ACCOUNTS PAGE 60
2. Information relating to the directors and officers as at 31 December 2016
Name Date of Date of Occupation Other directorships Birth appointment Directors J.P. Allen 3.6.1953 Nov 2009 Consultant Emerson Developments (Holdings) Limited J & JA Associates Limited Jones Homes Limited Pallet-Track Limited H.F. Baines 12.3.1957 Aug 2013 Consultant Halifax Pension Nominees Limited Harry Baines Consulting Limited HBOS Final Salary Trust Limited Lloyds Banking Group Pension Trustees Limited PACE Trustees Limited I.A. Dewar 14.9.1957 Aug 2013 Chartered Accountant Aldenham Foundation Brewin Dolphin Limited Brewin Dolphin Holdings plc Arbuthnot Banking Group plc D.A. Harding 29.7.1947 Apr 2013 Company Director P.A. Lynch 31.8.1969 Apr 2002 Building Society Executive MBS (Mortgages) Limited MBS (Property) Limited F.B. Smith 3.1.1959 Jan 2015 General Counsel Officers C.W. Gee Head of Corporate Development & Society Secretary R.H. Green Interim Finance Director I.A. Johnson IT Manager J. C. Johnson Operations Manager E. Lord Interim Chief Risk & Compliance Officer R. Mervill TCF Conduct & Operations Manager A.C. Pradena Savings Customer Services Manager D. Spencer Lending Manager G.C. Worthington HR & Administration Manager Buzybakson Enterprises Limited Executive Director Position Date of signing service contract P.A. Lynch 31.8.1969 Interim Chief Executive 3.4.2002
The executive director has an employment contract which is terminable by the Society by giving 12 months’ notice. The executive director is required to give 6 months’ notice to the Society to terminate his contract.

ANNUAL BUSINESS STATEMENT FOR THE YEAR ENDED 31 DECEMBER 2016
MANCHESTER BUILDING SOCIETY ANNUAL REPORT & ACCOUNTS PAGE 61
2. Information relating to the directors and officers as at 31 December 2016 (continued)
Non Executive Directors
Non-executive directors are not appointed under service contracts. Their appointment is terminable by 1 month’s notice on either side. In the event of the Society merging with another society whilst D.A. Harding is the Chairman of the Board, he is entitled to 6 months fees under his letter of appointment.
It is indicated to each non-executive director that they would not be expected to serve more than nine years on the board, although for the avoidance of doubt this is not a contractual commitment to the directors. Accordingly, by reference to a full nine year term, the unexpired part of each non-executive director’s term at 31 December 2016 would be:
J.P. Allen 1 years and 10 months H.F. Baines 5 years and 8 months I.A. Dewar 5 years and 8 months D.A. Harding 5 years and 4 months F.B. Smith 6 years
Any documents may be served on the above named directors at the following address: Lyons Wilson, 1 Central Street, Manchester M2 5WR.

COUNTRY BY COUNTRY REPORTING FOR THE YEAR ENDED 31 DECEMBER 2016
MANCHESTER BUILDING SOCIETY ANNUAL REPORT & ACCOUNTS PAGE 62
Capital Requirements (Country-by-Country) Reporting
The reporting obligations set out in Article 89 of the European Union’s Capital Requirements Directive IV (CRD IV) have been implemented in the UK by the Capital Requirements (Country-by Country) Reporting Regulations.
Manchester Building Society is owned by its members. The means by which its value is preserved is by providing products that meet the financial needs of both existing and potential members.
The principal objectives of the Group remain the provision of competitive facilities for personal savings and for mortgage finance primarily to support owner occupation of residential property.
The Manchester Building Society Group is made up of:
Entity Nature of Activity Location Manchester Building Society Provision of mortgage and
savings products United Kingdom
and its wholly owned subsidiaries: MBS (Mortgages) Limited Mortgage lending United Kingdom MBS (Property) Limited Commercial property rental United Kingdom
All of the activities of the Society and its subsidiaries are conducted in the United Kingdom and therefore 100% of the total operating income, profit before tax and the employee numbers disclosed below are related to the United Kingdom.
For the year ended 31 December 2016:
Group turnover (total operating income) was £9.2m (2015: £9.8m), the loss before tax was £3.0m (2015: loss of £0.6m). Total operating income is defined as net interest income plus fees and commissions receivable (net of fees and commissions payable) together with other operating income.
The average number of Group full time employees was 48 (2015: 46).
The Society and the Group paid no corporation tax for the year (2015: £nil) due to the reversal of temporary differences and availability of brought forward trading losses.
No public subsidies were received by the Society and the Group in the year.
In 2016 the Society generated interest receivable and similar income of £3.2m (2015: £2.6m) in respect of Euro denominated loans and advances made on properties in Spain, however, all activities of the Society were conducted in the United Kingdom.
Independent auditors’ report to the Directors of Manchester Building Society
We have audited the accompanying schedule of Manchester Building Society for the year ended 31 December 2016 ("the schedule"). The schedule has been prepared by the directors based on the requirements of the Capital Requirements (Country-by-Country Reporting) Regulations 2013.
Directors’ Responsibility for the schedule
The directors are responsible for the preparation of the schedule in accordance with the Capital Requirements (Country-by-Country Reporting) Regulations 2013, for the appropriateness of the basis of preparation and the interpretation of the Regulations as they affect the preparation of the schedule, and for such internal control as the directors determine is necessary to enable the preparation of the schedule that is free from material misstatement, whether due to fraud or error.
Auditors’ Responsibility
Our responsibility is to express an opinion on the schedule based on our audit. We conducted our audit in accordance with International Standards on Auditing. Those standards require that we comply with ethical requirements and plan and perform the audit to obtain reasonable assurance about whether the schedule is free from material misstatement.
An audit involves performing procedures to obtain audit evidence about the amounts and disclosures in the schedule. The procedures selected depend on the auditors’ judgement, including the assessment of the risks of material misstatement of the schedule, whether due to fraud or error. In making those risk assessments, the auditor considers internal control relevant to the entity's preparation of the schedule in order to design audit procedures that are appropriate in the circumstances, but not for the purpose of expressing an opinion on the effectiveness of the entity's internal control. An audit also includes evaluating the appropriateness of accounting policies used and the reasonableness of accounting estimates made by management, as well as evaluating the overall presentation of the schedule.
We believe that the audit evidence we have obtained is sufficient and appropriate to provide a basis for our audit opinion.

COUNTRY BY COUNTRY REPORTING FOR THE YEAR ENDED 31 DECEMBER 2016
MANCHESTER BUILDING SOCIETY ANNUAL REPORT & ACCOUNTS PAGE 63
Opinion
In our opinion, the country-by-country information in the schedule as at 31 December 2016 is prepared, in all material respects, in accordance with the requirements of the Capital Requirements (Country-by-Country Reporting) Regulations 2013.
Basis of Preparation and Restriction on Distribution
Without modifying our opinion, we draw attention to the schedule, which describes the basis of preparation. The schedule is prepared to assist the directors to meet the requirements of the Capital Requirements (Country-by-Country Reporting) Regulations 2013. As a result, the schedule may not be suitable for another purpose.
Our report is intended solely for the benefit of the directors of Manchester Building Society. We do not accept or assume any responsibility or liability to any other party save where terms are agreed between us in writing.
PricewaterhouseCoopers LLP
Chartered Accountants
Manchester
13 March 2017

00000 Annual Report 2016_27728_MBS_Ann_Report_2006 13/03/2017 13:17 Page 5

125 Portland StreetManchester M1 4QDTel 0161 923 8000 Fax 0161 923 8950 Web www.themanchester.co.ukAuthorised by the Prudential RegulationAuthority and regulated by the FinancialConduct Authority and Prudential RegulationAuthority
Member of the Building Societies Association
Member of the Council of Mortgage Lenders
00000 Annual Report 2016_27728_MBS_Ann_Report_2006 13/03/2017 13:17 Page 1