annual report 2019 · 4.3.10 income tax expense ... 4.5.12 number of employees ... board of the...
TRANSCRIPT

ANNUAL REPORT 2019

2 - SBM OFFSHORE ANNUAL REPORT 2019
2019 was a positive year for SBM Offshore. Several years of technological development and the implementation of more standardized ways of working are bearing fruit. The flexibility of our Fast4Ward® program allowed us to adapt to the market’s fluctuations in a profitable, efficient and reliable manner.
During the year, the Company moved into new markets, with the arrival of the FPSO Liza Destiny in Guyanese waters and a ramp-up in activity in Chinese locations, while re-engaging with our historic market in Brazil. SBMers also made great strides in transformation programs, driving digitalization and supporting sustainable development.
This is our story.
The following sections of this 2019 SBM Offshore Annual Report form the management report (“bestuursverslag”) within the meaning of section 2:391 of the Dutch Civil Code (and related Decrees): Chapter 1 At a glance, Chapter 2 Strategy and Performance and Chapter 3 Governance (with the exception of section 3.4 Remuneration Report), section 4.1 Financial Review and the following section of Chapter 5 Non-Financial Data: 5.3 Non-Financial Indicators. The Financial Statements in the meaning of the Dutch Civil Code are included in Chapter 4 Financial Statements 2019 (with the exception of section 4.1 Financial Review, 4.6 Other Information and 4.7 Key Figures).

SBM OFFSHORE ANNUAL REPORT 2019 - 105
1.AT A GLANCE4.FINANCIAL STATEMENTS 2019

4 FINANCIAL STATEMENTS 2019
106 - SBM OFFSHORE ANNUAL REPORT 2019
4.1 Financial Review.....................................................................................................................................................................1084.1.1 Financial Overview.................................................................................................................................................................1084.1.2 Financial Highlights............................................................................................................................................................... 1084.1.3 Financial Review Directional................................................................................................................................................. 1104.1.4 Financial Review IFRS............................................................................................................................................................ 1174.1.5 Outlook and Guidance..........................................................................................................................................................119
4.2 Consolidated Financial Statements..................................................................................................................................... 1204.2.1 Consolidated Income Statement......................................................................................................................................... 1204.2.2 Consolidated Statement of Comprehensive Income......................................................................................................... 1214.2.3 Consolidated Statement of Financial Position.................................................................................................................... 1224.2.4 Consolidated Statement of Changes in Equity...................................................................................................................1234.2.5 Consolidated Cash Flow Statement.....................................................................................................................................1244.2.6 General Information.............................................................................................................................................................. 1254.2.7 Accounting Principles............................................................................................................................................................125
A. Accounting Framework.....................................................................................................................................................125B. Critical Accounting Policies.............................................................................................................................................. 127C. Significant Accounting Policies........................................................................................................................................132
4.3 Notes to the Consolidated Financial Statements...............................................................................................................1394.3.1 Financial Highlights............................................................................................................................................................... 1394.3.2 Operating Segments and Directional Reporting................................................................................................................ 1414.3.3 Revenue.................................................................................................................................................................................. 1534.3.4 Other Operating Income and Expense............................................................................................................................... 1544.3.5 Expenses by Nature...............................................................................................................................................................1554.3.6 Employee Benefit Expenses................................................................................................................................................. 1554.3.7 Research and Development Expenses................................................................................................................................ 1604.3.8 Net Impairment Gains/(Losses) on Financial and Contract Assets....................................................................................1604.3.9 Net Financing Costs.............................................................................................................................................................. 1614.3.10 Income Tax Expense..............................................................................................................................................................1614.3.11 Earnings/(Loss) Per Share......................................................................................................................................................1634.3.12 Dividends Paid and Proposed and Share Repurchase Program........................................................................................1644.3.13 Property, Plant and Equipment.............................................................................................................................................1644.3.14 Intangible Assets....................................................................................................................................................................1684.3.15 Finance Lease Receivables................................................................................................................................................... 1694.3.16 Other Financial Assets...........................................................................................................................................................1704.3.17 Deferred Tax Assets and Liabilities.......................................................................................................................................1714.3.18 Inventories.............................................................................................................................................................................. 1724.3.19 Trade and Other Receivables............................................................................................................................................... 1724.3.20 Construction Work-In-Progress............................................................................................................................................ 1744.3.21 Derivative Financial Instruments...........................................................................................................................................1744.3.22 Net Cash and Cash Equivalent............................................................................................................................................. 1754.3.23 Equity Attributable to Shareholders.....................................................................................................................................1754.3.24 Borrowings and Lease Liabilities.......................................................................................................................................... 1784.3.25 Deferred Income....................................................................................................................................................................1824.3.26 Provisions................................................................................................................................................................................1824.3.27 Trade and Other Payables.....................................................................................................................................................1834.3.28 Commitments and Contingencies....................................................................................................................................... 1844.3.29 Financial Instruments − Fair Values and Risk Management...............................................................................................1844.3.30 List of Group Companies...................................................................................................................................................... 1934.3.31 Investment in Associates and Joint Ventures...................................................................................................................... 1944.3.32 Information on Non-controlling Interests............................................................................................................................ 1974.3.33 Related Party Transactions.................................................................................................................................................... 1994.3.34 Independent Auditor’s Fees and Services........................................................................................................................... 2004.3.35 Events After End of Reporting Period..................................................................................................................................200
4.4 Company Financial Statements............................................................................................................................................2014.4.1 Company Balance Sheet.......................................................................................................................................................2014.4.2 Company Income Statement................................................................................................................................................2024.4.3 General................................................................................................................................................................................... 203

SBM OFFSHORE ANNUAL REPORT 2019 - 107
4.5 Notes to the Company Financial Statements..................................................................................................................... 2044.5.1 Investment in Group Companies......................................................................................................................................... 2044.5.2 Deferred Tax Asset.................................................................................................................................................................2044.5.3 Other Receivables..................................................................................................................................................................2044.5.4 Cash and Cash Equivalents...................................................................................................................................................2054.5.5 Shareholders' Equity..............................................................................................................................................................2054.5.6 Other Current and Non-Current Liabilities..........................................................................................................................2054.5.7 Revenue.................................................................................................................................................................................. 2064.5.8 General and Administrative Expenses.................................................................................................................................2064.5.9 Financial Expenses.................................................................................................................................................................2064.5.10 Commitments and Contingencies....................................................................................................................................... 2064.5.11 Directors Remuneration........................................................................................................................................................ 2064.5.12 Number of Employees.......................................................................................................................................................... 2064.5.13 Independent Audit Fees....................................................................................................................................................... 2064.5.14 Events After End of Reporting Period..................................................................................................................................207
4.6 Other information.................................................................................................................................................................. 2084.6.1 Appropriation of Result.........................................................................................................................................................2084.6.2 Independent Auditor’s Report .............................................................................................................................................209
4.7 Key Figures.............................................................................................................................................................................218

108 - SBM OFFSHORE ANNUAL REPORT 2019
4.1 FINANCIAL REVIEW
4.1.1 FINANCIAL OVERVIEW
Directional IFRS
in US$ million FY 2019 FY 2018 FY 2019 FY 2018
Revenue 2,171 1,703 3,391 2,240
Lease and Operate 1,315 1,298 1,327 1,302
Turnkey 856 406 2,064 938
EBITDA1 921 995 1,010 838
Lease and Operate 842 824 783 761
Turnkey 53 278 290 184
Other 26 (107) (63) (107)
Underlying EBITDA 832 784 1,010 844
Lease and Operate 842 824 783 761
Turnkey 53 24 290 147
Other (63) (64) (63) (64)
Profit/(loss) attributable to shareholders 235 301 366 212
Underlying profit attributable to shareholders 171 113 391 2471 EBITDA, earnings (profit attributable to shareholders) excluding net financing costs, income tax expense, depreciation, amortization and impairment as well
as share of profit/(loss) of equity-accounted investees
GeneralThe Company's primary business segments are 'Lease and Operate' and 'Turnkey' plus 'Other' non-allocated corporateincome and expense items. Revenue and EBITDA are analyzed by segment, but it should be recognized that businessactivities are closely related.
During recent years the Company’s awarded lease contracts were systematically classified under IFRS as finance leases foraccounting purposes, whereby the fair value of the leased asset is recorded as a Turnkey ‘sale’ during construction. For theTurnkey segment, this accounting treatment results in the acceleration of recognition of lease revenues and profits into theconstruction phase of the asset, whereas the asset generates the cash mainly only after construction and commissioningactivities have been completed, as that is the moment the Company is entitled to start receiving the lease payments. In thecase of an operating lease, lease revenues and profits are recognized during the lease period, in effect more closely trackingcash receipts. Following the implementation of accounting standards IFRS 10 and 11 starting January 1, 2014, it has alsobecome challenging to extract the Company’s proportionate share of results. To address these accounting issues, theCompany discloses Directional reporting in addition to its IFRS reporting. Directional reporting treats all lease contracts asoperating leases and consolidates all co-owned investees related to lease contracts on a proportional basis. UnderDirectional, the accounting results more closely track cash flow generation and this is the basis used by the ManagementBoard of the Company to monitor performance and for business planning. Reference is made to 4.3.2 Operating Segmentsand Directional Reporting for further detail on the main principles of Directional reporting.
As the Management Board, as chief operating decision maker, monitors the operating results of its operating segmentsprimarily based on Directional reporting, the financial information in this section 4.1 Financial Review is presented bothunder Directional and IFRS while the financial information presented in note 4.3.2 Operating Segments and DirectionalReporting is presented under Directional with a reconciliation to IFRS. For clarity, the remainder of the financial statementsare presented solely under IFRS, except where expressly stated.
4.1.2 FINANCIAL HIGHLIGHTS
The year was marked by the following financial highlights (please refer to note 4.3.1 Financial Highlights for further detail).
ExxonMobil awards Liza Unity contracts to SBM OffshoreOn May 10, 2019, the Company announced that Esso Exploration and Production Guyana Limited (EEPGL), an affiliate ofExxon Mobil Corporation, has confirmed the award of contracts to the Company for the next phase of the Liza project inGuyana. Under these contracts, the Company will construct, install and thereafter lease and operate FPSO Liza Unity for aperiod of up to two years after which the ownership and operations will transfer to ExxonMobil. The FPSO Liza Unity design
4 FINANCIAL STATEMENTS 2019

SBM OFFSHORE ANNUAL REPORT 2019 - 109
is based on the Fast4Ward® program as it incorporates the Company’s new-build, multi-purpose hull combined with severalstandardized topsides modules.
On October 16, 2019 the Company announced that it completed the project financing of FPSO Liza Unity for a total ofUS$1.14 billion.
Completion 2019 Share Repurchase ProgramOn May 20, 2019 the Company completed its EUR175 million (US$196 million) share repurchase program. BetweenFebruary 14, 2019 and May 20, 2019 a total of 10,422,259 common shares were repurchased, at an average price of EUR16.79per share.
Closing of Brazil legacy caseIn 2018 the Company entered into two Leniency Agreements in Brazil in relation to its legacy issue; the one with the BrazilianMinistry of Transparency and Comptroller’s General Office (Ministério da Transparência e Controladoria-Geral da União –'CGU'), the General Counsel for the Republic (Advocacia Geral da União – 'AGU') and Petróleo Brasileiro S.A. ('Petrobras'),as reported on July 26, 2018 ('July LA'), and the other with the Brazilian Federal Prosecutor’s Office (Ministério PúblicoFederal – 'MPF'), as reported on September 1, 2018 ('September LA').
The July LA was immediately effective upon signing. In October 2019, the Company provided an additional update on theBrazilian Federal Court decision, which has formally closed the Improbity Lawsuit filed by the Brazilian Federal ProsecutorsOffice (Ministério Público Federal, MPF) in 2017. This approval made the September LA effective. The court decision issubject to a mandatory re-examination by the Brazilian Court of Appeal.
CGU and AGU informed the Company that the signing of an amendment to the July LA, foreseen in order to align theamounts of the July LA with those of the September LA shall occur after the mandatory re-examination by the Court ofAppeal.
ExxonMobil awards contracts to SBM Offshore for third FPSO in GuyanaOn November 7, 2019 the Company announced that ExxonMobil subsidiary Esso Exploration and Production GuyanaLimited (EEPGL) has awarded the Company contracts to perform Front End Engineering and Design (FEED) for a FloatingProduction, Storage and Offloading vessel (FPSO) for the Payara development project located in the Stabroek block inGuyana.
FPSO Prosperity will utilize a design that largely replicates the design of FPSO Liza Unity. As such, FPSO Prosperity willbecome the second vessel built under the Company's Fast4Ward® program.
Prior to the necessary government approvals and final project sanction, the award of contracts initiated a limited release offunds to the Company to begin FEED activities and secure a Fast4Ward® hull.
SBM Offshore and Constellation complete transaction regarding minority ownership in SBM Offshore operated FPSOcompaniesOn November 22, 2019, the Company and Constellation Oil Services Holding S.A. ('Constellation') jointly confirmed that theyhad completed the transaction regarding the sale to the Company of Constellation’s equity ownership in the lease andoperating entities related to five Brazilian FPSOs (with Constellation’s ownership percentage in brackets): Cidade de Paraty(20%), Cidade de Ilhabela (12.75%), Cidade de Marica (5%), Cidade de Saquarema (5%) and Capixaba (20%). The Companywas already the majority shareholder of the entities and operator of these FPSOs before the transaction was completed.Upon completion of the transaction, the Company paid the total cash consideration of US$149 million.
The shares acquired by the Company are subject to potential repurchase by the Company's partners in the lease andoperating entities related to the five FPSOs, to the extent of their pro-rata portion of their existing ownership in theinvestees. The partners have waived their rights to repurchase shares, except for two partners, who expressed interest inpurchasing their portion of shares in the lease and operating entities related to one FPSO.

110 - SBM OFFSHORE ANNUAL REPORT 2019
SBM Offshore orders two additional Fast4Ward® hullsOn December 5, 2019, the Company announced that it has signed contracts for the construction of the Company’s fourthand fifth hulls under its purchase program for Fast4Ward® new build multi-purpose hulls. The contracts were signed withShanghai Waigaoqiao Shipbuilding and Offshore Co., Ltd. (SWS) and China Merchants Industry Holdings (CMIH).
SBM Offshore optimizes FPSO N'Goma project loanOn December 9, 2019, the Company announced the closure of a supplemental non-recourse project loan facility of US$250million related to Sonasing Xikomba Ltd., the entity that owns FPSO N'Goma. The total outstanding loan amount increasedto c.US$450 million and the original maturity date of the loan was extended by c. 4.5 years to an expiration date of 15 May2026, to match more closely the term of the underlying contract of the vessel.
SBM Offshore signs FPSO Sepetiba lease and operate contracts and sells down minority shareOn December 11, 2019, the Company announced that is has signed the contracts with Petróleo Brasileiro S.A. (Petrobras) fora 22.5 years lease and operate of FPSO Sepetiba. These contracts follow the signing of the binding Letter of Intent (LOI) asannounced on June 11, 2019. The Company will design and construct the FPSO Sepetiba using the Fast4Ward® program.Delivery of the FPSO is expected in 2022.
On December 13, 2019, following the signature of the contracts with Petrobras, the Company announced that it has enteredinto a shareholder agreement with Mitsubishi Corporation (MC) and Nippon Yusen Kabushiki Kaisha (NYK) regarding thedivestment of a 35.5% interest in the special purpose companies related to the lease and operation of FPSO Sepetiba. MCacquired 20% and NYK acquired 15.5% while the Company, as operator, remained as the majority shareholder with a 64.5%ownership interest.
FPSO Liza Destiny producing and on hireFPSO Liza Destiny has produced first oil as of December 20, 2019 and is formally on hire.
4.1.3 FINANCIAL REVIEW DIRECTIONAL
Directional
in US$ million FY 2019 FY 2018
Revenue 2,171 1,703
Lease and Operate 1,315 1,298
Turnkey 856 406
EBITDA 921 995
Lease and Operate 842 824
Turnkey 53 278
Other 26 (107)
Underlying EBITDA 832 784
Lease and Operate 842 824
Turnkey 53 24
Other (63) (64)
Profit/(loss) attributable to shareholders 235 301
Underlying profit attributable to shareholders 171 113
Directional
in US$ billion FY 2019 FY 2018
Backlog 20.7 14.8
UNDERLYING PERFORMANCENon-recurring items in 2019 impacted the Directional profit attributable to shareholders by US$65 million as follows:■ A US$90 million impact on EBITDA related to the gain that arose on the acquisition of the minority ownership in five
Brazilian FPSOs from Constellation on November 22, 2019. Refer to note 4.3.1 Financial Highlights for full detail on thistransaction.
■ A total impairment of US$(25) million relating to two, individually not material, impairments of property, plant andequipment of which one already impacted the Company's half-year results.
4 FINANCIAL STATEMENTS 2019

SBM OFFSHORE ANNUAL REPORT 2019 - 111
For reference, non-recurring items for 2018 were impacting the Directional profit attributable to shareholders by US$188million as follows:■ EBITDA for US$211 million relating to (i) the realized gain on the sale of Turritella (FPSO) (US$217 million), (ii) the Yme
project estimated net insurance claim income (US$37 million) and (iii) the additional fine payable following the signatureof the agreement with the Brazilian Federal Prosecutor’s Office (US$(43) million).
■ A net impairment impact of US$(11) million.■ US$(13) million impact on profit attributable to shareholders, relating to the updated estimate of the liability and
unwinding of the discount on the liability for the signed Leniency Agreement with Brazilian authorities and Petrobras.Note that from 2019 onwards, this item will no longer be excluded from the Company's underlying performance due tothe recurring and insignificant nature of this item.
BACKLOGChange in ownership scenarios and lease contract duration have the potential to significantly impact the Company's futurecash flows, net debt balance as well as the profit and loss statement. The Company therefore provides a pro-forma backlogon the basis of the most likely ownership scenarios for the various projects.
The pro-forma backlog at the end of 2019 reflects the following key assumptions:■ The Liza Destiny contract covers 10 years of lease and operate but based on discussions with the client, it is expected that
the client will purchase the unit after a period of up to two years of operations. As a result, the pro-forma backlog hasbeen adjusted to reflect a shortened lease and operate period of two years for FPSO Liza Destiny. The impact of thesubsequent sale of FPSO Liza Destiny is reflected in the Turnkey backlog.
■ The Liza Unity contract covers a maximum period of two years of lease and operate within which the unit will bepurchased by the client. Under the Company's policy, the backlog would not yet take the operating and maintenancescope on FPSO Liza Unity into account which is agreed in principle but pending a final work order. However, to beconsistent with prior year and to better reflect the current reality, the pro-forma backlog represented below takes theoperating and maintenance scope on FPSO Liza Unity into account. The impact of the sale of FPSO Liza Unity is reflectedin the Turnkey backlog.
■ With respect to FPSO Prosperity, for which the full lease and operate contract award is subject to necessary governmentapprovals and final work order to be received from the client, the amount included in the pro-forma backlog is limited tothe value of the initial limited release of funds to the Company to begin FEED activities and secure a Fast4Ward® hull.
■ With respect to the completion of the Constellation transaction (refer to note 4.3.1 Financial Highlights ), the Companyincluded the acquired backlog, with the exception of 7% ownership in one FPSO for which two partners have expressedinterest in purchasing their pro-rata share.
The pro-forma Directional backlog at the end of December 2019 increased by almost US$6 billion to a total of US$20.7billion. This increase was mainly the result of (i) the awarded lease and operate contracts for FPSO Liza Unity and FPSOSepetiba; (ii) the awarded initial scope to begin FEED activities and build a Fast4Ward® hull for the FPSO Prosperity projectand (iii) the acquisition of the minority shares in the lease and operate entities related to the five Brazilian FPSOs. Turnoverfor the period consumed US$2.2 billion of backlog.
Consequently, the pro-forma Directional backlog at the end of 2019 is substantial at US$20.7 billion (US$14.8 billion at theend of 2018).
in billions of US$ Turnkey Lease & Operate Total
2020 0.6 1.6 2.2
2021 1.2 1.5 2.7
2022 0.2 1.2 1.4
Beyond 2022 1.3 13.1 14.4
Total Backlog 3.2 17.4 20.7

112 - SBM OFFSHORE ANNUAL REPORT 2019
Pro-forma Backlog (in billions of US$)
20.720.7
14.814.8
Lease & Operate Turnkey
2019 2018
PROFITABILITY
RevenueTotal Directional revenue increased by 27% to US$2,171 million compared with US$1,703 million in 2018, with the increaseprimarily attributable to an improvement in the Turnkey segment.
Revenue Directional (in millions of US$)
2,1712,1711,7031,703
Lease & Operate Turnkey
2019 2018
Directional Turnkey revenue increased to US$856 million, representing 39% of total 2019 revenue. This compares withUS$406 million, or 24% of total revenue, in 2018. The increase was mostly attributable to the progress made on the JohanCastberg Turret Mooring System EPC project, in addition to a general ramp-up of Turnkey activities. This includes i) theconstruction activities on FPSO Sepetiba, which started to contribute to Directional revenue thanks to disposal of theminority share of 35.5% to MC and NYK, and ii) the contribution of upfront payments related to specific construction workbefore the commencement of the lease on the Liza projects.
Directional Lease and Operate revenue was stable at US$1,315 million, versus US$1,298 million in the prior period, despiteseveral vessels leaving the fleet in 2018 (Turritella (FPSO), FSO Yetagun and FSO N'Kossa II). Lease and Operate revenue in2019 represents 61% of total Directional revenue contribution in 2019, down from a 76% contribution in 2018.
EBITDADirectional EBITDA amounted to US$921 million, representing a 7% decrease compared with US$995 million in 2018. The2019 EBITDA figure includes a non-recurring item of US$90 million, while 2018 Directional EBITDA includes non-recurringitems totalling US$211 million (refer to the paragraph on Underlying Performance in this same section).
4 FINANCIAL STATEMENTS 2019

SBM OFFSHORE ANNUAL REPORT 2019 - 113
EBITDA Directional (in millions of US$)
921921 832832995995
784784
Lease & Operate TurnkeyOther
2019
2019
underlying
2018
2018
underlying
Adjusted for non-recurring items, Underlying Directional EBITDA increased to US$832 million in 2019 compared with US$784million in 2018. This variance is further detailed as follows by segment:■ Underlying Directional Lease and Operate EBITDA increased to US$842 million versus US$824 million in the year-ago
period. The impact of units leaving the fleet in 2018 (Turritella (FPSO), FSO Yetagun and FSO N'Kossa II) was more thanoffset by a reduction in planned maintenance, an overall improvement in performance of the fleet and the firstcontribution of FPSO Liza Destiny after achieving first oil at the end of 2019. Full year 2019 Underlying Directional Lease &Operate EBITDA margin was stable at 64% (64% in 2018).
■ Underlying Directional Turnkey EBITDA increased by US$29 million to US$53 million. The impact of a number of positiveproject close-out items in 2018 was more than offset by the contribution of the Johan Castberg Turret Mooring SystemEPC in 2019. The Underlying Directional Turnkey EBITDA margin expressed as a percentage of Turnkey revenue stood at6%, equal to the year-ago period. The level of activity resulting in Directional EBITDA during 2019 was sufficient to absorbthe structural costs of the segment.
■ The Underlying Other non-allocated costs charged to EBITDA stood at US$(63) million, stable when compared with theyear-ago period.
It should be noted that the (finalized) EPC work on FPSO Liza Destiny and the ongoing EPC works on FPSO Liza Unity andFPSO Prosperity did not contribute to Directional gross margin over the period. This is because the contracts are 100%owned by the Company and are classified as operating leases as per Directional accounting principles. The Company hasindeed determined that it is optimal from an operational and financial perspective to retain full ownership as opposed topartnering on these projects. As a consequence, under the Company’s Directional accounting policy, the revenuerecognition on these projects is as follows:■ The Company does not recognize any revenue and margin during the Turnkey phase of the project unless defined
invoicing (if any) to the client occurred during the construction phase to cover specific construction work and/or servicesperformed before the commencement of lease. These upfront payments are recognized as revenues and the costsassociated with the related construction work and/or services are recognized as cost of sales with no margin duringconstruction.
■ The Company will book all revenue and margin associated to the lease and operate contracts for its 100% share in theLease and Operate phase, in line with the cash flows, during the lease period.
■ Upon transfer of the FPSO to the client, after reaching the end of the lease and operate period or upon exercising of thepurchase option by the client, the Company will book all revenue and margin associated with the transfer in the Turnkeysegment.

114 - SBM OFFSHORE ANNUAL REPORT 2019
Net income
Underlying Directional depreciation, amortization and impairment increased by US$41 million year-on-year primarily due to aUS$25 million impairment charge accounted for in 2019 related to two, individually not material, impairments of property,plant and equipment.
Directional net financing costs totaled US$142 million in 2019, showing a decrease versus US$166 million in the year-agoperiod, following the scheduled amortization of project loans. The Directional effective tax rate increased to 15% versus 11%in the year-ago period.
As a result, the Company recorded an Underlying Directional net profit of US$171 million, or US$0.86 per share, a 51% and54% increase respectively when compared with US$113 million, or US$0.56 per share, in the year-ago period.
STATEMENT OF FINANCIAL POSITIONin millions of US$ 2019 2018
Total equity 1,179 1,317
Net debt1 3,460 2,353
Net cash 458 657
Total assets 7,414 6,535
Solvency ratio2 35.7 36.1
1 Net debt is calculated as total borrowings (including lease liabilities) less cash and cash equivalents.
2 Solvency ratio is calculated in accordance with the definition provided in section 4.3.24 Covenants
Shareholder's equity decreased from US$1,317 million at year-end 2018 to US$1,179 million at year-end 2019, mostly due tocompletion of the EUR175 million share repurchase program executed between February 14, 2019 and May 20, 2019,dividend distributed to the shareholders for US$75 million and a decrease of the hedging reserves by US$105 million, partlyoffset by the positive net result in 2019. The movement in hedging reserve is mainly caused by the impact of the marked-to-market value of the interest rate swaps due to declining market interest rates during the year.
Net debt increased by US$1,107 million to US$3,460 million at year-end 2019. With the Lease and Operate segmentgenerating strong operating cash flow in line with expectation, the increase of the net debt mainly reflected significantcapital expenditures over the period, the payment of the agreed part of the Yme insurance proceeds (net of legal fees andother claim-related expenses) to Repsol, the return of funds to the shareholders through dividend and the completed sharerepurchase program, the acquisition of the minority shares in lease and operating entities related to five Brazilian FPSOs aswell as the expected unwinding of a large portion of working capital in the Turnkey segment (significant milestone paymentsinvoiced and received in 2018). It should be noted that the optimization of the project loan on FPSO N'Goma contributed tothe reduction of the level of net debt as the additional funds received from the co-owned entity have partially been used toreimburse a funding loan against the Company.
Net Income Directional (in millions of US$)
235235171171
301301
113113
2019
2019
underlying
2018
2018
underlying
Weighted Average Earnings Per Share Directional (in US$)
1.181.18
0.860.86
1.471.47
0.560.56
2019
2019
underlying
2018
2018
underlying
4 FINANCIAL STATEMENTS 2019

SBM OFFSHORE ANNUAL REPORT 2019 - 115
All of the Company’s debt (except for lease liabilities and the project loans on FPSO Liza Destiny and FPSO Liza Unity)consisted of non-recourse project financing in special purpose investees with no borrowing at corporate level as ofDecember 31, 2019. Following the start of production on FPSO Liza Destiny in December 2019, the Company is currentlygoing through the process of releasing the corporate guarantee after which the project loan on FPSO Liza Destiny willbecome non-recourse. The financing on FPSO Liza Unity will become non-recourse once the FPSO is completed and thepre-completion guarantees have been released.
Total assets increased to US$7.4 billion as of December 31, 2019, compared with US$6.5 billion at year-end 2018, with theinvestments in property, plant and equipment (mainly FPSO Liza Destiny, FPSO Liza Unity and FPSO Sepetiba), partiallyfinanced by the use of the cash available at Corporate level, being partially offset by a consequent decrease of net cash andregular depreciation of property, plant and equipment.
The relevant covenants (solvency ratio and interest cover ratio) applicable for the Company’s RCF, undrawn as at year-end2019, were all met at December 31, 2019. In line with previous years, the Company had no off-balance sheet financing.
The Company’s financial position has remained strong as a result of the cash flow generated by the fleet and the adaptationof the Turnkey segment to a recovering market. It should be noted that the significant investment in the FPSOs Liza Destinyand Liza Unity are expected to be fully recovered through the sale of these vessels to the client in a period of up to 2 yearsfollowing the start of operations of each unit.

116 - SBM OFFSHORE ANNUAL REPORT 2019
CASH FLOW / LIQUIDITIESCash and undrawn committed credit facilities amount to US$2,422 million at December 31, 2019, of which US$132 million isconsidered as pledged to specific project debt servicing or otherwise restricted in its utilization, US$155 million comprises aproject loan dedicated to FPSO Liza Destiny and US$809 million comprises a project loan dedicated to FPSO Liza Unity.
The consolidated cash flow statement under Directional reporting is as follows:
in millions of US$ 2019 2018
EBITDA 921 995
Adjustments for non-cash and investing items
Addition/(release) provision 2 78
(Gain)/loss on disposal of property, plant and equipment (0) (221)1
(Gain) / loss on acquisition of shares in investees (90)2 0
Share-based payments 17 17
Changes in operating assets and liabilities
(Increase)/Decrease in operating receivables (130) 100
Movement in construction work-in-progress / contract liability (50) 98
(Increase)/Decrease in inventories (3) (90)3
Increase/(Decrease) in operating liabilities (230)4 (317)5
Income taxes paid (35) (35)
Net cash flows from (used in) operating activities 401 625
Capital expenditures (764) (332)
(Addition) / repayments of funding loans 85 (60)
Other investing activities (118)6 5847
Net cash flows from (used in) investing activities (796) 192
Additions and repayments of borrowings and lease liabilities 627 (783)8
Dividends paid to shareholders (74) (51)
Share repurchase program (196) -
Interest paid (150) (176)
Net cash flows from (used in) financing activities 207 (1,010)
Foreign currency variations (10) (29)
Net increase/(decrease) in cash and cash equivalents (198) (222)1 Mainly includes net gain on disposal of Turritella (FPSO) for US$(217) million.
2 The amount of US$90 million represents the gain on the purchase of shares in FPSO Cidade de Paraty, FPSO Cidade de Ilhabela, FPSO Cidade deSaquarema, FPSO Cidade de Marica and FPSO Capixaba.
3 Mainly includes investment in two Fast4Ward® hulls.
4 Includes (i) US$(21) million payment for the settlement with Brazilian authorities and Petrobras and (ii) US$(181) million payment to Repsol for sharedinsurance proceeds.
5 Includes US$(196) million payment for the settlement with Brazilian authorities and Petrobras and US$(80) million compensation paid to the partners in theinvestee owning the Turritella (FPSO) before acquisition by Shell.
6 Includes US$149 million payment for the purchase of shares in FPSO Cidade de Paraty, FPSO Cidade de Ilhabela, FPSO Cidade de Saquarema, FPSOCidade de Marica and FPSO Capixaba.
7 Mainly includes the Company 55% share in the proceeds from the sale of Turritella (FPSO) for US$544 million.
8 Includes the Company 55% share in the redemption of Turritella (FPSO) project financing loan for US$(398) million.
The strong operating cash flows and drawdowns on the project loans related to FPSO Liza Destiny, FPSO Liza Unity andFPSO N'Goma have, together with some of the Company's existing cash, primarily been used to: (i) invest in the FPSO LizaDestiny, FPSO Liza Unity and FPSO Sepetiba projects, including the construction of the allocated Fast4Ward® new-buildmulti-purpose hulls, (ii) pay Yme insurance proceeds to Repsol, (iii) return funds to the shareholders through dividend andthe completed share repurchase program as well as serve the Company’s non-recourse debt and interests in accordance withthe respective repayment schedules. As a result cash and cash equivalents decreased from US$657 million at year end 2018to US$458 million at year-end 2019.
4 FINANCIAL STATEMENTS 2019

SBM OFFSHORE ANNUAL REPORT 2019 - 117
4.1.4 FINANCIAL REVIEW IFRS
IFRS
in US$ million FY 2019 FY 2018
Revenue 3,391 2,240
Lease and Operate 1,327 1,302
Turnkey 2,064 938
EBITDA 1,010 838
Lease and Operate 783 761
Turnkey 290 184
Other (63) (107)
Underlying EBITDA 1,010 844
Lease and Operate 783 761
Turnkey 290 147
Other (63) (64)
Profit/(loss) attributable to shareholders 366 212
Underlying profit attributable to shareholders 391 247
UNDERLYING PERFORMANCENot all 2019 non-recurring items described in note 4.1.3 Financial Review Directional have the same impact under IFRS andDirectional reporting:■ The purchase of minority shares in the lease and operating entities related to Cidade de Paraty, Cidade de Ilhabela,
Cidade de Marica, Cidade de Saquarema and Capixaba is considered a transaction with non-controlling interest ownersunder IFRS and is therefore accounted for directly in equity. As a result, there is no impact of non-recurring items on 2019EBITDA.
■ The total impairment of US$(25) million relating to two individually not material impairments of property, plant andequipment has the same impact on IFRS and Directional 2019 profit attributable to shareholders.
For reference, non-recurring items for 2018 impacted the IFRS profit attributable to shareholders by US$(35) million.
PROFITABILITY
RevenueTotal IFRS revenue increased by 51% to US$3,391 million compared with US$2,240 million in 2018. This increase was drivenby the Turnkey segment with full-year construction activities related to FPSO Liza Destiny and the Johan Castberg TurretMooring System EPC and the start of construction activities on FPSO Liza Unity, FPSO Sepetiba and FPSO Prosperity.
Lease and Operate revenue was stable year-on-year at US$1,327 million in 2019 compared with US$1,302 million in the year-ago period with the reduction of planned maintenance and improved performance throughout the fleet more than offsettingthe impact of units leaving the fleet in 2018 and the declining profile of interest revenue from finance leases.
EBITDAEBITDA amounted to US$1,010 million, representing a 20% increase compared with Underlying EBITDA of US$844 million inthe year-ago period, mainly driven by the Turnkey segment with the full-year contribution of the Johan Castberg TurretMooring System EPC, finalization of FPSO Liza Destiny project and the start of construction activities on FPSO Liza Unitymore than offsetting the impact of a number of positive project close-out items in 2018.
Net incomeExcluding non-recurring items, 2019 underlying consolidated IFRS net income attributable to shareholders stood at US$391million, an increase of US$144 million from the previous year.

118 - SBM OFFSHORE ANNUAL REPORT 2019
STATEMENT OF FINANCIAL POSITIONin millions of US$ 2019 2018 2017 2016 2015
Total equity 3,613 3,612 3,559 3,513 3,465
Net debt1 4,416 3,818 4,613 5,216 5,208
Net cash 506 718 957 904 515
Total assets 10,287 9,992 11,007 11,488 11,340
1 Net debt at is calculated as total borrowings (including lease liabilities) less cash and cash equivalents.
Total equity was stable at US$3,613 million versus US$3,612 million at December 31, 2018 mainly explained by (i) thecompletion of the EUR175 million share repurchase program executed between February 14, 2019 and May 20, 2019,ii) dividends distributed to the shareholders, iii) the net impact of the acquisition of the minority shares in the lease andoperating entities related to five Brazilian FPSOs, iv) equity repayment and dividends paid to non-controlling interests andv) a decrease of the hedging reserves, fully offset by the result over the year and equity contributions of non-controllinginterest.
IFRS net debt stood at US$4,416 million at year-end 2019 compared with US$3,818 million in 2018. With the Lease andOperate segment generating strong operating cash flow in line with expectation, the increase of the net debt mainlyreflected significant investments over the period in FPSO Liza Destiny, FPSO Liza Unity and FPSO Sepetiba, the payment ofthe agreed part of the Yme insurance proceeds to Repsol, the return of funds to the shareholders through dividend and thecompleted share repurchase program, as well as the expected unwinding of a large portion of working capital in the Turnkeysegment (significant milestone payments invoiced and received in 2018). It should be noted that the optimization of theproject loan on FPSO N'Goma contributed to the reduction of the level of net debt as the additional funds received from theco-owned entity have partially been used to reimburse a funding loan against the Company.
All of the Company’s debt (except for lease liabilities and the project loans on FPSO Liza Destiny and FPSO Liza Unity)consisted of non-recourse project financing in special purpose investees with no borrowing at corporate level as ofDecember 31, 2019. Following the start of production on FPSO Liza Destiny in December 2019, the Company is currentlygoing through the process of releasing the corporate guarantee after which the project loan on FPSO Liza Destiny willbecome non-recourse. The financing on FPSO Liza Unity will become non-recourse once the FPSO is completed and thepre-completion guarantees have been released.
Total assets increased to US$10.3 billion as of December 31, 2019, compared with US$10.0 billion at year-end 2018, with theinvestments in FPSO Liza Destiny, FPSO Liza Unity and FPSO Sepetiba, partially financed by the use of the cash available atCorporate level, being largely offset by a consequent decrease of net cash, reduction of the gross amount of finance leasereceivable in line with the repayment schedule and regular depreciation of property, plant and equipment.
RETURN ON AVERAGE CAPITAL EMPLOYEDReturn on average capital employed (ROACE) is a measure of the return generated on capital invested in the Company. Themeasure provides a guide for long-term value creation by the Company. ROACE is calculated as Underlying EBIT divided bythe annual average of: i) total equity, ii) total borrowings and lease liabilities, iii) non-current provisions and iv) deferred taxliabilities minus the cash and cash equivalents. It should be noted that historically the Company used EBIT as opposed toUnderlying EBIT to calculate ROACE. Historical numbers have been updated to reflect this change.
9.79.7 7.67.6 7.07.0 6.96.9
Return on Average Capital Employed
2019 2018 2017 2016
2019 ROACE stood at 9.4%, well above the past three year average of 7.1%. This is driven by a higher EBIT, mainly explainedby the increase in Turnkey activity.
4 FINANCIAL STATEMENTS 2019
SBM OFFSHORE ANNUAL REPORT 2019 - 119
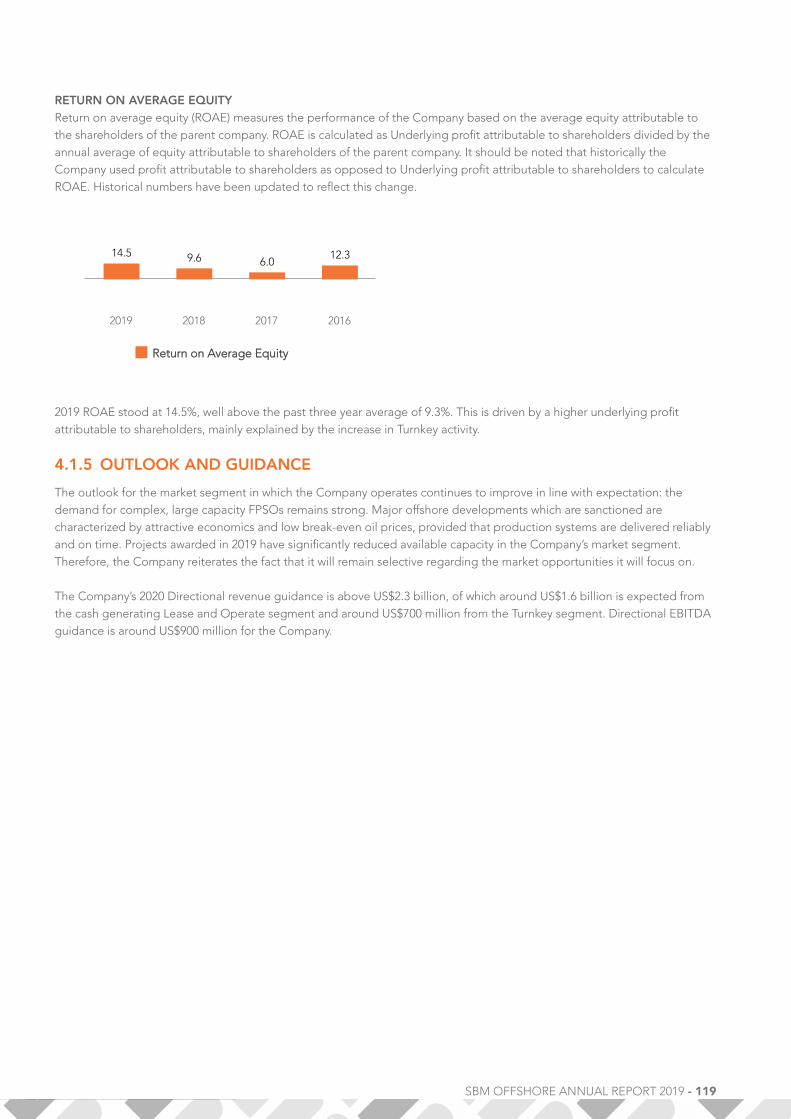
RETURN ON AVERAGE EQUITYReturn on average equity (ROAE) measures the performance of the Company based on the average equity attributable tothe shareholders of the parent company. ROAE is calculated as Underlying profit attributable to shareholders divided by theannual average of equity attributable to shareholders of the parent company. It should be noted that historically theCompany used profit attributable to shareholders as opposed to Underlying profit attributable to shareholders to calculateROAE. Historical numbers have been updated to reflect this change.
14.514.5 9.69.6 6.06.012.312.3
Return on Average Equity
2019 2018 2017 2016
2019 ROAE stood at 14.5%, well above the past three year average of 9.3%. This is driven by a higher underlying profitattributable to shareholders, mainly explained by the increase in Turnkey activity.
4.1.5 OUTLOOK AND GUIDANCE
The outlook for the market segment in which the Company operates continues to improve in line with expectation: thedemand for complex, large capacity FPSOs remains strong. Major offshore developments which are sanctioned arecharacterized by attractive economics and low break-even oil prices, provided that production systems are delivered reliablyand on time. Projects awarded in 2019 have significantly reduced available capacity in the Company’s market segment.Therefore, the Company reiterates the fact that it will remain selective regarding the market opportunities it will focus on.
The Company’s 2020 Directional revenue guidance is above US$2.3 billion, of which around US$1.6 billion is expected fromthe cash generating Lease and Operate segment and around US$700 million from the Turnkey segment. Directional EBITDAguidance is around US$900 million for the Company.

120 - SBM OFFSHORE ANNUAL REPORT 2019
4.2 CONSOLIDATED FINANCIAL STATEMENTS
4.2.1 CONSOLIDATED INCOME STATEMENT
in millions of US$ Notes 2019 2018
Revenue from contracts with customers 2,915 1,744
Interest revenue from finance lease calculated using the effectiveinterest method 476 496
Total revenue 4.3.2 / 4.3.3 3,391 2,240
Cost of sales 4.3.5 (2,457) (1,437)
Gross margin 934 802
Other operating income/(expense) 4.3.4 / 4.3.5 5 (30)
Selling and marketing expenses 4.3.5 (48) (36)
General and administrative expenses 4.3.5 (128) (122)
Research and development expenses 4.3.5 / 4.3.7 (24) (23)
Net impairment gains/(losses) on financial and contract assets 4.3.5 / 4.3.8 3 13
Operating profit/(loss) (EBIT) 742 603
Financial income 4.3.9 31 46
Financial expenses 4.3.9 (274) (279)
Net financing costs (243) (233)
Share of profit/(loss) of equity-accounted investees 4.3.31 43 13
Profit/(loss) before income tax 542 384
Income tax expense 4.3.10 (31) (40)
Profit/(loss) 511 344
Attributable to shareholders of the parent company 366 212
Attributable to non-controlling interests 4.3.32 145 132
Profit/(loss) 511 344
Earnings/(loss) per share
Notes 2019 2018
Weighted average number of shares outstanding 4.3.11 198,574,975 204,270,610
Basic earnings/(loss) per share 4.3.11 US$1.84 US$1.04
Fully diluted earnings/(loss) per share 4.3.11 US$1.84 US$1.04
4 FINANCIAL STATEMENTS 2019

SBM OFFSHORE ANNUAL REPORT 2019 - 121
4.2.2 CONSOLIDATED STATEMENT OF COMPREHENSIVE INCOME
in millions of US$ 2019 2018
Profit/(loss) for the period 511 344
Cash flow hedges (142) 4
Deferred tax on cash flow hedges - -
Foreign currency variations (23) (15)
Items that are or may be reclassified to profit or loss (165) (11)
Remeasurements of defined benefit liabilities 1 (4)
Deferred tax on remeasurement of defined benefit liabilities - -
Items that will never be reclassified to profit or loss 1 (4)
Other comprehensive income/(expense) for the period, net of tax (164) (15)
Total comprehensive income/(expense) for the period, net of tax 347 329
Of which
- on controlled entities 308 312
- on equity-accounted entities 39 16
Attributable to shareholders of the parent company 248 164
Attributable to non-controlling interests 98 165
Total comprehensive income/(expense) for the period, net of tax 347 329

122 - SBM OFFSHORE ANNUAL REPORT 2019
4.2.3 CONSOLIDATED STATEMENT OF FINANCIAL POSITION
in millions of US$ Notes 31 December 2019 31 December 2018
ASSETS
Property, plant and equipment 4.3.13 1,005 1,198
Intangible assets 4.3.14 23 19
Investment in associates and joint ventures 4.3.31 325 421
Finance lease receivables 4.3.15 6,407 5,753
Other financial assets 4.3.16 104 211
Deferred tax assets 4.3.17 22 26
Derivative financial instruments 4.3.21 5 12
Total non-current assets 7,891 7,641
Inventories 4.3.18 8 101
Finance lease receivables 4.3.15 287 195
Trade and other receivables 4.3.19 573 596
Income tax receivables 11 11
Construction work-in-progress 4.3.20 973 695
Derivative financial instruments 4.3.21 37 34
Cash and cash equivalents 4.3.22 506 718
Assets held for sale 1 2
Total current assets 2,396 2,351
TOTAL ASSETS 10,287 9,992
EQUITY AND LIABILITIES
Issued share capital 56 59
Share premium reserve 1,034 1,163
Treasury shares (46) (14)
Retained earnings 1,942 1,533
Other reserves 4.3.23 (238) (108)
Equity attributable to shareholders of the parent company 2,748 2,634
Non-controlling interests 4.3.32 865 978
Total Equity 3,613 3,612
Borrowings and lease liabilities 4.3.24 4,309 4,017
Provisions 4.3.26 165 150
Deferred income 4.3.25 150 200
Deferred tax liabilities 4.3.17 23 36
Derivative financial instruments 4.3.21 156 41
Other non-current liabilities 4.3.27 123 100
Total non-current liabilities 4,926 4,545
Borrowings and lease liabilities 4.3.24 612 519
Provisions 4.3.26 118 317
Trade and other payables 4.3.27 896 899
Income tax payables 37 25
Derivative financial instruments 4.3.21 85 75
Total current liabilities 1,748 1,835
TOTAL EQUITY AND LIABILITIES 10,287 9,992
4 FINANCIAL STATEMENTS 2019

SBM OFFSHORE ANNUAL REPORT 2019 - 123
4.2.4 CONSOLIDATED STATEMENT OF CHANGES IN EQUITY
in millions of US$, except shares
Outstandingnumber of
shares
Issuedshare
capital
Sharepremium
reserveTreasury
sharesRetainedearnings
Otherreserves
Attributableto
shareholders
Non-controlling
interestsTotal
Equity
At 1 January 2019 205,671,305 59 1,163 (14) 1,533 (108) 2,634 978 3,612
Profit/(loss) for the period - - - 366 - 366 145 511
Foreign currency translation (1) - 0 - (22) (23) 0 (23)
Remeasurements of definedbenefit provisions - - - - 1 1 - 1
Cash flow hedges - - - - (96) (96) (47) (142)
Total comprehensive incomefor the period (1) - 0 366 (117) 249 98 347
IFRS 2 vesting cost of sharebased payments - - - - 17 17 - 17
Re-issuance treasury shares onthe share based scheme 0 - 32 (4) (21) 7 - 7
Purchase of treasury shares - - (196) - - (196) - (196)
Share cancellation1 (7,000,000) (2) (130) 132 - - - - -
Cash dividend - - - (75) - (75) (25) (100)
Equity repayment - - - - - - (13) (13)
Transaction with non-controlling interests - - - 1202 (10)3 111 (174)4 (63)
At 31 December 2019 198,671,305 56 1,034 (46) 1,942 (238) 2,747 865 3,6131 Following the completion of the share repurchase program in 2019, the Company has cancelled 7 million shares.
2 Includes: (i) US$279 million of acquired non-controlling interest (excl. acquired other reserves for IRS) from Constellation, which is recognized against thepurchase price of US$149 million, offset by (ii) the Company's US$11 million purchase option of non-controlling interest in one of its other subsidiaries.
3 Includes US$10 million of aquired hedging reserve of the entities purchased from Constellation.
4 Includes: (i) US$269 million acquisition of non-controlling interest from Constellation, which is offset by (ii) US$95 million equity contribution by partners onentities related to FPSO Sepetiba.
in millions of US$, except shares
Outstandingnumber of
shares
Issuedshare
capital
Sharepremium
reserveTreasury
sharesRetainedearnings
Otherreserves
Attributableto
shareholders
Non-controlling
interestsTotal
Equity
At 31 December 2017 205,671,305 62 1,163 (35) 1,376 (65) 2,501 1,058 3,559
Change in accounting policy -IFRS 9 - - - (4) - (4) (1) (5)
At 1 January 20181 205,671,305 62 1,163 (35) 1,372 (65) 2,497 1,057 3,554
Profit/(loss) for the period - - - 212 - 212 132 344
Foreign currency translation (3) - 1 - (17) (19) 3 (15)
Remeasurements of definedbenefit provisions - - - - (4) (4) - (4)
Cash flow hedges - - - - (26) (26) 30 4
Total comprehensive incomefor the period (3) - 1 212 (46) 164 165 329
IFRS 2 vesting cost of sharebased payments - - - - 17 17 - 17
Re-issuance treasury shares onthe share based scheme - - 20 (4) (14) 2 - 2
Cash dividend - - - (51) - (51) (73) (124)
Equity repayment2 - - - - - - (165) (165)
Transaction with non-controlling interests - - - 1 - 1 (6) (5)
Other - - - 3 - 3 - 3
At 31 December 2018 205,671,305 59 1,163 (14) 1,533 (108) 2,634 978 3,6121 Restated.
2 Equity repayment from SBM Stones S.à r.l., Alfa Lula Alto S.à r.l, Beta Lula Central S.à r.l. and Guara Norte S.à.r.l. following shareholders resolution.

124 - SBM OFFSHORE ANNUAL REPORT 2019
4.2.5 CONSOLIDATED CASH FLOW STATEMENT
in millions of US$ Notes 2019 2018
Cash flow from operating activities
Profit/(loss) before income tax 542 384
Adjustments to reconcile profit before taxation to net cash flows:
Depreciation and amortization 243 237
Impairment 27 (2)
Net financing costs 254 233
Share net income of associates and joint ventures (43) (13)
Share based compensation 17 17
(Increase)/Decrease in working capital:
- (Increase)/Decrease Trade and other receivables (39) 178
- (Increase)/Decrease Construction work in progress (1,176) (315)
- (Increase)/Decrease Inventories (3) (90)
- Increase/(Decrease) Trade and other payables (46) 104
Increase/(Decrease) Other provisions (165)1 (307)2
Reimbursement finance lease assets 197 1,2523
Income taxes paid (29) (30)
Net cash flows from (used in) operating activities (220) 1,647
Cash flow from investing activities
Investment in property, plant and equipment (30) (42)
Investment in intangible assets (9) (6)
Additions to funding loans 4.3.16 (0) (181)
Redemption of funding loans 4.3.16 175 71
Interest received 8 42
Dividends received from equity-accounted investees 139 59
Proceeds from disposal of financial assets and other assets (0) (4)
Net cash flows from (used in) investing activities 282 (61)
Cash flow from financing activities
Equity repayment to partners 82 (165)
Additions to borrowings and loans 4.3.24 1,389 1
Repayments of borrowings and lease liabilities 4.3.24 (1,039) (1,269)4
Dividends paid to shareholders and non-controlling interests (108) (103)
Payments to non-controlling interests for change in ownership (149)5 (5)
Share repurchase program (196) -
Interest paid (244) (257)
Net cash flows from (used in) financing activities (264) (1,797)
Net increase/(decrease) in cash and cash equivalents (202) (211)
Net cash and cash equivalents as at 1 January 718 957
Net increase/(decrease) in net cash and cash equivalents (202) (211)
Foreign currency variations (9) (28)
Net cash and cash equivalents as at 31 December 506 7181 Includes US$181 million payment of Yme proceeds shared with Repsol
2 Includes US$(196) million payment for the settlement with Brazilian authorities and Petrobras and US$(80) million compensation paid to the partners in theinvestee owning the Turritella (FPSO) before acquisition by Shell.
3 Includes US$987 million purchase price acquisition of Turritella (FPSO) by Shell.
4 Includes US$(723) million redemption of Turritella (FPSO) project financing loan.
5 Relates to US$149 million payment for the purchase of shares in Cidade de Paraty, Cidade de Ilhabela, Cidade de Marica, Cidade de Saquarema andCapixaba.
4 FINANCIAL STATEMENTS 2019

SBM OFFSHORE ANNUAL REPORT 2019 - 125
The reconciliation of the net cash and cash equivalents as at 31 December with the corresponding amounts in the statementof financial position is as follows:
Reconciliation of net cash and cash equivalents as at 31 December
in millions of US$ 31 December 2019 31 December 2018
Cash and cash equivalents 506 718
Net cash and cash equivalents 506 718
4.2.6 GENERAL INFORMATION
SBM Offshore N.V. has its registered office in Amsterdam, the Netherlands and is located at Evert van de Beekstraat 1-77,1118 CL in Schiphol, the Netherlands. SBM Offshore N.V. is the holding company of a group of international marinetechnology-oriented companies. The Company globally serves the offshore oil and gas industry by supplying engineeredproducts, vessels and systems, as well as offshore oil and gas production services.
The Company is registered at the Dutch Chamber of Commerce under number 24233482 and is listed on the EuronextAmsterdam stock exchange.
The consolidated financial statements for the year ended December 31, 2019 comprise the financial statements ofSBM Offshore N.V., its subsidiaries and interests in associates and joint ventures (together referred to as ‘the Company’).They are presented in millions of US dollars, except when otherwise indicated. Figures may not add up due to rounding.
The consolidated financial statements were authorized for issue by the Supervisory Board on February 12, 2020.
4.2.7 ACCOUNTING PRINCIPLES
A. ACCOUNTING FRAMEWORKThe consolidated financial statements of the Company have been prepared in accordance with, and comply with, IFRS andinterpretations adopted by the EU, where effective, for financial years beginning January 1, 2019 and also comply with thefinancial reporting requirements included in Part 9 of Book 2 of the Dutch Civil Code.
The Company financial statements included in section 4.4 are part of the 2019 financial statements of SBM Offshore N.V.
NEW STANDARDS, AMENDMENTS AND INTERPRETATIONS APPLICABLE AS OF JANUARY 1, 2019The Company has adopted the following new standards as of January 1, 2019:■ IFRIC 23 - 'Uncertainty over Income Tax Treatments';■ Amendments to IFRS 9 - 'Prepayment Features with Negative Compensation';■ Amendments to IAS 19 - 'Plan Amendment, Curtailment or Settlement'; and■ Annual Improvements to 2015-2017 Cycle.
IFRIC 23 – Uncertainty over Income Tax TreatmentsIFRIC 23 provides a framework to consider, recognize and measure the accounting impact of tax uncertainties. Theinterpretation provides specific guidance in several areas where previously IAS 12 was silent. The Interpretation also explainswhen to reconsider the accounting for a tax uncertainty.
An entity is to assume that a taxation authority with the right to examine any amounts reported to it will examine thoseamounts and will have full knowledge of all relevant information when doing so. An entity has to consider whether it isprobable that the relevant authority will accept each tax treatment, or group of tax treatments, that it used or plans to use inits income tax filing.
The adoption of this interpretation has no significant effect on the financial statements for earlier periods and the year-endfinancial statements for the period ended December 31, 2019.
IFRS 9 – Prepayment Features with negative CompensationThe International Accounting Standards Board (IASB) has issued a narrow-scope amendment to IFRS 9. The amendmentcovers two issues:

126 - SBM OFFSHORE ANNUAL REPORT 2019
■ What financial assets may be measured at amortized cost. The amendment permits more assets to be measured atamortized cost than under the previous version of IFRS 9, in particular some prepayable financial assets.■ How to account for the modification of a financial liability. The amendment confirms that most such modifications will resultin immediate recognition of a gain or loss.
The adoption of this amendment has no significant effect on the financial statements for earlier periods and the year-endfinancial statements for the period ended December 31, 2019.
IAS 19 – Plan Amendment, Curtailment or SettlementThe IASB issued amendments to the guidance in IAS 19, ‘Employee Benefits’, in connection with accounting for planamendments, curtailments and settlements. The amendments require an entity:■ To use updated assumptions to determine current service cost and net interest for the remainder of the period after a planamendment, curtailment or settlement; and■ To recognize in profit or loss as part of past service cost, or a gain or loss on settlement, any reduction in a surplus, even ifthat surplus was not previously recognized because of the impact of the asset ceiling.The surplus is the present value of the defined benefit obligation less the fair value of plan assets (if any).
The adoption of this amendment has no significant effect on the financial statements for earlier periods and year-endfinancial statements for the period ended December 31, 2019.
Annual Improvements 2015-2017 CycleAnnual Improvements 2015-2017 Cycle consisted of clarifications regarding following topics: (i) IFRS 3 BusinessCombinations and IFRS 11 Joint Arrangements, (ii) Income tax consequences under IAS 12 of payments on financialinstruments classified as equity and (iii) IAS 23 Borrowing Costs.
The IFRS amendments included in the annual improvements 2015-2017 cycle have a negligible impact on the Company’sconsolidated 2019 financial statements.
STANDARDS AND INTERPRETATIONS NOT MANDATORILY APPLICABLE TO THE COMPANY AS OFJANUARY 1, 2019The following standards and amendments published by the IASB and endorsed by the European Commissionare not mandatorily applicable as of January 1, 2019:■ Amendments to IAS 1 and IAS 8 - 'Definition of material';■ Amendment to References to the Conceptual Framework in IFRS Standards; and■ Interest Rate Benchmark Reform (Amendments to IFRS 9, IAS 39 and IFRS 7).
Other new standards and amendments have been published by the IASB but have not been endorsed yet by the EuropeanCommission. Early adoption is not possible until European Commission endorsement. Those which may be relevant to theCompany are set out below:■ Amendments to IFRS 3 - 'Business Combinations'.
The Company does not expect a significant effect on the financial statements due to adoption of these amendments.Other standards and amendments are not relevant to the Company.
CHANGES IN THE PRESENTATION
Consolidated Cash Flow StatementUntil 2018, The Company reported the IFRS cash flow statement using direct method. From 2019 onwards, the Companyreports the IFRS cash flow statement under the indirect method as this is the method used by the Management Board of theCompany to monitor performance and as a basis for managerial decisions. Note that the cash flow statement presented innote 4.3.2 Operating Segments and Directional Reporting, based on Directional reporting, is also prepared using theindirect method.
The voluntary change to report the Company's cash flow statement using the indirect method has the purpose to increase(i) consistency in the financial report (the Company will apply the same method for both IFRS reporting and segmentreporting prepared based on Directional reporting); (ii) comparability between the Company and other peer companies
4 FINANCIAL STATEMENTS 2019
SBM OFFSHORE ANNUAL REPORT 2019 - 127
since based on performed benchmark studies, the indirect cash flow method is the method used by most of the competitorsas well as other Dutch listed companies; and (iii) efficiency of the internal processes by reducing the efforts of preparation ofcash flow statement based on both methods.
B. CRITICAL ACCOUNTING POLICIESCritical accounting policies involving a high degree of judgement or complexity, or areas where assumptions and estimatesare material, are disclosed in the paragraphs below.
(a) Use of estimates and judgementWhen preparing the financial statements, it is necessary for the Management of the Company to make estimates and certainassumptions that can influence the valuation of the assets and liabilities and the outcome of the income statement. Theactual outcome may differ from these estimates and assumptions, due to changes in facts and circumstances. Estimates andjudgements are continually evaluated and are based on historical experience and other factors, including expectations offuture events that are believed to be reasonable.
Estimates:Significant areas of estimation and uncertainty in applying accounting policies that have the most significant impact onamounts recognized in the financial statements are:
The measurement and recognition of revenues on construction contracts based on the input method:Revenue of the Company is measured and recognized based on the input method (i.e. costs incurred). Costs and revenue atcompletion are reviewed periodically throughout the life of the contract. This requires a large number of estimates,especially of the total expected costs at completion, due to the complex nature of the Company’s construction contracts.Judgement is also required for the accounting of contract modifications and claims from clients where negotiations ordiscussions are at a sufficiently advanced stage. Costs and revenue (and the resulting gross margin) at completion reflect, ateach reporting period, the Management’s current best estimate of the probable future benefits and obligations associatedwith the contract. The policy for measurement of transaction price including variable considerations (i.e. claims, performancebased incentives) is included below in the point (d) Revenue.In case a contract meets the definition of an onerous contract as per IAS 37, provisions for anticipated losses are made in fullin the period in which they become known.
Impairments:Assumptions and estimates used in the discounted cash flow model and the adjusted present value model to determine thevalue in use of assets or group of assets (e.g. discount rates, residual values and business plans) are subject to uncertainty.There is a possibility that changes in circumstances or in market conditions could impact the recoverable amount of the assetor group of assets.
The anticipated useful life of the leased facilities:Management uses its experience to estimate the remaining useful life of an asset. The actual useful life of an asset may beimpacted by an unexpected event that may result in an adjustment to the carrying amount of the asset.
The Company’s taxation:The Company is subject to income taxes in multiple jurisdictions. Significant judgement is required in determining theCompany's overall income tax liability. There are many transactions and calculations for which the ultimate tax determinationis uncertain during the ordinary course of business. The Company takes into account the following considerations whendetermining the liabilities related to uncertain income tax:■ When necessary the Company engages with local tax advisers which provide advice on the expected view of tax
authorities on the treatment of judgemental areas of income tax;■ The Company considers any changes in tax legislation and knowledge built based on prior cases to make an estimate/
judgement on whether or not to provide for any tax payable; and■ The Company takes into account any dispute resolutions, case law and discussions between peer companies and the tax
authorities on similar cases over an uncertain tax treatment.
The Company consistently monitors each issue around uncertain tax treatments across the group in order to ensure that theCompany applies sufficient judgement to the resolution of tax disputes that might arise from examination by relevant taxauthorities of the Company’s tax position.

128 - SBM OFFSHORE ANNUAL REPORT 2019
The Company recognizes liabilities for anticipated tax audit issues based on estimates of whether additional taxes will bedue. The income tax liabilities include any penalties and interest that could be associated with a tax audit issue. Where thefinal tax outcome of these matters is different from the amounts that were initially recorded, such differences will influencethe income tax and deferred tax provisions in the period in which such determination is made.
The Company’s exposure to litigation with third parties and non-compliance:The Company identifies and provides analysis on a regular basis of current litigation and measures, when necessary,provisions on the basis of its best estimate of the expenditure required to settle the obligations, taking into accountinformation available and different possible outcomes at the reporting period.
The warranty provision:A warranty provision is accrued during the construction phase of projects, based on historical warranty expenditure perproduct type. At the completion of a project, a warranty provision (depending on the nature of the project) is thereforeprovided for and reported as provision in the statement of financial position. Following the acceptance of a project thewarranty provision is released over the warranty period. For some specific claims formally notified by the customer and whichcan be reliably estimated, an amount is provided in full and without discounting. An overall review of the warranty provisionis performed by Management at each reporting date. Nevertheless, considering the specificity of each asset, actual warrantyexpenditures could vary significantly from one project to another and therefore differ materially from initial statisticalwarranty provision provided at the completion of a said project.
The timing and estimated cost of demobilization:The estimated future costs of demobilization are reviewed on a regular basis and adjusted when appropriate. Nevertheless,considering the long-term expiry date of the obligations, these costs are subject to uncertainty. Cost estimates can vary inresponse to many factors, including for example new demobilization techniques, the Company’s own experience ondemobilization operations, future changes in laws and regulations, and timing of demobilization operation.
Estimates and assumptions made in determining these obligations, can therefore lead to significant adjustments to thefuture financial results. Nevertheless, the cost of demobilization obligations at the reporting date represent Management’sbest estimate of the present value of the future costs required.
Judgements:In addition to the above estimates, the Management exercises the following judgements:
Lease classification as Lessor:When the Company enters into a new lease arrangement, the terms and conditions of the contract are analyzed in order toassess whether or not the Company retains the significant risks and rewards of ownership of the asset subject of the leasecontract. To identify whether risks and rewards are retained, the Company systematically considers, amongst others, all theexamples and indicators listed by IFRS 16.63 on a contract-by-contract basis. By performing such analysis, the Companymakes significant judgement to determine whether the arrangement results in a finance lease or an operating lease. Thisjudgement can have a significant effect on the amounts recognized in the consolidated financial statements and itsrecognition of profits in the future. The most important judgement areas assessed by the Company are (i) determination ofthe fair value, (ii) determination of the useful life of the asset and (iii) the probability of the client exercising the purchase ortermination option (if relevant).
(b) Leases: accounting by lessorA lease is an agreement whereby the lessor conveys to the lessee, in return for a payment, or series of payments, the right touse an asset for an agreed period of time.
Leases in which a significant portion of the risk and rewards of ownership are retained by the lessor are classified asoperating leases. Under an operating lease, the asset is included in the statement of financial position as property, plant andequipment. Lease income is recognized over the term of the lease on a straight-line basis. This implies the recognition ofdeferred income when the contractual day rates are not constant during the initial term of the lease contract.
When assets are leased under a finance lease, the present value of the lease payments is recognized as a finance leasereceivable. Under a finance lease, the difference between the gross receivable and the present value of the receivable isrecognized as revenue during the lease phase. Lease income is, as of the commencement date of the lease contract,
4 FINANCIAL STATEMENTS 2019

SBM OFFSHORE ANNUAL REPORT 2019 - 129
recognized over the term of the lease using the net investment method, which reflects a constant periodic rate of return.During the construction phase of the facility, the contract is accounted for as a construction contract.
(c) Impairment of non-financial assetsUnder certain circumstances, impairment tests must be performed. Assets that are subject to amortization or depreciationare tested for impairment whenever events or changes in circumstances indicate that the carrying amount may not berecoverable.
The recoverable amount is the higher of an asset’s Cash Generating Unit’s (’CGU’) fair value less costs of disposal and itsvalue-in-use. The recoverable amount is determined for an individual asset, unless the asset does not generate cash inflowsthat are largely independent of those from other assets or group of assets. An impairment loss is recognized for the amountby which the assets or CGU’s carrying amount exceeds its recoverable amount.
In assessing value in use, the estimated future cash flows are discounted to their present value using a pre-tax discount ratethat reflects current market assessments of the time value of money, and risks specific to the asset. The Company bases itsfuture cash flows on detailed budgets and forecasts.
Non-financial assets, other than goodwill, that have been impaired are reviewed for possible reversal of the impairment ateach statement of financial position date.
(d) RevenueThe Company provides design, supply, installation, operation, life extension and demobilization of Floating Production,Storage and Offloading (FPSO) vessels. The vessels are either owned and operated by SBM Offshore and leased to its clients(Lease and Operate arrangements) or supplied on a Turnkey sale basis (construction contracts). Even in the latter case, thevessels can be operated by the Company, under a separate operating and maintenance agreement, after transfer to theclients.
Other products of the Company include: semi-submersibles, Tension Leg Platforms (TLP), Liquefied Natural Gas FPSOs,Turret Mooring Systems (TMS), Floating Offshore Wind (FOW), brownfield and offshore (off)loading terminals. Theseproducts are mostly delivered as construction, lease or service type agreements.
Some contracts include multiple deliverables (such as Front-End Engineering Design (’FEED’), engineering, construction,procurement, installation, maintenance, operating services, demobilization). The Company assesses the level of integrationbetween different deliverables and ability of the deliverable to be performed by another party. Based on this assessment theCompany concludes whether the multiple deliverables are one, or separate, performance obligation(s).
The Company determines the transaction price for its performance obligations based on contractually agreed prices. TheCompany has various arrangements with its customers in terms of pricing, but in principle i) the construction contracts haveagreed fixed pricing terms, including fixed lump sums and reimbursable type of contracts, ii) the majority of the Company’slease arrangements have fixed lease rates and iii) the operating and service type of contracts can be based on fixed lumpsums or reimbursable type of contracts. The Lease and Operate contracts generally include a variable component for whichthe treatment is described below under ’Lease and Operate contracts’. In rare cases when the transaction prices are notdirectly observable from the contract, they are estimated based on expected cost plus margin (e.g. operating leasecomponent in lease arrangement).
The Company assesses for each performance obligation whether the revenue should be recognized over time or at a pointin time, this is explained more in detail under the below sections ’Construction contracts’ and ’Lease and Operate contracts’.
The Company can agree on various payment arrangements which generally reflect the progress of delivered performanceobligations. However, if the Company‘s delivered performance obligation exceeds instalments invoiced to the client, a‘Construction work-in-progress‘ (contract asset) is recognized (see note 4.3.20 Construction Work-In-Progress ). If theinstalments invoiced to the client exceed the work performed, a contract liability is recognized (see note 4.3.27 Trade andOther Payables ).

130 - SBM OFFSHORE ANNUAL REPORT 2019
Revenue policies related to specific arrangements with customers are described below.
Construction contracts:The Company under its construction contracts usually provides Engineering, Procurement, Construction and Installation(’EPCI’) of vessels. The Company assesses the contracts on an individual basis as per the policy described above. Based onthe analysis performed for existing contracts:■ The construction contracts generally include one performance obligation due to significant integration of the activities
involved; and■ Revenue is recognized over time as the Company has an enforceable right to payment for performance completed to
date and the assets created have no direct alternative use.
Based on these requirements, the Company concludes that, in principle, construction contracts meet the criteria of revenueto be recognized over time. Revenue is recognized at each period based upon the advancement of the work, using the inputmethods. The input method is based on the ratio of costs incurred to date to total estimated costs. Up to the moment thatthe Company can reasonably measure the outcome of the performance obligation, revenue is recognized to the extent ofcost incurred.
Complex projects that present a high risk profile due to technical novelty, complexity or pricing arrangements agreed withthe client are subject to independent project reviews at advanced degrees of completion in engineering. An independentproject review is an internal but independent review of the status of a project based upon an assessment of a range ofproject management and company factors. Until this point, and when other significant uncertainties related to the cost atcompletion are mitigated, revenue is recognized to the extent of cost incurred.
Due to the nature of the services performed,variation orders and claims are commonly billed to clients in the normal courseof business. The variation orders and claims are modifications of contracts that are usually not distinct and are thereforenormally considered as part of the existing performance obligation. When the contract modification (including claims) isinitially approved by oral agreement or implied by customary business practise, the Company recognizes revenue only to theextent of contract costs incurred. Once contract modifications and claims are approved the revenue is no longer capped atthe level of costs and is recognized based on the input method.
Generally, the payments related to the construction contracts are corresponding to the work completed to date, thereforethe Company does not adjust any of the transaction prices for the time value of money. However the time value of money isassessed on a contract by contract basis and in case the period between the transfer of the promised goods or services tothe customer and payment by the customer exceeds one year, the financing component is separated from otherperformance obligations.
Lease and Operate contracts:The Company provides to its customers possibilities to lease the units under charter contracts. The charter contracts aremulti-year contracts and some of them contain options to extend the term of the lease or terminate the lease earlier. Someof the contracts also contain purchase options that are exercisable throughout the lease term.
Charter ratesCharter rates received on long-term operating lease contracts are reported on a straight-line basis over the period of thecontract once the facility has been brought into service. The difference between straight-line revenue and the contractualday-rates, which may not be constant throughout the charter, is accounted for as deferred income.
Revenue from finance lease contracts is, as of the commencement date of the lease contract, recognized over the term ofthe lease using the amortized cost method, which reflects a constant periodic rate of return.
Operating feesOperating fees are received by the Company for facilitating receipt, processing and storage of petroleum services on boardof the facilities which occur continuously through the term of the contract. As such they are a series of services that aresubstantially the same and that have the same pattern of transfer to the customer. Revenue is recognized over time based oninput methods by reference to the stage of completion of the service rendered either on a straight-line basis for lump sumcontracts or in line with cost incurred on reimbursable contracts.
4 FINANCIAL STATEMENTS 2019
SBM OFFSHORE ANNUAL REPORT 2019 - 131
Bonuses/penaltiesOn some contracts the Company is entitled to receive bonuses (incentives) and incurs penalties depending on the level ofinterruption of production or processing of oil. Bonuses are recognized as revenue once it is highly probable that nosignificant reversal of revenue recognized will occur, which is generally the case only once the performance bonus is earned.Penalties are recognized as a deduction of revenue when they become probable. For estimation of bonuses and penaltiesthe Company applies the ‘most likely’ method, where the Company assesses which single amount is the most likely in arange of possible outcomes.
Contract costsThe incremental costs of obtaining a contract with a customer (for example sales commissions) are recognized as an asset.The Company uses a practical expedient that permits to expense the costs to obtain a contract as incurred when theexpected amortization period is one year or less. Costs of obtaining a contract that are not incremental are expensed asincurred unless those costs are explicitly chargeable to the customer. Bid, proposal, and selling and marketing costs, as wellas legal costs incurred in connection with the pursuit of the contract, are not incremental, as the Company would haveincurred those costs even if it did not obtain the contract.
If the costs incurred in fulfilling a contract with a customer are not within the scope of another IFRS standard (e.g. IAS 2Inventories, IAS 16 Property, Plant and Equipment or IAS 38 Intangible Assets), the Company recognizes an asset for thecosts incurred to fulfill a contract only if those costs meet all of the following criteria:■ The costs relate directly to a contract or to an anticipated contract that the Company can specifically identify (for example,
costs relating to services to be provided under renewal of an existing contract or costs of designing an asset to betransferred under a specific contract that has not yet been approved);
■ The costs generate or enhance resources of the entity that will be used in satisfying (or in continuing to satisfy)performance obligations in the future; and
■ The costs are expected to be recovered.
An asset recognized for contract costs is amortized on a systematic basis that is consistent with the transfer to the customerof the goods or services to which the asset relates.
(e) Operating segment informationAs per IFRS 8, an operating segment is a component of an entity that engages in business activities from which it may earnrevenues and incur expenses, whose segmental operating results are regularly reviewed by the entity’s chief operatingdecision maker, and for which distinct financial information is available.
The Management Board, as chief operating decision maker, monitors the operating results of its operating segmentsseparately for the purpose of making decisions about resource allocation and performance assessment. Segmentperformance is evaluated based on revenue, gross margin, EBIT and EBITDA, and prepared in accordance with Directionalreporting. The Company has two reportable segments:■ The Lease and Operate segment includes all earned day-rates on operating lease and operate contracts.■ The Turnkey segment includes revenues from Turnkey supply contracts and after-sales services, which consist mainly of
large production systems, large mooring systems, deep water export systems, fluid transfer systems, tanker loading anddischarge terminals, design services and supply of special components and proprietary designs and equipment.
No operating segments have been aggregated to form the above reportable operating segments.
The Company’s corporate overhead functions do not constitute an operating segment as defined by IFRS 8 ’Operatingsegments’ and are reported under the ’Other’ section in note 4.3.2 Operating Segments and Directional Reporting.
Operating segment information is prepared and evaluated based on Directional reporting for which the main principles areexplained in note 4.3.2 Operating Segments and Directional Reporting.
(f) Construction work-in-progressConstruction work-in-progress represents the Company‘s contract assets as defined in IFRS 15. Construction work-in-progress is the Company‘s right to consideration in exchange for goods and services that the Company has transferred tothe customer. The Company‘s construction work-in-progress is measured as revenue recognizable to date, less any losses

132 - SBM OFFSHORE ANNUAL REPORT 2019
from onerous contracts and less invoiced instalments. The impairment of construction work-in-progress is measured,presented and disclosed on the same basis as financial assets that are within the scope of IFRS 9. The Company applies thesimplified approach in measuring expected credit losses for construction work-in-progress. In case of construction work-in-progress balances relating to the finance lease contracts, the Company applies the low credit risk simplification of IFRS 9 forthe computation of the expected credit loss. The simplification is applied as the credit risk profile of these balances has beenassessed as low.
Where instalments received from the customers exceed the value of the performance obligation delivered to the customer,the excess is included in ‘Trade and other payables’ as ‘Contract liability‘.
(g) Demobilization obligationsThe demobilization obligations of the Company are either stated in the lease contract or derived from the internationalconventions and the specific legislation applied in the countries where the Company operates assets. Demobilization costswill be incurred by the Company at the end of the operating life of the Company’s facilities.
For operating leases, the net present value of the future obligations is included in property, plant and equipment with acorresponding amount included in the provision for demobilization. As the remaining duration of each lease reduces, andthe discounting effect on the provision unwinds, accrued interest is recognized as part of financial expenses and added tothe provision. The subsequent updates of the measurement of the demobilization costs are recognized both impacting theprovision and the asset.
In some cases, when the contract includes a demobilization bareboat fee that the Company invoices to the client during thedemobilization phase, a receivable is recognized at the beginning of the lease phase for the discounted value of the fee.These receivables are subject to expected credit loss impairment which are analyzed together with the finance leasereceivable using the same methodology.
For finance leases, demobilization obligations are analyzed as a component of the sale recognized under IFRS 15. It isdetermined whether the demobilization obligation should be defined as a separate performance obligation. In that case,because the demobilization operation is performed at a later stage, the related revenue is deferred until the demobilizationoperations occur. Subsequent updates of the measurement of the demobilization costs are recognized immediately throughdeferred revenue, for the present value of the change.
C. SIGNIFICANT ACCOUNTING POLICIESThe consolidated financial statements of the Company have been prepared on the historical cost basis except for therevaluation of certain financial instruments.
(a) Distinction between current and non-current assets and liabilitiesThe Company classifies its assets as current when it expects to realize the asset, or intends to sell or consume it, in its normaloperating cycle. Inventory and construction work-in-progress are classified as current while the time when these assets aresold or consumed might be longer than twelve months. Financial assets are classified as current when they are realized withintwelve months. Liabilities are classified as current when they are expected to be settled within less than twelve months andthe Company does not have an unconditional right to defer settlement of the liability for at least 12 months after thereporting period. All other assets and liabilities are classified as non-current.
(b) ConsolidationThe Company’s consolidated financial statements include the financial statements of all controlled subsidiaries.
In determining under IFRS 10 whether the Company controls an investee, the Company assesses whether it has i) power overthe investee, ii) exposure or rights to variable returns from its involvement, and iii) the ability to use power over investees toaffect the amount of return. To determine whether the Company has power over the investee, multiple contractual elementsare analyzed, amongst which i) voting rights of the Company at the General Meeting, ii) voting rights of the Company atBoard level and iii) the power of the Company to appoint, reassign or remove other key management personnel.
For investees whereby such contractual elements are not conclusive because all decisions about the relevant activities aretaken on a mutual consent basis, the main deciding feature resides then in the deadlock clause existing in shareholders’agreements. In case a deadlock situation arises at the Board of Directors of an entity, whereby the Board is unable to
4 FINANCIAL STATEMENTS 2019

SBM OFFSHORE ANNUAL REPORT 2019 - 133
conclude on a decision, the deadlock clause of the shareholders’ agreements generally stipulates whether a substantive rightis granted to the Company or to all the partners in the entity to buy its shares through a compensation mechanism that is fairenough for the Company or one of the partners to acquire these shares. In case such a substantive right resides with theCompany, the entity will be defined under IFRS 10 as controlled by the Company. In case no such substantive right is held byany of the shareholders through the deadlock clause, the entity will be defined as a joint arrangement.
Subsidiaries:Subsidiaries are all entities over which the group has control. The group controls an entity when the group is exposed to, orhas rights to, variable returns from its involvement with the entity and has the ability to affect those returns through its powerover the entity. Subsidiaries are consolidated using the full consolidation method.
All reciprocal transactions between two controlled subsidiaries, with no profit or loss impact at consolidation level, are fullyeliminated for the preparation of the consolidated financial statements.
Interests in joint ventures:The Company has applied IFRS 11 ’Joint Arrangements’ to all joint arrangements. Under IFRS 11 investment in jointarrangements are classified as either joint operations or joint ventures depending on the contractual rights and obligationsof each investor. In determining under IFRS 11 the classification of a joint arrangement, the Company assessed that all jointarrangements were structured through private limited liability companies incorporated in various jurisdictions. As a result,assets and liabilities held in these separate vehicles were those of the separate vehicles and not those of the shareholders ofthese limited liability companies. Shareholders had therefore no direct rights to the assets, nor primary obligations forliabilities of these vehicles. The Company has considered the nature of its joint arrangements and determined them to bejoint ventures. Joint ventures are accounted for using the equity method.
Investments in associates:Associates are all entities over which the Company has significant influence. Significant influence is the power to participatein the financial and operating policy decisions of the investee, but it is not control over those policies. Investments inassociates are accounted for using the equity method.
When losses of an equity-accounted entity are greater than the value of the Company’s net investment in that entity, theselosses are not recognized unless the Company has a constructive obligation to fund the entity. The share of the negative netequity of these is first accounted for against the loans held by the owner towards the equity-accounted company that formspart of the net investment. Any excess is accounted for under provisions.
Reciprocal transactions carried out between a subsidiary and an equity-accounted entity, are not eliminated for thepreparation of the consolidated financial statements. Only transactions leading to an internal profit (e.g. for dividends orinternal margin on asset sale) are eliminated applying the percentage owned in the equity-accounted entity.
The financial statements of the subsidiaries, associates and joint ventures are prepared for the same reporting period as theCompany and the accounting policies are in line with those of the Company.
(c) Non-derivative financial assetsThe Company’s financial assets consist of finance lease receivables, loans to joint ventures and associates and trade andother receivables. The accounting policy on trade and other receivables is described separately.
Finance lease receivables are non-derivative financial assets with fixed or determined payments that are not quoted in anactive market.
Loans to joint ventures and associates relate primarily to interest-bearing loans to joint ventures. These financial assets areinitially measured at fair value plus transaction costs (if any) and subsequently measured at amortized cost.
The Company classifies its financial assets at amortized cost only if both of the following criteria are met:■ The asset is held within a business model whose objective is to collect the contractual cash flows; and■ The contractual terms give rise to cash flows that are solely payments of principal and interest.
134 - SBM OFFSHORE ANNUAL REPORT 2019
Financial assets are derecognized when the contractual rights to the cash flows from the financial asset expire or have beentransferred and the Company has transferred substantially all the risks and rewards of ownership.
(d) Borrowings (bank and other loans) and lease liabilitiesBorrowings are recognized on settlement date, being the date on which cash is paid or received. They are initiallyrecognized at fair value, net of transaction costs incurred (transaction price), subsequently measured at amortized cost andclassified as current liabilities unless the Company has an unconditional right to defer settlement of the liability for at leasttwelve months after the statement of financial position date.
Borrowing costs that are directly attributable to the acquisition, construction or production of a qualifying asset arecapitalized into the cost of the asset in the period in which they are incurred. Otherwise, borrowing costs are recognized asan expense in the period in which they are incurred.
Borrowings are derecognized when the Company either discharges the borrowing by paying the creditor, or is legallyreleased from primary responsibility for the borrowing either by process of law or by the creditor.
Lease liabilities, arising from lease contracts in which the Company is the lessee, are initially measured at the net presentvalue of the following:■ Fixed lease payments (including in-substance fixed payments), less any lease incentives receivable;■ Variable lease payments that are based on an index or a rate;■ Amounts expected to be payable under residual value guarantees;■ The exercise price of a purchase option if the Company is reasonably certain to exercise that option; and■ Payments of penalties for terminating the lease, if the lease term reflects the Company exercising that option.
The lease payments are discounted using the interest rate implicit in the lease, if that rate can be determined, or theCompany’s incremental borrowing rate.
Each lease payment is allocated between the lease liability and finance cost. Finance cost is charged to the consolidatedincome statement over the lease period so as to produce a constant periodic rate of interest on the remaining balance of theliability for each period.
(e) Foreign currency transactions and derivative financial instrumentsForeign currency transactions are translated into the functional currency, the US dollar, at the exchange rate applicable onthe transaction date. At the closing date, monetary assets and liabilities stated in foreign currencies are translated into thefunctional currency at the exchange rate prevailing on that date. Resulting exchange gains or losses are directly recorded inthe income statement. At the closing date, non-monetary assets and liabilities stated in foreign currency remain translatedinto the functional currency using the exchange rate at the date of the transaction.
Translation of foreign currency income statements of subsidiaries (except for foreign operations in hyperinflationaryeconomies) into US dollars is converted at the average exchange rate prevailing during the year. Statements of financialposition are translated at the exchange rate at the closing date. Differences arising in the translation of financial statementsof foreign subsidiaries are recorded in other comprehensive income as foreign currency translation reserve. Onconsolidation, exchange differences arising from the translation of the net investment in foreign entities, and borrowings ofsuch investments, are taken to Company equity.
Derivative financial instruments held by the Company are aimed at hedging risks associated with market risk fluctuations. TheCompany uses primarily forward currency contracts and interest rate swaps to hedge foreign currency risk and interest raterisk. Further information about the financial risk management objectives and policies is included in note 4.3.29 FinancialInstruments − Fair Values and Risk Management.
A derivative instrument (cash flow hedge) qualifies for hedge accounting when all relevant criteria are met. A cash flowhedge aims at reducing risks incurred by variations in the value of future cash flows that may impact net income. In order fora derivative to be eligible for hedge accounting, the following criteria must be met:■ There is an economic relationship between the hedging instrument and the hedged item.■ The effect of credit risk does not dominate the value changes resulting from that economic relationship.
4 FINANCIAL STATEMENTS 2019

SBM OFFSHORE ANNUAL REPORT 2019 - 135
■ The hedge ratio of the hedging relationship is the same as that used for risk management purposes.
All derivative instruments are recorded and disclosed in the statement of financial position at fair value. Purchases and salesof derivatives are accounted for at trade date. Where a portion of a financial derivative is expected to be realized withintwelve months of the reporting date, that portion is presented as current; the remainder of the financial derivative as non-current.
Changes in fair value of derivatives designated as cash flow hedge relationships are recognized as follows:■ The effective portion of the gain or loss of the hedging instrument is recorded directly in other comprehensive income,
and the ineffective portion of the gain or loss on the hedging instrument is recorded in the income statement. The gain orloss which is deferred in equity, is reclassified to the net income in the period(s) in which the specified hedged transactionaffects the income statement.
■ The changes in fair value of derivative financial instruments that do not qualify as hedging in accounting standards aredirectly recorded in the income statement.
The sources of hedge ineffectiveness are:■ The non-occurrence of the hedged item;■ The change in the principal terms of the hedged item;■ The severe deterioration of the credit risk of the Company and, or the derivative counterparty.
When measuring the fair value of a financial instrument, the Company uses market observable data as much as possible. Fairvalues are categorized into different levels in a fair value hierarchy based on the inputs used in the valuation techniques.Further information about the fair value measurement of financial derivatives is included in note 4.3.29 Financial Instruments− Fair Values and Risk Management.
(f) ProvisionsProvisions are recognized if and only if the following criteria are simultaneously met:■ The Company has an ongoing obligation (legal or constructive) as a result of a past event.■ It is probable that an outflow of resources embodying economic benefits will be required to settle the obligation.■ The amount of the obligation can be reliably estimated; provisions are measured according to the risk assessment or the
exposed charge, based upon best-known facts.
Demobilization provisions relate to estimated costs for demobilization of leased facilities at the end of the respective leaseperiod or operating life.
Warranty provisions relate to the Company’s obligations to replace or repair defective items that become apparent within anagreed period starting from final acceptance of the delivered system. Such warranties are provided to customers on mostTurnkey sales. These provisions are estimated on a statistical basis regarding the Company’s past experience or on anindividual basis in the case of any warranty claim already identified. These provisions are classified as current by nature as itcoincides with the production cycle of the Company.
Other provisions include provisions like commercial claims, regulatory fines related to operations and local content penalty.In relation to local content penalty, Brazilian oil and gas contracts typically include local content requirements. Theserequirements are issued by the Agência Nacional do Petróleo, Gás Natural e Biocombustíveis (ANP) to the winningconcessionaire/consortia of auctioned Brazilian exploratory blocks or areas at the end of the bidding round, with theintention to strengthen the domestic Brazilian market and expand local employment. The owning concessionaire/consortianormally contractually passes such requirements on to, amongst other suppliers, the company delivering the FPSO. For theCompany's Brazilian contracts, the Company assesses the execution strategy and may decide that execution of the project inlocations other than Brazil is more beneficial. Such a decision takes into account factors such as optimization of overall costof delivery, quality and timeliness. As a result, following the chosen execution strategy, the Company may expect to not meetentirely the agreed local content requirements. In such circumstances, the expected penalty to be paid, as a result of notmeeting the local content requirements, is determined based on management's best estimate and recognized as provisionduring the construction period. The corresponding cost is expensed over the construction period of the asset.

136 - SBM OFFSHORE ANNUAL REPORT 2019
(g) Property, plant and equipmentProperty, plant and equipment are stated at cost less accumulated depreciation and accumulated impairment losses.Historical cost includes expenditure that is directly attributable to the acquisition of such items. The capital value of a facilityto be leased and operated for a client is the sum of external costs (such as shipyards, subcontractors and suppliers), internalcosts (design, engineering, construction supervision, etc.), third party financial costs including interest paid duringconstruction and attributable overhead.
Subsequent costs are included in an assets’ carrying amount or recognized as a separate asset, as appropriate, only when itis probable that future economic benefits associated with the item will flow to the Company and the cost of the item can bemeasured reliably. The costs of assets include the initial estimate of costs of demobilization of the asset net ofreimbursement expected to be received by the client. Costs related to major overhaul which meet the criteria forcapitalization are included in the assets carrying amount. All other repairs and maintenance are charged to the incomestatement during the financial period in which they are incurred.
When significant parts of an item of property, plant and equipment have different useful lives, those components areaccounted for as separate line items of property, plant and equipment. The depreciation charge is calculated based onfuture anticipated economic benefits, e.g. based on the unit of production method or on a straight-line basis as follows:■ Converted tankers 10-20 years (included in vessels and floating equipment);■ Floating equipment 3-15 years (included in vessels and floating equipment);■ Buildings 30-50 years;■ Other assets 2-20 years;■ Land is not depreciated.
Useful lives and methods of depreciation are reviewed at least annually, and adjusted if appropriate.
The assets’ residual values are reviewed and adjusted, if appropriate, at each statement of financial position date. An asset’scarrying amount is written down immediately to its recoverable amount if the asset’s carrying amount is higher than itsestimated recoverable amount.
Gains and losses arising on disposals or retirement of assets are determined by comparing any sales proceeds and thecarrying amount of the asset. These are reflected in the income statement in the period that the asset is disposed of orretired.
Right-of-use assets related to the Company’s lease contracts in which the Company is a lessee are included in Property, plantand equipment. Right-of-use assets and corresponding liabilities are recognized when the leased asset is available for use bythe Company. Right-of-use assets are measured at cost comprising the following:■ The amount of the initial measurement of the lease liability;■ Any lease payments made at or before the commencement date;■ Any initial direct costs; and■ Restoration costs.
The right-of-use asset is depreciated over the shorter of the asset‘s useful life and the lease term on a straight-line basis.
Payments associated with short-term leases and leases of low-value assets are recognized on a straight-line basis as anexpense in profit or loss. Short-term leases are leases with a lease term of 12 months or less.
(h) Intangible assetsGoodwill represents the excess of the cost of an acquisition over the fair value of the Company’s share of the net identifiableassets of the acquired subsidiary at the date of the acquisition, less accumulated impairment.
Goodwill is allocated to cash-generating units (CGUs) for the purpose of the annual impairment testing.
Patents are recognized at historical cost and patents acquired in a business combination are recognized at fair value at theacquisition date when intangible assets criteria are met and amortized on a straight-line basis over their useful life, generallyover fifteen years.
4 FINANCIAL STATEMENTS 2019

SBM OFFSHORE ANNUAL REPORT 2019 - 137
Research costs are expensed when incurred. In compliance with IAS 38, development costs are capitalized if all of thefollowing criteria are met:■ The projects are clearly defined.■ The Company is able to reliably measure expenditures incurred by each project during its development.■ The Company is able to demonstrate the technical feasibility of the project.■ The Company has the financial and technical resources available to achieve the project.■ The Company can demonstrate its intention to complete, to use or to commercialize products resulting from the project.■ The Company is able to demonstrate the existence of a market for the output of the intangible asset, or, if it is used
internally, the usefulness of the intangible asset.
When capitalized, development costs are carried at cost less any accumulated amortization. Amortization begins when theproject is complete and available for use. It is amortized over the period of expected future benefit, which is generallybetween three and five years.
(i) Assets (or disposal groups) held for saleThe Company classifies assets or disposal groups as being held for sale when their carrying amount will be recoveredprincipally through a sale transaction rather than through continuing use.
(j) InventoriesInventories are valued at the lower of cost and net realizable value. Cost is determined using the first-in first-out method. Netrealizable value is the estimated selling price in the ordinary course of business, less the estimated cost of completion andselling expenses. Inventories comprise semi-finished, finished products and the Company’s Fast4Ward® Multi PurposeFloater (’MPF’) valued at cost including attributable overheads and spare parts stated at the lower of purchase price ormarket value. MPFs under construction are accounted for as inventories until they are allocated to awarded projects.
(k) Trade and other receivablesTrade receivables are amounts due from customers for goods sold or services performed in the ordinary course of business.They are generally due for settlement within a maximum of 90 days and are therefore all classified as current. Tradereceivables are recognized initially at fair value. The Company holds the trade receivables with the objective to collect thecontractual cash flows and therefore measures them subsequently at amortized cost using the effective interest method. TheCompany applies the simplified approach in measuring expected credit losses for trade receivables.
Other receivables are recognized initially at fair value and subsequently measured at amortized cost, using the effectiveinterest rate method. Interest income, together with gains and losses when the receivables are derecognized or impaired, isrecognized in the income statement.
(l) Impairment of finance lease receivablesFor finance lease receivables the Company assumes that the credit risk has not increased significantly since the initialrecognition if the finance lease receivable is determined to have a low credit risk at the reporting date (i.e. the Companyapplies the low credit risk simplification). As a result, if the finance lease receivable is determined to have a low credit risk atthe reporting date, the Company recognizes a 12-month expected credit loss.
(m) Cash and cash equivalentsCash and cash equivalents consist of cash in bank and in hand fulfilling the following criteria: a maturity of usually less thanthree months, highly liquid, a fixed exchange value and an extremely low risk of loss of value.
(n) Share capitalOrdinary shares and protective preference shares are classified as equity. Incremental costs directly attributable to the issueof new shares are shown in equity as a deduction, net of tax, from the proceeds.
(o) Income taxThe tax expense for the period comprises current and deferred tax. Tax is recognized in the income statement, except to theextent that it relates to items recognized in other comprehensive income or directly in equity. In this case the associated taxis also recognized in other comprehensive income or directly in equity.

138 - SBM OFFSHORE ANNUAL REPORT 2019
Income tax expenses comprise corporate income tax due in countries of incorporation of the Company’s main subsidiariesand levied on actual profits. Income tax expense also includes the corporate income taxes which are levied on a deemedprofit basis and revenue basis (withholding taxes in the scope of IAS 12). This presentation adequately reflects theCompany’s global tax burden.
(p) Deferred income taxDeferred income tax is recognized using the liability method, on temporary differences arising between the tax bases ofassets and liabilities and their carrying amounts in the financial statements. Deferred tax is determined using tax rates andlaws that have been enacted or substantially enacted by the statement of financial position date and are expected to applywhen the related deferred tax asset is realized or the deferred tax liability is settled.
Deferred tax assets are recognized only to the extent that it is probable that future taxable profit will be available againstwhich the temporary differences can be utilized. Deferred tax is provided for on temporary differences arising on investmentsin subsidiaries and associates, except where the timing of the reversal of the temporary difference is controlled by theCompany and it is probable that the temporary difference will not reverse in the foreseeable future.
(q) Employee benefitsPension obligations: the Company operates various pension schemes that are generally funded through paymentsdetermined by periodic actuarial calculations to insurance companies or are defined as multi-employer plans. The Companyhas both defined benefit and defined contribution plans:■ A defined benefit plan is a pension plan that defines an amount of pension benefit that an employee will receive on
retirement, usually dependent on one or more factors such as age, years of service and compensation■ A defined contribution plan is a pension plan under which the Company pays fixed contributions to public or private
pension insurance plans on a mandatory, contractual or voluntary basis. The Company has no legal or constructiveobligation to pay further contributions if the fund does not hold sufficient assets to pay all employees the benefits relatingto employee service in the current and prior periods. The contributions to defined contribution plans and multi-employerplans are recognized as an expense in the income statement as incurred.
The liability recognized in the statement of financial position in respect of defined benefit pension plans is the present valueof the defined benefit obligation at the statement of financial position date less the fair value of the plan assets, togetherwith adjustments for unrecognized actuarial gains and losses and past service costs. The defined benefit obligation iscalculated periodically by independent actuaries using the projected unit credit method. The present value of the definedbenefit obligation is determined by discounting the estimated future cash outflows using interest rates on high-qualitycorporate bonds that have maturity dates approximating the terms of the Company’s obligations.
The expense recognized within the EBIT comprises the current service cost and the effects of any change, reduction orwinding up of the plan. The accretion impact on actuarial debt and interest income on plan assets are recognized under thenet financing cost.
Cumulative actuarial gains and losses arising from experience adjustments and changes in actuarial assumptions arerecognized immediately in comprehensive income.
Share-based payments: within the Company there are four types of share based payment plans that qualify as equity settled:■ Restricted share unit (RSU);■ Long-term and Short-term Incentive Programs;■ Value Creation Stake (VCS); and■ Matching bonus shares.
The estimated total amount to be expensed over the vesting period related to share based payments is determined by(i) reference to the fair value of the instruments determined at the grant date, and (ii) non-market vesting conditions includedin assumptions about the number of shares that the employee will ultimately receive. Main assumptions for estimates arerevised at statement of financial position date. Total cost for the period is charged or credited to the income statement, witha corresponding adjustment to equity.
When equity instruments vest, the Company issues new shares, unless the Company has Treasury shares in stock.
4 FINANCIAL STATEMENTS 2019

SBM OFFSHORE ANNUAL REPORT 2019 - 139
4.3 NOTES TO THE CONSOLIDATED FINANCIAL STATEMENTS
4.3.1 FINANCIAL HIGHLIGHTS
ExxonMobil awards Liza Unity contract to SBM OffshoreOn May 10, 2019, the Company announced that Esso Exploration and Production Guyana Limited (EEPGL), an affiliate ofExxonMobil Corporation, has confirmed the award of contracts to the Company for the next phase of the Liza project inGuyana. Under these contracts, the Company will construct, install and thereafter lease and operate FPSO Liza Unity for aperiod of up to two years after which the ownership and operations will transfer to ExxonMobil. The FPSO Liza Unity designis based on the Fast4Ward® program as it incorporates the Company’s new-build, multi-purpose hull combined with severalstandardized topsides modules.
The contract is qualified and accounted for as a finance lease under IFRS 16. The operating and maintenance scope of theFPSO, which is agreed in principle, is pending a final work order.
The Company announced the completion of the project financing of FPSO Liza Unity for a total of US$1.14 billion onOctober 16, 2019. The Company expects to draw the loan in full, phased over the construction period of the FPSO. Thefinancing will become non-recourse once the FPSO is completed and the pre-completion guarantees have been released.The project loan has a tenor of two years post completion, in line with the duration of the charter, and carries a variableinterest cost of LIBOR plus 1.50%.
Completion 2019 Share Repurchase ProgramOn May 20, 2019 the Company completed its EUR175 million (US$196 million) share repurchase program. BetweenFebruary 14, 2019 and May 20, 2019 a total of 10,422,259 common shares were repurchased, at an average price of EUR16.79per share.
Closing of Brazil legacy caseIn 2018 the Company entered into two Leniency Agreements in Brazil in relation to its legacy issue; the one with the BrazilianMinistry of Transparency and Comptroller’s General Office (Ministério da Transparência e Controladoria-Geral da União –'CGU'), the General Counsel for the Republic (Advocacia Geral da União – 'AGU') and Petróleo Brasileiro S.A. ('Petrobras'),as reported on July 26, 2018 ('July LA'), and the other with the Brazilian Federal Prosecutor’s Office (Ministério PúblicoFederal – 'MPF'), as reported on September 1, 2018 ('September LA').
The July LA was immediately effective upon signing. In October 2019, the Company provided an additional update on theBrazilian Federal Court decision, which has formally closed the Improbity Lawsuit filed by the Brazilian Federal ProsecutorsOffice (Ministério Público Federal, MPF) in 2017. This approval made the September LA effective. The court decision issubject to a mandatory re-examination by the Brazilian Court of Appeal.
CGU and AGU informed the Company that the signing of an amendment to the July LA, foreseen in order to align theamounts of the July LA with those of the September LA shall occur after the mandatory re-examination by the Court ofAppeal.
SBM Offshore awarded contracts for ExxonMobil’s third FPSO in GuyanaOn November 7, 2019, the Company announced that ExxonMobil subsidiary Esso Exploration and Production GuyanaLimited (EEPGL) has awarded the Company contracts to perform Front End Engineering and Design (FEED) for a FloatingProduction, Storage and Offloading vessel (FPSO) for the Payara development project located in the Stabroek block inGuyana.
FPSO Prosperity will utilize a design that largely replicates the design of FPSO Liza Unity. As such, FPSO Prosperity willbecome the second vessel build under the Company's Fast4Ward® program.
Prior to the necessary government approvals and final project sanction to be formalized by a work order, the contract awardinitiated a limited release of funds to the Company to begin FEED activities and secure a Fast4Ward® hull.

140 - SBM OFFSHORE ANNUAL REPORT 2019
Following authorization to proceed with the next phase, the Company will construct, install and thereafter lease and operateFPSO Prosperity for a period of up to two years after which the ownership and operations will transfer to EEPGL. Thereforethe contract is qualified and accounted for as a finance lease under IFRS 16.
SBM Offshore and Constellation complete transaction regarding minority ownership in SBM Offshore operated FPSOentitiesOn November 22, 2019, the Company and Constellation Oil Services Holding S.A. ('Constellation') jointly confirmed that theyhad completed the transaction regarding the sale to the Company of Constellation’s equity ownership in the lease andoperate entities related to five Brazilian FPSOs (with Constellation’s former ownership percentage in brackets): Cidade deParaty (20%), Cidade de Ilhabela (12.75%), Cidade de Marica (5%), Cidade de Saquarema (5%) and Capixaba (20%). TheCompany was already the majority shareholder of the entities and operator of these FPSOs before the transaction wascompleted. Upon completion of the transaction the Company paid a total cash consideration of US$149 million.
The shares acquired by the Company from Constellation are subject to potential repurchase by other partners (NipponYusen Kabushiki Kaisha (NYK), Itochu Corporation and Mitsubishi Corporation) to the extent of the pro-rata portion of theirexisting ownership in the investees. The partners have waived their rights to repurchase shares, except for two partners, whoexpressed interest in purchasing their portion of shares in the lease and operating entities related to one FPSO. AtDecember 31, 2019, the shares that are subject to potential repurchase have not yet been purchased by these partners andare therefore still owned by the Company.
Under IFRS reporting, since the Company already controlled the lease and operating entities subject to the transaction, theentities were fully consolidated and a corresponding non-controlling interest (NCI) was recognized in equity. The acquisitionof the minority shares from Constellation is therefore a transaction with a minority shareholder and is accounted for asfollows:■ The book value of the NCI related to the acquired portion of the entities is transferred to equity attributable to
shareholders of the parent company for an amount of US$269 million.■ The Company recognized the purchase price of US$149 million against equity attributable to shareholders of the parent
company.■ As a result, under IFRS, the transaction resulted in a net increase of the Company’s equity attributable to shareholders of
the parent company of US$121 million.■ Subject to final agreement, the partners are expected to pay a total of US$28 million to the Company for their pro-rata
shares in the lease and operating entities related to one FPSO upon finalization of the sale. This equals the price theCompany paid for these shares.
The impact on the consolidated financial statements for the year ended December 31, 2019 under Directional reportingsignificantly differs from that under IFRS and is as follows:■ The Company proportionately consolidated the entities subject to the transaction. Under Directional reporting, it is
therefore the Company's policy to account for acquisitions of minority interests as a business combination, with thepreviously owned interest not being revalued.
■ The Company determined the fair value of the assets and liabilities acquired in this transaction per the acquisition date,anticipating the repurchase by two partners for their pro-rata share in the lease and operating entities related to oneFPSO, and applied these fair values for the recognition of the additionally acquired portion of assets and liabilities. Thefair value adjustment was applied only to those assets and liabilities where the impact was exceeding a threshold of US$10 million. The net fair value of the acquired portion of assets and liabilities at the acquisition date, excluding that part ofthe assets and liabilities that is expected to be transferred to two partners, was determined at US$210 million.
■ The total acquisition price of Constellation’s equity ownership in the lease and operate entities was US$149 million, ofwhich US$28 million is allocated to the pro-rata shares in the lease and operating entities related to one FPSO that areexpected to be sold to two partners. As a result, the transaction price for the acquired portion of assets and liabilities atthe acquisition date, excluding that part of the assets and liabilities that is expected to be transferred to two partners, isUS$120 million, resulting in a non-recurring gain on the transaction of US$90 million at the acquisition date.
■ For the potential acquisition of shares by the other partners in the lease and operating entities related to one FPSO, theCompany recognized a financial asset at the amount of US$28 million at December 31, 2019. The amount has beendetermined based on the expected price that the partners will pay for the shares in these entities.
4 FINANCIAL STATEMENTS 2019

SBM OFFSHORE ANNUAL REPORT 2019 - 141
SBM Offshore orders two additional Fast4Ward® hullsOn December 5, 2019, the Company announced that it has signed contracts for the construction of the Company’s fourthand fifth hulls under its purchase program for Fast4Ward® new build multi-purpose hulls. The contracts were signed withShanghai Waigaoqiao Shipbuilding and Offshore Co., Ltd. (SWS) and China Merchants Industry Holdings (CMIH).
SBM Offshore optimizes FPSO N'Goma project loanOn December 9, 2019, the Company announced that it has closed a supplemental non-recourse project loan facility ofUS$250 million related to Sonasing Xikomba Ltd., the entity that owns the FPSO N'Goma. The total outstanding loan amountincreased to c.US$450 million and the original maturity date of the loan was extended by c. 4.5 years to an expiration date ofMay 15, 2026, to match more closely the term of the underlying contract of the vessel.
SBM Offshore signs FPSO Sepetiba lease and operate contracts and sells down minority shareOn December 11, 2019, the Company announced that it has signed the contracts with Petróleo Brasileiro S.A. (Petrobras) fora 22.5 years lease and operate arrangement for FPSO Sepetiba. These contracts follow the signing of the binding Letter ofIntent (LOI) as announced on June 11, 2019. The Company will design and construct the FPSO Sepetiba using theFast4Ward® program. The contract is qualified and accounted for as a finance lease under IFRS 16.
On December 13, 2019, the Company announced that it had entered into an agreement with Mitsubishi Corporation (MC)and Nippon Yusen Kabushiki Kaisha (NYK) for the disposal of 35.5% of the Company’s share in the entities, incorporated forthe purpose of owning and operating FPSO Sepetiba, at the shares' nominal value. After the completion of this transaction,the Company has kept control of the related entities and the transaction has therefore been accounted for as an equitytransaction under IFRS. The transaction had a non-material impact on the equity of the Company.
In the operating segments disclosure, as a result of this transaction and as per the principles of Directional reporting, theCompany recognized the share of construction revenues made on the new partners' share.
FPSO Liza Destiny producing and on hireFPSO Liza Destiny has produced first oil as of December 20, 2019 and is formally on hire. Following the FPSO achieving firstoil, the construction work-in-progress balance related to the construction of FPSO Liza Destiny has been transferred to theline item finance lease receivable in the IFRS Consolidated Statement of Financial Position.
Simultaneously, under Directional reporting, the asset-under-construction balance related to FPSO Liza Destiny has beentransferred to property, plant and equipment in the Directional Consolidated Statement of Financial Position, triggering thestart of depreciation of the FPSO.
4.3.2 OPERATING SEGMENTS AND DIRECTIONAL REPORTING
OPERATING SEGMENTSThe Company ’s reportable operating segments as defined by IFRS 8 ‘Operating segments’ are:■ Lease and Operate;■ Turnkey.
DIRECTIONAL REPORTINGStrictly for the purposes of this note, the operating segments are measured under Directional reporting, which in essencefollows IFRS, but deviates on two main points:■ All lease contracts are classified and accounted for as if they were operating lease contracts under IFRS 16. Some lease
and operate contracts may provide for defined invoicing (‘upfront payments’) to the client occurring during theconstruction phase or at first-oil (beginning of the lease phase), to cover specific construction work and/or servicesperformed during the construction phase. These ’upfront payments’ are recognized as revenues and the costs associatedwith the construction work and/or services are recognized as ’Cost of sales’ with no margin during the construction. As aconsequence, these costs are not capitalized in the gross value of the assets under construction.
■ All investees related to Lease and Operate contracts are accounted for at the Company’s share as if they were classified asJoint Operation under IFRS 11, using the proportionate consolidation method (where all lines of the income statement,statement of financial position and cash flow statement are consolidated for the Company’s percentage of ownership).Yards and installation vessel related joint ventures remain equity accounted.
■ All other accounting principles remain unchanged compared with applicable IFRS standards.

142 - SBM OFFSHORE ANNUAL REPORT 2019
The above differences to the consolidated financial statements between Directional reporting and IFRS are highlighted inthe reconciliations provided in this note on revenue, gross margin, EBIT and EBITDA as required by IFRS 8 ’Operatingsegments’. The Company also provides the reconciliation of the statement of financial position and cash flow statementunder IFRS and Directional reporting. The statement of financial position and the cash flow statement under Directionalreporting are evaluated regularly by the Management Board in assessing the financial position and cash generation of theCompany. The Company believes that these additional disclosures should enable users of its financial statements to betterevaluate the nature and financial effects of the business activities in which it engages, while facilitating the understanding ofthe Directional reporting by providing a straightforward reconciliation with IFRS for all key financial metrics.
SEGMENT HIGHLIGHTSIn 2019, the Turnkey segment was not impacted by any non-recurring material item and benefited from the progress madeon the Johan Castberg Turret Mooring System EPC project, in addition to a general ramp-up of Turnkey activities. Thisincludes (i) the construction activities on FPSO Sepetiba, which started to contribute to Directional revenue thanks to thedisposal of the minority share of 35.5% to MC and NYK and ii) the contribution of upfront payments related to specificconstruction work before the commencement of the lease on the Liza projects.
The Lease and Operate segment was impacted by a total impairment of US$(25) million in 2019 relating to two, individuallynot material, impairments of property, plant and equipment (please refer to note 4.3.13 Property, Plant and Equipment. Safefrom any impact of impairment, Directional Lease and Operate revenue and EBITDA increased versus the year ago period.The impact of units leaving the fleet in 2018 (Turritella (FPSO), FSO Yetagun and FSO N'Kossa II) was indeed more than offsetby a reduction in planned maintenance, an overall improvement in performance of the fleet and the first contribution ofFPSO Liza Destiny after achieving first oil at the end of 2019.
The non-recurring gain of US$90 million on the purchase of additional shares in the five Brazilian vessels is presented in'Other'. Refer to note 4.3.1 Financial Highlights for the full details on the treatment of this transaction under Directionalreporting.
4 FINANCIAL STATEMENTS 2019

SBM OFFSHORE ANNUAL REPORT 2019 - 143
2019 operating segments (Directional)
Lease andOperate Turnkey
Reportedsegments Other
Total Directionalreporting
Third party revenue 1,315 856 2,171 - 2,171
Cost of sales (921) (726) (1,647) - (1,647)
Gross margin 394 130 524 - 524
Other operating income/expense 1 6 6 881 94
Selling and marketing expenses (1) (47) (48) (0) (48)
General and administrative expenses (19) (45) (64) (64) (128)
Research and development expenses (3) (22) (24) (0) (24)
Net impairment gains/(losses) on financialand contract assets (3) 3 0 (0) (0)
Operating profit/(loss) (EBIT) 369 25 395 23 418
Net financing costs (142)
Share of profit of equity-accountedinvestees 1
Income tax expense (42)
Profit/(Loss) 235
Operating profit/(loss) (EBIT) 369 25 395 23 418
Depreciation, amortization andimpairment2 473 28 500 3 503
EBITDA 842 53 895 26 921
Other segment information :
Impairment charge/(reversal) 25 - 25 (0) 25
1 Mainly includes a gain of US$90 million on the purchase of additional shares in Cidade de Paraty, Cidade de Ilhabela, Cidade de Marica, Cidade deSaquarema and Capixaba.
2 Includes net impairment losses on financial and contract assets.

144 - SBM OFFSHORE ANNUAL REPORT 2019
Reconciliation of 2019 operating segments (Directional to IFRS)
Reportedsegments under
Directionalreporting
Impact of leaseaccounting
treatment
Impact ofconsolidation
methodsTotal Consolidated
IFRS
Revenue
Lease and Operate 1,315 (261) 273 1,327
Turnkey 856 1,202 6 2,064
Total revenue 2,171 941 279 3,391
Gross margin
Lease and Operate 394 (4) 177 567
Turnkey 130 240 (3) 367
Total gross margin 524 236 174 934
EBITDA
Lease and Operate 842 (257) 197 783
Turnkey 53 238 (1) 290
Other 26 - (90)1 (63)
Total EBITDA 921 (18) 107 1,010
EBIT
Lease and Operate 369 4 176 549
Turnkey 25 236 (2) 259
Other 23 - (90) (66)
Total EBIT 418 240 84 742
Net financing costs (142) (31) (70) (243)
Share of profit of equity-accounted investees 1 - 42 43
Income tax expense (42) 6 5 (31)
Profit/(loss) 235 216 60 511
Impairment charge/(reversal) 25 2 1 28
1 Includes the removal of a gain of US$90 million on purchase of shares in Cidade de Paraty, Cidade de Ilhabela, Cidade de Marica, Cidade de Saquarema andCapixaba.
The reconciliation from Directional reporting to IFRS comprises two main steps:■ In the first step, those lease contracts that are classified and accounted for as finance lease contracts under IFRS are
restated from an operating lease accounting treatment to a finance lease accounting treatment.■ In the second step, the consolidation method is changed i) from proportional consolidation to full consolidation for those
Lease and Operate related subsidiaries over which the Company has control and ii) from proportional consolidation to theequity method for those Lease and Operate related investees that are classified as joint ventures in accordance withIFRS 11.
Impact of lease accounting treatmentFor the Lease and Operate segment, the restatement from an operating to a finance lease accounting treatment has themain following impacts for the 2019 period:■ Revenue is reduced by US$261 million. During the lease period, under IFRS, the revenue from finance leases is limited to
that portion of charter rates that is recognized as interest using the interest effective method. Under Directional reporting,in accordance with the operating lease treatment, the full charter rate is recognized as revenue, on a straight-line basis.Lease and Operate EBITDA is similarly impacted (reduction of US$257 million) for the same reasons.
■ Gross margin decreased by US$4 million and EBIT increased by US$4 million. As the current Company’s finance lease fleetis still relatively young, the amount of the (declining) interest recognized under IFRS is still in line with the linear grossmargin recognized under Directional for the related vessels. Under IFRS, gross margin and EBIT from finance leases equalthe recognized revenue, therefore following the declining profile of the interest recognized using the interest effectivemethod. On the other side, under the operating lease treatment applied under Directional, the gross margin and the EBIT
4 FINANCIAL STATEMENTS 2019

SBM OFFSHORE ANNUAL REPORT 2019 - 145
correspond to the revenue and depreciation of the recognized PP&E, both accounted for on a straight-line basis over thelease period.
For the Turnkey segment, the restatement from operating to finance lease accounting treatment had the following impactsover the 2019 period:■ Revenue and gross margin increased by US$1,202 million and US$240 million respectively, mainly due to the accounting
treatment of FPSO Liza Destiny, Liza Unity and Sepetiba as a finance lease under IFRS: under IFRS, a finance lease isconsidered as a virtual sale of the asset leading to recognition of revenue during the construction of the assetcorresponding to the present value of the future lease payments. This (non-cash) revenue is recognized within the Turnkeysegment.
■ The basic impact on Turnkey EBIT and EBITDA is largely in line with the impact on gross margin.
As a result, the restatement from operating to finance lease accounting treatment results in an increase of net profit ofUS$216 million under IFRS when compared with Directional reporting.
Impact of consolidation methodsThe impact of consolidation methods in the above table describes the net impact from:■ Proportional consolidation to full consolidation for those Lease and Operate related subsidiaries over which the Company
has control, resulting in an increase of revenue, gross margin, EBIT and EBITDA;■ Proportionate consolidation to the equity accounting method for those Lease and Operate related investees that areclassified as joint ventures in accordance with IFRS 11, resulting in a decrease of revenue, gross margin, EBIT and EBITDA.
The impact of the changes in consolidation methods results in a net increase of revenue, gross margin, EBIT, EBITDA andnet profit under IFRS when compared Directional reporting. This reflects the fact that the majority of the Company’s FPSOs,that are leased under finance lease contracts, are owned by subsidiaries over which the Company has control and which areconsolidated using the full consolidation method under IFRS.
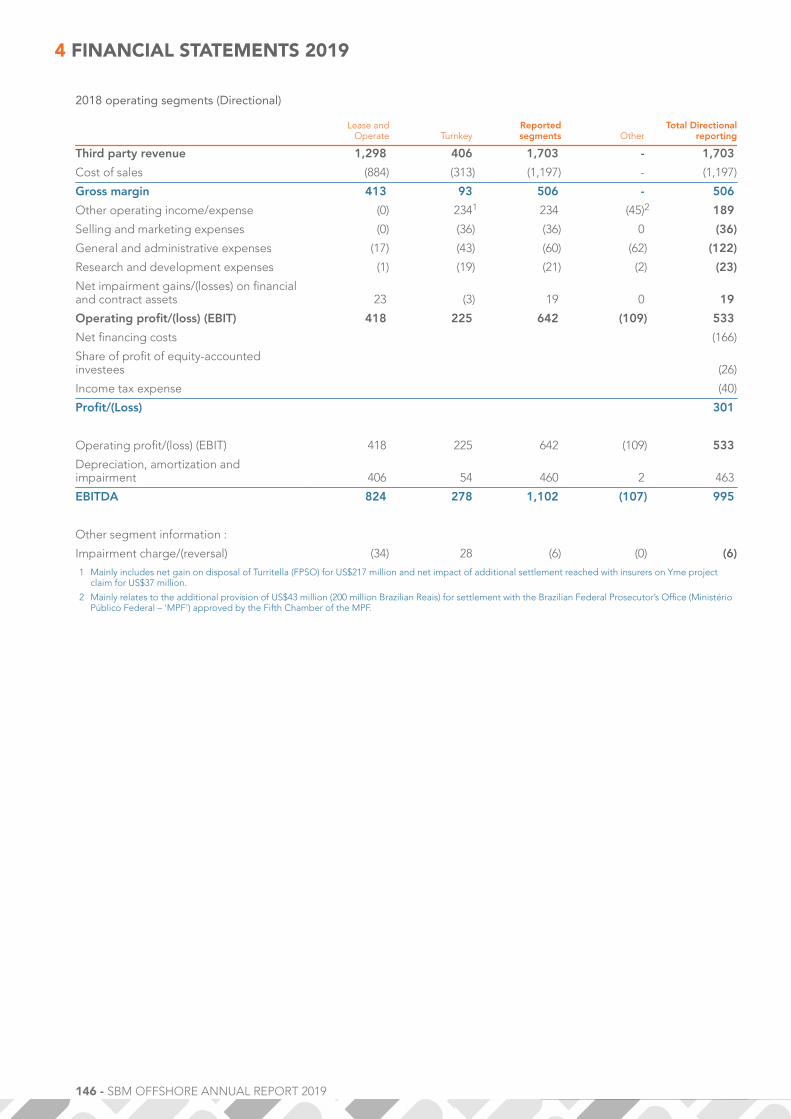
146 - SBM OFFSHORE ANNUAL REPORT 2019
2018 operating segments (Directional)
Lease andOperate Turnkey
Reportedsegments Other
Total Directionalreporting
Third party revenue 1,298 406 1,703 - 1,703
Cost of sales (884) (313) (1,197) - (1,197)
Gross margin 413 93 506 - 506
Other operating income/expense (0) 2341 234 (45)2 189
Selling and marketing expenses (0) (36) (36) 0 (36)
General and administrative expenses (17) (43) (60) (62) (122)
Research and development expenses (1) (19) (21) (2) (23)
Net impairment gains/(losses) on financialand contract assets 23 (3) 19 0 19
Operating profit/(loss) (EBIT) 418 225 642 (109) 533
Net financing costs (166)
Share of profit of equity-accountedinvestees (26)
Income tax expense (40)
Profit/(Loss) 301
Operating profit/(loss) (EBIT) 418 225 642 (109) 533
Depreciation, amortization andimpairment 406 54 460 2 463
EBITDA 824 278 1,102 (107) 995
Other segment information :
Impairment charge/(reversal) (34) 28 (6) (0) (6)1 Mainly includes net gain on disposal of Turritella (FPSO) for US$217 million and net impact of additional settlement reached with insurers on Yme project
claim for US$37 million.
2 Mainly relates to the additional provision of US$43 million (200 million Brazilian Reais) for settlement with the Brazilian Federal Prosecutor’s Office (MinistérioPúblico Federal – 'MPF') approved by the Fifth Chamber of the MPF.
4 FINANCIAL STATEMENTS 2019

SBM OFFSHORE ANNUAL REPORT 2019 - 147
Reconciliation of 2018 operating segments (Directional to IFRS)
Reportedsegments under
Directionalreporting
Impact of leaseaccounting
treatment
Impact ofconsolidation
methodsTotal Consolidated
IFRS
Revenue
Lease and Operate 1,298 (238) 242 1,302
Turnkey 406 528 4 938
Total revenue 1,703 290 246 2,240
Gross margin
Lease and Operate 413 7 159 579
Turnkey 93 133 (3) 223
Total gross margin 506 140 156 801
EBITDA
Lease and Operate 824 (248) 185 761
Turnkey 278 (86)1 (8) 184
Other (107) - (0) (107)
Total EBITDA 995 (335) 178 838
EBIT
Lease and Operate 418 3 158 579
Turnkey 225 (85)1 (6) 134
Other (109) - (0) (109)
Total EBIT 533 (82) 152 603
Net financing costs (166) (0) (67) (233)
Share of profit of equity-accounted investees (26) - 40 13
Income tax expense (40) (8) 8 (40)
Profit/(loss) 301 (90) 132 344
Impairment charge/(reversal) (6) 4 (0) (2)
1 Includes the removal of a gain on disposal of Turritella (FPSO) for US$217 million.
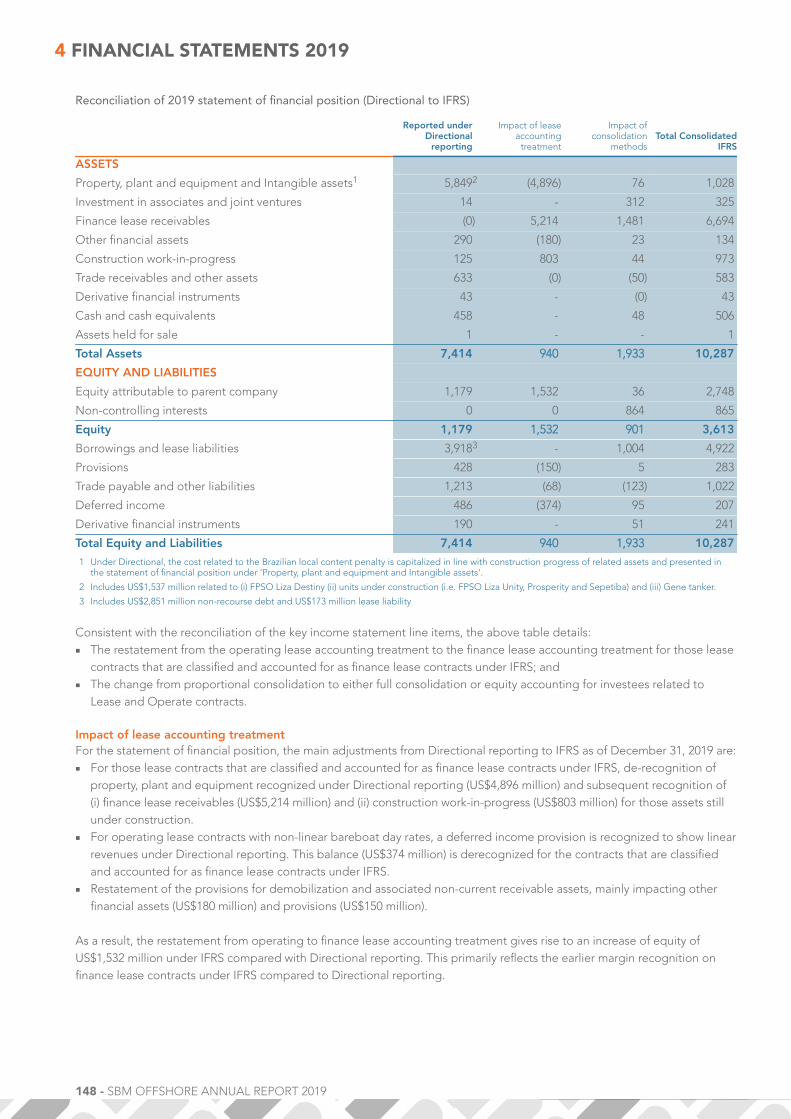
148 - SBM OFFSHORE ANNUAL REPORT 2019
Reconciliation of 2019 statement of financial position (Directional to IFRS)
Reported underDirectional
reporting
Impact of leaseaccounting
treatment
Impact ofconsolidation
methodsTotal Consolidated
IFRS
ASSETS
Property, plant and equipment and Intangible assets1 5,8492 (4,896) 76 1,028
Investment in associates and joint ventures 14 - 312 325
Finance lease receivables (0) 5,214 1,481 6,694
Other financial assets 290 (180) 23 134
Construction work-in-progress 125 803 44 973
Trade receivables and other assets 633 (0) (50) 583
Derivative financial instruments 43 - (0) 43
Cash and cash equivalents 458 - 48 506
Assets held for sale 1 - - 1
Total Assets 7,414 940 1,933 10,287
EQUITY AND LIABILITIES
Equity attributable to parent company 1,179 1,532 36 2,748
Non-controlling interests 0 0 864 865
Equity 1,179 1,532 901 3,613
Borrowings and lease liabilities 3,9183 - 1,004 4,922
Provisions 428 (150) 5 283
Trade payable and other liabilities 1,213 (68) (123) 1,022
Deferred income 486 (374) 95 207
Derivative financial instruments 190 - 51 241
Total Equity and Liabilities 7,414 940 1,933 10,2871 Under Directional, the cost related to the Brazilian local content penalty is capitalized in line with construction progress of related assets and presented in
the statement of financial position under 'Property, plant and equipment and Intangible assets'.
2 Includes US$1,537 million related to (i) FPSO Liza Destiny (ii) units under construction (i.e. FPSO Liza Unity, Prosperity and Sepetiba) and (iii) Gene tanker.
3 Includes US$2,851 million non-recourse debt and US$173 million lease liability
Consistent with the reconciliation of the key income statement line items, the above table details:■ The restatement from the operating lease accounting treatment to the finance lease accounting treatment for those lease
contracts that are classified and accounted for as finance lease contracts under IFRS; and■ The change from proportional consolidation to either full consolidation or equity accounting for investees related to
Lease and Operate contracts.
Impact of lease accounting treatmentFor the statement of financial position, the main adjustments from Directional reporting to IFRS as of December 31, 2019 are:■ For those lease contracts that are classified and accounted for as finance lease contracts under IFRS, de-recognition of
property, plant and equipment recognized under Directional reporting (US$4,896 million) and subsequent recognition of(i) finance lease receivables (US$5,214 million) and (ii) construction work-in-progress (US$803 million) for those assets stillunder construction.
■ For operating lease contracts with non-linear bareboat day rates, a deferred income provision is recognized to show linearrevenues under Directional reporting. This balance (US$374 million) is derecognized for the contracts that are classifiedand accounted for as finance lease contracts under IFRS.
■ Restatement of the provisions for demobilization and associated non-current receivable assets, mainly impacting otherfinancial assets (US$180 million) and provisions (US$150 million).
As a result, the restatement from operating to finance lease accounting treatment gives rise to an increase of equity ofUS$1,532 million under IFRS compared with Directional reporting. This primarily reflects the earlier margin recognition onfinance lease contracts under IFRS compared to Directional reporting.
4 FINANCIAL STATEMENTS 2019

SBM OFFSHORE ANNUAL REPORT 2019 - 149
Impact of consolidation methodsThe above table also describes the net impact of moving from proportionate consolidation to either full consolidation, forthose lease related investees in which the Company has control, or equity accounting, for those investees that are classifiedas joint ventures under IFRS 11. The two main impacts are:■ Full consolidation of asset specific entities that mainly comprise finance lease receivables (representing the net present
value of the future lease payments to be received) and non-recourse project debts.■ Derecognition of the individual line items from the statement of financial positions for those entities that are equity
accounted under IFRS, rolling up in the line item ’Investment in associates and joint ventures’.
Reconciliation of 2019 cash flow statement (Directional to IFRS)
Reported underDirectional
reporting
Impact of leaseaccountingtreatment
Impact ofconsolidation
methods
TotalConsolidated
IFRS
EBITDA 921 (18) 107 1,010
Adjustments for non-cash and investing items (71)1 21 87 37
Changes in operating assets and liabilities (414) (901) (121) (1,435)
Reimbursement finance lease assets (0) 196 2 197
Income taxes paid (35) - 7 (29)
Net cash flows from (used in) operating activities 401 (703) 81 (220)
Capital expenditures (764) 725 (0) (39)
Acquisition of shares in co-owned entities (125)2 - 125 (0)
Other investing activities 93 (0) 228 321
Net cash flows from (used in) investing activities (796) 725 353 282
Equity payment from/(repayment to) partners - - 82 82
Additions and repayments of borrowings and leaseliabilities 627 - (276) 351
Dividends paid to shareholders and non-controllinginterests (74) - (34) (108)
Interest paid (150) (23) (71) (244)
Share repurchase program (196) - - (196)
Payments to non-controlling interests for change inownership (0) - (149) (149)3
Net cash flows from (used in) financing activities 207 (23) (448) (264)
Net cash and cash equivalents as at 1 January 657 - 62 718
Net increase/(decrease) in net cash and cash equivalents (189) 0 (13) (202)
Foreign currency variations (10) (0) 1 (9)
Net cash and cash equivalents as at 31 December 458 - 48 5061 Includes a gain of US$90 million on the purchase of additional shares in Cidade de Paraty, Cidade de Ilhabela, Cidade de Marica, Cidade de Saquarema and
Capixaba.
2 Includes US$149 million for the purchase of shares in Cidade de Paraty, Cidade de Ilhabela, Cidade de Marica, Cidade de Saquarema and Capixaba net ofaquired cash.
3 Includes US$149 million for the purchase of shares in Cidade de Paraty, Cidade de Ilhabela, Cidade de Marica, Cidade de Saquarema and Capixaba.
Impact of lease accounting treatmentAt net cash level, the difference in lease accounting treatment is neutral. The impact of the different lease accountingtreatment under Directional reporting versus IFRS is limited to reclassifications between cash flow activities.
Capital expenditures (US$725 million) are reclassified from investing activities under Directional, to net cash flows fromoperating activity under IFRS, where finance lease contracts are accounted for as construction contracts. Furthermore theinterest expense which is capitalized under Directional as part of asset under construction (and therefore presented ininvesting activities) is reclassified to financing activities under IFRS.
The impact of the change of lease accounting treatment at EBITDA level is described in further detail in the earlierreconciliation of the Company’s income statement.

150 - SBM OFFSHORE ANNUAL REPORT 2019
Impact of consolidation methodsThe impact of the consolidation method on the cash flow statement is in line with the impact described for the statement offinancial position. The full consolidation of asset specific entities, mainly comprising finance lease receivables and the relatednon-recourse project debts, results in increased repayments of borrowings under IFRS versus Directional.
Reconciliation of 2018 statement of financial position (Directional to IFRS)
Reported underDirectional
reporting
Impact of leaseaccounting
treatment
Impact ofconsolidation
methodsTotal Consolidated
IFRS
ASSETS
Property, plant and equipment and Intangible assets 4,799 (3,699) 117 1,217
Investment in associates and joint ventures 10 (0) 411 421
Finance lease receivables 0 3,993 1,954 5,947
Other financial assets 356 (146) 102 312
Construction work-in-progress 43 652 (0) 695
Trade receivables and other assets 626 (0) 7 633
Derivative financial instruments 44 - 2 46
Cash and cash equivalents 657 - 62 718
Assets held for sale 2 (0) - 2
Total Assets 6,535 800 2,656 9,992
EQUITY AND LIABILITIES
Equity attributable to parent company 1,317 1,334 (17) 2,634
Non-controlling interests 0 (0) 978 978
Equity 1,317 1,334 961 3,612
Loans and borrowings 3,0101 - 1,527 4,536
Provisions 601 (145) 11 467
Trade payable and other liabilities 935 45 18 998
Deferred income 575 (433) 121 263
Derivative financial instruments 98 - 18 116
Total Equity and Liabilities 6,535 800 2,656 9,9921 Including US$2,821 million non-recourse debt and US$189 million lease liabilities.
4 FINANCIAL STATEMENTS 2019

SBM OFFSHORE ANNUAL REPORT 2019 - 151
Reconciliation of 2018 cash flow statement (Directional to IFRS)
Reported underDirectional
reporting
Impact of leaseaccounting
treatment
Impact ofconsolidation
methods
TotalConsolidated
IFRS
EBITDA 995 (335) 178 838
Adjustments for non-cash and investing items (126)1 218 10 102
Changes in operating assets and liabilities (209)2 (408) 102 (515)
Reimbursement finance lease assets (0) 7773 475 1,2524
Income taxes paid (35) (0) 6 (30)
Net cash flows from (used in) operating activities 625 252 770 1,647
Capital expenditures (332) 290 (6) (48)
Other investing activities 5245 (542) 5 (13)
Net cash flows from (used in) investing activities 192 (252) (1) (61)
Equity payment from/repayment to partners - - (165) (165)
Additions and repayments of borrowings and loans (783)6 - (485) (1,268)
Dividends paid to shareholders non-controlling interests (51) - (52) (103)
Interest paid (176) - (81) (257)
Payments to non-controlling interests for change inownership 0 - (5) (5)
Net cash flows from (used in) financing activities (1,010) - (787) (1,797)
Net cash and cash equivalents as at 1 January 878 - 79 957
Net increase/(decrease) in net cash and cash equivalents (193) - (18) (211)
Foreign currency variations (29) - 1 (28)
Net cash and cash equivalents as at 31 December 657 - 62 7181 Mainly includes net gain on disposal of Turritella (FPSO) for US$(217) million.
2 Includes US$(196) million payment for the settlement with Brazilian authorities and Petrobras and US$(80) million compensation paid to the partners in theinvestee owning the Turritella (FPSO) before acquisition by Shell.
3 Includes the Company 55% share in purchase price acquisition of Turritella (FPSO) by Shell for US$543 million reclassified from investing activities.
4 Includes US$987 million purchase price acquisition of Turritella (FPSO) by Shell.
5 Mainly includes the Company 55% share in the proceeds from the sale of Turritella (FPSO) for US$544 million.
6 Includes the Company 55% share in the redemption of Turritella (FPSO) project financing loan for US$(398) million.
Deferred income (Directional)
31 December 2019 31 December 2018
Within one year 98 100
Between 1 and 2 years 93 94
Between 2 and 5 years 188 241
More than 5 years 108 140
Balance at 31 December 486 575
The deferred income is mainly related to the revenue of those lease contracts which include a decreasing day-rate schedule.As income is shown in the income statement on a straight-line basis with reference to IFRS 16 ‘Leases’, the differencebetween the yearly straight-line revenue and the contractual day rates is included as deferred income. The deferral will bereleased through the income statement over the remaining duration of the relevant lease contracts.

152 - SBM OFFSHORE ANNUAL REPORT 2019
GEOGRAPHICAL INFORMATIONThe classification by country is determined by the final destination of the product for both revenues and non-current assets.
The revenue by country is analyzed as follows:
2019 geographical information (revenue by country and segment)
Directional IFRS
Lease andOperate Turnkey
Reportedsegments
Lease andOperate Turnkey
Reportedsegments
Brazil 759 42 801 1,050 117 1,167
Guyana 8 293 300 5 1,417 1,422
Norway - 246 246 - 246 246
Angola 178 8 186 0 13 13
Canada 135 1 136 135 1 136
The United States of America 41 71 112 41 71 112
Malaysia 85 18 103 0 22 22
China - 95 95 - 95 95
Equatorial Guinea 88 1 89 74 0 75
Virgin Islands - 13 13 - 13 13
Nigeria - 23 23 - 23 23
Other 22 46 67 22 46 67
Total revenue 1,315 856 2,171 1,327 2,064 3,391
2018 geographical information (revenue by country and segment)
Directional IFRS
Lease andOperate Turnkey
Reportedsegments
Lease andOperate Turnkey
Reportedsegments
Brazil 716 7 723 1,019 (0) 1,019
Angola 200 11 211 1 17 18
Canada 127 8 135 127 8 135
The United States of America 61 31 92 63 31 94
Norway - 88 88 - 88 88
Guyana - 88 88 - 616 616
Equatorial Guinea 87 0 87 76 - 76
Malaysia 77 8 86 1 14 15
Great Britain - 32 32 - 32 32
China - 31 31 - 31 31
Nigeria - 24 24 - 24 24
Congo 15 3 18 - 3 3
Australia - 12 12 - 12 12
Myanmar 11 0 11 12 0 12
Other 3 62 65 3 61 64
Total revenue 1,298 406 1,703 1,302 938 2,240
4 FINANCIAL STATEMENTS 2019

SBM OFFSHORE ANNUAL REPORT 2019 - 153
The non-current assets by country are analyzed as follows:
Geographical information (non-current assets by country)
31 December 2019 31 December 2018
IFRS DIR IFRS DIR
Brazil 6,050 3,656 6,343 3,311
Angola 242 323 412 435
Canada 182 182 245 245
The United States of America 87 65 130 109
Malaysia 93 61 128 84
Equatorial Guinea 106 160 121 181
Guyana 873 1,432 - 530
Monaco 66 67 78 78
Switzerland 49 50 - -
Other 142 170 184 174
Total 7,891 6,166 7,641 5,148
RELIANCE ON MAJOR CUSTOMERSUnder Directional, three customers each represent more than 10% of the consolidated revenue. Total revenue from thesethree major customers amounts to US$1,339 million (US$703 million, US$385 million and US$250 million, respectively). In2018 the revenue related to the two major customers was US$673 million (US$454 million and US$219 million, respectively).In 2019 and 2018, the revenue of these major customers was predominantly related to the Lease and Operate segment.
Under IFRS, two customers each represent more than 10% of the consolidated revenue. Total revenue from these majorcustomers amounts to US$2,393 million (US$1,450 million and US$943 million respectively). In 2018 three customersaccounted for more than 10% of the consolidated revenue (US$1,254 million), respectively for US$615 million, US$334 millionand US$305 million.
4.3.3 REVENUE
The Company’s revenue mainly originates from construction contracts and lease and operate contracts. Revenue originatingfrom construction contracts is presented in the Turnkey segment while revenue from lease and operate contracts ispresented in the Lease and Operate segment. Around 60% of the Company’s 2019 lease and operate revenue is made ofcharter rates related to lease contracts while the remaining amount originates from operating contracts.
The Company’s policy regarding revenue recognition is described in further detail in note 4.2.7 B. Critical Accounting Policies− (e) Revenue. For the disaggregation of total revenue by country and by segment, please refer to Geographical Informationunder note 4.3.2 Operating Segments and Directional Reporting.
The Company recognizes most of its revenue (more than 95%) over time. The Company’s construction contracts can last formultiple years depending on the type of product, scope and complexity of the project while the Company’s Lease andOperate contracts are generally multiple-year contracts. As a result, the Company has (partially) outstanding performanceobligations to its clients (unsatisfied performance obligations) at December 31, 2019. These unsatisfied performanceobligations relate to:■ Ongoing construction contracts, including the construction of vessels under finance lease that still need to be completed;■ Ongoing multiple-year operating contracts. Note that for the specific disclosure on unsatisfied performance obligations,
the lease component of the Lease and Operate contracts is excluded (this component being described in further detail innotes 4.3.13 Property, Plant and Equipment and 4.3.15 Finance Lease Receivables ).

154 - SBM OFFSHORE ANNUAL REPORT 2019
The following table presents the unsatisfied performance obligations as at December 31, 2019 (in billions of US$):
Unsatisfied performance obligations related to: 2019 2018
- constructions contracts including finance leases 3.1 1.1
- operating contracts 7.4 5.7
Total 10.5 6.8
The unsatisfied performance obligations for the committed construction contracts relate mostly to four major constructioncontracts (three FPSO's and one TMS). Revenue related to these construction contracts is expected to be recognized overthe coming three years in line with the construction progress on these projects.
The unsatisfied performance obligations for the operating contracts relate to i) the Company’s vessels leased to clientswhere the Company is the operator (both operating and finance lease contracts) and ii) one operating contract for operatingservices on a vessel that is owned by the client. The operating contracts end between 2021 and 2036. The Company willrecognize the unsatisfied performance obligation over this period in line with the work performed.
The Company can agree on various payment arrangements which generally reflect the progress of delivered performanceobligations. However, if the Company’s delivered performance obligation exceeds instalments invoiced to the client, a‘Construction work-in-progress‘ (contract asset) is recognized (see note 4.3.20 Construction Work-In-Progress ). If theinstalments invoiced to the client exceed the work performed, a contract liability is recognized (see note 4.3.27 Trade andOther Payables ).
As a result of various commercial discussions with clients, the Company recognized revenue amounting to US$16 million in2019 (2018: US$23 million) originating from performance obligations satisfied in previous periods.
Lease revenue recognized for leases where the Company is the lessor, for both operating and finance leases, relates to fixedand variable lease payments. Most of the Company's revenue from lease contracts is based on fixed day rates. However,some of the contracts consist of performance-based payments. These are variable lease payments that do not depend on anindex or a rate, and are excluded from the measurement of the lease payments receivable. The amount of performance-related lease payments for 2019 was US$24 million (2018: US$47 million).
4.3.4 OTHER OPERATING INCOME AND EXPENSE
2019 2018
Insurance claim income 5 37
Other operating income 2 3
Total other operating income 7 40
Settlement expenses (2) (45)
Impairment of goodwill - (25)
Restructuring expenses (0) (1)
Total other operating expense (2) (70)
Total 5 (30)
In 2019, the Company did not generate or incur any significant other operating income or expenses.
The previous year's insurance claim income corresponded to the Company’s share of the Yme insurance claim settlement,net of the claim-related costs.
2018 other operating expenses related mainly to the full impairment of the goodwill which was recognized upon theacquisition of Houston-based subsidiaries and the additional provision of US$43 million (BRL200 million) for settlement withthe Brazilian Federal Prosecutor’s Office (Ministério Público Federal – ’MPF’).
4 FINANCIAL STATEMENTS 2019

SBM OFFSHORE ANNUAL REPORT 2019 - 155
4.3.5 EXPENSES BY NATURE
The table below sets out expenses by nature for all items included in EBIT for the years 2019 and 2018:
Note 2019 2018
Expenses on construction contracts (1,319) (469)
Employee benefit expenses 4.3.6 (575) (519)
Vessels operating costs (312) (289)
Depreciation, amortization and impairment (268) (235)
Selling expenses (30) (22)
Other costs (153) (142)
Total expenses (2,657) (1,676)
Year-on-year, expenses on construction contracts increased mainly as a result of higher activity on Turnkey projects. The mainprojects responsible for the increase of expenses are: 2019 awards of FPSO Liza Unity and FPSO Sepetiba and the initiallimited scope awarded for the FPSO Prosperity project.
In 2019, depreciation, amortization and impairment was impacted by a US$16 million impairment of semi-submersibleproduction facility Thunder Hawk and a US$9 million impairment of Deep Panuke MOPU.
Expenses related to short-term leases and leases of low value assets amounted to US$6 million in 2019 (2018: US$4 million).
4.3.6 EMPLOYEE BENEFIT EXPENSES
Information with respect to employee benefits expenses are detailed as follows:
Note 2019 2018
Wages and salaries (329) (308)
Social security costs (54) (51)
Contributions to defined contribution plans (33) (31)
Contributions to defined benefit plans (3) (1)
Share-based payment cost (17) (17)
Contractors costs (88) (64)
Other employee benefits (51) (47)
Total employee benefits 4.3.5 (575) (519)
Contractors costs include expenses related to contractor staff not on the Company’s payroll. Other employee benefits mainlyinclude commuting, training, expatriate and other non-wage compensation costs.
DEFINED CONTRIBUTION PLANThe contributions to defined contribution plans includes the Company participation in the Merchant Navy Officers PensionFund (MNOPF). The MNOPF is a defined benefit multi-employer plan which is closed to new members. The fund is managedby a corporate Trustee, MNOPF Trustees Limited, and provides defined benefits for nearly 25,688 Merchant Navy Officersand their dependents out of which approximately 90 are SBM Offshore former employees.
The Trustee apportions its funding deficit between Participating Employers, based on the portions of the Fund’s liabilitieswhich were originally accrued by members in service with each employer. When the Trustee determines that contributionsare unlikely to be recovered from a Participating Employer, it can re-apportion the deficit contributions to other ParticipatingEmployers.
Entities participating in the MNOPF are exposed to the actuarial risk associated with the current and former employees ofother entities through exposure to their share of the deficit those other entities default. As there is only a notional allocationof assets and liabilities to any employer, the Company is accounting for the MNOPF in its financial statements as if it was adefined contribution scheme. There are no contributions to the plan agreed at present.

156 - SBM OFFSHORE ANNUAL REPORT 2019
DEFINED BENEFIT PLANS AND OTHER LONG-TERM BENEFITSThe employee benefits provisions recognized in accordance with accounting principles, relate to:
Note 2019 2018
Pension plan 6 5
Lump sums on retirement 7 6
Defined benefit plans 13 11
Long-service awards 14 13
Other long-term benefits 14 13
Employee benefits provisions 4.3.26 28 24
The defined benefit plan provision is partially funded as follows:
Benefit asset/liability included in the statement of financial position
31 December 2019 31 December 2018
Pension plansLump sums on
retirement Total Pension plansLump sums on
retirement Total
Defined benefit obligation 38 7 45 38 6 44
Fair value of plan assets (32) - (32) (32) - (32)
Benefit (asset)/liability 6 7 13 5 6 11
The main assumptions used in determining employee benefit obligations for the Company’s plans are shown below:
Main assumptions used in determining employee benefit obligations
in % 2019 2018
Discount rate 0.25 - 2.00 0.75 - 2.00
Inflation rate 1.00 - 1.75 1.00 - 1.75
Discount rate of return on plan assets during financial year 0.50 0.50
Future salary increases 1.00 - 3.00 1.00 - 3.00
Future pension increases - -
The overall expected rate of return on assets is determined on the market prices prevailing on that date, applicable to theperiod over which the obligation is to be settled.
REMUNERATION OF THE KEY MANAGEMENT PERSONNEL OF THE COMPANYThe remuneration of key management personnel of the Company paid during the year, including pension costs andperformance related Short-Term Incentives (STI), amounted to US$19 million (2018: US$23 million).
The performance-related part of the remuneration, comprising LTI, Value Creation Stake and STI components, was 60%(2018: 66%). The remuneration (including the Management Board’s remuneration which is euro denominated) decreased in2019 versus 2018, explained by the yearly portion of two LTI schemes being expensed in 2018 (as part of the RP 2015) versusonly one yearly portion (i.e. the last one under RP 2015) being expensed in 2019.
4 FINANCIAL STATEMENTS 2019

SBM OFFSHORE ANNUAL REPORT 2019 - 157
The total remuneration and associated costs of the Management Board and other key management personnel (members ofthe Executive Committee) is specified as follows:
Remuneration key management personnel
in thousands of US$ Base salary STI1Sharebased
compensation2 Other3 Pensions4Total
remuneration
Management Board Members5
2019 2,651 2,532 6,513 440 712 12,848
2018 2,657 3,245 9,472 460 719 16,553
Other key personnel6
2019 2,254 1,028 1,170 1,358 130 5,940
2018 2,482 1,478 808 1,353 151 6,272
Total 2019 4,905 3,560 7,683 1,798 842 18,788
Total 2018 5,139 4,723 10,280 1,813 870 22,8261 For the Management Board this represents the actual STI approved by the Supervisory Board, which has been accrued over the calendar year, payment of
which will be made in the following year.
2 This amount represents the period allocation to the calendar year of vesting costs of all unvested share-based incentives (notably Long Term Incentive shares(performance shares and Value Creation Stake under Remuneration Policy 2018), matching 'STI' shares, and RSUs COO and CFO), in accordance with IFRS2rules. The shares of the Value Creation Stake vest immediately.
3 Consisting of social charges, lease car expenses, and other allowances, a.o. in connection with the headquarter move, such as housing allowance, settling-inallowance.
4 This represents company contributions to pensions; in the absence of a qualifying pension scheme such contribution is paid gross, withholding wage tax atsource borne by the individuals.
5 For sharebased compensation, this includes the former CFO.
6 The definition of 'Other key personnel' has been amended to align with the Executive Committee, as disclosed on the Company's website.
The table above represents the total remuneration in US dollar, being the reporting currency of the Company.
The following table represents the movements during 2019 of all unvested shares (the total number of vested shares held by(former) Management Board members are reported in note 4.3.23 Equity Attributable to Shareholders ). Unvested LTI sharesin the columns Outstanding at the beginning and/or end of the year, are reported at the Target LTI numbers. The actualvesting hereof in the year is shown for the actual number as per the outcome of the performance criteria as per theRemuneration Policy. As at December 31, 2019 the following share-based incentives are outstanding:
Shared-based incentivesOutstanding at thebeginning of 2019 Granted Vested
Outstanding atthe end of 2019
Total 2019 574,062 - 326,373 247,689
SHORT-TERM INCENTIVE PROGRAM OF THE MANAGEMENT BOARDThe Short-Term Incentive Program is based upon the short-term operational performance, which includes three sets ofPerformance Indicators as noted below:■ Profitability;■ Growth;■ Health, Safety, Social and Environment (HSSE).
The Supervisory Board may adjust the outcome of the STI down by 10% (2018: 10% up as well as down). Any such adjustmentwill be explained in the Remuneration Report.
For 2019 (equal to 2018), the Supervisory Board concluded that the Company’s performance indicators had outcomesranging from below threshold to maximum. For the year 2019 a total of seven performance indicators were established(2018: seven). The Company's performance resulted in performance of 115% (2018: 146%) of salary for the CEO and 86%(2018: 106%) for the other Management Board members.

158 - SBM OFFSHORE ANNUAL REPORT 2019
VALUE CREATION STAKE AND LONG-TERM INCENTIVE SHARES OF THE MANAGEMENT BOARDUnder the Remuneration Policy 2018, the members of the Management Board are entitled to a Value Creation Stake, being anumber of shares determined by a four-year average share price (volume weighted). These shares vest immediately upon theaward date, and must be retained for five years from the vesting date, or − in the event of retirement or termination − twoyears after such event.
Number of issued shares 2019 2018
Total 2019 320,330 319,198
The number of shares granted is based upon 175% of the individual’s base salary and determined by the 4-year averagevolume-weighed share price (VWAP) over the years 2015 through 2018 (2018: 2014 through 2017), being EUR12.92 (2018:EUR12.34). The fair value of these shares upon issue was EUR12.67 (2018: EU13.295) , being the opening share price ofJanuary 2, 2019 (2018: January 2, 2018). During 2019 a board member was awarded an additional Value Creation Stake basedon the increase in the individual's base salary. As the increase in base salary was awarded on July 1, 2019 the VWAP over theperiod July 1, 2015 through June 30, 2019 was EUR13.57. The fair value of these shares upon issue was EUR16.85, being theopening share price of August 9, 2019, the day of the additional vesting.
Under the Remuneration Policy 2015, the Management Board was entitled to an LTI, built up of EPS and relative TSRperformance. For the LTI performance period 2017-2019, both the EPS performance indicator (weighting of 60%) and therelative TSR performance indicator (weighting of 40%) came in at the Maximum (2018: Maximum). The total vesting of the LTIgrant 2017 will result in 200% (2018: 193%) for the CEO, and 150% (2018: 150%) for each of the other Management Boardmembers.
RESTRICTED SHARE UNIT (RSU) PLANSThe number of shares granted under the RSU plan in 2019 was 601,200 (2018: 649,092), with the three year employmentperiod starting on January 1, 2019 (2018: January 1, 2018).
The annual RSU award is based on individual performance. The RSU plans themselves have no performance condition, only aservice condition, and will vest at the end of three years continuing service. The fair value is determined based on the shareprice at the grant dates, with an adjustment for the present value of the expected dividends during the vesting period.
2019 2018
Regular, relocation and skills retention RSU (share price as at January 2, 2019) € 11.80 € 14.72
RSU are valued at a share price at grant date, applying the Black & Scholes model. For regular, relocation and skills retentionRSU, an average annual forfeiture percentage (including expectations on for example the number of employees leaving theCompany before the vesting date of their respective RSU plan) of 2.5% is assumed.
MATCHING SHARESUnder the STI plans for the management and staff of the Company, 20% of the STI is or can be paid in shares. Subject to avesting period of three years, an identical number of shares (matching shares) will be issued to participants. Assumedprobability of vesting amounts to 95% for senior staff. The fair value is determined based on the share price at the grantdates, with an adjustment for the present value of the expected dividends during the vesting period.
The assumptions included in the calculation for the matching shares are:
2019 awards − Fair values
2019 2018
STI matching shares € 15.67 € 13.46
4 FINANCIAL STATEMENTS 2019

SBM OFFSHORE ANNUAL REPORT 2019 - 159
TOTAL SHARE-BASED PAYMENT COSTSThe amounts recognized in operating profit for all share-based payment transactions are summarized by taking into accountboth the provisional awards for the current year and the additional awards related to prior years. Total share-basedcompensation was almost stable versus 2018.
2019Performance shares and
RSU/Value Creation StakeMatching
shares Total
Instruments granted 13,211 2,050 15,262
Performance conditions 1,795 0 1,795
Total expenses 2019 15,007 2,050 17,057
2018Performance shares and
RSU/Value Creation StakeMatching
shares Total
Instruments granted 11,575 1,442 13,017
Performance conditions 4,281 0 4,281
Total expenses 2018 15,856 1,442 17,298
Rules of conduct with regard to inside information are in place to ensure compliance with the act on financial supervision. Forexample these rules forbid the exercise of options or other financial instruments during certain periods, more specificallywhen an employee is in possession of price sensitive information.
The movement in the outstanding number of shares which could potentially vest at a point in time under the Companyshare-based payment plans is illustrated in the following table.
in number of shares 2019 2018
Outstanding at 1 January 2,406,331 2,593,759
Granted 1,581,616 1,316,644
Vested (1,935,761) (1,309,005)
True-up at vesting (11,755) (100,477)
Cancelled (48,955) (94,589)
Total movements (414,855) (187,428)
Outstanding at 31 December 1,991,476 2,406,331
REMUNERATION OF THE SUPERVISORY BOARDThe remuneration of the Supervisory Board amounted to EUR778,000 (2018: EUR761,000) and can be specified as follows:
2019 2018
in thousands of EUR Basic remuneration Committees Total Basic remuneration Committees Total
Total 684 94 778 669 92 761
There are no share-based incentives granted to the members of the Supervisory Board. Nor are there any loans outstandingto the members of the Supervisory Board or guarantees given on behalf of members of the Supervisory Board.
NUMBER OF EMPLOYEESNumber of employees (by operating segment)
2019 2018
By operating segment: Average Year-end Average Year-end
Lease and Operate 1,596 1,656 1,524 1,535
Turnkey 1,620 1,783 1,443 1,456
Other 409 475 323 343
Total excluding employees working for JVs andassociates 3,624 3,914 3,289 3,334
Employees working for JVs and associates 635 525 814 745
Total 4,259 4,439 4,103 4,079

160 - SBM OFFSHORE ANNUAL REPORT 2019
Number of employees (by geographical area)
2019 2018
By geographical area: Average Year-end Average Year-end
the Netherlands 414 453 342 374
Worldwide 3,211 3,461 2,948 2,960
Total excluding employees working for JVs andassociates 3,624 3,914 3,289 3,334
Employees working for JVs and associates 635 525 814 745
Total 4,259 4,439 4,103 4,079
The figures exclude fleet personnel hired through crewing agencies as well as other agency and freelance staff for whomexpenses are included within other employee benefits. The increase year-on-year reflects the increased activity on Turnkeyprojects.
4.3.7 RESEARCH AND DEVELOPMENT EXPENSES
Research and development expenses amounted to US$24 million (2018: US$23 million) and mainly relate to the internalproject ’Digital FPSO’, Renewables and FPSO Product Line development costs and investments in laboratory facilities.
The amortization of development costs recognized in the statement of financial position is allocated to cost of sales whenthe developed technology is used through one or several projects. Otherwise, it is allocated to research and developmentexpenses.
4.3.8 NET IMPAIRMENT GAINS/(LOSSES) ON FINANCIAL AND CONTRACT ASSETS
Impairments of financial assets and contract assets which relate to credit risk as per IFRS 9 requirements are recognized in adedicated line of the income statement: ’Net impairment losses on financial and contract assets’. Impairments resulting fromcommercial disputes and other business decisions are not included in this dedicated line of the income statement.
During the year, the following gains/(losses) related to credit risks were recognized:2019 2018
Impairment losses
- Movement in loss allowance for trade receivables 3 (3)
- Movement in loss allowance for construction work-in-progress 0 -
- Movement in loss allowance for finance lease receivables 0 -
- Movement in loss allowance for other assets (1) 15
Net impairment gains/(losses) on financial and contract assets 3 13
During the year 2019, the Company recognized US$ 3 million net impairment gain on financial and contract assets. In 2018,the Company recognized a partial impairment reversal of funding loan provided to an Angolan joint venture. Thisimpairment reversal of US$15 million was recognized based on an updated cash flow forecast which included additional cashavailable at the level of the joint venture.
The limited amount of loss allowance recognized by the Company over 2019 reflects the creditworthiness of the Company'sclient portfolio.
4 FINANCIAL STATEMENTS 2019

SBM OFFSHORE ANNUAL REPORT 2019 - 161
4.3.9 NET FINANCING COSTS
2019 2018
Interest income on loans & receivables 10 10
Interest income on investments 10 19
Net foreign exchange gain 10 17
Other financial income 1 0
Financial income 31 46
Interest expenses on financial liabilities at amortized cost (247) (223)
Interest expenses on hedging derivatives (17) (36)
Interest expenses on lease liabilities (6) (7)
Interest addition to provisions (2) (14)
Net loss on financial instruments at fair value through profit and loss (0) (0)
Net cash flow hedges ineffectiveness (3) -
Net foreign exchange loss 0 (0)
Financial expenses (274) (279)
Net financing costs (243) (233)
The increase in net financing costs is mainly due to the net foreign exchange gain compared to 2018. The 2018 gain resultedfrom an index-linked term deposit protecting the Company against Kwanza devaluation for its cash held in Angola.
The decrease in interest income on investments comes mainly from the lower amounts of cash available in 2019 at corporatelevel.
In 2019 the settlement with the Brazilian authorities and Petrobras is now recognized as a financial liability and impactsinterest expenses on financial liabilities amortized at costs whereas it was a provision impacting interest addition toprovisions in 2018. Its unwinding effect is lower in 2019.
4.3.10 INCOME TAX EXPENSE
The relationship between the Company’s income tax expense and profit before income tax (referred to as ’effective tax rate’)can vary significantly from period to period considering, among other factors: (i) changes in the blend of income that is taxedbased on revenues versus profit; (ii) the different statutory tax rates in the location of the Company’s operations and (iii) thepossibility to recognize deferred tax assets on tax losses to the extent that suitable future taxable profits will be available.
Some of the taxes are withholding taxes (paid on revenues). The assessment of whether the withholding tax is in scope ofIAS 12 is judgemental; the Company performed this assessment in the past and some of the withholding taxes that theCompany pays in certain countries qualify as income taxes as it creates an income tax credit or it is considered as deemedprofit taxation.
Consequently, income tax expense does not change proportionally with profit before income taxes. Significant decreases inprofit before income tax typically lead to a higher effective tax rate, while significant increases in profit before income taxescan lead to a lower effective tax rate, subject to the other factors impacting income tax expense noted above. Additionally,where a deferred tax asset is not recognized on a loss carry forward, the effective tax rate is impacted by the unrecognizedtax loss.
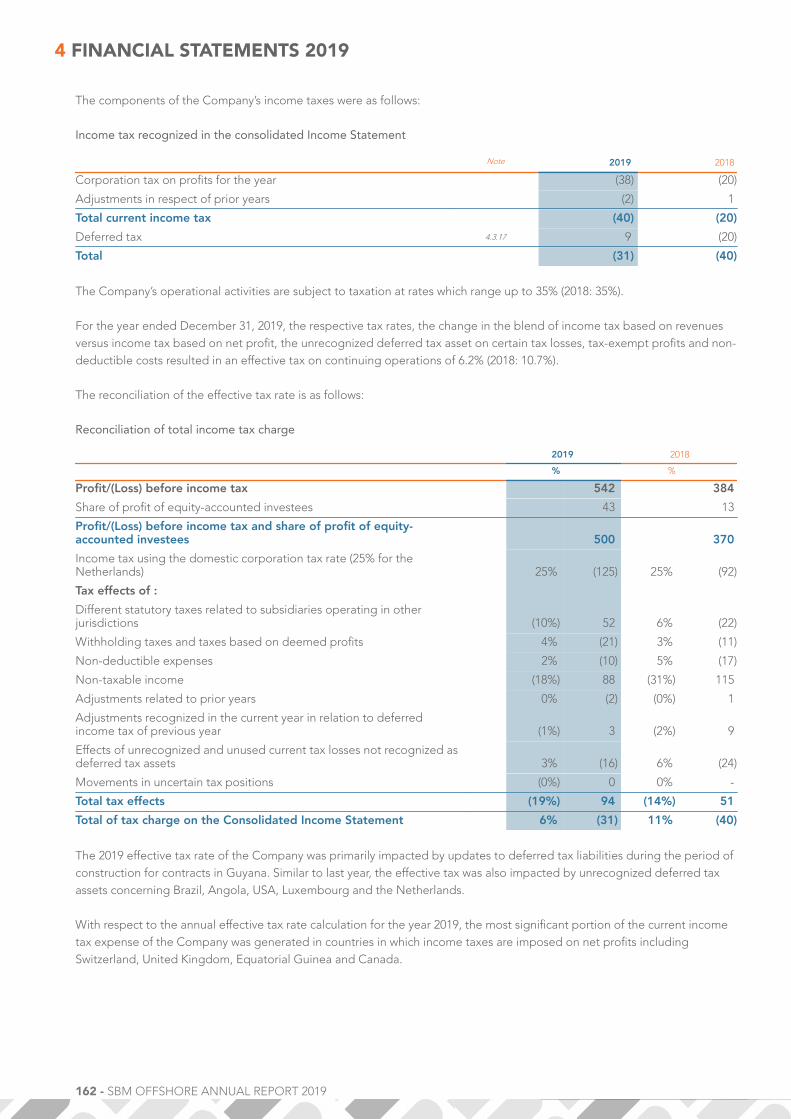
162 - SBM OFFSHORE ANNUAL REPORT 2019
The components of the Company’s income taxes were as follows:
Income tax recognized in the consolidated Income Statement
Note 2019 2018
Corporation tax on profits for the year (38) (20)
Adjustments in respect of prior years (2) 1
Total current income tax (40) (20)
Deferred tax 4.3.17 9 (20)
Total (31) (40)
The Company’s operational activities are subject to taxation at rates which range up to 35% (2018: 35%).
For the year ended December 31, 2019, the respective tax rates, the change in the blend of income tax based on revenuesversus income tax based on net profit, the unrecognized deferred tax asset on certain tax losses, tax-exempt profits and non-deductible costs resulted in an effective tax on continuing operations of 6.2% (2018: 10.7%).
The reconciliation of the effective tax rate is as follows:
Reconciliation of total income tax charge
2019 2018
% %
Profit/(Loss) before income tax 542 384
Share of profit of equity-accounted investees 43 13
Profit/(Loss) before income tax and share of profit of equity-accounted investees 500 370
Income tax using the domestic corporation tax rate (25% for theNetherlands) 25% (125) 25% (92)
Tax effects of :
Different statutory taxes related to subsidiaries operating in otherjurisdictions (10%) 52 6% (22)
Withholding taxes and taxes based on deemed profits 4% (21) 3% (11)
Non-deductible expenses 2% (10) 5% (17)
Non-taxable income (18%) 88 (31%) 115
Adjustments related to prior years 0% (2) (0%) 1
Adjustments recognized in the current year in relation to deferredincome tax of previous year (1%) 3 (2%) 9
Effects of unrecognized and unused current tax losses not recognized asdeferred tax assets 3% (16) 6% (24)
Movements in uncertain tax positions (0%) 0 0% -
Total tax effects (19%) 94 (14%) 51
Total of tax charge on the Consolidated Income Statement 6% (31) 11% (40)
The 2019 effective tax rate of the Company was primarily impacted by updates to deferred tax liabilities during the period ofconstruction for contracts in Guyana. Similar to last year, the effective tax was also impacted by unrecognized deferred taxassets concerning Brazil, Angola, USA, Luxembourg and the Netherlands.
With respect to the annual effective tax rate calculation for the year 2019, the most significant portion of the current incometax expense of the Company was generated in countries in which income taxes are imposed on net profits includingSwitzerland, United Kingdom, Equatorial Guinea and Canada.
4 FINANCIAL STATEMENTS 2019

SBM OFFSHORE ANNUAL REPORT 2019 - 163
Details of the withholding taxes and other taxes are as follows:
Withholding taxes per country
2019 2018
Withholding Tax and Overseas Taxes(per location) Withholding tax Withholding tax
Angola (1) -
Equatorial Guinea (0) -
Brazil (4) (4)
Guyana (15) (5)
Other1 (2) (2)
Total withholding and overseas taxes (21) (11)1 Mainly includes Nigeria and India
TAX RETURNS AND TAX CONTINGENCIESThe Company files federal and local tax returns in several jurisdictions throughout the world. Tax returns in the majorjurisdictions in which the Company operates are generally subject to examination for periods ranging from three to six years.Tax authorities in certain jurisdictions are examining tax returns and in some cases have issued assessments. The Companybelieves there is a sound basis for its tax positions in those jurisdictions. The Company provides for taxes that it considersprobable of being payable as a result of these audits and for which a reasonable estimate may be made. While the Companycannot predict or provide assurance as to the final outcome of these proceedings, the Company does not expect theultimate liability to have a material effect on its consolidated statement of financial position or results of operations, althoughit could have a material adverse effect on its consolidated cash flows.
Each year management completes a detailed review of uncertain tax positions across the Company and makes provisionsbased on the probability of the liability arising. The principal risks that arise for the Company are in respect of permanentestablishment, transfer pricing and other similar international tax issues. In common with other international groups, thedifference in alignment between the Company’s global operating model and the jurisdictional approach of tax authoritiesoften leads to uncertainty on tax positions.
As a result of the above, in the period, the Company recorded a net tax increase of US$42 million in respect of ongoing taxaudits and in respect of the Company’s review of its uncertain tax positions. This amount is primarily in relation to uncertaintax positions concerning various taxes other than corporate income tax. However it is possible that the ultimate resolution ofthe tax exposures could result in tax charges that are materially higher or lower than the amount provided.
The Company conducts operations through its various subsidiaries in a number of countries throughout the world. Eachcountry has its own tax regimes with varying nominal rates, deductions and tax attributes. From time to time, the Companymay identify changes to previously evaluated tax positions that could result in adjustments to its recorded assets andliabilities. Although the Company is unable to predict the outcome of these changes, it does not expect the effect, if any,resulting from these adjustments to have a material effect on its consolidated statement of financial position, results ofoperations or cash flows.
4.3.11 EARNINGS/(LOSS) PER SHARE
The basic earnings per share for the year amounted to US$1.84 (2018: US$1.04); the fully diluted earnings per shareamounted to US$1.84 (2018: US$1.04).
Basic earnings / (loss) per share amounts are calculated by dividing net profit / (loss) for the year attributable to shareholdersof the Company by the weighted average number of shares outstanding during the year.
Diluted earnings / (loss) per share amounts are calculated by dividing the net profit / loss attributable to shareholders of theCompany by the weighted average number of shares outstanding during the year plus the weighted average number ofshares that would be issued on the conversion of all the dilutive potential shares into ordinary shares.
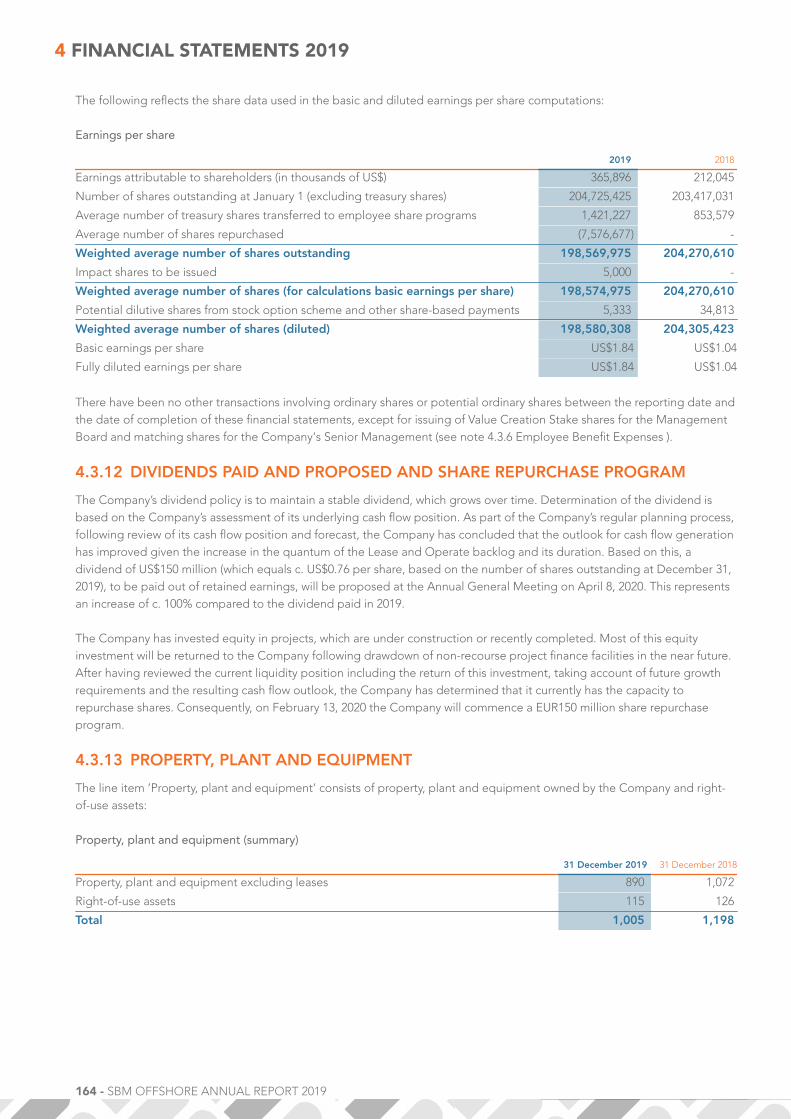
164 - SBM OFFSHORE ANNUAL REPORT 2019
The following reflects the share data used in the basic and diluted earnings per share computations:
Earnings per share
2019 2018
Earnings attributable to shareholders (in thousands of US$) 365,896 212,045
Number of shares outstanding at January 1 (excluding treasury shares) 204,725,425 203,417,031
Average number of treasury shares transferred to employee share programs 1,421,227 853,579
Average number of shares repurchased (7,576,677) -
Weighted average number of shares outstanding 198,569,975 204,270,610
Impact shares to be issued 5,000 -
Weighted average number of shares (for calculations basic earnings per share) 198,574,975 204,270,610
Potential dilutive shares from stock option scheme and other share-based payments 5,333 34,813
Weighted average number of shares (diluted) 198,580,308 204,305,423
Basic earnings per share US$1.84 US$1.04
Fully diluted earnings per share US$1.84 US$1.04
There have been no other transactions involving ordinary shares or potential ordinary shares between the reporting date andthe date of completion of these financial statements, except for issuing of Value Creation Stake shares for the ManagementBoard and matching shares for the Company's Senior Management (see note 4.3.6 Employee Benefit Expenses ).
4.3.12 DIVIDENDS PAID AND PROPOSED AND SHARE REPURCHASE PROGRAM
The Company’s dividend policy is to maintain a stable dividend, which grows over time. Determination of the dividend isbased on the Company’s assessment of its underlying cash flow position. As part of the Company’s regular planning process,following review of its cash flow position and forecast, the Company has concluded that the outlook for cash flow generationhas improved given the increase in the quantum of the Lease and Operate backlog and its duration. Based on this, adividend of US$150 million (which equals c. US$0.76 per share, based on the number of shares outstanding at December 31,2019), to be paid out of retained earnings, will be proposed at the Annual General Meeting on April 8, 2020. This representsan increase of c. 100% compared to the dividend paid in 2019.
The Company has invested equity in projects, which are under construction or recently completed. Most of this equityinvestment will be returned to the Company following drawdown of non-recourse project finance facilities in the near future.After having reviewed the current liquidity position including the return of this investment, taking account of future growthrequirements and the resulting cash flow outlook, the Company has determined that it currently has the capacity torepurchase shares. Consequently, on February 13, 2020 the Company will commence a EUR150 million share repurchaseprogram.
4.3.13 PROPERTY, PLANT AND EQUIPMENT
The line item ’Property, plant and equipment’ consists of property, plant and equipment owned by the Company and right-of-use assets:
Property, plant and equipment (summary)
31 December 2019 31 December 2018
Property, plant and equipment excluding leases 890 1,072
Right-of-use assets 115 126
Total 1,005 1,198
4 FINANCIAL STATEMENTS 2019

SBM OFFSHORE ANNUAL REPORT 2019 - 165
PROPERTY, PLANT AND EQUIPMENT OWNED BY THE COMPANYThe movement of the property, plant and equipment during the year 2019 is summarized as follows:
2019
Land andbuildings
Vessels andfloating
equipmentOther fixed
assetsAssets underconstruction Total
Cost 58 3,266 75 11 3,410
Accumulated depreciation and impairment (24) (2,262) (52) - (2,337)
Book value at 1 January 34 1,004 23 11 1,072
Additions - 34 14 12 59
Depreciation (5) (203) (7) - (214)
(Impairment)/impairment reversal - (25) - - (25)
Foreign currency variations (1) - (0) (0) (1)
Other movements - - (0) (1) (1)
Total movements (5) (194) 6 10 (183)
Cost 56 3,299 82 22 3,459
Accumulated depreciation and impairment (28) (2,490) (52) - (2,570)
Book value at 31 December 29 809 30 22 890
2018
Land andbuildings
Vessels andfloating
equipmentOther fixed
assetsAssets underconstruction Total
Cost 61 3,255 68 19 3,402
Accumulated depreciation and impairment (20) (2,084) (55) - (2,160)
Book value at 1 January 41 1,170 13 19 1,243
Additions 0 17 8 9 34
Depreciation (5) (203) (5) - (212)
(Impairment)/impairment reversal - 11 - - 11
Foreign currency variations (2) - (1) (0) (3)
Other movements - 8 9 (17) 0
Total movements (7) (166) 11 (8) (170)
Cost 58 3,266 75 11 3,410
Accumulated depreciation and impairment (24) (2,262) (52) - (2,337)
Book value at 31 December 34 1,004 23 11 1,072
During the 2019 period the following main events occurred:■ Additions to property, plant and equipment include the capitalization of dry dock and other capital expenditures related
to the IT infrastructure upgrade project.■ Impairment of Thunder Hawk semi-submersible production facility in the US Gulf of Mexico. Thunder Hawk is the only
facility in the Company lease fleet portfolio for which revenues are linked to volumes produced. During the routine reviewin the first half of 2019, the Company received an update of the long term production profile from the current reserves.Based on this, the revised estimates of future deliverable volumes, and associated cash flows, will be insufficient to sustainthe asset’s current book value. During the period, an updated value-in-use calculation was prepared using the revisedproduction profile and a discount rate of 6%. As a result, an impairment charge of US$16 million has been accounted forin the 2019 half year results. If the revenue, which is based on production, varies by +/- 5% the impairment would vary by+/- US$4 million respectively. If the discount rate varies by +/- 1% the impairment would vary by +/- US$2 millionrespectively.
■ An impairment assessment of Deep Panuke MOPU was performed following a reassessment of the towing and scrappingcosts. This resulted in adverse cash flows related to the unit and in consequence an impairment of US$9 million. Theimpairment assessment was performed assuming that the client will continue with the lease until the end of the contract.The impact of an early termination is disclosed below in the section 'Operating leases as a lessor'. If the discount rateused in the impairment test would vary by +/- 1%, the impairment would change by -/+ US$2 million.

166 - SBM OFFSHORE ANNUAL REPORT 2019
■ US$214 million of annual depreciation charges.
Property, plant and equipment at year-end comprises of:■ Three (2018: three) integrated floating production, storage and offloading systems (FPSOs) (namely FPSO Espirito Santo,
FPSO Capixaba and FPSO Cidade de Anchieta) each consisting of a converted tanker, a processing plant and onemooring system. These three FPSOs are leased to third parties under an operating lease contract.
■ One second-hand tanker (2018: one).■ One semi-submersible production platform, the Thunder Hawk (2018: one), leased to third parties under an operating
lease contract.■ One MOPU facility, the Deep Panuke (2018: one), leased to a third party under an operating lease contract.
The depreciation charge for the semi-submersible production facility Thunder Hawk is calculated based on its futureanticipated economic benefits, resulting in a depreciation plan based on the unit of production method. All other property,plant and equipment is depreciated on a straight-line basis.
Company-owned property, plant and equipment with a carrying amount of US$479 million (2018: US$569 million) has beenpledged as security for liabilities, mainly for external financing.
No interest has been capitalized during the financial year as part of the additions to property, plant and equipment (2018:nil).
RIGHT-OF-USE ASSETSThe Company leases buildings, cars and an installation vessel. The most significant lease contract relates to the installationvessel SBM Installer. The charter contract is for a fixed period of twelve years with the option to acquire the vessel during thecharter period. The other significant contracts relate to the lease of offices. The contract periods of the Company’s officerentals vary between two to fourteen years and most of the contracts include extension options between three to fifteenyears. The extension options are taken into account in the measurement of lease liabilities when the Company is reasonablycertain to exercise these options. The lease agreements do not impose any covenants.
The movement of the right-of-use assets during the year 2019 is summarized as follows:
2019
Buildings
Vessels andfloating
equipment Other fixed assets Total
Book value at 1 January 61 63 1 126
Additions 13 - 1 13
Depreciation (14) (8) (1) (23)
Foreign currency variations (1) - (0) (1)
Total movements (2) (8) (0) (11)
Cost 84 71 3 158
Accumulated depreciation and impairment (25) (16) (1) (43)
Book value at 31 December 59 55 1 115
4 FINANCIAL STATEMENTS 2019

SBM OFFSHORE ANNUAL REPORT 2019 - 167
2018
Buildings
Vessels andfloating
equipment Other fixed assets Total
Book value at 1 January 73 71 2 146
Additions 3 - 0 3
Depreciation (12) (8) (0) (20)
Foreign currency variations (3) - (0) (3)
Total movements (12) (8) (1) (21)
Cost 73 71 2 146
Accumulated depreciation and impairment (12) (8) (1) (20)
Book value at 31 December 61 63 1 126
OPERATING LEASES AS A LESSORThe category ’Vessels and floating equipment’ mainly relates to facilities leased to third parties under various operating leaseagreements which terminate between 2021 and 2030. Leased facilities included in the ’Vessels and floating equipment’amount to:
Leased facilities included in the vessels and floating equipment
31 December 2019 31 December 2018
Cost 3,257 3,230
Accumulated depreciation and impairment (2,481) (2,256)
Book value at 31 December 777 974
The nominal values of the future expected bareboat receipts (undiscounted lease payments) in respect of those operatinglease contracts are:
Nominal values of the future expected bareboat receipts
31 December 2019 31 December 2018
Within 1 year 319 320
2 years 297 324
3 years 134 302
4 years 121 141
5 years 94 126
After 5 years 508 607
Total 1,473 1,820
A number of agreements have extension options, which have not been included in the above table.
Purchase and termination options in operating lease contractsThe operating lease contracts of FPSO Espirito Santo and MOPU Deep Panuke, where the Company is the lessor, includecall options for the client to (i) purchase the underlying asset or (ii) terminate the contract early without obtaining theunderlying asset. The operating lease contract of semi-submersible Thunder Hawk includes a call option for the client topurchase the underlying asset. The exercise of any of the purchase options would have resulted in a gain for the Company asof December 31, 2019. The exercise of the early termination option for FPSO Espirito Santo as of December 31, 2019 wouldhave resulted in a gain for the Company, while exercising the early termination option for MOPU Deep Panuke as ofDecember 31, 2019 would have resulted in a non-material loss.

168 - SBM OFFSHORE ANNUAL REPORT 2019
4.3.14 INTANGIBLE ASSETS
2019
Developmentcosts Goodwill Software Patents Total
Cost 27 - 13 19 60
Accumulated amortization and impairment (12) - (9) (19) (41)
Book value at 1 January 15 - 4 0 19
Additions 7 - 2 - 9
Amortization (4) - (2) - (6)
Other movements - - 1 - 1
Total movements 3 - 2 - 4
Cost 34 - 16 19 70
Accumulated amortization and impairment (16) - (11) (19) (46)
Book value at 31 December 18 - 5 0 23
2018
Developmentcosts Goodwill Software Patents Total
Cost 23 25 12 19 79
Accumulated amortization and impairment (9) - (8) (19) (36)
Book value at 1 January 14 25 3 - 42
Additions 4 - 2 - 6
Amortization (4) - (1) - (5)
(Impairment)/impairment reversal - (25) - - (25)
Foreign currency variations - - (0) - (0)
Other movements - - (0) - (0)
Total movements 1 (25) 0 - (23)
Cost 27 25 13 19 84
Accumulated amortization and impairment (12) (25) (9) (19) (65)
Book value at 31 December 15 - 4 0 19
In 2019, the Company did not recognize any impairment related to intangible assets. In 2018, the Company has fullyimpaired its goodwill related to Houston based subsidiaries at amount of US$25 million.
Amortization of development costs is included in ’Research and development expenses’ in the income statement in 2019 forUS$ (4) million (2018: US$4 million).
4 FINANCIAL STATEMENTS 2019
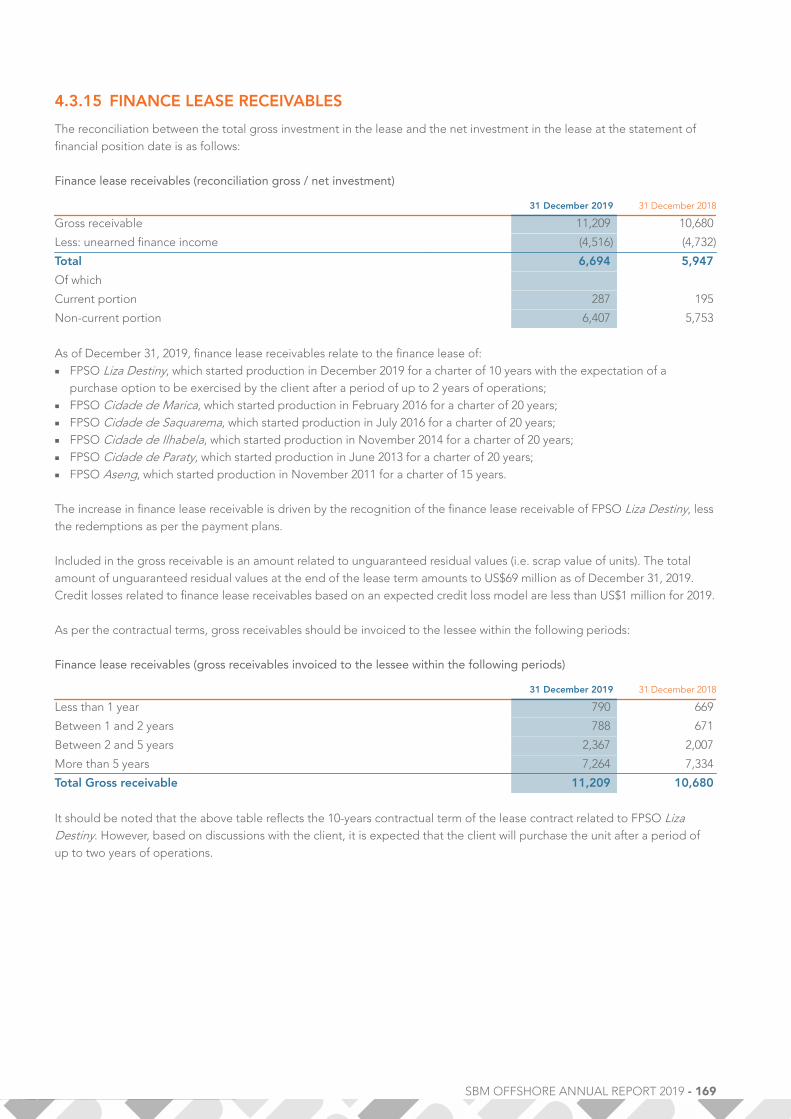
SBM OFFSHORE ANNUAL REPORT 2019 - 169
4.3.15 FINANCE LEASE RECEIVABLES
The reconciliation between the total gross investment in the lease and the net investment in the lease at the statement offinancial position date is as follows:
Finance lease receivables (reconciliation gross / net investment)
31 December 2019 31 December 2018
Gross receivable 11,209 10,680
Less: unearned finance income (4,516) (4,732)
Total 6,694 5,947
Of which
Current portion 287 195
Non-current portion 6,407 5,753
As of December 31, 2019, finance lease receivables relate to the finance lease of:■ FPSO Liza Destiny, which started production in December 2019 for a charter of 10 years with the expectation of a
purchase option to be exercised by the client after a period of up to 2 years of operations;■ FPSO Cidade de Marica, which started production in February 2016 for a charter of 20 years;■ FPSO Cidade de Saquarema, which started production in July 2016 for a charter of 20 years;■ FPSO Cidade de Ilhabela, which started production in November 2014 for a charter of 20 years;■ FPSO Cidade de Paraty, which started production in June 2013 for a charter of 20 years;■ FPSO Aseng, which started production in November 2011 for a charter of 15 years.
The increase in finance lease receivable is driven by the recognition of the finance lease receivable of FPSO Liza Destiny, lessthe redemptions as per the payment plans.
Included in the gross receivable is an amount related to unguaranteed residual values (i.e. scrap value of units). The totalamount of unguaranteed residual values at the end of the lease term amounts to US$69 million as of December 31, 2019.Credit losses related to finance lease receivables based on an expected credit loss model are less than US$1 million for 2019.
As per the contractual terms, gross receivables should be invoiced to the lessee within the following periods:
Finance lease receivables (gross receivables invoiced to the lessee within the following periods)
31 December 2019 31 December 2018
Less than 1 year 790 669
Between 1 and 2 years 788 671
Between 2 and 5 years 2,367 2,007
More than 5 years 7,264 7,334
Total Gross receivable 11,209 10,680
It should be noted that the above table reflects the 10-years contractual term of the lease contract related to FPSO LizaDestiny. However, based on discussions with the client, it is expected that the client will purchase the unit after a period ofup to two years of operations.

170 - SBM OFFSHORE ANNUAL REPORT 2019
The following part of the net investment in the lease is included as part of the current assets within the statement of financialposition:
Finance lease receivables (part of the net investment included as part of the current assets)
31 December 2019 31 December 2018
Gross receivable 790 669
Less: unearned finance income (503) (474)
Current portion of finance lease receivable 287 195
The maximum exposure to credit risk at the reporting date is the carrying amount of the finance lease receivables taking intoaccount the risk of recoverability. The Company performed an assessment which concluded that the credit risk for thesereceivables has not increased significantly since the initial recognition. The Company does not hold any collateral as security.
Purchase and termination optionsThe finance lease contracts of FPSO Aseng and FPSO Liza Destiny, where the Company is the lessor, include call options forthe client to purchase the underlying asset or to terminate the contract early. The exercise of the purchase option as ofDecember 31, 2019 would have resulted in a gain or a near break-even result for the Company. The exercise of the earlytermination option, in which case the Company would retain the vessels, would have resulted in a gain for FPSO Liza Destinyand break even for FPSO Aseng.
The finance lease contract of FPSO Liza Unity (under construction as per December 31, 2019) also contains options for theclient to purchase the underlying asset or terminate the contract early. These options are exercisable at any time startingfrom the delivery date of the vessel.
4.3.16 OTHER FINANCIAL ASSETS
The breakdown of the non-current portion of other financial assets is as follows:
31 December 2019 31 December 2018
Non-current portion of other receivables 76 79
Sublease receivable 4 -
Non-current portion of loans to joint ventures and associates 25 133
Total 104 211
The decrease in the non-current portion of loans to joint ventures and associates is mainly explained by the repayment ofloans from Sonasing Xikomba Ltd., the entity that owns the FPSO N'Goma, to the Company following optimization of thenon-recourse project loan in 2019 (see note 4.3.1 Financial Highlights ).
The maximum exposure to credit risk at the reporting date is the carrying amount of the interest-bearing loans taking intoaccount the risk of recoverability (for expected credit losses refer to note 4.3.8 Net Impairment Gains/(Losses) on Financialand Contract Assets and note 4.3.29 Financial Instruments − Fair Values and Risk Management ). The Company does nothold any collateral as security.
LOANS TO JOINT VENTURES AND ASSOCIATESNotes 31 December 2019 31 December 2018
Current portion of loans to joint ventures and associates 4.3.19 30 101
Non-current portion of loans to joint ventures and associates 25 133
Total 4.3.33 55 234
The decrease in the current portion of loans to joint ventures and associates is also linked to the repayment from jointventures to the Company following their external refinancing.
The carrying amount of funding loans is reduced by an amount of US$168 million as of December 31, 2019 (December 31,2018: US$168 million) due to cumulative losses in two joint ventures.
4 FINANCIAL STATEMENTS 2019

SBM OFFSHORE ANNUAL REPORT 2019 - 171
The maximum exposure to credit risk at the reporting date is the carrying amount of the loans to joint ventures andassociates, taking into account the risk of recoverability. The Company does not hold any collateral as security.
4.3.17 DEFERRED TAX ASSETS AND LIABILITIES
The deferred tax assets and liabilities and associated offsets are summarized as follows:
Deferred tax positions (summary)
31 December 2019 31 December 2018
Assets Liabilities Net Assets Liabilities Net
Property, plant and equipment - 16 (16) - 26 (26)
Tax losses 9 - 9 11 - 11
Other 12 7 6 15 10 5
Book value at 31 December 22 23 (1) 26 36 (10)
Movements in net deferred tax positions
2019 2018
Note Net Net
Deferred tax at 1 January (10) 11
Deferred tax recognized in the income statement 4.3.10 9 (20)
Foreign currency variations (0) (1)
Total movements 9 (21)
Deferred tax at 31 December (1) (10)
Expected realization and settlement of deferred tax positions is within 9 years. The current portion of the net deferred taxposition (liability) as of December 31, 2019 amounts to US$2 million. The deferred tax losses are expected to be recoveredbased on the anticipated profit in the applicable jurisdiction. The Company has US$16 million (2018: US$24 million) ofdeferred tax assets unrecognized in 2019 due to current tax losses not valued. The term in which these unrecognizeddeferred tax assets could be settled depends on the respective tax jurisdiction and ranges from seven years to an unlimitedperiod of time.
The non-current portion of deferred tax assets amounts to US$8 million (2018: US$17 million). On a cumulative basis a totalamount of US$197 million at the end of 2019 (2018: US$193 million) corresponds to deferred tax assets unrecognized ontemporary differences, unused tax losses and tax credits.
Expiry date on deferred tax assets unrecognized on temporary differences, unused tax losses and tax credits:
2019 2018
Within one year 1,657 9,837
More than a year but less than 5 years 18,527 7,768
More than 5 years but less than 10 years 8,555 19,033
More than 10 years but less than 20 years 92,181 91,259
Unlimited period of time 75,883 65,478
Total 196,803 193,375

172 - SBM OFFSHORE ANNUAL REPORT 2019
Deferred tax assets per location are as follows:
Deferred tax positions per location
31 December 2019 31 December 2018
Assets Liabilities Net Assets Liabilities Net
Canada 12 16 (4) 14 26 (12)
Guyana - 7 (7) - 10 (10)
Monaco 5 - 5 5 - 5
Switzerland 1 - 1 3 - 3
the Netherlands 3 - 3 3 - 3
Brazil 1 - 1 1 - 1
Other 0 - 0 - - -
Book value at 31 December 22 23 (1) 26 36 (10)
4.3.18 INVENTORIES
31 December 2019 31 December 2018
Materials and consumables 6 3
Goods for resale 2 2
MPF under construction 0 96
Total 8 101
Multi-purpose hulls under construction relate to the ongoing EPC phase of Fast4Ward® new-build hulls. The Fast4Ward®
hulls remain in inventory until they are allocated to a specific FPSO contract. The Company has five multi-purpose hulls as ofDecember 31, 2019 out of which three have been transferred to construction work-in-progress upon the award of the leaseand operate contracts for FPSO Liza Unity and FPSO Sepetiba and the awarded initial limited scope for the FPSO Prosperityproject. Two multipurpose hulls have not yet been allocated to a project and are therefore accounted for under inventory atDecember 31, 2019. Following the award of the respective contracts in December 2019 (see note 4.3.1 Financial Highlights ),progress on these two hulls has been limited up to December 31, 2019.
4.3.19 TRADE AND OTHER RECEIVABLES
Trade and other receivables (summary)
Note 31 December 2019 31 December 2018
Trade debtors 128 175
Other accrued income 140 121
Prepayments 115 87
Accrued income in respect of delivered orders 51 13
Other receivables 73 81
Taxes and social security 37 18
Current portion of loan to joint ventures and associates 4.3.16 30 101
Total 573 596
The decrease in 'Trade debtors' of US$47 million is mainly thanks to improved cash collection and an offsetting agreementbetween the Company and some of the joint ventures signed in 2019.
The increase in 'Prepayments' of US$28 million is a result of advance payments in relation to the construction of a new multi-purpose floater hull which has been allocated to the FPSO Sepetiba.
The increase in accrued income in respect of delivered orders of US$38 million is a result of the completion of the FPSO LizaDestiny project during the current year.
4 FINANCIAL STATEMENTS 2019

SBM OFFSHORE ANNUAL REPORT 2019 - 173
The carrying amounts of the Company’s trade debtors are distributed in the following countries:
Trade debtors (countries where Company’s trade debtors are distributed)
31 December 2019 31 December 2018
Angola 25 64
Brazil 16 31
Guyana 23 6
Equatorial Guinea 13 12
The United States of America 6 10
Malaysia 11 9
Australia 3 6
China 5 14
Other 28 22
Total 128 175
The trade debtors balance is the nominal value less an allowance for estimated impairment losses as follows:
Trade debtors (trade debtors balance)
31 December 2019 31 December 2018
Nominal amount 130 188
Impairment allowance (2) (12)
Total 128 175
The allowance for impairment represents the Company’s estimate of losses in respect of trade debtors. The allowancerelated to credit risk for significant trade debtors is built on specific expected loss components that relate to individualexposures. Furthermore, the Company uses historical credit loss experience as well as forward-looking information todetermine a 1% expected credit loss rate on individually insignificant trade receivable balances. The creation and release forimpaired trade debtors due to credit risk are reported in the line item ’Net impairment losses on financial and contractassets’ of the consolidated income statement. Amounts charged to the allowance account are generally written off whenthere is no expectation of recovery.
The ageing of the nominal amounts of the trade debtors are:
Trade debtors (ageing of the nominal amounts of the trade debtors)
31 December 2019 31 December 2018
Nominal Impairment Nominal Impairment
Not past due 67 (1) 108 (1)
Past due 0-30 days 27 (0) 23 (2)
Past due 31-120 days 22 (0) 23 (1)
Past due 121- 365 days 6 (0) 21 (4)
More than one year 8 (1) 12 (4)
Total 130 (2) 188 (12)
Not past due are those receivables for which either the contractual or ’normal’ payment date has not yet elapsed. Past dueare those amounts for which either the contractual or the ’normal’ payment date has passed. Amounts that are past due butnot impaired relate to a number of Company joint ventures and independent customers for whom there is no recent historyof default, or the receivable amount can be offset by amounts included in current liabilities.
For the closing balance and movements during the year of allowances on trade receivables, please refer to note 4.3.29Financial Instruments − Fair Values and Risk Management.

174 - SBM OFFSHORE ANNUAL REPORT 2019
4.3.20 CONSTRUCTION WORK-IN-PROGRESS
The details regarding construction work-in-progress are included in the following table:
Note 31 December 2019 31 December 2018
Recognized revenue 1,508 1,733
Instalments invoiced (577) (1,181)
Reclassification to contract liability 4.3.27 42 143
Total construction work-in-progress 973 695
The significant portion of the outstanding balance of construction work-in-progress as of December 31, 2019 relates to theFPSO Liza Unity and FPSO Sepetiba finance lease projects since the Company will receive most of the payments for theconstruction only during the lease period through bareboat charter payments.
Costs to fulfill the contract of FPSO Liza Unity, recognized in 2018 as part of construction work-in-progress for US$13 million,were reclassified to project costs during 2019 after formally being awarded the FPSO Liza Unity contract in May 2019. TheCompany has not recognized any amortization or impairment related to this vessel in 2019 (2018: nil).
Contract liabilities of US$42 million comprises the amounts of those individual contracts for which the total instalmentsinvoiced exceed the total revenue recognized. Contract liabilities are reclassified to other current liabilities (see note 4.3.27Trade and Other Payables ).
Regarding information about expected credit losses recognized for construction work-in-progress, refer to note 4.3.29Financial Instruments − Fair Values and Risk Management.
4.3.21 DERIVATIVE FINANCIAL INSTRUMENTS
Further information about the financial risk management objectives and policies, the fair value measurement and hedgeaccounting of financial derivative instruments is included in note 4.3.29 Financial Instruments − Fair Values and RiskManagement.
In the ordinary course of business and in accordance with its hedging policies as of December 31, 2019, the Company heldmultiple forward exchange contracts designated as hedges of expected future transactions for which the Company has firmcommitments or forecasts. Furthermore, the Company held several interest rate swap contracts designated as hedges ofinterest rate financing exposure. The most important floating rate is the US$ 3-month LIBOR. Details of interest percentagesof the long-term debt are included in note 4.3.24 Borrowings and Lease Liabilities.
The fair value of the derivative financial instruments included in the statement of financial position is summarized as follows:
Derivative financial instruments
31 December 2019 31 December 2018
Assets Liabilities Net Assets Liabilities Net
Interest rate swaps cash flow hedge 8 166 (159) 6 42 (36)
Forward currency contracts cash flow hedge 14 48 (35) 18 41 (23)
Forward currency contracts fair valuethrough profit and loss 22 27 (5) 22 32 (11)
Total 43 241 (198) 46 116 (70)
Non-current portion 5 156 (150) 12 41 (29)
Current portion 37 85 (48) 34 75 (41)
The ineffective portion recognized in the income statement (please refer to note 4.3.9 Net Financing Costs ) arises from cashflow hedges which totaled less than a US$3 million loss in 2019 (2018: US$0 million loss). The maximum exposure to creditrisk at the reporting date is the fair value of the derivative assets in the statement of financial position.
4 FINANCIAL STATEMENTS 2019

SBM OFFSHORE ANNUAL REPORT 2019 - 175
4.3.22 NET CASH AND CASH EQUIVALENT
31 December 2019 31 December 2018
Cash and bank balances 82 81
Short-term investments 424 637
Cash and cash equivalent 506 718
Net cash and cash equivalent 506 718
The cash and cash equivalents dedicated to debt and interest payments (restricted) amounted to US$188 million as perDecember 31, 2019 (2018: US$188 million). Short-term investment deposits are made for varying periods of up to one year,usually less than three months, depending on the immediate cash requirements of the Company and earn interest at therespective short-term deposit rates.
The cash and cash equivalents held in countries with restrictions on currency outflow (Angola, Brazil, Equatorial Guinea,Ghana and Nigeria) amounts to US$42 million (2018: US$50 million). These restrictions do not limit the liquidity of the cashbalances.
Further disclosure about the fair value measurement is included in note 4.3.29 Financial Instruments − Fair Values and RiskManagement.
4.3.23 EQUITY ATTRIBUTABLE TO SHAREHOLDERS
For a consolidated overview of changes in equity reference is made to the Consolidated Statement of Changes in Equity.
ISSUED SHARE CAPITALThe authorized share capital of the Company is two hundred million euros (EUR200,000,000). This share capital is divided intofour hundred million (400,000,000) ordinary shares with a nominal value of twenty-five eurocents (EUR0.25) each and fourhundred million (400,000,000) protective preference shares, with a nominal value of twenty-five eurocents (EUR0.25) each. Theprotective preference shares can be issued as a protective measure as described in note 3.5 Corporate Governance.
During the financial year the movements in the outstanding number of ordinary shares are as follows:
number of shares 2019 2018
Outstanding at 1 January 205,671,305 205,671,305
Treasury shares cancelled (7,000,000) -
Outstanding 31 December 198,671,305 205,671,305
TREASURY SHARESThe Company completed its share repurchase program under authorization granted by the AGM of the Company held onApril 11, 2018. In the period between February 14, 2019 and May 20, 2019 a total number of 10,422,259 shares totalingEUR175 million were repurchased. As a result, the Company decided to cancel 7,000,000 shares in 2019.
A total number of 2,444,192 treasury shares are still reported in the outstanding ordinary shares as at December 31, 2019 andheld predominantly for employee share programs. During 2019, a total of 1,923,947 shares were transferred to employeeshare programs (including the balance of the treasury shares from the 2016 share repurchase).
Within equity, an amount of US$1,206 million (2018: US$1,116 million) should be treated as legal reserve (please refer to note4.5.5 Shareholders' Equity ).
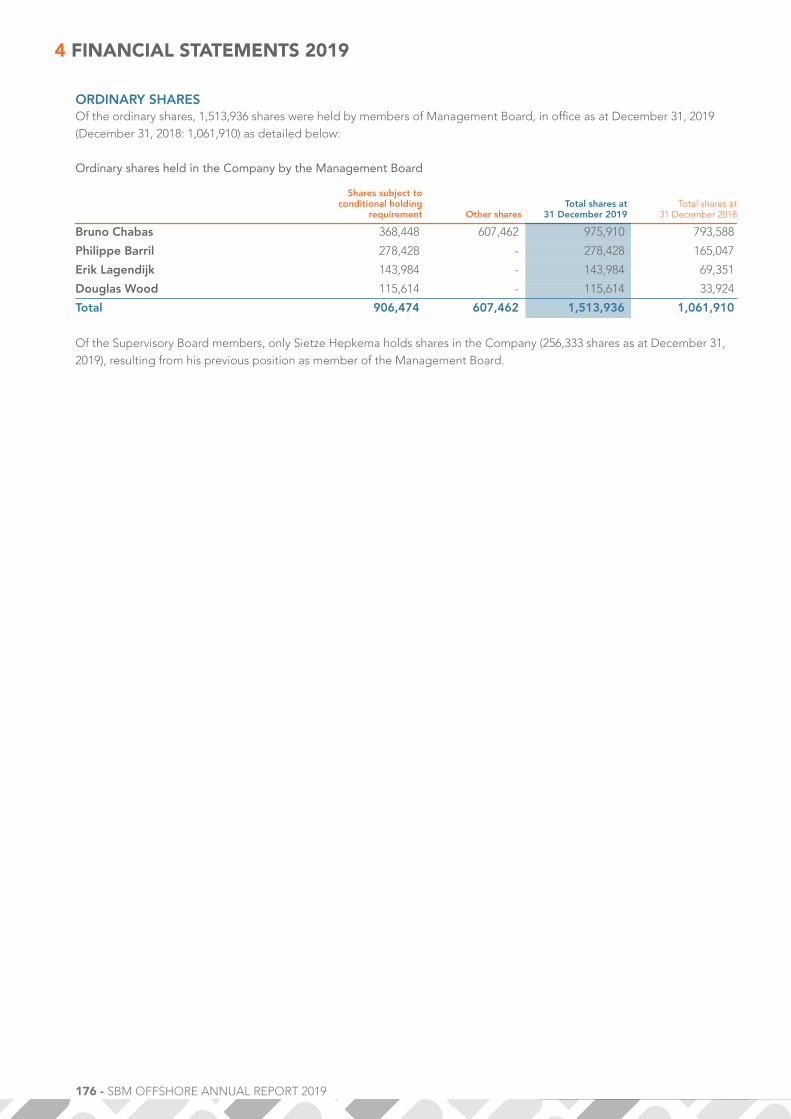
176 - SBM OFFSHORE ANNUAL REPORT 2019
ORDINARY SHARESOf the ordinary shares, 1,513,936 shares were held by members of Management Board, in office as at December 31, 2019(December 31, 2018: 1,061,910) as detailed below:
Ordinary shares held in the Company by the Management Board
Shares subject toconditional holding
requirement Other sharesTotal shares at
31 December 2019Total shares at
31 December 2018
Bruno Chabas 368,448 607,462 975,910 793,588
Philippe Barril 278,428 - 278,428 165,047
Erik Lagendijk 143,984 - 143,984 69,351
Douglas Wood 115,614 - 115,614 33,924
Total 906,474 607,462 1,513,936 1,061,910
Of the Supervisory Board members, only Sietze Hepkema holds shares in the Company (256,333 shares as at December 31,2019), resulting from his previous position as member of the Management Board.
4 FINANCIAL STATEMENTS 2019

SBM OFFSHORE ANNUAL REPORT 2019 - 177
OTHER RESERVESThe other reserves comprises the hedging reserve, actuarial gains/losses, the foreign currency translation reserve and IFRS 2reserves. The movement and breakdown of the other reserves can be stated as follows (all amounts are expressed net ofdeferred taxes):
Hedgingreserve
Forwardcurrency
contracts
Hedgingreserve
Interest rateswaps
Actuarialgain/(loss) on
definedbenefit
provisions
Foreigncurrency
translationreserve
IFRS 2Reserves
Total otherreserves
Balance at 1 January 2018 51 (77) 6 (62) 18 (65)
Cash flow hedges
Change in fair value (63) 39 - - - (23)
Transfer to financial income and expenses 0 5 - - - 5
Transfer to construction contracts and property,plant and equipment (14) - - - - (14)
Transfer to operating profit and loss 7 - - - - 7
IFRS 2 share based payments
IFRS 2 vesting costs for the year - - - - 17 17
IFRS 2 vested share based payments - - - - (14) (14)
Actuarial gain/(loss) on defined benefitprovision
Change in defined benefit provision due tochanges in actuarial assumptions - - (4) - - (4)
Foreign currency variations
Foreign currency variations - - - (17) - (17)
Balance at 31 December 2018 (19) (33) 2 (79) 21 (108)
Cash flow hedges
Change in fair value 17 (79) - - - (62)
Transfer to financial income and expenses 3 3 - - - 6
Transfer to construction contracts and property,plant and equipment (5) - - - - (5)
Transfer to operating profit and loss (34) - - - - (34)
IFRS 2 share based payments
IFRS 2 vesting costs for the year - - - - 17 17
IFRS 2 vested share based payments - - - - (21) (21)
Actuarial gain/(loss) on defined benefitprovision
Change in defined benefit provision due tochanges in actuarial assumptions - - 1 - - 1
Foreign currency variations
Foreign currency variations - - - (22) - (22)
Mergers and acquisitions - (10) - - (10)
Balance at 31 December 2019 (38) (119) 3 (101) 17 (238)
The hedging reserve consists of the effective portion of cash flow hedging instruments related to hedged transactions thathave not yet occurred, net of deferred taxes. The decreased marked-to-market value of interest rate swaps mainly arises fromdecreasing market interest rates whereas the increased marked-to-market value of forward currency contracts is mainlydriven by the appreciation of the US$ exchange rate versus the hedged currencies.
Actuarial gain/(loss) on defined benefits provisions includes the impact of the remeasurement of defined benefit provisions.
The foreign currency translation reserve is used to record exchange differences arising from the translation of the financialstatements of foreign subsidiaries.

178 - SBM OFFSHORE ANNUAL REPORT 2019
4.3.24 BORROWINGS AND LEASE LIABILITIES
The line item ’Borrowings and lease liabilities’ in the consolidated statement of financial position is further detailed asfollows:
Borrowings and lease liabilities (summary)
31 December 2019 31 December 2018
Borrowings 4,168 3,856
Lease liabilities 141 161
Total Non-current portion of Borrowings and lease liabilities 4,309 4,017
Borrowings 580 492
Lease liabilities 32 27
Total Current portion of Borrowings and lease liabilities 612 519
BORROWINGSThe movement in borrowings is as follows:
2019 2018
Non-current portion 3,856 4,347
Add: current portion 492 1,223
Remaining principal at 1 January 4,348 5,571
Additions 1,399 1
Redemptions (1,011) (1,241)
Transaction and amortized costs 13 17
Total movements 401 (1,223)
Remaining principal at 31 December 4,749 4,348
Less: Current portion (580) (492)
Non-current portion 4,168 3,856
Transaction and amortized costs 81 94
Remaining principal at 31 December (excluding transaction andamortized costs) 4,830 4,442
Less: Current portion (596) (508)
Non-current portion 4,234 3,934
The Company has no ’off-balance sheet’ financing through special purpose entities. All long-term debt is included in theconsolidated statement of financial position.
The additions of the total borrowings of US$1,399 million relates mainly to drawdowns on project finance facilities for FPSOLiza Destiny and FPSO Liza Unity and drawdowns made on the Company's RCF, the latter being fully redeemed as ofDecember 31, 2019.
Further disclosures about the fair value measurement are included in note 4.3.29 Financial Instruments − Fair Values and RiskManagement.
4 FINANCIAL STATEMENTS 2019

SBM OFFSHORE ANNUAL REPORT 2019 - 179
The borrowings, excluding transaction costs and amortized costs amounting to US$81 million (2018: US$94 million), have thefollowing forecast repayment schedule:
31 December 2019 31 December 2018
Within one year 596 508
Between 1 and 2 years 941 535
Between 2 and 5 years 1,599 1,567
More than 5 years 1,695 1,831
Balance at 31 December 4,830 4,442
The borrowings by entity are as follows:
Loans and borrowings per entity
Net book value at31 December 2019
Net book value at31 December 2018
Entity nameProject name ornature of loan
%Ownership % Interest1 Maturity
Non-current Current Total
Non-current Current Total
US$ Project Financefacilities drawn:
SBM Deep PanukeSA
MOPU DeepPanuke 100.00 3.50% 15-Dec-21 70 67 137 137 65 202
Tupi Nordeste SarlFPSO Cidadede Paraty 70.50 5.30% 15-Jun-23 311 110 421 421 103 524
Guara Norte SarlFPSO Cidadede Ilhabela 75.00 5.10% 15-Oct-24 555 122 677 677 115 792
SBM Baleia Azul SarlFPSO Cidadede Anchieta 100.00 5.50% 15-Sep-27 274 33 307 307 31 339
Alfa Lula Alto SarlFPSO Cidadede Marica 61.00 5.30% 15-Dec-29 1,016 103 1,119 1,119 97 1,216
Beta Lula Central SarlFPSO Cidadede Saquarema 61.00 4.10% 15-Jun-30 1,109 86 1,195 1,195 81 1,276
US$ Guaranteedproject financefacilities drawn:
Guyana Deep WaterUK Limited
FPSO LizaDestiny 100.00
Libor +1.65% 31-Oct-29 504 60 565 - - -
Guyana Deep WaterII UK Limited FPSO Liza Unity 100.00 3.50% 30-Dec-21 331 - 331 - - -
Revolving creditfacility:
SBM OffshoreFinance Sarl
CorporateFacility 100.00 Variable 16-Dec-21 (2) (1) (3) - (1) (1)
Other:
Other 100.00 1 (0) 1 1 (0) 1
Net book value ofloans andborrowings 4,168 580 4,749 3,856 492 4,3481 % interest per annum on the remaining loan balance.
The ’Other debt’ mainly includes loans received from partners in subsidiaries.
For the project finance facilities, the respective vessels are mortgaged to the banks or to note holders.
The Company has available borrowing facilities being the (i) undrawn revolving credit facility (RCF), (ii) the undrawn portionsof FPSO Liza Destiny and FPSO Liza Unity project facilities and (iii) short-term credit lines.

180 - SBM OFFSHORE ANNUAL REPORT 2019
The expiry date of the undrawn facilities and unused credit lines are:
Expiry date of the undrawn facilities and unused credit lines
2019 2018
Expiring within one year 249 100
Expiring beyond one year 1,964 1,720
Total 2,213 1,820
The revolving credit facility (RCF) in place as of December 31, 2019 has a maturity date of February 13, 2024. The US$1 billionfacility was secured with a selected group of 11 core relationship banks and has uncommitted option to increase the RCF byan additional US$500 million. The RCF allows the Company to finance EPC activities / working capital, bridge any long-termfinancing needs, and/or finance general corporate purposes, when needed, in the following proportions:■ EPC activities / working capital – 100% of the facility;■ General Corporate Purposes – up to 50% of the facility;■ Refinancing project debt – 100% of the facility but limited to a period of 18 months
The pricing of the RCF is based on LIBOR and a margin adjusted in accordance with the applicable leverage ratio rangingfrom a minimum level of 0.50% p.a. to a maximum of 1.50% p.a. The margin also includes a Sustainability AdjustmentMechanism whereby the margin may increase or decrease by 0.05% based on the absolute change in the Companyperformance as measured and reported by Sustainalytics1. The Company's performance in 2019 allows for a 0.05% decreasein margin for 2020.
On February 5, 2020, the Company has exercised a one-year extension option with regards to the RCF, refer to note 4.3.35Events After End of Reporting Period for further details.
COVENANTSThe following key financial covenants apply to the RCF as agreed with the respective lenders on February 13, 2019, andunless stated otherwise, relate to the Company’s consolidated financial statements:■ Solvency: Consolidated IFRS Tangible Net Worth divided by Consolidated IFRS Tangible Assets must be > 25%;■ Interest Cover Ratio: Consolidated Directional Underlying EBITDA divided by Consolidated Directional Net Interest
Payable must be > 4.0.
The Lease Backlog Cover Ratio (LBCR) is used to determine the maximum funding availability under the RCF. The maximumfunding availability is determined by calculating the net present value of the future contracted net cash after debt service ofa defined portfolio of operational offshore units in the backlog. The maximum theoretical amount available under the RCF isthen determined by dividing this net present value by 1.5. The actual availability under the RCF will be the lower of thisamount and the then applicable Facility Amount. As at December 31, 2019 headroom on actual availability under the RCFexceeded US$0.5 billion.
For the purpose of covenants calculations, the following simplified definitions apply:■ IFRS Tangible Net Worth: Total equity (including non-controlling interests) of the Company in accordance with IFRS,
excluding the marked-to-market valuation of currency and interest derivatives undertaken for hedging purposes by theCompany through other comprehensive income, dividends declared, value of intangible assets and deferred taxes.
■ Consolidated IFRS Tangible Assets: The Company total assets (excluding intangible assets) in accordance with the IFRSconsolidated statement of financial position less the marked-to-market valuation of currency and interest derivativesundertaken for hedging purposes by the Company through other comprehensive income.
■ Consolidated Directional Underlying EBITDA: Consolidated profit of the Company adjusted for net interest payable,tax and depreciation of assets and impairments, any exceptional or extraordinary items, and by adding back (i) theannualized production EBITDA for units which started operations during the financial year, and (ii) the acquisitionannualized EBITDA for units acquired during the financial year.
■ Consolidated Directional Net Interest Payable: All interest and other financing charges paid up, payable (other thancapitalized interest during a construction period and interest paid or payable between wholly owned members of theCompany) or incurred by the Company less all interest and other financing charges received or receivable by theCompany, as per Directional reporting.
1 Sustainalytics is a provider of Environmental, Social and Governance and Corporate Governance research and ratings.
4 FINANCIAL STATEMENTS 2019
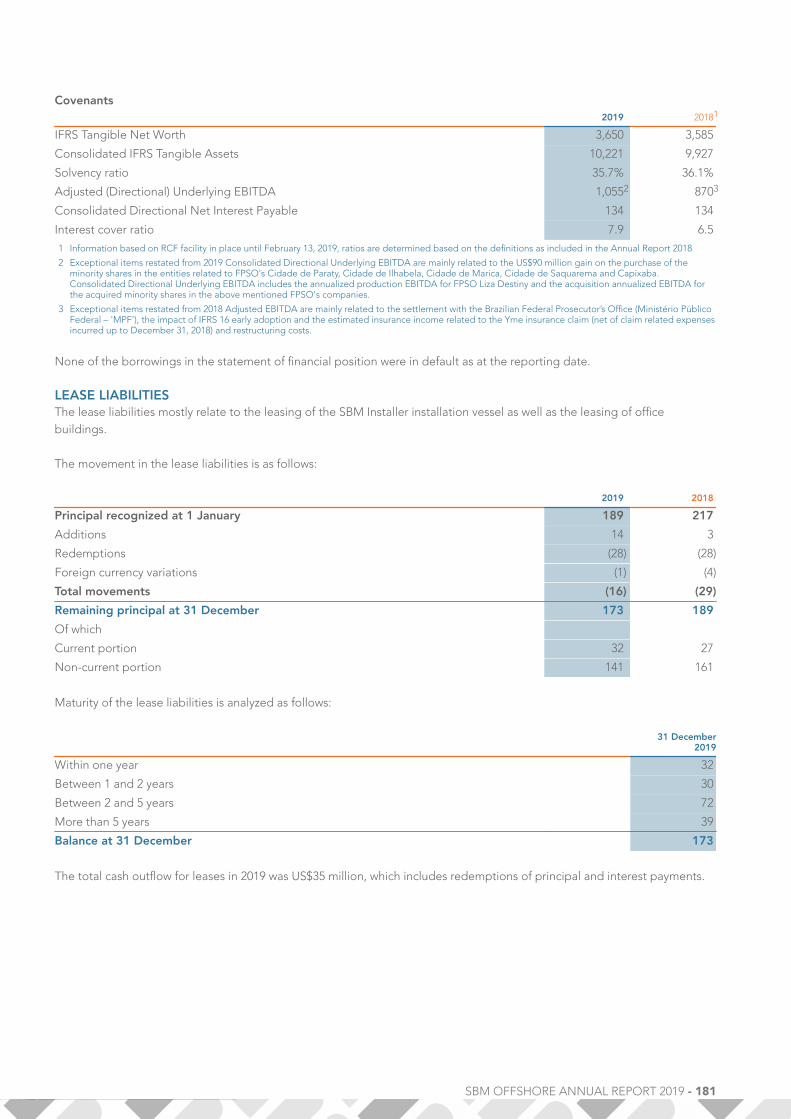
SBM OFFSHORE ANNUAL REPORT 2019 - 181
Covenants2019 20181
IFRS Tangible Net Worth 3,650 3,585
Consolidated IFRS Tangible Assets 10,221 9,927
Solvency ratio 35.7% 36.1%
Adjusted (Directional) Underlying EBITDA 1,0552 8703
Consolidated Directional Net Interest Payable 134 134
Interest cover ratio 7.9 6.5
1 Information based on RCF facility in place until February 13, 2019, ratios are determined based on the definitions as included in the Annual Report 2018
2 Exceptional items restated from 2019 Consolidated Directional Underlying EBITDA are mainly related to the US$90 million gain on the purchase of theminority shares in the entities related to FPSO's Cidade de Paraty, Cidade de Ilhabela, Cidade de Marica, Cidade de Saquarema and Capixaba.Consolidated Directional Underlying EBITDA includes the annualized production EBITDA for FPSO Liza Destiny and the acquisition annualized EBITDA forthe acquired minority shares in the above mentioned FPSO's companies.
3 Exceptional items restated from 2018 Adjusted EBITDA are mainly related to the settlement with the Brazilian Federal Prosecutor’s Office (Ministério PúblicoFederal – 'MPF'), the impact of IFRS 16 early adoption and the estimated insurance income related to the Yme insurance claim (net of claim related expensesincurred up to December 31, 2018) and restructuring costs.
None of the borrowings in the statement of financial position were in default as at the reporting date.
LEASE LIABILITIESThe lease liabilities mostly relate to the leasing of the SBM Installer installation vessel as well as the leasing of officebuildings.
The movement in the lease liabilities is as follows:
2019 2018
Principal recognized at 1 January 189 217
Additions 14 3
Redemptions (28) (28)
Foreign currency variations (1) (4)
Total movements (16) (29)
Remaining principal at 31 December 173 189
Of which
Current portion 32 27
Non-current portion 141 161
Maturity of the lease liabilities is analyzed as follows:
31 December2019
Within one year 32
Between 1 and 2 years 30
Between 2 and 5 years 72
More than 5 years 39
Balance at 31 December 173
The total cash outflow for leases in 2019 was US$35 million, which includes redemptions of principal and interest payments.
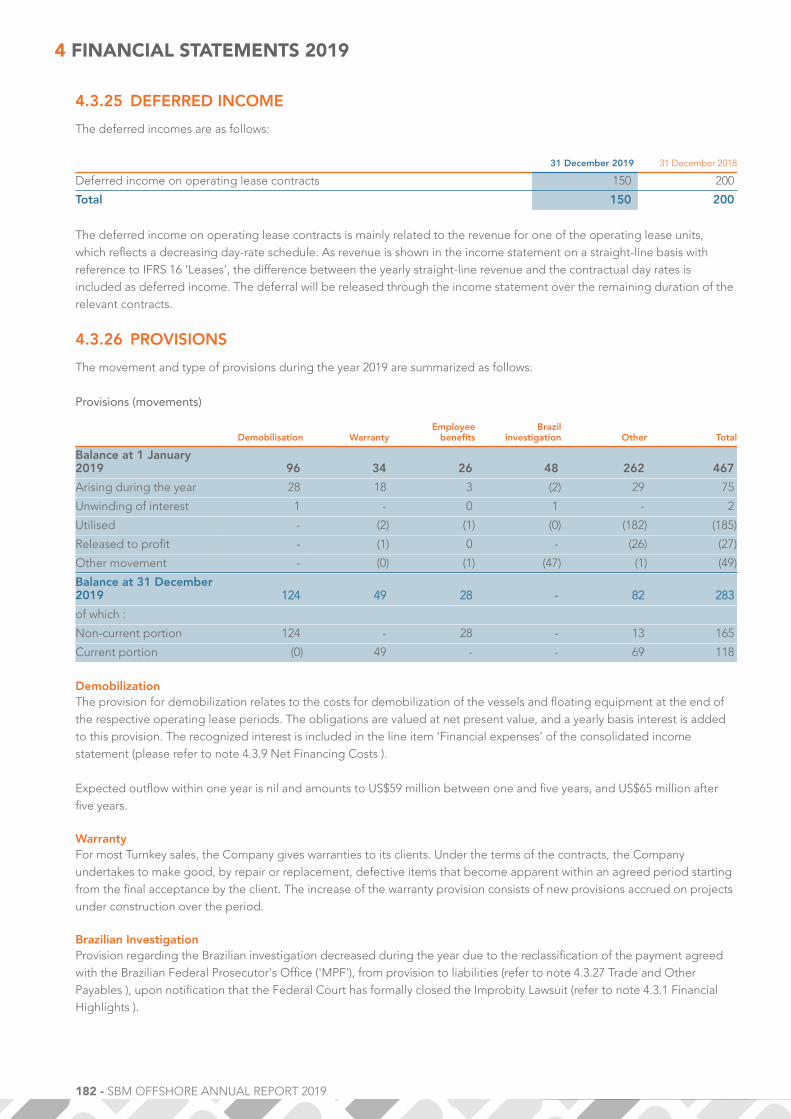
182 - SBM OFFSHORE ANNUAL REPORT 2019
4.3.25 DEFERRED INCOME
The deferred incomes are as follows:
31 December 2019 31 December 2018
Deferred income on operating lease contracts 150 200
Total 150 200
The deferred income on operating lease contracts is mainly related to the revenue for one of the operating lease units,which reflects a decreasing day-rate schedule. As revenue is shown in the income statement on a straight-line basis withreference to IFRS 16 ’Leases’, the difference between the yearly straight-line revenue and the contractual day rates isincluded as deferred income. The deferral will be released through the income statement over the remaining duration of therelevant contracts.
4.3.26 PROVISIONS
The movement and type of provisions during the year 2019 are summarized as follows:
Provisions (movements)
Demobilisation WarrantyEmployeebenefits
Brazilinvestigation Other Total
Balance at 1 January2019 96 34 26 48 262 467
Arising during the year 28 18 3 (2) 29 75
Unwinding of interest 1 - 0 1 - 2
Utilised - (2) (1) (0) (182) (185)
Released to profit - (1) 0 - (26) (27)
Other movement - (0) (1) (47) (1) (49)
Balance at 31 December2019 124 49 28 - 82 283
of which :
Non-current portion 124 - 28 - 13 165
Current portion (0) 49 - - 69 118
DemobilizationThe provision for demobilization relates to the costs for demobilization of the vessels and floating equipment at the end ofthe respective operating lease periods. The obligations are valued at net present value, and a yearly basis interest is addedto this provision. The recognized interest is included in the line item ’Financial expenses’ of the consolidated incomestatement (please refer to note 4.3.9 Net Financing Costs ).
Expected outflow within one year is nil and amounts to US$59 million between one and five years, and US$65 million afterfive years.
WarrantyFor most Turnkey sales, the Company gives warranties to its clients. Under the terms of the contracts, the Companyundertakes to make good, by repair or replacement, defective items that become apparent within an agreed period startingfrom the final acceptance by the client. The increase of the warranty provision consists of new provisions accrued on projectsunder construction over the period.
Brazilian InvestigationProvision regarding the Brazilian investigation decreased during the year due to the reclassification of the payment agreedwith the Brazilian Federal Prosecutor's Office ('MPF'), from provision to liabilities (refer to note 4.3.27 Trade and OtherPayables ), upon notification that the Federal Court has formally closed the Improbity Lawsuit (refer to note 4.3.1 FinancialHighlights ).
4 FINANCIAL STATEMENTS 2019

SBM OFFSHORE ANNUAL REPORT 2019 - 183
OtherThe decrease of 'Other' provisions during the period mainly relates to the insurance income shared with Repsol in relation tothe Yme insurance claim. During the first half of the year 2019, the Company paid the full amount due to Repsol.
The remainder of 'Other' provisions mainly relate to commercial claims, regulatory fines related to operations and localcontent penalty.
4.3.27 TRADE AND OTHER PAYABLES
Trade and other payables (summary)
Notes 31 December 2019 31 December 2018
Trade payables 143 140
Accruals on projects 288 256
Accruals regarding delivered orders 110 39
Other payables 68 69
Contract liability 4.3.20 42 143
Pension taxation 10 8
Taxation and social security costs 103 55
Current portion of deferred income 57 62
Other non-trade payables 75 127
Total 4.3.29 896 899
The total trade and other payables remained stable, despite the higher construction activities during 2019, due to the timingof payments made to suppliers.
Accruals regarding delivered orders increased in 2019 mainly due to the recognition of accruals related to the finalization ofFPSO Liza Destiny following project completion in December 2019.
Decrease of the contract liability relates to progress of the work performed by the Company mainly in relation to TurretMooring System EPC projects. The Company recognized revenue of US$125 million during the period, which was included inthe contract liability as per December 31, 2018.
Payables related to taxation and social security costs increased mainly due to the Company's updated assessment ofuncertain tax positions related mainly to various taxes other than corporate income tax.
Current portion of deferred income is mainly related to the revenue of one operating lease contract which includes adecreasing day-rate schedule. As income is shown in the income statement on a straight-line basis with reference to IFRS 16‘Leases’, the difference between the yearly straight-line revenue and the contractual day rates is included as deferredincome. The deferral is released through the income statement over the remaining duration of the relevant operating leasecontract.
Other non-trade payables include mostly interest payable, dividends payable and the short-term portion of the outstandingpayments related to the Leniency Agreement. The long-term portion of the liability for outstanding payments related to theLeniency Agreement and the settlement with Brazilian Federal Prosecutor’s Office (Ministério PúblicoFederal – 'MPF') ispresented in the line item 'Other non-current liabilities' in the Company's statement of financial position.
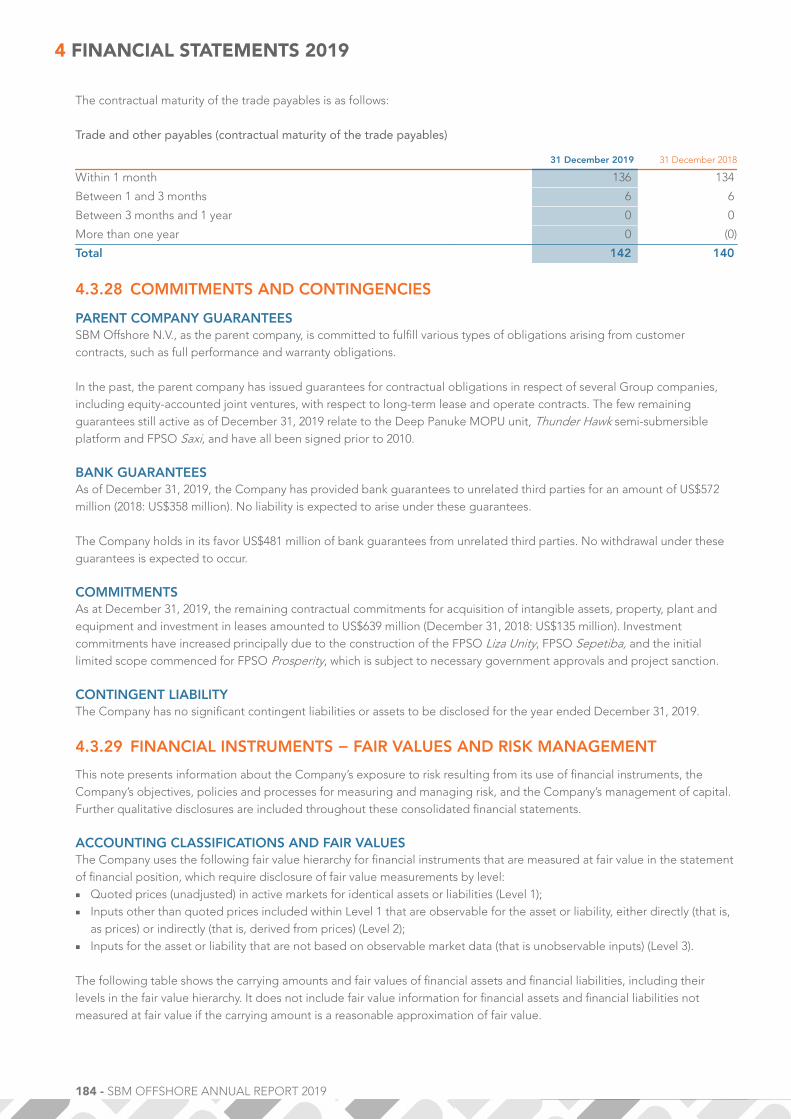
184 - SBM OFFSHORE ANNUAL REPORT 2019
The contractual maturity of the trade payables is as follows:
Trade and other payables (contractual maturity of the trade payables)
31 December 2019 31 December 2018
Within 1 month 136 134
Between 1 and 3 months 6 6
Between 3 months and 1 year 0 0
More than one year 0 (0)
Total 142 140
4.3.28 COMMITMENTS AND CONTINGENCIES
PARENT COMPANY GUARANTEESSBM Offshore N.V., as the parent company, is committed to fulfill various types of obligations arising from customercontracts, such as full performance and warranty obligations.
In the past, the parent company has issued guarantees for contractual obligations in respect of several Group companies,including equity-accounted joint ventures, with respect to long-term lease and operate contracts. The few remainingguarantees still active as of December 31, 2019 relate to the Deep Panuke MOPU unit, Thunder Hawk semi-submersibleplatform and FPSO Saxi, and have all been signed prior to 2010.
BANK GUARANTEESAs of December 31, 2019, the Company has provided bank guarantees to unrelated third parties for an amount of US$572million (2018: US$358 million). No liability is expected to arise under these guarantees.
The Company holds in its favor US$481 million of bank guarantees from unrelated third parties. No withdrawal under theseguarantees is expected to occur.
COMMITMENTSAs at December 31, 2019, the remaining contractual commitments for acquisition of intangible assets, property, plant andequipment and investment in leases amounted to US$639 million (December 31, 2018: US$135 million). Investmentcommitments have increased principally due to the construction of the FPSO Liza Unity, FPSO Sepetiba, and the initiallimited scope commenced for FPSO Prosperity, which is subject to necessary government approvals and project sanction.
CONTINGENT LIABILITYThe Company has no significant contingent liabilities or assets to be disclosed for the year ended December 31, 2019.
4.3.29 FINANCIAL INSTRUMENTS − FAIR VALUES AND RISK MANAGEMENT
This note presents information about the Company’s exposure to risk resulting from its use of financial instruments, theCompany’s objectives, policies and processes for measuring and managing risk, and the Company’s management of capital.Further qualitative disclosures are included throughout these consolidated financial statements.
ACCOUNTING CLASSIFICATIONS AND FAIR VALUESThe Company uses the following fair value hierarchy for financial instruments that are measured at fair value in the statementof financial position, which require disclosure of fair value measurements by level:■ Quoted prices (unadjusted) in active markets for identical assets or liabilities (Level 1);■ Inputs other than quoted prices included within Level 1 that are observable for the asset or liability, either directly (that is,
as prices) or indirectly (that is, derived from prices) (Level 2);■ Inputs for the asset or liability that are not based on observable market data (that is unobservable inputs) (Level 3).
The following table shows the carrying amounts and fair values of financial assets and financial liabilities, including theirlevels in the fair value hierarchy. It does not include fair value information for financial assets and financial liabilities notmeasured at fair value if the carrying amount is a reasonable approximation of fair value.
4 FINANCIAL STATEMENTS 2019
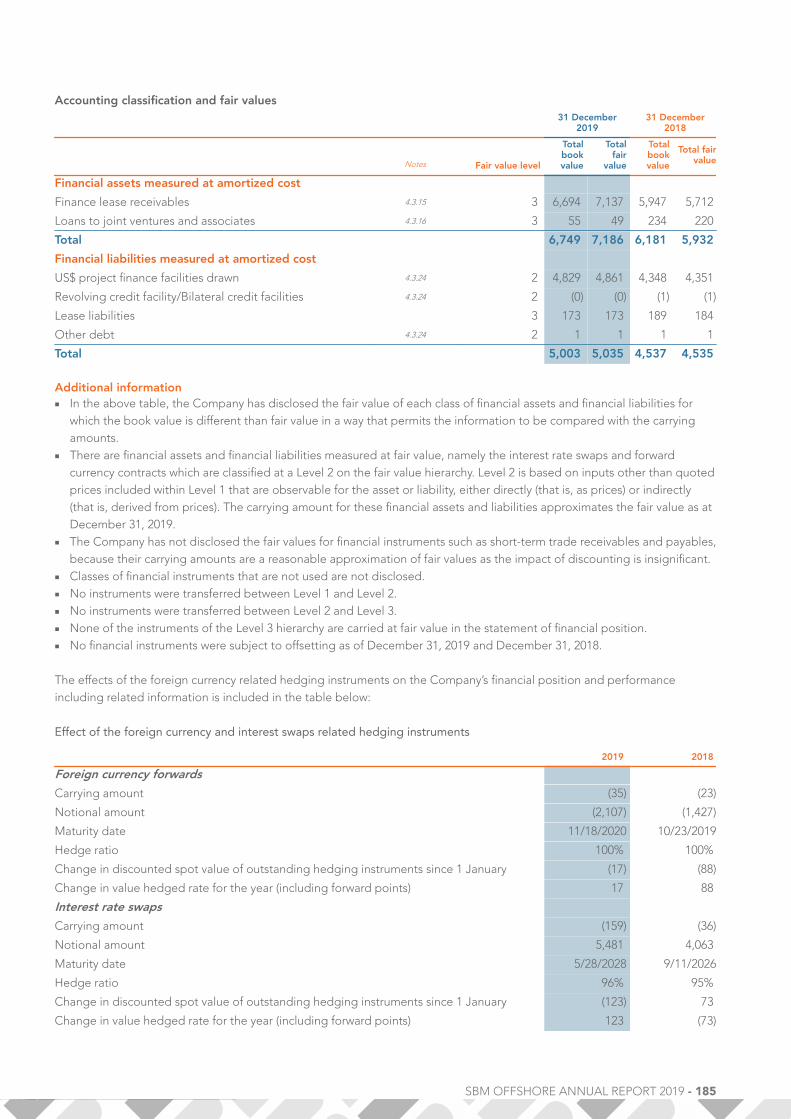
SBM OFFSHORE ANNUAL REPORT 2019 - 185
Accounting classification and fair values31 December
201931 December
2018
Notes Fair value level
Totalbookvalue
Totalfair
value
Totalbookvalue
Total fairvalue
Financial assets measured at amortized cost
Finance lease receivables 4.3.15 3 6,694 7,137 5,947 5,712
Loans to joint ventures and associates 4.3.16 3 55 49 234 220
Total 6,749 7,186 6,181 5,932
Financial liabilities measured at amortized cost
US$ project finance facilities drawn 4.3.24 2 4,829 4,861 4,348 4,351
Revolving credit facility/Bilateral credit facilities 4.3.24 2 (0) (0) (1) (1)
Lease liabilities 3 173 173 189 184
Other debt 4.3.24 2 1 1 1 1
Total 5,003 5,035 4,537 4,535
Additional information■ In the above table, the Company has disclosed the fair value of each class of financial assets and financial liabilities for
which the book value is different than fair value in a way that permits the information to be compared with the carryingamounts.
■ There are financial assets and financial liabilities measured at fair value, namely the interest rate swaps and forwardcurrency contracts which are classified at a Level 2 on the fair value hierarchy. Level 2 is based on inputs other than quotedprices included within Level 1 that are observable for the asset or liability, either directly (that is, as prices) or indirectly(that is, derived from prices). The carrying amount for these financial assets and liabilities approximates the fair value as atDecember 31, 2019.
■ The Company has not disclosed the fair values for financial instruments such as short-term trade receivables and payables,because their carrying amounts are a reasonable approximation of fair values as the impact of discounting is insignificant.
■ Classes of financial instruments that are not used are not disclosed.■ No instruments were transferred between Level 1 and Level 2.■ No instruments were transferred between Level 2 and Level 3.■ None of the instruments of the Level 3 hierarchy are carried at fair value in the statement of financial position.■ No financial instruments were subject to offsetting as of December 31, 2019 and December 31, 2018.
The effects of the foreign currency related hedging instruments on the Company’s financial position and performanceincluding related information is included in the table below:
Effect of the foreign currency and interest swaps related hedging instruments
2019 2018
Foreign currency forwards
Carrying amount (35) (23)
Notional amount (2,107) (1,427)
Maturity date 11/18/2020 10/23/2019
Hedge ratio 100% 100%
Change in discounted spot value of outstanding hedging instruments since 1 January (17) (88)
Change in value hedged rate for the year (including forward points) 17 88
Interest rate swaps
Carrying amount (159) (36)
Notional amount 5,481 4,063
Maturity date 5/28/2028 9/11/2026
Hedge ratio 96% 95%
Change in discounted spot value of outstanding hedging instruments since 1 January (123) 73
Change in value hedged rate for the year (including forward points) 123 (73)

186 - SBM OFFSHORE ANNUAL REPORT 2019
MEASUREMENT OF FAIR VALUESThe following table shows the valuation techniques used in measuring Level 2 and Level 3 fair values, as well as thesignificant unobservable inputs used.
Level 2 and level 3instruments Level 3 instruments
Type Valuation technique Significant unobservable inputsInter-relationship between significant unobservable inputsand fair value measurement
Financial instrumentmeasured at fair value
Interest rate swaps Income approach −Present valuetechnique
Not applicable Not applicable
Forward currencycontracts
Income approach −Present valuetechnique
Not applicable Not applicable
Financial instrument notmeasured at fair value
Loans to joint venturesand associates
Income approach −Present valuetechnique
■ Forecast revenues■ Risk-adjusted discount
rate (3%-7%)
The estimated fair value would increase(decrease) if:■ the revenue was higher (lower)■ the risk-adjusted discount rate was lower
(higher)
Finance leasereceivables
Income approach −Present valuetechnique
■ Forecast revenues■ Risk-adjusted discount
rate (3%-8%)
The estimated fair value would increase(decrease) if:■ the revenue was higher (lower)■ the risk-adjusted discount rate was lower
(higher)
Loans and borrowings Income approach −Present valuetechnique
Not applicable Not applicable
Other long term debt Income approach −Present valuetechnique
Not applicable Not applicable
DERIVATIVE ASSETS AND LIABILITIES DESIGNATED AS CASH FLOW HEDGESThe following table indicates the period in which the cash flows associated with the cash flow hedges are expected to occurand the carrying amounts of the related hedging instruments. The amounts disclosed in the table are the contractualundiscounted cash flows. The future interest cash flows for interest rate swaps are estimated using the forward rates as at thereporting date.
Cash flows
Carrying amountLess than
1 yearBetween
1 and 5 yearsMore than
5 years Total
31 December 2019
Interest rate swaps (159) (20) (204) 54 (170)
Forward currency contracts (35) (28) (34) - (62)
31 December 2018
Interest rate swaps (36) (4) (32) (5) (40)
Forward currency contracts (23) (30) (14) - (44)
4 FINANCIAL STATEMENTS 2019

SBM OFFSHORE ANNUAL REPORT 2019 - 187
The following table indicates the period in which the cash flows hedges are expected to impact profit or loss and thecarrying amounts of the related hedging instruments.
Expected profit or loss impact
Carrying amountLess than
1 yearBetween
1 and 5 yearsMore than
5 years Total
31 December 2019
Interest rate swaps (159) (20) (204) 54 (170)
Forward currency contracts (35) (28) (34) - (62)
31 December 2018
Interest rate swaps (36) (4) (32) (5) (40)
Forward currency contracts (23) (30) (14) - (44)
Interest rate swapsGains and losses recognized in the hedging reserve in equity on interest rate swap contracts will be continuously released tothe income statement until the final repayment of the hedged items (please refer to note 4.3.23 Equity Attributable toShareholders ).
Forward currency contractsGains and losses recognized in the hedging reserve on forward currency contracts are recognized in the income statement inthe period or periods during which the hedged transaction affects the income statement. This is mainly within twelve monthsfrom the statement of financial position date unless the gain or loss is included in the initial amount recognized in thecarrying amount of fixed assets, in which case recognition is over the lifetime of the asset. If the gain or loss is included in theinitial amount recognized in the carrying amount of the cost incurred on construction contracts then the recognition is overtime.
LOSS ALLOWANCE ON FINANCIAL ASSETS AND CONSTRUCTION WORK-IN-PROGRESSThe movement of loss allowance during the year 2019 is summarized as follows:
Finance lease receivableConstruction work-in-
progress Trade receivables Other financial assets
2019 2018 2019 2018 2019 2018 2019 2018
Closing disclosed31 December 2017 underIAS 39 (0) - (0) - (7) (1) (99) (114)
Amounts restated throughopening retained earnings (0) (0) (0) (0) (4) (0)
Opening loss allowance asat 1 January (0) (0) (1) (0) (7) (5) (99) (114)
Increase in loss allowancerecognized in profit or lossduring the year (0) (0) (0) (0) (1) (2) (0)
Receivables written offduring the year asuncollectible
Unused amount reversed 0 1 4 - - 15
At 31 December (0) (0) (0) (0) (4) (7) (99) (99)

188 - SBM OFFSHORE ANNUAL REPORT 2019
FINANCIAL RISK MANAGEMENTThe Company’s activities expose it to a variety of financial risks, market risks (including currency risk, interest rate risk andcommodity risk), credit risk and liquidity risk. The Company’s overall risk management program focuses on theunpredictability of financial markets and seeks to minimize potential adverse effects on the Company’s financial performance.The Company uses derivative financial instruments to hedge certain risk exposures. The Company buys and sells derivativesin the ordinary course of business and also incurs financial liabilities in order to manage market risks. All such transactions arecarried out within the guidelines set in the Company policy. Generally the Company seeks to apply hedge accounting inorder to manage volatility in the income statement and statement of comprehensive income. The purpose is to manage theinterest rate and currency risk arising from the Company’s operations and its sources of finance. Derivatives are only used tohedge closely correlated underlying business transactions.
The Company’s principal financial instruments, other than derivatives, comprise trade debtors and creditors, bank loans andoverdrafts, cash and cash equivalents (including short-term deposits) and financial guarantees. The main purpose of thesefinancial instruments is to finance the Company’s operations. Trade debtors and creditors result directly from the businessoperations of the Company.
Financial risk management is carried out by a central treasury department under policies approved by the ManagementBoard. Treasury identifies, evaluates and hedges financial risks in close co-operation with the subsidiaries and the ChiefFinancial Officer (CFO) during the quarterly Asset and Liability Committee. The Management Board provides writtenprinciples for overall risk management, as well as written policies covering specific areas, such as foreign exchange risk,interest rate risk, credit risk, use of derivative financial instruments and non-derivative financial instruments, and investmentof excess liquidity. It is, and has been throughout the year under review, the Company’s policy that no speculation in financialinstruments shall be undertaken. The main risks arising from the Company’s financial instruments are market risk, liquidity riskand credit risk.
Market riskMarket risk is the risk that changes in market prices, such as foreign exchange rates and interest rates, will affect theCompany’s income or the value of its holding of financial instruments. The objective of market risk management is tomanage and control market risk exposures within acceptable parameters, while optimizing the return on risk.
Foreign exchange riskThe Company operates internationally and is exposed to foreign exchange risk arising from transactional currencyexposures, primarily with respect to the euro, Singapore dollar, and Brazilian real. The exposure arises from sales orpurchases in currencies other than the Company’s functional currency. The Company uses forward currency contracts toeliminate the currency exposure once the Company has entered into a firm commitment of a project contract.
For foreign currency risk, the principle terms of the forward currency contract (notional and settlement date) and the futureexpense or revenue (notional and expected cash flow date) are identical. The Company has established a hedge ratio of 1:1for all its hedging relationships.
4 FINANCIAL STATEMENTS 2019

SBM OFFSHORE ANNUAL REPORT 2019 - 189
The main Company’s exposure to foreign currency risk is as follows based on notional amounts:
Foreign exchange risk (summary)
31 December 2019 31 December 2018
in millions of local currency EUR SGD BRL EUR SGD BRL
Fixed assets 83 - 516 81 - 388
Current assets 89 1 868 89 2 1,009
Long-term liabilities (48) - (235) (51) - -
Current liabilities (105) (20) (1,169) (93) (12) (1,415)
Gross balance sheet exposure 18 (19) (21) 26 (10) (19)
Estimated forecast sales 65 - - 110 - -
Estimated forecast purchases (1,175) (276) (888) (937) (171) (734)
Gross exposure (1,092) (295) (909) (801) (181) (753)
Forward exchange contracts 1,086 293 1,111 795 179 811
Net exposure (6) (1) 202 (6) (2) 58
The increase of the BRL exposure during 2019 was mainly driven by the recapitalization of the Brazilian operations entitiesand the Company's new estimated forecast purchases increased compared to the year 2018.
The estimated forecast purchases relate to project expenditure and overhead expenses for up to three years. The maincurrency exposures of overhead expenses are hedged at 100% for the coming year, between 66% and 100% for the yearafter, and between 33% and 100% for the subsequent year depending on internal review of the foreign exchange marketconditions.
Foreign exchange risk (exchange rates applied)
2019 2018 2019 2018
Average rate Closing rate
EUR 1 1.1195 1.1810 1.1234 1.1450
SGD 1 0.7330 0.7414 0.7434 0.7344
BRL 1 0.2540 0.2753 0.2488 0.2577
The sensitivity on equity and the income statement resulting from a change of ten percent of the US dollar’s value againstthe following currencies at December 31 would have increased (decreased) profit or loss and equity by the amounts shownbelow. This analysis assumes that all other variables, in particular interest rates, remain constant. The analysis is performed onthe same basis as for 2018.
Foreign exchange risk (sensitivity)
Profit or loss Equity
10 percent increase 10 percent decrease 10 percent increase 10 percent decrease
31 December 2019
EUR 1 (1) (125) 125
SGD 0 (0) (21) 21
BRL 0 (0) (27) (27)
31 December 2018
EUR 1 (1) (95) 95
SGD 0 (0) (13) 13
BRL (0) 0 (20) 20
As set out above, by managing foreign currency risk the Company aims to reduce the impact of short-term market pricefluctuations on the Company’s earnings. Over the long-term however, permanent changes in foreign currency rates wouldhave an impact on consolidated earnings.

190 - SBM OFFSHORE ANNUAL REPORT 2019
Interest rate riskThe Company’s exposure to risk from changes in market interest rates relates primarily to the Company’s long-term debtobligations with a floating interest rate. In respect of controlling interest rate risk, the floating interest rates of long-termloans are hedged by fixed rate swaps for the entire maturity period. The revolving credit facility is intended for thefluctuating needs of construction financing and bears interest at floating rates, which is also swapped for fixed rates whenexposure is significant.
For interest rate risk, the principle terms of the interest rate swap (notional amortization, rate-set periods) and the financing(repayment schedule, rate-set periods) are identical. The Company has established a hedge ratio of 1:1, as the hedging layercomponent matches the nominal amount of the interest rate swap for all its hedging relationships.
At the reporting date, the interest rate profile of the Company’s interest-bearing financial instruments (excluding transactioncosts) was:
Interest rate risk (summary)
2019 2018
Fixed rate instruments
Financial assets 6,770 6,026
Financial liabilities (448) (544)
Total 6,322 5,482
Variable rate instruments
Financial assets 55 234
Financial liabilities (4,382) (3,898)
Financial liabilities (future) (1,879) (313)
Total (6,206) (3,977)
Interest rate risk (exposure)
2019 2018
Variable rate instruments (6,206) (3,977)
Less: Reimbursable items 565 -
Less: IRS contracts 5,481 4,063
Exposure (160) 86
At December 31, 2019, it is estimated that a general increase of 100 basis points in interest rates would decrease theCompany’s profit before tax for the year by approximately US$1 million (2018: increase of US$1 million) mainly related toresidual exposure on un-hedged financial liabilities.
The sensitivity on equity and the income statement resulting from a change of 100 basis points in interest rates at thereporting date would have increased (decreased) equity and profit or loss by the amounts shown below. This analysisassumes that all other variables, in particular foreign currency rates, remain constant. The analysis is performed on the samebasis as for 2018.
4 FINANCIAL STATEMENTS 2019

SBM OFFSHORE ANNUAL REPORT 2019 - 191
Interest rate risk (sensitivity)
Profit or loss Equity
100 bp increase 100 bp decrease 100 bp increase 100 bp decrease
31 December 2019
Variable rate instruments (1) 1 - -
Interest rate swap 0 (0) 240 (240)
Sensitivity (net) (1) 1 240 (240)
31 December 2018
Variable rate instruments 1 (1) - -
Interest rate swap 0 (0) 159 (171)
Sensitivity (net) 1 (1) 159 (171)
As set out above, the Company aims to reduce the impact of short-term market price fluctuations on the Company’searnings. Over the long-term however, permanent changes in interest rates could have an impact on consolidated earnings.
Credit riskCredit risk is the risk of financial loss to the Company if a customer or counterparty to a financial instrument fails to meet itscontractual obligations, and arises principally from the Company’s other financial assets, trade and other receivables(including committed transactions), derivative financial instruments and cash and cash equivalents.
Credit risk
2019 2018
Rating Assets Liabilities Assets Liabilities
AA - (4) 1 (1)
AA- 21 (89) 15 (34)
A+ 20 (147) 29 (79)
A - (1) 2 (1)
BBB 1 - - -
Non-investment grade 1 - - -
Derivative financial instruments 43 (241) 46 (116)
AAA 120 - 246 -
AA 27 - 106 -
AA- 183 - 202 -
A+ 131 - 104 -
A 11 - 11 -
A- 0 - 2 -
Non-investment grade 34 - 47 -
Cash and cash equivalents and bank overdrafts 506 - 718 -
The Company maintains and reviews its policy on cash investments and limits per individual counterparty are set to:■ BBB- to BBB+ rating: US$25 million or 10% of cash available.■ A- to A+ rating: US$75 million or 20% of cash available.■ AA- to AA+ rating: US$100 million or 20% of cash available.■ Above AA+ rating: no limit.
As per December 31, 2019, cash investments above AA+ rating do not exceed US$100 million per individual counterparty.
Cash held in banks rated below A- is mainly related to the Company’s activities in Angola (US$24 million).
For trade debtors the credit quality of each customer is assessed, taking into account its financial position, past experienceand other factors. Bank or parent company guarantees are negotiated with customers. Individual risk limits are set based oninternal or external ratings in accordance with limits set by the Management Board. At the date of the financial statements,

192 - SBM OFFSHORE ANNUAL REPORT 2019
there are no customers that have an outstanding balance with a percentage over 10% of the total of trade and otherreceivables. Reference is made to note 4.3.19 Trade and Other Receivables for information on the distribution of thereceivables by country and an analysis of the ageing of the receivables. Furthermore, limited recourse project financingremoves a significant portion of the risk on long-term leases.
For other financial assets, the credit quality of each counterpart is assessed taking into account its credit agency rating.
Regarding loans to joint ventures and associates, the maximum exposure to credit risk is the carrying amount of theseinstruments. As the counterparties of these instruments are joint ventures, the Company has visibility over the expected cashflows and can monitor and manage credit risk that mainly arises from the joint venture’s final client.
Liquidity riskLiquidity risk is the risk that the Company will not be able to meet its financial obligations as they fall due. The Company’sapproach to managing liquidity is to ensure, as far as possible, that it will always have sufficient liquidity to meet its liabilitieswhen due, under both normal and abnormal conditions, without incurring unacceptable losses or risking damage to theCompany’s reputation.
Liquidity is monitored using rolling forecasts of the Company’s liquidity reserves on the basis of expected cash flows.Flexibility is secured by maintaining availability under committed credit lines.
The table below analyses the Company’s non-derivative financial liabilities, derivative financial liabilities and derivativefinancial assets into relevant maturity groupings based on the remaining period at the statement of financial position date tothe contractual maturity date. The amounts disclosed in the table are the contractual undiscounted cash flows. The futureinterest cash flows for borrowings and derivative financial instruments are based on the LIBOR rates as at the reporting date.
Liquidity risk 2019
Note Less than 1 year Between 1 and 5 years Over 5 years Total
31 December 2019
Borrowings 766 3,043 1,944 5,753
Derivative financial liabilities 89 105 29 223
Derivative financial assets (25) (3) - (29)
Trade and other payables 4.3.27 911 - - 911
Total 1,740 3,144 1,973 6,858
Liquidity risk 2018
Note Less than 1 year Between 1 and 5 years Over 5 years Total
31 December 2018
Borrowings 687 2,638 2,072 5,397
Derivative financial liabilities 88 34 7 128
Derivative financial assets (38) 0 (0) (38)
Trade and other payables 4.3.27 847 (0) - 847
Total 1,583 2,672 2,079 6,334
Capital risk managementThe Company’s objectives when managing capital are to safeguard the Company’s ability to continue as a going concern inorder to provide returns for shareholders, benefits for other stakeholders and to maintain a capital structure which optimizesthe Company’s cost of capital while at the same time, ensures diversification of sources of external funds.
SBM Offshore generally uses its corporate revolving credit facility (RCF, US$1 billion) to bridge financing requirements onprojects under construction prior to putting a dedicated project finance facility in place. When a project finance facility isarranged and draw-downs have started, the RCF is repaid and a corporate guarantee from the Company is put in place forthe construction period. When the project facility is drawn in full and the associated FPSO is producing, the corporateguarantee is relinquished and the project finance becomes non-recourse debt.
4 FINANCIAL STATEMENTS 2019
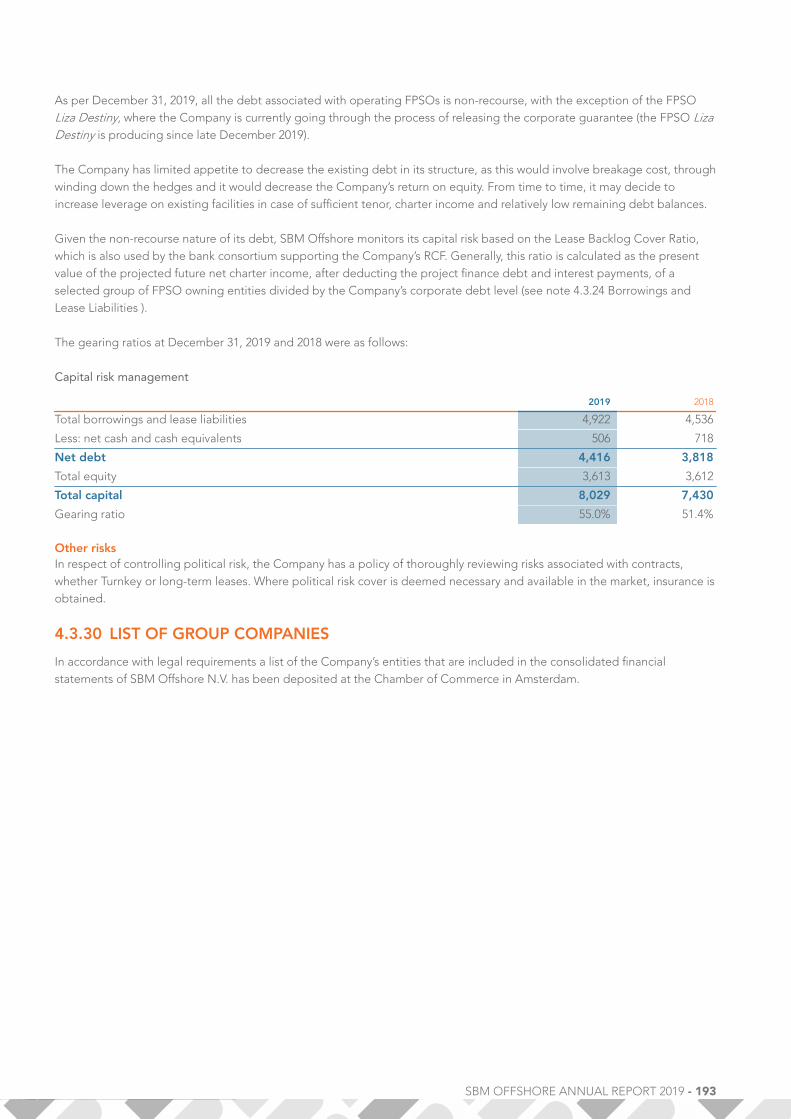
SBM OFFSHORE ANNUAL REPORT 2019 - 193
As per December 31, 2019, all the debt associated with operating FPSOs is non-recourse, with the exception of the FPSOLiza Destiny, where the Company is currently going through the process of releasing the corporate guarantee (the FPSO LizaDestiny is producing since late December 2019).
The Company has limited appetite to decrease the existing debt in its structure, as this would involve breakage cost, throughwinding down the hedges and it would decrease the Company’s return on equity. From time to time, it may decide toincrease leverage on existing facilities in case of sufficient tenor, charter income and relatively low remaining debt balances.
Given the non-recourse nature of its debt, SBM Offshore monitors its capital risk based on the Lease Backlog Cover Ratio,which is also used by the bank consortium supporting the Company’s RCF. Generally, this ratio is calculated as the presentvalue of the projected future net charter income, after deducting the project finance debt and interest payments, of aselected group of FPSO owning entities divided by the Company’s corporate debt level (see note 4.3.24 Borrowings andLease Liabilities ).
The gearing ratios at December 31, 2019 and 2018 were as follows:
Capital risk management
2019 2018
Total borrowings and lease liabilities 4,922 4,536
Less: net cash and cash equivalents 506 718
Net debt 4,416 3,818
Total equity 3,613 3,612
Total capital 8,029 7,430
Gearing ratio 55.0% 51.4%
Other risksIn respect of controlling political risk, the Company has a policy of thoroughly reviewing risks associated with contracts,whether Turnkey or long-term leases. Where political risk cover is deemed necessary and available in the market, insurance isobtained.
4.3.30 LIST OF GROUP COMPANIES
In accordance with legal requirements a list of the Company’s entities that are included in the consolidated financialstatements of SBM Offshore N.V. has been deposited at the Chamber of Commerce in Amsterdam.

194 - SBM OFFSHORE ANNUAL REPORT 2019
4.3.31 INVESTMENT IN ASSOCIATES AND JOINT VENTURES
The Company has several joint ventures and associates:
Entity name PartnersJoint venture/Associate
% ofownership
Countryregistration
2019 mainreportingsegment Project name
Sonasing Xikomba Ltd. Sociedad Nacional deCombustiveis de AngolaEmpresa Publica -SonangolE.P.; Angola Offshore ServicesLimitada
Jointventure
50.00 Bermuda Lease &Operate
FPSON'Goma
OPS-Serviços deProdução de PetróleosLtd.
Sociedad Nacional deCombustiveis de AngolaEmpresa Publica -SonangolE.P.
Jointventure
50.00 Bermuda Lease &Operate
Angolaoperations
OPS-Serviços deProdução de PetróleosLtd. Branch
Sociedad Nacional deCombustiveis de AngolaEmpresa Publica -SonangolE.P.
Jointventure
50.00 Angola Lease &Operate
Angolaoperations
Sonasing Sanha Ltd. Sociedad Nacional deCombustiveis de AngolaEmpresa Publica -SonangolE.P.; Angola Offshore ServicesLimitada
Jointventure
50.00 Bermuda Lease &Operate
FPSO Sanha
Sonasing Kuito Ltd. Sociedad Nacional deCombustiveis de AngolaEmpresa Publica -SonangolE.P.; Angola Offshore ServicesLimitada
Jointventure
50.00 Bermuda Lease &Operate
FPSO Kuito
Sonasing Mondo Ltd. Sociedad Nacional deCombustiveis de AngolaEmpresa Publica -SonangolE.P.; Vernon Angolan ServicesLimitada
Jointventure
50.00 Bermuda Lease &Operate
FPSO Mondo
Sonasing Saxi BatuqueLtd.
Sociedad Nacional deCombustiveis de AngolaEmpresa Publica -SonangolE.P.; Vernon Angolan ServicesLimitada
Jointventure
50.00 Bermuda Lease &Operate
FPSO Saxi-Batuque
OPS Production Ltd. Sociedad Nacional deCombustiveis de AngolaEmpresa Publica -SonangolE.P.
Jointventure
50.00 Bermuda Lease &Operate
Angolaoperations
Anchor Storage Ltd. Maersk group Jointventure
49.00 Bermuda Lease &Operate
Nkossa II FSO
Gas Management(Congo) Ltd.
Maersk group Jointventure
49.00 Bahamas Lease &Operate
Nkossa II FSO
Solgaz S.A. Deepwater Enterprises A/S (anentity of Maersk group)
Jointventure
49.00 France Lease &Operate
Nkossa II FSO
Malaysia DeepwaterFloating Terminal(Kikeh) Ltd.
Malaysia InternationalShipping Corporation Behard
Jointventure
49.00 Malaysia Lease &Operate
FPSO Kikeh
Malaysia DeepwaterProduction ContractorsSdn Bhd
Malaysia InternationalShipping Corporation Behard
Jointventure
49.00 Malaysia Lease &Operate
FPSO Kikeh
SNV Offshore Ltd. Naval Ventures Corp (an entityof Synergy group)
Jointventure
50.00 Bermuda Turnkey Brazilian yard
Estaleiro Brasa Ltda. SNV Offshore Limited (seeinformation above)
Jointventure
50.00 Brazil Turnkey Brazilian yard
Brasil Superlift Serviçosde Içamento Ltda.
SNV Offshore Limited (seeinformation above)
Jointventure
50.00 Brazil Turnkey Brazilian yard
Pelican Assets S.à.r.l. SNV Offshore Limited (seeinformation above)
Jointventure
50.00 Luxembourg Turnkey Brazilian yard
4 FINANCIAL STATEMENTS 2019

SBM OFFSHORE ANNUAL REPORT 2019 - 195
Entity name PartnersJoint venture/Associate
% ofownership
Countryregistration
2019 mainreportingsegment Project name
Normand Installer S.A. The Solstad group Jointventure
49.90 Switzerland Turnkey NormandInstaller
SBM Ship Yard Ltd. Sociedad Nacional deCombustiveis de AngolaEmpresa Publica -SonangolE.P.; Daewoo Shipbuilding &Marine Engineering Co. Ltd.
Associate 33.33 Bermuda Turnkey Angolan yard
PAENAL - PortoAmboim EstaleirosNavais Ltda.
Sociedad Nacional deCombustiveis de AngolaEmpresa Publica -SonangolE.P.; SBM Shipyard
Associate 30.00 Angola Turnkey Angolan yard
OS Installer Limited Ocean Yield Malta Ltd Associate 25.00 Malta Turnkey SBM Installer
The Company has no joint operation as per definition provided by IFRS 11 ‘Joint arrangements’.
The movements in investments in associates and joint ventures are as follows:
Purchase and termination options in finance lease contracts - Joint ventures and associatesThe finance lease contracts of FPSO N'Goma, FPSO Saxi and FPSO Mondo, where the Company is the lessor, include calloptions for the client to purchase the underlying asset or to terminate the contract early. The finance lease contract of FPSOKikeh also includes options for the client to purchase the underlying asset or to terminate the contract early, but it should benoted that the first option for the client to exercise the purchase option on FPSO Kikeh is early 2022.
The exercise of the purchase option on FPSOs N'Goma, Saxi and Mondo as per December 31, 2019 would have resulted in again for the Company or a near break-even result. The exercise of the option to terminate the contract early, in which casethe Company retains ownership of the vessel, would result in a gain for FPSO Kikeh, break-even result for FPSOs Saxi andMondo, while this would result in a loss for the Company on FPSO N'Goma. The Company considers the likelihood of theclient exercising the option to terminate the contract on this specific contract as remote.
Hyperinflation AngolaAngola is no longer a hyperinflation country in 2019. In 2018 the Company applied hyperinflation accounting in line with therequirements of IAS 29 for its local branch in Angola (OPS-Serviçõs de Produção de Petróleos Ltd.).
2019 2018
Investments in associates and joint ventures at 1 January 421 457
Share of profit of equity-accounted investees 44 13
Dividends (137) (59)
Cash flow hedges (1) 2
Capital increase/(decrease) 2 3
Foreign currency variations (3) 1
Share in negative net equity reclassification to loans to joint ventures and associates (1) 2
Other - 3
Investments in associates and joint ventures at 31 December 325 421

196 - SBM OFFSHORE ANNUAL REPORT 2019
The following tables present the figures at 100%.
Information on significant joint arrangements and associates - 2019
Project name Place of the businessTotal
assets
Non-currentassets Cash Loans
Non-current
liabilitiesCurrent
liabilitesDividends
paid Revenue
FPSO N'Goma Angola 987 795 55 445 445 128 170 81
Angola operations Angola 120 2 9 25 - 105 - 132
FPSO Kikeh Malaysia 204 103 5 - 5 17 91 82
Brazilian yard Brazil 2 2 (0) 0 - 2 - 0
Angolan yard Angola 80 (0) 45 485 485 32 - 3
Non material jointventures/associates 216 198 11 242 166 82 15 5
Total at 100% 1,610 1,099 126 1,197 1,101 367 275 304
Information on significant joint arrangements and associates - 2018
Project name Place of the businessTotal
assets
Non-currentassets Cash Loans
Non-current
liabilitiesCurrent
liabilitesDividends
paid Revenue
FPSO N'Goma Angola 1,055 892 35 414 339 190 - 89
Angola operations Angola 210 3 9 40 0 194 - 175
FPSO Kikeh Malaysia 280 181 11 - 5 21 104 87
Brazilian yard Brazil 13 7 1 (0) - 9 - 12
Angolan yard Angola 94 (0) 49 460 460 36 - 8
Non material jointventures/associates 231 200 15 245 193 64 20 38
Total at 100% 1,883 1,282 119 1,159 997 514 124 408
The bank interest-bearing loans and other borrowings held by joint ventures and associates are as follows:
Information on loans and borrowings of joint ventures and associates
Net book value at31 December 2019
Net book value at31 December 2018
Entity name%
Ownership % Interest MaturityNon-
current Current TotalNon-
current Current Total
US$ Project Finance facilities drawn:
Sonasing Xikomba Ltd 50.00 5.10% 15-05-2026 386 59 445 166 90 256
Normand Installer SA 49.90 4.30% 23-02-2023 32 3 35 - 35 35
OS Installer Limited 25.00Libor +
2.35% 17-09-2026 66 7 73 73 7 80
Loans from subsidiaries ofSBM Offshore N.V.1 314 25 339 408 93 501
Loans from other shareholders of thejoint ventures and associates 297 - 297 275 5 280
Loans from other joint ventures2 248 6 254 258 3 261
Net book value of loans and borrowings 1,343 100 1,443 1,181 234 1,4151 Please refer to note 4.3.16 'Loans to joint-ventures and associates' for presentation of the carrying amount of these loans in the Company's Consolidated
Statement of financial position.
2 Mainly loans from the joint ventures SBM Shipyard Ltd to the JV PAENAL - Porto Amboim Estaleiros Navais Ltda.
On December 9, 2019, the Company closed a supplemental non-recourse project loan facility of US$250 million related toSonasing Xikomba Ltd., the entity that owns the FPSO N'Goma. The total outstanding loan amount increased to c.US$450million and the original maturity date of the loan was extended by c. 4.5 years to an expiration date of 15 May 2026.
4 FINANCIAL STATEMENTS 2019

SBM OFFSHORE ANNUAL REPORT 2019 - 197
Aggregated information on joint ventures and associates
2019 2018
Net result at 100% 68 29
Reconciliation equity at 100 % with investment in associates and joint ventures
2019 2018
Equity at 100% 142 372
Partner ownership 15 (120)
Share in negative net equity reclassification to loans to joint venturesand associates 168 168
Investments in associates and joint ventures 325 421
4.3.32 INFORMATION ON NON-CONTROLLING INTERESTS
The Company has several jointly owned subsidiaries:
Entity name Partners% of
ownershipCountryregistration
2019 mainreportingsegment Project name
Aseng Production Company Ltd. GE Petrol 60.00 Caymanisland
Lease &Operate
FPSO Aseng
Gepsing Ltd. GE Petrol 60.00 Caymanisland
Lease &Operate
FPSO Aseng /FPSOSerpentina
Gepsing Ltd - Equatorial GuineaBranch
GE Petrol 60.00 EquatorialGuinea
Lease &Operate
FPSO Aseng /FPSOSerpentina
Brazilian Deepwater FloatingTerminals Ltd.
Malaysia International ShippingCorporation Behard
51.00 Bermuda Lease &Operate
FPSO EspiritoSanto
Brazilian Deepwater ProductionLtd.
Malaysia International ShippingCorporation Behard
51.00 Bermuda Lease &Operate
FPSO EspiritoSanto
Brazilian Deepwater ProductionContractors Ltd.
Malaysia International ShippingCorporation Behard
51.00 Bermuda Lease &Operate
FPSO EspiritoSanto
Operações Marítimas em MarProfundo Brasileiro Ltda
owned by Brazilian DeepwaterProduction Contractors (seeinformation above)
51.00 Brazil Lease &Operate
FPSO EspiritoSanto
Alfa Lula Alto S.à.r.l. Mitsubishi Corporation; NipponYusen Kabushiki Kaisha ; QueirozGalvao Oleo e Gas, S.A.
61.00 Luxembourg Turnkey FPSO Cidadede Marica
Alfa Lula Alto Holding Ltd. Mitsubishi Corporation; NipponYusen Kabushiki Kaisha ; QueirozGalvao Oleo e Gas, S.A.
61.00 Bermuda Lease &Operate
FPSO Cidadede Marica
Alfa Lula Alto OperaçõesMarítimas Ltda.
owned by Alfa Lula Alto HoldingLtd. (see information above)
61.00 Brazil Lease &Operate
FPSO Cidadede Marica
Beta Lula Central S.à.r.l. Mitsubishi Corporation; NipponYusen Kabushiki Kaisha ; QueirozGalvao Oleo e Gas, S.A.
61.00 Luxembourg Turnkey FPSO Cidadede Saquarema
Beta Lula Central Holding Ltd. Mitsubishi Corporation; NipponYusen Kabushiki Kaisha ; QueirozGalvao Oleo e Gas, S.A.
61.00 Bermuda Lease &Operate
FPSO Cidadede Saquarema
Beta Lula Central OperaçõesMarítimas Ltda.
Owned by Betal Lula CentralHolding Ltd. (see informationabove)
61.00 Brazil Lease &Operate
FPSO Cidadede Saquarema
Tupi Nordeste S.à.r.l. Nippon Yusen Kabushiki Kaisha;Itochu Corporation; QueirozGalvao Oleo e Gas, S.A.
70.50 Luxembourg Lease &Operate
FPSO Cidadede Paraty
Tupi Nordeste OperaçõesMarítimas Ltda.
Owned by Tupi Nordeste Holding(see information below)
70.50 Brazil Lease &Operate
FPSO Cidadede Paraty

198 - SBM OFFSHORE ANNUAL REPORT 2019
Entity name Partners% of
ownershipCountryregistration
2019 mainreportingsegment Project name
Tupi Nordeste Holding Ltd. Nippon Yusen Kabushiki Kaisha;Itochu Corporation; QueirozGalvao Oleo e Gas, S.A.
70.50 Bermuda Lease &Operate
FPSO Cidadede Paraty
Guara Norte S.à.r.l. Mitsubishi Corporation; NipponYusen Kabushiki Kaisha ; QueirozGalvao Oleo e Gas, S.A.
75.00 Luxembourg Lease &Operate
FPSO Cidadede Ilhabela
Guara Norte Holding Ltd. Mitsubishi Corporation; NipponYusen Kabushiki Kaisha ; QueirozGalvao Oleo e Gas, S.A.
75.00 Bermuda Lease &Operate
FPSO Cidadede Ilhabela
Guara Norte Operações MarítimasLtda.
Owned by Guara Norte HoldingLtd. (see information above)
75.00 Brazil Lease &Operate
FPSO Cidadede Ilhabela
FPSO Brasil Venture S.A. MISC Berhad 51.00 Switzerland Lease &Operate
FPSO Brazil
SBM Operações Ltda. MISC Berhad 51.00 Brazil Lease &Operate
FPSO Brazil
SBM Systems Inc. MISC Berhad 51.00 Switzerland Lease &Operate
FPSO Brazil
SBM Nauvata Private Limited Nauvata Engineering PrivateLimited
51.00 India Turnkey Engineeringservices
South East Shipping Co. Ltd. Mitsubishi Corporation 75.00 Bermuda Lease &Operate
Yetagun
Mero 2 Operacoes Maritima Ltd. Mitsubishi Corporation; NipponYusen Kabushiki Kaisha
64.50 Brazil Lease &Operate
FPSOSepetiba
Mero 2 Operacoes Holding S.A. Mitsubishi Corporation; NipponYusen Kabushiki Kaisha
64.50 Switzerland Lease &Operate
FPSOSepetiba
Mero 2 Owning B.V. Mitsubishi Corporation; NipponYusen Kabushiki Kaisha
64.50 TheNetherlands
Lease &Operate
FPSOSepetiba
Mero 2 B.V. Mitsubishi Corporation; NipponYusen Kabushiki Kaisha
64.50 TheNetherlands
Lease &Operate
FPSOSepetiba
Note that the percentage of ownership of entities related to FPSO Cidade de Marica, FPSO Cidade de Saquarema, FPSOCidade de Paraty, FPSO Cidade de Ilhabela presented above reflect the ownership of the Company at year-end 2019 afterthe purchase of shares from Constellation. FPSO Capixaba is excluded from the table above as it is now 100% owned by theCompany as a result of the Constellation transaction. For more information refer to note 4.3.1 Financial Highlights.
Included in the consolidated financial statements are the following items that represent the Company’s interest in therevenues, assets and loans of the partially owned subsidiaries.
Figures are presented at 100% before elimination of intercompany transactions.
Information on non-controlling interests (NCI) − 2019
Project name Place of businessTotal
assets
Non-currentassets Cash Loans
Non-current
liabilitiesCurrent
liabilitiesDividends
to NCI Revenue
FPSO Aseng / FPSOSerpentina Equatorial Guinea 152 106 6 0 0 20 0 74
FPSO Espirito Santo Brazil 231 181 19 - 150 94 12 107
FPSO Cidade de Marica Brazil 1,684 1,540 61 1,119 1,069 158 2 200
FPSO Cidade deSaquarema Brazil 1,651 1,532 37 1,195 1,155 123 8 202
FPSO Cidade de Paraty Brazil 1,126 1,025 26 421 318 151 - 161
FPSO Cidade deIlhabela Brazil 1,503 1,336 87 677 562 168 - 197
FPSO Sepetiba Brazil 415 - 3 - 13 136 - 121
Non material NCI 27 0 4 - - 3 4 3
Total 100% 6,790 5,721 243 3,411 3,267 854 25 1,065
4 FINANCIAL STATEMENTS 2019

SBM OFFSHORE ANNUAL REPORT 2019 - 199
Information on non-controlling interests (NCI) − 2018
Project name Place of businessTotal
assets
Non-currentassets Cash Loans
Non-current
liabilitiesCurrent
liabilitiesDividends
to NCI Revenue
FPSO Aseng / FPSOSerpentina Equatorial Guinea 163 121 5 0 0 22 23 77
FPSO Espirito Santo Brazil 281 223 9 - 200 86 20 107
FPSO Cidade de Marica Brazil 1,725 1,591 61 1,216 1,144 145 - 198
FPSO Cidade deSaquarema Brazil 1,677 1,581 23 1,276 1,200 95 - 202
FPSO Cidade de Paraty Brazil 1,167 1,077 31 524 427 150 - 151
FPSO Cidade deIlhabela Brazil 1,546 1,388 87 792 677 161 - 190
FPSO Capixaba Brazil 191 176 8 83 113 79 - 51
Non material NCI1 39 0 9 - - 7 23 31
Total 100% 6,789 6,158 234 3,891 3,761 745 66 1,0061 Turritella (FPSO) was sold in January 2018. Turritella's numbers have been condensed into non-material NCI.
Reference is made to note 4.3.24 Borrowings and Lease Liabilities for a description of the bank interest-bearing loans andother borrowings per entity.
Included in the consolidated financial statements are the following items that represent the aggregate contribution of thepartially owned subsidiaries to the Company consolidated financial statements:
Interest in non-controlling interest (summary)
2019 2018
Net result 145 132
Accumulated amount of NCI 865 978
Reconciliation equity at 100 % with Non-controlling interests on partially owned subsidiaries
2019 2018
Equity at 100% 2,670 2,284
Company ownership (1,805) (1,305)
Accumulated amount of NCI 865 978
4.3.33 RELATED PARTY TRANSACTIONS
During 2019, no major related party transactions requiring additional disclosure in the financial statements took place.
For relations with Supervisory Board members, Management Board members and other key personnel reference is made tonote 4.3.6 Employee Benefit Expenses.
The Company has transactions with joint ventures and associates which are recognized as follows in the Company’sconsolidated financial statements:
Related party transactions
Note 2019 2018
Revenue 19 27
Cost of sales (13) (18)
Loans to joint ventures and associates 4.3.16 55 234
Trade receivables 52 99
Trade payables 17 56
Lease liabilities1 97 109
1 DSCV SBM Installer charter lease contract.

200 - SBM OFFSHORE ANNUAL REPORT 2019
The Company has provided loans to joint ventures and associates such as shareholder loans and funding loans at ratescomparable to the commercial rates of interest.
During the period, the Company entered into trading transactions with joint ventures and associates on terms equivalent tothose that prevail in arm’s-length transactions.
Additional information regarding the joint ventures and associates is available in note 4.3.31 Investment in Associates andJoint Ventures.
4.3.34 INDEPENDENT AUDITOR’S FEES AND SERVICES
Fees included in other operating costs related to PwC, the 2019 and 2018 Company’s external independent auditor, aresummarized as follows:
in thousands of US$ 2019 2018
Audit of financial statements 2,204 2,209
Out of which:
- invoiced by PwC Accountants N.V. 1,488 1,133
- invoiced by PwC network firms 716 1,076
Tax advisory services by PwC network firms 59 79
Other assurance services 131 111
Total 2,394 2,399
In both 2019 and 2018, the other assurance services were mainly related to the review of the Company sustainability report.
4.3.35 EVENTS AFTER END OF REPORTING PERIOD
DIVIDEND AND SHARE REPURCHASE PROGRAMThe Company’s dividend policy is to maintain a stable dividend, which grows over time. Determination of the dividend isbased on the Company’s assessment of its underlying cash flow position. As part of the Company’s regular planning process,following review of its cash flow position and forecast, the Company has concluded that the outlook for cash flow generationhas improved given the increase in the quantum of the Lease and Operate backlog and its duration. Based on this, adividend of US$150 million (which equals c. US$0.76 per share, based on the number of shares outstanding at December 31,2019), to be paid out of retained earnings, will be proposed at the Annual General Meeting on April 8, 2020. This representsan increase of c. 100% compared to the dividend paid in 2019.
The Company has invested equity in projects, which are under construction or recently completed. Most of this equityinvestment will be returned to the Company following drawdown of non-recourse project finance facilities in the near future.After having reviewed the current liquidity position including the return of this investment, taking account of future growthrequirements and the resulting cash flow outlook, the Company has determined that it currently has the capacity torepurchase shares. Consequently, on February 13, 2020 the Company will commence a EUR150 million share repurchaseprogram.
RCF EXTENSION OPTION EXERCISED BY THE COMPANYOn February 5, 2020, the lenders to the Company’s US$1 billion Revolving Credit Facility (RCF) agreed to the Company’srequest to exercise the first one-year extension option. The final maturity date of the RCF is thereby extended fromFebruary 12, 2024 to February 12, 2025. The Company has one additional one-year extension option remaining which can berequested 60 days prior to the second anniversary of the RCF.
4 FINANCIAL STATEMENTS 2019
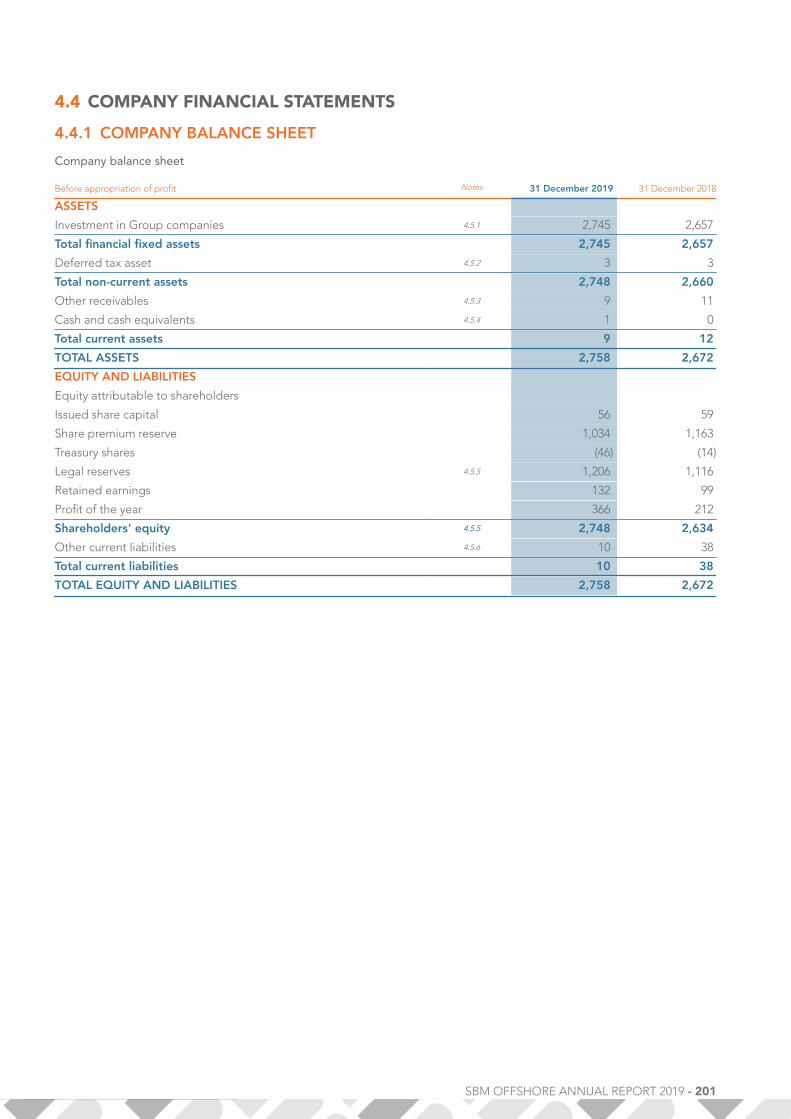
SBM OFFSHORE ANNUAL REPORT 2019 - 201
4.4 COMPANY FINANCIAL STATEMENTS
4.4.1 COMPANY BALANCE SHEET
Company balance sheet
Before appropriation of profit Notes 31 December 2019 31 December 2018
ASSETS
Investment in Group companies 4.5.1 2,745 2,657
Total financial fixed assets 2,745 2,657
Deferred tax asset 4.5.2 3 3
Total non-current assets 2,748 2,660
Other receivables 4.5.3 9 11
Cash and cash equivalents 4.5.4 1 0
Total current assets 9 12
TOTAL ASSETS 2,758 2,672
EQUITY AND LIABILITIES
Equity attributable to shareholders
Issued share capital 56 59
Share premium reserve 1,034 1,163
Treasury shares (46) (14)
Legal reserves 4.5.5 1,206 1,116
Retained earnings 132 99
Profit of the year 366 212
Shareholders' equity 4.5.5 2,748 2,634
Other current liabilities 4.5.6 10 38
Total current liabilities 10 38
TOTAL EQUITY AND LIABILITIES 2,758 2,672

202 - SBM OFFSHORE ANNUAL REPORT 2019
4.4.2 COMPANY INCOME STATEMENT
Company income statement
For the years ended 31 December Note 2019 2018
Revenue 4.5.7 6 7
General and administrative expenses 4.5.8 (28) (34)
Operating profit/(loss) (EBIT) (22) (27)
Financial expenses 4.5.9 (1) (0)
Net financing costs (1) (0)
Result of Group companies 4.5.1 389 239
Profit/(Loss) before income tax 366 212
Income tax (expense)/income - -
Profit/(Loss) 366 212
4 FINANCIAL STATEMENTS 2019

SBM OFFSHORE ANNUAL REPORT 2019 - 203
4.4.3 GENERAL
The Company financial statements are part of the 2019 financial statements of SBM Offshore N.V.
SBM Offshore N.V. costs mainly comprise of management activities and cost of the headquarters office at Schiphol of whichpart is recharged to Group companies.
PRINCIPLES FOR THE MEASUREMENT OF ASSETS AND LIABILITIES AND THE DETERMINATION OF THERESULTThe stand-alone financial statements were prepared in accordance with the statutory provisions of Part 9, Book 2 of theDutch Civil Code and the firm pronouncements of the ‘Raad voor de Jaarverslaggeving’. SBM Offshore N.V. uses the optionprovided in section 2:362 (8) of the Dutch Civil Code in that the principles for the recognition and measurement of assets andliabilities and determination of result (hereinafter referred to as principles for recognition and measurement) of the separatefinancial statements of SBM Offshore N.V. are the same as those applied for the consolidated financial statements. Theconsolidated financial statements are prepared according to the standards set by the International Accounting StandardsBoard and adopted by the European Union (referred to as EU-IFRS). Reference is made to the notes to the consolidatedfinancial statements (‘ 4.2.7 Accounting Principles ’) for a description of these principles.
Investments in group companies, over which control is exercised, are stated on the basis of the net asset value.
Results on transactions, involving the transfer of assets and liabilities between SBM Offshore N.V. and its participatinginterests or between participating interests themselves, are not incorporated insofar as they are deemed to be unrealized.
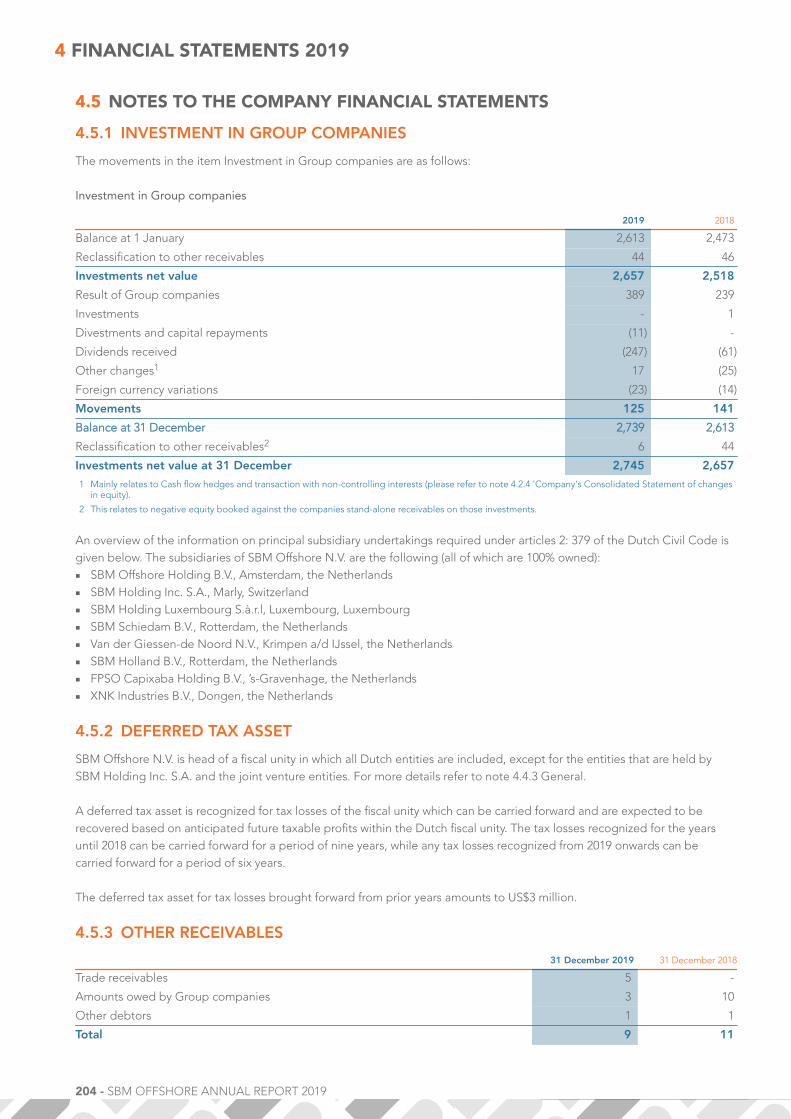
204 - SBM OFFSHORE ANNUAL REPORT 2019
4.5 NOTES TO THE COMPANY FINANCIAL STATEMENTS
4.5.1 INVESTMENT IN GROUP COMPANIES
The movements in the item Investment in Group companies are as follows:
Investment in Group companies
2019 2018
Balance at 1 January 2,613 2,473
Reclassification to other receivables 44 46
Investments net value 2,657 2,518
Result of Group companies 389 239
Investments - 1
Divestments and capital repayments (11) -
Dividends received (247) (61)
Other changes1 17 (25)
Foreign currency variations (23) (14)
Movements 125 141
Balance at 31 December 2,739 2,613
Reclassification to other receivables2 6 44
Investments net value at 31 December 2,745 2,6571 Mainly relates to Cash flow hedges and transaction with non-controlling interests (please refer to note 4.2.4 'Company's Consolidated Statement of changes
in equity).
2 This relates to negative equity booked against the companies stand-alone receivables on those investments.
An overview of the information on principal subsidiary undertakings required under articles 2: 379 of the Dutch Civil Code isgiven below. The subsidiaries of SBM Offshore N.V. are the following (all of which are 100% owned):■ SBM Offshore Holding B.V., Amsterdam, the Netherlands■ SBM Holding Inc. S.A., Marly, Switzerland■ SBM Holding Luxembourg S.à.r.l, Luxembourg, Luxembourg■ SBM Schiedam B.V., Rotterdam, the Netherlands■ Van der Giessen-de Noord N.V., Krimpen a/d IJssel, the Netherlands■ SBM Holland B.V., Rotterdam, the Netherlands■ FPSO Capixaba Holding B.V., ’s-Gravenhage, the Netherlands■ XNK Industries B.V., Dongen, the Netherlands
4.5.2 DEFERRED TAX ASSET
SBM Offshore N.V. is head of a fiscal unity in which all Dutch entities are included, except for the entities that are held bySBM Holding Inc. S.A. and the joint venture entities. For more details refer to note 4.4.3 General.
A deferred tax asset is recognized for tax losses of the fiscal unity which can be carried forward and are expected to berecovered based on anticipated future taxable profits within the Dutch fiscal unity. The tax losses recognized for the yearsuntil 2018 can be carried forward for a period of nine years, while any tax losses recognized from 2019 onwards can becarried forward for a period of six years.
The deferred tax asset for tax losses brought forward from prior years amounts to US$3 million.
4.5.3 OTHER RECEIVABLES
31 December 2019 31 December 2018
Trade receivables 5 -
Amounts owed by Group companies 3 10
Other debtors 1 1
Total 9 11
4 FINANCIAL STATEMENTS 2019

SBM OFFSHORE ANNUAL REPORT 2019 - 205
Other receivables fall due in less than one year. The fair value of the receivables reasonably approximates the book value,due to their short-term character.
4.5.4 CASH AND CASH EQUIVALENTS
Cash and cash equivalents are at SBM Offshore N.V.’s free disposal.
4.5.5 SHAREHOLDERS' EQUITY
For an explanation of the shareholders equity, reference is made to the Consolidated Statement of Changes in Equity andnote 4.3.23 Equity Attributable to Shareholders.
Legal reserve
31 December 2019 31 December 2018
Investees equity non-distributable 1,446 1,232
Capitalized development expenditure1 18 15
Translation reserve (101) (79)
Cash flow hedges (157) (52)
Total 1,206 1,1161 Relates to the development expenditures of the Company's subsidiaries.
The 'Investees equity non-distributable' legal reserve relates mainly to non-distributable profits generated by the co-ownedentities (refer to note 4.3.31 Investment in Associates and Joint Ventures and 4.3.32 Information on Non-controllingInterests ). The agreed principle in the applicable shareholders’ agreements is that the shareholders shall procure that anyavailable reserves are distributable after paying any expenses due and taking into account co-owned entity and applicablelegal requirements. However, as unanimous decision of shareholders agreements in most of the co-owned entities isrequired to distribute the profits generated, the equity of these entities is classified as a non-distributable reserve underDutch guidelines for financial reporting. On a regular basis the Company ensures that dividends are approved by thepartners and distributed accordingly to the shareholders.
PROPOSED APPROPRIATION OF RESULTWith the approval of the Supervisory Board, it is proposed that the result shown in SBM Offshore N.V. income statement beappropriated as follows (in US$):
Appropriation of result
2019
Profit/(Loss) attributable to shareholders 366
In accordance with note 4.6.1 to be transferred to the 'Retained earnings' 366
At the disposal of the General Meeting of Shareholders -
It is proposed that US$150 million of retained earnings is distributed among the shareholders.
4.5.6 OTHER CURRENT AND NON-CURRENT LIABILITIES
Current and non current liabilities
31 December 2019 31 December 2018
Trade payables 4 1
Amounts owed to Group companies 1 31
Taxation and social security costs 0 0
Other creditors 5 6
Total current liabilities 10 38
The other current liabilities fall due in less than one year. The fair value of other current liabilities approximates the bookvalue, due to their short-term character.

206 - SBM OFFSHORE ANNUAL REPORT 2019
4.5.7 REVENUE
The revenue comprises management fees charged to 100% owned Group companies.
4.5.8 GENERAL AND ADMINISTRATIVE EXPENSES
2019 2018
Employee Benefits (26) (27)
Other costs (2) (7)
Total (28) (34)
The employee benefits include the Management Board remuneration, and recharge of other personnel costs at theheadquarters, as well as share-based payments (IFRS 2 costs) for the entire Group. For further details on the ManagementBoard remuneration, reference is made to note 4.3.6 Employee Benefit Expenses.
The other costs include audit fees, legal, compliance, corporate governance and investor relation costs. For the audit feesreference is made to note 4.3.34 Independent Auditor’s Fees and Services.
4.5.9 FINANCIAL EXPENSES
The financial expenses relate mainly to foreign currency results and interest expenses charged by Group companies toSBM Offshore N.V.
4.5.10 COMMITMENTS AND CONTINGENCIES
COMPANY GUARANTEESSBM Offshore N.V. has issued performance guarantees for contractual obligations to complete and deliver projects inrespect of several Group companies, and fulfillment of obligations with respect to long-term lease/operate contracts.Furthermore, the Company has issued parent company guarantees in respect of several Group companies’ financingarrangements.
FISCAL UNITYSBM Offshore N.V. is head of a fiscal unity in which all Dutch entities are included, except for the entities that are held bySBM Holding Inc. S.A. and the joint venture entities. All tax liabilities and tax assets are transferred to the fiscal unity parent,however all members of the fiscal unity can be held liable for all tax liabilities concerning the fiscal unity.
Corporate income tax is levied at the head of the fiscal unity on the basis of the fiscal results allocated by the members toSBM Offshore N.V., taking into account an allocation of the benefits of the fiscal unity to the different members. Thesettlement amount, if any, is equal to the corporate income tax charge included in the Company income statement.
SBM Offshore Amsterdam B.V. is an exception to this rule, as the entity is not entitled to the allocation of the benefits ofthefiscal unity, whereby the tax charge is included in its statutory income statement.
4.5.11 DIRECTORS REMUNERATION
For further details on the Directors remuneration, reference is made to note 4.3.6 Employee Benefit Expenses of theconsolidated financial statements.
4.5.12 NUMBER OF EMPLOYEES
The members of the Management Board are the only employees of SBM Offshore N.V.
4.5.13 INDEPENDENT AUDIT FEES
For the audit fees relating to the procedures applied to SBM Offshore N.V. and its consolidated group entities by accountingfirms and external independent auditors, reference is made to note 4.3.34 Independent Auditor’s Fees and Services of theconsolidated financial statements.
4 FINANCIAL STATEMENTS 2019

SBM OFFSHORE ANNUAL REPORT 2019 - 207
4.5.14 EVENTS AFTER END OF REPORTING PERIOD
DIVIDEND AND SHARE REPURCHASE PROGRAMThe Company’s dividend policy is to maintain a stable dividend, which grows over time. Determination of the dividend isbased on the Company’s assessment of its underlying cash flow position. As part of the Company’s regular planning process,following review of its cash flow position and forecast, the Company has concluded that the outlook for cash flow generationhas improved given the increase in the quantum of the backlog and its duration. Based on this, a dividend of US$150 million(which equals to US$0.76 per share, based on the number of shares outstanding at December 31, 2019), to be paid out ofretained earnings, will be proposed at the Annual General Meeting on April 8, 2020. This represents an increase of 100%compared to the dividend paid in 2019.
The Company has invested equity cash flow in projects which are under construction or recently completed. Most of thisequity investment will be returned to the Company following draw-down of project finance facilities in the near future. Afterhaving reviewed the current liquidity position including the return of this investment, taking account of future growthrequirements and the resulting cash flow outlook, the Company has determined that it currently has the capacity torepurchase shares. Consequently, on February 13, 2020 the Company will commence a EUR150 million share repurchaseprogram.
RCF EXTENSION OPTION EXERCISED BY THE COMPANYOn February 5, 2020, the lenders to the Company’s US$1 billion Revolving Credit Facility (RCF) agreed to the Company’srequest to exercise the first one-year extension option. The final maturity date of the RCF is thereby extended fromFebruary 12, 2024 to February 12, 2025. The Company has one additional one-year extension option remaining which can berequested 60 days prior to the second anniversary of the RCF.
Schiphol, the NetherlandsFebruary 12, 2020
Management BoardBruno Chabas, Chief Executive OfficerPhillippe Barril, Chief Operating OfficerErik Lagendijk, Chief Governance and Compliance OfficerDouglas Wood, Chief Financial Officer
Supervisory BoardFloris Deckers, ChairmanThomas Ehret, Vice-ChairmanRoeland BaanBernard BajoletFrancis GugenSietze HepkemaLaurence MulliezCheryl Richard

208 - SBM OFFSHORE ANNUAL REPORT 2019
4.6 OTHER INFORMATION
4.6.1 APPROPRIATION OF RESULT
ARTICLES OF ASSOCIATION GOVERNING PROFIT APPROPRIATIONWith regard to the appropriation of result, article 29 of the Articles of Association states:
1. When drawing up the annual accounts, the Management Board shall charge such sums for the depreciation ofSBM Offshore N.V.’s fixed assets and make such provisions for taxes and other purposes as shall be deemed advisable.
2. Any distribution of profits pursuant to the provisions of this article shall be made after the adoption of the annual accountsfrom which it appears that the same is permitted. SBM Offshore N.V. may make distributions to the shareholders and toother persons entitled to distributable profits only to the extent that its shareholders’ equity exceeds the sum of theamount of the paid and called up part of the capital and the reserves which must be maintained under the law. A deficitmay be offset against the statutory reserves only to the extent permitted by law.
3. a. The profit shall, if sufficient, be applied first in payment to the holders of protective preference shares of a percentageas specified in b. below of the compulsory amount due on these shares as at the commencement of the financial yearfor which the distribution is made.
b. The percentage referred to above in subparagraph a. shall be equal to the average of the Euribor interest charged forloans with a term of twelve (12) months − weighted by the number of days for which this interest was applicable −during the financial year for which the distribution is made, increased by two hundred (200) basis points.
c. If in the course of the financial year for which the distribution is made the compulsory amount to be paid on theprotective preference shares has been decreased or, pursuant to a resolution for additional payments, increased, thenthe distribution shall be decreased or, if possible, increased by an amount equal to the aforementioned percentage ofthe amount of the decrease or increase as the case may be, calculated from the date of the decrease or from the daywhen the additional payment became compulsory, as the case may be.
d. If in the course of any financial year protective preference shares have been issued, the dividend on protectivepreference shares for that financial year shall be decreased proportionately.
e. If the profit for a financial year is being determined and if in that financial year one or more protective preferenceshares have been cancelled with repayment or full repayment has taken place on protective preference shares, thepersons who according to the shareholders’ register referred to in article 12 at the time of such cancellation orrepayment were recorded as the holders of these protective preference shares, shall have an inalienable right to adistribution of profit as described hereinafter. The profit which, if sufficient, shall be distributed to such a person shallbe equal to the amount of the distribution to which he would be entitled pursuant to the provisions of this paragraph ifat the time of the determination of the profits he had still been the holder of the protective preference shares referredto above, calculated on a time-proportionate basis for the period during which he held protective preference shares inthat financial year, with a part of a month to be regarded as a full month. In respect of an amendment of the provisionslaid down in this paragraph, the reservation referred to in section 2: 122 of the Dutch Civil Code is hereby explicitlymade.
f. If in any one financial year the profit referred to above in subparagraph a. is not sufficient to make the distributionsreferred to in this article, then the provisions of this paragraph and those laid down hereinafter in this article shall in thesubsequent financial years not apply until the deficit has been made good.
g. Further payment out of the profits on the protective preference shares shall not take place.4. The Management Board is authorized, subject to the approval of the Supervisory Board, to determine each year what part
of the profits shall be transferred to the reserves, after the provisions of the preceding paragraph have been applied. 5. The residue of the profit shall be at the disposal of the General Meeting. 6. The General Meeting may only resolve to distribute any reserves upon the proposal of the Management Board, subject to
the approval of the Supervisory Board.
4 FINANCIAL STATEMENTS 2019
SBM OFFSHORE ANNUAL REPORT 2019 - 209
4.6.2 INDEPENDENT AUDITOR’S REPORT
To: the general meeting and Supervisory Board of SBM Offshore N.V.
Report on the financial statements 2019
Our opinion
In our opinion:■ the consolidated financial statements of SBM Offshore N.V. together with its subsidiaries (‘the Group’) give a true and fair
view of the financial position of the Group as at 31 December 2019 and of its result and cash flows for the year then endedin accordance with International Financial Reporting Standards as adopted by the European Union (EU-IFRS) and with Part9 of Book 2 of the Dutch Civil Code;
■ the company financial statements of SBM Offshore N.V. (‘the Company’) give a true and fair view of the financial position ofthe Company as at 31 December 2019 and of its result for the year then ended in accordance with Part 9 of Book 2 of theDutch Civil Code.
What we have audited
We have audited the financial statements 2019 of SBM Offshore N.V., Amsterdam, as included in sections 4.2 to 4.5. Thefinancial statements include the consolidated financial statements of the Group and the company financial statements.
The consolidated financial statements comprise:■ the consolidated statement of financial position as at 31 December 2019;■ the following statements for 2019: the consolidated income statement, the consolidated statements of comprehensive
income, changes in equity and cash flow; and■ the notes, comprising significant accounting policies and other explanatory information.
The company financial statements comprise:■ the company balance sheet as at 31 December 2019;■ the company income statement for the year then ended;■ the notes, comprising the accounting policies applied and other explanatory information.
The financial reporting framework applied in the preparation of the financial statements is EU-IFRS and the relevantprovisions of Part 9 of Book 2 of the Dutch Civil Code for the consolidated financial statements and Part 9 of Book 2 of theDutch Civil Code for the company financial statements.
The basis for our opinion
We conducted our audit in accordance with Dutch law, including the Dutch Standards on Auditing. We have furtherdescribed our responsibilities under those standards in the section ‘Our responsibilities for the audit of the financialstatements’ of our report.
We believe that the audit evidence we have obtained is sufficient and appropriate to provide a basis for our opinion.
Independence
We are independent of SBM Offshore N.V. in accordance with the European Union Regulation on specific requirementsregarding statutory audit of public-interest entities, the ‘Wet toezicht accountantsorganisaties’ (Wta, Audit firms supervisionact), the ‘Verordening inzake de onafhankelijkheid van accountants bij assuranceopdrachten’ (ViO, Code of Ethics forProfessional Accountants, a regulation with respect to independence) and other relevant independence requirements in theNetherlands. Furthermore, we have complied with the ‘Verordening gedrags- en beroepsregels accountants’ (VGBA, DutchCode of Ethics).
Our audit approach
Overview and context
SBM Offshore N.V. serves the offshore oil and gas industry by supplying engineered products, vessels and systems, as well asoffshore oil and gas production services. This includes the construction and the leasing and operating of large and complexoffshore floating production, storage and offloading vessels (FPSOs). The Group is comprised of several components and,therefore, we considered our group audit scope and approach as set out in the section ‘The scope of our group audit’. Wepaid specific attention to the areas of focus driven by the operations of the Group, as set out below.

210 - SBM OFFSHORE ANNUAL REPORT 2019
The Group has continued the construction of its large projects and has seen a further demand for its products and servicesduring the year. As a result of this increase in demand, the Group was awarded two additional lease and operate contractsfor FPSO in 2019, of which one already contributed to margin and both contributed to turnkey revenue in 2019. With theGroup’s growing turnkey activities significantly contributing to the Group’s results of operations and increasing the Group’sasset base, we continue to consider the estimates and judgements in construction contracts to be a key audit matter. Theincrease in results from the turnkey activities also led to a revision of the benchmark for materiality to profit before tax asdescribed in the section ‘Materiality’.
Due to the Group’s large asset base, the valuation of the Group’s assets remains an area of importance for the (consolidated)financial statements. Although the majority of the assets of the group are backed with long-term lease and operatecontracts, conditions such as performance or a failure of equipment can affect the profitability and valuation of these assets.Given the significant estimation uncertainty and the related higher risks in revenue recognition and valuation of constructionwork-in-progress, as well as the valuation uncertainty in property, plant and equipment, we considered these to be key auditmatters as set out in the section ‘Key audit matters’ of this report.
Lastly, in 2019 the Group has received the notification that the Federal Court has formally closed the improbity lawsuit filedby the Brazilian Federal Prosecutors Office (MPF). This effectuated the leniency agreement between the Group and the MPF,and as a result a portion of the final settlement of BRL 200 million has been paid. As a result of the formal closure of thelawsuit in 2019, we no longer considered this matter to be a key audit matter.
Other transactions and accounting matters that were not considered as key audit matters have also characterized the currentyear for the Group. This year, the Group has increased its shareholdings in five FPSOs by purchasing the minority share fromone of its partners through a public sale auction in Brazil. This transaction affected the Group’s equity attributable toshareholders of the parent company under IFRS and the Group’s results under its ‘directional reporting’, which is included inthe segment reporting of the financial statements. Other accounting matters, that were not considered to be key auditmatters, were the lease classification of awarded contracts, segment reporting disclosures, accounting for uncertain taxprovisions and other provisions. There were also internal control matters identified relating to the IT environment that werenot considered key audit matters.
As part of designing our audit, we determined materiality and assessed the risks of material misstatement in the financialstatements. In particular, we considered where the Management Board made important judgements. For example, weconsidered significant accounting estimates that involved making assumptions and considering future events that areinherently uncertain. In section 4.2.7 subsection ‘Use of estimates and judgement’ of the financial statements, the Groupdescribes the areas of judgement in applying accounting policies and the key sources of estimation uncertainty.
We ensured that the audit teams both at group and at component levels included the appropriate skills and competences,that are needed for the audit of a company providing floating production solutions to the offshore energy industry over thefull product life-cycle. We included members with relevant industry-expertise and specialists in the areas of IT and corporateincome tax, as well as experts in the areas of valuation and employee benefits, in our audit team. We also discussed thesettlement agreements reached in Brazil with forensics specialists.
The outline of our audit approach was as follows:
Materiality
Audit Scope
Key auditmatters
Materiality■ Overall materiality: US$27 million.
Audit scope■ We conducted audit work in three locations on four components.■ Site visits were conducted to Monaco and China.■ Audit coverage: 100% of consolidated revenue, 99% of consolidated total assets and
98% of consolidated profit before tax.
Key audit matters■ Estimates and judgements in construction contracts■ Valuation of property, plant and equipment
Materiality
The scope of our audit is influenced by the application of materiality, which is further explained in the section ‘Ourresponsibilities for the audit of the financial statements’.
Based on our professional judgement, we determined certain quantitative thresholds for materiality, including the overallmateriality for the financial statements as a whole as set out in the table below. These, together with qualitativeconsiderations, helped us to determine the nature, timing and extent of our audit procedures on the individual financialstatement line items and disclosures and to evaluate the effect of identified misstatements, both individually and inaggregate, on the financial statements as a whole and on our opinion.
4 FINANCIAL STATEMENTS 2019

SBM OFFSHORE ANNUAL REPORT 2019 - 211
Overall group materiality US$27 million (2017: US$21.24 million).
Basis for determiningmateriality
We used our professional judgement to determine overall materiality. As a basis for ourjudgement, we used 5% of profit before income tax.
Rationale for benchmarkapplied
We used this benchmark and the rule of thumb (%), based on our analysis of the commoninformation needs of users of the financial statements, including factors such as the headroomon covenants and the financial position of the Group. On this basis, we believe that profit beforeincome tax is an important metric for the financial performance of the Group.
The benchmark has changed from last year. In prior year we used net assets as a materialitybenchmark. Profit before tax was not considered an appropriate benchmark due to thedecreased turnkey activities of the Group. In the current year the Group has seen an increase inthe profit contribution of the turnkey segment to the financial results and position of the Group.As a result, we consider the benchmark of profit before tax for the current year appropriate.
Component materiality To each component in our audit scope, we, based on our judgement, allocated materiality thatis less than our overall group materiality. The range of materiality allocated across componentswas between US$11 million and US$20 million.
We also take misstatements and/or possible misstatements into account that, in our judgement, are material for qualitativereasons.
We agreed with the Supervisory Board that we would report to them misstatements identified during our audit above US$10million (2018: US$10 million) for balance sheet reclassifications and US$2 million for profit before tax impact (2018: US$2.1million) as well as misstatements below that amount that, in our view, warranted reporting for qualitative reasons in general.
The scope of our group audit
SBM Offshore N.V. is the parent company of a group of entities. The financial information of this group is included in theconsolidated financial statements of SBM Offshore N.V.
We tailored the scope of our audit to ensure that we, in aggregate, provide sufficient coverage of the financial statements forus to be able to give an opinion on the financial statements as a whole, taking into account the management structure of theGroup, the nature of operations of its components, the accounting processes and controls, and the markets in which thecomponents of the Group operate. In establishing the overall group audit strategy and plan, we determined the type of workrequired to be performed at component level by the group engagement team and by each component auditor.
The group audit focused on two significant components in Monaco (Turnkey as well as Operations), the treasury sharedservice center in Marly, and one other component (Group Corporate Departments). The Turnkey as well as Operationscomponents in Monaco were subject to audits of their complete financial information as those components are individuallysignificant to the Group.
The processes and financial statement line-items managed by the treasury function shared service center in Marly,Switzerland, were subject to specified audit procedures. Additionally, Group Corporate Departments was selected forspecified audit procedures to achieve appropriate coverage on financial statement line items in the consolidated financialstatements.
In total, in performing these procedures, we achieved the following coverage on the financial line items:
Revenue 100%
Total assets
Profit before tax
99%
98%
For the remaining components we performed, among other things, analytical procedures to corroborate our assessment thatthere were no significant risks of material misstatements within those components.
For the Group Corporate Departments component in Amsterdam, the group engagement team performed the audit work.For the components in Monaco and the treasury function shared service center in Marly, Switzerland, we used componentauditors who are familiar with the local laws and regulations to perform the audit work.
Where component auditors performed the work, we determined the level of involvement we needed to have in their auditwork to be able to conclude whether we had obtained sufficient and appropriate audit evidence as a basis for our opinion onthe consolidated financial statements as a whole.
We issued instructions to the component audit teams in our audit scope. These instructions included among others, our riskanalysis, materiality and scope of the work. We explained to the component audit teams the structure of the Group, the maindevelopments that are relevant for the component auditors, the risks identified, the materiality levels to be applied and ourglobal audit approach. We had individual calls with each of the in-scope component audit teams during the year and uponconclusion of their work. During these calls, we discussed the significant accounting and audit issues identified by thecomponent auditors, their reports, the findings of their procedures and other matters, which could be of relevance for theconsolidated financial statements.

212 - SBM OFFSHORE ANNUAL REPORT 2019
The group engagement team visits the component teams and local management on a rotational basis. In the current year,the group audit team visited the Turnkey as well as Operations components in Monaco given the importance of thesecomponents to the consolidated financial statements as a whole and the judgements involved in the estimates inconstruction contracts (refer to the respective key audit matter). In addition, the group audit team visited the SBM Offshorelocation in Shanghai, China, which is part of the Turnkey component. We have also visited a shipyard in Shanghai wheremulti-purpose hulls as used in the Company’s ‘Fast4ward’ projects are being constructed. For the components in Monacoand the treasury function shared service center in Marly, Switzerland, we reviewed selected working papers of the respectivecomponent auditors.
In addition to the work on the Group Corporate Departments component, the group engagement team performed the auditwork on the group consolidation, financial statement disclosures and a number of accounting matters at head office. Theseincluded impairment assessments, share-based payments, provisions for warranty obligations, taxes including deferred taxesand uncertain tax provisions and directional reporting as part of the segment reporting disclosures.
By performing the procedures above at components, combined with additional procedures at group level, we have beenable to obtain sufficient and appropriate audit evidence on the Company’s financial information as a whole to provide a basisfor our opinion on the financial statements.
Our focus on the risk of fraud and non-compliance with laws and regulations
Our objectives
The objectives of our audit with respect to fraud and non-compliance with laws and regulations are:
With respect to fraud:
■ to identify and assess the risks of material misstatement of the financial statements due to fraud;■ to obtain sufficient appropriate audit evidence regarding the assessed risks of material misstatement due to fraud, through
designing and implementing appropriate audit responses; and■ to respond appropriately to fraud or suspected fraud identified during the audit.
With respect to non-compliance with laws and regulations:
■ to identify and assess the risk of material misstatement of the financial statements due to non-compliance with laws andregulations; and
■ to obtain reasonable assurance that the financial statements, taken as a whole, are free from material misstatement,whether due to fraud or error when considering the applicable legal and regulatory framework.
The primary responsibility for the prevention and detection of fraud and non-compliance with laws and regulations lies withthe Management Board, with oversight by the Supervisory Board. We refer to chapter 3 of the Annual Report where theManagement Board included its fraud risk assessment and where the Supervisory Board reflects on this assessment.
Our risk assessment
As part of our process of identifying fraud risks, we evaluated fraud risk factors with respect to financial reporting fraud,misappropriation of assets and bribery and corruption. We, together with our forensics specialists, evaluated the fraud riskfactors to consider whether those factors indicated a risk of material misstatement due to fraud.
In addition, we performed procedures to obtain an understanding of the legal and regulatory frameworks that are applicablefor the Company. We identified provisions of those laws and regulations, generally recognized to have a direct effect on thedetermination of material amounts and disclosures in the financial statements such as the financial reporting framework, taxand pension laws and regulations as well as environmental regulations.
As in all of our audits, we addressed the risk of management override of internal controls, including evaluating whether therewas evidence of bias by management that may represent a risk of material misstatement due to fraud. We refer to the keyaudit matters ’Estimates and judgements in construction contracts’ and ’Valuation of property, plant and equipment’, thatare examples of our approach related to areas of higher risk due to accounting estimates where management makessignificant judgements.
Our response to the risks identified
We performed the following audit procedures (not limited) to respond to the assessed risks:
■ We evaluated the design and the implementation and, where considered appropriate, tested the operating effectivenessof internal controls that mitigate fraud risks. In case of internal control deficiencies, where we considered there would beopportunity for fraud, we performed supplemental detailed risk-based testing.
■ We performed data analysis of high-risk journal entries and evaluated key estimates and judgements for bias bySBM Offshore N.V., including retrospective reviews of prior year’s estimates. Where we identified instances of unexpectedjournal entries or other risks through our data analytics, we performed additional audit procedures to address eachidentified risk. These procedures also included testing of transactions back to source information.
■ Assessment of matters reported on the (Company’s) whistleblowing and complaints procedures with the entity and resultsof management’s investigation of such matters.
4 FINANCIAL STATEMENTS 2019

SBM OFFSHORE ANNUAL REPORT 2019 - 213
■ With respect to the risk of fraud in revenue recognition we refer to the key audit matter ’Estimates and judgements inconstruction contracts’. Further, we have performed audit procedures over the various other revenue streams of theCompany, such as the lease and operate revenues.
■ With respect to the risk of bribery and corruption across various countries, we evaluated the Company’s controls andprocedures such as due diligence procedures on third parties. We considered the possibility of fraudulent or corruptpayments made through third parties including agents and conducted detailed testing on third-party vendors in high-riskjurisdictions.
■ We incorporated elements of unpredictability in our audit.■ We considered the outcome of our other audit procedures and evaluated whether any findings or misstatements were
indicative of fraud. If so, we re-evaluated our assessment of fraud risk and its resulting impact on our audit procedures.■ We obtained audit evidence regarding compliance with the provisions of those laws and regulations generally recognized
to have a direct effect on the determination of material amounts and disclosures in the financial statements.■ As to the other laws and regulations, we inquired of the Management Board and/or the Supervisory Board as to whether
the entity is in compliance with such laws and regulations and inspected correspondence, if any, with relevant licensing andregulatory authorities.
Key audit matters
Key audit matters are those matters that, in our professional judgement, were of most significance in the audit of thefinancial statements. We have communicated the key audit matters to the Supervisory Board. The key audit matters are not acomprehensive reflection of all matters identified by our audit and that we discussed. In this section, we described the keyaudit matters and included a summary of the audit procedures we performed on those matters.
We addressed the key audit matters in the context of our audit of the financial statements as a whole, and in forming ouropinion thereon. We do not provide separate opinions on these matters or on specific elements of the financial statements.Any comment or observation we made on the results of our procedures should be read in this context.
As a result of the magnitude of the current projects undertaken by the Group and inherent estimation uncertainty wecontinue to consider ‘Estimates and judgements in construction contracts’ a key audit matter. The key audit matter ‘Valuationof property, plant and equipment’ is similar in nature to the key audit matter ‘Valuation of goodwill and non-current assets’we reported in 2018, the key audit matter changed since the identified risk is no longer related to goodwill and is insteadfocused on property, plant and equipment. The other key audit matter considered in the 2018 auditor’s report (‘Settlementagreements reached in Brazil’), in our opinion, does not longer warrant the classification of key audit matter in 2019, as theimprobity lawsuit was formally closed during the year.
Key audit matter Our audit work and observations
Estimates and judgements in construction contracts
Note 4.2.7, 4.3.3 and 4.3.20 to the consolidated financialstatements
The accounting for contracts with customers under IFRS 15‘Revenue from contracts with customers’ is complex and isdependent on the specific arrangements between the Groupand its clients as agreed upon in the contracts. Given theunique nature of each separate project and contract,management performed a contract analysis on a case-by-case basis to determine the applicable accounting forrevenues from construction contracts under IFRS 15.Significant management judgement is applied in identifyingthe performance obligations and determining whether theyare distinct, the method of revenue recognition as eitherpoint in time or over time, contract modifications andvariable consideration
We determined, based on reading the contracts with thecustomers, that the most critical and judgemental inputs andestimates to determine satisfaction of the performanceobligations over time is the estimate of the cost to completeand the measurement of progress towards completesatisfaction of the performance obligation, including theassessment of the remaining risks and contingencies that aproject is or could be facing.
Given the magnitude of the amounts involved (US$2,064million of turnkey revenue and US$973 million of constructionwork-in-progress), the complex nature of the Group’sconstruction contracts and the significant judgements andestimates, particularly these areas were subject to the risk of
We have read the relevant contracts. Based on our reading ofthe contracts, we considered whether the judgements madeby management on the accounting treatment and thecorresponding selection of the accounting treatment wereappropriate. We concur with the estimates and judgementsmade by management and the corresponding accountingtreatment in the consolidated financial statements.
We performed look-back procedures in respect of our riskassessment procedures by comparing the estimates includedin the current projects with past projects of similar nature asthis provides insight in the ability of management to providereliable estimates. We found no material deviations.
We gained an understanding, evaluated and tested thecontrols the Group designed and implemented over itsprocess to record costs and revenues relating to contracts.This includes project forecasting, measurement of theprogress towards complete satisfaction of the performanceobligation to determine the timing of revenue recognitionand the Group’s internal project reviews. We found thecontrols to be designed, implemented and operatingeffectively for the purpose of our audit.
We examined project documentation and challenged thestatus, progress and forecasts of projects under constructionand discussed those with management, Finance andtechnical staff of the Group. We evaluated and substantiatedthe outcome of these discussions by examining modifications

214 - SBM OFFSHORE ANNUAL REPORT 2019
Key audit matter Our audit work and observations
misstatement related to either error or fraud. We thereforeconsidered this area to be a key audit matter.
of contracts such as claims and variation orders between theGroup, subcontractors and clients and responses thereto,performing procedures such as a detailed evaluation offorecasts and ongoing assessment of management’sjudgement on issues, evaluation of budget variances andobtaining corroborating evidence, evaluation of projectcontingencies and milestones and recalculation of theprogress towards complete satisfaction of the performanceobligation. In addition, we evaluated management bias.
Our audit procedures did not indicate material findings withrespect to the estimates and judgements in constructioncontracts.
Valuation of property, plant and equipmentNotes 4.2.7 and 4.3.13 to the consolidated financialstatements
Property, plant and equipment are subject to an impairmenttest when triggering events are identified. Impairments arerecognized when the carrying value is higher than therecoverable amounts. The recoverable amounts of the cash-generating units (‘CGUs’) have been determined based onvalue-in-use calculations based on expected future cash flowsfrom those CGUs.
In particular, we focused our audit procedures on theidentification of triggering events and instances wheretriggering events occurred. In those cases managementprepared an updated value-in-use calculation, for instancerelated to the Thunder Hawk semi-submersible productionunit, which led to an impairment charge of US$16 million inthe current year following an update of the unit’s productionprofile (Thunder Hawk is the only facility in the Group leasefleet portfolio for which revenues are linked to volumesproduced). We also noted a triggering event for DeepPanuke, which resulted in an impairment of US$9 million.
We determined the valuation of property, plant andequipment to be a key audit matter, due to the aggregatesize of these assets and because in case of a triggering event,management’s determination of the recoverable valuesincludes a variety of significant assumptions, such as internaland external factors with respect to the future level andresults of the business and the discount rates applied to theforecasted cash flows. Therefore, this area is particularlysubject to the risk of misstatement either due to error orfraud.
We have discussed and reviewed the triggering eventanalysis of management. Based on this analysis, managementdid not identify any triggering events for impairment, otherthan the triggering event relating to the Thunder Hawk semi-submersible production unit and the Deep Panuke MOPU.
We evaluated whether management’s triggering eventanalysis identified all relevant CGU’s and the completeness offactors included in the analysis. These included among otherscontractual arrangements, operational performance, financialperformance and changes in discount rates. We challengedthese aspects and with the assistance of our valuationexperts, we independently calculated the discount rates. Incalculating the discount rates, the key inputs used wereindependently sourced from market data and comparablecompanies. We compared the discount rates determined bymanagement to our independently calculated rates. Basedon the sensitivity analysis, we found the discount rates usedby management to be within an acceptable range. Weconcur with management’s conclusions on the triggeringevents for impairment.
In relation to the determination of the recoverable value ofthe impaired assets, we considered the prior year forecast todetermine whether this forecast included assumptions that,with hindsight, had been too optimistic. We performed auditprocedures on management’s inputs and assumptions suchas prospective financial information based on the approvedbudget, externally sourced production profile forecasts,contractually agreed rates and operating costs. Wereconciled the carrying amount of the CGU with the amountsas included in the (consolidated) financial statements. Wehave re-performed calculations and compared theimpairment models with generally accepted valuationtechniques. We further evaluated the adequacy of thedisclosure of the key assumptions and sensitivities underlyingthe tests, as well as management bias.
As a result of our audit procedures, we found theassumptions to be reasonable and supported by theavailable evidence. Our procedures did not identify materialomissions in the disclosures in the financial statements.
4 FINANCIAL STATEMENTS 2019

SBM OFFSHORE ANNUAL REPORT 2019 - 215
Report on the other information included in the Annual Report
In addition to the financial statements and our auditor’s report thereon, the Annual Report contains other information thatconsists of:■ the director’s report comprising of chapters ‘ 1 At a Glance ’, ‘ 2 Strategy and Performance ’, ‘ 3 Governance ’ (with the
exception of section 3.4 Remuneration Report ), ‘ 4.1 Financial Review ’, and ‘ 5.3 Non-Financial Indicators ’ of the AnnualReport;
■ the other information pursuant to article 392.1 Part 9 of Book 2 of the Dutch Civil Code as included in section 4.6.1 of theAnnual Report;
■ the chapters ‘ 3.4 Remuneration Report ’, ‘ 4.7 Key Figures ’, ‘ 5 Non-Financial Data ’ (with the exception of section 5.3Non-Financial Indicators ) and ‘ 6 Other Information ’ of the Annual Report
Based on the procedures performed as set out below, we conclude that the other information:■ is consistent with the financial statements and does not contain material misstatements;■ contains the information that is required by Part 9 of Book 2 of the Dutch Civil Code.
We have read the other information. Based on our knowledge and understanding obtained in our audit of the financialstatements or otherwise, we have considered whether the other information contains material misstatements.
By performing our procedures, we comply with the requirements of Part 9 of Book 2 of the Dutch Civil Code and the DutchStandard 720. The scope of such procedures was substantially less than the scope of those performed in our audit of thefinancial statements.
The Management Board is responsible for the preparation of the other information, including the directors’ report and theother information in accordance with Part 9 of Book 2 of the Dutch Civil Code.
Report on other legal and regulatory requirements
Our appointment
We were nominated as auditors of SBM Offshore N.V. on 13 November 2013 by the Supervisory Board and appointedthrough the passing of a resolution by the shareholders at the annual meeting held on 17 April 2014. Our appointment hasbeen renewed on 11 April 2018 for a period of three years by the shareholders. Our appointment represents a total period ofuninterrupted engagement of six years.
No prohibited non-audit services
To the best of our knowledge and belief, we have not provided prohibited non-audit services as referred to in Article 5(1) ofthe European Regulation on specific requirements regarding the statutory audit of public-interest entities.
Services rendered
The services, in addition to the audit, that we have provided to the Company and its controlled entities, for the period towhich our statutory audit relates, are disclosed in note 4.3.34 to the financial statements.
Responsibilities for the financial statements and the audit
Responsibilities of the Management Board and the Supervisory Board for the financial statements
The Management Board is responsible for:■ the preparation and fair presentation of the financial statements in accordance with EU-IFRS and with Part 9 of Book 2 of
the Dutch Civil Code; and for■ such internal control as the Management Board determines is necessary to enable the preparation of the financial
statements that are free from material misstatement, whether due to fraud or error.
As part of the preparation of the financial statements, the Management Board is responsible for assessing the Company’sability to continue as a going concern. Based on the financial reporting frameworks mentioned, the Management Boardshould prepare the financial statements using the going-concern basis of accounting unless the Management Board eitherintends to liquidate the Company or to cease operations, or has no realistic alternative but to do so. The Management Boardshould disclose events and circumstances that may cast significant doubt on the Company’s ability to continue as a goingconcern in the financial statements.
The Supervisory Board is responsible for overseeing the Company’s financial reporting process.

216 - SBM OFFSHORE ANNUAL REPORT 2019
Our responsibilities for the audit of the financial statements
Our responsibility is to plan and perform an audit engagement in a manner that allows us to obtain sufficient andappropriate audit evidence to provide a basis for our opinion. Our objectives are to obtain reasonable assurance aboutwhether the financial statements as a whole are free from material misstatement, whether due to fraud or error and to issuean auditor’s report that includes our opinion. Reasonable assurance is a high but not absolute level of assurance, whichmakes it possible that we may not detect all material misstatements. Misstatements may arise due to fraud or error. They areconsidered to be material if, individually or in the aggregate, they could reasonably be expected to influence the economicdecisions of users taken on the basis of the financial statements.
Materiality affects the nature, timing and extent of our audit procedures and the evaluation of the effect of identifiedmisstatements on our opinion.
A more detailed description of our responsibilities is set out in the appendix to our report.
Amsterdam, 12 February 2020PricewaterhouseCoopers Accountants N.V.
M. de Ridder RA
4 FINANCIAL STATEMENTS 2019

SBM OFFSHORE ANNUAL REPORT 2019 - 217
Appendix to our auditor’s report on the financial statements 2019 of SBM Offshore N.V.
In addition to what is included in our auditor’s report, we have further set out in this appendix our responsibilities for theaudit of the financial statements and explained what an audit involves.
The auditor’s responsibilities for the audit of the financial statements
We have exercised professional judgement and have maintained professional skepticism throughout the audit in accordancewith Dutch Standards on Auditing, ethical requirements and independence requirements. Our audit consisted, among otherthings of the following:■ Identifying and assessing the risks of material misstatement of the financial statements, whether due to fraud or error,
designing and performing audit procedures responsive to those risks, and obtaining audit evidence that is sufficient andappropriate to provide a basis for our opinion. The risk of not detecting a material misstatement resulting from fraud ishigher than for one resulting from error, as fraud may involve collusion, forgery, intentional omissions, misrepresentations,or the intentional override of internal control.
■ Obtaining an understanding of internal control relevant to the audit in order to design audit procedures that areappropriate in the circumstances, but not for the purpose of expressing an opinion on the effectiveness of the Company’sinternal control.
■ Evaluating the appropriateness of accounting policies used and the reasonableness of accounting estimates and relateddisclosures made by the Management Board.
■ Concluding on the appropriateness of the Management Board’s use of the going-concern basis of accounting, and basedon the audit evidence obtained, concluding whether a material uncertainty exists related to events and/or conditions thatmay cast significant doubt on the Company’s ability to continue as a going concern. If we conclude that a materialuncertainty exists, we are required to draw attention in our auditor’s report to the related disclosures in the financialstatements or, if such disclosures are inadequate, to modify our opinion. Our conclusions are based on the audit evidenceobtained up to the date of our auditor’s report and are made in the context of our opinion on the financial statements as awhole. However, future events or conditions may cause the Company to cease to continue as a going concern.
■ Evaluating the overall presentation, structure and content of the financial statements, including the disclosures, andevaluating whether the financial statements represent the underlying transactions and events in a manner that achieves fairpresentation.
Considering our ultimate responsibility for the opinion on the consolidated financial statements, we are responsible for thedirection, supervision and performance of the group audit. In this context, we have determined the nature and extent of theaudit procedures for components of the Group to ensure that we performed enough work to be able to give an opinion onthe financial statements as a whole. Determining factors are the geographic structure of the Group, the significance and/orrisk profile of group entities or activities, the accounting processes and controls, and the industry in which the Groupoperates. On this basis, we selected group entities for which an audit or review of financial information or specific balanceswas considered necessary.
We communicate with the Supervisory Board regarding, among other matters, the planned scope and timing of the auditand significant audit findings, including any significant deficiencies in internal control that we identify during our audit. In thisrespect, we also issue an additional report to the audit committee in accordance with Article 11 of the EU Regulation onspecific requirements regarding the statutory audit of public-interest entities. The information included in this additionalreport is consistent with our audit opinion in this auditor’s report.
We provide the Supervisory Board with a statement that we have complied with relevant ethical requirements regardingindependence, and to communicate with them all relationships and other matters that may reasonably be thought to bearon our independence, and where applicable, related safeguards.
From the matters communicated with the Supervisory Board, we determine those matters that were of most significance inthe audit of the financial statements of the current period and are therefore the key audit matters. We describe these mattersin our auditor’s report unless law or regulation precludes public disclosure about the matter or when, in extremely rarecircumstances, not communicating the matter is in the public interest.
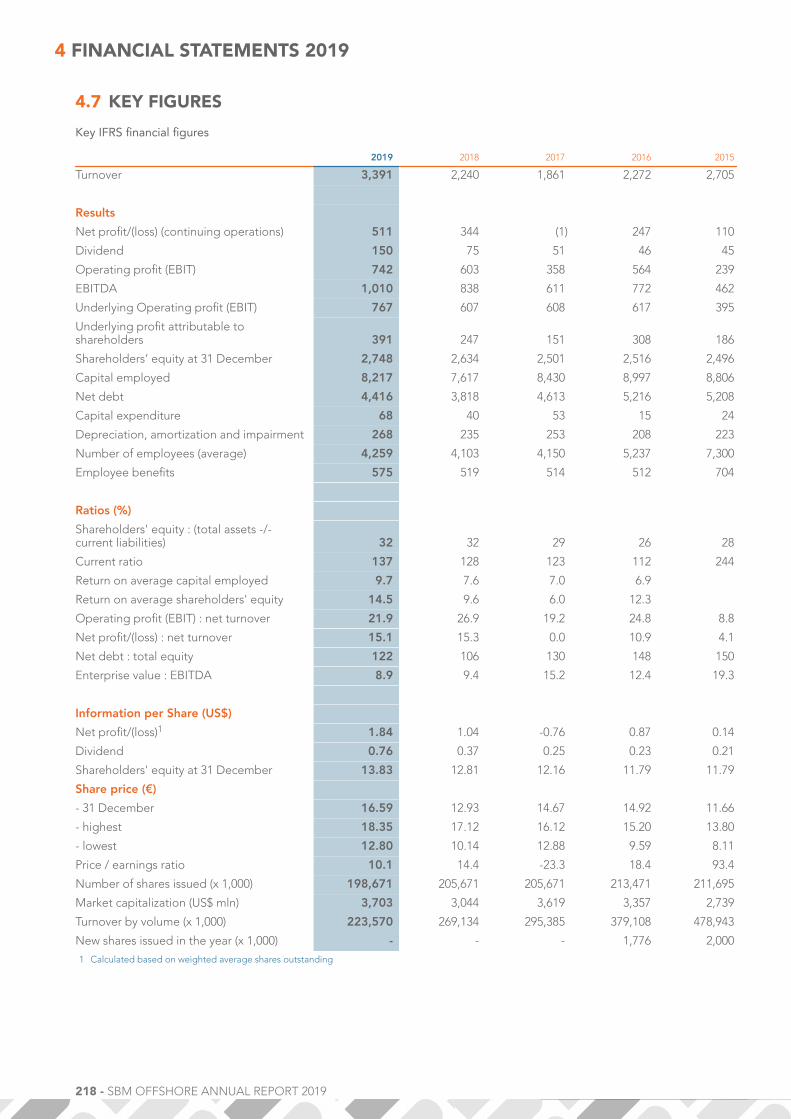
218 - SBM OFFSHORE ANNUAL REPORT 2019
4.7 KEY FIGURES
Key IFRS financial figures
2019 2018 2017 2016 2015
Turnover 3,391 2,240 1,861 2,272 2,705
Results
Net profit/(loss) (continuing operations) 511 344 (1) 247 110
Dividend 150 75 51 46 45
Operating profit (EBIT) 742 603 358 564 239
EBITDA 1,010 838 611 772 462
Underlying Operating profit (EBIT) 767 607 608 617 395
Underlying profit attributable toshareholders 391 247 151 308 186
Shareholders’ equity at 31 December 2,748 2,634 2,501 2,516 2,496
Capital employed 8,217 7,617 8,430 8,997 8,806
Net debt 4,416 3,818 4,613 5,216 5,208
Capital expenditure 68 40 53 15 24
Depreciation, amortization and impairment 268 235 253 208 223
Number of employees (average) 4,259 4,103 4,150 5,237 7,300
Employee benefits 575 519 514 512 704
Ratios (%)
Shareholders' equity : (total assets -/-current liabilities) 32 32 29 26 28
Current ratio 137 128 123 112 244
Return on average capital employed 9.7 7.6 7.0 6.9
Return on average shareholders' equity 14.5 9.6 6.0 12.3
Operating profit (EBIT) : net turnover 21.9 26.9 19.2 24.8 8.8
Net profit/(loss) : net turnover 15.1 15.3 0.0 10.9 4.1
Net debt : total equity 122 106 130 148 150
Enterprise value : EBITDA 8.9 9.4 15.2 12.4 19.3
Information per Share (US$)
Net profit/(loss)1 1.84 1.04 -0.76 0.87 0.14
Dividend 0.76 0.37 0.25 0.23 0.21
Shareholders' equity at 31 December 13.83 12.81 12.16 11.79 11.79
Share price (€)
- 31 December 16.59 12.93 14.67 14.92 11.66
- highest 18.35 17.12 16.12 15.20 13.80
- lowest 12.80 10.14 12.88 9.59 8.11
Price / earnings ratio 10.1 14.4 -23.3 18.4 93.4
Number of shares issued (x 1,000) 198,671 205,671 205,671 213,471 211,695
Market capitalization (US$ mln) 3,703 3,044 3,619 3,357 2,739
Turnover by volume (x 1,000) 223,570 269,134 295,385 379,108 478,943
New shares issued in the year (x 1,000) - - - 1,776 2,000
1 Calculated based on weighted average shares outstanding
4 FINANCIAL STATEMENTS 2019

SBM OFFSHORE ANNUAL REPORT 2019 - 219
Key Directional financial figures
2019 2018 2017 2016 2015
Turnover 2,171 1,703 1,676 2,013 2,618
Lease and Operate 1,315 1,298 1,501 1,310 1,105
Turnkey 856 406 175 702 1,512
EBIT 418 533 117 290 191
Lease and Operate 369 418 487 398 315
Turnkey 25 225 11 (22) 231
Other 23 (109) (381) (86) (354)
EBITDA 921 995 596 725 561
Net Profit 235 301 (203) (5) 24