annual report 2018 - nimir.com.pk · 2 nimir industrial chemicals ltd. company information board of...
TRANSCRIPT

Annual Report 2018

Annual Report 2018 1
01 –– Corporate Data
02 Company Information
03 Vision and Mission Statement
04 Chairman’s Message
05 CEO’s Message
06 –– Accreditations & Core Business
07 Core Business at a Glance
08 –– Our Performance
09 Year at a Glance
10 Horizontal & Vertical Analysis
12 Wealth Generated and Distributed
13 Key Operating & Financial Data
14 –– Directors’ Report
19 –– Statement of Compliance CCG
21 –– Financial Statements - Standalone
22 Review Report from Auditors’ CCG
23 Independent Auditors’ Report
26 Statement Of Financial Position
32 Notes to the Financial Statements
58 –– Financial Statements - Consolidated
59 Directors’ Report
61 Independent Auditors’ Report
64 Statement Of Financial Position
70 Notes to the Financial Statements
101 –– Pattern of Shareholding
104–– Notice of Annual General Meeting
Form of Proxy
Table of Contents

Nimir Industrial Chemicals Ltd.2
COMPANY INFORMATION
Board of DirectorsMr. Abdul Jalil Jamil - ChairmanMr. Zafar Mahmood - Chief Executive OfficerMr. M. Saeed-uz-ZamanMr. Imran Afzal Mr. Aamir Jamil Mr. Javed Saleem Arif Mr. Muhammad Yahya Khan Mr. Mohsin Tariq Mr. Saqib Raza Mr. Abdul Jaleel Shaikh (Nominee - Pak Brunei Investment Company Limited)
Executive ManagementMr. Zafar MahmoodMr. Khalid Mumtaz QaziMr. Imran AfzalMr. Umar IqbalMr. Aamir Jamil
Chief Financial OfficerMr. Aamir Jamil
Company SecretaryMr. Muhammad Inam-ur-Rahim
Head of Internal AuditMr. Nabeel Ahmad Khan
Audit CommitteeMr. Javed Saleem Arif - ChairmanMr. M. Saeed-uz-Zaman - Member Mr. Abdul Jaleel Shaikh - Member
Human Resource & Remuneration CommitteeMr. M. Saeed-uz-Zaman - ChairmanMr. Muhammad Yahya Khan - MemberMr. Zafar Mahmood - Member
External AuditorsEY Ford RhodesChartered Accountants
Legal AdvisorCornelius, Lane & MuftiAdvocates & Solicitors
Shares’ RegistrarCorplink (Pvt.) LimitedWings Arcade, 1-K (Commercial),Model Town, Lahore.Tel: +92 42 35916714 & 19Fax: +92 42 35869037www.corplink.com.pk
BankersThe Bank of PunjabHabib Bank LimitedStandard Chartered Bank (Pakistan) LimitedSamba Bank LimitedPak Brunei Investment Company LimitedSoneri Bank LimitedAskari Bank LimitedNational Bank of PakistanMCB Bank Limited
Al Baraka Bank (Pakistan) LimitedMeezan Bank Limited
Registered Office / Factory14.8 km., Sheikhupura-Faisalabad Road,Bhikhi, District Sheikhupura, Pakistan.Tel: +92 56 3883001-7Fax: +92 56 3883010Cell: +92 301-8221151, 301-8483950
Lahore Office12-B, New Muslim Town,Lahore, Pakistan.Tel: +92 42 35926090-93Fax: +92 42 35926099 Web Sitewww.nimir.com.pk

Annual Report 2018 3
Our VisionTo become an industry leader through a persistent commitment to customer focus, technical innovation, managerial excellence, entrepreneurial spirit and social responsibility.
Our MissionTo deliver unparalleled value to stakeholders and continually striving to exceed customer expectations by developing innovative industrial chemical solutions with special emphasis on workforce, health, safety, environment and contribution to the national economic development.

Nimir Industrial Chemicals Ltd.4
CHAIRMAN’S MESSAGEThrough FY2017-2018, the GDP growth rate has been 5.8% (0.4% higher than last year), witnessed due to a significant growth of the manufacturing industry and other sectors, which have been fuelled by massive CPEC investments, improvement in security and increased power supply. However, FY2017-2018 has also been a year of challenges for the manufacturing sector. Devaluation of PKR, increase in interest rates and high trade deficit have resulted in a higher cost of production, which has negatively impacted the growth of various industries nationwide.
The new Government is forming strategies and policies to curb imports, boost exports to immediately improve the balance of payment and is focused on bringing financial discipline to the nation. This will also have a positive impact on the local industry.
The FMCG industry showed significant improvement as a result of continued national economic growth. Your company, taking advantage of this economic and industrial growth exceeded the sales and profitability of all previous years. The consolidated sales turnover grew by 57% and crossed the Rupees Fifteen Billion mark.
In other developments, the company enhanced its production capacities and improved its efficiencies after achieving international economies of scale.
It is the constant dedication of the management team and staff at Nimir Industrial Chemicals Limited that has led the company to becoming one of the fastest growing companies in Pakistan’s Chemicals Sector.
I wish them all the success and Allah’s blessings in meeting new challenges.
Abdul Jalil JamilChairman

Annual Report 2018 5
It is with great pleasure and pride that I report, FY 2018 has been completed with a series of milestones for the company. We crossed the Rs.15 billion mark in consolidated sales turnover and earned consolidated net profit of Rs. 0.8 billion during the year. Overall we have been successful to post a robust 57% growth in the company’s consolidated top and bottom line.
With incessant efforts of our team, the plant up-gradation and expansion has been successfully commissioned, which contributed towards higher production and improvement in efficiencies. As a result, the standalone sale revenue of the company grew to over Rs.12 billion (up by 65%) and net profit of the company grew to Rs.695 million (up by 48%). Consequently, the company declared 30% cash dividend to its shareholders for the FY 2018.
In our quest to advance and improve our services for our customers, we left no stone unturned. We set up a soap finishing facility a few years back. Upon receiving an overwhelmingly favorable feedback from our customers, we have decided to expand this facility. Furthermore, we have been a small player in chlor alkali (caustic soda) business. Currently we are consuming caustic soda in-house and selling by-products in the market. Having gauged the untapped potential in the market, we wish to engage in the ambitious task of selling additional volumes. Taking advantage of the basic available infrastructure, we have initiated the process of expanding the capacity of our chlor alkali plant. Since we are self-reliant in energy, additional power required for the expanded chlor alkali plant will be arranged through increasing the power generation capacity.
Besides these achievements, the company will continue to strive to improve its quality assurance and compliance capabilities. The Company will also continue its trend of investing in innovative and sustainable technologies, enabling it to cement its reputation as a market leader.
Once again, I would like to thank our staff and the management team for their tireless efforts, without which none of this success would be possible.
Zafar MahmoodChief Executive Officer
CEO’S MESSAGE

Nimir Industrial Chemicals Ltd.6
RSPORoundtable on Sustainable Palm Oi l
ACCREDITATIONS
Sedex is a not for profit membership organisation dedicated to driving
improvements in ethical and responsible business practices in global
supply chains.
The Roundtable on Sustainable Palm Oil (RSPO) was established in 2004
with the objective of promoting the growth and use of sustainable oil
palm products through credible global standards and engagement of
stakeholders.
Good Manufacturing Practices (GMP) in accordance with
ISO 22716 : 2007 - Guidelines for Cosmetics

Annual Report 2018 7
CORE BUSINESS AT A GLANCE
• Soap noodles
• Stearic Acid
• Glycerine
• Toilet soap
• Tyre and Rubber• Textile Softener• Metal Polishing• Plastic• Cosmetics• Soap
• Pharmaceutical
• Alkyd Resin
• Tobacco
• Cosmetics
• Textile Sector
• Cleaning & Bleaching
• Steel
• Third party toilet soap
finishing and packing facility
Distilled FattyAcid / OleoChemicals
Soap Noodles(Palm Bright)
Stearic Acid(Double & Triple Press)
Glycerine
Caustic Soda
SodiumHypochlorite
Hydrochloric Acid
Soap Bars

Nimir Industrial Chemicals Ltd.8
2013 2014 2015 2016 2017 2018 Rupees in million Sales - net 3,002 3,332 3,663 5,011 7,369 12,154 Gross Profit 503 513 561 972 1,065 1,613 Profit before taxation 233 259 294 603 701 887 Long term loans and leases 139 276 166 348 354 480 Equity 1,264 1,459 1,681 1,788 2,144 2,615 Number of Shares (in Million) 111 111 111 111 111 111 Breakup value per share - Rupee 11.4 13.2 15.2 16.2 19.4 23.6 Earning per share - Rupee 1.2 1.8 2.0 4.0 4.3 6.3
OUR PERFORMANCE

Annual Report 2018 9
YEAR AT A GLANCE 2018 2018 2017
Rupees in million
Performance Parameters
Net Sales 12,154 7,369
Gross Profit 1,613 1,065
Operating Profit 1,295 835
Profit before taxation 887 701
Net Profit for the year 696 471
Net Worth 2,615 2,144
Long Term Loans and Leases 480 354
Total Assets 7,588 5,474
Breakup value per share - Rupee 23.6 19.4
Earning per share - Rupee 6.3 4.3
Financial Highlights
Net Profit
Net Worth
Gross Profit
Break-up Value Per Share
Opertaing Profit
Earning Per Share
48%
22% 22% 48%
51% 55%
Up by
Up by Up by Up by
Up by Up by

Nimir Industrial Chemicals Ltd.10
2013 2014 2015 2016 2017 2018
Rupees in million
STATEMENT OF FINANCIAL POSITION
Non Current Assets 1,143 1,583 1,659 2,063 2,548 2,862
Current Assets 1,043 1,040 1,494 1,966 2,926 4,726
TOTAL ASSETS 2,185 2,623 3,153 4,029 5,474 7,588
Share Capital and Reserves 1,265 1,459 1,681 1,788 2,144 2,615
Non Current Liabilities 174 318 273 458 567 699
Current Liabilities 747 846 1,199 1,784 2,763 4,274
TOTAL EQUITY AND LIABILITIES 2,185 2,623 3,153 4,029 5,474 7,588
PROFIT OR LOSS ACCOUNT
Sales- Net 3,002 3,332 3,663 5,011 7,369 12,154
Cost of Sales 2,499 2,819 3,103 4,039 6,304 10,542
Gross Profit 503 513 561 972 1,065 1,613
Distribution & Administration Cost 137 145 149 207 230 317
Operating Profit 366 368 412 765 835 1,295
Other Expenses/ (Income) 26 25 4 47 (11) 115
Finance Cost 97 81 106 91 135 204
Foreign Exchange Loss 11 3 8 24 10 89
Profit before Taxation 233 259 294 603 701 887
Taxation 105 65 72 163 229 192
Other Comprehensive Loss 1 0.2 0.2 2 4 4
Net Comprehensive income for the Year 126 194 222 439 467 692
HORIZONTAL & VERTICAL ANALYSIS

Annual Report 2018 11
Horizontal Analysis Vertical Analysis
2013 2014 2015 2016 2017 2018 2013 2014 2015 2016 2017 2018
percentage change from last year percentage
(5.78) 38.52 4.79 24.35 23.52 12.34 52.30 60.36 52.61 51.19 46.54 37.72
38.61 (0.27) 43.69 31.62 48.82 61.50 47.70 39.64 47.39 48.81 53.46 62.28
11.21 20.01 20.21 27.79 35.87 38.62 100.00 100.00 100.00 100.00 100.00 100.00
11.19 15.37 15.19 6.38 19.94 21.94 57.87 55.63 53.31 44.37 39.17 34.46
(24.72) 82.72 (13.88) 67.37 23.88 23.30 7.95 12.11 8.67 11.36 10.36 9.21
25.15 13.29 41.66 48.79 54.92 54.70 34.18 32.26 38.02 44.27 50.47 56.33
11.21 20.01 20.21 27.79 35.87 38.62 100.00 100.00 100.00 100.00 100.00 100.00
12.13 10.97 9.96 36.78 47.06 64.94 100.00 100.00 100.00 100.00 100.00 100.00
7.26 12.79 10.07 30.18 56.08 67.22 83.24 84.61 84.69 80.60 85.55 86.73
44.78 1.94 9.35 73.30 9.58 51.40 16.76 15.39 15.31 19.40 14.45 13.27
29.24 5.86 2.65 39.22 11.23 37.67 4.56 4.35 4.06 4.13 3.13 2.61
51.60 0.48 11.99 85.61 9.13 55.19 12.20 11.04 11.25 15.26 11.33 10.66
32,542.5 (5.29) (85.11) 1,170.9 (124.4) (1,108.4) 0.87 0.74 0.10 0.93 (0.16) 0.95
(15.31) (16.82) 31.98 (14.87) 49.61 50.82 3.23 2.42 2.90 1.81 1.84 1.68
(24.59) (68.55) 131.24 210.31 (59.42) 805.14 0.36 0.10 0.21 0.48 0.13 0.73
105.92 11.50 13.49 105.04 16.15 26.58 7.75 7.78 8.03 12.04 9.51 7.30
(188.64) (38.48) 12.13 124.52 40.94 (16.48) 3.50 1.94 1.98 3.25 3.11 1.58
- (76.83) (22.54) 782.01 162.33 (12.63) 0.04 0.01 0.01 0.03 0.06 0.03
(45.40) 53.81 13.99 98.09 6.41 48.10 4.21 5.83 6.05 8.76 6.34 5.69

Nimir Industrial Chemicals Ltd.12
2018 Rupees in million Percentage Wealth Generated Sales with sales Tax 14,222 99.9% Other income 17 0.1% 14,239 100.0% Distribution of Wealth Cost of materials & services 9,837 69.0% Duties & taxes 3,037 21.3% Employees 380 2.7% Finance cost 293 2.1% Dividend 221 1.6% Wealth retained 471 3.3% 14,239 100.0%
WEALTH GENERATED AND DISTRIBUTEDFOR THE YEAR ENDED JUNE 2018
Wealth retained3.3%
Dividend1.6%
Cost of materials& services
69.0%
Employees2.7%
Duties & taxes21.3%
Finance cost2.1%

Annual Report 2018 13
KEY OPERATING & FINANCIAL DATA FOR LAST SIX YEARS 2013 2014 2015 2016 2017 2018
Rupees in million
Net Sales 3,002 3,332 3,663 5,011 7,369 12,154
Gross Profit 503 513 561 972 1,065 1,613
Operating Profit 366 368 412 765 835 1,295
Profit before taxation 233 259 294 603 701 887
Profit after taxation 127 195 222 441 471 696
Paid-up Capital 1,106 1,106 1,106 1,106 1,106 1,106
Net Worth 1,265 1,459 1,681 1,788 2,144 2,615
Long Term Loans and Leases 139 276 166 348 354 480
Current Liabilities 747 846 1,199 1,784 2,763 4,274
Current Assets 1,043 1,040 1,494 1,966 2,926 4,726
Total Assets 2,185 2,623 3,153 4,029 5,474 7,588
Breakup value per share - Rupee 11.4 13.2 15.2 16.2 19.4 23.6
Earning per share - Rupee 1.2 1.8 2.0 4.0 4.3 6.3
Current Ratio 1.4 : 1 1.23 : 1 1.25 : 1 1.1 : 1 1.06 : 1 1.11 : 1
Lont Terms Debt to Equity Ratio 10 : 90 16 : 84 9 : 91 16 : 84 14 : 86 16 : 84
Interest Coverage Ratio 3.40 4.22 3.77 7.67 6.17 5.34
Nimir Industrial Chemicals Ltd.14
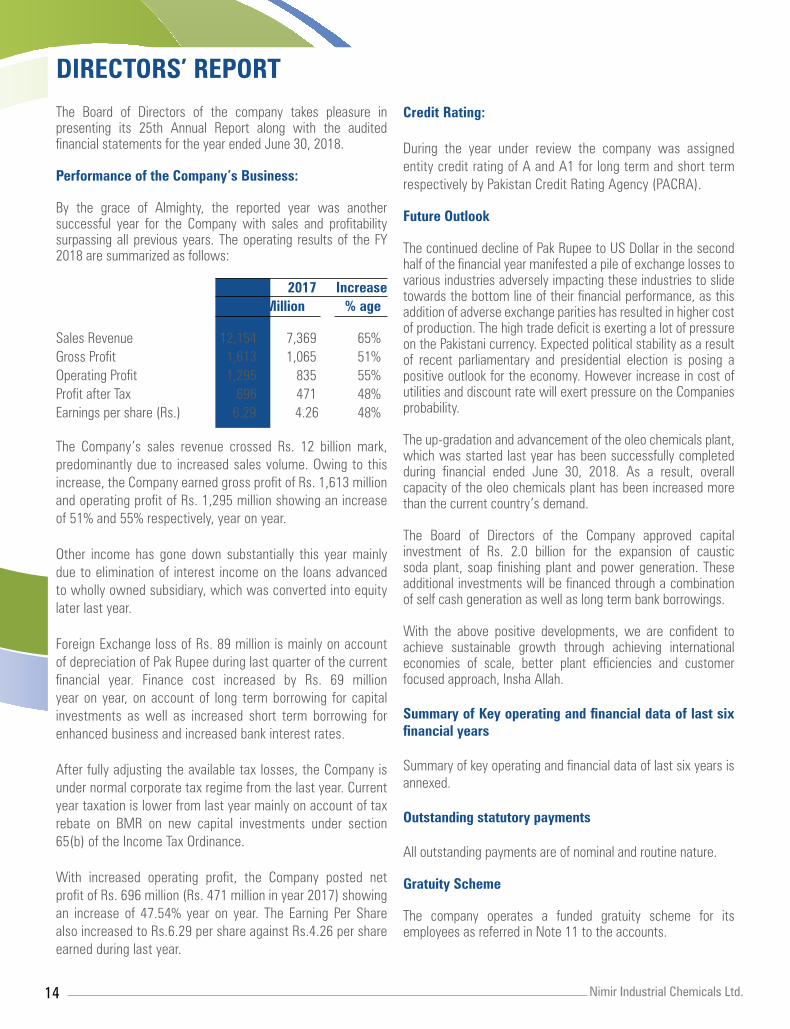
DIRECTORS’ REPORT The Board of Directors of the company takes pleasure in presenting its 25th Annual Report along with the audited financial statements for the year ended June 30, 2018.
Performance of the Company’s Business:
By the grace of Almighty, the reported year was another successful year for the Company with sales and profitability surpassing all previous years. The operating results of the FY 2018 are summarized as follows: 2018 2017 Increase PKR Million % age
Sales Revenue 12,154 7,369 65%Gross Profit 1,613 1,065 51%Operating Profit 1,295 835 55%Profit after Tax 696 471 48%Earnings per share (Rs.) 6.29 4.26 48%
The Company’s sales revenue crossed Rs. 12 billion mark, predominantly due to increased sales volume. Owing to this increase, the Company earned gross profit of Rs. 1,613 million and operating profit of Rs. 1,295 million showing an increase of 51% and 55% respectively, year on year. Other income has gone down substantially this year mainly due to elimination of interest income on the loans advanced to wholly owned subsidiary, which was converted into equity later last year. Foreign Exchange loss of Rs. 89 million is mainly on account of depreciation of Pak Rupee during last quarter of the current financial year. Finance cost increased by Rs. 69 million year on year, on account of long term borrowing for capital investments as well as increased short term borrowing for enhanced business and increased bank interest rates. After fully adjusting the available tax losses, the Company is under normal corporate tax regime from the last year. Current year taxation is lower from last year mainly on account of tax rebate on BMR on new capital investments under section 65(b) of the Income Tax Ordinance. With increased operating profit, the Company posted net profit of Rs. 696 million (Rs. 471 million in year 2017) showing an increase of 47.54% year on year. The Earning Per Share also increased to Rs.6.29 per share against Rs.4.26 per share earned during last year.
Credit Rating:
During the year under review the company was assigned entity credit rating of A and A1 for long term and short term respectively by Pakistan Credit Rating Agency (PACRA).
Future Outlook
The continued decline of Pak Rupee to US Dollar in the second half of the financial year manifested a pile of exchange losses to various industries adversely impacting these industries to slide towards the bottom line of their financial performance, as this addition of adverse exchange parities has resulted in higher cost of production. The high trade deficit is exerting a lot of pressure on the Pakistani currency. Expected political stability as a result of recent parliamentary and presidential election is posing a positive outlook for the economy. However increase in cost of utilities and discount rate will exert pressure on the Companies probability.
The up-gradation and advancement of the oleo chemicals plant, which was started last year has been successfully completed during financial ended June 30, 2018. As a result, overall capacity of the oleo chemicals plant has been increased more than the current country’s demand.
The Board of Directors of the Company approved capital investment of Rs. 2.0 billion for the expansion of caustic soda plant, soap finishing plant and power generation. These additional investments will be financed through a combination of self cash generation as well as long term bank borrowings.
With the above positive developments, we are confident to achieve sustainable growth through achieving international economies of scale, better plant efficiencies and customer focused approach, Insha Allah. Summary of Key operating and financial data of last six financial years
Summary of key operating and financial data of last six years is annexed.
Outstanding statutory payments
All outstanding payments are of nominal and routine nature.
Gratuity Scheme
The company operates a funded gratuity scheme for its employees as referred in Note 11 to the accounts.

Annual Report 2018 15
Board of Directors
During the year Mr. Javed Saleem Arif was appointed as independent director as well as Chairman of Audit Committee on the Board of Directors after the sad demise of Mr. Muhammad Sajid. The Board recorded its appreciation of the valuable services rendered by Mr. Muhammad Sajid during the tenure of his office.
Currently the Board is comprising of ten (10) male directors. There is no female director on the Board. Out of these ten directors, six are non executive, three executive and one independent.
During the year under review, Four (4) Board, Four (4) Audit Committee and Two (2) Human Resource & Remuneration Committee meetings were held. Names of persons who, at any time during the financial year were directors of the company along with their attendance are as follow:
Name of Board of Audit HR & RDirector Directors Committee Committee
Abdul Jalil Jamil 3 Zafar Mahmood 4 2Imran Afzal 3Aamir Jamil 4 Muhammad Yahya Khan 4 2Muhammad Saeed-uz-Zaman 4 4 2Muhammad Sajid 3 3Javed Saleem Arif 1Mohsin Tariq 4 Saqib Raza 4 Abdul Jaleel Shaikh 4 4
Leaves of absence were granted to directors who could not attend some of the meetings.
The Board has two sub committees namely Audit Committee and Human Resource and Remuneration Committee. The Board reconstituted the audit committee in their meeting held on April 24, 2018. The composition of these two committees are as under:
Audit committee:
1. Javed Saleem Arif (Independent) Chairman2. M. Saeed-uz-Zaman (Non Executive) Member3. Abdul Jaleel Shaikh (Non Executive) Member
Human Resource and Remuneration committee:
1. M. Saeed-uz-Zaman (Non Executive) Chairman2. M. Yahya Khan (Non Executive) Member3. Zafar Mahmood (Executive) Member
Remuneration of Non Executive and Independent Directors
Non-executive and Independent directors are entitled only for fee for attending the meetings.
Corporate Governance
As required under Code of Corporate Governance incorporated in the Listing Rules of the Stock Exchanges in the country, the Board of Directors is pleased to state as follows:
• The Financial statements, prepared by the management of the Company, present fairly its state of affairs, the results of its operations, cash flows and changes in equity.
• Proper books of accounts of the Company have been maintained.
• Appropriate accounting policies have been consistently applied in preparation of the financial statements and accounting estimates are based on reasonable and prudent judgment.
• International Financial Reporting Standards (IFRS), as applicable in Pakistan, have been followed in the preparation of financial statements.
• The system of internal control is sound in design and has been effectively implemented and monitored.
• There is no significant doubt upon the company ability to continue as a going concern.
• There has been no material departure from the best practices of the corporate governance, as detailed in the listing regulations.
• Key operating and financial data for the last 6 years is annexed.
• Outstanding taxes and levis are given in the notes to the financial statements
The management of the Company is committed towards good corporate governance, and taking all appropriate measures to comply with best practices and also continuously reviewing the system of internal control in the light of Companies Act 2017.
Internal Financial Controls
The system of internal control is sound in design and has been effectively implemented and monitored.

Nimir Industrial Chemicals Ltd.16
Corporate Social Responsibilities
The Company recognizes its social responsibilities as a key member of the community. It is committed to contribute its resources for the better environment with an unprejudiced approach. Its safety, health and environmental (SHE) policies are geared towards unbiased betterment of employees and community.
The Company ensures environment friendly operations, products and services and promotes environmental awareness among its employee and the community. It inducts employees from the surrounding community and offer internships and apprenticeship opportunities to technical institutes. It also encourages visits by the students of different educational institutions and support needy children of the employees for studies to promote education in the country.
During the year under review the Company had donated Image Intensifier machine worth Rs. 1.2 million to DHQ Hospital – Sheikhupura and Rs. 0.4 million to The Pakistan Society for Rehabilitation of the Disabled - Lahore.
Parent Company
Subsequent to the year end the parent Company (Nimir Resources Private Limited) has filed an application with Securities and Exchange Commission of Pakistan of voluntary winding up after the withdrawal of waiver of group tax relief under sec 59B of Income Tax Ordinance 2001.
External Auditors
The present auditors M/s EY Ford Rhodes, Chartered Accountant, retiring this year, being eligible, have offered themselves for re-appointment. The audit committee has recommended the re-appointment of M/s EY Ford Rhodes, Chartered Accountant as external auditor of the Company for the year ending June 30, 2019.
Dividend / Bonus Shares
The Board has recommended a 20% final cash dividend for the year ended June 30, 2018. The Board had earlier declared and paid interim cash dividends totaling Rs. 1 per share (i.e. 10%). The total cash dividend for the year amounted to Rs. 3 per share (i.e. 30%). Pattern of Shareholding
A pattern of shareholding of the Company is annexed. There was no trading in the shares of the Company by the Directors, Chief Executive, Chief Financial Officer, Company Secretary,
Company Executive and their spouses and minor children during the year except those which are mentioned in the annexed statement required under code of Code of Corporate Governance (CCG). Necessary returns in this respect filed with the regulatory authorities besides informing the Board and the stock exchanges of the said transactions as required under the Code of Corporate Governance.
Acknowledgment
We are thankful to our valued stakeholders including customers, banks, suppliers, contractors and shareholders, regulators for their excellent support and confidence. We also thank our employees for their focused dedication and hard work throughout this period.
For and on behalf of the Board
Zafar Mahmood Aamir Jamil Chief Executive Officer Director
Lahore September 25, 2018.

Annual Report 2018 17

Nimir Industrial Chemicals Ltd.18

Annual Report 2018 19
STATEMENT OF COMPLIANCE WITH THE LISTED COMPANIES(CODE OF CORPORATE GOVERNANCE) REGULATIONS, 2017
Nimir Industrial Chemicals Limited (the “Company”) has complied the requirement of the Regulations in the following manner:
1. The total number of directors are 10 as per the following:
a. Male : 10 b. Female : Nil 2. The composition of the board is as follows:
a. Independent Director : 01 b. Other Non-Executive Directors : 06 c. Executive Directors : 03
Name Category
Zafar Mahmood Chief Executive Officer Imran Afzal Executive Director
Aamir Jamil Executive Director Abdul Jalil Jamil Non- Executive Director Muhammad Saeed uz Zaman Non- Executive Director Muhammad Yahya Khan Non- Executive Director Mohsin Tariq Non- Executive Director Saqib Raza Non- Executive Director Javed Saleem Arif Independent Director Abdul Jaleel Shaikh Nominee Director-PBIC
3. The directors have confirmed that none of them is serving as a director on more than five listed companies, including this Company (excluding the listed subsidiaries of listed holding companies where applicable).
4. The Company has prepared a “Code of Conduct” and has ensured that appropriate steps have been taken to disseminate it throughout the Company along with its supporting policies and procedures.
5. The board has developed a vision/mission statement, overall corporate strategy and significant policies of the Company. A complete record of particulars of significant policies along with the dates on which they were approved or amended has been maintained.
6. All the powers of the board have been duly exercised and decisions on relevant matters have been taken by the board/shareholders as empowered by the relevant provisions of the Act and these regulations.
7. The meetings of the board were presided over by the Chairman and, in his absence, by a director elected by the board for this purpose. The board complied with requirements of the Act and the Regulations with respect to frequency, recording and circulating minutes of the meeting of board.
8. The board of directors have a formal policy and transparent procedures for remuneration of directors in accordance with the Act and these Regulations.
9. The following Directors got trained under Directos Training Program:
i. Mr. Saqib Raza ii. Mr. Abdul Jaleel Shaikh
10. No appointment of Chief Financial Officer, Company Secretary and Head of Internal Audit has been made during the year.
11. CFO and CEO duly endorsed the financial statements before approval of the board.
12. The Board has formed committees comprising of members given below:
I. Audit Committee: i. Mr. Javed Saleem Arif – Chairman ii. Mr. Muhammad Saeed uz Zaman iii. Mr. Abdul Jaleel Shaikh
II. HR and Remuneration Committee: i. Mr. Muhammad Saeed uz Zaman – Chairman ii. Mr. Muhammad Yahya Khan iii. Mr. Zafar Mahmood
FOR THE YEAR ENDED JUNE 30, 2018

Nimir Industrial Chemicals Ltd.20
13. The terms of reference of the aforesaid committees have
been formed, documented and advised to the committee
for compliance.
14. The frequency of meetings (quarterly/half-yearly/yearly) of
the committee were as per following:
S. No. Members Name No. of
Meetings
Audit Committee
1 Mr. Javed Saleem Arif – Chairman 0/4
2 Mr. Muhammad Saeed uz Zaman 4/4
3 Mr. Abdul Jaleel Shaikh 4/4
4 Mr. Muhammad Sajid (Late) 3/4
HR and Remuneration Committee:
1 Mr. Muhammad Saeed uz Zaman 2/2
2 Mr. Muhammad Yahya Khan 2/2
3 Mr. Zafar Mahmood 2/2
15. The board has set up an effective internal audit function, which is considered suitably qualified and experienced for the purpose and are conversant with the policies and procedures of the Company.
16. The statutory auditors of the Company have confirmed that they have been given a satisfactory rating under the quality control review program of the ICAP, that they or any of the partners of the firm, their spouses and minor children do not hold shares of the Company and that the firm and all its partners are in compliance with International Federation of Accountants (IFAC) guidelines on code of ethics as adopted by the ICAP.
17. The statutory auditors or the persons associated with them have not been appointed to provide other services except in accordance with the Act, these regulations or any other requirement and the auditors have confirmed that they
have observed IFAC guidelines in this regard.
18. We confirm that all other requirements of the Regulations
have been complied with.
For Nimir Industrial Chemicals Limited
Abdul Jalil Jamil Zafar MahmoodChairman Chief Executive Officer
LahoreSeptember 25, 2018

Annual Report 2018 21
FINANCIAL STATEMENTS - SEPARATEFOR THE YEAR ENDED JUNE 30, 2018
22 Review Report From Auditors’ CCG23 Report On The Audit Of The Financial Statements26 Statement Of Financial Position32 Notes To The Separate Financial Statements

Nimir Industrial Chemicals Ltd.22
We have reviewed the enclosed Statement of Compliance
with the Listed Companies (Code of Corporate Governance)
Regulations, 2017 (the Regulations) prepared by the Board of
Directors of Nimir Industrial Chemicals Limited (the Company)
for the year ended June 30, 2018 in accordance with the
requirements of regulation 40 of the Regulations.
The responsibility for compliance with the Regulations is that
of the Board of Directors of the Company. Our responsibility is
to review whether the Statement of Compliance reflects the
status of the Company’s compliance with the provisions of the
Regulations and report if it does not and to highlight any non-
compliance with the requirements of the Regulations. A review
is limited primarily to inquiries of the Company’s personnel
and review of various documents prepared by the Company to
comply with the Regulations.
As a part of our audit of the financial statements we are required
to obtain an understanding of the accounting and internal control
systems sufficient to plan the audit and develop an effective
audit approach. We are not required to consider whether the
Board of Directors’ statement on internal control covers all
risks and controls or to form an opinion on the effectiveness
of such internal controls, the Company’s corporate governance
procedures and risks.
The Regulations require the Company to place before the Audit
Committee, and upon recommendation of the Audit Committee,
place before the Board of Directors for their review and approval,
its related party transactions and also ensure compliance with
the requirements of section 208 of the Companies Act, 2017.
We are only required and have ensured compliance of this
requirement to the extent of the approval of the related party
transactions by the Board of Directors upon recommendation
of the Audit Committee. We have not carried out procedures to
assess and determine the Company’s process for identification
of related parties and that whether the related party transactions
were undertaken at arm’s length price or not.
Based on our review, nothing has come to our attention which
causes us to believe that the Statement of Compliance does not
appropriately reflect the Company’s compliance, in all material
respects, with the requirements contained in the Regulations as
applicable to the Company for the year ended June 30, 2018.
______________________EY Ford Rhodes
Chartered AccountantsAudit Engagement Partner : Abdullah Fahad Masood
Lahore October 02, 2018
REVIEW REPORT TO THE MEMBERS ON STATEMENTOF COMPLIANCE WITH BEST PRACTICES OF CCG

Annual Report 2018 23
Key audit matters
1. Tax Contingencies
As disclosed in note 13 to the financial statements, certain tax matters are pending adjudication at various levels with the taxation authorities and other legal forums.
The aggregate amounts involved in such contingencies is Rs. 373 million as of 30 June 2018.
The tax contingencies require the management to make judgements and estimates in relation to the interpretation of tax laws and regulations that may be required against such contingencies. Due to inherent uncertainties and the time period such matters may take to resolve, the management judgements and estimates in relation to such contingencies may be complex.
How our audit addressed the key audit matter
We assessed key technical tax issues and legislative developments and focused on the judgements made by management in assessing the quantification and likelihood of significant exposures and the level of liability required for specific cases. In particular, we focused on the impact of recent tax rulings and the status of on-going inspections by local tax authorities.
We obtained explanations from management and corroborative evidence including communication with local tax authorities and confirmations of external tax advisors. We gained an understanding of the current status of tax assessments and investigations to monitor developments in on-going disputes.
We analyzed and challenged management’s key assumptions, in particular on cases where there had been significant developments with local tax authorities, based on our knowledge and experience of the application of the tax legislation by the relevant authorities and courts. We also evaluated whether the liabilities and exposures for uncertain tax positions were appropriately disclosed in the financial statements.
We involved internal tax experts to assess and review the management’s conclusions on contingent tax matters and evaluated whether adequate disclosures have been made in note 13 to the financial statements.
Opinion We have audited the annexed financial statements of Nimir Industrial Chemicals Limited (the Company), which comprise the statement of financial position as at 30 June 2018, and the statement of profit or loss, the statement of comprehensive income, the statement of changes in equity, the statement of cash flows for the year then ended, and notes to the financial statements, including a summary of significant accounting policies and other explanatory information, and we state that we have obtained all the information and explanations which, to the best of our knowledge and belief, were necessary for the purposes of the audit. In our opinion and to the best of our information and according to the explanations given to us, the statement of financial position, statement of profit or loss, statement of comprehensive income, the statement of changes in equity and the statement of cash flows together with the notes forming part thereof conform with the accounting and reporting standards as applicable in Pakistan and give the information required by the Companies Act, 2017 (XIX of 2017), in the manner so required and respectively give a true and fair view of the state of the Company’s affairs as at 30 June 2018 and of the profit, total comprehensive income, the changes in equity and its cash flows for the year then ended.
Basis for Opinion
We conducted our audit in accordance with International Standards on Auditing (ISAs) as applicable in Pakistan. Our responsibilities under those standards are further described in the Auditors’ Responsibilities for the Audit of the Financial Statements section of our report. We are independent of the Company in accordance with the International Ethics Standards Board for Accountants’ Code of Ethics for Professional Accountants as adopted by the Institute of Chartered Accountants of Pakistan (the Code) and we have fulfilled our other ethical responsibilities in accordance with the Code. We believe that the audit evidence we have obtained is sufficient and appropriate to provide a basis for our opinion.
Key Audit Matters
Key audit matters are those matters that, in our professional judgment, were of most significance in our audit of the financial statements of the current period. These matters were addressed in the context of our audit of the financial statements as a whole, and in forming our opinion thereon, and we do not provide a separate opinion on these matters.
Following are the key audit matters:
REPORT ON THE AUDIT OF THE FINANCIAL STATEMENTS FOR THE YEAR ENDED JUNE 30, 2018

Nimir Industrial Chemicals Ltd.24
2. Financial Reporting Framework
As referred in note 2 to the accompanying financial statements, the Companies Act 2017 (the Act) became applicable for the first time for the preparation of the Company’s annual financial statements for the year ended 30 June 2018. The Act forms an integral part of the statutory financial reporting framework as applicable to the Company and amongst others, prescribes the nature and content of disclosures in relation to various elements of the financial statements.
In the case of the Company, specific additional disclosures and changes to the existing disclosures have been included in the financial statements as referred to note 2 to the financial statements.
These changes and enhancements in the financial statements are considered important and a key audit matter because of the volume and significance of the changes in the financial statements resulting from the transition to the new reporting requirements under the Act.
We assessed the procedures applied by the management for identification of the changes required in the financial statements due to the application of the Act. We considered the adequacy and appropriateness of the additional disclosures and changes to the previous disclosures based on the new requirements. We also evaluated the sources of information used by the management for the preparation of the above referred disclosures and the internal consistency of such disclosures with other elements of the financial statements.
Information Other than the Financial Statements and Auditors’ Report Thereon Management is responsible for the other information. The other information comprises the information included in the Annual Report, but does not include the financial statements and our auditors’ report thereon.
Our opinion on the financial statements does not cover the other information and we do not express any form of assurance conclusion thereon.
In connection with our audit of the financial statements, our responsibility is to read the other information and, in doing so, consider whether the other information is materially inconsistent with the financial statements or our knowledge obtained in the audit or otherwise appears to be materially misstated. If, based on the work we have performed, we conclude that there is a material misstatement of this other information, we are required to report that fact. We have nothing to report in this regard.
Responsibilities of Management and Board of Directors for the Financial Statements Management is responsible for the preparation and fair presentation of the financial statements in accordance with the accounting and reporting standards as applicable in Pakistan and the requirements of Companies Act, 2017 (XIX of 2017) and for such internal control as management determines is necessary to enable the preparation of financial statements that are free from material misstatement, whether due to fraud or error.
In preparing the financial statements, management is responsible for assessing the Company’s ability to continue as a going concern, disclosing, as applicable, matters related to going concern and using the going concern basis of accounting unless management either intends to liquidate the Company or to cease operations, or has no realistic alternative but to do so.
Board of directors are responsible for overseeing the Company’s financial reporting process. Auditors’ Responsibilities for the Audit of the Financial Statements
Our objectives are to obtain reasonable assurance about whether the financial statements as a whole are free from material misstatement, whether due to fraud or error, and to issue an auditors’ report that includes our opinion. Reasonable assurance is a high level of assurance, but is not a guarantee that an audit conducted in accordance with ISAs as applicable in Pakistan will always detect a material misstatement when it exists. Misstatements can arise from fraud or error and are considered material if, individually or in the aggregate, they could reasonably be expected to influence the economic decisions of users taken on the basis of these financial statements.
As part of an audit in accordance with ISAs as applicable in Pakistan, we exercise professional judgment and maintain professional skepticism throughout the audit. We also: • Identify and assess the risks of material misstatement of the
financial statements, whether due to fraud or error, design

Annual Report 2018 25
and perform audit procedures responsive to those risks, and obtain audit evidence that is sufficient and appropriate to provide a basis for our opinion. The risk of not detecting a material misstatement resulting from fraud is higher than for one resulting from error, as fraud may involve collusion, forgery, intentional omissions, misrepresentations, or the override of internal control.
• Obtain an understanding of internal control relevant to
the audit in order to design audit procedures that are appropriate in the circumstances, but not for the purpose of expressing an opinion on the effectiveness of the Company’s internal control.
• Evaluate the appropriateness of accounting policies used
and the reasonableness of accounting estimates and related disclosures made by management.
• Conclude on the appropriateness of management’s use of
the going concern basis of accounting and, based on the audit evidence obtained, whether a material uncertainty exists related to events or conditions that may cast significant doubt on the Company’s ability to continue as a going concern. If we conclude that a material uncertainty exists, we are required to draw attention in our auditors’ report to the related disclosures in the financial statements or, if such disclosures are inadequate, to modify our opinion. Our conclusions are based on the audit evidence obtained up to the date of our auditors’ report. However, future events or conditions may cause the Company to cease to continue as a going concern.
• Evaluate the overall presentation, structure and content
of the financial statements, including the disclosures, and whether the financial statements represent the underlying transactions and events in a manner that achieves fair presentation.
We communicate with the board of directors regarding, among other matters, the planned scope and timing of the audit and significant audit findings, including any significant deficiencies in internal control that we identify during our audit. We also provide the board of directors with a statement that we have complied with relevant ethical requirements regarding independence, and to communicate with them all relationships and other matters that may reasonably be thought to bear on our independence, and where applicable, related safeguards. From the matters communicated with the board of directors, we determine those matters that were of most significance in the audit of the financial statements of the current period and are therefore the key audit matters. We describe these matters in our auditors’ report unless law or regulation precludes
public disclosure about the matter or when, in extremely rare circumstances, we determine that a matter should not be communicated in our report because the adverse consequences of doing so would reasonably be expected to outweigh the public interest benefits of such communication. Report on Other Legal and Regulatory Requirements Based on our audit, we further report that in our opinion: a) proper books of account have been kept by the Company
as required by the Companies Act, 2017 (XIX of 2017); b) the statement of financial position, the statement of
profit or loss, statement of comprehensive income, the statement of changes in equity and the statement of cash flows together with the notes thereon have been drawn up in conformity with the Companies Act, 2017 (XIX of 2017) and are in agreement with the books of account and returns;
c) investments made, expenditure incurred and guarantees
extended during the year were for the purpose of the Company’s business; and
d) Zakat deductible at source under the Zakat and Ushr
Ordinance, 1980 (XVIII of 1980), was deducted by the Company and deposited in the Central Zakat Fund established under section 7 of that Ordinance.
The engagement partner on the audit resulting in this independent auditors’ report is Abdullah Fahad Masood.
______________________EY Ford Rhodes
Chartered Accountants
Lahore October 02, 2018

Nimir Industrial Chemicals Ltd.26
Note 2018 2017 (Rupees) (Rupees) EQUITY AND LIABILITIES SHARE CAPITAL AND RESERVES Authorized share capital 145,000,000 (2017: 145,000,000) Ordinary shares of Rs.10 each 1,450,000,000 1,450,000,000 Issued, subscribed and paid up capital 6 1,105,905,460 1,105,905,460Unappropriated profit 1,508,958,521 1,038,425,310 2,614,863,981 2,144,330,770 NON CURRENT LIABILITIES Long term loans 7 418,254,615 259,262,449Liabilities against assets subject to finance lease 8 61,938,930 94,614,453Deferred tax liability 9 218,877,025 213,099,608
699,070,570 566,976,510 CURRENT LIABILITIES Trade and other payables 10 910,966,292 414,756,293Net defined benefit liability - funded gratuity 11 56,710,402 47,366,587Mark up accrued 35,916,282 27,494,527Unclaimed dividend 5,849,713 2,415,790Short term borrowings 12 2,774,291,313 1,861,588,054Current maturity of long term loans 7 174,159,225 127,604,162Current maturity of liabilities against assets subject to finance lease 8 46,186,411 36,938,773Provision for taxation 270,369,019 244,912,300
4,274,448,657 2,763,076,486 CONTINGENCIES AND COMMITMENTS 13 - - TOTAL EQUITY AND LIABILITIES 7,588,383,208 5,474,383,766 The annexed notes from 1 to 45 form an integral part of these financial statements.
STATEMENT OF FINANCIAL POSITION
Chief Executive Officer Chairman

Annual Report 2018 27
Note 2018 2017 (Rupees) (Rupees) ASSETS NON CURRENT ASSETS Property, plant and equipment 14 2,553,191,606 2,230,437,430Intangibles 15 962,275 1,753,763Investment in subsidiary 16 281,852,260 281,852,260Long term deposits and prepayments 17 26,285,362 33,878,812
2,862,291,503 2,547,922,265 CURRENT ASSETS Stores, spare parts and loose tools 18 141,338,878 170,303,282Stock in trade 19 2,258,597,477 1,274,615,055Trade debts 20 1,621,680,980 983,440,014Loans and advances 21 77,639,694 55,335,840Trade deposits and short term prepayments 22 28,103,403 12,255,680Other receivables 23 64,059,950 18,356,270Tax refunds due from the Government 24 528,225,358 396,639,159Cash and bank balances 25 6,445,965 15,516,201
4,726,091,705 2,926,461,501
TOTAL ASSETS 7,588,383,208 5,474,383,766
AS AT JUNE 30, 2018
Chief Financial Officer

Nimir Industrial Chemicals Ltd.28
Note 2018 2017 (Rupees) (Rupees) Sales - net 26 12,154,312,383 7,369,139,953 Cost of sales 27 (10,541,804,264) (6,304,069,597) Gross profit 1,612,508,119 1,065,070,356 Distribution costs 28 (149,740,475) (114,755,645) Administrative expenses 29 (167,528,649) (115,698,790)
(317,269,124) (230,454,435) Operating profit 1,295,238,995 834,615,921 Other expenses 30 (131,944,187) (50,300,107) Other income 31 16,734,751 61,724,546 Foreign exchange loss 32 (88,657,880) (9,794,917) Finance cost 33 (204,254,459) (135,427,376) Profit before taxation 887,117,220 700,818,067 Taxation 34 (191,582,093) (229,384,775) Profit after taxation 695,535,127 471,433,292 Earnings per ordinary share - basic and diluted 36 6.29 4.26 The annexed notes from 1 to 45 form an integral part of these financial statements.
STATEMENT OF PROFIT OR LOSSFOR THE YEAR ENDED JUNE 30, 2018
Chief Executive Officer Chairman Chief Financial Officer

Annual Report 2018 29
Note 2018 2017 (Rupees) (Rupees) Profit after taxation 695,535,127 471,433,292 Items not to be reclassified to profit or loss in subsequent periods: Re-measurement losses on defined benefit plan 11.4 (5,381,443) (6,247,292) Income tax effect 1,560,619 1,874,188 Re-measurement losses on defined benefit plan - net of tax (3,820,824) (4,373,104)
Total comprehensive income for the year 691,714,303 467,060,188 The annexed notes from 1 to 45 form an integral part of these financial statements.
Issued, subscribed and paid up Unappropriated share capital profit Total (Rupees) (Rupees) (Rupees)
Balance as on July 1, 2016 1,105,905,460 681,955,668 1,787,861,128 Interim dividend for 2017 @ Rs. 1 per share - (110,590,546) (110,590,546) Total comprehensive income for the year - 467,060,188 467,060,188 Balance as on June 30, 2017 1,105,905,460 1,038,425,310 2,144,330,770 Final dividend for 2017 @ Rs. 1 per share - (110,590,546) (110,590,546) Interim dividend for 2018 @ Rs. 1 per share - (110,590,546) (110,590,546) Total comprehensive income for the year - 691,714,303 691,714,303 Balance as on June 30, 2018 1,105,905,460 1,508,958,521 2,614,863,981 The annexed notes from 1 to 45 form an integral part of these financial statements.
STATEMENT OF COMPREHENSIVE INCOME
FOR THE YEAR ENDED JUNE 30, 2018
FOR THE YEAR ENDED JUNE 30, 2018
STATEMENT OF CHANGES IN EQUITY
Chief Executive Officer Chairman Chief Financial Officer

Nimir Industrial Chemicals Ltd.30
Note 2018 2017 (Rupees) (Rupees) CASH FLOWS FROM OPERATING ACTIVITIES Profit before taxation 887,117,220 700,818,067 Adjustment for: Depreciation 14.6 247,341,485 165,723,980 Amortization 15 791,488 845,188 Impairment expense 30 63,365,020 - Mark-up expense 198,739,688 132,144,308 Profit on loan to subsidiary 31 - (26,352,260) Reversal of provision against stock in trade 19.1 & 19.2 (4,619,258) (82,436,341) Provision for gratuity 11.3 10,973,769 9,943,427 Provision against refundable sales tax 30 5,339,850 - Reversal of provision 31 (7,037,498) (28,102,567) Gain on disposal of property, plant and equipment 31 (3,267,392) (7,161,059) Exchange loss - unrealized 32.1 6,669,205 857,990 Workers profit participation fund provision 30 47,517,827 37,459,682 Workers welfare fund provision 30 15,721,490 10,915,886 581,535,674 213,838,234 Operating profit before working capital changes 1,468,652,894 914,656,301 (Increase) / decrease in current assets Stores, spare parts and loose tools 28,964,404 (39,475,094) Stock in trade (979,363,164) (554,183,192) Trade debts (638,240,966) (162,787,319) Loans and advances (22,303,854) 9,048,398 Trade deposits and short term prepayments (15,847,723) (4,519,667) Other receivables (45,703,680) (1,864,920) Tax refunds due from government 67,099,224 (47,532,334) (1,605,395,759) (801,314,128)
Increase in current liabilities
Trade and other payables 476,159,057 107,539,606 (1,129,236,702) (693,774,522) Cash generated from operations 339,416,192 220,881,779 Contribution to gratuity fund 11.4 (7,011,397) (18,630,000) Mark-up expense paid (182,210,316) (115,014,753) Tax paid (362,812,611) (114,332,620) Long term deposits 7,593,450 (2,709,684) WPPF Paid 10.3 (32,000,000) (32,507,240) WWF Paid 10.4 (10,820,082) (8,392,413) (587,260,956) (291,586,710)
Net cash utilized in operating activities - Balance carried forward (247,844,764) (70,704,931)
STATEMENT OF CASH FLOWSFOR THE YEAR ENDED JUNE 30, 2018

Annual Report 2018 31
Note 2018 2017 (Rupees) (Rupees)
Balance brought forward (247,844,764) (70,704,931) CASH FLOWS FROM INVESTING ACTIVITIES Purchase of property, plant and equipment - net (18,039,510) (20,205,138) Additions in capital work in progress 14.7 (615,696,696) (600,732,090) Purchase of intangible - (2,037,750) Sale proceeds from disposal of property, plant and equipment 14.2 3,542,917 7,390,250 Net cash used in investing activities (630,193,289) (615,584,728) CASH FLOWS FROM FINANCING ACTIVITIES Long term loan obtained 334,591,987 136,345,774 Long term loan repaid (129,044,758) (93,229,163) Dividend paid (217,747,169) (119,762,036) Repayment of liabilities against assets subject to finance lease (38,042,502) (43,638,535) New leases acquired during the year 6,507,000 32,311,000 Short term borrowings - net 912,703,259 728,102,070 Net cash generated from financing activities 868,967,817 640,129,110 Net decrease in cash and cash equivalents (9,070,236) (46,160,549) Cash and cash equivalents at the beginning of the year 15,516,201 61,676,750 Cash and cash equivalents at the end of the year 6,445,965 15,516,201 The annexed notes from 1 to 45 form an integral part of these financial statements.
Chief Executive Officer Chairman Chief Financial Officer
Nimir Industrial Chemicals Ltd.32
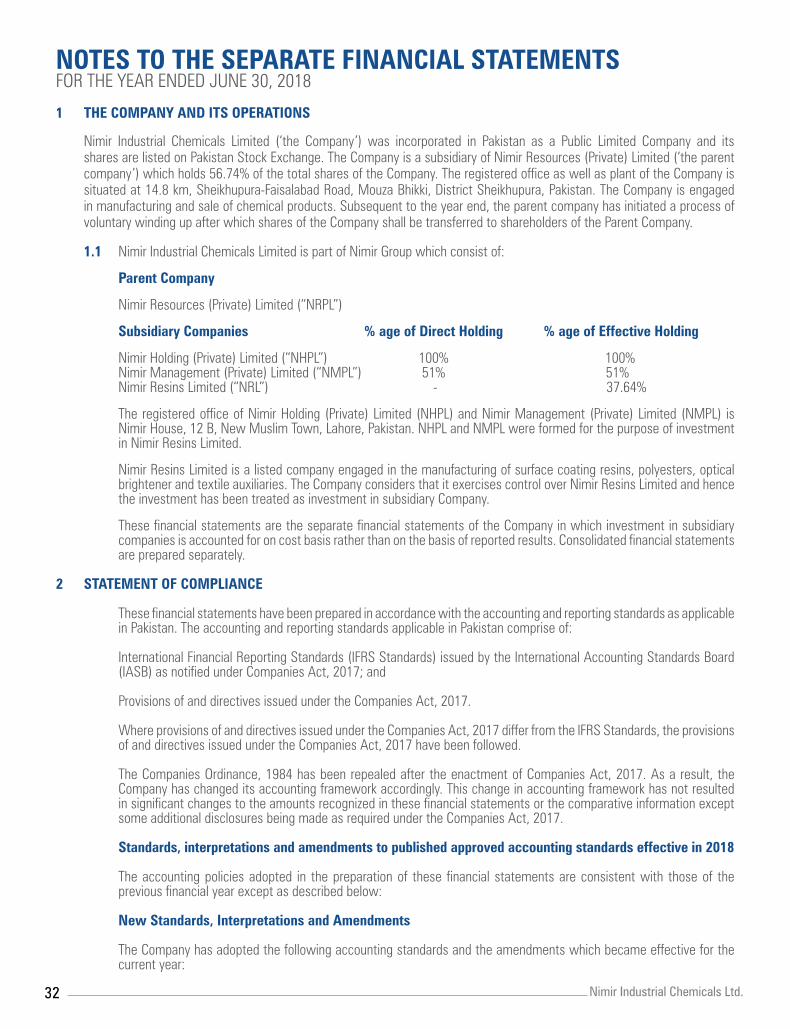
1 THE COMPANY AND ITS OPERATIONS
Nimir Industrial Chemicals Limited (‘the Company’) was incorporated in Pakistan as a Public Limited Company and its shares are listed on Pakistan Stock Exchange. The Company is a subsidiary of Nimir Resources (Private) Limited (‘the parent company’) which holds 56.74% of the total shares of the Company. The registered office as well as plant of the Company is situated at 14.8 km, Sheikhupura-Faisalabad Road, Mouza Bhikki, District Sheikhupura, Pakistan. The Company is engaged in manufacturing and sale of chemical products. Subsequent to the year end, the parent company has initiated a process of voluntary winding up after which shares of the Company shall be transferred to shareholders of the Parent Company. 1.1 Nimir Industrial Chemicals Limited is part of Nimir Group which consist of:
Parent Company
Nimir Resources (Private) Limited (“NRPL”)
Subsidiary Companies % age of Direct Holding % age of Effective Holding
Nimir Holding (Private) Limited (“NHPL”) 100% 100% Nimir Management (Private) Limited (“NMPL”) 51% 51% Nimir Resins Limited (“NRL”) - 37.64% The registered office of Nimir Holding (Private) Limited (NHPL) and Nimir Management (Private) Limited (NMPL) is
Nimir House, 12 B, New Muslim Town, Lahore, Pakistan. NHPL and NMPL were formed for the purpose of investment in Nimir Resins Limited.
Nimir Resins Limited is a listed company engaged in the manufacturing of surface coating resins, polyesters, optical brightener and textile auxiliaries. The Company considers that it exercises control over Nimir Resins Limited and hence the investment has been treated as investment in subsidiary Company.
These financial statements are the separate financial statements of the Company in which investment in subsidiary companies is accounted for on cost basis rather than on the basis of reported results. Consolidated financial statements are prepared separately.
2 STATEMENT OF COMPLIANCE
These financial statements have been prepared in accordance with the accounting and reporting standards as applicable in Pakistan. The accounting and reporting standards applicable in Pakistan comprise of:
International Financial Reporting Standards (IFRS Standards) issued by the International Accounting Standards Board (IASB) as notified under Companies Act, 2017; and
Provisions of and directives issued under the Companies Act, 2017.
Where provisions of and directives issued under the Companies Act, 2017 differ from the lFRS Standards, the provisions of and directives issued under the Companies Act, 2017 have been followed.
The Companies Ordinance, 1984 has been repealed after the enactment of Companies Act, 2017. As a result, the Company has changed its accounting framework accordingly. This change in accounting framework has not resulted in significant changes to the amounts recognized in these financial statements or the comparative information except some additional disclosures being made as required under the Companies Act, 2017.
Standards, interpretations and amendments to published approved accounting standards effective in 2018
The accounting policies adopted in the preparation of these financial statements are consistent with those of the previous financial year except as described below:
New Standards, Interpretations and Amendments
The Company has adopted the following accounting standards and the amendments which became effective for the current year:
FOR THE YEAR ENDED JUNE 30, 2018NOTES TO THE SEPARATE FINANCIAL STATEMENTS

Annual Report 2018 33
IAS 7 - Statement of Cash Flows - Disclosure Initiative - (Amendment). IAS 12 - Income Taxes - Recognition of Deferred Tax Assets for Unrealized losses - (Amendments).
Improvements to Accounting Standards Issued by the IASB in December 2014
IFRS 12 - Disclosure of Interests in Other Entities - Clarification of the scope of the disclosure requirements in lFRS 12.
The adoption of the above amendments, improvements to accounting standards and interpretations did not have any effect on the financial statements.
Standards, interpretation and amendments to approved accounting standards that are not yet effective
The following standards, amendments and interpretations with respect to the approved accounting standards as applicable in Pakistan would be effective from the dates mentioned below against the respective standard or interpretation:
Effective date (annual periods Standard or Interpretation beginning on or after)
IFRS 2 - Share based Payments — Classification and Measurement of Share-based Payments Transactions (Amendments). January 1, 2018
IFRS 10 - Consolidated Financial Statements and IAS 28 Investment in Associates and Joint Ventures - Sale or Contribution of Assets between an Investor and its Associate or Joint Venture (Amendment) Not yet finalized
IFRS 4 - Insurance Contracts: Applying IFRS 9 Financial Instruments with IFRS 4 Insurance Contracts — (Amendments) January 1, 2018
IAS 40 - Transfers to Investment Property — (Amendments) January 1, 2018
IFRIC 22 - Foreign Currency Transactions and Advance Consideration January 1, 2018
IFRS 9 - Financial Instruments: Classification and Measurement July 1, 2018
IFRS 15 - Revenue from Contracts with Customers July 1, 2018
IFRS 16 - Leases January 1, 2019
IFRS 9 - Prepayment Features with Negative Compensation — (Amendments) January 1, 2019
IAS 28 - Long-term Interests in Associates and Joint Ventures — (Amendments) January 1, 2019
IFRIC 23 - Uncertainty over Income Tax Treatments January 1, 2019
IAS 19 - Plan Amendment, Curtailment or Settlement — (Amendments) January 1, 2019
The Company expects that such improvements to the standards will not have any material impact on the Company’s
financial statements in the period of initial application except for IFRS 15 and IFRS 16. The management is in the process of determining the effect of application of IFRS 15 and IFRS 16.
In addition to the above standards and amendments, improvements to various accounting standards and conceptual framework have also been issued by the IASB. Such improvements are generally effective for accounting periods beginning on or after January 1, 2018.
The Company expects that such improvements to the standards will not have any material impact on the Company’s financial statements.
Further, following new standards have been issued by IASB which are yet to be notified by the SECP for the purpose of applicability in Pakistan.

Nimir Industrial Chemicals Ltd.34
Effective date (annual periods Standard or Interpretation beginning on or after)
IFRS 14 Regulatory Deferral Accounts January 1, 2016
IFRS-17 Insurance Contracts January 1, 2021
3 BASIS OF PREPARATION
3.1 BASIS OF MEASUREMENT
These financial statements have been prepared under the historical cost convention except that certain employee benefits are recognized on the basis mentioned in note 5.13.
3.2 PRESENTATION CURRENCY
These financial statements are presented in Pak Rupee, which is the Company’s functional currency.
4 SIGNIFICANT ACCOUNTING JUDGEMENTS, ESTIMATES AND ASSUMPTIONS
The preparation of financial statements in conformity with approved accounting and reporting standards, as applicable in Pakistan, requires the use of certain critical accounting estimates. It also requires management to exercise its judgment in the process of applying the Company’s accounting policies. Estimates and judgments are continually evaluated and are based on the historical experience, including expectations of future events that are believed to be reasonable under the circumstances. These estimates and underlying assumptions are reviewed on an ongoing basis. Revisions to accounting estimates are recognized in the period in which the estimate is revised if the revision affects only that period or in the period of the revision and future periods if the revision affects both current and future periods. The areas involving a higher degree of judgments or complexity or areas where assumptions and estimates are significant to the financial statements are as follows: 4.1 Provision for doubtful receivables
A provision for impairment of trade and other receivables is established when there is objective evidence that the
Company will not be able to collect all amounts due according to the original terms of receivables. These estimates and underlying assumptions are reviewed on an ongoing basis based on changes in recoverability pattern, credit history and market conditions.
4.2 Useful life, residual values and impairment of property, plant and equipment
Estimates with respect to residual values, depreciable lives and pattern of flow of economic benefits are based on the analysis of the management of the Company. Further, the Company reviews the value of the assets for possible impairments on an annual basis. Any change in the estimates in the future might affect the carrying amount of respective item of property, plant and equipment, with a corresponding effect on the depreciation charge and impairment, as applicable.
4.3 Provision for taxation and deferred tax
In making the estimates for income tax payable, the Company takes into account the applicable laws and the decisions by appellate authorities on certain issues in the past.
A deferred tax liability is recognized for all taxable temporary differences and deferred tax assets are recognized for deductible temporary differences and unused tax losses to the extent that it is probable that taxable profits will be available against which the losses can be utilized. Significant management judgment is required to determine the amount of deferred tax liabilities and assets that can be recognized, based upon the likely timing and level of future taxable profits together with future tax planning strategies.
4.4 Provision against stock
Provision for obsolete and slow moving store is recognized based on the management’s best estimate regarding the future usability and prevailing prices.

Annual Report 2018 35
5 SUMMARY OF SIGNIFICANT ACCOUNTING POLICIES
The accounting policies applied are consistent with prior year except as stated otherwise. 5.1 Property, plant and equipment
Owned assets
Property, plant and equipment are stated at cost less accumulated depreciation and impairment, if any except land
which is stated at cost. Cost of property, plant and equipment consists of historical cost and directly attributable cost of bringing the assets to their present location and condition.
Depreciation is calculated using the straight line method at rates disclosed in note 14.1 which are considered appropriate to write off the cost of the assets over their useful lives.
Depreciation on additions is charged from the month in which an asset is acquired or capitalized while no depreciation is charged for the month in which the asset is disposed of.
The carrying amounts of the Company’s assets are reviewed at each reporting date to determine whether there is any indication of impairment. If any such indication exists, the carrying amounts of such assets are reviewed to assess whether they are recorded in excess of their recoverable amount. Where carrying values exceed the respective recoverable amount, assets are written down to their recoverable amounts and the resulting impairment is recognized in the income currently. The recoverable amount is the higher of an asset’s fair value less cost to sell and value in use. Where an impairment loss is charged, the depreciation charge is adjusted for the future periods to allocate the asset’s revised carrying amount over its estimated useful life.
Subsequent costs are included in the asset’s carrying amount or recognized as separate asset, as appropriate, only when it is probable that future economic benefits associated with the item will flow to the Company and the cost of the item can be measured reliably. All other repair and maintenance costs are charged to income during the period in which they are incurred.
An item of property, plant and equipment is derecognized upon disposal or when no future economic benefits are expected from its use or disposal.
The gain or loss on disposal or retirement of an asset represents the difference between the sale proceeds and the
carrying amount of the asset and is recognized as an income or expense in the period it relates.
Capital Work In Progress
These are stated at cost less impairment loss, if any, including capitalization of borrowing costs. It consists of expenditures incurred and advances made in respect of fixed assets in the course of their construction and installation.
Leased Asset
Leases where the Company has substantially all the risks and rewards of ownership are classified as finance leases. At inception, finance leases are capitalized at the lower of present value of minimum lease payments under the lease agreements and the fair value of the assets.
The related rental obligations, net of finance cost, are included in liabilities against assets subject to finance lease as referred to in note 8. The liabilities are classified as current and non-current depending upon the timing of the payment.
Each lease payment is allocated between the liability and finance cost so as to achieve a constant rate on the balance
outstanding. The interest element of the rental is charged to profit over the lease term. The financial charges are calculated at the interest rates implicit in the lease and are charged to the statement of profit or loss.
Assets held under finance lease are stated at cost less accumulated depreciation and impairment loss, if any, at the
rates and basis applicable to the Company owned assets.

Nimir Industrial Chemicals Ltd.36
5.2 Intangibles
Intangibles acquired separately are measured on initial recognition at cost. Following initial recognition, intangibles are carried at cost less any accumulated amortization and any accumulated impairment losses. The useful lives of intangibles are measured to be finite. Intangibles with finite lives are amortized over the useful life and assessed for impairment whenever there is an indication that the asset may be impaired. The amortization period and amortization method for an intangibles with a finite life is reviewed at each financial period end. The amortization expense is recognized in profit or loss in the expense category consistent with the function of the intangibles.
Amortization on additions is charged from the month in which an asset is acquired or capitalized while no amortization is charged for the month in which the asset is disposed off.
5.3 Stock in trade
Stock in trade, stores, spares and loose tools are valued at lower of cost or net realizable value except those in transit, which are valued at invoice value including other charges, if any, incurred thereon. Basis of determining cost is as follows:
Raw and packing material - weighted average cost Material in transit - cost Work in process - cost Finished goods - weighted average cost Stores, spares and loose tools - weighted average cost
Items considered obsolete are carried at nil value.
Provision for obsolete and slow moving inventory is based on management estimates of usage in normal business operations.
Net realizable value is determined on the basis of estimated selling price of the product in the ordinary course of business less costs of completion and costs necessary to be incurred in order to make the sale.
5.4 Trade debts
Trade debts are carried at invoice amount on transaction date less any estimate for doubtful debts. Known bad debts are written off as and when identified.
5.5 Cash and cash equivalents
Cash and cash equivalents are carried in the statement of financial position at cost.
For the purpose of cash flow statement, cash and cash equivalents comprise of cheques in hand, cash and bank balances.
5.6 Financial instruments
All the financial assets and financial liabilities are recognized at the time when the Company becomes a party to the contractual provisions of the instruments. The Company derecognizes a financial asset or a portion of financial asset when, and only when, the Company loses control of the contractual rights that comprise the financial asset or portion of financial asset. While a financial liability or part of financial liability is derecognized from the balance sheet when, and only when, it is extinguished, i.e. when the obligation specified in the contract is discharged, cancelled or expires.
All financial assets and financial liabilities are initially measured at cost, which is the fair value of the consideration given and received respectively. These financial assets and liabilities are subsequently measured at fair value, amortised cost or cost, as the case may be.
Financial assets are investments, trade deposits, trade debts, loans and advances, other receivables, cash and bank balances. These are stated at their nominal values as reduced by the appropriate allowances for estimating irrecoverable amount.

Annual Report 2018 37
Financial liabilities are classified according to the substance of the contractual arrangements entered into. Significant financial liabilities are long term loans, short term borrowing utilized under mark-up arrangements, creditors, liabilities against assets subject to finance lease, accrued and other liabilities. Mark-up bearing finances are recorded at the gross proceeds received. Other liabilities are stated at their nominal value.
5.7 Offsetting of financial assets and financial liabilities
A financial asset and financial liability is offset and the net amount is reported in the statement of financial position if the Company has a legal enforceable right to set off the recognized amounts and intends either to settle on net basis or to realize the assets and settle the liabilities simultaneously.
5.8 Impairment of financial assets
The Company assesses at each reporting date whether there is any objective evidence that a financial asset or a group of financial assets is impaired. A financial asset or a group of financial assets is deemed to be impaired if, and only if, there is objective evidence of impairment as a result of one or more events that has occurred after the initial recognition of the asset (an incurred ‘loss event’) and that loss event has an impact on the estimated future cash flows of the financial asset or the group of financial assets that can be reliably estimated.
Evidence of the impairment may include indicators that the debtor or a group of debtors is experiencing significant financial difficulty, default or delinquency in interest or principal payments, the probability that they will enter bankruptcy or other financial reorganization and where observable data indicates that there is a measurable decrease in the estimated future cash flows, such as changes in arrears or economic conditions that correlate with defaults.
The amount of loss is measured as the difference between the asset’s carrying amount and the present value of the estimated future cash flows discounted at the financial asset’s original effective interest rate. The carrying amount of the asset is reduced and the amount of the loss is recognized in the profit and loss account. If, in a subsequent period, the amount of the impairment loss decreases and the decrease can be related objectively to an event occurring after the impairment was recognized, the reversal of the previously recognized impairment loss is recognized in statement of profit or loss.
5.9 Trade and other payables
Creditors relating to trade and other payables are carried at cost which is the fair value of the consideration to be paid in the future for goods and services received, whether or not billed to the Company.
5.10 Provisions
A provision is recognized in the statement of financial position when the Company has a legal or constructive obligation as a result of a past event, it is probable that an outflow of resources embodying economic benefits will be required to settle the obligation and a reliable estimate can be made of the amount of obligation.
5.11 Taxation
Current
Provision for the current tax is based on the taxable income for the year determined in accordance with the provisions of the Income Tax Ordinance, 2001. The charge for current tax is calculated using prevailing tax rates or tax rates expected to apply to the profit for the year if enacted after taking into account tax credits, rebates and exemptions, if any. The charge for current tax also includes adjustments, where considered necessary, to provision for tax made in previous years arising from assessments framed during the year for such years.
Deferred
Deferred tax is provided using the statement of financial position liability method for all temporary differences at the balance sheet date between tax base of assets and liabilities and their carrying amounts for financial reporting purposes.
Deferred tax liability is recognized for all taxable temporary differences and deferred tax assets are recognized for all deductible temporary differences, carry forward of unused tax credits and unused tax losses, if any, to the extent that it is probable that future taxable profit will be available against which the deductible temporary differences, carry-forward of unused tax credits and unused tax losses can be utilized.

Nimir Industrial Chemicals Ltd.38
Deferred tax assets and liabilities are measured at the tax rates that are expected to apply to the period when the liability is settled based on tax rates that have been enacted or substantially enacted at the reporting date.
5.12 Revenue recognition
Sale of goods - Local
Revenue is recognized when the significant risks and rewards of ownership of the goods is transferred to the buyer, usually at the time of issuance of delivery challan (i.e on dispatch of goods to the customers).
Sale of goods - Export
Revenue from export of goods is recognized at the time of issuance of bill of lading.
Profit on bank deposit
Profit earned on saving and deposit accounts is accrued on time proportion basis by reference to the principal outstanding at the applicable rate of return.
5.13 Staff retirement benefits
Defined benefit plan
The Company formed an approved funded defined benefit gratuity plan for all of its permanent employees. Under this plan, gratuity is paid to the retiring employees on the basis of their last drawn gross salary for each completed year of service.
Experience adjustments are recognized in other comprehensive income when they occur. Amounts recorded in statement of profit or loss are limited to current and past service cost, gains or losses on settlements, and net interest income / (expense). All other changes in net defined benefit liability are recognized in other comprehensive income with no subsequent recycling to profit and loss account.
The distinction between short term and other long term employee benefits is based on the expected timing of settlement rather than the employees’ entitlement to benefits.
5.14 Foreign currency translation
Foreign currency transactions are recorded at the rate of exchange prevailing on the date of transactions. Monetary assets and liabilities in foreign currencies are translated into Pak rupees at the rate of exchange prevailing at the balance sheet date.
Profits or losses arising on translation are recognized in the statement of profit or loss.
5.15 Borrowing costs
Borrowing costs are recognized as an expense in the period in which these are incurred except to the extent of borrowing costs that are directly attributable to the acquisition, construction or production of qualifying assets, which are assets that necessarily take a substantial period of time to get ready for their intended use. Such borrowing costs are capitalized as part of the cost of the qualifying asset.
5.16 Operating segments
Operating segments are reported in a manner consistent with the internal reporting provided to the chief operating decision maker. The chief operating decision maker, who is responsible for allocating resources and assessing performance of the operating segments, has been identified as the Board of Directors that makes strategic decision. The management has determined that the Company has a single reportable segment, as Board of Directors views the Company’s operations as one reportable segment.

Annual Report 2018 39
6 ISSUED, SUBSCRIBED AND PAID UP CAPITAL
2018 2017 2018 2017 No. of shares (Rupees) (Rupees)
110,590,546 110,590,546 Ordinary shares of Rs. 10 each fully paid in cash 1,105,905,460 1,105,905,460 6.1 Nimir Resources (Private) Limited holds 62,750,000 ordinary shares of Rs.10 each, representing 56.74% (2017:
62,670,647 ordinary shares of Rs. 10 each, representing 56.67%) of the issued capital.
7 LONG TERM LOANS Note 2018 2017 (Rupees) (Rupees)
Term finance - Secured I 7.1 18,750,000 59,375,000 Term finance - Secured II 7.2 83,854,171 134,895,837 Term finance - Secured III 7.3 37,500,000 56,250,000 Term finance - Secured IV 7.4 204,910,414 136,345,774 Term finance - Secured V 7.5 135,000,000 - Term finance - Secured VI 7.6 112,399,255 - 592,413,840 386,866,611 Less: Current maturity shown under current liabilities (174,159,225) (127,604,162) 418,254,615 259,262,449
7.1 This represents long term finance facility obtained from a financial institution carrying mark-up at the rate of 3 months KIBOR plus 200 bps per annum repayable in 48 monthly instalments starting from December 2013 with grace period of one year. This facility is secured against first joint pari passu charge over present and future fixed assets of the Company.
7.2 This represents long term finance facility obtained from a financial institution carrying mark-up at the rate of 3 months KIBOR plus 200 bps per annum repayable in 48 monthly instalments starting from December 2015 with grace period of six months. This facility is secured against first joint pari passu charge over present and future fixed assets of the Company.
7.3 This represents long term finance facility obtained from a financial institution carrying mark-up at the rate of 3 months KIBOR plus 200 bps per annum repayable in 48 monthly instalments starting from December 2015 with grace period of six months. This facility is secured against first joint pari passu charge over present and future fixed assets of the Company.
7.4 This represents long term finance facility amounting to Rs.250 million from a financial institution carrying mark-up at the rate of 3 months KIBOR plus 125 bps per annum repayable in 48 monthly instalments starting from February 2017 with grace period of one year. As of year end, Rs. 204.91 million has been availed out of total facility. This facility is secured against first joint pari passu charge over present and future fixed assets of the Company.
7.5 This represents long term finance facility amounting to Rs. 150 million from a financial institution carrying mark-up at the rate of 3 months KIBOR plus 125 bps per annum repayable in 54 monthly instalments starting from December 2017 with grace period of six months. As of year end, Rs. 135 million has been availed out of total facility. This facility is secured against first joint pari passu charge over present and future fixed assets of the company.
7.6 This represents long term finance facility amounting to Rs. 300 million from a financial institution carrying mark-up at the rate of 3 months KIBOR plus 125 bps per annum repayable in 48 monthly instalments starting from March 2018 with grace period of one year. As of year end, Rs. 112 million has been availed out of total facility. This facility is secured against first joint pari passu charge over all present and future fixed assets of the Company.

Nimir Industrial Chemicals Ltd.40
8 LIABILITIES AGAINST ASSETS SUBJECT TO FINANCE LEASE
The interest rates used as the discounting factor (i.e. implicit in the lease) range from 1 month KIBOR plus 175 bps to 1 year KIBOR plus 100 bps (2017: 1 month KIBOR plus 175 bps to 1 year KIBOR plus 200 bps). The amount of future payments and the period during which they will become due are:
2018 2017 Year ending 30 June (Rupees) (Rupees)
2018 - 46,136,677 2019 51,823,961 49,366,866 2020 23,413,970 20,615,826 2021 25,502,247 22,406,634 2022 11,500,849 8,457,826 2023 5,664,894 - 117,905,921 146,983,829 Less: Future finance charges (9,780,580) (15,430,603) 108,125,341 131,553,226 Less: Current maturity shown under current liabilities (46,186,411) (36,938,773) 61,938,930 94,614,453
8.1 The lease agreements have the option for purchase of asset at the end of the lease period. There are no financial restrictions in the lease agreements.
8.2 Minimum Lease Payments (MLP) and their Present Value (PV) are as follow:
2018 2017 MLP PV of MLP MLP PV of MLP (Rupees) (Rupees) (Rupees) (Rupees)
Due not later than 1 year 51,823,961 46,186,411 46,136,677 36,938,773 Due later than 1 year but not later than 5 years 66,081,960 61,938,930 100,847,152 94,614,453 117,905,921 108,125,341 146,983,829 131,553,226
2018 2017
(Rupees) (Rupees) 9 DEFFERED TAX LIABILITY
This comprises of:
Deferred tax liabilities on taxable temporary differences Accelerated tax depreciation 255,784,179 242,030,556
Deferred tax assets on deductible temporary differences
Capital work in progress - impairment (18,375,856) - Provision for doubtful trade debts (5,616,674) (5,810,353) Provision against stock - (1,385,777) Deferred and unpaid liabilities (10,562,055) (20,903,081) Provision against others (2,352,569) (831,737) 218,877,025 213,099,608 Reconciliation of deferred tax liabilities - net
As of 1 July 213,099,608 109,560,554 Tax expense recognized in statement of profit or loss 7,338,036 105,413,242 Tax income recognized in OCI (1,560,619) (1,874,188) As at 30 June 218,877,025 213,099,608

Annual Report 2018 41
Note 2018 2017 (Rupees) (Rupees)
10 TRADE AND OTHER PAYABLES
Creditors 505,500,098 174,197,146 Accrued liabilities 286,086,253 167,181,421 Security deposits 10.1 400,000 400,000 Advances from customers 10.2 34,571,678 15,099,762 Workers’ profit participation fund 10.3 52,977,509 37,459,682 Workers’ welfare fund 10.4 15,721,490 10,915,886 Sales tax payable 3,572,869 - Withholding tax payable 526,926 2,708,599 Others 11,609,469 6,793,797 910,966,292 414,756,293
10.1 These represent security deposits from distributors and transporters which, by virtue of agreement, are interest free, repayable on demand and are used in the normal course of business.
10.2 This include advance received from customers in ordinary course of business. No amounts have been received from related parties (2017: Nil).
Note 2018 2017 (Rupees) (Rupees)
10.3 Balance as at 01 July 37,459,682 32,507,240 Add: Provision for the year 30 47,517,827 37,459,682 Less: Payments made during the year (32,000,000) (32,507,240) Balance as at 30 June 52,977,509 37,459,682 10.4 Balance as at 01 July 10,915,886 34,647,760
Add: Provision for the year 30 15,721,490 10,915,886 Less: Payments made during the year (10,820,082) (8,392,413) Less: Reversal during the year (95,804) (26,255,347) Balance as at 30 June 15,721,490 10,915,886
11 NET DEFINED BENEFIT LIABILITY - FUNDED GRATUITY
Staff retirement benefits - gratuity 11.1 56,710,402 47,366,587
11.1 The amounts recognized in the statement of financial position are as follows:
Present value of defined benefits obligation 11.5 77,199,315 64,901,853 Less: Fair value of plan assets 11.6 (20,488,913) (17,535,266) 56,710,402 47,366,587 11.2 The amounts recognized in the profit or loss account are as follows:
Current service cost 7,793,855 7,007,839 Interest cost on defined benefit obligation - net 3,179,914 2,935,588 Expense recognized in the profit or loss account 11.3 10,973,769 9,943,427 11.3 The charge for the year has been allocated as follows:
Cost of sales 27.2 7,588,144 7,600,391 Distribution costs 28.1 982,196 659,460 Administrative expenses 29.1 2,403,429 1,683,576 10,973,769 9,943,427

Nimir Industrial Chemicals Ltd.42
2018 201711.4 Movements in the net liability recognized as follows: (Rupees) (Rupees) Net liabilities at the beginning of the year 47,366,587 49,805,868 Current service cost 7,793,855 7,007,839 Interest cost on defined benefit obligation 3,179,914 2,935,588 Contribution by employer (7,011,397) (18,630,000) Remeasurements charged to other comprehensive income 5,381,443 6,247,292 Net liabilities at the end of the year 56,710,402 47,366,587 11.5 Movements in the present value of defined benefit obligation:
Present value of defined benefits obligation at the beginning of the year 64,901,853 59,666,550 Current service cost 7,793,855 7,007,839 Interest cost on defined benefit obligation 4,451,221 3,940,600 Benefits paid (7,011,397) (10,626,900)
Remeasurement: Experience adjustments 7,063,783 4,913,764
Present value of defined benefits obligation at the end of the year 77,199,315 64,901,853 11.6 Movements in the fair value of plan assets:
Fair value of plan assets at the beginning of the year 17,535,266 9,860,682 Contribution by employer 7,011,397 18,630,000 Interest Income 1,271,307 1,005,012 Benefits paid (7,011,397) (10,626,900) Return on plan assets excluding interest income 1,682,340 (1,333,528) Fair value of plan assets as at the end of the year 20,488,913 17,535,266
2019 11.7 Estimated expense to be charged to profit or loss in next year (Rupees)
Current service cost 8,812,947 Interest cost on defined benefit obligation - net 4,497,501 Amount chargeable to profit or loss 13,310,448
Qualified actuaries have carried out the valuation as at June 30, 2018. The projected unit credit method, based on
the following significant assumptions, is used for valuation of the plan:
2018 2017
Discount rate for interest cost in profit or loss charge 9.75% 9.75% Discount rate for obligation 7.75% 7.25% Expected rates of salary increase in future years 6.75% 6.25% Retirement assumption Age 60 Age 60
A quantitative sensitivity analysis for significant assumption on defined benefit obligation is as shown below: Defined benefit
Sensitivity level Assumption obligation +100 bps Discount rate 70,769,941 -100 bps Discount rate 84,631,349 +100 bps Expected increase in salary 84,631,349 -100 bps Expected increase in salary 70,656,886

Annual Report 2018 43
The sensitivity analysis above have been determined based on a method that extrapolates the impact on defined benefit obligation as a result of reasonable changes in key assumptions occurring at the end of the reporting period.
The average duration of the defined benefit plan obligation at the end of the reporting period is 8 years.
12 SHORT TERM BORROWINGS - SECURED
The aggregate of short term finance facilities available from various financial institutions (including commercial banks) at period end is Rs. 5,254 million (2017: Rs. 3,640 million) which includes running finance facilities amounting Rs. 750 million (2017: Rs. 805 million). The rate of mark up ranges from 1 month KIBOR to 6 months KIBOR + 0 to 150 bps with no floor and no cap (2017: 1 month KIBOR to 6 months KIBOR + 100 bps with no floor and no cap). The facilities are secured against joint pari passu charge on the present and future current assets of the Company.
In addition to above, the unutilized facility for opening letters of credit and bank guarantees as at June 30, 2018 amounts to Rs. 911 million (2017: Rs. 473 million) and Rs. 89 million (2017: Rs. 95 million) respectively.
13 CONTINGENCIES AND COMMITMENTS 13.1 CONTINGENCIES
Pending the outcome of below cases, no provision has been made in the financial statements, since the management
of the Company based on its consultants’ opinion, is confident that the outcome of the appeals will be in the favour of the Company.
13.1.1 The income tax authority amended the Company’s assessment relating to Tax Year 2016 under section 161 / 205 of the Income Tax Ordinance, 2001 (the Ordinance) raised a demand of Rs. 8 million vide Order dated 15 May 2017. The Company filed an appeal before Commissioner Inland Revenue (Appeals), who upheld the said order. The Company filed second appeal before the Appellate Tribunal Inland Revenue (ATIR) who decided the case in favour of the Company vide Order dated 22 January 2018. The tax authority has filed a reference dated 11 June 2018 before the Lahore High Court against the decision of the ATIR which is pending adjudication.
13.1.2 The income tax authority raised a tax demand of Rs. 206 million by treating the remission of loan as taxable income of Rs. 711 million for the Tax Year 2011 which was challenged at Appellate Tribunal Inland Revenue (ATIR). The ATIR decided the case in favour of the Company vide Order dated December 2, 2013. The Income Tax Department has filed an appeal date Feburary 2014 before the Honorable Lahore High Court against the ATIR’s decision which is pending adjudication.
13.1.3 The income tax authority amended the proceedings the Company’s assessment relating to Tax Year 2014 under section 122 (5) / 177 / 214C of the Ordinance and raised demand of Rs. 123 million. The Company filed an appeal before Commissioner Inland Revenue (Appeals), who decided the case in favour of the Company in toto vide order dated March 21, 2018. The Company as well as its consultant has not received any intimation for filing of appeal by the tax department to the ATIR.
13.1.4 The income tax authority amended the Company’s assessment relating to tax year 2009 under section 122 (5A) of the Ordinance, disallowing certain expenses thereby reducing declared loss from Rs. 167 million to Rs. 65 million (conseqent tax exposure Rs. 35.7 million). The Company filed an appeal before the Commissioner Inland Revenue (Appeals), who upheld the order on major additions vide Order dated April 23, 2018. The Company has filed second appeal before the ATIR dated May 21 2018, which is pending adjudication.

Nimir Industrial Chemicals Ltd.44
13.2 COMMITMENTS
Commitments in respect of letters of credit and letters of guarantee as at June 30, are as follows: Note 2018 2017
(Rupees) (Rupees) Letters of credit established for the import of raw materials, spare parts and machinery 1,307 million 947 million Letter of guarantee given to SNGPL 96 million 96 million Letter of guarantee given to PSO 22 million 16 million Letter of guarantee given to Total PARCO 3 million 3 million
14 PROPERTY, PLANT AND EQUIPMENT Operating fixed assets 14.1 2,260,375,722 1,657,414,199 Capital work in progress 14.7 292,815,884 573,023,231 2,553,191,606 2,230,437,430
14.3 There are fully depreciated assets, having cost of Rs. 238 million that are still in use as at the reporting date.
14.4 Company’s immovable fixed assets are located at 14.8 km, Sheikhupura-Faisalabad Road, Mouza Bhikki, District Sheikhupura, Pakistan having area of 51.8 acres.
14.5 No assets were sold to the Chief Executive, Directors, Executives or shareholders holding more than 10% of total paid-up capital.
` Note 2018 2017 14.6 Depreciation for the year has been allocated as under: (Rupees) (Rupees)
Cost of sales 27 232,119,830 152,946,283 Distribution costs 28 2,807,453 3,157,774 Administrative expenses 29 12,414,202 9,619,923 247,341,485 165,723,980
14.7 Capital work in progress 2018 2017 Land and Plant and Building machinery Others Total Total (Rupees) (Rupees)
Opening balance 12,315,782 560,707,449 - 573,023,231 190,420,201 Impairment charge - (63,365,020) - (63,365,020) - Additions during the year 110,511,709 485,683,588 19,501,399 615,696,696 600,732,090 122,827,491 983,026,017 19,501,399 1,125,354,907 791,152,291 Transferred to fixed assets (42,319,511) (781,765,499) (8,454,013) (832,539,023) (218,129,060) 80,507,980 201,260,518 11,047,386 292,815,884 573,023,231
14.7.1 Plant and machinery includes borrowing cost capitalized during the year amounting to Rs. 7,424,954 (2017: Rs. 2,310,950). The expansion has been financed by a term finance facility from a financial institution.
14.7.2 During the year company has tested its two steam turbines for impairment from a renowned valuer (Iqbal A. Nanjee & Co. (Private) Limited). As per valuation report, the valuer determined the recoverable value of these turbines under normal condition amounting to Rs. 12 million, resulting in an impairment charge of Rs. 63.37 million.

Annual Report 2018 45

Nimir Industrial Chemicals Ltd.46
15 INTANGIBLE Note 2018 2017 (Rupees) (Rupees)
Software and licenses Cost:
As at 1 July 4,204,250 2,166,500 Additions during the year - 2,037,750 As at 30 June 4,204,250 4,204,250 Accumulated amortization:
As at 1 July (2,450,487) (1,605,299) Amortization during the year 29 (791,488) (845,188) As at 30 June (3,241,975) (2,450,487) Net book value 962,275 1,753,763
Rate of amortization 20%-33.33% 20%-33.33%
16 INVESTMENT IN SUBSIDIARY
In 2016, Nimir Industrial Chemicals Limited formed a wholly owned subsidiary under the name of Nimir Holding (Private) Limited. NHPL formed a sub-subsidiary, Nimir Management (Private) Limited, which acquired the majority shareholding of Nimir Resins Limited, a listed company engaged in the business of industrial chemicals. The effective shareholding of the Company in Nimir Resins Limited is 37.64%. The Company has determined that Nimir Resins Limited is a subsidiary in accordance with IFRS 10 Consolidated Financial Statements.
Note 2018 2017 (Rupees) (Rupees) Investment at cost 281,852,260 281,852,260 17 LONG TERM DEPOSITS
Security deposits Financial institutions (including banks) 11,479,520 19,072,970
Others 17.1 14,805,842 14,805,842 26,285,362 33,878,812
17.1 It includes deposit amounting to Rs. 12.24 million (2017: Rs. 12.24 million) given to Electricity supply company for
dedicated line. 2018 2017 18 STORES, SPARE PARTS AND LOOSE TOOLS (Rupees) (Rupees) Stores, spare parts and loose tools
In hand 141,210,766 155,569,634 In transit 128,112 14,733,648 141,338,878 170,303,282

Annual Report 2018 47
19 STOCK IN TRADE Note 2018 2017 (Rupees) (Rupees) Raw and packing material
In hand 229,498,360 371,800,510 In transit 1,557,410,921 654,160,772 1,786,909,281 1,025,961,282 Provision against raw material 19.1 - (4,191,285) Provision against packing material 19.2 - (427,973) - (4,619,258) 1,786,909,281 1,021,342,024 Finished goods 471,688,196 253,273,031 2,258,597,477 1,274,615,055
19.1 Movement in provision for raw material is as follows:
Opening balance 4,191,285 10,433,626 Reversal during the year (4,191,285) (6,242,341) Closing balance - 4,191,285 19.2 Movement in provision for packing material is as follows:
Opening balance 427,973 427,973 Reversal during the year (427,973) - Closing balance - 427,973
20 TRADE DEBTS
Considered good - unsecured Due from customers 20.1 1,600,839,881 974,375,084
Due from associated companies 20.2 20,841,099 9,064,930 1,621,680,980 983,440,014 Considered doubtful 19,367,842 19,367,842 Provision for doubtful debts (19,367,842) (19,367,842) - - 1,621,680,980 983,440,014
20.1 These customers have no recent history of default. For age analysis of these trade debts, refer to Note 37.1.1.
20.2 Trade debts from Nimir Resins Limited amounting to Rs. 20,382,248 (2017: Rs. 8,968,282) and Nimir Chemicals
Pakistan Limited Rs. 458,851 (2017: Rs. 96,648).
20.3 Aggregate amount due from Directors, Chief Executive and Executives of the Company is Rs. Nil (2017: Rs. Nil).
20.4 Maximum aggregate amount due from associated undertakings at the end of any month in the year was Rs.49,205,949 (2017: Rs. 27,964,883). No interest has been charged on the amounts due from associated undertakings.
21 LOANS AND ADVANCES Note 2018 2017 (Rupees) (Rupees) Considered good - unsecured
Suppliers 67,375,105 44,426,993 Employees against business expenses 21.1 2,663,077 2,558,013 Employees against salary 21.2 7,601,512 8,350,834 77,639,694 55,335,840

Nimir Industrial Chemicals Ltd.48
21.1 This includes advance given to executives amounting to Rs. 42,577 (2017: Rs. 1.94 million).
21.2 This includes advance given to executives amounting to Rs. 3.7 million (2017: Rs. 6.4 million). No amount is due from CEO or directors.
22 TRADE DEPOSITS AND SHORT TERM PREPAYMENTS Note 2018 2017 (Rupees) (Rupees)
Current maturity of long term security deposits - financial institutions (including banks) 10,856,528 4,143,666 Prepayments 17,246,875 8,112,014 28,103,403 12,255,680 23 OTHER RECEIVABLES
Margin against bank guarantee 17,202,950 16,602,950 Margin against LC 46,857,000 1,753,320 64,059,950 18,356,270 24 TAX REFUNDS DUE FROM THE GOVERNMENT
Income tax 524,476,858 320,451,585 Sales tax - 72,439,074 Federal excise duty 3,748,500 3,748,500 528,225,358 396,639,159
25 CASH AND BANK BALANCES
Cash in hand 522,610 7,374,961 Cash at bank
Current accounts 4,112,365 7,202,589 Saving accounts 25.1 1,810,990 938,651 5,923,355 8,141,240 6,445,965 15,516,201
25.1 These carry mark-up rate ranging from 4% to 4.5% (2017: 3% to 4%) per annum.
26 SALES
Local sales 14,221,874,664 8,623,982,453 Export sales - 311,640 Gross sales 14,221,874,664 8,624,294,093 Less: Sales tax (2,067,562,281) (1,254,509,246) 12,154,312,383 7,369,784,847
Less: Trade discounts - (644,894) Net sales 12,154,312,383 7,369,139,953
26.1 Sales include toll servicing revenue amounting to Rs. 130 million.

Annual Report 2018 49
27 COST OF SALES Note 2018 2017 (Rupees) (Rupees) Raw and packing material consumed 27.1 9,517,454,002 5,325,260,262 Salaries, wages and benefits 27.2 285,363,442 222,329,831 Depreciation 14.6 232,119,830 152,946,283 Fuel and power 540,372,635 418,626,868 Stores, spare parts and loose tools consumed 107,472,078 82,590,026 Repairs and maintenance 24,684,547 38,035,081 Traveling, conveyance and entertainment 23,512,848 17,547,918 Communications 977,257 925,704 Insurance 14,065,102 10,743,950 Rent, rates and taxes 6,790,845 5,226,590 Printing and stationery 2,176,142 1,640,273 Dues, fees and subscription 2,229,530 1,067,687 Other expenses 3,001,171 2,512,425 10,760,219,429 6,279,452,898 Add: Opening stock-finished goods 19 253,273,031 277,889,730 Less: Closing stock-finished goods 19 (471,688,196) (253,273,031) 10,541,804,264 6,304,069,597
27.1 Raw and packing material consumed
Opening Balance 1,021,342,024 360,105,792 Purchases 10,283,021,259 5,986,496,494 11,304,363,283 6,346,602,286 Less: Closing Balance 19 (1,786,909,281) (1,021,342,024) Raw and packing material consumed 9,517,454,002 5,325,260,262 27.2 This includes Rs. 7.6 million (2017: Rs. 7.6 million) in respect of staff retirement benefits - gratuity scheme.
27.3 Cost of sales includes direct toll manufacturing expenses amounting to Rs. 39.3 million.
28 DISTRIBUTION COSTS Note 2018 2017 (Rupees) (Rupees)
Salaries, wages and benefits 28.1 29,085,917 22,370,448 Depreciation 14.6 2,807,453 3,157,774 Repairs and maintenance 114,313 29,292 Traveling, conveyance and entertainment 2,956,024 2,314,901 Communications 249,137 261,220 Insurance 1,802,909 2,767,385 Printing and stationery 402,084 473,545 Freight outward 48,844,382 44,310,923 Distribution commission 63,070,424 38,637,473 Packing, carriage and forwarding 20,760 68,510 Dues, fees and subscription 294,733 333,874 Other expenses 92,339 30,300 149,740,475 114,755,645
28.1 This includes Rs. 0.98 million (2017: Rs. 0.7 million) in respect of staff retirement benefits - gratuity scheme.

Nimir Industrial Chemicals Ltd.50
29 ADMINISTRATIVE EXPENSES Note 2018 2017 (Rupees) (Rupees)
Salaries, wages and benefits 29.1 95,030,614 66,476,360 Depreciation 14.6 12,414,202 9,619,923 Amortization 15 791,488 845,188 Fuel and power 1,492,375 961,869 Repairs and maintenance 4,007,775 1,579,525 Traveling, conveyance and entertainment 13,302,985 11,055,774 Communications 2,913,693 2,742,142 Insurance 2,151,085 1,828,719 Rent, rates and taxes 3,805,173 2,080,289 Printing and stationery 1,941,808 2,941,913 Advertisement 956,062 955,783 Legal, professional and consultancy charge 13,532,252 5,271,250 Auditors’ remuneration 29.2 2,550,000 1,925,000 Dues, fees and subscription 6,895,406 6,143,870 Other expenses 29.3 5,743,731 1,271,185 167,528,649 115,698,790
29.1 This includes Rs. 2.4 million (2017: Rs. 1.7 million) in respect of staff retirement benefits - gratuity scheme.
2018 2017 (Rupees) (Rupees)
29.2 Auditors’ remuneration
Audit fee 1,200,000 1,100,000 Consolidation, reviews and certifications 1,275,000 748,000 Out of pocket expenses 75,000 77,000 2,550,000 1,925,000
29.3 This includes Rs. 1.6 million paid in respect of donation to different approved organizations, out of this Rs.1.2 million was paid to District Headquarter Hospital, Sheikhupura (2017: Nil). Directors (or their spouses) have no interest in donees.
30 OTHER EXPENSES Note 2018 2017 (Rupees) (Rupees) Workers profit participation fund 10.3 47,517,827 37,459,682 Workers welfare fund 10.4 15,721,490 10,915,886 Loss on sale of damaged packing material - scrap - 1,924,539 Impairment expense 14.7 63,365,020 - Provision against refundable sales tax 5,339,850 - 131,944,187 50,300,107 31 OTHER INCOME
Non financial assets
Gain on disposal of property, plant and equipment 14.2 3,267,392 7,161,059 Reversal of provision 7,037,498 28,102,567 Other Income 31.1 6,378,923 - Financial assets
Profit on savings account 50,938 108,660 Profit on loan to subsidiary - 26,352,260 16,734,751 61,724,546
31.1 This relates to income from sale of scrap material.

Annual Report 2018 51
32 FOREIGN EXCHANGE LOSS Note 2018 2017 (Rupees) (Rupees)
On foreign exchange denominated liabilities 32.1 88,657,880 9,794,917
32.1 This include unrealized exchange loss on translation of liabilities in foreign currency amounting to Rs. 6,669,205
(2017: Rs. 857,990).
33 FINANCE COST 2018 2017 (Rupees) (Rupees) Mark-up on
Long term loans 30,034,006 23,706,291 Short term borrowings 160,598,065 94,019,762 Financial charges on lease 8,107,617 9,801,782 Bank charges, fee and commission 5,514,771 3,283,068 Early payment discount - 4,616,473 204,254,459 135,427,376 34 TAXATION
Current tax:
Current year 184,385,392 158,928,673 Prior year (141,335) (34,957,140) 184,244,057 123,971,533 Deferred tax:
Relating to the reversal and origination of temporary differences 14,441,356 108,947,453 Effect of rate change from prior year (7,103,320) (3,534,211) 7,338,036 105,413,242 191,582,093 229,384,775
Relationship between tax expenses and accounting profit
Accounting profit before taxation 887,117,220 700,818,067 Tax at applicable tax rate of 30% (2017: 31%) 266,135,166 217,253,601 Effect of expenses not allowed for tax (27,691,228) 53,971,950 Effect of super tax 23,110,590 16,045,538 Effect of tax credit (69,351,100) (22,920,758) Effect of tax on export sales under Final Tax Regime - (8,416) Effect of prior years tax (141,335) (34,957,140) Tax credit on donation (480,000) - Tax expense for the year 191,582,093 229,384,775
35 COMPARSION OF TAX PROVISION 2017* 2016** 2015 Provision as per Financial Statement 158,928,673 111,497,880 295,386 Amount as per Income Tax Return 130,926,746 128,303,349 295,386
* The difference mainly relates to super tax which was computed separately from tax return in tax year 2017. ** The difference mainly relates to adjustment of brought forward minimum taxes.

Nimir Industrial Chemicals Ltd.52
36 EARNINGS PER ORDINARY SHARE - BASIC AND DILUTED 2018 2017 (Rupees) (Rupees)
36.1 Basic
Profit attributable to ordinary shareholders 695,535,127 471,433,292 Weighted average number of ordinary shares 110,590,546 110,590,546 Earnings per ordinary share 6.29 4.26
36.2 Diluted
No figure for diluted earning per share has been presented as the Company has not issued any instrument carrying option which would have an impact on earnings per share when exercised.
37 FINANCIAL INSTRUMENTS AND RELATED DISCLOSURES
The main risks arising from the Company’s financial instruments are credit risk, liquidity risk, foreign currency risk, interest rate risk and equity price risk. The management reviews and agrees policies for managing each of these risks which are summarized below. 37.1 Credit Risk
Credit risk is the risk which arises with the possibility that one party to a financial instrument will fail to discharge its
obligation and cause the other party to incur a financial loss. The Company attempts to control credit risk by monitoring credit exposures, limiting transactions with specific counterparties and continually assessing the creditworthiness of counterparties. The Company does not believe it is exposed to major concentration of credit risk, however to manage any possible exposure the Company applies approved credit limits to its customers.
The management monitors and limits the Company’s exposure to credit risk through monitoring of client’s credit exposure review and conservative estimates of provisions for doubtful receivables, if any, and through the prudent use of collateral policy.
The Company is exposed to credit risk on long-term deposits, trade debts, other receivables and bank balances. The Company seeks to minimize the credit risk exposure through having exposures only to customers considered credit worthy and obtaining securities where applicable. The maximum exposure to credit risk at the reporting date is:
Carrying values 2018 2017
(Rupees) (Rupees) Long-term deposits 14,805,842 14,805,842 Trade debts – unsecured 1,621,680,980 983,440,014 Other receivables 64,059,950 18,356,270 Bank balances 5,923,355 8,141,240 The credit quality of financial assets can be assessed by reference to external credit ratings or the historical information
about counter party defaults as shown below:

Annual Report 2018 53
2018 2017 37.1.1 Trade Debts (Rupees) (Rupees)
Other than related parties
Neither past due nor impaired 707,568,207 803,584,904 Past due but not impaired
01-30 days 831,211,422 123,488,351 31-60 days 31,137,482 47,301,829 61-90 days 24,348,629 36,364 Over 90 days 6,574,141 - 893,271,674 170,826,544 Past due and impaired 01-30 days - - 31-60 days - -
61-90 days - - Over 90 days 19,367,842 19,367,842 19,367,842 19,367,842 1,620,207,723 993,779,290
Related parties
Neither past due nor impaired 12,744,272 9,009,489 Past due but not impaired
01-30 days 8,096,827 7,722 31-60 days - 7,722 61-90 days - - Over 90 days - 3,633 8,096,827 19,077 20,841,099 9,028,566
37.1.1.1 As at June 30, 2018, trade debts of Rs. 19.37 million (2017: Rs. 19.37 million) were impaired and provided for.
37.1.2 Bank Ratings 2018 2017 Financial institution Agency Short Term Long term (Rupees) (Rupees)
Albaraka Bank (Pakistan) Limited PACRA A1 A 17,794 70,213 Habib Bank Limited JCR-VIS A1+ AAA (155,394) (229,413) MCB Bank Limited PACRA A1+ AAA 1,810,990 938,651 Meezan Bank Limited JCR-VIS A-1+ AA+ (3,245,496) (957,628) National Bank of Pakistan PACRA A1+ AAA 30,906 335,543 Silk Bank Limited JCR-VIS A-2 A- 6,117 6,116 Standard Chartered Bank Limited PACRA A1+ AAA 1 2,482,457 The Bank of Punjab PACRA A1+ AA 7,458,437 5,495,301 5,923,355 8,141,240 37.2 Liquidity Risk
Liquidity risk is the risk that the Company will not be able to meet its commitments associated with financial liabilities
when they fall due. Liquidity requirements are monitored regularly and management ensures that sufficient liquid funds are available to meet any commitments as they arise.

Nimir Industrial Chemicals Ltd.54
Financial liabilities are analysed below, with regard to their remaining contractual maturities.
Maturity Up to Maturity After One Year One Year Total (Rupees)
As at June 30, 2018 Long term loans 174,159,225 418,254,615 592,413,840
Liabilities against assets subject to finance lease 46,186,411 61,938,930 108,125,341 Short term borrowings 2,774,291,313 - 2,774,291,313 Mark up accrued 35,916,280 - 35,916,282 Unclaimed dividend 5,849,713 - 5,849,713 Trade and other payables 791,586,351 - 791,586,351 Total financial liabilities 3,827,989,295 480,193,545 4,308,182,840
As at June 30, 2017 Long term loans 127,604,162 259,262,449 386,866,611
Liabilities against assets subject to finance lease 36,938,773 94,614,453 131,553,226 Short term borrowings 1,861,588,054 - 1,861,588,054 Mark up accrued 27,494,527 - 27,494,527 Unclaimed dividend 2,415,790 - 2,415,790 Trade and other payables 341,378,567 - 341,378,567 Total financial liabilities 2,397,419,873 353,876,902 2,751,296,775
37.3 Market Risk
37.3.1 Currency Risk
Currency risk is the risk that the fair value or future cash flows of a financial instrument will fluctuate because of changes in foreign exchange rates. The Company’s exposure to the risk of changes in foreign exchange rates relates primarily to the foreign trade payables. However at the year end, there are no material foreign currency balances.
37.3.2 Interest Rate Risk
Interest rate risk arises from the possibility that changes in interest rate will affect the fair value or future cash flows of financial instruments. The Company is exposed to interest rate risk for loans obtained from the financial institutions and liabilities against assets subject to finance lease, which have been disclosed in the relevant note to the financial statements.
If interest rates at the year end, fluctuate by 1% higher / lower, profit for the year would have been Rs. 34.7 million (2017: Rs. 23.7 million) higher / lower. This analysis is prepared assuming that all other other variables held constant and the amounts of liabilities outstanding at the reporting date were outstanding for the whole year.
37.4 Capital Management
The primary objective of the Company’s capital management is to ensure that it maintains a strong credit rating and
healthy capital ratios in order to support its business and maximize shareholders’ value. The Company manages its capital structure and makes adjustments to it in the light of changes in economic conditions. Capital includes ordinary share capital and reserves. The gearing ratio of the Company is 27% (2017: 24%).
37.5 Fair value of financial assets and financial liabilities
Fair value is the price that would be received to sell an asset or paid to transfer a liability in an orderly transaction between market participants at the measurement date. As at the balance sheet date, carrying value of all the financial instruments in the financial statements approximates their fair value. Further, all financial assets and financial liabilities at balance sheet date are categorized into loans and advances.

Annual Report 2018 55
38 RELATIONSHIP AND TRANSACTIONS WITH RELATED PARTIES
The Company have interest based on common directorship and / or percentage of shareholding in following mentioned companies. Basis of Status of Percentage of
Names of Companies Relationship relationship direct shareholding Nimir Resources (Private) Limited Shareholding (Ultimate) Parent Company 56.74% Nimir Holdings (Private) Limited Shareholding Subsidiary Company 100% Nimir Management (Private) Limited Shareholding Sub-Subsidiary Company 51.00% Nimir Resins Limited Shareholding Sub-Subsidiary Company 37.64% Nimir Chemicals Pakistan Limited Common Directorship Associated company Nil Terranova Limited Common Directorship Associated company Nil Extract 4 Life (Private) Limited Common Directorship Associated company Nil The related parties and associated undertakings comprise parent company, related group companies, directors and key
management personnel. Remuneration of Chief Executive, directors and executives is shown in Note 39. Transactions with related parties during the year are as follows:
Nature and Description of Name of Related Party Related Party Transaction 2018 2017 (Rupees) (Rupees) Nimir Resources (Private) Limited Dividend Paid 125,420,647 62,670,647 Nimir Holdings (Private) Limited Markup on loan - 26,352,260 Nimir Resins Limited Purchase of goods 306,640 - Sale of goods 102,392,320 80,114,948 Services provided 3,683,304 7,728,000 Services acquired 2,730,000 2,520,000 Reimbursement of expenses 924,000 342,667 Nimir Chemicals Pakistan Limited Sale of goods 14,397,680 5,462,100 Staff retirement fund Contribution to gratuity fund 7,011,397 18,630,000
39 REMUNERATION OF CHIEF EXECUTIVE, DIRECTORS AND EXECUTIVES
Chief Executive Directors Executives 2018 2017 2018 2017 2018 2017*
Number of persons 1 1 2 2 12 8 (Rupees)
Remuneration 8,825,806 7,354,839 13,378,064 11,148,388 31,339,353 22,761,291 Housing 3,971,613 3,309,679 6,020,128 5,016,776 14,102,709 10,242,588 Utilities 882,581 735,482 1,337,808 1,114,836 3,133,938 2,276,121 Bonus 4,174,932 3,978,434 6,328,336 5,967,652 15,372,410 12,081,042 17,854,932 15,378,434 27,064,336 23,247,652 63,948,410 47,361,042
39.1 The Chief Executive Officer and Directors have been provided with company - maintained cars and generator sets, further they are also entitled to club membership and reimbursement of medical and entertainment expenses whereas some executives have been provided with company- maintained cars.
39.2 An amount of Rs. 1,900,000 (2017: Rs. 1,330,000) was paid to directors for attending the board meetings.
*The number of executives and their remuneration has been restated as per the requirement of fourth schedule of Companies Act, 2017.

Nimir Industrial Chemicals Ltd.56
40 TOTAL NUMBER OF EMPLOYEES 2018 2017 Number of employees as at June 30 150 137 Average number of employees during the year 144 136 Number of employees in factory
Number of employees as at June 30 111 105 Average number of employees during the year 108 105 41 PRODUCTION CAPACITY IN METRIC TONS 2018 2018 2017 2017 *Maximum Actual *Maximum Actual Capacity (MT) Production (MT) Capacity (MT) Production (MT) Oleo Chemicals 68,000 67,407 52,000 50,710 Chlor Alkali Products 50,000 48,722 44,500 43,642 Soap Finishing Line 16,000 12,005 - -
* Determined on weighted average basis. 41.1 The variance between maximum capacity and actual utilization is due to market conditions.
42 SIGNIFICANT TRANSACTION AND EVENTS
Summary of significant transactions and events that have affected the Company’s position and performance during the period, as follows,
- The Turnover in 2018 has grown by Rs.4.8 billion (approximately 65%) over the year 2017. - The devaluation in Pak Rupees has resulted into an exchange loss of Rs.89 million during the year. - Since the increased volume of business was mainly financed through short term financing, the financial cost increased substantially while on the other hand EPS increased by 48%.
43 SUBSEQUENT EVENTS
The Board of Directors at its meeting held on September 25, 2018 has proposed a final dividend @ Rs. 2 per share for the year ended June 30, 2018 (2017: Rs. 1) amounting to Rs. 221,181,092 (2017: Rs. 110,590,546) for approval of the members at the Annual General Meeting to be held on October 26, 2018. These financial statements do not reflect this dividend.
44 GENERAL
44.1 RE - CLASSIFICATION
Corresponding figures of the following, along with related impact on cash flow statement, have been reclassified for
better and fair presentation:
Particulars Classified from Re-classified to 2017 (Rupees) Membership fee Other expense (Admin. expense) Due fee and Subscription (Admin. expense) 759,239 Membership fee Other expense (Distrubtion cost) Due fee and Subscription (Distribution cost) 333,874
44.2 Figures have been rounded off to nearest rupee unless otherwise stated.
45 DATE OF AUTHORIZATION FOR ISSUE
These financial statements were authorized for issue by the Board of Directors on Tuesday, September 25, 2018.
Chief Executive Officer Chairman Chief Financial Officer

Annual Report 2018 57
This page has been left blank intentionally

Nimir Industrial Chemicals Ltd.58
FINANCIAL STATEMENTS - CONSOLIDATEDFOR THE YEAR ENDED JUNE 30, 2018
59 Directors’ Report61 Report On The Audit Of The Financial Statements64 Statement Of Financial Position70 Notes To The Consolidated Financial Statements

Annual Report 2018 59
The Directors are pleased to present consolidated financial statement of the Company for the year ended on June 30, 2018.Nimir Industrial Chemicals Limited (NICL) controls the management of Nimir Resins Limited (NRL) through Nimir Holding Private Limited (NHPL) (a wholly owned subsidiary of NICL) and Nimir Management Private Limited (majority owned i.e. 51% by NHPL). NRL is a listed Company engaged in the manufacturing and sales of surface coating, polyesters, paper chemicals and textile auxiliaries. The effective shareholding of the NICL in NRL is 37.64%.
The group showed significant growth in its top line and crossed Rs. 15 billion mark; registering a year on year increase of 57%. Both sale volumes and sale prices contributed in the growth of the group turnover. As a result of this growth, the group’s pre-tax profit increased from Rs.508 million to Rs.796 million (up by 57%).
The plant up-gradation and expansion activities continued throughout the year in the group companies, which contributed towards increased production capacities, improvement in efficiency, product quality and reduction in operating cost. The management is fully committed and focused to sustain the growth in top and bottom lines of the group companies in the next financial year. Insha Allah
Corporate Governance
As required under Code of Corporate Governance incorporated in the Listing Rules of the Stock Exchanges in the country, the board of Directors is pleased to state as follows:
• The Financial statements, prepared by the management of the Company, present fairly its state of affairs, the results of its operations, cash flows and changes in equity.
• Proper books of accounts of the Company have been maintained.
• Appropriate accounting policies have been consistently applied in preparation of the financial statements and accounting estimates are based on reasonable and prudent judgment.
• International Financial Reporting Standards (IFRS), as applicable in Pakistan, have been followed in the preparation of financial statements.
• The system of internal control is sound in design and has been effectively implemented and monitored.
• There is no significant doubt upon the company ability to continue as a going concern.
• There has been no material departure from the best practices of the corporate governance, as detailed in the listing regulations.
• Key operating and financial data for the last 6 years is annexed.
• Outstanding taxes and levis are given in the notes to the financial statements
The management of the Company is committed towards good corporate governance, and taking all appropriate measures to comply with best practices and also continuously reviewing the system of internal control in the light of Companies Act 2017.Internal Financial Control
Internal Financial Control
The system of internal control is sound in design and has been effectively implemented and monitored.
External Auditors
The present auditors M/s EY Ford Rhodes, Chartered Accountant, retiring this year, being eligible, have offered themselves for re-appointment. The audit committee has recommended the re-appointment of M/s EY Ford Rhodes, Chartered Accountant as external auditor of the Company for the year ending June 30, 2019.
Pattern of Shareholding
A pattern of shareholding of Nimir Industrial Chemicals Limited and Nimir Resins Limited are annexed to their respective directors’ report. There was no trading in the shares of the Companies by the Directors, Chief Executive, Chief Financial Officer, Company Secretary, Company Executive and their spouses and minor children during the year except those which are mentioned in the annexed statement required under Code of Corporate Governance (CCG) in their respective financial accounts.
Dividend / Bonus Shares
The NICL board has recommended a Rs. 2 per share (i.e. 20%) final cash dividend for the year ended June 30, 2018. The NICL had earlier declared and paid interim cash dividends totaling Rs. 1 per share (i.e. 10%). The total cash dividend of NICL for the year remained Rs. 3 per share (i.e. 30%).
The NRL board has examine the financial position of the Company, did not recommend any cash dividend for the year ended June 30, 2018.
For and on behalf of the Board
Zafar Mahmood Aamir Jamil Chief Executive Officer Director
Lahore September 25, 2018.
DIRECTORS’ REPORT

Nimir Industrial Chemicals Ltd.60

Annual Report 2018 61
REPORT ON THE AUDIT OF THE FINANCIAL STATEMENTS
Key audit matters
1. Tax Contingencies
As disclosed in note 15 to the consolidated financial statements, certain tax matters are pending adjudication at various levels with the taxation authorities and other legal forums.
The aggregate amounts involved in such contingencies is Rs. 430 million as of June 30, 2018.
The tax contingencies requires the management to make judgements and estimates in relation to the interpretation of tax laws and regulations and the recognition and measurement of any provisions that may be required against such contingencies. Due to inherent uncertainties and the time period such matters may take to resolve, the management judgements and estimates in relation to such contingencies may be complex.
How our audit addressed the key audit matter
We assessed key technical tax issues and legislative developments and focused on the judgements made by management in assessing the quantification and likelihood of significant exposures and the level of liability required for specific cases. In particular, we focused on the impact of recent tax rulings and the status of on-going inspections by local tax authorities.
We obtained explanations from management and corroborative evidence including communication with local tax authorities and confirmations of external tax advisors. We gained an understanding of the current status of tax assessments and investigations to monitor developments in on-going disputes.
We analyzed and challenged management’s key assumptions, in particular on cases where there had been significant developments with local tax authorities, based on our knowledge and experience of the application of the tax legislation by the relevant authorities and courts. We also evaluated whether the liabilities and exposures for uncertain tax positions were appropriately disclosed in the consolidated financial statements.
We involved internal tax experts to assess and review the management’s conclusions on contingent tax matters and evaluated whether adequate disclosures have been made in note 15 to the consolidated financial statements.
Opinion We have audited the annexed consolidated financial statements of Nimir Industrial Chemicals Limited and its subsidiaries (the Group), which comprise the consolidated statement of financial position as at June 30, 2018 and the consolidated statement of profit or loss, the consolidated statement of comprehensive income, the consolidated statement of changes in equity and the consolidated statement of cash flows for the year then ended, and notes to the consolidated financial statements, including a summary of significant accounting policies and other explanatory information. In our opinion, consolidated financial statements give a true and fair view of the consolidated financial position of the Group as at June 30, 2018, and its consolidated financial performance and consolidated cash flows for the year then ended in accordance with the accounting and reporting standards as applicable in Pakistan. Basis for Opinion
We conducted our audit in accordance with International
Standards on Auditing (ISAs) as applicable in Pakistan. Our responsibilities under those standards are further described in the Auditor’s Responsibilities for the Audit of the Consolidated Financial Statements section of our report. We are independent of the Group in accordance with the International Ethics Standards Board for Accountants” Code of Ethics for Professional Accountants as adopted by the Institute of the Chartered Accountants of Pakistan (the Code), and we have fulfilled our other ethical responsibilities in accordance with the Code. We believe that the audit evidence we have obtained is sufficient and appropriate to provide a basis for our opinion.
Key Audit Matters
Key audit matters are those matters that, in our professional judgment, were of most significance in our audit of the consolidated financial statements of the current period. These matters were addressed in the context of our audit of the consolidated financial statements as a whole, and in forming our opinion thereon, and we do not provide a separate opinion on these matters. Following are the key audit matters:
FOR THE YEAR ENDED JUNE 30, 2018

Nimir Industrial Chemicals Ltd.62
Information Other than the Financial Statements and Auditors’ Report Thereon Management is responsible for the other information. The other information comprises the information included in the Annual Report, but does not include the financial statements and our auditors’ report thereon.
Our opinion on the financial statements does not cover the other information and we do not express any form of assurance conclusion thereon.
In connection with our audit of the financial statements, our responsibility is to read the other information and, in doing so, consider whether the other information is materially inconsistent with the financial statements or our knowledge obtained in the audit or otherwise appears to be materially misstated. If, based on the work we have performed, we conclude that there is a material misstatement of this other information, we are required to report that fact. We have nothing to report in this regard.
Responsibilities of Management and Board of Directors for the Consolidated Financial Statements
Management is responsible for the preparation and fair presentation of the consolidated financial statements in accordance with accounting and reporting standards as applicable in Pakistan and Companies Act, 2017 and for such internal control as management determines is necessary to enable the preparation of consolidated financial statements that are free from material misstatement, whether due to fraud or error.
In preparing the consolidated financial statements, management is responsible for assessing the Group’s ability to continue as a going concern, disclosing, as applicable, matters related to going concern and using the going concern basis of accounting unless management either intends to liquidate the Group or to cease operations, or has no realistic alternative but to do so. The Board of Directors is responsible for overseeing the Group’s financial reporting process.
Auditors’ Responsibilities for the Audit of the Consolidated Financial Statements
Our objectives are to obtain reasonable assurance about whether the consolidated financial statements as a whole are free from material misstatement, whether due to fraud or error, and to issue an auditor’s report that includes our opinion. Reasonable assurance is a high level of assurance, but is not a guarantee that an audit conducted in accordance with ISAs as applicable in Pakistan will always detect a material misstatement when it exists. Misstatements can arise from fraud or error and are considered material if, individually or in the aggregate, they could reasonably be expected to influence the economic decisions of users taken on the basis of these consolidated financial statements.
As part of an audit in accordance with ISAs as applicable in Pakistan, we exercise professional judgment and maintain professional skepticism throughout the audit. We also: • Identify and assess the risks of material misstatement of
2. Financial Reporting Framework
As referred in note 2 to the accompanying consolidated financial statements, the Companies Act 2017 (the Act) became applicable for the first time for the preparation of the Company’s annual financial statements for the year ended June 30, 2018. The Act forms an integral part of the statutory financial reporting framework as applicable to the Company and amongst others, prescribes the nature and content of disclosures in relation to various elements of the consolidated financial statements.
In the case of the Company, specific additional disclosures and changes to the existing disclosures have been included in the consolidated financial statements as referred to note 2 to the consolidated financial statements.
These changes and enhancements in the consolidated financial statements are considered important and a key audit matter because of the volume and significance of the changes in the consolidated financial statements resulting from the transition to the new reporting requirements under the Act.
We assessed the procedures applied by the management for identification of the changes required in the consolidated financial statements due to the application of the Act. We considered the adequacy and appropriateness of the additional disclosures and changes to the previous disclosures based on the new requirements. We also evaluated the sources of information used by the management for the preparation of the above referred disclosures and the internal consistency of such disclosures with other elements of the consolidated financial statements.

Annual Report 2018 63
the consolidated financial statements, whether due to fraud or error, design and perform audit procedures responsive to those risks, and obtain audit evidence that is sufficient and appropriate to provide a basis for our opinion. The risk of not detecting a material misstatement resulting from fraud is higher than for one resulting from error, as fraud may involve collusion, forgery, intentional omissions, misrepresentations, or the override of internal control.
• Obtain an understanding of internal control relevant to
the audit in order to design audit procedures that are appropriate in the circumstances, but not for the purpose of expressing an opinion on the effectiveness of the Group’s internal control.
• Evaluate the appropriateness of accounting policies used
and the reasonableness of accounting estimates and related disclosures made by management.
• Conclude on the appropriateness of management’s use of
the going concern basis of accounting and, based on the audit evidence obtained, whether a material uncertainty exists related to events or conditions that may cast significant doubt on the Group’s ability to continue as a going concern. If we conclude that a material uncertainty exists, we are required to draw attention in our auditor’s report to the related disclosures in the consolidated financial statements or, if such disclosures are inadequate, to modify our opinion. Our conclusions are based on the audit evidence obtained up to the date of our auditor’s report. However, future events or conditions may cause the Group to cease to continue as a going concern.
• Evaluate the overall presentation, structure and content
of the consolidated financial statements, including the disclosures, and whether the consolidated financial statements represent the underlying transactions and events in a manner that achieves fair presentation.
We communicate with the Board of Directors regarding, among other matters, the planned scope and timing of the audit and significant audit findings, including any significant deficiencies in internal control that we identify during our audit. We also provide the Board of Directors with a statement that we have complied with relevant ethical requirements regarding independence, and to communicate with them all relationships and other matters that may reasonably be thought to bear on our independence, and where applicable, related safeguards. From the matters communicated with the Board of Directors, we determine those matters that were of most significance in the audit of the consolidated financial statements of the current period and are therefore the key audit matters. We describe
these matters in our auditor’s report unless law or regulation precludes public disclosure about the matter or when, in extremely rare circumstances, we determine that a matter should not be communicated in our report because the adverse consequences of doing so would reasonably be expected to outweigh the public interest benefits of such communication. The engagement partner on the audit resulting in this independent auditors’ report is Abdullah Fahad Masood.
______________________EY Ford Rhodes
Chartered Accountants
Lahore October 02, 2018

Nimir Industrial Chemicals Ltd.64
Note 2018 2017 (Rupees) (Rupees) EQUITY AND LIABILITIES SHARE CAPITAL AND RESERVES Authorized share capital 145,000,000 (2017: 145,000,000) Ordinary shares of Rs.10 each 1,450,000,000 1,450,000,000 Issued, subscribed and paid up capital 7 1,105,905,460 1,105,905,460Unappropriated profit 1,642,847,738 1,136,016,902Non-controlling interest 516,162,255 453,805,470 3,264,915,453 2,695,727,832 NON CURRENT LIABILITIES Long term loans 8 525,254,615 366,262,449Liabilities against assets subject to finance lease 9 61,938,930 94,614,453Diminishing musharaka finance 10 4,828,077 2,007,412 Deferred tax liability 11 225,854,126 240,897,999 817,875,748 703,782,313 CURRENT LIABILITIES Trade and other payables 12 1,367,860,966 704,348,586Net defined benefit liability - funded gratuity 13 64,327,955 47,366,587Mark up accrued 50,140,627 38,006,072Unclaimed dividend 6,142,532 2,708,609Short term borrowings 14 3,986,468,603 2,677,866,752Current maturity of long term loans 8 174,159,225 127,604,162Current maturity of liabilities against assets subject to finance lease 9 46,186,411 36,938,773Current maturity of diminishing musharaka finance 10 1,445,876 485,211Provision for taxation 313,549,791 285,256,640 6,010,281,986 3,920,581,392 CONTINGENCIES AND COMMITMENTS 15 TOTAL EQUITY AND LIABILITIES 10,093,073,187 7,320,091,537 The annexed notes from 1 to 46 form an integral part of these financial statements.
Chief Executive Officer Chairman
CONSOLIDATED STATEMENT OF FINANCIAL POSITION

Annual Report 2018 65
Chief Financial Officer
Note 2018 2017 (Rupees) (Rupees) ASSETS NON CURRENT ASSETS Property, plant and equipment 16 3,020,447,496 2,703,808,438Intangibles 17 1,957,485 3,080,710Long term deposits 18 37,025,318 44,618,768Net defined benefit assets - funded gratuity 13 - 1,174,999 3,059,430,299 2,752,682,915 CURRENT ASSETS Stores, spare parts and loose tools 19 155,023,243 182,949,058Stock in trade 20 3,239,786,542 1,895,520,050Trade debts 21 2,370,809,817 1,576,152,141Loans and advances 22 147,519,037 111,759,503Trade deposits and short term prepayments 23 31,693,739 14,249,233Interest accrued 264,329 224,383Other receivables 24 65,168,950 19,574,270Tax refunds due from the Government 25 908,250,639 666,360,522Cash and bank balances 26 115,126,592 100,619,462 7,033,642,888 4,567,408,622
TOTAL ASSETS 10,093,073,187 7,320,091,537
AS AT JUNE 30, 2018

Nimir Industrial Chemicals Ltd.66
Note 2018 2017 (Rupees) (Rupees) Sales - net 27 15,632,038,948 9,957,829,669 Cost of sales 28 (13,702,738,640) (8,614,144,716) Gross profit 1,929,300,308 1,343,684,953 Distribution costs 29 (201,736,682) (160,192,804) Administrative expenses 30 (245,950,036) (173,164,284)
(447,686,718) (333,357,088) Operating profit 1,481,613,590 1,010,327,865 Other expenses 31 (139,188,196) (58,273,442) Other income 32 27,060,440 43,095,140 Foreign exchange loss 33 (118,354,868) (12,958,090) Finance cost 34 (279,369,838) (207,810,141) Profit before taxation 971,761,128 774,381,332 Taxation 35 (175,648,055) (266,123,637) Profit after taxation 796,113,073 508,257,695 Attributable to: Equity holders of the parent 732,556,771 474,218,530Non-controlling interests 63,556,302 34,039,165 796,113,073 508,257,695 Earnings per share - basic and diluted 36 6.62 4.29 The annexed notes from 1 to 46 form an integral part of these financial statements.
CONSOLIDATED STATEMENT OF PROFIT OR LOSSFOR THE YEAR ENDED JUNE 30, 2018
Chief Executive Officer Chairman Chief Financial Officer

Annual Report 2018 67
Note 2018 2017 (Rupees) (Rupees)
Profit after taxation 796,113,073 508,257,695 Items not to be reclassified to profit or loss in subsequent periods: Re-measurement losses on defined benefit plan 13.4 (8,090,648) (6,009,456) Income tax effect 2,346,288 1,802,837 Re-measurement losses on defined benefit plan - net of tax (5,744,360) (4,206,619) Total comprehensive income for the year 790,368,713 504,051,076 Attributable to: Equity holders of the parent 728,011,928 469,908,091 Non-controlling interests 62,356,785 34,142,985 790,368,713 504,051,076 The annexed notes from 1 to 46 form an integral part of these financial statements.
Issued, subscribed and paid up Unappropriated Non-controlling share capital profit interest Total (Rupees) (Rupees) (Rupees) (Rupees)
Balance as on 30 June 2016 1,105,905,460 779,601,452 206,192,467 2,091,699,379 Interim dividend for 2017 @ Rs. 1 per share - (110,590,546) - (110,590,546) Right issue by subsidiary - - 218,319,245 218,319,245 Reversal of equity portion of sponsors’ interestfree loans (Note 8.7) - (2,902,095) (4,849,227) (7,751,322) Total comprehensive income for the year - 469,908,091 34,142,985 504,051,076 Balance as on 30 June 2017 1,105,905,460 1,136,016,902 453,805,470 2,695,727,832 Final dividend for 2017 @ Rs. 1 per share - (110,590,546) - (110,590,546) Interim dividend for 2018 @ Rs. 1 per share - (110,590,546) - (110,590,546) Total comprehensive income for the year - 728,011,928 62,356,785 790,368,713 Balance as on 30 June 2018 1,105,905,460 1,642,847,738 516,162,255 3,264,915,453
The annexed notes from 1 to 46 form an integral part of these financial statements.
CONSOLIDATED STATEMENT OF CHANGES IN EQUITY
CONSOLIDATED STATEMENT OF COMPREHENSIVE INCOME
FOR THE YEAR ENDED JUNE 30, 2018
FOR THE YEAR ENDED JUNE 30, 2018
Chief Executive Officer Chairman Chief Financial Officer

Nimir Industrial Chemicals Ltd.68
2018 2017 (Rupees) (Rupees)CASH FLOWS FROM OPERATING ACTIVITIES Profit before taxation 971,761,128 774,381,332 Adjustment for: Depreciation 282,626,211 203,377,806 Amortization 1,123,225 1,176,925 Mark-up expense 265,152,563 198,099,884 Income from financial assets (3,124,273) (3,693,438) Provision against stock in trade 11,029,599 19,657,046 Impairment expense 63,365,020 - Reversal of provision against stock in trade (4,619,258) (82,436,341) Provision against doubtful debts 36,243,158 21,647,174 Bad debts recovered - (739,400) Provision for gratuity 17,057,116 10,390,607 Reversal of provision (7,037,498) (28,102,567) Gain on disposal of property, plant and equipment (3,267,392) (7,161,059) Exchange loss - unrealized 22,376,273 4,021,163 Workers’ profit participation fund provision 52,137,620 43,508,351 Workers’ welfare fund provision 18,345,706 14,765,091 751,408,070 394,511,242 Operating profit before working capital changes 1,723,169,198 1,168,892,574 (Increase) / Decrease in current assets Stores, spares parts and loose tools 27,925,815 (41,009,216) Stock in trade (1,350,676,833) (708,509,856) Trade debts (830,900,834) (372,292,353) Loans and advances (35,759,534) 1,093,475 Trade deposits and short term prepayments (17,444,506) (4,308,473) Other receivables (45,594,680) 26,939,731 Tax refunds due from the Government 7,151,483 (113,039,969) (2,245,299,089) (1,211,126,661) Increase in current liabilities Trade and other payables 632,113,301 211,009,478 (1,613,185,788) (1,000,117,183) Cash generated from operations 109,983,410 168,775,391 Contribution to gratuity fund (7,011,397) (18,630,000) Mark-up paid (244,339,002) (168,743,324) Tax paid (411,275,762) (185,075,512) Long term deposits 7,593,450 (5,799,684) Workers’ profit participation fund paid (38,048,669) (35,557,857) Workers’ welfare fund paid (14,192,680) (8,392,413) (707,274,060) (422,198,790) Net cash used in operating activities - Balance carried forward (597,290,650) (253,423,399)
CONSOLIDATED STATEMENT OF CASH FLOWSFOR THE YEAR ENDED JUNE 30, 2018

Annual Report 2018 69
2018 2017 (Rupees) (Rupees) Balance brought forward (597,290,650) (253,423,399)
CASH FLOWS FROM INVESTING ACTIVITIES Purchase of property, plant and equipment - net (30,535,923) (34,556,764) Additions in capital work in progress - net (632,369,891) (620,201,625) Purchase of intangible - (2,037,750) Sale proceeds from disposal of property, plant and equipment 3,542,917 7,390,250 Interest received 3,084,327 3,469,055 Net cash used in investing activities (656,278,570) (645,936,834) CASH FLOWS FROM FINANCING ACTIVITIES Long term loan obtained 334,591,987 138,795,774 Long term loan repaid (129,044,758) (93,281,351) Dividend paid (217,747,169) (119,762,036) Repayment of liabilities against assets subject to finance lease (38,042,502) (43,638,535) Repayment of liabilities against diminishing musharaka finance (2,247,259) (396,438) New leases acquired 6,507,000 32,311,000 New diminishing musharaka acquired 5,457,200 - Subscription against right issue - 104,983,484 Short term borrowings 1,308,601,851 773,014,700 Net cash generated from financing activities 1,268,076,350 792,026,598 Net increase / (decrease) in cash and cash equivalents 14,507,130 (107,333,635) Cash and cash equivalents at the beginning of the year 100,619,462 207,953,097 Cash and cash equivalents at the end of the year 115,126,592 100,619,462 The annexed notes from 1 to 46 form an integral part of these financial statements.
Chief Executive Officer Chairman Chief Financial Officer
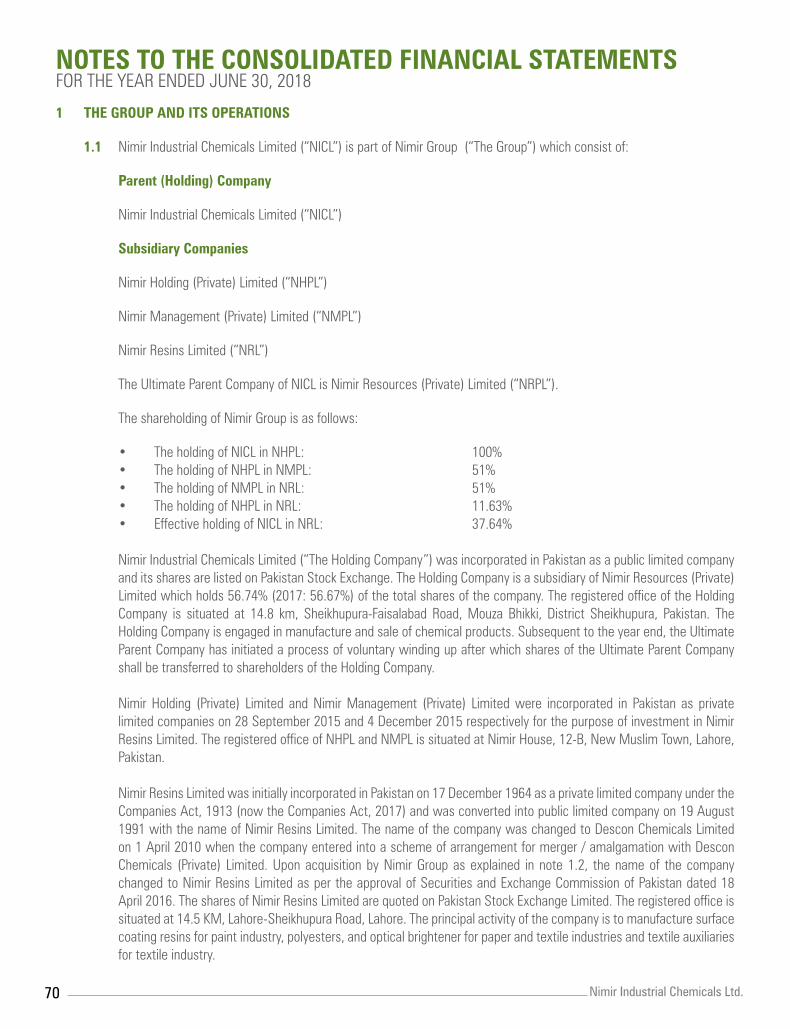
Nimir Industrial Chemicals Ltd.70
1 THE GROUP AND ITS OPERATIONS 1.1 Nimir Industrial Chemicals Limited (“NICL”) is part of Nimir Group (“The Group”) which consist of:
Parent (Holding) Company
Nimir Industrial Chemicals Limited (“NICL”)
Subsidiary Companies
Nimir Holding (Private) Limited (“NHPL”)
Nimir Management (Private) Limited (“NMPL”)
Nimir Resins Limited (“NRL”) The Ultimate Parent Company of NICL is Nimir Resources (Private) Limited (“NRPL”).
The shareholding of Nimir Group is as follows:
• The holding of NICL in NHPL: 100%
• The holding of NHPL in NMPL: 51% • The holding of NMPL in NRL: 51% • The holding of NHPL in NRL: 11.63% • Effective holding of NICL in NRL: 37.64%
Nimir Industrial Chemicals Limited (“The Holding Company”) was incorporated in Pakistan as a public limited company and its shares are listed on Pakistan Stock Exchange. The Holding Company is a subsidiary of Nimir Resources (Private) Limited which holds 56.74% (2017: 56.67%) of the total shares of the company. The registered office of the Holding Company is situated at 14.8 km, Sheikhupura-Faisalabad Road, Mouza Bhikki, District Sheikhupura, Pakistan. The Holding Company is engaged in manufacture and sale of chemical products. Subsequent to the year end, the Ultimate Parent Company has initiated a process of voluntary winding up after which shares of the Ultimate Parent Company shall be transferred to shareholders of the Holding Company.
Nimir Holding (Private) Limited and Nimir Management (Private) Limited were incorporated in Pakistan as private
limited companies on 28 September 2015 and 4 December 2015 respectively for the purpose of investment in Nimir Resins Limited. The registered office of NHPL and NMPL is situated at Nimir House, 12-B, New Muslim Town, Lahore, Pakistan.
Nimir Resins Limited was initially incorporated in Pakistan on 17 December 1964 as a private limited company under the Companies Act, 1913 (now the Companies Act, 2017) and was converted into public limited company on 19 August 1991 with the name of Nimir Resins Limited. The name of the company was changed to Descon Chemicals Limited on 1 April 2010 when the company entered into a scheme of arrangement for merger / amalgamation with Descon Chemicals (Private) Limited. Upon acquisition by Nimir Group as explained in note 1.2, the name of the company changed to Nimir Resins Limited as per the approval of Securities and Exchange Commission of Pakistan dated 18 April 2016. The shares of Nimir Resins Limited are quoted on Pakistan Stock Exchange Limited. The registered office is situated at 14.5 KM, Lahore-Sheikhupura Road, Lahore. The principal activity of the company is to manufacture surface coating resins for paint industry, polyesters, and optical brightener for paper and textile industries and textile auxiliaries for textile industry.
NOTES TO THE CONSOLIDATED FINANCIAL STATEMENTSFOR THE YEAR ENDED JUNE 30, 2018

Annual Report 2018 71
1.2 As a result of adoption of International Financial Reporting Standard (IFRS) – 10 ‘Consolidated Financial Statements’, the Holding Company assessed the control conclusion of its investment in Nimir Resins Limited (NRL) that although, the Holding Company has less than 50% shareholding in NRL, however, based on absolute size of the Holding Company’s shareholding, common directorship and management, the Holding Company has the ability to exercise control over NRL as per the terms of IFRS-10. Henceforth, Nimir Industrial Chemicals Limited (NICL) is deemed to be holding company of NRL.
2 STATEMENT OF COMPLIANCE
These financial statements have been prepared in accordance with the accounting and reporting standards as applicable in Pakistan. The accounting and reporting standards applicable in Pakistan comprise of:
- International Financial Reporting Standards (IFRS Standards) issued by the International Accounting Standards Board (IASB) as notified under Companies Act, 2017; and
- Provisions of and directives issued under the Companies Act, 2017.
Where provisions of and directives issued under the Companies Act, 2017 differ from the lFRS Standards, the provisions of and directives issued under the Companies Act, 2017 have been followed.
The Companies Ordinance, 1984 has been repealed after the enactment of Companies Act, 2017. As a result, the Company has changed its accounting framework accordingly. This change in accounting framework has not resulted in significant changes to the amounts recognized in these financial statements or the comparative information except some additional disclosures being made as required under the Companies Act, 2017. 2.1 Standards, interpretations and amendments to published approved accounting standards effective in 2018
The accounting policies adopted in the preparation of these financial statements are consistent with those of the
previous financial year except as describe below:
New / Revised Standards and Amendments
The Company has adopted the following accounting standards and amendments which became effective for the current year:
IAS 7 Statement of Cash Flows - Disclosure Initiative - (Amendment)
IAS 12 Income Taxes — Recognition of Deferred Tax Assets for Unrealized Losses (Amendments)
Improvements to Accounting Standards Issued by the IASB in December 2014
IFRS 12 Disclosure of Interests in Other Entities - Clarification of the scope of the disclosure requirements in lFRS 12.
The adoption of the above amendments, improvements to accounting standards and interpretations do not have any material effect on the financial statements.
2.2 Standards, interpretation and amendments to approved accounting standards that are not yet effective
The following standards, amendments and interpretations with respect to the approved accounting standards as applicable in Pakistan would be effective from the dates mentioned below against the respective standard or interpretation:

Nimir Industrial Chemicals Ltd.72
Effective date (annual periods Standard or Interpretation beginning on or after)
IFRS 2 Share-based Payments — Classification and Measurement of Share-based Payments Transactions (Amendments). January 1, 2018
IFRS 10 Consolidated Financial Statements and IAS 28 Investment in Associates and Joint Ventures - Sale or Contribution of Assets between an Investor and its Associate or Joint Venture (Amendment) Not yet finalized
IFRS 4 Insurance Contracts: Applying IFRS 9 Financial Instruments with IFRS 4 Insurance Contracts — (Amendments) January 1, 2018
IAS 40 Transfers to Investment Property — (Amendments) January 1, 2018
IFRIC 22 Foreign Currency Transactions and Advance Consideration January 1, 2018
IFRS 9 Financial Instruments: Classification and Measurement July 1, 2018
IFRS 15 Revenue from Contracts with Customers July 1, 2018
IFRS 16 Leases January 1, 2019
IFRS 9 Prepayment Features with Negative Compensation — (Amendments) January 1, 2019
IAS 28 Long-term Interests in Associates and Joint Ventures — (Amendments) January 1, 2019
IFRIC 23 Uncertainty over Income Tax Treatments January 1, 2019
IAS 19 Plan Amendment, Curtailment or Settlement — (Amendments) January 1, 2019
The Company expects that such improvements to the standards will not have any material impact on the Company’s
financial statements in the period of initial application except for IFRS 15 and IFRS 16. The management is in the process of determining the effect of application of IFRS 15 and IFRS 16.
In addition to the above standards and amendments, improvements to various accounting standards and conceptual framework have also been issued by the IASB. Such improvements are generally effective for accounting periods beginning on or after January 01, 2018.
Further, following new standards have been issued by IASB which are yet to be notified by the SECP for the purpose of applicability in Pakistan.
Effective date (annual periods Standard or Interpretation beginning on or after)
IFRS 14 Regulatory Deferral Accounts January 1, 2016
IFRS-17 Insurance Contracts January 1, 2021
The Company expects that such improvements to the standards will not have any material impact on the Company’s
financial statements.

Annual Report 2018 73
3 BASIS OF PREPARATION 3.1 Basis of measurement
These financial statements have been prepared under the historical cost convention except that certain employee
benefits are recognized on the basis mentioned in note 5.13.
These financial statements are the consolidated financial statements of the Group in which investment in subsidiaries is accounted for on the basis of acquisition method. Standalone financial statements of the Holding Company and its Subsidiaries are prepared separately.
3.2 Basis of consolidation
The consolidated financial statements include the financial statement of the Holding Company and its subsidiary companies. The Group uses the acquisition method of accounting to account for business combination. The consideration transferred is the fair value of the assets transferred, the liabilities assumed and the equity interest issued by the Group, if any. The Group recognizes any non-controlling interest in the acquiree at the non- controlling interest’s proportionate share of the identifiable net assets of the acquiree. The financial statement of the Holding Company and its Subsidiaries are prepared up to the same reporting date using consistent accounting policy except as stated otherwise. Identifiable assets acquired and liabilities assumed in the acquisition are measured initially at their fair value at the date of acquisition.
Goodwill is initially measured as the excess of the aggregate of the consideration transferred and the value of non- controlling interest using proportionate share method over the net identifiable assets acquired and liabilities assumed. If this is less than the fair value of the net asset of the subsidiary acquired, the difference is recognized in profit or loss account. After initial recognition it is measured at carrying value i.e. at date of acquisition less any accumulated impairment.
The financial statements of subsidiaries have been consolidated on line by line basis. Intra Group balances, transactions, income and expenses have been eliminated. Assets, liabilities, income and expense have been consolidated from the date the Group acquired the control of the subsidiary till the control cease to exist. Unrealized gain or loss on intra group transactions are also eliminated but unrealized losses are however recognized to the extent of impairment, if any.
3.3 Non-controlling interest
The Group applies a policy of treating transactions with non-controlling interests as transaction with parties external to the Group. Disposals of non-controlling interests results in gain and losses for the Group that are recorded in the statement of profit or loss account.
3.4 Functional and presentation currency
These financial statements are presented in Pak Rupee, which is the Group’s functional currency.
4 SIGNIFICANT ACCOUNTING JUDGEMENTS, ESTIMATES AND ASSUMPTIONS
The preparation of these consolidated financial statements in conformity with approved accounting and reporting standards, as applicable in Pakistan, requires the use of certain critical accounting estimates. It also requires management to exercise its judgment in the process of applying the Group’s accounting policies. Estimates and judgments are continually evaluated

Nimir Industrial Chemicals Ltd.74
and are based on the historical experience and other factors including expectations of future events that are believed to be reasonable under the circumstances. These estimates and underlying assumptions are reviewed on an ongoing basis. Revisions to accounting estimates are recognized in the period in which the estimate is revised if the revision affects only that period or in the period of the revision and future periods if the revision affects both current and future periods. The areas involving a higher degree of judgments or complexity or areas where assumptions and estimates are significant to the financial statements are as follows: 4.1 Provision for doubtful receivables
A provision for impairment of trade and other receivables is established when there is objective evidence that the
Group will not be able to collect all amounts due according to the original terms of receivables. These estimates and underlying assumptions are reviewed on an ongoing basis.
4.2 Useful life and residual values of property, plant and equipment
Estimates with respect to residual values, depreciable lives and pattern of flow of economic benefits are based on the analysis of the management of the Group. Further, the Group reviews the value of the assets for possible impairments on an annual basis. Any change in the estimates in the future might affect the carrying amount of respective item of property, plant and equipment.
Other areas where estimates and judgments involved are disclosed in respective notes to the financial statements.
4.3 Taxation and deferred tax
In making the estimates for income tax payable, the Holding Company and its subsidiary companies takes into account the applicable laws and the decisions by appellate authorities on certain issues in the past. Since, the Group has not opted for Group taxation, therefore, provision for taxation is determined on separate financial statements of the Holding Company and its subsidiary companies.
A deferred tax liability is recognized for all taxable temporary differences and deferred tax assets are recognized for deductible temporary differences and unused tax losses to the extent that it is probable that taxable profits will be available against which the losses can be utilized. Significant management judgment is required to determine the amount of deferred tax liabilities and assets that can be recognized, based upon the likely timing and level of future taxable profits together with future tax planning strategies.
4.4 Impairment of non-financial assets The Group assesses whether there are any indicators of impairment for all non-financial assets at each reporting date.
Non-financial assets are also tested for impairment when there are indicators that the carrying amounts may not be recoverable. For assets which can generally be sold in the market, the prevailing market price is used as an indicator of current recoverable amount. Technical analysis and market data, including recent transactions and economic factors, are used to arrive at recoverable amount for specialized assets.
Other areas where estimates and judgments are involved are disclosed in respective notes to the financial statements.

Annual Report 2018 75
5 SUMMARY OF SIGNIFICANT ACCOUNTING POLICIES
The accounting policies applied are consistent with prior year except as stated otherwise. 5.1 Property, plant and equipment
Owned assets
Property, plant and equipment of the Group are stated at cost less accumulated depreciation and impairment.
Cost of property, plant and equipment consists of historical cost and directly attributable cost of bringing the assets to
their present location and condition.
Depreciation on additions is charged from the month in which an asset is acquired or capitalized while no depreciation is charged for the month in which the asset is disposed off.
The carrying amounts of the Group’s assets are reviewed at each reporting date to determine whether there is any indication of impairment. If any such indication exists, the carrying amounts of such assets are reviewed to assess whether they are recorded in excess of their recoverable amount. Where carrying values exceed the respective recoverable amount, assets are written down to their recoverable amounts and the resulting impairment is recognized in the income currently. The recoverable amount is the higher of an asset’s fair value less cost to sell and value in use. Where an impairment loss is recognized, the depreciation charge is adjusted for the future periods to allocate the asset’s revised carrying amount over its estimated useful life.
Subsequent costs are included in the asset’s carrying amount or recognized as separate asset, as appropriate, only when it is probable that future economic benefits associated with the item will flow to the Group and the cost of the item can be measured reliably. All other repair and maintenance costs are charged to statement of profit or loss during the period in which they are incurred.
The gain or loss on disposal or retirement of operating fixed asset represents the difference between the sale proceeds and the carrying amount of the asset and is recognized as an income or expense in the period it relates.
An item of property, plant and equipment is derecognized upon disposal or when no future economic benefits are expected from its use or disposal.
Capital Work In Progress
These are stated at cost less impairment loss, if any, including capitalization of borrowing costs. It consists of expenditures incurred and advances made in respect of fixed assets in the course of their construction and installation.
Leased Asset
Leases, where the Group has substantially all the risks and rewards of ownership are classified as finance leases. At inception, finance leases are capitalized at the lower of present value of minimum lease payments under the lease agreements and the fair value of the assets.
The related rental obligations, net of finance cost, are included in liabilities against assets subject to finance lease. The liabilities are classified as current and non-current depending upon the timing of the payment.

Nimir Industrial Chemicals Ltd.76
Each lease payment is allocated between the liability and finance cost so as to achieve a constant rate on the balance outstanding. The interest element of the rental is charged to profit over the lease term. The financial charges are calculated at the interest rates implicit in the lease and are charged to the statement of profit or loss account.
Assets held under finance lease are stated at cost less accumulated depreciation and impairment loss, if any, at the rates and basis applicable to the Group owned assets.
5.2 Intangibles
Intangibles acquired separately are measured on initial recognition at cost. Following initial recognition, intangibles are carried at cost less any accumulated amortization and any accumulated impairment losses. The useful lives of intangibles are measured to be finite. Intangibles with finite lives are amortized over the useful life and assessed for impairment whenever there is an indication that the asset may be impaired. The amortization period and amortization method for an intangibles with a finite life is reviewed at each financial period end. The amortization expense is recognized in statement of profit or loss in the expense category consistent with the function of the intangibles.
Amortization on additions is charged from the month in which an asset is acquired or capitalized while no amortization is charged for the month in which the asset is fully amortized.
5.3 Stock in trade, stores, spare parts and loose tools
Stock in trade, stores, spares and loose tools are valued at lower of cost or net realizable value except those in transit, which are valued at invoice value including other charges, if any, incurred thereon. Basis of determining cost is as follows:
Raw and packing material - weighted average cost Material in transit - cost Work in process - cost Finished goods - weighted average cost
Stores, spare parts and loose tools - weighted average cost
Obsolete items are carried at nil value. Provision for obsolete and slow moving stock is based on management estimates.
Net realizable value is determined on the basis of estimated selling price of the product in the ordinary course of business less costs of completion and costs necessary to be incurred in order to make the sale.
5.4 Trade debts
Trade debts are carried at invoice amount on transaction date less provision for doubtful debts, if any. Bad debts are written off as and when identified.
5.5 Cash and cash equivalents
Cash and cash equivalents are carried in the statement of financial position at cost.
For the purpose of cash flow statement, cash and cash equivalents comprise of cheques in hand, cash and bank balances.

Annual Report 2018 77
5.6 Financial instruments
All the financial assets and financial liabilities are recognized at the time when the Group becomes a party to the contractual provisions of the instruments. The Group derecognizes a financial asset or a portion of financial asset when, and only when, the Group loses control of the contractual rights that comprise the financial asset or portion of financial asset. While a financial liability or part of financial liability is derecognized from the balance sheet when, and only when, it is extinguished, i.e. when the obligation specified in the contract is discharged, cancelled or expired.
All financial assets and financial liabilities are initially measured at cost, which is the fair value of the consideration given and received respectively. These financial assets and liabilities are subsequently measured at fair value, amortized cost or cost, as the case may be.
Financial assets are long term deposits, trade deposits, trade debts, loans and advances, other receivables, cash and bank balances. These are stated at their nominal values as reduced by the appropriate allowances for estimating irrecoverable amount.
Financial liabilities are classified according to the substance of the contractual arrangements entered into. Significant financial liabilities are long term loans, short term running finance utilized under mark-up arrangements, creditors, liabilities against assets subject to finance lease, accrued and other liabilities. Mark-up bearing finances are recorded at the gross proceeds received. Other liabilities are stated at their nominal value.
5.7 Offsetting of financial assets and financial liabilities
A financial asset and financial liability is offset and the net amount is reported in the statement of financial position if the Group has a legal enforceable right to set off the recognized amounts and intends either to settle on net basis or to realize the assets and settle the liabilities simultaneously.
5.8 Impairment of financial assets
The Group assesses at each reporting date whether there is any objective evidence that a financial asset or a group of financial assets is impaired. A financial asset or a group of financial assets is deemed to be impaired if, and only if, there is objective evidence of impairment as a result of one or more events that has occurred after the initial recognition of the asset (an incurred ‘loss event’) and that loss event has an impact on the estimated future cash flows of the financial asset or the group of financial assets that can be reliably estimated.
Evidence of the impairment may include indicators that the debtor or a group of debtors is experiencing significant financial difficulty, default or delinquency in interest or principal payments, the probability that they will enter bankruptcy or other financial reorganization and where observable data indicates that there is a measurable decrease in the estimated future cash flows, such as changes in arrears or economic conditions that correlate with defaults.
The amount of loss is measured as the difference between the asset’s carrying amount and the present value of the
estimated future cash flows discounted at the financial asset’s original effective interest rate. The carrying amount of the asset is reduced and the amount of the loss is recognized in the statement of profit or loss account. If, in a subsequent period, the amount of the impairment loss decreases and the decrease can be related objectively to an event occurring after the impairment was recognized, the reversal of the previously recognized impairment loss is recognized in statement of profit or loss account.
5.9 Trade and other payables
Creditors and other payables are carried at cost which is the fair value of the consideration to be paid in the future for goods and services received, whether or not invoiced to the Group.

Nimir Industrial Chemicals Ltd.78
5.10 Provisions
Provisions are recognized in the statement of financial position when the Group has a legal or constructive obligation as a result of a past event, it is probable that an outflow of resources embodying economic benefits will be required to settle the obligation and a reliable estimate can be made of the amount of obligation. However provisions are reviewed at each statement of financial position date and adjusted to reflect current best estimate.
5.11 Taxation
Current
The charge for the current tax is based on the taxable income for the year determined in accordance with the provisions of the Income Tax Ordinance, 2001. The charge for current tax is calculated using prevailing tax rates or tax rates expected to apply to the profit for the year if enacted after taking into account tax credits, rebates and exemptions, if any. The charge for current tax also includes adjustments, where considered necessary, to provision for tax made in previous years arising from assessments framed during the year for such years.
Deferred
Deferred tax is provided using the balance sheet liability method on all temporary differences arising at the reporting date, between the tax bases of the assets and liabilities and their carrying values. Deferred tax assets and liabilities are recognized for all deductible temporary differences to the extent that it is probable that future taxable profits will be available against which the temporary differences can be utilized.
Deferred tax liability is recognized for all taxable temporary differences and deferred tax assets are recognized for all deductible temporary differences, carry forward of unused tax credits and unused tax losses, if any, to the extent that it is probable that future taxable profit will be available against which the deductible temporary differences, carry-forward of unused tax credits and unused tax losses can be utilized.
Deferred tax assets and liabilities are measured at the tax rates that are expected to apply to the period when the liability is settled based on tax rates that have been enacted or substantially enacted at the reporting date.
5.12 Revenue recognition
Sale of goods - Local
Revenue is recognized when the significant risks and rewards of ownership of the goods have transferred to the buyer at the time of issuance of delivery challan.
Sale of goods - Export
Revenue from export of goods is recognized at the time of issuance of bill of lading.
Profit on bank deposit
Profit earned on saving and deposit accounts is accrued on time proportion basis by reference to the principal
outstanding at the applicable rate of return.
5.13 Staff retirement benefits
Defined benefit plan
The Group operates funded defined benefit gratuity plan for all of its permanent employees. Under this plan, gratuity is paid to the retiring employees on the basis of their last drawn gross salary for each completed year of service.

Annual Report 2018 79
Experience adjustments are recognized in statement of other comprehensive income when they occur. Amounts recorded in the statement of profit or loss are limited to current and past service cost, gains or losses on settlements, and net interest income (expense). All other changes in net defined benefit liability are recognized in the statement of other comprehensive income with no subsequent recycling to the statement of profit or loss.
The distinction between short term and other long term employee benefits is based on the expected timing of settlement rather than the employees’ entitlement to benefits.
5.14 Foreign currency translation
Foreign currency transactions are recorded using the rate ruling at the date of transactions. Monetary assets and liabilities in foreign currencies are translated into Pakistani rupees using the exchange rate ruling at the reporting date.
Profits or losses arising on translation are recognized in the statement of profit or loss account.
5.15 Borrowing costs
Borrowing costs are recognized as an expense in the period in which these are incurred except to the extent of borrowing costs that are directly attributable to the acquisition, construction or production of qualifying assets, which are assets that necessarily take a substantial period of time to get ready for their intended use. Such borrowing costs are capitalized as part of the cost of the qualifying asset.
5.16 Pricing for related party transactions
All transactions with related parties and associated undertakings are entered into arm’s length determined in accordance with comparable uncontrolled price method.
Parties are said to be related if they are able to influence the operating and financial decisions of the Group and vice versa.
5.17 Operating segments
For management purposes, the Group is organized into business units based on its products and services and has two reportable segments, as follows:
- Oleo chemicals and chlor alkali
- Coating emulsion and resins
Segment reporting is based on the operating (business) segments of the Group. An operating segment is a component of the Group that engages in business activities from which it may earn revenues and incur expenses, including revenues and expenses that relate to transactions with any of the Group’s other components. An operating segment’s operating results are reviewed regularly by the Chief Operating Decision Maker (CODM) to assess segment’s performance, and for which discrete financial information is available. Segment results that are reported to the CODM include items directly attributable to a segment as well as those that can be allocated on a reasonable basis.

Nimir Industrial Chemicals Ltd.80
6 BUSINESS COMBINATIONS AND ACQUISITION OF NON-CONTROLLING INTEREST 6.1 Material partly-owned subsidiaries
Financial information of subsidiaries that have material non-controlling interests is provided below:
Proportion of equity interest held by non-controlling interests (NCI):
Group effective NCI Country of Financial Name of subsidiary shareholding shareholding incorporation year end % %
Nimir Management (Private) Limited (NMPL) 51.00 49.00 Pakistan 30 June Nimir Resins Limited (NRL) 37.64 62.36 Pakistan 30 June
Accumulated balances of material non-controlling interest: 2018 2017 (Rupees) (Rupees) Nimir Management (Private) Limited (NMPL) 102,313,730 103,057,253 Nimir Resins Limited (NRL) 413,848,525 350,748,217
Profit allocated to material non-controlling interest:
Nimir Management (Private) Limited (NMPL) (743,523) (12,317,170) Nimir Resins Limited (NRL) 63,100,308 46,460,155
The summarized financial information of these subsidiaries is provided below. This information is based on amounts before inter-company eliminations.
Summarized statement of profit or loss:
2018 2017 NMPL NRL NMPL NRL (Rupees) (Rupees)
Sales - net - 3,580,118,885 - 2,668,804,664 Cost of sales - (3,261,493,820) - (2,391,124,100) Distribution costs - (51,996,207) - (45,437,159) Administrative expenses (486,725) (78,163,387) (1,855,200) (54,350,744) Other expenses - (7,244,009) - (9,897,874) Other income - 8,741,805 - 7,236,751 Foreign exchange loss - (29,696,988) - (3,163,173) Finance cost (480) (75,114,419) (23,281,882) (60,992,853) (Loss) / profit before taxation (487,205) 85,151,860 (25,137,082) 111,075,512 Taxation (1,030,189) 17,958,828 - (36,738,862) (Loss) / profit after taxation (1,517,394) 103,110,688 (25,137,082) 74,336,650 Total comprehensive income (1,517,394) 101,187,152 (25,137,082) 74,503,135 Attributable to non-controlling interests (743,523) 63,100,308 (12,317,170) 46,460,155

Annual Report 2018 81
7 ISSUED, SUBSCRIBED AND PAID UP CAPITAL
2018 2017 2018 2017 No. of shares (Rupees) (Rupees)
110,590,546 110,590,546 Ordinary shares of Rs. 10 each fully paid in cash 1,105,905,460 1,105,905,460
7.1 Nimir Resources (Private) Limited holds 62,750,000 ordinary shares of Rs.10 each, representing 56.74% (2017: 62,670,647 ordinary shares of Rs. 10 each, representing 56.67%) of the issued capital.
8 LONG TERM LOANS Note 2018 2017 (Rupees) (Rupees)
Term finance - Secured I 8.1 18,750,000 59,375,000 Term finance - Secured II 8.2 83,854,171 134,895,837 Term finance - Secured III 8.3 37,500,000 56,250,000 Term finance - Secured IV 8.4 204,910,414 136,345,774 Term finance - Secured V 8.5 135,000,000 - Term finance - Secured VI 8.6 112,399,255 - Loan from directors / sponsors 8.7 107,000,000 107,000,000 699,413,840 493,866,611
Less: Current maturity shown under current liabilities (174,159,225) (127,604,162) 525,254,615 366,262,449
8.1 This represents long term finance facility obtained from a financial institution carrying mark-up at the rate of 3 months KIBOR plus 200 bps per annum repayable in 48 monthly instalments starting from December 2013 with grace period of one year. This facility is secured against first joint pari passu charge over present and future fixed assets of the Holding Company.
8.2 This represents long term finance facility obtained from a financial institution carrying mark-up at the rate of 3 months KIBOR plus 200 bps per annum repayable in 48 monthly instalments starting from December 2015 with grace period of six months. This facility is secured against first joint pari passu charge over present and future fixed assets of the Holding Company.
8.3 This represents long term finance facility obtained from a financial institution carrying mark-up at the rate of 6 months KIBOR plus 200 bps per annum repayable in 48 monthly instalments starting from December 2015 with grace period of six months. This facility is secured against joint pari passu charge over present and future fixed assets of the Holding Company.
8.4 This represents long term finance facility amounting to Rs. 250 million from a financial institution carrying mark-up at the rate of 3 months KIBOR plus 125 bps per annum repayable in 48 monthly instalments starting from February 2017 with grace period of one year. As of year end, Rs. 204.91 million has been availed out of total facility. This facility is secured against first joint pari passu charge over present and future fixed assets of the Holding Company.
8.5 This represents long term finance facility amounting to Rs. 150 million from a financial institution carrying mark-up at the rate of 3 months KIBOR plus 125 bps per annum repayable in 54 monthly instalments starting from December 2017 with grace period of six months. As of year end, Rs. 135 million has been availed out of total facility. This facility is secured against first joint pari passu charge over present and future fixed assets of the Holding Company.
8.6 This represents long term finance facility amounting to Rs. 300 million from a financial institution carrying mark-up at the rate of 3 months KIBOR plus 125 bps per annum repayable in 48 monthly instalments starting from March 2018 with grace period of one year. As of year end, Rs. 112 million has been availed out of total facility. This facility is secured against first joint pari passu charge over all present and future fixed assets of the Holding Company.
8.7 This represents loan obtained from ex-director / sponsors of Nimir Resins Limited. This loan is interest free and repayable on demand, however, the lender has agreed not to demand repayment for a period of next twelve months. As a result of understanding reached between subsidiaries and ex-director during the year and resultant reinstatement adjustment in the books of Nimir Resins Limited, the amount has been stated with an adjustment to equity portion.

Nimir Industrial Chemicals Ltd.82
9 LIABILITIES AGAINST ASSETS SUBJECT TO FINANCE LEASE The interest rates used as the discounting factor (i.e. implicit in the lease) range from 1 month KIBOR plus 175 bps to 1 year
KIBOR plus 100 bps (2017: 1 month KIBOR plus 175 bps to 1 Year KIBOR plus 200 bps). The amount of future payments and the period during which they will become due are: 2018 2017
(Rupees) (Rupees) Year ending 30 June
2018 - 46,136,677
2019 51,823,961 49,366,866 2020 23,413,970 20,615,826 2021 25,502,247 22,406,634 2022 11,500,849 8,457,826 2023 5,664,894 - 117,905,921 146,983,829 Less: Future finance charges (9,780,580) (15,430,603) 108,125,341 131,553,226 Less: Current maturity shown under current liabilities (46,186,411) (36,938,773) 61,938,930 94,614,453
9.1 The lease agreements have the option for purchase of asset at the end of the lease period. There are no financial restrictions in the lease agreements.
Minimum lease payments (MLP) and their present value (PV) are grouped below:
2018 2017 MLP PV of MLP MLP PV of MLP (Rupees) (Rupees)
Due not later than 1 year 51,823,961 46,186,411 46,136,677 36,938,773 Due later than 1 year but not later than 5 years 66,081,960 61,938,930 100,847,152 94,614,453 117,905,921 108,125,341 146,983,829 131,553,226
2018 2017 (Rupees) (Rupees)
10 DIMINISHING MUSHARAKA FINANCE Diminishing musharaka finance 6,273,953 2,492,623
Less: Current maturity shown under current liabilities (1,445,876) (485,211) 4,828,077 2,007,412
10.1 During the year, the subsidiary acquired further vehicles under the diminishing musharaka financing arrangements
entered into with First Punjab Modaraba, for a period of 60 months. The effective rate of rent per unit is 3 month KIBOR plus 2.5% with floor rate of 8.55% - 8.66% per annum (2017: 8.53%).

Annual Report 2018 83
Note 2018 201711 DEFFERED TAX LIABILITY (Rupees) (Rupees) This comprises of: Deferred tax liabilities on taxable temporary differences
Accelerated tax depreciation 312,120,569 303,966,190 Deferred tax assets on deductible temporary differences
Provision for doubtful trade debts (42,854,911) (33,459,720) Provision against stock (9,810,948) (8,226,153) Provision against others (2,352,569) (831,737) Deferred and unpaid liabilities (12,771,145) (20,550,581) Capital work in progress - impairment (18,375,856) - Amortization on intangible assets (101,014) - 225,854,126 240,897,999 Reconciliation of deferred tax liabilities - net
As of 1 July 240,897,999 140,261,558 Tax expense recognized in statement of profit or loss (12,697,585) 102,439,278 Tax income recognized in OCI (2,346,288) (1,802,837) As at 30 June 225,854,126 240,897,999 12 TRADE AND OTHER PAYABLES
Creditors 912,860,135 431,018,899 Accrued liabilities 311,643,259 184,755,610 Security deposits 12.1 400,000 400,000 Advances from customers 12.2 50,745,472 20,315,018 Workers’ profit participation fund 12.3 57,597,302 43,508,351 Workers’ welfare fund 12.4 18,905,534 14,848,312 Withholding tax payable 526,926 2,708,599 Sales tax payable 3,572,869 - Others 11,609,469 6,793,797 1,367,860,966 704,348,586
12.1 These represent security deposits from distributors which, by virtue of agreement, are interest free, repayable on
demand and are used in the normal course of business.
12.2 These represents advances from customers in ordinary course of business. No amounts have been received from related parties (2017: Nil).
Note 2018 2017 (Rupees) (Rupees)
12.3 Balance as at 01 July 43,508,351 35,557,857 Add: Provision for the year 31 52,137,620 43,508,351 Less: Payments made during the year (38,048,669) (35,557,857) Balance as at 30 June 57,597,302 43,508,351 12.4 Balance as at 01 July 14,848,312 34,730,981 Add: Provision for the year 31 18,345,706 14,765,091 Less: Payments made during the year (14,192,680) (8,392,413) Less: Reversal during the year (95,804) (26,255,347) Balance as at 30 June 18,905,534 14,848,312

Nimir Industrial Chemicals Ltd.84
Note 2018 201713 NET DEFINED BENEFIT LIABILITY / (ASSET) - FUNDED GRATUITY (Rupees) (Rupees)
Staff retirement benefit plan - Parent Present value of defined benefits obligation 77,199,315 64,901,853
Less: Fair value of plan assets (20,488,913) (17,535,266) 56,710,402 47,366,587
Staff retirement benefit plan - Subsidiary
Present value of defined benefits obligation 15,031,194 9,319,363 Less: Fair value of plan assets (7,413,641) (10,494,362) 7,617,553 (1,174,999)
13.1 The amounts recognized in the statement of financial position are as follows:
Present value of defined benefits obligation 13.5 92,230,517 74,221,216 Less: Fair value of plan assets 13.6 (27,902,562) (28,029,628) 64,327,955 46,191,588 13.2 The amounts recognized in the statement of profit or loss account are as follows:
Current service cost 13,962,389 7,560,689 Interest cost on defined benefit obligation 3,094,727 2,829,918 Expense recognized in the profit or loss account 17,057,116 10,390,607 13.3 The charge for the year has been allocated as follows:
Cost of sales 28.2 11,547,916 8,047,571 Distribution costs 29.1 2,104,844 659,460 Administrative expenses 30.1 3,404,356 1,683,576 17,057,116 10,390,607 13.4 Movement in the net liability recognized in the statement of financial position are as follows:
Net liabilities at the beginning of the year 46,191,588 48,421,525 Current service cost 13,962,389 7,560,689 Interest cost on defined benefit obligation - net 3,094,727 2,829,918 Contribution by employer (7,011,397) (18,630,000) Remeasurements charged to other comprehensive income 8,090,648 6,009,456 Net liabilities at the end of the year 64,327,955 46,191,588
13.5 Movement in the present value of defined benefit obligation Present value of defined benefits obligation at the beginning of the year 74,221,224 67,747,229 Current service cost 13,962,389 7,560,689 Interest cost on defined benefit obligation 5,085,439 4,521,144 Benefits paid (8,154,465) (10,773,225) Remeasurement:
Experience adjustments 7,115,930 5,165,387 Present value of defined benefit obligation at the end of year 92,230,517 74,221,224

Annual Report 2018 85
2018 201713.6 Movement in the fair value of plan assets (Rupees) (Rupees)
Fair value of plan assets at the beginning of the year 28,029,636 19,325,703 Contribution by employer 7,011,397 18,630,000 Interest Income 1,990,712 1,691,226 Benefits paid (8,154,465) (10,773,225) Return on plan assets excluding interest income (974,718) (844,068) Fair value of plan assets at the end of year 27,902,562 28,029,636 2019 13.7 Estimated expense to be charged to the statement of profit or loss in next year (Rupees) Current service cost 15,041,584 Interest cost on define benefit obligation 5,124,930 Amount chargeable to profit or loss 20,166,514 13.8 Qualified actuaries have carried out the valuation as at June 30, 2018. The projected unit credit method, based on the
following significant assumptions, is used for valuation of the plan:
2018 2017 Discount rate for interest cost in profit or loss charge 9.75% 9.75% Discount rate for obligation 7.75% 7.25% Expected rates of salary increase in future years 6.75% 6.25% Retirement assumption Age 60 Age 60
13.9 A quantitative sensitivity analysis for significant assumptions on defined benefit obligation is shown as below:
Impact on defined Sensitivity level Assumption benefit obligation
+100 bps Discount rate 84,423,172 -100 bps Discount rate 101,282,601 +100 bps Expected increase in salary 101,282,601 -100 bps Expected increase in salary 84,286,094
The sensitivity analysis above have been determined based on a method that extrapolates the impact on defined benefit
obligation as a result of reasonable changes in key assumptions occurring at the end of the reporting period.
The average duration of the defined benefit plan obligation at the end of the reporting period is 8 years for the Holding Company and 9.1 years for subsidiary.
14 SHORT TERM BORROWINGS - SECURED
The aggregate of short term finance facilities from financial institutions available at period end is Rs. 5,821 million (2017: Rs. 4,237 million) which includes running finance facilities amounting Rs. 1,350 million (2017: Rs. 1,152 million). The rate of mark up ranges from 1 month KIBOR + 50 bps to 6 months KIBOR + 175 bps with no floor and no cap (2017: 1 month KIBOR to 6 months KIBOR + 175 bps with no floor and no cap). The facilities are secured against joint pari passu charge on the present and future current assets of the Group.
The unutilized facility for opening letters of credit and bank guarantees as at June 30, 2018 amounts to Rs. 1,249 million (2017: Rs. 678 million) and Rs. 93 million (2017: Rs. 103 million) respectively.

Nimir Industrial Chemicals Ltd.86
15 CONTINGENCIES AND COMMITMENTS 15.1 CONTINGENCIES
Pending the outcome of below cases, no provision has been made in the financial statements, since the management
of the Group based on its consultants’ opinion, is confident that the outcome of the appeals will be in favor of the Group.
Holding Company
15.1.1 The income tax authority amended the Company’s assessment relating to Tax Year 2016 under section 161 / 205 of the Income Tax Ordinance, 2001 (the Ordinance) raised a demand of Rs. 8 million vide Order dated May 15, 2017. The Company filed an appeal before Commissioner Inland Revenue (Appeals), who upheld the said order. The Company filed second appeal before the Appellate Tribunal Inland Revenue (ATIR) who decided the case in favor of the Company vide Order dated January 22, 2018. The tax authority has filed a reference dated June 11, 2018 before the Lahore High Court against the decision of the ATIR which is pending adjudication.
15.1.2 The income tax authority raised a tax demand of Rs. 206 million by treating the remission of loan as taxable income of Rs. 711 million for the Tax Year 2011 which was challenged at Appellate Tribunal Inland Revenue (ATIR). The ATIR decided the case in favor of the Company vide Order dated December 2, 2013. The Income Tax Department has filed an appeal in February 2014 before the Honorable Lahore High Court against the ATIR’s decision which is pending adjudication.
15.1.3 The income tax authority amended the proceedings the Company’s assessment relating to Tax Year 2014 under section 122 (5) / 177 / 214C of the Ordinance and raised demand of Rs. 123 million. The Company filed an appeal before Commissioner Inland Revenue (Appeals), who decided the case in favor of the Company in toto vide order dated March 21, 2018. The Company as well as its consultant has not received any intimation for filing of appeal by the tax department to the ATIR.
15.1.4 The income tax authority amended the Company’s assessment relating to tax year 2009 under section 122 (5A) of the Ordinance, disallowing certain expenses thereby reducing declared loss from Rs. 167 million to Rs. 65 million. The Company filed an appeal before the Commissioner Inland Revenue (Appeals), who upheld the order on major additions vide Order dated April 23, 2018. The Company has filed second appeal before the ATIR dated May 21, 2018, which is pending adjudication.
Subsidiary Company
15.1.5 In respect of tax year 2014, the Company was confronted for audit through random computer balloting. On production of records, the concerned Assistant Commissioner of Inland Revenue (ACIR) has made additions of Rs. 27.828 million (consequent tax exposure Rs. 9.46 million), whereas the company had declared a tax loss of Rs. 55.554 million in its tax return. Against this order, the Company has initiated preferred appeal on October 25, 2017 with CIR (appeals) and such appeal is pending adjudication.

Annual Report 2018 87
15.1.6 The Company has filed suit in Civil Court, Lahore against one Mr. Sh. Anwar Hussain and others for the recovery of trade debts for Rs. 29.411 million. The matter is under adjudication.
15.1.7 The Company has filed a suit in Civil Court, Lahore against M/s Chitral Ghee and Oil Mills Company for the recovery of balance of advance given to said vendor party, calculated at Rs. 22.17 million. In another suit before the Civil Court, Lahore the same party has demanded an amount of Rs. 5.860 million allegedly receivable from the Company on account of supplies of various products made to the Company. Both the matters are pending adjudication.
15.1.8 In respect of tax year 2011, the Company was confronted for audit through random computer balloting. On production of records, the concerned Assistant Commissioner of Inland Revenue (ACIR) has made additions of Rs. 61.702 million vide order dated October 30, 2017(consequent tax exposure Rs. 21.60 million) , whereas the Company had declared a tax loss of Rs. 147.994 million in its tax return. Against this order, the Company has initiated preferred appeal on January 11, 2018 with CIR(appeals) and such appeal is pending adjudication.
15.2 COMMITMENTS
Commitments in respect of letters of credit, letters of guarantee, capital expenditures and diminishing musharika as at 30 June are as follows:
2018 2017 (Rupees) (Rupees) Letters of credit established for the import of raw materials, spare parts and machinery 1,819 million 1,124 million Letter of guarantee given to SNGPL 99 million 102 million Letter of guarantee given to PSO 25 million 19 million Letter of guarantee given to Total PARCO 8 million 6 million Capital expenditures - 13 million Diminishing musharaka finance - 2 million
Note 2018 2017
16 PROPERTY, PLANT AND EQUIPMENT (Rupees) (Rupees) Operating fixed assets 16.1 2,719,291,356 2,113,635,836 Capital work in progress 16.6 301,156,140 590,172,602 3,020,447,496 2,703,808,438

Nimir Industrial Chemicals Ltd.88

Annual Report 2018 89
16.3 No assets were sold to the Chief Executive, Directors, Executives or Shareholders holding more than 10% of total paid-up capital. Note 2018 2017
16.4 Depreciation for the year has been allocated as under: (Rupees) (Rupees) Cost of sales 28 263,313,074 188,082,640 Distribution costs 29 3,733,323 3,157,774 Administrative expenses 30 15,579,814 12,137,392 282,626,211 203,377,806
16.5 Holding Company’s immovable fixed assets are located at 14.8 km, Sheikhupura-Faisalabad Road, Mouza Bhikki, District Sheikhupura, Pakistan having area of 51.8 acres whereas Subsidiary Company’s immovable fixed assets are located at 14.5 Km, Lahore- Sheikhupura Road and 14.8 Km, Sheikhupura-Faisalabad Road having area of 19.35 acres.
16.6 Capital work in progress 2018 2017 Land and Plant and Building machinery Others Total Total (Rupees) (Rupees)
Opening balance 13,648,869 576,356,933 166,800 590,172,602 194,901,936 Impairment charge - (63,365,020) - (63,365,020) - Additions during the year 112,400,055 500,635,237 19,334,599 632,369,891 620,201,625 126,048,924 1,013,627,150 19,501,399 1,159,177,473 815,103,561 Transferred to operating fixed assets (45,540,944) (804,026,376) (8,454,013) (858,021,333) (224,930,959) 80,507,980 209,600,774 11,047,386 301,156,140 590,172,602 16.6.1 Plant and machinery includes borrowing cost capitalized during the year amounting to Rs. 7,424,954 (2017: Rs.
2,310,950). The expansion has been financed by a term finance facility from a financial institution.
16.6.2 During the year company has tested its two steam turbines for impairment from a renowned valuer (Iqbal A. Nanjee & Co. (Private) Limited). As per valuation report, the valuer determined the recoverable value of these turbines under normal condition amounting to Rs. 12 million, resulting in an impairment charge of Rs. 63.37 million.
17 INTANGIBLE Note 2018 2017 (Rupees) (Rupees) Software and licenses
Cost:
As at 1 July 5,862,934 3,825,184 Additions during the year - 2,037,750 As at 30 June 5,862,934 5,862,934 Accumulated amortization:
As at 1 July (2,782,224) (1,605,299) Amortization during the year 30 (1,123,225) (1,176,925) As at 30 June (3,905,449) (2,782,224)
Net book value 1,957,485 3,080,710 Rate of amortization 20% - 33.33% 20% - 33.33%

Nimir Industrial Chemicals Ltd.90
18 LONG TERM DEPOSITS Note 2018 2017 (Rupees) (Rupees) Security deposits
Financial institutions 11,479,520 19,072,970 Others 18.1 25,545,798 25,545,798 37,025,318 44,618,768
18.1 This includes deposit amounting to Rs. 12.24 million (2017: Rs. 12.24 million) given to electricity supply company for dedicated line.
19 STORES, SPARES PARTS AND LOOSE TOOLS Note 2018 2017 (Rupees) (Rupees)
In hand 154,895,131 168,215,410 In transit 128,112 14,733,648 155,023,243 182,949,058
20 STOCK IN TRADE
Raw and packing material In hand 667,822,712 642,006,751
In transit 1,953,986,049 841,986,870 2,621,808,761 1,483,993,621 Less:
Provision for raw material 20.1 - (4,191,285) Provision for packing material - (427,973) - (4,619,258) 2,621,808,761 1,479,374,363 Finished goods 651,808,635 438,946,942 Less: Provision for obsolescence 20.2 (33,830,854) (22,801,255) 617,977,781 416,145,687 3,239,786,542 1,895,520,050
20.1 Movement in provision for raw material is as follows:
Opening balance 4,191,285 10,433,626 Charge for the year - - Reversal during the year (4,191,285) (6,242,341) (4,191,285) (6,242,341) Closing balance - 4,191,285 20.2 Movement in provision for obsolescence of stock is as follows:
Opening balance 22,801,255 3,144,209 Charge for the year 11,029,599 19,657,046 Written off during the year - - Closing balance 33,830,854 22,801,255

Annual Report 2018 91
Note 2018 2017 (Rupees) (Rupees)21 TRADE DEBTS
Unsecured - considered good
Due from customers 21.1 2,370,350,966 1,576,055,493 Due from associated company 21.2 458,851 96,648 2,370,809,817 1,576,152,141 Considered doubtful 147,775,556 111,532,398 Provision for doubtful debts 21.4 (147,775,556) (111,532,398) - - 2,370,809,817 1,576,152,141
21.1 These customers have no recent history of default. For age analysis of these trade debts, referred to Note 37.1.1
21.2 This relates to the amount due from Nimir Chemicals Pakistan Limited.
21.3 Aggregate amount due from directors, Chief Executive Officer and executives of the Group is Rs. Nil (2017: Rs. Nil).
Note 2018 2017 (Rupees) (Rupees)
21.4 Provision for doubtful debts
As at 1 July 111,532,398 89,885,224 Charge for the year 30 36,243,158 21,647,174 As at 30 June 147,775,556 111,532,398 21.5 Maximum aggregate amount due from associated undertakings at the end of any month in the year was Rs. 8,106,275
(2017: Rs. 2,078,718). No interest has been charged on the amounts due from associated undertakings. Note 2018 201722 LOANS AND ADVANCES (Rupees) (Rupees)
Considered good - unsecured
Suppliers 136,555,329 98,792,532 Employees against business expenses 22.1 3,348,057 4,190,708 Employees against salary 22.2 7,615,651 8,776,263 147,519,037 111,759,503
22.1 This includes advance given to executives amounting to Rs. 0.043 million (2017: Rs. 1.94 million).
22.2 This includes advance given to executives amounting to Rs. 3.7 million (2017: Rs. 6.4 million).
23 TRADE DEPOSITS AND SHORT TERM PREPAYMENTS Current maturity - financial institutions (including banks) 10,856,528 4,653,666 Prepayments 20,837,211 9,595,567 31,693,739 14,249,233

Nimir Industrial Chemicals Ltd.92
Note 2018 201724 OTHER RECEIVABLES (Rupees) (Rupees)
Margin against bank guarantee 18,311,950 17,820,950 Margin against letters of credit 46,857,000 1,753,320 65,168,950 19,574,270
25 TAX REFUNDS DUE FROM THE GOVERNMENT
Income tax 755,687,424 506,645,824 Sales tax 148,814,715 155,966,198 Federal excise duty 3,748,500 3,748,500 908,250,639 666,360,522 26 CASH AND BANK BALANCES
Cash in hand 674,474 7,413,750 Cash at bank
Current accounts 44,284,301 25,910,234 Saving accounts 3,167,817 2,295,478 Term Deposit Certificate 67,000,000 65,000,000 114,452,118 93,205,712 115,126,592 100,619,462
27 SALES
Local sales 18,186,195,894 11,570,773,575 Export sales - 311,640 Gross sales 18,186,195,894 11,571,085,215 Less: Sales tax (2,554,156,946) (1,612,610,652) Less: Trade discounts - (644,894) Net sales 15,632,038,948 9,957,829,669
27.1 Sales includes toll manufacturing services amounting to Rs. 130 million.
28 COST OF SALES
Raw and packing material consumed 28.1 12,426,420,925 7,486,621,158 Salaries, wages and benefits 28.2 382,625,059 303,906,438 Depreciation 16.4 263,313,074 188,082,640 Fuel and power 611,546,096 469,861,597 Stores, spares and loose tools consumed 122,438,723 98,639,742 Repairs and maintenance 27,159,909 44,731,657 Traveling, conveyance and entertainment 30,283,126 23,283,102 Communication 1,784,914 1,415,262 Insurance 17,874,980 14,816,949 Rent, rates and taxes 6,199,375 4,966,890 Printing and stationery 2,851,068 2,060,564 Provision for obsolescence 11,029,599 19,657,046 Fee and consultancy charges 4,165,305 - Dues, fees and subscription 2,229,530 1,067,687 Product development charges 2,386,482 - Other expenses 3,292,168 2,727,472 13,915,600,333 8,661,838,204
Add: Opening stock-finished goods 20 438,946,942 391,253,454 Less: Closing stock-finished goods 20 (651,808,635) (438,946,942) 13,702,738,640 8,614,144,716

Annual Report 2018 93
Note 2018 2017 (Rupees) (Rupees)28.1 Raw and packing material consumed
Opening Balance 1,479,374,363 739,284,827 Purchases 13,568,855,323 8,226,710,694 15,048,229,686 8,965,995,521 Less: Closing Balance 20 (2,621,808,761) (1,479,374,363) Raw and packing material consumed 12,426,420,925 7,486,621,158 28.2 This includes Rs. 11.55 million (2017: Rs. 9.4 million) in respect of staff retirement benefits.
28.3 Cost of sales includes direct toll manufacturing expenses amounting to Rs. 39.3 million.
Note 2018 201729 DISTRIBUTION COSTS (Rupees) (Rupees) Salaries, wages and benefits 29.1 56,295,495 41,486,647 Repairs and maintenance 281,973 411,016 Traveling, conveyance and entertainment 5,931,010 3,983,108 Communication 638,585 493,888 Insurance 3,004,800 3,262,591 Freight outward 48,844,382 44,310,923 Distribution commission 63,521,509 38,637,473 Packing, carriage and forwarding 18,015,355 21,807,442 Printing and stationery 554,637 571,933 Depreciation 16.4 3,733,323 3,157,774 Sales promotion expenses 193,270 1,411,509 Utilities 294,430 251,225 Dues, fees and subscription 294,733 333,874 Other expenses 133,180 73,401 201,736,682 160,192,804
29.1 This includes Rs. 2.1 million (2017: Rs. 1.3 million) in respect of staff retirement benefits.
Note 2018 201730 ADMINISTRATIVE EXPENSES (Rupees) (Rupees) Salaries, wages and benefits 30.1 119,949,259 83,999,535 Fuel and power 1,799,925 1,213,094 Repairs and maintenance 4,445,042 2,321,782 Traveling, conveyance and entertainment 15,740,299 13,284,646 Communications 5,618,896 5,127,364 Insurance 2,151,085 1,966,330 Rent, rates and taxes 3,115,173 1,600,289 Printing and stationery 2,770,244 3,548,694 Advertisement expense 1,411,775 1,429,933 Legal, professional and consultancy charge 16,326,597 9,594,834 Auditors’ remuneration 30.2 4,348,580 3,866,000 Depreciation 16.4 15,579,814 12,137,392 Amortization 17 1,123,225 1,176,925 Dues, fees and subscription 9,368,969 8,796,419 Provision for doubtful debts 21.4 36,243,158 21,647,174 Other expenses 5,957,995 1,453,873 245,950,036 173,164,284
30.1 This includes Rs. 3.4 million (2017: Rs. 2.3 million) in respect of staff retirement benefits.

Nimir Industrial Chemicals Ltd.94
Note 2018 2017 (Rupees) (Rupees)30.2 Auditors’ remuneration
Audit fee 2,437,580 2,475,000 Consolidation, reviews and certifications 1,760,000 1,188,000 Out of pocket expenses 151,000 203,000 4,348,580 3,866,000
31 OTHER EXPENSES
Workers’ profit participation fund 12.3 52,137,620 43,508,351 Workers’ welfare fund 12.4 18,345,706 14,765,091 Impairment charged to assets 63,365,020 - Provision against refundable sales tax 5,339,850 - 139,188,196 58,273,442 32 OTHER INCOME
Non financial assets
Gain on disposal of property, plant and equipment 16.2 3,267,392 7,161,059 Sale of waste material / scrap 12,334,137 3,398,676 Reversal of provision 7,037,498 28,102,567 Bad debts recovered - 739,400 Fee for technical services 1,297,140 - Financial assets
Profit on savings accounts 50,938 202,796 Profit on term deposit receipt 3,073,335 3,490,642 27,060,440 43,095,140 33 FOREIGN EXCHANGE LOSS
Foreign liabilities 33.1 118,354,868 12,958,090
33.1 This include unrealized exchange loss on translation of liabilities in foreign currency amounting to Rs. 22,376,273
(2017: Rs. 4,021,163).
2018 201734 FINANCE COST (Rupees) (Rupees) Mark-up on - Long term loans 30,034,006 35,096,203 - Short term borrowings 226,439,551 148,453,514 Financial charges on lease 8,107,617 9,801,782 Diminishing musharaka finance 571,389 131,912 Bank charges, fee and commission 14,217,275 9,710,257 Early payment discount - 4,616,473 279,369,838 207,810,141 35 TAXATION
Current tax
Current year 228,831,315 199,273,013 Prior year (40,485,675) (35,588,654) 188,345,640 163,684,359 Deferred tax
Relating to the reversal and origination of temporary differences (5,594,265) 106,963,844 Expense resulting from reduction in tax rate (7,103,320) (4,524,566) (12,697,585) 102,439,278 175,648,055 266,123,637

Annual Report 2018 95
2017 * 2016 ** 2015 35.1 COMPARSION OF TAX PROVISION (Rupees) (Rupees) (Rupees) Provision as per Financial Statements 215,523,017 129,495,864 18,484,708 Amount as per Income Tax Return 182,156,509 146,150,174 18,320,539 * The difference mainly relates to super tax which was computed separately from tax return in tax year 2017
** The difference mainly relates to adjustment of brought forward minimum taxes.
36 EARNINGS PER ORDINARY SHARE - BASIC AND DILUTED
36.1 Basic 2018 2017
Profit attributable equity holders of the parent (Rupees) 732,556,771 474,218,530 Weighted average number of ordinary shares (number) 110,590,546 110,590,546 Earnings per ordinary share (Rupees) 6.62 4.29 36.2 Diluted
No figure for diluted earning per share has been presented as the Holding Company has not issued any instrument
carrying option which would have an impact on earnings per share when exercised.
37 FINANCIAL INSTRUMENTS AND RELATED DISCLOSURES
The main risks arising from the Group’s financial instruments are credit risk, liquidity risk, foreign currency risk, interest rate risk and equity price risk. The management reviews and agrees policies for managing each of these risks which are summarized below. 37.1 Credit Risk
Credit risk is the risk which arises with the possibility that one party to a financial instrument will fail to discharge its
obligation and cause the other party to incur a financial loss. The Group attempts to control credit risk by monitoring credit exposures, limiting transactions with specific counterparties and continually assessing the creditworthiness of counterparties. The Group does not believe it is exposed to major concentration of credit risk, however to manage any possible exposure the Group applies approved credit limits to its customers.
The management monitors and limits the Group’s exposure to credit risk through monitoring of client’s credit exposure review and conservative estimates of provisions for doubtful receivables, if any, and through the prudent use of collateral policy.
The Group is exposed to credit risk on long-term deposits, trade debts, other receivables and bank balances. The Group seeks to minimize the credit risk exposure through having exposures only to customers considered credit worthy and obtaining securities where applicable. The maximum exposure to credit risk at the reporting date is: Carrying values
2018 2017 (Rupees) (Rupees) Long-term deposits 25,545,798 25,545,798 Trade debts – unsecured 2,370,809,817 1,576,152,141 Other receivables 65,168,950 19,574,270 Bank balances 114,452,118 93,205,712

Nimir Industrial Chemicals Ltd.96
The credit quality of financial assets can be assessed by reference to external credit ratings or the historical information about counter party defaults as shown below:
2018 201737.1.1 Trade Debts (Rupees) (Rupees) Other than related parties
Neither past due nor impaired 707,568,207 1,023,054,631 Past due but not impaired
01-30 days 1,077,625,770 313,051,421 31-60 days 286,835,160 127,547,236 61-90 days 221,438,571 53,353,638 Over 90 days 76,883,258 59,048,567 1,662,782,759 553,000,862 Past due and impaired
01-30 days - - 31-60 days - - 61-90 days - - Over 90 days 147,775,556 111,532,398 147,775,556 111,532,398 2,518,126,522 1,687,587,891 Related parties
Neither past due nor impaired 14,672 41,207 Past due but not impaired
01-30 days 444,179 7,722 31-60 days - 7,722 61-90 days - 36,364 Over 90 days - 3,633 444,179 55,441 458,851 96,648
As at 30 June 2018, trade debts of Rs. 147.8 million (2017: Rs. 111.53 million) were impaired and provided for. 37.1.2 Bank Ratings 2018 2017 Financial institution Agency Short Term Long term (Rupees) (Rupees)
Albaraka Bank (Pakistan) Limited PACRA A1 A 11,257,179 773,237 Bank AL Habib Limited PACRA A1+ AA+ 6,151,210 5,183,823 Habib Bank Limited JCR-VIS A1+ AAA 1,047,078 79,246 Habib Metropolitan Bank Limited PACRA A1+ AA+ 24,820 667,330 MCB Bank Limited PACRA A1+ AAA 1,810,990 938,651 Meezan Bank Limited JCR-VIS A1+ AA+ 14,031,125 5,382,327 National Bank of Pakistan PACRA A1+ AAA 881,776 726,856 Silk Bank Limited JCR-VIS A-2 A- 6,117 6,116 Standard Chartered Bank Limited PACRA A1+ AAA 1 2,482,457 The Bank of Punjab PACRA A1+ AA 79,241,822 76,965,669 114,452,118 93,205,712 37.2 Liquidity Risk
Liquidity risk is the risk that the Group will not be able to meet its commitments associated with financial liabilities when they
fall due. Liquidity requirements are monitored regularly and management ensures that sufficient liquid funds are available to meet any commitments as they arise. Financial liabilities are analyzed below, with regard to their remaining contractual maturities.

Annual Report 2018 97
At Group’s Maturity Up Maturity After discretion to One Year One Year Total (Rupees) As at June 30, 2018 Long term loans 13,943,500 174,159,225 511,311,115 699,413,840 Liabilities against assets subject to finance lease - 46,186,411 61,938,930 108,125,341 Diminishing musharaka finance - 1,445,876 4,828,077 6,273,953 Short term borrowings - 3,986,468,603 - 3,986,468,603 Mark up accrued - 50,140,627 - 50,140,627 Unclaimed dividend - 6,142,532 - 6,142,532 Trade and other payables - 1,236,512,863 - 1,236,512,863 Total financial liabilities 13,943,500 5,501,056,137 578,078,122 6,093,077,759 As at June 30, 2017
Long term loans 13,943,500 127,604,162 352,318,949 493,866,611 Liabilities against assets subject to finance lease - 36,938,773 94,614,453 131,553,226 Diminishing musharaka finance - 485,211 2,007,412 2,492,623 Short term borrowings - 2,677,866,752 - 2,677,866,752 Mark up accrued - 38,006,072 - 38,006,072 Unclaimed dividend - 2,708,609 - 2,708,609 Trade and other payables - 622,968,306 - 622,968,306 Total financial liabilities 13,943,500 3,506,577,885 448,940,814 3,969,462,199
37.3 Market Risk 37.3.1 Currency Risk
Currency risk is the risk that the fair value or future cash flows of a financial instrument will fluctuate because of changes in foreign exchange rates. The Group’s exposure to the risk of changes in foreign exchange rates relates primarily to the foreign trade payables. However at the year end, there are material foreign currency balances.
37.3.2 Interest Rate Risk
Interest rate risk arises from the possibility that changes in interest rate will affect the fair value or future cash flows of financial instruments. The Group is exposed to interest rate risk for loans obtained from the financial institutions and liabilities against assets subject to finance lease, which have been disclosed in the relevant note to the financial statements.
If interest rates at the year end, fluctuate by 1% higher / lower, profit for the year would have been Rs. 45.1 million (2017: Rs. 31.9 million) higher / lower. This analysis is prepared assuming that all other variables held constant and the amounts of liabilities outstanding at the reporting dates were outstanding for the whole year.
37.4 Capital Management
The primary objective of the Group’s capital management is to ensure that it maintains a strong credit rating and healthy capital ratios in order to support its business and maximize shareholders’ value. The Group manages its capital structure and makes adjustments to it in the light of changes in economic conditions. Capital includes ordinary share capital and reserves. The gearing ratio of the Group is 25% (2017: 23%).
37.5 Fair value of financial assets and financial liabilities
IFRS 13 defines fair value as the price that would be received to sell an asset or paid to transfer a liability in an orderly transaction between market participants at the measurement date. As at the reporting date, carrying value of all the financial instruments in the financial statements approximates their fair value. Further, all financial assets and financial liabilities at reporting date are categorized into loans and advances.

Nimir Industrial Chemicals Ltd.98
38 TRANSACTIONS WITH RELATED PARTIES
The related parties and associated undertakings comprise parent company, related group companies, directors and key management personnel. Remuneration of Chief Executive, directors and executives is also shown in Note 39. Transactions with related parties during the year are as follows:
Nature and Description of Relationship with the Group Related Party Transaction 2018 2017 (Rupees) (Rupees) Nimir Resources (Private) Limited Dividend Paid 125,420,647 62,670,647 Nimir Chemical Pakistan Limited Sale of goods 14,397,680 5,462,100 Staff retirement benefits Contribution to gratuity fund 7,011,397 18,630,000
39 REMUNERATION OF CHIEF EXECUTIVE, DIRECTORS AND EXECUTIVES
Chief Executive Directors Executives 2018 2017 2018 2017 2018 2017*
Number of persons 1 1 3 3 23 14 (Rupees)
Remuneration 10,502,806 7,354,839 17,765,064 13,471,388 47,303,353 33,614,291 Housing 4,726,613 3,309,679 7,994,128 6,061,776 22,538,709 15,126,588 Utilities 1,050,581 735,482 1,776,808 1,346,836 4,729,938 3,361,121 Bonus 4,174,932 3,978,434 7,024,336 5,967,652 17,670,410 12,658,042 20,454,932 15,378,434 34,560,336 26,847,652 92,242,410 64,760,042
39.1 The Chief Executive Officer and Directors have been provided Company - maintained cars and generators sets, further they are also entitled to club membership, reimbursement of medical and entertainment expenses whereas some executives have been provided Company- maintained cars.
39.2 An amount of Rs. 2,320,000 (2017: Rs. 1,780,000) were paid to directors for attending the meetings.
* The number of executives and their remuneration has been restated as per the requirement of fourth schedule of Companies Act, 2017.
40 TOTAL NUMBER OF EMPLOYEES 2018 2017 40.1 Number of employees as at 30 June 275 252 Average number of employees during the year 267 244 40.2 Number of factory employees
Number of employees as at 30 June 204 198 Average number of employees during the year 200 193
41 PRODUCTION CAPACITY IN METRIC TONS 2018 2018 2017 2017 Maximum Actual *Maximum Actual Capacity (MT) Production (MT) Capacity (MT) Production (MT) Oleo Chemicals 68,000 67,407 52,000 50,710 Chlor Alkali Products 50,000 48,722 44,500 43,642 Soap Finishing Line 16,000 12,005 - - Resin Products 39,000 26,242 39,000 22,227
* Determined on weighted average basis.

Annual Report 2018 99
41.1 There is no significant difference between maximum installed capacity and actual capacity.
42 OPERATING SEGMENT INFORMATION
Oleo chemicals Coating, emulsion Other segments Inter segment and chlor alkali and resins eliminations Total 2018 2017 2018 2017 2018 2017 2018 2017 2018 2017 (Rupees)
Sales 12,154,312,383 7,369,139,953 3,580,118,885 2,668,804,664 - - (102,392,320) (80,114,948) 15,632,038,948 9,957,829,669
Cost of sales (10,541,804,264) (6,304,069,597) (3,261,493,820) (2,391,124,100) - - 100,559,444 81,048,981 (13,702,738,640) (8,614,144,716)
Gross profit 1,612,508,119 1,065,070,356 318,625,065 277,680,564 - - (1,832,876) 934,033 1,929,300,308 1,343,684,953
Distribution cost (149,740,475) (114,755,645) (51,996,207) (45,437,159) - - - - (201,736,682) (160,192,804)
Administrative expenses (167,528,649) (115,698,790) (78,163,387) (54,350,744) (948,000) (3,594,750) 690,000 480,000 (245,950,036) (173,164,284)
Operating profit / (loss) 1,295,238,995 834,615,921 188,465,471 177,892,661 (948,000) (3,594,750) (1,142,876) 1,414,033 1,481,613,590 1,010,327,865
Other expenses (131,944,187) (48,375,568) (7,244,009) (9,897,874) - - - - (139,188,196) (58,273,442)
Other income 16,734,751 59,800,007 8,741,805 7,236,751 2,993,884 15,382,612 (1,410,000) (39,324,230) 27,060,440 43,095,140
Foreign exchange loss (88,657,880) (9,794,917) (29,696,988) (3,163,173) - - - - (118,354,868) (12,958,090)
Finance cost (204,254,459) (135,427,376) (75,114,419) (60,992,853) (960) (49,634,142) - 38,244,230 (279,369,838) (207,810,141)
Profit / (loss) before taxation 887,117,220 700,818,067 85,151,860 111,075,512 2,044,924 (37,846,280) (2,552,876) 334,033 971,761,128 774,381,332
Taxation (191,582,093) (229,384,775) 17,958,828 (36,738,862) (2,024,790) - - - (175,648,055) (266,123,637)
Profit / (loss) for the year 695,535,127 471,433,292 103,110,688 74,336,650 20,134 (37,846,280) (2,552,876) 334,033 796,113,073 508,257,695
Segment assets 7,588,383,208 5,474,383,766 2,778,427,654 2,106,349,457 580,214,944 579,844,091 (853,952,619) (840,485,777) 10,093,073,187 7,320,091,537
Segment liabilities 4,973,519,227 3,330,052,996 1,767,478,222 1,196,587,177 94,237,219 93,886,500 (7,076,934) 3,837,032 6,828,157,734 4,624,363,705
42.1 Inter segment sales, purchases and balances have been eliminated.
43 SIGNIFICANT TRANSACTIONS AND EVENTS
Holding Company- Nimir Industrial Chemicals Limited
Summary of significant transactions and events that have affected the Company’s financial position and performance during the year is as follows:
- The turnover in 2018 has grown by Rs.4.8 billion (approximately 65%) over the year 2017. - The devaluation in Pak Rupees has resulted into an exchange loss of Rs.89 million during the year. - Since the increased volume of business was mainly financed through short term financing, the financial cost increased substantially while on the other hand EPS increased by 48%.

Nimir Industrial Chemicals Ltd.100
Subsidiary Company- Nimir Resins Limited
Summary of significant transactions and events that have affected the Company’s financial position and performance during the year is as follows: 2018
Rupees - Issue of bonus shares during the year 30,421,360 - Reclassification of revaluation surplus owing to the requirements of the 4th Schedule to the Companies Act, 2017 84,744,209 - Reclassification of unclaimed dividend owing to the requirements of the 4th Schedule to the Companies Act, 2017 292,819 - Procurement of raw material from a related party - Nimir Industrial Chemicals Limited 102,392,320 - Obtained further short term borrowings 395,898,592 - Purchase of property, plant and equipment 37,978,723 - Increase in tax refunds - net 110,016,284 - Increase in revenue as compared to last year 911,314,221 - Exchange loss during the year 29,696,988 - Adjustment of current tax expense arising from prior year tax credits 40,344,340 There is no significant transactions and events during the period in Nimir Management (Private) Limited and Nimir Holding
(Private) Limited which affect the financial performance and financial position of the Group.
44 SUBSEQUENT EVENTS
The Board of Directors at its meeting held on September 25, 2018 has proposed a final dividend @ Rs. 2 per share for the year ended June 30, 2018 (2017: Rs. 1) amounting to Rs. 221,181,092 (2017: Rs. 110,590,546) for approval of the members at the Annual General Meeting to be held on October 26, 2018. These financial statements do not reflect this dividend.
45 GENERAL
45.1 Re - classification
Corresponding figures of the following have been reclassified for better and fair presentation:
Particulars Classified from Re-classified to 2017 Membership fee Other expense (Administrative expenses) Dues, fee and subscription (Administrative expenses) 759,239 Membership fee Other expense (Distribution cost) Dues, fee and subscription (Distribution cost) 333,874 45.2 Figures have been rounded off to nearest rupee unless otherwise stated.
46 DATE OF AUTHORIZATION FOR ISSUE
These financial statements were authorized for issue by the Board of Directors on Tuesday, September 25, 2018.
Chief Executive Officer Chairman Chief Financial Officer

Annual Report 2018 101
------Shareholding------ No. of Shareholders From To Total Shares Held 201 1 100 7,682 948 101 500 283,562 208 501 1,000 183,129 318 1,001 5,000 870,448 87 5,001 10,000 682,336 42 10,001 15,000 531,978 18 15,001 20,000 320,495 11 20,001 25,000 269,271 5 25,001 30,000 142,675 5 30,001 35,000 165,850 7 35,001 40,000 266,812 1 40,001 45,000 45,000 7 45,001 50,000 346,250 4 50,001 55,000 205,351 4 55,001 60,000 235,692 1 60,001 65,000 60,500 2 65,001 70,000 139,000 3 80,001 85,000 248,316 2 85,001 90,000 174,500 4 95,001 100,000 400,000 1 105,001 110,000 109,624 1 115,001 120,000 119,000 2 120,001 125,000 244,500 1 145,001 150,000 145,125 2 170,001 175,000 350,000 1 190,001 195,000 192,500 1 195,001 200,000 200,000 1 220,001 225,000 225,000 2 245,001 250,000 500,000 1 250,001 255,000 251,000 1 265,001 270,000 269,500 1 295,001 300,000 297,000 1 300,001 305,000 300,750 1 305,001 310,000 310,000 1 320,001 325,000 321,500 1 470,001 475,000 471,000 1 645,001 650,000 650,000 1 650,001 655,000 652,425 1 670,001 675,000 672,500 1 740,001 745,000 745,000 1 930,001 935,000 932,000 1 995,001 1,000,000 1,000,000 1 1,805,001 1,810,000 1,808,500 1 3,455,001 3,460,000 3,458,000 1 8,510,001 8,515,000 8,511,750 1 8,820,001 8,825,000 8,824,999 1 10,700,001 10,705,000 10,700,026 1 62,745,001 62,750,000 62,750,000 1,909 110,590,546
PATTERN OF SHAREHOLDINGAS AT JUNE 30, 2018

Nimir Industrial Chemicals Ltd.102
CATEGORIES OF SHAREHOLDERSAS AT JUNE 30, 2018
S. No. Categories of shareholders Shares held Percentage 5.1 Directors, Chief Executive Officers and their spouse and minor childern 13,263,295 11.9932% 5.2 Associated Companies, undertakings and related parties. (Parent Company) 62,750,000 56.7408% 5.3 NIT and ICP 1,500 0.0014% 5.4 Banks Development Financial Institutions, Non-Banking Financial Institutions. 2,300 0.0021% 5.5 Insurance Companies 17,500 0.0158% 5.6 Modarabas and Mutual Funds 783,124 0.7081% 5.7 Share holders holding 10% or more 62,750,000 56.7408% 5.8 General Public 1- Local 32,678,241 29.5489% 2- Foreign 0 0.0000% 5.9 Others (to be specified) 1- Joint Stock Companies 1,028,964 0.9304% 2- Foreign Companies 30,600 0.0277% 3- Leasing Companies 24,010 0.0217% 4- Investment Companies 11,012 0.0100%

Annual Report 2018 103
CATEGORIES OF SHAREHOLDERSAS AT JUNE 30, 2018
Sr. No. Name No. of Percentage Shares Held
1. Associated Companies, Undertakings and Related Parties: 1 Nimir Resourcs (Pvt.) Limited (CDC) 62,750,000 56.7408 2. Mutual Funds: 1 CDC - Triustee AKD Opportunity Fund (CDC) 109,624 0.0991 2 Golden Arrow Selected Stocks Fund Limited (CDC) 672,500 0.6081 3. Directors and their Spouse and Minor Children: 1 Mr. Abdul Jalil Jamil (CDC) 13,688 0.0124 2 Mr. Zafar Mahmood (CDC) (Chief Executive) 395,125 0.3573 3 Mr. Aamir Jamil (CDC) 188,750 0.1707 4 Mr. Muhammad Yahya Khan (CDC) 10,700,026 9.6754 5 Mr. Muhammad Saeed uz Zaman 310,781 0.2810 6 Mr. Imran Afzal (CDC) 1,000,000 0.9042 7 Mr. Mohsin Tariq (CDC) 1,000 0.0009 8 Mr. Saqib Raza (CDC) 1,000 0.0009 9 Mr. Javeed Saleem Arif (CDC) 500 0.0005 10 Mr. Abdul Jaleel Shaikh (Nominee of Pak Brunai) - 0.0000 11 Mrs. Nusrat Jamil W/o Abdul Jalil Jamil (CDC) 652,425 0.5899
4. Executives: 471,500 0.4263 5. Public Sector Companies & Corporations: – – 6. Banks, Development Finance Institutions, Non Banking Finance Companies, 44,810 0.0405 Insurance Companies, Takaful, Modarabas and Pension Funds: 7. Shareholders holding five percent or more voting intrest in the listed Company: Sr. No. Name No. of Percentage Shares Held 1 Nimir Resourcs (Pvt.) Limited (CDC) 62,750,000 56.7408 2 Mr. Muhammad Yahya Khan (CDC) 10,700,026 9.6754 3 Mr. Nadeem Nasir (CDC) 8,824,999 7.9799 4 Mrs. Shaheen Nadeem (CDC) 8,511,750 7.6966
8. All trades in the shares of the listed company, carried out by its Directors, Executives and their spouses and minor children are as follows: S. No. Name Sale Purchase
1 Mr. Zafar Mahmood (CDC) (Chief Executive) - 250,000 2 Mr. Muhammad Yahya Khan (CDC) - 200,000 3 Mr. Aamir Jamil (CDC) - 13,000 4 Mr. Khalid Mumtaz Qazi (CDC) - 265,250

Nimir Industrial Chemicals Ltd.104
NOTICE OF 25th ANNUAL GENERAL MEETING
Notice is hereby given that the 25th Annual General Meeting of Nimir Industrial Chemicals Limited (the “Company”) will be held on Friday, October 26, 2018 at 11:30 a.m. at Qaser-e-Sultan, Lahore – Faisalabad By-pass, near Housing colony, Sheikhupura to transact the following business:
ORDINARY BUSINESS:
1. To receive, consider and adopt the audited Standalone and Consolidated accounts of the Company for the year ended June 30, 2018 together with the reports of the Directors’, Auditors’ and Chairmans’ review thereon.
2. To approve the payment of final cash dividend of Rs. 2 per share (i.e. 20%) in the addition to the interim dividend of Rs. 1 per share, in total of Rs. 3 per share (i.e.30%) cash dividend for the year ended June 30, 2018.
3. To appoint Auditors for the year ended June 30, 2019 and fix their remuneration. The retiring auditors M/s EY Ford Rhodes – Chartered Accountants have offered themselves for re-appointment.
By Order of the Board
Lahore Muhammad Inam-ur-RahimOctober 5, 2018 (Company Secretary)
Notes:
i. The share transfer books of the Company shall remain closed from October 19, 2018 to October 26, 2018 (both days inclusive). Transfers received in order at the office of the Company’s shares registrar at the close of business on Thursday, October 18, 2018 will be treated in time for purpose of determine the entitlements attend and vote at the AGM.
ii. A member eligible to attend and vote at this meeting is entitled to appoint another member as his/her proxy to attend and vote instead of him/her. A proxy must be a member of the Company and shall produce his/her original Computerized National Identity Card (CNIC) or passport at the time of meeting. Proxies in order to be effective must be received at the registered office of the Company not later than forty eight (48) hours before the time of holding the meeting.
iii. The corporate shareholders shall nominate someone to represent them at the AGM. The nominations, in order to be effective must be received by the Company not later than forty eight (48) hours before time of holding the meeting.
iv. Any individual beneficial owner of Central Depository Company of Pakistan Limited (CDC), entitled to attend and vote at this meeting, must bring his/her original CNIC or passport, Account and participants’ I.D numbers to prove his/her identity, and in case of proxy must enclose an attested copy of his / her CNIC or passport. Representatives of corporate members should bring the, Board resolution/power of attorney with specimen signature (unless it had been provided earlier) along with the proxy form to the Company.
v. All shareholders who had not yet submitted the valid copies of CNIC and NTN Certificate(s) are requested to send the copies of the same to the Shares Registrar. Shareholders of the Company who holds shares in scrip-less form on CDC are requested to submit/send valid copies of CNIC and NTN Certificate(s) directly to their CDC participant (brokers)/CDC Investor Account Services.
FOR THE YEAR ENDED JUNE 30, 2018

Annual Report 2018 105
vi. Shareholders are requested to immediately notify change in address, if any, to the Company’s Share Registrar, at the following address :
M/s Corplink (Pvt.) Limited Wings Arcade, 1-K (Commercial), Model Town, Lahore. Tel : 042 35916714, 35916719, 35839182. Fax : 042 35869037 www.corplink.com.pk Submission of CNIC - (Mandatory)
With reference to the notification of Securities and Exchange Commission of Pakistan (SECP), SRO 779(I)/2011, dated August 18, 2011, the Members/Shareholders who have not yet submitted photocopy of their valid Computerized National Identity Card (CNIC) to the Company are required to send the same at the earliest directly of the Company’s Share Registrar, M/s Corplink (Pvt.) Limited.
Kindly comply with the request, in case of non-receipt of the copy of valid CNIC and non-compliance of the above mentioned SRO of SECP, the Company may be constrained to withhold dividends in the future.
Shareholders are requested to promptly notify any change of address to the Company’s Share Register (for Physical shares) or to their respective participant / broker (for CDS shares) as the case may be.
Deduction of withholding Tax on the amount of Dividend
Pursuant of the provisions of Finance Act 2017 effective from July 1, 2017, the deduction of income tax from the dividend payments shall be made on the bases of filer and non-filers as follows:
S. No. Nature of shareholders Rate of deduction
1 Filers of Income Tax Return 15%
2 Non-Filers of Income Tax Return 20%
Shareholders seeking exemption from deduction of income tax or are eligible at a reduced rate are requested to submit a valid tax certificate or necessary documentary evidence as the case may be. Shareholders desiring non-deduction of Zakat are also requested to submit a valid declaration for non-deduction of Zakat.
The shareholders who have joint shareholdings held by filers or Non-filers shall be dealt with separately. If the shares are not ascertainable then each account holder will be assumed to hold equal proportion of shares and deduction will be made accordingly.
Video Conference Facility
Pursuant to the provisions of the Section 132(2) of Companies Act, 2017 the shareholders residing in city and holding at least 10% of the total paid up capital may demand the Company to provide the facility of video link for participation in the meeting. The demand for video-link facility shall be received at Shares Registrar address given hereinabove at least 7 days prior to the date of AGM.
Payment of Cash Dividend through Electronic Mode (IBAN format)
In accordance with the Section 242 of the Companies Act, 2017 cash dividend can only be paid through electronic mode directly into the respective bank account designated by the entitled Shareholders. Shareholders are requested to provide their bank account details (IBAN format) to our share registrar (for Physical shares) or to their respective participant / broker (for CDS shares) as the case may be. The subject Form is available at Company’s website i.e. www.nimir.com.pk. In case of unavailability of IBAN, the Company would be constrained to withhold dividend in accordance with the Companies (Distribution of Dividends) Regulations, 2017.

Nimir Industrial Chemicals Ltd.106

Annual Report 2018 107
FORM OF PROXY 25th ANNUAL GENERAL MEETING

Nimir Industrial Chemicals Ltd.108
