annual report 2018 - helsedirektoratet
TRANSCRIPT

2019:29
##Forfatter####T
ittel##
Anne Hatløy, Ketil Bråthen, Svein Erik Stave and Anne Inga Hilsen
Partnership for a healthier diet Annual report 2018
Fafo-paper


Anne Hatløy, Ketil Bråthen, Svein Erik Stave and Anne Inga Hilsen
Partnership for a healthier diet Annual report 2018
Fafo-paper 2019:29

Fafo-notat 2019:25
2
© Fafo 2019 ISSN 0804-5135

Partnership for a healthier diet
3
Contents
Preface .............................................................................................................. 4 Self-reporting 2018 ............................................................................................. 5
Organization of the letter of intent ................................................................................... 5 Methodology ...................................................................................................................... 6
The participants' actions ..................................................................................... 7 Actions for the individual priority areas ............................................................................ 7 The participants measures are summarized .................................................................. 11 The Keyhole label ............................................................................................................. 12
The participants assessment of the agreement.................................................... 13 Assessment of the agreement ......................................................................................... 13 Assessment by the health authorities ............................................................................. 14
Main findings .................................................................................................... 16 Appendix 1 Questionnaire .................................................................................. 17 Appendix 2 List of all participants in 2018 ........................................................... 30

Fafo-notat 2019:25
4
Preface
Fafo has been commissioned by the Directorate of Health to evaluate the Letter of Intent for facilitating a healthier diet. The agreement is between the health authorities and the food industry. The evaluation includes an annual self-report from the parties who have signed the agreement, and in addition, we will carry out a mid-term and a final evaluation. This memorandum is the second annual report from the project.
We thank the co-ordination group of the letter of intent for the valuable input in the process.
Oslo, 5th November 2019 Anne Hatløy, Ketil Bråthen, Svein Erik Stave and Anne Inga Hilsen

Partnership for a healthier diet
5
Self-reporting 2018
This annual report is the second in the series of interim reports in Fafo's follow-up evaluation of the letter of intent on facilitating a healthier diet, signed by the food in-dustry and the Ministry of Health and Care Services in December 2016.1 In June 2018, the agreement was extended to include the food service industry. The agreement is valid until 31 December 2021. In addition to an annual self-report from the parties who have signed the agreement, a mid-term and a final evaluation will also be carried out.
The self-reporting covers all priority areas, and it is about cooperation between the parties to reduce the intake of salt, added sugar and saturated fat in the popula-tion, and to increase the intake of fruits and berries, vegetables, whole grain products and seafood.
This memorandum presents the results of the annual survey from 2018. The survey was sent to the 97 participants who had signed the agreement in 2018 (see appendix 2). The survey is primarily related to the measures that the participants report that they have completed in 2018, and to their own assessment of the agreement.
Organization of the letter of intent As described in the annual report for 2017, the letter of intent is organized by the high-level business group of the Minister for the Elderly and Public Health. The over-all responsibility for coordinating the work on the letter of intent lies with the coor-dination group. This group consists of representatives of the participants: 2 representatives from Virke (the Enterprise Federation of Norway)/NorgesGruppen, 2 representatives from NHO Service (Norwegian Federation of Service Industries and Retail Trade)/Rema, 2 representatives from Coop, 1 representative from Sjømat Norge (Norwegian Seafood Federation), 1 representative from the Norges Frukt- og Grønnsakgrossisters Forbund (Norwegian Fruit and Vegetable Wholesalers' Association), 4 representatives from NHO Mat og Drikke (FoodDrinkNorway)/food and beverage manufacturers, 1 representative from NHO Reiseliv (The Norwegian Hospitality Association), 1 representative from Virke KBS (kiosk, petrol and service trade industry), 2 representatives from the authorities, head of the secretariat meet in the coordina-tion group. The Directorate of Health is the secretariat for the letter of intent.
1 https://www.regjeringen.no/globalassets/departementene/hod/folkehelse/20161206_intensjon-savtale_naeringslivet_hod_m_vedlegg.pdf
Fafo-notat 2019:25
6
Methodology Self-reporting is based on a questionnaire which has been sent to all contract part-ners. The questionnaire consists of one part addressing each priority area and the measures that have been implemented, as well as one part that includes the partici-pants' assessment of the agreement.
The questionnaire has been prepared by Fafo, and has been presented and ap-proved by the coordination group for the letter of intent.
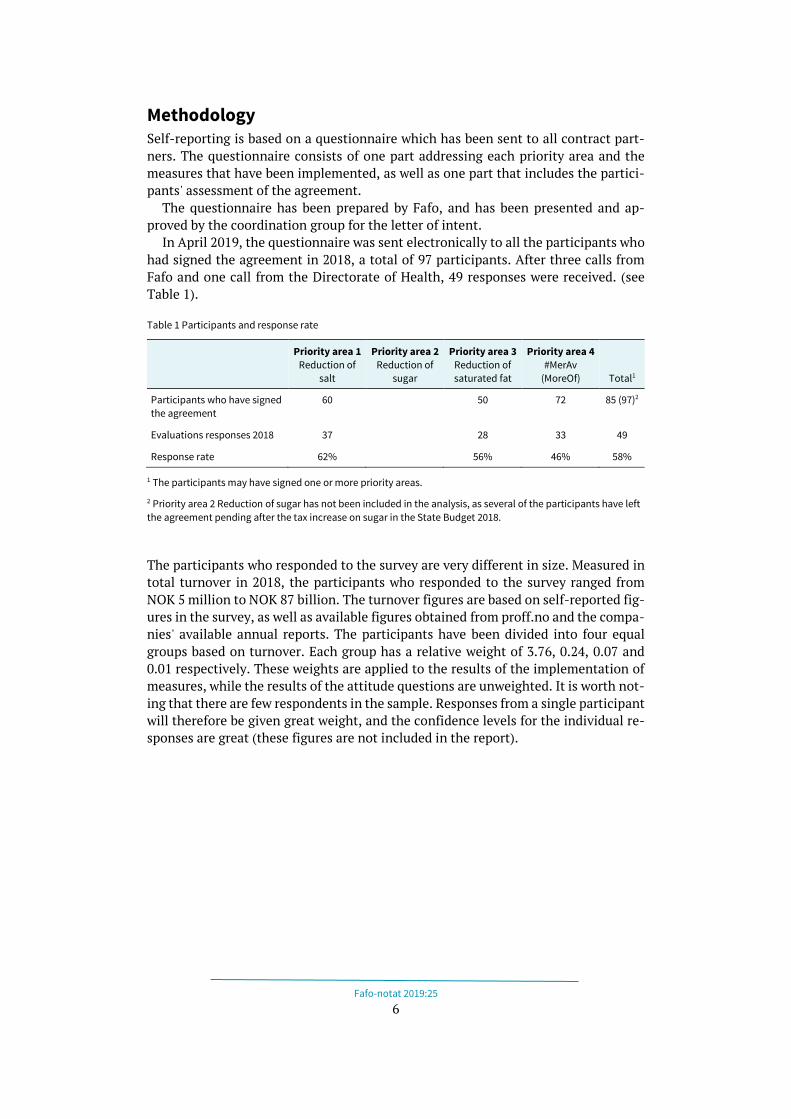
In April 2019, the questionnaire was sent electronically to all the participants who had signed the agreement in 2018, a total of 97 participants. After three calls from Fafo and one call from the Directorate of Health, 49 responses were received. (see Table 1).
Table 1 Participants and response rate
Priority area 1 Reduction of
salt
Priority area 2 Reduction of
sugar
Priority area 3 Reduction of saturated fat
Priority area 4 #MerAv
(MoreOf) Total1
Participants who have signed the agreement
60 50 72 85 (97)2
Evaluations responses 2018 37 28 33 49
Response rate 62% 56% 46% 58%
1 The participants may have signed one or more priority areas.
2 Priority area 2 Reduction of sugar has not been included in the analysis, as several of the participants have left the agreement pending after the tax increase on sugar in the State Budget 2018.
The participants who responded to the survey are very different in size. Measured in total turnover in 2018, the participants who responded to the survey ranged from NOK 5 million to NOK 87 billion. The turnover figures are based on self-reported fig-ures in the survey, as well as available figures obtained from proff.no and the compa-nies' available annual reports. The participants have been divided into four equal groups based on turnover. Each group has a relative weight of 3.76, 0.24, 0.07 and 0.01 respectively. These weights are applied to the results of the implementation of measures, while the results of the attitude questions are unweighted. It is worth not-ing that there are few respondents in the sample. Responses from a single participant will therefore be given great weight, and the confidence levels for the individual re-sponses are great (these figures are not included in the report).

Partnership for a healthier diet
7
The participants' actions
Actions for the individual priority areas
Priority area 1: Reduction of salt content in foods and the reduction of salt intake in the population through the Salt partnership.
- 37 out of 60 participants who signed responded - 26 with their own goals, 24 measure themselves - 24 have attended meetings, seminars or workshops during 2018
Development of new products and optimization of existing products are the most frequently reported measures the participants have taken in 2018 to reduce salt (see Figure 1). It is also these two measures that the participants consider to be the most effective. These are the same areas that were highlighted in the 2017 Annual Report.
Figure 1 Actions within priority area 1: Reduction in salt implemented in 2017 (n=29) and 2018 (n=37). Weighted by total turnover
Recipe optimization is highlighted as the most effective - especially gradual changes in large volume products. The comments mention that small changes that consumers barely notice can affect habits and preferences over time. By gradually reducing the salt content in order to get consumers accustomed to a less salty taste on familiar products, new and healthier habits can be established. As someone said: "It was rel-atively easy to implement, and it made little difference to the taste."

Fafo-notat 2019:25
8
Priority area 2: Reduction of added sugar in foods and reduction in the popu-lation's intake of added sugar
As in the annual report for 2017, the priority area "added sugar" is omitted. This was because many of the agreement participants withdrew from the letter of intent after product taxes on chocolate and sugar confectionery and non-alcoholic beverages in-creased in the state budget for 2018.2
Priority area 3: Reduction of saturated fat in foods and reduction of the pop-ulation's intake of saturated fat
- 28 of 50 participants who have signed responded - 12 with their own goals, all measure themselves - 18 have attended meetings, seminars or workshops during 2018
As for salt, optimizing existing products and developing new products are also the most important measures in reducing the amount of saturated fat in 2018. Interest-ingly, marketing measures were the most frequently reported measure in 2017, while they have been greatly reduced in 2018. Based on the reported figures, it is not pos-sible to conclude on what has happened, but it would have been interesting to know if the strong marketing the year before has produced results. Several participants point out that a stronger focus on saturated fat is perceived as important. Some com-ment that it is possible that this was achieved with last year's marketing and that they could focus on other measures in 2018.
Figure 2 Measures within priority area 3: Reduction in saturated fat carried out in 2017 (n=21) and 2018 (n=28). Weighted by total turnover
2 The beverage manufacturers have put a halt on work on the agreement. Other producers have stopped the cooperation on the reduction of added sugar (priority area 2), but the companies are still working individually on sugar reduction. One consequence of the fact that the producers have ceased the cooperation is that they do not report on activities from priority area 2 in this evalua-tion.

Partnership for a healthier diet
9
A majority of the participants highlight recipe optimizations the most effective measure - making changes to large volume products while offering alternatives with less saturated fat. At the same time, several actors point out that reduced fat content can affect the properties of the product, and several also mention that if the raw ma-terials of animal origin have too high a saturated fat content, it can present chal-lenges with regard to reduction.
Priority area 4: Increase the population's intake of fruit and berries, vegeta-bles, whole grain products and fish and seafood by 20% by 2021
Fruits, berries and vegetables
- 22 respondents - 12 with their own goals, 7 measure themselves - 16 have attended meetings, seminars or workshops during 2018
In contrast to Priority areas 1-3, which all aim to reduce the intake of different nutri-ents, the three measures within Priority area 4 are about achieving increased intake of different food groups. For the instruments that apply to increased intake of fruits, berries and vegetables, the most important are the development of new products, design change on packaging and changed packaging or portion size. Several mention that changing the packaging size is about smaller packages that are "easy to carry", making it easier therefore to take with you. Marketing measures are still important, but there has been some reduction in the extent of such reported measures since 2017.
Figure 3 Measures within Priority area 4: Increased intake of fruit, berries and vegetables completed in 2017 (n=19) and 2018 (n=22) Weighted by total turnover
There is a major focus on fruit and vegetables, with the use of available means at all levels of the value chain. According to some of the open text responses, 2018 was characterized by an exceptionally hot summer and long periods of drought, and this is an important explanation for the decline in volume for fruit and vegetables. Com-ments were made that delivery challenges for large and volume-driven goods, com-

Fafo-notat 2019:25
10
bined with consumers' desires for lightweight solutions in the summer heat, contrib-uted to a clear fall in comparable sales volume. As one participant pointed out, sig-nificant growth was seen in finished processed salads weighing little per unit, while large and heavy commodity lines such as onions, carrots and cauliflowers declined, which greatly impacted the overall measurement.
Whole grain products
- 20 respondents - 6 with their own goals, 5 measure themselves - 11 have attended meetings, seminars or workshops during 2018
Measures related to increased intake of whole grain foods are particularly related to the development and launch of new products and changes of packaging design and changed packaging or portion size. Here too, marketing is somewhat reduced from 2017, although it still scores high.
Figure 4 Measures within Priority area 4: Increased intake of whole grain foods in 2017 (n=16) and 2018 (n=20) Weighted by total turnover
It is pointed out that new products are being launched that contain more whole grains. Furthermore, some product groups appear to replace some of the meat con-tent with cereals. Experience so far is that the measures are perceived as relevant and implementable, and that this has led to an increased range and sale of whole grains.
Fish and seafood
- 15 respondents - 9 with their own goals, 8 measure themselves - 10 have attended meetings, seminars or workshops during 2018
In 2018, the most important measures to promote increased intake of fish and sea-food were the marketing, optimization of existing products and development of new products.

Partnership for a healthier diet
11
Several examples of new products are highlighted, especially in the category "ready meals" that will make it easier for consumers to choose fish in a busy everyday life.
Figure 5 Measures within Priority area 4: Increased intake of fish and seafood in 2017 (n=14) and 2018 (n=15) Weighted by total turnover
When it comes to product placement, measures were taken such as placing seafood before meat in the warm food section. Several also mentioned that measures such as highlighting fish as a natural choice for grilling have a positive effect.
At the same time, challenges were identified with volume loss of unpackaged fish. It was said that this was somewhat, but not fully, offset by an increase in packaged fish. In the open text of the questionnaire it was stated that fish is perceived as ex-pensive and that people have been critical of farmed fish.
The participants measures are summarized For the measures that are aimed at reducing salt and fat, also called "MindreAv" (Les-sOf), the most focus is on developing new products and optimizing existing products. Marketing is still important, albeit to a lesser extent than the year before.
For the measures in priority area 4, popularly called "MerAv" (MoreOf), they are most frequently reported related to the development of new products. For fruit/veg-etables, change of design on packaging and packaging size is also important, while for fish/seafood, marketing and optimization of existing products are the most fre-quently reported measures.

Fafo-notat 2019:25
12
Figure 6 Overall overview of measures within all the priority areas. Weighted based on turnover
The Keyhole label Of all the 49 respondents, 19 report that they have products with the keyhole symbol in their 2018 range. Four of these have fewer than 10 products, nine have between 10 and 100, four have between 100 and 1000, and the last two have over 1000 different products with the keyhole symbol.
There are 17 participants with their own keyhole products, with an average of 115 products each (ranked from 2 to 970). In 2018, five participants launched new prod-ucts with the keyhole symbol. In total, these participants launched 43 such new prod-ucts.

Partnership for a healthier diet
13
The participants assessment of the agreement
Assessment of the agreement So far, the participants are largely satisfied with the partnership for a healthier diet. As Figure 7 indicated, most are satisfied with the deal. The average score is 4.3 out of 6, which is the same as for 2017. Nobody says they are not satisfied with the agree-ment at all.
In terms of whether they feel they are getting something from the agreement, the score is somewhat lower, namely 3.9 - for both years.
The assessment of whether it is difficult or easy to achieve the agreement's goals in their own company, scores are 3.2 on average, about the same as 2017. This is where the greatest potential for improvement is.
Figure 7 Assessment of the agreement 2017 (n=44) and 2018 (n=48) Not weighted
Motivation: The main motivation for the participants to take part in the agreement is the wish to contribute to improved public health. As one participant described it: "A binding cooperation between the authorities and (...) the industry to provide con-sumers with healthier choices and thereby improved public health." Several mention that social responsibility is about customers and how to influence their choices in a healthier direction. At the same time, many point out that joining the agreement leads to increased commercial visibility.
Output of the partnership: The elements that are highlighted most frequently that this is a joint measure. It is about raising awareness about a healthier diet, both in general and in the individual areas, such as more seafood, less salt, etc. It is also a matter of the industry and the authorities pulling in the same direction.

Fafo-notat 2019:25
14
Challenge: There are several factors that are perceived as challenging. Especially the areas "MindreAv" (LessOf) are highlighted, since both fat, salt and sugar affect the taste and consistency of the products. Consequently, it is not only consumer prefer-ences that need to be changed, but the quality of the products must be maintained in terms of consistency, durability, taste etc. Several also point out that they have al-ready made changes, making it more difficult to make further reductions.
Several point out that elements beyond the control of the participants also make it challenging. Some raw materials of animal origin naturally contain a proportion of saturated fat which is challenging to affect in later stages of the food production. It was said that since agriculture is not part of the agreement, there is less potential for influence. The product fees for chocolate and confectionery and non-alcoholic bev-erages are also mentioned as changes in the framework conditions during the agree-ment period.
Assessment by the health authorities We asked for an assessment of the health authorities' work in the partnership. First, we asked respondents to evaluate each area separately. On a scale of 1 to 6, where 6 is very good - the participants give around 4 for the health authorities fulfilling their obligations in all areas. It is reporting to the coordination group on activities and overall goal attainment that scores the highest, while regular dietary studies score the lowest, although the differences are small.
Figure 8 The participants' assessment of how the health authorities are meeting their obligations in 2017 and 2018. 1 = very poor, 6 = very good
We also asked the companies to state what is the most important commitment of the health authorities, from their perspective. They could mark only one option. "Work-ing with systematic measures that promote public health in general and increase the proportion of the population who have a diet that is in line with the national dietary guidelines" is what is considered most important by most. Next is "Influencing con-sumers through communication and implementing other systematic measures to make it easier to make healthy choices". No one gives top priority to "Report to the coordination group on activities and overall goal achievement".

Partnership for a healthier diet
15
When they have to prioritize, the answers become clearer than when they answer according to each area individually. At the same time, the answers in each area show that all areas are perceived as important.
Finally, we asked if they had any further comments on the implementation of the letter of intent in 2018. Not many comments were received, but both increased re-sources in school/kindergarten to influence the direction of a healthy diet, product taxes and reduced VAT on healthy goods were mentioned. It was also stated that the public should take precedence and prioritize quality over price in public agreements.

Fafo-notat 2019:25
16
Main findings
The letter of intent is perceived as important and meaningful by the participants who have entered into the agreement. They report that they are happy with it, they feel they are getting something from the agreement, but they also point out that it can be challenging to succeed.
In general, there seem to be greater challenges associated with the "MindreAv" (LessOf) than the "MerAv" (MoreOf) areas. The challenges of "MindreAv" (LessOf) are not just about changing consumer preferences, consciously or unconsciously, but also about preserving the quality of the products.
"MerAv" (MoreOf) is about developing new products that will make it easy and tempting for consumers to choose the healthier alternatives, but also that the pack-aging size and design of the packaging will influence consumers. Marketing is im-portant, and it highlights the role of the authorities in promoting healthy choices.
Motivation to join the agreement is clearly linked to the main goal, better public health. Dividends for those who participate are about common spotlight on measures that promote public health, such as raising awareness of a healthier diet and that the industry and the authorities are moving in the same direction.
At the same time, it is challenging that only 49 of the 97 companies that signed the agreement submitted the annual report for 2018. Therefore we know little about how the agreement is working, is perceived and lived up to by about half of the agree-ment partners. Monitoring is a goal of the agreement, and the annual reports con-tribute to this. It is therefore a clear challenge to increase reporting during the rest of the agreement period.

Appendix 1: Questionnaire
The letter of intent for a healthier diet
Reporting is voluntary.
The form is assessed according to competition regulations by the Norwegian Directorate of Health.
Business background
B1 Business name ……………………………………………………………………..
B2 Location of head office ……………………………………………………………………..
B3 Is your business nationwide or local? 1. Nationwide
2. Local
B4 Total turnover last year (use numbers)
1. Prefer not to answer 2. Don't know
B5 Number of employees (use numbers)
1. Prefer not to answer 2. Don't know
B6 Type of business Select all that are relevant
a. Manufacturer
b. Wholesaler
c. Agent
d. Industry organization/health authority
B7 Link to the agreement Select all that are relevant
a. Priority area 1: Reduction of salt
b. Priority area 2: Reduction of added sugar
c. Priority area 3: Reduction of saturated fat
d. Priority area 4: Increased intake of fruits, berries, vegetables
e. Priority area 4: Increased intake of whole grain foods
f. Priority area 4: Increased intake of fish and seafood

Priority area 1: Reduction of salt [Only to be answered by those who have checked B7a on page 1]
SA1 Have you set your own goals for salt reduction? 1: Yes 2: NoSA4
SA2 Do you monitor the development of the salt reduction targets yourself?
1: Yes 2: NoSA4
SA3 How often is it measured? 1: Monthly or more often 2: Quarterly 3: Biannually 4: Annually 5: Other……………………………………………….
SA4 Has your company implemented any of the following measures in relation to Priority area 1: Reduction of salt within the 2017 agreement?
a Development and launch of new product(s) 1: Yes 2: No 3: Not applicable
b Optimizing existing product(s) 1: Yes 2: No 3: Not applicable
c Changed packaging or portion size (intended to influence healthier choices)
1: Yes 2: No 3: Not applicable
d Change of packaging design, retail pack (intended to influence healthier choices)
1: Yes 2: No 3: Not applicable
e Marketing initiatives 1: Yes 2: No 3: Not applicable
f Changed product placement in retail outlets (intentionally influencing healthier choices)
1: Yes 2: No 3: Not applicable
g Other measures implemented 1: Yes 2: No
If yes, please describe …………………................................. SA5 What was the most effective measure you took in 2017?
…………………………………………………………. SA6 Why was this measure effective?
………………………………………………………….
SA7 Has anyone from your company attended meetings/seminars/workshops within Priority area 1: Reduction of salt during 2017?
1: Yes 2: No 3: Not applicable

Priority area 2: Reduction of added sugar [Only to be answered by those who have ticked B7b on page 1]
SU1 Have you set your own goals for reducing added sugar? 1: Yes 2: NoSU4
SU2 Do you monitor progress in relation to the goals of reducing added sugar?
1: Yes 2: NoSU4
SU3 How often are they measured? 1: Monthly or more often 2: Quarterly 3: Biannually 4: Annually 5: Other
SU4 Has your company taken any of the following measures in connection with Priority area 2 within the 2017 agreement?
a Development and launch of new product(s) 1: Yes 2: No 3: Not applicable
b Optimizing existing product(s) 1: Yes 2: No 3: Not applicable
c Changed packaging or portion size (intentionally affecting healthier choices)
1: Yes 2: No 3: Not applicable
d Change of packaging design, retail pack (intended to influence healthier choices)
1: Yes 2: No 3: Not applicable
e Marketing initiatives 1: Yes 2: No 3: Not applicable
f Changed product placement in retail outlets (intentionally influencing healthier choices)
1: Yes 2: No 3: Not applicable
g Other measures implemented within "Priority area 2: Reduction of added sugar" last year?
1: Yes 2: No
If yes, please describe …………………................................. SU5 What was the most effective measure you implemented
in 2017? …………………………………………………………. SU6 Why was this measure effective?
………………………………………………………….
SU7 Has anyone from your company participated in meetings/seminars/workshops for Priority area 2: Reduction of added sugar during 2017?
1: Yes 2: No 3: Not applicable

Priority area 3: Reduction of saturated fat [Only to be answered by those who have ticked B7c on page 1]
FE1 Have you set your own goals for reducing saturated fat? 1: Yes 2: NoFE4
FE2 Do you monitor the development in relation to the goals for reducing saturated fat yourself?
1: Yes 2: NoFE4
FE3 How often is it measured? 1: Monthly or more often 2: Quarterly 3: Biannually 4: Annually 5: Other
FE4 Has your company taken any of the following measures in relation to Priority area 3 within the 2017 agreement?
a Development and launch of new product(s) 1: Yes 2: No 3: Not applicable
b Optimizing existing product(s) 1: Yes 2: No 3: Not applicable
c Changed packaging or portion size (intentionally affecting healthier choices)
1: Yes 2: No 3: Not applicable
d Change of packaging design, retail pack (intentionally affecting healthier choices)
1: Yes 2: No 3: Not applicable
e Marketing initiatives 1: Yes 2: No 3: Not applicable
f Changed product placement in retail outlets (intentionally influencing healthier choices)
1: Yes 2: No 3: Not applicable
g Other measures implemented within "Priority area 3: Reduction of saturated fat" last year?
1: Yes 2: No
If yes, please describe …………………................................. FE5 What was the most effective measure you implemented
in 2017? …………………………………………………………. FE6 Why was this measure effective?
………………………………………………………….
FE7 Has anyone from your company participated in meetings/seminars/workshops within Priority area 3: Reduction of saturated fat during 2017?
1: Yes 2: No 3: Not applicable

Priority area 4: Increased intake of fruits, berries, vegetables [Only to be answered by those who have ticked B7d on page 1]
FG1 Have you set your own goals for increasing the intake of fruit, berries and vegetables?
1: Yes 2: NoFG4
FG2 Do you monitor the development in relation to the goals of increased intake of fruits, berries and vegetables?
1: Yes 2: NoFG4
FG3 How often is it measured? 1: Monthly or more often 2: Quarterly 3: Biannually 4: Annually 5: Other
FG4 Has your company taken any of the following measures in relation to Priority area 4: Increased intake of fruits, berries, vegetables within the 2017 agreement?
a Development and launch of new product(s) 1: Yes 2: No 3: Not applicable
b Optimizing existing product(s) 1: Yes 2: No 3: Not applicable
c Changed packaging or portion size(intentionally affecting healthier choices)
1: Yes 2: No 3: Not applicable
d Change of packaging design, retail pack (intentionally affecting healthier choices)
1: Yes 2: No 3: Not applicable
e Marketing initiatives 1: Yes 2: No 3: Not applicable
f Changed product placement in retail outlets (intentionally influencing healthier choices)
1: Yes 2: No 3: Not applicable
g Other measures implemented within "Priority area 4: Increased intake of fruits, berries, vegetables" last year?
1: Yes 2: No
If yes, please describe …………………................................. FG5 What was the most effective measure implemented
in 2017? …………………………………………………………. FG6 Why was this measure effective?
…………………………………………………………. FG7 Has anyone from your company participated in
meetings/seminars/workshops within Priority area 4: Increased intake of fruits, berries, vegetables during 2017?
1: Yes 2: No 3: Not applicable

Priority area 4: Increased intake of whole grain foods [Only to be answered by those who have ticked B7e on page 1]
KO1 Have you set your own goals for increasing the intake of whole grain foods?
1: Yes 2: NoKO4
KO2 Do you monitor developments in relation to the goal of increasing the intake of whole grain foods?
1: Yes 2: NoKO4
KO3 How often is it measured? 1: Monthly or more often 2: Quarterly 3: Biannually 4: Annually 5: Other
KO4 Has your company taken any of the following measures in relation to Priority area 4: Increased intake of whole grain foods within the 2017 agreement?
a Development and launch of new product(s) 1: Yes 2: No 3: Not applicable
b Optimizing existing product(s) 1: Yes 2: No 3: Not applicable
c Changed packaging or portion size(intentionally affecting healthier choices)
1: Yes 2: No 3: Not applicable
d Change of packaging design, retail packk (intentionally affecting healthier choices)
1: Yes 2: No 3: Not applicable
e Marketing initiatives 1: Yes 2: No 3: Not applicable
f Changed product placement in retail outlets (intentionally influencing healthier choices)
1: Yes 2: No 3: Not applicable
g Other measures implemented within "Priority area 4: Increased intake of whole grain foods" last year?
1: Yes 2: No
If yes, please describe …………………................................. KO5 What was the most effective measure implemented
in 2017? ……………………………………………… KO6 Why was this measure effective?
………………………………………………… KO7 Has anyone from your company participated in
meetings/seminars/workshops within Priority area 4: Increased intake of whole grain foods during 2017?
1: Yes 2: No 3: Not applicable

Priority area 4: Increased intake of fish and seafood [Only to be answered by those who have ticked B7e on page 1]
FI1 Have you set your own goals for increasing the intake of fish and seafood?
1: Yes 2: NoFI4
FI2 Do you monitor your own development in relation to the goal of increasing the intake of fish and seafood?
1: Yes 2: NoFI4
FI3 How often is it measured? 1: Monthly or more often 2: Quarterly 3: Biannually 4: Annually 5: Other
FI4 Has your company taken any of the following measures in relation to Priority area 4: Increased intake of fish and seafood within the 2017 agreement?
a Development and launch of new product(s) 1: Yes 2: No 3: Not applicable
b Optimizing existing product(s) 1: Yes 2: No 3: Not applicable
c Changed packaging or portion size(intentionally affecting healthier choices)
1: Yes 2: No 3: Not applicable
d Change of packaging design, retail pack (intentionally affecting healthier choices)
1: Yes 2: No 3: Not applicable
e Marketing initiatives 1: Yes 2: No 3: Not applicable
f Changed product placement in retail outlets (intentionally influencing healthier choices)
1: Yes 2: No 3: Not applicable
g Other measures implemented within "Priority area 4: Increased intake of fish and seafood" last year?
1: Yes 2: No
If yes, please describe …………………................................. FI5 What was the most effective measure implemented
in 2017? ……………………………………………… FI6 Why was this measure effective?
………………………………………………… FI7 Has anyone from your company participated in
meetings/seminars/workshops within Priority area 4: Increased intake of fish and seafood during 2017?
1: Yes 2: No 3: Not applicable

The keyhole symbol NO1 Total number of products with the keyhole symbol in 2017
Don't know; Not applicable NO1b
How many products in the entire range are the company's own brands? (use numbers)
Don't know; Not applicable
NO2 Number of new products with the keyhole symbol in 2017
Don't know; Not applicable NO2b How many of the new products in 2017 were the company's
own brands? (use numbers)
Don't know; Not applicable
The participants' assessment of the agreement
AV1 How satisfied is your company with the agreement? 1 = Not satisfied at all 6= Very satisfied
1 2 3 4 5 6
AV2 Do you feel you are gaining something from the agreement? 1= Haven't gained anything from the agreement 6= Have gained a lot from the agreement
1 2 3 4 5 6
AV3 What do you think you have gained the most from? ……………………….…..
AV4 How difficult is it for your company to achieve the goals of the agreement?
1= Very difficult 6= Very easy
1 2 3 4 5 6
AV5 What is particularly challenging ……………………….…..
AV6 What kind of measures give the best result? ……………………….…..
AV7 What is your main motivation for joining the agreement? ……………………….…..

The participants' assessment of the health authorities AV9 What measures significant to your business do you feel that
the health authorities have taken in relation to the agreement during 2017?
…………………………….. None; Not applicable
AV10 What measures significant to the entire agreement do you feel that the health authorities have taken during 2017?
…………………………….. None; Not applicable
AV11 How well do you think the health authorities fulfil their obligations within the following fields?
1= Very badly 6= Very well 9= Don't know
a. Monitoring the population's diet 1 2 3 4 5 6 9 b. Obtaining data to evaluate the performance of this
agreement and working towards its implementation 1 2 3 4 5 6 9
c. Fielding regular representative dietary surveys 1 2 3 4 5 6 9 d. Working with systematic measures that promote public
health in general and increase the proportion of the population who have a diet that is in line with the national dietary advice. Having a special focus on children and young people
1 2 3 4 5 6 9
e. Reporting to the coordination group on measures and overall goal achievement
1 2 3 4 5 6 9
f. Influencing consumers through communication and taking other systematic measures to make healthy choices easier
1 2 3 4 5 6 9
g. Participating in dialogue and interaction with other relevant authorities and the Research Council related to the objectives of the letter of intent.
1 2 3 4 5 6 9
AV12 From your business perspective, what is the most important commitment for the health authorities (of those mentioned above) Tick only one
a b c d e f g

The participants' assessment of NHO Mat og Drikke (FoodDrinkNorway) AV13 What measures significant to your business do you feel that
NHO Mat og Drikke (FoodDrinkNorway) has taken in relation to the agreement during 2017?
…………………………….. None; Not applicable
AV14 How well do you think NHO Mat og Drikke (FoodDrinkNorway) fulfils its obligations within the following fields?
1= Very badly 6= Very well 9= Don't know
a. Preparing and contributing information to your own
member companies about the letter of intent and the importance of joining it
1 2 3 4 5 6 9
b. Contributing to sharing their experience and development of expertise among your members
1 2 3 4 5 6 9
c. Appointing representatives from their organization to the coordination group, cf. the mandate of the coordination group
1 2 3 4 5 6 9
d. Representing your own members in the group's letter of intent, cf. the mandate of the coordination group
1 2 3 4 5 6 9
e. Reporting to the coordination group according to the format agreed upon by the parties under the current priority area
1 2 3 4 5 6 9
AV15 From your business perspective, what is the most important obligation of NHO Mat og Drikke (FoodDrinkNorway) (of those mentioned above) Tick only one
a b c d e
The participants' assessment of NHO Service og Handel (Service and Trade) AV16 What measures significant to your business do feel that
NHO Service og Handel (Service and Trade) have taken in relation to the agreement during 2017?
…………………………….. None; Not applicable
AV17 How well do you think NHO Service og Handel (Service and Trade) fulfils their obligations within the following fields?
1= Very badly 6= Very well 9= Don't know
a. Preparing and contributing information to your own
member companies about the letter of intent and the importance of joining it
1 2 3 4 5 6 9
b. Contributing to sharing their experience and development of expertise among your members
1 2 3 4 5 6 9
c. Appointing representatives from their organization to the coordination group, cf. the mandate of the coordination group
1 2 3 4 5 6 9
d. Representing your own members in the group's letter of intent, cf. the mandate of the coordination group
1 2 3 4 5 6 9
e. Reporting to the coordination group according to the format agreed upon by the parties under the current priority area
1 2 3 4 5 6 9
AV18 From your business perspective, what is the main commitment to NHO Service og Handel (Service and Trade) (of those mentioned above) Tick only one
a b c d e
The participants' assessment of Virke Dagligvare (consumer goods) AV19 What measures significant to your business do you feel that
Virke dagligvare (consumer goods) ……………………………..
None; Not applicable

have taken in relation to the agreement during 2017? AV20 How well do you think Virke dagligvare (consumer goods) fulfil their obligations within
the following fields? 1= Very badly 6= Very well 9= Don't know
a. Preparing and contributing information to your own
member companies about the letter of intent and the importance of joining it
1 2 3 4 5 6 9
b. Contributing to sharing their experience and development of expertise among your members 1 2 3 4 5 6 9
c. Appointing representatives from their organization to the coordination group, cf. the mandate of the coordination group
1 2 3 4 5 6 9
d. Representing your own members in the group's letter of intent, cf. the mandate of the coordination group 1 2 3 4 5 6 9
e. Reporting to the coordination group according to the format agreed upon by the parties under the current priority area
1 2 3 4 5 6 9
AV21 From your business perspective, what is the most important commitment for the Virke dagligvare (consumer goods) (of those mentioned above) Tick only one
a b c d e
The participants' assessment of Norges Frukt- og Grønnsaksgrossisters Forbund (NFGF) (Norwegian Fruit and Vegetable Wholesalers' Association) AV22 What measures significant to your business do you feel that
Norges Frukt- og Grønnsaksgrossisters Forbund (NFGF) (Norwegian Fruit and Vegetable Wholesalers' Association) has taken in relation to the agreement during 2017??
…………………………….. None; Not applicable
AV23 How well do you think Norges Frukt- og Grønnsaksgrossisters Forbund (NFGF) (Norwegian Fruit and Vegetable Wholesalers' Association) fulfils its obligations within the following fields?
1= Very badly 6= Very well 9= Don't know
a. Preparing and contributing information to your own
member companies about the letter of intent and the importance of joining it
1 2 3 4 5 6 9
b. Contributing to sharing their experience and development of expertise among your members 1 2 3 4 5 6 9
d. Representing your own members in the group's letter of intent, cf. the mandate of the coordination group 1 2 3 4 5 6 9
e. Reporting to the coordination group according to the format agreed upon by the parties under the current priority area
1 2 3 4 5 6 9
AV24 From your business perspective, what is the most important commitment for the Norges Frukt- og Grønnsaksgrossisters Forbund (NFGF) (Norwegian Fruit and Vegetable Wholesalers' Association)(of those mentioned above) Tick only one
a b d e

The participants' assessment of Baker- og Konditorbransjens Landsforening (BKLF) (Bakery and Confectionery Industry Association) AV25 What measures significant to your business do you feel that
Baker- og Konditorbransjens Landsforening (BKLF) (Bakery and Confectionery Industry Association) has taken in relation to the agreement during 2017?
…………………………….. None; Not applicable
AV26 How well do you think Baker- og Konditorbransjens Landsforening (BKLF) (Bakery and Confectionery Industry Association) fulfils its obligations within the following fields?
1= Very badly 6= Very well 9= Don't know
a. Preparing and contributing information to your own
member companies about the letter of intent and the importance of joining it
1 2 3 4 5 6 9
b. Contributing to sharing their experience and development of expertise among your members 1 2 3 4 5 6 9
d. Representing your own members in the group's letter of intent, cf. the mandate of the coordination group 1 2 3 4 5 6 9
e. Reporting to the coordination group according to the format agreed upon by the parties under the current priority area
1 2 3 4 5 6 9
AV27 From your business perspective, what is the most important commitment for Baker- og Konditorbransjens Landsforening (BKLF) (Bakery and Confectionery Industry Association) (of those mentioned above) Tick only one
a b d e
The participants' assessment of Sjømat Norge (Norwegian Seafood Federation) AV28 What measures significant to your business do you feel that
Sjømat Norge (Norwegian Seafood Federation) has taken in relation to the agreement during 2017?
…………………………….. None; Not applicable
AV29 How well do you think Sjømat Norge (Norwegian Seafood Federation) fulfils its obligations within the following fields?
1= Very badly 6= Very well 9= Don't know
a. Preparing and contributing information to your own member companies about the letter of intent and the importance of joining it
1 2 3 4 5 6 9
b. Contributing to sharing their experience and development of expertise among your members 1 2 3 4 5 6 9
c. Appointing representatives from their organization to the coordination group, cf. the mandate of the coordination group
1 2 3 4 5 6 9
d. Representing your own members in the group's letter of intent, cf. the mandate of the coordination group 1 2 3 4 5 6 9
e. Reporting to the coordination group according to the format agreed upon by the parties under the current priority area
1 2 3 4 5 6 9
AV30 From your business perspective, what is the most important commitment for the Sjømat Norge (Norwegian Seafood Federation) (of those mentioned above) Tick only one
a b c d e

To conclude: AV31
Do you have any further comments on the implementation of the Letter of Intent in 2017? ……………………………..
None

Fafo-notat 2019:25
30
Appendix 2 List of all participants in 20183
A. Nilsson & Co AS A/S Nestlé Norge AS Pals Bakehuset AS Baker Brun AS Bama Barilla Norge AS Best Stasjon AS BKLF AS Brynhild Gruppen Brødrene Karlsen AS Brødrene Raastad AS Cater Mysen AS Cernova Circle K Norge AS Coop Norge SA Coor Service Management AS Den Stolte Hane AS Det Glutenfrie Verksted Diplom-Is AS Domstein Sjømat AS Duga AS Engrosfrukt AS Eugen Johansen AS Fatland Jæren AS Findus Norge AS Finsbråten AS Finstad Gård Engros AS Fjordland AS Gartnerhallen AS Germann Vervik eftf AS Grilstad AS H. A. Brun AS Hennig Olsen Is Hoff SA Holmens AS Huseby Gård Da Ingebrigtsen kjøtt AS Insula AS Interfrukt AS ISS Facility Services AS JÆDER Ådne Espeland AS Kavli Norge AS – O. Kavli AS Kavli Norge AS – Q-Meieriene AS King Oscar AS / Thai Union
Kolonial.no AS Lantmännen Unibake Leiv Vidar AS Lerøy Seafood Group Lunde Gård engros AS MAARUD AS Matbørsen AS Mesterbakeren AS Meum Frukt & Grønt AS Mills AS Mondelez Norge AS NHO Mat og Drikke NHO Reiseliv NHO Service og Handel Norfesh AS Norges frukt- og grønnsaksgrossisters forbund NorgesGruppen ASA NorgesGruppen Servicehandel AS Norgesmøllene AS Norrek Dypfrys AS Nortura SA Nærbakst AS Odd Langdalen frukt og engros AS Orkla ASA Pelagia AS REMA 1000 Rolf Olsen Engros AS Salatmestern AS Salmon Brands AS Scandic Hotels AS Servicegrossistene AS Sjømat Norge ST1 Norge AS Svanøy Røykeri AS Synnøve Finden AS T.L. Måkestad AS TINE SA Toma Facility Services AS Toma Mat AS Umoe Restaurants AS United Bakeries Norway AS Virke Virke KBS YX Norge AS Økern Engros
3 Participants hwo had signed only priority area 2: Reduction of added sugar, is not included.


Partnership for a healthier diet
##Forfatter####T
ittel##In December 2016, the food industry and the Norwegian Ministry of Health and Care Services signed the Letter of intent for facilitating a healthier diet. The goal is to achieve a more comprehensive and overall collaboration between the health authorities and the food industry in order to make it easier for the consumer to make healthier choices.
Fafo is commissioned by the Directorate of Health to evaluate the agreement. The evaluation includes an annual self-report from the parties who have signed the agreement. This paper is the second annual report from the project.
Borggata 2BP.O. Box 2947 TøyenN-0608 Oslowww.fafo.no
Fafo-paper 2019:29ISSN 0804-5135 Order no. 10319