annual report 2018 - asx
TRANSCRIPT

ANNUAL REPORT 2018
Consolidated Annual Financial Report for the Year ended 31 March 2018
Investor Update June 2018
For
per
sona
l use
onl
y
DISCLAIMERF
or p
erso
nal u
se o
nly

GROWTH
78%↑Subscribers
240%↑Users
46%↑Revenue
TECHNOLOGY INNOVATION PIPELINE
InterEXData Exchange
Platform
CogMoESmart decision making system
ESimEmbedded SIM
*Growth from Year ended March 2017 to Year ended March 2018.
FLEXIROAM 2018F
or p
erso
nal u
se o
nly
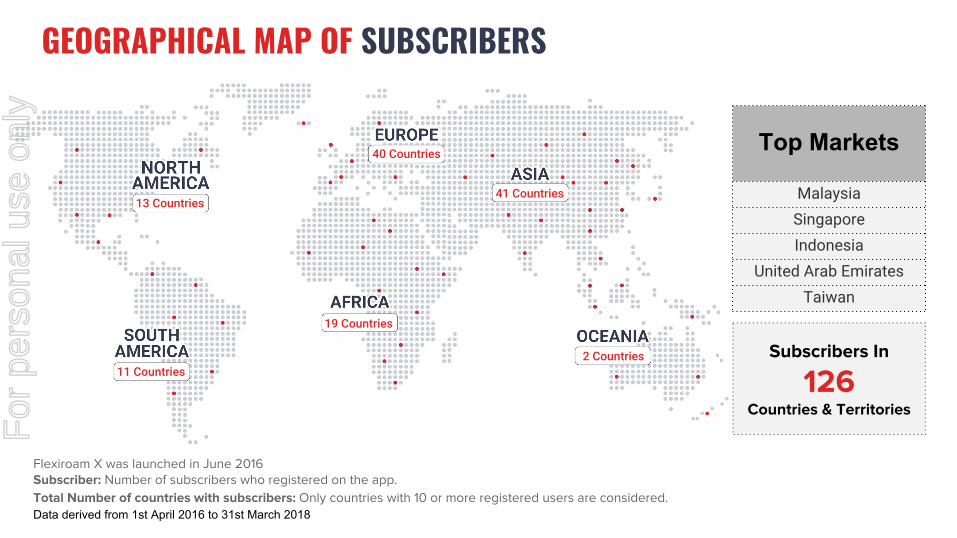
Top Markets
MalaysiaSingaporeIndonesia
United Arab EmiratesTaiwan
Flexiroam X was launched in June 2016Subscriber: Number of subscribers who registered on the app.Total Number of countries with subscribers: Only countries with 10 or more registered users are considered. Data derived from 1st April 2016 to 31st March 2018
Subscribers In
126 Countries & Territories
GEOGRAPHICAL MAP OF SUBSCRIBERS
41 Countries13 Countries
40 Countries
19 Countries
11 Countries2 Countries
For
per
sona
l use
onl
y
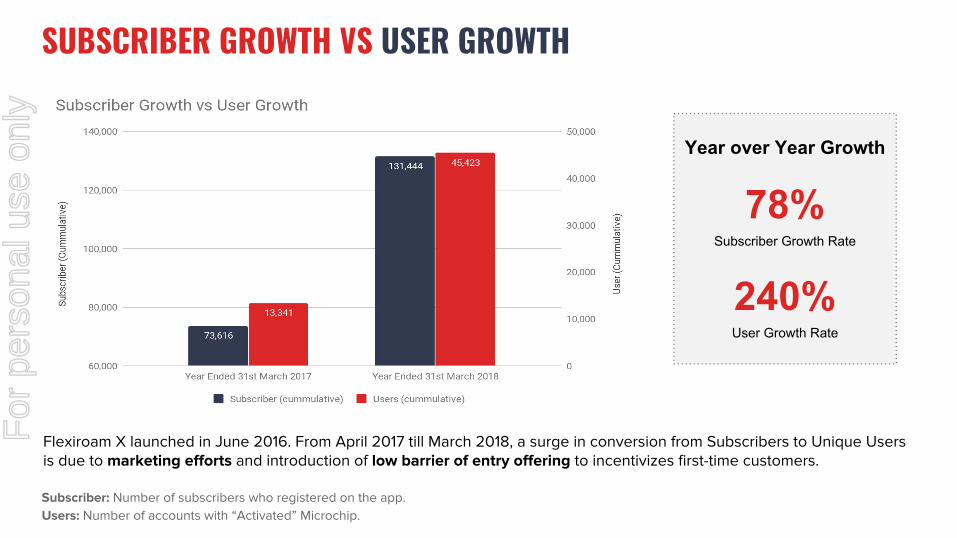
Subscriber: Number of subscribers who registered on the app. Users: Number of accounts with “Activated” Microchip.
Year over Year Growth
78% Subscriber Growth Rate
240%User Growth Rate
Flexiroam X launched in June 2016. From April 2017 till March 2018, a surge in conversion from Subscribers to Unique Users is due to marketing efforts and introduction of low barrier of entry offering to incentivizes first-time customers.
SUBSCRIBER GROWTH VS USER GROWTHF
or p
erso
nal u
se o
nly
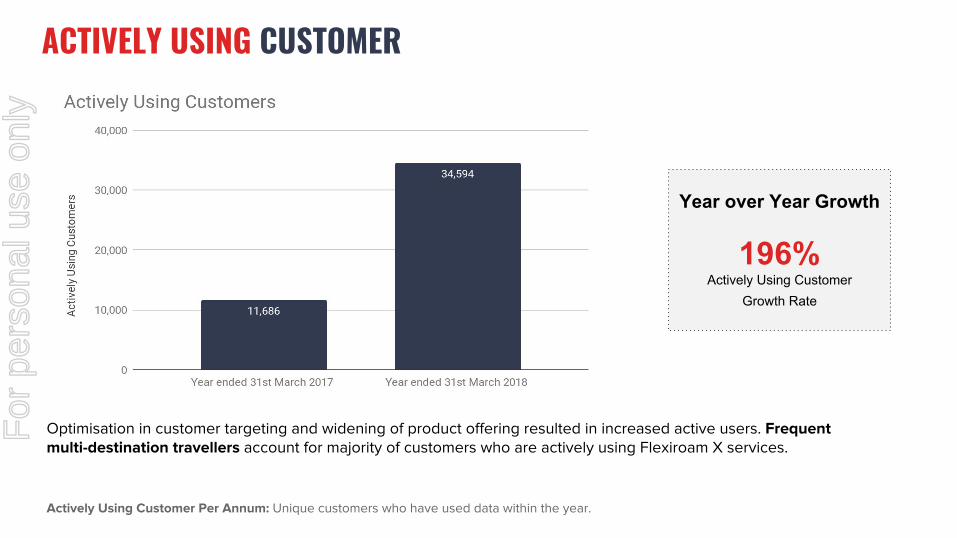
Actively Using Customer Per Annum: Unique customers who have used data within the year.
Year over Year Growth
196%Actively Using Customer
Growth Rate
Optimisation in customer targeting and widening of product offering resulted in increased active users. Frequent multi-destination travellers account for majority of customers who are actively using Flexiroam X services.
ACTIVELY USING CUSTOMERF
or p
erso
nal u
se o
nly
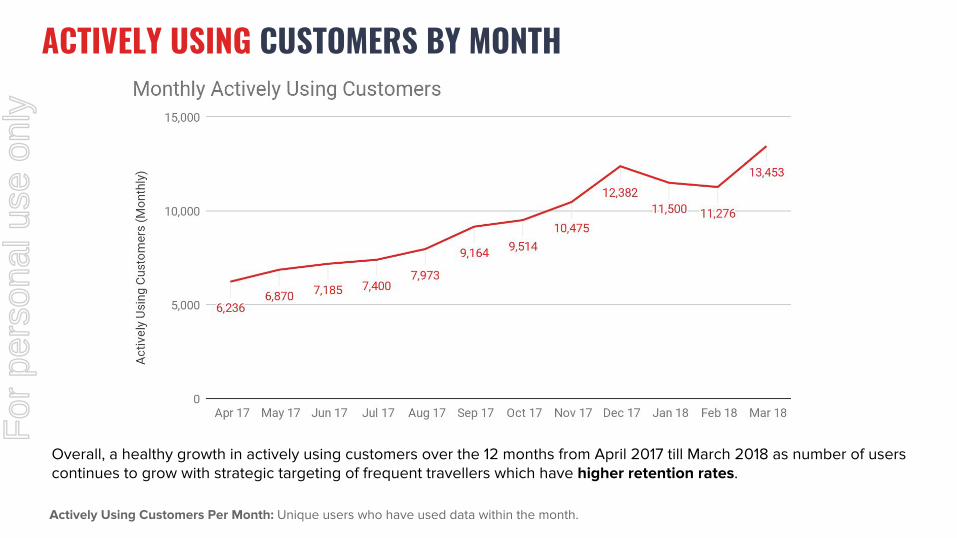
Actively Using Customers Per Month: Unique users who have used data within the month.
Overall, a healthy growth in actively using customers over the 12 months from April 2017 till March 2018 as number of users continues to grow with strategic targeting of frequent travellers which have higher retention rates.
ACTIVELY USING CUSTOMERS BY MONTHF
or p
erso
nal u
se o
nly

Transactions: Total number of unique purchases by customer per quarterPaying User: Total number of unique paying customer who has made one or more transactions per quarter.For the Year ended 31st March 2017, the data is derived from June 2016 when Flexiroam was launched till March 2017 as Flexiroam X.
Year over Year Growth
155% Paying User Growth Rate
329% Transaction Growth Rate
2.15 Average Transactions per
Paying User
Number of paying users increase rapidly as ongoing promotions to first time customers lower the cost of purchasing a plan. Number of transactions tripled as Flexiroam introduced local data plans along with ongoing promotions for global plans to existing users.
PAYING USERS AND TRANSACTIONSF
or p
erso
nal u
se o
nly

Repeat Customers: Total Number of unique repeat customers (purchase at least 1 subsequent data plans) over total number of Flexiroam X users.
Despite growing its user base by 240%, the percentage of repeat customers continue to grow Year over Year almost doubling as Flexiroam introduces more data plans. Increase in repeat customers will see stronger recurring revenue with future purchases expected to grow in following years.
Year over Year Growth
192% Percentage of Repeat Customer
Growth Rate
REPEAT CUSTOMERSF
or p
erso
nal u
se o
nly

Flexiroam’s change in strategy from focus on corporate sales to consumer sales generated higher recurring revenues. Currently, over 71% of Flexiroam’s revenue is derived from consumer sales.
CONSUMER REVENUE VS CORPORATE REVENUEF
or p
erso
nal u
se o
nly
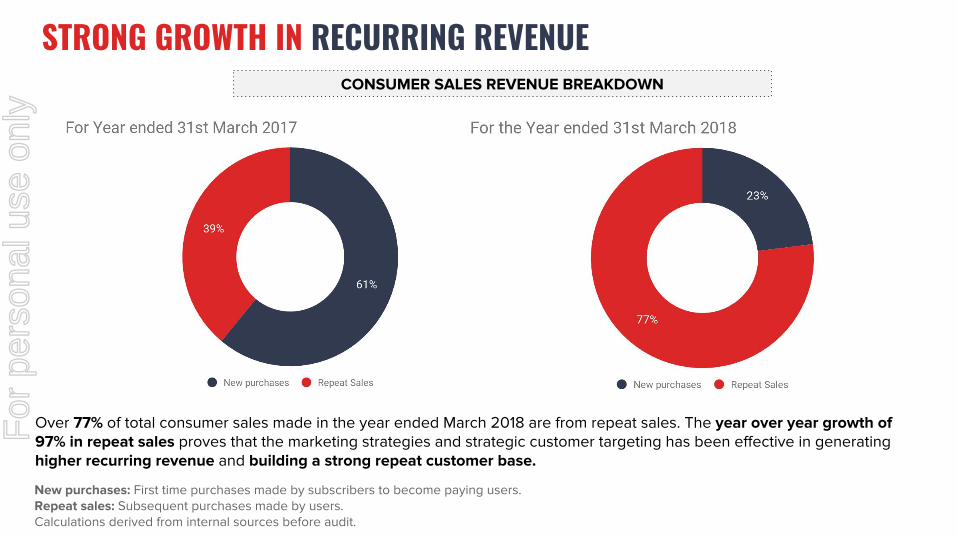
STRONG GROWTH IN RECURRING REVENUECONSUMER SALES REVENUE BREAKDOWN
New purchases: First time purchases made by subscribers to become paying users. Repeat sales: Subsequent purchases made by users. Calculations derived from internal sources before audit.
Over 77% of total consumer sales made in the year ended March 2018 are from repeat sales. The year over year growth of 97% in repeat sales proves that the marketing strategies and strategic customer targeting has been effective in generating higher recurring revenue and building a strong repeat customer base.
For
per
sona
l use
onl
y
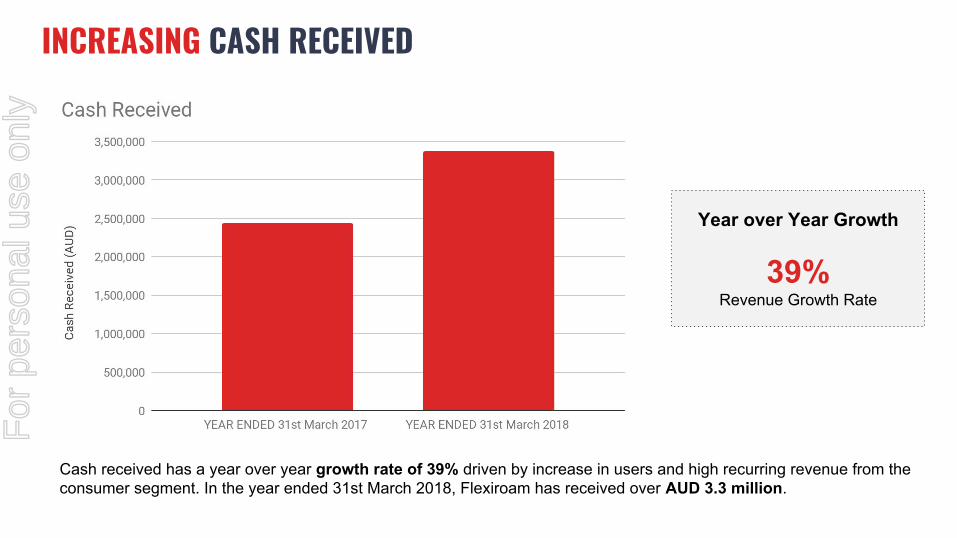
Year over Year Growth
39% Revenue Growth Rate
Cash received has a year over year growth rate of 39% driven by increase in users and high recurring revenue from the consumer segment. In the year ended 31st March 2018, Flexiroam has received over AUD 3.3 million.
INCREASING CASH RECEIVEDF
or p
erso
nal u
se o
nly
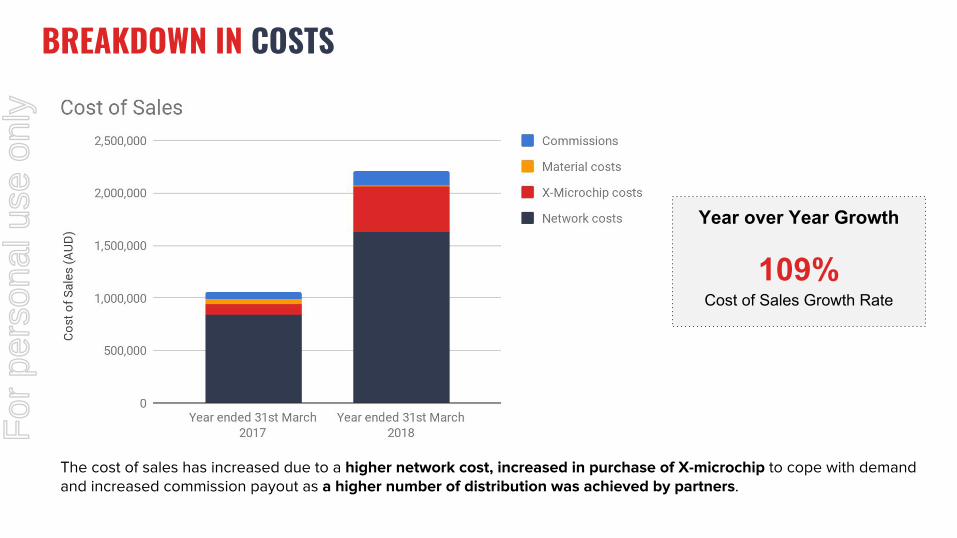
Year over Year Growth
109% Cost of Sales Growth Rate
The cost of sales has increased due to a higher network cost, increased in purchase of X-microchip to cope with demand and increased commission payout as a higher number of distribution was achieved by partners.
BREAKDOWN IN COSTSF
or p
erso
nal u
se o
nly
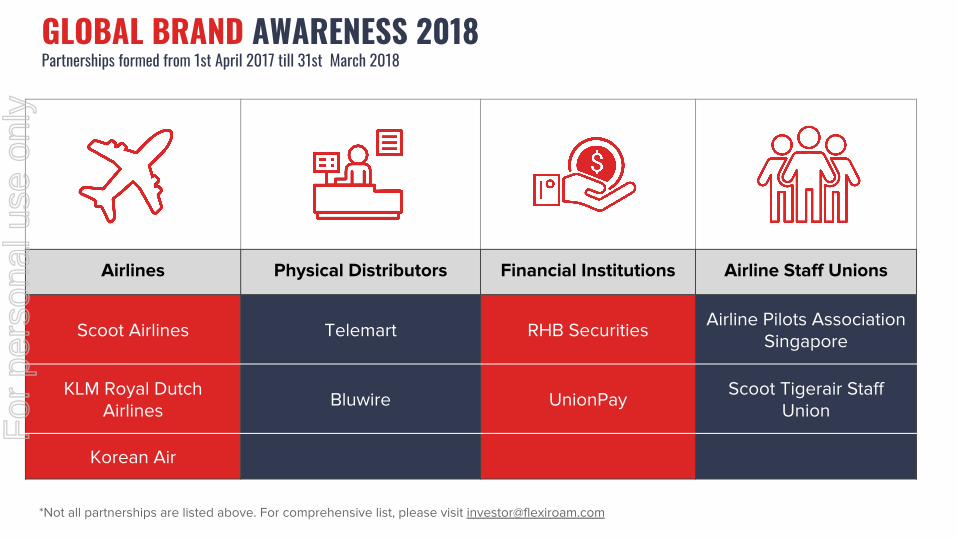
Airlines Physical Distributors Financial Institutions Airline Staff Unions
Scoot Airlines Telemart RHB Securities Airline Pilots Association Singapore
KLM Royal Dutch Airlines Bluwire UnionPay Scoot Tigerair Staff
Union
Korean Air
*Not all partnerships are listed above. For comprehensive list, please visit [email protected]
GLOBAL BRAND AWARENESS 2018Partnerships formed from 1st April 2017 till 31st March 2018
For
per
sona
l use
onl
y

243 Partners &
Sub-Partners
From
45 Countries
GEOGRAPHIC LOCATIONS OF DISTRIBUTION PARTNERS
Data derived from 1st April 2017 - 31st March 2018
1 Countries
13 Countries
20 Countries
3 Countries
7 Countries1 Countries
15 Partners
16 Partners
4 Partners
13 Partners
192 Partners
3 Partners
For
per
sona
l use
onl
y
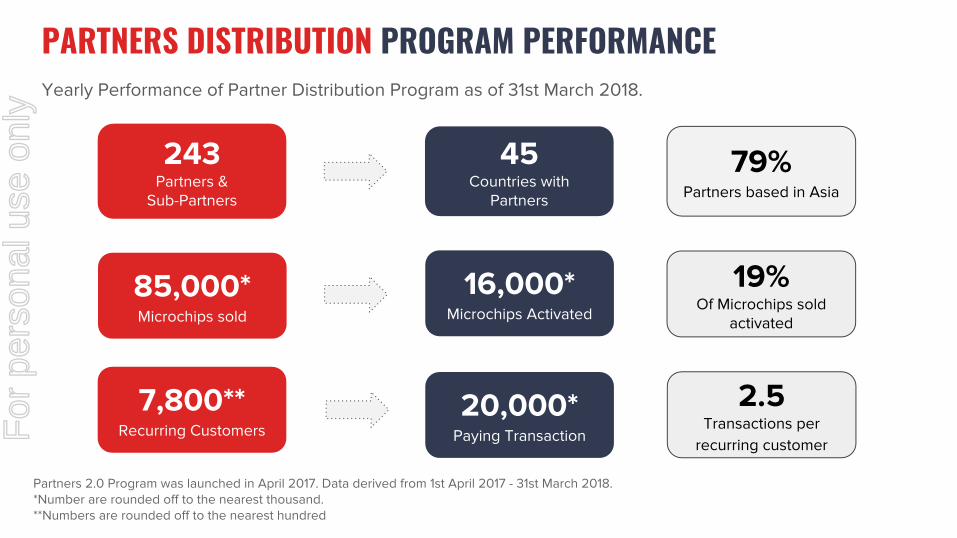
Yearly Performance of Partner Distribution Program as of 31st March 2018.
Partners 2.0 Program was launched in April 2017. Data derived from 1st April 2017 - 31st March 2018. *Number are rounded off to the nearest thousand.**Numbers are rounded off to the nearest hundred
45Countries with
Partners
16,000* Microchips Activated
79% Partners based in Asia
19%Of Microchips sold
activated
85,000* Microchips sold
7,800** Recurring Customers
20,000* Paying Transaction
2.5 Transactions per
recurring customer
243 Partners &
Sub-Partners
PARTNERS DISTRIBUTION PROGRAM PERFORMANCEF
or p
erso
nal u
se o
nly
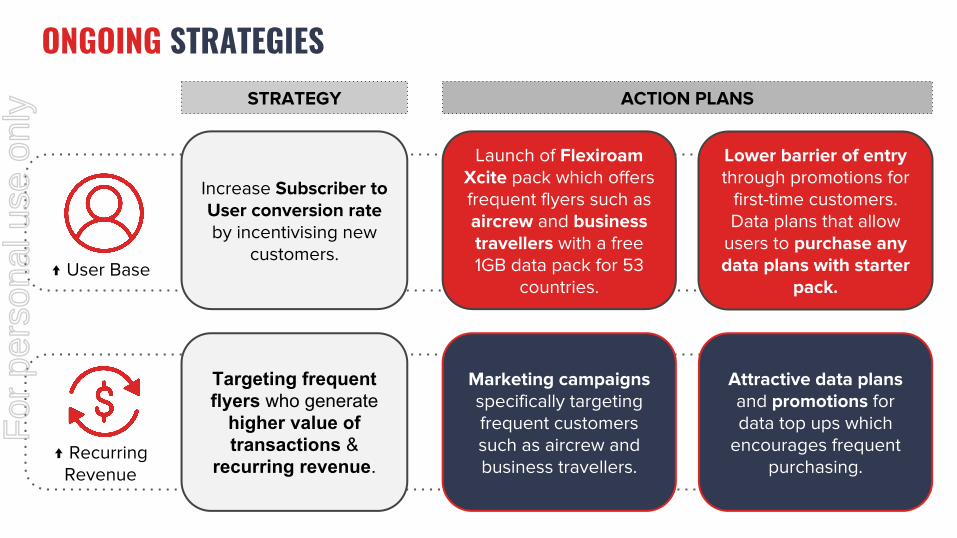
↑ User Base
Increase Subscriber to User conversion rate by incentivising new
customers.
Launch of Flexiroam Xcite pack which offers frequent flyers such as aircrew and business travellers with a free 1GB data pack for 53
countries.
↑ Recurring Revenue
Marketing campaigns specifically targeting frequent customers such as aircrew and business travellers.
Targeting frequent flyers who generate
higher value of transactions &
recurring revenue.
STRATEGY ACTION PLANS
Lower barrier of entry through promotions for
first-time customers. Data plans that allow
users to purchase any data plans with starter
pack.
Attractive data plans and promotions for data top ups which
encourages frequent purchasing.
ONGOING STRATEGIESF
or p
erso
nal u
se o
nly
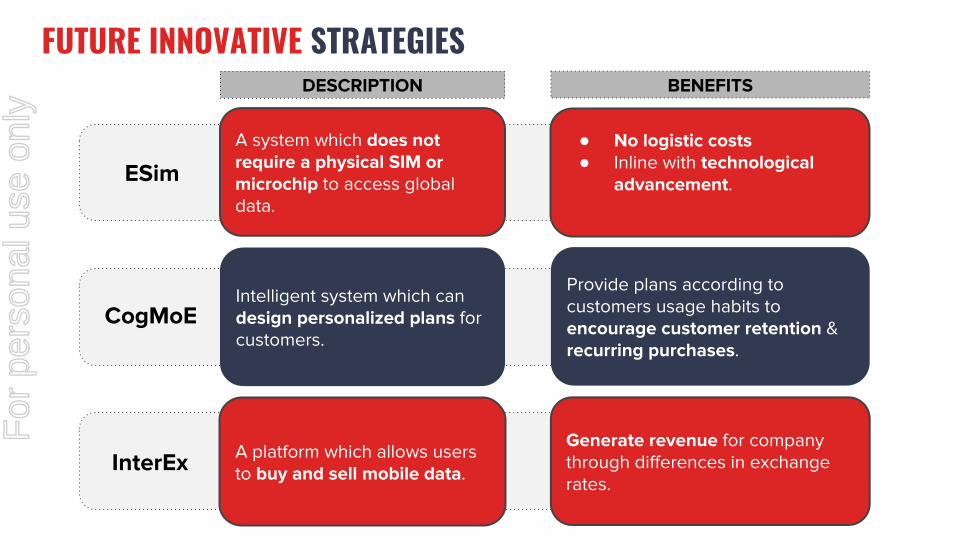
ESim A system which does not require a physical SIM or microchip to access global data.
● No logistic costs● Inline with technological
advancement.
CogMoE Intelligent system which can design personalized plans for customers.
Provide plans according to customers usage habits to encourage customer retention & recurring purchases.
InterEx A platform which allows users to buy and sell mobile data.
Generate revenue for company through differences in exchange rates.
BENEFITS
FUTURE INNOVATIVE STRATEGIESDESCRIPTION
For
per
sona
l use
onl
y

Increase in subscriber growth by 78% whilst users grow by 240%
Year over Year, driven by stronger subscriber to user conversion rate.
Over 13,000 monthly actively using
customers connecting to Flexiroam, driving up
data usage and revenue.
An increase of 155% of paying users from 31st
March 2017 to 31st March 2018, with an
average of 2.15 transactions per paying
user.
By 31st March 2018, over 35% of Flexiroam users are repeat
customers. Over 77% of consumer sales are from repeat sales, this
proves that the strategy to focus on driving up repeat sales is effective in
generating higher revenue as there is a continuous stream of revenue.
Flexiroam continues developing innovative technologies such as
ESim, CogmoE, and InterEx.
SUMMARY OF FINANCIAL YEAR 2018F
or p
erso
nal u
se o
nly

Jefrey OngManaging Director
Jason KhooVP, Business & Investor Development, Global+60 16 686-8965 [email protected]
Flexiroam LimitedACN 143 777 397
PO Box 3438, Nedlands, Western Australia 6909
79 Broadway, Nedlands, Western Australia 6009
Australia +61281883919Malaysia +60326318181Singapore +6531577333
For
per
sona
l use
onl
y