annual report 2017/18 - voestalpine.com · ebit margin 10.2% employees (full-time equivalent)...
TRANSCRIPT

ANNUALREPORT 2017/18
www.voestalpine.com

In millions of euros 2013/14 2014/15 2015/16 2016/17 2017/18
Income statementRevenue 11,077.2 11,189.5 11,068.7 11,294.5 12,897.8EBITDA 1,374.0 1,530.1 1,583.4 1,540.7 1,954.1Depreciation 585.6 643.9 694.6 717.4 774.1EBIT 788.4 886.2 888.8 823.3 1,180.0Profit before tax 640.8 739.0 751.3 699.9 1,042.5Profit after tax1 503.4 595.0 602.1 527.0 817.9
Statement of financial positionInvestments in tangible and intangible assets and interests 936.0 1,177.8 1,310.9 1,011.4 895.2Equity 5,261.6 5,115.0 5,651.6 6,060.3 6,554.3Net financial debt 2,421.4 2,978.1 3,079.9 3,221.1 2,995.1Net financial debt in % of equity (gearing) 46.0% 58.2% 54.5% 53.2% 45.7%
Financial key figuresEBITDA margin 12.4% 13.7% 14.3% 13.6% 15.2%EBIT margin 7.1% 7.9% 8.0% 7.3% 9.1%Return on capital employed (ROCE) 9.3% 10.0% 9.2% 8.1% 11.1%Cash flows from operating activities 934.6 1,119.9 1,282.2 1,150.4 1,195.1
Share informationShare price, end of period (euros) 31.91 34.10 29.41 36.90 42.57Dividend per share (euros) 0.95 1.00 1.05 1.10 1.402
Market capitalization, end of period 5,501.1 5,878.7 5,143.5 6,506.2 7,506.0Number of outstanding shares as of March 31 172,420,566 172,420,566 174,920,566 176,320,566 176,320,566EPS – earnings per share (euros) 2.59 3.18 3.35 2.84 4.40
PersonnelEmployees (full time equivalent), end of period 47,485 47,418 48,367 49,703 51,621
1 Before deduction of non-controlling interests and interest on hybrid capital.2 As proposed to the Annual General Meeting.
DEVELOPMENT OF THE KEY FIGURES

3A N N U A L R E P O R T 2 0 1 7 / 1 8
HIGHLIGHTS 2017/18
» Strong economic development, comprehensive internationalization strategy as well as consistent innovation, efficiency, and cost management lead to all-time-highs in revenue and all earnings categories
» Strong growth momentum in Europe, China, India as well as largely in North America, Brazil back on expansion track after four years of recession
» “America First” policy dampens economic sentiment, but de facto effects on real economy modest up to now
» Automotive industry remains strong; consumer goods and aerospace stable on a high level; con-tinued recovery in oil and gas; upward trend in mechanical engineering, construction; potential for improvement in railway systems
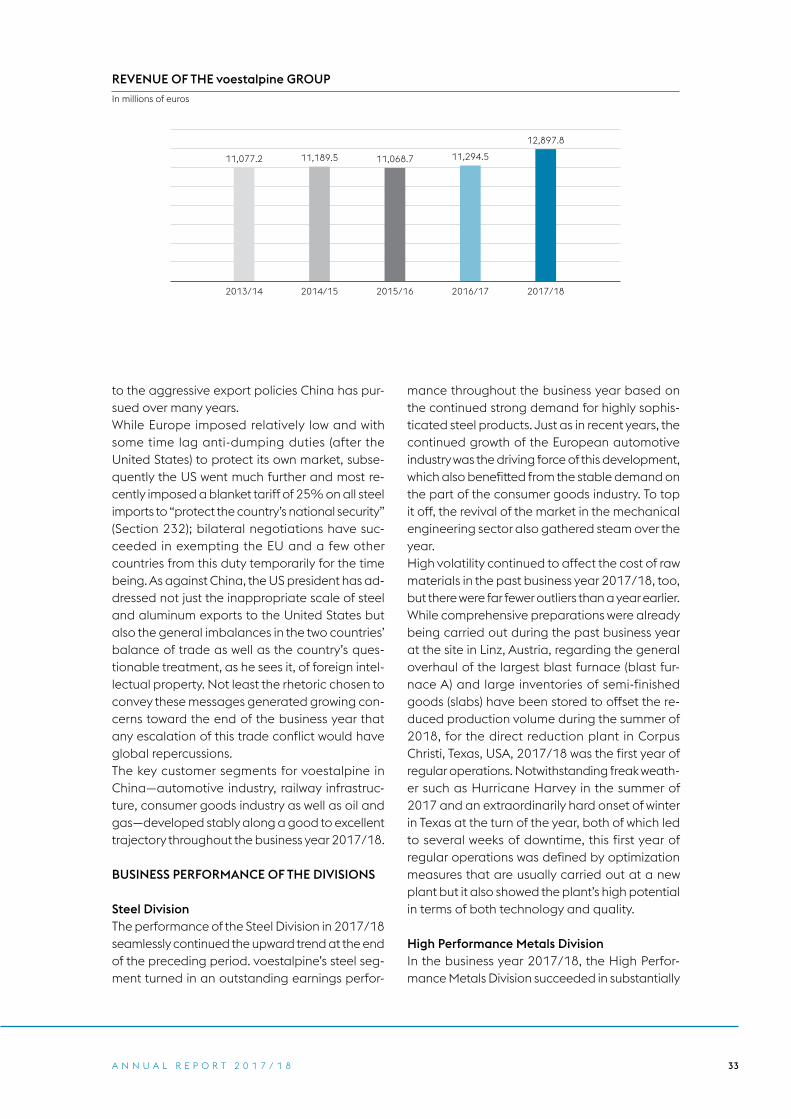
» Revenue rises by 14.2% from EUR 11,295 million to EUR 12,898 million
» Operating result (EBITDA) improves by 26.8% to EUR 1,954 million (previous year: EUR 1,541 million), EBITDA margin of 15.2% (previous year: 13.6%)
» Profit from operations (EBIT) jumps by 43.3% to EUR 1,180 million (previous year: EUR 823 million), EBIT margin of 9.1% (previous year: 7.3%)
» Profit before tax soars by 48.9% from EUR 700 million in the previous year to EUR 1,043 million in 2017/18
» Profit after tax soars by 55.2% from EUR 527 million in the previous year to EUR 818 million
» Equity climbs to EUR 6,554 million as of March 31, 2018 (EUR 6,060 million as of March 31, 2017)
» Gearing ratio (net financial debt relative to equity) falls from 53.2% in the previous year to 45.7%
» Dividend proposed to the Annual General Meeting: EUR 1.40 EUR per share (previous year: EUR 1.10 per share), sixth consecutive year of dividend increases
» Fully digitalized 550,000 ton wire rod mill goes into regular operations, “new special steel plant” and “hydrogen pilot plant” investment projects approved
4 T H E G R O U P
THE GROUP
3 Highlights
6 voestalpine Group – Global presence
8 Overview of the voestalpine Group
10 Supervisory Board of voestalpine AG
12 Management Board of voestalpine AG
14 Letter of the Management Board
16 Investor relations
20 Consolidated Corporate Governance Report 2017/18
28 Compliance
MANAGEMENT REPORT
30 Report on the Group’s business performance and the economic situation
36 Report on the financial key performance indicators of the voestalpine Group
41 Investments
43 Acquisitions
44 Employees
47 Raw materials
49 Research and development, digitalization
52 Environment
55 Report on company risk exposure
60 Number of own shares
61 Disclosures on capital, share, voting, and control rights as well as associated obligations
62 Outlook
CONTENTSThis report is a translation of the original report in German, which is solely valid.

5A N N U A L R E P O R T 2 0 1 7 / 1 8
DIVISIONAL REPORTS
64 Steel Division
68 High Performance Metals Division
72 Metal Engineering Division
76 Metal Forming Division
CONSOLIDATED FINANCIAL STATEMENTS
81 Report of the Supervisory Board
82 Consolidated Statement of Financial Position
84 Consolidated Statement of Cash Flows
85 Consolidated Statement of Comprehensive Income
86 Consolidated Statement of Changes in Equity
88 Notes to the Consolidated Financial Statements
186 Auditor’s report
195 Management Board statement in accordance with Section 82 (4) of the Austrian Stock Exchange Act (Börsegesetz – BörseG)
196 Investments
SERVICE
209 Glossary
210 Contact, imprint
All quantities expressed as tons in this Annual Report are metric tons (1,000 kg).

6 T H E G R O U P
voestalpine GROUPGLOBAL PRESENCEPresent in more than 50 countries as global leader in the manufacturing, processing, and development of sophisticated steel products, particu-larly for technology-intensive sectors such as the automotive, railway, aerospace, and energy industries. In 500 Group companies and loca-tions in more than 50 countries and on all 5 continents. With revenue of EUR 12.9 billion in the business year 2017/18 and an operating result (EBITDA) of EUR 2.0 billion.
Sou
rce
© w
ww
.da
ta2
ma
p.d
e

7A N N U A L R E P O R T 2 0 1 7 / 1 8
8 T H E G R O U P
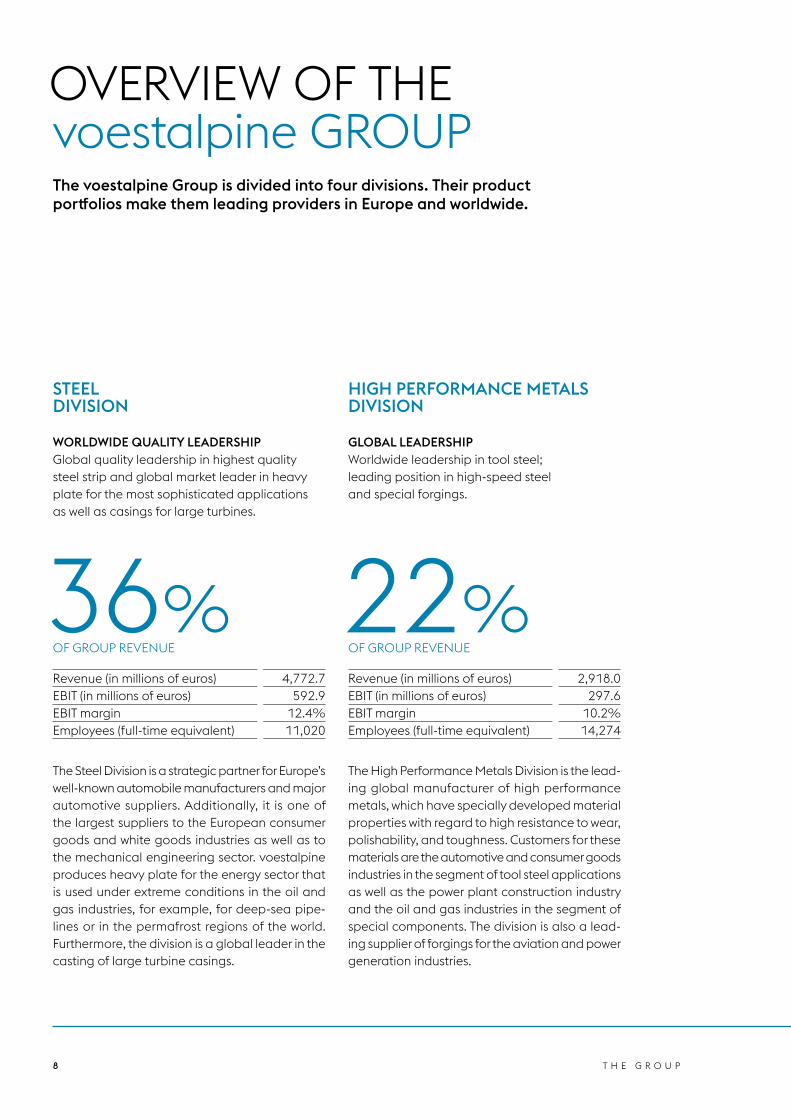
Revenue (in millions of euros) 4,772.7EBIT (in millions of euros) 592.9EBIT margin 12.4%Employees (full-time equivalent) 11,020
The Steel Division is a strategic partner for Europe’s well-known automobile manufacturers and major automotive suppliers. Additionally, it is one of the largest suppliers to the European consumer goods and white goods industries as well as to the mechanical engineering sector. voest alpine produces heavy plate for the energy sector that is used under extreme conditions in the oil and gas industries, for example, for deep-sea pipe-lines or in the permafrost regions of the world. Furthermore, the division is a global leader in the casting of large turbine casings.
Revenue (in millions of euros) 2,918.0EBIT (in millions of euros) 297.6EBIT margin 10.2%Employees (full-time equivalent) 14,274
The High Performance Metals Division is the lead-ing global manu facturer of high performance metals, which have specially developed material properties with regard to high resistance to wear, polishability, and toughness. Customers for these materials are the automotive and consumer goods industries in the segment of tool steel applications as well as the power plant construction industry and the oil and gas industries in the segment of special components. The division is also a lead-ing supplier of forgings for the aviation and power generation industries.
36% OF GROUP REVENUE
22% OF GROUP REVENUE
STEEL DIVISION
HIGH PERFORMANCE METALS DIVISION
WORLDWIDE QUALITY LEADERSHIPGlobal quality leadership in highest quality steel strip and global market leader in heavy plate for the most sophisticated applications as well as casings for large turbines.
GLOBAL LEADERSHIPWorldwide leadership in tool steel; leading position in high-speed steel and special forgings.
OVERVIEW OF THE voestalpine GROUPThe voestalpine Group is divided into four divisions. Their product portfolios make them leading providers in Europe and worldwide.

9A N N U A L R E P O R T 2 0 1 7 / 1 8
Revenue (in millions of euros) 2,989.7EBIT (in millions of euros) 191.0EBIT margin 6.4%Employees (full-time equivalent) 13,481
The Metal Engineering Division has developed a leading position on the global railway market with its ultra long, head-hardened HSH© rails with a length of up to 120 meters. Furthermore, the division is the largest global provider of highly developed turnout systems as well as track-based monitoring systems for all railway applications. The division also has a leading market position in the specially treated wire segment, for sophis-ticated seamless tubes for the oil and gas indus-tries worldwide, and high quality welding consum-ables.
Revenue (in millions of euros) 2,743.4EBIT (in millions of euros) 212.8EBIT margin 7.8%Employees (full-time equivalent) 12,003
Within voestalpine the Metal Forming Division constitutes the center of competence for highly refined sections, tubes and precision strip steel products as well as for ready-to-install system components made of pressed, stamped and roll-formed parts. Its combination of material exper-tise and pro cessing competence, which is unpar-alleled throughout the industry, and its global presence make the division the preferred partner to customers who are looking for innovation and quality.
22% OF GROUP REVENUE
20% OF GROUP REVENUE
METAL ENGINEERING DIVISION
METAL FORMING DIVISION
GLOBAL LEADERSHIPWorldwide market leader in turnout technology; European market leader in rails and specially treated wire; and leading position in seamless tubes for special applications and high quality welding consumables.
GLOBAL LEADERSHIPGlobal market leader in defined niches supplying high quality metal processing solutions with a global network and service.
10 T H E G R O U P
Dr. Joachim LemppenauChairman of the Supervisory Board (since July 1, 2004)Initial appointment: July 7, 1999Former Chairman of the Management Board of Volksfürsorge Versicherungsgruppe, Hamburg
Dr. Heinrich SchallerDeputy Chairman of the Supervisory Board (since July 4, 2012)Initial appointment: July 4, 2012CEO of Raiffeisenlandesbank Oberösterreich AG, Linz
KR Dr. Franz Gasselsberger, MBAMember of the Supervisory BoardInitial appointment: July 1, 2004CEO of Oberbank AG, Linz
Dr. Hans-Peter HagenMember of the Supervisory BoardInitial appointment: July 4, 2007Managing Director of BALDUS Consulting GmbH, Vienna
Dr. Michael Kutschera, MCJ. (NYU)Member of the Supervisory BoardInitial appointment: July 1, 2004Attorney at law; partner at Binder Grösswang Rechtsanwälte GmbH, Vienna
Prof. (em) Dr. Helga Nowotny, Ph.D. Member of the Supervisory BoardInitial appointment: July 2, 2014Former President of the European Research Council
Mag. Dr. Josef PeischerMember of the Supervisory BoardInitial appointment: July 1, 2004Former Director of the Chamber of Workers and Employees for Upper Austria, Linz
SUPERVISORY BOARD voestalpine AG

11A N N U A L R E P O R T 2 0 1 7 / 1 8
Dipl.-Ing. Dr. Michael SchwarzkopfMember of the Supervisory BoardInitial appointment: July 1, 2004Chairman of the Supervisory Board of Plansee Holding AG, Reutte
Appointed by the Works Council:
Josef GritzMember of the Supervisory BoardInitial appointment: January 1, 2000Chairman of the Works Council for Wage Earners of voestalpine StahlDonawitz GmbH, Donawitz
Friedrich Hofstätter (from July 1, 2017)Member of the Supervisory BoardInitial appointment: July 1, 2017Chairman of the Works Council for Salaried Employees of voestalpine AG, Linz
Brigitta Rabler (until June 30, 2017)Member of the Supervisory BoardInitial appointment: May 1, 2013Chairwoman of the Works Council for Salaried Employees of voestalpine AG, Linz
Hans-Karl SchallerMember of the Supervisory BoardInitial appointment: September 1, 2005Chairman of the Group Works Council of voestalpine AG, LinzChairman of the European Works Council of voestalpine AG, Linz
Gerhard Scheidreiter Member of the Supervisory BoardInitial appointment: January 1, 2012Chairman of the Works Council for Wage Earners of BÖHLER EdelstahlGmbH & Co KG, Kapfenberg

12 T H E G R O U P
MANAGEMENT BOARD voestalpine AG
From left to right: Franz Rotter, Herbert Eibensteiner, Robert Ottel, Wolfgang Eder, Franz Kainersdorfer, Peter Schwab

13A N N U A L R E P O R T 2 0 1 7 / 1 8
Dr. Wolfgang Eder Born 1952, Member of the Management Board since 1995 Chairman of the Management Board since 2004» Assigned areas of responsibility: Corporate Development, including Raw Materials
Strategy; R&D and Innovation Strategy; Corporate Human Resources; Corporate Communications and Corporate Image; Compliance; Legal Department; M&A; Strategic Environmental Management; Investor Relations; Internal Auditing
Dipl.-Ing. Herbert Eibensteiner Born 1963, Member of the Management Board since 2012 Head of the Steel Division» Assigned area of responsibility: Information Technology
Dipl.-Ing. Dr. Franz Kainersdorfer Born 1967, Member of the Management Board since 2011 Head of the Metal Engineering Division » Assigned area of responsibility: Long-term energy supply of the Group
Mag. Dipl.-Ing. Robert Ottel, MBA Born 1967, Member of the Management Board since 2004 Chief Financial Officer (CFO)» Assigned areas of responsibility: Corporate Accounting and Reporting; Controlling
including Investment Controlling; Group Treasury; Taxes; Management Information Systems; Risk Management
Dipl.-Ing. Franz Rotter Born 1957, Member of the Management Board since 2011 Head of the High Performance Metals Division» Assigned areas of responsibility: Procurement Strategy; Health & Safety
Dipl.-Ing. Dr. Peter Schwab, MBA Born 1964, Member of the Management Board since 2014 Head of the Metal Forming Division

14 T H E G R O U P
Ladies and Gentlemen:
Geopolitically, the business year 2017/18 was defined by a number of new and partly surprising developments. Aside from the Middle East, a perpetual flash point, and the ongoing escalation of the sanctions race between Russia and the West, the past 12 months saw China clearly articulating its claim to global leadership, both economically and politically, for the very first time. The initially massive intensification of the decades-old conflict between North and South Korea was followed most re cently by the completely unexpected easing of tensions in the two countries’ bilateral relation-ship; whether this is sustainable remains to be seen. The current US administration is asserting the country’s claim to political and economic leadership—based on a record defense budget, the questioning of the NAFTA approach, and massive protectionist tendencies in the realm of trade as embodied by the “America First” slogan—more transparently than was the case under previous ad-ministrations in recent history.
In this environment and driven primarily by France’s president Macron, the European Union is making an attempt yet again to push its own integration not least as an answer to the Brexit. But these attempts are being counteracted by overtly nationalist and protectionist tendencies, especially in some of the more recent member states. Europe would undoubtedly be well advised, precisely against the backdrop of the race between the United States and China for political and economic dominance, to position itself more explicitly and assertively in the global play of forces. It would be high time for the EU to finally move away from its inward-looking focus on the resolution of conflicts and to face international challenges, actively and consciously.
No matter how intense the political uncertainties, economically and globally speaking the past busi-ness year brought a return to the growth rates last seen in the pre-crisis years. Rising global demand in almost all industrial segments, the dramatic reduction in sovereign debt due to reforms in a number of countries, and relatively stable foreign exchange rates in tandem with the continued low interest rate environment were the most important drivers of this positive development. As far as the voestalpine Group is concerned, the new business year 2018/19 (at least its first half) should be defined by con-ditions similar to those that characterized the previous one. Given the aforementioned recent develop-ments, however, increasingly uncertain parameters will be the name of the game: In the short term, the potential escalation of tensions worldwide owing to the intensification of national trade barriers will be the largest instability factor. Yet the political sphere anywhere in this world should be conscious of the fact that any increase in protectionist tendencies, i.e. those that limit international competition, will sooner or later lead to decreases in supplies and concurrent increases in prices. As a result, ulti-mately such developments always harm consumers. That international trade can only function on the basis of uniform, minimum quality standards and plausible cost structures must be indisputable in this connection. Equally difficult to predict is the extent to which the interest rate reversal that will be necessary sooner or later in Europe too will affect the general economic growth. Finally and ultimately, there is the question as to how long the current upturn across the entire industrial spectrum is going to last on this scale.
LETTER OF THE MANAGEMENT BOARD

15A N N U A L R E P O R T 2 0 1 7 / 1 8
For voestalpine, the past business year brought not just new all-time highs with respect to both revenue and results, but also key steps toward the Group’s goal of securing its position as a technology and quality leader in its main product segments over the long term. This includes the successful commis-sioning of the world’s first fully digitalized wire production as much as the decision to build the first new special steel plant in Europe in more than 40 years. It also includes the massive global expansion of our production capacities in high-tech automotive components as well as the construction of a cutting-edge hydrogen pilot plant for the development of alternatives to fossil fuels. Finally, the development of the framework for the comprehensive digitalization of the Group as well as the con-tinuation of its work to develop a broad technological concept for the Group’s traditional Austrian steel sites in Linz and Leoben/Donawitz are key to the achievement of the ultimate goal.
Both the financial position and the balance sheet structure of the voestalpine Group are defined by the continual increase in equity, the decrease in net financial debt, and thus also the declining gearing ratio—despite the ambitious investment programs in all four of the Group’s divisions that con-tinue unabated, albeit at a slightly slower pace as planned. The Group’s solid position, operationally and strategically, and the resulting strong development of its cash flow as an expression of its increas-ing ability to finance itself have convinced Management Board and Supervisory Board alike to pro-pose, as in previous years, that the dividend for the past business year be raised significantly yet again.
The history of the voestalpine Group shows a steady upward trajectory since its IPO in the autumn of 1995. Not even the critical period of the financial and economic crisis changed anything with respect to the uninterrupted stream of profits and dividends. Nothing should change this in the future, not least in the light of the Group’s excellent performance in the business year 2017/18 and the con sistent expansion of its strengths—in the interest of our customers, shareholders, and employees.
Linz, May 25, 2018
The Management Board
This report is a translation of the original report in German, which is solely valid.
Wolfgang Eder Herbert Eibensteiner Franz Kainersdorfer
Robert Ottel Franz Rotter Peter Schwab

16 T H E G R O U P
DEVELOPMENT OF THE voestalpine SHARE
There are two aspects to the development of the voestalpine share in the business year 2017/18: Continuous share price increases in the first three quarters were followed by a dramatic share price decline in the year’s final quarter.
While debt remained a problem in search of a solution in a number of European countries in 2017 too, the subsequent growth caused the issue to become less significant in the capital market players’ perception; even the geopolitical hot spots dampened the positive mood but tempo-rarily. For example, the tensions between the United States and North Korea in September 2017
INVESTOR RELATIONS
voestalpine AG VS. THE ATX AND INTERNATIONAL INDICESChanges compared to March 31, 2017, in %
voestalpine ATX (Austria) STOXX Index (Europe) DJ Industrial Index (USA)
April 1, 2017 March 31, 2018
150
145
140
135
130
125
120
115
110
105
100
95
90

17A N N U A L R E P O R T 2 0 1 7 / 1 8
led to relatively minor price corrections on the stock markets. While in the US, the tax reform in particular had a positive effect on the develop-ment of the stock markets, in Europe the European Central Bank’s easy-money policies continued to be the primary source of support for the capital markets. The Vienna Stock Exchange also bene-fited from the strong growth rates in neighboring Eastern European countries. As far as voestalpine is concerned, the continuous gains of the Com-pany’s share in the first nine months of the busi-ness year were driven not just by the continued positive economic outlook but also by the very good performance of the voestalpine Group. However, the fact that the global stock markets are not immune to negative trends in economic policies—even in the current low-interest environ-
ment—became very clear when the United States announced that it would impose worldwide im-port tariffs on steel and aluminum products. The concerns about incrementally increasing restric-tions on world trade triggered a trend reversal in the financial markets, putting massive pressure on the voestalpine share as a result. Consequent-ly, a large portion of the gains in the first three quarters of the business year 2017/18 were elim-inated in the fourth quarter. On the whole, how-ever, the voestalpine share ended the business year 2017/18 on a plus of 13.9% (increase from EUR 37.36 as of April 1, 2017, to EUR 42.57 as of March 31, 2018), falling slightly short of the Austrian benchmark index (ATX) but more or less on par with the Dow Jones Industrial and even substantially higher than the STOXX Index Europe.
BONDS
Type of bond ISIN number Issuing volumeInterest
rateShare price
(03/31/2018)
Corporate bond 2012 – 2018 XS0838764685 EUR 500 million 4.0% 101.9Hybrid bond 2013 AT0000A0ZHF1 EUR 500 million 7.125%1 106.8Corporate bond 2014 – 2021 AT0000A19S18 EUR 400 million 2.25% 105.1Corporate bond 2014 – 2024 AT0000A1Y3P7 EUR 500 million 1.375% 100.3
1 Interest rate: 7.125% p.a. from issue date to October 31, 2014 (excl.); 6% p.a. from October 31, 2014, to October 31, 2019; five-year swap rate (from October 29, 2019) +4.93% p.a. from October 31, 2019, to October 31, 2024; thereafter three-month EURIBOR +4.93% p.a. + step-up of 1% p.a. from October 31, 2024.

18 T H E G R O U P
SHAREHOLDER STRUCTURE
The shareholder structure by region as of the end of the business year 2017/18 presents the following (indicative) picture:
voestalpine AG is currently being analyzed by the following investment banks/ financial institutions:» Alpha Value, Paris» Baader Bank AG, Munich» Barclays, London» Bank of America/Merrill Lynch, London» Citigroup, London» Commerzbank, Frankfurt» Credit Suisse, London» Deutsche Bank, London
» Erste Bank, Vienna» Exane BNP Paribas, Paris» Goldman Sachs, London» Jefferies, London» J.P. Morgan, London» Kepler Cheuvreux, Frankfurt» Morgan Stanley, London» Raiffeisen Centrobank, Vienna» Société Générale, Paris» UBS, London
MAJOR INDIVIDUAL SHAREHOLDERS
Raiffeisenlandesbank Oberösterreich Invest GmbH & Co OG < 15%voestalpine employee shareholding scheme 14.0%Oberbank AG 8.1%
SHAREHOLDER STRUCTURE
2%France
6%Scandinavia
5%Rest of Europe
2%Asia
14%Employee shareholding scheme
15%North America
6%UK, Ireland
6%Germany
44%Austria (excluding employee shareholding scheme)

19A N N U A L R E P O R T 2 0 1 7 / 1 8
SHARE INFORMATION
Share capital EUR 320,394,836.99 divided into176,349,163 no-par value shares
Own shares as of March 31, 2018 28,597 sharesClass of shares Ordinary bearer sharesStock identification number 93750 (Vienna Stock Exchange)ISIN AT0000937503Reuters VOES.VIBloomberg VOE AV
PRICES (AS OF END OF DAY)
Share price high April 2017 to March 2018 EUR 54.60Share price low April 2017 to March 2018 EUR 35.91Share price as of March 31, 2018 EUR 42.57Initial offering price (IPO) October 1995 EUR 5.18All-time high price (July 12, 2007) EUR 66.11Market capitalization as of March 31, 2018* EUR 7,505,966,494.62 * Based on total number of shares minus repurchased shares.
BUSINESS YEAR 2017/18
Earnings per share EUR 4.40Dividend per share EUR 1.40*Carrying amount per share as of March 31, 2018 EUR 36.22 * As proposed to the Annual General Meeting.
FINANCIAL CALENDAR 2018/19
Record date for participation in the AGM June 24, 2018Annual General Meeting July 4, 2018Ex-dividend date July 12, 2018Record date for dividend payment July 13, 2018Dividend payment date July 16, 2018Letter to Shareholders for the first quarter of 2018/19 August 8, 2018Letter to Shareholders for the second quarter of 2018/19 November 7, 2018Letter to Shareholders for the third quarter of 2018/19 February 7, 2019Annual Report 2018/19 June 5, 2019Annual General Meeting July 3, 2019

20 T H E G R O U P
COMMITMENT TO THE AUSTRIAN CORPORATE GOVERNANCE CODE
The Austrian Corporate Governance Code pro-vides Austrian stock corporations with a frame-work for managing and monitoring their company. The Code aims to establish a system of manage-ment and control of companies and Groups that is accountable and geared to creating sustain-able, long-term value. It is designed to increase the degree of transparency for all stakeholders of a company.
The Code is based on the provisions of Austrian stock corporation, stock exchange, and capital market law; the EU recommendations regarding the responsibilities of members of supervisory boards and the compensation of directors; as well as the basics of the OECD Principles of Cor-porate Governance. Since 2002, the Code has undergone a number of revisions. The present
Corporate Governance Report is based on the most recent amendment of the Code, which was adopted in January 2018.
» The Code is publicly accessible www.corporate-governance.at
The Code achieves validity when companies vol-untarily undertake to adhere to it. The Manage-ment Board and the Supervisory Board of voest-alpine AG decided as early as in 2003 to recognize the Corporate Governance Code and have also accepted and implemented the amendments in-troduced since that date. voestalpine AG has thus committed itself to comply with the most recent version of the Austrian Corporate Governance Code, as amended.
In addition to the mandatory “L rules,” the Com-pany also complies with all of the “C rules” and “R rules” of the Code.1
1 The Corporate Governance Code contains the following rules: “L rules” (= Legal) are measures prescribed by law; “C rules” (= Comply or Explain) must be justified in the event of non-compliance; “R rules” (= Recommendations) are recommendations.
CONSOLIDATED CORPORATE GOVERNANCE REPORT 2017/18

21A N N U A L R E P O R T 2 0 1 7 / 1 8
COMPOSITION OF THE MANAGEMENT BOARD
» Dr. Wolfgang Eder
Born 1952; Member of the Management Board since 1995; Chairman of the Management Board since 2004; End of the current term of office: 03/31/2019; Member of the Supervisory Board of Oberbank AG, Austria, Linz; Member of the Supervisory Board of Infineon Technologies AG, Germany, Munich
Assigned areas of responsibility Corporate Development, including Raw Materials Strategy; R&D and Innovation Strategy; Corporate Human Resources; Corporate Communi-cations and Corporate Image; Compliance; Legal Department; M&A; Strategic Environmental Management; Investor Relations; Internal Auditing
Positions at material subsidiaries1 of the voestalpine Groupvoestalpine Stahl GmbH, Chairman of the Supervisory Board; voestalpine High Performance Metals GmbH, Chairman of the Supervisory Board; voestalpine Metal Engineering GmbH, Chairman of the Supervisory Board;voestalpine Metal Forming GmbH, Chairman of the Supervisory Board; voestalpine Rohstoffbeschaffungs GmbH, Chairman of the Advisory Board
» Dipl.-Ing. Herbert Eibensteiner
Head of the Steel Division Born 1963; Member of the Management Board since 2012; End of the current term of office: 03/31/2019
Assigned area of responsibility Information Technology
Positions at material subsidiaries1 of the voestalpine Groupvoestalpine Stahl GmbH, Chairman of the Management Board; voestalpine High Performance Metals GmbH, Member of the Supervisory Board;voestalpine Metal Engineering GmbH, Member of the Supervisory Board; voestalpine Metal Forming GmbH, Member of the Supervisory Board; voestalpine Grobblech GmbH, Chairman of the Supervisory Board;voestalpine Steel & Service Center GmbH, Chairman of the Supervisory Board; Logistik Service GmbH, Chairman of the Supervisory Board; voestalpine Texas LLC, Chairman of the Board of Directors;voestalpine Rohstoffbeschaffungs GmbH, Deputy Chairman of the Advisory Board
» Dipl.-Ing. Dr. Franz Kainersdorfer
Head of the Metal Engineering Division Born 1967; Member of the Management Board since 2011; End of the current term of office: 03/31/2019; Member of the Supervisory Board of VA Erzberg GmbH, Austria, Eisenerz
Assigned area of responsibility Long-term energy supply of the Group
Positions at material subsidiaries1 of the voestalpine Groupvoestalpine Metal Engineering GmbH, Chairman of the Management Board;voestalpine Stahl GmbH, Member of the Supervisory Board;voestalpine High Performance Metals GmbH, Member of the Supervisory Board;voestalpine Metal Forming GmbH, Member of the Supervisory Board;voestalpine Stahl Donawitz GmbH, Chairman of the Supervisory Board;voestalpine Schienen GmbH, Chairman of the Supervisory Board;voestalpine Tubulars GmbH, Chairman of the Supervisory Board;voestalpine Wire Rod Austria GmbH, Chairman of the Supervisory Board;voestalpine Texas LLC, Member of the Board of Directors; voestalpine Rohstoffbeschaffungs GmbH, Member of the Advisory Board
1 The material subsidiaries listed in this report are the divisions’ lead companies as well as subsidiaries of the voestalpine Group with revenue of over EUR 200 million.

22 T H E G R O U P
» Mag. Dipl.-Ing. Robert Ottel, MBA
Chief Financial Officer (CFO)Born 1967; Member of the Management Board since 2004; End of the current term of office: 03/31/2019; Deputy Chairman of the Supervisory Board of APK- Pensionskasse AG, Austria, Vienna; Member of the Supervisory Board of Josef Manner & Comp. AG, Austria, Vienna; Member of the Super visory Board of CEESEG AG, Austria, Vienna; Member of the Super visory Board of Wiener Börse AG, Austria, Vienna
Assigned areas of responsibility Corporate Accounting and Reporting; Controlling including Investment Controlling; Group Treasury; Taxes; Management Information Systems; Risk Management
Positions at material subsidiaries1 of the voestalpine Group:voestalpine Stahl GmbH, Deputy Chairman of the Supervisory Board;voestalpine High Performance Metals GmbH, Deputy Chairman of the Supervisory Board;voestalpine Metal Engineering GmbH, Deputy Chairman of the Super visory Board; voestalpine Metal Forming GmbH, Deputy Chairman of the Supervisory Board; voestalpine Texas LLC, Member of the Board of Directors
» Dipl.-Ing. Franz Rotter
Head of the High Performance Metals Division Born 1957; Member of the Management Board since 2011; End of the current term of office: 03/31/2019
Assigned areas of responsibility Procurement Strategy; Health & Safety
Positions at material subsidiaries1 of the voestalpine Groupvoestalpine High Performance Metals GmbH, Chairman of the Management Board;voestalpine Stahl GmbH, Member of the Supervisory Board; voestalpine Metal Engineering GmbH, Member of the Supervisory Board;voestalpine Metal Forming GmbH, Member of the Supervisory Board;voestalpine BÖHLER Edelstahl GmbH, Member of the Supervisory Board;Buderus Edelstahl GmbH, Member of the Supervisory Board; Uddeholms AB, Member of the Board of Directors;Villares Metal S.A., Member of the Supervisory Board; voestalpine BÖHLER Aerospace GmbH, Member of the Supervisory Board
» Dipl.-Ing. Dr. Peter Schwab, MBA
Head of the Metal Forming Division Born 1964; Member of the Management Board since 2014; End of the current term of office: 03/31/2019
Positions at material subsidiaries1 of the voestalpine Groupvoestalpine Metal Forming GmbH, Chairman of the Management Board;voestalpine Stahl GmbH, Member of the Supervisory Board;voestalpine High Performance Metals GmbH, Member of the Supervisory Board;voestalpine Metal Engineering GmbH, Member of the Supervisory Board; voestalpine Precision Strip GmbH, Chairman of the Supervisory Board; voestalpine Krems GmbH, Chairman of the Supervisory Board; voestalpine Sadef nv, Chairman of the Supervisory Board
1 The material subsidiaries listed in this report are the divisions’ lead companies as well as subsidiaries of the voestalpine Group with revenue of over EUR 200 million.

23A N N U A L R E P O R T 2 0 1 7 / 1 8
COMPOSITION OF THE SUPERVISORY BOARD
» Dr. Joachim Lemppenau Born 1942
Chairman of the Supervisory Board (since 07/01/2004) Initial appointment: 07/07/1999Former Chairman of the Management Board of Volksfürsorge Versicherungsgruppe, Germany, Hamburg
» Dr. Heinrich Schaller Born 1959
Deputy Chairman of the Supervisory Board (since 07/04/2012) Initial appointment: 07/04/2012CEO of Raiffeisenlandesbank Oberösterreich AG, Austria, Linz; Second Deputy Chairman of the Supervisory Board of Raiffeisen Bank International AG, Austria, Vienna; Deputy Chairman of the Super-visory Board of AMAG Austria Metall AG, Austria, Braunau-Ranshofen
» KR Dr. Franz Gasselsberger, MBA Born 1959
Member of the Supervisory Board, Initial appointment: 07/01/2004CEO of Oberbank AG, Austria, Linz; Chairman of the Super visory Board of Bank für Tirol und Vorarlberg Aktiengesellschaft, Austria, Innsbruck; Deputy Chairman of the Supervisory Board of BKS Bank AG, Austria, Klagenfurt; Member of the Supervisory Board of AMAG Austria Metall AG, Austria, Braunau-Ranshofen; Member of the Supervisory Board of Lenzing AG, Austria, Lenzing
» Dr. Hans-Peter Hagen Born 1959
Member of the Supervisory Board, Initial appointment: 07/04/2007 Managing Director of BALDUS Consulting GmbH, Austria, Vienna; Member of the Supervisory Board of Telekom Austria AG, Austria, Vienna
» Dr. Michael Kutschera, MCJ. (NYU) Born 1957
Member of the Supervisory Board, Initial appointment: 07/01/2004Attorney at law; Partner at Binder Grösswang Rechtsanwälte GmbH, Austria, Vienna
» Prof. (em) Dr. Helga Nowotny, Ph.D. Born 1937
Member of the Supervisory Board, Initial appointment: 07/02/2014Former President of the European Research Council
» Mag. Dr. Josef Peischer Born 1946
Member of the Supervisory Board, Initial appointment: 07/01/2004Former Director of the Chamber of Workers and Employees for Upper Austria, Austria, Linz
» Dipl.-Ing. Dr. Michael Schwarzkopf Born 1961
Member of the Supervisory Board, Initial appointment: 07/01/2004Chairman of the Supervisory Board of Plansee Holding AG, Austria, Reutte; Member of the Supervisory Board of Mayr-Melnhof Karton AG, Austria, Vienna
Delegated by the Works Council:» Josef Gritz Born 1959
Member of the Supervisory Board, Initially delegated: 01/01/2000Chairman of the Works Council for Wage Earners of voestalpine Stahl Donawitz GmbH, Austria, Donawitz
» Friedrich Hofstätter (from 07/01/2017) Born 1965
Member of the Supervisory Board, Initially delegated: 07/01/2017 Chairman of the Works Council for Salaried Employees of voestalpine AG, Austria, Linz
» Brigitta Rabler (until 06/30/2017) Born 1959
Member of the Supervisory Board, Initially delegated: 05/01/2013 Chairwoman of the Works Council for Salaried Employees of voestalpine AG, Austria, Linz
» Hans-Karl Schaller Born 1960
Member of the Supervisory Board, Initially delegated: 09/01/2005Chairman of the Group Works Council of voestalpine AG, Austria, Linz; Chairman of the European Works Council of voestalpine AG, Austria, Linz
» Gerhard Scheidreiter Born 1964
Member of the Supervisory Board, Initially delegated: 01/01/2012Chairman of the Works Council for Wage Earners of voestalpine BÖHLER Edelstahl GmbH & Co KG, Austria, Kapfenberg
All Supervisory Board positions held by shareholders representatives end as of the close of the Annual General Meeting of voestalpine AG, which adopts resolutions relative to the business year 2018/19.
None of the members of the Supervisory Board missed more than half of the meetings of the Supervisory Board during the past business year.

24 T H E G R O U P
COMPENSATION REPORT FOR MANAGEMENT BOARD AND SUPERVISORY BOARDRegarding the compensation report for Manage-ment Board and Supervisory Board, we refer to the notes to the annual financial statements (page 178).
INFORMATION REGARDING THE INDEPENDENCE OF THE MEMBERS OF THE SUPER VISORY BOARD
All of the members elected to the Supervisory Board by the Annual General Meeting have con-firmed that they consider themselves to be in-dependent based on the criteria defined by the Supervisory Board (Corporate Governance Code, Rule 53). The criteria for independence defined by the Supervisory Board may be viewed on the Company’s website, www.voestalpine.com. Further-more, with the exception of Dr. Heinrich Schaller, who represents the shareholder Raiffeisenlandes-bank Oberösterreich Invest GmbH & Co OG, and Mag. Dr. Josef Peischer, who represents the voest-alpine Mitarbeiterbeteiligung Privatstiftung, none of the members elected to the Supervisory Board by the Annual General Meeting are shareholders with an investment of more than 10% or repre-sent the interests of such shareholders (Rule 54).
COMMITTEES OF THE SUPERVISORY BOARD
The Articles of Incorporation authorize the Super-visory Board to appoint committees from among its ranks and to define their rights and responsi-bilities. The committees can also be given the right to make decisions. In accordance with the ratio defined in Section 110 (1) Austrian Labor Consti-tution Act (Arbeitsverfassungsgesetz – ArbVG), the employee representatives on the Supervisory Board have the right to nominate members with
a seat and a vote for Supervisory Board commit-tees. This does not apply to committees that han-dle relations between the Company and the mem-bers of the Management Board.
The following Supervisory Board committees have been established:
GENERAL COMMITTEEThe General Committee is both the Nomination and the Compensation Committee as defined in the Corporate Governance Code.
As the Nomination Committee, the General Com-mittee submits recommendations to the Super-visory Board as to the filling of Management Board positions that are becoming vacant and handles issues related to succession planning. As the Compensation Committee, the General Committee is also responsible for executing, amending, and dissolving employment agree-ments with members of the Management Board as well as for all matters associated with the man-agement of Management Board members’ stock option plans. Furthermore, the General Commit-tee has the right to make decisions in urgent cases. It also makes decisions as to whether mem-bers of the Management Board are permitted to take on ancillary activities.
Members of the General Committee of the Supervisory Board: » Dr. Joachim Lemppenau (Chairman)» Dr. Heinrich Schaller (Deputy Chairman) » Hans-Karl Schaller
AUDIT COMMITTEEThe Audit Committee is responsible for monitor-ing the financial reporting process; supervising the work of the auditor and both reviewing and preparing the approval of the annual financial statements; reviewing and monitoring the audi-tor’s independence; as well as reviewing the pro-posal for the appropriation of earnings, the Man-agement Report, and the Consolidated Corporate

25A N N U A L R E P O R T 2 0 1 7 / 1 8
Governance Report. It is also this committee’s re-sponsibility to review the Group’s Consolidated Financial Statements and to submit a recommen-dation for the selection of the auditor and to re-port to the Supervisory Board in this matter. Fur-thermore, the Audit Committee is responsible for monitoring the effectiveness of the Company- wide internal control system, the internal audit system, and the risk management system.
Members of the Audit Committee of the Supervisory Board:» Dr. Joachim Lemppenau (Chairman)» Dr. Heinrich Schaller (Deputy Chairman) » KR Dr. Franz Gasselsberger, MBA» Dr. Hans-Peter Hagen» Hans-Karl Schaller » Josef Gritz
NUMBER OF AND SIGNIFICANT CONTENT OF THE MEETINGS OF THE SUPERVISORY BOARD AND THE COMMITTEE IN THE BUSINESS YEAR 2017/18
During the business year 2017/18, the Super visory Board fulfilled its responsibilities under the law and the Articles of Incorporation, holding five ple-nary sessions, three meetings of the Audit Com-mittee, and one meeting of the General Commit-tee. In addition to regular reports on the Group’s current business and financial position, these meetings dealt in particular with corporate ac-quisitions, the core elements of the voestalpine Group’s digital transformation, succession plan-ning as well as matters involving raw materials supplies, innovation, and IT. The Audit Committee dealt especially with the preparation and review of the Company’s consolidated and individual financial statements, the preparation of the rec-ommendation regarding the appointment of the auditor as well as topics related to the internal control system, the risk management system, and Internal Auditing.
The auditor, Grant Thornton Unitreu GmbH Wirt-schafts prüfungs- und Steuerberatungsgesellschaft, Vienna, Austria, attended all three meetings of the Audit Committee and was available for ques-tions and discussions.
At the last meeting of the business year, the Super-visory Board also carried out the self-evaluation stipulated under Rule 36 of the Corporate Gov-ernance Code and, after asking the Management Board to leave the room, used a list of questions to deal with the general cooperation between Management Board and Supervisory Board, the quality and scope of the documents made avail-able to the Supervisory Board as well as organi-zational issues.
PRINCIPLES OF THE voestalpine GROUP’S COMPENSATION POLICY
Employees’ total compensation is paid, for one, in the form of a fixed salary in line with market conditions and, for another, in the form of vari-able compensation.
The amount of the fixed salary is based on the activities, role, and position of the given employee, as well as their individual experience and exper-tise. Any relevant statutory requirements and con-tracts under collective bargaining agreements or works agreements are complied with as applica-ble. The amount of variable compensation is con-tingent on the achievement of stipulated targets. Depending on the given employee’s role, both qualitative and quantitative targets are agreed (in particular EBIT and ROCE). Targets are usually set for one business year at a time.
There are limits on the maximum possible vari-able compensation and the weighting of targets with respect to managing directors and execu-tives. Compensation packages for all other em-ployees are determined by the individual com-

26 T H E G R O U P
panies in line with market conditions, taking into account both local practice and local require-ments. Various compensation elements are pos-sible, including non-monetary elements:» Pension plans (e.g., in the Austrian pension fund)» Insurance (e.g., accident insurance)» Discounts on cafeteria offerings » Coupons
The compensation packages for managing di-rectors and executives always include variable compensation (bonus) and, in some cases, both a pension plan and a company car.
COMPOSITION OF THE MANAGEMENT BOARD AND THE SUPERVISORY BOARD
The selection of Management Board members is based on the following material criteria: profes-sional suitability (i.e. whether the candidate pos-sesses the requisite competence and experience) and personality traits (e.g. personal integrity). In addition, age and gender are also included in the decision-making process. Independent manage-ment audits by external advisers as necessary en-sure that the decisions are also based on objec-tive evaluations. At present, no woman sits on the Management Board of voestalpine AG. There is balance in terms of the distribution of age, edu-cational background, and professional experi-ence.
The shareholder representatives on the Super-visory Board are elected by the Annual General Meeting in accordance with the applicable statutory framework. This also includes taking ac-count of the requirements under the Austrian Act on Gender Parity in Supervisory Boards (Gleich-stellungsgesetz von Frauen und Männern im Auf-sichtsrat – GFMA-G). At this time, the Supervisory Board includes one woman and one non-Austrian national. There is balance in terms of the distribu-tion of age, educational background, and pro-fessional experience.
STEPS FOR PROMOTING WOMEN
In the business year 2017/18, the percentage of female executives was about 12.3%, a slight in-crease over the previous year (11.5%). One woman has been appointed to a divisional management position since the business year 2013/14. Within the scope of internal leadership develop-ment efforts, great importance is being placed on continuing to expand the percentage of fe-male participants. The Group is trying to ensure that women are represented at each training level of the Leadership Development Program (“value program”). Of the total of 254 participants in the business year 2017/18, 15.7% were women. This means that the percentage of women has increased slightly compared with the previous year (15.1%) and still exceeds the percentage of women in the Group.Overall, the percentage of women in the voest-alpine Group in the business year 2017/18 was 13.8% (previous year: 13.5%). There are industry- specific, historical, and cultural reasons for this percentage—which remains low compared with other industries. In the consciousness of the pub-lic, the image of a steel, technology, and indus-trial goods company is still the image of heavy industry and, therefore, broad-based recruitment of female employees is a challenging undertak-ing. Nonetheless, the percentage of women in the voestalpine Group among salaried employees up to the age of 30 is now around 40.5%; despite all of our efforts, however, women still only ac-count for a mere 6.0% among workers. None of the Group companies have explicit “female quotas.” Instead, the voestalpine Group is striving to raise the percentage of women in the Group at all levels through appropriate measures. This includes a number of activities, some of which are country-specific, e.g. participation in the “Girls’ Day,” the specific advancement of women in tech-nical apprenticeships, and/or boosting the hiring of female graduates of technical schools and universities. In addition, the establishment and expansion of in-house child care facilities and/ or collaborations with external facilities is being

27A N N U A L R E P O R T 2 0 1 7 / 1 8
accelerated. Such facilities and collaborations can be found at the Group’s plants in Linz and Leoben/Donawitz, Austria, for instance. As a re-sult of these efforts, by now women are also em-ployed in leadership positions in traditionally male-dominated, technical areas of the Com-pany. Women also occupy executive positions in the financial, legal, strategic, communications, and human resources departments in a number of Group companies. For example, “Legal and Compliance” in two of the four divisions is headed by women.As part of the annual human resources report, data on the percentage of women in executive positions is regularly collected and analyzed based on qualifications and training programs for the purpose of monitoring the sustainability of all measures.
EXTERNAL EVALUATION OF COM-PLIANCE WITH THE CORPORATE GOVERNANCE CODE
The Corporate Governance Code provides for a regular external evaluation of compliance with
Wolfgang Eder Herbert Eibensteiner Franz Kainersdorfer
Robert Ottel Franz Rotter Peter Schwab
the Code by the Company. This evaluation was carried out by the Group’s auditor as part of the audit of the 2017/18 financial statements. The law firm WOLF THEISS Rechtsanwälte GmbH & Co KG conducted the review of compliance with the C rules of the Code regarding the audit (Rules 77 to 83). As a result of this evaluation, the auditors have determined that the declaration provided by voestalpine AG with regard to com-pliance with the Corporate Governance Code as amended in January 2018 conforms to actual conditions.
The external review may be inspected on the Company’s website, www.voestalpine.com.
Linz, May 18, 2018
The Management Board
This report is a translation of the original report in German, which is solely valid.
28 T H E G R O U P
COMPLIANCE
CODE OF CONDUCT
In its business segments, voestalpine is a globally leading technology and capital goods Group that boasts combined expertise in materials and pro-cessing, focuses on product and system solutions in steel and other metals in technology-intensive industries and niches, and applies the most de-manding quality standards. As a reliable partner, the Group not only takes ownership of the chal-lenges facing its customers, but also is fully aware of its particular responsibilities in its dealings with customers, suppliers, and other business partners as well as with its employees and shareholders. Consequently, in all of their professional actions and decisions both the executive and the non- executive personnel must comply with all statu-tory and other external requirements as well as with all internal rules and regulations applicable to voestalpine AG and its Group companies. This understanding is expressed in the Code of Con-duct of voestalpine AG, which provides the basis for the morally, ethically, and legally sound conduct of all of the Group’s employees. The Management Board explicitly and emphatically commits to both this Code of Conduct and a zero-tolerance policy toward violations thereof.
COMPLIANCE MANAGEMENT SYSTEM
A new, comprehensive compliance management system encompassing risk analysis/prevention and identification/reaction was established in the voestalpine Group during the business year 2011/12, thus placing Compliance on a very broad groupwide basis. In addition to a Group Compliance Officer, additional compliance offi-cers were appointed for all divisions and a num-ber of business units as well as larger Group com-panies. The Group Compliance Officer reports directly to the Chairman of the Management Board and is not bound by instructions.
The Compliance organization is responsible for the following areas:» Antitrust law;» Corruption;» Capital market compliance;» Fraud (internal cases of theft, fraud, embezzlement, breach of trust);» Conflicts of interest; and» Special issues that are assigned to the compliance officers by the Management Board of voestalpine AG (e.g. UN or EU sanctions).
All other compliance issues—such as those relat-ing to the environment, taxes, accounting, labor law, employee protection, data protection and privacy, etc.—do not fall within the responsibility of the compliance officers and/or are not cov-ered by Compliance. In this regard, the responsi-bility for compliance management rests with the respective specialist department.
COMPLIANCE GUIDELINES
The provisions of the Code of Conduct are sup-plemented and fleshed out by the Group guide-lines as follows:
» ANTITRUST LAWThis guideline describes the prohibition of agree-ments restricting competition; establishes rules for dealing and interacting with industry asso-ciations, professional associations, and/or other sector organizations; and defines particular rules of conduct for employees of the voestalpine Group.
» BUSINESS CONDUCT Among other things, this guideline regulates conduct relative to gifts, invitations, and other benefits; donations, sponsoring, and ancillary activities; as well as the private purchase of goods and services by employees from custom-ers and suppliers.

29A N N U A L R E P O R T 2 0 1 7 / 1 8
» GUIDELINE ON DEALINGS WITH SALES REPRESENTATIVES AND CONSULTANTS
This guideline prescribes the procedure to be followed prior to contracting or engaging sales representatives, marketing and other consul-tants, or lobbyists. An objective analysis of the prospective business partner’s environment and scope of activities prior to establishing business relations serves to ensure that the business part-ners, too, comply with all applicable laws and the voestalpine Code of Conduct.
The Code of Conduct and the Compliance Guide-lines apply Group-wide and are available in 14 languages.
PREVENTION
Preventive measures are the first line of defense of an efficient compliance management system. In this context, comprehensive training programs have been carried out across the Group in recent years. E-learning systems are increasingly being used in addition to face-to-face training in order to achieve the broadest possible training effect. For example, to date Web-based e-learning courses have been used to train some 10,000 Group employees in antitrust law and some 22,500 employees with respect to the Code of Conduct, in each case including a final test. Face-to-face training is tailored to target groups, for one, and generally carried out in connection with execu-tive training programs as well as specific training programs for non-executive employees in sales and procurement, for another. In addition to these measures, compliance issues are brought to the attention of voestalpine’s personnel through reg-ular communications, especially employee mag-azines and poster campaigns or in the context of Group and divisional events.
» Information on the subject of Compliance in the voestalpine Group is also available on the website of voestalpine AG and, specifically for employees, on the Group’s Intranet.
WHISTLEBLOWING SYSTEM
A Web-based whistleblower system was launched in January 2012. Reports of Compliance viola-tions are generally expected to be made openly, i.e. using the whistleblower’s name. This Web-based system, however, offers the additional possibility of reporting misconduct anonymously and of communicating with whistleblowers in ways that allow them to remain completely anonymous. The system is designed to utilize internal information for the purpose of identifying Compliance risks in the Group early on and effectively.

30 M A N A G E M E N T R E P O R T
CORPORATE GOVERNANCE REPORT
The (consolidated) Corporate Governance Report for the business year 2017/18 was published on the voest alpine AG website under the heading “Investors.”
» The full link is http://www.voestalpine.com/group/en/ investors/corporate-governance
REPORT ON THE GROUP’S BUSINESS PERFORMANCE AND THE ECONOMIC SITUATION
Considered in global economic terms, all coun-tries pivotal to the voestalpine Group developed along a positive trajectory in the business year 2017/18. Economic growth in Europe, for exam-ple, accelerated substantially compared with the previous year and even surpassed that of the United States which, after slightly weaker growth in 2016, also succeeded in gaining new momen-tum. China, too, continued along its solid growth course despite expectations to the contrary and, after four years of recession, even Brazil turned the corner and returned to expansive economic growth.This positive picture of economic development, which is rarely so uniform across the globe, was not disturbed until the end of the past business year when politics intruded. The “America First” policy, replete with unusually explicit rhetoric on
the part of the current US president, first caused turbulence in the international financial markets due to the fears of an imminent global trade war and then led to a dampening of the economic mood; so far, however, no deterioration in real terms has occurred.
EUROPEWhile first signs of an upswing already made themselves felt in the business year 2016/17, which were visibly borne along by private con-sumption in particular, the positive trend solidified in the business year 2017/18 and gained mo-mentum across the board.This long-awaited, all-encompassing impetus arose primarily from investment-driven industrial growth in almost all sectors. Against this back-drop, the economic forward momentum in Europe also expanded geographically during the year—from the already prospering Central and North-ern European member states of the European Union (EU) to almost all EU countries—and led, in the final analysis, to the unexpectedly homoge-neous development of the European Economic Area (EEA) on the whole. Besides excellent domestic demand, Europe’s positive economic trajectory was also driven by the prospering global economy, giving further impetus to Europe’s export-oriented economy.Not until the business year’s final quarter did lead-ing economic indicators point to a potential slow-down in growth, which had been accelerating continuously until then. With the exception of initial indications at the start of the 2018 calendar year that the economy was overheating, this turn of
REPORT OF THE MANAGEMENT BOARD
MANAGEMENT REPORT 2017/18This Consolidated Management Report refers to the Consolidated Financial Statements, which were prepared in accordance with the International Financial Reporting Standards (IFRS) as mandated by Section 245a (1) of the Austrian Commercial Code (UGB).

31A N N U A L R E P O R T 2 0 1 7 / 1 8
events was triggered above all by the in creasingly real walling-off trends in the economic policies of the United States which, in turn, led to growing uncertainty about the global economic growth in the future.Moreover, the negative economic fallout of the Brexit vote in Great Britain clearly made itself felt for the first time in the fourth quarter of the busi-ness year 2017/18. Private consumption in par-ticular lost steam, but the construction industry also showed first signs of an economic slowdown since the leave vote.
In a macroeconomic environment that was largely positive nonetheless throughout the business year 2017/18, almost all market segments critical to the voestalpine Group exhibited strong demand growth. The automotive industry succeeded in continuing its upward trend that has been on-going for several years now, and there was no change in the extremely solid demand from the con sumer goods industry. At the same time, the momentum in the mechanical engineering sector accelerated substantially throughout the business year thanks to the increase in industrial invest-ment activities. Demand from the construction industry also began to recover after an extended period of weakness. Of the sectors in voestalpine’s portfolio, the Euro-pean railway infrastructure sector was less dy-namic due to the substantial decline in invest-ments, which triggered not only declining demand for rails but also substantial reductions in prices. Power plant construction in Europe remained as weak as before. No turnaround is indicated for
this segment in the foreseeable future, with the result that it is no longer part of voestalpine’s strategic core portfolio. The conventional energy sector (i.e. the oil and gas industry), by contrast, showed moderate signs of recovering over the business year, even in Europe.
NORTH AMERICA Following rather restrained growth in the previous year, the US economy developed considerable momentum in the business year 2017/18 that solidified as the year wore on, just as in Europe.This trend was driven by the increase in investment activities, especially the easing of conditions in the oil and gas sector. Just as in previous years, private consumption remained robust as a result of consistently solid labor market data along with high hopes that the tax reform would have posi-tive effects. Unlike its European counterpart, how-ever, the US Federal Reserve reacted to these positive developments and began to lift interest rates incrementally.While the unusually powerful hurricane season after the summer as well as an extremely cold winter at the turn of the calendar year led to some volatility, the resulting negative impact on the economy was temporary and easily overcome. The greatest challenge by far not just for the North American economy but also beyond its borders is the protectionist economic policy of the current US president who, besides demanding that the NAFTA agreements be renegotiated, most re-cently imposed worldwide import tariffs on steel and aluminum based on the argument that the country’s national security is being threatened,

32 M A N A G E M E N T R E P O R T
thus casting doubt on free global trade—at least as far as these two product areas are concerned. America’s ire is directed at Europe, Brazil, and Japan, but particularly at China, whose trade surplus with the US is very large.While this development has not yet led to a damp-ening of the global economy in real terms, there has been a substantial increase in the resulting risks to continued economic growth as evidenced not least by the partially massive corrections on the international financial markets.But the voestalpine Group also benefitted from the largely positive environment of the US’s real economy in recent months. Even though the mo-mentum of the country’s automotive industry flat-tened somewhat in the business year 2017/18, the European automotive manufacturers mana ged to buck this trend and continued to expand their position, enabling voestalpine as their partner to leverage its automotive body parts factories.Demand from the US aerospace industry remained solid also and the railway infrastructure sector in North America showed some sign of rebounding, given the recovery of the oil and gas sector during the business year’s second half.The first year of full operations at the HBI plant in Texas was characterized by a largely positive market environment, for one, and production losses due to hurricane Harvey and the unfore-seen onset of winter, for another.
SOUTH AMERICA After more than four years of recession that were accompanied by corruption scandals, political instability, and the financial weakness of the pub-lic sector, Brazil’s economy finally rebounded in the business year 2017/18. The upward trend so-lidified during the business year, after merely weak signs of a recovery at the start of the year. At first, it was driven by rising private consump-tion which, in turn, was fueled not just by labor market reforms but also by tax incentives and a small reduction in interest rates. Exports rose slightly as well in the wake of more favorable for-eign exchange rates.
While the trend toward private consumption de-clined again toward the end of the business year owing to the expiration of tax benefits, there was a slight uptick in investment activities for the first time in years. On the whole, therefore, in the past business year Brazil developed along a substan-tially positive trajectory even though the starting point was fairly low, as to be expected after sev-eral years of recession.Aside from Venezuela above all, a number of other South American countries experienced a turnaround over the past business year, which was borne along by increasing domestic consump-tion, for one, and by growing private-sector in-vestment activities, for another.All of voestalpine’s sites in Brazil responded to the multi-year downward trend by taking drastic steps to reduce costs and boost efficiency, even making product portfolio adjustments. As a result, they weathered the economic crisis of South America’s largest economy and, in the past busi-ness year, profited directly from the most recent signs of an economic upturn.
ASIAThe largely stable growth trend in Asia, which has been ongoing for years, especially in China, con-tinued unabated in the business year 2017/18. Not even announcements of and first steps in the implementation of reforms that are related to the environment but also are aimed at reducing mas-sive excess capacities in a number of industries triggered any noticeable weakening of the eco-nomic upward trend overall. Finding its stride again right after the New Year celebrations last February, which usually trigger a slowdown in eco-nomic activity, China’s unbroken momentum has so far continued in 2018 as well.Although the initial reduction in capacities to-gether with the country’s high domestic demand led to a slight decline in the enormous scale of Chinese steel exports and thus an easing of price pressures in the international steel markets, in the past 18 months international economic tensions have intensified at the political level in response
33A N N U A L R E P O R T 2 0 1 7 / 1 8
REVENUE OF THE voestalpine GROUPIn millions of euros
11,077.2
2013/14 2014/15 2015/16 2016/17 2017/18
11,189.5 11,068.7 11,294.5
12,897.8
to the aggressive export policies China has pur-sued over many years.While Europe imposed relatively low and with some time lag anti-dumping duties (after the United States) to protect its own market, subse-quently the US went much further and most re-cently imposed a blanket tariff of 25% on all steel imports to “protect the country’s national security” (Section 232); bilateral negotiations have suc-ceeded in exempting the EU and a few other countries from this duty temporarily for the time being. As against China, the US president has ad-dressed not just the inappropriate scale of steel and aluminum exports to the United States but also the general imbalances in the two countries’ balance of trade as well as the country’s ques-tionable treatment, as he sees it, of foreign intel-lectual property. Not least the rhetoric chosen to convey these messages generated growing con-cerns toward the end of the business year that any escalation of this trade conflict would have global repercussions.The key customer segments for voestalpine in China—automotive industry, railway infrastruc-ture, consumer goods industry as well as oil and gas—developed stably along a good to excellent trajectory throughout the business year 2017/18.
BUSINESS PERFORMANCE OF THE DIVISIONS
Steel DivisionThe performance of the Steel Division in 2017/18 seamlessly continued the upward trend at the end of the preceding period. voestalpine’s steel seg-ment turned in an outstanding earnings perfor-
mance throughout the business year based on the continued strong demand for highly sophis-ticated steel products. Just as in recent years, the continued growth of the European automotive industry was the driving force of this development, which also benefitted from the stable demand on the part of the consumer goods industry. To top it off, the revival of the market in the mechanical engineering sector also gathered steam over the year.High volatility continued to affect the cost of raw materials in the past business year 2017/18, too, but there were far fewer outliers than a year earlier.While comprehensive preparations were already being carried out during the past business year at the site in Linz, Austria, regarding the general overhaul of the largest blast furnace (blast fur-nace A) and large inventories of semi-finished goods (slabs) have been stored to offset the re-duced production volume during the summer of 2018, for the direct reduction plant in Corpus Christi, Texas, USA, 2017/18 was the first year of regular operations. Notwithstanding freak weath-er such as Hurricane Harvey in the summer of 2017 and an extraordinarily hard onset of winter in Texas at the turn of the year, both of which led to several weeks of downtime, this first year of regular operations was defined by optimization measures that are usually carried out at a new plant but it also showed the plant’s high potential in terms of both technology and quality.
High Performance Metals DivisionIn the business year 2017/18, the High Perfor-mance Metals Division succeeded in substantially

34 M A N A G E M E N T R E P O R T
surpassing its prior year performance. Yet again, the key drivers of this development were both the automotive industry and the consumer goods in-dustry which, compared with the previous year, continued to increase their demand for tool and high-speed steel. While the aerospace industry’s demand for special steel parts remained as high as in the previous periods, 2017/18 saw demand from the oil and gas sector for the division’s special products ris-ing again for the first time since its extended pe-riod of weakness. Both heavy mechanical and energy engineering remained the weakest area, suffering for yet another year from the un certainty in Europe’s climate policies.Compared with the previous year, however, the division’s pleasingly positive development overall led to a substantial improvement in the division’s capacity utilization worldwide.While the Brazilian Villares plant in Sumaré, above all, finally turned the corner in 2017/18 after hard years of recession, in the course of the business year the United States—the plant’s most import-ant export market—announced protectionist tariffs on steel imports. Given the resulting uncer-tainties, impairment losses of about EUR 10 million on property, plant and equipment were recog-nized in the Company’s current annual financial statements.For the rest, market developments in the NAFTA region were very satisfactory, and the same ap-plies to Europe and Asia.
Metal Engineering DivisionAs far as the market is concerned, in the business year 2017/18 the Metal Engineering Division was confronted with the continued challenging en-vironment in the railway infrastructure segment as well as the oil and gas sector’s recovery from a low level.While the weakening trend in the rail segment al-ready became apparent in the previous business year, the downward trend accelerated substan-tially in 2017/18 and hit bottom in the last busi-ness quarter. This development was triggered by shrinking demand in Europe, the division’s core
market, together with equally weak demand from its traditional export markets. By contrast, the turnout production segment largely succeeded in offsetting the weaker demand in other regions thanks to the outstanding development of the market in Asia.The oil and gas industry expanded, albeit from a low level, which led to excellent developments in volume terms over the year, but there is still room at the top in pricing terms.The Welding Consumables segment, which also depends to a significant degree on the business climate in the oil and gas sector, developed along a stable trajectory.Thanks to the excellent performance of the auto-motive industry, demand for high-quality wire was very satisfactory, but the division was unable to exploit the market’s potential until the final busi-ness quarter because the commissioning of the new wire rod mill caused production shortfalls in the year’s first business quarters. Impairment losses of EUR 15 million on property, plant and equipment were recognized in the first half of 2017/18 in the sub-product segment of ultra high-strength fine wire, which is used particularly in the solar and photovoltaics industry, due to ongoing market challenges; which has a corresponding negative non-recurring effect on earnings.
Metal Forming DivisionThe environment of the Metal Forming Division in the business year 2017/18 was defined by the continued dynamic development of the market in practically all product areas.This applies especially to the Automotive Com-ponents business segment which, in keeping with its international growth strategy, has been in-creasingly supplying customers in both North America and China besides its European home market. Given that the start-up of many new plants initially generates expenses by definition, these costs had a temporary and manageable adverse effect on the results of this division.Last year’s positive trends in the Tubes and Sec-tions segment continued in the past business year. Special sections for the commercial vehicle and

35A N N U A L R E P O R T 2 0 1 7 / 1 8
REVENUE BY DIVISIONSAs percentage of total divisional revenue, business year 2017/18
22%Metal Engineering
20%Metal Forming
36%Steel
22%High Performance Metals
REVENUE BY REGIONSAs percentage of Group revenue, business year 2017/18
66%European Union (of which Austria: 7%)
8%Asia
14%NAFTA
4%South America
8%Rest of world
REVENUE BY INDUSTRIESAs percentage of Group revenue, business year 2017/18
34%Automotive
5%White goods/Consumer goods
15%Energy
9%Building/Construction
3%Aerospace
11%Railway systems
9%Mechanical engineering
14%Other
36 M A N A G E M E N T R E P O R T
agricultural machinery segment were in particu-larly high demand, just as the passive safety com-ponent segment (e.g. precision tubes for auto-motive seat belt tensioners). The market environment of the Precision Strip segment, which produces precision strip steel for the sawmill industry, for example, was excellent in the past business year, and the Warehouse and Rack Solutions segment benefited from the con-tinued strength of project-based demand for stor-age technology.
REPORT ON THE FINANCIAL KEY PERFORMANCE INDICATORS OF THE voestalpine GROUP
REVENUE AND OPERATING RESULTThe substantial increase in revenue in the busi-ness year 2017/18 signifies a turnaround from several years of a largely negative trend in the development of revenue thanks to the voest alpine Group’s ability to capitalize both on the sustained positive macroeconomic climate and the invest-ments it had made in the previous years. The Steel Division posted the largest increase in percent-age terms, benefiting from significantly improved prices in the face of almost stable volume growth. But significantly higher delivery volumes from the HBI facility in Texas, USA, which has been fully operational since the start of the business year 2017/18, also contributed to this outcome. The higher revenue of the High Performance Metals Division reflects not only the overall improvement in the economic climate but also the gradual re-covery of the oil and gas sector. Likewise, sub-stantially higher delivery volumes in this energy segment account for the growth in the Metal Engineering Division’s revenue, whereas the rev-enue from the division’s core segment (railway systems) remained more or less at the previous year’s level. In terms of revenue development, the Metal Forming Division profited from both the continual expansion of its international activities in the automotive segment and the stable, posi-tive environment in its other three business seg-
ments. Given the strong performance of all four divisions, the voestalpine Group boosted its rev-enue by 14.2% year over year, from EUR 11,294.5 million to EUR 12,897.8 million—an all-time high.The operating result (EBITDA) for the business year 2017/18 signifies not just a dramatic increase compared with the previous year, but also a level that the Group was unable to achieve even in the boom years preceding the financial crisis. This development is all the more remarkable in that individual economic regions (e.g. South America) but also customer segments (incl. railway infra-structure and the oil and gas industry) still have upward potential, economically speaking. The record result also underscores, however, that the Group made the right investment decisions in the past ten years and that its efforts in connection with the consistent implementation of measures aimed at cutting costs and boosting efficiency paid off. This applies not only, but especially to the Steel Division’s outstanding performance. After years of major investments and continuous inter-nal optimization measures, this division has been key to improving the Group’s EBITDA by 26.8% to EUR 1,954.1 million in the business year 2017/18 (previous year: EUR 1,540.7 million). In turn, this pushed the EBITDA margin from 13.6% in the previous year to 15.2% in the current business year. The Steel Division capitalized on the positive economic climate by expanding its gross margin even though its delivery volumes remained the same compared with the previous year’s high level despite the build-up of pre-materials for the planned general overhaul of blast furnace A in the summer of 2018. The High Performance Metals Division also succeeded in improving its results thanks to both the expansion of its sales volume and the increase in its base prices. For its part, the Metal Engineering Division succeeded in capitalizing on the increasingly positive market environment in the oil and gas sector (seamless tubes) to more than merely offset the price pres-sure in the rail segment and thus in improving its operating result. The same goes for the Metal Forming Division, whose increase in reporting cat-egories was driven by excellent market develop-

37A N N U A L R E P O R T 2 0 1 7 / 1 8
EBITDAIn millions of euros
1,374.0
2013/14 2014/15 2015/16 2016/17 2017/18
1,530.1 1,583.4 1,540.7
1,954.1
2013/14 2014/15 2015/16 2016/17 2017/18
EBITIn millions of euros
788.4886.2 888.8
823.3
1,180.0
2013/14 2014/15 2015/16 2016/17 2017/18
PROFIT AFTER TAXIn millions of euros
503.4
595.0 602.1527.0
817.9

38 M A N A G E M E N T R E P O R T
ments in general and the outstanding perfor-mance of the Precision Strip business segment in particular. A year-over-year comparison by quarter shows not only that the summer and autumn quarters are usually subject to seasonal influences but also that the year’s final quarter was the strongest yet again in terms of the result achieved. Histori cally, this was the second-best quarterly operating re sult of the Group since the second quarter of 2008/09.The profit from operations (EBIT) in the business year 2017/18 also presented a positive picture: at EUR 1,180.0 million (margin of 9.1%), it sur-passed the previous year’s level (EUR 823.3 mil-lion, margin of 7.3%) by 43.3%. Due to higher depreciation in the past business year, in absolute terms the EBIT increase is not as strong as that of EBITDA. The increase in depreciation is due, for one, to the commissioning of new facilities and, for another, to EUR 15 million in write-downs on investments in the ultra high-strength fine wire product segment (Metal Engineering Division) as well as EUR 10 million in write-downs on in-vestments in Villares Metals, Sumaré, Brazil (High Performance Metals Division).
PROFIT BEFORE TAX AND PROFIT AFTER TAXThe voestalpine Group also posted excellent numbers for the business year 2017/18 in the profit before and after tax (net income) catego-ries. After gradually declining in recent years, net interest expense rose slightly in the current busi-ness year. Nevertheless, the profit before tax jumped 48.9% year over year from EUR 699.9 million in 2016/17 to EUR 1,042.5 million in 2017/18. In contrast to the net interest expense, the tax rate for the same period fell from 24.7% to 21.5%. This boosted the profit after tax by 55.2% from EUR 527.0 million in the previous year to EUR 817.9 million in the current year. Both the profit before tax and the profit after tax are at an all-time high.
PROPOSED DIVIDENDSubject to the approval of the Annual General Meeting of voestalpine AG on July 4, 2018, a divi-
dend of EUR 1.40 per share will be paid to the shareholders, which corresponds to an increase of 27.3% compared with the previous year’s divi dend of EUR 1.10 per share. Based on the earnings per share (reported in accordance with IFRS) of EUR 4.40 (previous year: EUR 2.84), this proposal corresponds to a distribution ratio of 31.8% (previous year: 39.0%). Relative to the average price of the voestalpine share of EUR 44.46 in the business year 2017/18, the dividend yield is 3.1% (previous year: 3.3%).
GEARING RATIOIn the business year 2017/18, the voestalpine Group succeeded in further lowering the gearing ratio (net financial debt as a percentage of equity) thanks to the significant improvement in both key performance indicators that affect the level of indebtedness. As a result, net financial debt fell from EUR 3,221.1 million as of March 31, 2017, to EUR 2,995.1 million as of March 31, 2018, des-pite the substantial increase in working capital. The increase in working capital stems from the substantial increase in inventories, which are partly due to higher raw materials costs (e.g. for scrap and alloys) but mostly due to the build-up of a slabyard in the Steel Division in connection with the repairs of the blast furnace, which will be car-ried out in the business year 2018/19. Moreover, the working capital also rose due to the general expansion of business activities resulting from the economic upturn as well as the accelerated expansion at international facilities belonging to the Automotive Components segment (Metal Forming Division). The portion of working capital that is related to the blast furnace repairs will be eliminated in the business year 2018/19. Both the reduction in investment activities and the excellent performance during the current busi-ness year have had a positive effect on net debt, with the equity base receiving a substantial boost from the result at the same time. By contrast, the development of the currency parities, particul arly the devaluation of the US dollar against the euro, had a negative effect on the equity in the annual financial statements 2017/18. On the whole,

39A N N U A L R E P O R T 2 0 1 7 / 1 8
EPS – EARNINGS PER SHAREIn euros
2.59
2013/14 2014/15 2015/16 2016/17 2017/18
3.18 3.35
2.84
4.40
2013/14 2014/15 2015/16 2016/17 2017/18
DIVIDEND PER SHAREIn euros * As proposed to the Annual General Meeting.
0.95 1.00 1.05 1.10
1.40*
NET FINANCIAL DEBT – EQUITY – GEARING RATIOIn millions of euros Net financial debt Equity Gearing (in %)
2,421.4
46.0
58.254.5 53.2
45.7
5,261.6
2013/14 2014/15 2015/16 2016/17 2017/18
2,978.1
5,115.0
3,079.9
5,651.6
3,221.1
6,060.3
2,995.1
6,554.3

40 M A N A G E M E N T R E P O R T
Net financial debt can be broken down as follows:
NET FINANCIAL DEBTIn millions of euros 03/31/2017 03/31/2018
Financial liabilites, non-current 2,764.7 2,783.6Financial liabilites, current 1,332.9 1,315.5Cash and cash equivalents –503.3 –705.8Other financial assets –348.3 –388.1Loans and other receivables from financing –24.9 –10.1Net financial debt 3,221.1 2,995.1
QUARTERLY DEVELOPMENT OF THE voestalpine GROUPIn millions of euros BY
1st quarter 2017/18
2nd quarter 2017/18
3rd quarter 2017/18
4th quarter 2017/18
2017/18 2016/17 Change in %
Revenue 3,251.5 3,050.8 3,158.1 3,437.4 12,897.8 11,294.5 14.2EBITDA 513.8 455.1 436.6 548.6 1,954.1 1,540.7 26.8EBITDA margin 15.8% 14.9% 13.8% 16.0% 15.2% 13.6% EBIT 328.8 255.4 250.4 345.4 1,180.0 823.3 43.3EBIT margin 10.1% 8.4% 7.9% 10.0% 9.1% 7.3% Profit before tax 292.4 221.3 223.5 305.3 1,042.5 699.9 48.9Profit after tax1 218.4 170.5 167.0 262.0 817.9 527.0 55.2Employees (full-time equivalent) 50,047 50,638 50,658 51,621 51,621 49,703 3.9
1 Before deduction of non-controlling interests and interest on hybrid capital.
equity rose year over year from EUR 6,060.3 million as of March 31, 2017, to EUR 6,554.3 mil-lion as of March 31, 2018. Given the aforemen-tioned factors, the gearing ratio declined sig-nificantly in the same period, specifically, from 53.2% as of March 31, 2017, to 45.7% as of March 31, 2018.
CASH FLOWThe cash flow from operating activities rose by 3.9% from EUR 1,150.4 million in 2016/17 to EUR 1,195.1 million in 2017/18 despite the significant
increase in working capital by a total of EUR 426.9 million in the current business year. While this was rooted in the outstanding earnings perfor-mance, the outflow of funds for investments fell yet again, with the effect that the cash flow from investing activities (EUR –847.7 million) is lower than the previous year (EUR –1,049.8 million). The cash flow from Group financing activities is EUR –129.7 million (previous year: EUR –366.7 million). As of March 31, 2018, therefore, the closing balance of cash and cash equivalents is EUR 705.8 million.

41A N N U A L R E P O R T 2 0 1 7 / 1 8
INVESTMENTS
After five business years during which not just numerous large-scale projects, but also many smaller projects were carried out and investments in property, plant, and equipment as well as in intangible assets and interests regularly exceed-ed depreciation, an investment consolidation phase aimed at narrowing the gap between in-vestments and depreciation was launched in the business year 2017/18. Specifically, in the business year 2017/18 the voestalpine Group in vested EUR 895.2 million and thus 11.5% less than in the business year 2016/17 (EUR 1,011.4 million). For the most part, a balance was achieved in the allocation of these investments among the four divisions.
The Steel Division’s investment expenditure in the business year 2017/18 was EUR 229.5 million and thus 43.8% less than in the previous year (2016/17: EUR 408.1 million). In this connection, the focus was on the ongoing implementation of the “Linz 2020” investment program, which serves to secure the technology and quality leadership of the Linz-based flat steel facility in the long term. The successful start-up of continu-ous casting facility 8 in the fourth quarter of 2017/18 was yet another step forward in the ex-pansion of the technology at the steel plant. Com-bined with the secondary metallurgy system 4, which was already commissioned two years ago, highly sophisticated, vacuum-treated steel ac-counts for about 80% of the plant’s steel pro-duction ca pacity overall. But activities in the Steel Division during the past business year also encompassed extensive preparations for the general overhaul of blast furnace A, which has been planned for a long time and will be carried out between early June and mid-September 2018. A pre-materials inventory of slabs was succes-sively created during the business year 2017/18 to both offset the temporary loss of production volume at the Group’s largest blast furnace by far and ensure that customers are supplied with highest-quality steel strip in the summer of 2018.
At EUR 226.4 million, the investment expenditure of the High Performance Metals Division in the business year 2017/18 was 26.1% higher than in the same period of 2016/17 (EUR 179.5 million). The decision was made at the end of September 2017 to build a brand-new special steel plant at the traditional site of Kapfenberg, Austria, that will meet all cutting-edge requirements going for-ward. At a total investment of between EUR 330 million and EUR 350 million, based on the same capacity of 205,000 tons per annum this facility will replace the existing plant in 2021 after a three-year construction period. The Group’s leadership in innovation—which it owes to state-of-the-art equipment, the comprehensive digitalization of processes as well as the resulting qualitative op-timization of products for the aerospace, auto-motive, and energy industries—creates the pre-requisites for the continued expansion of the division’s dominant position worldwide in special-ty steels. Current investments in new state-of- the-art production lines at two sites (also in the Kapfenberg area), which will produce pre- material for extremely stress-resilient aircraft components in the future, serve to implement additional proj-ects important to the aerospace industry. In this connection, the construction of a high-tech fast-forging line has already progressed to such a degree that the plant will probably be commis-sioned before the 2018 calendar year is out, while yet another fully automated forging line will go into production about a year later. Our activities with respect to the cutting-edge, additive ma nu-facturing technology (3D metal printing) also con-tinued in the business year 2017/18. While in-vestments in new facilities for manufacturing metallic powder as the base material for 3D print-ing at two sites (Hagfors, Sweden, and Kapfenberg, Austria) are ongoing, two additional facilities for producing highly complex metal com ponents by 3D printing were established in Taipei, Taiwan, and Toronto, Canada, to supplement the existing development center in Düsseldorf, Germany. In the Value Added Services segment, among other things the High Performance Metals Division

42 M A N A G E M E N T R E P O R T
launched the world’s largest vacuum hardening furnace in Shanghai, China, for heat treating structural parts used in lightweight automotive construction.
In the Metal Engineering Division, the investment volume of EUR 207.5 million in 2017/18 was about the same as in the previous year (EUR 211.0 mil-lion). The Group’s most extensive investment in recent years is embodied in the world’s most ad-vanced wire rod mill in Leoben/Donawitz, Austria, which was officially inaugurated at the end of September 2017. This fully digitalized, high-tech facility is used to manufacture steel-based wires which—in terms of purity, strength, and ductility—conform to the highest technological standard currently achievable. In the future, this facility, which was built at a cost of EUR 140 million, will produce 550,000 tons of wire rod annually for the most sophisticated applications in the automo-tive, energy, construction, and mechanical engi-neering industries. In the metallurgical area, the Group’s current activities in Leoben/Donawitz, Austria, are focused on the construction of a new continuous casting facility (“CC4”) for the produc-tion of high-purity steels used in premium rails, quality wire as well as the most sophisticated seamless tubes especially for the oil and gas sec-tor. The foundation work for this new facility with an annual capacity of up to 950,000 tons, which will be commissioned in the second half of 2019, started in the past business year. Currently, we are also investing in a new, additional research facil-ity (the “Metallurgy Center”) to further boost the division’s innovative power. Fully two projects aimed not just at expanding, but also at increas-
ing the flexibility of production were completed in Kindberg, Austria, in the past business year: the expansion of the seamless tube rolling mill, for one, and the construction of an additional heat treatment line, for another.
In the Metal Forming Division, investment expen-ditures rose in the business year 2017/18 by 6.6% from EUR 205.1 million in the previous year to EUR 218.6 million this year. As in recent years, the division’s focus in this connection was on the Automotive Components business segment, in particular, the continued expansion of key tech-nologies related to ultra high-strength auto motive components. This resulted in the commissioning of two “phs” hot forming lines in Cartersville, Georgia, USA, during the past business year; a similar facility was launched in Shenyang, China, at the same time. One assembly plant each was built in Aguascalientes, Mexico, and Tianjin, China, in direct proximity to international automotive customers. In Nagold, Germany, the capa cities for inline-bonded lamination stacks (compacore®), which are used especially in e-mobility applica-tions, were expanded pursuant to long-term con-tracts with European automotive manufacturers. Given the continually rising demand for lightweight automotive parts, our investment in two additional laser welding systems, which will be operational in the fall of 2018 and in 2019, respectively, aims to further expand the production of laser- welded blanks in Linz, Austria. The launch of the second facility in the fall of 2016 already made Linz the world’s largest “blanks production site”—a status that these investments will underscore.

43A N N U A L R E P O R T 2 0 1 7 / 1 8
Just as in previous business years, the voestalpine Group’s acquisition activities in the business year 2017/18, too, were subject to tight limits. In most cases, strategically meaningful acquisitions failed in the face of purchase price demands which were untenable due to the extremely low interest rate environment.Against this backdrop, in the past business year solely the Metal Forming Division carried out a noteworthy acquisition, specifically, by means of
an asset deal. Under this deal, voestalpine Rotec GmbH took over the coating facilities of BARUM Technik, a Romanian company headquartered in Timisoara, Romania. BARUM has been a part-ner of voestalpine Rotec GmbH for many years in the field of cathodic dip-coating (CDC). By carrying out the coating process itself from now on, the voestalpine Rotec Group is adding yet another step to its value chain.
ACQUISITIONS

44 M A N A G E M E N T R E P O R T
EMPLOYEES
As of the close of the business year 2017/18 (March 31, 2018), the voestalpine Group had 47,603 employees (excluding apprentices and temporary employees) and thus around 1,737 employees or 3.8% more than as of March 31, 2017. Including the 1,301 apprentices and 3,868 temporary employees, the resulting total is 51,621 full-time equivalents (FTEs); this represents a year-over-year increase in the total headcount of 3.9% (or 1,918 FTEs).Compared with the previous business year, the headcount of temporary personnel (3,868) rep-resents an increase of 5.1%.A total of 54.1% of the employees (27,922 FTEs) work at Group sites outside of Austria and 23,699 employees in Austrian voestalpine companies.As of the reporting date (March 31, 2018), the voestalpine Group was training 1,301 appren-tices: 59.5% of them in Austrian companies and 40.5% at sites abroad. Compared with the pre-vious year, the number of apprentices overall has decreased by 19 individuals or 1.4%.
EMPLOYEE PARTICIPATION PLAN
voestalpine has had an employee participation plan since 2001, which has been continually ex-panded since then. Besides all of the employees in Austria, employees in Great Britain, Germany, the Netherlands, Poland, Belgium, the Czech Republic, Italy, Switzerland, and Romania have a share in “their” company. The expansion of the number of participating personnel at loca-tions abroad continued in the business year 2017/18. The voestalpine Mitarbeiterbeteiligung Privat-stiftung (employee foundation for the Group’s employee participation plan) is the second largest shareholder of voestalpine AG. As of March 31, 2018, a total of 25,100 employees have a stake in voestalpine AG through voestalpine Mit ar beiter-beteiligung Privatstiftung. They hold about 22.8 million shares which, due to the general bundling of voting rights, represent 12.9% of the Com pany’s share capital (previous year: 13.6%). In addition,
the foundation manages about 2.0 million “private shares” owned by former and current Group employees, which they may freely dispose of; this corresponds to an additional 1.1% of the voting shares. As of March 31, 2018, there-fore, 14.0% of voestalpine AG’s share capital (previous year: 14.8%) is owned by employees.
THE STAHLSTIFTUNG (STEEL FOUNDATION)
In 1987, the “Stahlstiftung” (Steel Foundation) was founded in Linz, Austria, as an employee fund with the aim of providing not only employees of the VOEST-ALPINE Group (as it was called at the time), who had to leave due to a crisis, but also employees of companies outside of the Group the opportunity to realign themselves profession-ally while undergoing up to four years of training and continuing education in order to offset or at least alleviate the impact of the job loss. In the business year 2017/18, more than 88% of the participants looking for work were able to de-velop a new professional perspective with the help of the Stahlstiftung.As of the reporting date (March 31, 2018), the Stahlstiftung was supporting a total of 374 indi-viduals, 56.7% of whom were participants from voestalpine Group companies. The total number of active Stahlstiftung participants in the business year 2017/18 was 676, i.e. 12.2% less than the previous year (770 individuals).
APPRENTICES AND YOUNG SKILLED WORKERS
The fifth voestalpine Group Apprentice Day was held at the headquarters of voestalpine AG in Linz, Austria, in October 2017. Three hundred and fifty apprentices from Austria and Germany at-tended together with their trainers. The event aims to introduce the Group employees in training to as many of their young colleagues from other locations as possible and, at the same time, to

45A N N U A L R E P O R T 2 0 1 7 / 1 8
give them something of a first-hand overview of the Group. The Company invests about EUR 70,000 per ap-prentice in the comprehensive three- or four-year apprenticeship program. In order to efficiently approach potential apprentices, voestalpine has continuously expanded its social media activities via Facebook, YouTube, Twitter, LinkedIn, Watchado, and Instagram in recent years. Using the Job Bot, voestalpine has also been offering an innovative job search option on Facebook since the current business year. By using this chatbot technology, the Company is setting a benchmark in digital HR communications yet again. The Group’s excellent performance in terms of the number of apprentices who complete their pro-grams is creating a solid base of skilled workers for the future: 96.7% of the apprentices who sat for their exams in Austria and Germany in the past business year passed their final apprenticeship exam. Of the Austrian graduates, 58.1% even got “good” or “excellent” grades. At the WorldSkills 2017 Competition in Abu Dhabi (a vocational education and skills excellence championship), the voestalpine apprentices were awarded a “Medallion for Excellence” yet again. During the business year just ended, the voestalpine training center in Kapfenberg, Austria, was awarded the Austrian National Prize for “Best Apprentice Train-ing Companies – Fit for Future” for its forward-look-ing approach to training. Projects such as the “digital learning factory,” which already train our apprentices for the coming digitalization, carried the day with the jury.For the apprenticeship year 2018/19 beginning in the fall of 2018, voestalpine is offering around 415 new apprenticeships in Austria and Germany alone. This concerns a total of 50 vocational oc-cupations at 40 companies. Every year, many of these companies organize an “Open House” ahead of time where schoolchildren and their parents can obtain information in person on the wide range of training and apprenticeship op-tions.
DEVELOPMENT OF EXECUTIVES
In the business year 2017/18, 254 participants (15.7% of which were women) from 24 countries began their training course in various categories of the voestalpine management development system as part of the Group-wide development of executives or “value:program.” It provides train-ing and advancement programs tailored to tar-get groups for all executive levels based on a combination of classroom and online courses, including external programs for postgraduates and those attending business schools. In addition to specialized tasks, focal points include strategy, change management, leadership, compliance, and organization.
OTHER DEVELOPMENT PROGRAMS
In order to foster and boost required employee capabilities and skills in targeted fashion, a num-ber of programs are being offered more or less continually, such as the Purchasing Power Acad-emy, the HR Academy, the China Young Profes-sional Training Program, the Early Career Program in North America, or the High Mobility Pool whose “Generation 2018” just recently started their two-year program. Numerous other programs and training options in individual divisions and business units com-plement the Group-wide training and continuing education portfolio for employees.
EMPLOYEE SURVEY
Comprehensive employee surveys are conducted in the voestalpine Group at three-year intervals. The most recent one took place in October 2016, and about 47,000 employees from over 200 com-panies in 47 countries were surveyed. The gener-ally pleasing findings confirmed the Company’s strengths relative to its employees yet again, but also shed light on critical aspects that remain

46 M A N A G E M E N T R E P O R T
unresolved. The first reporting on the steps taken in response to the survey took place in December 2017 and January 2018. Most of them concern issues such as “information & communication,” “professional development options,” and “iden-tification/employer.”
COOPERATION WITH UNIVERSITIES
Many voestalpine Group companies offer intern-ships for college and university students; one spe-cial focus here includes scientific papers by stu-dents in cooperation with voestalpine companies. Currently, a total of around 200 masters theses and dissertations are being written in coopera-tion with the Group.For several years now, voestalpine has offered students of Emory University (Atlanta, Georgia,
USA) a ten-week internship in the Group. In ex-change, students of the Johannes Kepler Univer-sity Linz, Austria, receive a scholarship to Emory University. Under another special program, stu-dents enrolled in the international “ACT – Austria, Canada, Taiwan” training course—a joint project of Johannes Kepler University Linz, Austria; the University of Victoria, Canada; and the National Sun Yat-sen University in Kaohsiung, Taiwan—take part in project work lasting several weeks at the Group’s Linz site.There are also numerous educational collabora-tion projects with the University of Mining and Metallurgy in Leoben, Austria. They range from sponsoring commitments to generate interest among young people in aiming for a degree in a technical field, to the so-called “voestalpine talks” (a collaborative event with all student represen-tatives), all the way to support for the annual “teconomy” student trade fair.

47A N N U A L R E P O R T 2 0 1 7 / 1 8
RAW MATERIALS
The prices of the most important input ma terials—iron ore and coal—for the production of steel in blast furnaces remained volatile even in the busi-ness year 2017/18, but the spreads were a lot smaller than in previous years. The price of iron ore, which is key to the production of pig iron, gradually fell during the first quarter of the business year 2017/18 and lost about one third of its value by the end of June 2017 relative to the start of the business year, with a low for the entire past business year of about USD 55 per ton of fine ore (CFR China) toward the end of the first quarter. Subsequently, the base price of iron ore fluctuated between roughly USD 60 per ton and just under USD 80 per ton. The development of steel production in China played a central role yet again, because China is responsible for about one half of crude steel production worldwide. Both the fairly low quality of the iron ore mined in China and the rising number of resulting mine closings in recent times continue to intensify the Chinese steel industry’s dependence on interna-tional ore suppliers. Demand in China for high-grade core material such as iron ore pellets (compressed ore) and lump ores is rising sharply for two reasons: to reduce harmful emissions and to boost productivity. As a result, in the past two years this has led to a substantial structural in-crease in the surcharges for iron ore pellets and lump ores relative to fine ores.When processed into blast furnace coke, coking coal is the second most important raw material besides iron ore for the pig iron production pro-cess and serves as both a source of energy and a reducing agent in order to release the oxygen from the ore-bearing rock. In the business year 2016/17, mine closings in China ordered by author-ities as well as a reduction in the annual number of work days in Chinese coal mines triggered a virtual explosion in the price of coking coal. A massive temporary supply shortage arose at the same time due to weather-related logistical prob-lems that affected the transportation of domes-tic coal from Northern China to other parts of the country. The price fluctuated substantially yet again at the start of the past business year, this
time due to a cyclone that paralyzed the railway connections from the important mining areas in Queensland, Australia, to the shipping ports. Subsequently, the price of coking coal remained highly volatile throughout the entire business year 2017/18, fluctuating between a per ton price of USD 140 and USD 250. The year 2017 also saw a turning point in the structural pricing of coking coal in that Japanese steel companies and Australian raw materials suppliers replaced the “benchmark system” (where a major contract largely dictates the general contract price) that had been in place for decades with an index-based pricing system. Besides coking coal for the in-house production of coke, voestalpine also sourc-es blast furnace coke externally, albeit in much smaller quantities. Naturally, the purchase price of coke was more or less as volatile as that of its base product coal. At its peak, the price of one ton of coke (FOB China) on the spot market was USD 380, in contrast to a low in 2017/18 of about USD 250 per ton. While iron ore is the base material and scrap solely a supplementary material in blast furnace-based steel production, scrap is the primary raw mate-rial in the electric arc furnace technology the High Performance Metals Division uses to manufacture special steel. In the past, the pricing curves of iron ore and scrap developed largely in sync with each other, albeit at different levels, but in the business year 2017/18 they began to diverge substantially from each other in that the price of scrap increased much more sharply than that of iron ore—even when accounting for higher surcharges on special grade ores such as lump ores or iron ore pellets. The price of high-value scrap (type E3, Germany) went from about EUR 260 per ton at the start of the business year to more than EUR 300 per ton 12 months later. The prices of numerous alloy elements used in steel processing soared during the business year 2017/18. Alloys are an important basic element in the production of special steel and thus are an important cost factor for the Group in general and for the High Performance Metals Division in particular. The prices of vanadium, wolfram, and

48 M A N A G E M E N T R E P O R T
molybdenum rose sharply in 2017/18, while the prices of chromium and manganese trended lat-erally. As regards nickel, the alloy with the highest value ratio in the alloy portfolio of the division, dramatic changes on the supply side were but one factor that triggered the considerable in-crease in its price. Although the Indonesian gov-ernment loosened the prohibition on the export of nickel ores that had been enacted in 2014, the
Philippines ordered numerous nickel mines to close for environmental reasons. While a ton of nickel cost less than USD 10,000 on the London Metal Exchange at the start of the business year 2017/18, the price continued to climb over the year to more than USD 13,000 at its close. At some 20%, the increase in the price of zinc (the element utilized mainly in the Steel Division) during the past 12 months is just slightly lower than that of nickel.

49A N N U A L R E P O R T 2 0 1 7 / 1 8
RESEARCH AND DEVELOPMENT, DIGITALIZATION
Research and Development (R&D) are a key to voestalpine’s long-term corporate strategy. Re-search expenditures (basis of calculation: Frascati Manual) have climbed continually in recent years. Actual expenses in the business year 2017/18 were EUR 152.1 million. The increase in the bud-get for the business year 2018/19 by 13.4% to EUR 172.5 million reflects the great importance of R&D to the Group.
The research activities are aimed at the expan-sion in the long term of the Group’s quality and technology leadership—especially in the defined growth industries, mobility and energy—as well as at the ongoing optimization of processes re-lated to energy and raw materials efficiency and the continuous reduction of emissions.Greatest weight in this connection is given to the holistic analysis of products and processes, i.e. the entire product life cycle, from raw materials to production all the way to recycling.
By developing new steel grades and continually improving existing ones, the voestalpine Group also aims to boost energy efficiency in sustain-able ways and thus to reduce environmental pollution in connection with the end products. While this applies mainly to the automotive and aircraft construction sectors, where weight and hence CO2 emissions can be substantially reduced while continuing to enhance product quality, it also applies to new applications in the energy sector with respect to both conventional and re-newable sources of energy.The voestalpine Group has traditionally and con-sistently worked to refine processes in view of bringing about an incremental decarbonization of steel production. For now, this is being achieved through “bridging technologies” based particu-larly on natural gas—e.g. the new direct reduction plant in Texas, USA, where voestalpine is endeav-oring to replace coal with alternative sources of energy in the production of steel. This also entails
RESEARCH EXPENDITURE FOR THE voestalpine GROUPIn millions of euros, R&D gross expenditure (without R&D facility investments)
125.6116.7
2012/132011/12 2013/14 2014/15 2015/16 2016/17 2017/18
128.4 126.7 131.8140.3
152.1
50 M A N A G E M E N T R E P O R T
the long-term goal of refining the technology such that direct reduction can be based on hydrogen instead of natural gas. In this connection, currently a hydrogen electrolyzer pilot plant is being built at the Group’s steel facility in Linz, Austria, to re-search the technology and its potential for the production of steel on the basis of hydrogen. Concurrently with the development of new pro-duction methods, existing processes are contin-ually refined with respect to resource conservation and environmental compatibility. This includes projects aimed at reducing the use of primary materials, lowering the use of water, or recycling residues such as slag and dust in environmentally compatible ways. Rapidly advancing digitalization contributes in-creasingly to the enhancement of process effi-ciency and quality. Research & development are a key component of digitalization—and vice versa. We are carrying out intensive research on issues such as model-based controls and adaptive sys-tems, and are translating applications into prac-tice on an ongoing basis. This refers, for example, to the world’s first fully digitalized wire rod mill at our steel facility in Leoben/Donawitz, Austria, which was commissioned in the previous year and is now operating successfully in normal mode. The voestalpine “Digitalization Day,” a two-day top-class symposium that features lectures by inter-national experts, presented new information and expanded views of what is currently the number one topic in the industry. Workshops were orga-nized to showcase numerous in-house projects, which brought home yet again how deeply digi-talization has already taken root in the Group.Mobility—voestalpine’s core segment—was the main topic at the “voestalpine Synergy Platform,” which took place for the 11th time this business year. External experts introduced aspects of future mobility and mobility concepts, while in-house experts used numerous examples to show the great extent to which mobility already is a driver of innovation in the voestalpine Group.Lightweight construction and e-mobility are stra-tegic growth areas in the automotive segment. The lightweight construction of automotive body
parts requires the continuous development of ultra-high tensile steels with extraordinary malle-ability in cold forming processes, for one, and the different hot forming processes based on phs-technology, for another. In this connection, the multi-material competence of voestalpine contributes a great deal to an understanding, both comprehensive and forward looking, of the central concept of “lightweight construction.”Metal-based additive manufacturing is another cutting-edge technology that is rapidly becom-ing ever more significant to the voestalpine Group. The high-tech steel powders required for it are developed by voestalpine BÖHLER Edelstahl GmbH & Co KG in Kapfenberg, Austria, and by Uddeholms AB in Hagfors, Sweden—specifically, for third-party applications as well as for the voest alpine Additive Manufacturing Centers in Düsseldorf (Germany), Singapore, and Toronto (Canada). Currently, the entire process chain—from production of the powder, to design, to post-product processing—is being analyzed in detail as part of a cross-divisional project. The results will provide the basis for focusing on the most promising applications.“compacore®,” an absolute innovation, has been implemented in the rapidly growing electromo-bility sector. It connects the voestalpine Group’s cross-divisional competence with respect to ma-terials and processing such that in a newly devel-oped process next-level, state-of-the-art electri-cal steel strip (isovac®) manufactured by the Steel Division is turned into inline-bonded electrical strip steel packages at the Metal Forming Divi-sion’s facility in Nagold, Germany, which, in turn, makes it possible to build highly efficient and qui-et electric motors. In March 2018, voestalpine won the Austrian Special State Prize VERENA that is awarded for cutting-edge innovations in the field of energy efficiency. In the Metal Engineering Division, following the successful completion of the massive, digital “new wire mill” project, the focus in digital research has turned to optimizing the entire railway turnouts system. “i-switch,” an “intelligent” turnout, is cur-rently being developed with the aim of reducing
51A N N U A L R E P O R T 2 0 1 7 / 1 8
both failures and maintenance work based on a system that makes it possible to safely control the turnout remotely and perform forward-looking status diagnostics along with relevant mainte-nance planning.In this business year, the “voestalpine Steel Re-search Prize” was awarded for the second time. The work of two voestalpine employees out of a total of 23 high-quality dissertations that had been submitted by international and national
candidates won the day. Their papers on the “Malleability and Breakage of State-of-the-Art, High-Tensile Multiphase Steels” (by Marianne Kapp, voestalpine BÖHLER Edelstahl GmbH & Co KG ) and on the “Investigation of the Effects of a Turnout Zone on the Mechanical Properties of High-Strength Welds” (by Wilhelm Maurer, voestalpine Stahl GmbH) were deemed equally excellent.

52 M A N A G E M E N T R E P O R T
ENVIRONMENT
ENVIRONMENTAL EXPENDITURES
The ongoing operating expenses of the voest-alpine Group for environmental systems in the business year 2017/18 rose from EUR 231.5 mil-lion a year earlier to EUR 257.7 million; at about EUR 40 million, investments were as high as in the previous years.
ENVIRONMENTAL FOCUS AND MEASURES
All of our efforts at bringing about sustainability are centered on the permanent optimization of process-related emissions and the continuous improvement of resource efficiency. Hence the most important investment projects of the Steel Division with respect to environmental issues in the business year 2017/18 concerned a new water processing facility including the asso-ciated measurement and control technology and the requisite cooling water system; optimizing the use of steel mill gas; regenerative afterburning in connection with the drying of coal for the pulver-ized coal injection (PCI) facility in the blast furnace area; as well as various measures aimed at im-proving dust collection and dedusting (e.g. in connection with continuous casting and the cok-ing plant). We also continued to work on the en-vironmental project of the century, i.e. the “coking plant remediation.”Environmental measures at the Metal Engineering Division focused principally on issues related to the blast furnace and sintering plant with the aim of reducing diffuse dust emissions by some 15 tons per year. Among other things, this includes the installation of a new misting system in the coke unloading area, the expansion of the local de-dusting system in the coke and coal unloading area as well as the improvement of existing jetting systems at various conveyors. The High Performance Metals Division commissioned a new oil spray extraction system in Böhlerwerk, Austria, for example, which eliminates the oil and/or emul-sion mists that arise in connection with profiling
during the heat treatment and milling processes. The Metal Forming Division implemented a num-ber of environmental measures particularly at its facilities in China, among them systems serving to combat dusts containing phosphorous and ammonia and/or the associated pollution of sur-face water. This so-called Air Brewing System, which comprises a novel process for collecting the pollutants as well as diverting and vaporizing four tons daily of wastewater containing phos-phorous followed by reprocessing, has a removal efficiency of 95%. The energy self-sufficiency through renewables of the Company’s sites is consistently being ex-panded wherever there are adequate roof sur-faces that satisfy the given structural requirements and offer economically viable options for using the generated energy. At the Kapfenberg site in Austria, for example, buildings were equipped with photovoltaics as part of a collaborative proj-ect with industrial partners. The expected output corresponds to the annual needs of up to 300 households. The feeding of the energy into the grid was agreed with a regional utility.
ECOLOGICAL PRODUCT CONSIDERATIONS
The potential of steel as a material and/or of products made of steel and hence their life cycle assessment, i.e. the comprehensive ecological assessment of materials, is one of the linchpins of our environmental activities. In the past business year, additional projects were implemented or fleshed out, for example, with customers in the automotive or railway infrastructure industry. Be-sides preparing Environmental Product Declara-tions (EPD) and participating in the preparation of data sets, e.g. in cooperation with worldsteel (the World Steel Association), this also includes Group-wide activities regarding our water foot-print.

53A N N U A L R E P O R T 2 0 1 7 / 1 8
ENVIRONMENTAL EXPENDITURESIn millions of euros Environmental investments Environmental operating expenses
212
2012/132011/12 2013/14 2014/15 2015/161 2016/17 2017/18
213 218 222237 231
258
1 In the business year 2015/16, in addition to the emission-intensive Austrian Group sites, a number of other, primarily international, production companies were included.
32 27 2343
55 46 40
ENVIRONMENTAL MANAGEMENT SYSTEMS
Of the approx. 130 production-oriented Group companies worldwide listed in the environmental data management system, about 60% have an environmental management system (EMS) pur-suant to ISO 14001, about 15% have also been validated under the EU’s Eco-Management and Audit Scheme (EMAS), and more than 20% utilize the energy management standard pursuant to ISO 50001. ISO 14001 is currently being imple-mented at the Group’s facility in Corpus Christi, Texas, USA, among other sites.
Besides operating/corporate issues, decisions on long-term energy and climate policies at the global, European, and national level as well as on the resulting planning options available to the Company have been and are at the heart of the Group’s environmental activities. Through a coordinated dialogue with stakeholders, in this connection voestalpine actively participates at several levels, both directly and via advocacy groups, in the political opinion-forming and de-cision-making process. The goal is to shape the
political parameters that are key to the Company in ways that create a balance between long-term societal, social, and economic interests.
ENERGY AND CLIMATE POLICY
The world climate agreement of the United Na-tions, which has taken effect by now, provides the framework for both the European and the nation-al polity to act in respect of energy and climate policy and will replace the Kyoto Protocol from 2020 as the global climate protection agreement. In the meantime, the Paris Agreement has been ratified by 175 countries, including the European Union, and is being fleshed out step by step. The EU and its individual member states have committed to abide by their “2030 Goals” in this connection and have established the “Energy Union” to serve as the framework for energy, climate, competition, and innovation policies. A key action package thereunder—“Clean Energy for all Europeans”—which is intended to address issues such as energy efficiency, expansion of renewables, energy market design, and over-arching governance including the preparation

54 M A N A G E M E N T R E P O R T
of national energy and climate plans, is currently in a “trilogue” between the Commission, the Council, and the Parliament of the European Union. In the Company’s view, the global compe-titiveness of the European economy as a whole (and not just of individual sectors) must always be central to the decisions at that level.
The reform of the EU emissions trading system for the 2021 to 2030 trading period was finally adopted at the end of 2017. Despite an official carbon leakage protection level of 100% which, in actual fact, is insufficient due to systematic deductions, in our current estimation the voest-alpine Group’s future needs for additional credits will correspond more or less to those in the cur-rent trading period, i.e. about one third of the Company’s total CO2 emissions. Aside from specu-lative aspects of the certificates market, the most recent price developments with respect to emis-sions trading certificates lead us to believe that, as a result of the decision, the voestalpine Group will be saddled with a rapidly growing financial burden in the future. In the business year 2017/18, the “CO2 price” shot up from EUR 4.86 to EUR 13.26 and thus by 172.8%, an increase that occurred largely after the date on which the reso-lution on the emissions trading reform was ad-opted.
At the national level, finally, voestalpine is part of a comprehensive stakeholder dialogue on the “Integrated Energy and Climate Strategy,” which was being decided upon politically at the time this annual report was prepared.
THE H2FUTURE PROJECT
In order to support the development of energy management as it relates to the production of steel in the long term against this backdrop, at this time the currently largest and most advanced electrolyzer plant for the generation of “green”—i.e. CO2-free—hydrogen is being built at voest-alpine’s Linz, Austria, site. Starting in 2019, the
possibilities for using “green” hydrogen in the different process stages of steel production as well as the interaction with the grid’s electricity balancing market will be tested in the flagship project named “H2FUTURE – green hydrogen” that is being undertaken by the Fuel Cells and Hydrogen Joint Undertaking (FCH JU) as part of the EU’s “Horizon 2020 Program” and has a total investment volume of EUR 18 million. Besides voestalpine, the project also involves VERBUND as the provider of electricity from renewable sourc-es; Siemens as the technology provider of the electrolysis module that was newly developed for the H2FUTURE project; the transmission sys-tem operator Austrian Power Grid (APG) as well as the scientific partners K1-MET and the Energy Research Centre of the Netherlands (ECN). After having been officially launched at the beginning of 2017, the construction work started in early 2018 once the construction permit was granted and has been largely completed by now such that the installation of the key electrical components is slated for the summer of 2018 and the commis-sioning for the end of 2018. The start-up of the extensive, two-year pilot program, which will run until about the middle of 2021, is planned for the spring of 2019.
A program entitled “Sustainable Steel” (SuSteel), which serves to develop a novel hydrogen plas-ma technology for the smelting reduction of iron ores and thus the direct production of steel from ore, is also being pursued at voestalpine. In this case, hydrogen plasma is to be used for reducing the oxides and the plasma energy for the smelt-ing of the metallic iron. The fundamental feasibil-ity of manufacturing steel directly from iron oxides by way of hydrogen plasma has already been tested and confirmed in bench-scale tests. To push the development for purposes of broader technological adoption, currently a pilot plant for the incremental adaptation of components and component groups is being built in Leoben/Donawitz, Austria.

55A N N U A L R E P O R T 2 0 1 7 / 1 8
REPORT ON COMPANY RISK EXPOSUREProactive risk management, as it has been under-stood by and practiced in the voestalpine Group for many years, serves both to ensure the exis-tence of the Group as a going concern in the long term and boost its value and thus is key to the success of the voestalpine Group on the whole.The voestalpine Group has had a comprehensive risk management system since the business year 2000/01, which is rooted in a general policy that applies throughout the Group and has been up-dated and expanded repeatedly since then.In accordance with the Austrian Company Law Amendment Act of 2008 (Unternehmensrechts- Änderungsgesetz) and the associated increased importance of the internal control system (ICS) and the risk management system, an Audit Com-mittee has been set up at voestalpine AG which, among other things, addresses questions related to risk management and the internal control sys-tem as well as the monitoring thereof on an on-going basis. Both the risk management and the internal control systems are integral components of the existing management systems within the voestalpine Group. The Internal Auditing depart-ment monitors the operational and business pro-cesses as well as the ICS and, as an independent, in-house department, also has full discretion with respect to the appraisal of the audit results.The systematic risk management process assists management in recognizing risks early on and initiating appropriate action to avert or prevent dangers. As is proper in shareholder value man-agement, risk management is an integral part of the business processes; it covers both the strate-gic and the operational levels and thus is a ma-terial element of the Group’s sustainable success.
Strategic risk management serves to evaluate and safeguard the strategic planning for the future. The strategy is reviewed as to its confor-mity with the Group’s system of objectives in order to ensure value-added growth by way of an op-timum allocation of resources.
Operational risk management is based on a re-volving procedure (“identify and analyze, assess,
manage, document, and monitor”) that is run at least once a year uniformly across the entire Group. Identified risks are appraised using a nine-field assessment matrix that evaluates possible losses and the probability of their occurring. In the main, it documents operational, environmen-tal, market, procurement, technological, financial, compliance, and IT risks. This process is support-ed by a special Web-based IT system.
The preventive measures for the main risk areas presented in last year’s Annual Report are still valid.
» AVAILABILITY OF RAW MATERIALSIn order to ensure the supply of raw materials and energy in the required quantities and qual-ity in the long term, the voestalpine Group has for some years pursued a diversified procure-ment strategy appropriate to the heightened political and economic risks of this globalized market. Long-term relationships with suppliers, the expansion of the supplier portfolio as well as the development of the Group’s self-suffi-ciency are the core elements of this strategy, which are becoming increasingly important in view of the present volatility on the raw ma terials markets. (For more details, please refer to the “Raw Materials” chapter of this Annual Report).
» GUIDELINE FOR HEDGING RAW MATERIALS PRICE RISK
An internal guideline defines objectives, prin-ciples and responsibilities, in addition to meth-odology, processes, and decision-making pro-cesses for how raw materials risks are handled. Based thereon and taking into account indi-vidual specificities of the business model of the respective Group company, prices are hedged by means of delivery contracts containing fixed price agreements or by means of derivative fi-nancial instruments. Financial derivatives are deployed to hedge raw materials procurement contracts.

56 M A N A G E M E N T R E P O R T
» CO2 ISSUERisks associated with CO2 are covered sepa-rately in the ”Environment” chapter of this Annual Report.
» FAILURE OF IT SYSTEMSAt the majority of the Group’s sites, business and production processes, which are largely based on complex IT systems, are serviced by voestalpine group-IT GmbH, a company that specializes in IT and that is wholly owned by the Group holding company voestalpine AG. Due to the importance of IT security and in order to minimize possible IT breakdown and security risks, minimum security standards for IT have been developed. These minimum standards are regularly revised and adapted to new circum-stances; compliance with these new standards is reviewed annually by way of an audit. Addi-tional periodic penetration tests are carried out in order to further reduce the risk of unautho-rized access to IT systems and applications. In the business year just ended, broad online cam-paigns were carried out to further sensitize our employees to issues of IT security; the topic of cyber security was also addressed at length.
» FAILURE OF PRODUCTION FACILITIESIn order to minimize the risk of breakdowns of critical facilities, ongoing targeted and com-prehensive investments are made in the techni-cal optimization of sensitive units. Supplemen-tary measures encompass consistent preventive maintenance, risk-oriented storage of spare parts as well as appropriate employee training.
» KNOWLEDGE MANAGEMENTIn order to sustainably safeguard the Group’s knowledge and especially to prevent the loss of know-how, previously initiated complex projects are consistently maintained. Available knowl-edge is permanently documented on an ongo-ing basis, while new findings from key projects as well as lessons learned as the result of un-planned events are incorporated accordingly. Detailed process documentation, especially in
IT-supported areas, also contributes to securing the available knowledge.
» RISKS IN THE FINANCIAL SECTORFinancial risk management is organized cen-trally with respect to policy-making power, strat-egy determination, and target definition. The existing policies include targets, principles, du-ties, and responsibilities for both the Group Treasury and the financial departments of the individual Group companies. Financial risks are monitored continuously and hedged where feasible. In particular, this strategy aims to bring about natural hedges and to reduce the fluc-tuations in both the cash flow and the income. Market risks are largely secured through de-rivative financial instruments that are used ex-clusively in connection with an underlying trans-action.
Specifically, financing risks are hedged using the following measures:
» Liquidity riskLiquidity risks generally consist of a company being potentially unable to raise the funds nec-essary to meet its financial obligations. Existing liquidity reserves enable the Company to meet its obligations even in times of crisis. The primary instrument for controlling liquidity risk, further-more, is a precise financial plan that is prepared on a revolving, quarterly basis. The need for fi-nancing and bank credit lines is determined centrally by Group Treasury based on the con-solidated operating results.
» Credit riskCredit risk refers to financial losses that may arise from the non-fulfillment of contractual ob-ligations by individual business partners. The credit risk of the underlying transactions is min-imized to a large degree through credit insur-ance and bankable securities (guarantees, letters of credit). The default risk for the Group’s remaining own risk is managed by way of de-fined credit assessment, risk evaluation, risk

57A N N U A L R E P O R T 2 0 1 7 / 1 8
classification, and credit monitoring processes. As of March 31, 2018, 79% of the trade receiv-ables were covered by credit insurance. Coun-terparty credit risk in financial contracts is man-aged by way of daily monitoring of the ratings and any changes in the counterparties’ credit default swap (CDS) levels.
» Currency riskThe primary objective of foreign currency risk management is to create a natural hedge (cross-currency netting) within the Group by bundling the cash flows. In this connection, hedges are implemented centrally by Group Treasury based on derivative hedging instru-ments. voestalpine AG hedges the budgeted foreign currency payments (net) for the next twelve months. Longer-term hedging is carried out only in connection with contracted project business. The hedging ratio is between 25% and 100% of the budgeted cash flows within the next twelve months.
» Interest rate riskvoestalpine AG conducts the interest rate risk assessment centrally for the entire Group. In particular, this entails managing the cash flow risk (the risk that interest expenses or interest income may undergo an adverse change). As of the March 31, 2018, reporting date, any in-crease in the interest rate by one percentage point would result in an increase of the net in-terest expense by EUR 8.8 million in the next business year. However, this is a reporting date assessment that may be subject to significant fluctuations over time. Interest-bearing invest-ments have also been made, because voest-alpine AG maintains a liquidity reserve to ensure the availability of liquidity. In order to avoid any resulting interest rate risk, the interest rate ex-posure on the asset side, which is expressed by way of the modified duration, is linked to the interest rate exposure on the liability side (asset/liability management).
» Price riskvoestalpine AG also assesses price risk, primar-ily using scenario analyses for the purpose of quantifying interest and currency risks.
» Compliance risksCompliance violations, e.g. antitrust and cor-ruption violations, represent a significant risk and may have adverse effects, with respect to both financial losses and damage to the Group’s reputation. In particular, we address antitrust and corruption violations by way of the Group-wide Compliance management system, but they cannot be excluded. Regarding antitrust pro-ceedings and allegations, see Chapter 19 in the Notes.
» UNCERTAINTIES STEMMING FROM LEGISLATIONEnergy tax rebate in AustriaIt must be noted with respect to the Austrian en-ergy tax rebate that the Austrian Federal Finance Court (Bundesfinanzgericht) has directed a re-quest for a preliminary ruling to the European Court of Justice (ECJ) (BFG 10/31/2014, RE/5100001/2014). The amendment of the Aus-trian Energy Tax Rebate Act (Energieab gabenver-gütungsgesetz) by means of the 2011 Austrian Budget Accompanying Act (Budget begleitgesetz – BBG 2011), which applies to periods after De-cember 31, 2010, limited the energy tax rebate to manufacturing companies. Subsequently, the question as to whether this restriction, which may be deemed state aid, violated European Union law was submitted to the ECJ for a preliminary ruling; the highest court has by now answered the question in the affirmative (ECJ 07/21/2016, docket no. C-493/14, Dilly’s Wellnesshotel GmbH). This means that the restrictions envisioned in the BBG 2011 have not taken effect. Therefore, ser-vice providers, in particular, can retroactively apply for the energy tax rebate with respect to periods after February 1, 2011. In its subsequent ruling, the Austrian Federal Finance Court de-clared that the restriction to manufacturing com-panies did not enter into effect. The Austrian fiscal
58 M A N A G E M E N T R E P O R T
author ities appealed this decision to the Austrian Higher Administrative Court (Ver waltungs gerichts-hof), which in September 2017 (Decision dated 09/14/2017, EU 2017/0005 and 0006-1) again sought recourse with the ECJ. No adverse impact is anticipated for the voestalpine Group.
ECONOMIC AND FINANCIAL CRISIS
Based on the knowledge gained as a result of the recent economic and financial crises and/or their effect on the voestalpine Group, additional mea-sures—primarily of a corporate nature—were taken in recent years to minimize the risk exposure, and these measures were consistently implemented in the past business year and will be pursued in the coming years too. In particular, these measures are targeted at » Minimizing the negative effects that a reces-
sionary economic trend would have on the Com-pany by means of relevant planning precautions (“scenario planning”);
» Maintaining high product quality along with concurrent continual efficiency gains and on-going cost optimization;
» Ensuring that sufficient financial liquidity is avail-able even in the event of tight financial markets; and
» Securing in-house expertise even more efficient-ly than before with a view to continuing the long-term expansion of the Group’s quality and tech-nology leadership.
Specific measures to hedge the risks previously identified within the voestalpine Group have been developed and implemented. These measures are aimed at reducing potential losses and/or minimizing the likelihood of losses occurring.
It can be stated that, from today’s perspective, the risks of the voestalpine Group are limited and man-ageable and that they do not threaten the con-tinuation of the Group as a going concern. There is no indication of any future going-concern risks.
REPORT ON THE KEY FEATURES OF THE GROUP’S INTERNAL CONTROL AND RISK MANAGEMENT SYSTEMS WITH REGARD TO ACCOUNTING PROCEDURES
In accordance with Section 243a (2) of the Aus-trian Commercial Code (Unternehmensgesetz-buch – UGB), companies whose shares are trad-ed on the regulated markets must describe the key features of their internal control and risk man-agement system with regard to accounting pro-cedures in their management reports. It is the responsibility of the Management Board to establish a suitable internal control and risk management system for accounting procedures pursuant to Section 82 of the Austrian Stock Corporation Act (Aktiengesetz – AktG). Therefore, the Management Board of voestalpine AG has adopted guidelines that are binding for the entire Group.In line with the decentralized structure of the voest alpine Group, the local management of each Group company is obligated to establish and refine an internal control and risk management system for accounting procedures that meets the requirements of that individual company and ensures compliance with existing Group-wide guidelines and regulations.The entire process, from procurement to payment, is subject to strict and unified Group-wide guide-lines that are designed to reduce the risks asso-ciated with the business processes to a minimum. These Group guidelines set forth measures and rules for avoiding risk, such as the separation of functions, signature authority rules, and particu-larly signatory powers for authorizing payments that apply only collectively and are limited to only a few persons (four-eyes principle).In this context, control measures for IT security constitute a cornerstone of the internal control system. Issuing IT authorizations restrictively sup-ports the separation and/or segmentation of sen-sitive activities. Accounting in the individual Group companies is largely performed using SAP soft-

59A N N U A L R E P O R T 2 0 1 7 / 1 8
ware. The reliability of these SAP systems is being guaranteed by automated business process con-trols that are built into the system as well as by other methods. Reports about critical authori za-tions and authorization conflicts are generated automatically. In preparing the Consolidated Financial State-ments, the data for fully consolidated entities is transferred to the unified Group consolidation and reporting system.The unified Group accounting policies for record-ing, posting, and recognition of commercial trans-actions are regulated in the voestalpine consol-idated financial statements handbook and are binding for all Group companies. On the one hand, automatic controls built into the reporting and consolidation system, together with numerous manual reviews on the other are implemented in order to avoid material misstate-ments to the greatest extent possible. These con-trols extend from management reviews and dis-cussions of income and expenses for each period to the specific reconciliation of accounts. The summarizing presentation of how the Group re-ports its accounting processes is provided in the voestalpine AG controlling handbook.The accounting and controlling departments of the individual Group companies submit monthly reports with key performance indicators (KPIs) to their own managing directors and management boards of the divisions, and, after approval, to the holding division Corporate Accounting & Reporting to be aggregated, consolidated, and reported to the Group Management Board. Quar-terly reports include additional information, such as detailed target-performance comparisons, and follow a similar process. Quarterly reports are submitted to the supervisory board, management board, or advisory board of each Group com-pany and a consolidated report is submitted to the Supervisory Board of voestalpine AG.Besides operational risks, accounting procedures are also subject to the Group risk management. In this context, possible risks regarding account-ing are analyzed on a regular basis, and mea-sures to avoid them are taken. The focus is placed
on those risks that are regarded as fundamental to the activities of that company. Compliance with the internal control system, including the re-quired quality standards, is monitored on an on-going basis in the form of audits at the Group company level. The Internal Audit department works closely with the responsible Management Board members and managing directors. The Internal Audit department reports directly to the CEO and submits reports periodically to the Management Board and, subsequently, to the Audit Committee of the Supervisory Board of voest alpine AG.

60 M A N A G E M E N T R E P O R T
NUMBER OF OWN SHARES
As of March 31, 2018, holdings of own shares for the purpose of issuing shares to employees and executives of the Company and of affiliated com-
panies under the existing employee stock owner-ship plan are as follows:
Own shares in thousands
of shares
Percentage of share capital
in %
Percentage of share capital in thousands
of euros
As of 03/31/2017 28.6 0.0 52.0Additions in 2017/18 0.0 0.0 0.0 Disposals in 2017/18 0.0 0.0 0.0 As of 03/31/2018 28.6 0.0 52.0
The own shares have been held by the Company for years.

61A N N U A L R E P O R T 2 0 1 7 / 1 8
DISCLOSURES ON CAPITAL, SHARE, VOTING, AND CONTROL RIGHTS AS WELL AS ASSOCIATED OBLIGATIONS
At EUR 320,394,836.99, the share capital of voest-alpine AG as of March 31, 2018, is unchanged from the previous year and is divided into 176,349,163 no-par value bearer shares. There are no restrictions on voting rights (1 share = 1 vote). voestalpine AG is unaware of any agree-ments among or between its shareholders and third parties that restrict voting rights or the trans-fer of shares.
Raiffeisenlandesbank Oberösterreich Invest GmbH & Co OG, Linz, Austria, and the voest alpine Mitarbeiterbeteiligung Privatstiftung (a private foundation for the Company’s employee partici-pation plan), Linz, Austria, each hold more than 10% (and less than 15%) of the Company’s share capital. Oberbank AG, Linz, Austria, holds more than 5% (and less than 10%).
The Management Board of voestalpine Mitar-beiterbeteiligung Privatstiftung exercises the voting rights of shares held in trust by voestalpine Mitarbeiterbeteiligung Privatstiftung for the em-ployees of the Group companies of voestalpine AG that participate in the employee participation plan. However, the way the voting rights are ex-ercised requires the approval of the Advisory Board of voestalpine Mitarbeiterbeteiligung Privatstiftung. The Advisory Board resolves the approval with a simple majority. It is constituted on the basis of parity, with six members each rep-resenting the employees and the employer. The chairperson of the Advisory Board, who must be appointed by the employee representatives, casts the deciding vote in the event of a tie.
As regards the Management Board’s powers that do not follow directly from the law such as buybacks of the Company’s own shares, autho-rized or contingent capital, reference is made to
chapter 17 (Equity) of the Notes to the Consoli-dated Financial Statements 2017/18.
The EUR 500 million hybrid bond issued in March 2013; the EUR 500 million fixed-interest securities 2012–2018; the EUR 400 million fixed- interest securities 2014–2021; the EUR 500 million fixed- interest securities 2017–2024; the promissory note loans totaling EUR 514.5 million and USD 100 mil-lion; the EUR 900 million syndicated loan execut-ed in March 2015 (which is used for general cor-porate purposes and to refinance the syndicated loan 2011, EUR 600 million of which is being used as a revolving credit facility to ensure liquidity); as well as bilateral loan agreements for a total of EUR 469.4 million and USD 457.3 million contain change-of-control clauses. With the exception of the hybrid bonds, under the terms of these financ-ing agreements the bondholders or the lenders have the right to demand redemption of their bonds or repayment of their loans if control of the Company changes hands. Under the terms and conditions of the hybrid bond issue, the respective fixed interest rate (interest rate during the fixed- interest periods) and/or the margin (interest rate during the variable interest periods) rise by 5% (five percent) 61 days after a change of control has taken place. voestalpine AG has the right to call and redeem the bonds effective no later than 60 days from the change of control. Under the terms and conditions of the aforementioned bonds and financing agreements, the acquisition by an-other party of a controlling interest as defined in the Austrian Takeover Act (Übernahmegesetz) triggers a change of control at voestalpine AG.
There are no indemnity agreements between the Company and the members of the Management Board, Supervisory Board, or employees in the event of a public takeover bid.

62 M A N A G E M E N T R E P O R T
OUTLOOK
Ultimately, the business year 2017/18 ended ex-actly the way it was forecast in the Outlook sec-tion of the annual report 2016/17, specifically, the Group’s substantially positive performance in terms of both revenue and results. But the fact that, in the end, all the revenue and results figures for the previous years—including those of the “pre-Lehman era”—were surpassed could not be foreseen a year ago. Even though the point of departure for 2018/19 looks promising against this backdrop, the geo-political events in the spring of 2018 underscore yet again that the deck of cards is always re-shuffled every business year—and the relevant indicators do contain certain contradictions. Economic growth that has been stable across just about all major industries and countries for the first time in a decade is contrasted by the growth of uncertainty that arises from in creasingly protectionist economic policies in ever more re-gions. What surprises, however—and not just for the first time—is the global economy’s high resilience overall to critical political developments com-pared with previous years. Neither the blatant attempt on the part of the United States to con-trol economic flows in its sense, nor the perma-nently growing political and military escalation in the Middle East or the increasingly escalating sanctions carousel between Russia and the West seem to undermine the broad current of eco no-mic growth. As before, particularly China and Europe but (with limitations) the United States as well are driving an ongoing upward momentum that is supported by heretofore unknown growth rates in India and new economic traction in Brazil. Never theless, the question remains, how long these developments will be sustained by the trust of the capital and financial markets and the will-ingness of investors to continue funneling funds into these markets. At the start of the Group’s new business year, potential political risks still do not seem to have any palpable effect on at least the fundamentals of the global economy. Demand remains positive in almost all sectors of the economy and cus tomer
segments. Many industrial sectors are experienc-ing strong, worldwide momentum that continues unabated, and this is not expected to change in the coming months because orders on hand are high. This applies, in particular, to the auto-motive industry, the consumer goods industry, the aircraft construction sector as well as large portions of the mechanical engineering sector; the construction industry is seeing a gradual re-covery, not just in Europe. The same goes for the oil and natural gas sector. By contrast, devel-opments in the railway infrastructure segment (especially in the European Union) remain re-strained, and demand in the conventional ener-gy generation sector (power plant construction) remains low.The availability of the primary raw materials used in steel production (iron ore, metallurgical coal, scrap, alloys) should not pose a problem in the new business year despite the booming econo-my. Judging from developments in the first few months, we may expect prices to trend toward lower short-term volatility than in the previous year, not least due to growing capacities in the mining sector.In sum, the excellent economic environment in the first quarter of the business year 2018/19 gives us reason to expect that the strong de-velopment of key markets will continue unabated at minimum until the fall of 2018. But one must take into account with respect to the earnings performance of voestalpine AG that the results for 2018/19—particularly those of the second quarter—will be massively affected by the long-planned repairs and resulting downtime of the Group’s largest blast furnace. Excluding this non- recurring effect, the operating result for the first six months of the current business year should more or less equal that for the first half of the business year 2017/18.It is much more difficult, however, to provide a forecast for the second half of the business year 2018/19, because material adverse effects from the trade policies of at least some countries will likely make themselves felt by this time. Moreover, the question as to the sustainability of the current

63A N N U A L R E P O R T 2 0 1 7 / 1 8
This report is a translation of the original report in German, which is solely valid.
economic boom, whose roots reach back to 2016, will also crop up by then.The uncertainties in the second half of the busi-ness year 2018/19 notwithstanding, both EBITDA and EBIT for the year on the whole should corre-spond more or less to the previous year’s level. This is based on the assumption that the negative effects of the blast furnace repairs can be offset largely by positive effects from the recovery of individual sectors (railway infrastructure, oil and natural gas sector) and that the fallout from in-ternational trade policies will be limited. The
successful ramp up of major facilities in the past 12 months (wire rolling mill in Austria; automotive components plants in the United States, Mexico, and China; HBI-plant in the US; etc.) should have a stabilizing effect on the results as well.
Linz, May 25, 2018
The Management Board
Wolfgang Eder Herbert Eibensteiner Franz Kainersdorfer
Robert Ottel Franz Rotter Peter Schwab
64 D I V I S I O N A L R E P O R T S
MARKET ENVIRONMENT AND BUSINESS DEVELOPMENT
The economic upward trend in the Steel Division already evident in the closing quarter of the past business year continued (with the usual seasonal fluctuations) throughout the business year 2017/18. Supported especially by increasing mo-mentum in Europe over the course of the year, the division succeeded in delivering its best result by far since the onset of the financial and eco-nomic crisis. In addition to the favorable environ-ment, the excellent development stems not least from the consistent implementation of our efforts to boost efficiency across all stages of value cre-ation. This was proof yet again that continuous process and cost-optimization measures are not inconsistent with an ambitious approach to qual-ity. Furthermore, the investments made in the past years into the continuous expansion of the prod-uct mix have played a crucial role in the division’s excellent performance.As expected, China, the world’s largest steel pro-ducer, also influenced the European steel market in 2017/18, primarily because Chinese steel pro-ducers tried to stick to their policy of steadily ex-panding global exports over the past years in order to offset slowing domestic demand. How-ever, trade measures in the form of across-the-board import duties (including in Europe) as well as growing public resistance to rising air pollution in urban centers led in 2017 to the first serious efforts to close down ageing Chinese steel pro-duction capacities. The significant decline in Chinese exports over the course of the calendar
year 2017 should be considered in this light and in relation to positive demand in China’s domes-tic market. All in all, ultimately steel imports to Europe did not decline as a result regardless, be-cause rising imports from other countries (includ-ing Turkey, India, South Korea, and Iran) offset lower Chinese delivery volumes. But the decline in China’s tendency to flood markets reduced the pressure on the market. Against this backdrop, the European steel industry’s capacity utilization rates increased significantly in 2017.Towards the end of the business year 2017/18, the announcements by the US administration of their intention to impose global punitive import tariffs on steel imports to the United States led to uncertainty with respect to future developments in an otherwise thriving market environment. The EU Commission initiated intensive efforts, which were still ongoing at the time of Annual Report was written, to achieve a permanent exemption for the European steel industry. Although the di-rect impact on the Steel Division of import restric-tions into the USA is limited, any diversionary ef-fects on the global trade flows of steel products could represent a potential threat to some extent. At the end of March 2018, the European Com-mission initiated a “Safeguard Measures” proce-dure to curb the threat of a flood of imports to Europe. In terms of sales, the Steel Division profited from the excellent performance of all of its key indus-try segments during the business year 2017/18. The division’s most important (in terms of volume) as well as qualitatively most sophisticated cus-tomer segment—the automotive industry—saw
STEEL DIVISION

65A N N U A L R E P O R T 2 0 1 7 / 1 8
strong and stable demand. In 2017, the automo-tive manufacturers succeeded in boosting sales of passenger cars in Europe for the fourth year in a row. Even in the Steel Division’s most important premium segment, which has been booming for years, the number of vehicle registrations contin-ued to rise even further. All in all, demand from the white goods and consumer goods sectors re-mained high. During the past business year, the mechanical engineering industry was embedded in an increasingly dynamic market environment based on improved capacity utilization in the in-dustry together with the stable low interest rate environment. Although project activity in the oil and gas sector was only moderate overall, the Heavy Plate busi-ness segment secured several large volume or-ders with extremely exacting production specifi-cations in this sector. In lieu of deliveries for the “Nord Stream II” pipeline project, which were suc-
cessfully completed by the end of the business year 2017/18, currently follow-up orders for ex-tremely sophisticated steel grades, especially in the deep-sea pipeline segment, are being com-pleted.The first year of full-capacity production at the direct reduction plant in Corpus Christi, Texas, USA, was characterized by excellent product qual-ity, a solid market environment, but also numer-ous freak weather conditions. While the plant and the surrounding area, in particular, were impact-ed by Hurricane Harvey at the end of August and in September 2017, winter weather, which was wholly atypical for Texas, and which had a sub-stantial impact on the site’s supply infrastructure, hit in January 2018. Despite these adversities, the plant fulfilled its contractual obligations by sup-plying its customers throughout the entire busi-ness year 2017/18.
KEY FIGURES OF THE STEEL DIVISIONIn millions of euros 2016/17 2017/18 Change
in %
Revenue 3,912.4 4,772.7 22.0EBITDA 563.9 908.2 61.1EBITDA margin 14.4% 19.0% EBIT 263.2 592.9 125.3EBIT margin 6.7% 12.4% Employees (full-time equivalent) 10,898 11,020 1.1

66 D I V I S I O N A L R E P O R T S
FINANCIAL KEY PERFORMANCE INDICATORS
The excellent performance of the Steel Division in the business year 2017/18 is immediately evi-dent from the figures, particularly revenue as well as the operating result (EBITDA) which reached an unprecedented level—thanks also to the HBI plant in Texas, USA, which was almost fully op-erational this year for the first time. Revenue rose by 22.0% year over year from EUR 3,912.4 million in 2016/17 to EUR 4,772.7 million in 2017/18. While delivery volumes roughly matched the re-cord volume achieved in 2016/17—due above all to excellent demand—the price of high- quality grades was significantly higher than in the pre-vious year. The direct reduction plant in Texas, USA, which was officially inaugurated in October 2016 and has been in regular operation (subject to weather- related interruptions) since the be-ginning of the business year, as well as the Heavy Plate business segment, which succeeded in sig-nificantly boosting deliveries and simultaneously raising prices, have been key to the revenue growth in the current business year. Together with a gen-eral increase in the gross margin and a continued strong focus on cost optimization, these two busi-ness segments also contributed significantly to the improvement of the operating result (EBITDA) of the Steel Division by 61.1% as of the close of the year, from EUR 563.9 million to EUR 908.2 million. This lifted the EBITDA margin from 14.4% to 19.0%. Profit from operations (EBIT) soared
125.3%, from EUR 263.2 million to EUR 592.9 million, during the same period, almost doubling the EBIT margin from 6.7% to 12.4%.In a direct quarter-to-quarter comparison be-tween the third and fourth quarters of 2017/18, the Steel Division demonstrated a surge in both revenue and results, which stems primarily from the significant growth in delivery volumes, itself the result of traditionally rising demand during the first quarter of the calendar year. In light of the positive market environment, at the start of the calendar year the division succeeded in pass-ing the preceding increases in raw material costs on to the market in connection with the fairly large number of renegotiated contracts. As a result, the Steel Division was able to boost its revenue by 10.3%, from EUR 1,176.2 million in the third quar-ter to EUR 1,297.7 million in the fourth quarter of the business year. EBITDA rose by 22.2% during the same period, from EUR 209.5 million to EUR 256.0 million, primarily due to the quarter-on- quarter increase in the sales volume of about 10%, while EBIT improved by as much as one third, from EUR 130.9 million to EUR 174.1 million. The EBITDA margin rose from 17.8% in the third quarter to 19.7% in the fourth quarter of 2017/18, while the EBIT margin increased in the same pe-riod from 11.1% to 13.4%.
As of March 31, 2018, the Steel Division had 11,020 employees (FTE), an increase of 1.1% compared with the figure (10,898 employees) as of on the previous year’s reporting date.

67A N N U A L R E P O R T 2 0 1 7 / 1 8
CUSTOMERS OF THE STEEL DIVISIONAs percentage of divisional revenue, business year 2017/18
21%Energy
4%White goods/Consumer goods
8%Building/Construction
37%Automotive
4%Mechanical engineering
26%Other
MARKETS OF THE STEEL DIVISIONAs percentage of divisional revenue, business year 2017/18
4%South America
9%NAFTA
3%Asia
6%Rest of world
78%European Union
(of which Austria: 16%)
QUARTERLY DEVELOPMENT OF THE STEEL DIVISIONIn millions of euros 1st quarter
2017/182nd quarter
2017/183rd quarter
2017/184th quarter
2017/18BY
2017/18
Revenue 1,213.3 1,085.5 1,176.2 1,297.7 4,772.7EBITDA 227.8 214.9 209.5 256.0 908.2EBITDA margin 18.8% 19.8% 17.8% 19.7% 19.0%EBIT 150.2 137.7 130.9 174.1 592.9EBIT margin 12.4% 12.7% 11.1% 13.4% 12.4%Employees (full-time equivalent) 10,810 10,905 10,879 11,020 11,020

68 D I V I S I O N A L R E P O R T S
MARKET ENVIRONMENT AND BUSINESS DEVELOPMENT
The economic environment improved substan-tially in the business year 2017/18 compared with the previous year—also for the High Performance Metals Division. This positive change stabilized as the year wore on, especially with respect to in-vestments in the onshore oil and gas sector, but offshore activities stagnated at a low level. In their capacity as major drivers of demand for tool and high-speed steel, both the automotive industry and the consumer goods industry continued to develop along a positive trajectory worldwide. While sales of special forging products for the aerospace industry were a bit more volatile this past business year than in previous years, the fun-damentals remained dynamic. By contrast, the situation in “conventional” power plant and en-ergy engineering was critical yet again through-out the entire past business year.Regionally speaking, the High Performance Metals Division benefited first and foremost from Europe’s economic recovery. The automotive industry was the main driver of strong order levels yet again, followed by the mechanical engineering industry, which gained strength throughout the year, as well as the oil and gas sector. Developments in the NAFTA region, by contrast, were fueled by ambivalent trends. For one, order levels devel-oped more or less positively due to advantageous market conditions in the automotive industry (especially in Mexico) and a significant upward trend in the oil and gas industry; for another, how-
ever, both the change in the US dollar to euro rate parity and increasing protectionist trends had a negative impact on economic sentiment. Most recently, the economic climate in Brazil showed slight signs of a recovery on the heels of a multi-year recession. Production figures particularly for the entire industrial sector—above all automotive construction, but the oil industry too—rose for the first time in years, which had a positive effect on the economic climate overall. Impairment losses of EUR 10 million were recognized on property, plant and equipment in the fourth quarter of 2017/18 due to the demand for protectionist tariffs on the part of the United States with respect to steel imports from Brazil and the resulting un-certainties for the Villares special steel plant in Sumaré, Brazil for which the United States are the most important export market. In Asia, particu-larly China but also increasingly India, the division benefited chiefly from very good developments in consumer goods and the resulting high demand for tool steel. The investments and acquisitions of the previous years in Asia in the Value Added Ser-vices segment further strengthened our global market position in these rapidly growing markets.To push its strategy of becoming a market leader in cutting-edge technologies, the High Perfor-mance Metals Division is establishing additive manufacturing capacities (“3D printing”) for components in the challenging metals segment in Europe as well as in North America and Asia. Linking the respective local additive manu fac-turing centers with the powder production plants in both Kapfenberg, Austria, and Hagfors,
HIGH PERFORMANCE METALS DIVISION

69A N N U A L R E P O R T 2 0 1 7 / 1 8
Sweden, is aimed at ensuring in the medium term that the division achieves technology leadership across the entire process chain.Compared with the previous year, manufacturing saw a substantial improvement in capacity utilization in almost all production facilities. Im-proved conditions overall in both the automotive and the oil and gas sectors were the critical drivers of volume. The sales volumes for aerospace prod-ucts developed at a solid stable pace. By con-trast, the open die forging products segment for the heavy mechanical and energy engineering industries remained challenging due to difficul-ties with respect to demand, which continued un-abated.In the Value Added Services business segment, the strategy of distinguishing the division from the competition through the broadest possible ser-vices portfolio progressed as planned during the
past business year. The division’s 160 service centers worldwide are a key to its ability to distin-guish itself from the competition. Ultimately, they provide the basis for positioning the division as a premium service provider in toolmaking.
FINANCIAL KEY PERFORMANCE INDICATORS
In a year-over-year comparison, the positive mar-ket environment led to dramatic improvements in the division’s key financial performance indi-cators. As far as revenue is concerned, all major production facilities as well as sales areas suc-ceeded in expanding their volume—in some cas-es considerably. The increase is borne by both improved prices and rising quantities. On the whole, the division’s revenue rose by 8.2%, from
KEY FIGURES OF THE HIGH PERFORMANCE METALS DIVISIONIn millions of euros 2016/17 2017/18 Change
in %
Revenue 2,697.9 2,918.0 8.2EBITDA 395.2 453.9 14.9EBITDA margin 14.6% 15.6% EBIT 252.7 297.6 17.8EBIT margin 9.4% 10.2% Employees (full-time equivalent) 13,733 14,274 3.9

70 D I V I S I O N A L R E P O R T S
EUR 2,697.9 million in 2016/17 to EUR 2,918.0 million in the past business year. The operating result (EBITDA) climbed by 14.9%, from EUR 395.2 million in the previous year to EUR 453.9 in the current year, which also led to an improvement in the EBITDA margin by one percentage point from 14.6% to 15.6%. The slightly lower absolute increase in the profit from operations (EBIT) stems from the aforementioned impairment losses of EUR 10 million on property, plant and equipment at the Brazilian Villares site in the fourth quarter of 2017/18. Hence EBIT rose by 17.8%, specifi-cally, from EUR 252.7 million (margin of 9.4%) in the previous year to currently EUR 297.6 million (margin of 10.2%).A direct comparison of the third and fourth quar-ters of 2017/18 shows that the High Performance Metals Division succeeded in expanding its rev-enue by 11.3% from EUR 703.5 million to EUR 783.1 million, mainly due to the substantial in-crease in delivery volumes, but also due to the cost-driven increase in prices, albeit to a lesser degree. As regards the delivery volumes, the level
achieved in the final quarter of the business year harked back to that achieved in the first quarter of 2012/13. Due to the strength of the market, EBITDA jumped 21.9% in the fourth quarter of 2017/18 to EUR 124.9 million (previous quarter: EUR 102.5 million). This signifies an increase from 14.6% to 15.9% in the EBITDA margin. Owing to non-recurring depreciation in Brazil, the improve-ment in EBIT was a little less pronounced in the fourth quarter of 2017/18, but it rose nonetheless by 18.0% from EUR 66.7 million in the third quar-ter to EUR 78.7 million in the subsequent quarter. A direct quarter- on-quarter comparison also shows that the EBIT margin improved from 9.5% to 10.0%.
As of March 31, 2018, the High Performance Metals Division had 14,274 employees (FTE). This corresponds to an increase of 3.9% over the num-ber (13,733 FTE) on the previous year’s reporting date, due in particular to the large production volume and the resulting excellent capacity uti-lization at all manufacturing plants.

71A N N U A L R E P O R T 2 0 1 7 / 1 8
CUSTOMERS OF THE HIGH PERFORMANCE METALS DIVISIONAs percentage of divisional revenue, business year 2017/18
29%Automotive
12%Energy
13%White goods/Consumer goods
4%Building/Construction
11%Aerospace
19%Mechanical engineering
12%Other
MARKETS OF THE HIGH PERFORMANCE METALS DIVISIONAs percentage of divisional revenue, business year 2017/18
15%NAFTA
18%Asia
6%South America
53%European Union
(of which Austria: 5%)
8%Rest of world
QUARTERLY DEVELOPMENT OF THE HIGH PERFORMANCE METALS DIVISIONIn millions of euros 1st quarter
2017/182nd quarter
2017/183rd quarter
2017/184th quarter
2017/18BY
2017/18
Revenue 739.3 692.1 703.5 783.1 2,918.0EBITDA 127.4 99.1 102.5 124.9 453.9EBITDA margin 17.2% 14.3% 14.6% 15.9% 15.6%EBIT 89.6 62.6 66.7 78.7 297.6EBIT margin 12.1% 9.0% 9.5% 10.0% 10.2%Employees (full-time equivalent) 13,823 13,950 14,049 14,274 14,274

72 D I V I S I O N A L R E P O R T S
MARKET ENVIRONMENT AND BUSINESS DEVELOPMENT
While the Metal Engineering Division generates about two-thirds of its revenue in the railway in-frastructure and oil and gas customer segments, unlike almost all other industries, prices in these sectors were largely subdued in the business year 2017/18. At the end of 2016 already, when a clear upward trend began in most economic sectors in Europe, demand in the railway infrastructure sec-tor, with the exception of China, developed only moderately and hence distinctly from the eco-nomic euphoria that was setting in elsewhere. Towards the end of the business year 2017/18, however, there were first signs of a recovery in de-mand, albeit in a market environment that re-mains highly competitive.Against this backdrop, the Rail Technology busi-ness segment in particular was confronted with challenging conditions in the business year 2017/18, especially in Europe. Overall, capacity utilization was satisfactory, but there was strong competition with respect to rail project pricing. There was also very little momentum in European rail suppliers’ traditional export markets. Due to low raw material prices, the level of logistics ac-tivity in the mining regions of Brazil and South Africa was fairly modest. In the Gulf States, which strongly depend on crude oil, investments in the railway infrastructure were greatly reduced. The performance of the Turnout Systems business segment was much more positive, partially due to its expanded global market presence, but also as a positive consequence of its leading techno-
logical and market position in the demanding turnout sector. Furthermore, a weakening of de-mand in individual regions was offset by other volume increases—for example, in connection with high-speed lines in China. The demand for turnouts for heavy-haul transports in the USA, which fell sharply in 2016 due to low freight trans-port volumes, showed the first signs of recovering in 2017.In the business year 2017/18, the Wire Technology business segment benefited from excellent de-mand momentum, especially in the automotive industry. The new, state-of-the-art, fully digitalized wire rod mill in Leoben/Donawitz, Austria, which went into full operation in the first half of the busi-ness year following a slightly longer start-up phase, was running at full capacity in the second half of the year. Now, both external and internal wire rod customers have access to pre- material that meets all quality requirements for wire products. As a result of challenging market conditions, which continue unabated, the ultra high-strength fine wire product segment, which primarily serves the solar and photovoltaics industry, had to recognize EUR 15 million in impairment losses on property, plant and equipment in the first half of 2017/18, which had a corresponding negative one-time effect on earnings.The Tubulars (seamless tubes) business segment, which manufactures primarily products for the oil and gas sector, benefited in the business year 2017/18 from the accelerating recovery in drill-ing activities in the United States. As a result, the production site in Kindberg, Austria, saw full capacity utilization of the units throughout the
METAL ENGINEERING DIVISION

73A N N U A L R E P O R T 2 0 1 7 / 1 8
business year 2017/18, but prices improved only gradually, mainly due to exchange rate effects. Order activity in the Gulf States, which was re-strained in the first half of the year, improved in the second half, though here, too, the pricing situation remained a challenge. Demand for in-dustrial pipes, such as those used in crane and tunnel construction or in the commercial vehicle industry among others, was solid throughout the year thanks to the economic climate. The Welding Consumables business segment, which is also highly active in the energy segment, also saw good capacity utilization in 2017/18, but simultaneously faced high price competition. In the interest of alleviating this pressure, efforts are currently being stepped up to gain a foothold in previously less developed industry segments, while at the same time cost measures are again being intensified.
FINANCIAL KEY PERFORMANCE INDICATORS
The increase in revenue in the Metal Engineering Division is primarily the result of passing the in-crease in pre-material costs on to customers. In the Tubulars business segment, it is also due to the overall improved economic environment in the oil and gas sector. As a result, the Tubulars business segment also is the one that made the largest contribution to the division’s 11.4% increase in revenue in 2017/18, from EUR 2,684.6 million in the previous year to currently EUR 2,989.7 million. Despite increasing compe-tition, the Rail Technology business segment succeeded in keeping delivery volumes stable year over year, while Wire Technology reported slightly lower delivery volumes. However, due to a generally positive price trend, all of the
KEY FIGURES OF THE METAL ENGINEERING DIVISIONIn millions of euros 2016/17 2017/18 Change
in %
Revenue 2,684.6 2,989.7 11.4EBITDA 360.8 372.0 3.1EBITDA margin 13.4% 12.4% EBIT 200.8 191.0 –4.9EBIT margin 7.5% 6.4% Employees (full-time equivalent) 13,157 13,481 2.5
74 D I V I S I O N A L R E P O R T S
division’s business segments were able to lift their revenue in 2017/18.As the positive and negative factors more or less balanced each other out in the past business year, the Metal Engineering Division’s earnings perfor-mance was relatively stable compared with the previous year. Thanks to the gradual upward trend in the Tubulars business segment on account of the slow yet continuous improvement in prices for seamless tubes, the division more than offset the pressure on margins in the rail sector and the higher start-up costs for the new wire rod mill in the first half of 2017/18. While the Turnout Sys-tems business segment was able to maintain the previous year’s excellent earnings performance, the Welding Consumables business segment suf-fered slight losses as a result of the ongoing weak-ness of the traditional energy sector. Overall, the Metal Engineering Division increased its operat-ing result (EBITDA) by 3.1% from EUR 360.8 mil-lion (margin of 13.4%) in the previous year to cur-rently EUR 372.0 million (margin of 12.4%). The fact that the profit from operations (EBIT) of EUR 191.0 million in the business year 2017/18 was 4.9% lower than the previous year’s level of EUR 200.8 million stems from the initial depreciation of the new wire rod mill at the beginning of the business year 2017/18, for one, and from EUR 15 million in negative one-time effects due to im-pairment on property, plant and equipment in the ultra high-strength fine wire product segment, for another. This caused the EBIT margin to de-cline from 7.5% to 6.4%.
The direct quarter-to-quarter comparison shows a clear upward trend, especially in terms of earn-ings. The 3.1% increase in revenue from EUR 727.8 million to EUR 750.7 million between the third and fourth quarters also shows a positive trend. While the Rail Technology and Turnout Systems business segments were confronted with lower revenue due to winter-related lower investments in the railway infrastructure, the other three business segments reported significant revenue increases. The stron-gest driver of the improvement in earnings was the Wire Technology division, which significantly improved its performance in the final quarter thanks to the new, now fully operational, wire rod mill. Rail Technology was the only business seg-ment whose earnings in the fourth quarter were slightly lower than in the previous quarter. The di-rect quarter-to-quarter comparison shows that the profit from operations (EBITDA) rose by 31.6% from EUR 83.9 million to EUR 110.4 mil-lion, boosting the margin from 11.5% to 14.7%. The percentage increase in EBIT was even clearer, soaring by 57.9% from EUR 42.5 million (margin of 5.8%) in the third quarter to EUR 67.1 million (margin of 8.9%) in the fourth quarter of 2017/18.
As of the end of the business year 2017/18, the number of employees (FTE) in the Metal Engineer-ing Division was 13,481, or 2.5% higher than the previous year’s figure (13,157). This increase re-sults primarily from the rising production volume in the Tubulars business segment.

75A N N U A L R E P O R T 2 0 1 7 / 1 8
CUSTOMERS OF THE METAL ENGINEERING DIVISIONAs percentage of divisional revenue, business year 2017/18
48%Railway systems
3%Building/Construction
5%Mechanical engineering
20%Energy
16%Automotive
1%White goods/Consumer goods
7%Other
MARKETS OF THE METAL ENGINEERING DIVISIONAs percentage of divisional revenue, business year 2017/18
17%NAFTA
11%Asia
3%South America
57%European Union
(of which Austria: 7%)
12%Rest of world
QUARTERLY DEVELOPMENT OF THE METAL ENGINEERING DIVISIONIn millions of euros 1st quarter
2017/182nd quarter
2017/183rd quarter
2017/184th quarter
2017/18BY
2017/18
Revenue 770.0 741.2 727.8 750.7 2,989.7EBITDA 87.2 90.5 83.9 110.4 372.0EBITDA margin 11.3% 12.2% 11.5% 14.7% 12.4%EBIT 47.0 34.4 42.5 67.1 191.0EBIT margin 6.1% 4.6% 5.8% 8.9% 6.4%Employees (full-time equivalent) 13,274 13,450 13,267 13,481 13,481

76 D I V I S I O N A L R E P O R T S
MARKET ENVIRONMENT AND BUSINESS DEVELOPMENT
In a solid economic environment overall, the Metal Forming Division’s upward trend of the previous years continued in 2017/18 as well. This positive development is due not just to the economic tail-wind, but increasingly also to the projects imple-mented in recent years. Worth mentioning in this connection is the fact that not least the division’s two small business units—Precision Strip & Ware-house & Rack Solutions—made material contri-butions to its good performance.The Automotive Components business segment profited in the past business year from demand levels that remained excellent, which is also illus-trated by the fact that 2017 was the fourth con-secutive year of rising vehicle registrations in the European Union. At just over 15 million new pas-senger car registrations, this is the first time that registrations are back to pre-crisis levels. Follow-ing a massive, longer-term meltdown in the wake of the financial and economic crisis 2008/09, the statistics on new vehicle registrations particularly in Southern European countries show that this market has returned to strong growth in recent years. The strategic expansion of the production capacities in the non-European core markets of the Automotive Components business segment is proceeding as planned. This means that Euro-pean premium customers in particular are in-creasingly being supplied at their sites in the United States and China by local voestalpine facilities. The Tubes & Sections business segment benefited especially from very good demand in the com-
mercial vehicle and agricultural machine industry. The construction machinery unit also profited from accelerating demand. Regionally, the European core markets saw highly satisfactory momentum, whereas the construction industry particularly in Great Britain continued to lose mo-mentum throughout the year in consequence of the negative BREXIT vote. In 2017/18, Brazil, our most important South American market, finally showed first signs of an economic recovery after years of a recession. The considerable strength-ening of project activity in the solar industry must be emphasized in this connection. In the United States, customer orders became ever more vola-tile on a merely moderate level. In China, by con-trast, demand especially for customer-specific product solutions improved relative to the previ-ous years. Demand momentum in the passive safety components product area for the automo-tive industry, which produces high-tech tube com-ponents for safety belt tensioners as well as air-bags, was strong. The acquisition of coating facilities in Romania enabled the division in De-cember 2017 to further extend the process chain in this segment.Thanks to its excellent market position, the Preci-sion Strip business segment recorded high order levels for both bi-metal strip and special strip steel, but demand from the sawmill industry (wood and stone saws) in both Europe and China also im-proved greatly compared with the previous year. Substantial growth was recorded in the sophisti-cated thin-strip area too. Changing consumption patterns in favor of on-line purchases are having a positive effect on the
METAL FORMING DIVISION

77A N N U A L R E P O R T 2 0 1 7 / 1 8
Warehouse & Rack Solutions segment. Catalog companies and online retailers are increasingly investing in efficient inventory systems which, in turn, continuously boosts the number of projects. As a result, the volume of orders received in the business year 2017/18 for high-bay warehouses and storage systems made of steel sections stretch-es far into the future.
FINANCIAL KEY PERFORMANCE INDICATORS
In a solid economic environment, the Metal Form-ing Division posted revenue growth and slightly improved its earnings performance. All four of the division’s business segments contributed equally to the increase in revenue by 13.1% from EUR 2,426.1 million in the previous year to EUR 2,743.4
million in 2017/18. While the positive economic environment had a particularly strong effect on the development of revenue in the Tubes & Sections, Precision Strip, and Warehouse & Rack Solutions business segments, the expansion of activities at non-European sites further boosted the performance of the Automotive Components business segment. In terms of earnings, it is largely thanks to the division’s two smaller business seg-ments, Precision Strip and Warehouse & Rack Solutions, that the operating income (EBITDA) rose by 2.6% from EUR 317.0 million in the busi-ness year 2016/17 to EUR 325.2 million in the past business year. The Tubes & Sections and Automotive Components business segments, on the other hand, posted slightly weaker EBITDA. The performance of the Automotive Components segment was affected in particular by the accel-erated start-up of new facilities and plants at sites
KEY FIGURES OF THE METAL FORMING DIVISIONIn millions of euros 2016/17 2017/18 Change
in %
Revenue 2,426.1 2,743.4 13.1EBITDA 317.0 325.2 2.6EBITDA margin 13.1% 11.9% EBIT 210.7 212.8 1.0EBIT margin 8.7% 7.8% Employees (full-time equivalent) 11,073 12,003 8.4

78 D I V I S I O N A L R E P O R T S
in North America and China and the resulting start-up costs, whereas Tubes & Sections was confronted with contradictory economic trends in its main markets. Due to the substantial increase in revenue, the EBITDA margin fell by 13.1% to 11.9% year over year. The profit from opera-tions (EBIT) also rose slightly, specifically, by 1.0% from EUR 210.7 million to EUR 212.8 million. Yet the EBIT margin, too, fell as a result of the rela-tively stronger revenue growth from 8.7% to 7.8%.A direct quarter-to-quarter comparison between the third and the fourth quarters of 2017/18 shows a significant upward trend in revenue and an even greater increase in profitability. Specifically, the division succeeded in raising its revenue be-tween the second-to-last and the last quarter by 10.3% from EUR 676.2 million to EUR 745.6 mil-lion. The two large business segments, Tubes & Sections as well as Automotive Components, pre-sented the largest revenue growth not just in ab-solute terms but also in percentage terms. All
four business segments posted increases in earn-ings, with Tubes & Sections showing the strongest growth. On the whole, the division’s operating result (EBITDA) climbed by 22.5% from EUR 72.6 million in the third quarter to EUR 88.9 million in the fourth quarter of 2017/18. In turn, this pushed up the EBITDA margin from 10.7% to 11.9%. The increase in the profit from operations (EBIT) was even better: it soared by more than a third from EUR 44.2 million to EUR 59.9 million in the quarter- to-quarter comparison, pushing the EBIT margin from 6.5% in the third quarter to 8.0% in the fourth quarter of 2017/18.
At 12,003, the number of employees (FTE) in the Metal Forming Division as of March 31, 2018, surpassed the previous year’s figure (11,073) by 8.4%. This increase is due primarily to the ex-pansion of the automotive activities at sites out-side of Europe.

79A N N U A L R E P O R T 2 0 1 7 / 1 8
MARKETS OF THE METAL FORMING DIVISIONAs percentage of divisional revenue, business year 2017/18
14%NAFTA
3%South America
4%Asia
3%Rest of world
76%European Union
(of which Austria: 4%)
CUSTOMERS OF THE METAL FORMING DIVISIONAs percentage of divisional revenue, business year 2017/18
55%Automotive
1%Energy
9%Mechanical engineering
4%White goods/Consumer goods
23%Building/Construction
8%Other
QUARTERLY DEVELOPMENT OF THE METAL FORMING DIVISIONIn millions of euros 1st quarter
2017/182nd quarter
2017/183rd quarter
2017/184th quarter
2017/18BY
2017/18
Revenue 672.7 648.9 676.2 745.6 2,743.4EBITDA 88.6 75.1 72.6 88.9 325.2EBITDA margin 13.2% 11.6% 10.7% 11.9% 11.9%EBIT 61.3 47.4 44.2 59.9 212.8EBIT margin 9.1% 7.3% 6.5% 8.0% 7.8%Employees (full-time equivalent) 11,300 11,498 11,634 12,003 12,003

80 C O N S O L I D A T E D F I N A N C I A L S T A T E M E N T S
CONSOLIDATED FINANCIAL STATEMENTS
81 Report of the Supervisory Board
82 Consolidated Statement of Financial Position
84 Consolidated Statement of Cash Flows
85 Consolidated Statement of Comprehensive Income
86 Consolidated Statement of Changes in Equity
88 Notes to the Consolidated Financial Statements
186 Auditor’s report
195 Management Board statement in accordance with Section 82 (4) of the Austrian Stock Exchange Act (Börsegesetz – BörseG)
196 Investments
SERVICE
209 Glossary
210 Contact, imprint
voestalpine AG
CONSOLIDATED FINANCIAL STATEMENTS 2017/18
This report is a translation of the original report in German, which is solely valid.

81A N N U A L R E P O R T 2 0 1 7 / 1 8
REPORT OF THE SUPERVISORY BOARD ON THE BUSINESS YEAR 2017/18
During the business year 2017/18, the Super visory Board fulfilled its responsibilities under both the law and the Articles of Incorporation, holding five plenary sessions, three meetings of the Audit Committee, and one meeting of the Executive Committee. The Management Board provided comprehensive information both orally and in written form regarding the development of the Company’s business and its position.In addition to ongoing reports on the Group’s current economic and financial position, these meetings dealt in particular with corporate acquisitions, core elements of the digital transformation of the voestalpine Group, succession planning as well as matters involving raw material supplies, innovation, and information technology. The Audit Committee dealt especially with the preparation and review of the Company’s Consolidated and Individual Financial Statements, the preparation of the recommendation for the appointment of an auditor as well as topics related to the internal control system, the risk management system, and Internal Auditing. Please refer to the Consolidated Corporate Governance Report 2017/18 for further information on the composition and workings of the Supervisory Board and its committees.The Annual Financial Statements and the Consolidated Financial Statements as of March 31, 2018, were audited by Grant Thornton Unitreu GmbH Wirtschaftsprüfungs und Steuerberatungsgesellschaft, Vienna, Austria, which was engaged as mandated by Section 270 Austrian Commercial Code (Unternehmensgesetzbuch – UGB). The auditor attended all three meetings of the Audit Committee and was available for questions and discussions.The audit did not give rise to any objections and showed that the Annual Financial Statements and the Consolidated Financial Statements, which were prepared in accordance with the International Financial Reporting Standards (IFRS) as mandated by Section 245a UGB, conform to the statutory requirements. The auditor issued an unqualified audit opinion both for the Annual Financial Statements and the Consolidated Financial Statements and confirmed that the Management
Report is consistent with the Annual Financial Statements and that the Consolidated Management Report is consistent with the Consolidated Financial Statements.Following the Audit Committee’s review of the financials, on June 5, 2018, the Supervisory Board reviewed and approved the Annual Financial Statements as of March 31, 2018. The Annual Finan cial Statements are herewith deemed adopted pursuant to Section 96 (4) Austrian Stock Corporation Act (Aktiengesetz – AktG). Again following the Audit Committee’s review, the Supervisory Board reviewed and approved the Management Report as well as the Consolidated Financial Statements together with the Consolidated Management Report and the Consoli dated Corporate Governance Report.The Consolidated Corporate Governance Report was also audited by Grant Thornton Unitreu GmbH Wirtschaftsprüfungs und Steuerberatungsge sellschaft, Vienna, as part of the annual external review of voestalpine AG’s compliance with the Corporate Governance Code, and it was determined that the Report is consistent with the facts on the ground and that the rules are being complied with. Compliance with the C rules of the Code pertaining to the auditor (Rules 77 to 83) was reviewed by the law firm, WOLF THEISS Rechtsanwälte GmbH & Co KG. This review also confirmed compliance with the rules.It is established hereby that the business year 2017/18 has ended with a net profit of EUR 247,000,000.00; it is being proposed that a dividend of EUR 1.40 per dividendbearing share be paid to the shareholders and that the remaining amount be carried forward.
The Supervisory Board
Dr. Joachim Lemppenau(Chairman)
Linz, June 5, 2018
This report is a translation of the original report in German, which is solely valid.

82 C O N S O L I D A T E D F I N A N C I A L S T A T E M E N T S
voestalpine AG
CONSOLIDATED STATEMENT OF FINANCIAL POSITION FOR THE YEAR ENDED MARCH 31, 2018
ASSETS
Notes 03/31/2017 03/31/2018
A. Non-current assetsProperty, plant and equipment 9 6,371.9 6,282.1Goodwill 10 1,549.5 1,545.9Other intangible assets 11 419.4 396.0Investments in entities consolidated according to the equity method 12 113.0 118.5Other financial assets 12 66.1 51.1Deferred tax assets 13 213.7 196.1
8,733.6 8,589.7
B. Current assetsInventories 14 3,408.2 3,998.4Trade and other receivables 15 1,714.1 1,773.0Other financial assets 12 348.3 388.1Cash and cash equivalents 16 503.3 705.8
5,973.9 6,865.3
Total assets 14,707.5 15,455.0
In millions of euros

83A N N U A L R E P O R T 2 0 1 7 / 1 8
EQUITY AND LIABILITIES
Notes 03/31/2017 03/31/2018
A. EquityShare capital 320.3 320.3Capital reserves 607.1 609.6Hybrid capital 497.9 497.9Reserve for own shares –1.5 –1.5Other reserves 21.7 –91.9Retained earnings 4,446.6 5,051.3
Equity attributable to equity holders of the parent 5,892.1 6,385.7Noncontrolling interests 168.2 168.6
17 6,060.3 6,554.3
B. Non-current liabilitiesPensions and other employee obligations 18 1,226.4 1,171.7Provisions 19 79.4 76.6Deferred tax liabilities 13 119.4 107.6Financial liabilities 20 2,764.7 2,783.6
4,189.9 4,139.5
C. Current liabilities Provisions 19 585.0 615.2Tax liabilities 77.2 183.4Financial liabilities 20 1,332.9 1,315.5Trade and other payables 21 2,462.2 2,647.1
4,457.3 4,761.2
Total equity and liabilities 14,707.5 15,455.0
In millions of euros

84 C O N S O L I D A T E D F I N A N C I A L S T A T E M E N T S
voestalpine AG
CONSOLIDATED STATEMENT OF CASH FLOWS 2017/18
Notes 2016/17 2017/18
Operating activitiesProfit after tax 527.0 817.9Noncash expenses and income 24 722.0 804.1 Change in inventories –385.0 –689.3 Change in receivables and liabilities 295.3 114.4 Change in provisions –8.9 148.0Changes in working capital –98.6 –426.9
Cash flows from operating activities 1,150.4 1,195.1
Investing activitiesAdditions to other intangible assets, property, plant and equipment –1,068.1 –850.2Income from disposals of assets 15.5 30.1Cash flows from the acquisition of control of subsidiaries 24 –27.9 –6.8Cash flows from the loss of control of subsidiaries 24 2.0 –Additions to/divestments of other financial assets 28.7 –20.8
Cash flows from investing activities –1,049.8 –847.7
Financing activitiesDividends paid –213.7 –223.9Dividends paid/capital increase noncontrolling interests 24 –15.8 –12.9Acquisition of noncontrolling interests –3.8 –Capital increase 55.9 –Increase in longterm financial liabilities 71.4 758.1Repayment of longterm financial liabilities –256.0 –785.8Repayment of longterm finance lease liabilities –4.8 –4.2Change in current financial liabilities and other financial liabilities 0.1 139.0
Cash flows from financing activities –366.7 –129.7
Net decrease/increase in cash and cash equivalents –266.1 217.7Cash and cash equivalents, beginning of year 774.8 503.3Net exchange differences –5.4 –15.2
Cash and cash equivalents, end of year 16 503.3 705.8
In millions of euros

85A N N U A L R E P O R T 2 0 1 7 / 1 8
voestalpine AG
CONSOLIDATED STATEMENT OF COMPREHENSIVE INCOME 2017/18
CONSOLIDATED INCOME STATEMENT
Notes 2016/17 2017/18
Revenue 1, 2 11,294.5 12,897.8
Cost of sales –8,777.1 –9,923.3
Gross profit 2,517.4 2,974.5
Other operating income 3 348.8 415.7
Distribution costs –1,079.2 –1,149.6
Administrative expenses –622.3 –662.2
Other operating expenses 4 –356.0 –413.6
Share of profit of entities consolidated according to the equity method 5 14.6 15.2
EBIT 823.3 1,180.0
Finance income 6 51.5 44.5
Finance costs 7 –174.9 –182.0
Profit before tax 699.9 1,042.5
Tax expense 8 –172.9 –224.6
Profit after tax 527.0 817.9
Attributable to:
Equity holders of the parent 496.8 775.2
Noncontrolling interests 7.7 20.2
Share planned for hybrid capital owners 22.5 22.5
Basic and diluted earnings per share (euros) 30 2.84 4.40
CONSOLIDATED OTHER COMPREHENSIVE INCOME
2016/17 2017/18
Profit after tax 527.0 817.9
Items of other comprehensive income that will be reclassified subsequently to profit or loss
Cash flow hedges 7.0 7.1
Currency translation 62.2 –123.0
Share of result of entities consolidated according to the equity method 0.2 –1.6
Subtotal of items of other comprehensive income that will be reclassified subsequently to profit or loss 69.4 –117.5
Items of other comprehensive income that will not be reclassified subsequently to profit or loss
Actuarial gains/losses –13.7 22.9
Subtotal of items of other comprehensive income that will not be reclassified subsequently to profit or loss –13.7 22.9
Other comprehensive income for the period, net of income tax 55.7 –94.6
Total comprehensive income for the period 582.7 723.3
Attributable to:
Equity holders of the parent 551.3 684.8
Noncontrolling interests 8.9 16.0
Share planned for hybrid capital owners 22.5 22.5
Total comprehensive income for the period 582.7 723.3
In millions of euros

86 C O N S O L I D A T E D F I N A N C I A L S T A T E M E N T S
voestalpine AG
CONSOLIDATED STATEMENT OF CHANGES IN EQUITY 2017/18
Other reserves
Share capital
Capital reserves
Hybrid capital
Reserve for own shares
Translation reserve
Hedging reserve
Retained earnings Total attributable to equity holders
of the parent
Non-controlling interests
Total equity
Balance as of April 1, 2016 317.8 553.7 497.9 –1.5 –41.3 –5.4 4,150.2 5,471.4 180.2 5,651.6
Profit after tax – – – – – – 519.3 519.3 7.7 527.0
Items of other comprehensive income that will be reclassified subsequently to profit or loss
Cash flow hedges – – – – – 7.0 – 7.0 – 7.0
Currency translation – – – – 61.2 – – 61.2 1.0 62.2
Share of result of entities consolidated according to the equity method – – – – 0.2 – – 0.2 – 0.2
Subtotal of items of other comprehensive income that will be reclassified subsequently to profit or loss – – – – 61.4 7.0 – 68.4 1.0 69.4
Items of other comprehensive income that will not be reclassified subsequently to profit or loss
Actuarial gains/losses – – – – – – –13.9 –13.9 0.2 –13.7
Subtotal of items of other comprehensive income that will not be reclassified subsequently to profit or loss – – – – – – –13.9 –13.9 0.2 –13.7
Other comprehensive income for the period, net of income tax – – – – 61.4 7.0 –13.9 54.5 1.2 55.7
Total comprehensive income for the period – – – – 61.4 7.0 505.4 573.8 8.9 582.7
Dividends – – – – – – –183.6 –183.6 –17.9 –201.5
Dividends to hybrid capital owners – – – – – – –30.0 –30.0 – –30.0
Tax effect from transactions with hybrid capital owners – – – – – – 7.5 7.5 – 7.5
Capital increase 2.5 53.4 – – – – – 55.9 2.0 57.9
Other changes – – – – – – –2.9 –2.9 –5.0 –7.9
2.5 53.4 – – – – –209.0 –153.1 –20.9 –174.0
Balance as of March 31, 2017 = Balance as of April 1, 2017 320.3 607.1 497.9 –1.5 20.1 1.6 4,446.6 5,892.1 168.2 6,060.3
Profit after tax – – – – – – 797.7 797.7 20.2 817.9
Items of other comprehensive income that will be reclassified subsequently to profit or loss
Cash flow hedges – – – – – 7.1 – 7.1 – 7.1
Currency translation – – – – –119.1 – – –119.1 –3.9 –123.0
Share of result of entities consolidated according to the equity method – – – – –1.6 – – –1.6 – –1.6
Subtotal of items of other comprehensive income that will be reclassified subsequently to profit or loss – – – – –120.7 7.1 – –113.6 –3.9 –117.5
Items of other comprehensive income that will not be reclassified subsequently to profit or loss
Actuarial gains/losses – – – – – – 23.2 23.2 –0.3 22.9
Subtotal of items of other comprehensive income that will not be reclassified subsequently to profit or loss – – – – – – 23.2 23.2 –0.3 22.9
Other comprehensive income for the period, net of income tax – – – – –120.7 7.1 23.2 –90.4 –4.2 –94.6
Total comprehensive income for the period – – – – –120.7 7.1 820.9 707.3 16.0 723.3
Dividends – – – – – – –194.0 –194.0 –12.8 –206.8
Dividends to hybrid capital owners – – – – – – –30.0 –30.0 – –30.0
Tax effect from transactions with hybrid capital owners – – – – – – 7.5 7.5 – 7.5
Sharebased payment – 2.5 – – – – – 2.5 – 2.5
Other changes – – – – – – 0.3 0.3 –2.8 –2.5
– 2.5 – – – – –216.2 –213.7 –15.6 –229.3
Balance as of March 31, 2018 320.3 609.6 497.9 –1.5 –100.6 8.7 5,051.3 6,385.7 168.6 6,554.3
In millions of euros

87A N N U A L R E P O R T 2 0 1 7 / 1 8
Other reserves
Share capital
Capital reserves
Hybrid capital
Reserve for own shares
Translation reserve
Hedging reserve
Retained earnings Total attributable to equity holders
of the parent
Non-controlling interests
Total equity
Balance as of April 1, 2016 317.8 553.7 497.9 –1.5 –41.3 –5.4 4,150.2 5,471.4 180.2 5,651.6
Profit after tax – – – – – – 519.3 519.3 7.7 527.0
Items of other comprehensive income that will be reclassified subsequently to profit or loss
Cash flow hedges – – – – – 7.0 – 7.0 – 7.0
Currency translation – – – – 61.2 – – 61.2 1.0 62.2
Share of result of entities consolidated according to the equity method – – – – 0.2 – – 0.2 – 0.2
Subtotal of items of other comprehensive income that will be reclassified subsequently to profit or loss – – – – 61.4 7.0 – 68.4 1.0 69.4
Items of other comprehensive income that will not be reclassified subsequently to profit or loss
Actuarial gains/losses – – – – – – –13.9 –13.9 0.2 –13.7
Subtotal of items of other comprehensive income that will not be reclassified subsequently to profit or loss – – – – – – –13.9 –13.9 0.2 –13.7
Other comprehensive income for the period, net of income tax – – – – 61.4 7.0 –13.9 54.5 1.2 55.7
Total comprehensive income for the period – – – – 61.4 7.0 505.4 573.8 8.9 582.7
Dividends – – – – – – –183.6 –183.6 –17.9 –201.5
Dividends to hybrid capital owners – – – – – – –30.0 –30.0 – –30.0
Tax effect from transactions with hybrid capital owners – – – – – – 7.5 7.5 – 7.5
Capital increase 2.5 53.4 – – – – – 55.9 2.0 57.9
Other changes – – – – – – –2.9 –2.9 –5.0 –7.9
2.5 53.4 – – – – –209.0 –153.1 –20.9 –174.0
Balance as of March 31, 2017 = Balance as of April 1, 2017 320.3 607.1 497.9 –1.5 20.1 1.6 4,446.6 5,892.1 168.2 6,060.3
Profit after tax – – – – – – 797.7 797.7 20.2 817.9
Items of other comprehensive income that will be reclassified subsequently to profit or loss
Cash flow hedges – – – – – 7.1 – 7.1 – 7.1
Currency translation – – – – –119.1 – – –119.1 –3.9 –123.0
Share of result of entities consolidated according to the equity method – – – – –1.6 – – –1.6 – –1.6
Subtotal of items of other comprehensive income that will be reclassified subsequently to profit or loss – – – – –120.7 7.1 – –113.6 –3.9 –117.5
Items of other comprehensive income that will not be reclassified subsequently to profit or loss
Actuarial gains/losses – – – – – – 23.2 23.2 –0.3 22.9
Subtotal of items of other comprehensive income that will not be reclassified subsequently to profit or loss – – – – – – 23.2 23.2 –0.3 22.9
Other comprehensive income for the period, net of income tax – – – – –120.7 7.1 23.2 –90.4 –4.2 –94.6
Total comprehensive income for the period – – – – –120.7 7.1 820.9 707.3 16.0 723.3
Dividends – – – – – – –194.0 –194.0 –12.8 –206.8
Dividends to hybrid capital owners – – – – – – –30.0 –30.0 – –30.0
Tax effect from transactions with hybrid capital owners – – – – – – 7.5 7.5 – 7.5
Sharebased payment – 2.5 – – – – – 2.5 – 2.5
Other changes – – – – – – 0.3 0.3 –2.8 –2.5
– 2.5 – – – – –216.2 –213.7 –15.6 –229.3
Balance as of March 31, 2018 320.3 609.6 497.9 –1.5 –100.6 8.7 5,051.3 6,385.7 168.6 6,554.3
In millions of euros
88 C O N S O L I D A T E D F I N A N C I A L S T A T E M E N T S
voestalpine AG
NOTES TO THE CONSOLIDATED FINANCIAL STATEMENTS 2017/18
A. GENERAL INFORMATION AND CORPORATE PURPOSE
The voestalpine Group is a steel-based technology and capital goods group that operates worldwide. With its top-quality products, the Group is one of the leading partners to the automotive and con-sumer goods industries in Europe and to the oil and gas industries worldwide.
voestalpine AG is the Group’s ultimate parent company and prepares the Consolidated Financial Statements. It is registered in the Commercial Register of Linz and has its registered office in voest-alpine-Strasse 1, 4020 Linz, Austria. The shares of voestalpine AG are listed on the stock exchange in Vienna, Austria.
The Consolidated Financial Statements for the year ended March 31, 2018 (including comparative figures for the year ended March 31, 2017) have been prepared pursuant to Section 245a (1) of the Austrian Commercial Code (Unternehmensgesetzbuch – UGB) in accordance with the International Financial Reporting Standards (IFRS) as published by the International Accounting Standards Board (IASB) and adopted by the European Union.
The Consolidated Financial Statements are presented in millions of euros (= functional currency of the parent company).
The consolidated income statement has been prepared using the cost-of-sales method.
The use of automated calculation systems may result in rounding differences that affect amounts and percentages.
The Management Board of voestalpine AG approved the Consolidated Financial Statements and authorized the Consolidated Financial Statements for submission to the Supervisory Board on May 25, 2018.

89A N N U A L R E P O R T 2 0 1 7 / 1 8
B. SUMMARY OF ACCOUNTING POLICIES
GENERAL INFORMATIONThe accounting policies applied to the Consolidated Financial Statements are consistent with those of the previous year with the exceptions listed below.
The following new and revised standards were adopted for the first time in the business year 2017/18:
THE FOLLOWING NEW AND REVISED STANDARDS AND INTERPRETATIONS WERE ADOPTED FOR THE FIRST TIME IN THE BUSINESS YEAR 2017/18
Standard Content Effective date1
IAS 12, amendments Recognition of Deferred Tax Assets for Unrealized Losses January 1, 2017IAS 7, amendments Disclosure Initiative January 1, 2017IFRS 12, amendments Annual Improvements to International Financial
Reporting Standards, 2014–2016 Cycle January 1, 2017
1 In accordance with EU endorsements, these standards are applicable to reporting periods beginning on or after the effective date.
The application of the above amendments did not have any material effects on the Consolidated Financial Statements.

90 C O N S O L I D A T E D F I N A N C I A L S T A T E M E N T S
The following new and revised standards had already been published as of the reporting date but their application was not yet mandatory for the business year 2017/18 or they have not yet been adopted by the European Union:
PUBLISHED BY IASB BUT NOT YET ADOPTED BY THE EUROPEAN UNION OR WHOSE APPLICATION WAS NOT YET MANDATORY AS OF THE REPORTING DATE
Standard Content Effective date according
to IASB1
IFRS 9 Financial Instruments January 1, 2018IFRS 15 Revenue from Contracts with Customers January 1, 2018IFRS 15, clarifications Clarifications to IFRS 15 Revenue from
Contracts with CustomersJanuary 1, 2018
IFRS 2, amendments Classification and Measurement of Share-based Payment Transactions
January 1, 2018
IAS 1 and IAS 28, amendments
Annual Improvements to International Financial Reporting Standards, 2014–2016 Cycle
January 1, 2018
IAS 40, amendments Transfers of Investment Property January 1, 2018IFRIC 22 Foreign Currency Transactions and Advance
ConsiderationJanuary 1, 2018
IFRS 4, amendments Applying IFRS 9 with IFRS 4 January 1, 2018IFRS 16 Leases January 1, 2019IFRS 9, amendments Prepayment Features with Negative Compensation January 1, 2019IAS 28, amendments Long-term Interests in Associates and Joint Ventures January 1, 20192
IAS 19, amendments Plan Amendment, Curtailment or Settlement January 1, 20192
Various standards, amendments
Annual Improvements to International Financial Reporting Standards, 2015–2017 Cycle
January 1, 20192
IFRIC 23 Uncertainty over Tax Income Treatments January 1, 20192
Framework, amendments
Amendments to References to the Conceptual Framework
January 1, 20202
IFRS 17 Insurance Contracts January 1, 20212
IFRS 10 and IAS 28, amendments
Sale or Contribution of Assets between an Investor and its Associate or Joint Venture
postponed
1 These standards are applicable to reporting periods beginning on or after the effective date. 2 Has not yet been endorsed by the EU.
These standards—in so far as they have been adopted by the European Union—will not be adopted early by the Group. From today’s perspective, the new and revised standards and interpretations are not expected to have any material effects on the voestalpine Group’s net assets, financial position, and results of operations.

91A N N U A L R E P O R T 2 0 1 7 / 1 8
The following effects are expected from the new standards IFRS 9, IFRS 15, and IFRS 16:
IFRS 9 Financial Instruments results in amendments and revisions in the area of financial instruments and will replace IAS 39 (except for portfolio fair value hedges). Going forward, the classification rules vary according to the characteristics of the business model and the contractual cash flows of finan-cial assets, whereas the existing requirements regarding financial liabilities were largely incorporated into IFRS 9. Depending on the characteristics, there are also changes with respect to subsequent measurements of financial assets. In the future, three measurement categories will generally be avail-able; with the exception of a few measurement choices they must always be considered mandatory categories. Another fundamental change arises in connection with impairment, which in the future will be based on an expected loss model rather than, as has been the case to date, on incurred loss. In ad dition, IFRS 9 contains new general accounting requirements for hedge accounting but retains the existing provisions on the recognition and derecognition of financial instruments from IAS 39. The new rules under IFRS 9 expand the options for applying hedge accounting by shifting the focus to the risk management goals and strategies as the measurement basis. Accordingly, in the future a mostly quali tative and forward-looking approach to the measurement of the effectiveness of hedging rela-tionships will apply.
The voestalpine Group will apply the amendments to IFRS 9 for the first time as of April 1, 2018. As far as classification and measurement are concerned, retrospective application is the rule pursuant to which the comparative periods are not adjusted and any differences in the carrying amounts are recognized in retained earnings as of April 1, 2018, due to the initial application. The accounting requirements for hedge accounting must only be applied prospectively anyway.
Significant effects on the classification of financial assets are not currently expected. At this time, trade and other receivables are recognized at amortized cost less value adjustments. In the future, a portion of these receivables, which are intended for factoring, will be measured at fair value through profit or loss (FVTPL), which is not expected to give rise to any valuation adjustments, however. As of March 31, 2018, the voestalpine Group is holding an equity instrument valued at EUR 32.1 million, which was classified as available for sale at fair value. In the future, this will be classified as FVTPL under IFRS 9.
A valuation model was created in the voestalpine Group to abide by the requirements of IFRS 9 regarding the impairment model. The actual historical losses in the past five years will serve as the basis for estimating expected credit losses. Given the existing credit insurances and a diversified customer portfolio dominated by very good to good credit ratings, there is no concentration of default risks. Due to low historical and expected loan losses, the application of the new impairment method will not result in any material adjustments of the allowances for trade receivables.

92 C O N S O L I D A T E D F I N A N C I A L S T A T E M E N T S
With respect to hedge accounting, there are additional options for raw materials hedges, in par ticular, those that will lead to an expansion of the hedging relationships that qualify for hedge accounting. The hedges existing at the date of transition meet the requirements of IFRS 9 and correspond to the risk management strategies and goals of the voestalpine Group; as a result, initial application is not expected to have any significant effect at this point.
Given the explanations in the foregoing, the voestalpine Group does not expect the initial application of IFRS 9 to have any significant effects.
IFRS 15 Revenue from Contracts with Customers brings together the rules for revenue recognition and replaces IAS 18 and IAS 11 as well as the related interpretations. In the future, it is no longer determined by transfers of significant opportunities and risks but rather the point in time when the transfer of control over the goods and services occurs and thus the benefits to be derived through it. Both the scope and the timeframe for the recognition of revenue are determined based on the newly introduced five-step model.
The voestalpine Group evaluated the effects in a Group-wide implementation project and will apply the new standard for the first time as of April 1, 2018, using the modified retrospective method. It will be applied to all open contracts. The resulting cumulative initial application effect of about minus EUR –7 million after taxes will be recognized in retained earnings as of April 1, 2018. This effect results mainly from customer-specific series production subject to the applicability of IFRS 15.35c which, in contrast to IAS 11, in turn leads to the earlier recognition of revenue as well as the reversal of pre-viously capitalized pre-series losses; in the future, under the requirements of IFRS 15 these must be recognized in income in the period in which they occur.
Aside from the initial application effect, the new standard will also result in reclassifications to con-tract liabilities and contract assets of advances received and existing PoC receivables.
IFRS 16 Leases governs accounting for leasing arrangements and will replace IAS 17 as well as pre-vious interpretations. The new rules eliminate the prior distinction between finance and operating leasing arrangements by the lessee. In this respect, operating leases will essentially be treated in the same way as finance leases in the future.
The voestalpine Group plans to apply the new standard using the modified retrospective method for the first time as of April 1, 2019. Accordingly, the resulting cumulative initial application effect will be recognized in retained earnings as of April 1, 2019, but no adjustment of the comparative data is made at the same time. voestalpine Group companies currently operate as lessees in operating leases and so the application of IFRS 16 is expected to have an impact on net assets, financial posi-tion, and results of operations. In its initial assessment, the voestalpine Group identified the future capitalization of right-of-use assets and the corresponding liabilities as the most significant effect. As a result, instead of recognizing lease expenses on a straight-line basis as in the past, depreciation expenses for right-of-use assets and interest on lease liabilities are recognized. This will lead to an improvement in EBITDA and EBIT as well as a shift between cash flows from operating activities and
93A N N U A L R E P O R T 2 0 1 7 / 1 8
financing activities. However, it is not possible to quantify these effects at the moment since the un-derlying contracts have not yet been examined in detail with respect to the applicability of IFRS 16. Aside from the composition of the leasing portfolio, as of April 1, 2019, the actual effects will also be shaped by the interest rate, the assessments regarding the exercise of any renewal options as well as the utilization of exceptions and exemptions from recognition rules. In any case, the initial application will not make it impossible to satisfy permitted caps on borrowings (Chapter 23, Financial Instruments). In order to be able to ensure proper accounting treatment under the requirements of IFRS 9, in the new business year an IT solution serving to provide a system-based presentation of the leases will be implemented in the voestalpine Group. For a list of existing operating leases as of the reporting date, see Note 9. Property, plant and equipment. No significant effects are expected for existing finance leases.
BASIS OF CONSOLIDATIONThe Annual Financial Statements of fully consolidated entities are prepared using uniform accounting policies. For entities included using the equity method (associates and joint ventures), local account-ing policies and different reporting dates (see “Investments” appendix to the Notes) are maintained due to considerations regarding cost and benefit if the relevant amounts are immaterial.
In the case of initial consolidation, assets, liabilities, and contingent liabilities are measured at their fair value at the date of acquisition. Any excess of the cost of acquisition over the net of the assets acquired and liabilities assumed is recognized as goodwill. If the net of the assets acquired and liabilities assumed exceeds the cost of acquisition, the difference is recognized in profit or loss in the period of acquisition. The hidden reserves and/or hidden losses attributed to the non-controlling interests are also accounted for.
All intra-group profits, receivables and payables, income and expenses are eliminated.
FOREIGN CURRENCY TRANSLATIONIn accordance with IAS 21, Annual Financial Statements prepared in foreign currencies that are included in the Consolidated Financial Statements are translated into euros using the functional currency method. The relevant national currency is the functional currency in all cases since, from a financial, economic, and organizational perspective, these entities all operate independently. Assets and liabilities are translated using the exchange rate on the reporting date. Income and expenses are translated using the average exchange rate for the business year.
Equity is translated using the historical exchange rate. Currency translation differences are recognized directly in equity in the currency translation reserve.

94 C O N S O L I D A T E D F I N A N C I A L S T A T E M E N T S
In the Separate Financial Statements of consolidated entities, foreign currency transactions are trans-lated into the functional currency of the entity using the exchange rate at the date of the transaction. Foreign exchange gains and losses resulting from translation at the transaction date and reporting date are recognized in the consolidated income statement.
Currency exchange rates (ECB fixing) of key currencies have changed as follows:
USD GBP BRL SEK PLN
Closing exchange rate03/31/2017 1.0691 0.8555 3.3800 9.5322 4.2265
03/31/2018 1.2321 0.8749 4.0938 10.2843 4.2106
Average annual rate2016/17 1.0975 0.8413 3.6220 9.5122 4.35212017/18 1.1711 0.8826 3.7673 9.7519 4.2213
UNCERTAINTIES IN ACCOUNTING ESTIMATES AND ASSUMPTIONSThe preparation of the Consolidated Financial Statements in conformity with IFRS requires the management to make accounting estimates and assumptions that may significantly affect the recognition and measurement of assets and liabilities, the recognition of other obligations as of the reporting date, and the recognition of income and expenses during the business year.
The following assumptions bear a significant risk of causing a material adjustment to assets and liabilities within further periods:
» Recoverability of assetsThe assessment of the recoverability of intangible assets, goodwill as well as property, plant and equipment is based on assumptions concerning the future. The determination of the recoverable amount in the course of an impairment test is based on various assumptions, such as future net cash flows and discount rates. The net cash flows correspond to the amounts in the most current business plan at the time of the preparation of Financial Statements. See therefore also B. Summary of accounting policies, the section entitled Impairment testing of goodwill, other intangible assets, and property, plant and equipment, as well as the Notes 9. Property, plant and equipment; 10. Goodwill; and 11. Other intangible assets.
» Recoverability of financial instrumentsWhere the assessment of the recoverability of financial instruments cannot be derived from active markets, it is determined using alternative actuarial models. The underlying parameters used in the determination of the fair values are based partially on assumptions concerning the future. See also B. Summary of accounting policies, the section entitled Financial instruments, as well as Note 23. Financial instruments.

95A N N U A L R E P O R T 2 0 1 7 / 1 8
» Pensions and other employee obligationsThe valuation of existing severance payment and pension obligations is based on assumptions regarding interest rate, retirement age, life expectancy, and future salary/wage increases. See also B. Summary of accounting policies, the section entitled Pensions and other employee obligations, as well as Note 18. Pensions and other employee obligations.
» Assets and liabilities associated with acquisitionsEstimates associated with determining the fair value of identified assets, liabilities, and contingent considerations are required in the context of acquisitions. All available information about the situation at the acquisition date is applied in this procedure. The fair values of buildings and land are typically determined by external experts or experts within the Group. Intangible assets are measured using appropriate valuation methods depending on the type of asset and the availa- bility of information. These measurements are closely connected with assumptions about the future development of estimated cash flows as well as the applied discount rates.
Information about acquisitions made during the reporting period is reported under D. Acquisitions and other additions to the scope of Consolidated Financial Statements.
» Other provisionsOther provisions due to present obligations arising from past events, which lead to an outflow of resources embodying economic benefits, are stated at the amount that reflects the most pro- bable value based on a reliable estimate. Provisions are discounted where the effect is material. For details concerning provisions see B. Summary of accounting policies, the section entitled Other provisions, as well as Note 19. Provisions.
» Income taxesIncome tax expense represents the total of current and deferred tax. Current tax is based on tax-able income and is calculated using the tax rates currently applicable. The calculation of deferred taxes is based on the respective local income tax rates that have been enacted or substantively enacted. The recognition and measurement of current and deferred taxes is subject to numerous uncertainties.
The voestalpine Group’s international scope means that the Group falls within multiple tax juris-dictions in the respective relevant tax jurisdictions. The tax items presented in the Financial State-ments were established according to the relevant tax regulations, and, because of their com plexity, may possibly support interpretations that vary between taxpayers and local finance authorities. Since varying interpretations of tax laws may lead to additional tax payments for past years as a result of company audits, they are included in the analysis based on the assessment by company management. Recognition of deferred tax assets is based on the assumption that sufficient taxable profit will be generated in the future to utilize these tax loss carryforwards.
For further information see B. Summary of accounting policies, the section entitled Income taxes, as well as the Note 8. Income taxes and 13. Deferred taxes.

96 C O N S O L I D A T E D F I N A N C I A L S T A T E M E N T S
» Legal risksAs an internationally active Company, the voestalpine Group is exposed to legal risks. The results of present or future legal disputes are generally not predictable and may have a material effect on the Group’s net assets, financial position, and results of operations. In order to reliably assess poten-tial obligations, the underlying information and assumptions are continually reviewed by manage-ment and used for further evaluation both internally and by external legal counsel. Provisions are recognized to cover probable present obligations, including a reliable estimate of legal costs. If the future outflow of resources is not probable, or if the confirmation of actual events is not within the Company’s control, the option to record a contingent liability is considered.
Estimates and underlying assumptions are reviewed on an ongoing basis. Actual results may differ from these estimates if the determining factors at the reporting date differ from expectations. Revisions to accounting estimates are recognized through profit or loss in the period in which the estimates are revised, and the assumptions are adjusted accordingly.
RECOGNITION OF REVENUE AND EXPENSESRevenue arising from the provision of goods and services is realized when all material risks and rewards arising from the goods or services provided have passed to the buyer. Operating expenses are recognized when goods or services are used or when the expense is incurred.
Investment grants are treated as deferred items and recognized as income over the useful life of the asset. Cost subsidies are recognized on an accrual basis, corresponding to the associated expenses. Government grants of EUR 21.4 million (2016/17: EUR 22.6 million) for capital expenditures, research and development, and promotion of job opportunities were recognized as income during the re- porting period. Expenses for research and development amounted to EUR 152.1 million (2016/17: EUR 140.3 million) in the business year 2017/18.
PROPERTY, PLANT AND EQUIPMENTProperty, plant and equipment are measured at cost less accumulated depreciation and any impair-ment losses.
The cost of self-constructed property, plant and equipment includes direct costs and an appropriate portion of indirect materials and indirect labor as well as borrowing costs for qualifying assets. The commencement date for capitalization is the date when expenditures for the asset and borrowing costs are incurred as well as activities are undertaken that are necessary to prepare the asset for its intended use or sale.

97A N N U A L R E P O R T 2 0 1 7 / 1 8
Depreciation is calculated on a straight-line basis over the expected useful lives. Land is not subject to depreciation. Depreciation is based on the following rates for each asset category:
Buildings 2.0 – 20.0%Plant and equipment 3.3 – 25.0%Fixtures and fittings 5.0 – 20.0%
Investment property is measured using the cost model. Useful lives and depreciation methods are identical to property, plant and equipment recognized under IAS 16.
LEASESLeased assets are treated as finance leases when they are considered asset purchases subject to long-term financing in economic terms. All other leased assets are classified as operating leases. Lease payments under operating leases are shown as expenses in the consolidated income statement.
Finance leases are initially recognized as Group assets at fair value or the lower present value of the minimum lease payments at the inception of the lease. The corresponding liabilities to the lessors are recorded under financial liabilities in the consolidated statement of financial position.
Finance leases are depreciated over their expected useful lives on the same basis as comparable assets or, where shorter, over the term of the relevant lease. The Group does not act as a lessor.
GOODWILLAll corporate acquisitions are accounted for by applying the purchase method. Goodwill arises from the acquisition of subsidiaries and investments in associates and joint ventures.
Goodwill is allocated to cash-generating units or groups of cash-generating units and, in accordance with IFRS 3, is not amortized, but tested for impairment at least annually and additionally if circum-stances exist that indicate possible impairment. The carrying amount of investments in associates and joint ventures also includes the carrying amount of goodwill.
Negative goodwill arising from an acquisition is immediately recognized as income.
On disposal of a subsidiary, the goodwill associated with the subsidiary is included in the determi-nation of the profit or loss on disposal based on relative value in accordance with IAS 36.86.

98 C O N S O L I D A T E D F I N A N C I A L S T A T E M E N T S
OTHER INTANGIBLE ASSETSExpenses for research activities, undertaken with the prospect of gaining new scientific or technical knowledge and understanding, are recognized as an expense as incurred. In accordance with IAS 38.57, development expenditure is capitalized from the date on which the relevant criteria are satis-fied. In this way, the expenses incurred are not capitalized subsequently if all of the above conditions are only met at a later date. Expenditure on internally generated goodwill and brands is recognized as an expense as incurred.
Other intangible assets are stated at cost less accumulated amortization and impairment charges. In the case of a business combination, the cost of acquisition is the fair value as of the acquisition date. Amortization is charged on a straight-line basis over the expected useful life of the asset. The maximum expected useful lives are as follows:
Backlog of orders 1 yearCustomer relations 15 yearsTechnology 10 yearsSoftware 10 years
IMPAIRMENT TESTING OF GOODWILL, OTHER INTANGIBLE ASSETS, AND PROPERTY, PLANT AND EQUIPMENTCash-generating units or groups of cash-generating units that include goodwill and other intangible assets with indefinite useful lives are tested for impairment at least annually as well as if circum stances exist that indicate possible impairment. All other assets and cash-generating units are tested for im-pairment if there are any indications that impairment may have arisen. Impairment testing is based on the value-in-use concept; accordingly, the recoverable amount is determined based on value in use.
For the purpose of impairment testing, assets are grouped at the lowest levels at which cash flows are independently generated (cash-generating units). Goodwill is allocated to those cash-generating units or groups of cash-generating units that are expected to benefit from synergies of the related business combination and this must be on the lowest level at which the goodwill in question is monitored for internal management purposes.
An impairment loss is recognized for the amount by which the asset’s or cash-generating unit’s carry-ing amount exceeds its recoverable amount. The recoverable amount is the higher of the fair value less cost to sell and the value in use. Impairment losses recognized with regard to cash-generating
99A N N U A L R E P O R T 2 0 1 7 / 1 8
units or groups of cash-generating units to which goodwill has been allocated are first applied against the carrying amount of goodwill. Any remaining impairment loss reduces the carrying amounts of the assets of the cash-generating unit on a pro-rata basis. Insofar as the impairment test for goodwill is conducted for a group of cash-generating units and this results in an impairment, the individual cash-generating units included in this group are also tested for impairment and a possible impair-ment of assets is first recorded at this level. This is followed by another impairment test for the cash- generating units at the group level.
If there are indications that an impairment loss recognized for an asset, a cash-generating unit, or a group of cash-generating units (excluding goodwill) in earlier periods no longer exists or may have declined, the recoverable amount is to be estimated and then recognized (reversal of impairment).
FINANCIAL INSTRUMENTSDerivative financial instruments are used by voestalpine AG exclusively for the purpose of hedging the foreign currency risk, interest rate risk, and raw materials price risk. Derivative financial instruments are carried at fair value and recognized as profit or loss. Hedge accounting in accordance with IAS 39 is used for some of the Group’s derivative financial instruments. Consequently, gains or losses resulting from changes in the value of derivative financial instruments are recognized either as profit or loss or under other comprehensive income, depending on whether a fair value hedge or the effec-tive portion of a cash flow hedge is involved.
Loans and receivables are carried at amortized cost. Since the Group’s securities meet the criteria in accordance with IAS 39.9 for application of the fair value option, securities are recognized at fair value through profit or loss. The designation of fair value was selected to convey more useful informa-tion because this group of financial assets is managed according to their fair value, as documented in the risk management and investment strategy, and performance is observed and reported by means of fair value. There are no held-to-maturity financial instruments.
OTHER INVESTMENTSInvestments in subsidiaries, joint ventures, and associates that are not included in the Consolidated Financial Statements by full consolidation or the equity method are reported under other investments. They are held as “available for sale at cost” and measured at cost because these investments do not have a price quoted in an active market, and their fair value cannot be reliably determined. Only the non-consolidated investment in Energie AG Oberösterreich is measured at fair value as “available for sale at fair value” because the fair value of this company can be reliably determined based on the valuation report prepared once a year for Energie AG Oberösterreich as a whole.

100 C O N S O L I D A T E D F I N A N C I A L S T A T E M E N T S
INCOME TAXESIncome tax expense represents the total of current and deferred tax. Current tax is based on taxable income and is calculated using the tax rates currently applicable.
In accordance with IAS 12, all temporary differences between items in the Consolidated Financial Statements and their tax bases are included in deferred taxes. Deferred tax assets on carryforwards of unused tax losses are recognized to the extent that it is probable that future taxable profit will be available against which the tax losses can be utilized.
In accordance with IAS 12.39 and IAS 12.44, deferred taxes on differences resulting from investments in subsidiaries, associates, and joint ventures were not recognized.
Deferred tax assets are recognized for planned dividends subject to withholding tax.
The calculation of deferred taxes is based on the respective local income tax rates that have been enacted or substantively enacted. Deferred tax assets and deferred tax liabilities are offset when they relate to the same tax authority and an offset right exists.
INVENTORIESInventories are stated at the lower of cost and net realizable value. Net realizable value represents the estimated selling price less estimated costs of completion and estimated costs necessary to make the sale. In exceptional cases, the replacement cost of raw materials and supplies may serve as the basis of measurement in accordance with IAS 2.32.
The cost of inventories of the same type is determined by the weighted average price method or a similar method. Cost includes directly attributable costs and all pro-rated material and production overheads based on normal capacity utilization. Borrowing costs, general administrative expenses, and distribution costs are not recognized in inventory.
EMISSION CERTIFICATESFree certificates are measured at zero cost over the entire holding period, as the rights have been allocated free of charge. Purchased emission certificates are recorded at actual cost under current assets and measured at fair value at the reporting date (limited by the actual cost).
In the case of under-allocation, amounts for CO2 emission certificates are included in other provisions. The measurement is based on the rate prevailing on the reporting date (or the carrying amount) of the relevant certificates.

101A N N U A L R E P O R T 2 0 1 7 / 1 8
TRADE AND OTHER RECEIVABLESTrade and other receivables are stated at amortized cost. Identifiable risks are mainly covered by acquiring credit insurance. Non-interest- or low-interest-bearing receivables with a remaining period of more than one year are recognized at their discounted present value. Sold receivables are derecog-nized according to the provisions of IAS 39 (see Note 28. Disclosures of transactions not recorded in the statement of financial position).
When the outcome of a construction contract pursuant to IAS 11 can be estimated reliably, contract revenue and contract costs associated with the construction contract are recognized by reference to the stage of completion of the contract activity at the end of the reporting period (“percentage of completion method”), measured based on the proportion of contract costs incurred for work per-formed to date relative to the estimated total contract costs. When the outcome of a construction contract cannot be estimated reliably, contract revenue is recognized to the extent of contract cost incurred that is probably recoverable. Contract costs are recognized as expenses in the period in which they are incurred. When it is probable that total contract costs will exceed total contract revenue, the expected loss is immediately recognized as an expense.
Accruals and deferrals are reported under other receivables and other liabilities.
CASH AND CASH EQUIVALENTSCash and cash equivalents include cash on hand, cash at banks, and checks and are carried at mar-ket value.
PENSIONS AND OTHER EMPLOYEE OBLIGATIONSPensions and other employee obligations include provisions for severance payments, pensions, and long-service bonuses and are recognized in accordance with IAS 19 using the projected unit credit method.
Actuarial gains and losses from severance and pension provisions are taken directly to other compre-hensive income in the year in which they are incurred. Actuarial gains and losses from provisions for long-service bonuses are recognized immediately in profit or loss.
Severance obligationsEmployees of Austrian entities who started their employment before January 1, 2003, are entitled to receive a severance payment if their employment is terminated by the employer or if they retire. The amount to be paid depends on the number of years of service and the employee’s salary or wage at the time employment ends. For employees who started their employment after December 31, 2002, a contribution-based system is provided. The contributions to external employee pension funds are recognized as expenses.

102 C O N S O L I D A T E D F I N A N C I A L S T A T E M E N T S
Defined contribution plansDefined contribution plans do not entail further obligations on the Company’s part once the premi-ums have been paid to the managing pension fund or insurance company.
Defined benefit plansUnder defined benefit plans, the Company guarantees that a given employee will receive a pension in a specified amount. The pension payments begin upon the retirement (or disability or death) and end upon the death of the former employee (or that of their survivors). Widow’s and widower’s pensions (50% to 75% of the old age pension) are paid to the surviving spouse until death or re-marriage. Orphans’ pensions (10% to 20% of the old age pension) are paid to dependent children until the end of their education but only up to the age of 27.
Longevity is the central risk within these defined benefit pension obligations. All calculations are made using the most recent mortality tables. Given a 10% relative decrease or increase in mortality, the DBO of pensions changes by +3.9% or –3.4% on the reporting date. Other risks, such as the risk of rising costs of medical services, do not have any significant impact on the obligations.
Almost all pension obligations within the Group cover vested claims.
AustriaThe amount of the pension is either based on a certain percentage of the final salary depending on the years of service or on a valorized fixed amount per year of service. The predominant part of the defined benefit pension obligations is transferred to a pension fund although the obligation for sub-sequent payments remains within the company.
GermanyThere are different pension schemes in Germany, which calculate the amount of the pension as follows:» A certain percentage of the final salary depending on the years of service» An increasing percentage of a fixed target pension depending on the years of service» A fixed pension amount» A fixed, valorized amount per year of service linked to the average salary within the company» A fixed, valorized amount per year of service
A small part of the pension rights are financed by insurers although the obligations themselves remain within the companies.

103A N N U A L R E P O R T 2 0 1 7 / 1 8
The calculation of employee benefits in all countries with significant benefit obligations is based on the following parameters:
2016/17 2017/18
Interest rate (%) 1.60 1.80Salary/wage increases (%)1 3.00 3.00Pension benefit increases (%)1 2.25 2.25
Retirement age men/women Austria max. 62 years max. 62 years Germany 63 – 67 years 63 – 67 years
Mortality tables Austria AVÖ 2008-P AVÖ 2008-P Germany Richttafeln 2005 G Richttafeln 2005 G
1 Recognition only for salary-dependent and/or value-guaranteed commitments.
Net interest expenses resulting from employee benefits are included in the consolidated income state-ment under finance costs.
Obligations from long-service bonusesIn most of the Austrian Group companies, employees are entitled to payment of a long-service bonus, which is based either on a collective agreement or a provision in a works agreement. This is a one-time payment when the anniversary of service has been reached; depending on the length of service, the bonus generally amounts to between one monthly salary and three monthly salaries.

104 C O N S O L I D A T E D F I N A N C I A L S T A T E M E N T S
OTHER PROVISIONSOther provisions due to present obligations arising from past events, which lead to an outflow of resources embodying economic benefits, are stated at the amount that reflects the most probable value based on a reliable estimate. Provisions are discounted where the effect is material.
The assumptions that underlie the provisions are reviewed on an ongoing basis. The actual figures can deviate from the assumptions if the underlying circumstances as of the reporting date have not developed as expected. As soon as better information is available, changes are recognized through profit and loss and the assumptions are adjusted accordingly.
Please note that we are invoking the safeguard clause in accordance with IAS 37.92, according to which information about provisions is not disclosed if this could seriously and adversely impact the Company’s interests.
CONTINGENT LIABILITIESContingent liabilities are present obligations arising from past events, where it is not probable that an outflow of resources will be required to settle the obligation, or possible obligations arising from past events whose existence or non-existence depends on less certain future events, which are not within the Company’s full control. When, in extremely rare cases, an existing debt cannot be stated in the statement of financial position as a provision because a reliable estimate of the debt is not possible, a contingent liability shall also be recognized.
With regard to possible obligations, we wish to point out that in accordance with IAS 37.92 infor mation about contingent liabilities is not disclosed if this could seriously and adversely impact the Company’s interests.
LIABILITIESLiabilities, except liabilities from derivative financial instruments, are stated at amortized cost.

105A N N U A L R E P O R T 2 0 1 7 / 1 8
EMPLOYEE STOCK OWNERSHIP PLANThe employee stock ownership plan in Austrian Group companies is based on the appropriation of a part of the salary and wage increase due to collective bargaining agreements over several business years. For the first time in the business year 2000/01, employees received voestalpine AG shares in return for a 1% lower salary or wage increase.
In each of the business years 2002/03, 2003/04, 2005/06, 2007/08, 2008/09, and 2014/15, between 0.3 percentage points and 0.5 percentage points of the total amount of wages and salaries required for the increase were used to provide voestalpine AG shares to employees. The actual amount is cal-culated from the monthly amount of wages and salaries waived, based on November 1, 2002, 2003, 2005, 2007, 2008, and 2014, applying an annual increase of 3.5%. In the business years 2012/13, 2013/14, 2016/17, and 2017/18, an additional 0.27 percentage points to 0.43 percentage points of the total amount of wages and salaries needed for the collective agreement pay increase for 2012, 2013, 2016, and 2017, respectively, were used to provide shares under the participation plan for those Austrian Group companies whose initial participation in the employee stock ownership plan had begun at a later date.
The Works Council and each company enter into an agreement for implementation of the Austrian employee stock ownership plan. Shares are acquired by the voestalpine Mitarbeiterbeteiligung Privatstiftung (a private foundation for the Company’s employee shareholding scheme), which trans-fers the shares to employees according to the wages and salaries they have waived. The value of the consideration provided is independent of price fluctuations. Therefore, IFRS 2 does not apply to the allocation of shares based on lower collective bargaining agreements.
An international participation model was developed for Group companies outside Austria, which was initially implemented in several companies in Great Britain and Germany in the business year 2009/10. Due to very positive experience gained in these pilot projects, the model was expanded in these two countries and introduced step by step in the Netherlands, in Poland, in Belgium, in the Czech Repub-lic, in Italy, in Switzerland, and in Romania, in the following business years. In the business year 2017/18, a total of 84 companies participated in the international employee stock ownership program in these nine countries.
As of March 31, 2018, the voestalpine Mitarbeiterbeteiligung Privatstiftung held approximately 14.0% (March 31, 2017: 14.8%) of voestalpine AG’s shares in trust for employees.

106 C O N S O L I D A T E D F I N A N C I A L S T A T E M E N T S
C. SCOPE OF CONSOLIDATED FINANCIAL STATEMENTS
The consolidated Group (see “Investments” appendix to the Notes) is defined in accordance with IFRS. In addition to the Annual Financial Statements of voestalpine AG, the Consolidated Financial State-ments also include the Financial Statements of entities controlled by voestalpine AG (and its subsi-diaries). Entities controlled by voestalpine AG that are not included in the Financial Statements of voestalpine AG are negligible, both individually and collectively.
Subsidiaries are entities controlled by the Group. Control exists when the voestalpine Group has the power over the investee, is exposed to variable returns, and has the ability to use its power over the investee to affect the amount of the investor’s returns. The Annual Financial Statements of subsidiar-ies are included in the Consolidated Financial Statements as of the point in time at which the Group acquires control over the subsidiary and extends to the point in time at which the Group ceases to exercise control over the subsidiary.
Associates are entities over which the voestalpine Group has significant influence through partici-pating in the financial and operating policy decisions, but not control or joint control of those policies. Joint ventures are joint arrangements in which partner companies (the voestalpine Group and one or more partners) exercise joint control over the arrangement and possess rights to the company’s net assets. The Annual Financial Statements of associates and joint ventures are included in the Con-solidated Financial Statements using the equity method from the acquisition date until disposal date. The Group’s associates and joint ventures are listed in the “Investments” appendix to the Notes.

107A N N U A L R E P O R T 2 0 1 7 / 1 8
CHANGES IN SCOPE OF CONSOLIDATED FINANCIAL STATEMENTSThe scope of Consolidated Financial Statements changed as follows during the business year under review:
Full consolidation Equity method
As of April 1, 2017 277 9 Acquisitions 1 Change in consolidation method Additions 6 Reorganizations –3 Divestments or disposals –1 As of March 31, 2018 280 9 Of which foreign companies 222 4
The following entities were deconsolidated during the business year 2017/18:
Name of entity Date of deconsolidation
Full consolidation in the business year 2016/17Microcosmic Metal Co., Ltd. September 13, 2017
Reorganizations voestalpine Finanzierungs GmbH April 1, 2017 voestalpine Finanzierungs Holding GmbH April 1, 2017 Eifeler Swiss AG April 1, 2017
The non-operating company Microcosmic Metal Co., Ltd., China was liquidated.

108 C O N S O L I D A T E D F I N A N C I A L S T A T E M E N T S
D. ACQUISITIONS AND OTHER ADDITIONS TO THE SCOPE OF CONSOLIDATED FINANCIAL STATEMENTS
The following entities were included in the Consolidated Financial Statements for the first time during the business year 2017/18:
Name of entity Interest in % Date of initial consolidation
Full consolidationvoestalpine Automotive Components Tianjin Co., Ltd. 100.000% April 1, 2017voestalpine Rotec Coating SRL 100.000% April 12, 2017voestalpine Böhler Welding Austria Vertriebs-GmbH 100.000% September 14, 2017voestalpine Böhler Welding Automation GmbH 70.040% September 23, 2017voestalpine Additive Manufacturing Centre Ltd. 100.000% November 23, 2017voestalpine Böhler Welding Germany Vertriebs-GmbH 100.000% November 29, 2017voestalpine Böhler weldCare AB 100.000% December 6, 2017
The additions to the scope of Consolidated Financial Statements of fully consolidated entities include one acquisition, five newly established subsidiaries, and the consolidation of one entity not previous-ly included in the scope of the Consolidated Financial Statements.
In accordance with IFRS 3, the acquired companies are included in the Consolidated Financial State-ments at the fair value carried forward of the acquired assets, liabilities, and contingent liabilities determined as of the acquisition date, including depreciation and amortization as appropriate. The carrying amount of the non-controlling interests is determined based on the fair values carried forward for the assets and liabilities acquired. With regard to the first-time full consolidations in accordance with IFRS 3, due to time constraints and the fact that not all valuations have been com-pleted, the following items are to be considered provisional: property, plant and equipment; intan-gible assets; inventories; and provisions—and consequently goodwill as well.

109A N N U A L R E P O R T 2 0 1 7 / 1 8
The increase in majority interests is treated as a transaction between owners. The difference between the costs of acquisition of additional shares and the pro-rated carrying amount of the non-controlling interests is recognized directly in equity. During the reporting period, EUR 0.0 million (2016/17: EUR 3.8 million) was paid for the acquisition of non-controlling interests or provisions were formed for the payment thereof. Non-controlling interests amounting to EUR 0.0 million (2016/17: EUR 2.2 million) were derecognized and the remaining amount of EUR 0.0 million (2016/17: EUR 1.6 million) was recognized directly in equity.
Put options granted to non-controlling shareholders in exchange for their shares in Group companies are recorded in the statement of financial position as liabilities stated at fair value. If the risks and re-wards associated with ownership of a non-controlling interest have already been transferred at the time the majority interest was acquired, an acquisition of 100% of the entity is assumed. If, however, the risks and rewards are not transferred, the non-controlling interests continue to be shown in equity. The liability is covered by a direct transfer from retained earnings with no effect on profit or loss (dou-ble credit approach).
Outstanding put options, which are offset against equity, had a fair value of EUR 0.4 million (March 31, 2017: EUR 0.3 million) as of March 31, 2018. For the purposes of the valuation, the discounted cash flow method was applied, taking the contractual maximum limits into account. Input factors in the discounted cash flow method include but are not limited to the medium-term busi-ness plan and the discount rate.
As of September 23, 2017, voestalpine Böhler Welding Group GmbH, which is part of the voestalpine Group’s Metal Engineering Division, acquired 70.04% of the business of and voting shares in WELTRON GmbH, Germany, the welding automation specialist. This business combination now enables the Group to offer customers turnkey solutions and to expand its existing product range in the Welding Consumables business segment by control, steering, and regulating devices for welding plants. From now on, the company will be known as voestalpine Böhler Welding Automation GmbH.
On October 2, 2017, voestalpine High Performance Metals UK Limited, a company that is part of the High Performance Metals Division, acquired the business and selected assets of CMP Alloys Ltd. under an asset deal. CMP’s strong presence on the Scottish market allows voestalpine High Performance Metals UK Limited to serve key global OEMs (and their supply chains) in Great Britain as well as to improve both customer proximity and customer service.
In December 2017, voestalpine Rotec GmbH, which is part of the voestalpine Group’s Metal Forming Division, took over the CDC facilities of Barum Technik, a Romanian company, as part of an asset deal. From now on, the company will be known as voestalpine Rotec Coating SRL; it is domiciled in Timisoara, Romania.

110 C O N S O L I D A T E D F I N A N C I A L S T A T E M E N T S
These acquisitions have the following impact on the Consolidated Financial Statements:
Recognized values
Non-current assets 3.8Current assets 1.8Non-current provisions and liabilities –0.1Current provisions and liabilities –1.6Net assets 3.9Goodwill 0.3Costs of acquisition 4.2Cash and cash equivalents acquired 0.0Net cash outflow 4.2
In millions of euros
Goodwill of EUR 0.3 million results from the profit potential of the company, which cannot be allocat-ed to individual capitalizable items according to IFRS and is expected to be deductible for tax pur-poses. Goodwill is assigned completely to the “Welding Consumables” unit, which carries the goodwill.
Since their initial consolidation, these acquisitions have contributed revenue of EUR 1.8 million to con-solidated revenue. Their share of the Group’s profit after tax was EUR 0.1 million for the same period. The consolidated revenue would have been EUR 1.3 million higher and the Group’s profit after tax would have been EUR 0.1 million higher if the acquisitions had been consolidated as of April 1, 2017.
As part of the first-time full consolidation of voestalpine Böhler Welding Automation GmbH, fair values for trade receivables of EUR 0.1 million (gross carrying amount: EUR 0.1 million) were taken over. Receivables that are expected to be uncollectible are considered immaterial and negligible. Acquisition-related costs of EUR 0.1 million were recognized in other operating expenses for these acquisitions.
In the current reporting period, EUR 2.6 million were paid for earlier acquisitions made in accordance with IFRS 3.

111A N N U A L R E P O R T 2 0 1 7 / 1 8
E. SUBSIDIARIES WITH MATERIAL NON-CONTROLLING INTERESTS
Name of the subsidiary Domicile 03/31/2017 03/31/2018
voestalpine Tubulars GmbH & Co KG Kindberg, Austria
Proportion of ownership 49.8875% 49.8875%Proportion of ownership interests held by non-controlling interests 50.1125% 50.1125%
CNTT Chinese New Turnout Technologies Co., Ltd. Qinhuangdao, China
Proportion of ownership 50.0000% 50.0000%Proportion of ownership interests held by non-controlling interests 50.0000% 50.0000%
In the reporting period, the total of all non-controlling interests amounts to EUR 168.6 million (March 31, 2017: EUR 168.2 million), of which EUR 84.4 million (March 31, 2017: EUR 80.7 million) is attributable to voestalpine Tubulars GmbH & Co KG and EUR 35.5 million (March 31, 2017: EUR 32.8 million) is attributable to CNTT Chinese New Turnout Technologies Co., Ltd. The remaining non-controlling interests, seen individually, can be considered immaterial for the Group.
Summarized financial information for each subsidiary with non-controlling interests that are material for the Group is depicted in the following chart. The figures correspond to amounts prior to the elimi-nation of intragroup transactions.
SUMMARIZED STATEMENT OF FINANCIAL POSITION
voestalpine Tubulars GmbH & Co KG
CNTT Chinese New Turnout Technologies Co., Ltd.
03/31/2017 03/31/2018 03/31/2017 03/31/2018
Non-current assets 112.3 122.3 18.2 15.1Current assets 124.7 165.0 96.1 95.7Non-current provisions and liabilities 30.0 30.2 3.0 2.9Current provisions and liabilities 103.6 137.0 46.7 37.8Net assets (100%) 103.4 120.1 64.6 70.1
In millions of euros

112 C O N S O L I D A T E D F I N A N C I A L S T A T E M E N T S
SUMMARIZED INCOME STATEMENT
voestalpine Tubulars GmbH & Co KG
CNTT Chinese New Turnout Technologies Co., Ltd.
2016/17 2017/18 2016/17 2017/18
Revenue 274.8 456.1 93.2 76.1EBIT –7.7 20.0 30.7 28.7Profit after tax –8.0 16.8 23.5 21.7
Attributable to: Equity holders of the parent –4.0 8.4 11.7 10.8 Non-controlling interests –4.0 8.4 11.7 10.8
Dividends paid to non-controlling interests 5.2 0.0 4.5 6.5
In millions of euros
SUMMARIZED STATEMENT OF CASH FLOWS
voestalpine Tubulars GmbH & Co KG
CNTT Chinese New Turnout Technologies Co., Ltd.
2016/17 2017/18 2016/17 2017/18
Cash flows from operating activities 4.8 2.4 37.2 13.0Cash flows from investing activities –30.2 –24.6 –0.8 –1.0 thereof additions to/divestments of other financial assets 0.1 0.1 0.0 0.0Cash flows from financing activities 25.8 21.7 –14.0 –12.9Net decrease/increase in cash and cash equivalents 0.4 –0.5 22.4 –0.9
In millions of euros

113A N N U A L R E P O R T 2 0 1 7 / 1 8
F. INVESTMENTS IN ASSOCIATES AND JOINT VENTURES
SHARES IN IMMATERIAL JOINT VENTURESProfits from the joint ventures, which are individually immaterial for the voestalpine Consolidated Financial Statements, are included using the equity method. Interests held are presented in the ap-pendix to the Notes on “Investments.” This information relates to the interests held by the voestalpine Group in immaterial joint ventures and is broken down as follows:
2016/17 2017/18
Group share of Profit after tax 0.9 0.9 Other comprehensive income 0.0 –0.2 Comprehensive income 0.9 0.7
Carrying amount immaterial joint ventures 3.8 4.6
In millions of euros
voestalpine Giesserei Linz GmbH holds 51.0% of shares in Jiaxing NYC Industrial Co., Ltd. The Articles of Incorporation require at least one vote from another partner for all significant decisions (budget, investments). As a result, it is assumed that despite the 51.0% interest, control is not exercised over the interest.
SHARES IN IMMATERIAL ASSOCIATESThe profit from associates that are individually immaterial for the voestalpine Consolidated Financial Statements are included using the equity method. This information relates to the interests held by the voestalpine Group in associates and is broken down as follows:
2016/17 2017/18
Group share of Profit after tax 13.7 14.3 Other comprehensive income 0.2 –1.4 Comprehensive income 13.9 12.9
Carrying amount immaterial associates 109.2 113.9
In millions of euros
Associates and the interests held in them are presented in the appendix to the Notes on “Investments.”

114 C O N S O L I D A T E D F I N A N C I A L S T A T E M E N T S
G. EXPLANATIONS AND OTHER DISCLOSURES
1. REVENUERevenue is broken down as follows:
2016/17 2017/18
Revenue from the sale of products (including services) 11,049.2 12,558.2Revenue from construction contracts 245.3 339.6Revenue 11,294.5 12,897.8
In millions of euros
2. OPERATING SEGMENTSThe voestalpine Group operates in five reportable segments: Steel Division, High Performance Metals Division, Metal Engineering Division, Metal Forming Division, and Other. The reporting system, which is based primarily on the nature of the products provided, reflects the internal financial reporting, the organization’s management structure, and the Company’s main sources of risks and rewards.
The Steel Division of the voestalpine Group is the global leader in quality for highest quality strip steel and a global market leader for both heavy plate used in the most sophisticated applications and casings for large turbines. Its activities include the production of sophisticated hot and cold-rolled strip steel as well as electrogalvanized, hot-dip galvanized, and organically coated strip steel. This is augmented by electrical steel strip, heavy plate and foundry activities as well as the downstream areas, Steel & Service Center and Logistics Services. The division operates the world’s most modern direct reduction plant in Corpus Christi, Texas, USA, which manufactures highest quality pre-materials (HBI) for both own and third-party steel production. The Steel Division is the first point of contact for important automotive manufacturers and suppliers with respect to strategic product development and supports its customers globally. Moreover, it also is a key partner of the European white goods and mechanical engineering industries. The Steel Division produces heavy plate for the energy sector (which is used in the oil and natural gas industry as well as in connection with renewable energies) and for applications under extreme conditions (for example, deep-sea pipelines or in the world’s perma-frost regions).

115A N N U A L R E P O R T 2 0 1 7 / 1 8
The High Performance Metals Division is the global market leader in the tool steel and high-speed steel sector. In the segment of special alloys for the oil and natural gas industries, the aerospace in-dustry, and the energy engineering industry, the High Performance Metals Division holds a leading position on the global market. The division has a global network of service centers with a focus on tool manufacturing, offering heat treatment and coating services as well as warehousing and preprocess-ing of special steels. In Houston, Texas, USA, Singapore, and Birmingham, Great Britain, the division offers a broad spectrum of services including logistics, distribution, and processing, especially for the oil and natural gas industries. Its position as a technology leader in this field is highlighted by the one-stop-shop solutions it offers customers. Additive manufacturing, a business segment that will be hugely important in the future, with facilities in Düsseldorf, Germany, Toronto, Canada and Singapore is being established along its entire value chain, from powders to the finished “printed” part.
The Metal Engineering Division is the global market leader in turnout technology, the European mar-ket leader in rails and specially treated wire, and has a leading position in seamless tubes for special applications and high-quality welding consumables. The division manufactures the world’s widest range of high-quality rails and turnout products, high-quality rod wire, drawn wire, premium seamless tubes, and welding filler materials. Furthermore, the division offers an extensive range of services in the railway systems sector. Moreover, the Metal Engineering Division has access to its own steel production.
The Metal Forming Division is the expertise center at voestalpine for highly developed special sections, tube products, and precision strip steel as well as pre-finished system components made from pressed, punched, and roll-profiled parts. This combination of expertise in materials and processing is unique in the industry, and with its global presence, the division is the first choice for customers who value in-novation and quality. These customers include nearly all leading manufacturers in the automotive manufacture and supply industry, with a significant focus on the premium segment, as well as several companies in the commercial vehicle, construction, storage, energy, and (agricultural) equipment industries.
The holding company, several Group financing and raw materials purchasing companies as well as one personal services company and the group-IT companies are included in the segment Other. These companies are combined in this segment because their focus is on providing coordination services and assistance to the subsidiaries.
Segment revenue, segment expenses, and segment results include transfers between operating segments. Such transfers are accounted for at competitive market prices charged to unaffiliated cus-tomers for similar products. These transactions have been eliminated in the Consolidated Financial Statements.
The voestalpine Group uses EBIT as the key figure to measure the performance of the segments. In the voestalpine Group, this figure is a widely accepted indicator for measuring profitability.

116 C O N S O L I D A T E D F I N A N C I A L S T A T E M E N T S
The operating segments of the Group are as follows:
OPERATING SEGMENTS
Steel Division
High Performance Metals Division
Metal Engineering Division
Metal Forming Division Other Reconciliation Total Group
2016/17 2017/18 2016/17 2017/18 2016/17 2017/18 2016/17 2017/18 2016/17 2017/18 2016/17 2017/18 2016/17 2017/18
Segment revenue 3,912.4 4,772.7 2,697.9 2,918.0 2,684.6 2,989.7 2,426.1 2,743.4 1,395.0 1,629.4 –1,821.5 –2,155.4 11,294.5 12,897.8 Of which revenue with third parties 3,599.5 4,368.9 2,641.7 2,860.5 2,648.8 2,947.1 2,386.4 2,705.5 18.1 15.8 0.0 0.0 11,294.5 12,897.8 Of which revenue with other segments 312.9 403.8 56.2 57.5 35.8 42.6 39.7 37.9 1,376.9 1,613.6 –1,821.5 –2,155.4 0.0 0.0EBITDA 563.9 908.2 395.2 453.9 360.8 372.0 317.0 325.2 –89.3 –102.5 –6.9 –2.7 1,540.7 1,954.1Depreciation and amortization of property, plant and equipment and intangible assets 300.6 315.3 142.5 156.3 160.0 181.0 106.3 112.4 8.0 9.1 0.0 0.0 717.4 774.1 Of which impairment 0.0 0.0 0.0 10.1 5.0 15.6 0.1 0.0 0.0 0.0 0.0 0.0 5.1 25.7Reversal of impairment of property, plant and equipment and intangible assets 0.0 0.0 0.0 0.0 0.0 0.0 0.0 0.0 0.0 0.0 0.0 0.0 0.0 0.0Share of profit of entities consolidated according to the equity method 12.7 11.7 0.0 0.0 0.2 0.4 0.0 0.0 0.7 1.6 1.0 1.5 14.6 15.2EBIT 263.2 592.9 252.7 297.6 200.8 191.0 210.7 212.8 –97.2 –111.6 –6.9 –2.7 823.3 1,180.0EBIT margin 6.7% 12.4% 9.4% 10.2% 7.5% 6.4% 8.7% 7.8% 7.3% 9.1%Interest and similar income 8.8 1.0 13.5 12.7 2.7 2.4 2.2 1.5 147.7 170.5 –147.3 –165.8 27.6 22.3Interest and similar expenses 54.1 60.8 69.2 66.1 39.8 40.0 28.0 31.7 130.2 148.7 –150.6 –169.9 170.7 177.4Income tax expense –33.2 –124.8 –65.9 –65.6 –47.9 –40.1 –48.3 –41.4 21.3 47.3 1.1 0.0 –172.9 –224.6Profit after tax 187.5 410.1 132.8 178.2 117.4 114.3 136.6 141.1 523.0 798.2 –570.3 –824.0 527.0 817.9Segment assets 5,255.3 5,292.3 4,087.2 4,128.4 3,260.5 3,357.9 2,236.3 2,442.8 10,984.2 11,656.5 –11,116.0 –11,422.9 14,707.5 15,455.0 Of which investments in entities consolidated according to the equity method 93.9 96.8 0.0 0.0 5.1 5.2 0.0 0.0 6.7 8.0 7.3 8.5 113.0 118.5Net financial debt 1,926.8 1,623.5 914.0 1,002.7 838.2 972.0 556.3 757.9 –1,038.4 –1,396.7 24.2 35.7 3,221.1 2,995.1Investments in property, plant and equipment and intangible assets 404.2 229.5 179.5 226.4 211.0 207.5 205.1 218.6 7.7 13.1 –0.1 0.0 1,007.4 895.1Employees (full-time equivalent) 10,898 11,020 13,733 14,274 13,157 13,481 11,073 12,003 842 843 0 0 49,703 51,621
In millions of euros

117A N N U A L R E P O R T 2 0 1 7 / 1 8
The operating segments of the Group are as follows:
OPERATING SEGMENTS
Steel Division
High Performance Metals Division
Metal Engineering Division
Metal Forming Division Other Reconciliation Total Group
2016/17 2017/18 2016/17 2017/18 2016/17 2017/18 2016/17 2017/18 2016/17 2017/18 2016/17 2017/18 2016/17 2017/18
Segment revenue 3,912.4 4,772.7 2,697.9 2,918.0 2,684.6 2,989.7 2,426.1 2,743.4 1,395.0 1,629.4 –1,821.5 –2,155.4 11,294.5 12,897.8 Of which revenue with third parties 3,599.5 4,368.9 2,641.7 2,860.5 2,648.8 2,947.1 2,386.4 2,705.5 18.1 15.8 0.0 0.0 11,294.5 12,897.8 Of which revenue with other segments 312.9 403.8 56.2 57.5 35.8 42.6 39.7 37.9 1,376.9 1,613.6 –1,821.5 –2,155.4 0.0 0.0EBITDA 563.9 908.2 395.2 453.9 360.8 372.0 317.0 325.2 –89.3 –102.5 –6.9 –2.7 1,540.7 1,954.1Depreciation and amortization of property, plant and equipment and intangible assets 300.6 315.3 142.5 156.3 160.0 181.0 106.3 112.4 8.0 9.1 0.0 0.0 717.4 774.1 Of which impairment 0.0 0.0 0.0 10.1 5.0 15.6 0.1 0.0 0.0 0.0 0.0 0.0 5.1 25.7Reversal of impairment of property, plant and equipment and intangible assets 0.0 0.0 0.0 0.0 0.0 0.0 0.0 0.0 0.0 0.0 0.0 0.0 0.0 0.0Share of profit of entities consolidated according to the equity method 12.7 11.7 0.0 0.0 0.2 0.4 0.0 0.0 0.7 1.6 1.0 1.5 14.6 15.2EBIT 263.2 592.9 252.7 297.6 200.8 191.0 210.7 212.8 –97.2 –111.6 –6.9 –2.7 823.3 1,180.0EBIT margin 6.7% 12.4% 9.4% 10.2% 7.5% 6.4% 8.7% 7.8% 7.3% 9.1%Interest and similar income 8.8 1.0 13.5 12.7 2.7 2.4 2.2 1.5 147.7 170.5 –147.3 –165.8 27.6 22.3Interest and similar expenses 54.1 60.8 69.2 66.1 39.8 40.0 28.0 31.7 130.2 148.7 –150.6 –169.9 170.7 177.4Income tax expense –33.2 –124.8 –65.9 –65.6 –47.9 –40.1 –48.3 –41.4 21.3 47.3 1.1 0.0 –172.9 –224.6Profit after tax 187.5 410.1 132.8 178.2 117.4 114.3 136.6 141.1 523.0 798.2 –570.3 –824.0 527.0 817.9Segment assets 5,255.3 5,292.3 4,087.2 4,128.4 3,260.5 3,357.9 2,236.3 2,442.8 10,984.2 11,656.5 –11,116.0 –11,422.9 14,707.5 15,455.0 Of which investments in entities consolidated according to the equity method 93.9 96.8 0.0 0.0 5.1 5.2 0.0 0.0 6.7 8.0 7.3 8.5 113.0 118.5Net financial debt 1,926.8 1,623.5 914.0 1,002.7 838.2 972.0 556.3 757.9 –1,038.4 –1,396.7 24.2 35.7 3,221.1 2,995.1Investments in property, plant and equipment and intangible assets 404.2 229.5 179.5 226.4 211.0 207.5 205.1 218.6 7.7 13.1 –0.1 0.0 1,007.4 895.1Employees (full-time equivalent) 10,898 11,020 13,733 14,274 13,157 13,481 11,073 12,003 842 843 0 0 49,703 51,621
In millions of euros

118 C O N S O L I D A T E D F I N A N C I A L S T A T E M E N T S
The reconciliation of the key figures EBITDA and EBIT are shown in the following tables:
EBITDA
2016/17 2017/18
Net exchange differences and result from valuation of derivatives –2.2 –3.2Consolidation –4.7 0.5EBITDA – Total reconciliation –6.9 –2.7
In millions of euros
EBIT
2016/17 2017/18
Net exchange differences and result from valuation of derivatives –2.2 –3.2Consolidation –4.7 0.5EBIT – Total reconciliation –6.9 –2.7
In millions of euros
All other key figures contain solely the effects of consolidation.
GEOGRAPHICAL INFORMATIONThe following table provides selected financial information summarized according to the major geo-graphical areas. External revenue is allocated to the customers’ geographical location. Non-current assets and investments are reported based on the geographical location of the companies.
Austria European Union Other countries2016/17 2017/18 2016/17 2017/18 2016/17 2017/18
External revenue 813.5 900.9 7,036.8 7,659.9 3,444.2 4,337.0Non-current assets 5,123.6 5,126.4 1,613.6 1,664.8 1,702.0 1,537.7Investments in property, plant and equipment and intangible assets 522.7 492.4 188.5 209.4 296.2 193.3
In millions of euros
The voestalpine Group does not record any revenue from transactions with a single external cus tomer amounting to 10% or more of the entity’s revenue.
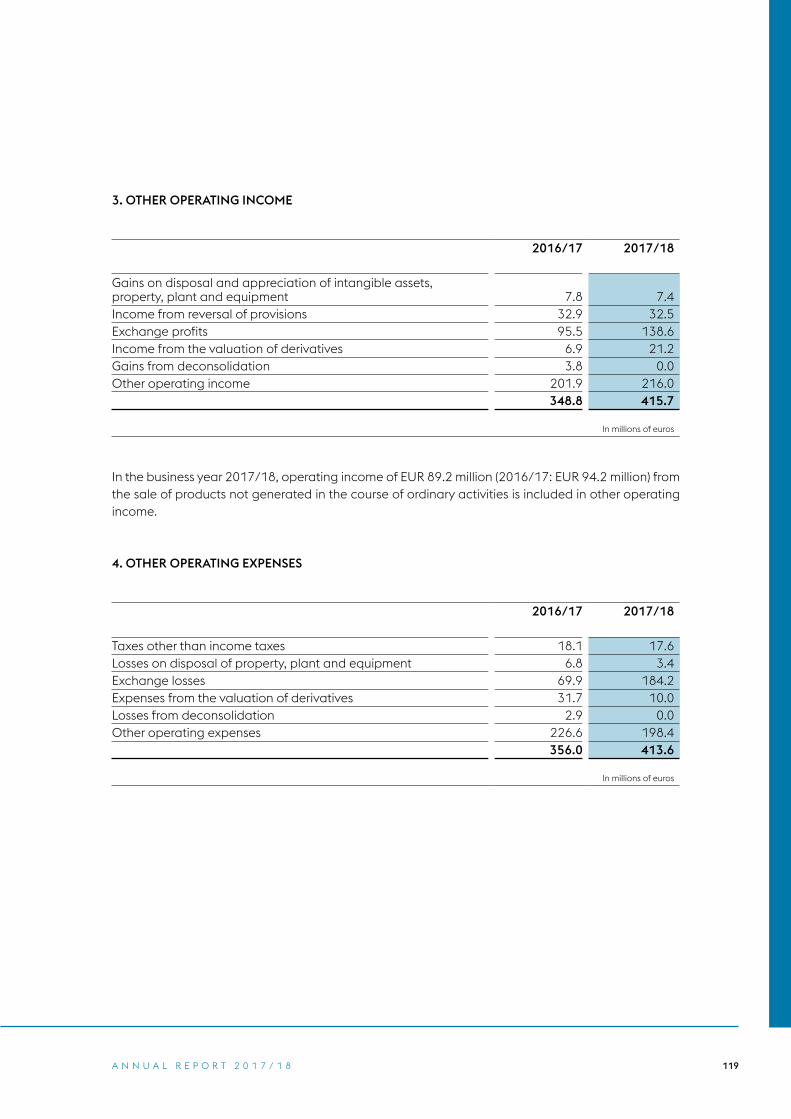
119A N N U A L R E P O R T 2 0 1 7 / 1 8
3. OTHER OPERATING INCOME
2016/17 2017/18
Gains on disposal and appreciation of intangible assets, property, plant and equipment 7.8 7.4Income from reversal of provisions 32.9 32.5Exchange profits 95.5 138.6Income from the valuation of derivatives 6.9 21.2Gains from deconsolidation 3.8 0.0Other operating income 201.9 216.0
348.8 415.7
In millions of euros
In the business year 2017/18, operating income of EUR 89.2 million (2016/17: EUR 94.2 million) from the sale of products not generated in the course of ordinary activities is included in other operating income.
4. OTHER OPERATING EXPENSES
2016/17 2017/18
Taxes other than income taxes 18.1 17.6Losses on disposal of property, plant and equipment 6.8 3.4Exchange losses 69.9 184.2Expenses from the valuation of derivatives 31.7 10.0Losses from deconsolidation 2.9 0.0Other operating expenses 226.6 198.4
356.0 413.6
In millions of euros
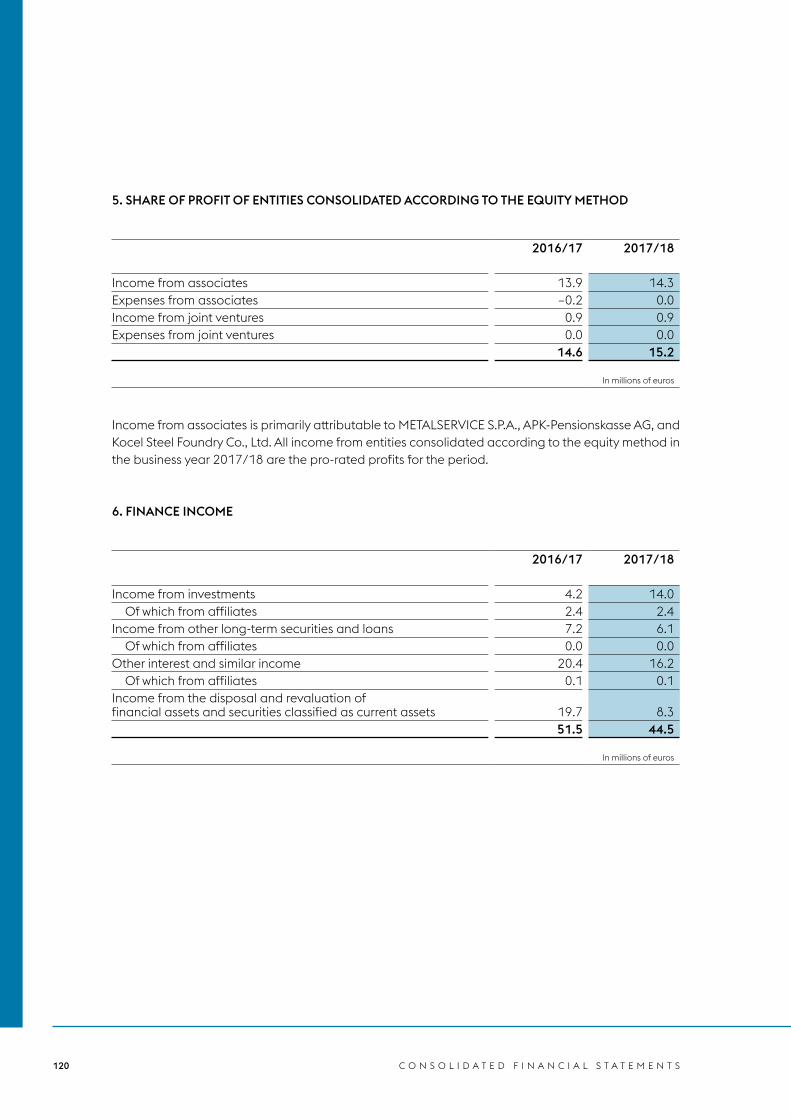
120 C O N S O L I D A T E D F I N A N C I A L S T A T E M E N T S
5. SHARE OF PROFIT OF ENTITIES CONSOLIDATED ACCORDING TO THE EQUITY METHOD
2016/17 2017/18
Income from associates 13.9 14.3Expenses from associates –0.2 0.0Income from joint ventures 0.9 0.9Expenses from joint ventures 0.0 0.0
14.6 15.2
In millions of euros
Income from associates is primarily attributable to METALSERVICE S.P.A., APK-Pensionskasse AG, and Kocel Steel Foundry Co., Ltd. All income from entities consolidated according to the equity method in the business year 2017/18 are the pro-rated profits for the period.
6. FINANCE INCOME
2016/17 2017/18
Income from investments 4.2 14.0 Of which from affiliates 2.4 2.4Income from other long-term securities and loans 7.2 6.1 Of which from affiliates 0.0 0.0Other interest and similar income 20.4 16.2 Of which from affiliates 0.1 0.1Income from the disposal and revaluation of financial assets and securities classified as current assets 19.7 8.3
51.5 44.5
In millions of euros

121A N N U A L R E P O R T 2 0 1 7 / 1 8
7. FINANCE COSTS
2016/17 2017/18
Expenses from other financial assets Valuation of securities 4.2 4.1 Expenses from affiliates 0.0 0.5 Other expenses 0.0 0.0
4.2 4.6
Other interest and similar expenses 170.7 177.4 Of which from affiliates 0.1 0.3
174.9 182.0
In millions of euros
8. INCOME TAXESIncome taxes include income taxes paid and owed as well as deferred taxes (+ income tax expense / – income tax benefit).
2016/17 2017/18
Current tax expense 142.8 235.0 Effective tax expense 141.4 241.9 Adjustments of taxes from previous periods 1.7 –8.7 Recognition of tax losses from prior periods –0.3 1.8
Deferred tax expense 30.1 –10.4 Origination/reversal of temporary differences 47.5 –20.6 Adjustments of taxes from previous periods –6.5 7.2 Impact of changes in tax rates 0.0 10.2 Recognition of tax losses from prior periods –10.9 –7.2
172.9 224.6
In millions of euros
The result of the changes in tax rates (EUR 10.2 million) applies solely to foreign taxes. The enactment of the US tax reform (“Tax Cuts and Jobs Act”) on December 22, 2017, requires recognizing a non- recurring effect from the remeasurement of all deferred tax assets and liabilities in the United States in order to reflect the reduction in the US corporate income tax rate from 35% to 21%. On the whole, the US tax reform will have a negative tax effect in the amount of EUR 11.4 million.

122 C O N S O L I D A T E D F I N A N C I A L S T A T E M E N T S
The following reconciliation shows the difference between the Austrian corporate tax rate of 25% and the effective Group tax rate:
2016/17 2017/18
Profit before tax 699.9 1,042.5Income tax using the Austrian corporate tax rate 25.0% 175.0 25.0% 260.6
Difference to foreign tax rates –0.6% –4.1 0.1% 1.4
Non-taxable income and expenses –2.5% –17.5 –1.8% –19.2
Non-taxable income from investments –0.7% –4.9 –0.5% –4.8
Effects of depreciation of investments and utilization of previously unrecognized losses carried forward and non-recognition of losses carried forward, respectively 0.2% 1.4 –4.1% –43.0
Taxes from previous periods –0.7% –4.8 –0.1% –1.5
Other differences 4.0% 27.8 3.0% 31.1
Effective Group tax rate (%)/income tax expense 24.7% 172.9 21.5% 224.6
In millions of euros

123A N N U A L R E P O R T 2 0 1 7 / 1 8
9. PROPERTY, PLANT AND EQUIPMENT
Land, land rights, and
buildingsPlant and
equipmentFixtures and
fittings
Advance payments and
plant under construction Total
Gross carrying amount 3,187.7 10,082.9 1,113.6 1,150.2 15,534.4
Accumulated depreciation and impairment –1,499.3 –7,202.8 –823.7 –2.1 –9,527.9
Carrying amount as of April 1, 2016 1,688.4 2,880.1 289.9 1,148.1 6,006.5
Gross carrying amount 3,433.8 11,374.4 1,185.3 486.1 16,479.6
Accumulated depreciation and impairment –1,577.7 –7,655.8 –873.1 –1.1 –10,107.7
Carrying amount as of March 31, 2017 1,856.1 3,718.6 312.2 485.0 6,371.9
Gross carrying amount 3,385.8 11,650.4 1,224.9 591.5 16,852.6
Accumulated depreciation and impairment –1,645.2 –8,022.5 –901.3 –1.5 –10,570.5
Carrying amount as of March 31, 2018 1,740.6 3,627.9 323.6 590.0 6,282.1
In millions of euros

124 C O N S O L I D A T E D F I N A N C I A L S T A T E M E N T S
The following table shows a reconciliation of the carrying amounts of property, plant and equipment for the periods presented in the Consolidated Financial Statements as of March 31, 2018:
Land, land rights, and
buildingsPlant and
equipmentFixtures and
fittings
Advance payments and plant
under construction Total
Carrying amount as of April 1, 2016 1,688.4 2,880.1 289.9 1,148.1 6,006.5
Changes in the scope of Consoli-dated Financial Statements 1.9 7.6 0.3 0.8 10.6
Additions 166.2 338.5 73.8 366.3 944.8
Transfers 63.3 961.7 20.6 –1,053.9 –8.3
Disposals –1.8 –2.9 –1.8 –3.9 –10.4
Depreciation –84.6 –507.8 –73.4 0.0 –665.8
Impairment 0.0 –3.3 0.0 –0.1 –3.4
Reversal of impairment 0.0 0.0 0.0 0.0 0.0
Net exchange differences 22.7 44.7 2.8 27.7 97.9
Carrying amount as of March 31, 2017 1,856.1 3,718.6 312.2 485.0 6,371.9
Changes in the scope of Consoli-dated Financial Statements 2.0 1.6 0.1 0.0 3.7
Additions 61.9 259.3 80.0 460.4 861.6
Transfers –30.0 345.2 16.9 –335.6 –3.5
Disposals –5.1 –4.5 –1.6 –2.0 –13.2
Depreciation –84.5 –538.1 –77.9 0.0 –700.5
Impairment –6.4 –15.1 –0.7 0.0 –22.2
Reversal of impairment 0.1 0.0 0.0 0.0 0.1
Net exchange differences –53.5 –139.1 –5.4 –17.8 –215.8
Carrying amount as of March 31, 2018 1,740.6 3,627.9 323.6 590.0 6,282.1
In millions of euros
As of March 31, 2018, restrictions on the disposal of property, plant and equipment amounted to EUR 4.0 million (March 31, 2017: EUR 11.9 million). Furthermore, as of March 31, 2018, commitments for the purchase of property, plant and equipment amounted to EUR 398.1 million (March 31, 2017: EUR 242.6 million).

125A N N U A L R E P O R T 2 0 1 7 / 1 8
Borrowing costs related to qualifying assets in the amount of EUR 6.2 million (2016/17: EUR 15.8 mil-lion) were capitalized in the reporting period. The calculation was based on an average borrowing cost rate of 2.4% (2016/17: 2.5%).
As of March 31, 2018, the gross carrying amount and accumulated depreciation of investment prop-erties (IAS 40) are reported as follows:
03/31/2017 03/31/2018
Gross carrying amount 23.3 22.1Accumulated depreciation and impairment –8.6 –8.5Carrying amount 14.7 13.6
In millions of euros
The following table shows a reconciliation of the carrying amounts of investment properties for the periods presented in the Consolidated Financial Statements as of March 31, 2018:
2016/17 2017/18
Carrying amount as of April 1 14.8 14.7
Transfers 0.0 –1.1
Net exchange differences –0.1 0.0
Carrying amount as of March 31 14.7 13.6
In millions of euros
Investment properties are measured at cost. Depreciation is recorded in line with the general account-ing policies for property, plant and equipment. Based on comparable sales transactions, the market value of these assets is estimated at EUR 24.8 million (March 31, 2017: EUR 15.7 million). Rental in-come and expenses for investment properties are immaterial.

126 C O N S O L I D A T E D F I N A N C I A L S T A T E M E N T S
The carrying amount for each class of asset under finance leases is reported as follows:
Property, plant and equipmentIntangible
Assets TotalLand, land rights, and
buildings
Plant and equipment
Fixtures and fittings
Advance payments and plant
under construction
2016/17Gross carrying amount 49.9 32.7 6.4 0.5 1.0 90.5
Accumulated depreciation and impairment –20.6 –24.7 –3.5 0.0 –1.0 –49.8
Carrying amount 29.3 8.0 2.9 0.5 0.0 40.7
2017/18Gross carrying amount 49.9 31.1 6.3 0.0 1.0 88.3
Accumulated depreciation and impairment –22.0 –25.1 –4.3 0.0 –1.0 –52.4
Carrying amount 27.9 6.0 2.0 0.0 0.0 35.9
In millions of euros
The present value of the minimum finance lease payments is due as follows:
Minimum finance lease payments
Discounts on finance lease payments
Present value of the minimum finance lease payments
2016/17 2017/18 2016/17 2017/18 2016/17 2017/18
Less than one year 5.9 14.2 –1.4 –0.8 4.5 13.3
Between one and five years 17.9 4.3 –1.2 –1.0 16.7 3.3
More than five years 5.2 5.4 –0.4 –0.1 4.8 5.3
29.0 23.9 –3.0 –1.9 26.0 21.9
In millions of euros
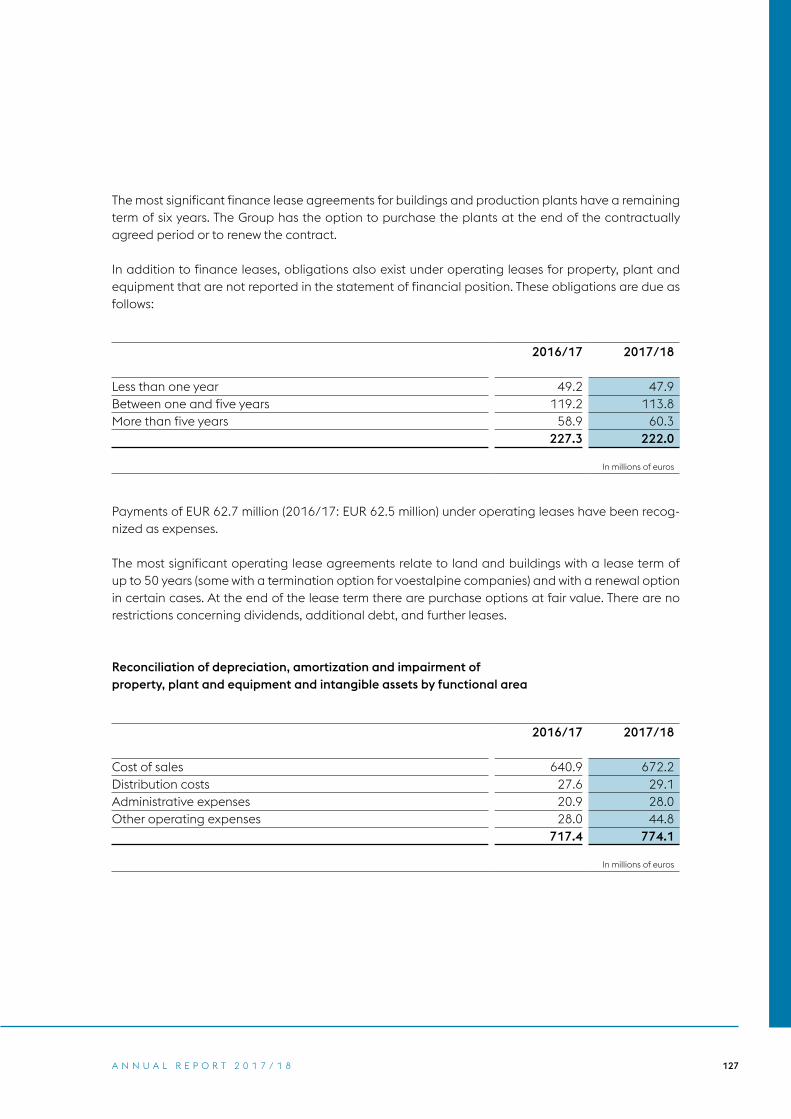
127A N N U A L R E P O R T 2 0 1 7 / 1 8
The most significant finance lease agreements for buildings and production plants have a remaining term of six years. The Group has the option to purchase the plants at the end of the contractually agreed period or to renew the contract.
In addition to finance leases, obligations also exist under operating leases for property, plant and equipment that are not reported in the statement of financial position. These obligations are due as follows:
2016/17 2017/18
Less than one year 49.2 47.9Between one and five years 119.2 113.8More than five years 58.9 60.3
227.3 222.0
In millions of euros
Payments of EUR 62.7 million (2016/17: EUR 62.5 million) under operating leases have been recog-nized as expenses.
The most significant operating lease agreements relate to land and buildings with a lease term of up to 50 years (some with a termination option for voestalpine companies) and with a renewal option in certain cases. At the end of the lease term there are purchase options at fair value. There are no restrictions concerning dividends, additional debt, and further leases.
Reconciliation of depreciation, amortization and impairment of property, plant and equipment and intangible assets by functional area
2016/17 2017/18
Cost of sales 640.9 672.2Distribution costs 27.6 29.1Administrative expenses 20.9 28.0Other operating expenses 28.0 44.8
717.4 774.1
In millions of euros

128 C O N S O L I D A T E D F I N A N C I A L S T A T E M E N T S
Impairment losses and reversal of impairment lossesIn the business year 2017/18, the cash-generating unit of the Metal Engineering Division that pro-duces special drawn wire (ultrafine wire), recognized impairment losses of EUR 12.2 million (2016/17: EUR 3.3 million) on property, plant and equipment as well as of EUR 3.5 million (2016/17: EUR 0.0 million) on intangible assets for a total of EUR 15.7 million (2016/17: EUR 3.3 million) in other operat-ing expenses due to negative sales-related developments as well as the resulting adjustment of the strategic alignment and lowered earnings forecasts. These contrast with reversals of investment grants in the amount of EUR 0.8 million (2016/17: EUR 1.0 million). The recoverable amount (value in use) for these assets is EUR 31.5 million (2016/17: EUR 50.2 million). A pre-tax discount rate of 7.88% (2016/17: 7.52%) was applied.
In the business year 2017/18, write-downs of EUR 10.1 million were taken on property, plant and equipment in other operating expenses for the Brazilian cash-generating unit of the High Performance Metals Division —whose largest export market is the US—due to the restrictions placed on exports under Section 232 and the ensuing uncertainties. The recoverable amount (value in use) for this cash-generating unit is EUR 197.9 million (translated at the end of period exchange rate). The discount rates applied are between 8.19% and 16.95% before tax.
10. GOODWILL
03/31/2016 03/31/2017 03/31/2018
Gross carrying amount 1,556.7 1,561.8 1,558.2
Impairment –12.3 –12.3 –12.3
Carrying amount 1,544.4 1,549.5 1,545.9
In millions of euros

129A N N U A L R E P O R T 2 0 1 7 / 1 8
The following table shows a reconciliation of the carrying amounts of goodwill for the periods present-ed in the Consolidated Financial Statements as of March 31, 2018:
Goodwill
Carrying amount as of April 1, 2016 1,544.4
Additions 5.4
Disposals –2.0
Net exchange differences 1.7
Carrying amount as of March 31, 2017 1,549.5
Additions 0.3
Net exchange differences –3.9
Carrying amount as of March 31, 2018 1,545.9
In millions of euros
The additions to goodwill of EUR 0.3 million relate to company acquisitions in the business year 2017/18.

130 C O N S O L I D A T E D F I N A N C I A L S T A T E M E N T S
Impairment tests for cash-generating units or groups of cash-generating units containing goodwillGoodwill is allocated to the following cash-generating units or groups of cash-generating units:
2016/17 2017/18
Total Steel Division 160.1 160.1
HPM Production 378.8 378.8
Value Added Services 314.9 311.2
Total High Performance Metals Division 693.7 690.0
Steel 25.8 25.8
Wire Technology 7.1 7.1
Rail Technology 29.8 29.8
Tubulars 67.1 67.1
Turnout Systems 124.7 124.5
Welding Consumables 172.2 172.5
Total Metal Engineering Division 426.7 426.8
Tubes & Sections 70.0 70.0
Automotive Components 84.0 84.0
Precision Strip 103.8 103.8
Warehouse & Rack Solutions 11.2 11.2
Total Metal Forming Division 269.0 269.0
voestalpine Group 1,549.5 1,545.9
In millions of euros
With regard to the value in use, goodwill is reviewed for impairment applying the discounted cash flow method. The calculation is performed on the basis of cash flows as of the beginning of March under a five-year medium-term business plan approved by the Supervisory Board. This medium-term busi-ness plan is based on historical data as well as on assumptions regarding the expected future market performance. The Group’s planning assumptions are extended to include sectoral planning assump-tions. Intra-group evaluations are complemented by external market studies. The cash flows in the perpetual annuity are based on the assumption of country-specific growth derived from external sources. The capital costs are calculated as the weighted average cost of equity and the weighted average cost of borrowed capital using the capital asset pricing model (weighted average cost of capital (WACC)). The parameters used for determining the WACC are established on an objective basis.

131A N N U A L R E P O R T 2 0 1 7 / 1 8
Estimates and assumptions used to measure the recoverable amounts of cash-generating units or groups of cash-generating units with a significant share in the voestalpine Group’s total goodwill include the following:
The Steel Division focuses on the production and processing of steel products for the automotive, white goods, electrical, processing, energy, and engineering industries. The five-year, medium-term business plan for the Steel Division was prepared on the basis of external economic forecasts for the eurozone, the USA, China, Russia, and Mexico (based on the IMF’s World Economic Outlook)1 and taking into account expected steel consumption.2 EUROFER anticipates growth in demand for steel, especially in the automotive and construction industries. The CRU-index is also taken into account in planning for flat steel products.
Some quality-related adjustments have been made due to positive feedback from individual cus-tomer segments. The production plan reflects the sales forecasts. With respect to procurement, the assumptions regarding raw materials according to global market forecasts (based on e.g. Platts price assessments) were taken as a basis for planning. Based on these assumptions, the gross margin is expected to develop positively in the medium term.
The fifth plan year was used to calculate the perpetual annuity based on an expected growth rate of 1.43% (2016/17: 1.27%). The pre-tax WACC is 8.35% (2016/17: 7.74%).
The five-year, medium-term business plan for the High Performance Metals Division and its two good-will-carrying units—High Performance Metals (HPM) Production and Value Added Services—was based on both the general economic environment of the relevant industry segments (in particular the auto-motive,3 oil and gas,4 and aerospace industries5) as well as the growth forecasts for the regional sales markets in its core markets, especially the eurozone, the USA, China, Brazil, and Mexico (based on the voestalpine Macroeconomic Report6 and Eurostat7).
HPM Production bundles seven production locations around the world. Production covers a highly complex and highly demanding production spectrum: tool steel, high-speed steel, valve steel, special constructional steel, powder-metallurgical steel, powder for additive manufacturing, special steels, and nickel-based alloys. It includes smelting and transforming (rolling, forging, hot-rolled, and cold-rolled strips), heat treatment and processing, as well as meeting the properties and specifications required by the customer. The processing companies produce plate, profiles, and forged parts made of titanium alloys, nickel-based alloys as well as high, medium, and low-grade alloyed steels.
1 World Economic Outlook, IMF2 EUROFER—the European Steel Association3 LMC Automotive Q3 2017, HIS Automotive—global light vehicle production forecast4 IEA Energy Statistics & Wood Mackenzie 5 Oxford Economics6 voestalpine Macroeconomic Report7 Eurostat

132 C O N S O L I D A T E D F I N A N C I A L S T A T E M E N T S
The internal forecasts and estimates for HPM production—in particular with regard to the components business that targets sophisticated metallurgical applications in the aerospace, oil and gas, energy engineering, and automotive industries—rely on external sources of information and are largely con-sistent with them. A positive trend is again forecast for the automotive segment. The recovery of the oil and gas segment has been incremental. The aerospace industry should again see a positive trend with market dynamics flattening at a high level. Overall, this will lead to higher revenue and a positive gross margin trend in the planning period.
Changes in the cost of input materials and smelting electrodes due to the price of alloys can mostly be passed on to customers. The final plan year was used to calculate the perpetual annuity based on a growth factor of 1.78% (2016/17: 1.72%). The pre-tax WACC is 10.19% (2016/17: 9.54%).
In the Value Added Services business segment, the continued systematic expansion of services in the planning period will lead to greater customer loyalty and increased value creation. Further focus areas were defined here in the past business year. Preprocessing, heat treatment, and coating— Value Added Services now operates 18 coating centers for customers worldwide—will also be expand-ed in line with customer requirements. Moreover, an all-out effort is being undertaken in coordination with the powder strategy of the HPM Production unit to turn additive manufacturing technology into the division’s core competence. Ongoing activities will additionally focus on the systematic continu-ation of tried and tested cost-cutting and optimization programs as well as new initiatives, especially in the area of digitalization. This will lead to higher revenue and a positive gross margin trend in the planning period. Changes in material costs due to alloy prices can also be passed on to the market through what are known as “alloy surcharges.” The perpetual annuity begins with the fifth plan year and is based on a growth factor of 1.71% (2016/17: 1.60%). The pre-tax WACC is 10.21% (2016/17: 9.70%).
The medium-term planning for Turnout Systems for the next five years is based on market forecasts1 and project planning for railway infrastructure, taking into consideration the business segment’s stra-tegic focus and the increasing influence of digitalization in the rail segment. It also accounts for the different levels of economic development in the individual regions.2 With regard to cost developments (the most important factor), general forecasts of the development of personnel expenses and inter-nal assumptions on the development of steel prices were integrated into the budgets. The planning assumes that the gross margin is kept relatively constant over the planning period and that potential fluctuations in the individual markets will balance each other out as a result of the business segment’s global reach. The perpetual annuity begins with the fifth plan year and is based on a growth factor of 1.72% (2016/17: 1.64%). The pre-tax WACC is 9.05% (2016/17: 9.35%).
1 UNIFE Annual Report 20162 World Economic Outlook, IMF

133A N N U A L R E P O R T 2 0 1 7 / 1 8
The five-year, medium-term planning for Welding Consumables takes into account both macroeco-nomic trends1 in each region as well as the projected developments in the relevant industry segments. The expected price trends for raw materials, particularly alloys, are derived from current quoted market prices as well as the available forecasts. Given the organizational measures and optimization program—which have been initiated, are being implemented, and will be pushed systematically in the planning period—as well as pertinent market forecasts, both volume growth and a slight increase in the gross margin are anticipated for the planning period. The discounted cash flow method used in the impairment tests is applied using a perpetual annuity based on the last planning period. A growth factor of 1.51% (2016/17: 1.45%) was applied to calculate the perpetual annuity. The pre-tax WACC is 8.46% (2016/17: 8.97%).
The cash flow forecasts for Automotive Components are based on the medium-term market growth and production forecasts for the global automotive market according to the forecasts published by LMC Automotive,2 particularly for our most important markets in Europe, in the NAFTA region, and in Asia, as well as for our most important customers—premium European manufacturers. Internal esti-mates reflect the business segment’s internationalization and growth strategy. External indicators and market dynamics were adjusted in line with the current model portfolio of Automotive Components customers. Customer-specific information about medium-term outlooks and sales projections also served as sources for business planning at Automotive Components. This will lead to higher revenue and a positive gross margin trend in the planning period. The fifth plan year was used to calculate the perpetual annuity based on a growth factor of 1.37% (2016/17: 1.24%). The pre-tax WACC is 9.37% (2016/17: 9.04%).
Precision Strip specializes in the production of globally available, technologically complex cold-rolled strip steel products with exact dimensional accuracy, outstanding surface quality, and unique edge profiles for the highest customer requirements in the process industry. The five-year medium-term busi-ness plan for Precision Strip was prepared taking into account the general regional conditions in the core markets and reflects the general economic environment of the most important industry segments for the companies. Current market conditions are characterized by strong competition and pressure on margins. The growth indicated in the planning is largely based on securing market leadership in niche markets, expanding market shares, and developing new markets. External forecasts were taken into account in internal estimates and, as a general rule, were adjusted very slightly downward. These external forecasts are country-specific figures for expected economic growth (GDP forecasts),3 supplemented by industry-specific experience in the relevant markets for each product segment. Customer-specific information about medium-term outlooks and sales projections also served as sources for business planning at Precision Strip. As a result, revenue is expected to increase and the gross margin should be stable in the planning period. The final plan year was used to calculate the perpetual annuity based on a growth factor of 1.40% (2016/17: 1.31%). The pre-tax WACC is 9.17% (2016/17: 8.91%).
1 World Economic Outlook, IMF 2 LMCA GAPF Data 3 World Economic Outlook, IMF

134 C O N S O L I D A T E D F I N A N C I A L S T A T E M E N T S
The value of all goodwill was confirmed by the impairment tests. A sensitivity analysis of the good-will-carrying units described above showed that all carrying amounts (with the exception of Welding Consumables) would still be covered if the interest rate were to rise by one percentage point and that there is no need to recognize an impairment loss. Furthermore, the cash flow sensitivity analysis showed that if the cash flows are reduced by 10%, all carrying amounts (with the exception of Welding Con-sumables) are still covered and that there is no need to recognize an impairment loss. A combined sensitivity analysis of the goodwill-carrying units described above showed that, with an increase of the discount rate by one percentage point and a reduction in cash flow of 10%, the carrying amounts are still covered with three exceptions (High Performance Metals Production, Welding Consumables, Automotive Components).
The following table shows the carrying amount coverage as well as the amount by which both major assumptions would have to change for the estimated recoverable amount to become equal to the carrying amount:
HIGH PERFORMANCE METALS PRODUCTION
2016/17 2017/18
Carrying amount coverage in millions of euros 308.3 380.3
Discount rate in % 1.1 1.4
Cash flow in % –13.6 –16.3
WELDING CONSUMABLES
2016/17 2017/18
Carrying amount coverage in millions of euros 112.0 25.9
Discount rate in % 1.7 0.3
Cash flow in % –20.6 –5.5
AUTOMOTIVE COMPONENTS
2016/17 2017/18
Carrying amount coverage in millions of euros 350.1 192.6
Discount rate in % 3.7 1.9
Cash flow in % –34.2 –19.5

135A N N U A L R E P O R T 2 0 1 7 / 1 8
11. OTHER INTANGIBLE ASSETS
Brands Other
Advance payments or payments in
progress Total
Gross carrying amount 227.6 1,263.9 56.3 1,547.8
Accumulated amortization and impairment –25.2 –1,108.5 0.0 –1,133.7
Carrying amount as of April 1, 2016 202.4 155.4 56.3 414.1
Gross carrying amount 227.6 1,322.5 50.0 1,600.1
Accumulated amortization and impairment –30.9 –1,149.8 0.0 –1,180.7
Carrying amount as of March 31, 2017 196.7 172.7 50.0 419.4
Gross carrying amount 227.6 1,349.3 34.9 1,611.8
Accumulated amortization and impairment –36.6 –1,179.2 0.0 –1,215.8
Carrying amount as of March 31, 2018 191.0 170.1 34.9 396.0
In millions of euros
The “Brands” column contains brands with an indefinite useful life amounting to EUR 170.6 million. It also includes a capital market funding advantage associated with the brand name Böhler-Uddeholm. The amortization period of the capital market funding advantage is ten years.
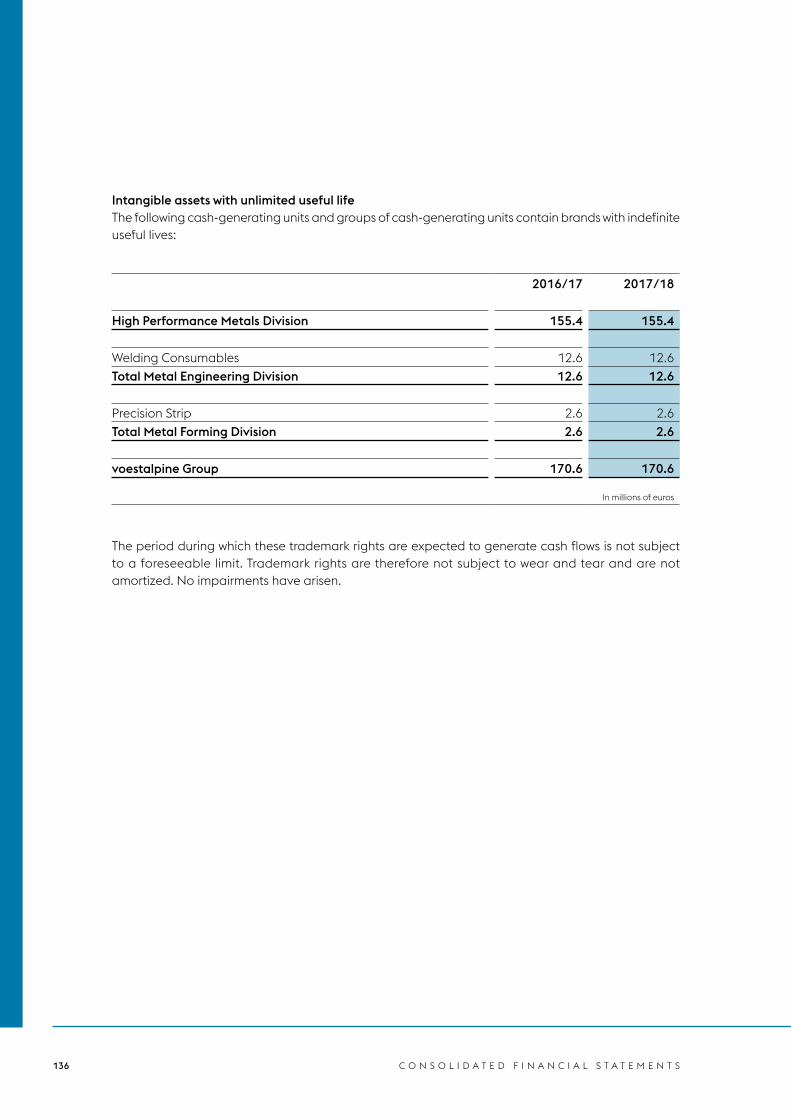
136 C O N S O L I D A T E D F I N A N C I A L S T A T E M E N T S
Intangible assets with unlimited useful lifeThe following cash-generating units and groups of cash-generating units contain brands with in definite useful lives:
2016/17 2017/18
High Performance Metals Division 155.4 155.4
Welding Consumables 12.6 12.6
Total Metal Engineering Division 12.6 12.6
Precision Strip 2.6 2.6
Total Metal Forming Division 2.6 2.6
voestalpine Group 170.6 170.6
In millions of euros
The period during which these trademark rights are expected to generate cash flows is not subject to a foreseeable limit. Trademark rights are therefore not subject to wear and tear and are not amortized. No impairments have arisen.

137A N N U A L R E P O R T 2 0 1 7 / 1 8
The following table shows a reconciliation of the carrying amounts of other intangible assets for the periods presented in the Consolidated Financial Statements as of March 31, 2018:
Brands Other
Advance payments or payments in
progress Total
Carrying amount as of April 1, 2016 202.4 155.4 56.3 414.1
Changes in the scope of Consolidated Financial Statements 0.0 7.9 0.0 7.9
Additions 0.0 23.3 16.0 39.3
Transfers 0.0 27.0 –22.5 4.5
Disposals 0.0 0.0 0.0 0.0
Amortization –5.7 –40.7 0.0 –46.4
Impairment 0.0 –1.7 0.0 –1.7
Net exchange differences 0.0 1.5 0.2 1.7
Carrying amount as of March 31, 2017 196.7 172.7 50.0 419.4
Changes in the scope of Consolidated Financial Statements 0.0 0.2 0.0 0.2
Additions 0.0 18.3 10.8 29.1
Transfers 0.0 29.3 –25.9 3.4
Disposals 0.0 –0.1 0.0 –0.1
Amortization –5.7 –42.1 0.0 –47.8
Impairment 0.0 –3.5 0.0 –3.5
Net exchange differences 0.0 –4.7 0.0 –4.7
Carrying amount as of March 31, 2018 191.0 170.1 34.9 396.0
In millions of euros
The functional areas of cost of sales, distribution costs, administrative expenses, and other operating expenses may include amortization of intangible assets.
As of March 31, 2018, commitments for the acquisition of intangible assets amounted to EUR 0.2 mil-lion (March 31, 2017: EUR 1.0 million). Additions to “Advance payments or payments in progress” contain EUR 8.0 million (March 31, 2017: EUR 15.1 million) in capitalized development costs for a soft-ware project intended to map cross-company business processes and business processes that have been harmonized within the Steel Division. The carrying amount in the other intangible assets as of March 31, 2018, amounts to EUR 82.3 million (March 31, 2017: EUR 76.9 million); the expected useful life is ten years.

138 C O N S O L I D A T E D F I N A N C I A L S T A T E M E N T S
Impairment losses and reversal of impairment lossesIn the business year 2017/18, the Metal Engineering Division recognized impairment losses of EUR 3.5 million (2016/17: EUR 0.0 million) on intangible assets under other operating expenses. Detailed information on this impairment is outlined in chapter 9. Property, plant and equipment.
12. INVESTMENTS IN ENTITIES CONSOLIDATED ACCORDING TO THE EQUITY METHOD AND OTHER FINANCIAL ASSETS
Investments in affiliates
Investments in associates
Investments in joint ventures
Other investments Securities
Loans granted
Advance payments Total
Gross carrying amount 17.5 109.4 3.2 54.9 3.3 18.2 0.2 206.7
Accumulated depre-ciation/revaluation –6.8 –0.2 0.0 –16.8 0.1 –0.8 0.0 –24.5
Carrying amount as of April 1, 2016 10.7 109.2 3.2 38.1 3.4 17.4 0.2 182.2
Gross carrying amount 14.3 109.6 3.8 55.0 2.1 17.9 0.1 202.8
Accumulated depre-ciation/revaluation –6.0 –0.4 0.0 –17.0 0.3 –0.7 0.0 –23.8
Carrying amount as of March 31, 2017 8.3 109.2 3.8 38.0 2.4 17.2 0.1 179.0
Gross carrying amount 14.1 114.4 4.6 47.9 1.1 6.7 0.2 189.0
Accumulated depre-ciation/revaluation –6.5 –0.5 0.0 –12.0 0.3 –0.7 0.0 –19.4
Carrying amount as of March 31, 2018 7.6 113.9 4.6 35.9 1.4 6.0 0.2 169.6
In millions of euros

139A N N U A L R E P O R T 2 0 1 7 / 1 8
The following table shows a reconciliation of the carrying amounts of investments in entities consoli-dated according to the equity method and other financial assets for the periods presented in the Consolidated Financial Statements as of March 31, 2018:
Investments in affiliates
Investments in associates
Investments in joint ventures
Other investments Securities
Loans granted
Advance payments Total
Carrying amount as of April 1, 2016 10.7 109.2 3.2 38.1 3.4 17.4 0.2 182.2
Changes in the scope of Consolidated Financial Statements 0.0 0.0 0.0 0.0 0.0 1.6 0.0 1.6
Additions 0.1 18.5 0.9 0.1 0.0 2.4 0.0 22.0
Transfers –0.2 0.0 0.0 0.0 0.0 –0.2 –0.1 –0.5
Disposals –2.3 –18.5 –0.3 0.0 –1.1 –3.9 0.0 –26.1
Depreciation/ Impairment 0.0 –0.2 0.0 –0.2 0.0 0.0 0.0 –0.4
Revaluation 0.0 0.0 0.0 0.0 0.1 0.0 0.0 0.1
Net exchange differences 0.0 0.2 0.0 0.0 0.0 –0.1 0.0 0.1
Carrying amount as of March 31, 2017 8.3 109.2 3.8 38.0 2.4 17.2 0.1 179.0
Changes in the scope of Consolidated Financial Statements 0.0 0.0 0.0 0.0 0.0 0.0 0.0 0.0
Additions 0.1 14.3 0.9 0.0 0.0 0.1 0.1 15.5
Transfers 0.0 0.0 0.0 0.0 0.0 –0.1 0.0 –0.1
Disposals –0.3 –8.1 0.0 –2.1 –1.1 –11.1 0.0 –22.7
Depreciation/ Impairment –0.5 –0.1 0.0 0.0 0.0 0.0 0.0 –0.6
Revaluation 0.0 0.0 0.0 0.0 0.1 0.0 0.0 0.1
Net exchange differences 0.0 –1.4 –0.2 0.0 0.0 –0.1 0.0 –1.7
Carrying amount as of March 31, 2018 7.6 113.9 4.6 35.9 1.4 6.0 0.2 169.6
In millions of euros

140 C O N S O L I D A T E D F I N A N C I A L S T A T E M E N T S
Loans granted comprise the following items:
03/31/2016 03/31/2017 03/31/2018
Loans to affiliates 0.6 0.5 0.3Other loans 9.3 10.9 5.3Other receivables from financing 7.5 5.8 0.4
17.4 17.2 6.0
In millions of euros
13. DEFERRED TAXESThe tax effects of temporary differences, tax losses carried forward, and tax credits that result in a recognition of deferred tax assets and liabilities include the following items:
Deferred tax assets Deferred tax liabilities
03/31/2017 03/31/2018 03/31/2017 03/31/2018
Non-current assets 40.6 37.4 319.8 250.3
Current assets 61.2 66.5 111.4 91.9
Non-current provisions and liabilities 219.1 205.2 29.9 48.8
Current provisions and liabilities 32.8 32.2 28.5 22.0
Losses carried forward 219.6 154.8 0.0 0.0
573.3 496.1 489.6 413.0
Intercompany profit elimination (netted) 23.7 28.1 0.0 0.0
Hidden reserves (netted) 0.0 0.0 104.9 97.3
Acquisition-related tax credit 72.3 54.2 0.0 0.0
Other 21.8 20.4 2.3 0.0
Netting of deferred taxes to the same tax authority –477.4 –402.7 –477.4 –402.7
Net deferred taxes 213.7 196.1 119.4 107.6
In millions of euros
Pursuant to IAS 12.34, the tax benefit from the acquisition of BÖHLER-UDDEHOLM Aktiengesellschaft is reported as unused tax credit and will be released as a deferred tax expense over a period of 14 years with an amount of EUR 18.1 million per year (remaining term: three years). This is offset by actual tax savings.
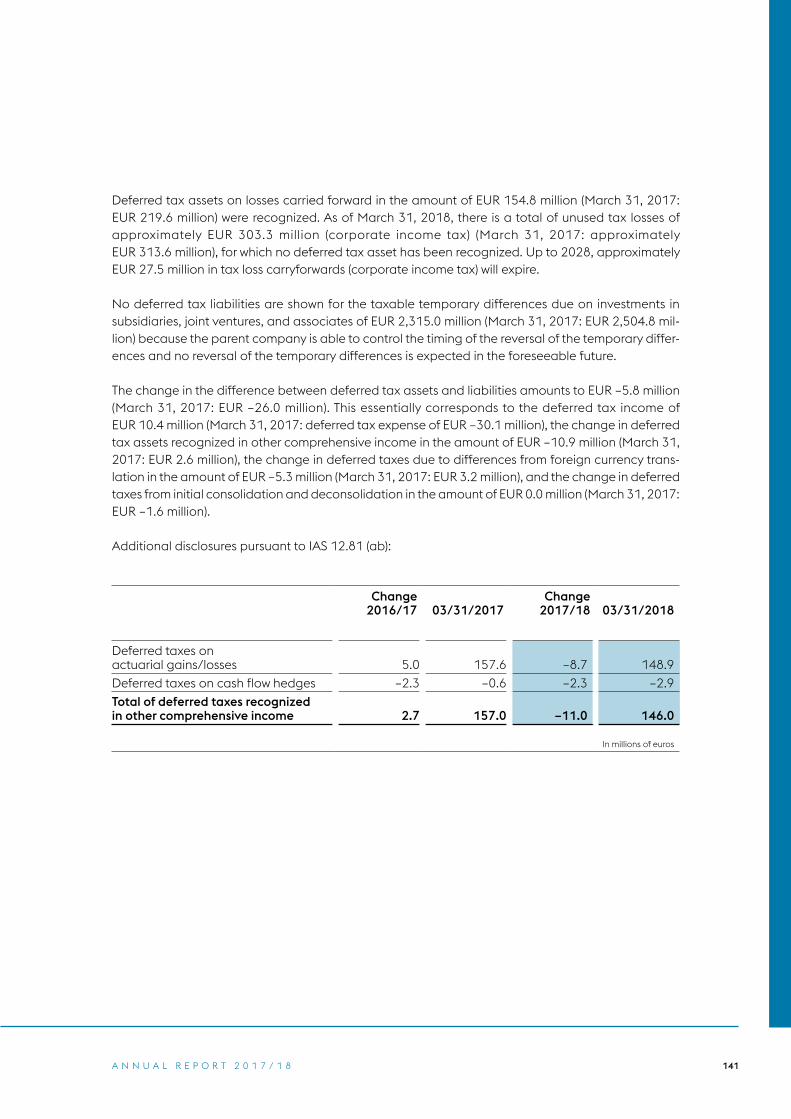
141A N N U A L R E P O R T 2 0 1 7 / 1 8
Deferred tax assets on losses carried forward in the amount of EUR 154.8 million (March 31, 2017: EUR 219.6 million) were recognized. As of March 31, 2018, there is a total of unused tax losses of approximately EUR 303.3 million (corporate income tax) (March 31, 2017: approximately EUR 313.6 million), for which no deferred tax asset has been recognized. Up to 2028, approximately EUR 27.5 million in tax loss carryforwards (corporate income tax) will expire.
No deferred tax liabilities are shown for the taxable temporary differences due on investments in subsidiaries, joint ventures, and associates of EUR 2,315.0 million (March 31, 2017: EUR 2,504.8 mil-lion) because the parent company is able to control the timing of the reversal of the temporary differ-ences and no reversal of the temporary differences is expected in the foreseeable future.
The change in the difference between deferred tax assets and liabilities amounts to EUR –5.8 million (March 31, 2017: EUR –26.0 million). This essentially corresponds to the deferred tax income of EUR 10.4 million (March 31, 2017: deferred tax expense of EUR –30.1 million), the change in deferred tax assets recognized in other comprehensive income in the amount of EUR –10.9 million (March 31, 2017: EUR 2.6 million), the change in deferred taxes due to differences from foreign currency trans-lation in the amount of EUR –5.3 million (March 31, 2017: EUR 3.2 million), and the change in deferred taxes from initial consolidation and deconsolidation in the amount of EUR 0.0 million (March 31, 2017: EUR –1.6 million).
Additional disclosures pursuant to IAS 12.81 (ab):
Change 2016/17 03/31/2017
Change 2017/18 03/31/2018
Deferred taxes on actuarial gains/losses 5.0 157.6 –8.7 148.9
Deferred taxes on cash flow hedges –2.3 –0.6 –2.3 –2.9
Total of deferred taxes recognized in other comprehensive income 2.7 157.0 –11.0 146.0
In millions of euros

142 C O N S O L I D A T E D F I N A N C I A L S T A T E M E N T S
14. INVENTORIES
03/31/2017 03/31/2018
Raw materials and supplies 1,207.8 1,337.0
Work in progress 931.0 1,213.7
Finished goods 1,060.7 1,185.5
Merchandise 176.9 194.2
As yet unbillable services 7.7 16.9
Advance payments 24.1 51.1
3,408.2 3,998.4
In millions of euros
Write-downs to the lower net realizable value amounting to EUR 135.5 million (March 31, 2017: EUR 140.4 million) are recorded in the Consolidated Financial Statements. The carrying amount of the inventories that have been written down to the lower net realizable value amounts to EUR 458.3 million (March 31, 2017: EUR 541.0 million). As in the previous year, no inventories are pledged as security for liabilities as of March 31, 2018. An amount of EUR 6,935.7 million (March 31, 2017: EUR 5,689.7 million) has been recognized as cost of materials.
15. TRADE AND OTHER RECEIVABLES
03/31/2017
Remaining term over one year 03/31/2018
Remaining term over one year
Trade receivables 1,320.3 1.5 1,330.2 0.4
Other receivables and other assets 393.8 11.0 442.8 18.7
of which current tax assets 39.8 42.2
1,714.1 12.5 1,773.0 19.1
In millions of euros
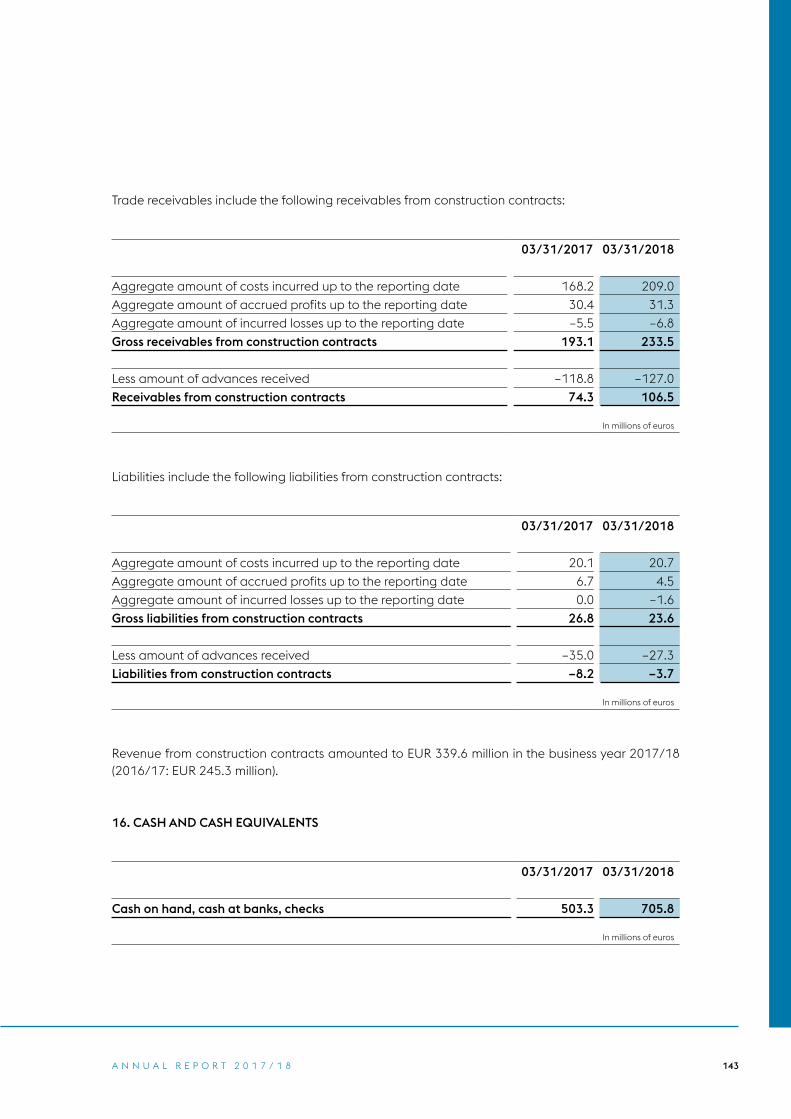
143A N N U A L R E P O R T 2 0 1 7 / 1 8
Trade receivables include the following receivables from construction contracts:
03/31/2017 03/31/2018
Aggregate amount of costs incurred up to the reporting date 168.2 209.0
Aggregate amount of accrued profits up to the reporting date 30.4 31.3
Aggregate amount of incurred losses up to the reporting date –5.5 –6.8
Gross receivables from construction contracts 193.1 233.5
Less amount of advances received –118.8 –127.0
Receivables from construction contracts 74.3 106.5
In millions of euros
Liabilities include the following liabilities from construction contracts:
03/31/2017 03/31/2018
Aggregate amount of costs incurred up to the reporting date 20.1 20.7
Aggregate amount of accrued profits up to the reporting date 6.7 4.5
Aggregate amount of incurred losses up to the reporting date 0.0 –1.6
Gross liabilities from construction contracts 26.8 23.6
Less amount of advances received –35.0 –27.3
Liabilities from construction contracts –8.2 –3.7
In millions of euros
Revenue from construction contracts amounted to EUR 339.6 million in the business year 2017/18 (2016/17: EUR 245.3 million).
16. CASH AND CASH EQUIVALENTS
03/31/2017 03/31/2018
Cash on hand, cash at banks, checks 503.3 705.8
In millions of euros

144 C O N S O L I D A T E D F I N A N C I A L S T A T E M E N T S
17. EQUITY
Share capital (incl. disclosures in accordance with Section 241 of the Austrian Commercial Code (Unternehmensgesetzbuch – UGB))As of March 31, 2018, the share capital amounts to EUR 320,394,836.99, remaining unchanged compared to the previous year, and is divided into 176,349,163 no-par value bearer shares. All shares are fully paid in.
Under Article 4 (2a) of the Articles of Incorporation, the Management Board of voestalpine AG is authorized until June 30, 2019, with the consent of the Supervisory Board, to increase the Company’s share capital by up to EUR 125,323,693.90 by issuing up to 68,979,665 shares (= 40%) against cash contributions, if necessary in several tranches (Authorized Capital 2014/I). The Management Board did not exercise this authority up until now.
Under Article 4 (2b) of the Articles of Incorporation, the Management Board of voestalpine AG is authorized until June 30, 2019, with the consent of the Supervisory Board, to increase the Company’s share capital by up to EUR 31,330,923.02 by issuing up to 17,244,916 shares (= 10%) against con-tributions in kind and/or cash contributions to issue shares to employees, executives, and members of the Management Board of the Company or an affiliated company—if necessary in several tranches—as well as the right to exclude the shareholders’ legal subscription right if (i) the capital increase is made against contributions in kind, which means that shares are issued for the purpose of acquiring companies, operations, partial operations, or shares in one or more companies located in Austria or abroad, or (ii) the capital increase is performed for the purpose of issuing shares to em ployees, executives, and members of the Management Board of the Company or an affiliated company in the context of an employee stock ownership plan (Authorized Capital 2014/II). The Management Board of voestalpine AG decided on March 9, 2015, to use this authorization to increase the share capital of voestalpine AG by issuing 2,500,000 new no-par value bearer shares and thus by 1.45% for the purpose of issuing shares to employees and executives of the Company and affiliated companies in the context of an existing employee stock ownership plan. This capital increase was entered into the Commercial Register on April 25, 2015. Furthermore, the Management Board of voestalpine AG decided on March 6, 2017, to use this authorization to increase the share capital of voestalpine AG by issuing 1,400,000 new no-par value bearer shares and thus by 0.8% for the pur-pose of issuing shares to em ployees and executives of the Company and affiliated companies in the context of an existing employee stock ownership plan. This capital increase was entered into the Com-mercial Register on March 30, 2017.
Under Article 4 (6) of the Articles of Incorporation, the Management Board of voestalpine AG is authorized to increase the share capital of the Company by up to EUR 31,330,923.02 by issuing up to 17,244,916 ordinary no-par value bearer shares (= 10%) for issuance to creditors of financial instruments within the meaning of Section 174 of the Austrian Stock Corporation Act (Aktiengesetz – AktG) (convertible bonds, income bonds, or participation rights); the Management Board was author-ized to issue these shares during the Annual General Meeting on July 2, 2014 (contingent capital increase). To date, the Management Board has not exercised the authority granted on July 2, 2014, to issue financial instruments within the meaning of Section 174 of the Austrian Stock Corporation Act.

145A N N U A L R E P O R T 2 0 1 7 / 1 8
During the Annual General Meeting on July 5, 2017, the Management Board was authorized to repurchase own shares for a term of validity of 30 months, representing no more than 10% of the respective share capital. The repurchase price may not be more than 20% below or 10% above the average closing price of the shares on the three market trading days prior to the repurchase. The Management Board has not exercised this authority to date.
Capital reserves mainly include the share premium (net of capital funding costs), gains/losses from the sale of own shares, and share-based compensation.
Reserves for own shares include the deducted cost of acquisition and the increase in equity from disposal of own shares at cost.
Retained earnings include the profit after tax less dividend distributions. When increasing or de creasing majority interests, the difference between the cost of acquisition for the additional shares and the pro-rated carrying amount of the non-controlling interests is recognized directly in retained earnings. Actuarial gains and losses from severance and pension obligations are recognized directly in retained earnings in the year in which they are incurred.
The translation reserve comprises all foreign currency differences arising from the translation of the Financial Statements of foreign subsidiaries.
The hedging reserve comprises gains and losses from the effective portion of the cash flow hedges. The cumulative gains or losses from hedged transactions recognized in the reserves are not recog-nized in the income statement until the hedged transaction also affects the result.
The number of shares outstanding for the periods presented in the Consolidated Financial Statements as of March 31, 2018, has changed as follows:
Number of no-par value shares
Number of own shares
Number of shares outstanding
Balance as of April 1, 2016 174,949,163 28,597 174,920,566
Additions 1,400,000 1,400,000
Balance as of March 31, 2017 176,349,163 28,597 176,320,566
Balance as of March 31, 2018 176,349,163 28,597 176,320,566
Shares

146 C O N S O L I D A T E D F I N A N C I A L S T A T E M E N T S
Hybrid capital In the fourth quarter of the business year 2012/13, voestalpine AG issued a new subordinate un - dated bond (hybrid bond 2013) with a volume of EUR 500 million following an invitation extended to the holders of the hybrid bond 2007 to exchange the bond for a new hybrid bond at a 1:1 ratio. The outstanding nominal value of the hybrid bond 2007 as a result of this exchange was thus EUR 500 million. This was later completely terminated and redeemed as of October 31, 2014. The coupon of the hybrid bond 2013 is 7.125% until October 31, 2014, 6% from October 31, 2014, to October 31, 2019, the 5-year swap rate +4.93% from October 31, 2019, to October 31, 2024, and the 3-month EURIBOR +4.93% plus a step-up of 1% starting October 31, 2024. The hybrid bond 2013 can be first called in and redeemed by voestalpine AG, but not the creditors, on October 31, 2019. A total of EUR 30.0 million was paid out on October 31, 2017 (October 31, 2016: EUR 30.0 million) for interest on the hybrid bond 2013.
As the hybrid bond satisfies the IAS 32 criteria for equity, the proceeds from the bond issues are recognized as part of equity. Accordingly, coupon payments are also presented as part of the appro-priation of profit.
The issue costs of the hybrid bond 2013 amounted to EUR 2.8 million, less EUR 0.7 million tax effect. Therefore, hybrid capital amounts to EUR 497.9 million in equity.
Share-based compensationDue to the practice of granting employees voestalpine shares as part of the annual profit bonus, 40 thousand shares with a market value of EUR 1.6 million (2016/17: EUR 1.7 million) were taken from equity to pay for this, and 85 thousand shares with a value of EUR 4.1 million (2016/17: EUR 1.7 million) were added to equity.
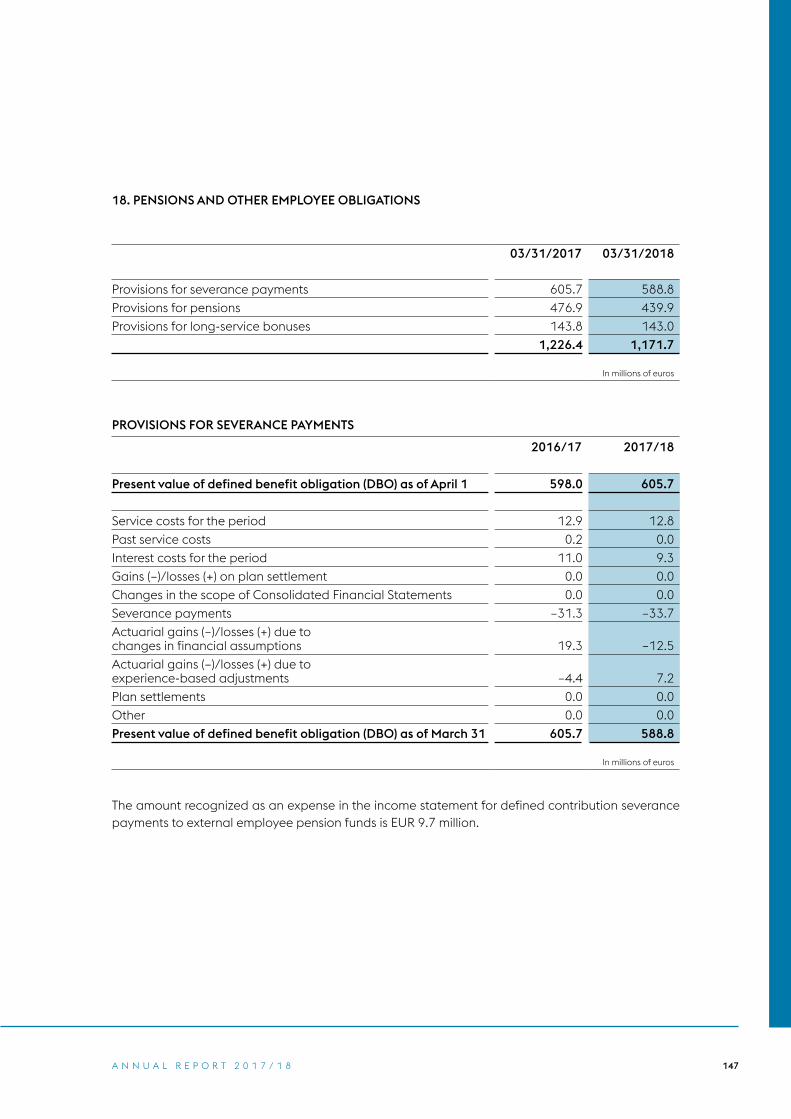
147A N N U A L R E P O R T 2 0 1 7 / 1 8
18. PENSIONS AND OTHER EMPLOYEE OBLIGATIONS
03/31/2017 03/31/2018
Provisions for severance payments 605.7 588.8
Provisions for pensions 476.9 439.9
Provisions for long-service bonuses 143.8 143.0
1,226.4 1,171.7
In millions of euros
PROVISIONS FOR SEVERANCE PAYMENTS
2016/17 2017/18
Present value of defined benefit obligation (DBO) as of April 1 598.0 605.7
Service costs for the period 12.9 12.8
Past service costs 0.2 0.0
Interest costs for the period 11.0 9.3
Gains (–)/losses (+) on plan settlement 0.0 0.0
Changes in the scope of Consolidated Financial Statements 0.0 0.0
Severance payments –31.3 –33.7
Actuarial gains (–)/losses (+) due to changes in financial assumptions 19.3 –12.5
Actuarial gains (–)/losses (+) due to experience-based adjustments –4.4 7.2
Plan settlements 0.0 0.0
Other 0.0 0.0
Present value of defined benefit obligation (DBO) as of March 31 605.7 588.8
In millions of euros
The amount recognized as an expense in the income statement for defined contribution severance payments to external employee pension funds is EUR 9.7 million.
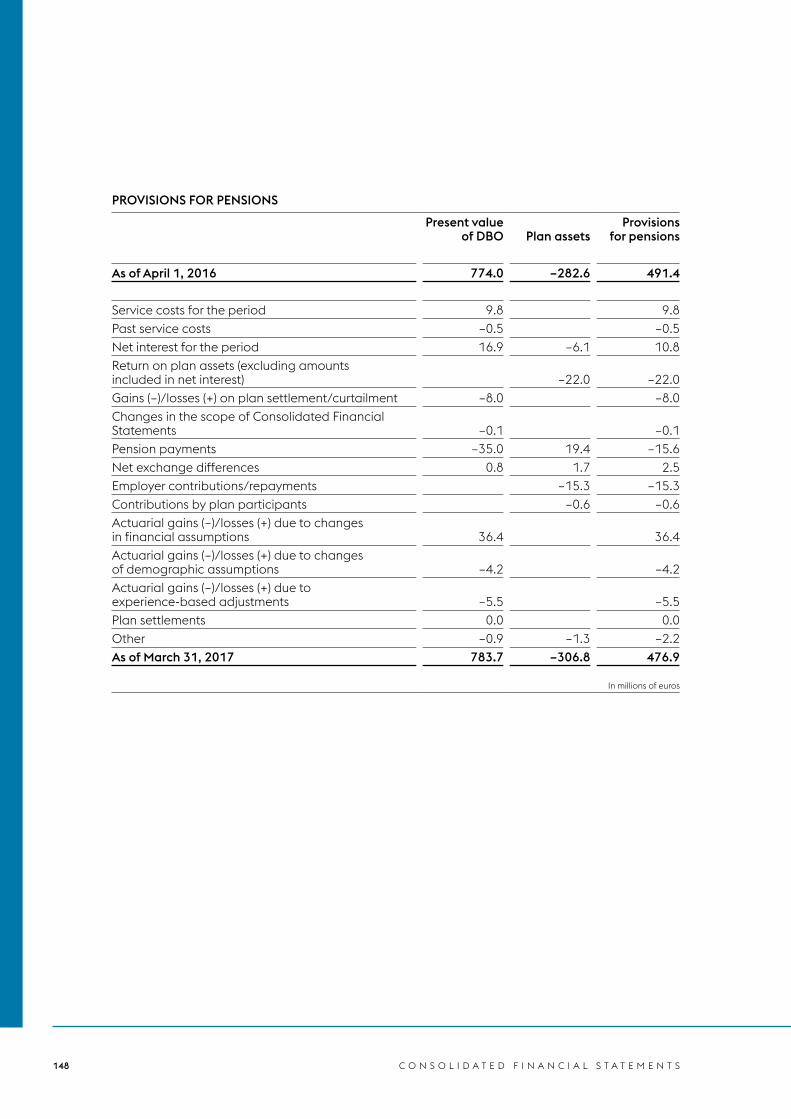
148 C O N S O L I D A T E D F I N A N C I A L S T A T E M E N T S
PROVISIONS FOR PENSIONS
Present value of DBO Plan assets
Provisions for pensions
As of April 1, 2016 774.0 –282.6 491.4
Service costs for the period 9.8 9.8
Past service costs –0.5 –0.5
Net interest for the period 16.9 –6.1 10.8
Return on plan assets (excluding amounts included in net interest) –22.0 –22.0
Gains (–)/losses (+) on plan settlement/curtailment –8.0 –8.0
Changes in the scope of Consolidated Financial Statements –0.1 –0.1
Pension payments –35.0 19.4 –15.6
Net exchange differences 0.8 1.7 2.5
Employer contributions/repayments –15.3 –15.3
Contributions by plan participants –0.6 –0.6
Actuarial gains (–)/losses (+) due to changes in financial assumptions 36.4 36.4
Actuarial gains (–)/losses (+) due to changes of demographic assumptions –4.2 –4.2
Actuarial gains (–)/losses (+) due to experience-based adjustments –5.5 –5.5
Plan settlements 0.0 0.0
Other –0.9 –1.3 –2.2
As of March 31, 2017 783.7 –306.8 476.9
In millions of euros

149A N N U A L R E P O R T 2 0 1 7 / 1 8
PROVISIONS FOR PENSIONS
Present value of DBO Plan assets
Provisions for pensions
As of April 1, 2017 783.7 –306.8 476.9
Service costs for the period 9.7 9.7
Past service costs –2.8 –2.8
Net interest for the period 14.7 –5.6 9.1
Return on plan assets (excluding amounts included in net interest) –8.3 –8.3
Gains (–)/losses (+) on plan settlement/curtailment –1.4 –1.4
Changes in the scope of Consolidated Financial Statements 0.0 0.0
Pension payments –33.5 18.6 –14.9
Net exchange differences –12.1 4.9 –7.2
Employer contributions/repayments –1.9 –1.9
Contributions by plan participants –1.7 –1.7
Actuarial gains (–)/losses (+) due to changes in financial assumptions –16.4 –16.4
Actuarial gains (–)/losses (+) due to changes of demographic assumptions 0.0 0.0
Actuarial gains (–)/losses (+) due to experience-based adjustments –1.4 –1.4
Plan settlements –0.1 –0.1
Other 3.1 –2.8 0.3
As of March 31, 2018 743.5 –303.6 439.9
In millions of euros
In the business year 2016/17, the obligation to active employees to make an additional payment to the national health care plan in their pension phase was eliminated at a Brazilian company. Provisions were therefore adjusted in line with the obligations to the remaining beneficiaries.

150 C O N S O L I D A T E D F I N A N C I A L S T A T E M E N T S
The major categories of plan assets for the periods presented in the Consolidated Financial State-ments as of March 31, 2018, are as follows:
2016/17
Category
Assets with quoted market price in an
active market
Assets without quoted market price
in an active market Total assets
Debt instruments 43.8% 0.0% 43.8%
Equity instruments 30.7% 0.0% 30.7%
Property 0.0% 2.2% 2.2%
Cash and cash equivalents 5.7% 0.1% 5.8%
Insurance 0.0% 9.0% 9.0%
Other assets 8.4% 0.1% 8.5%
Total 88.6% 11.4% 100.0%
2017/18
Category
Assets with quoted market price in an
active market
Assets without quoted market price
in an active market Total assets
Debt instruments 48.4% 0.3% 48.7%
Equity instruments 30.0% 0.0% 30.0%
Property 0.0% 2.4% 2.4%
Cash and cash equivalents 5.3% 0.1% 5.4%
Insurance 0.0% 8.6% 8.6%
Other assets 4.8% 0.1% 4.9%
Total 88.5% 11.5% 100.0%

151A N N U A L R E P O R T 2 0 1 7 / 1 8
The plan assets include own shares with a fair value of EUR 1.8 million (March 31, 2017: EUR 1.0 million).
The average expected return is determined by the portfolio structure of the plan assets, empirical data, and estimates of future investment returns. The calculation of the provisions for pensions was based on an expected (average) interest rate of 1.8% on plan assets. The actual interest rate was 4.5%.
The amount recognized as an expense in the income statement for defined contribution plans is EUR 28.6 million (2016/17: EUR 29.6 million).
The sensitivity analysis of the key actuarial assumptions used to determine defined benefit obligations is depicted below:
SENSITIVITIES
Interest rate Salary/wage increases Pension increases+1.0% –1.0% +0.5% –0.5% +0.25% –0.25%
Pensions –12.9% +16.4% +0.8% –0.7% +2.8% –2.6%
Severance –9.6% +11.4% +5.3% –4.9%
Group-wide figures were determined for the effects associated with the interest rate, wage and salary increases, and pension increases. The sensitivities are not determined by way of estimates or approximations, but by way of comprehensive analyses subject to variation of the parameters.
For the business year 2018/19, the expected contributions to the defined benefit plans amount to EUR 2.3 million.
The interest-weighted, average duration for pension plans is 14.6 years, and 10.6 years for severance payments.

152 C O N S O L I D A T E D F I N A N C I A L S T A T E M E N T S
PROVISIONS FOR LONG-SERVICE BONUSES
2016/17 2017/18
Present value of long-service bonus obligations (DBO) as of April 1 139.7 143.8
Service costs for the period 8.8 9.4
Interest costs for the period 2.5 2.2
Changes in the scope of Consolidated Financial Statements 0.0 0.0
Long-service bonus payments –9.0 –7.9
Actuarial gains (–)/losses (+) due to changes in assumptions 5.0 –3.4
Actuarial gains (–)/losses (+) due to experience-based adjustments –1.7 –0.7
Other –1.5 –0.4
Present value of long-service bonus obligations (DBO) as of March 31 143.8 143.0
In millions of euros
Expenses/revenue relative to provisions for severance payments, pensions, and long-service bonuses recognized in the income statement are categorized as follows:
2016/17 2017/18
Service costs for the period 31.2 29.1
Net interest for the period 24.3 20.6
Gains (–)/losses (+) on plan settlement/curtailment –8.0 –1.4
Actuarial gains (–)/losses (+) from long-service bonus obligations 3.3 –4.1
Expenses/revenue recognized in the income statement 50.8 44.2
In millions of euros
Net interest for the period is recognized in finance costs.

153A N N U A L R E P O R T 2 0 1 7 / 1 8
19. PROVISIONS
Balance as of
04/01/2017
Changes in the scope of
Consolidated Financial
Statements
Net exchange
differences Use Reversals Transfers Additions
Balance as of
03/31/2018
Non-current provisions Other personnel expenses 24.4 0.0 –1.7 –4.0 –0.1 0.0 3.0 21.6
Warranties and other risks 14.6 0.0 –0.2 –2.6 –2.8 0.1 1.2 10.3
Other non-current provisions 40.4 0.0 –1.5 –5.4 –0.4 1.0 10.6 44.7
79.4 0.0 –3.4 –12.0 –3.3 1.1 14.8 76.6
Current provisions Unused vacation entitlements 135.1 0.0 –2.9 –80.0 –0.2 0.1 93.1 145.2
Other personnel expenses 186.3 0.0 –3.5 –152.7 –7.4 0.1 189.5 212.3
Warranties and other risks 53.3 0.0 –1.4 –11.4 –8.8 –0.2 17.9 49.4
Onerous contracts 54.7 0.0 –0.1 –46.1 –1.0 0.0 23.6 31.1
Other current provisions 155.6 0.3 –2.7 –77.7 –9.7 –1.1 112.5 177.2
585.0 0.3 –10.6 –367.9 –27.1 –1.1 436.6 615.2
664.4 0.3 –14.0 –379.9 –30.4 0.0 451.4 691.8
In millions of euros
The provisions for personnel expenses mainly include bonuses. Provisions for warranties and other risks as well as onerous contracts apply to current operating activities. The other provisions mainly consist of provisions for commissions; litigation, legal, and consulting fees; and environmental protection obligations.

154 C O N S O L I D A T E D F I N A N C I A L S T A T E M E N T S
The amount recognized as a provision for warranties and other risks is calculated as the most reliable estimated value of the amount that would be required to settle these obligations at the reporting date. The statistical measure is the expected value, which is based on the probability of occurrence of an event according to past experience.
Provisions for onerous contracts are recognized when the earnings expected to be derived by the Group from contracts are lower than the unavoidable cost of meeting its obligations under these contracts. Before recognizing a separate provision for onerous contracts, the Group recognizes an impairment loss on the assets associated with such contracts.
The provisions recognized in the Annual Financial Statements 2016/17 in the amount of EUR 35.6 million for the anti-trust proceedings and associated actions and costs relating to railway superstruc-ture material as well as for the closure of TSTG Schienen Technik GmbH & Co KG have been reduced to EUR 30.2 million due to the use of these provisions in the business year 2017/18.
Companies of the High Performance Metals Division of the voestalpine Group are affected by proceedings of the German Federal Cartel Office (Bundeskartellamt) that became known as of November 26, 2015, due to searches of the premises of voestalpine’s competitors. voestalpine is tak-ing these proceedings very seriously, is cooperating with the authorities, and currently does not expect that significant fines will be imposed against voestalpine in these proceedings. No provisions were formed in this regard in the current reporting period.
In the course of the current investigations of the German Federal Cartel Office (Bundeskartellamt) against steel producers, a search was conducted in the offices of voestalpine in Linz, Austria, from September 12 to 14, 2017, for the German Federal Cartel Office. The search took place on suspicion of anti-competitive practices in the market for heavy plates. Austrian authorities took part in accord-ance with European legal requirements. voestalpine AG is taking these allegations very seriously and is cooperating with the authorities. No provisions were formed in this regard in the current reporting period.
Increases in provisions totaling EUR 0.7 million (2016/17: EUR 9.4 million) are included in the report-ing period based on accrued interest and on changes in the discount rate.

155A N N U A L R E P O R T 2 0 1 7 / 1 8
20. FINANCIAL LIABILITIES
Up to one year Over one year03/31/2017 03/31/2018 03/31/2017 03/31/2018
Bank loans and bonds 1,280.9 1,189.4 2,681.0 2,714.0
Liabilities from finance leases 4.5 13.3 21.5 8.6
Liabilities from affiliates 11.6 12.0 0.0 0.0
Liabilities from other investments 1.3 1.2 0.0 0.0
Other payables and liabilities 34.6 99.6 62.2 61.0
1,332.9 1,315.5 2,764.7 2,783.6
In millions of euros
On February 3, 2011, voestalpine AG issued a corporate bond amounting to EUR 500.0 million. The bond was redeemed on February 5, 2018. The outstanding principal amount of the bond accrued interest at an annual rate of 4.75%.
On October 5, 2012, voestalpine AG issued a corporate bond with a volume of EUR 500.0 million. The bond will be redeemed on October 5, 2018. The outstanding principal amount of the bond ac-crues interest at an annual rate of 4.00%.
On October 14, 2014, voestalpine AG issued a fixed interest bond of EUR 400.0 million. The bond will be redeemed in October 2021 and carries an annual interest rate of 2.25%.
voestalpine AG has successfully placed a new EUR 500.0 million corporate bond issue in the capital market for general corporate funding purposes as well as for refinancing a senior bond that expires in February 2018. The coupon rate for the 7-year bond is 1.375%.
In the business year 2017/18, there were no ongoing buybacks of corporate bonds. In the business year 2016/17, EUR 16.2 million were repurchased from the total principal amount of the 2012–2018 corporate bond and EUR 13.6 million from the total principal amount of the 2011–2018 corporate bond.

156 C O N S O L I D A T E D F I N A N C I A L S T A T E M E N T S
21. TRADE AND OTHER PAYABLES
03/31/2017 03/31/2018
Prepayments received on orders 100.5 76.5
Trade payables 1,294.2 1,412.5
Trade payables with reverse factoring agreements 9.5 43.6
Liabilities from bills of exchange accepted and drawn 561.0 620.3
Other liabilities from taxes 109.5 95.9
Other liabilities related to social security 48.0 49.9
Other payables and liabilities 339.5 348.4
2,462.2 2,647.1
In millions of euros
22. CONTINGENT LIABILITIES
03/31/2017 03/31/2018
Liabilities from the issue and transfer of bills of exchange 1.1 1.4
Surety bonds and guarantees 1.5 0.5
2.6 1.9
In millions of euros
The Federal Finance Court has directed a request for a preliminary ruling to the ECJ with regard to the Austrian energy tax rebate (BFG 10/31/2014, RE/5100001/2014). The energy tax rebate was re-stricted to production companies through the amendment to the Energy Tax Rebate Act in the Budget Accompanying Act 2011, applicable to the periods after December 31, 2010. Subsequently, the ques-tion of whether this restriction that can be deemed to constitute state aid violated EU law was submitted to the European Court of Justice for a preliminary ruling; this has actually been affirmed by the highest court (ECJ 7/21/2016, case no. C-493/14, Dilly’s Wellnesshotel GmbH). Thus, the restric-tions pursued by the Budget Accompanying Act 2011 did not enter into force with legal effect and therefore, service providers specifically, among others, can retroactively assert the energy tax rebate for periods after February 1, 2011. In its subsequent ruling, the Federal Finance Court declared that the restriction to production companies did not enter into effect. The Tax Office appealed this deci-sion to the Higher Administrative Court, which forwarded the case anew to the ECJ in September 2017 (Resolution of September 14, 2017, EU 2017/0005 and 0006-1). No adverse impact is anticipated for the voestalpine Group.
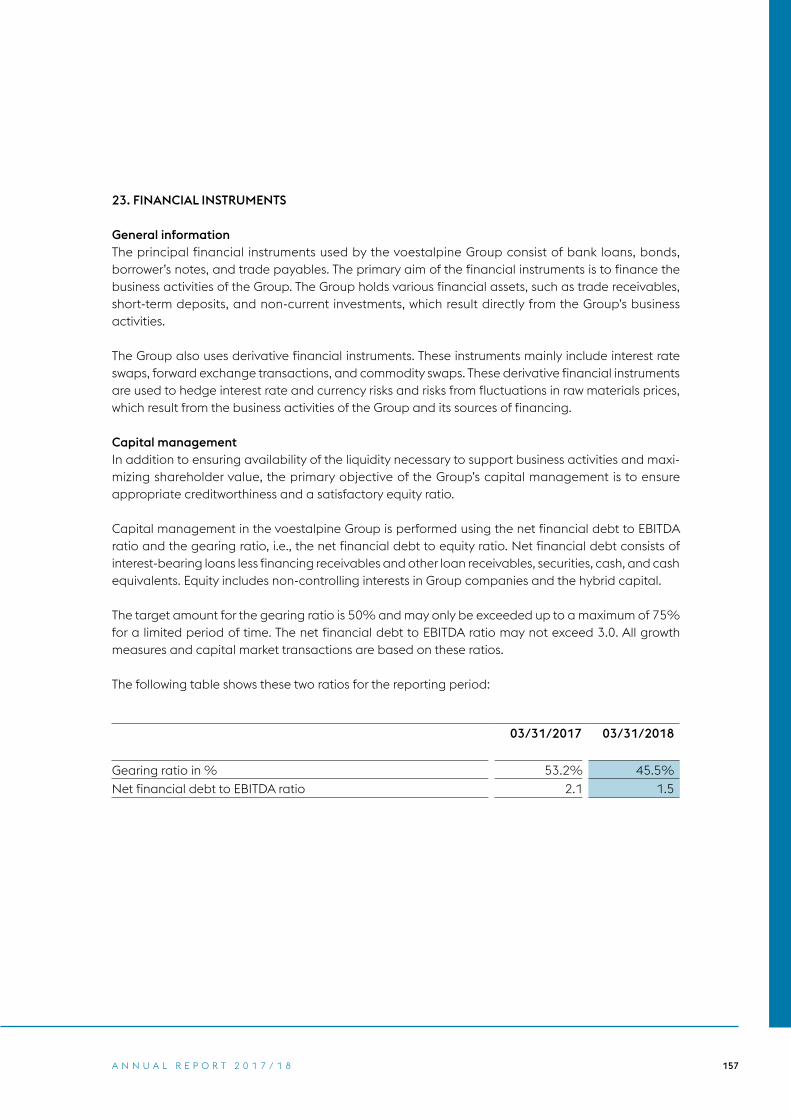
157A N N U A L R E P O R T 2 0 1 7 / 1 8
23. FINANCIAL INSTRUMENTS
General informationThe principal financial instruments used by the voestalpine Group consist of bank loans, bonds, borrower’s notes, and trade payables. The primary aim of the financial instruments is to finance the business activities of the Group. The Group holds various financial assets, such as trade receivables, short-term deposits, and non-current investments, which result directly from the Group’s business activities.
The Group also uses derivative financial instruments. These instruments mainly include interest rate swaps, forward exchange transactions, and commodity swaps. These derivative financial instruments are used to hedge interest rate and currency risks and risks from fluctuations in raw materials prices, which result from the business activities of the Group and its sources of financing.
Capital managementIn addition to ensuring availability of the liquidity necessary to support business activities and maxi-mizing shareholder value, the primary objective of the Group’s capital management is to ensure appropriate creditworthiness and a satisfactory equity ratio.
Capital management in the voestalpine Group is performed using the net financial debt to EBITDA ratio and the gearing ratio, i.e., the net financial debt to equity ratio. Net financial debt consists of interest-bearing loans less financing receivables and other loan receivables, securities, cash, and cash equivalents. Equity includes non-controlling interests in Group companies and the hybrid capital.
The target amount for the gearing ratio is 50% and may only be exceeded up to a maximum of 75% for a limited period of time. The net financial debt to EBITDA ratio may not exceed 3.0. All growth measures and capital market transactions are based on these ratios.
The following table shows these two ratios for the reporting period:
03/31/2017 03/31/2018
Gearing ratio in % 53.2% 45.5%
Net financial debt to EBITDA ratio 2.1 1.5

158 C O N S O L I D A T E D F I N A N C I A L S T A T E M E N T S
Financial risk management—Corporate finance organizationFinancial risk management also includes the area of raw material risk management. Financial risk management is organized centrally with respect to policy-making power, strategy determination, and target definition. The existing policies include targets, principles, duties, and responsibilities for both the Group Treasury and individual Group companies. In addition, they govern the areas of pooling, money market, credit and securities management, currency, interest rate, liquidity, and commodity price risk, and reporting. The Group Treasury, acting as a service center, is responsible for implemen-tation. Three organizationally separate units are responsible for closing, processing, and recording transactions, which guarantees a six-eyes principle. Policies, policy compliance, and the ICS conform-ity of business processes are additionally audited at regular intervals by an external auditor.
It is part of the voestalpine Group’s corporate policy to continuously monitor, quantify, and, where reasonable, hedge financial risks. The Group’s willingness to accept risk is relatively low. The strategy aims at achieving natural hedges and reducing fluctuations in cash flows and income. Market risks are largely hedged by means of derivative financial instruments.
To quantify interest rate risk, voestalpine AG uses interest rate exposure and fair value risk as indica-tors. Interest rate exposure quantifies the impact of a 1% change in the market interest rate on inter-est income and interest expenses. Fair value risk means the change in the fair value of an interest rate-sensitive item with a 1% parallel shift of the interest yield curve.
voestalpine AG uses the “@risk” concept to quantify currency risk. The maximum loss within one year is determined with 95% certainty. Risk is calculated for the open position, which is defined as the bud geted quantity for the next twelve months less the quantity that has already been hedged. The variance-covariance approach is used to evaluate foreign currency risk.
Liquidity risk—FinancingLiquidity risk refers to the risk of not being able to fulfill payment obligations due to insufficient means of payment.
The primary instrument for controlling liquidity risk is a precise financial plan that is submitted quarterly by the operating entities directly to the Group Treasury of voestalpine AG. The funding re-quirements with regard to financing and bank credit lines are determined based on the consolidated results.

159A N N U A L R E P O R T 2 0 1 7 / 1 8
Working capital is financed by the Group Treasury. A central clearing system performs intra-group netting daily. Entities with liquidity surpluses indirectly put these funds at the disposal of entities requiring liquidity. The Group Treasury places any residual liquidity with their principal banks. This allows the volume of outside borrowing to be decreased and net interest income to be optimized.
Financing is carried out in the local currency of the borrower in order to avoid exchange rate risk or is currency-hedged using cross currency swaps.
voestalpine AG holds securities and current investments as a liquidity reserve. As of March 31, 2018, non-restricted securities amounted to EUR 388.1 million (March 31, 2017: EUR 348.3 million). Further-more, cash and cash equivalents in the amount of EUR 705.8 million (March 31, 2017: EUR 503.3 mil-lion) are reported in the Consolidated Financial Statements.
Additionally, adequate credit lines that are callable at any time exist with domestic and foreign banks. These credit lines have not been drawn. In addition to the possibility of exhausting these financing arrangements, contractually guaranteed credit lines of EUR 700.0 million (2016/17: EUR 710.0 mil-lion) are available to bridge any economic downturns.
The sources of financing are managed on the basis of the principle of bank independence. Financing is currently being provided by approximately 20 different domestic and foreign banks. Covenants agreed for a minor part of the total credit volume with a single bank are adhered to. The capital mar-ket is also used as a source of financing. No new debt was raised through capital market transactions in the business year 2016/17. The capital increase decided by the Management Board on March 6, 2017, and approved by the Supervisory Board on March 23, 2017, in the amount of 1.4 million shares was entered into the Commercial Register on March 30, 2017, and is therefore effective as of this date. The following capital market transaction was effected in the business year 2017/18:
Issuance of a new Senior Bond 2017–2024 EUR 500.0 million

160 C O N S O L I D A T E D F I N A N C I A L S T A T E M E N T S
A maturity analysis of all liabilities existing as of the reporting date is presented below:
LIABILITIES
Due within one year Due between one and five years
Due after more than five years
2016/17 2017/18 2016/17 2017/18 2016/17 2017/18
Bonds 460.9 459.0 852.4 395.4 0.0 496.8
Bank loans 820.0 730.4 1,595.2 1,640.2 233.3 181.6
Trade payables 1,302.9 1,455.6 0.8 0.4 0.0 0.0
Liabilities from finance leases 4.5 13.3 16.7 3.3 4.8 5.3
Liabilities from foreign currency hedges and commodity hedges 13.1 17.0 0.6 0.0 0.0 0.0
thereof designated as hedge accounting 1.7 3.9 0.3 0.0 0.0 0.0
Liabilities from interest hedges (incl. cross currency swaps) 11.1 4.2 6.0 0.4 0.0 0.0
thereof designated as hedge accounting 0.0 0.5 2.5 0.0 0.0 0.0
Other financial liabilities 47.5 112.8 36.9 35.9 25.3 25.0
Total liabilities 2,660.0 2,792.3 2,508.6 2,075.6 263.4 708.7
In millions of euros

161A N N U A L R E P O R T 2 0 1 7 / 1 8
As estimated as of the reporting date, the following (prospective) interest charges correspond to these existing liabilities:
Due within one year Due between one and five years
Due after more than five years
2016/17 2017/18 2016/17 2017/18 2016/17 2017/18
Interest on bonds 49.3 34.3 54.4 54.5 0.0 13.8
Interest on bank loans 40.9 42.2 62.4 61.0 11.5 11.4
Interest on liabilities from finance leases 1.4 0.8 1.2 1.0 0.4 0.1
Interest on interest hedges (incl. cross currency swaps) 14.3 7.8 4.9 8.8 0.0 0.0
Interest on other financial liabilities 1.8 1.8 5.4 4.6 2.3 1.5
Total interest charges 107.7 86.9 128.3 129.9 14.2 26.8
In millions of euros
Credit riskCredit risk refers to financial losses that may occur through non-fulfillment of contractual obligations by business partners.
The credit risk of the underlying transactions is kept low by precise management of receivables. A high percentage of delivery transactions is covered by credit insurance. Bankable security is also provided, such as guarantees and letters of credit.
As of the reporting date, there were receivables that are neither past due nor impaired in the amount of EUR 1,480.3 million (March 31, 2017: EUR 1,357.9 million).

162 C O N S O L I D A T E D F I N A N C I A L S T A T E M E N T S
The age structure of receivables that are past due but not impaired is presented below:
RECEIVABLES THAT ARE PAST DUE BUT NOT IMPAIRED
2016/17 2017/18
Up to 30 days past due 136.2 157.8
31 to 60 days past due 29.9 45.4
61 to 90 days past due 11.5 14.8
91 to 120 days past due 10.5 10.0
More than 120 days past due 41.8 31.8
Total 229.9 259.8
In millions of euros
The following impairment was recorded for receivables of voestalpine AG during the reporting period:
IMPAIRMENT FOR RECEIVABLES
2016/17 2017/18
Gross value impaired receivables 159.2 57.5 Opening balance as of April 1 31.0 32.8
Additions 10.0 5.8
Net exchange differences 0.7 –1.4
Changes in the scope of Consolidated Financial Statements –0.1 –0.1
Reversal –2.7 –8.2
Use –6.1 –4.3
Closing balance as of March 31 32.8 24.6 Net value impaired receivables 126.4 32.9
In millions of euros
As most of the receivables are insured, the risk of bad debt losses is limited. The maximum loss, which is theoretically possible, equals the amount at which the receivables are stated in the statement of financial position.

163A N N U A L R E P O R T 2 0 1 7 / 1 8
The management of credit risk from investment and derivative transactions is governed by internal guidelines. All investment and derivative transactions are limited for each counterparty, with the size of the limit dependent on the rating of the bank.
The credit risk for derivative financial instruments is limited to transactions with a positive market value and to the replacement cost of such transactions. Therefore, derivative transactions are only valued at their positive market value up to this limit. Derivative transactions are exclusively based on standardized master agreements for financial forward transactions.
BREAKDOWN OF INVESTMENTS AT FINANCIAL INSTITUTIONS BY RATING CLASSES
AAA AA A BBB <BBB/NR
Bonds 59.4 135.0 2.7 2.0 0.0
Money market investments excl. account credit balances 0.0 238.7 112.0 4.5 0.0
Derivatives1 0.0 4.3 13.6 6.9 2.4
1 Only positive market value In millions of euros
Currency riskThe largest currency position in the Group arises from raw materials purchases in USD; however, the global business activities of the voestalpine Group also give rise to currency exposures in various other currencies.
Cash inflows and outflows in the respective currencies are offset thanks to the implementation of roll-ing multi-currency netting. The natural hedge created in this way mitigates risk. The use of derivative hedging instruments is another possibility. voestalpine AG hedges budgeted foreign currency pay-ments over the next twelve months. Longer-term hedging occurs only for contracted projects. The hedging ratio is between 25% and 100%. The further in the future the cash flow lies, the lower the hedging ratio.
The net requirement for USD in the voestalpine Group was USD 933.8 million in the business year 2017/18. The increase compared to the previous year (USD 582.0 million) was due primarily to the increase in prices of raw materials purchased. The remaining foreign currency exposure, resulting primarily from exports to the “non-eurozone” and raw material purchases, is significantly lower than the USD risk.

164 C O N S O L I D A T E D F I N A N C I A L S T A T E M E N T S
Based on the Value-at-Risk calculation, as of March 31, 2018, the risks for all open positions for the upcoming business year are as follows:
Undiversified USD CAD GBP CNY RON SEK PLN Other
Position1 –387.5 63.9 63.0 60.5 59.9 –47.0 38.1 41.5
VaR (95%/year) 55.7 9.4 8.3 8.6 4.0 5.1 4.7 12.7
1 Unhedged planned positions for the business year 2018/19 In millions of euros
Taking into account the correlation between the different currencies, the resulting portfolio risk is EUR 57.7 million (March 31, 2017: EUR 65.0 million) for the voestalpine Group.
Interest rate riskvoestalpine AG differentiates between cash flow risk (the risk that interest expenses or interest income will undergo a detrimental change) for variable-interest financial instruments and present value risk for fixed-interest financial instruments. The positions shown include all interest rate-sensitive financial instruments (loans, money market, issued and purchased securities, as well as interest rate derivatives).
The primary objective of interest rate management is to optimize interest expenses while taking the risk into consideration. In order to achieve a natural hedge for interest-bearing positions, the modified duration of assets is closely linked to the modified duration of the liabilities.
FOREIGN CURRENCY PORTFOLIO 2017/18
9%Other
4%PLN
6%SEK
5%RON
58%USD
6%CAD
6%GBP
6%CNY

165A N N U A L R E P O R T 2 0 1 7 / 1 8
The variable-interest positions on the liabilities side significantly exceed the positions on the assets side so that a 1% increase in the money market rate increases the interest expense by EUR 8.8 million (2016/17: EUR 13.1 million).
The weighted average interest rate for asset positions is 0.42% (2016/17: 0.50%) with a duration of 0.70 years (2016/17: 0.86 years)—including money market investments—and 1.82% (2016/17: 2.03%) for liability positions with a duration of 1.77 years (2016/17: 1.15 years).
Position1
Weighted average
interest rateDuration
(years)
Average capital
commitment (years)2
Sensitivity to a 1%
change in the interest
rate1Cash flow
risk1
Assets 1,230.9 0.42% 0.70 0.92 –2.5 –10.1
Liabilities –4,146.8 1.82% 1.77 2.87 77.2 18.9
Net –2,915.9 74.7 8.8
1 In millions of euros2 Excluding revolving export loans of EUR 326.1 million
The present value risk determined using the Value-at-Risk calculation for March 31, 2018, is equal to EUR 0.3 million (March 31, 2017: EUR 1.0 million) for positions on the assets side, given a 1% change in the interest rate, and EUR 30.5 million (March 31, 2017: EUR 37.4 million) for positions on the lia-bilities side. Therefore, in the event of a 1% drop in the interest rate, voestalpine AG would have an imputed (unrecognized) net present value loss of EUR 30.2 million (March 31, 2017: EUR 36.4 million).
The asset positions include EUR 337.0 million (March 31, 2017: EUR 343.3 million) in investments in the V54 fund of funds. 100% of the fund assets are invested in bonds and money market securities in euros or in cash in the two sub-funds V101 and V103 and in various special funds as follows:
Funds
Sub-fund V101 EUR 142.0 million with a duration of 2.2
Sub-fund V103 EUR 60.6 million with a duration of 1.9
Special funds EUR 133.4 million (only included in V54)
In addition to the investment fund, there are also securities exposures in the amount of EUR 55.6 million (March 31, 2017: EUR 50.1 million).

166 C O N S O L I D A T E D F I N A N C I A L S T A T E M E N T S
VA Intertrading Aktiengesellschaft was recognized—as in the previous year—under other current financial investments, as the prerequisites for the application of IFRS 5 provisions have now been met; however, as these are immaterial and negligible, it is not appropriate to list them as a separate line item in the consolidated statement of financial position. VA Intertrading Aktiengesellschaft is part of the operating segment “Other”.
In the business year 2017/18, gains in the amount of 0.44% (2016/17: 1.19%) were recorded in the V54 fund of funds.
Securities are measured at fair value. For the determination of the fair value, quoted prices for iden-tical assets or liabilities in active markets (unadjusted) are used. Net profit amounting to EUR 10.3 million (2016/17: EUR 22.7 million) is recognized at fair value through profit or loss for financial instru-ments that are measured using the fair value option.
Derivative financial instrumentsPortfolio of derivative financial instruments:
Nominal value (in millions of euros)
Market value (in millions of euros)
Of which accounted for in equity Maturity
03/31/2017
03/31/2018
03/31/2017
03/31/2018
03/31/2017
03/31/2018
03/31/2017
03/31/2018
Foreign currency hedges 1,533.4 1,463.8 –7.7 5.0 –0.9 13.0 < 2 years < 4 years
thereof designated as hedge accounting 209.2 436.2 –0.9 13.0
Interest hedges 255.8 253.7 –2.5 –0.5 –2.5 –0.5 < 2 years < 1 year
thereof designated as hedge accounting 254.4 253.7 –2.5 –0.5
Cross currency swaps 135.3 186.9 –13.3 4.9 0.0 0.0 ≤ 3 years < 3 years
thereof designated as hedge accounting 0.0 0.0 0.0 0.0
Commodity hedges 47.5 55.4 9.9 –2.3 5.6 –0.9 < 1 year < 3 years
thereof designated as hedge accounting 44.8 23.6 9.7 –1.1
Total 1,972.0 1,959.8 –13.6 7.1 2.2 11.6 thereof designated as hedge accounting 508.4 713.5 6.3 11.4
167A N N U A L R E P O R T 2 0 1 7 / 1 8
The derivative transactions are marked to market daily by determining the value that would be real-ized if the hedging position were closed out (liquidation method). Input for the calculation of market values are observable currency exchange rates and raw materials prices as well as interest rates. Based on the input, the market value is calculated using generally accepted actuarial formulas.
Unrealized profits or losses from hedged transactions are accounted for as follows:
» If the hedged asset or liability is already recognized in the statement of financial position or an ob-ligation not recorded in the statement of financial position is hedged, the unrealized profits and losses from the hedged transaction are recognized through profit and loss. At the same time, the hedged item is reported at fair value, regardless of its initial valuation method. The resulting unre-alized profits and losses are offset with the unrealized results of the hedged transaction in the in-come statement so that, in total, only the ineffective portion of the hedged transaction is reported in profit or loss for the period (fair value hedges).
» If a future transaction is hedged, the effective portion of the unrealized profits and losses accumu-lated up to the reporting date is recognized in other comprehensive income. The ineffective portion is recognized through profit and loss. When the transaction that is hedged results in the recognition of a non-financial asset or a liability in the statement of financial position, the amount recognized in other comprehensive income is taken into account when the carrying amount of this item is de-termined. Otherwise, the amount reported in other comprehensive income is recognized through profit or loss in accordance with the income effectiveness of the future transaction or the existing obligation (cash flow hedges).
In the business year 2017/18, hedge accounting in accordance with IAS 39 was used for hedging for-eign currency cash flows, interest-bearing receivables and liabilities, and raw materials purchase agreements. The hedges are mainly cash flow hedges, while only a small proportion—largely raw material hedges—are designated as fair value hedges. Hedge accounting is only applied to a part of any completed hedge transactions.
Net gains of foreign currency, raw material, and interest rate derivatives amounting to EUR 11.4 mil-lion (2016/17: net losses amounting to EUR 27.3 million) were recognized through profit and loss in the reporting period.
Losses amounting to EUR 1.0 million (2016/17: losses amounting to EUR 1.5 million) on raw material hedges, which are designated as fair value hedges, were recognized through profit and loss. Gains for the corresponding underlying transactions amounting to EUR 1.0 million (2016/17: gains amount-ing to EUR 1.5 million) were also recognized through profit and loss.
In the business year 2017/18, ineffective hedging amounting to EUR –0.1 million (2016/17: EUR 0.4 million) was recorded in profit or loss.

168 C O N S O L I D A T E D F I N A N C I A L S T A T E M E N T S
Negative market values amounting to EUR 0.9 million (2016/17: negative market values amounting to EUR 2.7 million) previously recorded in the reserve for foreign exchange hedges were recognized through profit and loss in the cost of materials during the reporting period; positive market values amounting to EUR 13.0 million (2016/17: negative market values amounting to EUR 0.9 million) were allocated to the reserve. In the business year 2017/18, the reserve for interest rate hedges was in-creased by EUR 2.0 million (2016/17: increased by EUR 2.0 million) due to changes in the fair values. The commodity hedge reserve was decreased by EUR 0.8 million (2016/17: increased by EUR 5.6 mil-lion) as a result of redesignations and changes in fair value; EUR –5.7 million were withdrawn and reclassified to inventories. There were no additional changes and no amounts were withdrawn or reclassified.
Derivatives designated as cash flow hedges have the following effects on cash flows and profit or loss for the period:
Total contractual cash flows
Contractual cash flows
< 1 year > 1 year and < 5 years > 5 years
2016/17 2017/18 2016/17 2017/18 2016/17 2017/18 2016/17 2017/18
Interest hedgesAssets 0.2 0.0 0.2 0.0 0.0 0.0 0.0 0.0
Liabilities –2.7 –0.5 –1.7 –0.5 –1.0 0.0 0.0 0.0
–2.5 –0.5 –1.5 –0.5 –1.0 0.0 0.0 0.0
Foreign currency hedges Assets 0.5 15.6 0.5 6.0 0.0 9.6 0.0 0.0
Liabilities –1.4 –2.6 –1.1 –2.6 –0.3 0.0 0.0 0.0
–0.9 13.0 –0.6 3.4 –0.3 9.6 0.0 0.0
Commodity hedges Assets 10.6 0.3 10.6 0.3 0.0 0.0 0.0 0.0
Liabilities –0.3 –1.4 –0.3 –1.4 0.0 0.0 0.0 0.0
10.3 –1.1 10.3 –1.1 0.0 0.0 0.0 0.0
In millions of euros

169A N N U A L R E P O R T 2 0 1 7 / 1 8
Categories of financial instruments
Classes Financial assets measured at amortized cost
Financial assets measured at fair value
Total
Categories Loans and receivables
Available for sale at cost
Available for sale
at fair value
Financial assets measured at fair value
through profit or loss
Held for trading
(derivatives)
Other
Assets 2016/17 Other financial assets – non-current 17.4 14.2 32.1 2.4 66.1
Trade and other receivables 1,697.0 17.1 1,714.1
Other financial assets – current 348.3 348.3
Cash and cash equivalents 503.3 503.3
Carrying amount (= Fair value) 2,217.7 14.2 32.1 17.1 350.7 2,631.8 Assets 2017/18 Other financial assets – non-current 6.1 11.4 32.1 1.4 51.0
Trade and other receivables 1,743.6 29.4 1,773.0
Other financial assets – current 388.1 388.1
Cash and cash equivalents 705.8 705.8
Carrying amount (= Fair value) 2,455.5 11.4 32.1 29.4 389.5 2,917.9
In millions of euros
The carrying amount of the financial assets represents a reasonable approximation of fair value.
The item “Other” in the category “Financial assets measured at fair value through profit or loss” contains securities measured using the fair value option.

170 C O N S O L I D A T E D F I N A N C I A L S T A T E M E N T S
Subsidiaries, joint ventures, and investments in associates that are not fully consolidated in these Consolidated Financial Statements or are included using the equity method are held as “available for sale at cost” and measured at cost because these investments do not have a price quoted in an ac-tive market, and their fair value cannot be reliably determined. Only the non-consolidated investment in Energie AG Oberösterreich is measured at fair value as “available for sale at fair value” because the fair value of this company as a whole can be reliably determined based on the valuation report performed once a year for Energie AG Oberösterreich taking into account all relevant information.
Classes Financial liabilities measured at
amortized cost
Financial liabilities measured at
fair value
Total
Categories Financial liabilities measured at
amortized cost
Financial liabilities measured at fair
value through profit or loss –
Held for trading (derivatives)
Carrying amount
Fair value Carrying amount (= Fair value)
Carrying amount
Fair value
Liabilities 2016/17 Financial liabilities – non-current 2,764.7 2,833.9 2,764.7 2,833.9
Financial liabilities – current 1,332.9 1,346.5 1,332.9 1,346.5
Trade and other payables 2,436.7 2,436.7 30.7 2,467.4 2,467.4
Total 6,534.3 6,617.1 30.7 6,565.0 6,647.8
Liabilities 2017/18 Financial liabilities – non-current 2,783.6 2,804.6 2,783.6 2,804.6
Financial liabilities – current 1,315.6 1,324.4 1,315.6 1,324.4
Trade and other payables 2,633.8 2,633.8 22.2 2,656.0 2,656.0
Total 6,733.0 6,762.8 22.2 6,755.2 6,785.0
In millions of euros

171A N N U A L R E P O R T 2 0 1 7 / 1 8
The financial liabilities measured at amortized cost, excluding bonds issued, fall under Level 2. Valuation is performed according to the mark-to-market method, whereby the input parameters for the calculation of the market values are the foreign exchange rates, interest rates, and credit spreads observable on the market. Based on the input parameters, fair values are calculated by discounting estimated future cash flows at typical market interest rates.
Bonds issued are measured using Level 1 inputs according to the quoted price as of the reporting date.
The carrying amounts of trade and other payables are an appropriate approximation of fair value.
The table below analyzes financial assets and financial liabilities that are measured at fair value on a recurring basis. These measurements are based on a fair value hierarchy that categorizes the inputs for the valuation methods used to measure fair value into three levels. The three levels are defined as follows:
INPUTS
Level 1 Comprises quoted prices (unadjusted) in active markets for identical assets or liabilities that the entity can access at the measurement date.
Level 2 Comprises inputs other than quoted prices included within Level 1 that are observable for the asset or liability, either directly or indirectly.
Level 3 Comprises unobservable inputs for the asset or liability.

172 C O N S O L I D A T E D F I N A N C I A L S T A T E M E N T S
LEVEL OF THE FAIR VALUE HIERARCHY FOR RECURRING FAIR VALUE MEASUREMENTS
Level 1 Level 2 Level 3 Total
2016/17
Financial assets Financial assets measured at fair value through profit or loss
Held for trading (derivatives) 17.1 17.1
Fair value option (securities) 350.7 350.7
Available for sale at fair value 32.1 32.1
350.7 17.1 32.1 399.9
Financial liabilities Financial liabilities measured at fair value through profit or loss – Held for trading (derivatives) 30.7 30.7
0.0 30.7 0.0 30.7
2017/18
Financial assets Financial assets measured at fair value through profit or loss
Held for trading (derivatives) 29.4 29.4
Fair value option (securities) 389.5 389.5
Available for sale at fair value 32.1 32.1
389.5 29.4 32.1 451.0
Financial liabilities Financial liabilities measured at fair value through profit or loss –Held for trading (derivatives) 22.2 22.2
0.0 22.2 0.0 22.2
In millions of euros
The underlying assets of the fund of funds are reported as part of the “fair value option.” The desig-nation of fair value was selected to convey more useful information because this group of financial assets is managed according to their fair value, as documented in the risk management and invest-ment strategy, and performance is observed and reported by means of fair value.

173A N N U A L R E P O R T 2 0 1 7 / 1 8
The derivative transactions (Level 2) are marked to market by determining the value that would be realized if the hedging position were closed out (liquidation method). The observable currency ex-change rates and raw materials prices as well as the interest rates are the input for the calculation of fair values. Fair values are calculated based on the inputs by discounting expected future cash flows at typical market interest rates.
The voestalpine Group recognizes reclassifications between different levels of the fair value hierarchy as of the end of the reporting period in which the change occurred. As of March 31, 2017, own bonds with a carrying amount of EUR 1,313.3 million were transferred from Level 2 to Level 1 since the quot-ed prices on the German stock exchange as the principal market now represent the more appropriate basis of observation for calculating fair value. Apart from this reclassification, there were no other reclassifications in the business years 2016/17 or 2017/18.
The reconciliation of Level 3 financial assets measured at fair value from the opening balance to the closing balance is depicted as follows:
LEVEL 3 – AVAILABLE FOR SALE AT FAIR VALUE
2016/17 2017/18
Opening balance 32.1 32.1
Total of gains/losses recognized in the income statement:
Finance costs/Finance income 0.0 0.0
Closing balance 32.1 32.1
In millions of euros
Level 3 includes the non-consolidated investment in Energie AG Oberösterreich that is measured at fair value as “available for sale at fair value.” The fair value of this company can be reliably determined based on the valuation report performed once a year for Energie AG Oberösterreich as a whole and taking into account all relevant information.
Significant sensitivities in the determination of fair values can result from changes in the underlying market data of comparable entities and the input factors used to determine net present value (in particular discount rates, long-term forecasts, plan data, etc.).

174 C O N S O L I D A T E D F I N A N C I A L S T A T E M E N T S
The table below shows net gains and losses on financial instruments, broken down by category:
2016/17 2017/18
Loans and receivables 7.9 17.6
Available for sale at cost 4.2 13.4
Held for trading (derivatives) –27.3 11.4
Available for sale at fair value 0.0 0.0
Other 22.8 8.1
Financial liabilities –128.8 –135.2
In millions of euros
Total interest income and total interest expense for financial assets and financial liabilities that were not measured at fair value through profit or loss were recorded as follows:
2016/17 2017/18
Total interest income 11.7 10.4
Total interest expense –128.8 –135.2
In millions of euros
The impairment loss on financial instruments measured at amortized cost amounts to EUR 7.4 million (2016/17: EUR 11.9 million).
24. CONSOLIDATED STATEMENT OF CASH FLOWSThe consolidated statement of cash flows was prepared using the indirect method. Cash and cash equivalents include cash on hand, cash at banks, and checks. The effects of changes in the scope of Consolidated Financial Statements were eliminated and reported in the cash flows from investing activities.
2016/17 2017/18
Interest received 7.3 6.4
Interest paid 139.1 141.1
Taxes paid 160.0 123.5
In millions of euros

175A N N U A L R E P O R T 2 0 1 7 / 1 8
Interest received and paid as well as taxes paid are included in the cash flows from operating acti-vities.
NON-CASH EXPENSES AND INCOME
2016/17 2017/18
Depreciation, amortization, and impairment 717.8 770.1
Result from sale of assets –1.6 –14.2
Changes in pensions and other employee obligations, non-current provisions, and deferred taxes 10.5 –25.4
Other non-cash income and expenses –4.7 73.6
722.0 804.1
In millions of euros
Cash flows from operating activities include dividend income of EUR 15.5 million (2016/17: EUR 14.0 million) from associates and joint ventures as well as other investments.
Cash flows from investing activities include inflows of cash and cash equivalents from acquisitions in the amount of EUR 0.0 million (2016/17: EUR 0.4 million) and outflows of the purchase price in the amount of EUR 6.8 million (2016/17: EUR 28.3 million) (details see chapter D. Acquisitions and other additions to the scope of consolidated financial statements). The sale of subsidiaries resulted in an outflow of cash and cash equivalents from cash flows from investing activities of EUR 0.0 million (2016/17: EUR 0.5 million) and an inflow of the sale price in the amount of EUR 0.0 million (2016/17: EUR 2.5 million).
Cash flows from financing activities include dividends for non-controlling interests amounting to EUR 12.9 million (2016/17: EUR 17.9 million) and capital increase from non-controlling interests in the amount of EUR 0.0 million (2016/17: EUR 2.1 million).

176 C O N S O L I D A T E D F I N A N C I A L S T A T E M E N T S
The cash flows and the non-cash changes of the financial liabilities are presented below:
Balance as of April 1, 2017
Cashflows Non-cash changes Balance as of March 31, 2018
Increase in long-term
financial liabilities
Repayment of long-term
financial liabilities
Repayment of long-term
finance lease liabilities
Change in current financial
liabilities and other financial
liabilities
Acquisitions Foreign exchange
movements
Reclassifi- cations
Other changes
Long-term financial liabilities 2,743.2 758.1 –136.5 0.0 0.7 0.0 –87.5 –502.1 –0.9 2,775.0
Current financial liabilities 1,328.4 0.0 –649.3 0.0 138.6 0.5 –18.2 502.1 0.1 1,302.2
Long-term finance lease liabilities 21.5 0.0 0.0 –0.3 –0.1 0.0 –0.1 –13.0 0.6 8.6
Current finance lease liabilities 4.5 0.0 0.0 –3.9 –0.2 0.0 –0.2 13.0 0.1 13.3
Total financial liabilities 4,097.6 758.1 –785.8 –4.2 139.0 0.5 –106.0 0.0 –0.1 4,099.1
In millions of euros
Repayment of long-term finance-lease liabilities includes EUR 649.3 million, which were reclassified from long-term to current financial liabilities in the business year 2016/17.
The additions to assets due to finance lease activities contain non-cash investments amounting to EUR 0.7 million (2016/17: EUR 0.8 million).

177A N N U A L R E P O R T 2 0 1 7 / 1 8
The cash flows and the non-cash changes of the financial liabilities are presented below:
Balance as of April 1, 2017
Cashflows Non-cash changes Balance as of March 31, 2018
Increase in long-term
financial liabilities
Repayment of long-term
financial liabilities
Repayment of long-term
finance lease liabilities
Change in current financial
liabilities and other financial
liabilities
Acquisitions Foreign exchange
movements
Reclassifi- cations
Other changes
Long-term financial liabilities 2,743.2 758.1 –136.5 0.0 0.7 0.0 –87.5 –502.1 –0.9 2,775.0
Current financial liabilities 1,328.4 0.0 –649.3 0.0 138.6 0.5 –18.2 502.1 0.1 1,302.2
Long-term finance lease liabilities 21.5 0.0 0.0 –0.3 –0.1 0.0 –0.1 –13.0 0.6 8.6
Current finance lease liabilities 4.5 0.0 0.0 –3.9 –0.2 0.0 –0.2 13.0 0.1 13.3
Total financial liabilities 4,097.6 758.1 –785.8 –4.2 139.0 0.5 –106.0 0.0 –0.1 4,099.1
In millions of euros
Repayment of long-term finance-lease liabilities includes EUR 649.3 million, which were reclassified from long-term to current financial liabilities in the business year 2016/17.
The additions to assets due to finance lease activities contain non-cash investments amounting to EUR 0.7 million (2016/17: EUR 0.8 million).

178 C O N S O L I D A T E D F I N A N C I A L S T A T E M E N T S
25. RELATED PARTY DISCLOSURESBusiness transactions between the Group and non-consolidated subsidiaries and associates or their subsidiaries as well as joint ventures are carried out at arm’s length and are included in the following items of the Consolidated Financial Statements:
2016/17 2017/18
With joint
ventures
With associates
and non-consolidated
subsidiaries
With joint
ventures
With associates
and non-consolidated
subsidiaries
Revenue 1.1 284.4 0.7 434.3
Material expenses 4.4 128.5 4.0 136.4
Other operating income 0.3 5.5 0.7 5.1
Other operating expenses 0.0 6.1 0.0 5.7
03/31/2017 03/31/2018
Trade and other receivables 0.6 67.6 0.1 79.8
Financial liabilities/trade and other payables 0.0 41.0 0.2 39.0
In millions of euros
Receivables and liabilities with associates and joint ventures as well as with non-consolidated sub-sidiaries comprise both direct and indirect relationships.

179A N N U A L R E P O R T 2 0 1 7 / 1 8
In addition, there are business transactions with core shareholders that have a significant influence due to consolidation of the voestalpine shares using the equity method. Business transactions are carried out at arm’s length and can be depicted as follows:
03/31/2017 03/31/2018
Cash and cash equivalents 2.1 63.1
Financial liabilities/trade and other payables 120.3 121.1
Guarantees received 1.1 1.4
In millions of euros
The non-inclusion of non-consolidated entities in the Consolidated Financial Statements has no significant impact on the Group’s net assets, financial position, or results of operations.
Management BoardThe fixed compensation of the Management Board is determined by the General Committee of the Supervisory Board pursuant to Austrian legal requirements and is reviewed periodically.
The award of a bonus is subject to a target agreement to be concluded with the General Committee of the Supervisory Board that consists of quantitative and qualitative targets. The maximum bonus is limited to 200% of the annual gross salary for members of the Management Board and to 250% of the annual gross salary for the Chairman of the Management Board. If the agreed target values for quantitative targets are achieved exactly, 60% of the maximum bonus applies; if the agreed target values for qualitative targets are achieved, 20% of the maximum bonus applies. The overachieve-ment of the targets is taken into consideration proportionately until the maximum bonus is reached. The quantitative targets are “earnings before interest and taxes” (EBIT) and “return on capital em-ployed” (ROCE). Specific target amounts are determined periodically (in each case for a period of three years) by the General Committee of the Supervisory Board in consultation with the Management Board. They are computed independently of the respective budget and/or the medium-term business plan, i.e. budget compliance does not mean that a bonus is granted. The stipulated qualitative tar-gets for the business year 2017/18 were, first, presentation of a report to the Supervisory Board regarding the core elements of the digital transformation of the voestalpine Group and, second, presentation of the long-term fundamentals regarding sustainability and diversity in the voestalpine Group.

180 C O N S O L I D A T E D F I N A N C I A L S T A T E M E N T S
The amount of the contractually approved company pension payable to the members of the Management Board Dr. Eder, Mag. Dipl.-Ing. Ottel, and Dipl.-Ing. Eibensteiner depends on the length of their service. The amount of the annual pension equals 1.2% of the most recent annual gross salary for each year of service. However, the pension benefit cannot exceed 40% of the most recent annual gross salary (excluding variable compensation). A defined contribution arrangement was put in place for the members of the Management Board Dipl.-Ing. Rotter, Dipl.-Ing. Dr. Kainersdorfer, and Dipl.-Ing. Dr. Schwab (pursuant to which the Company pays 15% of their annual gross salary (exclud-ing bonuses) into the pension fund). If an individual is appointed to the Management Board repeat-edly, as of the current business year the defined contribution plan may be linked to the option to raise the given pension to a specific level upon retirement at the discretion of the General Committee of the Supervisory Board.
Upon termination of their director’s contracts, Management Board members are granted severance pay that is modeled on the approach set forth in the Austrian Employment Act (Angestelltengesetz – AngG); the maximum allowable under the law may not be surpassed.
D&O insurance has been taken out for the members of the Management Board (as well as for ex- ecu tives) and for the members of the Supervisory Board at a cost of EUR 0.2 million (2016/17: EUR 0.1 million) that is borne by the entity.
The compensation paid to the members of the Management Board of voestalpine AG is structured as follows for the business year 2017/18:
Current fixedcompensation
Current variable
compensation Total
Dr. Wolfgang Eder 1.10 2.66 3.76
Dipl.-Ing. Herbert Eibensteiner 0.80 1.53 2.33
Dipl.-Ing. Dr. Franz Kainersdorfer 0.80 1.53 2.33
Mag. Dipl.-Ing. Robert Ottel, MBA 0.80 1.53 2.33
Dipl.-Ing. Franz Rotter 0.80 1.53 2.33
Dipl.-Ing. Dr. Peter Schwab, MBA 0.80 1.53 2.33
2017/18 5.10 10.31 15.412016/17 5.10 7.88 12.98
In millions of euros
In addition to the compensation contained in the above table, the following service costs (personnel expenses) are recognized in the Consolidated Financial Statements for members of the Management Board with defined benefit pension agreements: Dr. Eder EUR 0.00 million (2016/17: EUR 0.00 million), Mag. Dipl.-Ing. Ottel EUR 0.35 million (2016/17: EUR 0.30 million), and Dipl.-Ing. Eibensteiner EUR 0.31 million (2016/17: EUR 0.27 million). Given the potential upgrading described above, a de

181A N N U A L R E P O R T 2 0 1 7 / 1 8
facto defined benefit pension agreement with past service costs has been recognized as follows in the Consolidated Financial Statements for the Management Board members with defined contri bution pension agreements: Dipl.-Ing. Rotter EUR 0.37 million, Dipl.-Ing. Dr. Kainersdorfer EUR 0.88 million, and Dipl.-Ing. Dr. Schwab EUR 0.24 million; in the business year 2017/18, pension fund contributions of EUR 0.12 million in each case (2016/17: EUR 0.12 million in each case) are expensed in the Consolidated Financial Statements for these Management Board members. Pension payments amount-ing to EUR 1.00 million (2016/17: EUR 0.96 million) were paid by the pension fund for former members of the Management Board with defined benefit pension agreements.
As of the reporting date, the outstanding balance of the variable compensation was EUR 8.22 million (2016/17: EUR 6.64 million). No advances or loans were granted to the members of the Management Board of voestalpine AG.
Directors’ dealings notices of the members of the Management Board are published on the Com-pany’s website (www.voestalpine.com » Investors » Corporate Governance).
Supervisory BoardUnder Article 15 of the Articles of Incorporation, the shareholder representatives on the Supervisory Board of voestalpine AG are paid compensation of 0.1% of the profit after tax pursuant to the adopted Consolidated Financial Statements. The total amount is distributed as follows based on an allocation key: 100% for the Chairman, 75% for the Deputy Chairman, and 50% for each of the other members, with a minimum compensation of EUR 27,000 for the Chairman, EUR 20,000 for the Deputy Chairman, and EUR 13,000 for each of the other members of the Supervisory Board pursuant to the amendment of Article 15 of the Articles of Incorporation resolved by the Annual General Meeting 2016. The compensation of the Supervisory Board is limited to four times the stated amounts. The members of the Supervisory Board nominated by the Works Council do not receive any compen-sation. All members of the Supervisory Board are paid an attendance fee of EUR 500 per meeting. No separate compensation is paid for meetings of the committees of the Supervisory Board, but an attendance fee of EUR 500 per meeting is paid nonetheless.
According to this arrangement, the shareholder representatives on the Supervisory Board were paid the following compensation for the business year 2017/18: Dr. Joachim Lemppenau (Chairman): EUR 108,000 (2016/17: EUR 108,000); Dr. Heinrich Schaller (Deputy Chairman): EUR 80,000 (2016/17: EUR 80,000); all other shareholder representatives: EUR 52,000 (2016/17: EUR 52,000).
The Articles of Incorporation have contained finalized rules as to the annual compensation of the members of the Supervisory Board and the method of calculating it since the 2006 Annual General Meeting. As a result, the Annual General Meeting need not adopt a separate resolution every year.
The compensation of the Supervisory Board (including attendance fees) for the business year 2017/18 totaled EUR 0.54 million (2016/17: EUR 0.55 million). The compensation of the Supervisory Board for the business year 2017/18 is paid out at the latest 14 days after the Annual General Meeting on July 4, 2018. No advances or loans were granted to members of the Supervisory Board of voestalpine AG.

182 C O N S O L I D A T E D F I N A N C I A L S T A T E M E N T S
Directors’ dealings notices of the members of the Supervisory Board are published on the Company’s website (www.voestalpine.com » Investors » Corporate Governance).
As legal counsel to voestalpine AG and its subsidiaries, the law firm of Binder Grösswang Rechts anwälte GmbH, of which the Supervisory Board member Dr. Michael Kutschera is a partner, provided legal services in the business year 2017/18 particularly in connection with matters related to antitrust and real estate law. Fees for these matters were invoiced at the general hourly rates of the law firm of Binder Grösswang Rechtsanwälte GmbH applicable at the time. For the business year 2017/18, total net fees of EUR 15,808.00 (2016/17: EUR 32,098.00) were incurred for services provided by Binder Grösswang Rechtsanwälte GmbH.
26. EMPLOYEE INFORMATION
TOTAL NUMBER OF EMPLOYEES
Reporting date Average03/31/2017 03/31/2018 2016/17 2017/18
Waged employees 28,712 29,887 28,283 29,207
Salaried employees 17,154 17,716 17,031 17,458
Apprentices 1,320 1,301 1,449 1,403
47,186 48,904 46,763 48,068
The personnel expenses included in these Consolidated Financial Statements amount to EUR 3,000.0 million (2016/17: EUR 2,859.6 million).
27. EXPENSES FOR THE GROUP AUDITORExpenses for the Group auditor in the business year are structured as follows:
2016/17 2017/18
Expenses for the audit of the Consolidated Financial Statements 0.25 0.26
Expenses for other certifications 1.06 1.19
Expenses for tax consulting services 0.00 0.00
Expenses for other services 0.22 0.06
1.53 1.51
In millions of euros

183A N N U A L R E P O R T 2 0 1 7 / 1 8
28. DISCLOSURES OF TRANSACTIONS NOT RECORDED IN THE STATEMENT OF FINANCIAL POSITIONIn the voestalpine Group, trade receivables are sold monthly to various banks on a revolving basis. In this context, there are four different types of factoring agreements.
In the first type of factoring agreement, trade receivables totaling EUR 799.0 million (March 31, 2017: EUR 611.1 million) were sold to various banks. Receivables covered by credit insurance were assigned to banks in an amount corresponding to 100% of the nominal value, with the acquiring banks assum-ing the risk of default. Any claims arising from credit insurance are assigned to the acquiring bank. The Group company that is selling only assumes liability for default up to—generally—10% of the retention level under the credit insurance. On the reporting date, the maximum risk associated with liability for default was EUR 79.9 million (March 31, 2017: EUR 59.5 million). The liability for default corresponds to the theoretical maximum loss. The probability of needing to fall back on this liability is extremely low. The fair value of this risk is assessed at EUR 0.3 million (March 31, 2017: EUR 0.0 million). The receivables are fully derecognized in accordance with the regulations of IAS 39 on the basis of the cessions of the essential opportunities and risks and on the basis of the transfer of the right of use to the acquiring party.
In the second type of factoring agreement, uninsured trade receivables of EUR 163.6 million (March 31, 2017: EUR 117.1 million) are sold. The purchasing bank assumes 100% of the risk of default. All of the receivables are fully derecognized. With the exception of the capitalized service fee mentioned below for administration of receivables, there is no ongoing commitment.
In the third type of factoring agreement (introduced in October 2014), both insured and uninsured trade receivables of EUR 131.7 million (March 31, 2017: EUR 124.3 million) are sold. Any claims arising from credit insurance are assigned to the acquiring bank. At the time of the sale of the receiv-able, loss reserves of 0.9% and dilution reserves of 1.6% (with reference to the sold receivables) are deducted from the purchase price. The dilution reserves totaling EUR 2.1 million (March 31, 2017: EUR 2.0 million) for receivables sold on the reporting date are for payment of discounts, bonuses, etc. and are posted as other receivables. The carrying amount corresponds to the fair value. A loss reserve to cover any defaults to the amount of EUR 1.2 million (March 31, 2017: EUR 1.1 million) for receiv-ables sold on the reporting date was posted as an expenditure, which is reversed in the absence of any defaults. The theoretical maximum loss is limited to the loss reserve. The receivables are fully derecognized in accordance with the regulations of IAS 39 on the basis of the cessions of the essen-tial opportunities and risks and on the basis of the transfer of the right of use to the acquiring party.

184 C O N S O L I D A T E D F I N A N C I A L S T A T E M E N T S
In the fourth type of factoring agreement, both insured and uninsured trade receivables of EUR 33.4 million (March 31, 2017: EUR 28.0 million) are sold. Any claims arising from credit insurance are assigned to the acquiring bank. For any bad debts, a “first loss reserve account” was funded in the amount of EUR 0.2 million for 12 months by the selling Group company. The first loss reserve account was EUR 0.2 million (March 31, 2017: EUR 0.2 million) on the reporting date and was reported as cash. The carrying amount corresponds to the fair value. The theoretical maximum loss is limited to the amount of the “first loss reserve account.” Because of the transfer of significant rewards and risks and the transition of control to the purchaser, the receivables were fully derecognized pursuant to the pro-visions of IAS 39.
In all of the types of factoring agreements, the payments received from customers during the period between the last sale of receivables and the reporting date are recognized on an accrual basis under other short-term financial liabilities in the voestalpine Group.
Administration of receivables for all types of factoring contracts remains with the particular compa-nies of the Group. For the receivables that were sold, as of March 31, 2018, a total service fee of 0.15% of the sold amount of receivables of EUR 1.7 million (March 31, 2017: EUR 1.3 million) was recorded as other provisions. The carrying amount corresponds to the fair value of the ongoing commitment.
29. EVENTS AFTER THE REPORTING PERIODNo significant events have occurred after the reporting period.
30. EARNINGS PER SHAREDiluted and basic (undiluted) earnings per share are calculated as follows:
2016/17 2017/18
Profit attributable to equity holders of the parent (in millions of euros) 496.8 775.2
Issued ordinary shares (average) 175,065,830 176,349,163
Effect of own shares held (average) –28,597 –28,597
Weighted average number of outstanding ordinary shares 175,037,233 176,320,566
Diluted and basic (undiluted) earnings per share (euros) 2.84 4.40

185A N N U A L R E P O R T 2 0 1 7 / 1 8
31. APPROPRIATION OF NET PROFITIn accordance with the Austrian Stock Corporation Act, the appropriation of net profit is based on the Annual Financial Statements of voestalpine AG as of March 31, 2018. These Financial Statements show net retained profits of EUR 247.0 million. The Management Board proposes a dividend of EUR 1.40 per share (2016/17: EUR 1.10).
Linz, May 25, 2018
The Management Board
The Consolidated Financial Statements of voestalpine AG and associated documents will be filed with the Commercial Register of the Commercial Court of Linz under company register number FN 66209 t.
Appendix to the Notes: Investments
This report is a translation of the original report in German, which is solely valid.
Wolfgang Eder Herbert Eibensteiner Franz Kainersdorfer
Robert Ottel Franz Rotter Peter Schwab

186 C O N S O L I D A T E D F I N A N C I A L S T A T E M E N T S
REPORT ON THE CONSOLIDATED FINANCIAL STATEMENTS
AUDIT OPINIONWe have audited the consolidated financial statements of voestalpine AG, Linz, and of its subsidi-aries (the Group) comprising the consolidated statement of financial position as of March 31, 2018, the consolidated statement of comprehensive income, the consolidated statement of changes in equity and the consolidated statement of cash flows for the fiscal year then ended and the notes to the consolidated financial statements.
Based on our audit the accompanying consolidated financial statements were prepared in accord-ance with the legal regulations and present fairly, in all material respects, the assets and the financial position of the Group as of March 31, 2018, and its financial performance for the year then ended in accordance with IFRS as endorsed in the European Union and the addition requirements of Section 245a Companies Act.
BASIS FOR OPINIONWe conducted our audit in accordance with the regulation (EU) no. 537/2014 (in the following “EU regulation”) and in accordance with Austrian Standards on Auditing. Those standards require that we comply with International Standards on Auditing (ISA). Our responsibilities under those regulations and standards are further described in the “Auditor’s Responsibilities for the Audit of the Financial Statements” section of our report. We are independent of the Group in accordance with laws and regu lations applicable in Austria and we have fulfilled our other ethical responsibilities in accordance with these requirements. We believe that the audit evidence we have obtained is sufficient and appropriate to provide a basis for our opinion.
KEY AUDIT MATTERSKey audit matters are those matters that, in our professional judgment, were of most significance in our audit of the consolidated financial statements of the fiscal year. These matters were addressed in the context of our audit of the consolidated financial statements as a whole, and in forming our opin-ion thereon, and we do not provide a separate opinion on these matters.
In the following we present the matters which, in our view, represent the key audit matters:
a) Recoverability of goodwillb) Recoverability of property, plant and equipmentc) Recoverability of deferred tax assets on tax losses brought forward
AUDITOR’S REPORT

187A N N U A L R E P O R T 2 0 1 7 / 1 8
a) Recoverability of goodwillIn the consolidated financial statements of voestalpine AG as at March 31, 2018, an amount of 1.545,9 million EUR (10,0% of total assets) is presented under the item “Goodwill” (previous year 1.549,5 mil-lion EUR, 10,5% of total assets). Goodwills are tested for impairment at least annually, and – if appli-cable – as events occur. The valuation of goodwill is performed based on a valuation model accord-ing to the discounted cash flow methodology. The book value goodwill is compared to the recoverable amount (value in use) derived from the valuation model. As far as the recoverable amount is lower than the book value, goodwill will be impaired. In the financial year 2017/18, no impairments of goodwill were reported.
Given the materiality of goodwill, the estimation uncertainty involved in the derivation of data for the valuation model, the immanent discretionary decisions as well as the complexity of the valuation model itself, the recoverability of goodwill is considered a key audit matter. The results of the valuation model depend heavily on management’s estimates of future cash inflows and of the discount rate applied and are therefore subject to material uncertainty. The risk for the consolidated financial statements consists in the fact that assumptions and estimates on which the valuation is based can lead to a shortfall of book values in case of a negative deviation of the actual development.
We have verified the appropriateness of the future cash flows used in the calculation by comparing these to the current values in the five-year mid-term planning prepared by management and ap-proved by the supervisory board and to general and industry-specific market expectations. Here we also acknowledged the major assumptions and discretionary decisions that formed the basis of the planning. Under consideration of the fact that already small changes of the discount rate applied can significantly influence the amount of the resulting entity value, we also placed audit emphasis on the parameters used in determining the applicable discount rate including the average cost of capital (“weighted average cost of capital”), among others by comparing them to market and industry specific guideline values and verified the mathematical correctness of the valuation result. Due to the substantial role of goodwill, which makes up for 10,0% of group total assets and due to the fact that its valuation is also influenced by the macroeconomic environment which cannot be influenced by the Group, we have also re-performed the sensitivity analyses prepared by the Group and verified the impact of parameter changes (changes in discount rate and cash flows) on the amount by which the value in use derived from the valuation model exceeds the book value of goodwill.
The Group’s disclosures concerning goodwill and impairment tests are included in Sections B. and G.10. of the notes to the consolidated financial statements.

188 C O N S O L I D A T E D F I N A N C I A L S T A T E M E N T S
b) Recoverability of property, plant and equipmentIn the consolidated financial statements of voestalpine AG, an amount of 6.282,1 million EUR (40,6% of total assets) is disclosed under the item “property, plant and equipment” (previous year 6.371,9 million EUR, 43,3% of total assets). Management will determine upon identification of triggering events whether a permanent impairment or full recoverability of property, plant and equipment or of the relevant cash generating unit (CGU) is present.
An impairment charge is recognized to the extent that the book value of an individual asset or of a cash generating unit exceeds the recoverable amount. The recoverable amount is the higher of net realizable value and value in use. The valuation model is basically the same as for the impairment tests of goodwill.
Due to the materiality of property, plant and equipment, the estimation uncertainty for the derivation of data for the valuation model and the immanent discretionary decisions as well as the complexity of the valuation model, recoverability of property, plant and equipment is considered a key audit mat-ter. The results of the valuation model depend significantly on the estimation of future cash inflows by management as well as on the discount rate applied and are therefore exposed to significant uncer-tainty. The risk for the consolidated financial statements consists in the fact that the assumptions and estimates on which the valuation is based can lead to a shortfall of book values in case of a negative deviation of the actual development.
Thus for property, plant and equipment the same reasons for the classification as a key audit matters are relevant. Our audit approach therefore corresponds to our approach in the audit of the recover-ability of goodwill, so that we can refer to our explanations in the context of recoverability of goodwill.
In the fiscal year 2017/18, the Metal Engineering Division has accounted for impairments of pro- perty, plant and equipment amounting to 12,2 million EUR and for impairments of intangible assets amounting to 3,5 million EUR in the cash generating unit dealing with the production of special wires (fine wires) which are due to negative sales development, the resulting adjustment of the strategic set-up and reduced profit expectations.
In the fiscal year 2017/18, the High Performance Metals Division has accounted for impairments of property, plant and equipment amounting to 10,1 million EUR in the cash generating unit in Brazil which are due to the economic environment in Brazil, the imminent import duties on steel in the USA as well as the resulting uncertainties.

189A N N U A L R E P O R T 2 0 1 7 / 1 8
In connection with our audit of the recoverability we have also verified to which extent reversals of im-pairments recognized in previous years were required in the fiscal year 2017/18.
The Group’s disclosures concerning the recoverability of property, plant and equipment as well as concerning impairments and reversals of past impairments are included in Sections B. and G.9. of the notes to the consolidated financial statements.
c) Recoverability of deferred tax assets on tax losses brought forwardIn the consolidated financial statements of voestalpine AG as at March 31, 2018, deferred tax assets on tax losses brought forward amounting to 154,8 million EUR (previous year: 219,6 million EUR) are recognized. Moreover, the group has unused tax losses amounting to 303,3 million EUR (previous year: 313,6 million EUR) for which no deferred tax asset has been recognized.
In our view, this matter is of particular importance for the consolidated financial statements as the calculation model for deferred taxes is complex, the result of the calculation of the deferred tax asset on tax losses brought forward is highly dependent on the estimate of the future tax results of the rele-vant group companies and is therefore subject to material uncertainty. The risk for the consolidated financial statements consists in the fact that the assumptions and estimates on which the accounting treatment of deferred taxes is based do not lead to the expected tax relief in case of a negative de-viation of the actual development.
We have audited the calculation model as well as the structure and effectiveness of existing controls with the involvement of tax experts. The corresponding notes in the group reporting concerning de-ferred taxes (tax workbook), which have been completed by the individual group companies and – on an aggregated basis – by the divisions and the group itself have been analysed for their correctness and reasonableness. We have reviewed and corroborated the planning of the future tax results which also included the verification as to whether the planning of future tax results is consistent with the five-year plans approved by the relevant bodies. Moreover, we have performed an evaluation whether any limitations in the use of tax losses or expiry dates for the usage of tax losses have been incorporated in the calculation. Finally, we have audited the impact of changes in tax rates.
The Group’s disclosures concerning deferred taxes are included in Sections B., G.8 and G.13. of the notes to the consolidated financial statements.

190 C O N S O L I D A T E D F I N A N C I A L S T A T E M E N T S
RESPONSIBILITIES OF MANAGEMENT AND OF THE SUPERVISORY BOARD/AUDIT COMMITTEE FOR THE CONSOLIDATED FINANCIAL STATEMENTS Management is responsible for the preparation of the consolidated financial statements in accord-ance with IFRS as endorsed in the European Union and the additional requirements of Section 245a Companies Act, for them to present a true and fair view of the assets, the financial position and the financial performance of the Group and for such internal controls as management determines are necessary to enable the preparation of consolidated financial statements that are free from ma-terial misstatement, whether due to fraud or error.
In preparing the consolidated financial statements, management is responsible for assessing the Group’s ability to continue as a going concern, disclosing, as applicable, matters related to going concern and using the going concern basis of accounting unless management either intends to liqui-date the Group or to cease operations, or has no realistic alternative but to do so.
The Supervisory Board/Audit Committee is responsible for overseeing the Group’s financial reporting process.
AUDITOR’S RESPONSIBILITIES FOR THE AUDIT OF THE CONSOLIDATED FINANCIAL STATEMENTS Our objectives are to obtain reasonable assurance about whether the consolidated financial state-ments as a whole are free from material misstatement, whether due to fraud or error, and to issue an auditor’s report that includes our opinion. Reasonable assurance is a high level of assurance, but is not a guarantee that an audit conducted in accordance with the EU regulation and in accordance with Austrian Standards on Auditing will always detect a material misstatement when it exists. Misstatements can arise from fraud or error and are considered material if, individually or in the aggregate, they could reasonably be expected to influence the economic decisions of users taken on the basis of these consolidated financial statements.
As part of an audit in accordance with the EU regulation and in accordance with Austrian Standards on Auditing, which require the application of ISA, we exercise professional judgment and maintain professional scepticism throughout the audit.

191A N N U A L R E P O R T 2 0 1 7 / 1 8
We also:» identify and assess the risks of material misstatement of the consolidated financial statements,
whether due to fraud or error, design and perform audit procedures responsive to those risks, and obtain audit evidence that is sufficient and appropriate to provide a basis for our opinion. The risk of not detecting a material misstatement resulting from fraud is higher than for one resulting from error, as fraud may involve collusion, forgery, intentional omissions, misrepresentations, or the over-ride of internal control.
» obtain an understanding of internal control relevant to the audit in order to design audit procedures that are appropriate in the circumstances, but not for the purpose of expressing an opinion on the effectiveness of the Group’s internal control.
» evaluate the appropriateness of accounting policies used and the reasonableness of accounting estimates and related disclosures made by management.
» conclude on the appropriateness of management’s use of the going concern basis of accounting and, based on the audit evidence obtained, whether a material uncertainty exists related to events or conditions that may cast significant doubt on the Group’s ability to continue as a going concern. If we conclude that a material uncertainty exists, we are required to draw attention in our auditor’s report to the related disclosures in the consolidated financial statements or, if such disclosures are inadequate, to modify our opinion. Our conclusions are based on the audit evidence obtained up to the date of our auditor’s report. However, future events or conditions may cause the Group to cease to continue as a going concern.
» evaluate the overall presentation, structure and content of the consolidated financial statements, including the disclosures, and whether the consolidated financial statements represent the under-lying transactions and events in a manner that achieves fair presentation.
» obtain sufficient appropriate audit evidence regarding the financial information of the entities or business activities within the Group to express an opinion on the consolidated financial statements. We are responsible for the direction, supervision and performance of the group audit. We remain solely responsible for our audit opinion.

192 C O N S O L I D A T E D F I N A N C I A L S T A T E M E N T S
We communicate with the Supervisory Board/Audit Committee regarding, among other matters, the planned scope and timing of the audit and significant audit findings, including any significant defi-ciencies in internal control that we identify during our audit.
We also provide the Supervisory Board/Audit Committee with a statement that we have complied with relevant ethical requirements regarding independence, and to communicate with them all relation-ships and other matters that may reasonably be thought to bear on our independence, and where applicable, related safeguards.
From the matters communicated with the Supervisory Board/Audit Committee, we determine those matters that were of most significance in the audit of the consolidated financial statements of the current period and are therefore the key audit matters. We describe these matters in our auditor’s report unless law or regulation precludes public disclosure about the matter or when, in extremely rare circumstances, we determine that a matter should not be communicated in our report because the adverse consequences of doing so would reasonably be expected to outweigh the public interest benefits of such communication.
REPORT ON OTHER LEGAL AND REGULATORY REQUIREMENTS
Comments on the Management Report for the GroupPursuant to Austrian Generally Accepted Accounting Principles, the Group management report is to be audited as to whether it is consistent with the consolidated financial statements and as to whether it was prepared in accordance with the applicable legal regulations.
Management is responsible for the preparation of the Group’s management report in accordance with Austrian Generally Accepted Accounting Principles.

193A N N U A L R E P O R T 2 0 1 7 / 1 8
We conducted our audit in accordance with Austrian Standards on Auditing for the audit of the Group’s management report.
» OpinionIn our opinion, the management report for the group was prepared in accordance with the appli cable legal requirements, contains appropriate indications according to Section 243a Companies Act and is consistent with the consolidated financial statements.
» StatementBased on the findings during the audit of the consolidated financial statements and due to the thus obtained understanding concerning the Group and its circumstances no material misstatements in the Group’s management report came to our attention.
Other InformationManagement is responsible for the other information. The other information comprises the informa-tion included in the annual report, but does not include the consolidated financial statements, the Group’s management report and the auditor’s report thereon. The annual report is estimated to be provided to us after the date of the auditor’s report. Our opinion on the consolidated financial state-ments does not cover the other information and we do not express any form of assurance conclusion thereon.
In connection with our audit of the consolidated financial statements, our responsibility is to read the other information, as soon as it is available, and, in doing so, to consider whether – based on our knowledge obtained in the audit – the other information is materially inconsistent with the consoli-dated financial statements or otherwise appears to be materially misstated.

194 C O N S O L I D A T E D F I N A N C I A L S T A T E M E N T S
This report is a translation of the original report in German, which is solely valid.
Publication or sharing with third parties of the group financial statements together with our auditor’s opinion is only allowed if the finan-cial statements and the management report are identical with the audited version. This audit opinion is only applicable to the German and complete financial statements with the management report. Section 281 paragraph 2 UGB (Austrian Company Code) applies to alternated versions.
Additional information in accordance with article 10 of the EU regulationWe were elected as auditor by the annual shareholders’ meeting on July 5, 2017. We were engaged by the Supervisory Board on December 14, 2017. We are auditors without cease since the company’s initial public offering in October 1995.
We confirm that the audit opinion in the section “Report on the consolidated financial statements” is consistent with the additional report to the audit committee referred to in article 11 of the EU regu-lation.
We declare that no prohibited non-audit services (article 5 par. 1 of the EU regulation) were provided by us and that we remained independent of the audited company in conducting the audit.
We provided no further services, in addition to the statutory audit, to the audited company and its controlled undertakings, which have not been disclosed in the group’s management report or in the consolidated financial statements.
Responsible Austrian Certified Public AccountantThe engagement partner on the audit resulting in this independent auditor’s report is Univ.Doz. Dr. Walter Platzer, Certified Public Accountant.
Vienna, May 25, 2018
Grant Thornton Unitreu GmbHWirtschaftsprüfungs- und Steuerberatungsgesellschaft
Univ. Doz. Dr. Walter Platzer

195A N N U A L R E P O R T 2 0 1 7 / 1 8
The Management Board of voestalpine AG confirms to the best of its knowledge that the Consoli-dated Financial Statements give a true and fair view of the assets, liabilities, financial position and profit or loss of the Group as required by the applicable accounting standards and that the Group Management Report gives a true and fair view of the development and performance of the business and the position of the Group, together with a description of the principal risks and uncertainties the Group faces.
Linz, May 25, 2018
The Management Board
This report is a translation of the original report in German, which is solely valid.
MANAGEMENT BOARD STATEMENT IN ACCORDANCE WITH SECTION 82 (4) OF THE AUSTRIAN STOCK EXCHANGE ACT (BÖRSEGESETZ – BÖRSEG)
Wolfgang EderChairman of the Management Board
Herbert Eibensteiner Member of the Management Board
Franz KainersdorferMember of the Management Board
Robert Ottel Member of the Management Board
Franz Rotter Member of the Management Board
Peter Schwab Member of the Management Board

196 C O N S O L I D A T E D F I N A N C I A L S T A T E M E N T S
voestalpine AG
INVESTMENTS
STEEL DIVISION
1 For companies consolidated according to the equity method marked1, the reporting date of December 31 applies.
Explanations:
KV Full consolidationKEA Equity method associatesKEG Equity method joint venturesK0 No consolidation
Company names reflect the status as of April 13, 2018.
03/31/2018 03/31/2017Domicile of
the companyInterest
heldType of conso lidation
Interest held
Type of conso lidation
voestalpine Stahl GmbH AUT 100.000% KV 100.000% KVCargo Service GmbH AUT 100.000% KV 100.000% KVCaseli GmbH AUT 100.000% KV 100.000% KVLogistik Service GmbH AUT 100.000% KV 100.000% KVVAPS GmbH AUT 100.000% KV 100.000% KVvoestalpine Camtec GmbH AUT 100.000% KV 100.000% KVvoestalpine Eurostahl GmbH AUT 100.000% KV 100.000% KVvoestalpine Giesserei Linz GmbH AUT 100.000% KV 100.000% KVvoestalpine Giesserei Traisen GmbH AUT 100.000% KV 100.000% KVvoestalpine Grobblech GmbH AUT 100.000% KV 100.000% KVvoestalpine Standortservice GmbH AUT 100.000% KV 100.000% KVvoestalpine Steel & Service Center GmbH AUT 100.000% KV 100.000% KVvoestalpine Steel Service Center Polska Sp. z o.o. POL 100.000% KV 100.000% KVvoestalpine Steel Service Center Romania SRL ROU 100.000% KV 100.000% KVvoestalpine Steel Trading (Shenyang) Co., Ltd. CHN 100.000% KV 100.000% KVvoestalpine Texas Holding LLC USA 100.000% KV 100.000% KVvoestalpine Texas LLC USA 100.000% KV 100.000% KVGEORG FISCHER FITTINGS GmbH1 AUT 49.000% KEA 49.000% KEAIndustrie-Logistik-Linz GmbH1 AUT 49.000% KEA 49.000% KEAJiaxing NYC Industrial Co., Ltd1 CHN 51.000% KEG 51.000% KEGKocel Steel Foundry Co., Ltd.1 CHN 49.000% KEA 49.000% KEAKühne + Nagel Euroshipping GmbH1 DEU 49.000% KEA 49.000% KEAMETALSERVICE S.P.A.1 ITA 40.000% KEA 40.000% KEAScholz Austria GmbH1 AUT 34.011% KEA 34.011% KEAEnergie AG Oberösterreich AUT 2.061% K0 2.061% K0

197A N N U A L R E P O R T 2 0 1 7 / 1 8
STEEL DIVISION
03/31/2018 03/31/2017Domicile of
the companyInterest
heldType of conso lidation
Interest held
Type of conso lidation
K1-Met GmbH AUT 35.000% K0 35.000% K0Kontext Druckerei GmbH AUT 64.800% K0Linzer Schlackenaufbereitungs- und vertriebsgesellschaft m.b.H.
AUT 33.333% K0 33.333% K0
vivo Mitarbeiter-Service GmbH AUT 100.000% K0 100.000% K0voestalpine Belgium NV/SA BEL 100.000% K0 100.000% K0voestalpine Camtec Corp. CAN 100.000% K0 100.000% K0voestalpine CR, s.r.o. CZE 100.000% K0 100.000% K0voestalpine d.o.o. HRV 100.000% K0 100.000% K0voestalpine d.o.o. SRB 100.000% K0 100.000% K0voestalpine d.o.o. SVN 100.000% K0 100.000% K0voestalpine Danmark ApS. DNK 100.000% K0voestalpine Deutschland GmbH DEU 100.000% K0 100.000% K0voestalpine France SAS FRA 100.000% K0 100.000% K0voestalpine Hungaria Kft. HUN 99.000% K0 99.000% K0voestalpine Italia S.r.l. ITA 100.000% K0 100.000% K0voestalpine Nederland B.V. NLD 100.000% K0 100.000% K0voestalpine Polska Sp. z o. o. POL 100.000% K0 100.000% K0voestalpine Romania S.R.L. ROU 100.000% K0 100.000% K0voestalpine Scandinavia AB SWE 100.000% K0 100.000% K0voestalpine Schweiz GmbH CHE 100.000% K0 100.000% K0voestalpine Slovakia, s.r.o. SVK 100.000% K0 100.000% K0voestalpine Stahlwelt GmbH AUT 100.000% K0 100.000% K0voestalpine UK Ltd. GBR 100.000% K0 100.000% K0voestalpine USA Corp. USA 100.000% K0 100.000% K0Werksgärtnerei Gesellschaft m.b.H. AUT 100.000% K0 100.000% K0

198 C O N S O L I D A T E D F I N A N C I A L S T A T E M E N T S
HIGH PERFORMANCE METALS DIVISION
03/31/2018 03/31/2017Domicile of
the companyInterest
heldType of conso lidation
Interest held
Type of conso lidation
voestalpine High Performance Metals GmbH AUT 100.000% KV 100.000% KVAceros Boehler del Ecuador S.A. ECU 100.000% KV 100.000% KVACEROS BOEHLER UDDEHOLM S.A. ARG 100.000% KV 100.000% KVAÇOS BÖHLER-UDDEHOLM DO BRASIL LTDA. BRA 100.000% KV 100.000% KVAdvanced Tooling Tek (Shanghai) Co., Ltd. CHN 100.000% KV 100.000% KVASSAB Japan KK JPN 100.000% KV 100.000% KVASSAB Steels (HK) Ltd. CHN 95.000% KV 95.000% KVASSAB Steels (Malaysia) Sdn Bhd MYS 95.000% KV 95.000% KVASSAB Steels (Taiwan) Ltd. TWN 94.500% KV 94.500% KVASSAB Steels (Thailand) Ltd. THA 95.000% KV 95.000% KVASSAB Steels Korea Co., Ltd KOR 100.000% KV 100.000% KVASSAB Steels Singapore (Pte) Ltd. SGP 100.000% KV 100.000% KVASSAB Steels Vietnam Company Limited VNM 100.000% KV 100.000% KVASSAB Tooling (Beijing) Co., Ltd. CHN 100.000% KV 100.000% KVASSAB Tooling (Dong Guan) Co., Ltd. CHN 95.000% KV 95.000% KVASSAB Tooling (Qing Dao) Co., Ltd. CHN 100.000% KV 100.000% KVASSAB Tooling (Xiamen) Co., Ltd. CHN 95.000% KV 95.000% KVASSAB Tooling Technology (Chongqing) Co., Ltd. CHN 95.000% KV 95.000% KVASSAB Tooling Technology (Ningbo) Co., Ltd. CHN 95.000% KV 95.000% KVASSAB Tooling Technology (Shanghai) Co., Ltd. CHN 95.000% KV 95.000% KVBÖHLER GRUNDSTÜCKS BETEILIGUNGS GMBH DEU 100.000% KV 100.000% KVBöhler Grundstücks GmbH & Co. Kommanditgesellschaft1
DEU 100.000% KV 100.000% KV
Bohler Special Steels (Shanghai) Co., Ltd. CHN 100.000% KV 100.000% KVBOHLER UDDEHOLM AFRICA (PTY) LTD ZAF 100.000% KV 100.000% KVBöhler Uddeholm Celik Sanayi ve Ticaret A.S. TUR 100.000% KV 100.000% KVBOHLER-UDDEHOLM COLOMBIA S.A. COL 100.000% KV 100.000% KVBOHLER-UDDEHOLM INDIA PRIVATE LIMITED IND 100.000% KV 100.000% KVBöhler-Uddeholm Schweiz AG CHE 99.833% KV 99.833% KVBuderus Edelstahl GmbH DEU 100.000% KV 100.000% KVDensam Industrial Co. Ltd. TWN 97.305% KV 97.305% KVDeville Rectification S.A.S.U. FRA 100.000% KV 100.000% KVDIN ACCIAI S.p.A. ITA 100.000% KV 100.000% KVEDRO Engineering, Inc. USA 100.000% KV 100.000% KVEDRO Specialty Steels GmbH DEU 100.000% KV 100.000% KVEDRO Specialty Steels, Inc. USA 100.000% KV 100.000% KV
1 These consolidated financial statements represent an exemption for Böhler Grundstücks GmbH & Co. Kommanditgesellschaft in accordance with Section 264b of the German Commercial Code (dHGB).

199A N N U A L R E P O R T 2 0 1 7 / 1 8
HIGH PERFORMANCE METALS DIVISION
03/31/2018 03/31/2017Domicile of
the companyInterest
heldType of conso lidation
Interest held
Type of conso lidation
Eifeler Coatings Technology, Inc. USA 100.000% KV 100.000% KVEifeler Swiss AG CHE 100.000% KVENPAR Sonderwerkstoffe GmbH DEU 100.000% KV 100.000% KVEschmann Textura Internacional - Transformacao de Ferramentas, Unipessoal, LDA
PRT 100.000% KV 100.000% KV
Eschmann Textures India Private Limited IND 100.000% KV 100.000% KVEschmann Textures International GmbH DEU 100.000% KV 100.000% KVEschmannStahl GmbH & Co. KG1 DEU 100.000% KV 100.000% KVGMV Eschmann International SAS FRA 100.000% KV 100.000% KVGravutex Eschmann International Limited GBR 100.000% KV 100.000% KVIS Intersteel Stahlhandel GmbH DEU 100.000% KV 100.000% KVJing Ying Industrial Co. Ltd. TWN 97.305% KV 97.305% KVMicrocosmic Metal Co., Ltd. CHN 100.000% KVOOO BÖHLER-UDDEHOLM RUS 100.000% KV 100.000% KVPT Assab Steels Indonesia IDN 100.000% KV 100.000% KVSacma Acciai Speciali S.p.A. ITA 100.000% KV 100.000% KVSermetal Barcelona, S.L. ESP 100.000% KV 100.000% KVSermetal, Unipessoal Lda PRT 100.000% KV 100.000% KVSturdell Industries Inc. CAN 100.000% KV 100.000% KVSturdell Industries, Inc. USA 100.000% KV 100.000% KVUddeholm Eiendom AS NOR 100.000% KV 100.000% KVUddeholms AB SWE 100.000% KV 100.000% KVVillares Metals International B.V. NLD 100.000% KV 100.000% KVVillares Metals S.A. BRA 100.000% KV 100.000% KVvoestalpine Additive Manufacturing Center GmbH DEU 100.000% KV 100.000% KVvoestalpine Additive Manufacturing Centre Ltd. CAN 100.000% KV voestalpine Additive Manufacturing Center Singapore Pte. Ltd.
SGP 100.000% KV 100.000% KV
voestalpine BÖHLER Aerospace GmbH AUT 100.000% KV 100.000% KVvoestalpine BÖHLER Aerospace GmbH & Co KG AUT 100.000% KV 100.000% KVvoestalpine BÖHLER Bleche GmbH AUT 100.000% KV 100.000% KVvoestalpine BÖHLER Bleche GmbH & Co KG AUT 100.000% KV 100.000% KVvoestalpine BÖHLER Edelstahl GmbH AUT 100.000% KV 100.000% KVvoestalpine BÖHLER Edelstahl GmbH & Co KG AUT 100.000% KV 100.000% KVvoestalpine BÖHLER Profil GmbH AUT 100.000% KV 100.000% KVvoestalpine Edelstahl Deutschland GmbH DEU 100.000% KV 100.000% KV
1 These consolidated financial statements represent an exemption for EschmannStahl GmbH & Co. KG in accordance with Section 264b of the German Commercial Code (dHGB).

200 C O N S O L I D A T E D F I N A N C I A L S T A T E M E N T S
HIGH PERFORMANCE METALS DIVISION
03/31/2018 03/31/2017Domicile of
the companyInterest
heldType of conso lidation
Interest held
Type of conso lidation
voestalpine Edelstahl Wärmebehandlung GmbH DEU 100.000% KV 100.000% KVvoestalpine eifeler Coating GmbH DEU 100.000% KV 100.000% KVvoestalpine eifeler Lasertechnik GmbH DEU 100.000% KV 100.000% KVvoestalpine eifeler Vacotec GmbH DEU 100.000% KV 100.000% KVvoestalpine High Performance Metals (Australia) Pty Ltd
AUS 100.000% KV 100.000% KV
voestalpine High Performance Metals B.V. NLD 100.000% KV 100.000% KVvoestalpine High Performance Metals Corporation USA 100.000% KV 100.000% KVvoestalpine High Performance Metals CZ s.r.o. CZE 100.000% KV 100.000% KVvoestalpine High Performance Metals del Peru S.A. PER 100.000% KV 100.000% KVvoestalpine High Performance Metals Deutschland GmbH
DEU 100.000% KV 100.000% KV
voestalpine High Performance Metals Deutschland Holding GmbH
DEU 100.000% KV 100.000% KV
voestalpine High Performance Metals Finland Oy Ab
FIN 100.000% KV 100.000% KV
voestalpine High Performance Metals France S.A.S.
FRA 100.000% KV 100.000% KV
voestalpine High Performance Metals Hungary Kft.
HUN 100.000% KV 100.000% KV
voestalpine High Performance Metals Iberica, S.A.U.
ESP 100.000% KV 100.000% KV
voestalpine High Performance Metals International GmbH
AUT 100.000% KV 100.000% KV
voestalpine High Performance Metals Italia S.p.A. ITA 100.000% KV 100.000% KVvoestalpine High Performance Metals Ltd. CAN 100.000% KV 100.000% KVvoestalpine High Performance Metals Norway AS NOR 100.000% KV 100.000% KVvoestalpine High Performance Metals Pacific Pte. Ltd.
SGP 100.000% KV 100.000% KV
voestalpine High Performance Metals Polska Sp. z o. o.
POL 100.000% KV 100.000% KV
voestalpine High Performance Metals Romania S.R.L.
ROU 100.000% KV 100.000% KV
voestalpine High Performance Metals S.A. de C.V. MEX 100.000% KV 100.000% KVvoestalpine High Performance Metals Slovakia, s.r.o.
SVK 100.000% KV 100.000% KV
voestalpine High Performance Metals Sweden AB SWE 100.000% KV 100.000% KVvoestalpine High Performance Metals UK Limited GBR 100.000% KV 100.000% KV

201A N N U A L R E P O R T 2 0 1 7 / 1 8
HIGH PERFORMANCE METALS DIVISION
03/31/2018 03/31/2017Domicile of
the companyInterest
heldType of conso lidation
Interest held
Type of conso lidation
voestalpine HPM Denmark A/S DNK 100.000% KV 100.000% KVvoestalpine Specialty Metals Pte. Ltd. SGP 100.000% KV 100.000% KVvoestalpine Special Steels China Limited CHN 100.000% KV 100.000% KVvoestalpine Technology Institute (Asia) Co. Ltd. TWN 100.000% KV 100.000% KVBohlasia Steels Sdn. Bhd. MYS 53.333% K0 53.333% K0BÖHLER-UDDEHOLM Immobilien GmbH AUT 100.000% K0 100.000% K0Böhler-Uddeholm Solidaritätsfonds Privatstiftung AUT 100.000% K0BÖHLER-UDDEHOLM UKRAINE LLC UKR 100.000% K0 100.000% K0EDRO Limited CHN 100.000% K0 100.000% K0Eschmann Beteiligungsgesellschaft mbH DEU 100.000% K0 100.000% K0Grundstück-Verwaltungsgesellschaft Gewerbehof Sendling mbH & Co. KG
DEU 62.916% K0 62.916% K0
HOTEL BÖHLERSTERN Gesellschaft m.b.H. AUT 100.000% K0 100.000% K0V.K. Italia S.r.l. in liquidazione ITA 20.000% K0voestalpine High Performance Metals Zagreb d.o.o.
HRV 100.000% K0 100.000% K0

202 C O N S O L I D A T E D F I N A N C I A L S T A T E M E N T S
METAL ENGINEERING DIVISION
03/31/2018 03/31/2017Domicile of
the companyInterest
heldType of conso lidation
Interest held
Type of conso lidation
voestalpine Metal Engineering GmbH & Co KG AUT 100.000% KV 100.000% KVCNTT Chinese New Turnout Technologies Co., Ltd. CHN 50.000% KV 50.000% KVJEZ Sistemas Ferroviarios S.L. ESP 70.000% KV 70.000% KVLASA Schienentechnik GmbH DEU 100.000% KV 100.000% KVMateriel Ferroviaire d’Arberats SASU FRA 70.000% KV 70.000% KVNortrak-Damy, Cambios de Via, S.A.P.I. de C.V. MEX 51.007% KV 51.007% KVOOO voestalpine Bohler Welding Russia RUS 100.000% KV 100.000% KVPT voestalpine Bohler Welding Asia Pacific IDN 100.000% KV 100.000% KVTSF-A GmbH AUT 50.100% KV 50.100% KVTSTG Schienen Technik GmbH & Co KG1 DEU 100.000% KV 100.000% KVTSTG Schienen Technik Verwaltungs GmbH DEU 100.000% KV 100.000% KVVAMAV Vasúti Berendezések Kft. HUN 50.000% KV 50.000% KVvoestalpine Bahnsysteme Beteiligungsverwaltung Deutschland GmbH
DEU 100.000% KV 100.000% KV
voestalpine Bahnsysteme Vermögensverwaltungs GmbH
AUT 100.000% KV 100.000% KV
voestalpine Böhler weldCare AB SWE 100.000% KV voestalpine Böhler Welding (China) Co., Ltd. CHN 100.000% KV 100.000% KVvoestalpine Bohler Welding Asia Pacific Pte. Ltd. SGP 100.000% KV 100.000% KVvoestalpine Böhler Welding Austria GmbH AUT 100.000% KV 100.000% KVvoestalpine Böhler Welding Austria Vertriebs-GmbH AUT 100.000% KV voestalpine Böhler Welding Automation GmbH DEU 70.040% KV voestalpine Böhler Welding Belgium S.A. BEL 100.000% KV 100.000% KVvoestalpine Bohler Welding Canada Ltd. CAN 100.000% KV 100.000% KVvoestalpine Böhler Welding CEE GmbH AUT 100.000% KV 100.000% KVvoestalpine Böhler Welding Fileur SRL ITA 90.000% KV 90.000% KVvoestalpine Böhler Welding Fontargen GmbH DEU 100.000% KV 100.000% KVvoestalpine Böhler Welding France SAS FRA 100.000% KV 100.000% KVvoestalpine Böhler Welding Germany GmbH DEU 100.000% KV 100.000% KVvoestalpine Böhler Welding Germany Vertriebs-GmbH
DEU 100.000% KV
voestalpine Böhler Welding GmbH AUT 100.000% KV 100.000% KVvoestalpine Böhler Welding Group GmbH DEU 100.000% KV 100.000% KVvoestalpine Böhler Welding Hellas S.A. GRC 100.000% KV 100.000% KVvoestalpine Bohler Welding India Private Limited IND 100.000% KV 100.000% KVvoestalpine Bohler Welding India Technology Private Limited
IND 100.000% KV 100.000% KV
1 These consolidated financial statements represent an exemption for TSTG Schienen Technik GmbH & Co KG in accordance with Section 264b of the German Commercial Code (dHGB).

203A N N U A L R E P O R T 2 0 1 7 / 1 8
METAL ENGINEERING DIVISION
03/31/2018 03/31/2017Domicile of
the companyInterest
heldType of conso lidation
Interest held
Type of conso lidation
voestalpine Böhler Welding Italia S.r.l. ITA 100.000% KV 100.000% KVvoestalpine Bohler Welding Mexico S.A. de C.V. MEX 100.000% KV 100.000% KVvoestalpine Bohler Welding Middle East FZE ARE 100.000% KV 100.000% KVvoestalpine Böhler Welding Nederland B.V. NLD 100.000% KV 100.000% KVvoestalpine Böhler Welding Nordic AB SWE 100.000% KV 100.000% KVvoestalpine Böhler Welding Northeast Asia Ltd. KOR 100.000% KV 100.000% KVvoestalpine Bohler Welding Romania SRL ROU 100.000% KV 100.000% KVvoestalpine Böhler Welding Schweiz AG CHE 100.000% KV 100.000% KVvoestalpine Böhler Welding Soldas do Brasil Ltda. BRA 100.000% KV 100.000% KVvoestalpine Böhler Welding Spain, S.A. ESP 100.000% KV 100.000% KVvoestalpine Böhler Welding Trading (Shanghai) Co., Ltd.
CHN 100.000% KV 100.000% KV
voestalpine Bohler Welding UK Limited GBR 100.000% KV 100.000% KVvoestalpine Bohler Welding USA, Inc. USA 100.000% KV 100.000% KVvoestalpine Bohler Welding USA Technology LLC USA 100.000% KV 100.000% KVvoestalpine Böhler Welding UTP Maintenance GmbH
DEU 100.000% KV 100.000% KV
voestalpine BWG GmbH DEU 100.000% KV 100.000% KVvoestalpine Forschungsservicegesellschaft Donawitz GmbH
AUT 93.986% KV 93.986% KV
voestalpine Kardemir Demiryolu Sistemleri Sanayi ve Ticaret Anonim Sirketi
TUR 59.935% KV 59.935% KV
voestalpine Klöckner Bahntechnik GmbH DEU 100.000% KV 100.000% KVvoestalpine Metal Engineering GmbH AUT 100.000% KV 100.000% KVvoestalpine Nortrak Inc. USA 100.000% KV 100.000% KVvoestalpine Nortrak Ltd. CAN 100.000% KV 100.000% KVvoestalpine Rail Center Duisburg GmbH1 DEU 100.000% KV 100.000% KVvoestalpine Rail Center Königsborn GmbH1 DEU 100.000% KV 100.000% KVvoestalpine Railpro B.V. NLD 70.000% KV 70.000% KVvoestalpine Railway Systems (Beijing) Co. Ltd. CHN 100.000% KV 100.000% KVvoestalpine Railway Systems (Thailand) Co., Ltd. THA 100.000% KV 100.000% KVvoestalpine Railway Systems Polska Sp. z o. o. POL 100.000% KV 100.000% KVvoestalpine Schienen GmbH AUT 100.000% KV 100.000% KVvoestalpine SIGNALING Fareham Ltd. GBR 100.000% KV 100.000% KVvoestalpine SIGNALING Sainerholz GmbH DEU 100.000% KV 100.000% KVvoestalpine SIGNALING Siershahn GmbH DEU 100.000% KV 100.000% KVvoestalpine SIGNALING Sopot Sp. z o.o. POL 100.000% KV 100.000% KV
1 These consolidated financial statements represent an exemption for voestalpine Rail Center Duisburg GmbH and voestalpine Rail Center Königsborn GmbH in accordance with Section 264 (3) of the German Commercial Code (dHGB).

204 C O N S O L I D A T E D F I N A N C I A L S T A T E M E N T S
METAL ENGINEERING DIVISION
03/31/2018 03/31/2017Domicile of
the companyInterest
heldType of conso lidation
Interest held
Type of conso lidation
voestalpine SIGNALING USA Inc. USA 100.000% KV 100.000% KVvoestalpine SIGNALING Zeltweg GmbH AUT 100.000% KV 100.000% KVvoestalpine Special Wire GmbH AUT 100.000% KV 100.000% KVvoestalpine Stahl Donawitz GmbH AUT 100.000% KV 100.000% KVvoestalpine Track Solutions Saudi Arabia Limited SAU 51.000% KV 51.000% KVvoestalpine Tubulars Al Bassam Company Limited SAU 29.325% KV 29.325% KVvoestalpine Tubulars GmbH AUT 57.500% KV 57.500% KVvoestalpine Tubulars GmbH & Co KG AUT 49.888% KV 49.888% KVvoestalpine VAE Africa (Pty) Ltd. ZAF 100.000% KV 100.000% KVvoestalpine VAE Apcarom SA ROU 100.000% KV 100.000% KVvoestalpine VAE Brasil Produtos Ferroviários Ltda. BRA 100.000% KV 100.000% KVvoestalpine VAE GmbH AUT 100.000% KV 100.000% KVvoestalpine VAE Italia S.r.l. ITA 100.000% KV 100.000% KVvoestalpine VAE Legetecha UAB LTU 66.000% KV 66.000% KVvoestalpine VAE Railway Systems Pty.Ltd. AUS 100.000% KV 100.000% KVvoestalpine VAE Riga SIA LVA 100.000% KV 100.000% KVvoestalpine VAE SA (Pty) Ltd. ZAF 69.000% KV 69.000% KVvoestalpine VAE Sofia OOD BGR 51.000% KV 51.000% KVvoestalpine VAE UK Ltd. GBR 100.000% KV 100.000% KVvoestalpine VAE VKN India Private Limited IND 55.200% KV 55.200% KVvoestalpine WBN B.V. NLD 100.000% KV 100.000% KVvoestalpine Weichensysteme GmbH AUT 100.000% KV 100.000% KVvoestalpine Wire (Suzhou) Co., Ltd. CHN 100.000% KV 100.000% KVvoestalpine Wire Austria GmbH AUT 100.000% KV 100.000% KVvoestalpine Wire Germany GmbH DEU 100.000% KV 100.000% KVvoestalpine Wire Italy s.r.l. ITA 100.000% KV 100.000% KVvoestalpine Wire Rod Austria GmbH AUT 100.000% KV 100.000% KVvoestalpine Wire Technology GmbH AUT 100.000% KV 100.000% KVWeichenwerk Wörth GmbH AUT 56.950% KV 56.950% KVWS Service GmbH1 AUT 49.000% KEA 49.000% KEABurbiola S.A. ESP 35.000% K0 35.000% K0Casedo GmbH AUT 100.000% K0 100.000% K0KW PenzVAEE GmbH AUT 49.000% K0 49.000% K0Liegenschaftsverwaltungs GmbH AUT 100.000% K0 100.000% K0Parkwood Way Holdings Ltd. CAN 40.000% K0 40.000% K0va Tubulars Export GmbH AUT 100.000% K0 100.000% K0VOEST-ALPINE TUBULAR CORP. USA 57.500% K0 57.500% K0voestalpine Tubulars Middle East DMCC ARE 57.500% K0 57.500% K0
1 For the company consolidated according to the equity method marked1, the reporting date of December 31 applies.

205A N N U A L R E P O R T 2 0 1 7 / 1 8
METAL FORMING DIVISION
03/31/2018 03/31/2017Domicile of
the companyInterest
heldType of conso lidation
Interest held
Type of conso lidation
voestalpine Metal Forming GmbH AUT 100.000% KV 100.000% KVCompania de Industria y Comercio, S.A. de C.V. MEX 100.000% KV 100.000% KVGlobal Rollforming Corporation USA 100.000% KV 100.000% KVNedcon B.V. NLD 100.000% KV 100.000% KVNedcon Bohemia, s.r.o. CZE 100.000% KV 100.000% KVNedcon France SASU FRA 100.000% KV 100.000% KVNedcon Lagertechnik GmbH DEU 100.000% KV 100.000% KVNedcon USA Inc. USA 100.000% KV 100.000% KVPolynorm Leasing B.V. NLD 100.000% KV 100.000% KVRoll Forming Corporation USA 100.000% KV 100.000% KVSharon Custom Metal Forming, Inc. USA 100.000% KV 100.000% KVSTAMPTEC France SAS FRA 100.000% KV 100.000% KVvoestalpine Automotive Components Aguascalientes S. de R.L. de C.V.
MEX 100.000% KV 100.000% KV
voestalpine Automotive Components Arad SRL ROU 100.000% KV 100.000% KVvoestalpine Automotive Components Birkenfeld GmbH1
DEU 100.000% KV 100.000% KV
voestalpine Automotive Components Böhmenkirch GmbH & Co. KG2
DEU 100.000% KV 100.000% KV
voestalpine Automotive Components Bunschoten B.V.
NLD 100.000% KV 100.000% KV
voestalpine Automotive Components Cartersville Inc.
USA 100.000% KV 100.000% KV
voestalpine Automotive Components Dettingen GmbH1
DEU 100.000% KV 100.000% KV
voestalpine Automotive Components Deutschland GmbH
DEU 100.000% KV 100.000% KV
voestalpine Automotive Components East London (Pty) Ltd.
ZAF 100.000% KV 100.000% KV
voestalpine Automotive Components Fontaine FRA 99.998% KV 99.998% KVvoestalpine Automotive Components Linz GmbH AUT 100.000% KV 100.000% KVvoestalpine Automotive Components Nagold GmbH & Co. KG2
DEU 100.000% KV 100.000% KV
voestalpine Automotive Components Schmölln GmbH1
DEU 100.000% KV 100.000% KV
1 These consolidated financial statements represent an exemption for voestalpine Automotive Components Birkenfeld GmbH, voestalpine Automotive Components Dettingen GmbH and voestalpine Automotive Components Schmölln GmbH in accordance with Section 264 (3) of the German Commercial Code (dHGB).2 These consolidated financial statements represent an exemption for voestalpine Automotive Components Böhmenkirch GmbH & Co. KG and voestalpine Automotive Components Nagold GmbH & Co. KG in accordance with Section 264b of the German Commercial Code (dHGB).

206 C O N S O L I D A T E D F I N A N C I A L S T A T E M E N T S
METAL FORMING DIVISION
03/31/2018 03/31/2017Domicile of
the companyInterest
heldType of conso lidation
Interest held
Type of conso lidation
voestalpine Automotive Components Schwäbisch Gmünd Beteiligung GmbH
DEU 100.000% KV 100.000% KV
voestalpine Automotive Components Schwäbisch Gmünd GmbH & Co. KG1
DEU 100.000% KV 100.000% KV
voestalpine Automotive Components Shenyang Co., Ltd.
CHN 100.000% KV 100.000% KV
voestalpine Automotive Components (Tianjin) Co., Ltd.
CHN 100.000% KV 100.000% K0
voestalpine Elmsteel Group Limited GBR 100.000% KV 100.000% KVvoestalpine HTI Beteiligungs GmbH AUT 100.000% KV 100.000% KVvoestalpine Krems Finaltechnik GmbH AUT 100.000% KV 100.000% KVvoestalpine Krems GmbH AUT 100.000% KV 100.000% KVVOEST-ALPINE KREMS U.K. plc GBR 100.000% KV 100.000% KVvoestalpine Meincol S.A. BRA 100.000% KV 100.000% KVvoestalpine Metal Forming Netherlands Holding B.V.
NLD 100.000% KV 100.000% KV
voestalpine Metsec plc GBR 100.000% KV 100.000% KVvoestalpine Präzisionsprofil GmbH DEU 100.000% KV 100.000% KVvoestalpine Precision Strip AB SWE 100.000% KV 100.000% KVvoestalpine Precision Strip GmbH AUT 100.000% KV 100.000% KVvoestalpine Precision Strip LLC USA 100.000% KV 100.000% KVvoestalpine Precision Strip Trading (Suzhou) Co., Ltd
CHN 100.000% KV 100.000% KV
voestalpine Precision Strip, S.A.U. ESP 100.000% KV 100.000% KVvoestalpine Profilafroid FRA 99.925% KV 99.925% KVvoestalpine Profilform (China) Co., Ltd. CHN 100.000% KV 100.000% KVvoestalpine Profilform s.r.o. CZE 100.000% KV 100.000% KVvoestalpine Rotec Coating SRL ROU 100.000% KV voestalpine Rotec GmbH AUT 100.000% KV 100.000% KVvoestalpine Rotec GmbH & Co. KG1 DEU 100.000% KV 100.000% KVvoestalpine Rotec Iberica S.A. ESP 100.000% KV 100.000% KVvoestalpine Rotec Incorporated USA 100.000% KV 100.000% KVvoestalpine Rotec Limited GBR 100.000% KV 100.000% KVvoestalpine Rotec Sp. z o. o. POL 100.000% KV 100.000% KV
1 These consolidated financial statements represent an exemption for voest alpine Automotive Components Schwäbisch Gmünd GmbH & Co. KG and voestalpine Rotec GmbH & Co. KG in accordance with Section 264b of the German Commercial Code (dHGB).
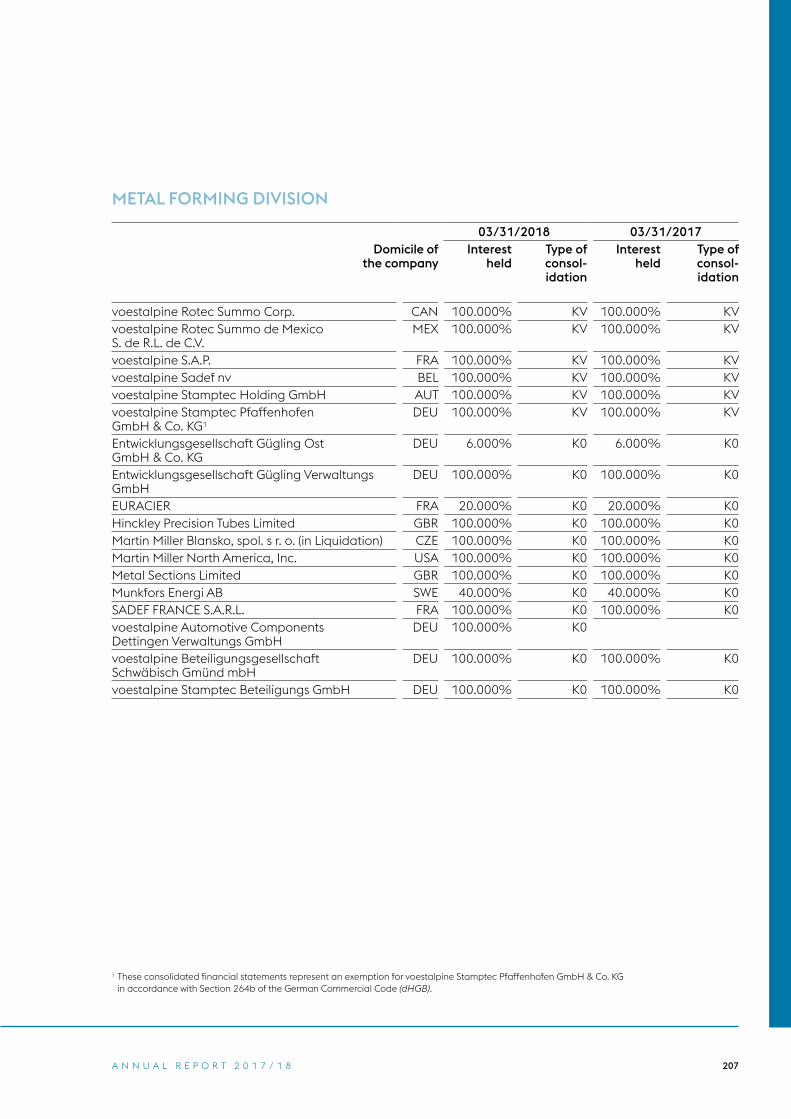
207A N N U A L R E P O R T 2 0 1 7 / 1 8
METAL FORMING DIVISION
03/31/2018 03/31/2017Domicile of
the companyInterest
heldType of conso lidation
Interest held
Type of conso lidation
voestalpine Rotec Summo Corp. CAN 100.000% KV 100.000% KVvoestalpine Rotec Summo de Mexico S. de R.L. de C.V.
MEX 100.000% KV 100.000% KV
voestalpine S.A.P. FRA 100.000% KV 100.000% KVvoestalpine Sadef nv BEL 100.000% KV 100.000% KVvoestalpine Stamptec Holding GmbH AUT 100.000% KV 100.000% KVvoestalpine Stamptec Pfaffenhofen GmbH & Co. KG1
DEU 100.000% KV 100.000% KV
Entwicklungsgesellschaft Gügling Ost GmbH & Co. KG
DEU 6.000% K0 6.000% K0
Entwicklungsgesellschaft Gügling Verwaltungs GmbH
DEU 100.000% K0 100.000% K0
EURACIER FRA 20.000% K0 20.000% K0Hinckley Precision Tubes Limited GBR 100.000% K0 100.000% K0Martin Miller Blansko, spol. s r. o. (in Liquidation) CZE 100.000% K0 100.000% K0Martin Miller North America, Inc. USA 100.000% K0 100.000% K0Metal Sections Limited GBR 100.000% K0 100.000% K0Munkfors Energi AB SWE 40.000% K0 40.000% K0SADEF FRANCE S.A.R.L. FRA 100.000% K0 100.000% K0voestalpine Automotive Components Dettingen Verwaltungs GmbH
DEU 100.000% K0
voestalpine Beteiligungsgesellschaft Schwäbisch Gmünd mbH
DEU 100.000% K0 100.000% K0
voestalpine Stamptec Beteiligungs GmbH DEU 100.000% K0 100.000% K0
1 These consolidated financial statements represent an exemption for voestalpine Stamptec Pfaffenhofen GmbH & Co. KG in accordance with Section 264b of the German Commercial Code (dHGB).

208 C O N S O L I D A T E D F I N A N C I A L S T A T E M E N T S
OTHER
1 For the company consolidated according to the equity method marked1, the reporting date of December 31 applies.
03/31/2018 03/31/2017Domicile of
the companyInterest
heldType of conso lidation
Interest held
Type of conso lidation
Danube Equity AG AUT 71.373% KV 71.373% KVImportkohle Gesellschaft m.b.H. AUT 100.000% KV 100.000% KVRLBV54 Fonds AUT 99.554% KV 99.554% KVvoestalpine Dienstleistungs- und Finanzierungs GmbH
DEU 100.000% KV 100.000% KV
voestalpine Finanzierungs GmbH AUT 100.000% KVvoestalpine Finanzierungs Holding GmbH AUT 100.000% KVvoestalpine Funding International GmbH AUT 100.000% KV 100.000% KVvoestalpine group-IT AB SWE 100.000% KV 100.000% KVvoestalpine group-IT GmbH AUT 100.000% KV 100.000% KVvoestalpine group-IT GmbH DEU 100.000% KV 100.000% KVvoestalpine group-IT Tecnologia da Informacao Ltda.
BRA 100.000% KV 100.000% KV
voestalpine Personal Services GmbH AUT 100.000% KV 100.000% KVvoestalpine Rohstoffbeschaffungs GmbH AUT 100.000% KV 100.000% KVAPK-Pensionskasse Aktiengesellschaft1 AUT 29.192% KEA 29.192% KEAAC styria Mobilitätscluster GmbH AUT 12.333% K0 12.333% K0Donauländische Baugesellschaft m.b.H. AUT 100.000% K0 100.000% K0VA Intertrading Aktiengesellschaft AUT 3.397% K0 3.397% K0voestalpine group-IT (Suzhou) Co., Ltd. CHN 100.000% K0 100.000% K0voestalpine HR Services GmbH DEU 100.000% K0 voestalpine Insurance Services GmbH AUT 100.000% K0 100.000% K0

209A N N U A L R E P O R T 2 0 1 7 / 1 8
GLOSSARY
Acquisition. Takeover or purchase of companies or of interests in companies.
Asset deal. Company takeover, where the buyer pur-chases individual assets (rather than shares).
ATX. “Austrian Traded Index,” the leading index of the Vienna Stock Exchange, which contains the 20 most important stocks in the prime market segment.
Capital employed. Total employed interest -bearing capital.
Cash flow.» From investing activities: outflow/inflow of liquid
assets from investments/disinvestments;» From operating activities: outflow/inflow of liquid
assets not affected by investment, disinvestment, or financing activities.
» From financing activities: outflow/inflow of liquid assets from capital expenditures and capital contri-butions.
EBIT (earnings before interest and taxes). Profit before the deduction of taxes, non- controlling interests, and financial result.
EBIT margin. EBIT as a percentage of revenue.
EBITDA (earnings before interest, taxes, depreciation, and amortization). Profit before the deduction of taxes, non-controlling interests, financial result, and depre ciation and amortization expenses.
EBITDA margin. EBITDA as a percentage of reve nue.
Equity. Assets made available to a corporation by the owners through deposits and/or con tributions or from retained profits.
Equity ratio. Equity divided by total assets.
Free float. The portion of the share capital that is ac-tively traded on the stock exchange.
Fulltime equivalent (FTE). A full-time employee cor-responds to a full-time equivalent of one, part-time employees are taken into account on a pro-rata basis corresponding to their working hours.
Gearing. Ratio of net financial debt to equity.
Gross profit. Revenue less cost of sales.
IFRS (International Financial Reporting Standards). Accounting regulations developed to guarantee com-parable accounting and disclosure.
Market capitalization. Market capitaliza tion reflects the current market price of an exchange-listed com-pany.
Net financial debt. Interest-bearing liabilities less interest-earning assets.
Rating. An evaluation of the credit quality of a com-pany recognized on international capital markets.
Return on equity. ROE is the ratio of profit for the pe-riod to equity as recorded in the previous period.
ROCE (return on capital employed). ROCE is the ratio of EBIT to average capital employed, that is, profit gen-erated by the capital invested.
Volatility. The degree of fluctuation in stock prices and currency exchange rates or in prices of consumer goods in comparison to the market.
Weighted average cost of capital (WACC). Average capital costs for both borrowed capital and equity.

210 S E R V I C E
CONTACT & IMPRINT
CONTACT
voestalpine AG, Group CommunicationsT. +43/50304/15-2090, F. +43/50304/[email protected]
voestalpine AG, Investor RelationsT. +43/50304/15-9949, F. +43/50304/[email protected]
www.voestalpine.com
Imprint Owner and media proprietor: voestalpine AG, voestalpine-Strasse 1, 4020 Linz. Senior editor and editorial staff: voestalpine AG, Investor Relations, T. +43/50304/15-9949, F. +43/50304/55-5581, [email protected], www.voestalpine.com. Design and implementation: gugler* brand & digital, 3100 St. Pölten


voestalpine AG voestalpine-Strasse 1 4020 Linz, AustriaT. +43/50304/15-0F. +43/50304/55-Ext.www.voestalpine.com