annual report 2017 - veritas investments · 7 director independent director michael morton mba...
TRANSCRIPT

ANNUAL REPORT
2017
Investors in Food, Franchise and Hospitality Businesses


04 Chairman’s Report
06 Directors’ Profiles
09 Corporate Governance Statement
13 Directors’ Responsibility Statement
Contents14 Financial Report
51 Shareholder and Statutory Information
58 Corporate Directory
O’Hagans.

4
compared to $4,800,903 in FY16. This is a decrease of $(595,107) or 12%.
Veritas’ underlying net profit after tax for continuing operations prior to significant items of $4.2 million for FY17 is within the guidance range provided to the market on 28 February 2017 of $3.7- $4.3 million. Revenue was $30.8 million compared to the guidance range of $26-$31 million and EBITDA prior to significant items was $8.2 million compared to the guidance range of $7.9-$8.5 million. Operating cash flow improved significantly over the previous year from $1.4 million to $4.1 million, an improvement of 190%.
Commentary on Veritas’ individual businesses is detailed below:
Mad ButcherThe market has been very competitive during the year. Three franchised stores closed, Tauranga, Mangere and Papanui, which has reduced and impacted on the Mad Butcher’s revenue and earnings. The company is focusing on improving the profitability within each franchise and is introducing a number of initiatives to assist with driving profitability.
The Mad Butcher generated EBITDA of $3,650,453 in the year, compared
Chairman’s Report
REPORT TO SHAREHOLDERS
On behalf of the Veritas Board we present the Annual Report for the year ended 30 June 2017. We have already reported our FY 2017 results on 29 August 2017 and advised the market that our revised forecast of underlying net profit after tax from continuing operations excluding significant items (underlying NPAT), of $4,205,796, for the year was met.
to $2,398,843 in FY16. EBITDA prior to significant items was $3,650,453 in the year, compared to $4,574,720 in FY16.
There are currently 31 Mad Butcher stores in the Group, 28 of which are franchised and three are company owned. The Board is considering a range of options for these company owned stores, including their sale or potential closure, in conjunction with other strategic initiatives for the Mad Butcher.
The Better Bar Company The Better Bar Company exceeded its forecast for the year, generating EBITDA of $5,919,570, compared to $5,037,290 in FY16. EBITDA prior to significant items was $5,919,570 in the year, compared to $5,509,085 in FY16. All bars in the Group are profitable with several significantly exceeding their forecasts. Those in the Viaduct/waterfront area of Auckland enjoyed very strong patronage from activities such as the Lions tour and an increase in tourism.
Nosh Nosh Group Limited (now Old NGL Limited [in liquidation]) sold its business and assets on 24 February 2017 to Gosh Holding Limited (now
The Year in Review2017 has seen an improvement in the Group’s financial performance and achievement of the market guidance. During the year the Nosh Group was sold and the Group’s investment in Kiwi Pacific Foods was realised in cash. The Mad Butcher has seen declining sales and profitability with three franchised stores closing during the year. The BBC has had an excellent year exceeding its budgeted earnings results and the prior year.
The net loss for the year ended 30 June 2017 was $(792,999), compared to a net loss of $(4,591,622) in FY16. This is an improvement of $3,798,623 or 83%. This is after significant items net of tax of $(143,988), compared to $(5,399,362) in FY16. Losses from operations held for sale and discontinued operations were $(4,854,807), compared to $(3,993,162) in FY16.
The net profit after tax from continuing operations was $4,061,808, compared to a net loss of $(598,460) in FY16. This is an improvement of $4,660,268. Veritas’ underlying net profit after tax for continuing operations prior to significant items was $4,205,796,
5
Nosh Group Limited [in receivership]) for a loss on sale of $2.6 million after tax. This compares with the guidance range of $2.2-$2.6 million. As a term of that sale the purchaser agreed to take over the business contracts, all leases, pay employee entitlements and pay existing trade creditors of Old NGL Limited. At the time the directors of Old NGL Limited were led to believe that the purchaser would comply with those obligations but they have not.
Old NGL Limited commenced proceedings in the High Court against Nosh Group Limited, who were subsequently placed into receivership on 14 July 2017. Judgment has been granted in Old NGL Limited’s favour for just over $1.9 million. The directors of Veritas now believe that any material payment of the judgment debt is unlikely and have appointed Iain Shephard and Jessica Kellow of ShephardDunphy as liquidators of Old NGL Limited to a§ect an orderly wind-up of the company’s a§airs.
As the parent company of Old NGL Limited, Veritas Investments Limited is not exposed to any third party for any obligations of Old NGL Limited, other than under one lease, which has been fully provided for in the accounts.
Going Concern BasisThe financial statements have been prepared under the going concern basis and the Directors have disclosed a number of uncertainties that exist in regard to this assumption in note 1.
The ANZ Bank have advised they do not intend to renew the banking facilities when they fall due in October and November 2017, and through to September 2019. These factors result in a material uncertainty which casts significant doubt over the Group’s ability to continue as a going concern.
The Directors are working through a number of options which may include the potential sale or merger of the business units with external parties to the Group, or recapitalisation and/or refinancing of the Group with alternative banking arrangements, or some combination of all of these.
In preparing the financial statements, the Directors have assessed the Group’s ability to continue as a going concern. In determining this assessment, the Directors conducted a comprehensive review of the financial position of the Group, the carrying value of its assets, the level of debt and facilities the Group has at 30 June 2017 and its forecast financial results for the next 12 months subsequent to the date of issue of these financial statements and the options for the Group noted above.
The Directors acknowledge that if the Group is unable to obtain alternative sources of funding, within the required timeframe to enable the repayment of the bank debt, or receive an extension of timing of debt repayments to the bank to enable the Group to execute any of the above options, then the going concern assumption would not be appropriate.
Whilst material uncertainties exist, the Directors consider that there is a reasonable expectation that the above options can be executed and that the ANZ will support the Group through this process. Taking this into account and the expected financial performance of the Group and the positive operating cash flows, it is the considered view of the Board that the Group is a going concern.
No Dividend The Board has resolved that no dividend will be declared for the year ended 30 June 2017.
I would like to extend my thanks to the Board and senior management team for their leadership and support of the business units and the Board appreciates the continued support from our shareholders.
Regards
Tim Cook Chairman, Veritas Investments Limited

6
DIRECTORS’ PROFILES
Independent Chairman
TIM COOK CMInstD
Tim is a Director of a number of companies within Veritas. He is also Chairman of SaferSleep NZ Limited, SaferSleep USA, MyWave Limited, MyWave Holdings Limited, Flossie.com and The Auckland Heart Group, NZ’s largest private cardiology practice. He is a Director of MoleMap NZ Limited, Distil Skincare Limited and NZX Listed Plexure Group Limited.
He chairs the Remuneration Committee and Audit Committee for Veritas.
His earlier management career includes senior retail and operational management roles in the supermarket, retail, franchising, food and fashion industry sectors.
From 2006 to 2011 he was a Director of NZX listed Charlie’s Group Limited, representing Collins Asset Management who was the cornerstone shareholder at 19.69%. He was a member of the Finance and Audit Committee and Chairman of the Remuneration Committee. He was heavily involved in its sale to Asahi Group for $129 million in 2011.
The Cav.

7
DirectorIndependent Director
MICHAEL MORTONMBA (Massey)
SHARON HUNTER
Michael Morton has extensive management experience and over 17 years’ experience as CEO of the Mad Butcher business.
Michael’s first management position was Assistant Manager at Stallone’s Pizza Delivery Company; a South Island based pizza chain which later became Eagle Boys Pizza. He was later appointed Operations Manager of that company.
Michael next worked for PepsiCo as Assistant Manager of KFC and then Operations Manager, before moving to Restaurant Brands New Zealand Limited to become General Manager of the Pizza Hut business. In 2000, Michael left Restaurant Brands and joined the Mad Butcher Holdings Limited as CEO under Sir Peter Leitch’s ownership. In 2007, Michael completed the acquisition of the Mad Butcher Holdings Limited.
Since Michael joined the Mad Butcher business as CEO in 2000, the number of Mad Butcher stores throughout New Zealand has more than doubled to 31.
Following on from the successful acquisition of the Mad Butcher Holdings Limited by Veritas, Michael joined the Board of Veritas as continued his role as CEO of the Mad Butcher.
Sharon is one of New Zealand’s best-known and respected business women. In 1989 she co-founded PC Direct which rapidly became New Zealand’s largest and most successful personal computer company.
After selling the company in 1997, she and Tenby Powell formed Hunter Powell Investments Partners Ltd (HPIP) in 1999.
Their first acquisition was Continental Distributors, subsequently re-launched as Euro Pacific Foods. After that business doubled in size, it was sold to Delmaine Fine Foods. Later they purchased Hirepool from Owens Group with private equity partners Goldman Sachs JB Were.
Sharon currently sits on the Investment Advisory panel for the Government’s Primary Growth Partnership and was previously a member of the Advisory Board for Rugby World Cup 2011. Sharon is a non-executive director for Spicer’s Portfolio Management. She is also a Director of The Skin Institute Group, Plexure Group Limited, Flossie.com, Eventfinda Limited and Antarctica New Zealand.
In addition to her business activities, Sharon is actively involved in the not-for-profit sector. She is a trustee of the Starship Foundation and past Chair and Board member of the Robin Hood Foundation.
Sharon joined the Board in February 2014.
8
Independent Director
JOHN MOORE B.Com (Hons), LLB (Hons) – University of Queensland
DIRECTORS’ PROFILES CONTINUED
John is an experienced banker and corporate adviser who has worked in Australia, Hong Kong, Singapore and New Zealand.
John started his career with CS First Boston in Australia in 1993, before moving to Ord Minnett / Jardine Fleming, transferring to Hong Kong in 1997. Joining ABN AMRO in Hong Kong in 1997, he then had various roles in both Equity Capital Markets and Mergers & Acquisitions for ABN AMRO, including being responsible for NZ ECM (2001 – 2003) and holding senior positions in the group’s investment banking operations in Asia between 2004 and 2009.
John has been based in New Zealand since 2009 and, from 2010 to early 2014, was Head of ECM for Craigs Investment Partners.
John has experience working with a range of New Zealand companies, including working on the IPOs of Freightways, Skellerup, Summerset, Moa, SLI Systems and the Fonterra Shareholders Fund, as well as transactions for Veritas (the acquisition of Mad Butcher Holdings and the associated equity raising), Goodman Property, Contact Energy and Arrium.
In May 2014, John established Miro Capital Advisory Limited, an advisory firm focused on providing capital markets advice to small and medium sized companies in New Zealand, both listed and unlisted. Miro Capital is an NZX Sponsor firm as well as being an accredited NXT Market Advisor.

9
The overall responsibility for ensuring that the Group is properly managed to enhance investor confidence through corporate governance and accountability lies with the Board of Directors.
Corporate
GOVERNANCE STATEMENT
The Cav.

10
The Board and Management are committed to ensuring that the Group maintains Corporate Governance structures which ensure that the Group operates e°ciently and e§ectively in shareholders’ best interests.
VIL’s corporate governance processes do not materially di§er from the principles set out in NZX’s Corporate Governance Best Practice Code. The Board with continue to monitor best practice in the governance area and update the Group’s policies to ensure it maintains the most appropriate standards.
Role and Composition of the BoardThe business and a§airs of the Group are managed under the direction of the Board of Directors, which has overall responsibility for decision making within the Group. At a general level, the Board is elected by the shareholders to:
• Establish the Group’s objectives;
• Develop major strategies for achieving the Group’s objectives;
• Approve all material transactions relating to the Group;
• Set investment parameters for management;
• Monitor management’s performance with respect to these matters;
• Ensure legislative compliance;
• Communicate with shareholders and other stakeholders;
• Approve the annual and half-year financial reports.
The Board of Directors currently consists of three independent directors and one non-independent director who all have a diverse range of experience and expertise (profiles of the individual Directors can be found on pages 6-8) and are committed to use this to benefit the Group.
As at 30 June 2017, the Board consisted of:
Tim Cook Chairman and Independent Director
John Moore Independent Director
Sharon Hunter Independent Director
Michael Morton Director
A director is “independent” when he or she does not have any direct or indirect interest or relationship with the Group
CORPORATE GOVERNANCE STATEMENT
which could reasonably influence, in a material way, that Director’s decisions relating to the Group. The Board will consider all relevant circumstances when determining independence, but is of the view that a Director cannot be independent where the Director, or an associated person of the Director:
• is a substantial security holder in the Group;
• has a relationship with the Group (other than being a Director of the Group) under which the Director or associated person is likely to derive a substantial portion (generally 10% or more) of their annual revenue or income from the Group;
Quantitative Breakdown of Directors and O�cers
At 30 June 2017 At 30 June 2016
Male 5 5
Female 1 1
TOTAL 6 6
Nomination and Appointment of DirectorsThe Board is responsible for identifying and recommending candidates. Directors may also be nominated by shareholders under NZX Listing Rule 3.3.5.
A director may be appointed by ordinary resolution and all directors are subject to removal by ordinary resolution.
The Board may at any time appoint additional directors. A director appointed by the Board shall only hold o°ce until the next annual meeting of the Group but shall be eligible for election at that meeting.
The procedures for the appointment and removal of Directors are governed by the Group’s constitution. The constitution provides for one third of the Group’s Directors (rounded down to the nearest whole number) to retire and stand for re-election at every Annual General Meeting. The Directors who must retire are those who have been in o°ce the longest since last elected or deemed to be elected.
Any increase in the total Directors’ remuneration is approved by shareholders at the Group’s Annual Shareholders’ Meeting, upon the recommendation of the Board as a whole. Within that cap, the Board is responsible for determining the remuneration paid to each Director.

11
Disclosure of Interests by DirectorsThe Code sets out the procedures to be followed where directors have an interest in a transaction or proposed transaction or are faced with a potential conflict of interest requiring the disclosure of that conflict to the Board.
Veritas maintains an Interests’ Register that contains all the relevant and material directorships held by the members of the Board. Entries in the Interests’ Register made in the financial year ended 30 June 2017 are shown on pages 55 – 57.
Ethical ConductThe Group has adopted a Code of Conduct, which sets out the ethical and behavioural standards expected of Veritas’ Directors and employees. The Code of Conduct outlines the Group’s policies in respect of conflicts of interest, competing corporate opportunities, maintaining confidentiality of information, acceptance of gifts and compliance with laws and Group policies. Procedures for dealing with breaches of these policies are contained within the Code of Conduct, which forms part of each employee’s conditions of employment.
Share DealingsVeritas’ Directors and employees must comply with the Group’s Securities Trading Policy and Procedures, to ensure that no trades in shares are e§ected whilst that person is in possession of material information which is not generally available to the market.
Indemnification and Insurance of Directors and O�cersThe Group has D&O insurance with Vero which ensures that generally, Directors and O°cers will incur no monetary loss as a result of actions undertaken by them. The Group entered into an indemnity in favour of its Directors under a policy dated 8 May 2013.
Shareholder RelationsVeritas is committed to providing comprehensive and timely information to its shareholders. Shareholders are encouraged to participate in annual meetings and the Group encourages queries from shareholders outside formal meetings
Board ProcessesThe Board met formally 13 times for the financial year ended 30 June 2017 for the purpose of reviewing the progress of the Group, approving communications with shareholders and the maintenance of all internal procedures and governance.
These formal meetings included discussions relating to the Investment, Audit and Remuneration Committees. There were a number of informal meetings throughout the financial year, but these are not included in the table below.
Board Members Meetings Attended
Tim Cook (Chairman) 12
Michael Morton 13
Sharon Hunter 12
John Moore 12
CommitteesThe Board has three formally constituted committees. These committees, established by the Board, review and analyse policies and strategies as developed by the Board. The committees examine proposals and where appropriate make recommendations to the Board. Committees do not take action or make decisions on behalf of the Board unless specifically authorised to do so by the Board.
Audit CommitteeThe Group’s Audit Committee has been established to monitor audit and risk management processes (including treasury and financing policies). It specifically ensures adequate financial reporting and regulatory conformance. The committee is accountable to the Board for considering and, if necessary or desirable, adopting the recommendations of the external Auditor and addressing the adequacy of the external audit function.
The committee provides the Board with additional assurance regarding the accuracy of financial information for inclusion in the Group’s annual report, including all financial information released through NZX.
A number of the Board meetings incorporated Audit Committee discussions. For the financial year ended 30 June 2017, the Audit Committee had three formal meetings. These formal meetings are intended to continue for the financial year ended 30 June 2018.
Meetings Audit Committee Members Attended
Tim Cook (Chairman) 3
John Moore 3
Sharon Hunter 3
PricewaterhouseCoopers are the Group’s external Auditor. During the year they provided the Group with taxation
CORPORATE GOVERNANCE STATEMENT CONTINUED

12
services. Notwithstanding this, the Group is satisfied with PricewaterhouseCoopers independence and the quality of the audit it provides.
PricewaterhouseCoopers have undertaken the audit of the financial statements for the year ended 30 June 2017.
Investment CommitteeThe Board has a separate Investment Committee. A number of the Board meetings incorporated Investment Committee discussions. For the financial year ended 30 June 2017, the Investment Committee had no formal meetings. It has been agreed that these formal meetings will be held as and when required.
Members of the Investment Committee are John Moore (Chairman) and Michael Morton.
Remuneration CommitteeThe Remuneration Committee is responsible for overseeing management succession planning, establishing employee incentive schemes, reviewing and approving the compensation arrangements for the executive directors and senior management and recommending to the full Board the remuneration of directors. A number of the Board meetings incorporated Remuneration Committee discussions. For the year ended 30 June 2017, the Remuneration Committee had no formal meetings. It has been agreed that these formal meetings will be held as and when required.
Members of the Remuneration Committee are Tim Cook (Chairman), John Moore and Sharon Hunter.
CORPORATE GOVERNANCE STATEMENT CONTINUED
Managing RiskThe Board has overall responsibility for the Group system of risk management and internal control and has procedures in place to provide e§ective control within the management and reporting structure. The Board has in place policies and procedures to identify significant business risks and to implement procedures for e§ectively managing those risks. Key risk management tools used by Veritas include the Audit Committee and Investment Committee functions, outsourcing of certain functions to experts, internal controls, financial and compliance reporting procedures and adequate insurance cover.
Financial Statements are prepared monthly and reviewed by the Board to monitor performance against budget goals and objectives. The Board also requires management to identify and respond to risk exposures.
A structure framework is in place for capital expenditure, including appropriate authorisations and approval levels.
The Board maintains an overall view of the risk profile of the Group and is responsible for monitoring corporate risk assessment processes.
DisclosureThe Group adheres to the NZX continuous disclosure requirements which govern the release of all material information that may a§ect the value of the Group’s listed shares. The Board and senior management team have processes in place to ensure that all material information is promptly provided to the Chairman and disclosed to the market as appropriate.

13
The Board of Directors have pleasure in presenting the financial statements and audit report for Veritas Investments Limited for the year ended 30 June 2017.
The Directors are responsible for presenting financial statements in accordance with New Zealand law and generally accepted accounting practice, which present fairly the financial position of the Group as at 30 June 2017 and financial performance and cash flows for the year ended on that date.
The Directors believe that proper accounting records have been kept which enable with reasonable accuracy, the determination of the financial position of the Group and facilitate compliance of the financial statements with the Financial Markets Conduct Act 2013.
The directors consider that they have taken adequate steps to safeguard the assets of the Group and to prevent and detect fraud and other irregularities. Internal control procedures are also considered to be su�cient to provide a reasonable assurance as to the integrity and reliability of the financial statements.
The Board of Directors of the Group authorised these financial statements presented on pages 17 to 50 for issue on 21 September 2017. This Annual Report is dated 21 September 2017.
For and on behalf of the Board
Tim Cook Sharon Hunter Chairman, Veritas Investments Limited Independent Director Audit Committee Chairman
Directors’
RESPONSIBILITY STATEMENT

FINANCIAL REPORT
15 Independent Auditors’ Report
Financial Statements
17 Consolidated Statement of Comprehensive Income
18 Consolidated Statement of Financial Position
19 Consolidated Statement of Changes in Equity
20 Consolidated Statement of Cash Flows
21 Notes to the Financial Statements
O’Hagans.

15
PricewaterhouseCoopers, 188 Quay Street, Private Bag 92162, Auckland 1142, New Zealand T: +64 9 355 8000, F: +64 9 355 8001, pwc.co.nz
Independent auditor’s report To the shareholders of Veritas Investments Limited The financial statements comprise:
the consolidated statement of financial position as at 30 June 2017; the consolidated statement of comprehensive income for the year ended 30 June 2017; the consolidated statement of changes in equity for the year ended 30 June 2017; the consolidated statement of cash flows for the year ended 30 June 2017; and the notes to the financial statements, which include a summary of significant accounting policies.
Disclaimer of opinion We were engaged to audit the financial statements of Veritas Investments Limited (the Company), including its subsidiaries (the Group).
We do not express an opinion on the accompanying financial statements of the Group. Because of the significance of the matters described in the Basis for disclaimer of opinion section of our report, we have not been able to obtain sufficient appropriate audit evidence to provide a basis for an audit opinion on these financial statements.
Basis for disclaimer of opinion As described in Notes 1 and 19 to the financial statements, the Group’s bank facility agreement is due for renewal in October 2017. As at the date of this opinion the Group had not renewed its bank facility agreement, which casts significant doubt about the Group’s ability to continue as a going concern, the consequence of which is that the Group may not be able to recover the carrying value of the net assets. The carrying value of net assets at 30 June 2017 was $7.2 million. We were unable to obtain sufficient appropriate audit evidence to support the carrying value of the net assets recorded in the consolidated statement of financial position as the value is dependent on the outcome of the refinancing of the bank facility agreement. With respect to this uncertainty, we were unable to obtain sufficient appropriate audit evidence to form an opinion as to whether the going concern assumption is appropriate. In addition, we have been unable to obtain sufficient appropriate audit evidence over the recoverability of certain trade and other receivables. Consequently we were unable to determine whether any adjustment to the carrying values are necessary at 30 June 2017, and the consequential impact on the consolidated statement of comprehensive income and consolidated statement of changes in equity.
Information other than the financial statements and auditor’s report The Directors are responsible for the annual report. Our opinion on the financial statements does not cover the other information included in the annual report and we do not express any form of assurance conclusion on the other information.
In connection with our audit of the financial statements, our responsibility is to read the other information and, in doing so, consider whether the other information is materially inconsistent with the financial statements or our knowledge obtained in the audit, or otherwise appears to be materially misstated. If, based on the work we have performed on the other information that we obtained prior to the date of this auditor’s report, we conclude that there is a material inconsistency of this other information, we are required to report that fact. We have nothing to report in this regard.

16
Responsibilities of the Directors for the financial statements The Directors are responsible, on behalf of the Company, for the preparation and fair presentation of the financial statements in accordance with NZ IFRS and IFRS, and for such internal control as the Directors determine is necessary to enable the preparation of financial statements that are free from material misstatement, whether due to fraud or error.
In preparing the financial statements, the Directors are responsible for assessing the Group’s ability to continue as a going concern, disclosing, as applicable, matters related to going concern and using the going concern basis of accounting unless the Directors either intend to liquidate the Group or to cease operations, or have no realistic alternative but to do so.
Auditor’s responsibilities for the audit of the financial statements Our responsibility is to conduct an audit of the Group’s financial statements in accordance with ISAs NZ and ISAs and to issue an auditor’s report. However, because of the matter described in the Basis for Disclaimer of Opinion section of our report, we were not able to obtain sufficient appropriate audit evidence to provide a basis for an audit opinion on these financial statements.
We are independent of the Group in accordance with Professional and Ethical Standard 1 (Revised) Code of Ethics for Assurance Practitioners (PES 1) issued by the New Zealand Auditing and Assurance Standards Board and the International Ethics Standards Board for Accountants’ Code of Ethics for Professional Accountants (IESBA Code), and we have fulfilled our other ethical responsibilities in accordance with these requirements.
Our firm carries out other services for the Group in the area of tax compliance and advice services. The provision of these other services has not impaired our independence as auditor of the Group.
Who we report to This report is made solely to the Company’s shareholders, as a body. Our audit work has been undertaken so that we might state those matters which we are required to state to them in an auditor’s report and for no other purpose. To the fullest extent permitted by law, we do not accept or assume responsibility to anyone other than the Company and the Company’s shareholders, as a body, for our audit work, for this report or for the opinions we have formed.
The engagement partner on the audit resulting in this independent auditor’s report is Lisa Crooke.
For and on behalf of:
Chartered Accountants Auckland 21 September 2017
17
Responsibilities of the Directors for the financial statements The Directors are responsible, on behalf of the Company, for the preparation and fair presentation of the financial statements in accordance with NZ IFRS and IFRS, and for such internal control as the Directors determine is necessary to enable the preparation of financial statements that are free from material misstatement, whether due to fraud or error.
In preparing the financial statements, the Directors are responsible for assessing the Group’s ability to continue as a going concern, disclosing, as applicable, matters related to going concern and using the going concern basis of accounting unless the Directors either intend to liquidate the Group or to cease operations, or have no realistic alternative but to do so.
Auditor’s responsibilities for the audit of the financial statements Our responsibility is to conduct an audit of the Group’s financial statements in accordance with ISAs NZ and ISAs and to issue an auditor’s report. However, because of the matter described in the Basis for Disclaimer of Opinion section of our report, we were not able to obtain sufficient appropriate audit evidence to provide a basis for an audit opinion on these financial statements.
We are independent of the Group in accordance with Professional and Ethical Standard 1 (Revised) Code of Ethics for Assurance Practitioners (PES 1) issued by the New Zealand Auditing and Assurance Standards Board and the International Ethics Standards Board for Accountants’ Code of Ethics for Professional Accountants (IESBA Code), and we have fulfilled our other ethical responsibilities in accordance with these requirements.
Our firm carries out other services for the Group in the area of tax compliance and advice services. The provision of these other services has not impaired our independence as auditor of the Group.
Who we report to This report is made solely to the Company’s shareholders, as a body. Our audit work has been undertaken so that we might state those matters which we are required to state to them in an auditor’s report and for no other purpose. To the fullest extent permitted by law, we do not accept or assume responsibility to anyone other than the Company and the Company’s shareholders, as a body, for our audit work, for this report or for the opinions we have formed.
The engagement partner on the audit resulting in this independent auditor’s report is Lisa Crooke.
For and on behalf of:
Chartered Accountants Auckland 21 September 2017
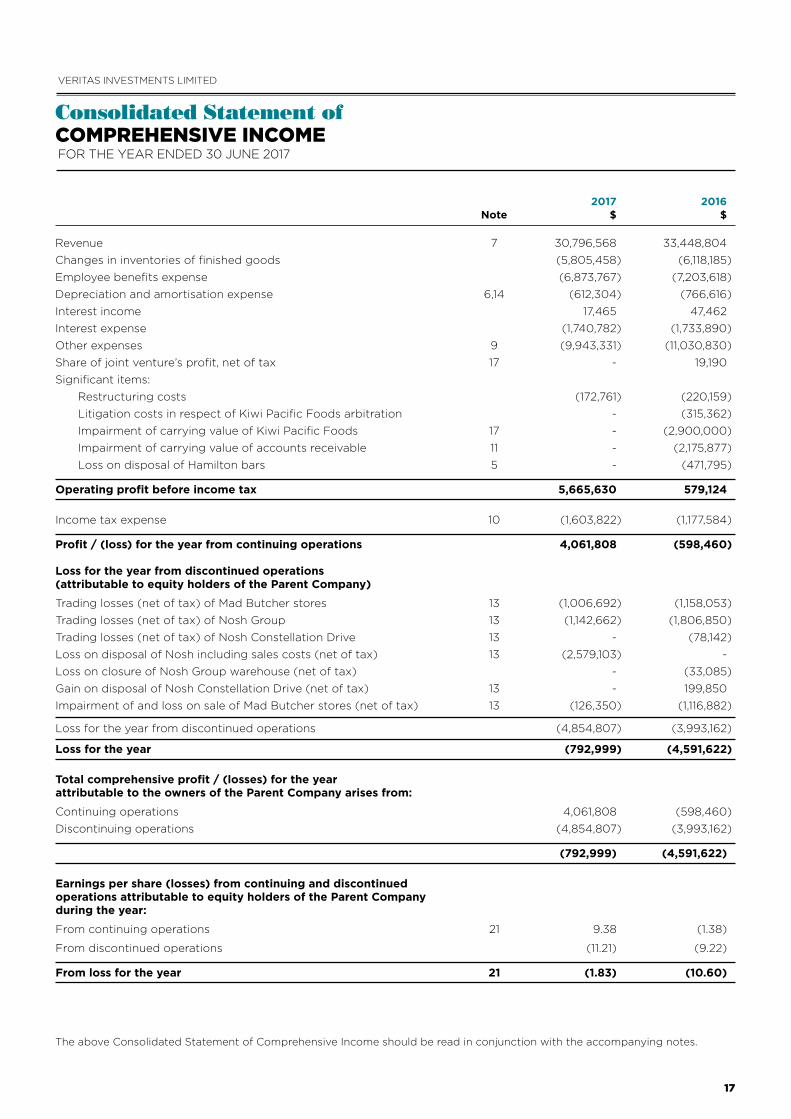
2017 2016 Note $ $
Revenue 7 30,796,568 33,448,804Changes in inventories of finished goods (5,805,458) (6,118,185)Employee benefits expense (6,873,767) (7,203,618)Depreciation and amortisation expense 6,14 (612,304) (766,616)Interest income 17,465 47,462Interest expense (1,740,782) (1,733,890)Other expenses 9 (9,943,331) (11,030,830)Share of joint venture’s profit, net of tax 17 - 19,190Significant items:
Restructuring costs (172,761) (220,159)Litigation costs in respect of Kiwi Pacific Foods arbitration - (315,362)Impairment of carrying value of Kiwi Pacific Foods 17 - (2,900,000)Impairment of carrying value of accounts receivable 11 - (2,175,877)Loss on disposal of Hamilton bars 5 - (471,795)
Operating profit before income tax 5,665,630 579,124
Income tax expense 10 (1,603,822) (1,177,584)
Profit / (loss) for the year from continuing operations 4,061,808 (598,460)
Loss for the year from discontinued operations (attributable to equity holders of the Parent Company)
Trading losses (net of tax) of Mad Butcher stores 13 (1,006,692) (1,158,053)Trading losses (net of tax) of Nosh Group 13 (1,142,662) (1,806,850)Trading losses (net of tax) of Nosh Constellation Drive 13 - (78,142)Loss on disposal of Nosh including sales costs (net of tax) 13 (2,579,103) - Loss on closure of Nosh Group warehouse (net of tax) - (33,085)Gain on disposal of Nosh Constellation Drive (net of tax) 13 - 199,850Impairment of and loss on sale of Mad Butcher stores (net of tax) 13 (126,350) (1,116,882)
Loss for the year from discontinued operations (4,854,807) (3,993,162)
Loss for the year (792,999) (4,591,622)
Total comprehensive profit / (losses) for the year attributable to the owners of the Parent Company arises from:
Continuing operations 4,061,808 (598,460)Discontinuing operations (4,854,807) (3,993,162)
(792,999) (4,591,622)
Earnings per share (losses) from continuing and discontinued operations attributable to equity holders of the Parent Company during the year:
From continuing operations 21 9.38 (1.38)
From discontinued operations (11.21) (9.22)
From loss for the year 21 (1.83) (10.60)
The above Consolidated Statement of Comprehensive Income should be read in conjunction with the accompanying notes.
Consolidated Statement of COMPREHENSIVE INCOMEFOR THE YEAR ENDED 30 JUNE 2017
VERITAS INVESTMENTS LIMITED

18
The above Consolidated Statement of Financial Position should be read in conjunction with the accompanying notes.
Consolidated Statement of FINANCIAL POSITIONAS AT 30 JUNE 2017
VERITAS INVESTMENTS LIMITED
2017 2016 Note $ $
ASSETS
Cash and cash equivalents 24 598,494 1,694,037Restricted cash 24 225,000 75,000Trade and other receivables 11 2,426,779 1,421,175Inventories 12 327,859 278,633Assets from operations classified as held for sale 13 745,673 7,547,503Assets of discontinued operations held for realisation 13 - 644,359Investment held for realisation 17 - 386,011
Total current assets 4,323,805 12,046,718
Property, plant and equipment 14 3,715,863 3,859,968Deferred tax asset 15 919,673 392,232Intangible assets 6 30,628,228 30,609,500
Total non-current assets 35,263,764 34,861,700
TOTAL ASSETS 39,587,569 46,908,418
LIABILITIES
Trade and other payables 18 3,195,814 2,191,782Income tax payable 15 - 846,417Liabilities from operations classified as held for sale 13 390,220 1,786,781Liabilities of discontinued operations 13 315,558 757,377Borrowings 19 27,556,937 16,561,666
Total current liabilities 31,458,529 22,144,023
Borrowings 19 909,583 16,751,939
TOTAL LIABILITIES 32,368,112 38,895,962
NET ASSETS 7,219,457 8,012,456
EQUITY
Share capital 20 34,136,660 34,136,660Retained Earnings (26,917,203) (26,124,204)
TOTAL EQUITY 7,219,457 8,012,456
For and on behalf of the Board of Directors, who authorised these Financial Statements on 21 September 2017.
Tim Cook Sharon Hunter Chairman Director
19
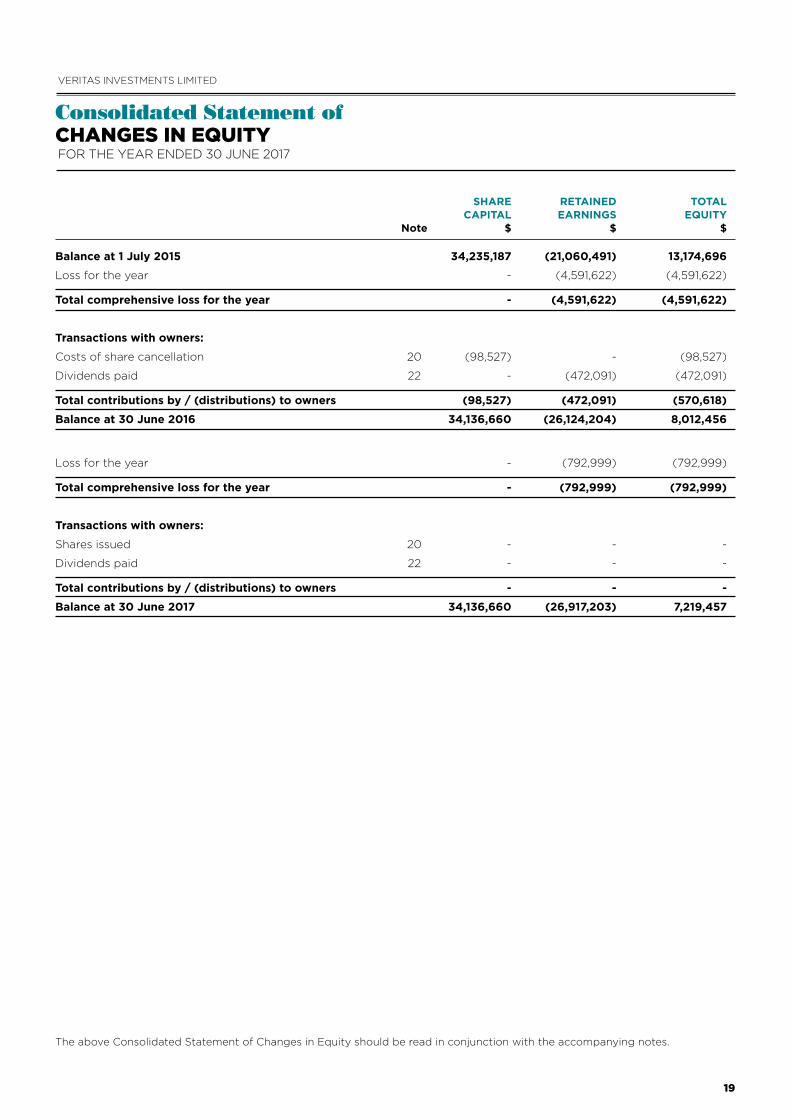
SHARE RETAINED TOTAL CAPITAL EARNINGS EQUITY Note $ $ $
Balance at 1 July 2015 34,235,187 (21,060,491) 13,174,696
Loss for the year - (4,591,622) (4,591,622)
Total comprehensive loss for the year - (4,591,622) (4,591,622)
Transactions with owners:
Costs of share cancellation 20 (98,527) - (98,527)
Dividends paid 22 - (472,091) (472,091)
Total contributions by / (distributions) to owners (98,527) (472,091) (570,618)
Balance at 30 June 2016 34,136,660 (26,124,204) 8,012,456
Loss for the year - (792,999) (792,999)
Total comprehensive loss for the year - (792,999) (792,999)
Transactions with owners:
Shares issued 20 - - -
Dividends paid 22 - - -
Total contributions by / (distributions) to owners - - -
Balance at 30 June 2017 34,136,660 (26,917,203) 7,219,457
The above Consolidated Statement of Changes in Equity should be read in conjunction with the accompanying notes.
Consolidated Statement of CHANGES IN EQUITYFOR THE YEAR ENDED 30 JUNE 2017
VERITAS INVESTMENTS LIMITED

20
The above Consolidated Statement of Cash Flows should be read in conjunction with the accompanying notes.
Consolidated Statement of CASH FLOWS
VERITAS INVESTMENTS LIMITED
2017 2016 Note $ $
Receipts from customers 29,590,964 33,809,412
Payments to suppliers and employees (21,128,474) (26,052,605)
Interest received 18,613 47,462
Interest paid (1,739,163) (1,733,890)
Taxes (paid) / received 15 201,354 (513,256)
Cash outflows from significant items (102,671) (581,472)
Discontinued - operating cash flows (2,734,029) (3,560,040)
Net cash inflows from operating activities 28 4,106,594 1,415,611
Sale of property, plant and equipment and other intangibles - 1,379,053
Sale of property, plant and equipment and other intangibles from discontinued operations - 47,244
Sale of business assets from discontinued operations 159,762 -
Distribution received from Kiwi Pacific Foods 17 410,000 911,335
Sale of associate - 439,252
Purchase of Mad Butchers stores (282,206) -
Purchase of property, plant and equipment and other intangibles (490,499) (232,681)
Purchase of property, plant and equipment and other intangibles from discontinued operations - (1,103,195)
Net cash inflows/(outflows) from investing activities (202,943) 1,441,008
Dividends paid 22 - (472,091)
Transaction costs of share cancellation 20 - (98,527)
Repayment of borrowings (4,849,194) (8,929,186)
Bond payment (150,000) -
Bank borrowings drawn down - 5,179,531
Net cash outflows from financing activities (4,999,194) (4,320,273)
Net decrease in cash and cash equivalents (1,095,543) (1,463,654)
Cash and cash equivalents at beginning of the year 1,694,037 3,172,125Restatement of Nosh’s cash as a discontinued asset - (14,434)
Cash and cash equivalents at end of the year 598,494 1,694,037
Cash and bank balances 24 598,494 1,694,037
598,494 1,694,037
FOR THE YEAR ENDED 30 JUNE 2017

21
1. General Information Veritas Investments Limited is an investment company with shareholdings in New Zealand businesses in the food and beverage and hospitality sectors.
Entities reporting These financial statements are for Veritas Investments Limited (“Veritas”) and its subsidiaries (together “the Group”).
The Group is considered a for profit-oriented entity for financial reporting purposes.
Statutory base Veritas Investments Limited is registered in New Zealand under the Companies Act 1993 and is an FMC reporting entity under part 7 of the Financial Markets Conduct Act 2013. The financial statements of the Group have been prepared in accordance with the requirements of Part 7 and the NZX Listing Rules as applicable to the NZX Main Board.
Veritas Investments is domiciled and incorporated in New Zealand. Its registered o°ce is at Ground Floor, Building B, Ascot Business Park, 95 Ascot Avenue, Greenlane, Auckland 1051.
There have been no changes made to accounting policies unless otherwise stated.
Going Concern The Group reported a loss of $(792,999) during the year. However, its net cash inflows from operating activities were $4,106,594 and the Group repaid debt of $4,849,194 during the year. At 30 June 2017 the Group has current liabilities of $31.5 million, significantly higher than its current assets of $4.3 million. During the year the banking covenants have been met.
The ANZ Bank have advised they do not intend to renew the banking facilities when they fall due in October and November 2017, and through to September 2019. These factors result in a material uncertainty which casts significant doubt over the Group’s ability to continue as a going concern.
The Directors are working through a number of options which may include the potential sale or merger of the business units with external parties to the Group, or recapitalisation and/or refinancing of the Group with alternative banking arrangements, or some combination of all of these.
In preparing the financial statements, the Directors have assessed the Group’s ability to continue as a going concern. In determining this assessment, the Directors conducted a comprehensive review of the financial position of the Group, the carrying value of its assets, the level of debt and facilities the Group has at 30 June 2017 and its forecast financial results for the next 12 months subsequent to the date of issue of these financial statements and the options for the Group noted above.
The Directors acknowledge that if the Group is unable to obtain alternative sources of funding, within the required timeframe to enable the repayment of the bank debt, or receive an extension of timing of debt repayments to the bank to enable the Group to execute any of the above options, then the going concern assumption would not be appropriate.
Whilst material uncertainties exist, the Directors consider that there is a reasonable expectation that the above options can be executed and that the ANZ will support the Group through this process. Taking this into account and the expected financial performance of the Group and the positive operating cash flows, it is the considered view of the Board that the Group is a going concern.
These financial statements do not include any adjustments that may be made to reflect that situation should the Group be unable to continue as a going concern. Such adjustments may include realising assets at other than the amounts at which they are recorded in the financial statements. In addition, the Group may have to provide for further liabilities that may arise and to reclassify certain non-current assets and liabilities as current.
Notes to the FINANCIAL STATEMENTSFOR THE YEAR ENDED 30 JUNE 2017
VERITAS INVESTMENTS LIMITED

22
NOTES TO THE FINANCIAL STATEMENTS CONTINUED
2. Summary of Significant Accounting Policies (a) Basis of PreparationThe principal accounting policies adopted in the preparation of the financial statements are set out below. These policies have been consistently applied to all the periods presented, unless otherwise stated.
These financial statements have been prepared in accordance with Generally Accepted Accounting Practice in New Zealand, which is the New Zealand equivalent to International Financial Reporting Standards (NZ IFRS). They also comply with International Financial Reporting Standards.
During the year the Board made the decision to sell the Nosh business unit. Accordingly the results of Nosh have been reclassified as a discontinued operation and the comparative balances have been restated. The loss for the year, the total equity balance and the net cash inflows from operating activities remain unchanged, however all other comparative balances in the statement of comprehensive income, the statement of financial position and the statement of cash flows may have changed. In addition the Group has restated other balances to confirm with the current presentation.
Historical Cost Convention These financial statements have been prepared under the historical cost convention, modified by the revaluation of financial assets and liabilities as identified in the specific accounting policies below.
(b) Principles of consolidation The consolidated financial statements incorporate the financial statements of all subsidiaries of Veritas Investments Limited (“Parent”) as at the reporting date. Veritas Investments Limited and its subsidiaries together are referred to in these financial statements as the “Group” or the consolidated entity.
Subsidiaries are all those entities over which the Group has control. The Group controls an entity when it is exposed to, or has rights to, variable returns from its involvement with the entity and has the ability to a§ect those returns through its power over the entity.
Subsidiaries are included in the consolidated financial statements using the acquisition method of consolidation. They are fully consolidated from the date on which control is transferred to the Parent. They are de-consolidated from the date that control ceases or they cease to be part of the Group.
The results of the entities acquired or disposed of during the year are included in the profit or loss from the e§ective date of acquisition or up to the e§ective date of disposal, as appropriate.
The Group applies the acquisition method to account for business combinations. The consideration transferred for the acquisition of a subsidiary is the fair values of the assets transferred, the liabilities incurred to the former owners of the acquiree and the equity interests issued by the Group. The consideration transferred includes the fair value of any asset or liability resulting from a contingent consideration arrangement. Identifiable assets acquired and liabilities and contingent liabilities assumed in a business combination are measured initially at their fair values at the acquisition date. The Group recognises any non-controlling interest in the acquiree on an acquisition-by-acquisition basis, either at fair value or at the non-controlling interest’s proportionate share of the recognised amounts of the acquiree’s identifiable net assets.
Acquisition related costs are expensed as incurred.
If the business combination is achieved in stages, the acquisition date carrying value of the acquirer’s previously held equity interest in the acquiree is re-measured to fair value at the acquisition date; any gains or losses arising from such re-measurement are recognised in profit or loss.
Any contingent consideration to be transferred by the Group is recognised at fair value at the acquisition date. Subsequent changes to the fair value of the contingent consideration that is deemed to be a financial asset or financial liability is recognised in accordance with NZ IAS 39 either in profit or loss or as a change to other comprehensive income. Contingent consideration that is classified as equity is not re-measured, and its subsequent settlement is accounted for within equity.

23
The excess of the consideration transferred, the amount of any non-controlling interest in the acquiree and the acquisition date fair value of any previous equity interest in the acquiree over the fair value of the identifiable net assets acquired is recorded as goodwill. If the total of consideration transferred, non-controlling interest recognised and previously held interest measured is less than the fair value of the net assets of the subsidiary acquired in the case of a bargain purchase, the di§erence is recognised direct in the profit and loss component of the statement of comprehensive income.
Intercompany transactions, balances and unrealised gains on transactions between Group companies are eliminated. Unrealised losses are also eliminated. When necessary, amounts reported by subsidiaries have been adjusted to conform with the Group’s accounting policies.
Associates and joint venture investments Associates are those entities in which the Group has significant influence, but not control, over the financial and operating policies. Joint venture investments are those entities in which the Group has joint control over financial and operating policies. Associates and joint venture investments are accounted for using the equity method. Under the equity method, the investment is initially recognised at cost and the carrying amount is increased or decreased to recognise the investor’s share of the profit or loss of the investee after the date of acquisition.
(c) Segment reporting Operating segments are reported in a manner consistent with internal reporting provided to the chief operating decision-making body. The chief operating decision-making body responsible for allocating resources and assessing performance of operating segments is the Board of Directors.
(d) Functional and presentation currencyThe presentation currency of the Group is New Zealand Dollars ($). Transactions in foreign currencies are initially recorded in the functional currency by applying exchange rates ruling at the date of the transaction. Monetary assets and liabilities denominated in foreign currencies are re-translated at the exchange rate at balance date. Non-monetary items that are measured in terms of historical cost in a foreign currency are translated using the exchange rate as at the date of the initial transaction.
(e) Revenue recognitionRevenue comprises the fair value of the consideration received or receivable for the sale of goods and services, excluding Goods and Services Tax and discounts, to the extent that it is probable that the economic benefits will flow to the Group and the amount of the revenue can be reliably measured.
Store and bar sales - Store and bar sales are recognised when the Group sells to the customer. Store and bar sales are usually in cash and the recorded revenue is the amount of the sale, net of any applicable discounts.
Carcass rebates - Mad Butcher Limited (MBL) acts as an agent for the sale of carcasses. Net revenue is recognised when the carcasses are received by the franchise stores.
Supplier rebates - The Group acts as an agent for the sale of products. Supplier rebates on these products are recognised as revenue when the goods are received by the franchise store.
Advertising fees - Contracted annual advertising charges are recognised in the period to which they relate.
Franchise fees - Franchise fees are recognised in the period to which they relate.
Other income - Management fees and gaming income are recognised in other income in the period to which they relate. Door cover charges are recognised when they are received.
(f) Interest bearing liabilitiesInterest bearing loans and borrowings are initially measured at fair value, less directly attributable transaction costs. After initial recognition, interest bearing loans and borrowings are subsequently measured at amortised cost using the e§ective interest method. Loans and borrowings are classified as current liabilities unless the Group has an unconditional right to defer settlement of the liability for at least 12 months after the reporting date.
24
NOTES TO THE FINANCIAL STATEMENTS CONTINUED
(g) Cash and cash equivalentsCash and cash equivalents in the statement of financial position and statement of cash flows comprise cash at bank and in hand and short-term deposits with an original maturity of three months or less that are readily convertible to known amounts of cash and which are subject to an insignificant risk of changes in value. Short term deposits with an original maturity of greater than three months are also included within cash and cash equivalents if the term deposit can be terminated at an earlier date, without incurring penalties.
Restricted cash comprises deposits held by the ANZ Bank and the NZX on behalf of Veritas.
(h) Trade and other receivablesTrade receivables are recognised initially at fair value and subsequently measured at amortised cost using the e§ective interest method, less an allowance for impairment. Collectability of trade receivables is reviewed on an on-going basis and a provision for doubtful debts is made when there is objective evidence that the Group will not be able to collect all amounts due according to the original term of the receivables. Financial di°culties of the debtor, or amounts significantly overdue are considered objective evidence of impairment. The amount of the loss is recognised in the profit and loss component of the statement of comprehensive income. Subsequent recoveries of amounts previously written o§ are credited to the profit and loss component of the statement of comprehensive income.
(i) InventoriesRaw materials and finished goods are stated at the lower of cost, determined on a weighted average basis, and net realisable value. Net realisable value is the estimated selling price in the ordinary course of business, less the estimated costs necessary to make the sale.
(j) Goods and Service Tax (“GST”)The statement of comprehensive income has been prepared so that all components are stated exclusive of GST. All items in the statement of financial position are stated net of GST, with the exception of receivables and payables, which include GST invoiced.
(k) Income taxThe income tax expense or benefit for the period is the tax payable on the current period’s taxable income adjusted by changes in deferred tax assets and liabilities attributed to temporary di§erences between the tax base of assets and liabilities and their carrying amounts in the financial statements.
Current tax assets and liabilities are measured at the amount expected to be recovered from or paid to the taxation authorities based on the current period’s taxable income. The tax rates and laws used to compute the amount are those that are enacted or substantively enacted at balance date.
Deferred tax assets and liabilities are recognised for temporary di§erences at the balance date between the tax base of assets and liabilities and their carrying amounts for financial reporting purposes.
Deferred income tax assets are recognised for all deductible temporary di§erences, carry-forward of unused tax credits and unused tax losses, to the extent that it is probable that taxable profit will be available against which the deductible temporary di§erences, and carry-forward of unused tax credits and unused tax losses can be utilised.
The carrying amount of deferred income tax assets is reviewed at each reporting date and reduced to the extent that it is no longer probable that su°cient taxable profit will be available to allow all or part of the deferred income tax asset to be utilised.
Deferred income tax assets and liabilities are measured at the tax rates that are expected to apply to the year when the asset is realised or the liability is settled, based on tax rates (and tax laws) that have been enacted or substantively enacted at balance date.
The income tax expense or revenue attributable to amounts recognised directly in equity are also recognised directly in equity.

25
(l) Property, plant and equipmentProperty, plant and equipment is initially recorded at cost, including costs directly attributable to bring the asset to its working condition, less accumulated depreciation and any accumulated impairment losses. Any expenditure that increases the economic benefits derived from the asset is capitalised. Expenditure on repairs and maintenance that does not increase the economic benefits is expensed in the period it occurs.
Depreciation of property, plant and equipment is calculated using the diminishing value method to allocate their cost, net of their residual values, over their estimated useful lives. The rates are as follows:
Fixtures plant and o°ce equipment 8 - 50%
Vehicles 12 - 30%
Computer equipment 20 - 50%
Lease improvements 4 - 20%
The assets’ residual values and useful lives are reviewed, and adjusted if appropriate, at each balance date. An assets carrying amount is written down immediately to its recoverable amount if the asset’s carrying amount is greater that its estimated recoverable amount. Gains and losses on disposals are determined by comparing proceeds with carrying amount. These are included in the profit and loss component of the statement of comprehensive income.
An item of property, plant and equipment is derecognised upon disposal or when no further future economic benefits are expected from its use.
(m) Other intangible assetsIntangible assets acquired separately are reported at cost less accumulated amortisation and accumulated impairment losses.
Computer software - Acquired computer software licences are capitalised on the basis of the costs incurred to acquire and bring to use the specific software. These costs are amortised over their estimated useful lives (three to five years).
An intangible asset is derecognised on disposal, or when no future economic benefit is expected from use. Gains and losses arising from derecognition of an intangible asset, measured as the di§erence between the net disposal proceeds and the carrying amount of the asset are recognised in profit or loss when the asset is derecognised.
(n) GoodwillGoodwill represents the excess of the consideration transferred in an acquisition over the fair value of the Group’s interest of the net identifiable assets, liabilities and contingent liabilities of the acquiree.
For the purpose of impairment testing, goodwill acquired in a business combination is allocated to each cash generating unit (CGU) or groups of CGU’s that is expected to benefit from the synergies of the combination. Each unit or group of units to which the goodwill is allocated represents the lowest level within the entity at which the goodwill is monitored for internal management purposes. Goodwill is monitored at the operating segment level.
Goodwill impairment reviews are undertaken annually or more frequently if events or changes in circumstances indicate a potential impairment. The carrying value of goodwill is compared to the recoverable amount, which is the higher of value in use and the fair value less costs of disposal. Any impairment is recognised immediately as an expense and is not subsequently reversed.
(o) Impairment of tangible and intangible assets other than goodwillAt the end of each reporting period, the Group reviews the carrying amounts of its tangible and intangible assets to determine whether there is any indication that those assets have su§ered an impairment loss. If any such indication exists, the recoverable amount of the asset is estimated in order to determine the extent of the impairment loss (if any). When it is not possible to

26
NOTES TO THE FINANCIAL STATEMENTS CONTINUED
estimate the recoverable amount of an individual asset, the Group estimates the recoverable amount of the cash-generating unit to which the asset belongs. When a reasonable and consistent basis of allocation can be identified, corporate assets are also allocated to individual cash-generating units, or otherwise they are allocated to the smallest group of cash-generating units for which a reasonable and consistent allocation basis can be identified.
Intangible assets with indefinite useful lives and intangible assets not yet available for use are tested for impairment at least annually, and whenever there is an indication that the asset may be impaired.
Recoverable amount is the higher of fair value less costs to sell and value in use. In assessing value in use, the estimated future cash flows are discounted to their present value using a pre-tax discount rate that reflects current market assessments of the time and value of money and the risks specific to the asset for which the estimates of future cash have not been adjusted.
If the recoverable amount of an asset is estimated to be less than its carrying amount, the carrying amount of the asset is reduced to its recoverable amount. An impairment loss is recognised immediately in profit or loss.
When an impairment loss subsequently reverses, the carrying amount of the asset is increased to the revised estimate of its recoverable amount, but so that the increased carrying amount does not exceed the carrying amount that would have been determined had no impairment loss been recognised for the asset in prior years. A reversal of an impairment loss is recognised immediately in profit or loss.
(p) Trade and other payablesTrade and other payables are carried at amortised cost and due to their short term nature they are not discounted. They represent liabilities for goods and services provided to the Group by suppliers in the ordinary course of business prior to the end of the financial year that are unpaid and arise when the Group become obliged to make future payments in respect of the purchase of these goods and services. The amounts are unsecured and are usually paid within normal business trading terms. The Group acts as an agent for some carcass transactions. The income and expense is shown as a net amount in the statement of comprehensive income, however as the Group bears the credit risk, the trade payables show the full amount payable.
(q) Employee entitlementsLiabilities for wages, salaries and annual leave are recognised in the provision for employee benefits and measured at the amounts expected to be paid when the liabilities are settled. The employee benefit liability expected to be settled within twelve months from balance date is recognised in current liabilities.
(r) LeasesThe determination of whether an arrangement is or contains a lease is based on the substance of the arrangement at inception date, whether the fulfilment of the arrangement is dependent on the use of a specific asset or assets or the arrangement conveys the right to use the asset, even if that right is not explicitly specified in an arrangement.
Operating leases - Group as lesseeWhere the Group is the lessee, leases where the lessor retains substantially all the risks and benefits of ownership of assets are classified as operating leases. Net rental payments and incentives, excluding contingent payments, are recognised as an expense in profit or loss on a straight-line basis over the period of the lease.
(s) Classification as debt or equityDebt and equity instruments issued by a Group entity are classified as either financial liabilities or as equity in accordance with the substance of the contractual arrangements and the definitions of a financial liability and an equity instrument.
(t) Contributed equityOrdinary shares are classified as equity. Incremental costs directly attributable to the issue of new shares or options are shown in equity as a deduction, net of tax, from the proceeds.

27
(u) Earnings per shareThe Group presents basic and diluted earnings per share (EPS) data for its ordinary shares. Basic EPS is computed based on the weighted average number of ordinary shares outstanding during the period. Diluted EPS is computed based on the weighted average number of ordinary shares plus the e§ect of dilutive potential ordinary shares outstanding during the period
(v) Discontinued operations / assets held for sale / assets held for realisationA discontinued operation is a component of the Group’s business, the operations and cash flows of which can be clearly distinguished from the rest of the Group and which:
• represents a separate major line of business or geographical area of operations; or
• is part of a single co-ordinated plan to dispose of a separate major line of business or geographical area of operations; or
• is a subsidiary acquired exclusively with a view to re-sale.
Classification as a discontinued operation occurs at the earlier of disposal or when the operation meets the criteria to be classified as held-for-sale.
When an operation is classified as a discontinued operation, the comparative statement of financial performance and statement of comprehensive income is re-presented as if the operation had been discontinued from the start of the comparative year.
Non-current assets (or disposal groups) are classified as assets held for sale when their carrying amount is to be recovered principally through a sale transaction and a sale is considered highly probable. They are stated at the lower of carrying amount and fair value less costs to sell.
Any impairment loss on a disposal group is allocated first to goodwill, and then to the remaining assets and liabilities on a pro rata basis, except that no loss is allocated to inventories, financial assets, employee benefit assets, investment property, which continue to be measured in accordance with the Group’s other accounting policies. Impairment losses on initial classification as held-for-sale or held-for-distribution and subsequent gains and losses on remeasurement are recognised in profit or loss.
Once classified as held-for-sale, intangible assets and property, plant and equipment are no longer amortised or depreciated, and any equity-accounted investee is no longer equity accounted.
Where operations have been shut the remaining assets are held for realisation and have been written down to their expected recoverable value.
(w) Non-GAAP reporting measuresAdditional reporting measures have been referenced in the notes to the financial statements. The directors consider the following non-GAAP measures are relevant to the understanding of the Group’s financial performance.
• EBITDA before significant items (a non-GAAP measure) represents earnings before income taxes (a GAAP measure), excluding interest income, interest expense, depreciation and amortisation, excluding significant items, as reported in the financial statements.
• Total comprehensive income from continued operations after tax, excluding significant items (a non-GAAP measure) represents profit for the year (a GAAP measure) from continuing operations, less tax, excluding significant items.
28
NOTES TO THE FINANCIAL STATEMENTS CONTINUED
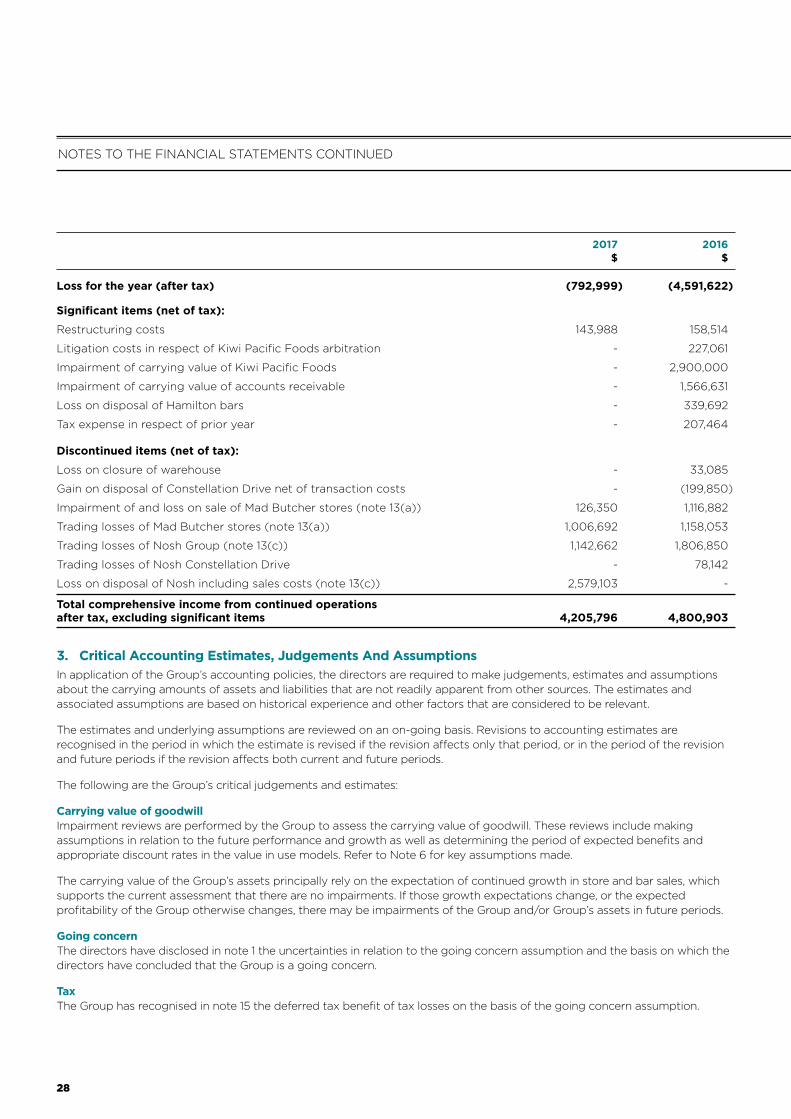
2017 2016 $ $
Loss for the year (after tax) (792,999) (4,591,622)
Significant items (net of tax):
Restructuring costs 143,988 158,514
Litigation costs in respect of Kiwi Pacific Foods arbitration - 227,061
Impairment of carrying value of Kiwi Pacific Foods - 2,900,000
Impairment of carrying value of accounts receivable - 1,566,631
Loss on disposal of Hamilton bars - 339,692
Tax expense in respect of prior year - 207,464
Discontinued items (net of tax):
Loss on closure of warehouse - 33,085
Gain on disposal of Constellation Drive net of transaction costs - (199,850)
Impairment of and loss on sale of Mad Butcher stores (note 13(a)) 126,350 1,116,882
Trading losses of Mad Butcher stores (note 13(a)) 1,006,692 1,158,053
Trading losses of Nosh Group (note 13(c)) 1,142,662 1,806,850
Trading losses of Nosh Constellation Drive - 78,142
Loss on disposal of Nosh including sales costs (note 13(c)) 2,579,103 -
Total comprehensive income from continued operations after tax, excluding significant items 4,205,796 4,800,903
3. Critical Accounting Estimates, Judgements And AssumptionsIn application of the Group’s accounting policies, the directors are required to make judgements, estimates and assumptions about the carrying amounts of assets and liabilities that are not readily apparent from other sources. The estimates and associated assumptions are based on historical experience and other factors that are considered to be relevant.
The estimates and underlying assumptions are reviewed on an on-going basis. Revisions to accounting estimates are recognised in the period in which the estimate is revised if the revision a§ects only that period, or in the period of the revision and future periods if the revision a§ects both current and future periods.
The following are the Group’s critical judgements and estimates:
Carrying value of goodwill Impairment reviews are performed by the Group to assess the carrying value of goodwill. These reviews include making assumptions in relation to the future performance and growth as well as determining the period of expected benefits and appropriate discount rates in the value in use models. Refer to Note 6 for key assumptions made.
The carrying value of the Group’s assets principally rely on the expectation of continued growth in store and bar sales, which supports the current assessment that there are no impairments. If those growth expectations change, or the expected profitability of the Group otherwise changes, there may be impairments of the Group and/or Group’s assets in future periods.
Going concern The directors have disclosed in note 1 the uncertainties in relation to the going concern assumption and the basis on which the directors have concluded that the Group is a going concern.
Tax The Group has recognised in note 15 the deferred tax benefit of tax losses on the basis of the going concern assumption.

29
Disposal of Nosh The directors have disclosed in note 5 and note 27 details around the disposal of the Nosh business unit during the year and the impact of the purchaser, Nosh Group Limited, going into receivership subsequent to year end. The Group has provided for those liabilities guaranteed by Veritas Investments Limited.
Trade and other receivables Where trade and other receivables are outstanding beyond their normal trading terms, the likelihood of the recovery of these trade receivables is assessed by management. The Group reviews the standing of each trade receivable balance to determine what provision, if any, is required.
For some balances that are outside of normal trading terms, new terms have been re-negotiated and based on these renegotiations the Board is of the view that these amounts are collectable.
For outstanding advances to Mad Butcher stores, these are considered normal operations for a large group of stores. In some cases additional collateral has been received from the debtor to support collectability, otherwise the Group has various guarantees in place that can be initiated if required. The Group reviews the standing of each advance balance to determine what provision, if any, is required.
Assets from operations classified as held for sale From time to time Mad Butcher will buy stores from a franchisee who choses to exit from the business. During the year two stores were purchased and were classified as held for sale. One store was sold, see note 5.
Impairment reviews are performed by the Group to assess the carrying value of the assets from operations held for sale. These reviews include making assumptions on what sales price would be achieved on each asset, less the cost to sell, to assess the likelihood of recovery of these assets held for sale. The Board have reviewed the recent history of sales prices achieved for similar assets and based on this analysis have determined that an additional impairment provision is not required.
4. New Standards, Amendments and InterpretationStandards, amendments and interpretations not e¦ective in the current yearRelevant standards, amendments and interpretations that are not yet e§ective and have not been early adopted by the Group are:
E¦ective for annual Expected to be initially reporting period applied in the financial Standard / interpretation beginning on or after year ending NZ IAS 7 ‘Cash Flow Statement’ 1 January 2017 30 June 2018 - Addresses disclosures regarding financial liabilities
NZ IFRS 9 ‘Financial Instruments’ 1 January 2018 30 June 2019 - Addresses measurement and recognition of financial assets and liabilities
NZ IFRS 15 ‘Revenue from Contracts with Customers’ 1 January 2018 30 June 2019 - Establishes principles for reporting information to users of financial statements about the nature, amount, timing and uncertainty of revenues and cash flows from contracts with customers
NZ IFRS 16 ‘Leases’ 1 January 2019 30 June 2020 - Addresses measurement and recognition of leases and will require all leases to be on balance sheet, except for certain short term, low value assets

30
NOTES TO THE FINANCIAL STATEMENTS CONTINUED
The impact of adoption of NZ IAS 7 will require additional disclosure requirements in the financial statements.
The financial statement impact of adoption of NZ IFRS 9 is not expected to have a material measurement impact on the financial statements reported by the Group, however there will be additional disclosure requirements.
The financial statement impact of adoption of NZ IFRS 15 is not expected to have a material measurement impact on the financial statements reported by the Group, however there may be additional disclosure requirements.
The Group intends to adopt NZ IFRS 16 on its e§ective date. The Group is yet to assess the full impact of the new standard, however as per note 25, the value of operating lease commitments is $13.6 million. The total value of the future lease payments to the final expiry dates of the leases is $26 million and the net present value of this is $14 million. Approximately this value will come on balance sheet increasing property, plant and equipment, and current and term liabilities. Interest expense and depreciation expense will increase, but this will be o§set by a decrease in operating expenses. While there may be a timing issue in recognition of future earnings we do not expect this to significant and there will be no change to the on-going earnings on a sustainable basis.
Standards, amendments and interpretations e¦ective in the current yearThere have been no new standards, amendments and interpretations that are e§ective in the current year, which have a material impact on the financial statements.
5. Acquisitions and Disposals Nosh GroupOld NGL Limited, previously Nosh Group Limited (Nosh Group) sold its business and assets to Gosh Holdings Limited on 24 February 2017. Gosh Holdings Limited then changed it’s name to Nosh Group Limited. The sale of Nosh Group’s assets included the assumption by Nosh Group Limited of the leases, employee entitlements and trade creditors of Nosh Group. The loss on sale after tax including sales costs of Nosh Group was $(2,579,103). Old NGL Limited was place into liquidation on 29 August 2017.
The interest in Nosh Constellation Limited (“Nosh CD”) was sold on 2 November 2015 for a gain on sale of $199,850, including transaction costs. The business was a franchisee store and its results were not recorded as part of the Veritas Group, except for the transactions between it and Nosh Group Limited.
The Better Bar Company Limited On 7 December 2015 The BBC sold three of its Hamilton bars that were not trading to expectations for a total consideration of $1,012,256. The loss on sale of these bars, including transactions costs was $(471,795).
Mad Butcher stores As master franchisor, from time to time the Mad Butcher will buy stores from a franchisee who chooses to exit from the business. If it is beneficial to keep these stores open, these are run on normal business terms and are held for sale until a new franchisee is confirmed. During the year two stores (2016: nil) were purchased for a total consideration of $282,206 and were classified as held for sale. During the year one store (2016: nil) was sold and no stores have been closed (2016: three stores) for a total loss after tax of $(126,350).
2017 2016
Owned stores held at the start of the year 2 5
Owned stores purchased during the year 2 -
Owned stores sold during the year (1) -
Owned stores closed during the year - (3)
Owned stores held at the end of the year 3 2

31
6. Intangible Assets Computer Goodwill Software Total $ $ $
Year ended 30 June 2017
Opening balance net book value 30,593,167 16,333 30,609,500
Additions - 26,792 26,792
Amortisation charge - (8,064) (8,064)
Closing net book value 30,593,167 35,061 30,628,228
At 30 June 2017
Cost 30,593,167 135,829 30,728,996
Accumulated amortisation - (100,768) (100,768)
Net book value 30,593,167 35,061 30,628,228
Year ended 30 June 2016
Opening balance net book value 30,593,167 50,362 30,643,529
Additions - 58,675 58,675
Amortisation charge - (92,704) (92,704)
Closing net book value 30,593,167 16,333 30,609,500
At 30 June 2016
Cost 30,593,167 109,037 30,702,204
Accumulated amortisation - (92,704) (92,704)
Net book value 30,593,167 16,333 30,609,500
Goodwill arose on the acquisition of The BBC and has been allocated to it’s eight CGU’s. A CGU is a bar or a group of bars that share operational facilities. For all CGU’s on an annual basis, the recoverable amount of the goodwill is determined based on value in use calculations for each CGU to which the goodwill relates. Goodwill was tested for impairment in June 2017.
The value in use calculations are initially based on financial budgets and business plans approved by the Directors. Cash flows beyond this period are extrapolated using the estimated growth rates below. The growth rates do not exceed the long-term average growth rate for the business in which the CGU operates.
The carrying values of the Group’s assets principally rely on the expectation of continued growth in bar sales, which supports the current assessment that there are no impairments. If those growth expectations change, or the expected profitability of the Group otherwise changes, there may be impairments of the Group assets in future periods. Management believe that any reasonably possible change in the key assumptions would not cause the carrying amount of the goodwill to exceed the recoverable amount. These values represent past experience and are consistent with external sources of information.

32
NOTES TO THE FINANCIAL STATEMENTS CONTINUED
The key assumptions used for the value in use calculations in all models are as follows:
2017 2016
Pre tax discount rate 13.9% 13.9%
Cash flow forecast period 3 years 3 years
Terminal growth rate 2.0% 2.0%
Annual sales growth rate 0% - 1% 2% - 3%
Based on the sensitivity analysis performed the discount rate would need to increase to 17%, or the terminal growth rate would need to become a negative amount, before there would be an impairment of the Group’s total goodwill amount. As goodwill is tested at a CGU level, impairments may occur at lower levels of sensitivity.
Goodwill has been allocated to the following bars:
2017 2016 $ $
Danny Doolans 11,701,241 11,701,241
O’Hagan’s 6,083,170 6,083,170
The Cav 4,853,300 4,853,300
Doolan Brothers Botany 3,702,035 3,702,035
Doolan Brothers Ellerslie 3,234,170 3,234,170
Other 1,019,251 1,019,251
30,593,167 30,593,167
7. Revenue 2017 2016 $ $
Store and bar sales 23,624,324 24,462,965
Carcass rebates 611,110 1,218,884
Supplier rebates 3,735,865 4,614,206
Advertising income 2,313,345 2,543,877
Franchise fees 506,715 596,371
Other income 5,209 12,501
30,796,568 33,448,804
8. Segment Reporting The Group is organised into the following business segments, predominantly reflecting trading divisions in the Group:
The Mad Butcher This segment represents the activities of the Mad Butcher franchisor business, as well as four owned retail stores in 2017 which have been reclassified to assets held for sale. The Mad Butcher franchisor comprises the brand, franchise system and franchisor rights for Mad Butcher stores across New Zealand. Mad Butcher stores are retail butchers.
The BBC This segment includes the business activities of The Better Bar Company Limited which operates a chain of eight bars based in Auckland and Hamilton.

33
Kiwi Pacific Foods This segment includes the 50% joint venture interest Veritas held in Kiwi Pacific Foods Limited. It produced and distributed meat patties to the Burger King Franchise in New Zealand and other customers. The business was closed in June 2016 and the assets sold and distributed to the shareholders in 2017. In the segment analysis that follows, Kiwi Pacific Foods, results are shown at EBITDA, in line with management reporting and consistent with other segment reporting. In the statement of comprehensive income results are shown as net profit after tax.
Operations held for sale This segment includes the business activities of the Nosh business and the owned Mad Butchers stores held for sale.
Other Includes the activities of the Parent Company.
The Board of Directors (“The Board”) continues to be the Chief Decision Maker (“CODM”) for the Group as they are responsible for allocating resources and assessing performance across the Group. For each of the entities the Board reviews management reports on a monthly basis.
Information regarding the results of each reportable segment is included below. Performance is measured based on segment EBITDA before significant items as included in the management reports that are reviewed by the Board. Segment EBITDA before significant items is used to measure performance as the Board believes that such information is the most relevant in evaluating the results of certain segments relative to other entities that operate within these industries.
Statement of Comprehensive Income 2017 2016 EBITDA EBITDA before before significant significant Revenue EBITDA items Revenue EBITDA items $ $ $ $ $ $
Mad Butcher 7,167,035 3,650,453 3,650,453 9,342,139 2,398,843 4,574,720
The BBC 23,624,324 5,919,570 5,919,570 24,094,164 5,037,290 5,509,085
Kiwi Pacific Foods - - - - (3,032,621) 182,741
Other 5,209 (1,568,772) (1,396,011) 12,501 (1,207,793) (987,634)
Group 30,796,568 8,001,251 8,174,012 33,448,804 3,195,719 9,278,912
Significant and other items
Restructuring costs (172,761) (220,159)
Litigation costs in respect of Kiwi Pacific Foods arbitration - (315,362)
Impairment of carrying value of Kiwi Pacific Foods - (2,900,000)
Impairment of carrying value of accounts receivable - (2,175,877)
Loss on disposal of Hamilton bars - (471,795)
Depreciation and amortisation (612,304) (766,616)
Finance expense (net of income) (1,723,317) (1,686,428)
Share of joint venture’s depreciation, finance and taxation expenses - (163,551)
Profit /(loss) before income tax from continuing operations 5,665,630 579,124

34
NOTES TO THE FINANCIAL STATEMENTS CONTINUED
Balance Sheet 2017 2016 Segment Segment Segment Segment Assets Liabilities Assets Liabilities $ $ $ $
Mad Butcher 2,527,420 1,679,537 1,859,369 1,301,913
The BBC 35,577,010 21,946,512 35,243,715 25,053,837
Kiwi Pacific Foods - - 386,011 -
Other 737,466 8,036,285 1,227,461 9,996,054
Operations held for sale 745,673 705,778 8,191,862 2,544,158
Group 39,587,569 32,368,112 46,908,418 38,895,962
Geographical Veritas and its subsidiaries operate within New Zealand, and derived no revenue from foreign countries for the year ended 30 June 2017 (2016: nil).
Information about major customers No single customer contributed 10% or more to the Group’s revenue for the year ended 30 June 2017 (2016: nil).
Capital expenditure (including software) 2017 2016 $ $
Capital expenditure for each reporting segment for the year:
Mad Butcher 31,990 62,718
Nosh Group - 1,103,195
The BBC 458,509 169,963
490,499 1,335,876
9. Other Expenses 2017 2016 $ $
Other expenses include:
Advertising and marketing costs 2,987,150 4,578,682
Property expenses including lease costs 3,696,508 3,630,081
Professional and other advisory costs 753,899 273,437
Equipment hire 17,037 57,396
Insurance 104,094 93,693
Travel expenses 66,947 90,034
Provision for doubtful debts 340,000 3,191
Other 1,977,696 2,304,316
9,943,331 11,030,830

35
Remuneration to auditors included:
2017 2016 $ $
Audit of the financial statements 225,575 226,650
Agreed upon procedures in relation to the interim financial statements - 18,165
Other fees paid to Auditors* - 108,965
Other fees paid to Auditors - tax compliance services 31,790 28,615
Other fees paid to Auditors - tax compliance services prior year 40,000 -
Total remuneration paid or payable to auditors 297,365 382,395
* Other fees relate to understanding and analysis of historical and projected financial information as well as the Group’s performance improvement plans to assist in reporting to our funding provider.
10. Tax Expense 2017 2016 $ $
The income tax expense consists of the following:
Profit before income tax from continuing operations 5,665,630 579,124
Income tax expense calculated at 28% (2016: 28%) 1,586,376 162,155
Non deductible expenses 40,788 813,338
Joint venture results reported net of tax - (5,373)
Tax in respect of prior years 10,835 207,464
Non assessable income (34,177) -
Tax expense 1,603,822 1,177,584
Current tax expense 1,560,970 1,955,463
Deferred tax charge / (benefit) 42,852 (777,879)
Tax expense 1,603,822 1,177,584
Imputation credits available for subsequent reporting periods based on a tax rate of 28% (2016: 28%) 1,106,352 1,150,601
The imputed portions of any dividend recommended after 30 June 2017 will be imputed out of the existing imputation credits.

36
NOTES TO THE FINANCIAL STATEMENTS CONTINUED
11. Trade and Other Receivables 2017 2016 $ $
Trade receivables 1,909,782 1,443,931
Related party receivables (note 23) 635,853 118,117
Advances to stores 366,485 208,468
2,912,120 1,770,516
Prepayments 248,975 148,999
Provision for doubtful debts (734,316) (498,340)
Total current 2,426,779 1,421,175
The fair value of trade and other receivables approximates their carrying value. Non current trade receivables relate to customers where the terms of payment have been renegotiated.
Aging of trade and other receivables The aging analysis of trade receivables is as follows: 2017 2016 $ $
Current 587,456 861,222
30 days 114,640 119,252
60 days 109,076 67,950
More than three months 1,098,610 395,507
Total 1,909,782 1,443,931
The aging analysis of related party receivables is as follows: 2017 2016 $ $
Current 104,297 13,606
30 days 58,442 -
60 days 33,582 10,395
More than three months 439,532 94,116
Total 635,853 118,117
The aging analysis of advances to stores is as follows: 2017 2016 $ $
Current 22,923 -
30 days 31,626 42,765
60 days 27,000 15,703
More than three months 284,936 150,000
Total 366,485 208,468

37
As at 30 June 2017 in regard to receivables which are past due but not impaired, for some balances new terms have been renegotiated and, based on these renegotiations, the Board views that these amounts are collectable. In some cases additional support has been received from the debtor to support collectability, otherwise the Group has various guarantees in place that can be initiated if required. For any receivable which may be considered impaired, the Board have established a provision against these as below.
Provision for doubtful debts 2017 2016 $ $
Opening balance (498,340) (204,652)
Impairment of carrying value of accounts receivable - (2,175,877)
Provision recognised during the year (340,000) (3,191)
Receivables written o§ during the year 104,024 1,885,380
As at 30 June 2017 (734,316) (498,340)
12. Inventories 2017 2016 $ $
Raw materials 75,724 87,734
Finished goods 252,135 190,899
327,859 278,633
13. Discounted Operations Held for Sale and Realisation 2017 2016 $ $
Assets from operations classified as held for sale:
Mad Butcher stores 745,673 620,728
Nosh Group - 6,926,775
745,673 7,547,503
Consisting of:
Working capital 291,835 2,856,903
Non-current assets 453,838 4,690,600
745,673 7,547,503

38
NOTES TO THE FINANCIAL STATEMENTS CONTINUED
During the year the Group transferred 2016 tax losses of $1,397,078 from discontinued operations to Veritas Investments Limited.
2017 2016 $ $
Liabilities from operations classified as held for sale:
Mad Butcher stores 390,220 224,274
Nosh Group - 1,562,507
390,220 1,786,781
Trading loss for the year from operations classified as held for sale and discontinued operations:
2017 2016 $ $
Mad Butcher stores (see a below) (1,006,692) (1,158,053)
Nosh Constellation Limited (see b below) - (78,142)
Nosh Group (see c below) (1,142,662) (1,806,850)
(2,149,354) (3,043,045)
2017 2016 $ $
(a) Mad Butcher stores
Revenue 6,515,864 9,053,978
Expenses (7,914,047) (10,662,385)
Loss before tax (1,398,183) (1,608,407)
Tax benefit 391,491 450,354
Trading loss for the year (1,006,692) (1,158,053)
Loss on sale and impairment of Mad Butcher stores, including sales costs (129,728) (1,551,225)
Tax benefit 3,378 434,343
Net loss on sale or closure of Mad Butcher stores (126,350) (1,116,882)
As master franchisor, from time to time Mad Butcher will buy stores from a franchisee who choses to exit from the business. If it is beneficial to keep these stores open, these are run on normal business terms and are held for sale until a new franchisee is confirmed. During the current year two stores were purchased and one store was sold. Refer note 5.
The assets of the stores held for sale have been written down to their realisable value and have been separately disclosed as assets held for realisation. The liabilities of the discontinued stores have been separately disclosed as liabilities from discontinued stores.
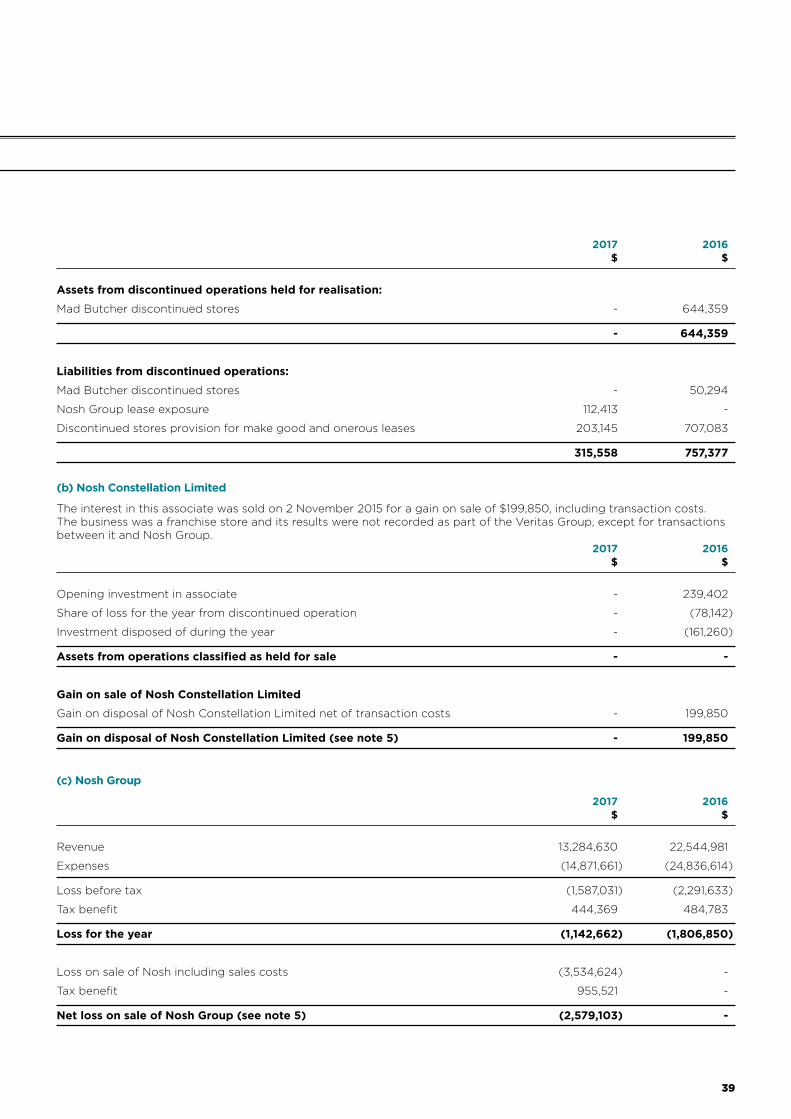
39
2017 2016 $ $
Assets from discontinued operations held for realisation:
Mad Butcher discontinued stores - 644,359
- 644,359
Liabilities from discontinued operations:
Mad Butcher discontinued stores - 50,294
Nosh Group lease exposure 112,413 -
Discontinued stores provision for make good and onerous leases 203,145 707,083
315,558 757,377
(b) Nosh Constellation Limited
The interest in this associate was sold on 2 November 2015 for a gain on sale of $199,850, including transaction costs. The business was a franchise store and its results were not recorded as part of the Veritas Group, except for transactions between it and Nosh Group. 2017 2016 $ $
Opening investment in associate - 239,402
Share of loss for the year from discontinued operation - (78,142)
Investment disposed of during the year - (161,260)
Assets from operations classified as held for sale - -
Gain on sale of Nosh Constellation Limited
Gain on disposal of Nosh Constellation Limited net of transaction costs - 199,850
Gain on disposal of Nosh Constellation Limited (see note 5) - 199,850
(c) Nosh Group
2017 2016 $ $
Revenue 13,284,630 22,544,981
Expenses (14,871,661) (24,836,614)
Loss before tax (1,587,031) (2,291,633)
Tax benefit 444,369 484,783
Loss for the year (1,142,662) (1,806,850)
Loss on sale of Nosh including sales costs (3,534,624) -
Tax benefit 955,521 -
Net loss on sale of Nosh Group (see note 5) (2,579,103) -

40
NOTES TO THE FINANCIAL STATEMENTS CONTINUED
14. Property, Plant and Equipment Fixtures Plant, O�ce Computer Lease Vehicles Equipment Equipment Improvements Total
$ $ $ $ $
Year ended 30 June 2017
Opening balance net book value 40,626 1,313,982 18,573 2,486,787 3,859,968
Additions - 240,551 2,428 220,728 463,707
Disposals - (3,572) - - (3,572)
Depreciation charge (11,940) (306,216) (11,632) (274,452) (604,240)
Closing net book value 28,686 1,244,745 9,369 2,433,063 3,715,863
At 30 June 2017
Cost 81,546 2,116,874 46,564 3,276,810 5,521,794
Accumulated depreciation (52,860) (872,129) (37,195) (843,747) (1,805,931)
Net book value 28,686 1,244,745 9,369 2,433,063 3,715,863
Year ended 30 June 2016
Opening balance net book value 64,066 2,275,063 30,157 3,666,847 6,036,133
Reclassifications to other assets including assets of discontinued operations held for realisation (6,520) (336,721) (2,671) 56,669 (289,243)
Additions - 125,703 7,380 40,923 174,006
Disposals - (430,893) (1,218) (946,942) (1,379,053)
Depreciation charge (16,920) (319,170) (15,075) (330,710) (681,875)
Closing net book value 40,626 1,313,982 18,573 2,486,787 3,859,968
At 30 June 2016
Cost 81,546 1,879,895 44,136 3,056,082 5,061,659
Accumulated depreciation (40,920) (565,913) (25,563) (569,295) (1,201,691)
Net book value 40,626 1,313,982 18,573 2,486,787 3,859,968
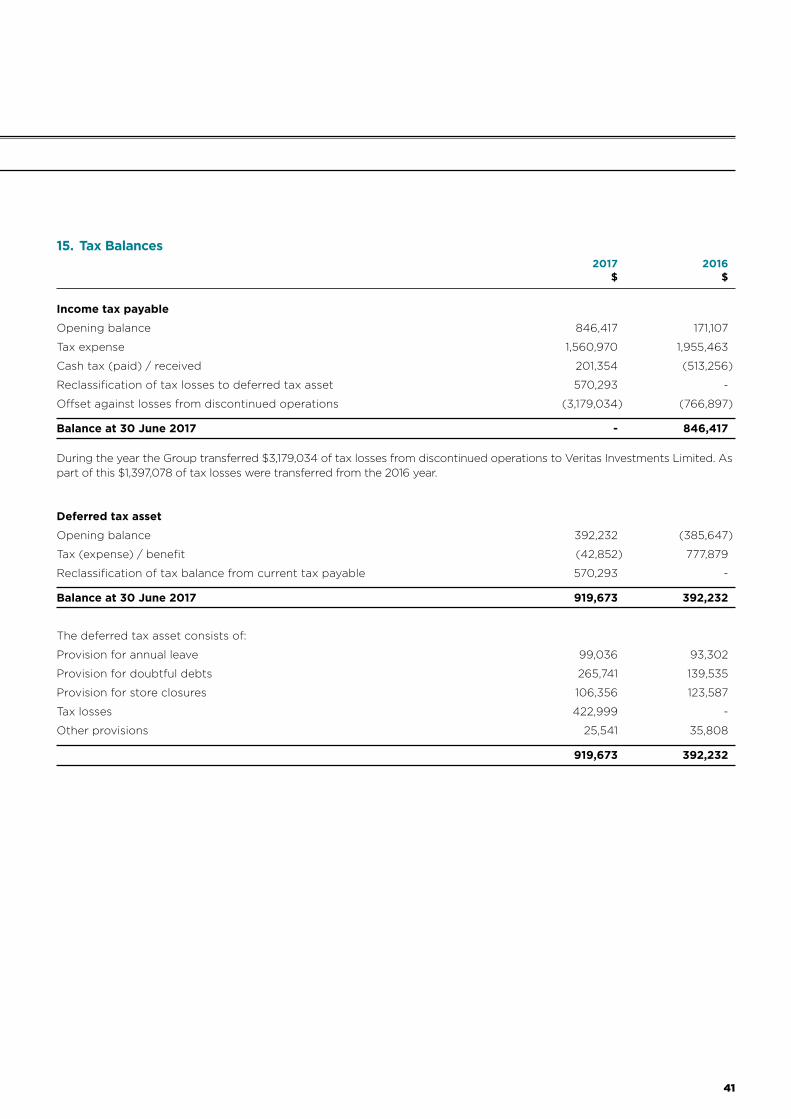
41
15. Tax Balances 2017 2016 $ $
Income tax payable
Opening balance 846,417 171,107
Tax expense 1,560,970 1,955,463
Cash tax (paid) / received 201,354 (513,256)
Reclassification of tax losses to deferred tax asset 570,293 -
O§set against losses from discontinued operations (3,179,034) (766,897)
Balance at 30 June 2017 - 846,417
During the year the Group transferred $3,179,034 of tax losses from discontinued operations to Veritas Investments Limited. As part of this $1,397,078 of tax losses were transferred from the 2016 year.
Deferred tax asset
Opening balance 392,232 (385,647)
Tax (expense) / benefit (42,852) 777,879
Reclassification of tax balance from current tax payable 570,293 -
Balance at 30 June 2017 919,673 392,232
The deferred tax asset consists of:
Provision for annual leave 99,036 93,302
Provision for doubtful debts 265,741 139,535
Provision for store closures 106,356 123,587
Tax losses 422,999 -
Other provisions 25,541 35,808
919,673 392,232
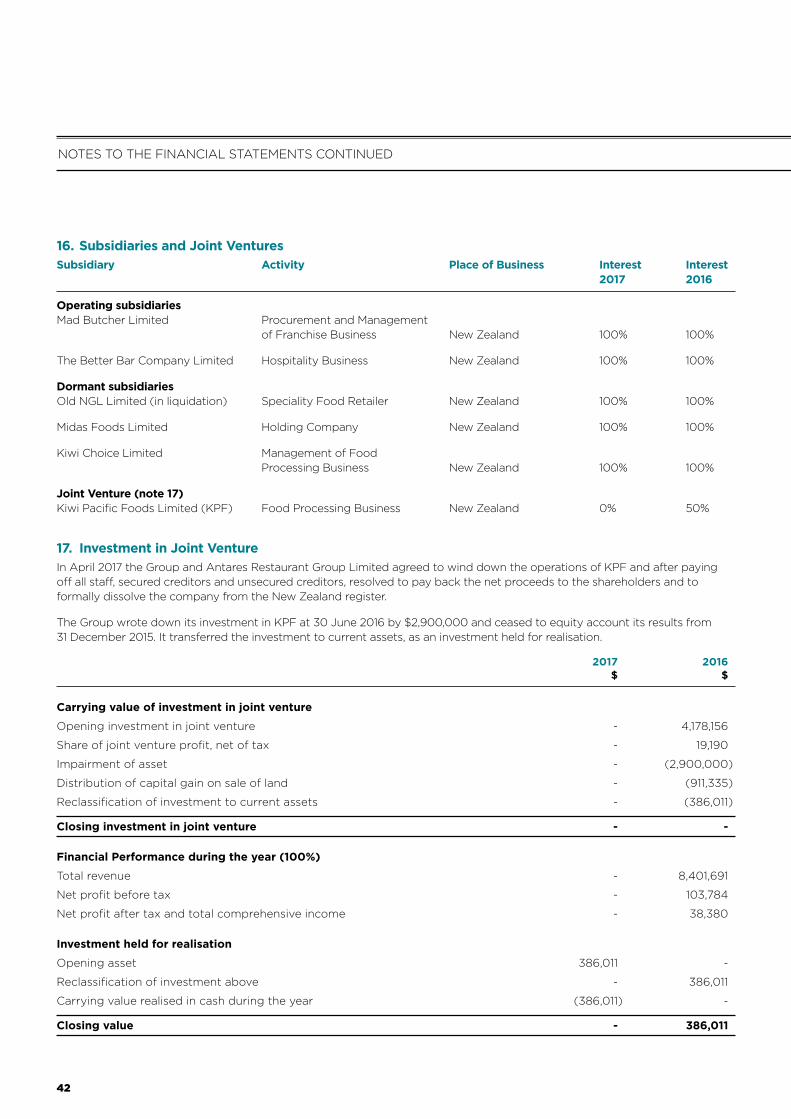
42
NOTES TO THE FINANCIAL STATEMENTS CONTINUED
16. Subsidiaries and Joint Ventures Subsidiary Activity Place of Business Interest Interest 2017 2016
Operating subsidiaries Mad Butcher Limited Procurement and Management of Franchise Business New Zealand 100% 100%
The Better Bar Company Limited Hospitality Business New Zealand 100% 100%
Dormant subsidiaries Old NGL Limited (in liquidation) Speciality Food Retailer New Zealand 100% 100%
Midas Foods Limited Holding Company New Zealand 100% 100%
Kiwi Choice Limited Management of Food Processing Business New Zealand 100% 100%
Joint Venture (note 17) Kiwi Pacific Foods Limited (KPF) Food Processing Business New Zealand 0% 50%
17. Investment in Joint Venture In April 2017 the Group and Antares Restaurant Group Limited agreed to wind down the operations of KPF and after paying o§ all sta§, secured creditors and unsecured creditors, resolved to pay back the net proceeds to the shareholders and to formally dissolve the company from the New Zealand register.
The Group wrote down its investment in KPF at 30 June 2016 by $2,900,000 and ceased to equity account its results from 31 December 2015. It transferred the investment to current assets, as an investment held for realisation.
2017 2016 $ $
Carrying value of investment in joint venture
Opening investment in joint venture - 4,178,156
Share of joint venture profit, net of tax - 19,190
Impairment of asset - (2,900,000)
Distribution of capital gain on sale of land - (911,335)
Reclassification of investment to current assets - (386,011)
Closing investment in joint venture - -
Financial Performance during the year (100%)
Total revenue - 8,401,691
Net profit before tax - 103,784
Net profit after tax and total comprehensive income - 38,380
Investment held for realisation
Opening asset 386,011 -
Reclassification of investment above - 386,011
Carrying value realised in cash during the year (386,011) -
Closing value - 386,011
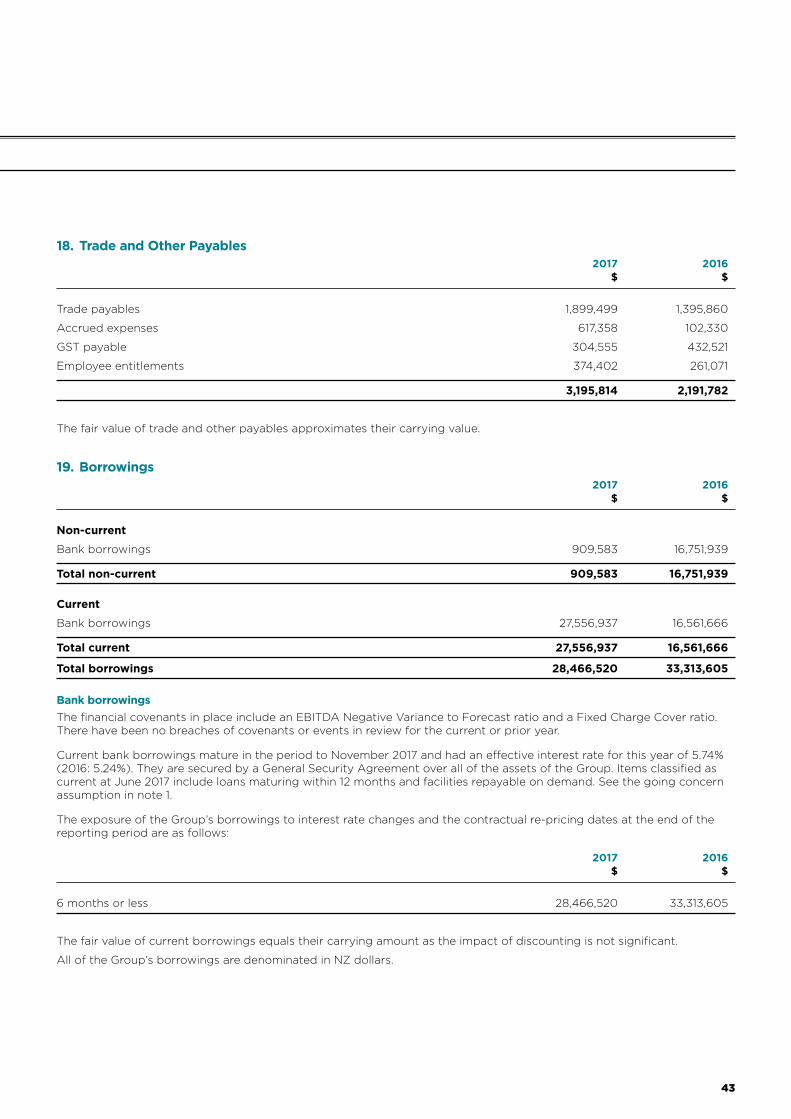
43
18. Trade and Other Payables 2017 2016 $ $
Trade payables 1,899,499 1,395,860
Accrued expenses 617,358 102,330
GST payable 304,555 432,521
Employee entitlements 374,402 261,071
3,195,814 2,191,782
The fair value of trade and other payables approximates their carrying value.
19. Borrowings 2017 2016 $ $
Non-current
Bank borrowings 909,583 16,751,939
Total non-current 909,583 16,751,939
Current
Bank borrowings 27,556,937 16,561,666
Total current 27,556,937 16,561,666
Total borrowings 28,466,520 33,313,605
Bank borrowings The financial covenants in place include an EBITDA Negative Variance to Forecast ratio and a Fixed Charge Cover ratio. There have been no breaches of covenants or events in review for the current or prior year.
Current bank borrowings mature in the period to November 2017 and had an e§ective interest rate for this year of 5.74% (2016: 5.24%). They are secured by a General Security Agreement over all of the assets of the Group. Items classified as current at June 2017 include loans maturing within 12 months and facilities repayable on demand. See the going concern assumption in note 1.
The exposure of the Group’s borrowings to interest rate changes and the contractual re-pricing dates at the end of the reporting period are as follows:
2017 2016 $ $
6 months or less 28,466,520 33,313,605
The fair value of current borrowings equals their carrying amount as the impact of discounting is not significant.
All of the Group’s borrowings are denominated in NZ dollars.

44
NOTES TO THE FINANCIAL STATEMENTS CONTINUED
The Group has the following undrawn borrowing facilities:
2017 2016 $ $
Expiring within one year 360,000 360,000
Total 360,000 360,000
The facilities expiring within one year are annual facilities subject to review at various dates.
The Group has $27.6 million of current borrowings. Non-current borrowings of $0.9 million expires on a monthly basis out to September 2019. The Group’s current liabilities are now significantly in excess of its current assets.
The Directors have confirmed that no dividend will be paid for the year and have agreed that future dividends will only be paid with the approval of the ANZ.
20. Share Capital 2017 2016 Shares $ Shares $
Issued and paid-up capital - ordinary shares Balance at beginning of the year 43,306,618 34,136,660 43,306,618 34,235,187
Shares issued - - - -
Share buyback - - - (98,527)
Balance at end of year 43,306,618 34,136,660 43,306,618 34,136,660
All ordinary shares carry equal rights in respect of voting and the receipt of dividends. Ordinary shares do not have a par value.
As part of the BBC business acquisition settlement adjustment the Directors agreed to buy back 1,000,000 shares at a nominal value of $1. For the purpose of earnings per share these were considered unissued from the date of acquisition, 28 November 2014, and were excluded from the calculation in note 21. The buy back was subject to normal shareholder approval at the Annual General Meeting held on 19 November 2015. The costs of the buyback of $98,527 have been recognised in the prior year against opening share capital.

45
21. Earnings Per Share 2017 2016 $ $
Profit / (loss) for the year from continuing operations 4,061,808 (598,460)
Profit / (loss) for the year (792,999) (4,591,622)
Issued Ordinary Shares 43,306,618 43,306,618
Weighted average no. of shares 43,306,618 43,306,618
cents centsBasic and diluted earnings per share (losses) from continuing operations 9.38 (1.38)
Basic and diluted earnings per share (losses) (1.83) (10.60)
22. Dividend Paid or Authorised Veritas paid dividends amounting to $nil during the year (2016: $472,091).
2017 2016 Cents per share Cents per share
Final dividend for the prior year - 1.07
Interim dividend for the current year - -
23. Related PartiesAll subsidiaries and joint ventures disclosed in note 16 are classified as related parties. Transactions and balances between these related parties are as follows:
Nosh Group purchased certain butchery products from Mad Butcher franchisee stores on normal arms length basis. The total purchases for the year to the date of disposal of Nosh were $273,122 (2016: $484,000). Amount owing at balance date is $nil (2016: $nil).
Transactions With Key ManagementMad Butcher Limited receives advertising and franchisee fees from the Mad Butcher stores. Michael Morton (acting CEO, Director and Shareholder) owns five Mad Butcher stores (2016 three). Mt Roskill, Manukau and Upper Hutt were owned throughout the year. Napier and Dunedin were purchased in the year. Total fees received for the year from these stores were $389,728 (2016: $110,185). Mad Butcher Limited waived certain fees during the year totalling $19,404 (2016: $201,808) and provided advances to these stores for the year for the amount of $nil (2016: $11,124).
The total receivable owing at balance date for these stores is $703,908 (2016: $118,117), consisting of $635,853 owed to the Mad Butcher Limited and $68,055 owed to the Mad Butcher Onehunga store.
Cook Executive Recruitment Limited of which Tim Cook (Chairman and Shareholder of the Group) is a Shareholder, supplies recruitment services to the Group as and when required on a normal arms length basis. Total transactions for the year were $nil (2016: $72,853). There was no amount owing at balance date (2016: nil).
Corporate Advisory Limited of which Tim Cook (Chairman and Shareholder of the Group) is a Shareholder, supplied consulting services to the Group as and when required on a normal arms length basis. Total transactions for the year were $50,000 (2016: $nil). The amount owing at balance date was $57,500 (2016: nil).
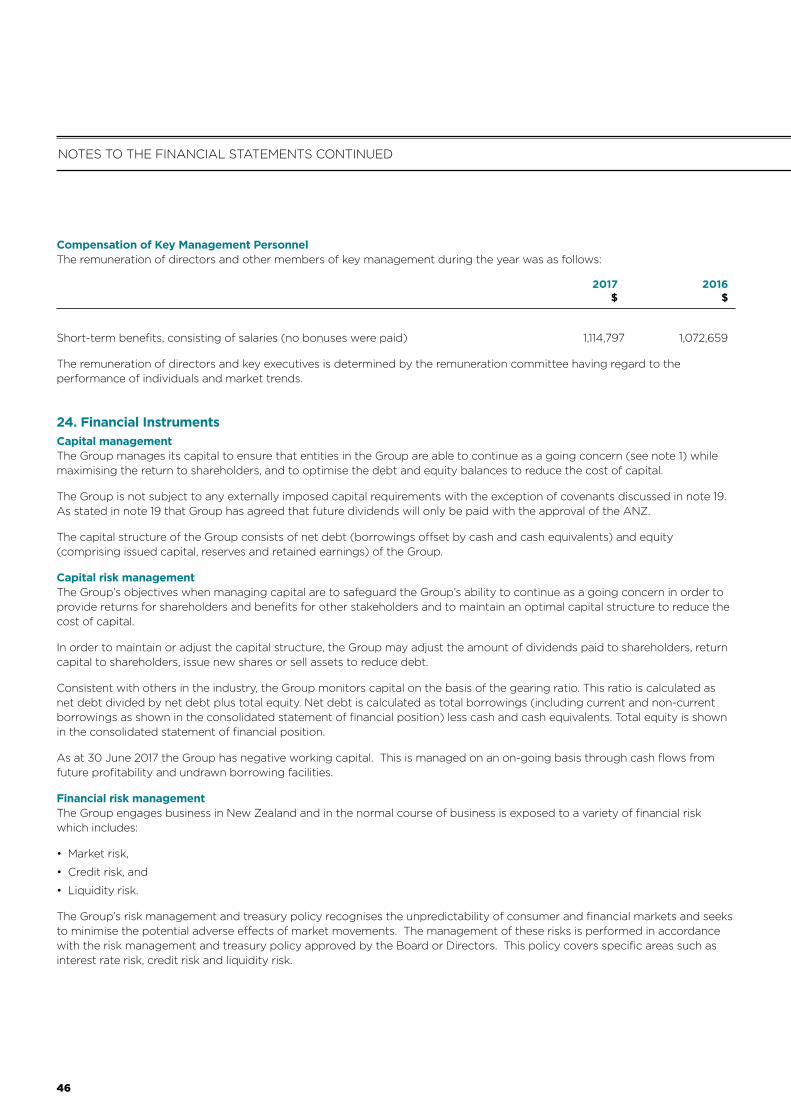
46
NOTES TO THE FINANCIAL STATEMENTS CONTINUED
Compensation of Key Management Personnel The remuneration of directors and other members of key management during the year was as follows:
2017 2016 $ $
Short-term benefits, consisting of salaries (no bonuses were paid) 1,114,797 1,072,659
The remuneration of directors and key executives is determined by the remuneration committee having regard to the performance of individuals and market trends.
24. Financial Instruments Capital managementThe Group manages its capital to ensure that entities in the Group are able to continue as a going concern (see note 1) while maximising the return to shareholders, and to optimise the debt and equity balances to reduce the cost of capital.
The Group is not subject to any externally imposed capital requirements with the exception of covenants discussed in note 19. As stated in note 19 that Group has agreed that future dividends will only be paid with the approval of the ANZ.
The capital structure of the Group consists of net debt (borrowings o§set by cash and cash equivalents) and equity (comprising issued capital, reserves and retained earnings) of the Group.
Capital risk management The Group’s objectives when managing capital are to safeguard the Group’s ability to continue as a going concern in order to provide returns for shareholders and benefits for other stakeholders and to maintain an optimal capital structure to reduce the cost of capital.
In order to maintain or adjust the capital structure, the Group may adjust the amount of dividends paid to shareholders, return capital to shareholders, issue new shares or sell assets to reduce debt.
Consistent with others in the industry, the Group monitors capital on the basis of the gearing ratio. This ratio is calculated as net debt divided by net debt plus total equity. Net debt is calculated as total borrowings (including current and non-current borrowings as shown in the consolidated statement of financial position) less cash and cash equivalents. Total equity is shown in the consolidated statement of financial position.
As at 30 June 2017 the Group has negative working capital. This is managed on an on-going basis through cash flows from future profitability and undrawn borrowing facilities.
Financial risk management The Group engages business in New Zealand and in the normal course of business is exposed to a variety of financial risk which includes:
• Market risk,
• Credit risk, and
• Liquidity risk.
The Group’s risk management and treasury policy recognises the unpredictability of consumer and financial markets and seeks to minimise the potential adverse e§ects of market movements. The management of these risks is performed in accordance with the risk management and treasury policy approved by the Board or Directors. This policy covers specific areas such as interest rate risk, credit risk and liquidity risk.

47
The Group hold the following financial instruments:
2017 2016 $ $
Financial assetsCash and cash equivalents 598,494 1,694,037
Restricted cash 225,000 75,000
Trade and other receivables (excluding prepayments) 2,177,804 1,272,176
3,001,298 3,041,213
Financial liabilities Bank borrowings 28,466,520 33,313,605
Trade and other payables (excluding GST and employee entitlements) 2,516,857 1,498,190
30,983,377 34,811,795
Market risk Interest rate risk The Group’s primary interest rate risk arises from bank borrowings. Borrowings issued at variable rates expose the business to cash flow interest rate risk. The Group’s risk management and treasury policy allows the potential use of derivative financial instruments to manage interest rate risk. However, for the year ended 30 June 2017 the Group did not enter into any derivative financial instruments (2016: nil).
As at 30 June 2017 the Group had $28,466,520 drawn on a facility provided by the bank (2016: $33,313,605).
If interest rates had moved by + / - 1% with all other variables held constant, Group profit before income tax, and equity for the year ended 30 June 2017 would have decreased / increased by $310,000 (2016: $352,000).
Credit risk Exposure to credit risk arises from the potential default of the counterparty, with the maximum exposure equal to the carrying amount of the financial assets. The Group’s credit risk arises from the Group’s financial assets, which include cash and cash equivalents and trade and other receivables. Financial assets are assessed for indicators of impairment at each reporting date. Financial assets are impaired when there is objective evidence that the estimated future cash flows of the assets have been impacted as a result of one or more events that occurred after the initial recognition of the financial asset.
For banks and financial institutions, only independently rated parties with a minimum long term rating of A are accepted. The Group has a concentration of credit risk with its cash and cash equivalents, which are held with one bank. The maximum exposure to credit risk at the reporting date is the carrying amount of the financial assets summarised above. On occasion the Group holds security on the Personal Property Security Register for amounts outstanding from franchisees.
The Group’s risk management and treasury policy also sets the maximum counterparty credit exposure to any individual bank or financial institution.
The quality of financial assets which are neither past due nor impaired are considered collectable.
Liquidity risk Liquidity risk arises from the financial liabilities of the Group and the Group’s subsequent ability to meet its obligation to repay its financial liabilities as and when they fall due.
The Group maintains su°cient cash and the availability of funding through undrawn facilities as part of its management of liquidity risk.

48
NOTES TO THE FINANCIAL STATEMENTS CONTINUED
The Group had access to the following borrowing facilities at the reporting date: 2017 2016 $ $
Borrowing facilities (of which $28,466,520 drawn, 2016: $33,313,605) 28,916,520 33,783,605
28,916,520 33,783,605
The following table details the Group’s remaining contractual maturity of its financial liabilities. The tables have been drawn up based on the undiscounted cash flows of financial liabilities based on the earliest date on which the Group can be required to pay, including loans repayable on demand. The tables include both interest and principal cash flows. To the extent that interest flows are at floating rates, the undiscounted cash flow are derived from the interest rate at 30 June.
0 - 3 Mths 3 - 12 Mths Year 2 Years 3 - 5 $ $ $ $
As 30 June 2017 Interest bearing liabilities 8,009,654 20,382,760 751,812 211,325
Trade and other payables 2,516,857 - - -
10,526,511 20,382,760 751,812 211,325
As 30 June 2016
Interest bearing liabilities 8,756,031 8,718,094 7,035,848 11,713,889
Trade and other payables 1,498,190 - - -
10,254,221 8,718,094 7,035,848 11,713,889
Fair Value EstimationFair value measurements are analysed by level in the fair value hierarchy as follows: (i) Level 1 are measurements at quoted prices (unadjusted) in active markets for identical assets or liabilities, (ii) Level 2 measurements are valuations techniques with all material inputs observable for the asset or liability, either directly or indirectly, and (iii) Level 3 measurements are valuations not based on observable market data (unobservable inputs). Management applies judgment in categorising financial instruments using the fair value hierarchy. If a fair value measurement uses observable inputs that require significant adjustment, that measurement is a Level 3 measurement. The significance of a valuation input is assessed against the fair value measurement in its entity.
Assets and liabilities not measured at fair value but for which fair value is disclosedAssets and liabilities held for sale The Group has valued its non-current assets held for sale at their carrying value. The fair value less cost to sell is higher than the carrying value. The fair value is categorised in Level 2 and represents the consideration receivable for the assets and liabilities through a sale transaction in the subsequent period.
Financial assets and liabilities Fair values analysed by level in the fair value hierarchy for other financial assets and liabilities not measured at fair value, for which the Group estimates their fair value approximates the carrying amounts, are as follows:
• Level 1 - Cash on hand • Level 2 - Cash and cash equivalents held at banks (note 24), restricted cash (note 24), trade and other financial receivables
(note 11), trade and other financial payables (note 18) • Level 3 - Advances to stores (note 11), borrowings (note 19)

49
The fair values in Level 2 and 3 of fair value hierarchy were estimated using the discounted cash flows valuation technique. The fair value of floating rate instruments that are not quoted in an active market was estimated to be equal to their carrying amount.
25. Operating Leases Leases as lessee Lease commitments expire as follows:
2017 2016 $ $
Within one year 2,075,999 2,872,459
One to two years 2,028,803 2,702,266
Two to five years 5,714,308 7,342,061
More than five years 3,809,860 5,625,675
Total 13,628,969 18,542,461
The lease commitments are for the following business units:
2017 2016 $ $
Mad Butcher 1,005,610 924,582
Nosh Group - 3,540,092
The BBC 12,623,359 14,077,787
13,628,969 18,542,461
The Group leases various retail and hospitality outlets, o°ces and equipment under operating lease agreements. The leases reflect normal commercial arrangements with varying terms, escalation clauses and renewal rights.
26. Commitments The Group has capital commitments of $nil as at 30 June 2017 (2016: $120,000).
The Group has other commitments of $nil as at 30 June 2017 (2016: $350,000).
27. Contingent Liabilities Nosh Group Limited (now Old NGL Limited) sold its business and assets on 24 February 2017 to Gosh Holdings Limited (now Nosh Group Limited [in receivership]) for a loss on sale of $2.6 million after tax. As a term of that sale the purchaser agreed to take over all leases, pay employee entitlements and pay existing trade creditors of Old NGL Limited. At the time the directors of Old NGL were led to believe that the purchaser would comply with those obligations but they have not.
Old NGL Limited commenced proceedings in the High Court against Nosh Group Limited, who were subsequently placed into receivership on 14 July 2017. Judgement has been granted in Old NGL Limited’s favour for just over $1.9 million. The directors of Veritas now believe that any material payment of the judgment debt is unlikely and have appointed Iain Shephard and Jessica Kellow of ShephardDunphy as liquidators of Old NGL Limited to a§ect an orderly wind-up of the company’s a§airs.
As the parent company of Old NGL Limited, Veritas Investments Limited is not exposed to any third party for any obligations of Old NGL Limited, other than under one lease, which has been fully provided for in the accounts.
Aside from the above the Group has no contingent liabilities as at 30 June 2017 (2016: $nil)
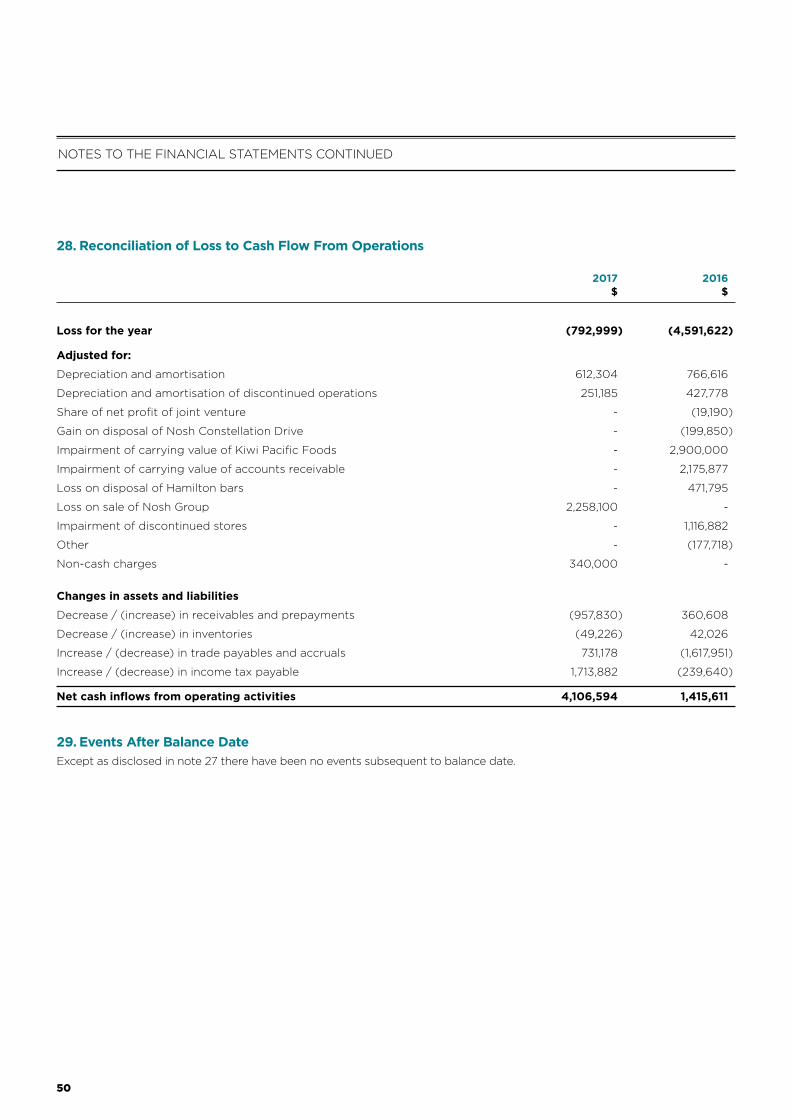
50
NOTES TO THE FINANCIAL STATEMENTS CONTINUED
28. Reconciliation of Loss to Cash Flow From Operations 2017 2016 $ $
Loss for the year (792,999) (4,591,622)
Adjusted for:
Depreciation and amortisation 612,304 766,616
Depreciation and amortisation of discontinued operations 251,185 427,778
Share of net profit of joint venture - (19,190)
Gain on disposal of Nosh Constellation Drive - (199,850)
Impairment of carrying value of Kiwi Pacific Foods - 2,900,000
Impairment of carrying value of accounts receivable - 2,175,877
Loss on disposal of Hamilton bars - 471,795
Loss on sale of Nosh Group 2,258,100 -
Impairment of discontinued stores - 1,116,882
Other - (177,718)
Non-cash charges 340,000 -
Changes in assets and liabilities
Decrease / (increase) in receivables and prepayments (957,830) 360,608
Decrease / (increase) in inventories (49,226) 42,026
Increase / (decrease) in trade payables and accruals 731,178 (1,617,951)
Increase / (decrease) in income tax payable 1,713,882 (239,640)
Net cash inflows from operating activities 4,106,594 1,415,611
29. Events After Balance Date Except as disclosed in note 27 there have been no events subsequent to balance date.

SHAREHOLDER AND STATUTORY INFORMATION
Doolan Brothers.

52
Quotation of sharesThe Company’s shares are listed and quoted on the main board of the equity security market operated by NZX Limited under the ticker code “VIL”.
Size of Shareholding as at 31 August 2017
Size of shareholding Number of Number of % of total ordinary shareholders ordinary shares shares on issue
1 to 1,000 197 78,838 0.18
1,001 to 5,000 179 562,234 1.30
5,001 to 10,000 82 674,049 1.56
10,001 to 50,000 83 1,971,309 4.55
50,001 to 100,000 18 1,361,492 3.14
100,001 and Over 28 38,658,696 89.27
Total 587 43,306,618 100
Substantial Security Holders The following shareholders have filed notices with the Company that they are Substantial Security Holders in the Company as at 31 August 2017 (there being a total of 43,306,618 shares on issue at that date).
Shareholder Date of Number of Disclosure ordinary shares %
Michael John Morton & WBM Trustee Limited 27/02/15 15,384,615 35.52
Collins Asset Management Limited 27/03/15 6,166,684 14.24
Salt Funds Management Limited 14/02/17 4,267,528 9.85
Timothy John Burcher & Graham Edward Jackson & Richards Christopher Guy Sigley 20/11/15 2,847,235 6.57
Geo§rey Eamon Tuttle & Carl David Sowter 20/11/15 2,385,714 5.51
Directors’ Security Holdings as at 31 August 2017Name Beneficial Shareholding Non-Beneficial Shareholding (number of ordinary shares) (number of ordinary shares)
Tim Cook 665,000 -
Michael Morton * 15,384,615 -
John Moore 110,000 -
Sharon Hunter - -
* Holding is through MBH Limited, a company owned by interests associated with Michael Morton.
SHAREHOLDER AND STATUTORY INFORMATION CONTINUED

53
Top 20 ShareholdersThe following table shows the names and holdings of the top 20 shareholders of the Company as at 31 August 2017.
Shareholder Shares held % of Total
1 Michael John Morton & WBM Trustee Limited 15,384,615 35.52
2 Collins Asset Management Limited 6,166,684 14.24
3 New Zealand Central Securities Depository Limited 4,670,041 10.78
4 Timothy John Burcher & Graham Edward Jackson & Richards Christopher Guy Sigley 2,847,235 6.57
5 Geo§rey Eamon Tuttle & Carl David Sowter 2,385,714 5.51
6 Ambrosia Trustees Limited 1,538,462 3.55
7 Bruce Howden Blake 700,296 1.62
8 Timothy John Cook 665,000 1.54
9 Custodial Services Limited 428,896 0.99
10 JBWERE (NZ) Nominees Limited 400,000 0.92
11 Public Trust 361,117 0.83
12 Philip James Clark 353,078 0.82
13 Richard George Anthony Kroon 272,629 0.63
14 Timothy James Mahoney & Patricia Mary Carter & Wylie Mcdonald Trustees No 13 Limited 217,392 0.50
15 John Charles Wilkinson & Howard Roger Hill & Henrietta Wilkinson 217,391 0.50
16 Kenneth Alfred Eaves & Anthony Christopher Edward 205,000 0.47
17 James Tear Stewart & Susan Rita Stewart & Peter Allen Lewis 204,173 0.47
18 Agrichemical Consultancy And Certification Limited 190,992 0.44
19 Lapauge Limited 181,901 0.42
20 Matthew Charles Goodson & Dianna Dawn Perron & Goodson & Perron Independent Limited 180,000 0.42

54
Directors’ Remuneration and Other BenefitsThe table below sets out the total remuneration received by each Director from the Group for the year ended 30 June 2017.
Name Directors Chairman Committee Salary Fees Fees Chair Fees
Tim Cook $70,000 $ 10,000
Michael Morton $ 40,000 $420,277*
Sharon Hunter $ 40,000
John Moore $ 40,000
* Salary from the Group Business
Indemnity and InsuranceVeritas Investments Limited has insured and indemnified all of its Directors and O°cers against liabilities and costs referred to in sections 162(3), 162(4) and 162(5) of the Companies Act 1993. The insurance and indemnities do not cover liabilities arising from criminal activities.
Employees’ RemunerationDuring the year, the number of employees, not being a Director or a member of the Group, who received remuneration and the value of other benefits exceeding NZ$100,000 were as follows:
Range $ No of Employees
100,000 - 109,999 1
120,000 - 129,999 2
130,000 - 139,999 1
280,000 - 289,999 1
290,000 - 299,999 1
Audit FeesThe amount paid to PwC, as auditor of the Group, is as set out in the notes to the financial statements.
DonationsNo donations have been made by the Group for the year ended 30 June 2017.
Disclosure of InterestsEntries in the Interests’ Register made during the year and disclosed pursuant to sections 211(e), 140(1) and 148(2)(b) of the Companies Act 1993 are as follows:
SHAREHOLDER AND STATUTORY INFORMATION CONTINUED

55
Share Dealings by DirectorsDirectors conducted no share transactions in respect of the Group in the year ended 30 June 2017.
General disclosure of interestsGeneral disclosure of interests as at 31 August 2017 given by Directors pursuant to section 140(2) of the Companies Act 1993.
Director Company/Entity O�ce
Tim Cook Churchill Trust Director
Cook Executive Recruitment Limited Director
Corporate Advisory Limited Director
Mad Butcher Limited Chairman
MB Henderson Limited Director
MB Onehunga Limited Director
MyWave Holdings Limited Chairman
MyWave Limited Chairman
Old NGL Limited (in liquidation) Chairman
Safer Sleep Holdings (NZ) Limited Chairman
Safer Sleep Limited Chairman
The Better Bar Company Limited Chairman
The Heart Institute Chairman
Midas Foods Limited Director
Kiwi Choice Limited Director
JKCP Limited Director
MB Silverdale Limited Director
OldCD Limited (in liquidation) Director
MoleMapNZ Limited Director
Veritas Investments Limited Chairman and Shareholder
Plexure Group Limited Director
Distil Skincare Limited Director
Flossie.com Chairman

56
Michael Morton Funky Chicken Limited Director
Clipper Horizons Limited Director
JKCP Limited Director
Kiwi Choice Limited Director
MB Silverdale Limited Director
Mad Butcher Limited Director
MB Bacon Company Limited Director
MB Henderson Limited Director
MB Onehunga Limited Director
MB Upper Hutt Limited Director
Midas Foods Limited Director
MJM Bloodstock Limited Director
MJM Trustees (No. 1) Limited Director and Shareholder
Old NGL Limited (in liquidation) Director
The Better Bar Company Limited Director
Veritas Investments Limited Director
WDMMGM Limited Director and Shareholder
Yogg Limited Director and Shareholder
Yogg Mission Bay Limited Director and Shareholder
Sharon Hunter Southern Cross Finance Limited Director
Hunter Powell Investments Limited Director and Shareholder
Hunter Powell Trustee Limited Director and Shareholder
Hunter Powell Ventures Limited Director and Shareholder
Mad Butcher Limited Director
Old NGL Limited (in liquidation) Director
Skin Institute Group Director
The Better Bar Company Limited Director
Veritas Investments Limited Director
Flossie.com Director
Eventfinda Limited Director
Antarctica New Zealand Director
Plexure Group Limited Director
SHAREHOLDER AND STATUTORY INFORMATION CONTINUED
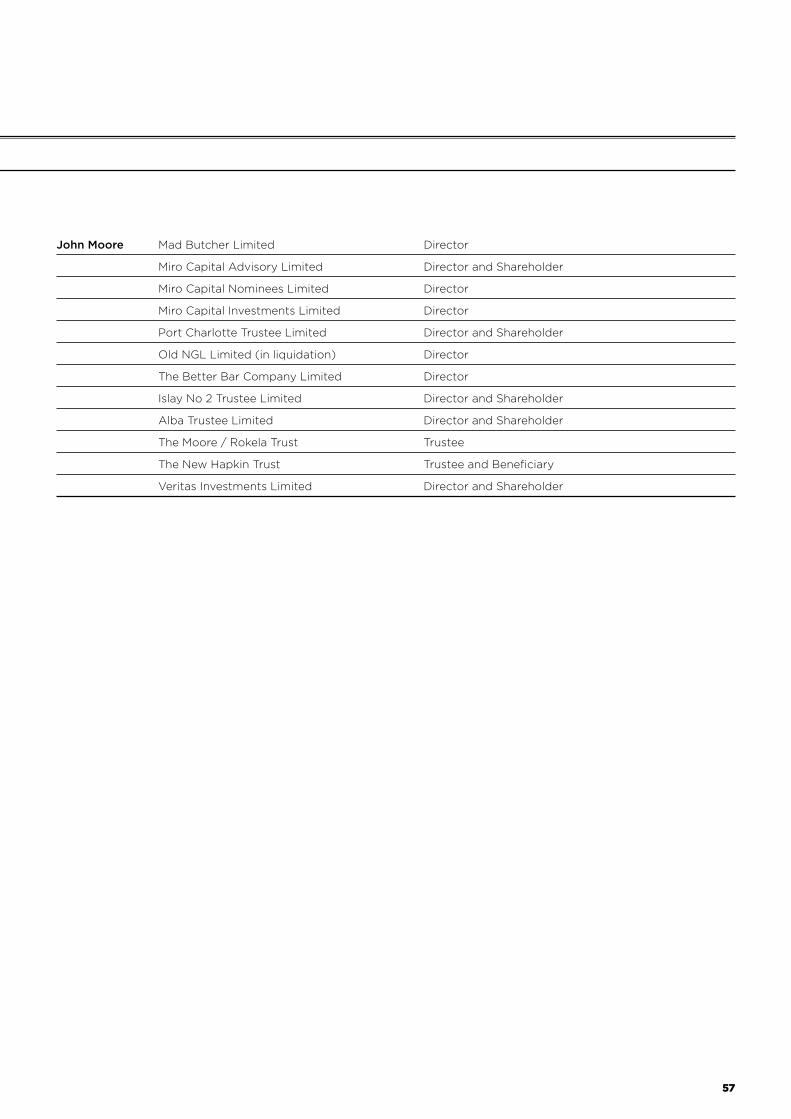
57
John Moore Mad Butcher Limited Director
Miro Capital Advisory Limited Director and Shareholder
Miro Capital Nominees Limited Director
Miro Capital Investments Limited Director
Port Charlotte Trustee Limited Director and Shareholder
Old NGL Limited (in liquidation) Director
The Better Bar Company Limited Director
Islay No 2 Trustee Limited Director and Shareholder
Alba Trustee Limited Director and Shareholder
The Moore / Rokela Trust Trustee
The New Hapkin Trust Trustee and Beneficiary
Veritas Investments Limited Director and Shareholder

58
Nature of BusinessListed Investment Company
Independent DirectorsTim Cook (Chairman)Sharon HunterJohn Moore
Non Independent DirectorMichael Morton
Chief Financial O�cerJohn Hames
Registered O�cec/o Mad Butcher LimitedGround Floor, Building B95 Ascot AvenueGreenlanePO Box 17474, Auckland 1546
Share RegistrarLink Market Services LimitedLevel 7, Zurich House21 Queen Street, Auckland
AuditorsPricewaterhouseCoopersChartered Accountants188 Quay Street, AucklandPrivate Bag 92162, Auckland 1142
SolicitorsHarmos Horton LuskLevel 37, Vero Centre48 Shortland Street PO Box 28, Auckland 1010
Investor [email protected]
BankersANZ
Corporate
DIRECTORY

