annual report 2017 - solar.eu · return on invested capital (roic) ... solar group is a leading...
TRANSCRIPT

Solar A/S ■ Executive Board
Industrivej Vest 43 ■ DK-6600 Vejen ■ Denmark Tel. +45 79 30 00 00 ■ CVR no. 15 90 84 16 ■ Web: www.solar.eu
1 of 3
LEI: 21380031XTLI9X5MTY92 9 February 2018
Announcement no. 4 2018
Annual Report 2017
Our core business delivered growth and EBITA above the 2016
level. Also our related business delivered growth, but did, however,
dilute earnings.The Board of Directors will propose 2017 dividends
distribution of DKK 10 per share at the annual general meeting.
CEO Jens Andersen says:
"We will continue to challenge the status quo to keep moving from a
product-focused to a more solution-focused business and remain an
attractive sourcing and services company. We invest in productivity
improvement with the purpose to continuously grow the business
and expand the services to our customers. We will exercise a strict
management of our cost base. At the same time, we will reallocate
costs to growth areas and further digitalisation of the business. The
recently announced divestments of our Austrian and Belgium
business activities are important steps in order to obtain profitable
growth and free up capital for development."
Financial highlights
(DKK million)*
Q4
2017
Q4
2016
2017
2016
Revenue 2,979 2,851 11,105 10,420
EBITA 85 125 295 312
Earnings before tax -90 102 126 223
Cash flow from operating
activities
282 415 12 203
Financial ratios (%)
Organic growth adj. for number of
working days
7.0 5.4 6.9 2.3
EBITA margin 2.9 4.4 2.7 3.0
Net working capital, period-
end/revenue (LTM)
9.7 8.4 9.7 8.4
Net working capital,
average/revenue (LTM)**
10.2 10.1 10.2 10.1
Gearing (NIBD/EBITDA), no. of
times
1.4 0.1 1.4 0.1
Return on invested capital (ROIC) 3.8 10.0 3.8 10.0
* Due to the divestments of our Austrian and Belgian business activities, GFI GmbH and
Claessen ELGB NV, 2016 and 2017 figures in this announcement relate to our continuing
operations.
** Calculated as an average of the past four quarters’ inventories, trade receivables and
trade payables.

Solar A/S ■ Executive Board
Industrivej Vest 43 ■ DK-6600 Vejen ■ Denmark Tel. +45 79 30 00 00 ■ CVR no. 15 90 84 16 ■ Web: www.solar.eu
2 of 3
2017 Revenue
• Overall, our core business experienced growth of 6.5%, while
related business overall saw growth of more than 19%.
• Actual organic growth for the group increased to 6.9% from 2.3% in
2016, adjusted for the number of working days.
2017 EBITA
• EBITA from the core business increased by DKK 16m compared to
2016 even though EBITA was affected by one-off costs of DKK
39m in 2017, while one-off costs amounted to an income of DKK
1m in 2016. Adjusted for one-offs, EBITA for the core business saw
an increase of DKK 56m or 17% in 2017.
• Related business diluted EBITA by DKK -45m compared to DKK
-12m in 2016.
Dividends distribution
• At the annual general meeting, the Board of Directors will propose
dividends distribution of DKK 10.00 per share, down from DKK
12.00 distributed in 2017.
2018 outlook
• For 2018, we expect revenue of approx. DKK 11.4bn
corresponding to organic growth of approx. 4%. Within core
business we expect growth of approx. 3%, which is on par or above
the expected market growth. Related business is expected to show
growth of approx. 25%.
• For 2018 we expect an EBITA of approx. DKK 345m, of which DKK
365m is expected from core business and DKK -20m from related
business.
EBITA, DKK million Core
business
Related
business
Solar
Group
2017, actual,
published 12.01.2018
309 -45 264
Divestment of Austrian
and Belgian businesses
31 - 31
2017, actual
continuing
operations
340 -45 295
Overhead costs* -10 - -10
Planned improvements 35 25 60
2018 guidance 365 -20 345
*The Austrian and Belgian businesses carried approx. DKK 10m in overhead
costs, which will now be placed in the continuing operations within core business.
Financial targets
• Following our strategy review we have changed our long-term
financial targets, which are stated in the Annual Report.
Audio webcast and teleconference today
The presentation of Annual Report 2017 will be made in English on 9
February 2018 at 11:00 CET. The presentation will be transmitted as
an audio webcast and will be available at www.solar.eu. Participation
will be possible via a teleconference.
Teleconference call-in numbers:
DK: tel. +45 354 455 83
UK: tel. +44 203 194 0544
US: tel. +1 855 269 2604
Yours faithfully,
Solar A/S
Jens Andersen

Solar A/S ■ Executive Board
Industrivej Vest 43 ■ DK-6600 Vejen ■ Denmark Tel. +45 79 30 00 00 ■ CVR no. 15 90 84 16 ■ Web: www.solar.eu
3 of 3
Contacts:
CEO Jens Andersen - tel. +45 79 30 02 01
CFO Michael H. Jeppesen - tel. +45 79 30 02 62
Director, Stakeholder Relations Charlotte Risskov Kræfting -
tel. +45 40 34 29 08
Enclosures: Annual Report 2017, pages 1-139 + Q4 2017 Quarterly
information, pages 1-10. Please see Annual Report 2017 for
comments on Q4 2017.
Facts about Solar
Solar Group is a leading sourcing and services company. Our core
business centres on product sourcing, value-adding services and
optimisation of our customers’ businesses.
Being a sourcing and services company, we focus on each individual
customer. We always strive to understand our customers’ unique
and genuine needs in order to provide relevant, personal and value-
adding services, turning our customers into winners.
Solar Group is headquartered in Denmark, generated revenue of
more than DKK 11bn in 2017 and has approx. 3,000 employees.
Solar is listed on Nasdaq Copenhagen and operates under the short
designation SOLAR B. For more information, please visit
www.solar.eu.
Disclaimer
This announcement was published in English and Danish today via
Nasdaq Copenhagen. In the event of any inconsistency between the
two versions, the English version shall prevail.

Annual Report2017
Solar A/SCVR NO.: 15 90 84 16

Contents
Management’s review 03 Preface04 Solar Group – in brief05 Financial highlights 06 Strategy and business07 Strategy11 Financial targets12 Business update14 Customer cases16 People18 Group structure
19 Results and outlook20 Financial review25 Segments27 Outlook 2018 28 Responsibility and management29 Risks35 Corporate Social Responsibility37 Corporate Governance38 Shareholder information41 Management42 Board of Directors
Financial statements 44 Consolidated financial statements46 Summary for the Solar Group48 Statement of comprehensive income49 Balance sheet50 Cash flow statement51 Statement of changes in equity53 Notes
97 Separate financial statements99 Statement of comprehensive income100 Balance sheet101 Cash flow statement102 Statement of changes in equity104 Notes
131 Group companies overview
133 Statements and reports134 Statement by the Executive Board and the Board of Directors135 Independent auditor’s report
2 Solar Annual Report 2017Contents MANAGEMENT’S
REVIEWFINANCIAL STATEMENTS CONTENTS

Preface
Earning our customers’ trust every day
The cornerstone of our strategy is to work proactively with our customers to help them run their businesses more efficiently and to meet their specific requirements.
Productivity improvement is crucial to Solar. With rising urbanisation and an increasing labour shortage, we see nothing but a growing need for this.
We have a strong platform in our core business, which we will continue to develop in order to ensure that we
Jens E. AndersenCEO
With a business environment that changes at an ever increasing pace, the need to keep moving from a product-focused to a solution-focused business to remain relevant to our customers is imperative. We believe in optimising efficiency in the value chain and we are committed to earning our customers’ trust every day.
remain a competitive and highly attractive sourcing and services company.
An innovative and commercial approach is a prerequisite for our progress. We seek both to generate more cross-border cohesion in our four key markets to harvest synergies and to increasingly capitalise on our respective strengths.
We aim to become better at developing our common Solar concepts based on best practice to benefit from economies of scale and grow our concept sales.
We also want to strengthen our position in the industry segment. Hence, we are working on a growth strategy within industry sales.
In addition, strong and open-minded partnerships with strategic and preferred suppliers are essential in order to ensure that our category offer is in line with market requirements.
Our digital business development will continue. We are adding new digital services and are pleased to see that smartphones and tablets are playing an increasingly important role in our customers’ daily work and that they are easily adapting to digital tools.
We are looking forward to presenting our new Customer Experience Platform to our customers. This e-business and marketing platform will replace our webshop and provide us with new opportunities. Ideally this will help us to further develop our e-business share.
3 MANAGEMENT’SREVIEW
FINANCIAL STATEMENTS CONTENTS
Solar Annual Report 2017 — Management’s reviewPreface

Our customers
Product sourcing
Optimisation of our customers’
businessesValue-adding
services
Solar Group – in brief
The business model for our core business
We work with our customers to:• support them in running their businesses more
efficiently• bundle their spend and improve their sourcing• create the best offer and to proactively
develop alternatives• raise their productivity, optimise transportation
and minimise required inventory• improve their employees’ skills and efficiency
A leading sourcing and services companySolar Group is a leading European sourcing and services company mainly within electrical, heating and plumbing, ventilation, and climate and energy solutions.
We serve professionals operating within the area of technical installation and a variety of industrial customers.
Our core business focus is product sourcing, value-adding services and optimising our customers’ businesses.
Being a sourcing and services company, we focus on the individual customer. We strive to understand their specific requirements in order to provide relevant, personal and value-adding services.
Solar Group is based in Denmark.
2017 in figures – continuing operations
Revenue in DKK million
EBITA in DKK million
Dividend per share in DKK
Net working capital at year-end
E-business share
11,105
295
10
9.7%
DKK
> 50%
MANAGEMENT’SREVIEW
FINANCIAL STATEMENTS CONTENTS4 Solar Annual Report 2017 — Management’s review
Solar Group – in brief

Financial highlightsConsolidated (DKK million) 2017 2016 2015 2014 2013
Revenue 11,105 10,420 10,587 10,252 10,463
Earnings before interest, tax, depreciation and amortisation (EBITDA) 347 368 362 227 307
Earnings before interest, tax and amortisation (EBITA) 295 312 296 117 225
Earnings before interest and tax (EBIT) 126 256 249 -73 160
Earnings before tax (EBT) 126 223 201 -122 106
Net profit for the year 19 125 167 -234 21
Balance sheet total 4,717 4,506 4,671 4,574 4,961
Equity 1,591 1,683 1,831 1,732 2,138
Interest-bearing liabilities, net 489 43 -184 302 316
Cash flow from operating activities 12 203 331 187 310
Net investments in property, plant and equipment -15 51 -25 -41 -81
Employees
Average number of employees (FTEs), continuing operations 2,901 2,814 2,871 2,898 2,943
Financial ratios (% unless otherwise stated) 2017 2016 2015 2014 2013
Organic growth adjusted for number of working days 6.9 2.3 5.2 0.1 -5.0
Gross profit margin 21.0 21.1 20.8 21.2 21.8
EBITDA margin 3.1 3.5 3.4 2.2 2.9
EBITA margin 2.7 3.0 2.8 1.1 2.2
Effective tax rate 19.8 28.3 33.2 -47.2 17.3
Net working capital (year-end NWC)/revenue (LTM) 9.7 8.4 9.3 10.8 10.7
Gearing (net interest-bearing liabilities/EBITDA), no. of times 1.4 0.1 -0.5 1.3 1.0
Return on equity (ROE) 1.2 7.1 9.4 -12.1 1.0
Return on invested capital (ROIC) 3.8 10.0 8.5 -4.3 4.5
Equity ratio 33.7 37.4 39.2 37.9 43.1
Share ratios (DKK unless otherwise stated)
Earnings per share outstanding (EPS) 2.60 16.50 21.26 -29.79 2.67
Dividend per share 10.00 12.00 10.00 7.00 12.00
Dividend in % of net profit for the year (payout ratio) 385.6 70.2 46.8 - 421.5
Financial ratios are calculated in accordance with the Danish Finance Society’s “Recommendations & Financial Ratios 2015”.
In general, restatements have been made of income statements, cash flows and key ratios for the discontinued operations in Claessen ELGB N.V. and GFI GmbH for 2016 and 2017 and for Solar Deutschland GmbH for 2013 and 2014, whereas these are not adjusted for previous years. In accordance with IFRS, the balance sheet has not been restated. The key ratio interest-bearing liabilities, net, has been adjusted for interest-bearing receivables relating to the divestment of Aurora Group Danmark A/S, up until the settlement in Q1 2015.
5 MANAGEMENT’SREVIEW
FINANCIAL STATEMENTS CONTENTS
Solar Annual Report 2017 — Management’s reviewFinancial highlights

Strategy and business
MANAGEMENT’SREVIEW
FINANCIAL STATEMENTS CONTENTS6 Solar Annual Report 2017 — Management’s review
Strategy and business

Strategy
Our strategic sourcing and services approach
• Solar is a leading European sourcing and services company mainly within electrical, heating and plumbing as well as ventilation, climate and energy solutions.
• Our strategy is to deliver the right products at the right price in a way which makes our customers more productive.
• We serve installation customers on both smaller maintenance and repair jobs and on larger renovation and construction projects as well as industry customers on maintaining their production facilities.
• Digital is in our DNA, and we have led our industry in terms of digital catalogues, e-business and digitalisation for decades.
• Our objective is to drive best in class organic growth and earnings, through a relentless focus on customer productivity and satisfaction combined with strong operational excellence.
Value proposition
Customer segments
Core capabilities
Delivery model
Objectives
Customer productivity
Installation Construction1 Industry
Digital leadership Sourcing excellence Services excellence
Operational excellence
Customer productivity
Customer satisfaction
Growth above market
Asset productivity
EBITA increase
1. In our financial reporting, “Construction” is a subsegment of “Installation”, covering medium to large renovation and construction installation projects.
7 MANAGEMENT’SREVIEW
FINANCIAL STATEMENTS CONTENTS
Solar Annual Report 2017 — Management’s reviewStrategy and business: Strategy

Customer segments
• We serve three distinct customer segments and always strive to understand our customers’ unique and genuine needs in order to provide relevant, personal and value-adding services.
• Small and large service firms within electrical installation and heating and plumbing, conducting minor installation or repair jobs.
• The installation business is affected by capacity bottlenecks and price transparency all the way to the end consumer, making productivity a winning value proposition.
• Installers should not waste time on procurement, logistics or inefficient processes.
• Solar constantly seeks out products, services, digital solutions and business opportunities in order to support installer productivity.
• One example is our Fastbox service, which offers delivery within one hour, thus enabling installers to spend more time with their customers.
• Small and large installation firms, working as subcontractors on large renovation or new construction projects.
• Construction projects are highly complex operations, susceptible to delays and budget overruns.
• Solar can support design, product selection and planning decisions to reduce costs and risks effectively.
• Solar is a construction partner, not merely a supplier and logistics provider.
• As an example, we provide a broad range of services, such as advanced construction site logistics to further reduce total costs and boost efficiency and productivity.
• Small and large companies within selected verticals.
• Panel building & Machine building
• Marine & Offshore, Oil & Gas, Wind Power
• Telecom & Infrastructure
• Food & Beverage
• Agriculture & Fishery
• Pharmaceutical & High Tech2
• To exemplify, Solar is an industry specialist engaging with a Total Cost of Ownership (TCO) approach and managing non-strategic procurement, warehousing and logistics.
1. In our financial reporting, “Construction” is a subsegment of “Installation”, covering medium to large renovation and construction installation projects.
2. Segments serviced globally through MAG45.
Installation
Other
Industry
Construction
Installation Construction1 Industry
8 MANAGEMENT’SREVIEW
FINANCIAL STATEMENTS CONTENTS
Solar Annual Report 2017 — Management’s reviewStrategy and business: Strategy

Core capabilities and delivery model
• We strengthen our value proposition to our customers by developing our business with specific focus on these core capabilities.
• We proactively develop our business based on our digital leadership, with up to 80% of our business transacted digitally in key markets.
• We leverage decades of experience and scale to optimise sourcing on behalf of our customers.
• Our services are proprietary and based on our strong know-how, customer understanding and specialisation.
• We always strive to keep our costs low to protect our margins in a market with increasing price transparency.
• Solar drives continuous improvement within a broad range of disciplines, and we effectively leverage our regional footprint to reduce costs and improve efficiency.
Digital leadership Sourcing excellence Services excellence
• Craftsmen are adopting mobile apps in their work on a large scale.
• Internet of Things and technologies related to the construction value chain, such as Building Information Modelling (BIM), are maturing rapidly.
• Opportunities for new services to drive productivity, efficiency and cost savings in close collaboration with existing and new customers.
• Our upcoming customer platform is an example hereof. The platform, which includes webshop, website and digital marketing, is integrated to support a personalised customer experience.
• Bundling customer spend within selected product categories.
• Working both with brand manufacturers and proactively seeking alternatives, based on our understanding of customers’ needs.
• Differentiated concept assortments within multiple solution areas.
• As an important part of our sourcing excellence, we offer Solar concepts in close cooperation with our strategic suppliers.
• We work closely with our customers to offer tailored services that optimise their businesses and make them more productive.
• We ensure that our services maintain a clear commercial standard, i.e. are sufficiently value-adding for customers to be willing to pay for them.
• We offer services, which range from product engineering, advisory services and technical support to customer logistics and smart supply.
• Central and regional warehousing, common lean processes, integrated IT systems and shared services across our local operating companies.
• Reducing the need for drive-in visits, e.g. through our strong e-business focus combined with digital and logistics services, thereby reducing costs and inventory, and increasing customer productivity.
Operational excellence
Continuous improvement
9 MANAGEMENT’SREVIEW
FINANCIAL STATEMENTS CONTENTS
Solar Annual Report 2017 — Management’s reviewStrategy and business: Strategy

INDU
STRY
INSTALLATION
CO
NSTRUCTION
Operational excellence
HomeBob
Viva Labs
Minuba
GenieBelt
BIMobject
Solar Light
Solar Plus
Fastbox
STI
TCO
MAG45 Solar Project
Solar Polaris
New business development driven through:
own development, acquisitions or partnership
Accelerating business development
• While we meticulously continue to develop our core business, we are also proactively positioning Solar at the forefront of industry change to take advantage of new opportunities.
• To accelerate our business development we execute our strategy through a combination of own development, acquisitions and strategic partnerships.
• Our investments in front line digital businesses combine our deep industry knowledge and decades of digitalisation experience with their business innovation and new, scalable digital platforms. This means that we are able to deliver innovative industry solutions to the market at a higher pace.
• Acquisitions and partnerships specifically strengthen Solar with regards to new roles in the value chain, commercial insight and digital construction.
• We strategically position ourselves to benefit from industry transformation and digitalisation, making Solar an attractive business development partner for innovative customers and entrepreneurs. Digital leadership
Sourcing and services
10 MANAGEMENT’SREVIEW
FINANCIAL STATEMENTS CONTENTS
Solar Annual Report 2017 — Management’s reviewStrategy and business: Strategy

Solar’s financial targets
Through our sourcing and services strategy we are aiming for profitable growth. Following our strategy review we have changed our long-term financial targets.
Financial targets
Core business
We aim for an EBITA margin of minimum 4% by 2020, corresponding to ROIC of minimum 15% after tax. In order to reach the target, we strive to improve profitability in all subsidiaries.
We have three major strategic focus areas:
1. Strategic suppliersWe pursue growth opportunities in concept sales. Solar offers a number of concepts to the market that meet different customer needs. We offer these concepts with a combination of both high quality, value-adding services and market-oriented pricing. We build on long-term cooperation with our suppliers, and by consolidating our customer’s sourcing needs, we strengthen the margin throughout the supply chain. We see an upside potential by expanding our product categories and our concept offerings, mainly in the Netherlands, Sweden, Norway and, to a lesser extent, in Denmark 2. Industry focusWith industry sales being the most profitable of our main segments, we will continue to strengthen our focus on this business area. The industry sales organisation will continue to approach our customers with cross-national solutions in order to identify individual solutions for optimising their businesses. Today, we offer a broad range of services to our industry customers.
3. Operational excellenceWe will continue to invest in productivity improvements in order to continuously grow the business and expand the services to our customers. We will exercise a strict management of our cost base. At the same time, we will reallocate costs to growth areas and further digitalisation of the business.
A prerequisite for achieving our targets for 2020 is that the markets in Denmark, the Netherlands, Sweden and Norway remain stable.
Related business
Related business is a high growth area. We expect organic growth of minimum 15% per year. Short term, this will lead to dilution of margins. However, the target is that each company must deliver a positive EBITA within 2-3 years after the acquisition.
Digital, construction & services
Today, we hold a substantial investment in companies within digital, construction & services. Towards 2020, we expect to invest a maximum of DKK 25m in total within this segment. Currently, we do not foresee new investments.
Financial ratios Financial targets1
Growth Core business We aim to generate profitable growth above market levels
Growth Related business Organic growth of minimum 15% per year
EBITA margin Core business Minimum 4% by 2020, corresponding to a ROIC of minimum 15% after tax
Equity ratio 35-40%
Gearing (NIBD/EBITDA) 1.5-2.5
Payout ratio 35-45%
1. If the implementation of new accounting standards entails changes, the target will be recalculated.
11 MANAGEMENT’SREVIEW
FINANCIAL STATEMENTS CONTENTS
Solar Annual Report 2017 — Management’s reviewStrategy and business: Financial targets

Business update
We develop our business considering megatrends
Installation productivity and urbanisation
We seek to strengthen our focus on our core business, i.e. the sourcing of electrical, heating, plumbing and ventilation products combined with value-adding services within support, logistics and other areas. At the same time, our digital journey continues through the launch of digital solutions and collaboration with strategic partners within digital construction and services.
One of the driving factors behind our business activities is to meet our customers’ needs and support them in running their businesses more efficiently.
Professionals getting held up in traffic just to pick up goods is inefficient and wastes time. Instead, using intelligent digital tools to order products and services reduces stress, increases efficiency and enables our customers to plan and manage their working day and to digitalise or outsource administrative tasks.
Our Fastbox concept has proved itself as a means of responding to labour shortage within the construction industry. It also complements the ongoing urbanisation.
By 2050, 66 per cent of the world’s population will live in cities and increased urbanisation will lead to major changes. There is a growing need to integrate sustainability, energy efficiency and increased productivity.
As people move closer together and away from rural areas, less energy will be consumed per person. However, in many cities, greater energy optimisation is
required to reduce consumption. Our energy-efficient solutions support this.
New roles and business models
With the changes in our broader value chain, decision-makers, buying criteria and sourcing channels are shifting. At the same time, new services and business models are entering the market.
We aim to bring our products and services into new contexts and open up new business opportunities for our customers. Innovation often develops from our core business.
We are attentive to the sharing and circular economies and capitalise on these trends by developing new business models.
An example is FyrFyret, recently launched in Denmark. Solar supplies heating as a service via a subscription model and a fixed monthly fee. The idea is to replace oil burners and gas furnaces with energy-efficient heat pumps. FyrFyret handles the removal of the oil burner and replaces it with a heat pump. Typically, the monthly heating costs will be approx. 25% lower. Moreover, since the heat pump is serviced by FyrFyret, the customer avoids unforeseen repair and service costs.
As a large company, we believe Solar has an obligation to drive the ’green’ transition. In our opinion, this transition is, however, only sustainable if it benefits both the environment and the economy.
We wish to promote a greener society based on economic common sense and aim to increase the production of renewable energy.
We work with many advanced technologies to support energy efficiency, including ventilation, LED lighting, heat pumps and solar power.
Digitalisation and standardisation
New technologies affect the entire value chain. Customer interaction, services, areas of expertise, internal processes and competitors in the market are changing and we need to adapt accordingly.
With an e-business share of more than 50%, digitalisation is part of our DNA. We firmly believe that the future does not lie in a business model involving significant investments in physical distribution infrastructure.
We focus on digital activities and solutions that improve our customers’ experience, simplify and facilitate their
12 MANAGEMENT’SREVIEW
FINANCIAL STATEMENTS CONTENTS
Solar Annual Report 2017 — Management’s reviewStrategy and business: Business update

routines, and reduce waste and inefficiency – both for them and for Solar. We aim to digitalise all aspects of our business and our customer interaction where relevant.
We wish to standardise our concept sales to make the most of our Solar concepts in all our key markets. We aim to scale our business to grow sales.
We also aim to be best in class within sourcing and logistics based on our digital platform. Joint procurement across our countries enables us to create synergies and benefit from our SAP platform.
We also obtain better utilisation of our central warehouses, easier maintenance of our product and catalogue data, and we have a strategic response to the strong brands.
We want to stock our goods in a uniform manner to increase the availability for our customers without more capital being tied up.
Creating a ’favourites list’ for each of our customers improves our buying efficiency on their behalf.
We wish to work with suppliers who are skilled in master data and data discipline and who are able to deliver high-quality data on products, categorisation and product descriptions.
Industry transformation
We have initiated a programme to explore the potential for us to grow our industry segment in our key markets.
Solar has an outstanding logistical offer and technical capabilities and combined with our industry customers’ expertise within their field, we have the opportunity to establish winning teams together.
We want Solar Industry to be known as a proactive and highly value-adding partner for our customers.
Commercialising our services
We offer a number of logistics services. Our smart supply set-up is just one example of a frequently used logistics service, and we will continue to develop these services.
Furthermore, new digital services and opportunities for our customers are constantly being developed alongside our digital partners; BIMobject (Building Information Modelling within digital construction) GenieBelt (dynamic project management) and Minuba (online job and resource management).
The purpose of our digital investments is to strengthen our core business through close collaboration and knowledge sharing with these digital frontrunners.
Related businesses
We have a similar approach to our related businesses consisting of MAG45 (industrial supply solutions), STI (training) and Solar Polaris (solar power project solutions).
Each of these businesses is specialised to an extent that far exceeds our core business, which benefits both us and our customers.
MAG45 is strong on industry supply solutions and TCO reduction. If there is sufficient critical mass, they follow their customers to new geographical zones. In 2017, MAG45 established new hubs in Singapore, Hungary and Italy.
Together, Solar and MAG45 can identify solutions for optimising our customers’ businesses. By focusing on the whole value chain, we help our customers better understand the overall solution. This, in turn, optimises sourcing, warehousing, transport, waste and administrative costs.
Training as a service to develop new skills
For technical installations, new technology means that IT and intelligence have a greater role to play. Not only are new areas of expertise required, but working processes need to be organised in a different way.
Our training business, Scandinavian Technology Institute, is our response to this new scenario. Our customers can develop their skills via e-learning platforms. This goes hand in hand with our productivity improvement agenda and is yet another way for customers to cut waste and reduce their costs.
13 MANAGEMENT’SREVIEW
FINANCIAL STATEMENTS CONTENTS
Solar Annual Report 2017 — Management’s reviewStrategy and business: Business update

We help our customers...
HOW INDUSTRY CUSTOMERS REDUCE COSTS VIA THE SOLAR SMART INVENTORY CONCEPT
A more strategic view on supply chain management has proved to be a good investment for the Swedish company VEAB Heat Tech AB, the market leader in Europe within heating solutions for ventilation systems.
With the implementation of a new inventory concept from Solar, VEAB Heat Tech has increased competitiveness and significantly reduced overall costs.
Solar’s total cost of ownership approach has saved VEAB both time and money. With the introduction of fixed delivery days and thus a more systematic ordering system, VEAB has reduced the number of orders by approx. 40 per cent and the number of deliveries by approx. 30 per cent. The extra time gained can thus be used on more value-creating processes.
At the same time, the total stock value has been reduced, and with less capital tied up in stock, VEAB can invest in other areas. Letting go of their own stock control is a matter of trust between the customer and Solar.
Lars M. Nilsson, Purchase Manager at VEAB Heat Tech says:
We have been working with Solar for almost 30 years, and we don’t need to spend time on monitoring the management of
orders from such a reliable supplier. Our cooperation is based on trust, and instead of monitoring each other, we can actively address any issues that may arise. A number of jobs are repeated on a daily basis, which we have now automated by technically connecting our system to Solar‘s, and enabling Solar to control our stock.”
HOW SOLAR FASTBOX INCREASES INSTALLATION PRODUCTIVITY
As a sourcing and services company, Solar works professionally with installation productivity, and the Solar Fastbox is a proven concept in all our markets.
In Denmark, the electrical and plumbing contractor, Finn L. & Davidsen A/S, now uses the Fastbox concept as a means of running a more efficient business. Things used to be different: in 2016, Finn L. & Davidsen had more than 22,000 pickups from various shops. Today, equipped with photos of their projects, a new selection of products in their vehicles, and the Fastbox concept, they have reduced their number of pickups by 75%.
Solar helped Finn L. & Davidsen create a new selection of products for their vehicles and helped identify relevant products. Solar then supplied Finn L. & Davidsen’s vehicles with new products at the nearest Fastbox Centre. The electricians now have a favourites catalogue that makes it easy to find the items they use most frequently. Solar also provides the company with weekly statistics to keep track of developments.
Lasse Houengaard, owner of Finn L. & Davidsen explains:
Our customers are now asked to send a photo of the job they want done. In this way, the service engineer is able to make
preparations before visiting the customer. If the required product is not already in the vehicle, the electrician orders a Fastbox. A good customer experience is when an electrician stays with the customer and continues his work or can help the customer with other jobs until the required products arrive. Our customers think that the Fastbox concept is a great initiative. In addition, our electricians are under less pressure and are able to focus on the job at hand. This results in fewer mistakes, less stress and more satisfied customers.”
14 CONTENTSFINANCIAL STATEMENTS
MANAGEMENT’SREVIEW
Solar Annual Report 2017 — Management’s reviewStrategy and business: Customer cases

...to run their businesses more efficiently
HOW OUR TCO APPROACH HELPS STREAMLINE PURCHASING PROCESSES
The Norwegian company Optimar is one of the world’s leading innovation companies and a supplier of fish handling solutions and processing equipment for vessels, land-based factories and aquaculture. Optimar’s revenue totalled NOK 650 million in 2016. The company has 340 employees at three locations in Møre and Romsdal, as well as departments in Spain, Romania and the United States.
Optimar has seen significant growth in recent years, and has developed its procurement processes. A supplier agreement was reached with Solar in the early autumn of 2017, and Optimar’s Purchase & Logistics Manager, Sandra Gudlaugsdottir, explains why:
Optimar was looking for a partner within electrical equipment that could also offer more value creation than just standard
deliveries from its own central warehouse. Solar presented its offensive commitment to the industry segment with professional concepts within Total Cost of Ownership (TCO) and value-adding services. Solar’s focus on sourcing and services is attractive to us based on the savings this will add to our procurement processes. Supplier consolidation and cost reductions in several sections are some of the focus areas for Optimar, and we see opportunities for streamlining the purchasing process by sourcing material from several suppliers through Solar, as well as streamlining our internal processes. Furthermore, Solar offers packaging services such as kitting and labelling, as well as preparing and carrying out export deliveries. These are very useful services, which save Optimar a lot of material handling.
HOW WE HELP TO REDUCE ENERGY CONSUMPTION AND SAVE MONEY
With the two new services Power Quality and Solar Insight, Solar has improved the process and energy management of the candy manufacturer Matthijs. This means that this family business saves thousands of euros every year and takes its responsibility towards a cleaner world.
CEO Walter Matthijs and his technical colleague, Daniel Nijhuis, welcome their cooperation with Solar Industry. From a Power Quality point of view, several projects have been carried out by Solar for Matthijs. First, the fans of six ovens were installed behind a PID controller and the other ovens are now being modified, which means an energy saving of 30 percent.
Other examples are the use of softstarters on engines with power greater than 2.2 kW, better coordination of the processing parts of the chocolate production line and better management of the oven pumps. With the pumps alone, the saving is around EUR 3,200 on an annual basis. Several of the improvements had an important side effect; for an adapted production line, a second high-voltage transformer equalling an investment of EUR 150,000 was no longer required.
CEO Walter Matthijs explains:
By controlling the peak loads in a controlled manner, we can deal with our existing assets. It is important to be able to fall
back on partners who offer tailor-made solutions. With regard to CSR, I believe that we need to look further into what we can do as a company in the field of energy efficiency. With the help of Solar, this has been put in motion.”
With Solar Insight, an energy monitoring system based on Panoramic Power technology, this has now been made possible. With Solar Insight, an app enables detailed consumption to be read on site via a monitor and also remotely via a tablet or telephone.
15 CONTENTSFINANCIAL STATEMENTS
MANAGEMENT’SREVIEW
Solar Annual Report 2017 — Management’s reviewStrategy and business: Customer cases

People
Recruitment and retention are key factors
New management profiles
We have made a targeted effort to appoint new profiles to our management teams at both national and group level to support faster development of Solar’s business.
Our aim is to enhance expertise, introduce new thinking into Solar and define roles and responsibilities in such a way that many managers are jointly responsible for developing Solar both locally and across the group. This creates energy, motivation and group engagement.
People development and recruitment
We focus on employee development and on creating job and career opportunities within Solar. To do so, we look at the potential of every employee.
In 2015, we implemented a uniform recruitment process with identical assessment tools. This enabled our switch to a cross-border digital tool for recruitment in 2016. Through this, we have improved our recruitment processes and our ability to recruit the right people for the right jobs.
To complement our global introduction programme based on e-learning, which is aimed at familiarising new
16 MANAGEMENT’SREVIEW
FINANCIAL STATEMENTS CONTENTS
Solar Annual Report 2017 — Management’s reviewStrategy and business: People
employees with the company before their first working day, we use a satisfaction survey for employees leaving the company to better understand the holistic perspective of employees and their work-lifecycle decisions.
In 2017, we have renewed our employee performance appraisal system. We focus on performance, development and development potential.
We run internal management training programmes that promote management and leadership competences, allowing our managers to grow.
Our effort to develop strong collaboration across the group continued in 2017. This furthered our ambition to enable more employees and managers to drive initiatives across the whole group.
Diversity
The Solar Group’s approach is for all employees to be treated equally, regardless of gender, age, race and religion. All employees have equal opportunities when it comes to employment, terms of employment, training and promotion.
We aim for a higher degree of diversity, as we believe that this will make us a better and stronger business. However, we do not compromise on qualifications. We will continue to employ the most qualified candidates regardless of their gender, political, religious or personal orientation.
We believe it is important that the Board of Directors represents a wide diversity of skills, age and gender, and that we maintain a dynamic balance between continuity and renewal through a periodic turnover of board members.
Our diversity policy sets out our objective regarding the composition of the board. Solar wishes its board to be as diverse as possible, including equal participation of women and men, while still ensuring that the board represents the overall skills set required.
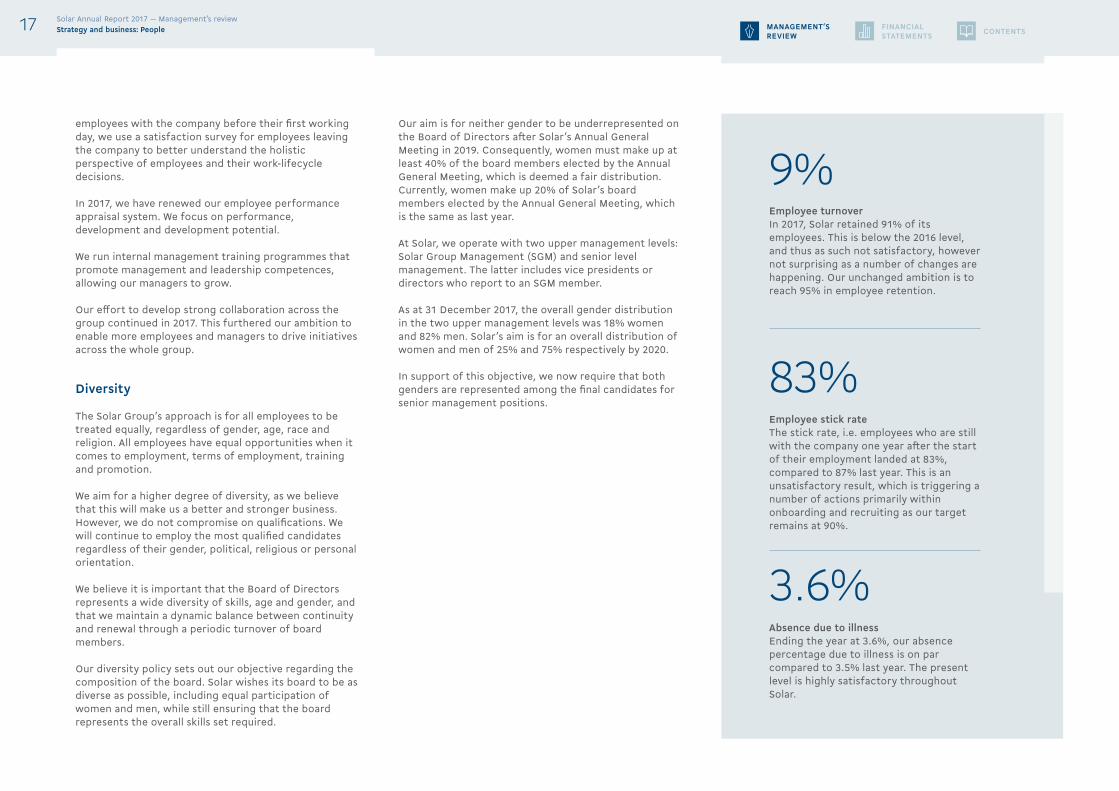
Absence due to illnessEnding the year at 3.6%, our absence percentage due to illness is on par compared to 3.5% last year. The present level is highly satisfactory throughout Solar.
Employee turnoverIn 2017, Solar retained 91% of its employees. This is below the 2016 level, and thus as such not satisfactory, however not surprising as a number of changes are happening. Our unchanged ambition is to reach 95% in employee retention.
Employee stick rateThe stick rate, i.e. employees who are still with the company one year after the start of their employment landed at 83%, compared to 87% last year. This is an unsatisfactory result, which is triggering a number of actions primarily within onboarding and recruiting as our target remains at 90%.
83%
9%
3.6%
Our aim is for neither gender to be underrepresented on the Board of Directors after Solar’s Annual General Meeting in 2019. Consequently, women must make up at least 40% of the board members elected by the Annual General Meeting, which is deemed a fair distribution. Currently, women make up 20% of Solar’s board members elected by the Annual General Meeting, which is the same as last year.
At Solar, we operate with two upper management levels: Solar Group Management (SGM) and senior level management. The latter includes vice presidents or directors who report to an SGM member.
As at 31 December 2017, the overall gender distribution in the two upper management levels was 18% women and 82% men. Solar’s aim is for an overall distribution of women and men of 25% and 75% respectively by 2020.
In support of this objective, we now require that both genders are represented among the final candidates for senior management positions.
17 MANAGEMENT’SREVIEW
FINANCIAL STATEMENTS CONTENTS
Solar Annual Report 2017 — Management’s reviewStrategy and business: People

Solar A/S
Reg. no. 15908416Share capital DKK 774,562,500
Solar Danmark A/S, DenmarkReg. no. 15908416
Solar Sverige AB, SwedenReg. no. 5562410406Share capital SEK 100,000,000
Solar Norge AS, NorwayReg. no. 980672891Share capital NOK 70,000,000
Solar Nederland B.V., the NetherlandsReg. no. 09013687Share capital € 67,000,500
MAG45 Holding B.V., the NetherlandsReg. no. 17213145Share capital € 27,571
Solar Polska Sp. z o.o., PolandReg. no. 0000003924Share capital PLN 65,050,000
Claessen ELGB NV, BelgiumReg. no. 0436.564.831Share capital € 3,697,100
GFI GmbH, AustriaReg. no. FN 44849fShare capital € 1,863,365
P/F Solar Føroyar, the FaroesReg. no. P/F 104Share capital DKK 12,000,000
Scandinavian Technology Institute, NorwayReg. no. 976094786Share capital NOK 533,000
Solar Polaris A/S, DenmarkReg. no. 38378171Share capital DKK 5,000,000
All group companies are wholly owned. Companies where Solar’s equity interest is less than 50% and a few companies without any activities are not included in this structure. For more information, see page 131.
Group structure
Group structure
18 MANAGEMENT’SREVIEW
FINANCIAL STATEMENTS CONTENTS
Solar Annual Report 2017— Management’s reviewStrategy and business: Group structure

Results and outlook
19 MANAGEMENT’SREVIEW
FINANCIAL STATEMENTS CONTENTS19 Solar Annual Report 2017 — Management’s review
Results and outlook

Financial review
Core business delivered growth and EBITA above 2016 levels
Revenue from continuing operations was up at DKK 11.1bn from DKK 10.4bn in 2016, while EBITA from continuing operations amounted to DKK 295m, slightly down from DKK 312m in 2016. In 2017, one-off costs affected EBITA by DKK 42m (income of DKK 1m in 2016), of which DKK 39m affected the core business.
Core business delivered growth and EBITA above the 2016 levels, showing 6.5% in organic growth and DKK 340m in EBITA against EBITA of DKK 324m in 2016. Related business diluted earnings by delivering EBITA of DKK -45m but growth was more than 19%.
In line with Solar’s strategy on profitable growth, we considered several alternatives before we decided that a divestment of the activities in the loss-making subsidiaries, GFI GmbH, Austria, and Claessen ELGB NV, Belgium, was the right decision. Thus, at the end of January 2018, Solar entered into an agreement with Sonepar concerning these divestments, cf. company announcement no. 3 2018.
GFI GmbH, Austria, and Claessen ELGB NV, Belgium, are therefore presented as discontinued operations in Annual Report 2017. The divestment is expected to constitute a loss of approx. DKK 47m, which is recognised in the Solar Group’s income statement as part of the loss from discontinued operations.
Unless otherwise stated, the following comments relate to the continuing operations.
Q4 (unaudited) Revenue EBITAInvested
capital
DKK million 2017 2016 2017 2016 2017 2016
Core business 2,855 2,757 101 130 1,682 1,590
Related business 124 94 -16 -5 108 154
Digital, construction & services - - - - 236 18
Elimination - - - - -236 -18
Total 2,979 2,851 85 125 1,790 1,744
Q1-Q4
DKK million 2017 2016 2017 2016 2017 2016
Core business 10,649 10,096 340 324 1,682 1,590
Related business 456 324 -45 -12 108 154
Digital, construction & services - - - - 236 18
Elimination - - - - -236 -18
Total 11,105 10,420 295 312 1,790 1,744
Q4 (unaudited)Adj. organic
growthEBITA margin ROIC
% 2017 2016 2017 2016 2017 2016
Core business 6.3 5.4 3.5 4.7 11.4 12.1
Related business 29.2 - -12.7 -5.5 N/A N/A
Total 7.0 5.4 2.9 4.4 3.8 10.0
Q1-Q4
% 2017 2016 2017 2016 2017 2016
Core business 6.5 2.3 3.2 3.2 11.4 12.1
Related business 19.3 - -9.9 -3.7 N/A N/A
Total 6.9 2.3 2.7 3.0 3.8 10.0
Core business includes Solar Danmark, Solar Sverige, Solar Norge, Solar Nederland, Solar Polska, and P/F Solar Føroyar.
Related business includes MAG45, Scandinavian Technology Institute and Solar Polaris.
Digital, construction & services includes all associated businesses BIMobject, GenieBelt, Minuba, Viva Labs, Monterra, and HomeBob.
20 MANAGEMENT’SREVIEW
FINANCIAL STATEMENTS CONTENTS
Solar Annual Report 2017 — Management’s reviewResults and outlook: Financial review
Q4 2017 (unaudited)
RevenueIn Q4, adjusted organic growth was up at 7.0% from 5.4% in Q4 2016. Related business saw growth of more than 29%, while growth in core business increased to 6.3%. Revenue amounted to DKK 3.0bn, up from DKK 2.9bn in Q4 2016.
EBITAEBITA was down at DKK 85m from DKK 125m in Q4 2016. The decrease in EBITA was mainly due to a lower gross profit margin and one-off costs. The gross profit margin was down due to a change in the customer mix within our core business combined with margin dilution in MAG45. Q4 2016 was impacted by a DKK 3m income from one off costs, net, while Q4 2017 was affected by approx. DKK 23m in one-off costs, including severance pay.
Earnings before taxQ4
DKK million 2017 2016
Earnings before tax -90 102
Core business
One-off costs, net 23 -6
Impairment loss, other intangible assets 10 -
Related business
One-off costs, net - 3
Impairment loss, goodwill 65 -
Impairment loss, customer-related assets 22 -
Earn-out provision reversed -15 -
Digital, construction & services
Share of net profit from associates 10 -
Fair value adjustment, net, of BIMobject 59 -
Adjusted earnings before tax 84 99
Earnings before taxEarnings before tax amounted to DKK -90m against DKK 102m in Q4 2016. In Q4 2017, one-off costs, impairment losses etc. affected earnings before tax, see table to the left.
Adjusted for these items earnings before tax amounted to DKK 84m against DKK 99m in Q4 2017.
2017
RevenueRevenue amounted to DKK 11.1bn, up from DKK 10.4bn in 2016. Overall, our core business experienced growth of 6.5%, while related business overall saw growth of more than 19%.
Actual organic growth for the group increased to 6.9% from 2.3% in 2016, adjusted for the number of working days.
Gross profit marginThe gross profit margin amounted to 21.0%, slightly down from 21.1% in 2016. The margin was negatively impacted by a change in customer mix within our core business.
EBITAEBITA amounted to 2.7% of revenue or DKK 295m in 2017, down from 3.0% of revenue or DKK 312m in 2016.
EBITA from the core business increased by DKK 16m compared to 2016 even though EBITA was affected by one-off costs of DKK 39m in 2017, while one-off costs amounted to an income of DKK 1m in 2016. Adjusted for one-offs, EBITA for the core business saw an increase of DKK 56m or 17% in 2017.
Related business diluted EBITA by DKK -45m compared to DKK -12m in 2016 partly driven by investments in future growth. The integration of Solar School into STI
and the planned upgrade of the e-learning platform have required more resources than expected. Revenue has been delayed and more costs added leading to a negative EBITA in 2017.
Compared to 2016, there has been an increase in external operating costs and staff costs, which primarily relate to MAG45’s growth initiatives, the effect of the acquisitions of STI and Solar Polaris in 2016 and 2017 as well as necessary structural changes, including severance pay.
In 2017, costs related to innovation and business development amounted to approx. DKK 26m against DKK 20m in 2016.
AmortisationAmortisation increased by DKK 113m in 2017. Review of goodwill, customer lists and other intangible assets resulted in an impairment loss of DKK 97m, of which DKK 87m relate to goodwill and customer lists in respect of the company’s activities in MAG45, Scandinavian Technology Institute, and Solar Polaris.
Furthermore, as part of our focus on digital improvement projects, our investments in software led to increased amortisation.
Q1-Q4DKK million 2017 2016
Core business, amortisation 66 50
Core business, impairment loss 10 -
Related business, amortisation 6 6
Related business, impairment loss 87 -
Amortisation and impairment of intangible assets 169 56
Share of net profit from associatesIn 2017, DKK -11m is included as our share of earnings from our digital, construction and services associates.
21 MANAGEMENT’SREVIEW
FINANCIAL STATEMENTS CONTENTS
Solar Annual Report 2017 — Management’s reviewResults and outlook: Financial review

-2
-4
0
2
4
6
8
10
Q4Q3Q2Q1
2016 2017
%
0
1
2
3
4
5
Q4Q3Q2Q1
2016 2017
%
Impairment on associatesBy the end of May 2017, we acquired additional shares in BIMobject and now hold 20.01% of the shares, cf. company announcement no. 15 2017. Consequently, at the end of May, BIMobject became an associate of Solar. From that date, our share of BIMobject’s earnings after tax is recognised in the income statement on a separate line together with our share of earnings after tax from other associates.
By the end of May, Solar determined a need for a fair value adjustment of BIMobject totalling DKK 79m based on the share price development. The amount is recognised in the income statement as financial income.
However, at year-end Solar identified a need for write-down of DKK 59m of BIMobject AB based on the share price. As Solar now holds more than 20% of the shares, the amount is recognised in the income statement as impairment on associates.
Earnings before tax
FinancialsAs mentioned above, net financials were affected by the fair value adjustment of BIMobject, totalling DKK 79m. Net financials were also affected by a reassessment of the earn-out liability concerning STI resulting in a DKK 15m reversal. Thus, net financials totalled DKK 70m against DKK -33m in 2016.
Earnings before taxEarnings before tax was down at DKK 126m from DKK 223m in 2016. However, earnings before tax was affected by one-off costs, impairment loss etc. See table to the left. If adjusted for these items, earnings before tax was up at DKK 241m from DKK 222m.
Income taxIncome tax totalled DKK 25m, down from DKK 63m in 2016, which corresponds to an effective tax rate of 19.8% against 28.3% in 2016. Adjusted for a change to the tax base of non-capitalised losses in subsidiaries, the effective tax rate was 32.2% against 24.7% in 2016.
Net profitProfit from continuing operations amounted to DKK 101m against DKK 160m in 2016. Expected loss on the divestments of DKK 47m is included in the loss from discontinued operations totalling DKK 82m against a loss of DKK 35m in 2016. Net profit for the Solar Group thus amounted to DKK 19m in 2017 against DKK 125m in 2016.
Share capitalFollowing approval at the Annual General Meeting on 17 March 2017, Solar reduced its B share capital mid-April 2017 by nominally DKK 17,498,200 from nominally DKK 792,060,700 to nominally DKK 774,562,500, corresponding to a reduction of the B share capital of 174,982 B shares of DKK 100 by cancelling treasury B shares.
Solar now holds 447,333 treasury B shares, corresponding to 5.8% of Solar’s total share capital and 2.8% of votes.
Organic growth in %(adjusted for number of working days)
EBITA margin in %
Q1-Q4
DKK million 2017 2016
Earnings before tax 126 223
Core business
One-off costs, net 39 -1
Impairment loss, other intangible assets 10 -
Related business
One-off costs, net 3 -
Impairment loss, goodwill 65 -
Impairment loss, customer-related assets 22 -
Earn-out provision reversed -15 -
Digital, construction & services
Share of net profit from associates 11 -
Fair value adjustment, net, of BIMobject -20 -
Adjusted earnings before tax 241 222
22 MANAGEMENT’SREVIEW
FINANCIAL STATEMENTS CONTENTS
Solar Annual Report 2017 — Management’s reviewResults and outlook: Financial review

0
2
4
6
8
12
14
10
ROIC Long-term objective above
%
Q4-17Q3-17Q2-17Q1-17Q4-16Q3-16Q2-16Q1-16
Gearing Objective low Objective high
Q4-17Q3-17Q2-17Q1-17Q4-16Q3-16Q2-16Q1-16
0.0
0.5
1.0
1.5
2.0
2.5
3.0
3.5
Investments in associatesIn 2017, we increased our investments in BIMobject and other associates. Thus, at year-end 2017, investments in associates totalled DKK 203m, of which DKK 188m realted to BIMobject.
Cash flowsCompared to 2016, net working capital calculated as an average of the last four quarters was almost unchanged at 10.2% of revenue. Net working capital at year-end amounted to 9.7% of revenue up from 8.4% at the end of 2016. However, the fact that the last day of 2017 was not a working day affected net working capital negatively by approx. 0.8 percentage point.
Cash flow from operating activities amounted to DKK 12m against DKK 203m in 2016. In 2017, changes to inventories had a DKK -226m impact on cash flow from operating activities, while changes to receivables had an impact of DKK -226m. The negative changes to inventories were partly due to the handing over of inventories from Fibia in Q2 2017, and initiatives have been started in order to reduce the inventory levels. The negative changes to receivables were due to higher level of activity and again to the fact that the last day of 2017 was not a working day.
Cash flow from investing activities saw a DKK 222m negative impact from the investment in BIMobject and other associated businesses. Investments in intangible assets were up by DKK 22m at DKK 110m, mainly due to digital improvement projects such as our new customer experience platform, including a new webshop. In 2016, cash flow from investing activities experienced a DKK 115m negative impact from the acquisition of MAG45, STI and investments in other associated businesses but a DKK 97m positive impact from the sale of properties. Thus in 2017, total cash flow from investing activities came to DKK -347m against DKK -152m in 2016.
Cash flow from financing activities was affected by a new loan of DKK 135m and by the distribution of DKK 88m in dividend against DKK 77m in 2016. In 2016, cash flow from financing activities saw a DKK -197m impact from Solar’s share buy-back programme and a DKK -65m impact from the repayment of a loan in connection with the sale of property in Denmark and the repayment of a loan in Norway. Overall, cash flow from financing activities totalled DKK -22m against DKK -388m in 2016.
Cash flow from discontinued operations amounted to DKK -13m against DKK 21m in 2016.
Consequently, total cash flow in 2017 amounted to DKK -370m against DKK -316m in 2016.
Compared to 2016, net interest-bearing liabilities increased by DKK 446m to DKK 489m. During 2017, we invested DKK 222m in subsidiaries and associated businesses and paid dividend of DKK 88m. By the end of 2017, gearing had increased to 1.4 times EBITDA from 0.1. Our gearing objective is 1.5-2.5 times EBITDA.
As at 31 December 2017, Solar had undrawn credit facilities of DKK 527m.
End 2017, ROIC was at 3.8% but negatively impacted by the impairment loss on related business. End 2016, ROIC was at 10.0%. ROIC on core business ended at 11.4% down from 12.1% before adjusting for one-offs etc.
Invested capital for the Solar Group totalled DKK 1,790m up from DKK 1,744m at the end of 2016.
Activities with a Solar equity interest less than 50% and discontinued activities are not included in the ROIC calculation. Invested capital includes operating assets and liabilities only.
Return on invested capital (ROIC) in %
Gearing, no. of times(interest-bearing liabilities, net / EBITA)
23 MANAGEMENT’SREVIEW
FINANCIAL STATEMENTS CONTENTS
Solar Annual Report 2017 — Management’s reviewResults and outlook: Financial review
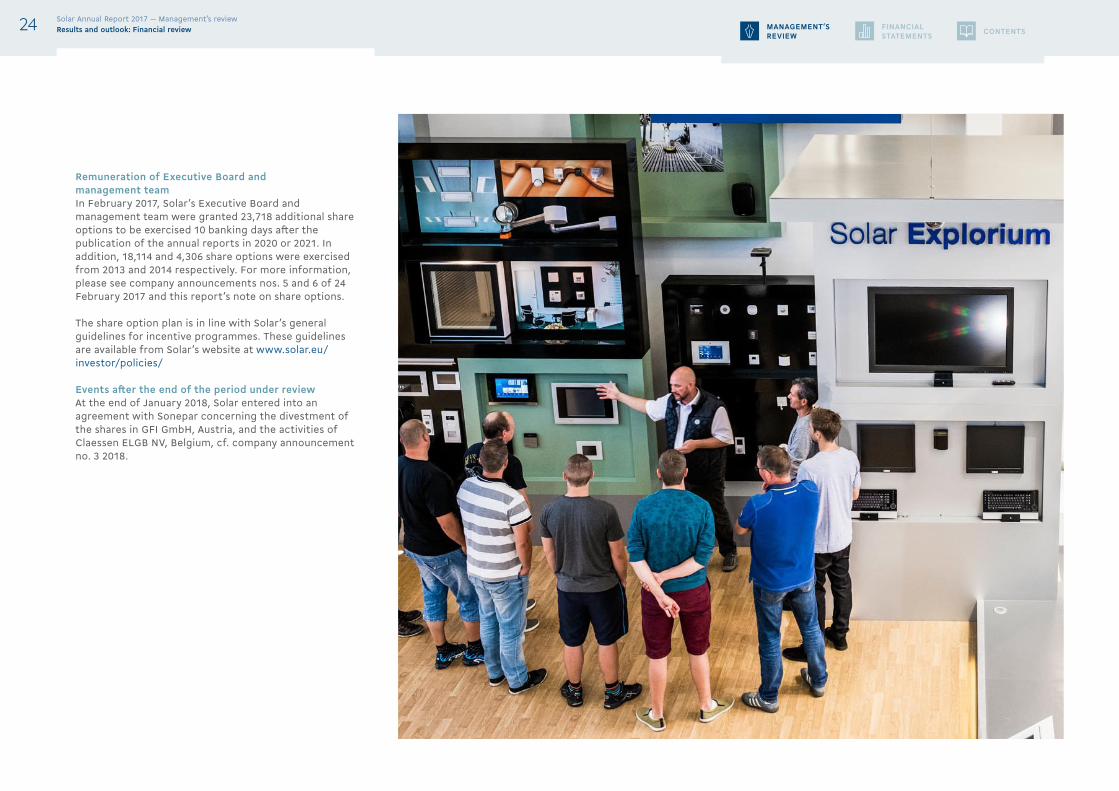
Remuneration of Executive Board and management teamIn February 2017, Solar’s Executive Board and management team were granted 23,718 additional share options to be exercised 10 banking days after the publication of the annual reports in 2020 or 2021. In addition, 18,114 and 4,306 share options were exercised from 2013 and 2014 respectively. For more information, please see company announcements nos. 5 and 6 of 24 February 2017 and this report’s note on share options.
The share option plan is in line with Solar’s general guidelines for incentive programmes. These guidelines are available from Solar’s website at www.solar.eu/investor/policies/
Events after the end of the period under reviewAt the end of January 2018, Solar entered into an agreement with Sonepar concerning the divestment of the shares in GFI GmbH, Austria, and the activities of Claessen ELGB NV, Belgium, cf. company announcement no. 3 2018.
24 MANAGEMENT’SREVIEW
FINANCIAL STATEMENTS CONTENTS
Solar Annual Report 2017 — Management’s reviewResults and outlook: Financial review

Segments
Q4 2017 (unaudited)
The installation sectorAs in previous quarters, we continue to see growth in Scandinavia and the Netherlands. In Poland, sales were slightly down compared to the previous quarter. In Scandinavia, however, we are seeing a slowdown in growth compared to the previous quarters.
Solar’s overall organic growth for Installation amounted to around 2% for Q4 2017.
The industry sectorIn Q4, we saw continued industrial growth in our markets, resulting in organic growth. This was especially the case in Denmark and the Netherlands, where we saw double-digit growth.
Sweden and Norway also recorded growth in Q4. In Norway, the North Sea offshore industry and related industries continue to improve and showed double-digit growth rates in Q4 2017.
Solar’s overall organic growth in the industry sector amounted to around 9% in Q4 2017.
Compared to 2016, the segment margin was down
mainly due to a drop in the gross margin. Approx. 50% of the drop in gross margin can be explained by the expansion of MAG45, since new contracts have a lower margin in the start-up period.
2017
The installation sectorConstruction activity saw ongoing improvement in a number of our markets during 2017, particularly in the Netherlands, but also in Scandinavia. This is mainly driven by the residential housing market, whereas commercial property is growing at a slower pace.
We did, however, see growth within all major sub-segments in Scandinavia and the Netherlands – particularly, within sales to our major customers in Scandinavia.
Solar’s overall organic growth for Installation amounted to around 5% for FY 2017.
Compared to 2016, the profit margin for the sector was slightly down mainly due to a less favourable country mix and product mix combined with more project deliveries.
In Q4 2017, organic growth amounted to 7.0%, whereas FY 2017 organic growth was 6.9%.
Trends in Installation and Industry
(Unaudited) Revenue Segment profit Segment margin
DKK millionQ4
2017Q4
2016Q4
2017Q4
2016Q4
2017Q4
2016
Installation 1,861 1,852 144 160 7.7% 8.6%
Industry 831 789 119 117 14.3% 14.8%
Others 287 210 58 49 20.2% 23.3%
Total 2,979 2,851 321 326 10.8% 11.4%
(Unaudited) Revenue Adj. organicgrowth in %
DKK millionQ4
2017Q4
2016Q4
2017Q4
2016
Denmark 889 822 8.8 10.6
Sweden 688 677 3.5 1.9
Norway 493 532 1.1 9.3
The Netherlands 730 665 11.5 1.3
Other markets 204 176 16.1 2.2
Eliminations -25 -21 - -
Total 2,979 2,851 7.0 5.4
25 MANAGEMENT’SREVIEW
FINANCIAL STATEMENTS CONTENTS
Solar Annual Report 2017 — Management’s reviewResults and outlook: Segments

Segments
The industry sectorWe also saw industrial growth in our markets in FY 2017, resulting in organic growth. The growth in Denmark was supported by our agreement with Fibia.
In Norway, the North Sea offshore industry and related industries improved and showed double-digit growth rates for FY 2017.
Furthermore, MAG45 showed growth of approx. 23% for FY 2017.
Solar’s overall organic growth in the industry sector amounted to around 8% for FY 2017.
OtherOur segment Other covers Scandinavian Technology Institute (STI), Solar Polaris and other small areas. In 2017, STI and Solar Polaris delivered revenue of DKK 61m, corresponding to approx. 6% of the segment revenue.
Non-allocated costsOur earnings before tax are impacted by non-allocated costs, which in 2017, increased by DKK 130m to DKK 860m compared to 2016. The increase was primarily related to MAG45’s growth initiatives, the effect of the acquisition of STI and Solar Polaris as well as one-off costs.
Revenue Segment profit Segment margin
DKK millionFY
2017FY
2016FY
2017FY
2016FY
2017FY
2016
Installation 6,976 6,731 568 572 8.1% 8.5%
Industry 3,179 2,921 472 423 14.8% 14.5%
Others 950 768 167 103 17.6% 13.4%
Total 11,105 10,420 1,207 1,098 10.9% 10.5%
Revenue Adj. organicgrowth in %
DKK millionFY
2017FY
2016FY
2017FY
2016
Denmark 3,338 3,008 10.7 7.3
Sweden 2,579 2,499 5.7 1.3
Norway 1,926 1,866 3.7 4.5
The Netherlands 2,612 2,463 6.6 -3.3
Other markets 745 654 13.6 -0.6
Eliminations -95 -70
Total 11,105 10,420 6.9 2.3
26 MANAGEMENT’SREVIEW
FINANCIAL STATEMENTS CONTENTS
Solar Annual Report 2017 — Management’s reviewResults and outlook: Segments

Outlook 2018
We expect continued growth albeit at a lower levelOutlook for Solar’s business areas
InstallationOverall, we expect Installation market growth in 2018 to match, or slightly exceed, the level for 2017.
New construction and renovation activities in the Danish market are expected to improve compared to 2017.
In Sweden, we saw an unexpected drop in the number of building permits late in 2017. This could potentially have a negative effect if it persists. We still expect to see growth in H1, whereas there is more uncertainty regarding developments in H2. In total, we expect the market to be on par with or slightly above 2017.
In Norway, we expect the installation segment to generate modest growth.
The positive trends in the Dutch market are expected to continue. Therefore, we expect to see continuous but modest improvement compared to 2017.
The sequential improvement that we are seeing in the Polish market is expected to continue.
Overall, our outlook for 2018 is for moderate, positive market growth.
IndustryOur outlook for Industry is for positive growth.
We maintain our outlook for a slightly positive trend in all major markets, including in MAG45’s global market niche.
OtherWe expect growth within the Other segment.
Financial outlook
For 2018, we expect revenue of approx. DKK 11.4bn corresponding to organic growth of approx. 4%. Within core business we expect growth of approx. 3%, which is on par with or above the expected market growth. Related business is expected to show growth of approx. 25%.
For 2018, we expect EBITA of approx. DKK 345m, of which DKK 365m are expected from core business and DKK -20m from related business.
The table below bridges the 2017 results we published on 12 January 2018 to our 2018 guidance. The divestment of the Austrian and Belgian loss-making businesses adds DKK 31m in EBITA to our core business.
The Austrian and Belgian businesses carried approx. DKK 10m in overhead costs, which will now be placed in the continuing operations within the core business.
To reach the expected EBITA improvements within our core business we have the following strategic focus areas:
1. Strategic suppliersWe have started initiatives to enhance cooperation with strategic suppliers. We have established a dedicated team across markets to align and grow our sales concepts.
2. Industry focusDuring Q4 2017, a new strategy for the industrial activities was launched and now all industry activities within Denmark, Sweden and Norway are organised under SCAN Industry. This will strengthen our industry focus just as dedicated regional resources will build strong insights and focus efforts in selected verticals. Furthermore, this structure will enable us to leverage resources, capabilities and our business platform just as the cooperation with MAG45 will be optimised. All this is to strengthen our TCO-based offering to existing and new industrial customers.
3. Operational excellenceWe expect the establishment of the master data organisation in Poland to be completed before the end of Q1. Furthermore, with effect from 2018, a new governance structure is established in order to ensure better cost containment.
EBITA, DKK millionCore
businessRelated
businessSolar
Group
2017, actual, published 12.01.2018 309 -45 264
Divestment of Austrian & Belgian businesses 31 - 31
2017, actual continuing operations 340 -45 295
Overhead costs -10 - -10
Planned improvements 35 25 60
2018 guidance 365 -20 345
Guidance 2018, DKK million
Core business
Related business
Solar Group
Revenue 10,800 600 11,400
EBITA 365 -20 345
Focus on improving asset productivity by reducing investments in net working capital will continue during the year. However, it should be noted that in 2018, all quarters end in a weekend.
27 MANAGEMENT’SREVIEW
FINANCIAL STATEMENTS CONTENTS
Solar Annual Report 2017 — Management’s reviewResults and outlook: Outlook 2018
Responsibility and management
MANAGEMENT’SREVIEW
FINANCIAL STATEMENTS CONTENTS28 Solar Annual Report 2017 — Management’s review
Responsibility and management

Risk management in Solar
The three lines of defence
Solar’s risk management system consists of policies and procedures approved by the Board of Directors. The overall purpose is to manage all major business risks and risk correlations across the organisation.
Risk management is based on Enterprise Risk Management (ERM) and was established to enable Solar to run a robust business that is able to react quickly and flexibly when conditions change.
The national management teams in our markets take a structured approach to risk management, providing us with updated risk assessments minimum twice a year.
This data is consolidated at group level and the findings are presented to the Board of Directors for approval. This means we analyse and identify both specific risks faced by the individual subsidiaries as well as group-widerisks.
Solar’s risk management is organised according to the three lines of defence model which demonstrates and structures roles, responsibilities and accountabilities for decision making, risks, and control to achieve effective governance, risk management, and assurance.
The three lines of defence model comprises:The first line of defence – functions that own and manage risks, the second line of defence – functions that oversee or specialise in risk management and compliance, and the third line of defence – functions that provide independent assurance, above all internal audit.
Business Management & Risk Owners
1st line of defence 2nd line of defence 3rd line of defence
Owns risks and risk management activities
Executive Board
Monitors the risk management framework and effectiveness
Establishes policies and frameworks, facilitates risk
identification and monitoring
Tests, validates and assesses efficiency in risk management
processes and activities
Group Risk Management & Risk Managers
Internal Audit
Approves and accepts risk policy including risk appetite and tolerance
Board of Directors / Audit Committee
Risks
29 MANAGEMENT’SREVIEW
FINANCIAL STATEMENTS CONTENTS
Solar Annual Report 2017 — Management’s reviewResponsibility and management: Risks

Anchoring
Solar’s risk management approach observes current corporate governance principles.
The group’s risk management is based on the Board of Directors’ rules of procedure, which place the responsibility for risk management with the Executive Board.
The Executive Board is responsible for ensuring that necessary risk management policies and procedures are available, that efficient risk management systems have been established for all relevant areas and are improved continuously.
The Executive Board follows up with the subsidiaries regularly.
Risk definition
The focus of risk management in Solar is to identify and assess operational risks and operational aspects of strategic risks throughout the Solar Group. Solar defines these risks as events or developments that could significantly reduce Solar’s ability to:
1) meet profit expectations,2) execute the strategy, and/or3) maintain license to operate.
Accordingly, Solar works with the concepts of gross risk (inherent risk) and net risk (residual risk).
The gross risk effect is defined as the product of the impact if the risk occurs without any change in current mitigation, and the probability that the risk occurs without any change in current mitigation.
The net risk effect is defined as the risk level when considering current as well as planned mitigation activities regarding both impact and probability.
30 MANAGEMENT’SREVIEW
FINANCIAL STATEMENTS CONTENTS
Solar Annual Report 2017 — Management’s reviewResponsibility and management: Risks
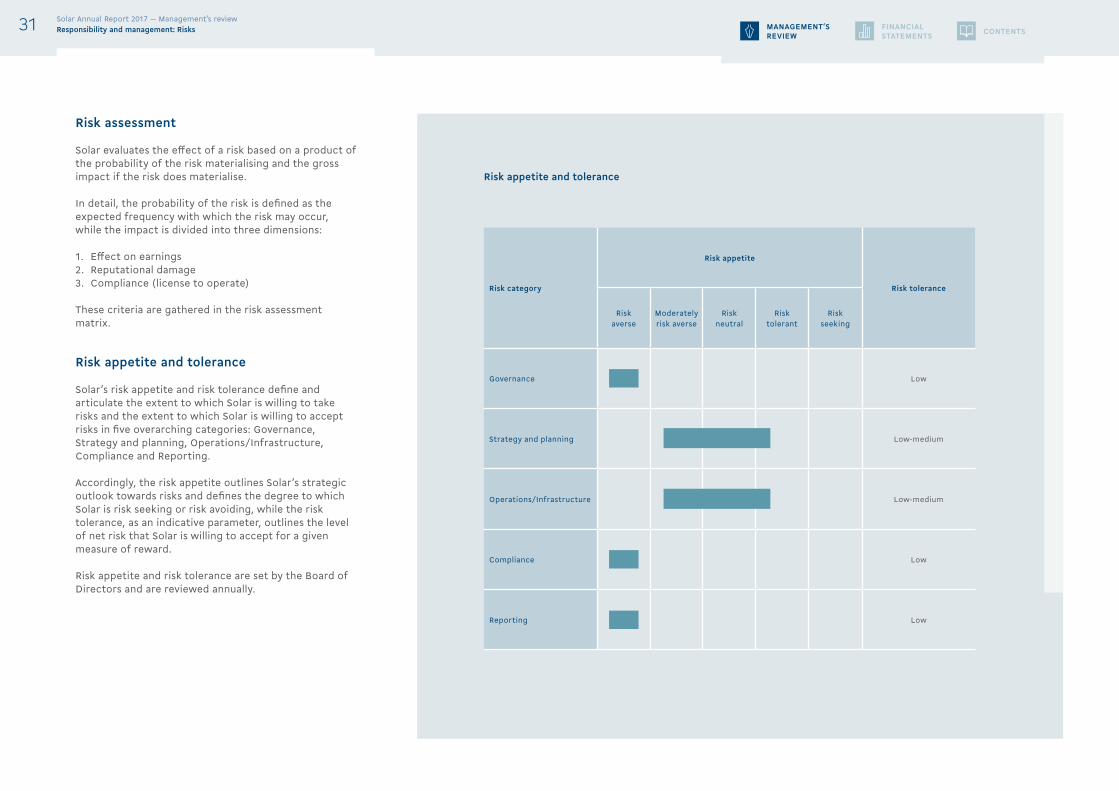
Risk category
Risk appetite
Risk tolerance
Risk averse
Moderately risk averse
Risk neutral
Risk tolerant
Risk seeking
Governance Low
Strategy and planning Low-medium
Operations/Infrastructure Low-medium
Compliance Low
Reporting Low
Risk appetite and tolerance
Risk assessment
Solar evaluates the effect of a risk based on a product of the probability of the risk materialising and the gross impact if the risk does materialise.
In detail, the probability of the risk is defined as the expected frequency with which the risk may occur, while the impact is divided into three dimensions:
1. Effect on earnings2. Reputational damage3. Compliance (license to operate)
These criteria are gathered in the risk assessment matrix.
Risk appetite and tolerance
Solar’s risk appetite and risk tolerance define and articulate the extent to which Solar is willing to take risks and the extent to which Solar is willing to accept risks in five overarching categories: Governance, Strategy and planning, Operations/Infrastructure, Compliance and Reporting.
Accordingly, the risk appetite outlines Solar’s strategic outlook towards risks and defines the degree to which Solar is risk seeking or risk avoiding, while the risk tolerance, as an indicative parameter, outlines the level of net risk that Solar is willing to accept for a given measure of reward.
Risk appetite and risk tolerance are set by the Board of Directors and are reviewed annually.
31 MANAGEMENT’SREVIEW
FINANCIAL STATEMENTS CONTENTS
Solar Annual Report 2017 — Management’s reviewResponsibility and management: Risks

Risk handling
The purpose of identifying and then handling risks is at all time to bring it to an acceptable level, which is in line with the above risk appetite and tolerance. In Solar, we work with four different risk treatment strategies when handling risks.
Avoid Seeking to eliminate uncertainty by changing circumstances.
Transfer Seeking to transfer ownership and/or liability of the risk to a third party.
Accept Seeking to reduce or minimise risk exposure to below acceptable threshold.
Mitigate Recognising residual risks and devising responses to control and monitor these.
The risk treatment strategies provide a number of formal responses to the identified risks to help risk owners manage these. Only if new or different activities are developed and implemented to treat the risks, will risk management add value to the business.
Process
Solar’s risk management efforts cover Denmark, Norway, Sweden, the Netherlands, Poland and MAG45.
The purpose of the risk management efforts is to assess, prioritise and report the most significant risks of these markets and of Solar Group. As part of this process, Solar Group’s risk management function collaborates closely with the subsidiaries’ local risk managers in administrating the annual cycle of work to ensure that the process is valid and addresses all relevant risk areas to identify all significant business risks.
The individual risk owners are responsible for mitigating the risks to a level within Solar’s risk appetite and tolerance. Throughout the year, Solar Group’s risk management function and the local risk managers actively monitor the progress of this mitigaion to ensure that risks are at an acceptable level.
32 MANAGEMENT’SREVIEW
FINANCIAL STATEMENTS CONTENTS
Solar Annual Report 2017 — Management’s reviewResponsibility and management: Risks

General Data Protection Regulation
ScenarioRisk of not meeting the requirements of the General Data Protection Regulation (GDPR) which is effective from May 25th 2018 in the whole European Union.
ImpactPotential financial and reputational consequences coming from not being compliant with the new regulation.
MitigationNecessary precautions have already been started and will continue in order to ensure readiness when GDPR is in place before May 25th 2018. With low risk tolerance for non-compliance Solar aims to ensure the right governance for handling this risk in order to build or maintain customers’ and investors’ trust in the Solar brand. Increased efforts in the communications area will be initiated to increase organisational awareness of the GDPR requirements.
Cyber risk
ScenarioWorldwide the speed and variety of cyber security events and crimes continue to intensify. Therefore, Solar must increasingly focus on protecting its critical operations, intellectual property and brands from cyber threats.
ImpactThe potential impact of cyber risks is multi-faceted. Business interruptions in the shape of data breaches, intellectual property theft and regulatory consequences as well as loss of reputation are among the consequences of cyber incidents, ultimately leading to financial losses.
MitigationSolar works with a governance structure and continuously strives to communicate appropriate internal information about i.e. security policies to uphold organisational awareness. Monitoring policies and procedures are in place for the main networks and systems. Furthermore, external studies are performed regularly to assess the maturity level of Solar’s overall cyber and information security management and to provide recommendations. It is natural for Solar to upgrade security tools regularly in order to protect value and reduce vulnerabilities.
Exposure to potential top risks and mitigation
33 MANAGEMENT’SREVIEW
FINANCIAL STATEMENTS CONTENTS
Solar Annual Report 2017 — Management’s reviewResponsibility and management: Risks

Central warehouse breakdown
ScenarioSolar’s activities are heavily dependent on a fully functioning supply chain. Consequently, Solar’s business is exposed to unforeseen IT systems’ disruption or events such as fire, power outages, flooding or other natural or manmade disasters.
ImpactUnwanted events may potentially lead to partial or complete warehouse breakdown. Accordingly, materialisation of this risk can result in financial losses as well as loss of reputation.
MitigationTo reduce the probability of the risk materialising, Solar aims to ensure the optimal warehouse management system and its safe implementation. Apart from that, external audits are conducted regularly, while Solar Group IT monitors performance and software continuously.
Several procedures are in place in case of a potential central warehouse breakdown, including contingency plans, which are updated or developed regularly.
IT breakdown
ScenarioSolar’s activities rely heavily on IT solutions and are thus exposed to risk of business interruptions during different initiatives, such as developments driven to improve customers’ experience.
ImpactPotential interruptions in the IT solutions area may result in financial losses and/or lead to reputational damage.
MitigationMost of the IT hardware is located at two central IT data centres. To lower the probability of the risk materialising, all business-critical applications are mirrored at these data centres to safeguard IT operations, meaning that the business can continue to run even if one centre experiences downtime.
Solar’s IT security board reviews IT security continuously and the IT area is constantly monitored and improved.
Project teams anchor risk management thoroughly in the project plans with mitigations comprising fallback scenarios, involvement of external experts, IT recovery plans and testing.
Change management
ScenarioRisk of failure to execute the sourcing and services strategy at sufficient pace as a result of inappropriate mindset and/or lack of competences. With constant focus on Solar’s core business, side initiatives may not reach their optimal speed and growth.
ImpactCurrently, the assumed impact of this risk would be low revenue and profits from services sales. In the long term, this situation may challenge Solar’s strategic direction and ability to run a successful business.
MitigationTo drive the execution of the sourcing and services strategy, a series of initiatives are executed including follow up tools, training, organisational investments and extensive communication on the advantages of the business transformation.
Contract management
ScenarioRisk of entering into contracts with terms and conditions (e.g. liabilities and warranties) that exceed Solar’s risk appetite.
ImpactThe consequence of not complying with these contracts could be significant sanctions that are not proportional to the delivery and responsibility of Solar and exceed the commitment that the local subsidiary is willing toaccept.
MitigationContracts were reviewed and standard contracts for suppliers and customers were adjusted according to the recommendations of a legal advisor. Escalation plans were also revised and clear guidelines on authority to sign contracts were prepared.
To mitigate the risk further, focus remains on strengthening contract management framework by providing standards and solutions to potential gaps as well as raising awareness within the organisation.
34 MANAGEMENT’SREVIEW
FINANCIAL STATEMENTS CONTENTS
Solar Annual Report 2017 — Management’s reviewResponsibility and management: Risks

Conducting business with social integrity
Corporate Social Responsibility in Solar
In Solar Group, we conduct business with integrity. While pursuing our strategy to achieve profitable growth, we want to explore opportunities that allow us to address some of the global challenges.
We acknowledge that our success has implications for the world around us in a number of ways. Therefore, we have made a formal decision to conduct business ethically and to contribute to sustainable development. We work to embed CSR thinking into our projects and operational processes to make sure that CSR is not a stand-alone discipline, but a natural part of our way of doing business.
Our primary aim is to create profitable growth for our business in a highly competitive market. We are determined to achieve this in a responsible manner.
Therefore, we implement socially responsible activities where it makes sense and where we see that we can create value. Some of these activities are a product of major projects, while others are small everyday activities, which, nevertheless, are equally important when defining Solar as a socially responsible company.
35 MANAGEMENT’SREVIEW
FINANCIAL STATEMENTS CONTENTS
Solar Annual Report 2017 — Management’s reviewResponsibility and management: Corporate Social Responsibility
Corporate Social Responsibility
Global Compact
Solar is a registered partner to the UN’s Global Compact and is committed to honouring the Global Compact’s 10 principles, which encompass human rights, working environment/labour, environment and anti-corruption.
As an active participant of the UN Global Compact, Solar Group communicates our CSR activities via an annual communication on progress (COP). Our COP report also represents Solar Group’s compliance with sections 99a and 99b of the Danish Financial Statements Act.
In addition to expressing our continued support for the programme, the report outlines our efforts to reduce CO2 emissions and our compliance with ethical standards.
The report is accessible atwww.solar.eu/our-company/corporate-social-responsibility/and at the Global Compact’s websitewww.unglobalcompact.org/what-is-gc/participants/10987-Solar-A-S#cop
Responsible supplier management
Solar Group operates in a global setting with business partners located internationally. Our global presence underlines the importance of a shared framework for responsible business and ethical behaviour. We seek to ensure safety in our supply chain by requiring our suppliers to act in compliance with the UN Global Compact through our Supplier Code of Conduct.
Therefore, Solar Group has intensified the focus on our collaboration with our suppliers in an on-going effort to promote Corporate Social Responsibility. In our updated
code of conduct, we have strengthened the expectations we have to our suppliers. Our Supplier Code of Conduct communicates a requirement for our suppliers to support and comply with internationally declared human rights and labour standards, endeavour to uphold environmental standards, and to support and comply with a zero tolerance policy on corruption.
Our Supplier Code of Conduct forms the basis of dialogue and control with our suppliers with regard to responsibility. On an ongoing basis, we are ensuring our suppliers’ commitment to the standards of our code of conduct.
Carbon Disclosure Project (CDP)
Reducing the emission of CO2 is a global responsibility. The Solar Group has taken measures to promote environmental responsibility throughout the Solar Group. Based on a new reporting system and by setting specific goals, Solar now has the possibility to improve our way of measuring and set goals for reducing our CO2 emission in Solar Group. One area measured is CO2 emissions generated from the direct burning of fossil fuels, i.e. fuel consumption relating to company vehicles, forklifts, etc. Other areas measured include CO2 emissions from purchased electricity and from goods distribution. All results are reported to the Carbon Disclosure Project.
SOS Children’s Villages
In 2017, the Solar Group continued our partnership with SOS Children’s Villages. This time with focus on ensuring sustainable energy supply for an SOS children’s village in Hawassa, Ethiopia.
With more than 90 million inhabitants, Ethiopia is the second most populous country in the African continent. Electricity in Ethiopia is not very stable, and in an SOS Children’s Village in Hawassa, they resort to generators to produce the power necessary to run basic equipment. The current energy source is costly, and frequent outages make schooling very difficult, in terms of both administration, teachers preparation, and use of IT for students.
Over the coming three years, Solar Group, together with Engineers without Borders and SOS Children’s Villages, will be implementing solar energy in Hawassa to provide a cheaper and stable energy source. This will make it a lot easier to conduct lessons requiring electronic devices and thus improve the children’s learning opportunities. With a possibility of connecting the solar energy to the local grid, the energy will benefit not only the SOS Children’s Village, but also the local community.
Our involvement in Ethiopia comes in two phases. In 2017, our focus was on researching the local conditions, designing the right solution and transporting materials to Hawassa, all to ensure renewable and stable electricity in the village. Over the coming two years, we will be aiming to initiate a strategic cooperation with the vocational training centre in Hawassa and the SOS training centre in Addis to educate the local youth in solar energy. By teaching and sharing their knowledge, they will not only train a number of youth but will support the development of a solar energy curriculum in the training centres to ensure that the system is sustained after the project ends.
You can read more about our partnership with SOS Children’s Villages – and learn more about Solar’s CSR profile – at www.solar.eu/our-company/corporate-social-responsibility/
36 MANAGEMENT’SREVIEW
FINANCIAL STATEMENTS CONTENTS
Solar Annual Report 2017 — Management’s reviewResponsibility and management: Corporate Social Responsibility

In general, Solar follows the corporate governance recommendations
Overall, Solar views the May 2013 recommendations of the Danish Committee on Corporate Governance as a valuable tool for ensuring sound management, goodtransparency for shareholders and other stakeholders and for efficient risk management.
Solar, therefore, basically follows the recommendations relevant to the company. A complete description of Solar’s stand on the individual points of the corporate governance recommendations is available at:www.solar.eu/investor/corporate-governance.
Deviations
Solar complies with 43 of 47 recommendations but deviates from:
Recommendation on nomination of candidates for the Board of DirectorsThe Board of Directors neither selects nor nominates candidates to the Board of Directors, as it is the Fund of 20th December, which is a majority shareholder, that submits proposals for the composition of the Board of Directors. In this connection, importance is attached to the board members representing relevant skills in relation to the company’s needs.
Recommendation on fixing an age limit for board membersThe age of the members of the Board of Directors is listed in Solar’s annual report. Solar wishes to promote age diversity on the Board of Directors but has no fixed retirement age for individual members. As Solar believes that skills are more important than age, there is no fixed retirement age for board members.
Recommendation on independence of a majority of the members of a board committeeTo the extent that the present necessary competences are available, we strive for a majority of independent board members in the board committee. The majority of members in the remuneration committee are independent, while one of the three audit committee members is independent.
Recommendation on establishment of a nomination committeeThe Fund of 20th December, the majority shareholder, makes proposals for the composition of the Board of Directors. Due to this ownership structure with a majority shareholder, Solar has not established a permanent nomination committee tasked with nominating members of the Board of Directors. However, every year, the board evaluates the skills requirements of the Board of Directors. In connection with the appointment of members of the Executive Board, a temporary nomination committee is established.
Evaluation
The chairman carries out the evaluation of the Board of Directors’ work by means of a questionnaire survey. The purpose is to assess whether the overall skills of the Board of Directors match the company’s current needs, the quality of material distributed to the board and the holding of the meetings themselves as well as the relevance of issues discussed as regards legal requirements, risk factors and the company’s development potential. The 2017 evaluation has not given rise to the introduction of additional measures.
Statutory corporate governance statement
Solar has chosen to make the statutory corporate governance statement, cf. Danish Financial Statements Act section 107b, available on the company’s website.
Please use this link to find the statutory corporate governance statement 2017:www.solar.eu/investor/corporate-governance.
The Audit Committee and Internal Audit
Descriptions about the roles and responsibilities for The Audit Committee and Internal Audit, respectively, are available at:www.solar.eu/investor/corporate-governance.
37 MANAGEMENT’SREVIEW
FINANCIAL STATEMENTS CONTENTS
Solar Annual Report 2017 — Management’s reviewResponsibility and management: Corporate Governance
Corporate Governance

Investor relations policy
Solar aims at transparency by giving investors and analysts the best possible insight into relevant issues.
The publication of information that may affect the share price must be issued in good time and in compliance with the stock exchange’s rules of ethics.
Everyone must have access to such information at the same time. We ensure this by publishing relevant information via Nasdaq Copenhagen and on www.solar.eu.
We hold meetings with investors and financial analysts. Investor meetings or similar events cannot be held during our IR quiet periods. These periods start on the 10th of every month following a closed quarter and end with the publication of the next quarterly or annual report. During such periods, no comments on financial results, expectations or market outlook will be issued by the company. The IR quiet periods are listed in the financial calendar.
Communicating with investors
Solar wants to be visible and accessible to both existing and potential institutional and private shareholders.
We need to know our target groups to have the best possible dialogue with them. This is why we recommend
shareholders that they register by name and e-mail in the register of shareholders.
We communicate with shareholders at general meetings, through frequent announcements via Nasdaq Copenhagen and our website www.solar.eu as well as via web presentations.
Relevant investor relations material is published on www.solar.eu, where Solar’s stakeholders can also sign up to receive company announcements by e-mail.
Investor relations activities
We hold audio webcasts in connection with the publication of annual and quarterly reports. In addition, Solar is also available for individual meetings with investors and analysts in Denmark and abroad. In 2017, Solar took part in 47 investor and analyst meetings.
In 2017, Solar attended roadshows in Copenhagen, Paris and Brussels. We also took part in other events, including SEB Nordic Seminar and Danske Bank Markets Copenhagen Winter Seminar.
Audio webcast
The presentation of Annual Report 2017 will be transmitted online on 9 February 2018 at 11:00 CET and will be available at www.solar.eu.
Solar’s capital and share structure
The Board of Directors regularly assesses the company’s capital and share structures to ensure that these are appropriate for both the shareholders and the company.
As a result the Board of Directors has decided to submit a proposal at the annual general meeting for distributing DKK 73m as dividend, corresponding to DKK 10.00 per share outstanding of DKK 100.
The payout ratio for 2017 is then 386% of net profit. However, if adjusted for impairment, fair value adjustments and discontinued operations, the payout ratio equals 48%, which is above Solar’s targeted payout ratio of 35-45%.
Solar’s shares
Solar’s share capital is divided into nominally DKK 90 million A shares and nominally DKK 685 million B shares.
The A shares are not listed. The B shares are listed on Nasdaq Copenhagen under the ID code DK0010274844 with the short designation SOLAR B and form part of the MidCap index and MidCap on Nasdaq Nordic.
Share capital includes 900,000 A shares and 6,845,625 B shares. A shares have 10 votes per share amount of DKK 100, while B shares have 1 vote for each share amount of DKK 100.
To be entitled to vote, shares must be registered in Solar’s register of shareholders no later than one week before the date of the annual general meeting.
Solar has an open approach towards all investors
38 MANAGEMENT’SREVIEW
FINANCIAL STATEMENTS CONTENTS
Solar Annual Report 2017 — Management’s reviewResponsibility and management: Shareholder information
Shareholder information

Annual general meeting
Solar will hold its annual general meeting on Friday 16 March 2018 at 11.00 at our premises: Solar A/S, Industrivej Vest 43, DK-6600 Vejen, Denmark.
Shareholders can register for the annual general meeting on the investor portal, accessible via www.solar.eu.
The Board of Directors will submit the following proposals for approval by the annual general meeting:
• Payment of DKK 10.00 in return per share outstanding of DKK 100.
• Authority to make the decision to distribute extraordinary dividends of up to DKK 15.00.
• Authority to acquire treasury shares valued at up to 10% of share capital.
• Approval of the Board of Directors’ remuneration in 2018.
Please find a presentation of our Board ofDirectors on pages 42-43.
DKK Total 2013-17
Average 2013-17
Year 2017
Year 2016
Share price increase 157.86 31.57 52.72 -69.89
Dividends distributed 47.65 9.53 12.00 10.00
Return 205.51 41.10 64.72 -59.89
Share price development
On 31 December 2017, the price of Solar’s B share was DKK 415, up from the 2017 starting price of DKK 362.
This is a rise of approx. 15% in Solar’s share price over the year, which exceeds the average MidCap index increase of approx. 12% in 2017.
Share price development (index)
30.12.1701.07.1701.01.17
MidCap Solar
90
100
110
120
130Holdings of 5% or more of share capital As at 31 December 2017
Share capital in % Votes in %
The Fund of 20th December, Vejen, Denmark 16.0% 58.1%
RWC Asset Management LLP, London, England 11.8% 5.8%
Chr. Augustinus Fabrikker A/S, Copenhagen, Denmark 10.6% 5.2%
Nordea Funds Oy, Danish Branch, Copenhagen, Denmark 10.1% 4.9%
Solar A/S, Vejen, Denmark 5.8% 2.8%
Dividends and return per shareAt the annual general meeting, the Board of Directors will propose dividends distribution of DKK 10.00 per share, down from DKK 12.00 distributed in 2017.
Return per share of nominally DKK 100
ShareholdersAs at 31 December 2017, registered share capital totalled 91.3%, distributed on 3,672 shareholders.
Solar’s portfolio of treasury shares totalled 447,333 B shares or 5.8% of share capital as at 31 December 2017.
Distribution of share capital and votesas at 31 December 2017 in %
Solar’s market valueSolar holds a 20.01% equity interest in BIMobject AB, which is a listed company on First North. This is an illustration of the impact of BIMobject’s market value on Solar’s market value.
39 MANAGEMENT’SREVIEW
FINANCIAL STATEMENTS CONTENTS
Solar Annual Report 2017 — Management’s reviewResponsibility and management: Shareholder information
0
500
1,000
1,500
2,000
2,500
3,000
3,500
Jan Feb Mar Apr May Jun Jul Aug Sep Oct Nov Dec
Market value of Solar excl. BIMobject
Solar’s part of the market value of BIMobject
Market value of Solar

Date No. Announcements 2017
29.12 20 Major shareholder announcement
26.10 19 Financial calendar 2017 for Solar A/S
26.10 18 Quarterly Report Q3 2017
08.10 17 Management change at Solar: Jens Andersen appointed new CEO
10.08 16 Quarterly Report Q2 2017
31.05 15 Solar A/S increases equity interest in BIMobject AB
03.05 12 Quarterly Report Q1 2017
01.05 11 Solar A/S’s total share capital and votes at the end of April 2017
19.04 10 Articles of association
19.04 9 Implementation of reduction of share capital
17.03 8 Articles of Association of Solar A/S
17.03 7 Course of annual general meeting (AGM)
24.02 6 Grant of share options to the Executive Board and management team of Solar A/S
24.02 5 Exercise of share options in Solar A/S
21.02 4 Notice of annual general meeting
10.02 3 Annual Report 2016
27.01 2 Swedish BIMobject AB has made a targeted emission, enabling Solar A/S to acquire 19.99% of the shares in BIMobject
13.01 1 Major shareholder announcement
Analysts
The following financial institutionscover the Solar share:
• Carnegie Bank• Danske Bank• Nordea Bank
Investor contact
Charlotte Risskov KræftingDirector, Stakeholder Relations
Tel.: +45 79 300 257E-mail: [email protected]
Financial calendar
16 March Annual general meeting
10 April – 24 April IR quiet period
24 April Quarterly Report Q1 2018
10 July - 9 August IR quiet period
9 August Quarterly Report Q2 2018
10 October-1 November IR quiet period
1 November Quarterly Report Q3 2018
Company announcements(excl. insider announcements)
Date No. Announcements 2018
31.01 3 Solar A/S enters into agreements concerning divestment of the group’s Austrian and Belgian business activities
12.01 2 Solar discloses the preliminary results for 2017 and writes down goodwill and customer lists
12.01 1 Major shareholder announcement
40 MANAGEMENT’SREVIEW
FINANCIAL STATEMENTS CONTENTS
Solar Annual Report 2017 — Management’s reviewResponsibility and management: Shareholder information

Solar Annual Report 2016 — Management’s reviewResponsibility and management: Executive Board and Solar Management
Management
Solar Group Management
Solar Group Management is made up of theExecutive Board, our senior vice presidents and the MDs of the Solar Group subsidiaries.
Marco de Bos (born 1971)Senior Vice President & MD Benelux
Jan Willy Fjellvær (born 1961)Senior Vice President, Sourcing & MD Norway
Lars Goth (born 1961)Senior Vice President, Supply Chain & MD Austria
Tore Håkonsson (born 1964)Senior Vice President, HR and Communications
Anders Koppel (born 1969)Senior Vice President & MD Sweden
Ole Sørensen (born 1971)Senior Vice President, Industry Sales
Dariusz Targosz (born 1969)Senior Vice President & MD Poland
Bauke Zeinstra (born 1966)Senior Vice President & MD MAG45
Executive Board and Solar Group Management
Executive Board
Jens E. Andersen (born 1968)CEO and MD Denmark
• Chairman of the boards of directors of all Solar Group subsidiaries.
• Member of the boards of directors of VELTEK, the Confederation of Danish Industry – Trade and Associated Danish Ports A/S.
• Holds 10,360 BIMobject shares acquired in 2017.• Holds 2,480 Solar B shares. Has not traded Solar shares
in 2017.• Holds 11,189 share options, 2,709 of these granted
in 2017. Exercised 6,113 share options in 2017.
• Remuneration: DKK 2m, in the period from joining the Executive Board on 8 October 2017.
Hugo Dorph (born 1965)CCO
• Chairman of the board of directors of Flexya Innovations A/S.
• Member of the boards of directors of Flexya A/S, Viva Labs AS and Geniebelt A/S.
• Holds no Solar shares.• Holds 11,597 share options, 2,703 of these granted
in 2017.
• Remuneration: DKK 4m.
Michael H. Jeppesen (born 1966)CFO
• Member of the boards of directors of all Solar Group subsidiaries.
• Holds 1,269 Solar B shares. Has not traded Solar shares in 2017.
• Holds 9,030 share options, 2,186 of these granted in 2017.
• Remuneration: DKK 3m.
41 MANAGEMENT’SREVIEW
FINANCIAL STATEMENTS CONTENTS
Solar Annual Report 2017 — Management’s reviewResponsibility and management: Executive Board and Solar Group Management

Jens Borum (born 1953, joined 1982)CHAIRMAN
• Associate professor, University of Copenhagen.• M.Sc. 1980, PhD 1985.
• Has long-time experience as chairman.
• Remuneration 2017: DKK 781,750.• Holds 6,900 Solar A shares and 118,520 Solar B shares.
Has not traded Solar shares in 2017.• Holds 38,000 BIMobject shares acquired in 2017.
Ulf Gundemark (born 1951, joined 2014)VICE CHAIRMAN
• Holds an electrical engineering degree (1975) and has since gotten supplementary education at, among others, IFL and INSEAD.
• Chairman of the board of directors of Nordic Waterproofing Holding A/S.
• Member of the boards of directors of Optigroup AB, Lantmännen Ekonomisk Förening, Scandi Standard Group AB, AQ Group AB and Ripasso Energy AB.
• Represents managerial experience from global and local businesses and holds significant knowledge of the trade and markets.
• Remuneration 2017: DKK 359,375.• Holds 1,500 B shares. Has not traded Solar shares in
2017.
Lars Lange Andersen (born 1968, joined 2010)EMPLOYEE-ELECTED MEMBER
• Head of F&B Scandinavia.
• Remuneration 2017: DKK 175,000.• Holds 93 Solar B shares. Has not traded Solar shares in
2017.• Holds 0 BIMobject shares but has traded 400 BIMobject
shares in 2017.
Niels Borum (born 1948, joined 1975)
• M.Sc. in engineering 1973.• Chairman of the Board of Directors of the Fund of 20th
December.
• Represents the Fund of 20th December and has experience of IT and processes.
• Remuneration 2017: DKK 293,750.• Holds 6,900 Solar A shares and 89,539 Solar B shares.
Has not traded Solar shares in 2017.
Ulrik Damgaard (born 1973, joined 2014)EMPLOYEE-ELECTED MEMBER
• Regional Manager.
• Remuneration 2017: DKK 175,000.• Holds 60 Solar B shares.Has not traded Solar shares in
2017.
Bent H. Frisk (born 1961, joined 2006)EMPLOYEE-ELECTED MEMBER
• Central Warehouse Manager.
• Remuneration 2017: DKK 175,000.• Holds 60 Solar B shares. Has not traded Solar shares in
2017.
Jesper Dalsgaard Jensen (born 1968, joined 2017)
• Managing Director, Rambøll Buildings, Rambøll Group A/S.
• M.Sc. in Law and Business Administration 1993.• Member of the board of directors of the Fund of
20th December.
• Represents experience of companies managed by funds and companies affiliated with the construction industry and has experience with strategy and business development as well as establishing new business models.
• Remuneration 2017: DKK 275,000.• Holds 250 Solar B shares acquired in 2017.
Board of Directors
42 MANAGEMENT’SREVIEW
FINANCIAL STATEMENTS CONTENTS
Solar Annual Report 2017 — Management’s reviewResponsibility and management: Board of Directors
Board of Directors

Louise Knauer (born 1983, joined 2017)
• Senior Executive Vice President of Group Data Security and Wholesale & Group Chief Data & Security Officer at TDC A/S.
• B.Sc. in business administration and commercial law, 2006, and M.Sc in finance and strategic management, 2008.
• Member of the boards of directors of DoGood.dk ApS and CubeIO A/S.
• Represents experience of developing strategies and both national and international companies as well as with technologically-driven innovation and business development. She also has experience with cyber security.
• Remuneration 2017: DKK 218,750.• Holds 381 Solar B shares acquired in 2017.
Jens Peter Toft (born 1954, joined 2009)
• CED of Selskabet af 11. december 2008 ApS and one subsidiary hereof.
• Graduate Diploma in Business Administration (Financial and Management Accounting) 1983, the Executive Program, University of Michigan Business School.
• Chairman of the boards of directors of Mipsalus Holding ApS and one subsidiary hereof.
• Vice chairman of the board of directors of M. Goldschmidt Holding A/S.
• Member of the boards of directors of Bitten og Mads Clausens Fond, the unit trusts Danske Invest, Danske Invest Select, Profil Invest, Procapture and the capital units Danske Invest Institutional and AP Invest, Civilingeniør N.T. Rasmussens Fond, Enid Ingemanns Fond, Fondet for Dansk Norsk Samarbejde, six subsidiaries of M. Goldschmidt Holding A/S, Dansk Vækstkapital II, Dagrofa ApS and Mahia 17 ApS, and Selskabet af 11. December 2008 ApS.
• Member of the investment committee of GRO Capital.
• Represents experience of capital market transactions, financial matters, investments, organisation, general management and stock exchange matters.
• Remuneration 2017: DKK 456,250.• Holds 1,250 Solar B shares.
Has not traded Solar shares in 2017.
Board of Directors’ affiliation with Solar
Ulf Gundemark, Louise Knauer and Jens Peter Toft are independent of the company pursuant to the definition in the recommendations on corporate governance in Denmark. Jens Borum has been member of the Board of Directors for more than 12 years. Niels Borum and Jesper Dalsgaard are affiliated with the Fund of 20th December, which is the majority shareholder in Solar A/S.
Jesper Dalsgaard and Jens Peter Toft are members of the Audit Committee together with Chairman of the Board of Directors Jens Borum. Jens Peter Toft chairs the Audit Committee and has special accounting qualifications.
Jens Peter Toft and Ulf Gundemark are members of the Remuneration Committee together with Chairman of the Board of Directors Jens Borum. Ulf Gundemark chairs the Remuneration committee.
Election of employee representatives
The most recent ordinary election of employee representatives took place electronically on 17-27 March 2014. The participation rate in the election was 57.3%. Under the law, employee representatives have the same rights, duties and responsibilities as the other members of the board. Under Danish law, employees have the right to elect a number of representatives and alternates, corresponding to half of the representatives elected by the annual general meeting at the time of calling the election of employee representatives. The next election will take place this year and the result of the election will be published on 2 March 2018.
Election period
All board members elected at the annual general meeting are up for election each year, whereas employee representatives are elected by and among the company’s employees for four-year terms.
Activities
A minimum of six ordinary board meetings as well as one conference for the Board of Directors will be held each year. In 2017, we had nine board meetings and one conference for the Board of Directors.
43 MANAGEMENT’SREVIEW
FINANCIAL STATEMENTS CONTENTS
Solar Annual Report 2017 — Management’s reviewResponsibility and management: Board of Directors
Financialstatements
Consolidated financial statements
44
Solar Annual Report 2017 — ConsolidatedResults and outlook: Financial review
MANAGEMENT’SREVIEW
FINANCIAL STATEMENTS CONTENTS
Solar Annual Report 2017 — Consolidated44

Summary for the Solar Group 46Statement of comprehensive income 48Balance sheet 49Cash flow statement 50Statement of changes in equity 51Notes 53
Basis for preparation1 General accounting policies 532 Significant accounting estimates and assessments 563 Financial risks 57
Notes to the income statement4 Segment information 585 Staff costs 626 Loss on trade receivables 637 Depreciation, write-down and amortisation 638 Income tax 649 Net profit for the year 67
Invested capital10 Intangible assets 6811 Property, plant and equipment 7212 Associates 7413 Inventories 7614 Trade receivables 7715 Other provisions 7816 Other payables 7917 Acquisitions of subsidiaries 8018 Assets and liabilities held for sale 83
Capital structure and financing costs19 Share capital 8520 Earnings per share in DKK per share outstanding
for the year 8621 Interest-bearing liabilities and maturity statement 8722 Financial income 9123 Financial expenses 91
Other notes24 Share option plans 9225 Contingent liabilities and other financial liabilities 9426 Related parties 9527 Auditors’ fees 9528 New financial reporting standards 96
45
Solar Annual Report 2017 — ConsolidatedResults and outlook: Financial review
MANAGEMENT’SREVIEW
FINANCIAL STATEMENTS CONTENTSMANAGEMENT’S
REVIEWFINANCIAL STATEMENTS CONTENTS
Notes to the financial statements
Contents
Solar Annual Report 2017 — ConsolidatedContents

Summary for the Solar Group2013-2017
Income statement (DKK million) 2017 2016 2015 2014 2013
Revenue 11,105 10,420 10,587 10,252 10,463
Earnings before interest, tax, depreciation and amortisation (EBITDA) 347 368 362 227 307
Earnings before interest, tax and amortisation (EBITA) 295 312 296 117 225
Earnings before interest and tax (EBIT) 126 256 249 -73 160
Financials, net 70 -33 -48 -49 -54
Earnings before tax (EBT) 126 223 201 -122 106
Net profit for the year 19 125 167 -234 21
Balance sheet (DKK million)
Non-current assets 1,522 1,397 1,250 1,324 1,814
Current assets 3,195 3,109 3,421 3,250 3,147
Balance sheet total 4,717 4,506 4,671 4,574 4,961
Equity 1,591 1,683 1,831 1,732 2,138
Non-current liabilities 557 375 592 655 771
Current liabilities 2,569 2,448 2,248 2,187 2,052
Interest-bearing liabilities, net 489 43 -184 302 316
Invested capital 1,790 1,744 1,662 2,172 2,637
Net working capital, year-end 1,081 998 989 1,111 1,318
Net working capital, average 1,133 1,187 1,252 1,267 1,538
Cash flow (DKK million) 2017 2016 2015 2014 2013
Cash flow from operating activities, continuing operations 12 203 331 187 310
Cash flow from investing activities, continuing operations -347 -152 -24 -58 -9
Cash flow from financing activities, continuing operations -22 -388 -125 -151 -291
Net investments in intangible assets -110 -88 -36 -18 -10
Net investments in property, plant and equipment -15 51 -25 -41 -81
Acquisition and divestment of subsidiaries and operations, net -16 -97 37 1 82
Financial ratios (% unless otherwise stated)
Revenue growth 6.6 5.2 3.3 -2.0 -5.9
Organic growth 6.4 3.2 5.2 0.4 -5.4
Organic growth adjusted for number of working days 6.9 2.3 5.2 0.1 -5.0
Gross profit margin 21.0 21.1 20.8 21.2 21.8
EBITDA margin 3.1 3.5 3.4 2.2 2.9
EBITA margin 2.7 3.0 2.8 1.1 2.2
EBIT margin 1.1 2.5 2.4 -0.7 1.5
Effective tax rate 19.8 28.3 33.2 -47.2 17.3
Net working capital (year-end NWC)/revenue (LTM) 9.7 8.4 9.3 10.8 10.7
Net working capital (average NWC)/revenue (LTM) 10.2 10.1 11.8 12.4 13.2
Gearing (net interest-bearing liabilities/EBITDA), no. of times 1.4 0.1 -0.5 1.3 1.0
Return on equity (ROE) 1.2 7.1 9.4 -12.1 1.0
Return on invested capital (ROIC) 3.8 10.0 8.5 -4.3 4.5
Adjusted enterprise value/earnings before interest, tax and amortisation (EV/EBITA) 11.0 8.8 10.6 21.7 12.8
Equity ratio 33.7 37.4 39.2 37.9 43.1
46
Solar Annual Report 2017 — ConsolidatedResults and outlook: Financial review
MANAGEMENT’SREVIEW
FINANCIAL STATEMENTS CONTENTS
Solar Annual Report 2017 — ConsolidatedSummary for the Solar Group

Summary for the Solar Group2013-2017 – continued
Share ratios (DKK unless otherwise stated) 2017 2016 2015 2014 2013
Earnings per share outstanding (EPS) 2.60 16.50 21.26 -29.79 2.67
Intrinsic value per share outstanding 218.00 230.60 234.43 220.62 272.34
Cash flow from operating activities per share outstanding 1.64 26.77 42.05 23.77 39.46
Share price 414.52 361.80 431.69 287.51 335.95
Share price/intrinsic value 1.90 1.57 1.84 1.30 1.23
Dividends per share 10.00 12.00 10.00 7.00 12.00
Dividend in % of net profit for the year (payout ratio) 385.6 70.2 46.8 - 421.5
Price Earnings (P/E) 159.2 21.9 20.3 -9.7 125.7
Employees
Average number of employees (FTEs), continuing operations 2,901 2,814 2,871 2,898 2,943
Definitions
Organic growth Revenue growth adjusted for enterprises acquired and sold off and any exchange rate changes. No adjustments have been made for number of working days.
Net working capital Inventories and trade receivables less trade payables.
ROIC Return on invested capital calculated on the basis of operating profit or loss less tax calculated using the effective tax rate.
Financial ratios are calculated in accordance with the Danish Finance Society’s “Recommendations & Financial Ratios 2015”.
In general, restatements have been made of income statements, cash flow and key ratios for the discontinued operations in Claessen ELGB N.V. and GFI GmbH for 2016 and 2017, and for Solar Deutschland GmbH for 2013 and 2014, whereas these are not adjusted for previous years. In accordance with IFRS, the balance sheet has not been restated. The key ratio interest-bearing liabilities, net, has been adjusted for interest-bearing receivables relating to the divestment of Aurora Group Danmark A/S, up until the settlement in Q1 2015.
47
Solar Annual Report 2017 — ConsolidatedResults and outlook: Financial review
MANAGEMENT’SREVIEW
FINANCIAL STATEMENTS CONTENTS
Solar Annual Report 2017 — ConsolidatedSummary for the Solar Group

Statement of comprehensive incomeIncome statement
Note DKK million 2017 2016
4 Revenue 11,105 10,420
Cost of sales -8,776 -8,225
Gross profit 2,329 2,195
27 External operating costs -482 -446
5 Staff costs -1,484 -1,368
6 Loss on trade receivables -16 -13
Earnings before interest, tax, depreciation and amortisation (EBITDA) 347 368
7 Depreciation and write-down on property, plant and equipment -52 -56
Earnings before interest, tax and amortisation (EBITA) 295 312
7 Amortisation and impairment of intangible assets -169 -56
Earnings before interest and tax (EBIT) 126 256
12 Share of net profit from associates -11 0
12 Impairment on associates -59 0
22 Financial income 110 26
23 Financial expenses -40 -59
Earnings before tax (EBT) 126 223
8 Income tax -25 -63
Profit of continuing operations 101 160
18 Loss of discontinued operations -82 -35
9 Net profit for the year 19 125
20 Earnings in DKK per share outstanding (EPS) for the year 2.60 16.50
20 Diluted earnings in DKK per share outstanding (EPS-D) for the year 2.60 16.49
20 Earnings in DKK per share outstanding (EPS) of continuing operations for the year 13.84 21.12
20 Diluted earnings in DKK per share outstanding (EPS-D) of continuing operations for the year 13.82 21.10
Please see note 18 on discontinued operations for earnings per share outstanding (EPS) from discontinued operations.
Other comprehensive income
DKK million 2017 2016
Net profit for the year 19 125
Other income and costs recognised:
Items that cannot be reclassified for the income statement
Actuarial gains / losses on defined benefit plans 0 -9
Tax on acturial gains/losses on defined benefit plans 0 2
Items that can be reclassified for the income statement
Foreign currency translation adjustments of foreign subsidiaries -35 2
Fair value adjustments of hedging instruments before tax 16 8
Tax on fair value adjustments of hedging instruments -4 -2
Other income and costs recognised after tax -23 1
Total comprehensive income for the year -4 126
48
Solar Annual Report 2017 — ConsolidatedResults and outlook: Financial review
MANAGEMENT’SREVIEW
FINANCIAL STATEMENTS CONTENTS
Solar Annual Report 2017 — ConsolidatedStatement of comprehensive income

Balance sheet as at 31 December
Notes DKK million 2017 2016
ASSETS
10 Intangible assets 427 475
11 Property, plant and equipment 814 865
8 Deferred tax asset 18 10
12 Investments in associates 203 0
Other non-current assets 60 47
Non-current assets 1,522 1,397
13 Inventories 1,437 1,321
14 Trade receivables 1,492 1,404
Income tax receivable 5 5
Receivables from construction contracts 1 0
Other receivables 13 10
Prepayments 45 26
Cash at bank and in hand 77 343
18 Assets held for sale 125 0
Current assets 3,195 3,109
Total assets 4,717 4,506
Notes DKK million 2017 2016
EQUITY AND LIABILITIES
19 Share capital 775 792
Reserves -158 -135
Retained earnings 901 938
Proposed dividends for the financial year 73 88
Equity 1,591 1,683
21 Interest-bearing liabilities 423 194
Provision for pension obligations 3 18
8 Provision for deferred tax 107 122
15 Other provisions 24 41
Non-current liabilities 557 375
21 Interest-bearing liabilities 143 192
Trade payables 1,848 1,727
Income tax payable 19 16
Payables from construction contracts 1 0
16 Other payables 482 495
Prepayments 1 0
15 Other provisions 7 18
18 Liabilities held for sale 68 0
Current liabilities 2,569 2,448
Liabilities 3,126 2,823
Total equity and liabilities 4,717 4,506
49
Solar Annual Report 2017 — ConsolidatedResults and outlook: Financial review
MANAGEMENT’SREVIEW
FINANCIAL STATEMENTS CONTENTS
Solar Annual Report 2017 — ConsolidatedBalance sheet
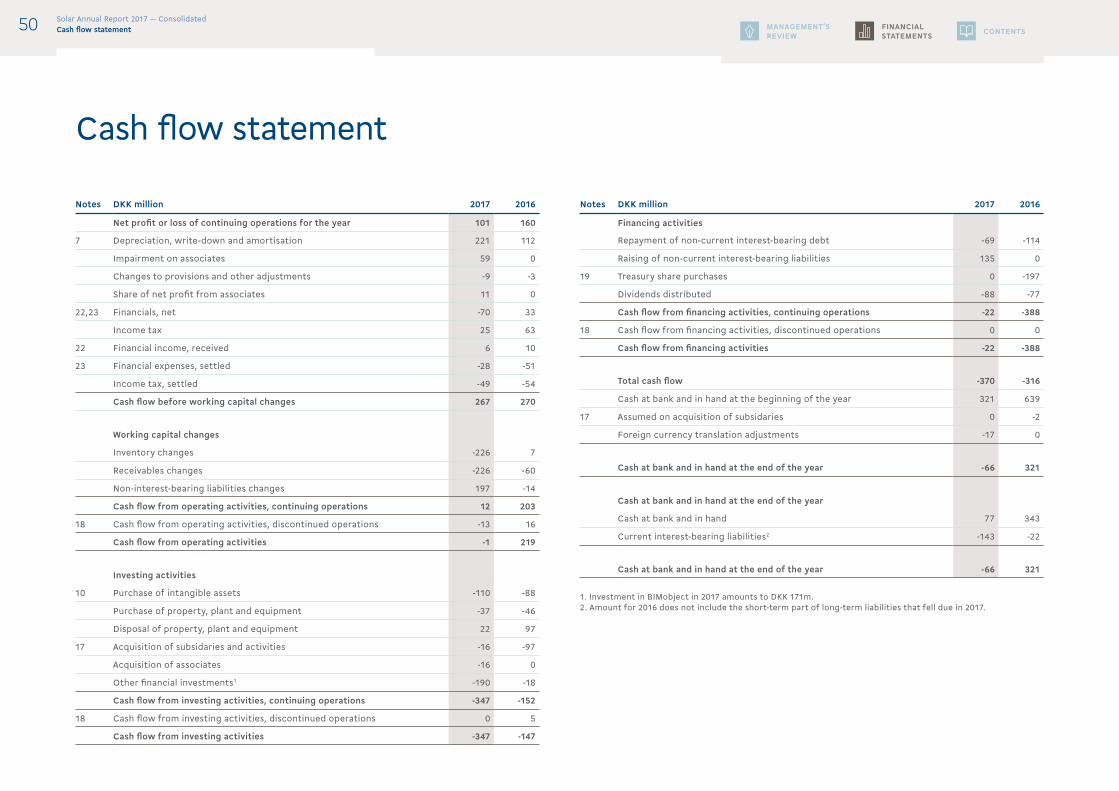
Cash flow statement
Notes DKK million 2017 2016
Net profit or loss of continuing operations for the year 101 160
7 Depreciation, write-down and amortisation 221 112
Impairment on associates 59 0
Changes to provisions and other adjustments -9 -3
Share of net profit from associates 11 0
22,23 Financials, net -70 33
Income tax 25 63
22 Financial income, received 6 10
23 Financial expenses, settled -28 -51
Income tax, settled -49 -54
Cash flow before working capital changes 267 270
Working capital changes
Inventory changes -226 7
Receivables changes -226 -60
Non-interest-bearing liabilities changes 197 -14
Cash flow from operating activities, continuing operations 12 203
18 Cash flow from operating activities, discontinued operations -13 16
Cash flow from operating activities -1 219
Investing activities
10 Purchase of intangible assets -110 -88
Purchase of property, plant and equipment -37 -46
Disposal of property, plant and equipment 22 97
17 Acquisition of subsidaries and activities -16 -97
Acquisition of associates -16 0
Other financial investments1 -190 -18
Cash flow from investing activities, continuing operations -347 -152
18 Cash flow from investing activities, discontinued operations 0 5
Cash flow from investing activities -347 -147
Notes DKK million 2017 2016
Financing activities
Repayment of non-current interest-bearing debt -69 -114
Raising of non-current interest-bearing liabilities 135 0
19 Treasury share purchases 0 -197
Dividends distributed -88 -77
Cash flow from financing activities, continuing operations -22 -388
18 Cash flow from financing activities, discontinued operations 0 0
Cash flow from financing activities -22 -388
Total cash flow -370 -316
Cash at bank and in hand at the beginning of the year 321 639
17 Assumed on acquisition of subsidaries 0 -2
Foreign currency translation adjustments -17 0
Cash at bank and in hand at the end of the year -66 321
Cash at bank and in hand at the end of the year
Cash at bank and in hand 77 343
Current interest-bearing liabilities2 -143 -22
Cash at bank and in hand at the end of the year -66 321
1. Investment in BIMobject in 2017 amounts to DKK 171m.2. Amount for 2016 does not include the short-term part of long-term liabilities that fell due in 2017.
50
Solar Annual Report 2017 — ConsolidatedResults and outlook: Financial review
MANAGEMENT’SREVIEW
FINANCIAL STATEMENTS CONTENTS
Solar Annual Report 2017 — ConsolidatedCash flow statement

Statement of changes in equity
DKK millionShare
capital
Reservesfor hedging
transactions
Reserves for foreign
currencytranslation
adjustmentsRetainedearnings
Proposeddividends Total
2017
Equity as at 1 January 792 -73 -62 938 88 1,683
Foreign currency translation adjustments of foreign subsidiaries -35 -35
Fair value adjustments of hedging instruments before tax 16 16
Tax on value adjustments -4 -4
Net income recognised in equity via other comprehensive income in the statement of comprehensive income 0 12 -35 0 0 -23
Net profit for the year -54 73 19
Comprehensive income 0 12 -35 -54 73 -4
Distribution of dividends (DKK 12.00 per share) -88 -88
Reduction in share capital -17 17 0
Transactions with the owners -17 0 0 17 -88 -88
Equity as at 31 December 775 -61 -97 901 73 1,591
51
Solar Annual Report 2017 — ConsolidatedResults and outlook: Financial review
MANAGEMENT’SREVIEW
FINANCIAL STATEMENTS CONTENTS
Solar Annual Report 2017 — ConsolidatedStatement of changes in equity

Statement of changes in equity– continued
DKK millionShare
capital
Reservesfor hedging
transactions
Reserves for foreign
currencytranslation
adjustmentsRetainedearnings
Proposeddividends Total
2016
Equity as at 1 January 792 -79 -64 1,104 78 1,831
Foreign currency translation adjustments of foreign subsidiaries 2 2
Fair value adjustments of hedging instruments before tax 8 8
Actuarial gains / losses on defined benefit plans -9 -9
Tax on value adjustments -2 2 0
Net income recognised in equity via other comprehensive income in the statement of comprehensive income 0 6 2 -7 0 1
Net profit for the year 37 88 125
Comprehensive income 0 6 2 30 88 126
Distribution of dividends (DKK 10.00 per share) -77 -77
Buy-back of treasury shares -196 -1 -197
Transactions with the owners 0 0 0 -196 -78 -274
Equity as at 31 December 792 -73 -62 938 88 1,683
52
Solar Annual Report 2017 — ConsolidatedResults and outlook: Financial review
MANAGEMENT’SREVIEW
FINANCIAL STATEMENTS CONTENTS
Solar Annual Report 2017 — ConsolidatedStatement of changes in equity

1General accounting policies
The consolidated financial statements of Solar A/S for 2017 are presented in accordance with the International Financial Reporting Standards (IFRSs) as approved by the EU and additional Danish disclosure requirements for annual reports of listed companies cf. Nasdaq Copenhagen’s disclosure requirements for annual reports of listed companies and the IFRS executive order issued in accordance with the Danish Financial Statements Act.
The consolidated financial statements have been prepared using the historical cost formula with the exception of derivative financial instruments and investments in equity instruments, which are measured at fair value, as well as non-current assets and groups of assets held for sale, which are measured at the lowest value of the book value before changes in classification or fair value less sales costs.
The accounting policies described below have been applied consistently in the financial year and to the comparative figures.
Implementation of new financial reporting standards As of 1 January 2017, Solar implemented those new standards and interpretations approved by the EU that became effective in the financial year 2017 as well as any annual improvements on applicable IFRSs. The changes have no effect on Solar.
Note 28 includes a description of new standards and interpretations that have not yet become effective.
Presentation currency The annual report is presented in Danish kroner rounded off to the nearest 1,000,000 Danish kroner. Danish kroner is the parent company’s functional currency.
Translation of foreign currency items A functional currency has been set for each reporting group entity. The functional currencies are the currencies used in the primary economic environments in which each individual reporting entity operates. Transactions in other currencies than the functional currency are considered transactions in foreign currencies.
Transactions in foreign currency are translated at first recognition to the functional currency at the exchange rate prevailing at the date of the transaction. Differences between the exchange rate prevailing on the date of the transaction and the exchange rate on the payment date are recognised in the income statement as items under financial income and expenses.
All monetary items in foreign currencies that have not been settled on the balance sheet date are translated into the functional currencies using the exchange rates on the balance sheet date. Any difference between the exchange rate prevailing on the date of the transaction and the balance sheet date exchange rate are recognised in the income statement as items under financial income and expenses.
When recognising entities with different functional currencies than Danish kroner in the consolidated financial statements, the income statements are translated at the exchange rate prevailing on the date of the transaction and balance sheet items are translated at the balance sheet date exchange rates. The average rate of exchange for the individual months is used as exchange rate prevailing on the date of the transaction when this does not result in a considerably different presentation. Exchange rate differences, from translation of these entities’ equity at the beginning of the year at the balance sheet date exchange rates and in connection with the translation of income statements from the exchange rate prevailing at the date of transaction to the balance sheet date exchange rates, are recognised directly in other comprehensive income as a separate reserve for foreign currency translation adjustments.
When translating investments in associates with a functional currency other than Danish kroner in the consolidated financial statement, the group’s share of comprehensive income is translated at the average exchange rates and the share of equity, including goodwill, is translated at the exchange rate on the balance sheet date.
The exchange rate difference resulting from the translation of the share of foreign associates’ equity at the beginning of the year at the exchange rate on the balance sheet date and the translation of the share of comprehensive income from the average exchange rates to the exchange rate prevailing on the balance sheet date is recognised in other comprehensive income and presented in a separate reserve for foreign currency translation adjustments under equity. The cumulative currency translation adjustment is recycled to the income statement upon disposal of the investment.
53
Solar Annual Report 2017 — ConsolidatedResults and outlook: Financial review
MANAGEMENT’SREVIEW
FINANCIAL STATEMENTS CONTENTS
Solar Annual Report 2017 — ConsolidatedNotes: Basis for preparation

Consolidated financial statementsThe consolidated financial statements include the financial statements of the parent company Solar A/S and subsidiaries in which Solar A/S has control of the financial or operational policies in order to get returns or otherwise benefit from their activities. Control is achieved by directly or indirectly owning or controlling more than 50% of the voting rights or by other means controlling the entity in question.
The consolidated financial statements have been prepared as an aggregation of the parent company and the individual subsidiaries’ financial statements and in accordance with the group’s accounting policies. Intercompany revenue, other intercompany operating items, intercompany balances, profit and loss from transactions between the consolidated entities as well as internal equity investments are eliminated.
Entities over which the group has significant influence but not control over operational and financial decisions are classified as associates. Significant influence typically exists when the group directly or indirectly holds more than 20% of voting rights, but less than 50%.
The group’s share of the associates’ earnings after tax and the elimination of the proportional share of internal profit/loss is recognised in the income statement. The group’s share of the associates’ other comprehensive income is recognised in other comprehensive income.
When obtaining significant influence over an entity in which the group has previously held an interest accounted for as a financial asset, the fair value as of the date when the group obtained significant influence is deemed as cost under the equity method.
Statement of comprehensive income Solar A/S presents the statement of comprehensive income in two statements. An income statement and a statement of comprehensive income that show the year’s results and income that forms part of other comprehensive income. Other comprehensive income includes exchange rate adjustments, actuarial gains and losses, adjustments of investments in associates and hedging transactions.
Presentation of discontinued operations Discontinued operations consists of geographical areas where activities and cash flow can be clearly separated in an operational and accounting sense from the other parts of the entity and when the entity has either been divested or separated as held for sale.
Earnings after tax of discontinued operations as well as write-down to fair value less costs to sell and gains / losses from any sale are presented in a separate line in the income statement with adjustment of the comparative figures. Notes include information on revenue, costs, value adjustments, financials and tax for any discontinued operations. Assets and related liabilities of discontinued operations are presented separately in the balance sheet without adjustments to comparative figures.
Statement of comprehensive incomeConstruction contractsIf the outcome of a construction contract can be reliably estimated, revenue and contract expenses will be included in the profit based on the stage of completion of the contract at the balance sheet date (the percentage of completion method).
If a sufficiently reliable estimation of the outcome of a construction contract cannot be made, revenue corresponding to the contract expenses incurred during the period will be included if these expenses are likely to be recovered.
Balance sheetConstruction contractsWhen the outcome of a construction contract can be reliably estimated, the construction contract is measured at the selling price of the work performed up until the balance sheet date (percentage of completion method) less the on account invoicing and write-down made to parry expected losses.
The selling price is measured on the basis of the stage of completion at the balance sheet date and the total expected revenue on the individual construction contract.
The stage of completion of the individual project is usually calculated as the proportion of actually consumed resources compared to the total estimated consumption of resources. For individual projects where the consumption of resources cannot be used as a basis, the proportion of the nalised sub-activities compared to the total project is used.
The individual ongoing construction contract is included in the balance sheet under receivables or liabilities, depending on whether the net value is a receivable or a liability.
General accounting policies – continued
1
54
Solar Annual Report 2017 — ConsolidatedResults and outlook: Financial review
MANAGEMENT’SREVIEW
FINANCIAL STATEMENTS CONTENTS
Solar Annual Report 2017 — ConsolidatedNotes: Basis for preparation

1General accounting policies – continued
Cash flow statement The cash flow statement shows cash flow distributed on operating, investing and financing activities for the year, changes in cash and cash equivalents, and cash at bank and in hand at the beginning and end of the year.
The effect of cash flow on the acquisition and divestment of entities is shown separately under cash flow from investing activities. Cash flow from acquired entities is recognised in the cash flow statement from the date of acquisition and cash flow from divested entities is recognised until the time of divestment. Cash flow from discontinued operations is presented separately under operating, investing and financing activities.
Cash flow from operating activities is determined using the indirect method as earnings before tax adjusted for non-cash operating items, changes in working capital, interest received and paid, and income tax paid. Cash flow from investing activities includes payments in connection with the acquisition and sale of intangibles, property, plant and equipment and investments, and acquisition and divestment of entities. Cash flow from financing activities includes acquisition and sale of treasury shares, dividends distribution and incurrence or repayment of non-current interest-bearing liabilities. Cash at bank and in hand includes cash holdings, deposits with banks and current interest-bearing liabilities.
Financial ratiosEarnings per share (EPS) and diluted earnings per share (EPS-D) are determined in accordance with IAS 33. In general, financial ratios are calculated in accordance with the “Recommendations and Financial Ratios 2015” of the Danish Finance Society.
Description of accounting policies in notesDescriptions of accounting policies in the notes form part of the overall description of accounting policies.
These descriptions are found in the following notes:
Note 4 Segment informationNote 8 Income taxNote 9 Net profit loss for the yearNote 10 Intangible assetsNote 11 Property, plant and equipmentNote 12 AssociatesNote 13 InventoriesNote 14 Trade receivablesNote 15 Other provisionsNote 17 Acquisitions of subsidiariesNote 18 Assets and liabilities held for saleNote 19 Share capitalNote 21 Interest-bearing liabilities and maturity statementNote 24 Share option plansNote 25 Contingent liabilities and other financial liabilities
55
Solar Annual Report 2017 — ConsolidatedResults and outlook: Financial review
MANAGEMENT’SREVIEW
FINANCIAL STATEMENTS CONTENTS
Solar Annual Report 2017 — ConsolidatedNotes: Basis for preparation

2Significant accounting estimates and assessments
When preparing the annual report in accordance with generally applicable principles, management make estimates and assumptions that affect the reported assets and liabilities. Management base their estimates on historic experience and expectations for future events. Therefore, actual results may differ from these estimates. The following estimates and accompanying assessments are deemed material for the preparation of the financial statements:
• Impairment test of goodwill and equity investments• Capitalisation of software• Inventory write-down • Write-down for meeting of loss on doubtful receivables• Provision for deferred tax
These estimates and assessments are described in the following notes:Note 8 Income taxNote 10 Intangible assetsNote 13 InventoriesNote 14 Trade receivables
56
Solar Annual Report 2017 — ConsolidatedResults and outlook: Financial review
MANAGEMENT’SREVIEW
FINANCIAL STATEMENTS CONTENTS
Solar Annual Report 2017 — ConsolidatedNotes: Basis for preparation
3Financial risks
Results and equity are affected by a range of financial risks. All financial transactions are based on commercial activities, and no speculative transactions are made. Financial instruments are solely used for hedging of financial risks.
The financial risks are described in the following notes:
Note 14 Trade receivablesNote 21 Interest-bearing liabilities and maturity statement
For description of Solar’s other business related risks and our approach to risk management, see the management’s review on pages 29-34.
57
Solar Annual Report 2017 — ConsolidatedResults and outlook: Financial review
MANAGEMENT’SREVIEW
FINANCIAL STATEMENTS CONTENTS
Solar Annual Report 2017 — ConsolidatedNotes: Basis for preparation

4Segment information Accounting policies
The reporting on business segments follows the structure of Solar’s internal management reporting to chief operating decision makers, the group Executive Board. The group Executive Board uses business segmentation when allocating resources and following up on results.
No single customer makes up more than 10% of the total revenue.
Furthermore, Solar presents the geographical distribution of revenue and non-current assets divided on Denmark, Sweden, Norway, the Netherlands and Other markets. The geographical distribution is based on the business units operating in these geographical areas.
RevenueRevenue includes goods for resale recognised in the income statement if the passing of the risk to the customer takes place before the end of the year and if revenue can be determined reliably. Revenue is measured exclusive VAT and duties charged on behalf of a third party. All types of discounts allowed are recognised in revenue.
Cost of salesCost of sales includes the year’s purchases and change in inventory of goods for resale. This includes shrinkage and any write-down resulting from obsolescence.
Solar’s business segments are Installation, Industry and Others and are based on the customers’ affiliation with the segments. Installation covers installation of electrical, and heating and plumbing products, while Industry covers industry, offshore and marine, and utility and infrastructure. Others covers other small areas. The three main segments have been identified without aggregation of operating segments. Segment income and costs include any items that are directly attributable to the individual segment and any items that can be reliably allocated to the individual segment. Non-allocated costs refer to income and costs related to joint group functions. Assets and liabilities are not included in segment reporting.
DKK million Installation Industry Others Total
2017
Revenue 6,976 3,179 950 11,105
Cost of sales -5,631 -2,442 -703 -8,776
Gross profit 1,345 737 247 2,329
Direct costs -252 -93 -27 -372
Earnings before indirect costs 1,093 644 220 1,957
Indirect costs -525 -172 -53 -750
Segment profit or loss 568 472 167 1,207
Non-allocated costs -860
Earnings before interest, tax, depreciation and amortisation (EBITDA) 347
Depreciation and amortisation -221
Earnings before interest and tax (EBIT) 126
Financials, net 0
Earnings before tax (EBT) 126
58
Solar Annual Report 2017 — ConsolidatedResults and outlook: Financial review
MANAGEMENT’SREVIEW
FINANCIAL STATEMENTS CONTENTS
Solar Annual Report 2017 — ConsolidatedNotes to the income statement

4Segment information – continued
DKK million Installation Industry Others Total
2016
Revenue 6,731 2,921 768 10,420
Cost of sales -5,385 -2,242 -598 -8,225
Gross profit 1,346 679 170 2,195
Direct costs -261 -92 -19 -372
Earnings before indirect costs 1,085 587 151 1,823
Indirect costs -513 -164 -48 -725
Segment profit or loss 572 423 103 1,098
Non-allocated costs -730
Earnings before interest, tax, depreciation and amortisation (EBITDA) 368
Depreciation and amortisation -112
Earnings before interest and tax (EBIT) 256
Financials, net -33
Earnings before tax (EBT) 223
59
Solar Annual Report 2017 — ConsolidatedResults and outlook: Financial review
MANAGEMENT’SREVIEW
FINANCIAL STATEMENTS CONTENTS
Solar Annual Report 2017 — ConsolidatedNotes to the income statement

4Segment information – continued
DKK million – unless otherwise stated Core businessRelated
business
Digital, Construction
& Services Eliminations Total
2017
Revenue 10,649 456 - - 11,105
Gross profit 2,199 130 - - 2,329
EBITA 340 -45 - - 295
Invested capital 1,682 108 236 -236 1,790
Adj. organic growth 6.5% 19.3% - - 6.9%
Gross profit margin 20.6% 28.6% - - 21.0%
EBITA margin 3.2% -9.9% - - 2.7%
ROIC 11.4% N/A - - 3.8%
DKK million – unless otherwise stated Core businessRelated
business
Digital, Construction
& Services Eliminations Total
2016
Revenue 10,096 324 - - 10,420
Gross profit 2,107 88 - - 2,195
EBITA 324 -12 - - 312
Invested capital 1,590 154 18 -18 1,744
Adj. organic growth 2.3% N/A - - 2.3%
Gross profit margin 20.9% 27.2% - - 21.1%
EBITA margin 3.2% -3.7% - - 3.0%
ROIC 12.1% N/A - - 10.0%
Core business includes Solar Danmark, Solar Sverige, Solar Norge, Solar Nederland, Solar Polska, and P/F Solar Føroyar.
Related business includes MAG45, Scandinavian Technology Institute and Solar Polaris.
Digital, construction & services includes all associated businesses BIMobject, GenieBelt, Minuba, Viva Labs, Monterra, and HomeBob.
60
Solar Annual Report 2017 — ConsolidatedResults and outlook: Financial review
MANAGEMENT’SREVIEW
FINANCIAL STATEMENTS CONTENTS
Solar Annual Report 2017 — ConsolidatedNotes to the income statement

Segment information – continued
Geographical informationSolar A/S primarily operates on the Danish, Swedish, Norwegian and Dutch markets. In the below table, Other markets covers the remaining markets, which can be seen in the group structure available on page 18. The below allocation has been made based on the products’ place of sale.
DKK million Revenue
Adjustedorganicgrowth
Non-currentassets
2017
Denmark 3,338 10.7 1,987
Sweden 2,579 5.7 256
Norway 1,926 3.7 156
The Netherlands 2,612 6.6 293
Other markets 745 13.6 71
Eliminations1 -95 -1,241
Total 11,105 6.9 1,522
2016
Denmark 3,008 7.3 1,811
Sweden 2,499 1.3 281
Norway 1,866 4.5 208
The Netherlands 2,463 -3.3 287
Other markets 654 -0.6 104
Eliminations¹ -70 -1,294
Total 10,420 2.3 1,397
4
61
Solar Annual Report 2017 — ConsolidatedResults and outlook: Financial review
MANAGEMENT’SREVIEW
FINANCIAL STATEMENTS CONTENTS
Solar Annual Report 2017 — ConsolidatedNotes to the income statement

62 Solar Annual Report 2016 — Management’s reviewResults and outlook: Financial review MANAGEMENT’S
REVIEWFINANCIAL STATEMENTS CONTENTS
5Staff costs
DKK million 2017 2016
Salaries and wages etc. 1,231 1,149
Pensions, defined contribution 94 79
Pensions, defined benefit 0 -3
Costs related to social security 157 149
Share-based payment 2 -6
Total 1,484 1,368
Average number of employees (FTEs) 2,901 2,814
Number of employees at year-end (FTEs) 2,959 2,834
Remuneration of Board of Directors
Remuneration of Board of Directors 3 3
Remuneration of Executive Board
Remuneration and bonus 14 11
Share-based payment1 1 -1
Severance pay 10 0
Total 25 10
1. See note 24 Share option plans
We have a remuneration policy that describes guidelines for determining and approving remuneration of the Board of Directors and Executive Board. The annual general meeting adopts the Board of Directors’ remuneration for one year ahead at a time. The Executive Board’s remuneration is assessed every two years. The Board of Directors jointly approve the elements that make up the Executive Board’s salary package as well as all major adjustments to this package following previous discussions and recommendations of the chairman and vice-chairman of the Board of Directors. Under section 139 of the Danish Companies Act, a complete remuneration policy for the Board of Directors and Executive Board is presented for adoption at the annual general meeting.
Terms of notice for members of the Executive Board is 12 months. When stepping down, the CEO is entitled to 6 months’ remuneration.
In 2017 a provision of DKK 10m has been made for severance pay in connection with the change in CEO announced in October. The amount will be paid out during the notice period and is included in the above figures.
62
Solar Annual Report 2017 — ConsolidatedResults and outlook: Financial review
MANAGEMENT’SREVIEW
FINANCIAL STATEMENTS CONTENTS
Solar Annual Report 2017 — ConsolidatedNotes to the income statement

63 Solar Annual Report 2016 — Management’s reviewResults and outlook: Financial review MANAGEMENT’S
REVIEWFINANCIAL STATEMENTS CONTENTS
6Loss on trade receivables Depreciation, write-down and amortisation
7
DKK million 2017 2016
Recognised losses 23 21
Received on trade receivables previously written off -2 -2
21 19
Change in write-down for bad and doubtful debts -5 -6
Total 16 13
Relevant accounting policies are described in note 14, trade receivables.
DKK million 2017 2016
Buildings 27 29
Plant, operating equipment, tools and equipment 23 24
Leasehold improvements 2 2
Write-down on buildings 0 12
Profit/loss from the sale of property, plant and equipment 0 -11
Total depreciation and write-down on property, plant and equipment 52 56
Customer-related assets 8 9
Software 64 47
Impairment of intangible assets 97 0
Total amortisation of intangible assets 169 56
Relevant accounting policies are described in note 10, intangible assets, and note 11, property, plant and equipment.
63
Solar Annual Report 2017 — ConsolidatedResults and outlook: Financial review
MANAGEMENT’SREVIEW
FINANCIAL STATEMENTS CONTENTS
Solar Annual Report 2017 — ConsolidatedNotes to the income statement

64 Solar Annual Report 2016 — Management’s reviewResults and outlook: Financial review MANAGEMENT’S
REVIEWFINANCIAL STATEMENTS CONTENTS
8Income tax Accounting policies
Tax for the year is recognised with the share attributable to results for the year in the income statement and with the share attributable to other recognised income and costs in the statement of comprehensive income. Tax consists of current tax and changes to deferred tax.
DKK million 2017 2016
Current tax 57 54
Deferred tax -8 10
Tax on profit or loss for the year 49 64
Tax on taxable profit previous year 1 -1
Adjustment of deferred tax for previous years -25 0
Total 25 63
Statement of effective tax rate:
Danish income tax rate 22.0% 22.0%
Tax base change for non-capitalised loss in subsidiaries -12.4% 3.6%
Change to tax rates in Norway 0.1% 0.0%
Non-taxable/deductible items in parent company -0.7% 0.0%
Non-taxable/deductible items and differing tax rates compared to Danish tax rate in foreign subsidiaries 10.8% 2.7%
Effective tax rate 19.8% 28.3%
64
Solar Annual Report 2017 — ConsolidatedResults and outlook: Financial review
MANAGEMENT’SREVIEW
FINANCIAL STATEMENTS CONTENTS
Solar Annual Report 2017 — ConsolidatedNotes to the income statement

65 Solar Annual Report 2016 — Management’s reviewResults and outlook: Financial review MANAGEMENT’S
REVIEWFINANCIAL STATEMENTS CONTENTS
8Income tax – continued Accounting policies
Current tax liabilities and current tax receivables are recognised in the balance sheet as calculated tax on the year’s taxable income, adjusted for tax on previous year’s taxable income and for tax paid on account.
Deferred tax is measured in accordance with the balance sheet liability method of all temporary differentials between accounting and tax-related amounts and provisions. Deferred tax is recognised at the local tax rate that any temporary differentials are expected to be realised at based on the adopted or expected adopted tax legislation on the balance sheet date.
Deferred tax assets, including the tax value of tax loss allowed for carryforward, are measured at the value at which the asset is expected to be realised, either by elimination in tax of future earnings or by offsetting against deferred tax liabilities.
Deferred tax assets are assessed annually and only recognised to the extent that it is probable that they will be utilised.
Deferred tax is also recognised for the covering of the retaxation of losses in former foreign subsidiaries participating in joint taxation assessed as becoming current.
Accounting estimates and assesments
Deferred tax assetsDeferred tax assets are not recognised if it is not deemed sufficiently safe that these can reduce future taxable income. In this connection, management assess expected future taxable income.
DKK million 2017 2016
Provision for deferred tax
1/1 112 100
Foreign currency translation adjustments -1 -2
Acquired or divested enterprises 2 5
Recognised in other comprehensive income 4 0
Ordinary tax recognised in income statement -33 10
Other items, including reduction of Norwegian income tax rates 5 -1
Total 31/12 89 112
Specified as follows:
Deferred tax liabilities 107 122
Deferred tax assets -18 -10
Total deferred tax, net 89 112
Further specified as follows:
Expected use within 1 year -11 0
Expected use after 1 year 100 112
Total, net 89 112
Not recognised in balance sheet:
Deferred tax assets 50 90
Deferred tax assets not recognised in the balance sheet are the part of tax losses where it is not considered sufficiently certain that the tax losses can be realised within a short time frame based on the same assumptions as described in note 10, intangible assets. Non-recognised tax assets can in all material respects be attributed to tax losses in the Netherlands (2016: the Netherlands and Austria), where the non-recognised tax assets may be exercised until 2025.
65
Solar Annual Report 2017 — ConsolidatedResults and outlook: Financial review
MANAGEMENT’SREVIEW
FINANCIAL STATEMENTS CONTENTS
Solar Annual Report 2017 — ConsolidatedNotes to the income statement

66 Solar Annual Report 2016 — Management’s reviewResults and outlook: Financial review MANAGEMENT’S
REVIEWFINANCIAL STATEMENTS CONTENTS
8Income tax – continued
DKK million 1/1
Foreigncurrency
translationadjustments
Divestedenterprises
Change intax rate
Otheradjustments 2017 2016
Specification by balance sheet items
Property, plant and equipment 48 0 0 0 -14 34 48
Inventories -2 0 -1 0 0 -3 -2
Provisions for loss on receivables -3 0 0 0 0 -3 -3
Pension obligations -4 0 2 0 1 -1 -4
Other items1 73 -1 1 0 -11 62 73
Total, net 112 -1 2 0 -24 89 112
1. Other items particularly cover intangible assets and loss balances in jointly taxed entities.
66
Solar Annual Report 2017 — ConsolidatedResults and outlook: Financial review
MANAGEMENT’SREVIEW
FINANCIAL STATEMENTS CONTENTS
Solar Annual Report 2017 — ConsolidatedNotes to the income statement

67 MANAGEMENT’SREVIEW
FINANCIAL STATEMENTS CONTENTS
9Net profit for the year Accounting policies
DividendsProposed dividends are recognised as a liability at the time of adoption of the general meeting.
DKK million 2017 2016
Proposed distribution of net profit for the year:
Proposed dividends, parent 73 88
Retained earnings -54 37
Net profit for the year 19 125
Dividends in DKK per share of DKK 1001 10.00 12.00
1. Calculations are based on proposed dividends.
67
Solar Annual Report 2017 — ConsolidatedResults and outlook: Financial review
MANAGEMENT’SREVIEW
FINANCIAL STATEMENTS CONTENTS
Solar Annual Report 2017 — ConsolidatedNotes to the income statement

68 Solar Annual Report 2016 — Management’s reviewResults and outlook: Financial review MANAGEMENT’S
REVIEWFINANCIAL STATEMENTS CONTENTS
10Intangible assets Accounting policies
Customer-related intangible assetsCustomer-related intangible assets acquired in connection with business combinations are measured at cost less accumulated amortisation and impairment loss.
Customer-related intangible assets are amortised using the straight-line principle over the expected useful life. Typically, the amortisation period is 5-7 years.
GoodwillGoodwill is initially recognised in the balance sheet as the positive balance between the acquisition consideration of an enterprise on one side and the fair value of the assets, liabilities and contingent liabilities acquired on the other side. In cases of measurement uncertainty, the goodwill amount can be adjusted until 12 months after the date of the acquisition. Goodwill is not amortised but an impairment test is done annually. The first impairment test is done by the end of the year of acquisition. Subsequently, goodwill is measured at this value less accumulated impairment losses. On acquisition, goodwill is assigned to the cash-generating units that form the basis of the impairment test subsequently. The determination of cash-generating units follows the managerial structure andmanagement control.
SoftwareSoftware is measured at cost less accumulated amortisation and writedown. Cost includes both direct internal and external costs. Software is amortised using the straight-line principle over 4-8 years. The basis of amortisation is reduced by any write-down.
DKK million
Customer-relatedassets Goodwill Software Total
2017
Cost 1/1 848 334 444 1,626
Foreign currency translation adjustment -1 -8 -1 -10
Acquired enterprises 6 16 0 22
Additions during the year 0 0 107 107
Cost 31/12 853 342 550 1,745
Amortisation 1/1 813 110 228 1,151
Foreign currency translation adjustment -2 0 0 -2
Amortisation during the year 8 0 64 72
Impairments during the year 23 64 10 97
Amortisation 31/12 842 174 302 1,318
Carrying amount 31/12 11 168 248 427
Remaining amortisation period in number of years 1-7 - 1-8 -
68
Solar Annual Report 2017 — ConsolidatedResults and outlook: Financial review
MANAGEMENT’SREVIEW
FINANCIAL STATEMENTS CONTENTS
Solar Annual Report 2017 — ConsolidatedNotes: Invested capital

69 MANAGEMENT’SREVIEW
FINANCIAL STATEMENTS CONTENTS
10Intangible assets – continued Accounting policies (continued)
Impairment of intangible assetsGoodwill is tested yearly for impairment and first before the end of the year of acquisition.
The carrying amount of goodwill is tested for impairment together with the other non-current assets of the cash-generating unit to which goodwill is allocated, and is written down to the recoverable amount via the income statement, provided that the carrying amount is larger. Generally, the recoverable amount is determined as the present value of the expected future net cash flow from the company or activity (cash-generating unit) that the goodwill is affiliated to. Write-down of goodwill is recognised in the income statement as part of amortisation of intangible assets.
The carrying amount of intangible assets is assessed annually to determine whether there is any indication of impairment.
When such an indication is present, the asset’s recoverable amount is calculated, which is the highest of the asset’s fair value less expected costs of disposal or value in use. Value in use is calculated as the present value of expected cash flow from the smallest cash flow-generating unit to which the asset belongs.
Impairment loss is recognised when the carrying amount of an asset exceeds the asset’s recoverable amount. Impairment loss is recognised in the income statement.
Impairment loss relating to goodwill is not reversed. Impairment on other intangible assets are reversed to the extent that changes have been made to the assumptions and estimates that led to the write-down.
DKK million
Customer-relatedassets Goodwill Software Total
2016
Cost 1/1 827 263 347 1,437
Foreign currency translation adjustment -9 -3 0 -12
Acquired enterprises 30 74 9 113
Additions during the year 0 0 88 88
Cost 31/12 848 334 444 1,626
Amortisation 1/1 813 110 181 1,104
Foreign currency translation adjustment -9 0 0 -9
Amortisation during the year 9 0 47 56
Amortisation 31/12 813 110 228 1,151
Carrying amount 31/12 35 224 216 475
Remaining amortisation period in number of years 2-7 - 2-8 -
69
Solar Annual Report 2017 — ConsolidatedResults and outlook: Financial review
MANAGEMENT’SREVIEW
FINANCIAL STATEMENTS CONTENTS
Solar Annual Report 2017 — ConsolidatedNotes: Invested capital

70 Solar Annual Report 2016 — Management’s reviewResults and outlook: Financial review MANAGEMENT’S
REVIEWFINANCIAL STATEMENTS CONTENTS
10Intangible assets – continued
Goodwill, customer-related assets and other intangible assets(Comparative figures for 2016 in brackets)On 12 January 2018, management completed an impairment test of the carrying amount of goodwill, customer-related assets, and other intangible assets. The impairment test was based on the estimates and expectations as well as other assumptions approved by the Executive Board and Board of Directors with the necessary adjustments under IAS 36.
When performing an impairment test of cash-generating units, the recoverable amount (value in use), determined as the discounted value of expected future cash flow, is compared to the carrying amounts of the individual cash-generating units. Non-allocated costs are proportionately distributed between the individual segments and thus affect the individual impairment tests by the estimated total costs.
Overall, impairment tests made are based on the strategy approved by the Executive Board and Board of Directors. Budgets and expectations for the next 6 years (6 years) are based on Solar’s current, ongoing, and contract investments, in which risks of the material parameters have been assessed and recognised in future expected cash flow. In general, expected growth for the core business is based on a conservative outlook for market growth in the coming years, whereas the growth expectations for related business is substantially higher.
Management’s final assessment of the impairment tests made is based on an assessment of probable changes to the basic assumptions and that these will not result in the carrying amount of goodwill exceeding the recoverable amount.
Alvesta V.V.S.-Material AB DKK 137m of the carrying amount of goodwill result from the acquisition of the Swedish enterprise Alvesta V.V.S.-Material AB in 2007 by Solar Sverige AB. The impairment test is based on the installation segment in Sweden, which we estimate to be the lowest level of cash-generating units to which we can allocate.
The growth rate used in the impairment test for 2018 is 4% (5%), while the growth rate used in impairment tests for the years succeeding 2018 is 2-4% (2-3%). Expected growth for 2018 is a continuation of the growth rates seen in 2017, albeit at a lower level. The trends until the terminal period should be regarded as a normalisation of growth expectations.
Terminal value after 6 years is determined while taking general expectations for growth into consideration. Expected growth is by considerations of realistic assumptions determined at 2% (2%).
The discount rate (WACC) used to calculate the recoverable amount is 8.5%. Cash flow used includes any effect of related future risks, and therefore, such risks have not been added to the applied discount rates.
Based on the above and other impairment tests completed there is no need for impairment relating to the carrying amount of goodwill.
MAG45 B.V. DKK 22m of the carrying amount of goodwill and DKK 22m of the carrying amount of customer-related assets, amounting to DKK 44m in total, result from the acquisition of MAG45 in 2016 by Solar A/S.
The growth rate used in the impairment test for 2018 is 37% with simulations covering the range 20-37% (37%). The growth in 2017 was below expectations so despite an unchanged growth rate in 2018 the expected revenue remains below our initial expectations. The growth rate used in impairment tests for the years succeeding 2018 is 25-3% (42-6%). Growth for 2018 is a continuation of the growth rates seen in 2017 albeit at a higher level mainly based on contracts with existing customers, however experience shows that there is uncertainty relating to not only the actual up-start but also the ramp-up pace of these contracts. The trends until the terminal period should be regarded as a normalisation of growth expectations.
Net working capital is expected to improve gradually from approx. 15% (11%) to approx. 12% (11%) in year 6.
Terminal value after 6 years is determined while taking general expectations for growth into consideration. Expected growth is by considerations of realistic assumptions determined at 2% (2%).
The discount rate (WACC) used to calculate the recoverable amount is 8.5% (8.5%). Cash flow used includes any effect of related future risks, and therefore, such risks have not been added to the applied discount rates.
Based on the above and other impairment tests completed there is indication of a definite need for write-down. It has, therefore, been decided to write down the entire carrying amount of goodwill and customer-related assets, amounting to DKK 44m in total.
70
Solar Annual Report 2017 — ConsolidatedResults and outlook: Financial review
MANAGEMENT’SREVIEW
FINANCIAL STATEMENTS CONTENTS
Solar Annual Report 2017 — ConsolidatedNotes: Invested capital

Accounting estimates and assessments
Impairment test for goodwill and equity investmentsIn connection with the annual impairment test of goodwill, or when there is an indication of impairment, an estimate is made of how the parts of the business (cash-generating units), that goodwill is linked to, will be able to generate sufficient positive cash flow in future to support the value of goodwill and other net assets in the relevant part of the business.
Due to the nature of the business, estimates must be made of expected cash flow for many years ahead which, naturally, results in a certain level of uncertainty. This uncertainty is reflected in the discount rate determined. The impairment test and the very sensitive related aspects are described in more detail in the comments section.
SoftwareSoftware is evaluated annually for indicators of a need for impairment. If a need to perform impairment is identified, an impairment test for the software is performed.
The impairment test is made on the basis of different factors, including the software’s future application, the present value of the expected cost saving as well as interest and risks.
Scandinavian Technology Institute (STI)DKK 51m of the carrying amount of goodwill result from the acquisition of STI in 2016 by Solar A/S. The growth rate used in the impairment test for 2018 is 13% (10%), while the growth rate used in impairment tests for the years succeeding 2018 is 10-3% (8-4%). The growth in 2017 was clearly below expectations. Despite the expected higher growth rate in 2018 in percentage, the expected revenue remains below our initial expectations. The expected revenue in 2018 is based on the continued increase in order backlog that we have seen in H2 2017. The trends until the terminal period should be regarded as a normalisation of growth expectations.
The EBITA margin is expected to increase, albeit from a negative starting point and at a substantially slower rate than anticipated in 2017.
Terminal value after 6 years is determined while taking general expectations for growth into consideration. Expected growth is by considerations of realistic assumptions determined at 2% (2%).
The discount rate (WACC) used to calculate the recoverable amount is 8.5% (8.5%). Cash flow used includes any effect of related future risks, and therefore, such risks have not been added to the applied discount rates.
Based on the above and other impairment tests completed, there is indication of a definite need for write-down. It has, therefore, been decided to write down goodwill by DKK 32m.
Additionally, software has been written down by DKK 10m.
10Intangible assets – continued
71
Solar Annual Report 2017 — ConsolidatedResults and outlook: Financial review
MANAGEMENT’SREVIEW
FINANCIAL STATEMENTS CONTENTS
Solar Annual Report 2017 — ConsolidatedNotes: Invested capital

72 MANAGEMENT’SREVIEW
FINANCIAL STATEMENTS CONTENTS
11Property, plant and equipment Accounting policies
Property, plant and equipmentLand and buildings as well as other plant, operating equipment, and tools and equipment are measured at cost less accumulated depreciation and write-down.
Cost includes the purchase price and costs directly attributable to the acquisition until the time when the asset is ready for use. Cost of a combined asset is disaggregated into separate components which are depreciated separately if the useful lives of the individual components differ.
Subsequent expenditure, for example in connection with the replacement of components of property, plant or equipment, is recognised in the carrying amount of the relevant asset when it is probable that the incurrence will result in future economic benefits for the group.
The replaced components cease to be recognised in the balance sheet and the carrying amount is transferred to the income statement. All other general repair and maintenance costs are recognised in the income statement when these are incurred.
Property, plant and equipment are depreciated on a straight-line basis over their estimateduseful lives which are:
• Buildings 40 years• Technical installations 20 years• Plant, operating equipment, and tools
and equipment 2-5 years.
There are a few differences from the mentioned depreciation periods in which useful life is estimated as shorter. Leasehold improvements are depreciated over the lease term, however, maximum 5 years.
Land is not depreciated.
DKK millionLand andbuildings
Plant,operating
equipment,tools and
equipment,Leasehold
improvements
Assetsunder
construction Total
2017
Cost 1/1 1,210 522 71 17 1,820
Foreign currency translation adjustments -14 -9 -1 0 -24
Reclassified to assets held for sale 0 -15 -7 0 -22
Acquired enterprises 0 1 0 0 1
Additions during the year 22 24 4 22 72
Disposals during the year -49 -14 -1 -35 -99
Cost 31/12 1,169 509 66 4 1,748
Write-down and depreciation 1/1 421 475 59 0 955
Foreign currency translation adjustments -4 -8 -1 0 -13
Reversed write-down and depreciation related to assets held for sale 0 -15 -7 0 -22
Write-down during the year related to assets held for sale 0 2 1 0 3
Write-down and depreciation during the year 27 23 2 0 52
Write-down and depreciation of abandoned assets -30 -11 0 0 -41
Write-down and depreciation 31/12 414 466 54 0 934
Carrying amount 31/12 755 43 12 4 814
72
Solar Annual Report 2017 — ConsolidatedResults and outlook: Financial review
MANAGEMENT’SREVIEW
FINANCIAL STATEMENTS CONTENTS
Solar Annual Report 2017 — ConsolidatedNotes: Invested capital

73 MANAGEMENT’SREVIEW
FINANCIAL STATEMENTS CONTENTS
11Property, plant and equipment – continued Accounting policies (continued)
The basis of depreciation is determined in consideration of the asset’s residual value and reduced by any impairment. Residual value is determined at the time of acquisition and reassessed annually. If residual value exceeds the asset’s carrying amount, depreciation will cease.
By changing the depreciation period or residual value, the effect of future depreciation is recognised as a change to accounting estimates.
Impairment of property, plant and equipmentThe carrying amount of property, plant and equipment is assessed annually to determine whether there is any indication of impairment. When such an indication is present, the asset’s recoverable amount is calculated, which is the highest of the asset’s fair value less expected costs of disposal or value in use. Value in use is calculated as the present value of expected cash flow from the smallest cash flow-generating unit to which the asset belongs.
Impairment loss is recognised when the carrying amount of an asset exceeds the asset’s recoverable amount.
Impairment loss is recognised in the income statement. Write-down on property, plant and equipment is reversed to the extent that changes have been made to the assumptions and estimates that led to the write-down.
DKK millionLand andbuildings
Plant,operating
equipment,tools and
equipment,Leasehold
improvements
Assetsunder
construction Total
2016
Cost 1/1 1,213 518 67 1 1,799
Foreign currency translation adjustments -1 -2 1 0 -2
Acquired enterprises 0 4 1 0 5
Additions during the year 6 21 3 28 58
Disposals during the year -8 -19 -1 -12 -40
Cost 31/12 1,210 522 71 17 1,820
Write-down and depreciation 1/1 390 471 56 0 917
Foreign currency translation adjustments -2 -3 1 0 -4
Write-down and depreciation during the year 41 25 3 0 69
Write-down and depreciation of abandoned assets -8 -18 -1 0 -27
Write-down and depreciation 31/12 421 475 59 0 955
Carrying amount 31/12 789 47 12 17 865
73
Solar Annual Report 2017 — ConsolidatedResults and outlook: Financial review
MANAGEMENT’SREVIEW
FINANCIAL STATEMENTS CONTENTS
Solar Annual Report 2017 — ConsolidatedNotes: Invested capital
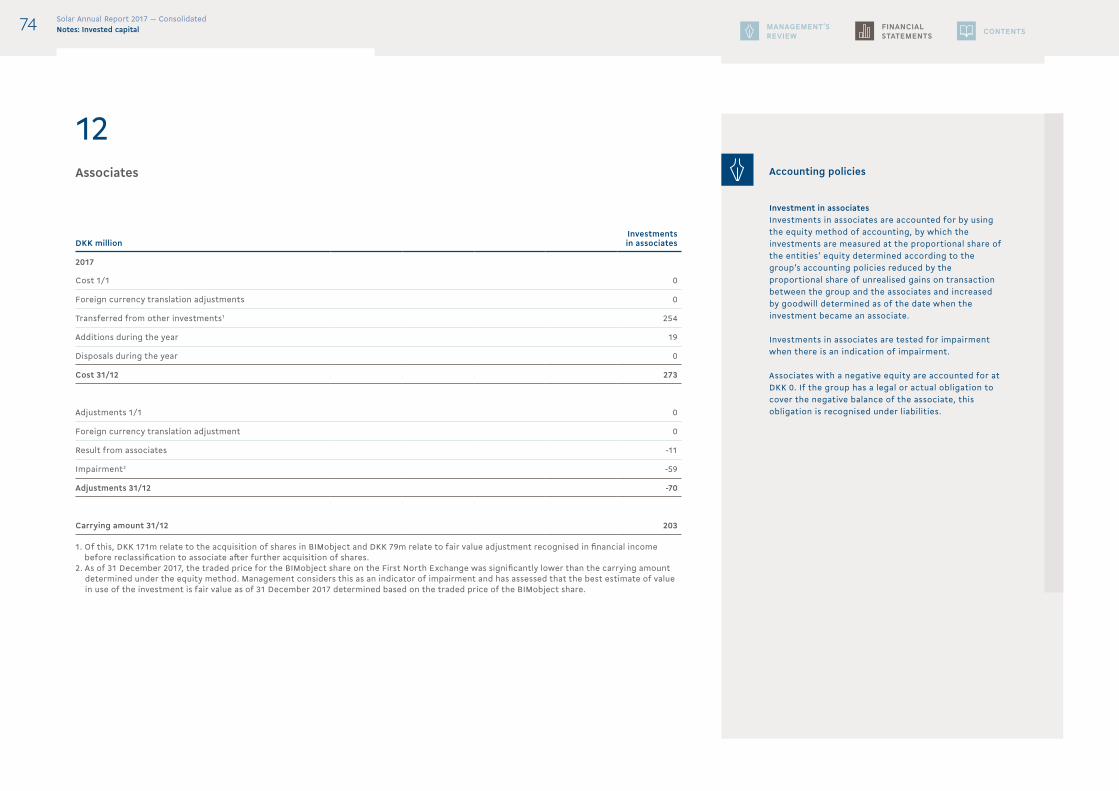
74 Solar Annual Report 2016 — Management’s reviewResults and outlook: Financial review MANAGEMENT’S
REVIEWFINANCIAL STATEMENTS CONTENTS
12Associates
DKK millionInvestments in associates
2017
Cost 1/1 0
Foreign currency translation adjustments 0
Transferred from other investments1 254
Additions during the year 19
Disposals during the year 0
Cost 31/12 273
Adjustments 1/1 0
Foreign currency translation adjustment 0
Result from associates -11
Impairment2 -59
Adjustments 31/12 -70
Carrying amount 31/12 203
1. Of this, DKK 171m relate to the acquisition of shares in BIMobject and DKK 79m relate to fair value adjustment recognised in financial income before reclassification to associate after further acquisition of shares.
2. As of 31 December 2017, the traded price for the BIMobject share on the First North Exchange was significantly lower than the carrying amount determined under the equity method. Management considers this as an indicator of impairment and has assessed that the best estimate of value in use of the investment is fair value as of 31 December 2017 determined based on the traded price of the BIMobject share.
Accounting policies
Investment in associatesInvestments in associates are accounted for by using the equity method of accounting, by which the investments are measured at the proportional share of the entities’ equity determined according to the group’s accounting policies reduced by the proportional share of unrealised gains on transaction between the group and the associates and increased by goodwill determined as of the date when the investment became an associate.
Investments in associates are tested for impairment when there is an indication of impairment.
Associates with a negative equity are accounted for at DKK 0. If the group has a legal or actual obligation to cover the negative balance of the associate, this obligation is recognised under liabilities.
74
Solar Annual Report 2017 — ConsolidatedResults and outlook: Financial review
MANAGEMENT’SREVIEW
FINANCIAL STATEMENTS CONTENTS
Solar Annual Report 2017 — ConsolidatedNotes: Invested capital
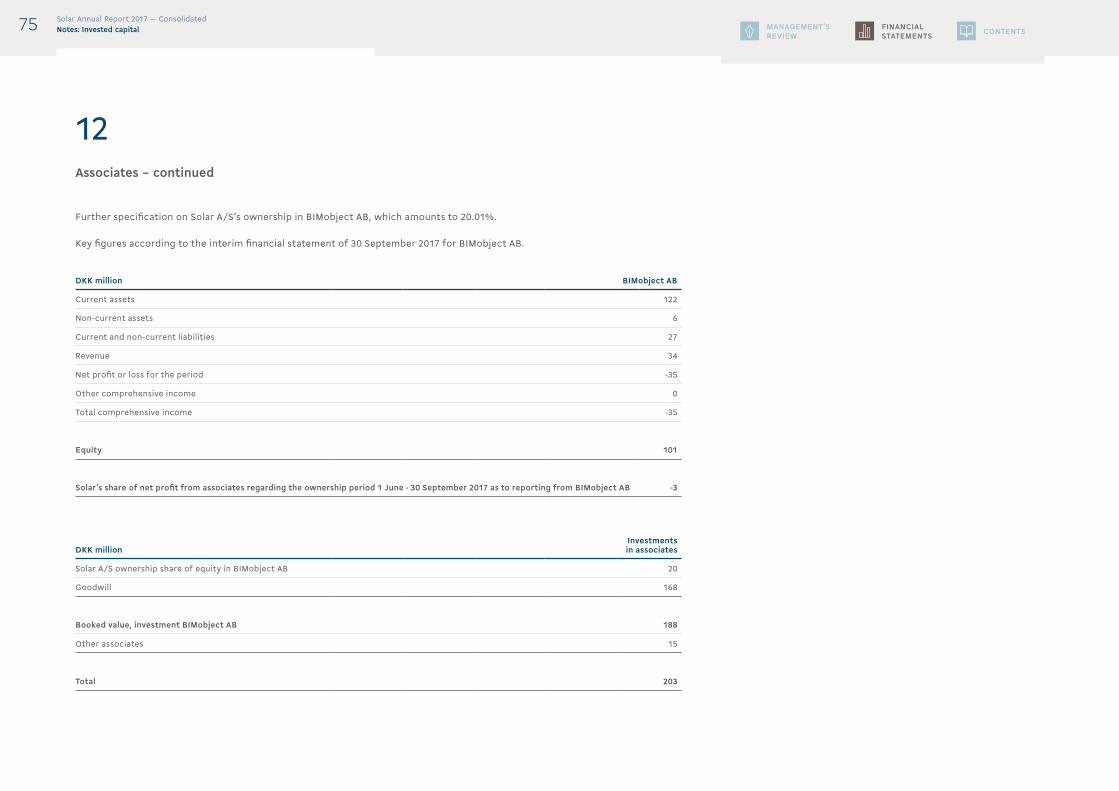
75 Solar Annual Report 2016 — Management’s reviewResults and outlook: Financial review MANAGEMENT’S
REVIEWFINANCIAL STATEMENTS CONTENTS
12Associates – continued
DKK million BIMobject AB
Current assets 122
Non-current assets 6
Current and non-current liabilities 27
Revenue 34
Net profit or loss for the period -35
Other comprehensive income 0
Total comprehensive income -35
Equity 101
Solar’s share of net profit from associates regarding the ownership period 1 June - 30 September 2017 as to reporting from BIMobject AB -3
DKK millionInvestments in associates
Solar A/S ownership share of equity in BIMobject AB 20
Goodwill 168
Booked value, investment BIMobject AB 188
Other associates 15
Total 203
Further specification on Solar A/S’s ownership in BIMobject AB, which amounts to 20.01%.
Key figures according to the interim financial statement of 30 September 2017 for BIMobject AB.
75
Solar Annual Report 2017 — ConsolidatedResults and outlook: Financial review
MANAGEMENT’SREVIEW
FINANCIAL STATEMENTS CONTENTS
Solar Annual Report 2017 — ConsolidatedNotes: Invested capital

76 Solar Annual Report 2016 — Management’s reviewResults and outlook: Financial review MANAGEMENT’S
REVIEWFINANCIAL STATEMENTS CONTENTS
13Inventories
DKK million 2017 2016
End products 1,437 1,321
Recognised write-down -4 3
The main reasons for the recognised write-downs are sales and scrapping of previously written-down products.
Accounting policies
Inventories are measured at cost according to the FIFO method or at net realisable value, if this is lower.
Cost of inventories includes purchase price with addition of delivery costs.
The net realisable value of inventories is determined as selling price less costs incurred to make the sale and is determined in consideration of marketability, obsolescence and development of expected selling price.
Accounting estimates and assesments
Write-down of inventoriesWrite-down of inventories is made due to the obsolescence of products.
Management specifically assess inventories, including the products’ turnover rate, current economic trends and product development when deciding whether the write-down is sufficient.
76
Solar Annual Report 2017 — ConsolidatedResults and outlook: Financial review
MANAGEMENT’SREVIEW
FINANCIAL STATEMENTS CONTENTS
Solar Annual Report 2017 — ConsolidatedNotes: Invested capital

77 Solar Annual Report 2016 — Management’s reviewResults and outlook: Financial review MANAGEMENT’S
REVIEWFINANCIAL STATEMENTS CONTENTS
14Trade receivables
DKK million 2017 2016
Maturity statement, trade receivables
Not due 1,329 1,261
Past due for 1-30 day(s) 159 121
Past due for 31-90 days 16 26
Past due for 91+ days 16 36
1,520 1,444
Write-down -28 -40
Total 1,492 1,404
Write-down based on:
Age distribution 5 14
Individual assessment 23 26
Total 28 40
Write-down 1/1 40 43
Foreign currency translation adjustment -1 0
Discontinued operations -6 0
Write-down for the year 6 12
Losses realised during the year -6 -9
Reversed for the year -5 -6
Write-down 31/12 28 40
We refer to the risk section in our management’s review on pages 29-34.
Accounting policies
Trade receivables are measured at fair value at acquisition and at amortised cost subsequently. Based on an individual assessment of the loss risk, write-down to net realisable value is made, if this is lower.
Accounting estimates and assesments
Write-down for meeting of loss on doubtful trade receivables Write-down is made to meet loss on doubtful trade receivables. Management specifically analyses trade receivables, including the customers’ credit rating and current economic trends, to ensure that write-down is sufficient.
Financial risks
Credit riskSolar is subject to credit risks in respect of trade receivables and cash at bank. No credit risk is deemed to exist in respect of cash as the counterparts are banks with good credit ratings. Solar A/S’ main banker is Nordea Bank Danmark A/S.
As a result of customer diversification, trade receivables are distributed so that there is no significant concentration risk. Credit granting to customers is regarded as a natural and important element in Solar’s business operations. Solar conducts efficient credit management at all times. The vast majority of our companies generally takes out insurance to hedge against loss to the extent possible. As a result, 73% of trade receivables is covered by insurance against 71% at year-end 2016.
Loss due to credit granting is considered a normal business risk and, therefore, will occur.
77
Solar Annual Report 2017 — ConsolidatedResults and outlook: Financial review
MANAGEMENT’SREVIEW
FINANCIAL STATEMENTS CONTENTS
Solar Annual Report 2017 — ConsolidatedNotes: Invested capital

78 Solar Annual Report 2016 — Management’s reviewResults and outlook: Financial review MANAGEMENT’S
REVIEWFINANCIAL STATEMENTS CONTENTS
15Other provisions Accounting policies
Provisions are measured in accordance with management’s best estimate of the amount required to settle a liability.
Restructuring expenses are recognised as liabilities when a detailed official plan for the restructuring has been published to the parties affected by the plan on the balance sheet date at the latest.
DKK million 2017 2016
Non-current
Others 24 41
Total 31/12 24 41
Specification, non-current
1/1 41 19
Acquired enterprises 0 7
Reversed during the year -18 -2
Provisions of the year 1 17
Total 31/12 24 41
Current
Other provisions 7 18
Total 31/12 7 18
Specification, current
1/1 18 28
Reversed during the year -18 -28
Provisions of the year 7 18
Total 31/12 7 18
78
Solar Annual Report 2017 — ConsolidatedResults and outlook: Financial review
MANAGEMENT’SREVIEW
FINANCIAL STATEMENTS CONTENTS
Solar Annual Report 2017 — ConsolidatedNotes: Invested capital

79 Solar Annual Report 2016 — Management’s reviewResults and outlook: Financial review MANAGEMENT’S
REVIEWFINANCIAL STATEMENTS CONTENTS
16Other payables
DKK million 2017 2016
Staff costs 226 220
Taxes and charges 95 93
Interest rate swaps 78 94
Other payables and amounts payable 83 88
Total 482 495
Relevant accounting policies for derivative financial instruments are described in note 21 on interest-bearing liabilities and maturity statement on pages 87-90.
79
Solar Annual Report 2017 — ConsolidatedResults and outlook: Financial review
MANAGEMENT’SREVIEW
FINANCIAL STATEMENTS CONTENTS
Solar Annual Report 2017 — ConsolidatedNotes: Invested capital
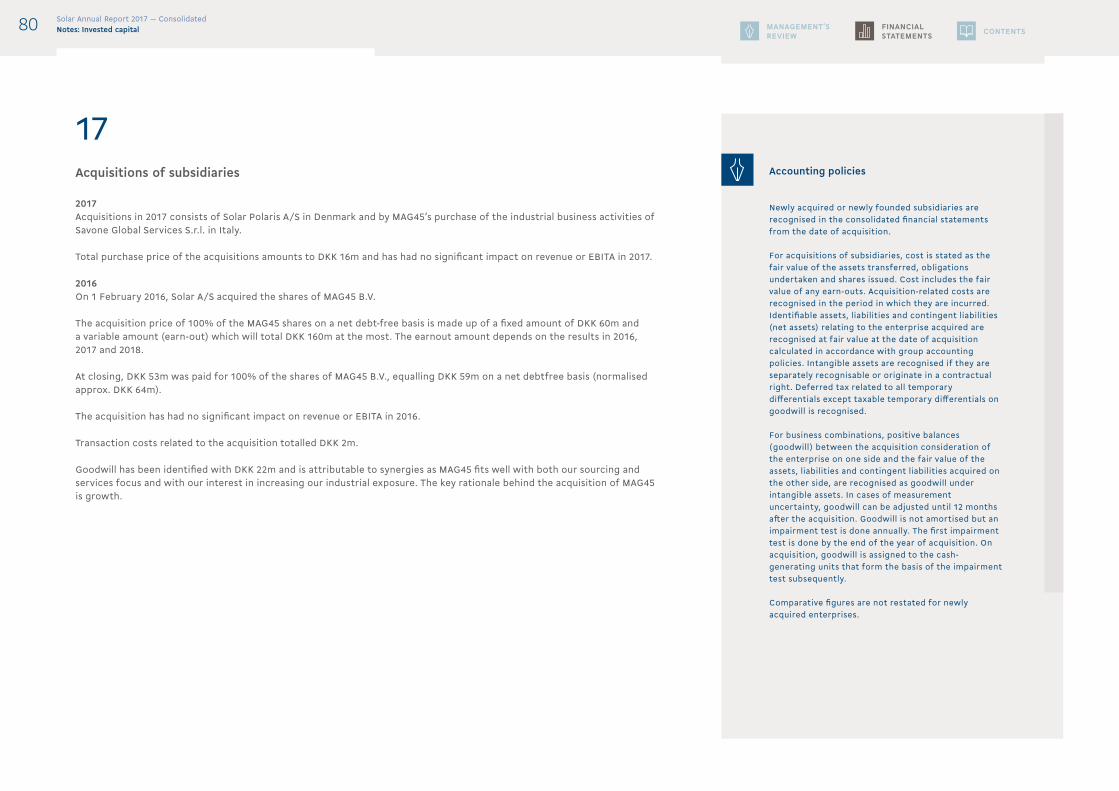
80 Solar Annual Report 2016 — Management’s reviewResults and outlook: Financial review MANAGEMENT’S
REVIEWFINANCIAL STATEMENTS CONTENTS
17Acquisitions of subsidiaries
2017Acquisitions in 2017 consists of Solar Polaris A/S in Denmark and by MAG45’s purchase of the industrial business activities of Savone Global Services S.r.l. in Italy.
Total purchase price of the acquisitions amounts to DKK 16m and has had no significant impact on revenue or EBITA in 2017.
2016On 1 February 2016, Solar A/S acquired the shares of MAG45 B.V.
The acquisition price of 100% of the MAG45 shares on a net debt-free basis is made up of a fixed amount of DKK 60m and a variable amount (earn-out) which will total DKK 160m at the most. The earnout amount depends on the results in 2016, 2017 and 2018.
At closing, DKK 53m was paid for 100% of the shares of MAG45 B.V., equalling DKK 59m on a net debtfree basis (normalised approx. DKK 64m).
The acquisition has had no significant impact on revenue or EBITA in 2016.
Transaction costs related to the acquisition totalled DKK 2m.
Goodwill has been identified with DKK 22m and is attributable to synergies as MAG45 fits well with both our sourcing and services focus and with our interest in increasing our industrial exposure. The key rationale behind the acquisition of MAG45 is growth.
Accounting policies
Newly acquired or newly founded subsidiaries are recognised in the consolidated financial statements from the date of acquisition.
For acquisitions of subsidiaries, cost is stated as the fair value of the assets transferred, obligations undertaken and shares issued. Cost includes the fair value of any earn-outs. Acquisition-related costs are recognised in the period in which they are incurred. Identifiable assets, liabilities and contingent liabilities (net assets) relating to the enterprise acquired are recognised at fair value at the date of acquisition calculated in accordance with group accounting policies. Intangible assets are recognised if they are separately recognisable or originate in a contractual right. Deferred tax related to all temporary differentials except taxable temporary differentials on goodwill is recognised.
For business combinations, positive balances (goodwill) between the acquisition consideration of the enterprise on one side and the fair value of the assets, liabilities and contingent liabilities acquired on the other side, are recognised as goodwill under intangible assets. In cases of measurement uncertainty, goodwill can be adjusted until 12 months after the acquisition. Goodwill is not amortised but an impairment test is done annually. The first impairment test is done by the end of the year of acquisition. On acquisition, goodwill is assigned to the cash-generating units that form the basis of the impairment test subsequently.
Comparative figures are not restated for newly acquired enterprises.
80
Solar Annual Report 2017 — ConsolidatedResults and outlook: Financial review
MANAGEMENT’SREVIEW
FINANCIAL STATEMENTS CONTENTS
Solar Annual Report 2017 — ConsolidatedNotes: Invested capital

17Acquisitions of subsidiaries – continued
Fair value at the date of acquisition: (DKK million)
Property, plant and equipment 3
Inventories 30
Trade receivables 41
Other receivables 1
Cash 17
Provision for deferred tax -6
Other non-current liabilities, interest-bearing -21
Current liabilities -91
Net assets acquired -26
Goodwill 22
Customer-related intangible assets 30
Other intangible assets 5
Acquisition cost 31
Of this, net cash 3
Other interest-bearing liabilities, net 20
Acquisition price on net debt-free basis 54
Hereof expected earn-out 0
Acquisition price on net debt-free basis excl. expected earn-out 54
81
Solar Annual Report 2017 — ConsolidatedResults and outlook: Financial review
MANAGEMENT’SREVIEW
FINANCIAL STATEMENTS CONTENTS
Solar Annual Report 2017 — ConsolidatedNotes: Invested capital

82 Solar Annual Report 2016 — Management’s reviewResults and outlook: Financial review MANAGEMENT’S
REVIEWFINANCIAL STATEMENTS CONTENTS
17Acquisitions of subsidiaries – continued
On 11 August 2016, Solar A/S acquired the shares of Scandinavian Technology Institute (STI).
The acquisition price of 100% of the Scandinavian Technology Institute shares on a net debt-free basis is made up of a fixed amount of DKK 43m and a variable amount (earn-out) expected to total DKK 15m. The earn-out amount depends on the achievement of the financial results by 2021 with payment to be made in 2022.
At closing, DKK 43m was paid for 100% of the shares of Scandinavian Technology Institute AS. Including expected earn-out of DKK 15m this equals DKK 58m on a net debtfree basis (normalised approx. DKK 58m).
The acquisition has had no significant impact on revenue or EBITA in 2016.
Transaction costs related to the acquisition totalled DKK 1m.
Goodwill has been identified with DKK 52m and is attributable to synergies as the acquisition reinforces Solar’s focus on growing our service business. It provides us with expert competences, professional training tools, and increases critical mass. This will facilitate the process of growing training as a business for Solar Group.
Fair value at the date of acquisition: (DKK million)
Property, plant and equipment 2
Trade receivables 7
Other receivables 3
Cash 1
Provision for deferred tax 2
Other non-current liabilities -8
Current liabilities -4
Net assets acquired 3
Goodwill 52
Other intangible assets 4
Acquisition cost 59
Of this, net cash -1
Acquisition price on net debt-free basis 58
Hereof expected earnout -15
Acquisition price on net debt-free basis excl. expected earn-out 43
Total acquisition price for MAG45 and STI 95
Of this, net cash 2
Total acquisition price for MAG45 and STI recognised in cash flow statement 97
82
Solar Annual Report 2017 — ConsolidatedResults and outlook: Financial review
MANAGEMENT’SREVIEW
FINANCIAL STATEMENTS CONTENTS
Solar Annual Report 2017 — ConsolidatedNotes: Invested capital

83 Solar Annual Report 2016 — Management’s reviewResults and outlook: Financial review MANAGEMENT’S
REVIEWFINANCIAL STATEMENTS CONTENTS
18Accounting policies
Assets held for sale are saleable assets with expected sale within 1 year. Write-down to a reduced fair value less sales costs is made.
Assets and liabilities held for sale
Discontinued operationOn 31 January 2018, Solar A/S finalised the divestment of all shares of GFI GmbH and assets in Claessen ELGB N.V. to Sonepar Group with an accounting loss of DKK 47m, which has been included in the financial statement for 2017.
The discontinued operation impacted the income statement as follows:
DKK million 2017 2016
2017
Revenue 664 652
Cost of sales -566 -539
Gross profit 98 113
Cost -129 -147
Earnings before interest and tax (EBIT) -31 -34
Financials -2 -1
Earnings before tax (EBT) -33 -35
Tax on net profit or loss for the period -2 0
Net profit or loss for the period -35 -35
Write-down to fair value less costs to sell -47 0
Net profit or loss for discontinued operations -82 -35
Earnings from discontinued operations in DKK per share outstanding (EPS) -11.24 -4.62
Diluted earnings from discontinued operations in DKK per share outstanding (EPS-D) -11.24 -4.62
83
Solar Annual Report 2017 — ConsolidatedResults and outlook: Financial review
MANAGEMENT’SREVIEW
FINANCIAL STATEMENTS CONTENTS
Solar Annual Report 2017 — ConsolidatedNotes: Invested capital

Assets and liabilities held for sale – continued
DKK million 2017
2017
Property, plant and equipment 0
Other non-current assets 2
Non-current assets 2
Inventories 59
Trade receivables 64
Other current assets 0
Current assets 123
Assets held for sale 125
Other non-current liabilities 13
Non-current liabilities 13
Interest-bearing liabilities 0
Trade payables 40
Other current liabilities 15
Current liabilities 55
Liabilities held for sale 68
Deferred tax assets not recognised in the balance sheet of GFI GmbH, Claessen ELGB NV and Solar Deutschland GmbH (divested in 2015) amounted to DKK 110m (2016: DKK 79m) at the end of the period.
18
84
Solar Annual Report 2017 — ConsolidatedResults and outlook: Financial review
MANAGEMENT’SREVIEW
FINANCIAL STATEMENTS CONTENTS
Solar Annual Report 2017 — ConsolidatedNotes: Invested capital

85
Accounting policies
Treasury sharesAcquisition and disposal sums related to treasury shares are recognised directly in transactions with the owners
MANAGEMENT’SREVIEW
FINANCIAL STATEMENTS CONTENTS
19Share capital
DKK million 2017 2016
Share capital 1/1 792 792
Reduction of share capital -17 0
Share capital 31/12 775 792
Share capital is fully paid in and divided into the following classes:
A shares, 40 shares at DKK 10,000 0 0
A shares, 2,240 shares at DKK 40,000 90 90
A shares total 90 90
B shares 6,845,625 / 7,020,607 at DKK 100 685 702
Total 775 792
Share capital remained unchanged from 2013 to 2016. In 2017 the share capital was reduced by 174,982 B shares.
Number of shares Nominal value
DKK million 2017 2016 2017 2016
A shares outstanding 31/121 900,000 900,000 90 90
B shares outstanding
Outstanding 1/1 6,398,292 6,910,598 640 691
Purchase of treasury shares 0 -512,306 0 -51
B shares outstanding 31/12 6,398,292 6,398,292 640 640
Total shares outstanding 31/12 7,298,292 7,298,292 730 730
1. A shares have been included in the calculation in units of DKK 100.
85
Solar Annual Report 2017 — ConsolidatedResults and outlook: Financial review
MANAGEMENT’SREVIEW
FINANCIAL STATEMENTS CONTENTS
Solar Annual Report 2017 — ConsolidatedNotes: Capital structure and financing costs
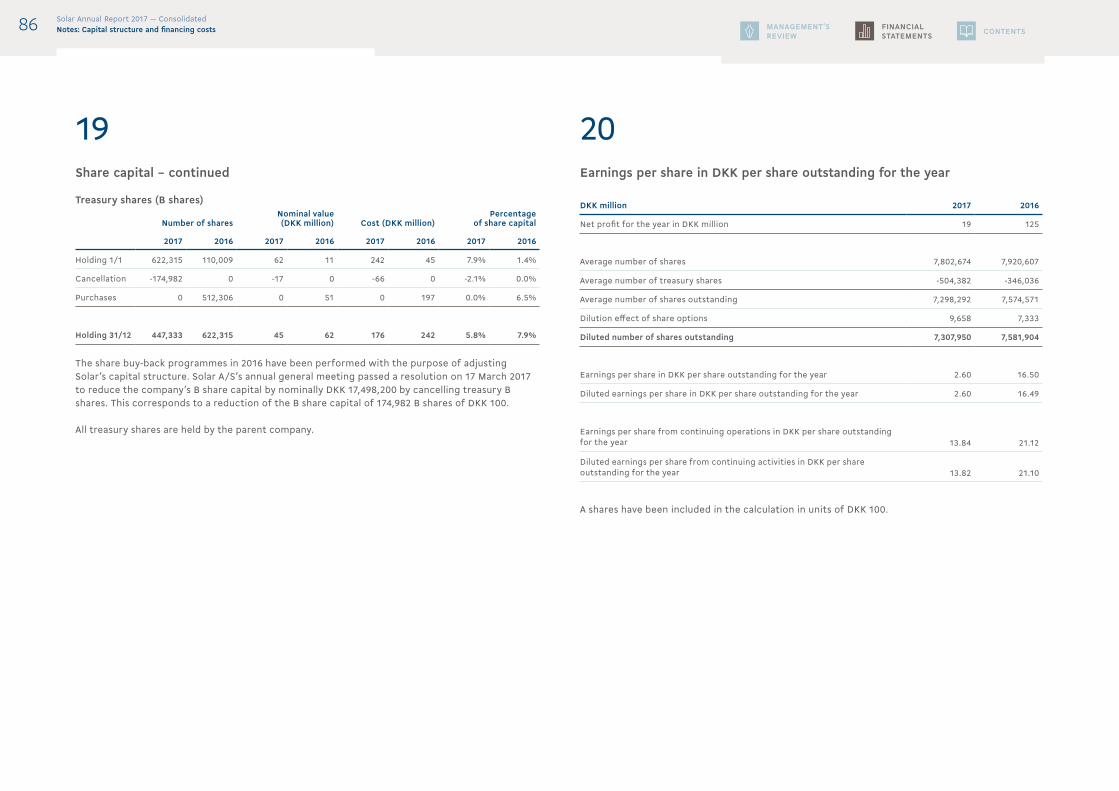
86 Solar Annual Report 2016 — Management’s reviewResults and outlook: Financial review MANAGEMENT’S
REVIEWFINANCIAL STATEMENTS CONTENTS
19 20Share capital – continued Earnings per share in DKK per share outstanding for the year
Treasury shares (B shares)
Number of sharesNominal value (DKK million) Cost (DKK million)
Percentage of share capital
2017 2016 2017 2016 2017 2016 2017 2016
Holding 1/1 622,315 110,009 62 11 242 45 7.9% 1.4%
Cancellation -174,982 0 -17 0 -66 0 -2.1% 0.0%
Purchases 0 512,306 0 51 0 197 0.0% 6.5%
Holding 31/12 447,333 622,315 45 62 176 242 5.8% 7.9%
The share buy-back programmes in 2016 have been performed with the purpose of adjusting Solar’s capital structure. Solar A/S’s annual general meeting passed a resolution on 17 March 2017 to reduce the company’s B share capital by nominally DKK 17,498,200 by cancelling treasury B shares. This corresponds to a reduction of the B share capital of 174,982 B shares of DKK 100.
All treasury shares are held by the parent company.
DKK million 2017 2016
Net profit for the year in DKK million 19 125
Average number of shares 7,802,674 7,920,607
Average number of treasury shares -504,382 -346,036
Average number of shares outstanding 7,298,292 7,574,571
Dilution effect of share options 9,658 7,333
Diluted number of shares outstanding 7,307,950 7,581,904
Earnings per share in DKK per share outstanding for the year 2.60 16.50
Diluted earnings per share in DKK per share outstanding for the year 2.60 16.49
Earnings per share from continuing operations in DKK per share outstanding for the year 13.84 21.12
Diluted earnings per share from continuing activities in DKK per share outstanding for the year 13.82 21.10
A shares have been included in the calculation in units of DKK 100.
86
Solar Annual Report 2017 — ConsolidatedResults and outlook: Financial review
MANAGEMENT’SREVIEW
FINANCIAL STATEMENTS CONTENTS
Solar Annual Report 2017 — ConsolidatedNotes: Capital structure and financing costs

87 Solar Annual Report 2016 — Management’s reviewResults and outlook: Financial review MANAGEMENT’S
REVIEWFINANCIAL STATEMENTS CONTENTS
21Interest-bearing liabilities and maturity statement Accounting policies
Financial liabilitiesDebt to credit institutions is recognised initially at the proceeds received net of transaction costs incurred.
In subsequent periods, the financial liabilities are measured at amortised cost using the effective interest method, meaning that the difference between the proceeds and the nominal value is recognised in the income statement under financials for the term of the loan.
Financial risks
Interest rate riskSolar monitors and adjusts interest-bearing liabilities on an ongoing basis. Loans are only raised in the currencies of the countries where Solar operates. Of total interest-bearing liabilities, Solar endeavours to ensure that a maximum of half is based on variable payment of interest fixed in accordance with current money market rates. The remaining interest-bearing liabilities are fixed-rate. Solar Group has no significant non-current interest-bearing assets.
As a result of Solar’s policies, a certain interest rate risk exists.
DKK million Interest rate 2017 2016
Debt to mortgage credit institutions Fixed1 183 188
Debt to credit institutions Floating (2017), fixed (2016)1 260 196
Bank loans and overdrafts Floating 123 2
Interest-bearing liabilities 566 386
Trade payables 1,848 1,727
Other payables 510 529
Financial liabilities 2,924 2,642
Cash at bank and in hand 77 343
Trade receivables 1,492 1,404
Other receivables 64 41
Financial assets 1,633 1,788
Total, net 1,291 854
1. Interest swaps have been used to hedge floating-rate loans, converting these loans to fixed-rate loans.
Reconciliation of development in interest-bearing debt to mortgage and credit institutions to financing activities in the cash flow statement:
DKK million 2017
Debt to mortgage and credit institutions 1/1 384
Repayment of debt to mortgage and credit institutions -69
Raising of debt to mortgage and credit instututions 135
Foreign currency translation adjustment -7
Debt to mortgage and credit institutions 31/12 443
87
Solar Annual Report 2017 — ConsolidatedResults and outlook: Financial review
MANAGEMENT’SREVIEW
FINANCIAL STATEMENTS CONTENTS
Solar Annual Report 2017 — ConsolidatedNotes: Capital structure and financing costs

88 Solar Annual Report 2016 — Management’s reviewResults and outlook: Financial review MANAGEMENT’S
REVIEWFINANCIAL STATEMENTS CONTENTS
21Interest-bearing liabilities and maturity statement – continued Financial risks (continued)
Currency riskSolar is exposed to currency risks in the form of translation risks since a substantial proportion of revenue derives from currencies other than Danish kroner. The currencies used are euro, Danish kroner, Swedish kroner, Norwegian kroner and, to a lesser extent, Polish zloty, Swiss Franc, US dollar and British pound.
The individual subsidiaries are not significantly affected by exchange rate fluctuations since revenue and costs in subsidiaries are mainly in the same currencies. Solar has a number of investments in foreign subsidiaries, where the translation of equity into Danish kroner depends on exchange rates. Investments in subsidiaries are not hedged as such investments are regarded as long-term and because hedging is seen as unlikely to create any long-term value.
Liquidity risksSolar has an objective of substantial self-financing to minimise dependence on lenders and thus gain greater freedom of action. Financing is primarily controlled centrally based on the individual subsidiary’s operating and investment cash requirements. Solar ensures that there are always sufficient and flexible cash reserves and diversification of maturities of both non-current and current credit facilities.
Effect on recognition of subsidiaries of any change in foreign exchange rates of 10%
Profit of the year EquityDKK million 2017 2016 2017 2016
NOK 6.1 4.4 32.1 32.7
SEK 6.8 5.8 36.8 32.6
PLN -0.1 -0.1 6.1 6.0
Total 12.8 10.1 75.0 71.3
DKK million 2017 2016
Maturity < 1 year
Debt to mortgage credit institutions 20 6
Debt to credit institutions 0 184
Bank loans and overdrafts 123 2
Current interest-bearing liabilities 143 192
Other financial liabilities 2,358 2,256
Financial liabilities 2,501 2,448
Financial assets 1,633 1,788
Total, net 868 660
Maturity 1-5 year(s)
Debt to mortgage credit institutions 36 35
Debt to credit institutions 249 12
Total 285 47
Maturity > 5 years
Debt to mortgage credit institutions 138 147
Total 138 147
Total non-current liabilities 423 194
Maturity, until year 2037 2037
The carrying amount of financial liabilities corresponds to fair value.
88
Solar Annual Report 2017 — ConsolidatedResults and outlook: Financial review
MANAGEMENT’SREVIEW
FINANCIAL STATEMENTS CONTENTS
Solar Annual Report 2017 — ConsolidatedNotes: Capital structure and financing costs
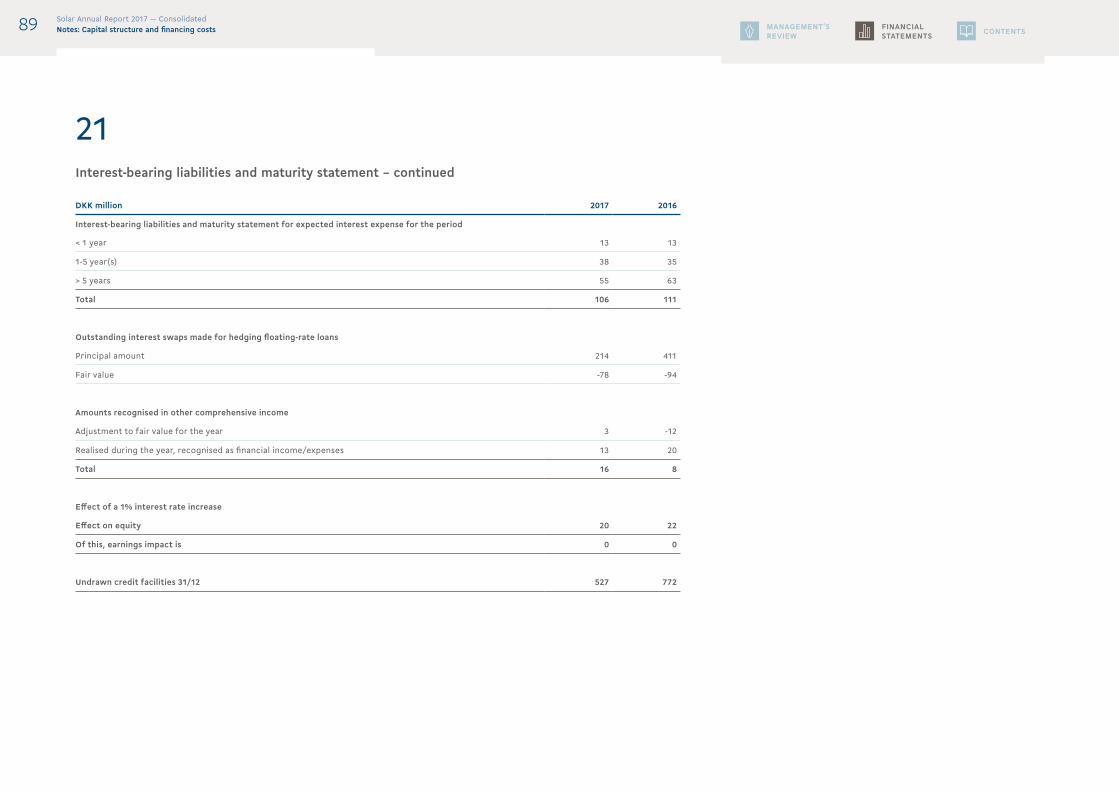
89 Solar Annual Report 2016 — Management’s reviewResults and outlook: Financial review MANAGEMENT’S
REVIEWFINANCIAL STATEMENTS CONTENTS
21Interest-bearing liabilities and maturity statement – continued
DKK million 2017 2016
Interest-bearing liabilities and maturity statement for expected interest expense for the period
< 1 year 13 13
1-5 year(s) 38 35
> 5 years 55 63
Total 106 111
Outstanding interest swaps made for hedging floating-rate loans
Principal amount 214 411
Fair value -78 -94
Amounts recognised in other comprehensive income
Adjustment to fair value for the year 3 -12
Realised during the year, recognised as financial income/expenses 13 20
Total 16 8
Effect of a 1% interest rate increase
Effect on equity 20 22
Of this, earnings impact is 0 0
Undrawn credit facilities 31/12 527 772
89
Solar Annual Report 2017 — ConsolidatedResults and outlook: Financial review
MANAGEMENT’SREVIEW
FINANCIAL STATEMENTS CONTENTS
Solar Annual Report 2017 — ConsolidatedNotes: Capital structure and financing costs

90 Solar Annual Report 2016 — Management’s reviewResults and outlook: Financial review MANAGEMENT’S
REVIEWFINANCIAL STATEMENTS CONTENTS
21Interest-bearing liabilities and maturity statement – continued Accounting policies
DerivativesDerivatives are only used to hedge financial risks in the form of interest rate and currency risks.
Derivatives are initially recognised at cost and at fair value subsequently. Both realised and unrealised gains and losses are recognised in the income statement unless the derivatives are part of hedging of future transactions. Value adjustments of derivatives for hedging of future transactions are recognised directly in other comprehensive income.
As hedged transactions are realised, gains or losses are recognised in the hedging instrument from other comprehensive income in the same item as the hedged items. Any non-effective part of the financial instrument in question is recognised in the income statement.
Derivatives are recognised under other receivables or other payables.
Fair value measurementThe group uses the fair value concept for recognition of certain financial instruments and in connection with some disclosure requirements. Fair value is defined as the price that can be secured when selling an asset or that must be paid to transfer a liability in a standard transaction between market participants (exit price).
Fair value is a marked-based and not enterprise-specific valuation. The enterprise uses the assumptions that market participants would use when pricing an asset or liability based on existing market conditions, including assumptions relating to risks.
As far as possible, fair value measurement is based on market value in active markets (level 1) or alternatively on values derived from observable market information (level 2).
If such observable information is not available or cannot be used without significant modifications, recognised valuation methods and fair estimates are used as the basis of fair values (level 3).
Distribution on currencies
Current liabilities Non-current liabilities
DKK million 2017 2016 2017 2016
EUR 20 20 174 193
DKK 113 0 135 0
NOK 0 0 1 1
PLN 10 2 0 0
SEK 0 170 113 0
Total 143 192 423 194
Interest rate in % 1.1-5.8 2.4-5.8 1.1-5.8 5.0-5.8
Fair value of Solar’s respective interest-bearing liabilities is seen as fair value measurement at level 2. Mortgage loans are valued based on underlying securities, while bank debt is calculated based on models for discounting to net present value. Non-observable market data is primarily made up of credit risks, which are seen as insignificant in Solar’s case.
The fair value of Solar’s derived financial instruments (interest rate instruments) is fixed as fair value measurement at level 2, since fair value can be determined directly based on the actual forward rates and instalments on the balance sheet date. Outstanding interest rate swaps for hedging of floating-rate loans expire over the period until 2037 (2016: 2037).
The group’s enterprises have raised loans in their respective functional currencies, while the parent company has also raised loans in euro. We refer to the risk section in our management’s review for more information on liquidity risk, interest rate and currency risk management.
90
Solar Annual Report 2017 — ConsolidatedResults and outlook: Financial review
MANAGEMENT’SREVIEW
FINANCIAL STATEMENTS CONTENTS
Solar Annual Report 2017 — ConsolidatedNotes: Capital structure and financing costs

91 MANAGEMENT’SREVIEW
FINANCIAL STATEMENTS CONTENTS
22 23Financial income Financial expenses
DKK million 2017 2016
Interest revenue 6 10
Foreign exchange gains 10 16
Fair value adjustments investments 79 0
Other financial income1 15 0
Total 110 26
Financial income, received 6 10
1. Reassessment of earn-out liability concerning STI has resulted in a DKK 15m reversal.
DKK million 2017 2016
Interest expenses 28 34
Foreign exchange losses 12 18
Other financial expenses 0 7
Total 40 59
Financial expenses, settled1 28 51
1. 2016 figure includes realisation of interest swap entered in 2015.
91
Solar Annual Report 2017 — ConsolidatedResults and outlook: Financial review
MANAGEMENT’SREVIEW
FINANCIAL STATEMENTS CONTENTS
Solar Annual Report 2017 — ConsolidatedNotes: Capital structure and financing costs

92 Solar Annual Report 2016 — Management’s reviewResults and outlook: Financial review MANAGEMENT’S
REVIEWFINANCIAL STATEMENTS CONTENTS
24Share option plans Accounting policies
Share options are measured at fair value at the grant date and are recognised in the income statement under staff costs over the period when the final right to the options is vested. The set-off to this is recognised under other payables, as the employees have the right to choose cash settlement. This liability is regularly adjusted to fair value and fair value adjustments are recognised in financials.
The fair value of the granted share options is estimated using the Black-Scholes model. Allowance is made for the conditions and terms related to the granted share options when performing the calculation.
ExecutiveBoard Others Total
No. of share options at year-end 2017
Outstanding at the beginning of 2017 25,525 83,451 108,976
Granted in 2017 9,261 14,457 23,718
Transferred on change to the Executive Board -2,970 2,970 0
Exercised 0 -22,420 -22,420
Outstanding at year-end 2017 31,816 78,458 110,274
No. of share options at year-end 2016
Outstanding at the beginning of 2016 14,436 107,407 121,843
Granted in 2016 7,297 21,101 28,398
Transferred on change to the Executive Board 8,894 -8,894 0
Exercised1 -5,102 -36,163 -41,265
Outstanding at year-end 2016 25,525 83,451 108,976
DKK million 2017 2016
Market value estimated using the Black-Scholes model, recognised under other liabilities 6 4
Conditions applying to the statement of market value using the Black-Scholes model:
Expected volatility 28% 30%
Expected dividends in proportion to market value 2% 3%
Risk-free interest rate 0% 0%
1. In Q1 2016, 41,265 share options were exercised. The share price at the exercise date was DKK 342.60. In Q1 2017, 22,420 share options were exercised. The share price at the exercise date was DKK 381.23
92
Solar Annual Report 2017 — ConsolidatedResults and outlook: Financial review
MANAGEMENT’SREVIEW
FINANCIAL STATEMENTS CONTENTS
Solar Annual Report 2017 — ConsolidatedNotes: Other notes

93 Solar Annual Report 2016 — Management’s reviewResults and outlook: Financial review MANAGEMENT’S
REVIEWFINANCIAL STATEMENTS CONTENTS
24Share option plans – continued
Specification of share option plans
Year of granting
No. of shares 2017 2016 2015 2014 2013
Executive Board
Granted 9,261 7,297 7,383 5,892 8,147
Transferred on change to the Executive Board -1,663 975 4,011 -1,340 -5,431
Exercised 0 0 0 0 -2,716
Total 7,598 8,272 11,394 4,552 0
Others
Granted 14,457 21,101 30,989 18,200 30,217
Transferred on change to the Executive Board 1,663 -975 -4,011 1,340 5,431
Forfeited on resignation of management employees 0 0 0 0 -6,011
Exercised 0 0 0 -4,306 -29,637
Total 16,120 20,126 26,978 15,234 0
Exercise price1 381.23 342.60 328.26 373.64 269.18
Exercise period
10 banking days following the publication of the annual report in 2020/2021 2019/2020 2018/2019 2017/2018 2016/2017
1. Exercise price was adjusted by DKK -7.00 in 2015 as dividends were distributed in 2015 despite the fact that the year’s results were negative.
93
Solar Annual Report 2017 — ConsolidatedResults and outlook: Financial review
MANAGEMENT’SREVIEW
FINANCIAL STATEMENTS CONTENTS
Solar Annual Report 2017 — ConsolidatedNotes: Other notes

94 Solar Annual Report 2016 — Management’s reviewResults and outlook: Financial review MANAGEMENT’S
REVIEWFINANCIAL STATEMENTS CONTENTS
25Contingent liabilities and other financial liabilities Accounting policies
LeasingLeasing agreements, in which the most important aspects of the asset’s risks and benefits remain with the lessor, are classified as operational leasing agreements. Leasing agreements, in which the most important aspects of the asset’s risks and benefits are transferred to enterprises in the Solar Group, are classified as financial leases. As at the balance sheet date, no leasing agreement is classified as a financial lease. Leasing payments concerning operational leasing are recognised in the income statement on a straight-line basis throughout the leasing period.
DKK million 2017 2016
Operational leases and rent contracts
Non-cancellable minimum lease payments are to be made within the following periods from the balance sheet date:
< 1 year 114 115
> 1 year < 5 years 264 190
> 5 years 37 22
Total 415 327
Operational leases and rent recognised in the income statement:
Total 137 119
Company cars and office furniture and equipment are leased under operating leases The typical lease period is:
No. of years 1-5 1-5
Rent obligations with non-cancellation periods:
No. of years up to: 10 10
Collateral
Assets have been pledged as collateral for bank and mortgage arrangements at a carrying amount of:
Land and buildings 491 249
Current assets 392 85
Total 883 334
In 2013 Solar Nederland B.V. closed its defined benefit pension plan and transferred all risks that in 2013 amounted to DKK 373m to an insurance company. In 2016 the Conelgro B.V. closed its defined benefit pension plan and transferred all risks that in 2016 amounted to DKK 250m to an insurance company. Solar is liable for payment of the benefit vs. the participants and has consequently a credit risk vs. the insurance company. Based on the insurance company’s current rating, this risk is determined to be limited.
94
Solar Annual Report 2017 — ConsolidatedResults and outlook: Financial review
MANAGEMENT’SREVIEW
FINANCIAL STATEMENTS CONTENTS
Solar Annual Report 2017 — ConsolidatedNotes: Other notes

95 Solar Annual Report 2016 — Management’s reviewResults and outlook: Financial review MANAGEMENT’S
REVIEWFINANCIAL STATEMENTS CONTENTS
26 27Related parties Auditors’ fees
DKK million 2017 2016
PricewaterhouseCoopers
Statutory audit 3 3
Other assurance engagements 0 0
Tax consulting 1 1
Other services1 3 1
Total 7 5
Other auditors
Statutory audit 1 0
Other services 0 2
Total 1 2
1. Other services mainly consists of IT-related services and services related to business combinations.
Group and parent Solar A/S are subject to control by the Fund of 20th December (registered as a commercial foundation in Denmark), which owns 16,0% of the shares and holds 58,1% of the voting rights. The remaining shares are owned by a widely combined group of shareholders.
Other related parties include the company’s Board of Directors and Executive Board. In 2017 there have been no transactions in the financial year with members of the Board of Directors and Executive Board other than those which appear from note 5. In 2016, member of the Board of Directors Ulf Gundemark invoiced Solar DKK 29,875 via Gumaco AB for consultancy services and member of the Board of Directors Jens Peter Toft DKK received DKK 29,875 as extra remuneration regarding extra work for the Board.
Solar invoices the Fund of 20th December for the performance of administrative services at DKK 20,000. Balances with the Fund of 20th December total 0 on balance sheet date.
95
Solar Annual Report 2017 — ConsolidatedResults and outlook: Financial review
MANAGEMENT’SREVIEW
FINANCIAL STATEMENTS CONTENTS
Solar Annual Report 2017 — ConsolidatedNotes: Other notes

96 Solar Annual Report 2016 — Management’s reviewResults and outlook: Financial review MANAGEMENT’S
REVIEWFINANCIAL STATEMENTS CONTENTS
28New financial reporting standards
IASB has issued the following new or amended standards which are not yet effective and which are relevant for Solar: • IFRS 9 on financial instruments, effective date 1 January 2018. IFRS 9 introduces a new model for
impairment of receivables based on expected losses. Further, IFRS 9 relaxes the requirements for applying hedge accounting.
• IFRS 15 on revenue from contracts with customers, effective date 1 January 2018. IFRS 15 introduces a comprehensive model for recognition of revenue. Revenue from sale of goods is recognised along with transfer of control.
• IFRS 16 leases, effective date 1 January 2019. Lessees must capitalise all leases other than leases with a term of 1 year or less and leases of assets with an individually low value.
• Part of Annual Improvements 2014-2016, effective date 11 January 2018.• Amendments to IFRS 2, Sharebased Payment, effective date 1 January 2018.• IFRIC 23, Uncertainty over income tax treatments, effective date 1 January 2019. • Amendments to IAS 28: Long-term Interests in Associates and Joint Ventures, effective date 1
January 2019.• Annual improvements to IFRSs 2015-2017 cycle, effective date 1 January 2019. IFRS 9, IFRS 15 and IFRS 16 have been EU endorsed. Solar has assessed the impact from adoption of IFRS 9 and IFRS 15 to be limited. Solar is currently assessing the impact from adoption of IFRS 16. Operating leases commitments as of 31 December 2017 amounts to DKK 415m, cf. note 25. The other standards and amendments have not yet been EU endorsed. Solar will continuously assess the impact but has not completed this assessment at present.
96
Solar Annual Report 2017 — ConsolidatedResults and outlook: Financial review
MANAGEMENT’SREVIEW
FINANCIAL STATEMENTS CONTENTS
Solar Annual Report 2017 — ConsolidatedNotes: Other notes

Separate financialstatements
97
Solar Annual Report 2017 — ConsolidatedResults and outlook: Financial review
MANAGEMENT’SREVIEW
FINANCIAL STATEMENTS CONTENTS97 Solar Annual Report 2017 — Separate financial statements

Notes to the separate financial statements
Contents Statement of comprehensive income 99 Balance sheet 100Cash flow statement 101Statement of changes in equity 102Notes 104
Basis for preparation1. General accounting policies 1042. Significant accounting estimates and assessments 104
Notes to the income statement3. Staff costs 1054. Loss on trade receivables 1065. Depreciation, write-down and amortisation 1066. Income tax 1077. Net profit for the year 110
Invested capital8. Intangible assets 1119. Property, plant and equipment 11310. Other non-current assets 11511. Inventories 11712. Trade receivables 11813. Other provisions 11914. Other payables 120
Capital structure and financing costs15. Share capital 12116. Interest-bearing liabilities and maturity statement 12317. Financial income 12718. Financial expenses 127
Other notes19. Contingent liabilities and other financial liabilities 12820. Related parties 12921. Auditors’ fees 130
98
Solar Annual Report 2017 — ConsolidatedResults and outlook: Financial review
MANAGEMENT’SREVIEW
FINANCIAL STATEMENTS CONTENTSMANAGEMENT’S
REVIEWFINANCIAL STATEMENTS CONTENTS98 Solar Annual Report 2017 — Separate financial statements
Contents

Statement of comprehensive incomeOther comprehensive incomeIncome statement
Note DKK million 2017 2016
Revenue 3,321 3,008
Cost of sales -2,537 -2,280
Gross profit 784 728
Other operating income and costs 44 36
21 External operating costs -96 -85
3 Staff costs -495 -460
4 Loss on trade receivables -6 -6
Earnings before interest, tax, depreciation and amortisation (EBITDA) 231 213
5 Depreciation and write-down on property, plant and equipment -19 -6
Earnings before interest, tax and amortisation (EBITA) 212 207
5 Amortisation of intangible assets -76 -51
Earnings before interest and tax (EBIT) 136 156
Profit from subsidiaries -52 7
Write-down of subsidiaries held for sale -47 0
Share of net profit from associates -11 0
Impairment of associates -59 0
17 Financial income 112 22
18 Financial expenses -27 -28
Earnings before tax (EBT) 52 157
6 Income tax -33 -32
7 Net profit for the year 19 125
Note DKK million 2017 2016
Net profit for the year 19 125
Other income and costs recognised:
Items that cannot be reclassified for the income statement
Actuarial gains / losses on defined benefit plans, subsidiaries 0 -9
Tax, subsidiaries 0 2
Items that can be reclassified for the income statement
Foreign currency translation adjustments of foreign subsidiaries -35 2
Fair value adjustments of hedging instruments before tax, parent company 14 -4
Fair value adjustments of hedging instruments before tax, subsidiaries 2 12
Tax on value adjustments of hedging instruments, parent company -4 1
Tax on value adjustments of hedging instruments, subsidiaries 0 -3
Other income and costs recognised after tax -23 1
Total comprehensive income for the year -4 126
99
Solar Annual Report 2017 — ConsolidatedResults and outlook: Financial review
MANAGEMENT’SREVIEW
FINANCIAL STATEMENTS CONTENTS
Solar Annual Report 2017 — Separate financial statementsStatement of comprehensive income

Balance sheetas at 31 December
Note DKK million 2017 2016
EQUITY AND LIABILITIES
15 Share capital 775 792
Reserves -39 -75
Retained earnings 782 878
Proposed dividends for the financial year 73 88
Equity 1,591 1,683
16 Interest-bearing liabilities 309 193
6 Provision for deferred tax 80 78
13 Other provisions 0 16
Non-current liabilities 389 287
16 Interest-bearing liabilities 133 20
Trade payables 776 613
Amounts owed to subsidiaries 216 519
Income tax payable 4 0
14 Other payables 236 234
13 Other provisions 1 2
Current liabilities 1,366 1,388
Liabilities 1,755 1,675
Total equity and liabilities 3,346 3,358
Note DKK million 2017 2016
ASSETS
8 Intangible assets 229 209
9 Property, plant and equipment 254 264
10 Investments measured at equity value 1,429 1,294
10 Other non-current assets 58 44
Non-current assets 1,970 1,811
11 Inventories 524 383
12 Trade receivables 392 350
Receivables from subsidiaries 379 562
Income tax receivable 0 6
Other receivables 6 6
Prepayments 30 13
Cash at bank and in hand 0 227
Assets held for sale 45 0
Current assets 1,376 1,547
Total assets 3,346 3,358
100
Solar Annual Report 2017 — ConsolidatedResults and outlook: Financial review
MANAGEMENT’SREVIEW
FINANCIAL STATEMENTS CONTENTS
Solar Annual Report 2017 — Separate financial statementsBalance sheet

Cash flow statement
Note DKK million 2017 2016
Net profit for the year 19 125
5 Depreciation, write-down and amortisation 95 57
Impairment on associates 59 0
Changes to provisions and other adjustments 0 -6
Profit from subsidiaries 52 -7
Write-down of subsidiaries held for sale 47 0
Share of net profit from associates 11 0
17.18 Financials, net -85 6
Income tax 33 32
17 Financial income, received 12 16
18 Financial expenses, settled -23 -32
Income tax, settled -24 -29
Cash flow before working capital changes 196 162
Working capital changes
Inventory changes -141 -26
Receivables changes -59 -40
Non-interest-bearing liabilities changes 178 -20
Cash flow from operating activities 174 76
Note DKK million 2017 2016
Investing activities
8 Purchase of intangible assets -99 -80
Purchase of property, plant and equipment -9 -6
Disposal of property, plant and equipment 0 30
Acquistion of subsidiaries and activities -1 -97
Acquistion of associates -16 0
Capital increase subsidiaries -79 -33
Other financial investments1 -190 -18
Cash flow from investing activities -394 -204
Financing activities
Repayment of non-current interest-bearing debt -19 -46
Raising of non-current interest-bearing liabilities 135 0
Changes to loans to subsidaries -196 78
Dividends from subsidiaries 48 34
Treasury share purchases 0 -197
Dividends distributed -88 -77
Cash flow from financing activities, continuing operations -120 -208
Total cash flow -340 -336
Cash at bank and in hand at the beginning of the year 207 543
Cash at bank and in hand at the end of the year -133 207
Cash at bank and in hand at the end of the year
Cash at bank and in hand 0 227
Current interest-bearing liabilities -133 -20
Cash at bank and in hand at the end of the year -133 207
1. Investment in BIMobject in 2017 amounts to DKK 171m.
101
Solar Annual Report 2017 — ConsolidatedResults and outlook: Financial review
MANAGEMENT’SREVIEW
FINANCIAL STATEMENTS CONTENTS
Solar Annual Report 2017 — Separate financial statementsCash flow statement
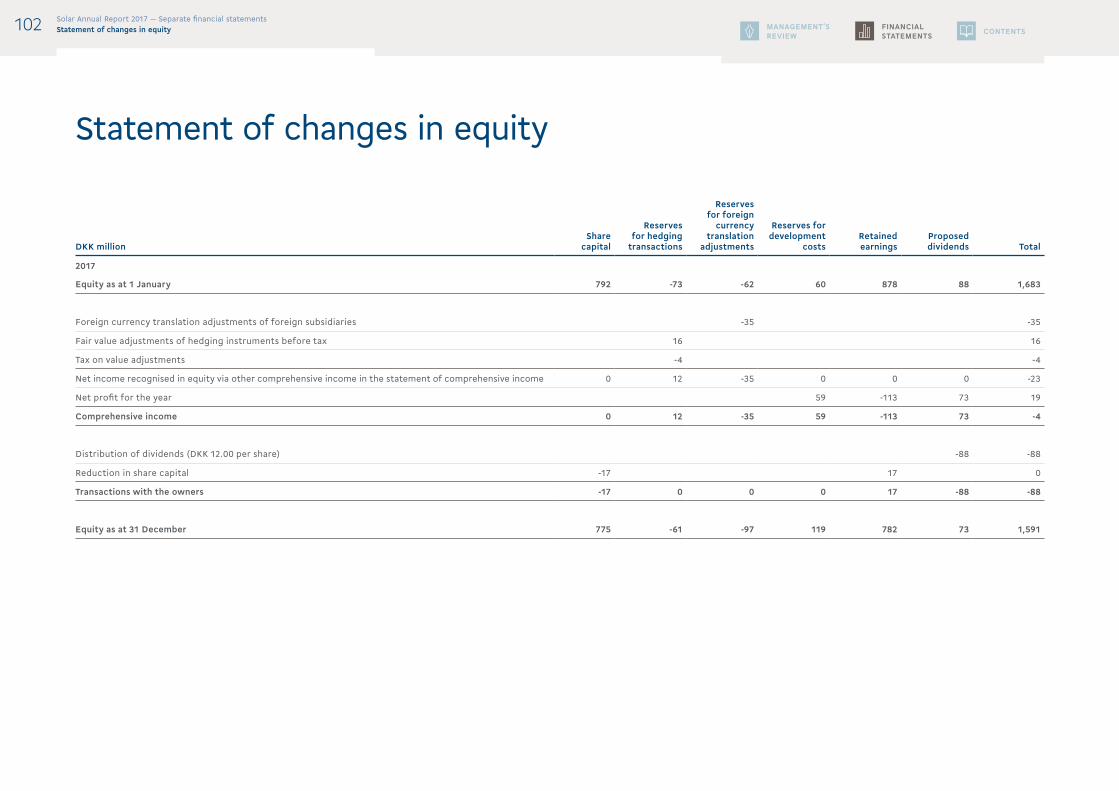
Statement of changes in equity
DKK millionShare
capital
Reservesfor hedging
transactions
Reservesfor foreign
currencytranslation
adjustments
Reserves fordevelopment
costsRetainedearnings
Proposeddividends Total
2017
Equity as at 1 January 792 -73 -62 60 878 88 1,683
Foreign currency translation adjustments of foreign subsidiaries -35 -35
Fair value adjustments of hedging instruments before tax 16 16
Tax on value adjustments -4 -4
Net income recognised in equity via other comprehensive income in the statement of comprehensive income 0 12 -35 0 0 0 -23
Net profit for the year 59 -113 73 19
Comprehensive income 0 12 -35 59 -113 73 -4
Distribution of dividends (DKK 12.00 per share) -88 -88
Reduction in share capital -17 17 0
Transactions with the owners -17 0 0 0 17 -88 -88
Equity as at 31 December 775 -61 -97 119 782 73 1,591
102
Solar Annual Report 2017 — ConsolidatedResults and outlook: Financial review
MANAGEMENT’SREVIEW
FINANCIAL STATEMENTS CONTENTS
Solar Annual Report 2017 — Separate financial statementsStatement of changes in equity

Statement of changes in equity– continued
DKK millionShare
capital
Reservesfor hedging
transactions
Reservesfor foreign
currencytranslation
adjustments
Reserves fordevelopment
costsRetainedearnings
Proposeddividends Total
2016
Equity as at 1 January 792 -79 -64 0 1,104 78 1,831
Foreign currency translation adjustments of foreign subsidiaries 2 2
Fair value adjustments of hedging instruments before tax 8 8
Actuarial gains / losses on defined benefit plans -9 -9
Tax on value adjustments -2 2 0
Net income recognised in equity via other comprehensive income in the statement of comprehensive income 0 6 2 0 -7 0 1
Net profit for the year 60 -23 88 125
Comprehensive income 0 6 2 60 -30 88 126
Distribution of dividends (DKK 10.00 per share) -77 -77
Buy-back of treasury shares -196 -1 -197
Transactions with the owners 0 0 0 0 -196 -78 -274
Equity as at 31 December 792 -73 -62 60 878 88 1,683
103
Solar Annual Report 2017 — ConsolidatedResults and outlook: Financial review
MANAGEMENT’SREVIEW
FINANCIAL STATEMENTS CONTENTS
Solar Annual Report 2017 — Separate financial statementsStatement of changes in equity

1General accounting policies
A general description of accounting policies can be found in the consolidated financial statements on pages 53-55, note 1, Accounting policies.
Descriptions of accounting policies in notesDescriptions of accounting policies in the notes form part of the overall description of accounting policies. Parent-specific descriptions are found in the following notes:
Note 6 Income taxNote 7 Net profit or loss for the yearNote 8 Intangible assetsNote 9 Property, plant and equipmentNote 10 Investments measured at equity value and other non-current assetsNote 11 InventoriesNote 12 Trade receivablesNote 13 Other provisionsNote 15 Share capitalNote 16 Interest-bearing liabilitiesNote 19 Contingent liabilities and other financial liabilities
2Significant accounting estimates and assessments
When preparing the annual report in accordance with generally applicable principles, management make estimates and assumptions that affect the reported assets and liabilities. Management base their estimates on historic experience and expectations for future events. Therefore, actual results may differ from these estimates. The following estimates and accompanying assessments are deemed material for the preparation of the financial statements:
• Impairment test for goodwill and equity investments• Software• Inventory write-down • Write-down for meeting of loss on doubtful receivables• Provision for deferred tax
These estimates and assessments are described in the following notes:Note 8 Intangible assetsNote 11 InventoriesNote 12 Trade receivables
104
Solar Annual Report 2017 — ConsolidatedResults and outlook: Financial review
MANAGEMENT’SREVIEW
FINANCIAL STATEMENTS CONTENTS
Solar Annual Report 2017 — Separate financial statementsNotes: Basis for preparation

3
DKK million 2017 2016
Salaries and wages etc. 452 426
Pensions, defined contribution 30 30
Costs related to social security 11 10
Share-based payment 2 -6
Total 495 460
Average number of employees (FTEs) 785 782
Number of employees at year-end (FTEs) 788 782
Remuneration of Board of Directors
Remuneration of Board of Directors 3 3
Remuneration of Executive Board
Remuneration and bonus 14 11
Share-based payment 1 -1
Severance pay 10 0
Total 25 10
We have a remuneration policy that describes guidelines for determining and approving remuneration of the Board of Directors and Executive Board. The annual general meeting adopts the Board of Directors’ remuneration for one year ahead at a time. The Executive Board’s remuneration is assessed every two years. The Board of Directors jointly approve the elements that make up the Executive Board’s salary package as well as all major adjustments to this package following previous discussions and recommendations of the chairman and vice-chairman of the Board of Directors. Under section 139 of the Danish Companies Act, a complete remuneration policy for the Board of Directors and Executive Board is presented for adoption at the annual general meeting.
Terms of notice for members of the Executive Board is 12 months. When stepping down, the CEO is entitled to 6 months’ remuneration.
In 2017, a provision of DKK 10m has been made for severance pay in connection with the change in CEO announced in October. The amount will be paid out during the notice period and is included in the above figures.
Staff costs
105
Solar Annual Report 2017 — ConsolidatedResults and outlook: Financial review
MANAGEMENT’SREVIEW
FINANCIAL STATEMENTS CONTENTS
Solar Annual Report 2017 — Separate financial statementsNotes to the income statement
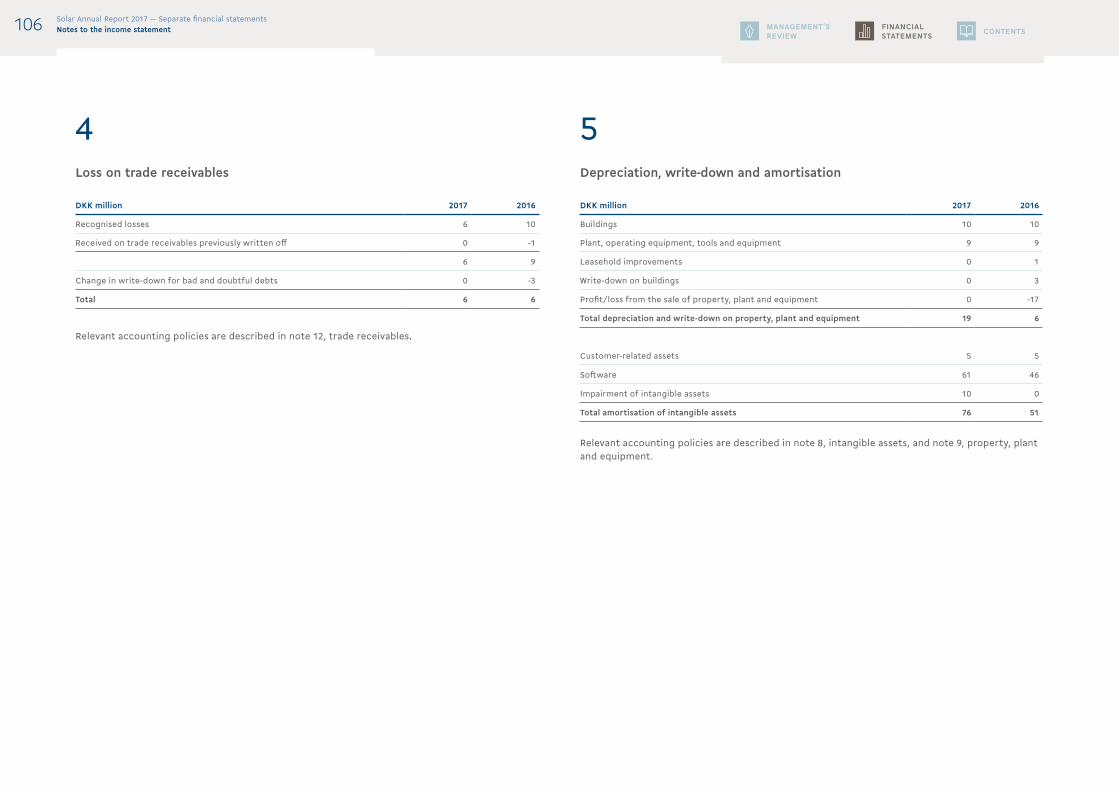
4Loss on trade receivables
5Depreciation, write-down and amortisation
DKK million 2017 2016
Recognised losses 6 10
Received on trade receivables previously written off 0 -1
6 9
Change in write-down for bad and doubtful debts 0 -3
Total 6 6
Relevant accounting policies are described in note 12, trade receivables.
DKK million 2017 2016
Buildings 10 10
Plant, operating equipment, tools and equipment 9 9
Leasehold improvements 0 1
Write-down on buildings 0 3
Profit/loss from the sale of property, plant and equipment 0 -17
Total depreciation and write-down on property, plant and equipment 19 6
Customer-related assets 5 5
Software 61 46
Impairment of intangible assets 10 0
Total amortisation of intangible assets 76 51
Relevant accounting policies are described in note 8, intangible assets, and note 9, property, plant and equipment.
106
Solar Annual Report 2017 — ConsolidatedResults and outlook: Financial review
MANAGEMENT’SREVIEW
FINANCIAL STATEMENTS CONTENTS
Solar Annual Report 2017 — Separate financial statementsNotes to the income statement

6Income tax
Accounting policies
Tax for the year is recognised with the share attributable to results for the year in the income statement and with the share attributable to other recognised income and costs in the statement of comprehensive income. Tax consists of current tax and changes to deferred tax.
DKK million 2017 2016
Current tax 34 26
Deferred tax -2 7
Tax on profit or loss for the year 32 33
Tax on taxable profit previous year 1 -1
Total 33 32
Statement of effective tax rate:
Danish income tax rate 22.0% 22.0%
Profit from subsidiaries 22.2% 1.0%
Write-down of subsidiaries 19.9% 0.0%
Non-taxable/deductible items in parent -0.6% -0.3%
Tax regarding prevoius years 0.0% -0.3%
Effective tax rate 63.5% 20.4%
107
Solar Annual Report 2017 — ConsolidatedResults and outlook: Financial review
MANAGEMENT’SREVIEW
FINANCIAL STATEMENTS CONTENTS
Solar Annual Report 2017 — Separate financial statementsNotes to the income statement

6Income tax – continued Accounting policies
Current tax liabilities and current tax receivables are recognised in the balance sheet as calculated tax on the year’s taxable income, adjusted for tax on previous year’s taxable income and for tax paid on account.
Deferred tax is measured in accordance with the balance sheet liability method of all temporary differentials between accounting and tax-related amounts and provisions. Deferred tax is recognised at the local tax rate that any temporary differentials are expected to be realised at based on the adopted or expected adopted tax legislation on the balance sheet date.
Deferred tax assets, including the tax value of tax loss allowed for carryforward, are measured at the value at which the asset is expected to be realised, either by elimination in tax of future earnings or by offsetting against deferred tax liabilities.
Deferred tax assets are assessed annually and only recognised to the extent that it is probable that they will be utilised.
Deferred tax is also recognised for the covering of retaxation of losses in former foreign subsidiaries participating in joint taxation assessed as becoming current.
DKK million 2017 2016
Provision for deferred tax
1/1 78 73
Recognised in other comprehensive income 3 -1
Ordinary tax recognised in income statement -1 7
Other items 0 -1
Total 31/12 80 78
Specified as follows:
Deferred tax 80 78
Total deferred tax, net 80 78
Further specified as follows:
Expected use within 1 year 0 0
Expected use after 1 year 80 78
Total, net 80 78
108
Solar Annual Report 2017 — ConsolidatedResults and outlook: Financial review
MANAGEMENT’SREVIEW
FINANCIAL STATEMENTS CONTENTS
Solar Annual Report 2017 — Separate financial statementsNotes to the income statement

6Income tax – continued
Specification by balance sheet items
DKK million 1/1Other
adjustments 2017 2016
Property, plant and equipment 17 1 18 17
Inventories 0 0 0 0
Provisions for loss on receivables -1 1 0 -1
Pension obligations 0 0 0 0
Other items1 62 0 62 62
Total, net 78 2 80 78
1. Other items particularly cover intangible assets and loss balances in jointly taxed entities.
109
Solar Annual Report 2017 — ConsolidatedResults and outlook: Financial review
MANAGEMENT’SREVIEW
FINANCIAL STATEMENTS CONTENTS
Solar Annual Report 2017 — Separate financial statementsNotes to the income statement

7Net profit for the year Accounting policies
DividendsProposed dividends are recognised as a liability at the time of adoption of the general meeting.
DKK million 2017 2016
Proposed distribution of net profit for the year:
Proposed dividends, parent 73 88
Reserves for development costs 59 60
Retained earnings -113 -23
Net profit for the year 19 125
Dividends in DKK per share of DKK 1001 10.00 12.00
1. Calculations are based on proposed dividends.
110
Solar Annual Report 2017 — ConsolidatedResults and outlook: Financial review
MANAGEMENT’SREVIEW
FINANCIAL STATEMENTS CONTENTS
Solar Annual Report 2017 — Separate financial statementsNotes to the income statement

8Intangible assets Accounting policies
Customer-related intangible assets Customer-related intangible assets acquired in connection with business combinations are measured at cost less accumulated amortisation and impairment loss.
Customer-related intangible assets are amortised using the straight-line principle over the expected useful life. Typically, the amortisation period is 5-7 years.
Goodwill Goodwill is initially recognised in the balance sheet as the positive balance between the acquisition consideration of an enterprise on one side and the fair value of the assets, liabilities and contingent liabilities acquired on the other side. In cases of measurement uncertainty, the goodwill amount can be adjusted until 12 months after the date of the acquisition. Goodwill is not amortised but an impairment test is done annually. The first impairment test is done by the end of the year of acquisition. Subsequently, goodwill is measured at this value less accumulated impairment losses. On acquisition, goodwill is assigned to the cash-generating units that form the basis of the impairment test subsequently. The determination of cash-generating units follows the managerial structure and management control.
Software Software is measured at cost less accumulated amortisation and write-down. Cost includes both direct internal and external costs. Software is amortised using the straight-line principle over 4-8 years. The basis of amortisation is reduced by any write-down.
DKK millionGood-
willCustomer-
related assetsSoft-ware Total
2017
Cost 1/1 9 41 426 476
Additions during the year 0 0 96 96
Cost 31/12 9 41 522 572
Amortisation and depreciation 1/1 9 32 226 267
Amortisation during the year 0 5 61 66
Impairment during the year 0 0 10 10
Amortisation and depreciation 31/12 9 37 297 343
Carrying amount 31/12 0 4 225 229
Remaining amortisation period in number of years - 1 1-8 -
111
Solar Annual Report 2017 — ConsolidatedResults and outlook: Financial review
MANAGEMENT’SREVIEW
FINANCIAL STATEMENTS CONTENTS
Solar Annual Report 2017 — Separate financial statementsNotes: Invested capital

8Intangible assets – continued
Accounting estimates and assesments
SoftwareSoftware is evaluated annually for indicators of a need for impairment. If a need to perform impairment is identified, an impairment test is performed for the software.
The impairment test is made on the basis of different factors, including the software’s future application, the present value of the expected cost saving as well as interest and risks.
Accounting policies (continued)
Impairment of intangible assets The carrying amount of intangible assets is assessed annually to determine whether there is any indication of impairment.
When such an indication is present, the asset’s recoverable amount is calculated, which is the highest of the asset’s fair value less expected costs of disposal or value in use. Value in use is calculated as the present value of expected cash flow from the smallest cash flow-generating unit to which the asset belongs.
Impairment loss is recognised when the carrying amount of an asset exceeds the asset’s recoverable amount. Impairment loss is recognised in the income statement.
Impairment loss on intangible assets is reversed if changes have been made to the assumptions and estimates that led to the impairment loss.
DKK millionGood-
willCustomer-
related assetsSoft-ware Total
2016
Cost 1/1 9 41 346 396
Additions during the year 0 0 80 80
Cost 31/12 9 41 426 476
Amortisation and depreciation 1/1 9 27 180 216
Amortisation during the year 0 5 46 51
Amortisation and depreciation 31/12 9 32 226 267
Carrying amount 31/12 0 9 200 209
Remaining amortisation period in number of years - 1-2 2-8 -
112
Solar Annual Report 2017 — ConsolidatedResults and outlook: Financial review
MANAGEMENT’SREVIEW
FINANCIAL STATEMENTS CONTENTS
Solar Annual Report 2017 — Separate financial statementsNotes: Invested capital

9Property, plant and equipment Accounting policies
Property, plant and equipment Land and buildings as well as other plant, operating equipment, and tools and equipment are measured at cost less accumulated depreciation and write-down.
Cost includes the purchase price and costs directly attributable to the acquisition until the time when the asset is ready for use. Cost of a combined asset is disaggregated into separate components which are depreciated separately if the useful lives of the individual components differ.
Subsequent expenditure, for example in connection with the replacement of components of property, plant or equipment, is recognised in the carrying amount of the relevant asset when it is probable that the incurrence will result in future economic benefits for the group. The replaced components cease to be recognised in the balance sheet and the carrying amount is transferred to the income statement. All other general repair and maintenance costs are recognised in the income statement when these are incurred.
Property, plant and equipment are depreciated on a straight-line basis over their estimated useful lives which are:
• Buildings 40 years• Technical installations 20 years• Plant, operating equipment, and tools and equipment
2-5 years.
There are a few differences from the mentioned depreciation periods in which useful life is estimated as shorter. Leasehold improvements are depreciated over the lease term, however, maximum 5 years.
Land is not depreciated.
DKK millionLand andbuildings
Plant,operating
equipment,tools and
equipment,Leasehold
improvements Total
2017
Cost 1/1 401 240 7 648
Additions during the year 0 9 0 9
Disposals during the year 0 -1 0 -1
Cost 31/12 401 248 7 656
Write-down and depreciation 1/1 153 224 7 384
Write-down and depreciation during the year 10 9 0 19
Write-down and depreciation of abandoned assets 0 -1 0 -1
Write-down and depreciation 31/12 163 232 7 402
Carrying amount 31/12 238 16 0 254
113
Solar Annual Report 2017 — ConsolidatedResults and outlook: Financial review
MANAGEMENT’SREVIEW
FINANCIAL STATEMENTS CONTENTS
Solar Annual Report 2017 — Separate financial statementsNotes: Invested capital

9Accounting policies (continued)
The basis of depreciation is determined in consideration of the asset’s residual value and reduced by any impairment. Residual value is determined at the time of acquisition and reassessed annually. If residual value exceeds the asset’s carrying amount, depreciation will cease.
By changing the depreciation period or residual value, the effect of future depreciation is recognised as a change to accounting estimates.
Impairment of property, plant and equipmentThe carrying amount of property, plant and equipment is assessed annually to determine whether there is any indication of impairment.
When such an indication is present, the asset’s recoverable amount is calculated, which is the highest of the asset’s fair value less expected costs of disposal or value in use. Value in use is calculated as the present value of expected cash flow from the smallest cash flow-generating unit to which the asset belongs.
Impairment loss is recognised when the carrying amount of an asset exceeds the asset’s recoverable amount. Impairment loss is recognised in the income statement.
Write-down on property, plant and equipment is reversed to the extent that changes have been made to the assumptions and estimates that led to the write-down.
Property, plant and equipment – continued
DKK millionLand andbuildings
Plant,operating
equipment,tools and
equipment,Leasehold
improvements Total
2016
Cost 1/1 401 234 7 642
Additions during the year 0 6 0 6
Disposals during the year 0 0 0 0
Cost 31/12 401 240 7 648
Write-down and depreciation 1/1 140 215 6 361
Write-down and depreciation during the year 13 9 1 23
Write-down and depreciation of abandoned assets 0 0 0 0
Write-down and depreciation 31/12 153 224 7 384
Carrying amount 31/12 248 16 0 264
114
Solar Annual Report 2017 — ConsolidatedResults and outlook: Financial review
MANAGEMENT’SREVIEW
FINANCIAL STATEMENTS CONTENTS
Solar Annual Report 2017 — Separate financial statementsNotes: Invested capital
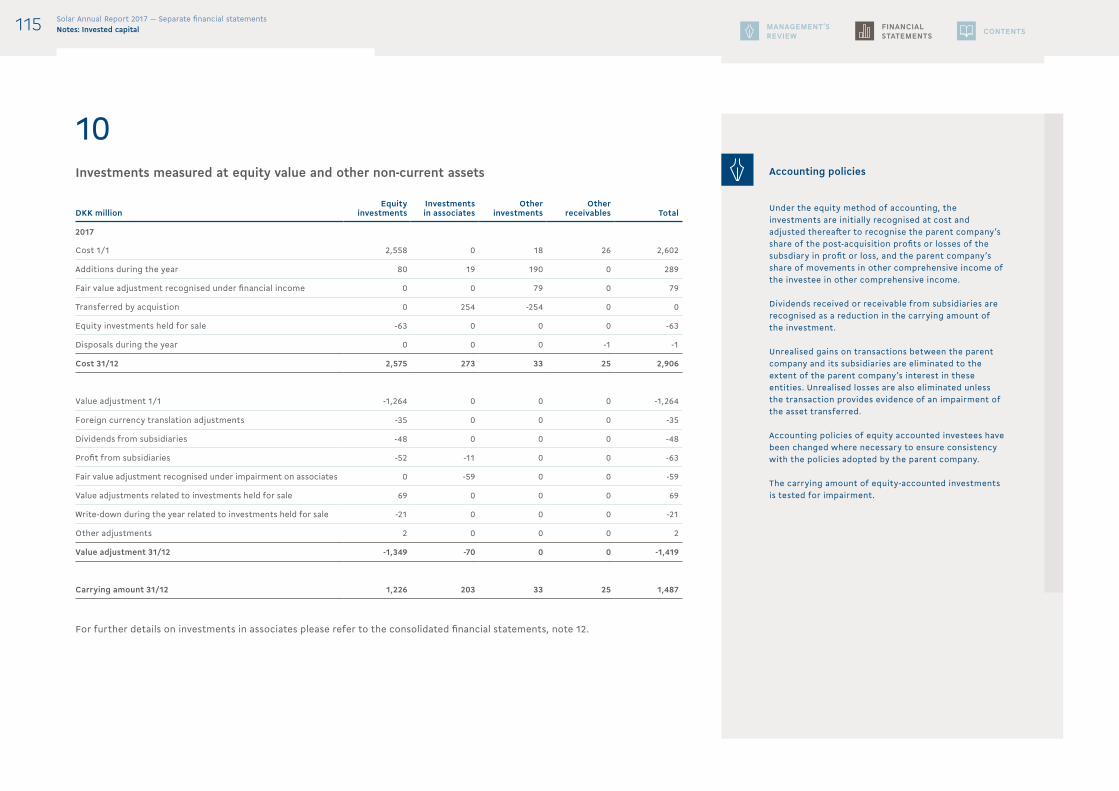
10Investments measured at equity value and other non-current assets Accounting policies
Under the equity method of accounting, the investments are initially recognised at cost and adjusted thereafter to recognise the parent company’s share of the post-acquisition profits or losses of the subsdiary in profit or loss, and the parent company’s share of movements in other comprehensive income of the investee in other comprehensive income.
Dividends received or receivable from subsidiaries are recognised as a reduction in the carrying amount of the investment.
Unrealised gains on transactions between the parent company and its subsidiaries are eliminated to the extent of the parent company’s interest in these entities. Unrealised losses are also eliminated unless the transaction provides evidence of an impairment of the asset transferred.
Accounting policies of equity accounted investees have been changed where necessary to ensure consistency with the policies adopted by the parent company. The carrying amount of equity-accounted investments is tested for impairment.
DKK millionEquity
investmentsInvestmentsin associates
Otherinvestments
Otherreceivables Total
2017
Cost 1/1 2,558 0 18 26 2,602
Additions during the year 80 19 190 0 289
Fair value adjustment recognised under financial income 0 0 79 0 79
Transferred by acquistion 0 254 -254 0 0
Equity investments held for sale -63 0 0 0 -63
Disposals during the year 0 0 0 -1 -1
Cost 31/12 2,575 273 33 25 2,906
Value adjustment 1/1 -1,264 0 0 0 -1,264
Foreign currency translation adjustments -35 0 0 0 -35
Dividends from subsidiaries -48 0 0 0 -48
Profit from subsidiaries -52 -11 0 0 -63
Fair value adjustment recognised under impairment on associates 0 -59 0 0 -59
Value adjustments related to investments held for sale 69 0 0 0 69
Write-down during the year related to investments held for sale -21 0 0 0 -21
Other adjustments 2 0 0 0 2
Value adjustment 31/12 -1,349 -70 0 0 -1,419
Carrying amount 31/12 1,226 203 33 25 1,487
For further details on investments in associates please refer to the consolidated financial statements, note 12.
115
Solar Annual Report 2017 — ConsolidatedResults and outlook: Financial review
MANAGEMENT’SREVIEW
FINANCIAL STATEMENTS CONTENTS
Solar Annual Report 2017 — Separate financial statementsNotes: Invested capital

10Investments measured at equity value and other non-current assets – continued
DKK millionEquity
investmentsInvestmentsin associates
Otherinvestments
Otherreceivables Total
2016
Cost 1/1 2,434 0 0 4 2,438
Additions during the year 124 0 18 22 164
Disposals during the year 0 0 0 0 0
Cost 31/12 2,558 0 18 26 2,602
Value adjustment 1/1 -1,242 0 0 0 -1,242
Foreign currency translation adjustments 2 0 0 0 2
Dividends from subsidiaries -34 0 0 0 -34
Profit from subsidiaries 7 0 0 0 7
Other adjustments 3 0 0 0 3
Value adjustment 31/12 -1,264 0 0 0 -1,264
Carrying amount 31/12 1,294 0 18 26 -1,338
116
Solar Annual Report 2017 — ConsolidatedResults and outlook: Financial review
MANAGEMENT’SREVIEW
FINANCIAL STATEMENTS CONTENTS
Solar Annual Report 2017 — Separate financial statementsNotes: Invested capital

11Inventories Accounting policies
Inventories are measured at cost according to the FIFO method or at net realisable value, if this is lower.
Cost of inventories includes purchase price with addition of delivery costs.
The net realisable value of inventories is determined as selling price less costs incurred to make the sale and is determined in consideration of marketability, obsolescence and development of expected selling price.
Accounting estimates and assesments
Write-down of inventoriesWrite-down of inventories is made due to the obsolescence of products.
Management specifically assess inventories, including the products’ turnover rate, current economic trends and product development when deciding whether the write-down is sufficient.
DKK million 2017 2016
End products 524 383
Recognised write-down 2 2
The main reasons for the recognised write-downs is an increase in write-down articles.
117
Solar Annual Report 2017 — ConsolidatedResults and outlook: Financial review
MANAGEMENT’SREVIEW
FINANCIAL STATEMENTS CONTENTS
Solar Annual Report 2017 — Separate financial statementsNotes: Invested capital

12Trade receivables Accounting policies
Trade receivables are measured at fair value at acquisition and at amortised cost subsequently. Based on an individual assessment of the loss risk, write-down to net realisable value is made, if this is lower.
Accounting estimates and assesments
Write-down for meeting of loss on doubtful trade receivablesWrite-down is made to meet loss on doubtful trade receivables. Management specifically analyses trade receivables, including the customers’ credit rating and current economic trends, to ensure that write-down is sufficient.
DKK million 2017 2016
Maturity statement, trade receivables
Not due 365 330
Past due for 1-30 day(s) 23 17
Past due for 31-90 days 1 4
Past due for 91+ days 7 3
396 354
Write-down -4 -4
Total 392 350
Write-down based on:
Age distribution 3 3
Individual assessment 1 1
Total 4 4
Write-down 1/1 4 7
Write-down for the year 2 1
Losses realised during the year 0 -2
Reversed for the year -2 -2
Write-down 31/12 4 4
We refer to the consolidated accounts, note 14, trade receivables, for information on credit risk.
118
Solar Annual Report 2017 — ConsolidatedResults and outlook: Financial review
MANAGEMENT’SREVIEW
FINANCIAL STATEMENTS CONTENTS
Solar Annual Report 2017 — Separate financial statementsNotes: Invested capital

13Other provisions Accounting policies
Provisions are measured in accordance with management’s best estimate of the amount required to settle a liability.
Restructuring expenses are recognised as liabilities when a detailed official plan for the restructuring has been published to the parties affected by the plan on the balance sheet date at the latest.
DKK million 2017 2016
Non-current
Others 0 16
Total 31/12 0 16
Specification, non-current
1/1 16 0
Reversed during the year -16 0
Provisions of the year 0 16
Total 31/12 0 16
Current
Restructuring costs 1 2
Total 31/12 1 2
Specification, current
1/1 2 6
Reversed during the year -2 -6
Provisions of the year 1 2
Total 31/12 1 2
119
Solar Annual Report 2017 — ConsolidatedResults and outlook: Financial review
MANAGEMENT’SREVIEW
FINANCIAL STATEMENTS CONTENTS
Solar Annual Report 2017 — Separate financial statementsNotes: Invested capital

14Other payables
DKK million 2017 2016
Staff costs 112 103
Taxes and charges 10 8
Hedging instruments 78 92
Other payables and amounts payable 36 31
Total 236 234
Accounting policies for hedging instruments are described in note 16, on interest-bearing liabilities and maturity statement.
120
Solar Annual Report 2017 — ConsolidatedResults and outlook: Financial review
MANAGEMENT’SREVIEW
FINANCIAL STATEMENTS CONTENTS
Solar Annual Report 2017 — Separate financial statementsNotes: Invested capital

15Share capital Accounting policies
Treasury sharesAcquisition and disposal sums related to treasury shares are recognised directly as transactions with the owners.
DKK million 2017 2016
Share capital 1/1 792 792
Reduction in share capital -17 0
Share capital 31/12 775 792
Share capital is fully paid in and divided into the following classes:
A shares, 40 shares at DKK 10,000 0 0
A shares, 2,240 shares at DKK 40,000 90 90
A shares total 90 90
B shares 6,845,625 / 7,020,607 at DKK 100 685 702
Total 775 792
Share capital remained unchanged from 2013 to 2016. In 2017 share capital was reduced by 174,982 B shares.
Number of shares Nominal value
2017 2016 2017 2016
A shares outstanding 31/121 900,000 900,000 90 90
B shares outstanding
Outstanding 1/1 6,398,292 6,910,598 640 691
Purchase of treasury shares 0 -512,306 0 -51
B shares outstanding 31/12 6,398,292 6,398,292 640 640
Total shares outstanding 31/12 7,298,292 7,298,292 730 730
1. A shares have been included in the calculation in units of DKK 100.
121
Solar Annual Report 2017 — ConsolidatedResults and outlook: Financial review
MANAGEMENT’SREVIEW
FINANCIAL STATEMENTS CONTENTS
Solar Annual Report 2017 — Separate financial statementsNotes: Capital structure and financing costs

15Share capital – continued
Treasury shares (B shares)
Number of shares Nominal value (DKK million) Cost (DKK million) Percentage of share capital
2017 2016 2017 2016 2017 2016 2017 2016
Holding 1/1 622,315 110,009 62 11 242 45 7.9% 1.4%
Purchases 0 512,306 0 51 0 197 0.0% 6.5%
Cancellation -174,982 0 -17 0 -66 0 -2.1% 0.0%
Holding 31/12 447,333 622,315 45 62 176 242 5.8% 7.9%
The share buy-back programmes in 2016 have been performed with the purpose of adjusting Solar’s capital structure. Solar A/S’s annual general meeting passed a resolution on 17 March 2017 to reduce the company’s B share capital by nominally DKK 17,498,200 by cancelling treasury B shares. This corresponds to a reduction of the B share capital of 174,982 B shares of DKK 100.
All treasury shares are held by the parent company.
122
Solar Annual Report 2017 — ConsolidatedResults and outlook: Financial review
MANAGEMENT’SREVIEW
FINANCIAL STATEMENTS CONTENTS
Solar Annual Report 2017 — Separate financial statementsNotes: Capital structure and financing costs

16Interest-bearing liabilities and maturity statement Accounting policies
Financial liabilitiesDebt to credit institutions is recognised initially at the proceeds received net of transaction costs incurred.
In subsequent periods, the financial liabilities are measured at amortised cost using the effective interest method, meaning that the difference between the proceeds and the nominal value is recognised in the income statement under financials for the term of the loan.
DKK million Interest rate 2017 2016
Debt to mortgage credit institutions Fixed1 183 188
Debt to credit institutions Floating (2017) / Fixed (2016)1 146 25
Bank loans and overdrafts Floating 113 0
Interest-bearing liabilities 442 213
Trade payables 776 613
Other payables 442 755
Financial liabilities 1,660 1,581
Cash at bank and in hand 0 227
Trade receivables 392 350
Other receivables 415 587
Financial assets 807 1,164
Total, net 853 417
1. Interest swaps have been used to hedge floating-rate loans, converting these loans to fixed-rate loans.
Reconciliation of development in interest-bearing debt to mortgage and credit institutions to financing activities in the cash flow statement:
DKK million 2017
Debt to mortgage and credit institutions 1/1 213
Repayment of debt to mortgage and credit institutions -19
Raising of debt to mortgage and credit institutions 135
Debt to mortgage and credit insittutions 31/12 329
123
Solar Annual Report 2017 — ConsolidatedResults and outlook: Financial review
MANAGEMENT’SREVIEW
FINANCIAL STATEMENTS CONTENTS
Solar Annual Report 2017 — Separate financial statementsNotes: Capital structure and financing costs

16Interest-bearing liabilities and maturity statement – continued Accounting policies
Financial liabilitiesDebt to credit institutions is recognised initially at the proceeds received net of transaction costs incurred.
In subsequent periods, the financial liabilities are measured at amortised cost using the effective interest method, meaning that the difference between the proceeds and the nominal value is recognised in the income statement under financials for the term of the loan.
DKK million 2017 2016
Maturity < 1 year
Debt to mortgage credit institutions 20 6
Debt to credit institutions 0 14
Bank loans and overdrafts 113 0
Current interest-bearing liabilities 133 20
Other financial liabilities 1,218 1,368
Financial liabilities 1,351 1,388
Financial assets 793 1,164
Total, net 558 224
Maturity 1-5 year(s)
Debt to mortgage credit institutions 36 35
Debt to credit institutions 135 11
Total 171 46
Maturity > 5 years
Debt to mortgage credit institutions 138 147
Total 138 147
Total non-current liabilities 309 193
Maturity, until year 2037 2037
The carrying amount of financial liabilities corresponds to fair value.
124
Solar Annual Report 2017 — ConsolidatedResults and outlook: Financial review
MANAGEMENT’SREVIEW
FINANCIAL STATEMENTS CONTENTS
Solar Annual Report 2017 — Separate financial statementsNotes: Capital structure and financing costs

16Interest-bearing liabilities and maturity statement – continued Accounting policies
DerivativesDerivatives are only used to hedge financial risks in the form of interest rate and currency risks.
Derivatives are initially recognised at cost and at fair value subsequently. Both realised and unrealised gains and losses are recognised in the income statement unless the derivatives are part of hedging of future transactions. Value adjustments of derivatives for hedging of future transactions are recognised directly in other comprehensive income. As hedged transactions are realised, gains or losses are recognised in the hedging instrument from other comprehensive income in the same item as the hedged items. Any non-effective part of the financial instrument in question is recognised in the income statement.
Derivatives are recognised under other receivables or other payables.
Fair value measurementThe group uses the fair value concept for recognition of certain financial instruments and in connection with some disclosure requirements. Fair value is defined as the price that can be secured when selling an asset or that must be paid to transfer a liability in a standard transaction between market participants (exit price).
Fair value is a market-based and not enterprise-specific valuation. The enterprise uses the assumptions that market participants would use when pricing an asset or liability based on existing market conditions, including assumptions relating to risks.
As far as possible, fair value measurement is based on market value in active markets (level 1) or alternatively on values derived from observable market information (level 2).
If such observable information is not available or cannot be used without significant modifications, recognised valuation methods and fair estimates are used as the basis of fair values (level 3).
DKK million 2017 2016
Interest-bearing liabilities and maturity statement for expected interest expense for the period
< 1 year 11 11
1-5 year(s) 36 35
> 5 years 55 63
Total 102 109
Outstanding interest swaps made for hedging floating-rate loans
Principal amount 214 237
Fair value -78 -92
Amounts recognised in other comprehensive income
Adjustment to fair value for the year 4 -15
Realised during the year, recognised as financial income/expenses 10 11
Total 14 -4
Effect of a 1% interest rate increase
Effect on equity 20 22
Of this, earnings impact is 0 0
Undrawn credit facilities 31/12 394 607
125
Solar Annual Report 2017 — ConsolidatedResults and outlook: Financial review
MANAGEMENT’SREVIEW
FINANCIAL STATEMENTS CONTENTS
Solar Annual Report 2017 — Separate financial statementsNotes: Capital structure and financing costs

16Interest-bearing liabilities and maturity statement – continued
Distribution on currencies
Current liabilities Non-current liabilities
DKK million 2017 2016 2017 2016
EUR 21 20 174 193
DKK 112 0 135 0
Total 133 20 309 193
Interest rate in % 1.1-5.8 5.2-5.8 1.1-5.8 5.2-5.8
Fair value of Solar’s respective interest-bearing liabilities is seen as fair value measurement at level 2. Mortgage loans are valued based on underlying securities, while bank debt is calculated based on models for discounting to net present value. Non-observable market data is primarily made up of credit risks, which are seen as insignificant in Solar’s case.
The fair value of Solar’s derived financial instruments (interest rate instruments) is fixed as fair value measurement at level 2, since fair value can be determined directly based on the actual forward rates and instalments on the balance sheet date. Outstanding interest rate swaps for hedging of floating-rate loans expire over the period until 2037 (2016: 2037).
The parent company has raised loans in Danish kroner and euro. We refer to the consolidated accounts, note 21, interest-bearing liabilities and maturity statement, for more information on liquidity risk, interest rate and currency risk management.
126
Solar Annual Report 2017 — ConsolidatedResults and outlook: Financial review
MANAGEMENT’SREVIEW
FINANCIAL STATEMENTS CONTENTS
Solar Annual Report 2017 — Separate financial statementsNotes: Capital structure and financing costs

17 18Financial income Financial expenses
DKK million 2017 2016
Interest revenue 3 2
Foreign exchange gains 5 6
Fair value adjustments on investments 79 0
Other financial income1 25 14
Total 112 22
Financial income, received 12 16
1. Reassessment of earn-out liability concerning STI has resulted in a DKK 15m reversal.
DKK million 2017 2016
Interest expenses 21 20
Foreign exchange losses 4 6
Other financial expenses 2 2
Total 27 28
Financial expenses, settled1 23 32
1. 2016 figure includes realisation of interest swap entered in 2015
127
Solar Annual Report 2017 — ConsolidatedResults and outlook: Financial review
MANAGEMENT’SREVIEW
FINANCIAL STATEMENTS CONTENTS
Solar Annual Report 2017 — Separate financial statementsNotes: Capital structure and financing costs

19Contingent liabilities and other financial liabilities Accounting policies
LeasingLeasing agreements, in which the most important aspects of the asset’s risks and benefits remain with the lessor, are classified as operational leasing agreements. Leasing agreements, in which the most important aspects of the asset’s risks and benefits are transferred to enterprises in the Solar Group, are classified as financial leases. As at the balance sheet date, no leasing agreement is classified as a financial lease. Leasing payments concerning operational leasing are recognised in the income statement on astraight-line basis throughout the leasing period.
DKK million 2017 2016
Operational leases and rent contracts
Non-cancellable minimum lease payments are to be made within the following periods from the balance sheet date:
< 1 year 21 25
> 1 year < 5 years 30 41
> 5 years 2 4
Total 53 70
Operational leases and rent recognised in the income statement:
Total 25 21
Company cars and office furniture and equipment are leased under operating leases The typical lease period is:
No. of years 2-4 2-4
Rent obligations with non-cancellation periods:
No. of years up to: 10 10
Collateral
Assets have been pledged as collateral for mortgage arrangements at a carrying amount of:
Land and buildings 239 248
Current assets 0 0
Total 239 248
128
Solar Annual Report 2017 — ConsolidatedResults and outlook: Financial review
MANAGEMENT’SREVIEW
FINANCIAL STATEMENTS CONTENTS
Solar Annual Report 2017 — Separate financial statementsNotes: Other notes

20Related parties
19Contingent liabilities and other financial liabilities – continued
DKK million 2017 2016
Mortgaging and guarantees
As security of subsidiaires’ bank arrangements, guarantees have been issued for:
Total 339 471
As security of subsidiaires’ liabilities, guarantees have been issued for:
Total 447 391
Group and parent Solar A/S are subject to control by the Fund of 20th December (registered as a commercial foundation in Denmark), which owns 16.0% of the shares and holds 58.1% of the voting rights. The remaining shares are owned by a widely combined group of shareholders.
Other related parties include the company’s Board of Directors and Executive Board. In 2017, there have been no transactions in the financial year with members of the Board of Directors and Executive Board other than those which appear from note 3. In 2016, member of the Board of Directors Ulf Gundemark invoiced Solar DKK 29,875 via Gumaco AB for consultancy services and member of the Board of Directors Jens Peter Toft DKK received DKK 29,875 as extra remuneration regarding extra work for the Board.
DKK million 2017 2016
Sale of services to subsidiaries 158 145
Sale of goods to subsidiaries 55 50
On the balance sheet date, the usual product balances derived from these transactions exist. These appear from the parent company’s balance sheet.
Solar also invoices the Fund of 20th December for the performance of administrative services at DKK 20,000. Balances with the Fund of 20th December total 0 on balance sheet date.
129
Solar Annual Report 2017 — ConsolidatedResults and outlook: Financial review
MANAGEMENT’SREVIEW
FINANCIAL STATEMENTS CONTENTS
Solar Annual Report 2017 — Separate financial statementsNotes: Other notes

21Auditors’ fees
DKK million 2017 2016
PricewaterhouseCoopers
Statutory audit 1 1
Other services1 3 1
Total 4 2
Other auditors
Other services 0 1
Total 0 1
1. Other services mainly consists of IT-related services and services related to business combinations.
130
Solar Annual Report 2017 — ConsolidatedResults and outlook: Financial review
MANAGEMENT’SREVIEW
FINANCIAL STATEMENTS CONTENTS
Solar Annual Report 2017 — Separate financial statementsNotes: Other notes

131
Solar Annual Report 2017 — ConsolidatedResults and outlook: Financial review
MANAGEMENT’SREVIEW
FINANCIAL STATEMENTS CONTENTS
Groupcompaniesoverview
Solar Annual Report 2017Group companies overview

Group companies overviewCompanies wholly owned by Solar A/S Companies wholly owned by Solar A/S – continued
Name Reg. no. Currency Share capital Country
Solar A/S 15908416 DKK 792,060,700 DK
Solar Sverige AB 5562410406 SEK 100,000,000 SE
Solar Norge AS 980672891 NOK 70,000,000 NO
Solar Nederland B.V. 09013687 € 67,000,500 NL
Eltechna B.V. KvK 23066336 € 18,151 NL
MAG45 Holding B.V. 17213145 € 27,571 NL
MAG45 B.V. 17168649 € 18,000 NL
MAG45 Sp.z.oo 277409 PLN 50,000 PL
MAG45 GmbH 18354 € 25,000 DE
MAG45 Ltd 311859 € 152 IE
MAG45 (UK) Ltd 4092664 £ 301 UK
MAG45 S.a.r.l. CHE-265,557,148 € 15,947 CH
MAG45 INC 123858292 $ 1,500 USA
MAG45 NV 0476603857 € 330,000 BE
MAG45 S.R.O 27697690 CZK 200,000 CZ
MAG45 Iss Co. Ltd 91320594693364287L $ 80,000 CN
MAG45 Ltd 39740334 $ 1 HK
MAG45 Pte Ltd. 201709959H SG$ 100,000 SG
MAG45 Kft 01-09-300892 HUF 3,000,000 HU
MAG45 Srl 10053890967 € 20,000 IT
Solar Polska Sp.z.oo 0000003924 PLN 65,050,000 PL
Claessen Holding N.V 0437.191.965 € 65,094 BE
Claessen ELGB NV 0436.564.831 € 3,697,100 BE
GFI GmbH FN44849f € 1,863,365 AT
Name Reg. no. Currency Share capital Country
P/F Solar Føroyar P/F 104 DKK 12,000,000 FO
Scandinavian Technology Institute AS 976094786 NOK 533,000 NO
SD of 16 March GmbH HRB 516 NM € 51,400,000 DE
SD of 17 March Gesellschaft für Vermögensverwaltung mbH HRB 16642 KI € 25,000 DE
SD of 16 March Gesellschaft für Vermögensverwaltung mbH HRB 16638 KI € 2,556,500 DE
SD of 16 March Immobilienverwaltung GmbH HRB 16616 KI € 25,000 DE
Solar Invest A/S 73316111 DKK 500,000 DK
Solar Polaris A/S 38378171 DKK 5,000,000 DK
Fyrfyret IVS 38560166 DKK 1 DK
Name Reg. no. Currency Share capital Country
GenieBelt ApS 35231129 DKK 190,372 DK
Minuba ApS 33259336 DKK 99,975 DK
Viva Labs AS 898 444 392 NOK 104,174 NO
BIMobject AB 556856-7696 SEK 1,137,780 SE
HomeBob A/S 38832840 DKK 4,512,636 DK
Monterra AB 559103-4847 SEK 50,000 SE
Companies, where Solar’s equity interest is less than 50%
132
Solar Annual Report 2017 — ConsolidatedResults and outlook: Financial review
MANAGEMENT’SREVIEW
FINANCIAL STATEMENTS CONTENTS
Solar Annual Report 2017Group companies overview

133
Solar Annual Report 2017 — ConsolidatedResults and outlook: Financial review
MANAGEMENT’SREVIEW
FINANCIAL STATEMENTS CONTENTS
Solar Annual Report 2017Statements and reports
Statements andreports

Statement bythe Executive Board and the Board of Directors
The group’s Board of Directors and Executive Board have today discussed and approved Annual Report for the financial year 1 January – 31 December 2017.
The consolidated financial statements and financial statements have been presented in accordance with International Financial Reporting Standards as approved by the EU. Moreover, the consolidated financial statements and financial statements have been prepared in accordance with additional Danish disclosure requirements of listed companies. Management’s review was also prepared in accordance with Danish disclosure requirements of listed companies.
In our opinion, the consolidated financial statements and financial statements give a fair presentation of the group and parent company’s assets, liabilities and equity, and financial position as at 31 December 2017 as well as the results of the group and parent company’s activities and cash flow for the financial year 1 January – 31 December 2017.
Further, in our opinion, Management review gives a true and fair statement of the development of the group and parent company’s activities and financial situation, net profit for the year and of the group and parent company’s financial positions and describes the most significant risks and uncertainties pertaining to the group and parentcompany.
The annual report is recommended for approval by the annual general meeting.
Vejen, 9 February 2018
EXECUTIVE BOARD
Jens E. Andersen Hugo Dorph Michael H. JeppesenCEO CCO CFO
BOARD OF DIRECTORS
Jens Borum Ulf Gundemark Lars Lange AndersenChairman Vice-chairman
Niels Borum Jesper Dalsgaard Ulrik Damgaard
Bent H. Frisk Louise Knauer Jens Peter Toft
134
Solar Annual Report 2017 — ConsolidatedResults and outlook: Financial review
MANAGEMENT’SREVIEW
FINANCIAL STATEMENTS CONTENTS
Solar Annual Report 2017Mangement’s statement

Our opinion
In our opinion, the Consolidated Financial Statements and the Parent Company Financial Statements give a true and fair view of the Group’s and the Parent Company’s financial position at 31 December 2017 and of the results of the Group’s and the Parent Company’s operations and cash flows for the financial year 1 January to 31 December 2017 in accordance with International Financial Reporting Standards as adopted by the EU and further requirements in the Danish Financial Statements Act.
Our opinion is consistent with our Auditor’s Long-form Report to the Audit Committee and the Board of Directors.
What we have auditedThe Consolidated Financial Statements and Parent Company Financial Statements of Solar A/S for the financial year 1 January to 31 December 2017 comprise statement of comprehensive income, balance sheet, cash flow statement, statement of changes in equity and notes, including summary of significant accounting policies for the Group as well as for the Parent Company. Collectively referred to as the “Financial Statements”.
Basis for opinion
We conducted our audit in accordance with International Standards on Auditing (ISAs) and the additional requirements applicable in Denmark. Our responsibilities under those standards and requirements are further described in the Auditor’s responsibilities for the audit of the Financial Statements section of our report.
We believe that the audit evidence we have obtained is sufficient and appropriate to provide a basis for our opinion.
IndependenceWe are independent of the Group in accordance with the International Ethics Standards Board for Accountants’ Code of Ethics for Professional Accountants (IESBA Code) and the additional requirements applicable in Denmark. We have also fulfilled our other ethical responsibilities in accordance with the IESBA Code.
To the best of our knowledge and belief, prohibited non-audit services referred to in Article 5(1) of Regulation (EU) No 537/2014 were not provided.
AppointmentWe were first appointed auditors of Solar A/S before 1995 and are therefore required to resign as auditors of the Company at the General Meeting in 2021 at the latest. We have been reappointed annually by shareholder resolution for a total period of uninterrupted engagement of more than 23 years including the financial year 2017.
To the shareholders of Solar A/S
Independent auditors’ report
135
Solar Annual Report 2017 — ConsolidatedResults and outlook: Financial review
MANAGEMENT’SREVIEW
FINANCIAL STATEMENTS CONTENTS
Solar Annual Report 2017Independent auditors’ report

Key audit matter
Goodwill and customer-related assets
The Group has recognised intangible assets totaling DKK 427 million at December 31, 2017, comprising customer related assets of DKK 11 million, goodwill of DKK 168 million and software of DKK 248 million.
Goodwill is tested annually for impairment. Other intangibles are assessed for impairment annually, and if indicators exist, an impairment test is performed.
The assessment of the carrying values of intangible assets is dependent on future cash flows and if these are below initial expectations, there is a risk that the assets
How our audit addressed the key audit matter
will be impaired. The reviews of carrying values performed by the Group contain a number of significant judgements and estimates such as revenue growth, profit margins and discount rates.
We focused on this area because the impairment assessments of these assets are dependent on complex and subjective judgements by Management.
Refer to note 10 for detailed information of intangible assets and specification of the year-end impairment charge.
Refer to note 10 Intangible assets.
• We performed our own sensitivity analysis around these key estimates to ascertain the extent of change in those assumptions that either individually or collectively would be required for the intangible assets tested to be impaired.
As a result of our procedures we did not propose any adjustments to the amount of impairment recognized in 2017. For those intangible assets where management determined that no impairment was required, we found that the assessments made by management were based upon reasonable assumptions, consistently applied.
We have discussed with Management and evaluated the process for preparing the budget supporting the impairment test. In particular:• We have assessed whether the models
applied by Management to calculate the value in use of the individual cash-generating units comply with the requirements of IFRS. We recalculated the model to ensure mathematical accuracy;
• We have assessed the appropriateness of the discount rates applied and underlying assumptions and discussed Management judgement, as relevant. We used PwC valuation specialist to assess the discount rates used by Management;
Key audit matters
Key audit matters are those matters that, in our professional judgement, were of most significance in our audit of the Financial Statements for 2017. These matters were addressed in the context of our audit of the Financial Statements as a whole, and in forming our opinion thereon, and we do not provide a separate opinion on these matters.
136
Solar Annual Report 2017 — ConsolidatedResults and outlook: Financial review
MANAGEMENT’SREVIEW
FINANCIAL STATEMENTS CONTENTS
Solar Annual Report 2017Independent auditors’ report

Statement on Management’s Review
Management is responsible for Management’s Review.
Our opinion on the Financial Statements does not cover Management’s Review, and we do not express any form of assurance conclusion thereon.
In connection with our audit of the Financial Statements, our responsibility is to read Management’s Review and, in doing so, consider whether Management’s Review is materially inconsistent with the Financial Statements or our knowledge obtained in the audit, or otherwise appears to be materially misstated.
Moreover, we considered whether Management’s Review includes the disclosures required by the Danish Financial Statements Act.
Based on the work we have performed, in our view, Management’s Review is in accordance with the Consolidated Financial Statements and the Parent Company Financial Statements and has been prepared in accordance with the requirements of the Danish Financial Statements Act. We did not identify any material misstatement in Management’s Review.
Management’s responsibilities for the Financial Statements
Management is responsible for the preparation of consolidated financial statements and parent company financial statements that give a true and fair view in accordance with International Financial Reporting Standards as adopted by the EU and further requirements in the Danish Financial Statements Act, and for such internal control as Management determines is necessary to enable the preparation of financial statements that are free from material misstatement, whether due to fraud or error.
In preparing the Financial Statements, Management is responsible for assessing the Group’s and the Parent Company’s ability to continue as a going concern, disclosing, as applicable, matters related to going concern and using the going concern basis of accounting unless Management either intends to liquidate the Group or the Parent Company or to cease operations, or has no realistic alternative but to do so.
Auditor’s responsibilities for the audit of the Financial Statements
Our objectives are to obtain reasonable assurance about whether the Financial Statements as a whole are free from material misstatement, whether due to fraud or error, and to issue an auditor’s report that includes our opinion. Reasonable assurance is a high level of assurance, but is not a guarantee that an audit conducted in accordance with ISAs and the additional requirements applicable in Denmark will always detect a material misstatement when it exists. Misstatements can arise from fraud or error and are considered material if, individually or in the aggregate, they could reasonably be expected to influence the economic decisions of users taken on the basis of these Financial Statements.
As part of an audit in accordance with ISAs and the additional requirements applicable in Denmark, we exercise professional judgement and maintain professional scepticism throughout the audit. We also:
• Identify and assess the risks of material misstatement of the Financial Statements, whether due to fraud or error, design and perform audit procedures responsive to those risks, and obtain audit evidence that is sufficient and appropriate to provide a basis for our opinion. The risk of not detecting a material misstatement resulting from fraud is higher than for one resulting from error, as fraud may involve collusion, forgery, intentional omissions, misrepresentations, or the override of internal control.
• Obtain an understanding of internal control relevant to the audit in order to design audit procedures that are appropriate in the circumstances, but not for the purpose of expressing an opinion on the effectiveness of the Group’s and the Parent Company’s internal control.
• Evaluate the appropriateness of accounting policies used and the reasonableness of accounting estimates and related disclosures made by Management.
• Conclude on the appropriateness of Management’s use of the going concern basis of accounting and based on the audit evidence obtained, whether a material uncertainty exists related to events or conditions that may cast significant doubt on the Group’s and the Parent Company’s ability to continue as a going concern. If we conclude that a material uncertainty exists, we are required to draw attention in our auditor’s report to the related disclosures in the Financial Statements or, if such disclosures are inadequate, to modify our opinion. Our conclusions are based on the audit evidence obtained up to the date of our auditor’s report. However, future events or conditions may cause the Group or the Parent Company to cease to continue as a going concern.
• Evaluate the overall presentation, structure and content of the Financial Statements, including the disclosures, and whether the Financial Statements represent the underlying transactions and events in a manner that achieves fair presentation.
137
Solar Annual Report 2017 — ConsolidatedResults and outlook: Financial review
MANAGEMENT’SREVIEW
FINANCIAL STATEMENTS CONTENTS
Solar Annual Report 2017Independent auditors’ report

• Obtain sufficient appropriate audit evidence regarding the financial information of the entities or business activities within the Group to express an opinion on the Consolidated Financial Statements. We are responsible for the direction, supervision and performance of the group audit. We remain solely responsible for our audit opinion.
We communicate with those charged with governance regarding, among other matters, the planned scope and timing of the audit and significant audit findings, including any significant deficiencies in internal control that we identify during our audit.
We also provide those charged with governance with a statement that we have complied with relevant ethical requirements regarding independence, and to communicate with them all relationships and other matters that may reasonably be thought to bear on our independence, and where applicable, related safeguards.
From the matters communicated with those charged with governance, we determine those matters that were of most significance in the audit of the Financial Statements of the current period and are therefore the key audit matters. We describe these matters in our auditor’s report unless law or regulation precludes public disclosure about the matter or when, in extremely rare circumstances, we determine that a matter should not be communicated in our report because the adverse consequences of doing so would reasonably be expected to outweigh the public interest benefits of such communication.
Trekantområdet, 9 February 2018
PricewaterhouseCoopersStatsautoriseret RevisionspartnerselskabCVR no. 3377 1231
Lars Almskou Ohmeyer Jan Bunk Harbo LarsenState Authorised Public Accountant State Authorised Public Accountantmne24817 mne30224
138
Solar Annual Report 2017 — ConsolidatedResults and outlook: Financial review
MANAGEMENT’SREVIEW
FINANCIAL STATEMENTS CONTENTS
Solar Annual Report 2017Independent auditors’ report
139
Solar Annual Report 2017 — ConsolidatedResults and outlook: Financial review
MANAGEMENT’SREVIEW
FINANCIAL STATEMENTS CONTENTS
Solar A/SIndustrivej Vest 43DK-6600 VejenTel. +45 79 30 00 00CVR no. 15908416
www.solar.euhttp://www.linkedin.com/company/solar-as