annual report 2017 - k3 capital group plc · annual report 2017 | contents page 3 table of ... 1=...
TRANSCRIPT

ANNUALREPORT2017

K3 CAPITAL GROUP PLCPAGE 2
THE FINANCIAL YEAR ENDING MAY 2017 HAS SEEN THE SUCCESSFUL IMPLEMENTATION OF OUR STRATEGY TO GROW OUR BRANDS
ORGANICALLY AND RAISE THE QUALITY AND VALUE OF CLIENTS ACROSS THE GROUP

ANNUAL REPORT 2017 | CONTENTS PAGE 3
TABLE OF CONTENTS
04 KEYHIGHLIGHTS
STRATEGIC REPORT
22 BOARD OFDIRECTORS
OTHER REPORTS
32 FINANCIAL STATEMENTS
FINANCIAL
06 CHAIRMAN’S STATEMENT
10 CHIEF EXECUTIVE OFFICER’S REPORT
24 DIRECTORS’ REPORT
16 CHIEF FINANCIAL OFFICER’S REPORT
79 NOTICE OFMEETING
30 INDEPENDENT AUDITOR’S REPORT

K3 CAPITAL GROUP PLCPAGE 4
BUSINESSHIGHLIGHTS
110STAFF MAY 17
CONTINUED INVESTMENT IN OUR PEOPLE
GROWTH ACROSS ALL THREE BUSINESS STREAMS
NEW HEAD OFFICE DURING FY17 ALLOWED FOR GROUP EXPANSION
INCREASED VOLUME OF CLIENTS ARE SECURED FROM VALUATION PORTAL
NUMBER ONE ADVISOR FOR UK DEAL VOLUME - THOMSON REUTERS H1 2017
IMPROVED BOARD & MANAGEMENT STRUCTURE FOLLOWING FLOAT
WE REMAIN THE ONLY UK ADVISOR TO OFFER FULLY CONTINGENT LEGAL FEES
CONTINUED SUCCESS IN ATTRACTING BIGGER AND
BETTER CLIENTS
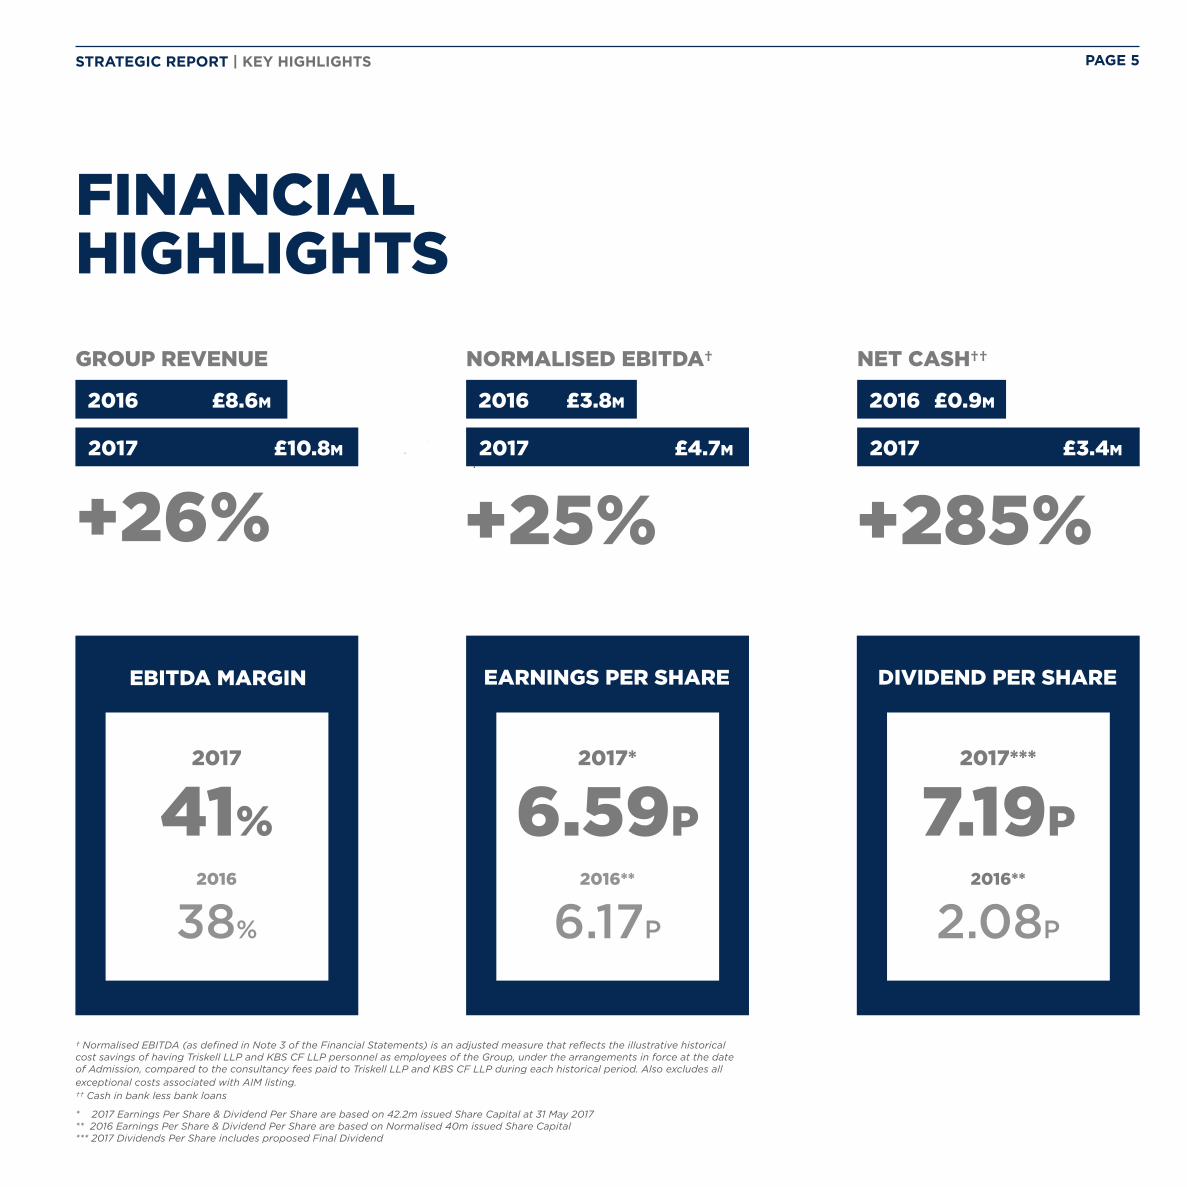
NORMALISED EBITDA†
2016 £3.8m
2017 £4.7m
NET CASH††
2017 £3.4m
GROUP REVENUE
2016 £8.6m
2017 £10.8m
2016 £0.9m
EARNINGS PER SHARE
2016**
6.17P
2017*
6.59P
EBITDA MARGIN
2016
38%
2017
41%
+26% +25% +285%
FINANCIALHIGHLIGHTS
DIVIDEND PER SHARE
2016**
2.08P
2017***
7.19P
STRATEGIC REPORT | KEY HIGHLIGHTS PAGE 5
* 2017 Earnings Per Share & Dividend Per Share are based on 42.2m issued Share Capital at 31 May 2017** 2016 Earnings Per Share & Dividend Per Share are based on Normalised 40m issued Share Capital*** 2017 Dividends Per Share includes proposed Final Dividend
† Normalised EBITDA (as defined in Note 3 of the Financial Statements) is an adjusted measure that reflects the illustrative historical cost savings of having Triskell LLP and KBS CF LLP personnel as employees of the Group, under the arrangements in force at the date of Admission, compared to the consultancy fees paid to Triskell LLP and KBS CF LLP during each historical period. Also excludes all exceptional costs associated with AIM listing.†† Cash in bank less bank loans
PAGE 6 K3 CAPITAL GROUP PLC
IANMATTIOLIMBE
IAN MATTIOLI MBE | CHAIRMAN

STRATEGIC REPORT | CHAIRMAN’S STATEMENT PAGE 7
CHAIRMAN’S STATEMENTINTRODUCTIONIt was a great pleasure to accept the Chairmanship of K3 Capital Group plc (K3C / the Group) at the time of its AIM floatation on 11th April 2017, a significant milestone in the history of K3C. I have seen first-hand the professionalism and dedication of the Board and management and I am delighted to be involved in contributing to the next chapter of the Group’s growth as a public company.
K3C has a disruptive business model which sets it apart from other professional services providers in the highly fragmented business and company sales marketplace which has and should enable it to increase market share and achieve sustainable organic growth.
The float represented the culmination of many years of successful year on year growth driven by the refinement of its business model and its people building expertise and knowledge. The skills and diligence of the K3C team and its advisers enabled a most satisfactory IPO process. The business is now at the beginning of a new chapter in its journey and the K3C team not only understand the growth opportunity but also understand the importance of controls, planning and governance which are required as a listed entity which all points towards a very compelling opportunity.
It is satisfying to report a year of robust growth that has seen revenues increase by 26% to £10.8m (FY16 £8.6m) and normalised EBITDA (note 3) increase by 25%, to £4.7m (FY16 £3.8m). In addition to this, despite costs relating to the IPO process, the Group are pleased to report a profit after tax of £2.8m, an increase of 13% (FY16 £2.5m).
K3C has continued to invest in innovative and high impact marketing throughout the financial year in order to enhance our high volume, direct marketing approach to client acquisition. A strategy that yielded 15% more client mandates in FY17. Non-contingent fee income across the brands has increased by 16% to £5.1m in FY17 (FY16 £4.3m). This marketing investment, combined with our floatation on AIM and continuing industry recognition has raised our profile and brand awareness throughout the UK.
Not only have we enjoyed success with new client wins, our operations department have also had a successful year with revenue from Group transaction fees increasing by 37%. These departments have grown as a direct result of investment into people, management and processes. The Group remains focussed on delivering a ‘best in class’ service to all clients in order to adhere to our strong client centric culture.
Once again, we find ourselves excelling in national league tables, with Thomson Reuters naming us as the most active dealmaker in the Small Cap Financial Advisory review for the first half of 2017. Such accolades are testament to the dedication of the board and employees in developing a successful service delivery model, that remains scalable for anticipated future growth.
26% INCREASE IN GROUP REVENUE
INCREASE IN NON-CONTINGENT FEE INCOME (FY16 - FY17)16%
Source: Thomson Reuters Small Cap M&A Review - H1 2017
RANK ADVISOR DEALS
1= KBS Corporate 32
1= Rothschild & Co 32
3 RSM Corporate Finance 29
4 Grant Thornton 28
5 KPMG 25
6 PricewaterhouseCoopers 21
7 Deloitte 18
8 Clearwater International 17
9 Baker Tilly International 15
10= IMAP 14
25% INCREASE IN NORMALISED EBITDA
THE UK’S MOST ACTIVE DEALMAKER H1 2017

PAGE 8 K3 CAPITAL GROUP PLC
FINANCIALSAs reported, revenues for the year stood at £10.8m, an increase of 26% (FY16 £8.6m), and 2.3% above market expectations.
We are also pleased to report a normalised EBITDA† of £4.7m for the financial year, an increase of 25% (FY16 £3.8m) and 4.7% above market expectations with net cash at the year-end standing at £3.4m (+285%) (FY16 £0.9m). The Group has also enjoyed an increase in Operating Profit of 16% to £3.7m (FY16 £3.2m).
Group net assets at FY17 were £5.4m (FY16: £1.7m) with current net assets standing at £1.5m (FY16: -£0.7m).
As a result, the Board is pleased to recommend the payment of a final dividend of 4.4p per share, resulting in total dividends for FY17 of £3.0m (FY16 £0.8m). The Board remains committed to a progressive dividend policy, whilst maintaining an appropriate level of dividend cover. If approved, the final dividend will be paid on 30 October 2017 to shareholders on the register at the close of business on 22 September 2017.
BOARD AND PEOPLEOur fantastic results have only been made possible with the commitment and dedication of my colleagues throughout the year. On behalf of the Board, I would like to extend my sincerest thanks for their hard work in growing the company to the position it is in today. A number have been with the Company since the start of our journey and our recent listing is a celebration of their success and determination to succeed.
Since the floatation I can announce that we have strengthened our board with the appointment of Martin Robinson as a Non-Executive Director. Martin brings a wealth of both public and private company director experience with over 25 years in the financial services industry.
RECOMMENDING A FINAL DIVIDEND OF 4.4P PER SHARE
EBITDA MARGIN
2016
38%
2017
41%
EARNINGS PER SHARE
2016**
6.17P
2017*
6.59P2017***
7.19P
2.08P
2016**
DIVIDEND PER SHARE
* 2017 Earnings Per Share & Dividend Per Share are based on 42.2m issued Share Capital at 31 May 2017** 2016 Earnings Per Share & Dividend Per Share are based on Normalised 40m issued Share Capital*** 2017 Dividends Per Share includes proposed Final Dividend
† Normalised EBITDA (as defined in Note 3 of the Financial Statements, along with a definition of reported EBITDA) is an adjusted measure that reflects the illustrative historical cost savings of having Triskell LLP and KBS CF LLP personnel as employees of the Group, under the arrangements in force at the date of Admission, compared to the consultancy fees paid to Triskell LLP and KBS CF LLP during each historical period. Also excludes all exceptional costs associated with AIM listing.

STRATEGIC REPORT | CHAIRMAN’S STATEMENT PAGE 9
OUTLOOKDuring FY18 we will continue to implement our strategy of organic growth across each of our three trading brands.
This strategy will be assisted by our ongoing mantra of targeting and winning ‘bigger and better’, higher value client mandates across the Group.
We are developing our technologies and enhancing our data profiling in order to improve operational efficiencies and both increase the volume of, and more closely define our key market segments through increased profiling of the data.
Most importantly, we will continue to invest in our people and their training and development. We recognise that their experience and dedication is the lifeblood of the business and ensuring that they have all the tools necessary to service our clients will always be a fundamental strategy of the Group.
Myself and the Board are confident that these strategies will assist us in achieving our growth expectations over the coming months and years.
In summary, the Board is pleased with the FY17 performance and is confident that the Group is well placed to continue the trend into FY18.
IAN MATTIOLI MBE Chairman
8th September 2017

PAGE 10 K3 CAPITAL GROUP PLC
JOHNRIGBY
JOHN RIGBY | CHIEF EXECUTIVE OFFICER

STRATEGIC REPORT | CHIEF EXECUTIVE OFFICER’S REPORT PAGE 11
CHIEF EXECUTIVE OFFICER’S REPORTINTRODUCTION AND HIGHLIGHTS
I am very pleased to report on what has been a very busy and extremely significant year in the development of K3 Capital Group plc.
Whilst the UK and wider economic and political landscapes have not been without some challenges and unexpected happenings during the period, the small cap M&A market has enjoyed a relatively stable and progressive period with deal volumes above the ten-year average. This was boosted by a significant upturn in inward investment as foreign bidders looked to take advantage of favourable exchange rates and high levels of private equity funding, which created strong activity from both UK and overseas houses.
The financial year ending 31 May 2017 has seen the continuing and successful implementation of our strategy to both grow our brands organically and also raise the quality and value of clients across the Group. I am pleased to report that our average transaction fee across the group increased 40% to £44.3k in FY17 (FY16 £31.6k).
During the previous year we identified a new Head Office building of 12,000 sq ft which we could purpose fit to our own requirements. After six months of building and fit out we relocated the businesses on 30 September 2016.
The building provides Grade A office accommodation, on-site parking, high quality client meeting rooms and presentational facilities, the latest technology and telecommunications infrastructure, catering facilities and a staff gymnasium. Our new home gave us the opportunity to relocate our corporate finance team from Manchester bringing all disciplines, management and central functions under one roof.
Relocating the corporate finance team has enabled us to share knowledge throughout the business including research, technical expertise, financial modelling, negotiation skills and all aspects of deal execution which is proving of great benefit across the Group.
The increased capacity created by the Head Office relocation has allowed us to increase staff numbers to 110 in May 17 (from 73 in May 16), attract and retain quality people and allows for additional capacity to future proof the business.
I would like to thank my fellow directors and indeed all the staff across the Group for their hard work and dedication over the last 12 months in achieving double digit growth in both revenue up 26% to £10.8m FY17 (FY16 £8.6m), and normalised EBITDA (note 3 of the Financial Statements) up 25% to £4.7m FY17 (FY16 £3.8m). Despite the costs of AIM floatation, the Group are still pleased to report an increase in Profit Before Tax of 18% to £3.6m (FY16 £3.1m).
These achievements alongside the two very significant milestones of a business relocation and an AIM floatation within the financial year speak volumes for the strength, commitment and professionalism of the entire team.
I am delighted to welcome Ian Mattioli, who joined the Board as Chairman during our successful AIM admission in April and also Martin Robinson who recently joined the Board as a Non-Executive Director. Both Ian and Martin bring significant plc pedigree and we welcome their experience and knowledge to the Board.
GROUP REVENUE
2016 £8.6m
2017 £10.8m+26%

PAGE 12 K3 CAPITAL GROUP PLC
After 17 years with the Group, the last ten of which have been spent as Chief Executive Officer, recent events make me exceptionally proud of what we have achieved and our ability to reward several key members who have helped to deliver this growth via our new share option scheme is very pleasing (the performance period for which commenced on 1 June 2017). This scheme will no doubt help us to both retain and attract key talent into the Group as we begin the next chapter of our exciting story.
We are delighted to have retained our high standing within industry league tables having been ranked by Thomson Reuters (small cap M&A review by deal volume) as No 3 Advisor for the calendar year 2016 and No 1 Advisor in the first six months of this calendar year (Jan to June 2017). Such accolades can only assist us as we continue to develop our marketing efforts and raise brand awareness.
We remain innovative and forward thinking in our disruptive approach to business and company sales. We are the only advisor in the UK to offer fully contingent legal fees to all clients through our national legal partnerships. We are driving new business generation through innovative use of data, high impact marketing techniques and our creative digital strategy. This is underpinned by our growing dataset of profiled seller targets which increased by 20% in FY17 to over 1.7m, through enhanced data profiling.
Our marketing spend has increased in line with our strategy to target and mandate ‘bigger and better’, higher value clients. The costs of £0.9m (8.5% of turnover) in FY17 compares with £0.6m (7.5% of turnover) in FY16 and has driven new client wins across all three brands, many of which will convert into transaction fee income as we move into FY18.
SALESThe Knightsbridge brand had traded positively across the year and since our relocation has seen investment into growing our national sales footprint. We have recruited a further two Regional Sales Managers, increasing the team to six, with supporting investment into Head Office sales staff.
This has been complemented by increased investment into direct marketing resulting in growth across all main KPIs (monthly appointments increased to 189 in FY17 (FY16 177); monthly fee quotes increased from to £204k in FY17 (FY16 £180k) and monthly new mandates increased to 57 in FY17 (FY16 51).
This has delivered a 22% increase in non-contingent fee income to £736k in FY17 (FY16 £603k). We strongly believe that this investment in people will underpin the expected growth in the sales efforts of the brand in FY18.
OPERATIONSWithin the financial year we created a separate department to manage commercial instructions under a new Knightsbridge Commercial brand. This has improved the customer journey, driven additional completions, which in turn has increased the income from this client base. In addition, we have strengthened the retail delivery team and we are already starting to see the benefit of this investment, delivering increased buyer activity, viewings and offers for our clients’ businesses.
The growth across all main KPIs included monthly buyer enquires increased to 2,965 in FY17 (FY16 2,658); monthly buyer meetings increased to 200 in FY17 (FY16 160) and monthly offers increased to 35 in FY17 (FY16 24).
This has delivered a 19% increase in transaction fee income to £532k in FY17 (FY16 £446k) in and we are confident that the investment will deliver further revenue growth in FY18.
APPOINTMENTS
2016 177
2017 189
FEE QUOTES
2016 £180k
2017 £204k
NEW MANDATES
2016 51
2017 57
BUYER ENQUIRIES
2016 2,658
2017 2,965
BUYER MEETINGS
2016 160
2017 200
OFFERS
2016 24
2017 35

STRATEGIC REPORT | CHIEF EXECUTIVE OFFICER’S REPORT PAGE 13
SALESSince relocation to our new Head Office we have continued to invest in both the national sales force and Head Office sales support functions. We have recruited an additional regional corporate director in the South East, taking the sales team to eight regional directors and recruited additional support staff and management internally to drive further productivity and growth as we move forward into FY18.
This has also been complemented by additional investment into marketing and ongoing refinement of the KBS Globe system resulting in growth across all KPIs. In common with many similar businesses we would typically expect a time lag from any investment and it is pleasing to note that we have seen some immediate returns in the financial period, which gives a positive outlook for the forthcoming financial year.
The investment has resulted in growth across all main KPIs (monthly appointments increased to 239 in FY17 (FY16 238); monthly fee quotes increased to £1.3m FY17 (FY16 £1.2m) and monthly new mandates increased to 52 in FY17 (FY16 43).
As a result non-contingent fee income has increased by 15% to £4.3m in FY17 (FY16 £3.7m)
OPERATIONSAs the sales function has delivered quality mandates and improved client numbers we have continued to invest in improving the customer journey. Additions to all the internal teams, that look after our clients’ needs, include document writers, researchers and deal executives. This combined investment coupled with a stable market has delivered some pleasing results across all major KPIs. These include, monthly Non Disclosure Agreements (NDAs) received increase to 673 in FY17 (FY16 274); monthly buyer meetings increased to 86 in FY17 (FY16 45) and monthly offers increased to 21 in FY17 (FY16 13).
Transaction Fee income has increased by 56% to £1.5m in FY17 (FY16 £1.0m) and we are confident that the investment will deliver further revenue growth and profitability in FY18 as we continue to deliver our ‘bigger and better’ strategy.
I am also pleased to report that the final phase of our KBS Globe CRM system is due to be in ‘test phase’ by Q4 2017 with a view to be operational by Q1 2018. This is an exciting development which we believe will bring operational efficiencies and an improved customer journey.
Further automation of the Buyer Matching Engine (BME) should see a significant increase in the number of NDAs, meetings and offers which we achieve for our client, ultimately resulting in further growth in transaction fee income streams.
APPOINTMENTS
2016 238
2017 239
FEE QUOTES
2016 £1.2m
2017 £1.3m
NEW MANDATES
2016 43
2017 52
NDAS
2016 274
2017 673
BUYER MEETINGS
2016 45
2017 86
OFFERS
2016 13
2017 21

PAGE 14 K3 CAPITAL GROUP PLC
OPERATIONSOur ‘execution only’ model and corporate finance team have continued to gain traction and deliver pleasing results across the financial year. Key highlights across the brand are:-
We now have a team of five highly experienced corporate finance directors following pre-float reorganisation and the acquisition of the trade and assets of Triskell LLP. The team have in-depth knowledge across many sectors and over 100 years combined expertise in company sales to PLCs, Private Equity, UK and Overseas buyers with transaction values ranging from £10m - £200m.
During FY17 our strategy of targeting higher value clients has resulted in us winning numerous mandates with profits typically ranging from £2m to £10m, many of which will transact in FY18.
Our Graduate Academy was established during the year. This incubates four undergraduates, during their work experience year, into our corporate finance department. They work and train directly with our senior staff and are involved in all aspects of a corporate finance transaction. This includes research, buyer contact, document writing, client meetings, data rooms and the completion process. At the end of their placement, which is in effect a one-year interview process, we will look to offer at least two of the interns a position with K3C, post degree to train as corporate financiers and qualify as Chartered Accountants.
Our Academy Programme has been enhanced by our new status as an ICAEW Authorised Training Employer and this is also assisting with the recruitment of both part qualified accountants and candidates who wish to take accountancy qualifications whilst training on the job.
The key focus of the business has been to attract and win larger and more profitable mandates. Our ever-improving reputation, successful case studies combined with our sector leading marketing strategy and national sales footprint, has allowed us to significantly increase the quality and fee value of the clients which we have both completed and brought to market in FY17. This has resulted in a 33% increase in fee income to £3.7m in FY17 (£2.8m in FY16).
Several of our key team members have been rewarded with their inclusion in the Share Option scheme and we continue to look for talented corporate finance staff as we build this income stream and drive further value from our client base.
INCREASE IN MANDATES OVER £2M EBITDA
ACQUISITION OF TRISKELL LLP TRADE AND ASSETS
INCREASE IN TRANSACTION FEE INCOME (FY16 - FY17)
33%
ESTABLISHED GRADUATE ACADEMY

STRATEGIC REPORT | CHIEF EXECUTIVE OFFICER’S REPORT PAGE 15
LOOKING AHEAD
Since 31 May 2017, we can report a strong start to the new financial year, with trading comfortably in line with management expectations. We have already completed two significant transactions, which have each generated transaction fees in excess of £1m. We expect this performance, together with the momentum gained throughout H2 FY17, to result in sustainable profit growth in FY18.
Our strategy for FY18 continues on a very similar theme, targeting organic growth across all three trading brands, together with our mantra of winning higher quality, ‘bigger and better’, more profitable mandates.
Our people remain at the core of our business. We continually strive to recruit high quality, experienced sales people and we invest a huge amount of time in training them in our ways and to our own exacting standards. Operationally we continue to focus on the recruitment and training of high quality graduates who complement the senior and experienced executive team.
We expect the KBS Globe business system to drive operational efficiencies from our delivery teams and remain excited by the prospects that this offers the Group. This will be complemented by the further enhancement of our proprietary BME and the part automation of our buyer targeting process. Both of these technological developments will deliver strategic advantage and add value to both our clients and the Group, as they drive increased buyer interest and help to realise our clients’ expectations, ultimately delivering significant transaction fee income to the Group.
We have developed a suite of high impact marketing collateral which is proving to be very compelling in attracting entrepreneurial business and company owners to our proposition. We aim to continue to develop new and exciting marketing initiatives throughout FY18 to set K3C apart from others within the professional services market.
During FY18 we are planning to refresh our various websites to assist our ability to drive income through our digital platforms and we will continue to improve our valuation portal which is delivering a growing income stream as part of our wider direct marketing ‘engine’.
We are excited by the prospects of the coming financial year and look forward to delivering sustainable organic growth and increasing profitability across the Group.
JOHN S RIGBYChief Executive Officer
8 September 2017

PAGE 16 K3 CAPITAL GROUP PLC
ANDREW MELBOURNE
ANDREW MELBOURNE | CHIEF FINANCIAL OFFICER

INCOME STATEMENTI am pleased to report that Group turnover for FY17 amounted to £10.8m, an increase of £2.2m (26%) compared to the prior year (FY16: £8.6m).
The bulk of turnover growth has come following continued investment in our transactional departments, resulting in ever improving success at completing deals, with transaction fee income derived from completions increasing by 37% to £5.8m in FY17 (FY16 £4.2m).
As a whole, the business significantly benefited from the Head Office relocation in September 16. With floor space being quadrupled, management across the Group undertook a calculated recruitment drive, seeing staff numbers rise to 110 on the payroll in May 17, a 51% increase in the year (May 16 payroll: 73). This resulted in a strong H2 which delivered many encouraging KPI results as discussed throughout this report.
NON-CONTINGENT FEE INCOMEReported Non-Contingent Fee Income grew by 16% to £5.1m, representing a £0.8m increase on the previous year (FY16 £4.3m). These recognised figures take into account the contractual nature of new client mandates, and spread income throughout the life of a contract. It is also worth noting the level of ‘banked’ Non-Contingent Fees, which equated to £5.3m in FY17, an increase of £0.8m (FY16 £4.5m), demonstrating the underlying performance of the business in terms of successfully generating new mandates.
This increase has predominantly come from the further targeting and winning of ‘bigger and better’ mandates across the Group. These typically attract a higher level of Non-Contingent Fee due to the nature of the services provided. We have also achieved an increased conversion rate, with 25% of appointments converting to new client mandates in FY17 (FY16 23%).
As part of the investment in staff, the Group have added to the regional sales force in order to increase our national footprint. There are currently 14 regional sales directors (FY16 11), increasing diary capacity by 27%. This increased capacity allows for more client appointments to generate further mandates, increasing the portfolio of clients within operational departments.
TRANSACTION FEE INCOMEGroup Transaction Fee Income increased by 37% in FY17, delivering £5.8m (FY16 £4.2m), continuing the trend of Transaction Fee growth exceeding Non-Contingent fee growth. This demonstrates that the driving factor in our success is derived from our core activity of completing transactions.
In aiming to deliver a ‘best in class’ service to our clients, we have seen the Group receive numerous industry awards and top league tables for transaction volumes, which in turn gives new clients confidence that K3C are one of the foremost business and company sales specialist in the UK.
Knightsbridge Transaction Fee income has seen the most modest growth in the year with £0.5m turnover delivered in FY17, a 19% increase (FY16 £0.4m). Since the Head Office relocation, a new commercial delivery team has been created to deliver a more focussed service into the larger commercial clients. This continues the ‘bigger and better’ mantra seen throughout the Group, and has delivered a number of completions towards the end of FY17 and would expect to see continuing success of this department throughout FY18.
Transaction Fees in KBS Corporate Finance have increased by 33% to £3.7m in FY17 (FY16 £2.8m). This growth comes as a result of the investments made into the ‘bigger and better’ mandate strategy, strengthening the deal delivery team and ultimately delivering successful outcomes for our clients.
During FY17, the Group made an acquisition of the trade and assets of Triskell LLP (as disclosed in note 15 of the Financial Statements). This resulted in senior resource being brought into the Group payroll, bringing commission structures in line with the rest of the team at 10% compared to previous rates up to 50%. KBS Corporate Finance ended FY17 with five experienced directors, a head of buyer intelligence, a senior researcher and five support staff, demonstrating the investment in this brand during the year.
CHIEF FINANCIAL OFFICER’S REPORT
STRATEGIC REPORT | CHIEF FINANCIAL OFFICER’S REPORT PAGE 17
FY16FY17
51%INCREASEIN STAFFNUMBERS
27%INCREASEIN DIARYCAPACITY

The largest percentage increase in Transaction Fee income came from KBS Corporate achieving £1.5m in FY17, an increase of 56% (FY16 £1.0m). This growth has been a direct result of both our ‘bigger and better’ mantra and the continued investment into service delivery. The Group has invested in the number of deal executives, document writers and researchers within the department. This additional resource has seen the quality of client documentation significantly enhanced, a more focused buyer targeting strategy and improved customer service standards across the brand.
KEY PERFORMANCE INDICATORS (KPIs)As reported in more detail within this report, the following KPIs are used by management to monitor the groups income statement. FY17 has seen a 26% increase in revenue compared to FY16, alongside a 39% increase in the reported EBITDA, and 10% growth in the reported EBITDA margin.
In addition to the above, management utilise non-financial KPIs to monitor underlying performance. In the year, the Group has seen increased non-financial KPIs, resulting in 24% more NDAs received, 40% more buyer meetings arranged and 51% more offers received.
MARKETING COSTSThe Group has continued to deliver high quality and relevant marketing campaigns through innovative and creative channels. The Group classify all marketing costs to include sales and operational marketing spend.
Expanded marketing activities in the year have seen costs growing in proportion to 8.5% of turnover (FY16 7.5%). Total marketing spend rose by 43% in FY17 to £0.9m (FY16 £0.6m), in line with our strategy of targeting ‘bigger and better’, higher value mandates into K3C. We continue to innovate across all marketing channels in order to drive organic growth across all brands in FY18.
OVERHEAD COSTSOverheads, excluding exceptional costs (note 11) have increased in FY17 by £0.7m to a total of £5.4m (FY16 £4.7m). The increases have been a direct result of the Head Office move, which has seen a stepped increase in fixed overheads, followed by the recruitment drive and subsequent increased wage bill. Changes to commission structures have mitigated some of this rise, with variable overheads (commission payments) being reduced marginally to £0.9m (FY16 £1.0m), though when compared to sales, the saving is more apparent with variable costs representing 17.6% of turnover (FY16 23.0%).
EBITDAAs a result, reported EBITDA (note 3) has increased by £1.3m (39%) to £4.5m in FY17 (FY16 £3.2m). This has seen the EBITDA margin also increase to 41% (FY16 38%).
An area reported on during the floatation process was a normalised EBITDA (note 3), which sought to adjust costs for historic commission payments pre Triskell LLP trade and asset acquisition and reflect what payments would have been made under the new employment terms. This shows that when these non-recurring costs are removed, the Group delivered a Normalised EBITDA of £4.7m in FY17 (FY16 £3.8m).
PAGE 18 K3 CAPITAL GROUP PLC
26%
REVENUEGROWTH
39%
EBITDAGROWTH
10%
EBITDA MARGINGROWTH
£1.0m£0.9m10% REDUCTION IN VARIABLE OVERHEADS (FY16 - FY17)
INCREASE IN NORMALISED EBITDA (FY16 - FY17)25%
24%
NDAs
40%
MEETINGS
51%
OFFERS

EXCEPTIONAL COSTSDuring FY17, the Group incurred significant costs related to the successful AIM float, with a total of £0.8m of costs identified as being directly attributable to the listing. This has seen £0.1m allocated to share premium (note 11), with the balance of £0.7m being an exceptional cost for the year (note 11).
TAXATIONThe pre-exceptional effective tax rate is 19.1% which is marginally lower than the prior year (FY16 19.5%) reflecting the reduction in the standard rate of Corporation Tax. The exceptional costs are not subject to tax relief.
PROFIT BEFORE TAXGroup Profit Before Tax has increased by 18% to £3.6m in FY17 (FY16 £3.1m). This is after exceptional costs of £0.7m bring incurred during FY17 (FY16 £nil).
EARNINGS PER SHAREBased on the closing 42.2m shares in circulation, the basic earnings per share was 6.6p for the year. This represents an increase of 7% on FY16 when using a normalised 40m shares in circulation that delivered a basic earnings per share of 6.2p. The Earnings Per Share, based on a weighted average measure, is disclosed in note 14.
STATEMENT OF FINANCIAL POSITION
CASHThe Group cash balances closed the year with £3.8m (FY16 £1.5m). The Group is highly cash generative as Non-Contingent Fee income is typically paid in advance of services, although is recognised in the accounts over a period of time. In addition to this, the Group still enjoys high levels of costs related directly to performance with 30.0% of all costs being variable in FY17 (FY16 36.8%). This year has seen exceptional cash movements in the year, notably £2m funds raised from the AIM float, £1.1m paid for the acquisition of the trade and assets of Triskell LLP, £0.2m of exceptional costs associated with AIM float, and £0.8m of capital expenditure related to the Head Office move.
By exception, other points of note with regard to the statement of financial position are:
• Goodwill increased by £1.1m in respect of the trade and asset
acquisition of Triskell LLP
• Goodwill relating to the 2007 acquisition adjusted to £2.8m under
IFRS transition (note 36).
• Increase in office equipment due to relocation, anticipated to be an
exceptional spend (note 16).
• Trade receivables/payables are subject to the timing of transactions
and recognised income around the reporting date.
• Accruals have increased by £0.1m largely relating to a rent accrual due
to the rent free period being recognised over the lease, in addition to
increased audit fees, post floatation.
• Other debtors reduced significantly with repayment of Director loans
in the year (note 19).
• Other financial liabilities are now nil following settlement of preference
shares (note 23).
• Deferred income continues to grow in line with Non-Contingent Fee
income to underpin future turnover (note 25).
• Borrowings continue to reduce with two historic term loans, one due
to be repaid in April 18, and the remaining due to be repaid by May
19 (note 22).
STRATEGIC REPORT | CHIEF FINANCIAL OFFICER’S REPORT PAGE 19
INCREASE IN PROFIT BEFORE TAX (FY16 - FY17)18%
7% INCREASE IN EARNINGS PER SHARE

PAGE 20 K3 CAPITAL GROUP PLC
RISKS AND UNCERTAINTIESManagement consider the following issues to be the principal risks potentially affecting the business:
Risk: Management consider there could be a risk to the Group growth strategy should it fail to retain or attract effective personnel.
Mitigation: Subsequent to the AIM floatation, key members of staff were granted share options as part of a Share Option Scheme as an incentive to retain talent within the Group. The performance period under this scheme commenced 1 June 2017. In addition, K3 Capital Group pride ourselves on employee wellbeing and, during the course of the year following Head Office relocation, have invested in providing gym facilities, a discounted onsite café and have coordinated a number of staff events to both retain and attract the high-quality employees required.
Risk: The AIM float process uncovered some weaknesses in contractual terms with clients and suppliers alike.
Mitigation: Management has worked closely with legal advisors and following listing have introduced revised terms of business to all brands, and are committed to ensuring all terms are refreshed in line with industry/regulatory changes. The Group now also have agreed formal terms with all key suppliers to ensure adequate protection with future trading.
Risk: K3 Capital Group operates within a partially unregulated market place and relies on a specific exemption from FCA in order to trade without formal regulatory approval.
Mitigation: Following listing, all new terms of engagement with clients make clear that K3 are not regulated by the FCA and are only able to act on behalf of share sales of 50% or above. Regional sales teams have been trained with the FCA exemption and are aware K3C are not able to act on minority share sales, in addition there are regular team meetings to review offers to ensure that no existing transactions fall foul of the exemption. In addition to this, both the FY17 audit and due diligence process have tested hundreds of transactions and have found no evidence of any transactions historically breaching this exemption.
Risk: There is a large impending change in May 2018 in respect of data protection. The General Data Protection Regulation (GDPR) (Regulation (EU) 2016/679) is a regulation by which the European Parliament, the Council of the European Union and the European Commission intend to strengthen and unify data protection for all individuals within the European Union and covers all firms that hold client data. These changes may threaten the marketing capabilities of businesses who are not prepared.
Mitigation: Management has commissioned an independent data protection audit for completion in September 2017 to ensure that the Group is fully prepared for all changes and is equally compliant with current legislation.
SHAREHOLDERS’ DIVIDENDThe Board is recommending a final dividend of 4.4 pence per ordinary share payable to shareholders on the register at 22 September 2017. The final dividend, together with the combined pre listing interim dividends based on the 42.2m closing shares of 2.8 pence, gives an indicative total dividend of 7.2 pence per share for the year.
On admission, the Board outlined an intention to pay approximately 80% of the Group’s post tax profits for the year weighted 1/3 on interim results and 2/3 on final results. The 4.4p final dividend represents approximately 2/3 of 80% of the Group’s post tax profits for the year adjusted for the costs associated with admission to AIM.
Going forward, the Board expects to maintain a consistent dividend policy in line with our intentions outlined on admission to AIM.
FINAL DIVIDEND OF 4.4P PER SHARE

STRATEGIC REPORT | CHIEF FINANCIAL OFFICER’S REPORT PAGE 21
SHARE PRICEThe K3 Capital Group plc share price closed the financial year at 120.5 pence, an increase of 27% since our successful AIM float on 11 April 2017, at a placing price of 95.0 pence.
GOING CONCERNAfter making enquiries, the directors have formed a judgement, at the time of approving the financial statements, that there is a reasonable expectation that the Group has adequate resources to continue in operational existence for the foreseeable future. For this reason, the directors continue to adopt the going concern basis in preparing the financial statements.
STRATEGIC REPORTThe Strategic Report on pages 4 to 21 was approved by the Board of Directors on 1 March 2017 and signed on its behalf by:
ANDREW MELBOURNE FCMAChief Financial Officer
8 September 2017
95.0p
125.0p 120.5p
11/04 31/05

K3 CAPITAL GROUP PLCPAGE 22
IAN MATTIOLI MBECHAIRMAN
JOHN RIGBYCHIEF EXECUTIVE OFFICER
ANDREW MELBOURNE FCMACHIEF FINANCIAL OFFICER
Ian has over 30 years’ experience in the financial
services sector and co-founded the Mattioli
Woods Group in 1991 where he is the Chief
Executive Officer and remains responsible
for the vision and operational management
of the group. Ian has been awarded an MBE
and also won the London Stock Exchange AIM
Entrepreneur of the Year award in 2007.
Ian was appointed on the 11 April 2017 upon
AIM floatation and is a member of the Audit,
Remuneration and Nominations Committees.
John joined K3C in 2000 following a career
in commercial and corporate banking. John
has over 17 years of operational, sales and
commercial management experience within
the sector and developed the national sales
infrastructure of the Group. John became
Chief Executive Officer of the Group in 2010
and has been responsible for driving growth
and integral in the development of the low
cost, process driven delivery platform.
Andrew joined the Group in 2012 following
ten years in various financial accounting roles
across various industries including media,
leisure and property management. Andrew
possesses strong financial, strategy and
commercial management skills including HR,
IT and special projects. Andrew is a fellow
of the Chartered Institute of Management
Accountants and has an MSC in Strategic
Financial Management. Andrew was voted
North West Young Finance Director of the Year
at the North West Finance Awards in 2016.
BOARD OF DIRECTORS

OTHER REPORTS | BOARD OF DIRECTORS PAGE 23
TONY FORD (FCA)EXECUTIVE VICE CHAIRMAN
STUART LEES (FCA)EXECUTIVE DIRECTOR
MARTIN ROBINSON (FCA)NON-EXECUTIVE DIRECTOR
Tony is a qualified chartered accountant and
experienced corporate financier. He founded
K3C and led its investment in the Group in
2007. He was subsequently responsible for the
overall strategic direction of the Group and,
previously as Chairman, he oversaw a period
of strong growth and internal development.
Tony possesses significant directorship
experience across a broad range of industries
including corporate finance, financial services,
technology and business services.
Stuart joined K3C as a Non-Executive
Director in September 2015 to assist with the
development of the strategic direction of the
Group. Stuart is a highly respected corporate
financier and was previously Managing
Director of Altium and head of corporate
finance at Arthur Andersen in the UK. Stuart
has a wealth of business experience and held
the position of Group CEO of Latium Holdings
Limited from 2004 to 2009 acquiring
Ultraframe plc, Spectus Systems, Kestrel
Building Products and the successful disposal
of Everest Home Improvements. Stuart moved
to an executive role in July 2017 where he has
an active involvement in deal execution of
larger corporate finance assignments.
Martin is a highly experienced private and
public company director with over 25 years’
experience in financial services. He currently
serves on the board of a number of the
subsidiary companies of AIM-quoted Brooks
Macdonald Group Plc, the integrated wealth
management group. Martin is a Fellow of the
Institute of Chartered Accountants in England
and Wales and was previously on the AIM
Advisory Committee as a founder member,
overseeing the development and regulation of
the market in 1995. Martin was appointed to
the K3 Capital Group board on 17 July 2017
and is a member of the Audit, Remuneration
and Nominations Committees.

DIRECTORS’REPORTThe directors’ present their report and the audited financial statements for the year ended 31 May 2017.
The directors who served the company during the year and to the date of this report were as follows:
Non-Executive DirectorsI J Mattioli (appointed 11 April 2017)W M Robinson (appointed 17 July 2017)
Both of the above are members of the Audit, Remuneration and Nominations Committees of the Board.
Executive DirectorsA J Ford J Rigby A R Melbourne S Lees M C Clancy (resigned 11 April 2017)S Daniels (resigned 11 April 2017)
FINANCIAL RISK MANAGEMENT OBJECTIVES AND POLICIESBusiness risks and uncertainties are included within the Chief Financial Officer’s Report on pages 16 to 21 and financial risks are set out in notes 4 and 28 to the financial statements.
DIRECTORS’ REMUNERATIONDirectors’ remuneration payable in year ended 31 May 2017:
EMPLOYEESAt K3 Capital Group, we recognise that we need to attract, motivate and develop good quality people. As a company, we aim to become one of the employers of choice within the local area and to be recognised as an organisation where you can work in a challenging and rewarding environment whilst having fun, developing a career and growing with the business.
As a company, we value the following:
• Honesty and integrity• Energy and enthusiasm• A strong desire to satisfy our customers• New and innovative ideas• Commitment and loyalty• Common sense and intelligence• Ambitious people who strive to succeed in whatever they do
We aim to provide a professional, friendly and safe work environment where our colleagues can develop as individuals and as part of the winning team, sharing the rewards of our success. The Group’s policy is to recruit and promote on the basis of aptitude and ability without discrimination of any kind. Applications for employment by disabled people are always fully considered bearing in mind the qualification and abilities of the applicants. In the event of employees becoming disabled, every effort is made to ensure their continued employment.
POLITICAL DONATIONSThere were no political donations in either FY17 or FY16.
SHARE CAPITALDuring the course of the year, K3 Capital Group plc undertook several share capital restructures in order to equalise ordinary shareholdings and enable the transformation from a Limited company to a PLC. All of these changes are detailed within note 27 of the financial statements. In addition to this, a total of £1.5m of redeemable preference shares were purchased in the year from company cash balances.
PAGE 24
£000 Salary & Fees
Benefits in Kind
Bonus payable in respect of FY17
PensionContributions
Total FY17
Total FY16
Ian Mattioli 10 - - - 10 -
Tony Ford 66 - 60 - 126 60
John Rigby 124 2 121 - 247 184
Andrew Melbourne 61 8 35 - 104 81
Stuart Lees 60 - - - 60 41
Total 321 10 216 - 547 366
K3 CAPITAL GROUP PLC

SHARE OPTIONSThe directors consider that an important part of the Group’s remuneration policy should include equity incentives through the grant of share options to directors and employees. Accordingly, the Company has adopted an Option Plan. On admission, a total of 6 employees were awarded options at the admission price subject to performance criteria commencing 1 June 2017, totalling 2.5% of the enlarged share capital.
Prior to the Admission to AIM, it was the intention of directors to open a Save As You Earn share scheme, however, a subsequent investigation of employee appetite and administration costs delivered the conclusion it was not appropriate at this time to open the scheme. This will be reviewed periodically.
It is the intention of the directors to grant further options to current and future employees of the Group. Following Admission, the maximum number of Ordinary Shares which will be subject to options granted to directors and employees under the Option Plan, ShareSave Plan and any other employee share plan adopted by the Company will not exceed 10 per cent. of the Company’s issued share capital from time to time in any rolling 10 year period.
HEALTH, SAFETY AND THE ENVIRONMENTThe directors consider the health, safety and environmental protection aspects of the Company to be of great importance, in addition to the prevention of any personal injury, avoidance of damage to health and the protection of the environment, which are important business and social responsibilities. Management practices within the Group are designed to ensure so far as is reasonably practicable, the health, safety and welfare at work of employees, contractors and visitors and the implementation of environmentally aware and friendly policies.
AUDITORSDuring the period, BDO LLP were appointed as statutory auditor. In accordance with Section 489 of the Companies Act 2006, a resolution will be proposed at the Annual General Meeting that BDO LLP will be reappointed auditors.
CORPORATE GOVERNANCEThe Board is committed to achieving high standards of corporate governance, integrity and business ethics. Under the AIM Rules the Company is not required to comply and has not complied with the provisions of the new edition of UK Corporate Governance Code issued by the Financial Reporting Council in 2014 (the Code) but recognises the importance of effective corporate governance procedures relevant to its size and nature of operations, as described below.
THE BOARDThe Board comprises a Chairman, four Executive Directors and one Non-Executive Director. Their names and biographical details are set out on pages 22 and 23. The Board considers the Non-Executive Director, WM Robinson, to be independent. The posts of Chairman and Chief Executive are held by different individuals. The Chairman is responsible for the Board and the Chief Executive for the operating performance of the Group.
The Board is scheduled to meet four times each year, with additional meetings called if required. The Board’s main responsibilities are to agree Group strategy, approve annual budgets, review management performance, financial results, board appointments and dividend policy. A comprehensive board pack is distributed to all directors prior to each scheduled board meeting. Directors are able, if necessary, to take independent professional advice, at the Group’s expense, in the furtherance of their duties. The Board has delegated specific responsibilities to Audit, Remuneration, and Nomination Committees.
REMUNERATION COMMITTEEThe Remuneration Committee is chaired by I T Mattioli, its other member is W M Robinson. The Remuneration Committee reviews the performance of the Executive Directors and makes recommendations to the Board on matters relating to their remuneration and terms of employment. The Remuneration Committee also makes recommendations to the Board on proposals for the granting of share options and other equity incentives pursuant to any share option scheme or equity incentive scheme in operation from time to time. The remuneration and terms and conditions of appointment of the Non-executive Directors of the Company are set by the Board. Details of directors’ remuneration are set out in the directors’ report on page 24.
PAGE 25OTHER REPORTS | DIRECTORS’ REPORT

K3 CAPITAL GROUP PLCPAGE 26
AT K3 CAPITAL GROUP, WE RECOGNISE THAT WE NEED TO ATTRACT, MOTIVATE AND DEVELOP GOOD QUALITY
PEOPLE

AUDIT COMMITTEEThe Audit Committee is chaired by W M Robinson, its other member is I T Mattioli.
The Audit Committee has primary responsibility for monitoring the quality of internal controls and ensuring that the financial performance of the Company is properly measured and reported on. It receives and reviews reports from the Company’s management and auditors relating to the interim and annual accounts and the accounting and internal control systems in use throughout the Company. The Audit Committee meets at least twice times a year and has unrestricted access to the Company’s auditors.
NOMINATIONS COMMITTEEThe Nominations Committee is chaired by I T Mattioli, its other member is W M Robinson. The Nominations Committee assists the Board in discharging its responsibilities relating to the composition of the Board, performance of Board members, induction of new directors, appointment of committee members and succession planning for senior management. The Nominations committee is responsible for evaluating the balance of skills, knowledge, diversity and experience on the Board, the size, structure and composition of the Board, retirements and appointments of additional and replacement directors and makes appropriate recommendations to the Board on such matters. The Nominations Committee prepares a description of the role and capabilities required for a particular appointment. The Nominations Committee meets formally at least twice a year and otherwise as required.
SUMMARY OF DIRECTORS INTERESTS IN THE COMPANY
SCHEME INTERESTS AND OUTSTANDING SHARE AWARDS
The above Share Option scheme has a performance period which
commenced on 1 June 2017.
OTHER REPORTS | DIRECTORS’ REPORT PAGE 27
Director Class of Share Shareholding at end of Year
Class of Share Shareholding at start of Year
Ian Mattioli Ordinary 596,316 - -
Tony Ford Ordinary 8,442,105 Preferred A Ordinary 1,000,000
B Preference 500,000
Ordinary A 200,000
Ordinary B 200,000
Ordinary F 26,786
Ordinary V 1
John Rigby Ordinary 8,442,105 Ordinary C 357,143
Andrew Melbourne Ordinary 675,854 Ordinary G 17,857
Stuart Lees Ordinary 800,000 Ordinary H 1
Director Description Options Granted during the Year
Outstanding interest at 31 May 2017
Andrew Melbourne LTIP Option 217,020 217,020

PAGE 28
AUDITORSDuring the period BDO LLP were appointed as statutory auditor.
In accordance with Section 489 of the Companies Act 2006 a resolution will be proposed at the Annual General Meeting that BDO LLP be reappointed auditors.
Each of the persons who is a director at the date of approval of this report confirms that:
• so far as they are aware, there is no relevant audit information of which the group and the company’s auditor is unaware; and
• they have taken all steps that they ought to have taken as a director to make themselves aware of any relevant audit information and to establish that the group and the company’s auditor is aware of that information.
DIRECTORS’ RESPONSIBILITIES STATEMENTThe directors are responsible for preparing the strategic report and the directors’ report and the financial statements in accordance with applicable law and regulations. Company law requires the directors to prepare financial statements for each financial year.
Under that law the directors have elected to prepare the financial statements in accordance with International Financial Reporting Standards (IFRSs) as adopted by the European Union. Under Company law, the directors must not approve the financial statements unless they are satisfied that they give a true and fair view of the state of affairs and profit or loss of the Company and Group for that period. The directors are also required to prepare financial statements in accordance with the rules of the London Stock Exchange for companies trading securities on the Alternative Investment Market. In preparing these financial statements, the directors are required to:
• select suitable accounting policies and then apply them consistently; • make judgements and accounting estimates that are reasonable and
prudent;• state whether they have been prepared in accordance with IFRSs as
adopted by the European Union;
• prepare the financial statements on the going concern basis unless it is inappropriate to presume that the Company will continue in business.
The directors are responsible for keeping adequate accounting records that are sufficient to show and explain the Company’s transactions and disclose with reasonable accuracy at any time the financial position of the Company and enable them to ensure that the financial statements comply with the requirements of the Companies Act 2006.
They are also responsible for safeguarding the assets of the Company and hence for taking reasonable steps for the prevention and detection of fraud and other irregularities.
The directors are responsible for ensuring the annual report and the financial statements are made available on a website. Financial statements are published on the Company’s website in accordance with legislation in the United Kingdom governing the preparation and dissemination of financial statements, which may vary from legislation in other jurisdictions. The maintenance and integrity of the Company’s website is the responsibility of the directors. The directors’ responsibility also extends to the ongoing integrity of the financial statements contained therein.
By order of the Board
K3 CAPITAL GROUP PLC
ANDREW MELBOURNE FCMACompany Secretary
8 September 2017

OUR ADVISERS
Auditors:BDO LLP
3 Hardman Street,
Spinningfields
Manchester
M3 3AT
Accountants:Beever & Struthers
St. George’s House
215 - 219 Chester Road
Manchester
M15 4JE
Solicitors:TLT LLP
3 Hardman Square
Manchester
M3 3EB
Nominated Advisor and Broker:finnCap Ltd
60 New Broad Street
London
EC2M 1JJ
Registrars:Computershare Investor Services PLC
The Pavillions
Bridgwater Road
Bristol
BS99 6ZZ
Registered Office:KBS House
5 Springfield Court
Summerfield Road
Bolton
BL3 2NT
Registered Number:06102618
Website Address:www.k3capitalgroupplc.com
OUR ADVISORS
PAGE 29OTHER REPORTS | DIRECTORS’ REPORT

PAGE 30
We have audited the financial statements of K3 Capital Group Plc for the year ended 31 May 2017 which comprise the consolidated statement of comprehensive income, the consolidated and company statement of financial position, the consolidated and company statement of changes in equity, the consolidated and company statement of cash flows and the related notes. The financial reporting framework that has been applied in their preparation is applicable law and International Financial Reporting Standards (IFRSs) as adopted by the European Union and, as regards the parent company financial statements, as applied in accordance with the provisions of the Companies Act 2006.
This report is made solely to the company’s members, as a body, in accordance with chapter 3 of part 16 of the Companies Act 2006. Our audit work has been undertaken so that we might state to the company’s members those matters we are required to state to them in an auditor’s report and for no other purpose. To the fullest extent permitted by law, we do not accept or assume responsibility to anyone other than the company and the company’s members as a body for our audit work, for this report, or for the opinions we have formed.
RESPECTIVE RESPONSIBILITIES OF DIRECTORS AND AUDITORAs explained more fully in the directors’ responsibilities statement, the directors are responsible for the preparation of the financial statements and for being satisfied that they give a true and fair view. Our responsibility is to audit and express an opinion on the financial statements in accordance with applicable law and International Standards on Auditing (UK and Ireland). Those standards require us to comply with the Financial Reporting Councils (FRC’s) Ethical Standards for Auditors.
SCOPE OF THE AUDIT OF THE FINANCIAL STATEMENTSA description of the scope of an audit of financial statements is provided on the FRC’s website at www.frc.org.uk/auditscopeukprivate
OPINION ON FINANCIAL STATEMENTSIn our opinion:
• the financial statements give a true and fair view of the state of the
group’s and of the parent company’s affairs as at 31 May 2017 and of
the group’s profit for the year then ended;
• the group financial statements have been properly prepared in
accordance with IFRSs as adopted by the European Union;
• the parent company financial statements have been properly prepared
in accordance with IFRSs as adopted by the European Union and
as applied in accordance with the provisions of the Companies Act
2006; and
• the financial statements have been prepared in accordance with the
requirements of the Companies Act 2006.
OPINION ON OTHER MATTER PRESCRIBED BY THE COMPANIES ACT 2006In our opinion based on the work undertaken in the course of the audit:
• the information given in the strategic report and the directors’ report
for the financial year for which the financial statements are prepared
is consistent with the financial statements; and.
• the strategic report and directors’ report have been prepared in
accordance with applicable legal requirements.
INDEPENDENT AUDITOR’S REPORT
K3 CAPITAL GROUP PLC

MATTERS ON WHICH WE ARE REQUIRED TO REPORT BY EXCEPTION
In the light of the knowledge and understanding of the group and the
parent company and its environment obtained in the course of the audit,
we have not identified material misstatements in the strategic report or
the directors’ report.
We have nothing to report in respect of the following matters where the
Companies Act 2006 requires us to report to you if, in our opinion:
• adequate accounting records have not been kept by the parent
company, or returns adequate for our audit have not been received
from branches not visited by us; or
• the parent company financial statements are not in agreement with
the accounting records and returns; or
• certain disclosures of directors remuneration specified by law are not
made; or
• we have not received all the information and explanations we require
for our audit.
Julien Rye (Senior Statutory Auditor)
For and on behalf of BDO LLP, Statutory Auditor
Manchester
United Kingdom
8 September 2017
BDO LLP is a limited Liability Partnership registered in England and
Wales (with registered Number: OC305127)
PAGE 31OTHER REPORTS | INDEPENDENT AUDITOR’S REPORT

FINANCIAL STATEMENTS
K3 CAPITAL GROUP PLCPAGE 32
Year Ended 31 May 2017 Restated for IFRS (see note 36)
2017 2016
Note £’000 £’000
Revenue 5 10,816 8,551
Distribution Costs (913) (645)
Administration expenses (6,200) (4,713)
EBITDA 4,463 3,215
Depreciation of tangible assets (47) (9)
Amortisation of intangible assets (9) (13)
AIM listing fees 11 (704) -
Operating Profit 7 3,703 3,193
Finance income 2 2
Finance costs 12 (100) (127)
Profit before taxation 3,605 3,068
Taxation 13 (823) (599)
Profit and total comprehensive income for the financial year 2,782 2,469
Attributable to the owners of the company 2,782 2,469
Earnings per share: 14
Basic and diluted EPS - based on the weighted average measure £0.27 £1.31
All the activities of the group are from continuing operations
CONSOLIDATED STATEMENT OF COMPREHENSIVE INCOMEFOR THE YEAR ENDED 31 MAY 2017

FINANCIAL | FINANCIAL STATEMENTS PAGE 33
CONSOLIDATED STATEMENT OF FINANCIAL POSITIONFOR THE YEAR ENDED 31 MAY 2017
31 May 2017 Restated for IFRS (see Note 36)
2017 2016 As at 1 June 2015
Note £000 £000 £000
ASSETS
Non-current assets
Intangible assets 15 3,978 2,853 2,847
Property, plant and equipment 16 146 31 13
Deferred tax assets 26 - - 120
Total non-current assets 4,124 2,884 2,980
Current assets
Trade and other receivables 18 105 48 41
Other financial assets 19 - 1,094 17
Other assets 20 286 440 99
Cash and cash equivalents 3,801 1,531 971
Total current assets 4,192 3,113 1,128
TOTAL ASSETS 8,316 5,997 4,108
Current liabilities
Trade and other payables 21 1,053 785 671
Borrowings 22 220 224 221
Other financial liabilities 23 - 1,500 -
Current tax liabilities 24 313 495 253
Deferred revenue 25 1,137 825 724
Total current liabilities 2,723 3,829 1,869
Non-current liabilities
Borrowings 22 211 431 655
Deferred tax liabilities 26 32 4 -
Total non-current liabilities 243 435 655
TOTAL LIABILITIES 2,966 4,264 2,524
NET ASSETS 5,350 1,732 1,584
EQUITYEquity attributable to owners of the Company:Issued capital and share premium 27 2,413 10 1,500
Capital redemption reserve - 1,500 1,500
Retained Earnings 2,937 222 (1,416)
TOTAL EQUITY 5,350 1,732 1,584
These financial statements were approved by the board of directors and authorised for issue on 8 September 2017, and are signed on behalf of the board by:
ANDREW MELBOURNE FCMA
Company Secretary
8 September 2017

PAGE 34
COMPANY STATEMENT OF FINANCIAL POSITIONFOR THE YEAR ENDED 31 MAY 2017
31 May 2017 2017 2016 As at 1 June 2015
Note £000 £000 £000
ASSETS
Non-current assets
Intangible assets 15 1,100 - -
Property, plant and equipment 16 - 12 -
Investments 17 5,597 5,597 5,597
Total non-current assets 6,697 5,609 5,597
Current assets
Trade and other receivables 18 18 - -
Other financial assets 19 - 1,675 -
Other assets 20 19 - -
Cash at bank and in hand 25 11 8
Total current assets 62 1,686 8
TOTAL ASSETS 6,759 7,295 5,605
Current liabilities
Trade and other payables 21 482 2,256 709
Borrowings 22 220 224 221
Other financial liabilities 23 - 1,500 -
Total current liabilities 702 3,980 930
Non-current liabilities
Borrowings 22 211 431 655
Total non-current liabilities 211 431 655
TOTAL LIABILITIES 913 4,411 1,585
NET ASSETS 5,846 2,884 4,020
EQUITY
Equity attributable to owners of the Company:
Issued capital and share premium 27 2,413 10 1,500
Capital redemption reserve - 1,500 1,500
Retained Earnings 3,433 1,374 1,020
TOTAL EQUITY 5,846 2,884 4,020
An income statement is not provided for the parent company as permitted by s408 of the Companies Act 2006.
The profit for the financial year of the parent company was £2,126,000 (2016: £1,185,000)
K3 CAPITAL GROUP PLC
These financial statements were approved by the board of directors and authorised for issue on 8 September 2017, and are signed on behalf of the board by:
ANDREW MELBOURNE FCMA
Company Secretary
8 September 2017

PAGE 35
CONSOLIDATED STATEMENT OF CHANGES IN EQUITYFOR THE YEAR ENDED 31 MAY 2017
Year Ended 31 May 2017 Share capital Share premium
Capital redemption
reserve
Retained earnings
Total
£000 £000 £000 £000 £000
Balance at 1 June 2015 (restated for IFRS) 1,500 - 1,500 (1,416) 1,584
Profit and total comprehensive income for the year - - - 2, 469 2,469
Transactions with owners
Issue of ordinary share captial - 10 - - 10
Cancellation of subscribed capital
- 2,499,750,000 Ordinary A (250) - - - (250)
- 2,499,750,000 Ordinary B (250) - - - (250)
Reclassification of preference shares from equity to liabilities (1,000) - - - (1,000)
Dividends - - - (831) (831)
Balance at 31 May 2016 (restated for IFRS) - 10 1,500 222 1,732
Profit and total comprehensive income for the year - - - 2,782 2,782
Transactions with owners
Issue of ordinary share capital 22 2,078 - - 2,100
Bonus issue of ordinary share capital 400 - - (400) -
Redemption of preference shares - - 1,500 (1,500) -
Cancellation of subscribed capital - (10) (3,000) 3,010 -
AIM listing fees - (87) - - (87)
Dividends - - - (1,177) (1,177)
As at 31 May 2017 422 1,991 - 2,937 5,350
FINANCIAL | FINANCIAL STATEMENTS

PAGE 36
COMPANY STATEMENT OF CHANGES IN EQUITYFOR THE YEAR ENDED 31 MAY 2017
Year Ended 31 May 2017 Share capital Share premium
Capital redemption
reserve
Retained earnings
Total
£000 £000 £000 £000 £000
Balance at 1 June 2015 1,500 - 1,500 1,020 4,020
Profit and total comprehensive income for the year - - - 1,185 1,185
Transactions with owners:
Issue of ordinary share captial - 10 - - 10
Cancellation of subscribed capital
- 2,499,750,000 Ordinary A (250) - - - (250)
- 2,499,750,000 Ordinary B (250) - - - (250)
Reclassification of preference shares from equity to liabilities (1000) - - - (1,000)
Dividends - - - (831) (831)
At 31 May 2016 - 10 1,500 (1,374) 2,884
Profit and total comprehensive income for the year - - - 2,126 2,126
Transactions with owners:
Issue of ordinary share capital 22 2,078 - - 2,100
Bonus issue of ordinary share capital 400 - - (400) -
Redemption of preference shares - - 1,500 (1,500) -
Cancellation of subscribed capital - (10) (3,000) 3,010 -
AIM listing fees - (87) - - (87)
Dividends - - - (1,177) (1,177)
At 31 May 2017 422 1,991 - 3,433 5,846
K3 CAPITAL GROUP PLC

PAGE 37
CONSOLIDATED STATEMENT OF CASH FLOWSFOR THE YEAR ENDED 31 MAY 2017Year Ended 31 May 2017 Restated for IFRS
2017 2016
Note £000 £000
Cash flows from operating activitiesProfit for the financial year 2,782 2,469
Adjustments for:
Depreciation and amortisation 7 56 22
Finance income (2) (2)
Finance costs 12 100 127
Income tax expense 13 823 599
3,759 3,215
Movement in working capital:(Increase) / decrease in trade and other receivables 18 (57) 62
Decrease / (increase) in other assets 154 (341)
Increase in trade and other payables 21 266 33
Increase in deferred revenue 25 312 101
Cash generated from operations 4,434 3,070
FInance costs paid (25) (27)
Finance income received 2 2
Income taxes paid (977) (233)
Net cash from operating activities 3,434 2,812
Investing activitiesPurchase of property, plant and equipment 16 (164) (27)
Proceeds from sale of property, plant and equipment 3 -
Purchase of intangible assets 15 34 (19)
Purchase of intangible assets arising from business combinations 15 (1,100) -
Amounts advanced to related parties 19 (600) (1,077)
Repayments by related parties 19 1,694 -
Net Cash used in investing activities (201) (1,123)
Financing activitiesProceeds from issue of shares 27 2,100 10
Payments of share issue costs (87) -
Redemption of preference shares 23 (1,500) -
Repayment fo bank borrowings 22 (224) (21)
Dividends paid to owners of the Company 30 (1,177) (831)
Dividends paid on preference shares classed as liabilities 30 (75) (100)
Net cash used in financing activities (963) (1,142)
Net increase in cash and cash equivalents 2,270 560
Cash and cash equivalents at beginning of year 1,531 971
Cash and equivalents at end of year 3,801 1,531
FINANCIAL | FINANCIAL STATEMENTS

PAGE 38
COMPANY STATEMENT OF CASH FLOWSFOR THE YEAR ENDED 31 MAY 2017
K3 CAPITAL GROUP PLC
Year Ended 31 May 2017 2017 2016
Note £000 £000
Cash flows from operating activitiesProfit for the financial year 2,126 1,185
Adjustments for:Income from shares in group undertakings (3,050) (1,300)
Finance costs 94 126
Movement in working capital:Increase in trade and other receivables 18 (18) -
Increase in other assets 20 (19) -
Increase in trade and other payables 21 2,063 2,847
Cash generated from operations
FInance costs paid (19) (26)
Net cash generated from operating activities 1,177 2,832
Investing activitiesPurchase of property, plant and equipment - (12)
Purchase of intangible assets arising from business combinations 15 (1,100) -
Amounts advanced to related parties 19 (600) (1,675)
Settlement of amounts due from related parties 19/21 1,500 -
Net Cash used in investing activities (200) (1,687)
Financing activitiesProceeds from issue of shares 27 2,100 10
Payments of share issue costs (87) -
Redemption of preference shares 23 (1,500) -
Repayment of bank borrowings 22 (224) (221)
Dividends paid to owners of the Company 30 (1,177) (831)
Dividends paid on preference shares classed as liabilities 30 (75) (100)
Net cash used in financing activities (963) (1,142)
Net increase in cash and cash equivalents 14 3
Cash and cash equivalents at beginning of year 11 8
Cash and equivalents at end of year 25 11

PAGE 39FINANCIAL | FINANCIAL STATEMENTS
NOTES TO THE FINANCIAL STATEMENTS

PAGE 40
NOTES TO THE FINANCIAL STATEMENTSFOR THE YEAR ENDED 31 MAY 2017
General Information
K3 Capital Group PLC (formerly K3 Capital Group Limited) is incorporated in England and Wales under the Companies Act, listed in the Alternative Investment Market, with the registered number 06102618. The address of the registered office is KBS House, 5 Springfield Court, Summerfield Road, Bolton, BL3 2NT.
The principal activity K3 Capital Group PLC to act as Business Sales Specialists.
Presentation of financial statements
The financial statements have been prepared in accordance with International Financial Reporting Standards, International Accounting Standards and Interpretations (collectively ‘’IFRSs’’) issued by the International Accounting Standards Board (‘’IASB’’) as adopted by the European Union (‘’adopted IFRSs’’).
The financial statements have been presented in Pounds Sterling (£, GBP) as this is the currency of the primary economic environment that the Company operates in.
Accounting Policies
The principal accounting policies applied in the preparation of the financial statements are set out below. These policies have been consistently applied to all periods presented, and in preparing an opening IFRS consolidated statement of financial position and company statement of financial position at 1 June 2015 for the purposes of transition to adopted IFRSs.
Basis of Accounting
The financial statements have been prepared on the historical cost basis except as stated. Historical cost is generally based on the fair value of consideration given in exchange for goods and services.
Basis of consolidation
The group financial statements consolidate, those of the company and its subsidiaries (together referred to as the “group”).
Subsidiary undertakings acquired are included using the acquisition method of accounting. Under this method the consolidated statement of comprehensive income, consolidated statement of financial position and consolidated statement of cash flows included the results and cash flows of subsidiaries from the date of acquisition and to the date of sale outside the group in the case of disposals of subsidiaries.
1.
2.
3.
K3 CAPITAL GROUP PLC

PAGE 41
NOTES TO THE FINANCIAL STATEMENTSFOR THE YEAR ENDED 31 MAY 2017 (CONTINUED)
Where the company has control over an investee, it is classified as a subsidiary. The company controls an investee if all three of the following elements are present: power over the investee, exposure to variable returns from the investee, and the ability of the investor to use its power to affect those variable returns. Control is reassessed whenever facts and circumstances indicate that there may be a change in any of these elements of control.
Transition to adopted IFRSs
The Group transitioned from UK GAAP to adopted IFRSs as at 1 June 2015 and consequently has applied IFRS 1, adjusted amounts reported previously in financial statements prepared in accordance with generally accepted accounting practice in the UK (UK GAAP). These financial statements for the year ended 31 May 2017 are the first the Group has prepared in accordance with adopted IFRSs. For first time adoption of International Financial Reporting Standards, an explanation of how the transition to adopted IFRSs has affected the reported financial position, financial performance and cash flows of the group is provided in note 36.
New standards, amendments to and interpretations to published standards not yet effective
There were no new standards, interpretations or amendments effective for the first time for periods beginning on or after 1 January 2016 that had a significant effect on the Group’s financial statements.
As at 31 May 2017, the following Standards and Interpretations which have not been applied in this financial information were in issue but not yet effective (and in some cases had not yet been adopted by the EU):IFRS 9, Financial instrumentsIFRS 15, Revenue from contracts with customersIFRS 16, LeasesDisclosure Initiative: Amendments to IAS 7Clarifications to IFRS 15 revenue from Contracts with CustomersClassification and Measurement of Share-based Payment Transactions (Amendments to IFRS 2)Annual Improvements to IFRSs (2014-2016 Cycle)
The directors are currently considering the potential impact of adoption of these standards and interpretations in future periods on the consolidated financial statements of the Group.
In respect of the above, the directors are specifically reviewing the requirements of IFRS 15, which will become effective for the 31 May 2019 year end. In particular an assessment is ongoing around specific elements within the standard’s guidance relating to recognition of revenue at a point in time versus over time, client payments received in advance of services being performed, and contingent pricing. Similarly, the directors are currently reviewing the impact of IFRS 16 and IFRS 9 which will become effective for the 31 May 2020 year end. At this point it is not practicable for the directors to provide a reasonable estimate of the effect of IFRS 9 as their detailed review of this standard is ongoing. Were IFRS 16 effective for the current year end, a lease asset and liability of £0.5m would be recognised on the balance sheet in respect of operating leases committed to. Annual lease costs would no longer be incurred, replaced by interest costs on the lease liability and depreciation costs on the lease asset.
FINANCIAL | FINANCIAL STATEMENTS

PAGE 42
NOTES TO THE FINANCIAL STATEMENTSFOR THE YEAR ENDED 31 MAY 2017 (CONTINUED)
Going Concern
The financial statements have been prepared on the basis that the Group will continue as a going concern.
After making enquiries, the Directors consider that the Group has adequate resources and committed borrowing facilities to continue in operational existence for the foreseeable future. Consequently, they have adopted the going concern basis in preparing the financial statements.
Revenue Recognition
Revenue comprises revenue recognised by the Group in respect of services supplied during the year, exclusive of Value Added Tax.
Revenue from the rendering of services is measured by reference to the stage of completion of the service transaction at the end of the reporting period provided that the outcome can be reliably estimated. When the outcome cannot be reliably estimated, revenue is recognised only to the extent that expenses recognised are recoverable. Further detail on revenue recognition policies is provided in the critical accounting estimates section in Note 4.
Employee Benefits
i. Short-term benefits Wages, salaries, paid annual leave and sick leave, bonuses and non-monetary benefits are accrued in the period in which the associated services are rendered by employees of the Group.
ii. Defined Contribution plans The Group operates a defined contribution pension scheme for employees. The assets of the scheme are held separately from those of the Group. The annual contributions are charged to the Statement of Comprehensive Income. The Group also contributes to the personal pension plans of the Directors at the Group’s discretion.
Operating Profit
Operating profit is stated after all expenses, including those considered to be exceptions, but before finance income or expenses. Distribution costs relate to marketing expenses. All other operational costs are classified as administrative expenses.
EBITDA
EBITBA is utilised as a key performance indication for the group and is calculated utilising profit before tax, adjusted for finance income and costs, amortisation and depreciation on non-current assets. It is also adjusted for AIM listing fees incurred in the year ended 31 May 2017.
K3 CAPITAL GROUP PLC

PAGE 43
CONSOLIDATED STATEMENT OF COMPREHENSIVE INCOMEFOR THE YEAR ENDED 31 MAY 2017
Normalised EDITDA reflects the illustrative historical cost savings of having Triskell and KBS CF personnel as employees of the group, under the arrangements in force during the period covered by the financial statements compared by the consultancy fees paid to Triskell and KBS CF during each period. Further details of the arrangements with Triskell and KBS CF are set out in note 29.
Operating Lease Agreements
Rentals applicable to operating leases where substantially all of the benefits and risks of ownership remain with the lessor are charged against profits on a straight line basis over the full period of the lease. Any lease incentives are spread on a straight line basis over the full period of the lease.
Business Combinations and Goodwill
Business combinations are accounted for using the acquisition method. The cost of an acquisition is measured as the aggregate of the consideration transferred, measured at acquisition date fair value and the amount of any non-controlling interest in the acquiree. Acquisition related costs are expensed as incurred and included in administrative expenses.
When the Group acquires a business, it assesses the assets and liabilities assumed for appropriate classification and designation in accordance with the contractual terms, economic circumstances and pertinent conditions as at the acquisition date.
Goodwill is measured as the excess of the aggregate of the consideration transferred and the amount recognised for the non-controlling interest over the fair value of the identifiable net assets acquired and liabilities assumed.
After initial recognition, goodwill is not amortised and is measured at cost less any accumulated impairment losses. For the purpose of impairment testing, goodwill acquired in a business combination is, from the acquisition date, allocated to a cash generating unit that is expected to benefit from the combination. For each period covered in these financial statements the Group has one cash generating unit, related to Business Sales.
Other Intangible Assets
The group classifies website costs as an intangible asset. Such intangible assets are initially recorded at cost, and are subsequently stated at cost less any accumulated amortisation and impairment losses.
FINANCIAL | FINANCIAL STATEMENTS
Year Ended 31 May 2017 2017 2016
£000 £000
EBITDA 4,463 3,216
Transaction fees paid to Triskell LLP 416 920
Remuneration due under employment terms (172) (383)
Normalised EBITDA 4,707 3,753

PAGE 44
NOTES TO THE FINANCIAL STATEMENTSFOR THE YEAR ENDED 31 MAY 2017 (CONTINUED)
Amortisation is calculated so as to write off the cost of an asset, less its estimated residual value, over the useful economic life of that asset as follows:
Website costs - 33% straight line
If there is an indication that there has been a significant change in amortisation rate, useful life or residual value of an intangible asset, the amortisation is revised prospectively to reflect the new estimates.Property, Plant and Equipment
Property, plant and equipment is initially recorded at cost, and subsequently stated at cost less any accumulated depreciation and impairment losses.
Depreciation is calculated so as to write off the cost or valuation of an asset, less its residual value, over the useful economic life of that asset as follows:
Long leasehold property - Over the lease termFixtures and fittings - 33% straight lineEquipment - 33% straight line
Investments
Fixed asset investments are initially recorded at cost, and subsequently stated at cost less any accumulated impairment losses.
Financial Instruments
A financial instrument is any contract that gives rise to a financial asset of one entity and a financial liability or equity instrument of another entity.
Financial assetsInitial recognition and measurement
The Group’s financial assets include cash and cash equivalents, trade and other receivables that arise from the business operations, as well as non-derivative other financial assets.
Cash and cash equivalents comprise deposits with banks and bank and cash balances, subject to insignificant risk of changes in value. All other financial assets are recognised initially at fair value and subsequently at amortised cost using the effective interest method, less provision for impairment. Interest is recognised by applying the effective interest method, except for short term receivables when the recognition of interest would be immaterial.
K3 CAPITAL GROUP PLC

PAGE 45
NOTES TO THE FINANCIAL STATEMENTSFOR THE YEAR ENDED 31 MAY 2017 (CONTINUED)
Financial liabilities and equity instrumentsClassification as debt or equity
Financial liabilities and equity instruments issued by the Company are classified according to the substance of the contractual arrangements entered into and the definitions of a financial liability and an equity instrument.
Equity instruments
An equity instrument is any contract that evidences a residual interest in the assets of the Company after deducting all of its liabilities. Equity instruments are recorded at the proceeds received, net of direct issue costs.
Financial liabilities and equity components
Debt and equity instruments are classified as either financial liabilities or as equity in accordance with the substance of the contractual arrangement and in conjunction with the application of IFRS. Financial instruments issued by the Group are treated as equity only to the extent that they meet the following two conditions:
a) they include no contractual obligations upon the Company (or Group as the case may be) to deliver cash or other financial assets or to exchange financial assets or financial liabilities with another party under conditions that are potentially unfavourable to the Company (or Group); andb) where the instruments will or may be settled in the Company’s own equity instruments, it is either a non-derivative that includes no obligation to deliver a variable number of the Company’s own equity instruments or is a derivative that will be settled by the Company’s exchanging a fixed amount of cash or other financial assets for a fixed number of its own equity instruments.
To the extent that this definition is not met, the proceeds of issue are classified as a financial liability. Where the instrument so classified takes the legal form of the Company’s own shares, the amounts presented in these financial statements for called up share capital and share premium account exclude amounts in relation to these shares.
Preference shares that carry a mandatory dividend that represents a market rate of interest at the issue date are presented in other financial liabilities. The dividends on these preference shares are recognised in the income statement as interest expense on an amortised cost basis using the effective interest method.
Derecognition of financial liabilities
The Group derecognises financial liabilities when, and only when, the Group’s obligations are discharged, cancelled or they expire.
FINANCIAL | FINANCIAL STATEMENTS

PAGE 46
NOTES TO THE FINANCIAL STATEMENTSFOR THE YEAR ENDED 31 MAY 2017 (CONTINUED)
Offsetting of financial instrumentsFinancial assets and financial liabilities are offset and the net amount reported in the statement of financial position if there is a currently enforceable legal right to offset the recognised amounts and there is an intention to settle on a net basis, or to realise the assets and settle the liabilities simultaneously.
Impairment of assets
Financial assetsA financial asset is assessed at each reporting date to determine whether there is any objective evidence that it is impaired. A financial asset is considered to be impaired if objective evidence indicates that one or more events have had a negative effect on the estimated future cash flows of that asset.
An impairment loss in respect of a financial asset measured at amortised cost is calculated as the difference between its carrying amount, and present value of the estimated future cash flows discounted at the original effective interest rate. An impairment loss is recognised in profit or loss.
Non-financial assetsThe carrying amounts of the Group’s non-financial assets, other than deferred tax assets, are reviewed at each reporting date to determine whether there is any indication of impairment. If any such indication exists, then the asset’s recoverable amount is estimated. For assets that have indefinite lives, the recoverable amount is estimated at each reporting date.
The recoverable amount of an asset or cash-generating unit is the greater of its value in use and its fair value less costs to sell. In assessing value in use, the estimated future cash flows are discounted to their present value using a pre-tax discount rate that reflects current market assessments of the time value of money and risk specific to the asset. For the purpose of impairment testing, assets are grouped together into the smallest group of assets that generates cash inflows from continuing use that are largely independent of the cash inflows of other assets or groups of assets. The goodwill acquired in a business combination, for the purpose of impairment testing, is allocated to cash-generating units that are expected to benefit from the synergies of the combination.
An impairment loss is recognised if the carrying amount of an asset or its cash generating unit exceeds its estimated recoverable amount. Impairment losses are recognised in the profit or loss. Impairment losses recognised in respect of cash generating units are allocated first to reduce the carrying amount of any goodwill allocated to the units and then to reduce the carrying amount of the other assets in the unit (or group of units) on a pro rata basis.
Income Tax
Income tax expense represents the sum of the tax currently payable and deferred tax.
The tax currently payable is based on taxable profit for the year. Taxable profit differs from profit as reported in the statement of
K3 CAPITAL GROUP PLC

PAGE 47
NOTES TO THE FINANCIAL STATEMENTSFOR THE YEAR ENDED 31 MAY 2017 (CONTINUED)
comprehensive income because it excludes items of income or expense that are taxable or deductible in other years and it further excludes items that are not taxable or tax deductible.
The Group’s liability for current tax is calculated using tax rates (and tax laws) that have been enacted or substantively enacted by the end of the financial period.
Deferred tax is recognised in respect of all timing differences that have originated but not reversed at the balance sheet date where transactions or events have occurred at that date that will result in an obligation to pay more, or a right to pay less or to receive more tax.
Deferred tax assets are recognised only to the extent that the directors consider that it is more likely than not that there will be suitable taxable profits from which the future reversal of the underlying timing differences can be deducted.
Deferred tax is measured on an undiscounted basis at the tax rates that are expected to apply in the periods in which timing differences reverse, based on tax rates and laws enacted or substantively enacted at the balance sheet date
Share Capital
Ordinary shares are recorded at nominal value and proceeds received in excess of nominal value of shares issued, if any, are accounted for as share premium. Both ordinary shares and share premium are classified as equity. Costs incurred directly to the issue of shares are accounted for as a deduction from share premium, otherwise they are charged to the Statement of Comprehensive Income.
Dividends
Dividends are recognised when they become legally payable. In the case of interim dividends to equity shareholders, this is when declared by the directors. In the case of final dividends, this is when approved by the shareholders at the AGM.
Events After the Balance Sheet Date
Post period-end events that provide additional information about the Group’s position at the reporting period end are reflected in the financial statements. Post period-end events that are not adjusting events are disclosed in the notes when material.
Related Parties
Parties are considered to be related if one party has the ability (directly or indirectly) to control the other party or exercise significant influence over the other party in making financial and operating decisions. Parties are also considered related if they are subject to common control or common significant influence. Related parties may be individuals or corporate entities.
FINANCIAL | FINANCIAL STATEMENTS

PAGE 48
NOTES TO THE FINANCIAL STATEMENTSFOR THE YEAR ENDED 31 MAY 2017 (CONTINUED)
Contingent Liabilities and Contingent Assets
A contingent liability is a possible obligation that arises from past events and whose existence will only be confirmed by the occurrence or non-occurrence of one or more uncertain future events not wholly within the control of the Company. It can also be a present obligation arising from past events that is not recognised because it is not probable that outflow of economic resources will be required or the amount of obligation cannot be measured reliably.
A contingent liability is not recognised but is disclosed in the notes to the accounts. When a change in the probability of an outflow occurs so that the outflow is probable, it will then be recognised as a provision.
A contingent asset is a possible asset that arises from past events and whose existence will be confirmed only by the occurrence or non-occurrence of one or more uncertain events not wholly within the control of the Company. Contingent assets are not recognised but are disclosed in the notes to the accounts when an inflow of economic benefits is probable. When inflow is virtually certain, an asset is recognised.
Exceptional Items
Exceptional items are disclosed separately in the financial statements in order to provide further understanding of the financial performance of the entity. They are material items of income or expense that have been shown separately because of their nature or amount.
Critical Accounting Estimates and Sources of Estimation Uncertainty
In applying the accounting policies, the directors may at times require to make critical accounting judgements, estimates and assumptions about the carrying amount of assets and liabilities. These estimates and assumptions, when made, are based on historical experience and other factors that the directors considers are relevant.
The key estimates and assumptions concerning the future and other key sources of estimation uncertainty at the end of the financial year, that have significant risk of causing a material adjustment to the carrying amounts of assets and liabilities within the next financial year are reviewed are as stated below
Revenue recognition
Revenue is recognised by the Group in respect of services supplied to clients of the Group in presenting the clients’ sales opportunity to market, sourcing potential acquirers and project managing transactions to completion. In relation to the services provided, a non-contingent fee (“retainer fee”) is typically paid by clients upon commencement of a contract with the Group, which is deferred and recognised as revenue over the period in which the initially specified services are provided. The directors are required to estimate the period over which these services are to be provided and accordingly recognise revenue based on that estimate. This leads to the deferral of revenue at period ends, which the directors assess for reasonableness based on the stage of completion of services at that point in time. A contingent fee (“transaction fee”) is payable upon the completion of a transaction. This fee is typically a percentage of the transaction value and therefore
4.
K3 CAPITAL GROUP PLC

PAGE 49
NOTES TO THE FINANCIAL STATEMENTSFOR THE YEAR ENDED 31 MAY 2017 (CONTINUED)
varies by client. Revenue on the transaction fee element of the contract is only recognised when the outcome of the transaction can be reliably estimated by management, which is on completion of the transaction.
Linked to the non-contingent fee at the commencement of a contract is a commission fee payable to employees for sourcing the contract. The commission costs are similarly deferred and recognised over the same period as the revenue. Commission costs deferred are accounted for within prepayments.
Assessing Goodwill for Potential Impairment
Determining whether goodwill is impaired requires an estimation of the value in use of the cash-generating units to which the assets have been allocated. The value in use calculation requires management to estimate the future cash flows expected to arise from the cash-generating unit and a suitable discount rate in order to calculate present value (see note 15).
Classification of Leases
The directors are required to make a judgement on the appropriate classification of lease agreements entered into. These judgements depend on an assessment of whether the risks and rewards of ownership have been transferred from the lessor to the lessee on a lease by lease basis.
Revenue
The Group’s revenue arises from the provision of services in fulfilling the principal activities. An analysis of revenue by subsidiary company is shown below:
A further breakdown of revenue by type is shown below:
5.
Revenue 2017 2016
Year Ended 31 May 2017 £000 £000
Non-contingent fees 5,056 4,345
Transaction fees 5,760 4,206
10,816 8,551
FINANCIAL | FINANCIAL STATEMENTS
Revenue 2017 2016
Year Ended 31 May 2017 £000 £000
KBS Corporate Sales Limited 5,816 4,714
KBS Corporate FInance Limited 3,732 2,788
Knightsbridge Business Sales Limited 1,268 1,049
10,816 8,551

PAGE 50
NOTES TO THE FINANCIAL STATEMENTSFOR THE YEAR ENDED 31 MAY 2017 (CONTINUED)
Segment Information
The Group has 3 operating segments based on the subsidiaries identified above, but one reporting segment due to the nature of services provided across the whole Group being the same, being business sales derived solely from the UK. The Group’s revenues, costs, assets, liabilities and cash flows are therefore totally attributable to this reporting segment.
Internal management reports are reviewed by the directors on a monthly basis, including revenue information by subsidiary. Such revenue information alone does not constitute sufficient information upon which to base resource allocation decisions.
Performance of the segment is assessed based on a number of financial and non-financial KPI’s as well as on EBITDA.
The Group is not reliant on a major customer or group of customers.
As the Group only has one reportable segment, all segmented information is provided by the consolidated income statement, the consolidated statement of financial position, the consolidated statement of changes in equity and the consolidated statement of cash flows.
Operating Profit
Operating profit or loss is stated after charging:
6.
7.
Year Ended 31 May 2017 2017 2016
£000 £000
Operating profit or loss is stated after charging:
Amortisation of intangibles - website costs 9 13
Depreciation of owned assets 47 9
Auditor remuneration 143 14
Impairment loss on trade receivables - 10
Operating lease charge 124 108
K3 CAPITAL GROUP PLC

PAGE 51
NOTES TO THE FINANCIAL STATEMENTSFOR THE YEAR ENDED 31 MAY 2017 (CONTINUED)
Auditors Remuneration
The analysis of the Auditor’s remuneration is as follows:
No non-audit services were provided on a contingent fee basis. In 2017, fees payable to the Auditor for other services are in respect of work required for the Group to complete its IPO. BDO were selected to undertake this work after consideration of the impact this may have on their independence, which it was concluded would not be impinged by undertaking the work. Fees of this type are ad hoc in nature and occur in respect of major events. Any such further occurrence will require Audit Committee approval.
8.
Employee Benefit Expense 2017 2016
Year Ended 31 May 2017 £000 £000
Beever & StruthersFees payable to the Company’s Auditor and their associates for the audit of the Company’s annual accounts
- 14
BDO LLP
Fees payable to the Company’s Auditor and their associates for the audit of the Company’s annual accounts
30 -
Fees payable to the Company’s Auditor and their associates for other services to the Group
– the audit of the Company’s accounts to 30 November 2016 for the purposes of the AIM listing
15 -
– non-audit services: IPO reporting accountant services
98 -
Total Auditors Remuneration 143 14
FINANCIAL | FINANCIAL STATEMENTS

PAGE 52
NOTES TO THE FINANCIAL STATEMENTSFOR THE YEAR ENDED 31 MAY 2017 (CONTINUED)
Employee Benefit Expense
The average number of persons employed by the Group during the year, including the directors, amounted to:
The aggregate payroll costs incurred during the year by the Group, relating to the above, were:
The aggregate payroll costs incurred during the year by the Company, relating to the above, were:
The average number of persons emplyed by the Company during the year, including Directors amounted to:
9.
Year Ended 31 May 2017 2017 2016
£000 £000
Wages and salaries 3,321 2,600
Social security costs 291 256
Other pension costs 14 9
3,626 2,865
Year Ended 31 May 2017 2017 2016
No. No.
Management 8 6
Sales 41 33
Marketing / Administration 46 36
95 75
K3 CAPITAL GROUP PLC
Year Ended 31 May 2017 2017 2016
£000 £000
Wages and salaries 80 -
Bonuses 165 -
Social security costs 33 -
278 -
Year Ended 31 May 2017 2017 2016
No. No.
Management 1 -

PAGE 53
NOTES TO THE FINANCIAL STATEMENTSFOR THE YEAR ENDED 31 MAY 2017 (CONTINUED)
Directors’ and Key Management RemunerationGroupThe directors aggregate remuneration in respect of qualifying services was:
Remuneration of highest paid director in respect of qualifying services:
CompanyThe directors aggregate remuneration in respect of qualifying services was:
Remuneration of highest paid director in respect of qualifying services:
The directors are considered to be key management personnel.
10.
Year Ended 31 May 2017 2017 2016
Group £000 £000
Fees 73 -
Wages and salaries 247 323
Bonuses 216 205
Social securtity costs 60 66
Pension contributions 1 1
597 595
FINANCIAL | FINANCIAL STATEMENTS
Year Ended 31 May 2017 2017 2016
Group £000 £000
Wages and salaries 124 100
Bonuses 121 82
Social securtity costs 33 22
278 204
Year Ended 31 May 2017 2017 2016
£000 £000
Wages and salaries 80 -
Bonuses 165 -
Social securtity costs 33 -
278 -
Year Ended 31 May 2017 2017 2016
£000 £000
Wages and salaries 31 -
Bonuses 80 -
Social securtity costs 15 -
126 -

PAGE 54
NOTES TO THE FINANCIAL STATEMENTSFOR THE YEAR ENDED 31 MAY 2017 (CONTINUED)
Exceptional Items
Finance costs
Tax on Profit
Major components of tax expense
11.
12.
13.
Year Ended 31 May 2017 2017 2016
£000 £000
Interest on bank loans 25 27
Dividends paid on shares classed as debt 75 100
100 127
The dividend above represents the 10 per cent coupon on the Preferred A Ordinary shares. B Preference share dividends were waived by the shareholder.
Year Ended 31 May 2017 2017 2016
£000 £000
Current tax:UK current tax expense 795 499
Adjustments in respect of prior periods - (24)
Total current tax 795 475
Deferred tax:Origination and reversal of timing differences 28 4
Impact of change in tax rate - 5
Adjustments in respect of prior periods - 115
Tax on profit 823 599
K3 CAPITAL GROUP PLC
Year Ended 31 May 2017 Group Company
2017 2016 2017 2016
£000 £000 £000 £000
AIM listing fees 704 - 704 -
Exceptional items incurred in the year are in relation to costs of converting the Company from a Limited Company to a PLC and the subsequent admission of the company to trading on AIM during the year. Total costs incurred were £791,000, with £87,000 charged to share premium as being directly related to newly issued shares.

PAGE 55
FINANCIAL STATEMENTSNOTES TO THE FINANCIAL STATEMENTSFOR THE YEAR ENDED 31 MAY 2017 (CONTINUED)
Reconciliation of tax expense
The tax assessed on the profit on ordinary activities for the year is higher than (2016: lower than) the standard rate of corporation tax in the UK of 19.83% (2016: 20%).
Changes Affecting Future Tax Rates
In the Budget on 8 July 2015, the Chancellor announced additional planned reductions to 19 per cent, with effect from 1 April 2017, and to 18 per cent, with effect from 1 April 2020. This rate was subsequently revised downwards to 17 per cent, with effect from 1 April 2020 in the 2016 Budget. These changes were substantially enacted on 26 October 2015 and 6 September 2016 respectively.
Earnings per Share
Basic earnings per share amounts are calculated by dividing the profit for the year attributable to equity holders of the Company by the weighted average number of ordinary shares outstanding during the period.
The following reflects the income and share data used in the basic and diluted earnings per share computations:
14.
Reconciliation of tax expense 2017 2016
Year Ended 31 May 2017 £000 £000
Profit on ordinary activities before taxation 3,605 3,068
Profit on ordinary activities by rate of tax 715 614
Adjustment to tax charge in respect of prior periods - (24)
Effect of expenses not deductable for tax purposes 123 28
Effect of capital allowances and depreciation 1 -
Effect of different UK tax rates on some earnings - 5
Utilisation of tax losses 2 (4)
Effect of research and development relief (18) (20)
Tax on profit 823 599
Year Ended 31 May 2017 2017 2016
£000 £000
Net profit attributable to equity holders of the Company 2,782 2,469
Initial weighted average of ordinary shares 10,305,651 1,879,978
Basic earnings per share 26.99p 131.33p
There are no share options in effect during the current prior years. As such there is no dilution of earnings per share.
FINANCIAL | FINANCIAL STATEMENTS

PAGE 56
NOTES TO THE FINANCIAL STATEMENTSFOR THE YEAR ENDED 31 MAY 2017 (CONTINUED)
Intangible AssetsGroup
Company
15.
Year Ended 31 May 2017 Goodwill Website Costs Total
£000 £000 £000
CostAt 1 June 2015 4,712 57 4,769
Additions - 19 19
At 31 May 2016 4,712 76 4,788
Additions - 34 34
Acquisitions through business combinations 1,100 - 1,100
Disposals - (20) (20)
At 31 May 2017 5,812 90 5,902
Amortisation
At 1 June 2015 1,885 37 1,922
Charge for the year - 13 13
At 31 May 2016 1,885 50 1,935
Charge for the year - 9 9
Amortisation on disposals - (20) (20)
At 31 May 2017 1,885 39 1,924
Carrying amountAt 31 May 2017 3,927 51 3,978
At 31 May 2016 2,827 26 2,853
At 31 May 2015 2,827 20 2,847
K3 CAPITAL GROUP PLC
Year Ended 31 May 2017 Goodwill
£000
Cost
At 1 June 2015, 31 May 2016
Acquisitions through business combinations 1,100
At 31 May 2017 1,100
Amortisation
At 1 June 2015, 31 May 2016 and 31 May 2017 -
Carrying amount
At 31 May 2017 1,100At 31 May 2016 -
At 31 May 2015 -

PAGE 57
NOTES TO THE FINANCIAL STATEMENTSFOR THE YEAR ENDED 31 MAY 2017 (CONTINUED)
Intangible Assets (continued)
£2,827,000 of goodwill relates to the cash generating unit that arose from the business combination that took place when the Group acquired KBS Corporate Sales Limited in the year ended 31 May 2008 and £1,100,000 relates to the business combination when the company acquired the trade and assets of Triskell LLP in the year ended 31 May 2017 (see note 32).
As explained in the accounting policies, the Group tests goodwill annually for impairment, or more frequently if there are indications that goodwill might be impaired. The recoverable amounts of the goodwill are determined by value-in-use calculations. The key assumptions for the value-in-use calculation are those regarding discount rates and growth rates as well as expected changes to costs and the forecast level of demand from clients wishing to engage in the group’s services. For the purposes of the impairment review, the goodwill acquired in the year has been subsumed by the cash generating unit that is already reviewed by the directors in assessing future cash flows and monitoring the existing goodwill carrying value.
The key assumptions for the value-in-use calculation are shown below:
Management has estimated the discount rate taking account of the way the market would assess specific risks inherent within the Group’s estimated future cash-flows.
The growth rates used in the value in use calculation reflect the long term economic growth rates in the UK.
No impairment was identified and furthermore, a reasonably possible change in the assumptions applied would not result in any impairment.
15.
Year Ended 31 May 2017 2017 2016
Period on which management approved forecasts are based 5 years 5 years
Growth rate applied beyond approved forecast period 2% 2%
Pre-tax discount rate 15% 15%
FINANCIAL | FINANCIAL STATEMENTS

PAGE 58
NOTES TO THE FINANCIAL STATEMENTSFOR THE YEAR ENDED 31 MAY 2017 (CONTINUED)
Tangible AssetsGroup
16.
Year Ended 31 May 2017 Long Lease-hold property
Fixtures and fittings
Equipment Total
£000 £000 £000 £000
CostAt 1 June 2015 - 75 206 281Additions 12 1 14 27
At 31 May 2016 12 76 220 308
Additions - 98 66 164
Disposals - (76) (188) (264)
At 31 May 2017 12 98 98 208
Depreciation
At 1 June 2015 - 74 194 268
Charge for the year - 1 8 9
At 31 May 2016 - 75 202 277
Charge for the year 3 21 23 47
Disposals - (76) (186) (262)
At 31 May 2017 3 20 39 62
Carrying amountAt 31 May 2017 9 78 59 146
At 31 May 2016 12 1 18 31
At 31 May 2015 - 1 12 13
CompanyLong leasehold
property£000
CostAt 1 June 2016 12Transferred to KBS Corporate Sales Limited (12)
At May 2017 -
DepreciationAt 1 June 2015, 31 May 2016 and 31 May 2017 -
Carrying amountAt 31 May 2017 -
At 31 May 2016 12
At 31 May 2015 -
K3 CAPITAL GROUP PLC

PAGE 59
NOTES TO THE FINANCIAL STATEMENTSFOR THE YEAR ENDED 31 MAY 2017 (CONTINUED)
Investments
The group has no investments.
Company
Subsidiaries, associates and other investments
Details of the investments in which the parent company has an interest in are as follows:
The Registered Office address of the subsidiaries is:
KBS House5 Springfield CourtSummerfield RoadBoltonEnglandBL3 2NT
17.
Year Ended 31 May 2017 Shares in group undertakings
£000
Cost
At 1 Jun 2015, 31 May 2016 and 31 May 2017 5,597
Impairment
At 1 Jun 2015, 31 May 2016 and 31 May 2017 -
Carrying amountAt 1 Jun 2015, 31 May 2016 and 31 May 2017 5,597
Year Ended 31 May 2017 Class of Share Percentage of shares held
Subsidiary undertakings
KBS Corporate Sales Limited Ordinary shares 100
KBS Corporate Finance Limited Ordinary shares 100
Knightsbridge Business Sales Limited Ordinary shares 100
FINANCIAL | FINANCIAL STATEMENTS

PAGE 60
NOTES TO THE FINANCIAL STATEMENTSFOR THE YEAR ENDED 31 MAY 2017 (CONTINUED)
Trade and Other receivables
The carrying amount of trade and other receivables approximates to their fair value.
Other Financial Assets
The amounts owed by related parties are stated at the undiscounted amount as the amounts are repayable on demand. No interest is charged on the loans.
The directors’ loan account consists of amounts due from certain directors which are stated at the undiscounted amount. This was repaid by 23 February 2017. No interest was charged on the loan.
18.
19.
Year Ended 31 May 2017 Group Company
As at 1 June As at 1 June
2017 2016 2015 2017 2016 2015
£000 £000 £000 £000 £000 £000
Trade receivables 105 48 24 - - -
Allowance for doubtful debts - (10) - - - -
105 38 24 - - -
Other receivables - 10 17 18 - -
105 48 41 18 - -
Year Ended 31 May 2017 Group Company
As at 1 June As at 1 June
2017 2016 2015 2017 2016 2015
£000 £000 £000 £000 £000 £000
Amounts owed by group undertakings - - - - 775 -
Amounts owed by related parties - 194 17 - - -
Directors loan amounts - 900 - - 900 -
- 1,094 17 - 1,675 -
K3 CAPITAL GROUP PLC

PAGE 61
NOTES TO THE FINANCIAL STATEMENTSFOR THE YEAR ENDED 31 MAY 2017 (CONTINUED)
Other assets
There are no other assets which are past due but not impaired in any period.
Trade and Other Payables
The carrying amount of trade and other payables approximates to their fair value due to their short term nature.
The amounts due group undertakings/related parties are stated at the undiscounted amount as they are repayable on demand. No interest is paid/payable and the loans are not secured.
20.
21.
Year Ended 31 May 2017 Group Company
As at 1 June As at 1 June
2017 2016 2015 2017 2016 2015
£000 £000 £000 £000 £000 £000
Prepayments and accrued income 286 440 99 19 - -
Year Ended 31 May 2017 Group Company
As at 1 June As at 1 June
2017 2016 2015 2017 2016 2015
£000 £000 £000 £000 £000 £000
Trade payables 173 151 92 21 - --
Payments received on account - 11 46 - - -
Amounts due to to group undertakings - - - 314 2,256 707
Amounts due to related parties - 13 - - - -
Accruals 267 168 107 25 - 2
Other taxation and social security 608 419 384 122 - -
Other payables 5 23 42 - - -
1,053 785 671 482 2,256 709
FINANCIAL | FINANCIAL STATEMENTS

PAGE 62
NOTES TO THE FINANCIAL STATEMENTSFOR THE YEAR ENDED 31 MAY 2017 (CONTINUED)
Borrowings
The bank loans repayable in monthly instalments and are secured by fixed and floating charge over the assets of the companies within the group. Interest is charged at a combination of 3% above LIBOR and 3% above Base Rate.
Other Financial Liabilities
22.
23.
Year Ended 31 May 2017 Group Company
As at 1 June As at 1 June
2017 2016 2015 2017 2016 2015
£000 £000 £000 £000 £000 £000
Bank loans 431 655 876 431 655 876
Current 220 224 221 220 224 221
Non-current 211 431 655 211 431 655
431 655 876 431 655 876
Year Ended 31 May 2017 Group Company
As at 1 June As at 1 June
2017 2016 2015 2017 2016 2015
£000 £000 £000 £000 £000 £000
Preferred A Ordinary shares - 1,000 - - 1,000 -
B Preference shares - 500 - - 500 -
- 1,500 - - 1,500 -
K3 CAPITAL GROUP PLC

PAGE 63
NOTES TO THE FINANCIAL STATEMENTSFOR THE YEAR ENDED 31 MAY 2017 (CONTINUED)
Current Tax Liabilitites
Deferred Revenue
The deferred revenue arises from the non-contingent contracts provided to certain customers in respect of providing business marketing and research to these clients. Revenue is recognised and deferred in accordance with services provided within contract terms.
Deferred Tax (Liability) / Asset
24.
25.
26.
Year Ended 31 May 2017 Group Company
As at 1 June As at 1 June
2017 2016 2015 2017 2016 2015
£000 £000 £000 £000 £000 £000
Corporation tax payable 313 495 253 - - -
Year Ended 31 May 2017 Group Company
As at 1 June As at 1 June
2017 2016 2015 2017 2016 2015
£000 £000 £000 £000 £000 £000
Arising from client contracts 1,137 825 724 - - -
Year Ended 31 May 2017 Group Company
£000 £000
Asset at 1 June 2015 120 -
Charge for the year (124) -
Liability at 31 May 2016 (4) -
Charge for the year (28) -
Liability at 31 May 2017 (32) -
FINANCIAL | FINANCIAL STATEMENTS

PAGE 64
NOTES TO THE FINANCIAL STATEMENTSFOR THE YEAR ENDED 31 MAY 2017 (CONTINUED)
27.
Deferred Tax
The deferred tax asset at 1 June 2015 was solely related to the revenue recognition policy adjustment arising on the Group’s transition to FRS 102, a policy consistent under adopted IFRS. Deferred tax liabilities thereafter arose on the timing difference between the carrying values of the certain the Group’s assets for financial reporting purposes and for income tax purposes. These will be released to the income statement as the fair value of the related assets are depreciated or amortised.
Unrecognised Deferred Tax
Share Capital
Alloted, called up and fully paid
Year Ended 31 May 2017 Group Company
As at 1 June As at 1 June
2017 2016 2015 2017 2016 2015
£000 £000 £000 £000 £000 £000
Tax losses - 9 5 - - -
Year Ended 31 May 2017 2017 2016 2015
Group No. £000 No. £000 No. £000
Amounts presented in equityOrdinary A shares - - 250,000 - 250,000 250
Ordinary B shares - - 250,000 - 250,000 250
Preference A Ordinary shares - - - - 1,000,000 1,000
Ordinary C shares - - 357,143 - 535,715 -
Ordinary D shares - - 89,286 - - -
Ordinary E shares - - 44,643 - - -
Ordinary F shares - - 26,786 - - -
Ordinary G shares - - 17,857 - - -
Ordinary H shares - - 1 - - -
Ordinary V shares - - 1 - - -
Ordinary shares 42,210,526 422 - - - -
42,210,526 422 1,035,717 - 2,035,715 1,500
K3 CAPITAL GROUP PLC

PAGE 65
NOTES TO THE FINANCIAL STATEMENTSFOR THE YEAR ENDED 31 MAY 2017 (CONTINUED)
Share Capital (continued)
On 5 April 2016 a share reorganisation was undertaken as follows:
(1) The Ordinary A and Ordinary B shares of £1 each in issue were subdivided into 2,500,000,000 shares in each category of £0.0001 each.(2) A new class of share, Ordinary V of £1 each, was created. One share was issued at a premium of £9,999.(3) 2,499,750,000 Ordinary A and Ordinary B shares of £0.0001 each were cancelled.(4) A new class of share, B Preference of £1 each, was created. 500,000 shares were issued at par.(5) 178,572 Ordinary C shares of £0.0001 each, owned by certain shareholders, were re-designated as 89,286 Ordinary D shares of £0.0001 each, 44,643 Ordinary E shares of £0.0001 each, 26,786 Ordinary F shares of £0.0001 each and 17,857 Ordinary G shares of £0.0001 each.(6) 44,643 Ordinary E shares of £0.0001 each were issued at par.(7) 53,572 Ordinary F shares of £0.0001 each were issued at par.(8) 71,428 Ordinary G shares of £0.0001 each were issued at par.(9) The Ordinary E shares of £0.0001 each were consolidated and subdivided and reclassified into 44,643 Ordinary E shares of £0.0002 each.(10) The Ordinary F shares of £0.0001 each were consolidated and subdivided and reclassified into 26,786 Ordinary F shares of £0.0003 each.(11) The Ordinary G shares of £0.0001 each were consolidated and subdivided and reclassified into 17,857 Ordinary G shares of £0.0005 each.(12) A further new class of share, Ordinary H of £9.00 each, was created. One share was issued at par.
The H Ordinary share carried the right to attend, speak and vote at any general meeting of the Company and on a poll to cast 5 per cent. of the votes attached to the equity shares.
The V Ordinary share carried the right to attend, speak and vote at any general meeting of the Company and on a poll to cast such number of votes as would when aggregated with the voting rights attributable to all the other equity shares held by that shareholder and his privileged relations entitle that shareholder and his privileged relations to together to cast 50.1 per cent. of the votes attached to the shares in the Company from time to time at all general meetings.
The holders of the Ordinary A, B, C, D, E, F and G shares carried the right to attend, speak and vote at any general meeting of the Company and on a poll to cast between them the remaining balance of the voting rights attached to the shares in the Company pro rata to their shareholdings.
27.
Year Ended 31 May 2017 2017 2016 2015
Group No. £000 No. £000 No. £000
Amounts presented in liabilities:Preference A Ordinary shares - - 1,000,000 1,000 - -
B Preference shares - - 500,000 500 - -
- - 1,500,000 1,500 - -
FINANCIAL | FINANCIAL STATEMENTS
PAGE 66
NOTES TO THE FINANCIAL STATEMENTSFOR THE YEAR ENDED 31 MAY 2017 (CONTINUED)
The Preferred A Ordinary shares and B Preference shares did not carry any right to vote at any general meeting, unless any amount of dividend on the respective shares is outstanding. The Preferred A Ordinary shares were entitled to a cumulative dividend of 10 per cent. per annum of the amount paid up on the shares. The B Preference shares were entitled to a cumulative dividend of 5 per cent. per annum of the amount paid up on the shares. Prior to the share reorganisation on 5 April 2016 such dividend rights were not in place on the Preferred A Ordinary shares – following the share reorganisation the Preferred A Ordinary shares were treated as liabilities rather than equity in line with IAS32.
In relation to the cancellation of the 2,499,750,000 Ordinary A and Ordinary B shares of £0.0001 each, no transfer was made from distributable profits to capital redemption reserve because the repurchase of shares was financed partly by a new issues of shares and hence the transfer required was reduced by the proceeds of the new issue and further reduced by the extent that the company could make a permissible capital payment. After reducing the amount to be transferred by these two amounts, the amount required to be transferred was immaterial.
Year ended 31 May 2017
On 23 February 2017, Anthony Ford repaid his directors loan of £1.5 million and the Group redeemed all the Preferred A Ordinary shares and the B Preference shares at par. In relation to the redemption of these shares, a transfer to capital redemption reserve from retained earnings occurred as required by Companies Act 2006.
On 8 March 2017 a bonus issue was carried out: 57 C shares of £0.0001 each, 14 D shares of £0.0001 each, 7 E shares of £0.0002 each, 4 F shares of £0.0003 each and 3 G shares of £0.0005 each were allotted.
On 8 March 2017 all ordinary shares were consolidated and subdivided such that the nominal values were all equalised at £0.01.
On 8 March 2017 a further bonus issue was carried out: 9,459,539 A shares of £0.01 each, 9,459,539 B shares of £0.01 each, 13,513,631C shares of £0.01 each, 3,378,417 D shares of £0.01 each, 1,688,762 E shares of £0.01 each, 1,012,989 F shares of £0.01 each, 674,961 G shares of £0.01 each and 799,100 H shares of £0.01 each were allotted.
On 8 March 2017 the Company purchased a fractional entitlement to a single F share of £0.01 each from Anthony Ford (which resulted from the bonus issue and consolidation described above) and it was cancelled.
By a resolution dated 8 March 2017 (taking effect on 9 March 2017) the Company reduced its capital using the statutory solvency statement procedure by cancelling the capital redemption reserve of £3,000,025 and the share premium account of £9,999 and crediting an amount equal to the sum so cancelled to a distributable reserve.
Immediately prior to Admission, by a resolution dated 5 April 2017 (conditional upon Admission occurring but deemed to take effect immediately before Admission) all of the issued shares in the capital of the Company were redesignated as ordinary shares ranking pari passu.
Following the company’s admission to trading on AIM on 11 April 2017 a further 2,210,526 shares were issued at a price of 95p per share.
K3 CAPITAL GROUP PLC
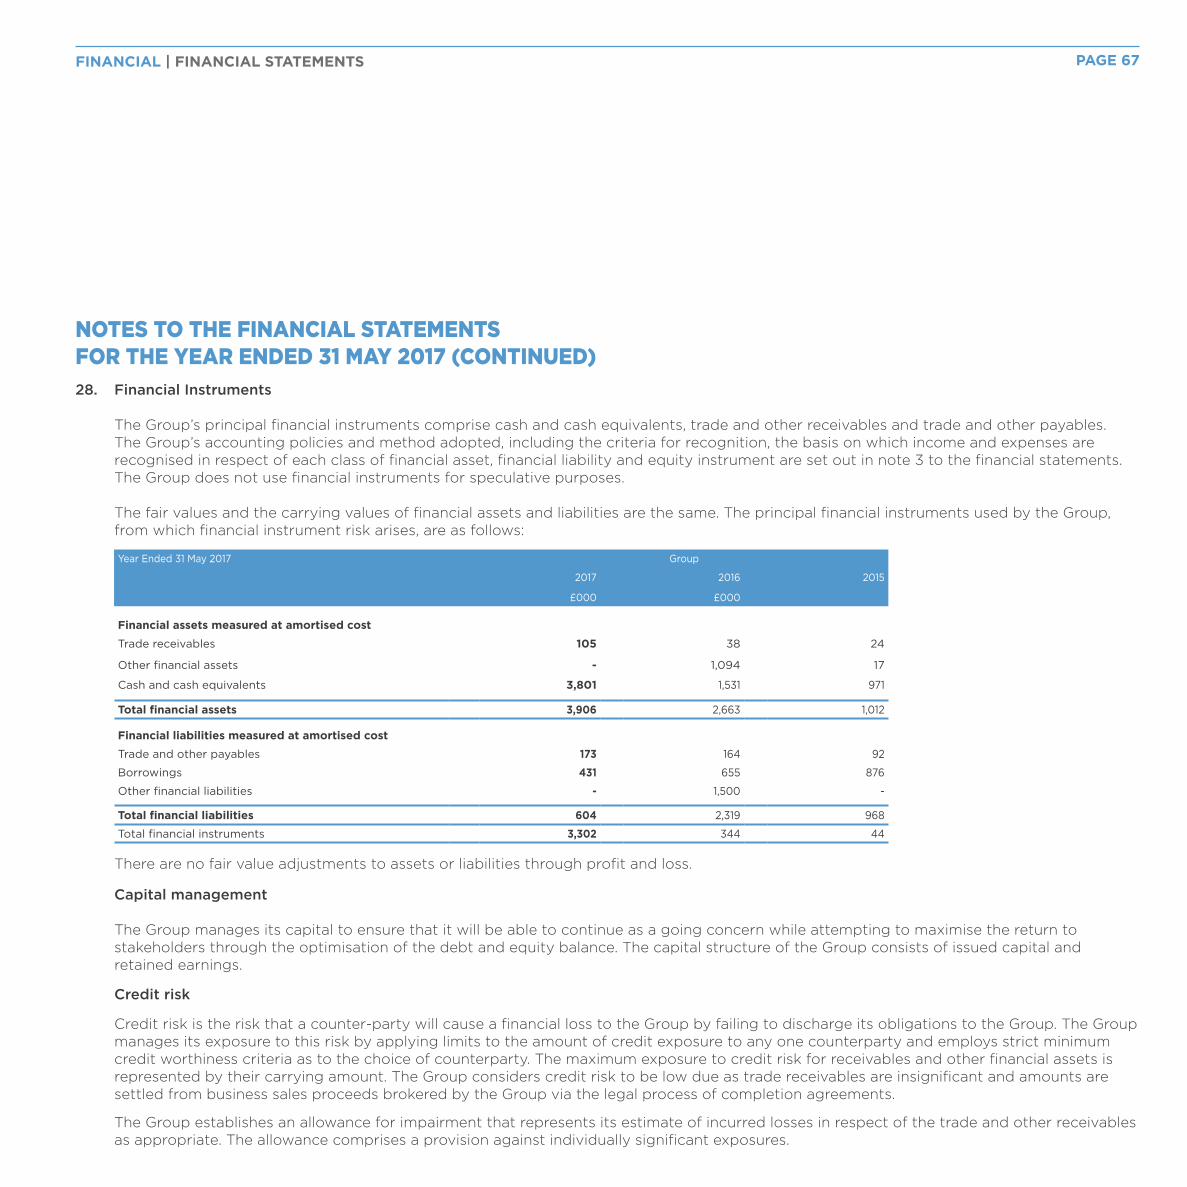
PAGE 67
NOTES TO THE FINANCIAL STATEMENTSFOR THE YEAR ENDED 31 MAY 2017 (CONTINUED)
Financial Instruments
The Group’s principal financial instruments comprise cash and cash equivalents, trade and other receivables and trade and other payables. The Group’s accounting policies and method adopted, including the criteria for recognition, the basis on which income and expenses are recognised in respect of each class of financial asset, financial liability and equity instrument are set out in note 3 to the financial statements. The Group does not use financial instruments for speculative purposes.
The fair values and the carrying values of financial assets and liabilities are the same. The principal financial instruments used by the Group, from which financial instrument risk arises, are as follows:
There are no fair value adjustments to assets or liabilities through profit and loss.
Capital management
The Group manages its capital to ensure that it will be able to continue as a going concern while attempting to maximise the return to stakeholders through the optimisation of the debt and equity balance. The capital structure of the Group consists of issued capital and retained earnings.
Credit risk
Credit risk is the risk that a counter-party will cause a financial loss to the Group by failing to discharge its obligations to the Group. The Group manages its exposure to this risk by applying limits to the amount of credit exposure to any one counterparty and employs strict minimum credit worthiness criteria as to the choice of counterparty. The maximum exposure to credit risk for receivables and other financial assets is represented by their carrying amount. The Group considers credit risk to be low due as trade receivables are insignificant and amounts are settled from business sales proceeds brokered by the Group via the legal process of completion agreements.
The Group establishes an allowance for impairment that represents its estimate of incurred losses in respect of the trade and other receivables as appropriate. The allowance comprises a provision against individually significant exposures.
28.
Year Ended 31 May 2017 Group
2017 2016 2015
£000 £000
Financial assets measured at amortised cost
Trade receivables 105 38 24
Other financial assets - 1,094 17
Cash and cash equivalents 3,801 1,531 971
Total financial assets 3,906 2,663 1,012
Financial liabilities measured at amortised costTrade and other payables 173 164 92
Borrowings 431 655 876
Other financial liabilities - 1,500 -
Total financial liabilities 604 2,319 968
Total financial instruments 3,302 344 44
FINANCIAL | FINANCIAL STATEMENTS

PAGE 68
NOTES TO THE FINANCIAL STATEMENTSFOR THE YEAR ENDED 31 MAY 2017 (CONTINUED)
Ageing analysis
The ageing analysis of the Group’s trade receivables is as follows:
These receivables are not secured by any collateral or credit enhancement. Normal credit terms are 30 days.
The maximum exposure to credit risk at each balance sheet date was:
For banks and financial institutions, only independently rated parties with minimum rating “A” are accepted.
Year Ended 31 May 2017 Group
2017 2016 2015
£000 £000
Current 104 38 24
Up to 30 days - - -
Up to 60 days - - -
90 days and older 1 10 -
105 48 24
Bad debt provision - (10) -
105 38 24
Year Ended 31 May 2017 Group
2017 2016 2015
£000 £000
Net trade receivables 105 38 24
Accrued income - 300 -
Cash and cash equivalents 3,801 1,531 971
3,906 1,869 995
K3 CAPITAL GROUP PLC

PAGE 69
NOTES TO THE FINANCIAL STATEMENTSFOR THE YEAR ENDED 31 MAY 2017 (CONTINUED)
Fair values
The directors have assessed that the fair values of cash and short-term deposits, trade receivables, trade payables and other current liabilities approximate to their carrying amounts largely due to the short-term maturities of these instruments.
The principal interest rate risks of the Group arise in respect of borrowings. As the interest expense on variable rate financial instruments is immaterial, the Group does not actively manage the exposure to this risk.
Interest rate risk
The Group’s policy is to fund its operations through the use of retained earnings and equity. The Group’s exposure to changes in interest rates relates primarily to cash at bank. Cash is held either on current or short-term deposits at a floating rate of interest determined by the relevant bank’s prevailing base rate.
Interest rate sensitivity
There would be no material impact resulting from a reasonably possible change in interest rates.
Market risk
Market risk is the risk that the fair value or future cash flows of a financial instrument will fluctuate because of changes in market prices. Market risk comprises three types of risk:
• commodity price risk• interest rate risk; and• foreign currency risk.
Financial instruments affected by market risk include deposits, trade receivables, trade payables and accrued liabilities.
Foreign currency exchange risks
The Group has no foreign currency risk currently as its operations and transactions are all denominated in Sterling.
FINANCIAL | FINANCIAL STATEMENTS

PAGE 70
NOTES TO THE FINANCIAL STATEMENTSFOR THE YEAR ENDED 31 MAY 2017 (CONTINUED)
29.
Liquidity risks
Liquidity risk arises from the Group’s management of working capital. It is the risk that the Group will encounter difficulty in meeting its financial obligations as they fall due.
The Group’s policy is to ensure that it will always have sufficient cash to allow it to meet its liabilities when they become due.
The maturity profile of the Group’s trade and other payables, and other financial liabilities are, at each period end, due within one year. The maturity profile of borrowings at the reporting dates, based on contractual undiscounted payments, are summarised below:
Related Party Transactions
Group
Key management personnel compensation has been disclosed in note 9. In addition to the related party information disclosed elsewhere in the financial information, the following were significant related party transactions during the current and prior year and at terms and rates agreed between the parties: During the years dividends were paid to individuals who were directors at the time and their close family members as follows:
The dividend above represents the 10 per cent coupon on the Preferred A Ordinary shares. B Preference share dividends were waived by the shareholder.
Year Ended 31 May 2017 Group
2017 2016 2015
£000 £000
Due within 1 year 220 237 221
Due in 1-2 years 211 220 224
Due in 2-5 years - 211 431
Year Ended 31 May 2017 2017 2016
£000 £000
Dividends paid to directors and their close family members 1,177 831
K3 CAPITAL GROUP PLC
Year Ended 31 May 2017 2017 2016
£000 £000
Dividends paid on preference shares classified as liabilities 75 100

PAGE 71
NOTES TO THE FINANCIAL STATEMENTSFOR THE YEAR ENDED 31 MAY 2017 (CONTINUED)
During the year the Group was charged the following costs from Triskell LLP (of which Anthony Ford is a designated member).
The amount owed by Triskell LLP as at the period ends were:
As disclosed in note 32, on 8 March 2017 the company acquired the trade and assets of Triskell LLP.
During the year the Group was charged the following costs from Signia Corporate Finance (a business owned by Stuart Lees)
The amount owed to Signia Corporate Finance as at the period ends were:
During the year the Group was recharged costs from K3 Estates LLP and provided a loan to K3 Estates LLP (of which the Directors, except for Stuart Lees, W Robinson and Ian Mattioli, are designated members).
Year Ended 31 May 2017 2017 2016
£000 £000
Consultancy fees 425 943
Group
Year Ended 31 May 2017 2017 2016 At 1 June 2015
£000 £000
Owed by Triskell LLP to the Group - 166 -
Group
Year Ended 31 May 2017 2017 2016
£000 £000
Consultancy fees 48 41
Group
Year Ended 31 May 2017 2017 2016
£000 £000
Recharges - 12
Rent 24 -
FINANCIAL | FINANCIAL STATEMENTS
Group
Year Ended 31 May 2017 2017 2016 At 1 June 2015
£000 £000
Owed to Signia Corporate Finance by the Group - 27 -

PAGE 72
NOTES TO THE FINANCIAL STATEMENTSFOR THE YEAR ENDED 31 MAY 2017 (CONTINUED)
The amount owed by K3 Estates LLP as at the period ends were:
The loan was provided on an interest free basis and is repayable on demand. The loan was repaid on 14 February 2017.
During the year ended 31 May 2017 the Group commenced the lease of a property from K3 Estates LLP, initially with a rent-free period. Rent payments commenced on 30 March 2017 at £8,250 per month. No amounts are outstanding at year end.
During the year the Group recharged and was charged the following costs from KBS CF LLP (of which the Directors, except Stuart Lees, William Robinson and Ian Mattioli, are designated members).
The amounts owed to / from KBS CF LLP as at the period ends were:
KBS CF LLP has now ceased to trade and no further consultancy fees will be paid.
Group
Year Ended 31 May 2017 2017 2016 At 1 June 2015
£000 £000
Owed by K3 Estates LLP to the Group - 175 -
Group
Year Ended 31 May 2017 2017 2016 At 1 June 2015
£000 £000
Loan to KBS CF LLP from the Group - 19 17
Amounts due to KBS CF LLP to the Group - (13) -
- 6 17
K3 CAPITAL GROUP PLC
Year Ended 31 May 2017 2017 2016
£000 £000
Consultancy fees paid to KBS CF LLP by the Group 432 133

PAGE 73
NOTES TO THE FINANCIAL STATEMENTSFOR THE YEAR ENDED 31 MAY 2017 (CONTINUED)
During the year the Group provided loans to various individuals who were also directors at the time. The amounts owed by such directors as at the period ends were:
The loan to Anthony Ford was repaid on 24 February 2017. All loans to directors were provided interest free and were deemed to be repayable on demand.
Company
K3 Capital Group Plc is the parent entity of the group. The group has taken advantage of the exemption available under IAS 24 not to disclose transactions with wholly owned subsidiary undertakings.
Group
Year Ended 31 May 2017 2017 2016 At 1 June 2015
£000 £000
Owed by Anthony Ford to the Group - 900 -
FINANCIAL | FINANCIAL STATEMENTS

PAGE 74
NOTES TO THE FINANCIAL STATEMENTSFOR THE YEAR ENDED 31 MAY 2017 (CONTINUED)
K3 CAPITAL GROUP PLC
Dividends
The adjusted dividends per share are adjusted for the impact of the bonus issues and share consolidations and subdivisions described in note 27.
30.2017 2016
Year Ended 31 May 2017 £000 £000
Dividends paid on equity shares
Ordinary A shares 284 201
Ordinary B shares 284 201
Ordinary C shares 406 429
Ordinary D shares 102 –
Ordinary E shares 51 –
Ordinary F shares 30 –
Ordinary G shares 20 –
Ordinary H shares – –
Ordinary V shares – –
Ordinary shares – –
Total 1,177 831
Dividend per share (unadjusted) 2017 2016
Ordinary A shares 113.72p 80.20p
Ordinary B shares 113.72p 80.20p
Ordinary C shares 113.72p 80.20p
Ordinary D shares 113.72p –
Ordinary E shares 113.72p –
Ordinary F shares 113.72p –
Ordinary G shares 113.72p –
Ordinary H shares – –
Ordinary V shares – –
Ordinary shares – –
Dividend per share (adjusted) 2017 2016
Ordinary A shares 3.00p 2.12p
Ordinary B shares 3.00p 2.12p
Ordinary C shares 3.00p 2.12p
Ordinary D shares 3.00p –
Ordinary E shares 3.00p –
Ordinary F shares 3.00p –
Ordinary G shares 3.00p –
Ordinary H shares – –
Ordinary V shares – –
Ordinary shares – –

PAGE 75
NOTES TO THE FINANCIAL STATEMENTSFOR THE YEAR ENDED 31 MAY 2017 (CONTINUED)
FINANCIAL | FINANCIAL STATEMENTS
31.
Dividends paid on shares classed as liabilities
The holder of the B preference shares waived the dividend payable during both financial years.
Dividend per share
On 23 February 2017 the Preferred A Ordinary shares and the B Preference shares were redeemed at par.
Commitments
The total future minimum lease payments under non-cancellable operating leases are as follows:
Year Ended 31 May 2017 2017 2016
£000 £000
Preferred A Ordinary shares 75 100
B Preference shares - -
Total 75 100
Year Ended 31 May 2017 2017 2016
£000 £000
Preferred A Ordinary shares 10p 10p
B Preference shares - -
Year Ended 31 May 2017 Group Company
As at 1 June
2017 2016 2015 2017 2016 2015
£000 £000 £000 £000 £000 £000
Not later than 1 year 100 122 14 - - -
Later than 1 year and not later than 5 years 79 109 183 - - -
179 231 197 - - -

NOTES TO THE FINANCIAL STATEMENTSFOR THE YEAR ENDED 31 MAY 2017 (CONTINUED)32.
33.
34.
35.
Business Combinations and Goodwill
Acquisition of Triskell LLP
On 8 March 2017 the company acquired the trade and assets of Triskell LLP. The fair value of consideration was initially set up as a loan at £1.1m, settled subsequently via cash in full prior to the year end.
The fair value of amounts recognised at the acquisition date in relation to Triskell LLP are as follows:
The fair value of total assets acquired was £nil, resulting in goodwill being recognised equivalent to the fair value of consideration. The goodwill recognised includes certain intangible assets that cannot be separately identified and measured due to their nature. This includes control over the acquired business, the skills and experience of the acquired workforce and the future growth opportunities that it provides the Group’s operations. The goodwill recognised is not deductible for tax purposes.
Contingencies
The group companies, including K3 Capital Group Plc, entered into a debenture dated 22 May 2014 for securing all monies due by K3 Capital Group Plc in respect of the bank loan facilities. This represents a fixed and floating charge over the group’s assets. The balance outstanding at 31 May 2017 was £431,376 (2016: £655,382).
Audit exemption statement
Under section 479A of the Companies Act 2006 the Group’s subsidiaries, listed below, are claiming exemption from audit. The parent undertaking, K3 Capital Group plc, registered number 06102618, guarantees all outstanding liabilities to which each subsidiary company is subject at the end of the financial year (being the year ended 31 May 2017 for each company listed below). The guarantee is enforceable against the parent undertaking by any person to whom the subsidiary company is liable in respect of those liabilities.
KBS Corporate Sales Limited 04141555KBS Corporate Finance Limited 08924449Knightsbridge Business Services Limited 08924297
Controlling Party
In the opinion of the directors, the group has no overall controlling party.
PAGE 76 K3 CAPITAL GROUP PLC
Year Ended 31 May 2017 Book Value Adjustments Fair Value
£000 £000 £000
Tangible assets acquired 23 (23) -
Trade receivables acquired 41 (41) -
64 (64) -

NOTES TO THE FINANCIAL STATEMENTSFOR THE YEAR ENDED 31 MAY 2017 (CONTINUED)
Transition to adopted IFRS
These are the first financial statements that comply with adopted IFRS. The group and the company transitioned to adopted IFRS on 1 June 2015.
Reconciliation of equity
No transitional adjustments were required for the company.
Reconciliation of profit or loss for the year
As a consequence of the transition to adopted IFRS on 1 June 2015 the group has reversed goodwill amortisation, previously charged in accordance with UK GAAP.
36.
Year Ended 31 May 2017 1 June 2015 31 May 2016
As previously stated
Effect of transition
IFRS (as restated)
As previously stated
Effect of transition
IFRS (as restated)
£000 £000 £000 £000 £000 £000
Non-current assets 2,980 - 2,980 2,648 236 2,884
Current assets 1,128 - 1,128 3,112 - 3,112
Current liabilities (1,869) - (1,869) (3,829) - (3,829)
Non-current liabilities (655) - (655) (435) - (435)
Net Assets 1,584 - 1,584 1,496 236 1,732
Equity 1,584 - 1,584 1,496 236 1,732
Year Ended 31 May 2016
As previously stated
Effect of Transition
IFRS (as restated)
£000 £000 £000
Revenue 8,551 - 8,551
Distribution costs (645) - (645)
Administrative expenses (4,949) 236 (4,713)
Operating profit 2,957 236 3,193
Other interest receivable and similar income 2 - 2
Interest payable and similar expenses (127) - (127)
Tax on profit (599) - (599)
Profit for the financial year 2,233 236 2,469
PAGE 77FINANCIAL | FINANCIAL STATEMENTS

NOTICE IS HEREBY GIVEN THAT THE FIRST ANNUAL GENERAL MEETING OF K3 CAPITAL GROUP PLC
WILL BE HELD AT TLT SOLICITORS LLP
K3 CAPITAL GROUP PLCPAGE 78

NOTICE OF ANNUAL GENERAL MEETINGNotice is hereby given that the first Annual General Meeting of K3 Capital Group plc will be held at TLT Solicitors LLP, 3 Hardman Square, 3 Hardman St, Manchester, M3 3EB on Friday, 27 October 2017 at 11:00 a.m. for the following purposes:
You will be asked to consider and vote on the Resolutions below. Resolutions 1 to 11 will be proposed as Ordinary Resolutions and Resolutions 12 and 13 will be proposed as Special Resolutions.
ORDINARY BUSINESS
Resolution 1To receive the Company’s annual accounts for the year ended 31 May 2017 together with the directors’ report and auditor’s report on those accounts.
Resolution 2To declare a final dividend in the sum of 4.4 pence per Ordinary Share for the year ended 31 May 2017.
Resolution 3To appoint Martin Robinson as director of the Company.
Resolution 4To re-appoint Ian Mattioli as a director of the Company.
Resolution 5To re-appoint John Rigby as a director of the Company.
Resolution 6To re-appoint Anthony Ford as a director of the Company.
Resolution 7To re-appoint Andrew Melbourne as a director of the Company.
Resolution 8To re-appoint Stuart Lees as a director of the Company.
Resolution 9To re-appoint BDO LLP as the Company’s auditor to hold office from the conclusion of this meeting until the conclusion of the next annual general meeting at which accounts are laid before the Company.
Resolution 10To authorise the directors to determine the auditor’s remuneration.
Resolution 11That:
1. in accordance with section 551 of the Companies Act 2006 (Act) the directors be generally and unconditionally authorised to allot shares in the Company, and to grant rights to subscribe for or to convert any security into shares in the Company:
(a). up to an aggregate nominal amount of £140,701.75 (such amount to be reduced by the nominal amount allotted or granted under paragraph (b) below in excess of such sum); and (b). comprising equity securities (as defined in Section 560 of the Act) up to an aggregate nominal amount of £281,403.50 (including within such limit any shares allotted or rights granted under paragraph (i) above) in connection with an offer by way of a rights issue as follows:
(i). to holders of ordinary shares of 1 pence each in the capital of the Company in proportion (as nearly as may be practicable) to their existing holdings; and(ii). to holders of other equity securities as required by the rights of those securities or as the directors otherwise consider it necessary;and so that the directors may make such exclusions or other arrangements as they consider expedient in relation to treasury shares, fractional entitlements, record dates, shares represented by depositary receipts, legal or practical problems under the laws in any territory or the requirements of any relevant regulatory body or stock exchange or any other matter;
2. this authority shall expire on the earlier of the date 15 months from the passing of this Resolution or the conclusion of the next Annual General Meeting of the Company after the passing of this Resolution (whichever is the earlier) save that the Company may make offers and enter into agreements during the relevant period which would, or might, require shares or rights to subscribe for or to convert any security into shares in the Company to be allotted after the authority ends and the Board may allot shares or rights to subscribe for or to convert any security into shares in the Company under any such offer or agreement as if the authority had not expired; and3. all previous authorities granted under Section 551 of the Act be revoked.
FINANCIAL | NOTICE OF MEETING PAGE 79
PAGE 80
NOTICE OF ANNUAL GENERAL MEETINGSPECIAL BUSINESS
Resolution 1212.1. That subject to the passing of Resolution 11 above, the Board be authorised to allot equity securities (as defined in section 560(1) of the Companies Act 2006) for cash under the authority given by that Resolution and/or to sell ordinary shares held by the Company as treasury shares for cash as if section 561 of the Act did not apply to any such allotment or sale, provided that such authority shall be limited to:
(a). the allotment of equity securities and sale of treasury shares for cash in connection with an offer of, or invitation to apply for, equity securities (but, in the case of the authority granted under Resolution 11.1(b)(ii), by way of a rights issue only):
(i). to the holders of ordinary shares in proportion (as nearly as may be practicable) to their respective holdings; and(ii). to holders of other equity securities as required by the rights of those securities or as the directors otherwise consider necessary, but subject to such exclusions or other arrangements as the directors may deem necessary or expedient in relation to treasury shares, fractional entitlements, record dates, legal or practical problems in or under the laws of any territory or the requirements of any regulatory body or stock exchange; and
(b). the allotment of equity securities or sale of treasury shares (otherwise than pursuant to Clause 12.1(a) of this Resolution) to any person up to an aggregate nominal amount of £21,105.26.The authority granted by this Resolution shall expire on the earlier of the date 15 months from the passing of this Resolution or the conclusion of the next Annual General Meeting of the Company after the passing of this Resolution (whichever is the earlier) save that such authority shall extend to the making before such expiry of an offer or arrangement that would, or might, require equity securities to be allotted after such expiry and the directors may allot equity securities in pursuance of that offer or arrangement as if the authority conferred hereby had not expired.
12.2. That subject to the passing of Resolution 11, the directors be authorised in addition to any authority granted under Clause 12.1 of this Resolution to allot equity securities (as defined in section 560(1) of the Companies Act 2006) for cash under the authority conferred by Resolution 11 and/or to sell ordinary shares held by the Company as treasury shares as if section 561 of the CA 2006 did not apply to any such allotment or sale, provided that such authority shall be:(a). limited to the allotment of equity securities or sale of treasury shares up to an aggregate nominal amount of £21,105.26; and(b). used only for the purpose of financing (or refinancing, if the
authority is to be used within 6 months after the original transaction) a transaction which the directors determine to be an acquisition or other capital investment of a kind contemplated by the Statement of Principles on Disapplying Pre Emption Rights most recently published by the Pre-Emption Group prior to the date of this notice.The authority granted by this Resolution shall expire on the earlier of the date 15 months from the passing of this Resolution or the conclusion of the next Annual General Meeting of the Company after the passing of this Resolution (whichever is the earlier) save that such authority shall extend to the making before such expiry of an offer or arrangement that would, or might, require equity securities to be allotted after such expiry and the directors may allot equity securities in pursuance of that offer or arrangement as if the authority conferred hereby had not expired.12.3. The Resolutions in Clause 12.1 and Clause 12.2 revoke and replace all unexercised powers previously granted to the directors to allot equity securities or sell treasury shares as if section 561 of the CA 2006 did not apply but without prejudice to any allotment of equity securities or sale of treasury shares already made or agreed to be made pursuant to such authorities.
Resolution 13That the Company be and is hereby generally and unconditionally authorised pursuant to Section 701 of the Act to make market purchases (within the meaning of Section 693(4) of the Act) of ordinary shares of 1 pence each in the capital of the Company, provided that:
1. the maximum number of ordinary shares hereby authorised to be purchased is 4,221,052 (representing 10% of the Company’s issued ordinary share capital at 8 September 2017);2. the minimum price, exclusive of any expenses, which may be paid for an ordinary share is 1 pence (equivalent to the nominal value of the Company’s ordinary shares);3. the maximum price, exclusive of any expenses, which may be paid for any ordinary share is the higher of:
(a). 105 per cent of the average market value of an ordinary share in the Company for the five business days immediately preceding the day on which such share is contracted to be purchased; and(b). the value of an ordinary share calculated on the basis of the higher of the price quoted for:(i). the last independent trade of; and(ii). the highest current independent bid for,any number of the Company’s ordinary shares on the trading venue where the purchase is carried out.
4. unless previously renewed, varied or revoked, the authority hereby
K3 CAPITAL GROUP PLC

NOTICE OF ANNUAL GENERAL MEETING
conferred shall expire on the earlier of the date 15 months from the passing of this Resolution or the conclusion of the next Annual General Meeting of the Company after the passing of this Resolution; and5. the Company may make a contract for the purchase of ordinary shares under this authority before the expiry of this authority which would or might be executed wholly or partly after the expiry of such authority, and may make purchases of ordinary shares in pursuance of such a contract as if such authority had not expired.
By Order of the Board
PAGE 81
Postcode for Sat Nav: M3 3EB
The best car park is Manchester Spinningfields Post Code: M3 3BE
From the car park, walk up Gartside Street and Bagel Nash will be to the left.
3 Hardman Square is the building facing Bagel Nash.
ANDREW MELBOURNE FCMACompany Secretary
8 September 2017
FINANCIAL | NOTICE OF MEETING
AGM
OCTOBER
27DIVIDEND
30OCTOBER
