annual report 2017 · about sandvik value-creating offerings to our customers worldwide sandvik is...
TRANSCRIPT

SANDVIK AN
NUAL REPO
RT 2017
ANNUAL REPORT2017

YEAR IN BRIEF
HIGHLIGHTS
• Significant increase in customer demand and growth in all segments and geographies.
• Record-high adjusted operating profit and cash flow.• Divestments of Sandvik Process Systems and Sandvik Mining Systems.• Agreements signed to divest the welding wire business and Sandvik
Hyperion.• Strengthened balance sheet allows for future growth.• Lost Time Injury Frequency Rate at a record-low level, 1.6.• Inclusion in the 2018 Global 100 Most Sustainable Corporations index
and the 2017 Dow Jones Sustainability Index.
CONTENTS
Sandvik 2017Year in brief About Sandvik 2CEO comment 4Our vision and strategy 6Targets and target fulfillment 7Our seven focus areas 8Trends and driving forces 10
Our operations Customer segments 12Business areas 16Code of Conduct 30Our people 31Human rights 33Health and safety 34Our environment 36Compliance 38Sustainable Supplier Management 39Community involvement 40 Our share 42
Directors' Report Group summary 46Development in business areas 50Risk management 54Corporate governance report 58
Financial statementsConsolidated financial statements 64
Income statement 65Balance sheet 66Changes in equity 68Cash flow statement 69
Parent company financial statements 70
Income statement 71Balance sheet 72Changes in equity 74Cash flow statement 75
Significant accounting policies 76Notes 84Board statement on dividend proposal 121Proposed appropriation of profits 122Auditor’s report 123
Sustainability notes 127Assurance report 145
Board of Directors 146Group Executive Management 148Annual General Meeting and dividend 150Definitions 150Financial targets 151Financial key figures 152
ADJUSTED EARNINGS PER SHARE, GROUP TOTAL, SEK1
0
2
4
6
8
10
12
2013 2014 2015 2016 2017
Cover photo: In 2017 Sandvik launched PrimeTurning™, a completely new meth-odology that enables turning in all direc-tions. Read more on pages 20 and 21.
The formal Annual Report comprises pages 46–122. The Statutory Sustain-ability report and Sustainable Business Report are defined on page 128. Unless otherwise stated, financial data on pages 0–6 and 8-29 and 50–53 refers to continuing operations, i.e excluding Sandvik Mining Systems.
0
1
2
3
4
5
2013 2014 2015 2016 2017
LOST TIME INJURY FREQUENCY RATE, LTIFR
REVENUES AND ORDER INTAKE, MSEK
60,000
70,000
80,000
90,000
100,000
2013 2014 2015 2016 2017
Revenue Orders2013 2014 2015 2016 2017
8,000
10,000
12,000
14,000
16,000
10%
12%
14%
16%
18%
ADJUSTED OPERATING PROFIT, MSEK AND ADJUSTED OPERATING MARGIN, %1
Adjusted operating profitAdjusted operating margin

YEAR IN BRIEF
ForbesSandvik was included on Forbes 2017 Global Top Multinational Performers 2000 list.
Sandvik is a constituent of the prestigious Dow Jones Sustainability Index (DJSI). In 2017, Sandvik performed better than 97 per-cent of its peer companies in the assessment.
Sandvik is included in the 2017 Ethibel Excel-lence Investment Register, an indication that Sandvik performs better than average in our sector when it comes to sustainability.
Sandvik is a member of the FTSE4Good Index Series, which measures the environ-mental, social and governance performance of companies worldwide.
Sandvik was included in RobecoSAM’s 2017 Sustainability Yearbook, listing the world’s most sustainable companies in each industry.
Sandvik is a signatory to the UN Global Compact (UNGC).
RECOGNITIONS AND MEMBERSHIPS
ORDER INTAKE, MSEK
95,444ADJUSTED EARNINGS PER SHARE, GROUP TOTAL, SEK1
8.01LOST TIME INJURY FREQUENCY RATE , LTIFR, GROUP TOTAL
1.6
ADJUSTED OPERATING MARGIN, %1
16.190,905REVENUES, MSEK
23.9RETURN ON CAPITAL EMPLOYED, %
79RECOVERED METALLIC RAW MATERIAL, %
19.4SHARE OF WOMEN, GROUP TOTAL, %
14,638ADJUSTED OPERATING PROFIT, MSEK1
1) Adjusted for items affecting comparability of -450 million SEK in Q2 2017 and +3,910 million SEK in Q4 2017.
Sandvik was included in the 2018 Global 100 Most Sustainable Corpora-tions in the World index by Corporate Knights.
Sandvik Annual Report 2017 | 1
n Europe, 39%n North America, 21%n Asia, 20%n Africa/Middle East, 9%n Australia, 6%n South America, 5%
REVENUES BY MARKET AREAREVENUES BY CUSTOMER SEGMENT
n Mining, 31%n Engineering, 24%n Automotive, 13% n Energy, 11%n Construction, 11%n Aerospace, 6%n Other, 4%
ABOUT SANDVIK
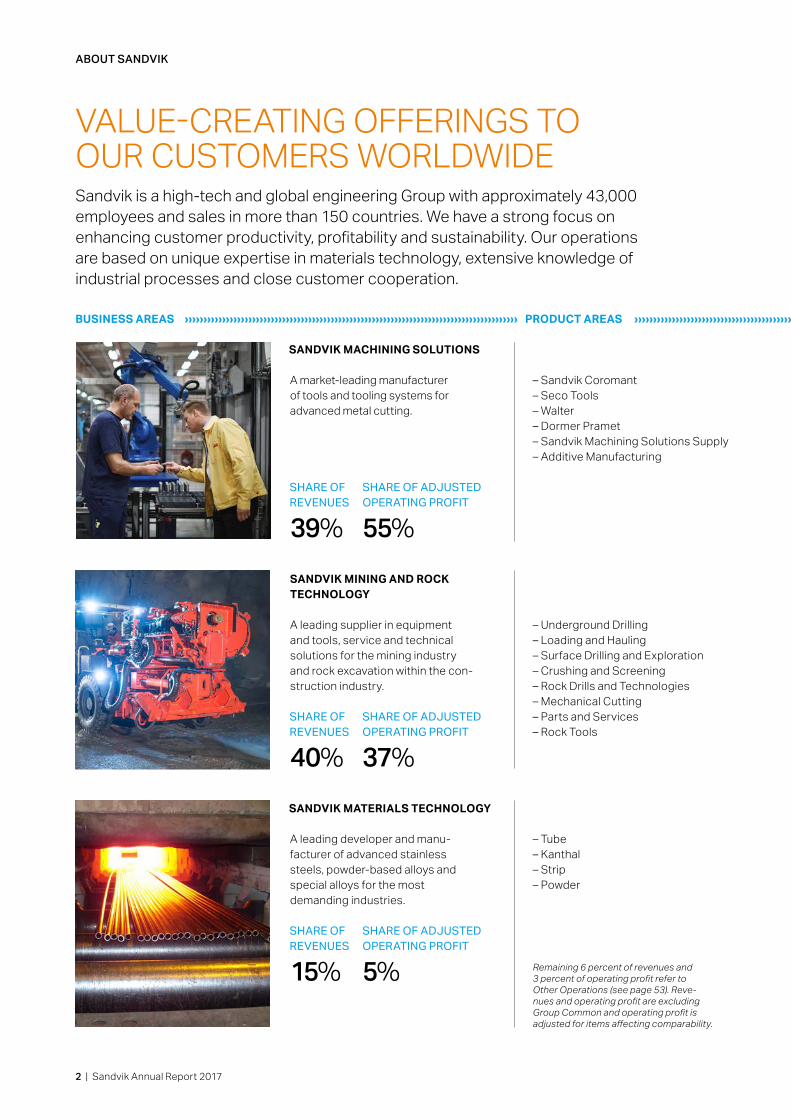
VALUE-CREATING OFFERINGS TOOUR CUSTOMERS WORLDWIDESandvik is a high-tech and global engineering Group with approximately 43,000 employees and sales in more than 150 countries. We have a strong focus on enhancing customer productivity, profitability and sustainability. Our operations are based on unique expertise in materials technology, extensive knowledge of industrial processes and close customer cooperation.
– Underground Drilling – Loading and Hauling– Surface Drilling and Exploration– Crushing and Screening – Rock Drills and Technologies – Mechanical Cutting– Parts and Services– Rock Tools
– Tube– Kanthal– Strip– Powder
40%SHARE OF REVENUES
37%SHARE OF ADJUSTED OPERATING PROFIT
SANDVIK MINING AND ROCK TECHNOLOGY
A leading supplier in equipment and tools, service and technical solutions for the mining industry and rock excavation within the con-struction industry.
– Sandvik Coromant– Seco Tools– Walter– Dormer Pramet– Sandvik Machining Solutions Supply – Additive Manufacturing
PRODUCT AREAS››››››››››››››››››››››››››››››››››››››››››››››››››››››››››››››››››››››››››››››››››››››››› ››››››››››››››››››››››››››››››››››››››››››››››››››››››››››››››››BUSINESS AREAS
A leading developer and manu-facturer of advanced stainless steels, powder-based alloys and special alloys for the most demanding industries.
15%SHARE OF REVENUES
5%SHARE OF ADJUSTED OPERATING PROFIT
SANDVIK MATERIALS TECHNOLOGY
SANDVIK MACHINING SOLUTIONS
A market-leading manufacturer of tools and tooling systems for advanced metal cutting.
39%SHARE OF REVENUES
55%SHARE OF ADJUSTED OPERATING PROFIT
Remaining 6 percent of revenues and 3 percent of operating profit refer to Other Operations (see page 53). Reve-nues and operating profit are excluding Group Common and operating profit is adjusted for items affecting comparability.
2 | Sandvik Annual Report 2017

Sandvik is organized in three business areas and 18 product areas. The product areas have individual strategies and are fully responsible for their performance. They deliver solutions mainly to six customer segments.
MAIN CUSTOMER SEGMENTS SHARE OF REVENUES›››››››››››››››››››››››››››››››››››››››››››››››››››››››››››››››› ›››››››››››› ›››››››››››››››››››››››››››››››››››››››››››››››››››››››››››››››››››››››››››
11%CONSTRUCTION
We offer products and services that increase safety and customer productivity in the breaking, drilling, crushing and screening niches of the construction industry. Application areas include tunneling, quarrying, civil engineering, demolition and recycling.
6%AEROSPACE
We work closely with the world's aerospace companies. As they apply new materials to manufacture airplanes that are lighter, safer and more fuel efficient, advanced tooling solutions and lightweight materials are critical.
ABOUT SANDVIK
13%AUTOMOTIVE
Our tools and tooling systems for turning, milling and drilling in metals raise productivity when manufacturing, for example, engines and transmissions. Our stainless and high-alloy products are found in, for example, safety belts, airbags, brakes, air conditioning and various instruments.
11%ENERGY
We offer solutions for all forms of energy production, including clean and renewable energy. We supply high-alloy products, such as stainless steel tubes for selected niches in the most demanding industries as well as tools and tooling systems to satisfy the industry’s metal- cutting needs.
MININGWe deliver drill rigs, rock-drilling tools and systems, mobile and stationary crushers, load and haul machines, tunneling equipment, continuous mining and mechanical cutting equipment, as well as various solutions to increase automation, safety and customer productivity.
31%
ENGINEERINGOur tools and tooling systems for metal cutting as well as advanced materials and components are used in engineering industries worldwide, improving productivity, profitability, quality, output, safety as well as reducing environmental impact. We are also a global leader in high-alloy metal powder.
24%
Remaining 4 percent includes mainly consumer, electronics and chemicals.
Sandvik Annual Report 2017 | 3
n Sandvik Machining Solutions n Sandvik Mining and Rock Technology n Sandvik Materials Technology

A SUCCESSFUL YEAR
Sandvik can look back on a successful 2017, when we improved our earnings, met our financial targets ahead of schedule and delivered strong cash flow. Combined with successful divestments, we have created a more focused, consolidated company that is prepared for growth. At the same time, the share price rose by 26 percent.
CEO COMMENT
Since the launch of Sandvik’s new strategy in 2015, we have been work-ing intensively to achieve the targets defined. In the first year, we focused on establishing the new decentralized structure and created a clear govern-ance framework, the Sandvik Way. We moved decision-making closer to customers, meaning to the product areas. They now have the character of independent companies with full accountability for their own perfor-mance and a focus on continuous improvements. During the year, we began to see the result of our efforts, with improved profitability, reduced working capital, strong cash flow and a reduction in the debt/equity ratio.
Employees have supported the new strategy and have worked hard to implement it, even if it has included organizational changes. This has yielded results. We have also been helped by a favorable market and strong demand.
FOCUS ON CORE OPERATIONSDuring the year, we successfully divested Sandvik Mining Systems and Sandvik Process Systems and also signed an agreement for the divestment of the welding wire oper-ations at Sandvik Materials Technol-ogy and for Sandvik Hyperion. The aim is to also divest the stainless wire business. Our strategy states that we are to be number one or two in
the markets in which we operate and after completion of these divest-ments we have largely achieved this. Overall, we have divested approx-imately 10 percent of the Group, which has resulted in a more focused, stronger company.
STABILITY AND PROFITABILITY BEFORE GROWTHThe stable foundation we have built offers us scope to focus on growth. I see three ways to grow. First, through organic growth, where Sandvik can create customer value through its strong innovation and the launch of thousands of new products each year. Digitalization is a strong industrial trend where we invest and mobilize
4 | Sandvik Annual Report 2017

CEO COMMENT
expertise to be competitive and where we can see substantial growth opportunities. We digitalize and auto-mate our own products, processes and manufacturing and strengthen our offering to our customers through digitalization, which not only makes our customers more efficient but also more sustainable. There are excel-lent growth opportunities in mining operations with automated solutions, and in metal cutting where digitalized tools and processes can enhance customer productivity. Growth is also possible through acquisitions, which is primarily a consideration for Sandvik Machining Solutions in the fields of round tools, additive manufacturing (3D printing), software solutions and metrology (measure-ment technology).
SANDVIK MACHINING SOLUTIONSThe Sandvik Machining Solutions business area is the star of our portfolio and continues to deliver strong results. Earnings increased from an already high level, all product areas improved and cash flow was very strong. The business area successfully launched a range of innovations, including the revolu-tionary PrimeTurning™ technology, which enables turning in all directions in a far more efficient and productive manner than conventional turning. Klas Forsström was appointed new business area president in April 2017.
SANDVIK MINING AND ROCK TECHNOLOGYThe Sandvik Mining and Rock Technol-ogy business area noted a significant improvement in earnings, driven by strong demand early in the year, though from low levels. This strong demand meant it was sometimes difficult to keep up with deliveries, but the situation stabilized during the second half of the year. We can see great opportunities in automation, where we are market leaders, and in our aftermarket business.
SANDVIK MATERIALS TECHNOLOGYThe Sandvik Materials Technology business area has failed to reverse the negative trend that has prevailed since 2014, resulting from low oil
prices and fierce competition from low-cost players. During the year, we carried out a number of measures, including comprehensive cost miti-gation programs and staff reductions. We will continue working for improved profitability under the leadership of the new business area president as of 1 November 2017, Göran Björkman. Order intake and volume improved during the second half of the year.
ACCOUNTABILITY AND DECISIONS CLOSE TO CUSTOMERSDecentralized decision-making close to customers is key to the success of our company. However, coordination is necessary in some areas and I often say that clever managers cooperate. In a decentralized world, we need clear and precise rules and we have created a shared framework that we call the Sandvik Way. This includes our Code of Conduct, our whistleblower system Speak Up, our performance manage-ment system and our joint leadership model, as well as policies and proce-dures in key areas.
SUSTAINABLE BUSINESSWe view sustainability from two per-spectives – how we can make our cus-tomers more productive and sustain-able, and how we can become more sustainable in our own operations. We are ambitious and can, as a leading company, drive progress by producing more effective and more sustainable solutions for our customers, such as products that are more energy efficient, safer or that are made from recycled materials. Examples include battery-powered mining equipment and components for solar panels and fuel cells. If we are to remain at the forefront, we must understand global market trends and requirements on issues such as energy supply and safe and sustainable solutions. We must also understand the challenges that we, our customers and our customers’ customers have, such as the impli-cations of a transition to a reduction in the use of fossil fuels or the risks associated with operating in less developed countries.
In our own operations, we must ensure that we work systematically
to reduce environmental impact and carbon emissions. However, anti- corruption, diversity and inclusion, supplier controls and regulatory compliance are equally important components. Occupational safety is a top priority, and it is gratifying that our lost time injury frequency rate in 2017 was the lowest in the company’s history.
Sustainability has also become an increasingly important component when young people decide on an employer and may be crucial in attracting top talent. Our commitment is manifested in our support for, and our intention to continue supporting, the principles of the United Nations' Global Compact. I am convinced that our solutions will contribute toward fulfilling the UN’s Sustainable Devel-opment Goals. It is encouraging that we have once again qualified for the prestigious Dow Jones Sustainability Index and also for the 2018 Global 100 Most Sustainable Corporations in the World index. During the year, we began an exciting collaboration with Engineers Without Borders, from which I expect great things.
EXCEPTIONAL PEOPLEWhen I travel around the company, I meet incredibly positive, committed employees who love Sandvik and what we do. Without our employ-ees we would not have achieved the earnings improvements nor the structural changes we have imple-mented in recent years. I would like to convey my sincere thanks to everyone who has contributed. We have laid a solid foundation for a stable company that is capable of delivering results, even when market conditions are difficult. This means I feel great confidence moving for-ward and that Sandvik will continue to be successful.
Stockholm, February 2018
Björn RosengrenPresident and CEO
Sandvik Annual Report 2017 | 5

OUR VISION AND STRATEGY
OUR STRATEGY
Sandvik is creating value for its customers, shareholders, employees and other stakeholders based on its vision, strategy and core capabilities. Our core values – Customer Focus, Innovation, Fair Play and Passion to Win – form the base for our corporate culture and ways of working.
Focus on core operations and be no 1 or 2 in chosen markets and segments
Efficiency and continuous improvements
Technology leadership and innovation
Culture of doing things right
Accountability and decisions close to customers
Exceptional people
Stability and profitability before growth
STRATEGIC AGENDA
CORE VALUES
SHAREHOLDERVALUE
CUSTOMERVALUE
EMPLOYEEVALUE
BUSINESS IDEA
OUR OPERATIONS
We promote sustainability in our own operations by continuously improving our processes, such as supply chain management, energy usage, emissions, anti-corruption and human rights.
VISION – WE SET THE INDUSTRY STANDARD
Our ambition is to set the benchmark for others to follow by continuously improving our offering, market presence and level of service. We strive to be number one or two in the eyes of our customers, within our chosen markets and segments.
Governance Environ mentalfootprint
Partners People
OUR OFFERINGS
We make our customers more sustainable by developing solu-tions that improve their efficiency and competitiveness, and reduce their costs. Our customers also reduce their environ-mental impact and improve their employees' health and safety.
Innovation and productivity
Environ mentalimpact
Health andsafety
Use, reuseand recycle
Customer Focus, Innovation, Fair Play, Passion to Win
Sandvik’s business idea is to develop, manufacture and market highly processed products and services based on our core capabilities that enhance customer productivity, profitability and sustainability. Our operations are primarily concentrated in areas where Sandvik is, or has the potential to become, a world leader.
6 | Sandvik Annual Report 2017

TARGETS AND TARGET FULFILLMENT
OUR STRATEGY
Sandvik’s financial targets in the period 2016 – 2018 stipulate improved operating profit, higher returns and a strengthening of the balance sheet, while maintaining a generous dividend policy.
1) For further information, see page 151. 2) Proposed adjusted dividend payout ratio.
In May 2016, Sandvik announced financial targets for the three-year period of 2016–2018. In 2017, a strong increase in demand and exe-cuted internal efficiency measures supported a significant improve-ment in adjusted operating profit and return on capital employed. Year-end 2017, the growth rate (CAGR) in adjusted EBIT amounted to16 percent and return on capital employed had improved by 4.6 percentage points to 19 percent. The targets for net debt/equity and
dividend payout are annual and the net debt/equity ratio target was achieved in 2017. The proposed dividend payout ratio for 2017 was slightly below the target level of 50 percent. Our operating deci-sions are based on the priorities of stability and profitability before growth. Given our improved operational performance and operating profit, the next phase of our journey will include a higher focus on growth, in particular for business area Sandvik Machining Solutions.
0
5
10
15
20
2013 2014 2015 2015 20170
5
1010,4
13,9
20
15
BSEK
0
5
10
15
20
2013 2014 2015 2015 20170
5
10
~14%
~19%20
15
%
Dividend payout ratio, reported EPSDividend payout ratio, adj. EPS
%
2015 2016 20170
50
100
150
GROUP TOTAL
0.2
0.4
0.6
0.8
1.0
1.2
Net debt/equity ratioTarget
2015 2016 2017
Sustainability targets are set at Group and business area levels to effi-ciently manage risks and leverage opportunities. The business areas integrate the targets in their businesses. In 2017, Sandvik worked toward achieving a lost time injury frequency rate (LTIFR) target of 1.4. The LTIFR improved by 6 percent to 1.6 at year-end (1.7). Each business area is responsible for ensuring compliance with the Code of Conduct. By the end of 2017, 93 percent of all employees and long
term contractors had completed training in the Code of Conduct. Energy intensity is measured as energy per hours worked. Since 2014, we have reduced hours worked more than the energy reduction during the same period. With 2014 as base year, the energy use decreased by 3 percent in absolute terms, while hours worked decreased by 10 percent. The share of recovered metal raw material was 79 percent. Increased demand for high-alloy products explains why the target was not reached.
OUTCOME AT END OF 2017
+16% +4.6% PTS <0.3 44%2
FINANCIAL TARGETS1
EBIT GROWTH (CAGR)
≥7%DIVIDEND PAYOUT RATIO
50%ROCE IMPROVEMENT
≥3% PTS
NET DEBT/EQUITY RATIO
<0.8
OUTCOME 2017
1.6 93% 7% 79%
SUSTAINABILITY GOALS
LOST TIME INJURY FREQUENCY RATE IN 2020
<1EMPLOYEES TRAINED IN THE CODE OF CONDUCT
100% ENERGY EFFICIENCY INCREASE IN 2020
20% MAINTAINED LEVEL OF RECOV�ERED METAL RAW MATERIAL
≥80%
Sandvik Annual Report 2017 | 7
OUR STRATEGY
PROGRESS IN OUR STRATEGIC FOCUS AREAS IN 2017
Sandvik divested four businesses that were not core or did not support our goal to be number one or two in chosen seg-ments and markets. The divestments of Sandvik Process Systems and Sandvik Mining Systems were completed and agreements to divest the welding wire
business and Sandvik Hyperion were signed. The divest-ments correspond to 10 percent of Group revenues and will generate an assumed cash flow of about 9 billion SEK. This was part of our continuous efforts to obtain a more consoli-dated portfolio focused on core.
Focus on core capabilities and to be number one or two in chosen segments and markets
Our research and development investments remained at a high level. We focused on product innovations to improve energy efficiency, increase safety and leverage the opportunities for potential growth through digitaliza-tion. These are some examples of the
innovations that are making us a technology leader:
– Sandvik Machining Solutions launched PrimeTurning™, a completely new methodology that enables turning in all directions and cuts conventional turning time for customers, increasing their productivity. Commer-cialization of additive manufacturing (3D printing) and establishment of a Digital Center of Excellence are other examples of strategic importance.
– Sandvik Mining and Rock Technology launched My Sandvik Digital Service Solutions where data is gath-ered from the customers' machines, analyzed and made available for improved customer productivity. New, intelligent mining trucks for automated haulage, Sandvik TH551i and Sandvik TH663i, and a totally new genera-tion of Ranger™ surface drill rigs are other examples of product launches during the year.
– Sandvik Materials Technology introduced the intel-ligent tube system Sentusys™. It helps customers control the status of the tubes inside their processes with the help of cloud-based computing. The business area also manufactures a wide range of powders includ-ing Osprey® gas atomized metal powders, which are being used in several applications, for example additive manufacturing.
Technology leadership and innovation
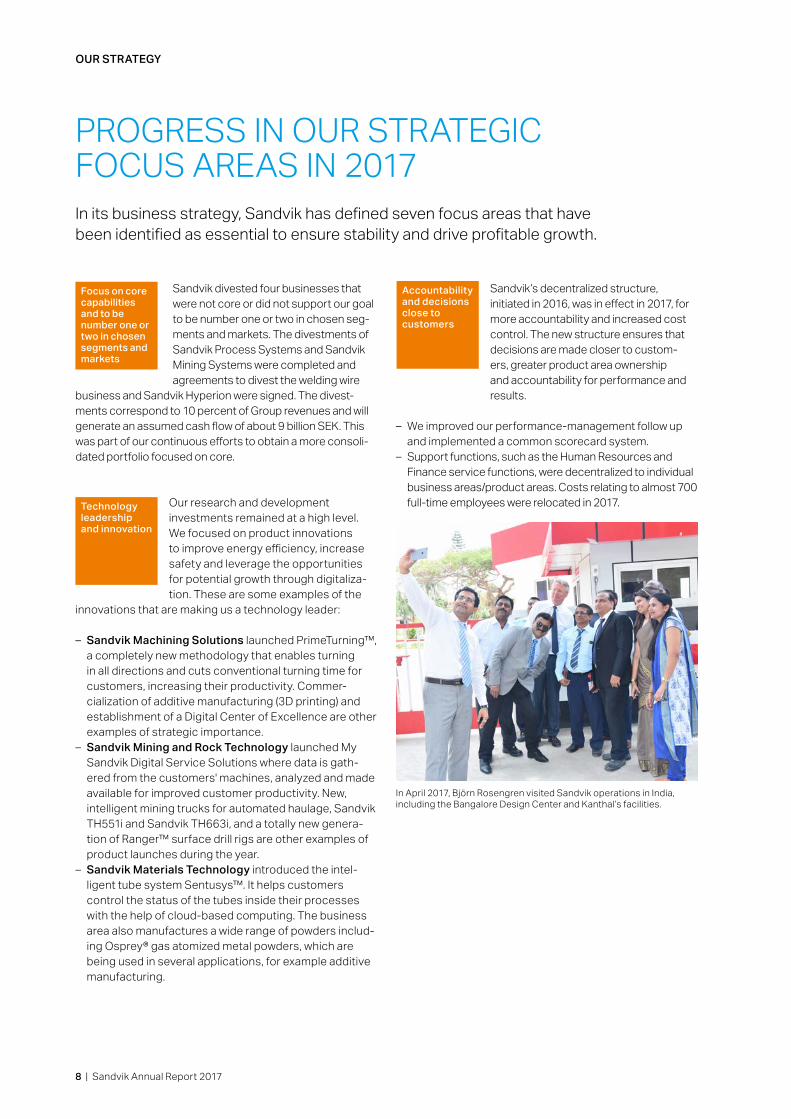
Sandvik’s decentralized structure, initiated in 2016, was in effect in 2017, for more accountability and increased cost control. The new structure ensures that decisions are made closer to custom-ers, greater product area ownership and accountability for performance and results.
– We improved our performance-management follow up and implemented a common scorecard system.
– Support functions, such as the Human Resources and Finance service functions, were decentralized to individual business areas/product areas. Costs relating to almost 700 full-time employees were relocated in 2017.
Accountability and decisions close to customers
In its business strategy, Sandvik has defined seven focus areas that have been identified as essential to ensure stability and drive profitable growth.
In April 2017, Björn Rosengren visited Sandvik operations in India, including the Bangalore Design Center and Kanthal’s facilities.
8 | Sandvik Annual Report 2017

– We continued programs to promote leadership and develop key compe-tences. About 500 people participated in Sandvik’s leadership training programs in 2017. – During 2017, about 3,800 open posi-tions were filled, of which a majority was
posted on the open internal job market.– We leveraged on the strength of social media platforms and new functionality made it possible to target potential employees more efficiently. This is vital as new market demands require new competencies.– We strengthened our focus on diversity and inclusion in the business.
OUR STRATEGY
– Sandvik has set up a target to improve productivity by at least 3 percent annu-ally (revenues per employee). In 2017, productivity improved by 8 percent.– Savings from announced programs, launched in 2013, amounted to 355 million SEK compared with last year.
Additional five units closed during 2017. – Cash flow from operations increased 19 percent to
14,286 million SEK (12,032). – ROCE improved to 19.4 percent (14.7), calculated on
adjusted EBIT. Reported ROCE was 23.9 percent (14.7). – Net working capital (12 month average) improved by 3
percentage points to 24 percent.
Efficiency and cost reductions
Exceptional people
– Continued roll out of The Sandvik Way, our Group governance system.– Training on our Code of Conduct reached a record high of 93 percent of employees including long time contrac-tors. About 25 percent of our employees also received more in-depth training on
one or more of our four compliance programs.– The Sandvik whistleblower system, Speak Up, managed a total of 224 (265) cases with a 55 percent substantiation rate. – We ramped up the roll-out of the data privacy program to meet the new European GDPR regulations.– In 2017, the Lost Time Injury Frequency Rate (LTIFR)decreased to 1.6 (1.7), a record-low.
Culture of doing things right
Sandvik reached its financial targets and had a strong focus on cost effi-ciency in 2017. Operational results increased significantly with sharp mar-gin improvements in Sandvik Machining Solutions and Sandvik Mining and Rock Technology. While Sandvik had a number
of loss-making product areas in 2016, there were none in 2017. This has created a solid platform for future growth. The business areas performed as follows:
– Sandvik Machining Solutions showed record-high margins and improved its operating profit by 21 percent. Round tools, digital solutions, software and metrology are prioritized growth areas.
– Sandvik Mining and Rock Technology improved profit-ability and grew due to a strong market demand. The key priority going forward is to profitably grow the aftermar-ket and automation business.
– Sandvik Materials Technology showed less satisfactory earnings in parts of the business. The key priority is to restore profitability short term through cost actions, and in the mid- to long term by trimming the portfolio while growing sales of high-value products, for example from product areas Kanthal and Powder.
Stability and profitability before growth
Sandvik Annual Report 2017 | 9

NEW MANUFACTURING TECHNIQUESAdditive manufacturing, or 3D printing, is one example of a new technology that requires fewer manufacturing steps and reduces
impact on the environment by producing lighter products and using less raw material. Another new production method is multi-axle technology, where you can machine a material from several different angles. This improves efficiency and enables completely new types of products. Optimizing manufacturing processes reduces carbon emissions and costs and increases productivity.
SCARCE RESOURCES AND ENERGY CONVERSIONA growing global population and economy mean more people must share the earth’s resources. This will require a transition to more sustainable
energy and technologies as well as an increased degree of recycling. One example of this can be seen in the auto-motive industry, which is experiencing a switch from petrol and diesel cars to electric cars, hybrid cars and hydrogen-powered cars. Sandvik is contributing new solutions, such as electric drill rigs, and is developing materials for solar panels and hydrogen-powered cars. We are also developing new technologies in metal cutting that help to reduce environmental impact and are striving to increase recycling within our operations.
DIGITALIZATION AND AUTOMATIONThe manufacturing industry is experienc-ing one of the greatest transformations ever, a transition that is often referred to as
Industry 4.0, and involves a shift to digitalization and auto-mation. Access to comprehensive data volumes, sophisti-cated analytical tools, robotization and artificial intelli-gence are creating new business opportunities. Sandvik offers digitalized solutions and services to optimize its customers’ operations, in terms of costs, productivity and environmental footprint. Automated mines, intelligent tubes and digital tools are some examples of how Sandvik is developing new solutions.
MATERIALS DEVELOPMENTWe are currently in the midst of a revolution-ary development of new materials. Innovative alloys, nanomaterials and advanced powder
technologies are creating new opportunities. Properties in demand include more sustainable and lightweight prod-ucts, with improved strength and anti-corrosion durability. The new materials often reduce environmental impact since lower weight reduces fuel consumption, for example. Sandvik is investing substantial resources in material development and is global leader in the field.
TRENDS AND DRIVING FORCES
A CHANGING WORLD
Sandvik has defined the external factors and drivers that have the greatest impact on the company and that we, together with our customers and other stakeholders, must respond to in order to generate stable and profitable growth.
10 | Sandvik Annual Report 2017

TRENDS AND DRIVING FORCES
More information about Sandvik and the UN SDGs can be found on page 140.
World leaders have committed themselves to 17 Global Goals for Sustainable Development (SDGs). Cross-sector collaboration between civil society, academia and the business community is key if the goals are to be achieved. Sandvik has defined the goals that are most relevant for the company and to which we actively contribute:
UNITED NATIONS' SUSTAINABLE DEVELOPMENT GOALS
Sandvik Annual Report 2017 | 11
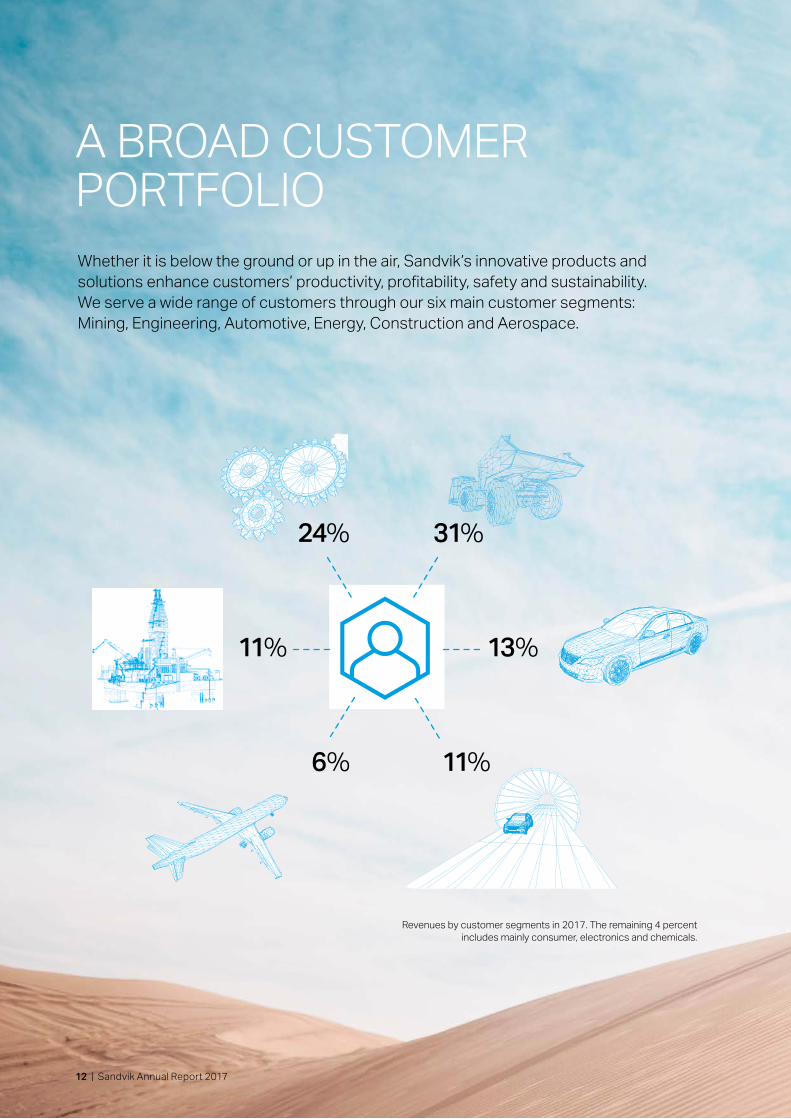
A BROAD CUSTOMER PORTFOLIOWhether it is below the ground or up in the air, Sandvik’s innovative products and solutions enhance customers’ productivity, profitability, safety and sustainability. We serve a wide range of customers through our six main customer segments: Mining, Engineering, Automotive, Energy, Construction and Aerospace.
Revenues by customer segments in 2017. The remaining 4 percent includes mainly consumer, electronics and chemicals.
24% 31%
6% 11%
11% 13%
12 | Sandvik Annual Report 2017

MININGThe mining industry is driven by ore production, commod-ity prices and CAPEX investments. It has relatively few customers, but they are large and mainly global - for whom availability, productivity, safety and total cost of ownership are key.
With three out of five leading metal-cutting brands, Sandvik is an industry authority on machining opera-tions. Our tools and tooling systems for metal cutting as well as advanced materials and components are used in engineering industries worldwide, improving productivity,
profitability, quality and safety as well as reducing environ-mental impact. Sandvik is also a global leader in high-alloy metal powder for several different applications such as additive manufacturing and Metal Injection Molding (MIM).
ENGINEERING
CUSTOMER SEGMENTS
LOADING AND HAULINGOur underground loaders and haul trucks are engineered for safety, productivity and reliability in the toughest of applications. Rugged, compact and highly maneuverable, the ergonomic products offer immense capacity for their size at a very low cost per ton.
AUTOMATION AND MONITORINGOur mine automation systems cover all aspects of automation, from single equipment to full fleet control.
SILENT TOOLS™ PLUSSilent Tools™ Plus is a connected turning solution that aims to optimize internal machining with long overhang. The solution gives access to information about what’s happening inside the machine and component, enabling informed decision making and productive manufacturing.
POWDERSandvik has a world-leading position in the production and sale of metal powders for a variety of high value and growth technologies and applications.
We deliver drill rigs, rock-drilling tools and systems, mobile and stationary crushers, load and haul machines, tunneling equipment, continuous mining and mechanical cutting equipment, as well as various solutions to increase automation, safety and customer productivity.
Sandvik Annual Report 2017 | 13

ENERGYA significant share of the consumption of cutting tools and stainless steel and high-alloy products in the energy sector is linked to the oil and gas industry and the number of drill rigs that are in operation.
Sandvik offers solutions for all forms of energy production, including clean and renewable energy.
The automotive sector is one of the largest consumers of cutting tools. Our tools and tooling systems for turning, milling and drilling in metals raise productivity when manu-facturing, for example, engines and transmissions.
AUTOMOTIVE
CUSTOMER SEGMENTS
CONTROL LINESControl lines are production safety critical when operating an oil well. They operate several different functions and valves down hole through a hydraulic system.
KANTHAL® FLOW HEATERThe electric flow heater from Kanthal enables professionals in the auto-motive testing industry to increase the temperature of gas flows from the standard 850 °C to 1,100 °C (1,562–2,012 °F) with zero emissions at point of use. The higher temperature facilitates more rigorous testing of new materials used in increasingly compact engine designs.
Our stainless and high-alloy products are found in, for example, safety belts, airbags, brakes, air conditioning and various instruments.
Our strip steel with functional coating is for instance used for different types of fuel cells. We supply high-alloy prod-ucts, such as seamless stainless steel tubes for selected niches in the most demanding industries, as well as tools and tooling systems to satisfy the industry’s metal-cutting needs.
METAL-CUTTING TOOLSWe offer a wide range of advanced tools for high productivity in metal cutting when for example producing gas turbines.
METAL-CUTTING TOOLSAdvanced tools are used for manufacturing transmission and engine components in, for example, steel, stainless steel, aluminum and cast iron.
14 | Sandvik Annual Report 2017
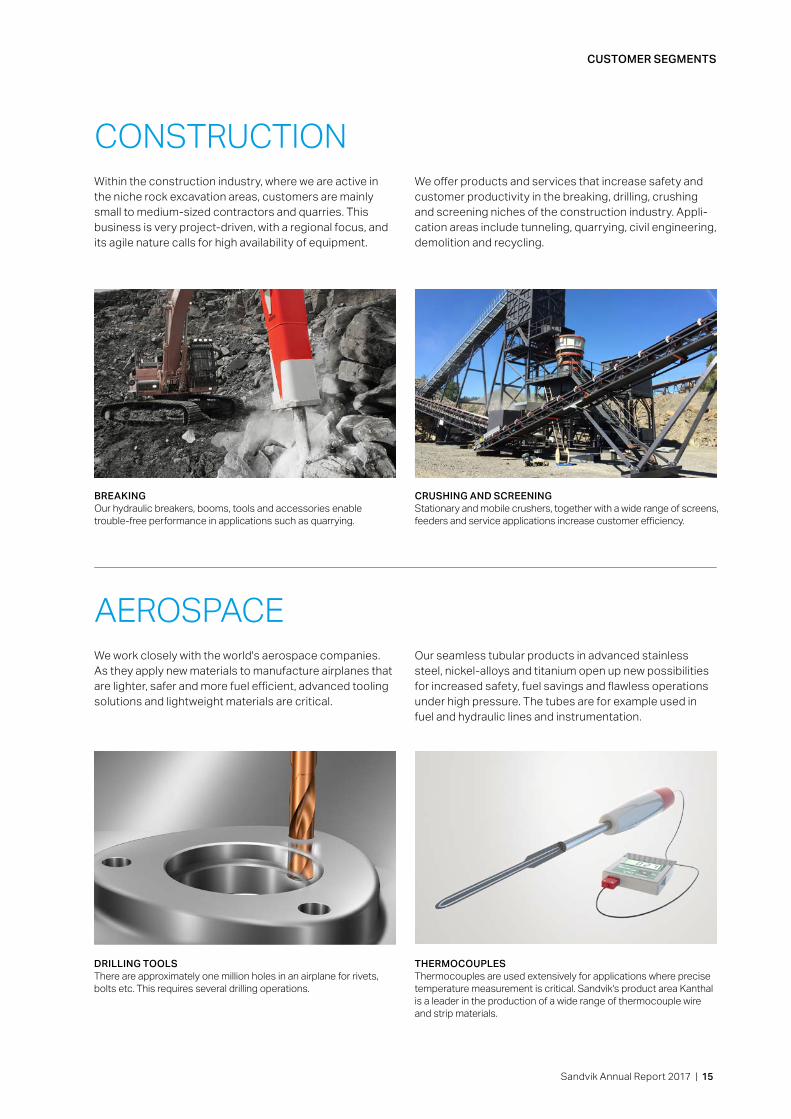
CONSTRUCTIONWithin the construction industry, where we are active in the niche rock excavation areas, customers are mainly small to medium-sized contractors and quarries. This business is very project-driven, with a regional focus, and its agile nature calls for high availability of equipment.
We work closely with the world's aerospace companies. As they apply new materials to manufacture airplanes that are lighter, safer and more fuel efficient, advanced tooling solutions and lightweight materials are critical.
AEROSPACE
CUSTOMER SEGMENTS
CRUSHING AND SCREENINGStationary and mobile crushers, together with a wide range of screens, feeders and service applications increase customer efficiency.
BREAKINGOur hydraulic breakers, booms, tools and accessories enable trouble-free performance in applications such as quarrying.
DRILLING TOOLSThere are approximately one million holes in an airplane for rivets, bolts etc. This requires several drilling operations.
Our seamless tubular products in advanced stainless steel, nickel-alloys and titanium open up new possibilities for increased safety, fuel savings and flawless operations under high pressure. The tubes are for example used in fuel and hydraulic lines and instrumentation.
We offer products and services that increase safety and customer productivity in the breaking, drilling, crushing and screening niches of the construction industry. Appli-cation areas include tunneling, quarrying, civil engineering, demolition and recycling.
THERMOCOUPLESThermocouples are used extensively for applications where precise temperature measurement is critical. Sandvik's product area Kanthal is a leader in the production of a wide range of thermocouple wire and strip materials.
Sandvik Annual Report 2017 | 15

OPERATIONS
THREE BUSINESS AREAS WITH DIFFERENT FOCUSES
We began decentralizing our organization and consolidating Sandvik’s business portfolio in 2016 to improve our long-term efficiency and customer proximity. Our three business areas – Sandvik Machining Solutions, Sandvik Mining and Rock Technology and Sandvik Materials Technology – are divided into 18 product areas with full operational responsibility.
Each business area has its own set of opportunities and challenges concerning stability, profitability and growth that require different strategies and focus. Decentraliza-tion and consolidation of the business portfolio, combined with a stronger market environment, contributed to the Group’s improved profitability in 2017.
16 | Sandvik Annual Report 2017
SANDVIK MACHINING SOLUTIONS
A market-leading manufacturer of tools and tooling systems for advanced metal cutting.
Key PrioritiesWorking to expand the market posi-tion through organic growth, innova-tion and niche acquisitions in the core business. Another part is to expand outside the core machining area, into pre-machining and post-machining and additive manufacturing.
SANDVIK MINING AND ROCK TECHNOLOGY
A leading supplier in equipment and tools, service and technical solutions for the mining industry and rock exca-vation within the construction industry.
Key PrioritiesImprove profitability by growing aftermarket and increase sales of our parts and services on installed base of equipment, as well as add value through automated solutions, aiming to reduce earnings volatility.
SANDVIK MATERIALS TECHNOLOGY
A leading developer and manu-facturer of advanced stainless steels, powder-based alloys and special alloys for the most demand-ing industries.
Key PrioritiesRestore profitability short-term through cost actions, and long term by growing sales of high value prod-ucts. Increased focus on operational and commercial excellence.
OPERATIONS
Sandvik Annual Report 2017 | 17

SANDVIK MACHINING SOLUTIONS
OPERATIONS
The stars were aligned for global market leader Sandvik Machining Solutions in 2017. Profit increased 21 percent compared to 2016, a number of innovative products were launched, and there was growth in all regions.
REVENUES BY MARKET AREA
n Europe, 55%n North America, 21%n Asia, 20%n South America, 2%n Africa/Middle East, 1%n Australia, 1%
REVENUES BY CUSTOMER SEGMENT
n Engineering, 47%n Automotive, 28%n Aerospace, 13%n Energy, 9%n Other, 3%
2017 IN FIGURESRevenues: 35,778 million SEK (32,852) with 8% organic growthOperating profit: 8,413 million SEK (6,970)Operating margin: 23.5% (21.2)Return on capital employed: 35% (28.9)Employees: 18,187 (18,043) Gender balance: Men 80%, Women 20%President: Klas Forsström, as of 1 April 2017Lost time injury frequency rate (LTIFR): 1.8 Share of recovered metallic raw material: 52%Estimated market size: 175 billion SEK
18 | Sandvik Annual Report 2017

OPERATIONS
Business area Sandvik Machining Solutions manufactures metal cutting tools and tooling systems for advanced industrial machining operations. Inserts (55%), round tools (18%) and tools (12%) account for the majority of reve-nues, while a smaller portion comes from tooling systems (7%). Products and solutions are sold under a number of world-leading brands, including Sandvik Coromant, Seco, Walter and Dormer Pramet.
MARKET SITUATIONOur customer segments strengthened in all regions. The customer segment aerospace, for example, continued to grow globally and the automotive sector was particularly strong in Asia. Sandvik Machining Solutions is in a strong position, with hundreds of thousands of customers spread around the world. However, competition and consolidation continue to increase in the global cutting tool industry.
BEING NO 1 OR 22017 was a strong year for Sandvik Machining Solutions, with growth in all regions and product areas and we main-tained our number one position in the market for machin-ing products and solutions.
FOCUS ON CORE During the year, we focused on our Value Selling Concept, which continued to support positive price effects. The Value Selling Concept enables us to offer our customers added value, with tools and solutions that improve perfor-mance and increase customers’ competitiveness.
This meets a growing demand for higher production effi-ciency in, for example China, where operational efficiency and productivity have become major business drivers.
EFFICIENCY AND CONTINUOUS IMPROVEMENTS Operational and efficiency improvements, such as lean methodology, benchmarking internal best practices and other efforts, helped lower production costs. Restructuring and factory closures within the business area also contri-buted to the year’s positive results.
SUSTAINABLE BUSINESS Within our own operations, Sandvik Machining Solutions’ energy use increased by 20 GWh in 2017, which was 3 percent higher than the year before. In relation to a 8 percent organic growth, this corresponds to a relative reduction in energy usage. Waste volumes remained unchanged compared to 2016, an improvement in relation to growth. We pay customers for their worn inserts and solid carbide tools through local buy-back programs. The recycled material is subsequently re-used in our production.
In addition to actively working with recycling of inserts and solid carbide products, we successfully help our custom-ers improve their operational efficiency. We also support customers to lower their energy consumption through improvements in tool speed and tool life. Sandvik Machining Solutions advises customers on how to reduce costs and increase efficiency through our productivity improvement programs.
Sandvik Annual Report 2017 | 19
OVERVIEWProduct portfolio Multi-brand strategy: Sandvik Coromant, Seco, Walter and Dormer Pramet. Metal-cutting tools: majority of revenues are derived
through inserts and round tools (consumables). Smaller part from tool holders.
Market characteristics
High barriers of entry due to capital intensive business model and intellectual property throughout the value chain (high degree of vertical integration). Cutting tools represent a small share of total manufacturing cost for the customers, however they are significant for the productivity. Service levels and product solutions are the main differentiator for premium offering. Lower service degree for mid-market which is more price sensitive.
Demand drivers – Global industrial production – Primary metals consumption – Materials evolution: aluminum, titanium, composites – New technologies: additive manufacturing, near-net shaping, 5-axis machining
Competitive landscape/Major competitors
– Consolidated in the premium segment: IMC group (Iscar brand), Kennametal (Kennametal brand) – Fragmented in mid-market including global premium players present with their mid-market brands: Mitsubishi, IMC group (Taegutec brand), Kennametal (Widia brand), Zhuzhou
Go-to- market model
Direct sales ~55-60 percent. Distribution sales is predominant in North America whereas direct sales is predominant in Europe. In Asia, mainly distribution sales with limited service offering in the mid-market segment and direct sales, with high service level, in the premium segment.
Growth strategy Expansion through organic growth, innovation and niche acquisitions in the core (round tools). Complementary expansion into pre-machining, post-machining and additive manufacturing.
Strategic risk management
Various forms of business environment risks with an impact on the metal cutting market in general, mainly changes in customer behavior, increased competition, brand positioning and the development of new products and services.
OPERATIONS
TECHNOLOGY LEADERSHIP AND INNOVATIONSandvik Machining Solutions has a high ratio of new prod-ucts and solutions sold to the market. Products that are less than five years old generate 30 percent of our sales. In 2014, that figure was 23 percent, which gives an indication of what we have achieved in a very short time.
We are expanding our capabilities in additive manufacturing through research and development and on January 1, 2017, we started a new product area to define a commercial model for an additive manufacturing offering. We are a leader in driving technological change in our industry and are confi-dent that Sandvik will add value in additive manufacturing, as we do in traditional, subtractive manufacturing.
During the year we released a number of innovative new products and solutions including the ones below.
PROFITABLE GROWTHWe are working to expand our market position through organic growth, innovation and niche acquisitions in the core business. Certain areas, such as round tools, are particularly in focus as the growth potential is interesting. Another part of our strategy is to expand into pre-machin-ing, post-machining and additive manufacturing. These areas have their own growth potential, but are also critical to master as these steps will be integrated more and more in the manufacturing process in the future.
Our overall ambition is profitable growth, driven by step-by-step continuous improvements, while we expand our business through acquisitions and innovation. We want to develop from a world-leading player in the “niche” industry of metal cutting, to a leading solutions provider to the wider manufacturing industry and deliver accelerated growth with maintained high profitability and returns.
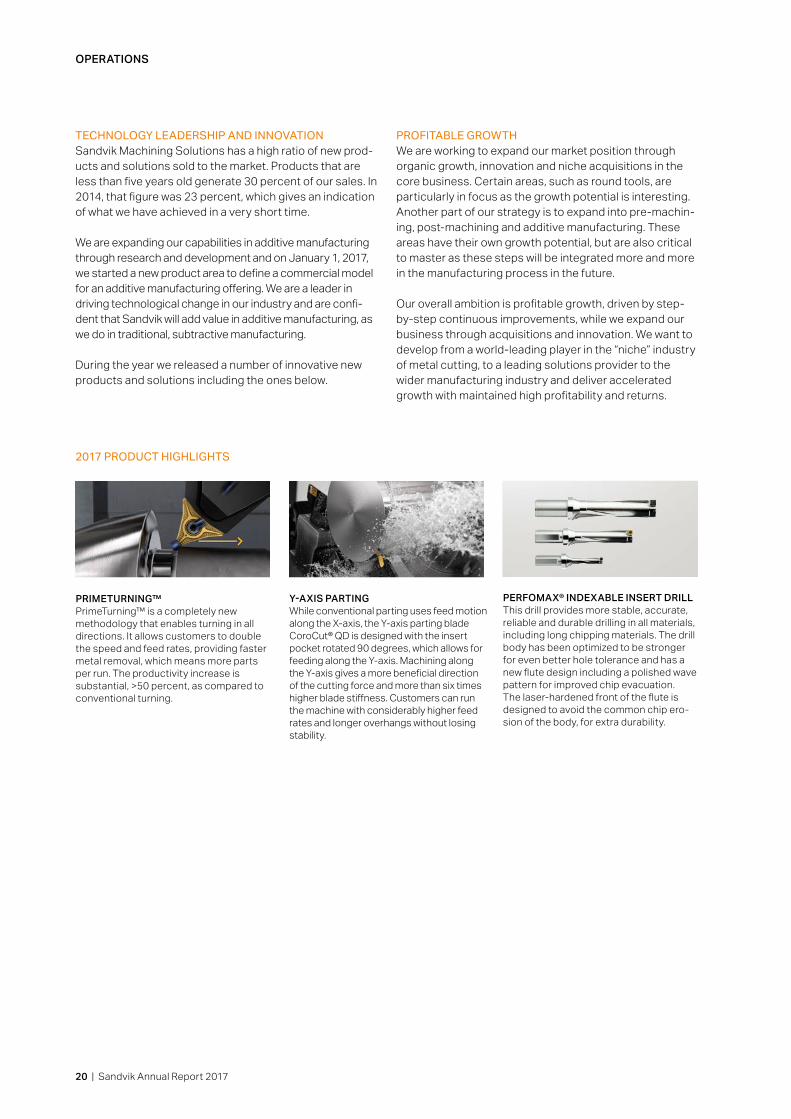
PRIMETURNING™ PrimeTurning™ is a completely new methodology that enables turning in all directions. It allows customers to double the speed and feed rates, providing faster metal removal, which means more parts per run. The productivity increase is substantial, >50 percent, as compared to conventional turning.
2017 PRODUCT HIGHLIGHTS
Y-AXIS PARTINGWhile conventional parting uses feed motion along the X-axis, the Y-axis parting blade CoroCut® QD is designed with the insert pocket rotated 90 degrees, which allows for feeding along the Y-axis. Machining along the Y-axis gives a more beneficial direction of the cutting force and more than six times higher blade stiffness. Customers can run the machine with considerably higher feed rates and longer overhangs without losing stability.
PERFOMAX® INDEXABLE INSERT DRILLThis drill provides more stable, accurate, reliable and durable drilling in all materials, including long chipping materials. The drill body has been optimized to be stronger for even better hole tolerance and has a new flute design including a polished wave pattern for improved chip evacuation. The laser-hardened front of the flute is designed to avoid the common chip ero-sion of the body, for extra durability.
20 | Sandvik Annual Report 2017

New solutions from Sandvik are helping customers improve their effi-ciency, flexibility and productivity. Sandvik Coromant’s new methodol-ogy, PrimeTurning™, helped Mexican customer Sisamex increase parts produced per hour by 100 percent.
PrimeTurning™ enables turning in all directions for much more efficiency and productivity in turning compared to conventional methods. Using the new turning method results in longer lasting inserts, faster metal removal rates, higher machine utilization and less time spent on setup and tool changes. All this makes for a very fast return on investment.
The team responsible for PrimeTurn-ing in Mexico approached Sisamex, a major automotive customer that manufactures transmission parts. The customer doubted that anything could outperform the pinion machin-ing method they had been working with and perfecting over the past 20 years.
TAKING THE CHALLENGEHowever, after some persuasion, Sisamex agreed to try the method, provided it could increase the com-
THERE’S NO TURNING BACK AFTER USING PRIMETURNING™
pany’s parts produced per hour by 25 percent. If it was capable of increasing their efficiency and pro-ductivity so substantially, then the automotive company would use all Sandvik Coromant tools for a new machine they were planning to install.
Tests were conducted at the Sandvik Coromant Center in Mexico, with a pinion sample from the customer that needed to be replicated and the desired increase in produced parts per hour was successfully achieved. Not only that, it was actually increased by 100 percent, from 10 to 20 components per hour.
This was enough to convince Sisamex to switch from pinion machining to PrimeTurning. "From the first presentation, CoroTurn® Prime felt like a good fit to increase our productivity at the pinion production line. After the first results we knew
we had hit a home run with this new project and we clearly saw increased performance of the tools, consid-erable reduction of cycle time and improved control of the process,” says Paul Mata, Manufacturing Manager at Sisamex.
Operators are happy they don’t have to change the insert as frequently as in the past, thanks to longer tool life. They are also pleased with the relative ease of changing the cut direction.
The method is such a groundbreaker that it went on to receive the prestig-ious MaschineMarkt (MM) Innovation award at the 2017 EMO The World of Metalworking exhibition in Hannover, Germany in September.
José Carrizales from Sandvik Coromant explains the advantages with PrimeTurning to customer Adrián Valdez.
Sandvik Annual Report 2017 | 21

SANDVIK MINING AND ROCK TECHNOLOGY
OPERATIONS
Customer demand rose with commodity prices resulting in a strong 2017 for Sandvik Mining and Rock Technology. The business area continued to develop automated solutions, which are boosting customer productivity, and it focused on aftermarket sales.
REVENUES BY MARKET AREA
n Africa/Middle East, 21%n North America, 20%n Asia, 19%n Europe, 17%n Australia, 14%n South America, 9%
2017 IN FIGURESRevenues: 36,547 million SEK (31,093) with 15% organic growthOperating profit: 5,743 million SEK (3,206)Operating margin: 15.7% (10.3)Return on capital employed: 25.4 (13.8)Employees: 15,041 (14,087)Gender balance: Men 85%, Women 15 %President: Lars EngströmLost time injury frequency rate (LTIFR): 1.0 Share of recovered metallic raw material: 91%Estimated market size: 280 billion SEK
REVENUES BY COMMODITY1
n Gold, 31%n Copper, 21%n Zinc, 10%n Coal, 8%n Platinum, 6%n Iron ore, 5%n Diamonds, 3%n Other minerals, 6%n Other base metals, 6%n Other metals, 4%
1) Only for mining-related revenues, i.e. 74 percent of total revenues.
22 | Sandvik Annual Report 2017
OPERATIONS
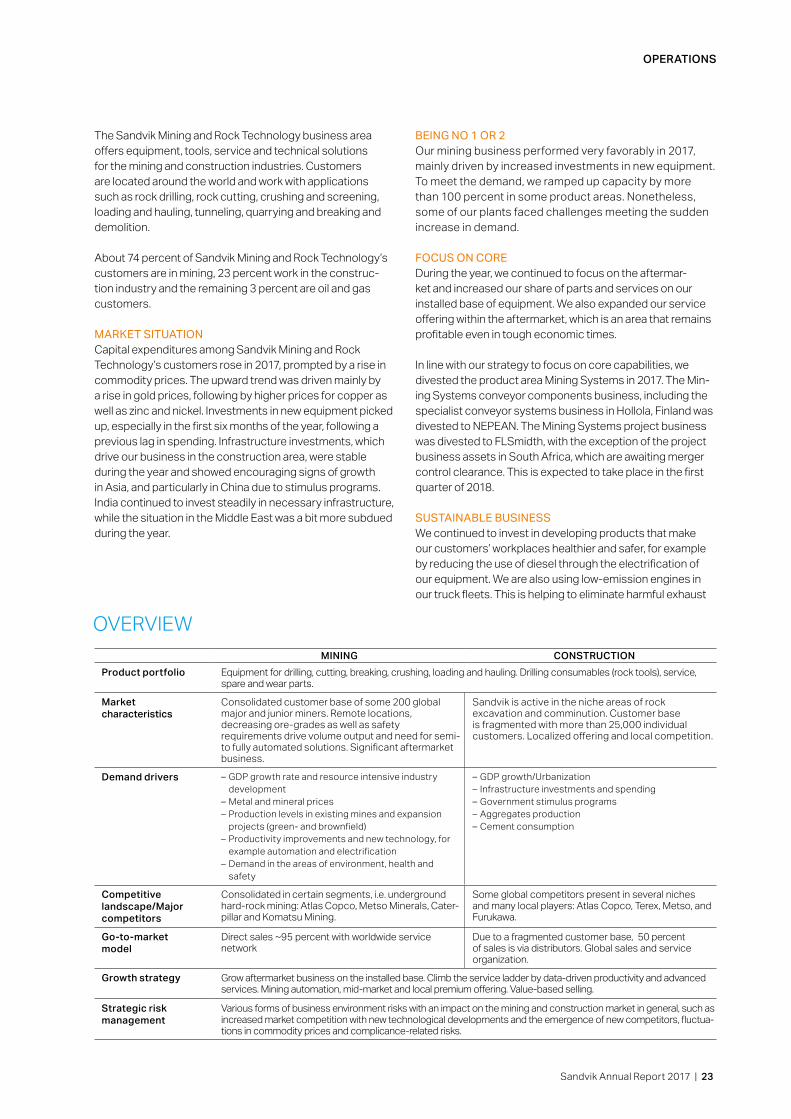
The Sandvik Mining and Rock Technology business area offers equipment, tools, service and technical solutions for the mining and construction industries. Customers are located around the world and work with applications such as rock drilling, rock cutting, crushing and screening, loading and hauling, tunneling, quarrying and breaking and demolition.
About 74 percent of Sandvik Mining and Rock Technology’s customers are in mining, 23 percent work in the construc-tion industry and the remaining 3 percent are oil and gas customers.
MARKET SITUATIONCapital expenditures among Sandvik Mining and Rock Technology’s customers rose in 2017, prompted by a rise in commodity prices. The upward trend was driven mainly by a rise in gold prices, following by higher prices for copper as well as zinc and nickel. Investments in new equipment picked up, especially in the first six months of the year, following a previous lag in spending. Infrastructure investments, which drive our business in the construction area, were stable during the year and showed encouraging signs of growth in Asia, and particularly in China due to stimulus programs. India continued to invest steadily in necessary infrastructure, while the situation in the Middle East was a bit more subdued during the year.
BEING NO 1 OR 2Our mining business performed very favorably in 2017, mainly driven by increased investments in new equipment. To meet the demand, we ramped up capacity by more than 100 percent in some product areas. Nonetheless, some of our plants faced challenges meeting the sudden increase in demand.
FOCUS ON COREDuring the year, we continued to focus on the aftermar-ket and increased our share of parts and services on our installed base of equipment. We also expanded our service offering within the aftermarket, which is an area that remains profitable even in tough economic times.
In line with our strategy to focus on core capabilities, we divested the product area Mining Systems in 2017. The Min-ing Systems conveyor components business, including the specialist conveyor systems business in Hollola, Finland was divested to NEPEAN. The Mining Systems project business was divested to FLSmidth, with the exception of the project business assets in South Africa, which are awaiting merger control clearance. This is expected to take place in the first quarter of 2018.
SUSTAINABLE BUSINESS We continued to invest in developing products that make our customers’ workplaces healthier and safer, for example by reducing the use of diesel through the electrification of our equipment. We are also using low-emission engines in our truck fleets. This is helping to eliminate harmful exhaust
OVERVIEWMINING CONSTRUCTION
Product portfolio Equipment for drilling, cutting, breaking, crushing, loading and hauling. Drilling consumables (rock tools), service, spare and wear parts.
Market characteristics
Consolidated customer base of some 200 global major and junior miners. Remote locations, decreasing ore-grades as well as safety requirements drive volume output and need for semi- to fully automated solutions. Significant after market business.
Sandvik is active in the niche areas of rock excavation and comminution. Customer base is fragmented with more than 25,000 individual customers. Localized offering and local competition.
Demand drivers – GDP growth rate and resource intensive industry development
– Metal and mineral prices – Production levels in existing mines and expansion projects (green- and brownfield)
– Productivity improvements and new technology, for example automation and electrification
– Demand in the areas of environment, health and safety
– GDP growth/Urbanization – Infrastructure investments and spending – Government stimulus programs – Aggregates production – Cement consumption
Competitive landscape/Major competitors
Consolidated in certain segments, i.e. underground hard-rock mining: Atlas Copco, Metso Minerals, Cater-pillar and Komatsu Mining.
Some global competitors present in several niches and many local players: Atlas Copco, Terex, Metso, and Furukawa.
Go-to- market model
Direct sales ~95 percent with worldwide service network
Due to a fragmented customer base, 50 percent of sales is via distributors. Global sales and service organization.
Growth strategy Grow aftermarket business on the installed base. Climb the service ladder by data-driven productivity and advanced services. Mining automation, mid-market and local premium offering. Value-based selling.
Strategic risk management
Various forms of business environment risks with an impact on the mining and construction market in general, such as increased market competition with new technological developments and the emergence of new competitors, fluctua-tions in commodity prices and complicance-related risks.
Sandvik Annual Report 2017 | 23

OPERATIONS
fumes especially in the confined spaces where many of our customers work.
Within our operations, Sandvik Mining and Rock Technology focuses on using materials and resources efficiently and on reducing emissions. Selecting lighter packaging for spare parts and recycling consumables such as drill bits through customer recycling programs, are a couple of examples of our activities.
We carefully select and audit suppliers to ensure they meet the requirements outlined in our Code of Conduct and there is zero tolerance for suppliers who do not live up to our standards.
EFFICIENCY AND CONTINUOUS IMPROVEMENTS Our operations focus on bringing value to customers through solutions that increase their productivity and effi-ciency. They also improve safety, with as little impact on the environment as possible.
TECHNOLOGY LEADERSHIP AND INNOVATIONSandvik’s remote monitoring and autonomous solutions for the mining industry, such as AutoMine™, are also making operations safer by releasing miners from areas of high heat, vibration, noise and pollution. Automated systems are also increasing productivity and cost efficiency in mining operations by enabling additional productive hours through remote operation and reducing wear and tear on equipment. Sandvik Mining and Rock Technology works together with customers, using their insights to develop products and
MY SANDVIK DIGITAL SERVICE SOLUTIONS
The service solution provides cus-tomers with readily analyzed data of their own operations. Data is gathered straight from the loaders, trucks or drills via a secure wireless connection, it is analyzed and made available in an easy-to-view format. Via the My Sandvik customer portal customers can access their own data 24/7 from anywhere in the world, allowing them to monitor and measure their operations as well as base decisions on accurate knowledge for improved productivity.
2017 PRODUCT HIGHLIGHTS
solutions. By using electric energy from an onboard battery during tramming, the drill rig Sandvik DD422iE produces zero emissions while maneuvering between headings. This improves health and safety for miners working underground. Less diesel usage in the mine can ease ventilation require-ments while also reducing associated diesel logistics and maintenance expenses.
In March, we signed an agreement with IBM to jointly develop market leading offerings in Data Driven Productivity and Predictive Maintenance services for the mining and rock excavation industry. During the year we also started a coop-eration with Cisco to provide customers with fast and reliable network infrastructure to support Sandvik's digital offering.
PROFITABLE GROWTHWe will continue to grow our market share by focusing on the extremely important and dependable aftermarket for parts and services. We will also invest in upgrading the way we manufacture and develop products such as our rock drills, to help our customers work more efficiently.
Sandvik Mining and Rock Technology is the market leader when it comes to running equipment autonomously and this is another important growth area. Our customers are investing in fleet management systems and autonomous equipment to improve their decision-making, maintenance, productivity, sustainability and efficiency. Connected equipment, made possible through the My Sandvik customer portal for fleet access and management, has opened a new era in fleet optimization and performance.
SANDVIK CS550 CONE CRUSHER
This powerful secondary stage crusher is dimensioned for 700–750 ton applications. In addition to flexibility and sheer tonnage, it offers advanced automation and maintenance features for maximal productivity and uptime.
RANGER™ DXI –NEW SERIES SURFACE DRILL RIGS
The new surface drill rig includes several new high-performing features for an improved drilling process. For example, it has 55 square meter drilling coverage and is equipped with a new powerful rock drill. This, combined with high fuel efficiency, makes it the most powerful and efficient top hammer drill rig in its class. It represents a totally new generation in the Ranger product family.
24 | Sandvik Annual Report 2017

Along with equipment and tools for mining, Sandvik Mining and Rock Technology is also a leading supplier of mining services. The Sandvik 365 maintenance agreement includes regularly scheduled mainte-nance checks and repairs to help mining companies improve safety and productivity – and reduce costs.
Thousands of people work at the Guizhou Kailin Group Co. Ltd (Kailin) underground rock phosphate mines in southwest China, where Sandvik has been supplying underground drill equipment for more than 30 years. Due to the hardness of the phosphate ore, a drill-and-blast technique is necessary, and Kailin’s employees rely on a fleet of more than 60 Sandvik drill rigs to drill the blast holes.
The mines operate two shifts per day with production blasts on a daily basis. To keep up such high productivity, the Sandvik rock drills mounted on the drill rigs need to be kept in good working order. Today, this is achieved through a mainte-nance agreement initiated in 2016.
MAINTENANCE ON SITEThe Sandvik 365 maintenance agreement comprises a Sand-vik-branded container with mainte-nance equipment and a workstation that is based permanently at the Kailin service yard near the mines. Sandvik engineers work on site together with the Kailin equipment teams and are on hand to perform regularly scheduled maintenance checks and make quick repairs
ON-SITE SERVICE RAISES PRODUCTIVITY
should anything go wrong. At just six meters long, the Sandvik container features a range of tools, a workbench and all necessary technical manuals and documented procedures. The container serves as a base for service operations, and despite its small size, the converted shipping container has made a big impact on Kailin’s operations.
“Before we signed the service con-tract with Sandvik, we had to wait weeks for spare parts,” says Shugao He, deputy manager of the remote Qingcaichong mine, one of Kailin’s four mines in the area. “Sometimes we would need to dismantle rock drills and ship them elsewhere to be checked. It took a long time and had a major impact on our productivity.” The problem wasn’t just on the rare occasions the rock drills needed repair. No regular maintenance schedules were adhered to, so the operating efficiency of the rock drills was sub-par. The local team didn’t have the equipment or knowledge of what was required to keep the drills running at their optimum levels.
30 SECONDS SAVEDOuyang Lin is deputy director of the Kailin Mining Company. “Before the
regular maintenance was intro-duced, drilling a single blast hole could take up to 90 seconds,” he says. “Now with the drills properly serviced, the average is down to 60 seconds. The price we pay for this service contract is very small considering the efficiency improve-ments we are seeing.”
The benefits don’t stop there. Kailin employees are also enjoying the use of professional tools and training in how to properly maintain and repair the Sandvik rock drills. Their safety is also vital.
“The biggest challenge we face in technology terms is to stay safe when we mine underground. Getting the right equipment and technology and keeping it operational is crucial,” says Zhongguo He, the general man-ager of Guizhou Kailin Mining Com-pany. “In the past, we purchased just the equipment, but increasingly we are focusing on purchasing both equipment and ongoing service and maintenance agreements. Not only does it improve our productivity, it helps our suppliers to better under-stand our needs, which can only benefit us in the years to come.”
Shugao He, deputy manager of the Qingcaichong mine in China’s Guizhou province, is satisfied with the Sandvik 365 service solution.
Sandvik Annual Report 2017 | 25
SANDVIK MATERIALS TECHNOLOGY
OPERATIONS
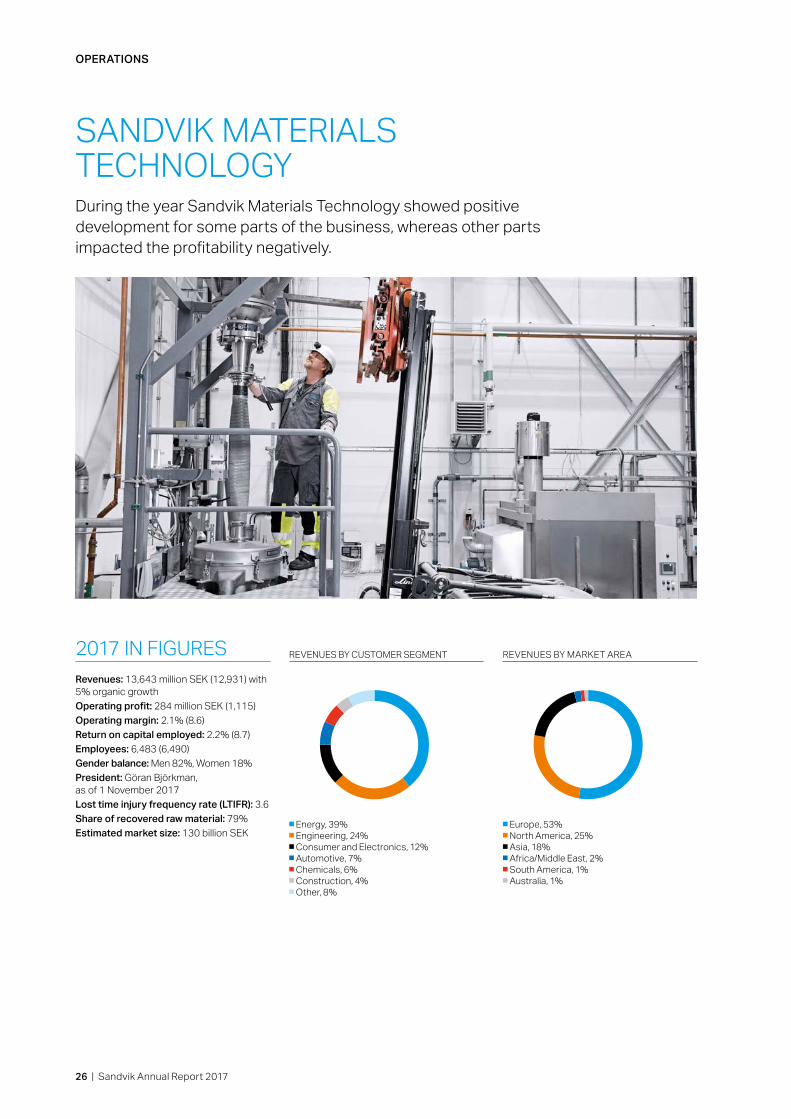
During the year Sandvik Materials Technology showed positive development for some parts of the business, whereas other parts impacted the profitability negatively.
2017 IN FIGURESRevenues: 13,643 million SEK (12,931) with 5% organic growthOperating profit: 284 million SEK (1,115)Operating margin: 2.1% (8.6)Return on capital employed: 2.2% (8.7)Employees: 6,483 (6,490)Gender balance: Men 82%, Women 18%President: Göran Björkman, as of 1 November 2017Lost time injury frequency rate (LTIFR): 3.6 Share of recovered raw material: 79%Estimated market size: 130 billion SEK
REVENUES BY MARKET AREA
n Europe, 53%n North America, 25%n Asia, 18%n Africa/Middle East, 2%n South America, 1%n Australia, 1%
REVENUES BY CUSTOMER SEGMENT
n Energy, 39%n Engineering, 24%n Consumer and Electronics, 12%n Automotive, 7%n Chemicals, 6%n Construction, 4%n Other, 8%
26 | Sandvik Annual Report 2017

OPERATIONS
Business area Sandvik Materials Technology is a developer and producer of advanced stainless steels, special alloys, titanium and other high-performance materials. It produces tubes, powder, strip and products for industrial heating technology.
MARKET SITUATIONDuring 2017, there was good development in several of the market segments addressed by Sandvik Materials Technol-ogy. However, continued low oil prices and fierce competition from China presented several uncertainties and challenges for the core and standard business within the Tube product area. While being late to react on changed market condi-tions, mitigation actions have been launched within product area Tube during 2017. It is now on track with a strong focus on cost efficiency improvements and an active portfolio management.
BEING NO 1 OR 2The wire product portfolio (welding wire and stainless wire), did not meet up to the company’s strategy to be number one or two in the market and was announced to be divested. In October 2017 it was announced that the welding wire busi-ness will be divested to ESAB, a global leader in the welding industry, while the process to divest the stainless wire busi-ness will continue during 2018.
FOCUS ON COREThere are several specific trends that work in favor of Sandvik Materials Technology’s portfolio. With additive manufactur-ing (3D printing) as well as other powder-based manufactur-ing methods developing at a fast pace, the powder market for stainless and advanced alloys is growing and the transi-tion from gas-heated industrial furnaces to electrical heating, present new opportunities for the Kanthal product area.
EFFICIENCY AND CONTINUOUS IMPROVEMENTSSandvik Materials Technology continued its efficiency program in 2017 with strict cost controls and cost reduc-tions, including layoffs. There was also heavy restructuring in line with the strategic direction to decentralize and allocate resources to the product areas. The goal is to bring business closer to customers for a positive impact on sales, efficiency and product innovation.
The restructuring generated four partly new product areas: Strip, Kanthal, Powder and Tube. This has led to improved accountability and transparency, as well as a more logical organizational structure.
SUSTAINABLE BUSINESS Sandvik Materials Technology collaborates with customers on ways to help them to work safer and more energy effi-ciently. One recent example is the development of Safurex®, a patented powder that reduces the risk of explosion during
OVERVIEWProduct portfolio Tubular products, bars, billets, strip. wire, rock drill steel, heating systems (Kanthal) – as well as metal,
powder to for example additive manufacturing as well as powder-based products.
Market characteristics
Selected niches in demanding industries where material requirements, as well as product quality and reliability, are extremely high. High entry barriers.
Demand drivers – Energy demand and oil and gas prices – Industrial production – Environmental demands and legislation e.g. reduced emissions and energy consumption
– Materials evolution i.e. advanced material requirements such as additive manufacturing – Increased demand for safety, reliability and more sustainable materials
Competitive landscape/Major competitors
Nippon Steel & Sumitomo Metal (tube), Tubacex (tube), Jiuli (tube) VoestAlpine (strip), Aperam (heating elements and systems), smaller niche players.
Go-to- market model Direct sales ~80 percent
Growth strategy Increased focus on products and solutions improving energy efficiency and reducing emissions. Continued material evolution through focused R&D efforts and green technologies such as powder metallurgy.
Strategic risk management
Fluctuating oil and gas prices. Increased competition of high-tech material from China. Local protec-tionism in the steel industry.
Sandvik Annual Report 2017 | 27

OPERATIONS
production of fertilizers. Umbilical tubes are improving safety in the oil and gas industry, flapper valves are helping to improve energy efficiency, and we offer material technol-ogies that can conduct heat in solar panels or be used in desalination plants.
We continue to optimize our operations through reduc-ing energy, water and waste. During the year, many local initiatives to minimize our environmental footprint were implemented; energy efficiency programs at a majority of the business units, improved monitoring and control of water use, improved treatment of process water and investigation of new solutions to optimize our waste management.
In 2017, energy usage remained unchanged and carbon emissions decreased by 2 percent, despite 5 percent organic growth. Total water usage decreased 140,000 cubic meters (–4%) and waste volumes were reduced by 7,000 metric tons (–8%).
TECHNOLOGY LEADERSHIP AND INNOVATIONResearch and development focuses on applications related to energy efficiency and other customer benefits, such as corrosion resistance, high-strength materials and materials that withstand higher temperatures for applications, such as in the solar power industry.
Working with modeling and simulation in materials design and in production processes, has not only optimized pro-duction, but also significantly reduced research lead time in materials design before entering product development.
PROFITABLE GROWTHWhile there was growth for some of the more specialized tubular products, profitability for the core and standard busi-ness within product area Tube remained at a low level. The Powder and Kanthal product areas had good growth devel-opment throughout the year, whereas the product area Strip was struggling to reach profitability and efficiency targets.
No competitor today has as many products in the materials technology field as Sandvik. In order for the business area to reach profitability targets, an increased focus on opera-tional and commercial excellence will be important. We will continue to solve the needs of our customers as trends and technologies shift, for example in the areas of digitalization and additive manufacturing. Sandvik’s wide range of Osprey® gas atomized metal powders, for example, are being used for, among other applications, additive manufacturing (3D printing). A small but rapidly growing niche of 3D printing customers are using metallic powder from Sandvik Materials Technology. Increased focus on sustainability targets from our customers will continue to influence our product devel-opment with more energy-efficient and fossil-free products for customers.
COILED TUBING/EXTREME COILS Extreme coils is the longest single seam-less stainless tube in the world. This is an innovation that fulfills customers' demands in critical applications mainly in the oil and gas industry.
2017 PRODUCT HIGHLIGHTS
SENTUSYSTM The intelligent tube system helps customers control the status of the tubes inside their processes with the help of cloud-based computing. The true innovation lies in the combination of metallurgical knowledge and the sensor technology.
FURNACE ROLLER Kanthal APMT™ is an iron-chromium-alu-minum alloy, ideal for high temperature applications, such as furnace rollers in the steel industry. The rollers remain straight and rigid with excellent resistance to oxi-dation and hot corrosion, even in extreme temperatures.
28 | Sandvik Annual Report 2017
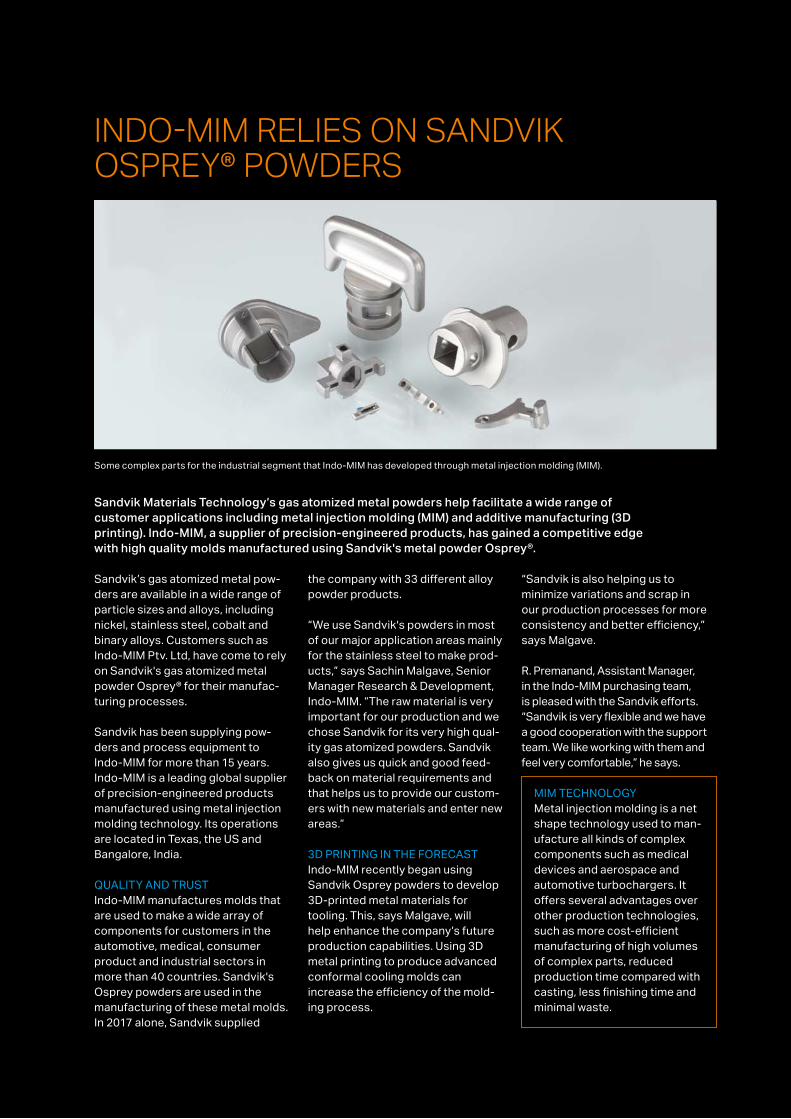
INDO-MIM RELIES ON SANDVIK OSPREY® POWDERS
Sandvik Materials Technology’s gas atomized metal powders help facilitate a wide range of customer applications including metal injection molding (MIM) and additive manufacturing (3D printing). Indo-MIM, a supplier of precision-engineered products, has gained a competitive edge with high quality molds manufactured using Sandvik's metal powder Osprey®.
Sandvik’s gas atomized metal pow-ders are available in a wide range of particle sizes and alloys, including nickel, stainless steel, cobalt and binary alloys. Customers such as Indo-MIM Ptv. Ltd, have come to rely on Sandvik's gas atomized metal powder Osprey® for their manufac-turing processes.
Sandvik has been supplying pow-ders and process equipment to Indo-MIM for more than 15 years. Indo-MIM is a leading global supplier of precision-engineered products manufactured using metal injection molding technology. Its operations are located in Texas, the US and Bangalore, India.
QUALITY AND TRUSTIndo-MIM manufactures molds that are used to make a wide array of components for customers in the automotive, medical, consumer product and industrial sectors in more than 40 countries. Sandvik's Osprey powders are used in the manufacturing of these metal molds. In 2017 alone, Sandvik supplied
the company with 33 different alloy powder products.
“We use Sandvik's powders in most of our major application areas mainly for the stainless steel to make prod-ucts,” says Sachin Malgave, Senior Manager Research & Development, Indo-MIM. “The raw material is very important for our production and we chose Sandvik for its very high qual-ity gas atomized powders. Sandvik also gives us quick and good feed-back on material requirements and that helps us to provide our custom-ers with new materials and enter new areas.”
3D PRINTING IN THE FORECAST Indo-MIM recently began using Sandvik Osprey powders to develop 3D-printed metal materials for tooling. This, says Malgave, will help enhance the company’s future production capabilities. Using 3D metal printing to produce advanced conformal cooling molds can increase the efficiency of the mold-ing process.
“Sandvik is also helping us to minimize variations and scrap in our production processes for more consistency and better efficiency,” says Malgave.
R. Premanand, Assistant Manager, in the Indo-MIM purchasing team, is pleased with the Sandvik efforts. “Sandvik is very flexible and we have a good cooperation with the support team. We like working with them and feel very comfortable,” he says.
Some complex parts for the industrial segment that Indo-MIM has developed through metal injection molding (MIM).
MIM TECHNOLOGY Metal injection molding is a net shape technology used to man-ufacture all kinds of complex components such as medical devices and aerospace and automotive turbochargers. It offers several advantages over other production technologies, such as more cost-efficient manufacturing of high volumes of complex parts, reduced production time compared with casting, less finishing time and minimal waste.
Sandvik Annual Report 2017 | 29

TRAININGThe Code of Conduct applies to all employees globally including the Sandvik Board of Directors. Our employees are provided with regular training to understand the Code of Conduct and the policies related to it. 93 percent of all employees and long time contractors had been trained by the end of 2017.
SPEAK UPA global reporting tool called Speak Up supports the Code of Conduct and the Supplier Code of Conduct (read more on page 39). Employees and external parties who witness a violation of the Codes can report this, anonymously if so desired. Speak Up is available through our intranet or internet portals and through country-specific telephone hot-lines 24 hours a day, 7 days a week, in all countries where Sandvik has operations. In addition to reporting incidents, the system can be used to ask questions related to the Codes.
All Speak Up reports are screened automatically to preserve the integrity of the reporter, albeit under oversight by the Group Ethics Office. The case is assigned to the relevant business area or Group Counsel for investigation, with support from the Business Integrity unit specialized in internal investigations and appropri-ate remediation. Reports, investiga-tions and remediation are recorded, monitored and included in reporting to the Group Audit Committee.
Our group-wide Code of Conduct, “It’s in our hands”, confirms our strong commitment to ethical and responsible business practices and compliance with relevant laws and regulations in all markets where we operate. The Code of Conduct describes the principles of behavior that our employees should adhere to and provides guidance in our actions and everyday business decisions. It is an important building block of our overall governance structure and it is supported by policies and proce-dures to further detail our internal requirements and rules.
FOUNDATION OF THE CODEThe Code of Conduct covers areas such as environment, working condi-tions, human rights and anti-corrup-tion. Its foundation is built on our core values, the International Bill of Human Rights, the International Labour Organization's Declaration on Funda-mental Principles and Rights at Work, the Rio Declaration on Environment and Development, and the United Nations Convention against Corrup-tion as outlined in the ten principles of the United Nations Global Compact, in which we participate. We are also committed to adhering to the OECD Guidelines for Multinational Enter-prises and the UN Guiding Principles on Business and Human Rights. We believe that by doing so, we provide a solid foundation that supports a more sustainable future for Sandvik and for our stakeholders.
OUR CODE OF CONDUCT
We believe that high ethical standards and strong values create long-term value for our customers, employees and other stakeholders. Through our values, our Code of Conduct and policies, all encompassed within our governance model, The Sandvik Way, we set clear standards for “doing things right”. Our Code of Conduct sets the principles for how we all must act as individuals and as a company; it supports us in making the right decisions.
OPERATIONS
93%PERCENTAGE OF EMPLOYEES TRAINED IN SANDVIK’S CODE OF CONDUCT
TOTAL AMOUNT OF SPEAK UP REPORTS IN 2017: 224
Business Integrity, 60% Human Resources, 25% Other, 15%
30 | Sandvik Annual Report 2017

OPERATIONS
Our business philosophy and way of working are guided by our core values: Customer Focus, Innovation, Fair Play and Passion to Win. These are the foundation for our Code of Conduct and Sandvik's Leadership Model, which serve as compasses for required behaviors. In 2017, we established a People Policy. The responsibility for implementing and communicating the policy lies within the business, including securing resource needs and taking appropri-ate measures when a breach of the policy has been confirmed.
ENGAGED EMPLOYEESSandvik encourages everyone to realize their full potential in the belief that a strong employee-employer relationship will benefit the company and customer development.
Annual individual performance dialogs and team dialogs set the foundation for career and team development. All employees should be offered at least one individual
OUR PEOPLE
Sandvik has a strong culture and solid leadership that encourages local and individual ownership. Our focus on technology and innovation, along with opportunities to develop and build a career, make Sandvik an attractive employer.
performance dialog annually. In 2017, 81 percent (84) of our employees participated in performance dialogs (target 95 percent).
In team performance dialogs, we set team objectives for the coming year and identify ways to improve and develop our workplace. Input to the dialogs comes from our bian-nual employee engagement survey, customer feedback and business objectives. The most recent employee engagement survey was performed in 2016, and during 2017, each business entity followed up on the conclusions and actions defined after it.
DIVERSITY AND INCLUSIONAn inclusive environment leveraging the different perspectives and ideas of a diverse workforce will enrich our customer relationships and make our business more competitive and successful.
Sandvik offers knowledge and train-ing in diversity and inclusion through
~500PARTICIPANTS IN GLOBAL LEADERSHIP PROGRAMS
Debbie Tucker is a manufacturing operator at the Palm Coast site in the US.
Average number of employees:43,376 (44,769)Of which women: 19% (19)Turnover rate: 9% (11)
a toolbox that includes e-learning, workshops and exercises. Our Bridge program focuses on leading across boundaries and our global core leader ship program provides an intro-duction on how to work with diversity and inclusion as a manager.
The share of women in managerial positions increased to 17.1 percent (16.5), the share of women in product area management teams decreased to 19 percent (24) and the share of women in the pool of managers pre-paring for senior managerial positions was 27 percent (28).
On a broader scale, we are engaging with educational institutes and other parts of society in local efforts, for example, in Sweden where we are partners in the Future Female Leader Award. The award goes to a female civil engineering student who has demonstrated outstanding problem- solving abilities and excellent leader-ship qualities.
Sandvik Annual Report 2017 | 31
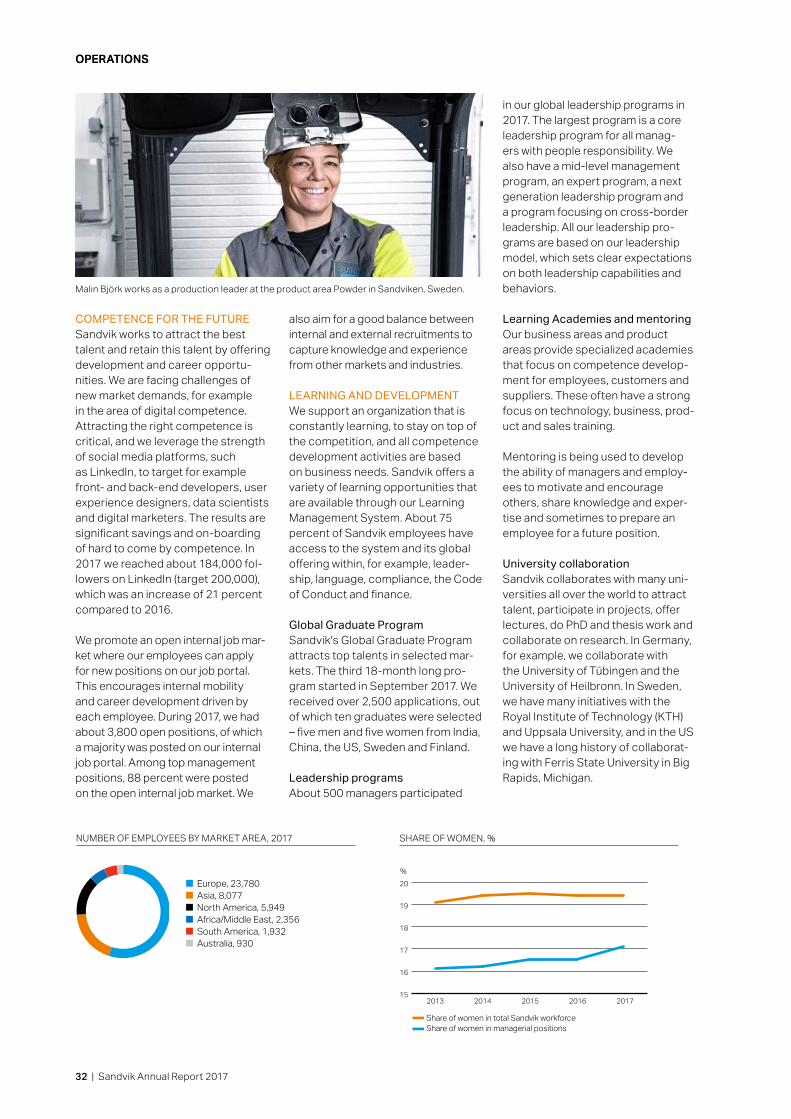
OPERATIONSOPERATIONS
COMPETENCE FOR THE FUTURESandvik works to attract the best talent and retain this talent by offering development and career opportu-nities. We are facing challenges of new market demands, for example in the area of digital competence. Attracting the right competence is critical, and we leverage the strength of social media platforms, such as LinkedIn, to target for example front- and back-end developers, user experience designers, data scientists and digital marketers. The results are significant savings and on-boarding of hard to come by competence. In 2017 we reached about 184,000 fol-lowers on LinkedIn (target 200,000), which was an increase of 21 percent compared to 2016.
We promote an open internal job mar-ket where our employees can apply for new positions on our job portal. This encourages internal mobility and career development driven by each employee. During 2017, we had about 3,800 open positions, of which a majority was posted on our internal job portal. Among top management positions, 88 percent were posted on the open internal job market. We
also aim for a good balance between internal and external recruitments to capture knowledge and experience from other markets and industries.
LEARNING AND DEVELOPMENTWe support an organization that is constantly learning, to stay on top of the competition, and all competence development activities are based on business needs. Sandvik offers a variety of learning opportunities that are available through our Learning Management System. About 75 percent of Sandvik employees have access to the system and its global offering within, for example, leader-ship, language, compliance, the Code of Conduct and finance.
Global Graduate ProgramSandvik's Global Graduate Program attracts top talents in selected mar-kets. The third 18-month long pro-gram started in September 2017. We received over 2,500 applications, out of which ten graduates were selected – five men and five women from India, China, the US, Sweden and Finland.
Leadership programsAbout 500 managers participated
in our global leadership programs in 2017. The largest program is a core leadership program for all manag-ers with people responsibility. We also have a mid-level management program, an expert program, a next generation leadership program and a program focusing on cross -border leadership. All our leadership pro-grams are based on our leadership model, which sets clear expectations on both leadership capabilities and behaviors.
Learning Academies and mentoring Our business areas and product areas provide specialized academies that focus on competence develop-ment for employees, customers and suppliers. These often have a strong focus on technology, business, prod-uct and sales training.
Mentoring is being used to develop the ability of managers and employ-ees to motivate and encourage others, share knowledge and exper-tise and sometimes to prepare an employee for a future position.
University collaboration Sandvik collaborates with many uni-versities all over the world to attract talent, participate in projects, offer lectures, do PhD and thesis work and collaborate on research. In Germany, for example, we collaborate with the University of Tübingen and the University of Heilbronn. In Sweden, we have many initiatives with the Royal Institute of Technology (KTH) and Uppsala University, and in the US we have a long history of collaborat-ing with Ferris State University in Big Rapids, Michigan.
NUMBER OF EMPLOYEES BY MARKET AREA, 2017
Europe, 23,780 Asia, 8,077 North America, 5,949 Africa/Middle East, 2,356 South America, 1,932 Australia, 930
15
16
17
18
19
20
Share of women in total Sandvik workforceShare of women in managerial positions
%
2013 2014 2015 2016 2017
SHARE OF WOMEN, %
Malin Björk works as a production leader at the product area Powder in Sandviken, Sweden.
32 | Sandvik Annual Report 2017

OPERATIONSOPERATIONS
Our commitment to human rights is confirmed in our Code of Conduct as well as in our Supplier Code of Conduct. The Codes also provide guidance in identifying, preventing and mitigating risks related to human rights. In 2017, 23 percent of all Speak Up reports related to human rights matters. In our supplier audits, 23 percent of the deviations were related to human rights.
To mitigate human rights risks, we continuously work to ensure compliance with national legislation and internationally agreed human rights standards and regulations. We regularly evaluate our standards and procedures for identifying, preventing and mitigating adverse human rights impacts in the Group’s operations and in our value chain. Our work on human rights is integrated in our regular processes and procedures in different ways, for example, in our
Sustainable Supplier Management, our safety work and in our diversity and inclusion scheme. We have zero tolerence for forced or slave labor and child labor.
We also support children’s rights and the right to education through our community involvement programs in, for example, India and China. All employees have the right, if they choose, to join a union and be covered by a collective agreement. Health and safety are key elements in our operations as we believe the right to a safe and healthy workplace is central.
We believe in a diverse workforce without any form of discrimination based on gender identity, ethnicity, national origin, age, disability, marital status, social group or any other characteristics, nor do we accept any form of harassment or bullying.
In light of the recent global cam-paign “#metoo”, the Group Executive Management encouraged every employee having been subjected to harassment or discrimination to report this to a manager or through our Speak Up system. In the last two months of 2017, a total of 15 harassment-related matters were reported through Speak Up. This can be compared to a previuous average of two reports per month. All individual reports through our Speak Up system are managed according to established processes and, when needed, followed up with appropriate measures.
HUMAN RIGHTS AND FAIR LABOR CONDITIONS
Miners at the Klondex Fire Creek mine in Nevada, USA listen during a morning pre-start meeting. The mine, the world’s highest-grade gold operation, relies on a Sandvik 365 Expertise On Site service agreement to help guarantee equipment reliability and availability.
Sandvik Annual Report 2017 | 33

OPERATIONS
We have reduced the Lost Time Injury Frequency Rate (LTIFR) for seven years in a row and the Total Recordable Injury Frequency Rate (TRIFR) for four years in a row – both to all-time lows. Sandvik’s health and safety work is in compliance with all relevant legislation, and strives to go beyond compliance to ensure the best performance for both our employees and our customers.
Maintaining a strong health and safety culture requires continuous vigilance and effort. Sandvik’s Envi-ronment, Health and Safety (EHS)management system provides us with a structured approach to help us achieve our health and safety vision. Reports are produced every month to monitor health and safety in every part of our organization so we can take corrective action where needed.
Our health and safety activities are based on Sandvik’s EHS Policy and Group EHS Objectives. Each business area works to meet these objectives according to their own
HEALTH AND SAFETY
Health and safety has the highest priority at Sandvik. Our vision is “Zero Harm to our people, our customers, our suppliers and the environment we work in”. This means that everyone should go home from Sandvik in at least the same condition as they arrived in.
plans, including activities to reduce the number of work-related injuries and illnesses. Targets are set year on year to drive performance for the Group, Business Areas and Product Areas.
Our management systems are audited by external agencies to ensure that they meet internationally accepted standards (OHSAS 18001 or equivalent) and are regularly audited internally to continually improve our operating practices.
MIND ON SAFETYA safe and healthy workplace requires a strong culture and the Sandvik EHS Council shares best practices across the Group to maintain a “people caring for people” mindset at all times.
Our employee survey results from 2016 indicate that there is strong belief among our employees that our safety culture is supporting our EHS Vision. A key factor is that our leaders “walk the talk” when it comes to health and safety. In all business
areas, for example, leaders must commit to three personal EHS Lead-ership Behaviors. These behaviors are monitored and measured.
PERFORMANCE IN 2017Sandvik utilizes a wide range of indicators to measure its safety and health performance, including Lost Time Injury Frequency Rate. Since 2012, Sandvik has also been meas-uring the Total Recordable Injury Fre-quency Rate as a group-wide safety performance indicator. Both of these indicators are showing long-term positive trends.
The target for 2017 was to achieve an LTIFR of 1.4. At year-end the LTIFR for the Group was 1.6 (1.7).
EMPLOYEE WELL-BEINGOur culture and working environment should also support the well-being of our employees. All of our sites implement health and well-being pro-grams that are selected by the local workforce. These programs address a wide range of issues from mental health to fitness and nutrition.
Surveys are conducted to ensure that the programs continue to meet the needs of the workforce. The main conclusion from this year's survey was that awareness about our health and well-being programs needs to increase. Roughly one third of the surveyed population said they did not know about the programs, whether or not they are adapted to local needs or if they are effective. The remaining respondents said the programs were adapted to local needs (94%) and they perceived them as effective (84%).
At a fire drill at the Tampere site in Finland in November, a widespread machine fire was simulated. The fire was extinguished and the evacuation was done within minutes for all 800 employees on site.
34 | Sandvik Annual Report 2017

OPERATIONS
0
2
4
6
8
10
2012 2013 2014 2015 2016 2017
Group Sandvik Machining Solutions Sandvik Mining and Rock Technology Sandvik Materials Technology
Lost time injuries per million work hours
LOST TIME INJURY FREQUENCY RATE (LTIFR)
OCCUPATIONAL ILLNESS AND HAZARDOUS MATERIALSSandvik records and investigates occupational illnesses to determine their causes and develop prevention strategies. The increasing incidence of work-related mental health issues is causing concern for many commu-nities around the world. Sandvik has already begun developing and imple-menting education and awareness campaigns to address this concern.
LOST TIME INJURIES (LTI) AND LTIFR
0
100
200
300
400
500
600Number Frequency
2012 2013 2014 2015 2016 2017
LTI LTIFR Target LTIFR
0
1
2
3
4
5
6
Sandvik continually works to replace hazardous materials with less haz-ardous options, and to invest in new equipment and improve processes to reduce employee exposure to hazards such as noise, dust and expo-sure to gases or other substances. We also help customers improve their health and safety through solutions and products that reduce exposure to the same hazards.
Safety is a top priority for employees at the Sandvik facility in Kumasi, Ghana.
Sandvik Annual Report 2017 | 35

OPERATIONS
OUR ENVIRONMENTAL FOOTPRINT
Responsible environmental business practices are an integral part of our business model and strategy. In addition to having a product and services portfolio that contrib-utes to our customers’ environmental performance, we strive to improve our environ-mental footprint within our own operations. We have production, distribution and service-related operations all around the world. Each site is responsible for minimizing their relative environmental footprint.
TARGETSOur objective is to achieve signifi-cant improvements in areas where our operations have an important environmental impact. The Group’s environmental targets have 2014 as a base year and run to the end of 2020. The targets are as follows:
– Increase energy efficiency related to worked hours by 20 percent
– Decrease carbon emissions related to worked hours by 20 percent
– Decrease freshwater consumption related to worked hours by 20 percent
– Increase the share of waste that goes to recovery operations by more than 20 percent of the total waste generated
– Maintain the percentage (80%) of metallic raw material that comes from recovered materials
Environmental data and progress are reported on a quarterly basis.
During 2017, the Sandvik EHS (Envi-ronment, Health and Safety) Council worked to develop its environmental target setting to reflect Sandvik’s decentralized business model.
Sandvik Materials Technology has the biggest environmental impact of our three business areas due to its stain-less steel production in Sandviken, Sweden. Hence, many environmental efforts lies within Sandvik Materials Technology. Sandvik Machining Solu-tions' production is highly automized and Sandvik Mining and Rock Tech-
nology is mainly based on assembly, both with less environmental impact.
REDUCING ENERGY AND EMISSIONSEnergy efficiency and climate change mitigation are key focus areas. Sandvik has hundreds of projects to reduce energy consumption and lower carbon dioxide (CO2) emissions at locations ranging from our largest, most energy-intensive operations, to some of our very smallest. In Europe, we purchase low-emission electricity in accordance with the European Guarantees of Origin (GoO) scheme. This has had a positive impact on our CO2 emissions, and the estimated avoidance for 2017 amounted to nearly 100,000 tons, correspond-ing to more than 25 percent of the Group's reported annual carbon emissions.
In 2017, Sandvik increased its total use of energy by 40 GWh, corre-sponding to an increase of 2 percent. In relation to Sandvik's 11 percent growth in invoiced sales, this con-stituted a 9 percent improvement of energy use.
Some of Sandvik’s production pro-cesses release emissions of sulphur dioxide (SO2) and nitrogen oxides (NOX), in addition to CO2. The Group’s emissions of SO2 originate mainly from the combustion of oils and coal, and amounted to approximately 31 tons (35) in 2017. NOX emissions mainly come from the smelting processes in Sandviken, Hallsta-
hammar and Svedala in Sweden. NOX
emissions remained unchanged and amounted to 329 tons (330).
The Sandviken operations have been switching some of their furnaces from Liquefied Petroleum Gas to Liquid Natural Gas. For 2017, this resulted in an estimated decrease in CO2 emis-sions of approximately 10,000 tons, or 2.6 percent in relation to the 2014 base year. The new furnaces also decreased emissions of NOX.
Sandvik Materials Technology in Sandviken has had a certified energy management system (ISO 50001) in place since 2006. In line with legal obligations, such as the EU Energy Efficiency Directive, Sandvik facilities in Sweden conduct energy reviews. During 2017 there were four energy reviews completed. The sites in Sandviken and Hallstahammar, Swe-den were assigned EU ETS emission rights corresponding to 84,368 tons of CO2.
Several of Sandvik’s locations are engaged in renewable energy pro-jects such as solar energy. Sandvik’s Pune, India location, for example, installed solar panels at their site, which began generating power in November 2017. Annual power gener-ation is expected to be 250 MWh.
USE, REUSE AND RECYCLE In our efforts to contribute to a more circular economy, we prioritize the use of recycled material as much as
36 | Sandvik Annual Report 2017

OPERATIONS
possible in production processes. We use 79 percent recycled steel in our production today, with a large portion of that coming from material created in our own turning and drilling production.
In 2017, the Sandvik Coromant product area set a target to recy-cle 75 percent of tungsten carbide according to sold weight through a closed-loop recycling system. In 2017, the outcome was 84 percent. Sandvik Coromant buys used inserts and solid carbide tools from its cus-tomers, collecting the used tools at
CO2 EMISSIONS 2017
Electricity, 48% Natural gas, 22% LPG, 15% Diesel, 7% Gasoline, 6% Fuel oils, 2%
ENERGY CONSUMPTION 2017
Electricity, 62% Natural gas, 17% LPG, 10% Diesel, 4% Gasoline, 3% Fuel oils, 1% District heating, 3%
customer premises. The solid mate-rial is sorted, purified and regrinded to powder that is then used by Sandvik’s production plants. Making new tools from recycled solid carbide uses 70 percent less energy than making them from virgin raw materials and 40 percent less CO2 is emitted.
WASTE MANAGEMENTMore than 80 percent of all waste is generated at Sandvik Materials Technology’s facilities in Sandviken, Sweden and Sandvik Machining Solutions’ Wolfram Bergbau und Hütten facility in Austria. The overall goal is to reduce the consumption of raw materials and waste to landfill. Currently 15 percent of the generated waste is reused or recycled and there are plans in place to increase this further.
Successful trials were performed in 2017 to reuse refractory as a slag-forming agent in Sandviken’s steel plant and the method is now under implementation as a standard operational procedure. Further trials have begun to reduce the amount of slag to landfill by creating products for both internal and external use.
The total amount of waste declined by 2 percent and the waste recovery ratio remained at 15 percent of total waste. 11 percent of Sandvik’s total waste was classified as hazardous.
This type of waste is treated and dis-posed of in a safe manner in accord-ance with strict legislation.
WATERIn our efforts to reduce water con-sumption, we strive to re-circulate water within our plants. Rainwater collection systems have been installed, for example at the Indian Pune site in 2017. A water recycling plant is also in place in our site in Jet Park, South Africa.
All wastewater from processes is treated before being released. Sandvik’s emissions to water consist mainly of phosphorous and nitrogen compounds, oxygen-consuming substances and metals.
Sandvik Materials Technology began using local groundwater for cooling processes in 2016 instead of potable water. This has resulted in an annual 30,000 m³ reduction of this resource.
Sandvik Annual Report 2017 | 37

OPERATIONS
COMPLIANCE
Sandvik is bound by international regulations and standards and by the laws of the countries in which it operates. Four compliance programs mitigate risks and meet the requirements of the law as well as stakeholder expectations. These programs address anti-bribery and corruption, competition law, trade compliance, and data privacy.
ENFORCEMENT AND REPORTINGThe Sandvik Compliance Func-tional Council includes compliance officers from the business areas and specialist legal counsel at the Group level. It oversees the programs that are implemented by each business area. The Council sets requirements, reviews performance and reports to the main board through the Audit Committee. The Council met four times in 2017.
The development in all programs are reported to the Board of Directors on a regular basis. Reporting is designed to provide visibility of program effec-tiveness and timely advice of risks as they occur.
Employees and other stakeholders are encouraged to report any defi-ciencies or breaches of Sandvik com-pliance programs through the Speak Up system. This facilitates rapid identification of risks and enables corrective remediation to take place.
ANTI-BRIBERY AND CORRUPTION Our policy on anti-bribery and anti-corruption states the following: “Sandvik is firmly committed to fair business practices without any form of bribery or corruption and confirms to comply with anti-bribery laws in all countries where we operate.” This policy applies to all entities and employees within the Sandvik Group and we expect the same high ethical standards from our business part-ners, suppliers and intermediaries regarding anti-bribery and corruption.
Sandvik’s anti-bribery and corruption program closely conforms to the guidance provided by major regula-tors with policies and procedures, assessment of bribery and corruption risks, screening and vetting of busi-ness partners, training of employees and monitoring and reporting of these activities.
In 2017, Sandvik strengthened group-wide management of commercial intermediaries by acquiring new IT systems support, which facilitates risk assessment, due diligence, ongoing management and monitor-ing of commercial intermediaries. Sandvik further enhanced penetra-tion and monitoring of anti-bribery and corruption compliance through embedding specific controls into the group-wide risk and control matrix.
OTHER PROGRAMSDuring the year, the competition law program focused on training and working on compliance issues together with business leaders in the industry.
The trade compliance program addresses customs, sanctions and export controls. In 2017 the program continued to support the business with the changes in the lifting of sanctions in Iran and elsewhere.
The data privacy program was revamped in 2017 for better align-ment with the requirements of the EU General Data Protection Regulation (GDPR), which comes into effect in May 2018.
EACH OF THE COMPLIANCE PROGRAMS COMPRISE THE FOLLOWING:
– Risk identification and assessment
– Controls (including policies, procedures and record keeping)
– Training – Enabling and enforcing – Follow up, reporting and
improvement – Organization
38 | Sandvik Annual Report 2017

OPERATIONS
SUSTAINABLE SUPPLIER MANAGEMENT
Sustainable supplier management is a prioritized area at Sandvik. We believe in acquir-ing goods and services in an ethical manner that, from a lifecycle perspective, achieves value for money while minimizing our negative social and environmental impact.
In 2017 we had approximately 82,000 suppliers situated around the world. Our supply base ranges from multi-national raw material and component suppliers to small, local service providers. Regardless of the type of supplier, we believe it is essential to partner with those who embrace our sustainability standards (out-lined in the Sandvik Supplier Code of Conduct).
SANDVIK PROCUREMENT POLICYDuring the year, we adopted a group-wide procurement policy that fully integrates our sustainability commitments into the procurement processes. The new policy sets the rules for procurement operations so that they contribute to the economic development of the Group, protect and create business value, reduce environmental footprint and negative social impact of our supply base, and prevent bribery and corruption.
SUPPLIER SUSTAINABILITY PROGRAMOur Supplier Sustainability Program focuses on three areas: Creating sup-plier commitment, building capacity and monitoring high-risk suppliers through audits.
Creating supplier commitmentAll suppliers are required to accept Sandvik’s Supplier Code of Conduct.
Building capacityWe continued our capacity-build-ing activities across the Sandvik organization in order to improve competence and increase awareness on the topic of sustainable supplier management. In 2017, 76 purchasers and related functions attended train-ing sessions focused on sustainable
supplier management and related processes. Additionally, 133 suppli-ers audited in 2017 received training in the Sandvik Supplier Code of Con-duct and our way of working with it.
Monitoring high-risk suppliers We conducted 134 Supplier Code of Conduct audits in 2017 as follows: 68 in India, 62 in China, and one audit in each of the following countries: Taiwan, South Korea, Singapore and Malaysia. 133 audits were performed on site. We did not identify any cases of child labor in 2017. All cases of forced labor (41) are related to salary deductions as a disciplinary measure, discrimination (4) relates to employ-ment practices, while deviations from competition law (110) and anti-bribery (1) refer to missing policies or training.
133 of the total audits performed dur-ing 2017 verified compliance with the conflict minerals section of Sandvik‘s Supplier Code of Conduct and they identified 6 deviations related to miss-ing policy or statement, and 3 related to missing procedures or documenta-tion as proof in a due diligence audit.
The health and safety deviations (592) vary widely from missing fire alarm systems, signage, daily maintenance records, firefighting or evacuation drill, to a lack of relevant policies, fire safety measures or unsafe conditions and risk assessments. Compensation and benefits deviations (152) relate to social insurance not covering all work-ers, overtime which was not compen-sated according to law, workers that were not granted legal annual leave and, in a few cases, minimum level wages that were not paid.
During 2017, we carried out a reason-able country of origin enquiry based on the OECD Due Diligence Guidance for Responsible Supply Chains of Minerals from Conflict-Affected and High-Risk Areas to identify smelters/refiners associated with our supply chain.
A large part of the tungsten supply across the organization comes from Sandvik’s own subsidiary Wolfram Bergbau und Hütten (WBH), a con-flict-free smelter that has maintained its compliant smelter status since the company successfully completed the Conflict-Free Smelter Program audit in March 2015.
PK��
DEVIATIONS IDENTIFIED AMONG SUPPLIERS 2017
Health and safety 592 Compensation and benefits 152 Competition law 110 Working hours 97 Employment conditions 91 Monitoring 72 Legal compliance 60 Environment 58 Forced labor 41 Conflict free origin of minerals 9 Discrimination 4 Management system 3 Anti-corruption 1 Freedom of association and collective bargaining 1
Right to property 1 Child labor 0
Total 1,292
Sandvik Annual Report 2017 | 39
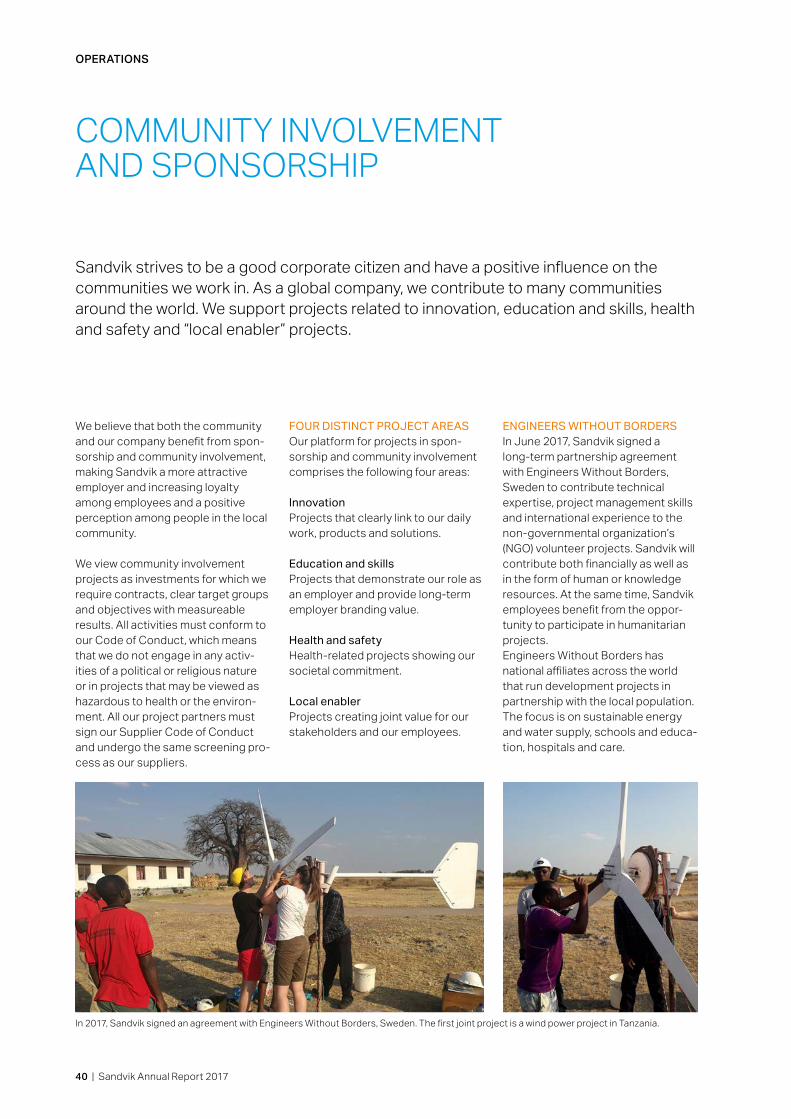
COMMUNITY INVOLVEMENT AND SPONSORSHIP
Sandvik strives to be a good corporate citizen and have a positive influence on the communities we work in. As a global company, we contribute to many communities around the world. We support projects related to innovation, education and skills, health and safety and “local enabler” projects.
We believe that both the community and our company benefit from spon-sorship and community involvement, making Sandvik a more attractive employer and increasing loyalty among employees and a positive perception among people in the local community.
We view community involvement projects as investments for which we require contracts, clear target groups and objectives with measureable results. All activities must conform to our Code of Conduct, which means that we do not engage in any activ-ities of a political or religious nature or in projects that may be viewed as hazardous to health or the environ-ment. All our project partners must sign our Supplier Code of Conduct and undergo the same screening pro-cess as our suppliers.
OPERATIONS
FOUR DISTINCT PROJECT AREASOur platform for projects in spon-sorship and community involvement comprises the following four areas:
InnovationProjects that clearly link to our daily work, products and solutions.
Education and skillsProjects that demonstrate our role as an employer and provide long-term employer branding value.
Health and safetyHealth-related projects showing our societal commitment.
Local enabler Projects creating joint value for our stakeholders and our employees.
ENGINEERS WITHOUT BORDERSIn June 2017, Sandvik signed a long-term partnership agreement with Engineers Without Borders, Sweden to contribute technical expertise, project management skills and international experience to the non-governmental organization’s (NGO) volunteer projects. Sandvik will contribute both financially as well as in the form of human or knowledge resources. At the same time, Sandvik employees benefit from the oppor-tunity to participate in humanitarian projects.Engineers Without Borders has national affiliates across the world that run development projects in partnership with the local population. The focus is on sustainable energy and water supply, schools and educa-tion, hospitals and care.
In 2017, Sandvik signed an agreement with Engineers Without Borders, Sweden. The first joint project is a wind power project in Tanzania.
40 | Sandvik Annual Report 2017

OPERATIONS
The NGO is active in Africa where it currently has some 20 projects in progress, including installing solar cell electricity to provide lighting in Kenyan schools and building sanita-tion systems in Tanzania.
SCHOOL PROGRAMS The Sandvik Every Child Counts cam-paign in India is an initiative to prevent child labor and provide education to migrant and street children in the country. Since 2014, a total of 3,335 out of school children have been enrolled in mainstream schools and 1,305 have continued education in 45 different schools across the Pune region.
The Sandvik School on Wheels program complements the Every Child Counts campaign by providing education at the doorstep of sites where there is no school. The School on Wheels is a refurbished bus equipped with classroom supplies in which we conduct classes across different sites. This initiative reaches out to children of the most margin-alized communities like rag pickers, roadside sellers and migrant workers.
In Sweden, Sandvik runs two technical secondary schools with the Sandviken and Östhammar municipalities.
VOCATIONAL TRAINING IN SOUTH AFRICA We run a number of vocational train-ing programs in order to increase the level of technical expertise in coun-tries where there is a lack of trained mechanics impacting our ability to obtain skilled labor.
More than 900 people have been trained and subsequently employed by Sandvik in South Africa through the Sandvik Apprenticeship program, established in 2001. The program was started to address a skills short-age in South Africa for tradespeople, including electricians, carpenters and mechanics. The corporate sector was encouraged to join forces with the South African government in addressing this shortage and
training tradespeople in conjunction with the Department of Education, the Department of Labor and the Department of Higher Education and Training.
Sandvik continues to provide work-shops, coaching, on-site learning and evaluations. We also provide Sandvik-specific machining courses and technical training at the local Sandvik Academy. The maximum four-year program includes formal courses at a chosen college.
Through the Sandvik Apprenticeship program, we help improve the skills and employability of South Africans in the area where we operate. All participants receive benefits such as access to medical health care.
Sandvik operates several school projects across the globe. The Sandvik Every Child Counts campaign aims to prevent child labor and provide education to migrant and street children in India.
Some of the participants in Sandvik's vocational training programs in South Africa.
Sandvik Annual Report 2017 | 41

OUR SHARE
Our growth prospects are based on our ability to continuously provide superior customer productivity enhancements as part of our offering of products and services. We do so by leveraging our core capabilities in materials and the ability to industrialize advanced products. During 2017, the share price increased by 26 percent, while the OMXS 30 index on Nasdaq Stockholm increased by 3 percent.
Sandvik’s share is listed on Nasdaq Stockholm, Sweden. At year-end 2017, the share was quoted at 143.7 SEK, corresponding to a market capitalization of 180 billion SEK, plac-ing Sandvik as the 12th (15) largest company on Nasdaq Stockholm.
SHARE TRADINGIn 2017, a total of 1,082 million shares (1,300) were traded for a total value of 145 billion SEK (113). Trading in Sandvik shares on the Nasdaq Stockholm accounted for 63 percent (55) of the total volume of shares traded. Other markets, e.g. BATS Chi-X, Turquoise etc. accounted for 37 percent (45). The Sandvik share can be traded in the US in the form of American Depositary Receipts (ADRs), a process handled by Deutsche Bank Trust Company Americas as a depository bank. In 2017, the average daily ADR trading volume was 17,995 (27,768). At the end of 2017 there were 2,546,925 ADRs outstanding (4,769,608).
DIVIDEND AND TOTAL SHAREHOLDER RETURNOur yearly target is that the dividend will amount to at least 50 percent of reported earnings per share. The Board has proposed a dividend of 3.50 SEK (2.75) per share to the 2018 Annual General Meeting, corre-sponding to approximately 4.4 billion SEK (3.4) and a dividend yield of 2.4
percent based on the share price at year-end. Assuming the approval of the proposed dividend for 2017 of 3.50 SEK, Sandvik’s dividend over the past five years has averaged 3.15 SEK annually. A total of 62 percent of reported earnings per share for the Group total has been distributed.
SHARE CAPITALThe number of Sandvik shares amounts to 1,254,385,923. Each share has a nominal value of 1.2 SEK and the share capital amounts to 1,505,263,108 SEK. Sandvik’s share capital comprises one series of share, with each share carrying equal voting rights and equal rights to a dividend. Sandvik does not hold any shares in treasury and the most recent occasion when new shares were issued was in conjunction with the acquisition of the shares out-standing in Seco Tools in 2012.
SUSTAINABILITY INDICESSandvik is included in several sus-tainability indices, such as the Dow Jones Sustainability Index, the Global 100 Most Sustainable Corpora-tions in the World, FTSE4Good and Ethibel Excellence Europe. These are international indices analyzing global companies that assume their respon-sible business practices. Sandvik’s inclusion in these indices confirms the Group’s achievements in relation to sustainable business practices. 3.50
PROPOSED DIVIDEND, SEK
OUR SHARE
OWNERSIn 2017, the number of shareholders decreased to 103,334 (109,072). There are shareholders in 81 coun-tries, and the total ownership outside of Sweden amounted to 37 percent (33) at year-end. The ten largest individual shareholders accounted for 31 percent of the share capital on the same date. As of 31 December 2017, members of Sandvik’s Group Executive Management owned a total of 164,846 shares in Sandvik. Mem-bers of the Board of Sandvik owned a total of 484,561 shares in Sandvik (including deputy board members, excluding the CEO). Total ownership of Group Executive Management and the Board corresponds to about 0.05 percent of the capital and voting rights.
42 | Sandvik Annual Report 2017

OUR SHARE
DISTRIBUTION OF SHAREHOLDING BY COUNTRY, 31 DECEMBER 2017
n Sweden, 63.0%n USA, 15.4%n UK, 9.8%n Luxembourg, 2.6%n Finland, 1.3%n Other countries, 7.9%
NUMBER OF SHAREHOLDERS, 31 DECEMBER 2013 –2017
0
25,000
50,000
75,000
100,000
125,000
2013 2014 2015 2016 2017
0
5,000
10,000
15,000
20,000
25,000
30,000
0
50
100
150
200
2013 2014 2015 2016 2017
THE SANDVIK SHARE, FIVE-YEAR TREND
n Sandvik share n OMX Stockholm 30 n Trading volumes '000
KEY FIGURES2016 2017
Number of shares at year-end (millions) 1,254 1,254Market capitalization at year-end (SEK billion) 141 180Number of shareholders 109,072 103,334Share price at year-end, SEK 112.7 143.7Earnings per share, SEK Group total 4.39 10.52P/E ratio at year-end 25.7 13.7Change in share price during the year, % 52.2 25.9Regular dividend, SEK/share 2.75 3.50*Dividend as a percentage of earnings per share 63 33*Total shareholder value (price increase + dividend), % 54.6 29.0*Proportion of shares in Sweden, % 67 63Proportion of shares owned by the ten largest shareholder groups, % 32 31* Proposed dividend.
Source: Euroclear, Monitor by Modular Finance AB
THE TEN LARGEST SHAREHOLDER GROUPS, AS OF 31 DECEMBER, %2016 2017
AB Industrivärden 11.8 11.8Alecta Pension Insurance 5.9 6.1AMF Insurance and Funds 2.8 2.7Handelsbanken Pension 3.2 2.6Swedbank Robur Funds 2.8 2.5L E Lundbergföretagen AB 2.4 2.4SEB Investment Management 1.6 1.9JP Morgan Chase 1.5 1.8Fourth Swedish National Pension Fund 1.5 1.4Nordea Investment Funds 2.2 1.4Source: Euroclear
Sandvik Annual Report 2017 | 43

OUR SHARE
INVESTMENT CASE
Sandvik’s equity story is built on more than 150 years of leading material and application knowledge with close long-term customer relations based on our offering to increase productivity.
Improved performance will be derived through maintained market and technology leadership supporting continuous product launches, combined with a decentralized and cost-efficient business model for higher transparency, accountability and speed as well as business portfolio review.
CAPITAL EFFICIENCY AND CASH FLOW GENERATION– Capital allocation to the higher growth and return
areas– Continued consolidation of the supply chain– Stringent management of net working capital
GENERATING GROWTH– All businesses should maintain or be able to achieve
a No. 1 or 2 position, supported by new product launches in core segments and applications in order to sustainably drive customer’s productivity
– Capture aftermarket opportunity in Sandvik Mining and Rock Technology through higher sales penetration on installed base
– Acquire growth within the already stable and profitable product areas
PORTFOLIO OPTIMIZATION– Acquisitions in the high-performing areas– Continuous review of operations to focus on core
businesses where Sandvik is or can be global no. 1 or 2
COST EFFICIENCY– In the decentralized set-up the product areas are
the highest operating level with full accountability on performance
– Decisions taken closer to customers making Sandvik more agile to changes in customer requirements
– Leaner overhead structure– Productivity improvements by 3 percent annually– High cost awareness, with focus on SG&A (Selling,
General & Administrative Costs)
44 | Sandvik Annual Report 2017

OUR SHARE
DIALOG WITH ANALYSTSApproximately 25 analysts cover Sandvik on a continuous basis. At year-end 2017, the breakdown of recommendations relating to the Sandvik share was as follows: 9 percent buy/increase, 59 percent retain/neutral and 32 percent sell/decrease according to Factset. Here are some of the most frequent questions discussed in 2017 and our answers:
Q: How will the transition to elec-trical vehicles impact Sandvik Machining Solutions? A: There are several factors to take into account, such as battery technology development, build rate for infrastructure supporting a fully electrified car fleet, how long hybrid vehicles will be dominating, etc. Manufacturing a fully electrical vehi-cle requires about 1/3 of inserts com-pared to a combustion engine, while hybrid vehicles require 20-30 percent more cutting tools. The net impact of these important technology shifts present both a long-term challenge and a short- to mid-term opportunity, depending on how rapidly and well we can develop our offering to better address customer issues, using new technologies as an enabler.
Q: Explain the key drivers for further margin improvement in Sandvik Mining and Rock Technology.A: Servicing more of our installed base. Improved performance in some still underperforming product areas, e.g. Drilling and Completions, Crush-ing and Screeening. We also see great potential within the automation offering. In total, we expect improved profitability and less volatility in earnings.
Q: How much could you spend on acquisitions?A: The most likely targets would be small- to mid-sized companies of strategic importance. For Sandvik Machining Solutions this could be within the digital offering and also in the core business for, for example, round tools. We are cautious to safeguard the BBB+ credit rating and a solid balance sheet.
Q: What is the most important in terms of sustainable business?A: That our sustainable business strategy gets even more deeply integrated into our businesses. In 2017, each business area developed ambitions and targets for sustainable offerings which are key to drive sus-tainability towards our customers. We are very proud to have been included in international sustainability indices, such as the Dow Jones Sustainability Index and the 2018 Global 100 Most Sustainable Corporations in the World index. This acknowledges that we are on track with our ambition to be in the forefront in sustainable business.
Q: Why such weak performance in Sandvik Materials Technology and how will you reach a 10 percent operating margin?A: The energy segment represents some 50 percent of sales and here demand has remained weak and put pressure on performance. Over time, competition has increased by the entry of new suppliers for standard tubular products. We have focused on maintaining our strong position in the capex-driven energy segment, pruned the portfolio by exiting from the wire business, decentralized the organiza-tion, announced staff reductions and, since the end of 2017, we have new management onboard. We expect to see improved performance in the coming years. The margin target is challenging but we are determined to implement the actions necessary to get there. We see potential to improve operational and commercial excellence and expect to grow some already stable and profitable product areas like Powder and Kanthal.
Q: How does digital/software impact Sandvik Machining Solu-tions and how does that fit into metal cutting?A: It is not about implementing a stand-alone digital strategy, it is about solving our customers’ current issues. For us, there are two aspects of digitalization: Internally, digital tools and technology will enable us to accelerate improvements in our own operations and customer service. Externally, we combine digitalization with our deep metal-cutting know-how to create a rich portfolio of offerings aiming to solve customer problems across the manufactur-ing process. Overall, we see a great opportunity to help customers achieve a more seamless and effi-cient production process.
Sandvik Annual Report 2017 | 45
DIRECTORS̓ REPORT
DIRECTORS’ REPORT
SUMMARY, GROUP TOTALIn 2017, demand for Sandvik’s products improved. This was the result of a broad-based improvement from all business areas and all main customer segments. The strongest growth was reported in the mining segment due to a significant improvement in demand for replacement equipment as well as higher demand in the aftermarket business. Demand for Sandvik’s products improved in all regions and Sandvik’s order intake and revenue for continuing operations increased by 15 percent (–1) and 10 percent (–6), respectively at fixed rates for comparable units.
FINANCIAL TARGETS1) Sandvik’s financial targets are based on assessments of the company’s strength and how it is positioned for the future. The Group’s targets and target fulfillment are presented in the table below.
TARGET FULFILLMENTThe financial targets are set for 2016–2018. In 2017, the EBIT growth was 16 percent and return on capital employed improved 4.6 percentage points. At the end of 2017, the net debt to equity ratio was 0.3. The pro-posed dividend for 2017 corresponds to a payout ratio of 33 percent of reported earnings per share.
EARNINGS AND RETURNSSandvik’s order intake amounted to 96,743 million SEK in 2017 (84,233), and revenue totaled 93,985 million SEK (84,430). The operating profit was 18,037 million SEK (9,657), corresponding to 19 percent (11) of revenue. Movements in metal prices for Sandvik Materials Technology made a positive contribution to the operating profit of 112 million SEK (64). Changes in foreign exchange rates since the beginning of the year affected earnings favorably by about 128 million SEK (–300) compared with the preceding year.
Net financial items amounted to –1,071 million SEK (–1,661). Result after financial income and expenses for the Group was 16,966 million SEK (7,996), and 17,018 million SEK (9,366) for continuing operations. Income tax had a total impact of –3,783 million SEK (–2,528) on earnings, corresponding to 22 percent (32) of profit before taxes. Profit for the year attributable to equity holders of the Parent Company was 13,197 million SEK (5,508). Earnings per share for the Group amounted to 10.52 SEK (4.39) and 10.56 SEK (5.48) for con-tinuing operations. Return on capital employed was 24 percent (13) and return on equity was 31 percent (15).
FINANCIAL POSITIONCash flow from operating activities increased to 14,286 million SEK (12,032). Net cash flow after invest-ing activities was 15,734 million SEK (8,601). At the end of the year, cash
and cash equivalents amounted to 12,724 million SEK (8,818).
Interest-bearing liabilities, minus cash and cash equivalents, yielded a net debt of 16,040 million SEK (28,579). Sandvik's credit facility of 9,000 million SEK was unutilized at year-end. Under the Swedish bond program, totaling 15,000 million SEK, bonds corresponding to a nominal amount of 6,218 million SEK were outstanding at year-end. Under the European bond program, totaling 3,000 million EUR, a nominal amount of 1,103 million EUR was outstanding at year-end. In addition, there were bonds outstanding in the US for a nominal amount of 555 million USD.
The remaining maturity of bonds averaged 3 years for Swedish bonds, 8.5 years for European bonds and 2.8 years for US bonds. At year-end, the international credit-rating agency Standard & Poor’s had a rating of BBB+ for Sandvik’s long-term borrowings, and A-2 for short-term borrowings.
Financial targets1) and target fulfillmentTarget
2016-2018Outcome
2017EBIT growth (CAGR), % ≥7 16Return on capital employed improvement, % pts ≥3 4.6Net debt/equity ratio <0.8 0.3Dividend payout ratio, % 50 442)
1) See page 151 for definition of targets.2) Proposed adjusted dividend payout ratio
46 | Sandvik Annual Report 2017
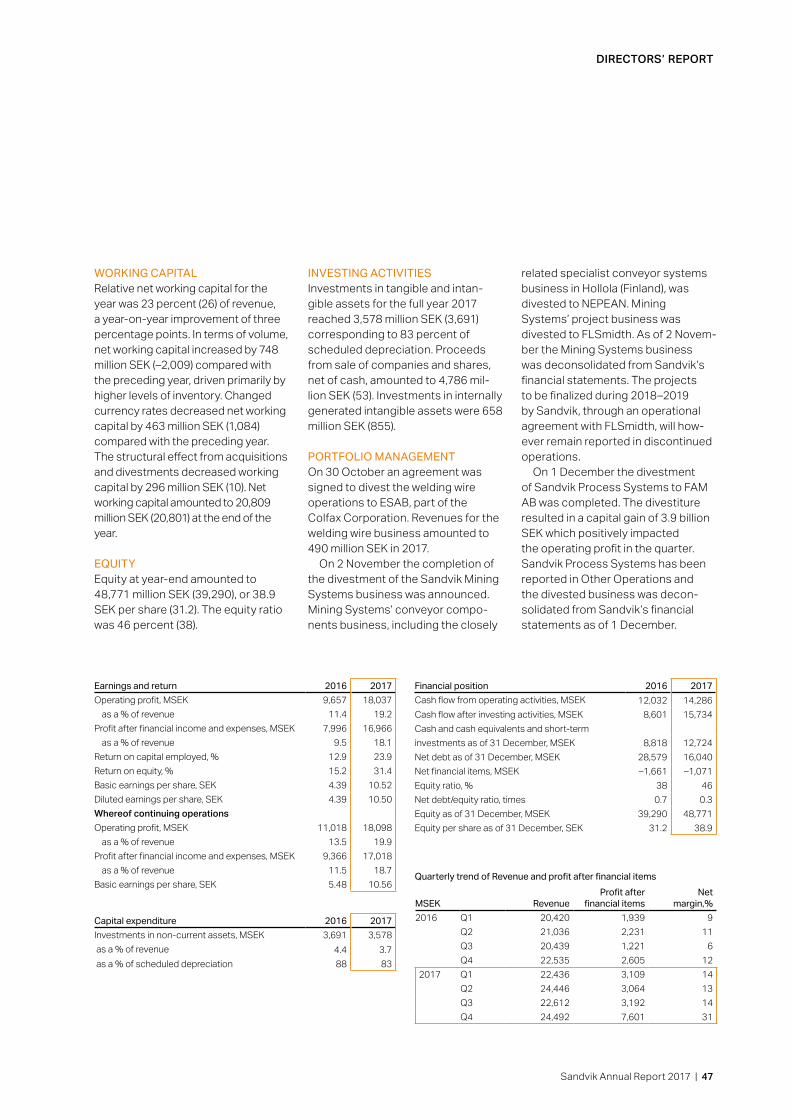
DIRECTORS̓ REPORT
WORKING CAPITALRelative net working capital for the year was 23 percent (26) of revenue, a year-on-year improvement of three percentage points. In terms of volume, net working capital increased by 748 million SEK (–2,009) compared with the preceding year, driven primarily by higher levels of inventory. Changed currency rates decreased net working capital by 463 million SEK (1,084) compared with the preceding year. The structural effect from acquisitions and divestments decreased working capital by 296 million SEK (10). Net working capital amounted to 20,809 million SEK (20,801) at the end of the year.
EQUITYEquity at year-end amounted to 48,771 million SEK (39,290), or 38.9 SEK per share (31.2). The equity ratio was 46 percent (38).
INVESTING ACTIVITIESInvestments in tangible and intan-gible assets for the full year 2017 reached 3,578 million SEK (3,691) corresponding to 83 percent of scheduled depreciation. Proceeds from sale of companies and shares, net of cash, amounted to 4,786 mil-lion SEK (53). Investments in internally generated intangible assets were 658 million SEK (855).
PORTFOLIO MANAGEMENT On 30 October an agreement was signed to divest the welding wire operations to ESAB, part of the Colfax Corporation. Revenues for the welding wire business amounted to 490 million SEK in 2017.
On 2 November the completion of the divestment of the Sandvik Mining Systems business was announced. Mining Systems’ conveyor compo-nents business, including the closely
related specialist conveyor systems business in Hollola (Finland), was divested to NEPEAN. Mining Systems’ project business was divested to FLSmidth. As of 2 Novem-ber the Mining Systems business was deconsolidated from Sandvik’s financial statements. The projects to be finalized during 2018–2019 by Sandvik, through an operational agreement with FL Smidth, will how-ever remain reported in discontinued operations.
On 1 December the divestment of Sandvik Process Systems to FAM AB was completed. The divestiture resulted in a capital gain of 3.9 billion SEK which positively impacted the operating profit in the quarter. Sandvik Process Systems has been reported in Other Operations and the divested business was decon-solidated from Sandvik’s financial statements as of 1 December.
Earnings and return 2016 2017Operating profit, MSEK 9,657 18,037
as a % of revenue 11.4 19.2Profit after financial income and expenses, MSEK 7,996 16,966
as a % of revenue 9.5 18.1Return on capital employed, % 12.9 23.9Return on equity, % 15.2 31.4Basic earnings per share, SEK 4.39 10.52Diluted earnings per share, SEK 4.39 10.50Whereof continuing operationsOperating profit, MSEK 11,018 18,098
as a % of revenue 13.5 19.9Profit after financial income and expenses, MSEK 9,366 17,018
as a % of revenue 11.5 18.7Basic earnings per share, SEK 5.48 10.56
Quarterly trend of Revenue and profit after financial items
MSEK RevenueProfit after
financial itemsNet
margin,%2016 Q1 20,420 1,939 9
Q2 21,036 2,231 11Q3 20,439 1,221 6Q4 22,535 2,605 12
2017 Q1 22,436 3,109 14 Q2 24,446 3,064 13 Q3 22,612 3,192 14 Q4 24,492 7,601 31
Financial position 2016 2017Cash flow from operating activities, MSEK 12,032 14,286Cash flow after investing activities, MSEK 8,601 15,734Cash and cash equivalents and short-term investments as of 31 December, MSEK 8,818 12,724Net debt as of 31 December, MSEK 28,579 16,040Net financial items, MSEK –1,661 –1,071Equity ratio, % 38 46Net debt/equity ratio, times 0.7 0.3Equity as of 31 December, MSEK 39,290 48,771Equity per share as of 31 December, SEK 31.2 38.9
Capital expenditure 2016 2017Investments in non-current assets, MSEK 3,691 3,578 as a % of revenue 4.4 3.7 as a % of scheduled depreciation 88 83
Sandvik Annual Report 2017 | 47
DIRECTORS̓ REPORT
On 8 December, Sandvik announced that it had signed an agreement to divest Hyperion to the US-listed investment firm KKR at a price of 4 billion SEK. Hyperion, with approxi-mately 1,400 employees, has in 2017 reported revenues of 3.3 billion SEK.
Hyperion will remain reported in Other Operations in the Sandvik financial statements until closure of the deal. The closing of the transac-tion is expected during the first half of 2018 and is subject to the approval of relevant authorities. Upon closing, the transaction will generate a capital gain to be reported in Sandvik’s finan-cial statements.
GOING FORWARDThe market conditions improved during 2017 with increased customer activity level in all customer seg-ments and geographies. This sup-ported our profitability. Our operating decisions are based on the priorities of stability and profitability before growth. Given our improved opera-tional performance, the next phase of our journey will include a higher focus on growth, in particular for business area Sandvik Machining Solutions.
PARENT COMPANY1)
The Parent Company’s revenues for 2017 amounted to 16,627 million SEK (15,146) and the operating result was 1,260 million SEK (722).
Expense of shares in Group com-panies consists primarily of dividends and Group contributions to and from these and profit from the divestment of Sandvik Process Systems and amounted to -706 million SEK (202). Interest-bearing liabilities, minus cash and cash equivalents and interest-bearing assets, amounted to 11,180 million SEK (14,478).
The Parent Company’s total assets decreased by 5,473 million SEK (from 66,692 million SEK to 61,219 million SEK). Investments in non-current
assets amounted to 875 million SEK (975). The number of employees in the Parent Company and the subsid-iaries operating on commission for Sandvik AB as of 31 December 2017 was 7,204 (7,451).
The Board of Directors proposes a dividend of 3.50 SEK (2.75) per share to the 2018 Annual General Meeting, corresponding to approximately 4.4 billion SEK (3.4).
Dividend, 3.50 SEK per share x number of shares 1,254,385,923 = 4,390,350,731Profits carried forward 19,672,405,379Total, SEK 24,062,756,110
EMPLOYEESThe average number of employees amounted to 43,376 (44,769), of which 19 percent (19) are women. The employee turnover rate was 9 per-cent (11). Wages, salaries and other remunerations for the year totaled 21,354 (20,008) million SEK.
Safety FirstDuring the year, Sandvik worked towards achieving a total recordable injury frequency rate (TRIFR) target of 4.5. Sandvik’s TRIFR improved 9 percent and was 4.6 at year-end, compared to 5.1 the year before. For lost time injury frequency rate (LTIFR) the target was 1.4. Sandvik’s LTIFR improved by 6 percent in 2017 and was 1.6 at year-end, compared to 1.7 at year-end 2016.
Proposal regarding guide lines for the remuneration of senior executivesThe Board of Directors proposes that the Annual General Meeting resolve to adopt the following guidelines for the remuneration of senior execu-tives for the period extending until the 2019 Annual General Meeting, which guidelines correspond to those adopted by the 2017 Annual General Meeting.
The remuneration of the Group Exec-utive Management is to comprise fixed salary, variable salary, pension and other benefits. The total remu-neration package should be based on market terms, be competitive and reflect the individual’s performance and responsibilities as well as the Group’s earnings trend.
The variable salary may comprise short-term incentives in cash, and long-term incentives in cash, shares and/or share-based instruments in Sandvik AB. Variable salary in cash is conditional upon the fulfillment of defined and measurable goals and should be maximized in relation to the fixed salary. Long-term incentives in the form of shares and/or share-based instruments in Sandvik AB may be provided through participation in long-term incentive programs approved by the General Meeting. Terms and conditions for variable salary should be designed so that the Board of Directors, if exceptional eco-nomic circumstances prevail, has the option of limiting or refraining from payment of variable salary if such a measure is considered reasonable.
In specific cases, agreements may be reached regarding one-off remuneration amounts provided that such remuneration does not exceed an amount corresponding to the individual’s annual fixed salary and maximum variable salary in cash, and is not paid more than once per year and individual.
Pension benefits should be defined contribution.
Normally, severance pay is paid when employment is terminated by Sandvik. Members of the Group Executive Management generally have a period of notice of not more than 12 months in combination with severance pay corresponding to 6–12 months fixed salary. An alternative solution may be applied to the Pres-ident comprising a period of notice
1) The Parent Company includes subsidiaries operating on commission for Sandvik AB. These are presented in Note 14.
48 | Sandvik Annual Report 2017
DIRECTORS̓ REPORT
of 24 months and no severance pay. No severance pay will be paid when employment is terminated by the employee.
The Board of Directors is to have the right to depart from the guidelines resolved on by the Annual General Meeting if, in an individual case, there are special reasons for this.
The sphere of senior executives encompassed by the guidelines comprises the President and other members of the Group Executive Management.
For information concerning the current remuneration of senior exec-utives, including ongoing long-term incentive programs, refer to Note 3.5.
The guidelines adopted by the 2017 Annual General Meeting are presented in Note 3.5.
RESEARCH AND DEVELOPMENT (R&D)Each product area/business area is responsible for its own R&D activities that focus on product development, technology platforms and new innovations.
Sandvik has a portfolio of approx-imately 7,300 active patents and other intellectual property rights. In 2017, 1,050 (1,150) new patents and other intellectual property rights were granted. Investments in R&D were 3,498 million SEK (3,483) in 2017, corresponding to 4 percent (4) of the Group’s revenues. The number of employees in R&D, including Quality Assurance, was 2,612 (2,850).
TAXSandvik is a multinational group with many intercompany transactions. The OECD has issued guidelines for transfer pricing of cross-border transactions in multinational groups. Sandvik adheres to these guidelines and also to the local legislation of each country to ensure that a correct pricing model is deployed and that
a correct amount of tax is paid in each country. Sandvik monitors the OECD’s tax reform work (BEPS project) and the EU initiatives on Tax transparency carefully and prepares to adopt these standards when enacted. Sandvik strives to have good relations with our stakeholders, such as tax authorities, non-govern-mental organizations and investors.
Sandvik has initiated cooperation with tax authorities in several coun-tries. We are convinced that an open discussion and cooperation with tax authorities around the globe will help us to reduce uncertainty about the taxes we are obliged to pay. We contribute to the local communities and countries in which we operate in the form of, for example, taxes and employment opportunities. In 2017, the Group paid 2,466 million SEK (1,650) in income taxes glob-ally. Income tax comprises just a portion of all taxes paid by Sandvik worldwide. In addition, we pay social security contributions, environmental and energy taxes, property taxes etc. Furthermore, Sandvik collects and pays taxes at the request of gov-ernments and authorities, including indirect taxes and payroll taxes.
ENVIRONMENT Sandvik respects and complies with environmental legislation in all coun-tries where it operates. The most significant aspects of environmental impact are:
- Energy use-Climate change-Water management-Waste management
Environmental permitsSandvik has approximately 120 sites worldwide that hold environmental permits. Sandvik is dependent on the environmental permits granted for these sites.
In Sweden, Sandvik conducts licensed operations at 11 plants and notifiable operations in one location. All these hold the requisite environ-mental permits. No breaches of the permits occurred during the year. A number of guideline values were exceeded for noise and emissions to air and water. Actions are taken to comply with these target values.
In other countries where Sandvik operates, some target values were exceeded and acted upon in co op-eration with relevant environmental authorities.
Investigations and remediation activities have been performed at production sites with ground pollution. These activities are always performed in close co operation with environmental authorities.
During the year, a lawsuit for alleged violations of the waste water discharge limits at our US site in Kenne wick, Washington was settled and completed. Mitigation payments and attorneys’ fees amounted to approximately 7.5 million SEK. In addi-tion, improved wastewater treatment measures were fully implemented.
STATUTORY SUSTAINABILITY REPORTSandvik has, in accordance with the Annual Accounts Act, prepared the statutory sustainability report as a separate report which was approved for issue by the Board of Directors and the President and CEO. The scope of the Statutory Sustainability report and Sustainable Business Report, is defined on page 128.
Sandvik Annual Report 2017 | 49

DIRECTORS̓ REPORT
DEVELOPMENT IN BUSINESS AREAS
Sandvik operations consist of three business areas: Sandvik Machining Solutions, Sandvik Mining and Rock Technology and Sandvik Materials Technology.
Sandvik’s order intake amounted to 95,444 million SEK (81,861), an increase of 15 percent at fixed exchange rates for comparable units. Revenue totaled 90,905 million SEK (81,553), up 10 percent at fixed exchange rates for comparable units.
Demand for Sandvik’s products increased during 2017. This was the result of a broad-based improvement in all business areas and all main customer segments. The strongest growth was reported in the mining segment due to a significant improve-ment in demand for replacement
equipment as well as higher demand in the aftermarket business. Demand for Sandvik’s products improved in all regions.
On the back of increased demand, improved cost control and ongo-ing efficiency programs, Sandvik improved the profitability compared to last year.
During 2017 several important product launches took place, such as Sandvik Machining Solutions' launch of PrimeTurning™, which is a new methodology that enables turning in all directions. One expample from Sandvik Mining and Rock Technology is the new Ranger™ DXI series surface drill rigs which includes several new high-performing features for an improved drilling process, such as 55 square meter drilling coverage and is equipped with a new powerful
ORDER INTAKE BY BUSINESS AREA
MSEK 2016 2017Change,
%Change,
%*Sandvik Machining Solutions 33,088 36,636 11 10Sandvik Mining and Rock Technology 31,886 38,973 22 20Sandvik Materials Technology 12,036 14,739 22 22Other Operations 4,830 5,096 6 9Group activities 21 0 n/m n/mContinuing operations 81,861 95,444 17 15Discontinued operations 2,372 1,299 -45 -48Group total 84,233 96,743 15 13
* Change compared with the preceding year, at fixed exchange rates for comparable units.
REVENUE BY BUSINESS AREA
MSEK 2016 2017Change,
%Change,
%*Sandvik Machining Solutions 32,852 35,778 9 8Sandvik Mining and Rock Technology 31,093 36,547 18 15Sandvik Materials Technology 12,931 13,643 6 5Other Operations 4,655 4,936 6 10Group activities 22 0 n/m n/mContinuing operations 81,553 90,905 11 10Discontinued operations 2,877 3,081 9 3Group total 84,430 93,985 11 10
* Change compared with the preceding year, at fixed exchange rates for comparable units.
OPERATING PROFIT BY BUSINESS AREAMSEK 2016 % of revenue 2017 % of revenue Change, % Change, %*Sandvik Machining Solutions 6,970 21 8,413 24 21 21Sandvik Mining and Rock Technology 3,206 10 5,743 16 79 76Sandvik Materials Technology 1,115 9 284 2 -75 -42Other Operations 545 12 4,432 90 713 11Group activities –818 n/m -774 n/m 5 7Continuing operations 11,018 14 18,098 20 64 33Discontinued operations –1,361 –47 –61 –2 96 60Group total 9,657 11 18,037 19 87 36
* Change compared with the preceding year, at fixed exchange rates for comparable units adjusted for items affecting comparability. n/m=non meaningful.
rock drill in combination with high fuel efficiency. Sandvik Materials Technlogy launched Sentusys™, an intelligent tube system helping customers control the status of the tubes inside their processes with the help of cloud-based computing. The true innovation lies in the combination of metallurgical knowledge and the sensor technology.
50 | Sandvik Annual Report 2017

DIRECTORS̓ REPORT
Sandvik Machining Solutions is a market-leading manufacturer of tools and tooling systems for advanced industrial metal cutting.
Order intake for the business area amounted to 36,636 million SEK (33,088), an increase of 10 percent at fixed exchange rates for comparable
Sandvik Mining and Rock Technology consists of the previous business areas Sandvik Mining and Sandvik Construction. The business area is a leading supplier of equipment and tools, service and support for the mining and construction industries. Order intake for the business area amounted to 38,973 million SEK
SANDVIK MACHINING SOLUTIONS
Financial overview, MSEK 2015 2016 2017Order intake 33,860 33,088 36,636Revenue 33,809 32,852 35,778Operating profit 5,504 6,970 8,413Operating margin, % 16.3 21.2 23.5Adjusted operating profit* 6,814 6,970 8,413Adjusted operating margin, % 20.2 21.2 23.5Return on capital employed, % 21.9 28.9 35.0Number of employees 18,713 18,043 18,187
* Operating profit adjusted for items affecting comparability of 1,310 million SEK in 2015.
units. Revenue totaled 35,778 million SEK (32,852), up 8 percent at fixed exchange rates for comparable units.
The operating margin was 23.5 per-cent (21.2) of revenues. 2017 marked the completion of the supply-chain optimization program with three addi-tional sites closed during the year.
(31,886), an increase of 20 percent at fixed exchange rates for compa-rable units. Revenue totaled 36,547 million SEK (31,093), up 15 percent at fixed exchange rates for comparable units. The operating margin was 15.7 percent (10.3) of revenues. 2017 was characterized by strong market recov-ery for mining equipment demand,
Generated savings combined with strong revenue growth supported the margin expansion. A new product area, Additive Manufacturing, was created at the beginning of the year with a purpose to capture new growth opportunities in 3D printing.
predominately for replacement of existing equipment, and driven by commodities gold, silver and zinc, and towards year-end also copper. The interest for our automation offer-ing Automine®, with remote to fully automated solutions for loading and hauling, increased significantly, albeit from a low base.
SANDVIK MINING AND ROCK TECHNOLOGY
REVENUE, MSEK AND OPERATING MARGIN, %
0
10,000
20,000
30,000
40,000
50,000
0
5
10
15
20
25
201720162015
MSEK %
FINANCIAL OVERVIEW, MSEK 2015 2016 2017Order intake 32,335 31,886 38,973Revenue 33,131 31,093 36,547Operating profit 2,417 3,206 5,743Operating margin, % 7.3 10.3 15.7Adjusted operating profit* 3,492 3,206 5,743Adjusted operating margin, % 10.5 10.3 15.7Return on capital employed, % 9.7 13.8 25.4Number of employees 14,595 14,087 15,041
* Operating profit adjusted for items affecting comparability of 1,075 million SEK in 2015.
SANDVIK MINING AND ROCK TECHNOLOGY, CONTINUING OPERATIONS
REVENUE, MSEK AND OPERATING MARGIN, %
0
10,000
20,000
30,000
40,000
0
4
8
12
16
201720162015
MSEK %
Sandvik Annual Report 2017 | 51

DIRECTORS̓ REPORT
Sandvik Materials Technology is a world-leading developer and manu-facturer of high value-added prod-ucts in advanced stainless steels, powder-based alloys and special alloys for the most demanding indus-tries, as well as products for industrial heating. Order intake for the business area amounted to 14,739 million SEK (12,036), an increase of 22 percent at
SANDVIK MATERIALS TECHNOLOGY
FINANCIAL OVERVIEW, MSEK 2015 2016 2017Order intake 12,625 12,036 14,739Revenue 13,909 12,931 13,643Operating profit 8 1,115 284Operating margin, % 0.1 8.6 2.1Adjusted operating profit* 818 1,115 734Adjusted operating margin, % 5.9 8.6 5.4Return on capital employed, % 0.1 8.7 2.2Number of employees 6,533 6,490 6,483
* Operating profit adjusted for items affecting comparability of 810 million SEK in 2015 and 450 million SEK in 2017.
In 2017, adjusted operating profit, excluding metal price effects totaling 112 million SEK amounted to 621 million SEK (1,051), with an adjusted underlying operating margin of 4.6 per-cent (8.1 for 2016 and 8.3 for 2015).
fixed exchange rates for comparable units. Revenue totaled 13,643 million SEK (12,931), up 5 percent at fixed exchange rates for comparable units. The adjusted operating margin was 5.4 percent (8.6) of revenues. Margin deteriorated as a consequence of less desirable product mix with higher share of low-value products. The overall demand improved across
most segments for the short-cycle standardized tubular offering, albeit from a low level. The demand for capex-related tubular offering for the oil and gas industry remained on par with last year. Towards the end of 2017 a new president was appointed to the business area and a plan to restore profitability was launched.
FINANCIAL OVERVIEW, MSEK 2015 2016 2017Order intake 35,116 34,258 40,272Revenue 38,108 33,970 39,628Operating profit 1,207 1,845 5,682Operating margin, % 3.2 5.4 14.3Adjusted operating profit* 3,384 1,845 5,682Adjusted operating margin, % 8.9 5.4 14.3Return on capital employed, % 4.7 7.9 25.5Number of employees 15,740 14,911 15,207
* Operating profit adjusted for items affecting comparability of 2,177 million SEK in 2015.
SANDVIK MINING AND ROCK TECHNOLOGY, TOTAL
REVENUE, MSEK AND OPERATING MARGIN, %
0
10,000
20,000
30,000
40,000
50,000
0
3
6
9
12
15
201720162015
MSEK %
REVENUE, MSEK AND ADJUSTED OPERATING MARGIN, %
0
5,000
10,000
15,000
0
5
10
15
201720162015
MSEK %
52 | Sandvik Annual Report 2017

DIRECTORS̓ REPORT
Other Operations consists of product areas Sandvik Process Systems and Sandvik Hyperion. They are leading suppliers of products and appli-cations in their respective niches. Sandvik Process Systems provides advanced industrial process solu-tions using steel belts and steel belt-based equipment. Sandvik Hyperion
OTHER OPERATIONS
FINANCIAL OVERVIEW, MSEK 2015 2016 2017Order intake 4,760 4,830 5,096Revenue 4,976 4,655 4,936Operating profit 489 545 4,432Operating margin, % 9.8 11.7 89.8Adjusted operating profit* 529 545 522Adjusted operating margin, % 10.6 11.7 10.6Return on capital employed, % 12.5 14.5 123.8Number of employees 2,074 1,913 1,531
* Operating profit adjusted for items affecting comparability of 40 million SEK in 2015 and 3,910 million SEK in 2017.
is a global full-line provider of inno-vative cemented carbide, diamond and cubic boron nitride solutions. Order intake amounted to 5,096 million SEK (4,830), up 9 percent at fixed exchange rates for comparable units. Revenue totaled 4,936 million SEK (4,655), up 10 percent at fixed exchange rates for comparable units.
The adjusted operating margin was 10.6 percent (11.7) of revenue. During 2017 the product area Sandvik Pro-cess Systems was divested. In addi-tion, a new owner for the remaining product area Sandvik Hyperion was announced, with expected closure of the deal during the first half of 2018.
REVENUE, MSEK AND ADJUSTED OPERATING MARGIN, %
0
1,000
2,000
3,000
4,000
5,000
6,000
0
2
4
6
8
10
12
201720162015
MSEK %
Sandvik Annual Report 2017 | 53

DIRECTORS̓ REPORT
RISK MANAGEMENT
The ability to effectively identify and manage risk is a vital element of business success for all parts of the Sandvik business. Risk management takes place in many different pro-cesses and operations throughout the Group.
The Group’s risk management approach follows our decentral-ized structure. Sandvik’s Board of Directors is ultimately responsible for the governance of risk management. Sandvik’s Group Executive Manage-ment ensures there is a common and efficient process in place.
All management teams in our different businesses are responsi-ble for their own risk management. The teams must follow the minimum requirements outlined in The Sandvik Way where specific policies, proce-dures, assessment tools and other guiding material are made available.
Part of the Board’s requirements are clear and transparent information about Sandvik’s enterprise risks and mitigating activities from all parts of our business operations.
ERM – A PART OF OUR BUSINESSES STRATEGIC WORKSandvik has implemented an Enterprise Risk Management (ERM) program that covers all business areas and product areas within the Group. The management teams analyze risks in their operations and related to their strategic objectives at least annually. During 2017 a Sandvik specific risk universe was introduced to increase the risk awereness and enhanced transparency of risk. Read more about the risk universe on page 55–56.
In 2017, two consolidated ERM reports were submitted to the Group Executive Management. A year-end ERM report summarizing key risks and mitigating activities across our business was provided to Sandvik’s Board of Directors in December 2017.
INSURANCE AS A RISK MANAGEMENT TOOL Sandvik has tailored insurance pro-grams that transfer the risks associ-ated with the Group’s property and
The Sandvik risk management processes support our business to manage and effectively mitigate critical risks.
liability exposures. Insurable risks are continuously evaluated and actions are taken to reduce these insurable risks, as part of Sandvik's loss- prevention strategy. Supported by the Sandvik loss-prevention guidance, risk evaluations highlight opportunities to reduce the potential for significant losses and to ensure the Group’s ability to deliver to its customers. In order to ensure cost efficient and tailored insurance solutions selected risks are reinsured through the Group’s captive insur-ance company.
CRISIS MANAGEMENT COMPLE�MENTS OUR RISK MANAGEMENTThe requirements for local manage-ment teams on how to act in a crisis situation is outlined in a global policy, which is rolled out to all business units in the Group. The overall pur-pose of Sandvik’s crisis management is to complement our proactive risk management work. Once a risk materializes, the priority of Sandvik’s crisis management is to minimize
ERM PROCESS AT SANDVIK
Assess and evaluate risks Communicate risks Manage risks Monitor and
follow up risks
54 | Sandvik Annual Report 2017

DIRECTORS̓ REPORT
harm to people, to the environment, and to minimize damage to Sandvik’s business, as well as ensuring a swift return to normal activities and safe-guarding the company brands.
INTERNAL AUDIT AND INTERNAL CONTROL IN SANDVIK’S RISK WORKThe internal audit function regularly follows up the implementation of different risk management programs such as ERM, business continuity, crisis management and the insurance programs. Sandvik also applies group-wide internal control activities to mit-igate many of the most critical risks. Read more about the internal controls program at Sandvik on page 63.
SANDVIK’S RISK UNIVERSE Sandvik's risk universe is based on risk categories that are organized in three main risk areas – strategic risks, business risks and financial risks. Each risk category can in one way or another significantly impact the Group's performance if not managed effectively. Read more about the main risk areas below. The detailed risk universe is outlined on page 56.
Sandvik's risk universe was devel-oped through analysis and stake-holder dialog of material risks for our industry, our different businesses, critical laws and regulations and criti-cal operational, commercial, sustain-ability and financial requirements.
Strategic risksStrategic risks are risks that can sig-nificantly impact the execution of our business strategies and our ability to
achieve our objectives. At Sandvik we include external and emerging risks in this risk area, such as industry shifts, technological shifts and macroeco-nomic developments. These risks can all impact our business nega-tively long term but often also create business opportunities if managed well. Our approach to managing these risks differs from other categories as it includes evaluation of which stra-tegic risks to take and improving the business ability to manage them by establishing risk tolerance, predicting the impact of possible risks and mon-itoring key risk indicators (KRIs).
Business risksAt Sandvik we include operational and commercial risks in the business risk area. These types of risks can often impact the financial perfor-mance of the business negatively or can have a negative reputational impact on the brands of the Group. Examples are sustainability risks, such as health and safety risks and compliance risks, and operational risks, such as IT failures, information and data protection, talent attrac-tion and retention and more. The approach to managing these risks is through active prevention and by designing mitigation controls.
Financial risksThrough its complex and interna-tional operations, Sandvik is exposed to multiple financial risks such as currency risks, interest risks, liquidity and refinancing risk. Sandvik’s Group Treasury is functionally responsible
for managing the greater part of the Group’s financial risks. The Board of Directors establishes the principles for the Group’s financial risk manage-ment, which comprises guidelines, objectives, and limits for financial management as well as the man-agement of financial risks within the Group.
Operating entities within the Sandvik Group present reports on their financial performance and economic status on a regular basis in accordance with internal reporting rules and the accounting policies applied by Sandvik and the Interna-tional Financial Reporting Standards (IFRS). The Group’s Finance function validates and analyzes the financial information as part of the quality control of financial reporting. More information is available in the Corpo-rate Governance Report on page 58.
For information about currency risks, interest risks, liquidity and refinancing risks, credit risks, raw material price risks and pension commitments, please see note 27 on page 112. For information about sustainability risks such as supplier management, envi-ronmental demand/climate change effects, Sandvik values and ethics compliance, and more, see sustaina-bility notes on page 132.
Sandvik Annual Report 2017 | 55

DIRECTORS̓ REPORT
Business risks
SANDVIK’S RISK UNIVERSE
Strategic risks
S1. Industry shifts and market developmentsS2. Macroeconomic development
S3. Technological change/shifts
S4. Regulatory change
S5. Emerging and complex market developments
S6. Sustainability expectations or requirements
S7. Geopolitical developments
S8. Portfolio management/M&A strategy
B1. Noncompliance with laws and regulationsB2. Health and safety
B3. Increased competition
B4. Product development and product support
B5. Intellectual property management
B6. Talent attraction and employee retention
B7. IT failures
B8. Insufficient IT security
B9. IT capacity or capabilities
B10. Information and data protection
B11. Data accuracy
B12. Cost flexibility and control
B13. Change management/demand/readiness
B14. Sales and distribution channels
B15. Business interruptions
B16. Product liability requirements
B17. Environmental demands/climate change effects
B18. Aftermarket developments and management
B19. Customer retention
B20. Pricing models and managementB21. Bottleneck processes/inefficient ways of working
B22. Governance and internal controls
B23. Sandvik values and ethics compliance developments
B24. Employee competence development and leadership development
B25. Contract management
B26. Technology development and innovation demand – internal operations
B27. Third-party liabilities, litigation and dispute resolution
B28. Contractor/short-term staff management
B29. Partners/agents /third-party management
B30. Measurement and operational reporting
B31. Insurable risk
B32. Security situation
B33. Project-related risk
B34. Communications (internal and external)
B35. Joint ventures and other partnership risks
B36. M&A transaction or integration
B37. Supplier and sourcing management
Financial risks
F1. Liquidity and refinancing riskF2. Currency risk
F3. Taxation risk
F4. Credit and counterparty risk
F5. Pension commitments
F6. Financial regulatory reporting risk
F7. Commodity price risk
F8. Interest rate risk
F9. Fraud activities
F10. Forecasting and planning
F11. Management estimates/assumption risk
F12. Accounting information risk
Sandvik’s risk universe has been developed through analysis and stakeholder dialog of material risks for our industry, our different businesses, critical laws and regulations and critical operational, commercial, sustainability and financial requirements. It is a comprehensive library of risks which management teams apply to better understand, evaluate and aggregate risk within the business. The risks highlighted below are the Sandvik Group’s key risks assessed during 2017.
56 | Sandvik Annual Report 2017

DIRECTORS̓ REPORT
SANDVIK GROUP KEY RISKS 2017
RISK CATEGORY RISK DESCRIPTION RISK CONSEQUENCE RISK MITIGATION
S1. INDUSTRY SHIFT AND MARKET DEVELOPMENTS
Risks connected to shifts or consolidation in the industry, in certain customer segments or markets.
The inability to reach strategic objectives long term, leading to lower growth or lower financial performance.
The different business areas are working with proactive business development and M&A. There is a strong focus on product segmentation (multi-company development/strategies, midmarket), aiming to diversify the product portfolio and reduce dependence on individual customer segments. There is also strong cost control in all our businesses.
S2. MACROECONOMIC DEVELOPMENTS
Risks connected to high market volatility, rapid macroeconomic fluctuations and cyclical industries/markets.
The inability to plan long term, leading to less agile business, higher costs or price models not being profitable, causing lower financial performance long term.
All businesses are working with strong cost control and cost flexibility. All businesses are closely monitoring relevant Key Risk Indicators (capex investment in mining, raw material prices, GDP, oil rig count, daily order rates, etc.) and scenario analysis are conducted in areas where risk impact is severe.
S3. TECHNOLOGICAL CHANGES/SHIFTS
Risks connected to technological developments/advancements that can impact or challenge current ways of doing business or demand for current products/ services.
The inability to reach strategic objectives long term, leading to lower growth or financial performance.
There is a strong focus on R&D in all our businesses as well as proactive business development and M&A activities where growth is a priority. The business is closely monitoring the development of new technologies and customer segments. Partnerships have been formed with key partners and research centers to advance knowledge and capabilities in areas currently not core business. The business has also invested in additive manufacturing, powder technology, digitalization and automation.
S4. REGULATORY CHANGE
Significant new legislation or regulations that could have an impact on the Sandvik business.
The inability to quickly respond to new regulations leading to higher costs, fines or the inability to continue manufacturing of certain products. Can have negative reputational impact.
All parts of Sandvik work with the monitoring of different initiatives and continually evaluate their impact on our business. We are active in business associations and other organizations, such as Jernkontoret and Svenskt Näringsliv, to name a few, to monitor regulatory development to benefit long-term sustainable business.
B1. NONCOMPLIANCE WITH LAWS AND REGULATIONS
Risks that legal and regulatory requirements are not met.
Worst-case scenarios show high financial impact due to fines in multiple markets. Can have a major negative reputational impact if risk were to materialize.
The Group has an established governance framework, The Sandvik Way, which includes Group policies, Group procedures and other steering documentation. The scope of the governance framework, including the controls implemented, is based on legal requirements and risk exposure. Sandvik's formal compliance programs of anti-bribery and anti-corruption,competition law, customs and export controls and data privacy are managed by the business with oversight through a Group functional council.
B6. TALENT ATTRACTION AND EMPLOYEE RETENTION
Increased need for digital and innovative business development competence. Increased need for specialist/expert competence in R&D and other niche areas. Inability to attract new talents in certain highly competitive markets.
A general risk of losing competitive-ness and business position on the market with a special risk focus of not being able to take a strong position in the digital area fast enough.
Sandvik has, across the business areas, focused on developing the Sandvik employer brand. One key area is to use new, digital channels to attract and recruit competence for the future. Succession planning has been strengthened for top management positions.
B7. IT FAILURES Risks of disturbances in critical IT systems, business processes or other digital infrastructure.
Inability to deliver products or services on time to customers or timely information to other stakeholders, leading to lower financial performance or negative financial impact due to fines.
Each business area is running an IT security improvement program, including risk review of critical business applications and risk-based network segmentation. A cyber security improvement program across the Sandvik Group is also initiated.
B10. INFORMATION AND DATA PROTECTION
Failure to adequately restrict access to information which may result in unauthorized knowledge or use of confidential information.
Can lead to business critical information being made available to unauthorized individuals/organizations.
Increased authentication to prevent unauthorized access to certain systems has been implemented in Sandvik’s IT environment. All business areas have strengthened their IT security management and information security resources during the year. Review of key processes for information release and overall communication channels initiated. GDPR (General Data Protection Regulation) implementation being rolled out globally.
B15. BUSINESS INTERRUPTIONS
Risks that major disasters or hazardous events disrupt the company’s ability to sustain operations, provide essential products and services to customers, or recover operating costs.
Inability to deliver products or services on time to customers or timely information to other stakeholders,, leading to lower financial performance or negative financial impact due to fines.
A review of the Group’s business interruption planning will be conducted during 2018. The business areas have already performed risk scenario planning for some of the most critical production entities, supply chain vulnerabilities and IT system dependencies.
F9. FRAUD ACTIVITIES Risk for fraudulent activities performed by employees, customers, suppliers, agents, brokers or other third parties against the company.
Can result in both financial losses and damaged reputation. Examples could be inappropriate use of assets or fraudulent payments.
Sandvik continues to develop its process for financial internal control, business integrity and the internal audit process to ensure relevant controls and monitoring to limit risks.
Sandvik Annual Report 2017 | 57

DIRECTORS̓ REPORT
CORPORATE GOVERNANCE REPORT
Corporate governance within Sandvik is based on external rules such as the Swedish Companies Act, the Stockholm Stock Exchange’s Rule Book for Issuers, the Swedish Code of Corporate Governance (the "Code") and other relevant laws and regulations. The Code is available from corporategovernance board.se. In 2017 Sandvik applied the Code without deviating from any of its regulations.
THE SANDVIK WAYSandvik’s corporate governance framework, The Sandvik Way, imple-ments these external rules and also sets out the internal rules and princi-
ples for governance that apply specifi-cally within Sandvik. It is based on four levels, as set forth in the model below, and describes how common ways of working have been implemented throughout the entire organization.
Oversight and DirectionThis level outlines how the Group is led and governed from the top. The Board of Directors, elected by the Shareholders’ Meeting, sets the strategic direction for the Group. The President carries this out through the Group Executive Management whose members manage and oversee the operations of the Group. The main operational responsibility in the Group
Sandvik AB has its head office in Stockholm and is the Parent Company of the Sandvik Group, with subsidiaries in more than 60 countries. The Group has about 43,000 employees and sales in more than 150 countries. Sandvik AB is a public company with its shares listed on Nasdaq Stockholm (the “Stockholm Stock Exchange”)
lies with the business areas and product areas, with Group functions responsible for functional policies and processes supporting the business. This level is the main focus of this Corporate Governance Report.
Culture and Enabling StructureThis level sets out the requirements and ambitions underpinning our operations. Our business philosophy is shaped by our Vision to excel, guided by our Core Values (Customer Focus, Innovation, Fair Play and Passion to Win), translated into the behaviors we outline in our Code of Conduct and motivated through the qualities out-lined in Sandvik’s Leadership Model.
Performance tracking &Performance reviews
External & InternalReportingPolicy Compliance
Programs
Financial Internal Control Self-assessments
THE SANDVIK WAY
Shareholders’ Meeting & Board of Directors
Business Areas & Group Functions Group Councils
Vision Core Values Code of Conduct Leadership Model
Legal Entity & Coun-try Coordination
OVERSIGHT & DIRECTION
CULTURE & ENABLING STRUCTURE
OPERATIONAL SYSTEM
Analysis & Continuous improvements
BUSINESS AREA GOVERNANCE
Sandvik Mining and Rock Technology Sandvik Materials Technology Sandvik Machining Solutions
AU
DIT
ING
Strategic Planning Three-year plan Forecasts & Targets
Policies & Procedures Speak Up & InvestigationsMO
NIT
OR
INGGroup
Strategies
Risk Assessments
President & Group Executive Management
58 | Sandvik Annual Report 2017

DIRECTORSʼ REPORT
Operational SystemThe operational system in The Sandvik Way is at the core of how we work on a day-to-day basis in the Sandvik Group. It contains informa-tion and ways of working for the whole Sandvik Group related to strategic planning, risk management, internal controls and compliance, as well as Sandvik’s monitoring activities, including performance tracking and compliance self-assessment for the business units. This is also where our group-wide policies and procedures are collected.
Business Area GovernanceWhereas the three top levels of The Sandvik Way set the group-wide way of working that applies across all of the business areas, product areas and Group functions, the business areas and product areas have their own tailored governance systems based on The Sandvik Way.
OWNERSHIP STRUCTUREAs of 31 December 2017 Sandvik’s share capital amounted to 1,505,263,107.60 SEK represented by 1,254,385,923 shares. According to the share register, Sandvik had about 103,000 shareholders as of 31 December 2017. AB Industrivärden was the largest owner with about 11.8 percent of the share capital. Of the total share capital at year-end, 37 percent was owned by investors outside Sweden.
SHAREHOLDERS’ MEETINGThe General Meeting of Sharehold-ers is the highest decision- making body. At the Annual General Meet-
ing, the shareholders are given the possibility to exercise their voting rights in relation to, for example, the Annual Report, dividends, election of the Board and appointment of auditor, and other matters stipulated in the Companies Act, the Articles of Association and, where applicable, the Code.
All shareholders who have been entered in the share register and have informed the company of their attendance within the time limit stated in the notice of the General Meeting are entitled to participate at Sandvik’s General Meetings and vote according to the number of shares held. Shareholders are also entitled to be represented by a proxy at the General Meeting.
All shares in Sandvik carry equal vot-ing rights, namely one vote per share.
2017 Annual General MeetingShareholders representing 49.52 percent of the share capital and votes attended the Annual General Meeting held on 27 April 2017 in Sandviken, Sweden. Sven Unger, attorney-at-law, was elected to chair the meeting. Resolutions passed at the General Meeting included the following:
– Dividend of 2.75 SEK per share – Election of Marika Fredriksson
as new member of the Board and re-election of Board members Jennifer Allerton, Claes Boust-edt, Johan Karlström, Johan Molin, Björn Rosengren, Helena Stjernholm and Lars Westerberg. Re-election of Johan Molin as Chairman of the Board.
– Guidelines for remuneration of senior executives
CORPORATE GOVERNANCE MODEL
GROUP FUNCTIONS BUSINESS AREAS
PRODUCT AREAS
NOMINATION COMMITTEE SHAREHOLDERS’ MEETING EXTERNAL AUDITOR
AUDIT COMMITTEE BOARD OF DIRECTORS REMUNERATION COMMITTEE
INTERNAL AUDIT
SPEAK UP & BUSINESS ETHICS
PRESIDENT & GROUP EXECUTIVE MANAGEMENT
TEN LARGEST SHAREHOLDERS, 31 DECEMBER 2017, %AB Industrivärden 11.8Alecta Pension Insurance 6.1AMF Insurance and Funds 2.7Handelsbanken Pension 2.6Swedbank Robur Funds 2.5L E Lundbergföretagen AB 2.4SEB Investment Management 1.9JP Morgan Chase* 1.8Fourth Swedish National Pension Fund 1.4Nordea Investment Funds 1.4
Source: Euroclear* Shares held in trust
– A long-term incentive program in the form of a performance share program for about 350 senior executives and key employees in the Group
– Re-election of KPMG AB as auditor
For additional information about the Annual General Meeting, including the minutes, refer to home.sandvik.
2018 Annual General MeetingThe next Annual General Meeting will be held on 27 April 2018 in Sandviken, Sweden. More information is available at home.sandvik.
NOMINATION COMMITTEEThe Nomination Committee is a preparatory body that prepares pro-posals for, among other things, the election of the Board of Directors, the Chairman of the Board and auditors as well as fees for adoption at the General Meeting. The Annual General Meeting has adopted an instruction for the Nomination Committee, which includes a procedure for appointing
Sandvik Annual Report 2017 | 59
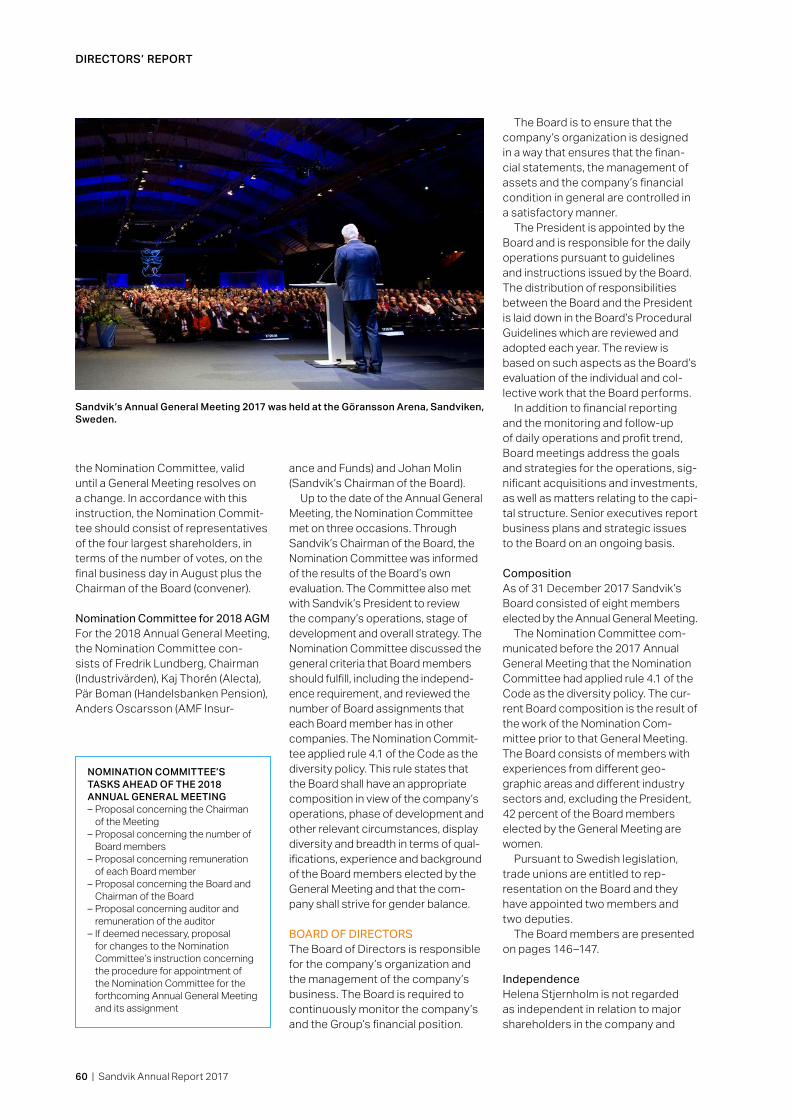
DIRECTORS̓ REPORT
the Nomination Committee, valid until a General Meeting resolves on a change. In accordance with this instruction, the Nomination Commit-tee should consist of representatives of the four largest shareholders, in terms of the number of votes, on the final business day in August plus the Chairman of the Board (convener).
Nomination Committee for 2018 AGMFor the 2018 Annual General Meeting, the Nomination Committee con-sists of Fredrik Lundberg, Chairman (Industrivärden), Kaj Thorén (Alecta), Pär Boman (Handelsbanken Pension), Anders Oscarsson (AMF Insur-
ance and Funds) and Johan Molin (Sandvik’s Chairman of the Board).
Up to the date of the Annual General Meeting, the Nomination Committee met on three occasions. Through Sandvik’s Chairman of the Board, the Nomination Committee was informed of the results of the Board’s own evaluation. The Committee also met with Sandvik’s President to review the company’s operations, stage of development and overall strategy. The Nomination Committee discussed the general criteria that Board members should fulfill, including the independ-ence requirement, and reviewed the number of Board assignments that each Board member has in other companies. The Nomination Commit-tee applied rule 4.1 of the Code as the diversity policy. This rule states that the Board shall have an appropriate composition in view of the company’s operations, phase of development and other relevant circumstances, display diversity and breadth in terms of qual-ifications, experience and background of the Board members elected by the General Meeting and that the com-pany shall strive for gender balance.
BOARD OF DIRECTORSThe Board of Directors is responsible for the company’s organization and the management of the company’s business. The Board is required to continuously monitor the company’s and the Group’s financial position.
The Board is to ensure that the company’s organization is designed in a way that ensures that the finan-cial statements, the management of assets and the company’s financial condition in general are controlled in a satisfactory manner.
The President is appointed by the Board and is responsible for the daily operations pursuant to guidelines and instructions issued by the Board. The distribution of responsibilities between the Board and the President is laid down in the Board’s Procedural Guidelines which are reviewed and adopted each year. The review is based on such aspects as the Board’s evaluation of the individual and col-lective work that the Board performs.
In addition to financial reporting and the monitoring and follow-up of daily operations and profit trend, Board meetings address the goals and strategies for the operations, sig-nificant acquisitions and investments, as well as matters relating to the capi-tal structure. Senior executives report business plans and strategic issues to the Board on an ongoing basis.
CompositionAs of 31 December 2017 Sandvik’s Board consisted of eight members elected by the Annual General Meeting.
The Nomination Committee com-municated before the 2017 Annual General Meeting that the Nomination Committee had applied rule 4.1 of the Code as the diversity policy. The cur-rent Board composition is the result of the work of the Nomination Com-mittee prior to that General Meeting. The Board consists of members with experiences from different geo-graphic areas and different industry sectors and, excluding the President, 42 percent of the Board members elected by the General Meeting are women.
Pursuant to Swedish legislation, trade unions are entitled to rep-resentation on the Board and they have appointed two members and two deputies.
The Board members are presented on pages 146–147.
IndependenceHelena Stjernholm is not regarded as independent in relation to major shareholders in the company and
NOMINATION COMMITTEE’S TASKS AHEAD OF THE 2018 ANNUAL GENERAL MEETING– Proposal concerning the Chairman
of the Meeting – Proposal concerning the number of
Board members – Proposal concerning remuneration
of each Board member – Proposal concerning the Board and
Chairman of the Board – Proposal concerning auditor and
remuneration of the auditor – If deemed necessary, proposal
for changes to the Nomination Committee’s instruction concerning the procedure for appointment of the Nomination Committee for the forthcoming Annual General Meeting and its assignment
Sandvik’s Annual General Meeting 2017 was held at the Göransson Arena, Sandviken, Sweden.
60 | Sandvik Annual Report 2017
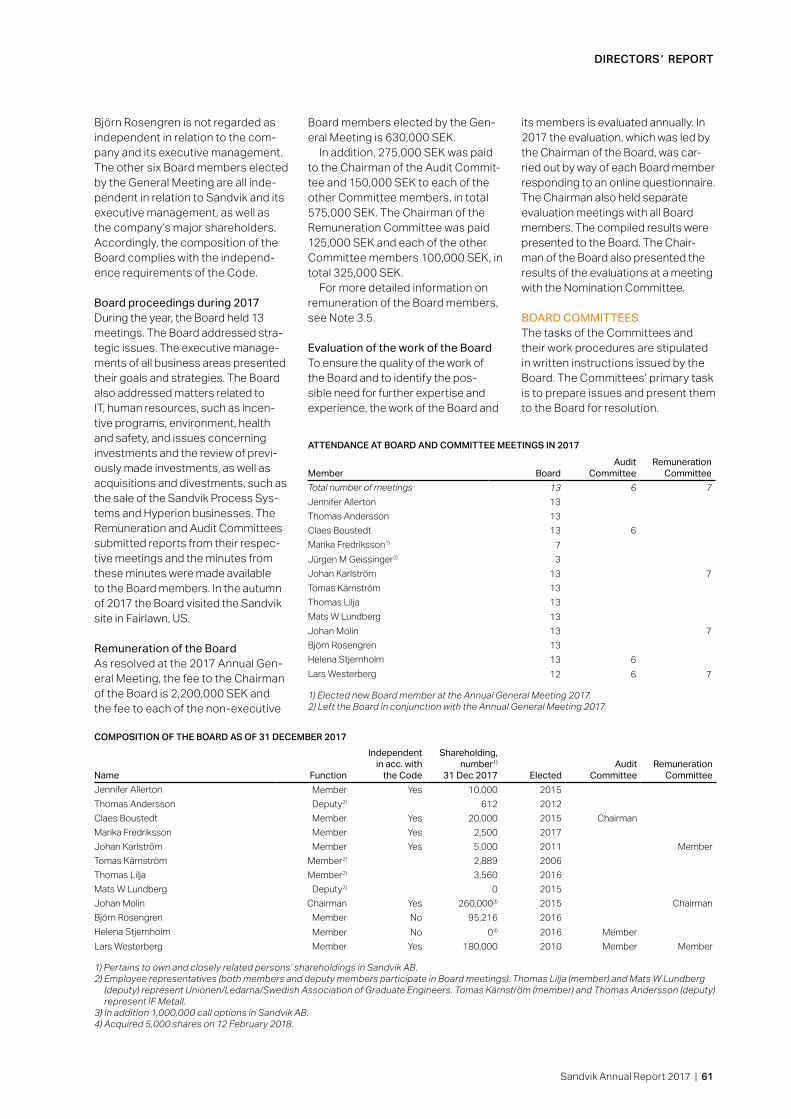
DIRECTORSʼ REPORT
Björn Rosengren is not regarded as independent in relation to the com-pany and its executive management. The other six Board members elected by the General Meeting are all inde-pendent in relation to Sandvik and its executive management, as well as the company’s major shareholders. Accordingly, the composition of the Board complies with the independ-ence requirements of the Code.
Board proceedings during 2017During the year, the Board held 13 meetings. The Board addressed stra-tegic issues. The executive manage-ments of all business areas presented their goals and strategies. The Board also addressed matters related to IT, human resources, such as incen-tive programs, environment, health and safety, and issues concerning investments and the review of previ-ously made investments, as well as acquisitions and divestments, such as the sale of the Sandvik Process Sys-tems and Hyperion businesses. The Remuneration and Audit Committees submitted reports from their respec-tive meetings and the minutes from these minutes were made available to the Board members. In the autumn of 2017 the Board visited the Sandvik site in Fairlawn, US.
Remuneration of the BoardAs resolved at the 2017 Annual Gen-eral Meeting, the fee to the Chairman of the Board is 2,200,000 SEK and the fee to each of the non-executive
Board members elected by the Gen-eral Meeting is 630,000 SEK.
In addition, 275,000 SEK was paid to the Chairman of the Audit Commit-tee and 150,000 SEK to each of the other Committee members, in total 575,000 SEK. The Chairman of the Remuneration Committee was paid 125,000 SEK and each of the other Committee members 100,000 SEK, in total 325,000 SEK.
For more detailed information on remuneration of the Board members, see Note 3.5.
Evaluation of the work of the BoardTo ensure the quality of the work of the Board and to identify the pos-sible need for further expertise and experience, the work of the Board and
its members is evaluated annually. In 2017 the evaluation, which was led by the Chairman of the Board, was car-ried out by way of each Board member responding to an online questionnaire. The Chairman also held separate evaluation meetings with all Board members. The compiled results were presented to the Board. The Chair-man of the Board also presented the results of the evaluations at a meeting with the Nomination Committee.
BOARD COMMITTEESThe tasks of the Committees and their work procedures are stipulated in written instructions issued by the Board. The Committees’ primary task is to prepare issues and present them to the Board for resolution.
COMPOSITION OF THE BOARD AS OF 31 DECEMBER 2017
Name Function
Independent in acc. with
the Code
Shareholding, number1)
31 Dec 2017 ElectedAudit
CommitteeRemuneration
CommitteeJennifer Allerton Member Yes 10,000 2015 Thomas Andersson Deputy2) 612 2012 Claes Boustedt Member Yes 20,000 2015 Chairman Marika Fredriksson Member Yes 2,500 2017 Johan Karlström Member Yes 5,000 2011 MemberTomas Kärnström Member2) 2,889 2006 Thomas Lilja Member2) 3,560 2016Mats W Lundberg Deputy2) 0 2015 Johan Molin Chairman Yes 260,0003) 2015 ChairmanBjörn Rosengren Member No 95,216 2016Helena Stjernholm Member No 04) 2016 Member Lars Westerberg Member Yes 180,000 2010 Member Member
1) Pertains to own and closely related persons’ shareholdings in Sandvik AB.2) Employee representatives (both members and deputy members participate in Board meetings). Thomas Lilja (member) and Mats W Lundberg
(deputy) represent Unionen/Ledarna/Swedish Association of Graduate Engineers. Tomas Kärnström (member) and Thomas Andersson (deputy) represent IF Metall.
3) In addition 1,000,000 call options in Sandvik AB.4) Acquired 5,000 shares on 12 February 2018.
ATTENDANCE AT BOARD AND COMMITTEE MEETINGS IN 2017
Member BoardAudit
Committee Remuneration
CommitteeTotal number of meetings 13 6 7Jennifer Allerton 13 Thomas Andersson 13 Claes Boustedt 13 6Marika Fredriksson1) 7Jürgen M Geissinger2) 3Johan Karlström 13 7Tomas Kärnström 13Thomas Lilja 13Mats W Lundberg 13Johan Molin 13 7Björn Rosengren 13Helena Stjernholm 13 6Lars Westerberg 12 6 7
1) Elected new Board member at the Annual General Meeting 2017. 2) Left the Board in conjunction with the Annual General Meeting 2017.
Sandvik Annual Report 2017 | 61

DIRECTORS̓ REPORT
Remuneration CommitteeDuring 2017 the members of the Remuneration Committee were the Chairman of the Board Johan Molin (Chairman of the Committee), Johan Karlström and Lars Westerberg. The tasks of the Remuneration Commit-tee are, among others, those pre-scribed by the Code, which include preparing proposals regarding guidelines for remuneration of senior executives and long-term incentive programs for senior executives.
Based on the recommendations of the Remuneration Committee, the Board decides the remuneration and terms of employment for the President, who in turn decides on the remuneration to be paid to the Group Executive Management in consultation with the Remuneration Committee.
For guidelines, remuneration and other benefits payable to the Group Executive Management, refer to Proposal regarding guidelines for the remuneration of senior executives on page 48 and Note 3.5.
During 2017 the Remuneration Committee held seven meetings. The increased number of meetings was mainly driven by the replacement of two members of the Group Executive Management during 2017.
Audit CommitteeDuring 2017 the members of the Audit Committee were Claes Boust-edt (Chairman of the Committee), Helena Stjernholm and Lars Wester-berg. Areas addressed by the Audit Committee mainly related to:
– Financial reporting – Effectiveness of the system of
internal control – Planning, scope and follow-up of the
internal and external audit for the year – The Group’s systematic processes
for risk management, including legal disputes, IT, accounting pro-cedures, taxation, treasury, finance operations and pension issues
– The development and effective-ness of compliance processes and Speak Up, Sandvik’s global whistle-blowing system
– Sandvik’s sustainable business strategy and materiality analysis
– Preparation for election of new auditor
During 2017 the Audit Committee held six meetings at which Sandvik’s external auditor and representatives of the company’s management were present.
PRESIDENT AND GROUP EXECU�TIVE MANAGEMENTThe President is accountable for Group decision-making in all areas delegated by the Board. In order to ensure a full Group perspective in these matters, the President has appointed the Group Executive Man-agement as an advisory forum, focus-ing on how to achieve Group targets, strategies, structure and organization. The Group Executive Management meets each month and its members are accountable for implementing the President’s decisions.
In 2017 the Group Executive Man-agement consisted of:
– Björn Rosengren, President and CEO – Tomas Eliasson, Executive Vice
President and CFO – Klas Forsström, President of
Sandvik Machining Solutions, from 1 April 2017
– Lars Engström, President of Sandvik Mining and Rock Technology
– Göran Björkman, President of Sandvik Materials Technology, from 1 November 2017
– Jessica Alm, Executive Vice President and Head of Group Communications
– Johan Kerstell, Executive Vice President and Head of Human Resources
– Åsa Thunman, Executive Vice President and General Counsel
– Jonas Gustavsson, President of Sandvik Machining Solutions, until 31 March 2017
– Petra Einarsson, President of Sandvik Materials Technology, until 31 October 2017
The President and other members of the Group Executive Management are presented further on pages 148–149.
BUSINESS AREASThe Sandvik organization model is based on a decentralized business model with three separate business areas – Sandvik Machining Solutions, Sandvik Mining and Rock Technology and Sandvik Materials Technology – based on distinct product offerings.
Each business area has full respon-sibility and accountability for its respective business results.
Each of the three business areas is organized in a number of product areas based on product offering or brand. The product area is the highest operational level in the Sandvik organ-izational structure. Where the product area structure is based on the product offering, each product area is organ-ized in business units representing defined parts of the product offering.
Visit home.sandvik for more detailed information relating to the Group’s business activities and prod-uct portfolios.
GROUP FUNCTIONSThere are currently four Group functions within Sandvik: Communi-cations, Finance, HR and Legal. Group Functions specifically focus on setting the appropriate enabling structures and processes that are common for the Group or cover a specific area for which the Group is responsible.
EXTERNAL AUDITORAt the 2017 Annual General Meet-ing, the audit firm KPMG AB was re-elected auditor of Sandvik AB for the period until the 2018 Annual General Meeting. Joakim Thilstedt is the auditor-in-charge.
The auditors continuously audit and monitor the company’s general accounting and the execution by the Board and the President of their respective responsibilities.
The progress of the audit is reported regularly during the year to the management teams of individual companies and the business areas, to the Group Executive Management, the Audit Committee and to the Board. The auditor meets with the Board at least once a year without the President or any other member of the Group Executive Management attending.
The independence of the external auditor is guaranteed by a require-ment that the Audit Committee pre-approves non-audit services to be provided by the auditors.
Audit fees are paid continuously over the period in office on an approved current account basis. For detailed information on fees paid to the auditor, see Note 3.6.
62 | Sandvik Annual Report 2017

DIRECTORSʼ REPORT
BREACH OF THE STOCKHOLM STOCK EXCHANGE’S RULE BOOKIn December 2017 the Disciplinary Committee of the Stockholm Stock Exchange found that Sandvik had breached the Stockholm Stock Exchange’s Rule Book for Issuers (the "Rule Book”) and imposed a fine on Sandvik amounting to one annual fee, equivalent to an amount of SEK 3,105,000. The Disciplinary Commit-tee found that Sandvik had contra-vened section 3.1 of the Rule Book by mistakenly publishing its interim report for the second quarter of 2017 on the company’s website before the report was disclosed in a correct manner as stipulated in the Rule Book.
INTERNAL CONTROL OF FINANCIAL REPORTING Sandvik’s finance organization manages a well-established financial reporting process aimed at ensuring a high level of internal control.
The internal control system aligns with the conceptual framework of COSO, which is based on five key components that jointly facilitate good internal control. The five com-ponents are Control Environment, Risk Assessment, Control Activities, Information and Communication and Monitoring and Follow-up. The application of the COSO framework is described below.
Control environmentThe Sandvik Way regulates the govern-ance of the Sandvik Group. It includes delegation of responsibilities, including signatory and authorization principles for decision making and cost approv-als, and request and approval proce-dures in respect to investments and acquisitions, among other items.
The Sandvik Financial Reporting Policies and Procedures govern control over financial reporting. These documents contain detailed instruc-tions regarding accounting policies and financial reporting procedures to be applied by all Sandvik reporting entities
A Sandvik Financial Internal Control Framework has been developed and includes key components such as; well-defined roles and responsibilities, internal control policy and the risk and
Quarterly interim reports are published externally and are sup-plemented by investor meetings attended by the Group Executive Management.
Monitoring and follow-upEach legal entity manager and their respective finance organization is ultimately responsible for con-tinuously monitoring the financial information of the various entities. The Audit Committee is to ensure that the company’s financial reports are produced in accordance with legislation, applicable accounting standards and other requirements for listed companies. The Audit Com-mittee prepares issues and presents them to the Board for resolution.
The external auditors review the third-quarter interim report and study the financial reports prepared for the other quarters. In conjunction with the close of the third quarter, the external auditors perform a more detailed examination of the level of internal control over the financial reporting as part of a hard-close audit, which includes an assessment of the Parent Company’s reporting and internal control over financial reporting in the business areas, sub-sidiaries and Group functions.
Internal auditThe Internal Audit function audits the corporate governance, inter-nal control and risk-management procedures. Internal Audit is subordi-nated to the Audit Committee and the head of the unit reports to the Audit Committee.
Internal audits include, as a basis, the Group’s policies for corporate governance, risk management and internal control with regard to areas such as financial reporting, com-pliance with the Code of Conduct and IT. The outputs of the audits include action plans and programs for improvement.
Findings are reported to the Group Executive Management and the busi-ness area management and to the Audit Committee.
control matrix which defines a manda-tory minimum of control activities that contribute to the mitigation of risks to acceptable levels. The process of roll-ing-out the common framework to the Sandvik entities is well underway.
Risk assessment and risk managementThe Enterprise Risk Management (ERM) process at Sandvik encom-passes the area of financial reporting. Key risks noted in local assessments and observations made by Internal and External Audit are also taken into consideration to ensure that adequate controls exist to mitigate these risks.
Control activitiesIn each legal entity, the finance staff is responsible for accurate accounting and the closing of books. At Group level, Group Control manages the reporting process to ensure the com-pleteness and accuracy of financial reporting and compliance with IFRS requirements. Both statutory and management reporting is conducted in close cooperation with product areas, business areas and specialist functions such as tax, treasury and legal to ensure the correct reporting of the income statement, balance sheet, equity and cash flow.
Controllers in the product and busi-ness areas perform analytical reviews and investigations, conduct business trend analyses and update forecasts. They investigate certain issues related to the financial information as and when needed. All business areas present their financial performance in written reports to the Group Execu-tive Management on a monthly and quarterly basis.
Information and communicationFinancial reports setting out the Group’s financial position and the earnings trend of operations are submitted regularly to Sandvik’s Board. The Board deals with all quar-terly interim reports as well as the Annual Report prior to publishing and monitors the audit of internal control and financial statements conducted by Internal Audit and the external auditors.
Sandvik Annual Report 2017 | 63

CONSOLIDATED FINANCIAL STATEMENTS
64 | Sandvik Annual Report 2017
INCOME STATEMENT 65
BALANCE SHEET 66
CHANGES IN EQUITY 68
CASH FLOW STATEMENT 69
CONSOLIDATED FINANCIAL STATEMENTS

CONSOLIDATED FINANCIAL STATEMENTS
CONSOLIDATED INCOME STATEMENT
MSEK Note 2016 2017
Continuing operationsRevenue 1, 2 81,553 90,905Cost of sales and services –49,882 –54,279Gross profit 31,671 36,626Selling expenses –11,865 –12,819Administrative expenses –5,842 –5,954Research and development costs 4 –3,075 –3,163Share of results of associated companies 16 56Other operating income 5 214 4,219Other operating expenses 6 –101 –867Operating profit 1, 3, 7, 8 11,018 18 ,098Financial income 191 381Financial expenses –1,843 –1,462Net financing cost 9 –1,652 –1,080Profit after financial items 9,366 17,018Income tax 10 –2,528 –3,783Profit for the year, continuing operations 6,838 13,235
Discontinued operations Revenue 2,877 3,080Operating profit –1,361 –61Profit after financial items –1,370 –52Profit for the year, discontinued operations 30 –1,370 –52
Group total Revenue 84,430 93,985Operating profit 9,657 18,037Profit after financial items 7,996 16,966Profit for the year, Group total 5,468 13,183
Other comprehensive incomeItems that cannot be reclassified to profit/loss for the year Actuarial gains/losses on defined-benefit pension plans 20 168 860Tax relating to items that cannot be reclassified to profit/loss for the year 10 –82 –108 86 751Items that can be reclassified to profit/loss for the year Translation differences during the year 2,323 –1,355Fair-value changes in cash flow hedges –47 9Fair-value changes in cash flow hedges transferred to profit/loss for the year 153 76Tax related to fair-value changes in cash flow hedges 10 –22 –19 2,407 –1,288Total other comprehensive income for the year 2,493 –537Total comprehensive income for the year 7,961 12,646
Profit for the year attributable to: Equity holders of the Parent 5,508 13,197Non-controlling interests –40 –14
Total comprehensive income for the year attributable to: Equity holders of the Parent 8,001 12,660Non-controlling interests –40 –14
Earnings per share, SEK*Continuing operations 11 5.48 10.56Discontinued operations 11 –1.09 –0.04Group Total 11 4.39 10.52
* Basic and diluted earnings per share.
Sandvik Annual Report 2017 | 65
CONSOLIDATED FINANCIAL STATEMENTS

CONSOLIDATED FINANCIAL STATEMENTS
MSEK Note 31 Dec. 2016 31 Dec. 2017
ASSETSNon-current assetsIntangible assets
Patents and other intangible assets 12 5,907 5,465Goodwill 12 13,333 11,911
Total 19,240 17,376
Property, plant and equipmentLand and buildings 12 9,369 8,811Plant and machinery 12 13,181 11,718Equipment, tools, fixtures and fittings 12 1,675 1,494Construction in progress and advance payments 12 2,484 2,376
Total 26,709 24,399
Financial assetsInvestments in associated companies 1, 15 246 269Financial assets 82 83Deferred tax assets 10 5,928 4,192Non-current receivables 16 1,780 2,220
Total 8,036 6,764Total non-current assets 53,985 48,539
Current assetsInventories 17 20,977 21,389
Current receivablesTrade receivables 18 13,301 13,239Due from associated companies 116 131Income tax receivables 10 1,047 961Other receivables 16 4,005 4,466Prepaid expenses and accrued income 893 833
Total 19,362 19,630Cash and cash equivalents 8,818 12,724Assets held for sale 30 358 4,522Total current assets 49,515 58,265TOTAL ASSETS 103,500 106,804
For information on contingent liabilities and pledged assets, refer to Note 26.
CONSOLIDATED BALANCE SHEET
66 | Sandvik Annual Report 2017

CONSOLIDATED FINANCIAL STATEMENTS
CONSOLIDATED BALANCE SHEET (CONTINUED)
MSEK Note 31 Dec. 2016 31 Dec. 2017
EQUITY AND LIABILITIESEquity
Share capital 1,505 1,505Other paid-in capital 7,678 7.678Reserves 4,658 3,370Retained earnings including profit/loss for the year 25,356 36,190
Equity attributable to equity holders of the Parent 39,197 48,743Non-controlling interests 93 28TOTAL EQUITY 19 39,290 48,771
Non-current liabilitiesInterest-bearing liabilities
Provisions for pensions 20 6,449 5,630Loans from financial institutions 4,576 1,442Other liabilities 23 22,162 21,391
Total 33,187 28,463
Non-interest-bearing liabilitiesDeferred tax liabilities 10 2,130 1,463Provisions for taxes 10 1,356 1,722Other provisions 21 1,029 984Other non-current liabilities 24 352 294
Total 4,867 4,463Total non-current liabilities 38,054 32,926
Current liabilitiesInterest-bearing liabilities
Loans from financial institutions 2,883 404Other liabilities 23 1,797 582
Total 4,680 986
Non-interest-bearing liabilitiesAdvance payments from customers 2,127 2,499Accounts payable 6,286 7,380Due to associated companies 2 0Income tax liabilities 10 948 1,147Other liabilities 24 2,926 2,616Provisions 21 1,788 1,676Accrued expenses and deferred income 6,502 7,233
Total 20,579 22,551Liabilities directly attributed to assets held for sale 30 897 1,570Total current liabilities 26,156 25,107TOTAL LIABILITIES 64,210 58,033TOTAL EQUITY AND LIABILITIES 103,500 106,804
For information on contingent liabilities and pledged assets, refer to Note 26.
Sandvik Annual Report 2017 | 67

CONSOLIDATED FINANCIAL STATEMENTS
MSEK
Equity attributable to equity holders of the parent company
Share capital
Other paid-in capital Reserves
Retained earnings incl.
profit/ loss for the year Total
Non- controlling
interestsTotal
equity
Equity at 1 January 2016 1,505 7,678 2,251 22,545 33,979 81 34,060Profit for the year — — — 5,508 5,508 –40 5,468Other comprehensive income/loss — — 2,407 86 2,493 — 2,493Total comprehensive income/loss for the year
— — 2,407 5,594 8,001 –40 7,961
New stock issue to non-controlling interest — — — — — 52 52Share-based payment settled by equity instruments — — — 47 47 — 47Payments on exercise of options program 2012 and 2013 — — — 19 19 — 19Reduction of hedge options program 2011 — — — 262 262 — 262Other options — — — –4 –4 — –4Dividends, hedged options program 2011 — — — 29 29 — 29Dividend — — — –3,136 –3,136 — –3,136Equity at 31 December 2016 1,505 7,678 4,658 25,356 39,197 93 39,290
Equity at 1 January 2017 1,505 7,678 4,658 25,356 39,197 93 39,290Profit for the year — — — 13,197 13,197 -14 13,183Other comprehensive income/loss –1,288 751 –537 — –537Total comprehensive income/loss for the year
— — –1,288 13,948 12,660 -14 12,646
New stock issue to non-controlling interest — — — — — –43 –43Acquired non-controlling interest — — — –9 –9 — –9Share-based payment settled by equity instruments — — — 107 107 — 107Payments on exercise of options program 2012 and 2013 — — — 258 258 — 258Reduction of hedge options program 2011 — — — –39 –39 — –39Other options — — — — — — —Dividends, hedged options program 2011 — — — 18 18 — 18Dividend — — — –3,449 –3,449 –8 –3,457Equity at 31 December 2017 1,505 7,678 3,370 36,190 48,743 28 48,771
CONSOLIDATED CHANGES IN EQUITY
68 | Sandvik Annual Report 2017
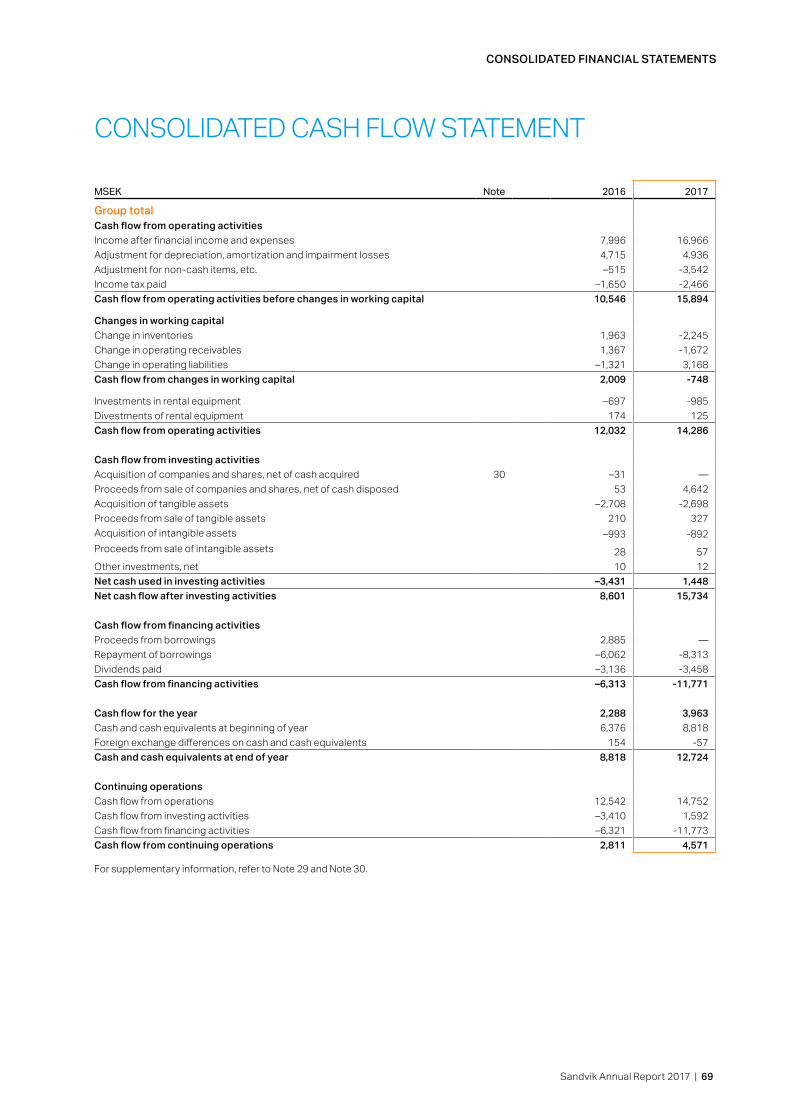
CONSOLIDATED FINANCIAL STATEMENTS
CONSOLIDATED CASH FLOW STATEMENT
MSEK Note 2016 2017
Group total Cash flow from operating activities Income after financial income and expenses 7,996 16,966Adjustment for depreciation, amortization and impairment losses 4,715 4.936Adjustment for non-cash items, etc. –515 -3,542Income tax paid –1,650 -2,466Cash flow from operating activities before changes in working capital 10,546 15,894
Changes in working capital Change in inventories 1,963 -2,245Change in operating receivables 1,367 -1,672Change in operating liabilities –1,321 3,168Cash flow from changes in working capital 2,009 -748 Investments in rental equipment –697 -985Divestments of rental equipment 174 125Cash flow from operating activities 12,032 14,286
Cash flow from investing activitiesAcquisition of companies and shares, net of cash acquired 30 –31 —Proceeds from sale of companies and shares, net of cash disposed 53 4,642Acquisition of tangible assets –2,708 -2,698Proceeds from sale of tangible assets 210 327Acquisition of intangible assets –993 -892Proceeds from sale of intangible assets 28 57Other investments, net 10 12Net cash used in investing activities –3,431 1,448Net cash flow after investing activities 8,601 15,734
Cash flow from financing activities Proceeds from borrowings 2,885 —Repayment of borrowings –6,062 -8,313Dividends paid –3,136 -3,458Cash flow from financing activities –6,313 -11,771
Cash flow for the year 2,288 3,963Cash and cash equivalents at beginning of year 6,376 8,818Foreign exchange differences on cash and cash equivalents 154 -57Cash and cash equivalents at end of year 8,818 12,724
Continuing operations Cash flow from operations 12,542 14,752Cash flow from investing activities –3,410 1,592Cash flow from financing activities –6,321 -11,773Cash flow from continuing operations 2,811 4,571
For supplementary information, refer to Note 29 and Note 30.
Sandvik Annual Report 2017 | 69
PARENT COMPANY FINANCIAL STATEMENTS
PARENT COMPANY FINANCIAL STATEMENTS
INCOME STATEMENT 71
BALANCE SHEET 72
CHANGES IN EQUITY 74
CASH FLOW STATEMENT 75
70 | Sandvik Annual Report 2017

PARENT COMPANY FINANCIAL STATEMENTS
PARENT COMPANY INCOME STATEMENT
MSEK Note 2016 2017
Revenue 2 15,146 16,627Cost of sales and services –8,418 –9,514Gross profit 6,728 7,113
Selling expenses –820 –963Administrative expenses –2,144 –2,287Research and development costs 4 –1,371 –1,336Other operating income 5 11 257Other operating expenses 6 –1,682 –1,524Operating profit/loss 3, 8 722 1,260
Result from shares in Group companies 9 202 –706Result from shares in associated companies 9 10 77Interest income and similar items 9 824 770Interest expenses and similar items 9 –1,342 –1,004Profit after financial items 416 397
Appropriations 8 –62Income tax 10 –240 547Profit for the year 184 882
Profit for the year corresponds to total comprehensive income for the year.
PARENT COMPANY FINANCIAL STATEMENTS
Sandvik Annual Report 2017 | 71

PARENT COMPANY FINANCIAL STATEMENTS
PARENT COMPANY BALANCE SHEET
MSEK Note 31 Dec. 2016 31 Dec. 2017
ASSETSNon-current assetsIntangible assets
Patents and other intangible assets 13 24 22Goodwill 13 137 109
Total 161 131
Property, plant and equipmentLand and buildings 13 1,046 1,021Plant and machinery 13 4,902 4,398Equipment, tools, fixtures and fittings 13 425 385Construction in progress and advance payments 13 1,237 1,436
Total 7,610 7,240
Financial assetsShares in Group companies 14 33,111 32,558Due from Group companies 13,800 10,969Investments in associated companies 15 4 —Other investments 1 3Non-current receivables 16 67 95Deferred tax assets 10 93 712
Total 47,076 44,337Total non-current assets 54,847 51,708
Current assetsInventories 17 2,927 2,926
Current receivablesTrade receivables 716 581Due from Group companies 6,788 4,859Due from associated companies 115 131Income tax receivables 10 163 169Other receivables 16 426 214Prepaid expenses and accrued income 709 631
Total 8,917 6,585Cash and cash equivalents 1 0Total current assets 11,845 9,511TOTAL ASSETS 66,692 61,219
72 | Sandvik Annual Report 2017

PARENT COMPANY FINANCIAL STATEMENTS
PARENT COMPANY BALANCE SHEET (CONTINUED)
MSEK Note 31 Dec. 2016 31 Dec. 2017
EQUITY AND LIABILITIESEquityNon-distributable equity
Share capital 1,505 1,505Statutory reserve 1,611 1,611
Total 3,116 3,116
Distributable equityProfit brought forward 26,102 23,181Profit for the year 184 882
Total 26,286 24,063TOTAL EQUITY 19 29,402 27,179
Untaxed reservesOther untaxed reserves 3 3
Total 3 3
ProvisionsProvisions for pensions 20 341 306Other provisions 21 333 254
Total 674 560
Non-current interest-bearing liabilitiesLoans from financial institutions 22 2,804 —Loans from Group companies 22 302 1Other liabilities 22 16,718 16,468
Total 19,824 16,469
Non-current non-interest-bearing liabilitiesOther liabilities 316 250
Total 316 250
Current interest-bearing liabilitiesLoans from financial institutions 689 3Loans from Group companies 6,812 5,854Other liabilities 1,793 576
Total 9,294 6,433
Current non-interest-bearing liabilitiesAdvance payments from customers 450 285Accounts payable 1,649 1,680Due to Group companies 2,474 5,463Other liabilities 318 374Accrued expenses and deferred income 25 2,288 2,523
Total 7,179 10,325TOTAL EQUITY AND LIABILITIES 66,692 61,219
For information on contingent liabilities and pledged assets, refer to Note 26.
Sandvik Annual Report 2017 | 73

PARENT COMPANY FINANCIAL STATEMENTS
PARENT COMPANY CHANGES IN EQUITY
MSEKShare
capitalStatutory
reserveDistribut able
equityTotal
equity
Equity at 1 January 2016 1,505 1,611 28,881 31,997Comprehensive income for the year –– –– 184 184Dividend –– –– –3,136 –3,136Share-based payment settled by equity instruments –– –– 47 47Reduction of hedge options programs 2011 — — 262 262Payments on exercise of options program 2012 and 2013 –– –– 19 19Dividends, hedged options program 2011 –– –– 29 29Equity at 31 December 2016 1,505 1,611 26,286 29,402
Comprehensive income for the year — — 882 882Dividend — — –3,449 –3,449Share-based payment settled by equity instruments — — 107 107Reduction of hedge options programs 2011-2014 — — –39 –39Payments on exercise of options program 2012 and 2013 — — 258 258Dividends, hedged options program 2011 — — 18 18Equity at 31 December 2017 1,505 1,611 24,063 27,179
74 | Sandvik Annual Report 2017

PARENT COMPANY FINANCIAL STATEMENTS
PARENT COMPANY CASH FLOW STATEMENT
MSEK 2016 2017Cash flow from operating activitiesProfit before tax 424 335Adjustment for depreciation, amortization and impairment losses 913 965Adjustment for non-cash items, etc. 1,554 –1,864Income tax paid –57 –77Cash flow from operating activities before changes in working capital 2,834 –641
Changes in working capitalChanges in inventories 260 0Changes in operating receivables –538 5,085Changes in operating liabilities 1,548 3,323Cash flow from operating activities 4,104 7,767
Cash flow from investing activitiesAcquisition of companies and shares, net of cash acquired –1,292 –264Acquisition of property, plant and equipment –975 –876Proceeds from sale of companies and shares, net of cash disposed of 752 3,247Proceeds from sale of property, plant and equipment –1 48Net cash used in investing activities –1,516 2,155Net cash flow after investing activities 2,588 9,922
Cash flow from financing activitiesChanges in advances/loans to/from Group companies, net 3,951 –1,184Proceeds from external borrowings 689 –3Repayment of external borrowings –4,092 –5,286Dividend paid –3,136 –3,450Net cash used in financing activities –2,588 –9,923
Cash flow for the year 0 0Cash and cash equivalents at beginning of year 1 1Cash and cash equivalents at end of year 1 0
Supplementary information, Note 29.
Sandvik Annual Report 2017 | 75

SIGNIFICANT ACCOUNTING POLICIES
SIGNIFICANT ACCOUNTING POLICIES – ASSESSMENTS AND ASSUMPTIONS FOR ACCOUNTING PURPOSES
STATEMENT OF COMPLIANCEThe consolidated financial statements have been prepared in accordance with International Financial Reporting Standards (IFRS) adopted by the International Accounting Standards Board (IASB) as endorsed by the EU. In addition, the recommendation RFR 1 Sup-plementary Accounting Rules for Groups, issued by the Swedish Financial Reporting Board, has been applied.
The Parent Company has applied the same accounting policies as those applied in the consolidated financial statements except as set out below in the section “Parent Company’s accounting policies.”
The financial statements are presented on pages 46-122 in the printed Annual Report. The Parent Company’s Annual Report and the consolidated financial statements were approved for issu-ance by the Board of Directors on 1 March 2018. The Group’s and the Parent Company’s income statements and balance sheets are subject to adoption at the Annual General Meeting on 27 April 2018.
Basis of measurementAssets and liabilities are stated on a historical cost basis except for certain financial assets and liabilities, which are stated at their fair value. Financial assets and liabilities measured at fair value com-prise derivative instruments. Receivables and liabilities and items of income and expense are offset only when required or expressly permitted in an accounting standard.
The preparation of financial statements in conformity with IFRS requires management to make assessments, estimates and assumptions that affect the application of accounting policies and recognized amounts of assets and liabilities, income and expenses. Actual results may differ from these assessments. The estimates and underlying assumptions are reviewed on an ongoing basis. Revisions to accounting estimates are recognized in the period in which the estimate is revised if the revision affects only that period or in the period of the revision and future periods if the revision affects both current and future periods.
Judgments made by management in the application of IFRS that have a significant effect on the financial statements, and estimates with a significant risk of material adjustment in the next year, are further discussed below. Events after the balance sheet date refer to both favorable and unfavorable events that have occurred after the balance sheet date but before the date the financial statements were authorized for issue by the Board of Directors. Significant non-adjusting events, that is, events indicative of conditions that arose after the balance sheet date, are disclosed in the financial statements. Only adjusting events, that is, those that provide evi-dence of conditions that existed at the balance sheet date, have been considered in the final establishment of the financial state-ments. The most significant accounting policies for the Group, as set out below, have been applied consistently to all periods pre-sented in these consolidated financial statements except as spe-cifically described. Moreover, the Group’s accounting policies have been consistently applied in the Group reporting by all members of the Group and also in the Group reporting of associated compa-nies, where necessary, by adaptation to Group policies.
Changes in accounting policiesThe below amendments of standards and new and amended inter-pretations came into effect 1 January 2017. None of these stand-ards had any material impact on Sandvik’s financial statements.
– Amendments to IAS 7 Statement of Cash Flows: Entities shall provide disclosures that enable users of financial statements to evaluate changes in liabilities arising from financing activities. The entity is required to disclose information on what changes in lia-bilities, relating to financing activities according to IAS 7, that are affecting cash flow and what changes are not affecting cash flow. Amendments to IAS 12 Recognition of Deferred taxes for Unre-alized Losses: The amendments clarify the requirements on rec-ognition of deferred tax assets for unrealized losses give rise to a deductible tax difference regardless of whether the holder expects to recover the carrying amount by holding the debt instrument until maturity or by selling the debt instrument. In circumstances in which tax law restricts the utilization of tax losses against income of a specified type, an entity would assess a deferred tax asset in combination with other deferred tax assets of the same type.
New standards published by IASB, but not yet effective– IFRS 9 Financial Instruments. The standard specifies how an entity should classify and measure financial assets, a forward look-ing expected credit loss model is introduced and hedge account-ing aligned to how the entity manages risks. The standard is effec-tive from 1 January 2018, which also is the date when Sandvik will start to apply the standard. The standard is adopted by the EU. The assessment made by Sandvik of the new categories of assets introduced will not have any greater impact on Sandvik reporting of Trade receivables, Loan receivables or investment in securities and shares hold on basis of fair value. Sandvik have chosen to make reservations for expected credit losses over the financial assets lifetime based on the simplified model. The group have chosen to continue to apply IAS 39 Financial Instruments: Recognition and Measurement for its hedge accounting. The Group will not restate prior periods. Any differences between between previous car-rying amounts and those determined under IFRS 9 at the date of initial application will be included in opening retained earnings and reserves as per 1 January 2018.– IFRS 15 Revenue from Contracts with Customers. The purpose with a new revenue standard is to create one single principle based standard for all industries to replace existing standards and state-ments concerning revenues. The standard is effective from 1 Jan-uary 2018, which also is the date from when Sandvik will apply the standard. EU has adopted the standard. Sandvik have chosen to apply the partial retroactive method for the transition to IFRS 15. Sandvik has estimated the effects from the transition to IFRS 15 on group financial statements. The effect on the Group equity as per 1 January 2018 is summarized below.
MSEK
Closing balance 31
Dec 2017 before transi-
tion to IFRS 15
Estimated adjustments
due to IFRS 15 transition
Estimated adjusted ope-
ning balance 1 Jan 2018
Retained earnings
36,190 –23 36,167
In the parallel reporting performed during 2017 Sandvik has iden-tified only smaller amounts that are being deferred to a later period compared to revenue reported under IAS 18 Revenue and IAS 11 Construction contracts. The effect is mainly related to turnkey con-tracts and extended warranties where control has been identified to take place at a later period, point in time respectively over time.
76 | Sandvik Annual Report 2017
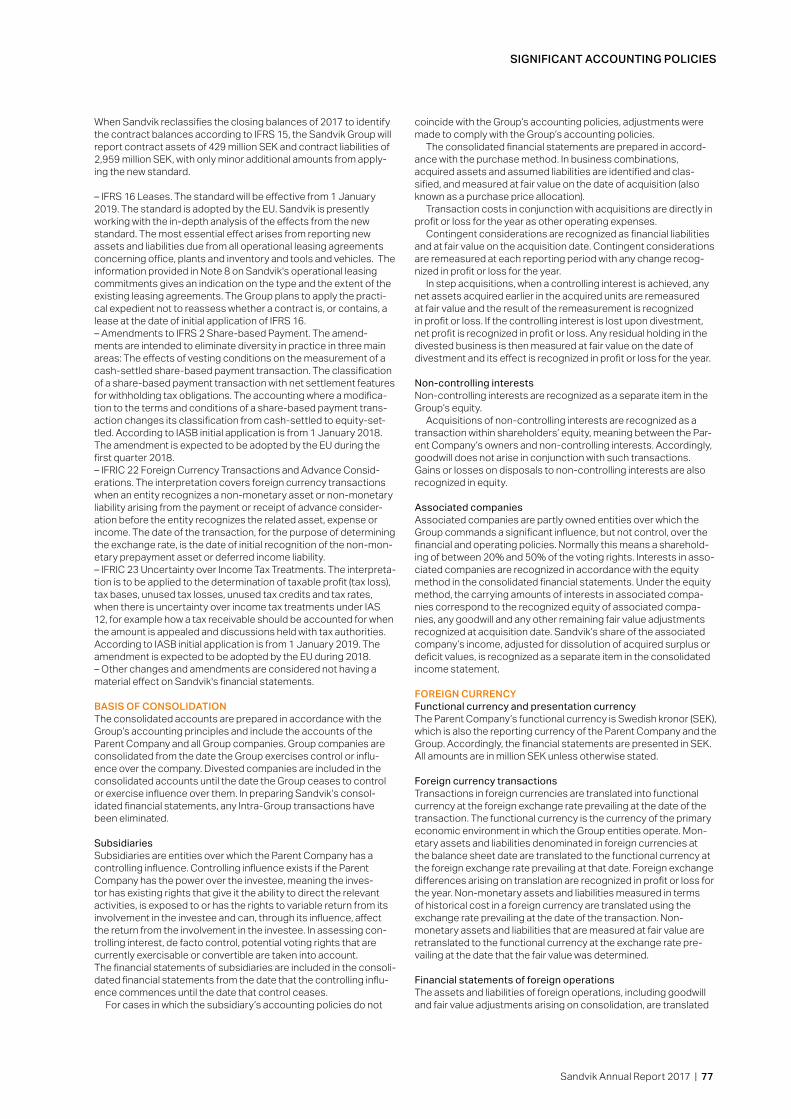
SIGNIFICANT ACCOUNTING POLICIES
When Sandvik reclassifies the closing balances of 2017 to identify the contract balances according to IFRS 15, the Sandvik Group will report contract assets of 429 million SEK and contract liabilities of 2,959 million SEK, with only minor additional amounts from apply-ing the new standard.
– IFRS 16 Leases. The standard will be effective from 1 January 2019. The standard is adopted by the EU. Sandvik is presently working with the in-depth analysis of the effects from the new standard. The most essential effect arises from reporting new assets and liabilities due from all operational leasing agreements concerning office, plants and inventory and tools and vehicles. The information provided in Note 8 on Sandvik's operational leasing commitments gives an indication on the type and the extent of the existing leasing agreements. The Group plans to apply the practi-cal expedient not to reassess whether a contract is, or contains, a lease at the date of initial application of IFRS 16. – Amendments to IFRS 2 Share-based Payment. The amend-ments are intended to eliminate diversity in practice in three main areas: The effects of vesting conditions on the measurement of a cash-settled share-based payment transaction. The classification of a share-based payment transaction with net settlement features for withholding tax obligations. The accounting where a modifica-tion to the terms and conditions of a share-based payment trans-action changes its classification from cash-settled to equity-set-tled. According to IASB initial application is from 1 January 2018. The amendment is expected to be adopted by the EU during the first quarter 2018.– IFRIC 22 Foreign Currency Transactions and Advance Consid-erations. The interpretation covers foreign currency transactions when an entity recognizes a non-monetary asset or non-monetary liability arising from the payment or receipt of advance consider-ation before the entity recognizes the related asset, expense or income. The date of the transaction, for the purpose of determining the exchange rate, is the date of initial recognition of the non-mon-etary prepayment asset or deferred income liability.– IFRIC 23 Uncertainty over Income Tax Treatments. The interpreta-tion is to be applied to the determination of taxable profit (tax loss), tax bases, unused tax losses, unused tax credits and tax rates, when there is uncertainty over income tax treatments under IAS 12, for example how a tax receivable should be accounted for when the amount is appealed and discussions held with tax authorities. According to IASB initial application is from 1 January 2019. The amendment is expected to be adopted by the EU during 2018.– Other changes and amendments are considered not having a material effect on Sandvik's financial statements.
BASIS OF CONSOLIDATIONThe consolidated accounts are prepared in accordance with the Group’s accounting principles and include the accounts of the Parent Company and all Group companies. Group companies are consolidated from the date the Group exercises control or influ-ence over the company. Divested companies are included in the consolidated accounts until the date the Group ceases to control or exercise influence over them. In preparing Sandvik’s consol-idated financial statements, any Intra-Group transactions have been eliminated.
SubsidiariesSubsidiaries are entities over which the Parent Company has a controlling influence. Controlling influence exists if the Parent Company has the power over the investee, meaning the inves-tor has existing rights that give it the ability to direct the relevant activities, is exposed to or has the rights to variable return from its involvement in the investee and can, through its influence, affect the return from the involvement in the investee. In assessing con-trolling interest, de facto control, potential voting rights that are currently exercisable or convertible are taken into account.The financial statements of subsidiaries are included in the consoli-dated financial statements from the date that the controlling influ-ence commences until the date that control ceases.
For cases in which the subsidiary’s accounting policies do not
coincide with the Group’s accounting policies, adjustments were made to comply with the Group’s accounting policies.
The consolidated financial statements are prepared in accord-ance with the purchase method. In business combinations, acquired assets and assumed liabilities are identified and clas-sified, and measured at fair value on the date of acquisition (also known as a purchase price allocation).
Transaction costs in conjunction with acquisitions are directly in profit or loss for the year as other operating expenses.
Contingent considerations are recognized as financial liabilities and at fair value on the acquisition date. Contingent considerations are remeasured at each reporting period with any change recog-nized in profit or loss for the year.
In step acquisitions, when a controlling interest is achieved, any net assets acquired earlier in the acquired units are remeasured at fair value and the result of the remeasurement is recognized in profit or loss. If the controlling interest is lost upon divestment, net profit is recognized in profit or loss. Any residual holding in the divested business is then measured at fair value on the date of divestment and its effect is recognized in profit or loss for the year.
Non-controlling interestsNon-controlling interests are recognized as a separate item in the Group’s equity.
Acquisitions of non-controlling interests are recognized as a transaction within shareholders’ equity, meaning between the Par-ent Company’s owners and non-controlling interests. Accordingly, goodwill does not arise in conjunction with such transactions. Gains or losses on disposals to non-controlling interests are also recognized in equity.
Associated companiesAssociated companies are partly owned entities over which the Group commands a significant influence, but not control, over the financial and operating policies. Normally this means a sharehold-ing of between 20% and 50% of the voting rights. Interests in asso-ciated companies are recognized in accordance with the equity method in the consolidated financial statements. Under the equity method, the carrying amounts of interests in associated compa-nies correspond to the recognized equity of associated compa-nies, any goodwill and any other remaining fair value adjustments recognized at acquisition date. Sandvik’s share of the associated company’s income, adjusted for dissolution of acquired surplus or deficit values, is recognized as a separate item in the consolidated income statement.
FOREIGN CURRENCYFunctional currency and presentation currencyThe Parent Company’s functional currency is Swedish kronor (SEK), which is also the reporting currency of the Parent Company and the Group. Accordingly, the financial statements are presented in SEK. All amounts are in million SEK unless otherwise stated.
Foreign currency transactionsTransactions in foreign currencies are translated into functional currency at the foreign exchange rate prevailing at the date of the transaction. The functional currency is the currency of the primary economic environment in which the Group entities operate. Mon-etary assets and liabilities denominated in foreign currencies at the balance sheet date are translated to the functional currency at the foreign exchange rate prevailing at that date. Foreign exchange differences arising on translation are recognized in profit or loss for the year. Non-monetary assets and liabilities measured in terms of historical cost in a foreign currency are translated using the exchange rate prevailing at the date of the transaction. Non- monetary assets and liabilities that are measured at fair value are retranslated to the functional currency at the exchange rate pre-vailing at the date that the fair value was determined.
Financial statements of foreign operations The assets and liabilities of foreign operations, including goodwill and fair value adjustments arising on consolidation, are translated
Sandvik Annual Report 2017 | 77

SIGNIFICANT ACCOUNTING POLICIES
from the foreign operation’s functional currency to the Group’s reporting currency, SEK, at foreign exchange rates prevailing at the balance sheet date. Revenues and expenses of foreign operations are translated to SEK at average rates that approximate the foreign exchange rates prevailing at each of the transaction dates. Trans-lation differences arising from the translation of the net invest-ment in foreign operations are recognized in other comprehensive income and are accumulated in a separate component of equity, a translation reserve. When the foreign operation is divested, the accumulated translation differences attributable to the divested foreign operation are reclassified from equity to profit or loss for the year as a reclassification adjustment at the date on which the profit or loss of the divestment is recognized. For cases in which divestments made include a residual controlling influence, the pro-portionate share of accumulated translation differences from other comprehensive income is transferred to non-controlling interests.
Net investments in foreign operationsMonetary non-current receivables or monetary non-current lia-bilities to a foreign operation for which no settlement is planned or is not likely to take place in the foreseeable future are, in practice, part of the company’s net investment in foreign operations. A for-eign exchange difference arising on the monetary non-current receivable or monetary non-current liability is recognized in other comprehensive income and accumulated in a separate compo-nent of shareholders’ equity, entitled translation reserve. When a foreign operation is divested, the accumulated foreign exchange differences attributable to monetary non-current receivables or monetary noncurrent liabilities are included in the accumulated translation differences reclassified from the translation reserve in equity to profit or loss for the year.
FINANCIAL INSTRUMENTSFinancial instruments recognized in the balance sheet include assets, such as cash and cash equivalents, loan and trade receiv-ables, financial investments and derivatives, and liabilities such as loan liabilities, accounts payable and derivatives.
Recognition and derecognitionA financial asset or a financial liability is recognized on the balance sheet when the entity becomes a party to the contractual provi-sions of the instrument. Trade receivables are recognized upon issuance of the invoice. A liability is recognized when the coun-terparty has performed under the agreement and the company is contractually obliged to settle the obligation, even if no invoice has been received.
A financial asset is derecognized when the rights under the agreement are realized or have expired, or when control of the con-tractual rights is lost. The same applies to a portion of a financial asset. A financial liability is derecognized when the obligation spec-ified in the contract is discharged or otherwise expires.
A financial asset and a financial liability are offset and pre-sented in a net amount in the balance sheet only if there is a legally enforceable right to set off the recognized amounts and there is an intention either to settle on a net basis or to realize the asset and settle the liability simultaneously.
Classification and measurementA non-derivative financial instrument is initially recognized at fair value plus any transaction costs. The Group classifies its financial instruments based on the purpose for its acquisition. Management decides its classification on initial recognition. The classification of a financial asset determines how it is measured after initial recogni-tion, as described below.Cash and cash equivalents comprise cash balances and bank deposits, and short-term investments that have a maturity of no more than three months from the date of acquisition, and are exposed only to an insignificant risk of changes in value.
Financial assets and liabilities are classified as follows:Financial assets and financial liabilities measured at fair value in profit or loss.
Financial assets and financial liabilities held for trading, which comprise all derivatives held by Sandvik to which hedge account-ing is not applied. Derivative agreements are entered mainly to hedge the Group’s foreign exchange and interest-rate risks. Deriv-atives with positive fair values are recognized as other short-term or long-term receivables (unrealized profits), while derivatives with negative fair values are recognized as other short-term or long-term liabilities (unrealized losses).
The assets held for trading consist of investments in non-listed shares. The fair value cannot be established reliably and the shares are thus measured at cost. The shares are tested regularly for impairment.
Loans and receivablesLoans and receivables are non-derivative financial assets, with fixed or determinable payments that are not quoted in an active market. Loans and receivables are measured at amortized cost using the effective interest method, less any impairment losses. The effective interest rate is the rate that exactly discounts esti-mated future cash payments or receipts through the expected life of the financial instrument to the net carrying amount of the financial asset or financial liability. The calculation includes all fees and points paid or received between contractual parties that are an integral part of the effective interest rate, transaction costs, and all other premiums or discounts.
Bad debt provisions are made based on negative information and observed non-payment patterns. A provision for 50-100% of the value is made for receivables overdue by between 181 and 360 days, while a provision for 100% of the value is made for receiva-bles overdue by 361 days or more.
Financial liabilitiesGroup borrowings are classified as short-term liabilities and long-term liabilities. Borrowings are initially measured at fair value net of transaction costs. Subsequently, borrowings are measured at amortized cost. Any difference between the loan amount, net of transaction costs, and the repayable amount is allocated to profit or loss for the year over the term of the loan using the effective interest method.
Derivatives and hedge accountingAll derivatives are initially recognized at fair value excluding any transaction costs. After initial recognition, derivatives not qualified for hedge accounting are measured at fair value and the change in value is recognized in profit or loss either as other operating income or expenses or financial income or expenses.
Hedge accountingTo meet the criteria for hedge accounting, there must be a clear-cut relation to the hedged item and the hedge must be expected to be highly effective and it must be possible to measure such effec-tiveness reliably. Moreover, the hedge must be formally designated and documented. Gains and losses on hedges are recognized in profit or loss for the year at the same time that the gains and losses are recognized for the hedged items. Gains and losses on remeas-urement of derivatives used for hedging purposes are recognized as described below under cash flow or fair-value hedges.
Cash flow hedgesHedge accounting is applied when hedging a particular risk associ-ated with highly probable future cash flows and forecast transac-tions. The effective portion of the change in fair value for the year, of derivatives that are qualified as cash flow hedges, is recognized in other comprehensive income and the accumulated changes in a separate component of shareholders’ equity. The ineffective por-tion of a gain or loss is immediately recognized in profit or loss for the year. When the hedged item impacts profit or loss for the year, the accumulated changes in value of the hedging instrument are reclassified to profit or loss for the year.
78 | Sandvik Annual Report 2017
SIGNIFICANT ACCOUNTING POLICIES
The accumulated gain or loss recognized in equity is reclassi-fied into profit or loss for the year in the periods during which the hedged item affects profit or loss (for instance, when the forecast sales that are hedged take place). If the hedged forecast transac-tion subsequently results in the recognition of a non-financial asset (for instance, inventories or an item of property, plant and equip-ment), or a non-financial liability, the hedging reserve is dissolved and the gain or loss is included in the operating profit.
Fair-value hedgesWhen a hedging instrument is used to hedge the exposure to changes in fair value, changes in the fair value of the instrument are recognized in profit or loss for the year. The gain or loss on the hedged item attributable to the hedged risk, adjusts the carrying amount of the hedged liability and the change for the period is recog nized in profit or loss.
Fair-value hedges are used to hedge the fair value of fixed rate funding recognized in the balance sheet, provided that the hedged item is otherwise recognized at amortized cost. The derivative instrument used is interest rate swaps to hedge fixed interest rate risk on borrowings. If the hedge relationship is discontinued, the carrying amount of the hedged item is adjusted with the accumu-lated amount referring to the hedge relationship. Foreign currency gains and losses are recognized net.
REPORTING OF OPERATING SEGMENTSSandvik’s business is organized in a manner that allows the Group’s chief operating decision maker, meaning the CEO, to monitor results, return and cash flow generated by the various products and services in the Group. Each operating segment has a president that is responsible for day-to-day activities and who regularly reports to the CEO regarding the results of the operating segment’s work and the need for resources. Since the CEO monitors the business’ result and decides on the distribution of resources based on the products the Group manufactures and sells and the services it pro-vides, these constitute the Group’s operating segments.
The Group’s operations are organized in a number of business areas based on products and services. The market organization also reflects this structure. In accordance with IFRS 8, segment information is presented only on the basis of the consolidated financial statements.
Segment results, assets and liabilities include only those items that are directly attributable to the segment and the relevant portions of items that can be allocated on a reasonable basis to the segments. Unallocated items comprise interest and divi-dend income, gains on disposal of financial investments, interest expense, losses on the disposal of financial investments, income tax expense and certain administrative expenses. Unallocated assets and liabilities include income tax receivables and payables, financial investments and financial liabilities.
REVENUERevenue from sales and servicesRevenue from the sale of goods is recognized in profit or loss for the year when the significant risks and rewards of ownership have been transferred to the buyer, that is, normally in connection with delivery. If the product requires installation at the buyer, and instal-lation is a significant part of the contract, revenue is recognized when the installation is completed. Buy-back commitments may entail that sales revenue cannot be recognized if the agreement with the customer in reality implies that the customer has only rented the product for a certain period of time.
Revenue from service assignments is normally recognized in connection with the rendering of the service. Revenue from service and maintenance contracts is recognized in accordance with the percentage of completion method. The stage of completion is nor-mally determined based on the proportion of costs incurred on the balance sheet date in relation to the estimated total costs of the assignment. Only expenditures relating to work carried out or to be carried out are included in calculating the total costs.
Construction contractsConstruction contracts exist to some extent, mainly in the busi-ness areas Sandvik Mining and Rock Technology and Other Oper-ations, product area Process Systems. Contract revenue and expenses are recognized in profit or loss for the year in proportion to the stage of completion of the contract, if the customer contract is considered enforceable, contains a customer specific delivery and the proportion of stage of completion can be estimated relia-bly. The stage of completion is based on the input method and is determined based on the proportion that contract costs incurred to date bear to the estimated total contract costs. Expected losses are immediately recognized as an expense in consolidated profit or loss for the year.
Other revenueRevenue in the form of royalty is recognized on the basis of the financial implications of the agreement.
Government grantsGovernment grants are recognized as deferred income in the balance sheet when there is reasonable assurance that the grant will be received and that the entity will comply with the conditions attached to them. Grants are recognized in profit or loss for the year in the same way and over the same periods as the related costs that they are intended to compensate, on a systematic basis. Grants related to assets are presented by deducting the grant from the carrying amount of the asset.
FINANCIAL INCOME AND EXPENSESFinancial expenses consists of interest expense on borrowings, interest income and expenses on interest swaps that are recog-nized net as an interest expense. Credit losses on financial assets and foreign exchange gains and losses on hedging instruments are recognized in profit or loss for the year.
INCOME TAXIncome tax comprises current and deferred tax. Income tax is rec-ognized in profit or loss for the year except when the underlying transaction is recognized in other comprehensive income. In these cases, the associated tax effects are recognized in other compre-hensive income.
Current tax is the expected tax payable on the taxable income for the year, using tax rates enacted at the balance sheet date, and any adjustment to tax payable in respect of previous years.
Current tax liabilities are offset against current tax receivables and deferred tax assets are offset against deferred tax liabilities when the entity has a legal right to offset these items.
Deferred tax is recognized based on temporary differences between the carrying amounts of assets and liabilities for financial reporting purposes and their value for tax purposes. Deferred taxes are measured at their nominal amount and based on the expected manner of realization or settlement of the carrying amount of the underlying assets and liabilities, using tax rates and fiscal regula-tions enacted or substantively enacted at the balance sheet date.
Deferred tax assets relating to deductible temporary differences and tax loss carry-forwards are recognized only to the extent that it is probable they can be utilized against future taxable profits.
INTANGIBLE ASSETSGoodwillGoodwill acquired in a business combination represents the excess of the cost of the business combination over the net fair value of the identifiable assets, liabilities and contingent liabilities recognized.
Goodwill is measured at cost less any accumulated impair-ment losses. Goodwill is allocated to cash-generating units and an annual impairment test is made in the fourth quarter or when there is an indication of impairment. Impairment losses on goodwill are not reversed. Goodwill arising on the acquisition of an associated company is included in the carrying amount of participations in associated companies.
Sandvik Annual Report 2017 | 79

SIGNIFICANT ACCOUNTING POLICIES
Research and developmentExpenditure on research activities related to the obtaining of new scientific or technical knowledge is expensed as incurred. Expend-iture on development activities, whereby the research results or other knowledge is applied to accomplish new or improved products or processes, is recognized as an intangible asset in the balance sheet, provided the product or process is technically and commercially feasible and the company has sufficient resources to complete development, and is subsequently able to use or sell the intangible asset.
The carrying amount includes the directly attributable expendi-ture, such as the cost of materials and services, costs of employee benefits, fees to register intellectual property rights and amortiza-tion of patents and licenses. Other expenses for development are expensed as incurred. In the balance sheet, capitalized develop-ment expenditure is stated at cost less accumulated amortization and any impairment losses.
Other intangible assetsOther intangible assets acquired by the company are recognized at cost less accumulated amortization and any impairment losses. Capitalized expenditure for the development and purchase of soft-ware for the Group’s IT operations are included here.
Intangible assets also include patents, trademarks, licenses, customer relationships and other rights. They are split between acquired and internally generated intangible assets.
Amortization of intangible assets Amortization is charged to profit or loss for the year on a straight-line basis over the estimated useful lives of intangible assets unless such lives are indefinite. Intangible assets with an indefinite useful life are systematically tested for impairment annually or as soon as there is an indication that the asset may be impaired. Intangible assets with a finite useful life are amortized as of the date the asset is available for use.The estimated useful lives are as follows:
– Patents and trademarks 10–20 years – Customer relationships 10 years – Capitalized development costs 3–7 years – Software for IT operations 3 years
PROPERTY, PLANT AND EQUIPMENT Owned assetsProperty, plant and equipment are recognized at cost less accumu-lated depreciation and any impairment losses.
Leased assetsIn the consolidated financial statements, leases are classified as either finance leases or operating leases. Further details on how Sandvik recognizes leases are found below.
Depreciation of tangible assetsDepreciation is based on cost less estimated residual value. The assets are depreciated over the estimated useful lives, as follows:
– Plant and machinery is generally depreciated on a straight-line basis over 5–10 years
– Rental assets over 3 years – Buildings over 10–50 years – Site improvements over 20 years – Land is regarded as having an indefinite useful life – Computer equipment is depreciated over 3–5 years using the
reducing balance method
If an item of property, plant and equipment comprises compo-nents with different useful lives, each such significant component is depreciated separately. Depreciation methods and estimated residual values and useful lives are reviewed at each year-end.
IMPAIRMENT AND BORROWING COSTSImpairment and reversals of impairmentAssets with an indefinite useful life are not amortized, but tested annually for impairment. Assets that are amortized or depreciated
are tested for impairment whenever events or changed circum-stances indicate that the carrying amount may not be recoverable. An impairment loss is recognized in the amount by which the car-rying amount of an asset exceeds its recoverable amount, which is the greater of the fair value less selling costs and value in use.
In assessing value in use, the estimated future cash flows are discounted to their present value using a rate that reflects current market assessments of the time value of money and the risks spe-cific to the asset. For an asset that does not generate largely inde-pendent cash inflows, the recoverable amount is determined for the cash-generating unit to which the asset belongs.
In respect to items of property, plant and equipment and intan-gible fixed assets, an impairment loss is reversed if there has been a change in the estimates used to determine the recoverable amount. An impairment loss in respect to goodwill is not reversed. An impairment loss is reversed only to the extent that the asset’s carrying amount does not exceed the carrying amount that would have been determined, net of depreciation and amortization, if no impairment loss had been recognized.
Borrowing costs for intangible and tangible assetsBorrowing costs attributable to the construction of qualifying assets are capitalized as a portion of the qualifying asset’s cost. A qualifying asset is an asset that takes a substantial period of time to get ready for its intended use or sale. The Group considers a period in excess of one year to be a substantial period of time. For the Group, the capitalization of borrowing costs relating to intangibles is mainly relevant for capitalized expenditure for the development of new data systems. For tangibles it relates to the construction of production buildings on a proprietary basis.
INVENTORIESInventories are stated at the lower of cost and net realizable value, with due consideration of obsolescence. Net realizable value is the estimated selling price in the ordinary course of business, less the estimated costs of completion and selling expenses.
Cost is based on the first-in/first-out (FIFO) principle and includes expenditure incurred in acquiring the inventories and bringing them to their existing location and condition. In the case of manufactured inventories and work in progress, cost includes an appropriate share of overheads based on normal operating capacity.
EQUITYDividends are recognized as a liability in the period in which they are resolved at a shareholders’ meeting.
Earnings per shareThe calculation of basic earnings per share is based on the profit or loss attributable to ordinary equity holders of the Parent Company and the weighted average number of ordinary shares outstand-ing during the year. When calculating diluted earnings per share, the weighted average number of shares outstanding is adjusted for the effects of all dilutive potential ordinary shares, which during reported periods relates to share-based payment arrangements issued to employees. The shared-based awards are dilutive if the exercise price is less than the quoted stock price and increases with the size of the difference.
EMPLOYEE BENEFITSThe Group’s pension plansThe Group sponsors a number of defined-contribution and defined-benefit pension plans, some of which with plan assets held by separate foundations or equivalent. A number of Group entities also provide post-employment medical benefits.
Whenever possible, Sandvik nowadays seeks defined contribu-tion pension solutions and in recent years defined-benefit plans have as far as possible been closed for new entrants in connection with negotiations about defined-contribution pension arrange-ments. The Group’s Swedish companies offer all newly hired sala-ried employees, regardless of age, the defined-contribution pen-sion solution (ITP 1) resulting from the renegotiation of the ITP Plan
80 | Sandvik Annual Report 2017

SIGNIFICANT ACCOUNTING POLICIES
between the Confederation of Swedish Enterprise and the Nego-tiation Cartel for Salaried Employees in the Private Business Sector.
Defined-contribution plansA defined-contribution plan is a post-employment benefit plan under which an entity pays fixed contributions into a separate entity and will have no legal or constructive obligation to pay fur-ther amounts. The size of the pension that the employee will ulti-mately receive in such cases depends on the size of the contribu-tions that the entity pays to the plan or an insurance company and the return that the contributions yield. Obligations for contribu-tions to defined-contribution pension plans are recognized as an employee benefit expense in profit or loss for the year as the employee renders services to the entity.
Defined-benefit plansThe Group’s net obligation in respect of defined-benefit pen-sion plans is calculated separately for each plan by estimating the amount of future benefit that employees have vested in return for their service in the current and prior periods. This benefit is discounted to its present value. The discount rate is the yield on high-quality corporate bonds, mortgage bonds – or if there is no deep market for such bonds, government bonds – that have matu-rity dates approximating the terms of the Group’s obligations. The calculation is performed annually by a qualified actuary. In addi-tion, the fair value of any plan assets is assessed. This method of accounting is applied to the most significant defined-benefit plans in the Group. A number of plans, which neither individually nor in the aggregate are significant in relation to the Group’s total pension obligations, are still recognized in accordance with local regulations.
In measuring the present value of pension obligations and the fair value of plan assets, actuarial gains and losses may accrue either because the actual outcome differs from earlier assump-tions (so-called experience adjustments) or the assumptions are changed. These actuarial gains and losses are recognized in the balance sheet and in profit or loss under other comprehensive income.
When the benefits under a plan are improved, the portion of the increased benefits that relate to past service by employees is rec-ognized in profit or loss for the year. The amount of obligations rec-ognized in the balance sheet for pensions and similar obligations reflects the present value of the obligations at the balance sheet date, less the fair value of any plan assets.
Pension assumptionsActuarial assumptions are important ingredients in the actuarial methods used to measure pension obligations and they can sig-nificantly affect the recognized net liability and the annual pension cost. One critical assumption – the discount rate – is essential for the measurement of both the expense of the year and the present value of the defined-benefit obligations’ current year. The discount rate is used both for calculating the present value of the obligation and as an estimate for the return on plan assets. The discount rate is reviewed quarterly, which affects the net liability, and annually, which also affects the expense for coming years. Other assump-tions are reviewed annually, which can relate to demographic fac-tors such as pension age, mortality rates and employee turnover. A lower discount rate increases the present value of the pension obligation and the annual pension cost.
Termination benefitsWhen employment is terminated, a provision is recognized only when the entity is demonstrably committed either to terminate the employment of an employee or a group of employees before the normal retirement age or provide termination benefits as a result of an offer made to encourage voluntary redundancy. In the latter case, a liability and an expense are recognized if it is probable that the offer will be accepted and the number of employees that will accept the offer can be reliably estimated.
Share-based paymentsShare-based payments refer to remuneration to employees in accordance with employee option programs and a share saving program.
Share option programs allow employees to acquire shares in the company. The fair value of options granted is recognized as an employee expense with a corresponding increase in equity. The fair value as measured at the grant date is spread over the vesting period. The fair value of the options is measured using the Black & Scholes formula, taking into account the terms and conditions upon which the options were granted. The share-based programs includes two types of rights. Matching share rights provide entitle-ment to shares in Sandvik if the participant remains employed and retains the saving share that has been purchased initially. Perfor-mance share rights provide entitlement to shares subject to the same conditions and if goals relating to operating performance are achieved.
The amount recognized as an expense is adjusted to reflect the actual number of share options/rights vested.
In order to meet its commitments under the option program, Sandvik has entered into an equity swap agreement with a financial institution. Under the agreement, the financial institution under-takes to distribute Sandvik shares to participants in the program when the date for allotment occurs in accordance with the terms and conditions of the program. The fair value of the Sandvik share when the swap agreement was signed is recognized as a financial liability and as a reduction of equity in accordance with IAS 32.
Social costs relating to share-based payments to employees are expensed over the accounting periods during which the services are provided. The charge is based on the fair value of the options at the reporting date. The fair value is calculated using the same for-mula as that used when the options were granted.
PROVISIONSA provision is recognized in the balance sheet when the Group has a legal or constructive obligation as a result of a past event, and it is probable that an outflow of resources will be required to settle the obligation, and a reliable estimate of the amount can be made. If the effect is material, the provision is determined by discount-ing the expected future cash flows at a pre-tax rate that reflects the current market assessments of the time value of money and, where appropriate, the risks specific to the liability. The provisions are mainly related to warranty commitments, restructuring, envi-ronmental obligations, long-term incentives and legal disputes and claims, such as value added tax issues, customer and supplier claims relating to ongoing or finished projects.
WarrantiesA provision for warranties is recognized when the underlying products or services are sold. The provision is based on historical warranty data and a weighing of all possible outcomes with their associated probabilities.
RestructuringA provision for restructuring is recognized when the Group has approved a detailed and formal restructuring plan, and the restruc-turing has either commenced or has been announced publicly. No provision is posted for future operating costs.
Site restorationIn accordance with the Group’s published environmental policy and applicable legal requirements, a provision for site restoration in respect of contaminated land is recognized when land has become contaminated.
Onerous contractsA provision for onerous contracts is recognized when the expected benefits to be derived by the Group are lower than the unavoidable cost of meeting its obligations under the contract.
Sandvik Annual Report 2017 | 81
SIGNIFICANT ACCOUNTING POLICIES
Contingent liabilitiesA contingent liability is recognized when there is a possible obli-gation that arises from past events and whose existence will be confirmed only by the occurrence or non- occurrence of one or more uncertain future events or when there is a present obligation that cannot be recognized as a liability because it is not probable that an outflow of resources will be required, alternatively because the amount of the obligation cannot be measured with sufficient reliability.
DISCONTINUED OPERATIONSTo qualify as Discontinued operations, a component of the Sandvik Group must have been classified as held for sale and represent a separate major line of business or be a part of a single coordinated plan to dispose of a separate major line of business. Product area Mining Systems within business area Sandvik Mining and Rock Technology is classified as discontinued operation and reported as held for sale. The discontinued operation is measured at fair value less cost to sell. See Consolidated financial statements and Notes for further information.
LEASINGThere are two basic categories of leases, finance and operating. Lease contract terms, under which the lessor has transferred the majority of the risks and rewards of ownership to the lessee, are classified as finance leases. All other leases are classified as oper-ating leases.
Sandvik as a lesseeUnder a finance lease, the lessee recognizes the leased asset measured at the lower of its fair value and the present value of future lease payments. Simultaneously, a liability corresponding to future lease expenses is recognized. The asset is depreciated according to the proper accounting policy valid for the type of asset. However, depreciation may never exceed the lease term. The lease payments are recognized against the lease liability. Operating leases are not recognized in the balance sheet. Expenses attrib-utable to an operating lease are recognized in profit or loss for the year on a straight line basis following the lease term.
Sandvik as a lessorUnder a finance lease, the lessor recognizes a sale and a finan-cial receivable equal to the future lease installments and resid-ual values that might have been guaranteed to the lessee. For the duration of the lease term, interest revenue is recognized in profit or loss for the year, while amortization is recognized as a decline of the financial receivable. Under an operating lease, the lessor rec-ognizes the equipment as an asset, and revenue and depreciation are recognized on a straight line basis over the lease term.
PARENT COMPANY’S ACCOUNTING POLICIESThe Parent Company has prepared its Annual Report in accord-ance with the Annual Accounts Act (1995:1554) and the standard, RFR 2 Reporting by a legal entity, issued by the Swedish Finan-cial Reporting Board. The interpretations issued by the Financial Reporting Board valid for listed companies have also been applied. Under RFR 2, the Parent Company in its Annual Report is to apply all the IFRS and IFRIC interpretations approved by the EU to the extent possible within the framework of the Annual Accounts Act, the Act on Income Security, and taking into account the close tie between financial reporting and taxation. The standard specifies what exceptions from or additions to the IFRS shall be made.
Changed accounting policiesUnless otherwise stated below, the Parent Company’s account-ing policies in 2017 changed in accordance with the amendments described above for the Group’s accounting policies.
Classification and presentationThe Parent Company’s income statement and balance sheet adhere to the presentation included in the Annual Accounts Act. The differences compared with IAS 1 Presentation of Financial
Statements applied when presenting the consolidated financial statements mainly pertain to the presentation of finance income and expenses, non-current assets, equity and the presentation of provisions as a separate heading in the balance sheet.
Shares in Group companies and associated companiesThe Parent Company recognizes shares in Group companies and associated companies in accordance with the cost model, mean-ing that transaction costs are included in the carrying amount of holdings in subsidiaries and associated companies. Transaction costs related to shares in Group companies are recognized directly in profit or loss in the consolidated financial statements when they arise. Contingent consideration is valued based on the probability that the consideration will be paid. Any changes in the provision/ receivable are added to/deducted from the cost. Contingent con-sideration is measured at fair value in the consolidated financial statements with changes in value recognized in profit or loss. Divi-dends from subsidiaries are recognized in full as income in profit or loss for the year.
Leased assetsThe Parent Company recognizes all lease contracts according to the rules for operating leases.
Intangible assetsThe Parent Company recognizes all expenditure for research and development conducted on a proprietary basis as an expense in profit or loss.
Borrowing costsIn the Parent Company, borrowing costs are expensed in the periods to which they relate. Borrowing costs for assets are not capitalized.
Employee benefitsThe Parent Company calculates expenses for defined- benefit pen-sion plans differently from the manner prescribed in IAS 19. The Parent Company applies the Act on Income Security and regula-tions issued by the Swedish Financial Supervisory Authority, which is a prerequisite for income tax purposes. Compared to IAS 19, the most significant differences relate to the determination of the discount rate and the fact that the obligation is calculated based on the current salary level disregarding assumptions about future levels.
Income taxThe Parent Company recognizes untaxed reserves including the deferred tax component.
In the consolidated financial statements, untaxed reserves are recognized in their equity and deferred tax components. Corre-spondingly, portions of appropriations are not allocated to deferred tax expenses in the Parent Company’s income statement.
Group contributions and shareholders’ contributions in legal entity accountsGroup contributions that a Parent Company receives from a sub-sidiary are recognized in the Parent Company in accordance with the same policies as normal dividends from subsidiaries. Group contributions paid by the Parent Company to subsidiaries are rec-ognized as investments in shares in the subsidiaries.
Anticipated dividendsAnticipated dividends from subsidiaries are recognized in cases where the Parent Company unilaterally may determine the size of the dividend and provided that the Parent Company has made such a decision before it published its financial statements.
Financial guaranteesThe Parent Company applies a relaxation rule permitted by the Swedish Financial Reporting Board to the reporting of financial guarantees as opposed to the rules stipulated by IAS 39. This relax-ation rule pertains to financial guarantee agreements issued for the
82 | Sandvik Annual Report 2017
SIGNIFICANT ACCOUNTING POLICIES
benefit of subsidiaries, associated companies and joint ventures. The Parent Company recognizes financial guarantees as a provi-sion in the balance sheet when the company has an obligation for which payment is probably necessary to settle the commitment.
CRITICAL ACCOUNTING ESTIMATES AND JUDGMENTSKey sources of estimation uncertaintyIn order to prepare the financial statements, management and the Board make various judgments and estimates that can affect the amounts recognized in the financial statements for assets, lia-bilities, revenues and expenses as well as information in general, including issues with regard to contingent liabilities. The judgments and estimates discussed in this section are those deemed to be most important for an understanding of the financial statements, considering the level of significant estimations and uncertainty. The conditions under which Sandvik operates are gradually chang-ing meaning that the judgments also change.
Impairment tests of goodwillGoodwill is tested for impairment annually and whenever events or changes in circumstances indicate that the carrying amount of goodwill has been impaired, for example due to a changed busi-ness climate or a decision taken either to sell or close down certain operations. In order to determine if the value of goodwill has been impaired, the cash-generating unit to which goodwill has been allocated must be valued using present value techniques. When applying this valuation technique, the Company relies on a number of factors, including historical results, business plans, forecasts and market data. This is further described in Note 12. As can be deduced from this description, changes in the conditions for these judgments and estimates can significantly affect the assessed value of goodwill.
Impairment tests of other non-current assetsSandvik’s property, plant and equipment and intangible assets – excluding goodwill – are stated at cost less accumulated deprecia-tion/amortization and any impairment losses. Other than goodwill, Sandvik has not identified any intangible assets with indefinite useful lives. The assets are depreciated or amortized over their estimated useful lives to their estimated residual values. Both the estimated useful life and the residual value are reviewed at least at each financial year-end.
The carrying amount of the Group’s non-current assets is tested for impairment whenever events or changes in circumstances indicate that the carrying amount will not be recovered. The carry-ing amount of intangible assets not yet available for use is tested annually. If such analysis indicates an excessive carrying amount, the recoverable amount of the asset is estimated. The recoverable amount is the higher of the asset’s fair value less selling costs, and its value in use. Value in use is measured as the discounted future cash flows of the asset, alternatively the cash-generating unit to which the asset belongs. The rental fleets of Sandvik Mining and Rock Technology are subject to special examination considering their dependence on the business climate in the mining- and oil
industry and the risk that rental agreements may be cancelled. The carrying amount of the rental fleets at the end of 2017 was 544 mil-lion SEK (652).
A call for an impairment test also arises when a non-current asset is classified as being held for sale, at which time it must be remeasured at the lower of its carrying amount and fair value less cost to sell.
Income taxSignificant estimates are made to determine both current and deferred tax liabilities/assets, not least the value of deferred tax assets. The company must then determine the possibility that deferred tax assets will be utilized and offset against future tax-able profits. The actual results may differ from these estimates, for instance due to changes in the business climate, changed tax legislation, or the outcome of the final review by tax authorities and tax courts of tax returns. At year-end 2017, Sandvik recognized deferred tax assets of 4,192 million SEK (5,928). Furthermore, the Group had additional tax loss carry-forward of about 1,663 million SEK (2,428) at the end of 2017 for which no deferred tax assets are recognized since utilization of these losses is not deemed proba-ble. A change in the estimate of the possibility for utilization thus can affect results both positively and negatively. The expenditure recognized as a provision for ongoing tax litigations is based on management’s best estimate of the outcome, and amounted to 1,722 million SEK (1,356) at the end of 2017.
Post-employment benefitsSandvik provides pension solutions and other post-employment benefits to employees throughout the Group. In certain countries defined-benefit plans are provided and the accounting for these plans is complex because actuarial assumptions are required to determine the obligation and the expense. Life expectancy, inflation and discount rate are examples of assumptions used for the calculations. Furthermore, the obligations are measured on a discounted basis since they may be settled many years after the employment. The applied actuarial assumptions as well as a sensi-tivity analysis are presented in Note 20. Some of the defined-bene-fit plans are funded, with plan assets held by separate foundations or equivalent. The financial risk management associated with the defined-benefit plans are presented in the Directors' Report in the section Financial Risk Management.
DisputesSandvik is besides the tax litigation cases set out above – party to a number of disputes and legal proceedings in the ordinary course of business. Management consults with legal experts on issues related to legal disputes and with other experts internal or exter-nal to the Company on issues related to the ordinary course of business. It is management’s best estimate that neither the Parent Company, nor any subsidiary, is involved in legal proceedings or arbitration that may be deemed to have a materially negative effect on the business, the financial position or results of operations.
For additional information on risks related to disputes, refer to the Enterprise Risk Management section.
Sandvik Annual Report 2017 | 83
NOTES
Note 1 Segment information 85Note 2 Categories of revenue 86Note 3 Personnel information and remuneration
of management and auditors 86Note 4 Research, development and quality assurance 91Note 5 Other operating income 91Note 6 Other operating expenses 91Note 7 Operating expenses 91Note 8 Fees for finance and operating leases 91Note 9 Net financing cost 92Note 10 Income tax 92Note 11 Earnings per share 94Note 12 Intangible assets and property, plant and equipment,
Group 95Note 13 Intangible assets and property, plant and equipment,
Parent Company 98Note 14 Shares in Group companies 100Note 15 Investments in associated companies 105Note 16 Non-current receivables and other current receivables 106Note 17 Inventories 106Note 18 Trade receivables 106Note 19 Capital and reserves 106Note 20 Provisions for pension and other non-current
post-employment benefits 107Note 21 Other provisions 110Note 22 Non-current interest-bearing liabilities 111Note 23 Other interest-bearing liabilities 111Note 24 Other non-interest-bearing liabilities 111Note 25 Accrued expenses and deferred income 111Note 26 Contingent liabilities and pledged assets 111Note 27 Supplementary information – financial risk management 112Note 28 Related parties 118Note 29 Supplementary information to the cash flow statement 118Note 30 Acquisition and divestment of operations
and discontinued operations 119Note 31 Parent Company particulars 120Note 32 Information on shares, owners and rights 120Note 33 Proposed appropriation of profits 120Note 34 Events after the close of the period 120
NOTES
84 | Sandvik Annual Report 2017

NOTES
NOTESConsolidated and Parent Company financial statements(Amounts in tables in MSEK, unless otherwise stated)
NOTE 1. Segment information
1.1 INFORMATION ON BUSINESS SEGMENTS/BUSINESS AREAS, CONTINUING OPERATIONSSandvik
Machining Solutions
Sandvik Mining and Rock
Technology
Sandvik Materials
TechnologyOther
Operations Group activities Eliminations Group total2016 2017 2016 2017 2016 2017 2016 2017 2016 2017 2016 2017 2016 2017
RevenueExternal revenue 32,852 35,778 31,093 36,547 12,931 13,643 4,655 4,936 22 1 81,553 90,905Internal revenue 973 983 32 48 311 331 302 218 — — –1,618 –1,580Group total 33,825 36,761 31,125 36,595 13,242 13,974 4,957 5,154 22 1 –1,618 –1,580 81,553 90,905Share of results of associated companies 4 2 5 20 12 33 — — –5 1 16 56Operating profit/loss by business area 6,970 8,413 3,206 5,743 1,115 284 545 4,432 –818 –774 11,018 18,098Net financing cost –1,652 –1,080Income tax expense for the year –2,528 –3,783Profit for the year 6,838 13,235Other disclosuresAssets 30,147 30,067 31,104 32,581 16,252 15,566 4,693 491 2,214 1,795 84,410 80,500Investments in associates 32 5 72 89 142 175 — — — — 246 269Total assets 30,179 30,072 31,176 32,670 16,394 15,741 4,693 491 2,214 1,795 84,656 80,769Unallocated assets 18,486 21,513Group total 103,142 102,282Liabilities 5,703 6,424 8,360 10,033 3,263 3,467 945 272 1,469 1,699 19,740 21,895Unallocated liabilities 43,572 34,568Group total 63,312 56,463Capital expenditure 1,697 1,561 802 778 849 869 129 150 196 222 3,673 3,580Depreciation/Amortization –1,916 –1,956 –1,348 –1,553 –773 –792 –195 –157 –142 –123 –4,374 –4,581Impairment losses 40 11 –158 –39 33 –320 –2 –1 –43 –1 –130 –350Other non-cash expenses –347 –122 –247 109 –153 77 –19 –4,157 3 552 –763 –3,541
All transactions between the business areas are on market terms. For information regarding business combinations, see Note 30.
1.2 INFORMATION BY COUNTRY, CONTINUING OPERATIONSRevenue by country, Group 2016 2017USA 11,951 13,917Germany 6,707 7,147China 5,569 6,259Australia 4,286 5,304Italy 3,561 3,721Sweden 3,189 3,541South Africa 2,736 3,164Russia 2,792 3,163France 2,839 3,149UK 2,824 2,967India 2,560 2,923Canada 2,213 2,889Mexico 2,356 2,712Japan 2,197 2,241Brazil 1,359 1,479Other countries 24,414 26,329Total 81,553 90,905
Income is specified by country based on where customers are located.
Non-current assets by country, Group 2016 2017Sweden 13,990 13,494USA 11,369 9,922Germany 3,788 3,663Austria 2,576 2,545Finland 1,754 1,865UK 1,724 1,656China 1,584 1,422India 1,367 1,270Australia 956 928France 873 907Czech Republic 747 817Canada 570 575Japan 592 479Italy 435 466Switzerland 456 445Other countries 3,168 1,322Total 45,949 41,776
Non-current assets are specified by country based on where the assets are located.
Sandvik Annual Report 2017 | 85
NOTES 1
2
3
4
5
6
7
8
9
10
11
12
13
14
15
16
17
18
19
20
21
22
23
24
25
26
27
28
29
30
31
32
33
34

NOTES
NOTE 2. Categories of revenue
Group Parent Company2016 2017 2016 2017
Sale of goods 78,251 86,494 15,060 16,029Contract revenue 675 1,433 8 582Rendering of services 1,915 1,913 73 6Rental income 712 1,065 5 10Total 81,553 90,905 15,146 16,627
NOTE 3. Personnel information and remuneration of management and auditors
3.1 AVERAGE NUMBER OF EMPLOYEES Group Parent Company
2016 2017 2016 2017Number Women, % Number Women, % Number Women, % Number Women, %
Sweden 9,940 24 9,572 24 7,590 22 7,328 23Rest of Europe 14,599 19 14,363 20 — — — —Total Europe 24,539 21 23,934 21 7,590 22 7,328 23
North America 5,912 16 5,835 16 — — — —South America 2,211 15 2,019 16 — — — —Africa, Middle East 2,839 17 2,556 17 — — — —Asia 7,958 16 8,049 15 — — — —Australia 1,310 14 983 16 — — — —Total 44,769 19 43,376 19 7,590 22 7,328 23
Whereof discontinued operations 984 495Continuing operations 43,785 42,881
3.2 WAGES, SALARIES, OTHER REMUNERATION AND SOCIAL COSTS
Group Parent Company2016 2017 2016 2017
Wages, salaries and other remuneration 20,008 21,354 4,141 4,331Social costs 5,085 5,354 1,794 1,887Employee profit sharing 169 213 130 154Total 25,262 26,921 6,065 6,372
Whereof discontinued operations 476 371 — —Continuing operations 24,786 26,550 6,065 6,372Of which, pension costs recognized in social costs 1,414 1,540 588 638
A total of 56 million SEK (79) of the Group’s pension costs relates to Boards and presidents. The Group’s pension liability to these persons amounted to 159 million SEK (156). Correspondingly, 22 million SEK (47) of the Parent Company’s pension costs related to the Boards and presidents. The Parent Company’s pension liability relating to these persons amounted to 4 million SEK (4).
Employee profit-sharing programTo promote performance that is favorable to the Group’s long-term development and also to stimulate continued employee loyalty, Sandvik has had a profit-sharing system for all employees in wholly owned companies in Sweden since 1986. The Group’s return dur-ing 2017 resulted in an allocation of 213 million SEK (169) to the profit-sharing foundation.
3.3 WAGES, SALARIES AND OTHER REMUNERATION BY MARKET AREA
Group Parent Company2016 2017 2016 2017
Sweden 5,418 5,628 4,141 4,331Rest of Europe 7,122 7,719 — —Total Europe 12,540 13,347 4,141 4,331North America 3,165 3,356 — —South America 620 651 — —Africa, Middle East 817 1,088 — —Asia 2,031 2,084 — —Australia 835 828 — —Total 20,008 21,354 4,141 4,331Whereof discontinued operations 352 275 — —Total continuing operations 19,656 21,079 4,141 4,331Of which, to Boards of Directors and presidentsSalaries and other remuneration 707 746 46 56Of which, variable salary 79 96 13 17
3.4 GENDER DISTRIBUTION IN SENIOR MANAGEMENT Group Parent Company
Proportion of women, % 2016 2017 2016 2017Gender distribution in senior management 15 14 18 27Other senior executives 21 20 43 29
86 | Sandvik Annual Report 2017
1
2
3
4
5
6
7
8
9
10
11
12
13
14
15
16
17
18
19
20
21
22
23
24
25
26
27
28
29
30
31
32
33
34
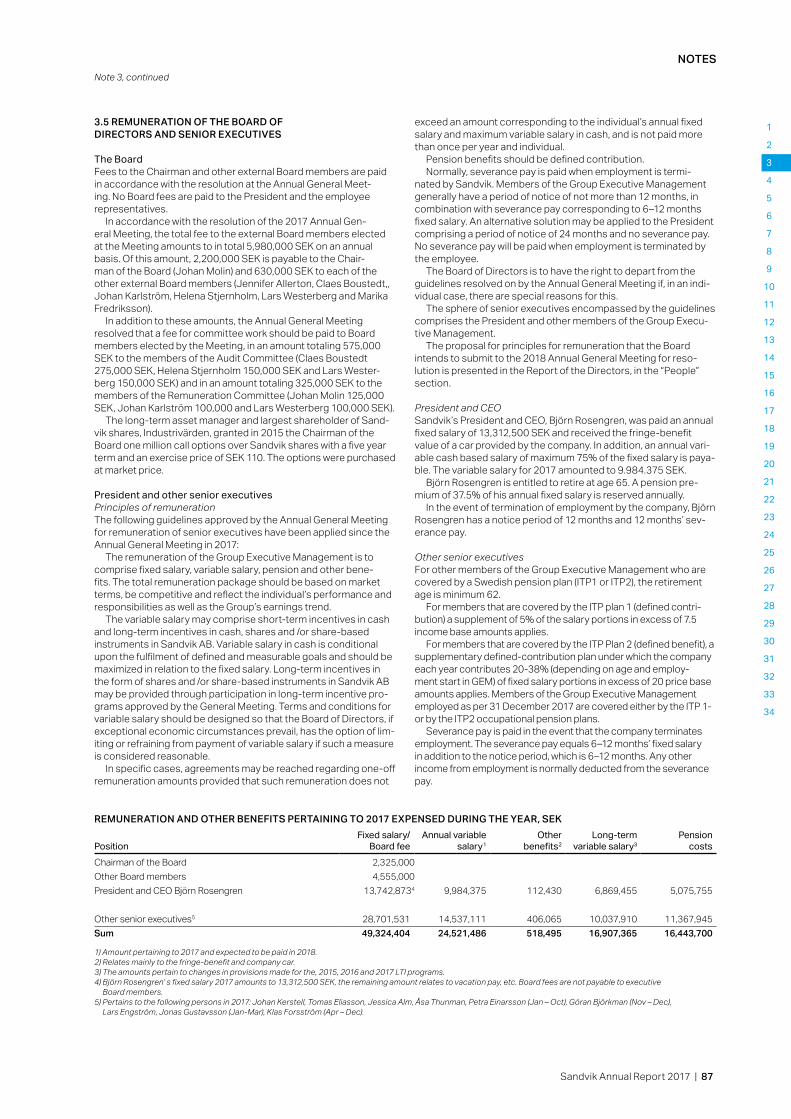
NOTES
3.5 REMUNERATION OF THE BOARD OF DIRECTORS AND SENIOR EXECUTIVES
The BoardFees to the Chairman and other external Board members are paid in accordance with the resolution at the Annual General Meet-ing. No Board fees are paid to the President and the employee representatives.
In accordance with the resolution of the 2017 Annual Gen-eral Meeting, the total fee to the external Board members elected at the Meeting amounts to in total 5,980,000 SEK on an annual basis. Of this amount, 2,200,000 SEK is payable to the Chair-man of the Board (Johan Molin) and 630,000 SEK to each of the other external Board members (Jennifer Allerton, Claes Boustedt,, Johan Karlström, Helena Stjernholm, Lars Westerberg and Marika Fredriksson).
In addition to these amounts, the Annual General Meeting resolved that a fee for committee work should be paid to Board members elected by the Meeting, in an amount totaling 575,000 SEK to the members of the Audit Committee (Claes Boustedt 275,000 SEK, Helena Stjernholm 150,000 SEK and Lars Wester-berg 150,000 SEK) and in an amount totaling 325,000 SEK to the members of the Remuneration Committee (Johan Molin 125,000 SEK, Johan Karlström 100,000 and Lars Westerberg 100,000 SEK).
The long-term asset manager and largest shareholder of Sand-vik shares, Industrivärden, granted in 2015 the Chairman of the Board one million call options over Sandvik shares with a five year term and an exercise price of SEK 110. The options were purchased at market price.
President and other senior executivesPrinciples of remunerationThe following guidelines approved by the Annual General Meeting for remuneration of senior executives have been applied since the Annual General Meeting in 2017:
The remuneration of the Group Executive Management is to comprise fixed salary, variable salary, pension and other bene-fits. The total remuneration package should be based on market terms, be competitive and reflect the individual’s performance and responsibilities as well as the Group’s earnings trend.
The variable salary may comprise short-term incentives in cash and long-term incentives in cash, shares and /or share-based instruments in Sandvik AB. Variable salary in cash is conditional upon the fulfilment of defined and measurable goals and should be maximized in relation to the fixed salary. Long-term incentives in the form of shares and /or share-based instruments in Sandvik AB may be provided through participation in long-term incentive pro-grams approved by the General Meeting. Terms and conditions for variable salary should be designed so that the Board of Directors, if exceptional economic circumstances prevail, has the option of lim-iting or refraining from payment of variable salary if such a measure is considered reasonable.
In specific cases, agreements may be reached regarding one-off remuneration amounts provided that such remuneration does not
exceed an amount corresponding to the individual’s annual fixed salary and maximum variable salary in cash, and is not paid more than once per year and individual.
Pension benefits should be defined contribution.Normally, severance pay is paid when employment is termi-
nated by Sandvik. Members of the Group Executive Management generally have a period of notice of not more than 12 months, in combination with severance pay corresponding to 6–12 months fixed salary. An alternative solution may be applied to the President comprising a period of notice of 24 months and no severance pay. No severance pay will be paid when employment is terminated by the employee.
The Board of Directors is to have the right to depart from the guidelines resolved on by the Annual General Meeting if, in an indi-vidual case, there are special reasons for this.
The sphere of senior executives encompassed by the guidelines comprises the President and other members of the Group Execu-tive Management.
The proposal for principles for remuneration that the Board intends to submit to the 2018 Annual General Meeting for reso-lution is presented in the Report of the Directors, in the “People” section.
President and CEO Sandvik’s President and CEO, Björn Rosengren, was paid an annual fixed salary of 13,312,500 SEK and received the fringe-benefit value of a car provided by the company. In addition, an annual vari-able cash based salary of maximum 75% of the fixed salary is paya-ble. The variable salary for 2017 amounted to 9.984.375 SEK.
Björn Rosengren is entitled to retire at age 65. A pension pre-mium of 37.5% of his annual fixed salary is reserved annually.
In the event of termination of employment by the company, Björn Rosengren has a notice period of 12 months and 12 months’ sev-erance pay.
Other senior executivesFor other members of the Group Executive Management who are covered by a Swedish pension plan (ITP1 or ITP2), the retirement age is minimum 62.
For members that are covered by the ITP plan 1 (defined contri-bution) a supplement of 5% of the salary portions in excess of 7.5 income base amounts applies.
For members that are covered by the ITP Plan 2 (defined benefit), a supplementary defined-contribution plan under which the company each year contributes 20-38% (depending on age and employ-ment start in GEM) of fixed salary portions in excess of 20 price base amounts applies. Members of the Group Executive Management employed as per 31 December 2017 are covered either by the ITP 1- or by the ITP2 occupational pension plans.
Severance pay is paid in the event that the company terminates employment. The severance pay equals 6–12 months’ fixed salary in addition to the notice period, which is 6–12 months. Any other income from employment is normally deducted from the severance pay.
REMUNERATION AND OTHER BENEFITS PERTAINING TO 2017 EXPENSED DURING THE YEAR, SEK
PositionFixed salary/
Board feeAnnual variable
salary1Other
benefits2Long-term
variable salary3Pension
costsChairman of the Board 2,325,000Other Board members 4,555,000President and CEO Björn Rosengren 13,742,8734 9,984,375 112,430 6,869,455 5,075,755
Other senior executives5 28,701,531 14,537,111 406,065 10,037,910 11,367,945Sum 49,324,404 24,521,486 518,495 16,907,365 16,443,700
1) Amount pertaining to 2017 and expected to be paid in 2018.2) Relates mainly to the fringe-benefit and company car.3) The amounts pertain to changes in provisions made for the, 2015, 2016 and 2017 LTI programs. 4) Björn Rosengren’ s fixed salary 2017 amounts to 13,312,500 SEK, the remaining amount relates to vacation pay, etc. Board fees are not payable to executive
Board members.5) Pertains to the following persons in 2017: Johan Kerstell, Tomas Eliasson, Jessica Alm, Åsa Thunman, Petra Einarsson (Jan – Oct), Göran Björkman (Nov – Dec),
Lars Engström, Jonas Gustavsson (Jan-Mar), Klas Forsström (Apr – Dec).
Note 3, continued
Sandvik Annual Report 2017 | 87
1
2
3
4
5
6
7
8
9
10
11
12
13
14
15
16
17
18
19
20
21
22
23
24
25
26
27
28
29
30
31
32
33
34

NOTES
Long-term incentive programShare-based incentive program 2012 and 2013 The 2012 and 2013 Annual General Meetings approved the Board proposals to introduce a share-based LTI program for each year. The programs were aimed at about 400 senior executives and key individuals in the Sandvik Group and a maximum of 23,405,188 Sandvik shares could maximum be used.
The program participants have been allotted employee stock options that entitle the employee to acquire Sandvik shares after three years at a set exercise price, on condition that certain per-formance targets linked to the Sandvik Group’s growth in value – Sandvik Value Added (SVA) – are met (“performance shares”). For the President, senior executives and certain top level executives, a personal investment in Sandvik shares (“saving shares”), corre-sponding to 10% of fixed annual pre-tax salary for the year in which the investment in saving shares is made, was required in order to receive allotment of employee stock options. Provided that such a personal investment in Sandvik shares has been made, these executives also received allotment of “matching rights” (one per saving share acquired) that entitle the executive to acquire Sandvik shares after three years at a set exercise price (“matching shares”). Employee stock options and matching rights are non-transferrable.
Each employee stock option entitles the employee to acquire one performance share not earlier than three years and not later than five years following allocation of the employee stock option. The number of the allotted employee stock options that will even-tually provide entitlement to the acquisition of performance shares depends on the development of SVA over the three financial years following approval of the program by the Annual General Meeting.
The exercise of the employee stock options to acquire perfor-mance shares requires continued employment at Sandvik and that
all acquired saving shares are held for a three-year period after the allotment of the employee stock options.
Each matching right automatically provides entitlement to acquire one matching share not earlier than three and not later than five years after the allotment of the matching rights. The exercise of matching rights to acquire matching shares requires continued employment at Sandvik and that all acquired saving shares are held for a three-year period after the allotment of matching rights.
The exercise price to acquire a performance share or matching share equals an amount corresponding to 110% and 75%, respec-tively, of the average volume-weighted price paid for the Sandvik share on NASDAQ Stockholm during a period of ten trading days immediately following the Annual General Meeting that approved the program. The average volume-weighted price paid was deter-mined for 2012 at 97.12 SEK and for 2013 at 92.41 SEK.
For the 2012 LTI program, encompassing the years 2012–2014, 36% of the performance stock options vested. The program lapsed June 2017.For the 2013 LTI program, encompassing the years 2013–2015, no performance stock options vested, since the per-formance targets set by the Board of Directors were not met.
The number of allotted employee stock options and acquired matching rights under the 2012 and 2013 programs for the Presi-dent and other members of the Group Executive Management on 31 December 2017 corresponds to the number of outstanding employee stock options and matching rights at year-end.
The number of allotted matching rights under the 2012 and 2013 programs corresponds to the number of outstanding matching rights at 31 December 2017.
The expected volatility was determined by analyzing the histor-ical volatility of Sandvik AB and some comparable listed compa-nies. When determining the expected maturity, assumptions were
NUMBER AND EXERCISE PRICE, GROUP (INCLUDING PARENT COMPANY), 2012 – 2013 LTI PROGRAMSEmployee stock
options 2012Matching
rights 2012Employee stock
options 2013Matching
rights 2013Outstanding at beginning of year 3,082,320 62,610 — 74,729Allotted during the period — — — —Exercised during the year –2,187,360 –48,580 — –56,474Forfeited during the year –894,960 –14,030 — –263Outstanding at year-end — — — 17,992Theoretical value when allotted acc. to Black & Scholes, SEK 13 24 14.30 26.30Exercise price, SEK 106.80 72.80 101.70 69.30
NUMBER AND EXERCISE PRICE, PARENT COMPANY, 2012 – 2013 LTI PROGRAMSEmployee stock
options 2012Matching rights
2012Employee stock
options 2013Matching rights
2013Outstanding at beginning of year 399,240 14,812 — 21,466Allotted during the year — — — —Exercised during the year –185,040 –5,466 — –7,487Forfeited during the year –214,200 –9,346 — –9,530Outstanding at year-end — — — 4,449Theoretical value when allotted acc. to Black & Scholes, SEK 13 24 14.30 26.30Exercise price, SEK 106.80 72.80 101.70 69.30
ASSUMPTIONS FOR DETERMINING THE VALUE BASED ON THE BLACK & SCHOLES MODEL, 2012 AND 2013 LTI PROGRAMS
AssumptionsProgram 2012
(on date of issue)Program 2013
(on date of issue)Share price 92.65 SEK 94.65 SEKExercise price 106.80/72.80 SEK 101.70/69.30 SEKExpected volatility 36.50 % 35 %Expected maturity 3 years 3 yearsPresent value of forecasted future dividends1 12.17 SEK 12.22 SEKRisk-free interest rate 0.95 % 0.91%
1) Based on analysts’ combined expectations.
Note 3, continued
88 | Sandvik Annual Report 2017
1
2
3
4
5
6
7
8
9
10
11
12
13
14
15
16
17
18
19
20
21
22
23
24
25
26
27
28
29
30
31
32
33
34
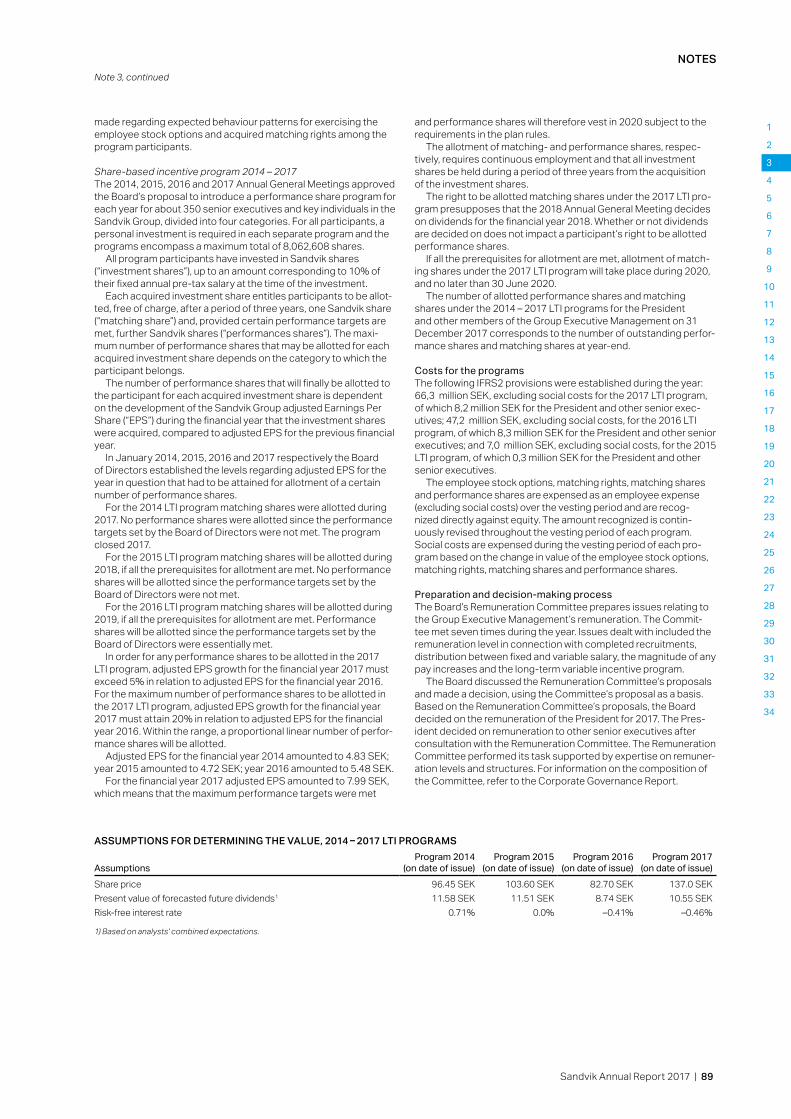
NOTES
made regarding expected behaviour patterns for exercising the employee stock options and acquired matching rights among the program participants.
Share-based incentive program 2014 – 2017The 2014, 2015, 2016 and 2017 Annual General Meetings approved the Board’s proposal to introduce a performance share program for each year for about 350 senior executives and key individuals in the Sandvik Group, divided into four categories. For all participants, a personal investment is required in each separate program and the programs encompass a maximum total of 8,062,608 shares.
All program participants have invested in Sandvik shares (“investment shares”), up to an amount corresponding to 10% of their fixed annual pre-tax salary at the time of the investment.
Each acquired investment share entitles participants to be allot-ted, free of charge, after a period of three years, one Sandvik share (“matching share”) and, provided certain performance targets are met, further Sandvik shares (“performances shares”). The maxi-mum number of performance shares that may be allotted for each acquired investment share depends on the category to which the participant belongs.
The number of performance shares that will finally be allotted to the participant for each acquired investment share is dependent on the development of the Sandvik Group adjusted Earnings Per Share (“EPS”) during the financial year that the investment shares were acquired, compared to adjusted EPS for the previous financial year.
In January 2014, 2015, 2016 and 2017 respectively the Board of Directors established the levels regarding adjusted EPS for the year in question that had to be attained for allotment of a certain number of performance shares.
For the 2014 LTI program matching shares were allotted during 2017. No performance shares were allotted since the performance targets set by the Board of Directors were not met. The program closed 2017.
For the 2015 LTI program matching shares will be allotted during 2018, if all the prerequisites for allotment are met. No performance shares will be allotted since the performance targets set by the Board of Directors were not met.
For the 2016 LTI program matching shares will be allotted during 2019, if all the prerequisites for allotment are met. Performance shares will be allotted since the performance targets set by the Board of Directors were essentially met.
In order for any performance shares to be allotted in the 2017 LTI program, adjusted EPS growth for the financial year 2017 must exceed 5% in relation to adjusted EPS for the financial year 2016. For the maximum number of performance shares to be allotted in the 2017 LTI program, adjusted EPS growth for the financial year 2017 must attain 20% in relation to adjusted EPS for the financial year 2016. Within the range, a proportional linear number of perfor-mance shares will be allotted.
Adjusted EPS for the financial year 2014 amounted to 4.83 SEK; year 2015 amounted to 4.72 SEK; year 2016 amounted to 5.48 SEK.
For the financial year 2017 adjusted EPS amounted to 7.99 SEK, which means that the maximum performance targets were met
and performance shares will therefore vest in 2020 subject to the requirements in the plan rules.
The allotment of matching- and performance shares, respec-tively, requires continuous employment and that all investment shares be held during a period of three years from the acquisition of the investment shares.
The right to be allotted matching shares under the 2017 LTI pro-gram presupposes that the 2018 Annual General Meeting decides on dividends for the financial year 2018. Whether or not dividends are decided on does not impact a participant’s right to be allotted performance shares.
If all the prerequisites for allotment are met, allotment of match-ing shares under the 2017 LTI program will take place during 2020, and no later than 30 June 2020.
The number of allotted performance shares and matching shares under the 2014 – 2017 LTI programs for the President and other members of the Group Executive Management on 31 December 2017 corresponds to the number of outstanding perfor-mance shares and matching shares at year-end.
Costs for the programsThe following IFRS2 provisions were established during the year: 66,3 million SEK, excluding social costs for the 2017 LTI program, of which 8,2 million SEK for the President and other senior exec-utives; 47,2 million SEK, excluding social costs, for the 2016 LTI program, of which 8,3 million SEK for the President and other senior executives; and 7,0 million SEK, excluding social costs, for the 2015 LTI program, of which 0,3 million SEK for the President and other senior executives.
The employee stock options, matching rights, matching shares and performance shares are expensed as an employee expense (excluding social costs) over the vesting period and are recog-nized directly against equity. The amount recognized is contin-uously revised throughout the vesting period of each program. Social costs are expensed during the vesting period of each pro-gram based on the change in value of the employee stock options, matching rights, matching shares and performance shares.
Preparation and decision-making processThe Board’s Remuneration Committee prepares issues relating to the Group Executive Management’s remuneration. The Commit-tee met seven times during the year. Issues dealt with included the remuneration level in connection with completed recruitments, distribution between fixed and variable salary, the magnitude of any pay increases and the long-term variable incentive program.
The Board discussed the Remuneration Committee’s proposals and made a decision, using the Committee’s proposal as a basis. Based on the Remuneration Committee’s proposals, the Board decided on the remuneration of the President for 2017. The Pres-ident decided on remuneration to other senior executives after consultation with the Remuneration Committee. The Remuneration Committee performed its task supported by expertise on remuner-ation levels and structures. For information on the composition of the Committee, refer to the Corporate Governance Report.
ASSUMPTIONS FOR DETERMINING THE VALUE, 2014 – 2017 LTI PROGRAMS
AssumptionsProgram 2014
(on date of issue)Program 2015
(on date of issue)Program 2016
(on date of issue)Program 2017
(on date of issue)Share price 96.45 SEK 103.60 SEK 82.70 SEK 137.0 SEKPresent value of forecasted future dividends1 11.58 SEK 11.51 SEK 8.74 SEK 10.55 SEKRisk-free interest rate 0.71% 0.0% –0.41% –0.46%
1) Based on analysts’ combined expectations.
Note 3, continued
Sandvik Annual Report 2017 | 89
1
2
3
4
5
6
7
8
9
10
11
12
13
14
15
16
17
18
19
20
21
22
23
24
25
26
27
28
29
30
31
32
33
34

NOTES
NUMBER OF SHARES, GROUP (INCLUDING PARENT COMPANY), 2014 – 2017 LTI PROGRAMS Performance shares 2014
Matching shares 2014
Performance shares 2015
Matching shares 2015
Performance shares 2016
Matching shares 2016
Performance shares 2017
Matching shares 2017
Outstanding at beginning of year — 315,769 — 299,279 1,519,686 355,390 — —Allotted during the year — — — — — — 1,291,369 282,694Vested during the year — –303,755 — –5,692 –16,042 –4,023 — —Forfeited during the year — –12,014 — –18,066 –76,864 –17,307 — —Outstanding at year-end — — — 277,521 1,426,780 334,060 1,291,369 282,694Theoretical value when alloted, SEK 84.90 84.90 92.10 92.10 74.00 74.00 126.40 126.40
NUMBER OF SHARES, PARENT COMPANY, 2014 – 2017 LTI PROGRAMS
Performance shares 2014
Matching shares 2014
Performance shares 2015
Matching shares 2015
Performance shares 2016
Matching shares 2016
Performance shares 2017
Matching shares 2017
Outstanding at beginning of year — 42,937 — 28,428 227,568 43,832 — —Allotted during the year — — — — — — 249,533 44,662Vested during the year — –36,932 — — — — — —Forfeited during the year — –6,005 — –3,365 –4,450 –1,217 — —Outstanding at year-end — — — 25,063 223,118 42,615 249,533 44,662Theoretical value when allotted, SEK 84.90 84.90 92.10 92.10 74.00 74.00 126.40 126.40
Note 3, continued
90 | Sandvik Annual Report 2017
1
2
3
4
5
6
7
8
9
10
11
12
13
14
15
16
17
18
19
20
21
22
23
24
25
26
27
28
29
30
31
32
33
34
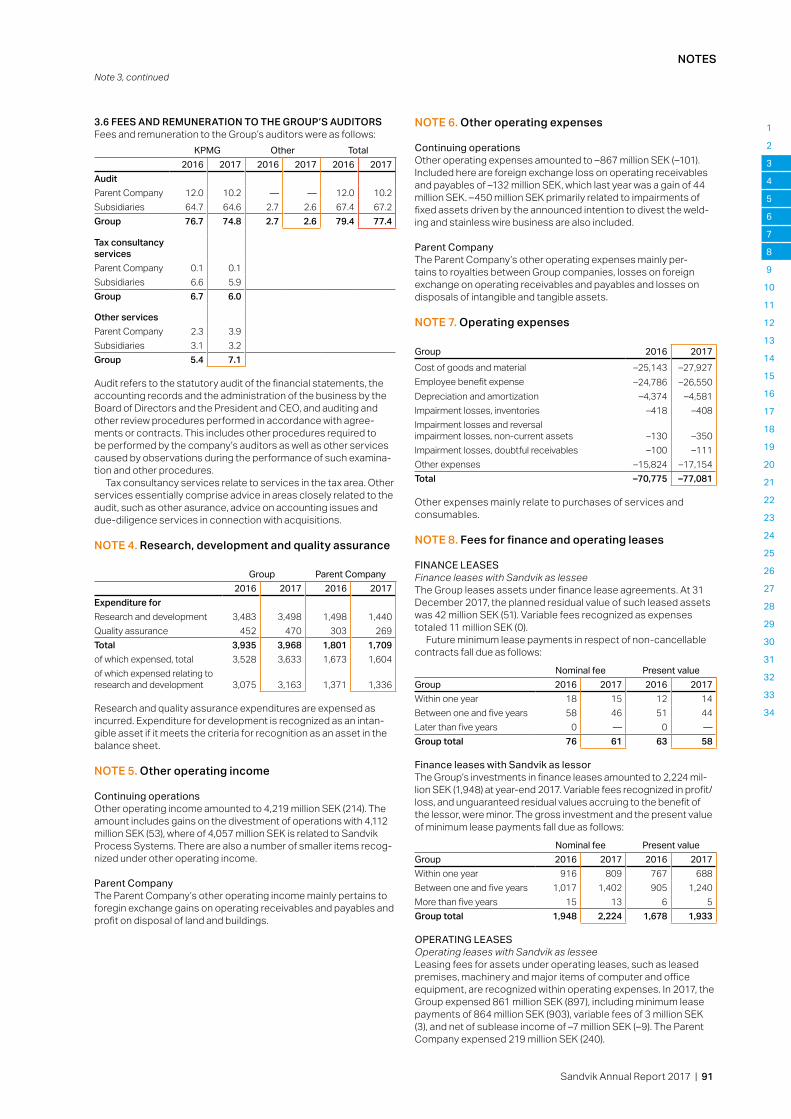
NOTES
3.6 FEES AND REMUNERATION TO THE GROUP’S AUDITORSFees and remuneration to the Group’s auditors were as follows:
KPMG Other Total2016 2017 2016 2017 2016 2017
AuditParent Company 12.0 10.2 — — 12.0 10.2Subsidiaries 64.7 64.6 2.7 2.6 67.4 67.2Group 76.7 74.8 2.7 2.6 79.4 77.4
Tax consultancy servicesParent Company 0.1 0.1Subsidiaries 6.6 5.9Group 6.7 6.0
Other servicesParent Company 2.3 3.9Subsidiaries 3.1 3.2Group 5.4 7.1
Audit refers to the statutory audit of the financial statements, the accounting records and the administration of the business by the Board of Directors and the President and CEO, and auditing and other review procedures performed in accordance with agree-ments or contracts. This includes other procedures required to be performed by the company’s auditors as well as other services caused by observations during the performance of such examina-tion and other procedures.
Tax consultancy services relate to services in the tax area. Other services essentially comprise advice in areas closely related to the audit, such as other asurance, advice on accounting issues and due-diligence services in connection with acquisitions.
NOTE 4. Research, development and quality assurance
Group Parent Company2016 2017 2016 2017
Expenditure forResearch and development 3,483 3,498 1,498 1,440Quality assurance 452 470 303 269Total 3,935 3,968 1,801 1,709of which expensed, total 3,528 3,633 1,673 1,604of which expensed relating to research and development 3,075 3,163 1,371 1,336
Research and quality assurance expenditures are expensed as incurred. Expenditure for development is recognized as an intan-gible asset if it meets the criteria for recognition as an asset in the balance sheet.
NOTE 5. Other operating income
Continuing operationsOther operating income amounted to 4,219 million SEK (214). The amount includes gains on the divestment of operations with 4,112 million SEK (53), where of 4,057 million SEK is related to Sandvik Process Systems. There are also a number of smaller items recog-nized under other operating income.
Parent CompanyThe Parent Company’s other operating income mainly pertains to foregin exchange gains on operating receivables and payables and profit on disposal of land and buildings.
NOTE 6. Other operating expenses
Continuing operationsOther operating expenses amounted to –867 million SEK (–101). Included here are foreign exchange loss on operating receivables and payables of –132 million SEK, which last year was a gain of 44 million SEK. –450 million SEK primarily related to impairments of fixed assets driven by the announced intention to divest the weld-ing and stainless wire business are also included.
Parent CompanyThe Parent Company’s other operating expenses mainly per-tains to royalties between Group companies, losses on foreign exchange on operating receivables and payables and losses on disposals of intangible and tangible assets.
NOTE 7. Operating expenses
Group 2016 2017Cost of goods and material –25,143 –27,927Employee benefit expense –24,786 –26,550Depreciation and amortization –4,374 –4,581Impairment losses, inventories –418 –408Impairment losses and reversal impairment losses, non-current assets –130 –350Impairment losses, doubtful receivables –100 –111Other expenses –15,824 –17,154Total –70,775 –77,081
Other expenses mainly relate to purchases of services and consumables.
NOTE 8. Fees for finance and operating leases FINANCE LEASESFinance leases with Sandvik as lesseeThe Group leases assets under finance lease agreements. At 31 December 2017, the planned residual value of such leased assets was 42 million SEK (51). Variable fees recognized as expenses totaled 11 million SEK (0).
Future minimum lease payments in respect of non-cancellable contracts fall due as follows:
Nominal fee Present valueGroup 2016 2017 2016 2017Within one year 18 15 12 14Between one and five years 58 46 51 44Later than five years 0 — 0 —Group total 76 61 63 58
Finance leases with Sandvik as lessorThe Group’s investments in finance leases amounted to 2,224 mil-lion SEK (1,948) at year-end 2017. Variable fees recognized in profit/loss, and unguaranteed residual values accruing to the benefit of the lessor, were minor. The gross investment and the present value of minimum lease payments fall due as follows:
Nominal fee Present valueGroup 2016 2017 2016 2017Within one year 916 809 767 688Between one and five years 1,017 1,402 905 1,240More than five years 15 13 6 5Group total 1,948 2,224 1,678 1,933
OPERATING LEASESOperating leases with Sandvik as lesseeLeasing fees for assets under operating leases, such as leased premises, machinery and major items of computer and office equipment, are recognized within operating expenses. In 2017, the Group expensed 861 million SEK (897), including minimum lease payments of 864 million SEK (903), variable fees of 3 million SEK (3), and net of sublease income of –7 million SEK (–9). The Parent Company expensed 219 million SEK (240).
Note 3, continued
Sandvik Annual Report 2017 | 91
1
2
3
4
5
6
7
8
9
10
11
12
13
14
15
16
17
18
19
20
21
22
23
24
25
26
27
28
29
30
31
32
33
34

NOTES
Future minimum lease payments under non-cancellable operating lease contracts fall due as follows:
Group Parent Company2016 2017 2016 2017
Within one year 809 761 220 211Between one and five years 1,625 1,601 558 633Later than five years 697 625 378 404Group total 3,131 2,988 1,156 1,248
Future minimum lease payments under non-cancellable lease con-tracts that pertain to subleased items amounted to 156 million SEK (211).
Operating leases with Sandvik as lessorThe planned residual value of the Group’s rental fleet is 544 million SEK (652). Depreciation for the year amounted to 599 million SEK (418). The future minimum lease payments under non-cancellable leases amount to 713 million SEK (763). Variable fees amounted to 29 million SEK (22).
Future minimum lease payments under non-cancellable operat-ing lease contracts fall due as follows:
Group Parent Company2016 2017 2016 2017
Within one year 340 287 0 0Between one and five years 423 426 — —Later than five years 0 — — —Group total 763 713 0 0
NOTE 9. Net financing cost
Group 2016 2017Interest income 159 207Dividend 5 25Other investments incl. derivativesNet gain on remeasurement of financial assets/ liabilities 5 134Net foreign-exchange gains — —Other financial income 7 15Financial income 176 381
Interest expense -1,670 –1,377Other investments incl. derivativesNet loss on remeasurement of financial assets/liabilities –108 –41Net foreign-exchange losses –12 –9Other financial expenses –47 –34Financial expenses –1,837 –1,462Net financing cost –1,661 –1,080
Net interest income/expense from financial assets and liabilities not measured at fair value through profit or loss amounted to –1,157 million SEK (–1,507). In 2017, the hedging of fair values resulting from the valuation of hedged items had an effect of –4 million SEK (–4) on the result, while the valuation of hedged instruments affected the result by 4 million SEK (4). No inefficiencies in cash flow hedges impacted profit for the year (0). For further information regarding valuation policies for financial instruments, refer to Note 27.
Income from shares in Group companies
Income from shares in associated companies
Parent Company 2016 2017 2016 2017Dividend, net of withholding tax 328 1,072 10 5Group contributions paid/received 525 –3,955 — —Gain on sale of shares and participations 47 2,3441 — 72Impairment –698 –167 — —Reversed impairment — — — —Total 202 –706 10 77
1) Profit from disposal of shares in Sandvik Process Systems AB.
Interest income and similar items
Parent Company 2016 2017Interest income, Group companies 823 631Other interest income 1 0Derivatives, Group companies — 139Other — —Total 824 770
Interest expense and similar items
Parent Company 2016 2017Interest expense, Group companies –546 –451Other interest expense –701 –543Derivatives, Group companies –81 5Other –14 –15Total –1,342 –1,004
NOTE 10. Income tax
RECOGNIZED IN PROFIT AND LOSSGroup Parent Company
Income tax expense for the year 2016 2017 2016 2017Current tax –1,831 –2,772 –73 –71Adjustment of taxes attributable to prior years –196 –322 — —Total current tax expense –2,027 – 3,094 –73 –71Deferred taxes relating to temporary differences and tax loss carry-forward –501 –689 –167 618Total tax expense –2,528 –3,783 –240 547
The Group’s recognized tax expense for the continuing operations for the year amounted to 3,783 million SEK (2,528) or 22.2% (27.0) of profit after financial items.
Reconciliation of the Group’s tax expenseThe Group’s weighted average tax rate for the continuing oper-ations, calculated in accordance with the statutory tax rates in each country, is 22.4% (19.7). The tax rate in Sweden is 22% (22). The federal corporate tax rate in the Unites States of America has been reduced from 35% to 21%. A positive nonrecurring effect on deferred tax for the year of approximately 190 million SEK, related to this change, has affected the weighted average tax rate.
Reconciliation of the Group’s weighted average tax rate, based on the tax rates in each country, and the Group’s actual tax expense:
2016 2017Continuing operations MSEK % MSEK %Profit after financial items 9,366 17,018Weighted average tax based on each country’s tax rate –1,841 –19.7 –3,813 –22.4
Tax effect ofNon-deductible expenses –396 –4.2 –149 –0.9Tax-exempt income 61 0.7 646 3.8Adjustments relating to prior years –196 –2.1 –322 –1.9Effects of tax loss carry-forward, net –12 –0.1 –53 –0.3Other –144 –1.6 –92 –0.5Total recognized tax expense –2,528 –27.0 –3,783 –22.2
The weighted average tax rate for Group total, based on the stat-utory tax rates in each country, is 22.5% (23.0). The federal corpo-rate tax rate change in the US, described above, is included in the weighted average tax.
Note 8, continued
92 | Sandvik Annual Report 2017
1
2
3
4
5
6
7
8
9
10
11
12
13
14
15
16
17
18
19
20
21
22
23
24
25
26
27
28
29
30
31
32
33
34

NOTES
2016 2017Group total MSEK % MSEK %Profit after financial items 7,996 16,966Weighted average tax based on each country’s tax rate –1,841 –23.0 –3,813 –22.5
Tax effect ofNon-deductible expenses –396 –5.0 –149 –0.9Tax-exempt income 61 0.8 646 3.8Adjustments relating to prior years –196 –2.4 –322 –1.9Effects of tax loss carry-forward, net –12 –0.2 –53 –0.3Other –144 –1.8 –92 –0.5Total recognized tax expense –2,528 –31.6 –3,783 –22.3
TAX ITEMS ATTRIBUTABLE TO OTHER COMPREHENSIVE INCOME2016 2017
Group Before tax Tax After tax Before tax Tax After taxActuarial gains/losses attributable to defined- benefit pension plans 168 –82 86 860 –108 752Translation differences for the year 2,323 — 2,323 –1,355 — –1,355Fair-value changes in cash flow hedges for the year –47 12 –35 9 – 2 7Fair-value changes in cash flow hedges carried forward to profit/loss for the year 153 –34 119 76 – 17 59Other comprehensive income 2,597 –104 2,493 –410 –127 –537
Recognized in the balance sheetDeferred tax assets and liabilitiesThe deferred tax assets and liabilities recognized in the balance sheet are attributable to the following assets and liabilities (liabilities shown with a minus sign).
2016 2017
GroupDeferred tax
assetsDeferred tax
liabilities NetDeferred tax
assetsDeferred tax
liabilities NetIntangible assets 1,310 –1,435 –125 38 –1,294 –1,256Property, plant and equipment 112 –1,070 –958 151 –880 –729 Financial non-current assets 72 –97 –25 66 –151 –85Inventories 1,041 –78 963 925 –86 839Receivables 277 –66 211 162 –93 69Interest-bearing liabilities 1,482 –10 1,472 1,191 –3 1,188Non-interest-bearing liabilities 1,027 –133 894 1,018 –17 1,001Other — –1 –1 — –10 –10Tax loss carry-forward 1,367 — 1,367 1,712 — 1,712Total 6,688 –2,890 3,798 5,263 –2,534 2,729
Offsetting within companies –760 760 — –1,071 1,071 —Total deferred tax assets and liabilities 5,928 –2,130 3,798 4,192 –1,463 2,729
2016 2017
Parent CompanyDeferred tax
assetsDeferred tax
liabilities NetDeferred tax
assetsDeferred tax
liabilities NetProperty, plant and equipment — –27 –27 — –27 –27Inventories 7 — 7 8 — 8Provisions 46 –12 34 28 –8 20Non-interest-bearing assets and liabilities 56 — 56 18 — 18Tax loss carry-forward 23 — 23 693 — 693Total 132 –39 93 747 –35 712Offsetting –39 39 — –35 35 —Total deferred tax assets and liabilities 93 — 93 712 — 712
Reconciliation of the Parent Company’s tax expenseThe Parent Company’s effective tax rate is lower than the nomi-nal tax rate in Sweden, mainly due to the sale of shares in Group companies which are non-taxable incomes.
Reconciliation of the Parent Company’s nominal tax rate and actual tax expense:
2016 2017Parent company MSEK % MSEK %Profit before tax 424 335Tax based on the nominal tax rate for the Parent Company –93 –22 –74 –22Tax effects ofNon-deductible expenses –212 –50 –88 –26Tax-exempt income 115 27.1 705 210.6Tax related to Sandvik Pro-cess Systems1) –24 –7.2Adjustments relating to prior years –50 –11.8 28 8.3Total recognized tax expense –240 –56.6 547 163.4
1) Related to exit of the commissionarie structure in current year.
Note 10, continued
Sandvik Annual Report 2017 | 93
1
2
3
4
5
6
7
8
9
10
11
12
13
14
15
16
17
18
19
20
21
22
23
24
25
26
27
28
29
30
31
32
33
34
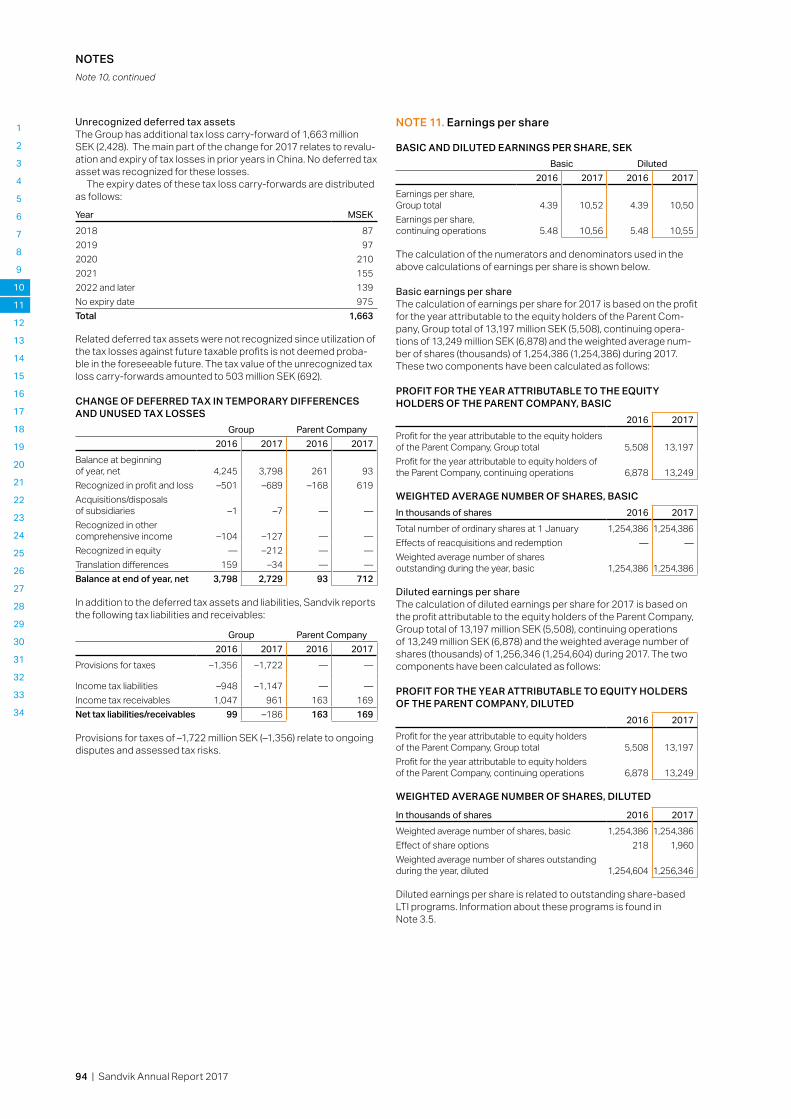
NOTES
Unrecognized deferred tax assetsThe Group has additional tax loss carry-forward of 1,663 million SEK (2,428). The main part of the change for 2017 relates to revalu-ation and expiry of tax losses in prior years in China. No deferred tax asset was recognized for these losses.
The expiry dates of these tax loss carry-forwards are distributed as follows:
Year MSEK2018 872019 972020 2102021 1552022 and later 139No expiry date 975Total 1,663
Related deferred tax assets were not recognized since utilization of the tax losses against future taxable profits is not deemed proba-ble in the foreseeable future. The tax value of the unrecognized tax loss carry-forwards amounted to 503 million SEK (692).
CHANGE OF DEFERRED TAX IN TEMPORARY DIFFERENCES AND UNUSED TAX LOSSES
Group Parent Company2016 2017 2016 2017
Balance at beginning of year, net 4,245 3,798 261 93Recognized in profit and loss –501 –689 –168 619Acquisitions/disposals of subsidiaries –1 –7 — —Recognized in other comprehensive income –104 –127 — —Recognized in equity — –212 — —Translation differences 159 –34 — —Balance at end of year, net 3,798 2,729 93 712
In addition to the deferred tax assets and liabilities, Sandvik reports the following tax liabilities and receivables:
Group Parent Company2016 2017 2016 2017
Provisions for taxes –1,356 –1,722 — —
Income tax liabilities –948 –1,147 — —Income tax receivables 1,047 961 163 169Net tax liabilities/receivables 99 –186 163 169
Provisions for taxes of –1,722 million SEK (–1,356) relate to ongoing disputes and assessed tax risks.
NOTE 11. Earnings per share
BASIC AND DILUTED EARNINGS PER SHARE, SEKBasic Diluted
2016 2017 2016 2017Earnings per share, Group total 4.39 10,52 4.39 10,50Earnings per share, continuing operations 5.48 10,56 5.48 10,55
The calculation of the numerators and denominators used in the above calculations of earnings per share is shown below.
Basic earnings per share The calculation of earnings per share for 2017 is based on the profit for the year attributable to the equity holders of the Parent Com-pany, Group total of 13,197 million SEK (5,508), continuing opera-tions of 13,249 million SEK (6,878) and the weighted average num-ber of shares (thousands) of 1,254,386 (1,254,386) during 2017. These two components have been calculated as follows:
PROFIT FOR THE YEAR ATTRIBUTABLE TO THE EQUITY HOLDERS OF THE PARENT COMPANY, BASIC
2016 2017Profit for the year attributable to the equity holders of the Parent Company, Group total 5,508 13,197Profit for the year attributable to equity holders of the Parent Company, continuing operations 6,878 13,249
WEIGHTED AVERAGE NUMBER OF SHARES, BASICIn thousands of shares 2016 2017Total number of ordinary shares at 1 January 1,254,386 1,254,386Effects of reacquisitions and redemption — —Weighted average number of shares outstanding during the year, basic 1,254,386 1,254,386
Diluted earnings per shareThe calculation of diluted earnings per share for 2017 is based on the profit attributable to the equity holders of the Parent Company, Group total of 13,197 million SEK (5,508), continuing operations of 13,249 million SEK (6,878) and the weighted average number of shares (thousands) of 1,256,346 (1,254,604) during 2017. The two components have been calculated as follows:
PROFIT FOR THE YEAR ATTRIBUTABLE TO EQUITY HOLDERS OF THE PARENT COMPANY, DILUTED
2016 2017Profit for the year attributable to equity holders of the Parent Company, Group total 5,508 13,197Profit for the year attributable to equity holders of the Parent Company, continuing operations 6,878 13,249
WEIGHTED AVERAGE NUMBER OF SHARES, DILUTED
In thousands of shares 2016 2017Weighted average number of shares, basic 1,254,386 1,254,386Effect of share options 218 1,960Weighted average number of shares outstanding during the year, diluted 1,254,604 1,256,346 Diluted earnings per share is related to outstanding share-based LTI p rograms. Information about these programs is found in Note 3.5.
Note 10, continued
94 | Sandvik Annual Report 2017
1
2
3
4
5
6
7
8
9
10
11
12
13
14
15
16
17
18
19
20
21
22
23
24
25
26
27
28
29
30
31
32
33
34
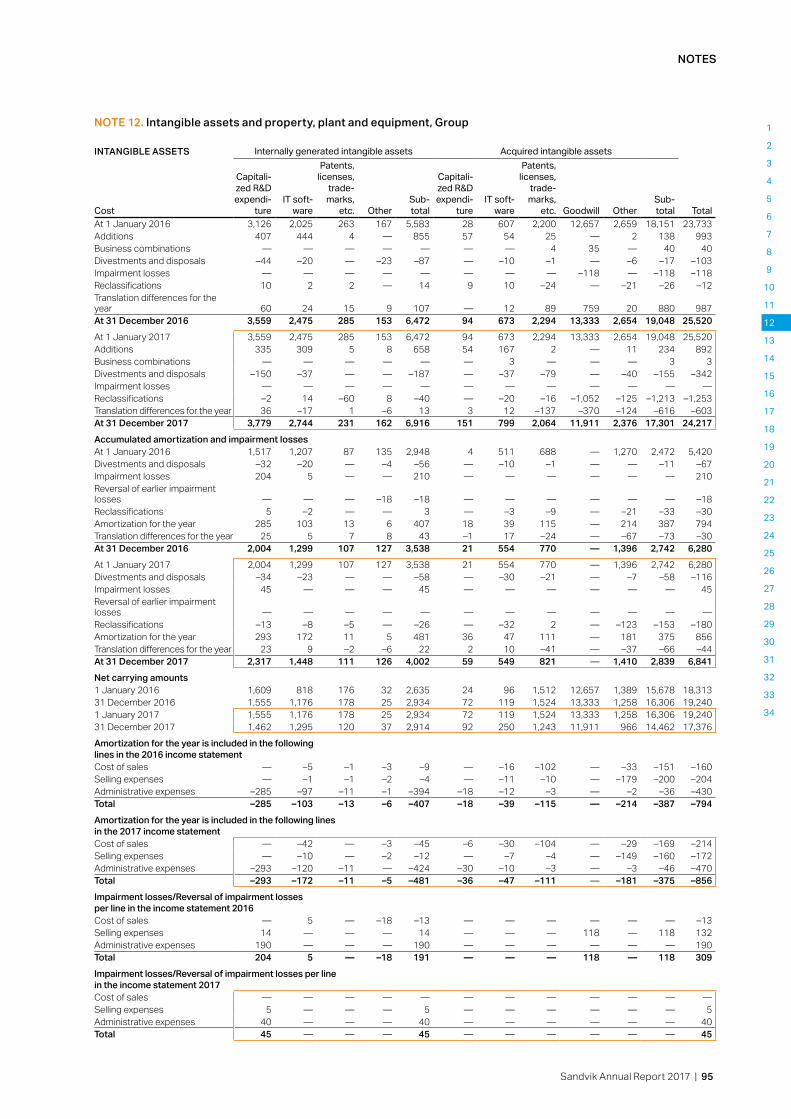
NOTES
NOTE 12. Intangible assets and property, plant and equipment, Group
INTANGIBLE ASSETS Cost
Internally generated intangible assets Acquired intangible assets
Capitali-zed R&D expendi-
tureIT soft-
ware
Patents, licenses,
trade-marks,
etc. OtherSub- total
Capitali-zed R&D expendi-
tureIT soft-
ware
Patents, licenses,
trade-marks,
etc. Goodwill OtherSub- total Total
At 1 January 2016 3,126 2,025 263 167 5,583 28 607 2,200 12,657 2,659 18,151 23,733Additions 407 444 4 — 855 57 54 25 — 2 138 993Business combinations — — — — — — — 4 35 — 40 40Divestments and disposals –44 –20 — –23 –87 — –10 –1 — –6 –17 –103Impairment losses — — — — — — — — –118 — –118 –118Reclassifications 10 2 2 — 14 9 10 –24 — –21 –26 –12Translation differences for the year 60 24 15 9 107 — 12 89 759 20 880 987At 31 December 2016 3,559 2,475 285 153 6,472 94 673 2,294 13,333 2,654 19,048 25,520At 1 January 2017 3,559 2,475 285 153 6,472 94 673 2,294 13,333 2,654 19,048 25,520Additions 335 309 5 8 658 54 167 2 — 11 234 892Business combinations — — — — — — 3 — — — 3 3Divestments and disposals –150 –37 — — –187 — –37 –79 — –40 –155 –342Impairment losses — — — — — — — — — — — —Reclassifications –2 14 –60 8 –40 — –20 –16 –1,052 –125 –1,213 –1,253Translation differences for the year 36 –17 1 –6 13 3 12 –137 –370 –124 –616 –603At 31 December 2017 3,779 2,744 231 162 6,916 151 799 2,064 11,911 2,376 17,301 24,217Accumulated amortization and impairment losses At 1 January 2016 1,517 1,207 87 135 2,948 4 511 688 — 1,270 2,472 5,420Divestments and disposals –32 –20 — –4 –56 — –10 –1 — — –11 –67Impairment losses 204 5 — — 210 — — — — — — 210Reversal of earlier impairment losses — — — –18 –18 — — — — — — –18Reclassifications 5 –2 — — 3 — –3 –9 — –21 –33 –30Amortization for the year 285 103 13 6 407 18 39 115 — 214 387 794Translation differences for the year 25 5 7 8 43 –1 17 –24 — –67 –73 –30At 31 December 2016 2,004 1,299 107 127 3,538 21 554 770 — 1,396 2,742 6,280At 1 January 2017 2,004 1,299 107 127 3,538 21 554 770 — 1,396 2,742 6,280Divestments and disposals –34 –23 — — –58 — –30 –21 — –7 –58 –116Impairment losses 45 — — — 45 — — — — — — 45Reversal of earlier impairment losses — — — — — — — — — — — —Reclassifications –13 –8 –5 — –26 — –32 2 — –123 –153 –180Amortization for the year 293 172 11 5 481 36 47 111 — 181 375 856Translation differences for the year 23 9 –2 –6 22 2 10 –41 — –37 –66 –44At 31 December 2017 2,317 1,448 111 126 4,002 59 549 821 — 1,410 2,839 6,841Net carrying amounts1 January 2016 1,609 818 176 32 2,635 24 96 1,512 12,657 1,389 15,678 18,31331 December 2016 1,555 1,176 178 25 2,934 72 119 1,524 13,333 1,258 16,306 19,2401 January 2017 1,555 1,176 178 25 2,934 72 119 1,524 13,333 1,258 16,306 19,24031 December 2017 1,462 1,295 120 37 2,914 92 250 1,243 11,911 966 14,462 17,376Amortization for the year is included in the following lines in the 2016 income statementCost of sales — –5 –1 –3 –9 — –16 –102 — –33 –151 –160Selling expenses — –1 –1 –2 –4 — –11 –10 — –179 –200 –204Administrative expenses –285 –97 –11 –1 –394 –18 –12 –3 — –2 –36 –430Total –285 –103 –13 –6 –407 –18 –39 –115 — –214 –387 –794Amortization for the year is included in the following lines in the 2017 income statementCost of sales — –42 — –3 –45 –6 –30 –104 — –29 –169 –214Selling expenses — –10 — –2 –12 — –7 –4 — –149 –160 –172Administrative expenses –293 –120 –11 — –424 –30 –10 –3 — –3 –46 –470Total –293 –172 –11 –5 –481 –36 –47 –111 — –181 –375 –856Impairment losses/Reversal of impairment losses per line in the income statement 2016Cost of sales — 5 — –18 –13 — — — — — — –13Selling expenses 14 — — — 14 — — — 118 — 118 132Administrative expenses 190 — — — 190 — — — — — — 190Total 204 5 — –18 191 — — — 118 — 118 309Impairment losses/Reversal of impairment losses per line in the income statement 2017Cost of sales — — — — — — — — — — — —Selling expenses 5 — — — 5 — — — — — — 5Administrative expenses 40 — — — 40 — — — — — — 40Total 45 — — — 45 — — — — — — 45
Sandvik Annual Report 2017 | 95
1
2
3
4
5
6
7
8
9
10
11
12
13
14
15
16
17
18
19
20
21
22
23
24
25
26
27
28
29
30
31
32
33
34

NOTES
For 2016, the impairment losses/reversal of impairment losses amounted to 309 million SEK and were related to the business areas Sandvik Mining and Rock Technology 270 million SEK, Sandvik Materials Technology –4 million SEK and Group common 43 million SEK.
PROPERTY, PLANT AND EQUIPMENT
CostLand and buildings
Plant and machinery
Equipment, tools, fixtures
and fittingsConstruction
in progress TotalAt 1 January 2016 16,249 40,782 6,332 2,495 65,857Additions 216 1,328 199 1,662 3,404Business combinations — — 1 — 1Divestments and disposals –335 –1,681 –308 –22 –2,347Reclassifications 204 511 187 –1,725 –823Translation differences for the year 668 1,406 271 75 2,420At 31 December 2016 17,001 42,346 6,681 2,484 68,512
At 1 January 2017 17,001 42,346 6,681 2,484 68,512Additions 258 1,537 197 1,666 3,658Business combinations — — — — —Divestments and disposals –736 –2,616 –588 –166 –4,107Reclassifications 113 –1,218 56 –1,585 –2,632Translation differences for the year –224 –390 –60 –22 –697At 31 December 2017 16,411 39,660 6,287 2,376 64,734
Depreciation and impairment lossesAt 1 January 2016 7,166 27,720 4,641 0 39,526Divestments and disposals –291 –1,430 –282 — –2,003Reclassifications –63 –713 16 5 –755Depreciation for the year 521 2,629 431 — 3,581Impairment losses 41 62 2 — 106Reversal of earlier impairment losses –12 –58 — –5 –75Translation differences for the year 271 953 198 — 1,422At 31 December 2016 7,632 29,165 5,006 0 41,803
At 1 January 2017 7,632 29,165 5,006 0 41,803Divestments and disposals –324 –1,977 –516 — –2,817Reclassifications –281 –1,874 –88 — –2,243Depreciation for the year 530 2,688 446 — 3,663Impairment losses 103 216 2 — 322Reversal of earlier impairment losses — –35 — — –35Translation differences for the year –61 –240 –57 — –358At 31 December 2017 7.599 27,942 4,793 0 40,335
Net carrying amounts1 January 2016 9,083 13,062 1,691 2,495 26,33131 December 2016 9,369 13,181 1,675 2,484 26,7091 January 2017 9,369 13,181 1,675 2,484 26,70931 December 2017 8,811 11,718 1,494 2,376 24,399
For 2017, the impairment losses/reversal of impariment losses amounted to 45 million SEK and were related to the business areas Sandvik Mining and Rock Technology –40 million SEK and Sandvik Machining Solutions –5 million SEK.
96 | Sandvik Annual Report 2017
1
2
3
4
5
6
7
8
9
10
11
12
13
14
15
16
17
18
19
20
21
22
23
24
25
26
27
28
29
30
31
32
33
34
Note 12, continued

NOTES
Additional informationItems of property, plant and equipment totaling 281 million SEK (214) have been pledged as security for liabilities. In 2017, contrac-tual commitments for the acquisition of property, plant and equip-ment amounted to 231 million SEK (299).
Borrowing costs included in the cost of assets during the year amounted to zero for 2017 and 2016.
Disclosure regarding government grants in the GroupGovernment grants during the year amounted to 10 million SEK (34).
Impairment tests of goodwillGoodwill was impairment tested on the balance sheet date of 31 December 2017. As stated below, the carrying amount of goodwill in the consolidated balance sheet is 11,911 million SEK (13,333), essentially related to a number of major business combinations.
Carrying amountGoodwill by cash-generating unit 2016 2017Sandvik Machining Solutions Walter Group 1,059 1,092Seco Tools 253 256Wolfram 1,460 1,506Business area level 1,414 1,303Total 4,186 4,157
Sandvik Mining and Rock TechnologyBusiness area level 6,903 6,580Total 6,903 6,580
Sandvik Materials TechnologyBusiness area level 1,154 1,132Total 1,154 1,132
Other OperationsHyperion 1,046 950Total 1,046 950
Other 44 42Group total 13,333 12,861
Transfer to held for sale — -950Continuing operations 13,333 11,911
Consolidated goodwill is allocated to the cash-generating units stated above. The recoverable amount of all of the cash-generating units has been assessed based on estimates of value in use. Calcu-lations of value in use are based on the estimated future cash flows using forecasts covering a four-year period, which are in turn based on the three-year plans prepared annually by each of the business areas and approved by Sandvik Group Executive Management.
Impairment losses/Reversal of impairment losses per line in the income statement 2016
Land and buildings
Plant and machinery
Equipment, tools, fixtures
and fittingsConstruction
in progress TotalCost of sales 29 –15 — –5 9Selling expenses — 8 — — 8Administrative expenses — 12 2 — 14Total 29 5 2 –5 31
Impairment losses/Reversal of impairment losses per line in the income statement 2017Cost of sales 103 189 — — 292Selling expenses — –4 — — –4Administrative expenses — –3 2 — –1Total 103 182 2 — 287
Impairment losses/Reversal of impairment losses per business area 2016Sandvik Machining Solutions 3 –44 — — –41Sandvik Mining and Rock Technology 34 64 — — 98Sandvik Materials Technology –8 –16 — –5 –29Other Operations — 1 2 — 3Total 29 5 2 –5 31
Impairment losses/Reversal of impairment losses per business area 2017Sandvik Machining Solutions — –24 — — –24Sandvik Mining and Rock Technology — 4 2 — 6Sandvik Materials Technology 103 202 — — 305Other Operations — — — — —Total 103 182 2 — 287
Sandvik Annual Report 2017 | 97
1
2
3
4
5
6
7
8
9
10
11
12
13
14
15
16
17
18
19
20
21
22
23
24
25
26
27
28
29
30
31
32
33
34
Note 12, continued

NOTES
These plans are founded on the business areas’ strategies and an analysis of the current and anticipated business climate, and the impact this is expected to have on the market in which the business area operates. A range of economic indicators, which differ for each market, and external and internal studies of these, are used in the analysis of the business situation. The forecasts form the basis for how the values of the material assumptions are established.
The assumptions mentioned below reflect past experience and are consistent with external information. The most material assumptions when determining the value in use include anticipated demand, growth rate, operating margin, working capital require-ments and the discount rate. The factor used to calculate growth in the terminal period after four years was 2% for Walter (2), Seco Tools (2), Wolfram (2), Sandvik Machining Solutions business area level (3), Sandvik Materials Technology business area level (2) and Hyperion (2), and 3% for Sandvik Mining and Rock Technology business area level (3). Need of working capital beyond the four-year period is deemed to increase approximately as the expected growth in the terminal period. The discount rate consists of a weighted average cost of capital for borrowed capital and share-holders’ equity and was assumed to amount to 10% (10) before tax. These assumptions apply to all cash-generating units. The specific risks of the cash-generating units have been adjusted for in the future cash flow forecasts.
Production and marketing processes of acquired businesses have, in most cases, been integrated into other Sandvik opera-tions to such an extent that it is no longer possible to identify the cash flows and assets of the originally acquired businesses. For
such reason, the impairment tests were largely made at a higher level although in no case above segment level. Mobile Crushing and Screening and Drilling and Completions , which were defined as own cash-generating units within the business areas Sandvik Construction and Other Operations (Sandvik Venture) earlier, have been included in Sandvik Mining and Rock Technology during 2016 and have been tested for impairment on a business area level, due to reasons mentioned above. At present, the activities of Walter, Seco Tools, Wolfram and Hyperion are conducted in such a way that it has been possible to separately test goodwill allocated to these acquisitions.
Goodwill attributable to Hyperion, amounting to 950 million SEK, has been classified as assets held for sale and is measured at cost.
Goodwill testing did not indicate any impairment requirement. Sensitivity in the calculations where impairment was not carried out implies that the goodwill value would be maintained even if the discount rate was increased by 2 percentage points or if the long-term growth rate was lowered by 2 percentage points. The goodwill value would also be maintained, given an operating margin drop by 2 percentage points.
Other impairment testsProperty, plant and equipment and intangible assets with a definite useful life were tested for impairment when an indication for impair-ment was identified. The tests resulted in impairment losses of 332 million SEK (222) for 2017. For property, plant and equipment the amount was 287 million SEK and for intangible assets 45 million SEK (excluding goodwill).
NOTE 13. Intangible assets and property, plant and equipment, Parent Company
Intangible assetsPatents and other intangible assets Goodwill Total
CostAt 1 January 2016 112 — 112Additions 6 1391 145Divestments and disposals –6 — –6Reclassifications 9 — 9At 31 December 2016 121 139 260
At 1 January 2017 121 139 260Additions 3 — 3Divestments and disposals –14 — –14Reclassifications 2 — 2At 31 December 2017 112 139 251 1) Generated from internal transactions within the Group.
98 | Sandvik Annual Report 2017
1
2
3
4
5
6
7
8
9
10
11
12
13
14
15
16
17
18
19
20
21
22
23
24
25
26
27
28
29
30
31
32
33
34
Note 12, continued

NOTES
Property, plant and equipmentLand and buildings
Plant and machinery
Equipment, tools, fixtures
and fittingsConstruction
in progress TotalCostAt 1 January 2016 1,703 14,324 1,508 1,285 18,820Additions 6 177 35 620 838Divestments and disposals –4 –191 –28 –17 –240Reclassifications 14 568 60 –651 –9At 31 December 2016 1,719 14,878 1,575 1,237 19,409
At 1 January 2017 1,719 14,878 1,575 1,237 19,409Additions 23 110 22 729 884Divestments and disposals –60 –899 –65 –43 –1,067Reclassifications 29 422 34 –487 –2At 31 December 2017 1,711 14,511 1,566 1,436 19,224
RevaluationsAt 1 January 2016 41 — — — 41Divestments and disposals –2 — — — –2At 31 December 2016 39 — — — 39
At 1 January 2017 39 — — — 39Divestments and disposals — — — — —At 31 December 2017 39 — — — 39
DepreciationAt 1 January 2016 662 9,398 1,076 — 11,136Divestments and disposals –1 –178 –26 — –205Reclassifications 0 –2 2 — 0Depreciation for the year 51 721 98 — 870Impairment losses — 37 — — 37At 31 December 2016 712 9,976 1,150 — 11,838
At 1 January 2017 712 9,976 1,150 — 11,838Divestments and disposals –36 –642 –57 — –735Reclassifications 1 0 –1 — 0Depreciation for the year 52 731 89 — 872Impairment losses — 51 — — 51Reversal of impairment losses — –3 — — –3At 31 December 2017 729 10,113 1,181 — 12,023
Net carrying amounts1 January 2016 1,082 4,926 432 1,285 7,72531 December 2016 1,046 4,902 425 1,237 7,6101 January 2017 1,046 4,902 425 1,237 7,61031 December 2017 1,021 4,398 385 1,436 7,240
Patents and other intangible assets Goodwill Total
Accumulated amortizationAt 1 January 2016 92 — 92Amortization for the year 5 2 7At 31 December 2016 97 2 99Net carrying amount at end of year 24 137 161
At 1 January 2017 97 2 99Divestments and disposals –11 — –11Reclassifications 0 — 0Amortization for the year 4 28 32At 31 December 2017 90 30 120Net carrying amount at end of year 22 109 131 AMORTIZATION FOR THE YEAR IS INCLUDED IN THE FOLLOWING LINES IN THE INCOME STATEMENT
2016 2017Administrative expenses 7 32Total 7 32
Sandvik Annual Report 2017 | 99
1
2
3
4
5
6
7
8
9
10
11
12
13
14
15
16
17
18
19
20
21
22
23
24
25
26
27
28
29
30
31
32
33
34
Note 13, continued

NOTES
NOTE 14. Shares in Group companiesParent Company
2016 2017CostAt beginning of year 33,881 34,469Additions 0 0Capital contributions 1,269 265Divestments –681 –651Total 34,469 34,083
Parent Company (Continued) 2016 2017Accumulated impairment lossesAt beginning of year –676 –1,374Impairment losses for the year –698 –167Impairment reversed during the year 0 0Total –1,374 -1,541
Accumulated revaluations At beginning of year 16 16Total 16 16Carrying amount at year-end 33,111 32,558
SANDVIK AB’S HOLDINGS OF SHARES AND PARTICIPATIONS IN SUBSIDIARIES, DIRECT HOLDINGS, ACCORDING TO BALANCE SHEET AT 31 DECEMBER
2016 2017
Company, domicileCorp. Reg.
numberNo. of
shares Holding,
%2)
Carrying amount
000s SEKNo. of
sharesHolding,
%2)
Carrying amount
000s SEKSWEDENFörvaltningsbolaget Predio 4 KB, Sandviken 916624-2181 — 03) 0 — — —Gimo Utbildningsaktiebolag, Gimo 556061-4041 1,000 91 5,091 1,000 91 8,354Gusab Holding AB, Sandviken 556001-9290 1,831,319 100 53,474 1,831,319 100 53,474Gusab Stainless AB, Mjölby 556012-1138 200,000 100 23,788 200,000 100 23,788Industri AB Skomab, Sandviken 556008-8345 2,000 100 25,809 2,000 100 23,729Rammer Svenska AB, Sandviken 556249-4004 3,000 100 851 — — —Sandvik Global Purchasing AB, Stockholm 556052-4315 1,000 100 50 1,000 100 50Sandvik Mining AB, Sandviken1) 556659-6952 1,000 100 100 1,000 100 100AB Sandvik Coromant, Sandviken1) 556234-6865 1,000 100 50 1,000 100 50Sandvik Coromant Sverige AB, Stockholm1) 556350-7846 1,000 100 100 1,000 100 100Sandvik Far East Ltd. AB, Sandviken 556043-7781 10,000 100 10,000 10,000 100 10,000Sandvik Försäkrings AB, Sandviken 516401-6742 1,500 100 15,000 1,500 100 35,000Sandvik Hyperion AB, Stockholm1) 556234-6857 1,000 100 50 1,000 100 50Sandvik Besöksservice AB, Sandviken1) 556235-3838 1,000 100 50 1,000 100 50Sandvik Intellectual Property AB, Sandviken 556288-9401 1,000,000 100 3,499,950 1,000,000 100 3,499,950AB Sandvik International, Sandviken1) 556147-2977 1,000 100 50 1,000 100 50Sandvik Materials Technology EMEA AB, Stockholm 556734-2026 501,000 100 50,100 501,000 100 50,100AB Sandvik Materials Technology, Sandviken1) 556234-6832 1,000 100 2,050 1,000 100 2,050Sandvik Construction AB, Sandviken1) 556664-9983 1,000 100 100 1,000 100 100Sandvik Mining and Construction Sverige AB, Sandviken1) 556288-9443 1,000 100 50 1,000 100 50Sandvik Mining and Construction Tools AB, Sandviken1) 556234-7343 1,000 100 50 1,000 100 50Sandvik Nora AB, Nora 556075-0506 80,000 100 8,000 80,000 100 8,000Sandvik Powder Solutions AB, Surahammar 556032-6760 600 100 60,000 600 100 60,000AB Sandvik Process Systems, Sandviken1) 556312-2992 1,000 100 100 — — —Sandvik Rotary Tools AB, Köping 556191-8920 101,000 100 103,231 101,000 100 103,231AB Sandvik Skogsfastigheter, Sandviken 556579-5464 1,000 100 51 1,000 100 51AB Sandvik Steel Investment, Sandviken 556350-7853 1,000 100 100 1,000 100 100Sandvik Stål Försäljnings AB, Stockholm1) 556251-5386 1,000 100 50 1,000 100 50Sanrip AB, Sandviken1) 556692-0038 1,000 100 100 1,000 100 100Sandvik Machining Solutions AB, Sandviken1) 556692-0053 1,000 100 100 1,000 100 100Sandvik Utbildnings AB, Sandviken 556304-8791 910 91 91 910 91 9,391Sandvikens Brukspersonals Byggnadsförening upa, Sandviken 785500-1686 — 100 0 — 100 0Dormer Pramet AB, Halmstad 556240-8210 80,000 100 46,145 80,000 100 46,145Walter Norden AB, Halmstad 556752-4698 15,000 100 5,139 15,000 100 5,139Sandvik Mining and Construction Köping AB, Köping1) 556776-9525 1,000 100 100 1,000 100 100Wire Sandviken AB, Sandviken1) 556779-3897 1,000 100 100 1,000 100 100Sandvik IT Services AB, Sandviken1) 556788-9059 1,000 100 100 1,000 100 100Sandvik Venture AB, Stockholm1) 556868-7155 1,000 100 100 1,000 100 100Sandvik Credit AB, Stockholm 556843-7296 10,000 100 75,000 10,000 100 75,000Seco Tools AB, Fagersta 556071-1060 145,467,690 100 15,658,859 145,467,690 100 15,658,859Svensk Export Flyg AB, Stockholm 556934-7452 100,000 100 179 — — —
1) Subsidiaries conducting business on behalf of the Parent Company. 2) Refers to voting rights, which also equals share of capital unless
otherwise indicated. 3) Remaining shares are held by other Group companies.
4) Share of capital 76%.5) Shares up to an ownership interest of 100% are held by other Group companies.
100 | Sandvik Annual Report 2017
1
2
3
4
5
6
7
8
9
10
11
12
13
14
15
16
17
18
19
20
21
22
23
24
25
26
27
28
29
30
31
32
33
34

NOTES
SANDVIK AB’S HOLDINGS OF SHARES AND PARTICIPATIONS IN FOREIGN SUBSIDIARIES, DIRECT HOLDINGS,ACCORDING TO BALANCE SHEET AT 31 DECEMBER
2016 2017
Country/Location Company No. of shares Holding,
%2)
Carrying amount
000s SEK No. of shares Holding,
%2)
Carrying amount
000s SEKAustralia Sandvik Australia Pty. Ltd. — 643.4) 859,926 — 253.4) 235,382
Sandvik Australian Ltd. Partnership — 99 — — 99 —Brazil Dormer Tools S.A. 2,137,623,140 100 461,197 2,137,623,140 100 461,197
Sandvik do Brasil S.A. 1,894,797,190 100 821,575 1,894,797,190 100 821,575Sandvik Materials Technology do Brasil S.A. 10,877,380 100 142,093 10,877,380 100 193,284Sandvik MGS S.A. 14,999,998 100 175,661 14,999,998 100 11,064Sandvik Mining and Construction do Brasil S.A. 85,329,996 100 942,434 85,329,996 100 942,434
Walter do Brasil Ltda 1,809,999 100 109,574 1,809,999 100 109,574Bulgaria Sandvik Bulgaria Ltd. — 100 0 — 100 0Chile Sandvik Credit Chile S.A. 9,900 99 165,331 9,900 99 165,331China Sandvik China Holding Co Ltd. — 100 1,157,560 — 100 1,263,072
Sandvik Materials Technology (China) Ltd. — 583) 207,854 — 583) 282,749Czech Republic Sandvik CZ s.r.o. — 100 0 — 100 0Democratic Republic of Congo
Sandvik Mining and Construction DRC S.P.R.L. 9,990 100 66 9,990 100 —
Hungary Sandvik Magyarorszag Kft. — 100 3,258 — 100 3,258India Sandvik Asia Ltd. 16,030,241 175) 277,028 1,801,241 755) 252,481Ireland Sandvik Mining and Construction
Logistics Ltd. 100 100 5,508 100 100 5,508Japan Sandvik K.K. 2,780,000 100 224,701 2,780,000 100 224,701Korea Sandvik Korea Ltd. 752,730 100 46,856 752,730 100 46,856Mali Sandvik Mining and Construction Mali 25,000 100 3,462 25,000 100 3,462Mexico Sandvik Méxicana S.A. de C.V. 406,642,873 903) 712,312 406,642,873 903) 712,312Mongolia Sandvik Mongolia LLC. 400,000 100 2,682 400,000 100 2,682Netherlands Sandvik Finance B.V. 18,788 100 7,093,582 18,788 100 7,093,582
Frost Holding B.V. 1 100 0 1 100 0Peru Sandvik del Perú S.A. 6,562,795 903) 26,025 6,562,795 903) 26,025Slovakia Sandvik Slovakia s.r.o. — 100 1,238 — 100 1,238Turkey Sandvik Endüstriyel Mamüller
Sanayi ve Ticaret A.S. 125,154,588 100 3,200 125,154,588 100 3,200UAE Sandvik Middle East FZE. 1 100 19,886 1 100 19,886Zimbabwe Sandvik Mining and Construction
Zimbabwe (Pty) Ltd. 233,677 100 3,269 233,677 100 3,269 Total 33,110,586 32,557,783
1) Subsidiaries conducting business on behalf of the Parent Company. 2) Refers to voting rights, which also equals share of capital unless otherwise indicated. 3) Remaining shares are held by other Group companies. 4) Share of capital 76%.5) Shares up to an ownership interest of 100% are held by other Group companies.
Sandvik Annual Report 2017 | 101
1
2
3
4
5
6
7
8
9
10
11
12
13
14
15
16
17
18
19
20
21
22
23
24
25
26
27
28
29
30
31
32
33
34
Note 14, continued
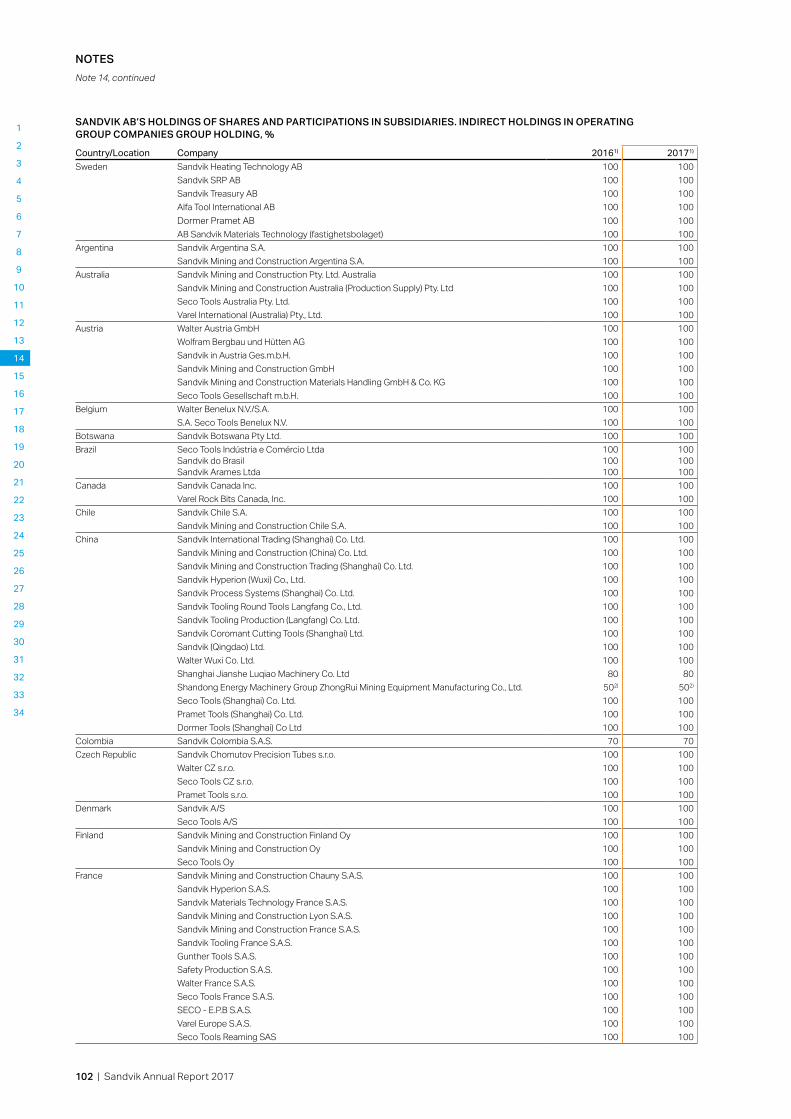
NOTES
SANDVIK AB’S HOLDINGS OF SHARES AND PARTICIPATIONS IN SUBSIDIARIES. INDIRECT HOLDINGS IN OPERATING GROUP COMPANIES GROUP HOLDING, %
Country/Location Company 20161) 20171)
Sweden Sandvik Heating Technology AB 100 100 Sandvik SRP AB 100 100 Sandvik Treasury AB 100 100
Alfa Tool International AB 100 100Dormer Pramet AB 100 100
AB Sandvik Materials Technology (fastighetsbolaget) 100 100Argentina Sandvik Argentina S.A. 100 100 Sandvik Mining and Construction Argentina S.A. 100 100Australia Sandvik Mining and Construction Pty. Ltd. Australia 100 100 Sandvik Mining and Construction Australia (Production Supply) Pty. Ltd 100 100
Seco Tools Australia Pty. Ltd. 100 100 Varel International (Australia) Pty., Ltd. 100 100Austria Walter Austria GmbH 100 100 Wolfram Bergbau und Hütten AG 100 100 Sandvik in Austria Ges.m.b.H. 100 100 Sandvik Mining and Construction GmbH 100 100 Sandvik Mining and Construction Materials Handling GmbH & Co. KG 100 100 Seco Tools Gesellschaft m.b.H. 100 100Belgium Walter Benelux N.V./S.A. 100 100 S.A. Seco Tools Benelux N.V. 100 100Botswana Sandvik Botswana Pty Ltd. 100 100Brazil Seco Tools Indústria e Comércio Ltda
Sandvik do BrasilSandvik Arames Ltda
100100100
100100100
Canada Sandvik Canada Inc. 100 100Varel Rock Bits Canada, Inc. 100 100
Chile Sandvik Chile S.A. 100 100 Sandvik Mining and Construction Chile S.A. 100 100China Sandvik International Trading (Shanghai) Co. Ltd. 100 100 Sandvik Mining and Construction (China) Co. Ltd. 100 100 Sandvik Mining and Construction Trading (Shanghai) Co. Ltd. 100 100 Sandvik Hyperion (Wuxi) Co., Ltd. 100 100 Sandvik Process Systems (Shanghai) Co. Ltd. 100 100 Sandvik Tooling Round Tools Langfang Co., Ltd. 100 100 Sandvik Tooling Production (Langfang) Co. Ltd. 100 100 Sandvik Coromant Cutting Tools (Shanghai) Ltd. 100 100 Sandvik (Qingdao) Ltd. 100 100 Walter Wuxi Co. Ltd. 100 100 Shanghai Jianshe Luqiao Machinery Co. Ltd 80 80 Shandong Energy Machinery Group ZhongRui Mining Equipment Manufacturing Co., Ltd. 502) 502)
Seco Tools (Shanghai) Co. Ltd. 100 100Pramet Tools (Shanghai) Co. Ltd. 100 100
Dormer Tools (Shanghai) Co Ltd 100 100Colombia Sandvik Colombia S.A.S. 70 70Czech Republic Sandvik Chomutov Precision Tubes s.r.o. 100 100 Walter CZ s.r.o. 100 100 Seco Tools CZ s.r.o. 100 100 Pramet Tools s.r.o. 100 100Denmark Sandvik A/S 100 100 Seco Tools A/S 100 100Finland Sandvik Mining and Construction Finland Oy 100 100 Sandvik Mining and Construction Oy 100 100 Seco Tools Oy 100 100France Sandvik Mining and Construction Chauny S.A.S. 100 100 Sandvik Hyperion S.A.S. 100 100 Sandvik Materials Technology France S.A.S. 100 100 Sandvik Mining and Construction Lyon S.A.S. 100 100 Sandvik Mining and Construction France S.A.S. 100 100
Sandvik Tooling France S.A.S. 100 100Gunther Tools S.A.S. 100 100
Safety Production S.A.S. 100 100 Walter France S.A.S. 100 100 Seco Tools France S.A.S. 100 100 SECO - E.P.B S.A.S. 100 100 Varel Europe S.A.S. 100 100 Seco Tools Reaming SAS 100 100
102 | Sandvik Annual Report 2017
1
2
3
4
5
6
7
8
9
10
11
12
13
14
15
16
17
18
19
20
21
22
23
24
25
26
27
28
29
30
31
32
33
34
Note 14, continued

NOTES
Country/Location Company 20161) 20171)
Germany Sandvik Mining and Construction Crushing Technology GmbH 100 100 Prototyp-Werke GmbH 100 100 Sandvik Materials Technology Deutschland GmbH 100 100 Sandvik Mining and Construction Europe GmbH 100 100 Sandvik Mining and Construction Supply GmbH 100 100 Sandvik Tooling Deutschland GmbH 100 100 TDM Systems GmbH 100 100 Walter AG
Comara GmbH100100
100100
Walter Deutschland GmbH 100 100 Werner Schmitt PKD-Werkzeug GmbH 100 100 Seco Tools GmbH 100 100 Pramet GmbH 100 100 Sandvik Mining & Construction Central Europe GmbH 100 100Ghana Sandvik Mining and Construction Ghana Ltd. 100 100Hong Kong Sandvik Hong Kong Ltd. 100 100Hungary Walter Hungaria Kft. 100 100 Seco Tools Kft. 100 100India Walter Tools India Pvt. Ltd. 100 100 Seco Tools India Private Limited 100 100Indonesia PT Sandvik Indonesia 100 100 PT Sandvik Mining and Construction Indonesia 100 100 PT Sandvik SMC 100 100Italy Sandvik Italia S.p.A. 100 100 Walter Italia S.R.L. 100 100 Seco Tools Italia S.p.A. 100 100Japan Sandvik Tooling Supply Japan K.K. 100 100 Walter Japan K. K. 100 100 Seco Tools Japan K.K. 100 100Kazakhstan Sandvik Mining and Construction Kazakhstan Ltd 100 100Korea Sandvik SuhJun Ltd. 100 100 Walter Korea Ltd. 100 100 Seco Tools Korea Ltd. 100 100Malaysia Sandvik Malaysia Sdn. Bhd. 100 100 Sandvik Mining and Construction (Malaysia) Sdn. Bhd. 100 100Mexico Sandvik de México S.A. de C.V. 100 100 Sandvik Mining and Construction de México S.A. de C.V. 100 100
Walter Tools S.A. de C.V. 100 100Sandvik Hard Materials de Mexico S.A. de C.V. 100 100
Varel de Mexico S.A. de C.V. 100 100 Varel International de Mexico S.A. de C.V. 100 100Namibia Sandvik Namibia Pty Ltd 100 100Netherlands Sandvik Benelux B.V. 100 100
Jabro Tools B.V. 100 100 SGL Technology B.V. 100 100Nigeria Sandvik Mining and Construction Nigeria Ltd. 100 100Norway Teeness ASA 100 100 Sandvik Norge AS 100 100 Seco Tools AS 100 100New Zealand Sandvik New Zealand Ltd. 100 100Philippines Sandvik Tamrock (Philippines) Inc. 100 100Poland Walter Polska Sp. z.o.o. 100 100 Seco Tools (Poland) Sp. z.o.o. 100 100Romania Sandvik SRL 100 100 Walter Tools SRL 100 100Russia LLC Sandvik 100 100 OOO Walter 100 100 Sandvik Mining and Construction CIS LLC 100 100 Sandvik-MKTC OAO 100 100 Firma ALG LLC
LLC Pramet100100 100
LLC "Seco Tools" 100 100
Sandvik Annual Report 2017 | 103
1
2
3
4
5
6
7
8
9
10
11
12
13
14
15
16
17
18
19
20
21
22
23
24
25
26
27
28
29
30
31
32
33
34
Note 14, continued

NOTES
1) Refers to share of capital, which also corresponds to voting rights for the total number of shares, unless otherwise stated.2) Share of votes 60% (60).
Country/Location Company 20161) 20171)
Singapore Sandvik Mining and Construction S.E. Asia Pte. Ltd. 100 100 Sandvik South East Asia Pte. Ltd. 100 100 Walter AG Singapore Pte. Ltd. 100 100 Seco Tools (SEA) Pte. Ltd. 100 100Slovakia Walter Slovakia s.r.o. 100 100Slovenia Sandvik D.o.o.
Walter Tools d.o.o.100100
100100
South Africa Sandvik Mining RSA (Pty) Ltd. 100 100 Sandvik (Pty) Ltd. 100 100 Seco Tools South Africa (Pty) Ltd. 100 100Spain Sandvik Española S.A. 100 100 Walter Tools Iberica S.A.U. 100 100 Seco Tools España S.A. 100 100Switzerland Sandvik AG 100 100 Santrade Ltd. 100 100 Walter (Schweiz) AG 100 100 Seco Tools AG 100 100Taiwan Sandvik Hyperion Taiwan Limited 100 100 Sandvik Taiwan Ltd. 100 100Tanzania Sandvik Mining and Construction Tanzania Ltd. 100 100Thailand Sandvik Thailand Ltd. 100 100
Walter (Thailand) Co. Ltd. 100 100 Seco Tools (Thailand) Co., Ltd 100 100Turkey Walter Cutting Tools Industry and Trade LLC 100 100
Seco Tools Kesici Takmlar Makina San.Tic. A.S 100 100UK Dormer Tools Ltd. 100 100 Sandvik Ltd. 100 100 Sandvik Osprey Ltd. 100 100
Walter GB Ltd. 100 100 Seco Tools (U.K) Ltd. 100 100 Downhole Products Limited 100 100Ukraine Sandvik Ukraine 100 100US Diamond Innovations Inc. 100 100
TDM System Inc. 100 100 Sandvik Wire and Heating Technology Corporation 100 100 Sandvik Thermal Process Inc. 100 100 Pennsylvania Extruded Tube Co. 70 70
Dormer Pramet Sales USA 100 100Sandvik Customer Finance LLC 100 100
Sandvik Inc. 100 100 Sandvik Mining and Construction USA LLC 100 100
Sandvik Process Systems LLC 100 100 Sandvik Special Metals LLC 100 100 Walter USA LLC 100 100 Seco Tools LLC 100 100 Niagara Cutter,LLC
uFab LLC100100
100100
Precorp Inc. 100 100 Varel International Ind., LLC 100 100 Aberdeen Products, Inc. 100 100Zambia Sandvik Mining and Construction Zambia Ltd. 100 100
104 | Sandvik Annual Report 2017
1
2
3
4
5
6
7
8
9
10
11
12
13
14
15
16
17
18
19
20
21
22
23
24
25
26
27
28
29
30
31
32
33
34

NOTES
NOTE 15. Investments in associated companies
Group shares in associated companies 2016 2017Accumulated share of equityAt beginning of year 236 246Acquisition of associates — —Divestment of associates –25 –24Share of profits for the year 16 56Capital contribution 25 —Less dividend received –11 –6Translation differences during the year 5 –3Carrying amount at end of year 246 269
Parent Company’s shares in associated companies 2016 2017Accumulated costAt beginning of year 4 4Divestment of associates — –4Carrying amount at end of year 4 0
SUMMARIZED FINANCIAL INFORMATION OF ASSOCIATED COMPANIES, AND THE GROUP’S SHARE
2017 Country Revenue Profit Assets Liabilities EquityGroup’s
share, %Owned directly by Sandvik ABOerlikon Balzers Sandvik Coating AB (sold in August 2017) Sweden 60 6 — — — —
Owned indirectly by Sandvik AB Eimco Elecon India 260 32 401 45 356 25.1Fagersta Stainless AB Sweden 1,560 63 819 464 355 50.0Fagersta Seco AB Sweden 0 0 3 2 1 50.0Fagerstahälsan AB Sweden 7 0 8 6 2 50.0Shanghai Innovatools Co. Ltd. China –6 0 12 3 9 40.0
2016 Country Revenue Profit Assets Liabilities EquityGroup’s
share, %Owned directly by Sandvik ABOerlikon Balzers Sandvik Coating AB Sweden 84 9 70 17 53 49.0
Owned indirectly by Sandvik AB Eimco Elecon India 182 21 335 47 288 25.1Fagersta Stainless AB Sweden 1,200 28 727 438 289 50.0Fagersta Seco AB Sweden 0 0 3 2 1 50.0Fagerstahälsan AB Sweden 7 0 9 7 2 50.0Shanghai Innovatools Co. Ltd. China 5 –1 12 3 9 40.0Bromma Business Jet AB Sweden 41 –8 — — — —
Additional informationThe close of the reporting period for the associate Eimco Elecon is 31 March 2017. The dividend paid in 2017 is included in the cal-culation of the proportion of equity. No financial statements as of a later date have been obtained. Other associates are recognized one month in arrears. The associated company Oerlikon Balzers Sandvik Coating AB was divested in 2017. Revenue and profit were recog-nized up to the date of sale.
Corp. Reg. No. Share of capital
and voting rights, %2017— — —
2016Oerlikon Balzers Sandvik Coating AB, Stockholm 556098-1333 49
Sandvik Annual Report 2017 | 105
1
2
3
4
5
6
7
8
9
10
11
12
13
14
15
16
17
18
19
20
21
22
23
24
25
26
27
28
29
30
31
32
33
34

NOTES
Group 2016 2017Non-current receivablesDerivatives designated as hedging instruments 58 104Funded pension plans 470 695Other non-interest-bearing receivables 425 347Other interest-bearing receivables 924 1,152Total 1,877 2,298
Whereof discontinued operations and assets held for sale –97 –78Continuing operations 1,780 2,220
Other current receivablesDerivatives designated as hedging instruments 210 491Due from customers for contract work 412 394Other non-interest-bearing receivables 2,349 2,815Other interest-bearing receivables 991 1,167Advances to suppliers 253 290Total 4,215 5,157
Whereof discontinued operations and assets held for sale –210 –691Continuing operations 4,005 4,466
NOTE 16. Non-current receivables and other current receivables
NOTE 17. Inventories
Group Parent Company2016 2017 2016 2017
Raw materials and consumables 4,598 5,434 820 1,014Work in progress 3,918 4,264 1,528 1,170Finished goods 12,441 12,683 579 742Total 20,957 22,381 2,927 2,926
Whereof discontinued operations 20 –993Continuing operations 20,977 21,388
Parent Company 2016 2017Non-current receivablesDerivatives 41 77Other non-interest-bearing receivables 0 0Other interest-bearing receivables 26 19Total 67 96
Other current receivablesDerivatives 27 30Other non-interest-bearing receivables 398 182Other interest-bearing receivables 1 2Total 426 214
Construction contracts, Group 2016 2017Contract costs incurred and recognized profits (less recognized losses) 12,924 12,767Advances received 546 88Amounts retained by customers 41 48Gross amount due from customers 412 394Gross amount due to customers 112 238
Cost of sales of the Group includes impairment of inventories of 408 million SEK (418) while cost of sales of the Parent Company includes impairment of 104 million SEK (35). There were no signifi-cant reversals of impairment losses during 2017 and 2016.
NOTE 18. Trade receivablesAGE ANALYSIS OF TRADE RECEIVABLES, GROUP
2016 2017
GrossAllowance for
bad debtsNet carrying
amount GrossAllowance for
bad debtsNet carrying
amountCurrent receivables 11,384 –126 11,258 12,091 –100 11,991Past due receivables 0–3 months 1,770 –33 1,738 1,719 –23 1,696Past due receivables 4–12 months 539 –180 359 592 –172 420Past due receivables >12 months 541 –528 14 465 –429 36Group total 14,235 –867 13,368 14,867 –724 14,143
Whereof discontinued operations –81 14 –67 –950 46 –904Continuing operations 14,154 –853 13,301 13,917 –678 13,239
106 | Sandvik Annual Report 2017
1
2
3
4
5
6
7
8
9
10
11
12
13
14
15
16
17
18
19
20
21
22
23
24
25
26
27
28
29
30
31
32
33
34
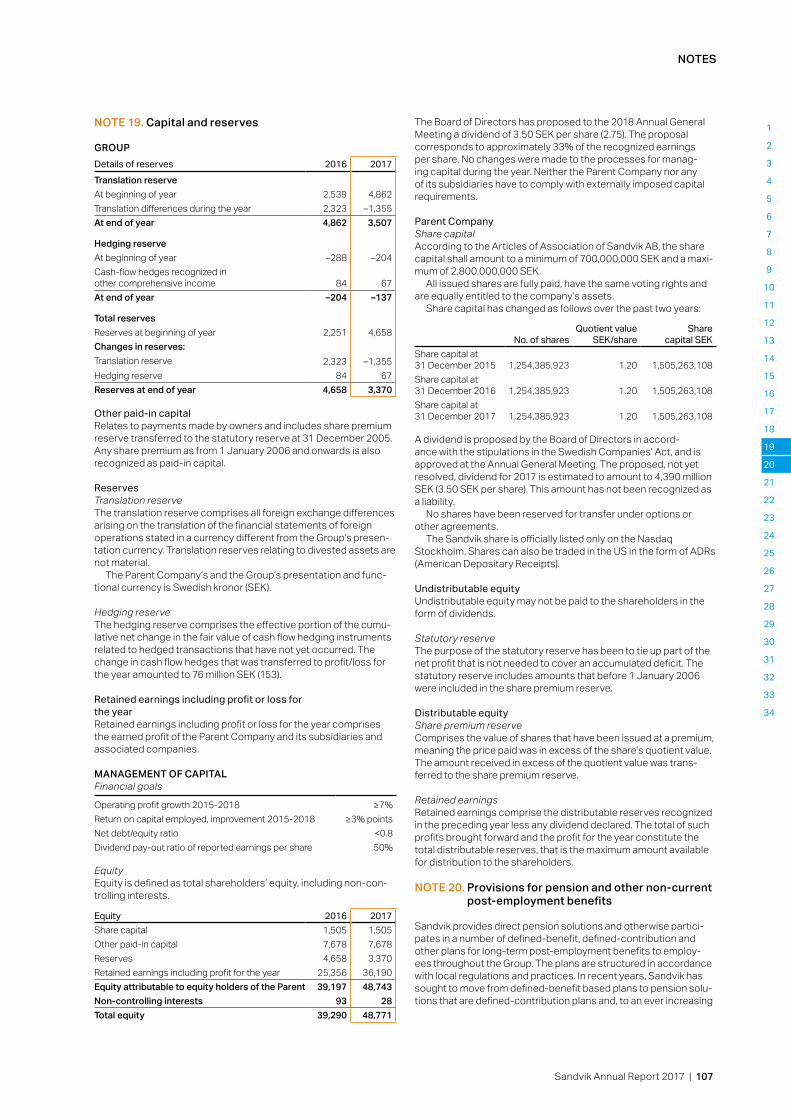
NOTES
NOTE 19. Capital and reserves
GROUPDetails of reserves 2016 2017Translation reserveAt beginning of year 2,539 4,862Translation differences during the year 2,323 –1,355At end of year 4,862 3,507
Hedging reserveAt beginning of year –288 –204Cash-flow hedges recognized in other comprehensive income 84 67At end of year –204 –137
Total reservesReserves at beginning of year 2,251 4,658Changes in reserves:Translation reserve 2,323 –1,355Hedging reserve 84 67Reserves at end of year 4,658 3,370
Other paid-in capitalRelates to payments made by owners and includes share premium reserve transferred to the statutory reserve at 31 December 2005. Any share premium as from 1 January 2006 and onwards is also recognized as paid-in capital.
Reserves Translation reserveThe translation reserve comprises all foreign exchange differences arising on the translation of the financial statements of foreign operations stated in a currency different from the Group’s presen- tation currency. Translation reserves relating to divested assets are not material.
The Parent Company’s and the Group’s presentation and func-tional currency is Swedish kronor (SEK).
Hedging reserveThe hedging reserve comprises the effective portion of the cumu-lative net change in the fair value of cash flow hedging instruments related to hedged transactions that have not yet occurred. The change in cash flow hedges that was transferred to profit/loss for the year amounted to 76 million SEK (153).
Retained earnings including profit or loss for the yearRetained earnings including profit or loss for the year comprises the earned profit of the Parent Company and its subsidiaries and associated companies.
MANAGEMENT OF CAPITALFinancial goals
Operating profit growth 2015-2018 ≥7%Return on capital employed, improvement 2015-2018 ≥3% pointsNet debt/equity ratio <0.8Dividend pay-out ratio of reported earnings per share 50%
EquityEquity is defined as total shareholders’ equity, including non-con-trolling interests.
Equity 2016 2017Share capital 1,505 1,505Other paid-in capital 7,678 7,678Reserves 4,658 3,370Retained earnings including profit for the year 25,356 36,190Equity attributable to equity holders of the Parent 39,197 48,743Non-controlling interests 93 28Total equity 39,290 48,771
The Board of Directors has proposed to the 2018 Annual General Meeting a dividend of 3.50 SEK per share (2.75). The proposal corresponds to approximately 33% of the recognized earnings per share. No changes were made to the processes for manag-ing capital during the year. Neither the Parent Company nor any of its subsidiaries have to comply with externally imposed capital requirements.
Parent CompanyShare capitalAccording to the Articles of Association of Sandvik AB, the share capital shall amount to a minimum of 700,000,000 SEK and a maxi-mum of 2,800,000,000 SEK.
All issued shares are fully paid, have the same voting rights and are equally entitled to the company’s assets.
Share capital has changed as follows over the past two years:
No. of sharesQuotient value
SEK/shareShare
capital SEKShare capital at 31 December 2015 1,254,385,923 1.20 1,505,263,108Share capital at 31 December 2016 1,254,385,923 1.20 1,505,263,108Share capital at 31 December 2017 1,254,385,923 1.20 1,505,263,108
A dividend is proposed by the Board of Directors in accord-ance with the stipulations in the Swedish Companies’ Act, and is approved at the Annual General Meeting. The proposed, not yet resolved, dividend for 2017 is estimated to amount to 4,390 million SEK (3.50 SEK per share). This amount has not been recognized as a liability.
No shares have been reserved for transfer under options or other agreements.
The Sandvik share is officially listed only on the Nasdaq Stockholm. Shares can also be traded in the US in the form of ADRs (American Depositary Receipts).
Undistributable equityUndistributable equity may not be paid to the shareholders in the form of dividends.
Statutory reserveThe purpose of the statutory reserve has been to tie up part of the net profit that is not needed to cover an accumulated deficit. The statutory reserve includes amounts that before 1 January 2006 were included in the share premium reserve.
Distributable equityShare premium reserve Comprises the value of shares that have been issued at a premium, meaning the price paid was in excess of the share’s quotient value. The amount received in excess of the quotient value was trans-ferred to the share premium reserve.
Retained earningsRetained earnings comprise the distributable reserves recognized in the preceding year less any dividend declared. The total of such profits brought forward and the profit for the year constitute the total distributable reserves, that is the maximum amount available for distribution to the shareholders.
NOTE 20. Provisions for pension and other non-current post-employment benefits
Sandvik provides direct pension solutions and otherwise partici- pates in a number of defined-benefit, defined-contribution and other plans for long-term post-employment benefits to employ-ees throughout the Group. The plans are structured in accordance with local regulations and practices. In recent years, Sandvik has sought to move from defined-benefit based plans to pension solu-tions that are defined-contribution plans and, to an ever increasing
Sandvik Annual Report 2017 | 107
1
2
3
4
5
6
7
8
9
10
11
12
13
14
15
16
17
18
19
20
21
22
23
24
25
26
27
28
29
30
31
32
33
34

NOTES
extent, the total pension expense comprises the costs for such plans. In principle, the plans cover all employees. The Group’s most significant defined-benefit pension plans are described below.
SwedenThe Swedish pension plan is funded through a foundation and is based on salary at the time of retirement and is partly closed for new participants, meaning that only new employees born prior to 1979 have the option of joining the plan. Employees born after 1979 are encompassed by a defined-contribution plan. There are no funding requirements for the defined-benefit plan. Pension pay-ments to retirees are made directly from Sandvik.
The commitment for family pension, also a defined-benefit plan, is insured with Alecta. Sufficient information to use defined-benefit accounting for this plan was not available, which is why these com-mitments are recognized as a defined-contribution plan. At the end of 2017, Alecta reported a preliminary plan surplus of 154% (148).
UKThe main pension plan in the UK is funded through a foundation, which is closed for new participants and the pension is based on salary at the time of retirement. The funding level is revalued every three years, and if this valuation indicates a requirement to increase the funding, the company pays money into the plan over a certain period of time. The plan is governed by Trustees who make invest-ment decisions after having consulted with the company. As a part of the actuarial valuation, Sandvik and the Trustees have agreed a plan to clear shortfall and meet the costs of the further build-up of benefits. Pension payments to retirees are made from the plan.
USThere are a number of pension plans in the US, including com-mitments for medical benefits. The largest pension plan covers
approximately 75% of the total commitment in the US. The pension is based on salary at the time of retirement and is closed for new participants. The funding level is revalued every year with a target of restoring the funding level over a seven-year period. Pension payments to retirees are primarily made from the plan.
FinlandIn Finland, Sandvik sponsors a defined-benefit pension plan funded in a foundation. The benefits offered include an old-age pension and disability pension. In addition to the benefits guaranteed by the Finnish subsidiary, there is also a defined-contribution pension component. Pension payments to retirees are made from the plan.
GermanyIn Germany, Sandvik has defined-benefit pension plans. A few years ago, Sandvik formed a foundation, a Contractual Trust Agreement (CTA), which covers the current employees in most of Sandvik’s German companies. The pension commitments for retirees and paid-up policyholders remain unfunded. The pension is based on salary at the time of retirement and other parameters. There are no funding requirements and employees in the plan are required to contribute a certain percentage of their salary to the plan. Pension payments to retirees are mainly made from the company.
CanadaThere are a number of pension plans in Canada. The pension is based on average salary at the time of retirement and is closed for new participants for non-bargaining unit plans starting 2008. The funding level is revalued every year or up to every three years for the plans, and is based on the solvency ratio determined by actuar-ies. Pension payments to retirees are mainly made from the com-pany. Employees who joined the company after 1 January 2008 are included in a defined-contribution plan.
Information by country, 31 December 2016 Sweden UK US Finland Germany Canada Other TotalAmount in the balance sheetPresent value of funded and unfunded pension obligations 4,517 7,134 6,690 3,029 2,553 548 1,898 26,369- of which for actives 2,295 1,633 3,326 891 1,210 287 1,178 10,820- of which for vested deferreds 983 2,245 851 817 217 26 454 5,593- of which for retirees 1,239 3,256 2,513 1,321 1,126 235 266 9,956Plan assets 2,445 6,346 5,673 3,123 1,298 602 1,134 20,621Total surplus/(deficit) –2,072 –788 –1,017 94 –1,255 54 –764 –5,748Funding level, % 54% 89% 85% 103% 51% 110% 60% 78%Pension plans recognized according to local rules — — — — — — — –231Duration (remaining term of pension obligation), years 23 19 15 18 9 15 — 17Amount in income statement/other comprehensive incomeCurrent service cost –171 –51 –131 –89 –42 –20 –54 –558Net interest –65 –15 –48 –7 –22 2 –30 –185Actuarial gains/(losses) 42 –405 152 483 –95 18 –27 168Total cost of defined-benefit pension plans before tax –194 –471 –27 387 –159 0 –111 –575Amount in cash flowEmployer contributions to pension plans — –139 –182 –6 –35 –16 –59 –437Pension payments directly from the company –103 — –27 — –61 –2 –26 –219Settlements paid — — — — — — –68 –68Key assumptions used in the valuation of the pension liability Life expectancy, years1) 22 22 21 21 21 22 — —Inflation, % 1.50% 3.30% 2.50% 1.40% 2.00% 2.00% — 2.31%Discount rate, % (weighted average) 3.00% 2.70% 4.23% 1.90% 1.51% 3.93% — 2.91%Future salary increases (weighted average) 3.00% 3.40% 3.00% 2.50% 2.99% 3.00% — 3.08%
1) Expressed as the expected remaining life expectancy of a 65 year old in number of years.
108 | Sandvik Annual Report 2017
1
2
3
4
5
6
7
8
9
10
11
12
13
14
15
16
17
18
19
20
21
22
23
24
25
26
27
28
29
30
31
32
33
34
Note 20, continued
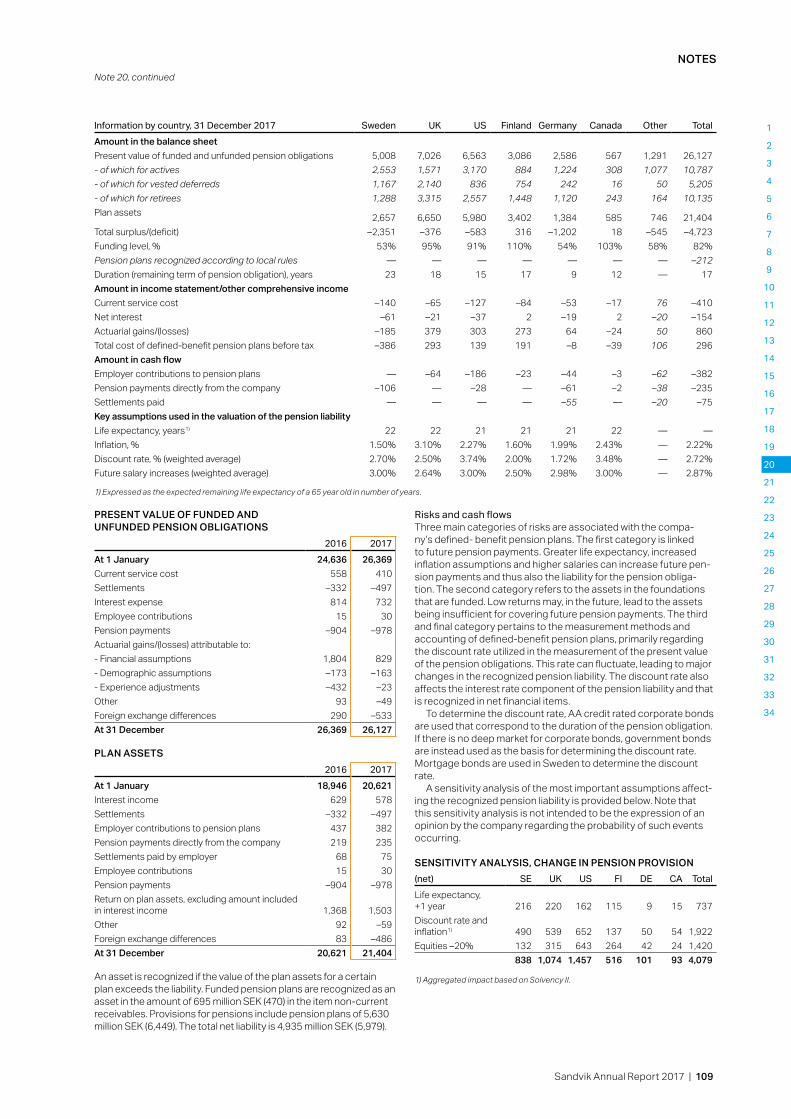
NOTES
Information by country, 31 December 2017 Sweden UK US Finland Germany Canada Other TotalAmount in the balance sheetPresent value of funded and unfunded pension obligations 5,008 7,026 6,563 3,086 2,586 567 1,291 26,127- of which for actives 2,553 1,571 3,170 884 1,224 308 1,077 10,787- of which for vested deferreds 1,167 2,140 836 754 242 16 50 5,205- of which for retirees 1,288 3,315 2,557 1,448 1,120 243 164 10,135Plan assets 2,657 6,650 5,980 3,402 1,384 585 746 21,404Total surplus/(deficit) –2,351 –376 –583 316 –1,202 18 –545 –4,723Funding level, % 53% 95% 91% 110% 54% 103% 58% 82%Pension plans recognized according to local rules — — — — — — — –212Duration (remaining term of pension obligation), years 23 18 15 17 9 12 — 17Amount in income statement/other comprehensive incomeCurrent service cost –140 –65 –127 –84 –53 –17 76 –410Net interest –61 –21 –37 2 –19 2 –20 –154Actuarial gains/(losses) –185 379 303 273 64 –24 50 860Total cost of defined-benefit pension plans before tax –386 293 139 191 –8 –39 106 296Amount in cash flowEmployer contributions to pension plans — –64 –186 –23 –44 –3 –62 –382Pension payments directly from the company –106 — –28 — –61 –2 –38 –235Settlements paid — — — — –55 — –20 –75Key assumptions used in the valuation of the pension liability Life expectancy, years1) 22 22 21 21 21 22 — —Inflation, % 1.50% 3.10% 2.27% 1.60% 1.99% 2.43% — 2.22%Discount rate, % (weighted average) 2.70% 2.50% 3.74% 2.00% 1.72% 3.48% — 2.72%Future salary increases (weighted average) 3.00% 2.64% 3.00% 2.50% 2.98% 3.00% — 2.87%
1) Expressed as the expected remaining life expectancy of a 65 year old in number of years.
PRESENT VALUE OF FUNDED AND UNFUNDED PENSION OBLIGATIONS
2016 2017At 1 January 24,636 26,369Current service cost 558 410Settlements –332 –497Interest expense 814 732Employee contributions 15 30Pension payments –904 –978Actuarial gains/(losses) attributable to: - Financial assumptions 1,804 829- Demographic assumptions –173 –163- Experience adjustments –432 –23Other 93 –49Foreign exchange differences 290 –533At 31 December 26,369 26,127
PLAN ASSETS2016 2017
At 1 January 18,946 20,621Interest income 629 578Settlements –332 –497Employer contributions to pension plans 437 382Pension payments directly from the company 219 235Settlements paid by employer 68 75Employee contributions 15 30Pension payments –904 –978Return on plan assets, excluding amount included in interest income 1,368 1,503Other 92 –59Foreign exchange differences 83 –486At 31 December 20,621 21,404
An asset is recognized if the value of the plan assets for a certain plan exceeds the liability. Funded pension plans are recognized as an asset in the amount of 695 million SEK (470) in the item non-current receivables. Provisions for pensions include pension plans of 5,630 million SEK (6,449). The total net liability is 4,935 million SEK (5,979).
Risks and cash flowsThree main categories of risks are associated with the compa-ny’s defined- benefit pension plans. The first category is linked to future pension payments. Greater life expectancy, increased inflation assumptions and higher salaries can increase future pen-sion payments and thus also the liability for the pension obliga-tion. The second category refers to the assets in the foundations that are funded. Low returns may, in the future, lead to the assets being insufficient for covering future pension payments. The third and final category pertains to the measurement methods and accounting of defined-benefit pension plans, primarily regarding the discount rate utilized in the measurement of the present value of the pension obligations. This rate can fluctuate, leading to major changes in the recognized pension liability. The discount rate also affects the interest rate component of the pension liability and that is recognized in net financial items.
To determine the discount rate, AA credit rated corporate bonds are used that correspond to the duration of the pension obligation. If there is no deep market for corporate bonds, government bonds are instead used as the basis for determining the discount rate. Mortgage bonds are used in Sweden to determine the discount rate.
A sensitivity analysis of the most important assumptions affect-ing the recognized pension liability is provided below. Note that this sensitivity analysis is not intended to be the expression of an opinion by the company regarding the probability of such events occurring.
SENSITIVITY ANALYSIS, CHANGE IN PENSION PROVISION(net) SE UK US FI DE CA TotalLife expectancy, +1 year 216 220 162 115 9 15 737Discount rate and inflation1) 490 539 652 137 50 54 1,922Equities –20% 132 315 643 264 42 24 1,420 838 1,074 1,457 516 101 93 4,079
1) Aggregated impact based on Solvency II.
Sandvik Annual Report 2017 | 109
Note 20, continued
1
2
3
4
5
6
7
8
9
10
11
12
13
14
15
16
17
18
19
20
21
22
23
24
25
26
27
28
29
30
31
32
33
34

NOTES
Sandvik estimates that approximately 662 million SEK (630) will be paid into existing defined-benefit plans in 2018.
Plan assetsPlan assets amounted to 21,404 million SEK (20,621). Actual return on plan assets was 2,081 million SEK (1,997) in 2017. The consol-idation ratio for funded plans is 88% (85). For all plans including unfunded plans, the consolidation ratio is 82% (78).
CLASS OF ASSETS
n Interest bearing securities 44% (46)
n Shares 36% (35)n Properties 9% (8)n Other 7% (7)n Cash and cash
equivalents 4% (4)
2016 2017
Assets without quoted prices amounted to approximately 9% (8) of the total plan assets of 21,404 million SEK.
The fair value of plan assets on 31 December 2017 included loans of 0 million SEK (2) to Sandvik companies and the value of properties leased to Sandvik of 210 million SEK (220).
GovernanceThe defined-benefit and defined-contribution plans are governed through Sandvik’s Pension Supervisory Board (PSB). PSB meets twice a year and has the following areas of responsibility:– Implement policies and directives – Ensure efficient administration of the major pension plans and
efficient management of reserved plan assets – Approve establishment of new plans, material changes or closure
of existing plan – Approve guidelines for management of assets
The Group Pension Committee (GPC) is another operating body, which is also preparatory to the PSB, that has representatives from countries with large defined-benefit plans and the relevant Group functions. The GPC’s task is to monitor developments in countries, submit proposals on changes to pension plans to the PSB and approve the principle of how actuarial assumptions are estab-lished. GPC meets twice a year.
Investment strategyThe aims of the investment decisions made in the foundations managing plan assets are as follows: – Ensure that the plan assets are sufficient to cover the founda-
tion’s future pension commitments – Achieve optimal returns while taking into account a reasonable
level of risk
Each foundation is to have a written investment policy approved by GPC. Reviews are performed annually. The foundation makes its own decisions on its investment strategy and takes into consider-ation the composition of the pension commitments, requirements of cash and cash equivalents and available investment opportuni-ties. The investment strategy is to be long term and in line with the guidelines established by PSB. An investment committee is to be in place.
Parent CompanyThe Parent Company’s recognized pension provision was 305 million SEK (341). The Parent Company’s PRI pensions are secured through Sandvik’s own pension foundation, the Sandvik Pension Foundation in Sweden. Sandvik AB and most of its Swedish subsid-iaries are members of the foundation. The total value of the assets held by the foundation was 2,657 million SEK (2,445), which was 229 million SEK lower than the capital value of the correspond-ing pension obligations for the entire foundation. The deficit was recognized as a liability in the companies. The Parent Company’s funded obligations mainly comprise ITP Plans.
PRESENT VALUE OF FUNDED AND UNFUNDED PENSION OBLIGATIONS
2016 2017Present value of funded and unfunded pension obligations 2,151 2,210Plan assets 1,901 2,060Deficit in the assets of the pension foundation –91 –155Net amount recognized for pension obligations –341 –305
NOTE 21. Other provisions
Warranties RestructuringEmployee
benefitsEnvironmental
obligationsLegal
disputesOther
obligations TotalGroupBalance at 31 December 2016 449 1,124 507 251 186 299 2,816Provisions made during the year 482 491 368 12 82 1,172 2,607Provisions used during the year –273 –465 –275 –25 –60 –802 –1,900Unutilized provisions reversed during the year –82 –219 –37 –2 –52 –130 –522Provision disposed through divestment –27 0 –15 — — –12 –54Reclassifications –54 –59 23 3 –11 98 0Translation differences 0 –3 –2 –7 –11 –41 –64Transfer to liabilities held for sale 5 –102 –34 –4 33 –124 –226Balance at 31 December 2017 500 767 537 228 168 460 2,660
of which current 374 567 204 9 128 394 1,676of which non-current 125 200 334 219 40 66 984
Parent CompanyBalance at 31 December 2016 18 161 136 18 — 0 333Provisions made during the year 2 36 66 5 — — 109Provisions used during the year –1 –110 –74 — — — –185Unutilized provisions reversed during the year –1 –1 — — — — –2Provisions disposed trough divestment — — –1 — — — –1Reclassifications 0 0 0 — — — 0Balance at 31 December 2017 18 86 127 23 — 0 254
110 | Sandvik Annual Report 2017
1
2
3
4
5
6
7
8
9
10
11
12
13
14
15
16
17
18
19
20
21
22
23
24
25
26
27
28
29
30
31
32
33
34
Note 20, continued

NOTES
WarrantiesA provision for warranties is recognized when the underlying prod-ucts or services are sold. The provision is based on historical war-ranty data and a weighing of all possible outcomes against their associated probabilities.
RestructuringA provision for restructuring is recognized when the Group has approved a detailed and formal restructuring plan and the restruc-turing has either commenced or has been announced publicly. Future operating costs are not provided for.
Employee benefitsA provision for personnel-related benefits is recognized in accord-ance with agreements entered for long-term incentive programs, local bonus programs, part-time pensions and other personnel obligations.
Environmental obligationsEnvironment-related provisions include provisions for environmen-tal remediation measures related to the Group’s sites.
Legal disputesLegal disputes include provisions for claims which, at the balance sheet date, had not been closed.
Other obligationsOther obligations include provisions for onerous contracts and obligations within the scope of Sandvik Försäkring AB’s operations. Provisions classified as current are expected to result in an outflow of resources within twelve months from the balance sheet date.
NOTE 22. Non-current interest-bearing liabilities
PARENT COMPANYNon-current interest-bearing liabilities fall due as follows:
2016 2017Within one
to five yearsLater than five years Total
Within one to five years
Later than five years Total
Loans from financial institutions 2,804 — 2,804 — — —Loans from Group companies 302 — 302 1 — 1Other liabilities 5,915 10,803 16,7181) 6,830 9,638 16,4681)
Total 9,021 10,803 19,824 6,831 9,638 16,469
1) Other liabilities mainly comprise bond loans.
NOTE 23. Other interest-bearing liabilities
Group 2016 2017Non-current liabilitiesBond issues 22,055 21,264Other 107 127Total 22,162 21,391
Current liabilitiesBond issues 1,792 576Other 5 6Total 1,797 582
For information on contractual terms, scheduled repayments and the exposure to interest risk and foreign-currency risk, refer to the section “Financial risk management.”
NOTE 24. Other non-interest-bearing liabilities
Group 2016 2017Other non-current liabilitiesDerivatives designated as hedging instruments 320 255Other 32 39Total 352 294
Other current liabilitiesDerivatives designated as hedging instruments 701 341Bills payable 91 111Gross amount due to construction contract customers 112 238Other 2,281 2.205Total 3,185 2,895Whereof discontinued operations –259 –279Continuing operations 2,926 2,616
NOTE 25. Accrued expenses and deferred income Parent Company 2016 2017Personnel related 1,596 1,837Expenses related to finance 299 298Other 393 388Total 2,288 2,523
NOTE 26. Contingent liabilities and pledged assets
On occasion, Sandvik is party to litigation and administrative pro-ceedings related to its operations, including responsibility for prod-ucts, the environment, health and safety. However, Sandvik does not deem that any of these ongoing proceedings and processes will significantly affect the Sandvik Group.
CONTINUING OPERATIONSGroup Parent Company
Contingent liabilities 2016 2017 2016 2017Bills discounted 5 7 —Other surety undertakings and contingent liabilities 449 351 13,463 10,705Total 454 359 13,463 10,705
of which for subsidiaries 13,284 10,659
The Parent Company’s surety undertakings and contingent liabil-ities amounted to 10,705 million SEK (13,463), of which 6,367mil-lion SEK (8,816) related to the Parent Company’s guarantees for Sandvik Treasury AB’s financial borrowings. The remainder com-prised mainly indemnity bonds for commitments of Group com-panies to their customers and vendors on advances received and various types of performance bonds and guarantees to financial institutions relating to local borrowings, and guarantee facilities as well as to pension programs.
Sandvik Annual Report 2017 | 111
Note 21, continued
1
2
3
4
5
6
7
8
9
10
11
12
13
14
15
16
17
18
19
20
21
22
23
24
25
26
27
28
29
30
31
32
33
34
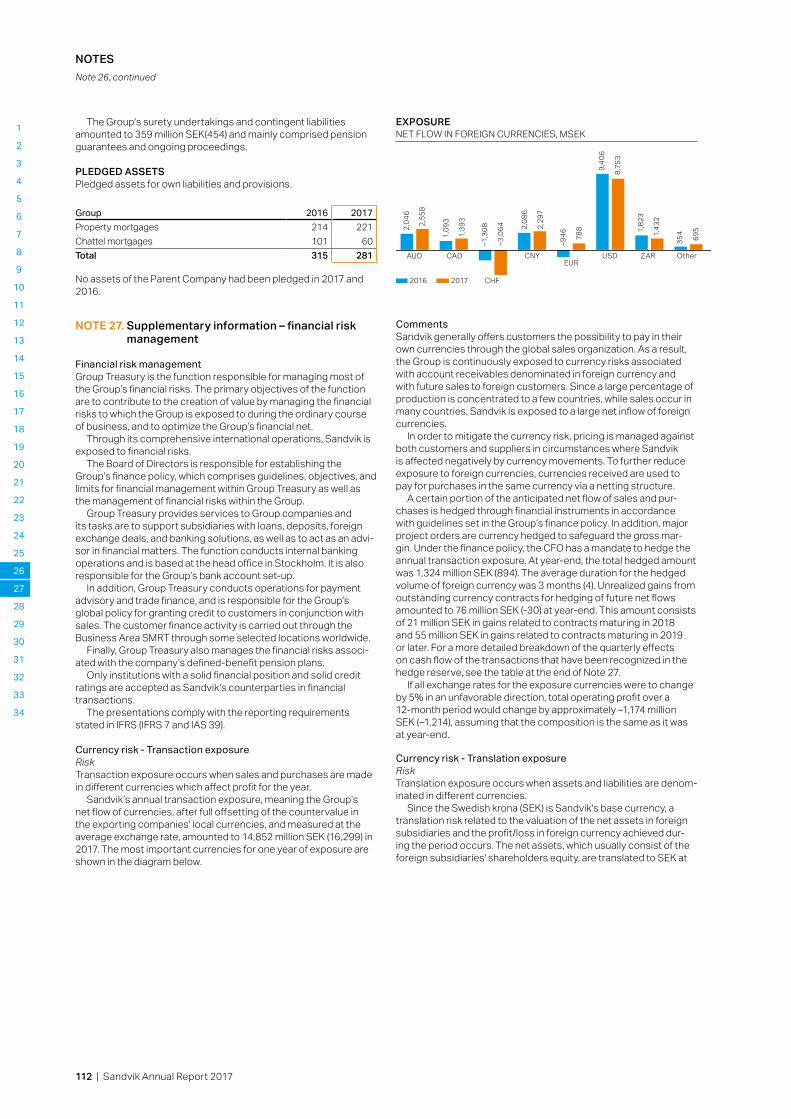
NOTES
The Group's surety undertakings and contingent liabilities amounted to 359 million SEK(454) and mainly comprised pension guarantees and ongoing proceedings.
PLEDGED ASSETSPledged assets for own liabilities and provisions.
Group 2016 2017Property mortgages 214 221Chattel mortgages 101 60Total 315 281
No assets of the Parent Company had been pledged in 2017 and 2016.
NOTE 27. Supplementary information – financial risk management
Financial risk management Group Treasury is the function responsible for managing most of the Group’s financial risks. The primary objectives of the function are to contribute to the creation of value by managing the financial risks to which the Group is exposed to during the ordinary course of business, and to optimize the Group’s financial net.
Through its comprehensive international operations, Sandvik is exposed to financial risks.
The Board of Directors is responsible for establishing the Group’s finance policy, which comprises guidelines, objectives, and limits for financial management within Group Treasury as well as the management of financial risks within the Group.
Group Treasury provides services to Group companies and its tasks are to support subsidiaries with loans, deposits, foreign exchange deals, and banking solutions, as well as to act as an advi-sor in financial matters. The function conducts internal banking operations and is based at the head office in Stockholm. It is also responsible for the Group’s bank account set-up.
In addition, Group Treasury conducts operations for payment advisory and trade finance, and is responsible for the Group’s global policy for granting credit to customers in conjunction with sales. The customer finance activity is carried out through the Business Area SMRT through some selected locations worldwide.
Finally, Group Treasury also manages the financial risks associ-ated with the company’s defined-benefit pension plans.
Only institutions with a solid financial position and solid credit ratings are accepted as Sandvik’s counter parties in financial transactions.
The presentations comply with the reporting requirements stated in IFRS (IFRS 7 and IAS 39).
Currency risk - Transaction exposureRiskTransaction exposure occurs when sales and purchases are made in different currencies which affect profit for the year.
Sandvik’s annual transaction exposure, meaning the Group’s net flow of currencies, after full offsetting of the countervalue in the exporting companies’ local currencies, and measured at the average exchange rate, amounted to 14,852 million SEK (16,299) in 2017. The most important currencies for one year of exposure are shown in the diagram below.
EXPOSURENET FLOW IN FOREIGN CURRENCIES, MSEK
AUD
2016
CAD
CHF
CNYEUR
USD OtherZAR
–1,3
08 2,08
6
–946
9,40
6
1,82
3
3541,
093
2017
2,55
8
2,04
6
1,39
3
–3,0
64 2,29
7
788
8,75
3
1,43
2
695
CommentsSandvik generally offers customers the possibility to pay in their own currencies through the global sales organization. As a result, the Group is continuously exposed to currency risks associated with account receivables denominated in foreign currency and with future sales to foreign customers. Since a large percentage of production is concentrated to a few countries, while sales occur in many countries, Sandvik is exposed to a large net inflow of foreign currencies.
In order to mitigate the currency risk, pricing is managed against both customers and suppliers in circum stances where Sandvik is affected negatively by currency movements. To further reduce exposure to foreign currencies, currencies received are used to pay for purchases in the same currency via a netting structure.
A certain portion of the anticipated net flow of sales and pur-chases is hedged through financial instruments in accordance with guidelines set in the Group’s finance policy. In addition, major project orders are currency hedged to safeguard the gross mar-gin. Under the finance policy, the CFO has a mandate to hedge the annual transaction exposure. At year-end, the total hedged amount was 1,324 million SEK (894). The average duration for the hedged volume of foreign currency was 3 months (4). Unrealized gains from outstanding currency contracts for hedging of future net flows amounted to 76 million SEK (-30) at year-end. This amount consists of 21 million SEK in gains related to contracts maturing in 2018 and 55 million SEK in gains related to contracts maturing in 2019 or later. For a more detailed breakdown of the quarterly effects on cash flow of the transactions that have been recognized in the hedge reserve, see the table at the end of Note 27.
If all exchange rates for the exposure currencies were to change by 5% in an unfavorable direction, total operating profit over a 12-month period would change by approximately –1,174 million SEK (–1,214), assuming that the composition is the same as it was at year-end.
Currency risk - Translation exposureRiskTranslation exposure occurs when assets and liabilities are denom-inated in different currencies.
Since the Swedish krona (SEK) is Sandvik's base currency, a translation risk related to the valuation of the net assets in foreign subsidiaries and the profit/loss in foreign currency achieved dur-ing the period occurs. The net assets, which usually consist of the foreign subsidiaries' shareholders equity, are translated to SEK at
112 | Sandvik Annual Report 2017
1
2
3
4
5
6
7
8
9
10
11
12
13
14
15
16
17
18
19
20
21
22
23
24
25
26
27
28
29
30
31
32
33
34
Note 26, continued
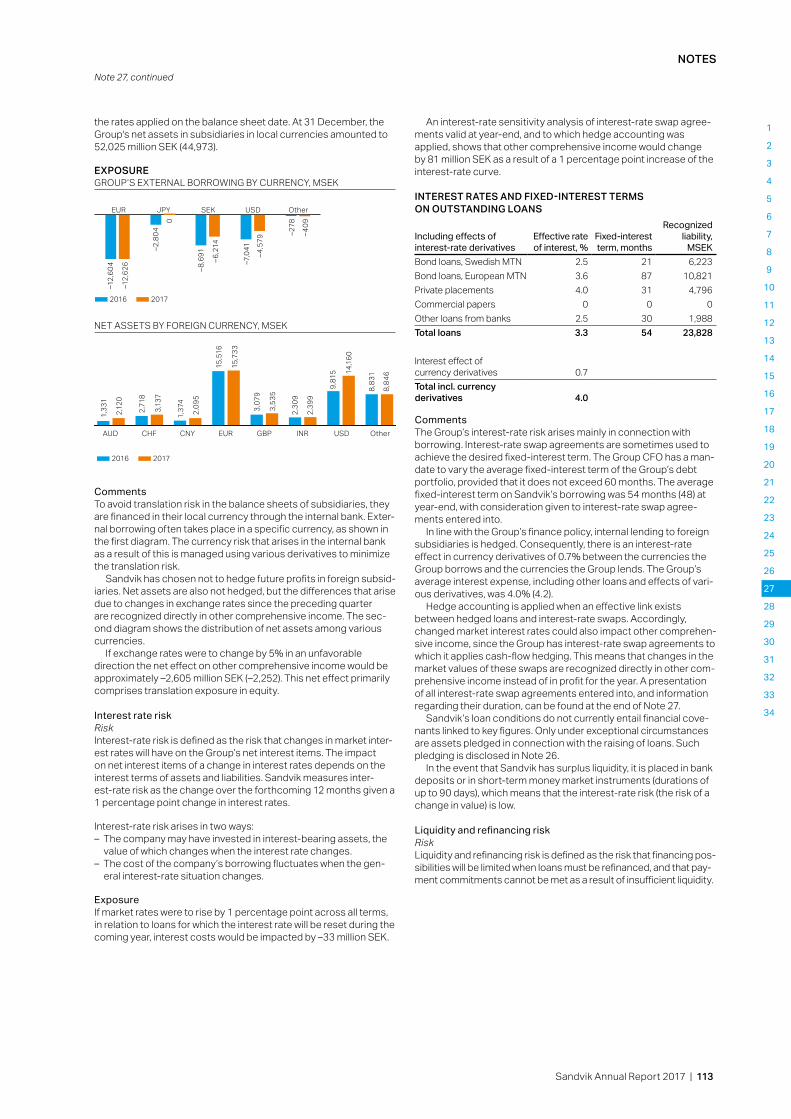
NOTES
the rates applied on the balance sheet date. At 31 December, the Group's net assets in subsidiaries in local currencies amounted to 52,025 million SEK (44,973).
EXPOSUREGROUP’S EXTERNAL BORROWING BY CURRENCY, MSEK
2016
EUR JPY SEK USD Other
–12,
604
–2,8
04
–8,6
91
–7,0
41
–278
2017
–12,
626
0
–6,2
14
–4,5
79
–409
NET ASSETS BY FOREIGN CURRENCY, MSEK
2016
CHF CNY EUR GBP INR Other
3,07
9
2,30
9
9,81
5
8,83
1
2017
2,12
0
1,33
1
3,13
7
2,71
8
2,09
5
1,37
4
15,7
33
15,5
16
3,53
5
2,39
9
14,16
0
8,84
6
USDAUD
CommentsTo avoid translation risk in the balance sheets of subsidiaries, they are financed in their local currency through the internal bank. Exter-nal borrowing often takes place in a specific currency, as shown in the first diagram. The currency risk that arises in the internal bank as a result of this is managed using various derivatives to minimize the translation risk.
Sandvik has chosen not to hedge future profits in foreign subsid-iaries. Net assets are also not hedged, but the differences that arise due to changes in exchange rates since the preceding quarter are recognized directly in other comprehensive income. The sec-ond diagram shows the distribution of net assets among various currencies.
If exchange rates were to change by 5% in an unfavorable direction the net effect on other comprehensive income would be approximately –2,605 million SEK (–2,252). This net effect primarily comprises translation exposure in equity.
Interest rate riskRiskInterest-rate risk is defined as the risk that changes in market inter-est rates will have on the Group’s net interest items. The impact on net interest items of a change in interest rates depends on the interest terms of assets and liabilities. Sandvik measures inter-est-rate risk as the change over the forthcoming 12 months given a 1 percentage point change in interest rates.
Interest-rate risk arises in two ways:– The company may have invested in interest-bearing assets, the
value of which changes when the interest rate changes.– The cost of the company’s borrowing fluctuates when the gen-
eral interest-rate situation changes.
ExposureIf market rates were to rise by 1 percentage point across all terms, in relation to loans for which the interest rate will be reset during the coming year, interest costs would be impacted by –33 million SEK.
An interest-rate sensitivity analysis of interest-rate swap agree-ments valid at year-end, and to which hedge accounting was applied, shows that other comprehensive income would change by 81 million SEK as a result of a 1 percentage point increase of the interest-rate curve.
INTEREST RATES AND FIXED-INTEREST TERMS ON OUTSTANDING LOANS
Including effects of interest-rate derivatives
Effective rate of interest, %
Fixed-interest term, months
Recognized liability,
MSEKBond loans, Swedish MTN 2.5 21 6,223Bond loans, European MTN 3.6 87 10,821Private placements 4.0 31 4,796Commercial papers 0 0 0Other loans from banks 2.5 30 1,988Total loans 3.3 54 23,828
Interest effect of currency derivatives 0.7Total incl. currency derivatives 4.0
CommentsThe Group’s interest-rate risk arises mainly in connection with borrowing. Interest-rate swap agreements are sometimes used to achieve the desired fixed-interest term. The Group CFO has a man-date to vary the average fixed-interest term of the Group’s debt portfolio, provided that it does not exceed 60 months. The average fixed-interest term on Sandvik’s borrowing was 54 months (48) at year-end, with consideration given to interest-rate swap agree-ments entered into.
In line with the Group’s finance policy, internal lending to foreign subsidiaries is hedged. Consequently, there is an interest-rate effect in currency derivatives of 0.7% between the currencies the Group borrows and the currencies the Group lends. The Group’s average interest expense, including other loans and effects of vari-ous derivatives, was 4.0% (4.2).
Hedge accounting is applied when an effective link exists between hedged loans and interest-rate swaps. Accordingly, changed market interest rates could also impact other comprehen-sive income, since the Group has interest-rate swap agreements to which it applies cash-flow hedging. This means that changes in the market values of these swaps are recognized directly in other com-prehensive income instead of in profit for the year. A presentation of all interest-rate swap agreements entered into, and information regarding their duration, can be found at the end of Note 27.
Sandvik’s loan conditions do not currently entail financial cove-nants linked to key figures. Only under exceptional circumstances are assets pledged in connection with the raising of loans. Such pledging is disclosed in Note 26.
In the event that Sandvik has surplus liquidity, it is placed in bank deposits or in short-term money market instruments (durations of up to 90 days), which means that the interest-rate risk (the risk of a change in value) is low.
Liquidity and refinancing riskRiskLiquidity and refinancing risk is defined as the risk that financing pos-sibilities will be limited when loans must be refinanced, and that pay-ment commitments cannot be met as a result of insufficient liquidity.
Sandvik Annual Report 2017 | 113
Note 27, continued
1
2
3
4
5
6
7
8
9
10
11
12
13
14
15
16
17
18
19
20
21
22
23
24
25
26
27
28
29
30
31
32
33
34

NOTES
EXPOSUREMATURITY PROFILE FOR BORROWING AND LIQUID ASSETSNominal amount, MSEK
8,80
0
–1,19
0
–796
–1,4
69
–3,4
50
2019
Cash and cash equivalents
20202021
20222023
20242025
20262027
20282029
20302031
20322033
Jan-June 2018
July-Dec 2018
–298
–677
–2,15
1
–3,9
19
–3,6
92
–3,2
12
0 0
–1,17
3
–887
–493
0
–246
12,7
24
BORROWING, SIZE OF PROGRAMS, AND REMAINING CREDIT PERIODS
Currency
Recognized liability,
MSEK
Size of programs,
MSEK
Average remaining
credit period, years
Bond loans, Swedish MTN SEK 6,223 15,000 3.0Bond loans, European MTN EUR 10,821 29,569 8.5Private placements USD 4,796 — 2.8Commercial papers EUR, SEK — 17,392 0.0Other loans from banks Others 1,988 — 4.3Total borrowing 23,828 61,961 5.6
CommentsAccording to the finance policy, the Group’s capital employed excluding cash and cash equivalents should be financed on a long-term basis. At year-end, the Group’s capital employed, excluding cash and cash equivalents, was 65,506 million SEK and long-term financing, including share capital, pension liabilities, long-term tax liabilities, long-term provisions and the guaranteed long-term credit facility, amounted to 86,343 million SEK. The short-term liquidity reserve, comprising committed credit facilities and accessible cash and cash equivalents was 19,286 million SEK. This reserve should at a minimum correspond to loans that mature for payment over the next six months and two weeks operating expenses, calculated to 3,126 million SEK.
Sandvik has a credit facility totaling 9,000 million SEK matur-ing in year 2022. The facility, which is the Group’s primary liquidity reserve, was unutilized at year-end.
The aim of Sandvik’s financing strategy is to achieve a well-bal-anced maturity profile for liabilities to thereby reduce the refinanc-ing risk. The share of long-term loans in relation to total borrowing was 96% at year-end 2017 compared with 85% one year earlier. The maturity structure for the Group's financial liabilities and deriv-atives is presented further down in Note 27.
At year-end, Standard & Poor’s, the international credit rating agency, had assigned a BBB+ credit rating to Sandvik’s long-term borrowing and A-2 for its short-term borrowing. For a continuous update on Sandvik’s credit rating, refer to home.sandvik.
Credit riskRiskThe Group’s commercial and financial transactions give rise to credit risk in relation to Sandvik’s counterparties. Credit risk or
counterparty risk is defined as the risk for losses if the counter-party does not fulfill its commitments.
The credit risk to which Sandvik is exposed can be divided into three categories:– Financial credit risk– Credit risk in trade receivables– Credit risk in customer financing
EXPOSURE
Total credit risk, MSEK 2015 2016 2017Trade receivables 12,238 13,301 13,928Cash and cash equivalents 6,376 8,818 12,724Unrealized net gains on derivatives 708 269 595Other receivables 418 424 407Outstanding credits 1,324 2,073 2,623Total 21,064 24,885 30,277
CommentsSandvik has entered into agreements with the banks that are most important to the company covering such matters as the right to offset assets and liabilities that arise from financial derivative trans-actions, so-called ISDA agreements. This means that the compa-ny’s counterparty exposure to the financial sector is limited to the unrealized net gains that arise in derivative agreements, and invest-ments and bank balances. At 31 December 2017, the value of these amounted to 13,319 million SEK (9,086).
Sandvik companies are exposed to the credit risk associated with outstanding trade receivables from ongoing sales. Credit risk is spread over a large number of customers in all business areas and reflects the spread of sales. In 2017, Sandvik’s bad debts written off amounted to –111 million SEK (–115), corresponding to 0.15% of sales. The total gross value of outstanding trade receiva-bles was 14,617 million SEK (14,154) at 31 December. Total impair-ment of these was –690 million SEK (–853). Age analysis of trade receivables at 31 December is presented in Note 19.
Sandvik offers short and long-term customer financing through its own financing companies and in partnership with financial insti-tutions and banks. At year-end, the value of outstanding credits was 2,668 million SEK (2,126), of which –45 million SEK (–53) was reserved for doubtful receivables.
In addition to the traditional financing of equipment, Sandvik also offers short-lease machinery. At year-end, the net carrying amount of this short-lease machinery was 390 million SEK (408).
Raw materials price riskRiskSandvik’s financial risks related to raw materials are primarily con-centrated to nickel and electricity. The price risks associated with these are partially hedged through the signing of financial contracts. A change in the electricity price of 0.1 SEK per kWh is estimated to affect Sandvik’s operating profit by plus or minus 85 million SEK on an annual basis, based on the prevailing conditions at year-end 2017.
ExposureWhen Sandvik Materials Technology obtains a customer order at a fixed price for nickel, molybdenum or copper, the prices of these materials are hedged by signing financial contracts. This means that Sandvik's operating profit is not impacted by movements in the price of these raw materials, relating to the aforementioned orders at a fixed price.
The Group applies a hedging strategy in order to minimize the metal price risk in connection with transactions conducted at a variable metal price. The measurement of inventory is not affected by hedging.
114 | Sandvik Annual Report 2017
1
2
3
4
5
6
7
8
9
10
11
12
13
14
15
16
17
18
19
20
21
22
23
24
25
26
27
28
29
30
31
32
33
34
Note 27, continued

NOTES
Changes in metal prices affect the result as a consequence of the rules regarding revaluation of inventory. The net effect is pre-sented in the "Development in business areas" section.
For Sandvik’s large production units in Sweden and Finland, the electricity price is continuously hedged through derivatives. Electricity consumption at these units normally totals some 850 GWh. The hedging horizon at year-end was about 17 months' (18) expected consumption.
CommentsNet total consumption of nickel amounted to about 15,600 metric tons during the year.
At year-end, the volume of hedged nickel inventory was 2,068 metric tons (1,888). The market value of commodity derivatives entered into was 21 million SEK (–1).
The volume of electricity hedged with derivatives was 1,204 GWh (1,241) at year-end. The market value of these derivative con-tracts amounted to 42 million SEK (14).
For a more detailed breakdown of the quaterly effects on cash flow of the transactions that have been recognized in the hedge reserve, see the table at the end of Note 27.
Pension commitmentsRiskSandvik has comprehensive pension obligations in the countries in which it operates. The pension solutions and funding require-ments vary depending on legislation and local agreements. The largest funded pension plans are found in the UK, US, Finland, Sweden, Germany, and Canada. Three main risks are associated with Sandvik’s pension obligations; interest rate fluctuations, capi-tal market volatility and changes in life expectancy.
ExposureThe group pension liability has an average duration of 16.6 years. The average duration of the group’s interest-bearing assets in the pension portfolio is currently also 16.6 years. Since only 44% of the pension portfolio is invested in interest-bearing assets, Sandvik is exposed to interest rate fluctuations, both when discounting the liability but also as market values change in the bond port-folio. Based on a 95% (once every 20 years) approach under the Solvency II framework, the potential net impact in relation to such interest rate fluctuations is 2,214 million SEK.
A portion of the pension portfolio is invested in equities. A 20% movement in the equity portfolio would result in a change in mar-ket value of 1,421 million SEK. If the life expectancy assumptions increase by one year, the pension liability would rise by 3% which corresponds to 645 million SEK. The calculated total loss potential during one year (Pension risk), based on stress tests according to the Solvency II framework, is on aggregate 4,189 million SEK.
DEVELOPMENT OF PENSION LIABILITY AND ASSETS
0
5,000
10,000
15,000
20,000
25,000
Liabilities
2013 2014 2015 2016 2017
Assets Funding
MSEK %
0
20
40
60
80
100
CommentsIn 2017, the pension assets totaled 21,415 million SEK (20,632) and the corresponding pension liability amounted to 24,255 million SEK (24,363), which is equal to a funding level of 88% (85). The return on the pension assets was 10.6% during the year (10.6). In addition, Sandvik has unfunded pension commitments of 1,872 million SEK (2,010).
The pension plans are governed through Sandvik’s Pension Supervisory Board (PSB). PSB is responsible for implementing pol-icies and directives, approving new plans or material changes and closure of existing plans. The pension plans and governance are further described in Note 20.
Disclosure regarding financial instruments measured at fair value in the balance sheetUnder the IFRS 13 disclosure requirements, the method applied to the valuation of assets and liabilities measured at fair value in the balance sheet is presented below. The valuation is divided into three levels:
Level 1: Fair value is determined according to prices listed on an active market for the same instrument.
Level 2: Fair value is determined based on either directly (as a price) or indirectly (derived from prices) observable market data that is not included in level 1.
Level 3: Fair value is determined based on input data that is not observable in the market.
All of Sandvik’s financial instruments are measured according to Level 2.
Measurements of fair valueThe following is a summary of the methods and assumptions pri-marily applied to determine the fair value of the financial instru-ments presented in the table below.
The fair value of foreign exchange contracts is determined based on observable market prices. The fair value of interest-rate swaps is based on discounting estimated future cash flows under the contractual terms and conditions and maturity dates and based on the market interest rate for similar instruments on the bal-ance sheet date. Where discounted cash flows are used, the future cash flows are calculated on the best assessments of company management. The discount rate applied is the market-based inter-est rate of similar instruments on the balance sheet date.
All valuation techniques applied are accepted in the market and take into account all parameters that the market would consider in its pricing. These techniques are reviewed regularly so as to ensure their reliability. Applied assumptions are compared against actual outcomes to identify any needs for adjusting the measurement or forecasting tools.
For means of payment, receivables and payables with variable interest and current receivables and payables (for example, trade receivables and accounts payable), the fair value has been consid-ered to correspond to the carrying amount.
Sandvik Annual Report 2017 | 115
Note 27, continued
1
2
3
4
5
6
7
8
9
10
11
12
13
14
15
16
17
18
19
20
21
22
23
24
25
26
27
28
29
30
31
32
33
34

NOTES
THE GROUP’S FINANCIAL INSTRUMENTS MEASURED AT FAIR VALUE IN THE BALANCE SHEET Financial instruments measured at fair value 2016 2017Financial assetsDerivatives Foreign exchange contracts 185 509 Foreign currency options — — Interest-rate swaps 20 8 Commodity and electricity derivatives 64 78 Total 269 595
Financial liabilitiesDerivatives Foreign exchange contracts 663 323 Foreign currency options — — Interest-rate swaps 310 261 Commodity and electricity derivatives 49 12 Total 1,022 595
Financial assets and liabilities are not offset in the balance sheet. Derivative contracts are subject to framework agreements govern-ing offsetting, and the carrying amounts of assets not offset in the
balance sheet amounted to 595 million SEK. The carrying amount of corresponding liabilities was –595 million SEK. No collateral has been received or pledged. In the event of a default by a derivative counterparty, assets and liabilities for a total value of 259 million SEK would be offset in accordance with the framework agreement governing offsetting.
Financial assets and liabilities, except financial derivatives, are measured at amortized cost. Calculation at fair value would increase the Group’s non-current borrowings by 2,117 million SEK (2,358). When measuring interest-bearing liabilities, the company’s Swedish and European bond loans have then been remeasured using observable market prices for identical securities to value the Group’s marketable debt instruments. Other non-current debt has been remeasured in accordance with the principles described above. For short-term loans and deposits, no remeasurement was carried out, given that the carrying amount is considered to represent a good approximation of the fair value due to the short duration.
The table below shows the fair value of financial assets and liabilities compared with their carrying amounts. Fair value is the amount at which an asset or liability can be sold between well-in-formed partners who are independent in relation to each other and who have a vested interest in completing the transaction.
Liabilities at fair value through profit and loss
Balance sheet itemsDerivatives for
hedge accounting1)Derivatives held
for trading2)Other financial
liabilitiesTotal carrying
amount Fair valueFinancial liabilities 2016 2017 2016 2017 2016 2017 2016 2017 2016 2017Borrowings5) — — — — 31,418 23,828 31,418 23,828 33,776 25,945Derivatives6) 334 197 688 398 — — 1,022 595 1,022 595Accounts payable — — — — 6,286 7,645 6,286 7,645 6,286 7,645Due to associates — — — — 2 3 2 3 2 3Other liabilities7) — — — — 91 111 91 111 91 111Total financial liabilities 334 197 688 398 37,797 31,586 38,819 32,181 41,177 34,298
1) Of which –177 million SEK (–262) pertains to cash flow hedges recognized in the hedging reserve in equity and -13 million SEK (11) pertains to fair-value hedges recognized in profit or loss.
2) Of which 169 million SEK (-510) pertains to financial hedges; hedge accounting is not applied.3) Comprises parts of the Group’s non-current receivables, accrued income and other receivables recognized in the balance sheet.4) Derivatives form part of the other receivables recognized in the balance sheet.5) Recognized in the balance sheet as non-current and current liabilities to financial institutions and other liabilities.6) Derivatives form part of the other liabilities recognized in the balance sheet.7) Form part of the Group’s non-current liabilities, accrued expenses and other liabilities recognized in the balance sheet.
FAIR VALUE OF FINANCIAL ASSETS AND LIABILITIES BY VALUATION CATEGORY
Assets at fair value through profit and loss
Balance sheet itemsDerivatives for
hedge accounting1)Derivatives held
for trading2)Available-for-sale
financial assetsLoans and
receivablesTotal carrying
amount Fair valueFinancial assets 2016 2017 2016 2017 2016 2017 2016 2017 2016 2017 2016 2017Financial investments — –– — — 81 83 — — 81 83 81 83Trade receivables — –– — — — — 13,301 13,928 13,301 13,928 13,301 13,928Other receivables3) — –– — — — — 2,067 2,487 2,067 2,487 2,067 2,487Derivatives4) 91 28 178 567 — — — — 269 595 269 595Cash and cash equivalents — –– — — — — 8,818 12,724 8,818 12,724 8,818 12,724Total financial assets 91 28 178 567 81 83 24,185 29,139 24,535 29,816 24,535 29,816
116 | Sandvik Annual Report 2017
1
2
3
4
5
6
7
8
9
10
11
12
13
14
15
16
17
18
19
20
21
22
23
24
25
26
27
28
29
30
31
32
33
34
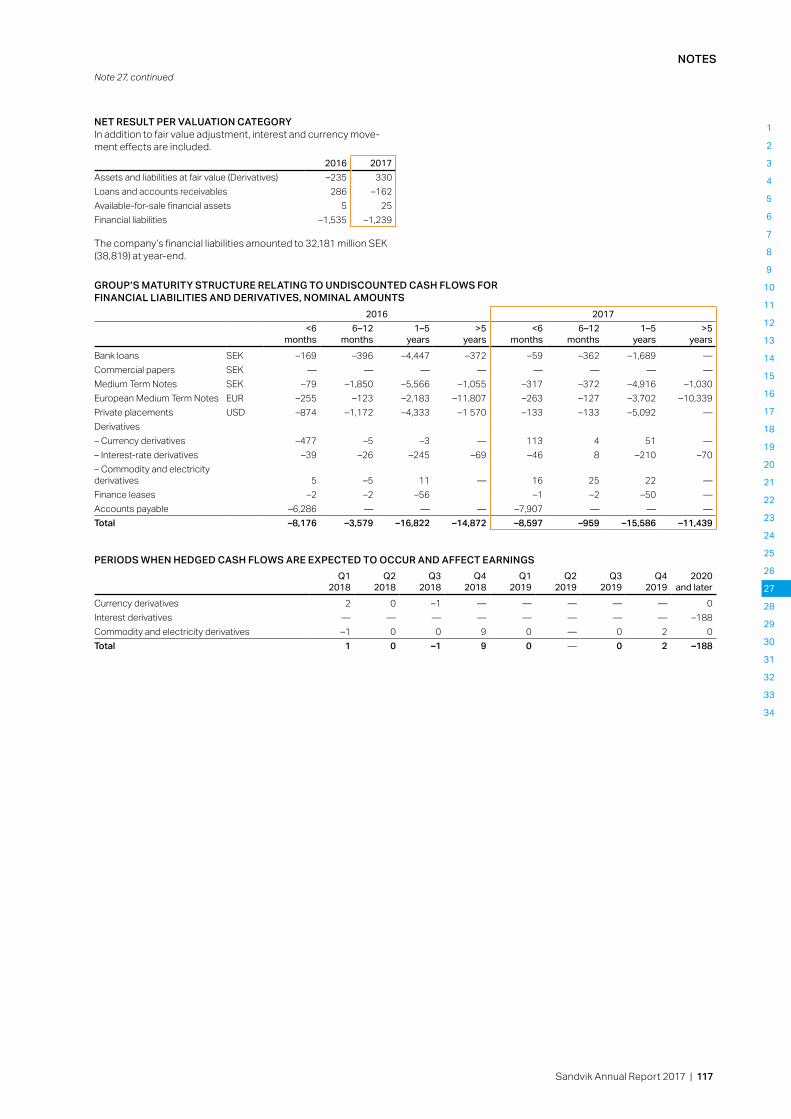
NOTES
NET RESULT PER VALUATION CATEGORYIn addition to fair value adjustment, interest and currency move-ment effects are included.
2016 2017Assets and liabilities at fair value (Derivatives) –235 330Loans and accounts receivables 286 –162Available-for-sale financial assets 5 25Financial liabilities –1,535 –1,239
The company’s financial liabilities amounted to 32,181 million SEK (38,819) at year-end.
GROUP’S MATURITY STRUCTURE RELATING TO UNDISCOUNTED CASH FLOWS FOR FINANCIAL LIABILITIES AND DERIVATIVES, NOMINAL AMOUNTS
2016 2017
<6
months6–12
months1–5
years>5
years<6
months6–12
months1–5
years>5
yearsBank loans SEK –169 –396 –4,447 –372 –59 –362 –1,689 — Commercial papers SEK — — — — — — — — Medium Term Notes SEK –79 –1,850 –5,566 –1,055 –317 –372 –4,916 –1,030European Medium Term Notes EUR –255 –123 –2,183 –11,807 –263 –127 –3,702 –10,339Private placements USD –874 –1,172 –4,333 –1 570 –133 –133 –5,092 — Derivatives – Currency derivatives –477 –5 –3 — 113 4 51 — – Interest-rate derivatives –39 –26 –245 –69 –46 8 –210 –70– Commodity and electricity derivatives 5 –5 11 — 16 25 22 — Finance leases –2 –2 –56 –1 –2 –50 —Accounts payable –6,286 — — — –7,907 — — — Total –8,176 –3,579 –16,822 –14,872 –8,597 –959 –15,586 –11,439
PERIODS WHEN HEDGED CASH FLOWS ARE EXPECTED TO OCCUR AND AFFECT EARNINGSQ1
2018Q2
2018Q3
2018Q4
2018Q1
2019Q2
2019Q3
2019Q4
20192020
and laterCurrency derivatives 2 0 –1 — — — — — 0Interest derivatives — — — — — — — — –188Commodity and electricity derivatives –1 0 0 9 0 — 0 2 0Total 1 0 –1 9 0 — 0 2 –188
Sandvik Annual Report 2017 | 117
1
2
3
4
5
6
7
8
9
10
11
12
13
14
15
16
17
18
19
20
21
22
23
24
25
26
27
28
29
30
31
32
33
34
Note 27, continued
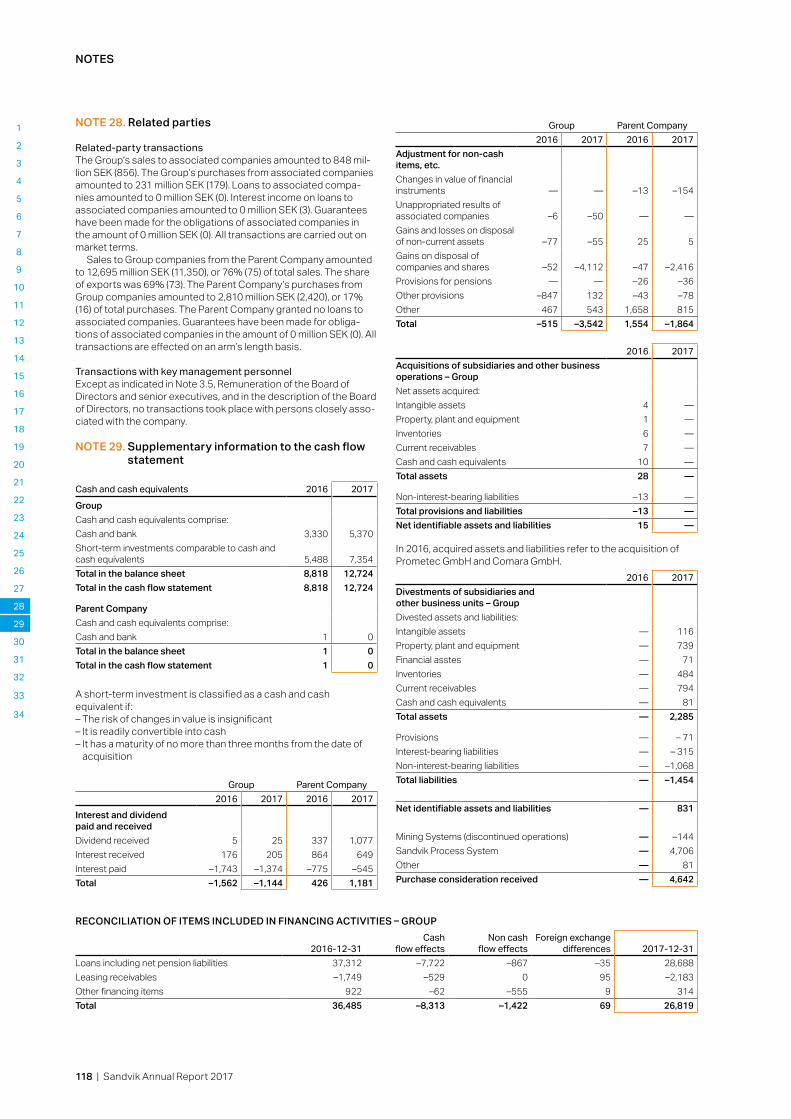
NOTES
NOTE 28. Related parties
Related-party transactionsThe Group’s sales to associated companies amounted to 848 mil-lion SEK (856). The Group’s purchases from associated companies amounted to 231 million SEK (179). Loans to associated compa-nies amounted to 0 million SEK (0). Interest income on loans to associated companies amounted to 0 million SEK (3). Guarantees have been made for the obligations of associated companies in the amount of 0 million SEK (0). All transactions are carried out on market terms.
Sales to Group companies from the Parent Company amounted to 12,695 million SEK (11,350), or 76% (75) of total sales. The share of exports was 69% (73). The Parent Company’s purchases from Group companies amounted to 2,810 million SEK (2,420), or 17% (16) of total purchases. The Parent Company granted no loans to associated companies. Guarantees have been made for obliga-tions of associated companies in the amount of 0 million SEK (0). All transactions are effected on an arm’s length basis.
Transactions with key management personnelExcept as indicated in Note 3.5, Remuneration of the Board of Directors and senior executives, and in the description of the Board of Directors, no trans actions took place with persons closely asso-ciated with the company.
NOTE 29. Supplementary information to the cash flow statement
Cash and cash equivalents 2016 2017GroupCash and cash equivalents comprise:Cash and bank 3,330 5,370Short-term investments comparable to cash and cash equivalents 5,488 7,354Total in the balance sheet 8,818 12,724Total in the cash flow statement 8,818 12,724
Parent CompanyCash and cash equivalents comprise:Cash and bank 1 0Total in the balance sheet 1 0Total in the cash flow statement 1 0
A short-term investment is classified as a cash and cash equivalent if:– The risk of changes in value is insignificant – It is readily convertible into cash – It has a maturity of no more than three months from the date of
acquisition
Group Parent Company2016 2017 2016 2017
Interest and dividend paid and receivedDividend received 5 25 337 1,077Interest received 176 205 864 649Interest paid –1,743 –1,374 –775 –545Total –1,562 –1,144 426 1,181
Group Parent Company2016 2017 2016 2017
Adjustment for non-cash items, etc.Changes in value of financial instruments — — –13 –154Unappropriated results of associated companies –6 –50 — —Gains and losses on disposal of non-current assets –77 –55 25 5Gains on disposal of companies and shares –52 –4,112 –47 –2,416Provisions for pensions — — –26 –36Other provisions –847 132 –43 –78Other 467 543 1,658 815Total –515 –3,542 1,554 –1,864
2016 2017Acquisitions of subsidiaries and other business operations – GroupNet assets acquired:Intangible assets 4 —Property, plant and equipment 1 —Inventories 6 —Current receivables 7 —Cash and cash equivalents 10 —Total assets 28 —
Non-interest-bearing liabilities –13 —Total provisions and liabilities –13 —Net identifiable assets and liabilities 15 —
In 2016, acquired assets and liabilities refer to the acquisition of Prometec GmbH and Comara GmbH.
2016 2017Divestments of subsidiaries and other business units – GroupDivested assets and liabilities:Intangible assets — 116Property, plant and equipment — 739Financial asstes — 71Inventories — 484Current receivables — 794Cash and cash equivalents — 81Total assets — 2,285
Provisions — – 71Interest-bearing liabilities — – 315Non-interest-bearing liabilities — –1,068Total liabilities — –1,454
Net identifiable assets and liabilities — 831
Mining Systems (discontinued operations) — –144Sandvik Process System — 4,706Other — 81Purchase consideration received — 4,642
118 | Sandvik Annual Report 2017
RECONCILIATION OF ITEMS INCLUDED IN FINANCING ACTIVITIES – GROUP
2016-12-31Cash
flow effectsNon cash
flow effectsForeign exchange
differences 2017-12-31Loans including net pension liabilities 37,312 –7,722 –867 –35 28,688Leasing receivables –1,749 –529 0 95 –2,183Other financing items 922 –62 –555 9 314Total 36,485 –8,313 –1,422 69 26,819
1
2
3
4
5
6
7
8
9
10
11
12
13
14
15
16
17
18
19
20
21
22
23
24
25
26
27
28
29
30
31
32
33
34

NOTES
NOTE 30. Acquisition and divestment of operations, discontinued operations and assets held for sale
The business combinations effected during 2016 and 2017 are set out below. Annual revenue and number of employees reflect the situation at the date of the respective acquisition.Business area Company Acquisition date Annual revenue No. of employeesSandvik Machining Solutions Prometec GmbH 25 January 2016 48 35Sandvik Machining Solutions Comara GmbH 1 October 2016 8 16
There were no acquisitions carried out during 2017.
Total fair value of assets and liabilities of acquired businesses in 2016The value of acquired assets and assumed liabilities has been finalized for the acquisitions of Prometec and Comara, which were implemented in 2016. No adjustment was made to the acquisition values.
Fair value recognized in the GroupIntangible assets 4Property, plant and equipment 1Inventories 6Current receivables 7Cash and cash equivalents 10Non-interest-bearing liabilities –13Net identifiable assets and liabilities 15Goodwill 35Purchase consideration 50Cash and cash equivalents in acquired businesses –10Part of consideration entered as a liability –5Contingent purchase consideration not to be paid –4Net cash outflow 31
CONTRIBUTIONS FROM COMPANIES ACQUIRED IN 2016 BY BUSINESS AREA
Sandvik Machining Solutions Total
Contributions as of acquisition dateRevenue 46 46Profit/loss for the year –2 –2
Contributions as though the acquisition date had been 1 January 2016Revenue 56 56Profit/loss for the year –2 –2
Discontinued operationsIn November 2017, Sandvik completed the divestment of the Min-ing Systems business, which is a separate product area within Sandvik Mining and Rock Technology and a supplier of design and engineering of material handling systems for the mining industry. The Mining Systems conveyor components business, includ-ing the closely related specialist conveyor systems business in Hollola (Finland) was divested to Nepean Conveyors Pty Ltd. The Mining Systems project business was divested to FLSmidth, with the exception of the project business assets in South Africa, which awaits merger control clearance. Clearance is expected during the first quarter of 2018.
The Mining Systems business has been reported as discontin-ued operations as from the third quarter of 2015 until the closure of the divestment in November 2017. Some projects are to be final-ized during 2018-2019 by Sandvik, through an operational agree-ment with FLSmidth, and these remain reported as discontinued operations in the Sandvik Group’s financial statements until the closure the projects.
In 2016 the Mining Systems business recorded sales of 2.9 bil-lion SEK, of which the conveyor components' part corresponded to about 20%.
Assets held for saleOn 17 May 2017, Sandvik announced Sandvik Materials Technol-ogy's intention to divest its welding and stainless wire operations. These businesses are subject to intense competition and Sandvik Materials Technology does not hold a leading market position. In connection with the ongoing divestment, a write-down of assets, related to impairment of fixed assets, amounting to 450 million SEK was done.
As from the second quarter of 2017 and until closure of the divestment, these businesses will be reported as assets held for sale in Sandvik Group's financial statements. The divestment is expected to be completed during 2018.
On 8 December 2017, Sandvik announced that it has signed an agreement to divest Hyperion to the US listed investment firm KKR. Hyperion is a separate product area within Other Operations, offering products and solutions based on hard and super-hard materials. The divestment of Hyperion is expected to be completed during 2018 and will make Sandvik even more focused on its core businesses.
As from the fourth quarter of 2017 and until closure of the divest-ment, Hyperion will be reported as assets held for sale in Sandvik Group's financial statements.
INCOME STATEMENT FOR DISCONTINUED OPERATIONS2016 2017
Revenue 2,877 3,080Cost of sales and services –3,001 –2,851Gross profit –124 229Selling expenses –305 –102Administrative expenses –222 –210Research and development costs –22 –15Other operating income 0 49Other operating expenses –688 –12Operating loss –1,361 –61Financial income — 9Financial expenses –9 —Net financing costs –9 9Loss after financial items –1,370 –52Income tax — —Loss for the year –1,370 –52
ASSETS AND LIABILITIES HELD FOR SALE2016 2017
Intangible assets 4 1,016Property, plant and equipment 2 823Financial assets 97 79Current assets 255 2,604Total assets 358 4,522Provisions 240 438Interest-bearing liabilities 0 9Non-interest-bearing liabilities 657 1,123Total liabilities 897 1,570
Profit for the year –1,370 –38
Total liabilities 897 1,570
Sandvik Annual Report 2017 | 119
1
2
3
4
5
6
7
8
9
10
11
12
13
14
15
16
17
18
19
20
21
22
23
24
25
26
27
28
29
30
31
32
33
34

NOTES
ASSETS AND LIABILITIES INCLUDED IN DIVESTMENTS
SMRTOther
Operations SMS and SMT TotalIntangible assets 21 95 — 116Property, plant and equipment 291 444 4 739Financial assets — 47 24 71Inventories 112 368 3 484Current receivables 171 620 4 794Cash and cash equivalents — 81 — 81Provisions –13 –58 — –71Interest-bearing liabilities — –315 — –315Non-interest-bearing liabilities –267 –795 –6 –1,068Reversal of impairment from earlier year1) –591 — — –591Gain/loss on sale excl. reversal to profit or loss of realized translation differences in the divested company 0 3,986 52 4,037Compensation received after divestment costs –276 4,473 81 4,278Less: Cash and cash equivalents in the divested company — –81 — –81Impact on the Group's cash and cash equivalents, divested operations –276 4,391 81 4,196Divestment of operations during the year excl. transferred net loan debt (Group's operating cash flow statement) –144 4,706 81 4,6421) Reversal of impaired items 2016 disposed of in 2017 selling.
NOTE 31. Parent Company particulars
Sandvik Aktiebolag, corporate registration number 556000-3468, is a Swedish limited liability company. The registered office of its Board of Directors is in Stockholm, Sweden. The address of the head office is PO Box 510, SE-101 30 Stockholm, Sweden. The vis-iting address is World Trade Center, Kungsbron 1, section G, floor 6.
The Parent Company’s shares are quoted on Nasdaq Stockholm. Shares can also be traded in the US in the form of ADRs (American Depositary Receipts).
The 2017 consolidated financial statements comprise the Parent Company and all its subsidiaries, jointly the Group. The Group also includes the owned share of investments in associated companies.
NOTE 32. Information on shares, owners and rights
The following information is presented in accordance with the pro-visions of Chapter 6, Section 2.a. of the Swedish Annual Accounts Act.
The Parent Company has issued one series of shares and each share carries one vote. The total number of shares shall be no less than 1,000,000,000 and no more than 4,000,000,000.
At the end of 2017, 1,254,385,923 shares (1,254,385,923) with a quotient value of 1.20 SEK per share had been issued. Sharehold-ers have a preferential right to subscribe to newly issued shares
CASH FLOW STATEMENT FOR DISCONTINUED OPERATIONS2016 2017
Cash flow from operating activities –510 –466Cash flow from investing activities –21 –144Cash flow from financing activities 8 2Cash flow from discontinued activities –523 –608
DivestmentsIn December 2017, Sandvik divested the business of Sandvik Pro-cess Systems to FAM AB. The preliminary purchase consideration received totaled 4,473 million SEK, which was paid in full. The final purchase price will be calculated based on the net debt and net working capital changes between the preliminary closing balance sheet and the final closing balance sheet. The final purchase price is expected to be paid during the first two quarters of 2018.In 2016 the business recorded sales of 1.7 billion SEK with about 600 employees.
issued for cash or with terms and conditions concerning rights of setoff. All shares are fully negotiable.
Shareholdings that directly and indirectly represent at least 10% of the voting rights are held by AB Industrivärden (11.8%).
Sandvik AB’s Articles of Association govern such policies as the direction of the business, domicile and share capital (minimum and maximum capital). The Articles do not stipulate that the members of the Board of Directors shall be elected in any other way than at the Annual General Meeting. However, Board representatives of the employees are appointed by the trade unions under the Private Sector Employees (Board Representation) Act.
Companies in the Group entered into borrowing agreements that include conditions coming into effect should the control of the company change as a result of a public takeover bid.
There are no employment agreements between the compa-nies in the Group and the Parent Company’s directors or employ-ees who provide compensation if those persons give notice of termination, or their services are terminated on a reasonable basis, or the employment is terminated as a consequence of a public takeover bid.
NOTE 33. Proposed appropriation of profits
The Board of Directors proposes a dividend of 3.50 SEK (2.75) per share to the 2018 Annual General Meeting, corresponding to approximately 4.4 billion SEK (3.4).
Dividend, 3.50 SEK per share × number of shares 1,254,385,923 = 4,390,350,731 Profits carried forward 19,672,405,379 Total, SEK 24,062,756,110
NOTE 34. Events after the close of the period
On 30 October 2017, Sandvik announced the agreement to divest its welding wire business to ESAB. On 31 January 2018, Sandvik announced that the divestment was completed in line with previ-ous communication.
120 | Sandvik Annual Report 2017
1
2
3
4
5
6
7
8
9
10
11
12
13
14
15
16
17
18
19
20
21
22
23
24
25
26
27
28
29
30
31
32
33
34
Note 30, continued

BOARD STATEMENT ON DIVIDEND PROPOSAL
BOARD STATEMENT ON DIVIDEND PROPOSAL
Board statement in accordance with Chapter 18, Section 4 of the Swedish Companies Act.
The nature and extent of the company’s operations are stated in the Articles of Association and issued annual reports.
Such nature and extent do not entail risks over and above those inherent, or reasonably to be expected, in the industry or otherwise inherent in business operations. For information on significant events, reference is made to the Report of the Directors.
The company’s financial position at 31 December 2017 is apparent from this Annual Report. The proposed dividend does not infringe on investments deemed to be required.
In addition, the company’s liquidity reserve is in the form
of an unutilized credit facility amounting to 9,000 million SEK, which means that the company should reasonably be able to meet unexpected events and temporary fluctua-tions in cash flows of reasonable proportions. The compa-ny’s financial position supports the assessment that the company will be able to continue its business and meet its obligations in both the short and long term.
In view of the above and based on what the Board is otherwise aware, the proposed dividend in the Board’s opinion is justified considering the requirements which the nature, extent and risks associated with the opera-tions place on the size of the equity of the company, and also taking into consideration the company’s need to strengthen its balance sheet, liquidity and financial posi-tion in general.
Stockholm, 1 March 2018
Sandvik Aktiebolag (publ)BOARD OF DIRECTORS
Sandvik Annual Report 2017 | 121

PROPOSED APPROPRIATION OF PROFITS
PROPOSED APPROPRIATION OF PROFITS
The Board of Directors proposes that the profits at the disposal of the Annual General Meeting:
profits carried forward 23,180,435,990and result for the year 882,320,120SEK 24,062,756,110
be appropriated as follows:a dividend of 3.50 SEK per share to the shareholders 4,390,350,731profits carried forward 19,672,405,379SEK 24,062,756,110
The proposed record date for dividends is Wednesday, 2 May 2018.
The income statements and the balance sheets of the Group and of the Parent Company are subject to the adop-
tion by the Annual General Meeting on 27 April 2018.The Board of Directors and the President hereby certify
that the Annual Report has been prepared in accordance with generally accepted accounting principles in Sweden, and that the consolidated financial statements have been prepared in accordance with the international financial reporting standards referred to in the regulation (EU) no. 1606/2002 of the European Parliament and Council dated 19 July 2002, pertaining to the application of international financial reporting standards. The Annual Report and the consolidated financial statements give a true and fair view of the Parent Company’s and the Group’s financial position and results. The Report of the Directors pertaining to the Parent Company and the Group gives a fair overview of the development of the Parent Company’s and the Group’s operations, financial position and results, and describes the significant risks and uncertainties facing the Parent Company and the companies included in the Group.
Stockholm, 1 March 2018
Johan Molin Jennifer Allerton Claes Boustedt Chairman Board member Board member
Marika Fredriksson Johan Karlström Tomas Kärnström Board member Board member Board member
Thomas Lilja Helena Stjernholm Lars Westerberg Board member Board member Board member
Björn RosengrenBoard member
President and CEO
Our auditor's report was submitted on 6 March 2018
KPMG AB
Joakim ThilstedtAuthorized Public Accountant
122 | Sandvik Annual Report 2017

AUDITOR’S REPORT
AUDITOR’S REPORT
TO THE ANNUAL MEETING OF THE SHAREHOLDERS OF SANDVIK AB (PUBL), CORP. ID. 556000-3468
Report on the annual accounts and consolidated accounts
OpinionsWe have audited the annual accounts and consolidated accounts of Sandvik AB (publ.) for the year 2017. The annual accounts and consolidated accounts of the company are included on pages 46-122 in this document.
In our opinion, the annual accounts have been prepared in accord-ance with the Annual Accounts Act, and present fairly, in all mate-rial respects, the financial position of the parent company as of 31 December 2017 and its financial performance and cash flow for the year then ended in accordance with the Annual Accounts Act. The consolidated accounts have been prepared in accordance with the Annual Accounts Act and present fairly, in all material respects, the financial position of the group as of 31 December 2017 and their financial performance and cash flow for the year then ended in accordance with International Financial Reporting Standards (IFRS), as adopted by the EU, and the Annual Accounts Act.
A corporate governance statement has been prepared. The statutory administration report and the corporate governance statement are consistent with the other parts of the annual accounts and consolidated accounts, and the corporate govern-ance statement is in accordance with the Annual Accounts Act.
We therefore recommend that the general meeting of share-holders adopts the income statement and balance sheet for the parent company and the group.
Our opinions in this report on the the annual accounts and consolidated accounts are consistent with the content of the additional report that has been submitted to the parent compa-ny's audit committee in accordance with the Audit Regulation (537/2014) Article 11.
Basis for OpinionsWe conducted our audit in accordance with International Stand-ards on Auditing (ISA) and generally accepted auditing standards in Sweden. Our responsibilities under those standards are further described in the Auditor’s Responsibilities section. We are inde-pendent of the parent company and the group in accordance with professional ethics for accountants in Sweden and have other-wise fulfilled our ethical responsibilities in accordance with these requirements.This includes that, based on the best of our knowl-edge and belief, no prohibited services referred to in the Audit Regulation (537/2014) Article 5.1 have been provided to the audited company or, where applicable, its parent company or its controlled companies within the EU.
We believe that the audit evidence we have obtained is sufficient and appropriate to provide a basis for our opinions.
Key Audit Matters Key audit matters of the audit are those matters that, in our pro-fessional judgment, were of most significance in our audit of the annual accounts and consolidated accounts of the current period. These matters were addressed in the context of our audit of, and in forming our opinion thereon, the annual accounts and consoli-dated accounts as a whole, but we do not provide a separate opin-ion on these matters.
Accounting for Assets held for sale and discontinued operationsSee disclosure 30 and accounting principles on pages 82 in the annual accounts and consolidated accounts for detailed information and description of the matter.
Description of key audit matterThe Group has completed the divestment of product area Mining Systems. The divested businesses has been deconsolidated from the financial statements apart from the ongoing contracts to be finalized by the Group that was not part of the divestment. The con-tracts are still presented as a discontinued operation in the income statement and as a disposal Group held for sale within the balance sheet. The result of the discontinued operations amounts to –52 million SEK for 2017.
The remaining contracts involves complex estimates on the pro-jected final revenue and cost to complete.
The Group has during 2017 completed the divestment of product area Process Systems which by 1 December 2017 has been decon-solidated from the financial statements.
The Group has also during 2017 decided to divest product area Hyperion and the Material Technology operations Welding and Stainless wire. These businesses are presented as disposal groups held for sale within the balance sheet.
Accounting treatments for discontinued operations and Assets held for sale require specific conditions to be met and judgments to be made by Group management. There are also detailed related disclosure requirements.
Response in the auditWe have assessed the divestments of Mining Systems and Pro-cess Systems by obtaining and reviewing sales agreements and other relevant documentation.
We have evaluated the internal control of the business in rela-tion to monitoring of the remaining ongoing contract as well as challenged managements assumptions on final project forecasts. Assessment have also been made through sampling of project estimates for which we have evaluated the underlying assump-tions used by the business for revenue recognition and provisions, if any.
We have assessed the assumptions applied by the Group for presenting remaining ongoing contract within Mining Systems as a discontinued operation, as well as the presentation of Hyperion and Welding and Stainless wire operations as held for sale, by obtaining and reviewing minutes and other relevant documenta-tion of the sales processes and board decisions as well as holding discussions with Group management.
We have further assessed whether the assets and liabilities pre-sented as held for sale have been accurately identified and appro-priately measured at the balances sheet date.
We have also reviewed the Annual Report disclosures for completeness.
Sandvik Annual Report 2017 | 123

AUDITOR’S REPORT
Provisions for pensions See disclosure 20 and accounting principles on pages 80-81 in the annual accounts and consolidated accounts for detailed information and description of the matter.
Description of key audit matterThe Group has a pension obligation that mainly concerns the United Kingdom, the United States, Sweden, Finland and Germany. Before reduction by the fair value of plan assets, this pension obligation is valued at 26,339 million SEK as at 31 December 2017.
Estimation of the value of the pension obligation relies upon a number of assumptions, including mortality, inflation, and discount rates that are applied to estimate the present value of future pen-sion payments. The Group engages external actuaries to perform these complex calculations.
Changes to the assumptions which the calculations are based on could have a significant impact on total comprehensive income as well as on the balance of the pension obligation.
Response in the auditWe have examined the external actuarial report that is used by the Group for valuation of its pension obligation.
We have critically assessed the key assumptions used for dis-count rate, inflation, salary increases and mortality within the cal-culations against assumptions used by other comparative compa-nies and externally obtained market data.
We have reviewed and assessed the documentation supporting significant changes in plan assets and significant events impact-ing the obligation.
We have also reviewed the Annual Report disclosures for com-pleteness and assessed whether they are in line with the assump-tions and sensitivity analysis used.
Other Information than the annual accounts and consolidated accounts This document also contains other information than the annual accounts and consolidated accounts and is found on pages 1-45, 127–144 and 146–152. The Board of Directors and the President and CEO are responsible for this other information.
Our opinion on the annual accounts and consolidated accounts does not cover this other information and we do not express any form of assurance conclusion regarding this other information.
In connection with our audit of the annual accounts and consoli-dated accounts, our responsibility is to read the information identi-fied above and consider whether the information is materially incon-sistent with the annual accounts and consolidated accounts. In this procedure we also take into account our knowledge otherwise obtained in the audit and assess whether the information otherwise appears to be materially misstated.
If we, based on the work performed concerning this information, conclude that there is a material misstatement of this other informa-tion, we are required to report that fact. We have nothing to report in this regard.
Responsibilities of the Board of Directors and the President and CEOThe Board of Directors and the President and CEO are responsi-ble for the preparation of the annual accounts and consolidated accounts and that they give a fair presentation in accordance with the Annual Accounts Act and, concerning the consolidated accounts, in accordance with IFRS as adopted by the EU. The Board of Directors and the President and CEO are also responsible for such internal control as they determine is necessary to enable the preparation of annual accounts and consolidated accounts that are free from material misstatement, whether due to fraud or error.
In preparing the annual accounts and consolidated accounts The Board of Directors and the President and CEO are responsi-ble for the assessment of the company’s and the group's ability to continue as a going concern. They disclose, as applicable, matters related to going concern and using the going concern basis of accounting. The going concern basis of accounting is however not applied if the Board of Directors and the President and CEO intend to liquidate the company, to cease operations, or has no realistic alternative but to do so.
The Audit Committee shall, without prejudice to the Board of Director’s responsibilities and tasks in general, among other things oversee the company’s financial reporting process.
Valuation of acquired intangible assets and the parent company's shares in Group companiesSee disclosure 12 and 14 respectively and accounting principles on pages 79-80 and 82 in the annual accounts and consolidated accounts for detailed information and description of the matter.
Description of key audit matterThe carrying value of acquired intangible assets of goodwill, patents, licenses, trademarks, etc. is 17,376 million SEK as at 31 December 2017, which represents approximately 16 % of total assets. Annually, or if certain indicators of impairment exist, goodwill is subject to an impairment test which is complex and contains
significant elements of judgment. An impairment test must be performed for each identified cash-generating unit.
The impairment test as required by IFRS is to be performed taking into account both forecasted internal and external assumptions and plans. Examples of such judgments are future cash flows and the discount rate to be used considering that estimated future pay-ments are subject to risk.
The parent company holds shares in Group companies of 32,558 million SEK as at 31 December 2017. If the book value of the shares exceeds the equity in a given Group company, a similar type of impairment test is performed using the same methodology and assumptions as is done in respect of goodwill in the Group.
Response in the auditWe have obtained and assessed the Group's impairment tests to ascertain whether they are carried out in accordance with the techniques prescribed by IFRS.
In addition, we have assessed the reasonableness of future cash flows and discount rate by obtaining and evaluating Group management’s written documentation and plans. We have also had discussions with Group management and performed retro-spective review over prior period estimates.
We have assessed the methodology used and an important part of our work has been to evaluate how changes in assump-tions may affect the valuation.
We have assessed the reasonableness of the allocation of goodwill to cash-generating units. The assessment was con-ducted through interviews with Group management and evalua-tion of the Group's documentation of the allocation.
We have reviewed the Annual Report disclosures for com-pleteness, assessed whether the disclosures are in line with the assumptions used by management in their valuation and that they are, in all material respects, in accordance with disclosures required by IFRS.
124 | Sandvik Annual Report 2017
AUDITOR’S REPORT
Auditor’s responsibilityOur objectives are to obtain reasonable assurance about whether the annual accounts and consolidated accounts as a whole are free from material misstatement, whether due to fraud or error, and to issue an auditor’s report that includes our opinions. Reasonable assurance is a high level of assurance, but is not a guarantee that an audit conducted in accordance with ISAs and generally accepted auditing standards in Sweden will always detect a material misstate-ment when it exists. Misstatements can arise from fraud or error and are considered material if, individually or in the aggregate, they could reasonably be expected to influence the economic decisions of users taken on the basis of these annual accounts and consoli-dated accounts.
As part of an audit in accordance with ISAs, we exercise profes-sional judgment and maintain professional scepticism throughout the audit. We also:
– Identify and assess the risks of material misstatement of the annual accounts and consolidated accounts, whether due to fraud or error, design and perform audit procedures responsive to those risks, and obtain audit evidence that is sufficient and appropriate to provide a basis for our opinions. The risk of not detecting a material misstatement resulting from fraud is higher than for one resulting from error, as fraud may involve collusion, forgery, intentional omissions, misrepresentations, or the over-ride of internal control.
– Obtain an understanding of the company’s internal control rel-evant to our audit in order to design audit procedures that are appropriate in the circumstances, but not for the purpose of expressing an opinion on the effectiveness of the company’s internal control.
– Evaluate the appropriateness of accounting policies used and the reasonableness of accounting estimates and related disclosures made by the Board of Directors and the President and CEO.
– Conclude on the appropriateness of the Board of Directors’ and the President and CEO's, use of the going concern basis of accounting in preparing the annual accounts and consoli-dated accounts. We also draw a conclusion, based on the audit evidence obtained, as to whether any material uncertainty exists related to events or conditions that may cast significant doubt on the company’s and the group's ability to continue as a going concern. If we conclude that a material uncertainty exists, we are required to draw attention in our auditor’s report to the related disclosures in the annual accounts and consolidated accounts or, if such disclosures are inadequate, to modify our opinion about the annual accounts and consolidated accounts. Our conclusions are based on the audit evidence obtained up to the date of our auditor’s report. However, future events or con-ditions may cause a company and a group to cease to continue as a going concern.
– Evaluate the overall presentation, structure and content of the annual accounts and consolidated accounts, including the dis-closures, and whether the annual accounts and consolidated accounts represent the underlying transactions and events in a manner that achieves fair presentation.
– Obtain sufficient and appropriate audit evidence regarding the financial information of the entities or business activities within the group to express an opinion on the consolidated accounts. We are responsible for the direction, supervision and perfor-mance of the group audit. We remain solely responsible for our opinions.
We must inform the Board of Directors of, among other matters, the planned scope and timing of the audit. We must also inform of significant audit findings during our audit, including any significant deficiencies in internal control that we identified.
We must also provide the Board of Directors with a statement that we have complied with relevant ethical requirements regard-ing independence, and to communicate with them all relationships and other matters that may reasonably be thought to bear on our independence, and where applicable, related safeguards.
From the matters communicated with the Board of Directors, we determine those matters that were of most significance in the audit of the annual accounts and consolidated accounts, including the most important assessed risks for material misstatement, and are therefore the key audit matters. We describe these matters in the auditor’s report unless law or regulation precludes disclosure about the matter.
Sandvik Annual Report 2017 | 125

AUDITOR’S REPORT
Report on other legal and regulatory requirementsOpinionsIn addition to our audit of the annual accounts and consolidated accounts, we have also audited the administration of the Board of Directors and the President and CEO of Sandvik AB (publ.) for the year 2017 and the proposed appropriations of the company's profit or loss.
We recommend to the general meeting of shareholders that the profit be appropriated in accordance with the proposal in the stat-utory administration report and that the members of the Board of Directors and the President and CEO be discharged from liability for the financial year.
Basis for OpinionsWe conducted the audit in accordance with generally accepted auditing standards in Sweden. Our responsibilities under those standards are further described in the Auditor’s Responsibilities section. We are independent of the parent company and the group in accordance with professional ethics for accountants in Sweden and have otherwise fulfilled our ethical responsibilities in accord-ance with these requirements.
We believe that the audit evidence we have obtained is sufficient and appropriate to provide a basis for our opinions.
Responsibilities of the Board of Directors and the President and CEOThe Board of Directors is responsible for the proposal for appropri-ations of the company’s profit or loss. At the proposal of a dividend, this includes an assessment of whether the dividend is justifia-ble considering the requirements which the company's and the group's type of operations, size and risks place on the size of the parent company's and the group’s equity, consolidation require-ments, liquidity and position in general.
The Board of Directors is responsible for the company’s organ-ization and the administration of the company’s affairs. This includes among other things continuous assessment of the com-pany’s and the group's financial situation and ensuring that the company's organization is designed so that the accounting, man-agement of assets and the company’s financial affairs otherwise are controlled in a reassuring manner.
The President and CEO shall manage the ongoing administration according to the Board of Directors' guidelines and instructions and among other matters take measures that are necessary to fulfill the company's accounting in accordance with law and handle the management of assets in a reassuring manner.
Auditor’s responsibility Our objective concerning the audit of the administration, and thereby our opinion about discharge from liability, is to obtain audit evidence to assess with a reasonable degree of assurance whether any member of the Board of Directors or the President and CEO in any material respect:
– has undertaken any action or been guilty of any omission which can give rise to liability to the company, or
– in any other way has acted in contravention of the Companies Act, the Annual Accounts Act or the Articles of Association.
Our objective concerning the audit of the proposed appropriations of the company’s profit or loss, and thereby our opinion about this, is to assess with reasonable degree of assurance whether the pro-posal is in accordance with the Companies Act.
Reasonable assurance is a high level of assurance, but is not a guarantee that an audit conducted in accordance with generally accepted auditing standards in Sweden will always detect actions or omissions that can give rise to liability to the company, or that the proposed appropriations of the company’s profit or loss are not in accordance with the Companies Act.
As part of an audit in accordance with generally accepted audit-ing standards in Sweden, we exercise professional judgment and maintain professional scepticism throughout the audit. The exam-ination of the administration and the proposed appropriations of the company’s profit or loss is based primarily on the audit of the accounts. Additional audit procedures performed are based on our professional judgment with starting point in risk and materiality. This means that we focus the examination on such actions, areas and relationships that are material for the operations and where deviations and violations would have particular importance for the company’s situation. We examine and test decisions undertaken, support for decisions, actions taken and other circumstances that are relevant to our opinion concerning discharge from liability. As a basis for our opinion on the Board of Directors’ proposed appro-priations of the company’s profit or loss we examined the Board of Directors' reasoned statement and a selection of supporting evidence in order to be able to assess whether the proposal is in accordance with the Companies Act.
KPMG AB, Box 382, 101 27, Stockholm, was appointed auditor of Sandvik AB (publ.) by the general meeting of the shareholders on the 27 April 2017. KPMG AB or auditors operating at KPMG AB have been the company's auditor since financial years before 1994.
Stockholm 6 March 2018 KPMG AB
Joakim ThilstedtAuthorized Public Accountant
126 | Sandvik Annual Report 2017

SUSTAINABILITY NOTES
Sandvik Annual Report 2017 | 127
ABOUT THIS REPORT 128
STAKEHOLDER DIALOGS 128
SUSTAINABLE BUSINESS STRATEGY 128
MATERIALITY ANALYSIS 130
SUSTAINABILITY RISKS 132
SUSTAINABILITY TARGETS 134
KEY FIGURES 138
UN GLOBAL GOALS INDEX 140
GRI INDEX 141
ACCOUNTING PRINCIPLES 144
ASSURANCE REPORT 145
SUSTAINABILITY NOTES

SUSTAINABILITY NOTES
SUSTAINABILITY NOTES
ABOUT THIS REPORTThis is the twelfth consecutive year of Sustainable Busi-ness reporting for Sandvik. We aim to continue reporting the same way on an annual basis. Sandvik's most recent Sustainable Business Report was published in March 2017.
The sustainability notes give the opportunity to present more detailed information on strategy, stakeholder dia-logs, materiality analysis and sustainability data, as well as a more comprehensive description of our sustainability risks and targets. This information is also complemented by the website home.sandvik.
Information meeting the Swedish legal requirements on sustainability reporting, the Statutory Sustainability report, and Sandvik's Sustainable Business Report, is
found on pages 30–41 and 127–144.The sustainability information in this report has been
prepared in accordance with the Global Reporting Initi-ative Guidelines, GRI G4 Core and has been reviewed by an external party. Sandvik is a signatory to the UN Global Compact (UNGC) and reports on the ten princples in accordance with the UNGC Advanced level criteria,
GRI’s guidance on the reporting principles of material-ity, stakeholder inclusiveness, sustainability context, and completeness is used to define the content of the report. This report refers to the 2017 fiscal year and covers all operations of the Group, including subsidiaries, but excludes associated companies and joint ventures.
STAKEHOLDER DIALOGS
SUSTAINABLE BUSINESS STRATEGY
During 2017, stakeholder dialogs have focused on how Sandvik implements its sustainable business strategy, that is sustainability aspects in our offerings and our operations. We held dialogs with stakeholders which we deemed could have the biggest impact, such as internal business leaders and other affected employees, the investor community and business networks. Internal and business network dialogs often take place in workshops or in other interactive fora. Investor dialogs are mainly conducted through individual meetings in smaller or larger groups.
Among the key issues raised in these dialogues are strategy implementation related to the decentralization
of the company. This builds on the dialogs that we held in 2016, when we conducted a stakeholder dialog focusing on the materiality analysis for 2017–2018.
MEMBERSHIPS IN ORGANIZATIONS Sandvik is a member of the UN Global Compact. The company is also part of the network Swedish Leadership for Sustainable Development, facilitated by Sida, com-prising some 20 large Swedish companies and three expert organizations. Sandvik is also part of the industry organization Jernkontoret and Swemin where a number of sustainability initiatives are being taken, particularly in relation to the UN Development Goals.
The sustainable business strategy for the Group was revised and adopted by the Group Executive Management in 2016. The sustainable business strategy builds on the two impact areas “our offerings” and “our operations” and their eight dimensions, four under each impact area. This is our sustainability agenda, and it is based on this agenda that we select a number of material aspects. The dimensions under “our offerings” are further defined by each business area and not defined at Group level. The dimensions under “our operations” have been defined in the agenda on the next page.
This is the result of an impact assessment made of our products and services in relation to our own operations. The strategy focuses on integrating sustainability as an integral part of the Group’s central processes and busi-ness decisions, rather than having a separate sustainabil-ity agenda. The strategy includes international guidelines and principles such as the UN Global Compact, the OECD Guidelines for Multilateral Corporations and the UN Guid-ing Principles for Business and Human Rights.
128 | Sandvik Annual Report 2017

SUSTAINABILITY NOTES
SANDVIK’S SUSTAINABILITY AGENDA:
OUR OFFERINGS GOVERNANCE PARTNERS ENVIRONMENTAL FOOTPRINT PEOPLE
Innovation and productivity
Health and safety
Environmental impact
Governance framework
Performance management
Compliance
Taxation
Customer relations
Sustainable supplier management
Community involvement
Carbon dioxide (CO2) emissions
Use, reuse, recondition and recycle
Use, reuse, recondition and recycle
Efficient use of materials and resources
Reduction of other emissions
Health and safety
Employer branding and fair recruitment
Employee engagement, training and development
A diverse and inclusive organization
Excellent leaders
Human rights and fair labor conditions
Governance Environ mentalfootprint
Partners People
OUR OPERATIONSOUR OFFERINGS
Innovation and productivity
Environ mentalimpact
Health andsafety
Use, reuseand recycle
OUR OFFERINGSWe want to make our customers more sustainable. We develop products, solutions and services that enhance our customers’ sustainability through improved produc-tivity and competitiveness, while reducing environmental impact, and promoting health and safety for our custom-ers’ employees. We work with our customers throughout the product’s lifecycle by providing service and aftermar-ket support, such as customer buy-back programs which enable us to recover and recycle used products. We con-stantly strive to make our products more energy efficient, thereby lowering our customers’ costs.
OUR OPERATIONSWe want to become more sustainable. We believe that promoting sustainability and responibility in our own oper-ations makes us a more long-term and trusted partner to our customers and other stakeholders. We work con-tinuously to improve our internal processes, to address aspects such as our supplier management, energy use, emissions, water consumption, anti-corruption, fair work-ing conditions as well as other human rights.
Sandvik Annual Report 2017 | 129

SUSTAINABILITY NOTES
Material inside Sandvik Material mainly outside Sandvik (supplier and/or customer) Material both inside and outside Sandvik (supplier and/or customer)
OUR OFFERINGS OUR OPERATIONS
Group Followed up entirely by the business areas
Compliance Sustainable supplier management Use, reuse, recondition and recycle Health and safety A diverse and inclusive organization
Sandvik Machining Solutions
Innovation and productivity Compliance Sustainable supplier management Efficient use of materials and resources Health and safety
Sandvik Mining and Rock Technology
Innovation and productivity Health and safety Environmental impact
Governance Compliance Customer relations Sustainable supplier management Efficient use of materials and resources Reduction of other emissions Health and safety A diverse and inclusive organization
Sandvik Materials Technology
Innovation and productivity Environmental impact
Customer relations Sustainable supplier management Carbon dioxide emissions Use, reuse, recondition and recycling Efficient use of materials and resources Health and safety
SANDVIK MATERIAL ASPECTS 2017–2018
The Group Executive Management conducts a materiality analysis on a regular basis. The starting point comprises the aforementioned sustainability agenda for the Group, deriving from international frameworks and institutions such as the Global Reporting Initiative (GRI), the UN Global Compact, from media reports, global trends and from dia-logs with our stakeholders, in addition to our own assess-ment of relevant areas.
In late 2016, following a decentralization process in the company, a materiality analysis was conducted which
applies for 2017–2018. A number of questions relating to the prioritization of our Group sustainability agenda were sent out to internal and external stakeholders. Following a decision by the Group Executive Management, inspired by the stakeholder dialog, five aspects were selected as material for the Group and several aspects were found relevant for the business areas for 2017–2018.
A complete list of material aspects is found below. Targets and key performance indicators have been devel-oped for each material aspect both at the Group level and at the business area level.
MATERIALITY ANALYSIS
130 | Sandvik Annual Report 2017

SUSTAINABILITY NOTES
COMPLIANCECompliance includes four areas: anti-corruption com-pliance, competition law, trade compliance and data protection. The main purpose is to ensure a well- functioning structure with control over Sandvik's interna-tional business and to manage compliance risks. Com-pliance programs (including risk identification, policies, training, controls, etc.) are implemented by each business area and overseen by the Sandvik Compliance Functional Council which sets requirements, reviews performance and provides assurance of satisfaction to the main board through the Audit Committee. The Functional Council comprises Compliance Officers from the business areas and specialist legal counsel at the Group. See page 38 for more information.
SUSTAINABLE SUPPLIER MANAGEMENT A sustainable supply chain and strong supplier relation-ships are central to Sandvik’s commitment to provide customers with the best and most innovative offerings. It is important for us to partner with suppliers who under-stand and embrace our sustainability standards regard-ing areas such as environment, labor, human rights and anti-corruption. Our requirements, which are the same for all types of suppliers, are outlined in our Supplier Code of Conduct. See page 39 for more information about our Sustainable Supplier Management Program, including pur-chasing practices, monitoring of suppliers and identified deviations.
USE, REUSE, RECONDITION AND RECYCLEComprehensive recycling programs are underway in all parts of the Group. The global raw material shortage is an impediment for a successful business. Recycling results in less virgin raw material used, lower energy consump-tion and reduced emissions of acidifying substances and wastewater discharge, in addition to less waste. These factors are important to Sandvik, the Group's customers and society at large.
Sandvik has an Environment, Health and Safety (EHS) policy valid for the entire Group which is supported by a number of internal environmental standards for our oper-ations. Major sites with production, services and ware-houses have certified management systems according to ISO 14001 (99%). Environmental issues are included in the process for sustainable supplier management and both environmental and safety issues form part of the process for developing new products. Lifecycle assessments are carried out for selected products, mainly within Sandvik Materials Technology. Read more about our work on envi-ronmental issues on page 36.
HEALTH AND SAFETYMaintaining a safe work environment will always be a top priority, out of respect for both Sandvik's employees and customers. The Group's performance is meeting growing expectations from its customers and other stakeholders. Health and safety is a significant competitive advantage to Sandvik. Sandvik has an Environment, Health and Safety (EHS) policy valid for the entire Group. Objectives and targets are set at Group level, and the business areas integrate these aspects and standards in their respective organizations. KPIs are reported and consolidated to fol-low up objectives and targets at Group and business area levels. Major sites with production, services and ware-houses have certified management systems according to OSHAS 18001 (99%). Furthermore, safety is an important aspect when developing new products. Read more about our health and safety work on page 34.
A DIVERSE AND INCLUSIVE ORGANIZATION Sandvik's view is that diverse teams are more effective, more likely to think and act outside the box and contribute to greater creativity and innovation. Diversity and inclusion are integral parts of a modern society and, for Sandvik, a strong competitive advantage. Having the right mix of people, reflecting Sandvik's markets, will support the business and our ambition to meet the needs of global and local customers. Read more on page 31.
MANAGING OUR (GROUP) MATERIALS ASPECTS
Sandvik Annual Report 2017 | 131

SUSTAINABILITY NOTES
RISK CATEGORY RISK DESCRIPTION RISK CONSEQUENCES RISK MITIGATION
S4. Regulatory change Significant new legislation or regulations that could have an impact on the Sandvik business
The inability to quickly respond to new regulations leading to higher costs, fines or the inability to continue manufacturing of certain products. Can also have a negative reputational impact if not managed effectively
All parts of Sandvik work with the monitoring of different initiatives and continually evaluate their impact on our business. We are active in business associations and other organizations, such as Jernkontoret and the Confederation of Swedish Enterprises (Svenskt Näringsliv), to monitor regulatory development to benefit long-term sustainable business
S6. Sustainability expectations and/or requirements
Risks of not keeping up with and/or meeting the increasing legal requirements and stakeholder expectations in the area of sustainability reporting, sustainable supply chain, and with requirements on more non-financial data and increased customer demands for more sustainable products and services
Slower than the competition with regards to new business models built on sustainability. Negative reputational impact and not being able to meet customer expectations which could lead to a loss of business. Negative impact on the share's attraction as an investment as well as on the attraction and retention of future or current employees
Further clarify content as well as roles and responsibilities in the delivery on the sustainable business strategy. Ensure training and awareness-raising activities throughout the organization
B1. Noncompliance with laws and regulations
Risks that legal and regulatory requirements are not met
Worst-case scenarios show high financial impact due to fines in multiple markets. Can have a major negative reputational impact if risk was to materialize
The Group has an established governance framework, The Sandvik Way, which includes Group policies, Group procedures and other steering documentation. The scope of the governance framework, including controls implemented, is based on legal requirements and risk exposure. Sandvik's formal compliance programs on anti-bribery and corruption, competition law, customs and export controls and data privacy are managed by the business with oversight through a Compliance Functional Council
B2. Health and safety Risk connected to health and safety procedures being non-existent or not adhered to, causing injuries, increased sick leave, or even fatalities. Also including health and safety requirements set by our customers or suppliers
Business risk that our safety records don't meet the customer requirements, resulting in loss of business. Reputational risk if poor safety conditions exist in the company, resulting in brand damage. Risk that employees find the work environment unsatisfactory, resulting in difficulties to retain and recruit
Build a strong EHS culture and effective EHS Management Systems. As a minimum requirement, be certified in accordance with OHSAS 18001
B6. Talent attraction and employee retention
Increased need for digital and innovative business development competence. Increased need for specialist/expert competence in R&D and other niche areas. Inability to attract new talents in certain highly competitive markets
A general risk of losing competitiveness and business position on the market with a special risk focus of not being able to take a strong position in the digital area fast enough
Sandvik has, across the business areas, focused on developing the Sandvik employer brand. One key area is to use new, digital channels to attract and recruit competence for the future. Succession planning has been strengthened for top management positions
SUSTAINABILITY RISKSThe Group’s risk management approach follows our decentralized structure and the same applies to our sus-tainability risks. All managers at Sandvik with operational responsibilities are expected to ensure that risks asso-ciated with their operations are appropriately identified, evaluated and managed.
The below listed risks are sustainability risk categories embedded in Sandvik’s risk universe and are managed within all our operations. Risk S.4, B.1 and B.6 have been identified by the Group Executive Management Team as part of the key risks for the Group. Read more about our risk management on page 54–57.
132 | Sandvik Annual Report 2017

SUSTAINABILITY NOTES
RISK CATEGORY RISK DESCRIPTION RISK CONSEQUENCES RISK MITIGATION
B17. Environmental demands/climate change effects
Managing increased demand of more environmentally conscious products and services by our customers. Increased demand to understand climate change effect on both internal operations and other stakeholders, such as suppliers, customers and society
Risk of losing customers and market shares due to:- Changes in the demand of products and services- Not being able to meet customer expectations on our internal operations and/or products and services with regards to environmental performance, including mitigation of climate change impact- Tarnished reputation- Not being able to comply with new or changed legislation
Keep high awareness in the organization regarding market demands, customer expectations, business development and legislation.Follow the development in society and the market to be able to adapt products and services according to changed preconditions. Focus on improved efficiency to minimize environmental impact in our own operations, including in the supply chain
B23. Sandvik values and ethics compliance
Non-compliance with Sandvik's Code of Conduct. Risks connected to lack of understanding of the core values or the Code of Conduct
Internal risks, such as breaches of law and regulations that can have severe consequences for Sandvik. Unethical behavior leading to unhealthy or unsafe work environment. Difficulties to attract new employees. External risks such as reputational damage and fines
Ensure that all employees, including long-term contractors, are trained in Sandvik's Code of Conduct. Compliance with the Code of Conduct is a requirement in employment contracts for new hires. Ensure that breaches of the Code of Conduct are reported and properly investigated
B28. Contractor/short-term staff management
Risk of not managing contractors sufficiently. Outsourcing activities to contractors may for example result in the contractors not acting within the intended limits of their authority or not performing in a manner consistent with agreed requirements, including Sandvik's Supplier Code of Conduct
General risk to tarnish our reputation, weaken our financial position, lose customers and market share, face disruptions in our activities
Contractors are included in the supplier group. Strengthen the implementation of our Procurement Policy and related processes. Further integrate sustainability into procurement processes. Increase awareness and competences, leverage technology to drive process efficiency. Strengthen overall control activities and performance management. Further align procurement targets and sustainable supplier management
B29. Partners/agents/third- party management
Risk of not managing partners/agents/distributor relationships sufficiently. Outsourcing activities to a third party may for example result in the third party not acting within the intended limits of their authority or not performing in a manner consistent with agreed requirements, including ethical requirement
General risk of tarnished reputation. Failure to meet customer, investor and regulator expectations and requirements. Breach of ethical standards or breach of law
Conduct partner/agent/distributor due diligence to establish the level and scope of risks, nominate specific mitigations and monitor compliance
B32. Security situation Risks connected with doing business in unstable conflict-affected regions. Can be related to transportation of goods or people. Could lead to increased security risks or threats for employees, injuries or even fatalities. Included in this category are risks related to travel
Safety risks for employees traveling. If our processes have weaknesses, the risk of incidents occurring could be higher and proper handling if they do occur could be weaker. Apart from the negative impact for the employee, it could potentially implicate a risk from an employer branding perspective, as well as a risk of damaging the Sandvik reputation and brand
Strengthening processes in relation to travel safety and security by ensuring that robust processes are in place and by ensuring good cooperation with external experts in the area
B37. Supplier and sourcing management
All risks related to the management of and partnership with suppliers and products/services that we purchase
General risk to tarnish our reputation, weaken our financial position, lose customers and market share, a higher cost for capital and financing, face disruptions in the supply chain, lose partnership opportunities for innovations and green solutions with our suppliers
Strengthen implementation of the Procurement Policy and supporting processes. Further integrate sustainability in procurement processes. Increase awareness and competences and leverage technology to drive process efficiency. Strengthen the overall control activities and performance management. Further align procurement targets and sustainable supplier management
Sandvik Annual Report 2017 | 133
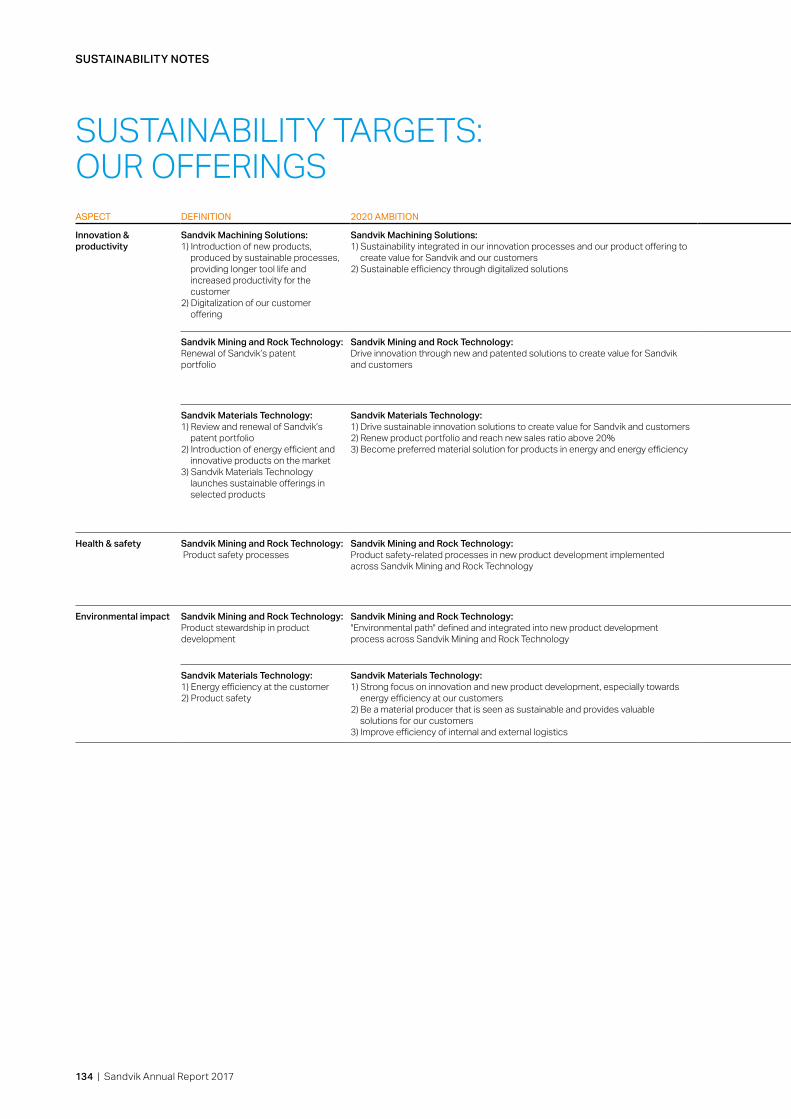
SUSTAINABILITY NOTES
ASPECT DEFINITION 2020 AMBITION FOCUS ACTIONS 2017 TARGETS 2017 RESULTS 2017
GLOBAL COMPACT PRINCIPLE
Innovation & productivity
Sandvik Machining Solutions:1) Introduction of new products,
produced by sustainable processes, providing longer tool life and increased productivity for the customer
2) Digitalization of our customer offering
Sandvik Machining Solutions:1) Sustainability integrated in our innovation processes and our product offering to
create value for Sandvik and our customers 2) Sustainable efficiency through digitalized solutions
Sandvik Machining Solutions:Sandvik Coromant: sustainable strategy development work launched Seco Tools: Risk/opportunity analysis regarding sustainability done in all prod-uct and technology projects. Increase sales ratio of new productsEnforce digitalization development
Sandvik Machining Solutions:New sales ratio in the range of 30-40%.Lower average age of patents
Sandvik Machining Solutions:New sales ratio within target range. Share of new patents increased 10%
7-9
Sandvik Mining and Rock Technology:Renewal of Sandvik’s patentportfolio
Sandvik Mining and Rock Technology:Drive innovation through new and patented solutions to create value for Sandvik and customers
Sandvik Mining and Rock Technology:Run two innovation workshops peryear to inspire innovation ideas (forexample drilling systems, environmentalperception)
Sandvik Mining and Rock Technology:Maintain healthy trend of New FilingRatio, NFR (share of patents filed in the last 5 years as % of the total portfolio), NFR 2017: 39%
Sandvik Mining and Rock Technology:NFR 2017: 40.6%.
7-9
Sandvik Materials Technology:1) Review and renewal of Sandvik’s
patent portfolio 2) Introduction of energy efficient and
innovative products on the market3) Sandvik Materials Technology
launches sustainable offerings in selected products
Sandvik Materials Technology:1) Drive sustainable innovation solutions to create value for Sandvik and customers2) Renew product portfolio and reach new sales ratio above 20%3) Become preferred material solution for products in energy and energy efficiency
Sandvik Materials Technology:Launch of Sustainability and Modelling Research & Innovation (R&I) PlatformsSustainability Strategy documentDevelop sustainable product offering through product area workshops
Sandvik Materials Technology:1) More than 25 patents filed per year2) New sales ratio of 15%3) Launch of Sustainability and Modelling
R&I Platforms4) Initiate sustainability strategy
development5) Perform product area workshops to
define sustainable product offering
Sandvik Materials Technology:1) 23 patents filed during 20172) New sales ratio at 15%3) Sustainability and Modelling R&I Platforms
launched4) Sustainability Strategy document under
development5) Workshops performed within selected product
areas. Sustainable product offering initiated together with customers
7-9
Health & safety Sandvik Mining and Rock Technology: Product safety processes
Sandvik Mining and Rock Technology:Product safety-related processes in new product development implemented across Sandvik Mining and Rock Technology
Sandvik Mining and Rock Technology:Revising current processes, followedby internal communication and training
Sandvik Mining and Rock Technology:Revised and communicated product safety-related common processfor new product development across SMRT
Sandvik Mining and Rock Technology:Product safety process for new product safety development has been revised and communi-cated to the relevant product areas through the business area's product safety network
3-6
Environmental impact Sandvik Mining and Rock Technology: Product stewardship in productdevelopment
Sandvik Mining and Rock Technology: "Environmental path" defined and integrated into new product development process across Sandvik Mining and Rock Technology
Sandvik Mining and Rock Technology: Defining a model for identifying andreducing product-related environmentalrisks
Sandvik Mining and Rock Technology:Create a common model for productenvironmental risk assessment
Sandvik Mining and Rock Technology:Common model for product environmental risk assessment has been created.
7-9
Sandvik Materials Technology:1) Energy efficiency at the customer2) Product safety
Sandvik Materials Technology:1) Strong focus on innovation and new product development, especially towards
energy efficiency at our customers 2) Be a material producer that is seen as sustainable and provides valuable
solutions for our customers3) Improve efficiency of internal and external logistics
Sandvik Materials Technology:Three year environmental planDevelop tools and processes for lifecycle analysis
Sandvik Materials Technology:1) Three year environmental plan2) Develop tools and processes for
lifecycle analysis
Sandvik Materials Technology:1) Three year environmental plan developed by
vast majority of operations2) Prestudy and pilot finished. Decision to
continue initiative
7-9
SUSTAINABILITY TARGETS: OUR OFFERINGS
134 | Sandvik Annual Report 2017

SUSTAINABILITY NOTES
ASPECT DEFINITION 2020 AMBITION FOCUS ACTIONS 2017 TARGETS 2017 RESULTS 2017
GLOBAL COMPACT PRINCIPLE
Innovation & productivity
Sandvik Machining Solutions:1) Introduction of new products,
produced by sustainable processes, providing longer tool life and increased productivity for the customer
2) Digitalization of our customer offering
Sandvik Machining Solutions:1) Sustainability integrated in our innovation processes and our product offering to
create value for Sandvik and our customers 2) Sustainable efficiency through digitalized solutions
Sandvik Machining Solutions:Sandvik Coromant: sustainable strategy development work launched Seco Tools: Risk/opportunity analysis regarding sustainability done in all prod-uct and technology projects. Increase sales ratio of new productsEnforce digitalization development
Sandvik Machining Solutions:New sales ratio in the range of 30-40%.Lower average age of patents
Sandvik Machining Solutions:New sales ratio within target range. Share of new patents increased 10%
7-9
Sandvik Mining and Rock Technology:Renewal of Sandvik’s patentportfolio
Sandvik Mining and Rock Technology:Drive innovation through new and patented solutions to create value for Sandvik and customers
Sandvik Mining and Rock Technology:Run two innovation workshops peryear to inspire innovation ideas (forexample drilling systems, environmentalperception)
Sandvik Mining and Rock Technology:Maintain healthy trend of New FilingRatio, NFR (share of patents filed in the last 5 years as % of the total portfolio), NFR 2017: 39%
Sandvik Mining and Rock Technology:NFR 2017: 40.6%.
7-9
Sandvik Materials Technology:1) Review and renewal of Sandvik’s
patent portfolio 2) Introduction of energy efficient and
innovative products on the market3) Sandvik Materials Technology
launches sustainable offerings in selected products
Sandvik Materials Technology:1) Drive sustainable innovation solutions to create value for Sandvik and customers2) Renew product portfolio and reach new sales ratio above 20%3) Become preferred material solution for products in energy and energy efficiency
Sandvik Materials Technology:Launch of Sustainability and Modelling Research & Innovation (R&I) PlatformsSustainability Strategy documentDevelop sustainable product offering through product area workshops
Sandvik Materials Technology:1) More than 25 patents filed per year2) New sales ratio of 15%3) Launch of Sustainability and Modelling
R&I Platforms4) Initiate sustainability strategy
development5) Perform product area workshops to
define sustainable product offering
Sandvik Materials Technology:1) 23 patents filed during 20172) New sales ratio at 15%3) Sustainability and Modelling R&I Platforms
launched4) Sustainability Strategy document under
development5) Workshops performed within selected product
areas. Sustainable product offering initiated together with customers
7-9
Health & safety Sandvik Mining and Rock Technology: Product safety processes
Sandvik Mining and Rock Technology:Product safety-related processes in new product development implemented across Sandvik Mining and Rock Technology
Sandvik Mining and Rock Technology:Revising current processes, followedby internal communication and training
Sandvik Mining and Rock Technology:Revised and communicated product safety-related common processfor new product development across SMRT
Sandvik Mining and Rock Technology:Product safety process for new product safety development has been revised and communi-cated to the relevant product areas through the business area's product safety network
3-6
Environmental impact Sandvik Mining and Rock Technology: Product stewardship in productdevelopment
Sandvik Mining and Rock Technology: "Environmental path" defined and integrated into new product development process across Sandvik Mining and Rock Technology
Sandvik Mining and Rock Technology: Defining a model for identifying andreducing product-related environmentalrisks
Sandvik Mining and Rock Technology:Create a common model for productenvironmental risk assessment
Sandvik Mining and Rock Technology:Common model for product environmental risk assessment has been created.
7-9
Sandvik Materials Technology:1) Energy efficiency at the customer2) Product safety
Sandvik Materials Technology:1) Strong focus on innovation and new product development, especially towards
energy efficiency at our customers 2) Be a material producer that is seen as sustainable and provides valuable
solutions for our customers3) Improve efficiency of internal and external logistics
Sandvik Materials Technology:Three year environmental planDevelop tools and processes for lifecycle analysis
Sandvik Materials Technology:1) Three year environmental plan2) Develop tools and processes for
lifecycle analysis
Sandvik Materials Technology:1) Three year environmental plan developed by
vast majority of operations2) Prestudy and pilot finished. Decision to
continue initiative
7-9
Sandvik Annual Report 2017 | 135

SUSTAINABILITY NOTES
ASPECT DEFINITION 2020 AMBITION FOCUS ACTIONS 2017 TARGETS 2017 RESULTS 2017
GLOBAL COMPACT PRINCIPLE
Code of Conduct Defined by the content in the Code of Conduct
An operation where business ethics is fully embedded in everyday discussions and decisions, and no breaches of the principles of our Code of Conduct exists
Training of all existing employees and design/imple-mentation of process for training of new hires
1) 100% of all employees trained in the Code of Conduct
93% 1-10
Speak Up All in Code of Conduct All employees fully aware of Speak Up as an opportunity to report, and input used in the continuous improvement of business ethics as Sandvik
Awareness campaign as part of Code of Conduct training, release of Speak Up in remaining coun-tries, and investigations set-up in the business areas
1) Completed awareness campaign as part of Code of Conduct roll-out training.
Completed and ongoing 1-10
Compliance* 1) Anti-corruption and bribery2) Data protection 3) Trade compliance4) Competition law
Compliance optimized to be both effective and efficient, as evidenced by pervasive risk assessments throughout the organization, implementation of controls down to reporting entity, trained employees, clear tone from the top and from the middle management, systematic monitoring the effectiveness of controls, Speak Up reporting and internal audit, and a compliance organization which is thoroughly embedded in the day-to-day operations of the business
Consistent with our direction to embed compli-ance in our business areas, strengthen processes and systems with respect to commercial interme-diaries and record keeping
1) 100% of employees trained in the Code of Conduct (including ABC and competition law)
2) Number of employees trained within compliance
3) Number of commercial intermediaries screened during the year
1) 93%2 )10,000+3) 447
10
Sustainable Supplier Management*
1) Sustainable supply base2) Sustainable purchasing practices3) Sustainable supplies
1) Increase supply base compliance with Sandvik Supplier Code of Conduct and other sustainability requirements
2) Embed sustainability in the purchasing processes3) Use of sustainable raw materials, resources and goods, whenever practical
In line with our direction to further embed sus-tainability into the procurement processes and improve our supply base compliance with Supplier Code of Conduct in the new organizational set up
1) Audit high-risk suppliers 2) Develop a Group Procurement policy with
integrated sustainability commitments 3) Capacity building activities
1) 134 suppliers audited 2) Completed 3) 76 purchasers and related functions
trained and 133 suppliers trained
1-10
Environmental footprint
1) Climate change 2) Energy use3) Water use
1-3) Achieve significant improvements in areas where our operations have a significant environmental impact. The ambition is to see a 20% relative decrease of in these areas between 2016–2020 compared to 2014 as base year. This corresponds to 4% per year, meaning that the anticipated relative improvement gives a -8% target by the end of 2017
Environmental improvement actions are identified, reported and measured in order to monitor suc-cessful progress
1) Relative decrease of CO₂ emissions by 8% compared to 2014
2) Relative decrease of energy use by 8% compared to 2014
3) Relative decrease of water use by 8% compared to 2014
1) CO₂ / worked hours: +8% CO₂ / invoiced sales: −8%2) Energy / worked hours: +7% Energy / invoiced sales: –9%3) Water / worked hours: +4% Water / invoiced sales: –12%
7-9
Use, reuse, recondi-tioning and recycling of material and natural resources*
1) Use of sustainable materials and resources
2) Reuse and recondition 3) Recycling of materials and
resources
1) Increase share of waste going to recovery operations to >20% of total waste generated
2) Maintain >80% of metallic raw material that comes from recovered materials
Establish EHS plans that work towards completing activities that make it possible for us to meet the EHS ambitions for 2020
1) 15% share of waste going to recovery2) 80% share of metallic raw materials from
recovered materials
1) 15%2) 79%
7-9
Health and Safety* 1) Elimination of fatalities2) Reduce injuries and illness3) Health and well-being
1) To eliminate fatalities at Sandvik controlled locations2) LTIFR of <1.03) To have our employees working in a culture and environment that supports their
health and well-being
Critical ControlsImprove Incident Investigation process
1) No Fatalities2) LTIFR 1.4
TRIFR 4.53) 90% of staff access to well-being programs
that are adapted to local needs 75% of employees believe that their health and well-being program is effective.
1) 02) LTIFR 1.6
TRIFR 4.63) 81% access 91% adaptation 84% effectiveness
3-6
A diverse and inclusive organization*
1) Equal career opportunities 2) Open and transparent internal job
market 3) Balance internal vs external sourcing
to management positions
1) A high performing organization capitalizing on diversity and inclusion to secure competitiveness
2) Strengthen an open and transparent internal job market where job opportunities are visible and available to our employees in order for them to take responsibility for their own career
3) Our ability to develop and appoint internal candidates and using all of Sandvik as a candidate pool is a key success factor to ensure future performance and growth
Ensured diversity perspectives in all HR areas for example recruitment, talent managementAll top management positions posted Encourage and monitor internal sourcing to top management positions. Focus on developing managers and experts to build a solid pipeline of internal candidates
1) 17,1% share of women in managerial positions2) 90% share of open recruitments to top
management positions. 3) 80% internal and 20% external share
of internal and external sourcing to top management positions
1) 17.1%2) 88%3) 78% internal, 22% external
1-2, 6
* Identified as a material aspect in the Group's materiality analysis.
SUSTAINABILITY TARGETS: OUR OPERATIONS
136 | Sandvik Annual Report 2017
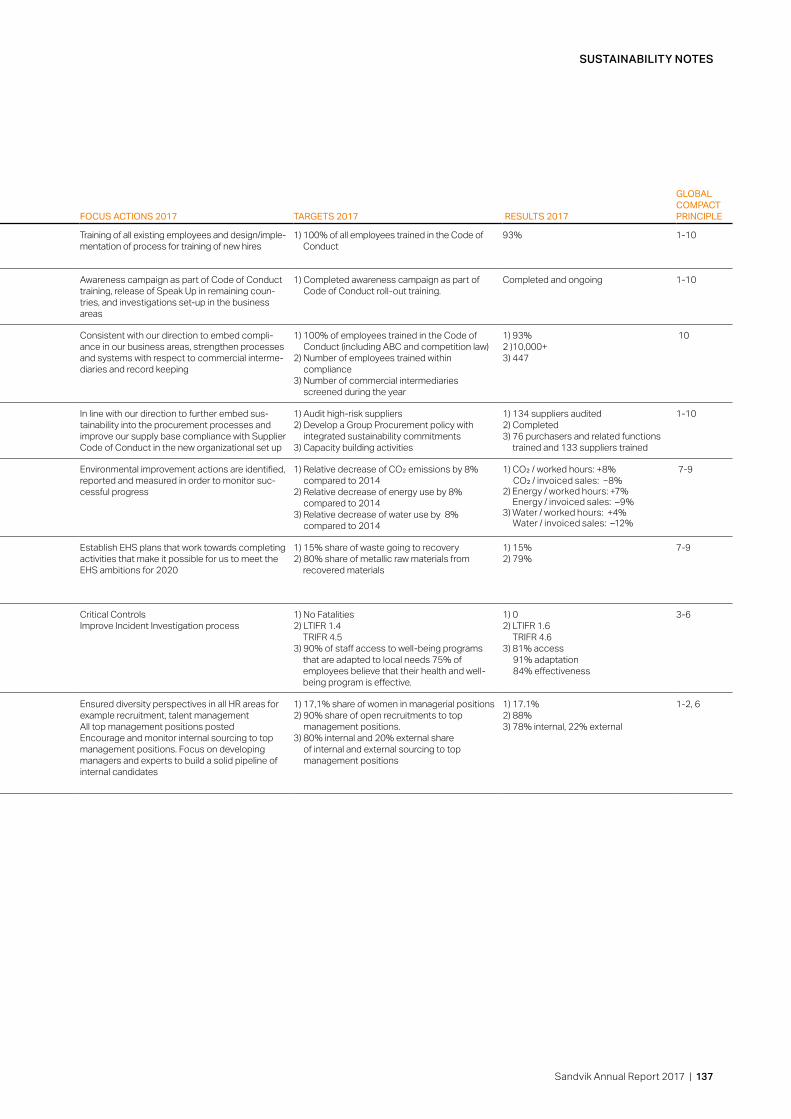
SUSTAINABILITY NOTES
ASPECT DEFINITION 2020 AMBITION FOCUS ACTIONS 2017 TARGETS 2017 RESULTS 2017
GLOBAL COMPACT PRINCIPLE
Code of Conduct Defined by the content in the Code of Conduct
An operation where business ethics is fully embedded in everyday discussions and decisions, and no breaches of the principles of our Code of Conduct exists
Training of all existing employees and design/imple-mentation of process for training of new hires
1) 100% of all employees trained in the Code of Conduct
93% 1-10
Speak Up All in Code of Conduct All employees fully aware of Speak Up as an opportunity to report, and input used in the continuous improvement of business ethics as Sandvik
Awareness campaign as part of Code of Conduct training, release of Speak Up in remaining coun-tries, and investigations set-up in the business areas
1) Completed awareness campaign as part of Code of Conduct roll-out training.
Completed and ongoing 1-10
Compliance* 1) Anti-corruption and bribery2) Data protection 3) Trade compliance4) Competition law
Compliance optimized to be both effective and efficient, as evidenced by pervasive risk assessments throughout the organization, implementation of controls down to reporting entity, trained employees, clear tone from the top and from the middle management, systematic monitoring the effectiveness of controls, Speak Up reporting and internal audit, and a compliance organization which is thoroughly embedded in the day-to-day operations of the business
Consistent with our direction to embed compli-ance in our business areas, strengthen processes and systems with respect to commercial interme-diaries and record keeping
1) 100% of employees trained in the Code of Conduct (including ABC and competition law)
2) Number of employees trained within compliance
3) Number of commercial intermediaries screened during the year
1) 93%2 )10,000+3) 447
10
Sustainable Supplier Management*
1) Sustainable supply base2) Sustainable purchasing practices3) Sustainable supplies
1) Increase supply base compliance with Sandvik Supplier Code of Conduct and other sustainability requirements
2) Embed sustainability in the purchasing processes3) Use of sustainable raw materials, resources and goods, whenever practical
In line with our direction to further embed sus-tainability into the procurement processes and improve our supply base compliance with Supplier Code of Conduct in the new organizational set up
1) Audit high-risk suppliers 2) Develop a Group Procurement policy with
integrated sustainability commitments 3) Capacity building activities
1) 134 suppliers audited 2) Completed 3) 76 purchasers and related functions
trained and 133 suppliers trained
1-10
Environmental footprint
1) Climate change 2) Energy use3) Water use
1-3) Achieve significant improvements in areas where our operations have a significant environmental impact. The ambition is to see a 20% relative decrease of in these areas between 2016–2020 compared to 2014 as base year. This corresponds to 4% per year, meaning that the anticipated relative improvement gives a -8% target by the end of 2017
Environmental improvement actions are identified, reported and measured in order to monitor suc-cessful progress
1) Relative decrease of CO₂ emissions by 8% compared to 2014
2) Relative decrease of energy use by 8% compared to 2014
3) Relative decrease of water use by 8% compared to 2014
1) CO₂ / worked hours: +8% CO₂ / invoiced sales: −8%2) Energy / worked hours: +7% Energy / invoiced sales: –9%3) Water / worked hours: +4% Water / invoiced sales: –12%
7-9
Use, reuse, recondi-tioning and recycling of material and natural resources*
1) Use of sustainable materials and resources
2) Reuse and recondition 3) Recycling of materials and
resources
1) Increase share of waste going to recovery operations to >20% of total waste generated
2) Maintain >80% of metallic raw material that comes from recovered materials
Establish EHS plans that work towards completing activities that make it possible for us to meet the EHS ambitions for 2020
1) 15% share of waste going to recovery2) 80% share of metallic raw materials from
recovered materials
1) 15%2) 79%
7-9
Health and Safety* 1) Elimination of fatalities2) Reduce injuries and illness3) Health and well-being
1) To eliminate fatalities at Sandvik controlled locations2) LTIFR of <1.03) To have our employees working in a culture and environment that supports their
health and well-being
Critical ControlsImprove Incident Investigation process
1) No Fatalities2) LTIFR 1.4
TRIFR 4.53) 90% of staff access to well-being programs
that are adapted to local needs 75% of employees believe that their health and well-being program is effective.
1) 02) LTIFR 1.6
TRIFR 4.63) 81% access 91% adaptation 84% effectiveness
3-6
A diverse and inclusive organization*
1) Equal career opportunities 2) Open and transparent internal job
market 3) Balance internal vs external sourcing
to management positions
1) A high performing organization capitalizing on diversity and inclusion to secure competitiveness
2) Strengthen an open and transparent internal job market where job opportunities are visible and available to our employees in order for them to take responsibility for their own career
3) Our ability to develop and appoint internal candidates and using all of Sandvik as a candidate pool is a key success factor to ensure future performance and growth
Ensured diversity perspectives in all HR areas for example recruitment, talent managementAll top management positions posted Encourage and monitor internal sourcing to top management positions. Focus on developing managers and experts to build a solid pipeline of internal candidates
1) 17,1% share of women in managerial positions2) 90% share of open recruitments to top
management positions. 3) 80% internal and 20% external share
of internal and external sourcing to top management positions
1) 17.1%2) 88%3) 78% internal, 22% external
1-2, 6
* Identified as a material aspect in the Group's materiality analysis.
Sandvik Annual Report 2017 | 137

SUSTAINABILITY NOTES
PEOPLE KEY FIGURES Unit 2010 2011 2012 2013 2014 2015 2016 2017PeopleTotal number of employees FTE* 47,064 50,030 48,742 47,338 47,318 45,808 43,732 43,024
Of whom are women % 17.6 17.9 18.5 19.1 19.4 19.5 19.4 19.4Full-time employees % – – – 97 98 98 97 97
Of whom are women % – – – – 18 18 18 18Part-time employees % – – – 3 2 2 3 3
Of whom are women % – – – – 59 59 58 57Contracted employees FTE – – – 3,524 1,776 2,376 2,456 2,814LTIFR Number of LTIs per
million hours worked 5.6 4.6 4.4 3.2 2.5 2.2 1.7 1.6TRIFR Number of TRIs per
million hours worked – – – 8.7 6.4 6.0 5.1 4.6
EuropeNorth
AmericaSouth
AmericaAfrica/
Middle East Asia AustraliaEmployees by region FTE 23,780 5,949 1,932 2,356 8,077 930
Sandvik Mining and Rock Technology
Sandvik Machining Solutions
Sandvik Materials Technology
Other Operations
Group Activities Total
Employees by business area FTE 15,207 18,187 6,483 1,531 1,616 43,024Total share of women % 15.4 20.2 18.3 18.1 48.1 19.4Women in management positions % 16.0 15.1 17.8 17.6 39.1 17.1
Age structureShare of women Under 30 30–50 50 and above
Composition of governance bodies and breakdown of other employeesBoard of Directors % 31 0 31 69Group Executive Management % 25 0 38 63Management % 17 1 68 31Other employees % 20 16 57 27
Unit 2010 2011 2012 2013 2014 2015 2016 2017New employee hires and employee turnoverNew employee hires per year number – – – – 3,293 2,799 2,235 3,653
Of whom are women % – – – – 22 19 19 20Employee turnover per year % 8 8 11 12 10 11 11 9
Age structureUnder 30 30-50 50 and above
New employee hires by age number 1,287 2,054 312Employee turnover by age % 9 9 10
Men WomenEmployee turnover by gender % 9 10
2017Employees receiving regular performance and career development reviewsTotal % 81Men % 81Women % 79
* full time equivalent
KEY FIGURES
138 | Sandvik Annual Report 2017
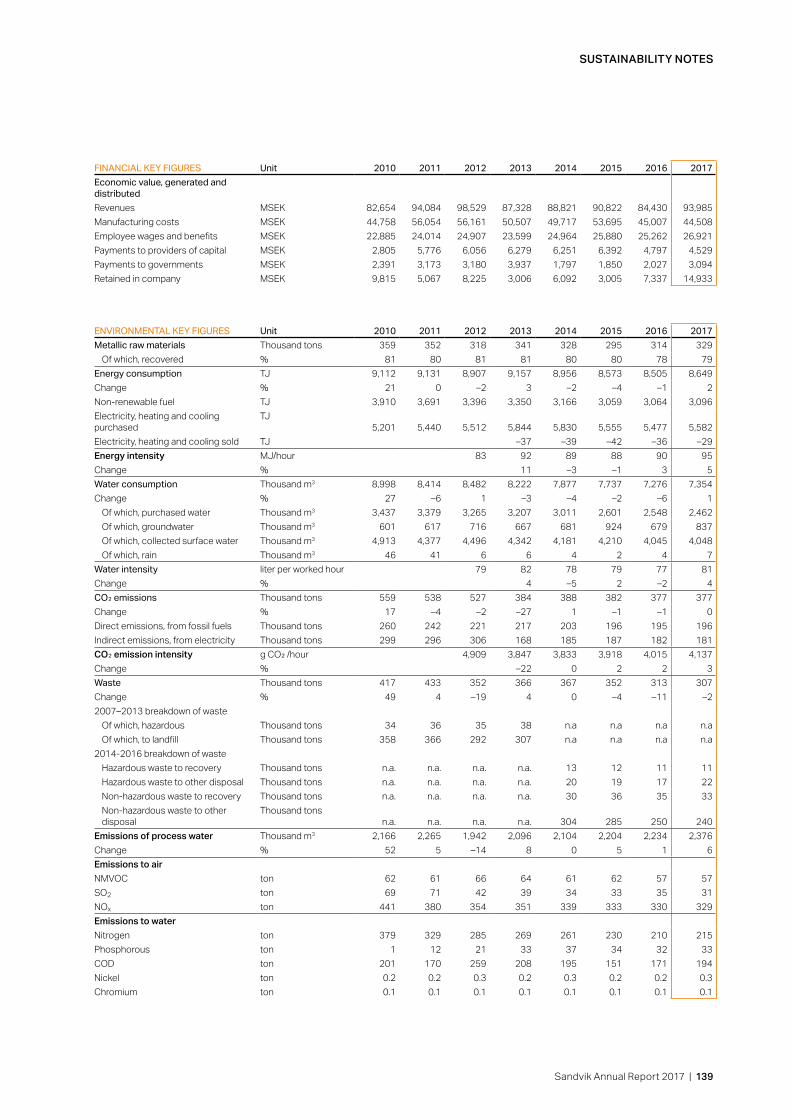
SUSTAINABILITY NOTES
ENVIRONMENTAL KEY FIGURES Unit 2010 2011 2012 2013 2014 2015 2016 2017Metallic raw materials Thousand tons 359 352 318 341 328 295 314 329
Of which, recovered % 81 80 81 81 80 80 78 79Energy consumption TJ 9,112 9,131 8,907 9,157 8,956 8,573 8,505 8,649Change % 21 0 –2 3 –2 –4 –1 2Non-renewable fuel TJ 3,910 3,691 3,396 3,350 3,166 3,059 3,064 3,096Electricity, heating and cooling purchased
TJ5,201 5,440 5,512 5,844 5,830 5,555 5,477 5,582
Electricity, heating and cooling sold TJ –37 –39 –42 –36 –29Energy intensity MJ/hour 83 92 89 88 90 95Change % 11 –3 –1 3 5Water consumption Thousand m3 8,998 8,414 8,482 8,222 7,877 7,737 7,276 7,354Change % 27 –6 1 –3 –4 –2 –6 1
Of which, purchased water Thousand m3 3,437 3,379 3,265 3,207 3,011 2,601 2,548 2,462Of which, groundwater Thousand m3 601 617 716 667 681 924 679 837Of which, collected surface water Thousand m3 4,913 4,377 4,496 4,342 4,181 4,210 4,045 4,048Of which, rain Thousand m3 46 41 6 6 4 2 4 7
Water intensity liter per worked hour 79 82 78 79 77 81Change % 4 –5 2 –2 4CO₂ emissions Thousand tons 559 538 527 384 388 382 377 377Change % 17 –4 –2 –27 1 –1 –1 0Direct emissions, from fossil fuels Thousand tons 260 242 221 217 203 196 195 196Indirect emissions, from electricity Thousand tons 299 296 306 168 185 187 182 181CO₂ emission intensity g CO₂ /hour 4,909 3,847 3,833 3,918 4,015 4,137Change % –22 0 2 2 3Waste Thousand tons 417 433 352 366 367 352 313 307Change % 49 4 –19 4 0 –4 –11 –22007–2013 breakdown of waste
Of which, hazardous Thousand tons 34 36 35 38 n.a n.a n.a n.aOf which, to landfill Thousand tons 358 366 292 307 n.a n.a n.a n.a
2014-2016 breakdown of wasteHazardous waste to recovery Thousand tons n.a. n.a. n.a. n.a. 13 12 11 11Hazardous waste to other disposal Thousand tons n.a. n.a. n.a. n.a. 20 19 17 22Non-hazardous waste to recovery Thousand tons n.a. n.a. n.a. n.a. 30 36 35 33Non-hazardous waste to other disposal
Thousand tonsn.a. n.a. n.a. n.a. 304 285 250 240
Emissions of process water Thousand m3 2,166 2,265 1,942 2,096 2,104 2,204 2,234 2,376Change % 52 5 –14 8 0 5 1 6Emissions to airNMVOC ton 62 61 66 64 61 62 57 57SO2 ton 69 71 42 39 34 33 35 31NOx ton 441 380 354 351 339 333 330 329Emissions to waterNitrogen ton 379 329 285 269 261 230 210 215Phosphorous ton 1 12 21 33 37 34 32 33COD ton 201 170 259 208 195 151 171 194Nickel ton 0.2 0.2 0.3 0.2 0.3 0.2 0.2 0.3Chromium ton 0.1 0.1 0.1 0.1 0.1 0.1 0.1 0.1
FINANCIAL KEY FIGURES Unit 2010 2011 2012 2013 2014 2015 2016 2017Economic value, generated and distributedRevenues MSEK 82,654 94,084 98,529 87,328 88,821 90,822 84,430 93,985Manufacturing costs MSEK 44,758 56,054 56,161 50,507 49,717 53,695 45,007 44,508Employee wages and benefits MSEK 22,885 24,014 24,907 23,599 24,964 25,880 25,262 26,921Payments to providers of capital MSEK 2,805 5,776 6,056 6,279 6,251 6,392 4,797 4,529Payments to governments MSEK 2,391 3,173 3,180 3,937 1,797 1,850 2,027 3,094Retained in company MSEK 9,815 5,067 8,225 3,006 6,092 3,005 7,337 14,933
Sandvik Annual Report 2017 | 139

SUSTAINABILITY NOTES
UN GOAL 2030
ASSO�CIATED TARGETS SANDVIK'S CONTRIBUTION TO THE UN'S GLOBAL GOALS
REFERENCE/PAGE
Good health and well-being
3.3
3.9
OUR OFFERINGS: Sandvik's battery-driven underground equipment helps to address the potential impacts of diesel particulate matter (DPM) and other underground engine emissions with the launch of, for example, the Sandvik DD422iE automated drill rig and Sandvik LH307B loader.
OUR OPERATIONS: For over 10 years, Sandvik has been part of the SHWAP program in Southern Africa, with the aim to decrease cases of HIV/AIDS within our workforce and their families, mainly by preventative measures.
24
home.sandvik
Gender equality 5.1
5.c
OUR OPERATIONS: Our Code of Conduct and Supplier Code of Conduct prohibit discrimination against women or on any other discriminatory ground. We have adopted policies and processes in order to strengthen the empowerment of women. Diversity and inclusion are material areas for Sandvik that are closely followed up.
31
home.sandvik
Affordable and clean energy
7.2
7.3
OUR OFFERINGS: Coated strips for fuel cell bipolar interconnect plates can be used both in mobile (for example hydrogen cars) and stationary hydrogen solutions which are clean energy sources. Sanicro™ 25 is a next-generation alloy that copes with extreme heat. This alloy is critical in next generation power plants. Efficiency goes from approximately 35% to >50% by increasing pressure and temperature, significantly reducing CO₂ emissions.
OUR OPERATIONS: In our major production sites in Europe we buy energy from renewable energy sources since 2013, thereby reducing the Group’s CO₂ emissions by 20%. We constantly work on improving energy efficiency in our production as well as in our products and services.
home.sandvik
36
Decent work and economic growth
8.7
8.8
OUR OFFERINGS: AutoMine®, a mining automation solution, removes people from hazardous areas to a safer and healthier environment while not impacting production efficiency.
OUR OPERATIONS: Decent working conditions are a prerequisite set out in our Code of Conduct and in our Supplier Code of Conduct. We respect the ILO Declaration on fundamental principles and rights at work, as well as principles 4, 5 and 6 of the UN Global Compact. We have a strict prohibition against forced, slave and child labor. Safety is a highly prioritized area with a vision of zero harm to our employees and contractors. We have lowered our LTIFR for the seventh consecutive year to 1.6.
home.sandvik
30, 34
Industry, innovation and infrastructure
9.4 OUR OFFERINGS: PrimeTurning™ is a completely new methodology that enables turning in all directions. It allows customers to double the speed and feed rates, providing faster metal removal, which means more parts per run. The productivity increase is substantial, >50%, compared to conventional turning. Smart Powder Solutions design reduces marine emissions through a dual-fuel marine engine running on diesel and natural gas, improving efficiency and reducing carbon footprint. Sandvik Hiflex® precision strip steel is designed for the manufacture of compressor valves for next-generation compressors. The precision strip steel contributes to enhancing compressor efficiency, promoting long service life and reducing noise.
OUR OPERATIONS: Using refractory as a slag-forming agent in the steel plants is now under implementation as a standard operational procedure.
21
home.sandvik
37
Responsible consumption and production
12.2
12.4
12.5
OUR OFFERINGS: We have extensive recycling schemes of natural resources and raw materials with the aim to constantly increase the levels of recycled materials. We buy back used cemented-carbide tools from our customers and convert them back into basic raw materials in an extensive recycling program. This reduces energy consumption, lower carbon emissions and produces less waste. Our Plug and Play Grinding Container increases bit life, decreases expenses of bits, reduces emissions and environmental and human cobalt exposure.
OUR OPERATIONS: Circularity is a key aspect for Sandvik. We have schemes in place to reduce and contain chemicals in order to prevent any damage to people or the surrounding environment. We have a number of initiatives which aim to turn waste into raw materials to be used in other processes.
37
home.sandvik
37
Climate action 13.1 OUR OFFERINGS: The drill rig Sandvik DD422iE®, an environmentally responsible solution, reduces particulates (NOx) and emissions underground. Hi-Flex flapper valve material helps our customers reduce energy and create more efficient air conditioners and fridges, leading to CO₂ emission reduction.
OUR OPERATIONS: Reduction of CO₂ emissions is a priority for Sandvik and we invest in clean solutions. Since 2013, we have been buying energy from renewable energy sources at our major production sites in Europe, thereby reducing the Group’s CO₂ emissions by 20%.
home.sandvik
36
UN GLOBAL GOALS INDEX
140 | Sandvik Annual Report 2017

SUSTAINABILITY NOTES
GRI INDEXGENERAL STANDARD DISCLOSURES Page Comments and omissions
GEN
ERAL
STA
NDA
RD D
ISC
LOSU
RES
Strategy and analysisG4-1 Letter from the President and CEO 4-5Organizational profileG4-3 Name of the organization 2, 58G4-4 Primary brands, products, and services 2-3, 12-29,
50-53G4-5 Location of the organization's headquarters 58G4-6 Number of countries where the organization operates 2, 100-104G4-7 Nature of ownership and legal form 58G4-8 Markets served 1-3, 12-29,
100-104G4-9 Scale of the organization 1-3, 31-32, 58,
138 G4-10 Number of employees 31, 48, 138 Data on gender not available
for contracted employeesG4-11 Employees covered by collective bargaining agreements 33 Data on specific numbers
not availableG4-12 Description of the organization's supply chain 39 Information on size of the
supply chain not availableG4-13 Significant changes during the reporting period 4-5, 8-9G4-14 Precautionary approach 36-37, 49G4-15 Externally developed economic, environmental and social charters,
principles, or other initiatives to which the organization subscribes or endorses
1, 4-5, 30, 128
G4-16 Memberships of associations 1, 128Identified material aspects and boundariesG4-17 Entities included in the organization's consolidated financial
statements 128G4-18 Defining report content 128-130G4-19 Material aspects 129-131G4-20 Aspect boundary within the organization 130-131G4-21 Aspect boundary outside the organization 130-131G4-22 Restatements of information 144G4-23 Significant changes from previous reporting periods in the scope
and aspect boundaries 144Stakeholder engagementG4-24 Stakeholder groups engaged by the organization 128G4-25 Basis for identification of stakeholders 128G4-26 The organization's approach to stakeholder engagement 128G4-27 Topics and concerns raised through stakeholder engagement 128Reporting profileG4-28 Reporting profile 128G4-29 Date of most recent report 128G4-30 Reporting cycle 128G4-31 Contact point for questions regarding the report 151G4-32 GRI content index 141-143G4-33 External assurance 145GovernanceG4-34 Governance structure of the organization 30, 58-63Ethics and integrityG4-56 Values, principles, standards and norms of behavior 6, 30, 38, 58,
136-137
Sandvik Annual Report 2017 | 141

SUSTAINABILITY NOTES
SPECIFIC STANDARD DISCLOSURES Page Comments and omissions
ECO
NO
MIC
IMPA
CT
Economic performance DMA 46-63EC1 Direct economic value generated and distributed 139COMPLIANCE (ANTI-BRIBERY AND ANTI-CORRUPTION, TRADE, DATA PRIVACY)Anticorruption DMA 30, 38, 131-
133, 136-137SO3 Total number and percentage of operations assessed for risks
related to corruption and the significant risks identified38, 136-137 Figure consolidated for
entire Group SO4 Communication and training on anti-corruption policies and
procedures 38, 136-137
Compliance (environment) DMA 36-37, 132-133, 136-137
EN29 Monetary value of significant fines and total number of non- monetary sanctions for non-compliance with environmental laws and regulations
111-112
Compliance (product) DMA 132-135PR9 Monetary value of significant fines for non-compliance with laws
and regulations concerning the provision and use of products and services
111-112
Compliance (social) DMA 132SO8 Monetary value of significant fines and total number of non-
monetary sanctions for non-compliance with laws and regulations111-112
SUSTAINABLE SUPPLIER MANAGEMENTChild labor DMA 30, 33, 39, 131-
133, 136-137HR5 Operations and suppliers identified as having significant risk for
incidents of child labor, and measures to contribute to the effective abolition of child labor
30, 39, 136-137
Forced and compulsory labor
DMA 30, 33, 39, 131-133, 136-137
HR6 Operations and suppliers identified as having significant risk for incidents of forced or compulsory labor, and measures to contribute to elimination of all forms of forced or compulsory labor
30, 39, 136-137
Supplier assessment for human rights
DMA 33, 39, 131-133, 136-137
HR10 Percentage of new suppliers that were screened using human rights criteria
39, 136-137 Percentage not available
Supplier assessment for labor practices
DMA 33, 39, 131-133, 136-137
LA14 Percentage of new suppliers that were screened using labor practices criteria
39, 136-137 Percentage not available
Supplier assessment forImpacts on Society
DMA 33, 39, 131-133, 136-137
SO09 Percentage of new suppliers that were screened using criteria for impacts on society
39, 136-137 Percentage not available
Supplier assessment forenvironment
DMA 39, 131-133, 136-137
EN32 Percentage of new suppliers that were screened using environmental criteria
39, 136-137 Percentage not available
ENVI
RON
MEN
TAL
IMPA
CT
ENERGY, EMISSIONS AND CLIMATE CHANGEEnergy DMA 36-37, 131,
136-137EN3 Energy consumption within the organization 139 Data not divided by typeEN5 Energy intensity 139Emissions DMA 36-37, 131,
136-137EN15 Direct greenhouse gas emissions 139 No data on biogenic
CO₂ emissionsEN16 Energy indirect greenhouse gas emissions 139EN18 Greenhouse gas emissions intensity 139EN21 NOX, SO2, and other significant air emissions. 139 No data on POP,
HAP or PM
142 | Sandvik Annual Report 2017

SUSTAINABILITY NOTES
SPECIFIC STANDARD DISCLOSURES (CONTINUED) Page Comments and omissions
ENVI
RON
MEN
TAL
IMPA
CT
USE, REUSE, AND RECYCLING OF MATERIALS AND NATURAL RESOURCESMaterials DMA 36-37, 131,
136-137EN1 Materials used by weight or volume 36-37, 136-137,
139Data not available on
packaging materialEN2 Percentage of materials used that are recycled input materials 1, 7, 18-29,
36-37, 136-137, 139
Water DMA 36-37, 136-137EN8 Total water withdrawal by source 139Waste DMA 36-37, 136-137EN23 Total weight of waste by type and disposal method 139 No detailed information on
disposal method
SOC
IAL
IMPA
CT
DIVERSITY AND INCLUSIONDiversity and equal opportunity
DMA 4-5, 8-9, 31-33, 131, 136-137
LA12 Composition of governance bodies and breakdown of employees per employee category according to gender, age group, minority group membership, and other indicators of diversity
18, 22, 26, 138
HEALTH AND SAFETYOccupational health & safety
DMA 4-5, 34-35, 132, 136-137
LA6 Type of injury and rates of injury, occupational diseases, lost days, and absenteeism, and total number of work-related fatalities, by region and by gender
34-35, 136-137, 138
Data by gender not available
TALENT ATTRACTION, DEVELOPMENT AND RETENTIONEmployment DMA 4-5, 8-9, 31-33,
131, 136-137LA1 Total number and rates of new employees hires and employee turn-
over by age group, gender, and region136-137, 138 Data by region
not availableTraining and education DMA 31-33LA11 Percentage of employees receiving regular performance and career
development reviews, by gender and by employee category31-32, 138 Data by gender and
employee category not available
Sandvik Annual Report 2017 | 143

SUSTAINABILITY NOTES
ACCOUNTING PRINCIPLES The reporting of Sandvik’s sustainability activities is based on the UN Global Compact's requirements on reporting on progress as well as the Global Reporting Initiative (GRI). The report is in accordance with GRI G4 Guidelines (Core level). Some information found in the reports of previous years was not considered material and is therefore not disclosed in this report. The sustainability information in the Annual Report has been reviewed by external auditors in accordance with ISAE 3000 Assurance engagements other than audits or reviews of financial information.
REPORT SCOPE, BOUNDARY AND CALCULATION METHODS GRI’s guidance on the Reporting Principles of Material-ity, Stakeholder Inclusiveness, Sustainability Context, and Completeness was used to define the content of the report. The sustainability information in the Annual Report refers to the 2017 fiscal year and covers all operations of the Group, including subsidiaries, and discontinued operations, but excludes associated companies and joint ventures.
Employee statistics regarding age, turnover, new employ-ees, part time/full time and gender are derived from the Group's common HR system, which covers 98% of Sandvik employees. These figures are compiled on a yearly basis. Financial figures and employee statistics not stated above are derived from our financial reporting system. EHS data is derived from our EHS reporting system in which reporting is conducted on a monthly basis for safety-related indicators and on a quarterly basis for the areas relating to environ-mental key figures. Supplementary data is collected and compiled manually once a year, and thus the quality of the data is subject to a higher level of uncertainty. These figures are rounded to a greater degree to manage this higher level of uncertainty. In the event of further limitations in the report, these are indicated in the text.
The calculations of CO₂ emissions do not include emissions from the transport of raw materials and finished products or travel. For most of our production units spe-cific conversion factors from their electricity supplier were used when calculating indirect CO₂ emissions. In other
cases, factors from the International Energy Agency Data Services were used. For the majority of the European sites, the emission factor is zero, with reference to the European Guarantees of Origin scheme. Waste data reporting was changed in 2014, and is since then broken down by a) haz-ardous or non-hazardous and b) sent to recovery (recov-ery, reuse or recycling) or to other disposal.
Previous waste data was reported as total waste plus a) of which hazardous and/or b) of which sent to landfill. As a consequence of the change, the waste data details can only be used for indicative comparisons for the years up to and including 2013 in comparison with the waste data details from and after 2014. However, it is possible to com-pare total waste amounts between all the years.
Worked hours used in calculation of injury frequency rates were derived from an assumption of 2,000 worked hours per employee per year for the years 2008–2011 and from actual hours worked from 2012 and onwards.
The key figures compiled are based on informa-tion available at the date of the most recent year-end accounts, which may entail that historical figures have been adjusted.
The Group’s results in relation to its objectives are measured using relevant performance indicators and key figures. The figures presented are the accumulated figures for 2017 for all active reporting units, unless otherwise stated.
As explained in the section about environmental targets, a new concept of following environmental improvements was decided during 2017. The environmental targets in this report have remained in their previous wording. Specifically it's important to note that the denominator for measuring relative development of the environmental performance was worked hours. Worked hours has since decreased significantly. A big driver behind this decline is the introduction of the productivity target in the company. In a way, these are contra productive, in that the denomi-nator works in different ways for these two target catego-ries. Therefore, we have presented the relative environ-mental performance both in relation to worked hours and in relation to the development of invoiced sales.
144 | Sandvik Annual Report 2017

SUSTAINABILITY NOTES
ASSURANCE REPORTAUDITOR’S LIMITED ASSURANCE REPORT ON SANDVIK AB'S SUSTAINABLE BUSINESS REPORT AND STATE�MENT REGARDING THE STATUTORY SUSTAINABILITY REPORT
To Sandvik AB, Corp. Id. 556000-3468
IntroductionWe have been engaged by the Board of Directors and the Managing Director of Sandvik to undertake a limited assurance engagement of Sandvik AB’s Sustainability Report for the year 2017. Sandvik has defined the scope of the Sustainability Business Report that also is the Statu-tory Sustainability Report on page 128 in this document.
Responsibilities of the Board of Directors and the Managing DirectorThe Board of Directors and the Managing Director are responsible for the preparation of the Sustainability Busi-ness Report including the Statutory Sustainability Report in accordance with applicable criteria and the Annual Accounts Act respectively. The criteria are defined on page 144 in the Sandvik Annual Report, and are part of the Sustainability Reporting Guidelines published by GRI (The Global Reporting Initiative), that are applicable to the Sus-tainability Business information, as well as the accounting and calculation principles that the Company has devel-oped. This responsibility also includes the internal control relevant to the preparation of Sustainability Business information that is free from material misstatements, whether due to fraud or error.
Auditor’s responsibilityOur responsibility is to express a conclusion on the Sus-tainability Business Report based on the limited assurance procedures we have performed and to express an opinion regarding the Statutory Sustainability Report.
We conducted our limited assurance engagement in accordance with ISAE 3000 Assurance engagements other than audits or reviews of financial information. A lim-ited assurance engagement consists of making inquiries, primarily of persons responsible for the preparation of the
Sustainability Report, and applying analytical and other limited assurance procedures. Our examination regarding the Statutory Sustainability Report has been conducted in accordance with FAR’s accounting standard RevR12 The auditor’s opinion regarding the Statutory Sustainability Report. A limited assurance engagement and an exami-nation according to RevR 12 is different and substantially less in scope than an audit conducted in accordance with International Standards on Auditing and generally accepted auditing standards in Sweden.
The firm applies ISQC 1 (International Standard on Quality Control) and accordingly maintains a compre-hensive system of quality control including documented policies and procedures regarding compliance with ethi-cal requirements, professional standards and applicable legal and regulatory requirements. We are independent of Sandvik in accordance with professional ethics for accountants in Sweden and have otherwise fulfilled our ethical responsibilities in accordance with these requirements.
The limited assurance procedures performed and the examination according to RevR 12 do not enable us to obtain assurance that we would become aware of all significant matters that might be identified in an audit. The conclusion based on a limited assurance engagement and an examination according to RevR 12 does not provide the same level of assurance as a conclusion based on an audit.
Our procedures are based on the criteria defined by the Board of Directors and the Managing Director as described above. We consider these criteria suitable for the preparation of the Sustainability Report.
We believe that the evidence obtained is sufficient and appropriate to provide a basis for our conclusions below.
ConclusionsBased on the limited assurance procedures performed, nothing has come to our attention that causes us to believe that the Sustainability Report is not prepared, in all material respects, in accordance with the criteria defined by the Board of Directors and the Managing Director.
A Statutory Sustainability Report has been prepared.
Stockholm, 6 March 2018
KPMG AB
Joakim Thilstedt Karin Sivertsson Authorized Public Accountant Expert Member of FAR
Sandvik Annual Report 2017 | 145
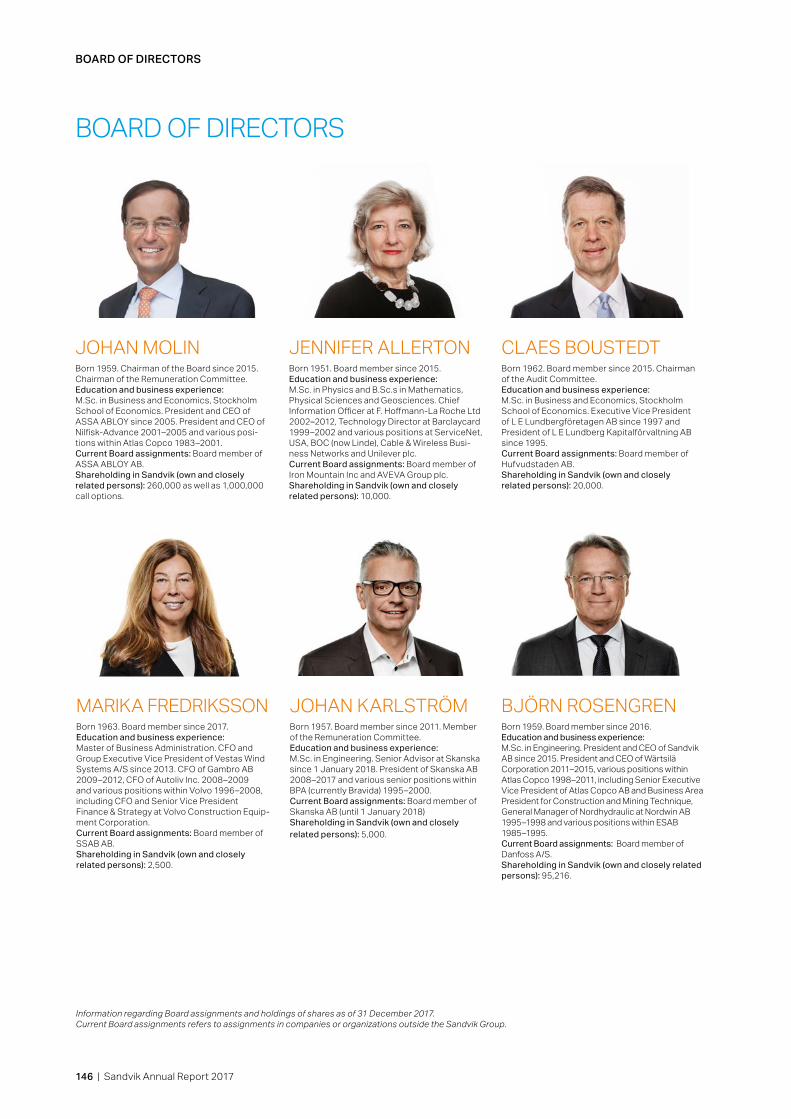
BOARD OF DIRECTORS
BOARD OF DIRECTORS
Born 1959. Chairman of the Board since 2015. Chairman of the Remuneration Committee.Education and business experience:M.Sc. in Business and Economics, Stockholm School of Economics. President and CEO of ASSA ABLOY since 2005. President and CEO of Nilfisk-Advance 2001–2005 and various posi-tions within Atlas Copco 1983–2001.Current Board assignments: Board member of ASSA ABLOY AB.Shareholding in Sandvik (own and closely related persons): 260,000 as well as 1,000,000 call options.
JOHAN MOLINBorn 1951. Board member since 2015.Education and business experience: M.Sc. in Physics and B.Sc.s in Mathematics, Physical Sciences and Geosciences. Chief Information Officer at F. Hoffmann-La Roche Ltd 2002–2012, Technology Director at Barclaycard 1999–2002 and various positions at ServiceNet, USA, BOC (now Linde), Cable & Wireless Busi-ness Networks and Unilever plc.Current Board assignments: Board member of Iron Mountain Inc and AVEVA Group plc. Shareholding in Sandvik (own and closely related persons): 10,000.
JENNIFER ALLERTON
Information regarding Board assignments and holdings of shares as of 31 December 2017. Current Board assignments refers to assign ments in companies or organizations outside the Sandvik Group.
CLAES BOUSTEDTBorn 1962. Board member since 2015. Chairman of the Audit Committee.Education and business experience: M.Sc. in Business and Economics, Stockholm School of Economics. Executive Vice President of L E Lundbergföretagen AB since 1997 and President of L E Lundberg Kapitalförvaltning AB since 1995. Current Board assignments: Board member of Hufvudstaden AB.Shareholding in Sandvik (own and closely related persons): 20,000.
Born 1963. Board member since 2017.Education and business experience: Master of Business Administration. CFO and Group Executive Vice President of Vestas Wind Systems A/S since 2013. CFO of Gambro AB 2009–2012, CFO of Autoliv Inc. 2008–2009 and various positions within Volvo 1996–2008, including CFO and Senior Vice President Finance & Strategy at Volvo Construction Equip-ment Corporation.Current Board assignments: Board member of SSAB AB.Shareholding in Sandvik (own and closely related persons): 2,500.
MARIKA FREDRIKSSONBorn 1957. Board member since 2011. Member of the Remuneration Committee.Education and business experience: M.Sc. in Engineering. Senior Advisor at Skanska since 1 January 2018. President of Skanska AB 2008–2017 and various senior positions within BPA (currently Bravida) 1995–2000.Current Board assignments: Board member of Skanska AB (until 1 January 2018)Shareholding in Sandvik (own and closely related persons): 5,000.
JOHAN KARLSTRÖM BJÖRN ROSENGRENBorn 1959. Board member since 2016.Education and business experience: M.Sc. in Engineering. President and CEO of Sandvik AB since 2015. President and CEO of Wärtsilä Corporation 2011–2015, various positions within Atlas Copco 1998–2011, including Senior Executive Vice President of Atlas Copco AB and Business Area President for Construction and Mining Technique, General Manager of Nordhydraulic at Nordwin AB 1995–1998 and various positions within ESAB 1985–1995.Current Board assignments: Board member of Danfoss A/S.Shareholding in Sandvik (own and closely related persons): 95,216.
146 | Sandvik Annual Report 2017
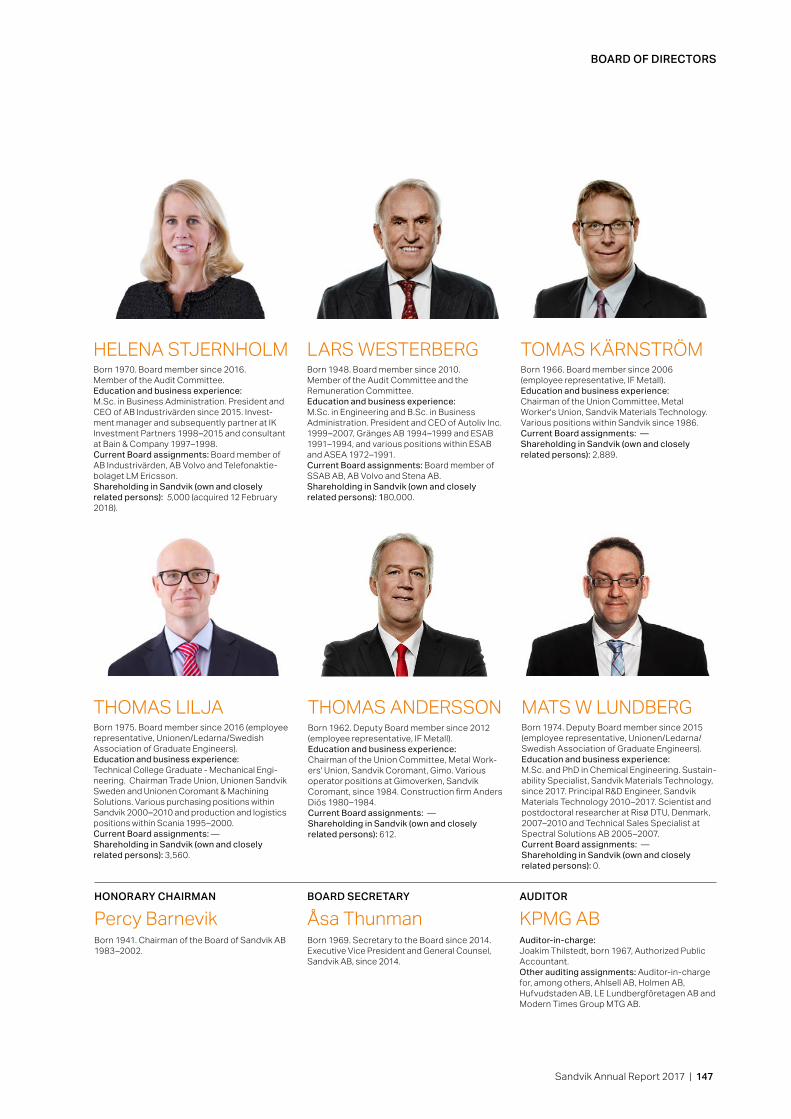
BOARD OF DIRECTORS
Born 1975. Board member since 2016 (employee representative, Unionen/Ledarna/Swedish Association of Graduate Engineers).Education and business experience: Technical College Graduate - Mechanical Engi-neering. Chairman Trade Union, Unionen Sandvik Sweden and Unionen Coromant & Machining Solutions. Various purchasing positions within Sandvik 2000–2010 and production and logistics positions within Scania 1995–2000.Current Board assignments: —Shareholding in Sandvik (own and closely related persons): 3,560.
THOMAS LILJA
AUDITOR
KPMG ABAuditor-in-charge: Joakim Thilstedt, born 1967, Authorized Public Accountant.Other auditing assignments: Auditor-in-charge for, among others, Ahlsell AB, Holmen AB, Hufvudstaden AB, LE Lundbergföretagen AB and Modern Times Group MTG AB.
Born 1970. Board member since 2016. Member of the Audit Committee.Education and business experience: M.Sc. in Business Administration. President and CEO of AB Industrivärden since 2015. Invest-ment manager and subsequently partner at IK Investment Partners 1998–2015 and consultant at Bain & Company 1997–1998.Current Board assignments: Board member of AB Industrivärden, AB Volvo and Telefonaktie-bolaget LM Ericsson.Shareholding in Sandvik (own and closely related persons): 5,000 (acquired 12 February 2018).
HELENA STJERNHOLM Born 1948. Board member since 2010. Member of the Audit Committee and the Remuneration Committee.Education and business experience: M.Sc. in Engineering and B.Sc. in Business Administration. President and CEO of Autoliv Inc. 1999–2007, Gränges AB 1994–1999 and ESAB 1991–1994, and various positions within ESAB and ASEA 1972–1991.Current Board assignments: Board member of SSAB AB, AB Volvo and Stena AB.Shareholding in Sandvik (own and closely related persons): 180,000.
LARS WESTERBERGBorn 1966. Board member since 2006 (employee representative, IF Metall).Education and business experience:Chairman of the Union Committee, Metal Worker's Union, Sandvik Materials Technology. Various positions within Sandvik since 1986.Current Board assignments: —Shareholding in Sandvik (own and closely related persons): 2,889.
TOMAS KÄRNSTRÖM
Born 1962. Deputy Board member since 2012 (employee representative, IF Metall).Education and business experience: Chairman of the Union Committee, Metal Work-ers' Union, Sandvik Coromant, Gimo. Various operator positions at Gimoverken, Sandvik Coromant, since 1984. Construction firm Anders Diös 1980–1984.Current Board assignments: —Shareholding in Sandvik (own and closely related persons): 612.
THOMAS ANDERSSONBorn 1974. Deputy Board member since 2015 (employee representative, Unionen/Ledarna/Swedish Association of Graduate Engineers).Education and business experience: M.Sc. and PhD in Chemical Engineering. Sustain-ability Specialist, Sandvik Materials Technology, since 2017. Principal R&D Engineer, Sandvik Materials Technology 2010–2017. Scientist and postdoctoral researcher at Risø DTU, Denmark, 2007–2010 and Technical Sales Specialist at Spectral Solutions AB 2005–2007.Current Board assignments: —Shareholding in Sandvik (own and closely related persons): 0.
MATS W LUNDBERG
HONORARY CHAIRMAN
Percy BarnevikBorn 1941. Chairman of the Board of Sandvik AB 1983–2002.
BOARD SECRETARY
Åsa ThunmanBorn 1969. Secretary to the Board since 2014.Executive Vice President and General Counsel, Sandvik AB, since 2014.
Sandvik Annual Report 2017 | 147

GROUP EXECUTIVE MANAGEMENT
GROUP EXECUTIVE MANAGEMENT
Born 1977. Executive Vice President and Head of Group Communications, Sandvik AB, since 2013.Education and business experience: M.Sc. in Geological and Earth Sciences/Geo-sciences, and Journalism. Various positions within Sandvik since 2006, including Vice Pres-ident Communication and Marketing at Sandvik Coromant.Current Board assignments: –Shareholding in Sandvik (own and closely related persons): 8,284.
JESSICA ALMBorn 1965. President of the Sandvik Materials Technology business area since 1 November 2017.Education and business experience: M.Sc. in Mechanical Engineering. Various positions within Sandvik since 1990, including Head of Business Development, Vice President Production Strategy and Vice President Produc-tion at Sandvik Coromant and Head of Primary Products at Sandvik Materials Technology .Current Board assignments: –Shareholding in Sandvik (own and closely related persons): 6,438.
GÖRAN BJÖRKMAN
Born 1963. President of the Sandvik Mining and Rock Technology business area since 2016.Education and business experience: M.Sc. in Industrial Engineering and Management.President of the Sandvik Mining business area 2015–2016, acting President and CEO of BE Group AB 2014–2015, President and CEO of Munters AB 2006-2014, various positions within Atlas Copco 1994–2006 and various positions within Seco Tools 1988–1994.Current Board assignments: Board member of the industry association Svemin.Shareholding in Sandvik (own and closely related persons): 9,995.
LARS ENGSTRÖMBorn 1967. President of the Sandvik Machining Solutions business area since 1 April 2017.Education and business experience: M.Sc. in Material Physics and MBA in Inter-national Marketing and Business. AMP from INSEAD, France.Various positions within Sandvik since 1992, including President for Sandvik Coromant and President for Sandvik Hard Materials.Current Board assignments: –Shareholding in Sandvik (own and closely related persons): 12,483.
KLAS FORSSTRÖM
Born 1959. President and CEO, Sandvik AB, since 2015.Education and business experience: M.Sc. in Engineering. President and CEO of Wärtsilä Corporation 2011–2015, various positions within Atlas Copco 1998–2011, including SeniorExecutive Vice President of Atlas Copco AB andBusiness Area President for Construction and Min-ing Technique; General Manager of Nordhydraulicat Nordwin AB 1995–1998, and various positionswithin ESAB 1985–1995.Current Board assignments: Board member of Sandvik AB and Danfoss A/S.Shareholding in Sandvik (own and closely related persons): 95,216.
BJÖRN ROSENGREN
TOMAS ELIASSONBorn 1962. Executive Vice President and Chief Financial Officer, Sandvik AB, since 2016. Education and business experience: B.Sc. in Business Administration and Economics. CFO of AB Electrolux 2012–2016, CFO and Executive Vice President of ASSA ABLOY AB 2006–2012, CFO of Seco Tools AB 2002–2006 and various positions within ABB 1987–2002. Current Board assignments: Board member of Millicom International Cellular S.A. Shareholding in Sandvik (own and closely related persons): 20,964.
148 | Sandvik Annual Report 2017

Born 1970. Executive Vice President and Head of Human Resources, Sandvik AB, since 2016.Education and business experience: M.Sc. in Business and Economics. Various posi-tions in Human Resources and Organizational Development within Sandvik since 2004 and consultant at Cap Gemini 1999–2003. Current Board assignments: –Shareholding in Sandvik (own and closely related persons): 9,400.
JOHAN KERSTELL
GROUP EXECUTIVE MANAGEMENT
Born 1969. Executive Vice President and General Counsel, Sandvik AB, since 2014.Education and business experience: Master of Laws (LL.M), Sweden and the Netherlands.Various positions within Securitas 2009–2011, including General Counsel, Elekta AB 1999–2009, including General Counsel, and Lagerlöf & Leman law firm 1996–1999.Current Board assignments: –Shareholding in Sandvik (own and closely related persons): 9,101.
ÅSA THUNMAN
Information regarding Board assignments and holdings of shares as of 31 December 2017.Current Board assignments refer to assign ments in companies or organizations outside the Sandvik Group.
Members who left the Group Executive Management in 2017:Petra Einarsson (President of business area Sandvik Materials Technology)Jonas Gustavsson (President of business area Sandvik Machining Solutions)
Sandvik Annual Report 2017 | 149

ANNUAL GENERAL MEETING AND DEFINITIONS
ANNUAL GENERAL MEETINGANNUAL GENERAL MEETINGThe Annual General Meeting will be held on Friday, 27 April 2018 at 3:00 p.m. at the Göransson Arena, Sätragatan 21, Sandviken, Sweden.
Shareholders who wish to participate in the Meeting must:- be recorded in the share register maintained by Euro-clear Sweden AB on Saturday, 21 April 2018 (however, since the record date is on a Saturday the shareholders must be registered in the share register already on Friday, 20 April 2018), and - notify the company of their participation in the Meeting not later than Monday, 23 April 2018.
Notice of participation in the Meeting shall be made on the company’s website home.sandvik, by telephone +46 (0) 26-26 09 40 weekdays 9:00 a.m.–4:00 p.m. or by letter to Computershare AB, “Sandvik’s AGM”, Box 610, SE-182 16 Danderyd, Sweden.
Shareholders whose shares are registered in the name of a nominee must temporarily have re-registered the shares in their own name at Euroclear Sweden AB on Friday, 20 April 2018 to be entitled to participate in the Meeting. Please note that this procedure also applies with respect to shares held on a bank’s shareholder deposit
account and certain investment savings accounts.When giving notice, please state name, personal or
corporate registration number, address and telephone number and the number of assistants, if any. If partici-pation is by proxy, the proxy should be submitted to the address stated above in advance of the Meeting.
DIVIDENDThe Board proposes that the 2018 Annual General Meet-ing declare a dividend of 3.50 SEK per share.
The proposed record date is Wednesday, 2 May 2018. If the proposal is adopted by the Annual General Meeting, it is expected that dividends will be paid on Monday, 7 May 2018. Dividends will be sent to those who on the record date are entered in the share register or on the separate list of assignees, etc. To facilitate the distribution of divi-dends, shareholders who have changed address should report this change to their bank in sufficient time prior to the record date.
ANNUAL REPORT The Annual Report is available at home.sandvik, where a printed copy can also be ordered.
DEFINITIONSEARNINGS PER SHARE Profit/loss for the year attributable to equity holders of the Parent Company divided by the average number of shares outstanding during the year.
EBITEarnings before interest and taxes. Corresponds to operating profit.
EQUITY RATIOShareholders’ equity including non- controlling interests in relation to total capital.
NET DEBT/EQUITY RATIOInterest-bearing current and non-current debts, including net pension liabilities, less cash and cash equivalents divided by shareholders’ equity including non-controlling interests.
RATE OF CAPITAL TURNOVERRevenues for the last quarter annualized divided by average total capital.
WORKING CAPITALTotal of inventories, trade receivables, account payables and other current- interest-bearing receivables and liabili-ties, excluding tax assets and liabilities.
RELATIVE WORKING CAPITALAverage working capital for the last four quarters, divided by revenues in the last twelve months.
RETURN ON CAPITAL EMPLOYEDOperating profit/loss plus financial income, as a percent-age of a four quarter average capital employed. Capital employed is defined as total capital less current non-interest bearing debt.
RETURN ON SHAREHOLDERS’ EQUITYConsolidated net profit/loss for the year as a percentage of average shareholders’ equity during the year.
RETURN ON TOTAL CAPITALOperating profit/loss plus financial income, as a percentage of four quarter average total capital.
150 | Sandvik Annual Report 2017

DEFINITIONS (CONT.) AND FINANCIAL TARGETS
DEFINITIONS (CONT.)
If you have any comments on our Annual Report, please contact Group Communications, +46 (0)8 456 11 00 or [email protected].
For comments or questions on sustainability-relatedinformation, please contact Sustainable Business, +46 (0)8 456 11 00 or [email protected].
FINANCIAL TARGETSDIVIDEND PAY-OUT RATIO OF 50% OF REPORTED EARNINGS PER SHAREReported group total earnings per share are used.
EBIT GROWTH CAGR1 ≥7% 2016–2018EBIT improvement excluding impact from changed exchange rates, items affecting comparability2 for the Group and metal price effect due to revaluation of invento-ries in Sandvik Materials Technology. Metric is calculated for continuing operations excluding Other Operations.
NET GEARING, NET DEBT/EQUITY <0.8Net debt is calculated on group total and comprises inter-est-bearing current and non-current debts less cash and cash equivalents divided by shareholders' equity including non-controlling interests. Excludes major acquisitions.
ROCE IMPROVEMENT2 ≥3% PTS, 2016–2018ROCE improvement calculated with annual ROCE 2015 as base.– Operating profit/loss excludes items affecting
comparability2.– Capital employed excludes remaining provisions related
to items affecting comparability2, however in the event of major impairments, the base – annual capital employed 2015 – is restated to align with the current level of capital employed.
Metric is calculated for continuing operations excluding Other Operations.
1) Compound Annual Growth Rate.2) Items affecting comparability: major acquisitions and disposals, restructuring
costs and impairments.
ORDER INTAKEOrder intake for a period refers to the value of all orders received for immediate delivery and those orders for future delivery for which delivery dates and quantities have been confirmed. General sales agreements are included only when they have been finally agreed upon and confirmed. Service contracts are included in the order intake with the full binding contract amount upon signing of the contract.
Order intake for a period also includes all changes in the opening backlog of orders such as cancellation of orders, price changes affecting the order backlog and credit notes issued during the period.
LOST TIME INJURY FREQUENCY RATE (LTIFR)Number of lost time injuries per million worked hours.
Sandvik Annual Report 2017 | 151

FINANCIAL KEY FIGURES
KEY FIGURES, GROUP TOTAL2008 2009 2010 2011 2012 2013 2014 2015 2016 2017
Revenue, MSEK 92,654 71,937 82,654 94,084 98,529 87,328 88,821 90,822 84,430 93,985Change, % +7 –22 +15 +14 +5 –11 +2 +2 –7 +11
of which organic, % +5 –30 +17 +20 +5 –7 –2 –6 –6 +10of which structural, % +2 0 +1 0 0 0 +2 0 0 0of which currency, % 0 +10 –2 –5 0 –5 +2 +8 –1 +1
Operating profit/loss, MSEK 12,794 –1,412 11,029 10,148 13,490 8,638 10,120 6,062 9,657 18,037as % of revenue 14 –2 13 11 14 10 11 7 11 19
Profit/loss after financial items, MSEK 10,577 –3,472 9,412 8,179 11,516 6,753 8,264 4,059 7,996 16,966as % of revenue 11 –5 11 9 12 8 9 4 9 18
Consolidated net profit for the year, MSEK 7,836 –2,596 6,943 5,861 8,107 5,008 5,992 2,194 5,468 13,183Shareholders equity1, MSEK 36,725 29,957 33,813 31,264 32,536 33,610 36,672 34,060 39,290 48,771Equity ratio1, % 36 33 38 32 31 36 34 34 38 46Net debt/equity ratio2 3, multiple 0.9 1.0 0.7 0.7 0.8 0.9 1.0 1.0 0.7 0.3Rate of capital turnover2, % 101 73 92 100 97 89 89 86 83 93Cash and cash equivalents, MSEK 4,998 7,506 4,783 5,592 13,829 5,076 6,327 6,376 8,818 12,724Return on shareholders equity1,% 24.8 –7.9 22.1 18.5 25.3 15.3 17.4 6.2 15.2 31.4Return on capital employed1,% 19.9 –1.3 17.4 16.0 19.8 12.6 13.4 7.9 12.9 23.9Investments in non-current assets, MSEK 6,634 4,006 3,378 4,994 4,820 4,185 4,703 4,161 3,691 3,578Total investments, MSEK 7,766 6,161 4,493 5,332 4,859 4,674 7,537 4,168 3,722 3,578Cash flow from operations, MSEK 9,335 11,792 12,149 7,764 11,892 5,133 9,515 11,952 12,032 14,286Cash flow, MSEK 2,764 2,471 –2,642 907 8,450 –8,656 1,039 79 2,288 3,963Number of employees, 31 December 50,028 44,355 47,064 50,030 48,742 47,338 47,318 45,808 43,732 43,024
1) As of 2011, comparative figures adjusted due to amended accounting principles.2) As of 2011, comparative figures adjusted due to changed definition. For definitions see page 150.3) As of 2012, net debt includes net pension liabilities.
PER-SHARE DATA (All historical figures are adjusted taking into account the 5:1 split)
2008 2009 2010 2011 2012 2013 2014 2015 2016 2017Basic earnings1 6.30 –2.24 5.59 4.63 6.51 4.00 4.79 1.79 4.39 10.52Diluted earnings2 6.29 –2.24 5.59 4.63 6.51 4.00 4.79 1.79 4.39 10.50Equity3 30.0 24.4 27.5 25.2 25.9 26.7 29.1 27.1 31.2 38.9Dividend (2017 as proposed) 3.15 1.00 3.00 3.25 3.50 3.50 3.50 2.50 2.75 3.50Direct return4,% 6.4 1.2 2.3 3.8 3.4 3.9 4.6 3.4 2.4 2.4Payout percentage5,% 50 — 54 70 54 88 73 140 63 33Quoted prices, Sandvik Share, highest 108 90 133 135 107 108 97 107 116 153.9
lowest 42 41 76 73 82 79 74 68 65 113.5year-end 49 86 131 84 103.50 90.70 76.40 74.05 112.70 143.7
No. of shares at year-end, million 1,186.3 1,186.3 1,186.3 1,186.3 1,254.4 1,254.4 1,254.4 1,254.4 1,254.4 1,254.4Average no. of shares, million 1,186.3 1,186.3 1,186.3 1,186.3 1,245.9 1,254.4 1,254.4 1,254.4 1,254.4 1,254.4P/E ratio6 7.8 — 23.5 18.2 15.9 22.7 15.9 41.4 25.7 13.7Quoted price, % of equity2 7 163 352 476 333 400 340 261 273 361 370
1) Profit/Loss for the year per share.2) Profit/Loss for the year after dilution of outstanding convertible program.3) As of 2011, comparative figures adjusted due to amended accounting principles.4) Dividend by quoted price at year-end.
DEVELOPMENT BY BUSINESS AREA, GROUP TOTALREVENUE OPERATING PROFIT AND OPERATING MARGIN
2015 2016 2017 2015 2016 2017MSEK MSEK MSEK MSEK % MSEK % MSEK %
Sandvik Machining Solutions 33,809 32,852 35,778 5,504 16 6,970 21 8,413 24Sandvik Mining and Rock Technology 33,131 31,093 36,547 2,417 7 3,206 10 5,743 16Sandvik Materials Technology 13,909 12,931 13,643 8 0 1,115 9 284 2Other Operations 4,976 4,655 4,936 489 10 545 12 4,432 90Discontinued Operations 4,977 2,877 3,080 –1,209 –24 –1,361 –47 –61 –2
For more key figures, please visit our investors page at home.sandvik
5) Dividend by basic earnings per share.6) Market price of share at year-end in relation to earnings per share.7) Market price of share at year-end, as a percentage of equity per share.Supplementary definitions see page 150.
152 | Sandvik Annual Report 2017


HOME.SANDVIK