annual report 2016 - greenergy report 2016_web... · £13.7 bn turnover £ 52.6 m ebitda...
TRANSCRIPT

ANNUAL REPORT 2016
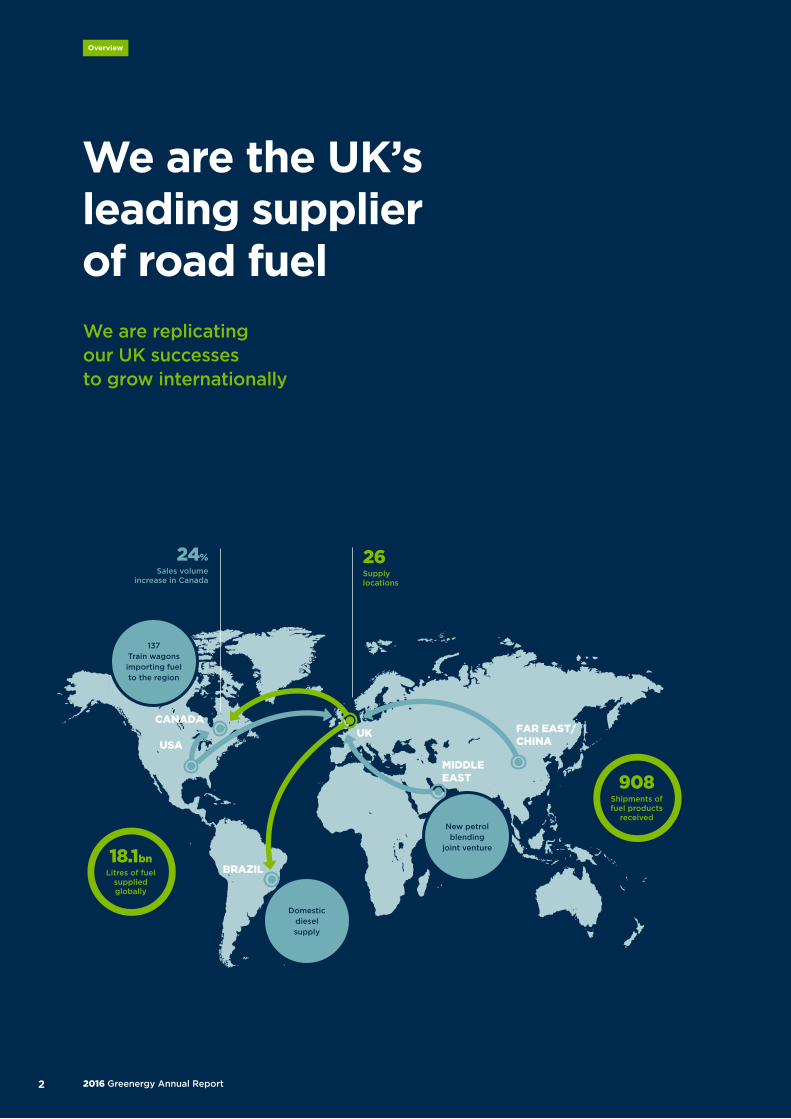
USA
BRAZIL
CANADAUK FAR EAST/
CHINA
MIDDLE EAST
26Supply locations
24% Sales volume
increase in Canada
Domestic diesel supply
New petrol blending
joint venture
908 Shipments of fuel products
received
137 Train wagons importing fuel to the region
We are the UK’s leading supplier of road fuelWe are replicating our UK successes to grow internationally
18.1bn Litres of fuel
supplied globally
2016 Greenergy Annual Report2
Overview

£13.7bn
Turnover
£52.6m
EBITDA (pre-exceptionals)
£57.9m
Profit before tax
£15.7bn
£13.7bn
£14.1bn
FY14
FY16
FY15
£3.8m
£6.8mFY14
FY16 £57.9m
FY15
£23.5m
£52.6m
£30.3m
FY14
FY16
FY15
Financial Highlights Strategic Report
OverviewOur business model 4Our mission 6Strategic summary 8
Chairman’s Statement 10
Chief Executive’s Review 14
Health and Safety Safety record 22Approach 24
Market ReviewGlobal markets 28UK market 30Our other markets 32
Strategy in Action UK Fuels 36International Fuels 44Infrastructure 48Haulage 56
Key Performance Indicators Financial KPIs 59Service quality KPIs 60
Chief Financial Officer’s Review 62
Managing Our RisksRisk overview 67Risk register 68Risk analysis 72
People and EnvironmentApprenticeships 80Employment 81Biofuel sustainability 82Carbon emissions 84Carbon savings from biofuel 85
Strategic Report 85
Governance
Board of Directors 88
Statement on corporate governance 90
Directors’ report 92
Financials
Independent auditors’ report 96
Consolidated income statement 97
Consolidated statement 98 of comprehensive income
Consolidated and Company 99 balance sheets
Consolidated statement 101 of changes in equity
Consolidated and Company 103 statements of cash flows
Notes to the financial statements 104
Officers and professional advisors 138
3

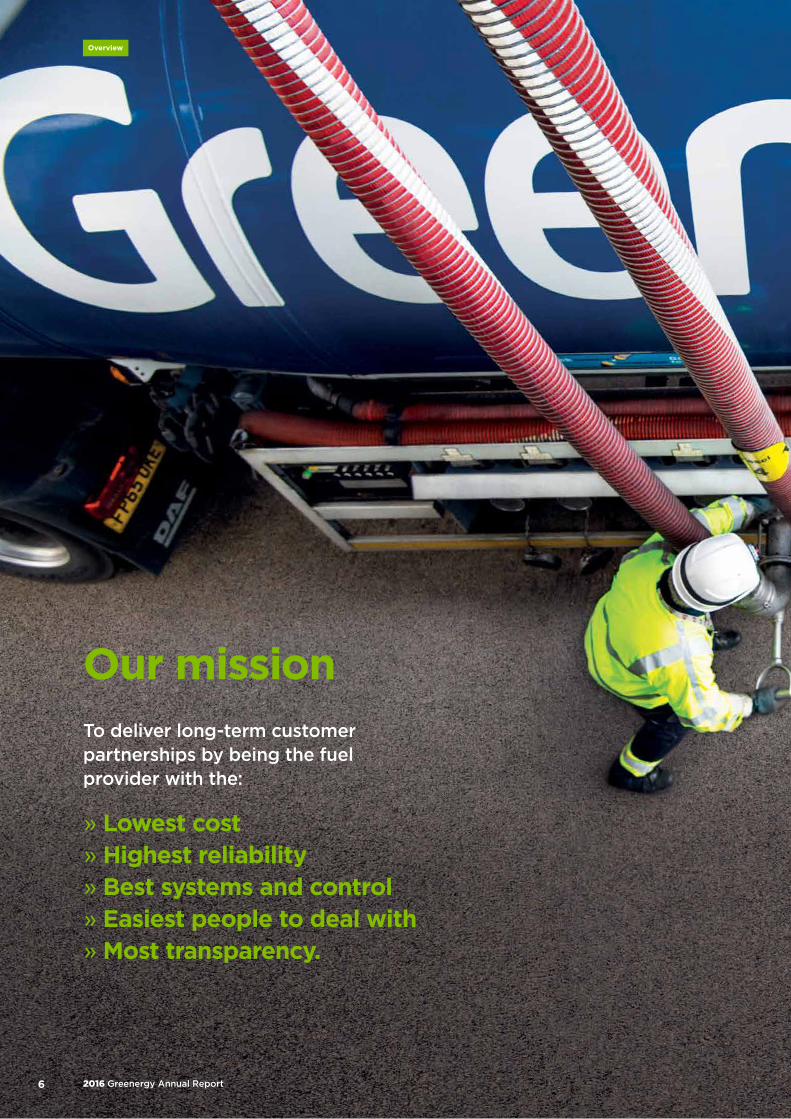
» Lowest cost» Highest reliability» Best systems and control» Easiest people to deal with» Most transparency.
Our missionTo deliver long-term customer partnerships by being the fuel provider with the:
2016 Greenergy Annual Report6
Overview

7

UK Fuels p36
International Fuels p44
UK Fuels International Fuels Infrastructure Haulage
STRATEGIC ICONS
UK Fuels International Fuels Infrastructure Haulage
STRATEGIC ICONS
Our aim: Develop low-cost and resilient fuel supply chains to earn the long-term loyalty of our UK customers
Our aim: Expand internationally by replicating our UK successes in other markets
Highlights
» Continued development of our import capabilityto allow us to receive fuel on larger, lower-cost ships.
» Strong biodiesel manufacturing margins as a resultof greater raw material flexibility, improved reliabilityand increased output.
» Conclusion of long-term storage contractswith Navigator Terminals at strategic locations,including where we have petrol blending facilities.
» Growth in sales to independent forecourtoperators, including under our BrandedWholesaler agreement with Esso.
Highlights
» Successful start to our new Cargoflo rail-to-road supplylocation in Canada. This first-of-its-kind facility offersa low-cost distribution concept in a new location thatis convenient for our customers.
» First diesel imports into Brazil, marking the startof a fuel import and supply business in a new market.
» Planning for a new joint venture with the BahrainPetroleum Company (Bapco) to blend petrol to meetdomestic Bahraini demand and for import/export.
UK Fuels
International Fuels
Strategic summary
2016 Greenergy Annual Report8
Overview

Infrastructure p48
Haulage p56
UK Fuels International Fuels Infrastructure Haulage
STRATEGIC ICONS
UK Fuels International Fuels Infrastructure Haulage
STRATEGIC ICONS
Our aim: Acquire, regenerate and operate assets that support our supply chain objectives
Our aim: Make reliable and cost-efficient fuel deliveries to customers through our in-house haulage operation
Highlights
» Opening of Thames Oilport for diesel storageand completion of infrastructure that will be needed as we move on to a fully-fledged import and distribution terminal.
» Creation of Navigator Terminals to invest in fuel and chemical storage in the UK. This gives Greenergy greater influence at key supply locations in theUK and creates a platform for future growth that is underpinned by long-term investment income.
» Sale of Greenergy North Tees to Navigator Terminals after four years of regeneration.
Highlights
» Continued safe operations, with increased resourcingof driver training and an ever greater safety awarenessamongst drivers.
» Cost-efficiency improvements, with an expansionof our driver workforce leading to improved fleetutilisation and profitability.
Infrastructure Haulage
9

This was another strong year for the business, both financially and operationally. We completed strategically important infrastructure transactions and derived value from all parts of our supply chain to deliver our best-ever financial results.
2016 Greenergy Annual Report10
Chairman’s Statement
Paul LesterChairman

Health and Safety p20
Global markets p28
UK market p30
Chairman’s Statement
Market
The underlying changes in the UK fuels market continue to favour our business.
Road fuel demand in the UK continued to grow this period, up 2.1%. This is the third consecutive year of UK market growth, following a five-year period of decline. While diesel consumption rose by 4.3%, petrol demand declined by 1.5%, continuing the trend of the last decade, and by year-end diesel consumption reached 63% of total road fuel demand (FY15: 61.6%).
This trend means that the few remaining UK refineries are increasingly producing too much petrol and not enough diesel to meet the UK’s product demand profile, leaving the UK structurally short of diesel. As a result, in calendar year 2015, the UK again imported more fuel than it exported and, in spite of a temporary recovery in refinery production, net imports were at their highest level for more than 30 years.
UK refinery supply of petrol and diesel
This was the most successful year ever for the business financially. We have capitalised on our previous infrastructure investments and acquisitions to drive financial success.
Safety
We continue to identify, assess and mitigate the risks associated with our operations as our first priority. Our approach is founded on a culture of open and honest reporting and we encourage everyone working in the business to observe, report and respond to hazards, near misses and unwanted events, without fear of blame. This is an extension of the values of care and ownership which extend across the business.
We have also increased our focus on process safety at Group as well as site level, with continuous review and improvement of our safe operating standards, an extension of process safety training which included the Non-Executive Directors and completion of our first round of process integrity audits.
Oil prices continued to fall in the early part of this period, reaching a ten-year low of $27/barrel in January 2016 before recovering somewhat. This did not directly impact sales margins because customer pricing is based on spot market prices, our operating inventory is relatively constant and we remain hedged against price fluctuations.
Low crude oil prices drove an increase in refinery production globally, which in turn resulted in an abundance of refined products and contango market conditions for diesel. This made it profitable to store oil and created opportunities for us to bring redundant storage capacity back into operation in our own facilities, including at Thames Oilport.
We expect UK refinery production to continue to decline as refiners increasingly struggle to sell their surplus petrol in other markets and as competitive pressures grow from refiners in the US, Middle East and Asia. Greenergy is best-placed to make up the shortfall in domestic refinery production by supplying low-cost product imported from the most efficient producers around the world.
500
400
300
200
600
kb/d
Diesel
Petrol
2005 2010 2015 2020 F
11

Infrastructure p48
Corporate governance p91
Operational performance
We continued to explore new sales opportunities both within the UK and internationally, expanding our fuel sales in the UK and supplying diesel into Brazil for the first time. Our Canadian business delivered a profit after two years of development and investment.
Strategic investments
During the period we acquired Vopak’s one third share in the Thames Oilport joint venture with Shell. In addition, we co-founded Navigator Terminals with Macquarie Capital to acquire Vopak’s UK operating bulk fuel storage terminals as well as Greenergy’s North Tees Terminal. The establishment of Navigator provides a platform for continued growth in key infrastructure to support our business, both in the UK and abroad.
With our low-cost model, the scale of our operation and our import infrastructure, we are ideally placed to capture future opportunities created by a growing requirement for fuel imports, both in the UK and internationally.
The hidden highlight for me this year was the effectiveness of our control processes across all parts of the business. Market conditions were favourable and, with robust daily operations throughout the period, we consistently captured the opportunities that the market presented.
Financial performance
This was another strong year for the company, with EBITDA (excluding exceptionals) reaching £52.6m, and we derived value across all segments of our business. Financially we benefited from a global diesel surplus, keeping our supply costs low, as well as strong petrol blending and biofuel margins.
Supply chain and blend margins were strongest at locations where we have made infrastructural investment – a pay-back from our strategyover the last decade.
Corporate governance
We are committed to operating to high standards of corporate governance, measuring ourselves against the best publicly quoted companies. We will continue to review our processes in this context as the scale and breadth of our business grows.
This year saw a further increase in our risk management processes. We are increasingly fostering a risk awareness culture within our business, with constant activity to minimise risk across management levels and functions.
Chairman’s Statement (continued)
2016 Greenergy Annual Report12
Chairman’s Statement

In its referendum on 23 June 2016 the UK voted to leave the European Union. Whilst the changes to the UK’s trading relationships are still uncertain, we do not anticipate any problematic outcomes for the business and are confident in our ability to manage the impact of any changes.
We have a track record of managing change effectively and, as an entrepreneurial business, are quicker than many of our competitors to identify and respond to opportunity. We are ready to capture any opportunities created by a UK Brexit to create value for the business.
Q&AHow will the UK’s referendum vote on EU membership affect Greenergy?
Outlook
Over the last decade we have positioned ourselves to take full advantage of underlying changes in the UK market caused by refinery closures. We have invested in the infrastructure we need to meet the UK’s growing fuel import requirements and to benefit from the availability of low-cost products sourced from global refiners.
Our participation within Navigator Terminals will allow us to develop existing assets to their fullest potential. It also creates a funding base for further acquisitions within the UK and to support our expansion in new markets.
13
Paul LesterChairman

Our infrastructure capability is important to our success, allowing us to access global markets and lowest-cost products to meet customers’ fuel requirements. Having completed strategically important infrastructure transactions, we now have greater control of key facilities to support future growth.
14
Chief Executive’s Review
2016 Greenergy Annual Report
Andrew OwensChief Executive

Health and safety p20
UK market p30
Global markets p28
Sales volume growthChief exec review
Sales volume growth
FY120
20
15
10
FY13 FY14 FY15 FY16
Bill
ion
litr
es
10.9
13.5 15
.0 15.6
5
18.1
Safety, health, environment and quality
We have continued to operate with safety and environmental care as our first priority in a culture of open and honest reporting. There were no RIDDOR dangerous occurrences this period and an improvement in the rate of RIDDOR reportable and lost-time injuries, but the number of minor injuries (not requiring time off work) increased. We continue to address this through increased discussion and awareness training.
Maintaining our focus on process safety at Group as well as at site and function level, we completed a single set of safe operating standards that define the expectations for the management of safety across the business. We will continue to develop and improve this going forward and to share learnings with our colleagues in Navigator.
Markets
Refinery expansion outside Europe resulted in a significant surplus of diesel globally. With our growing sales volume and deep-water import infrastructure, we were able to benefit from this global supply/demand imbalance by importing diesel on larger ships, strengthening our diesel margins.
Since January 2015 we have operated three petrol blending facilities in the UK. This gives us additional economies of scale and, with petrol demand falling in the UK and elsewhere in Europe, we were able to source competitively-priced petrol products for blending from European refiners which had limited alternative markets.
Results
Our global sales volume for the period totalled 18.1 billion litres, up 15% on the same period last year.
EBITDA (excluding exceptionals) amounted to £52.6m this period, significantly improved on FY15 (£30.3m). This was due to a combination of factors:
» Continued sales growthin the UK and internationally
» Strong purchase margins for diesel
» Strong petrol blend marginsthrough our in-houseblending operations
» Strong biodiesel manufacturingmargins driven by increasedproduction and supplychain flexibility
» Prior to the creation of NavigatorTerminals, infrastructureincome from third-partystorage at North Tees
» Continued unit cost reduction,to £6.67 per cbm excludingacquisitions (FY15: £6.79).
Chief Executive’s Review
15
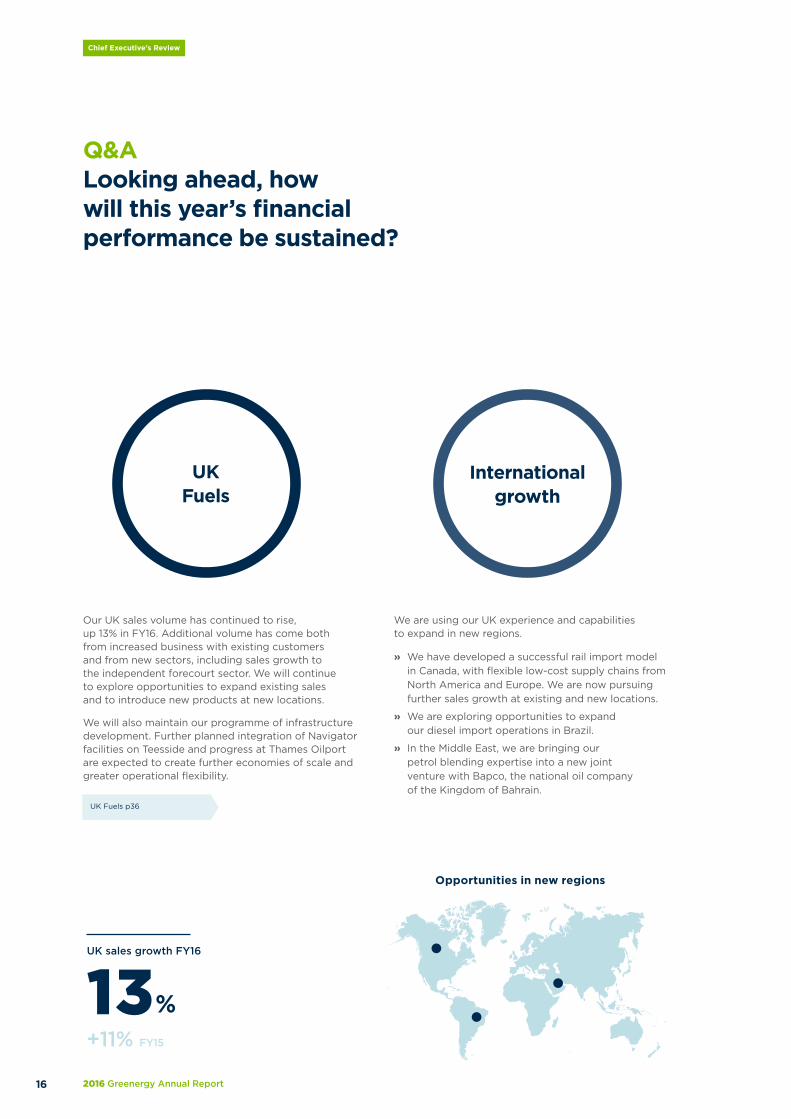
13%
UK sales growth FY16
+11% FY15
UK Fuels p36
Opportunities in new regions
Q&ALooking ahead, how will this year’s financial performance be sustained?
International growth
UK Fuels
Our UK sales volume has continued to rise, up 13% in FY16. Additional volume has come both from increased business with existing customers and from new sectors, including sales growth to the independent forecourt sector. We will continue to explore opportunities to expand existing sales and to introduce new products at new locations.
We will also maintain our programme of infrastructure development. Further planned integration of Navigator facilities on Teesside and progress at Thames Oilport are expected to create further economies of scale and greater operational flexibility.
We are using our UK experience and capabilities to expand in new regions.
» We have developed a successful rail import modelin Canada, with flexible low-cost supply chains fromNorth America and Europe. We are now pursuingfurther sales growth at existing and new locations.
» We are exploring opportunities to expandour diesel import operations in Brazil.
» In the Middle East, we are bringing ourpetrol blending expertise into a new jointventure with Bapco, the national oil companyof the Kingdom of Bahrain.
16
Chief Executive’s Review
2016 Greenergy Annual Report

Our strategy is to grow profits in our core UK Fuels business by continuing to invest in infrastructure to deliver cost and operational efficiencies, while replicating our success by growing in international markets with similar import dynamics.
£57.9m
Profit before tax FY16
£3.8m FY15
Navigator fuel terminals
OtherInfrastructure
We partnered with Macquarie Capital to co-found Navigator Terminals. This strategic investment gives us greater influence over supply facilities that are key to our ongoing UK business. In addition, it provides access to long-term, low-cost capital to finance major infrastructure investments and facilitate future growth.
Thames Oilport continues to be a key development project, offering potential for sales growth and giving us the ability to receive products on larger ships, further improving our access to global markets. We now have a clear route-map to develop the terminal in phases.
Our strong financial performance this year and the transfer of Greenergy North Tees into Navigator Terminals will reduce our capital constraints going forward. We are now in a position to fund further acquisitions and infrastructure investments, either directly as Greenergy or within Navigator, to support our continued growth.
17

358Independently owned forecourts
298 FY15
UK Fuels p36
Strategy
UK FuelsWe have continued to grow our business in a highly competitive market place. Our UK market share for the period averaged 28% for fuel originated by Greenergy (FY15: 25%) and 35% including domestic third-party purchases (FY15: 32%).
Growth in UK petrol and diesel sales has primarily been from locations where we have made infrastructural investment and acquisition. These investments have allowed us to develop low-cost, global supply chains with which to compete successfully in the market. As our sales volume grows, we are increasingly developing economies of scale, to optimise our purchasing, receive product on larger ships and drive down unit costs.
We also increased sales to independent forecourt operators, including as part of our Branded Wholesaler agreement with Esso. This remains a relatively new area of business for us offering potential for long-term growth. As we begin to establish a reputation in the sector as a flexible and high service fuel supplier, the number of sites we were contracted to supply has increased, reaching 358 at year-end (FY15:298).
We made further upgrades and expanded capacity at our biodiesel manufacturing facilities, resulting in greater raw material flexibility, improved reliability and increased output. We also further diversified our supply chains for waste oils, to source from new markets globally and to purchase product in smaller containers. As a result, our biodiesel manufacturing operations made a significant additional contribution to profits this year. With our manufacturing operations producing more biodiesel than we require for our own blending, we also increased biodiesel sales to third parties.
We reconfigured operations as a sole user of the Navigator Thames terminal to improve efficiency. This has reduced variable costs and reduced waiting times for customers and for our in-house haulage operation. A long-term contract has been concluded with Navigator Terminals, to secure our continued access to this facility.
International FuelsIn Canada, we commenced fuel sales from a new location north of Toronto. Developed in partnership with Canadian National Railway, this is a first-of-its-kind rail-to-road Cargoflo facility that uses the train as the tank terminal. This offers a low-cost distribution concept in a new location that is convenient for our customers. Despite the loss of an important customer elsewhere, sales have been strong. Our Cargoflo rail-to-road facility in Toronto reached capacity within nine months of commissioning, enabling us to commit to expanding the facility in 2016.
We made our first diesel imports for sale within Brazil, a market historically supplied predominantly from domestic production. These imports leveraged long-standing relationships with storage companies and diesel users in Brazil and have taken advantage of trading windows created by lower international diesel prices, a favourable US Dollar-Real exchange rate and high domestic diesel prices within the Brazilian market. We expect the Brazilian market to continue to open up to competition as Petrobras focuses on other matters and we will explore opportunities to increase our involvement going forward.
We have used our infrastructure capability to deliver supply chain flexibility and resilience, allowing us to retain and win new business in our home market and internationally.
Chief Executive’s Review (continued)
18
Chief Executive’s Review
2016 Greenergy Annual Report

Thames Oilport p50
International Fuels p44
Post year-end we concluded a new joint venture between Greenergy and the Bahrain Petroleum Company (Bapco) to blend petrol to meet domestic Bahraini demand and for import/export. Bapco’s facilities are located on a trading channel in and out of the Arabian Gulf and form an ideal base for a new petrol blending operation.
InfrastructureIn this period we acquired Vopak’s shares and voting rights in Thames Oilport directly, giving us a two thirds shareholding in the joint venture with the remaining third held by Shell. As a separate transaction, we also established Navigator Terminals in partnership with Macquarie Capital, to acquire Vopak’s other UK assets as well as the operational storage assets of Greenergy North Tees. Both transactions are strategically important for Greenergy, giving us greater influence over infrastructure that is key to our continued success in the UK market.
I am pleased at the significant progress that has been made in the development of Thames Oilport during this period. Under the new ownership structure the regeneration of the terminal is being carried out in phases. In the first phase, we brought some 175k cbm of tankage back into use for diesel storage and restored pipeline connections from the tanks to the jetty. A further 32k cbm of diesel tankage is planned for our own use from Q3 2017. By storing diesel, we have benefited from contango market conditions to generate revenue in FY17 that can be re-invested.
The works completed so far have prepared infrastructure that will be needed in future stages in the development of Thames Oilport, as we move on to storage and road loading for diesel, gasoil and kerosene and, eventually, petrol. In preparation for these future works, we also recommenced our own petrol project development engineering.
Meanwhile, demolition of former refinery infrastructure has continued clearing land not required for an import terminal, allowing us to market it for alternative uses.
We made significant investment to upgrade our North Tees terminal following the acquisition from Petroplus in 2012. Most significantly, we integrated the terminal with the neighbouring Seals Sands petrol blending facility, allowing us to add petrol throughout and export by rail. This investment enabled us to maximise value through the sale of the facility to Navigator during the year and gives us a platform to further integrate with Seal Sands, also now owned by Navigator Terminals, to create a fuel and chemical storage hub in the North East.
HaulageOur in-house operation has again provided a safe and reliable operation, providing visibility, control and team spirit in this essential part of our supply chain.
We recruited more drivers into the business this period in order to deliver more fuel and created cost efficiencies by improving the utilisation of our vehicle fleet. The number of drivers we employed on average across the year increased to 285 (FY15: 261).
Outlook
Our business has again proved robust to changing market conditions. Our continuing success stems from our import model, which enables us to optimise our purchasing in response to global market trends.
As we expand within the UK and internationally, we will continue to prioritise infrastructure development in order to develop further supply chain flexibility and operational efficiencies.
19
Andrew OwensChief Executive

We continue to focus on safety across our business as our number one priority.
Health and Safety
20
Health and Safety
2016 Greenergy Annual Report

21

Barbara LeadbetterHead of Process Integrity
‘‘Our Process Integrity committee ensures that health and safety issues are addressed openly and are resourced appropriately. The Committee brings together Executive Directors, terminal and manufacturing plant managers and our SHEQ team.
’’
Safety record
Our health and safety reporting is open and transparent.
There was a further reduction in the rate of RIDDOR reportable and lost time injuries this period. However the rate of minor injuries (not requiring time off work) increased and is being addressed through increased discussion and awareness workshops.
There were no RIDDOR dangerous occurrences.
There were seven separate RIDDOR reportable injuries across the business:
» One in our fuel terminal operations, being a twisted ankle
» Six in our haulage operations, of which two resulted from slips and trips, two from manual lifting, one from running and one from banging an elbow exiting a vehicle.
22
Health and Safety
2016 Greenergy Annual Report

Incident rate per 100,000 hours worked
FY14-15
0
0.16 0.65
1.1
2.4
18.2
172.3
Incident rate per 100,000 hours worked
FY15-16
Incident rate per 100,000 hours worked
FY15-16
occurrence
0
0.0 0.53
0.98
3.9
16.8
213.0
injury
Fatalities
Fatalities
RIDDOR dangerous occurrence or injury
RIDDOR dangerous occurrence or injury
Lost time injury
Lost time injury
Minor injuries
Minor injuries
Near misses
Near misses
Hazard observations
Hazard observations
Group safety record FY16
Definitions RIDDOR dangerous occurrence: an incident with a high potential to cause death or serious injury (as defined by the RIDDOR regulations).
RIDDOR or lost time injury: an injury resulting in an absence from work beyond the shift in which the injury was sustained or one which led to significant injury such as a fracture or serious burns.
Minor injury: an injury which is not RIDDOR reportable and does not require time off work or restricted work duties.
Near misses: an unplanned event that did not result in injury, illness, damage or non-compliance but which had the potential to do so.
Hazard observations: an ‘act’ or a ‘condition’ that has the potential to cause injury, loss or damage.
23
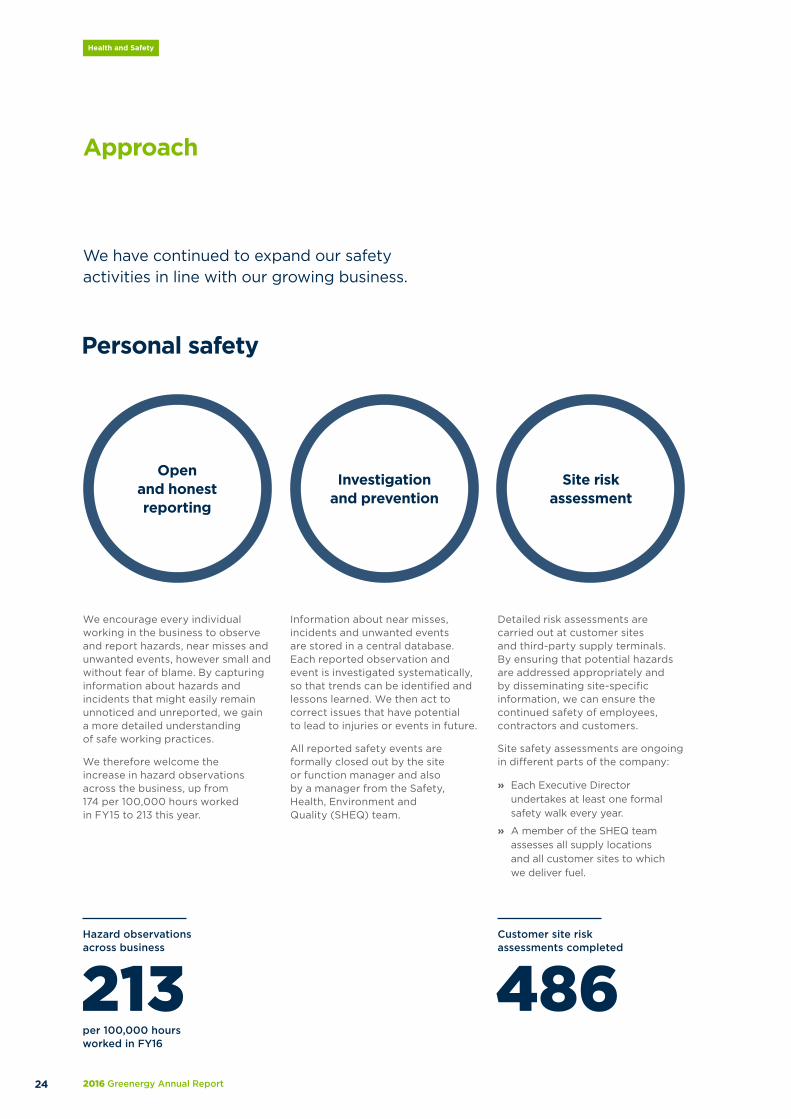
213 486Hazard observations across business
Customer site risk assessments completed
per 100,000 hours worked in FY16
Open and honest reporting
Investigation and prevention
We have continued to expand our safety activities in line with our growing business.
Approach
Personal safety
We encourage every individual working in the business to observe and report hazards, near misses and unwanted events, however small and without fear of blame. By capturing information about hazards and incidents that might easily remain unnoticed and unreported, we gain a more detailed understanding of safe working practices.
We therefore welcome the increase in hazard observations across the business, up from 174 per 100,000 hours worked in FY15 to 213 this year.
Information about near misses, incidents and unwanted events are stored in a central database. Each reported observation and event is investigated systematically, so that trends can be identified and lessons learned. We then act to correct issues that have potential to lead to injuries or events in future.
All reported safety events are formally closed out by the site or function manager and also by a manager from the Safety, Health, Environment and Quality (SHEQ) team.
Detailed risk assessments are carried out at customer sites and third-party supply terminals. By ensuring that potential hazards are addressed appropriately and by disseminating site-specific information, we can ensure the continued safety of employees, contractors and customers.
Site safety assessments are ongoing in different parts of the company:
» Each Executive Director undertakes at least one formal safety walk every year.
» A member of the SHEQ team assesses all supply locations and all customer sites to which we deliver fuel.
Site risk assessment
24
Health and Safety
2016 Greenergy Annual Report
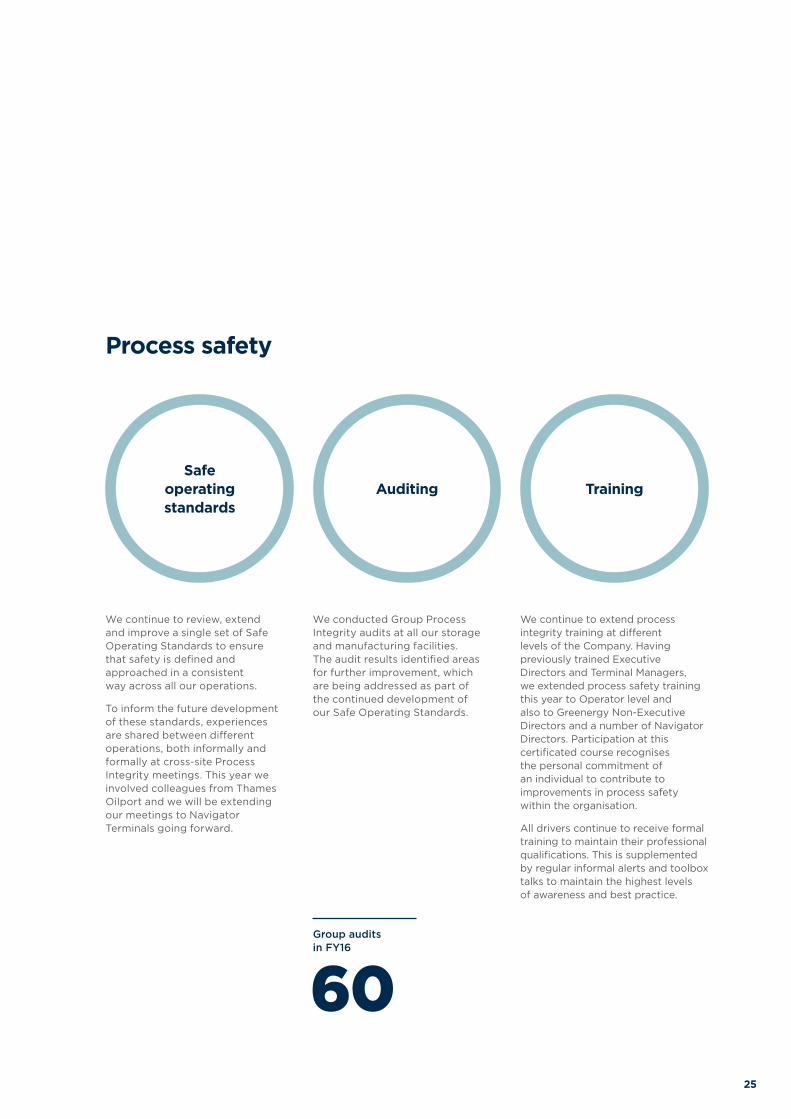
60Group audits in FY16
Safe operating standards
Auditing
Process safety
We continue to review, extend and improve a single set of Safe Operating Standards to ensure that safety is defined and approached in a consistent way across all our operations.
To inform the future development of these standards, experiences are shared between different operations, both informally and formally at cross-site Process Integrity meetings. This year we involved colleagues from Thames Oilport and we will be extending our meetings to Navigator Terminals going forward.
We conducted Group Process Integrity audits at all our storage and manufacturing facilities. The audit results identified areas for further improvement, which are being addressed as part of the continued development of our Safe Operating Standards.
We continue to extend process integrity training at different levels of the Company. Having previously trained Executive Directors and Terminal Managers, we extended process safety training this year to Operator level and also to Greenergy Non-Executive Directors and a number of Navigator Directors. Participation at this certificated course recognises the personal commitment of an individual to contribute to improvements in process safety within the organisation.
All drivers continue to receive formal training to maintain their professional qualifications. This is supplemented by regular informal alerts and toolbox talks to maintain the highest levels of awareness and best practice.
Training
25
Market Review
Globally, the supply of refined products exceeded demand. However, in the markets where we supply fuel, supply/demand imbalances resulted in a structural requirement for fuel imports.
26
Market Review
2016 Greenergy Annual Report

27

We used our deep-water import infrastructure to source diesel not required regionally in Asia, the Middle East and the US. With expansion of the refining sector in these countries expected to continue, access to these markets will continue to be strategically important.
Middle East
+2.7m b/d
China
+2.4m b/d
Other Asia
+1.65m b/d
Europe
–0.1m b/d
North America
+1.15m b/d
Expected change in regional refining capacity 2015–2021*
Global markets
Higher refinery utilisation rates combined with refinery expansion in Asia, North America and the Middle East resulted in an oversupply of diesel. We were able to access this low-cost diesel through our deep-water import terminals.
28
Market Review
2016 Greenergy Annual Report

370
450
430
410
390
$/t
on
ne
Contago price structure
Jan 2017 Nov 2017
ICE Diesel Future Price, 14 April 2016
May 2016
370
450
430
410
390
$/t
on
ne
Contago price structure
Jan 2017 Nov 2017
ICE Diesel Future Price, 14 April 2016
May 2016
Contango price structure
Increased refinery production
Brent crude oil prices fell to their ten year low of $27/barrel in January 2016 before recovering somewhat. However, product prices remained buoyant relative to crude, pushing up refining margins and refinery utilisation rates, particularly in the first half of FY16. At the same time, refinery expansion continued in Asia, the Middle East and North America.
These factors together resulted in a 2mb/d increase in global refinery production in 2015 compared with the previous calendar year*.
Supply/demand imbalances
The growth in refinery production was not matched by demand growth (up 1.6mb/d in 2015*). With most new refinery capacity set up for higher diesel yields, the increase in refinery production was stronger for diesel than for petrol. Demand growth, on the other hand, was primarily for petrol, driven by lower fuel prices in North America and increased vehicle ownership in China and India.
This created a global surplus of diesel particularly, resulting in:
» A significant increase in storage of products globally and, by December 2015, a seasonal record of diesel stocks in Europe*
» Contango market conditions for diesel.
* Source: IEA
The over-supply of diesel resulted in contango market conditions this year, meaning that prompt prices were lower than forward prices.
The level of contango was sufficient to cover tankage and working capital costs and therefore it was advantageous to store products.
This expedited the development of Thames Oilport within the joint venture and we brought into use an initial 175cbm tankage for diesel storage. Elsewhere, most of our storage capacity is fully utilised for our ongoing fuel supply commitments, but we did bring into use additional tankage for contango storage at Navigator North Tees.
We expect to continue to benefit from contango market conditions during FY17.
A contango market
29

Net petroleum product imports into the UK market
(15)
(10)
(5)
5
0
10
15
2004 2006 2008 2010 2012 2014 2016 F 2018 F 2020 F
Mill
ion
to
nn
es
Net imports
Net exports
Declining UK refinery production
UK refinery production declined in 2015, continuing the trend of the last decade. The causes of declining refinery output remain unchanged:
» Competition from larger and lower-cost refiners in other regions
» A mismatch between UK refined products and consumption patterns. UK refiners produce a surplus of petrol and a deficit of diesel relative to domestic consumption and are constrained by their ability to sell surplus petrol internationally.
We expect UK refinery utilisation rates to decline further until 2020.
Diesel demand growth
Demand for road fuel in the UK increased 2.1% overall in the financial year. Once again all of that growth was in diesel demand, up 4.3% (FY15: up 3.3%), with petrol demand falling by 1.5% (FY15: down 2.5%). This is an ongoing trend caused by continuing dieselisation of the car fleet and by the improving fuel efficiency of petrol-engined vehicles. By the end of this financial year diesel accounted for 63% of road fuel consumption (FY15: 61.6%) with petrol accounting for just 37% of the market (FY15: 38.4%). This growth in diesel demand relative to domestic refinery production is expected to continue to drive the UK’s import requirements.
UK market
Rationalisation of UK refinery capacity has made the UK structurally reliant on imports to meet its fuel requirements. We are well positioned to meet this shortfall with supply through our import terminals.
30
Market Review
2016 Greenergy Annual Report

The UK was a net importer of petroleum products in 2015 by 9.3m tonnes. This is the highest annual figure since 1984, when industrial action in the coal sector led to greater demand for oil products for electricity generation.
With our access to import infrastructure and our low-cost model, we have the capacity to meet the UK’s growing import requirements.
Insight
The UK’s growing reliance on fuel imports
31
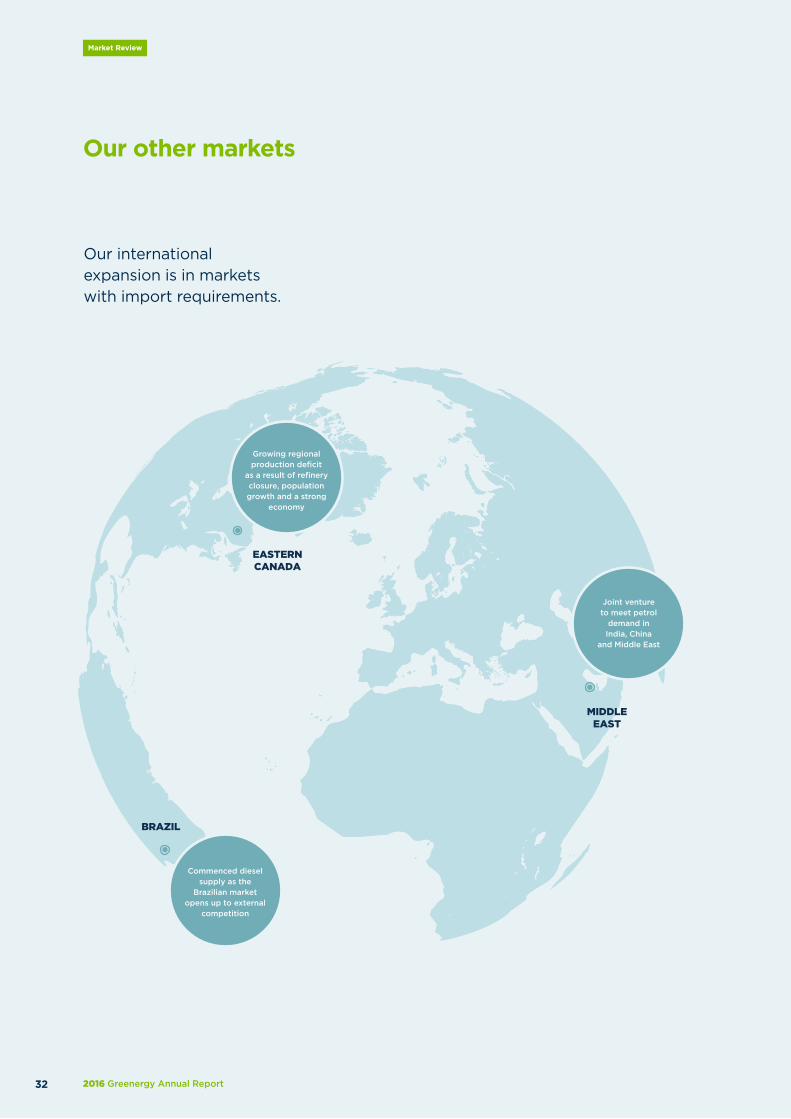
EASTERNCANADA
BRAZIL
MIDDLEEAST
Growing regional production deficit
as a result of refinery closure, population growth and a strong
economy
Commenced diesel supply as the
Brazilian market opens up to external
competition
Joint venture to meet petrol
demand in India, China
and Middle East
Our other markets
Our international expansion is in markets with import requirements.
32
Market Review
2016 Greenergy Annual Report

International Fuels p44
International Fuels p44
International Fuels p44
Supply chain flexibility
Changing regional dynamics
Petrol blending
Brazil
Historically domestic petrol and diesel supply has been almost exclusively from Petrobras, but this market is increasingly opening to outside competition. Petrobras’ position has been diminished by the ongoing corruption scandal, with refinery projects cancelled and a lack of investment in alternative supply. At the same time, road fuel demand is growing due to increasing vehicle ownership and a return to economic growth.
This year we commenced diesel imports into Brazil, having previously been an ethanol exporter. As the country’s requirement for fuel imports grows, there is potential to increase our infrastructure and fuel supply position in this market.
Middle East
We negotiated a petrol blending joint venture in the Kingdom of Bahrain which will be formed shortly after year-end.
Eastern Canada
We supply fuel in the Eastern provinces of Canada, which account for 65% of Canadian road fuel demand. This region is an import market in which:
» Refinery production has declined following refinery closures in 2010 (Dartmouth) and 2013 (Montreal).
» Road fuel demand has been robust due to population and economic growth.
This period we imported fuel from Western Canada and the US Mid-West, where refinery production increased due to the availability of low-cost crude oil produced from fracking. Refineries in these areas are landlocked and, unable to export by sea, sought markets elsewhere in North America.
This represents a change from 2014 and 2015, when most of the petrol we supplied in Canada originated in Europe.
33

Strategy in Action
Our strategy is to grow our core UK fuels business, replicate our successes internationally and continue to invest in strategic infrastructure and operations.
2016 Greenergy Annual Report34
Strategy In Action
35

Strategy in actionFuel sales by customer segment
12%
23%
17%
48%
Fuel sales by customer segment
UK Fuels International Fuels Infrastructure Haulage
STRATEGIC ICONS
‘‘Competition in the UK road fuel market was again intense. We bought well to reduce product costs and delivered strong manufacturing margins, allowing us to continue to retain and win new business. We maintain our focus on cost reduction and service quality in order to deliver a compelling customer offer and maintain our loyal customer base.
’’
Aim: Develop low-cost and resilient fuel supply chains to earn the long-term loyalty of our UK customers
Caroline LumbardUK Trading Director
Hypermarkets Independents
Oil majors Other
UK Fuels
2016 Greenergy Annual Report36
Strategy In Action

Ross
Clydebank
TeessideSeal Sands
North Tees
Thames Oilport
Thames
Cardi�
Plymouth
With our own import infrastructure in key demand regions and lifting rights at inland locations, we have a unique national supply capability.
Greenergy stock-managed terminals
Biofuel manufacturing facilities
Areas of population density
Supply locations
Our UK supply locations and facilities
Infrastructure p48
37

UK Fuels (continued)
Strategic priority 1 Source diesel from the lowest-cost global producers
With the expansion of the global refining sector and a growth in global diesel production ahead of demand, there was a rise in diesel imports into Europe from the Middle East and the Baltics. This increased the availability of diesel in the European market.
With an ownership interest in the UK’s only deep-water road fuel jetties, at Navigator North Tees and Thames Oilport, we were able to purchase lowest-cost diesel both from within the European market and direct from global producers, giving us supply chain flexibility and strong purchase margins.
Strategic priority 2 Blend petrol from component products
We operate sophisticated petrol blending systems at three UK locations, being Navigator Thames, Navigator Seal Sands and Inter-Terminals Seal Sands (effective January 2015). The operation of three facilities this year created greater operational flexibility.
Blend margins were strong due to an over-supply of petrol products in the European market. Although naphtha, typically one of our main petrol blend components, was expensive relative to petrol, other blend products that had historically been exported to the USA became available at favourable prices.
Global market review p28
Our import infrastructure enabled us to take advantage of global oversupply of refined products, to source products from lowest-cost producers wherever they are.
Petrol blend margins
By purchasing petrol blend components, typically from outside the UK, and combining them to make UK-specification petrol we:
» Generated purchase and blend margins by blending component products for less than the market value of the finished petrol
» Controlled the supply reliability and quality of the petrol we supplied
» Produced customer-specific petrol grades, such as high octane fuels.
2016 Greenergy Annual Report38
Strategy In Action UK Fuels

Size of ships importing Greenergy fuel into the UK
25,000
20,000
0
15,000
5,000
10,000
Ave
rgae
car
go
siz
e (c
bm
)
700
680
660
540
640
620
580
560
600
Nu
mb
er o
f sh
ips
FY11 FY12 FY16FY15FY13 FY14
Number of cargoes
Average ship size
21,068
11,777
We have an ownership interest in two of the UK’s deep-water road fuel jetties, at Navigator North Tees and Thames Oilport. These give us the ability to import fuel on larger ships and buy direct from producers in the US, Middle East or Asia, when this is the lowest-cost option.
Further planned development of Navigator and Thames Oilport facilities will allow us to increase our long-haul imports in future.
Deep-water fuel imports
39

423m
Third-party biodiesel sales in litres
FY12 FY13 FY14*
*A�ected by floodingFY15 FY16
cbm
Strategy in actionBiodiesel production
FY12 FY13 FY14*
*A�ected by floodingFY15 FY16
cbm
Strategy in actionBiodiesel production
UK Fuels (continued)
Strategic priority 3 Biofuel manufacturing and supply
Biodiesel manufacturing
We own two of Europe’s largest waste-to-biodiesel production facilities, having purchased the right to operate our second facility in January 2015.
Further upgrades at both facilities resulted in greater raw material flexibility, improved reliability and increased output. In particular, we installed a new refinery distillation column at our Teesside facility, increasing capacity, and built facilities to receive waste oils in smaller containers, allowing us to purchase from suppliers without bulk storage. This has allowed for further diversification of our global waste oil supply chains and reduced raw material costs.
Transfer of knowledge and experience between both facilities also created cost savings and production efficiencies, including through allocation of raw materials with different quality characteristics to the most appropriate site.
Biodiesel production
Biofuel sales to third parties
Our biofuel sales focus on matching the right product with the right customer, recognising the specific sustainability requirements of different customers and markets. By applying our sustainability expertise across different continents, we maximise the value of biofuel we supply.
Biodiesel sales to third parties grew significantly this year from new storage arrangements in Rotterdam. These included biodiesel manufactured in our UK facilities and not required for our own blending.
Ethanol sales to other oil companies in the UK, Europe and the USA also grew. We used our sustainability expertise to source products meeting different customer requirements. As our ethanol origination grows and we buy from multiple parties, we were increasingly able to optimise our purchasing to benefit from market opportunities.
Generation and sale of RTFO certificates
We blend biofuel into the fuel we supply in order to meet UK biofuel supply obligations and generate Renewable Transport Fuel Obligation (RTFO) certificates which can be sold to other oil companies.
Demand for RTFO certificates fell this year and the volume of our certificate sales was lower. However, we expect demand to increase from April 2017 when a change in legislation is expected to increase RTFO biodiesel inclusion mandates.
In the first full year of operating a second biodiesel manufacturing facility, our own biodiesel production increased by 75%. We also grew biodiesel sales to third parties from new storage arrangements in Rotterdam.
2016 Greenergy Annual Report40
Strategy In Action UK Fuels
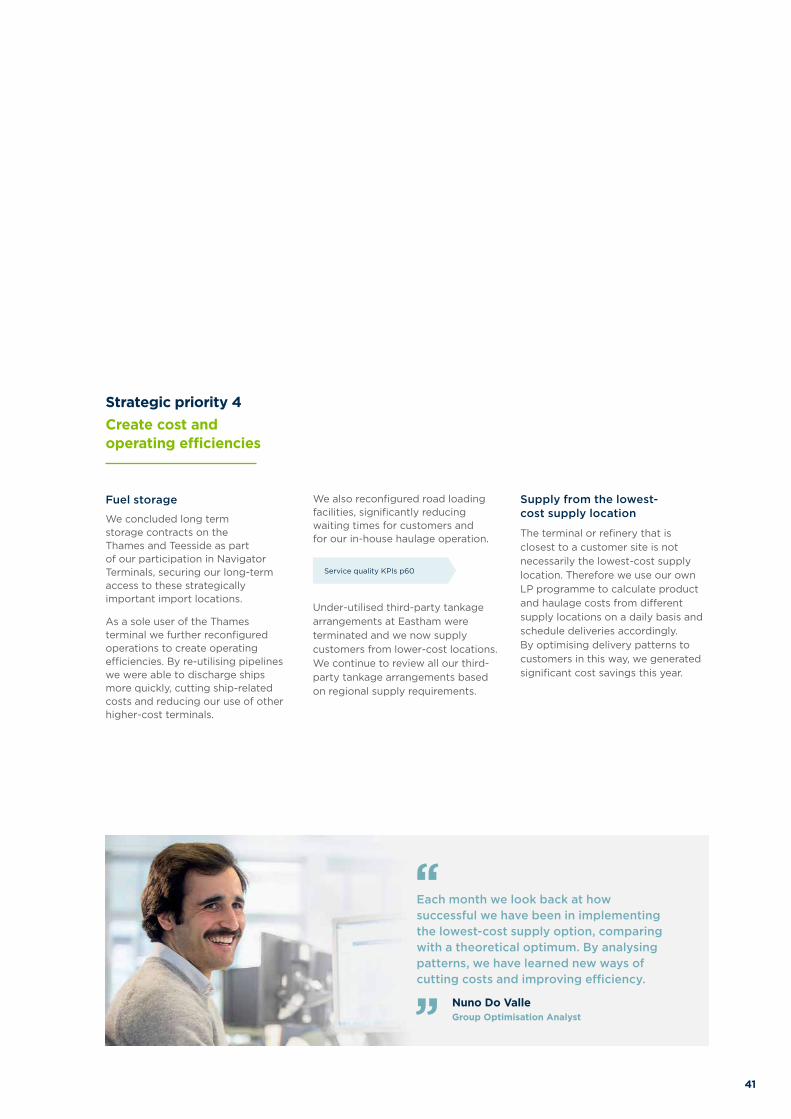
Strategic priority 4 Create cost and operating efficiencies
Fuel storage
We concluded long term storage contracts on the Thames and Teesside as part of our participation in Navigator Terminals, securing our long-term access to these strategically important import locations.
As a sole user of the Thames terminal we further reconfigured operations to create operating efficiencies. By re-utilising pipelines we were able to discharge ships more quickly, cutting ship-related costs and reducing our use of other higher-cost terminals.
Service quality KPIs p60
Under-utilised third-party tankage arrangements at Eastham were terminated and we now supply customers from lower-cost locations. We continue to review all our third-party tankage arrangements based on regional supply requirements.
Supply from the lowest- cost supply location
The terminal or refinery that is closest to a customer site is not necessarily the lowest-cost supply location. Therefore we use our own LP programme to calculate product and haulage costs from different supply locations on a daily basis and schedule deliveries accordingly. By optimising delivery patterns to customers in this way, we generated significant cost savings this year.
We also reconfigured road loading facilities, significantly reducing waiting times for customers and for our in-house haulage operation.
‘‘Each month we look back at how successful we have been in implementing the lowest-cost supply option, comparing with a theoretical optimum. By analysing patterns, we have learned new ways of cutting costs and improving efficiency.
’’ Nuno Do ValleGroup Optimisation Analyst
41

UK Fuels (continued)
Strategic priority 5 Grow in new markets
Independent forecourt sector
Over the last decade major oil companies have significantly scaled back their UK downstream operations, selling or closing refineries and disposing of company-owned sites. The independent forecourt sector has grown as a result and the market continues to open up to fuel suppliers such as Greenergy.
We have developed an innovative supply offer which gives forecourt operators a choice of forecourt brands, including the Esso, Nisa or operators’ own brands, combining competitively priced fuel with the highest standards of supply reliability and customer service.
We plan to: » Commence fuel sales from Thames Oilport
» Create cost efficiencies through increased use of larger ships
» Further optimise biodiesel manufacturing operations
» Continue to expand sales to the independent forecourt sector.
In a major enhancement to our customer offer, we developed a new fuel card scheme which was piloted after year-end.
Sales growth in other sectors
Sales growth was also achieved in other parts of our UK business:
» Spot sales, to customers buying on the day rather than under a long-term contract, were up 51% on FY15 following the introduction of a sales force dedicated to this part of our business.
» We significantly expanded sales from Ross, a new supply location that we took on in January 2015.
» We began selling kerosene from North Tees and Ross.
» Increased sales of gasoil, up 45% on FY15.
2016 Greenergy Annual Report42
Strategy In Action UK Fuels

164
298
358
FY14
FY15
FY16
We have further expanded our fuel supply to independent forecourt operators, including as part of our Branded Wholesaler agreement with Esso.
The number of independently-owned forecourts we were contracted to supply increased to 358 at year-end (Esso: 269; Nisa: 7; other: 82).
Case Study
Independent forecourts
43

Sales volume in Canada
244
400 49
4
0
500
400
300
Mill
ion
litr
es
100
200
FY14FY13 FY15 FY16
UK Fuels International Fuels Infrastructure Haulage
STRATEGIC ICONS
Aim: Expand internationally by replicating our UK experience in other markets
CanadaSales growth
BrazilFirst diesel imports
Middle EastNew petrol blending in Bahrain
International Fuels
44
Strategy In Action
2016 Greenergy Annual Report44
Strategy In Action Rail-to-road facility Canada

We plan to: » Increase sales from existing locations
» Develop further rail-to-road supply locations
» Develop deep-water import capability in the east of Canada
» Further develop our logistics capability in the US Mid-West.
Our Canadian business has established itself as a low-cost and reliable provider of fuels in the Ontario and Quebec regions of Canada, with a unique supply chain concept. The business made its first positive contribution to consolidated EBITDA this period, in only its second full year of operation.
Strategic priority 1 Develop low-cost supply chains from North America and Europe
A priority this year was to diversify our product sourcing in order to reduce reliance on local refiners and increase supply optionality, minimise product costs and deliver improved supply resilience for customers.
We developed alternative sources of supply from North America, establishing new flexible supply partnerships with refiners in the US Mid-West. As part of this, we took on new tankage arrangements in the US Mid-West to enable us to load product from refinery pipelines onto railcars for delivery to our supply locations in Canada. To support these relationships, we moved our US office from Georgia to Houston.
Strategic priority 2 Expand our supply footprint and increase sales
Sales commenced from our innovative new rail-to-road facility north of Toronto, developed in partnership with Canadian National Railway. This facility allows petrol and diesel to be loaded directly from railcars onto trucks and makes use of existing rail infrastructure to create a new supply location in a heavily congested area.
The rail-to-road concept, known as Cargoflo, was received well by the market and our sales from the facility were strong. Following year-end we commenced an expansion project at our Toronto facility, doubling its capacity. We have also completed engineering studies to bring two new facilities to market in FY17.
Our sales volume in Canada increased 24% compared with FY15.
The number of railcars that we operate increased to 137 (FY15:116) while lease costs per railcar fell.
We continued to import petrol from Europe, although this year our petrol blending facilities were fully utilised in meeting our UK supply commitments.
Canada
45

We negotiated a new joint venture with Bahrain Petroleum Company, the national oil company of the Kingdom of Bahrain, to create a regional petrol blending hub in the Middle East.
Strategic priority 3 Develop new relationships in the Middle Eastern market
Planning was completed this period for a new joint venture between Greenergy and Bahrain Petroleum Company (Bapco) to blend petrol to meet domestic Bahraini demand and for import/export, which was announced post year-end.
The joint venture, called Bahrain Gasoline Blending (BGB), combines Bapco’s infrastructure and refinery petrol production with Greenergy’s expertise in blending, terminal operation and trading.
Middle East
BGB will blend petrol components produced by Bapco’s refining operations and purchased from third parties. It intends to sell finished-grade petrol to Bapco and to customers in the region and further afield.
‘‘Our new gasoline blending joint venture, Bahrain Gasoline Blending, is a further area for expansion for us, allowing us to bring our experience and expertise to bear in a new market.
’’ Tirath MagdaniChief Executive, Greenergy Asia
International Fuels
46
Strategy In Action
2016 Greenergy Annual Report

We made our first diesel imports for domestic sale within Brazil, delivering competitive pricing in a market that has historically been closed to us.
Strategic priority 4 Increase domestic sales into Brazil
This period we imported diesel into Brazil for the first time, supplying fuel wholesalers through existing tankage at Santos in the centre south and new storage arrangements in Paranagua in the south.
The Brazilian diesel market has historically been supplied predominantly from domestic production, but this has failed to keep up with rising fuel demand. With domestic (regulated) diesel prices higher than international prices in the second half of this year, we were able to make our first in a series of diesel imports.
We plan to:
Middle East
» Develop new dedicated blending facilities within the joint venture to process a wider variety of petrol components
Brazil
» Explore opportunities to expand our fuel supply
» Expand our access to infrastructure in the long term.
Brazil
As an exporter of ethanol over ten years, we have developed long-standing relationships with storage companies in Brazil. Access to infrastructure, and therefore market entry, is difficult but we were able to leverage existing relationships to establish a diesel import operation in a short space of time.
We will consider opportunities to expand our position in Brazil, to meet the country’s growing requirements for fuel imports on a larger scale.
47

UK Fuels International Fuels Infrastructure Haulage
STRATEGIC ICONS
Navigator p52
Thames Oilport p50
‘‘We significantly extended our ownership of fuel infrastructure in the UK this year, taking a majority shareholding in Thames Oilport and, through Navigator, purchasing Vopak’s UK storage facilities. These transactions give us greater influence over infrastructure that is important to our future success.
We are now in a position to fund further infrastructure investment and acquisition, either directly as Greenergy or within Navigator, to support our continued growth.
’’ Chris BrookhouseInfrastructure Director
Aim: Acquire, regenerate and operate assets that support our supply chain objectives
Infrastructure
48
Strategy In Action
2016 Greenergy Annual Report48
Strategy In Action

Strategic priority 1 Regenerate legacy infrastructure to increase value
Thames Oilport
This period we purchased Vopak’s shares in Thames Oilport and Thames Enterprise Park, giving us two thirds of the joint venture with the remaining one third held by Shell. Chris Brookhouse, Director of Infrastructure at Greenergy, continues as Chief Executive of the joint venture.
With the new shareholder structure streamlining decision-making and reducing ongoing overhead costs, significant progress was made on site this period. In the first step to full commercial operations, an initial 175k cbm of tankage was engineered and commissioned this period and oil was received into Thames Oilport for the first time.
Thames Oilport p50
Navigator p52
Creation of an integrated infrastructure hub on Teesside
We continued work to integrate Navigator fuel facilities on Teesside.
Planning work was completed for a new diesel pipeline between the Navigator North Tees and Seal Sands facilities and work began on site shortly after year-end. North Tees has a deep-water jetty, allowing us to import diesel on large ships from the lowest-cost global producers. By linking with the Navigator Seal Sands facility, where we utilise sophisticated petrol blending facilities and supply ‘retail mix’ (petrol and diesel on the same road tanker), we aim to create economies of scale, reducing shipping-related costs and improving purchase margins.
49

Infrastructure
Connected to the UKOP pipeline, giving the potential to move fuel inland
to other areas of significant demand
Deep-water jetty able to receive
long-haul diesel ships and connect with the Middle Eastern, Asian
and US markets
Strategically important location
with a rapidly growing population, rising fuel demand and
limited suitable fuel infrastructure
The opening of Thames Oilport
50
Strategy In Action
2016 Greenergy Annual Report

Phase 2Road & pipeline
connections
Phase 3Blending
Phase 1Diesel
storage
KENT
ESSEX
LONDON
M25
M25
We have agreed a route-map to progress Thames Oilport in phases, to create a fully-fledged import terminal. The facility has now opened for diesel storage and we are moving on to road loading and storage for other products.
The ongoing development of Thames Oilport continues to be a priority for Greenergy.
51

Strategy In Action Infrastructure
Strategic priority 2 Increase income from rental of storage or sale of assets to third parties
Creation of Navigator Terminals to own and operate bulk storage facilities in the UK
We co-founded a new oil and chemical storage company called Navigator Terminals Ltd in partnership with Macquarie Capital. Navigator’s first two acquisitions were the purchase of:
» Vopak’s UK storage facilitiesat West Thurrock on the Thames,Seal Sands on Teesside andWindmill at Barry, near Cardiff
» The operational assetsof Greenergy North Tees,also in the UK.
These acquisitions give Navigator an initial storage capacity of more than 1.5m cbm, making it the UK’s largest independent storage provider in the oil and chemicals sectors and providing long-term investment income for Greenergy as a Navigator shareholder.
Sale of Greenergy North Tees to Navigator
The sale of Greenergy North Tees to Navigator generated significant value that is recognised in our exceptional profits for the year, reflecting the additional capability added to the facility since we acquired it in 2012 from the administrators of Petroplus:
» New petrol storage facilities
» Rail loading facilities to enableonward distribution of petrolto other UK locations by rail
» Pipeline links withadjacent terminals to createcost efficiencies
» Increased tank utilisation
» Jetty modifications creatinggreater operational flexibilityfor discharge of large ships.
Our third-party storage agreements for crude oil and kerosene transferred to Navigator Terminals from 8 April 2016 as part of the sale of the North Tees facility. We will benefit in the future from these and from third-party storage agreements at other Navigator facilities through our shareholding in Navigator.
52
Strategy In Action
2016 Greenergy Annual Report

Our participation in Navigator ensures our continued access to the infrastructure assets that currently underpin our UK supply position. It gives us greater flexibility at these facilities, ensuring we will be best placed to deliver low-cost and resilient fuel supply for our customers in the long-term.
As an infrastructure investment company, Navigator will also provide a vehicle to fund further infrastructure acquisitions supporting our continued growth in the fuels sector both in the UK and abroad.
Case Study
Creation of Navigator Terminals
53
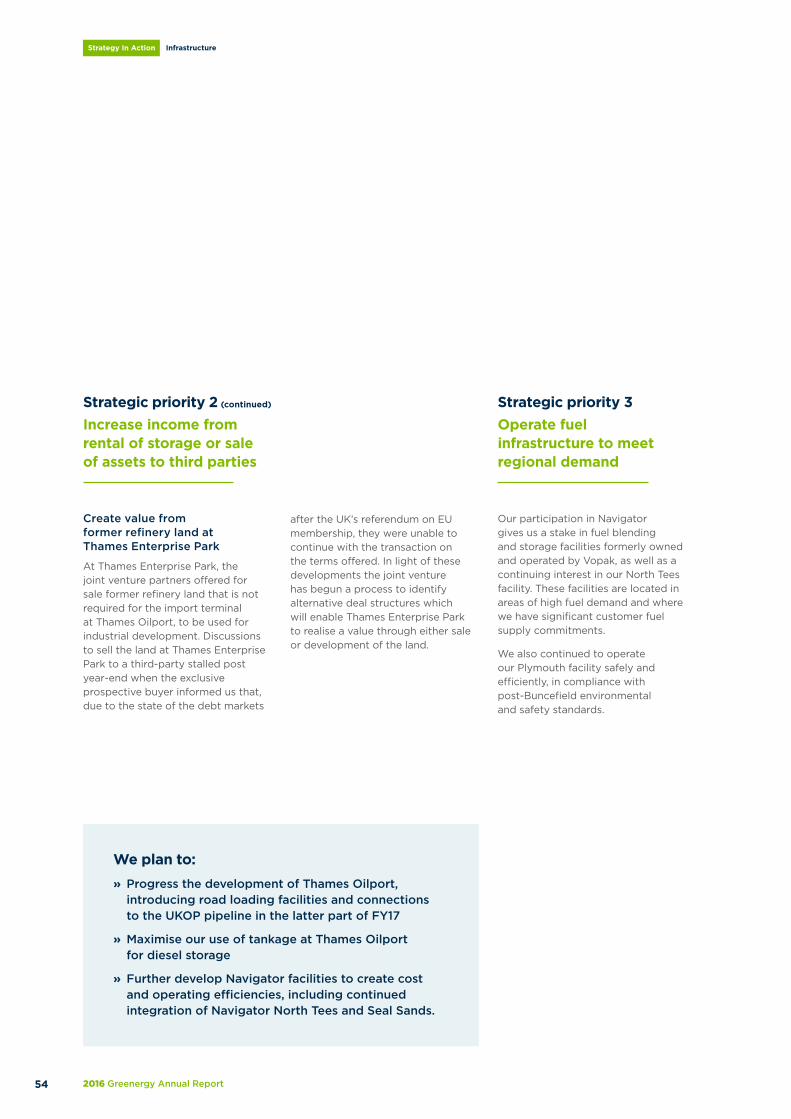
Strategic priority 3 Operate fuel infrastructure to meet regional demand
Our participation in Navigator gives us a stake in fuel blending and storage facilities formerly owned and operated by Vopak, as well as a continuing interest in our North Tees facility. These facilities are located in areas of high fuel demand and where we have significant customer fuel supply commitments.
We also continued to operate our Plymouth facility safely and efficiently, in compliance with post-Buncefield environmental and safety standards.
We plan to:» Progress the development of Thames Oilport,
introducing road loading facilities and connectionsto the UKOP pipeline in the latter part of FY17
» Maximise our use of tankage at Thames Oilportfor diesel storage
» Further develop Navigator facilities to create costand operating efficiencies, including continuedintegration of Navigator North Tees and Seal Sands.
Infrastructure
Strategic priority 2 (continued)
Increase income from rental of storage or sale of assets to third parties
Create value from former refinery land at Thames Enterprise Park
At Thames Enterprise Park, the joint venture partners offered for sale former refinery land that is not required for the import terminal at Thames Oilport, to be used for industrial development. Discussions to sell the land at Thames Enterprise Park to a third-party stalled post year-end when the exclusive prospective buyer informed us that, due to the state of the debt markets
after the UK’s referendum on EU membership, they were unable to continue with the transaction on the terms offered. In light of these developments the joint venture has begun a process to identify alternative deal structures which will enable Thames Enterprise Park to realise a value through either sale or development of the land.
54
Strategy In Action
2016 Greenergy Annual Report

55

‘‘We have continued to expand our haulage capability within Greenergy Flexigrid to meet our growing supply requirements in the UK.
We have recruited more drivers in order to improve efficiency and built strong foundations for further growth.
’’
Aim: Make reliable and cost-efficient fuel deliveries to customers through our in-house haulage operation
Tim DavisonChief Executive, Greenergy Flexigrid
2016 Greenergy Annual Report56
Strategy In Action
Haulage
285
6.4bn
Number of drivers (year average)
Litres of fuel delivered
+9% FY15
+10% FY15
UK Fuels International Fuels Infrastructure Haulage
STRATEGIC ICONS

Strategic priority 1 Ensure a safe operation
We seek to ensure that drivers, vehicles and equipment are prepared for all foreseeable hazards.
Our resourcing of driver training increased this period in order to provide formal and informal training and assessment, over and above legal requirements. We began providing individual, data-based feedback to drivers on safer, more efficient driving styles.
All drivers are encouraged to report hazards, however small. The frequency of reporting in our in-house operation increased to 396 hazard observations per 100,000 hours worked (FY15: 338), reflecting a growing safety awareness amongst our drivers.
Strategic priority 3 Create an inclusive employee relations environment
We continue to focus on maintaining an active dialogue with our drivers, to ensure effective teamwork and shared goals. A quarter of the shares in Greenergy Flexigrid are held by a drivers’ trust on behalf of our drivers. The number of drivers benefiting from this trust increased significantly this year.
Strategic priority 2 Efficient use of resources
By increasing our in-house driver force to over 300 by year-end (year average: 285), we have been able to move more volume onto our own fleet than ever before, giving improved efficiency and profitability.
We improved the cost-efficiency of our operation by:
» Expanding our driver workforcein order to maximise the volumeof fuel delivered using ourin-house fleet
» Bringing a larger proportion of ourin-house fleet into 24/7 operation
» Working proactively and on a dailybasis to minimise the numberof vehicles that are off-road.
We plan to:» Make further improvements in fleet utilisation
» Improve communication with customerson truck arrival times
» Increase fleet availability through more effectivemanagement of service providers
» Review planning and scheduling platforms
» Improve the review process with third-party providers.
57

Key Performance Indicators
This year we achieved our best ever results as we converted opportunity into financial success.
58
Key Performance Indicators
2016 Greenergy Annual Report
Teesside biodiesel plant UK

15bn
18.1bn
15.6bn
KPI s sales volume
FY15
FY14
FY16
15.7bn
13.7bn
14.1bn
Financial KPI s turnover
FY15
FY14
FY16
6.8m
57.9m
3.8m
Financial KPI s pro�t before tax
FY15
FY14
FY16
23.5m
52.6m
30.3m
Financial KPI s EBITDA excluding exceptionals
FY15
FY14
FY16
Financial KPIs
Our sales volume grew 15% this year as a result of continued growth in our UK business as well as expansion in Canada and Brazil.
18.1bn
Sales volume in litres
Turnover decreased because of lower oil prices, whilst sales volumes increased. Market prices were lower overall this period, resulting in lower revenue per litre of fuel sold to customers.
Turnover
EBITDA grew due to increased sales volume, reduced supply chain costs as well as an improved contribution from our international businesses.
Profit before tax was affected by lower depreciation charges following asset sales, reduced interest costs in line with lower oil prices and exceptional income of £30.8m.
£52.6m £57.9m
EBITDA (pre-exceptionals) Profit before tax
£13.7bn
59

Invoice accuracyOn-time deliveries
97
95
98
96
100
May 15 Apr 16
99% Average99
Per
cent
age
97
95
98
96
100
99
May 15 Apr 16
Per
cent
age
99.57% Average
Service quality KPIs
We measure our operational efficiency through many KPIs. We publish three key KPIs that underpin our mission to be the fuel supplier with the lowest-cost, highest reliability and best systems and control.
99.0%
99.6%
On-time deliveries
Invoice accuracy
99.1% FY15
99.6% FY15
On-time deliveries
The complexity of our delivery operations increased further this year as we expanded our UK sales, including to the independent forecourt sector. We made 10% more customer deliveries in this period than in FY15 and delivered to 214 more sites. Despite this, the reliability of our operation remained high, with 99% of our deliveries made within the delivery window agreed with the customer.
Invoice accuracy
Our invoice accuracy is a measure of the quality of the information flow throughout our business.
In order to improve the efficiency and accuracy of our processes, we continue to automate our invoicing wherever possible. The proportion of invoices that were automatically generated this period was 93%, unchanged from last year.
60
Key Performance Indicators
2016 Greenergy Annual Report

22:27Average loading time Thames Terminal
14.41%
Number of trucks taking more than 30 minutes to load
26:14 FY15 27.42% FY15
We seek to minimise delays for trucks when collecting fuel from our terminals in order to improve our own, and our customers’ operational efficiency. Particular attention is paid to our busiest site at West Thurrock on the Thames estuary, where peak-time queuing has occurred in the past as a result of increased demand following the closure of the former Coryton refinery.
This period we completed a number of steps to improve operational flexibility at the facility, which have resulted in a significant reduction in waiting times for customers.
Case Study
Operational efficiency: Loading times
61
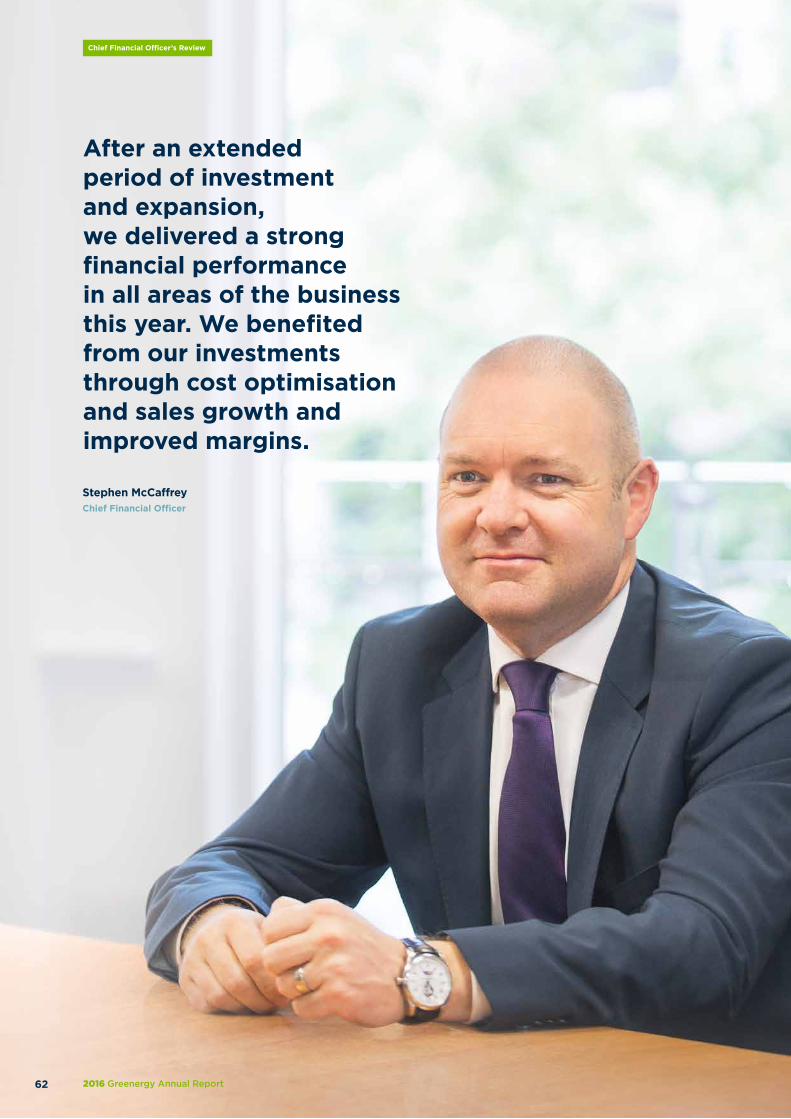
After an extended period of investment and expansion, we delivered a strong financial performance in all areas of the business this year. We benefited from our investments through cost optimisation and sales growth and improved margins.
62
Chief Financial Officer’s Review
2016 Greenergy Annual Report
Stephen McCaffreyChief Financial Officer

Chief Financial Officer’s Review
Realising investments
We have made significant investments over recent years to create cost efficiencies and prepare for expansion, both within the UK and internationally. We used our underlying infrastructure assets this year to source product from the lowest-cost global producers, resulting in improved margins and sales growth.
The establishment of Navigator Terminals will ensure our continued access to infrastructure that is strategically important to our UK business, allowing us to continue to source lowest-cost product and make petrol manufacturing margins. By selling our North Tees facility into Navigator Terminals, we realised a significant gain from our capital investments at this facility over the past three years. In addition, this will deliver us an annuity return from the investment we now hold in Navigator Terminals.
Biodiesel manufacturing margins were improved this year and production was up 75% following the purchase of our second biodiesel manufacturing facility in 2015. We have developed new cost savings and production efficiencies across both of our sites and made upgrades to improve supply chain flexibility and reduce raw material costs. All the biodiesel we blend into our fuel in the UK is waste-based and is now produced from our own facilities.
Our fuel supply business in Canada, which we established as a start-up in 2012, also performed well, with strong sales growth and diversification of our supply chain to minimise product costs and improve supply resilience for customers. Our Canadian business made a positive contribution to EBITDA for the first time this year.
Asset sales and an improved contribution from our overseas businesses complemented our strong underlying growth in the UK.
63

UK Fuels p36
Infrastructure p48
CFO reviewTurnover
FY120
16
10
FY13 FY14 FY15 FY16
Bill
ion
4
6
8
14
12
18
2
CFO reviewhistoric prices for diesel,
petroland brent
01.14200
300
1200
120
700
01.1507.14 07.15 01.16
400
500
600
800
900
1000
1100
20
30
50
40
60
70
80
90
100
110
140
130
Bre
nt
cru
de
futu
res
US
$ /
bar
rel
Die
sel /
pet
rol p
rice
US
$ /
to
nn
e
In a similar pattern to last year, turnover was down due to lower fuel retail prices. Sales volume has continued to grow, reaching 18.1bn litres this year.
This period we made our first infrastructure sale, delivering value from our investment over the last three years.
Chief Financial Officer’s Review (continued)
Performance
Our performance was strong in a low-price environment. Brent crude reached its ten year low of $27/barrel in January 2016 before recovering somewhat. With Rotterdam market prices for petrol and diesel following crude oil down, revenue per litre of fuel supplied was lower. Our business model is not affected by the underlying oil price, with margins remaining unaffected, but our turnover was down slightly due to falling prices and in spite of growing sales volume.
Profit before tax was £57.9m (FY15: £3.8m). This was driven by:
» Increased sales volume
» Improved margin drivenby economies of scale inour supply chain, particularlyin locations where we havemade infrastructure investments
» Operational and cost efficiencies,resulting in continued reductionin unit costs excluding acquisitionsto £6.67 per cbm of fuelsupplied (FY15: £6.79)
» Upgrades to our biodieselmanufacturing facilities resultingin lower raw material costs,improved reliability andincreased production
» Positive contributionsfor our Brazilian andNorth American businesses
» Exceptional incometotalling £30.8m.
EBITDA (pre-exceptionals) was £52.6m (FY15: 30.3m).
Exceptional items
We are reporting two exceptional items resulting from the creation of Navigator Terminals, which amounted to £30.8m.
Value from the sale of Greenergy North Tees to Navigator is reported as an exceptional non-cash item, reflecting the additional capability added to the facility since we acquired it in 2012 from the administrators of Petroplus.
As part of the finalisation of the Navigator transaction, we also reached agreement with the previous owners to rebate us for excess throughput charges which had impacted our earnings over the last three years.
Sales volume (litre)
Platts Petrol
Turnover (£)
Platts Diesel
Brent Crude
64
Chief Financial Officer’s Review
2016 Greenergy Annual Report

Financing our business
We continue to work closely with our banking group to ensure they have an effective understanding of our business and especially any significant activities or transactions that have taken place.
Our main working capital facility was extended this year with some important modifications to reflect the changing needs of the business. Given the reduction in oil prices we slimmed down the size of the facility from $1bn to $750m which still leaves us with a comfortable level of headroom to accommodate growth and unforeseen price fluctuations. We also reduced the number of syndicate banks to reflect the smaller size of the facility. The facility itself has continued to operate well and our banks continue to be supportive.
The Group’s total cash outflow from operations has been impacted during the year by two significant unusual adverse working capital movements. Firstly a £23m outflow arising from our decision to build a longer term stock position to take advantage of the contango in the market. And secondly the settlement of an unusually high 2015 year-end creditor balance which had arisen as a result of a change to the Group’s VAT registration. If the impact of these one-off items is eliminated then the adjusted cash outflow from operations for the year is £34m which is consistent with the normal working capital movements we expect to experience within the business.
TaxationThe Group’s corporation tax charge for the year was £6.1m (FY15: £1.5m) representing an effective rate of 11% (FY15: 41%).
As noted above, current year results have been positively impacted by the profit realised on disposal of our North Tees terminal. Due to the nature of this transaction, the profit on disposal is deemed to be non-taxable. As a result, we are able to retain all of the profit within the Group, which improves our effective tax rate for the year.
Accounting and control environmentAs the business has continued to expand and evolve, the flexibility of our control environment has remained high on our agenda.
The sustained volatility in product prices during the year has continued to require rigorous application of hedging strategies. I am pleased to report that the falling fuel prices have once again had a minimal effect on our profits, which is testament to the robustness of our controls in this area.
Post balance sheet eventDuring the year, the joint venture partners at Thames Enterprise Park offered for sale former refinery land that is not required for the import terminal at Thames Oilport to be used for industrial development.
An agreement for sale was reached and the associated assets were classified as held for sale at year-end. Discussions to sell the land at Thames Enterprise Park to a third-party stalled post year-end when the exclusive prospective buyer informed us that due to the state of the debt markets after the UK’s referendum on EU membership, they were unable to continue with the transaction on the terms offered.
In light of these developments the joint venture has begun a process to identify alternative deal structures which will enable Thames Enterprise Park to realise a value which exceeds the asset carrying value through either sale or development of the land. This process will ultimately lead to a determination during FY17 of whether the classification as held for sale and the asset carrying values remain appropriate. These developments are considered a non-adjusting post balance sheet event and therefore any accounting implications will be recognised in the financial statements of future periods.
Earnings per share
These results translated into earnings per share of £328 compared to £15 in the previous year.
65
Stephen McCaffreyChief Financial Officer

Managing Our Risks
We have comprehensive controls in place across the business to mitigate risk.
6666
Managing Our Risks
2016 Greenergy Annual Report

Mag
nitu
de
of
imp
act
Likelihood of occurence after mitigation
Oil price volatility
Loss of key sta�
Loss of operator licence
Liquidityrisk
Counterpartyrisk
Currencyrisk
Biofuel compliance risk
HIGH
HIG
H
LOW
2015
HIG
HLO
W
Business process controls
Health, safety and
environmental incidents
Bribery and corruption
Interruption of fuel supply to customers
Infrastructure damage or
failure
Product quality issue
Industrial relations
Extreme weather
conditionsIT failure
and security breaches
Project over-run or over-spend
Risk overview
The risks we face in our business, and the action we take to mitigate those risks, are formalised in a risk register which is reviewed regularly by the Board.
67

Risk register
Risk Magnitude of impact Mitigating action Responsibility
Likelihoodof occurrence
after mitigation
Group risks
Health, safety and environmental incidents
Major pollution, injury and/or loss of life and associated reputational damage.
High Rigorous process and personal safetymanagement systems are in place ina culture of no-blame reporting.
Executive DirectorsMedium
IT failure and security breaches
Financial loss due to malicious cyber-attack.Medium Our security strategy continues to evolve
in response to emerging global cyber threats. Executive DirectorsLow
Business disruption caused by major IT system failure of extended loss of connectivity.
Medium A business continuity plan and an IT Disaster Recovery planare in place, complementing our information security strategy. Executive Directors
Medium
Business process controls Financial exposure due to inadequate controls of business processes.
Medium An independent audit has been carried out of our businesscontrols and mitigating action is being implemented via processimprovement, automation and documentation.
Executive DirectorsMedium
Extreme weather conditions Impact on fuel supply, infrastructure and haulage operations.
Medium Weather protection infrastructure is reviewed and implementedand infrastructure is adequately insured. Executive Directors
Medium
Loss of key staff Loss of knowledge and key skills.Medium Staff retention and succession planning is carried out
by the Remuneration Committee. Executive DirectorsLow
Bribery and corruptionFailure to comply with UK and international legislation, including bribery laws.
Low Group policy is in place to inform and apply limitationsand prohibitions. Executive Directors
Low
UK and International Fuel supply
Oil price volatility
Difference between purchase and sales prices due to volatility.
HighComprehensive control processes and hedging mechanisms limitexposure to oil and product price fluctuations.
Chief FinancialOfficer/Audit andRisk Committee
Low
Loss of manufacturing/blend/biofuel margins due to changes in the spread between raw material and finished product prices or between biofuels and their fossil equivalents.
High Using our understanding of market structures, we lock in marginswhen opportunities exist.
Chief OperatingOfficer
Low
Interruption of fuel supply to customers
Failure to meet contractual requirements bringing commercial and reputational risk.
Medium Supply and service optionality through a UK-wide networkof supply locations and use of in-house and third-partysub-contractors. In Canada supply resilience is achievedby combining rail and import infrastructure.
UK TradingDirector/ChiefOperating Officer
Low
Product quality issues Remediation costs and reputational damage.Medium The risk of a quality issue in the field is minimised through
extensive operational controls within the Group and withthird-party suppliers.
ManagingDirector and ChiefOperating Officer
Medium
68
Managing Our Risks
2016 Greenergy Annual Report

Risk Magnitudeof impact Mitigating action Responsibility
Likelihood of occurrence
after mitigation
Group risks
Health, safety andenvironmental incidents
Major pollution, injury and/or loss of lifeand associated reputational damage.
High Rigorous process and personal safety management systems are in place in a culture of no-blame reporting.
Executive DirectorsMedium
IT failure and security breaches
Financial loss due to malicious cyber-attack.Medium Our security strategy continues to evolve
in response to emerging global cyber threats. Executive DirectorsLow
Business disruption caused by major ITsystem failure of extended loss of connectivity.
Medium A business continuity plan and an IT Disaster Recovery plan are in place, complementing our information security strategy. Executive Directors
Medium
Business process controls Financial exposure due to inadequatecontrols of business processes.
Medium An independent audit has been carried out of our business controls and mitigating action is being implemented via process improvement, automation and documentation.
Executive DirectorsMedium
Extreme weather conditions Impact on fuel supply, infrastructureand haulage operations.
Medium Weather protection infrastructure is reviewed and implemented and infrastructure is adequately insured. Executive Directors
Medium
Loss of key staff Loss of knowledge and key skills.Medium Staff retention and succession planning is carried out
by the Remuneration Committee. Executive DirectorsLow
Bribery and corruptionFailure to comply with UK and internationallegislation, including bribery laws.
Low Group policy is in place to inform and apply limitations and prohibitions. Executive Directors
Low
UK and International Fuel supply
Oil price volatility
Difference between purchase and sales pricesdue to volatility.
HighComprehensive control processes and hedging mechanisms limit exposure to oil and product price fluctuations.
Chief Financial Officer/Audit and Risk Committee
Low
Loss of manufacturing/blend/biofuel margins dueto changes in the spread between raw material andfinished product prices or between biofuels andtheir fossil equivalents.
High Using our understanding of market structures, we lock in margins when opportunities exist.
Chief Operating Officer
Low
Interruption of fuelsupply to customers
Failure to meet contractual requirements bringingcommercial and reputational risk.
Medium Supply and service optionality through a UK-wide network of supply locations and use of in-house and third-party sub-contractors. In Canada supply resilience is achieved by combining rail and import infrastructure.
UK Trading Director/Chief Operating Officer
Low
Product quality issues Remediation costs and reputational damage.Medium The risk of a quality issue in the field is minimised through
extensive operational controls within the Group and with third-party suppliers.
Managing Director and Chief Operating Officer
Medium
Health and safety p20
69
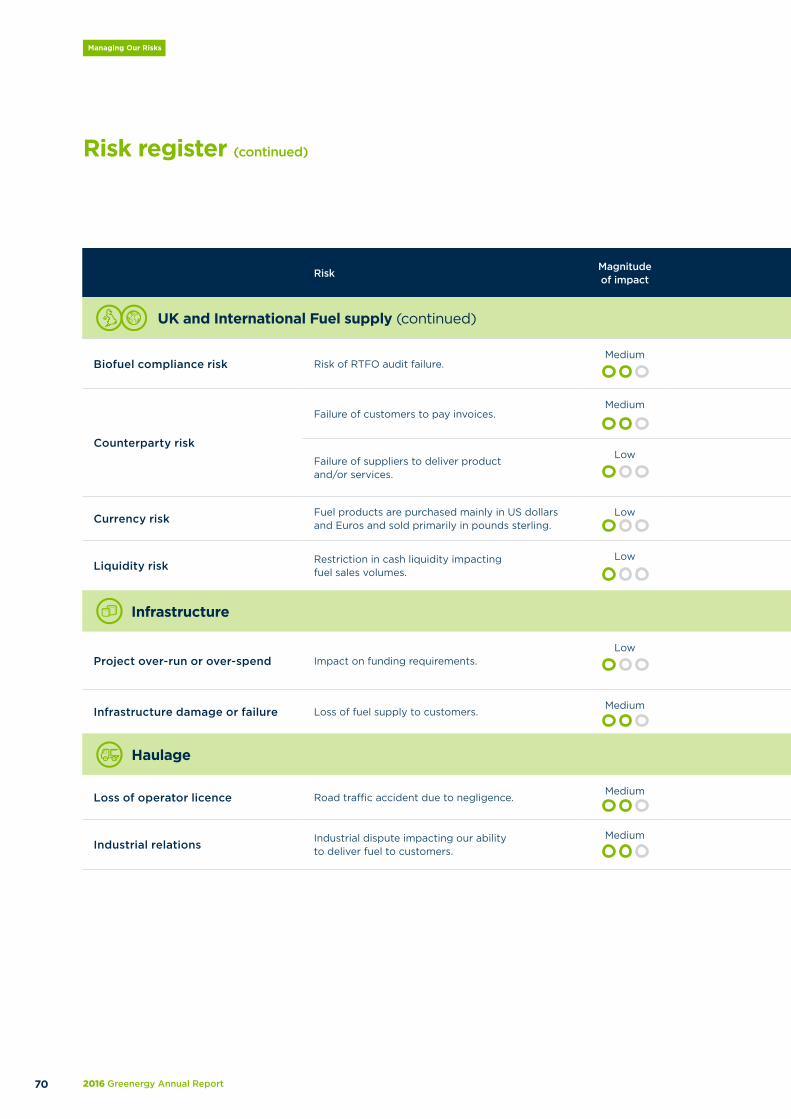
Risk register (continued)
Risk Magnitude of impact Mitigating action Responsibility
Likelihoodof occurrence
after mitigation
UK and International Fuel supply (continued)
Biofuel compliance risk Risk of RTFO audit failure.Medium By manufacturing all our own biodiesel we reduce reliance
on third-party suppliers’ sustainability data. Additionalcontrols exist for purchases from third parties.
Chief OperatingOfficer
Low
Counterparty risk
Failure of customers to pay invoices.Medium Value limits are set for all counterparties and are reviewed
by the Audit and Risk Committee. Improved controls arecurrently being implemented.
Chief FinancialOfficer
Medium
Failure of suppliers to deliver product and/or services.
LowLimits or indicators are set for all suppliers definingthe maximum level of trade, and form of trade.
UK TradingDirector/ChiefOperating Officer
Low
Currency risk Fuel products are purchased mainly in US dollars and Euros and sold primarily in pounds sterling.
Low The Group’s treasury department balances assets and liabilitiesby currency to eliminate transactional foreign exchange risk.
Chief FinancialOfficer
Low
Liquidity risk Restriction in cash liquidity impacting fuel sales volumes.
Low A borrowing base facility is in place with a diversifiedgroup of high-quality banks, with headroom for fluctuationsin oil prices and working capital requirements.
Chief FinancialOfficer
Low
Infrastructure
Project over-run or over-spend Impact on funding requirements.Low A clearly defined budgetary approval process exists.
The Capital Committee regularly reviews ongoing andfuture projects and sets controls.
InfrastructureDirector/ChiefFinancial Officer
Medium
Infrastructure damage or failure Loss of fuel supply to customers.Medium Maintenance programmes exist to ensure continuous
availability of critical assets.InfrastructureDirector
Low
Haulage
Loss of operator licence Road traffic accident due to negligence.Medium Diarised maintenance and service schedules are managed
in-house. Ongoing and extensive driver training is provided.Chief Executive,Greenergy Flexigrid
Low
Industrial relations Industrial dispute impacting our ability to deliver fuel to customers.
Medium Insourcing of our haulage operations in-house has givenus control of dialogue with drivers. Drivers are shareholdersin our service company.
Chief Executive,Greenergy Flexigrid
Medium
70
Managing Our Risks
2016 Greenergy Annual Report

Risk Magnitudeof impact Mitigating action Responsibility
Likelihood of occurrence
after mitigation
UK and International Fuel supply (continued)
Biofuel compliance risk Risk of RTFO audit failure.Medium By manufacturing all our own biodiesel we reduce reliance
on third-party suppliers’ sustainability data. Additional controls exist for purchases from third parties.
Chief Operating Officer
Low
Counterparty risk
Failure of customers to pay invoices.Medium Value limits are set for all counterparties and are reviewed
by the Audit and Risk Committee. Improved controls are currently being implemented.
Chief Financial Officer
Medium
Failure of suppliers to deliver productand/or services.
LowLimits or indicators are set for all suppliers defining the maximum level of trade, and form of trade.
UK Trading Director/Chief Operating Officer
Low
Currency risk Fuel products are purchased mainly in US dollarsand Euros and sold primarily in pounds sterling.
Low The Group’s treasury department balances assets and liabilities by currency to eliminate transactional foreign exchange risk.
Chief Financial Officer
Low
Liquidity risk Restriction in cash liquidity impactingfuel sales volumes.
Low A borrowing base facility is in place with a diversified group of high-quality banks, with headroom for fluctuations in oil prices and working capital requirements.
Chief Financial Officer
Low
Infrastructure
Project over-run or over-spend Impact on funding requirements.Low A clearly defined budgetary approval process exists.
The Capital Committee regularly reviews ongoing and future projects and sets controls.
Infrastructure Director/Chief Financial Officer
Medium
Infrastructure damage or failure Loss of fuel supply to customers.Medium Maintenance programmes exist to ensure continuous
availability of critical assets.Infrastructure Director
Low
Haulage
Loss of operator licence Road traffic accident due to negligence.Medium Diarised maintenance and service schedules are managed
in-house. Ongoing and extensive driver training is provided.Chief Executive, Greenergy Flexigrid
Low
Industrial relations Industrial dispute impacting our abilityto deliver fuel to customers.
Medium Insourcing of our haulage operations in-house has given us control of dialogue with drivers. Drivers are shareholders in our service company.
Chief Executive, Greenergy Flexigrid
Medium
71

Health and Safety p20
Risk analysis
Under the guidance of the Audit and Risk Committee, the Executive Directors carried out an extensive analysis of the actions taken to control risk, including in the context of changing external factors and continued growth.
Group risks
Health, safety and environmental incidentsRISK: Our operations involve the storage and processing of fuel products and the movement of fuel products by ship, train and truck, including deliveries to customer sites. These activities bring us into contact with members of the public and with the environment. We focus on preventing major pollution, injury and/or loss of life due to systems or equipment failure.
RESPONSE: Personal and process management systems based on best industry practice are implemented at both corporate and country level. Our approach is to ensure all incidents are reported, systematically investigated and followed up in an atmosphere of ownership and responsibility. Our increased focus on Process Integrity is resulting in additional controls and improved reporting.
IT failure and security breaches: Financial loss due to cyber-attack RISK: IT security threats and malicious cyber-attacks present themselves in many forms, including viruses, targeted emails which can lead to data integrity issues or loss of data, and can result in inaccurate reporting or financial loss.
RESPONSE: Our information security strategy continues to evolve in response to emerging global cyber threats. By working with leading external security specialists,
government departments and agencies, we enhance our maturity level by aligning with industry good practice and ensure that we are appropriately prepared for company-specific or industry-targeted attacks.Alongside process and technological enhancements, a programme of regular end-user IT security training and awareness is ongoing to ensure all staff are alert to potential threats and appraised of necessary actions in the event of a security suspicion or breach.
IT failure and security breaches: Disruption to business operations caused by major IT system failure of extended loss of connectivity
RISK: An extended loss of connectivity, breach or major IT system failure would cause significant disruption to our business operations, with potential for reputational damage and loss of sales.
RESPONSE: Complementing our information security strategy, we have in place a tested business continuity plan alongside an IT Disaster Recovery (DR) plan. These address situations that could lead to an extended IT interruption and include site connectivity, data loss, hardware failure and system failure. Our production IT systems are hosted by best-in-class third-party data centres, supplemented by a secondary DR facility appropriate to the scale of our business and accredited to relevant standards.
Business process controlsRISK: In a high value/high volume/low margin business, inadequate control of business processes can lead to significant financial exposure.
RESPONSE: We have continued to upgrade our systems and processes as part of our Process Review, which is overseen by the Board. Our aim is to remove manual intervention from business processes and increase automation through greater use of IT. IT systems development will continue during FY17 as we work to complete this process.
Extreme weather conditionsRISK: Adverse weather conditions have the potential to impact the movement of fuel into our storage, our road distribution operations and our deliveries to customer sites. Our owned terminal infrastructure and our biodiesel manufacturing facilities are all located in ports, where tidal flooding can occur.
RESPONSE: Customer supply resilience is achieved in the UK through a national network of supply locations (see interruption of fuel supply on page 73). In Canada we use a combination of rail and shipping to move product into our storage facilities, with rail providing resilience when waterways freeze. With the diversification of our supply chains into Canada and an increase in the number of load points this year, we have reduced the likelihood of our fuel supply chains being disrupted by a long period of extremely cold weather. Flood protection systems have also been reviewed and enhanced where appropriate following flooding of our Immingham biodiesel manufacturing facility in 2013 and infrastructure is adequately insured.
72
Managing Our Risks
2016 Greenergy Annual Report
Employment p81
International Fuels p44
UK Fuels p36
RESPONSE: We have adopted a policy designed to inform employees of all protocols and practices setting limitations, limits and prohibitions. We identify any roles which may be considered to be high risk and ensure that staff are aware of the requirements placed on them by the Bribery Act (2010). We also ensure that procedures and checks are in place, including a gift register and an audit of supplier/customer entertainment.
UK and International Fuel supply risk
Oil price volatilityRISK: Fuel product prices are subject to international supply and demand, which are themselves particularly dependent on political climates throughout the world. The resulting risk of product price fluctuations impacting our future cash flows is therefore high.
RESPONSE: We have developed comprehensive internal control processes and hedging mechanisms to minimise this inherent risk. The objective of these mechanisms is to match our priced physical positions (generated from spot and term contracts entered into with suppliers and customers) with equal and opposite derivative positions. In order to achieve this, our risk management department analyses the priced position for each product type throughout each day. Traders use this information to identify the most appropriate derivative for hedging purposes. The Audit and Risk Committee sets limits around the structure of hedges.
Bribery and Corruption RISK: The business sources product globally and from a wide variety of suppliers, counterparties, agents and intermediaries which brings with it the ever-present risk of non-compliance with domestic and international rules, codes and guidelines around facilitation and equivalent payments (in the UK these are stipulated under the Bribery Act 2010). The company has an increased use of agents and subcontractors and overseas offices. The rules are changing and now require demonstration of more active policing and enforcement.
Loss of key staffRISK: Loss of key staff would mean loss of knowledge and skills to the Group. As we expand, the need for the strength and depth of the senior management increases.
RESPONSE: Staff retention and succession planning is carried out by the Remuneration Committee, with a focus on both culture and financial reward, including an established performance-related-pay scheme. There is a good management connection and team building between different offices and active and functioning subsidiary company Boards which widen the participation and responsibility of management functions.
Cyber Security Strategy is viewed within the business as an evolving commitment, adapting to the current threat landscape. We work with best-in-class external security specialists, government bodies and agencies and are increasing our activities to embed a Cyber Security culture across our organisation.
In response to global supply and demand risk, we maintain an active forward purchasing and sales activity hedged with appropriate market instruments. Sales contracts also include floating elements which are linked to market prices which reduces exposure to fuel product price rises.
Interruption of fuel supply to customers RISK: An event which significantly interrupts the supply of fuel to our customers has potential to cause reputational, commercial and financial damage. Potential causes of supply disruption include weather-related shipping delays leading to a product outage at a specific supply location, IT failure causing closure of a supply location, industrial action or a fuel quality issue (see also product quality issue on page 74).
RESPONSE: Supply resilience is central to our mission. By maintaining optionality across our supply chain, we have minimised reliance on any single supplier, supply location or haulage provider. With our global product sourcing, UK-wide network of storage and supply locations and our in-house and third-party haulage arrangements, we have operational flexibility and the ability to switch to other sites in the event of an outage or closure at one location. In Canada supply resilience is achieved by combining rail and import infrastructure, giving us the ability to source from local suppliers and also from the US and Europe.
73

Risk analysis (continued)
UK and International Fuel supply risk (continued)
Product quality issueRISK: The supply of fuel failing to meet quality standards could lead to significant reputational damage and remediation costs.
RESPONSE: The risk of a field quality issue is minimised through extensive operational controls, certified to ISO 9001 and overseen by our Process Integrity Committee. These include independent product quality tests on receipt of product, in tank and prior to releasing product for customer deliveries.
Biofuel compliance risk RISK: In order to meet biofuel supply obligations under the UK’s Renewable Transport Fuel Obligation (RTFO), all fuel suppliers are required to supply a certain proportion of our fuel as biofuel, purchase Renewable Transport Fuel Certificates from other suppliers or pay a ‘buy-out fee’.To count towards these obligations, biofuel must meet independently audited sustainability and carbon requirements. With a buy-out fee currently set at 30ppl, audit failure would have significant financial implications for the business.
In Canada, fossil fuel suppliers are required to comply with the Canadian Government’s minimum biofuel blending and reporting obligations or buy Compliance Units from biofuel producers or importers.
RESPONSE: By manufacturing our own biodiesel in the UK we reduce reliance on third-party suppliers’ sustainability data. Our manufacturing facilities are certified by the ISCC sustainability and carbon system, making the biodiesel we produce automatically compliant with RTFO criteria. Additional controls exist for purchases from third parties.
In Canada, we blended sustainable biofuels above our blending obligation and sold Compliance Units to other parties. A trained compliance team fulfils our reporting and auditing requirements.
Counterparty risk: Failure of customers to pay invoicesRISK: Our customers include major oil companies and supermarkets as well as independently owned forecourts, resellers and commercial customers. The failure by any of these customers to pay for product after delivery would represent a credit loss which could potentially be significant for the business.
RESPONSE: The Audit and Risk Committee sets trading limits for all counterparties and keeps these limits under review in context of oil product price volatility and increasing customer preference for fixed priced sales contracts. Credit insurance is maintained where considered appropriate.
Counterparty risk: Failure of suppliers to deliver product RISK: Petrol and diesel products are purchased primarily from major oil companies, whereas suppliers of ethanol and waste oils for biodiesel production are global and generally smaller in size. Failure by one of these parties to deliver product would potentially impact our supply availability and/or hedging arrangements.
RESPONSE: Value limits or other relevant key indicators are set for all suppliers, including in new areas of business, defining the maximum level of trade, and form of trade. Counterparty limits are set for all non-oil major or vegetable oil suppliers prior to entering into a first transaction and are reviewed by the Audit and Risk Committee.
74
Managing Our Risks
2016 Greenergy Annual Report
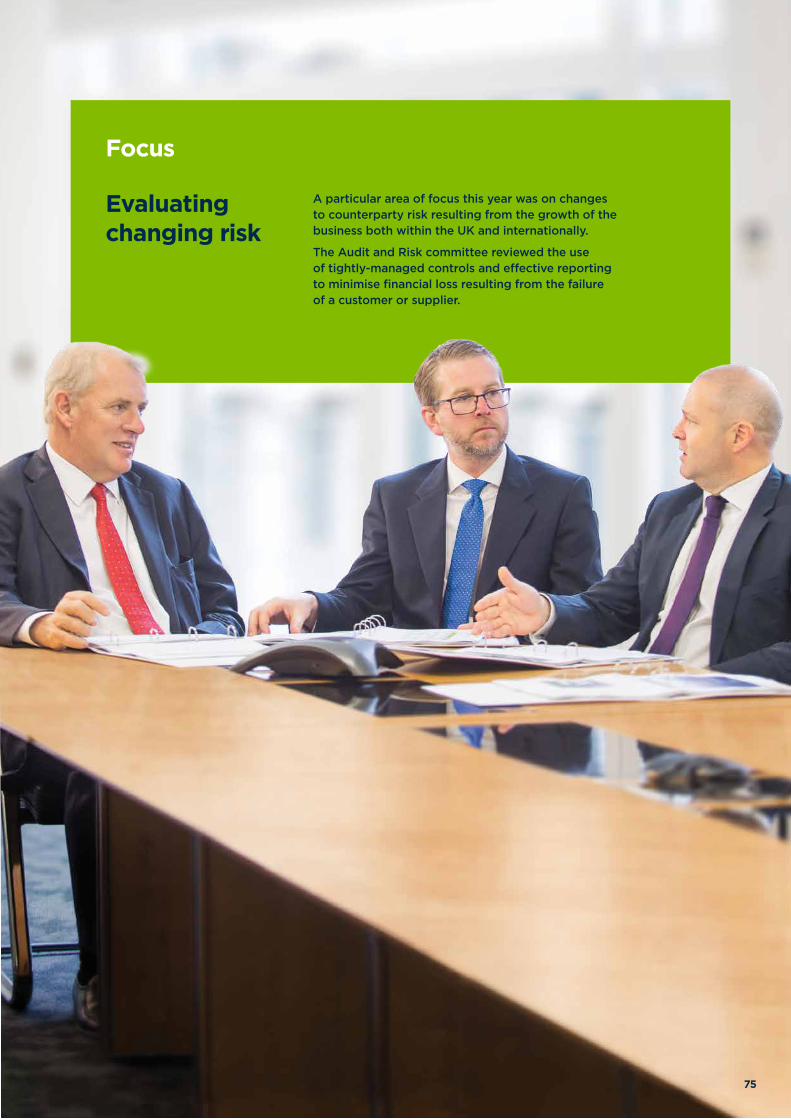
A particular area of focus this year was on changes to counterparty risk resulting from the growth of the business both within the UK and internationally.
The Audit and Risk committee reviewed the use of tightly-managed controls and effective reporting to minimise financial loss resulting from the failure of a customer or supplier.
Focus
Evaluating changing risk
75

Infrastructure p48
Currency riskRISK: We purchase fuel products mainly in US Dollars and Euros. Because the international oil markets generally price in US Dollars, and the majority of our UK customers wish to purchase fuel products in Pounds Sterling, there can be a significant foreign currency exchange risk inherent in this part of our business. Biofuel products are also often priced in Euros, adding a further dimension of risk to manage.
RESPONSE: In order to minimise the financial effect of this risk, we look to ensure that at all times, the financial assets denominated in a particular currency match the financial liabilities denominated in the same currency. Where product is purchased and sold in the same currency, no foreign exchange exposure exists.
Where the Group’s inventory is denominated in US Dollars and a sale is priced in Pounds Sterling, a net US Dollar financial liability is generated, resulting in a potential foreign exchange exposure. Where purchases and sales are priced in different currencies, our treasury department buys or sells currency to balance the assets and liabilities by currency, thus eliminating this transactional foreign exchange risk.
As a further control, balance sheets for each of our major currencies are prepared on a monthly basis and any surplus assets or liabilities are hedged as appropriate.
Risk analysis (continued)
In response to market and exchange risks, we continue to develop and implement comprehensive internal control processes, hedging mechanisms and IT systems including ever more automation of price and risk-related processes such as customer invoicing.
Liquidity riskRISK: If the cash liquidity of the business were restricted in any way it could potentially impact the volume of fuel that could be delivered. It could also restrict the hedging capacity of the business, thereby exposing the company to market and price volatility. A significant increase in the cost of product would result in higher utilisation of credit lines and could also restrict trading capacity if there were no corresponding increase in those lines.
RESPONSE: A borrowing base facility is in place with a diversified group of seven high quality banks. The business maintains close relationships with all its banks, keeping them informed of the current market and business plans. Headroom is maintained on facilities to accommodate price fluctuations and regular forecasting takes place to determine working capital requirements and available headroom.
Infrastructure risks
Project over-run or over-spend RISK: Stringent controls exist on capital expenditure, overseen by the Capital Committee and/or the Board. Significant over-spend could affect availability of funding for other projects, while delays in project completion could impact efficiency or cost savings.
Haulage
Loss of operator licenceRISK: Our operator licence (required to operate goods vehicles) could be revoked or reduced by the Driver and Vehicle Standards Agency (DVSA) if we were found to be negligent in our processes, maintenance or training procedures.
Infrastructure damage or failure RISK: Failure of equipment at one of our facilities could cause interruption of fuel supply to customers (see interruption of fuel supply to customers on page 73).
RESPONSE: Rigorous maintenance programmes, including of fire protection systems, are ongoing to ensure continuous availability of critical assets. With 26 UK supply locations, we have the ability to supply customers from alternative locations in the event of a prolonged terminal outage.
RESPONSE: A clearly defined budgetary approval process exists, with the Capital Committee and the Board regularly reviewing ongoing and future projects and setting controls. The potential impact of a project over-run or over-spend is reduced following the sale of Greenergy North Tees to Navigator.
76
Managing Our Risks
2016 Greenergy Annual Report

RESPONSE: Diarised maintenance and service schedules are managed in-house and ongoing and extensive driver training is provided.
Greenergy Flexigrid, our in-house haulage operation, is regarded as a low risk operator by the DVSA and is categorised as Green, the highest score available under the Operator Compliance Risk Score.
Industrial relationsRISK: Our driver workforce is largely unionised. An industrial dispute involving our drivers has the potential to disrupt fuel supply to customers, with potentially significant implications for the business (see interruption of fuel supply to customers on page 73). Deliveries could also be disrupted by industrial action involving third-party facilities or drivers.
RESPONSE: Having in-sourced most of our haulage operations, we focus on open dialogue with our in-house drivers under a respect agenda and provide a variety of forums for communication, both formal and informal, including regular updates on the performance of the business. Past and present drivers are shareholders in Greenergy Flexigrid through an employee ownership trust, encouraging performance and ownership. A practical working relationship with the union is ensured through various channels including full engagement with shop stewards. Disruption at third-party sites is minimised through our national network of supply locations, giving us the flexibility to lift from alternative locations if required.
The Directors do not believe that the UK’s referendum vote to leave the UK, post year-end, translates into a material or specific risk to the business. Any consequences of Brexit, such as exchange rate movements, are already included within our risk register and are managed effectively by our existing business practices and controls.
Dealing with changes to international trade regulations and practice is a normal skill set and activity of the business and creates competitive advantage.
The UK’s referendum vote on EU membership
77
People and Environment
Our values are to:» Respect each other» Take care to do no harm
to people or place » Act in a fair, responsible
and honest manner.
People and Environment
78 2016 Greenergy Annual Report

79

Apprentices working across five UK sites
10
Apprenticeships
‘‘I started in August 2015 as one of four apprentices at Greenergy’s biodiesel plant on Teesside. I’ve been shadowing the Process Technicians, many of whom were apprentices themselves, to understand their role and how the plant works.
’’ Maddie ByrneApprentice
We have taken on additional apprentices throughout the year across a number of our UK sites.
Having seen existing apprentices become full time employees, we are excited at the future potential of this scheme.
We want our apprentices to get the most out of their experience. With on-site mentors providing regular support and assessment, we aim to ensure each of our apprentices is on target to achieve their individual KPIs.
80 2016 Greenergy Annual Report
People and Environment

114
54295
42
85%
15%
ALL PERMANENT EMPLOYEES SENIOR MANAGEMENT
73%
27%
EXECUTIVE DIRECTORS
67%
33%
Employment
Our average headcount increased from 563 in FY15 to 637 in FY16, due in part to the increase in our Flexigrid driver workforce and despite the sale of the North Tees terminal to Navigator which affected 26 colleagues.
Culture
Corporate culture reflects the values and behaviours of everyone in the workplace, and we have worked hard to keep the quick decision-making and hands-on approach of a small company as we have grown. The open communication channels from the Executive Management Team coupled with our company values ensure that all employees are recognised, respected and rewarded.
We remain committed to being an employer of choice, and ensuring our people are working within safe, productive and overall enjoyable environments. Staff retention and succession planning is key, and our Senior Management Team having an average service of six and a half years is testament to that.
Our unique Performance Related Pay (PRP) bonus scheme gives employees opportunities to thrive and develop with targets designed specifically to improve both the business and the individual. In addition, we hold an annual awards evening, with staff honoured for their achievements over the previous 12 months. Around ten awards are handed out, including the coveted ‘Spirit of Greenergy’, and all are based on nominations from colleagues as well as input from the Executive Directors.
Charitable giving
Each year, the Board sets a charity budget through which it can help fund socially orientated and development causes both nationally and internationally.
This year’s charity budget was distributed by our 19 charity teams. The teams are made up of permanent employees, each of whom can nominate a charity for consideration by the wider team. The way by which funds are disbursed allows for employees to share ideas and make decisions as a team.
The company’s charitable payments totalled £210,217. No political donations were made and no political expenditure was incurred during the year.
All permanent employees Senior management Executive Directors
81

Percentage of ethanol derived from waste
Biodiesel manufacturing p82
8%
17%
32 %
0
35
30
25
Per
cen
tag
e
5
20
10
15
Percentage of ethanol derived from waste
FY15FY14 FY16
We are committed to using biofuels that deliver the greatest carbon benefits with the minimum land use impacts. We continue to focus on using waste-based biofuels produced in our own manufacturing operations and sourced from third parties.
Action 1 Maximise use of biofuels from wastes
Biodiesel
99.95% of the biodiesel we supplied in the UK this year was derived from wastes (FY14: 93%). With a second waste-to-biodiesel facility, we have significantly increased the proportion of biodiesel from our own production and reduced our reliance on third-party suppliers. This gives us a secure supply of waste-based biodiesel.
Biofuel sustainability
Ethanol
Although not ourselves an ethanol producer, we continue to work with innovative third-party producers to increase the proportion of waste-derived ethanol in the petrol we supply. This year 32% of the ethanol we blended was derived from waste materials (FY15: 17%), including:
» The tops and tails of sugar beets, which are unsuitable for sugar processing
» The starches and sugars left in waste water from sugar production
» Municipal organic waste
» The starches and sugars contained in food waste.
Action 2 Choose biofuels with the greatest carbon benefit
At 74%, the average carbon saving from the biofuel blended into our petrol and diesel in the UK this year significantly exceeded the saving required under the EU Renewable Energy Directive (35%).
This high level of carbon saving was achieved by making extensive use of waste-based biofuel and, where we do need to use biofuels made from crops, by choosing those that deliver the greatest carbon benefit. We maintain our strong relationships with best-in-class ethanol producers, primarily in Europe, capable of supplying lowest-carbon product.
The average carbon saving from the biofuel in the fuel we supplied in the UK was 74% (FY15: 68%), of which biodiesel was 88% (FY15: 79%) and ethanol 65% (FY15: 61%). This year’s increased carbon saving for biodiesel reflects the use of energy derived from biomass at one of our manufacturing facilities.
Action 3 Diversifying sustainable supply chains
Historically most of the waste oils and fats we use for biodiesel production are sourced in the UK, but we are increasingly investing in the development of new global supply chains in order to expand the availability of waste products for our biodiesel manufacturing.
Where we do use biofuels derived from crops, we ensure they are produced in accordance with EU-approved biofuel sustainability standards. 100% of the crop-based biofuel we supplied in the UK was verified as compliant with one of these standards (FY15: 100%).
People and Environment
82 2016 Greenergy Annual Report

Thames depot UK
We significantly expanded our sourcing of waste oils as a raw material for biodiesel manufacturing, in line with our increased production. This year we developed new supply chains in order to purchase waste oils in smaller containers from a wider variety of collectors globally. We worked closely with collectors in the US, Middle East and Asia to establish waste-to-energy and traceability schemes that did not previously exist.
320m
Litres of waste oil purchased annually
Case Study
Global supply chains for waste oils
83

Carbon emissions
67%
28%
4%
1%
Carbon emissions
Group carbon emissions totalled 94m tonnes CO2e this period (FY15: 67m tonnes CO2e) as we expanded our business.
Biodiesel manufacturing p82
We reduced carbon emission from our biodiesel manufacturing by increasing our use of renewable energy. The carbon intensity of the biodiesel we manufactured fell 52% from 0.02kg CO2e to 0.01kg CO2e.
All permanent employees
UK Fuel Supply Infrastructure
Haulage Other
UK Fuels
79% of the emissions associated with our fuel operations in the UK were produced by our biodiesel manufacturing activities. Total emissions from this part of our business rose 70% overall as our manufacturing increased, but emissions per litre of biodiesel produced improved due to the use of renewable energy.
The remaining emissions from our UK Fuels business were from our fuel storage and from shipping and transfers of fuel between storage locations. We continue to prioritise our use of ships with the lowest carbon emissions, as ranked by RightShip.
International Fuels
The emissions associated with our fuel supply business in Canada and Brazil remain relatively low, totalling 260 tCO2e, down on FY15 due to a reduction in long-haul flights and improved reporting.
Infrastructure
Most of the emissions from our fuel storage terminals were from electricity for pumping and heating. Emissions were lower at Thames Oilport due to a lower gasoil use, achieved primarily by moving to a modern, energy-efficient building.
Haulage
Our in-house and third-party hauliers drove 16% further than in FY15 to deliver fuel to customers, while the volume of fuel we delivered increased by 10%. Emissions per cbm of fuel delivered increased from 4.06kg CO2e (FY15: 3.78kg CO2e) due to increased mileage.
Office and travel
The emissions associated with office and travel fell 9% year on year due to lower electricity consumption in our offices and reduced business travel. With the number of employees increasing in line with the growth of the business, emissions per employee fell 37% to 732kg.
MethodologyAll CO2e conversions from Greenergy operational data have been calculated in accordance with DEFRA's 2015 conversion factors for Company Reporting (2015, Version 1.1. Expiry – 31 May 2016), except for office workers where an industry standard carbon factor was used as government data was unavailable.
We have included all emissions classified in Scope 1 & 2 of the World Business Council on Sustainable Development Scope GHG Protocol (http://www.ghgprotocol.org/about-ghgp). Certain aspects of Scope 3 have also been included on a voluntary basis.
People and Environment
84 2016 Greenergy Annual Report

Carbon savings from biofuel
The total carbon savings from the biofuel we supplied globally, including to other oil companies, was 3.8m tonnes (FY15: 2.4m tonnes) as we increased our biofuel sales to third parties and increased our use of waste-based biofuels in our own petrol and diesel in the UK.
By blending biofuel into the petrol and diesel we supply in the UK and Canada, we saved 2.2m tonnes CO2e compared with using the fossil fuel equivalent. This was equivalent to taking 1.6m cars off the road (FY15: 1,980).
Biodiesel manufacturing p82
Strategic report for the year ended 14 April 2016
The Directors present their strategic report on the Group for the year ended 14 April 2016 on pages 2-85.
Review of the business
The review of the business can be found on pages 14-19.
Strategic report
3.8m
Savings from biofuel we supplied in CO2e tonnes
85
Andrew OwensChief Executive

Governance
Our aim is to ensure that an appropriate balance is maintained between effective risk mitigation and increasing long-term shareholder value.
Governance
86 2016 Greenergy Annual Report

87

Paul BatesonChief Operating Officer
Paul joined Greenergy in 2007 and brings 33 years’ experience in the downstream oil sector, including at Exxon, Conoco Phillips, and Louis Dreyfus Refining and Marketing. He manages the company’s trading, biodiesel manufacturing, projects and international businesses.
Caroline LumbardUK Trading Director
Since joining Greenergy over 18 years ago, Caroline has helped champion our rapid sales and customer growth. As UK Trading Director, Caroline is responsible for the Group’s sales, purchasing and operations strategies and leads complex supply chain activities with major oil companies in the UK.
Chris BrookhouseInfrastructure Director
Chris joined Greenergy in 2015 to take up a new position as Infrastructure Director to maximise the value potential of our assets. He brings significant project and capital development expertise from the downstream oil and energy sectors. Chris has also been appointed as Chief Executive for the joint venture activities at Thames Oilport and Thames Enterprise Park.
Andrew Owens MBEChief Executive
Andrew is a co-founder of Greenergy and has more than 30 years’ experience working in the oil industry. Andrew has a Chemical Engineering degree from Imperial College and retains links with the college as Adjunct Professor at Imperial College Business School.
Stephen McCaffreyChief Financial Officer
Stephen joined Greenergy in 2005 as the Chief Financial Officer of Greenergy Biofuels and has subsequently fulfilled numerous roles including Managing Director of Greenergy Terminals. Stephen is a chartered accountant and has over 20 years’ experience in the oil and gas industry including roles with Amerada Hess and The BOC Group plc.
Tamara EarleyManaging Director
Tamara has over 25 years’ experience in the oil industry, including nearly 20 with Greenergy. Before Greenergy, Tamara worked with Safeway and BP in various roles. Tamara’s portfolio includes forecasting and planning, cost reduction, major client contracts, IT infrastructure and security, industrial relations and regulatory affairs.
Executive Directors
Governance
88 2016 Greenergy Annual Report
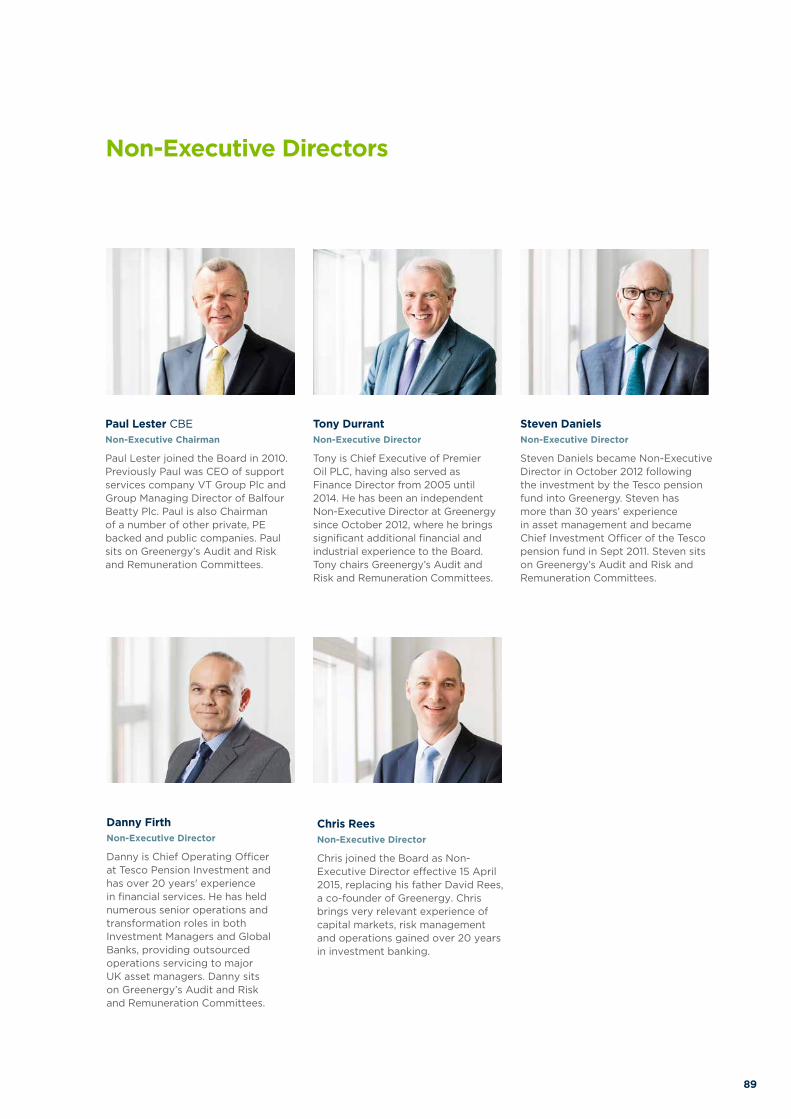
Paul Lester CBENon-Executive Chairman
Paul Lester joined the Board in 2010. Previously Paul was CEO of support services company VT Group Plc and Group Managing Director of Balfour Beatty Plc. Paul is also Chairman of a number of other private, PE backed and public companies. Paul sits on Greenergy’s Audit and Risk and Remuneration Committees.
Chris ReesNon-Executive Director
Chris joined the Board as Non-Executive Director effective 15 April 2015, replacing his father David Rees, a co-founder of Greenergy. Chris brings very relevant experience of capital markets, risk management and operations gained over 20 years in investment banking.
Tony DurrantNon-Executive Director
Tony is Chief Executive of Premier Oil PLC, having also served as Finance Director from 2005 until 2014. He has been an independent Non-Executive Director at Greenergy since October 2012, where he brings significant additional financial and industrial experience to the Board. Tony chairs Greenergy’s Audit and Risk and Remuneration Committees.
Steven DanielsNon-Executive Director
Steven Daniels became Non-Executive Director in October 2012 following the investment by the Tesco pension fund into Greenergy. Steven has more than 30 years’ experience in asset management and became Chief Investment Officer of the Tesco pension fund in Sept 2011. Steven sits on Greenergy’s Audit and Risk and Remuneration Committees.
Danny FirthNon-Executive Director
Danny is Chief Operating Officer at Tesco Pension Investment and has over 20 years' experience in financial services. He has held numerous senior operations and transformation roles in both Investment Managers and Global Banks, providing outsourced operations servicing to major UK asset managers. Danny sits on Greenergy’s Audit and Risk and Remuneration Committees.
Non-Executive Directors
89

Board of Directors p88
Statement on corporate governance
We continue to review our corporate governance practices in the context of our UK and international growth and our new acquisitions and investments.
Statutory governance
Board responsibility and accountabilityOur approach to corporate governance is both ‘top-down’, with the Board taking collective responsibility for the overall management and leadership of the business, and ‘bottom up’, with individuals and teams taking ownership and being empowered to take appropriate decisions.
The Board acknowledges its accountability in the performance and success of the business to its shareholders.
Health and safety is always the first agenda item on all Board meetings, informed by the work of the Process Integrity Committee. The Board’s agenda also covers:
» Planning and monitoringGroup strategy
» Financial risk and operationalrisk management
» Financial reporting and treasury matters
» Performance of keymanagement personnel.
The Board operates robust procedures to ensure all decisions are made objectively:
» Board meetings take placeon a bimonthly basis, with100% attendance expected.
» Conflicts of interest are declaredopenly and in advance andare managed respectfully.
» The Board receives a report fromthe Chief Executive and ChiefFinancial Officer as well as reportsfrom its various committees.
» Members of the seniormanagement team makepresentations to the Board onspecific topics, creating a closeconnection between the Boardand the rest of the business.
» In the period between Boardmeetings, all Directors receiveemail updates on significantmatters arising. This may resultin discussion by conference callbetween Board meetings.
Board balance and effectivenessThere was one Board change this period, with Christopher Rees joining as a Non-Executive Director on 15 April 2016 replacing David Rees. The collective experience, independence and diversity of expertise of the Board have been ably demonstrated over the last year, including during the significant role that Greenergy played in the creation of the Navigator business.
The Board remains of the view that all Non-Executive Directors have demonstrated objectivity and independence in their roles and have sufficient time to fulfil their responsibilities effectively. This was apparent during the oversight and approval processes required during this year’s infrastructure transactions.
The Board comprised six Executive Directors, a non-Executive Chairman and four Non-Executive Directors.
The Directors are not currently subject to retirement by rotation and there is no plan to implement such a regime. The Board always aims to keep an appropriate balance of Board expertise and length of Director tenure and recognises that tenure must be considered when examining the independent status of Non-Executive Directors.
Governance
90 2016 Greenergy Annual Report

Board sub-committeesThe Board is supported by three sub-committees – a Process Integrity Committee, an Audit and Risk Committee and a Remuneration Committee. Each committee has terms of reference which are reviewed and revised where necessary.
Outside appointmentsThis period we appointed Directors to our joint venture companies in the UK, Middle East and China. Most notably, Andrew Owens (Greenergy Chief Executive) was appointed to the Board of the Navigator holding company and Stephen McCaffrey (Greenergy Chief Financial Officer) to the Thames Oilport joint venture company. Stephen’s appointment reflects Greenergy now majority interest in Thames Oilport.
The good governance of these joint venture Boards is important to Greenergy. We will endeavour to bring our corporate governance and risk management principles to these companies and to learn from others’ best practice with a view to continual improvement.
Anti-bribery procedures and modern slavery regulationsAs the business grows, we are doing more business globally involving more local partners and more complex transactions. We publish our anti-bribery procedure on our intranet and are committed to actively investigating any reports of a breach in policy. No breaches were reported this year.
Looking forwards, we will be working to demonstrate appropriate due diligence of our supply chain as required by the newly introduced Modern Slavery regulations.
Non-statutory governance
Clearly defined roles and responsibilitiesTo ensure the effectiveness of every individual Greenergy employee and team, we ensure:
» Clear roles and responsibilities
» Sufficient independence andownership of specific objectives
» An understandable andfair performance review
» On-going professionaldevelopment.
Over the year we have updated and simplified our reporting structures. These are published on our intranet, so everyone knows who reports to who. There are no ‘dark corners’ or ‘roving briefs’.
By empowering individuals and creating effective teams, we ensure that appropriate controls are in place to mitigate risk effectively, while at the same time ensuring that we remain an agile, innovative and entrepreneurial organisation.
Culture and valuesWe require employees to have high standards in honesty, professionalism and proficiency and to adhere to our values of doing no harm to people or place.
Greenergy encourages all its employees to be respectful in their dealings with other people, whether that person is within Greenergy or does business with Greenergy. Respect applies equally to the work as it does to the worker. Timely, clear and accurate reporting of both good and bad news is considered a mark of respect.
Communication with stakeholdersThroughout the year, the Company has maintained regular contact with its key shareholders and investors to ensure that the interests of shareholders are aligned with the Company’s. Good governance is an essential tool in ensuring that stakeholders remain committed partners as we invest in our business for the longer term.
91
Employment p81
Directors’ Report
Directors’ report for the year ended 14 April 2016.
The Directors present their report and the audited financial statements of the company for the year ended 14 April 2016.
Future developmentsAn indication of the likely future developments in the business can be found on pages 34-57.
Results and dividendsThe Group‘s profit before tax for the financial year was £57.9m (FY15: £3.8m).
The Directors propose a final dividend of £nil (FY15: £2.4m). The Directors declared interim dividends of £4.9m (FY15: £nil) in respect of the current year.
Political and charitable contributionsAs referred to on page 81, the Group allocated £210,217 for charitable donations during the year (FY15: £203,130).
Suppliers Terms and conditions for business transaction are agreed individually with suppliers. Payment is then made on these terms, subject to the terms and conditions being met by the suppliers including the timely submission of satisfactory invoices. For the year ended 14 April 2016 the average trade payables period for the Company was two days, increased from one day last year.
Financial risk management The risk management programme of the Company, including financial risk management, is detailed on pages 66-77.
DirectorsThe Directors of the Company who served during the period and up to the date of signing the financial statements are listed on pages 88-89.
Applications for employment by disabled persons are always fully considered, bearing in mind the respective aptitudes and abilities of the applicant concerned. It is the policy of the company that the training, career development and promotion of a disabled person should, as far as possible, be identical to that of a person who does not suffer from a disability.
EmployeesCommunications are established and maintained with all employees through the company intranet and twice yearly presentations.
Consultation with employees or their representatives has continued at all levels, with the aim of ensuring that their views are taken into account when decisions are made that are likely to affect their interests and that all employees are aware of the financial and economic performance of their business units and of the company as a whole.
Governance
92 2016 Greenergy Annual Report
Statement of Directors’ responsibilities
The Directors are responsible for preparing the Directors’ Report and the financial statements in accordance with applicable law and regulations.
Company law requires the Directors to prepare financial statements for each financial year. Under that law the Directors have prepared the Group and parent company financial statements in accordance with International Financial Reporting Standards (IFRSs) as adopted by the European Union. Under company law the Directors must not approve the financial statements unless they are satisfied that they give a true and fair view of the state of affairs of the Group and the Company and of the profit or loss of the Group for that period. In preparing these financial statements, the Directors are required to:
» Select suitable accounting policies and then apply them consistently
» Make judgements and estimates that are reasonable and prudent
» State whether applicable IFRSs as adopted by the European Union have been followed, subject to any material departures disclosed and explained in the financial statements
» Prepare the financial statements on the going concern basis unless it is inappropriate to presume that the Company will continue in business.
The Directors are responsible for keeping adequate accounting records that are sufficient to show and explain the Company’s transactions and disclose with reasonable accuracy at any time the financial position of the Company and the Group and enable them to ensure that the financial statements comply with the Companies Act 2006. They are also responsible for safeguarding the assets of the Company and the Group and hence for taking reasonable steps for the prevention and detection of fraud and other irregularities.
The Directors are responsible for the maintenance and integrity of the Company’s website. Legislation in the United Kingdom governing the preparation and dissemination of financial statements may differ from legislation in other jurisdictions.
Disclosure of information to auditors
Each of the Directors who held office at the date of approval of this Directors’ report confirm that, so far as they are each aware, there is no relevant audit information of which the Group and parent company’s auditors are unaware; and each Director has taken all the steps that he/she ought to have taken as a Director to make himself/herself aware of any relevant audit information and to establish that the Group and parent company’s auditors are aware of that information.
By order of the Board
93
R W CliftonCompany Secretary

Financials
Financials
94 2016 Greenergy Annual Report

Hamilton terminal Canada
95

2016 Greenergy Annual Report
Independent auditors’ report to the members of Greenergy Fuels Holdings Limited
Report on the financial statements
Our opinion
In our opinion:
» Greenergy Fuels Holdings Limited’s Group financial statements and company financial statements (the ‘financial statements’) give a true and fair view of the state of the group’s and of the company’s affairs as at 14 April 2016 and of the group’s profit and the group’s and the company’s cash flows for the year then ended;
» the group financial statements have been properly prepared in accordance with International Financial Reporting Standards (‘IFRSs’) as adopted by the European Union;
» the company financial statements have been properly prepared in accordance with IFRSs as adopted by the European Union and as applied in accordance with the provisions of the Companies Act 2006; and
» the financial statements have been prepared in accordance with the requirements of the Companies Act 2006.
What we have auditedThe financial statements, included within the Annual Report, comprise:
» the Consolidated and Company balance sheets as at 14 April 2016;
» the Consolidated income statement and Consolidated statement of comprehensive income for the year then ended;
» the Consolidated and Company statements of cash flows for the year then ended;
» the Consolidated statement of changes in equity and Company statement of changes in equity for the year then ended; and
» the notes to the financial statements, which include a summary of significant accounting policies and other explanatory information.
The financial reporting framework that has been applied in the preparation of the financial statements is IFRSs as adopted by the European Union and applicable law and, as regards the company financial statements, as applied in accordance with the provisions of the Companies Act 2006.
In applying the financial reporting framework, the Directors have made
a number of subjective judgements, for example in respect of significant accounting estimates. In making such estimates, they have made assumptions and considered future events.
Opinion on other matter prescribed by the Companies Act 2006In our opinion, the information given in the Strategic Report and the Directors’ Report for the financial year for which the financial statements are prepared is consistent with the financial statements.
Other matters on which we are required to report by exception
Adequacy of accounting records and information and explanations received
Under the Companies Act 2006 we are required to report to you if, in our opinion:
» we have not received all the information and explanations we require for our audit; or
» adequate accounting records have not been kept by the company, or returns adequate for our audit have not been received from branches not visited by us; or
» the company financial statements are not in agreement with the accounting records and returns.
We have no exceptions to report arising from this responsibility.
Directors’ remuneration
Under the Companies Act 2006 we are required to report to you if, in our opinion, certain disclosures of Directors’ remuneration specified by law are not made. We have no exceptions to report arising from this responsibility.
Responsibilities for the financial statements and the audit
Our responsibilities and those of the Directors
As explained more fully in the Statement of Directors’ Responsibilities Statement set out on page 93, the Directors are responsible for the preparation of the financial statements and for being satisfied that they give a true and fair view.
Our responsibility is to audit and express an opinion on the financial statements in accordance with applicable law and International Standards on Auditing (UK and Ireland) (‘ISAs (UK & Ireland)’). Those standards require us to comply with the Auditing Practices Board’s Ethical Standards for Auditors.
This report, including the opinions, has been prepared for and only for the company’s members as a body in accordance with Chapter 3 of Part 16 of the Companies Act 2006 and for no other purpose. We do not, in giving these opinions, accept or assume responsibility for any other purpose or to any other person to whom this report is shown or into whose hands it may come save where expressly agreed by our prior consent in writing.
What an audit of financial statements involves
We conducted our audit in accordance with International Standards on Auditing (UK and Ireland) (‘ISAs (UK & Ireland)’). An audit involves obtaining evidence about the amounts and disclosures in the financial statements sufficient to give reasonable assurance that the financial statements are free from material misstatement, whether caused by fraud or error. This includes an assessment of:
» whether the accounting policies are appropriate to the group’s and the company’s circumstances and have been consistently applied and adequately disclosed;
» the reasonableness of significant accounting estimates made by the Directors; and
» the overall presentation of the financial statements.
In addition, we read all the financial and non-financial information in the Annual Report to identify material inconsistencies with the audited financial statements and to identify any information that is apparently materially incorrect based on, or materially inconsistent with, the knowledge acquired by us in the course of performing the audit. If we become aware of any apparent material misstatements or inconsistencies we consider the implications for our report.
Nicholas Stevenson Senior Statutory Auditorfor and on behalf of PricewaterhouseCoopers LLP Chartered Accountants and Statutory Auditors
London 26 July 2016
96
FinancialsFinancials

Note
Year ended 14 April 2016
£’000
Year ended 14 April 2015
£’000
Revenue 13,672,479 14,103,958
Cost of sales (13,515,919) (13,984,350)*
Gross profit 156,560 119.608
Distribution costs (67,610) (57,847)*
Administrative expenses (53,591) (46,912)
Other operating income 1,849 1,581
Exceptional operating items 6 7,500 (3,284)
Operating profit 5 44,708 13,146
Exceptional profit on disposal of fixed assets 6 23,341 -
Finance income 8 552 1,021
Finance costs 9 (10,660) (10,413)
Profit before taxation 57,941 3,754
Income tax expense 10 (6,100) (1,526)
Profit for the financial year 51,841 2,228
Profit attributable to:
Owners of the Parent 51,827 2,440
Non-controlling interest 14 (212)
Profit for the financial year 51,841 2,228
* Haulage cost and depreciation of £19.8 million have been re-presented between cost of sales and distribution costs in the 2015comparative information.
The results stated above are all derived from continuing operations.
The notes on pages 104-138 are an integral part of these consolidated financial statements.
The company has elected to take the exemption under section 408 of the Companies Act 2006 not to present the parent company income statement.
The profit of the parent company for the year was £7,274,000 (2015: £2,850,000).
Consolidated income statement For the year ended 14 April 2016
97

2016 Greenergy Annual Report
Consolidated statement of comprehensive income For the year ended 14 April 2016
Group Note
Year ended 14 April 2016
£’000
Year ended 14 April 2015
£’000
Profit for the financial year 51,841 2,228
Other comprehensive (expense)/income:
Items that may be reclassified subsequently to profit or loss
Available-for-sale financial assets 15 169 85
Exchange difference on translation of net assets of subsidiaries (110) 974
Cash flow hedges (344) (353)
Total items that may be reclassified subsequently to profit or loss (285) 706
Other comprehensive (expense)/income for the period, net of tax (285) 706
Total comprehensive income for the year, net of tax 51,556 2,934
Attributable to:
Owners of the Parent 51,542 3,146
Non-controlling interest 14 (212)
Total comprehensive income for the year, net of tax 51,556 2,934
The items in the statement above are disclosed net of tax. The income tax impact relating to the cash flow hedges is a credit of £69,000 (2015: £76,000). There are no other taxation charges or credits associated with the elements of other comprehensive income reported above (2015: none).
The notes on pages 104-138 are an integral part of these consolidated financial statements.
98
Financials

Consolidated and Company balance sheets
Group Company
Note14 April 2016
£’00014 April 2015
£’00014 April 2016
£’00014 April 2015
£’000
Assets
Non-current assets
Property, plant and equipment 12 202,161 196,250 - -
Intangible assets 13 36,754 38,479 - -
Investment in Group undertakings 14 - - 243 243
Investments in associates 14 164 164 - -
Available-for-sale financial assets 15 13,264 403 - -
Other receivables 17 28,537 14,187 - -
Deferred income tax assets 22 1,620 1,455 - -
282,500 250,938 243 243
Current assets
Inventories 16 365,903 302,348 - -
Trade and other receivables 17 903,515 762,310 - -
Cash and cash equivalents 18 83,370 379,304 - -
1,352,788 1,443,962 - -
Assets held for sale 19 41,269 - - -
1,394,057 1,443,962 - -
Total assets 1,676,557 1,694,900 243 243
LiabilitiesNon-current liabilities
Borrowings 20 (13,572) (13,805) - -
Provisions for other liabilities and charges 21 (1,700) (500) - -
Other payables 23 (7,730) (2,184) - -
Deferred income tax liabilities 22 (10,568) (11,841) - -
(33,570) (28,330) - -
Current liabilities
Trade and other payables 23 (1,355,727) (1,382,050) - -
Borrowings 20 (118,730) (164,388) - -
Corporation tax liabilities (4,053) (477) - -
(1,478,510) (1,546,915) - -
Total liabilities (1,512,080) (1,575,245) - -
Net assets 164,477 119,655 243 243
As at 14 April 2016
Company number: 07318726
99

2016 Greenergy Annual Report
Consolidated and Company balance sheets(continued)
Group Company
Note14 April 2016
£’00014 April 2015
£’00014 April 2016
£’00014 April 2015
£’000
Equity
Share capital 26 158 158 158 158
Share premium account 85 85 85 85
Merger reserve 24,904 24,904 - -
Capital redemption reserve (689) (689) - -
Hedging reserve (272) (353) -
Revaluation reserve 446 277 - -
Retained earnings 140,457 95,898 - -
Equity attributable to owners of the Parent 165,089 120,280 243 243
Non-controlling interests (612) (625) -
Total equity 164,477 119,655 243 243
The notes on pages 104-138 are an integral part of these consolidated financial statements.
The financial statements on pages 97-138 were approved by the Board of Directors on 26 July 2016 and were signed on its behalf by:
As at 14 April 2016
Company number: 07318726
SE McCaffreyDirector
100
Financials

Consolidated statement of changes in equity As at 14 April 2016
Attributable to owners of the Parent
Group Note
Share capital £’000
Share premium account
£’000
Merger reserve
£’000
Retained earnings
£’000
Capital redemption
reserve £’000
Hedging reserve
£’000
Revaluation reserve
£’000Total
£’000
Non- controlling
interest £’000
Total equity £’000
Balance at 15 April 2014 158 85 24,904 95,023 (689) - 192 119,673 (413) 119,260
Comprehensive income
Profit for the year - - - 2,440 - - - 2,440 (212) 2,228
Other comprehensive income
Available-for-sale financial assets
15 - - - - - - 85 85 - 85
Exchange difference on translation of net assets of subsidiaries
- - - 974 - - - 974 - 974
Cash flow hedge: Fair value gains in year
- - - - - (353) - (353) - (353)
Total comprehensive income - - - 3,414 - (353) 85 3,146 (212) 2.934
Share-based payments - - - 311 - - - 311 - 311
Dividends 11 - - - (2,850) - - - (2,850) - (2,850)
Total transactions with owners - - - (2,539) - - - (2,539) - (2,539)
Balance at 15 April 2015 158 85 24,904 95,898 (689) (353) 277 120,280 (625) 119,655
Comprehensive income
Profit for the year - - - 51,827 - - - 51,827 14 51,841
Other comprehensive income
Available-for-sale financial assets
15 - - - - - - 169 169 - 169
Exchange difference on translation of net assets of subsidiaries
- - - (110) - - - (110) - (110)
Cash flow hedge: Amount recycled to income statement
- - - - - 425 - 425 - 425
Cash flow hedge: Fair value gains in year
- - - - - (344) - (344) - (344)
Total comprehensive income - - - 51,717 - 81 169 51,967 14 51,981
Share-based payments - - - 116 - - - 116 - 116
Dividends 11 - - - (7,274) - - - (7,274) - (7,274)
Total transactions with owners - - - (7,158) - - - (7,158) - (7,158)
Balance at 14 April 2016 158 85 24,904 140,457 (689) (272) 446 165,089 (612) 164,477
The notes on pages 104-138 are an integral part of these consolidated financial statements.
101
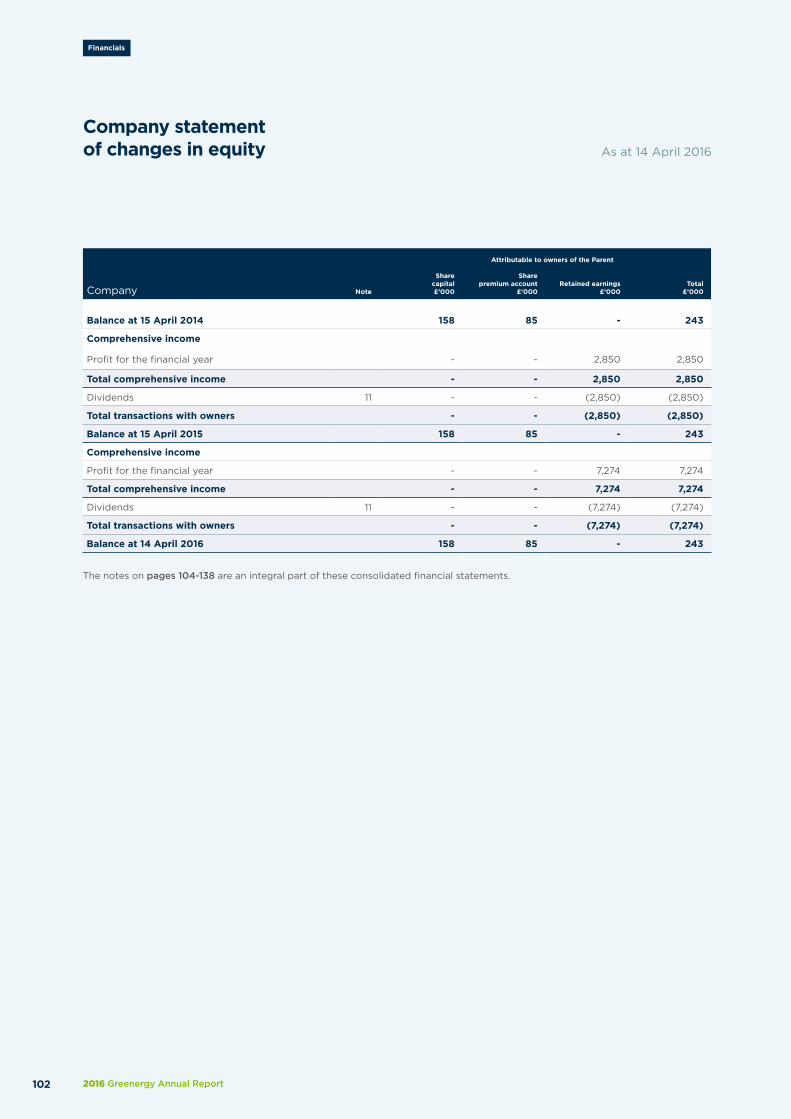
2016 Greenergy Annual Report
Company statementof changes in equity
Attributable to owners of the Parent
Company Note
Share capital £’000
Share premium account
£’000Retained earnings
£’000Total
£’000
Balance at 15 April 2014 158 85 - 243
Comprehensive income
Profit for the financial year - - 2,850 2,850
Total comprehensive income - - 2,850 2,850
Dividends 11 - - (2,850) (2,850)
Total transactions with owners - - (2,850) (2,850)
Balance at 15 April 2015 158 85 - 243
Comprehensive income
Profit for the financial year - - 7,274 7,274
Total comprehensive income - - 7,274 7,274
Dividends 11 - - (7,274) (7,274)
Total transactions with owners - - (7,274) (7,274)
Balance at 14 April 2016 158 85 - 243
The notes on pages 104-138 are an integral part of these consolidated financial statements.
As at 14 April 2016
102
Financials

Consolidated and Company statements of cash flows
Group Company
Note14 April 2016
£’00014 April 2015
£’00014 April 2016
£’00014 April 2015
£’000
Net cash (used in)/generated from operating activities
28 (187,543) 288,699 7,274 2.850
Investing activitiesAcquisition of increased shareholding in joint arrangement
(26,181) (52,237) - -
Acquisition of investment in associate - (150) - -
Purchases of property, plant and equipment (29,417) (18,972) - -
Purchases of intangible assets (199) (5,869) - -
Proceeds from sale of property, plant and equipment 2,356 141 - -
Disposal of investment 7,606 - - -
Net cash used in investing activities (45,835) (77,087) - -
Financing activitiesProceeds from borrowings 15,000 - - -
Repayments of borrowings (17,199) (9,988) - -
Finance income 551 917 - -
Finance costs (9,943) (9,788) - -
Dividends paid 11 (7,274) (2,850) (7,274) (2,850)
Net cash used in financing activities (18,865) (21,709) - (2,850)
(Decrease)/Increase in cash and cash equivalents (252,243) 189,903 - -
Cash and cash equivalents and bank overdrafts at the beginning of the year
223,799 33,896 - -
Cash and cash equivalents and bank overdrafts at the end of the year
18 (28,444) 223,799 - -
The notes on pages 104-138 are an integral part of these consolidated financial statements.
For the year ended 14 April 2016
103
2016 Greenergy Annual Report104
FinancialsFinancials
1. Summary of business and significantaccounting policies
General business descriptionGreenergy Fuels Holdings Limited (the ‘Company’) is a company domiciled and incorporated in the UK. The address of the registered office is given on page 138.
The Company and its subsidiaries (together, ‘the Group’) is one of the major petrol and diesel oil suppliers in the UK, being both the UK’s largest independent oil group and one of the largest privately owned groups in the UK. The Group is also a major supplier, manufacturer and trader of biofuels and has supporting supply and trading operations outside the UK.
Basis of preparationThe consolidated financial statements have been prepared in accordance with International Financial Reporting Standards as adopted by the European Union (IFRS) and International Financial Reporting Interpretations Committee (IFRIC) interpretations and the Companies Act 2006 applicable to companies reporting under IFRS.
The consolidated financial statements have been prepared on the going concern basis and under the historical cost convention, as modified by the revaluation of inventories, available-for-sale financial assets and financial assets and financial liabilities (including derivative instruments) at fair value through profit or loss. The accounting policies that follow have been consistently applied to all years presented. The consolidated financial statements are presented in Pounds Sterling and all values are rounded to the nearest thousand Pounds Sterling (£ thousand), except where otherwise indicated.
In preparing the financial statements on the going concern basis, the Directors have considered the reliance the Group has on the $750 million working capital facility provided by a syndicate of banks which is due to expire in April 2017. The existing agreement includes provision for a 12 month extension of the facility beyond this date. It is the Directors’ intention to utilise this extension option and, given the relationship the Group has with the banks within the syndicate, expect the facility to be renewed as a matter of course for a further 12 month period.
ConsolidationThe consolidated financial statements include the financial statements of the Company and the entities it controls (its subsidiary undertakings) made up to the year-end date. Control is achieved where the Company has the power to govern the financial and operating policies of an entity, generally accompanying a shareholding of greater than half of the voting rights, so as to obtain benefits from its activities.
The financial performance and position of subsidiaries are consolidated for the same reporting year as the parent company, using consistent accounting policies.
The results of subsidiaries acquired or disposed of during the year are fully consolidated from the effective date of acquisition or up to the effective date of disposal.
All intragroup balances, transactions, income and expenses are eliminated in full.
Foreign currency
a. Functional and presentational currency
Items included in the financial statements of each of theGroup’s entities are measured using the currency of theprimary economic environment in which the entity operates(‘the functional currency’). The consolidated financialstatements are presented in Pounds Sterling, which is theCompany’s functional and the Group’s presentational currency.
b. Transactions and balances
Transactions in foreign currencies are initially recorded usingmonthly rates of exchange. Monetary assets and liabilitiesdenominated in foreign currencies are translated using therate of exchange ruling at the balance sheet date and thegains or losses on translation are included in the incomestatement within cost of sales.
Non-monetary assets and liabilities that are measured at historical cost and denominated in a foreign currency are translated into the functional currency using the rates of exchange as at the dates of the initial transactions. Non-monetary assets and liabilities measured at fair value in a foreign currency are translated into the functional currency using the rate of exchange at the date the fair value was determined. These gains or losses on translation are included in the income statement within administrative expenses.
Group companiesThe results and financial position of all the Group entities (none of which has the currency of a hyper-inflationary economy) that have a functional currency different from the presentational currency are translated into the presentational currency as follows:
i. assets and liabilities for each balance sheet presentedare translated at the closing rate at the date of thebalance sheet;
ii. income and expenses for each income statement aretranslated at average exchange rates; and
iii. all resulting exchange differences are recognised in othercomprehensive income.
Notes to the financial statements

105
Property, plant and equipmentProperty, plant and equipment are stated at historical cost less accumulated depreciation and/or accumulated impairment losses, if any.
Historical cost includes the original purchase price or construction cost, any costs directly attributable to bringing the asset to its working condition for its intended use and the initial estimate of any decommissioning obligation, if any, and borrowing costs.
Land is not depreciated. Depreciation on other assets is calculated using the straight line method and charged to write off the cost less the estimated residual value by equal instalments over their estimated useful lives once the asset has been successfully commissioned and is proven to be able to operate at normal levels. The useful lives of the Group’s property, plant and equipment are as follows:
Buildings 15 to 20 years Plant and machinery 2 to 20 years Office equipment 2 to 5 years Motor vehicles 1 to 10 years
Depreciation is not charged on assets which are under construction or on plant and machinery which has yet to be successfully commissioned until such time that the asset is in a working condition for its intended use.
The residual values and useful lives of property, plant and equipment are reviewed, and adjusted if appropriate, at the end of each reporting period.
Gains and losses on disposals are determined by comparing the proceeds with the carrying amount and are recognised with ‘Other operating income/(losses)’ in the income statement.
Borrowing costsBorrowing costs directly attributable to the acquisition, construction or production of an asset that necessarily takes a substantial period of time to get ready for its intended use or sale are capitalised as part of those respective assets. All other borrowing costs are expensed in the period in which they occur. Borrowing costs consist of interest and other costs that an entity incurs in connection with the borrowing of funds.
Intangible assets
a. Goodwill
On acquiring a subsidiary, the acquisition method of accounting is used whereby the purchase consideration is allocated to the identifiable net assets on the basis of fair value at the date of acquisition.
Goodwill represents the excess of the cost of an acquisition over the fair value of the Group’s share of the net identifiable assets of the acquired subsidiary at the date of acquisition.
If the fair value attributable to the Group’s share of the acquiree’s identifiable net assets exceeds the fair value of the consideration, the Group reassesses whether it has correctly identified and measured the acquiree’s identifiable net assets and recognises any assets or liabilities that are identified in that review. If that excess remains after the reassessment, the Group recognises the resulting gain in profit or loss on the acquisition date.
After initial recognition, goodwill is measured at cost less any accumulated impairment losses. Goodwill is reviewed for impairment on an annual basis or more frequently if indications that the carrying value may be impaired arise. Impairment is determined by assessing the recoverable amount of the cash-generating unit to which the goodwill relates. Goodwill is allocated to those cash-generating units that are expected to benefit from the business combination in which the goodwill arose. Where the carrying amount of the cash-generating unit exceeds its recoverable amount an impairment loss is recognised.
Goodwill arising on business combinations prior to 1 April 2009 is stated at the previous carrying amount under UK generally accepted accounting practice.
b. Other intangible assets
Intangible assets with a finite useful life are capitalised at their cost and written off on a straight line basis over their useful economic life.
» Research & Development All expenditure on research is charged to the income
statement in the period in which it is incurred.
Development expenditure is charged to the income statement as incurred unless it meets the recognition criteria set out in IAS 38 ‘Intangible Assets’. Where the recognition criteria are met, intangible assets are capitalised and amortised over their useful economic lives.
» Branding Rights Expenditure in relation to branding rights which meets
the recognition criteria set out in IAS 38 ‘Intangible Assets’ has been capitalised and amortised over the life of the branded wholesale agreement.
The carrying values of intangible assets are reviewed for impairment whenever events or changes in circumstances indicate the carrying value may not be recoverable.
The amortisation of intangibles has been recognised within administrative expenses in the consolidated income statement.

2016 Greenergy Annual Report
Notes to the financial statements(continued)
106
Financials
1. Summary of business and significantaccounting policies (continued)
Investments in subsidiariesInvestments in subsidiary companies held in the Company are stated at cost less impairment.
Investments in joint arrangementsThe Group applies IFRS 11 to all joint arrangements. A joint arrangement is a contractual arrangement whereby the Group and other parties undertake an economic activity that is subject to joint control; that is, when the strategic financial and operating policy decisions relating to the activities require the unanimous consent of the parties sharing control. Under IFRS 11, investments in joint arrangements are classified as joint operations as the Group has rights to the assets and obligations for the liabilities of these arrangements. As such, the Group has accounted for its share of the assets, liabilities, revenue and expenses on a line by line basis.
Unrealised gains on transactions between the Group and its joint operations are eliminated to the extent of the Group’s interest in the joint arrangement. Unrealised losses are also eliminated unless the transaction provides evidence of an impairment of the asset transferred.
Impairment of non-financial assetsThe carrying amounts of assets are reviewed at each balance sheet date to determine whether there is any indication of impairment. An asset is deemed to be impaired if, and only if, there is objective evidence of impairment as a result of one or more events that has occurred after the initial recognition of the asset (an incurred ‘loss event’) and that loss event has an impact on the estimated future cash flows of the financial asset or the group of financial assets that can be reliably estimated. If any such indication exists, a full impairment review is undertaken for that asset or group of assets, and any estimated loss is recognised in the income statement. The amount of the loss is measured as the difference between the asset’s carrying amount and the present value of estimated future cash flows. For the purposes of assessing impairment assets are grouped at the lowest levels for which there are separately identifiable cash flows (cash-generating units).
Financial assets
a. Classification
Financial assets are classified as financial assets at fair valuethrough profit or loss, loans and receivables, held-to-maturityinvestments, or as available-for-sale financial assets. TheGroup determines the classification of its financial assetsupon initial recognition.
b. Measurement
The initial and subsequent measurement of financial assetsheld by the Group depends on their classification as follows:
Financial assets at fair value through profit or loss
Financial assets at fair value through profit or loss include financial assets held for trading and financial assets designated upon initial recognition at fair value through profit or loss. Initial measurement is at fair value and transaction costs are expensed in the income statement. Subsequent measurement is at fair value with gains or losses to the fair value recognised in the income statement.
Loans and receivables
Loans and receivables are non-derivative financial assets with fixed or determinable payments that are not quoted in an active market. Such financial assets are held at amortised cost using the effective interest rate method.
Available-for-sale financial assets
Other investments in debt and equity securities held by the Group are classified as being available-for-sale and are stated at fair value, with any resultant gain or loss being recognised directly in other comprehensive income, except for impairment losses. When these investments are derecognised, the cumulative gain or loss previously recognised directly in equity is recognised in the income statement.
c. Impairment of financial assets
The Group assesses at the end of each reporting periodwhether there is objective evidence that a financial assetor group of financial assets is impaired. A financial assetor a group of financial assets is impaired and impairmentlosses are incurred only if there is objective evidenceof impairment as a result of one or more events that occurredafter the initial recognition of the asset (a ‘loss event’) and thatloss event (or events) has an impact on the estimated futurecash flows of the financial asset or group of financial assetsthat can be reliably estimated.
For the loans and receivables category, the amount of the loss is measured as the difference between the asset’s carrying amount and the present value of estimated future cash flows (excluding future credit losses that have not been incurred) discounted at the financial asset’s original effective interest rate. The carrying amount of the asset is reduced and the amount of the loss is recognised in the income statement. If, in a subsequent period, the amount of the impairment loss decreases and the decrease can be related objectively to an event occurring after the impairment was recognised (such as an improvement in the debtor’s credit rating), the reversal of the previously recognised impairment loss is recognised in the income statement.
For available-for-sale financial assets, a significant or prolonged decline in the fair value of the security below its cost is also evidence that the assets are impaired. If any such evidence exists for available-for-sale financial assets, the cumulative loss – measured as the difference between the acquisition cost and the current fair value, less any impairment loss on that financial asset previously recognised in profit or loss – is removed from equity and recognised in the income statement. Impairment losses recognised on equity instruments are not reversed through the income statement.
107
Financial liabilitiesWhen a financial liability is recognised initially, the Group measures it at its fair value plus, in the case of a financial liability not at fair value through profit or loss, transaction costs that are directly attributable to the issue of the financial liability. Financial liabilities include trade payables, other payables, borrowings and derivative financial instruments. Subsequent measurement depends on its classification as follows:
Financial liabilities at fair value through profit or loss
Financial liabilities classified as held for trading and derivative liabilities that are not designated as effective hedging instruments are classified as financial liabilities at fair value through profit or loss. Such liabilities are carried on the balance sheet at fair value with gains or losses being recognised in the income statement.
Other
All other financial liabilities not classified as fair value through profit or loss are measured at amortised cost using the effective interest method.
Derivative financial instruments and hedging activitiesDerivatives are initially recognised at fair value on the date a derivative contract is entered into and are subsequently re-measured at their fair value. The method of recognising the resulting gain or loss depends on whether the derivative is designated as a hedging instrument, and if so, the nature of the item being hedged. The Group designates certain derivatives as either:
» Hedges of the fair value of recognised assets or liabilitiesor a firm commitment (fair value hedge)
» Hedges of a particular risk associated with a recognisedasset or liability or a highly probable forecast transaction(cash flow hedge), or
» Hedges of a net investment in a foreign operation(net investment hedge).
The Group documents at the inception of the transaction the relationship between hedging instruments and hedged items, as well as its risk management objectives and strategy for undertaking various hedging transactions. The Group also documents its assessment, both at hedge inception and on an ongoing basis, of whether the derivatives that are used in hedging transactions are highly effective in offsetting the changes in fair values or cash flows of hedged items.
The fair values of various derivative instruments used for hedging purposes are disclosed in Note 25. The full fair value of a hedging derivative is classified as a non-current asset or liability when the remaining hedged item is more than 12 months; and as a current asset or liability when the remaining maturity of the hedged item is less than 12 months. Trading derivatives are classified as a current asset or liability.
Cash flow hedgeThe effective portion of changes in the fair value of derivatives that are designated and qualify as cash flow hedges is recognised in other comprehensive income. The gain or loss relating to the ineffective portion is recognised immediately in the income statement within Cost of sales.
Amounts accumulated in equity are reclassified to profit or loss in the periods when the hedged item affects profit or loss (for example, when the forecast sale that is hedged takes place).
When a hedging instrument expires or is sold, or when a hedge no longer meets the criteria for hedge accounting, any cumulative gain or loss existing in equity at that time remains in equity and is recognised when the forecast transaction is ultimately recognised in the income statement. When a forecast transaction is no longer expected to occur, the cumulative gain or loss that was reported in equity is immediately transferred to the income statement within Cost of sales.
LeasesLeases in which a significant portion of the risks and rewards of ownership are retained by the lessor are classified as operating leases. Payments made under operating leases (net of any incentives received from the lessor) are charged to the income statement on a straight-line basis over the period of the lease.
Finance leases, which transfer to the Group substantially all the risks and benefits incidental to ownership of the leased item, are capitalised at the commencement of the lease at the fair value of the leased property or, if lower, at the present value of the minimum lease payments. Lease payments are apportioned between finance charges and reduction of the lease liability so as to achieve a constant rate of interest on the remaining balance of the liability. Finance charges are recognised in the income statement.
Leased assets are depreciated over the useful life of the asset. However, if there is no reasonable certainty that the Group will obtain ownership by the end of the lease term, the asset is depreciated over the shorter of the estimated useful life of the asset and the lease term.
InventoriesFuel products are traded in active markets and are purchased with a view to resale in the near future, generating a profit from fluctuations in prices or margins. As a result, stocks of fuel products are carried at market value by reference to quoted market prices at year-end, in accordance with the broker/ trader exemption granted by IAS 2. Changes in fair value are recognised in the income statement through cost of sales. Fuel products held for extended periods in order to benefit from future anticipated increase in fuel prices or located in territories where no active market exists are recognised at the lower of cost and net realisable value. Used cooking oil and other products and chemicals used in the production of biofuels are valued at the lower of cost and net realisable value. Duty paid on stock is valued at cost.

2016 Greenergy Annual Report
1. Summary of business and significantaccounting policies (continued)
Renewable Transport Fuel Obligation (RTFO) Since 1 April 2008 the Group has been part of the Renewable Transport Fuel Obligation (RTFO) Scheme under which it is required to meet annual targets for the supply of biofuels. The obligations which arise are either settled by cash or through the delivery of certificates which are generated by the Group through the blending of biofuels. To the extent that the Group generates certificates in excess of its current year obligation, these can either be carried forward to offset up to 25% of the next year’s obligation of the Group or sold to other parties.
The liability associated with the Group’s obligations under the scheme is recognised in the year in which the obligation arises and is valued by reference to either the cost of generating the certificates which will be surrendered to meet the obligation or the expected future cash outflow where cash settled.
Certificates generated or purchased during the year which will be used to settle the current obligation are recognised at the lower of cost and net realisable value. Where certificates are generated, cost is deemed to be the average cost of blending biofuels during the year in which the certificates are generated.
Certificates held for sale to third parties are recognised at fair value by reference to year-end market prices. Changes in market prices of the certificates and the quantity of tickets considered to be realisable through external sales are recognised immediately in the income statement.
Certificates for which no active market is deemed to exist are not recognised.
Trade receivablesTrade receivables are amounts due from customers for fuel products sold or services performed in the ordinary course of business. If collection is expected in one year or less they are classified as current assets, otherwise they are presented as non-current assets.
Trade receivables are recognised initially at fair value and subsequently at amortised cost, less provision for impairment.
Cash and cash equivalentsCash and cash equivalents include cash in hand, deposits held at call with banks, and other short-term highly liquid investments with original maturities of three months or less.
Share capitalOrdinary shares are classified as equity. Incremental costs directly attributable to the issue of new shares are shown in equity as a deduction, net of tax, from the proceeds.
Trade payablesTrade payables are obligations to pay for goods or services that have been acquired in the ordinary course of business from suppliers. Accounts payable are classified as current liabilities if payment is due within one year or less, otherwise they are presented as non-current liabilities.
Trade payables are recognised initially at fair value and subsequently measured at amortised cost.
BorrowingsBorrowings are recognised initially at fair value, net of transaction costs incurred. Borrowings are subsequently carried at amortised cost; any difference between the proceeds (net of transaction costs) and the redemption value is recognised in the income statement over the period of the borrowings using the effective interest method.
Fees paid on the establishment of loan facilities are recognised as transaction costs of the loan to the extent that it is probable that some or all of the facility will be drawn down. In this case, the fee is deferred until the draw-down occurs. To the extent there is no evidence that it is probable that some or all of the facility will be drawn down, the fee is capitalised as a pre-payment for liquidity services and amortised over the period of the facility to which it relates.
Bank overdrafts are included within the current borrowings on the balance sheet.
Current and deferred income taxesThe tax expense for the year comprises current and deferred tax. Tax is recognised in the income statement, except to the extent that it relates to items recognised in other comprehensive income or directly in equity. In this case, the tax is also recognised in other comprehensive income or directly in equity, respectively.
a. Current taxes
The current income tax charge is calculated on the basisof the tax laws enacted or substantively enacted at thebalance sheet date in the countries where the Company’ssubsidiaries operate and generate taxable income.
b. Deferred taxes
Deferred income tax is recognised, using the liability method,on temporary differences arising between the tax basesof assets and liabilities and their carrying amounts in theconsolidated financial statements. However, deferred taxliabilities are not recognised if they arise from the initialrecognition of goodwill; deferred income tax is not accountedfor if it arises from initial recognition of an asset or liability ina transaction other than a business combination that at thetime of the transaction affects neither accounting nor taxableprofit or loss. Deferred income tax is determined using taxrates (and laws) that have been enacted or substantiallyenacted by the balance sheet date and are expected to applywhen the related deferred income tax asset is realised or thedeferred income tax liability is settled.
Notes to the financial statements(continued)
108
Financials

Deferred income tax assets are recognised only to the extent that it is probable that future taxable profit will be available against which the temporary differences can be utilised.
Deferred income tax is provided on temporary differences arising on investments in subsidiaries and associates, except for deferred income tax liability where the timing of the reversal of the temporary difference is controlled by the Group and it is probable that the temporary difference will not reverse in the foreseeable future.
Deferred income tax assets and liabilities are offset when there is a legally enforceable right to offset current tax assets against current tax liabilities and when the deferred income taxes assets and liabilities relate to income taxes levied by the same taxation authority on either the same taxable entity or different taxable entities where there is an intention to settle the balances on a net basis.
Share-based paymentsThe Group operates a number of equity-settled, share-based compensation plans. The cost of equity-settled transactions with employees is measured by reference to the fair value at the date at which they are granted and is recognised as an expense over the vesting period, which ends on the date on which the relevant employees become fully entitled to the award. The total amount to be expensed over the vesting period is determined by reference to the fair value of the options granted, excluding the impact of any non-market vesting conditions (for example, profitability and sales growth targets). Non-market vesting conditions are included in assumptions about the number of options that are expected to vest. At each balance sheet date, the entity revises its estimates of the number of options that are expected to vest. It recognises the impact of the revision to original estimates, if any, in income statement, with a corresponding adjustment to equity.
The financial effect of awards by the Group of options over its equity shares to the employees of subsidiary undertakings are recognised by the subsidiary undertakings in their separate financial statements.
The proceeds received net of any directly attributable transaction costs are credited to share capital (nominal value) and share premium when the options are exercised.
Pension costsContributions are made to the personal plans of certain employees. The expenditure is charged to the income statement in the period to which it relates.
Provisions and contingenciesProvisions are recognised when the Group has a present obligation (legal or constructive) as a result of a past event, it is probable that an outflow of resources will be required to settle the obligation and a reliable estimate can be made of the amount.
A contingent liability is disclosed where the existence of an obligation will only be confirmed by future events or where the amount of the obligation cannot be measured reliably. Contingent assets are not recognised, but are disclosed where an inflow of economic benefits is probable.
Where the Company enters into financial guarantee contracts to guarantee the indebtedness of other companies within its Group, the Company considers these to be insurance arrangements, and accounts for them accordingly. In this respect, the Company treats the guarantee contract as a contingent liability until such time as it becomes probable that the Company will be required to make a payment under the guarantee.
Revenue recognitionRevenue comprises the fair value of the consideration received or receivable for the sale of goods and services in the ordinary course of the Group’s activities.
Revenue is recognised when the significant risks and rewards of ownership have passed to the buyer and the value can be reliably measured. Revenue is measured at the fair value of the consideration received or receivable for goods provided in the normal course of business, net of discounts, rebates, VAT and after eliminating sales within the Group.
The following criteria must also be met before revenue is recognised:
a. Sale of goods
Revenue from the sale of goods represents net invoiced salesof fuel products and RTFO certificates, excluding value addedtax and including excise duty. Revenue is recognised at thepoint that title passes to the customer.
b. Managed services and storage services
Managed services and storage services income is recognisedevenly over the contract period. Revenue related to one-offservices is recognised on the date of the service provision.
c. Haulage services
The Group provides haulage services to third-party customerson a delivered-in basis. The revenue related to haulageservices is recognised at the point the goods are receivedby the customer.
Dividend distributionDividend distribution to the Company’s shareholders is recognised as a liability in the Group and the Company’s financial statements in the year in which the dividends are approved by the Company’s shareholders.
Exceptional itemsExceptional items are disclosed separately in the financial statements where it is necessary to do so to provide further understanding of the financial performance of the Group. They are material items of income or expense that have been shown separately due to the significance of their nature or amount.
109

2016 Greenergy Annual Report
1. Summary of business and significantaccounting policies (continued)
Recent accounting developments
a. New and amended standards and interpretationsadopted by the Group for the first time for the financialyear beginning 15 April 2015.
Amendments to IFRS 2 ‘Share-based payment’ Annual Improvements
Amendments to IFRS 3 ‘Business combinations’ Annual Improvements
Amendments to IFRS11 ‘Joint arrangements’ on acquisition of an interest in a joint operation
Amendments to IFRS 13 ‘Fair value measurement’ Annual Improvements
Amendments to IAS 16 ‘Property, plant and equipment’ and IAS 38 ‘Intangible assets’ on depreciation and amortisation
IAS 37 ‘Provisions, contingent liabilities and contingent assets’
Amendments to IAS 39 ‘Financial instruments – Recognition and measurement’ Annual Improvements
b. New standards, amendments and interpretationsissued but not effective for the financial year beginning15 April 2015 and not early adopted.
IFRS 7 ‘Financial instruments: Disclosures’
Amendments to IFRS 9 ‘Financial instruments’ Annual Improvements
IFRS 15 ‘Revenue from contracts with customers’
IFRS 16 ‘Leases’
Amendments to IAS 7 ‘Statement of cash flows’ Annual improvements
Amendments to IAS 12 ‘Income taxes’ on Recognition of deferred tax assets for unrealised losses
Amendments to IAS 27 ‘Separate financial statements’ on the equity method
IAS 28 ‘Investments in associates and joint ventures’
Management is currently assessing the likely impact that these new standards may have on the Group’s financial statements.
2. Critical accounting estimatesand judgements
Estimates and judgements applied within the business are continually evaluated and are based on historical experience, current issues and events, and expectations of future events.
Valuation of inventoryThe Group’s inventories which include fuel products and RTFO certificates are subject to fluctuations in value as a result of changes in their market price. As set out in Note 1 above both fuel products and RTFO certificates held for sale to third parties are recognised at market value in the financial statements. Where there is no quoted marker for certain fuel products or vintages of RTFO certificates, a year-end market value is assigned based on relevant comparative market data and recent realised prices. Inventories used in production are valued at cost.
Estimate of impairment of non-current assetsThe Group determines whether property, plant and equipment are impaired when there is an indicator of potential impairment. This requires the determination of the recoverable amount of the cash-generating units to which the property, plant and equipment are allocated. The recoverable amounts are determined by estimating the value in use of those cash-generating units. Value in use calculations require the Group to make an estimate of the expected future cash flows to be derived from the cash-generating units and to choose a suitable discount rate in order to calculate the present value of those cash flows. Further detail on the assumptions used in determining the value in use is provided in Note 13.
3. Nature and extent of risks arising fromfinancial instruments
The Directors have identified the following types of risk which may arise from the use of financial instruments
Credit riskThe Group is exposed to credit risk from its operating activities (primarily trade receivables and derivative instruments) and from its financing activities, including deposits with banks and financial institutions, foreign exchange transactions and other financial instruments.
In respect of trade receivables, the Group operates a strict policy of applying credit limits to all new customers prior to entering into a transaction. These limits are then subject to regular review throughout the term of the contractual relationship. The Group uses third-party credit referencing agencies as an input into this process and monitors all trade debtor balances on a daily basis. Exposure to debt default is managed by the use of credit insurance where the cost of acquiring cover is considered commensurate with the risk incurred.
The counterparties involved in the Group’s other financial instruments such as swaps, futures and fixed price sales and purchase contracts within the scope of IAS 39 are subjected to the same credit review process. In addition, contractual terms for all such instruments are reviewed in detail to ensure that credit risk is minimised.
Credit risk from balances with banks and financial institutions is managed by the Treasury team. Investments of surplus funds are only made with approved counterparties who are highly rated investment grade.
The maximum exposure to credit risk at the reporting date is the carrying value of each class of financial assets (refer to Note 24). The value of trade and other receivables pledged as security against borrowings is disclosed in Note 17.
Notes to the financial statements(continued)
110
Financials

Liquidity riskThe Group’s treasury department constantly monitors the Group’s cash position by maintaining up-to-date cash flow projections so that appropriate action may be taken to ensure financial liabilities are met as they become due. The Directors therefore consider that the exposure to liquidity risk is low.
In managing its working capital requirements, the Group currently relies on a combination of uncommitted revolving facilities, which could be withdrawn at any time and a committed credit line. The existing facility is a $750 million (£530 million) asset backed facility which was amended and extended at the end of the 2015/16 financial year to support its trade financing and working capital requirements. The working capital facility has been secured with a syndicate of seven high-quality UK and European banks which are highly rated investment grade.
The previous facility had a two-year term with extension options which were exercised at the end of each term. The new facility is a 12 month revolving facility and comprises $300 million of committed and $450 million of uncommitted funding. In addition, an accordion feature has been included in the credit facility which would increase the facility by a further $200 million, if required.
Given the long standing nature of these banking relationships, the bankers’ willingness to renew and extend credit lines in the recent past, and verbal assurances received from the bankers, the Directors are satisfied that both the uncommitted and committed facilities will continue to be available to the Group for the foreseeable future.
Group
14 April 2016 14 April 2015
Credit facility £’000
Utilised £’000
Credit facility £’000
Utilised £’000
Counterparty
Syndicated facility — committed ($0.5bn) - - 338,000 208,000
Syndicated facility — uncommitted ($0.5bn) - - 338,000 -
On 13th April 2016 the facility was renewed with the following limits:
Syndicated facility — committed ($0.3bn) 212,000 79,000 - -
Syndicated facility — uncommitted ($0.45bn) 318,000 - - -
The table below shows the financial liabilities of the Group outstanding at the year-end, on the basis of all future contractual undiscounted cash flows for liabilities.
Less than 1 year£’000
Between 1 and 2 years
£’000
Between 2and 5 years
£’000
At 14 April 2016
Borrowings including future interest payments 119,531 5,015 9,548
Trading and net settled derivative financial instruments 92,040 5,107 60
Trade and other payables 286,322 873 1,690
497,893 10,995 11,298
At 14 April 2015
Borrowings including future interest payments 164,388 7,800 6,005
Trading and net settled derivative financial instruments 16,464 129 -
Trade and other payables 283,006 780 837
463,858 8,709 6,842
111

2016 Greenergy Annual Report
3. Nature and extent of risks arising fromfinancial instruments (continued)
Market riskThis area can be further subdivided into fuel product price risk, foreign exchange risk and interest rate risk which are addressed separately below.
a. Fuel product price risk
Fuel product prices are subject to international supply anddemand, which are themselves particularly dependent onpolitical climates throughout the world. The resulting riskof product price fluctuations impacting the Group’s futurecash flows is therefore high.
The Group has developed comprehensive internal control processes and hedging mechanisms to minimise this inherent risk. The objective of these mechanisms is to match the Group’s priced physical positions (generated from spot and term contracts entered into with suppliers and customers) with equal and opposite derivative positions. In order to achieve this, the Group’s risk management department analyses the priced position for each product type throughout each day. Traders use this information to identify the most appropriate derivative for hedging purposes.
The main types of hedge transaction which the Group enters into are as follows:
i. Exchange-traded commodity derivativesTypically in the form of futures and options traded on arecognised exchange such as the International PetroleumExchange or the New York Mercantile Exchange. The fairvalue of these derivatives changes with movements inthe underlying commodity price. The Group is generallyobliged to make margin calls to the exchange where thefair value of the instrument is in favour of the exchange.The Group generally closes out any futures contracts priorto crystallisation.
At 14 April 2016, if the closing price for each of the Group’sexchange-traded commodity derivatives had been 1 USDollar per metric tonne lower with all other variables heldconstant, consolidated pre-tax profit for the year wouldhave been £54,000 lower (2015: £77,000 lower).
ii. Over-the-counter (‘OTC’) contractsTypically in the form of commodity swaps; OTCcontracts are negotiated between two parties andare not traded on an exchange. Swaps are entered intoin respect of specified indices and time periods. Theamount payable under such instruments varies directlywith the quote of those indices over the specified period.The Group is generally obliged to make margin callsto the counterparty where the fair value of the instrumentis in favour of the counterparty.
At 14 April 2016, if the closing price for each of the openOTC contracts had been 1 US Dollar per metric tonnelower with all other variables held constant, consolidatedpre-tax profit for the year would have £109,000 lower(2015: £12,000 higher).
iii. Sales and purchase contract embedded hedgesTypically in the form of fixed price spot and termphysical contracts. The fair values of the hedgesembedded in fixed price sales and purchase contractsfor the delivery of specified quantities of a commodityat a determined future date are calculated by referenceto the difference between the market index price of therelevant commodity at the balance sheet date and at thecontract pricing date(s).
At 14 April 2016, if the market price indices of therelevant commodities for the total priced physicalposition had been 1 US Dollar per metric tonne lowerwith all other variables held constant, consolidated pre-taxprofit for the year would have been £154,000 higher (2015:£65,000 higher).
b. Foreign currency exchange risk
The Group purchases fuel products mainly in US Dollarsand Euros. Because the international oil markets generallyprice in US Dollars, and the majority of the Group’s UKcustomers wish to purchase fuel products in Pounds Sterling,there can be a significant foreign currency exchange riskinherent in this aspect of the Group’s business. In orderto minimise the financial effect of this risk, the Group looksto ensure that at all times, the financial assets denominatedin a particular currency match the financial liabilitiesdenominated in the same currency.
The following table illustrates only the Group’s sensitivity to the fluctuation of the major currencies on its income statement and financial assets and liabilities:
Where the Group’s stock is denominated in US Dollars and a sale is priced in Pounds Sterling, a net US Dollar financial liability is generated, resulting in a potential foreign exchange exposure. Where purchases and sales are priced in different currencies, the Group’s treasury department buys or sells currency to balance the assets and liabilities by currency, thus eliminating this transactional foreign exchange risk.
As a further control, balance sheets for each of the Group’s major currencies are prepared on a monthly basis and any surplus assets or liabilities are hedged as appropriate.
There are also highly probable forecast sales denominated in foreign currencies. The risk of changes in the relevant spot exchange rate associated with these highly probable forecast foreign currency transactions is hedged as appropriate using forward contracts.
Notes to the financial statements(continued)
£’000
At 14 April 2016
Equity£’000
Sterling/US dollar +/- 10% change 11,294 435
Sterling/Euro +/- 10% change 2 -
Income statement
112
Financials

c. Interest rate risk
The tangible fixed assets within the Group act as securityfor a term loan within Greenergy Terminals Limited. Intereston this loan is charged at variable rates related to LIBOR.The interest rate risk inherent in the movement of LIBOR hasbeen mitigated by an interest rate swap covering a portionof the value of the loan.
The effect of the interest rate swap has been to convert £8,550,000 of the loan into debt at a fixed rate of 4.1% per annum.
Interest on the Group’s deposits/overdrafts is credited/charged on a daily basis based on LIBOR plus a commercial margin. The Directors consider that there is no material exposure to interest rate risk on the Group’s financial instruments at the balance sheet date.
4. Capital management
Management regard the capital of the business to be equity and net debt (constituting borrowings less cash and cash equivalents).
The Group’s objective for managing capital is to maintain a solid capital base in order to preserve the confidence of the Group’s investors and creditors and to sustain future development of its businesses.
Group members are subject to various banking covenants on their financing facilities. These generally take the form of a requirement to meet a variety of financial ratio targets. Such targets are monitored as part of the regular reporting processes for the entities concerned.
One of the covenants places a restriction on the level of dividend which Greenergy Fuels Holdings Limited’s subsidiary Greenergy Fuels Limited may distribute.
A variety of financial modelling techniques are employed in the appraisal of potential capital expenditure projects and board approval is required before such projects are entered into.
A Group Capital Committee was formed during the prior year, and meetings are held regularly to discuss both ongoing and prospective capital projects.
5. Operating profit
Note14 April 2016
£’00014 April 2015
£’000
5a. Group operating profit is stated after charging/(crediting):
Operating lease rentals:
Land and buildings 2,258 1,687
Other 41,321 34,934
Depreciation, amortisation and impairment 15,356 14,325
(Profit)/Loss on disposal of property, plant and equipment (105) 93
Employee benefit expense 7 45,597 36,626
Foreign exchange loss/(gain) 2,902 (2,902)
5b. Auditors’ remuneration:
Fees payable to the Company’s auditors for the audit of Parent Company and consolidated financial statements
144 155
Fees payable to the Company’s auditor and its associates for other services:
Audit of financial statements of subsidiaries pursuant to legislation 220 226
All other audit-related assurance services 30 76
Taxation compliance services 104 109
All other taxation advisory services 148 132
All other non-audit services - 6
113
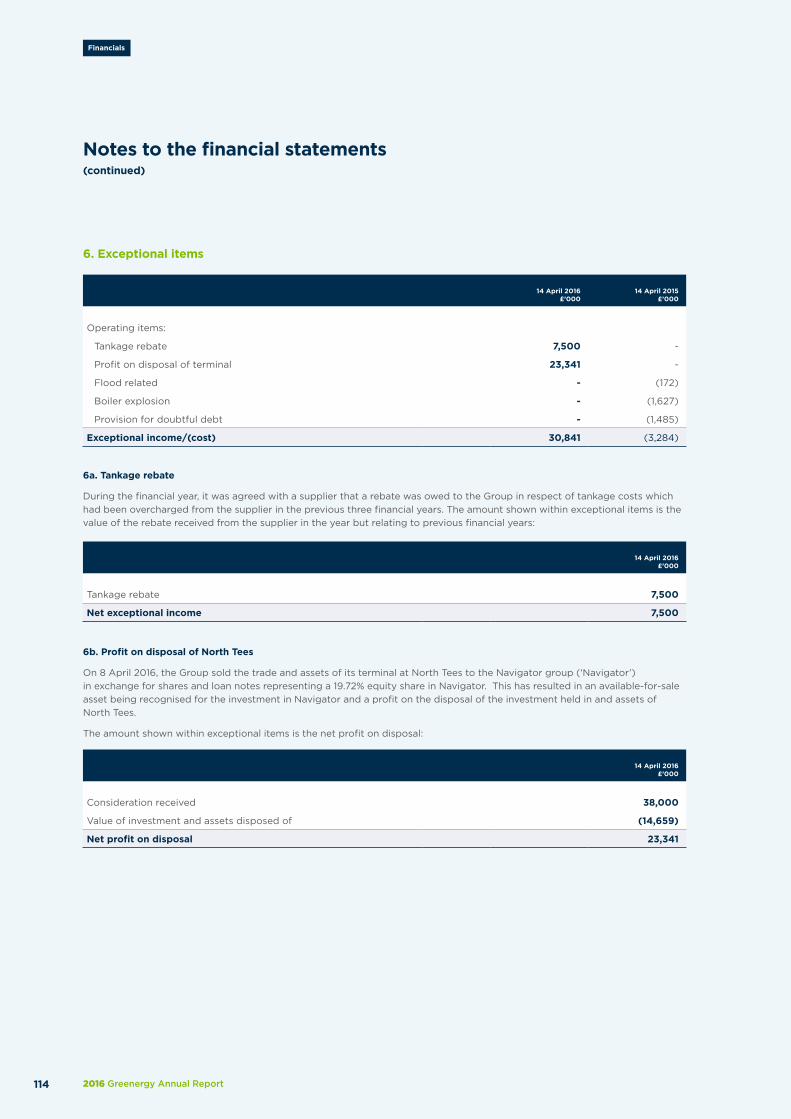
2016 Greenergy Annual Report
6. Exceptional items
Notes to the financial statements(continued)
14 April 2016£’000
Tankage rebate 7,500
Net exceptional income 7,500
14 April 2016 £’000
14 April 2015 £’000
Operating items:
Tankage rebate 7,500 -
Profit on disposal of terminal 23,341 -
Flood related - (172)
Boiler explosion - (1,627)
Provision for doubtful debt - (1,485)
Exceptional income/(cost) 30,841 (3,284)
6a. Tankage rebate
During the financial year, it was agreed with a supplier that a rebate was owed to the Group in respect of tankage costs which had been overcharged from the supplier in the previous three financial years. The amount shown within exceptional items is the value of the rebate received from the supplier in the year but relating to previous financial years:
6b. Profit on disposal of North Tees
On 8 April 2016, the Group sold the trade and assets of its terminal at North Tees to the Navigator group (‘Navigator’) in exchange for shares and loan notes representing a 19.72% equity share in Navigator. This has resulted in an available-for-sale asset being recognised for the investment in Navigator and a profit on the disposal of the investment held in and assets of North Tees.
The amount shown within exceptional items is the net profit on disposal:
14 April 2016
£’000
Consideration received 38,000
Value of investment and assets disposed of (14,659)
Net profit on disposal 23,341
114
Financials

14 April 2016 14 April 2015
The average monthly number of persons employed by the Group (including Directors) during the year, analysed by category, was as follows:
Drivers – Flexigrid 285 261
Infrastructure staff 119 94
Office staff 233 208
637 563
14 April 2016 £’000
14 April 2015 £’000
The aggregate payroll costs of these persons were as follows:
Wages and salaries 39,225 31,167
Social security costs 4,540 3,894
Other pension costs 1,716 1,254
Equity-settled share-based payments 116 311
45,597 36,626
The Company had no direct employees during the year.
7. Employee numbers and benefit expense
8. Finance income
14 April 2016 £’000
14 April 2015 £’000
Interest receivable on bank balances 507 917
Fair value gain on financial instruments: cash flow hedges - 104
Interest receivable on other loans 45 -
552 1,021
9. Finance costs
14 April 2016 £’000
14 April 2015 £’000
Interest payable in servicing of:
Term loans 283 1,172
Fair value loss on financial instruments: cash flow hedges 94 -
Working capital facilities 10,283 9,241
10,660 10,413
115
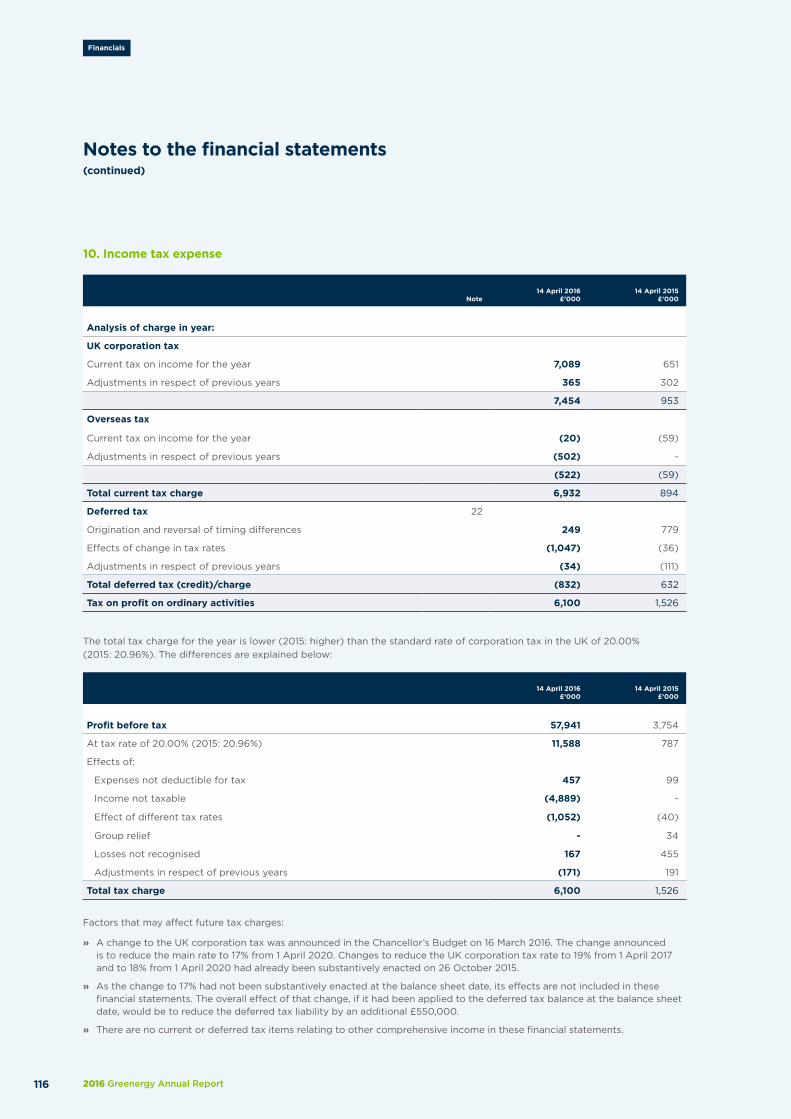
2016 Greenergy Annual Report
10. Income tax expense
Note14 April 2016
£’00014 April 2015
£’000
Analysis of charge in year:
UK corporation tax
Current tax on income for the year 7,089 651
Adjustments in respect of previous years 365 302
7,454 953
Overseas tax
Current tax on income for the year (20) (59)
Adjustments in respect of previous years (502) -
(522) (59)
Total current tax charge 6,932 894
Deferred tax 22
Origination and reversal of timing differences 249 779
Effects of change in tax rates (1,047) (36)
Adjustments in respect of previous years (34) (111)
Total deferred tax (credit)/charge (832) 632
Tax on profit on ordinary activities 6,100 1,526
The total tax charge for the year is lower (2015: higher) than the standard rate of corporation tax in the UK of 20.00% (2015: 20.96%). The differences are explained below:
14 April 2016 £’000
14 April 2015 £’000
Profit before tax 57,941 3,754
At tax rate of 20.00% (2015: 20.96%) 11,588 787
Effects of:
Expenses not deductible for tax 457 99
Income not taxable (4,889) -
Effect of different tax rates (1,052) (40)
Group relief - 34
Losses not recognised 167 455
Adjustments in respect of previous years (171) 191
Total tax charge 6,100 1,526
Factors that may affect future tax charges:
» A change to the UK corporation tax was announced in the Chancellor’s Budget on 16 March 2016. The change announced is to reduce the main rate to 17% from 1 April 2020. Changes to reduce the UK corporation tax rate to 19% from 1 April 2017 and to 18% from 1 April 2020 had already been substantively enacted on 26 October 2015.
» As the change to 17% had not been substantively enacted at the balance sheet date, its effects are not included in these financial statements. The overall effect of that change, if it had been applied to the deferred tax balance at the balance sheet date, would be to reduce the deferred tax liability by an additional £550,000.
» There are no current or deferred tax items relating to other comprehensive income in these financial statements.
Notes to the financial statements(continued)
116
Financials

GroupAssets under construction
£’000
Land and buildings
£’000
Plant and machinery
£’000
Office equipment
£’000
Motor vehicles
£’000Total
£’000
Cost
At 15 April 2014 43,943 1,842 171,482 5,340 2,761 225,368
Additions 14,837 - 344 69 313 15,563
Disposals - - (446) - (219) (665)
Foreign exchange adjustments - - 5 (11) - (6)
Acquisition of subsidiary 1,879 - 2,784 - - 4,663
Reclassifications (21,972) (4) 20,040 2,406 1 471
Re-measurement of dismantlement provision - - (1,250) - - (1,250)
At 14 April 2015 38,687 1,838 192,959 7,804 2,856 244,144
Additions 34,061 - 43 - - 34,104
Disposals (1,885) - (22,971) (90) (277) (25,223)
Foreign exchange adjustments - - 35 (1) - 34
Acquisition of increased shareholding in joint operation 18,196 - 31,975 - - 50,171
Reclassifications (45,052) 41,293 (923) 1,307 740 (2,635)
Amounts reclassified as held for sale - (41,269) - - - (41,269)
At 14 April 2016 44,007 1,862 201,118 9,020 3,319 259,326
Accumulated depreciation and impairment
At 15 April 2014 - (66) (33,631) (3,448) (557) (37,702)
Charge for the year - (23) (8,850) (1,292) (330) (10,495)
Disposals - - 343 - 88 431
Foreign exchange adjustments - - (3) 4 - 1
Reclassifications - (2) (87) (40) - (129)
At 14 April 2015 - (91) (42,228) (4,776) (799) (47,894)
Charge for the year - (27) (9,151) (1,297) (383) (10,858)
Disposals - - 1,397 17 182 1,596
Foreign exchange adjustments - - (6) (3) - (9)
At 14 April 2016 - (118) (49,988) (6,059) (1,000) (57,165)
Net book value at 14 April 2016 44,007 1,744 151,130 2,961 2,319 202,161
Net book value at 14 April 2015 38,687 1,747 150,731 3,028 2,057 196,250
Net book value at 14 April 2014 43,943 1,776 137,851 1,892 2,204 187,666
Depreciation and impairment expenses of £3,564,000 (2015: £3,445,000) has been charged to cost of sales, £5,925,000 (2015: £5,714,000) in distribution costs and £1,369,000 (2015: £1,256,000) in administration expenses. During the financial year, the Group acquired 100% of the share capital of Vopak Holding UK Limited (Note 33). Through this acquisition, the Group’s shareholding in its joint operation, Morzine Limited, increased from 33.3% to 66.7%, increasing the Group’s share of the joint operation’s tangible assets.
Dividends paid in the year were £7,274,000 (£46.02 per share) (2015: £2,850,000 or £18.03 per share). The Directors propose a final dividend of £nil (2015: £2,422,000 or £15.32 per share), to be paid after the balance sheet date.
11. Dividends
12. Property, plant and equipment
117

2016 Greenergy Annual Report
Notes to the financial statements(continued)
13. Intangible assets
118
Financials
GroupPurchased
goodwill £’000
Branding rights £’000
Software £’000
Total £’000
Cost
11,434 3,601 17,771 32,806
Additions 5,052 3,201 2,668 10,921
Disposals - - - -
Reclassifications - - (470) (470)
At 14 April 2015 16,486 6,802 19,969 43,257
Additions - 199 - 199
Disposals (9) (3) (51) (63)
Reclassifications - 1,977 658 2,635
At 14 April 2016 16,477 8,975 20,576 46,028
Accumulated amortisation and impairment
- (843) (357) (1,200)
Charge for the year - (1,851) (1,856) (3,707)
Reclassifications - - 129 129
At 14 April 2015 - (2,694) (2,084) (4,778)
Charge for the year - (2,415) (2,083) (4,498)
Disposals - 2 - 2
At 14 April 2016 - (5,107) (4,167) (9,274)
Net book value at 14 April 2016 16,477 3,868 16,409 36,754
Net book value at 14 April 2015 16,486 4,108 17,885 38,479
Net book value at 14 April 2014 11,434 2,758 17,414 31,606
Research and development relates to internally generated software assets.
Branding rights relate to the costs associated with the Group becoming a branded wholesaler within the UK market.
Goodwill has arisen on the UK Fuels business and on acquisition of Greenergy Biofuels Teesside Limited during the prior year.
As detailed in the accounting policies goodwill is assessed for impairment annually.
Impairment reviews are performed for all other tangible and intangible assets where there has been an indicator of impairment during the year. These impairment reviews are based on value-in-use calculations for the relevant Cash-Generating Units (CGU). These calculations use post-tax cash flow projections based on financial budgets approved by management covering a five-year period. Cash flows beyond the five-year period are extrapolated using estimated growth rates.
Key assumptions for impairment reviews conducted in the current year were as follows:
» Pre-tax discount rate of 7.5%
» Nominal growth rate of cash flows after five years kept steady to reflect the overall state of the market.
As part of the review process a sensitivity analysis is applied, flexing key assumptions such as growth rates and discount rates. The impairment reviews conducted, including the sensitivity analysis, indicated that there were no impairments of CGUs in the year.
At 14 April 2014
At 14 April 2014
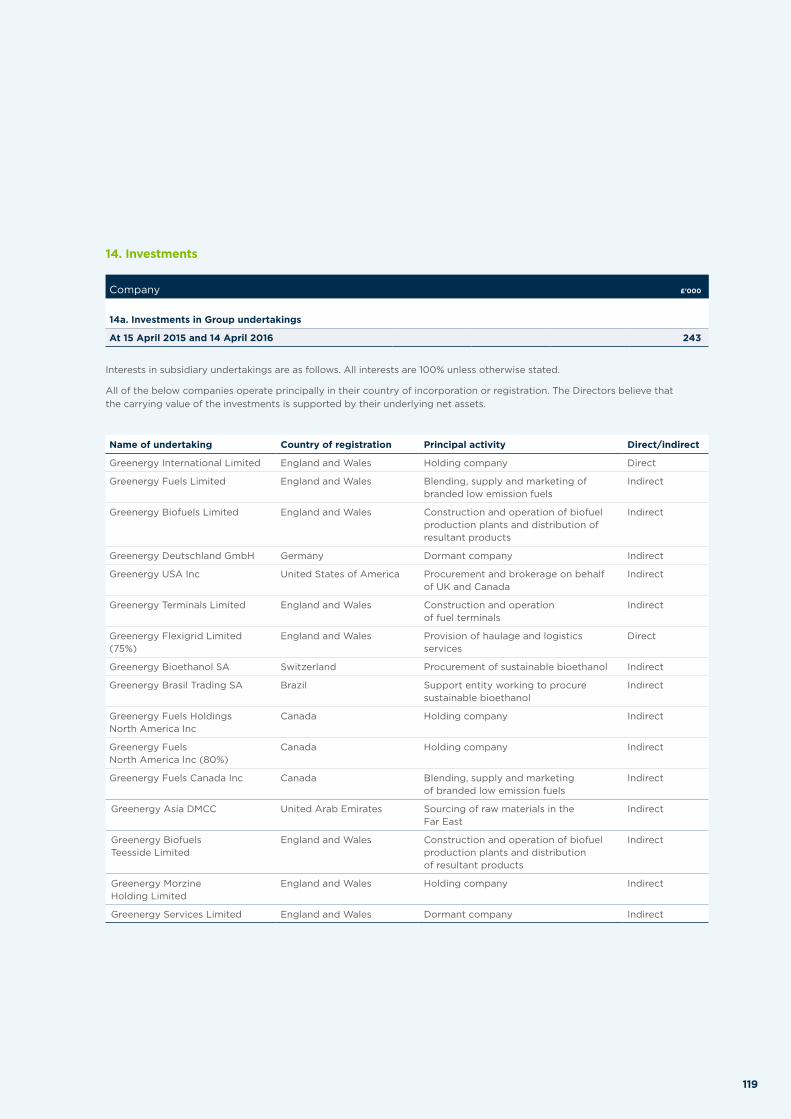
14. Investments
Company £’000
14a. Investments in Group undertakings
At 15 April 2015 and 14 April 2016 243
Interests in subsidiary undertakings are as follows. All interests are 100% unless otherwise stated.
All of the below companies operate principally in their country of incorporation or registration. The Directors believe that the carrying value of the investments is supported by their underlying net assets.
Name of undertaking Country of registration Principal activity Direct/indirect
Greenergy International Limited England and Wales Holding company Direct
Greenergy Fuels Limited England and Wales Blending, supply and marketing of branded low emission fuels
Indirect
Greenergy Biofuels Limited England and Wales Construction and operation of biofuel production plants and distribution of resultant products
Indirect
Greenergy Deutschland GmbH Germany Dormant company Indirect
Greenergy USA Inc United States of America Procurement and brokerage on behalf of UK and Canada
Indirect
Greenergy Terminals Limited England and Wales Construction and operation of fuel terminals
Indirect
Greenergy Flexigrid Limited (75%)
England and Wales Provision of haulage and logistics services
Direct
Greenergy Bioethanol SA Switzerland Procurement of sustainable bioethanol Indirect
Greenergy Brasil Trading SA Brazil Support entity working to procure sustainable bioethanol
Indirect
Greenergy Fuels Holdings North America Inc
Canada Holding company Indirect
Greenergy Fuels North America Inc (80%)
Canada Holding company Indirect
Greenergy Fuels Canada Inc Canada Blending, supply and marketing of branded low emission fuels
Indirect
Greenergy Asia DMCC United Arab Emirates Sourcing of raw materials in the Far East
Indirect
Greenergy Biofuels Teesside Limited
England and Wales Construction and operation of biofuel production plants and distribution of resultant products
Indirect
Greenergy Morzine Holding Limited
England and Wales Holding company Indirect
Greenergy Services Limited England and Wales Dormant company Indirect
119

2016 Greenergy Annual Report
Notes to the financial statements(continued)
14. Investments (continued) Group
£’000
14b. Investments in associates
Cost
At 14 April 2015 and 14 April 2016 288
Impairment
At 14 April 2015 and 14 April 2016 (124)
Net fair value at 14 April 2016 164
Net fair value at 14 April 2015 164
The investments in associates relates to a 23% investment in Scarab Distributed Energy Limited, a private company set up to investigate alternative methods of biofuel production from food waste. The company is currently in a start-up phase and as such there are no material profits or losses to recognise. Investments also relate to a 49% investment in Anglo China Chemical Company Limited, which is deemed an associate of Greenergy International Limited.
Name Country of registration
Principal activity Percentage shareholdings
Scarab Distributed Energy Limited England and Wales Investigating alternative methods of biofuel production from food waste
23
Anglo China Chemical Company Limited
Hong Kong Procurement of used cooking oil 49
14c. Investments in joint arrangements
At 14 April 2016, the Group had the following interests in joint operations carrying on businesses which affect consolidated profits and losses. Unless otherwise stated the Group’s principal joint operations all have share capital consisting solely of ordinary shares, which are indirectly held, and the country of incorporation or registration is also their principal place of operation.
Name Country of registration
Principal activity Percentage shareholdings 1
Morzine Limited t/a Thames Oilport 2
England and Wales Blending, supply and marketing of branded low emission fuels
66.7
North Cave Limited England and Wales Construction and operation of waste processing plant and distribution of resultant products
50.0
1 Rounded to nearest tenth of one per cent. 2 Morzine Limited t/a Thames Oilport’s most recent financial period related to the year ended 30 November 2015.
An impairment assessment has been carried out over the recoverability of the Group’s share of the assets of its joint operation in Morzine Limited and management consider that the value is recoverable through either the sale of surplus land or its development for commercial property usage and the economic benefit that will be generated in the Greenergy group of operating Thames Oilport. The net assets of Morzine Limited which have been included in the Group consolidated balance sheet at 14 April 2016 were £118,696,000 (2015: £59,348,000).
14. Investments (continued)
120
Financials

15. Available-for-sale financial assets
Group14 April 2016
£’00014 April 2015
£’000
Equity investments classified as available for sale:
Fair value on acquisition 5,704 5,704
Additions 12,692 -
Impairment provision for permanent diminution in value (5,578) (5,578)
AFS reserve 446 277
Net fair value 13,264 403
The investments classified as available for sale relate to a 4.45% investment in RedT Energy Plc (formerly Camco Clean Energy Plc, renamed on 25 November 2015), and a 19.72% investment in Navigator Topco. RedT Energy is a company quoted on the London Stock Exchange’s Alternative Investment Market. The fair value of the investment in RedT Energy is determined by reference to published price quotations in an active market. As at 14 April 2016, the published price quote of this investment was 9.06p per share (2015: 4.75p per share). Navigator Topco is the holding company for Navigator Terminal assets. The Group acquired its shareholding in this company on 8 April 2016.
16. Inventories
Group14 April 2016
£’00014 April 2015
£’000
Fuel products 265,543 257,005
RTFO certificates – own use 84,106 35,695
RTFO certificates – held for trading 16,254 9,648
365,903 302,348
During the year £13,510,484,000 of inventory was expensed through cost of sales (2015: £14,004,186,000).
Inventories with a carrying amount of £155,556,000 were pledged as security for certain of the Group’s borrowings (2015: £207,143,000).
There is currently no externally quoted market for the valuation of RTFO certificates. In order to value these contracts, management have adopted a pricing methodology, combining both observable inputs based on market data and assumptions developed internally based on observable market activity.
The anticipated market premia above the calculated cost of creation of RTFO certificates is the most significant input. Assuming other inputs remain unchanged, if the premia was decreased by 1ppl, pre-tax profit would decrease by £814,000 (2015: decrease by £748,000).
Certificate marker -1ppl
£’000
Certificate marker
+1ppl£’000
Level 3 asset
Movement in fair value of RTFO certificates (814) 814
121

2016 Greenergy Annual Report
Notes to the financial statements(continued)
16. Inventories (continued)
17. Trade and other receivables
Group14 April 2016
£’000
14 April 2015
£’000
Trade receivables 669,138 639,545
Less: Provision for impairment of receivables (1,869) (1,664)
667,269 637,881
Other receivables 40,760 20,417
Prepayments 35,920 17,272
Accrued income 90,751 71,333
Derivative financial instruments 97,352 29,594
932,052 776,497
Less non-current portion:
Other receivables (27,717) (14,187)
Derivative financial instruments (820) -
Current portion 903,515 762,310
Trade and other receivables with a carrying amount of £704,661,000 were pledged as security for certain of the Group’s borrowings (2015: £660,424,000).
Trade and other receivables are predominantly non-interest bearing.
As of 14 April 2016, trade debtors of the Group with a carrying value of £1,869,000 (2015: £1,664,000) were provided for. The amount of the provision was £1,869,000 (2015: £1,664,000). The aging of these debtors is as follows:
Group14 April 2016
£’000
14 April 2015
£’000
30+ Days 1,869 1,664
1,869 1,664
During the year, receivables of the Group written off as uncollectible amounted to £nil (2015: £47,000).
The maximum exposure to credit risk at the reporting date is the fair value of each class of receivable mentioned above. Neither the Group nor the Company hold any collateral as security.
14 April 2016
£’00014 April 2015
£’000
Opening balance 9,648 6,377
Reversal of fair value movements on non-financial instruments (9,648) (6,377)
Gain from non-financial instruments held at fair value 16,254 9,648
Closing balance 16,254 9,648
122
Financials
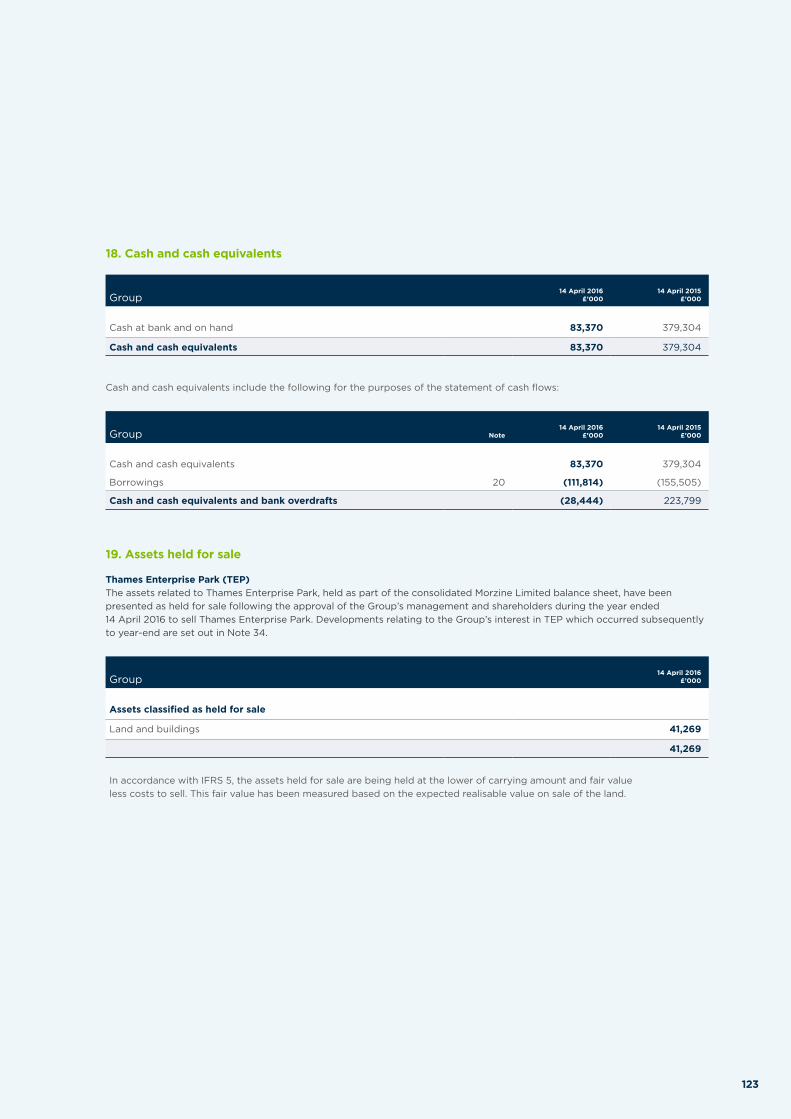
Group14 April 2016
£’000
14 April 2015
£’000
Cash at bank and on hand 83,370 379,304
Cash and cash equivalents 83,370 379,304
Cash and cash equivalents include the following for the purposes of the statement of cash flows:
Group Note14 April 2016
£’000
14 April 2015
£’000
Cash and cash equivalents 83,370 379,304
Borrowings 20 (111,814) (155,505)
Cash and cash equivalents and bank overdrafts (28,444) 223,799
18. Cash and cash equivalents
Thames Enterprise Park (TEP) The assets related to Thames Enterprise Park, held as part of the consolidated Morzine Limited balance sheet, have been presented as held for sale following the approval of the Group’s management and shareholders during the year ended 14 April 2016 to sell Thames Enterprise Park. Developments relating to the Group’s interest in TEP which occurred subsequently to year-end are set out in Note 34.
Group
14 April 2016£’000
Assets classified as held for sale
Land and buildings 41,269
41,269
In accordance with IFRS 5, the assets held for sale are being held at the lower of carrying amount and fair value less costs to sell. This fair value has been measured based on the expected realisable value on sale of the land.
19. Assets held for sale
123
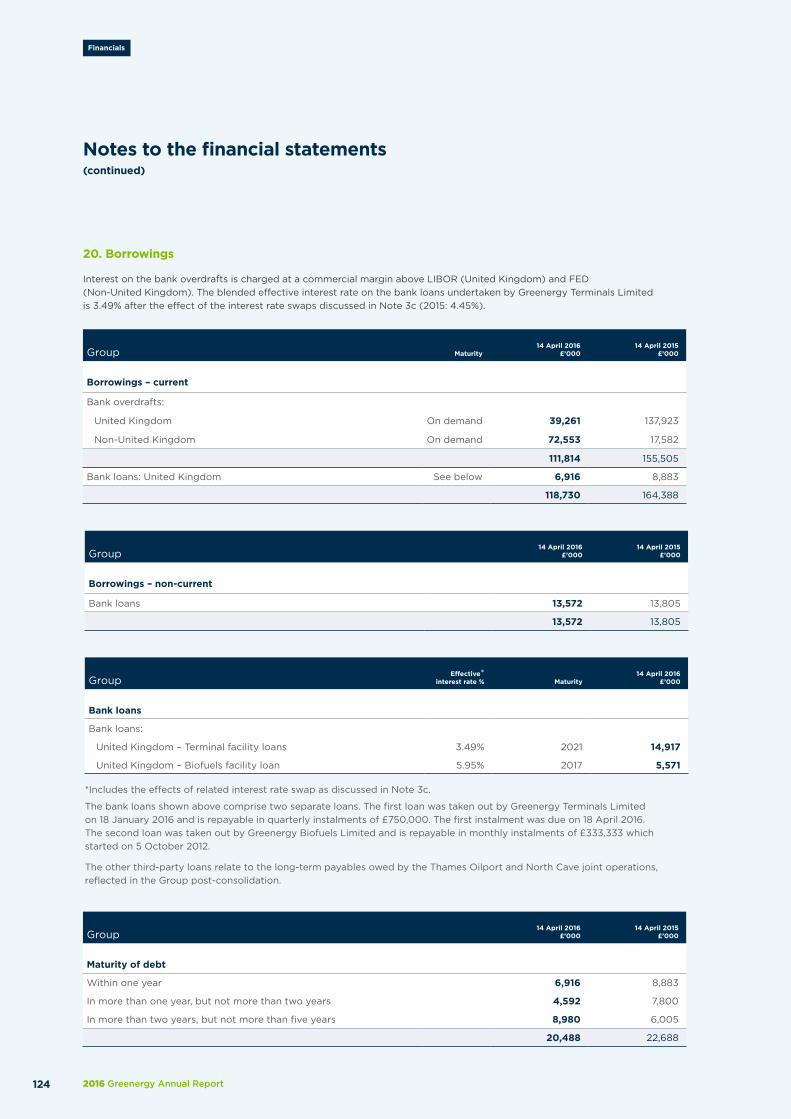
2016 Greenergy Annual Report
Notes to the financial statements(continued)
20. Borrowings
Interest on the bank overdrafts is charged at a commercial margin above LIBOR (United Kingdom) and FED (Non-United Kingdom). The blended effective interest rate on the bank loans undertaken by Greenergy Terminals Limited is 3.49% after the effect of the interest rate swaps discussed in Note 3c (2015: 4.45%).
Group Maturity14 April 2016
£’00014 April 2015
£’000
Borrowings – current
Bank overdrafts:
United Kingdom On demand 39,261 137,923
Non-United Kingdom On demand 72,553 17,582
111,814 155,505
Bank loans: United Kingdom See below 6,916 8,883
118,730 164,388
Group14 April 2016
£’00014 April 2015
£’000
Borrowings – non-current
Bank loans 13,572 13,805
13,572 13,805
GroupEffective*
interest rate % Maturity14 April 2016
£’000
Bank loans
Bank loans:
United Kingdom – Terminal facility loans 3.49% 2021 14,917
United Kingdom – Biofuels facility loan 5.95% 2017 5,571
*Includes the effects of related interest rate swap as discussed in Note 3c.
The bank loans shown above comprise two separate loans. The first loan was taken out by Greenergy Terminals Limited on 18 January 2016 and is repayable in quarterly instalments of £750,000. The first instalment was due on 18 April 2016. The second loan was taken out by Greenergy Biofuels Limited and is repayable in monthly instalments of £333,333 which started on 5 October 2012.
The other third-party loans relate to the long-term payables owed by the Thames Oilport and North Cave joint operations, reflected in the Group post-consolidation.
Group14 April 2016
£’00014 April 2015
£’000
Maturity of debt
Within one year 6,916 8,883
In more than one year, but not more than two years 4,592 7,800
In more than two years, but not more than five years 8,980 6,005
20,488 22,688
124
Financials

Group
Provision for
plant dismantlement £’000
Provision for legal claims
£’000
Total
£’000
At 14 April 2015 500 - 500
Increase in the year - 1,200 1,200
At 14 April 2016 500 1,200 1,700
The dismantlement provision represents management’s estimate of the costs involved in dismantling the Immingham biofuels plant at the end of its useful life and returning the site to the same state in which it was originally acquired. Management review the provision on an annual basis to ensure that the expected outflow of economic benefits is correctly provided for.
The lease is due to expire in 10 years, however currently it is management’s intention to renew this lease; therefore the date of outflow of economic resource in relation to this provision is unknown.
21. Provisions for other liabilities and charges
22. Deferred income tax
Group14 April 2016
£’000
14 April 2015
£’000
The elements of the deferred taxation is as follows:
Accelerated capital allowances (10,599) (12,622)
Other short-term timing differences 637 953
Losses and other differences 1,014 1,283
Net deferred tax liability (8,948) (10,386)
Deferred tax asset 1,620 1,455
Deferred tax liability (10,568) (11,841)
Net deferred tax liability (8,948) (10,386)
14 April 2016 £’000
14 April 2015
£’000
The movement on deferred taxation is as follows:
At the beginning of the year (10,386) (10,236)
Income statement charge 798 (743)
Adjustments in respect of prior years 34 111
Movement arising from the acquisition of subsidiary 606 482
At the end of the year (8,948) (10,386)
The Group has unused losses of £3,771,000 (2015: £3,839,000) for which no deferred tax asset has been recognised.
125

2016 Greenergy Annual Report
Notes to the financial statements(continued)
Group14 April 2016
£’000
14 April 2015
£’000
Trade payables 75,997 62,785
RTFO – current year obligation 84,106 35,695
Other taxes and social security 885,759 1,032,992
Other creditors 51,558 20,550
Accrued expenses 161,330 201,287
Deferred income 7,500 14,332
Derivative financial instruments 97,207 16,593
1,363,457 1,384,234
Less non-current portion:
Other payables (2,563) (2,184)
Derivative financial instruments (5,167) -
Current portion 1,355,727 1,382,050
The carrying amounts of trade payables and other payables approximate to their fair values. Trade and other payables are predominantly non-interest bearing.
23. Trade and other payables
The accounting policies for financial instruments in Note 1 have been applied to the line items below:
Group Loans and receivables
£’000
Financial assets at fair value through
profit and loss £’000
Available-for-sale financial assets
£’000Total
£’000
Assets at 14 April 2016
Available-for-sale investments (Level 1) - - 572 572
Available-for-sale investments (Level 3) - - 12,692 12,692
Derivative financial instruments (Level 1) - 3,777 - 3,777
Derivative financial instruments (Level 2) - 93,575 - 93,575
Receivables 798,780 - - 798,780
Cash and cash equivalents 83,370 - - 83,370
882,150 97,352 13,264 992,766
Assets at 14 April 2015
Available-for-sale investments (Level 1) - - 403 403
Derivative financial instruments (Level 1) - 4,762 - 4,762
Derivative financial instruments (Level 2) - 23,736 - 23,736
Derivative financial instruments (Level 3) - 1,096 - 1,096
Receivables 729,630 - - 729,630
Cash and cash equivalents 379,304 - - 379,304
1,108,934 29,594 403 1,138,931
Of the £97,352,000 of financial assets at fair value through profit and loss, £74,000 of these are hedging instruments (Note 25).
24. Financial instruments
126
Financials

24. Financial instruments (continued)
Group
Financial liabilities at fair value through
profit and loss £’000
Financial liabilities measured at
amortised cost £’000
Total £’000
Liabilities at 14 April 2016
Payables - 372,991 372,991
Bank loans and overdrafts - 132,302 132,302
Derivative financial instruments (Level 1) 7,675 - 7,675
Derivative financial instruments (Level 2) 89,532 - 89,532
97,207 505,293 602,500
Liabilities at 14 April 2015
Payables - 320,317 320,317
Bank loans and overdrafts - 178,193 178,193
Derivative financial instruments (Level 1) 405 - 405
Derivative financial instruments (Level 2) 15,318 - 15,318
Derivative financial instruments (Level 3) 870 - 870
16,593 498,510 515,103
Of the £97,207,000 of financial liabilities at fair value through profit and loss, £337,000 of these are hedging instruments (Note 25).
The fair value of financial instruments traded in active markets is based on quoted market prices at the balance sheet date. A market is regarded as active if quoted prices are readily and regularly available from an exchange, dealer, broker, industry group, pricing service, or regulatory agency, and those prices represent actual and regularly occurring market transactions on an arm’s length basis. The quoted market price used for financial instruments held by the Group is the current mid-price. These instruments are included in Level 1. Instruments included in Level 1 comprise AIM equity investments classified as available for sale and exchange traded commodity derivative financial instruments.
The fair value of financial instruments that are not traded in an active market (for example, over-the-counter derivatives) is determined by using valuation techniques. These valuation techniques maximise the use of observable market data where it is available and rely as little as possible on entity specific estimates. For derivative contracts where publically available information is not available, fair value estimations are generally determined using models and other valuation methods, the key inputs for which include future prices, volatility, price correlations, counterparty credit risk and market liquidity, as appropriate; for other assets and liabilities, fair value estimations are generally based on the net present value of expected future cash flows. If all significant inputs required to fair value an instrument are observable, the instrument is included in Level 2.
Available-for-sale investments are held at fair value, measured using appropriate valuation techniques. During the prior year certain financial instruments were valued using observable market inputs that required significant adjustment based on unobservable inputs. We have deemed these instruments to be Level 3 within the hierarchy above.
The carrying value of the financial instruments is deemed to be the same as fair value due to them being predominantly short-term in nature.
127
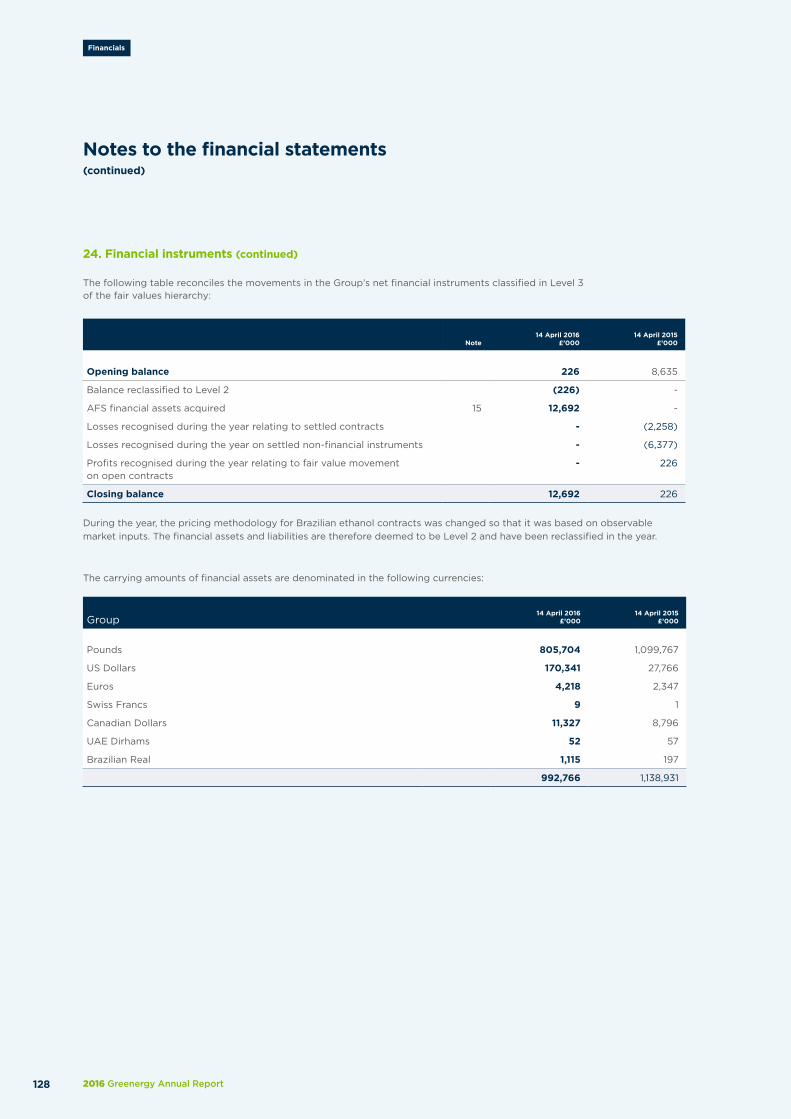
2016 Greenergy Annual Report
Notes to the financial statements(continued)
24. Financial instruments (continued)
Note
14 April 2016
£’000
14 April 2015
£’000
Opening balance 226 8,635
Balance reclassified to Level 2 (226) -
AFS financial assets acquired 15 12,692 -
Losses recognised during the year relating to settled contracts - (2,258)
Losses recognised during the year on settled non-financial instruments - (6,377)
Profits recognised during the year relating to fair value movement on open contracts
- 226
Closing balance 12,692 226
The following table reconciles the movements in the Group’s net financial instruments classified in Level 3 of the fair values hierarchy:
Group14 April 2016
£’000
14 April 2015
£’000
Pounds 805,704 1,099,767
US Dollars 170,341 27,766
Euros 4,218 2,347
Swiss Francs 9 1
Canadian Dollars 11,327 8,796
UAE Dirhams 52 57
Brazilian Real 1,115 197
992,766 1,138,931
During the year, the pricing methodology for Brazilian ethanol contracts was changed so that it was based on observable market inputs. The financial assets and liabilities are therefore deemed to be Level 2 and have been reclassified in the year.
The carrying amounts of financial assets are denominated in the following currencies:
128
Financials

24. Financial instruments (continued)
Gross amounts of recognised
financial liabilities £’000
Amounts being offset in the
balance sheet £’0000
Net amounts of financial liabilities
presented in the balance sheet
£’000
Balances subject to a contractual
right of offset £’000
Cash collateral pledged
£’000Net amounts
£’000
As at 14 April 2016
Derivative financial liabilities 14,564 (3,551) 11,013 (6,763) (4,065) 185
Total 14,564 (3,551) 11,013 (6,763) (4,065) 185
As at 14 April 2015
Derivative financial liabilities 1,715 (2,465) (750) - - (750)
Total 1,715 (2,465) (750) - - (750)
Offsetting financial assets and financial liabilitiesThe following table sets out the Group’s financial assets and financial liabilities that are subject to counterparty offsetting or a master netting agreement. The master netting agreements regulate settlement amounts in the event either party defaults on their obligations:
Gross amounts of recognised
financial assets £’000
Amounts being offset in the
balance sheet £’000
Net amounts of financial assets
presented in the balance sheet
£’000
Balances subject to a contractual
right of offset £’000
Cash collateral pledged
£’000Net amounts
£’000
As at 14 April 2016
Derivative financial assets 9,991 (2,890) 7,101 (6,763) - 338
Total 9,991 (2,890) 7,101 (6,763) - 338
As at 14 April 2015
Derivative financial assets 6,202 (2,190) 4,012 - - 4,012
Total 6,202 (2,190) 4,012 - - 4,012
Group
14 April 2016 Charge/(credit)
to hedging reserve
£’000
14 April 2016 Charge/(credit) to profit & loss
account £’000
14 April 2016 Fair value
asset/ (liability)
£’000
14 April 2015 Charge/(credit)
to hedging reserve
£’000
14 April 2015 Charge/(credit) to profit & loss
account £’000
14 April 2015 Fair value
asset/ (liability)
£’000
Derivative financial instruments (81) 11,384 (4,421) 353 (7,962) 6,882
Sales and purchase commodity contracts - 1,553 4,566 - 6,828 6,119
(81) 12,937 145 353 (1,134) 13,001
Included in trade and other receivables 97,352 29,594
Included in trade and other payables (97,207) (16,593)
145 13,001
Derivative financial instruments shown above generally relate to exchange traded commodity derivatives and over-the-counter contracts. Sales and purchase commodity contracts relate to open contracts that the Group have entered into.
129
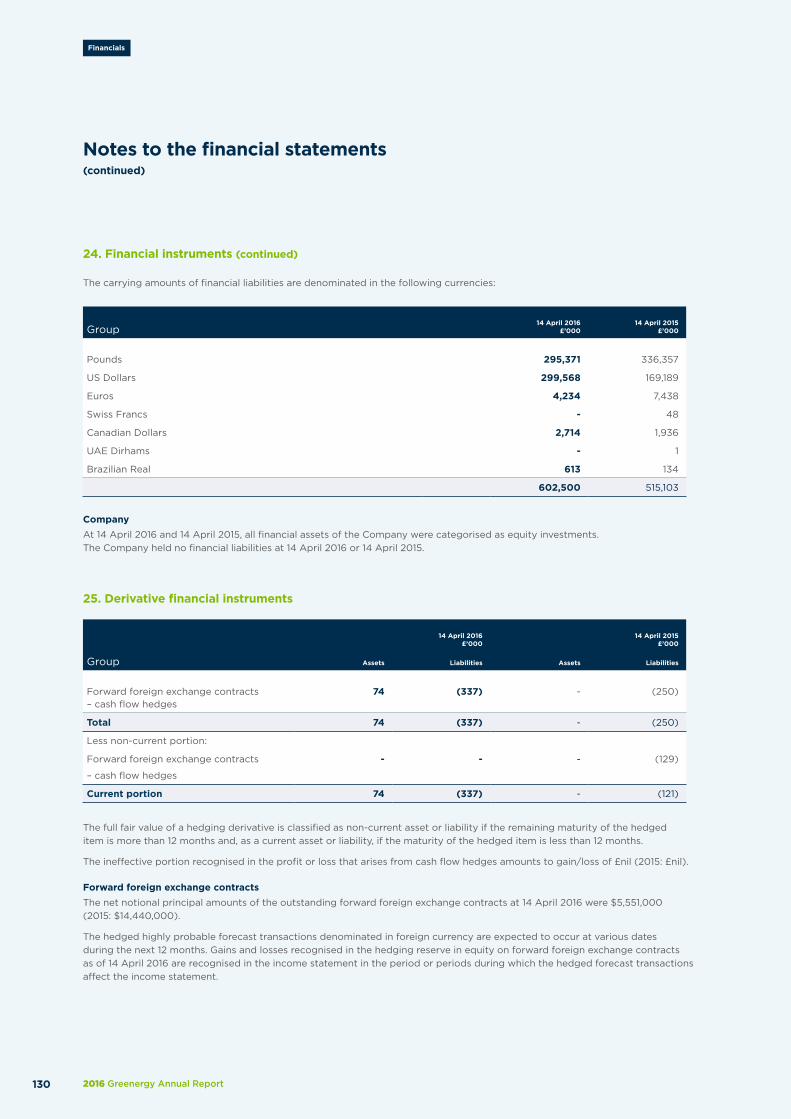
2016 Greenergy Annual Report
Notes to the financial statements(continued)
24. Financial instruments (continued)
The carrying amounts of financial liabilities are denominated in the following currencies:
Group14 April 2016
£’000
14 April 2015
£’000
Pounds 295,371 336,357
US Dollars 299,568 169,189
Euros 4,234 7,438
Swiss Francs - 48
Canadian Dollars 2,714 1,936
UAE Dirhams - 1
Brazilian Real 613 134
602,500 515,103
CompanyAt 14 April 2016 and 14 April 2015, all financial assets of the Company were categorised as equity investments. The Company held no financial liabilities at 14 April 2016 or 14 April 2015.
25. Derivative financial instruments
14 April 2016 £’000
14 April 2015 £’000
Group Assets Liabilities Assets Liabilities
Forward foreign exchange contracts – cash flow hedges
74 (337) - (250)
Total 74 (337) - (250)
Less non-current portion:
Forward foreign exchange contracts
– cash flow hedges
- - - (129)
Current portion 74 (337) - (121)
The full fair value of a hedging derivative is classified as non-current asset or liability if the remaining maturity of the hedged item is more than 12 months and, as a current asset or liability, if the maturity of the hedged item is less than 12 months.
The ineffective portion recognised in the profit or loss that arises from cash flow hedges amounts to gain/loss of £nil (2015: £nil).
Forward foreign exchange contractsThe net notional principal amounts of the outstanding forward foreign exchange contracts at 14 April 2016 were $5,551,000 (2015: $14,440,000).
The hedged highly probable forecast transactions denominated in foreign currency are expected to occur at various dates during the next 12 months. Gains and losses recognised in the hedging reserve in equity on forward foreign exchange contracts as of 14 April 2016 are recognised in the income statement in the period or periods during which the hedged forecast transactions affect the income statement.
130
Financials

26. Share capital
Group and Company14 April 2016
£’000
14 April 2015
£’000
Allotted, called up and fully paid
102,549 (2015: 102,549) ordinary shares of £1 each 103 103
55,525 (2015: 55,525) non-voting ordinary shares of £1 each 55 55
158 158
Other than the ability to vote at general meetings, the rights of ordinary and non-voting ordinary shareholders are identical.
27. Share-based payments
During the year ending 14 April 2013, the Group introduced a hurdle scheme for its employees with effect from 8 May 2012, in addition to the share option plan which was already in existence. The details of both plans are outlined in the following tables.
Share option planThe Group’s equity-settled share-based payments are made under a share option plan dated 5 July 2000, as amended on 21 March 2006 (the ‘Plan’). From time to time, the Company awards share options to employees of the Company itself and employees of other Group companies.
Options awarded under the Plan have a life of 10 years and normally vest equally on the first, second, third and fourth anniversary of grant. Subject to certain conditions, vested options may be exercised on or after the earlier of flotation or takeover of the Company; and 50% of those options granted on or after 21 March 2006, may be exercised on the fifth anniversary of grant.
Details of outstanding share options awarded to Group employees including Directors are set out below.
Date of grant Date of expiryStrike
price £Opening balance
Vested at opening
Repurchased in the year
Balance of options remaining
Vested at closing
15 Apr 2002 14 Apr 2013* £6.00 275 100% - 275 100%
21 Mar 2006 20 Mar 2016* £6.00 231 100% - 231 100%
21 Mar 2006 20 Mar 2016* £100.00 2,269 100% - 2,269 100%
21 Mar 2006 20 Mar 2016* £100.00 147 100% - 147 100%
21 Mar 2006 20 Mar 2016* £200.00 1,413 100% - 1,206 100%
28 Feb 2008 27 Feb 2018 £750.00 2,000 100% - 2,000 100%
28 Feb 2008 27 Feb 2018 £750.00 4,264 100% - 2,314 100%
*Expiry date is in the process of being extended.
131
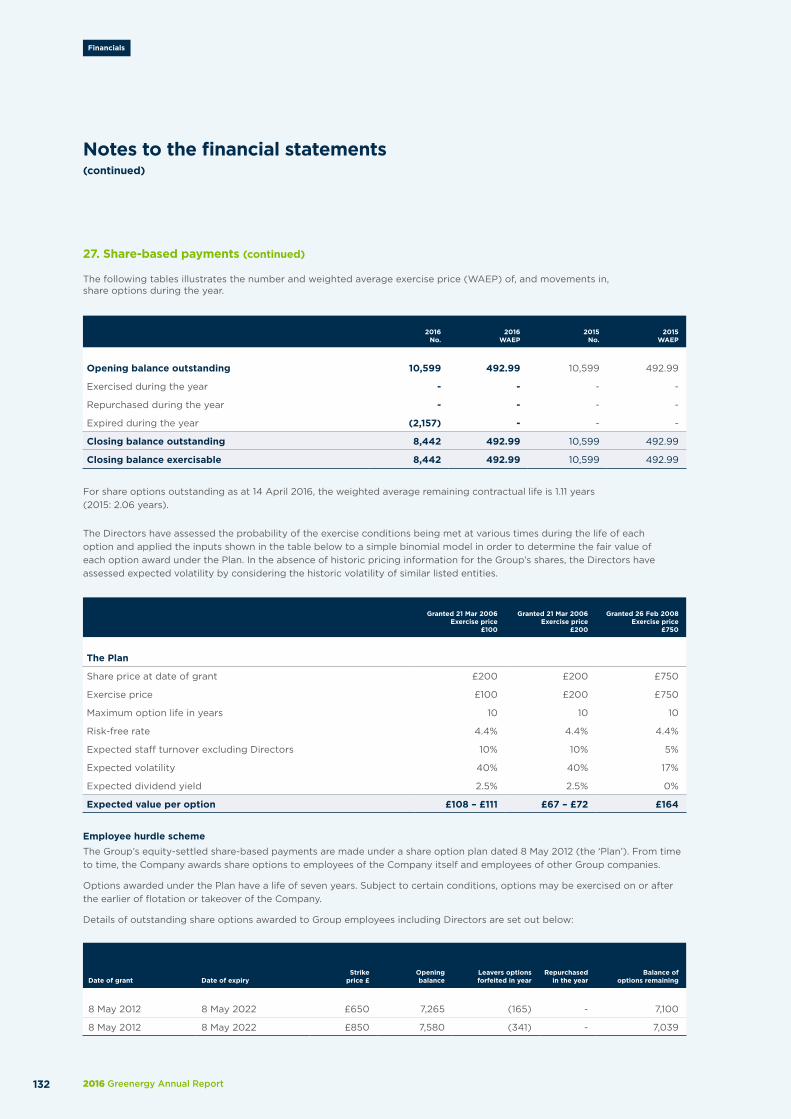
2016 Greenergy Annual Report
Notes to the financial statements(continued)
27. Share-based payments (continued)
2016 No.
2016WAEP
2015No.
2015 WAEP
Opening balance outstanding 10,599 492.99 10,599 492.99
Exercised during the year - - - -
Repurchased during the year - - - -
Expired during the year (2,157) - - -
Closing balance outstanding 8,442 492.99 10,599 492.99
Closing balance exercisable 8,442 492.99 10,599 492.99
For share options outstanding as at 14 April 2016, the weighted average remaining contractual life is 1.11 years (2015: 2.06 years).
The following tables illustrates the number and weighted average exercise price (WAEP) of, and movements in, share options during the year.
Granted 21 Mar 2006Exercise price
£100
Granted 21 Mar 2006Exercise price
£200
Granted 26 Feb 2008Exercise price
£750
The Plan
Share price at date of grant £200 £200 £750
Exercise price £100 £200 £750
Maximum option life in years 10 10 10
Risk-free rate 4.4% 4.4% 4.4%
Expected staff turnover excluding Directors 10% 10% 5%
Expected volatility 40% 40% 17%
Expected dividend yield 2.5% 2.5% 0%
Expected value per option £108 – £111 £67 – £72 £164
Employee hurdle scheme The Group’s equity-settled share-based payments are made under a share option plan dated 8 May 2012 (the ‘Plan’). From time to time, the Company awards share options to employees of the Company itself and employees of other Group companies.
Options awarded under the Plan have a life of seven years. Subject to certain conditions, options may be exercised on or after the earlier of flotation or takeover of the Company.
Details of outstanding share options awarded to Group employees including Directors are set out below:
Date of grant Date of expiryStrike
price £Opening balance
Leavers options forfeited in year
Repurchased in the year
Balance of options remaining
8 May 2012 8 May 2022 £650 7,265 (165) - 7,100
8 May 2012 8 May 2022 £850 7,580 (341) - 7,039
The Directors have assessed the probability of the exercise conditions being met at various times during the life of each option and applied the inputs shown in the table below to a simple binomial model in order to determine the fair value of each option award under the Plan. In the absence of historic pricing information for the Group’s shares, the Directors have assessed expected volatility by considering the historic volatility of similar listed entities.
132
Financials

27. Share-based payments (continued)
The following table illustrates the number and weighted average exercise price (WAEP) of, and movements in, share options during the period.
2016No.
2016 WAEP
2015No.
2015WAEP
Opening balance outstanding 14,845 752.12 17,530 754.11
Granted during the period - - - -
Exercised during the period - - - -
Repurchased during the period - - - -
Forfeited during the period (706) 803.26 (2,685) 765.08
Closing balance outstanding 14,139 749.57 14,845 752.12
Closing balance exercisable 14,139 749.57 14,845 752.12
For share options outstanding as at 14 April 2016, the weighted average remaining contractual life is 6.07 years (2015: 7.07 years).
The fair value of awards was calculated using a Monte-Carlo simulation model.
Granted 8 May 2012Exercise price
£650
Granted 8 May 2012Exercise price
£850
The Plan
Share price at date of grant £662.53 £662.53
Exercise price £650 £850
Maximum option life in years 10 10
Risk-free rate 0.97% 0.97%
Expected staff turnover excluding Directors 0% 0%
Expected volatility 37.37% 37.37%
Expected dividend yield 3.68% 3.68%
Expected value per option £13 - £124 £15 - £76
The expense recognised for equity-settled share-based payments in respect of employee services received during the year is £116,000 (2015: £311,000).
133

2016 Greenergy Annual Report
Notes to the financial statements(continued)
28. Net cash generated from operating activities
Group Company
Note14 April 2016
£’00014 April 2015
£’00014 April 2016
£’00014 April 2015
£’000
Profit before taxation 57,941 3,754 7,274 2,850
Adjustments for: - -
Depreciation of property, plant and equipment 12 9,754 10,494 - -
(Profit)/loss on disposal of property, plant and equipment
5 (105) 93 - -
Profit on non-cash disposal of investment (23,341) - - -
Amortisation of intangibles 13 4,498 3,707 - -
Impairment of investment in associate 14 - 124 - -
Share-based payments charge 116 311 - -
Revaluation of financial instruments 12,843 (1,134) - -
(Increase)/decrease in inventory 16 (15,260) 75,883 - -
(Increase)/decrease in receivables 17 (67,590) 71,273 - -
(Decrease)/increase in payables 23 (173,254) 112,489 - -
Income taxes (paid)/refunded (3,255) 2,303 - -
Net finance costs 10,108 9,392 - -
Other non-operating charges 2 10 - -
Net cash (used)/generated from operating activities (187,543) 288,699 7,274 2,850
134
Financials
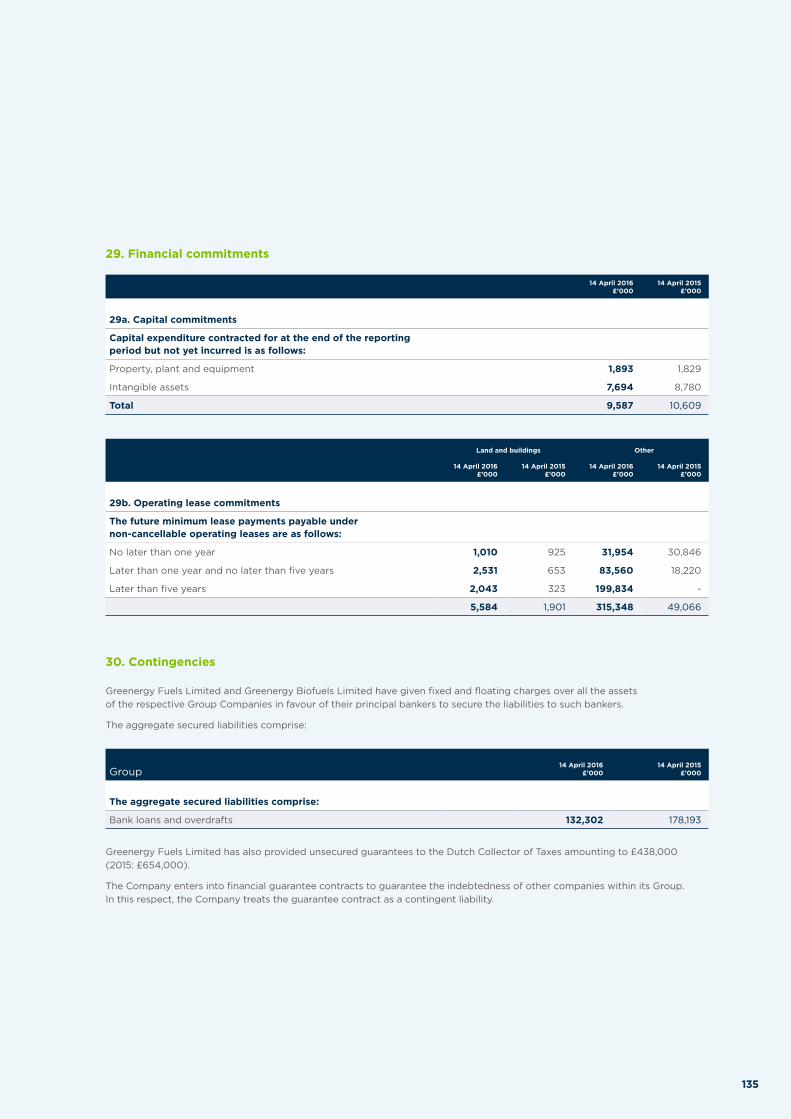
Greenergy Fuels Limited and Greenergy Biofuels Limited have given fixed and floating charges over all the assets of the respective Group Companies in favour of their principal bankers to secure the liabilities to such bankers.
The aggregate secured liabilities comprise:
Group14 April 2016
£’00014 April 2015
£’000
The aggregate secured liabilities comprise:
Bank loans and overdrafts 132,302 178,193
Greenergy Fuels Limited has also provided unsecured guarantees to the Dutch Collector of Taxes amounting to £438,000 (2015: £654,000).
The Company enters into financial guarantee contracts to guarantee the indebtedness of other companies within its Group. In this respect, the Company treats the guarantee contract as a contingent liability.
30. Contingencies
14 April 2016£’000
14 April 2015£’000
29a. Capital commitments
Capital expenditure contracted for at the end of the reporting period but not yet incurred is as follows:
Property, plant and equipment 1,893 1,829
Intangible assets 7,694 8,780
Total 9,587 10,609
Land and buildings Other
14 April 2016 £’000
14 April 2015 £’000
14 April 2016 £’000
14 April 2015 £’000
29b. Operating lease commitments
The future minimum lease payments payable under non-cancellable operating leases are as follows:
No later than one year 1,010 925 31,954 30,846
Later than one year and no later than five years 2,531 653 83,560 18,220
Later than five years 2,043 323 199,834 -
5,584 1,901 315,348 49,066
29. Financial commitments
135
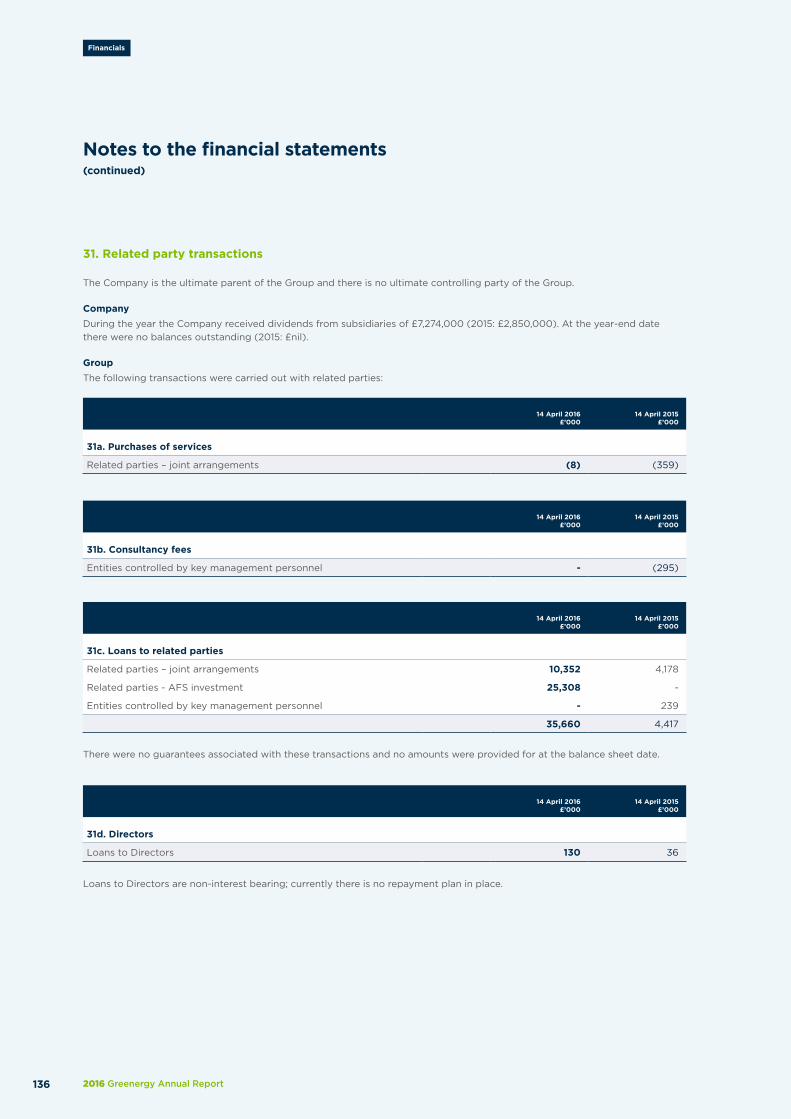
2016 Greenergy Annual Report
Notes to the financial statements(continued)
31. Related party transactions
The Company is the ultimate parent of the Group and there is no ultimate controlling party of the Group.
CompanyDuring the year the Company received dividends from subsidiaries of £7,274,000 (2015: £2,850,000). At the year-end date there were no balances outstanding (2015: £nil).
GroupThe following transactions were carried out with related parties:
14 April 2016£’000
14 April 2015£’000
31a. Purchases of services
Related parties – joint arrangements (8) (359)
14 April 2016£’000
14 April 2015£’000
31b. Consultancy fees
Entities controlled by key management personnel - (295)
14 April 2016£’000
14 April 2015£’000
31c. Loans to related parties
Related parties – joint arrangements 10,352 4,178
Related parties - AFS investment 25,308 -
Entities controlled by key management personnel - 239
35,660 4,417
Loans to Directors are non-interest bearing; currently there is no repayment plan in place.
14 April 2016£’000
14 April 2015£’000
31d. Directors
Loans to Directors 130 36
There were no guarantees associated with these transactions and no amounts were provided for at the balance sheet date.
136
Financials
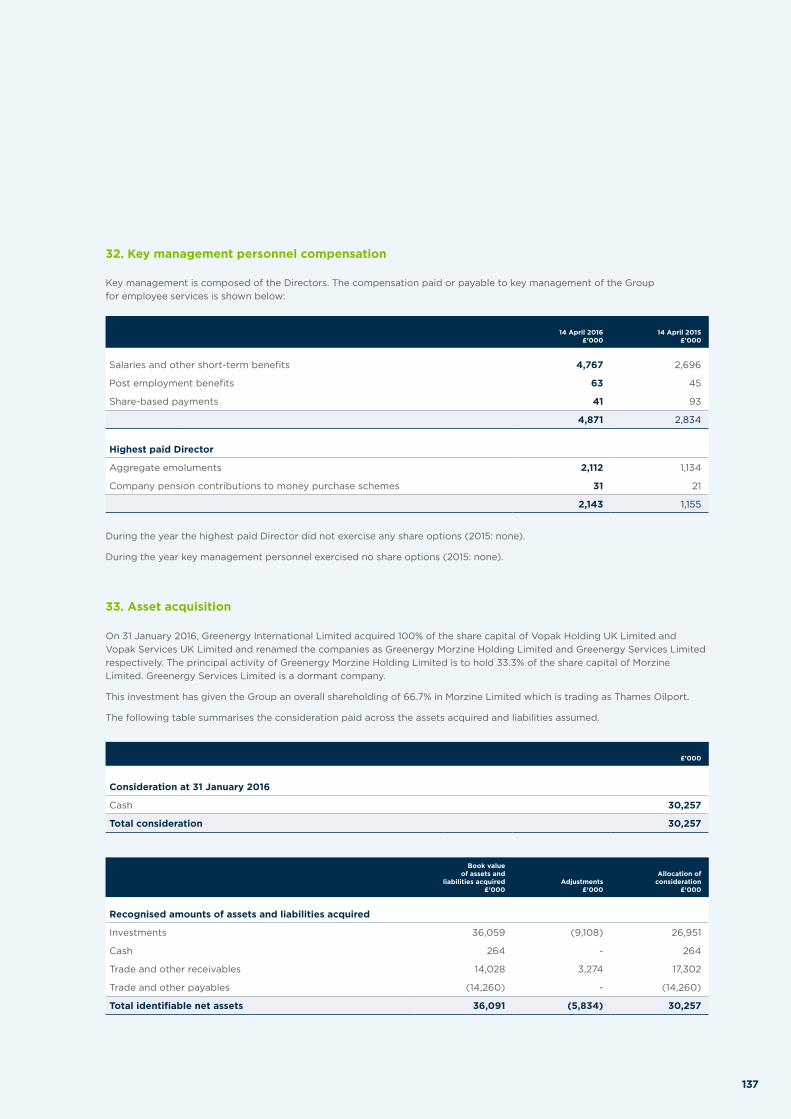
Key management is composed of the Directors. The compensation paid or payable to key management of the Group for employee services is shown below:
14 April 2016£’000
14 April 2015£’000
Salaries and other short-term benefits 4,767 2,696
Post employment benefits 63 45
Share-based payments 41 93
4,871 2,834
Highest paid Director
Aggregate emoluments 2,112 1,134
Company pension contributions to money purchase schemes 31 21
2,143 1,155
During the year the highest paid Director did not exercise any share options (2015: none).
During the year key management personnel exercised no share options (2015: none).
32. Key management personnel compensation
On 31 January 2016, Greenergy International Limited acquired 100% of the share capital of Vopak Holding UK Limited and Vopak Services UK Limited and renamed the companies as Greenergy Morzine Holding Limited and Greenergy Services Limited respectively. The principal activity of Greenergy Morzine Holding Limited is to hold 33.3% of the share capital of Morzine Limited. Greenergy Services Limited is a dormant company.
This investment has given the Group an overall shareholding of 66.7% in Morzine Limited which is trading as Thames Oilport.
The following table summarises the consideration paid across the assets acquired and liabilities assumed.
£’000
Consideration at 31 January 2016
Cash 30,257
Total consideration 30,257
33. Asset acquisition
Book value of assets and
liabilities acquired £’000
Adjustments £’000
Allocation of consideration
£’000
Recognised amounts of assets and liabilities acquired
Investments 36,059 (9,108) 26,951
Cash 264 - 264
Trade and other receivables 14,028 3,274 17,302
Trade and other payables (14,260) - (14,260)
Total identifiable net assets 36,091 (5,834) 30,257
137

2016 Greenergy Annual Report
Officers and professional advisors
DirectorsP T Bateson C J Brookhouse S Daniels (Non-Executive) A R C Durrant (Non-Executive) T G Earley D Firth (Non-Executive) P J Lester (Non-Executive) C S Lumbard S E McCaffrey C Rees (Non-Executive) A W Owens
Company secretaryR W Clifton
Registered office198 High Holborn London WC1V 7BD
Registration number 07318726 England and Wales
Independent auditorsPricewaterhouseCoopers LLP Chartered Accountants and Statutory Auditors 1 Embankment Place London WC2N 6RH
SolicitorsMacfarlanes LLP 20 Cursitor Street London EC4A 1LT
BankersBarclays Bank plc Level 28 1 Churchill Place London E14 5HP
ING Bank N.V. Bijlmerplein 888 1102 MG Amsterdam The Netherlands
34. Post balance sheet events
BrexitIn its referendum on 24 June, the UK voted to leave the European Union. Whilst the changes to the UK’s trading relationships are still uncertain, we are confident in our ability to manage the impact of potential scenarios, whatever they may be. We will continue to monitor the impact on the business going forward.
Thames Enterprise Park Land held for saleDuring the year, the joint venture partners at Thames Enterprise Park offered for sale former refinery land that is not required for the import terminal at Thames Oilport to be used for industrial development. An agreement for sale was reached and the associated assets were classified as held for sale at year-end (see Note 19). Discussions to sell the land at Thames Enterprise Park to a third-party stalled post year-end when the exclusive prospective buyer informed us that due to the state of the debt markets after the UK’s referendum on EU membership, they were unable to continue with the transaction on the terms offered.
In light of these developments the joint venture has begun a process to identify alternative deal structures which will enable Thames Enterprise Park to realise a value which exceeds the asset carrying value through either sale or development of the land. This process will ultimately lead to a determination during FY17 of whether the classification as held for sale and the asset carrying values remain appropriate. These developments are considered a non-adjusting post balance sheet event and therefore any accounting implications will be recognised in the financial statements of future periods.
Notes to the financial statements(continued)
138
Financials

Designed by Mr B & Friends

GR
EE
NE
RG
Y A
NN
UA
L RE
PO
RT
2016
Printed on FSC certified paper, acid free with 100% virgin ECF fibre using waterless printing and vegetable-based inks.
Greenergy Fuels Holdings Ltd 198 High Holborn, London WC1V 7BDwww.greenergy.com