annual report 2016 - home - treasury wine estates · the company is focused on delivering...
TRANSCRIPT

ANNUAL REPORT 2016

ABOUT TWE
Treasury Wine Estates (TWE) is one of the world’s largest wine companies, listed on the Australian Securities Exchange.
With a rich heritage and diverse portfolio of some of the most recognised and awarded wine brands in the world,
the Company is focused on delivering shareholder value through the production of quality wine, coupled with
world-class, brand-led marketing. Employing approximately 3,500 talented winemakers, viticulturalists, sales,
marketing, distribution and support staff, TWE’s wine is sold in more than 100 countries around the world.
CONTENTS
1 / Our Locations
2 / Chairman and Chief Executive Officer’s Report
4 / Operating and Financial Review
24 / Corporate Responsibility
31 / Diversity and Inclusion
34 / Board of Directors
36 / Corporate Governance
39 / Directors’ Report
42 / Auditor’s Independence Declaration
43 / Remuneration Report – Audited
65 / Consolidated Statement of Profit or Loss and Other Comprehensive Income
66 / Consolidated Statement of Financial Position
67 / Consolidated Statement of Changes in Equity
68 / Consolidated Statement of Cash Flows
69 / Notes to the Consolidated Financial Statements
111 / Directors’ Declaration
112 / Independent Auditor’s Report
114 / Details of Shareholders, Shareholdings and Top 20 Shareholders
115 / Shareholder Information
Forward looking statement disclaimerThis Report contains certain forward looking statements. Words such as 'expects', 'targets', 'likely', 'should', 'could', 'intend' and other similar
expressions are intended to identify forward looking statements. Indicators of and guidance on future earnings and financial position are also forward looking statements. Such forward looking statements are not guarantees of future performance and involve known and unknown risks, uncertainties
and other factors many of which are beyond the control of the Company or the TWE Group which may cause actual results to differ materially from those expressed or implied in such statements. Further information on important factors that could cause actual results to differ materially
from those projected in such statements is included in the 'Material Business Risks' section of the Operating and Financial Review.
All currency referred to in this Annual Report is in Australian dollars, unless otherwise stated.

TWE ASIASINGAPORE
TWE ANZMELBOURNE, VICTORIA
TWE EUROPETWICKENHAM, UK
TWE EUROPETUSCANY, ITALY
TWE ANZAUCKLAND
TWE AMERICASNAPA VALLEY, CALIFORNIA
TWE AMERICASTORONTO, ONTARIO
TWE ASIASHANGHAI, CHINA
AUSTRALIACorporate head office: Melbourne, Victoria*
78 vineyards8,939 planted hectares8 wineries
NEW ZEALANDCountry head office: Auckland
8 vineyards339 planted hectares1 winery
USRegional head office: Napa Valley, California
49 vineyards4,002 planted hectares10 wineries
CANADACountry head office: Toronto, Ontario
SOUTH EAST ASIARegional head office: Singapore
NORTH ASIARegional head office: Shanghai, China
UKRegional head office: Twickenham, Middlesex
ITALYCountry head office: Gabbiano, Tuscany
2 vineyards145 planted hectares1 winery
OUR LOCATIONS
AUSTRALIA & NEW ZEALAND AMERICAS
ASIAEUROPE & LATAM
*TWE also has significant other operations across Australia.
TREASURY WINE ESTATES ANNUAL REPORT 2016 / 1

CHAIRMAN AND CHIEF EXECUTIVE OFFICER’S REPORT
Dear Shareholders,
Fiscal 16 was a strong year for our Company; a year of significant progress in which Treasury Wine Estates built momentum through simplifying our operations, refocusing our portfolio and investing to drive growth. As a result, we have delivered a more sustainable and profitable business, with adjusted Earnings Per Share1 up 45%, as the Company transitions successfully from an order-led, agricultural business to a brand-led marketing organisation.
Working off solid foundations laid by the reset of our operations in F15, the Company has continued its journey of positive transformation in F16. Together, the Board and management have taken the necessary decisions to strengthen our core business and execute a strategic plan that will deliver future growth.
F16 saw a greater focus, and ongoing investment, in the Company’s brands. Significant marketing campaigns for established Priority Brands such as Penfolds, Wolf Blass and Beringer were undertaken over the year, with considerable success. A portfolio of iconic Australian wines were reinvigorated as ‘Regional Gems’, with a dedicated team tasked to drive growth and consumer engagement domestically and in export markets.
The Company’s brands continued to receive global accolades in F16, with Wolf Blass awarded ‘Red Winemaker of the Year’ for the third time at the 2016 International Wine Challenge in London, and Penfolds crowned the ‘World’s Most Admired Wine Brand’ by Drinks International in March 2016.
TWE entered F16 with an outstanding pipeline of new product developments, brand innovations and consumer marketing campaigns. Particular highlights were Lindeman’s Gentleman’s Collection and Penfolds Max’s. TWE is now leveraging strong consumer insights to deliver margin accretive innovation and growth for both our customers and consumers around the world.
The acquisition of the Diageo Wine business on 1 January 2016 was a significant milestone for TWE during F16. A strategically and financially compelling acquisition, it provided the Company with immediate access to more Luxury and Masstige fruit that will, in turn, enable TWE to take our outstanding portfolio of US brands to the world, notably into Asia.
The integration of Diageo Wine is largely complete and the reset period is on track. The first half of F17 commences with some very exciting brand and marketing activity focused on reinvigorating former Diageo Wine brands, including Sterling Vineyards, Beaulieu Vineyard and Blossom Hill.
Working off solid foundations laid by the reset of our operations in F15, the Company
has continued its journey of positive transformation in F16.
1. Earnings Per Share before material items and self-generating and regenerating assets (SGARA). Reported Earnings Per Share on a statutory basis was 25.1 cents per share, up 13.4 cents on the previous corresponding period, as announced by the Company at its F16 annual results on 18 August 2016.
TREASURY WINE ESTATES ANNUAL REPORT 2016 / 2
During the financial year, changes were made to optimise TWE’s supply chain and wine production network in Australia, New Zealand and the United States, as the Company took action to maximise the utilisation of production facilities, dispose of non-core assets and improve capital efficiency. This optimisation is delivering strong results and is expected to be a key driver of TWE’s EBITS margin accretion over time.
Quality, a term long applied to the Company’s winemaking processes, is now an increasingly appropriate descriptor for TWE’s earnings.
In the Americas, TWE delivered both EBITS growth and EBITS margin accretion whilst integrating Diageo Wine. Our portfolio mix in the region is continuing to improve, as is our sales and marketing execution. With the divestment of the non-priority Commercial portfolio on 4 July 2016, the Americas region is now well positioned to deliver volume and value growth across the Commercial, Masstige and Luxury segments in F17 and beyond.
Growth opportunities remain significant for our Company in Asia. In F16, TWE delivered another strong performance, with China once again a particular highlight. Changes to TWE’s route-to-market in key countries, coupled with outstanding marketing and superior execution, were critical factors contributing to this strong growth.
Our business in Australia & New Zealand (ANZ) performed well despite challenging market conditions. The region delivered both EBITS and EBITS margin accretion from a more diverse portfolio mix and by optimising price on supply constrained Luxury and Masstige wine.
In Europe, TWE reported EBITS growth and EBITS margin accretion by focusing brand building investment on priority brands and embedding a more efficient cost-base.
Looking ahead, it is clear TWE is now a more balanced business, with a wide range of brands and markets contributing to the Company’s financial success.
We are a business that is firmly on track for growth, with both the Board and management focused on the delivery of strategic plans that will realise sustainable growth opportunities.
Whilst opportunities remain to drive improvements in our Company’s performance, F16 marked a tangible step towards realising our ambition of becoming the world’s most celebrated wine company. With a refreshed and prioritised brand portfolio, and accelerating momentum across all our regions, the Board and management are confident that TWE will deliver high-teens EBITS margins by F18, two years ahead of our previously stated target.
Strong brands, an efficient business model, engaged partners and growing markets have all been integral components to TWE’s strategy and financial performance in F16. However, one other factor has been crucially important to the Company’s success – our people.
The progress made by the Company in F16 would not have been possible without the capabilities and commitment of our people, and we would like to recognise the significant contribution made by the entire TWE team in delivering this strong set of financial results.
Finally, we wish to express our appreciation to you, our shareholders, for your ongoing investment and support of TWE.
Kind regards,
Paul Rayner Michael Clarke Chairman ChiefExecutiveOfficer
TREASURY WINE ESTATES ANNUAL REPORT 2016 / 3

OPERATING AND FINANCIAL REVIEW
The following Operating and Financial Review contains details of the significant changes in TWE’s state of affairs that occurred during the year ended 30 June 2016.
TWE’s business activitiesTWE is a vertically integrated wine business and is focused on portfolio premiumisation supported by innovation and optimised brand building investment. The Company’s transition to a quality, brand-led marketing organisation is driven by the accelerated growth of its Priority and Regional Brand portfolios, represented across the Luxury, Masstige and Commercial segments and sold in more than 100 countries around the world.
The Company employs approximately 3,500 winemakers, viticulturists, sales distribution and support staff across the globe.
TWE’s organisational structure and significant changes in the state of affairsTWE continues to be focused on four regional segments:
• Australia and New Zealand (ANZ)
• Asia
• Europe
• Americas
During the year, management of TWE’s small but growing Latin American operations were transitioned to the Europe region, having previously been under the management of the Americas region.
To drive increased focus and presence in the region, TWE transitioned the management of its Middle East and Africa operations to the Asia region, having previously been under the management of the Europe region. From 1 July 2015, Latin America was reported as part of Europe, and Middle East and Africa was reported as part of South East Asia.
OPERATIONS
Treasury Wine Estates (TWE) is one of the world’s largest wine companies,
listed on the Australian Securities Exchange. The Company is focused on delivering shareholder
value through the production of quality wine, and marketing and selling quality wine brands
to consumers around the world.
During the year, a number of changes to the Executive Leadership Team were implemented. Noel Meehan was appointed as the Company’s new Chief Financial Officer, effective 1 January 2016. The Company also appointed Bob Spooner, previously Chief Supply Officer, as the new President of the Company’s operations in the Americas. Separately, TWE appointed Tim Ford, previously Head of Supply for the Americas region, as Director – Global Supply Chain during the year. These appointments will continue to drive the positive transformation of TWE forward.
A particular highlight during the year was the acquisition of Diageo Plc’s Wine business (‘Diageo Wine’). The acquisition drives a crucial step-change in the growth of TWE’s Luxury and Masstige portfolio in the US, by providing instant access to more Luxury and Masstige fruit.
TWE assumed ownership of Diageo Wine, effective 1 January 2016.
Other than the above matters and those matters referred to in both the ‘TWE Strategy’ section of the Operating and Financial Review and the Financial Statements of this Annual Report, there have been no other significant changes in the state of affairs of the Group during the financial year.
TWE’s business modelTWE is a vertically integrated wine business with three principal activities:
• Grape growing and sourcing
• Wine production
• Wine marketing, sales and distribution
TREASURY WINE ESTATES ANNUAL REPORT 2016 / 4
OPERATING AND FINANCIAL REVIEW (CONTINUED)
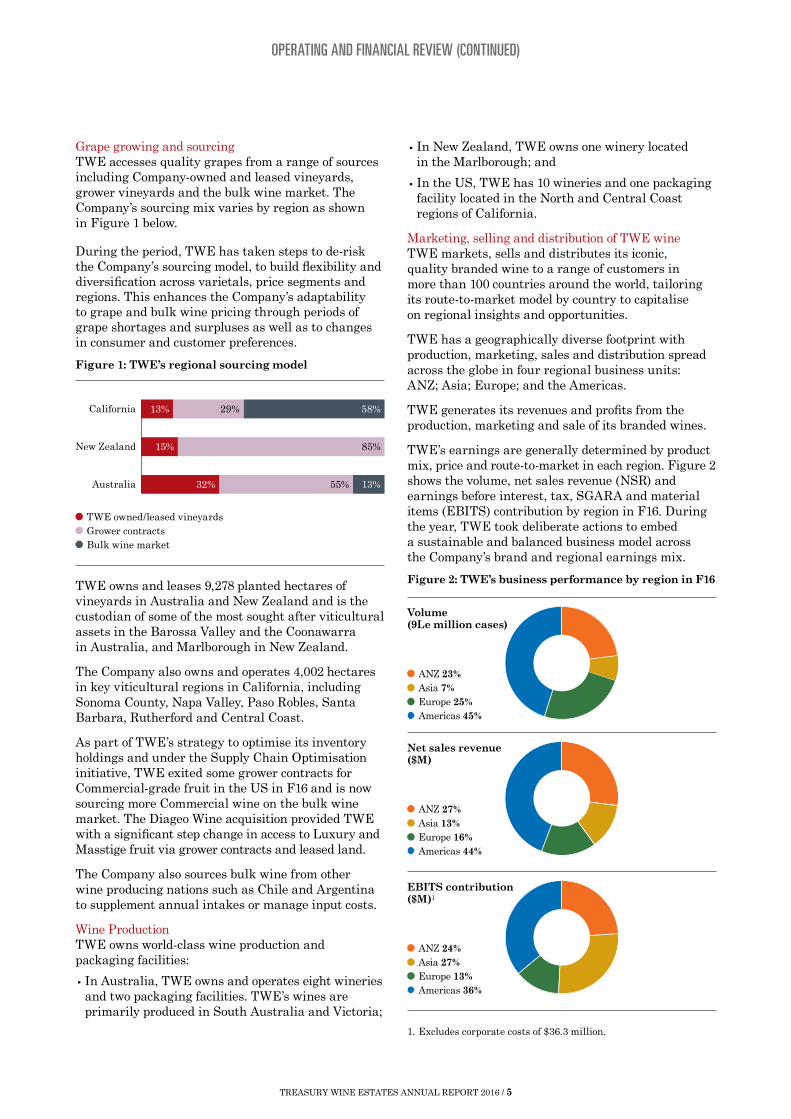
Grape growing and sourcingTWE accesses quality grapes from a range of sources including Company-owned and leased vineyards, grower vineyards and the bulk wine market. The Company’s sourcing mix varies by region as shown in Figure 1 below.
During the period, TWE has taken steps to de-risk the Company’s sourcing model, to build flexibility and diversification across varietals, price segments and regions. This enhances the Company’s adaptability to grape and bulk wine pricing through periods of grape shortages and surpluses as well as to changes in consumer and customer preferences.
Figure 1: TWE’s regional sourcing model
13% 29% 58%
15% 85%
32% 55% 13%
California
New Zealand
Australia
TWE owned/leased vineyardsGrower contractsBulk wine market
TWE owns and leases 9,278 planted hectares of vineyards in Australia and New Zealand and is the custodian of some of the most sought after viticultural assets in the Barossa Valley and the Coonawarra in Australia, and Marlborough in New Zealand.
The Company also owns and operates 4,002 hectares in key viticultural regions in California, including Sonoma County, Napa Valley, Paso Robles, Santa Barbara, Rutherford and Central Coast.
As part of TWE’s strategy to optimise its inventory holdings and under the Supply Chain Optimisation initiative, TWE exited some grower contracts for Commercial-grade fruit in the US in F16 and is now sourcing more Commercial wine on the bulk wine market. The Diageo Wine acquisition provided TWE with a significant step change in access to Luxury and Masstige fruit via grower contracts and leased land.
The Company also sources bulk wine from other wine producing nations such as Chile and Argentina to supplement annual intakes or manage input costs.
Wine ProductionTWE owns world-class wine production and packaging facilities:
• In Australia, TWE owns and operates eight wineries and two packaging facilities. TWE’s wines are primarily produced in South Australia and Victoria;
• In New Zealand, TWE owns one winery located in the Marlborough; and
• In the US, TWE has 10 wineries and one packaging facility located in the North and Central Coast regions of California.
Marketing, selling and distribution of TWE wineTWE markets, sells and distributes its iconic, quality branded wine to a range of customers in more than 100 countries around the world, tailoring its route-to-market model by country to capitalise on regional insights and opportunities.
TWE has a geographically diverse footprint with production, marketing, sales and distribution spread across the globe in four regional business units: ANZ; Asia; Europe; and the Americas.
TWE generates its revenues and profits from the production, marketing and sale of its branded wines.
TWE’s earnings are generally determined by product mix, price and route-to-market in each region. Figure 2 shows the volume, net sales revenue (NSR) and earnings before interest, tax, SGARA and material items (EBITS) contribution by region in F16. During the year, TWE took deliberate actions to embed a sustainable and balanced business model across the Company’s brand and regional earnings mix.
Figure 2: TWE’s business performance by region in F16
ANZ 23%Asia 7%Europe 25%Americas 45%
Volume(9Le million cases)
ANZ 27%Asia 13%Europe 16%Americas 44%
Net sales revenue($M)
ANZ 24%Asia 27%Europe 13%Americas 36%
EBITS contribution ($M)1
1. Excludes corporate costs of $36.3 million.
TREASURY WINE ESTATES ANNUAL REPORT 2016 / 5

OPERATING AND FINANCIAL REVIEW (CONTINUED)
Global industry overview
Global wine production and consumptionThe fundamentals of the global wine industry remain attractive. Consistent with trends observed in F15, the long-term global demand and supply continues to move into balance (as shown in Figure 3 below). Global wine production in 2015 was supported by strong vintages in three of the world’s largest wine producing nations: Italy, France and Spain. This was partially offset by lower yielding vintages in Argentina, South Africa and China.
Figure 3: Global wine production and consumption2
4,500
4,000
3,500
3,000
2,500
2,0001979 1982 1985 1988 1991 1994 1997 2000 2003 2006 2009 2012 2015E
10.5
10.0
9.5
9.0
8.5
8.0
7.5
7.0
6.5
6.0
m 9
L c
ases
m h
a
Global vineyard area
* Consumption figures include ˜ 330m 9L cases of wine used in the production of fortifieds and industrial applications.
Global wine production (LHS) Global wine consumption* (LHS)
Global demandGlobal wine consumption trends also remained relatively consistent with those observed in F15. Of particular note, wine consumption is growing in emerging and large alcohol consuming regions, notably China and the US. This trend is forecast to continue as shown in Figure 4 below.
Figure 4: Forecast five-year compound annual growth rate (CAGR) in wine consumption in key growth areas and markets3
COUNTRY CAGR (2014 – 2019F)
China 5.9%Italy 2.9%Canada 2.0%New Zealand 1.5%USA 0.5%Australia 0.1%Germany (0.3)%France (0.8)%United Kingdom (1.0)%
2. International organisation of Vine and Wine (OIV).3. Euromonitor International.
TREASURY WINE ESTATES ANNUAL REPORT 2016 / 6

OPERATING AND FINANCIAL REVIEW (CONTINUED)
Growth in consumer demand is strongest at the Masstige and Luxury price points; with value growth highest in these segments across all regions, as outlined in Figure 5. While below Luxury and Masstige, the Commercial category returned to growth in F16 in the US, the UK, Australia and China.
Figure 5: Value growth by price point
United States of America4 United Kingdom5
Australia6 Value growth of Australian bottled wine exports (freight on board) to China7
$20+
$10–$20
$4–$8
$20+
$10–$20
<$10
£8+
£6–£8
<£6
>$20
$10–$20
<$10
0%
4%
2%
7%
-3%
-4%
12%
7%
12%
11%
-1%
-3%
12%
11%
2%
-2%
2%
-5%
114%
47%
32%
31%
39%
28%
Mkt MAT to June 15Mkt MAT to June 16 Mkt MAT to June 15Mkt MAT to June 16
Mkt MAT to June 15Mkt MAT to June 16 Mkt MAT to June 15Mkt MAT to June 16
4. Nielsen FDL Scan MAT to June 2016.5. Aztec Sales Data | Off-premise Channel Only | Bottled Wine Only | Weighted MAT to June 2016.6. Nielsen (750mL bottled still wine only) MAT to June 2016.7. Wine Australia MAT to June 2016.
TREASURY WINE ESTATES ANNUAL REPORT 2016 / 7

OPERATING AND FINANCIAL REVIEW (CONTINUED)
TWE’s vision is to be the world’s most celebrated wine company; a company that enriches
people’s lives with quality wine brands.
TWE VISION
TWE STRATEGY
Underpinning this vision is TWE’s transition from an order-taking, agricultural company to a brand-led marketing organisation.
During F16, the Company simplified its strategic imperatives into the five listed below:
1. Transform our portfolio
2. Win in priority markets
3. Build a high performing organisation
4. Develop long-term relationships
5. Optimise our capital base
• Grow our 15 Priority Brands
• Support our Regional Brands
• Premiumise our portfolio
• Step-up advertising and promotion investment
• Deliver bigger, better campaigns
In F16, TWE achieved the following:
• Significantly enhanced profitability of Priority Brand portfolio; this portfolio comprised more than 85% of total NSR;
• Launched ‘Regional Gems’ strategy to scale up treasured, regionally appellated Australian brands;
• Acquired Diageo Wine on 1 January 2016, enhancing TWE’s premiumisation strategy by providing immediate access to increased Luxury and Masstige fruit;
• Developed new brand positioning and campaigns for key acquired Diageo Wine brands, including Sterling Vineyards, Beaulieu Vineyard and Blossom Hill;
• Commenced a re-set period for the Diageo Wine business; accelerating investment in consumer marketing and embedding a more sustainable base business;
• Managed down TWE’s non-priority Commercial (NPC) brand portfolio in the US; ahead of divestment of 12 NPC brands, comprising circa one million cases on 4 July 2016; and
• Continued to focus consumer marketing investment on Priority Brands in key growth markets, notably North Asia and the US.
Transform our portfolio
In F16, TWE achieved the following:
• Integration of Diageo Wine is largely complete; re-set period ongoing;
• Exited unprofitable volume and unsustainable customer contracts in the US and UK to deliver improved profitability;
• Further embedded TWE’s enhanced route-to-market in China with the launch of the wholesale distribution model in F16;
• Continued to invest in TWE’s sales, marketing and support functions in all regions to support TWE’s expanding presence globally;
• Delivered NSR per case growth in the US, reflecting favourable portfolio mix, price increases on select brands and focus on sustainable volume;
• Strengthened partnerships with retail customers in Australia in F16 underpinned by continued investment in category growth initiatives; and
• Managed challenging pricing and trading environment in Europe with focused investment on core Priority Brand tiers and market combinations.
• Grow share in Asia through route-to-market and portfolio expansion
• Grow in US through premiumisation
• Strengthen no.1 position in Australia through category leadership
• Protect profitability in other key markets
Win in priority markets
PROGRESS AGAINST INITIATIVE IN F16STRATEGIC IMPERATIVE
TREASURY WINE ESTATES ANNUAL REPORT 2016 / 8

OPERATING AND FINANCIAL REVIEW (CONTINUED)
• Drive an inclusive, supportive and collaborative culture
• Grow capability now and for the future
• Operate an efficient and sustainable structure
In F16, TWE achieved the following:
• Supported the diversity agenda by expanding the Women in Wine network across key regions;
• Invested in organisational capability with the launch of the TWE Leadership Framework across functions and regions, and expanded the Treasury University, globally; and
• Continued to embed a cost conscious culture; TWE delivered more than $15 million of overhead reductions in F16, further building on the $40 million plus overhead reduction delivered in F15.
Build a high performing organisation
• Connect with consumers
• Partner with key customers to grow wine category
• Drive performance for all stakeholders
In F16, TWE achieved the following:
• Continued to focus on deepening and broadening partnerships with distributor and retail customers across all regions, underpinned by TWE’s consumer insights and brand health; and
• Enhanced routes-to-market in Japan, Taiwan and Korea; embedding closer partnerships with customers and consumers.
Develop long-term relationships
• Operate sustainably, safely and responsibly
• Create supply chain cost and quality advantage
• Address high cost structures in mature markets
• Simplify processes
In F16, TWE achieved the following:
• Reduced cost and complexity in TWE’s supply chain by:
– Delivering a 30% reduction in TWE’s base business stock keeping units (SKUs) in F16;
– Discontinuing 11 non-core Diageo Wine brands and removing 35% of SKUs in the US in the second half of F16;
• Delivered $41 million of cost of goods sold (COGS) savings from its Supply Chain Optimisation initiative, representing a saving of $1.36 per case;
• Complemented TWE’s efficient capital base with the acquisition of Diageo Wine;
• Completed a US$356 million capital raising to facilitate an equal-weighted debt and equity financing arrangement for the acquisition of Diageo Wine; and
• Repaid in full the acquisition bridge facility of US$125 million in March 2016.
Optimise our capital base
PROGRESS AGAINST INITIATIVE IN F16STRATEGIC IMPERATIVE
Refer to the Corporate Responsibility section of this Annual Report for TWE’s progress on sustainability and safety.
TREASURY WINE ESTATES ANNUAL REPORT 2016 / 9

OPERATING AND FINANCIAL REVIEW (CONTINUED)
TWE remains focused on leveraging operational, strategic and cultural change delivered over the past two years to drive value for its shareholders. Areas of current and ongoing business focus that will likely impact TWE’s future operational and financial prospects include the following:
• Ongoing focus on premiumising TWE’s portfolio, supported by TWE’s non-current inventory of Luxury and Masstige wine;
• Continuing to transition the business from an order-taking, agricultural company to a brand-led, marketing organisation;
• Reinvigorating TWE’s brand portfolio by investing behind fewer, bigger, better brands, globally;
• Building scale and flexibility of TWE’s Priority Brand portfolio; enabling the brands to have truly global reach;
• Investing in sales and marketing capability in TWE’s key growth regions; North Asia and the US, while expanding and investing in new markets and channels, including Global Travel Retail and Latin America;
• TWE now expects total, cumulative COGS savings from its Supply Chain Optimisation initiative to reach a run rate of at least $100 million (up from $80 million) by F20. These COGS savings are expected to offset COGS headwinds as a result of higher vintage costs in F17;
• Re-set period for the acquired Diageo Wine business is ongoing; TWE will continue to reposition Diageo Wine brands by investing in a more sustainable base business;
• TWE expects total cash synergies recognised from the acquisition of Diageo Wine to reach a run rate of US$35 million (up from US$25 million) by F20;
• Acquisition of Diageo Wine business expected to continue to enhance both return on capital employed (ROCE) and EBITS margin as improved financial results and synergies are delivered;
• TWE targets financial metrics that are consistent with an investment grade credit profile. TWE’s balance sheet provides the Company with the flexibility to pursue value accretive opportunities for shareholders;
• Maintenance and replacement capital expenditure expected to be $110 million in F17, with capital expenditure associated with the Diageo Wine acquisition expected to be circa $80 million in F17; and
• TWE now expects to deliver high-teens EBITS margin by F18; representing a two-year acceleration of this target.
FUTURE PROSPECTS
TREASURY WINE ESTATES ANNUAL REPORT 2016 / 10

OPERATING AND FINANCIAL REVIEW (CONTINUED)
Material Business RisksThere are various risks that could have a material impact on the achievement of TWE’s strategies and future prospects.
Below are those risks that TWE considers of greatest materiality to the business, and existing mitigations against these risks.
RISK DESCRIPTION MITIGATION
Embedding and operationalising changes to our asset base
In the past year, TWE has embarked on significant changes to reposition and grow the business. The Company has executed important divestment and acquisition transactions, introduced new business models and supporting infrastructure. This has and will continue to involve organisational change and restructuring, development of new processes, technologies and ways of working.
TWE’s ability to effect and embed such change without significant disruption to existing operations will influence future success.
• Organisational restructuring and rightsizing;
• Realignment, redesign and simplification of key business processes;
• Focused and specially resourced project teams to support acquisition integration planning and implementation;
• Investment in organisational capability; and
• Project steering committees and continuous monitoring.
Significant business disruption and/or catastrophic damage or loss
TWE’s broad scope of operations exposes it to a number of business disruption risks, such as environmental catastrophes, natural and man-made hazards and incidents, or politically motivated violence. Significant business disruption could result in TWE sites or employees being harmed or threatened, loss of key infrastructure, inventory shortages or loss, customer dissatisfaction, financial and reputation loss.
• Crisis and Business Continuity Plans and training;
• Dedicated health and safety team;
• Physical site security systems and resources;
• Strong health and safety culture via ongoing employee training and awareness programs;
• Preventative repair and maintenance program;
• Multi-regional and global sourcing arrangements and key supplier alternatives; and
• Comprehensive operational and employee insurance program.
Climate change and agricultural factors
Grape growing and winemaking are subject to a variety of agricultural and climate change factors, such as disease, pests, extreme weather conditions, water scarcity and biodiversity loss. To the extent that any of the foregoing impacts the quality and quantity of grapes available to TWE for the production of its wines, the financial prospects of operations could be adversely affected, both in the year of harvest and in future periods.
• Long-term vintage planning and ongoing integrated business planning processes;
• Strategic climate change remediation investment plan and vineyard capital investment plan;
• Supply chain specialised and flexible, including:
– Defined program to progressively reduce COGS over the next five years;
– Balancing long-term and flexible grape and bulk wine purchase commitments;
– Balancing grape intake between owned/leased vineyards and external suppliers;
– Multi-regional sourcing of grapes;
• Collaborating with research institutes on adaption research, development and extension projects; and
• Environment policy, monitoring and reporting systems.
TREASURY WINE ESTATES ANNUAL REPORT 2016 / 11

OPERATING AND FINANCIAL REVIEW (CONTINUED)
RISK DESCRIPTION MITIGATION
Market concentration and critical industry developments
TWE’s customer portfolio is dominated by large retailers, distributors and state-owned monopolies. The concentration of the market means that instability and changes to market dynamics can significantly impact the Company’s relationship with key customers. Of particular note is:
• The concentrated liquor retail landscape in Australia and the UK, where a small number of retailers account for a significant proportion of the market;
• The concentration of the US liquor market, which is dominated by a small number of large distributors;
• Increased competition; and
• Volatile regulatory environments in many key Asia markets.
TWE’s financial performance, revenues and market share may be adversely affected based on the Company’s ability to respond to changes in these market dynamics.
• Diversity of the Company’s customer base, country and product portfolio;
• Evaluating and where required, re-establishing the Company’s route-to-market particularly across Asia;
• Investing in strong and sustainable customer relationships;
• Investment in on-the-ground sales and marketing capability; and
• Participation and representation in industry bodies.
Economic and consumer trends
Domestic and/or international economic trends (consumer sentiment, economic growth, employment level and inflation) play an important factor in overall wine market growth. In addition, changes in consumer preferences over time drive industry trends for different varietals and country of origin wines.
Leading, participating in, or managing these trends is of increased importance to TWE. Failure to do so can result in missed sales opportunities, margin losses and stock write-downs. Wine production asset utilisation may also be adversely impacted.
• Strategic product portfolio, brand, pricing and product allocation decisions, supporting long-term growth objectives;
• Investing in brands to drive consumer awareness, purchasing behaviours and demand;
• Dedicated consumer insights and innovation team;
• Integrated sales, operations and financial planning processes; and
• Enhanced supply chain flexibility enabling more agile response to changing consumer needs.
Brand reliance and reputation
TWE’s success in generating profits and increasing market share is based on the success of its key brands.
As a marketing focused organisation, TWE must build and manage the reputation of its brands, balance reliance on key brands and mitigate the potential for events which might cause brand damage (e.g. engagement of unsatisfactory suppliers, social and environmental risks, inaccurate and unfavourable media coverage).
Failure to do so could impact TWE’s market share, financial performance and increase the risk of stock and asset write-downs.
• Investment in brand strength through targeted customer and consumer marketing focused on Priority Brands;
• TWE Code of Conduct, Responsible Marketing Guidelines; Environment Policy, Media and Social Media Policy; and incident management processes;
• Dedicated consumer insights and innovation team supporting monitoring and awareness of brand health and broader consumer trends;
• Strategic brand and product portfolio planning processes;
• Dedicated technical services team (overseeing product quality, sustainability and continuous improvement); and
• Brand and intellectual property protection and management.
TREASURY WINE ESTATES ANNUAL REPORT 2016 / 12

OPERATING AND FINANCIAL REVIEW (CONTINUED)
RISK DESCRIPTION MITIGATION
Loss of key management or specialist resources
TWE’s ability to grow, make, distribute and sell wine is reliant on attracting, retaining and developing skilled and motivated talent within the Company’s leadership team, core functions, such as winemaking, sales and marketing, and in emerging markets.
Inability to grow and develop talent would place stress on the ability of the business to execute its strategy and increase the risk of burnout of existing talent.
• Emerging Leaders training program;
• Talent review and succession planning processes;
• Incentive and reward programs aligned to TWE’s vision and key growth behaviours; and
• Employee retention agreements.
Compliance with laws and regulations
TWE operates in a highly regulated industry in many of the markets in which it makes and sells wine, and is rapidly expanding into new and emerging markets. Each of these markets have differing regulations that govern many aspects of TWE operations, including taxation, manufacturing, marketing, advertising, distribution and sales of wine.
Remaining compliant with and abreast of changes to such regulations requires diligent and ongoing monitoring by the business. Additionally, changes and additional regulations can significantly impact the nature of operations in these markets.
• Company-wide policies, standards and procedures;
• TWE Compliance, and New Market Entry policy and supporting frameworks;
• Specialised and experienced resources and teams;
• Executive Leadership Team oversight via the Risk, Compliance and Governance Committee;
• TWE Assurance framework, including targeted reviews from external and internal audit and other specialist providers; and
• Strong relationships with key government and regulatory bodies.
Foreign exchange rate impacts
TWE is exposed to foreign exchange risk from a number of sources, namely from the export of Australian produced wine to key offshore markets in North America and Europe. Foreign exchange rate movements impact TWE’s earnings on a transactional and translational basis.
• Active foreign exchange hedging strategy;
• Partial natural hedges (purchases and sales within same currency) where possible; and
• Match debt funding of assets by currency, where possible.
Cyber threat Data/information security is essential to protect business critical intellectual property and privacy of data. Continuing advances in technology, systems and communication channels mean increasing amounts of private and confidential data are now stored electronically. This, together with increasing cyber-crime, heightens the need for robust data security measures.
• Information security policy, supporting framework and specialised resources;
• Periodic employee training and alerts to ensure secure handling of sensitive data;
• Crisis management and IT Disaster Recovery Plans; and
• Periodic user access and general system penetration testing.
TREASURY WINE ESTATES ANNUAL REPORT 2016 / 13

OPERATING AND FINANCIAL REVIEW (CONTINUED)
PROFIT REPORT
Financial Performance
$M F16
REPORTED CURRENCY CONSTANT CURRENCY
F15 CHANGE F15 CHANGE
Volume (m 9Le cases) 33.6 30.1 11.5% 30.1 11.5%Net sales revenue 2,232.6 1,857.2 20.2% 1,972.2 13.2%NSR per case ($) 66.50 61.66 7.8% 65.48 1.6%Other Revenue 110.7 113.8 (2.7)% 111.0 (0.3)%Cost of goods sold (1,508.3) (1,324.1) (13.9)% (1,370.7) (10.0)%Cost of goods sold per case ($) 44.92 43.96 (2.2)% 45.51 1.3%Gross profit 835.0 646.9 29.1% 712.5 17.2%Gross profit margin (% of NSR) 37.4% 34.8% 7.5% 36.1% 3.6%Cost of doing business (493.0) (421.8) (16.9)% (446.4) (10.4)%Cost of doing business margin (% of NSR) 22.1% 22.7% 0.6ppts 22.6% 0.5pptsEBITS 342.0 225.1 51.9% 266.1 28.5%EBITS margin (%) 15.3% 12.1% 3.2ppts 13.5% 1.8pptsSGARA (8.5) (18.9) 55.0% (19.7) 56.9%EBIT 333.5 206.2 61.7% 246.4 35.3%Net finance costs (21.2) (21.6) 1.9% (21.9) 3.2%Tax expense (94.7) (57.4) (65.0)% (59.1) (60.2)%Net profit after tax (before material items) 217.6 127.2 71.1% 165.4 31.6%Material items (after tax) (38.1) (49.6) 23.2% (50.0) 23.8%Non-controlling interests (0.1) – – – –Net profit after tax 179.4 77.6 131.2% 115.4 55.5%Reported EPS (A¢) 25.1 11.7 114.5%Net profit after tax (before material items and SGARA) 221.8 142.5 55.6% 181.5 22.2%EPS (before material items and SGARA) (A¢) 31.1 21.5 44.7%Average no. of shares (m) 713.7 663.0Dividend (A¢) 20.0 14.0 43%
Diageo WineF16
Volume (m 9Le) 3.4NSR (A$m) 200.7NSR per case (A$) 59.26EBITS (A$m) 33.2EBITS margin (%) 16.5%
Base Business
F16
REPORTED CURRENCY
F15 %
Volume (m 9Le) 30.2 30.1 0.2%NSR (A$m) 2,031.9 1,857.2 9.4%NSR per case (A$) 67.31 61.66 9.2%EBITS (A$m) 308.8 225.1 37.2%EBITS margin (%) 15.2% 12.1% 3.1ppts
* Refer to page 15 for supporting footnotes.
TREASURY WINE ESTATES ANNUAL REPORT 2016 / 14
OPERATING AND FINANCIAL REVIEW (CONTINUED)
Financial headlines1
• Net Sales Revenue (NSR) up 20% on a reported currency basis and by 13% on a constant currency basis2
• EBITS3,4 $342.0 million, up 52% on a reported currency basis and 29% on a constant currency basis
• 3.2ppts EBITS margin accretion on the previous corresponding period (pcp) on a reported currency basis
• Statutory net profit after tax $179.4 million
• Reported EPS 25.1 cents per share
• EPS of 31.1 cents per share (before material items and SGARA)
• Strong cash conversion at 123%
• Net debt5/EBITDAS: headline, 0.9x; adjusted for operating leases 1.6x6 and interest cover 16.5x7
Business headlines
• Margin accretion delivered by base business portfolio premiumisation, acquisition of Diageo Wine, lower Cost of Doing Business margin and Supply Chain savings
• Integration of Diageo Wine largely complete; re-set period ongoing
• Deliberate action to exit unsustainable volume and customer arrangements in the US and UK in F16
• Significantly improved profitability of Priority Brand portfolio8; portfolio comprised more than 85% of total NSR9
• Supply Chain Optimisation initiative delivered increased COGS savings in F16; COGS savings now expected to be a run-rate of at least $100 million by F20
• Sale of non-priority Commercial (NPC) brand portfolio10 in July 2016
1. F15 comparatives have been restated to reflect minor reclassifications of selling and IT related costs.2. Unless otherwise stated all percentage or Dollar movements from prior periods are pre any material items and on a constant currency basis.3. Earnings before interest, tax, SGARA and material items.4. Financial information in this report is based on audited financial statements. Non-IFRS measures have not been subject to audit or
review. The non-IFRS measures are used internally by management to assess the operational performance of the business and make decisions on the allocation of resources.
5. Borrowings have been adjusted to include $12.9 million fair value of interest rate derivatives designated in a fair value hedge of US Private Placement notes.
6. Adjusted for TWE’s long-term operating lease profile, which increased following the acquisition of Diageo Wine.7. Interest cover calculated as the ratio of earnings to net interest expense, where earnings is the consolidated pre-tax profit (pre material
items and SGARA) plus the sum of the amount of net interest expense adjusted for amortised interest costs, per financial covenants.8. Priority Brand NSR adversely impacted by exit from unsustainable volume and customer contracts in the US and UK in F16.9. Based on base business NSR in F16.10. Divested NPC brands include: Little Penguin, Stone Cellars, Cellar No 8, Colores Del Sol, Black Opal, Century Cellars, Great American
Wine Company, Chateau La Paws, Once Upon A Vine, Rosenblum, Snapdragon and Orogeny.11. TWE targets a dividend payout ratio of between 55%–70% of Net Profit After Tax (pre-material items and SGARA) over a fiscal year.
Diageo Wine EBITS margin driven by:
• Favourable mix driven by aggressive withdrawal from unprofitable volume and unsustainable customer contracts in the second half of F16
• Absorption of overheads into TWE’s base business via integration in the second half of F16, notably in Europe
• Partially offset by significantly elevated brand building investment
Dividend
• Annual dividend 20 cents per share, unfranked, 6 cents per share higher than the pcp (up 43%)
• Dividend payout ratio 67%; consistent with dividend policy11
Outlook
• TWE now expects to deliver a high-teens EBITS margin by F18, supported by continued momentum across all regions and increased COGS savings
TREASURY WINE ESTATES ANNUAL REPORT 2016 / 15
OPERATING AND FINANCIAL REVIEW (CONTINUED)
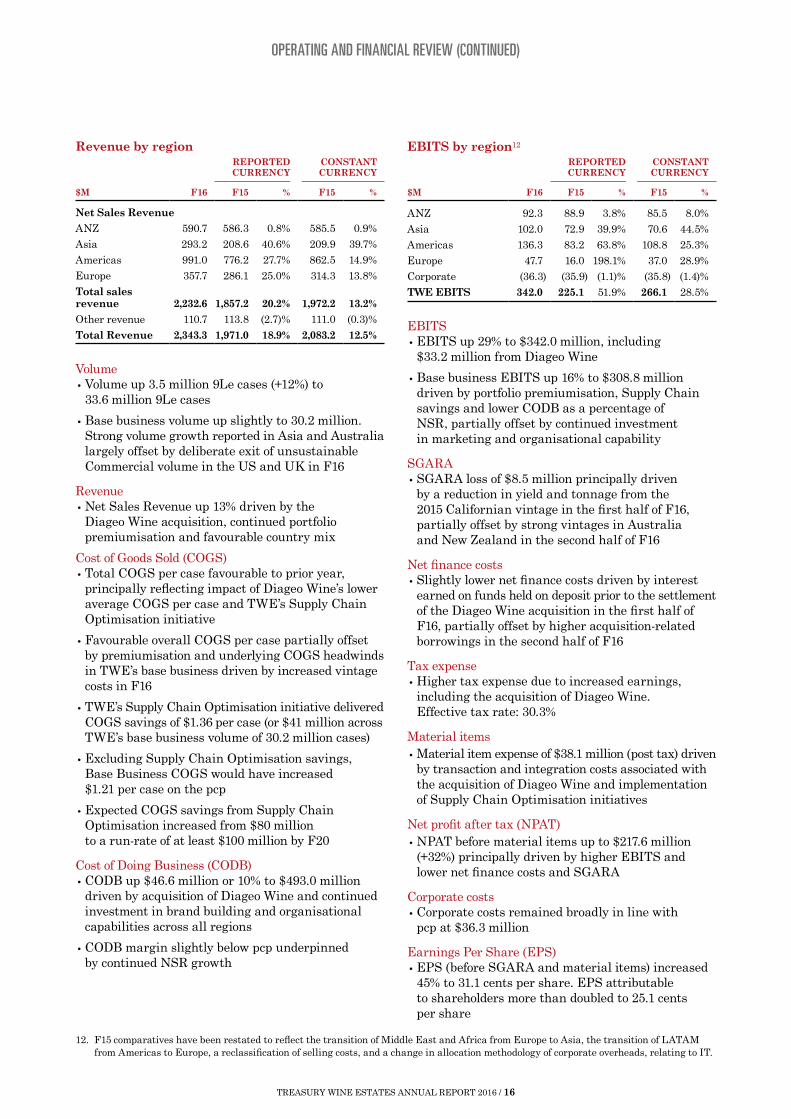
Revenue by region
$M F16
REPORTED CURRENCY
CONSTANT CURRENCY
F15 % F15 %
Net Sales RevenueANZ 590.7 586.3 0.8% 585.5 0.9%Asia 293.2 208.6 40.6% 209.9 39.7%Americas 991.0 776.2 27.7% 862.5 14.9%Europe 357.7 286.1 25.0% 314.3 13.8%Total sales revenue 2,232.6 1,857.2 20.2% 1,972.2 13.2%Other revenue 110.7 113.8 (2.7)% 111.0 (0.3)%Total Revenue 2,343.3 1,971.0 18.9% 2,083.2 12.5%
Volume• Volume up 3.5 million 9Le cases (+12%) to
33.6 million 9Le cases
• Base business volume up slightly to 30.2 million. Strong volume growth reported in Asia and Australia largely offset by deliberate exit of unsustainable Commercial volume in the US and UK in F16
Revenue• Net Sales Revenue up 13% driven by the
Diageo Wine acquisition, continued portfolio premiumisation and favourable country mix
Cost of Goods Sold (COGS)• Total COGS per case favourable to prior year,
principally reflecting impact of Diageo Wine’s lower average COGS per case and TWE’s Supply Chain Optimisation initiative
• Favourable overall COGS per case partially offset by premiumisation and underlying COGS headwinds in TWE’s base business driven by increased vintage costs in F16
• TWE’s Supply Chain Optimisation initiative delivered COGS savings of $1.36 per case (or $41 million across TWE’s base business volume of 30.2 million cases)
• Excluding Supply Chain Optimisation savings, Base Business COGS would have increased $1.21 per case on the pcp
• Expected COGS savings from Supply Chain Optimisation increased from $80 million to a run-rate of at least $100 million by F20
Cost of Doing Business (CODB)• CODB up $46.6 million or 10% to $493.0 million
driven by acquisition of Diageo Wine and continued investment in brand building and organisational capabilities across all regions
• CODB margin slightly below pcp underpinned by continued NSR growth
EBITS by region12
$M F16
REPORTED CURRENCY
CONSTANT CURRENCY
F15 % F15 %
ANZ 92.3 88.9 3.8% 85.5 8.0%Asia 102.0 72.9 39.9% 70.6 44.5%Americas 136.3 83.2 63.8% 108.8 25.3%Europe 47.7 16.0 198.1% 37.0 28.9%Corporate (36.3) (35.9) (1.1)% (35.8) (1.4)%TWE EBITS 342.0 225.1 51.9% 266.1 28.5%
EBITS• EBITS up 29% to $342.0 million, including
$33.2 million from Diageo Wine
• Base business EBITS up 16% to $308.8 million driven by portfolio premiumisation, Supply Chain savings and lower CODB as a percentage of NSR, partially offset by continued investment in marketing and organisational capability
SGARA• SGARA loss of $8.5 million principally driven
by a reduction in yield and tonnage from the 2015 Californian vintage in the first half of F16, partially offset by strong vintages in Australia and New Zealand in the second half of F16
Net finance costs• Slightly lower net finance costs driven by interest
earned on funds held on deposit prior to the settlement of the Diageo Wine acquisition in the first half of F16, partially offset by higher acquisition-related borrowings in the second half of F16
Tax expense• Higher tax expense due to increased earnings,
including the acquisition of Diageo Wine. Effective tax rate: 30.3%
Material items
• Material item expense of $38.1 million (post tax) driven by transaction and integration costs associated with the acquisition of Diageo Wine and implementation of Supply Chain Optimisation initiatives
Net profit after tax (NPAT)
• NPAT before material items up to $217.6 million (+32%) principally driven by higher EBITS and lower net finance costs and SGARA
Corporate costs• Corporate costs remained broadly in line with
pcp at $36.3 million
Earnings Per Share (EPS)• EPS (before SGARA and material items) increased
45% to 31.1 cents per share. EPS attributable to shareholders more than doubled to 25.1 cents per share
12. F15 comparatives have been restated to reflect the transition of Middle East and Africa from Europe to Asia, the transition of LATAM from Americas to Europe, a reclassification of selling costs, and a change in allocation methodology of corporate overheads, relating to IT.
TREASURY WINE ESTATES ANNUAL REPORT 2016 / 16

OPERATING AND FINANCIAL REVIEW (CONTINUED)
Balance Sheet (condensed)13
$M F16 F15
Cash and cash equivalents 256.1 122.1Receivables 611.4 506.6Current inventories 904.0 704.2Non-current inventories 678.4 533.8Property, plant and equipment 1,154.5 928.8Agricultural assets 340.0 255.1Intangibles 1,060.2 791.1Other assets 372.6 308.1Total assets 5,377.2 4,149.8
Payables 725.4 460.6Borrowings 630.9 324.6Provisions 80.4 93.4Other liabilities 305.4 220.5Total liabilities 1,742.1 1,099.1Net assets 3,635.1 3,050.7
Balance sheet movements as at June 2016Net assets up $584.4 million reflecting the acquisition of Diageo Wine. Adjusting for movements in foreign currency, net assets increased $564.3 million
Cash and cash equivalentsHigher cash balance principally driven by the contribution of Diageo Wine in F16 and continued base business momentum
Working CapitalHigher working capital driven by:
• Increased inventory reflecting the acquisition of Diageo Wine as well as the outstanding 2016 vintages in Australia and New Zealand in F16 where yield and quality was excellent. Higher inventory in F16 was partially offset by a significant reduction in underlying costs as a result of TWE’s Supply Chain Optimisation initiative
• Continued focus on optimising payment terms with key suppliers
• Partially offset by higher receivables driven by the acquisition of Diageo Wine in F16 and strong sales growth across TWE’s base business
InventoryTotal inventory increased $344.4 million. Factors driving the movement in inventory included:
• Significant uplift in Luxury inventory; up $255.4 million to $798.1 million in the period driven by the acquisition of Diageo Wine in F16 and outstanding 2016 vintages in both Australia and New Zealand
• Partially offset by lower average production costs driven by TWE’s Supply Chain Optimisation initiative executed in F16
• Continued focus on optimising TWE’s inventory mix by reducing Commercial and lower-end Masstige inventory holdings; TWE managed down the NPC portfolio in the US in F16 prior to divestment of the remaining inventory on 4 July 2016
• Movements in foreign exchange rates did not have a material impact on inventory in F16 relative to the pcp
Property, plant and equipmentProperty, plant and equipment increased $225.7 million to $1,154.5 million reflecting wineries and packaging facilities acquired from Diageo Wine
Agricultural assetsAgricultural assets increased to $340.0 million reflecting increased owned vines following acquisition of Diageo Wine
IntangiblesIncreased intangible assets reflected goodwill and brand value on the acquisition of Diageo Wine
Borrowings14
Borrowings increased $306.3 million to $630.9 million reflecting the debt funding component of the Diageo Wine acquisition in F16. US$125m Diageo Wine acquisition bridge facility repaid in the second half of F16, funded by cash and existing undrawn facilities
Balance sheet leverageHeadline Net debt/EBITDAS 0.9x (adjusted for operating leases: 1.6x) and interest cover of 16.5x
Funding structureAt 30 June 2016, TWE had committed debt facilities totalling approximately $1 billion, comprising bank facilities of $669.2 million and US private placement notes of $335.6 million
• Undrawn committed, syndicated debt facilities total $467.8 million
• Weighted average term to maturity of committed facilities 4.4 years
13. Unless otherwise stated, all balance sheet percentage or Dollar movements from the previous corresponding period are on a reported currency basis.
14. Borrowings have been adjusted to include $12.9 million fair value of interest rate derivatives designated in a fair value hedge of US Private Placement notes.
TREASURY WINE ESTATES ANNUAL REPORT 2016 / 17

OPERATING AND FINANCIAL REVIEW (CONTINUED)
Cash flow – reconciliation of net debt
$M F16 F15
EBITDAS 441.0 309.6Change in working capital 87.1 12.0Other items 16.3 (4.4)Net operating cash flows before financing costs, tax and material items 544.4 317.2Cash conversion 123.4% 102.5%Capital expenditure (133.8) (90.8)Net investment expenditure/other (803.7) (1.3)Asset sale proceeds 5.4 6.8Cash flows after net capital expenditure, before financing costs, tax and material items (387.7) 231.9Net interest paid (21.7) (22.1)Tax paid (10.8) (34.2)Cash flows before dividends and material items (420.2) 175.6Dividends/distributions paid (111.2) (84.7)Cash flows after dividends before material items (531.4) 90.9Material item cash flows (13.7) (85.1)Issue of shares, less transaction costs 475.4 –On-market share purchases (4.5) (0.1)Total cash flows from activities (74.2) 5.7Opening net debt (213.9) (209.4)Total cash flows from activities (above) (74.2) 5.7Proceeds from settlement of derivatives 10.3 47.0Acquired Diageo Wine finance lease (85.1) –Debt revaluation and foreign exchange movements (2.1) (57.2)Increase in net debt (151.1) (4.5)Closing net debt (365.0) (213.9)
Movement in net debtNet debt increased $151.1 million to $365.0 million. Drivers of the movement in net debt included:
Movement in EBITDASEBITDAS increased $131.4 million on a reported currency basis driven by continued momentum across TWE’s base business and the acquisition of Diageo Wine
Movement in working capitalFavourable movement in working capital of $87.1 million driven by:
• Significantly higher payables (including $26 million due to timing) as TWE optimises payment terms with suppliers
• Partially offset by increased inventory reflecting higher vintages in Australia and New Zealand in 2016
• Higher receivables balances from the acquisition of Diageo Wine and accelerated momentum in TWE’s base business in F16
Movement in capital expenditureCapital expenditure up $43 million to $133.8 million driven by:
• Maintenance and replacement capital expenditure of $91.4 million in line with guidance and reflected investment in premiumisation activities
• Capital expenditure supporting TWE’s Supply Chain Optimisation initiative of $26.9 million; in line with guidance
• Integration capital expenditure of $15.5 million relating to the acquisition of Diageo Wine in F16
Maintenance and replacement expenditure not expected to be more than $110 million in F17. Capital expenditure required to deliver TWE’s integration synergies of US$35 million (run rate by F20) is expected to be circa $80 million in F17
Movement in net investment expenditureAdverse movement in net investment expenditure reflects settlement of Diageo Wine acquisition on 1 January 2016
Movement in material itemsFavourable movement in net material items outflow driven by:
• Proceeds from the sale of the Asti Winery in the US as part of TWE’s Supply Chain Optimisation initiative in the first half of F16
• Offset by restructuring and redundancy outflows relating to TWE’s overhead reduction program and Supply Chain Optimisation initiative
Proceeds from issue of shares, less transaction costsProceeds from issue of shares, net of transaction costs of $475.4 million related to the cash inflow from the equity funding component of the Diageo Wine acquisition in the first half of F16
Tax paidLower tax paid driven by payment of franking deficits tax in the pcp to bring TWE’s franking account balance to nil
Acquired Diageo Wine finance leaseAcquired Diageo Wine finance lease relates to the capitalised lease acquired upon settlement of the Diageo Wine acquisition on 1 January 2016
Exchange rate impactLower period-end exchange rates used to revalue foreign currency borrowings as at 30 June 2016 increased net debt by $2.1 million. Cash flows from the close out of foreign currency exchange swap contracts decreased net debt by $10.3 million. These cash flows have nil impact on the Profit and Loss Statement
Cash conversionCash conversion was 123.4%, compared with 102.5% in the pcp
TREASURY WINE ESTATES ANNUAL REPORT 2016 / 18

OPERATING AND FINANCIAL REVIEW (CONTINUED)
REGIONAL SUMMARIES – AUSTRALIA AND NEW ZEALAND (ANZ)
Financial performance15
$M F16
REPORTED CURRENCY
CONSTANT CURRENCY
F15 % F15 %
Volume (m 9Le) 7.8 7.6 2.6% 7.6 2.6%NSR (A$m) 590.7 586.3 0.8% 585.5 0.9%NSR per case (A$) 75.88 77.28 (1.8)% 77.17 (1.7)%EBITS (A$m) 92.3 88.9 3.8% 85.5 8.0%EBITS margin (%) 15.6% 15.2% 0.4ppts 14.6% 1.0ppts
Business performance
• Volume up 197.5k 9Le cases (+2.6%) to 7,785k
• NSR up 1% despite adverse portfolio mix within Luxury segment and strong growth in TWE’s Commercial tiers in F16
• Supply constraints in TWE’s Masstige portfolio partially offset by price increases during the period, notably on Penfolds, Wynns and Annie’s Lane
• Increased consumer marketing activities supporting TWE’s Priority Brands underpinned strong growth in Commercial tiers of Wolf Blass and Lindeman’s, notably in the second half of F16
• TWE gaining share in Australian Luxury category driven by outstanding consumer and brand-led marketing campaigns
• COGS per case in line with pcp. Higher vintage costs from lower yielding 2014 and 2015 vintages offset by Supply Chain optimisation benefits and increased production overhead recoveries delivered by Commercial volume growth, particularly in the second half of F16
• Favourable CODB margin as lower overheads and NSR growth more than offset increased brand building investment
• Exit from less profitable volume and growth in the Masstige segment delivered positive mix and EBITS growth in New Zealand in the period
• EBITS up 8% to $92.3 million despite adverse portfolio mix
• EBITS margin accretion delivered, up 1ppt to 15.6%
ANZ regional perspectives
• Continued focus on strengthening partnerships with retail customers in Australia underpinned by investment in successful category growth initiatives
• Focused on strengthening category leadership position via continued consumer and brand-led marketing and building long term partnerships with key customers
• Regional Gem Brand portfolio now well positioned for growth with key innovation launches and portfolio realignment
• Focused on investment in innovation that drives portfolio premiumisation, optimisation of brand building investment and ongoing focus on cost management
Historical EBITS and EBITS margin
15. F15 EBITS restated to $88.9 million (from $84.4 million) and in the first half of F16 ANZ EBITS restated to $48.5 million (from $46.7 million), reflecting a change in allocation methodology of corporate overheads, relating to IT.
F14 F15 F16
A$M
Chart presented on a reported currency basis.
100.0
90.0
80.0
70.0
60.0
50.0
40.0
30.0
20.0
10.0
0
16.0%
15.5%
15.0%
14.5%
14.0%
13.5%
13.0%
12.5%
12.0%
11.5%
11.0%
1H
2H FY Total Business EBITS Margin
TREASURY WINE ESTATES ANNUAL REPORT 2016 / 19

OPERATING AND FINANCIAL REVIEW (CONTINUED)
REGIONAL SUMMARIES – ASIA16
Financial performance
$M F16
REPORTED CURRENCY
CONSTANT CURRENCY
F15 % F15 %
Volume (m 9Le)– Base business 2.3 1.7 37.2% 1.7 37.2%– Diageo Wine 0.1 Not Applicable– Total 2.4 1.7 39.9% 1.7 39.9%NSR (A$m) 293.2 208.6 40.6% 209.9 39.7%NSR per case (A$) 123.48 122.88 0.5% 123.65 (0.1)%EBITS (A$m)– Base business 101.8 72.9 39.6% 70.6 44.2%– Diageo Wine 0.2 Not Applicable– Total 102.0 72.9 39.9% 70.6 44.5%EBITS margin (%) 34.8% 34.9% (0.1)ppts 33.6% 1.2ppts
Business performance
• Total volume, NSR, EBITS and EBITS margin up driven by continued momentum in TWE’s base business, with a marginal contribution from the Diageo Wine acquisition in F16
• Volume up 40% to 2.4 million 9Le cases, delivered by both North Asia (+76%) and South Asia (+1%)
• Second half F16 volume (up 3% versus pcp) reflects higher volume-weighting to second half in F15: 67% of volume sold in second half F15 versus 43% in second half F16
• NSR per case in line with pcp reflecting favourable country mix and price increases on select brand tiers, partially offset by portfolio diversification
• Priority Brand portfolio NSR per case up led by Penfolds, Wolf Blass, Rawson’s Retreat, Wynns and Lindeman’s
• COGS per case broadly in line with pcp; higher inventory costs offset by Supply Chain savings and diversified portfolio mix, notably in second half F16
• Consumer marketing double prior year supporting price increases taken in F16 and driving consumer and brand-led marketing campaigns on key Priority Brands, notably TWE’s US brand portfolio
• Investment in consumer marketing and on-the-ground sales and marketing capabilities to support new routes-to-market offset by NSR growth; CODB margin down 1.2ppts
• EBITS up $31.4 million to $102.0 million; strong EBITS margin accretion delivered, up 1.2ppts to 34.8%
Asian regional perspectives
• Fundamentals of Asian wine markets continue to be highly attractive; imported wine category grew 17% in calendar year 2015 (CY15) versus historical CAGR of 10% per annum between CY10 and CY1417
• Continued focus on deepening customer partnerships and more efficient routes-to-market across Asia, notably China, Taiwan, Singapore, Japan and Malaysia
• Significant opportunity for US brand portfolio in F17 and beyond with US brand volume up strongly in F16; continued elevated brand investment to support US portfolio expected
• Asia region continues to focus on driving a balanced brand and country-of-origin (i.e. Australian, US, Italian and New Zealand wine) mix via portfolio diversification strategy
• EBITS margin between 30%–35% expected in F17 driven by portfolio mix diversification, continued investment in marketing and sales presence, partially offset by optimised pricing and brand building investment
Historical EBITS and EBITS margin
16. F15 EBITS restated to $72.9 million (from $73.1 million) to reflect the inclusion of the Middle East & Africa (MEA) business ($2.9 million) and changes in allocation methodology of corporate overheads, relating to IT. MEA contributed EBITS of $1.4 million in F16. The first half of F16 Asia EBITS restated to $45.0 million (from $46.5 million) reflecting the change in allocation methodology of corporate overheads, relating to IT.
17. IWSR Still and sparkling wines only (excludes non-grape and fortified wines).
1H
$M
2H
Diageo Wine contribution
FY Total Business EBITS Margin
Chart presented on a reported currency basis.
110.0100.090.080.070.060.050.040.030.020.010.0
0
40.0%
35.0%
30.0%
25.0%
20.0%
15.0%
10.0%
5.0%
0%F14 F15 F16
TREASURY WINE ESTATES ANNUAL REPORT 2016 / 20

OPERATING AND FINANCIAL REVIEW (CONTINUED)
REGIONAL SUMMARIES – EUROPE18
Financial performance
$M F16
REPORTED CURRENCY
CONSTANT CURRENCY
F15 % F15 %
Volume (m 9Le)– Base business 6.4 6.7 (4.3)% 6.7 (4.3)%– Diageo Wine 2.0 Not Applicable– Total 8.4 6.7 26.4% 6.7 26.4%NSR (A$m) 357.7 286.1 25.0% 314.3 13.8%NSR per case (A$) 42.46 42.94 (1.1)% 47.17 (10.0)%EBITS (A$m)– Base business 36.4 16.0 127.5% 37.0 (1.6)%– Diageo Wine 11.3 Not Applicable– Total 47.7 16.0 198.1% 37.0 28.9%EBITS margin (%) 13.3% 5.6% 7.7ppts 11.8% 1.5ppts
Business performance
• Total volume, NSR, EBITS and EBITS margin up driven by continued focus and investment in core brand tiers and six months contribution from the acquired Diageo Wine acquisition
• Base business volume down 284k 9Le cases to 6,379k cases largely driven by exit from unsustainable volume in the UK in F16
• Headline NSR up 14% driven by acquisition of Diageo Wine
• Lower NSR per case driven by increased Commercial wine volume and reallocation of Luxury wine to optimise global margins in the first half of F16, partially offset by growth in priority brand Masstige tiers in the second half of F16
• Masstige portfolio in Europe delivered 7% NSR per case growth in the second half of F16
• Key Priority Brands Wolf Blass and Lindeman’s core tiers and 19 Crimes delivering NSR per case growth
• Lower COGS per case driven by adverse portfolio mix and Supply Chain efficiencies
• Higher brand building investment driven by acquisition of Diageo Wine, partially offset by optimised consumer marketing spend; investment focused on core Priority Brand tiers, notably in the second half of F16
• CODB margin favourable versus pcp as NSR growth more than offset increased brand building investment. Overheads were broadly flat on the pcp
• Diageo Wine EBITS $11.3 million; 12-month re-set in progress
• LATAM EBITS in line with pcp at $5.8 million; ongoing investment in sales and marketing capability delivering positive momentum
• EBITS up 29% to $47.7 million; EBITS margin accretion delivered, up 1.5ppts to 13.3%
Europe regional perspectives
• TWE managing challenging pricing and trading environment in Europe with focused investment on core Priority Brand tiers and market combinations, supported by lean overhead structure
• Blossom Hill provides TWE with important scale and significance in higher margin Impulse channel
• Impact of Brexit on customer and consumer demand remains uncertain; cost and revenue mitigation plans for F17 and beyond in place
• Movements in foreign exchange rates as a result of Brexit likely to result in increased COGS for Australian and US imported wine in F17, notably Blossom Hill
Historical EBITS and EBITS margin
18. F15 EBITS restated to $16.0 million (from $14.4 million) to reflect the inclusion of the LATAM business ($5.3 million), the exclusion of the Middle East and Africa (MEA) business ($2.9 million) and changes in allocation methodology of corporate overheads, relating to IT. LATAM contributed EBITS of $5.8 million in F16 and MEA contributed EBITS of $1.4 million in F16. No change first half of F16 EBITS.
F14 F15 F16
1H
$M
2H
Diageo Wine contribution
FY Total Business EBITS Margin
Chart presented on a reported currency basis.
50.0
45.5
40.0
35.0
30.0
25.0
20.0
15.0
10.0
5.0
0
13.0%12.0%11.0%10.0%9.0%8.0%7.0%6.0%5.0%4.0%3.0%2.0%1.0%0%
TREASURY WINE ESTATES ANNUAL REPORT 2016 / 21

OPERATING AND FINANCIAL REVIEW (CONTINUED)
1H
$M
2H
Diageo Wine contribution
FY Total Business EBITS Margin
Chart presented on a reported currency basis.
150.0
125.0
100.0
75.0
50.0
25.0
0
14.0%
12.0%
10.0%
8.0%
6.0%
4.0%
2.0%
0.0%F14 F15 F16
REGIONAL SUMMARIES – AMERICAS19
Business performance
• Total volume, NSR, EBITS and EBITS margin up strongly driven by strengthened base business and six months contribution from the acquired Diageo Wine business
• TWE’s performance in Nielsen in F16 not representative of TWE’s underlying volume and profitability due to:
– Impact of accelerated depletions in F15 driven by deployment of Special Depletions Allowance
– TWE managed down Non-Priority Commercial (NPC) portfolio in the second half of F16; NPC portfolio divested on 4 July 2016
– Aggressive withdrawal from unsustainable volume and unprofitable customer arrangements in the second half of F16
– Adjusted Nielsen volume up 2%20
• Adjusting for NPC portfolio (managed down over F16) and divestment of Souverain in July 2015, Base business volume in line with the pcp. Headline volume down 3.4%
• NSR per case up reflecting favourable portfolio mix, price increases on select brands and focus on sustainable volume
• Priority Brand portfolio delivered solid NSR per case growth, led by Beringer Luxury tier, Chateau St Jean, Lindeman’s, Stags’ Leap, Matua and 19 Crimes
• Increased COGS per case reflects premiumised portfolio mix and higher inventory costs, partially offset by Supply Chain optimisation savings
• Increased CODB margin driven by investment in consumer and brand-led marketing programs and higher vacancy rates in the second half of F15 relative to the second half of F16
• EBITS reported in Canada in line with pcp underpinned by strong Masstige brand performance, particularly in the second half of F16, partially offset by adverse macroeconomic conditions
• Diageo Wine business EBITS $21.7 million; re-set period on track
• EBITS up 25% to $136.3 million; EBITS margin accretion delivered, up 1.2ppts to 13.8%
Americas regional perspectives
• Fundamentals of the US wine market remain highly attractive
• NPC portfolio divested in July 2016; TWE now positioned to deliver sustainable volume and value growth in F17 and beyond
• Strong portfolio premiumisation underpinned by Luxury and Masstige portfolio depletions, up 15% and 13%, respectively; Commercial depletions in single digit growth in F1621
• Continued margin accretion to be underpinned by portfolio premiumisation, enhanced returns from the Diageo Wine business, optimisation of brand investment and cost management
Financial performance
$M F16
REPORTED CURRENCY
CONSTANT CURRENCY
F15 % F15 %
Volume (m 9Le)– Base business 13.7 14.2 (3.4)% 14.2 (3.4)%– Diageo Wine 1.3 Not Applicable– Total 15.0 14.2 5.8% 14.2 5.8%NSR (A$m) 991.0 776.2 27.7% 862.5 14.9%NSR per case (A$) 66.10 54.77 20.7% 60.85 8.6%EBITS (A$m)– Base business 114.6 83.2 37.7% 108.8 5.3%– Diageo Wine 21.7 Not Applicable– Total 136.3 83.2 63.8% 108.8 25.3%EBITS margin (%) 13.8% 10.7% 3.1ppts 12.6% 1.2ppts
Historical EBITS and EBITS margin
19. F15 EBITS restated to $83.2 million (from $93.2 million) to reflect the exclusion of the LATAM business ($5.3 million) and changes in allocation methodology of corporate overheads, relating to IT. LATAM contributed EBITS of $5.8 million in F16. The first half of F16 Americas EBITS restated to $54.1 million (from $56.2 million) reflecting the change in allocation methodology of corporate overheads, relating to IT.
20. Nielsen (Food, Drug and Liquor channels), 52 weeks ending 18 June 2016 and Company estimates.21. Depletions growth excludes impact of Special Depletions Allowance in the prior period and excludes NPC brand portfolio divested in July 2016.
TREASURY WINE ESTATES ANNUAL REPORT 2016 / 22
OPERATING AND FINANCIAL REVIEW (CONTINUED)
SummaryIn summary, the strong full year result demonstrates continued progress to transition TWE from an agricultural, order-taking company to a brand-led, marketing organisation.
Crucial to this transition is embedding a balanced and sustainable business model across TWE’s brand and regional earnings mix, as well as building further flexibility and diversification into the Company’s supply model.
TWE is now marketing and selling its key brands across all four quarters of the year, rather than delivering the majority of its earnings from only a few brands in the final quarter of the financial year. As a result, TWE’s earnings will continue to be more evenly spread across the fiscal year.
Furthermore, the Company’s brand building investment is focused on a global, ‘portfolio of brands’ approach, which in turn, diversifies the revenue and earnings composition. This is demonstrated by the Priority Brand portfolio comprising more than 85% of total NSR.
TWE is also diversifying its sourcing profile; driving an improved balance across key varietals, sourcing regions and appellations.
TWE remains focused on fully integrating Diageo Wine in the first half of F17 and driving a more sustainable base business. The integration is progressing well and the re-set of the business is on track.
Following the strong F16 performance and with accelerating momentum across the business, the outlook for TWE is positive. As a result, TWE expects to deliver:
• Total cash synergies recognised from the acquisition of Diageo Wine to reach a run-rate of US$35 million (up from US$25 million) by F20
• Total COGS savings from its Supply Chain Optimisation initiative to reach a run-rate of at least $100 million (up from $80 million) by F20
• High-teens EBITS margin by F18; representing a two-year acceleration of this target
Vintage updateCaliforniaGrowing conditions for the 2016 Californian vintage to date have been characterised by an even-growing season, with winter rainfall reaching near average levels, minimal frost impact and a cool spring. Optimal temperatures and rainfall are supporting an early start to the harvest, with the season approximately one week ahead of long-term averages. Yields on high-demand varietals including Cabernet and Red Blenders are expected to be stronger throughout the coastal regions, especially in the Central Coast which was heavily impacted by the drought last year.
AustraliaThe 2016 Australian vintage was outstanding, driven by favourable growing conditions across South Australia, particularly in the Clare Valley and Barossa Valley. The 2016 intake was strong and above long-term average yields, especially for Luxury and Masstige fruit. Quality was excellent across all regions and varietals, particularly South Australian Cabernet and Shiraz.
New ZealandThe 2016 harvest was both high yielding and excellent quality, notably Pinot Noir from Central Otago and Sauvignon Blanc from the Marlborough region. Growing conditions were characterised by the driest Spring on record followed by well-timed rain in January. These conditions favoured all key regions and varietals.
TREASURY WINE ESTATES ANNUAL REPORT 2016 / 23

CORPORATE RESPONSIBILITY
In F16, TWE continued to advance its Corporate Responsibility (CR) program, focusing on the program’s three strategic priorities:
• Responsible Consumption
• Sustainable Sourcing
• Corporate Volunteering and Community Engagement
TWE’s CR program was overseen in F16 by the Company’s Global CR Council (the Council), chaired by the Chief Executive Officer (CEO), with representatives from the Executive Leadership Team (ELT) and key functions and regions. The Council provides oversight and drives delivery of the Company’s CR programs against agreed strategy and targets.
TWE’s CR program is underpinned by the Company’s commitment to the United Nations Global Compact (UNGC). TWE has embedded its commitment to the Compact’s principles on human rights, labour, the environment and anti-corruption in its business through various internal policies, and through its suppliers via implementation of the Company’s Responsible Procurement Code.
TWE provided a Communication on Progress (COP) against the UNGC for F14 and F15 in September 2015. The Company’s COPs are available on the Company’s website: w w w . tweglobal.com.
Treasury Wine Estates is committed to making a positive contribution to the local communities in which it operates. The Company’s Corporate
Responsibility program identifies ways it can improve this contribution, manage environmental and
social risks, and drive sustainability.
TREASURY WINE ESTATES ANNUAL REPORT 2016 / 24
CORPORATE RESPONSIBILITY (CONTINUED)
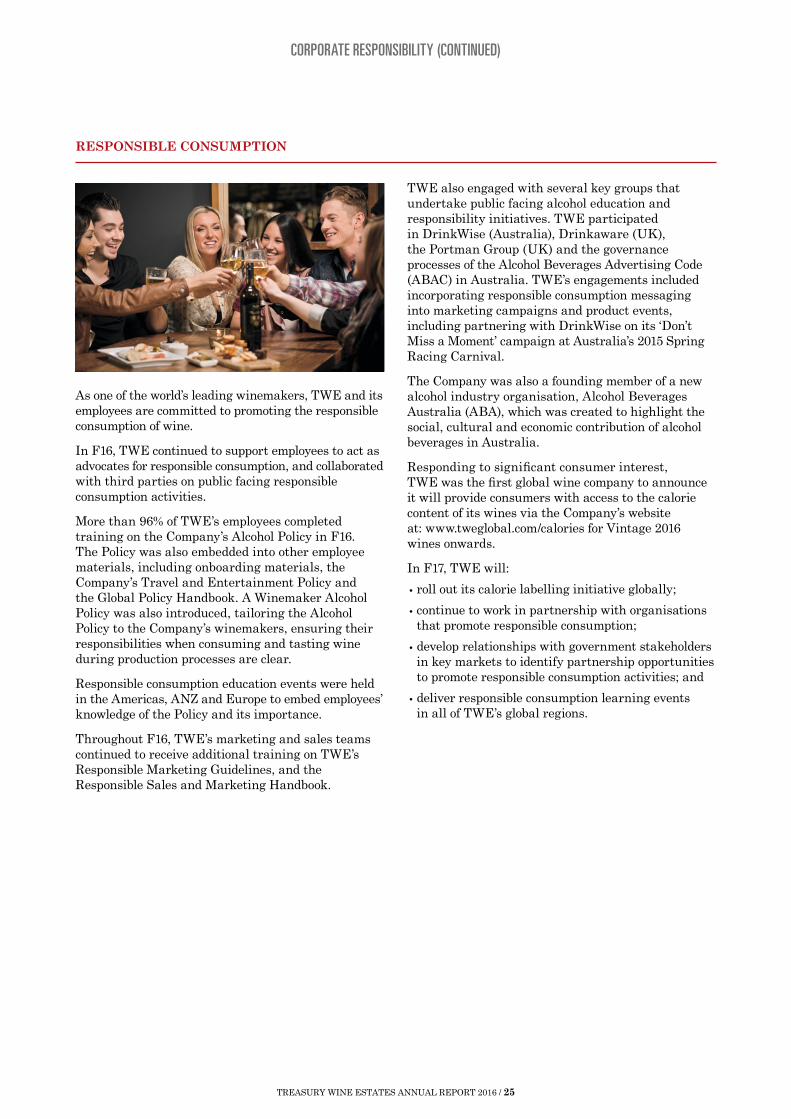
As one of the world’s leading winemakers, TWE and its employees are committed to promoting the responsible consumption of wine.
In F16, TWE continued to support employees to act as advocates for responsible consumption, and collaborated with third parties on public facing responsible consumption activities.
More than 96% of TWE’s employees completed training on the Company’s Alcohol Policy in F16. The Policy was also embedded into other employee materials, including onboarding materials, the Company’s Travel and Entertainment Policy and the Global Policy Handbook. A Winemaker Alcohol Policy was also introduced, tailoring the Alcohol Policy to the Company’s winemakers, ensuring their responsibilities when consuming and tasting wine during production processes are clear.
Responsible consumption education events were held in the Americas, ANZ and Europe to embed employees’ knowledge of the Policy and its importance.
Throughout F16, TWE’s marketing and sales teams continued to receive additional training on TWE’s Responsible Marketing Guidelines, and the Responsible Sales and Marketing Handbook.
TWE also engaged with several key groups that undertake public facing alcohol education and responsibility initiatives. TWE participated in DrinkWise (Australia), Drinkaware (UK), the Portman Group (UK) and the governance processes of the Alcohol Beverages Advertising Code (ABAC) in Australia. TWE’s engagements included incorporating responsible consumption messaging into marketing campaigns and product events, including partnering with DrinkWise on its ‘Don’t Miss a Moment’ campaign at Australia’s 2015 Spring Racing Carnival.
The Company was also a founding member of a new alcohol industry organisation, Alcohol Beverages Australia (ABA), which was created to highlight the social, cultural and economic contribution of alcohol beverages in Australia.
Responding to significant consumer interest, TWE was the first global wine company to announce it will provide consumers with access to the calorie content of its wines via the Company’s website at: w w w . tweglobal.com/calories for Vintage 2016 wines onwards.
In F17, TWE will:
• roll out its calorie labelling initiative globally;
• continue to work in partnership with organisations that promote responsible consumption;
• develop relationships with government stakeholders in key markets to identify partnership opportunities to promote responsible consumption activities; and
• deliver responsible consumption learning events in all of TWE’s global regions.
RESPONSIBLE CONSUMPTION
TREASURY WINE ESTATES ANNUAL REPORT 2016 / 25

CORPORATE RESPONSIBILITY (CONTINUED)
TWE is committed to adopting sustainable supply and sourcing initiatives throughout its supply chain.
In F16, TWE maintained independent third party sustainability certification of its owned and operated wineries and vineyards, including gaining certification for an acquired vineyard in Tasmania, Australia. Vineyards purchased as part of the Diageo Wine business acquisition also hold independent third party certifications. The Company intends on maintaining independent certifications for these sites.
TWE continued to undertake sustainability projects, and related research and development. Where appropriate, these projects were undertaken in partnership with research institutes or government agencies. In F16, projects included examining methods to mitigate the effect of heat waves with the South Australian Research Development Institute (SARDI), partnering with other industry members to identify opportunities to turn waste into valuable products in the Riverland region of Australia, and working to restore the river health and floodplains of the Napa River through supporting spawning habitat for sensitive native fish species and reducing flood damage impacts in partnership with other land owners, and the local and federal governments.
In F16, TWE renewed its commitment to the UK’s Courtauld Commitment (through the new Courtauld Commitment 2025) to make food and drink production and consumption more sustainable, and updated the Company’s Environment Policy. There were no significant environmental incidences throughout the year.
Building on progress made in the prior year, TWE commenced the global roll-out of its Responsible Procurement Code to all existing suppliers in F16, ensuring suppliers are aware of TWE’s expectations of their social, governance and environmental performance. These expectations are embedded in the Company’s supplier onboarding process, requiring all new suppliers to confirm they meet the requirements of the Code.
SUSTAINABLE SOURCING
The Code will be included in all supplier contracts as it is rolled out to existing partners from F16 onward. TWE employees who regularly engage with suppliers have commenced training on the Code, and this will continue as the global roll-out progresses.
In F16, TWE re-evaluated its baseline resource usage and identified a range of opportunities to reduce resource consumption. These included commencing a project to replace lighting at major production facilities with more efficient LED lighting, and identifying an opportunity to invest in improved monitoring of resource consumption, enabling the Company to associate resource consumption with specific production processes.
TWE made progress on its supply chain optimisation process throughout F16. As TWE continues to embed its optimised supply chain footprint in F17, it is expected that the Company will realise water, energy and emissions improvements on a per unit basis across its winery and packaging footprint, as production is moved to more efficient sites.
The scale of the Diageo Wine business acquisition during F16, and the differences in its resource use data collection methodologies, require additional work before robust sustainability targets for the Company can be set.
In F17, TWE will:
• continue to work with research institutes, industry partners and government agencies on sustainability and efficiency projects by providing in-kind support and undertaking pilot programs at sites, as appropriate;
• invest in a sub-metering monitoring strategy at key sites to ensure resource consumption is associated with specific production processes;
• reset its approach to data collection across its global sites, including those acquired during F16;
• continue the global roll-out of the RPC to existing partners, and continue training employees on the Code; and
• commence annual reporting under the UK Modern Slavery Act, with TWE’s statements provided on the Company website: w w w . tweglobal.com.
TREASURY WINE ESTATES ANNUAL REPORT 2016 / 26

CORPORATE RESPONSIBILITY (CONTINUED)
In F16, TWE continued to execute two programs aimed at supporting employees to give back to the communities in which they work and live.
First, the Company’s second Global Volunteering Week took place in May 2016. During the Week, employees from across the business partnered with local charities to deliver a range of valuable volunteering activities in the communities where TWE’s operations are based.
The 2016 Global Volunteering Week built on the inaugural event by providing a greater range of volunteering options, across a broader spectrum of the business. Employees also had the opportunity to identify charitable partners for the week, increasing their engagement with the activity.
In total, more than 1,300 employees volunteered at more than 80 charities across the globe, providing value of more than $500,000 to global communities.
In addition to volunteering, TWE’s second community program provides matched funds for employees’ fundraising activities.
Under the program, called the ‘1124 Gift’, TWE will match the monies raised by employees up to a limit of $1,124. During F16, TWE increased its payments under the 1124 Gift program by more than 20% from F15. Significant fundraising efforts were undertaken for specific regional events where TWE employees’ local communities were affected, including donations to the Valley Fire Relief Fund (US) and to the Red Cross, after wild fires in both California and Alberta (Canada).
In addition, employees who directly engage with local communities were trained on the Company’s Local Procurement Code. The Code is aimed at creating shared value for local communities by ensuring TWE continues to support and drive economic growth in urban and regional communities.
Site-specific community projects also continued in F16. Support was also provided to a number of charitable organisations through sales of wine at a significantly reduced price.
In F17, TWE will:
• deliver a third Global Volunteering Week and aim to increase overall employee participation; and
• continue the 1124 Gift program.
CORPORATE VOLUNTEERING AND COMMUNITY ENGAGEMENT
TREASURY WINE ESTATES ANNUAL REPORT 2016 / 27

CORPORATE RESPONSIBILITY (CONTINUED)
KEY PERFORMANCE INDICATORS FOR CORPORATE RESPONSIBILITY
METRIC UNIT OF MEASURE F16 F15 F14 F13
Environment1 Total energy consumed2 GJ 471,480 503,397 483,432 508,796Energy efficiency3 MJ/9LE 9.48 10.38 10.88 11.19Total water consumed2 ML 27,755 27,246 24,287 27,413Water efficiency3 L/9LE 25.24 29.76 37.69 36.28Total CO2-e emissions4 Tonnes CO2-e 60,780 63,826 62,758 65,628Total solid waste generated2 Tonnes 59,879 65,031 71,675 72,217% solid waste to recycling2 % 94.63 93.37 93.57 95.28
Environment: US Sites acquired from Diageo5
Total energy consumed2 GJ 31,891Total water consumed2 ML 84Total CO2-e emissions4 Tonnes CO2-e 1,251Total solid waste generated2 Tonnes 129% solid waste to recycling2 % 86.82
Social
LTIFR6
Lost time injuries per million hours worked 3.6 4.2 5.0
Metric change
Volunteering participation rate7
% (no. of employees)
39.1(1,357)
46.1(1,358)
Metric change
Metric change
1. Every year, due to timing requirements of reporting and billing latency from third party suppliers, the majority of the June environmental performance data for energy, water, waste and carbon emissions is estimated. Prior to annual publication, the June figures of the previous year are replaced with actual values. Similarly, any other discrepancies in the previous year’s data are amended.
2. Absolute figures include all wineries, packaging centres and company-owned vineyards. They do not include data from offices or cellar doors.3. Energy and water efficiency for TWE’s wineries and packaging centres include non-TWE Australian volumes packaged at our facilities
under contract. Efficiencies do not include energy and water used at company-owned vineyards, offices, and cellar doors.4. Includes all wineries, packaging centres and company-owned vineyards. Does not include emissions from offices, cellar doors, wastewater
treatment plants, refrigerants or Scope 3 emissions.5. This data reports on environmental indicators from the sites acquired by TWE from Diageo on 1 January 2016.6. Lost Time Injury Frequency Rate (LTIFR).7. The Company’s F15 Annual Report reported a volunteering participation rate of 58.6% based on the proportion of salaried employees
who accessed volunteering leave during that financial year. Reporting of the volunteering participation rate has changed in F16 to include salaried and non-salaried employees. This has resulted in a change to the rate previously reported for F15.
As outlined in the Company’s F15 Annual Report, TWE has seen energy and emissions improvements as it optimises the Company’s supply chain, moving production to more efficient sites and improving facility utilisation. These improvements occurred in the Company’s primary production regions of the US and Australia.
The Company expects that energy, water and emissions will improve as a result of further optimisation to the supply chain footprint due to be embedded in F17.
Total solid waste generated has also reduced over time due to a number of reasons, including an ongoing continuous improvement program, sustainability projects and supply chain optimisation. This has occurred alongside increases to the Company’s solid waste to recycling ratios.
While TWE has seen waste and energy efficiency improvements in F16, a number of environmental metrics are difficult for the Company to control given the nature of grape growing and influence of climatic conditions. Changes in production volumes and highly variable growing conditions year to year impact the Company’s overall efficiency.
During F16, TWE acquired Diageo’s Wine business, taking effect from 1 January 2016. As the US Vintage took place prior to TWE taking control of these sites, the environmental metrics attributable to the acquired assets have not been included in TWE’s F16 data, and have instead been reported separately. Efficiency data for these assets is not available for F16, as production occurred prior to 1 January 2016. From F17 onwards, these sites will be reported in the same form as all other TWE sites.
In F16, TWE undertook its second Global Volunteering Week. Due to the acquisition of the Diageo Wine business, TWE’s employee base increased in the months leading up to the Week. As a result, while on a like-for-like basis total participant numbers for Global Volunteering Week 2016 was very similar to 2015, the proportion of employees who participated reduced slightly.
TREASURY WINE ESTATES ANNUAL REPORT 2016 / 28

CORPORATE RESPONSIBILITY (CONTINUED)
TWE’s Health, Safety and Environment (HSE) program continued to deliver strong results in F16, with the key areas of focus being:
i. HSE Framework – the Company continued to broaden its HSE processes to cover all parts of the business. The acquisition of the Diageo wine business provided a valuable opportunity to review and improve TWE’s HSE processes and cultures by adopting a ‘best of breed’ HSE management system when the businesses were combined. This will continue in F17.
ii. Leadership Development – the Company’s two-day HSE leadership development program for managers and supervisors continued with more than 150 front line leaders from America and Australia attending the course in F16. In addition, a half-day program specifically designed for office-based employees was implemented with more than 150 employees attending. The HSE Leadership Development program will continue through F17 and will also include the development of a targeted program for viticulture, winemaking and packaging employees.
HEALTH, SAFETY AND ENVIRONMENT
iii. Audit Program – the Company’s HSE audit program continued throughout its global supply operations. TWE now has a team of internal auditors with capability to conduct an audit of safety management systems across all business operations. The program is supplemented by the use of an accredited external audit provider who also conducts specific audits throughout the year. These external audits involve TWE employees as part of the audit team and serve as a valuable mentoring and development process for TWE’s internal auditors. Audits were conducted at all existing TWE American supply sites, all Australian Cellar Door venues and a number of Australian supply sites. The audit program will continue throughout F17.
iv. Physical and Mental Health & Wellbeing – TWE continued its focus on health and wellbeing programs. In F16, all global employees were invited to participate in the health and wellness program ‘The Global Corporate Challenge’ (GCC). Almost 1,500 employees signed up for the program, which encourages TWE employees to improve their health through increased activity, healthy eating, and life balance. As part of the program, more than 1,000 employees voluntarily participated in a health and wellness survey, providing valuable information on areas of potential focus for the HSE program in future years. In addition, the Company partnered with relevant not-for-profit organisations to deliver information sessions on mental health and other health issues at both its head office and across a number of regions.
TWE’s primary lag indicator – lost time injury frequency rate (LTIFR) continued to demonstrate improvement. A target of achieving a five per cent or greater reduction on the F15 result was set for F16 and this was achieved with a LTIFR of 3.6. This is substantially lower than the 4.2 recorded in F15 and 5.0 in F14, and demonstrates long-term systematic improvement in employee safety and a reduction in ‘at-risk’ behaviour.
TREASURY WINE ESTATES ANNUAL REPORT 2016 / 29

CORPORATE RESPONSIBILITY (CONTINUED)
TWE is committed to ensuring a safe, sustainable and timely supply of quality products to its customers.
The Company’s policy on product safety and quality confirms this commitment by ensuring regular reviews of the Quality Management System are undertaken in order to achieve best practice and implement process improvements. The Company’s product safety and quality objectives are to:
• continuously improve existing processes by benchmarking against other leading beverage companies;
• engage employees to be quality focused;
• strive to exceed customers’ expectations; and
• meet full compliance with all statutory obligations.
A consistent risk management strategy has been developed across the Company to manage product safety and quality. This has resulted in the implementation of internationally recognised quality standards at production sites including Hazard Analysis and Critical Control Points (HACCP) standards, British Retail Consortium (BRC) standards and International Organisation for Standardisation of Quality and Food Safety systems (ISO 9000 and FSSC22000).
TWE’s quality systems have a robust raw material approval process to ensure that finished product adheres to relevant regulatory requirements and product quality is continually improved. This also identifies the presence of any allergens that are traced throughout the production process to ensure that wines containing these materials are appropriately labelled.
PRODUCT SAFETY AND QUALITY
TREASURY WINE ESTATES ANNUAL REPORT 2016 / 30

DIVERSITY AND INCLUSION
TWE is committed to creating a high-performance culture, attracting and retaining the best possible talent,
as well as creating an inclusive environment where people from diverse backgrounds can fulfil their potential.
This commitment serves to broaden the Company’s collective knowledge and give TWE a competitive edge. It helps the Company to understand and connect more effectively with its customers, communities and consumers.
The Board has committed to reviewing and assessing progress against TWE’s diversity and inclusion objectives annually. To that end, the Company is pleased to report progress made in F16, together with its F17 measurable objectives.
The Company’s Diversity and Inclusion policy can be found at the Company’s website: w w w . tweglobal.com.
F16 objectives and initiativesThe following diversity objectives were set by the Board for F16. Recommendation 1.5 of the ASX Corporate Governance Principles and Recommendations states that a company’s board or board committee is to set the measurable objectives for achieving gender diversity.
Increase Gender Diversity in Leadership
• Achieve an increase in females in leadership roles to 35%;
• Achieve at least one qualified woman on shortlist for 80% of leadership roles;
• Launch a Women in Wine hub in the Americas and Europe;
• Enrol twenty women in the female mentoring program ‘My Mentor’; and
• Complete a gender pay equity review and implement the recommendations.
Embrace Our Commitment to Sustainable and Effective Flexible Work Practices
• Roll-out flexible work practice training to 50% of all mid-level people leaders (including all newly promoted/hired senior and mid-level people leaders) and undertake a review to ensure that flexible work practices are being consistently implemented/applied, and are effective; and
• Ensure 75% of employees agree that flexibility is genuinely supported at TWE.
Develop Inclusive Leaders
• Delivery of inclusive leadership training workshop to 100% of senior leaders.
TREASURY WINE ESTATES ANNUAL REPORT 2016 / 31
Executive Leadership Team Diversity ObjectivesThe Chief Executive Officer (CEO) and all Executive Leadership Team (ELT) members had a diversity Key Performance Objective (KPO) to deliver these objectives in F16.
In an effort to achieve the objectives, various actions were undertaken throughout F16:
• Continuation of targeted mentoring programs for women;
• Continuation of momentum in the Company’s Women in Wine networks, including the formation of regional hubs in the Americas and Europe;
• Delivery of an Inclusive Leadership training program with a focus on building awareness of unconscious bias to senior leaders;
• Delivery of flexible work practices training to mid-level people leaders;
• Targeted shortlisting of women for leadership roles;
• Surveying of employees to assess whether flexibility is genuinely supported at TWE; and
• Continuation of the ‘Mary Penfold Award’ for outstanding female leadership.
F16 progressThe following outcomes were recorded against the objectives for the reporting period:
• Increased female representation in leadership roles, up from 33.8% to 35.9%;
• At least one suitably qualified female on shortlist for interview in 75.7% of leadership roles;
• A total of 26 women enrolled in the female mentoring program;
• A gender pay equity review completed and recommendations approved for implementation in F17;
• Flexible work practices training delivered to 66% of all mid-level people leaders;
• Inclusive Leadership training delivered to 100% of senior leaders;
• High potential female talent profiled at Diversity Council meetings;
• Internal recruitment processes reoriented to maximise and encourage female participation;
• Refreshed ANZ, Asia and EMEA Parental Leave policies;
• Women in Wine hubs launched in Europe and the Americas;
• A total of 98% of employees surveyed agreed that TWE’s senior leaders genuinely support flexibility.
The ELT continued to operate as the Diversity Council in F16 to focus their efforts on setting appropriate goals and targets, monitoring progress and driving action.
Progress with the Company’s diversity and inclusion agenda has improved across all three focus areas of gender diversity in leadership, flexibility and inclusive leadership. The following initiatives have been identified to maintain momentum in diversity and inclusion in F17:
• Driving more momentum in Women in Wine, including the formation of a regional hub in Asia;
• Continuing to profile high potential female talent at each Diversity Council meeting;
• Developing internal and external female talent pipelines;
• Conducting exit interview analysis to inform the development of retention strategies;
• Continuing to roll out flexible work practices training to People Leaders;
• Reviewing the Parental Leave policy in the Americas and implementing recommendations;
• Implementing sustainable flexible work practices that meet employee and business needs, including profiling of flexibility role models;
• Launching a ‘Keeping in Touch’ toolkit to support employees on long-term leave;
• Incorporating inclusive leadership training into the global induction program;
• Developing diversity and inclusion initiatives in the Americas;
• Developing cultural awareness training in Asia;
• Continuing to recognise outstanding female leadership through the annual ‘Mary Penfold Award’.
DIVERSITY AND INCLUSION (CONTINUED)
TREASURY WINE ESTATES ANNUAL REPORT 2016 / 32

DIVERSITY AND INCLUSION (CONTINUED)
F17 objectivesAs is the case in nurturing TWE’s premium wines, investment and time yield great results. F16 has continued momentum and in F17 the Company will continue to invest in core areas of gender diversity, flexibility and inclusive leadership through the following objectives to deliver sustainable improvement:
Increase Gender Diversity in Leadership
• Continue the journey towards achieving an increase in females in leadership roles to 38% within three years;
• At least one qualified women on shortlist for 80% of leadership roles; and
• Launch a Women in Wine hub in Asia.
Embrace Our Commitment to Sustainable and Effective Flexible Work Practices
• Ensure senior and mid-level leaders complete flexible work practices and inclusion training.
Develop Inclusive Leaders
• A total of 75% of senior leaders meet or exceed expectations on Inclusive Leadership.
Executive Leadership Team Diversity ObjectivesThe CEO and all ELT members have a diversity KPO to deliver the above objectives in F17.
Organisational gender profileThe Company makes the following diversity disclosures in relation to Recommendation 1.5 of the ASX Corporate Governance Principles and Recommendations:
RECOMMENDATION 1.5 REQUIREMENT
Proportion of women in the whole organisation
As at 30 June 2016, 39% of the Group’s employees were women.
Proportion of women in senior executive1 positions within the Group
As at 30 June 2016, 11% of the senior executive positions within the Group were held by women.
Proportion of women on the Board of the Company
As at 30 June 2016, 12.5% of the Company’s Board of Directors (including executive directors) were women.
The Board is committed to ensuring that it is comprised of individuals with appropriate skills, experience and diversity to develop and support the Company’s strategic aims.
As announced on 21 July 2016, Lauri Shanahan will join the Board of the Company on 1 November 2016, which will bring the proportion of women on the Board of the Company to 22%.
1. For the purposes of this disclosure, the Company has defined ‘senior executive’ as the Chief Executive Officer and his/her direct reports. To note, using the TWE definition of leader, 35.9% of roles were held by women as at 30 June 2016.
TREASURY WINE ESTATES ANNUAL REPORT 2016 / 33

Paul Rayner Lyndsey CattermoleWarwick Every-Burns Peter Hearl
Paul Rayner BEc, MAdmin, FAICD
Chairman
Member of the Board since May 2011 and Chairman of the Board and the Nominations Committee since 1 September 2012.
Mr Rayner is an independent Director and is an Australian resident.
He brings to the Board extensive international experience in markets relevant to Treasury Wine Estates including Europe, North America, Asia, as well as Australia. He has worked in the fields of finance, corporate transactions and general management in the consumer goods, manufacturing and resource industries. His last role as an executive was as Finance Director of British American Tobacco plc, based in London, from January 2002 to 2008.
Mr Rayner is also a director of Qantas Airways Limited (since July 2008 and where he also serves as Chairman of the Remuneration Committee), Boral Limited (since September 2008 and where he also serves as Chairman of the Audit Committee) and a director of Murdoch Childrens Research Institute, since December 2014.
Mr Rayner was a director of Centrica Plc, a UK listed company, from September 2004 until December 2014.
Warwick Every-Burns AMP, Harvard University (Advanced Management Program)
Non-executive Director
Member of the Board since May 2011, Chairman of the Human Resources Committee and a member of the Nominations Committee.
Mr Every-Burns is an independent Director and is an Australian resident.
He was Chief Executive Officer of Treasury Wine Estates on an interim basis from 23 September 2013 until 30 March 2014.
Mr Every-Burns previously worked for more than 30 years in the consumer packaged goods sector. Most recently, he was President of International Business and a member of the Worldwide Executive Committee of The Clorox Company, a NYSE listed, S&P 500 business with a market capitalisation of circa US$17 billion. He was based at The Clorox Company’s headquarters in the United States for more than five years. Mr Every-Burns began his career at Unilever; is a former Managing Director of Glad Products of Australia and New Zealand and was formerly on the Advisory Council of the Frontier Strategy Group.
Mr Every-Burns is a director of The a2 Milk Company Limited (since August 2016).
Lyndsey Cattermole AM, B.Sc., FACS
Non-executive Director
Member of the Board since February 2011, and a member of the Audit and Risk and Human Resources Committees.
Mrs Cattermole is an independent Director and is an Australian resident.
She has extensive information technology and telecommunications experience. She is a former executive director of Aspect Computing Pty Ltd, Kaz Group Limited, and a former director of PaperlinX Limited (from December 2010 to September 2012). She has also held a number of significant appointments to government, hospital and research boards and committees.
Mrs Cattermole is a director of Tatts Group Limited (since May 2005), Pact Group Holdings Limited (since November 2013) and Hexigo Pty Ltd.
Mrs Cattermole was a director of the Foster’s Group Limited Board from October 1999 until May 2011.
Peter Hearl B Com (with merit), MAIM, GAICD, Member – AMA
Non-executive Director
Member of the Board since February 2012, and a member of the Audit and Risk Committee.
Mr Hearl is an independent Director and is an Australian resident.
He is the former global Chief Operating and Development Officer for YUM Brands, the world’s largest restaurant company, and he oversaw much of the growth in the KFC, Taco Bell and Pizza Hut businesses around the world.
He is currently a director of Telstra Corporation Limited (since August 2014 and where he also serves as Chairman of the Remuneration Committee). He is also a director of Santos Ltd (since May 2016).
Mr Hearl was a director of Goodman Fielder Limited from 2010 until March 2015.
BOARD OF DIRECTORS
TREASURY WINE ESTATES ANNUAL REPORT 2016 / 34
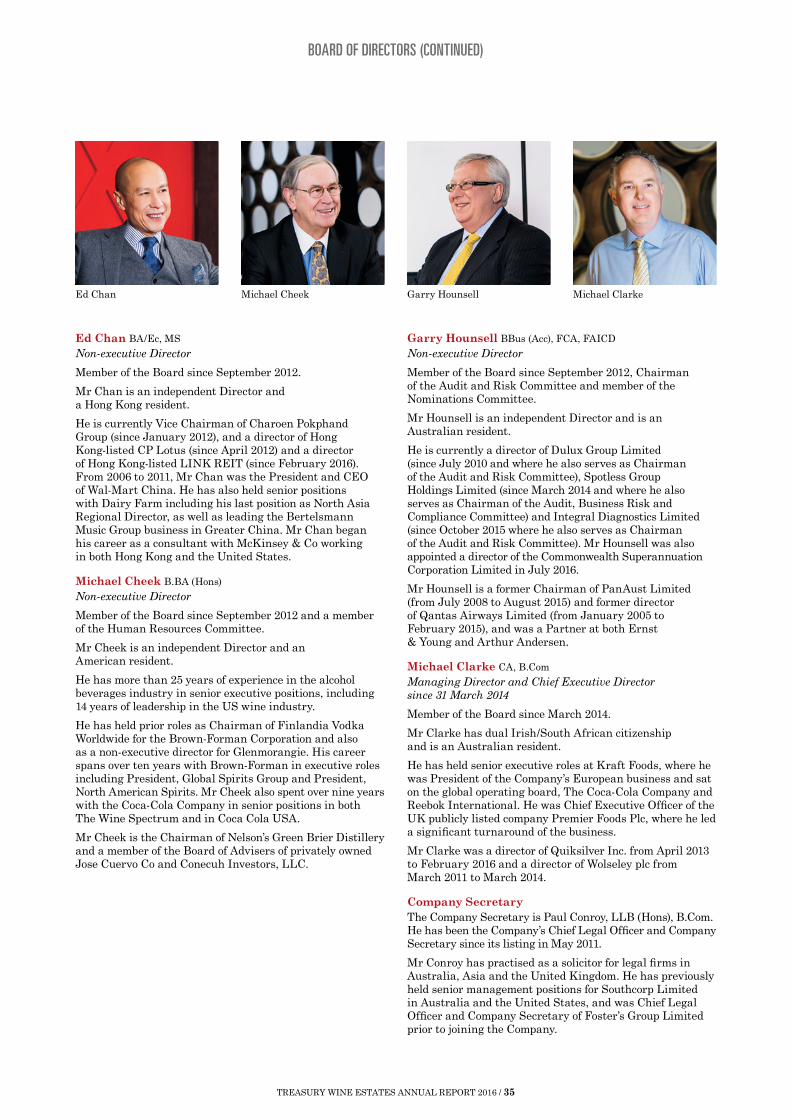
BOARD OF DIRECTORS (CONTINUED)
Ed Chan BA/Ec, MS
Non-executive Director
Member of the Board since September 2012.
Mr Chan is an independent Director and a Hong Kong resident.
He is currently Vice Chairman of Charoen Pokphand Group (since January 2012), and a director of Hong Kong-listed CP Lotus (since April 2012) and a director of Hong Kong-listed LINK REIT (since February 2016). From 2006 to 2011, Mr Chan was the President and CEO of Wal-Mart China. He has also held senior positions with Dairy Farm including his last position as North Asia Regional Director, as well as leading the Bertelsmann Music Group business in Greater China. Mr Chan began his career as a consultant with McKinsey & Co working in both Hong Kong and the United States.
Michael Cheek B.BA (Hons)
Non-executive Director
Member of the Board since September 2012 and a member of the Human Resources Committee.
Mr Cheek is an independent Director and an American resident.
He has more than 25 years of experience in the alcohol beverages industry in senior executive positions, including 14 years of leadership in the US wine industry.
He has held prior roles as Chairman of Finlandia Vodka Worldwide for the Brown-Forman Corporation and also as a non-executive director for Glenmorangie. His career spans over ten years with Brown-Forman in executive roles including President, Global Spirits Group and President, North American Spirits. Mr Cheek also spent over nine years with the Coca-Cola Company in senior positions in both The Wine Spectrum and in Coca Cola USA.
Mr Cheek is the Chairman of Nelson’s Green Brier Distillery and a member of the Board of Advisers of privately owned Jose Cuervo Co and Conecuh Investors, LLC.
Garry Hounsell BBus (Acc), FCA, FAICD
Non-executive Director
Member of the Board since September 2012, Chairman of the Audit and Risk Committee and member of the Nominations Committee.
Mr Hounsell is an independent Director and is an Australian resident.
He is currently a director of Dulux Group Limited (since July 2010 and where he also serves as Chairman of the Audit and Risk Committee), Spotless Group Holdings Limited (since March 2014 and where he also serves as Chairman of the Audit, Business Risk and Compliance Committee) and Integral Diagnostics Limited (since October 2015 where he also serves as Chairman of the Audit and Risk Committee). Mr Hounsell was also appointed a director of the Commonwealth Superannuation Corporation Limited in July 2016.
Mr Hounsell is a former Chairman of PanAust Limited (from July 2008 to August 2015) and former director of Qantas Airways Limited (from January 2005 to February 2015), and was a Partner at both Ernst & Young and Arthur Andersen.
Michael Clarke CA, B.Com
Managing Director and Chief Executive Director since 31 March 2014
Member of the Board since March 2014.
Mr Clarke has dual Irish/South African citizenship and is an Australian resident.
He has held senior executive roles at Kraft Foods, where he was President of the Company’s European business and sat on the global operating board, The Coca-Cola Company and Reebok International. He was Chief Executive Officer of the UK publicly listed company Premier Foods Plc, where he led a significant turnaround of the business.
Mr Clarke was a director of Quiksilver Inc. from April 2013 to February 2016 and a director of Wolseley plc from March 2011 to March 2014.
Company SecretaryThe Company Secretary is Paul Conroy, LLB (Hons), B.Com. He has been the Company’s Chief Legal Officer and Company Secretary since its listing in May 2011.
Mr Conroy has practised as a solicitor for legal firms in Australia, Asia and the United Kingdom. He has previously held senior management positions for Southcorp Limited in Australia and the United States, and was Chief Legal Officer and Company Secretary of Foster’s Group Limited prior to joining the Company.
Ed Chan Garry HounsellMichael Cheek Michael Clarke
TREASURY WINE ESTATES ANNUAL REPORT 2016 / 35

CORPORATE GOVERNANCE
The Board believes good corporate governance and transparency in corporate reporting is a fundamental part of the Group’s culture and business practices.
Key governance focuses of the Board for the year included:
• Commitment to the governance of workplace health and safety performance and developing a culture of leadership on safety across the business, with programs designed to empower the Company’s leaders to engage their teams and lead safety performance;
• Involvement in a comprehensive review of the Group’s risk profile and risk management framework to enhance the assessment and management of current and emerging material business risks facing the Group;
• Oversight of management’s commitment to a high-performance culture to lead the global business, supporting leadership developments during the year, and setting remuneration policy to attract and retain the best possible talent and reward high performance;
• Approval of the Diageo Wine business acquisition and the debt and equity funding arrangements for the acquisition, including the retail entitlement offer. The Board, with the assistance of its delegated committees, determined that the acquisition was strategically compelling and financially enhancing for the Group’s business strategy and consistent with plans for growth;
• Maintaining effective governance to facilitate high quality processes and internal controls as the business continues to grow, including Board and committee oversight of the integration of the Diageo Wine business;
• Input into and approval of management’s development of corporate strategy, including setting performance objectives and approving the annual financial budget; and monitoring corporate performance and the implementation of strategy and policy; and
• The appointment of a US-based independent non-executive director, Ms Lauri Shanahan, effective 1 November 2016.
INTRODUCTION
The Board is committed to conducting the Company’s business ethically and in accordance with high standards of corporate governance. This is essential for the long-term performance and sustainability of the Company, and to protect the interests of its stakeholders.
To this end, the Board regularly reviews the charters, codes and policies in respect of the Company’s corporate governance practices to ensure they remain appropriate and meet governance standards and regulatory requirements. The Company’s governance practices complied with the third edition of the ASX Corporate Governance Principles and Recommendations for the financial year.
This Corporate Governance section provides an overview of the Board’s operations, details on the governance framework and the key governance focuses of the Board for the financial year.
The full Corporate Governance Statement, which outlines the key aspects of the Company’s corporate governance framework and practices for the year ended 30 June 2016, together with the Appendix 4G Key to Disclosures – Corporate Governance Council Principles and Recommendations and key governance charters, codes and policies, are available at our website: w w w . tweglobal.com.
BOARD OF DIRECTORS
Members of the BoardThe Board continues to comprise a majority of independent directors with all directors other than the CEO being independent non-executive directors. The Board’s current members collectively possess the appropriate skills, experience and attributes that enable the Board to discharge its responsibilities effectively, contribute to the Company’s strategic growth plans and oversee the delivery of its corporate objectives.
The Board remains committed to ensuring it is comprised of individuals with appropriate skills, experience and diversity to develop and support the Company’s objectives. A skills matrix is utilised to assess the mix of skills, experience and diversity that the Board currently has, and to identify areas of focus as part of Board succession planning.
TREASURY WINE ESTATES ANNUAL REPORT 2016 / 36
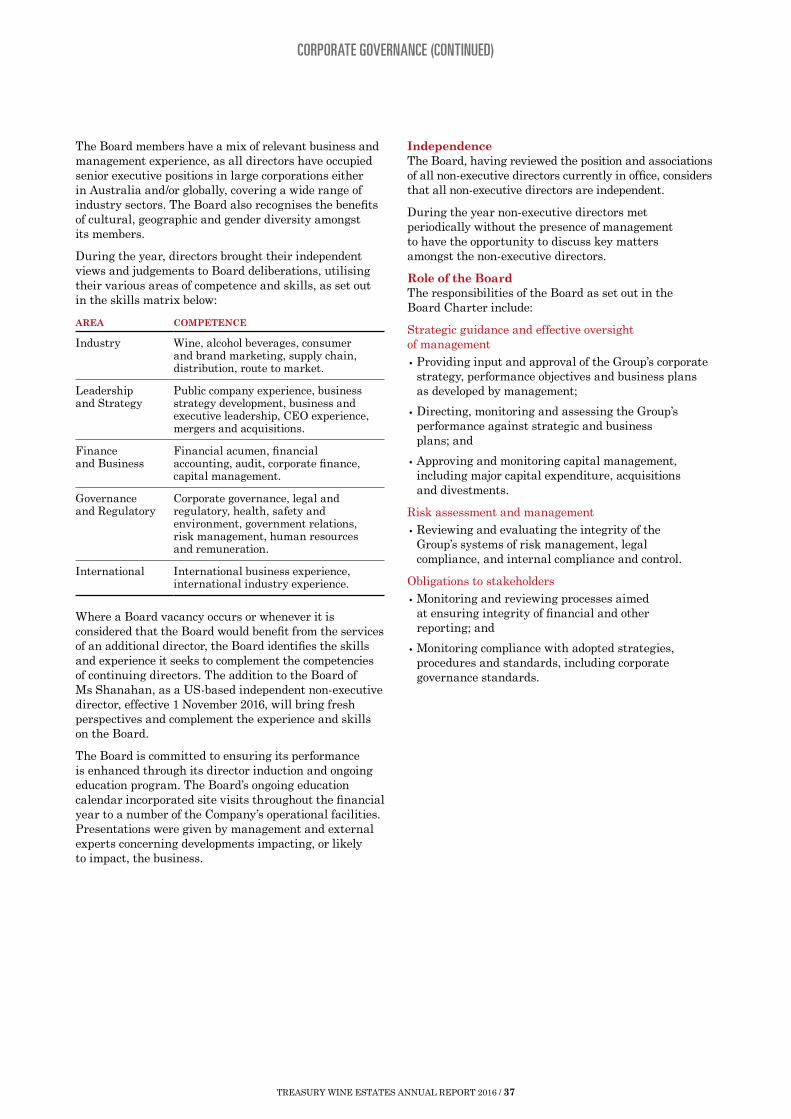
CORPORATE GOVERNANCE (CONTINUED)
The Board members have a mix of relevant business and management experience, as all directors have occupied senior executive positions in large corporations either in Australia and/or globally, covering a wide range of industry sectors. The Board also recognises the benefits of cultural, geographic and gender diversity amongst its members.
During the year, directors brought their independent views and judgements to Board deliberations, utilising their various areas of competence and skills, as set out in the skills matrix below:
AREA COMPETENCE
Industry Wine, alcohol beverages, consumer and brand marketing, supply chain, distribution, route to market.
Leadership and Strategy
Public company experience, business strategy development, business and executive leadership, CEO experience, mergers and acquisitions.
Finance and Business
Financial acumen, financial accounting, audit, corporate finance, capital management.
Governance and Regulatory
Corporate governance, legal and regulatory, health, safety and environment, government relations, risk management, human resources and remuneration.
International International business experience, international industry experience.
Where a Board vacancy occurs or whenever it is considered that the Board would benefit from the services of an additional director, the Board identifies the skills and experience it seeks to complement the competencies of continuing directors. The addition to the Board of Ms Shanahan, as a US-based independent non-executive director, effective 1 November 2016, will bring fresh perspectives and complement the experience and skills on the Board.
The Board is committed to ensuring its performance is enhanced through its director induction and ongoing education program. The Board’s ongoing education calendar incorporated site visits throughout the financial year to a number of the Company’s operational facilities. Presentations were given by management and external experts concerning developments impacting, or likely to impact, the business.
IndependenceThe Board, having reviewed the position and associations of all non-executive directors currently in office, considers that all non-executive directors are independent.
During the year non-executive directors met periodically without the presence of management to have the opportunity to discuss key matters amongst the non-executive directors.
Role of the BoardThe responsibilities of the Board as set out in the Board Charter include:
Strategic guidance and effective oversight of management
• Providing input and approval of the Group’s corporate strategy, performance objectives and business plans as developed by management;
• Directing, monitoring and assessing the Group’s performance against strategic and business plans; and
• Approving and monitoring capital management, including major capital expenditure, acquisitions and divestments.
Risk assessment and management
• Reviewing and evaluating the integrity of the Group’s systems of risk management, legal compliance, and internal compliance and control.
Obligations to stakeholders
• Monitoring and reviewing processes aimed at ensuring integrity of financial and other reporting; and
• Monitoring compliance with adopted strategies, procedures and standards, including corporate governance standards.
TREASURY WINE ESTATES ANNUAL REPORT 2016 / 37
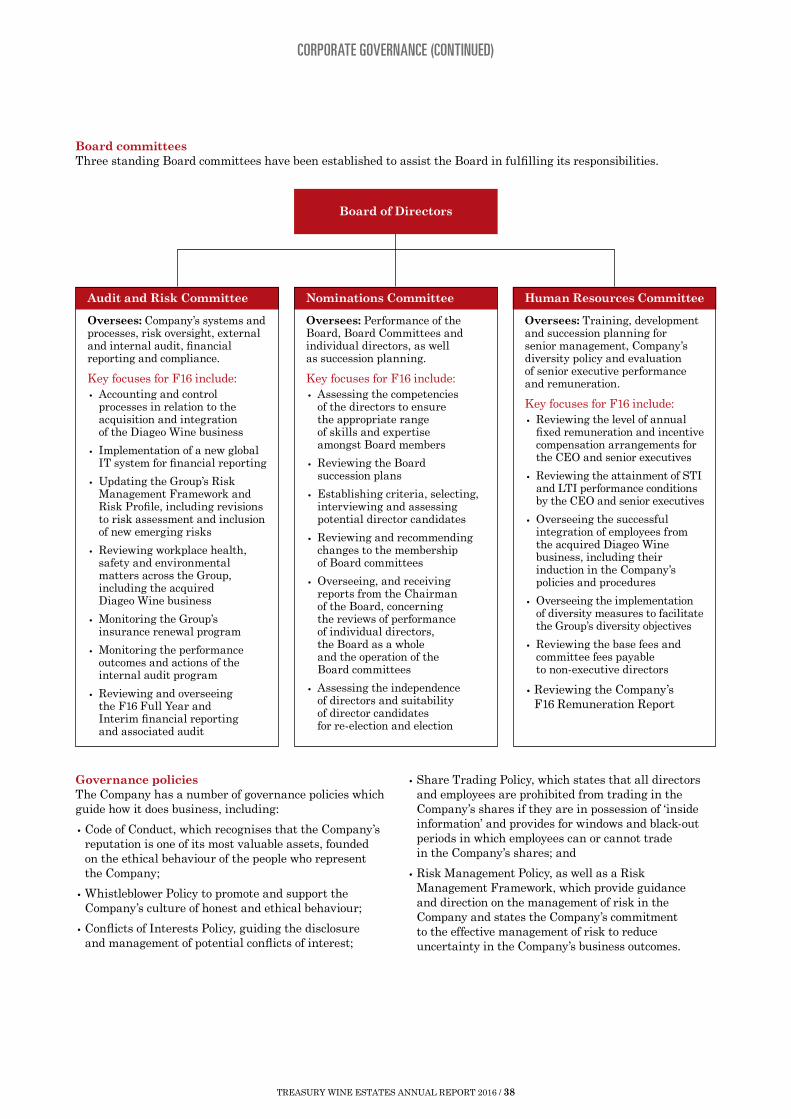
CORPORATE GOVERNANCE (CONTINUED)
Human Resources Committee
Oversees: Training, development and succession planning for senior management, Company’s diversity policy and evaluation of senior executive performance and remuneration.
Key focuses for F16 include:• Reviewing the level of annual
fixed remuneration and incentive compensation arrangements for the CEO and senior executives
• Reviewing the attainment of STI and LTI performance conditions by the CEO and senior executives
• Overseeing the successful integration of employees from the acquired Diageo Wine business, including their induction in the Company’s policies and procedures
• Overseeing the implementation of diversity measures to facilitate the Group’s diversity objectives
• Reviewing the base fees and committee fees payable to non-executive directors
• Reviewing the Company’s F16 Remuneration Report
Nominations Committee
Oversees: Performance of the Board, Board Committees and individual directors, as well as succession planning.
Key focuses for F16 include:• Assessing the competencies
of the directors to ensure the appropriate range of skills and expertise amongst Board members
• Reviewing the Board succession plans
• Establishing criteria, selecting, interviewing and assessing potential director candidates
• Reviewing and recommending changes to the membership of Board committees
• Overseeing, and receiving reports from the Chairman of the Board, concerning the reviews of performance of individual directors, the Board as a whole and the operation of the Board committees
• Assessing the independence of directors and suitability of director candidates for re-election and election
Audit and Risk Committee
Oversees: Company’s systems and processes, risk oversight, external and internal audit, financial reporting and compliance.
Key focuses for F16 include:• Accounting and control
processes in relation to the acquisition and integration of the Diageo Wine business
• Implementation of a new global IT system for financial reporting
• Updating the Group’s Risk Management Framework and Risk Profile, including revisions to risk assessment and inclusion of new emerging risks
• Reviewing workplace health, safety and environmental matters across the Group, including the acquired Diageo Wine business
• Monitoring the Group’s insurance renewal program
• Monitoring the performance outcomes and actions of the internal audit program
• Reviewing and overseeing the F16 Full Year and Interim financial reporting and associated audit
Board of Directors
Board committeesThree standing Board committees have been established to assist the Board in fulfilling its responsibilities.
Governance policiesThe Company has a number of governance policies which guide how it does business, including:
• Code of Conduct, which recognises that the Company’s reputation is one of its most valuable assets, founded on the ethical behaviour of the people who represent the Company;
• Whistleblower Policy to promote and support the Company’s culture of honest and ethical behaviour;
• Conflicts of Interests Policy, guiding the disclosure and management of potential conflicts of interest;
• Share Trading Policy, which states that all directors and employees are prohibited from trading in the Company’s shares if they are in possession of ‘inside information’ and provides for windows and black-out periods in which employees can or cannot trade in the Company’s shares; and
• Risk Management Policy, as well as a Risk Management Framework, which provide guidance and direction on the management of risk in the Company and states the Company’s commitment to the effective management of risk to reduce uncertainty in the Company’s business outcomes.
TREASURY WINE ESTATES ANNUAL REPORT 2016 / 38

The directors of Treasury Wine Estates Limited (the Company) present their report together with the financial report for the Company and its controlled entities (the Group) for the financial year ended 30 June 2016 and the auditor’s report.
The sections referred to below form part of, and are to be read in conjunction with, this Directors’ Report:
• Operating and Financial Review (OFR)
• Board of Directors
• Remuneration Report
PRINCIPAL ACTIVITIES
The principal activities of the Group during the financial year were viticulture and winemaking, and the marketing, sale and distribution of wine.
STATUTORY INFORMATION
The Group’s consolidated financial statements have been presented for the financial year ended 30 June 2016 and appear on pages 65 to 110.
DIRECTORSThe directors of the Company during the financial year and up to the date of this report are:
DATE OF APPOINTMENT
Lyndsey Cattermole AM 10 February 2011Warwick Every-Burns 9 May 2011Paul Rayner 9 May 2011Peter Hearl 17 February 2012Garry Hounsell 1 September 2012Ed Chan 1 September 2012Michael Cheek 1 September 2012Michael Clarke (Chief Executive Officer)
31 March 2014
Particulars of the current directors’ qualifications, experience and Board Committee responsibilities are detailed in the Board of Directors’ section of this Annual Report.
DIRECTORS’ REPORT
DIRECTORS’ MEETINGS
The number of Board and Board Committee meetings and the number of meetings attended by each of the directors of the Company during the financial year are listed below:
Meetings held during 2016 financial year
BOARD MEETINGS1AUDIT AND RISK
COMMITTEE1
HUMAN RESOURCESCOMMITTEE1
NOMINATIONSCOMMITTEE1
ADDITIONALMEETINGS2
HELD ATTENDED HELD ATTENDED HELD ATTENDED HELD ATTENDED ATTENDED
Paul Rayner 16 16 – – – – 3 3 9Lyndsey Cattermole3 16 16 4 4 6 6 1 1 –Warwick Every-Burns3 16 15 5 – – 6 6 2 2 1Peter Hearl4 16 14 5 4 3 3 3 – – –Garry Hounsell 16 15 5 4 4 – – 3 3 8Ed Chan 16 16 – – – – – – –Michael Cheek 16 16 – – 6 6 – – –Michael Clarke 16 16 – – – – – – 6
1. Shows the number of meetings held and attended by each director during the period that the director was a member of the Board or Committee. All directors have an open invitation to attend Board Committee meetings. Directors who are not members of Board Committees do attend Committee meetings from time to time. The above table reflects the meeting attendance of directors who are members of the relevant Committee(s).
2. Reflects the number of additional formal meetings attended during the financial year by each Director, including Committee meetings (other than Audit and Risk Committee, Human Resources or Nomination Committee) where any two Directors are required to form a quorum.
3. Effective from 1 July 2015, Mr Every-Burns re-joined the Human Resources Committee as Chairman of the Committee. In addition, effective from 1 January 2016, Mrs Cattermole retired from, and Mr Every-Burns joined the Nominations Committee.
4. Effective from 1 January 2016, Mr Hearl retired from the Human Resources Committee.5. Mr Every-Burns, Mr Hearl and Mr Hounsell attended all scheduled Board meetings. This number reflects additional unscheduled
Board meetings for which the relevant director was unable to attend due to prior commitments.
TREASURY WINE ESTATES ANNUAL REPORT 2016 / 39
DIRECTORS’ REPORT (CONTINUED)
Directors’ interests in share capitalThe relevant interest of each director in the share capital of the Company as at the date of this report is disclosed in the Remuneration Report.
DIVIDENDS
Interim dividend: The Company paid an interim dividend of 8 cents per ordinary share on 8 April 2016. The dividend was unfranked.
Final dividend: Since the end of the financial year, the directors have declared a final dividend of 12 cents per share unfranked and payable on 7 October 2016. The record date for entitlement to this dividend is 1 September 2016.
In summary:
DIVIDEND PER SHARE $’000
Interim dividend paid on 8 April 2016
8 cents per share $59,050
Final dividend payable on 7 October 2016
12 cents per share $88,600
Total 20 cents per share $147,650
The Company paid shareholders a final dividend in respect of the 2015 financial year of $52,101,000.
EVENTS SUBSEQUENT TO BALANCE DATE
On 4 July 2016, the Company announced the divestment of its non-priority Commercial brand portfolio in the US, representing the sale of 12 brands and comprising circa one million cases of non-priority Commercial wine.
On 21 July 2016, the Company announced the appointment to the Board of a US-based independent non-executive director, Ms Lauri Shanahan, effective 1 November 2016. On 11 August 2016, the Company announced the appointment of Linnsey Caya as Group General Counsel, replacing outgoing Group General Counsel and Company Secretary Paul Conroy, effective 12 September 2016, and the appointment of Fiona Last as Company Secretary, effective 1 September 2016.
Other than as disclosed in the financial statements, the directors are not aware of any other matters or circumstances that have arisen since the end of the financial year which have significantly affected or may significantly affect the operations of the Group, the results of those operations or the state of affairs of the Group in subsequent financial years.
CORPORATE RESPONSIBILITY
Matters of environmental and social significance to the Group are addressed within the Corporate Responsibility (CR) program. This program is governed by the Global CR Council, chaired by the Chief Executive Officer, and comprising representatives from regional and functional areas of the business.
Further detail on the Group’s CR program, strategy, initiatives and achievements to date are detailed in the Corporate Responsibility section of this Annual Report.
ENVIRONMENTAL REGULATION
Management of environmental issues is a core element of the CR program detailed in the Corporate Responsibility section of this Annual Report, with the Group subject to a range of licences, permits and internal policies and procedures governing its operations.
Additionally, the Group’s operations are subject to a number of regulatory frameworks governing energy and water consumption, waste generation and greenhouse gas reporting.
The Group recognises the direct link between effective management of its environmental and social impacts and its business success. To this end, the Group’s environment policies, procedures and practices are designed to ensure that the Group maintains focus on resource efficiency and continuous improvement, and that all environmental laws and permit conditions are complied with. Compliance with these regulatory and operational programs has been incorporated into relevant business practices and processes. The Company monitors its operations through a Health, Safety and Environment (HSE) Management System, overlaid with a risk management and compliance system overseen by the Audit and Risk Committee. The Global CR Council provides the executive oversight of the Company’s strategic approach to managing the environmental and social challenges it faces. Although the Company’s various operations involve relatively low inherent environmental risks, matters of non-compliance are identified from time to time and are corrected. Where required, the appropriate regulatory authority is notified.
During the financial year under review, the Group was not convicted of any breach of environmental regulations.
Under the compliance system, the Audit and Risk Committee and the Board receive six-monthly reports detailing matters involving non-compliance and potential non-compliance. These reports also detail the corrective action that has been taken.
PROCEEDINGS ON BEHALF OF THE COMPANY
There are no proceedings brought or intervened in, or applications to bring or intervene in proceedings, on behalf of the Company by a member or other person entitled to do so under section 237 of the Corporations Act 2001 (Cth).
TREASURY WINE ESTATES ANNUAL REPORT 2016 / 40
DIRECTORS’ REPORT (CONTINUED)
NON-AUDIT SERVICES AND AUDITOR INDEPENDENCE
KPMG is the Company’s auditor, appointed with effect from 23 October 2013.
The Group may decide to engage the auditor, KPMG, on assignments additional to their statutory audit duties where such services are not in conflict with their role as auditor and their expertise and/or detailed experience with the Company may allow cost efficiencies for the work.
The Board has considered the position and, in accordance with advice received from the Audit and Risk Committee, is satisfied that the provision of non-audit services by KPMG is compatible with the general standard of independence for auditors imposed by the Corporations Act 2001 (Cth). The Board also notes that:
• All non-audit services have been reviewed by the Audit and Risk Committee to ensure they do not impact the actual or perceived impartiality and objectivity of KPMG and are consistent with the Committee’s rules of engagement contained in its Charter; and
• None of the services provided by KPMG undermine the general principles relating to auditor independence as set out in APES 110 Code of Ethics for Professional Accountants.
During the financial year, the fees paid or payable for non-audit services provided by KPMG as the auditor of the Company and its related practices totalled $367,447. Amounts paid or payable for audit and non-audit services are disclosed in note 32 of the Financial Statements.
A copy of the auditor’s independence declaration is set out on page 42 and forms part of this report.
INDEMNITIES AND INSURANCE
Rule 40 of the Company’s Constitution provides that the Company will, to the extent permitted by law, indemnify directors and officers of Group companies in respect of any liability, loss, damage, cost or expense incurred or suffered in or arising out of the conduct of the business of the Group or in or arising out of the proper performance of any duty of that director or officer.
Each director of Treasury Wine Estates Limited has entered into a Deed of Indemnity, Insurance and Access (Deed) with the Company. Several members of the senior executive team have also entered into a Deed. No director or officer of the Company has received a benefit under an indemnity from the Company during the period ended 30 June 2016 or to the date of this report.
In accordance with the Company’s Constitution and the Deed, the Company has paid a premium in respect of an insurance contract that covers directors and officers of the Group companies against any liability arising in or out of the conduct of the business of the Group and the proper performance of any duty of that director or officer. Due to confidentiality undertakings of the policy, no further details in respect of the premium or the policy can be disclosed.
ROUNDING
Treasury Wine Estates Limited is a company of the kind referred to in ASIC Corporations (Rounding in Financial/Directors’ Reports) Instrument 2016/19 and, except where otherwise stated, amounts in the statutory financial statements forming part of this report have been rounded off to the nearest one hundred thousand dollars or to zero where the amount is $50,000 or less.
Dated at Melbourne 31 August 2016.
Paul Rayner Michael Clarke Chairman ChiefExecutiveOfficer
TREASURY WINE ESTATES ANNUAL REPORT 2016 / 41

AUDITOR’S INDEPENDENCE DECLARATION
ABCD
Liability limited by a scheme approved under Professional Standards Legislation.
KPMG, an Australian partnership and a member firm of the KPMG network of independent member firms affiliated with KPMG International, a Swiss cooperative.
Lead Auditor’s Independence Declaration under Section 307C of the Corporations Act 2001
To: the Directors of Treasury Wine Estates Limited
I declare that, to the best of my knowledge and belief, in relation to the audit for the financial yearended 30 June 2016 there have been:
(i) no contraventions of the auditor independence requirements as set out in the Corporations Act 2001 in relation to the audit; and
(ii) no contraventions of any applicable code of professional conduct in relation to the audit.
KPMG
Paul J McDonaldPartner
Melbourne
31 August 2016
TREASURY WINE ESTATES ANNUAL REPORT 2016 / 42

REMUNERATION REPORT – AUDITED
MESSAGE FROM THE CHAIRMAN OF THE HUMAN RESOURCES COMMITTEE
Dear Shareholders,
On behalf of my fellow directors, I am pleased to present the TWE F16 Remuneration Report, which will be put to shareholders at our 2016 Annual General Meeting (AGM).
F16 marked the second successful year of TWE’s transition from an order-taking, agricultural company to a brand-led marketing organisation.
Our strong financial results reflect our continued focus on portfolio premiumisation, optimisation of brand building investment, building stronger and more efficient routes-to-market in key growth regions, embedding a cost conscious culture and reducing cost and complexity from our supply chain, globally.
In F16, TWE delivered EBITS of $342 million, up 29% on a constant currency basis and adjusted Earnings Per Share growth of 45% (before material items and SGARA). The Company also delivered outstanding EBITS margin accretion and reported improved Return On Capital Employed (ROCE), up 2.8 percentage points to 9.6%.
F16 demonstrates outstanding execution across all regions and functions. Momentum in our business is clearly accelerating with the Company now targeting a high-teens EBITS margins by F18; two years ahead of previous guidance.
Importantly, our strong F16 results were delivered sustainably and demonstrate TWE’s commitment to generating enhanced shareholder value for the long term.
Critical facts contained in this report for F16 are as follows:
• A review of Key Management Personnel (KMP) fixed remuneration was undertaken in September 2015, with eligible executives subsequently receiving a market adjustment on fixed remuneration at an average rate of 3.1%;
• As announced in F16, the CEO’s fixed remuneration was reviewed for the first time since his appointment on 1 March 2014. In recognition of the significant turnaround of the business and strategic initiatives put in place for future growth, and to be competitive in a global context, Mr Clarke’s fixed remuneration was increased from $1.7 million to $2.2 million effective 1 March 2016;
• The Board believes the Group’s successful focus on sustainable earnings growth, cost management and operational effectiveness significantly enhanced shareholder value in F16. As a result, the Board has determined that the F16 short-term incentive plan (STIP) outcomes are from target to maximum for executives. The CEO was paid out at maximum due to exceptional performance.
• The Group’s Total Shareholder Return (TSR) performance relative to its peer group as well as the strong growth in EPS has driven a vesting outcome of 85.4% of the F14 long-term incentive plan (LTIP) for eligible executives.
• Rights adjustment: with the acquisition of the Diageo Wine business a renounceable rights issue was announced by the Company on 14 October 2015. To ensure this would neither unfairly disadvantage nor advantage executives holding Rights under an employee equity plan, the Board determined to make an additional grant of Rights to all existing holders. The aim was to ‘keep whole’ participants as a result of the dilution of the capital structure. The impact on executives is detailed in the relevant tables throughout the report;
• Share Cellar: the two purchases for executives under the company’s 2015 Share Cellar plan were completed in F16. The 2016 Share Cellar plan was successfully launched in the last quarter of F16 and all executive KMP as at 30 June 2016 are enrolled as participants; and
• Non-executive director (NED) fees: for the first time since the demerger in 2011, non-executive director base fees, as well as the Chairman’s fee and Human Resources Committee (HRC) member fees were increased in F16. The increases were made in order to remain market competitive and to continue to attract and retain high calibre NEDs. It is proposed the fee pool is increased from $2,200,000 per annum to $2,500,000 per annum in F17.
We have again included a non-statutory table (Table 6.2) in this report which details the actual pay and incentives crystallised during the year for executives and which supplements the disclosures in Table 6.1.
We continuously review our remuneration framework and the Company’s success means retention and reward of our leaders is more critical than ever. Therefore the following changes will be made for F17:
• The maximum STIP opportunity for the CEO will increase from 135% to 150%;
• The target STIP opportunity for executives (apart from the CEO) will increase from 60% to 66.5% and the maximum from 108% to 120%.
We have worked to streamline and improve our report this year and I encourage you to read it. I trust that you will find it relevant and useful in understanding the remuneration policies and practices of the Group and in better informing your investment decisions.
Yours sincerely,
Warwick Every-Burns Human Resources Committee Chairman
TREASURY WINE ESTATES ANNUAL REPORT 2016 / 43

REMUNERATION REPORT (CONTINUED)
INTRODUCTION
The directors present the Remuneration Report of the Company and its controlled entities (the Group) for F16, prepared in accordance with the requirements of the Corporations Act 2001 (Cth). The Remuneration Report forms part of the Directors’ Report and details the F16 remuneration framework and outcomes for Key Management Personnel (KMP).
All references to dollars in the Remuneration Report are to Australian dollars (A$) unless otherwise specified.
SECTION 1: ORGANISATION AND KEY MANAGEMENT PERSONNEL
This report details the F16 remuneration framework and outcomes for the KMP of the Group. KMP includes the non-executive directors of the Group. In this report, ‘executives’ refers to executives identified as KMP (excluding the non-executive directors).
A list of all KMP during F16 is presented below:
NAME POSITION DATES
Non-executive directorsCurrentPA Rayner Chairman Full yearML Cattermole Non-executive director Full yearEYC Chan Non-executive director Full yearMV Cheek Non-executive director Full yearWL Every-Burns Non-executive director Full yearPR Hearl Non-executive director Full yearGA Hounsell Non-executive director Full year
ExecutivesCurrent (as at 30 June 2016)MA Clarke Chief Executive Officer Full yearRB Foye President and Managing Director, Asia,
Europe & Latin AmericaFull year
AGJ McPherson Managing Director, ANZ Full yearNA Meehan Chief Financial Officer From 1 January 20161
RJC Spooner Chief Supply Officer/President TWE Americas Full year2
FormerSL LeDrew President TWE North America Until 29 February 20163
AJ Reeves Chief Financial Officer Until 31 December 20154
1. Mr Meehan joined the Group on 1 December 2015 and was appointed CFO on 1 January 2016, at which time he was considered to be KMP. Remuneration outcomes have been provided for the period Mr Meehan was KMP, as well as the initial transition period from 1 December 2015.
2. Mr Spooner commenced in the role of President TWE Americas effective 18 February 2016. Remuneration outcomes have been reported for the full year based on the role of Chief Supply Officer until 17 February 2016, and the role of President TWE Americas from 18 February 2016. The new Director Global Supply Chain role is not KMP.
3. Ms LeDrew ceased to be President TWE Americas and KMP on her departure from the Group on 29 February 2016.4. Mr Reeves ceased to be Chief Financial Officer, and KMP, on 31 December 2015 and remained with the Group to undertake a transition
to Mr Meehan. He subsequently left the Group on 31 January 2016. Remuneration outcomes have been provided for the period Mr Reeves was KMP, as well as the transition period through to 31 January 2016.
TREASURY WINE ESTATES ANNUAL REPORT 2016 / 44
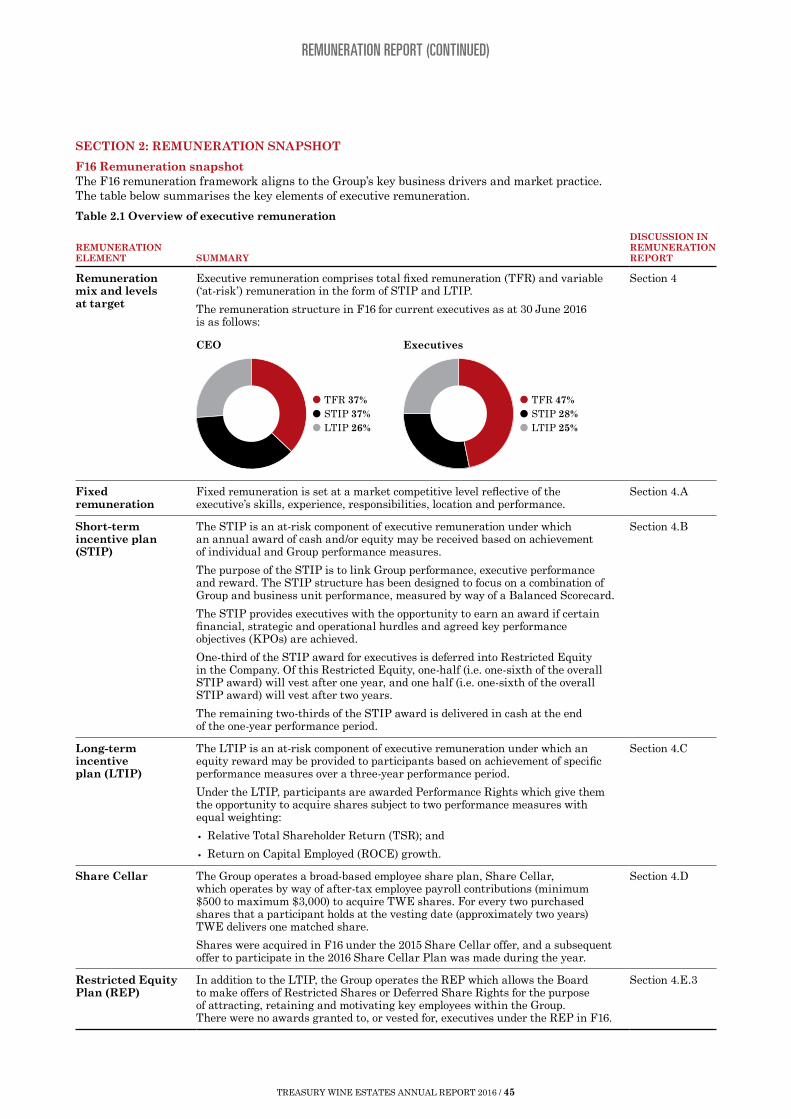
REMUNERATION REPORT (CONTINUED)
SECTION 2: REMUNERATION SNAPSHOT
F16 Remuneration snapshotThe F16 remuneration framework aligns to the Group’s key business drivers and market practice. The table below summarises the key elements of executive remuneration.
Table 2.1 Overview of executive remuneration
REMUNERATION ELEMENT SUMMARY
DISCUSSION IN REMUNERATION REPORT
Remuneration mix and levels at target
Executive remuneration comprises total fixed remuneration (TFR) and variable (‘at-risk’) remuneration in the form of STIP and LTIP.
The remuneration structure in F16 for current executives as at 30 June 2016 is as follows:
Section 4
CEO
TFR 37%STIP 37%LTIP 26%
Executives
TFR 47%STIP 28%LTIP 25%
Fixed remuneration
Fixed remuneration is set at a market competitive level reflective of the executive’s skills, experience, responsibilities, location and performance.
Section 4.A
Short-term incentive plan (STIP)
The STIP is an at-risk component of executive remuneration under which an annual award of cash and/or equity may be received based on achievement of individual and Group performance measures.
The purpose of the STIP is to link Group performance, executive performance and reward. The STIP structure has been designed to focus on a combination of Group and business unit performance, measured by way of a Balanced Scorecard.
The STIP provides executives with the opportunity to earn an award if certain financial, strategic and operational hurdles and agreed key performance objectives (KPOs) are achieved.
One-third of the STIP award for executives is deferred into Restricted Equity in the Company. Of this Restricted Equity, one-half (i.e. one-sixth of the overall STIP award) will vest after one year, and one half (i.e. one-sixth of the overall STIP award) will vest after two years.
The remaining two-thirds of the STIP award is delivered in cash at the end of the one-year performance period.
Section 4.B
Long-term incentive plan (LTIP)
The LTIP is an at-risk component of executive remuneration under which an equity reward may be provided to participants based on achievement of specific performance measures over a three-year performance period.
Under the LTIP, participants are awarded Performance Rights which give them the opportunity to acquire shares subject to two performance measures with equal weighting:
• Relative Total Shareholder Return (TSR); and
• Return on Capital Employed (ROCE) growth.
Section 4.C
Share Cellar The Group operates a broad-based employee share plan, Share Cellar, which operates by way of after-tax employee payroll contributions (minimum $500 to maximum $3,000) to acquire TWE shares. For every two purchased shares that a participant holds at the vesting date (approximately two years) TWE delivers one matched share.
Shares were acquired in F16 under the 2015 Share Cellar offer, and a subsequent offer to participate in the 2016 Share Cellar Plan was made during the year.
Section 4.D
Restricted Equity Plan (REP)
In addition to the LTIP, the Group operates the REP which allows the Board to make offers of Restricted Shares or Deferred Share Rights for the purpose of attracting, retaining and motivating key employees within the Group. There were no awards granted to, or vested for, executives under the REP in F16.
Section 4.E.3
TREASURY WINE ESTATES ANNUAL REPORT 2016 / 45

REMUNERATION REPORT (CONTINUED)
SECTION 3: LINK BETWEEN GROUP PERFORMANCE AND EXECUTIVE REMUNERATION
A. Company long-term performance against key financial measuresCritical to TWE’s transition from an order-taking, agricultural company to a brand-led marketing organisation is execution by all regions and functions. EBITS growth and EBITS margin accretion, together with improved asset returns will continue to be underpinned by the Company’s focus on portfolio premiumisation, optimisation of brand building investment, building stronger and more efficient routes-to-market in key growth regions, and the embedding of a cost conscious culture.
TWE’s F16 result demonstrates the benefits of this strategy with the Company delivering EBITS of $342 million, up 29% on a constant currency basis. Improved profitability was also delivered in F16, with strong EBITS margin accretion and significantly enhanced ROCE.
The table below summarises the Company’s financial performance over the last five financial years.
Table 3.1: Overview of Company performance
FINANCIAL YEAR ENDED 30 JUNE 2012 2013 2014 2015 2016
EBITS performance ($ million) 210.2 216.2 184.6 225.1 342.0Earnings per share (cents)1 20.9 21.9 17.4 21.9 31.1Dividends paid per share (cents) 12 13 13 13 162
Franked (%) 50 50 0 0 0Closing share price ($ at 30 June) 4.27 5.72 4.92 4.90 9.23Return on capital employed (%) 7.0 6.8 5.9 6.8 9.6
1. Before material items, SGARA and tax consolidation benefit.2. The 2016 dividend of 16 cents is comprised of the final F15 dividend of 8 cents paid on 2 October 2015 and the interim F16 dividend
of 8 cents paid on 8 April 2016. For the final F16 dividend see Note 6 of the Financial Statements.
The following graph shows movement in the Company share price against movement in the ASX200 over the last five years.
Share price (performance against ASX 200)
TWEASX200
Jun–2
011
Jun–2
016
Dec–2
011
Jun–2
012
Dec–2
012
Jun–2
013
June–
2015
Dec–2
015
Dec–2
014
Jun–2
014
Dec–2
013
350%
300%
250%
300%
150%
100%
50%
0%
B. STIP and LTIP remuneration outcomesThe Board has a strong focus on the alignment between remuneration and organisational performance. The remuneration of executives is linked to the Group’s performance through the use of targets based on the operating performance of the business for both the STIP and LTIP.
TREASURY WINE ESTATES ANNUAL REPORT 2016 / 46
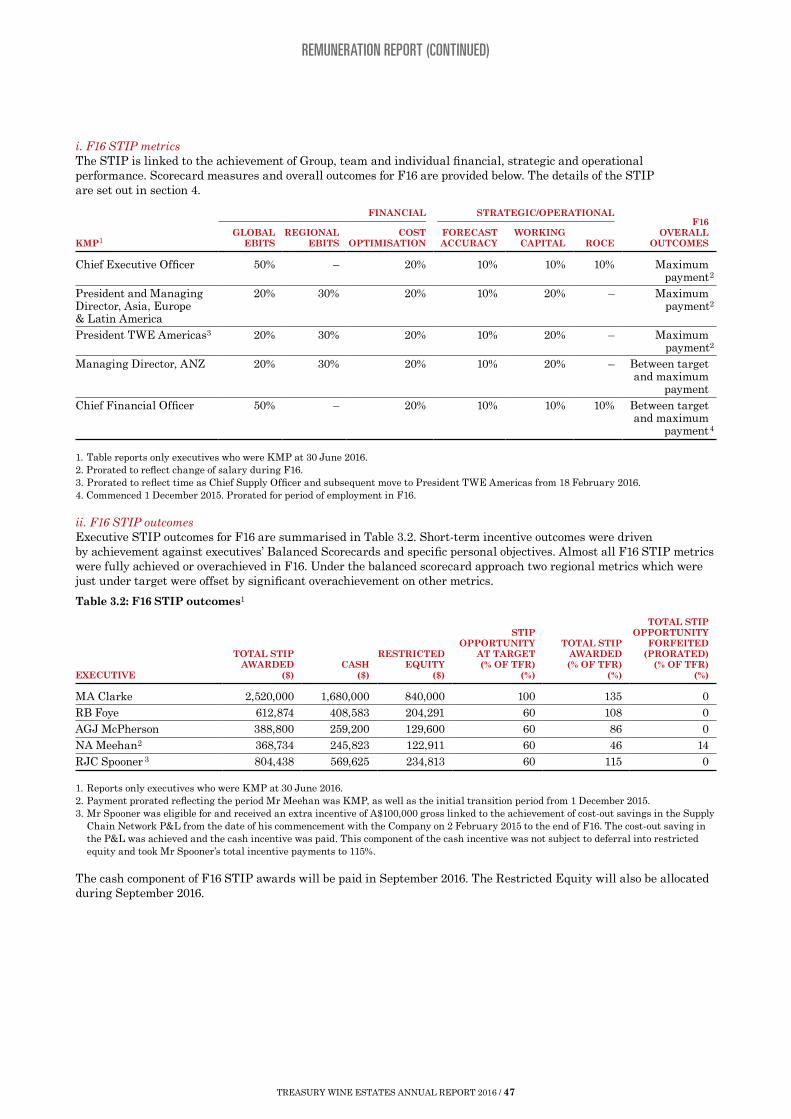
REMUNERATION REPORT (CONTINUED)
i. F16 STIP metricsThe STIP is linked to the achievement of Group, team and individual financial, strategic and operational performance. Scorecard measures and overall outcomes for F16 are provided below. The details of the STIP are set out in section 4.
KMP1
FINANCIAL STRATEGIC/OPERATIONALF16
OVERALL OUTCOMES
GLOBAL EBITS
REGIONAL EBITS
COST OPTIMISATION
FORECAST ACCURACY
WORKING CAPITAL ROCE
Chief Executive Officer 50% – 20% 10% 10% 10% Maximumpayment2
President and Managing Director, Asia, Europe & Latin America
20% 30% 20% 10% 20% – Maximumpayment2
President TWE Americas3 20% 30% 20% 10% 20% – Maximumpayment2
Managing Director, ANZ 20% 30% 20% 10% 20% – Between target and maximum
paymentChief Financial Officer 50% – 20% 10% 10% 10% Between target
and maximumpayment4
1. Table reports only executives who were KMP at 30 June 2016.2. Prorated to reflect change of salary during F16.3. Prorated to reflect time as Chief Supply Officer and subsequent move to President TWE Americas from 18 February 2016.4. Commenced 1 December 2015. Prorated for period of employment in F16.
ii. F16 STIP outcomesExecutive STIP outcomes for F16 are summarised in Table 3.2. Short-term incentive outcomes were driven by achievement against executives’ Balanced Scorecards and specific personal objectives. Almost all F16 STIP metrics were fully achieved or overachieved in F16. Under the balanced scorecard approach two regional metrics which were just under target were offset by significant overachievement on other metrics.
Table 3.2: F16 STIP outcomes1
EXECUTIVE
TOTAL STIP AWARDED
($)CASH
($)
RESTRICTED EQUITY
($)
STIP OPPORTUNITY
AT TARGET (% OF TFR)
(%)
TOTAL STIP AWARDED(% OF TFR)
(%)
TOTAL STIP OPPORTUNITY
FORFEITED (PRORATED)
(% OF TFR)(%)
MA Clarke 2,520,000 1,680,000 840,000 100 135 0RB Foye 612,874 408,583 204,291 60 108 0AGJ McPherson 388,800 259,200 129,600 60 86 0NA Meehan2 368,734 245,823 122,911 60 46 14RJC Spooner 3 804,438 569,625 234,813 60 115 0
1. Reports only executives who were KMP at 30 June 2016.2. Payment prorated reflecting the period Mr Meehan was KMP, as well as the initial transition period from 1 December 2015.3. Mr Spooner was eligible for and received an extra incentive of A$100,000 gross linked to the achievement of cost-out savings in the Supply
Chain Network P&L from the date of his commencement with the Company on 2 February 2015 to the end of F16. The cost-out saving in the P&L was achieved and the cash incentive was paid. This component of the cash incentive was not subject to deferral into restricted equity and took Mr Spooner’s total incentive payments to 115%.
The cash component of F16 STIP awards will be paid in September 2016. The Restricted Equity will also be allocated during September 2016.
TREASURY WINE ESTATES ANNUAL REPORT 2016 / 47

REMUNERATION REPORT (CONTINUED)
iii. F16 LTIP awardsThe LTIP has been designed to provide reward for long-term executive performance and long-term value creation for shareholders. Key terms of the LTIP are detailed in section 4.2. The allocation of F16 LTIP awards made to executives are summarised in Table 3.3. Performance rights have no exercise price. The minimum total value of the grant is zero. The maximum value is the number of awards granted multiplied by the share price at vesting.
Table 3.3: F16 LTIP Performance Rights
EXECUTIVE GRANT DATEVESTING
DATE
NUMBER OF AWARDS
GRANTED
FAIR VALUE AT GRANT
DATE1
($)
REVISED NUMBER OF
AWARDS2
REVISED FAIR VALUE AT
GRANT DATE3
($)
Current (as at 30 June 2016)MA Clarke 4 December 2015 30 June 2018 639,506 4,450,962 659,759 4,591,923RB Foye 4 December 2015 30 June 2018 179,617 1,250,134 185,305 1,289,723AGJ McPherson 4 December 2015 30 June 2018 105,800 736,368 109,150 759,684NA Meehan 4 December 2015 30 June 2018 131,663 916,374 135,832 945,391RJC Spooner 4 December 2015 30 June 2018 183,387 1,276,374 189,194 1,316,790
FormerSL LeDrew 4 4 December 2015 30 June 2018 179,340 1,248,206 185,019 1,287,732AJ Reeves4 4 December 2015 30 June 2018 181,833 1,265,558 181,833 1,265,558
1. The value of LTIP awards granted to executives was the face value of the volume weighted average price (VWAP) of Company shares sold on the Australian Securities Exchange over the 90-day period up to and including 30 June 2015 ($5.3166 per share). The value ($) in the table above is calculated using the valuation method detailed in note 21 of the Financial Statements.
2. The revised number of awards reflects the updated number of Performance Rights allocated to executives after the rights entitlement adjustments were made. The additional number of units granted was determined in accordance with the methodology provided to the Company by an independent third-party advisory firm.
3. This value is calculated using the valuation method detailed in note 21 of the Financial Statements based on the revised number of awards.4. The number of awards shown for Ms LeDrew and Mr Reeves represent the full F16 LTIP grant (and rights entitlement adjustments,
where applicable). However, upon ceasing employment with the Company, Ms LeDrew and Mr Reeves were only entitled to retain a pro-rata portion of their F16 LTIP awards, reflecting the expired portion of the performance period, and subject to post-employment vesting.
iv. LTIP vested during F16The F14 LTIP was tested for the performance period ended 30 June 2016. The Group’s relative TSR performance over the three year performance period placed the Company at the 77th percentile of its peer group resulting in 100% vesting for this metric. The earnings per share compound annual growth rate (EPS CAGR) for the performance period was 12.8% and excludes the acquisition of the Diageo Wine business, resulting in vesting at 70.8%. The combined vesting outcome for the F14 LTIP plan is 85.4%.
The vesting schedules for the F14 LTIP awards are shown in Table 3.4.
Table 3.4: Vesting schedules
Relative TSR vesting schedule
Relative TSR ranking % of Performance Rights subject to relative TSR measure which vest
Below 50th percentile 0%50th to 75th percentile 50–100%At or above 75th percentile 100%
EPS growth vesting schedule
% EPS CAGR % of Performance Rights subject to EPS measure which vest
Less than 7.5% 0%7.5% to 15% 0–100%15% or more 100%
TREASURY WINE ESTATES ANNUAL REPORT 2016 / 48

REMUNERATION REPORT (CONTINUED)
Table 3.5 details the Performance Rights which vested into shares and those which lapsed during F16 as a result of the partial vesting of the F14 LTIP awards.
Table 3.5: Vesting/lapse of F14 LTIP
EXECUTIVE
NUMBER OF PERFORMANCE
RIGHTSGRANTED1
REVISEDNUMBER OF
AWARDS2
NUMBER OF ORDINARY
SHARES ISSUED ON VESTING
OF RIGHTS
VALUE VESTED3
($)
NUMBER OF RIGHTS
WHICH LAPSED4
VALUE LAPSED3
($)
AGJ McPherson 72,212 74,498 63,621 587,225 10,877 100,395
Former
SL LeDrew 88,392 91,191 69,207 638,781 21,984 202,912AJ Reeves 133,701 133,701 98,450 908,694 35,251 325,367
1. Represents the original number of Performance Rights granted under the F14 LTIP.2. The revised number of awards reflects the updated number of Performance Rights allocated to employed executives after the rights
entitlement adjustments were made. The additional number of units granted was determined in accordance with the methodology provided to the Company by an independent third-party advisory firm.
3. The value vested and value lapsed are calculated based on the closing share price at the vesting date ($9.23).4. The number of rights which lapsed includes rights that did not vest and rights forfeited by former executives on termination
of employment.
SECTION 4: EXECUTIVE REMUNERATION FRAMEWORK
The Group’s remuneration strategy and structure is reviewed by the Board and the Human Resources Committee (HRC) for business fit and market relativity on an ongoing basis.
Remuneration Policy and strategyThe Group’s remuneration strategy is designed to:
• attract and retain high-calibre employees by providing competitive remuneration packages in the markets in which the Group operates;
• motivate employees to deliver exceptional individual and business results by rewarding high performance appropriately; and
• align remuneration outcomes directly with the achievement of short-term and long-term business strategies as well as shareholder value creation.
The Group’s Remuneration Policy and strategy ensure that remuneration is competitive, performance-focused, clearly links appropriate reward with desired business performance, and is simple to administer and understand by executives and shareholders. In accordance with the Remuneration Policy, remuneration levels and arrangements are reviewed annually to ensure alignment to market and the Group’s stated objectives.
To ensure the variable components of the Group’s remuneration structure remain ‘at-risk’, employees may not hedge against the risk inherent in arrangements such as the LTIP or any other equity-based incentive plans. Awards will be forfeited if the policy is breached.
Executive shareholding guidelines exist for the CEO and direct reports. Under the guidelines, each executive is encouraged to have control over ordinary shares in the Company that are worth at least the equivalent of one year’s fixed remuneration. Executives are expected to meet the guideline over a reasonable period of time (approximately five years). The Group’s variable incentive programs contribute towards executives meeting this guideline.
TREASURY WINE ESTATES ANNUAL REPORT 2016 / 49
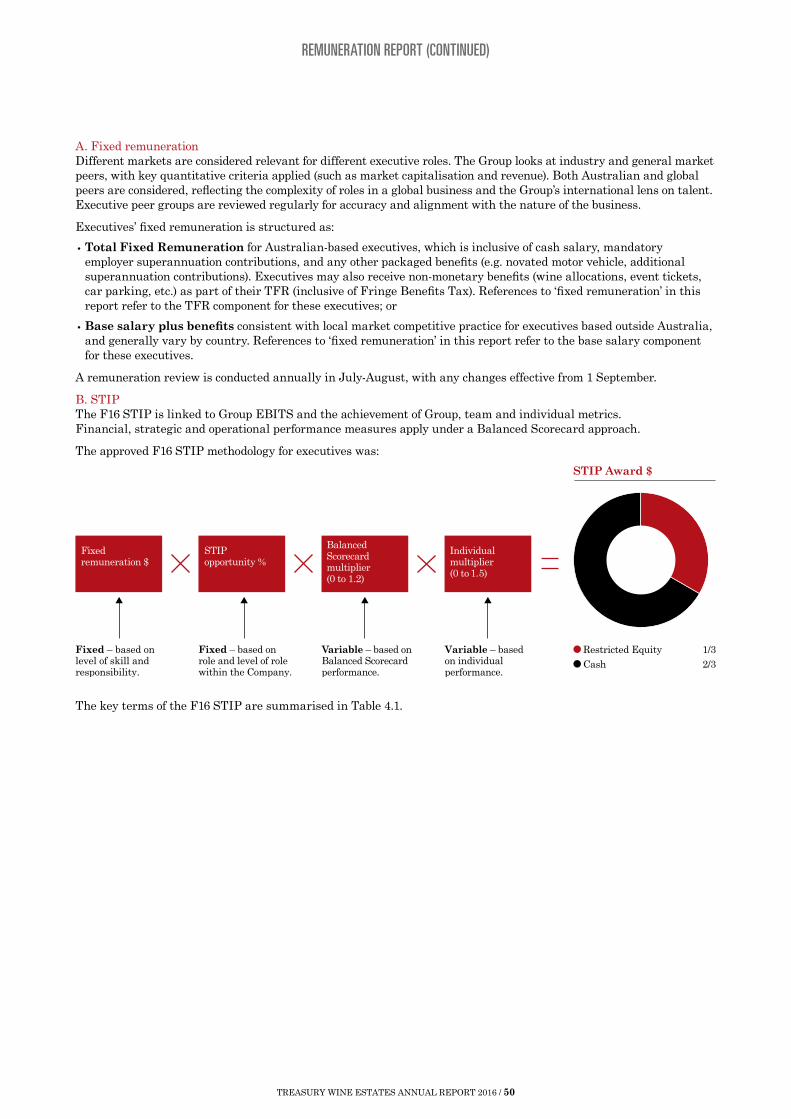
REMUNERATION REPORT (CONTINUED)
A. Fixed remunerationDifferent markets are considered relevant for different executive roles. The Group looks at industry and general market peers, with key quantitative criteria applied (such as market capitalisation and revenue). Both Australian and global peers are considered, reflecting the complexity of roles in a global business and the Group’s international lens on talent. Executive peer groups are reviewed regularly for accuracy and alignment with the nature of the business.
Executives’ fixed remuneration is structured as:
• Total Fixed Remuneration for Australian-based executives, which is inclusive of cash salary, mandatory employer superannuation contributions, and any other packaged benefits (e.g. novated motor vehicle, additional superannuation contributions). Executives may also receive non-monetary benefits (wine allocations, event tickets, car parking, etc.) as part of their TFR (inclusive of Fringe Benefits Tax). References to ‘fixed remuneration’ in this report refer to the TFR component for these executives; or
• Base salary plus benefits consistent with local market competitive practice for executives based outside Australia, and generally vary by country. References to ‘fixed remuneration’ in this report refer to the base salary component for these executives.
A remuneration review is conducted annually in July-August, with any changes effective from 1 September.
B. STIPThe F16 STIP is linked to Group EBITS and the achievement of Group, team and individual metrics. Financial, strategic and operational performance measures apply under a Balanced Scorecard approach.
The approved F16 STIP methodology for executives was:
Restricted Equity 1/3Cash 2/3
Fixed – based on level of skill and responsibility.
Fixed – based on role and level of role within the Company.
Fixedremuneration $
STIP opportunity %
STIP Award $
Variable – based on Balanced Scorecard performance.
BalancedScorecardmultiplier (0 to 1.2)
Variable – based on individual performance.
Individualmultiplier(0 to 1.5)
The key terms of the F16 STIP are summarised in Table 4.1.
TREASURY WINE ESTATES ANNUAL REPORT 2016 / 50

REMUNERATION REPORT (CONTINUED)
Table 4.1: Terms of the F16 STIP
ELEMENT DETAIL
STIP opportunity The STIP opportunity is a set percentage of fixed remuneration and varies by employee depending on the type and seniority of the role within the Company. The F16 STIP opportunity at target for executives is 60% and capped at 108%. For the CEO it is 100%, capped at 135% of TFR for maximum performance.
Performance measures
Vesting of any STIP award is subject to performance against a combination of financial, strategic and operational measures set at the beginning of the financial year and detailed in executive Balanced Scorecards.
To generate a payment under the F16 STIP, threshold performance must be achieved on at least one of the Balanced Scorecard measures along with at least target individual performance. Balanced Scorecard measures are individually weighted, and all measures are not required to be achieved in order to deliver a payment under the STIP.
The Board has the discretion to assess STIP outcomes more holistically in making any adjustments to the STIP outcome. The intention of the Board exercising its discretion is to ensure that any STIP awards payable are appropriately aligned to TWE’s underlying performance and the interests of shareholders.
Balanced Scorecard multiplier
Individual scorecard measures were set and approved by the Board for the CEO, and by the CEO for all other executives, based on 70% financial and 30% strategic and operational measures aligned to delivering TWE’s strategic plan.
Each measure is assessed after the financial year-end against full year audited accounts (where relevant) on a constant currency basis to determine the overall level of performance achieved. Using the weighting and the achievement against threshold, target or maximum for each Balanced Scorecard measure, a Balanced Scorecard multiplier is determined as part of the STIP methodology above.
Individual multiplier (KPO outcome)
In addition to the assessment of Balanced Scorecards, each executive is also assessed on the achievement of individual KPOs relevant to the executive’s area of responsibility, and performance against Company behaviours. Individuals KPOs are set and approved by the Board for the CEO, and by the CEO for all other executives.
Individual KPOs are assessed at the financial year-end and an overall performance rating allocated. This rating drives the individual multiplier as part of the STIP methodology above.
STIP Restricted Equity component
To further align executive remuneration with shareholder interests, one-third of any executive’s F16 STIP award is delivered as Restricted Equity in the form of Restricted Shares (Deferred Share Rights in jurisdictions where local legislations do not allow the allocation of Restricted Shares, or cash equivalent in locations where local regulations prohibit or restrict the allocation of equity). The balance of any earned award is delivered as cash.
The Restricted Equity is subject to mandatory restriction periods (one-half of the Equity for one year from the allocation date, and the other half for two years from the allocation date) and continued employment with the Group. Participants are entitled to dividends and voting rights in respect of their Restricted Shares. Participants holding Deferred Share Rights are entitled to neither dividends nor voting rights. The value of any cash equivalent would generally incorporate the value of dividends which would have been paid, had they instead been allocated Restricted Shares, however do not entitle the participant to any voting rights. The Board has absolute discretion as to whether participants retain their unvested Restricted Equity upon ceasing employment, taking into account the circumstances of their departure.
Cessation of employment
Prior to STIP payment date – under the STIP guidelines for F16, if an executive ceases employment with the Group prior to any STIP awards being paid (i.e. September 2016), they are generally not entitled to receive any cash STIP payment or corresponding Restricted Equity.
Post-STIP payment date – if the executive is dismissed for cause, tenders his/her resignation, is terminated for performance reasons (as determined by the Board) or commits an act that the Board deems to result in forfeiture after STIP awards have been allocated, but prior to the relevant vesting dates, then any Restricted Equity will generally be forfeited. Cash payments are not subject to any clawback, should the executive leave the Group at any time post-payment date.
Change of control In the event of a change of control, unless the Board determines otherwise, the transfer restrictions imposed on the shares will be lifted, but only in so far as to permit the executive to participate in the change of control event. Any shares that do not participate in the change of control event will continue to be subject to restrictions until the end of the applicable restriction period.
Clawback The Board maintains the discretion to clawback any unvested equity should a clawback event arise, such as (but not limited to) material mis-statement, which was not apparent at the time the equity was awarded.
TREASURY WINE ESTATES ANNUAL REPORT 2016 / 51

REMUNERATION REPORT (CONTINUED)
C. LTIPThe LTIP is designed to reward executives for long-term performance and long-term value creation for shareholders.
LTIP awards are delivered in the form of Performance Rights. No dividends or voting rights are attached to Performance Rights. If the performance conditions are met at the end of the three-year performance period, the relevant portion of Performance Rights automatically vests and executives receive a share for each vested Performance Right. Any Rights that do not vest lapse. No amount is payable on the vesting of the Performance Rights or on their conversion into shares.
i. Terms of the F16 LTIPThe key terms of the F16 LTIP are summarised in Table 4.2.
Table 4.2: Terms of the F16 LTIP
ELEMENT DETAIL
Eligibility Offers were made to select executives and senior leaders as nominated by the CEO and approved by the Board.
CEO offer As a matter of good corporate governance, the Company seeks shareholder approval for CEO LTIP equity grants. Following approval at the 2015 AGM (12 November 2015) F16 LTIP offers were granted on 4 December 2015. The Company will seek shareholder approval at the 2016 AGM for an F17 LTIP offer to the CEO.
Performance period
The performance period for the F16 LTIP is three years – from 1 July 2015 to 30 June 2018.
The Board considers three years an appropriate performance period as it is aligned to market practice and is sufficiently long-term to influence the desired performance outcomes, whilst providing a foreseeable and genuine incentive to participants.
Performance measures
The F16 LTIP is subject to two performance measures which are weighted equally and assessed at the end of the performance period. The Board chose performance measures that align management’s long-term interests with those of shareholders. These measures are considered consistent with market practice and are easily understood by both participants and shareholders.
• Relative TSR provides shareholder alignment by taking into consideration the increase in share price as well as dividends paid. The relative measure supports competitive returns against other comparable organisations. TWE applies a 90-day volume-weighted average price (VWAP) to determine the start and ending share price to determine the relative TSR measure.
• The peer group for relative TSR comprises companies within the S&P/ASX 200 Index, excluding companies from the energy, metal and mining, real estate and finance Global Industry Classification Standards sectors (106 companies at the start of the performance period). This peer group was chosen as these organisations exhibit similar characteristics in terms of business cyclicality, market capitalisation, stock volatility and business operations, and provide a sufficiently large population to minimise the risk of attrition. The relative TSR peer group remains relatively broad as there are too few industry peers (i.e. within the Consumer Goods/Distillers and Vintners subgroup) to make additional sector exclusions viable.
• ROCE Growth is a new measure in F16 and is aimed at driving improvements in capital efficiency. ROCE is widely regarded as a metric well suited to a capital intensive business, and encourages growth in earnings on an optimised cost base.
• ROCE is calculated as EBITS divided by average capital employed (at constant currency). Capital employed is the sum of average net assets (excluding SGARA) and average net debt. The Board retains the discretion to adjust the ROCE performance condition to ensure that participants are not penalised nor provided with a windfall benefit arising from matters outside of management’s control that affect ROCE.
Relative TSR vesting schedule
Relative TSR ranking % of Performance Rights subject to relative TSR measure which vest
Below 50th percentile 0%50th to 75th percentile 35–100%At or above 75th percentile 100%
ROCE growth vesting schedule
% ROCE growth % of Performance Rights subject to ROCE measure which vest
Less than 0.6% 0%0.6% to 1.2% 35–100%At or above 1.2% 100%
TREASURY WINE ESTATES ANNUAL REPORT 2016 / 52
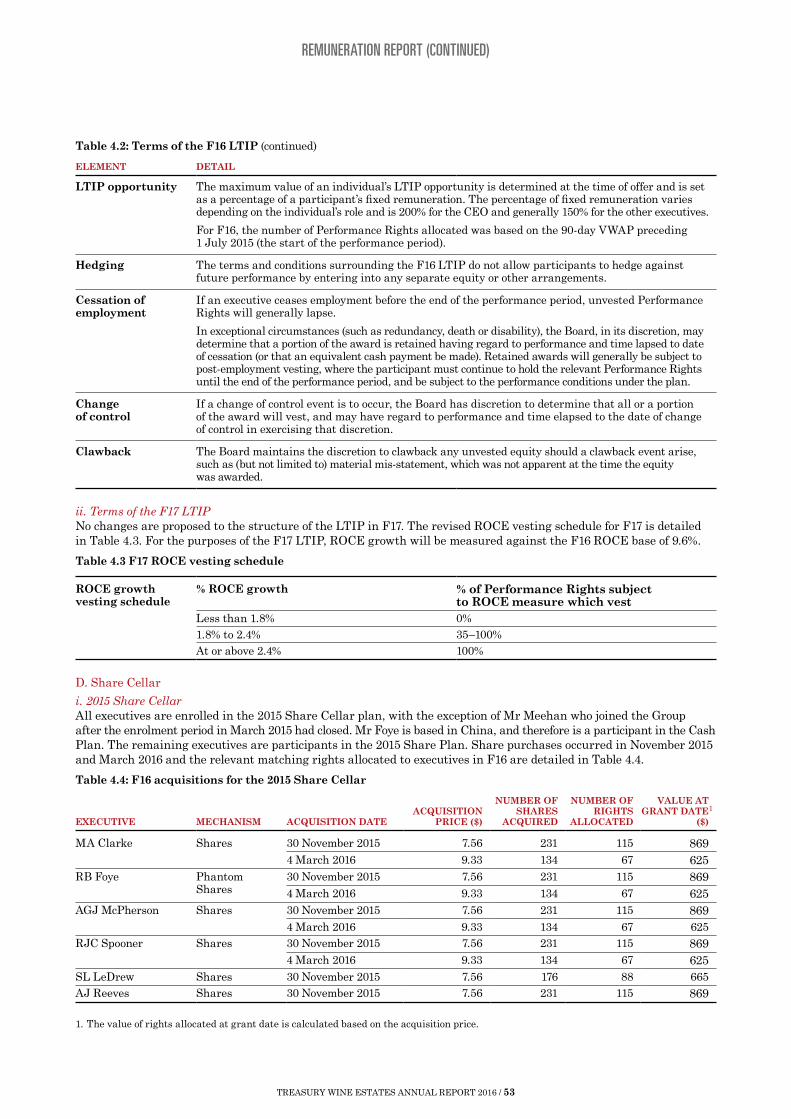
REMUNERATION REPORT (CONTINUED)
ELEMENT DETAIL
LTIP opportunity The maximum value of an individual’s LTIP opportunity is determined at the time of offer and is set as a percentage of a participant’s fixed remuneration. The percentage of fixed remuneration varies depending on the individual’s role and is 200% for the CEO and generally 150% for the other executives.
For F16, the number of Performance Rights allocated was based on the 90-day VWAP preceding 1 July 2015 (the start of the performance period).
Hedging The terms and conditions surrounding the F16 LTIP do not allow participants to hedge against future performance by entering into any separate equity or other arrangements.
Cessation of employment
If an executive ceases employment before the end of the performance period, unvested Performance Rights will generally lapse.
In exceptional circumstances (such as redundancy, death or disability), the Board, in its discretion, may determine that a portion of the award is retained having regard to performance and time lapsed to date of cessation (or that an equivalent cash payment be made). Retained awards will generally be subject to post-employment vesting, where the participant must continue to hold the relevant Performance Rights until the end of the performance period, and be subject to the performance conditions under the plan.
Change of control
If a change of control event is to occur, the Board has discretion to determine that all or a portion of the award will vest, and may have regard to performance and time elapsed to the date of change of control in exercising that discretion.
Clawback The Board maintains the discretion to clawback any unvested equity should a clawback event arise, such as (but not limited to) material mis-statement, which was not apparent at the time the equity was awarded.
ii. Terms of the F17 LTIPNo changes are proposed to the structure of the LTIP in F17. The revised ROCE vesting schedule for F17 is detailed in Table 4.3. For the purposes of the F17 LTIP, ROCE growth will be measured against the F16 ROCE base of 9.6%.
Table 4.3 F17 ROCE vesting schedule
ROCE growth vesting schedule
% ROCE growth % of Performance Rights subject to ROCE measure which vest
Less than 1.8% 0%1.8% to 2.4% 35–100%At or above 2.4% 100%
D. Share Cellar
i. 2015 Share CellarAll executives are enrolled in the 2015 Share Cellar plan, with the exception of Mr Meehan who joined the Group after the enrolment period in March 2015 had closed. Mr Foye is based in China, and therefore is a participant in the Cash Plan. The remaining executives are participants in the 2015 Share Plan. Share purchases occurred in November 2015 and March 2016 and the relevant matching rights allocated to executives in F16 are detailed in Table 4.4.
Table 4.4: F16 acquisitions for the 2015 Share Cellar
EXECUTIVE MECHANISM ACQUISITION DATEACQUISITION
PRICE ($)
NUMBER OF SHARES
ACQUIRED
NUMBER OF RIGHTS
ALLOCATED
VALUE ATGRANT DATE1
($)
MA Clarke Shares 30 November 2015 7.56 231 115 8694 March 2016 9.33 134 67 625
RB Foye Phantom Shares
30 November 2015 7.56 231 115 8694 March 2016 9.33 134 67 625
AGJ McPherson Shares 30 November 2015 7.56 231 115 8694 March 2016 9.33 134 67 625
RJC Spooner Shares 30 November 2015 7.56 231 115 8694 March 2016 9.33 134 67 625
SL LeDrew Shares 30 November 2015 7.56 176 88 665AJ Reeves Shares 30 November 2015 7.56 231 115 869
1. The value of rights allocated at grant date is calculated based on the acquisition price.
Table 4.2: Terms of the F16 LTIP (continued)
TREASURY WINE ESTATES ANNUAL REPORT 2016 / 53

REMUNERATION REPORT (CONTINUED)
ii. 2016 Share CellarDuring F16, the 2016 Share Cellar plan was launched with deductions commencing in April 2016. Actual share acquisitions under the plan will be completed in F17. Enrolment rates for the second year offer of Share Cellar were at a similar level to the original offer in 2015. All executives as at 30 June 2016 are enrolled in the 2016 Share Cellar plan.
iii. 2017 Share CellarTo continue to encourage employees to build shareholdings in the Group, and align the interests of Group employees with shareholder interests and the performance of the Group as a whole, the maximum possible contribution limit for Share Cellar will be increased in 2017 from $3,000 to $5,000 subject to affordability on a year by year basis.
E. Prior years’ equity arrangementsThe following section details all outstanding equity arrangements, including relevant F16 vesting events, for executives.
E.1 STIP Restricted EquityRestricted Equity allocated in respect of the F15 STIP is currently outstanding as detailed in Table 4.5. No awards were made in respect of the F14 STIP or F13 STIP as performance conditions under the plan were not met.
Table 4.5: F15 STIP Restricted Equity awards1
EXECUTIVE INSTRUMENT TYPE ALLOCATION DATE NUMBER
VALUE ATALLOCATION
DATE2 ($) VESTING DATE
MA Clarke Restricted Shares 15 September 2015 124,906 765,000 14 September 2017RB Foye Restricted Shares 23 November 20153 27,111 166,050 4 14 September 2017AGJ McPherson Restricted Shares 15 September 2015 14,694 90,000 14 September 2017RJC Spooner Restricted Shares 15 September 2015 12,393 75,906 14 September 2017
1. Table 4.5 reports only executives who were KMP at 30 June 2016. As Mr Meehan joined the Group during F16, there was no F15 STIP award made (including Restricted Equity).
2. The value at allocation date is calculated based on the allocation price ($6.125, the five-day VWAP up to and including the allocation date).3. Due to regulatory filings which were required to be made in China prior to the allocation of Restricted Shares, Mr Foye’s allocation
under the F15 STIP REP was delayed. This resulted in Mr Foye not being registered as a shareholder on the record date and accordingly not receiving the retail premium for the restricted shares. Mr Foye received in cash the renounceable value of the Restricted Shares that he was entitled to at the record date, being 19 October 2015, which was paid in December 2015. This cash amount is included in Table 6.1.
4. As Mr Foye is remunerated in US$, his local currency STIP award was converted to A$ at the payment date (15 September 2015) in order to determine the number of Restricted Shares to be allocated. Therefore, the final A$ amount varies to that disclosed in the F15 Remuneration Report.
E.2 LTIP
i. F15 LTIP awardsThe vesting schedules for the F15 LTIP awards are shown in Table 4.6.
Table 4.6: Vesting schedules
Relative TSR vesting schedule
Relative TSR ranking % of Performance Rights subject to relative TSR measure which vest
Below 50th percentile 0%50th to 75th percentile 35–100%At or above 75th percentile 100%
EPS growth vesting schedule
% EPS CAGR % of Performance Rights subject to EPS measure which vest
Less than 7.5% 0%7.5% to 15% 35–100%15% or more 100%
The Performance Rights allocated in respect of the F15 LTIP are currently outstanding as detailed in Table 4.7. The awards are due to vest, subject to testing of the performance conditions, after 30 June 2017.
TREASURY WINE ESTATES ANNUAL REPORT 2016 / 54
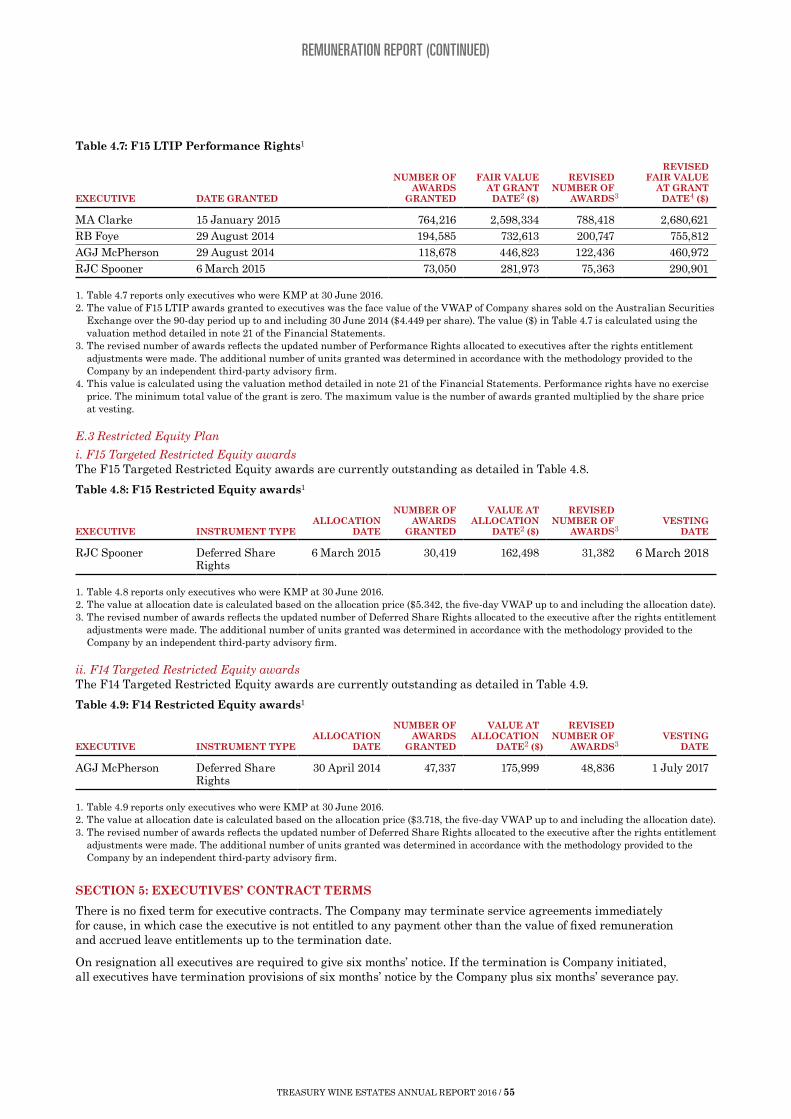
REMUNERATION REPORT (CONTINUED)
Table 4.7: F15 LTIP Performance Rights1
EXECUTIVE DATE GRANTED
NUMBER OF AWARDS
GRANTED
FAIR VALUE AT GRANT
DATE2 ($)
REVISEDNUMBER OF
AWARDS3
REVISED FAIR VALUE
AT GRANTDATE4 ($)
MA Clarke 15 January 2015 764,216 2,598,334 788,418 2,680,621RB Foye 29 August 2014 194,585 732,613 200,747 755,812AGJ McPherson 29 August 2014 118,678 446,823 122,436 460,972RJC Spooner 6 March 2015 73,050 281,973 75,363 290,901
1. Table 4.7 reports only executives who were KMP at 30 June 2016.2. The value of F15 LTIP awards granted to executives was the face value of the VWAP of Company shares sold on the Australian Securities
Exchange over the 90-day period up to and including 30 June 2014 ($4.449 per share). The value ($) in Table 4.7 is calculated using the valuation method detailed in note 21 of the Financial Statements.
3. The revised number of awards reflects the updated number of Performance Rights allocated to executives after the rights entitlement adjustments were made. The additional number of units granted was determined in accordance with the methodology provided to the Company by an independent third-party advisory firm.
4. This value is calculated using the valuation method detailed in note 21 of the Financial Statements. Performance rights have no exercise price. The minimum total value of the grant is zero. The maximum value is the number of awards granted multiplied by the share price at vesting.
E.3 Restricted Equity Plan
i. F15 Targeted Restricted Equity awardsThe F15 Targeted Restricted Equity awards are currently outstanding as detailed in Table 4.8.
Table 4.8: F15 Restricted Equity awards1
EXECUTIVE INSTRUMENT TYPEALLOCATION
DATE
NUMBER OF AWARDS
GRANTED
VALUE AT ALLOCATION
DATE2 ($)
REVISED NUMBER OF
AWARDS3VESTING
DATE
RJC Spooner Deferred Share Rights
6 March 2015 30,419 162,498 31,382 6 March 2018
1. Table 4.8 reports only executives who were KMP at 30 June 2016.2. The value at allocation date is calculated based on the allocation price ($5.342, the five-day VWAP up to and including the allocation date).3. The revised number of awards reflects the updated number of Deferred Share Rights allocated to the executive after the rights entitlement
adjustments were made. The additional number of units granted was determined in accordance with the methodology provided to the Company by an independent third-party advisory firm.
ii. F14 Targeted Restricted Equity awardsThe F14 Targeted Restricted Equity awards are currently outstanding as detailed in Table 4.9.
Table 4.9: F14 Restricted Equity awards1
EXECUTIVE INSTRUMENT TYPEALLOCATION
DATE
NUMBER OF AWARDS
GRANTED
VALUE AT ALLOCATION
DATE2 ($)
REVISED NUMBER OF
AWARDS3VESTING
DATE
AGJ McPherson Deferred Share Rights
30 April 2014 47,337 175,999 48,836 1 July 2017
1. Table 4.9 reports only executives who were KMP at 30 June 2016.2. The value at allocation date is calculated based on the allocation price ($3.718, the five-day VWAP up to and including the allocation date).3. The revised number of awards reflects the updated number of Deferred Share Rights allocated to the executive after the rights entitlement
adjustments were made. The additional number of units granted was determined in accordance with the methodology provided to the Company by an independent third-party advisory firm.
SECTION 5: EXECUTIVES’ CONTRACT TERMS
There is no fixed term for executive contracts. The Company may terminate service agreements immediately for cause, in which case the executive is not entitled to any payment other than the value of fixed remuneration and accrued leave entitlements up to the termination date.
On resignation all executives are required to give six months’ notice. If the termination is Company initiated, all executives have termination provisions of six months’ notice by the Company plus six months’ severance pay.
TREASURY WINE ESTATES ANNUAL REPORT 2016 / 55
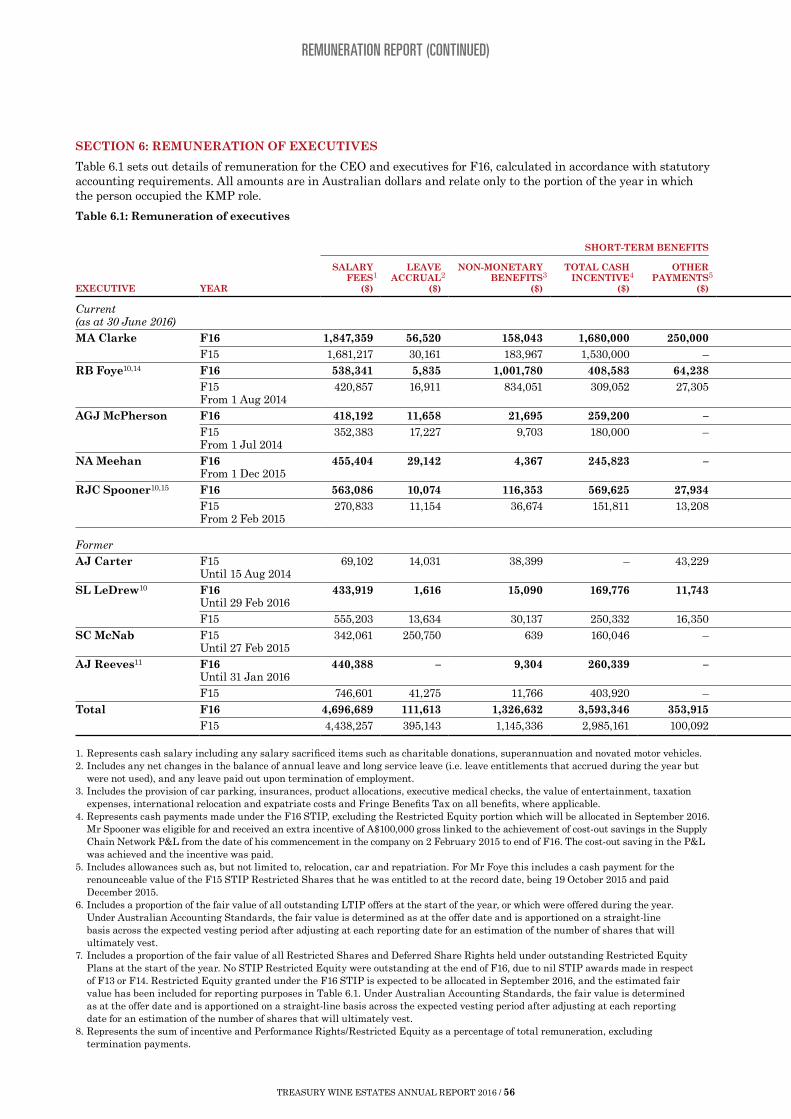
REMUNERATION REPORT (CONTINUED)
SECTION 6: REMUNERATION OF EXECUTIVES
Table 6.1 sets out details of remuneration for the CEO and executives for F16, calculated in accordance with statutory accounting requirements. All amounts are in Australian dollars and relate only to the portion of the year in which the person occupied the KMP role.
Table 6.1: Remuneration of executives
EXECUTIVE YEAR
SHORT-TERM BENEFITSPOST-EMPLOYMENT
BENEFITS SHARE-BASED PAYMENTS
TOTAL ($)
PERFORMANCE-RELATED8
(%)
TERMINATIONBENEFITS9
($)
SALARYFEES1
($)
LEAVEACCRUAL2
($)
NON-MONETARYBENEFITS3
($)
TOTAL CASHINCENTIVE4
($)
OTHERPAYMENTS5
($)
SUPERANNUATION/PENSION
($)
TOTAL AMORTISATIONVALUE OF LTIP6
($)OTHER EQUITY7
($)
Current (as at 30 June 2016)MA Clarke F16 1,847,359 56,520 158,043 1,680,000 250,000 19,308 1,631,316 255,000 5,897,546 60 –
F15 1,681,217 30,161 183,967 1,530,000 – 18,783 753,517 255,000 4,452,645 57 – RB Foye10,14 F16 538,341 5,835 1,001,780 408,583 64,238 12,441 508,251 51,509 2,590,978 37 –
F15 From 1 Aug 2014
420,857 16,911 834,051 309,052 27,305 8,978 149,250 51,509 1,817,913 28 –
AGJ McPherson F16 418,192 11,658 21,695 259,200 – 19,308 244,768 88,257 1,063,078 56 –F15 From 1 Jul 2014
352,383 17,227 9,703 180,000 – 18,783 19,548 64,359 662,003 40 –
NA Meehan F16 From 1 Dec 2015
455,404 29,142 4,367 245,823 – 11,263 79,855 31,615 857,469 42 –
RJC Spooner10,15 F16 563,086 10,074 116,353 569,625 27,934 26,665 334,973 98,659 1,747,369 57 –F15 From 2 Feb 2015
270,833 11,154 36,674 151,811 13,208 – 25,531 63,343 572,554 42 –
FormerAJ Carter F15
Until 15 Aug 201469,102 14,031 38,399 – 43,229 – (19,345) 3,906 149,322 – 478,077
SL LeDrew10 F16 Until 29 Feb 2016
433,919 1,616 15,090 169,776 11,743 7,489 259,79812 152,51712 1,048,716 56 626,625
F15 555,203 13,634 30,137 250,332 16,350 19,432 34,851 149,520 1,069,459 41 –SC McNab F15
Until 27 Feb 2015342,061 250,750 639 160,046 – 12,522 (13,300) 82,628 835,346 27 356,667
AJ Reeves11 F16 Until 31 Jan 2016
440,388 – 9,304 260,339 – 14,480 404,80113 207,82813 1,337,140 65 516,982
F15 746,601 41,275 11,766 403,920 – 18,783 221,575 247,658 1,691,578 52 –Total F16 4,696,689 111,613 1,326,632 3,593,346 353,915 110,954 3,463,762 885,385 14,542,296 1,143,607
F15 4,438,257 395,143 1,145,336 2,985,161 100,092 97,281 1,171,627 917,923 11,250,820 834,744
1. Represents cash salary including any salary sacrificed items such as charitable donations, superannuation and novated motor vehicles.2. Includes any net changes in the balance of annual leave and long service leave (i.e. leave entitlements that accrued during the year but
were not used), and any leave paid out upon termination of employment.3. Includes the provision of car parking, insurances, product allocations, executive medical checks, the value of entertainment, taxation
expenses, international relocation and expatriate costs and Fringe Benefits Tax on all benefits, where applicable.4. Represents cash payments made under the F16 STIP, excluding the Restricted Equity portion which will be allocated in September 2016.
Mr Spooner was eligible for and received an extra incentive of A$100,000 gross linked to the achievement of cost-out savings in the Supply Chain Network P&L from the date of his commencement in the company on 2 February 2015 to end of F16. The cost-out saving in the P&L was achieved and the incentive was paid.
5. Includes allowances such as, but not limited to, relocation, car and repatriation. For Mr Foye this includes a cash payment for the renounceable value of the F15 STIP Restricted Shares that he was entitled to at the record date, being 19 October 2015 and paid December 2015.
6. Includes a proportion of the fair value of all outstanding LTIP offers at the start of the year, or which were offered during the year. Under Australian Accounting Standards, the fair value is determined as at the offer date and is apportioned on a straight-line basis across the expected vesting period after adjusting at each reporting date for an estimation of the number of shares that will ultimately vest.
7. Includes a proportion of the fair value of all Restricted Shares and Deferred Share Rights held under outstanding Restricted Equity Plans at the start of the year. No STIP Restricted Equity were outstanding at the end of F16, due to nil STIP awards made in respect of F13 or F14. Restricted Equity granted under the F16 STIP is expected to be allocated in September 2016, and the estimated fair value has been included for reporting purposes in Table 6.1. Under Australian Accounting Standards, the fair value is determined as at the offer date and is apportioned on a straight-line basis across the expected vesting period after adjusting at each reporting date for an estimation of the number of shares that will ultimately vest.
8. Represents the sum of incentive and Performance Rights/Restricted Equity as a percentage of total remuneration, excluding termination payments.
TREASURY WINE ESTATES ANNUAL REPORT 2016 / 56

REMUNERATION REPORT (CONTINUED)
SECTION 6: REMUNERATION OF EXECUTIVES
Table 6.1 sets out details of remuneration for the CEO and executives for F16, calculated in accordance with statutory accounting requirements. All amounts are in Australian dollars and relate only to the portion of the year in which the person occupied the KMP role.
Table 6.1: Remuneration of executives
EXECUTIVE YEAR
SHORT-TERM BENEFITSPOST-EMPLOYMENT
BENEFITS SHARE-BASED PAYMENTS
TOTAL ($)
PERFORMANCE-RELATED8
(%)
TERMINATIONBENEFITS9
($)
SALARYFEES1
($)
LEAVEACCRUAL2
($)
NON-MONETARYBENEFITS3
($)
TOTAL CASHINCENTIVE4
($)
OTHERPAYMENTS5
($)
SUPERANNUATION/PENSION
($)
TOTAL AMORTISATIONVALUE OF LTIP6
($)OTHER EQUITY7
($)
Current (as at 30 June 2016)MA Clarke F16 1,847,359 56,520 158,043 1,680,000 250,000 19,308 1,631,316 255,000 5,897,546 60 –
F15 1,681,217 30,161 183,967 1,530,000 – 18,783 753,517 255,000 4,452,645 57 – RB Foye10,14 F16 538,341 5,835 1,001,780 408,583 64,238 12,441 508,251 51,509 2,590,978 37 –
F15 From 1 Aug 2014
420,857 16,911 834,051 309,052 27,305 8,978 149,250 51,509 1,817,913 28 –
AGJ McPherson F16 418,192 11,658 21,695 259,200 – 19,308 244,768 88,257 1,063,078 56 –F15 From 1 Jul 2014
352,383 17,227 9,703 180,000 – 18,783 19,548 64,359 662,003 40 –
NA Meehan F16 From 1 Dec 2015
455,404 29,142 4,367 245,823 – 11,263 79,855 31,615 857,469 42 –
RJC Spooner10,15 F16 563,086 10,074 116,353 569,625 27,934 26,665 334,973 98,659 1,747,369 57 –F15 From 2 Feb 2015
270,833 11,154 36,674 151,811 13,208 – 25,531 63,343 572,554 42 –
FormerAJ Carter F15
Until 15 Aug 201469,102 14,031 38,399 – 43,229 – (19,345) 3,906 149,322 – 478,077
SL LeDrew10 F16 Until 29 Feb 2016
433,919 1,616 15,090 169,776 11,743 7,489 259,79812 152,51712 1,048,716 56 626,625
F15 555,203 13,634 30,137 250,332 16,350 19,432 34,851 149,520 1,069,459 41 –SC McNab F15
Until 27 Feb 2015342,061 250,750 639 160,046 – 12,522 (13,300) 82,628 835,346 27 356,667
AJ Reeves11 F16 Until 31 Jan 2016
440,388 – 9,304 260,339 – 14,480 404,80113 207,82813 1,337,140 65 516,982
F15 746,601 41,275 11,766 403,920 – 18,783 221,575 247,658 1,691,578 52 –Total F16 4,696,689 111,613 1,326,632 3,593,346 353,915 110,954 3,463,762 885,385 14,542,296 1,143,607
F15 4,438,257 395,143 1,145,336 2,985,161 100,092 97,281 1,171,627 917,923 11,250,820 834,744
1. Represents cash salary including any salary sacrificed items such as charitable donations, superannuation and novated motor vehicles.2. Includes any net changes in the balance of annual leave and long service leave (i.e. leave entitlements that accrued during the year but
were not used), and any leave paid out upon termination of employment.3. Includes the provision of car parking, insurances, product allocations, executive medical checks, the value of entertainment, taxation
expenses, international relocation and expatriate costs and Fringe Benefits Tax on all benefits, where applicable.4. Represents cash payments made under the F16 STIP, excluding the Restricted Equity portion which will be allocated in September 2016.
Mr Spooner was eligible for and received an extra incentive of A$100,000 gross linked to the achievement of cost-out savings in the Supply Chain Network P&L from the date of his commencement in the company on 2 February 2015 to end of F16. The cost-out saving in the P&L was achieved and the incentive was paid.
5. Includes allowances such as, but not limited to, relocation, car and repatriation. For Mr Foye this includes a cash payment for the renounceable value of the F15 STIP Restricted Shares that he was entitled to at the record date, being 19 October 2015 and paid December 2015.
6. Includes a proportion of the fair value of all outstanding LTIP offers at the start of the year, or which were offered during the year. Under Australian Accounting Standards, the fair value is determined as at the offer date and is apportioned on a straight-line basis across the expected vesting period after adjusting at each reporting date for an estimation of the number of shares that will ultimately vest.
7. Includes a proportion of the fair value of all Restricted Shares and Deferred Share Rights held under outstanding Restricted Equity Plans at the start of the year. No STIP Restricted Equity were outstanding at the end of F16, due to nil STIP awards made in respect of F13 or F14. Restricted Equity granted under the F16 STIP is expected to be allocated in September 2016, and the estimated fair value has been included for reporting purposes in Table 6.1. Under Australian Accounting Standards, the fair value is determined as at the offer date and is apportioned on a straight-line basis across the expected vesting period after adjusting at each reporting date for an estimation of the number of shares that will ultimately vest.
8. Represents the sum of incentive and Performance Rights/Restricted Equity as a percentage of total remuneration, excluding termination payments.
9. Termination payments made to Ms LeDrew and Mr Reeves were in accordance with their contract terms.10. Mr Foye, Mr Spooner and Ms LeDrew are remunerated in US dollars. Amounts reported are converted to Australian dollars at average
A$:US$ exchange rate for June 2016 of 0.7617.11. Amounts reported for Mr Reeves for KMP period, to 31 December 2015, and post-KMP transition period, through to 31 January 2016.12. Ms LeDrew exited the business on 29 February 2016, and forfeited a portion of her F14 LTIP award, a portion of her F14 REP awards,
a portion of her F15 LTIP award and a portion of her F16 LTIP award. The remaining portions of her F14 LTIP award, F14 REP awards, F15 LTIP award and F16 LTIP award were retained, along with her full F15 STIP REP award, subject to post-employment vesting. Under Australian Accounting Standards, the accumulated reserve is reversed upon cessation of employment to the extent forfeited.
13. Mr Reeves exited the business on 31 January 2016, and forfeited a portion of his F14 LTIP award, a portion of his F14 REP awards, a portion of his F15 LTIP award and a portion of his F16 LTIP award. The remaining portions of his F14 LTIP award, F14 REP awards, F15 LTIP award and F16 LTIP award were retained, along with his full F15 STIP REP award, subject to post-employment vesting. Under Australian Accounting Standards, the accumulated reserve is reversed upon cessation of employment to the extent forfeited.
14. Mr Foye’s remuneration mix was adjusted on 1 April 2016 from Fixed Remuneration of US$397,100 and long-term assignment benefits of US$500,000 to Fixed Remuneration of US$500,000 and long-term assignment benefits of US$397,100.
15. Mr Spooner’s total fixed remuneration was adjusted to US$550,000 on his appointment to President TWE Americas as well as a US$70,000 per annum expatriate housing allowance.
TREASURY WINE ESTATES ANNUAL REPORT 2016 / 57

REMUNERATION REPORT (CONTINUED)
Table 6.2 has been prepared to provide shareholders with an outline of the remuneration which has been received for F16 as cash, or in the case of prior equity awards, the value which has vested in F16. Details in this table supplement the statutory requirements in Table 6.1. Unlike the statutory table, which represents remuneration outcomes prepared in accordance with the relevant Australian accounting standards, Table 6.2 shows the actual remuneration value received by executives and is not prepared in accordance with the standards.
Table 6.2: Actual pay and incentives crystallised in F16 for executives1
EXECUTIVE KMP DATES
CURRENT CASH REMUNERATION EARNED IN F16
ACTUAL CASH REMUNERATION
RECEIVED F16 ($)
FIXEDREMUNERATION2
($)
CASH INCENTIVES
INCLUDING STIP ($)
INCENTIVES (EQUITY)VESTED3
($)
Current (as at 30 June 2016)MA Clarke Full year 1,866,667 1,680,000 – 3,546,667 RB Foye Full year 550,782 408,583 – 959,365AGJ McPherson Full year 437,500 259,200 587,225 1,283,925 NA Meehan From 1 Dec 2015 466,667 245,823 – 712,490 RJC Spooner Full year 589,751 569,625 – 1,159,376
1. Represents only the portion of F16 that executives were KMP.2. Includes cash salary plus mandatory employer superannuation contributions for Australian executives, and base salary and employer
pension contributions for all other executives.3. Includes prior STIP and LTIP allocations subject to performance hurdles which have vested in F16, which is only the F14 LTIP.
The equity value has been calculated as at the vesting date and detail of the vesting event is disclosed in Section 3.
SECTION 7: NON-EXECUTIVE DIRECTOR REMUNERATION
A. Non-executive director fee poolThe Board determines the fees payable to non-executive directors within the current maximum aggregate fee pool of $2,200,000 per annum (inclusive of superannuation guarantee contributions and any fees that a non-executive director elects to sacrifice on a pre-tax basis). This fee pool has not been increased since 2012, when it was last approved by shareholders at the 2012 Annual General Meeting (AGM).
It is proposed that the non-executive director fee pool be increased to $2,500,000 in F17 subject to shareholder approval at the Company’s 2016 AGM. The Board believes it appropriate to increase the non-executive director fee pool to provide the Company with flexibility for future adjustments to annual fees, competitive with comparable companies, thereby enabling the Company to maintain and attract high calibre non-executive directors with the appropriate experience, expertise, skills and diversity to oversee the Company’s business and strategic direction. Also, as previously announced to the market, an additional non-executive director, Ms Lauri Shanahan, was appointed to the Board effective 1 November 2016. Further details will be included in the Company’s 2016 Notice of AGM.
B. Non-executive director fee policyIn setting the level of non-executive directors’ fees, the following factors are taken into account:
• Risks and responsibilities of the role;
• Global reach and complexity of the business;
• Director skills and experience; and
• Market benchmark data provided by independent external consultants.
Non-executive directors are remunerated by way of base Board fees (for their service as a director of the Board) and additional Committee fees (for membership of, or chairing, a Committee). The Chairman of the Board, taking into account the greater time commitment required, receives a higher base fee, but does not receive any additional payment for service on Committees.
In order to maintain independence, non-executive directors do not participate in the Company’s incentive plans and they do not receive retirement benefits other than the superannuation contributions disclosed in this report.
TREASURY WINE ESTATES ANNUAL REPORT 2016 / 58

REMUNERATION REPORT (CONTINUED)
C. Non-executive director shareholdingsNon-executive directors are encouraged to hold shares in the Company, and are required to build their shareholding to the equivalent of one year’s base fees over a reasonable period of time. In order to support this the Company operates the Director Share Acquisition Plan (DSAP). The DSAP operates by applying a portion of directors’ after-tax fees to acquire the Company’s shares on the ASX on a periodic basis at the prevailing market rate.
D. Non-executive director feesNon-executive director base fees increased during F16, effective 1 April 2016, for the first time since the demerger of Treasury Wine Estates in May 2011. The fee for the Chairman of the Board and member fees for the HRC also increased. Other Committee fees remain unchanged. The increases were based on advice from the Committee’s independent remuneration adviser and were made in order to remain competitive in the market, noting the increasing global operations, scale and complexity of the Group.
Current annual base fees and Committee fees are detailed in Table 7.1.
Table 7.1: F16 Non-executive director fees
BOARD/COMMITTEECHAIRMAN
FEE ($)MEMBER
FEE ($)
Board base fee 440,000 1 160,000 2
Audit and Risk Committee 40,000 20,000Human Resources Committee 40,000 20,000 3
Nominations Committee 10,000 4 5,000
The above fees were effective from 1 April 2016 and are inclusive of superannuation.
1. The Chairman fee was increased from $390,000 per annum to $440,000 per annum, effective 1 April 2016.2. The non-executive director base fee was increased from $130,000 per annum to $160,000 per annum, effective 1 April 2016.3. The HRC base fee was increased from $15,000 per annum to $20,000 per annum effective 1 April 2016.4. Currently, the Chairman of the Board is also the Chairman of the Nominations Committee, thereby not receiving any additional fees
for this role.
Non-executive directors elect how they wish to receive their total fees – e.g. as a combination of cash, contributions to the DSAP, superannuation contributions or charitable donations.
In addition to the above fees, non-executive directors receive a wine allowance. Currently, overseas-based directors are also entitled to a travel allowance. The travel allowance is intended to compensate the overseas-directors for travel undertaken in their duties, in addition to any business-related expenses that may be incurred in carrying out their duties, and it has previously been agreed that the travel allowance will cease at the end of F18. Details of the travel allowance applicable for F16 are set out in Table 7.2.
Travel costs are not included in base fees but are paid to non-executive directors as appropriate so that it is a targeted spend for the business to compensate for actual travel taken during the year.
Table 7.2: F16 Non-executive director travel allowances
TRAVEL TIME TRAVEL ALLOWANCE
Between 4–12 hours $1,250 each trip (i.e. generally $2,500 per meeting)
More than 12 hours $2,500 each trip (i.e. generally $5,000 per meeting)
The above allowances are inclusive of superannuation, if applicable.
TREASURY WINE ESTATES ANNUAL REPORT 2016 / 59
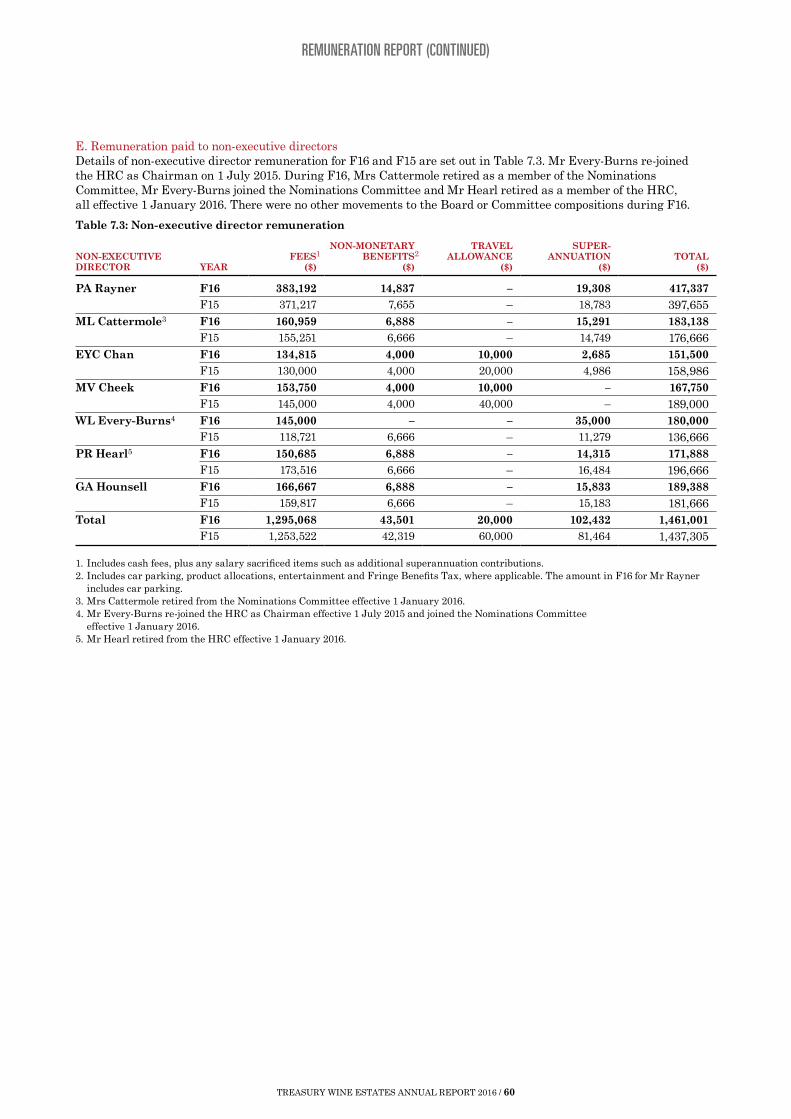
REMUNERATION REPORT (CONTINUED)
E. Remuneration paid to non-executive directorsDetails of non-executive director remuneration for F16 and F15 are set out in Table 7.3. Mr Every-Burns re-joined the HRC as Chairman on 1 July 2015. During F16, Mrs Cattermole retired as a member of the Nominations Committee, Mr Every-Burns joined the Nominations Committee and Mr Hearl retired as a member of the HRC, all effective 1 January 2016. There were no other movements to the Board or Committee compositions during F16.
Table 7.3: Non-executive director remuneration
NON-EXECUTIVE DIRECTOR YEAR
FEES1
($)
NON-MONETARYBENEFITS2
($)
TRAVEL ALLOWANCE
($)
SUPER-ANNUATION
($)TOTAL
($)
PA Rayner F16 383,192 14,837 – 19,308 417,337 F15 371,217 7,655 – 18,783 397,655
ML Cattermole3 F16 160,959 6,888 – 15,291 183,138 F15 155,251 6,666 – 14,749 176,666
EYC Chan F16 134,815 4,000 10,000 2,685 151,500 F15 130,000 4,000 20,000 4,986 158,986
MV Cheek F16 153,750 4,000 10,000 – 167,750 F15 145,000 4,000 40,000 – 189,000
WL Every-Burns4 F16 145,000 – – 35,000 180,000 F15 118,721 6,666 – 11,279 136,666
PR Hearl5 F16 150,685 6,888 – 14,315 171,888 F15 173,516 6,666 – 16,484 196,666
GA Hounsell F16 166,667 6,888 – 15,833 189,388 F15 159,817 6,666 – 15,183 181,666
Total F16 1,295,068 43,501 20,000 102,432 1,461,001 F15 1,253,522 42,319 60,000 81,464 1,437,305
1. Includes cash fees, plus any salary sacrificed items such as additional superannuation contributions.2. Includes car parking, product allocations, entertainment and Fringe Benefits Tax, where applicable. The amount in F16 for Mr Rayner
includes car parking.3. Mrs Cattermole retired from the Nominations Committee effective 1 January 2016.4. Mr Every-Burns re-joined the HRC as Chairman effective 1 July 2015 and joined the Nominations Committee
effective 1 January 2016.5. Mr Hearl retired from the HRC effective 1 January 2016.
TREASURY WINE ESTATES ANNUAL REPORT 2016 / 60

REMUNERATION REPORT (CONTINUED)
SECTION 8: ADDITIONAL KMP DISCLOSURES
i. Movement in sharesThe movement during F16 in the number of ordinary shares in the Company held by each director and executive of the Group, including their related parties, is shown in Table 8.1.
Table 8.1: KMP shareholdings
F16
BALANCE AT START OF
THE YEAR
ACQUIRED DURING THE
YEAR AS PART OFREMUNERATION1
OTHER CHANGES
DURINGTHE YEAR2
BALANCE AT END OF
YEAR
Non-executive directorPA Rayner 113,000 – 90,068 203,068ML Cattermole 131,031 1,990 38,518 171,539EYC Chan 19,752 3,980 16,000 39,732MV Cheek 32,142 1,592 7,264 40,998WL Every-Burns 61,667 – 28,333 90,000PR Hearl 40,000 – 5,000 45,000GA Hounsell 40,000 – 5,334 45,334Non-executive director total 437,592 7,562 190,517 635,671
F16
BALANCE AT START OF
THE YEAR
RECEIVED UPON VESTING/
EXERCISE3
OTHER CHANGES
DURINGTHE YEAR4
BALANCE AT END OF
YEAR
ExecutiveCurrent (as at 30 June 2016)MA Clarke – – 17,020 17,020 RB Foye – – 54,000 54,000 AGJ McPherson 67,542 63,621 5,365 136,528 NA Meehan5 – – – – RJC Spooner – – 2,018 2,018
FormerSL LeDrew6 154,368 69,207 (223,575) – AJ Reeves7 15,000 98,450 (113,450) – Executive total 236,910 231,278 (258,622) 209,566 Grand total 674,502 238,840 (68,105) 845,237
1. Shares acquired as part of the DSAP.2. Includes the purchase/sale of ordinary shares during F16, including take-up of retail entitlement offer.3. Includes shares acquired upon vesting of F14 LTIP awards.4. Includes the purchase/sale of ordinary shares during F16, including take-up of retail entitlement offer, and balance adjustments
for executives joining or leaving KMP.5. Commenced as KMP on 1 January 2016, with pre-KMP transition period from 1 December 2015.6. Ceased as KMP on 29 February 2016.7. Ceased as KMP on 31 December 2015, with post-KMP transition period through to 31 January 2016.
ii. Movement in awards – executivesThe movement during F16 in the number of Awards held by each executive of the Group, including their related parties, is shown in Table 8.2. Restricted Shares are generally issued under the REP and STIP (Restricted Equity). Performance Rights are issued under the LTIP. Deferred Share Rights are issued under the REP or represent the right to matching shares under the 2015 Share Cellar Plan.
TREASURY WINE ESTATES ANNUAL REPORT 2016 / 61
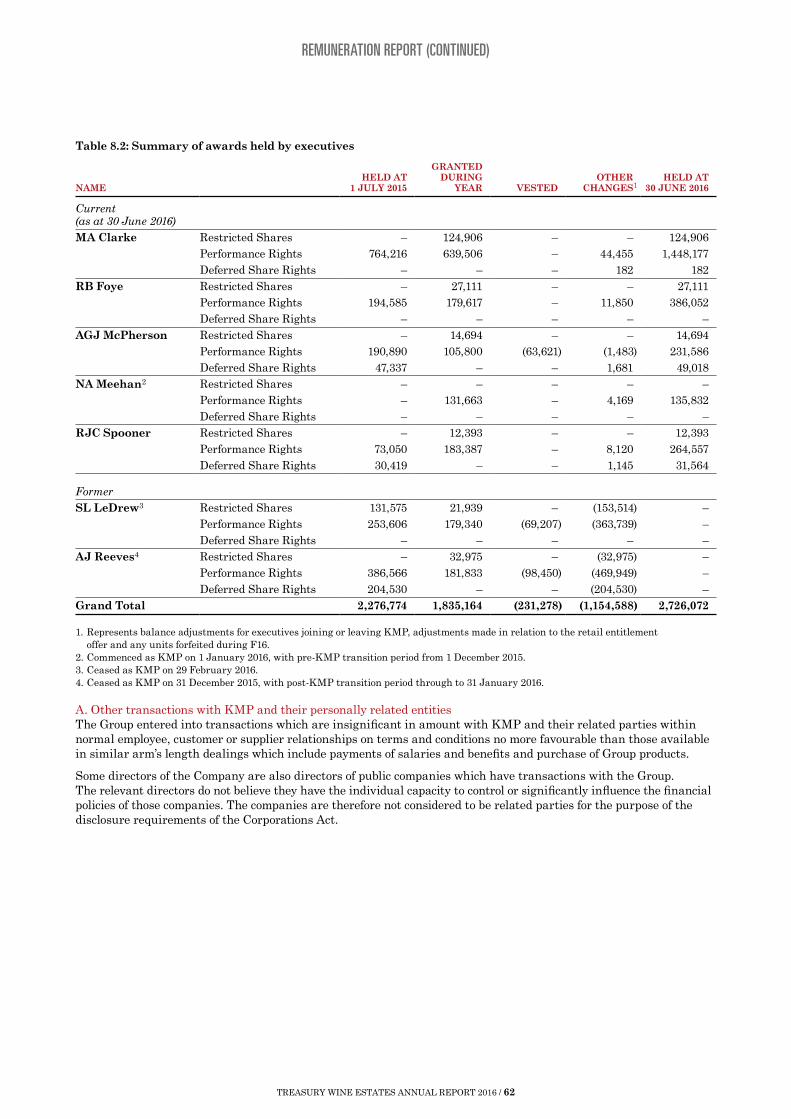
REMUNERATION REPORT (CONTINUED)
Table 8.2: Summary of awards held by executives
NAMEHELD AT
1 JULY 2015
GRANTED DURING
YEAR VESTEDOTHER
CHANGES1HELD AT
30 JUNE 2016
Current (as at 30 June 2016)MA Clarke Restricted Shares – 124,906 – – 124,906
Performance Rights 764,216 639,506 – 44,455 1,448,177Deferred Share Rights – – – 182 182
RB Foye Restricted Shares – 27,111 – – 27,111Performance Rights 194,585 179,617 – 11,850 386,052Deferred Share Rights – – – – –
AGJ McPherson Restricted Shares – 14,694 – – 14,694Performance Rights 190,890 105,800 (63,621) (1,483) 231,586Deferred Share Rights 47,337 – – 1,681 49,018
NA Meehan2 Restricted Shares – – – – –Performance Rights – 131,663 – 4,169 135,832Deferred Share Rights – – – – –
RJC Spooner Restricted Shares – 12,393 – – 12,393Performance Rights 73,050 183,387 – 8,120 264,557Deferred Share Rights 30,419 – – 1,145 31,564
Former SL LeDrew3 Restricted Shares 131,575 21,939 – (153,514) –
Performance Rights 253,606 179,340 (69,207) (363,739) –Deferred Share Rights – – – – –
AJ Reeves4 Restricted Shares – 32,975 – (32,975) –Performance Rights 386,566 181,833 (98,450) (469,949) –Deferred Share Rights 204,530 – – (204,530) –
Grand Total 2,276,774 1,835,164 (231,278) (1,154,588) 2,726,072
1. Represents balance adjustments for executives joining or leaving KMP, adjustments made in relation to the retail entitlement offer and any units forfeited during F16.
2. Commenced as KMP on 1 January 2016, with pre-KMP transition period from 1 December 2015.3. Ceased as KMP on 29 February 2016.4. Ceased as KMP on 31 December 2015, with post-KMP transition period through to 31 January 2016.
A. Other transactions with KMP and their personally related entitiesThe Group entered into transactions which are insignificant in amount with KMP and their related parties within normal employee, customer or supplier relationships on terms and conditions no more favourable than those available in similar arm’s length dealings which include payments of salaries and benefits and purchase of Group products.
Some directors of the Company are also directors of public companies which have transactions with the Group. The relevant directors do not believe they have the individual capacity to control or significantly influence the financial policies of those companies. The companies are therefore not considered to be related parties for the purpose of the disclosure requirements of the Corporations Act.
TREASURY WINE ESTATES ANNUAL REPORT 2016 / 62
REMUNERATION REPORT (CONTINUED)
SECTION 9: GROUP REMUNERATION GOVERNANCE
Role of the Human Resources CommitteeThe HRC provides assistance to the Board in relation to such matters as monitoring remuneration principles and frameworks, providing advice on remuneration matters, making remuneration recommendations for executives, approving incentive plans, and reviewing and governing remuneration policies. In addition to its remuneration responsibilities and together with the Board, the HRC’s duties include overseeing talent management, diversity and leadership development.
Its role ensures that the policies and frameworks in place at TWE facilitate the achievement of the Group’s strategic objectives, are aligned with market best practice, and fulfil the Board’s responsibility to shareholders.
As outlined in Section 3 of the Corporate Governance Statement disclosed on the Company’s website w w w . tweglobal.com, the Group has procedures in place for the reporting of any matter that may give rise to a conflict between the interests of a director and those of the Group. In addition, the Group has adopted a general policy for employees in relation to the disclosure and management of potential conflicts of interest (see Section 4 of the Corporate Governance Statement on w w w . tweglobal.com).
Engagement of remuneration advisersThe Board’s protocol and policies stipulate that any recommendations made by consultants in relation to remuneration arrangements of KMP at TWE must be made directly to the Board without any influence from management. The arrangements in place ensure any advice is independent of management and include management not being able to attend Board meetings where recommendations relating to their remuneration are discussed.
In F16, the Board and HRC engaged 3 degrees consulting as an independent adviser to the HRC. In the financial year, 3 degrees consulting provided remuneration recommendations as defined in the Corporations Act in relation to the level of NED fees and was paid $15,000 (excluding GST) for these services.
In addition to providing remuneration recommendations, 3 degrees consulting provided other services to the Group in F16 (including as independent adviser to the HRC and on a range of matters, including stakeholder engagement, remuneration and other people-related matters) and was paid a total of $109,750 (excluding GST) for these additional services. All remuneration recommendations were provided directly to the HRC or through the HRC Chairman, in accordance with the Corporations Act and the Company’s protocols. 3 degrees consulting provided a declaration of their independence from management. The Board, the HRC and 3 degrees consulting are satisfied the remuneration recommendations were made free from influence from the KMP to whom the remuneration recommendations applied. The Board and HRC considered the recommendations, along with other factors, in making its remuneration decisions.
TREASURY WINE ESTATES ANNUAL REPORT 2016 / 63

REMUNERATION REPORT (CONTINUED)
DEFINITIONS
TERM DEFINITION
Constant currency An exchange rate that eliminates the effects of exchange rate fluctuations year-on-year.
Earnings per Share (EPS)
NPAT excluding SGARA and material items, divided by the weighted average number of shares. Adjusted EPS is used to calculate performance outcomes, meaning that the Board retains the discretion to adjust EPS to ensure that participants are not penalised or provided with a windfall gain arising from matters outside of management’s control.
EBITS Earnings before interest, tax, SGARA and material items.
Key management personnel (KMP)
Those persons having authority and responsibility for planning, directing and controlling the major activities of the Company and the Group, directly or indirectly, including any director (whether executive or otherwise), as listed in the introduction to the Remuneration Report.
Phantom Shares Units which provide the participant with a right to a receive a cash payment at the vesting date, whereby the payment is tied to the market value of an equivalent number of TWE shares.
The amount of the payout will increase as the share price rises, and decrease if the share price falls, but without the participant actually receiving any TWE shares.
Relative Total Shareholder Return (TSR)
The return on investment of a company relative to a peer group of companies.
Return on Capital Employed (ROCE)
EBITS divided by Capital Employed (at constant currency). Capital Employed is the sum of average net assets (adjusted for SGARA impact) and average net debt.
SGARA Self-generating and regenerating assets.
The adjustment to self-generating and regenerating assets (SGARA) is excluded to reflect the fair value adjustment each financial year which is largely due to environmental conditions not within the Group’s control.
Total Shareholder Return (TSR)
Total return on investment of a security, taking into account both capital appreciation and distributed income that was reinvested.
TREASURY WINE ESTATES ANNUAL REPORT 2016 / 64

NOTE2016
$M2015
$M
Revenue 3 2,343.3 1,971.0 Cost of sales (1,509.5) (1,342.7)Gross profit 833.8 628.3
Other income 3 4.0 5.6 Selling expenses (264.8) (214.3)Marketing expenses (111.3) (115.3)Administration expenses (148.4) (110.3)Other expenses (32.6) (61.5)Profit before tax and finance costs 280.7 132.5
Finance income 13.6 5.4 Finance costs (34.8) (27.0)Net finance costs (21.2) (21.6)Profit before tax 259.5 110.9
Income tax expense 22 (80.0) (33.3)Net profit 179.5 77.6 Net profit attributable to non-controlling interests (0.1) –Net profit attributable to members of Treasury Wine Estates Limited 179.4 77.6
Other comprehensive incomeItems that may subsequently be reclassified to profit or lossCash flow hedges 2.4 (2.3)Tax on cash flow hedges (0.8) 0.9Exchange difference on translation of foreign operations 29.1 207.5 Other comprehensive income for the year, net of tax 30.7 206.1
Total comprehensive income for the year attributable to members of Treasury Wine Estates Limited 210.1 283.7Non-controlling interests 0.1 –Total comprehensive income for the year 210.2 283.7
CENTS PER SHARE
CENTS PER SHARE
Earnings per share for profit attributable to the ordinary equity holders of the CompanyBasic 7 25.1 11.7 Diluted 7 24.9 11.6
The consolidated statement of profit or loss and other comprehensive income should be read in conjunction with the accompanying notes.
CONSOLIDATED STATEMENT OF PROFIT OR LOSS AND OTHER COMPREHENSIVE INCOME
FOR THE YEAR ENDED 30 JUNE 2016
TREASURY WINE ESTATES ANNUAL REPORT 2016 / 65

NOTE2016
$M2015
$M
Current assetsCash and cash equivalents 9 256.1 122.1 Receivables 9 603.4 504.9 Inventories 9 904.0 704.2 Current tax assets – 18.2 Assets held for sale 13 98.8 91.2 Other current assets 4.2 3.1 Total current assets 1,866.5 1,443.7
Non-current assetsInventories 9 678.4 533.8 Property, plant and equipment 10 1,154.5 928.8 Agricultural assets 11 340.0 255.1 Intangible assets 12 1,060.2 791.1 Deferred tax assets 22 252.2 193.3 Derivative financial assets 14.8 0.1 Other non-current assets 10.6 3.9 Total non-current assets 3,510.7 2,706.1 Total assets 5,377.2 4,149.8
Current liabilitiesBank overdraft 9 4.0 13.0 Trade and other payables 9 653.1 455.2 Current tax liabilities 18.4 5.2 Provisions 15 77.4 90.3 Other current liabilities 5.0 7.0 Total current liabilities 757.9 570.7
Non-current liabilitiesTrade and other payables 9 72.3 5.4Borrowings 17 626.6 324.4 Deferred tax liabilities 22 273.7 194.1 Derivative financial liabilities 8.6 1.4 Other non-current liabilities 3.0 3.1Total non-current liabilities 984.2 528.4 Total liabilities 1,742.1 1,099.1 Net assets 3,635.1 3,050.7
EquityContributed equity 18 3,533.6 3,061.3 Reserves 20 20.5 (23.3)Retained earnings 78.3 10.1 Total parent entity interest 3,632.4 3,048.1 Non-controlling interest 2.7 2.6 Total equity 3,635.1 3,050.7
The consolidated statement of financial position should be read in conjunction with the accompanying notes.
CONSOLIDATED STATEMENT OF FINANCIAL POSITIONAS AT 30 JUNE 2016
TREASURY WINE ESTATES ANNUAL REPORT 2016 / 66

CONTRIBUTED EQUITY
$M
RETAINED EARNINGS
$M
FOREIGN CURRENCY
TRANSLATION RESERVE
$M
OTHER RESERVES
$M
TOTAL
$M
NON- CONTROLLING
INTERESTS $M
TOTAL
EQUITY $M
Balance at 30 June 2014 3,051.4 17.2 (234.2) 11.8 2,846.2 2.6 2,848.8
Profit for the year – 77.6 – – 77.6 – 77.6 Total other comprehensive income/(loss) – – 207.5 (1.4) 206.1 – 206.1 Total comprehensive income/(loss) for the year – 77.6 207.5 (1.4) 283.7 – 283.7
Transactions with owners in their capacity as owners directly in equity Share-based payment expense – – – 3.1 3.1 – 3.1 Net changes in contributed equity 9.9 – – (10.1) (0.2) – (0.2)Dividends to owners of the Company – (84.7) – – (84.7) – (84.7)Balance at 30 June 2015 3,061.3 10.1 (26.7) 3.4 3,048.1 2.6 3,050.7
Profit for the year – 179.4 – – 179.4 0.1 179.5Total other comprehensive income – – 29.1 1.6 30.7 – 30.7Total comprehensive income for the year – 179.4 29.1 1.6 210.1 0.1 210.2
Transactions with owners in their capacity as owners directly in equity Share-based payment expense – – – 14.5 14.5 – 14.5 Issue of ordinary shares 486.5 – – – 486.5 – 486.5 Transaction costs on issue of ordinary shares (11.1) – – – (11.1) – (11.1)Purchase of own shares (4.5) – – – (4.5) – (4.5)Vested deferred shares and share rights 1.4 – – (1.4) – – – Dividends to owners of the Company – (111.2) – – (111.2) – (111.2)Balance at 30 June 2016 3,533.6 78.3 2.4 18.1 3,632.4 2.7 3,635.1
The consolidated statement of changes in equity should be read in conjunction with the accompanying notes.
CONSOLIDATED STATEMENT OF CHANGES IN EQUITYFOR THE YEAR ENDED 30 JUNE 2016
TREASURY WINE ESTATES ANNUAL REPORT 2016 / 67

NOTE
2016 $M
INFLOWS/ (OUTFLOWS)
2015 $M
INFLOWS/ (OUTFLOWS)
Cash flows from operating activitiesReceipts from customers 2,991.5 2,511.9 Payments to suppliers, governments and employees (2,542.2) (2,279.8)Borrowing costs paid (35.1) (27.4)Income taxes paid (10.8) (34.2)Interest received 13.4 5.3 Net cash flows from operating activities 8 416.8 175.8
Cash flows from investing activities Payments for property, plant, equipment and agricultural assets (114.9) (78.8)Payments for intangible assets (18.9) (12.0)Business acquisitions, net of cash acquired (803.7) – Proceeds from sale of property, plant and equipment 86.8 6.8 Other cash payments – (1.3)Net cash flows from investing activities (850.7) (85.3)
Cash flows from financing activitiesProceeds from issue of shares net of transaction costs 475.4 – Dividend payments (111.2) (84.7)Proceeds from borrowings 470.7 190.9 Repayment of borrowings (258.7) (189.5)Proceeds from settlement of currency swaps and other derivatives 10.3 47.0 Other cash payments (4.5) (0.1)Net cash flows from financing activities 582.0 (36.4)Total cash flows from activities 148.1 54.1
Cash and cash equivalents at the beginning of the year 109.1 52.0 Effects of exchange rate changes on foreign currency cash flows and cash balances (5.1) 3.0 Cash and cash equivalents at end of the year1 9 252.1 109.1
1. Represented by cash at bank of $256.1 million and bank overdraft of $(4.0) million (F15: cash at bank of $122.1 million and bank overdraft of $(13.0) million).
The consolidated statement of cash flows should be read in conjunction with the accompanying notes.
CONSOLIDATED STATEMENT OF CASH FLOWSFOR THE YEAR ENDED 30 JUNE 2016
TREASURY WINE ESTATES ANNUAL REPORT 2016 / 68
NOTE 1 – ABOUT THIS REPORT
Treasury Wine Estates Limited (the ‘Company’) is a for profit company incorporated in Australia and limited by shares which are publicly traded on the Australian Securities Exchange (ASX).
The financial report was authorised for issue by the Board of Directors on 31 August 2016. The directors have the power to amend and reissue the financial statements.
Accounting policies have been adopted in preparing the consolidated financial statements of the Company and of its controlled entities (collectively, the ‘Group’), and these policies have been consistently applied to all the years presented, unless otherwise stated.
Accounting policies that are critical to understanding the financial statements as a whole are set out in this section. Where an accounting policy is specific to one note, the policy is described in the note to which it relates. Further policies, including the impact of upcoming changes to accounting standards, are set out in note 33.
Basis of preparationThe financial report is a general purpose financial report which:
• Has been prepared in accordance with the requirements of the Corporations Act 2001 (Cth), Australian Accounting Standards and other authoritative pronouncements of the Australian Accounting Standards Board (AASB);
• Is on a historical cost basis, except for derivative financial instruments, agricultural assets and the assets and liabilities acquired in a business combination which have been measured at fair value;
• Contains comparative information that has been adjusted to align with the presentation of the current period, where necessary; and
• Is presented in Australian dollars with all values rounded to the nearest tenth of one million dollars unless otherwise stated, in accordance with ASIC Corporations (Rounding in Financial/Directors’ Reports) Instrument 2016/191.
Key estimates and judgements
In preparing this financial report, the Group is required to make estimates, judgements and assumptions that affect the reported amounts in the financial statements.
These estimates, judgements and assumptions are continually evaluated, and are often based on historical experience and assessed to be reasonable under the circumstances at the relevant time. Actual results may differ from these estimates under different assumptions and conditions. The areas involving a higher degree of judgement or complexity, or areas where assumptions and estimates are significant to the financial statements are found in the following notes:
Note 3: Revenue and other income Note 9: Working capital Note 11: Agricultural assets Note 12: Intangible assets Note 14: Impairment of non-financial assets Note 22: Income tax Note 27: Business acquisitions
Statement of complianceThis financial report complies with Australian Accounting Standards and International Financial Reporting Standards (IFRS) as issued by the International Accounting Standards Board.
Line items labelled ‘other’ on the face of the consolidated statements comprise miscellaneous income, expenses, receivables, payables or cash flows which individually or in aggregate are not considered material to warrant additional disclosures.
The notes to the financial statementsThe notes include additional information required to understand the financial statements that is material and relevant to the operations, financial position and performance of the Group. Information is considered material and relevant if the amount in question is significant because of its size, nature or incidence or it helps to explain the impact of significant changes in the business, for example, acquisitions and asset write-downs.
The notes are organised into the following sections:
Earnings: focuses on the financial results and performance of the Group. It provides disclosures relating to income, expenses, segment information, material items and earnings per share.
Working capital: shows the current assets and current liabilities generated through trading activity. It provides information regarding working capital management and analysis of the elements of working capital.
Operating assets and liabilities: provides information regarding the physical assets and non-physical assets used by the Group to generate revenues and profits (including associated liabilities). This section also explains the accounting policies applied and specific judgements and estimates made by management in arriving at the value of these assets and operating liabilities.
Capital structure: provides information about the capital management practices adopted by the Group – particularly, how much capital is raised from shareholders (equity) and how much is borrowed from financial institutions (debt) in order to finance the activities of the Group both now and in the future.
Taxation: lays out the Group’s tax accounting policies, the current and deferred tax charges, a reconciliation of profit or loss before tax to the tax charge or credit and the movements in deferred tax assets and liabilities.
Risk: discusses the Group’s exposure to various financial risks, explains how these affect the financial position of the Group and what is done to manage these risks.
Group composition: explains aspects of the Group’s structure and business acquisitions.
Other: other required disclosures under Australian Accounting Standards and IFRS.
NOTES TO THE CONSOLIDATED FINANCIAL STATEMENTS: ABOUT THIS REPORTFOR THE YEAR ENDED 30 JUNE 2016
TREASURY WINE ESTATES ANNUAL REPORT 2016 / 69

NOTE 1 – ABOUT THIS REPORT (CONTINUED)
Principles of consolidationThe consolidated financial statements include the assets and liabilities of Treasury Wine Estates Limited and its controlled entities as a whole at year-end and the consolidated results and cash flows for the year. A list of controlled entities (subsidiaries) is provided in note 28.
An entity is regarded as a controlled entity when the Company is exposed to, or has rights to, variable returns from its involvement with the entity and has the ability to affect those returns through power over the entity.
The rights of other investors to the results and equity of the subsidiaries (called non-controlling interests) are shown separately in the consolidated statement of profit or loss and other comprehensive income, statement of changes in equity and statement of financial position respectively.
The financial reports of the subsidiaries are prepared for the same reporting period as the parent, using consistent accounting policies. Intra-group balances and transactions arising from intra-group transactions are eliminated.
A change in the ownership interest of a subsidiary, without a loss of control, is accounted for as an equity transaction.
Functional and presentation currencyThe consolidated financial statements are presented in Australian dollars, which is also the functional currency of the Australian subsidiaries. Each entity in the Group determines its own functional currency and items included in the financial statements of each entity are measured using that functional currency.
Foreign group companiesAs at the reporting date, the assets and liabilities of overseas subsidiaries are translated into Australian dollars at the rate of exchange ruling at the balance sheet date and the income statements are translated at the average exchange rates for the period. The exchange differences arising on the retranslation are taken directly to a separate component of equity.
When a foreign operation is sold, the cumulative exchange difference in equity for this operation is recognised in the statement of profit or loss and other comprehensive income as part of the gain and loss on sale.
Transactions and balancesTransactions in foreign currencies are initially recorded in the functional currency of the relevant entity at the exchange rates ruling at the date of the transaction. Monetary assets and liabilities denominated in foreign currencies are subsequently translated at the rate of exchange ruling at the balance sheet date.
Exchange differences arising are taken to the consolidated statement of profit and loss and other comprehensive income, except for gains or losses arising on assets or liabilities that qualify for hedge accounting, discussed further in note 23. Tax charges and credits attributable to these exchange differences are also recognised in equity.
Average exchange rates used in translating profit and loss items in F16 are:
A$1 = US$ 0.728 (F15: US$ 0.837) A$1 = GB£ 0.492 (F15: GB£ 0.530)
Year-end exchange rates used in translating financial position items in F16 are:
A$1 = US$ 0.745 (F15: US$ 0.767) A$1 = GB£ 0.554 (F15: GB£ 0.488)
Fair value measurementThe Group measures certain financial instruments, including derivatives, and certain non-financial assets such as agricultural assets, at fair value at each balance sheet date.
Fair value is the price that would be received to sell an asset or paid to transfer a liability in an orderly transaction between market participants in its principal or most advantageous market at the measurement date. It is measured using the assumptions that market participants would use when pricing the asset or liability, assuming that market participants act in their economic best interest. A fair value measurement of a non-financial item assumes it is put to its highest and best use.
The Group uses valuation techniques that are appropriate in the circumstances and for which sufficient data is available to measure fair value, maximising the use of relevant observable inputs and minimising the use of unobservable inputs.
Accounting standards prescribe a fair value hierarchy, described as follows, based on the lowest level input that is significant to the fair value measurement as a whole:
Level 1 – Quoted (unadjusted) market prices in active markets for identical assets or liabilities.
Level 2 – Valuation techniques for which the lowest level input that is significant to the fair value measurement is directly (i.e. as prices) or indirectly (i.e. derived by prices) observable.
Level 3 – Valuation techniques for which the lowest level input that is significant to the fair value measurement is unobservable.
Subsequent eventsOn 4 July 2016, the Company announced the divestment of its non-priority Commercial brand portfolio in the US, representing the sale of 12 brands and comprising circa 1 million cases of non-priority Commercial wine.
On 21 July 2016, the Company announced the appointment to the Board of a US-based independent non-executive director, Ms Lauri Shanahan, effective 1 November 2016. On 11 August 2016, the Company announced the appointment of Linnsey Caya as Group General Counsel, replacing outgoing Group General Counsel and Company Secretary Paul Conroy, effective 12 September 2016, and the appointment of Fiona Last as Company Secretary, effective 1 September 2016.
Since the end of the financial year, the Directors declared a final unfranked dividend of 12 cents per share. This dividend has not been recognised as a liability in the financial statements at 30 June 2016.
NOTES TO THE CONSOLIDATED FINANCIAL STATEMENTS: ABOUT THIS REPORT
FOR THE YEAR ENDED 30 JUNE 2016 (CONTINUED)
TREASURY WINE ESTATES ANNUAL REPORT 2016 / 70
NOTE 1 – ABOUT THIS REPORT (CONTINUED)
The directors are not aware of any other matters or circumstances that have arisen since the end of the financial year which have significantly affected or may significantly affect the operations of the Group, the results of those operations or the state of affairs of the Group in subsequent financial years.
NOTE 2 – SEGMENT INFORMATION
The Group’s segmentsThe Group reports segment information on the same basis as its internal management reporting structure and consistent with the information used to organise and manage the Group.
The reportable segments are based on the aggregation of operating segments determined by the similarity of the nature of products, the production process, the types of customers and the methods used to distribute the products.
During the year, the business structure was reorganised to better reflect the way the Group is currently being managed. Effective 1 July 2015, the regional results of Middle East and Africa are reported within Asia (previously combined with Europe) and the results of Latin America are reported within Europe (previously combined with Americas).
Following the re-organisation, the Group reviewed the allocation method for corporate charges across the segments. This has resulted in a change to the method used to allocate certain costs. To facilitate comparability over reporting periods, comparatives have been restated to incorporate these changes.
The identified reportable segments in the Group are below:
(i) Australia and New Zealand (ANZ) This segment is responsible for the manufacture,
sale and marketing of wine within Australia and New Zealand. The segment also distributes beer and cider under licence in New Zealand.
(ii) Americas This segment is responsible for the manufacture, sale
and marketing of wine within the Americas region.
(iii) Asia This segment is responsible for the sale and
marketing of wine within Asia (including the Middle East and Africa).
(iv) Europe This segment is responsible for the manufacture,
sale and marketing of wine within Europe and Latin America.
Presentation of segment results
Management EBITSThe principal profit metric for internal management reporting is Management earnings before interest, tax, SGARA and material items (EBITS). Management EBITS is profit from continuing operations excluding the effect of net finance costs, tax, material items and the net profit effects of fair valuing agricultural assets (SGARA). Corporate charges are allocated to each segment on a proportionate basis linked to segment revenue or head count depending on the nature of the charge.
Segment accounting policies
Segment assets and liabilitiesSegment assets and liabilities represent those working capital and non-current assets and liabilities which are located in the respective segments. Cash is not considered to be a segment asset as it is managed by the Group’s centralised treasury function. Consistent with the use of EBITS for measuring profit, tax assets and liabilities, which do not contribute towards EBITS, are not allocated to operating segments.
Intersegment transactionsThe price of an intersegment transaction is set at an arm’s length basis. Whilst these transactions are eliminated on consolidation, they are shown within the segment revenue and EBITS to properly reflect the segment of origin performance, including production.
Corporate chargesUnallocated corporate charges are reported in the Corporate/unallocated segment. Net finance costs are not allocated to segments as the Group’s financing function is centralised through its treasury function.
Segment loans payable and loans receivableSegment loans are initially recognised at the amount transferred. Intersegment loans receivable and payable that earn or incur non-market interest are not adjusted to fair value based on market interest rates.
OtherIf items of revenue and expense are not allocated to operating segments, then any associated assets and liabilities are not allocated to segments either.
NOTES TO THE CONSOLIDATED FINANCIAL STATEMENTS: EARNINGS
FOR THE YEAR ENDED 30 JUNE 2016
TREASURY WINE ESTATES ANNUAL REPORT 2016 / 71

NOTE 2 – SEGMENT INFORMATION (CONTINUED)
2016ANZ
$MAMERICAS
$MASIA
$MEUROPE
$M
INTERSEGMENT ELIMINATION
$M
TOTAL SEGMENT
$M
UNALLOCATED/ CORPORATE
$MCONSOLIDATED
$M
Total revenue comprises: Net sales revenue 590.7 991.0 293.2 357.7 – 2,232.6 – 2,232.6 Other revenue 93.8 11.2 (0.3) 1.6 – 106.3 4.4 110.7 Intersegment
revenue 426.0 28.5 0.1 29.6 (484.2) – – – Total segment revenue (excl other income/interest) 1,110.5 1,030.7 293.0 388.9 (484.2) 2,338.9 4.4 2,343.3
Management EBITS 92.3 136.3 102.0 47.7 – 378.3 (36.3) 342.0 SGARA loss 14.3 (22.8) – – – (8.5) – (8.5)Material items (5.9) (32.6) 0.4 (8.3) – (46.4) (6.4) (52.8)
Management EBIT 100.7 80.9 102.4 39.4 – 323.4 (42.7) 280.7 Net finance costs (21.2)Consolidated profit before tax 259.5
Depreciation of property, plant and equipment 46.6 36.8 0.4 2.1 – 85.9 2.7 88.6 Amortisation of intangible assets 1.0 2.0 – – – 3.0 7.4 10.4 Assets held for sale 39.7 59.1 – – – 98.8 – 98.8 Capital expenditure 62.1 51.8 0.4 2.2 – 116.5 17.3 133.8 Segment assets (excl intersegment assets) 2,136.5 2,268.8 51.5 356.6 – 4,813.4 563.8 5,377.2Segment liabilities (excl intersegment liabilities) 278.9 464.8 19.7 94.2 – 857.6 884.5 1,742.1
NOTES TO THE CONSOLIDATED FINANCIAL STATEMENTS: EARNINGS
FOR THE YEAR ENDED 30 JUNE 2016 (CONTINUED)
TREASURY WINE ESTATES ANNUAL REPORT 2016 / 72

NOTE 2 – SEGMENT INFORMATION (CONTINUED)
2015ANZ
$MAMERICAS
$MASIA
$MEUROPE
$M
INTERSEGMENT ELIMINATION
$M
TOTAL SEGMENT
$M
UNALLOCATED/ CORPORATE
$MCONSOLIDATED
$M
Total revenue comprises: Net sales revenue 586.3 776.2 208.6 286.1 – 1,857.2 – 1,857.2 Other revenue 94.9 13.2 – 0.9 – 109.0 4.8 113.8 Intersegment
revenue 386.1 2.0 0.2 22.1 (410.4) – – – Total segment revenue (excl other income/interest) 1,067.3 791.4 208.8 309.1 (410.4) 1,966.2 4.8 1,971.0
Management EBITS 88.9 83.2 72.9 16.0 – 261.0 (35.9) 225.1 SGARA loss (11.1) (7.8) – – – (18.9) – (18.9)Material items (37.8) (26.9) (0.8) (1.1) – (66.6) (7.1) (73.7)
Management EBIT 40.0 48.5 72.1 14.9 – 175.5 (43.0) 132.5 Net finance costs (21.6)Consolidated profit before tax 110.9
Depreciation of property, plant and equipment 48.9 22.0 – 2.3 – 73.2 2.0 75.2 Amortisation of intangible assets 0.8 – – – – 0.8 8.5 9.3 Assets held for sale 21.7 69.5 – – – 91.2 – 91.2 Capital expenditure 48.9 27.2 0.4 2.1 – 78.6 12.2 90.8 Segment assets (excl intersegment assets) 2,053.5 1,346.9 56.3 315.0 – 3,771.7 378.1 4,149.8 Segment liabilities (excl intersegment liabilities) 254.1 177.2 23.3 67.6 – 522.2 576.9 1,099.1
NOTE 3 – REVENUE AND OTHER INCOME
2016 $M
2015 $M
RevenueNet sales revenue* 2,232.6 1,857.2 Other revenue 110.7 113.8 Total revenue 2,343.3 1,971.0
Other incomeNet profit on disposal of property, plant and equipment and agricultural assets 4.0 4.8 Other receipts – 0.8 Total other income 4.0 5.6
* Net sales revenue is net of trade discounts and volume rebates.
NOTES TO THE CONSOLIDATED FINANCIAL STATEMENTS: EARNINGS
FOR THE YEAR ENDED 30 JUNE 2016 (CONTINUED)
TREASURY WINE ESTATES ANNUAL REPORT 2016 / 73

NOTE 3 – REVENUE AND OTHER INCOME (CONTINUED)
Types of products and servicesThe Group generates revenue through the sale of branded wines, principally as a finished, bottled product. The Group’s wine portfolio includes some of the world’s leading Commercial, Masstige and Luxury wine brands such as Penfolds, Beringer, Lindeman’s, Wolf Blass, Stags’ Leap, Chateau St Jean, Beaulieu Vineyard and Sterling Vineyards.
The Group also distributes beer and cider under licence in New Zealand and provides contract bottling services to third parties.
Sales approachThe Group distributes wine to a range of customers across the world, with routes to market tailored by country. In some geographies, wine is sold principally to large distributors. In others, the majority of sales are direct to national retail chains, independent retailers and on premise outlets. The Group also has some limited sales direct to the consumer.
The Group has two major customers whose revenues represent 15.4% (F15: 17.4%) and 9.0% (F15: 10.2%) of reported revenues. The customers are in the Americas and ANZ segments respectively.
Accounting policiesRevenue is measured at the fair value of the consideration received or receivable. As the Group does not generally provide extended credit terms, this is typically the amount shown on the invoice. Revenue is recorded net of sales discounts and rebates, duties and taxes. Revenue is recorded only if it is probable that the economic benefits will flow to the Group, such as when product is sold to a credit approved purchaser.
The following specific criteria are also applied:
WineRevenue is recognised when the risk and rewards of ownership have passed to the buyer. Sales to national retail chains, domestic distributors, independent retailers and on premise outlets are usually recognised when goods are delivered. Sales to international distributors are recognised based on the international commercial terms the goods are shipped under, but typically when goods are despatched. This is also the case for some national retail chains that manage their own distribution networks.
PropertyRevenue from the sale of properties is recognised when an executed contract becomes unconditional.
RoyaltiesRevenue is recognised on an accruals basis in accordance with the substance of the relevant agreements.
Bottling servicesRevenue is recognised when the relevant service has been completed.
Key estimate and judgement:
Volume discounts and rebatesProducts are often sold with volume discounts and other rebates. Sales are recorded based on the price specified in the sales contracts, net of the estimated discount or rebate at the time of sale. Accumulated experience is used to estimate and provide for the discounts based on anticipated annual purchases.
NOTE 4 – OTHER EARNINGS DISCLOSURES
2016 $M
2015 $M
Rental expense relating to operating leases (63.6) (53.6)Net foreign exchange (losses)/gains (5.0) (8.8) Salaries and wages expense (369.0) (336.7)Share based payments expense (14.5) (3.1)
NOTES TO THE CONSOLIDATED FINANCIAL STATEMENTS: EARNINGS
FOR THE YEAR ENDED 30 JUNE 2016 (CONTINUED)
TREASURY WINE ESTATES ANNUAL REPORT 2016 / 74

NOTE 4 – OTHER EARNINGS DISCLOSURES (CONTINUED)
Accounting policies
Agricultural valuation movementThe change in fair value of vines, picked grapes and olives is recognised in the statement of profit or loss and other comprehensive income in the year of harvest.
Finance incomeFinance income is recognised as the interest accrues (using the effective interest method, which applies a rate that discounts estimated future cash receipts through the expected life of the financial instrument) to the net carrying amount of the financial asset.
Finance costsFinance costs are recognised as an expense when they are incurred, except for interest charges attributable to major projects with substantial development and construction phases, which are capitalised as part of cost of the asset.
Operating leasesOperating lease payments are recognised as an expense in the statement of profit or loss and other comprehensive income on a straight-line basis over the lease term. Group policy on how to determine the nature of a lease is set out in note 19.
Employee benefitsEmployee benefits include wages, salaries, annual leave, bonuses, non-monetary benefits and share based payment expenses. Further details of Group policy on measuring employee benefits are set out in note 15.
SuperannuationEmployees are members of defined contribution superannuation schemes. Superannuation contributions are recognised as an employee benefit expense when they are due and payable.
NOTE 5 – MATERIAL ITEMS
The following individually material items are included within the consolidated statement of profit or loss and other comprehensive income.
2016
$M2015
$M
Individually material items included in profit before income tax: Acquisition transaction costs1 (24.5) –Restructuring, redundancy and onerous lease costs2 (30.0) (48.0)Reversal of write-down/(write-down) of assets 1.7 (18.9)Inventory (write-down) – (4.6)Earthquake related loss – (2.2)Total material items (before tax) (52.8) (73.7)Tax effect of material items 14.7 24.1 Total material items (after tax) (38.1) (49.6)
F161. Represents transaction costs ($24.5 million) in relation to business acquisitions (note 27).2. Comprises costs in relation to executing supply chain optimisation programs and implementing overhead reductions arising from changes
to the Group’s supply chain network and integrating businesses acquired.
F15The Group recognised costs in relation to executing its supply chain optimisation programs, implementing overhead reductions, onerous contracts and write-downs of assets as a result of implementing supply chain network changes. The Group also recognised earthquake damages in the Napa region and asset write-downs in relation to Asti winery and vineyard assets. Write-down of assets in F15 relates to property, plant and equipment which became redundant as a result of implementing supply network changes.
Material itemsMaterial items are defined as those items of income or expense which have been determined as being sufficiently significant by their size, nature or incidence and are disclosed separately to assist in understanding the Group’s financial performance.
NOTES TO THE CONSOLIDATED FINANCIAL STATEMENTS: EARNINGS
FOR THE YEAR ENDED 30 JUNE 2016 (CONTINUED)
TREASURY WINE ESTATES ANNUAL REPORT 2016 / 75

NOTE 6 – DIVIDENDS
2016 $M
2015 $M
Dividends declared and paid on ordinary shares:Final dividend for F15 of 8.0 cents per share (F14 7.0 cents per share) 52.1 45.6 Interim dividend for F16 of 8.0 cents per share (F15: 6.0 cents per share) 59.1 39.1
111.2 84.7
Dividends declared after balance dateSince the end of the financial year, the directors declared a final dividend of 12.0 cents per share (F15: 8.0 cents) unfranked (F15: unfranked). This dividend has not been recognised as a liability in the financial statements at year end. 88.6 52.1
Details in relation to franking credits are included in note 22.
NOTE 7 – EARNINGS PER SHARE
2016 CENTS PER
SHARE
2015 CENTS PER
SHARE
Basic EPSBasic EPS (cents) based on net profit attributable to members of Treasury Wine Estates Limited 25.1 11.7 Diluted EPSDiluted EPS (cents) based on net profit attributable to members of Treasury Wine Estates Limited 24.9 11.6
NUMBER NUMBER
Weighted average number of sharesWeighted average number of ordinary shares on issue used in the calculation of basic EPS (in thousands) 713,696 662,952 Effect of potentially dilutive securities:Deferred shares (in thousands) 7,220 4,070 Weighted average number of ordinary shares on issue used in the calculation of diluted EPS (in thousands) 720,916 667,022
$M $M
Earnings reconciliationBasic and diluted EPSNet profit 179.5 77.6 Net profit attributable to non-controlling interests (0.1) – Net profit attributable to members of Treasury Wine Estates Limited used in calculating basic and diluted EPS 179.4 77.6
In accordance with AASB 133 Earnings per Share, the comparative earnings per share calculations have been restated for the bonus element of the two-for-fifteen share rights issue undertaken in October 2015. The previously reported June 2015 weighted average number of shares has been adjusted by a factor of 1.02, being the market price of one ordinary share at the close of the last day at which the shares traded together with the rights $6.57, divided by the theoretical ex-rights value per share of $6.46.
Calculation of earnings per shareEarnings per share (EPS) is the amount of post-tax profit attributable to each share.
Basic EPS is calculated by dividing the net profit after income tax attributable to ordinary shareholders by the weighted average number of ordinary shares outstanding during the year.
Diluted EPS is determined by dividing the profit attributable to ordinary shareholders after tax by the weighted average number of ordinary shares outstanding during the period (adjusted for the effects of dilutive potential ordinary shares in the employee Long-term Incentive Plan and Restricted Equity Plan (see note 21)).
NOTES TO THE CONSOLIDATED FINANCIAL STATEMENTS: EARNINGS
FOR THE YEAR ENDED 30 JUNE 2016 (CONTINUED)
TREASURY WINE ESTATES ANNUAL REPORT 2016 / 76
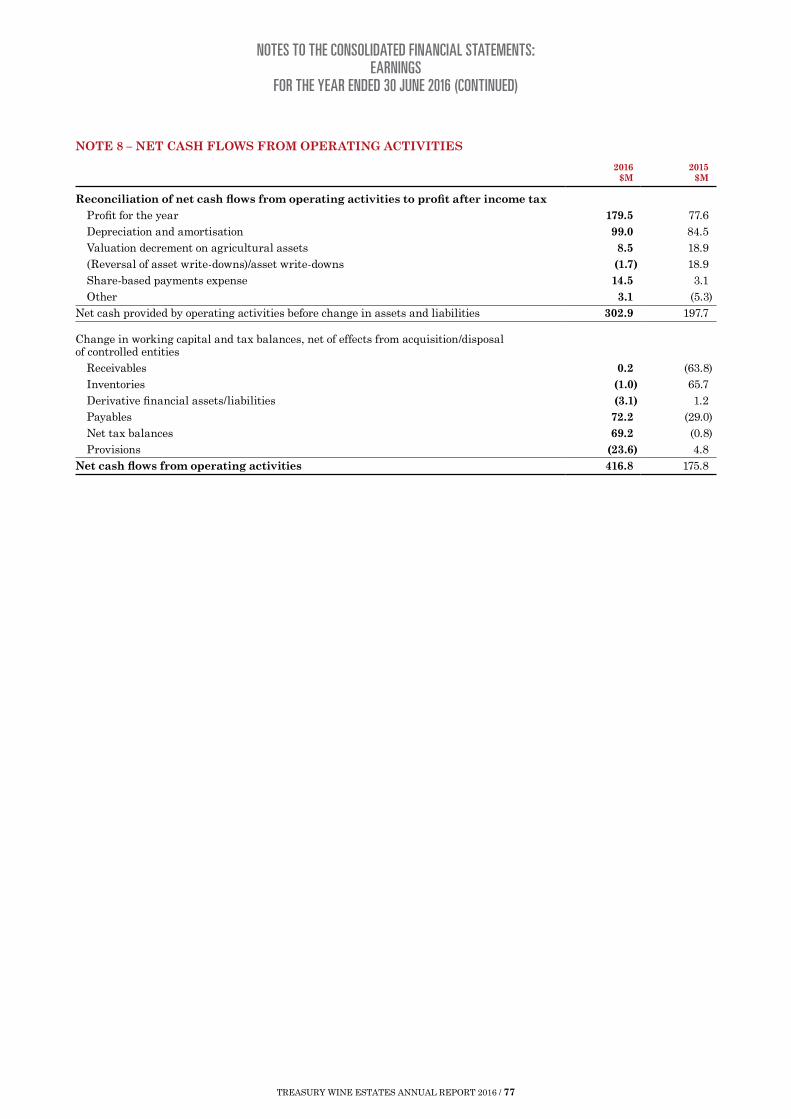
NOTE 8 – NET CASH FLOWS FROM OPERATING ACTIVITIES
2016 $M
2015 $M
Reconciliation of net cash flows from operating activities to profit after income tax Profit for the year 179.5 77.6 Depreciation and amortisation 99.0 84.5 Valuation decrement on agricultural assets 8.5 18.9 (Reversal of asset write-downs)/asset write-downs (1.7) 18.9 Share-based payments expense 14.5 3.1 Other 3.1 (5.3)Net cash provided by operating activities before change in assets and liabilities 302.9 197.7
Change in working capital and tax balances, net of effects from acquisition/disposal of controlled entities Receivables 0.2 (63.8) Inventories (1.0) 65.7 Derivative financial assets/liabilities (3.1) 1.2 Payables 72.2 (29.0) Net tax balances 69.2 (0.8) Provisions (23.6) 4.8 Net cash flows from operating activities 416.8 175.8
NOTES TO THE CONSOLIDATED FINANCIAL STATEMENTS: EARNINGS
FOR THE YEAR ENDED 30 JUNE 2016 (CONTINUED)
TREASURY WINE ESTATES ANNUAL REPORT 2016 / 77

NOTE 9 – WORKING CAPITAL
2016 $M
2015 $M
CurrentCash and cash equivalents 256.1 122.1 Receivables (a) 603.4 504.9 Inventories (b) 904.0 704.2 Bank overdraft (4.0) (13.0)Trade and other payables (653.1) (455.2)Total current 1,106.4 863.0
Non-currentInventories (b) 678.4 533.8 Trade and other payables (72.3) (5.4)Total non-current 606.1 528.4
(a) Receivables2016
$M2015
$M
CurrentTrade receivables 554.0 468.9 Allowance for doubtful debts (5.0) (3.3)Other receivables 20.6 14.1 Prepayments 33.8 25.2 Total current receivables 603.4 504.9
(b) Inventories2016
$M2015
$M
CurrentRaw materials and stores 27.5 22.9 Work in progress 414.8 368.8 Finished goods 461.7 312.5 Total current inventories 904.0 704.2
Non-currentWork in progress 566.6 452.2 Finished goods 111.8 81.6 Total non-current inventories 678.4 533.8
Total inventories 1,582.4 1,238.0
Inventories of wine stocks are classified between current and non-current based on sales projections for the ensuing year. Inventories recognised as an expense during the year and included in cost of sales amounted to $1,417.1 million (F15: $1,170.0 million). In F16, the write-down of inventories to net realisable value amounted to $23.4 million (F15: $16.9 million). The reversal of write-downs amounted to $7.3 million (F15: $3.5 million). These amounts are included in cost of sales.
NOTES TO THE CONSOLIDATED FINANCIAL STATEMENTS: WORKING CAPITALFOR THE YEAR ENDED 30 JUNE 2016
TREASURY WINE ESTATES ANNUAL REPORT 2016 / 78
NOTE 9 – WORKING CAPITAL (CONTINUED)
Accounting policies
Cash and cash equivalentsCash and cash equivalents consist of cash on hand, deposits held at call with banks, cash in transit, short-term deposits and investments with maturities of three months or less.
Cash assets and cash liabilities are offset and presented as a net amount in the statement of financial position when the Group has a legally enforceable right to offset or intent to settle on a net basis.
For the purposes of the consolidated statement of cash flows, cash and cash equivalents are disclosed net of outstanding bank overdrafts.
ReceivablesTrade receivables are initially recognised at invoice value (fair value) and subsequently measured at amortised cost, less allowance for doubtful debts.
Credit terms are generally between 30–120 days depending on the nature of the transaction. An allowance for doubtful debts is raised to reduce the carrying amount of trade receivables based on a review of outstanding amounts at reporting date where there is potential credit risk.
InventoriesInventories are valued at the lower of their cost (using average or FIFO basis) or estimated net realisable value.
The cost of raw materials is their purchase price or, in the case of grapes sourced from Group owned vineyards, fair value (see note 11 for further details). The cost of manufactured goods is determined on a consistent basis and is made up of the raw materials and direct labour used in manufacture. It also includes other direct costs and related production overheads based on normal operating capacity.
Net realisable value represents the estimated selling price in the ordinary course of business less estimated costs of completion and estimated costs to be incurred in marketing, selling and distribution.
Trade and other payablesTrade and other payables including accruals are recorded when the Group is required to make future payments as a result of purchases of goods or services. Trade and other payables are carried at amortised cost.
Key estimate and judgement:
Volume discounts and rebatesKey estimates relate to the amount accrued for discounts and rebates. Products are often sold with volume discounts and other rebates. Sales are recorded based on the price specified in the sales contracts, net of the estimated discount or rebate at the time of sale. Accumulated experience is used to estimate and provide for the discounts and rebates based on anticipated annual purchases and depletions.
Net realisable value of inventoryThe period over which some wine inventories are converted from raw materials to finished goods can be a significant length of time. Failure to forecast demand effectively may result in excess inventories or missed revenue opportunities.
Forecast demand and market prices can vary significantly over the holding period up to the likely date of sale. Estimating the most likely conditions at the expected point of sale is therefore more challenging over the longer term. Non-current inventory is $678.4 million (F15: $533.8 million) and its estimated selling price is therefore a key estimate.
NOTES TO THE CONSOLIDATED FINANCIAL STATEMENTS: WORKING CAPITAL
FOR THE YEAR ENDED 30 JUNE 2016 (CONTINUED)
TREASURY WINE ESTATES ANNUAL REPORT 2016 / 79
NOTE 10 – PROPERTY, PLANT AND EQUIPMENT
LANDFREEHOLD BUILDINGS
LEASEHOLD BUILDINGS
PLANT AND EQUIPMENT TOTAL
2016 $M
2015 $M
2016 $M
2015 $M
2016 $M
2015 $M
2016 $M
2015 $M
2016 $M
2015 $M
Cost 378.7 342.4 423.8 377.0 81.2 64.7 1,314.3 1,201.7 2,198.0 1,985.8 Projects in progress at cost – – – – – – 110.5 51.4 110.5 51.4 Accumulated depreciation and impairment (42.0) (42.7) (210.0) (191.7) (32.8) (48.4) (869.2) (825.6) (1,154.0) (1,108.4)Carrying amount at end of year 336.7 299.7 213.8 185.3 48.4 16.3 555.6 427.5 1,154.5 928.8
Reconciliations Carrying amount at start of year 299.7 299.0 185.3 198.6 16.3 15.0 427.5 445.7 928.8 958.3 Additions – 0.1 25.4 1.4 0.9 – 75.6 60.9 101.9 62.4 Business acquisitions (note 27) 62.5 – 25.5 – 39.8 – 136.7 – 264.5 – Assets held for sale (26.5) (30.1) (21.2) (14.0) (0.3) (1.4) (33.1) (34.0) (81.1) (79.5)Disposals (3.0) (0.1) (1.1) (0.1) (0.1) – (0.6) (1.6) (4.8) (1.8)(Write-downs)/reversals – – 0.3 (0.5) (0.2) (0.3) 1.6 (8.4) 1.7 (9.2)Depreciation expense – – (7.6) (6.1) (3.0) (1.4) (78.0) (67.7) (88.6) (75.2)Transfers – 0.1 4.5 (9.1) (4.9) 2.0 23.8 9.0 23.4 2.0 Foreign currency translation 4.0 30.7 2.7 15.1 (0.1) 2.4 2.1 23.6 8.7 71.8 Carrying amount at end of year 336.7 299.7 213.8 185.3 48.4 16.3 555.6 427.5 1,154.5 928.8
Included within plant and equipment are ‘Projects in progress’ of $110.5 million (F15: $51.4 million), which are assets under construction and therefore not yet depreciated. The cost of construction includes the cost of materials used in construction, direct labour on the project, and an allocation of overheads.
Accounting policiesProperty, plant and equipment is initially recorded at cost and then reduced by accumulated depreciation and any impairment losses.
Plant and equipment is depreciated so that the assets are written down to their residual value over their useful lives, using a reducing balance or straight-line method depending on the nature of the asset. Assets that relate to leases are written-off over the period of the lease or useful life, whichever is the shorter. Residual values, useful lives and amortisation methods are reviewed annually and adjusted when required. No changes to depreciation rates were made this year.
Depreciation expense is included in ‘costs of sales’, ‘selling expenses’ and ‘administration expenses’ in the statement of profit or loss and other comprehensive income.
The depreciation rates used for each class of asset are as follows:
Freehold buildings and improvements 1.5%–10.0% Leasehold buildings and improvements 10.0%–20.0% Plant and equipment 3.3%–40.0%
De-recognition and disposalWhen an asset is sold, scrapped or is no longer of use to the business it is derecognised. Any gain or loss arising on de-recognition of the asset (calculated as the difference between the net proceeds and the carrying amount of the asset) is recorded in the period the asset is derecognised in the statement of profit or loss and other comprehensive income.
NOTES TO THE CONSOLIDATED FINANCIAL STATEMENTS: OPERATING ASSETS AND LIABILITIES
FOR THE YEAR ENDED 30 JUNE 2016
TREASURY WINE ESTATES ANNUAL REPORT 2016 / 80
NOTE 11 – AGRICULTURAL ASSETS
2016 $M
2015 $M
Agricultural assets 340.0 255.1 Total agricultural assets 340.0 255.1
Reconciliations Carrying amount at start of year 255.1 229.9 Additions 13.0 16.5 Business acquisitions (note 27) 82.1 – Disposals (0.9) (1.2)Assets held for sale (2.5) (4.5)Fair value (decrease) (2.8) – Transfers (7.9) (6.5)Foreign currency translation 3.9 20.9 Carrying amount at end of year 340.0 255.1
Grape growing and sourcingThe Group has a variety of sources of fruit including owned and leased vineyards, contracted growers and the bulk wine market.
This approach provides flexibility through the economic cycle and assists with managing the risks arising from agricultural factors beyond the Group’s control such as pests, disease and extreme weather conditions.
The Group owned vineyards ensure access to super premium fruit from key viticultural regions including the Barossa Valley and Coonawarra in Australia, Marlborough in New Zealand and the Napa and Sonoma Valleys in California. These vineyards contribute to some of the Group’s most prestigious wines.
Vineyard resources2016
HECTARES2015
HECTARES
Australia 8,939 9,149 New Zealand 339 339 United States 4,002 2,484 Italy 145 145
13,425 12,117
The area under vine shown above:
• Includes 3,657 hectares (F15: 2,006 hectares) under lease arrangements and seven hectares (F15: seven hectares) of olive groves in Tuscany, a region of Italy.
• Yielded 100,737 tonnes of grapes (F15: 77,998 tonnes). This excludes grapes harvested from vines acquired from Diageo Chateau & Estates.
Harvests generally occur in September-October in the Northern Hemisphere and February–April in the Southern Hemisphere.
Impact on profit or loss (SGARA)2016
$M2015
$M
Decrease in vines (2.8) – Decrease in grapes (5.7) (18.9)Net agricultural valuation movement (8.5) (18.9)
NOTES TO THE CONSOLIDATED FINANCIAL STATEMENTS: OPERATING ASSETS AND LIABILITIES
FOR THE YEAR ENDED 30 JUNE 2016 (CONTINUED)
TREASURY WINE ESTATES ANNUAL REPORT 2016 / 81
NOTE 11 – AGRICULTURAL ASSETS (CONTINUED)
Accounting policiesThe agricultural assets of the Group (principally vines) are measured at their fair value, less estimated point of sale costs.
The net change in their fair value over the year is recognised within ‘Other Expenses’ in the statement of profit or loss and other comprehensive income.
Prior to harvest, grapes are considered as part of the agricultural asset and included in its fair value. Harvested grapes are transferred to inventory initially at fair value and are then subsequently accounted for in the cost of inventory (see note 9).
Costs incurred in maintaining agricultural assets are recognised as an expense as incurred.
Fair value determinationThe valuations of agricultural assets are Level 2 fair value measurements under the Group’s accounting policy (see note 1), with the principal inputs being:
VinesDetermined with reference to both independent valuations of the relevant vineyards and the market price of purchased vines (rootlings).
Grapes prior to harvestEstimated based on the expected yields per hectare, forecasted harvest costs and the anticipated market price of grapes.
Harvested grapesDetermined by reference to the weighted district average of grape prices for each region for the current vintage. Prices vary with the grade quality of grapes produced in each particular region.
Key estimate and judgement:
Fair value of vinesKey to estimating the value of vines is the identification of factors that could have a long-term impact on the viability of the vines and the measurement of the impact a change in these factors have on the valuation of vines. These are typically site dependent.
In addition, the estimated fair value of both vines and unharvested grapes could change if:
• Yield estimates were higher/(lower);
• The estimated harvest costs were lower/(higher);
• Market prices for grapes were higher/(lower); or
• The quality of grapes was higher/(lower).
NOTES TO THE CONSOLIDATED FINANCIAL STATEMENTS: OPERATING ASSETS AND LIABILITIES
FOR THE YEAR ENDED 30 JUNE 2016 (CONTINUED)
TREASURY WINE ESTATES ANNUAL REPORT 2016 / 82

NOTE 12 – INTANGIBLE ASSETS
BRAND NAMES AND LICENCES
IT DEVELOPMENT
COSTS GOODWILL TOTAL
2016 $M
2015 $M
2016 $M
2015 $M
2016 $M
2015 $M
2016 $M
2015 $M
Cost 1,407.3 1,194.9 45.4 35.2 709.2 655.0 2,161.9 1,885.1 Projects in progress at cost – – 23.4 12.2 – – 23.4 12.2 Accumulated amortisation and impairment (473.3) (463.2) (31.2) (22.7) (620.6) (620.3) (1,125.1) (1,106.2)Carrying amount at end of year 934.0 731.7 37.6 24.7 88.6 34.7 1,060.2 791.1
ReconciliationsCarrying amount at start of year 731.7 688.8 24.7 22.0 34.7 36.3 791.1 747.1 Additions – – 18.9 12.0 – – 18.9 12.0 Business acquisitions (note 27) 198.8 – 0.3 – 52.7 – 251.8 – Assets held for sale – (3.4) – – – – – (3.4)Amortisation expense – – (10.4) (9.3) – – (10.4) (9.3)Transfer from other asset classes – – 4.2 – – – 4.2 – Foreign currency translation 3.5 46.3 (0.1) – 1.2 (1.6) 4.6 44.7 Carrying amount at end of year 934.0 731.7 37.6 24.7 88.6 34.7 1,060.2 791.1
Goodwill is allocated to the Cash Generating Units (CGUs) or group of CGUs (see note 14 for further details) that are expected to benefit from the synergies of the combination. The allocation of intangible assets (other than IT development costs) is as follows:
ANZ AMERICAS EUROPE TOTAL
2016 $M
2015 $M
2016 $M
2015 $M
2016 $M
2015 $M
2016 $M
2015 $M
GoodwillCarrying amount at start of year 34.7 36.3 – – – – 34.7 36.3 Business acquisitions (note 27) – – 42.0 – 10.7 – 52.7 – Foreign currency translation 2.5 (1.6) (0.1) – (1.2) – 1.2 (1.6)Carrying amount at end of year 37.2 34.7 41.9 – 9.5 – 88.6 34.7
Brand names and licencesCarrying amount at start of year 480.9 481.2 247.9 204.7 2.9 2.9 731.7 688.8 Business acquisitions (note 27) – – 198.8 – – – 198.8 – Assets held for sale – – – (3.4) – – – (3.4)Foreign currency translation 0.3 (0.3) 3.1 46.6 0.1 – 3.5 46.3 Carrying amount at end of year 481.2 480.9 449.8 247.9 3.0 2.9 934.0 731.7
Indefinite life brandsBrand names with a carrying value of $934.0 million (F15: $731.7 million) are assessed as having an indefinite useful life. The indefinite useful life reflects the Group’s intention to continue to manufacture or distribute these brands to generate net cash inflows into the foreseeable future.
Key estimate and judgement:
Useful life of brand namesIn assessing whether a brand has a finite or indefinite useful life, the Group makes use of information on the long-term strategy for the brand, the level of growth or decline of the markets that the brand operates in, the history of the market and the brand’s position within that market.
If a brand is assessed to have a finite life, the Group will use judgement in determining the useful life of the brand and will consider the period over which expected cash flows will continue to be derived in making that decision.
NOTES TO THE CONSOLIDATED FINANCIAL STATEMENTS: OPERATING ASSETS AND LIABILITIES
FOR THE YEAR ENDED 30 JUNE 2016 (CONTINUED)
TREASURY WINE ESTATES ANNUAL REPORT 2016 / 83
NOTE 12 – INTANGIBLE ASSETS (CONTINUED)
Accounting policies
Brand names and licencesBrand names are recognised as assets when purchased individually and (primarily) as part of the allocation of the purchase price when the Group acquires other businesses. Internally generated brand names are not capitalised and expenditure incurred in developing, maintaining or enhancing brand names is charged to profit or loss in the year incurred.
Brand names are initially recognised at cost when purchased individually and at fair value when acquired with a business. This fair value is determined by reference to independent valuations.
Following initial recognition, intangible assets are carried at cost less any accumulated amortisation and any accumulated impairment losses.
The useful lives of brand names have been assessed to be indefinite and therefore are not amortised.
GoodwillGoodwill arises on the acquisition of businesses and represents the difference between the purchase price and share of the net assets of the acquired business, recorded at fair value.
Following initial recognition, goodwill is measured at cost less any accumulated impairment losses. Goodwill is not amortised but is tested for impairment (see note 14).
IT development and softwareCosts incurred in developing information technology (IT) products or systems and costs incurred in acquiring software and multi-year licenses are capitalised as intangible IT assets. They include the cost of purchased software and internal labour and contractors used in the development of software.
IT assets are carried at cost less any accumulated amortisation and are amortised over their expected useful life (2–10 years) on a straight line basis. Amortisation is included in ‘Other expenses’ in the statement of profit or loss and other comprehensive income.
NOTE 13 – ASSETS HELD FOR SALE
2016 $M
2015 $M
Disposal groups held for sale 98.8 91.2 Total assets classified as held for sale 98.8 91.2
Americas segmentThe Americas assets held for sale comprise assets acquired as part of the Diageo Chateau & Estates acquisition ($59.1 million) which are surplus to requirements and include Paicines and Acacia wineries as well as Rutherford House. The carrying value of total assets held for sale include land and buildings $41.0 million, plant and equipment $17.2 million and agricultural assets of $0.9 million.
ANZ segmentThe ANZ assets held for sale relate to Ryecroft winery, Matua Auckland winery as well as select vineyard assets which are surplus to requirements. The carrying value comprises land and buildings $14.4 million, plant and equipment $24.2 million and vineyards $1.1 million.
Accounting policiesNon-current assets are classified as held for sale if their value will be recovered principally through their sale, rather than through ongoing use within the business.
Assets are not depreciated or amortised while they are classified as held for sale. They are valued at the lower of their carrying amount and fair value less costs to sell with an impairment loss recognised for any difference. A gain is recognised for any subsequent increase in value, but not in excess of any cumulative impairment loss previously recognised. Any gain or loss not previously recognised by the date of the sale of the non-current asset is recognised at that point. The fair values of the assets based on independent market appraisals exceed the assets’ carrying values.
NOTES TO THE CONSOLIDATED FINANCIAL STATEMENTS: OPERATING ASSETS AND LIABILITIES
FOR THE YEAR ENDED 30 JUNE 2016 (CONTINUED)
TREASURY WINE ESTATES ANNUAL REPORT 2016 / 84
NOTE 14 – IMPAIRMENT OF NON-FINANCIAL ASSETS
In F16, the recoverable amounts of cash generating units (CGUs) exceed their carrying values and as a result no impairment has been recognised (F15: Nil). There were no indications that previously recognised impairment losses should be reversed (F15: Nil). The recoverable amount was determined through a value in use calculation.
The Group’s CGUs are consistent with the prior period and are:
• Americas;
• Europe; and
• Australia and New Zealand (ANZ).
Accounting policies
Timing of Impairment TestingThe Group tests property, plant and equipment and intangible assets for impairment:
• At least annually for goodwill and indefinite life brands; and
• Where there are indications that an asset may be impaired; or
• Where there is an indication that previously recognised impairments may have changed
Impairment losses are recognised in the statement of profit or loss and other comprehensive income.
Approach to Impairment TestingIf the asset does not generate independent cash inflows and its value in use cannot be estimated to be close to its fair value, the asset is tested for impairment as part of the CGU to which it belongs.
When an asset’s (or CGU’s) carrying value exceeds its recoverable amount, it is impaired. Recoverable amount is the higher of the asset’s (or CGU’s) fair value less costs of disposal or value in use.
Fair value is determined in accordance with the accounting policy set out in note 1.
In assessing value in use, the estimated future cash flows are discounted to their present value using a discount rate that reflects current market assessments of the time value of money and the risks specific to the asset or CGU.
Reversals of ImpairmentIf there is an indicator that a previously recognised impairment loss no longer exists or has decreased, recoverable amount is estimated. If there has been a change in the estimates used to determine an asset’s recoverable amount since an impairment loss was recognised, the carrying value of the asset is increased to its recoverable amount (limited to the amount that would have been determined, net of depreciation, had no impairment loss been recognised for the asset in prior years).
Any reversal is recognised in profit or loss with an adjustment to depreciation in future periods to allocate the asset’s revised carrying value, less any residual value, on a systematic basis over its remaining useful life. The Group does not reverse impairments recognised for goodwill.
NOTES TO THE CONSOLIDATED FINANCIAL STATEMENTS: OPERATING ASSETS AND LIABILITIES
FOR THE YEAR ENDED 30 JUNE 2016 (CONTINUED)
TREASURY WINE ESTATES ANNUAL REPORT 2016 / 85

NOTE 14 – IMPAIRMENT OF NON-FINANCIAL ASSETS (CONTINUED)
Key estimate and judgement:
Impairment testing key assumptions
Cash flow forecastsCash flow forecasts are based on the Group’s most recent five-year financial plans approved by the Board. Key assumptions in the cash flow forecasts include sales volume growth, cost of sales and cost of doing business.
The Group’s assumptions regarding sales volume growth and costs of doing business are based on expectations of the market demand and past experience. The assumption on cost of sales is based on expectation about future vintage costs.
This approach is consistent with the prior period.
Long-term growth ratesCash flow forecasts beyond a five-year period are extrapolated using a growth rate of 2.5% (F15: 2.7%).
Discount rateThe Group applies a post-tax discount rate to post-tax cash flows as the valuation calculated using this method closely approximates applying pre-tax discount rates to pre-tax cash flows. The post-tax discount rates incorporate a risk-adjustment relative to the risks associated with the net post-tax cash flows being achieved. The Group used the following pre-tax discount rates:
2016 2015
Americas 13.7% 12.7%Europe 11.6% 13.5%ANZ 12.8% 13.1%
Exchange ratesCash flow forecasts in foreign currency are forecast in that currency and discounted using the applicable regional discount rates (predominantly USD and GBP).
Sensitivity analysisIncreases in discount rates or changes in other key assumptions, such as operating conditions or financial performance, may cause the recoverable amount to fall below carrying values.
Based on current economic conditions and CGU performances, there are no reasonably possible changes to key assumptions used in the determination of CGU recoverable amounts that would result in a material impairment to the Group.
NOTES TO THE CONSOLIDATED FINANCIAL STATEMENTS: OPERATING ASSETS AND LIABILITIES
FOR THE YEAR ENDED 30 JUNE 2016 (CONTINUED)
TREASURY WINE ESTATES ANNUAL REPORT 2016 / 86

NOTE 15 – PROVISIONS
2016 $M
2015 $M
Current Employee entitlements 38.8 36.9 Other 38.6 53.4 Total current provisions 77.4 90.3
Other provisionsONEROUS
CONTRACTS $M
RESTRUCTURING $M
OTHER $M
TOTAL $M
2016 Carrying amount at start of year 8.7 41.1 3.6 53.4 Business acquisitions (note 27) 8.2 0.1 – 8.3 Charged/(credited) to profit or loss (4.2) 16.1 – 11.9 Payments (2.9) (30.2) (3.1) (36.2)Foreign currency translation 0.1 0.3 0.8 1.2 Carrying amount at end of year 9.9 27.4 1.3 38.6
2015 Carrying amount at start of year 8.9 32.0 8.2 49.1 Charged/(credited) to profit or loss 5.0 35.7 (1.3) 39.4 Payments (5.8) (28.0) (4.3) (38.1)Foreign currency translation 0.6 1.4 1.0 3.0 Carrying amount at end of year 8.7 41.1 3.6 53.4
Onerous contract provisions are held for non-cancellable leases, IT infrastructure service contracts and wine grape supply contracts that have been identified as being surplus to the Group’s needs. The Restructuring provision balance comprises costs in relation to the Group’s supply chain optimisation program and group rationalisation and restructure program.
Accounting policiesProvisions are recognised for present obligations (legal, equitable or constructive) to make future payments (or other transfer of value) to other entities due to past transactions or events. They are recognised only when it is probable the liability will arise and when a reliable estimate can be made of the amount.
If the effect of time value of money is material, provisions are determined by discounting the expected future cash flows at a pre-tax risk free rate plus, where appropriate, the risks specific to the liability. Where discounting is used, the increase in the provision due to the passage of time is recognised as a finance cost.
Employee entitlementsLiabilities for employees’ entitlements to wages and salaries, annual leave and other current employee entitlements (that are expected to be paid within 12 months) are measured at amounts expected to be paid as at the reporting date.
Liabilities for other employee entitlements, which are not expected to be paid or settled within 12 months of reporting date, are accrued in respect of all employees at the present value of future amounts expected to be paid.
RestructuringRestructuring provisions are recognised at the point when a detailed plan for the restructure has been developed and implementation has commenced. The cost of restructuring provided is the estimated future cash flows, discounted at the appropriate rate which reflects the risks of the cash flow.
Termination benefits are payable when employment is terminated before the normal retirement date or whenever an employee accepts voluntary redundancy in exchange for these benefits. The Group recognises termination benefits when it is demonstrably committed to either terminating the employment of a current employee according to a detailed formal plan without possibility of withdrawal or upon the provision of an offer to encourage voluntary redundancy.
Onerous contractsOnerous contracts are measured at the lower of the expected cost of terminating the contract and the expected net cost of continuing with the contract (discounted to present value if material).
NOTES TO THE CONSOLIDATED FINANCIAL STATEMENTS: OPERATING ASSETS AND LIABILITIES
FOR THE YEAR ENDED 30 JUNE 2016 (CONTINUED)
TREASURY WINE ESTATES ANNUAL REPORT 2016 / 87

NOTE 16 – CAPITAL MANAGEMENT
The Group considers capital to be the combination of shareholders’ equity, reserves and net debt. The key objectives of the Group’s approach to capital management include:
• Safeguard the Company’s ability to continue as a going concern;
• Maintaining a credit profile and the requisite financial metrics that secures access to funding with a spread of maturity dates and sufficient undrawn committed facility capacity;
• Optimising over the long term, and to the extent practicable, the weighted average cost of capital to reduce the Group’s cost of capital while maintaining financial flexibility; and
• To provide returns to shareholders and benefits to other stakeholders.
In order to optimise the Group’s capital structure and in line with the Group’s strategic objectives and operating plans, the Company may:
• Alter the amount of dividends paid to shareholders;
• Return capital to shareholders;
• Issue new shares;
• Vary discretionary capital expenditure;
• Draw-down additional debt; or
• Sell assets to reduce debt.
Various financial ratios and internal targets are assessed and reported to the Board on a regular basis by management to monitor and support the key objectives set out above. These ratios and targets include:
• An earnings to net interest expense ratio;
• A total net indebtedness to earnings before interest, tax, depreciation, amortisation and self-generating and regenerating assets ratio; and
• Group debt maturity profile.
NOTE 17 – BORROWINGS
2016 $M
2015 $M
Total borrowings consist of:Current 4.3 0.2Non-current 626.6 324.4Total borrowings 630.9 324.6
Details of major arrangementsThe Group has issued US Private Placement Notes of US$250.0 million (unsecured), maturing in December 2020 (US$75.0 million), December 2023 (US$125.0 million) and December 2025 (US$50.0 million). The carrying value at 30 June 2016 is $348.5 million (F15: $325.8 million).
As at 30 June 2016, US$150.0 million of bank debt has been drawn under facilities maturing in April 2018 (US$100.0 million) and December 2019 (US$50.0 million). The carrying value at 30 June 2016 is $201.4 million (F15: Nil).
US Private Placement Notes bear interest at fixed and floating interest rates. Drawn bank facilities bear interest at floating interest rates. In accordance with the Group’s risk management strategy, the Group has entered into a combination of fixed to floating and floating to fixed interest rate swaps to obtain the desired fixed/floating interest ratio. Refer to note 23 for further details.
The Group is party to a number of finance lease arrangements which have a carrying value of $85.0 million at 30 June 2016 (F15: $0.9 million). Included within this balance is a finance lease arrangement which has a carrying value of $81.2 million at 30 June 2016 and was acquired as part of the Diageo Chateau & Estates business acquisition (refer to note 27). The Group’s finance lease arrangements have durations up to 15 years.
NOTES TO THE CONSOLIDATED FINANCIAL STATEMENTS: CAPITAL STRUCTURE
FOR THE YEAR ENDED 30 JUNE 2016
TREASURY WINE ESTATES ANNUAL REPORT 2016 / 88
NOTE 17 – BORROWINGS (CONTINUED)
Financial guaranteesThe Group has financial guarantees to other persons of $23.2 million (F15: $27.5 million) that could be called upon at any time in the event of a breach of the Group’s financial obligations. The Group does not expect any payments will eventuate under these financial guarantees as the Group is expected to meet respective obligations to the beneficiaries of these guarantees.
Accounting policiesBorrowings are initially recorded at fair value of the consideration received, net of directly attributable costs.
After initial recognition, borrowings are measured at amortised cost, using the effective interest rate method. Amortised cost is calculated by taking into account any issue costs, and any discount or premium on issuance. Gains and losses are recognised in the statement of profit or loss and other comprehensive income if borrowings are derecognised.
NOTE 18 – CONTRIBUTED EQUITY
2016 $M
2015 $M
Issued and paid-up capital 738,135,033 (F15: 651,261,403) ordinary shares, fully paid 3,540.5 3,065.1 Own shares held (6.9) (3.8) 3,533.6 3,061.3
Contributed equity at the beginning of the period 3,061.3 3,051.4 Shares issued: 86,873,630 shares pursuant to the two for 15 rights issue (F15: Nil) 475.4 – Nil (F15: 1,833,843) shares in accordance with the Long Term Incentive Plans – 9.5 Net movement in own shares held (3.1) 0.4 Contributed equity at the end of the period 3,533.6 3,061.3
Securities purchased on market
The following securities were purchased on market during the financial year for the purpose of the employee incentive scheme:
NUMBER OF SHARES
PURCHASED
AVERAGE PRICE PAID PER SHARE
Ordinary Shares 339,767 $6.10Ordinary Shares 208,091 $5.99Ordinary Shares 208,091 $5.95
The shares have no par value.
Ordinary sharesOrdinary shares entitle the holder to participate in dividends and the proceeds on winding up of the Company in proportion to the number of and amounts paid on the shares held. Ordinary shares entitle their holder to one vote, either in person or by proxy, at a meeting of the Company. Incremental costs directly attributable to the issue of new shares or options are shown in equity as a deduction, net of tax from the proceeds.
Treasury sharesIncluded within ordinary fully paid shares are 1.3 million (F15: 0.9 million) shares which are available to satisfy any entitlements which vest under the Company’s Employee Equity Plans (set out in note 21). Share options exercised during the reporting period are satisfied with treasury shares.
When the Company reacquires its equity instruments (treasury shares) their cost is deducted from equity. No gain or loss is recognised in profit or loss on the purchase, sale, issue or cancellation of treasury shares. Any difference between the cost of acquisition and the consideration when reissued is recognised in share-based payments reserve.
NOTES TO THE CONSOLIDATED FINANCIAL STATEMENTS: CAPITAL STRUCTURE
FOR THE YEAR ENDED 30 JUNE 2016 (CONTINUED)
TREASURY WINE ESTATES ANNUAL REPORT 2016 / 89

NOTE 19 – COMMITMENTS
2016
$M2015
$M
LeasesNon-cancellable leasesCommitments in relation to leases contracted for at the reporting date but not recognised as liabilities, payable: under one year 98.7 41.6 between one year and five years 272.8 96.6 over five years 539.4 76.2 Total lease commitments 910.9 214.4
Capital expenditure and other commitmentsThe following expenditure has been contracted but not provided for in the financial statements: Capital expenditure 38.6 25.8
The Group’s leases of property expire between one and 20 years. Leases generally provide us with a right of renewal at which time all terms are renegotiated. During the year the Group acquired operating leases as part of the acquisition of Diageo Chateau & Estates.
Accounting policies
LeasesThe determination of which of the Group’s arrangements are leases can be complex; for example determining whether long term contracts are for the supply of grapes or a lease of the vineyard. The assessment is made based on the substance of the arrangement, whether it is dependent on the use of a specific asset or assets and if it conveys a right of use.
When an arrangement is a lease, it is accounted for in one of two ways. Where the lessor retains substantially all the risks and benefits of ownership of an asset it is classified as operating leases. Operating lease payments are recognised as an expense on a straight-line basis over the lease term in the statement of profit or loss and other comprehensive income.
Where the Group takes on substantially all the risks and benefits of ownership of the leased item it is classified as a finance lease. An asset is recognised at the inception of the lease at the fair value of the leased asset or, if lower, at the present value of the minimum lease payments. Lease payments are split between a finance expense and a reduction of the lease liability so as to record a constant rate of interest on the remaining balance of the liability. The asset is depreciated over the shorter of the estimated useful life of the asset or the lease term.
NOTE 20 – RESERVES
2016
$M2015
$M
Cash flow hedge reserve (2.3) (3.9)Share based payments reserve 20.4 7.3 Foreign currency translation reserve 2.4 (26.7)Total reserves 20.5 (23.3)
Cash flow hedge reserveThis reserve records the effective portion of gains or losses from open cash flow hedges.
Share based payment reserveThis reserve records amounts offered to employees under Long Term Incentive Plan (LTIP), Restricted Equity Plan (REP) and deferred Short Term Incentive Plan (STIP).
Foreign currency translation reserveThis reserve holds exchange differences arising on translation of foreign subsidiaries, as described in note 1.
NOTES TO THE CONSOLIDATED FINANCIAL STATEMENTS: CAPITAL STRUCTURE
FOR THE YEAR ENDED 30 JUNE 2016 (CONTINUED)
TREASURY WINE ESTATES ANNUAL REPORT 2016 / 90

NOTE 21 – EMPLOYEE EQUITY PLANS
STIP (RESTRICTED
SHARES/ DEFERRED SHARE RIGHTS)
LTIP (PERFORMANCE
RIGHTS)
REP (RESTRICTED
SHARES/ DEFERRED SHARE RIGHTS)
Outstanding at the beginning of the year – 4,714,074 2,244,432Granted during the year 292,482 3,310,842 315,361Vested during the year – (1,260,581) (338,331)Forfeited during the year – (976,672) (296,678)Outstanding at the end of the year 292,482 5,787,663 1,924,784Exercisable at the end of the year – – –
The Group operates equity plans as outlined below:
F15 Short Term Incentive Plan (STIP) Restricted EquityOne-third of earned STIP is delivered in the form of deferred equity (Restricted Shares/Deferred Share Rights). The key terms of this award are:
• Subject to a mandatory two-year disposal restriction period and continued employment;
• Holders of Restricted Shares are entitled to dividends and to exercise their voting rights during the restriction;
• Will generally be forfeited if the executive is dismissed for cause or resigns. Clawback mechanisms also exist.
F16 STIP Restricted EquityOne-third of earned STIP is delivered in the form of deferred equity (Restricted Shares). The key terms of this award are:
• Subject to a mandatory restriction period and continued employment. Half of the award is restricted for one year and the remaining half for two years from grant date;
• Holders of Restricted Shares are entitled to dividends and to exercise their voting rights during the restriction;
• Will generally be forfeited if the executive is dismissed for cause or resigns. Clawback mechanisms apply.
LTIPUnder the LTIP certain employees receive Performance Rights, which entitle participants to receive the Company’s shares at no cost subject to the achievement of performance conditions and continued employment. No dividends are payable to participants prior to vesting.
For the F14 and F15 award, Performance Rights are subject to dual performance measures with equal weighting over a performance period of three years.
• Relative Total Shareholder Return (TSR)
• Earnings per Share (EPS) compound annual growth rate (CAGR)
• Will generally be forfeited if the executive is dismissed for cause or resigns. Clawback mechanisms apply.
For the F16 award, Performance Rights are subject to dual performance measures with equal weighting over a performance period of three years.
• Relative Total Shareholder Return (TSR)
• Return on Capital Employed (ROCE) growth
• Will generally be forfeited if the executive is dismissed for cause or resigns. Clawback mechanisms apply.
Restricted Equity Plan (REP)Under the REP, certain employees receive a grant of restricted equity awards in the form of Restricted Shares. If Restricted Shares cannot be awarded (e.g. due to country specific regulation) Deferred Share Rights are granted. The award is at no cost to the employee and is subject to a restriction period. Restricted equity awards require continued employment with the Group through the restriction period. Other terms are similar to the STIP terms above.
Restricted equity awards may be granted to compensate employees for foregoing equity compensation in their previous organisation as a sign-on award and/or as a retention incentive.
Share Cellar (broad-based Employee Share Plan)Share Cellar is the Group’s broad-based Employee Share Plan and plan participation is offered annually. The plan was first launched early in 2015. Participation is voluntary and employees in select countries are eligible to join the Plan. Share Cellar operates as a matching plan whereby employees contribute funds to the Plan from their after-tax pay and shares are acquired by the Group on their behalf. If the individual continues to hold their shares, and remains an employee of the Group at the vesting date (approximately two years), the Group will grant one matched share for every two purchased shares they hold.
Participants are entitled to dividends and to exercise voting rights attached to the shares purchased under the plan, and matched shares once they have been allocated.
NOTES TO THE CONSOLIDATED FINANCIAL STATEMENTS: CAPITAL STRUCTURE
FOR THE YEAR ENDED 30 JUNE 2016 (CONTINUED)
TREASURY WINE ESTATES ANNUAL REPORT 2016 / 91

NOTE 21 – EMPLOYEE EQUITY PLANS (CONTINUED)
Accounting policiesEmployee equity plans are accounted for as share-based payments, whereby employees render services in exchange for the awards. The fair value of the shares and performance rights that are expected to vest is progressively recognised as an employee benefits expense over the relevant vesting period with a corresponding increase in equity.
The fair value of shares granted is determined by reference to observed market values. The fair value of the TSR component of performance rights is independently determined at grant date by an external valuer using a Monte-Carlo simulation. For the non-market components (EPS CAGR), the fair value is independently determined based on the share price less the present value of dividends.
Non-market performance conditions do not impact the value of shares and performance rights, but rather the estimate of the number of shares to vest.
At each reporting date the Company revises the estimate of the number of shares and the non-market component of performance rights that are expected to vest and the employee benefits expense recognised each period incorporates this change in estimate.
An expense is recognised for the TSR component of performance rights whether or not the TSR hurdle is met. No expense is recognised if these rights do not vest due to cessation of employment. No expense is recognised for shares and non-market components of performance rights that do not ultimately vest.
Active share based payment plans:
Long-Term Incentive Plans GRANT DATE 29-AUG-14 24-NOV-14 15-JAN-15 06-MAR-15 04-DEC-15
Grant date share price $5.11 $4.81 $4.74 $5.29 $7.97Expected share price volatility (%) 32.0 32.0 32.0 32.0 34.0Expected dividend yield (%) 2.6 2.9 2.9 2.8 2.8Risk-free interest rate (%) 2.6 2.5 2.2 1.9 2.2Fair value estimate at grant date – TSR $2.78 $2.51 $2.39 $2.76 $6.50Fair value estimate at grant date – EPS $4.75 $4.46 $4.41 $4.96 –
Fair value estimate at grant date – ROCE – – – – $7.42
Restricted Equity Plans
GRANT DATEGRANT DATE
SHARE PRICE
F1426-Aug-13 $4.6918-Dec-13 $4.5728-Feb-14 $3.8730-Apr-14 $3.8116-May-14 $4.08
F1529-Aug-14 $5.1124-Sep-14 $4.9317-Nov-14 $4.526-Mar-15 $5.29
F164-Sep-15 $5.984-Dec-15 $7.97
NOTES TO THE CONSOLIDATED FINANCIAL STATEMENTS: CAPITAL STRUCTURE
FOR THE YEAR ENDED 30 JUNE 2016 (CONTINUED)
TREASURY WINE ESTATES ANNUAL REPORT 2016 / 92
NOTE 22 – INCOME TAX
2016$M
2015$M
The major components of income tax expense are:
Statement of profit or lossCurrent income tax 38.3 21.7 Deferred income tax 41.7 11.6 Total tax expense 80.0 33.3
Deferred income tax expense included in the income tax expense comprises: Decrease in deferred tax assets 44.4 12.2 (Decrease) in deferred tax liabilities (2.7) (0.6)Deferred income tax 41.7 11.6
Tax reconciliationThe amount of income tax expense as shown in the statement of profit or loss and other comprehensive income differs from the prima facie income tax expense attributable to earnings. The differences are reconciled as follows:Profit before tax excluding material items 312.3 184.6 Material items before tax (52.8) (73.7)Profit before tax 259.5 110.9
Prima facie income tax expense attributable to profit from operations calculated at the rate of 30% (F15: 30%) 77.9 33.3 Tax effect of: Non-taxable income and profits, net of non-deductible expenditure 3.9 2.4 Other deductible items (0.9) (1.3) Tax losses recognised (5.7) (7.0) Change in tax rate 0.8 0.5 Foreign tax rate differential 0.9 0.5 Other 3.8 2.6 (Over)/under provisions in previous years (0.7) 2.3 Total tax expense 80.0 33.3
Income tax expense on operations 94.7 57.4 Income tax benefit attributable to material items (14.7) (24.1)Income tax expense 80.0 33.3
Deferred income tax relates to the following:Deferred tax assetsThe balance comprises temporary differences attributable to: Inventory 52.2 13.7 Property, plant and equipment 0.6 0.7 Accruals 36.5 18.7 Provisions 32.6 40.0 Foreign exchange 2.1 0.3 Tax losses 89.8 110.3 Other 38.4 9.6 Total deferred tax assets 252.2 193.3
Deferred tax liabilitiesThe balance comprises temporary differences attributable to: Inventory 2.2 – Property, plant and equipment 115.0 100.6 Intangibles 151.6 92.7 Other 4.9 0.8 Total deferred tax liabilities 273.7 194.1
NOTES TO THE CONSOLIDATED FINANCIAL STATEMENTS: TAXATION
FOR THE YEAR ENDED 30 JUNE 2016
TREASURY WINE ESTATES ANNUAL REPORT 2016 / 93

NOTE 22 – INCOME TAX (CONTINUED)
2016 $M
2015 $M
Movements in deferred income tax relate to the following:Movement in deferred tax assets:Opening balance 193.3 171.4 Credited/(charged) to the profit or loss (44.4) (12.2) Business acquisitions (note 27) 117.9 – Foreign currency translation 5.6 28.1 Balance sheet reclassification (22.0) 7.3 Other 1.8 (1.3)Closing balance 252.2 193.3
Movement in deferred tax liabilities:Opening balance 194.1 159.6 (Credited)/charged to the profit or loss (2.7) (0.6) Business acquisitions (note 27) 94.9 – Balance sheet reclassification (18.7) 0.1 Foreign currency translation 5.0 35.0 Other 1.1 –Closing balance 273.7 194.1
Amounts recognised directly in equity Aggregate current and deferred tax arising in the reporting period and not recognised in net profit or loss but directly debited or (credited) to equity (0.8) 0.9
Unrecognised tax assetsThere are potential future income tax benefits relating to accumulated losses in non-Australian group companies, which have not been brought to account. These possible benefits amount to $66.6 million (F15: $96.8 million).
The Group has carry forward capital tax losses in Australia and the UK respectively. These losses may be used to offset any future capital gains derived by activities in these countries. The Group will assess the conditions for deductibility imposed by the tax laws of Australia and the UK prior to any utilisation of the capital losses.
Ongoing tax auditsThe Group is subject to ongoing tax audits by taxation authorities in several jurisdictions covering a variety of taxes. The Group fully cooperates with these enquiries as and when they arise.
Franking creditsThe Australian Tax Consolidation Group has $9.5 million (F15: Nil) franking credits available for subsequent reporting periods.
Key estimate and judgement:
TaxationThe Group is subject to income taxes in Australia and jurisdictions where it has foreign operations. Significant judgement is required in determining the worldwide provision for income taxes. There are many transactions and calculations undertaken during the ordinary course of business for which the ultimate tax determination is uncertain. Where the final tax outcome of these matters is different from the amounts that were initially recorded, such differences will impact the current and deferred tax provisions in the period in which such determination is made.
NOTES TO THE CONSOLIDATED FINANCIAL STATEMENTS: TAXATION
FOR THE YEAR ENDED 30 JUNE 2016 (CONTINUED)
TREASURY WINE ESTATES ANNUAL REPORT 2016 / 94

NOTE 22 – INCOME TAX (CONTINUED)
Accounting policies
Current taxesCurrent tax assets and liabilities are measured at the amount expected to be recovered from, or paid to, taxation authorities at the tax rates and tax laws enacted or substantively enacted by the reporting date.
Deferred taxesDeferred income tax liabilities are recognised for all taxable temporary differences. Deferred income tax assets are recognised for all deductible temporary differences, carried forward unused tax assets and unused tax losses, to the extent it is probable that they will be utilised.
Unrecognised deferred income tax assets are reassessed at each reporting date and are recognised to the extent that it will become possible that future taxable profit will allow the deferred tax asset to be recovered.
The carrying amount of deferred income tax assets is reviewed at balance sheet date and reduced to the extent that it is no longer probable that sufficient taxable profit will be available to utilise them.
Deferred income tax assets and liabilities are measured at the tax rates that are expected to apply to the year when the asset is realised or the liability is settled, based on tax rates and tax laws that have been enacted or substantively enacted at the balance sheet date.
Deferred income tax is provided on temporary differences at balance sheet date between accounting carrying amounts and the tax bases of assets and liabilities, other than for:
• The initial recognition of an asset or liability in a transaction that is not a business combination and at the time of the transaction, affects neither the accounting profit nor taxable profit or loss or on the recognition of goodwill.
• Foreign taxes which may arise in the event of retained profits of foreign controlled entities being remitted to Australia as there is no present intention to make any such remittances.
Deferred tax assets and deferred tax liabilities associated with indefinite life intangibles such as brand names are measured based on the tax consequences that would follow from the sale of that asset.
Income taxes relating to items recognised directly in equity are recognised in equity and not in profit or loss.
Offsetting deferred tax balancesDeferred tax assets and deferred tax liabilities are offset only if a legally enforceable right exists to set off current tax assets against current tax liabilities and the deferred tax assets and liabilities relate to the same taxable entity and the same taxation authority.
NOTES TO THE CONSOLIDATED FINANCIAL STATEMENTS: TAXATION
FOR THE YEAR ENDED 30 JUNE 2016 (CONTINUED)
TREASURY WINE ESTATES ANNUAL REPORT 2016 / 95
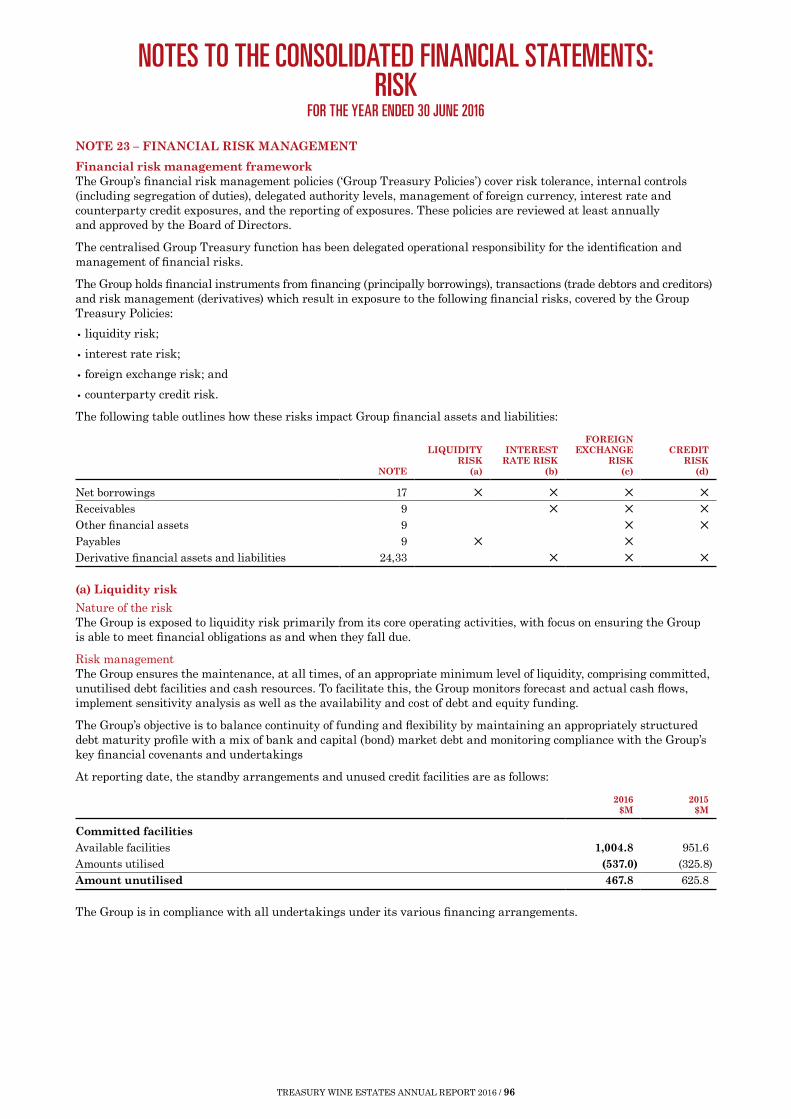
NOTE 23 – FINANCIAL RISK MANAGEMENT
Financial risk management frameworkThe Group’s financial risk management policies (‘Group Treasury Policies’) cover risk tolerance, internal controls (including segregation of duties), delegated authority levels, management of foreign currency, interest rate and counterparty credit exposures, and the reporting of exposures. These policies are reviewed at least annually and approved by the Board of Directors.
The centralised Group Treasury function has been delegated operational responsibility for the identification and management of financial risks.
The Group holds financial instruments from financing (principally borrowings), transactions (trade debtors and creditors) and risk management (derivatives) which result in exposure to the following financial risks, covered by the Group Treasury Policies:
• liquidity risk;
• interest rate risk;
• foreign exchange risk; and
• counterparty credit risk.
The following table outlines how these risks impact Group financial assets and liabilities:
NOTE
LIQUIDITY RISK
(a)
INTEREST RATE RISK
(b)
FOREIGN EXCHANGE
RISK (c)
CREDIT RISK
(d)
Net borrowings 17 ✕ ✕ ✕ ✕
Receivables 9 ✕ ✕ ✕
Other financial assets 9 ✕ ✕
Payables 9 ✕ ✕ Derivative financial assets and liabilities 24,33 ✕ ✕ ✕
(a) Liquidity risk
Nature of the riskThe Group is exposed to liquidity risk primarily from its core operating activities, with focus on ensuring the Group is able to meet financial obligations as and when they fall due.
Risk managementThe Group ensures the maintenance, at all times, of an appropriate minimum level of liquidity, comprising committed, unutilised debt facilities and cash resources. To facilitate this, the Group monitors forecast and actual cash flows, implement sensitivity analysis as well as the availability and cost of debt and equity funding.
The Group’s objective is to balance continuity of funding and flexibility by maintaining an appropriately structured debt maturity profile with a mix of bank and capital (bond) market debt and monitoring compliance with the Group’s key financial covenants and undertakings
At reporting date, the standby arrangements and unused credit facilities are as follows:
2016 $M
2015 $M
Committed facilitiesAvailable facilities 1,004.8 951.6Amounts utilised (537.0) (325.8)Amount unutilised 467.8 625.8
The Group is in compliance with all undertakings under its various financing arrangements.
NOTES TO THE CONSOLIDATED FINANCIAL STATEMENTS: RISK
FOR THE YEAR ENDED 30 JUNE 2016
TREASURY WINE ESTATES ANNUAL REPORT 2016 / 96

NOTE 23 – FINANCIAL RISK MANAGEMENT (CONTINUED)
(a) Liquidity risk (continued)
Level of exposure at balance dateThe following tables analyse the maturities of the Group’s contractual undiscounted cash flows arising from its material financial liabilities, net and gross settled derivative financial instruments.
MATURING IN:
CONTRACTUALTOTAL
$M
CARRYING AMOUNT
$M
6 MONTHS OR LESS
$M
6 MONTHSTO 1 YEAR
$M
1 TO 2 YEARS
$M
2 TO 5YEARS
$M
OVER5 YEARS
$M
2016Non-derivative financial liabilities Bank loans* 2.9 2.9 139.6 72.6 – 218.0 196.6Bank overdraft 4.0 – – – – 4.0 4.0Finance leases 4.2 4.2 8.6 25.3 73.9 116.2 85.0Other loans – – 0.8 – – 0.8 0.8US Private Placement Notes 6.2 5.8 11.6 135.0 267.0 425.6 348.5Trade payables 289.1 – – – – 289.1 289.1Other payables (financial liabilities) 364.0 – – – – 364.0 364.0
Derivative financial liabilitiesForeign exchange contracts 0.6 0.7 – – – 1.3 1.3Interest rate swaps 0.8 0.6 1.0 2.2 0.8 5.4 0.1Total financial liabilities 671.8 14.2 161.6 235.1 341.7 1,424.4 1,289.4
2015 Non-derivative financial liabilities Bank loans* 1.2 1.0 1.9 3.4 – 7.5 (2.9)Bank overdraft 13.0 – – – – 13.0 13.0Other loans – 1.6 0.2 – – 1.8 1.8US Private Placement Notes 6.2 6.2 12.5 37.4 331.6 393.9 325.8Trade payables 177.3 – – – – 177.3 177.3Other payables (financial liabilities) 277.9 – 5.4 – – 283.3 283.3
Derivative financial liabilitiesForeign exchange contracts 5.2 1.6 1.2 0.1 – 8.1 8.1Interest rate swaps (1.4) (1.3) (1.8) (1.0) 2.7 (2.8) 0.1Total financial liabilities 479.4 9.1 19.4 39.9 334.3 882.1 806.5
* Loans are stated net of capitalised facility finance costs. At reporting date, the balance of bank loans is US$150 million (F15: Nil) against capitalised facility finance costs of $4.8 million (F15: $2.9 million) to be amortised over the facility period.
(b) Interest rate risk
Nature of the riskThe Group is exposed to interest rate risk principally from floating rate borrowings, including bank borrowings and US Private Placement Notes. Other sources of interest rate risk include receivable purchasing agreements, interest-bearing investments, creditors’ accounts offering a discount and debtors’ accounts on which discounts are offered.
Risk managementThe Group manages interest rate risk by ensuring that the sensitivity of forecast future earnings to changes in interest rates is within acceptable limits. This involves longer term forecasting of both expected earnings and expected borrowing to determine the tolerable exposure.
NOTES TO THE CONSOLIDATED FINANCIAL STATEMENTS: RISK
FOR THE YEAR ENDED 30 JUNE 2016 (CONTINUED)
TREASURY WINE ESTATES ANNUAL REPORT 2016 / 97

NOTE 23 – FINANCIAL RISK MANAGEMENT (CONTINUED)
(b) Interest rate risk (continued)A combination of interest rate swaps were exchanged to obtain the desired ratio of fixed and floating interest rates. At 30 June 2016, interest rate swap contracts were in use to exchange fixed interest rates on $134.3 million (US$100.0 million) of US Private Placement notes to floating rates, maturing in December 2023 and $268.5 million (US$200.0 million) to fix interest rates on US Private Placement notes and drawn bank facilities. Please refer note 23(a) for the profile and timing of cash flows over the next five years.
Level of exposure at balance dateThe Group’s exposure to variable interest rate risk results from the following financial instruments at balance sheet date:
2016 $M
2015 $M
Financial assetsCash and cash equivalents 256.1 122.1Total assets 256.1 122.1
Financial liabilitiesBank overdraft 4.0 13.0US Private Placement Notes* 67.1 195.5Bank loans 67.1 –Total liabilities 138.2 208.5
* Net of hedged amounts.
Sensitivity analysisThe table below shows the impact by currency denomination if the Group’s weighted average floating interest rates change from the year-end rates of 1.10% (F15: 0.79%) with all other variables held constant.
CURRENCY
SENSITIVITY PRE-TAX IMPACT ON PROFIT
2016 2015 2016 2015
+ $M
– $M
+ $M
– $M
USD + / – 25bp + / – 25bp (0.2) 0.2 (0.2) 0.2
The movements in profit on a consolidated level are primarily a result of interest costs from borrowings. There would have been no significant impact on equity.
(c) Foreign exchange risk
Nature of the riskThe Group is exposed to foreign exchange risk through:
• Transaction exposures including sales of wine into export markets and the purchase of production inputs, denominated in foreign currencies other than the respective functional currency of the specific Group entity;
• Exposures arising from borrowings denominated in foreign currencies; and
• Translation exposures including earnings of foreign subsidiaries and revaluation of monetary assets and liabilities, including borrowings.
The currencies in which these transactions are primarily denominated are the Australian Dollar (AUD), United States Dollar (USD) and Great British Pound (GBP). Other currencies used include the Canadian Dollar, Euro, New Zealand Dollar, Singapore Dollar, Swedish Krona, Norwegian Krone and South African Rand.
Risk managementThe focus of the Group’s foreign exchange risk management activities is on the transactional exposures arising from the sourcing and sale of wine.
A proportion of expenses are hedged over time up to a period of three years. The timing, nominal amount and average price of the instruments in place at 30 June 2016 are disclosed in the table on the following page.
In determining the amount of hedging required, the Group also considers the ‘natural hedges’ arising from the underlying net cash flows in the relevant currency, comprising operating, investing and financing cash flows.
NOTES TO THE CONSOLIDATED FINANCIAL STATEMENTS: RISK
FOR THE YEAR ENDED 30 JUNE 2016 (CONTINUED)
TREASURY WINE ESTATES ANNUAL REPORT 2016 / 98

NOTE 23 – FINANCIAL RISK MANAGEMENT (CONTINUED)
(c) Foreign exchange risk (continued)Details of the Group’s open hedges at balance sheet date are shown below.
Open foreign currency hedges at 30 June 2016
CURRENCY HEDGE TYPEHEDGE VALUE
(NOTIONAL AUD)HEDGE
RATE
AUD/USD Option Collar 50.6 0.78Total 50.6
AUD/GBP Forward 20.0 0.51Purchased Option 12.4 0.56Option Collar 82.2 0.55Total 114.6
EUR/GBP Forward 9.4 0.79Option Collar 14.7 0.89Total 24.1
ZAR/GBP Forward 2.2 22.36Option Collar 0.5 20.00Total 2.7
Level of exposure at balance dateAt the reporting date, the Group’s financial assets and liabilities were denominated across the following currencies:
ALL BALANCES TRANSLATED TO AUDAUD
$MUSD
$MGBP
$MOTHER
$MTOTAL
$M
2016Net debtCash and cash equivalents 61.8 53.8 84.4 56.1 256.1Bank overdraft – – – (4.0) (4.0)Loan receivable 0.9 – – – 0.9Bank loans* 4.8 (201.4) – – (196.6)US Private Placement Notes (net of fair value hedge) – (335.6) – – (335.6)Lease liabilities (0.5) (84.5) (85.0)Other loan payable (0.8) – – – (0.8)Net debt 66.2 (567.7) 84.4 52.1 (365.0)
Other financial assets/(liabilities)Trade receivables (net of the allowance for doubtful debts) 238.9 178.3 60.8 71.0 549.0Other receivables 5.9 11.0 2.4 2.0 21.3Trade and other payables (262.4) (350.4) (79.9) (32.7) (725.4)Net other assets/(liabilities) (17.6) (161.1) (16.7) 40.3 (155.1)
2015Net debtCash and cash equivalents 24.2 60.3 3.6 34.0 122.1Bank overdraft (13.0) – – – (13.0)Loan receivable 1.0 0.6 – – 1.6Bank loans* 2.1 0.8 – – 2.9US Private Placement Notes – (325.8) – – (325.8)Other loan payable (1.7) – – – (1.7)Net debt 12.6 (264.1) 3.6 34.0 (213.9)
Other financial assets/liabilitiesTrade receivables (net of the allowance for doubtful debts) 226.6 108.8 51.1 79.1 465.6 Other receivables 5.0 4.5 – 4.7 14.2 Trade and other payables (233.8) (148.7) (44.7) (32.6) (459.8)Net other assets/(liabilities) (2.2) (35.4) 6.4 51.2 20.0
* Includes capitalised borrowing costs of $4.8 million (F15: $2.9 million).
NOTES TO THE CONSOLIDATED FINANCIAL STATEMENTS: RISK
FOR THE YEAR ENDED 30 JUNE 2016 (CONTINUED)
TREASURY WINE ESTATES ANNUAL REPORT 2016 / 99

NOTE 23 – FINANCIAL RISK MANAGEMENT (CONTINUED)
(c) Foreign exchange risk (continued)
Sensitivity analysisThe following table illustrates the impact of foreign exchange movements to profit before tax and the statement of financial position at 30 June:
CURRENCY
SENSITIVITYASSUMPTION*
PRE-TAX IMPACT ON PROFIT ($M)
IMPACT ON EQUITY ($M)
2016 2015 2016 2015 2016 2015
+ – + – + – + –
United States Dollar 12.3% 11.3% (0.2) 0.2 (1.5) 1.9 (178.0) 230.2 (108.8) 135.9Great Britain Pound** 13.1% 10.0% – (0.1) (1.3) 1.6 (25.3) 37.1 (11.2) 13.4Euro 11.1% 10.5% (3.8) 4.7 (3.0) 3.7 (5.3) 6.0 (2.6) 3.2Canadian Dollar** 9.1% 9.1% (1.8) 2.2 (1.7) 2.0 (0.9) 1.1 – –New Zealand Dollar** 8.8% 8.3% – – 0.1 (0.1) (9.6) 11.4 (8.2) 9.7
* Australian dollar versus individual currencies. Implied one year currency volatility at reporting date (Source: Bloomberg).** The ‘–’ denotes a balance that is less than $100,000.
(d) Credit risk
Nature of the riskCounterparty credit risk arises primarily from the following assets:
• cash and cash equivalents;
• trade and other receivables; and
• derivative instruments.
Risk managementThe Group’s counterparty credit risk management philosophy is to limit the Group’s loss from default by any one counterparty by dealing only with financial institution counterparties of good credit standing, setting maximum exposure limits for each counterparty, and taking a conservative approach to the calculation of counterparty credit limit usage. Where available, credit opinions on counterparties from two credit rating agencies are used to determine credit limits.
The Group assesses the credit quality of individual customers prior to offering credit terms and continue to monitor on a regular basis. Each customer is assigned a risk profile based upon the measurable risk indicators for dishonoured payments, adverse information and average days late along with the securities and guarantees held. All prospective accounts are required to complete a credit application and generally a director’s guarantee is required with minimal exceptions. Failure to provide a director’s guarantee results in either no credit or a limited level of credit offered. Credit terms may be reduced or extended for individual customers on the basis of risk.
Past due accounts are subject to a number of collection activities which range from telephone contact, suspension of orders through to legal action. Past due accounts are reviewed monthly with specific focus on accounts that are greater than 90 days overdue. Where debt cannot be recovered, it is escalated from the credit representative to the credit manager to initiate recovery action.
For derivatives, the Group transacts under an International Swaps and Derivatives Association (ISDA) master netting agreement. If a credit event such as a default occurs, all outstanding transactions under an ISDA agreement are terminated, the termination value is assessed and only a single net amount is payable in settlement of all transactions.
Level of exposure at balance dateThe maximum counterparty credit risk exposure at 30 June 2016 in respect of derivative financial instruments was $5.1 million (F15: $2.7 million) and in respect of cash and cash equivalents was $53.7 million (F15: $21.0 million). The Group’s authorised counterparties are restricted to banks and financial institutions whose long term credit rating is at or above a Standard and Poors rating of BBB+ (or Moody’s equivalent rating of Baa1). The magnitude of credit risk in relation to receivables is generally the carrying amount, net of any provisions for doubtful debts. The ageing of the consolidated Group trade receivables (net of provisions) is outlined below:
2016 $M
2015 $M
Not past due 521.4 438.9 Past due 1–30 days 16.8 17.6 Past due 31–60 days 6.0 0.5 Past due 61 days+ 4.8 8.6 Total 549.0 465.6
NOTES TO THE CONSOLIDATED FINANCIAL STATEMENTS: RISK
FOR THE YEAR ENDED 30 JUNE 2016 (CONTINUED)
TREASURY WINE ESTATES ANNUAL REPORT 2016 / 100

NOTE 23 – FINANCIAL RISK MANAGEMENT (CONTINUED)
(c) Foreign exchange risk (continued)Trade receivables have been aged according to their original due date. Terms may be extended on a temporary basis to support promotional activity with the approval of finance management. The past due receivables shown above relate to customers who have a good debt history and are considered recoverable. There is no collateral held as security against the receivables above and there are no other receivables past due.
NOTE 24 – DERIVATIVE FINANCIAL INSTRUMENTS
At reporting date there were $192.0 million (Australian dollar equivalent) net face value of outstanding foreign exchange contracts at contract rates (F15: $630.3 million) and interest rate swaps of $402.8 million (F15: $130.3 million). These instruments are regarded as being Level 2 under AASB’s Fair Value measurement hierarchy.
NOTE 25 – FAIR VALUES
The fair values of cash and cash equivalents, financial assets and most financial liabilities approximate their carrying value. The fair value of the US Private Placement Notes is $401.6 million (F15: $333.8 million). There have been no reclassifications of financial assets from fair value to cost, or from cost or amortised cost to fair value during the year.
The fair values of derivative financial instruments are based upon market prices, or models using inputs observed from the market, where markets exist or have been determined by discounting the expected future cash flows by the current interest rate for financial assets and financial liabilities with similar risk profiles (a Level 2 valuation).
The valuation of derivative financial assets and liabilities reflects the estimated amounts which the Group would be required to pay or receive to terminate the contracts (net of transaction costs) or replace the contracts at their current market rates at reporting date. This is based on internal valuations using standard valuation techniques.
As the purpose of these derivative financial instruments is to hedge the Group’s underlying assets and liabilities denominated in foreign currencies and to hedge against risk of interest rate fluctuations, it is unlikely in the absence of abnormal circumstances that these contracts would be terminated prior to maturity.
For all other recognised financial assets and financial liabilities, based on the facts and circumstances existing at reporting date and the nature of the Group’s financial assets and financial liabilities including hedge positions, the Group has no reason to believe that the financial assets could not be exchanged, or the financial liabilities could not be settled, in an arm’s length transaction at an amount approximating its carrying amount.
NOTE 26 – CLASS ACTION
On 2 July 2014, Brian Jones, represented by Maurice Blackburn, commenced a funded class action in the Federal Court of Australia (New South Wales Registry) for unspecified damages on behalf of shareholders who acquired the Company’s shares between 17 August 2012 and 15 July 2013. Mr Jones alleges that the Company engaged in misleading and deceptive conduct and breached obligations of continuous disclosure in respect of its US operations.
A second class action was commenced in the Supreme Court of Victoria on 22 December 2014 by Melbourne City Investments Pty Ltd (MCI) on behalf of shareholders who acquired the Company’s shares on or after 17 August 2012 and who held those shares on 15 July 2013. This proceeding was commenced following an earlier proceeding commenced by MCI having been permanently stayed by order of the Supreme Court of Victoria as being an abuse of process, and the High Court having refused MCI special leave to appeal this decision. MCI also alleges in the December 2014 proceeding that the Company misled the market and breached obligations of continuous disclosure in respect of its US operations. The Company made an application to the Federal Court to stay this second MCI proceeding as also being an abuse of process. On 5 July 2016 Justice Foster of the Federal Court granted the Company’s application and ordered the second MCI proceeding also be permanently stayed as an abuse of process. MCI has subsequently applied to the Federal Court to set aside or revoke this permanent stay. The outcome of this further application is not yet known.
With regard to continuing claims and applications in the Federal Court, the Company strongly denies any and all allegations made against it and is vigorously defending the proceeding.
No orders have yet been made for class closure or opt out. Based on the information currently available, the Company does not know the quantum of either class action. No provision has been recognised at 30 June 2016 in respect of the claim.
NOTES TO THE CONSOLIDATED FINANCIAL STATEMENTS: RISK
FOR THE YEAR ENDED 30 JUNE 2016 (CONTINUED)
TREASURY WINE ESTATES ANNUAL REPORT 2016 / 101

NOTE 27 – BUSINESS ACQUISITIONS
Diageo Chateau & EstatesOn 1 January 2016, the Company acquired 100% of the ordinary shares of Diageo Chateau & Estates (‘DC&E’), a Company incorporated in the US. This included the acquisition of related assets in the UK. DC&E is a leader in the US Luxury and Masstige wine market, being the owner of a collection of iconic wine brands based in Napa, California. Additionally, DC&E has a strong market presence in the Commercial wine market in the UK.
The cash consideration of $803.8 million was funded by a combination of cash resources generated from the issue of shares during the period and utilising the Group’s debt facilities.
From the date of acquisition, DC&E contributed $200.7 million of revenue and $23.8 million to profit before tax from continuing operations of the Group. Revenue and profit from the acquired entities that would have been earned if the acquisition had occurred at the commencement of the financial year has not been provided on the basis that the calculation of that information is impracticable. This is because the businesses were fully integrated into the Diageo Group and separate comparable financial information relating to the acquired business as a stand-alone entity is not available. Additionally, information relating to the fair value of assets acquired is not available to accurately determine the purchase price accounting adjustments that would have been recognised had the acquisition taken place on 1 July 2015. Transaction costs of $24.5 million were expensed and are included in administration expenses.
Assets acquired and liabilities assumedThe fair value of the identifiable assets and liabilities of DC&E at the date of acquisition were:
FAIR VALUE RECOGNISED ON
ACQUISITION (PROVISIONAL)
$M
AssetsTrade and other receivables 109.5 Inventories 386.0 Property, plant and equipment (note 10) 264.5 Agricultural assets (note 11) 82.1 Intangible assets (note 12) 198.8 Deferred tax assets (note 22) 117.9
1,158.8
LiabilitiesCash overdraft 1.7 Trade and other payables 184.6Onerous contract provisions (note 15) 8.2Employee entitlement provisions 1.1Borrowings 85.1Deferred tax liabilities (note 22) 94.9
375.6Total identifiable net assets at fair value 783.2Hedge loss recognised against purchase price (5.9) Goodwill arising on acquisition (note 12) 52.7Purchase consideration 830.0
Goodwill of $52.7 million comprises the value of expected synergies arising from the acquisition. Goodwill is not deductible for tax purposes.
Analysis of cash flows on acquisitionCash consideration paid 803.8 Cash overdraft acquired with acquisition 1.7 Net cash flow outflow on acquisition (included in cash flows from investing activities) 805.5
NOTES TO THE CONSOLIDATED FINANCIAL STATEMENTS: GROUP COMPOSITION
FOR THE YEAR ENDED 30 JUNE 2016
TREASURY WINE ESTATES ANNUAL REPORT 2016 / 102
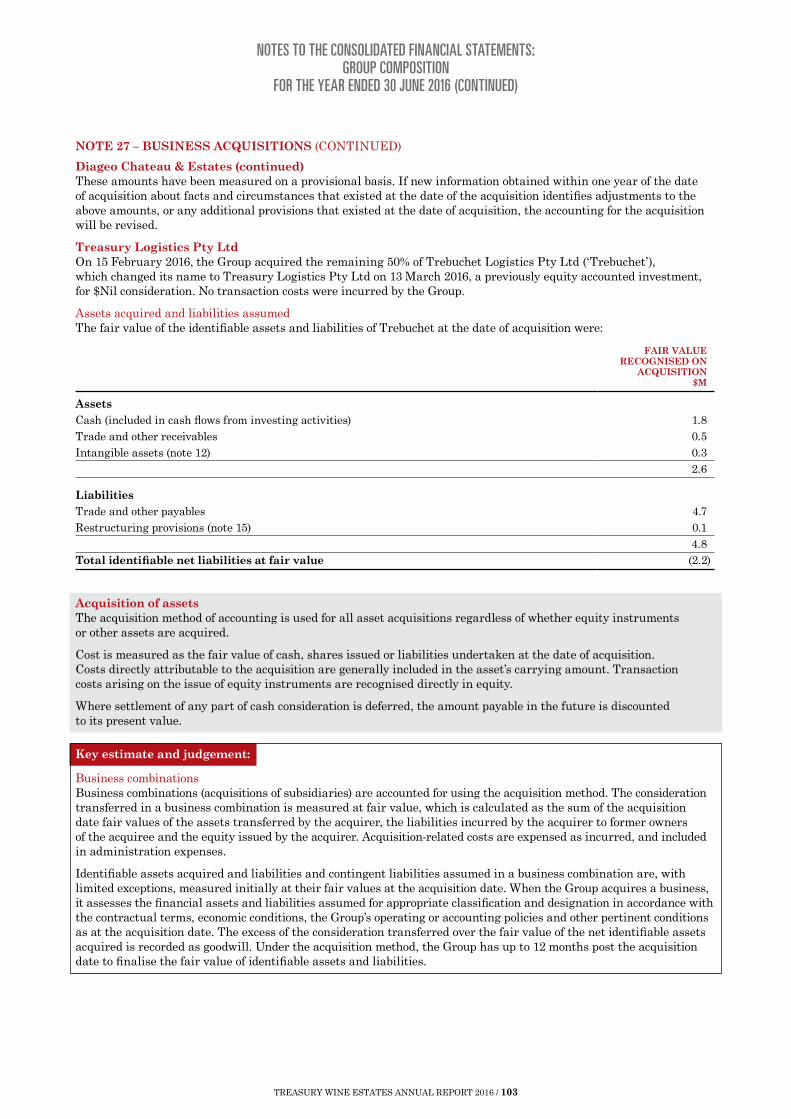
NOTE 27 – BUSINESS ACQUISITIONS (CONTINUED)
Diageo Chateau & Estates (continued)These amounts have been measured on a provisional basis. If new information obtained within one year of the date of acquisition about facts and circumstances that existed at the date of the acquisition identifies adjustments to the above amounts, or any additional provisions that existed at the date of acquisition, the accounting for the acquisition will be revised.
Treasury Logistics Pty LtdOn 15 February 2016, the Group acquired the remaining 50% of Trebuchet Logistics Pty Ltd (‘Trebuchet’), which changed its name to Treasury Logistics Pty Ltd on 13 March 2016, a previously equity accounted investment, for $Nil consideration. No transaction costs were incurred by the Group.
Assets acquired and liabilities assumedThe fair value of the identifiable assets and liabilities of Trebuchet at the date of acquisition were:
FAIR VALUE RECOGNISED ON
ACQUISITION $M
AssetsCash (included in cash flows from investing activities) 1.8Trade and other receivables 0.5Intangible assets (note 12) 0.3
2.6
LiabilitiesTrade and other payables 4.7Restructuring provisions (note 15) 0.1
4.8Total identifiable net liabilities at fair value (2.2)
Acquisition of assetsThe acquisition method of accounting is used for all asset acquisitions regardless of whether equity instruments or other assets are acquired.
Cost is measured as the fair value of cash, shares issued or liabilities undertaken at the date of acquisition. Costs directly attributable to the acquisition are generally included in the asset’s carrying amount. Transaction costs arising on the issue of equity instruments are recognised directly in equity.
Where settlement of any part of cash consideration is deferred, the amount payable in the future is discounted to its present value.
Key estimate and judgement:
Business combinationsBusiness combinations (acquisitions of subsidiaries) are accounted for using the acquisition method. The consideration transferred in a business combination is measured at fair value, which is calculated as the sum of the acquisition date fair values of the assets transferred by the acquirer, the liabilities incurred by the acquirer to former owners of the acquiree and the equity issued by the acquirer. Acquisition-related costs are expensed as incurred, and included in administration expenses.
Identifiable assets acquired and liabilities and contingent liabilities assumed in a business combination are, with limited exceptions, measured initially at their fair values at the acquisition date. When the Group acquires a business, it assesses the financial assets and liabilities assumed for appropriate classification and designation in accordance with the contractual terms, economic conditions, the Group’s operating or accounting policies and other pertinent conditions as at the acquisition date. The excess of the consideration transferred over the fair value of the net identifiable assets acquired is recorded as goodwill. Under the acquisition method, the Group has up to 12 months post the acquisition date to finalise the fair value of identifiable assets and liabilities.
NOTES TO THE CONSOLIDATED FINANCIAL STATEMENTS: GROUP COMPOSITION
FOR THE YEAR ENDED 30 JUNE 2016 (CONTINUED)
TREASURY WINE ESTATES ANNUAL REPORT 2016 / 103

NOTE 28 – SUBSIDIARIES
The consolidated financial statements incorporate the assets, liabilities and results of the following subsidiaries:
ENTITY NAMECOUNTRY OF
INCORPORATION
Equity holding of 100% (F15: 100%)Aldershot Nominees Pty. Ltd.* AustraliaB Seppelt & Sons Limited* AustraliaBeringer Blass Distribution S.R.L. ItalyBeringer Blass Italia S.R.L. ItalyBeringer Blass Wine Estates Chile Limitada ChileBeringer Blass Wine Estates Limited UKBeringer Blass Wines Pty. Ltd.* AustraliaBilyara Vineyards Pty. Ltd.* AustraliaCellarmaster Wines (UK) Limited UKCellarmaster Wines Holdings (UK) Limited UKColdstream Australasia Limited* AustraliaCuppa Cup Vineyards Pty. Ltd. AustraliaDevil’s Lair Pty. Ltd. AustraliaEwines Pty. Ltd. AustraliaFBL Holdings Limited UKIl Cavaliere del Castello di Gabbiano S.r.l. ItalyInterbev Pty. Ltd.* AustraliaInvin Wines Pty. Ltd.(a) AustraliaIsland Cooler Pty. Ltd.(b) AustraliaJames Herrick Wines Limited UKLeo Buring Pty. Ltd. AustraliaLindeman (Holdings) Limited* AustraliaLindemans Wines Pty. Ltd. AustraliaMag Wines Pty. Ltd AustraliaMajorca Pty. Ltd.* AustraliaMBL Packaging Pty. Ltd.(c) AustraliaMildara Holdings Pty. Ltd.* AustraliaNorth America Packaging (Pacific Rim) Corporation USAPenfolds Wines Pty Ltd AustraliaPiat Pere et Fils B.V.(d) NetherlandsPremium Land, Inc. USARH Wines Pty. Ltd(a) AustraliaRobertsons Well Pty. Ltd. AustraliaRobertsons Well Unit Trust AustraliaRosemount Estates Pty. Ltd. AustraliaRothbury Wines Pty. Ltd.* AustraliaRoxburgh Vineyards Pty. Ltd.(a) AustraliaSCA 605 Pty. Ltd.(a) AustraliaSCW905 Limited* AustraliaSeaview Wynn Pty. Ltd.* AustraliaSelion Pty. Ltd.(a) AustraliaSouthcorp Australia Pty. Ltd.* AustraliaSouthcorp Brands Pty. Ltd.* AustraliaSouthcorp International Investments Pty. Ltd.* AustraliaSouthcorp Limited* AustraliaSouthcorp NZ Pty. Ltd.* AustraliaSouthcorp Whitegoods Pty. Ltd. AustraliaSouthcorp Wines Asia Pty. Ltd. AustraliaSouthcorp Wines Europe Limited UKSouthcorp Wines Pty. Ltd.* Australia
NOTES TO THE CONSOLIDATED FINANCIAL STATEMENTS: GROUP COMPOSITION
FOR THE YEAR ENDED 30 JUNE 2016 (CONTINUED)
TREASURY WINE ESTATES ANNUAL REPORT 2016 / 104

ENTITY NAMECOUNTRY OF
INCORPORATION
Southcorp XUK Limited UKT’Gallant Winemakers Pty. Ltd. AustraliaThe New Zealand Wine Club Limited UKThe Rothbury Estate Pty. Ltd.* AustraliaTolley Scott & Tolley Limited* AustraliaTreasury Americas Inc USATreasury Chateau & Estates(e) USATreasury Logistics Pty Ltd(f) AustraliaTreasury Wine Brands Pty Limited(a) AustraliaTreasury Wine Estates (China) Holding Co Pty Ltd* AustraliaTreasury Wine Estates Shanghai Co Ltd ChinaTreasury Wine Estates (Matua) Limited New ZealandTreasury Wine Estates (NZ) Holding Co Pty Ltd* AustraliaTreasury Wine Estates Asia (SEA) Pte Limited SingaporeTreasury Wine Estates (UK) Holding Co Pty Ltd* AustraliaTreasury Wine Estates Americas Company USATreasury Wine Estates Asia Pty. Ltd. AustraliaTreasury Wine Estates Australia Limited* AustraliaTreasury Wine Estates Barossa Vineyards Pty. Ltd. AustraliaTreasury Wine Estates Canada, Inc. CanadaTreasury Wine Estates Denmark ApS DenmarkTreasury Wine Estates EMEA Limited UKTreasury Wine Estates Finland Oy FinlandTreasury Wine Estates Group Pty Limited(a) AustraliaTreasury Wine Estates HK Limited Hong KongTreasury Wine Estates Holdings Inc. USATreasury Wine Estates Japan KK JapanTreasury Wine Estates Limited* AustraliaTreasury Wine Estates Netherlands B.V NetherlandsTreasury Wine Estates Norway AS NorwayTreasury Wine Estates (Shanghai) Co Trading Limited ChinaTreasury Wine Estates Sweden AB SwedenTreasury Wine Estates UK Brands Limited UKTreasury Wine Estates Vintners Limited* AustraliaTWE Finance (Aust) Limited* AustraliaTWE Finance (UK) Limited UKTWE Insurance Company Pte. Ltd. SingaporeTWE Lima Pty Ltd(g) AustraliaTWE Share Plans Pty Ltd AustraliaTWE US Finance Co. USAVEA Pty. Ltd.(b) AustraliaWolf Blass Wines Pty. Ltd.* AustraliaWoodley Wines Pty. Ltd. AustraliaWynn Winegrowers Pty. Ltd. AustraliaWynns Coonawarra Estate Pty. Ltd Australia
* Entity is a member of the Closed Group under the Deed of Cross Guarantee (refer to note 30) and relieved from the requirement to prepare audited financial statements by ASIC Class Order (98/1418). During the F16 financial year, Treasury Logistics Pty Ltd and TWE Lima Pty Ltd joined as a member of the closed group under the Deed of Cross Guarantee.
(a) These entities were deregistered on 22 June 2016.(b) These entities were deregistered on 3 July 2016.(c) This entity was deregistered on 13 July 2016.(d) Acquired on 1 January 2016.(e) Acquired on 1 January 2016 (formerly Diageo Chateau & Estates).(f) Acquired remaining 50% shares on 15 February 2016 (formerly Trebuchet Logistics Pty Ltd, in which the Group held 50% interest).(g) Incorporated on 9 December 2015.
NOTE 28 – SUBSIDIARIES (CONTINUED)
NOTES TO THE CONSOLIDATED FINANCIAL STATEMENTS: GROUP COMPOSITION
FOR THE YEAR ENDED 30 JUNE 2016 (CONTINUED)
TREASURY WINE ESTATES ANNUAL REPORT 2016 / 105

NOTE 28 – SUBSIDIARIES (CONTINUED)
Equity holding of less than 100%
ENTITY NAME
COUNTRY OF INCORPORATION % OF HOLDING
2016 2015
Graymoor Estate Joint Venture Australia 48.8 48.8Graymoor Estate Pty. Ltd. Australia 48.8 48.8Graymoor Estate Unit Trust Australia 48.8 48.8North Para Environment Control Pty. Ltd. Australia 69.9 69.9
NOTE 29 – PARENT ENTITY FINANCIAL INFORMATION
(a) Summary financial informationThe individual financial statements for the parent entity show the following aggregate amounts:
2016 $M
2015 $M
Balance sheetCurrent assets 6,837.7 5,867.2 Total assets 9,187.4 7,735.1 Current liabilities 5,131.3 4,556.4 Total liabilities 5,131.3 4,556.4 Net assets 4,056.1 3,178.7
Shareholders’ equityIssued capital 3,540.5 3,065.1 Share-based payments reserve 20.4 7.3 Retained earnings 495.2 106.3 Total equity 4,056.1 3,178.7
Profit for the year 500.1 145.0 Total comprehensive income 500.1 145.0
(b) Financial guaranteesRefer note 17 for financial guarantees to banks, financiers and other persons.
(c) Class actionRefer note 26 for class actions pending.
(d) Tax consolidation legislationThe Company formed a consolidated group for income tax purposes with each of its Australian resident subsidiaries on 21 May 2011. The Company and the controlled entities in the tax consolidation group continue to account for current and deferred tax amounts separately. These tax amounts are measured on a ‘group allocation’ approach, under which the current and deferred tax amounts for the tax-consolidated group are allocated among each reporting entity in the group.
NOTE 30 – DEED OF CROSS GUARANTEE
Under the terms of ASIC class order 98/1418, certain wholly owned controlled entities have been granted relief from the requirement to prepare audited financial reports. It is a condition of the class order that the Company and each of the relevant subsidiaries enter into a Deed of Cross Guarantee whereby each company guarantees the debts of the companies’ party to the Deed. The member companies of the Deed of Cross Guarantee are regarded as the ‘Closed Group’ and identified in note 28.
A summarised consolidated statement of profit or loss and other comprehensive income, retained earnings reconciliation and a consolidated statement of financial position, comprising the Company and those controlled entities which are a party to the Deed of Cross Guarantee, after eliminating all transactions between parties to the Deed, at 30 June 2016 are set out below.
NOTES TO THE CONSOLIDATED FINANCIAL STATEMENTS: GROUP COMPOSITION
FOR THE YEAR ENDED 30 JUNE 2016 (CONTINUED)
TREASURY WINE ESTATES ANNUAL REPORT 2016 / 106

NOTE 30 – DEED OF CROSS GUARANTEE (CONTINUED)
2016 $M
2015 $M
Extract of the statement of profit or loss and other comprehensive income Profit before tax 762.6 40.3Income tax expense (64.8) (15.4)Net profit after tax 697.8 24.9Retained earnings at beginning of the year (44.8) 15.0External dividends (111.2) (84.7)Retained earnings at end of the year 541.8 (44.8)
Statement of financial position Current assets Cash and cash equivalents 66.7 7.0 Receivables 1,557.8 1,283.0 Inventories 332.8 312.1 Current tax assets – 13.2 Assets held for sale 21.5 14.1 Other current assets 5.3 10.0 Total current assets 1,984.1 1,639.4
Non-current assets Inventories 400.2 369.9 Investments 3,183.7 2,732.7 Property, plant and equipment 451.2 456.8 Agricultural assets 98.0 93.6 Intangible assets 397.9 388.8 Deferred tax assets 38.8 54.3 Other non-current assets 2.6 2.4 Total non-current assets 4,572.4 4,098.5 Total assets 6,556.5 5,737.9
Current liabilities Trade and other payables 250.3 222.6 Borrowings 2,117.2 2,400.7 Current tax liabilities 14.8 – Provisions 40.7 63.0 Other current liabilities 5.0 9.9 Total current liabilities 2,428.0 2,696.2
Non-current liabilities Deferred tax liabilities 20.9 9.5 Other non-current liabilities 5.0 4.6 Total non-current liabilities 25.9 14.1 Total liabilities 2,453.9 2,710.3 Net assets 4,102.6 3,027.6
Equity Contributed equity 3,540.5 3,065.1 Reserves 20.3 7.3 Retained earnings 541.8 (44.8)Total equity 4,102.6 3,027.6
Current borrowings comprise balances with other entities within the Group. These balances will not be called within the next 12 months.
NOTES TO THE CONSOLIDATED FINANCIAL STATEMENTS: GROUP COMPOSITION
FOR THE YEAR ENDED 30 JUNE 2016 (CONTINUED)
TREASURY WINE ESTATES ANNUAL REPORT 2016 / 107

NOTE 31 – RELATED PARTY DISCLOSURES
Ownership interests in related partiesAll material ownership interests in related parties are disclosed in note 28 to the financial statements.
Parent entityThe ultimate parent entity is Treasury Wine Estates Limited, which is domiciled and incorporated in Australia.
Transactions with entities in the wholly-owned GroupTransactions between companies within the Group during the current and prior year included:
• Purchases and sales of goods and services; and
• Provision of accounting and administrative assistance.
Transactions with controlled entities are made on normal commercial terms and conditions.
Transactions with other related partiesThere were no transactions with related parties during the current year.
Key management personnel compensation:The following table shows the compensation paid or payable to the key management personnel (‘executives’) of the Group.
2016 $
2015 $
Short-term employee benefits 10,082,195 9,063,989Post-employment benefits 110,954 97,281Share-based payments 4,349,147 2,089,550Termination benefits 1,143,607 834,744Total 15,685,903 12,085,564
Additionally, compensation paid to non-executive directors was $1,461,001 (F15: $1,437,305).
NOTE 32 – REMUNERATION OF AUDITORS
The Audit and Risk Committee has completed an evaluation of the overall effectiveness and independence of the external auditor, KPMG. As part of this process, the external auditor has provided a written statement that no professional engagement with us has been carried out which would impair their independence as auditor. The Chairman of the Audit and Risk Committee has advised the Board that the Committee’s assessment is that the auditor is independent.
During the year, the following fees were paid or payable for services provided by the auditor of the Group, and its related practices:
2016 $
2015 $
Audit and review of financial statements and other audit work under the Corporations Act 2001 1,744,205 782,032 Associate firms of Auditor 468,924 846,903Audit and review services 2,213,129 1,628,935
Other non-audit services 367,447 631,759 Total 2,580,576 2,260,694
The Group employs KPMG to provide other non-audit services where their expertise and experience best qualifies them to provide the appropriate service and as long as stringent independence requirements are satisfied. In the year ended 30 June 2016, KPMG earned fees in respect to the provision of advisory and taxation services.
NOTES TO THE CONSOLIDATED FINANCIAL STATEMENTS: OTHER
FOR THE YEAR ENDED 30 JUNE 2016
TREASURY WINE ESTATES ANNUAL REPORT 2016 / 108
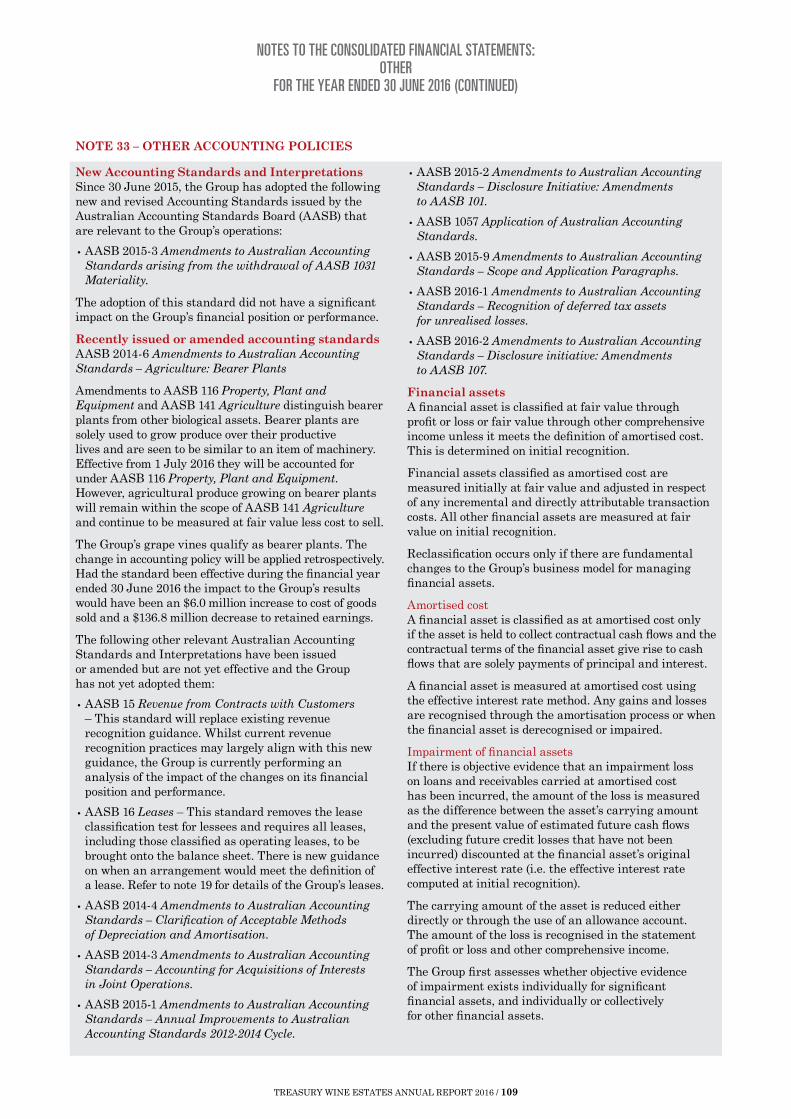
NOTE 33 – OTHER ACCOUNTING POLICIES
New Accounting Standards and InterpretationsSince 30 June 2015, the Group has adopted the following new and revised Accounting Standards issued by the Australian Accounting Standards Board (AASB) that are relevant to the Group’s operations:
• AASB 2015-3 Amendments to Australian Accounting Standards arising from the withdrawal of AASB 1031 Materiality.
The adoption of this standard did not have a significant impact on the Group’s financial position or performance.
Recently issued or amended accounting standardsAASB 2014-6 Amendments to Australian Accounting Standards – Agriculture: Bearer Plants
Amendments to AASB 116 Property, Plant and Equipment and AASB 141 Agriculture distinguish bearer plants from other biological assets. Bearer plants are solely used to grow produce over their productive lives and are seen to be similar to an item of machinery. Effective from 1 July 2016 they will be accounted for under AASB 116 Property, Plant and Equipment. However, agricultural produce growing on bearer plants will remain within the scope of AASB 141 Agriculture and continue to be measured at fair value less cost to sell.
The Group’s grape vines qualify as bearer plants. The change in accounting policy will be applied retrospectively. Had the standard been effective during the financial year ended 30 June 2016 the impact to the Group’s results would have been an $6.0 million increase to cost of goods sold and a $136.8 million decrease to retained earnings.
The following other relevant Australian Accounting Standards and Interpretations have been issued or amended but are not yet effective and the Group has not yet adopted them:
• AASB 15 Revenue from Contracts with Customers – This standard will replace existing revenue recognition guidance. Whilst current revenue recognition practices may largely align with this new guidance, the Group is currently performing an analysis of the impact of the changes on its financial position and performance.
• AASB 16 Leases – This standard removes the lease classification test for lessees and requires all leases, including those classified as operating leases, to be brought onto the balance sheet. There is new guidance on when an arrangement would meet the definition of a lease. Refer to note 19 for details of the Group’s leases.
• AASB 2014-4 Amendments to Australian Accounting Standards – Clarification of Acceptable Methods of Depreciation and Amortisation.
• AASB 2014-3 Amendments to Australian Accounting Standards – Accounting for Acquisitions of Interests in Joint Operations.
• AASB 2015-1 Amendments to Australian Accounting Standards – Annual Improvements to Australian Accounting Standards 2012-2014 Cycle.
• AASB 2015-2 Amendments to Australian Accounting Standards – Disclosure Initiative: Amendments to AASB 101.
• AASB 1057 Application of Australian Accounting Standards.
• AASB 2015-9 Amendments to Australian Accounting Standards – Scope and Application Paragraphs.
• AASB 2016-1 Amendments to Australian Accounting Standards – Recognition of deferred tax assets for unrealised losses.
• AASB 2016-2 Amendments to Australian Accounting Standards – Disclosure initiative: Amendments to AASB 107.
Financial assetsA financial asset is classified at fair value through profit or loss or fair value through other comprehensive income unless it meets the definition of amortised cost. This is determined on initial recognition.
Financial assets classified as amortised cost are measured initially at fair value and adjusted in respect of any incremental and directly attributable transaction costs. All other financial assets are measured at fair value on initial recognition.
Reclassification occurs only if there are fundamental changes to the Group’s business model for managing financial assets.
Amortised costA financial asset is classified as at amortised cost only if the asset is held to collect contractual cash flows and the contractual terms of the financial asset give rise to cash flows that are solely payments of principal and interest.
A financial asset is measured at amortised cost using the effective interest rate method. Any gains and losses are recognised through the amortisation process or when the financial asset is derecognised or impaired.
Impairment of financial assetsIf there is objective evidence that an impairment loss on loans and receivables carried at amortised cost has been incurred, the amount of the loss is measured as the difference between the asset’s carrying amount and the present value of estimated future cash flows (excluding future credit losses that have not been incurred) discounted at the financial asset’s original effective interest rate (i.e. the effective interest rate computed at initial recognition).
The carrying amount of the asset is reduced either directly or through the use of an allowance account. The amount of the loss is recognised in the statement of profit or loss and other comprehensive income.
The Group first assesses whether objective evidence of impairment exists individually for significant financial assets, and individually or collectively for other financial assets.
NOTES TO THE CONSOLIDATED FINANCIAL STATEMENTS: OTHER
FOR THE YEAR ENDED 30 JUNE 2016 (CONTINUED)
TREASURY WINE ESTATES ANNUAL REPORT 2016 / 109

Assets that are individually assessed for impairment and for which an impairment loss is, or continues to be, recognised are not included in a collective assessment of impairment. Otherwise the asset is included in a group of financial assets with similar credit risk characteristics to be assessed for impairment.
If, in a subsequent period, the amount of the impairment loss decreases due to an event occurring after the impairment was recognised, the loss is revised. The reversal of an impairment loss is recognised in the statement of profit or loss and other comprehensive income.
Derecognition of financial assetsThe derecognition of a financial asset takes place when the Group no longer control the contractual rights that comprise the financial instrument.
This is normally the case when the instrument is sold or all the cash flows attributable to the instrument are passed through to an independent third party.
DerivativesThe Group uses derivative financial instruments such as foreign currency contracts, interest rate swaps and options to hedge its risks associated with interest rate and foreign currency fluctuations. Such derivative financial instruments are carried at fair value and are financial assets when the fair value is positive and financial liabilities when the fair value is negative.
For derivatives that do not qualify for hedge accounting, any gains or losses arising from changes in fair value are taken directly to profit or loss for the year.
Hedge AccountingFor the purposes of hedge accounting, hedges are classified as either fair value hedges when they hedge the exposure to changes in the fair value of a recognised asset or liability; cash flow hedges where they hedge exposure to variability in cash flows that is either attributable to a particular risk associated with a recognised asset or liability or a forecasted transaction; or hedges of a net investment in a foreign operation.
Initial recognitionAt the beginning of a hedge relationship, the Group designates and documents the hedge relationship and the related risk management objective and strategy. The documentation identifies the hedging instrument and the hedged item as well as describing the economic relationship, the hedge ratio between them and potential sources of ineffectiveness. The documentation also includes the nature of the risk being hedged and the method of assessing the hedging instrument’s effectiveness. To achieve hedge accounting, the relationship must be expected to be highly effective and are assessed on an ongoing basis to determine that they continue to meet the risk management objective.
RebalancingIf the hedge ratio for risk management purposes is no longer met but the risk management objective remains unchanged and the hedge continues to qualify for hedge accounting, the Group will rebalance the relationship by adjusting either the volume of the hedged item or the volume of the hedging instrument.
DiscontinuationHedge accounting is discontinued when the hedge instrument expires or is sold, terminated or exercised, or no longer qualifies for hedge accounting. At that point in time, any cumulative gain or loss on the hedging instrument recognised in equity is kept in equity until the forecasted transaction occurs. If a hedged transaction is no longer expected to occur, the net cumulative gain or loss recognised in equity is transferred to profit or loss for the year.
Gains or losses recognised directly in equity are reclassified into profit and loss in the same period or periods the foreign currency risk affects consolidated profit and loss.
Fair value hedgesFor fair value hedges (for example interest rate swaps), any gain or loss from remeasuring the hedging instrument is recognised immediately in the statement of profit or loss and other comprehensive income. Where the adjustment is to the carrying amount of a hedged interest-bearing financial instrument, the adjustment is amortised to the statement of profit or loss and other comprehensive income such that it is fully amortised by maturity.
Cash flow hedgesIn relation to cash flow hedges (forward foreign currency contracts) to hedge firm commitments, the portion of the gain or loss on the hedging instrument that is determined to be an effective hedge is recognised directly in equity and the ineffective portion is recognised in the statement of profit or loss and other comprehensive income.
When the hedged item gives rise to the recognition of an asset or a liability, the associated deferred gains or losses are included in the initial measurement of the asset or liability.
For all other cash flow hedges, the gains or losses that are recognised in equity are transferred to the statement of profit or loss and other comprehensive income in the same period in which the hedged firm commitment affects the profit and loss, for example when the future sale actually occurs.
NOTE 33 – OTHER ACCOUNTING POLICIES (CONTINUED)
NOTES TO THE CONSOLIDATED FINANCIAL STATEMENTS: OTHER
FOR THE YEAR ENDED 30 JUNE 2016 (CONTINUED)
TREASURY WINE ESTATES ANNUAL REPORT 2016 / 110
In the directors’ opinion:
(a) The financial statements and notes 1 to 33 are in accordance with the Corporations Act 2001, including:
(i) complying with Accounting Standards, the Corporations Regulations 2001 and other mandatory professional reporting requirements; and
(ii) giving a true and fair view of the consolidated entity’s financial position as at 30 June 2016 and of its performance for the financial year ended on that date.
(b) there are reasonable grounds to believe that Treasury Wine Estates Limited will be able to pay its debts as and when they become due and payable; and
(c) there are reasonable grounds to believe that members of the Closed Group identified in note 28 will be able to meet any obligations or liabilities to which they are or may become subject to, by virtue of the Deed of Cross Guarantee described in note 30.
Note 1 confirms that the financial statements also comply with International Financial Reporting Standards as issued by the International Accounting Standards Board.
The directors have been given the declarations by the Chief Executive Officer and Chief Financial Officer as required by section 295A of the Corporations Act 2001.
This declaration is made in accordance with a resolution of the directors.
Paul Rayner Michael Clarke Chairman Chief Executive Officer
31 August 2016
DIRECTORS’ DECLARATIONFOR THE YEAR ENDED 30 JUNE 2016
TREASURY WINE ESTATES ANNUAL REPORT 2016 / 111

ABCD
Liability limited by a scheme approved under Professional Standards Legislation.
KPMG, an Australian partnership and a member firm of the KPMG network of independent member firms affiliated with KPMG International, a Swiss cooperative.
Independent auditor’s report to the members of Treasury Wine Estates Limited
Report on the financial reportWe have audited the accompanying financial report of Treasury Wine Estates Limited (the Company), which comprises the consolidated statement of financial position as at 30 June 2016, and consolidated statement of profit or loss and other comprehensive income, consolidated statement of changes in equity and consolidated statement of cash flows for the year ended on that date, notes 1 to 33 comprising a summary of significant accounting policies and other explanatory information and the Directors’ declaration of the Group comprising the Company and the entities it controlled at the year’s end or from time to time during the financial year.
Directors’ responsibility for the financial report
The Directors of the Company are responsible for the preparation of the financial report that gives a true and fair view in accordance with Australian Accounting Standards and the Corporations Act 2001 and for such internal control as the Directors determine is necessary to enable the preparation of the financial report that is free from material misstatement whether due to fraud or error. In note 1, the Directors also state, in accordance with Australian Accounting Standard AASB 101 Presentation of Financial Statements, that the financial statements of the Group comply with International Financial Reporting Standards.
Auditor’s responsibility
Our responsibility is to express an opinion on the financial report based on our audit. We conducted our audit in accordance with Australian Auditing Standards. These Auditing Standards require that we comply with relevant ethical requirements relating to audit engagements and plan and perform the audit to obtain reasonable assurance whether the financial report is free from material misstatement.
An audit involves performing procedures to obtain audit evidence about the amounts and disclosures in the financial report. The procedures selected depend on the auditor’s judgement, including the assessment of the risks of material misstatement of the financial report, whether due to fraud or error. In making those risk assessments, the auditor considers internal control relevant to the entity’s preparation of the financial report that gives a true and fair view in order to design audit procedures that are appropriate in the circumstances, but not for the purpose of expressing an opinion on the effectiveness of the entity’s internal control. An audit also includes evaluating the appropriateness of accounting policies used and the reasonableness of accounting estimates made by the Directors, as well as evaluating the overall presentation of the financial report.
We performed the procedures to assess whether in all material respects the financial report presents fairly, in accordance with the Corporations Act 2001 and Australian Accounting Standards, a true and fair view which is consistent with our understanding of the Group’s financial position and of its performance.
We believe that the audit evidence we have obtained is sufficient and appropriate to provide a basis for our audit opinion.
INDEPENDENT AUDITOR’S REPORT
TREASURY WINE ESTATES ANNUAL REPORT 2016 / 112

ABCD
KPMG, an Australian partnership and a member firm of the KPMG network of independent member firms affiliated with KPMG International, a Swiss cooperative.
Liability limited by a scheme approved under Professional Standards Legislation.
Independence
In conducting our audit, we have complied with the independence requirements of the Corporations Act 2001.
Auditor’s opinion
In our opinion:
(a) the financial report of the Group is in accordance with the Corporations Act 2001, including:
(i) giving a true and fair view of the Group’s financial position as at 30 June 2016 and of its performance for the year ended on that date; and
(ii) complying with Australian Accounting Standards and the Corporations Regulations 2001.
(b) the financial report also complies with International Financial Reporting Standards as disclosedin note 1.
Report on the remuneration reportWe have audited the Remuneration Report included in Directors’ report for the year ended 30 June 2016. The Directors of the Company are responsible for the preparation and presentation of the remuneration report in accordance with Section 300A of the Corporations Act 2001. Our responsibility is to express an opinion on the remuneration report, based on our audit conducted in accordance with auditing standards.
Auditor’s opinion
In our opinion, the remuneration report of Treasury Wine Estates Limited for the year ended 30 June 2016, complies with Section 300A of the Corporations Act 2001.
KPMG
Paul J McDonaldPartner
Melbourne
31 August 2016
INDEPENDENT AUDITOR’S REPORT (CONTINUED)
TREASURY WINE ESTATES ANNUAL REPORT 2016 / 113

DETAILS OF SHAREHOLDERS AND SHAREHOLDINGS
Holding of securities
LISTED SECURITIES 19 AUGUST 2016NO. OF
HOLDERSNO. OF
SHARES% HELD BY
TOP 20
Fully paid ordinary shares 61,494 738,135,033 88.52
SIZE OF HOLDING NUMBER
1 – 1,000 42,7591,001 – 5,000 16,4465,001 – 10,000 1,50010,001 – 100,000 721100,001 and over 68Total 61,494
Of these, 810 shareholders held less than a marketable parcel of $500 worth of shares (18,377 shares). In accordance with ASX Listing Rules, the last sale price of the Company’s shares on the ASX on 19 August 2016 was used to determine the number of shares in a marketable parcel.
TWENTY LARGEST SHAREHOLDERS – 19 AUGUST 2016
RANK SHAREHOLDERNO. OF FULLY PAID ORDINARY SHARES
% OF FULLY PAID ORDINARY SHARES
1. J P Morgan Nominees Australia Limited 204,269,230 27.672. HSBC Custody Nominees (Australia) Limited 200,609,250 27.183. National Nominees Limited 95,215,124 12.904. Citicorp Nominees Pty Limited 77,680,461 10.525. BNP Paribas Nominees Pty Ltd 30,911,217 4.196. RBC Global Services Australia Nominees Pty Limited 24,237,602 3.287. Australian Foundation Investment Company Limited 6,573,334 0.898. UBS Nominees Pty Ltd 1,846,338 0.259. Avanteos Investments Limited <2477966 DNR A/C> 1,501,451 0.2010. Mirrabooka Investments Limited 1,431,387 0.1911. AMP Life Limited 1,383,182 0.1912. RBC Investor Services Australia Nominees Pty Ltd <BKMINI A/C> 1,218,081 0.1713. Milton Corporation Limited 1,194,085 0.1614. Neweconomy.com.au Nominees Pty Limited 1,096,777 0.1515. Share Direct Nominees Pty Ltd <10015 A/C> 820,337 0.1116. Amcil Limited 760,144 0.1017. RBC Investor Services Australia Nominees Pty Ltd <PICREDIT> 759,943 0.1018. RBC Investor Services Australia Pty Limited <VFA A/C> 720,029 0.1019. Djerriwarrh Investments Limited 704,084 0.1020. Avanteos Investments Limited <ENCIRCLE IMA A/C> 515,459 0.07
Total 653,447,515 88.52
SUBSTANTIAL SHAREHOLDERS – 19 AUGUST 2016
The following shareholders have declared a relevant interest in the number of voting shares at the date of giving the notice under Part 6C.1 of the Corporations Act.
INSTITUTION INTEREST (% OF ISC)
The Capital Group Companies 7.82%
Blackrock Group 5.03%
DETAILS OF SHAREHOLDERS, SHAREHOLDINGS AND TOP 20 SHAREHOLDERS
TREASURY WINE ESTATES ANNUAL REPORT 2016 / 114

ANNUAL GENERAL MEETING
The Annual General Meeting of the Company will be held on Thursday 10 November 2016 at 11.00am (Adelaide time) at the National Wine Centre of Australia, Adelaide, South Australia. Full details are contained in the Company’s Notice of Meeting provided to shareholders and available on the Company’s website prior to the meeting.
VOTING RIGHTS
Shareholders are encouraged to attend the Annual General Meeting; however, when this is not possible, they can use the proxy form by which they can express their views.
Shareholders may also lodge a proxy electronically either via w w w . investorvote.com.au using the details printed on their personalised proxy form or w w w . tweglobal.com and clicking on ‘AGM Proxy’ or w w w . intermediaryonline.com for custodian voting (subscribers only).
Every shareholder, proxy or shareholder’s representative has one vote on a show of hands, except where a shareholder appoints two proxies, in which case neither proxy is entitled to vote on a show of hands. In the case of a poll, each share held by every shareholder, proxy or representative is entitled to one vote for each fully paid share.
SECURITIES EXCHANGE LISTING
Treasury Wine Estates Limited shares are listed on the Australian Securities Exchange under the code ‘TWE’.
American Depositary Shares, sponsored by The Bank of New York Mellon, can be purchased through brokers in the US.
SHARE REGISTER AND OTHER ENQUIRIES
If you have any questions in relation to your shareholding, share transfers or dividends, please contact our share registry:
Computershare Investor Services Pty Limited Yarra Falls 452 Johnston Street Abbotsford Victoria 3067 Australia
Telephone: 1800 158 360 International: +61 3 9415 4208 Facsimile: +61 3 9473 2500 [For faxing Proxy Forms only: +61 3 9473 2555 (outside Australia) or 1800 783 447 (within Australia)] Website: w w w . investorcentre.com/contact
Please include your securityholder reference number (SRN) or holder identification number (HIN) in all correspondence to the share registry. For enquiries relating to the operations of the Company, please contact the Investor Relations team on:
Telephone: +61 3 8533 3000 Facsimile: +61 3 9690 5196 Email: investors @ tweglobal.com Website: w w w . tweglobal.com 58–82 Queensbridge Street Southbank Victoria 3006 Australia
ELECTRONIC COMMUNICATIONS
The Company has an online share registry facility where shareholders can:
• check their current and previous holding balances;
• update their address details;
• update their bank details;
• review their dividend history;
• confirm whether they have lodged a TFN/ABN exemption;
• elect to receive communications and Company information electronically and change their Annual Report election;
• download commonly used forms; and
• elect to receive email notification when dividend statements and issuer sponsored holding statements are available to view online.
To access the online share registry, log on to w w w . tweglobal.com, go to the shareholder information section located under the investors menu and click the ‘online share registry’ icon. For security and privacy reasons, shareholders will be required to verify their identity before they can view their records.
TAX FILE NUMBERS, AUSTRALIAN BUSINESS NUMBERS OR EXEMPTIONS
Australian taxpayers who do not provide details of their tax file number will have dividends subjected to the top marginal personal tax rate plus Medicare levy (if applicable). It may be in the interests of shareholders to ensure that tax file numbers have been supplied to the share registry. Shareholders may request a form from the share registry or submit their details via the online share registry.
SHAREHOLDER INFORMATION
TREASURY WINE ESTATES ANNUAL REPORT 2016 / 115

CHANGE OF ADDRESS
It is important for shareholders to notify the share registry of any change of address. As a security measure, the old address should also be quoted as well as your securityholder reference number (SRN). Shareholders may access the online share registry to submit their details or download a personalised change of address form.
SHAREHOLDER WINE OFFER – CELLARDOOR.CO
Our shareholders have the opportunity to purchase our wines through Cellardoor.co.
Cellardoor.co is an exclusive members-only wine community for shareholders, friends and family of Treasury Wine Estates. Our virtual cellar door offers a range of wines across the Treasury Wine Estates portfolio. Members of Cellardoor.co have access to award winning wines, exclusive pricing and member-only events.
Shareholders can register for Cellardoor.co by calling 1300 846 863 or by visiting https://cellardoor.co/shareholders2016. Information about Cellardoor.co is also included in the welcome letter provided to new shareholders.
TREASURY WINE ESTATES LIMITED
ABN 24 004 373 862
COMPANY SECRETARY
Paul Conroy LLB (Hons), B.Com
REGISTERED OFFICE
58–82 Queensbridge Street Southbank Victoria 3006 Australia
Telephone: +61 3 8533 3000
SHAREHOLDER INFORMATION (CONTINUED)
TREASURY WINE ESTATES ANNUAL REPORT 2016 / 116

WWW.TWEGLOBAL.COM
