annual report 2015 - pioneer...
TRANSCRIPT
Annual Report 2015For the Year Ended March 31, 2015

2006 2007 2008 2009 2010 2011 2012 2013 2014 2015 2016 (Plan)
Net sales 755.0 797.1 774.5 558.8 439.0 457.5 436.8 451.8 498.1 501.7 487.0
Operating income (loss) (16.4) 12.5 9.2 (54.5) (17.5) 15.8 12.5 6.0 11.2 7.8 8.0
02
10
04 14
12
18
5916
17
Contents
Group Philosophy
“Move the Heart and Touch the Soul”
A New Pioneer Begins with You Corporate Vision
Spread the smiles. Feel the vibes. Share the passion.
Pioneer engages you anytime, anywhere.
Corporate Governance
Research and Development
Corporate Citizenship and Environmental Preservation Activities
Management
Financial Section
General Information on SharesReview of Operations
Annual Report 2015
To Our Stakeholders
Special Feature: Business Strategies
2015
70.9%
Ratio of Car Electronics sales to consolidated
net sales
2007
44.9%
2008
48.3%
2009
52.2%
2010
56.8%
2011
55.5%
2012
62.0%
2013
69.2%
2014
69.9%
Global financial crisis
Withdrawal from plasma display business
The Great East Japan Earthquake
Note: Effective from fiscal 2009, the year ended March 31, 2009, Pioneer has changed its basis for preparing consolidated financial statements from U.S. generally accepted accounting principles (GAAP) to Japanese GAAP. Consequently, figures for fiscal 2008 have been restated based on Japanese GAAP. For fiscal 2006 and 2007, figures prepared and reported in the past based on U.S. GAAP are shown.
Years ended March 31
(Billion yen)
2016 (Plan)
76.9%
Aiming to be the car electronics industry’s leading company for “Comprehensive Infotainment”
The car electronics industry is undergoing major transformations. Accordingly, Pioneer is concen-trating management resources in Car Electronics and implementing a new growth strategy, aiming to be a leading company for “Comprehensive Infotainment” that creates comfort, excitement, safety and reliability in vehicles.
Ratio of segment sales to consolidated net sales
Others
Car Electronics
2006
43.8%
Ratio of Car Electronics sales to consolidated
net sales
Transfer of home AV and DJ equipment businesses
01Pioneer Corporat ion Annua l Repor t 2015
Financial Highlights
Pioneer Corporation and Its Subsidiaries Years ended March 31
In millions of yen and thousands of U.S. dollars 2014 2015 2015
Net sales ¥498,051 ¥501,676 $4,180,633
Operating income 11,169 7,778 64,817
Net income 531 14,632 121,933
Net income per share (yen/U.S. dollars) 1.49 39.85 0.33
Total assets 327,913 328,277 2,735,642
Total equity 77,816 107,066 892,217
Free cash flows 12,380 71,444 595,367
Notes: 1. The U.S. dollar amounts represent translations of Japanese yen, for convenience only, at the rate of ¥120=US$1.00, the approximate rate prevailing on March 31, 2015.
2. Net income per share is calculated based on the number of shares outstanding, excluding treasury stock. 3. Free cash flows represent the sum of cash flows from operating activities and cash flows from investing activities.
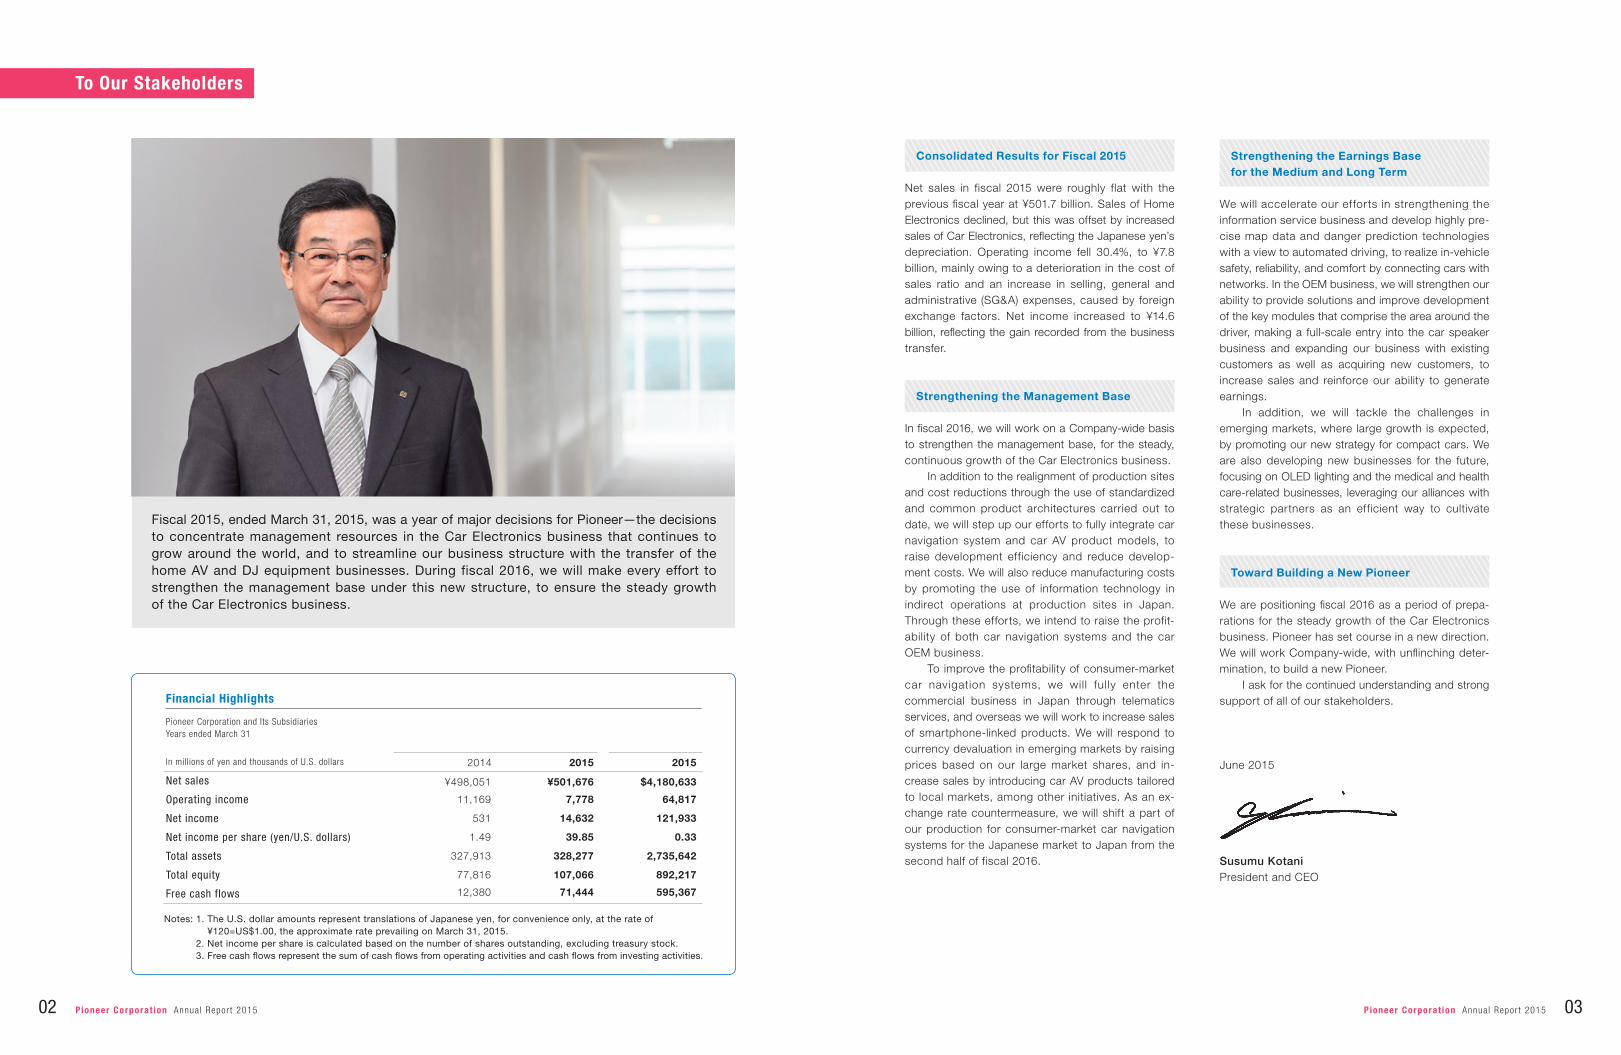
Fiscal 2015, ended March 31, 2015, was a year of major decisions for Pioneer—the decisions to concentrate management resources in the Car Electronics business that continues to grow around the world, and to streamline our business structure with the transfer of the home AV and DJ equipment businesses. During fiscal 2016, we will make every effort to strengthen the management base under this new structure, to ensure the steady growth of the Car Electronics business.
To Our Stakeholders
Consolidated Results for Fiscal 2015
Net sales in fiscal 2015 were roughly flat with the previous fiscal year at ¥501.7 billion. Sales of Home Electronics declined, but this was offset by increased sales of Car Electronics, reflecting the Japanese yen’s depreciation. Operating income fell 30.4%, to ¥7.8 billion, mainly owing to a deterioration in the cost of sales ratio and an increase in selling, general and administrative (SG&A) expenses, caused by foreign exchange factors. Net income increased to ¥14.6 billion, reflecting the gain recorded from the business transfer.
Strengthening the Management Base
In fiscal 2016, we will work on a Company-wide basis to strengthen the management base, for the steady, continuous growth of the Car Electronics business.
In addition to the realignment of production sites and cost reductions through the use of standardized and common product architectures carried out to date, we will step up our efforts to fully integrate car navigation system and car AV product models, to raise development efficiency and reduce develop-ment costs. We will also reduce manufacturing costs by promoting the use of information technology in indirect operations at production sites in Japan. Through these efforts, we intend to raise the profit-ability of both car navigation systems and the car OEM business.
To improve the profitability of consumer-market car navigation systems, we will fully enter the commercial business in Japan through telematics services, and overseas we will work to increase sales of smartphone-linked products. We will respond to currency devaluation in emerging markets by raising prices based on our large market shares, and in-crease sales by introducing car AV products tailored to local markets, among other initiatives. As an ex-change rate countermeasure, we will shift a part of our production for consumer-market car navigation systems for the Japanese market to Japan from the second half of fiscal 2016.
Strengthening the Earnings Base for the Medium and Long Term
We will accelerate our efforts in strengthening the information service business and develop highly pre-cise map data and danger prediction technologies with a view to automated driving, to realize in-vehicle safety, reliability, and comfort by connecting cars with networks. In the OEM business, we will strengthen our ability to provide solutions and improve development of the key modules that comprise the area around the driver, making a full-scale entry into the car speaker business and expanding our business with existing customers as well as acquiring new customers, to increase sales and reinforce our ability to generate earnings.
In addition, we will tackle the challenges in emerging markets, where large growth is expected, by promoting our new strategy for compact cars. We are also developing new businesses for the future, focusing on OLED lighting and the medical and health care-related businesses, leveraging our alliances with strategic partners as an efficient way to cultivate these businesses.
Toward Building a New Pioneer
We are positioning fiscal 2016 as a period of prepa-rations for the steady growth of the Car Electronics business. Pioneer has set course in a new direction. We will work Company-wide, with unflinching deter-mination, to build a new Pioneer.
I ask for the continued understanding and strong support of all of our stakeholders.
June 2015
Susumu KotaniPresident and CEO
02 Pioneer Corporat ion Annua l Repor t 2015 03Pioneer Corporat ion Annua l Repor t 2015

With a substantial business scale in both the OEM and consumer markets, our ability to create synergies be-tween these two markets is a major strength of Pioneer. To build on these strengths, in the OEM market, where further growth is expected, we are using our proprietary expertise and customer loyalty and the ability to create solutions that we have built in the consumer market, with the aim of being a key supplier that automakers and mega-suppliers consider essential.
In the consumer market, we will continue to hold the “DNA of being the first company to create and promote the world’s first, cutting-edge value,” which is our biggest strength, to lead the car electronics industry in creating new markets and providing new value.
With our operating environment undergoing major changes, we have realigned our business portfolio to make the most effective use of limited management resources, with a view toward how best to maintain growth going forward. Under our new structure, we are concentrating resources in the Car Electronics businesses and related areas, and have transferred the home AV and DJ equipment businesses.
We are also focusing on the new businesses of OLED lighting and medical and health care-related devices, and are efficiently cultivating these busi-nesses through alliances with strategic partners.
Aiming to be a key supplier in the OEM market, and a leader in providing new value in the consumer market
Realignment of the business portfolio
Pioneer’s operating environment is entering a period of major transformation.We expect continued growth in sales in the automotive industry, led by emerging countries, and developed
countries are seeing advances in the incorporation of information technology in cars, with an emphasis on automated driving, safety, and reliability. The car electronics industry is also entering a period of major transfor-mation in terms of technology as well as customer value. Such examples include the integration of navigation functions and audio-video functions to enjoy music and video on information terminals in cars, and a move to open-platform operating systems resulting from the full-fledged entry of major IT companies into the automotive market.
As the developer and manufacturer of the world’s first consumer-market car navigation system, Pioneer has been at the forefront of developing an information services business for cars, with map information services provided by its map software subsidiaries, Smart Loop*1 to support comfortable driving by avoiding traffic jams, and the Mobile Telematics Center that is a cloud platform for cars. These strengths place us in a highly advanta-geous position for the coming age of automated driving.
Using these strengths, we aim to deliver an experience of comfort, excitement, and safety and reliability in vehicles. This includes integrating various information services that can be used by connecting cars to net-works and information from vehicles, drivers, and passengers to generate optimal information for the drivers and passengers by using Pioneer’s proprietary technologies, offering such information through an optimal interface inside the vehicle, combining peripheral devices and hardware.
Furthermore, by adding an element of Pioneer’s unique strengths in entertainment, we aim to be a leading Comprehensive Infotainment*2 company that delivers new value in vehicles.
OEM Consumer market
Essential to automakers and mega-suppliers
Promoting the world’s first, cutting-edge value proposalsin the connected car life market
Key supplierCost competitiveness and reliable quality
Providing brand value
Synergies
Leader in providingnew value
*1 Smart Loop : Pioneer’s proprietary information network service for hardware
*2 Infotainment: Information + Entertainment; services that provide information in an enjoyable way
Areas other than car electronics
Accelerate selection and concentration
New areasCar electronicsOLED lighting
Medical and health care Car AV terminalsCar speakersCloud services
Car electronics
Car navigation systemsNew proposal-based products
Car electronics-related
Map software Factory automation systems
Other businesses
HighLow
・Expand under growth strategy・Further enhance profitability
Growthmarkets
Mature markets
Growth potential
Profitability
・Improve earnings structure・Promote penetration
Quickly commercialize
Business Strategies
Targeted future position
Creating comfort, excitement, safety and reliability in vehicles
Aiming to be a leading company in“Comprehensive Infotainment”
SpecialFeature
Experiencing comfort, excitement,safety and reliability in vehicles
Information services Peripheral devices Hardware
04 Pioneer Corporat ion Annua l Repor t 2015 05Pioneer Corporat ion Annua l Repor t 2015

Pioneer has designated the following as key themes of its growth strategy toward becoming a leading Comprehensive Infotainment company.
The following is an introduction to growing the “connected car business.”
In the f ie ld of information serv ices, Pioneer is strengthening its telematics services using probe information and the cloud, including its full-scale entry into the commercial-use vehicle business in Japan. We are also increasing our analysis capabili-ties for big data and developing map data in the ASEAN region to of fer our information services globally. In addition, we are leveraging the strength of our proprietary map data to create a high-precision map, and are participating in JARI’s development of “danger prediction technologies,” commissioned by Japan’s Ministry of Economy, Trade and Industry, to establish a solid position in anticipation of the coming age of automated driving.
In terms of peripheral devices, we are leveraging our expertise related to user inter faces of hard-ware. We will also strengthen our development and production capabilities for key modules and devices, including head-up displays (HUD) that project aug-mented-reality (AR) information beyond the windshield and OLED lighting that comprise the area around the driver, while in areas where Pioneer does not have a presence, like sensing devices, we will enhance our comprehensive strength through alliances and M&As.
To further strengthen our position as a leading com-pany for car AV products, we are quickly addressing changes in the market for hardware, enhancing smartphone and cloud linkage, and pursuing open plat form operating systems to integrate car AV and navigation models, to promote and popularize connected function-ready equipment linked to infor-mation services and peripheral devices.
Pioneer foresees the dissemination of connected cars with advanced information processing capabilities to achieve a comfortable space inside the vehicle by connecting with the cloud. We are using our strengths in the three key elements of information services, peripheral devices, and hardware to develop a connected car life market.
Key themes of growth strategy Information services
Peripheral devices
Hardware
Map data
AR HUD unit
Growing the connected car business
Developing a connected car life market– First create a market by offering consumer-market products– Expand product line to the OEM and commercial markets
Growing the OEM business
Expand business with existing accountsAcquire new global accountsStrengthen speaker business
Pursuing challenges in emerging markets
Cultivate business for compact cars and cars without pre-installed car audio products
Developing a connected car life market through growing the connected car business
Pioneer’s strengths Measures going forward Targeted direction
*1 Probe: Information such as vehicle’s tracking data
*2 JARI: Japan Automobile Research Institute. Pioneer is participating in the development of “danger prediction technologies” being carried out by JARI, commissioned by Japan’s Ministry of Economy, Trade and Industry.
*3 ADAS: Advanced Driver Assistance Systems: Advanced systems that support driving by assisting the driver from a safety perspective
Peripheral devices
Hardware
Alliance with NTT DOCOMO, INC.
Strengths related to map, hardware, and peripheral devices
Acquire technological development capabilities toEstablish position for automated driving
Promote and popularize connected function-ready equipment
that can be linked to information services and peripheral devices
Strong global share and brand
Has both car AV and car navigation
HUD, OLED lighting, audio products
Strengthen technological development for safety and reliabilityPursue alliances with various institutions (JARI,*2 etc.)
Strengthen alliances with IT companies
Integrate car AV and car navigation models by using open platforms
Strengthen areas related to interfaces and ADAS*3 Use alliances for cameras and other sensing devices
Group company’s map data
Create map data in ASEAN regionEstablished joint venture with MappointAsia
Create detailed map dataBusiness alliance with NTT GEOSPACE CORPORATION
Informationservices
Consider alliances and M&As toAcquire related technologies
and expertise
Strengthen big data analysis capabilitiesBusiness alliance with Treasure Data Inc. of U.S. Establish platform in ASEAN region
Use business model created in JapanGlobal development
For more information on the strategies listed in the above, please see “Measures to strengthen information services” on p. 08.
Cloud services using probe*1 information
Rearview mirror telematics unit
06 Pioneer Corporat ion Annua l Repor t 2015 07Pioneer Corporat ion Annua l Repor t 2015
In this section, we introduce Pioneer’s unique ability to provide integrated information services to vehicles, providing map data, storing and analyzing various data collected inside the vehicle, and providing information services inside the vehicle.
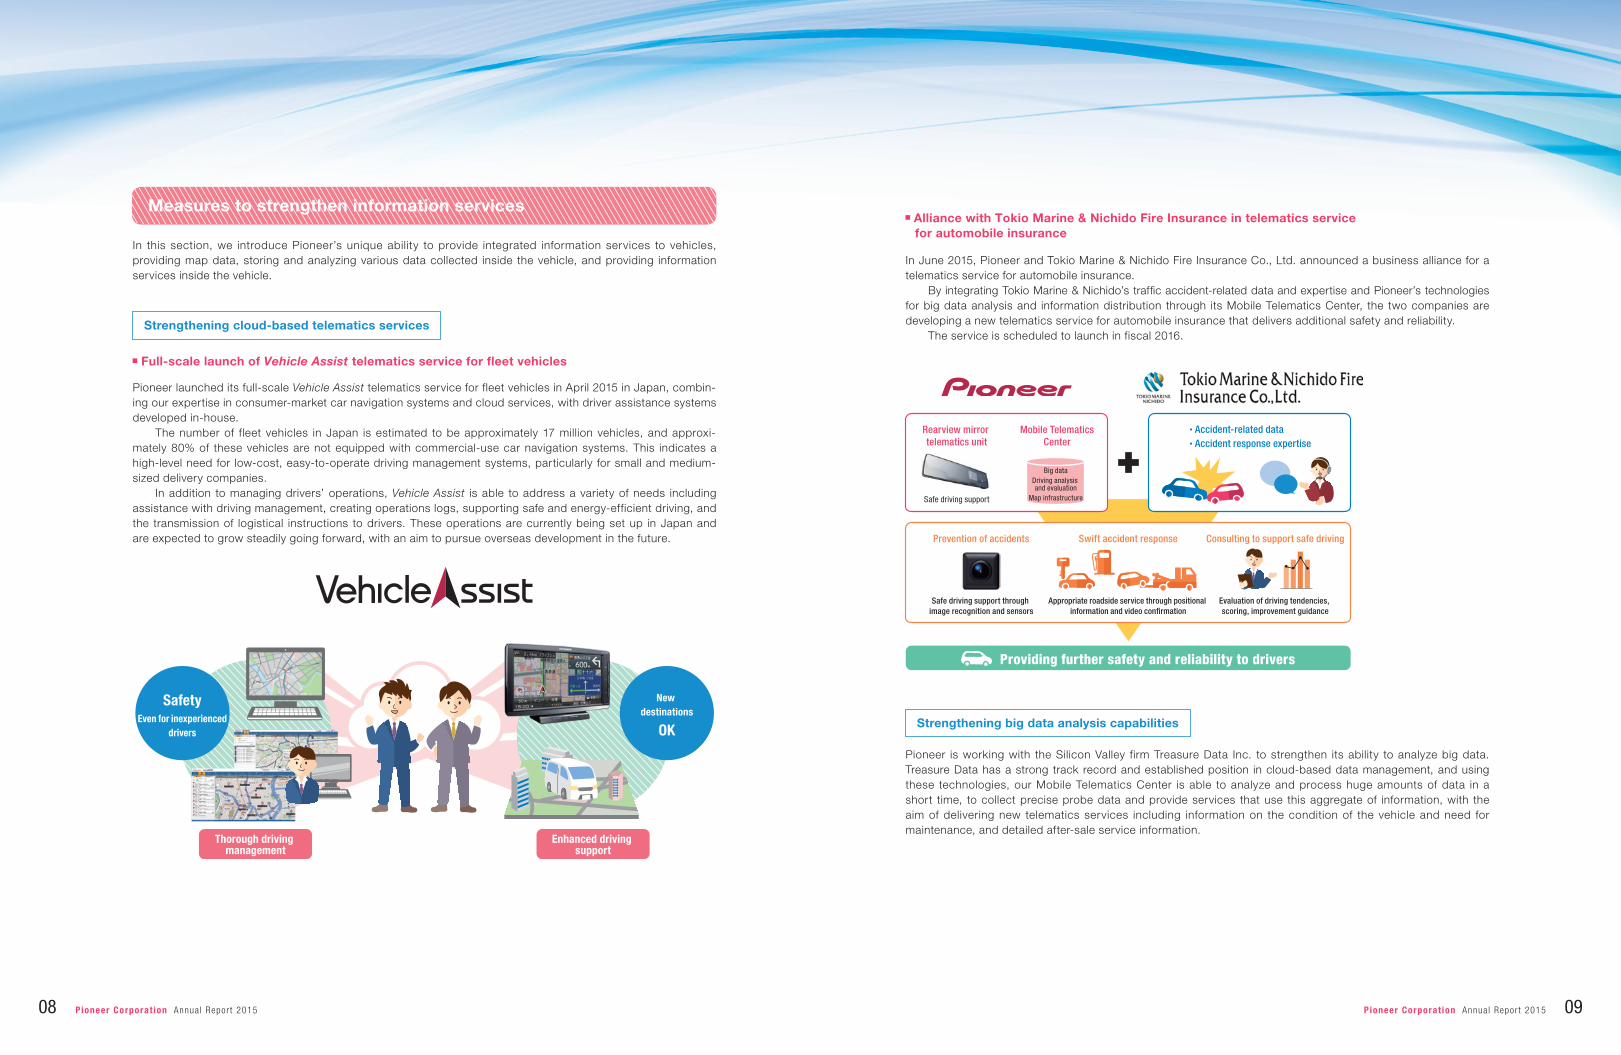
In June 2015, Pioneer and Tokio Marine & Nichido Fire Insurance Co., Ltd. announced a business alliance for a telematics service for automobile insurance.
By integrating Tokio Marine & Nichido’s traffic accident-related data and expertise and Pioneer’s technologies for big data analysis and information distribution through its Mobile Telematics Center, the two companies are developing a new telematics service for automobile insurance that delivers additional safety and reliability.
The service is scheduled to launch in fiscal 2016.
Measures to strengthen information services■ Alliance with Tokio Marine & Nichido Fire Insurance in telematics service
for automobile insurance
・Accident-related data・Accident response expertise
Rearview mirror telematics unit
Safe driving support
Prevention of accidents
Safe driving support through image recognition and sensors
Appropriate roadside service through positional information and video confirmation
Evaluation of driving tendencies, scoring, improvement guidance
Swift accident response Consulting to support safe driving
Mobile TelematicsCenter
Big dataDriving analysis and evaluation
Map infrastructure
Providing further safety and reliability to drivers
Pioneer is working with the Silicon Valley firm Treasure Data Inc. to strengthen its ability to analyze big data. Treasure Data has a strong track record and established position in cloud-based data management, and using these technologies, our Mobile Telematics Center is able to analyze and process huge amounts of data in a short time, to collect precise probe data and provide services that use this aggregate of information, with the aim of delivering new telematics services including information on the condition of the vehicle and need for maintenance, and detailed after-sale service information.
Pioneer launched its full-scale Vehicle Assist telematics service for fleet vehicles in April 2015 in Japan, combin-ing our expertise in consumer-market car navigation systems and cloud services, with driver assistance systems developed in-house.
The number of fleet vehicles in Japan is estimated to be approximately 17 million vehicles, and approxi-mately 80% of these vehicles are not equipped with commercial-use car navigation systems. This indicates a high-level need for low-cost, easy-to-operate driving management systems, particularly for small and medium-sized delivery companies.
In addition to managing drivers’ operations, Vehicle Assist is able to address a variety of needs including assistance with driving management, creating operations logs, supporting safe and energy-efficient driving, and the transmission of logistical instructions to drivers. These operations are currently being set up in Japan and are expected to grow steadily going forward, with an aim to pursue overseas development in the future.
■ Full-scale launch of Vehicle Assist telematics service for fleet vehicles
Strengthening cloud-based telematics services
Strengthening big data analysis capabilities
SafetyEven for inexperienced
drivers
New destinations
OK
Thorough driving management
Enhanced driving support
08 Pioneer Corporat ion Annua l Repor t 2015 09Pioneer Corporat ion Annua l Repor t 2015
Operating Loss (Billion yen)
5
0
-5
20152013 2014
-0
-2.8 -2.3
Operating Income (Billion yen)
20
10
0
20152013 2014
11.012.4
9.8
-0.1
-0.8-0.9
20152013 2014
Operating Loss (Billion yen)
2
0
-2
Review of Operations (Fiscal 2015, ended March 31, 2015)
Japan
38.5%
North America
21.9%Europe
11.5%
Other Regions
28.1%
2015
Main Products
● Car Navigation Systems ● Car Stereos● Car AV Systems ● Car Speakers
Main Products
● Audio Systems ● Audio Components ● DJ Equipment ● Equipment for Cable-TV Systems ● Blue-ray Disc Players ● Blue-ray Disc Drives ● DVD Players ● DVD Drives● AV Accessories ● Telephones
Car Electronics
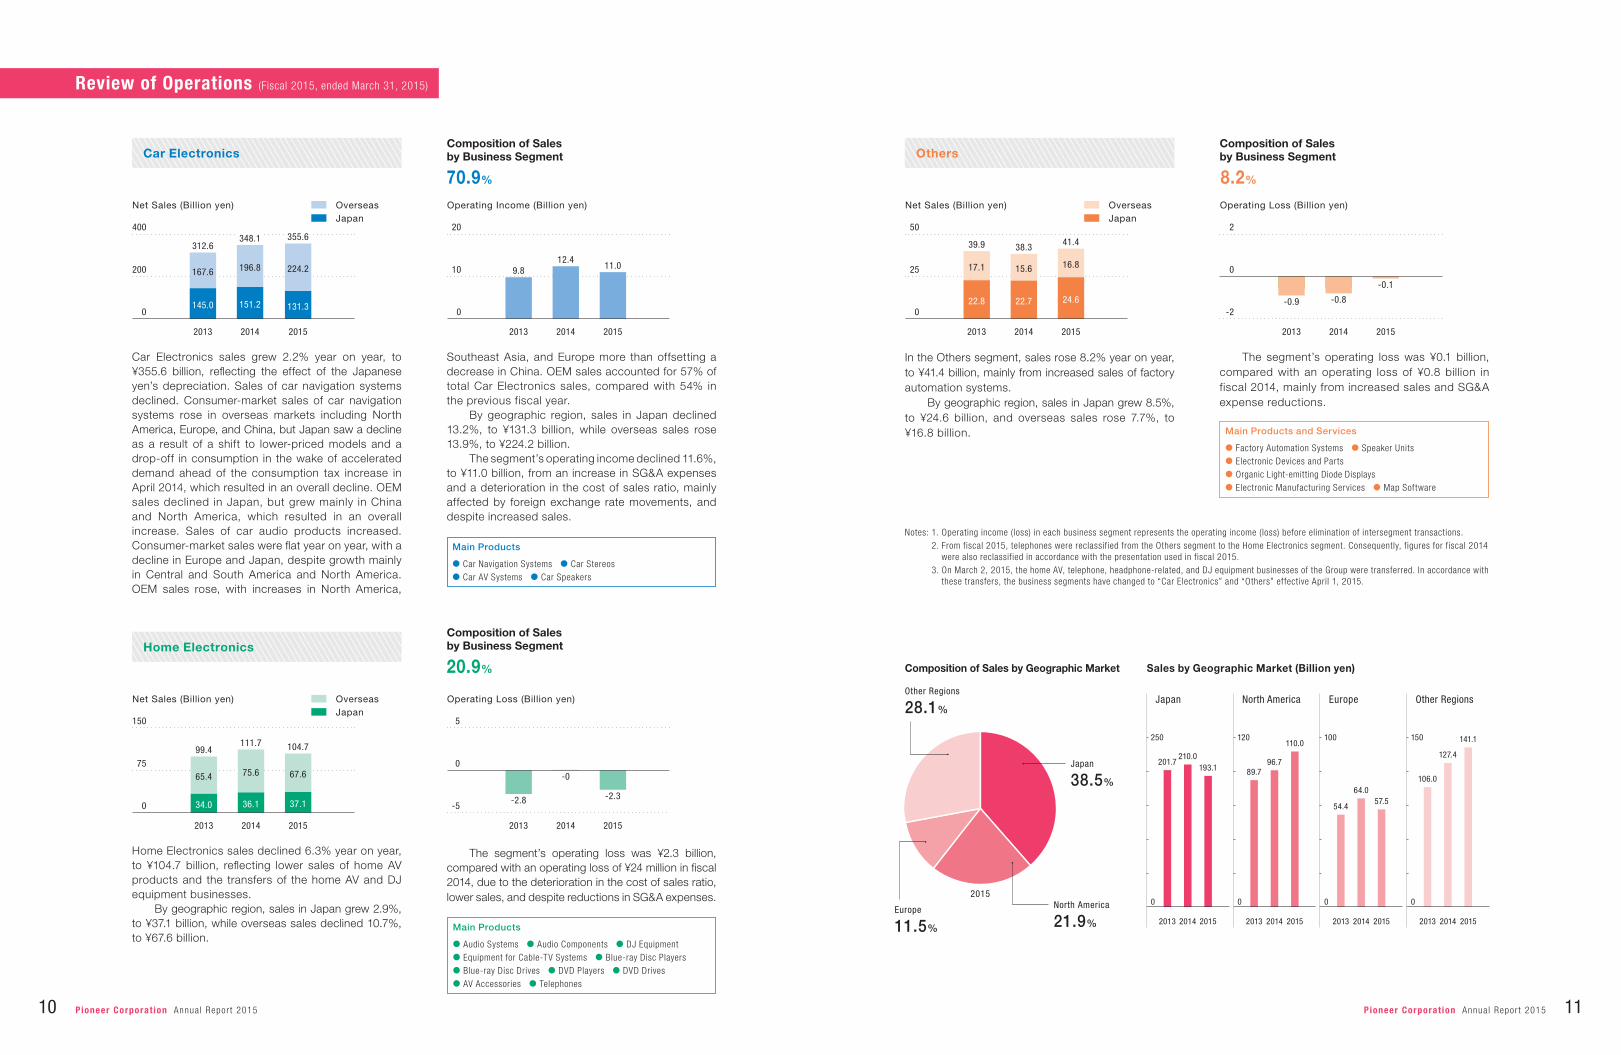
Car Electronics sales grew 2.2% year on year, to ¥355.6 billion, reflecting the effect of the Japanese yen’s depreciation. Sales of car navigation systems declined. Consumer-market sales of car navigation systems rose in overseas markets including North America, Europe, and China, but Japan saw a decline as a result of a shift to lower-priced models and a drop-off in consumption in the wake of accelerated demand ahead of the consumption tax increase in April 2014, which resulted in an overall decline. OEM sales declined in Japan, but grew mainly in China and North America, which resulted in an overall increase. Sales of car audio products increased. Consumer-market sales were flat year on year, with a decline in Europe and Japan, despite growth mainly in Central and South America and North America. OEM sales rose, with increases in North America,
Southeast Asia, and Europe more than offsetting a decrease in China. OEM sales accounted for 57% of total Car Electronics sales, compared with 54% in the previous fiscal year.
By geographic region, sales in Japan declined 13.2%, to ¥131.3 billion, while overseas sales rose 13.9%, to ¥224.2 billion.
The segment’s operating income declined 11.6%, to ¥11.0 billion, from an increase in SG&A expenses and a deterioration in the cost of sales ratio, mainly affected by foreign exchange rate movements, and despite increased sales.
Home Electronics
Home Electronics sales declined 6.3% year on year, to ¥104.7 billion, reflecting lower sales of home AV products and the transfers of the home AV and DJ equipment businesses.
By geographic region, sales in Japan grew 2.9%, to ¥37.1 billion, while overseas sales declined 10.7%, to ¥67.6 billion.
The segment’s operating loss was ¥2.3 billion, compared with an operating loss of ¥24 million in fiscal 2014, due to the deterioration in the cost of sales ratio, lower sales, and despite reductions in SG&A expenses.
Composition of Salesby Business Segment
20.9%
70.9%
Composition of Salesby Business Segment Others
In the Others segment, sales rose 8.2% year on year, to ¥41.4 billion, mainly from increased sales of factory automation systems.
By geographic region, sales in Japan grew 8.5%, to ¥24.6 billion, and overseas sales rose 7.7%, to ¥16.8 billion.
The segment’s operating loss was ¥0.1 billion, compared with an operating loss of ¥0.8 billion in fiscal 2014, mainly from increased sales and SG&A expense reductions.
Notes: 1. Operating income ( loss) in each business segment represents the operating income ( loss) before elimination of intersegment transactions. 2. From fiscal 2015, telephones were reclassified from the Others segment to the Home Electronics segment. Consequently, figures for fiscal 2014 were also reclassified in accordance with the presentation used in fiscal 2015. 3. On March 2, 2015, the home AV, telephone, headphone-related, and DJ equipment businesses of the Group were transferred. In accordance with these transfers, the business segments have changed to “Car Electronics” and “Others” effective April 1, 2015.
Main Products and Services
● Factory Automation Systems ● Speaker Units● Electronic Devices and Parts● Organic Light-emitting Diode Displays● Electronic Manufacturing Services ● Map Software
Composition of Sales by Geographic Market Sales by Geographic Market (Billion yen)
110.0
96.789.7
Japan North America Europe Other Regions
20152013 2014 20152013 2014 20152013 2014 20152013 2014
193.1210.0
57.5
141.1
64.0
127.4201.7
54.4
106.0
100 150250
0
120
0 00
8.2%
Composition of Salesby Business Segment
Net Sales (Billion yen)
20152013 2014
OverseasJapan
196.8
151.2
167.6
145.0
312.6348.1
224.2
131.3
400
200
0
355.6
Net Sales (Billion yen) OverseasJapan
20152013 2014
37.1
67.6
104.7
36.1
75.6
111.7
34.0
65.4
99.4
150
75
0
Net Sales (Billion yen) OverseasJapan
50
25
0
20152013 2014
24.622.8
16.817.1
41.439.9
22.7
15.6
38.3
10 Pioneer Corporat ion Annua l Repor t 2015 11Pioneer Corporat ion Annua l Repor t 2015
Research and Development
By providing new value derived from its core technologies, Pioneer aims to achieve a rich, mobile society in which everyone using roads can move safely, reliably, and comfortably.
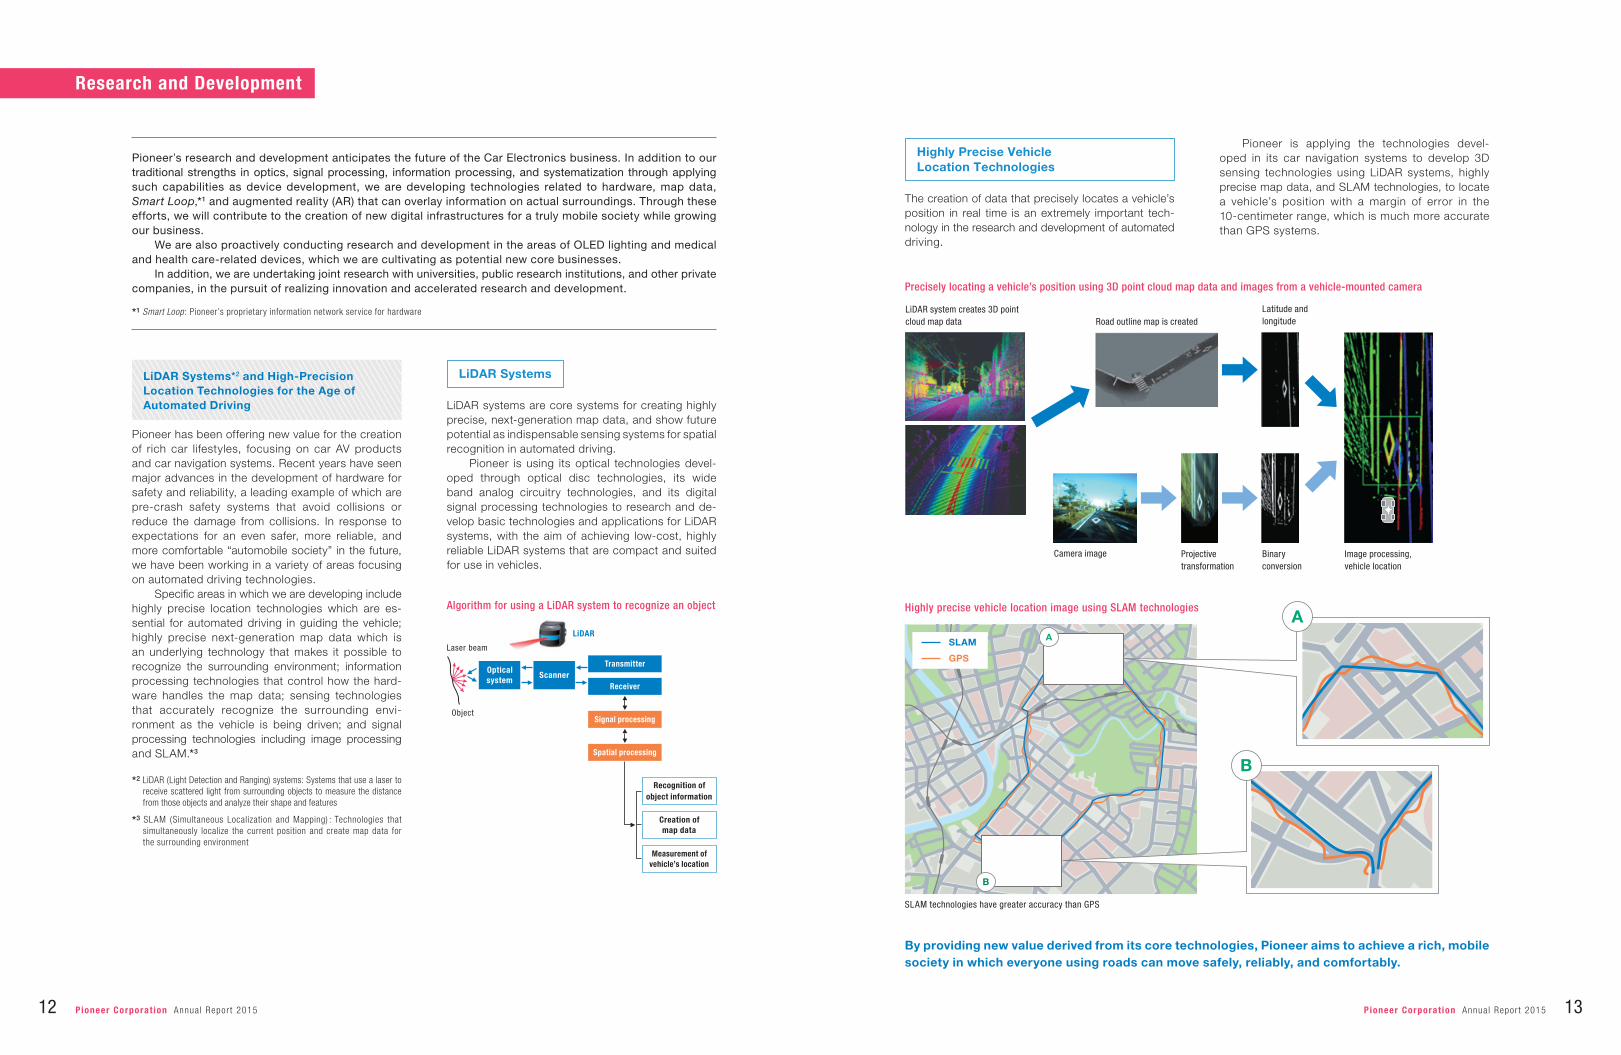
Precisely locating a vehicle’s position using 3D point cloud map data and images from a vehicle-mounted camera
Highly precise vehicle location image using SLAM technologies
Optical system
ScannerTransmitter
Receiver
Signal processing
Spatial processing
Creation of map data
Recognition of object information
LiDAR
Laser beam
Object
Measurement of vehicle’s location
SLAM technologies have greater accuracy than GPS
LiDAR system creates 3D point cloud map data Road outline map is created
Latitude and longitude
Binary conversion
Projective transformation
Camera image Image processing, vehicle location
AA
B
SLAM
GPS
Algorithm for using a LiDAR system to recognize an object
B
Pioneer’s research and development anticipates the future of the Car Electronics business. In addition to our traditional strengths in optics, signal processing, information processing, and systematization through applying such capabilities as device development, we are developing technologies related to hardware, map data, Smart Loop,*1 and augmented reality (AR) that can overlay information on actual surroundings. Through these efforts, we will contribute to the creation of new digital infrastructures for a truly mobile society while growing our business.
We are also proactively conducting research and development in the areas of OLED lighting and medical and health care-related devices, which we are cultivating as potential new core businesses.
In addition, we are undertaking joint research with universities, public research institutions, and other private companies, in the pursuit of realizing innovation and accelerated research and development.
*1 Smart Loop : Pioneer’s proprietary information network service for hardware
LiDAR systems are core systems for creating highly precise, next-generation map data, and show future potential as indispensable sensing systems for spatial recognition in automated driving.
Pioneer is using its optical technologies devel-oped through optical disc technologies, its wide band analog circuitry technologies, and its digital signal processing technologies to research and de-velop basic technologies and applications for LiDAR systems, with the aim of achieving low-cost, highly reliable LiDAR systems that are compact and suited for use in vehicles.
LiDAR Systems*2 and High-Precision Location Technologies for the Age of Automated Driving
Pioneer has been offering new value for the creation of rich car lifestyles, focusing on car AV products and car navigation systems. Recent years have seen major advances in the development of hardware for safety and reliability, a leading example of which are pre-crash safety systems that avoid collisions or reduce the damage from collisions. In response to expectations for an even safer, more reliable, and more comfortable “automobile society” in the future, we have been working in a variety of areas focusing on automated driving technologies.
Specific areas in which we are developing include highly precise location technologies which are es-sential for automated driving in guiding the vehicle; highly precise next-generation map data which is an underlying technology that makes it possible to recognize the surrounding environment; information processing technologies that control how the hard-ware handles the map data; sensing technologies that accurately recognize the surrounding envi-ronment as the vehicle is being driven; and signal processing technologies including image processing and SLAM.*3
*2 LiDAR (Light Detection and Ranging) systems: Systems that use a laser to receive scattered light from surrounding objects to measure the distance from those objects and analyze their shape and features
*3 SLAM (Simultaneous Localization and Mapping) : Technologies that simultaneously localize the current position and create map data for the surrounding environment
Pioneer is applying the technologies devel-oped in its car navigation systems to develop 3D sensing technologies using LiDAR systems, highly precise map data, and SLAM technologies, to locate a vehicle’s position with a margin of error in the 10-centimeter range, which is much more accurate than GPS systems.
The creation of data that precisely locates a vehicle’s position in real time is an extremely important tech-nology in the research and development of automated driving.
LiDAR Systems
Highly Precise Vehicle Location Technologies
12 Pioneer Corporat ion Annua l Repor t 2015 13Pioneer Corporat ion Annua l Repor t 2015
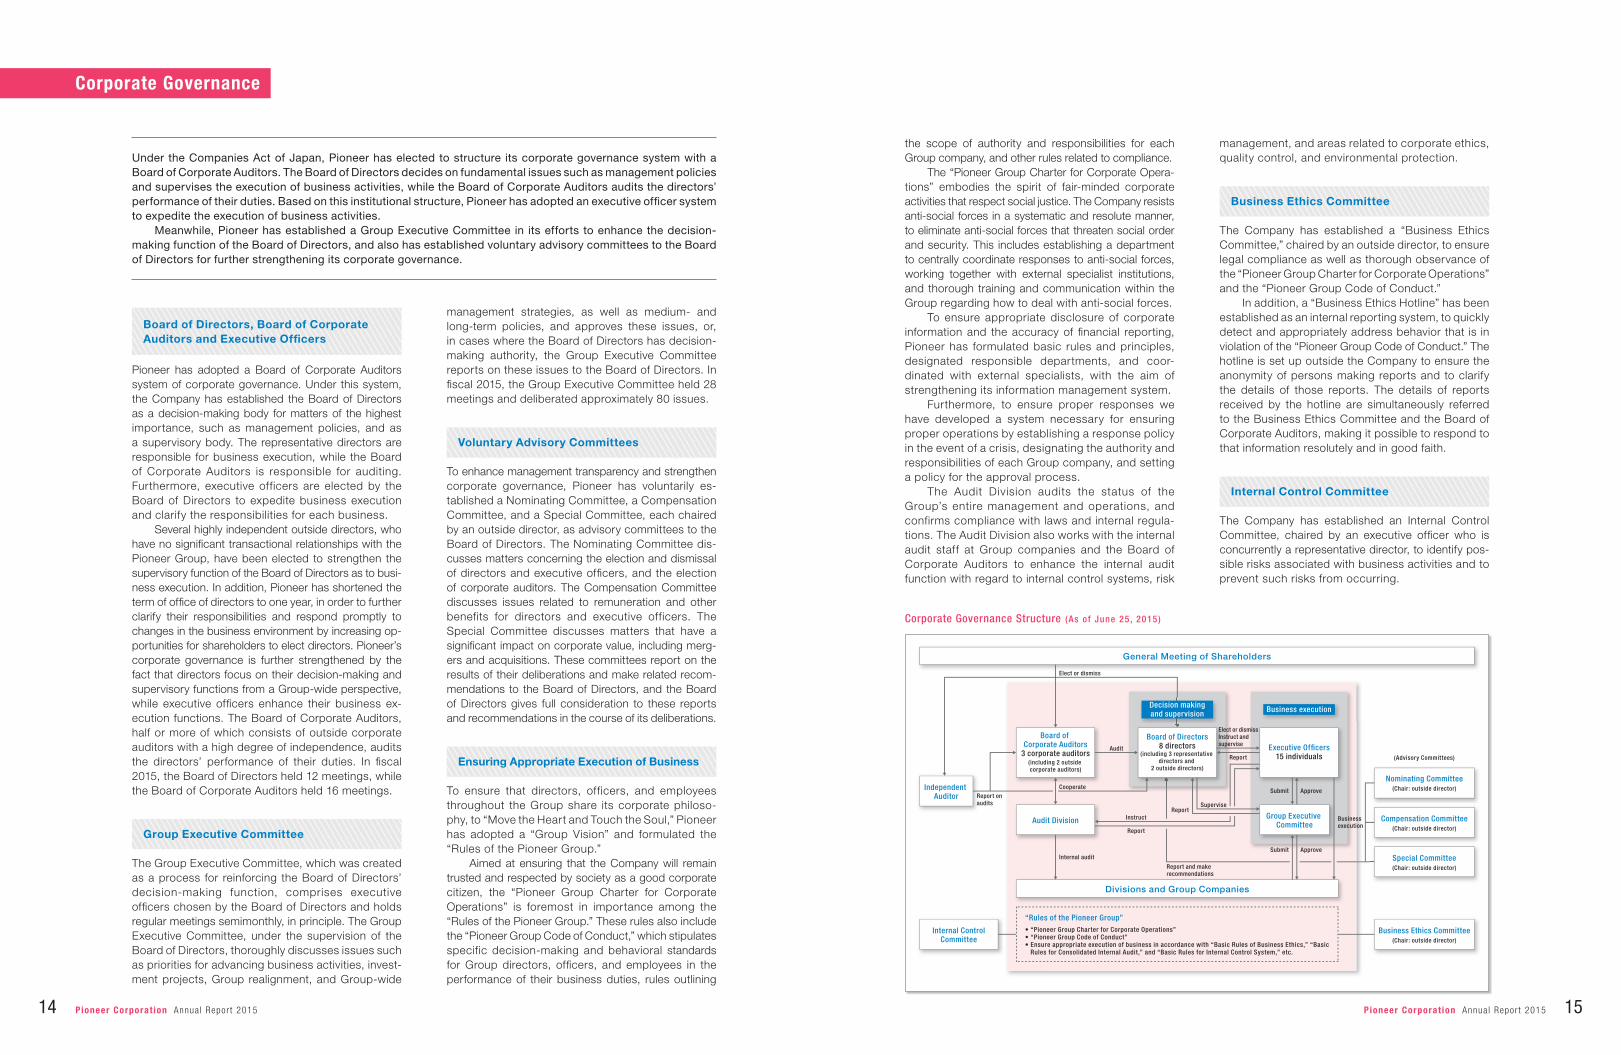
Corporate Governance Structure (As of June 25, 2015)
management strategies, as well as medium- and long-term policies, and approves these issues, or, in cases where the Board of Directors has decision-making authority, the Group Executive Committee reports on these issues to the Board of Directors. In fiscal 2015, the Group Executive Committee held 28 meetings and deliberated approximately 80 issues.
Voluntary Advisory Committees
To enhance management transparency and strengthen corporate governance, Pioneer has voluntarily es-tablished a Nominating Committee, a Compensation Committee, and a Special Committee, each chaired by an outside director, as advisory committees to the Board of Directors. The Nominating Committee dis-cusses matters concerning the election and dismissal of directors and executive officers, and the election of corporate auditors. The Compensation Committee discusses issues related to remuneration and other benefits for directors and executive officers. The Special Committee discusses matters that have a significant impact on corporate value, including merg-ers and acquisitions. These committees report on the results of their deliberations and make related recom-mendations to the Board of Directors, and the Board of Directors gives full consideration to these reports and recommendations in the course of its deliberations.
Ensuring Appropriate Execution of Business
To ensure that directors, officers, and employees throughout the Group share its corporate philoso-phy, to “Move the Heart and Touch the Soul,” Pioneer has adopted a “Group Vision” and formulated the “Rules of the Pioneer Group.”
Aimed at ensuring that the Company will remain trusted and respected by society as a good corporate citizen, the “Pioneer Group Charter for Corporate Operations” is foremost in importance among the “Rules of the Pioneer Group.” These rules also include the “Pioneer Group Code of Conduct,” which stipulates specific decision-making and behavioral standards for Group directors, officers, and employees in the performance of their business duties, rules outlining
the scope of authority and responsibilities for each Group company, and other rules related to compliance.
The “Pioneer Group Charter for Corporate Opera-tions” embodies the spirit of fair-minded corporate activities that respect social justice. The Company resists anti-social forces in a systematic and resolute manner, to eliminate anti-social forces that threaten social order and security. This includes establishing a department to centrally coordinate responses to anti-social forces, working together with external specialist institutions, and thorough training and communication within the Group regarding how to deal with anti-social forces.
To ensure appropriate disclosure of corporate information and the accuracy of financial reporting, Pioneer has formulated basic rules and principles, designated responsible departments, and coor-dinated with external specialists, with the aim of strengthening its information management system.
Furthermore, to ensure proper responses we have developed a system necessary for ensuring proper operations by establishing a response policy in the event of a crisis, designating the authority and responsibilities of each Group company, and setting a policy for the approval process.
The Audit Division audits the status of the Group’s entire management and operations, and confirms compliance with laws and internal regula-tions. The Audit Division also works with the internal audit staff at Group companies and the Board of Corporate Auditors to enhance the internal audit function with regard to internal control systems, risk
management, and areas related to corporate ethics, quality control, and environmental protection.
Business Ethics Committee
The Company has established a “Business Ethics Committee,” chaired by an outside director, to ensure legal compliance as well as thorough observance of the “Pioneer Group Charter for Corporate Operations” and the “Pioneer Group Code of Conduct.”
In addition, a “Business Ethics Hotline” has been established as an internal reporting system, to quickly detect and appropriately address behavior that is in violation of the “Pioneer Group Code of Conduct.” The hotline is set up outside the Company to ensure the anonymity of persons making reports and to clarify the details of those reports. The details of reports received by the hotline are simultaneously referred to the Business Ethics Committee and the Board of Corporate Auditors, making it possible to respond to that information resolutely and in good faith.
Internal Control Committee
The Company has established an Internal Control Committee, chaired by an executive officer who is concurrently a representative director, to identify pos-sible risks associated with business activities and to prevent such risks from occurring.
General Meeting of Shareholders
Divisions and Group Companies
“Rules of the Pioneer Group”
Independent Auditor
Board of Corporate Auditors
3 corporate auditors(including 2 outside corporate auditors)
Executive Officers15 individuals
Nominating Committee(Chair: outside director)
(Advisory Committees)
Compensation Committee(Chair: outside director)
Special Committee(Chair: outside director)
Business Ethics Committee(Chair: outside director)
Board of Directors8 directors
(including 3 representative directors and
2 outside directors)
Group Executive CommitteeAudit Division
Business executionDecision makingand supervision
Internal ControlCommittee
Elect or dismiss
Elect or dismissInstruct and supervise
Business execution
Submit
Report
Submit
CooperateApprove
Approve
Report onaudits
Internal audit
Report and makerecommendations
Audit
Instruct
Report
Report
• “Pioneer Group Charter for Corporate Operations”• “Pioneer Group Code of Conduct”• Ensure appropriate execution of business in accordance with “Basic Rules of Business Ethics,” “Basic Rules for Consolidated Internal Audit,” and “Basic Rules for Internal Control System,” etc.
Supervise
Corporate Governance
Under the Companies Act of Japan, Pioneer has elected to structure its corporate governance system with a Board of Corporate Auditors. The Board of Directors decides on fundamental issues such as management policies and supervises the execution of business activities, while the Board of Corporate Auditors audits the directors’ performance of their duties. Based on this institutional structure, Pioneer has adopted an executive officer system to expedite the execution of business activities.
Meanwhile, Pioneer has established a Group Executive Committee in its efforts to enhance the decision-making function of the Board of Directors, and also has established voluntary advisory committees to the Board of Directors for further strengthening its corporate governance.
Board of Directors, Board of Corporate Auditors and Executive Officers
Pioneer has adopted a Board of Corporate Auditors system of corporate governance. Under this system, the Company has established the Board of Directors as a decision-making body for matters of the highest importance, such as management policies, and as a supervisory body. The representative directors are responsible for business execution, while the Board of Corporate Auditors is responsible for auditing. Furthermore, executive officers are elected by the Board of Directors to expedite business execution and clarify the responsibilities for each business.
Several highly independent outside directors, who have no significant transactional relationships with the Pioneer Group, have been elected to strengthen the supervisory function of the Board of Directors as to busi-ness execution. In addition, Pioneer has shortened the term of office of directors to one year, in order to further clarify their responsibilities and respond promptly to changes in the business environment by increasing op-portunities for shareholders to elect directors. Pioneer’s corporate governance is further strengthened by the fact that directors focus on their decision-making and supervisory functions from a Group-wide perspective, while executive officers enhance their business ex-ecution functions. The Board of Corporate Auditors, half or more of which consists of outside corporate auditors with a high degree of independence, audits the directors’ performance of their duties. In fiscal 2015, the Board of Directors held 12 meetings, while the Board of Corporate Auditors held 16 meetings.
Group Executive Committee
The Group Executive Committee, which was created as a process for reinforcing the Board of Directors’ decision-making function, comprises executive officers chosen by the Board of Directors and holds regular meetings semimonthly, in principle. The Group Executive Committee, under the supervision of the Board of Directors, thoroughly discusses issues such as priorities for advancing business activities, invest-ment projects, Group realignment, and Group-wide
14 Pioneer Corporat ion Annua l Repor t 2015 15Pioneer Corporat ion Annua l Repor t 2015
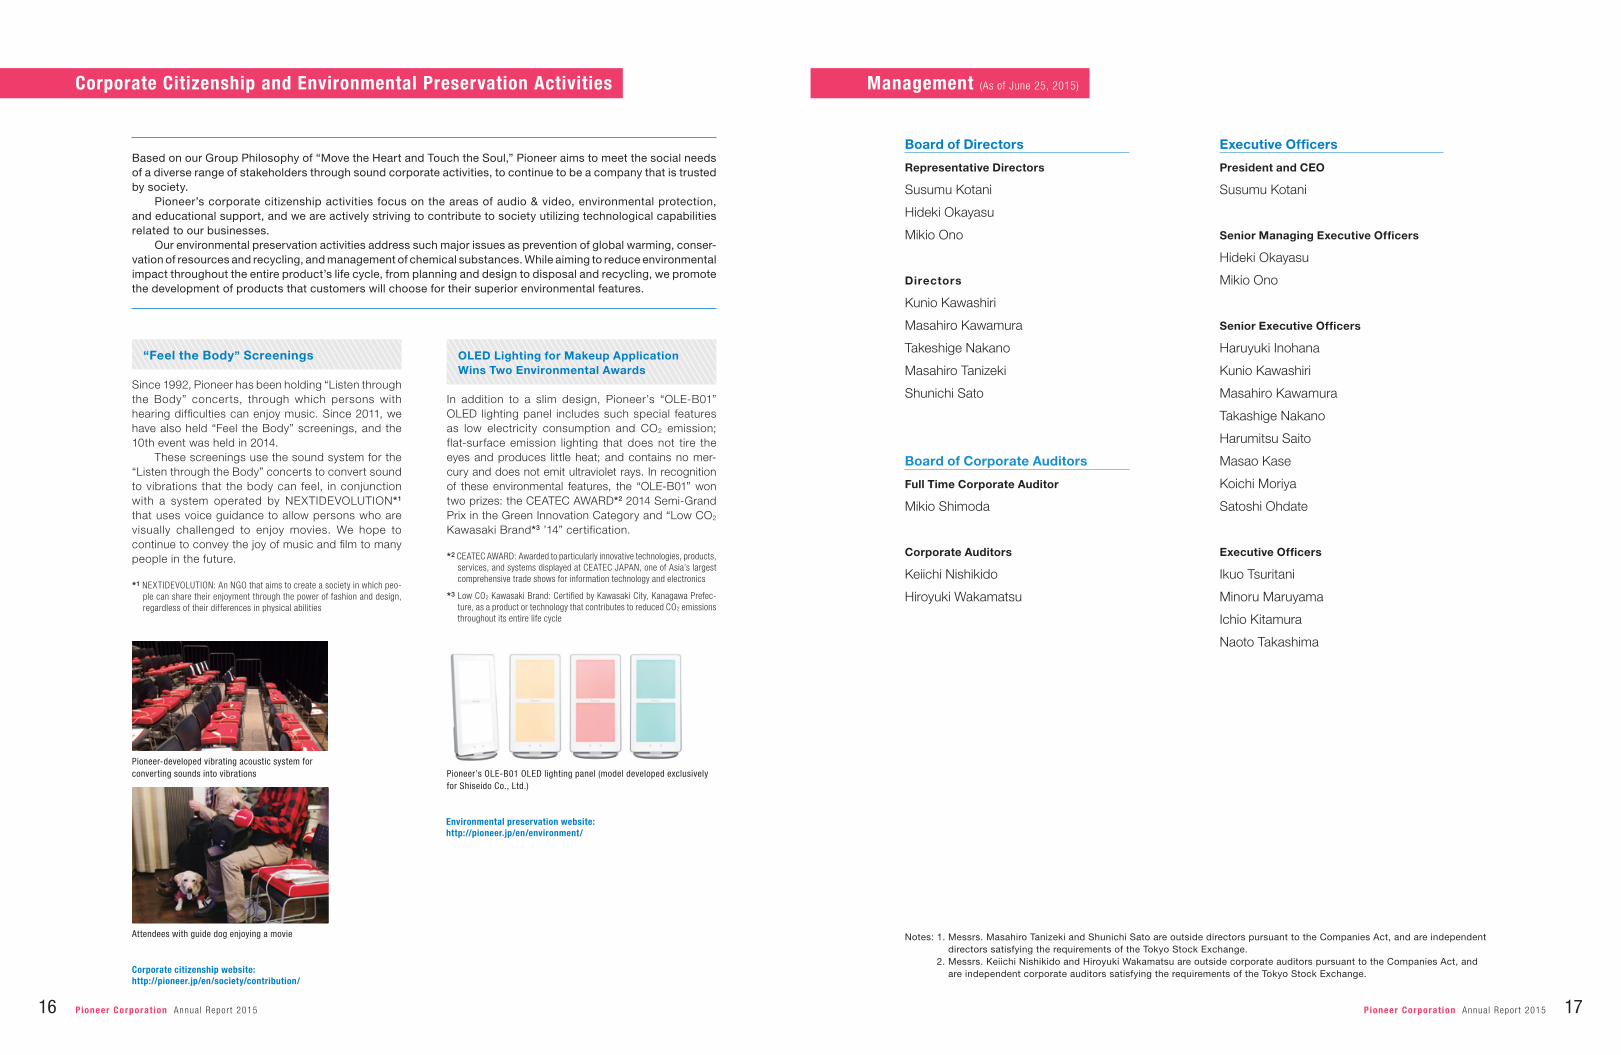
“Feel the Body” Screenings Since 1992, Pioneer has been holding “Listen through the Body” concerts, through which persons with hearing difficulties can enjoy music. Since 2011, we have also held “Feel the Body” screenings, and the 10th event was held in 2014.
These screenings use the sound system for the “Listen through the Body” concerts to convert sound to vibrations that the body can feel, in conjunction with a system operated by NEXTIDEVOLUTION*1 that uses voice guidance to allow persons who are visually challenged to enjoy movies. We hope to continue to convey the joy of music and film to many people in the future.
*1 NEXTIDEVOLUTION: An NGO that aims to create a society in which peo-ple can share their enjoyment through the power of fashion and design, regardless of their differences in physical abilities
OLED Lighting for Makeup Application Wins Two Environmental Awards
In addition to a slim design, Pioneer’s “OLE-B01” OLED lighting panel includes such special features as low electricity consumption and CO2 emission; flat-surface emission lighting that does not tire the eyes and produces little heat; and contains no mer-cury and does not emit ultraviolet rays. In recognition of these environmental features, the “OLE-B01” won two prizes: the CEATEC AWARD*2 2014 Semi-Grand Prix in the Green Innovation Category and “Low CO2 Kawasaki Brand*3 ’14” certification.
*2 CEATEC AWARD: Awarded to particularly innovative technologies, products, services, and systems displayed at CEATEC JAPAN, one of Asia’s largest comprehensive trade shows for information technology and electronics
*3 Low CO2 Kawasaki Brand: Certified by Kawasaki City, Kanagawa Prefec-ture, as a product or technology that contributes to reduced CO2 emissions throughout its entire life cycle
Notes: 1. Messrs. Masahiro Tanizeki and Shunichi Sato are outside directors pursuant to the Companies Act, and are independent directors satisfying the requirements of the Tokyo Stock Exchange.
2. Messrs. Keiichi Nishikido and Hiroyuki Wakamatsu are outside corporate auditors pursuant to the Companies Act, and are independent corporate auditors satisfying the requirements of the Tokyo Stock Exchange.
Executive Officers
President and CEO
Susumu Kotani
Senior Managing Executive Officers
Hideki Okayasu
Mikio Ono
Senior Executive Officers
Haruyuki Inohana
Kunio Kawashiri
Masahiro Kawamura
Takashige Nakano
Harumitsu Saito
Masao Kase
Koichi Moriya
Satoshi Ohdate
Executive Officers
Ikuo Tsuritani
Minoru Maruyama
Ichio Kitamura
Naoto Takashima
Board of Directors
Representative Directors
Susumu Kotani
Hideki Okayasu
Mikio Ono
Directors
Kunio Kawashiri
Masahiro Kawamura
Takeshige Nakano
Masahiro Tanizeki
Shunichi Sato
Board of Corporate Auditors
Full Time Corporate Auditor
Mikio Shimoda
Corporate Auditors
Keiichi Nishikido
Hiroyuki Wakamatsu
Corporate Citizenship and Environmental Preservation Activities
Based on our Group Philosophy of “Move the Heart and Touch the Soul,” Pioneer aims to meet the social needs of a diverse range of stakeholders through sound corporate activities, to continue to be a company that is trusted by society.
Pioneer’s corporate citizenship activities focus on the areas of audio & video, environmental protection, and educational support, and we are actively striving to contribute to society utilizing technological capabilities related to our businesses.
Our environmental preservation activities address such major issues as prevention of global warming, conser-vation of resources and recycling, and management of chemical substances. While aiming to reduce environmental impact throughout the entire product’s life cycle, from planning and design to disposal and recycling, we promote the development of products that customers will choose for their superior environmental features.
Pioneer-developed vibrating acoustic system for converting sounds into vibrations
Environmental preservation website: http://pioneer.jp/en/environment/
Corporate citizenship website: http://pioneer.jp/en/society/contribution/
Pioneer’s OLE-B01 OLED lighting panel (model developed exclusively for Shiseido Co., Ltd.)
Attendees with guide dog enjoying a movie
16 Pioneer Corporat ion Annua l Repor t 2015 17Pioneer Corporat ion Annua l Repor t 2015
Management (As of June 25, 2015)
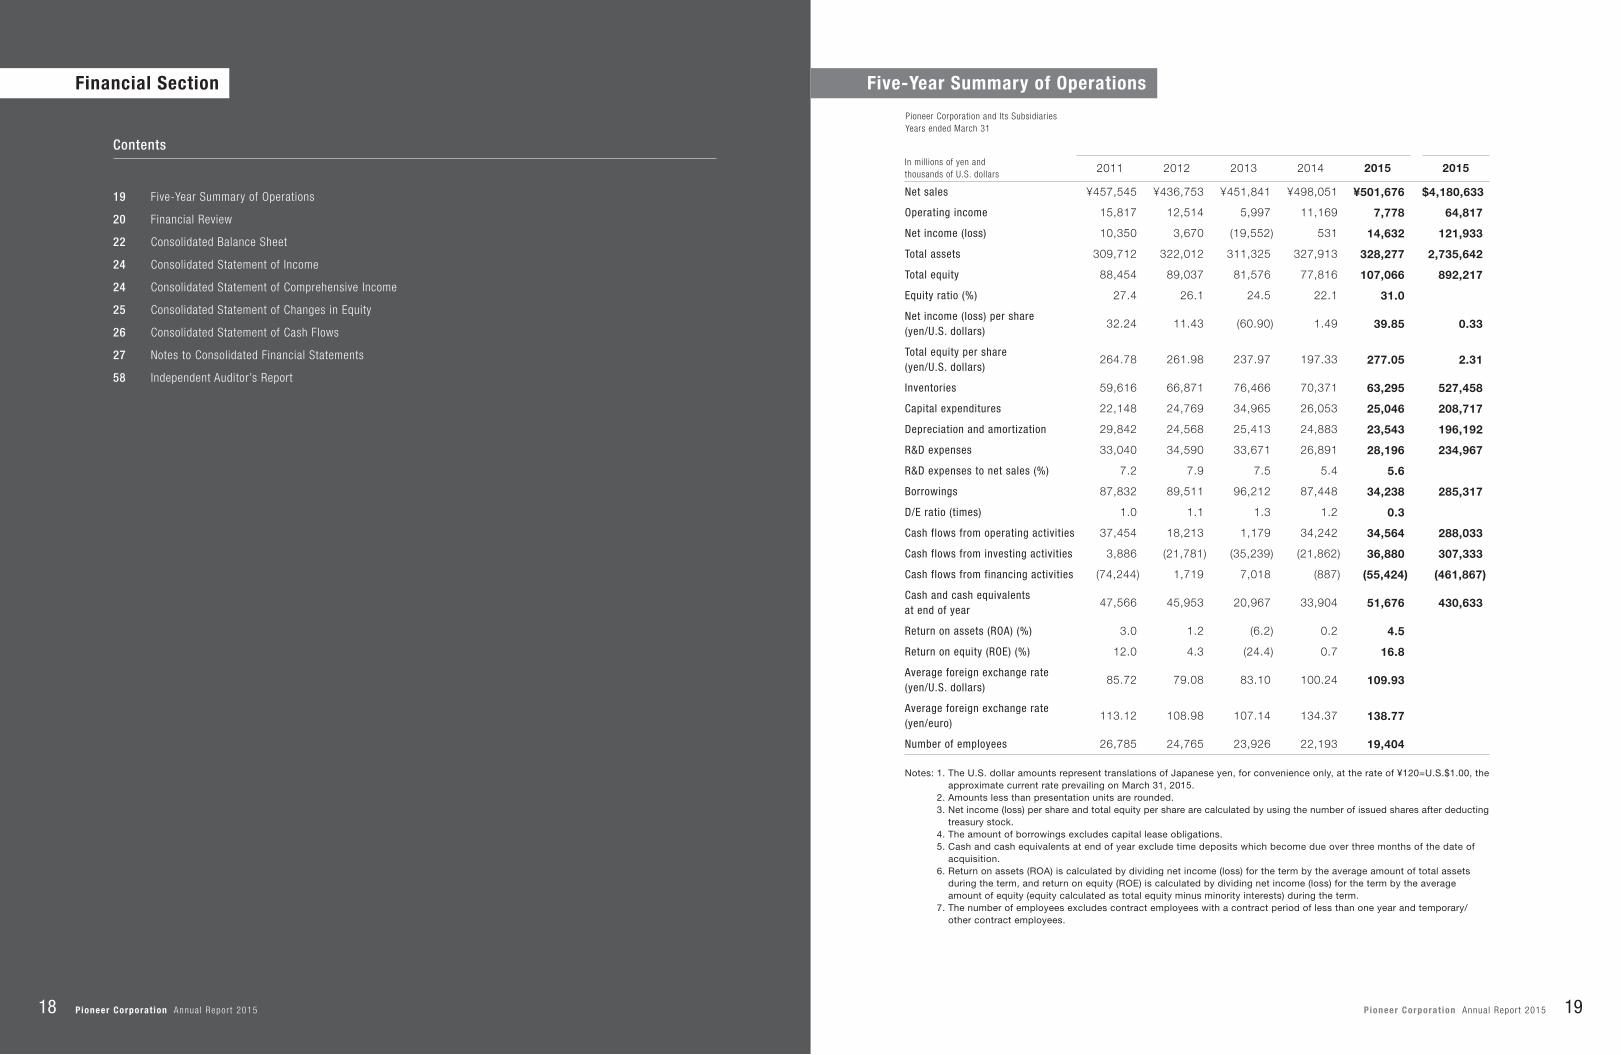
Pioneer Corporation and Its Subsidiaries Years ended March 31
In millions of yen and thousands of U.S. dollars
2011 2012 2013 2014 2015 2015
Net sales ¥457,545 ¥436,753 ¥451,841 ¥498,051 ¥501,676 $4,180,633
Operating income 15,817 12,514 5,997 11,169 7,778 64,817
Net income (loss) 10,350 3,670 (19,552) 531 14,632 121,933
Total assets 309,712 322,012 311,325 327,913 328,277 2,735,642
Total equity 88,454 89,037 81,576 77,816 107,066 892,217
Equity ratio (%) 27.4 26.1 24.5 22.1 31.0
Net income (loss) per share (yen/U.S. dollars)
32.24 11.43 (60.90) 1.49 39.85 0.33
Total equity per share (yen/U.S. dollars)
264.78 261.98 237.97 197.33 277.05 2.31
Inventories 59,616 66,871 76,466 70,371 63,295 527,458
Capital expenditures 22,148 24,769 34,965 26,053 25,046 208,717
Depreciation and amortization 29,842 24,568 25,413 24,883 23,543 196,192
R&D expenses 33,040 34,590 33,671 26,891 28,196 234,967
R&D expenses to net sales (%) 7.2 7.9 7.5 5.4 5.6
Borrowings 87,832 89,511 96,212 87,448 34,238 285,317
D/E ratio (times) 1.0 1.1 1.3 1.2 0.3
Cash flows from operating activities 37,454 18,213 1,179 34,242 34,564 288,033
Cash flows from investing activities 3,886 (21,781) (35,239) (21,862) 36,880 307,333
Cash flows from financing activities (74,244) 1,719 7,018 (887) (55,424) (461,867)
Cash and cash equivalents at end of year
47,566 45,953 20,967 33,904 51,676 430,633
Return on assets (ROA) (%) 3.0 1.2 (6.2) 0.2 4.5
Return on equity (ROE) (%) 12.0 4.3 (24.4) 0.7 16.8
Average foreign exchange rate (yen/U.S. dollars)
85.72 79.08 83.10 100.24 109.93
Average foreign exchange rate (yen/euro)
113.12 108.98 107.14 134.37 138.77
Number of employees 26,785 24,765 23,926 22,193 19,404
Notes: 1. The U.S. dollar amounts represent translations of Japanese yen, for convenience only, at the rate of ¥120=U.S.$1.00, the approximate current rate prevailing on March 31, 2015.
2. Amounts less than presentation units are rounded. 3. Net income (loss) per share and total equity per share are calculated by using the number of issued shares after deducting
treasury stock. 4. The amount of borrowings excludes capital lease obligations. 5. Cash and cash equivalents at end of year exclude time deposits which become due over three months of the date of
acquisition. 6. Return on assets (ROA) is calculated by dividing net income (loss) for the term by the average amount of total assets
during the term, and return on equity (ROE) is calculated by dividing net income (loss) for the term by the average amount of equity (equity calculated as total equity minus minority interests) during the term.
7. The number of employees excludes contract employees with a contract period of less than one year and temporary/other contract employees.
Contents
19 Five-Year Summary of Operations
20 Financial Review
22 Consolidated Balance Sheet
24 Consolidated Statement of Income
24 Consolidated Statement of Comprehensive Income
25 Consolidated Statement of Changes in Equity
26 Consolidated Statement of Cash Flows
27 Notes to Consolidated Financial Statements
58 Independent Auditor’s Report
Five-Year Summary of Operations Financial Section
19Pioneer Corporat ion Annua l Repor t 201518 Pioneer Corporat ion Annua l Repor t 2015

Year ended March 31, 2015,compared with year ended March 31, 2014
Financial Position
Total assets as of March 31, 2015, were ¥328,277 million, an increase of ¥364 million from March 31, 2014, owing to an increase in cash and deposits that more than offset decreases in inventories and trade receivables. Inventories decreased ¥7,076 million, to ¥63,295 million, resulting from transfers of inventory stock associated with business transfers more than offsetting the effect of the Japanese yen’s deprecia-tion. Trade receivables decreased ¥6,402 million, to ¥79,158 million, mainly due to the fact that fourth-quarter sales were lower than in the fourth quarter of the previous fiscal year, reflecting the effect of busi-ness transfers. Cash and deposits increased ¥16,763 million, to ¥52,160 million, mainly as a result of busi-ness transfers.
Total liabilities as of March 31, 2015, were ¥221,211 million, a decrease of ¥28,886 million from March 31, 2014. This was the result of a ¥53,210 million reduction in borrowings, which more than off-set increases of ¥15,861 million in accrued expenses, mainly owing to the recording of restructuring costs and ¥4,702 million in trade payables.
Total equity as of March 31, 2015, was ¥107,066 million, an increase of ¥29,250 million from March 31, 2014, reflecting net income of ¥14,632 million and a ¥12,319 million increase in foreign currency translation adjustments from the Japanese yen’s depreciation.
Results of Operations
• Net salesIn fiscal 2015, consolidated net sales were roughly flat with the previous fiscal year, at ¥501,676 million. Sales of Home Electronics declined, but this was offset by increased sales of Car Electronics, reflecting the Japanese yen’s depreciation.
Car Electronics sales grew 2.2% year on year, to ¥355,591 million, reflecting the effect of the Japanese yen’s depreciation. Sales of car navigation systems declined. Consumer-market sales of car navigation systems rose in overseas markets including North America, Europe, and China, but Japan saw a decline as a result of a shift to lower-priced models and a
Management’s Discussion and Analysis of Financial Position, Results of Operations, and Cash Flows
• Other income (expenses)—netIn fiscal 2015, other income (expenses)—net im-proved by ¥22,956 million, to other income—net of ¥17,452 million, compared with other expenses—net of ¥5,504 million in fiscal 2014. This reflected a ¥48,415 million gain from the transfer of the DJ equip-ment business, which more than offset a decrease in operating income, and a ¥6,450 million foreign exchange loss, as well as a ¥3,526 million loss from the transfer of the home AV and its related businesses and restructuring costs of ¥13,250 million in line with organizational streamlining, despite the negative ef-fect of foreign exchange rate movements.
• Income before income taxes and minority interestsAs a result of the foregoing, income before income taxes and minority interests increased to ¥25,230 mil-lion, from ¥5,665 million in fiscal 2014.
• Income taxesIncome taxes for fiscal 2015 increased to ¥11,142 million, compared with ¥5,159 million for fiscal 2014, principally due to a reversal of deferred tax assets.
• Net incomeAs a result of the above, net income rose to ¥14,632 million, from ¥531 million in fiscal 2014.
Cash Flows
During fiscal 2015, operating activities provided net cash in the amount of ¥34,564 million, a ¥322 mil-lion increase from fiscal 2014. Although net gain on business transfers of ¥44,889 million was posted and trade payables turned around to a ¥3,843 million decrease in fiscal 2015, compared with an ¥11,278 million increase in fiscal 2014, trade receivables de-creased ¥10,807 million in fiscal 2015, compared with an ¥8,648 million increase in fiscal 2014, and the amount of increase in accrued expenses grew ¥13,236 million, which resulted in an overall increase.
Investing activities provided net cash in the amount of ¥36,880 million, compared with ¥21,862 million used in fiscal 2014. This was mainly because of a ¥57,124 million cash inflow from business transfers.
drop-off in consumption in the wake of accelerated demand ahead of the consumption tax increase in April 2014, which resulted in an overall decline. OEM sales declined in Japan, but grew mainly in China and North America, which resulted in an overall increase. Sales of car audio products increased. Consumer-market sales were flat year on year, with a decline in Europe and Japan, despite growth mainly in Central and South America and North America. OEM sales rose, with increases in North America, Southeast Asia, and Europe more than offsetting a decrease in China. OEM sales accounted for 57% of total Car Electronics sales, compared with 54% in the previous fiscal year. By geographic region, sales in Japan declined 13.2%, to ¥131,347 million, while overseas sales rose 13.9%, to ¥224,244 million.
Home Electronics sales declined 6.3% year on year, to ¥104,697 million, reflecting lower sales of home AV products and the transfers of the home AV and DJ equipment businesses. By geographic region, sales in Japan grew 2.9%, to ¥37,139 million, while overseas sales declined 10.7%, to ¥67,558 million.
In the Others segment, sales rose 8.2% year on year, to ¥41,388 million, mainly from increased sales of factory automation systems. By geographic region, sales in Japan grew 8.5%, to ¥24,594 million, and overseas sales rose 7.7%, to ¥16,794 million.
• Operating incomeCost of sales increased to ¥403,072 million from ¥396,705 million a year earlier. Cost of sales ac-counted for 80.3% of net sales, worsening by 0.7 percentage point from 79.7% in fiscal 2014, mainly resulting from the negative effect of foreign exchange rate movements. Selling, general and administrative (SG&A) expenses increased to ¥90,826 million from ¥90,177 million in fiscal 2014, mainly reflecting foreign exchange rate movements. As a result, operating in-come decreased to ¥7,778 million in fiscal 2015, compared with ¥11,169 million in fiscal 2014. R&D expenses, which were included in cost of sales and SG&A expenses, increased 4.9% to ¥28,196 mil-lion, representing 5.6% of net sales. R&D expenses were mostly incurred to enhance our technological advantage in our strategic products, such as car navigation systems.
Financing activities used net cash in the amount of ¥55,424 million, a ¥54,537 million increase from fiscal 2014. This reflected a ¥44,795 million large decrease in the amount of net borrowings from the previous fiscal year, and the absence of the year-earlier ¥8,643 million inflow from the capital increase through third-party allotments.
Foreign currency translation adjustments on cash and cash equivalents were a positive ¥1,752 million, a ¥308 million increase from March 31, 2014.
As a result, cash and cash equivalents as of March 31, 2015, totaled ¥51,676 million, a ¥17,772 million increase from March 31, 2014.
Financial Review
20 Pioneer Corporat ion Annua l Repor t 2015 21Pioneer Corporat ion Annua l Repor t 2015
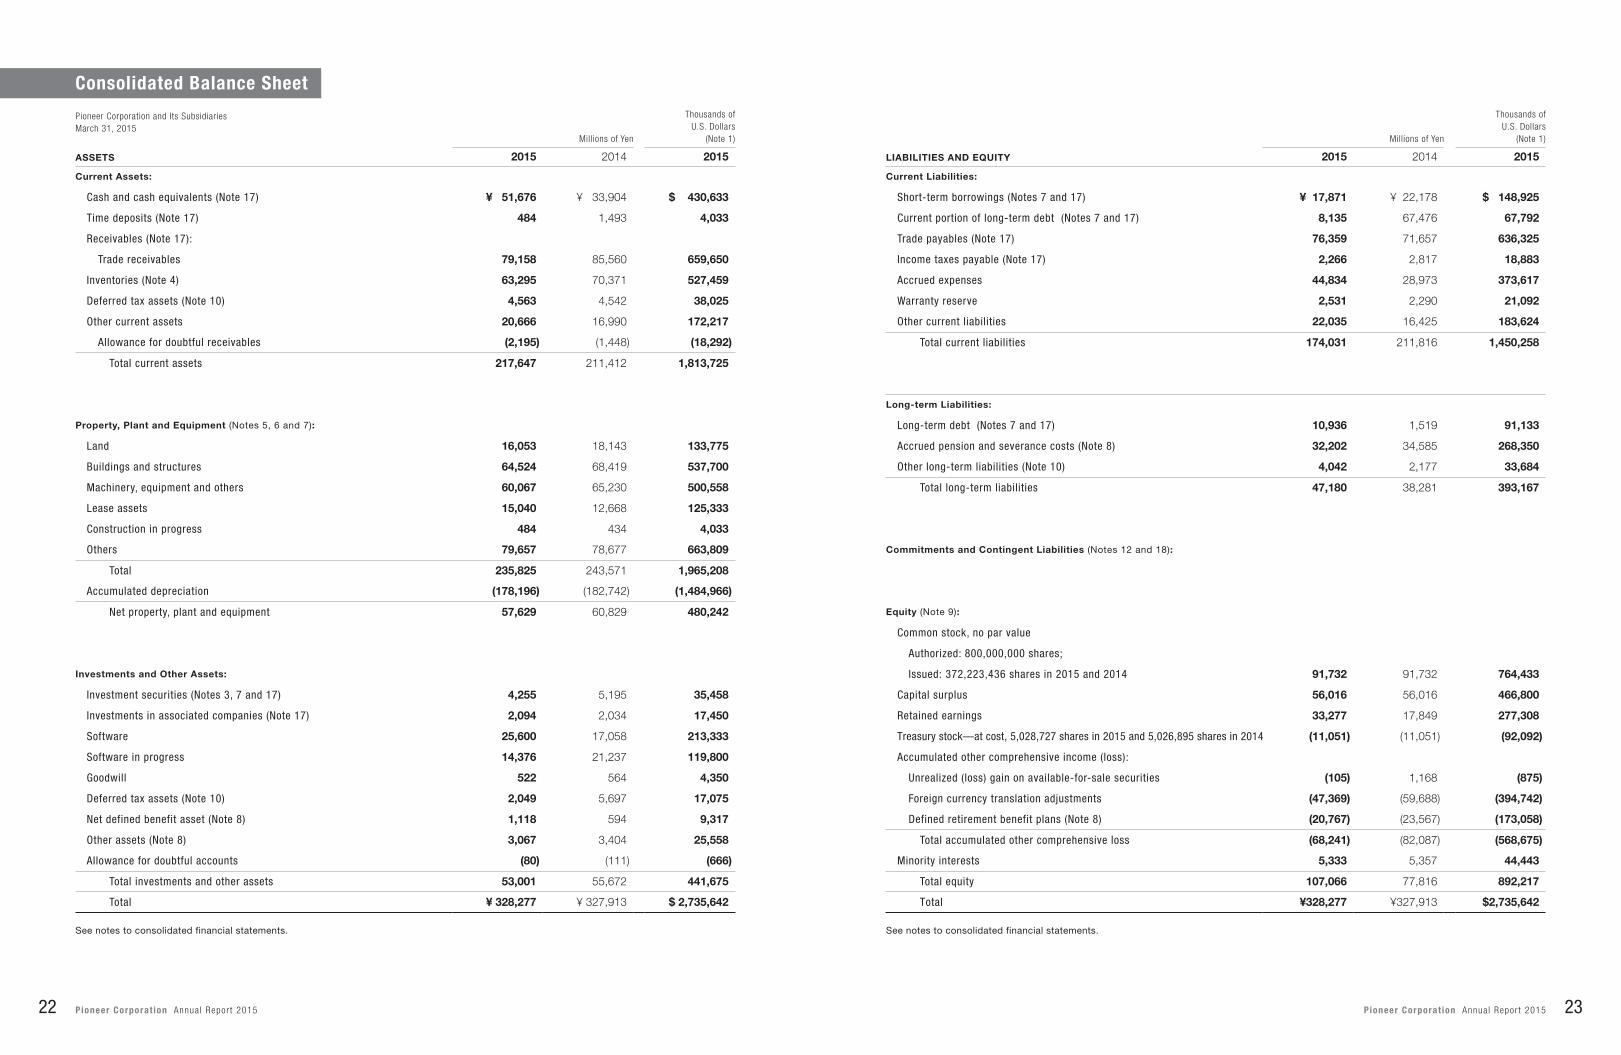
Pioneer Corporation and Its SubsidiariesMarch 31, 2015
Millions of Yen
Thousands of U.S. Dollars
(Note 1)
ASSETS 2015 2014 2015
Current Assets:
Cash and cash equivalents (Note 17) ¥ 51,676 ¥ 33,904 $ 430,633
Time deposits (Note 17) 484 1,493 4,033
Receivables (Note 17):
Trade receivables 79,158 85,560 659,650
Inventories (Note 4) 63,295 70,371 527,459
Deferred tax assets (Note 10) 4,563 4,542 38,025
Other current assets 20,666 16,990 172,217
Allowance for doubtful receivables (2,195) (1,448) (18,292)
Total current assets 217,647 211,412 1,813,725
Property, Plant and Equipment (Notes 5, 6 and 7):
Land 16,053 18,143 133,775
Buildings and structures 64,524 68,419 537,700
Machinery, equipment and others 60,067 65,230 500,558
Lease assets 15,040 12,668 125,333
Construction in progress 484 434 4,033
Others 79,657 78,677 663,809
Total 235,825 243,571 1,965,208
Accumulated depreciation (178,196) (182,742) (1,484,966)
Net property, plant and equipment 57,629 60,829 480,242
Investments and Other Assets:
Investment securities (Notes 3, 7 and 17) 4,255 5,195 35,458
Investments in associated companies (Note 17) 2,094 2,034 17,450
Software 25,600 17,058 213,333
Software in progress 14,376 21,237 119,800
Goodwill 522 564 4,350
Deferred tax assets (Note 10) 2,049 5,697 17,075
Net defined benefit asset (Note 8) 1,118 594 9,317
Other assets (Note 8) 3,067 3,404 25,558
Allowance for doubtful accounts (80) (111) (666)
Total investments and other assets 53,001 55,672 441,675
Total ¥ 328,277 ¥ 327,913 $ 2,735,642
Millions of Yen
Thousands of U.S. Dollars
(Note 1)
LIABILITIES AND EQUITY 2015 2014 2015
Current Liabilities:
Short-term borrowings (Notes 7 and 17) ¥ 17,871 ¥ 22,178 $ 148,925
Current portion of long-term debt (Notes 7 and 17) 8,135 67,476 67,792
Trade payables (Note 17) 76,359 71,657 636,325
Income taxes payable (Note 17) 2,266 2,817 18,883
Accrued expenses 44,834 28,973 373,617
Warranty reserve 2,531 2,290 21,092
Other current liabilities 22,035 16,425 183,624
Total current liabilities 174,031 211,816 1,450,258
Long-term Liabilities:
Long-term debt (Notes 7 and 17) 10,936 1,519 91,133
Accrued pension and severance costs (Note 8) 32,202 34,585 268,350
Other long-term liabilities (Note 10) 4,042 2,177 33,684
Total long-term liabilities 47,180 38,281 393,167
Commitments and Contingent Liabilities (Notes 12 and 18):
Equity (Note 9):
Common stock, no par value
Authorized: 800,000,000 shares;
Issued: 372,223,436 shares in 2015 and 2014 91,732 91,732 764,433
Capital surplus 56,016 56,016 466,800
Retained earnings 33,277 17,849 277,308
Treasury stock—at cost, 5,028,727 shares in 2015 and 5,026,895 shares in 2014 (11,051) (11,051) (92,092)
Accumulated other comprehensive income (loss):
Unrealized (loss) gain on available-for-sale securities (105) 1,168 (875)
Foreign currency translation adjustments (47,369) (59,688) (394,742)
Defined retirement benefit plans (Note 8) (20,767) (23,567) (173,058)
Total accumulated other comprehensive loss (68,241) (82,087) (568,675)
Minority interests 5,333 5,357 44,443
Total equity 107,066 77,816 892,217
Total ¥328,277 ¥327,913 $2,735,642
See notes to consolidated financial statements. See notes to consolidated financial statements.
Consolidated Balance Sheet
22 Pioneer Corporat ion Annua l Repor t 2015 23Pioneer Corporat ion Annua l Repor t 2015
Millions of Yen
Thousands of U.S. Dollars
(Note 1)
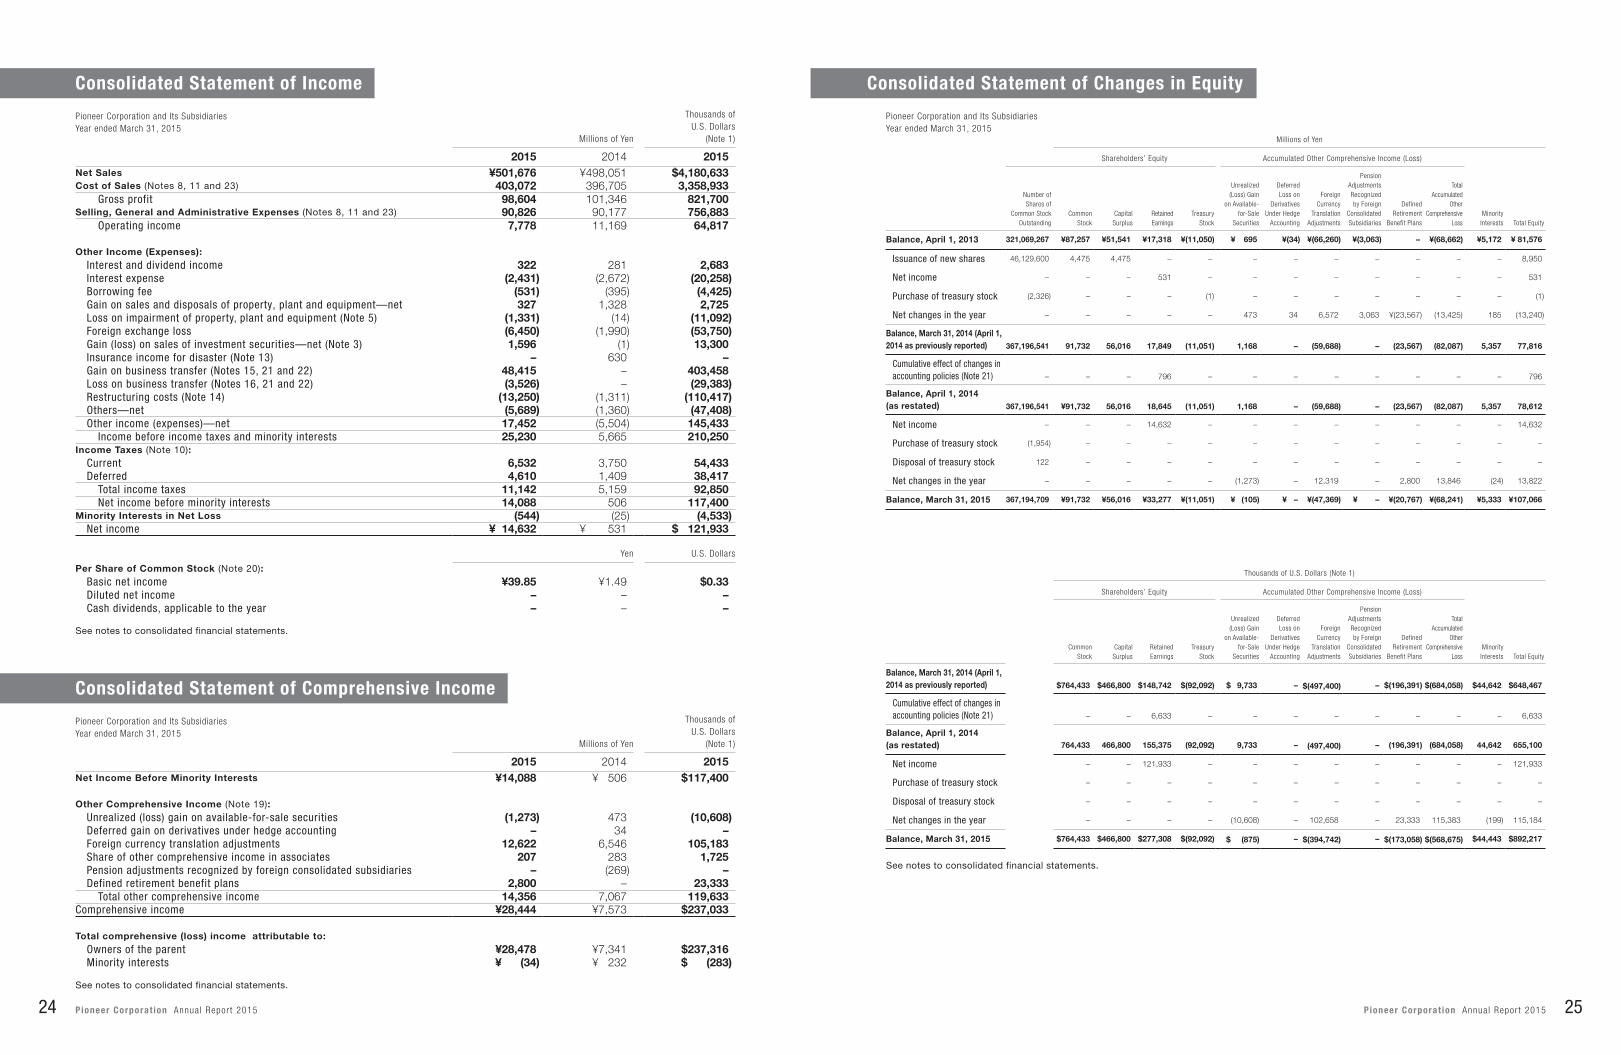
2015 2014 2015Net Sales ¥501,676 ¥498,051 $4,180,633 Cost of Sales (Notes 8, 11 and 23) 403,072 396,705 3,358,933
Gross profit 98,604 101,346 821,700 Selling, General and Administrative Expenses (Notes 8, 11 and 23) 90,826 90,177 756,883
Operating income 7,778 11,169 64,817
Other Income (Expenses):Interest and dividend income 322 281 2,683 Interest expense (2,431) (2,672) (20,258)Borrowing fee (531) (395) (4,425)Gain on sales and disposals of property, plant and equipment—net 327 1,328 2,725 Loss on impairment of property, plant and equipment (Note 5) (1,331) (14) (11,092)Foreign exchange loss (6,450) (1,990) (53,750)Gain (loss) on sales of investment securities—net (Note 3) 1,596 (1) 13,300 Insurance income for disaster (Note 13) – 630 – Gain on business transfer (Notes 15, 21 and 22) 48,415 – 403,458 Loss on business transfer (Notes 16, 21 and 22) (3,526) – (29,383)Restructuring costs (Note 14) (13,250) (1,311) (110,417)Others—net (5,689) (1,360) (47,408)Other income (expenses)—net 17,452 (5,504) 145,433
Income before income taxes and minority interests 25,230 5,665 210,250 Income Taxes (Note 10):
Current 6,532 3,750 54,433 Deferred 4,610 1,409 38,417
Total income taxes 11,142 5,159 92,850 Net income before minority interests 14,088 506 117,400
Minority Interests in Net Loss (544) (25) (4,533)Net income ¥ 14,632 ¥ 531 $ 121,933
Yen U.S. Dollars
Per Share of Common Stock (Note 20):Basic net income ¥39.85 ¥1.49 $0.33 Diluted net income – – – Cash dividends, applicable to the year – – –
Millions of Yen
Shareholders’ Equity Accumulated Other Comprehensive Income (Loss)
Number of Shares of
Common Stock Outstanding
Common Stock
Capital Surplus
Retained Earnings
Treasury Stock
Unrealized (Loss) Gain
on Available-for-Sale
Securities
Deferred Loss on
Derivatives Under Hedge
Accounting
Foreign Currency
Translation Adjustments
Pension Adjustments Recognized by Foreign
Consolidated Subsidiaries
Defined Retirement
Benefit Plans
Total Accumulated
Other Comprehensive
LossMinority Interests Total Equity
Balance, April 1, 2013 321,069,267 ¥87,257 ¥51,541 ¥17,318 ¥(11,050) ¥ 695 ¥(34) ¥(66,260) ¥(3,063) – ¥(68,662) ¥5,172 ¥ 81,576
Issuance of new shares 46,129,600 4,475 4,475 – – – – – – – – – 8,950
Net income – – – 531 – – – – – – – – 531
Purchase of treasury stock (2,326) – – – (1) – – – – – – – (1)
Net changes in the year – – – – – 473 34 6,572 3,063 ¥(23,567) (13,425) 185 (13,240)
Balance, March 31, 2014 (April 1, 2014 as previously reported) 367,196,541 91,732 56,016 17,849 (11,051) 1,168 – (59,688) – (23,567) (82,087) 5,357 77,816
Cumulative effect of changes in accounting policies (Note 21) – – – 796 – – – – – – – – 796
Balance, April 1, 2014 (as restated) 367,196,541 ¥91,732 56,016 18,645 (11,051) 1,168 – (59,688) – (23,567) (82,087) 5,357 78,612
Net income – – – 14,632 – – – – – – – – 14,632
Purchase of treasury stock (1,954) – – – – – – – – – – – –
Disposal of treasury stock 122 – – – – – – – – – – – –
Net changes in the year – – – – – (1,273) – 12,319 – 2,800 13,846 (24) 13,822
Balance, March 31, 2015 367,194,709 ¥91,732 ¥56,016 ¥33,277 ¥(11,051) ¥ (105) ¥ – ¥(47,369) ¥ – ¥(20,767) ¥(68,241) ¥5,333 ¥107,066
Thousands of U.S. Dollars (Note 1)
Shareholders’ Equity Accumulated Other Comprehensive Income (Loss)
Common Stock
Capital Surplus
Retained Earnings
Treasury Stock
Unrealized (Loss) Gain
on Available-for-Sale
Securities
Deferred Loss on
Derivatives Under Hedge
Accounting
Foreign Currency
Translation Adjustments
Pension Adjustments Recognized by Foreign
Consolidated Subsidiaries
Defined Retirement
Benefit Plans
Total Accumulated
Other Comprehensive
LossMinority Interests Total Equity
Balance, March 31, 2014 (April 1, 2014 as previously reported) $764,433 $466,800 $148,742 $(92,092) $ 9,733 – $(497,400) – $(196,391) $(684,058) $44,642 $648,467
Cumulative effect of changes in accounting policies (Note 21) – – 6,633 – – – – – – – – 6,633
Balance, April 1, 2014 (as restated) 764,433 466,800 155,375 (92,092) 9,733 – (497,400) – (196,391) (684,058) 44,642 655,100
Net income – – 121,933 – – – – – – – – 121,933
Purchase of treasury stock – – – – – – – – – – – –
Disposal of treasury stock – – – – – – – – – – – –
Net changes in the year – – – – (10,608) – 102,658 – 23,333 115,383 (199) 115,184
Balance, March 31, 2015 $764,433 $466,800 $277,308 $(92,092) $ (875) – $(394,742) – $(173,058) $(568,675) $44,443 $892,217
Millions of Yen
Thousands of U.S. Dollars
(Note 1)
2015 2014 2015Net Income Before Minority Interests ¥14,088 ¥ 506 $117,400
Other Comprehensive Income (Note 19):Unrealized (loss) gain on available-for-sale securities (1,273) 473 (10,608)Deferred gain on derivatives under hedge accounting – 34 – Foreign currency translation adjustments 12,622 6,546 105,183 Share of other comprehensive income in associates 207 283 1,725 Pension adjustments recognized by foreign consolidated subsidiaries – (269) – Defined retirement benefit plans 2,800 – 23,333
Total other comprehensive income 14,356 7,067 119,633 Comprehensive income ¥28,444 ¥7,573 $237,033
Total comprehensive (loss) income attributable to:Owners of the parent ¥28,478 ¥7,341 $237,316 Minority interests ¥ (34) ¥ 232 $ (283)
See notes to consolidated financial statements.
See notes to consolidated financial statements.
Pioneer Corporation and Its SubsidiariesYear ended March 31, 2015
Pioneer Corporation and Its SubsidiariesYear ended March 31, 2015
Pioneer Corporation and Its SubsidiariesYear ended March 31, 2015
See notes to consolidated financial statements.
Consolidated Statement of Income Consolidated Statement of Changes in Equity
Consolidated Statement of Comprehensive Income
24 Pioneer Corporat ion Annua l Repor t 2015 25Pioneer Corporat ion Annua l Repor t 2015
a. Basis of Consolidated Financial StatementsThe accompanying consolidated financial statements have been prepared in accordance with the provisions set forth in the Japanese Financial Instruments and Exchange Act and its related accounting regulations and in accordance with accounting principles gen-erally accepted in Japan (“Japanese GAAP”), which are different in certain respects as to the application and disclosure requirements of International Financial Reporting Standards (“IFRS”).
In preparing these consolidated financial state-ments, certain reclassifications and rearrangements have been made to the consolidated financial state-ments issued in Japan in order to present them in a form which is more familiar to readers outside Japan. In addition, certain reclassifications have been made in the 2014 consolidated financial statements to con-form to the classifications used in 2015.
The consolidated financial statements are stated in Japanese yen, the currency of the country in which Pioneer Corporation (Pioneer Kabushiki Kaisha; the “Company”) is incorporated and operates. The trans-lations of Japanese yen amounts into U.S. dollar amounts are included solely for the convenience of readers outside Japan and have been made at the rate of ¥120 to $1.00, the approximate rate of exchange
a. ConsolidationThe consolidated financial statements as of March 31, 2015 include the accounts of the Company and its 73 (80 in 2014) subsidiaries.
Under the control or influence concept, those companies in which the Company, directly or indi-rectly, is able to exercise control over operations are fully consolidated, and those companies over which the Group has the ability to exercise significant influ-ence are accounted for by the equity method.
Investments in seven (six in 2014) associated companies are accounted for by the equity method.
The excess of cost of an acquisition over the fair value of the net assets of an acquired subsidiary at the date of acquisition is being amortized over a period not exceeding 20 years.
All significant intercompany balances and trans-actions have been eliminated in consolidation. All material unrealized profit included in assets resulting from transactions within the Group is also eliminated.
1. Basis of Presentation
2. Summary of Significant Accounting Policies
as of March 31, 2015. Such translations should not be construed as representations that the Japanese yen amounts could be converted into U.S. dollars at that or any other rate.
b. Nature of OperationsThe Company and its subsidiaries (together, the “Group”) are engaged in the development, manufacture and sale of electronic products. The Group is a leading global manufacturer of consumer- and business-use electronic products such as car electronics and audio/video. The principal production activities of the Group are carried out in Asia including Japan, Brazil, and the United States. The Group’s products are generally sold under its own brand names, principally “Pioneer.” The Group sells its products to customers in consumer and commercial markets through its sales offices in Japan, and its sales subsidiaries and independent distributors overseas. On an OEM (original equipment manufactur-ing) basis, the Group markets certain products, such as car electronics products to other companies.
On March 2, 2015, the Group transferred its home AV, telephones, headphone-related and DJ equipment businesses. Details are described in Note 21. Business Combination.
b. Unification of Accounting Policies Applied to Foreign Subsidiaries for the Consolidated Financial StatementsIn May 2006, the Accounting Standards Board of Japan (the “ASBJ”) issued ASBJ Practical Issues Task Force (PITF) No. 18, “Practical Solution on Unification of Accounting Policies Applied to Foreign Subsid-iaries for Consolidated Financial Statements.” PITF No. 18 prescribes that the accounting policies and procedures applied to a parent company and its sub-sidiaries for similar transactions and events under similar circumstances should in principle be unified for the preparation of the consolidated financial state-ments. However, financial statements prepared by foreign subsidiaries in accordance with either IFRS or the generally accepted accounting principles in the United States of America tentatively may be used for the consolidation process, except for the following items which should be adjusted in the consolidation process so that net income is accounted for in ac-cordance with Japanese GAAP, unless they are not material: (a) amortization of goodwill; (b) scheduled amortization of actuarial gain or loss of pensions that has been recorded in equity through other comprehensive
Millions of Yen
Thousands of U.S. Dollars
(Note 1)
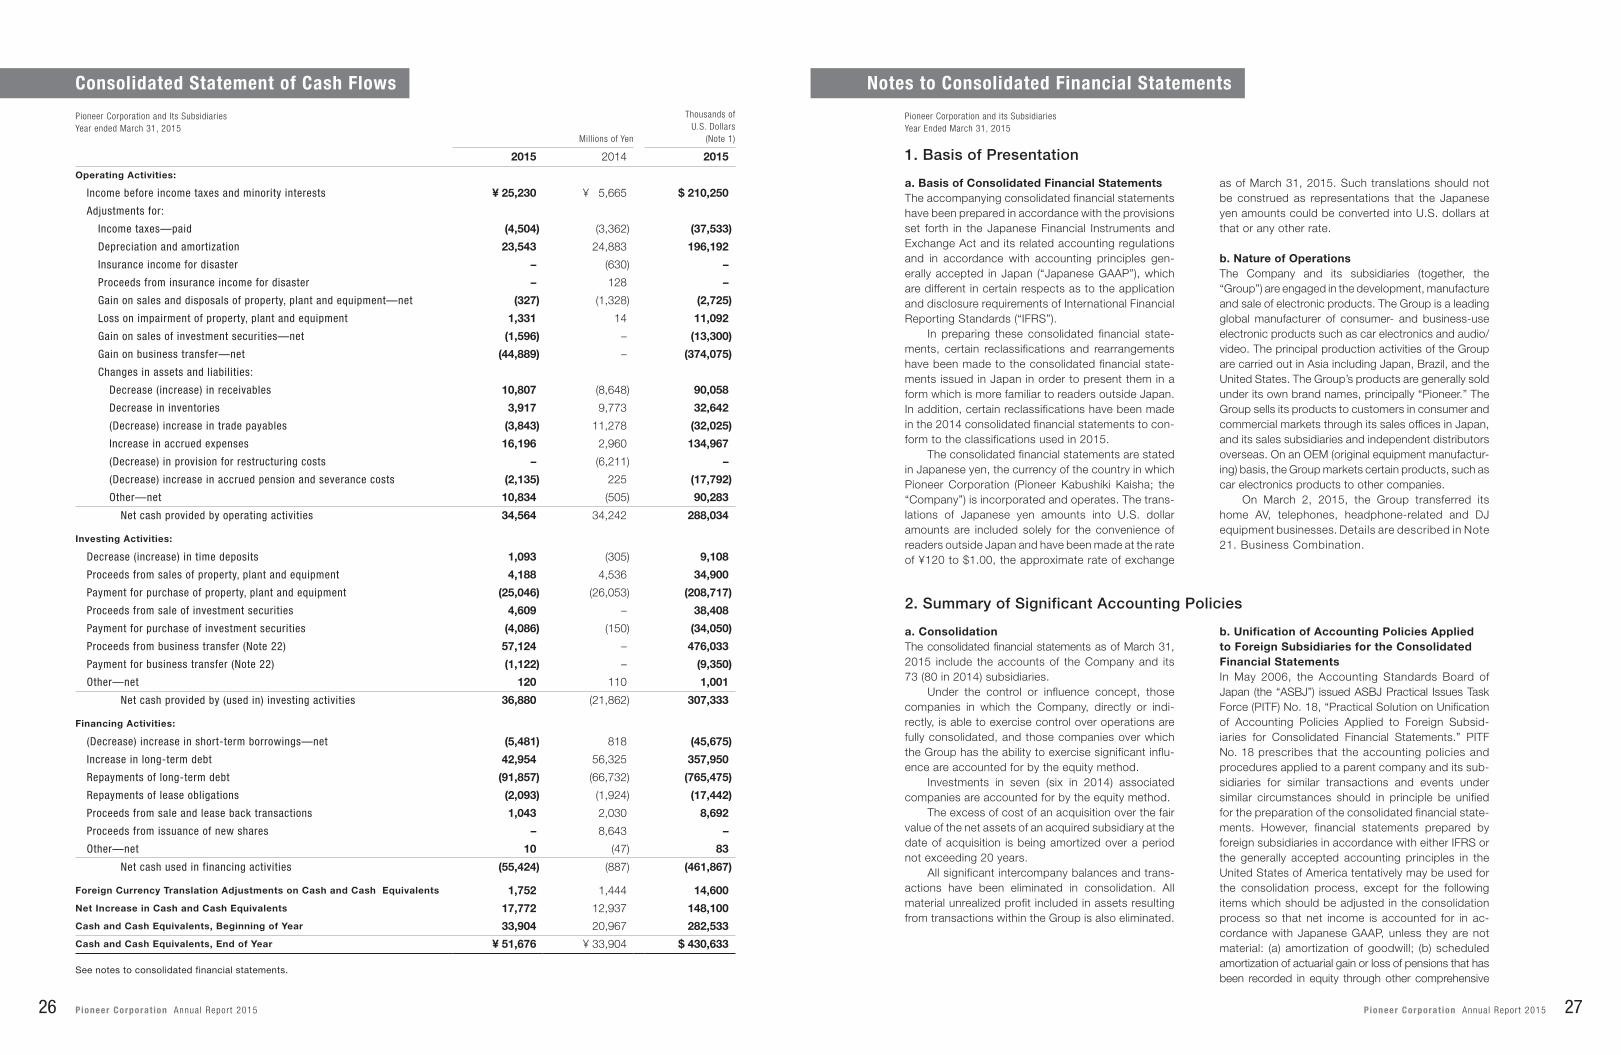
2015 2014 2015
Operating Activities:
Income before income taxes and minority interests ¥ 25,230 ¥ 5,665 $ 210,250
Adjustments for:
Income taxes—paid (4,504) (3,362) (37,533)
Depreciation and amortization 23,543 24,883 196,192
Insurance income for disaster – (630) –
Proceeds from insurance income for disaster – 128 –
Gain on sales and disposals of property, plant and equipment—net (327) (1,328) (2,725)
Loss on impairment of property, plant and equipment 1,331 14 11,092
Gain on sales of investment securities—net (1,596) – (13,300)
Gain on business transfer—net (44,889) – (374,075)
Changes in assets and liabilities:
Decrease (increase) in receivables 10,807 (8,648) 90,058
Decrease in inventories 3,917 9,773 32,642
(Decrease) increase in trade payables (3,843) 11,278 (32,025)
Increase in accrued expenses 16,196 2,960 134,967
(Decrease) in provision for restructuring costs – (6,211) –
(Decrease) increase in accrued pension and severance costs (2,135) 225 (17,792)
Other—net 10,834 (505) 90,283
Net cash provided by operating activities 34,564 34,242 288,034
Investing Activities:
Decrease (increase) in time deposits 1,093 (305) 9,108
Proceeds from sales of property, plant and equipment 4,188 4,536 34,900
Payment for purchase of property, plant and equipment (25,046) (26,053) (208,717)
Proceeds from sale of investment securities 4,609 – 38,408
Payment for purchase of investment securities (4,086) (150) (34,050)
Proceeds from business transfer (Note 22) 57,124 – 476,033
Payment for business transfer (Note 22) (1,122) – (9,350)
Other—net 120 110 1,001
Net cash provided by (used in) investing activities 36,880 (21,862) 307,333
Financing Activities:
(Decrease) increase in short-term borrowings—net (5,481) 818 (45,675)
Increase in long-term debt 42,954 56,325 357,950
Repayments of long-term debt (91,857) (66,732) (765,475)
Repayments of lease obligations (2,093) (1,924) (17,442)
Proceeds from sale and lease back transactions 1,043 2,030 8,692
Proceeds from issuance of new shares – 8,643 –
Other—net 10 (47) 83
Net cash used in financing activities (55,424) (887) (461,867)
Foreign Currency Translation Adjustments on Cash and Cash Equivalents 1,752 1,444 14,600
Net Increase in Cash and Cash Equivalents 17,772 12,937 148,100
Cash and Cash Equivalents, Beginning of Year 33,904 20,967 282,533
Cash and Cash Equivalents, End of Year ¥ 51,676 ¥ 33,904 $ 430,633
See notes to consolidated financial statements.
Pioneer Corporation and Its SubsidiariesYear ended March 31, 2015
Pioneer Corporation and its SubsidiariesYear Ended March 31, 2015
Consolidated Statement of Cash Flows Notes to Consolidated Financial Statements
26 Pioneer Corporat ion Annua l Repor t 2015 27Pioneer Corporat ion Annua l Repor t 2015

h. InventoriesInventories are stated at the lower of cost, determined by the average cost method for finished products, work in process and raw materials and supplies, or net selling value.
i. Property, Plant and EquipmentProperty, plant and equipment are stated at cost. Depreciation of property, plant and equipment (other than leased property) of the Company and its Japa-nese subsidiaries is computed principally using the declining-balance method based on the estimated useful lives of the assets, while the straight-line method based on the estimated useful lives of the assets is applied to property, plant and equipment of foreign subsidiaries. The useful lives for lease assets are the terms of the respective leases.
j. Long-lived AssetsThe Group reviews its long-lived assets for impairment whenever events or changes in circumstance indicate that the carrying amount of an asset or asset group may not be recoverable. An impairment loss would be recognized if the carrying amount of an asset or asset group exceeds the sum of the undiscounted future cash flows expected to result from the contin-ued use and eventual disposition of the asset or asset group. The impairment loss would be measured as the amount by which the carrying amount of the asset exceeds its recoverable amount, which is the higher of the discounted cash flows from the continued use and eventual disposition of the asset or the net selling price at disposition. Software for sales is amortized using the straight-line method over the expected sell-able period by product group of one to three years, considering the expected sales volume trend based on the life cycle of related products. Software for in-ternal use is amortized using the straight-line method over an estimated useful life of five years.
k. Warranty ReserveProvisions for warranty costs are recognized on the date of sales of the relevant products, based on the best estimate of the expenditure required to settle the Group’s after-sales service obligation.
l. Retirement and Pension PlansThe Group sponsors both defined benefit pension plans and defined contribution pension plans.
With respect to the defined benefit pension plan, the Group accounts for the “Accrued pension and severance costs” based on projected benefit obliga-tions and plan assets at the consolidated balance sheet date. The projected benefit obligations are at-tributed to periods on a benefit formula basis. Net
In December 2008, the ASBJ issued a revised accounting standard for business combinations, ASBJ Statement No. 21, “Accounting Standard for Business Combinations.” Major accounting changes under the revised accounting standard are as follows: (1) The revised standard requires accounting for busi-ness combinations only by the purchase method. As a result, the pooling-of-interests method of account-ing is no longer allowed. (2) The previous accounting standard required research and development costs to be charged to income as incurred. Under the re-vised standard, in-process research and development costs (IPR&D) acquired in the business combination are capitalized as an intangible asset. (3) The previous accounting standard provided for a bargain purchase gain (negative goodwill) to be systematically amortized over a period not exceeding 20 years. Under the re-vised standard, the acquirer recognizes the bargain purchase gain in profit or loss immediately on the ac-quisition date after reassessing and confirming that all of the assets acquired and all of the liabilities assumed have been identified after a review of the procedures used in the purchase allocation. The revised standard is applicable to business combinations undertaken on or after April 1, 2010.
e. Cash EquivalentsCash equivalents are short-term investments that are readily convertible into cash and exposed to insig-nificant risk of changes in value. Cash equivalents include time deposits which become due within three months of the date of acquisition.
f. Investment SecuritiesAvailable-for-sale securities for which market quota-tions are available are stated at fair value. Unrealized gain (loss) on these securities is stated at net of tax effect and minority interests as “unrealized gain (loss) on available-for-sale securities” in a separate component of equity. Available-for-sale securities for which market quotations are unavailable are stated at cost by using the moving average method. For other-than-temporary declines in fair value, invest-ment securities are reduced to net realizable value by a charge to income.
g. Allowance for Doubtful ReceivablesThe Group has provided an allowance for doubtful receivables by the method based on the percentage of its own historical bad debt loss against the bal-ance of total receivables, plus the amount deemed necessary to cover individual accounts receivables estimated to be uncollectible.
transitional obligation as of April 1, 2000, is being amortized in equal amounts mainly over 15 years. Prior service cost is amortized using the straight-line method over 10–15 years within the average of the estimated remaining service years. Actuarial gain or loss is primarily amortized using the straight-line method over 10–18 years within the average of the estimated remaining service years. The Group’s net periodic retirement benefit costs consist of service cost, interest cost, expected return on plan assets and amortization of such deferred amounts.
With respect to the defined contribution plans, the Group charges contributions to expenses when they are paid or accrued.
Certain consolidated subsidiaries apply the sim-plified method in computing net defined benefit assets or accrued pension and severance costs and retire-ment benefit costs. Under this method, the severance payment amount to be required at the year-end for voluntary termination is deemed as projected benefit obligation.
In May 2012, the ASBJ issued ASBJ Statement No. 26, “Accounting Standard for Retirement Ben-efits” and ASBJ Guidance No. 25, “Guidance on Accounting Standard for Retirement Benefits,” which replaced the accounting standard for retirement ben-efits that had been issued by the Business Accounting Council in 1998 with an effective date of April 1, 2000, and the other related practical guidance, and were followed by partial amendments from time to time through 2009.
(a) Under the revised accounting standard, actuarial gains and losses and past service costs that are yet to be recognized in profit or loss are recognized within equity (“Accumulated other comprehensive income”), after adjusting for tax effects, and any resulting defi-cit or surplus is recognized as a liability (“Accrued pension and severance costs”) or asset (“Asset for retirement benefits”).
(b) The revised accounting standard does not change how to recognize actuarial gains and losses and past service costs in profit or loss. Those amounts are recognized in profit or loss over a certain period no longer than the expected average remaining service period of the employees. However, actuarial gains and losses and past service costs that arose in the current period and have not yet been recognized in profit or loss are included in other comprehensive in-come and actuarial gains and losses and past service costs that were recognized in other comprehensive income in prior periods and then recognized in profit or loss in the current period shall be treated as reclas-sification adjustments.
income; (c) expensing capitalized development costs of R&D; (d) cancellation of the fair value model accounting for property, plant and equipment and investment properties and incorporation of the cost model accounting; and (e) exclusion of minority interests from net income, if contained in net income.
c. Unification of Accounting Policies Applied to Foreign Associated Companies for the Equity MethodIn March 2008, the ASBJ issued ASBJ Statement No. 16, “Accounting Standard for Equity Method of Accounting for Investments.” The new standard requires adjustments to be made to conform the as-sociate’s accounting policies for similar transactions and events under similar circumstances to those of the parent company when the associate’s financial statements are used in applying the equity method un-less it is impracticable to determine such adjustments. In addition, financial statements prepared by foreign associated companies in accordance with either IFRS or the generally accepted accounting principles in the United States of America tentatively may be used in applying the equity method if the following items are adjusted so that net income is accounted for in ac-cordance with Japanese GAAP, unless they are not material: (a) amortization of goodwill; (b) scheduled amortization of actuarial gain or loss of pensions that has been recorded in equity through other comprehen-sive income; (c) expensing capitalized development costs of R&D; (d) cancellation of the fair value model accounting for property, plant, and equipment and investment properties and incorporation of the cost model accounting; and (e) exclusion of minority inter-ests from net income, if contained in net income.
d. Business CombinationIn October 2003, the Business Accounting Council issued a Statement of Opinion, “Accounting for Busi-ness Combinations,” and in December 2005, the ASBJ issued ASBJ Statement No. 7, “Accounting Standard for Business Divestitures” and ASBJ Guidance No. 10, “Guidance on Accounting Standard for Business Combinations and Accounting Standard for Business Divestitures.” The accounting standard for business combinations allowed companies to apply the pooling-of-interests method of accounting only when certain specific criteria are met such that the business combi-nation is essentially regarded as a uniting-of-interests. For business combinations that do not meet the uniting-of-interests criteria, the business combination is considered to be an acquisition and the purchase method of accounting is required. This standard also prescribes the accounting for combinations of entities under common control and for joint ventures.
28 Pioneer Corporat ion Annua l Repor t 2015 29Pioneer Corporat ion Annua l Repor t 2015
the expected future tax consequences of temporary differences between the carrying amounts and the tax bases of assets and liabilities. Deferred taxes are measured by applying currently enacted tax laws to the temporary differences. A valuation allowance is established to reduce deferred tax assets if they are not considered to be recoverable.
q. Foreign Currency TranslationsAll short-term and long-term monetary receivables and payables denominated in foreign currencies are translated into Japanese yen at the exchange rates at the consolidated balance sheet date. The foreign exchange gains and losses from translation are rec-ognized in the consolidated statement of operations to the extent that they are not hedged by forward exchange contracts.
r. Foreign Currency Financial StatementsThe balance sheet accounts of the consolidated for-eign subsidiaries are translated into Japanese yen at the current exchange rate as of the consolidated balance sheet date, except for equity, which is trans-lated at the historical rate. Differences arising from such translations are shown as “Foreign currency translation adjustments” and “Minority interests” in a separate component of equity. Revenue and ex-pense accounts of consolidated foreign subsidiaries are translated into yen at the average exchange rate.
s. Derivatives and Hedging ActivitiesThe Group uses derivative financial instruments to manage its exposures to fluctuations in foreign exchange and interest rates. Foreign exchange for-ward contracts and currency swaps are utilized by the Group to reduce foreign currency exchange and interest rate risks associated with assets and liabilities denominated in foreign currencies and debt obliga-tions. The Group does not enter into derivatives for trading or speculative purposes.
Derivative financial instruments and foreign cur-rency transactions are classified and accounted for as follows: (a) all derivatives are recognized as either assets or liabilities and measured at fair value, and gains or losses on derivative transactions are rec-ognized in the consolidated statement of operations and (b) for derivatives used for hedging purposes, if such derivatives qualify for hedge accounting be-cause of high correlation and effectiveness between the hedging instruments and the hedged items, gains or losses on derivatives are deferred until maturity of the hedged transactions.
Foreign currency forward contracts, currency op-tions and currency swaps are utilized to hedge foreign currency exposures in export sales and procurements
reasonable estimate of the asset retirement obligation cannot be made in the period the asset retirement ob-ligation is incurred, the liability should be recognized when a reasonable estimate of asset retirement obliga-tion can be made. Upon initial recognition of a liability for an asset retirement obligation, an asset retirement cost is capitalized by increasing the carrying amount of the related fixed asset by the amount of the liability. The asset retirement cost is subsequently allocated to expense through depreciation over the remaining useful life of the asset. Over time, the liability is accreted to its present value each period. Any subsequent revisions to the timing or the amount of the original estimate of undiscounted cash flows are reflected as an increase or a decrease in the carrying amount of the liability and the capitalized amount of the related asset retirement cost.
n. Research and Development Costs and Intangible AssetsResearch and development costs are charged to in-come as incurred. Software for sale is amortized by the straight-line method over 1–3 years, while soft-ware for internal use is amortized by the straight-line method over the estimated useful life of five years. Intangible assets other than software are amortized using the straight-line method.
o. LeasesThe depreciation method for lease assets involving finance lease transactions of which the ownership is transferred to lessees is the same as that which applies to property, plant and equipment owned by the Company.
The depreciation method for lease assets involv-ing finance lease transactions of which the ownership is not transferred to lessees is the straight-line method with their residual values being zero over their leased periods used as the number of years for useful life.
In March 2007, the ASBJ issued ASBJ Statement No. 13, “Accounting Standard for Lease Transactions,” which revised the former accounting standard for lease transactions issued in June 1993, and ASBJ Guidance No. 16, “Guidance on Accounting Standard for Lease Transactions,” which revised the former guidance issued in January 1994. The adoption of the revised accounting standard was permitted for fiscal years beginning on or after April 1, 2008.
All other leases are accounted for as operating leases.
p. Income TaxesThe provision for income taxes is computed based on the pretax income included in the consolidated state-ment of operations. The asset and liability approach is used to recognize deferred tax assets and liabilities for
from overseas suppliers. Trade receivables and trade payables denominated in foreign currencies are trans-lated at the contracted rates if the foreign currency forward contracts, currency options and currency swaps qualify for hedge accounting.
The interest rate swaps which qualify for hedge accounting and meet specific matching criteria are not remeasured at market value but the differential paid or received under the swap agreements are rec-ognized and included in interest expense or income.
t. Per Share InformationBasic net income per share is computed by divid-ing net income available to common shareholders by the weighted-average number of shares of common stock outstanding for the period, after deduction of treasury stock, retroactively adjusted for stock splits. Diluted net income per share for the years ended March 31, 2015 and 2014, is not disclosed as there were no potentially dilutive securities for the years ended March 31, 2015 and 2014.
Diluted net income per share reflects the potential dilution that could occur if securities were exercised or converted into common stock. Diluted net income per share of common stock assumes full conversion of the outstanding convertible notes and bonds at the beginning of the year (or at the time of issuance) with an applicable adjustment for related interest expense, net of tax, and full exercise of outstanding warrants.
Cash dividends per share presented in the ac-companying consolidated statement of operations are dividends applicable to the respective years in-cluding dividends to be paid after the end of the year.
u. New Accounting PronouncementsAccounting Standards for Business Combinations and Consolidated Financial Statements — On September 13, 2013, the ASBJ issued revised ASBJ Statement No. 21, “Accounting Standard for Business Combinations,” revised ASBJ Guidance No. 10, “Guidance on Accounting Standards for Busi-ness Combinations and Business Divestitures,” and revised ASBJ Statement No. 22, “Accounting Stan-dard for Consolidated Financial Statements.”
Major accounting changes are as follows:
(a) Transactions with noncontrolling interest — A par-ent’s ownership interest in a subsidiary might change if the parent purchases or sells ownership interests in its subsidiary. The carrying amount of minority interest is adjusted to reflect the change in the parent’s owner-ship interest in its subsidiary while the parent retains its controlling interest in its subsidiary. Under the current accounting standard, any difference between the fair
(c) The revised accounting standard also made certain amendments relating to the method of attributing ex-pected benefit to periods and relating to the discount rate and expected future salary increases.
This accounting standard and the guidance for (a) and (b) above are effective for the end of annual periods beginning on or after April 1, 2013, and for (c) above are effective for the beginning of annual periods be-ginning on or after April 1, 2014, or for the beginning of annual periods beginning on or after April 1, 2015, subject to certain disclosure in March 2015, both with earlier application being permitted from the begin-ning of annual periods beginning on or after April 1, 2013. However, no retrospective application of this accounting standard to consolidated financial state-ments in prior periods is required.
The Company applied the revised accounting stan-dard and guidance for retirement benefits for (a) and (b) above, effective March 31, 2014, and for (c) above, effective April 1, 2014.
With respect to (c) above, the Company changed the method of attributing the expected benefit to periods from a straight-line basis to a benefit formula basis, the method of determining the discount rate from using the period which approximates the expected average remaining service period to using a single weighted av-erage discount rate reflecting the estimated timing and amount of benefit payment, and recorded the effect of (c) above as of April 1, 2014, in “Retained earnings.” As a result, “Accrued pension and severance costs” as of April 1, 2014, decreased by ¥812 million ($6,767 thousand), and “Retained earnings” as of April 1, 2014, increased by ¥796 million ($6,633 thousand). The ef-fect of this accounting change on net income, net assets per share and net income per share as of and for the year ended March 31, 2015 was immaterial.
m. Asset Retirement ObligationsIn March 2008, the ASBJ published ASBJ Statement No. 18 “Accounting Standard for Asset Retirement Ob-ligations” and ASBJ Guidance No. 21 “Guidance on Accounting Standard for Asset Retirement Obligations”. Under this accounting standard, an asset retirement obligation is defined as a legal obligation imposed ei-ther by law or contract that results from the acquisition, construction, development and the normal operation of a tangible fixed asset and is associated with the retire-ment of such tangible fixed asset. The asset retirement obligation is recognized as the sum of the discounted cash flows required for the future asset retirement and is recorded in the period in which the obligation is incurred if a reasonable estimate can be made. If a
30 Pioneer Corporat ion Annua l Repor t 2015 31Pioneer Corporat ion Annua l Repor t 2015

The above accounting standards and guidance for “transactions with noncontrolling interest,” “acqui-sition-related costs” and “presentation changes in the consolidated financial statements” are effective for the beginning of annual periods beginning on or after April 1, 2015. Earlier application is permitted from the beginning of annual periods beginning on or after April 1, 2014, except for the presentation changes in the consolidated financial statements. In the case of earlier application, all accounting standards and guid-ance above, except for the presentation changes, should be applied simultaneously. Either retrospective or prospective application of the revised accounting standards and guidance for “transactions with non-controlling interest” and “acquisition-related costs” is permitted. In retrospective application of the revised standards and guidance for “transactions with non-controlling interest” and “acquisition-related costs,” accumulated effects of retrospective adjustments for all “transactions with noncontrolling interest” and “acquisition-related costs” which occurred in the past shall be reflected as adjustments to the beginning balance of capital surplus and retained earnings for the year of the first-time application.
In prospective application, the new standards and guidance for “transactions with noncontrolling interest” and “acquisition-related costs” shall be ap-plied prospectively from the beginning of the year of the first-time application. The changes in presentation shall be applied to all periods presented in financial statements containing the first-time application of the revised standards and guidance.
The revised standards and guidance for “pro-visional accounting treatments for a business combination” are effective for a business combination which will occur on or after the beginning of annual periods beginning on or after April 1, 2015. Earlier application is permitted for a business combination which will occur on or after the beginning of annual periods beginning on or after April 1, 2014.
The Company expects to apply the revised ac-counting standards and guidance from the beginning of the annual period beginning on April 1, 2015, and is in the process of measuring the effects of applying the revised accounting standards and guidance in future applicable periods.
v. Consolidated Corporate Tax SystemThe Group files a tax return under the consolidated corporate tax system, which allows companies to base tax payments on the combined profits or losses of the parent company and its wholly owned domestic subsidiaries.
value of the consideration received or paid and the amount by which the minority interest is adjusted is accounted for as an adjustment of goodwill or as profit or loss in the consolidated statement of opera-tions. Under the revised accounting standard, such difference shall be accounted for as capital surplus as long as the parent retains control over its subsidiary.
(b) Presentation of the consolidated balance sheet — In the consolidated balance sheet, “Minority interest” un-der the current accounting standard will be changed to “Noncontrolling interest” under the revised accounting standard.
(c) Presentation of the consolidated statement of operations — In the consolidated statement of op-erations, “Income before minority interest” under the current accounting standard will be changed to “Net income” under the revised accounting standard, and “Net income” under the current accounting standard will be changed to “Net income attributable to owners of the parent” under the revised accounting standard.
(d) Provisional accounting treatments for a business combination — If the initial accounting for a business combination is incomplete by the end of the report-ing period in which the business combination occurs, an acquirer shall report in its financial statements provisional amounts for the items for which the ac-counting is incomplete. Under the current accounting standard guidance, the impact of adjustments to pro-visional amounts recorded in a business combination on profit or loss is recognized as profit or loss in the year in which the measurement is completed. Under the revised accounting standard guidance, during the measurement period, which shall not exceed one year from the acquisition, the acquirer shall retrospectively adjust the provisional amounts recognized at the acquisition date to reflect new information obtained about facts and circumstances that existed as of the acquisition date and that would have affected the measurement of the amounts recognized as of that date. Such adjustments shall be recognized as if the accounting for the business combination had been completed at the acquisition date.
(e) Acquisition-related costs — Acquisition-related costs are costs, such as advisory fees or professional fees, which an acquirer incurs to effect a business combination. Under the current accounting standard, the acquirer accounts for acquisition-related costs by including them in the acquisition costs of the in-vestment. Under the revised accounting standard, acquisition-related costs shall be accounted for as ex-penses in the periods in which the costs are incurred.
Unlisted securities are not included above because they do not have a quoted market price in an active market. The information for these investments is disclosed in Note 17.
There were no available-for-sale securities that the Group sold during the year ended March 31, 2014.
Cost, unrealized gains and losses and aggregate fair values of investment securities as of March 31, 2015 and 2014, were as follows:
3. Investment Securities
Millions of Yen Millions of Yen
2015 2014
CostUnrealized
GainsUnrealized
Losses Fair Value CostUnrealized
GainsUnrealized
Losses Fair Value
Available-for-sale:Equity securities ¥1,966 ¥46 ¥130 ¥1,882 ¥3,317 ¥1,603 – ¥4,920
Total ¥1,966 ¥46 ¥130 ¥1,882 ¥3,317 ¥1,603 – ¥4,920
Thousands of U.S. Dollars
2015
CostUnrealized
GainsUnrealized
Losses Fair Value
Available-for-sale:Equity securities $16,383 $383 $1,083 $15,683
Total $16,383 $383 $1,083 $15,683
Millions of YenThousands of
U.S. Dollars
2015 2015
Proceeds from sales:
Equity securities ¥4,609 $38,408
Others – –
Total ¥4,609 $38,408
Gains on sales:
Equity securities ¥1,596 $13,300
Others – –
Total ¥1,596 $13,300
Available-for-sale securities that the Group sold during the year ended March 31, 2015 were as follows:
Inventories as of March 31, 2015 and 2014, consisted of the following:
4. Inventories
Millions of YenThousands of
U.S. Dollars
2015 2014 2015
Finished products ¥29,039 ¥34,778 $241,992
Work in process 11,065 11,279 92,208
Raw materials and supplies 23,191 24,314 193,259
Total ¥63,295 ¥70,371 $527,459
32 Pioneer Corporat ion Annua l Repor t 2015 33Pioneer Corporat ion Annua l Repor t 2015
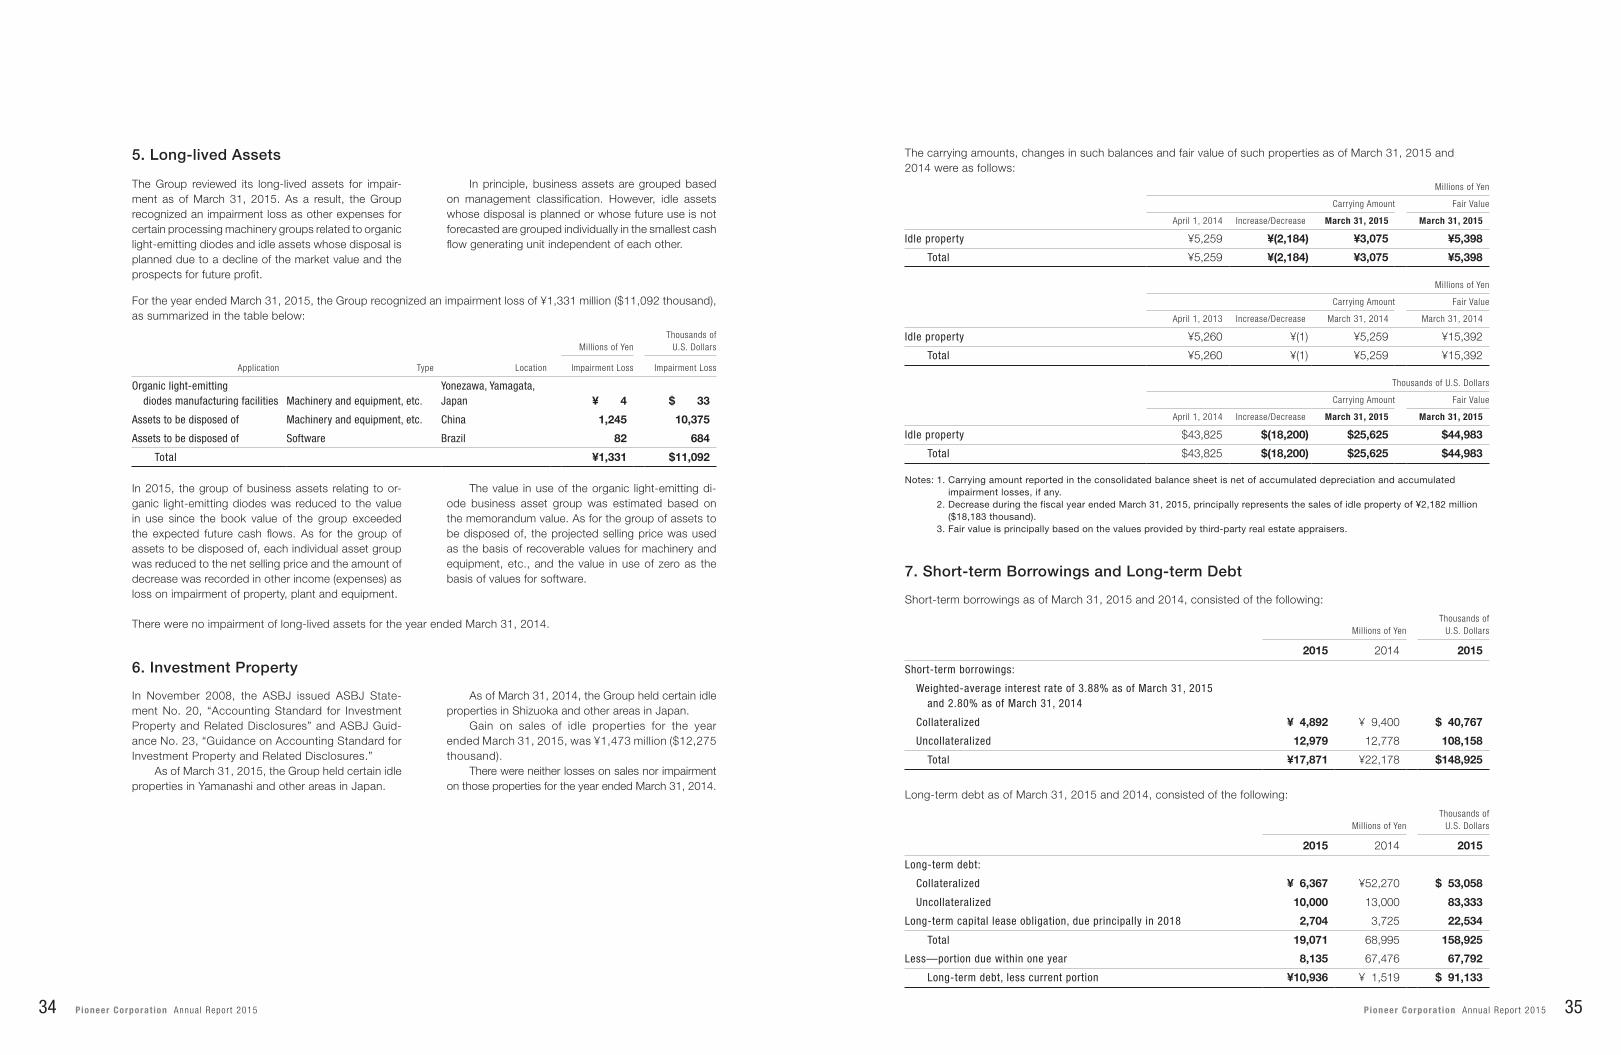
5. Long-lived Assets
Short-term borrowings as of March 31, 2015 and 2014, consisted of the following:
7. Short-term Borrowings and Long-term Debt
The Group reviewed its long-lived assets for impair-ment as of March 31, 2015. As a result, the Group recognized an impairment loss as other expenses for certain processing machinery groups related to organic light-emitting diodes and idle assets whose disposal is planned due to a decline of the market value and the prospects for future profit.
In 2015, the group of business assets relating to or-ganic light-emitting diodes was reduced to the value in use since the book value of the group exceeded the expected future cash flows. As for the group of assets to be disposed of, each individual asset group was reduced to the net selling price and the amount of decrease was recorded in other income (expenses) as loss on impairment of property, plant and equipment.
In November 2008, the ASBJ issued ASBJ State-ment No. 20, “Accounting Standard for Investment Property and Related Disclosures” and ASBJ Guid-ance No. 23, “Guidance on Accounting Standard for Investment Property and Related Disclosures.”
As of March 31, 2015, the Group held certain idle properties in Yamanashi and other areas in Japan.
In principle, business assets are grouped based on management classification. However, idle assets whose disposal is planned or whose future use is not forecasted are grouped individually in the smallest cash flow generating unit independent of each other.
The value in use of the organic light-emitting di-ode business asset group was estimated based on the memorandum value. As for the group of assets to be disposed of, the projected selling price was used as the basis of recoverable values for machinery and equipment, etc., and the value in use of zero as the basis of values for software.
As of March 31, 2014, the Group held certain idle properties in Shizuoka and other areas in Japan.
Gain on sales of idle properties for the year ended March 31, 2015, was ¥1,473 million ($12,275 thousand).
There were neither losses on sales nor impairment on those properties for the year ended March 31, 2014.
For the year ended March 31, 2015, the Group recognized an impairment loss of ¥1,331 million ($11,092 thousand), as summarized in the table below:
There were no impairment of long-lived assets for the year ended March 31, 2014.
Millions of Yen
Carrying Amount Fair Value
April 1, 2014 Increase/Decrease March 31, 2015 March 31, 2015
Idle property ¥5,259 ¥(2,184) ¥3,075 ¥5,398
Total ¥5,259 ¥(2,184) ¥3,075 ¥5,398
Millions of Yen
Carrying Amount Fair Value
April 1, 2013 Increase/Decrease March 31, 2014 March 31, 2014
Idle property ¥5,260 ¥(1) ¥5,259 ¥15,392
Total ¥5,260 ¥(1) ¥5,259 ¥15,392
Thousands of U.S. Dollars
Carrying Amount Fair Value
April 1, 2014 Increase/Decrease March 31, 2015 March 31, 2015
Idle property $43,825 $(18,200) $25,625 $44,983
Total $43,825 $(18,200) $25,625 $44,983
Notes: 1. Carrying amount reported in the consolidated balance sheet is net of accumulated depreciation and accumulated impairment losses, if any.
2. Decrease during the fiscal year ended March 31, 2015, principally represents the sales of idle property of ¥2,182 million ($18,183 thousand).
3. Fair value is principally based on the values provided by third-party real estate appraisers.
The carrying amounts, changes in such balances and fair value of such properties as of March 31, 2015 and2014 were as follows:
6. Investment Property
Millions of YenThousands of
U.S. Dollars
2015 2014 2015
Short-term borrowings:
Weighted-average interest rate of 3.88% as of March 31, 2015and 2.80% as of March 31, 2014
Collateralized ¥ 4,892 ¥ 9,400 $ 40,767
Uncollateralized 12,979 12,778 108,158
Total ¥17,871 ¥22,178 $148,925
Millions of YenThousands of
U.S. Dollars
Application Type Location Impairment Loss Impairment Loss
Organic light-emittingdiodes manufacturing facilities Machinery and equipment, etc.
Yonezawa, Yamagata, Japan ¥ 4 $ 33
Assets to be disposed of Machinery and equipment, etc. China 1,245 10,375
Assets to be disposed of Software Brazil 82 684
Total ¥1,331 $11,092
Long-term debt as of March 31, 2015 and 2014, consisted of the following:
Millions of YenThousands of
U.S. Dollars
2015 2014 2015
Long-term debt:
Collateralized ¥ 6,367 ¥52,270 $ 53,058
Uncollateralized 10,000 13,000 83,333
Long-term capital lease obligation, due principally in 2018 2,704 3,725 22,534
Total 19,071 68,995 158,925
Less—portion due within one year 8,135 67,476 67,792
Long-term debt, less current portion ¥10,936 ¥ 1,519 $ 91,133
34 Pioneer Corporat ion Annua l Repor t 2015 35Pioneer Corporat ion Annua l Repor t 2015

The current portion of long-term debt amounting to ¥6,367 million ($53,058 thousand) as of March 31, 2015, was borrowed by the Company in accordance with the syndicated loan agreement entered into with the banks on March 27, 2015. This agreement in-cludes certain financial covenants which require the Company to maintain certain levels of equity on a consolidated and nonconsolidated basis and certain levels of operating income on a consolidated basis.
In addition, long-term debt amounting to ¥10,000 million ($83,333 thousand) as of March 31, 2015, was borrowed by the Company in accordance with the syndicated loan agreement entered into with the banks on September 25, 2014. This agreement includes certain financial covenants which require the Company to maintain with the banks on September 25, 2014. This agreement includes certain financial cov-enants which require the Company to maintain certain levels of equity on a consolidated and nonconsoli-dated basis.
The current portion of long-term debt amounting to ¥52,270 million as of March 31, 2014, was borrowed by the Company and Tohoku Pioneer Corporation in accordance with the syndicated loan agreements en-tered into with the banks on September 25, 2013 and March 31, 2014. These agreements include certain financial covenants which require the Company to maintain certain levels of equity on a consolidated and nonconsolidated basis and certain levels of operat-ing income and net income on a consolidated basis, as well as Tohoku Pioneer Corporation maintaining certain levels of equity on a nonconsolidated basis.
In addition, the current portion of long-term debt amounting to ¥10,000 million as of March 31, 2014, was borrowed by the Company in accordance with the syndicated loan agreement contracted with the banks on September 27, 2011. This agreement in-cludes certain financial covenants which require the Company to maintain certain levels of equity on a consolidated and nonconsolidated basis.
8. Retirement and Pension Plans
The Company and major Japanese subsidiaries have defined benefit pension plans and defined contribution pension plans. The benefits are determined based on the sum of cumulative points and conditions under which retirement occurred. The cumulative points are accumulated based on years of service and job class. In some cases, additional retirement benefits are paid when an employee retires.
The Company and certain consolidated subsidiaries have joined multi-employer pension fund plans. Each company’s portion of plan assets corresponding to its contributions has been reasonably computed and included in the tables below for defined benefit pension plans.
Certain consolidated subsidiaries apply the
simplified method in computing accrued pension and severance costs and retirement benefit costs for their defined benefit pension plans and lump-sum severance payment plans. Reconciliations of the plans to which the simplified method is applied are omitted because they are immaterial.
Substantially all of the employees of U.S. and European subsidiaries are covered by defined benefit pension plans. Under such plans, the related cost of benefit is funded or accrued. The benefits are based on the level of salary at retirement or earlier termination of employment, the years of service and conditions under which termination occurs. Certain other foreign subsidiaries sponsor defined contribution pension plans or lump-sum payment plans.
(1) The changes in projected benefit obligation for the years ended March 31, 2015 and 2014, were as follows:
(2) The changes in plan assets for the years ended March 31, 2015 and 2014, were as follows:
Defined benefit pension plans
Years ending March 31 Millions of YenThousands of
U.S. Dollars
2016 ¥ 8,135 $ 67,792
2017 761 6,342
2018 10,175 84,791
2019 – –
2020 – –
2021 and thereafter – –
Total ¥19,071 $158,925
As of March 31, 2015 and 2014, the following assets were pledged as collateral for short-term borrowings and long-term debt of the Group:
Annual maturities of long-term debt and long-term capital lease obligations as of March 31, 2015, and for the next five years and thereafter were as follows:
Millions of YenThousands of
U.S. Dollars
2015 2014 2015
Land ¥10,594 ¥12,953 $ 88,283
Building and structures 13,184 14,016 109,867
Investment securities 2,090 4,594 17,417
Total ¥25,868 ¥31,563 $215,567
Millions of YenThousands of
U.S. Dollars
2015 2014 2015
Balance at beginning of year (as previously reported) ¥85,628 ¥80,185 $713,567
Cumulative effect of changes in accounting policies (812) – (6,767)
Balance at beginning of year (as restated) 84,816 80,185 706,800
Service cost 2,318 2,273 19,317
Interest cost 1,617 2,215 13,475
Actuarial losses 3,132 8,740 26,100
Benefits paid (4,122) (9,694) (34,350)
Others (491) 1,909 (4,092)
Balance at end of year ¥87,270 ¥85,628 $727,250
Millions of YenThousands of
U.S. Dollars
2015 2014 2015
Balance at beginning of year ¥51,637 ¥52,292 $430,308
Expected return on plan assets 2,118 2,053 17,650
Actuarial losses 2,828 1,821 23,567
Contributions from the employer 3,823 3,830 31,858
Benefits paid (4,122) (9,694) (34,350)
Others (98) 1,335 (816)
Balance at end of year ¥56,186 ¥51,637 $468,217
36 Pioneer Corporat ion Annua l Repor t 2015 37Pioneer Corporat ion Annua l Repor t 2015

(b) Method of determining the expected rate of return on plan assets
The expected rate of return on plan assets is determined considering the long-term rates of return which are expected currently and in the future from various components of the plan assets.
A salary increase index by age on March 31, 2013 as the base date is mainly used for measuring the projected benefit obligation.
(8) Assumptions used for the years ended March 31, 2015 and 2014, were set forth as follows:
2015 2014
Discount rate 1.3%–4.3% 1.3%–4.5%
Expected rate of return on plan assets 3.00%–7.25% 3.00%–7.25%
Defined contribution pension plan
The required contribution amount to the defined contribution plan of the Company and its consolidated subsidiaries is ¥482 million ($4,017 thousand) and ¥509 million as of March 31, 2015 and 2014, respectively.
(7) Plan assets
(a) Components of plan assetsPlan assets as of March 31, 2015 and 2014, consisted of the following:
2015 2014
Debt investments securities 41% 47%
Equity investments securities 32% 33%
Cash and cash equivalents 10% 14%
Others 17% 6%
Total 100% 100%
(3) The reconciliation between the liability recorded in the consolidated balance sheet and the balances of projected benefit obligation and plan assets at March 31, 2015 and 2014, was as follows:
Millions of YenThousands of
U.S. Dollars
2015 2014 2015
Funded projected benefit obligation ¥ 85,935 ¥ 84,442 $ 716,125
Plan assets (56,186) (51,637) (468,217)
29,749 32,805 247,908
Unfunded projected benefit obligation 1,335 1,186 11,125
Net liability for projected benefit obligation ¥ 31,084 ¥ 33,991 $ 259,033
Millions of YenThousands of
U.S. Dollars
2015 2014 2015
Accrued pension and severance costs ¥32,202 ¥34,585 $268,350
Asset for retirement benefits (1,118) (594) (9,317)
Net liability for projected benefit obligation ¥31,084 ¥33,991 $259,033
(4) The components of net periodic retirement benefit costs for the years ended March 31, 2015 and 2014, were as follows:
Millions of YenThousands of
U.S. Dollars
2015 2014 2015
Service cost ¥ 2,318 ¥ 2,273 $ 19,317
Interest cost 1,617 2,215 13,475
Expected return on plan assets (2,118) (2,053) (17,650)
Recognized actuarial losses 3,223 2,762 26,858
Amortization of prior service gain (886) (886) (7,383)
Amortization of transitional obligations for retirement benefits 181 202 1,508
Additional retirement benefits for an early retirement incentive plan 7,647 – 63,725
Others (72) (11) (600)
Net periodic retirement benefit costs ¥11,910 ¥ 4,502 $ 99,250
(5) Amounts recognized in other comprehensive income (before income tax effect) in respect of defined retirement benefit plans for the years ended March 31, 2015 and 2014, were as follows:
(6) Amounts recognized in accumulated other comprehensive income (before income tax effect) in respect of defined retirement benefit plans as of March 31, 2015 and 2014, were as follows:
Millions of YenThousands of
U.S. Dollars
2015 2014 2015
Prior service cost ¥ 1,018 – $ 8,483
Actuarial (gains) (3,004) – (25,033)
Transitional obligation for retirement benefits (182) – (1,517)
Total ¥(2,168) – $ (18,067)
Millions of YenThousands of
U.S. Dollars
2015 2014 2015
Unrecognized prior service gain ¥ (5,403) ¥ (6,421) $ (45,025)
Unrecognized actuarial losses 28,103 31,107 234,192
Unrecognized transitional obligation for retirement benefits – 182 –
Total ¥22,700 ¥24,868 $189,167
Note: This table includes plans to which the simplified method is applied.
Note: This table includes plans to which the simplified method is applied.
38 Pioneer Corporat ion Annua l Repor t 2015 39Pioneer Corporat ion Annua l Repor t 2015
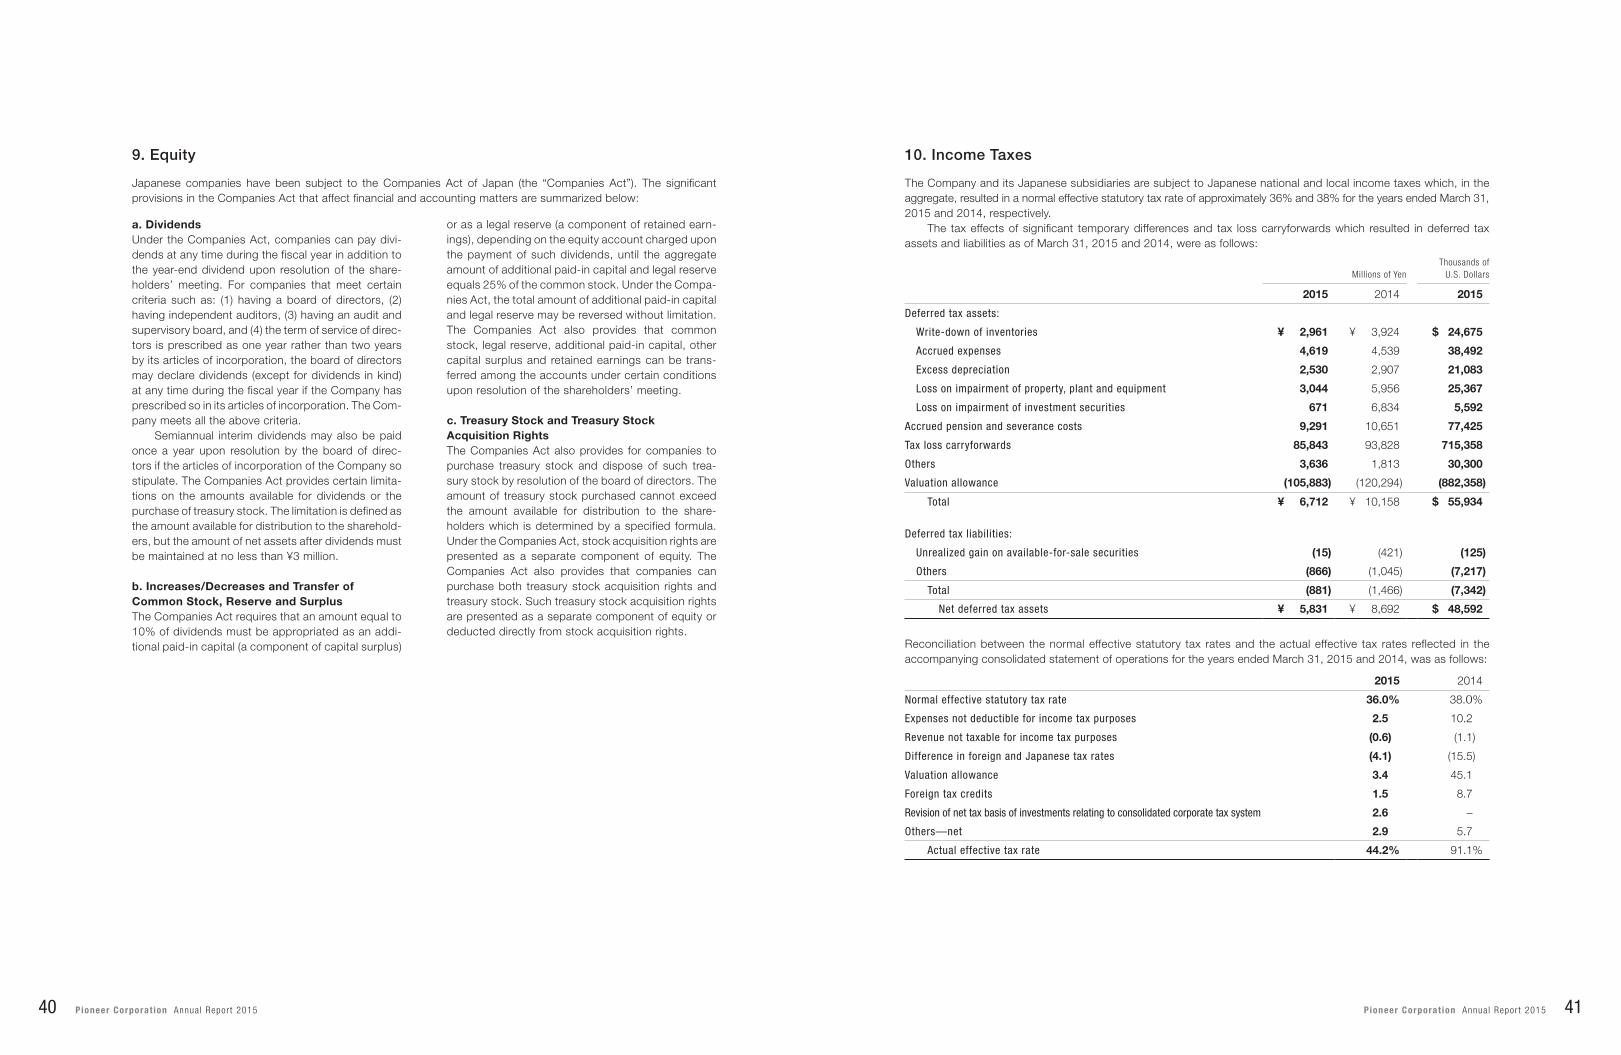
a. DividendsUnder the Companies Act, companies can pay divi-dends at any time during the fiscal year in addition to the year-end dividend upon resolution of the share-holders’ meeting. For companies that meet certain criteria such as: (1) having a board of directors, (2) having independent auditors, (3) having an audit and supervisory board, and (4) the term of service of direc-tors is prescribed as one year rather than two years by its articles of incorporation, the board of directors may declare dividends (except for dividends in kind) at any time during the fiscal year if the Company has prescribed so in its articles of incorporation. The Com-pany meets all the above criteria.
Semiannual interim dividends may also be paid once a year upon resolution by the board of direc-tors if the articles of incorporation of the Company so stipulate. The Companies Act provides certain limita-tions on the amounts available for dividends or the purchase of treasury stock. The limitation is defined as the amount available for distribution to the sharehold-ers, but the amount of net assets after dividends must be maintained at no less than ¥3 million.
b. Increases/Decreases and Transfer of Common Stock, Reserve and SurplusThe Companies Act requires that an amount equal to 10% of dividends must be appropriated as an addi-tional paid-in capital (a component of capital surplus)
or as a legal reserve (a component of retained earn-ings), depending on the equity account charged upon the payment of such dividends, until the aggregate amount of additional paid-in capital and legal reserve equals 25% of the common stock. Under the Compa-nies Act, the total amount of additional paid-in capital and legal reserve may be reversed without limitation. The Companies Act also provides that common stock, legal reserve, additional paid-in capital, other capital surplus and retained earnings can be trans-ferred among the accounts under certain conditions upon resolution of the shareholders’ meeting.
c. Treasury Stock and Treasury Stock Acquisition RightsThe Companies Act also provides for companies to purchase treasury stock and dispose of such trea-sury stock by resolution of the board of directors. The amount of treasury stock purchased cannot exceed the amount available for distribution to the share-holders which is determined by a specified formula. Under the Companies Act, stock acquisition rights are presented as a separate component of equity. The Companies Act also provides that companies can purchase both treasury stock acquisition rights and treasury stock. Such treasury stock acquisition rights are presented as a separate component of equity or deducted directly from stock acquisition rights.
10. Income Taxes9. Equity
The Company and its Japanese subsidiaries are subject to Japanese national and local income taxes which, in the aggregate, resulted in a normal effective statutory tax rate of approximately 36% and 38% for the years ended March 31, 2015 and 2014, respectively.
The tax effects of significant temporary differences and tax loss carryforwards which resulted in deferred tax assets and liabilities as of March 31, 2015 and 2014, were as follows:
Japanese companies have been subject to the Companies Act of Japan (the “Companies Act”). The significant provisions in the Companies Act that affect financial and accounting matters are summarized below:
Millions of YenThousands of
U.S. Dollars
2015 2014 2015
Deferred tax assets:
Write-down of inventories ¥ 2,961 ¥ 3,924 $ 24,675
Accrued expenses 4,619 4,539 38,492
Excess depreciation 2,530 2,907 21,083
Loss on impairment of property, plant and equipment 3,044 5,956 25,367
Loss on impairment of investment securities 671 6,834 5,592
Accrued pension and severance costs 9,291 10,651 77,425
Tax loss carryforwards 85,843 93,828 715,358
Others 3,636 1,813 30,300
Valuation allowance (105,883) (120,294) (882,358)
Total ¥ 6,712 ¥ 10,158 $ 55,934
Deferred tax liabilities:
Unrealized gain on available-for-sale securities (15) (421) (125)
Others (866) (1,045) (7,217)
Total (881) (1,466) (7,342)
Net deferred tax assets ¥ 5,831 ¥ 8,692 $ 48,592
2015 2014
Normal effective statutory tax rate 36.0% 38.0%
Expenses not deductible for income tax purposes 2.5 10.2%
Revenue not taxable for income tax purposes (0.6)% (1.1)%
Difference in foreign and Japanese tax rates (4.1)% (15.5)%
Valuation allowance 3.4 45.1%
Foreign tax credits 1.5 8.7%
Revision of net tax basis of investments relating to consolidated corporate tax system 2.6 –%
Others—net 2.9 5.7%
Actual effective tax rate 44.2% 91.1%
Reconciliation between the normal effective statutory tax rates and the actual effective tax rates reflected in the accompanying consolidated statement of operations for the years ended March 31, 2015 and 2014, was as follows:
40 Pioneer Corporat ion Annua l Repor t 2015 41Pioneer Corporat ion Annua l Repor t 2015
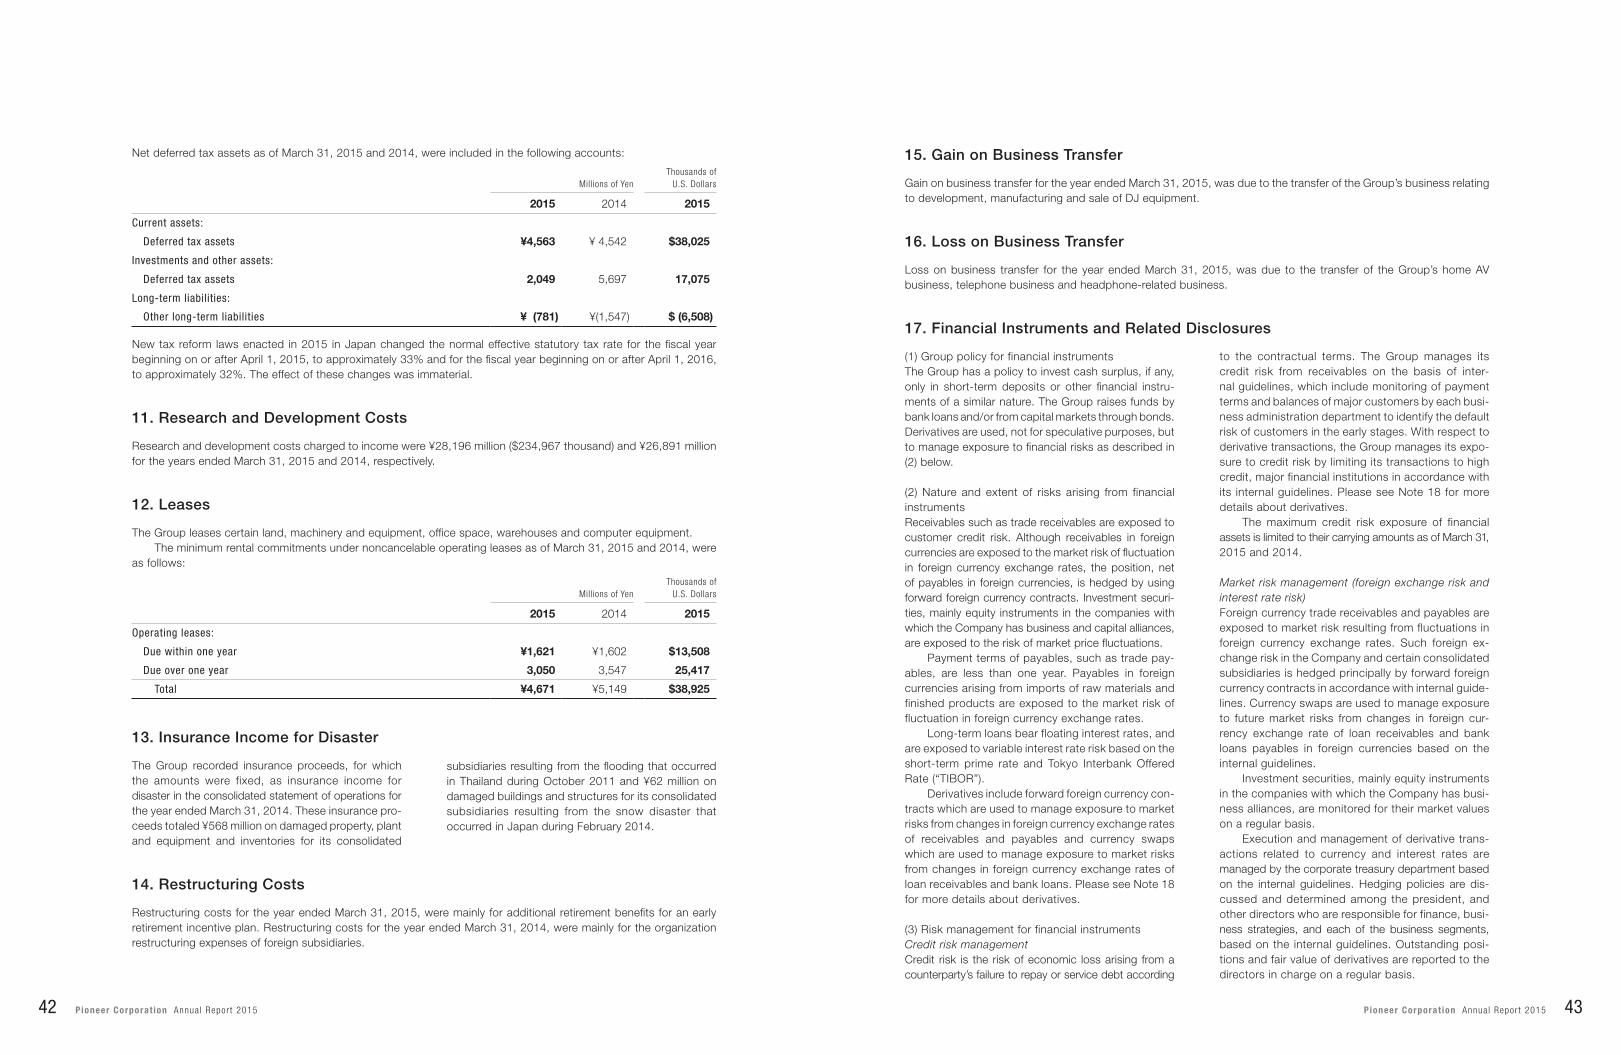
New tax reform laws enacted in 2015 in Japan changed the normal effective statutory tax rate for the fiscal year beginning on or after April 1, 2015, to approximately 33% and for the fiscal year beginning on or after April 1, 2016, to approximately 32%. The effect of these changes was immaterial.
Net deferred tax assets as of March 31, 2015 and 2014, were included in the following accounts:
Millions of YenThousands of
U.S. Dollars
2015 2014 2015
Current assets:
Deferred tax assets ¥4,563 ¥ 4,542 $38,025
Investments and other assets:
Deferred tax assets 2,049 5,697 17,075
Long-term liabilities:
Other long-term liabilities ¥ (781) ¥(1,547) $ (6,508)
11. Research and Development Costs
15. Gain on Business Transfer
16. Loss on Business Transfer
Research and development costs charged to income were ¥28,196 million ($234,967 thousand) and ¥26,891 million for the years ended March 31, 2015 and 2014, respectively.
Gain on business transfer for the year ended March 31, 2015, was due to the transfer of the Group’s business relating to development, manufacturing and sale of DJ equipment.
Loss on business transfer for the year ended March 31, 2015, was due to the transfer of the Group’s home AV business, telephone business and headphone-related business.
12. Leases
The Group leases certain land, machinery and equipment, office space, warehouses and computer equipment.The minimum rental commitments under noncancelable operating leases as of March 31, 2015 and 2014, were
as follows:
Millions of YenThousands of
U.S. Dollars
2015 2014 2015
Operating leases: Due within one year ¥1,621 ¥1,602 $13,508
Due over one year 3,050 3,547 25,417
Total ¥4,671 ¥5,149 $38,925
The Group recorded insurance proceeds, for which the amounts were fixed, as insurance income for disaster in the consolidated statement of operations for the year ended March 31, 2014. These insurance pro-ceeds totaled ¥568 million on damaged property, plant and equipment and inventories for its consolidated
subsidiaries resulting from the flooding that occurred in Thailand during October 2011 and ¥62 million on damaged buildings and structures for its consolidated subsidiaries resulting from the snow disaster that occurred in Japan during February 2014.
13. Insurance Income for Disaster
14. Restructuring Costs
Restructuring costs for the year ended March 31, 2015, were mainly for additional retirement benefits for an early retirement incentive plan. Restructuring costs for the year ended March 31, 2014, were mainly for the organization restructuring expenses of foreign subsidiaries.
(1) Group policy for financial instrumentsThe Group has a policy to invest cash surplus, if any, only in short-term deposits or other financial instru-ments of a similar nature. The Group raises funds by bank loans and/or from capital markets through bonds. Derivatives are used, not for speculative purposes, but to manage exposure to financial risks as described in (2) below.
(2) Nature and extent of risks arising from financial instrumentsReceivables such as trade receivables are exposed to customer credit risk. Although receivables in foreign currencies are exposed to the market risk of fluctuation in foreign currency exchange rates, the position, net of payables in foreign currencies, is hedged by using forward foreign currency contracts. Investment securi-ties, mainly equity instruments in the companies with which the Company has business and capital alliances, are exposed to the risk of market price fluctuations.
Payment terms of payables, such as trade pay-ables, are less than one year. Payables in foreign currencies arising from imports of raw materials and finished products are exposed to the market risk of fluctuation in foreign currency exchange rates.
Long-term loans bear floating interest rates, and are exposed to variable interest rate risk based on the short-term prime rate and Tokyo Interbank Offered Rate (“TIBOR”).
Derivatives include forward foreign currency con-tracts which are used to manage exposure to market risks from changes in foreign currency exchange rates of receivables and payables and currency swaps which are used to manage exposure to market risks from changes in foreign currency exchange rates of loan receivables and bank loans. Please see Note 18 for more details about derivatives.
(3) Risk management for financial instrumentsCredit risk managementCredit risk is the risk of economic loss arising from a counterparty’s failure to repay or service debt according
to the contractual terms. The Group manages its credit risk from receivables on the basis of inter-nal guidelines, which include monitoring of payment terms and balances of major customers by each busi-ness administration department to identify the default risk of customers in the early stages. With respect to derivative transactions, the Group manages its expo-sure to credit risk by limiting its transactions to high credit, major financial institutions in accordance with its internal guidelines. Please see Note 18 for more details about derivatives.
The maximum credit risk exposure of financial assets is limited to their carrying amounts as of March 31, 2015 and 2014.
Market risk management (foreign exchange risk and interest rate risk)Foreign currency trade receivables and payables are exposed to market risk resulting from fluctuations in foreign currency exchange rates. Such foreign ex-change risk in the Company and certain consolidated subsidiaries is hedged principally by forward foreign currency contracts in accordance with internal guide-lines. Currency swaps are used to manage exposure to future market risks from changes in foreign cur-rency exchange rate of loan receivables and bank loans payables in foreign currencies based on the internal guidelines.
Investment securities, mainly equity instruments in the companies with which the Company has busi-ness alliances, are monitored for their market values on a regular basis.
Execution and management of derivative trans-actions related to currency and interest rates are managed by the corporate treasury department based on the internal guidelines. Hedging policies are dis-cussed and determined among the president, and other directors who are responsible for finance, busi-ness strategies, and each of the business segments, based on the internal guidelines. Outstanding posi-tions and fair value of derivatives are reported to the directors in charge on a regular basis.
17. Financial Instruments and Related Disclosures
42 Pioneer Corporat ion Annua l Repor t 2015 43Pioneer Corporat ion Annua l Repor t 2015

Millions of Yen Thousands of U.S. Dollars
2015 2015
Carrying Amount Fair Value
Unrealized Gain/Loss
Carrying Amount Fair Value
Unrealized Gain/Loss
Cash and cash equivalents ¥ 51,676 ¥ 51,676 – $ 430,633 $ 430,633 –
Time deposits 484 484 – 4,033 4,033 –
Receivables:
Trade receivables 79,158 79,158 – 659,650 659,650 –
Allowance for doubtful receivables (*1) (2,195) (2,195) – (18,292) (18,292) –
129,123 129,123 – 1,076,024 1,076,024 –
Investment securities:
Available-for-sale securities 1,882 1,882 – 15,683 15,683 –
Total ¥131,005 ¥131,005 – $1,091,707 $1,091,707 –
Short-term borrowings ¥ 17,871 ¥ 17,871 – $ 148,925 $ 148,925 –
Current portion of long-term debt 8,135 8,135 – 67,792 67,792 –
Trade payables 76,359 76,359 – 636,325 636,325 –
Income taxes payable 2,266 2,266 – 18,883 18,883 –
Long-term debt 10,936 10,936 – 91,133 91,133 –
Total ¥115,567 ¥115,567 – $ 963,058 $ 963,058 –
Derivative transactions (*2) ¥ 141 ¥ 141 – $ 1,175 $ 1,175 –
(a) Fair values of financial instruments as of March 31, 2015 and 2014, were as follows:
*1. Allowance for doubtful receivables corresponding to trade receivables is deducted.
*2. Derivative transactions show the net amount after offsetting the receivables and payables.
Millions of Yen
2014
Carrying Amount Fair Value
Unrealized Gain/Loss
Cash and cash equivalents ¥ 33,904 ¥ 33,904 –
Time deposits 1,493 1,493 –
Receivables:
Trade receivables 85,560 85,560 –
Allowance for doubtful receivables (*1) (1,108) (1,108) –
84,452 84,452 –
Investment securities:
Available-for-sale securities 4,920 4,920 –
Total ¥124,769 ¥124,769 –
Short-term borrowings ¥ 22,178 ¥ 22,178 –
Current portion of long-term debt 67,476 67,476 –
Trade payables 71,657 71,657 –
Income taxes payable 2,817 2,817 –
Total ¥164,128 ¥164,128 –
Derivative transactions (*2) ¥ (12) ¥ (12) –
*1. Allowance for doubtful receivables corresponding to trade receivables is deducted.
*2. Derivative transactions show the net amount after offsetting the receivables and payables.
Cash and cash equivalents, time deposits and trade receivablesThe carrying values of cash and cash equivalents, time deposits and trade receivables approximate fair value because of their short maturities.
Investment securitiesThe fair values of investment securities are measured at the quoted market price of the stock exchange for the equity instruments. Fair value information for the investment securities by classification is included in Note 3.
Trade payables, short-term borrowings and income tax payableThe carrying values of trade payables, short-term borrowings and income tax payable approximate fair value because of their short maturities.
Current portion of long-term debt and long-term debtThe fair values of the current portion of long-term debt and long-term debt approximate fair value because the market interest rates reflected in the short-term period use mainly variable interests and the credit status of the Company has not changed significantly.
DerivativesFair value information for derivatives is included in Note 18.
Liquidity risk managementLiquidity risk comprises the risk that the Group can-not meet its contractual obligations in full on maturity dates. The Company manages its liquidity risk by holding adequate volumes of liquid assets, along with adequate financial planning by the corporate treasury department based on the liquidity requirement sched-ule from each department.
(4) Fair values of financial instrumentsFair values of financial instruments are based on quoted prices in active markets. If quoted prices are not available, other rational valuation techniques are used instead. Different assumptions may lead to different fair values, since varying elements are incor-porated in calculating the fair value. As for contract amount or any other information disclosed in Note 18, the amount itself does not indicate the market risk in relation to derivative transactions.
44 Pioneer Corporat ion Annua l Repor t 2015 45Pioneer Corporat ion Annua l Repor t 2015

Derivative transactions to which hedge accounting is not applied as of March 31, 2015 and 2014
Millions of Yen Thousands of U.S. Dollars
2015 2015
Contract Amount
Contract Amount
Due After 1 Year Fair Value
Unrealized (Loss) Gain
ContractAmount
Contract Amount
Due After 1 Year Fair Value
Unrealized (Loss) Gain
Foreign currency forward contracts:
Buying sterling pounds ¥5,082 – ¥ 29 ¥ 29 $42,350 – $ 242 $ 242
Selling U.S. dollars 1,518 – 11 11 12,650 – 91 91
Selling Australian dollars 270 – (6) (6) 2,250 – (50) (50)
Currency swap contracts:
Receiving Australian dollars, paying U.S. dollars 938 – 107 107 7,817 – 892 892
Total ¥7,808 – ¥141 ¥141 $65,067 – $1,175 $1,175
Millions of Yen
2014
Contract Amount
Contract Amount
Due After 1 Year Fair Value
Unrealized (Loss) Gain
Foreign currency forwardcontracts:
Buying U.S. dollars ¥ 515 – ¥ (2) ¥ (2)
Buying sterling pounds 5,244 – (31) (31)
Selling U.S. dollars 3,151 – 3 3
Selling Australian dollars 557 – 12 12
Currency swap contracts:
Receiving Australian dollars, paying U.S. dollars 674 – 6 6
Total ¥10,141 – ¥(12) ¥(12)
The fair value of foreign currency forward contracts is measured at the quoted price obtained from the forward exchange market.
The fair value of currency swap contracts is measured at the quoted price obtained from the financial institutions.
Millions of Yen
March 31, 2015Due in 1 Year
or LessDue After 1 Year Through 5 Years
Due After 5 Years Through 10 Years
Due After 10 Years
Cash and cash equivalents ¥ 51,676 – – –
Time deposits 484 – – –
Trade receivables 79,158 – – –
Total ¥131,318 – – –
Thousands of U.S. Dollars
March 31, 2015Due in 1 Year
or LessDue After 1 Year Through 5 Years
Due After 5 Years Through 10 Years
Due After 10 Years
Cash and cash equivalents $ 430,633 – – –
Time deposits 4,033 – – –
Trade receivables 659,650 – – –
Total $1,094,316 – – –
(5) Maturity analysis for financial assets and securities with contractual maturities subsequent to March 31, 2015, were as follows:
Please see Note 7 for annual maturities of long-term debt.
The Group enters into foreign currency forward con-tracts to hedge foreign exchange risk associated with certain assets and liabilities denominated in foreign currencies. The Group also enters into currency swap contracts to manage its interest rate exposure and foreign currency exposure on certain liabilities.
All derivative transactions are entered into to hedge foreign currency exposure. Accordingly, market risk in these derivatives is basically offset by opposite
movements in the value of hedged assets or liabilities.Because the counterparties to these derivatives
are limited to major international financial institutions, the Group does not anticipate any losses arising from credit risk.
Derivative transactions entered into by the Group have been made in accordance with internal poli-cies which regulate the authorization and credit limit amount.
18. Derivatives(b) Carrying amounts of financial instruments whose fair value cannot be reliably determined as of March 31, 2015 and 2014, were as follows:
Millions of YenThousands of
U.S. Dollars
2015 2014 2015
Investment in equity instruments that do not have a quoted market price in an active market:
Unlisted securities ¥2,373 ¥ 275 $19,775
Unlisted associated securities 2,094 2,034 17,450
Total ¥4,467 ¥2,309 $37,225
46 Pioneer Corporat ion Annua l Repor t 2015 47Pioneer Corporat ion Annua l Repor t 2015

20. Net Income per Share
Net income per share (“EPS”) for the years ended March 31, 2015 and 2014 was calculated as follows:
Millions of YenThousands of
Shares Yen U.S. Dollars
Year ended March 31, 2015 Net IncomeWeighted-Average Number of Shares EPS EPS
Basic EPS:
Net income available to common shareholders ¥14,632 367,196 ¥39.85 $0.33
Millions of YenThousands of
Shares Yen
Year ended March 31, 2014 Net IncomeWeighted-Average Number of Shares EPS
Basic EPS:
Net income available to common shareholders ¥531 356,076 ¥1.49
Diluted net EPS for the years ended March 31, 2015 and 2014 is not disclosed as there were no potentially dilutive securities for the years ended March 31, 2015 and 2014.
Company split, business transfer and transfer of shares in relation to transfer of DJ equipment businessThe Company resolved, at the board of directors’ meeting held on September 16, 2014, the transfer of the Group’s business relating to development, manufacturing and sale of DJ equipment (the “DJ equipment business”), by way of an absorption-type company split (the “Company Split”), and by way of a business transfer (the “Business Transfer”) for the DJ equipment business of the Group other than the Company, to the newly established companies by the Company, Pioneer DJ Corporation (the “Successor Company”), and Pioneer DJ Europe Limited and Pio-neer DJ Americas, Inc. (the “Sales Subsidiaries”) as of the effective date of March 2, 2015 and to transfer all the Successor Company’s outstanding shares to PDJ Holdings Co., Ltd. (the “PDJHD”) on the same day. The Company entered into a share transfer agreement with PDJHD on September 16, 2014 and transferred all the Successor Company’s outstanding shares to PDJHD on March 2, 2015.
1. Overview of the business split(1) Purpose of Company Split, Business Transfer and transfer of sharesThe Company will continue to pursue selection and concentration of its businesses other than the car electronics business by comprehensively examining
various factors, including the Company’s strengths, strategies for the car electronics business, profit-ability and market growth, in order to accelerate the concentration of management resources on the car electronics business and to implement its growth strategies quickly and steadily. As a part of those ef-forts, with respect to the DJ equipment business, the Company decided to expand its business and brand with the most suitable partner. Therefore, the Com-pany transferred the DJ equipment business to the newly established Successor Company and the Sales Subsidiaries by way of the Company Split and the Business Transfer, respectively, and transferred all the Successor Company’s outstanding shares to PDJHD. (2) Overview of the Company Split (a) Name of the counterparty of the Company Split
Pioneer DJ Corporation(b) Description of the business subject to the Com-
pany SplitDesigning, manufacturing and sale of DJ equip-ment and DJ equipment-related services
(c) Date of the Company SplitMarch 2, 2015
(d) Legal form of the Company SplitAn absorption-type company split (a simplified absorption-type company split) between the Company and the Successor Company.
21. Business Combination
19. Other Comprehensive Income
The components of other comprehensive income for the years ended March 31, 2015 and 2014, were the following:
Millions of YenThousands of
U.S. Dollars
2015 2014 2015
Unrealized (loss) gain on available-for-sale securities
(Losses) gains arising during the year ¥ (65) ¥ 490 $ (542)
Reclassification adjustments to profit or loss (1,609) – (13,408)
Amount before income tax effect (1,674) 490 (13,950)
Income tax effect 401 (17) 3,342
Total ¥ (1,273) ¥ 473 $ (10,608)
Deferred gain on derivatives under hedge accounting
Gains arising during the year – – –
Reclassification adjustments to profit or loss – ¥ 34 –
Amount before income tax effect – 34 –
Income tax effect – – –
Total – ¥ 34 –
Foreign currency translation adjustments
Adjustments arising during the year ¥12,622 ¥6,546 $105,183
Reclassification adjustments to profit or loss – – –
Amount before income tax effect 12,622 6,546 105,183
Income tax effect – – –
Total ¥12,622 ¥6,546 $105,183
Pension adjustments recognized by foreign consolidated subsidiaries
Adjustments arising during the year – ¥ (376) –
Reclassification adjustments to profit or loss – 265 –
Amount before income tax effect – (111) –
Income tax effect – (158) –
Total – ¥ (269) –
Defined retirement benefit plans
Adjustments arising during the year ¥ (304) – $ (2,533)
Reclassification adjustments to profit or loss 2,472 – 20,600
Amount before income tax effect 2,168 – 18,067
Income tax effect 632 – 5,266
Total ¥ 2,800 – $ 23,333
Share of other comprehensive income in associates
Gains arising during the year ¥ 207 ¥ 283 $ 1,725
Total other comprehensive income ¥14,356 ¥7,067 $119,633
48 Pioneer Corporat ion Annua l Repor t 2015 49Pioneer Corporat ion Annua l Repor t 2015

(2) Book value of assets and liabilities pertaining to the transferred business was as follows:
(2) Book value of assets and liabilities pertaining to the transferred business
(3) Reportable segment in which the transferred business was includedHome Electronics
(4) Estimated amounts of net sales and operating income of the transferred business included in the consolidated statement of income for the year ended March 31, 2015, were as follows:
(3) Reportable segment in which the transferred business was includedHome Electronics
(e) Details of allotment upon the Company SplitThe Successor Company issued common shares upon the establishment of the Successor Company and allocated all of the shares to the Company. The Company transferred to PDJHD all of the shares of the Successor Company, including the shares that were allocated to the Company by the Suc-cessor Company due to the Company Split, on the effective date of the Company Split.
(3) Overview of the Business Transfer(a) Subsidiaries that transferred the businesses
Pioneer Home Electronics CorporationPioneer Electronics Asiacentre Pte. Ltd.Pioneer Europe NVPioneer Electronics (USA) Inc.Pioneer International Latin America, S.A.
Pioneer RUS Limited Liability CompanyPioneer Korea Corporation
(b) Companies that acquired the businessesPioneer DJ Corporation Pioneer DJ Europe LimitedPioneer DJ Americas, Inc.
(4) Overview of the transfer of the shares(a) Name of the transferee
PDJ Holdings Co., Ltd.(b) Date of the transfer of the shares
March 2, 2015
2. Overview of the accounting treatment(1) Gain on Business Transfer
¥48,415 million ($403,458 thousand)
Millions of YenThousands of
U.S. Dollars
Current assets ¥5,008 $41,733
Non-current assets 448 3,733
Total assets ¥5,456 $45,466
Current liabilities ¥ 268 $ 2,233
Non-current liabilities 139 1,158
Total liabilities ¥ 407 $ 3,391
Millions of YenThousands of
U.S. Dollars
Current assets ¥ 9,380 $78,167
Non-current assets 627 5,225
Total assets ¥10,007 $83,392
Current liabilities ¥ 6,215 $51,792
Non-current liabilities 174 1,450
Total liabilities ¥ 6,389 $53,242
Millions of YenThousands of
U.S. Dollars
Net sales ¥21,369 $178,075
Operating income ¥ 4,199 $ 34,992
Company split, transfer of shares and business transfer relating to home AV businessThe Company resolved, at the board of directors’ meeting held on November 7, 2014, in order to in-tegrate the Group’s home AV business, telephone business and headphone-related business (“Pioneer’s Business”) into AV business of Onkyo Corporation (“Onkyo”), that the Company’s headphone-related business would be succeeded by PHE through a
1. Overview of the business split(1) Purpose of Company Split, transfer of shares and Business Transfer The audio market is transitioning from analog devices to digital devices whereby music is increasingly being played via PC and digital audio player devices and the environment for playing music and the style of music enjoyment have changed drastically. In view of this changing environment, the Company signed a capital and business alliance agreement with Onkyo and transferred the home AV business to enable both parties to mutually and effectively utilize their managerial resources such as their brand power and superior technology, to mutually improve their abil-ity to develop and launch attractive products, and to strengthen their respective managerial bases by improving cost competitiveness.
(2) Overview of the Company Split (a) Name of the counterparty of the Company Split
Pioneer Home Electronics Corporation(b) Description of the business subject to the Com-
pany SplitHeadphone-related business
(c) Date of the Company Split February 28, 2015
(d) Legal form of the Company SplitAn absorption-type company split (a simplified absorption-type company split) between the Company, as the splitting company, and PHE, a wholly-owned subsidiary of the Company, as the successor company.
(e) Details of allotment upon the Company SplitPHE issued common shares upon the split of the
Company Split, that the Company would transfer to Onkyo all of the shares of Pioneer Home Electronics Corporation (“PHE”), a wholly-owned subsidiary of the Company, and that the Company would transfer the Company’s business operated by some of its overseas subsidiaries to the Onkyo Group. The Company signed a capital and business alliance agreement with Onkyo on November 7, 2014, and transferred the home AV business on March 2, 2015.
headphone-related business and allotted all of the shares to the Company.
(3) Overview of the transfer of shares(a) Name of the counterparty of the transfer of shares
Onkyo Corporation(b) Description of business in relation to the transfer
of sharesHome AV business, telephone business and head-phone-related business
(c) Date of the transfer of shares March 2, 2015
(4) Overview of the transfer of business(a) Subsidiaries that transferred the businesses
Pioneer Electronics Asiacentre Pte. Ltd.Pioneer (HK) Ltd.Pioneer Europe NVPioneer Electronics (USA) Inc.Pioneer Electronics of Canada, Inc.Pioneer Gulf, Fze
(b) Companies that acquired the businessesOnkyo CorporationPioneer & ONKYO U.S.A. CorporationOnkyo Europe Electronics GmbHOnkyo Marketing Asia Limited
(c) Description of the transferred business Home AV business, telephone business and head-phone-related business
2. Overview of the accounting treatment(1) Loss on Business Transfer
¥(3,526) million ($(29,383) thousand)
50 Pioneer Corporat ion Annua l Repor t 2015 51Pioneer Corporat ion Annua l Repor t 2015
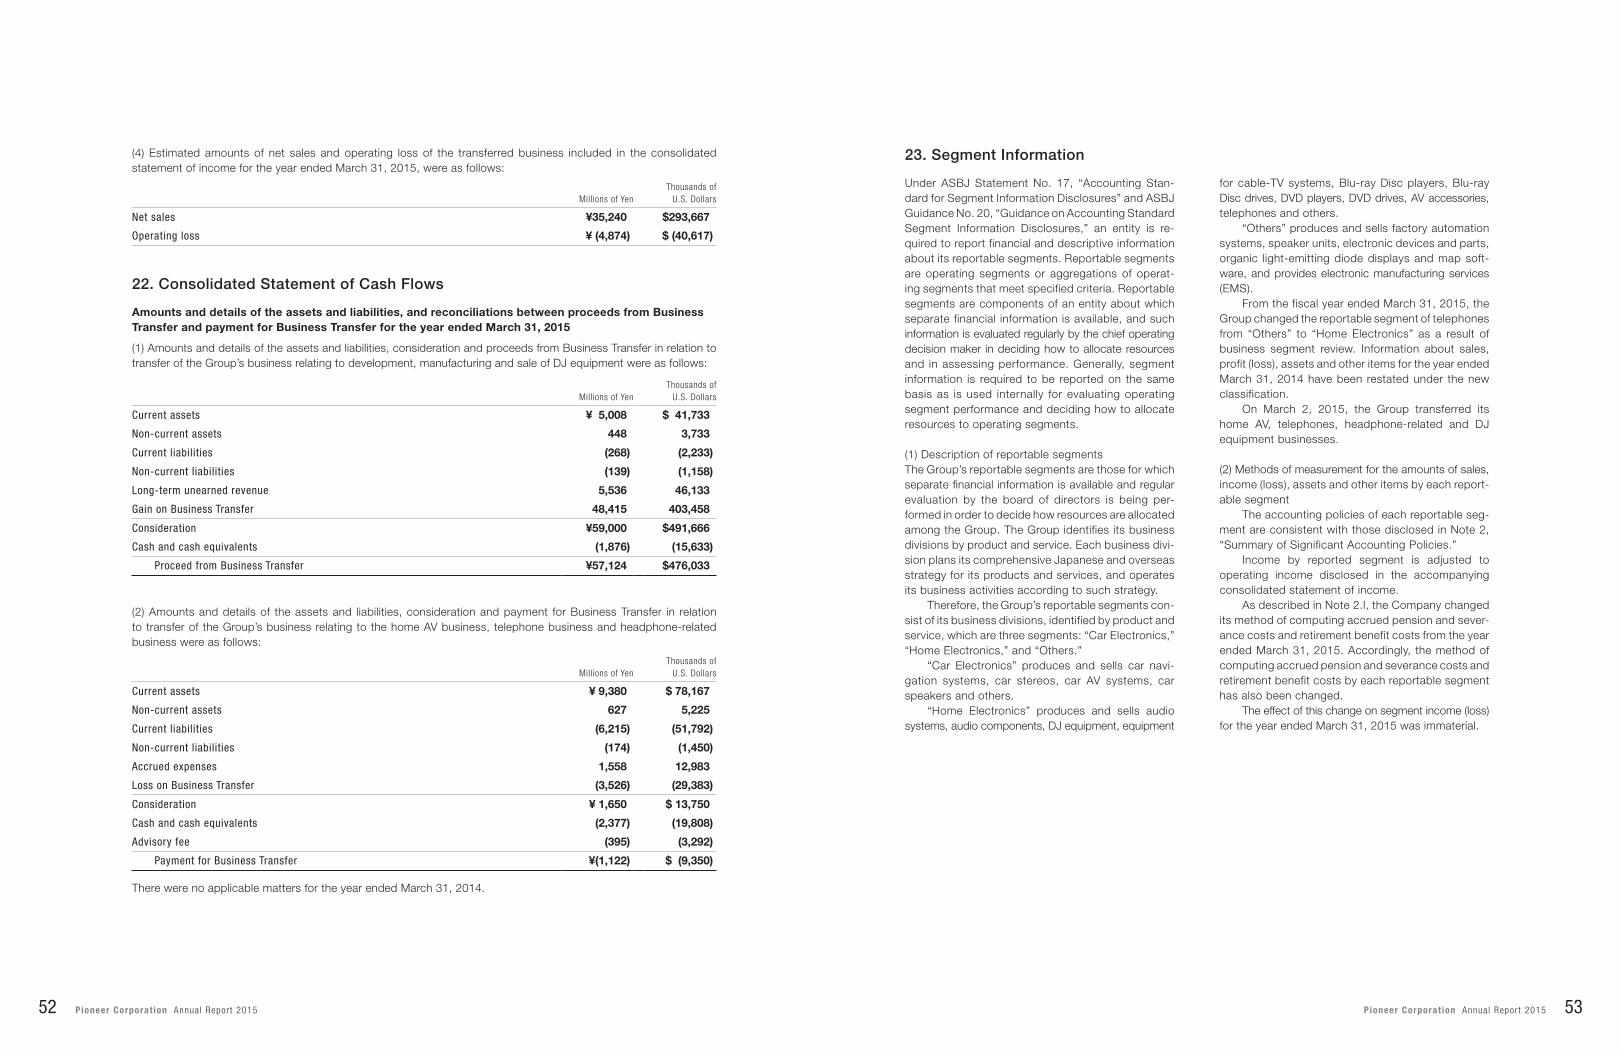
(4) Estimated amounts of net sales and operating loss of the transferred business included in the consolidated statement of income for the year ended March 31, 2015, were as follows:
Millions of YenThousands of
U.S. Dollars
Net sales ¥35,240 $293,667
Operating loss ¥ (4,874) $ (40,617)
(1) Amounts and details of the assets and liabilities, consideration and proceeds from Business Transfer in relation to transfer of the Group’s business relating to development, manufacturing and sale of DJ equipment were as follows:
(2) Amounts and details of the assets and liabilities, consideration and payment for Business Transfer in relation to transfer of the Group’s business relating to the home AV business, telephone business and headphone-related business were as follows:
Amounts and details of the assets and liabilities, and reconciliations between proceeds from Business Transfer and payment for Business Transfer for the year ended March 31, 2015
22. Consolidated Statement of Cash Flows
Millions of YenThousands of
U.S. Dollars
Current assets ¥ 5,008 $ 41,733
Non-current assets 448 3,733
Current liabilities (268) (2,233)
Non-current liabilities (139) (1,158)
Long-term unearned revenue 5,536 46,133
Gain on Business Transfer 48,415 403,458
Consideration ¥59,000 $491,666
Cash and cash equivalents (1,876) (15,633)
Proceed from Business Transfer ¥57,124 $476,033
Millions of YenThousands of
U.S. Dollars
Current assets ¥ 9,380 $ 78,167
Non-current assets 627 5,225
Current liabilities (6,215) (51,792)
Non-current liabilities (174) (1,450)
Accrued expenses 1,558 12,983
Loss on Business Transfer (3,526) (29,383)
Consideration ¥ 1,650 $ 13,750
Cash and cash equivalents (2,377) (19,808)
Advisory fee (395) (3,292)
Payment for Business Transfer ¥(1,122) $ (9,350)
There were no applicable matters for the year ended March 31, 2014.
Under ASBJ Statement No. 17, “Accounting Stan-dard for Segment Information Disclosures” and ASBJ Guidance No. 20, “Guidance on Accounting Standard Segment Information Disclosures,” an entity is re-quired to report financial and descriptive information about its reportable segments. Reportable segments are operating segments or aggregations of operat-ing segments that meet specified criteria. Reportable segments are components of an entity about which separate financial information is available, and such information is evaluated regularly by the chief operating decision maker in deciding how to allocate resources and in assessing performance. Generally, segment information is required to be reported on the same basis as is used internally for evaluating operating segment performance and deciding how to allocate resources to operating segments.
(1) Description of reportable segmentsThe Group’s reportable segments are those for which separate financial information is available and regular evaluation by the board of directors is being per-formed in order to decide how resources are allocated among the Group. The Group identifies its business divisions by product and service. Each business divi-sion plans its comprehensive Japanese and overseas strategy for its products and services, and operates its business activities according to such strategy.
Therefore, the Group’s reportable segments con-sist of its business divisions, identified by product and service, which are three segments: “Car Electronics,” “Home Electronics,” and “Others.”
“Car Electronics” produces and sells car navi-gation systems, car stereos, car AV systems, car speakers and others.
“Home Electronics” produces and sells audio systems, audio components, DJ equipment, equipment
for cable-TV systems, Blu-ray Disc players, Blu-ray Disc drives, DVD players, DVD drives, AV accessories, telephones and others.
“Others” produces and sells factory automation systems, speaker units, electronic devices and parts, organic light-emitting diode displays and map soft-ware, and provides electronic manufacturing services (EMS).
From the fiscal year ended March 31, 2015, the Group changed the reportable segment of telephones from “Others” to “Home Electronics” as a result of business segment review. Information about sales, profit (loss), assets and other items for the year ended March 31, 2014 have been restated under the new classification.
On March 2, 2015, the Group transferred its home AV, telephones, headphone-related and DJ equipment businesses.
(2) Methods of measurement for the amounts of sales, income (loss), assets and other items by each report-able segment
The accounting policies of each reportable seg-ment are consistent with those disclosed in Note 2, “Summary of Significant Accounting Policies.”
Income by reported segment is adjusted to operating income disclosed in the accompanying consolidated statement of income.
As described in Note 2.l, the Company changed its method of computing accrued pension and sever-ance costs and retirement benefit costs from the year ended March 31, 2015. Accordingly, the method of computing accrued pension and severance costs and retirement benefit costs by each reportable segment has also been changed.
The effect of this change on segment income (loss) for the year ended March 31, 2015 was immaterial.
23. Segment Information
52 Pioneer Corporat ion Annua l Repor t 2015 53Pioneer Corporat ion Annua l Repor t 2015
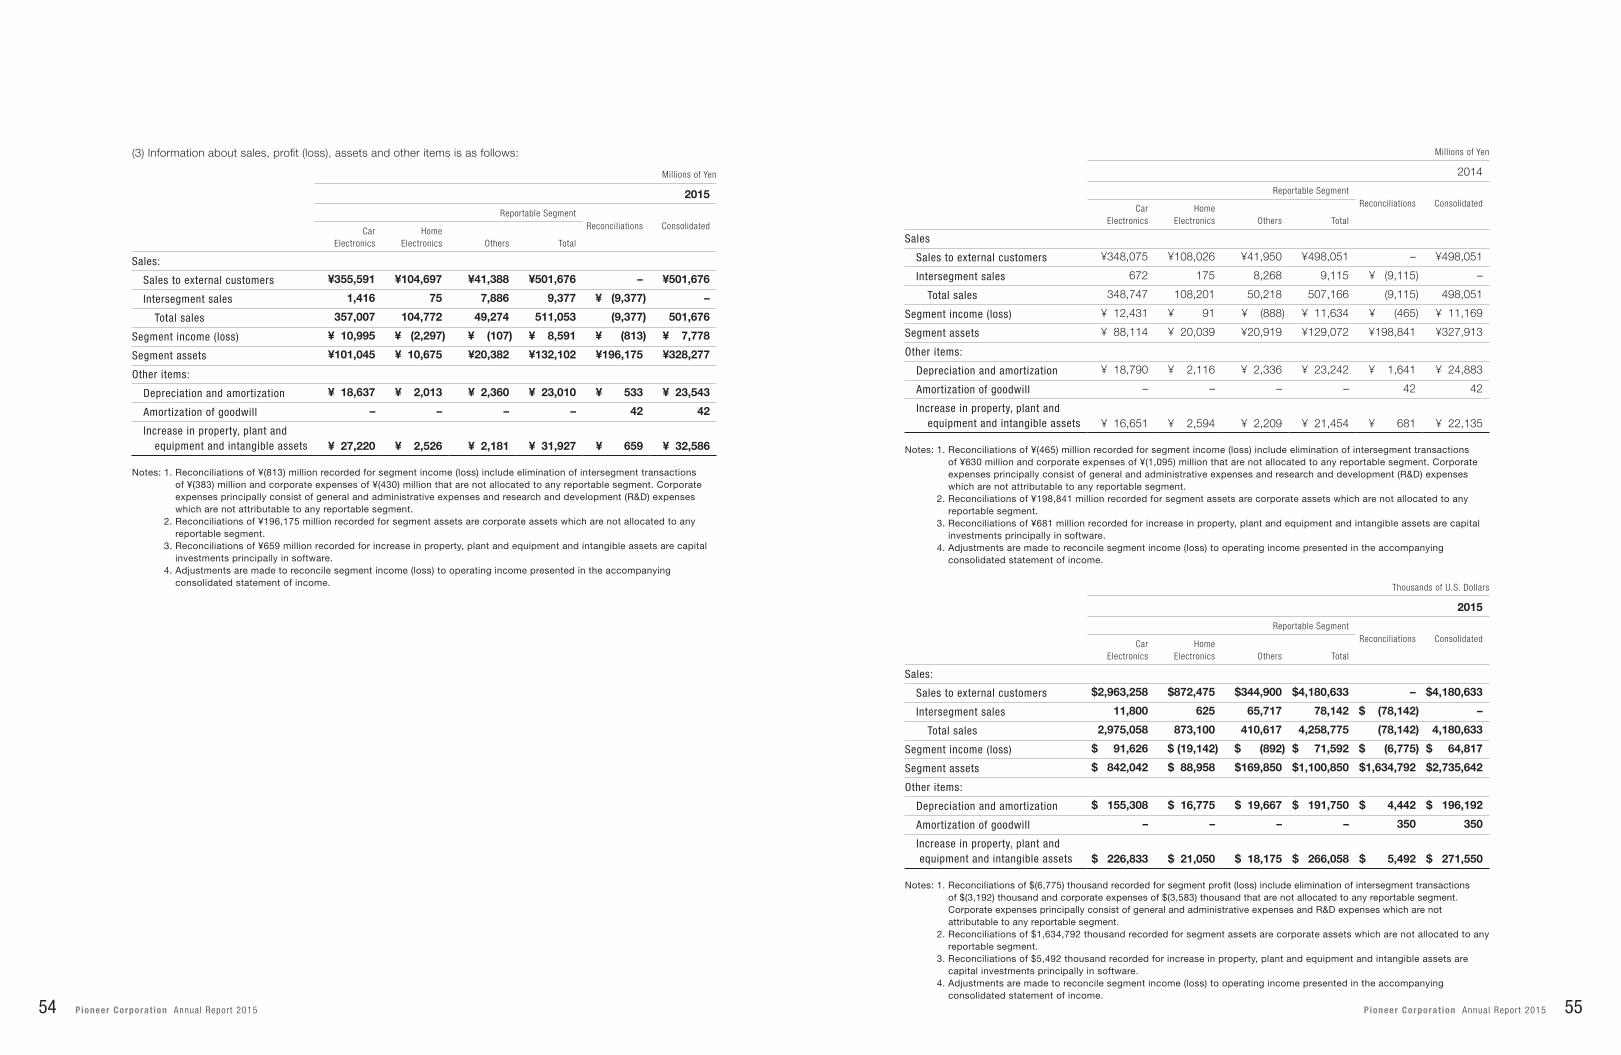
Millions of Yen
2014
Reportable SegmentReconciliations ConsolidatedCar
ElectronicsHome
Electronics Others Total
Sales
Sales to external customers ¥348,075 ¥108,026 ¥41,950 ¥498,051 – ¥498,051
Intersegment sales 672 175 8,268 9,115 ¥ (9,115) –
Total sales 348,747 108,201 50,218 507,166 (9,115) 498,051
Segment income (loss) ¥ 12,431 ¥ 91 ¥ (888) ¥ 11,634 ¥ (465) ¥ 11,169
Segment assets ¥ 88,114 ¥ 20,039 ¥20,919 ¥129,072 ¥198,841 ¥327,913
Other items:
Depreciation and amortization ¥ 18,790 ¥ 2,116 ¥ 2,336 ¥ 23,242 ¥ 1,641 ¥ 24,883
Amortization of goodwill – – – – 42 42
Increase in property, plant and equipment and intangible assets ¥ 16,651 ¥ 2,594 ¥ 2,209 ¥ 21,454 ¥ 681 ¥ 22,135
Thousands of U.S. Dollars
2015
Reportable SegmentReconciliations ConsolidatedCar
ElectronicsHome
Electronics Others Total
Sales:
Sales to external customers $2,963,258 $872,475 $344,900 $4,180,633 – $4,180,633
Intersegment sales 11,800 625 65,717 78,142 $ (78,142) –
Total sales 2,975,058 873,100 410,617 4,258,775 (78,142) 4,180,633
Segment income (loss) $ 91,626 $ (19,142) $ (892) $ 71,592 $ (6,775) $ 64,817
Segment assets $ 842,042 $ 88,958 $169,850 $1,100,850 $1,634,792 $2,735,642
Other items:
Depreciation and amortization $ 155,308 $ 16,775 $ 19,667 $ 191,750 $ 4,442 $ 196,192
Amortization of goodwill – – – – 350 350
Increase in property, plant and equipment and intangible assets $ 226,833 $ 21,050 $ 18,175 $ 266,058 $ 5,492 $ 271,550
Notes: 1. Reconciliations of ¥(465) million recorded for segment income (loss) include elimination of intersegment transactions of ¥630 million and corporate expenses of ¥(1,095) million that are not allocated to any reportable segment. Corporate expenses principally consist of general and administrative expenses and research and development (R&D) expenses which are not attributable to any reportable segment.
2. Reconciliations of ¥198,841 million recorded for segment assets are corporate assets which are not allocated to any reportable segment.
3. Reconciliations of ¥681 million recorded for increase in property, plant and equipment and intangible assets are capital investments principally in software.
4. Adjustments are made to reconcile segment income (loss) to operating income presented in the accompanying consolidated statement of income.
Notes: 1. Reconciliations of ¥(813) million recorded for segment income (loss) include elimination of intersegment transactions of ¥(383) million and corporate expenses of ¥(430) million that are not allocated to any reportable segment. Corporate expenses principally consist of general and administrative expenses and research and development (R&D) expenses which are not attributable to any reportable segment.
2. Reconciliations of ¥196,175 million recorded for segment assets are corporate assets which are not allocated to any reportable segment.
3. Reconciliations of ¥659 million recorded for increase in property, plant and equipment and intangible assets are capital investments principally in software.
4. Adjustments are made to reconcile segment income (loss) to operating income presented in the accompanying consolidated statement of income.
Notes: 1. Reconciliations of $(6,775) thousand recorded for segment profit (loss) include elimination of intersegment transactions of $(3,192) thousand and corporate expenses of $(3,583) thousand that are not allocated to any reportable segment. Corporate expenses principally consist of general and administrative expenses and R&D expenses which are not attributable to any reportable segment.
2. Reconciliations of $1,634,792 thousand recorded for segment assets are corporate assets which are not allocated to any reportable segment.
3. Reconciliations of $5,492 thousand recorded for increase in property, plant and equipment and intangible assets are capital investments principally in software.
4. Adjustments are made to reconcile segment income (loss) to operating income presented in the accompanying consolidated statement of income.
(3) Information about sales, profit (loss), assets and other items is as follows:
Millions of Yen
2015
Reportable SegmentReconciliations ConsolidatedCar
ElectronicsHome
Electronics Others Total
Sales:
Sales to external customers ¥355,591 ¥104,697 ¥41,388 ¥501,676 – ¥501,676
Intersegment sales 1,416 75 7,886 9,377 ¥ (9,377) –
Total sales 357,007 104,772 49,274 511,053 (9,377) 501,676
Segment income (loss) ¥ 10,995 ¥ (2,297) ¥ (107) ¥ 8,591 ¥ (813) ¥ 7,778
Segment assets ¥101,045 ¥ 10,675 ¥20,382 ¥132,102 ¥196,175 ¥328,277
Other items:
Depreciation and amortization ¥ 18,637 ¥ 2,013 ¥ 2,360 ¥ 23,010 ¥ 533 ¥ 23,543
Amortization of goodwill – – – – 42 42
Increase in property, plant and equipment and intangible assets ¥ 27,220 ¥ 2,526 ¥ 2,181 ¥ 31,927 ¥ 659 ¥ 32,586
54 Pioneer Corporat ion Annua l Repor t 2015 55Pioneer Corporat ion Annua l Repor t 2015
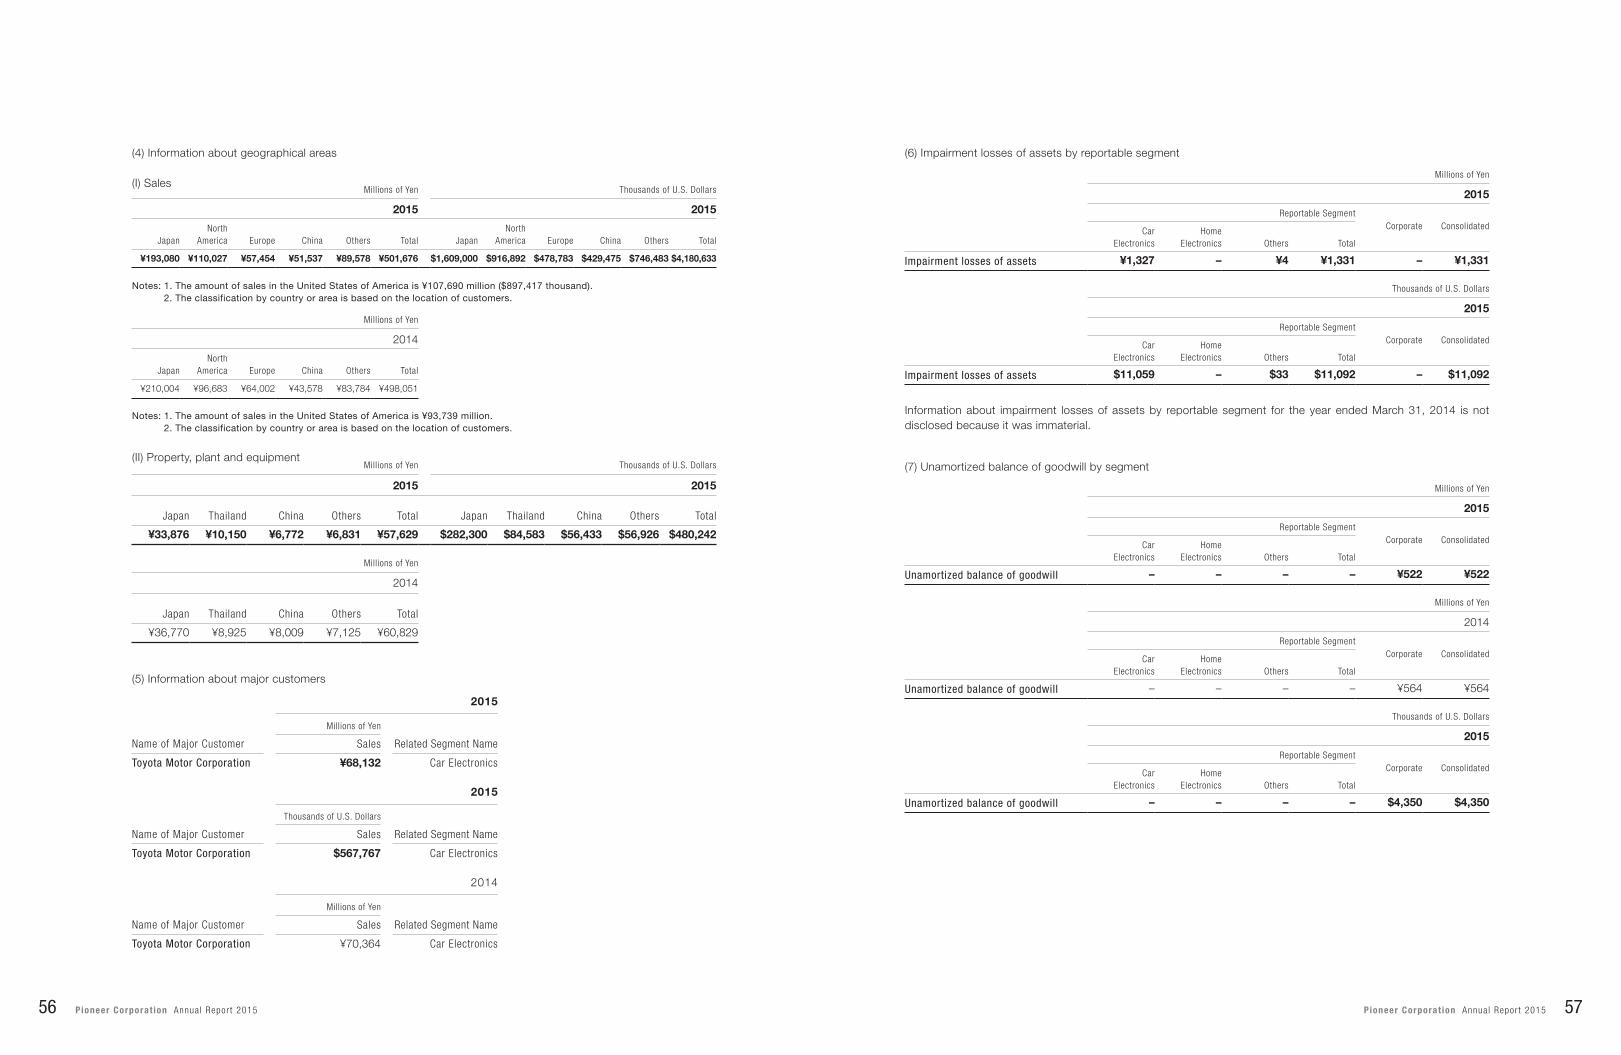
(4) Information about geographical areas
(I) SalesMillions of Yen Thousands of U.S. Dollars
2015 2015
JapanNorth
America Europe China Others Total JapanNorth
America Europe China Others Total
¥193,080 ¥110,027 ¥57,454 ¥51,537 ¥89,578 ¥501,676 $1,609,000 $916,892 $478,783 $429,475 $746,483 $4,180,633
Millions of Yen
2014
JapanNorth
America Europe China Others Total
¥210,004 ¥96,683 ¥64,002 ¥43,578 ¥83,784 ¥498,051
Notes: 1. The amount of sales in the United States of America is ¥107,690 million ($897,417 thousand). 2. The classification by country or area is based on the location of customers.
Notes: 1. The amount of sales in the United States of America is ¥93,739 million. 2. The classification by country or area is based on the location of customers.
(II) Property, plant and equipmentMillions of Yen Thousands of U.S. Dollars
2015 2015
Japan Thailand China Others Total Japan Thailand China Others Total
¥33,876 ¥10,150 ¥6,772 ¥6,831 ¥57,629 $282,300 $84,583 $56,433 $56,926 $480,242
Millions of Yen
2014
Japan Thailand China Others Total
¥36,770 ¥8,925 ¥8,009 ¥7,125 ¥60,829
(5) Information about major customers
2015
Millions of Yen
Name of Major Customer Sales Related Segment Name
Toyota Motor Corporation ¥68,132 Car Electronics
2015
Thousands of U.S. Dollars
Name of Major Customer Sales Related Segment Name
Toyota Motor Corporation $567,767 Car Electronics
2014
Millions of Yen
Name of Major Customer Sales Related Segment Name
Toyota Motor Corporation ¥70,364 Car Electronics
Information about impairment losses of assets by reportable segment for the year ended March 31, 2014 is not disclosed because it was immaterial.
(6) Impairment losses of assets by reportable segment
(7) Unamortized balance of goodwill by segment
Millions of Yen
2015
Reportable SegmentCorporate ConsolidatedCar
ElectronicsHome
Electronics Others Total
Impairment losses of assets ¥1,327 – ¥4 ¥1,331 – ¥1,331
Millions of Yen
2015
Reportable SegmentCorporate ConsolidatedCar
ElectronicsHome
Electronics Others Total
Unamortized balance of goodwill – – – – ¥522 ¥522
Millions of Yen
2014
Reportable SegmentCorporate ConsolidatedCar
ElectronicsHome
Electronics Others Total
Unamortized balance of goodwill – – – – ¥564 ¥564
Thousands of U.S. Dollars
2015
Reportable SegmentCorporate ConsolidatedCar
ElectronicsHome
Electronics Others Total
Impairment losses of assets $11,059 – $33 $11,092 – $11,092
Thousands of U.S. Dollars
2015
Reportable SegmentCorporate ConsolidatedCar
ElectronicsHome
Electronics Others Total
Unamortized balance of goodwill – – – – $4,350 $4,350
56 Pioneer Corporat ion Annua l Repor t 2015 57Pioneer Corporat ion Annua l Repor t 2015
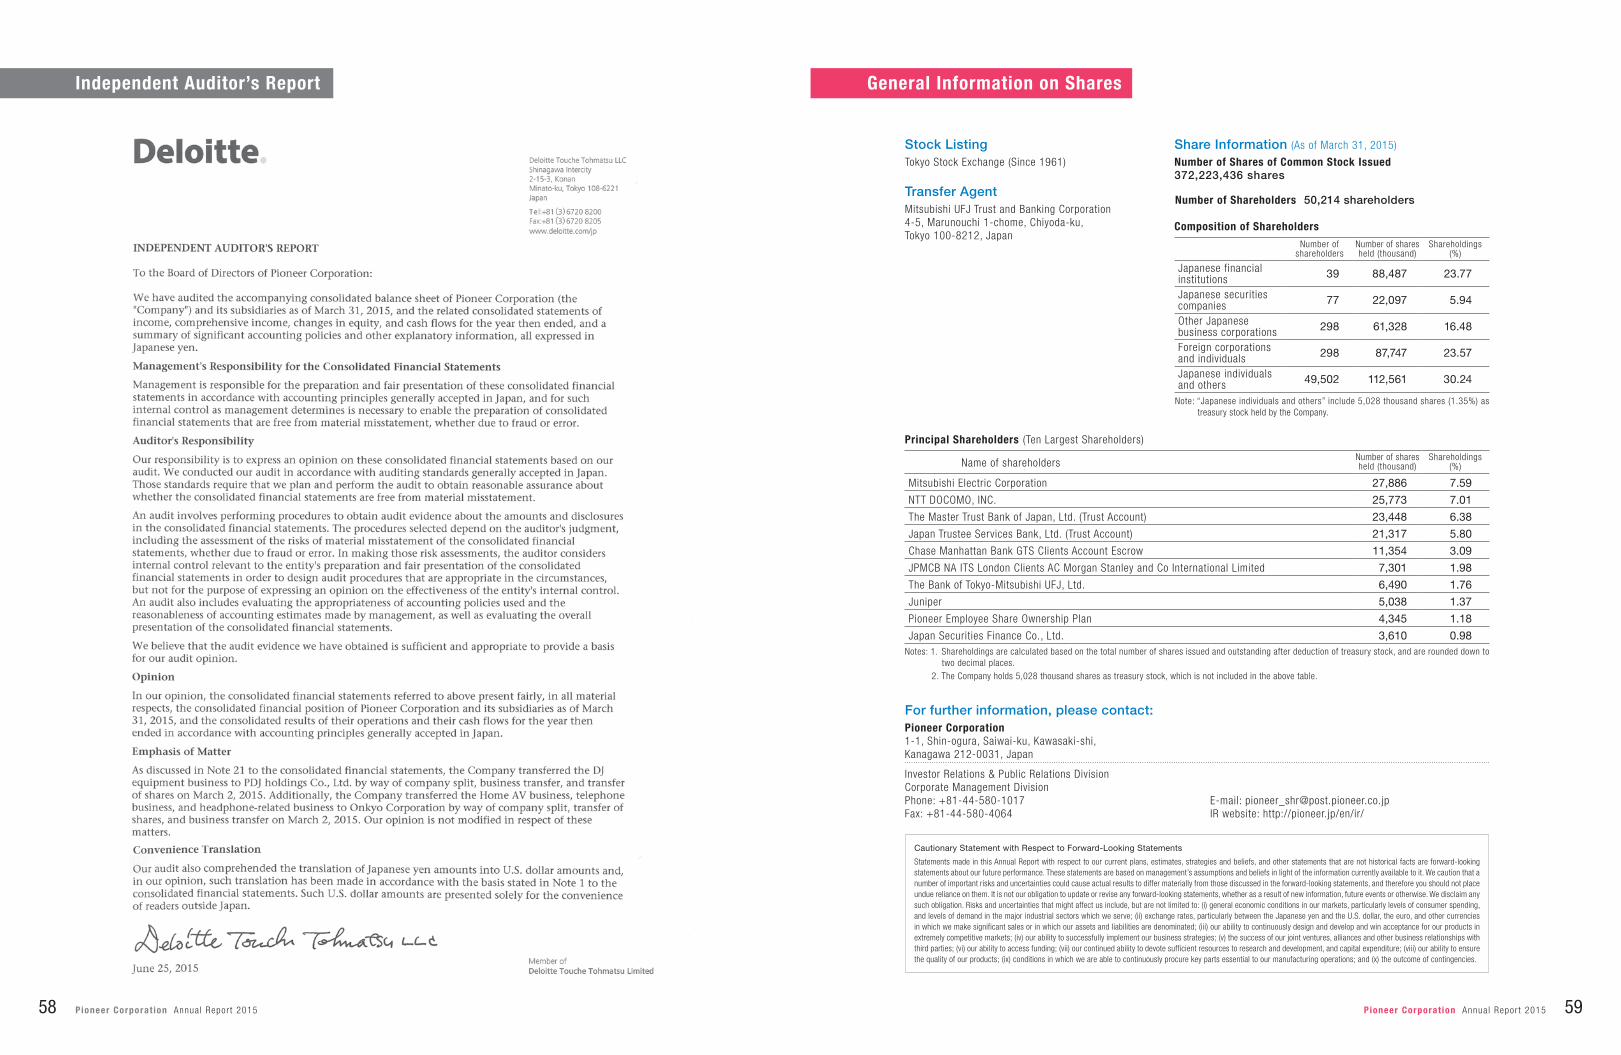
Stock ListingTokyo Stock Exchange (Since 1961)
Transfer AgentMitsubishi UFJ Trust and Banking Corporation4-5, Marunouchi 1-chome, Chiyoda-ku,Tokyo 100-8212, Japan
Composition of Shareholders
Number of shareholders
Number of shares held (thousand)
Shareholdings(%)
Japanese financial institutions 39 88,487 23.77
Japanese securities companies 77 22,097 5.94
Other Japanese business corporations 298 61,328 16.48
Foreign corporations and individuals 298 87,747 23.57
Japanese individuals and others 49,502 112,561 30.24
Note: “Japanese individuals and others” include 5,028 thousand shares (1.35%) as treasury stock held by the Company.
Number of Shareholders 50,214 shareholders
Share Information (As of March 31, 2015)
Number of Shares of Common Stock Issued 372,223,436 shares
Name of shareholdersNumber of shares held (thousand)
Shareholdings(%)
Mitsubishi Electric Corporation 27,886 7.59
NTT DOCOMO, INC. 25,773 7.01
The Master Trust Bank of Japan, Ltd. (Trust Account) 23,448 6.38
Japan Trustee Services Bank, Ltd. (Trust Account) 21,317 5.80
Chase Manhattan Bank GTS Clients Account Escrow 11,354 3.09
JPMCB NA ITS London Clients AC Morgan Stanley and Co International Limited 7,301 1.98
The Bank of Tokyo-Mitsubishi UFJ, Ltd. 6,490 1.76
Juniper 5,038 1.37
Pioneer Employee Share Ownership Plan 4,345 1.18
Japan Securities Finance Co., Ltd. 3,610 0.98
Principal Shareholders (Ten Largest Shareholders)
Investor Relations & Public Relations DivisionCorporate Management DivisionPhone: +81-44-580-1017Fax: +81-44-580-4064
E-mail: [email protected] website: http://pioneer.jp/en/ir/
For further information, please contact:Pioneer Corporation1-1, Shin-ogura, Saiwai-ku, Kawasaki-shi,Kanagawa 212-0031, Japan
Cautionary Statement with Respect to Forward-Looking Statements
Statements made in this Annual Report with respect to our current plans, estimates, strategies and beliefs, and other statements that are not historical facts are forward-looking statements about our future performance. These statements are based on management’s assumptions and beliefs in light of the information currently available to it. We caution that a number of important risks and uncertainties could cause actual results to differ materially from those discussed in the forward-looking statements, and therefore you should not place undue reliance on them. It is not our obligation to update or revise any forward-looking statements, whether as a result of new information, future events or otherwise. We disclaim any such obligation. Risks and uncertainties that might affect us include, but are not limited to: (i) general economic conditions in our markets, particularly levels of consumer spending, and levels of demand in the major industrial sectors which we serve; (ii) exchange rates, particularly between the Japanese yen and the U.S. dollar, the euro, and other currencies in which we make significant sales or in which our assets and liabilities are denominated; (iii) our ability to continuously design and develop and win acceptance for our products in extremely competitive markets; (iv) our ability to successfully implement our business strategies; (v) the success of our joint ventures, alliances and other business relationships with third parties; (vi) our ability to access funding; (vii) our continued ability to devote sufficient resources to research and development, and capital expenditure; (viii) our ability to ensure the quality of our products; (ix) conditions in which we are able to continuously procure key parts essential to our manufacturing operations; and (x) the outcome of contingencies.
General Information on Shares
Notes: 1. Shareholdings are calculated based on the total number of shares issued and outstanding after deduction of treasury stock, and are rounded down to two decimal places. 2. The Company holds 5,028 thousand shares as treasury stock, which is not included in the above table.
Independent Auditor’s Report
59Pioneer Corporat ion Annua l Repor t 201558 Pioneer Corporat ion Annua l Repor t 2015
