annual report 2015 - chicony.com.t · ctbc bank co ltd url: https ... communication and cloud...
TRANSCRIPT

一○二年股東常會
日期:中華民國一○二年六月十一日上午九時正
地點:新 北 市 五 股 區 五 工 六 路 二 十 五 號
一〇三年股東常會
中華民國一〇三年五月三十日上午九時正
14411P0314-00A-00D議.indd 1 2014/4/24 下午4:35
公開資訊觀測站網址:
http://mops.twse.com.tw/
本公司網址: 中國信託商業銀行代理部網址:
http://www.chicony.com.tw/ https://ecorp.ctbcbank.com/cts/index.jsp
群光電子股份有限公司 地址:新北市五股區五工六路二十五號
Chicony Electronics Co., Ltd. 電話:02-22988120 傳真:02-22989414
Market Observation Post System URL:
http://mops.twse.com.tw/
Chicony URL:
http://www.chicony.com.tw/
CTBC Bank Co Ltd URL:
https://ecorp.ctbcbank.com/cts/index.jsp
Chicony Electronics Co., Ltd
No.25, Wu-Gong 6th. Rd., Wu-Ku Industrial Park , New Ta ipe i C i ty 24891 , Ta iwanTel : 886-2-22988120 Fax : 886-2-22988442
Ticker Number: 2385
Chicony Electronics CO., Ltd.
Annual Report 2015
16429P0531-00A-00D-E2.indd 1 2016/5/12 下午10:40

Report to Shareholders
1. Year 2015 performance (All in NTD$)
1.1 Operating results
Joint efforts by our management team and employees, our Consolidated Revenue increased
to $80,663,369 thousands. Our Operation Income amounted to $4,605,263 thousands, while
the Net Income amounted to $3,847,991 thousands.
1.2 Financial highlights and profitability analysis
a. Financial highlights
Units: NTD thousands
Item 2015 2014 Increase (decrease)
Operating profit 4,605,263 4,681,669 (1.63%)
Net profit after tax 3,847,991 4,080,939 (5.71%)
Average total assets 58,029,971 53,949,884 7.56%
Average shareholder equity 22,249,419 21,569,176 3.15%
b.Profitability
Item 2015 2014
Return on average assets (%) 6.63 7.64
Return on average shareholder equity (%) 17.29 18.92
Operating profit on end-of-period shareholder equity (%) 65.43 67.38
Net profit margin (%) 4.77 5.09
Earnings per share (EPS) in NTD 5.79 6.22
*The 2015 EPS is unadjusted by employee bonus and plowback funding, which would affect
stock share numbers.
1.3 Research and development
In 2015, Chicony spent approximately $2,225,418 thousands on product development,
automation production equipment and process improvement. Our solid R&D capacity and
strength will be the major key point to make Chicony stay on top among when surrounded
by fierce competition and fast changing of macro environment. Therefore, we established
the “Chicony R&D scholarship” and “C&T laboratory” with National Taipei University of
Technology to cultivate internal R&D staffs and hire outstanding R&D candidates, and step
close to industry new development trend. Besides continuously invests in R&D for tablet
input/output devices, camera module for tablets and smart phones, sports camera, power
supply, multi-functional high quality digital video products integrated with wireless
communication, IoT and VR related application, LED car lighting and smart building green
energy solution, our portion of non-PC new product has also exceeded PC products to meet
the various market demands and to create more Blue-ocean market opportunity.
-1-

2 Year 2016 outlook
2.1 2016 goals and outlook
According to the global economy outlook published by IMF, the 2016 global GDP
growth rate is expected to be 3.4%. Due to the factors of price collapse of oil and
commodity, interest raise in America, slowing down economy in China, tense situation in
Mid-East and refugee crisis in Europe, the global economy growth will face more
uncertainty in 2016. The economy in Europe and America will continue to recover. The
2016 GDP growth rate is expected to be 2.8% in America and 1.6% in Europe. The
economy growth in China is slowing down with a 6.3% growth rate in 2016. And the
economic growth rate is anticipated to be 1.0% in Japan. The electronic industry will
benefit from the recovery of mature markets since the strengthened consuming power will
extend the high-end products demand to some extent. However, the strong USD will also
enhance the debt burden in emerging markets and have impact on the economy growth in
2016.
Due to the weak recovery of global economy, low demand from emergying market,
crowding effect of mobile devices, extension of PC usage and the free upgrade strategy of
Windows 10, the global PC sales is evidently slowing down with a 15% decline of desktop
in 2015. Though the demand of Desktop (DT) was decreasing in 2016, high-end gaming
and professional drawing PC are being popular, the demand of PC with new product, such
as Virtual Reality (VR) and Augmented Reality (AR) are increasing, so that the decline of
PC will be reduced. As for NB, the market was still looked worse than last year. Due to the
demand of gaming and 2-in-1 NB, the applied of Cloud and IoT are increasing, we are
looking forward to increasing the production in 2016. The recession of tablet will be
shortening to 4.8% according to the investigation of Digitimes Resaerch, the main reason
was size requirement of tablet has been adjusted. On the basis estimation of IEK, the
shipment of smartphone is about 15.8 hundred million pcs; annual growth rate is about
7.7%. It seems an obvious development trend for both high level and low-end smartphone.
The demand of smartphone will transferred to Emerging Markets since the penetration rate
has been high in Maniland China, Europe and America. As we mentioned above, the
average sales price (ASP) will be revised, and the sales amount of mid-level and low-end
smartphone will gradually increase. So far we are putting more and more emphasis on our new production line especially
in non-PC industry, such as cloud products like Gaming and Server from our subsidiary
Chicony Power Techonology; Wearable electronics, wireless camera and home
surveillance from Chicony. The sales revenue of non-PC products has more than 50% in
overall. Look into the future, the electronic component industry in Taiwan is under huge
pressure because of low growth in end-user market of smartphone, change of competitors
and IoT environment. Meanwhile, the electronic component industry in China has rapidly
being mature, what we used to depend on is economies of scale was instead of technical
upgrade and supply chain acceleration. In the next coming year, we are still facing more
challenges especially in multi-applied and complex market condition of IoT.
Our team will face the rapid change and challenges with confidence and optimistic
by integrating all resources and devoting in the development of keyboard, digital image,
-2-

power supply and other niche products. Moreover, to keep the consistent revenue growth,
we will also expand business into non-PC new products such as drone, smart car, VR and
AR. The computer peripheral sales units are estimated to reach 256.9 million units, and
136.9 million units in consumer and other electronic goods.
2.2 Business strategies
Chicony will keep the idea of sustainable and honest operation. Guided by the
principle of “No Quality, No sales”, we are committed to provide the most satisfactory
services and keep revenue and profit growing to reward to the shareholders, employees and
the society. Our strategies for products, production, marketing, R&D, human resource, and
finance are explained as follows:
a. Products
(1) To continue developing in keyboard, digital image, power supply, and other high
value-added and differentiated products.
(2) To continue developing in wireless, Bluetooth and ultra slim keyboards compatible
with Tablet, multi-functional digital video products integrated with wireless
communication and cloud function and cloud data center service to increase the
revenue.
(3) To develop the related application of IoT and Smart Home, input/output devices on
smart phone and cloud service, wearable device, drone, virtual reality (VR)
application, LED car light smart building green energy solution, and wireless power
products to enlarge the product scope.
b. Production
(1) To retain a competitive advantage in keyboard, digital video, and power supply
products, increase production capacity, and closely monitor product quality.
(2) To enhance the VMI (Vendor Managed Inventory) system with the information
provided by EDI and ERP to quickly react to customer needs by enhancing flexibility
in delivery, stocking, and production.
(3) To enhance greater bargain power and efficiently reduce material costs, by integrating
group procurement resources.
(4) To purchase the key component with the original suppliers directly to cut down the
material costs.
(5) To continue to find key material suppliers for vertical integration, in order to enhance
mutual complementarities and to expand benefit sharing from economic scale.
(6) Maintain the relationship with the suppliers on China to strengthen the procurement
localization. Take advantage of widely declined oil price to reduce the material cost and
to enlarge the CRP amount.
(7) Through automation implement and new production processes engineering to enhance
productivity and release the pressure caused by the increasing labor cost in China.
c. Marketing
-3-

(1) To integrate product categories and to satisfy customer needs with a “one-stop
shopping” approach. Maximize profitability with efficient marketing resource
consuming.
(2) To change product portfolios and increase the weight of high value-added products to
generate higher profit.
(3) To expand customers and extend products market shares of Keyboard, PC Camera,
DV, NB/Tablet build-in Camera Module and Power Supply.
(4) To strengthen the application of IoT and Smart Home and the new products such as
wearable devices, drone, virtual reality (VR) and wireless powers.
(5) To expand the Chinese domestic market for each product category
(6) To expand the revenue to non-PC and niche products.
(7) To expand the international marketing spot in America and Japan.
d. Research and Development
(1) To collaborate with major international hardware/software providers to co-develop new
products with patent values.
(2) To set up the barriers to entry with technology strength with I.P. Know-How.
(3) To continue VA/VE (value analysis/value engineering) and improve product design to
increase product efficiency and reduce the costs of production.
(4) To establish the “Chicony R&D scholarship” to excavate more excellent R&D
manpower to enhance overall R&D capability and efficiency.
(5) To continuously devote into the development of new products to seek for the
blue-ocean product in the future.
(6) To establish the Intellectual Property Center to conduct the acquirement and
protection of patents, and the cross-licensing of patents as well.。
e. Human Resources
(1) To set up human resources management index to help each business unit and
subsidiaries eternally operate in priority categories, in order to reach Group annual
profit goals.
(2) To cultivate employees for professional technique and help develop themselves, by
continuous professional and management training.
(3) To help employees develop stable self-career plan with position rotation and job
deputy, and, there through, the work capacity and position experience can be
continuously applied and inherited for eternal operation purpose.
(4) To promote corporate social responsibility items and to allocate certain ratio of the
company’s earning for donation to educational and medical groups; cooperate with the
schools to set up the mechanism of industrial and academic cooperation for manpower
reservation.
(5) To gain insight into government human resource policies in global each area,
especially in Asian countries, and form strategies for of optimal mutual benefit for both
sides.
-4-

(6) More care with employees and keep the excellent manpower with the profound
retaining system
f. Finance
(1) To supervise budget control of the company and in management of accounts receivable,
inventory, and cash turnover.
(2) Strictly manage the tax-preserving materials and ensure the conduct of tax-preserving
materials meet the legal regulation everywhere so that the company can continuously
benefit from the custom tax.
(3) To continually improve the debt ratio and strengthen the stock and finance affairs of
corporate governance.
(4) To adequately hedge against fluctuations in exchange rates and raw material costs.
(5) To well conduct tax planning for Chicony group by overviewing of relevant tax law
and regulation of each country.
(6) To minimize the interest cost and to plan the middle and long term fund facility
according to the trend of interest rate.
(7) Keep seeking for the companies with growth potential or complementary strength for
investment or further strategy alliance.
2.3 Important production and marketing policies
a.Continue to concentrate resources on the top 10 global brands of manufacturers in personal
computers, notebooks, webcams, digital video peripherals, and mobile phone. By increasing
our shares among these growing companies, we aim to expand our global market shares and
strengthen our position.
b.Utilize the competitive advantages based on Group’s diversified product portfolios,
collective sales and integrated procurement.
c.Continue to establish just-in-time supplying warehouses to shorten product delivery time
and gain advantages over competitors.
d.Keep reviewing and adjusting production process on the optimum track, and head up to
production automation to increase integrated efficiency.
e.Establish VMI (Vendor Managed Inventory) to enhance overall material delivery efficiency
and reduce stocks of inventory.
f.Strengthen the existing ERP system, apply the management index information to establish
the war room with timely information for decision making.
Chairman: Kent Hsu
Vice President and General Manger: MK Lin
Chief Accounting Officer: Molly Lin
-5-

CHICONY ELECTRONICS CO., LTD. AND
SUBSIDIARIES
CONSOLIDATED FINANCIAL STATEMENTS AND
REPORT OF INDEPENDENT ACCOUNTANTS
DECEMBER 31, 2015 AND 2014
------------------------------------------------------------------------------------------------------------------------------------
For the convenience of readers and for information purpose only, the auditors’ report and the accompanying
financial statements have been translated into English from the original Chinese version prepared and used in
the Republic of China. In the event of any discrepancy between the English version and the original
Chinese version or any differences in the interpretation of the two versions, the Chinese-language auditors’
report and financial statements shall prevail.
-6-

REPORT OF INDEPENDENT ACCOUNTANTS TRANSLATED FROM CHINESE
To the Board of Directors and Shareholders of CHICONY ELECTRONICS CO., LTD.
We have audited the accompanying consolidated balance sheets of Chicony Electronics Co., Ltd. and
its subsidiaries as of December 31, 2015 and 2014, and the related consolidated statements of
comprehensive income, of changes in stockholders’ equity and of cash flows for the years then ended,
expressed in thousands of New Taiwan dollars. These consolidated financial statements are the
responsibility of the Company’s management. Our responsibility is to express an opinion on these
financial statements based on our audits. We did not audit the 2015 and 2014 financial statements of
certain wholly-owned consolidated subsidiaries and long-term investments accounted for using equity
method. The total assets of those subsidiaries amounted to NT$1,211,360 thousand and NT$1,179,226
thousand, constituting 2.05% and 2.07% of total consolidated assets as of December 31, 2015 and
2014, respectively. The total revenues of those subsidiaries amounted to NT$2,468,615 thousand and
NT$2,457,751 thousand, constituting 3.06% and 3.07% of total consolidated revenues for the years
ended December 31, 2015 and 2014. The balance of those long-term investments accounted for using
equity method as of December 31, 2015 and 2014 were NT$83,317 thousand and NT$89,591 thousand,
constituting 0.14% and 0.16% of total consolidated assets, respectively. The share of comprehensive
income (loss) recognized (including the share of profit (loss) of associates and joint ventures accounted
for under equity method and the share of other comprehensive income of associates and joint ventures
accounted for under equity method) for the years ended December 31, 2015 and 2014 were (NT$6,275)
thousand and NT$4,253 thousand, constituting (0.18%) and 0.10% of consolidated comprehensive
income, respectively. These statements were audited by other independent accountants whose reports
thereon were furnished to us and our opinion herein insofar as it relates to the amounts included in the
consolidated financial statements and information disclosed in Notes 6(8) and 13 relative to these
subsidiaries and long-term investments accounted for using equity method, is based solely on the
reports of the other independent accountants.
We conducted our audits in accordance with the “Regulations Governing Auditing and Attestation of
Financial Statements by Certified Public Accountants” and generally accepted auditing standards in the
Republic of China. Those standards require that we plan and perform the audit to obtain reasonable
assurance about whether the financial statements are free of material misstatement. An audit also
includes examining, on a test basis, evidence supporting the amounts and disclosures in the financial
statements. An audit includes assessing the accounting principles used and significant estimates made
by management, as well as evaluating the overall financial statement presentation. We believe that our
audits provide a reasonable basis for our opinion.
-7-

In our opinion, based on our audits and the reports of other independent accountants, the consolidated
financial statements referred to in the first paragraph present fairly, in all material respects, the
financial position of Chicony Electronics Co., Ltd. and its subsidiaries as of December 31, 2015 and
2014 and the results of their financial performance and cash flows for the years then ended in
conformity with the “Rules Governing the Preparation of Financial Statements by Securities Issuers”
and the International Financial Reporting Standards, International Accounting Standards, IFRIC
Interpretations, and SIC Interpretations as endorsed by the Financial Supervisory Commission.
We have also audited the parent company only financial statements of Chicony Electronics Co., Ltd. as
of and for the years ended December 31, 2015 and 2014, and have expressed a modified unqualified
opinion on such financial statements.
March 21, 2016
------------------------------------------------------------------------------------------------------------------------------------------------- The accompanying consolidated financial statements are not intended to present the financial position and results of operations and cash flows in accordance with accounting principles generally accepted in countries and jurisdictions other than the Republic of China. The standards, procedures and practices in the Republic of China governing the audit of such financial statements may differ from those generally accepted in countries and jurisdictions other than the Republic of China. Accordingly, the accompanying consolidated financial statements and report of independent accountants are not intended for use by those who are not informed about the accounting principles or auditing standards generally accepted in the Republic of China, and their applications in practice. As the financial statements are the responsibility of the management, PricewaterhouseCoopers cannot accept any liability for the use of, or reliance on, the English translation or for any errors or misunderstandings that may derive from the translation.
-8-

CHICONY ELECTRONICS CO., LTD. AND SUBSIDIARIES CONSOLIDATED BALANCE SHEETS
(Expressed in thousands of New Taiwan dollars)
Assets Notes December 31, 2015 December 31, 2014
Current assets
1100 Cash and cash equivalents 6(1) $ 2,349,599 $ 1,980,696
1110 Financial assets at fair value
through profit or loss - current
6(2)
437,429 267,564
1125 Available-for-sale financial assets
- current
6(3)
3,969,736 5,151,339
1144 Financial assets carried at cost -
current
6(4)
10,617 -
1150 Notes receivable, net 266,456 15,999
1170 Accounts receivable, net 6(5) 18,073,961 18,913,995
1180 Accounts receivable - related
parties
7
329,439 241,285
1200 Other receivables 452,479 596,465
130X Inventories, net 6(7) 9,413,581 10,018,702
1410 Prepayments 972,681 1,305,852
1470 Other current assets 8 141,818 27,886
11XX Current Assets 36,417,796 38,519,783
Non-current assets
1523 Available-for-sale financial assets
- noncurrent
6(3)
1,596,614 382,573
1543 Financial assets carried at cost -
noncurrent
6(4)
917,494 1,097,746
1550 Investments accounted for under
the equity method
6(8)
999,597 1,176,824
1600 Property, plant and equipment, net 6(9) 15,461,482 14,204,652
1760 Investment property - net 6(10) and 8 1,968,855 -
1780 Intangible assets 6(11) 263,118 246,430
1840 Deferred income tax assets 6(28) 112,560 194,281
1900 Other non-current assets 6(12) and 8 1,322,668 1,177,469
15XX Non-current assets 22,642,388 18,479,975
1XXX Total assets $ 59,060,184 $ 56,999,758
(Continued)
-9-

The accompanying notes are an integral part of these consolidated financial statements.
See report of independent accountants dated March 21, 2016.
CHICONY ELECTRONICS CO., LTD. AND SUBSIDIARIES CONSOLIDATED BALANCE SHEETS
(Expressed in thousands of New Taiwan dollars)
Liabilities and Equity Notes December 31, 2015 December 31, 2014
Current liabilities 2100 Short-term borrowings 6(13) and 8 $ 2,473,216 $ 2,098,920 2120 Financial liabilities at fair value
through profit or loss - current
6(2)
107,399 143,388 2150 Notes payable 16,298 31,341 2170 Accounts payable 6(14) 18,588,195 19,115,143 2180 Accounts payable - related parties 7 500,250 425,304 2200 Other payables 7,181,716 6,939,367
2230 Current income tax liabilities 1,082,321 1,135,472 2300 Other current liabilities 6(15) 273,716 567,847
21XX Current Liabilities 30,223,111 30,456,782
Non-current liabilities 2540 Long-term borrowings 6(15) and 8 2,389,694 500,000 2570 Deferred income tax liabilities 6(28) 37,189 36,999 2600 Other non-current liabilities 205,673 179,335
25XX Non-current liabilities 2,632,556 716,334
2XXX Total Liabilities 32,855,667 31,173,116
Equity attributable to owners of
parent
Share capital 6(18)
3110 Share capital - common stock 7,038,101 6,948,654 Capital surplus 6(19) 3200 Capital surplus 4,090,426 3,602,741 Retained earnings 6(20) 3310 Legal reserve 3,477,140 3,069,046 3320 Special reserve 433,524 433,524 3350 Unappropriated retained earnings 8,591,961 8,440,750 Other equity interest 6(21) 3400 Other equity interest ( 951,489 ) ( 52,986 ) 3500 Treasury stocks 6(18) and 8 ( 311,277 ) ( 311,277 )
31XX Equity attributable to owners
of the parent
22,368,386 22,130,452
36XX Non-controlling interest 3,836,131 3,696,190
3XXX Total equity 26,204,517 25,826,642
Significant contingent liabilities
and unrecognised contract
commitments
9
Significant events after the
balance sheet date
11
3X2X Total liabilities and equity $ 59,060,184 $ 56,999,758
-10-

CHICONY ELECTRONICS CO., LTD. AND SUBSIDIARIES CONSOLIDATED STATEMENTS OF COMPREHENSIVE INCOME
(Expressed in thousands of New Taiwan dollars, except earnings per share amounts)
For the years ended December 31,
Items Notes 2015 2014
4000 Sales revenue 6(22) and 7 $ 80,663,369 $ 80,110,692
5000 Operating costs 6(7)(25)(26) and 7 ( 68,411,552 ) ( 67,564,442 )
5900 Net operating margin 12,251,817 12,546,250
Operating expenses 6(25)(26)
6100 Selling expenses ( 3,026,581 ) ( 3,265,651 )
6200 General & administrative
expenses
( 2,394,555 ) ( 2,416,535 )
6300 Research and development
expenses
( 2,225,418 ) ( 2,182,395 )
6000 Total operating expenses ( 7,646,554 ) ( 7,864,581 )
6900 Operating profit 4,605,263 4,681,669
Non-operating income and
expenses
7010 Other income 6(23) 735,082 517,712
7020 Other gains and losses 6(24) 233,881 544,979
7050 Finance costs 6(27) ( 76,212 ) ( 46,587 )
7060 Share of profit/(loss) of
associates and joint ventures
accounted for under equity
method
6(8)
( 168,666 ) ( 91,916 )
7000 Total non-operating income
and expenses
724,085 924,188
7900 Profit before income tax 5,329,348 5,605,857
7950 Income tax expense 6(28) ( 849,615 ) ( 950,027 )
8200 Profit for the year $ 4,479,733 $ 4,655,830
(Continued)
-11-
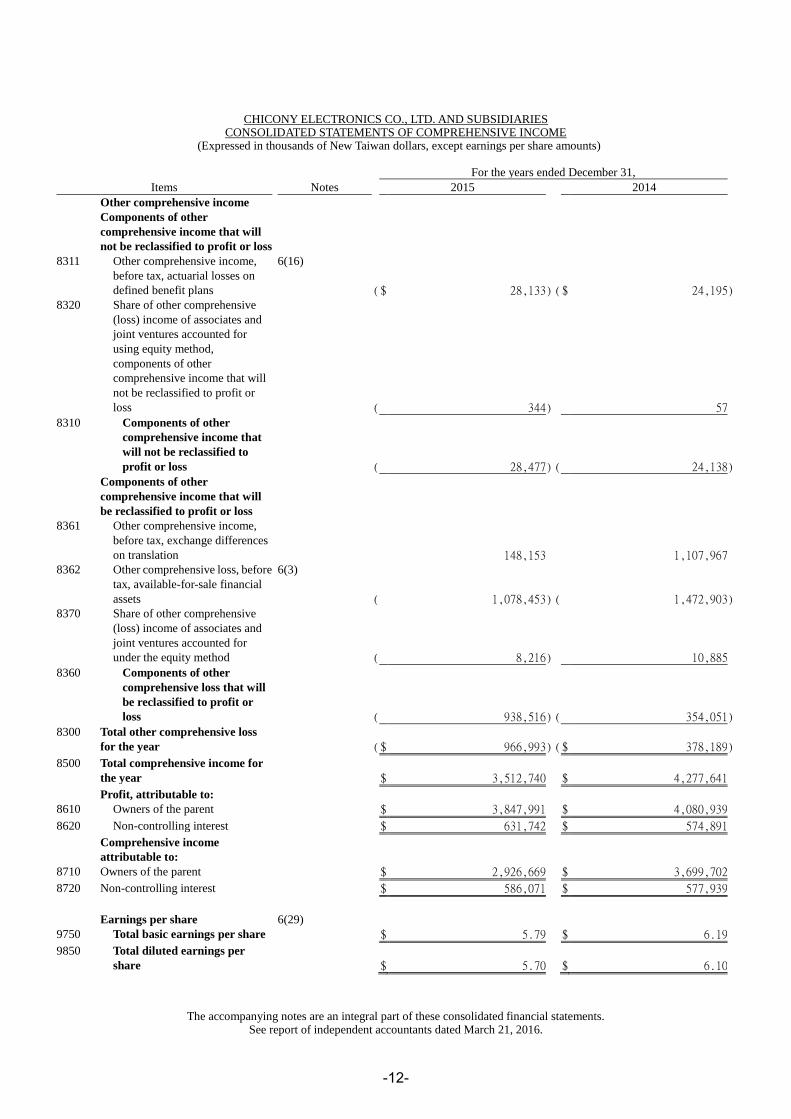
CHICONY ELECTRONICS CO., LTD. AND SUBSIDIARIES CONSOLIDATED STATEMENTS OF COMPREHENSIVE INCOME
(Expressed in thousands of New Taiwan dollars, except earnings per share amounts)
The accompanying notes are an integral part of these consolidated financial statements. See report of independent accountants dated March 21, 2016.
For the years ended December 31,
Items Notes 2015 2014
Other comprehensive income Components of other
comprehensive income that will
not be reclassified to profit or loss
8311 Other comprehensive income,
before tax, actuarial losses on
defined benefit plans
6(16)
( $ 28,133 ) ( $ 24,195 ) 8320 Share of other comprehensive
(loss) income of associates and
joint ventures accounted for
using equity method,
components of other
comprehensive income that will
not be reclassified to profit or
loss
( 344 ) 57
8310 Components of other
comprehensive income that
will not be reclassified to
profit or loss
( 28,477 ) ( 24,138 )
Components of other
comprehensive income that will
be reclassified to profit or loss
8361 Other comprehensive income,
before tax, exchange differences
on translation
148,153 1,107,967 8362 Other comprehensive loss, before
tax, available-for-sale financial
assets
6(3)
( 1,078,453 ) ( 1,472,903 ) 8370 Share of other comprehensive
(loss) income of associates and
joint ventures accounted for
under the equity method
( 8,216 ) 10,885
8360 Components of other
comprehensive loss that will
be reclassified to profit or
loss
( 938,516 ) ( 354,051 )
8300 Total other comprehensive loss
for the year
( $ 966,993 ) ( $ 378,189 )
8500 Total comprehensive income for
the year
$ 3,512,740 $ 4,277,641
Profit, attributable to: 8610 Owners of the parent $ 3,847,991 $ 4,080,939
8620 Non-controlling interest $ 631,742 $ 574,891
Comprehensive income
attributable to:
8710 Owners of the parent $ 2,926,669 $ 3,699,702
8720 Non-controlling interest $ 586,071 $ 577,939
Earnings per share 6(29) 9750 Total basic earnings per share $ 5.79 $ 6.19
9850 Total diluted earnings per
share
$ 5.70 $ 6.10
-12-

-13-
CH
ICO
NY
EL
EC
TR
ON
ICS
CO
., L
TD
. A
ND
SU
BS
IDIA
RIE
S
CO
NS
OL
IDA
TE
D S
TA
TE
ME
NT
S O
F C
HA
NG
ES
IN
EQ
UIT
Y
FO
R T
HE
YE
AR
S E
ND
ED
DE
CE
MB
ER
31
, 2
01
5 A
ND
20
14
(Exp
ress
ed i
n t
ho
usa
nd
s o
f N
ew T
aiw
an d
oll
ars
)
Eq
uit
y a
ttri
bu
tab
le t
o o
wner
s o
f th
e p
arent
Ret
ained
Ear
nin
gs
O
ther
eq
uit
y i
nte
rest
No
tes
Shar
e ca
pit
al
-
com
mo
n s
tock
Cap
ital
surp
lus,
add
itio
nal
pai
d-i
n c
apit
al
Legal
rese
rve
Sp
ecia
l re
serv
e
Unap
pro
pri
ated
reta
ined
earn
ing
s
F
inancia
l
stat
em
en
t
transl
atio
n
dif
fere
nce
s o
f
fore
ign
op
erat
ions
Un
reali
zed
gain
or
loss
on
avail
able
-fo
r-
sale
fin
ancia
l
asse
ts
Tre
asury
sto
cks
To
tal
No
n-c
ontr
oll
ing
inte
rest
To
tal
equ
ity
The
acco
mp
an
yin
g n
ote
s ar
e an
in
tegra
l p
art
of
thes
e co
nso
lid
ated
fin
ancia
l st
atem
ents
.
See
rep
ort
of
ind
epen
dent
acco
unta
nts
dat
ed
Mar
ch 2
1,
20
16
.
Yea
r 2
01
4
Bal
ance
at
Jan
uar
y 1
, 2
01
4
$ 6,867,21
6
$
3,068,07
4
$
2,690,843
$
1,457,609
$
6,927,69
5
$
167,564
$
140,176
( $
311,277 )
$ 21,007,9
00
$
3,295,40
9
$ 24,303,3
09
Ap
pro
pri
atio
n o
f 2
01
3 e
arn
ings
6(2
0)
Ap
pro
pri
ati
on o
f le
gal
rese
rve
-
-
378,203
- (
378,203 )
-
-
-
-
-
-
Rev
ersa
l o
f sp
ecia
l re
serv
e
-
-
- (
1,024,085 )
1,024,08
5
-
-
-
-
-
-
Dis
trib
uti
on o
f st
ock
div
idend
s
34,336
-
-
-
(
34,336 )
-
-
-
-
-
-
Cas
h d
ivid
end
s
-
-
-
-
(
3,158,91
9 )
-
-
- (
3,158,91
9 )
-
(
3,158,91
9 )
Pro
fit
for
20
14
-
-
-
-
4,080,93
9
-
-
-
4,080,93
9
574,891
4,655,83
0
Oth
er c
om
pre
hensi
ve
inco
me
(lo
ss)
for
20
14
-
-
-
-
(
20,511 )
1,062,380
(
1,423,10
6 )
- (
381,237 )
3,048
(
378,189 )
Cas
h d
ivid
end
s p
aid
to
the
sub
sid
iari
es
-
167,639
-
-
-
-
-
-
167,639
-
167,639
Ad
just
ments
to
shar
e o
f chan
ges
in
equ
ity o
f as
soci
ates
an
d j
oin
t ventu
res
- (
106 )
-
-
-
-
-
- (
106 )
-
(
106 )
Dif
fere
nce
bet
wee
n p
roce
eds
fro
m
add
itio
n a
nd
dis
po
sal
of
sub
sid
iary
an
d b
oo
k v
alu
e
-
47,736
-
-
-
-
-
-
47,736
-
47,736
A
pp
rop
riat
ion o
f em
plo
yee
bo
nuse
s
47,102
319,398
-
-
-
-
-
-
366,500
-
366,500
Min
ori
ty i
nte
rest
ad
just
ment
-
-
-
-
-
-
-
-
-
(
177,158 )
(
177,158 )
Bal
ance
at
Dec
em
ber
31
, 2
01
4
$ 6,948,65
4
$
3,602,74
1
$
3,069,046
$
433,524
$
8,440,75
0
$
1,229,944
( $ 1,282,93
0 )
( $
311,277 )
$ 22,130,4
52
$
3,696,19
0
$ 25,826,6
42
Y
ear
20
15
Bal
ance
at
Jan
uar
y 1
, 2
01
5
$ 6,948,65
4
$
3,602,74
1
$
3,069,046
$
433,524
$
8,440,75
0
$
1,229,944
( $ 1,282,93
0 )
( $
311,277 )
$ 22,130,4
52
$
3,696,19
0
$ 25,826,6
42
Ap
pro
pri
atio
n o
f 2
01
4 e
arn
ings
6(2
0)
Ap
pro
pri
ati
on o
f le
gal
rese
rve
-
-
408,094
- (
408,094 )
-
-
-
-
-
-
Dis
trib
uti
on o
f st
ock
div
idend
s
34,743
-
-
-
(
34,743 )
-
-
-
-
-
-
Cas
h d
ivid
end
s
-
-
-
-
(
3,231,12
4 )
-
-
- (
3,231,12
4 )
-
(
3,231,12
4 )
Pro
fit
for
20
15
-
-
-
-
3,847,99
1
-
-
-
3,847,99
1
631,742
4,479,73
3
Oth
er c
om
pre
hensi
ve
inco
me
(lo
ss)
for
20
15
-
-
-
-
(
22,819 )
175,816
(
1,075,66
5 )
- (
922,668 )
(
45,671
) (
968,339 )
Cas
h d
ivid
end
s p
aid
to
the
sub
sid
iari
es
-
170,307
-
-
-
-
-
-
170,307
-
170,307
Dif
fere
nce
bet
wee
n p
roce
eds
fro
m
add
itio
n a
nd
dis
po
sal
of
sub
sid
iary
an
d b
oo
k v
alu
e
-
9,353
-
-
-
(
1,711
)
3,057
-
10,699
-
10,699
A
dju
stm
ents
to
shar
e o
f chan
ges
in
equ
ity o
f as
soci
ates
an
d j
oin
t ventu
res
- (
58,271
)
-
-
-
-
-
- (
58,271
)
-
(
58,271
)
A
pp
rop
riat
ion o
f em
plo
yee
bo
nuse
s
54,704
366,296
-
-
-
-
-
-
421,000
-
421,000
Min
ori
ty i
nte
rest
ad
just
ment
-
-
-
-
-
-
-
-
-
(
446,130 )
(
446,130 )
Bal
ance
at
Dec
em
ber
31
, 2
01
5
$ 7,038,10
1
$
4,090,42
6
$
3,477,140
$
433,524
$
8,591,96
1
$
1,404,049
( $ 2,355,53
8 )
( $
311,277 )
$ 22,368,3
86
$
3,836,13
1
$ 26,204,5
17

CHICONY ELECTRONICS CO., LTD. AND SUBSIDIARIES CONSOLIDATED STATEMENTS OF CASH FLOWS
(Expressed in thousands of New Taiwan dollars)
For the years ended December 31,
Notes 2015 2014
CASH FLOWS FROM OPERATING ACTIVITIES Profit before tax $ 5,329,348 $ 5,605,857 Adjustments Income and expenses having no effect on cash flows Depreciation 6(26) 2,025,739 1,899,068 Amortization 6(9)(11) 87,546 89,295 Long-term lease amortization 6(12) 12,243 18,792 Reversal of allowance for doubtful accounts ( 3,801 ) ( 5,087 ) Interest expense 6(27) 76,212 46,587 Interest income 6(23) ( 71,602 ) ( 52,387 ) Dividend income 6(23) ( 228,005 ) ( 210,185 ) Gain on valuation of financial assets 6(2)(24) ( 565,867 ) ( 415,444 ) Investment loss recognized under the equity method 168,666 91,916 Loss on disposal of property, plant and equipment 6(24) 17,400 45,798 Loss on disposal of intangible assets 2,044 - Gain on investments 6(24) ( 162,019 ) ( 645,673 ) Gain on reversal of provisions for liabilities-noncurrent 6(24) - ( 66,221 ) Impairment loss of non-financial assets 6(11)(24) 53,000 - Changes in operating assets and liabilities Changes in operating assets Financial assets and liabilities at fair value through profit or
loss - current
360,013 396,295 Notes receivable ( 250,457 ) 27,840 Accounts receivable 1,000,127 ( 576,348 ) Accounts receivable - related parties ( 88,154 ) ( 122,878 ) Other receivables ( 9,280 ) 13,669 Inventories 651,917 ( 1,308,377 ) Prepayments 335,120 ( 635,181 ) Other current assets 27,165 ( 26,189 ) Changes in operating liabilities Notes payable ( 15,043 ) 15,717 Accounts payable ( 594,330 ) 3,083,365 Accounts payable - related parties 74,946 ( 145,384 ) Other payables 442,782 1,093,554 Other current liabilities 114,334 ( 47,443 ) Provisions - ( 224,245 ) Other non-current liabilities ( 1,795 ) ( 33,688 )
Cash flows generated from operations 8,788,249 7,913,023 Interest received 71,741 52,053 Dividend received 228,005 232,867 Interest paid ( 78,144 ) ( 41,987 ) Income tax paid ( 820,855 ) ( 912,304 )
Net cash flows provided by operating activities 8,188,996 7,243,652
(Continued)
-14-

CHICONY ELECTRONICS CO., LTD. AND SUBSIDIARIES CONSOLIDATED STATEMENTS OF CASH FLOWS
(Expressed in thousands of New Taiwan dollars)
For the years ended December 31,
Notes 2015 2014
CASH FLOWS FROM INVESTING ACTIVITIES
Acqusition of government grants $ 198,834 $ -
Increase in other current assets ( 141,097 ) -
Increase in available-for-sale financial assets ( 3,678,560 ) ( 4,147,769 )
Proceeds from disposal of available-for-sale financial assets 3,396,981 3,740,399
Increase in financial assets carried at cost – non-current ( 431,696 ) ( 652,331 )
Return of capital from financial assets carried at cost –
non-current
4,205 16,000
Acquisition of property, plant and equipment 6(30) ( 2,817,104 ) ( 4,094,872 )
Proceeds from disposal of property, plant and equipment 307,884 170,860
Acquisition of investment property 6(10) ( 1,893,763 ) -
Acquisition of intangible assets 6(11) ( 63,004 ) ( 69,863 )
Increase in other non-current assets ( 762,009 ) ( 321,864 )
Cash flows from business combinations ( 210,437 ) 525
Increase in refundable deposits ( 114,021 ) ( 56,516 )
Net cash flows used in investing activities ( 6,203,787 ) ( 5,415,431 )
CASH FLOWS FROM FINANCING ACTIVITIES
Increase in short-term borrowings 374,296 1,401,319
Increase in long-term borrowings 6,847,944 911,060
Decrease in long-term borrowings ( 5,369,310 ) ( 1,370,570 )
Payment of cash dividends ( 3,060,817 ) ( 2,991,280 )
Decrease in guarantee deposits - ( 200 )
Changes in non-controlling interests ( 552,969 ) ( 358,574 )
Net cash flows used in financing activities ( 1,760,856 ) ( 2,408,245 )
Effect of exchange rate changes on cash and cash equivalents 144,550 982,383
Net increase in cash and cash equivalents 368,903 402,359
Cash and cash equivalents at beginning of year 6(1) 1,980,696 1,578,337
Cash and cash equivalents at end of year 6(1) $ 2,349,599 $ 1,980,696
-15-

CHICONY ELECTRONICS CO., LTD. AND SUBSIDIARIES
NOTES TO THE CONSOLIDATED FINANCIAL STATEMENTS
DECEMBER 31, 2015 AND 2014
(EXPRESSED IN THOUSANDS OF NEW TAIWAN DOLLARS, EXCEPT AS OTHERWISE INDICATED)
1. HISTORY AND ORGANIZATION
Chicony Electronics Co., Ltd. (the “Company”) was incorporated in 1983 as a company limited by
shares under the provisions of the Company Law of the Republic of China. The Company has been a
listed company since 1999. The Company and its subsidiaries (collectively referred herein as the
“Group”) are engaged in the manufacturing and sales of keyboards and other computer peripheral
components.
2. THE DATE OF AUTHORIZATION FOR ISSUANCE OF THE CONSOLIDATED FINANCIAL
STATEMENTS AND PROCEDURES FOR AUTHORIZATION
These consolidated financial statements were authorized for issuance by the Board of Directors on
March 21, 2016.
3. APPLICATION OF NEW STANDARDS, AMENDMENTS AND INTERPRETATIONS
(1) Effect of the adoption of new issuances of or amendments to International Financial Reporting
Standards (“IFRS”) as endorsed by the Financial Supervisory Commission (“FSC”)
According to Financial-Supervisory-Securities-Auditing No. 1030010325 issued by FSC on April 3,
2014, commencing 2015, companies with shares listed on the TWSE or traded on the Taipei
Exchange or Emerging Stock Market shall adopt the 2013 version of IFRS (not including IFRS 9,
‘Financial instruments’) as endorsed by the FSC and Regulations Governing the Preparation of
Financial Reports by Securities Issuers effective January 1, 2015 (collectively referred herein as the
“2013 version of IFRS”) in preparing the consolidated financial statements. The impact of adopting
the 2013 version of IFRS is listed below:
A. IAS 1, ‘Presentation of financial statements’
The amendment requires entities to separate items presented in OCI classified by nature into two
groups on the basis of whether they are potentially reclassifiable to profit or loss subsequently
when specific conditions are met. If the items are presented before tax then the tax related to
each of the two groups of OCI items (those that might be reclassified and those that will not be
reclassified) must be shown separately. Accordingly, the Group will adjust its presentation of the
statement of comprehensive income.
B. IFRS 12, ‘Disclosure of interests in other entities’
The standard integrates the disclosure requirements for subsidiaries, joint arrangements,
associates and unconsolidated structured entities. And, the Group will disclose additional
information about its interests in consolidated entities and unconsolidated entities accordingly.
-16-

C. IFRS 13, ‘Fair value measurement’
The standard defines fair value as the price that would be received to sell an asset or paid to
transfer a liability in an orderly transaction between market participants at the measurement date.
The standard sets out a framework for measuring fair value from market participants’
perspective, and requires disclosures about fair value measurements. For non-financial assets
only, fair value is determined based on the highest and best use of the asset. Based on the
Group’s assessment, the adoption of the standard has no significant impact on its consolidated
financial statements, and the Group will disclose additional information about fair value
measurements accordingly.
(2) Effect of new issuances of or amendments to IFRSs as endorsed by the FSC but not yet adopted by
the Group
None.
(3) IFRSs issued by IASB but not yet endorsed by the FSC
New standards, interpretations and amendments issued by IASB but not yet included in the 2013
version of IFRSs as endorsed by the FSC:
Effective Date by
International Accounting
New Standards, Interpretations and Amendments Standards Board
IFRS 9, 'Financial instruments' January 1, 2018
Sale or contribution of assets between an investor and its
associate or joint venture (amendments to IFRS 10 and IAS
28)
To be determined by
International Accounting
Standards Board
Investment entities: applying the consolidation exception
(amendments to IFRS 10, IFRS 12 and IAS 28)
January 1, 2016
Accounting for acquisition of interests in joint operations
(amendments to IFRS 11)
January 1, 2016
IFRS 14, 'Regulatory deferral accounts' January 1, 2016
IFRS 15, 'Revenue from contracts with customers' January 1, 2018
IFRS 16, ‘Leases’ January 1, 2019
Disclosure initiative (amendments to IAS 1) January 1, 2016
Disclosure initiative (amendments to IAS 7) January 1, 2017
Recognition of deferred tax assets for unrealised losses January 1, 2017
(amendments to IAS 12)
Clarification of acceptable methods of depreciation and
amortization (amendments to IAS 16 and IAS 38)
January 1, 2016
Agriculture: bearer plants (amendments to IAS 16 and IAS 41) January 1, 2016
Defined benefit plans: employee contributions (amendments
to IAS 19R)
July 1, 2014
Equity method in separate financial statements (amendments to
IAS 27)
January 1, 2016
-17-

The Group is assessing the potential impact of the new standards, interpretations and amendments
above. The impact will be disclosed when the assessment is complete.
4. SUMMARY OF SIGNIFICANT ACCOUNTING POLICIES
The principal accounting policies applied in the preparation of these consolidated financial statements
are set out below. These policies have been consistently applied to all the periods presented, unless
otherwise stated.
(1) Compliance statement
The consolidated financial statements of the Group have been prepared in accordance with the
“Regulations Governing the Preparation of Financial Reports by Securities Issuers” and the
International Financial Reporting Standards, International Accounting Standards, IFRIC
Interpretations, and SIC Interpretations as endorsed by the FSC (collectively referred herein as the
“IFRSs”).
(2) Basis of preparation
A. Except for the following items, these consolidated financial statements have been prepared
under the historical cost convention:
(a) Financial assets and financial liabilities (including derivative instruments) at fair value
through profit or loss.
(b) Available-for-sale financial assets measured at fair value.
(c) Defined benefit liabilities recognized based on the net amount of pension fund assets plus
unrecognized past service cost and unrecognized actuarial losses, and less unrecognized
actuarial gains and present value of defined benefit obligation.
B. The preparation of financial statements in compliance with IFRSs requires the use of certain
critical accounting estimates. It also requires management to exercise its judgment in the
process of applying the Group’s accounting policies. The areas involving a higher degree of
judgment or complexity, or areas where assumptions and estimates are significant to the
consolidated financial statements are disclosed in Note 5.
Effective Date by
International Accounting
New Standards, Interpretations and Amendments Standards Board
Recoverable amount disclosures for non-financial assets
(amendments to IAS 36)
January 1, 2014
Novation of derivatives and continuation of hedge accounting
(amendments to IAS 39)
January 1, 2014
IFRIC 21, 'Levies' January 1, 2014
Improvements to IFRSs 2010-2012 July 1, 2014
Improvements to IFRSs 2011-2013 July 1, 2014
Improvements to IFRSs 2012-2014 January 1, 2016
-18-

(3) Basis of consolidation
A. Basis for preparation of consolidated financial statements:
(a) All subsidiaries are included in the Group’s consolidated financial statements. Subsidiaries
are all entities (including structured entities) controlled by the Group. The Group controls an
entity when the Group is exposed, or has rights, to variable returns from its involvement with
the entity and has the ability to affect those returns through its power over the entity.
Consolidation of subsidiaries begins from the date the Group obtains control of the
subsidiaries and ceases when the Group loses control of the subsidiaries.
(b) Inter-company transactions, balances and unrealized gains or losses on transactions between
companies within the Group are eliminated. Accounting policies of subsidiaries have been
adjusted where necessary to ensure consistency with the policies adopted by the Group.
(c) Profit or loss and each component of other comprehensive income are attributed to the
owners of the parent and to the non-controlling interests. Total comprehensive income is
attributed to the owners of the parent and to the non-controlling interests even if this results
in the non-controlling interests having a deficit balance.
(d) Changes in a parent’s ownership interest in a subsidiary that do not result in the parent losing
control of the subsidiary (transactions with non-controlling interests) are accounted for as
equity transactions, i.e. transactions with owners in their capacity as owners. Any difference
between the amount by which the non-controlling interests are adjusted and the fair value of
the consideration paid or received is recognized directly in equity.
(e) When the Group loses control of a subsidiary, the Group remeasures any investment retained
in the former subsidiary at its fair value. That fair value is regarded as the fair value on initial
recognition of a financial asset or the cost on initial recognition of the associate or joint
venture. Any difference between fair value and carrying amount is recognized in profit or
loss. All amounts previously recognized in other comprehensive income in relation to the
subsidiary are reclassified to profit or loss on the same basis as would be required if the
related assets or liabilities were disposed of. That is, when the Group loses control of a
subsidiary, all gains or losses previously recognized in other comprehensive income in
relation to the subsidiary should be reclassified from equity to profit or loss, if such gains or
losses would be reclassified to profit or loss when the related assets or liabilities are disposed
of.
-19-
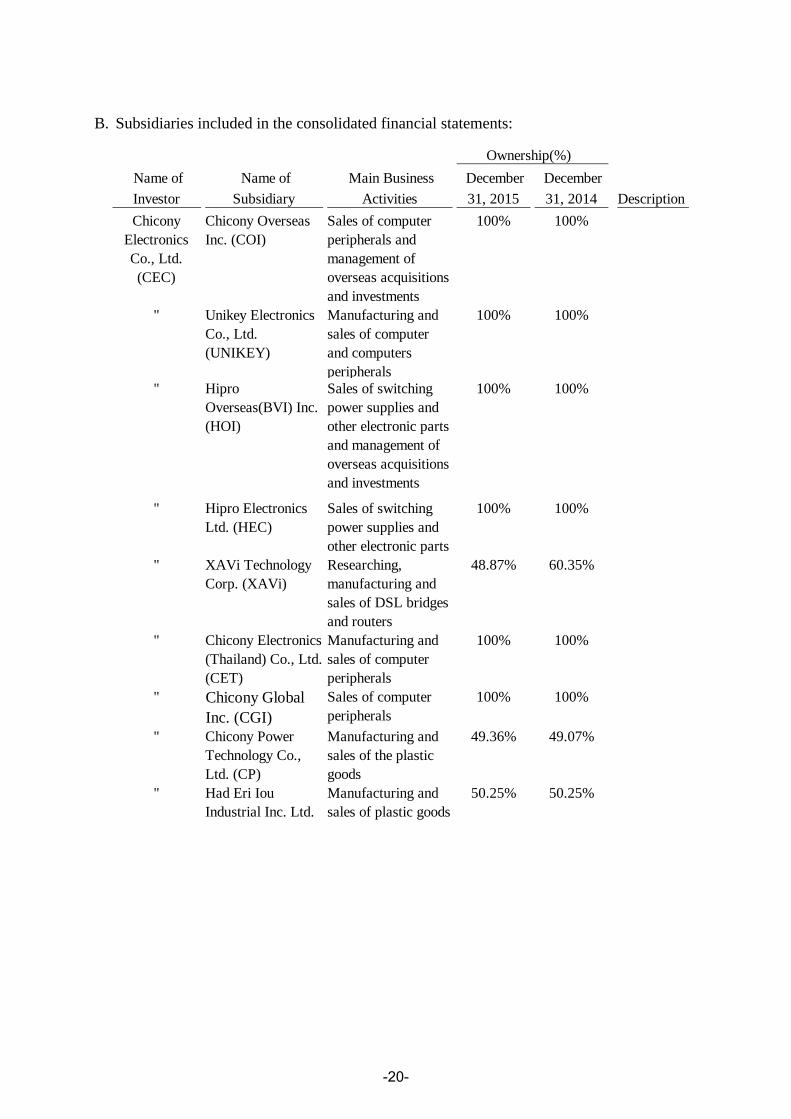
B. Subsidiaries included in the consolidated financial statements:
Name of
Investor
Name of
Subsidiary
Main Business
Activities
December
31, 2015
December
31, 2014 Description
Chicony
Electronics
Co., Ltd.
(CEC)
Chicony Overseas
Inc. (COI)
Sales of computer
peripherals and
management of
overseas acquisitions
and investments
100% 100%
" Unikey Electronics
Co., Ltd.
(UNIKEY)
Manufacturing and
sales of computer
and computers
peripherals
100% 100%
" Hipro
Overseas(BVI) Inc.
(HOI)
Sales of switching
power supplies and
other electronic parts
and management of
overseas acquisitions
and investments
100% 100%
" Hipro Electronics
Ltd. (HEC)
Sales of switching
power supplies and
other electronic parts
100% 100%
" XAVi Technology
Corp. (XAVi)
Researching,
manufacturing and
sales of DSL bridges
and routers
48.87% 60.35%
" Chicony Electronics
(Thailand) Co., Ltd.
(CET)
Manufacturing and
sales of computer
peripherals
100% 100%
" Chicony Global
Inc. (CGI)
Sales of computer
peripherals
100% 100%
" Chicony Power
Technology Co.,
Ltd. (CP)
Manufacturing and
sales of the plastic
goods
49.36% 49.07%
" Had Eri Iou
Industrial Inc. Ltd.
Manufacturing and
sales of plastic goods
50.25% 50.25%
Ownership(%)
-20-

Name of
Investor Name of Subsidiary
Main Business
Activities
December
31, 2015
December
31, 2014 Description
COI Chicony America Inc.
(CAI)
Sales of computer
peripherals
100% 100%
" Chicony Electronics
GmbH. (CEG)
" - 100%
" Chicony
Electronics(Dong
Guan) Co., Ltd.
(CEM2)
Manufacturing and
sales of computers
and computer
peripherals
100% 100%
" Mao-Feng
International
Inc.(Mao-Feng)
Sales of computer
peripherals and
management of
overseas acquisitions
and investments
100% 100%
" Chicony
Electronics(Suzhou)
Co., Ltd. (CEM3)
Manufacturing and
sales of computers
and computer
100% 100% Note G
" Global Faith Inc.
(GFI)
Sales of computer
peripherals
Management of
overseas acquisitions
and investments
60% 60%
" Real Young
Electronics Co.,
Ltd.
(Real Young)
Design and sales of
computer
peripherals and
management of
overseas
acquisitions and
investments
100% 100%
" Mao-Ray
Electronics
(DongGuan) Co.,
Ltd. (Mao-Ray)
Manufacturing of
electronic parts,
keyboards and
plastic products
100% 100%
" Suzhou Mao-Qun
Electronics Co., Ltd.
(Mao-Qun)
Manufacturing of
electronic parts,
keyboards and
plastic products
60% 60%
" Chicony Electronics
CEZ s.r.o. (CEZ)
Sales of computer
peripherals
100% 100%
Ownership(%)
-21-

Name of
Investor Name of Subsidiary
Main Business
Activities
December
31, 2015
December
31, 2014 Description
COI Suzhou Qun-Yang
Electronics Co., Ltd.
(Qun-Yang)
Manufacturing and
sales of electronic
parts, keyboard and
plastic products
60% 60%
" Chicony Electronics
Japan Co., Ltd.
(CEJ)
Sales of computer
peripherals
100% 100%
" Kuang Mao
International Inc.
(Kuang Mao)
Sales of computer
peripherals and
management of
overseas
acquisitions and
investments
100% 100%
" Chicony America
Group Inc. (CAGI)
Internet solution
for E-Commerce
solution
100% 100%
" Chicony Electronics
(Chong-Qing) Co.,
Ltd. (CEM5)
Manufacturing and
sales of computer
peripherals
100% 100%
〞 Hikari Investment
GK (Hikari)
Investment
holdings
99% - Note C
HEC Quansun Investment
Corp. Ltd.
(Quansun)
Investment
holdings
100% 100%
" Qun-Jing Power
Co., Ltd.
(Qun-Jing)
Sales of computer
peripherals and
consumer
equipment
100% 100%
CP Chicony Power
Holdings Inc.
(CPH)
Investment
holdings
100% 100%
" Chicony Power
International Inc.
(CPI)
Manufacturing and
sales of switching
power supplies and
other electronic
parts
100% 100%
Ownership(%)
-22-

Name of
Investor Name of Subsidiary
Main Business
Activities
December
31, 2015
December
31, 2014 Description
CP Chicony Power
USA Inc. (CPUS)
Manufacturing and
sales of switching
power supplies and
other electronic
parts
100% 100%
" Chicony Power
Technology
HongKong Limited
(CPHK)
Research and
development
centre
100% 100%
" WitsLight
Technology Co.,
Ltd (WTS)
Design, research
and development,
manufacturing and
sale of LED
lighting modules
78.125% 78.125% Note B
WTS WitsLight
Technology Co.,
Ltd (WT)
Design, research
and development
of LED lighting
modules and
international trade
100% 100% Note B
" WitsLight
Technology
(Kunshan) Co., Ltd
(WTK)
Manufacturing and
sales of LED
lighting modules
100% 100% Note B
〞 Zhuzhou Torch
Auto Lamp CO.,
Ltd (Zhuzhou
Torch)
Production and
sales of automotive
and motorcycle
components,
electric machine
and device, lamps
and plastic
100% - Note F
CPHK Hipro
Electronics(Dong
Guan) Co., Ltd.
(HDG)
Manufacturing and
sales of switching
power supplies and
other electronic
parts
100% 100% Note E
Ownership(%)
-23-

Name of
Investor Name of Subsidiary
Main Business
Activities
December
31, 2015
December
31, 2014 Description
CPHK Chicony Power
Technology
(Suzhou) Co., Ltd.
(CPSZ)
Production and
sales of electronic
equipment (high-
performance power
supply, power
module and
voltage
transformer) and
100% 100%
" Quang Sheng
Electronics
(Nanchang) Co.,
Ltd. (GSE)
Production and
sales of electronic
equipment
(magnetic element,
circuit board and
keyboard) and
100% 100%
" Chicony Power
Technology
(Chong-Qing) Co.,
Ltd. (CPCQ)
Production and
sales of electronic
equipment (high-
performance power
supply, power
module and
voltage
transformer) and
LED lighting
equipment
100% 100%
" Chicony Energy
Saving Technology
(Shanghai) Co., Ltd.
(CPSH)
Sales of LED
lighting equipments
100% 100%
" Trading
(Dong Guan) Co.,
Ltd. (CPDGT)
Importing and
exporting of
switching power
supplies, LED
lighting equipment,
and other
electronics parts
100% 100%
XAVi Directmax
International Ltd.
(Directmax)
Management of
overseas
acquisitions and
investments
100% 100%
Ownership(%)
-24-

Note A: Held 57.27% of the voting shares with COI as a whole.
Note B: CPI obtained 78.125% of share capital in WTS in July 2014. WTS and its subsidiaries
are included in the consolidated entity starting from the date as control was transferred
to CPI, refer to Note 6(31).
Note C: In January 2015, the Board of Directors has resolved COI to acquire 99% of the share
capital of Hikari which was established in Japan for US $32,760 thousand and
Name of
Investor Name of Subsidiary
Main Business
Activities
December
31, 2015
December
31, 2014 Description
XAVi XAVi Overseas Ltd.
(XAVi Overseas)
Sales of DSL
bridges and routers
Management of
overseas
acquisitions and
investments
100% 100%
" Systemax
Development Ltd.
Sales of DSL
bridges and routers
100% 100%
" XAVi Technologies
(Suzhou) Co., Ltd.
Manufacturing and
sales of DSL
bridges and routers
100% 100%
HEI GUIDWAY
GLOBAL
LIMITED
Investment 100% 100%
" HAD ERI IOU
INTERNATIONAL
Co., LIMITED
(Haderiiou HK)
Investment 100% 100%
" HOLYU
INTERNATIONAL
Co., Ltd.
Sales of plastic
toys, plastic
hardware molds,
plastic cases,
components for
computer hardware
and business
81% 81% Note A
" Dong Guan Had Eri
Iou Plastics
Corporation
(Haderiiou DG)
Manufacturing and
sales of plastic
goods and
computer parts
81% 81% Note D
Ownership(%)
-25-

obtained the control of Hikari.
Note D: On March 30, 2015, the Board of Directors of HEI has resolved to liquidate Haderiiou
DG.
Note E: On March 23, 2015, the Board of Directors has resolved HDG to increase capital by
USD 4,000 thousand and increase capital through capitalisation of earnings by USD
6,000 thousand. The capital increase was reinvestment through CPHK, a subsidiary of
Chicony Power in the third area. As of December 31, 2015, HDG has completed the
capital increase through capitalisation of earnings by USD 6,000 thousand and the
registration has been completed in December 2015.
Note F: WTK has acquired 100% of share ownership in Zhuzhou Torch in April 2015 and
Zhuzhou Torch is included in consolidated entities from the date when WTK has
obtained control of Zhuzhou Torch. Please refer to Note 6(31).
Note G: On September 21, 2015, the Board of Directors has resolved CEM3 to increase capital
through capitalization of earnings by USD 9,500 thousand.
C. Subsidiaries not included in the consolidated financial statements: None.
D. Adjustments for subsidiaries with different balance sheet dates: None.
E. Significant restrictions: None.
F. Subsidiaries that have non-controlling interests that are material to the Group
As of December 31, 2015 and 2014 the non-controlling interest amounted to $3,836,131 and
$3,696,190, respectively. The information of non-controlling interest and respective subsidiaries
is as follows:
Principal
place of Ownership Ownership
Name of subsidiary business Amount (%) Amount (%)
Chicony Power
Technology Co., Ltd.
Taiwan 3,327,010$ 50.64% 3,344,234$ 50.93%
Non-controlling interest
December 31, 2015 December 31, 2014
-26-

Summarized financial information of the subsidiaries:
Balance sheets
Statements of comprehensive income
Statements of cash flows
(4) Foreign currency translation
Items included in the financial statements of each of the Group’s entities are measured using the
currency of the primary economic environment in which the entity operates (the “functional
currency”). The consolidated financial statements are presented in New Taiwan dollars, which is
December 31, 2015 December 31, 2014
Current assets 13,690,605$ 14,237,400$
Non-current assets 4,542,067 4,269,267
Current liabilities 11,536,592)( 11,821,502)(
Non-current liabilities 71,618)( 56,861)(
Total net assets 6,624,462$ 6,628,304$
Chicony Power Technology Co., Ltd.
Year ended Year ended
December 31, 2015 December 31, 2014
Revenue 26,518,732$ 27,013,224$
Profit before income tax 1,404,995$ 1,337,462$
Income tax expense 255,747)( 212,867)(
Profit for the year 1,149,248 1,124,595
Other comprehensive loss, net of tax 155,140)( 31,802)(
Total comprehensive income for the year 994,108$ 1,092,793$
Comprehensive loss attributable to
non-controlling interest 7,432)($ 1,588)($
Dividends paid to non-controlling interest 414,616$ 347,407$
Chicony Power Technology Co., Ltd.
Year ended Year ended
December 31, 2015 December 31, 2014
Net cash provided by operating activities 2,053,801$ 2,209,896$
Net cash used in investing activities 1,102,041)( 1,140,446)(
Net cash used in financing activities 1,077,017)( 666,076)(
Effect of exchange rates on cash and cash
equivalents
47,905)( 93,713
Increase (decrease) in cash and cash
equivalents
173,162)( 497,087
Cash and cash equivalents, beginning of year 886,043 388,956
Cash and cash equivalents, end of year 712,881$ 886,043$
Chicony Power Technology Co., Ltd.
-27-

the Company’s functional and the Group’s presentation currency.
A. Foreign currency transactions and balances
(a) Foreign currency transactions are translated into the functional currency using the exchange
rates prevailing at the dates of the transactions or valuation where items are measured.
Foreign exchange gains and losses resulting from the settlement of such transactions are
recognized in profit or loss in the period in which they arise.
(b) Monetary assets and liabilities denominated in foreign currencies at the period end are
re-translated at the exchange rates prevailing at the balance sheet date. Exchange differences
arising upon re-translation at the balance sheet date are recognized in profit or loss.
(c) Non-monetary assets and liabilities denominated in foreign currencies held at fair value
through profit or loss are re-translated at the exchange rates prevailing at the balance sheet
date; their translation differences are recognized in profit or loss. Non-monetary assets and
liabilities denominated in foreign currencies held at fair value through other comprehensive
income are re-translated at the exchange rates prevailing at the balance sheet date; their
translation differences are recognized in other comprehensive income. However,
non-monetary assets and liabilities denominated in foreign currencies that are not measured
at fair value are translated using the historical exchange rates at the dates of the initial
transactions.
(d) All other foreign exchange gains and losses based on the nature of those transactions are
presented in the statement of comprehensive income within other gains and losses.
B. Translation of foreign operations
(a) The operating results and financial position of all the group entities, associates and joint
arrangements that have a functional currency different from the presentation currency are
translated into the presentation currency as follows:
(i) Assets and liabilities for each balance sheet presented are translated at the closing
exchange rate at the date of that balance sheet;
(ii) Income and expenses for each statement of comprehensive income are translated at
average exchange rates of that period; and
(iii) All resulting exchange differences are recognized in other comprehensive income.
(b) When the foreign operation partially disposed of or sold is an associate or joint arrangements,
exchange differences that were recorded in other comprehensive income are proportionately
reclassified to profit or loss as part of the gain or loss on sale. In addition, even when the
Group still retains partial interest in the former foreign associate or joint arrangements after
losing significant influence over the former foreign associate, or losing joint control of the
former joint arrangements, such transactions should be accounted for as disposal of all
interest in these foreign operations.
(c) When the foreign operation partially disposed of or sold is a subsidiary, cumulative exchange
-28-

differences that were recorded in other comprehensive income are proportionately
transferred to the non-controlling interest in this foreign operation. In addition, even when
the Group still retains partial interest in the former foreign subsidiary after losing control of
the former foreign subsidiary, such transactions should be accounted for as disposal of all
interest in the foreign operation.
(d) Goodwill and fair value adjustments arising on the acquisition of a foreign entity are treated
as assets and liabilities of the foreign entity and translated at the closing exchange rates at the
balance sheet date.
(5) Classification of current and non-current items
A. Assets that meet one of the following criteria are classified as current assets; otherwise they are
classified as non-current assets:
(a) Assets arising from operating activities that are expected to be realized, or are intended to be
sold or consumed within the normal operating cycle;
(b) Assets held mainly for trading purposes;
(c) Assets that are expected to be realized within twelve months from the balance sheet date;
(d) Cash and cash equivalents, excluding restricted cash and cash equivalents and those that are
to be exchanged or used to pay off liabilities more than twelve months after the balance sheet
date.
B. Liabilities that meet one of the following criteria are classified as current liabilities; otherwise
they are classified as non-current liabilities:
(a) Liabilities that are expected to be paid off within the normal operating cycle;
(b) Liabilities arising mainly from trading activities;
(c) Liabilities that are to be paid off within twelve months from the balance sheet date;
(d) Liabilities for which the repayment date cannot be extended unconditionally to more than
twelve months after the balance sheet date. Terms of a liability that could, at the option of the
counterparty, result in its settlement by the issue of equity instruments do not affect its
classification.
(6) Cash equivalents
Cash equivalents refer to short-term, highly liquid investments that are readily convertible to known
amounts of cash and which are subject to an insignificant risk of changes in value. Time deposits
that meet the definition above and are held for the purpose of meeting short-term cash commitments
in operations are classified as cash equivalents.
(7) Financial assets and liabilities at fair value through profit or loss
A. Financial assets at fair value through profit or loss are financial assets held for trading or
financial assets designated as at fair value through profit or loss on initial recognition. Financial
assets are classified in this category of held for trading if acquired principally for the purpose of
-29-

selling in the short-term. Derivatives are also categorized as financial assets held for trading
unless they are designated as hedges.
B. On a regular way purchase or sale basis, financial assets at fair value through profit or loss are
recognized and derecognized using trade date accounting.
C. Financial assets at fair value through profit or loss are initially recognized at fair value. Related
transaction costs are expensed in profit or loss. These financial assets are subsequently measured
and stated at fair value, and any changes in the fair value of these financial assets are recognized
in profit or loss.
(8) Available-for-sale financial assets
A. Available-for-sale financial assets are non-derivatives that are either designated in this category
or not classified in any of the other categories.
B. On a regular way purchase or sale basis, available-for-sale financial assets are recognized and
derecognized using trade date accounting.
C. Available-for-sale financial assets are initially recognized at fair value plus transaction costs.
These financial assets are subsequently measured and stated at fair value, and any changes in the
fair value of these financial assets are recognized in other comprehensive income. Investments
in equity instruments that do not have a quoted market price in an active market and whose fair
value cannot be reliably measured or derivatives that are linked to and must be settled by
delivery of such unquoted equity instruments are presented in ‘financial assets measured at cost’.
(9) Accounts receivable
Accounts receivable are loans and receivables originated by the entity. They are created by the
entity by selling goods or providing services to customers in the ordinary course of business.
Accounts receivable are initially recognized at fair value and subsequently measured at amortized
cost using the effective interest method, less provision for impairment.
However, short-term accounts receivable without bearing interest are subsequently measured at
initial invoice amount as effect of discounting is immaterial.
(10) Impairment of financial assets
A. The Group assesses at each balance sheet date whether there is objective evidence that a
financial asset or a group of financial assets is impaired as a result of one or more events that
occurred after the initial recognition of the asset (a ‘loss event’) and that loss event (or events)
has an impact on the estimated future cash flows of the financial asset or group of financial
assets that can be reliably estimated.
B. The criteria that the Group uses to determine whether there is objective evidence of impairment
loss is as follows:
(a) Significant financial difficulty of the issuer or debtor;
(b) A breach of contract, such as a default or delinquency in interest or principal payments;
-30-

(c) The Group, for economic or legal reasons relating to the borrower’s financial difficulty,
granted the borrower a concession that a lender would not otherwise consider;
(d) It becomes probable that the borrower will enter bankruptcy or other financial
reorganization;
(e) The disappearance of an active market for that financial asset because of financial
difficulties;
(f) Observable data indicating that there is a measurable decrease in the estimated future cash
flows from a group of financial assets since the initial recognition of those assets, although
the decrease cannot yet be identified with the individual financial asset in the group,
including adverse changes in the payment status of borrowers in the group or national or
local economic conditions that correlate with defaults on the assets in the group;
(g) Information about significant changes with an adverse effect that have taken place in the
technology, market, economic or legal environment in which the issuer operates, and
indicates that the cost of the investment in the equity instrument may not be recovered;
(h) A significant or prolonged decline in the fair value of an investment in an equity instrument
below its cost.
C. When the Group assesses that there has been objective evidence of impairment and an
impairment loss has occurred, accounting for impairment is made as follows according to the
category of financial assets:
(a) Financial assets measured at amortized cost
The amount of the impairment loss is measured as the difference between the asset’s
carrying amount and the present value of estimated future cash flows discounted at the
financial asset’s original effective interest rate, and is recognized in profit or loss. If, in a
subsequent period, the amount of the impairment loss decreases and the decrease can be
related objectively to an event occurring after the impairment loss was recognized, the
previously recognized impairment loss is reversed through profit or loss to the extent that
the carrying amount of the asset does not exceed its amortised cost that would have been at
the date of reversal had the impairment loss not been recognized previously. Impairment loss
is recognized and reversed by adjusting the carrying amount of the asset through the use of
an impairment allowance account.
(b) Financial assets measured at cost
The amount of the impairment loss is measured as the difference between the asset’s
carrying amount and the present value of estimated future cash flows discounted at current
market return rate of similar financial asset, and is recognized in profit or loss. Impairment
loss recognized for this category shall not be reversed subsequently. Impairment loss is
recognized by adjusting the carrying amount of the asset through the use of an impairment
allowance account.
-31-

(c) Available-for-sale financial assets
The amount of the impairment loss is measured as the difference between the asset’s
acquisition cost (less any principal repayment and amortization) and current fair value, less
any impairment loss on that financial asset previously recognized in profit or loss, and is
reclassified from ‘other comprehensive income’ to ‘profit or loss’. If, in a subsequent period,
the fair value of an investment in a debt instrument increases, and the increase can be related
objectively to an event occurring after the impairment loss was recognized, then such
impairment loss is reversed through profit or loss. Impairment loss of an investment in an
equity instrument recognized in profit or loss shall not be reversed through profit or loss.
Impairment loss is recognized and reversed by adjusting the carrying amount of the asset
through the use of an impairment allowance account.
(11) Derecognition of financial assets
The Group derecognizes a financial asset when the contractual rights to receive the cash flows
from the financial asset expire.
The Group derecognizes a financial asset when one of the following conditions is met:
A. The contractual rights to receive the cash flows from the financial asset expire.
B. The contractual rights to receive cash flows of the financial asset have been transferred and the
Group has transferred substantially all risks and rewards of ownership of the financial asset.
C. The contractual rights to receive cash flows of the financial asset have been transferred;
however, the Group has not retained control of the financial asset.
(12) Inventories
Inventories are stated at the lower of cost and net realizable value. Cost is determined using the
weighted-average method. The cost of finished goods and work in progress comprises raw
materials, direct labor, other direct costs and related production overheads (allocated based on
normal operating capacity). It excludes borrowing costs. The item by item approach is used in
applying the lower of cost and net realizable value. Net realizable value is the estimated selling
price in the ordinary course of business, less the estimated cost of completion and applicable
variable selling expenses.
(13) Investments accounted for using equity method / associates
A. Associates are all entities over which the Group has significant influence but not control. In
general, it is presumed that the investor has significant influence, if an investor holds, directly
or indirectly 20% or more of the voting power of the investee. Investments in associates are
accounted for using the equity method and are initially recognized at cost.
B. The Group’s share of its associates’ post-acquisition profits or losses is recognized in profit or
loss, and its share of post-acquisition movements in other comprehensive income is recognized
in other comprehensive income. When the Group’s share of losses in an associate equals or
exceeds its interest in the associate, including any other unsecured receivables, the Group does
-32-

not recognize further losses, unless it has incurred legal or constructive obligations or made
payments on behalf of the associate.
C. When changes in an associate’s equity that are not recognized in profit or loss or other
comprehensive income of the associate and such changes not affecting the Group’s ownership
percentage of the associate, the Group recognizes change in ownership interests in the associate
in ‘capital surplus’ in proportion to its ownership.
D. Unrealized gains on transactions between the Group and its associates are eliminated to the
extent of the Group’s interest in the associates. Unrealized losses are also eliminated unless
the transaction provides evidence of an impairment of the asset transferred. Accounting
policies of associates have been adjusted where necessary to ensure consistency with the
policies adopted by the Group.
E. When the Group disposes its investment in an associate, if it loses significant influence over
this associate, the amounts previously recognized in other comprehensive income in relation to
the associate, are reclassified to profit or loss, on the same basis as would be required if the
relevant assets or liabilities were disposed of. If it still retains significant influence over this
associate, then the amounts previously recognized in other comprehensive income in relation to
the associate are reclassified to profit or loss proportionately in accordance with the
aforementioned approach.
(14) Property, plant and equipment
A. Property, plant and equipment are initially recorded at cost. Borrowing costs incurred during
the construction period are capitalized.
B. Subsequent costs are included in the asset’s carrying amount or recognized as a separate asset,
as appropriate, only when it is probable that future economic benefits associated with the item
will flow to the Group and the cost of the item can be measured reliably. The carrying
amount of the replaced part is derecognized. All other repairs and maintenance are charged to
profit or loss during the financial period in which they are incurred.
C. Land is not depreciated. Other property, plant and equipment apply cost model and are
depreciated using the straight-line method to allocate their cost over their estimated useful lives.
Each part of an item of property, plant, and equipment with a cost that is significant in relation
to the total cost of the item must be depreciated separately.
D. The assets’ residual values, useful lives and depreciation methods are reviewed, and adjusted if
appropriate, at each balance sheet date. If expectations for the assets’ residual values and useful
lives differ from previous estimates or the patterns of consumption of the assets’ future
economic benefits embodied in the assets have changed significantly, any change is accounted
for as a change in estimate under IAS 8, ‘Accounting Policies, Changes in Accounting
Estimates and Errors’, from the date of the change. The estimated useful lives for the plant and
buildings are 7~55 years and for the other fixed assets are 1-10 years.
-33-

(15) Investment property
An investment property is stated initially at its cost and measured subsequently using the cost
model. Except for land, investment property is depreciated on a straight-line basis over its
estimated useful life of 31 years.
(16) Intangible assets
A. Trademarks and licenses
Separately acquired trademarks and licenses are stated at historical cost. Trademarks and
licenses acquired in a business combination are recognized at fair value at the acquisition date.
Trademarks and licenses have a finite useful life and are amortized on a straight-line basis over
their estimated useful lives of 3~10 years.
B. Computer software
Computer software is stated at cost and amortized on a straight-line basis over its estimated
useful life of 1~8 years.
C. Goodwill
Goodwill arises in a business combination accounted for by applying the acquisition method.
D. Other intangible assets are mainly technical skill and amortised on a straight-line basis over its
estimated useful life of 2~14 years.
(17) Impairment of non-financial assets
A. The Group assesses at each balance sheet date the recoverable amounts of those assets where
there is an indication that they are impaired. An impairment loss is recognized for the amount
by which the asset’s carrying amount exceeds its recoverable amount. The recoverable amount
is the higher of an asset’s fair value less costs to sell or value in use. Except for goodwill, when
the circumstances or reasons for recognizing impairment loss for an asset in prior years no
longer exist or diminish, the impairment loss is reversed. The increased carrying amount due to
reversal should not be more than what the depreciated or amortized historical cost would have
been if the impairment had not been recognized.
B. The recoverable amounts of goodwill, intangible assets with an indefinite useful life and
intangible assets that have not yet been available for use shall be evaluated periodically. An
impairment loss is recognized for the amount by which the asset’s carrying amount exceeds its
recoverable amount. Impairment loss of goodwill previously recognized in profit or loss shall
not be reversed in the following years.
C. For the purpose of impairment testing, goodwill acquired in a business combination is allocated
to each of the cash-generating units, or groups of cash-generating units, that is/are expected to
benefit from the synergies of the business combination. Each unit or group of units to which
the goodwill is allocated represents the lowest level within the entity at which the goodwill is
monitored for internal management purposes. Goodwill is monitored at the operating segment
-34-

level.
(18) Borrowings
A. Borrowings are recognized initially at fair value, net of transaction costs incurred. Borrowings
are subsequently stated at amortized cost; any difference between the proceeds (net of
transaction costs) and the redemption value is recognized in profit or loss over the period of the
borrowings using the effective interest method.
B. Fees paid on the establishment of loan facilities are recognized as transaction costs of the loan
to the extent that it is probable that some or all of the facility will be drawn down. In this case,
the fee is deferred until the draw-down occurs. To the extent there is no evidence that it is
probable that some or all of the facility will be drawn down, the fee is capitalised as a
pre-payment for liquidity services and amortised over the period of the facility to which it
relates.
(19) Notes and accounts payable
Notes and accounts payable are obligations to pay for goods or services that have been acquired in
the ordinary course of business from suppliers. They are recognized initially at fair value and
subsequently measured at amortized cost using the effective interest method. However, short-term
accounts payable without bearing interest are subsequently measured at initial invoice amount as
effect of discounting is immaterial.
(20) Derecognition of financial liabilities
A financial liability is derecognized when the obligation under the liability specified in the
contract is discharged or cancelled or expires.
(21) Derivative financial instruments
Derivatives are initially recognized at fair value on the date a derivative contract is entered into
and are subsequently remeasured at their fair value. Any changes in the fair value are recognized
in profit or loss.
(22) Provisions
Provisions are recognized when the Group has a present legal or constructive obligation as a result
of past events, and it is probable that an outflow of economic resources will be required to settle
the obligation and the amount of the obligation can be reliably estimated. Provisions are measured
at the present value of the expenditures expected to be required to settle the obligation on the
balance sheet date, which is discounted using a pre-tax discount rate that reflects the current
market assessments of the time value of money and the risks specific to the obligation. When
discounting is used, the increase in the provision due to passage of time is recognized as interest
expense. Provisions are not recognized for future operating losses.
-35-

(23) Employee benefits
A. Short-term employee benefits
Short-term employee benefits are measured at the undiscounted amount of the benefits
expected to be paid in respect of service rendered by employees in a period and should be
recognized as expenses in that period when the employees render service.
B. Pensions
(a) Defined contribution plans
For defined contribution plans, the contributions are recognized as pension expenses when
they are due on an accrual basis. Prepaid contributions are recognized as an asset to the
extent of a cash refund or a reduction in the future payments.
(b) Defined benefit plans
i. Net obligation under a defined benefit plan is defined as the present value of an amount
of pension benefits that employees will receive on retirement for their services with the
Group in current period or prior periods. The liability recognized in the balance sheet in
respect of defined benefit pension plans is the present value of the defined benefit
obligation at the balance sheet date less the fair value of plan assets. The defined benefit
net obligation is calculated annually by independent actuaries using the projected unit
credit method. The rate used to discount is determined by using interest rates of
government bonds (at the balance sheet date) of a currency and term consistent with the
currency and term of the employment benefit obligations.
ii. Remeasurement arising on defined benefit plans are recognized in other comprehensive
income in the period in which they arise and are recorded as retained earnings.
iii. Past service costs are recognized immediately in profit or loss.
C. Termination benefits
Termination benefits are employee benefits provided in exchange for the termination of
employment as a result from either the Group’s decision to terminate an employee’s
employment before the normal retirement date, or an employee’s decision to accept an offer of
redundancy benefits in exchange for the termination of employment. The Group recognizes
expense as it can no longer withdraw an offer of termination benefits or it recognizes relating
restructuring costs, whichever is earlier.
Benefits that are expected to be due more than 12 months after balance sheet date shall be
discounted to their present value.
D. Employees’ compensation and directors’ and supervisors’ remuneration
Employees’ compensation and directors’ and supervisors’ remuneration are recognized as
expenses and liabilities, provided that such recognition is required under legal obligation or
constructive obligation and those amounts can be reliably estimated. Any difference between
-36-
the resolved amounts and the subsequently actual distributed amounts is accounted for as
changes in estimates. If employee compensation is distributed by shares, the Group calculates
the number of shares based on the closing price at the previous day of the board meeting
resolution.
(24) Employee share-based payment
A. For the equity-settled share-based payment arrangements, the employee services received are
measured at the fair value of the equity instruments granted at the grant date, and are
recognized as compensation cost over the vesting period, with a corresponding adjustment to
equity. The fair value of the equity instruments granted shall reflect the impact of market
vesting conditions and non-market vesting conditions. Compensation cost is subject to
adjustment based on the service conditions that are expected to be satisfied and the estimates of
the number of equity instruments that are expected to vest under the non-market vesting
conditions at each balance sheet date. And ultimately, the amount of compensation cost
recognized is based on the number of equity instruments that eventually vest.
B. Restricted stocks:
(a) Restricted stocks issued to employees are measured at the fair value of the equity
instruments granted at the grant date, and are recognized as compensation cost over the
vesting period.
(b) For restricted stocks where those stocks do not restrict distribution of dividends to
employees and employees are not required to return the dividends received if they resign
during the vesting period, the Group recognizes the fair value of the dividends received by
the employees who are expected to resign during the vesting period as compensation cost at
the date of dividends declared.
(c) For restricted stocks where employees do not need to pay to acquire those stocks, if
employees resign during the vesting period, the Company will redeem at no consideration
and retire those stocks.
(25) Income tax
A. The tax expense for the period comprises current and deferred tax. Tax is recognized in profit
or loss, except to the extent that it relates to items recognized in other comprehensive income
or items recognized directly in equity, in which cases the tax is recognized in other
comprehensive income or equity.
B. The current income tax expense is calculated on the basis of the tax laws enacted or
substantively enacted at the balance sheet date in the countries where the Company and its
subsidiaries operate and generate taxable income. Management periodically evaluates positions
taken in tax returns with respect to situations in accordance with applicable tax regulations. It
establishes provisions where appropriate based on the amounts expected to be paid to the tax
authorities. An additional 10% tax is levied on the unappropriated retained earnings and is
recorded as income tax expense in the year the stockholders resolve to retain the earnings.
-37-
C. Deferred income tax is recognized, using the balance sheet liability method, on temporary
differences arising between the tax bases of assets and liabilities and their carrying amounts in
the consolidated balance sheet. However, the deferred income tax is not accounted for if it
arises from initial recognition of goodwill or of an asset or liability in a transaction other than a
business combination that at the time of the transaction affects neither accounting nor taxable
profit or loss. Deferred income tax is provided on temporary differences arising on investments
in subsidiaries and associates, except where the timing of the reversal of the temporary
difference is controlled by the Group and it is probable that the temporary difference will not
reverse in the foreseeable future. Deferred income tax is determined using tax rates (and laws)
that have been enacted or substantially enacted by the balance sheet date and are expected to
apply when the related deferred income tax asset is realized or the deferred income tax liability
is settled.
D. Deferred income tax assets are recognized only to the extent that it is probable that future
taxable profit will be available against which the temporary differences can be utilized. At each
balance sheet date, unrecognized and recognized deferred income tax assets are reassessed.
E. Current income tax assets and liabilities are offset and the net amount reported in the balance
sheet when there is a legally enforceable right to offset the recognized amounts and there is an
intention to settle on a net basis or realize the asset and settle the liability simultaneously.
Deferred income tax assets and liabilities are offset on the balance sheet when the entity has the
legally enforceable right to offset current tax assets against current tax liabilities and they are
levied by the same taxation authority on either the same entity or different entities that intend to
settle on a net basis or realize the asset and settle the liability simultaneously.
F. A deferred tax asset shall be recognized for the carryforward of unused tax credits resulting
from acquisitions of equipment or technology, research and development expenditures,
employees’ training costs and equity investments to the extent that it is possible that future
taxable profit will be available against which the unused tax credits can be utilized.
(26) Share capital
A. Ordinary shares are classified as equity. Incremental costs directly attributable to the issue of
new shares or stock options are shown in equity as a deduction, net of tax, from the proceeds.
B. Where the Company repurchases the Company’s equity share capital that has been issued, the
consideration paid, including any directly attributable incremental costs (net of income taxes) is
deducted from equity attributable to the Company’s equity holders. Where such shares are
subsequently reissued, the difference between their book value and any consideration received,
net of any directly attributable incremental transaction costs and the related income tax effects,
is included in equity attributable to the Company’s equity holders.
(27) Dividends
Dividends are recorded in the Company’s financial statements in the period in which they are
approved by the Company’s shareholders. Cash dividends are recorded as liabilities; stock
-38-

dividends are recorded as stock dividends to be distributed and are reclassified to ordinary shares
on the effective date of new shares issuance.
(28) Revenue recognition
The Group manufactures and sells computers and computers peripherals products. Revenue is
measured at the fair value of the consideration received or receivable taking into account of
value-added tax, returns, rebates and discounts for the sale of goods to external customers in the
ordinary course of the Group’s activities. Revenue arising from the sales of goods should be
recognized when the Group has delivered the goods to the customer, the amount of sales revenue
can be measured reliably and it is probable that the future economic benefits associated with the
transaction will flow to the entity. The delivery of goods is completed when the significant risks
and rewards of ownership have been transferred to the customer, the Group retains neither
continuing managerial involvement to the degree usually associated with ownership nor effective
control over the goods sold, and the customer has accepted the goods based on the sales contract
or there is objective evidence showing that all acceptance provisions have been satisfied.
(29) Government grants
Government grants are recognized at their fair value only when there is reasonable assurance that
the Group will comply with any conditions attached to the grants and the grants will be received.
Government grants are recognized in profit or loss on a systematic basis over the periods in which
the Group recognizes expenses for the related costs for which the grants are intended to
compensate. Government grants related to property, plant and equipment are presented by
deducting the grants from the asset’s carrying amount and are amortized to profit or loss over the
estimated useful lives of the related assets as reduced depreciation expense.
(30) Business combinations
A. The Group uses the acquisition method to account for business combinations. The
consideration transferred for an acquisition is measured as the fair value of the assets
transferred, liabilities incurred or assumed and equity instruments issued at the acquisition date,
plus the fair value of any assets and liabilities resulting from a contingent consideration
arrangement. All acquisition-related costs are expensed as incurred. Identifiable assets acquired
and liabilities and contingent liabilities assumed in a business combination are measured
initially at their fair values at the acquisition date. For each business combination, the Group
measures at either fair value or the present ownership instruments’ proportionate share in the
recognized amounts of the acquiree’s identifiable net assets. All other non-controlling interests
should be measured at the acquisition-date fair value.
B. The excess of the consideration transferred, the amount of any non-controlling interest in the
acquiree and the fair value of any previous equity interest in the acquiree over the fair value of
the identifiable assets acquired and the liabilities assumed is recorded as goodwill at the
acquisition date. If the total of consideration transferred, non-controlling interest in the
acquiree recognized and the fair value of previously held equity interest in the acquiree is less
-39-

than the fair value of the identifiable assets acquired and the liabilities assumed, the difference
is recognized directly in profit or loss on the acquisition date.
(31) Operating segments
Operating segments are reported in a manner consistent with the internal reporting provided to the
chief operating decision-maker. The chief operating decision-maker, who is responsible for
allocating resources and assessing performance of the operating segments, has been identified as
the Board of Directors that makes strategic decisions.
5. CRITICAL ACCOUNTING JUDGMENTS, ESTIMATES AND KEY SOURCES OF ASSUMPTION
UNCERTAINTY
The preparation of these consolidated financial statements requires management to make critical
judgments in applying the Group’s accounting policies and make critical assumptions and estimates
concerning future events. Assumptions and estimates may differ from the actual results and are
continually evaluated and adjusted based on historical experience and other factors. Such assumptions
and estimates have a significant risk of causing a material adjustment to the carrying amounts of assets
and liabilities within the next financial year; and the related information is addressed below:
(1) Critical judgments in applying the Group’s accounting policies
Financial asset — equity investment impairment
The Group follows the guidance of IAS 39 to determine whether a financial asset—equity
investment is impaired. This determination requires significant judgment. In making this judgment,
the Group evaluates, among other factors, the duration and extent to which the fair value of an
equity investment is less than its cost and the financial health of and short-term business outlook for
the investee, including factors such as industry and sector performance, changes in technology and
operational and financing cash flow.
If the decline of the fair value of an individual equity investment below cost was considered
significant or prolonged, the Group would suffer a loss in its financial statements, being the transfer
of the accumulated fair value adjustments recognized in other comprehensive income on the
impaired available-for-sale financial assets to profit or loss or being the recognition of the
impairment loss on the impaired financial assets measured at cost in profit or loss.
(2) Critical accounting estimates and assumptions
A. Revenue recognition
The Group estimates sales discounts and returns based on historical results and other known
factors. Provisions for such liabilities are recorded as a deduction item to sales revenues when
the sales are recognized. The Group reassesses the reasonableness of estimates of discounts and
returns periodically.
B. Impairment assessment of tangible and intangible assets (excluding goodwill)
The Group assesses impairment based on its subjective judgment and determines the separate
cash flows of a specific group of assets, useful lives of assets and the future possible income and
expenses arising from the assets depending on how assets are utilized and industrial
-40-

characteristics. Any changes of economic circumstances or estimates due to the change of Group
strategy might cause material impairment on assets in the future.
C. Impairment assessment of goodwill
The impairment assessment of goodwill relies on the Group’s subjective judgment, including
identifying cash-generating units, allocating assets and liabilities as well as goodwill to related
cash-generating units, and determining the recoverable amounts of related cash-generating units.
Please refer to Note 6(11) for the information of goodwill impairment.
D. Impairment assessment of investments accounted for using equity method
The Group assesses the impairment of an investment accounted for using equity method as soon
as there any indication that it might have been impaired and its carrying amount cannot be
recoverable. The Group assesses the recoverable amounts of an investment accounted for under
the equity method based on the present value of the Group’s share of expected future cash flows
of the investee, and analyzes the reasonableness of related assumptions.
E. Realisability of deferred income tax assets
Deferred income tax assets are recognized only to the extent that it is probable that future taxable
profit will be available against which the deductible temporary differences can be utilized.
Assessment of the realisability of deferred income tax assets involves critical accounting
judgments and estimates of the management, including the assumptions of expected future sales
revenue growth rate and profit rate, tax exempt duration, available tax credits, tax planning, etc.
Any variations in global economic environment, industrial environment, and laws and
regulations might cause material adjustments to deferred income tax assets.
F. Evaluation of inventories
As inventories are stated at the lower of cost and net realizable value, the Group must determine
the net realizable value of inventories on balance sheet date using judgments and estimates.
Due to the rapid technology innovation, the Group evaluates the amounts of normal inventory
consumption, obsolete inventories or inventories without market selling value on balance sheet
date, and writes down the cost of inventories to the net realizable value. Such an evaluation of
inventories is principally based on the demand for the products within the specified period in the
future. Therefore, there might be material changes to the evaluation.
6. DETAILS OF SIGNIFICANT ACCOUNTS
(1) Cash and cash equivalents
December 31, 2015 December 31, 2014
Cash on hand and revolving funds 23,555$ 23,785$
Checking accounts and demand deposits 2,244,721 1,855,393
Time deposits 81,323 101,518
Total 2,349,599$ 1,980,696$
-41-

A. The Group transacts with a variety of financial institutions all with high credit quality to disperse
credit risk, so it expects that the probability of counterparty default is remote.
B. Details of cash and cash equivalents pledged as collaterals are provided in Note 8.
(2) Financial assets and liabilities at fair value through profit or loss
A. The Group recognized net gain of $565,867 and $415,444 on financial assets held for trading for
the years ended December 31, 2015 and 2014, respectively.
B. The non-hedging derivative instruments transaction and contract information are as follows:
Items December 31, 2015 December 31, 2014
Financial assets held for trading
Non-hedging derivatives
Forward foreign exchange contracts 429,105$ 259,362$
Futures 8,324 8,202
Total 437,429$ 267,564$
Financial liabilities held for trading
Non-hedging derivatives
Forward foreign exchange contracts 107,399$ 141,668$
Exchange rate swaps - 1,720
Total 107,399$ 143,388$
Contract Amount
(Notional Principal)
Derivative Instruments (In thousands) Due Date
Financial assets held for trading
Forward foreign exchange contracts
-SELL NTD/BUY USD USD 483,000 2016.1.4~2016.12.30
-SELL RMB/BUY USD USD 30,069 2016.9.23~2016.10.25
Futures
-Metals Futures USD 5,792 2012.1.6
Financial liabilities held for trading
Forward foreign exchange contracts
-SELL NTD/BUY USD USD 5,000 2016.10.3
-SELL USD/BUY RMB USD 80,000 2016.7.5~2016.10.25
December 31, 2015
-42-

(a) Forward foreign exchange contracts
The Group entered into forward foreign exchange contracts to buy (sell) various forward
foreign currencies and these contracts are not accounted for under hedge accounting.
(b) Exchange rate swaps
The Group entered into exchange rate swap contracts with financial institutions to hedge
exchange rate risk of import and export proceeds. However, these exchange rate swap
contracts are not accounted for under hedge accounting.
(c) Futures
The Group entered into futures contracts, which are stock index futures, to earn the spread. As
of December 31, 2015, there were no margin deposits for these contracts. The Group entered
into futures contracts and commodity swap to hedge price risk of raw materials. However,
these futures are not accounted for under hedge accounting.
C. Due to the financial meltdown in 2008, listed stocks amounting to $1,180,881 that were initially
classified as ‘financial assets at fair value through profit or loss’ were reclassified to
‘available-for-sale financial assets’ on July 24, 2008 in accordance with paragraph 50(c) of IAS
39. The relevant information is set forth below:
(a) The balance of the above mentioned reclassified assets as of December 31, 2015 and 2014 is
as follows:
Contract Amount
(Notional Principal)
Derivative Instruments (In thousands) Due Date
Financial assets held for trading
Forward foreign exchange contracts
-SELL USD/BUY RMB USD 57,000 2015.1.26~2015.12.23
-SELL NTD/BUY USD USD 260,000 2015.3.31~2016.1.6
Futures
-TAIEX Futures $ 37,300 2015.2.28
-Metals Futures USD 5,792 2012.1.6
Financial liabilities held for trading
Forward foreign exchange contracts
-SELL USD/BUY RMB USD 336,000 2015.1.7~2015.12.16
-SELL NTD/BUY USD USD 80,000 2015.3.31
-SELL USD/BUY NTD USD 4,000 2015.1.7
Exchange rate swaps
-SELL USD/BUY NTD USD 4,000 2015.1.12
December 31, 2014
Decemer 31, 2015 Decemer 31, 2014
Book value/Fair value Book value/Fair value
Listed stocks 198,349$ 311,198$
-43-

(b) The relevant information in fair value change of the reclassified financial assets is as
follows:
The accumulated total changes in fair value of the above that were recognized in other
comprehensive income before January 1, 2014 amounted to $268,035.
(c) If the above financial assets were not classified to “available-for-sale financial assets” on
July 24, 2008, the Group would have recognized net gain (loss) as follows:
(d) The Group has no financial assets at fair value through profit or loss pledged to others.
(3) Available-for-sale financial assets
A. The above listed stocks of available-for-sale financial assets – non-current were private
placements that could not be sold during the private lock-up period in accordance with the
R.O.C. Securities Exchange Law. These private placements are remeasured and stated at value
adjusted by the same item’s fair value in active markets considering the effect of restriction.
2015 2014
Gain recognized in Loss recognized in
comprehensive comprehensive
income income
Listed stocks 112,848)($ 93,675)($
Years ended December 31,
2015 2014
Listed stocks 112,848)($ 93,675)($
Years ended December 31,
Items December 31, 2015 December 31, 2014
Current items:
Listed stocks 5,553,987$ 5,694,055$
Emerging stocks 52,022 -
Convertible bonds 281,562 10,000
Beneficiary certificates 128,818 33,539
Subtotal 6,016,389 5,737,594
Valuation adjustment 2,046,653)( 586,255)(
Total 3,969,736$ 5,151,339$
Non-current items:
Listed stocks 1,469,350$ 1,282,851$
Beneficiary certificates 645,598 -
Subtotal 2,114,948 1,282,851
Valuation adjustment 518,334)( 900,278)(
Total 1,596,614$ 382,573$
-44-

B. The Group’s beneficiary certificate, Fuh Hwa Securities Investment Trust Fund is a private
equity fund. The Trust Fund’s only invested share started to be listed in the Taiwan Stock
Exchange since the fourth quarter of 2015. As the stock has quoted market price in an active
market, it was reclassified from financial assets measured at cost to available-for-sale financial
assets – non-current beneficiary certificates.
C. The Group recognized ($916,276) and ($828,029) in other comprehensive income (loss) for fair
value change and reclassified ($162,178) and ($644,873) from equity to profit or loss for the
years ended December 31, 2015 and 2014, respectively.
D. The Group’s counterparties of debt instrument investments the Group invests in have good credit
quality.
E. The Group recognized no interest income for the convertible bonds for the years ended
December 31, 2015 and 2014.
F. As of December 31, 2015 and 2014, no available-for-sale financial assets owned by the Group
were pledged to others.
(4) Financial assets measured at cost
A. Based on the Group’s intention, its investment in stocks and beneficiary certificates above
should be classified as available-for-sale financial assets. However, the stocks above are not
traded in active market, and no sufficient industry information of companies similar to them is
available. Thus, the fair value of the investment in the stocks above cannot be measured reliably.
The Group classified those stocks as ‘financial assets measured at cost’.
B. Information about the financial assets measured at cost reclassified to available-for-sale financial
assets in the fourth quarter of 2015 is provided in Note 6(3).
C. Based on the objective information that LumenMax Corporation was reorganized due to
financial difficulty, the Group assessed and recognized impairment loss of $73,795 on equity
investments –LumenMax Corporation for the years ended December 31, 2015 and 2014.
D. As of December 31, 2015 and 2014, no financial assets measured at cost held by the Group were
pledged to others.
December 31, 2015 December 31, 2014
Current items:
Unlisted stocks 10,617$ -$
Non-current items:
Unlisted stocks $ 822,024 $ 517,155
Beneficiary certificates 169,265 654,386
Less: accumulated impairment ( 73,795) ( 73,795)
Total $ 917,494 $ 1,097,746
-45-

(5) Accounts receivable
A. The Group does not hold any collateral as security.
B. The credit quality information of accounts receivable is provided in Note 12(4) C.
(6) Transfer of financial assets
The Group entered into a factoring agreement with financial institutions to sell its accounts
receivable. Under the agreement, the Group is not obligated to bear the default risk of the
transferred accounts receivable and does not have any continuing involvement in the transferred
accounts receivable. Thus, the Group derecognized the transferred accounts receivable. As of
December 31, 2015, details of the guarantee notes issued for the factoring agreement are provided
in Note 9(2).
As of December 31, 2015 and 2014, the outstanding accounts receivable sold were as follows:
December 31, 2015 December 31, 2014
Accounts receivable 18,177,026$ 19,009,325$
Less: allowance for bad debts 103,065)( 95,330)(
18,073,961$ 18,913,995$
Purchaser of
accounts
Accounts
receivable Amount Amount
Interest rate
of amount
receivable transferred derecognised Facilities advanced advanced
SMBC 74,265$ 74,265$ 393,960$ 74,265$ 1.28%~1.37%
Taishin Bank 40,067 40,067 393,960 29,547 1.10%
E.SUN BANK 220,324 220,324 492,450 193,040 1.32%~1.65%
Ta Chong Bank 201,154 199,487 590,940 169,411 1.15%~1.30%
535,810$ 534,143$ 1,871,310$ 466,263$
Purchaser of
accounts
Accounts
receivable Amount Amount
Interest rate
of amount
receivable transferred derecognised Facilities advanced advanced
SMBC 146,378$ 146,378$ 379,440$ 146,378$ 1.16%~1.20%
Taishin Bank 153,300 153,300 189,720 120,156 1.50%
Ta Chong Bank 386,013 378,557 474,300 328,848 1.35%~1.45%
685,691$ 678,235$ 1,043,460$ 595,382$
December 31, 2015
December 31, 2014
-46-
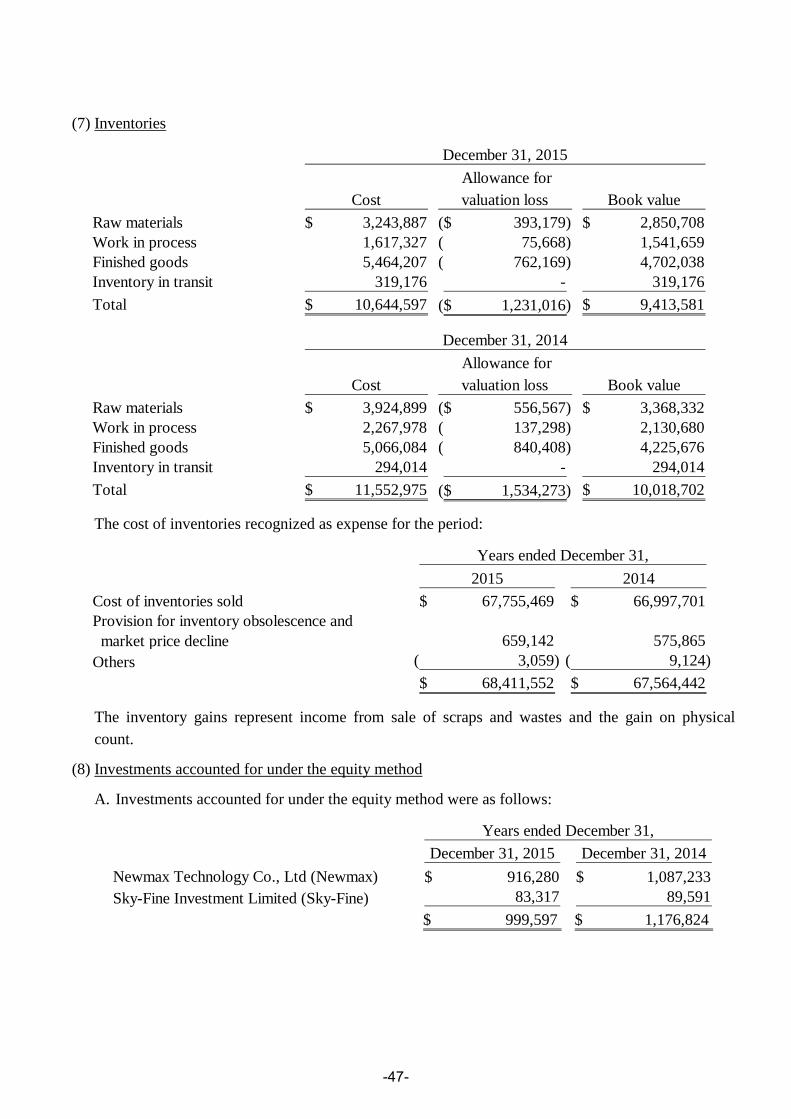
(7) Inventories
The cost of inventories recognized as expense for the period:
The inventory gains represent income from sale of scraps and wastes and the gain on physical
count.
(8) Investments accounted for under the equity method
A. Investments accounted for under the equity method were as follows:
Cost
Allowance for
valuation loss Book value
Raw materials 3,243,887$ 393,179)($ 2,850,708$
Work in process 1,617,327 75,668)( 1,541,659
Finished goods 5,464,207 762,169)( 4,702,038
Inventory in transit 319,176 - 319,176
Total 10,644,597$ 1,231,016)($ 9,413,581$
December 31, 2015
Cost
Allowance for
valuation loss Book value
Raw materials 3,924,899$ 556,567)($ 3,368,332$
Work in process 2,267,978 137,298)( 2,130,680
Finished goods 5,066,084 840,408)( 4,225,676
Inventory in transit 294,014 - 294,014
Total 11,552,975$ 1,534,273)($ 10,018,702$
December 31, 2014
2015 2014
Cost of inventories sold 67,755,469$ 66,997,701$
Provision for inventory obsolescence and
market price decline 659,142 575,865
Others 3,059)( 9,124)(
68,411,552$ 67,564,442$
Years ended December 31,
December 31, 2015 December 31, 2014
Newmax Technology Co., Ltd (Newmax) 916,280$ 1,087,233$
Sky-Fine Investment Limited (Sky-Fine) 83,317 89,591
$ 999,597 $ 1,176,824
Years ended December 31,
-47-
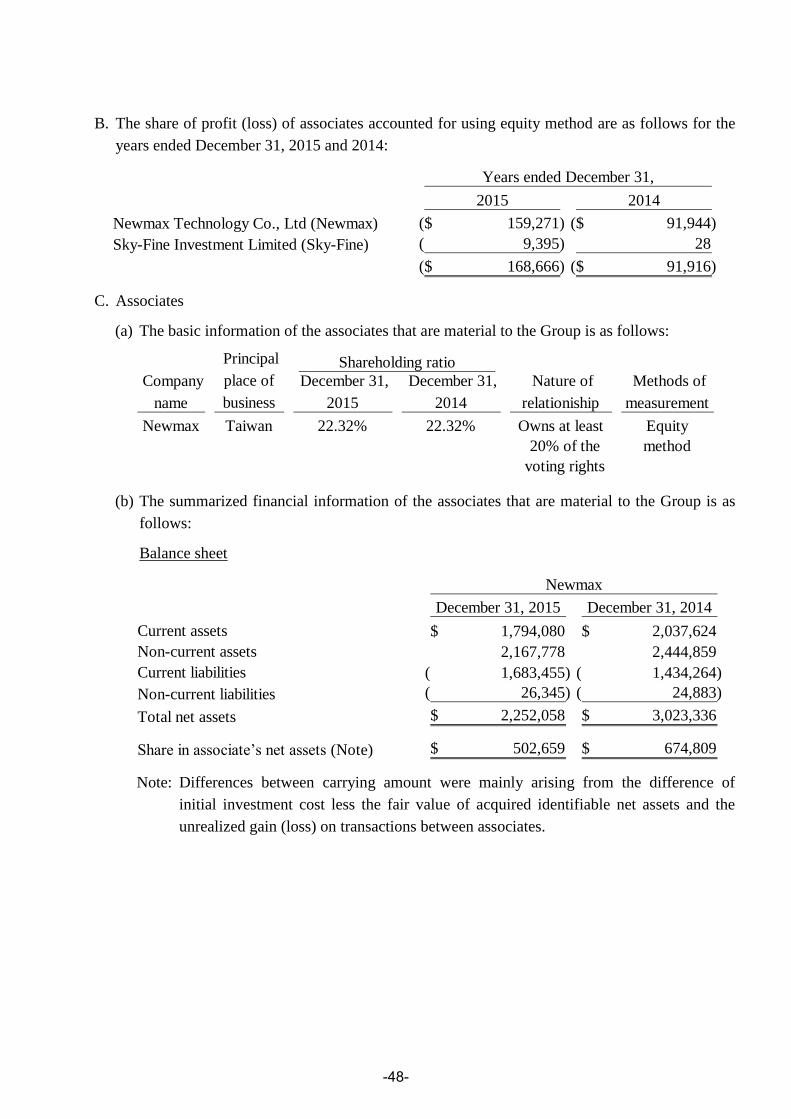
B. The share of profit (loss) of associates accounted for using equity method are as follows for the
years ended December 31, 2015 and 2014:
C. Associates
(a) The basic information of the associates that are material to the Group is as follows:
(b) The summarized financial information of the associates that are material to the Group is as
follows:
Balance sheet
Note: Differences between carrying amount were mainly arising from the difference of
initial investment cost less the fair value of acquired identifiable net assets and the
unrealized gain (loss) on transactions between associates.
2015 2014
Newmax Technology Co., Ltd (Newmax) 159,271)($ 91,944)($
Sky-Fine Investment Limited (Sky-Fine) 9,395)( 28
168,666)($ 91,916)($
Years ended December 31,
Company
name
December 31,
2015
December 31,
2014
Nature of
relationiship
Methods of
measurement
Newmax Taiwan 22.32% 22.32% Owns at least
20% of the
voting rights
Equity
method
Principal
place of
business
Shareholding ratio
December 31, 2015 December 31, 2014
Current assets 1,794,080$ 2,037,624$
Non-current assets 2,167,778 2,444,859
Current liabilities 1,683,455)( 1,434,264)(
Non-current liabilities 26,345)( 24,883)(
Total net assets 2,252,058$ 3,023,336$
Share in associate’s net assets (Note) 502,659$ 674,809$
Newmax
-48-

Statement of comprehensive income
(c) As of December 31, 2015 and 2014, the carrying amount of the Group’s individually
immaterial associates amounted to $83,317 and $89,591, respectively.
D. For the share of other comprehensive income of associates, the financial statements of the
Group’s associate accounted for using equity method –Sky-Fine for the years ended December
31, 2015 and 2014 were audited by other independent accountants.
E.The Group’s investment in Newmax Technology Co., Ltd. has quoted market price. The fair value
of Newmax Technology Co., Ltd. as at December 31, 2015 and 2014 was $385,595 and
$890,270, respectively.
2015 2014
Revenue 985,961$ 1,623,711$
Loss for the period from continuing
operations 713,211)($ 411,619)($
Other comprehensive (loss) income,
net of tax 58,067)( 56,916
Total comprehensive loss 771,278)($ 354,703)($
Newmax
Years ended December 31,
2015 2014
Profit (loss) for the period from continuing
operations
32,395)($ 99$
Other comprehensive income, net of tax 10,759 14,569
Total comprehensive (loss) income 21,636)($ 14,668$
Years ended December 31,
-49-

(9
) P
roper
ty, pla
nt
and e
quip
men
t
Lan
dB
uildin
gs
Mac
hin
ery
To
oling
equip
men
t
Tes
t
equip
men
t
Co
nst
ruct
ion
in p
rogre
ssO
ther
sT
ota
l
At
Januar
y 1
, 2015
Co
st2,1
34,5
98
$
4,5
11,5
12
$
6,3
97,7
94
$
4,8
79,6
76
$
1,9
02,3
80
$
2,4
20,5
07
$
2,9
12,6
65
$
25,1
59,1
32
$
Acc
um
ula
ted d
epre
ciat
ion
an
d im
pai
rmen
t-
1,2
80,7
99)
(
2,9
62,2
78)
(
3,4
95,7
02)
(
1,2
45,6
05)
(
-
1,9
70,0
96)
(
10,9
54,4
80)
(
2,1
34,5
98
$
3,2
30,7
13
$
3,4
35,5
16
$
1,3
83,9
74
$
656,7
75
$
2,4
20,5
07
$
942,5
69
$
14,2
04,6
52
$
2015
Open
ing n
et b
oo
k a
mo
unt
2,1
34,5
98
$
3,2
30,7
13
$
3,4
35,5
16
$
1,3
83,9
74
$
656,7
75
$
2,4
20,5
07
$
942,5
69
$
14,2
04,6
52
$
Addit
ions
70
35,9
13
690,8
22
524,6
15
122,7
96
1,1
08,5
61
425,1
47
2,9
07,9
24
Acq
uir
ed f
rom
busi
nes
s
co
mbin
atio
ns
-
-
47,5
31
-
-
-
2,1
91
49,7
22
Dis
po
sals
50,8
76)
(
705)
(
154,1
70)
(
77,5
02)
(
2,2
69)
(
19,1
56)
(
20,6
06)
(
325,2
84)
(
Rec
lass
ific
atio
ns
-
348,3
89
98,5
28
175,2
53
40,8
99
65,9
81)
(
110,4
20
707,5
08
Dep
reci
atio
n-
206,8
97)
(
576,9
76)
(
587,1
69)
(
223,5
34)
(
-
414,1
36)
(
2,0
08,7
12)
(
Net
exch
ange
dif
fere
nce
s1,4
87
39,9
15)
(
18,8
59)
(
3,6
88)
(
5,9
18)
(
4,2
50)
(
3,1
85)
(
74,3
28)
(
Clo
sing n
et b
oo
k a
mo
unt
2,0
85,2
79
$
3,3
67,4
98
$
3,5
22,3
92
$
1,4
15,4
83
$
588,7
49
$
3,4
39,6
81
$
1,0
42,4
00
$
15,4
61,4
82
$
At
Dec
ember
31,
2015
Co
st2,0
85,2
79
$
4,8
02,9
40
$
6,6
09,3
36
$
5,4
29,2
17
$
1,9
72,4
56
$
3,4
39,6
81
$
3,4
75,5
04
$
27,8
14,4
13
$
Acc
um
ula
ted d
epre
ciat
ion
an
d im
pai
rmen
t-
1,4
35,4
42)
(
3,0
86,9
44)
(
4,0
13,7
34)
(
1,3
83,7
07)
(
-
2,4
33,1
04)
(
12,3
52,9
31)
(
2,0
85,2
79
$
3,3
67,4
98
$
3,5
22,3
92
$
1,4
15,4
83
$
588,7
49
$
3,4
39,6
81
$
1,0
42,4
00
$
15,4
61,4
82
$
-50-

Lan
dB
uild
ing
sM
achin
ery
To
oling
equ
ipm
ent
Tes
t
equ
ipm
ent
Co
nst
ruct
ion
in p
rog
ress
Oth
ers
To
tal
At
Janu
ary 1
, 2
01
4
Co
st1
,37
4,4
09
$
3
,65
1,1
45
$
5,8
53
,52
3$
4
,34
6,8
75
$
1,6
25
,05
6$
1
,48
1,2
26
$
2,4
50
,78
6$
20
,78
3,0
20
$
Acc
um
ula
ted
d
epre
ciat
ion a
nd
im
pai
rmen
t-
1,1
17
,57
2)
(
2
,60
4,1
92
)(
2
,76
6,1
35
)(
1,0
00
,63
0)
(
-
1,5
52
,41
1)
(
9
,04
0,9
40
)(
1,3
74
,40
9$
2,5
33
,57
3$
3
,24
9,3
31
$
1,5
80
,74
0$
6
24
,42
6$
1,4
81
,22
6$
8
98
,37
5$
1
1,7
42
,08
0$
20
14
Op
enin
g n
et b
oo
k a
mo
unt
1,3
74
,40
9$
2,5
33
,57
3$
3
,24
9,3
31
$
1,5
80
,74
0$
6
24
,42
6$
1,4
81
,22
6$
8
98
,37
5$
1
1,7
42
,08
0$
Ad
dit
ions
75
7,8
13
75
,51
2
64
7,8
95
2
84
,84
8
1
79
,21
3
2,1
13
,46
2
1
77
,91
1
4
,23
6,6
54
Acq
uir
ed f
rom
bu
sines
s
com
bin
atio
ns
-
-
3,2
34
-
-
-
1
,31
1
4
,54
5
Dis
po
sals
-
7
,18
4)
(
15
7,3
16
)(
1
6,3
65
)(
6,1
61
)(
1
2,6
47
)(
16
,98
5)
(
2
16
,65
8)
(
Rec
lass
ific
atio
ns
-
7
25
,73
5
1
74
,75
9
14
2,1
28
43
,80
4
1
,16
1,5
34
)(
23
3,8
31
15
8,7
23
Dep
reci
atio
n-
16
0,2
79
)(
5
51
,16
0)
(
61
7,4
11
)(
1
99
,77
1)
(
-
37
0,4
47
)(
1,8
99
,06
8)
(
Net
exch
ang
e d
iffe
rence
s2
,37
6
6
3,3
56
6
8,7
73
10
,03
4
15
,26
4
-
1
8,5
73
1
78
,37
6
Clo
sing
net
bo
ok
am
ou
nt
2,1
34
,59
8$
3,2
30
,71
3$
3
,43
5,5
16
$
1,3
83
,97
4$
6
56
,77
5$
2,4
20
,50
7$
9
42
,56
9$
1
4,2
04
,65
2$
At
Dec
ember
31
, 2
01
4
Co
st2
,13
4,5
98
$
4
,51
1,5
12
$
6,3
97
,79
4$
4
,87
9,6
76
$
1,9
02
,38
0$
2
,42
0,5
07
$
2,9
12
,66
5$
25
,15
9,1
32
$
Acc
um
ula
ted
dep
reci
atio
n
an
d im
pai
rmen
t-
1,2
80
,79
9)
(
2
,96
2,2
78
)(
3
,49
5,7
02
)(
1,2
45
,60
5)
(
-
1,9
70
,09
6)
(
1
0,9
54
,48
0)
(
2,1
34
,59
8$
3,2
30
,71
3$
3
,43
5,5
16
$
1,3
83
,97
4$
6
56
,77
5$
2,4
20
,50
7$
9
42
,56
9$
1
4,2
04
,65
2$
-51-

A. Amount of borrowing costs capitalized as part of investment property and the range of the
interest rates for such capitalization are as follows:
B. As of December 31, 2015 and 2014, no property, plant and equipment owned by the Group were
pledged to others.
(10) Investment property
As of December 31, 2014, the Group did not hold any investment property.
A. Rental income from investment property and direct operating expenses arising from investment
property are shown below:
2015 2014
Amount capitalised $ 44,534 $ 25,002
Interest rate 1.08%~1.80% 0.72%~1.92%
Years ended December 31,
Land Buildings Total
At January 1, 2015
Cost $ - $ - $ -
Accumulated depreciation and
impairment - - -
-$ -$ -$
2015
Opening net book amount as at
January 1 $ - $ - $ -
Additions-from acquisitions 1,417,447 476,316 1,893,763
Depreciation charge - ( 17,027) ( 17,027)
Net exchange differences 69,368 22,751 92,119
Closing net book amount as at
December 31 $ 1,486,815 $ 482,040 $ 1,968,855
At December 31, 2015
Cost $ 1,486,815 $ 499,626 $ 1,986,441
Accumulated depreciation and
impairment - ( 17,586) ( 17,586)
$ 1,486,815 $ 482,040 $ 1,968,855
Year ended
December 31, 2015
Rental income from investment property 83,982$
Direct operating expenses arising from the investment property that
generated rental income during the period 50,155$
-52-

B. The fair value of the investment property held by the Group as at December 31, 2015 was
$1,803,077, respectively, which was valued by independent valuers. Valuations were made using
the income approach which is categorised within Level 3 in the fair value hierarchy. Key
assumptions are as follows:
C. Information on investment property that was pledged to others as collaterals is provided in Notes
6(15) and 8.
(11) Intangible assets
Year ended
December 31, 2015
Gross margin 4.4%
Growth rate 0.3%
Discount rate 4.1%
Trademarks
and patents Software Goodwill Others Total
At January 1, 2015
Cost 44,962$ 249,732$ 120,125$ 66,904$ 481,723$
Accumulated amortization
and impairment 33,590)( 169,201)( - 32,502)( 235,293)(
11,372$ 80,531$ 120,125$ 34,402$ 246,430$
2015
Opening net book amount 11,372$ 80,531$ 120,125$ 34,402$ 246,430$
Additions 15,986 38,761 - 8,257 63,004
Acquired from business
combinations - - 79,964 - 79,964
Disposals-cost 35,787)( 118,190)( - 8,382)( 162,359)(
Disposals-accumulated
amortization 35,787 116,146 - 8,382 160,315
Reclassifications - 13,347 - - 13,347
Amortization 13,800)( 67,480)( - 6,266)( 87,546)(
Impairment loss - - 53,000)( - 53,000)(
Net exchange differences 3 168)( 2,617 511 2,963
Closing net book amount 13,561$ 62,947$ 149,706$ 36,904$ 263,118$
At December 31, 2015
Cost 25,221$ 179,168$ 149,706$ 68,056$ 422,151$
Accumulated amortization
and impairment 11,660)( 116,221)( - 31,152)( 159,033)(
13,561$ 62,947$ 149,706$ 36,904$ 263,118$
-53-

A. Details of amortization on intangible assets are as follows:
B. Goodwill is allocated to the Group’s cash-generating units identified according to operating
segment as follows:
Trademarks
and patents Software Goodwill Others Total
At January 1, 2014
Cost 33,929$ 238,217$ 58,600$ 5,785$ 336,531$
Accumulated amortization
and impairment 25,017)( 139,696)( - 3,602)( 168,315)(
8,912$ 98,521$ 58,600$ 2,183$ 168,216$
2014
Opening net book amount 8,912$ 98,521$ 58,600$ 2,183$ 168,216$
Additions 11,015 58,848 - - 69,863
Acquired from business
combinations - 478 53,819 36,508 90,805
Disposals-cost 100)( 51,012)( - - 51,112)(
Disposals-accumulated
amortization 100 51,012 - - 51,112
Reclassifications - - - 2,174)( 2,174)(
Amortization 8,570)( 77,788)( - 2,937)( 89,295)(
Net exchange differences 15 472 7,706 822 9,015
Closing net book amount 11,372$ 80,531$ 120,125$ 34,402$ 246,430$
At December 31, 2014
Cost 44,962$ 249,732$ 120,125$ 66,904$ 481,723$
Accumulated amortization
and impairment 33,590)( 169,201)( - 32,502)( 235,293)(
11,372$ 80,531$ 120,125$ 34,402$ 246,430$
Year ended Year ended
December 31, 2015 December 31, 2014
Cost of revenue $ 2,219 $ 2,196
Selling expenses 6,901 4,302
Administrative expenses 43,828 53,615
Research and development expenses 34,598 29,182
$ 87,546 $ 89,295
December 31, 2015 December 31, 2014
Asia $ 139,281 $ 74,514
America 10,425 45,611
$ 149,706 $ 120,125
-54-

C. Goodwill is allocated to the Group’s cash-generating units identified according to operating
segment. The recoverable amount of all cash-generating units calculated using the value-in-use
exceeded their carrying amount. For the years ended December 31, 2015 and 2014, the Group
recognized impairment loss on goodwill amounting to $53,000 and $0, respectively.
D. Details of goodwill acquired from business combinations in 2015 and 2014 are provided in
Note 6(31).
(12) Other non-current assets
A. As of December 31, 2015, the Group signed a land use right contract with Bureau of Land
Resources for use of the land in municipality of Chongqing, WuJiang City of Jiangsu Province
and Dongguan City of Guangdong Province with term of 50 years. All rentals had been paid on
the contract date, shown as ‘Long-term prepaid rents - Land use right’. However, the local
government of Chongqing has negotiated with the Group in October 2014 for collecting certain
land use right in Chongqing and returning related rents to the Group. The Group recognized
rental expenses of $12,243 and $18,792 for the years ended December 31, 2015 and 2014,
respectively.
B. As of December 31, 2015 and 2014, CEM3, CEM5 and CPCQ received the local government
grants amounting to $316,709 and $326,983, respectively, as a reward for the local investment,
which were deducted from the cost of land use right.
C. Information on other non-current assets that were pledged to others as collaterals is provided in
Note 8.
(13) Short-term borrowings
A. As of December 31, 2015, the Group had issued promissory notes as guarantee for the
short-term loans. Please see Note 9(2).
December 31, 2015 December 31, 2014
Long-term prepaid rents - land use right 346,517$ 226,961$
Guarantee deposits paid 230,361 116,340
Prepayments for business facilities 260,495 295,463
Others 485,295 538,705
1,322,668$ 1,177,469$
Type of borrowings December 31, 2015 Interest rate range Collateral
Bank unsecured borrowings 2,353,216$ 0.69%~1.77% None
Bank secured borrowings 120,000 1.61% Time deposits
2,473,216$
Type of borrowings December 31, 2014 Interest rate range Collateral
Bank unsecured borrowings 2,098,920$ 0.86%~1.30% None
-55-

B. Information about the short-term borrowings that were pledged to others as collaterals is
provided in Note 8.
(14) Accounts payable
(15) Long-term borrowings
December 31, 2015 December 31, 2014
Accounts payable 14,702,478$ 15,119,979$
Estimated accounts payable 3,885,717 3,995,164
18,588,195$ 19,115,143$
Borrowing period and Interest rate December 31,
Type of borrowings repayment term range Collateral 2015
Long-term bank
borrowings
E.Sun Bank
(Series A)
Borrowing period is from
March 20, 2014 to March 20,
2019; borrowing is repayable in
installments by own funds or
through refinancing at the
maturity date of syndicated
contract.
1.60% None 1,000,000$
Sumitomo Mitsui
Banking Corporation
Borrowing period is from
December 1, 2015 to December
1, 2017; interest is repayable
monthly until the principal is
matured.
0.77% None 408,734
Sumitomo Mitsui
Banking Corporation
(Secured borrowings)
Borrowing period is from
March 13, 2015 to March 12,
2022; interest is repayable
monthly until the principal is
matured.
0.78% Investment
property
980,960
2,389,694$
-56-

Note:Revolving credit in three years starting from the first drawdown, each credit period limited to
90 to 180 days.
A. As of December 31, 2015 and 2014, the Company’s Chairman had issued promissory notes to
guarantee the long-term loans, please see Note 9(2).
B. A long-term syndicated construction loan facility amounting to $5,000,000 (Series A:
$2,000,000 can be financed in batches but credit revolvable; Series B: $3,000,000, credit
revolvable; Series C: USD 100,000,000, credit revolvable; the amount drawdown by Series B
and Series C cumulatively must be below $3,000,000.). For five years was signed by the
Company, with E. Sun Commercial Bank as the lead bank in January, 2014. The loan facility
will be used for medium-term operations, and repayments will be in accordance with contract
requirements. In September 2015, the credit amount of series A was renewed to $1,000,000,
resulting in total loan facility amounting to $4,000,000. As of December 31, 2015, $1,000,000
has been drawndown. The main contents of the contract are as follows:
(a) The Group should maintain financial ratios based on annual consolidated financial
statements as follows:
i. Current ratio is above 100%,
ii. Financial liabilities divided by net tangible assets is under 200%,
iii. Time interest earned is above 300%, and
iv. Net tangible assets are above $15,000,000,
If the Company does not conform to the contract, the Company should adjust within nine
Borrowing period and Interest rate December 31,
Type of borrowings repayment term range Collateral 2014
Long-term bank
borrowings
E.Sun Bank
(Series A)
Borrowing period is from
March 20, 2014 to March 20,
2019; borrowing is repayable in
installments by own funds or
through refinancing at the
maturity date of syndicated
contract.
1.63% None 500,000$
TCB Bank Borrowing period is from
October 6, 2014 to January 6,
2015; interest is repayable until
the principal is matured. (Note)
1.48% None 411,060
Less: current portion (shown as other current liabilities) 411,060)(
500,000$
-57-

months. If the adjusted financial ratios meet the requirements, there is no breach of contract.
(b) The Company should use the debts for its intended purpose (not for treasury stock, capital
expenditures, cash dividends and investments) and prepare the appropriate books and
records for cash disbursements for future examination. Lenders do not take responsibility
for supervision.
(c) If the Company needs additional operating capital, the Company should issue stocks for
cash, borrow from stockholders, or other means. If the borrower obtains capital from
stockholders, the Company should get the commitment from stockholders that the creditors’
rights are subordinated, and the interest rate should not be over the lowest rate mentioned in
the contract. The borrower should repay the principal, interests, and all the related expenses
before repaying the advances made by the borrower’s stockholders.
(d) Parts of the credit rights of qualified accounts receivable of the Company should be
transferred to the lead bank after the contract date. These qualified accounts receivable plus
the balance of the special-purpose bank account should be over 45% of the facility of Series
B and Series C as a whole.
As of December 31, 2015, the Company did not violate any of the above requirements.
C. A long-term syndicated construction loan facility amounting to $6,000,000 (Series A:
$3,000,000 can be financed in batches but credit revolvable; Series B: $3,000,000, credit
revolvable; Series C: USD 96,000,000, credit revolvable; the amount drawdown by Series B
and Series C cumulatively must be below $3,000,000.) for three years was signed by the
Company, with E. Sun Commercial Bank as the lead bank in July, 2011. The loan facility will
be used for medium-term operations, and repayments will be in accordance with contract
requirements.
The Company has repaid all the amounts mentioned above in January, 2014.
D. A long-term syndicated construction loan facility amounting to $4,500,000 for a period of five
years was signed by CP with Taiwan Cooperative Bank as the lead bank in October 2015. The
construction loan is for repaying for medium-term operations. The loan can be drawn down in
United States Dollars or New Taiwan Dollars. As of December 31, 2015, abovementioned loan
facility has not been withdrawn.
E. A long-term syndicated construction loan facility amounting to $5,000,000 for a period of three
years was signed by CP with Taiwan Cooperative Bank as the lead bank in May 2012 (CP
applied to reduce credit line by $3,000,000 on June 30, 2014. The credit line was decreased to
$2,650,000, $2,300,000, $1,950,000 and $0 on September 29, 2014, December 29, 2014,
March 29, 2015 and June 29, 2015 under the contract, respectively). The construction loan is
for repaying the 2009 syndicated construction loan and for medium-term operations. The loan
can be drawn down in United States Dollars or New Taiwan Dollars. The main contents of the
contract are as follows:
(a) CP’s annual consolidated financial statements should maintain financial ratios as follows:
-58-

i. Current ratio is above 100%,
ii. Financial liabilities divided by net tangible assets after subtracting cash and cash
equivalents is under 250%,
iii. Time interest earned is above 300%, and
iv. Net tangible assets are above $2,500,000,
If CP does not conform to the contract, CP should adjust within nine months. If the adjusted
financial ratios meet the requirements, there is no breach of contract.
(b) CP should maintain appropriate accounts receivable ratio, which means the total of
qualified accounts receivable balance and the compensation accounts balance divided by
the remainder of undrawn balance should be above 70%. The remainder of undrawn
balance is CP’s expected drawdown amounts plus the remainder of undrawn amounts. If the
ratio cannot be maintained appropriately, CP should choose any of the following actions to
make the accounts receivable ratio comply with the contract within seven days after the
managing bank’s notification:
i. Provide other qualified accounts receivable which was certified by the managing bank,
or,
ii. Repay the loan before maturity, or,
iii. Deposit in compensation accounts.
(c) As part of the contract, the commitment fee should be calculated every three months, which
begins six months after CP drawdowns the credit for the first time. During the commitment
fee calculation period, if the average drawdown amounts are less than 60% of the total loan
facility, the commitment fee should be calculated quarterly, using the difference of actual
drawdown amounts and 60% of the total loan facility, multiplied by 0.15%, the annual fee
rate, and then pay the managing bank every three months.
(d) The Group should maintain voting power over CP above 51% and also have control power
over CP’s operations. However, for the compilation of rules governing the listed companies,
the highest voting ratio and seats should follow “Taiwan Stock Exchange Corporation
Rules Governing Review of Securities Listings” and “GreTai Securities Market Rules
Governing the Review of Securities for Trading on the GTSM”.
The Company has repaid all the amounts mentioned above in June 2015.
F. The Group has the following undrawn borrowing facilities:
December 31, 2015 December 31, 2014
Floating rate:
Expiring within one year $ - $ 1,888,940
Expiring beyond one year 7,636,245 4,500,000
$ 7,636,245 $ 6,388,940
-59-

(16) Pensions
A. (a) The Company and its domestic subsidiaries have a defined benefit pension plan in
accordance with the Labor Standards Law, covering all regular employees’ service years
prior to the enforcement of the Labor Pension Act on July 1, 2005 and service years
thereafter of employees who chose to continue to be subject to the pension mechanism
under the Law. Under the defined benefit pension plan, two units are accrued for each
year of service for the first 15 years and one unit for each additional year thereafter, subject
to a maximum of 45 units. Pension benefits are based on the number of units accrued and
the average monthly salaries and wages of the last 6 months prior to retirement. The
Company contributes monthly an amount equal to 2% of the employees’ monthly salaries
and wages to the retirement fund deposited with Bank of Taiwan, the trustee, under the
name of the independent retirement fund committee. Also, the Company would assess the
balance in the aforementioned labor pension reserve account by the end of December 31,
every year. If the account balance is insufficient to pay the pension calculated by the
aforementioned method, to the employees expected to be qualified for retirement next year,
the Company will make contribution to cover the deficit by next March.
(b) The amounts recognized in the balance sheet are determined as follows:
December 31, 2015 December 31, 2014
Present value of defined benefit obligations 346,024)($ 338,454)($
Fair value of plan assets 197,690 214,999
Net defined benefit liability 148,334)($ 123,455)($
-60-

(c) Movements in net defined benefit liabilities are as follows:
(d) The Bank of Taiwan was commissioned to manage the Fund of the Company’s and
domestic subsidiaries’ defined benefit pension plan in accordance with the Fund’s annual
Present value of
defined benefit Fair value of Net defined
obligations plan asset benefit liability
Year ended December 31, 2015
Balance at January 1 338,454)($ 214,999$ 123,455)($
Current service cost 4,480)( - 4,480)(
Interest (expense) income 5,933)( 3,864 2,069)(
348,867)( 218,863 130,004)(
Remeasurements:
Return on plan assets (excluding
amounts included in interest income
or expense) - 2,028 2,028
Change in demographic assumptions 13,389)( - 13,389)(
Change in financial assumptions 10,978)( - 10,978)(
Experience adjustments 5,794)( - 5,794)(
30,161)( 2,028 28,133)(
Pension fund contribution - 4,999 4,999
Paid Pension 33,004 28,200)( 4,804
Balance at December 31 346,024)($ 197,690$ 148,334)($
Present value of
defined benefit Fair value of Net defined
obligations plan asset benefit liability
Year ended December 31, 2014
Balance at January 1 319,080)($ 221,053$ 98,027)($
Current service cost 5,085)( - 5,085)(
Interest (expense) income 5,806)( 4,432 1,374)(
329,971)( 225,485 104,486)(
Remeasurements:
Return on plan assets (excluding
amounts included in interest income
or expense) - 698 698
Change in demographic assumptions 5,530)( - 5,530)(
Change in financial assumptions 4,520)( - 4,520)(
Experience adjustments 14,843)( - 14,843)(
24,893)( 698 24,195)(
Pension fund contribution - 5,226 5,226
Paid Pension 16,410 16,410)( -
Balance at December 31 338,454)($ 214,999$ 123,455)($
-61-

investment and utilization plan and the “Regulations for Revenues, Expenditures, Safeguard
and Utilization of the Labor Retirement Fund” (Article 6: The scope of utilization for the
Fund includes deposit in domestic or foreign financial institutions, investment in domestic
or foreign listed, over-the-counter, or private placement equity securities, investment in
domestic or foreign real estate securitization products, etc.). With regard to the utilization of
the Fund, its minimum earnings in the annual distributions on the final financial statements
shall be no less than the earnings attainable from the amounts accrued from two-year time
deposits with the interest rates offered by local banks. If the earnings are less than
aforementioned rates, government shall make payment for the deficit after authorized by
the Regulator. The Company has no right to participate in managing and operating that fund
and hence the Company is unable to disclose the classification of plan asset fair value in
accordance with IAS 19 paragraph 142. The composition of fair value of plan assets as of
December 31, 2015 and 2014 is given in the Annual Labor Retirement Fund Utilisation
Report announced by the government.
(e) The principal actuarial assumptions used were as follows:
Assumptions regarding future mortality experience are set based on actuarial advice in
accordance with published statistics and experience in Taiwan and the analysis of present
value of affected defined benefit obligation is as follows:
The sensitivity analysis above is based on other conditions that are unchanged but only one
assumption is changed. In practice, more than one assumption may change all at once. The
method of analysing sensitivity and the method of calculating net pension liability in the
balance sheet are the same.
The method and assumptions used for the preparation of sensitivity analysis during 2015
and 2014 are the same.
(f) Expected contributions to the defined benefit pension plans of the Group for the year
2015 2014
Discount rate 1.375%~1.700% 1.750%~2.250%
Future salary increases 2.500%~3.000% 0.500%~3.000%
Increase 0.25% Decrease 0.25% Increase 0.25% Decrease 0.25%
December 31, 2015
Effect on present
value of defined
benefit obligation 8,507)($ 8,880$ 8,596$ 8,290)($
December 31, 2014
Effect on present
value of defined
benefit obligation 7,845)($ 8,185$ 7,936$ 7,656)($
Discount rate Future salary increases
-62-

ending December 31, 2016 amounts to $4,802.
(g) As of December 31, 2015, the weighted average duration of that retirement plan is 9.1~13.4
years. The analysis of timing of the future pension payment was as follows:
B. (a) Effective July 1, 2005, the Company and its domestic subsidiaries have established a
defined contribution pension plan (the “New Plan”) under the Labor Pension Act (the
“Act”), covering all regular employees with R.O.C. nationality. Under the New Plan, the
Company and its domestic subsidiaries contribute monthly an amount based on 6% of the
employees’ monthly salaries and wages to the employees’ individual pension accounts at
the Bureau of Labor Insurance. The benefits accrued are paid monthly or in lump sum upon
termination of employment.
(b) The overseas subsidiaries of the Company have defined contribution plans.
(c) The Company’s mainland China subsidiaries have a defined contribution plan. Monthly
contributions to an independent fund administered by the government in accordance with
the pension regulations in the People’s Republic of China (PRC) are based on certain
percentage of employees’ monthly salaries and wages. Other than the monthly contributions,
the Group has no further obligations.
(d) The pension costs under defined contribution pension plans of the Group for the years
ended December 31, 2015 and 2014 were $642,749 and $497,171, respectively.
(17) Share-based payment
A. (a) For the year ended December 31, 2015, CP’s share-based payment arrangements were as
follows:
Note: Vesting conditions:
i. The Company’s overall operating performance in the previous year should meet the
following indicators:
(A) Consolidated operating revenue shall grow by at least 10% higher than the average
amount over past three years.
(B) Consolidated net income shall grow by at least 10% higher than the average amount
Within 1 year 8,392$
1-2 year(s) 9,670
2-5 years 76,397
Over 5 years 80,919
175,378$
Quantity Contract Vesting
Type of arrangement Grant date granted period conditions
4,008
thousand shares
Restricted stocks to
employees
August 28, 2015 2 years Note
-63-

over past three years.
(C) Return on equity shall be at least 15%.
ii. For the employees who have met the vesting conditions since the allocation of restricted
stocks, the ratio of vested shares is as follows:
The restricted shares issued by the Company cannot be sold, pledged, transferred,
donated, collateralised, or disposed in any other method during the vesting period. Other
rights including but not limited to dividends, the distribution rights of bonuses and
capital surplus, and share options and voting rights of cash capital, etc., are the same as
the Company’s issued ordinary shares. At the date of resign, retirement or termination,
the restricted shares are considered as not meeting the vesting conditions if employees
resign, retire or are terminated during the vesting period. The Company redeems at no
consideration and retires the shares which do not meet the vesting condition. Employees
are not required to return the dividends received.
(b) The restricted stocks issued by CP. were measured at their fair value which is the closing
price of CP.’s shares at NT$34 on the grant date.
(c) Expenses incurred on share-based payment transactions are shown below:
B. (a) For the year ended December 31, 2015, XAVi’s share-based payment arrangements were as
follows:
Vesting conditions Ratio of vested shares
A month after the restricted stocks are kept at the trust 40% of the shares
September 30, 2016 30% of the shares
September 30, 2017 30% of the shares
2015 2014
Equity-settled 73,628$ -$
Years ended December 31,
Quantity Contract Vesting
Type of arrangement Grant date granted period conditions
Cash capital increase
reserved for
employee
preemption
September 30,
2015
670
thousand shares
- Vested
immediately
-64-

(b) Details of the share-based payment arrangements are as follows:
(c) XAVi’s fair value of stock options granted on grant date is measured using the
Black-Scholes option-pricing model. Relevant information is as follows:
Note: Expected price volatility rate was estimated by using the stock prices of the most
recent period with length of this period approximate to the length of the stock
options’ expected life, and the standard deviation of return on the stock during this
period.
(d) Expenses incurred on share-based payment transactions are shown below:
(18) Share capital
A. As of December 31, 2015, the Company’s authorized capital was $8,000,000, and the paid-in
capital was $7,038,101 with a par value of $10 (in dollars) per share, and the outstanding
common stock was 800,000 thousand shares.
Weighted-average
exercise
No. of options price (in dollars)
Options outstanding at January 1 - -$
Options granted 670 16
Options exercised 664)( 16
Options expired 6)( -
Options outstanding at December 31 - -
Options exercisable at December 31 - -
2015
Type of
Share
price
Exercise
price
Expected
price Expected Expected
Risk-free
interest
Fair value
per unit
arrangement Grant date (in dollars) (in dollars) volatility option life dividends rate (in dollars)
Cash capital
increase
reserved for
employee
preemption
September 30,
2015
$12.90 $16.00 40.80% 0.06 0.00% 0.80% 0.0081
2015 2014
Equity-settled 5$ -$
Years ended December 31,
-65-

Movements in the number of the Company’s ordinary shares outstanding are as follows:
Note: (a) Shares in thousands.
(b) The number of the Company’s ordinary shares outstanding, including shares held by
the subsidiaries.
B. The stockholders’ meeting held on June 17, 2015 had approved to issue common stock
dividends amounting to $34,743 and employees’ stock bonus amounting to $421,000 at a price
of $76.96 (in dollars) based on the previous closing price of $82.00 (in dollars) before the day
of the stockholders’ meeting, issuing 5,470 thousand shares. A total of 8,945 thousand shares
had been issued and, the Company has obtained a letter of approval from the appropriate
authorities. The issued date was set on August 17, 2015, and the Company had completed the
related registration on August 25, 2015.
C. The stockholders’ meeting held on May 30, 2014 had approved to issue common stock
dividends amounting to $34,336 and employees’ stock bonus amounting to $366,500 at a price
of $77.81 (in dollars) based on the previous closing price of $82.8 (in dollars) before the day of
the stockholders’ meeting on May 29, 2014, issuing 4,710 thousand shares. A total of 8,144
thousand shares had been issued and, the Company has obtained a letter of approval from the
appropriate authorities. The issued date was set on July 15, 2014, and the Company had
completed the related registration on August 8, 2014.
D. Treasury Stock
A summary of the Company’s common stock owned by its subsidiaries as of December 31,
2015 and 2014 are as follows:
2015 (Note) 2014 (Note)
At January 1 694,865 686,722
Common stock dividends 3,475 3,433
Employee bonuses 5,470 4,710
At December 31 703,810 694,865
Name of company Reason for Number of Carrying
Fair value
(in dollars)
holding the shares reacquisition shares(in thousand) amount (per share)
UNIKEY For investment 20,860 $ 205,795 $ 72.20
HEC For investment 15,948 105,482 72.20
December 31, 2015
Name of company Reason for Number of Carrying
Fair value
(in dollars)
holding the shares reacquisition shares(in thousand) amount (per share)
UNIKEY For investment 20,756 $ 205,795 $ 88.50
HEC For investment 15,869 105,482 88.50
December 31, 2014
-66-
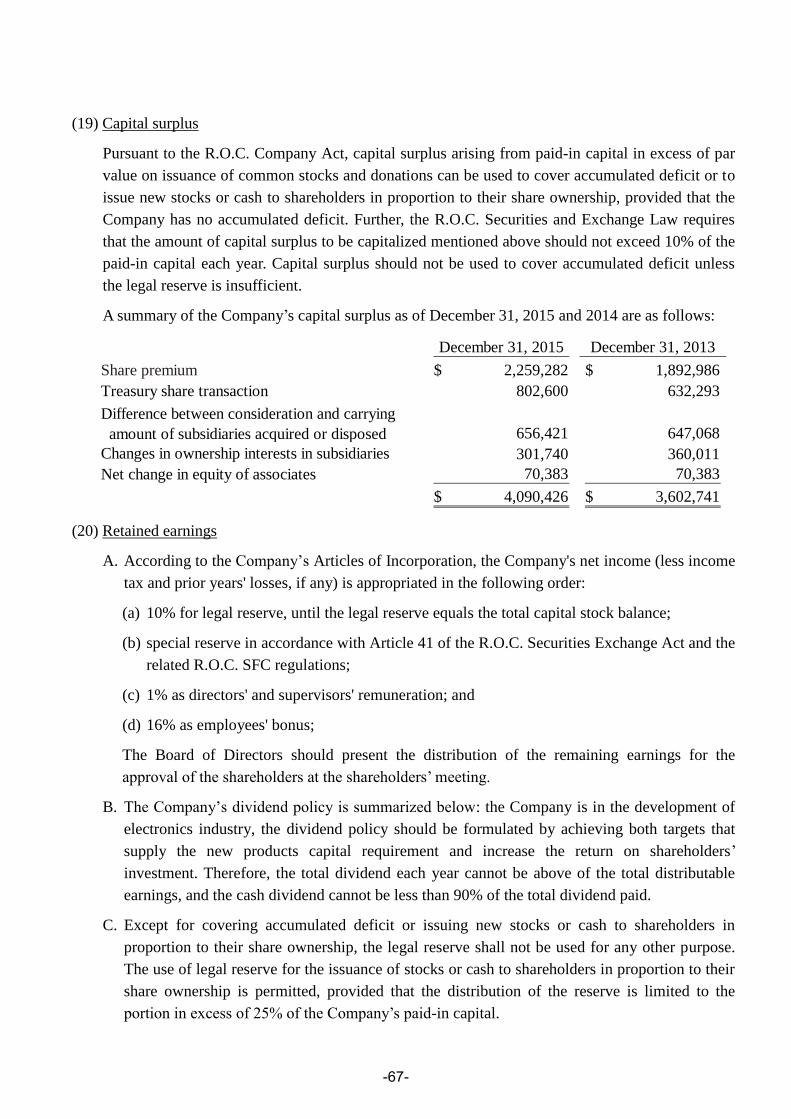
(19) Capital surplus
Pursuant to the R.O.C. Company Act, capital surplus arising from paid-in capital in excess of par
value on issuance of common stocks and donations can be used to cover accumulated deficit or to
issue new stocks or cash to shareholders in proportion to their share ownership, provided that the
Company has no accumulated deficit. Further, the R.O.C. Securities and Exchange Law requires
that the amount of capital surplus to be capitalized mentioned above should not exceed 10% of the
paid-in capital each year. Capital surplus should not be used to cover accumulated deficit unless
the legal reserve is insufficient.
A summary of the Company’s capital surplus as of December 31, 2015 and 2014 are as follows:
(20) Retained earnings
A. According to the Company’s Articles of Incorporation, the Company's net income (less income
tax and prior years' losses, if any) is appropriated in the following order:
(a) 10% for legal reserve, until the legal reserve equals the total capital stock balance;
(b) special reserve in accordance with Article 41 of the R.O.C. Securities Exchange Act and the
related R.O.C. SFC regulations;
(c) 1% as directors' and supervisors' remuneration; and
(d) 16% as employees' bonus;
The Board of Directors should present the distribution of the remaining earnings for the
approval of the shareholders at the shareholders’ meeting.
B. The Company’s dividend policy is summarized below: the Company is in the development of
electronics industry, the dividend policy should be formulated by achieving both targets that
supply the new products capital requirement and increase the return on shareholders’
investment. Therefore, the total dividend each year cannot be above of the total distributable
earnings, and the cash dividend cannot be less than 90% of the total dividend paid.
C. Except for covering accumulated deficit or issuing new stocks or cash to shareholders in
proportion to their share ownership, the legal reserve shall not be used for any other purpose.
The use of legal reserve for the issuance of stocks or cash to shareholders in proportion to their
share ownership is permitted, provided that the distribution of the reserve is limited to the
portion in excess of 25% of the Company’s paid-in capital.
December 31, 2015 December 31, 2013
Share premium 2,259,282$ 1,892,986$
Treasury share transaction 802,600 632,293
Difference between consideration and carrying
amount of subsidiaries acquired or disposed 656,421 647,068
Changes in ownership interests in subsidiaries 301,740 360,011
Net change in equity of associates 70,383 70,383
4,090,426$ 3,602,741$
-67-

D. (a) In accordance with the regulations, the Company shall set aside special reserve from the
debit balance on other equity items at the balance sheet date before distributing earnings.
When debit balance on other equity items is reversed subsequently, the reversed amount
could be included in the distributable earnings.
(b) The amounts previously set aside by the Company as special reserve on initial application
of IFRSs in accordance with Jin-Guan-Zheng-Fa-Zi Letter No. 1010012865, dated April 6,
2012, shall be reversed proportionately when the relevant assets are used, disposed of or
reclassified subsequently. The Company elected to reclassify the unrealized revaluation
increment and cumulative translation adjustment to unappropriated earnings and accrue
special reserve by $435,487 on initial application of IFRSs.
E. The appropriation of 2014 and 2013 earnings has been resolved at the shareholders’ meeting on
June 17, 2015 and May 30, 2014, respectively, and the details are summarized below:
F. Subsequent events: The appropriation of 2015 earnings had been proposed at the Board of
Directors’ meeting on March 21, 2016. However, the appropriation of earnings for 2015 was
yet to be resolved at the shareholders’ meeting in 2016. Details are summarized below:
G. For the information relating to employees’ compensation (bonuses) and directors’ and
supervisors’ remuneration, please refer to Note 6(26).
Dividends
per share
Dividends
per share
Amount (in dollars) Amount (in dollars)
Legal reserve 408,094$ 378,203$
Reversal of special reserve - 1,024,085)(
Stock dividends 34,743 0.05$ 34,336 0.05$
Cash dividends 3,231,124 4.65 3,158,919 4.60
2014 2013
Years ended December 31,
Dividends per share
Amount (in dollars)
Legal reserve 384,799$
Special reserve 517,964
Stock dividends 35,191 0.05$
Cash dividends 3,026,383 4.30
Year ended December 31, 2015
-68-

(21) Other equity items
(22) Net revenue
Available-for-sale Currency
investments translation Total
At January 1, 2015
Revaluation
1,282,930)($ 1,229,944$ 52,986)($
-Group 910,429)( - 910,429)(
-Associates 1)( - 1)(
Transfer 162,178)( - 162,178)(
Currency translation
differences:
-Group - 184,031 184,031
-Associates - 8,215)( 8,215)(
Transfer - 1,711)( 1,711)(
At December 31, 2015 2,355,538)($ 1,404,049$ 951,489)($
2015
Available-for-sale Currency
investments translation Total
At January 1, 2014
Revaluation
140,176$ 167,564$ 307,740$
-Group 778,234)( - 778,234)(
-Associates 1 - 1
Transfer 644,873)( - 644,873)(
Currency translation
differences:
-Group - 1,051,496 1,051,496
-Associates - 10,884 10,884
At December 31, 2014 1,282,930)($ 1,229,944$ 52,986)($
2014
2015 2014
Sales revenue $ 80,561,927 $ 80,017,860
Other operating revenue 101,442 92,832
Total 80,663,369$ 80,110,692$
Years ended December 31,
-69-

(23) Other income
(24) Other gains and losses
(25) Expenses by nature
2015 2014
Rental revenue 84,943$ 364$
Interest income 71,602 52,387
Dividend income 228,005 210,185
Others 350,532 254,776
Total 735,082$ 517,712$
Years ended December 31,
2015 2014
Net gains on financial assets and
liabilities at fair value through profit or
loss
565,867$ 415,444$
Reversal of allowance for doubtful accounts 3,801 5,087
Net currency exchange losses 248,243)( 447,347)(
Loss on disposal of property, plant and
equipment
17,400)( 45,798)(
Gains on disposal of investments 162,019 645,673
Impairment loss on non-financial assets 53,000)( -
Gain on reversal of provisions - 66,221
Others 179,163)( 94,301)(
Total 233,881$ 544,979$
Years ended December 31,
Costs of revenue Operating expense Total
Employee benefit expense $ 7,459,168 $ 3,368,881 $ 10,828,049
Depreciation on property,
plant and equipment 1,677,146 331,566 2,008,712
Amortization on
intangible assets 2,219 85,327 87,546
Year ended December 31, 2015
Costs of revenue Operating expense Total
Employee benefit expense $ 7,228,084 $ 3,539,405 $ 10,767,489
Depreciation on property,
plant and equipment 1,526,856 372,212 1,899,068
Amortization on
intangible assets 2,196 87,099 89,295
Year ended December 31, 2014
-70-

(26) Employee benefit expense
A. Details of the Company’s Articles of Incorporation are provided in Note 6(20).
However, in accordance with the Company Act amended on May 20, 2015, a company shall
distribute employee compensation, based on the distributable profit of the current year, in a
fixed amount or a ratio of profits. If a company has accumulated deficit, earnings should be
channeled to cover losses. A company may, by a resolution adopted by a majority vote at a
meeting of Board of Directors attended by two-thirds of the total number of directors, have the
profit distributable as employees' compensation distributed in the form of shares or in cash; and
in addition thereto a report of such distribution shall be submitted to the shareholders' meeting.
Qualification requirements of employees, including the employees of subsidiaries of the
company meeting certain specific requirements, entitled to receive aforementioned stock or
cash may be specified in the Articles of Incorporation.
The Board of Directors of the Company has approved the amended Articles of Incorporation of
the Company on November 12, 2015. According to the amended articles, a ratio of
distributable profit of the current year, after covering accumulated losses, shall be distributed as
employees' compensation and directors and supervisors remuneration. The ratio shall not be
lower than 11% for employees’ compensation and shall not be higher than 1% for directors’
and supervisors’ remuneration. The amended articles will be resolved in the shareholders’
meeting in 2016.
B. For the years ended December 31, 2015 and 2014, employees’ compensation was accrued at
$544,809 and $587,655, respectively; directors’ and supervisors’ remuneration was accrued at
$33,848 and $36,728, respectively. The aforementioned amounts were recognized in salary
expenses.
The employees’ compensation and directors’ and supervisors’ remuneration were estimated
and accrued based on 11.73% and 0.73% of distributable profit of current year for the year
ended December 31, 2015. The employees’compensation and directors’ and supervisors’
remuneration resolved by the Board of Directors were $544,809 and $33,848, respectively, and
the employees’ compensation will be distributed in the form of cash and shares.
Costs of revenue Operating expense Total
Wages and salaries $ 6,607,479 $ 2,969,214 $ 9,576,693
Labor and health insurance fees 148,107 147,635 295,742
Pension costs 511,975 137,323 649,298
Other personnel expenses 191,607 114,709 306,316
Total $ 7,459,168 $ 3,368,881 $ 10,828,049
Year ended December 31, 2015
Costs of revenue Operating expense Total
Wages and salaries $ 6,579,885 $ 3,165,460 $ 9,745,345
Labor and health insurance fees 108,153 144,901 253,054
Pension costs 374,239 126,975 501,214
Other personnel expenses 165,807 102,069 267,876
Total $ 7,228,084 $ 3,539,405 $ 10,767,489
Year ended December 31, 2014
-71-

The expenses recognized for the year of 2014 were accrued based on the net income of 2014
and the percentage as prescribed by the Company’s Articles of Incorporation (16% for
employees’ bonus and 1% for directors’ and supervisors’ remuneration, respectively), taking
into account other factors such as legal reserve. Where the accrued amounts for employees’
bonus and directors’ and supervisors’ remuneration are different from the actual distributed
amounts as resolved by the stockholders at their stockholders’ meeting subsequently, the
differences are accounted for as changes in estimates. Employees’ bonus and directors’ and
supervisors’ remuneration of 2014 as resolved by the shareholders’ meeting were in agreement
with those amounts recognized in the profit or loss of 2014. Actual number of shares
distributed as employees’ bonus for 2014 is 5,470 thousand shares, which is calculated based
on the fair value of $76.96. Information about employees’ compensation (bonus) and directors’
and supervisors’ remuneration of the Company as resolved by the Board of Directors and the
shareholders at the shareholders’ meeting will be posted in the “Market Observation Post
System” at the website of the Taiwan Stock Exchange.
(27) Finance costs
(28) Income tax
A. Components of income tax expense:
2015 2014
Finance costs
Interest expense of bank borrowings $ 120,746 $ 71,589
Less: capitalisation of qualifying assets ( 44,534) ( 25,002)
$ 76,212 $ 46,587
Years ended December 31,
2015 2014
Current tax:
Current tax on profits for the period 712,347$ 786,384$
Tax on undistributed surplus earnings 53,172 124,503
Adjustments in respect of prior years 2,185 9,571
Total current tax 767,704 920,458
Deferred tax:
Origination and reversal of temporary
differences 81,911 29,569
Income tax expense 849,615$ 950,027$
Years ended December 31,
-72-

B. Reconciliation between income tax expense and accounting profit
C. Amounts of deferred tax assets or liabilities as a result of temporary difference, loss
carryforward and investment tax credit are as follows:
2015 2014
Tax calculated based on profit before tax
and statutory tax rate
845,703$ 846,038$
Effects from items adjusted in accordance with
tax regulation 51,445)( 30,085)(
Prior year income tax underestimation 2,185 9,571
Additional 10% tax on undistributed earnings 53,172 124,503
Income tax expense 849,615$ 950,027$
Years ended December 31,
Recognised in
January 1 profit or loss December 31
Temporary differences:
-Deferred tax assets:
Unrealized exchange gain 11,760)($ 5,881$ 5,879)($
Unrealized profit (loss) from sales 622 1,174)( 552)(
Provision for inventory price
decline and obsolescence 30,318 4,370)( 25,948
Allowance for doubtful accounts
in excess of tax limit 112 66)( 46
Unrealized accrued expense 98,560 65,616)( 32,944
Long-term investment loss 6,978 6,978)( -
Unrealized compensation 60,936 8,019)( 52,917
Impairment loss 565 - 565
Others 7,950 1,379)( 6,571
Total 194,281$ 81,721)($ 112,560$
-Deferred tax liability:
Reserve for land revaluation
increment tax
21,756)($ -$ 21,756)($
Long-term investment gain 12,205)( - 12,205)(
Temporary differences of fixed
assets for tax and financial
purposes 3,038)( 190)( 3,228)(
Total 36,999)($ 190)($ 37,189)($
Year ended December 31, 2015
-73-

D. Expiration dates of unused net operating loss carryforward and amounts of unrecognized
deferred tax assets are as follows:
Recognised in
January 1 profit or loss December 31
Temporary differences:
-Deferred tax assets:
Unrealized exchange loss 8,084$ 19,844)($ 11,760)($
Unrealized profit (loss)
from sales221)( 843 622
Provision for inventory price
decline and obsolescence 17,400 12,918 30,318
Allowance for doubtful
accounts in excess of tax
limit 1,425 1,313)(
112
Unrealized accrued expense 45,972 52,588 98,560
Long-term investment loss 12,663 5,685)( 6,978
Unrealized compensation
revenue 55,562 5,374 60,936
Provision for legal claim 55,110 55,110)( -
Impairment loss 8,009 7,444)( 565
Others 19,658 11,708)( 7,950
Total 223,662$ 29,381)($ 194,281$
-Deferred tax liability:
Reserve for land revaluation
increment tax
21,756)($ -$ 21,756)($
Long-term investment gain 12,205)( - 12,205)(
Temporary differences of
fixed assets for tax and
financial purposes 2,850)( 188)( 3,038)(
Total 36,811)($ 188)($ 36,999)($
Year ended December 31, 2014
Amount filed/ Unrecognised
Year incurred assessed Unused amount deferred tax assets Usable until year
2006 $ 48,484 $ 24,250 $ 24,250 2016
2009 7,496 7,496 7,496 2019
2010 3,022 3,022 3,022 2020
2013 524 524 524 2023
2014 1,992 1,992 1,992 2024
2015 1,857 1,857 1,857 2025
December 31, 2015
-74-

E. As of December 31, 2015 and 2014, the amounts of deductible temporary difference that are
not recognized as deferred tax assets are as follows:
F. As of December 31, 2015, the Company’s income tax returns through 2013 have been assessed
and approved by the Tax Authority.
G. Unappropriated retained earnings:
H. As of December 31, 2015 and 2014, the balance of the imputation tax credit account was
$604,357 and $608,679, respectively. The creditable tax rate is estimated to be 7.05% for 2015.
I. The actual imputation credits for the Company’s distribution of cash dividends and stock
dividends of 2014 were 8.73% and 9.91%, respectively.
Amount filed/ Unrecognised
Year incurred assessed Unused amount deferred tax assets Usable until year
2006 $ 48,484 $ 24,250 $ 24,250 2016
2009 7,496 7,496 7,496 2019
2010 3,022 3,022 3,022 2020
2013 524 524 524 2023
2014 1,992 1,992 1,992 2024
2015 1,857 1,857 1,857 2025
December 31, 2014
December 31, 2015 December 31, 2014
Deductible temporary differences 915,652$ 817,662$
December 31, 2015 December 31, 2014
Earnings generated in and before 1997 17,867$ 17,867$
Earnings generated in and after 1998 8,574,094 8,422,883
8,591,961$ 8,440,750$
-75-

(29) Earnings per share
The above weighted-average outstanding shares of common stock have been adjusted according to
the earnings distribution approved by the Board of Directors and stockholders.
Weighted average
number of ordinary
shares outstanding Earnings per share
Amount after tax (share in thousands) (in dollars)
Basic earnings per share
Profit attributable to ordinary
shareholders of the parent 3,847,991$ 664,498 5.79$
Diluted earnings per share
Employees’ bonus - 10,049
Profit attributable to ordinary
shareholders of the parent
plus assumed conversion
of all dilutive potential
ordinary shares 3,847,991$ 674,547 5.70$
Year ended December 31, 2015
Weighted average
number of ordinary
shares outstanding Earnings per share
Amount after tax (share in thousands) (in dollars)
Basic earnings per share
Profit attributable to ordinary
shareholders of the parent 4,080,939$ 658,979 6.19$
Diluted earnings per share
Employees’ bonus - 9,905
Profit attributable to ordinary
shareholders of the parent
plus assumed conversion
of all dilutive potential
ordinary shares 4,080,939$ 668,884 6.10$
Year ended December 31, 2014
-76-

(30) Supplemental cash flow information
A. Investing activities with partial cash payments:
(31) Business combinations
A. For the years ended December 31, 2015 and 2014, the Group’s mergers are
as follows:
(a) In April 2015, the Group acquired 100% of the share capital of Zhuzhou Torch for
$221,755(RMB $44,612 thousand) through WTK and obtained the control of Zhuzhou
Torch.
(b) In July 2014, the Group acquired 78.125% of the share capital of WTS and its subsidiary
companies for $268,785 (USD 9,000 thousand) through CPI and obtained the control of
WTS.
2015 2014
Purchase of property, plant and equipment $ 2,907,924 $ 4,236,654
Add: opening balance of payable on equipment 179,439 37,657
Less: ending balance of payable on equipment ( 270,259) ( 179,439)
Cash paid during the period $ 2,817,104 $ 4,094,872
Years ended December 31,
-77-

B. The following table summarizes the consideration paid for abovementioned subsidiaries and
the fair values of the assets acquired and liabilities assumed at the acquisition date:
The operating revenue included in the consolidated statement of comprehensive income since
the Group’s acquisition of WTS and Zhuzhou Torch contributed by WTS and Zhuzhou Torch
was $264,376. WTS and Zhuzhou Torch also contributed loss before income tax of $49,925
over the same period. Had WTS and Zhuzhou Torch been consolidated from January 1, 2014,
the operating revenue and profit (loss) before income tax would have shown as follows:
2015 2014
Purchase consideration
Cash 221,755$ 268,785$
Fair value of the non-controlling interest - 60,191
221,755 328,976
Fair value of the identifiable assets acquired and
liabilities assumed
Cash 11,318$ 269,310$
Accounts receivable 156,292 4,320
Inventories 46,796 8,286
prepayments 1,949 251
Other current assets - 475
Property, plant and equipment 49,722 4,545
Intangible assets - 36,986
Other assets 2,267 24
Accounts payable 67,382)( 258)(
Other payables 56,576)( 21,782)(
Other current liabilities 2,595)( 750)(
Other non-current liabilities - 26,250)(
Total identifiable net assets 141,791 275,157
Goodwill (shown as “Intangible assets”) 79,964$ 53,819$
Years ended December 31,
2015 2014
Operating revenue 80,743,742$ 80,383,637$
Profit before income tax 5,298,019 5,492,475
Years ended December 31,
-78-

7. RELATED PARTY TRANSACTIONS
(1) Significant related party transactions and balances
A. Operating revenue:
The terms of the sales to related parties were the same as those to third parties, with reasonable
discounts. In general, the collection periods ranged from 60 to 90 days.
B. Purchases of goods:
The terms of the purchases from related parties were the same as those to third parties.
C. Receivables from related parties:
D. Payables to related parties:
(2) Key management compensation
2015 2014
Sales of goods:
Other related parties 669,650$ 604,965$
Years ended December 31,
2015 2014
Purchases of goods:
Associates 523,858$ 418,966$
Other related parties 1,512,075 1,749,589
Total 2,035,933$ 2,168,555$
Years ended December 31,
December 31, 2015 December 31, 2014
Accounts receivable:
Other related parties 329,439$ 241,285$
December 31, 2015 December 31, 2014
Accounts payable:
Associates 147,161$ 69,947$
Other related parties 353,089 355,357
Total 500,250$ 425,304$
2015 2014
Salaries and other short-term employee
benefits $ 353,829 $ 512,266
Termination benefits 2,573 3,665
$ 356,402 $ 515,931
Years ended December 31,
-79-

8. PLEDGED ASSETS
(1) The Group’s assets pledged as collateral are as follows:
(2) As of December 31, 2015, UNIKEY and HEC have pledged the Company’s common stock (shown
as “treasury stock”) amounting to 8,500,000 and 12,600,000 shares, respectively, as pledge for
loans.
9. SIGNIFICANT CONTINGENT LIABILITIES AND UNRECOGNIZED CONTRACT
COMMITMENTS
(1) Contingencies
A. An insurance company in the United States has filed a lawsuit in Arizona State court on behalf of
the insurees, claiming compensation from CP. The appellant claimed that the insurees’ use of
laptop power supply has caused fire and resulted in property damage. The Company had
informed its insurance company and the insurance company has appointed lawyers to handle this
case. As of December 31, 2015, CP could not determine the possible results and impact from this
lawsuit.
B. A customer of CP has filed a lawsuit in Florida State court, claiming compensation from CP. A
buyer claimed for compensation for a laptop produced by the customer of CP that burst into fire
and resulted in damages to the buyer’s body and thus filed a lawsuit in Florida State court. The
appellant filed a lawsuit demanding that CP pay for the compensation to the buyer and bear the
loss and expenses resulting from the lawsuit with the buyer. The Company had informed its
insurance company and the insurance company has appointed lawyers to handle this case. As of
December 31, 2015, CP could not determine the possible results and impact from this lawsuit.
(2) Commitments
A. As of December 31, 2015, the Group had unused letters of credit for purchases of raw materials
amounting to approximately $32,031.
Pledged asset
December 31,
2015
December 31,
2014 Purpose
Time deposits (shown as
other financial assets - current)
141,097$ 6,000$ Guarantee for tariff,
provisional attachment
and bank borrowing
Time deposits (shown as other
financial assets - noncurrent)
- 15,263 Guarantee for taxes and
social insurance
Pledged bank deposit (shown as
other financial assets - noncurrent)
- 188 Guarantee for
construction
Refundable deposits (shown as
other financial assets - non-current) 230,361 116,340
Guarantee for rental and
future deposits, etc.
Investment property 1,968,855 - Long-term borrowings
2,340,313$ 137,791$
Book value
-80-

B. As of December 31, 2015, for bank loans, financing forward exchange contracts, bill purchased
and accounts receivable factoring purposes, the Group provided standby promissory notes
totaling $40,290,095 as security.
C. The Company’s Board of Directors had resolved to increase the headquarter’s building
construction budget proposal amounting to $3,410,000. The related construction will be
conducted in accordance with the overall construction schedule. As of December 31, 2015, the
capital expenditures that have not been incurred amounted to $772,930.
D. Mao-Ray and Dong Guan Had Eri Iou Plastic Corporation have aggregate minimum
commitments under the agreements with local government for the lease of land from 1998 to
2042. The related leasing and management fee each year is $30,176.
E. The subsidiaries, XAVi, CP, UNIKEY, Mao-Ray, CAI, CPCQ, HDG, CPSZ, GSE, CPHK and
CPUS had leasing commitments, which are summarized below:
10. SIGNIFICANT DISASTER LOSS
None.
11. SIGNIFICANT EVENTS AFTER THE BALANCE SHEET DATE
Please see Note 6 (20) F. and 6(26) for the details on appropriation of the 2015 earnings.
12. OTHERS
(1) A. In January 2012, Dell Products (Manufacturing) Limited (abbreviated as Dell) had filed an
indictment in Ireland Supreme Court to charge against CP as co-defendant. In the case, the
original plaintiff (Thomas McDonagh & Sons) had claimed that Dell’s customer, which is ICI
Dulux Paint Limited (abbreviated as ICI,) had produced paint mixing machines (which
contained Dell’s brand-name desktop computers and also Dell desktop power adapters
produced by CP) that had caused the fire in its factory and caused the related losses. Therefore,
the original plaintiff (Thomas McDonagh & Sons) had requested compensation of EUR 1,273
thousand dollars from its defendant. During the lawsuit process, ICI had made Dell as
co-defendant, and Dell therefore also had made CP as co-defendant. Additionally, Dell had
filed a declaratory judgment in Williamson County, Texas District Court to charge against the
Company, HEC, and CPUS. Dell claimed that the Company, HEC, and CPUS should
compensate the losses and the attorneys’ fees in Ireland lawsuit according to the Master
Purchase Agreement which it had signed with HEC in 1995.
December 31, 2015 December 31, 2014
Not later than one year 107,496$ 85,062$
Later than one year but not later than five years 157,516 121,509
Later than five years 186,422 282,936
451,434$ 489,507$
-81-

B. Dell has withdrawn the above lawsuit in February 2015. Chicony Power Technology Co., Ltd.
paid the settlement in December 2014 and February 2015 which amounted to $20,603 (USD
673 thousand).
(2) Comarco, Inc. (abbreviated as Comarco) had ordered 90W NB Adapter from CP. As of March
2010, Comarco still had USD 1,153 thousand unpaid and inventory loss of USD 550 thousand; CP
filed an indictment against Comarco in Orange County Superior Court in April 2011 and June
2012 respectively, to request Comarco pay the accounts receivable remaining, amounting to USD
1,703 thousand in total; however, Comarco filed a counterclaim against CP in May 2011, claiming
that Comarco had recalled its products because the adapters CP had provided was defective, and
therefore Comarco requested compensation of USD 4,900 thousand from CP for the losses. In
April 2013, Comarco requested an additional amount for compensation; therefore the total
compensation was raised to USD 15,000 thousand. In September 2013, Comarco raised the total
compensation to USD 24,734 thousand based on the damage remedy appraisal expert. The U.S.
jury reached a judicial decision of the lawsuit mentioned above in February 5, 2013: Comarco
should pay the unpaid payment of USD 1,153 thousand to CP; and CP should pay compensation
amounting to USD 10,880 thousand to Comarco. CP disagreed with the verdict, but has signed a
Memorandum of Understanding with Comarco in May 2014 in consideration of changes and
related effects from the subsequent lawsuit. An official settlement agreement and release was
signed and CP paid USD7,600 thousand to Comarco after offsetting amounts paid by both parties.
In general, except for gain on reversal of provisions of $99,931 and impairment loss of related
accounts receivable of $33,710, CP recognized net gain of $66,221. The actual compensation paid
in May and June 2014 was $118,020 (USD4,000 thousand) and $106,225 (USD3,600 thousand),
respectively.
(3) Capital management
The Group’s objectives when managing capital are to safeguard the Group’s ability to continue as
a going concern in order to provide returns for shareholders and to maintain an optimal capital
structure to reduce the cost of capital.
(4) Financial instruments
A. Fair value information of financial instruments
Except for those listed in the table below, the carrying amounts of the Group’s financial
instruments not measured at fair value (including cash and cash equivalents, notes receivable,
accounts receivable (including related parties), other receivables, other current assets, other
non-current assets, short-term loans, notes payable, accounts payable (including related parties)
and other payables) are approximate to their fair values. The fair value information of financial
instruments measured at fair value is provided in Note 12(5).
B. Financial risk management policies
(a) The Group’s activities expose it to a variety of financial risks: market risk (including
foreign exchange risk, interest rate risk and price risk), credit risk and liquidity risk. The
-82-

Group’s overall risk management programme focuses on the unpredictability of financial
markets and seeks to minimize potential adverse effects on the Group’s financial position
and financial performance. The Group uses derivative financial instruments to hedge
certain risk exposures.
(b) Risk management is carried out by a central treasury department (Group treasury) under
policies approved by the Board of Directors. Group treasury identifies, evaluates and
hedges financial risks in close co-operation with the Group’s operating units. The Board
provides written principles for overall risk management, as well as written policies covering
specific areas and matters, such as foreign exchange risk, interest rate risk, credit risk, use
of derivative financial instruments and non-derivative financial instruments, and investment
of excess liquidity.
C. Significant financial risks and degrees of financial risks
(a) Market risk
Foreign exchange risk
The Group operates internationally and is exposed to foreign exchange risk arising from
various currency exposures, primarily with respect to the USD and RMB. Foreign exchange
risk arises from future commercial transactions, recognized assets and liabilities and net
investments in foreign operations.
Management has set up a policy to require group companies to manage their foreign
exchange risk against their functional currency. The group companies are required to hedge
their entire foreign exchange risk exposure with the Group treasury. To manage their
foreign exchange risk arising from future commercial transactions and recognized assets
and liabilities, entities in the Group use forward foreign exchange contracts, transacted with
Group treasury. Foreign exchange risk arises when future commercial transactions or
recognized assets or liabilities are denominated in a currency that is not the entity’s
functional currency.
The Group uses derivative financial instruments such as foreign exchange contracts and
swap contracts to hedge the expected transaction of recognized foreign currency
assets/liabilities to reduce the fair value risk and cash flow risk arising from fluctuations in
exchange rates.
D. The Group’s businesses involve some non-functional currency operations (the Company’s and
certain subsidiaries’ functional currency: NTD; other certain subsidiaries’ functional currency:
USD and RMB). The information on assets and liabilities denominated in foreign currencies
whose values would be materially affected by the exchange rate fluctuations is as follows:
-83-

Fo
reig
n C
urr
ency
Am
ount
(In T
ho
usa
nds)
E
xch
ange
Rat
e
Bo
ok V
alue
(NT
D)
Deg
ree
of
var
iati
on
Eff
ect
on p
rofi
t
or
loss
Eff
ect
on o
ther
com
pre
hen
sive
inco
me
(Fo
reig
n c
urr
ency
: fu
nct
ional
curr
ency
)
Fin
anci
al a
sset
s
M
onet
ary ite
ms
US
D:N
TD
US
D
445,8
64
32.8
300
14,6
37,7
15
$
1%
146,3
77
$
-$
US
D:R
MB
(N
ote
)U
SD
8
10,7
09
6.5
924
26,6
15,5
76
1%
266,1
56
-
Fin
anci
al lia
bilit
ies
M
onet
ary ite
ms
US
D:N
TD
US
D
815,2
97
32.8
300
26,7
66,2
01
$
1%
267,6
62
$
-$
US
D:R
MB
(N
ote
)U
SD
7
93,6
82
6.5
924
26,0
56,5
80
1%
260,5
66
-
JPY
:US
D (
No
te)
JPY
3,9
16,8
82
0.0
083
1,0
67,3
07
1%
10,6
73
-
Dec
ember
31,
2015
Yea
r en
ded
Dec
ember
31,
2015
Sen
siti
vit
y a
nal
ysi
s
-84-

Note
: T
he
funct
ional
curr
enci
es o
f ce
rtai
n s
ubsi
dia
ries
bel
ongin
g t
o t
he
Gro
up a
re n
ot
NT
D,
thus,
this
info
rmat
ion h
as t
o b
e co
nsi
der
ed w
hen
rep
ort
ing.
For
exam
ple
, w
hen
a s
ubsi
dia
ry’s
fun
ctio
nal
curr
ency i
s R
MB
, th
e su
bsi
dia
ry’s
seg
men
ts t
hat
are
involv
ed w
ith U
SD
hav
e to
be
tak
en i
nto
consi
der
atio
n.
Tota
l ex
chan
ge
(loss
) gai
n,
incl
udin
g r
eali
zed
and u
nre
aliz
ed a
risi
ng f
rom
sig
nif
ican
t fo
reig
n e
xch
ange
var
iati
on o
n t
he
monet
ary i
tem
s hel
d b
y t
he
Gro
up
for
the
yea
rs e
nd
ed D
ecem
ber
31, 2015 a
nd 2
014,
amounte
d t
o($
248,2
43)
and (
$447,3
47),
res
pec
tiv
ely.
Fo
reig
n C
urr
ency
Am
ou
nt
(In T
ho
usa
nd
s)
E
xch
ang
e
Rat
e
Bo
ok
Val
ue
(NT
D)
Deg
ree
of
var
iati
on
Eff
ect
on p
rofi
t
or
loss
Eff
ect
on o
ther
com
pre
hen
sive
inco
me
(Fo
reig
n c
urr
ency
: fu
nct
ional
cu
rren
cy)
Fin
anci
al a
sset
s
M
onet
ary ite
ms
US
D:N
TD
US
D
49
4,6
40
31
.62
00
15
,64
0,5
17
$
1%
15
6,4
05
$
-$
US
D:R
MB
(N
ote
)U
SD
7
81
,42
66
.25
12
2
4,7
08
,69
0
1
%2
47
,08
7
-
Fin
anci
al lia
bilit
ies
M
onet
ary ite
ms
US
D:N
TD
US
D
76
4,8
08
31
.62
00
24
,18
3,2
29
$
1%
24
1,8
32
$
-$
US
D:R
MB
(N
ote
)U
SD
8
75
,15
46
.25
12
2
7,6
72
,36
9
1
%2
76
,72
4
-
Dec
ember
31
, 2
01
4Y
ear
end
ed D
ecem
ber
31
, 2
01
4
Sen
siti
vit
y a
nal
ysi
s
-85-

Price risk
The Group is exposed to equity securities price risk because of investments held by the
Group and classified on the consolidated balance sheet either as available-for-sale or at fair
value through profit or loss. The Group is not exposed to commodity price risk. To manage
its price risk arising from investments in equity securities, the Group diversifies its portfolio.
Diversification of the portfolio is done in accordance with the limits set by the Group.
The Group’s investments in equity securities comprise domestic listed and unlisted stocks.
The prices of equity securities would change due to the change of the future value of
investee companies. If the prices of these equity securities had increased/decreased by 1%
with all other variables held constant, post-tax profit for the years ended December 31,
2015 and 2014 would have increased/decreased by $52,936 and $55,233, respectively.
Interest rate risk
The Group’s interest rate risk arises from long-term borrowings. Borrowings issued at
variable rates expose the Group to cash flow interest rate risk which is partially offset by
cash and cash equivalents held at variable rates. During the years ended December 31, 2015
and 2014, the Group’s borrowings at variable rate were denominated in the NTD, USD and
JPY.
At December 31, 2015 and 2014, if market interest rates had been 0.25% higher with all
other variables held constant, other comprehensive income for the years ended December
31, 2015 and 2014 would have been $6,346 and $2,024 higher, respectively.
(b) Credit risk
i. Credit risk refers to the risk of financial loss to the Group arising from default by the
clients or counterparties of financial instruments on the contract obligations. According
to the Group’s credit policy, each local entity in the Group is responsible for managing
and analyzing the credit risk for each of their new clients before standard payment and
delivery terms and conditions are offered. Internal risk control assesses the credit
quality of the customers, taking into account their financial position, past experience
and other factors. Individual risk limits are set based on internal or external ratings in
accordance with limits set by the Board of Directors. The utilization of credit limits is
regularly monitored. Credit risk arises from cash and cash equivalents, derivative
financial instruments and deposits with banks and financial institutions, as well as credit
exposures to wholesale and retail customers, including outstanding receivables.
ii. No credit limits were exceeded during the reporting periods, and management does not
expect any significant losses from non-performance by these counterparties.
-86-

iii. The credit quality information of accounts receivable (including related party) that are
neither past due nor impaired is as follows:
Group 1: Low-risk customers with larger scale of operations and better credits.
Group 2: Other normal-risk customers.
iv. The ageing analysis of accounts receivable that were past due but not impaired is as
follows:
v. The analysis of the Group’s accounts receivable that were impaired is as follows:
(1) As of December 31, 2015 and 2014, the Group’s accounts receivable that were impaired
amounted to $103,065 and $95,330, respectively.
(2) Movements on the Group provision for impairment of accounts receivable are as
follows:
(c) Liquidity risk
i. Cash flow forecasting is performed in the operating entities of the Group and
aggregated by Group treasury. Group treasury monitors rolling forecasts of the Group’s
liquidity requirements to ensure it has sufficient cash to meet operational needs while
maintaining sufficient headroom on its undrawn committed borrowing facilities at all
times so that the Group does not breach borrowing limits or covenants on any of its
borrowing facilities. Such forecasting takes into consideration the Group’s debt
December 31, 2015 December 31, 2014
Group 1 9,461,033$ 9,216,770$
Group 2 7,831,116 9,561,612
17,292,149$ 18,778,382$
December 31, 2015 December 31, 2014
Up to 30 days 633,697$ 261,079$
31 to 120 days 475,976 113,314
121 to 215 days 1,578 2,505
1,111,251$ 376,898$
Individual provision 2015 2014
At January 1 95,330$ 115,458$
Provision of impairment - 33,710
Reversal of bad debts 3,801)( 5,087)(
Write-offs during the period - 53,151)(
Acquired from business
combinations
12,161 -
Effect of exchange rate changes 625)( 4,400
At December 31 103,065$ 95,330$
-87-

financing plans, covenant compliance, compliance with internal balance sheet ratio
targets and, if applicable external regulatory or legal requirements.
ii. Group treasury invests surplus cash in interest bearing current accounts, time deposits
and marketable securities, choosing instruments with appropriate maturities or
sufficient liquidity to provide sufficient head-room as determined by the
above-mentioned forecasts. As at December 31, 2015 and 2014, the Group held money
market position of $6,306,397 and $7,108,250, respectively, that are expected to readily
generate cash inflows for managing liquidity risk.
iii. The table below analyses the Group’s non-derivative financial liabilities and net-settled
or gross-settled derivative financial liabilities into relevant maturity groupings based on
the remaining period at the balance sheet date to the contractual maturity date for
non-derivative financial liabilities and to the expected maturity date for derivative
financial liabilities. The amounts disclosed in the table are the contractual undiscounted
cash flows.
Derivative financial liabilities
As of December 31, 2015 and 2014, the Group’s derivative financial liabilities were all less
than one year.
(3) Fair value information
A. Details of the fair value of the Group’s financial assets and financial liabilities not measured at
fair value are provided in Note 12(4)A. Details of the fair value of the Group’s investment
property measured at cost are provided in Note 6(10).
B. The different levels that the inputs to valuation techniques are used to measure fair value of
financial and non-financial instruments have been defined as follows:
Level 1: Quoted prices (unadjusted) in active markets for identical assets or liabilities that the
Non-derivative financial liabilities:
December 31, 2015 Less than 1 year Over 1 year
Short-term borrowings 2,482,978$ -$
Notes payable 16,298 -
Accounts payable (including related parties) 19,088,445 -
Other payables (including related parties) 7,181,716 -
Long-term borrowings (including current portion) - 2,494,480
Non-derivative financial liabilities:
December 31, 2014 Less than 1 year Over 1 year
Short-term borrowings 2,100,304$ -$
Notes payable 31,341 -
Accounts payable (including related parties) 19,540,447 -
Other payables (including related parties) 6,939,367 -
Long-term borrowings (including current portion) 411,060 534,638
-88-

entity can access at the measurement date. A market is regarded as active where a
market in which transactions for the asset or liability take place with sufficient
frequency and volume to provide pricing information on an ongoing basis. The fair
value of the Group’s investment in listed stocks (including emerging stocks),
beneficiary certificates and convertible bonds, is included in Level 1
Level 2: Inputs other than quoted prices included within Level 1 that are observable for the
asset or liability, either directly or indirectly. The fair value of the Group’s investment
in private placement of listed shares and most derivative instruments is included in
Level 2.
Level 3: Unobservable inputs for the asset or liability. The fair value of the Group’s
investment in certain derivative instruments is included in Level 3.
C. The related information of financial and non-financial instruments measured at fair value by
level on the basis of the nature, characteristics and risks of the assets and liabilities at
December 31, 2015 and 2014 is as follows:
December 31, 2015 Level 1 Level 2 Level 3 Total
Assets
Recurring fair value
measurements
Financial assets at fair value
through profit or loss
Forward exchange
contracts
-$ 429,105$ -$ 429,105$
Futures contracts - - 8,324 8,324
Derivative financial assets for
hedging available-for-sale
financial assets
Equity securities 3,651,413 166,064 - 3,817,477
Debt securities 272,798 - - 272,798
Beneficiary certificates 1,476,075 - - 1,476,075
Total 5,400,286$ 595,169$ 8,324$ 6,003,779$
Liabilities
Recurring fair value
measurements
Financial liabilities at fair
value through profit or loss
Forward exchange contracts -$ 107,399$ -$ 107,399$
-89-

D. The methods and assumptions the Group used to measure fair value are as follows:
(a) The instruments the Group used market quoted prices as their fair values (that is, Level 1)
are listed below by characteristics:
(b) Except for financial instruments with active markets, the fair value of other financial
instruments is measured by using valuation techniques or by reference to counterparty
quotes.
(c) The valuation of derivative financial instruments is based on valuation model widely
accepted by market participants. Forward exchange contracts are usually valued based on
the current forward exchange rate.
(d) The output of valuation model is an estimated value and the valuation technique may not be
able to capture all relevant factors of the Group’s financial and non-financial instruments.
Therefore, the estimated value derived using valuation model is adjusted accordingly with
additional inputs, for example, model risk or liquidity risk and etc. In accordance with the
Group’s management policies and relevant control procedures relating to the valuation
December 31, 2014 Level 1 Level 2 Level 3 Total
Assets
Recurring fair value
measurements
Financial assets at fair value
through profit or loss
Forward exchange
contracts
-$ 259,362$ -$ 259,362$
Futures contracts - 185 8,017 8,202
Available-for-sale
financial assets
Equity securities 5,107,670 381,757 - 5,489,427
Debt securities - 10,600 - 10,600
Beneficiary certificates 33,885 - - 33,885
Total 5,141,555$ 651,904$ 8,017$ 5,801,476$
Liabilities
Recurring fair value
measurements
Financial liabilities at fair
value through profit or
Forward exchange contracts -$ 141,668$ -$ 141,668$
SWAP - 1,720 - 1,720
Listed Emerging Open-end Convertible
shares stocks fund bond
Market quoted price Closing price Average trades
price
Net asset value Closing price
-90-

models used for fair value measurement, management believes adjustment to valuation is
necessary in order to reasonably represent the fair value of financial and non-financial
instruments at the balance sheet date. The inputs and pricing information used during
valuation are carefully assessed and adjusted based on current market conditions.
(e) The Group takes into account adjustments for credit risks to measure the fair value of
financial and non-financial instruments to reflect credit risk of the counterparty and the
Group’s credit quality.
E. For the years ended December 31, 2015 and 2014, there was no transfer between Level 1 and
Level 2.
F. For the years ended December 31, 2015 and 2014, there was no transfer into or out from Level
3.
G. The Group treasury is in charge of valuation procedures for fair value measurements being
categorized within Level 3, which is to verify independent fair value of financial instruments.
Such assessment is to ensure the valuation results are reasonable by applying independent
information to make results close to current market conditions, confirming the source of
information is independent, reliable and in line with other sources and represented as the
exercisable price, and frequently calibrating valuation model, performing back-testing,
updating inputs used to the valuation model and making any other necessary adjustments to the
fair value.
13. SUPPLEMENTARY DISCLOSURES
(1) Significant transactions information
A. Loans to others: Please refer to table 1.
B. Provision of endorsements and guarantees to others: Please refer to table 2.
C. Holding of marketable securities at the end of the period (not including subsidiaries, associates
and joint ventures): Please refer to table 3.
D. Acquisition or sale of the same security with the accumulated cost exceeding $300 million or
20% of the Company’s paid-in capital: Please refer to table 4.
E. Acquisition of real estate reaching NT$300 million or 20% of paid-in capital or more: Please
refer to table 5.
F. Disposal of real estate reaching NT$300 million or 20% of paid-in capital or more: None.
G. Purchases or sales of goods from or to related parties reaching NT$100 million or 20% of
paid-in capital or more: Please refer to table 6.
H. Receivables from related parties reaching NT$100 million or 20% of paid-in capital or more:
Please refer to table 7.
-91-

I. Trading in derivative instruments undertaken during the reporting periods: Please refer to Notes
6(2), 6(24) and 12(4).
J. Significant inter-company transactions during the reporting periods: Please refer to table 8.
(2) Information on investees
Names, locations and other information of investee companies (not including investees in
Mainland China): Please refer to table 9.
(3) Information on investments in Mainland China
A. Basic information: Please refer to table 10.
B. Significant transactions, either directly or indirectly through a third area, with investee
companies in the Mainland Area: Please refer to table 13(1).
14. SEGMENT INFORMATION
(1) General information
The Group operates business from a geographic perspective; geographically, the Group currently
focuses on wholesale in Taiwan, Mainland China, America, and Europe.
(2) Measurement of segment information
The chief operating decision-maker evaluates the performance of the operating segments based on
a measure of adjusted EBITDA. Interest income and expense are not allocated to operating
segments, as this type of activity is driven by the Group treasury, which manages the cash position
of the group. The accounting policies of the operating segments are in agreement with the
significant accounting policies summarized in Note 4.
(3) Information about segment profit or loss, assets and liabilities
The segment information provided to the chief operating decision-maker for the reportable
segments is as follows:
(4) Reconciliation for segment income
The revenue from external customers reported to the chief operating decision-maker is measured
in a manner consistent with that in the statement of comprehensive income. A reconciliation of
reportable segment profit or loss to the profit before tax and discontinued operations for the years
Year ended December 31, 2015 Taiwan Mainland China America Europe Total
Revenue from external
customers 59,915,694$ 17,984,271$ 1,819,184$ 944,220$ 80,663,369$
Segment profit 1,770,255$ 4,267,899$ 612,120$ 68,274$ 6,718,548$
Year ended December 31, 2014 Taiwan Mainland China America Europe Total
Revenue from external
customers 59,507,153$ 18,020,200$ 1,495,757$ 1,087,582$ 80,110,692$
Segment profit 1,887,643$ 3,472,348$ 1,272,269$ 37,772$ 6,670,032$
-92-

ended December 31, 2015 and 2014 is provided as follows:
(5) Information on products and services
Revenue from third parties is mainly derived from the sale of computer peripheral products,
consumer electronic products and other electronic products as follows:
(6) Geographical information
Geographical information for the years ended December 31, 2015 and 2014 is as follows:
The Group’s geographical revenue information is determined based on the area collecting the
accounts receivable.
Non-current assets include property, plant and equipment, investment assets, intangible assets and
other assets, but excluding financial assets and deferred income tax assets.
2015 2014
Reportable segments income 6,718,548$ 6,670,032$
Related loss not yet classified 2,113,285)( 1,988,363)(
Total non-operating revenue and expenses 724,085 924,188
Income before tax from continuing operations 5,329,348$ 5,605,857$
Years ended December 31,
2015 2014
Computer peripheral products 39,182,665$ 41,780,729$
Consumer electronic products 26,908,776 21,707,033
Other electronic products 14,571,928 16,622,930
Total $ 80,663,369 $ 80,110,692
Years ended December 31,
Revenue
Non-current
assets Revenue
Non-current
assets
Domestic 59,915,694$ 5,498,684$ 59,507,153$ 4,756,922$
Asia 17,984,271 13,170,103 18,020,200 10,563,486
US 1,819,184 89,641 1,495,757 113,939
Europe 944,220 4,394 1,087,582 7,095
Total 80,663,369$ 18,762,822$ 80,110,692$ 15,441,442$
Year ended December 31, 2015 Year ended December 31, 2014
-93-

(7) Major customer information
Revenue % Selling department
Company A 9,412,409$ 12 Asia
Revenue % Selling department
Company A 9,336,801$ 12 Asia
Year ended December 31, 2015
Year ended December 31, 2014
-94-

一○二年股東常會
日期:中華民國一○二年六月十一日上午九時正
地點:新 北 市 五 股 區 五 工 六 路 二 十 五 號
一〇三年股東常會
中華民國一〇三年五月三十日上午九時正
14411P0314-00A-00D議.indd 1 2014/4/24 下午4:35
公開資訊觀測站網址:
http://mops.twse.com.tw/
本公司網址: 中國信託商業銀行代理部網址:
http://www.chicony.com.tw/ https://ecorp.ctbcbank.com/cts/index.jsp
群光電子股份有限公司 地址:新北市五股區五工六路二十五號
Chicony Electronics Co., Ltd. 電話:02-22988120 傳真:02-22989414
Market Observation Post System URL:
http://mops.twse.com.tw/
Chicony URL:
http://www.chicony.com.tw/
CTBC Bank Co Ltd URL:
https://ecorp.ctbcbank.com/cts/index.jsp
Chicony Electronics Co., Ltd
No.25, Wu-Gong 6th. Rd., Wu-Ku Industrial Park , New Ta ipe i C i ty 24891 , Ta iwanTel : 886-2-22988120 Fax : 886-2-22988442
Ticker Number: 2385
Chicony Electronics CO., Ltd.
Annual Report 2015
16429P0531-00A-00D-E2.indd 1 2016/5/12 下午10:40